UNITED STATES
SECURITIES AND EXCHANGE COMMISSION
Washington, D.C. 20549
FORM N-CSR
CERTIFIED SHAREHOLDER REPORT OF REGISTERED
MANAGEMENT INVESTMENT COMPANIES
Investment Company Act file number: 811-05639
Pacholder High Yield Fund, Inc.
(Exact name of registrant as specified in charter)
245 Park Avenue
New York, NY 10167
(Address of principal executive offices) (Zip code)
Frank J. Nasta
245 Park Avenue
New York, NY 10167
(Name and Address of Agent for Service)
Registrant’s telephone number, including area code: (513) 985-3200
Date of fiscal year end: December 31
Date of reporting period: January 1, 2008 through December 31, 2008
Form N-CSR is to be used by management investment companies to file reports with the Commission not later than 10 days after the transmission to stockholders of any report that is required to be transmitted to stockholders under Rule 30e-1 under the Investment Company Act of 1940 (17 CFR 270.30e-1). The Commission may use the information provided on Form N-CSR in its regulatory, disclosure review, inspection, and policymaking roles.
A registrant is required to disclose the information specified by Form N-CSR, and the Commission will make this information public. A registrant is not required to respond to the collection of information contained in Form N-CSR unless the Form displays a currently valid Office of Management and Budget (“OMB”) control number. Please direct comments concerning the accuracy of the information collection burden estimate and any suggestions for reducing the burden to Secretary, Securities and Exchange Commission, 450 Fifth Street, NW, Washington, DC 20549-0609. The OMB has reviewed this collection of information under the clearance requirements of 44 U.S.C. Section 3507.
ITEM 1. REPORTS TO STOCKHOLDERS.
The following is a copy of the report transmitted to shareholders pursuant to Rule 30e-1 under the Investment Company Act of 1940 (17 CFR 270.30e-1).
PACHOLDER HIGH YIELD FUND, INC.
Directors and Officers
| | |
Gary J. Madich, CFA President Robert L. Young Senior Vice President Patricia A. Maleski Vice President,
Chief Administrative Officer
and Treasurer Stephen M. Ungerman Chief Compliance Officer Jessica K. Ditullio Secretary | | Cheryl Ballenger Chairperson and Director Jerry B. Lewis Director John R. Rettberg Director John F. Ruffle Director Ken Whipple, Jr. Director John F. Williamson Director |
Investment Objective
A closed-end fund seeking a high level of total return
through current income and capital appreciation by
investing primarily in high-yield, fixed income securities
of domestic companies.
Investment Advisor
J.P. Morgan Investment Management Inc.
Administrator
JPMorgan Funds Management, Inc.
Custodian
JPMorgan Chase Bank, N.A.
Transfer Agent
Computershare Investor Services, LLC
Legal Counsel
Sullivan & Cromwell LLP
Independent Registered Public Accounting Firm
PricewaterhouseCoopers LLP
Independent Directors’ Counsel
Bingham McCutchen LLP
Executive Offices
Pacholder High Yield Fund, Inc.
245 Park Avenue
New York, NY 10167
Shareholder Services
(877) 217-9502
Please visit our web site, www.phf-hy.com, for information on the Fund’s NAV, share price, news releases, and SEC filings. We created this site to provide stockholders quick and easy access to the timeliest information available regarding the Fund.
This report is for the information of stockholders of Pacholder High Yield Fund, Inc. It is not a prospectus, offering circular or other representation intended for use in connection with the purchase or sale of shares of the Fund or any securities mentioned in this report.
PACHOLDER HIGH YIELD FUND, INC.
ANNUAL REPORT
DECEMBER 31, 2008
PACHOLDER HIGH YIELD FUND, INC.
(Unaudited)
January 28, 2009
Dear Stockholders:
The high-yield market experienced its worst year of performance in 2008, as the Credit Suisse High Yield Index, Developed Countries Only (the “Index”) returned -26.09%. This loss was more than four times greater than that of 2000, the previous worst year, when the Index returned -6.19%. Much of the negative return for the Index was generated in the fourth quarter of 2008, by far the worst quarter for risk assets in the year. The quarter began with an October equity crisis that was concentrated in several manic trading days early in the month, as confidence evaporated due to more failures of major financial institutions. Authorities around the world mounted a massive response. Governments across Europe — including those of Great Britain, Austria, Denmark, Germany, Sweden and Greece — increased their deposit guarantee programs in an effort to shore up confidence, while central banks coordinated interest rate cuts. Meanwhile, the U.S. Federal Reserve (Fed) expanded its balance sheet aggressively with purchases of commercial paper and money market fund assets. Further attempts to stop the hemorrhaging included bank capital injections and inter-bank loan guarantees, with the European Union pledging some £1.5 trillion and the U.S. Treasury dedicating $250 billion of its Troubled Asset Relief Program (TARP) to recapitalizing domestic banks.
For the year ended December 31, 2008, the Fund posted a -48.01%* return, based on Net Asset Value (“NAV”), underperforming the -40.82% return of the Morningstar Closed-End High Yield Category and the -26.09% return of the Index.
The Fund’s relative underperformance during the year, based on NAV, was due to its underweight in BB-rated securities, which outperformed the Index as a whole, and overweights in certain sectors that performed below the Index average, including information technology, broadcasting and transportation. Other detractors from performance included the forest products/containers and information technology segments of the market. Alternatively, the Fund’s underweights in the housing and retail sectors aided performance versus the Index during the year.
The Fund posted a -37.80% return, based on NAV, for the fourth quarter ended December 31, 2008, underperforming the -26.62% average total return of the Morningstar Closed-End High Yield Category and the Index’s -18.71% total return. The performance of the high-yield market during the fourth quarter was very mixed: the Index posted a -15.71% return in October, as the financial crisis hit full stride and equity markets collapsed. November began on the slightly positive side following the election but turned sharply negative as selling by hedge funds raising cash to reduce debt or meet expected redemptions continued unabated. As a result, the Index returned -8.71% for November. The first half of December continued the sharp sell-off; however, as some buyers stepped into the market and the GMAC restructuring was completed, allowing access to TARP funds, the market rallied back strongly, and the Index ended the month up 5.64%. Results for broad equity indexes during the fourth quarter clearly showed the equity markets’ concern about the financial crisis and sharp drop-off in the economy and credit markets. The Russell 2000, S&P 500, NASDAQ Composite and Dow Jones Industrial Indexes returned -26.12%, -21.94%, -24.37% and -18.38%, respectively, for the quarter.
The Moody’s global speculative-grade issuer-based default rate closed 2008 at 4.0%, up from the extremely low rate of 0.9% at the end of 2007. Moody’s currently believes that the trailing 12-month default rate will rise to 15.1% by the end of 2009, more than three times its historical average of approximately 5%.
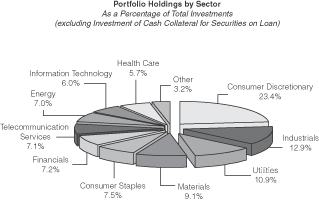
The Fund is well-diversified, with investments in 191 issuers in 55 different industries. As of December 31, 2008, the Fund’s largest industry concentration was in media, which accounted for 11.1% of the Fund’s total market value (excluding investments of cash collateral for securities loaned) at year-end.
During the fourth quarter, the high-yield market sustained an unprecedented drop, resulting in record-low prices and wide spreads, due to the crisis in the financial sector, rapid decline in the economy, hedge fund liquidations, plummeting equity markets and a drop in Treasury rates, with intermediate Treasuries falling anywhere from 143 and 177 basis points (bps). The average price of the index dropped 18.28 bps from 79.87 to 61.59, the average yield rose 585 bps from 13.10% to 18.95%, and the spread over the comparable Treasuries widened 705 bps from 1002 to 1707 bps.
Auction Rate Preferred Shares and Dividend
Since February 2008, most auctions for preferred shares of closed-end funds and auction rate securities of other issuers have failed. The weekly auction for the ARPS has failed since February 13, 2008. Since that time, a number of broker-dealers have announced that they will offer to repurchase auction rate securities from certain of their clients. Any action taken by the Fund to provide liquidity to the ARPS must be in the best interest of the Fund as a whole. The Fund has not been able to identify financing to redeem the ARPS that satisfies this requirement. As indicated below, the Fund has made two voluntary redemptions totaling 920 shares
PACHOLDER HIGH YIELD FUND, INC.
(Unaudited)
of the 2640 outstanding shares of the ARPS. To the extent that the Fund determines that additional redemptions are in the best interest of the Fund as a whole, we will post additional information on the Fund’s website and keep shareholders informed.
On November 26, 2008, the Fund announced that it was not permitted to pay the November monthly dividend on December 9, 2008, because the Fund’s asset coverage was less than 200% for its Auction Rate Preferred Shares (ARPS). The Fund also indicated that it would be unable to resume the declaration and payment of dividends until the asset coverage requirements were met. During December, the Fund issued notices to redeem 920 shares of ARPS, allowing the Fund to resume the declaration and payment of monthly dividends. The Fund declared a dividend in the amount of $0.13 on December 11, 2008, consisting of $0.075 in lieu of the cancelled November dividend and $0.055 for the December dividend.
In addition to the dividend announced above, the Board of Directors authorized the Fund to resume the declaration and payment of a monthly dividend, beginning in January 2009 and expects that the Fund would redeem additional shares of ARPS to the extent necessary for the Fund to maintain an asset coverage of at least 200% for the ARPS after payment of all dividends. From October 2003 until November 2008, the Fund paid a monthly of dividend of $0.075. Due to the redemption of the ARPS described above, and current market and economic conditions, the Fund anticipates that monthly dividends will be $0.055, beginning in January 2009.
Management believes that the lower monthly dividend is necessary to allow the Fund to continue to declare and pay monthly dividends, given the Fund’s reduced amount of leverage and current market conditions. In the event that the Fund does not meet its asset coverage requirements and is not able to declare or pay a dividend, shareholders will be notified. The Fund has posted an updated Q&A on the Fund’s website at www.phf-hy.com, which is intended to provide shareholders with additional information concerning asset coverage requirements and the impact that such requirements have on the ability to declare and pay dividends.
Fund Strategy and Outlook
We are continuing the Fund’s dual strategy of increasing positions that we expect will have lower credit volatility, such as senior secured loans (17.37% of the Fund) and investment-grade securities (BBB- or higher), which now accounts for 2.55% of the Fund (up from 0.28% in December 2007), while selectively investing in total return opportunities. The investment team continued to cull the Fund of issues with poor structure and sell credits that we believe are overvalued or that have unfavorable risk/reward characteristics.
Given the historical wide spreads in the credit markets, we have begun the process of searching for oversold, total return investments. While we think it remains too early in the cycle for a systematic increase in risk, it is time to begin to selectively add incremental total return investments to the Fund as our research discovers such opportunities.
As always, we appreciate your interest in the Fund and look forward to your continued support.
Sincerely,

Gary J. Madich, CFA
President
January 28, 2009
* The return shown is based on net asset value and may differ from the return shown in the financial highlights which reflect adjustments made to the net asset value in accordance with accounting principles generally accepted in the United States of America.
The performance quoted is past performance and is not a guarantee of future results. Closed-end funds are subject to certain market risks. Investment returns and principal value of an investment will fluctuate so that an investor’s shares, when sold, may be worth more or less than their original cost. Current performance may be higher or lower than the performance data shown.
PACHOLDER HIGH YIELD FUND, INC.
(Unaudited)
JPMorgan Asset Management is the marketing name for the asset management businesses of JPMorgan Chase & Co. Those businesses include, but are not limited to, J.P. Morgan Investment Management Inc., JPMorgan Investment Advisors, Inc., Security Capital Research & Management Incorporated and J.P. Morgan Alternative Asset Management, Inc.
Securities rated below investment grade are called “high-yield bonds,” “non-investment grade bonds,” “below investment-grade bonds,” or “junk bonds.” They generally are rated in the fifth or lower rating categories of Standard & Poor’s and Moody’s Investors Service. Although these securities tend to provide higher yields than higher-rated securities, there is a greater risk that the Fund’s share value will decline. Because this Fund primarily invests in bonds, it is subject to interest rate risks. Bond prices generally fall when interest rates rise.
Opinions and estimates offered constitute our judgment and are subject to change without notice, as are statements of financial market trends, which are based on current market conditions. We believe the information provided here is reliable, but do not warrant its accuracy or completeness. This material is not intended as an offer or solicitation for the purchase or sale of any financial instrument. The views and strategies described may not be suitable for all investors. This material has been prepared for informational purposes only, and is not intended to provide, and should not be relied on for, accounting, legal or tax advice. References to future returns are not promises or even estimates of actual returns a client portfolio may achieve. Any forecasts contained herein are for illustrative purposes only and are not to be relied upon as advice or interpreted as a recommendation.
Portfolio Holdings Availability
No sooner than 10 days after the end of each month, the Fund’s uncertified complete schedule of its portfolio holdings will be available on our website (www.phf-hy.com). In addition, the Fund files its certified, complete schedule of its portfolio holdings with the U.S. Securities and Exchange Commission (“SEC”) for the first and third quarters of each fiscal year on Form N-Q. The Fund’s Form N-Qs are available, without charge, on the SEC’s website at www.sec.gov. The Fund’s Form N-Qs may be reviewed and copied at the SEC’s Public Reference Room in Washington, DC. Information on the operation of the Public Reference Room may be obtained by calling 1-800-SEC-0330.
No sooner than 10 calendar days after the end of each month, the Fund’s top 10 holdings as of the last day of each month as well as certain other fund facts and statistical information will also be available on the Fund’s website.
Figure 1
| | | | | | | | |
Total Return ** | | Net Asset Value
(NAV) | | | Market Price | |
Six Months | | | (45.09 | )% | | | (51.68 | )% |
1 Year | | | (48.01 | )% | | | (47.76 | )% |
5 Year | | | (3.93 | )% | | | (7.34 | )% |
10 Year | | | (0.31 | )% | | | (2.46 | )% |
| | | | | | | | |
Price per share at December 31, 2008 | | $ | 4.14 | | | $ | 3.68 | |
| | | | | | | | |
** Total returns assume the reinvestment off all dividends and capital gains, if any.
PACHOLDER HIGH YIELD FUND, INC.
Statement of Net Assets Applicable to Common Stockholders
As of December 31, 2008
| | | | | | | | | |
| Description | | Par (000) | | Value | | Percent
of Net
Assets* | |
| | | | | | | | | |
CORPORATE BONDS — 139.6% | | | | | | | | | |
AEROSPACE & DEFENSE — 0.4% | | | | | | | | | |
L-3 Communications Corp., Sr Nt, 6.375%, 10/15/15 | | $ | 250 | | $ | 233,750 | | 0.4 | % |
| | | | | | | | | |
AIRLINES — 4.8% | | | | | | | | | |
American Airlines, Inc., Nt,
3.363%, 10/18/093,9 | | | 369 | | | 314,944 | | 0.6 | |
American Airlines, Pass Through Trust 1991, Collateral Trust Notes, 10.180%, 01/02/139 | | | 1,223 | | | 660,643 | | 1.2 | |
American Airlines, Pass Through Trust 1991, Private Placement, Nt, 10.320%, 07/30/142,9 | | | 743 | | | 379,154 | | 0.7 | |
Continental Airlines, Inc., Pass Thru Cert, 9.798%, 04/01/2110 | | | 1,418 | | | 800,978 | | 1.5 | |
Continental Airlines, Inc., Unsubordinated, 8.750%, 12/01/11 | | | 250 | | | 146,875 | | 0.3 | |
Delta Air Lines, Inc.,
7.111%, 09/18/11 | | | 100 | | | 80,000 | | 0.2 | |
8.300%, 12/15/291,4,6 | | | 1,145 | | | 22,900 | | 0.0 | 12 |
10.125%, 05/15/101,4 | | | 500 | | | 9,375 | | 0.0 | 12 |
UAL Pass Through Trust, Series 2007-1, Nt, Private Placement, VAR,
5.359%, 07/02/142,9 | | | 182 | | | 94,897 | | 0.2 | |
7.336%, 07/02/192 | | | 90 | | | 47,045 | | 0.1 | |
| | | | | | | | | |
| | | | | | 2,556,811 | | 4.8 | |
AUTO COMPONENTS — 0.0%12 | | | | | | | | | |
Delphi Corp., 7.125%, 05/01/291,4 | | | 725 | | | 10,875 | | 0.0 | 12 |
| | | | | | | | | |
AUTOMOBILES — 1.2% | | | | | | | | | |
Ford Motor Co., Debentures, 7.125%, 11/15/25 | | | 400 | | | 94,000 | | 0.2 | |
Ford Motor Co., Nt, | | | | | | | | | |
7.450%, 07/16/3110 | | | 500 | | | 140,000 | | 0.3 | |
9.980%, 02/15/4710 | | | 400 | | | 84,000 | | 0.1 | |
General Motors Corp., Debentures, 6.750%, 05/01/28 | | | 50 | | | 8,250 | | 0.0 | 12 |
8.100%, 06/15/2410 | | | 1,725 | | | 258,750 | | 0.5 | |
8.375%, 07/15/33 | | | 450 | | | 78,750 | | 0.1 | |
| | | | | | | | | |
| | | | | | 663,750 | | 1.2 | |
| | | | | | | | | |
| Description | | Par (000) | | Value | | Percent
of Net
Assets* | |
| | | | | | | | | |
BEVERAGES — 2.7% | | | | | | | | | |
Constellation Brands, Inc., Sr Nt, 7.250%, 05/15/17 | | $ | 500 | | $ | 472,500 | | 0.9 | % |
8.375%, 12/15/14 | | | 1,025 | | | 973,750 | | 1.8 | |
| | | | | | | | | |
| | | | | | 1,446,250 | | 2.7 | |
BUILDING PRODUCTS — 0.4% | |
Associated Materials, Inc., Sr Nt, 11.250%, 03/01/147 | | | 400 | | | 222,000 | | 0.4 | |
| | | | | | | | | |
CHEMICALS — 4.0% | |
Airgas, Inc., Private Placement,
7.125%, 10/01/182 | | | 250 | | | 213,750 | | 0.4 | |
Mosaic Co. (The), Private Placement, Sr Nt, | | | | | | |
7.375%, 12/01/142 | | | 125 | | | 102,500 | | 0.2 | |
7.625%, 12/01/162 | | | 125 | | | 100,000 | | 0.2 | |
PolyOne Corp., Nt,
8.875%, 05/01/1210 | | | 1,750 | | | 901,250 | | 1.7 | |
Sterling Chemicals, Inc.,
10.250%, 04/01/15 | | | 350 | | | 311,500 | | 0.6 | |
Terra Capital, Inc., Sr Nt,
7.000%, 02/01/17 | | | 525 | | | 385,875 | | 0.7 | |
Westlake Chemical Corp.,
6.625%, 01/15/16 | | | 250 | | | 145,000 | | 0.2 | |
| | | | | | | | | |
| | | | | | 2,159,875 | | 4.0 | |
COMMERCIAL BANKS — 0.7% | | | | | | | | | |
National City Bank, 5.800%, 06/07/17 | | | 250 | | | 212,415 | | 0.4 | |
National City Bank of Indiana,
4.250%, 07/01/18 | | | 250 | | | 175,225 | | 0.3 | |
| | | | | | | | | |
| | | | | | 387,640 | | 0.7 | |
COMMERCIAL SERVICES & SUPPLIES — 2.0% | | | | | | |
Cenveo Corp., Private Placement, 10.500%, 08/15/162 | | | 1,000 | | | 580,000 | | 1.1 | |
Cenveo Corp., Sr Sub Nt,
7.875%, 12/01/13 | | | 325 | | | 169,812 | | 0.3 | |
Harland Clarke Holdings Corp., VAR, 6.899%, 05/15/15 | | | 200 | | | 64,000 | | 0.1 | |
9.500%, 05/15/15 | | | 450 | | | 171,000 | | 0.3 | |
Quebecor World Capital Corp., Sr Nt, (Canada), | | | | | | |
6.125%, 11/15/131,4,10 | | | 1,100 | | | 30,250 | | 0.0 | 12 |
8.750%, 03/15/161,4,10 | | | 500 | | | 39,375 | | 0.1 | |
Quebecor World, Inc., Sr Nt, (Canada), 9.750%, 01/15/151,4,10 | | | 450 | | | 35,438 | | 0.1 | |
| | | | | | | | | |
| | | | | | 1,089,875 | | 2.0 | |
4
PACHOLDER HIGH YIELD FUND, INC.
Statement of Net Assets Applicable to Common Stockholders (continued)
As of December 31, 2008
| | | | | | | | | |
| Description | | Par (000) | | Value | | Percent
of Net
Assets* | |
| | | | | | | | | |
COMPUTERS & PERIPHERALS — 0.2% | | | | | | |
Seagate Technology HDD Holdings, (Cayman Islands), 6.800%, 10/01/16 | | $ | 250 | | $ | 130,000 | | 0.2 | % |
| | | | | | | | | |
CONSTRUCTION ENGINEERING — 1.1% | | | | | | |
United Rentals North America, Inc., Co
Guar, 6.500%, 02/15/12 | | | 750 | | | 592,500 | | 1.1 | |
| | | | | | | | | |
CONSTRUCTION MATERIALS — 0.3% | | | | | | |
Hanson Ltd., (United Kingdom),
6.125%, 08/15/16 | | | 500 | | | 174,122 | | 0.3 | |
| | | | | | | | | |
CONSUMER FINANCE — 5.5% | | | | | | | | | |
ACE Cash Express, Inc., Private
Placement, Sr Nt, 10.250%, 10/01/142 | | | 1,000 | | | 200,000 | | 0.4 | |
Ford Motor Credit Co. LLC, VAR,
7.569%, 01/13/12 | | | 1,000 | | | 650,000 | | 1.2 | |
Ford Motor Credit Co. LLC, Nt,
8.000%, 12/15/1610 | | | 700 | | | 455,957 | | 0.9 | |
8.625%, 11/01/1010 | | | 1,330 | | | 1,006,847 | | 1.9 | |
GMAC LLC, Private Placement, VAR, | | | | | | | | | |
4.403%, 12/01/142 | | | 307 | | | 171,920 | | 0.3 | |
6.625%, 05/15/122 | | | 158 | | | 122,969 | | 0.2 | |
8.000%, 11/01/312 | | | 567 | | | 337,019 | | 0.6 | |
| | | | | | | | | |
| | | | | | 2,944,712 | | 5.5 | |
CONSUMER PRODUCTS — 2.6% | | | | | | | | | |
Central Garden and Pet Co.,
9.125%, 02/01/13 | | | 175 | | | 103,250 | | 0.2 | |
Jarden Corp., 7.500%, 05/01/17 | | | 1,300 | | | 887,250 | | 1.6 | |
Spectrum Brands, Inc., Sr Nt,
7.375%, 02/01/154 | | | 1,075 | | | 196,187 | | 0.4 | |
PIK, 12.500%, 10/02/134,6 | | | 725 | | | 197,563 | | 0.4 | |
| | | | | | | | | |
| | | | | | 1,384,250 | | 2.6 | |
CONTAINERS & PACKAGING — 2.1% | | | | | | |
Berry Plastics Corp., VAR,
9.503%, 02/15/15 | | | 400 | | | 276,000 | | 0.5 | |
Berry Plastics Holding Corp., Nt,
8.875%, 09/15/14 | | | 400 | | | 174,000 | | 0.3 | |
Constar International, Inc., Co. Guar., VAR, 5.524%, 02/15/12 | | | 750 | | | 412,500 | | 0.8 | |
Constar International, Inc., Sr Sub Nt,
11.000%, 12/01/121,4,10 | | | 790 | | | 19,750 | | 0.0 | 12 |
Plastipak Holdings, Inc., Private
Placement, Sr Nt,
8.500%, 12/15/152 | | | 300 | | | 201,000 | | 0.4 | |
| | | | | | | | | |
| Description | | Par (000) | | Value | | Percent
of Net
Assets* | |
| | | | | | | | | |
CONTAINERS & PACKAGING (continued) | | | | | | |
Portola Packaging, Inc., Sr Nt,
8.250%, 02/01/121,3,4 | | $ | 270 | | $ | 62,100 | | 0.1 | % |
| | | | | | | | | |
| | | | | | 1,145,350 | | 2.1 | |
DISTRIBUTORS — 0.6% | | | | | | | | | |
American Tire Distributors, Inc., Nt,
10.750%, 04/01/13 | | | 435 | | | 324,075 | | 0.6 | |
| | | | | | | | | |
DIVERSIFIED CONSUMER SERVICES — 6.4% | | | | | | |
Allied Waste North America, Inc., Sr Nt,
6.125%, 02/15/14 | | | 500 | | | 452,500 | | 0.9 | |
6.875%, 06/01/17 | | | 250 | | | 232,500 | | 0.4 | |
Knowledge Learning Corp., Inc., Private Placement, Sr Sub Nt,
7.750%, 02/01/152 | | | 700 | | | 490,000 | | 0.9 | |
Mac-Gray Corp., Sr Nt,
7.625%, 08/15/15 | | | 650 | | | 598,000 | | 1.1 | |
Service Corp. International,
7.000%, 06/15/17 | | | 750 | | | 562,500 | | 1.1 | |
Sotheby’s, Private Placement,
7.750%, 06/15/152 | | | 250 | | | 130,000 | | 0.2 | |
Stewart Enterprises, Inc., Sr Nt,
6.250%, 02/15/1310 | | | 1,224 | | | 948,600 | | 1.8 | |
| | | | | | | | | |
| | | | | | 3,414,100 | | 6.4 | |
DIVERSIFIED FINANCIAL SERVICES — 0.2% | | | | | | |
Goldman Sachs Capital II, VAR,
5.793%, 06/01/12 | | | 250 | | | 96,106 | | 0.2 | |
| | | | | | | | | |
DIVERSIFIED MANUFACTURING — 2.4% | | | | | | |
Polypore, Inc., Sr Sub Nt,
8.750%, 05/15/1210 | | | 1,789 | | | 1,288,080 | | 2.4 | |
| | | | | | | | | |
DIVERSIFIED TELECOMMUNICATION SERVICES — 5.7% | | | |
Level 3 Financing, Inc., Co. Guar,
9.250%, 11/01/1410 | | | 800 | | | 464,000 | | 0.9 | |
Level 3 Financing, Inc., Sr Nt,
12.250%, 03/15/13 | | | 200 | | | 121,000 | | 0.2 | |
Qwest Corp., Sr Nt, 7.625%, 06/15/1510 | | | 1,650 | | | 1,353,000 | | 2.5 | |
Time Warner Telecom Holdings, Inc., Sr Nt, 9.250%, 02/15/1410 | | | 500 | | | 410,000 | | 0.8 | |
Windstream Corp., 8.125%, 08/01/13 | | | 750 | | | 690,000 | | 1.3 | |
| | | | | | | | | |
| | | | | | 3,038,000 | | 5.7 | |
5
PACHOLDER HIGH YIELD FUND, INC.
Statement of Net Assets Applicable to Common Stockholders (continued)
As of December 31, 2008
| | | | | | | | | |
| Description | | Par (000) | | Value | | Percent
of Net
Assets* | |
| | | | | | | | | |
ELECTRONIC EQUIPMENT, INSTRUMENTS & COMPONENTS — 2.4% | |
Flextronics International Ltd., Debentures, (Singapore),
6.250%, 11/15/14 | | $ | 210 | | $ | 156,450 | | 0.3 | % |
Intcomex, Inc., Sec’d Nt,
11.750%, 01/15/119 | | | 1,100 | | | 497,750 | | 0.9 | |
Sanmina-SCI Corp., 6.750%, 03/01/13 | | | 200 | | | 86,000 | | 0.2 | |
Sanmina-SCI Corp., Private Placement, Sr Nt, VAR, 4.746%, 06/15/142 | | | 300 | | | 162,000 | | 0.3 | |
Smart Modular Technologies, Sr Nt, (Cayman Islands), VAR,
9.383%, 04/01/123,9 | | | 423 | | | 351,671 | | 0.7 | |
| | | | | | | | | |
| | | | | | 1,253,871 | | 2.4 | |
ENERGY EQUIPMENT & SERVICES — 1.8% | | | | | | |
Bristow Group, Inc., Co Guar,
6.125%, 06/15/13 | | | 250 | | | 180,000 | | 0.3 | |
Calfrac Holdings LP, Private Placement, Debentures, 7.750%, 02/15/152 | | | 250 | | | 117,500 | | 0.2 | |
PHI, Inc., Co Guar, 7.125%, 04/15/13 | | | 783 | | | 477,630 | | 0.9 | |
Pride International, Inc., Sr Nt,
7.375%, 07/15/14 | | | 200 | | | 186,000 | | 0.4 | |
| | | | | | | | | |
| | | | | | 961,130 | | 1.8 | |
FOOD & STAPLES RETAILING — 4.7% | | | | | | |
Golden State Foods Corp., Private Placement, Sr Sub Nt,
9.240%, 01/10/122,8,9 | | | 1,550 | | | 1,551,937 | | 2.9 | |
Rite Aid Corp., 10.375%, 07/15/16 | | | 800 | | | 588,000 | | 1.1 | |
Rite Aid Corp., Debentures,
7.500%, 03/01/17 | | | 600 | | | 390,000 | | 0.7 | |
| | | | | | | | | |
| | | | | | 2,529,937 | | 4.7 | |
FOOD PRODUCTS — 2.0% | | | | | | | | | |
Chiquita Brands International, Inc., Sr Nt, 8.875%, 12/01/15 | | | 699 | | | 496,290 | | 0.9 | |
Eurofresh, Inc., Private Placement, Nt, 11.500%, 01/15/132,4 | | | 2,367 | | | 568,080 | | 1.1 | |
Tom’s Foods, Inc., Sr Nt,
10.500%, 11/01/041,3,4,9 | | | 872 | | | 8,718 | | 0.0 | 12 |
| | | | | | | | | |
| | | | | | 1,073,088 | | 2.0 | |
GAMING — 4.7% | | | | | | | | | |
FireKeepers Development Authority, Private Placement,
13.875%, 05/01/152 | | | 75 | | | 46,500 | | 0.1 | |
Isle of Capri Casinos, Inc., Sr Nt, 7.000%, 03/01/14 | | | 400 | | | 170,000 | | 0.3 | |
| | | | | | | | | |
| Description | | Par (000) | | Value | | Percent
of Net
Assets* | |
| | | | | | | | | |
GAMING (continued) | | | | | | | | | |
Mandalay Resort Group, Sr Nt,
6.375%, 12/15/11 | | $ | 500 | | $ | 350,000 | | 0.6 | % |
Mashantucket Western Pequot Tribe, Private Placement,
8.500%, 11/15/152 | | | 1,320 | | | 518,100 | | 1.0 | |
MGM Mirage, Inc., Co Guar,
7.625%, 01/15/17 | | | 150 | | | 96,750 | | 0.2 | |
Seminole Hard Rock Entertainment, Inc., Private Placement, VAR,
4.496%, 03/15/142 | | | 500 | | | 253,750 | | 0.5 | |
Shingle Springs Tribal Gaming Authority, Private Placement, Sr Nt,
9.375%, 06/15/152 | | | 1,000 | | | 500,000 | | 0.9 | |
Wynn Las Vegas Capital Corp., Nt, 6.625%, 12/01/14 | | | 750 | | | 566,250 | | 1.1 | |
| | | | | | | | | |
| | | | | | 2,501,350 | | 4.7 | |
HEALTH CARE PROVIDERS & SERVICES — 6.8% | |
CHS/Community Health Systems, Inc., 8.875%, 07/15/15 | | | 800 | | | 736,000 | | 1.4 | |
FMC Finance III S.A., (Luxembourg), 6.875%, 07/15/17 | | | 500 | | | 467,500 | | 0.9 | |
HCA, Inc., Sec’d Nt, 9.250%, 11/15/16 | | | 1,000 | | | 917,500 | | 1.7 | |
Multiplan, Inc., Private Placement, 10.375%, 04/15/162 | | | 1,000 | | | 810,000 | | 1.5 | |
Tenet Healthcare Corp., Sr Nt,
9.875%, 07/01/1410 | | | 850 | | | 684,250 | | 1.3 | |
| | | | | | | | | |
| | | | | | 3,615,250 | | 6.8 | |
HOTELS, RESTAURANTS & LEISURE — 0.5% | |
OSI Restaurant Partners, Inc.,
10.000%, 06/15/15 | | | 300 | | | 54,000 | | 0.1 | |
Six Flags Operations, Inc., Private Placement, 12.250%, 07/15/162 | | | 272 | | | 106,080 | | 0.2 | |
Six Flags, Inc., 9.625%, 06/01/14 | | | 611 | | | 91,650 | | 0.2 | |
| | | | | | | | | |
| | | | | | 251,730 | | 0.5 | |
HOUSEHOLD DURABLES — 1.3% | |
K Hovnanian Enterprises, Inc., Private Placement, Debentures,
11.500%, 05/01/132 | | | 500 | | | 380,000 | | 0.7 | |
KB Home, Sr Nt, 5.875%, 01/15/15 | | | 250 | | | 150,000 | | 0.3 | |
Meritage Homes Corp., Sr Nt,
7.000%, 05/01/14 | | | 250 | | | 142,500 | | 0.3 | |
| | | | | | | | | |
| | | | | | 672,500 | | 1.3 | |
6
PACHOLDER HIGH YIELD FUND, INC.
Statement of Net Assets Applicable to Common Stockholders (continued)
As of December 31, 2008
| | | | | | | | | |
| Description | | Par (000) | | Value | | Percent
of Net
Assets* | |
| | | | | | | | | |
INDEPENDENT POWER PRODUCERS & ENERGY TRADERS — 9.3% | |
Calpine Generating Co. LLC, Sec’d Nt, VAR, 14.370%, 04/01/111,3,4 | | $ | 1,000 | | $ | 70,000 | | 0.1 | % |
Dynegy Holdings, Inc., Sr Unsec’d Nt, 7.125%, 05/15/18 | | | 500 | | | 305,000 | | 0.6 | |
Dynegy Roseton/Danskammer Pass Through Trust, 7.670%, 11/08/16 | | | 500 | | | 355,312 | | 0.7 | |
Edison Mission Energy, Sr Nt,
7.750%, 06/15/16 | | | 1,000 | | | 890,000 | | 1.7 | |
Mirant Americas Generation LLC, Sr Nt, 8.300%, 05/01/1110 | | | 1,250 | | | 1,212,500 | | 2.2 | |
8.500%, 10/01/21 | | | 500 | | | 380,000 | | 0.7 | |
NRG Energy, Inc., Sr Nt,
7.250%, 02/01/14 | | | 250 | | | 233,750 | | 0.4 | |
7.375%, 01/15/17 | | | 1,375 | | | 1,265,000 | | 2.4 | |
Texas Competitive Electric Holdings Co. LLC, Private Placement,
10.500%, 11/01/152 | | | 350 | | | 248,500 | | 0.5 | |
| | | | | | | | | |
| | | | | | 4,960,062 | | 9.3 | |
INDUSTRIAL COMPONENTS — 2.1% | | | | | | | | | |
JB Poindexter & Co., Inc., Co Guar, 8.750%, 03/15/1410 | | | 2,084 | | | 1,135,780 | | 2.1 | |
| | | | | | | | | |
INDUSTRIAL CONGLOMERATES — 1.8% | | | | | | |
Milacron Escrow Corp., Sec’d Nt, 11.500%, 05/15/1110 | | | 1,445 | | | 939,250 | | 1.8 | |
| | | | | | | | | |
INDUSTRIAL MACHINERY — 1.9% | | | | | | | | | |
General Cable Corp., VAR,
6.258%, 04/01/15 | | | 250 | | | 116,875 | | 0.2 | |
RBS Global, Inc. & Rexnord Corp., Sr Nt, 8.875%, 09/01/1610 | | | 1,150 | | | 672,750 | | 1.3 | |
RBS Global, Inc. & Rexnord Corp., Sr Sub Nt, 11.750%, 08/01/16 | | | 410 | | | 232,675 | | 0.4 | |
| | | | | | | | | |
| | | | | | 1,022,300 | | 1.9 | |
INSURANCE — 1.8% | | | | | | | | | |
Crum and Forster Holdings Corp., 7.750%, 05/01/17 | | | 600 | | | 423,000 | | 0.8 | |
HUB International Holdings, Inc., Private Placement,
9.000%, 12/15/142 | | | 500 | | | 305,625 | | 0.6 | |
10.250%, 06/15/152 | | | 500 | | | 220,625 | | 0.4 | |
| | | | | | | | | |
| | | | | | 949,250 | | 1.8 | |
IT SERVICES — 0.8% | | | | | | | | | |
Unisys Corp., Sr Nt,
8.000%, 10/15/12 | | | 500 | | | 140,000 | | 0.3 | |
12.500%, 01/15/16 | | | 1,000 | | | 280,000 | | 0.5 | |
| | | | | | | | | |
| | | | | | 420,000 | | 0.8 | |
| | | | | | | | | |
| Description | | Par (000) | | Value | | Percent
of Net
Assets* | |
| | | | | | | | | |
LEISURE EQUIPMENT & PRODUCTS — 0.3% | | | | | | |
True Temper Sports, Inc., Sr Nt, 8.375%, 09/15/119 | | $ | 490 | | $ | 156,800 | | 0.3 | % |
| | | | | | | | | |
MARINE — 0.9% | | | | | | | | | |
Ultrapetrol Bahamas Ltd., 1st Mtg, (Bahamas), 9.000%, 11/24/14 | | | 700 | | | 456,750 | | 0.9 | |
| | | | | | | | | |
MEDIA — 14.7% | | | | | | | | | |
Adelphia Communications Corp., 6.000%, 02/15/061,4 | | | 125 | | | 12 | | 0.0 | 12 |
Adelphia Communications Corp., Sr Nt, 8.125%, 07/15/031,4 | | | 750 | | | 21,563 | | 0.0 | 12 |
9.375%, 11/15/091,4 | | | 560 | | | 16,100 | | 0.0 | 12 |
Adelphia Recovery Trust, Contingent Value1,4 | | | 1,297 | | | 25,938 | | 0.1 | |
Barrington Broadcasting Group LLC and Barrington Broadcasting Capital Corp., Sr Sub Nt,
10.500%, 08/15/14 | | | 700 | | | 272,125 | | 0.5 | |
Block Communications, Inc., Private Placement, Sr Nt,
8.250%, 12/15/152 | | | 800 | | | 528,000 | | 1.0 | |
CanWest MediaWorks LP, Private Placement, Sr Nt, (Canada),
9.250%, 08/01/152 | | | 750 | | | 285,000 | | 0.5 | |
CCH I Holdings LLC/CCH I Holdings Capital Corp., Co Guar,
11.125%, 01/15/144 | | | 350 | | | 17,938 | | 0.0 | 12 |
CCH I Holdings LLC/CCH I Holdings Capital Corp., Sec’d Nt,
11.000%, 10/01/154,10 | | | 700 | | | 122,500 | | 0.2 | |
CCH II LLC / CCH II Capital Corp., Private Placement, Sr Nt,
10.250%, 10/01/132,4 | | | 538 | | | 182,920 | | 0.4 | |
CCO Holdings LLC/CCO Holdings Capital Corp., 8.750%, 11/15/134 | | | 800 | | | 504,000 | | 1.0 | |
Charter Communications, Inc., Private Placement, Nt, 10.875%, 09/15/142 | | | 500 | | | 400,000 | | 0.8 | |
DirecTV Holdings LLC/DirecTV Financing Co., Private Placement,
7.625%, 05/15/162 | | | 250 | | | 242,500 | | 0.5 | |
DirecTV Holdings LLC/DirecTV Financing Co., Sr Nt,
8.375%, 03/15/13 | | | 500 | | | 497,500 | | 0.9 | |
Echostar DBS Corp.,
7.750%, 05/31/15 | | | 250 | | | 212,500 | | 0.4 | |
Fisher Communications, Inc., Sr Nt, 8.625%, 09/15/14 | | | 500 | | | 385,000 | | 0.7 | |
7
PACHOLDER HIGH YIELD FUND, INC.
Statement of Net Assets Applicable to Common Stockholders (continued)
As of December 31, 2008
| | | | | | | | | |
| Description | | Par (000) | | Value | | Percent
of Net
Assets* | |
| | | | | | | | | |
MEDIA (continued) | | | | | | | | | |
HSN, Private Placement, Sr Nt, 11.250%, 08/01/162 | | $ | 150 | | $ | 110,250 | | 0.2 | % |
Idearc, Inc., Sr Nt, 8.000%, 11/15/16 | | | 850 | | | 63,750 | | 0.1 | |
Intelsat Subsidiary Holding Co., Ltd., Private Placement, (Bermuda), 8.875%, 01/15/152 | | | 1,250 | | | 1,137,500 | | 2.1 | |
Lamar Media Corp., Sr Sub Nt,
6.625%, 08/15/15 | | | 250 | | | 180,625 | | 0.3 | |
7.250%, 01/01/13 | | | 39 | | | 31,102 | | 0.1 | |
LBI Media, Inc., Sr Disc Nt,
11.000%, 10/15/137 | | | 625 | | | 250,000 | | 0.5 | |
Nexstar Finance Holdings LLC/Nexstar Finance Holdings, Inc., Sr Disc Nt, 11.375%, 04/01/137 | | | 479 | | | 206,735 | | 0.4 | |
Quebecor Media, Inc., Sr Nt, (Canada), 7.750%, 03/15/1610 | | | 750 | | | 506,250 | | 0.9 | |
Radio One, Inc., Sr Sub Nt,
6.375%, 02/15/13 | | | 500 | | | 168,750 | | 0.3 | |
RH Donnelley, Inc., Private Placement, 11.750%, 05/15/152 | | | 795 | | | 194,775 | | 0.4 | |
Valassis Communications, Inc., Private Placement, 8.250%, 03/01/15 | | | 1,500 | | | 390,000 | | 0.7 | |
Virgin Media Finance plc, Sr Nt, (United Kingdom), 9.125%, 08/15/16 | | | 1,250 | | | 925,000 | | 1.7 | |
| | | | | | | | | |
| | | | | | 7,878,333 | | 14.7 | |
METALS & MINERALS — 1.1% | |
AK Steel Corp., Co. Guar, Sr Nt, 7.750%, 06/15/12 | | | 800 | | | 624,000 | | 1.1 | |
| | | | | | | | | |
METALS & MINING — 2.0% | |
FMG Finance Pty Ltd., Private Placement, (Australia),
10.625%, 09/01/162 | | | 250 | | | 145,000 | | 0.3 | |
Wolverine Tube, Inc., Sr Nt,
10.500%, 04/01/09 | | | 1,145 | | | 921,726 | | 1.7 | |
| | | | | | | | | |
| | | | | | 1,066,726 | | 2.0 | |
MULTILINE RETAIL — 0.6% | |
Dollar General Corp., PIK,
11.875%, 07/15/17 | | | 100 | | | 85,500 | | 0.2 | |
Dollar General Corp., Sr Nt,
10.625%, 07/15/15 | | | 250 | | | 238,750 | | 0.4 | |
| | | | | | | | | |
| | | | | | 324,250 | | 0.6 | |
MULTI-UTILITIES — 5.0% | |
AES Corp. (The), Private Placement, 8.750%, 05/15/132 | | | 1,000 | | | 960,000 | | 1.8 | |
| | | | | | | | | |
| Description | | Par (000) | | Value | | Percent
of Net
Assets* | |
| | | | | | | | | |
MULTI-UTILITIES (continued) | | | | | | | | | |
Energy Future Holdings Corp., Private Placement, Nt, 10.875%, 11/01/172 | | $ | 450 | | $ | 319,500 | | 0.6 | % |
Reliant Energy, Inc., 7.625%, 06/15/14 | | | 500 | | | 415,000 | | 0.8 | |
Reliant Energy, Inc., Sec’d Nt,
6.750%, 12/15/1410 | | | 1,100 | | | 990,000 | | 1.8 | |
| | | | | | | | | |
| | | | | | 2,684,500 | | 5.0 | |
OIL, GAS & CONSUMABLE FUELS — 11.7% | |
Arch Western Finance LLC,
6.750%, 07/01/13 | | | 250 | | | 217,500 | | 0.4 | |
El Paso Corp., Sr Nt, 6.875%, 06/15/14 | | | 150 | | | 121,097 | | 0.2 | |
El Paso Performance-Linked Trust, Private Placement, Sr Nt,
7.750%, 07/15/112 | | | 500 | | | 432,875 | | 0.8 | |
Encore Acquisition Co., Sr Nt,
6.000%, 07/15/1510 | | | 1,000 | | | 645,000 | | 1.2 | |
Forbes Energy Services Ltd., (Bermuda), 11.000%, 02/15/15 | | | 750 | | | 450,000 | | 0.8 | |
Forest Oil Corp., Nt, 7.250%, 06/15/19 | | | 269 | | | 196,370 | | 0.4 | |
Frontier Oil Corp., Debentures,
8.500%, 09/15/16 | | | 500 | | | 441,250 | | 0.8 | |
Helix Energy Solutions Group, Inc., Private Placement,
9.500%, 01/15/162 | | | 1,000 | | | 530,000 | | 1.0 | |
Massey Energy Co., Nt,
6.875%, 12/15/13 | | | 450 | | | 333,000 | | 0.6 | |
Newfield Exploration Co., Nt,
6.625%, 09/01/14 | | | 200 | | | 164,000 | | 0.3 | |
Northwest Pipeline Corp., Sr Nt, 7.000%, 06/15/16 | | | 500 | | | 452,833 | | 0.9 | |
Range Resources Corp.,
7.250%, 05/01/18 | | | 25 | | | 20,875 | | 0.0 | 12 |
Range Resources Corp., Sr Sub Nt, 7.500%, 05/15/16 | | | 267 | | | 231,623 | | 0.5 | |
Swift Energy Co., Sr Nt,
7.125%, 06/01/17 | | | 1,260 | | | 711,900 | | 1.3 | |
Targa Resources Partners LP, Private Placement, 8.250%, 07/01/162 | | | 280 | | | 173,600 | | 0.3 | |
Tesoro Corp., 6.250%, 11/01/12 | | | 571 | | | 393,990 | | 0.8 | |
W&T Offshore, Inc., Private Placement, Sr Nt, 8.250%, 06/15/142 | | | 1,000 | | | 540,000 | | 1.0 | |
Williams Partners LP/Williams Partners Finance Corp., Sr Nt,
7.250%, 02/01/17 | | | 250 | | | 197,500 | | 0.4 | |
| | | | | | | | | |
| | | | | | 6,253,413 | | 11.7 | |
8
PACHOLDER HIGH YIELD FUND, INC.
Statement of Net Assets Applicable to Common Stockholders (continued)
As of December 31, 2008
| | | | | | | | | |
| Description | | Par (000) | | Value | | Percent
of Net
Assets* | |
| | | | | | | | | |
PAPER & FOREST PRODUCTS — 2.8% | |
Abitibi-Consolidated Co. of Canada, Sr Nt, (Canada), | | | | | | | | | |
6.000%, 06/20/13 | | $ | 630 | | $ | 50,400 | | 0.1 | % |
8.375%, 04/01/15 | | | 1,395 | | | 111,600 | | 0.2 | |
Abitibi-Consolidated, Inc., Sr Nt, (Canada), 8.850%, 08/01/30 | | | 25 | | | 1,875 | | 0.0 | 12 |
Bowater Canada Finance Corp., Nt, (Canada), 7.950%, 11/15/11 | | | 500 | | | 52,500 | | 0.1 | |
Cascades, Inc., Sr Nt, (Canada), 7.250%, 02/15/13 | | | 168 | | | 85,680 | | 0.1 | |
Domtar Corp., (Canada)
7.125%, 08/15/15 | | | 500 | | | 325,000 | | 0.6 | |
Georgia-Pacific LLC, Private Placement, Co Guar, | | | | | | | | | |
7.000%, 01/15/152 | | | 125 | | | 106,250 | | 0.2 | |
7.125%, 01/15/172 | | | 325 | | | 273,000 | | 0.5 | |
NewPage Corp., Sr Nt,
10.000%, 05/01/12 | | | 200 | | | 88,000 | | 0.2 | |
12.000%, 05/01/13 | | | 800 | | | 228,000 | | 0.4 | |
Smurfit-Stone Container Enterprises, Inc., Sr Nt, 8.000%, 03/15/174,10 | | | 500 | | | 95,000 | | 0.2 | |
Verso Paper Holdings LLC/Verso Paper, Inc., Sr Nt, 9.125%, 08/01/14 | | | 250 | | | 98,750 | | 0.2 | |
| | | | | | | | | |
| | | | | | 1,516,055 | | 2.8 | |
PHARMACEUTICALS — 2.7% | |
Celtic Pharma Phinco B.V., (Bermuda), 17.000%, 06/15/129 | | | 1,345 | | | 982,176 | | 1.8 | |
Elan Finance plc/Elan Finance Corp., Sr Nt, (Ireland), VAR,
6.149%, 11/15/11 | | | 830 | | | 452,350 | | 0.9 | |
| | | | | | | | | |
| | | | | | 1,434,526 | | 2.7 | |
REAL ESTATE INVESTMENT TRUSTS (REITs) — 0.0%12 | | | |
Thornburg Mortgage, Inc., Sr Nt, 8.000%, 05/15/13 | | | 75 | | | 16,500 | | 0.0 | 12 |
| | | | | | | | | |
ROAD & RAIL — 0.7% | | | | | | | | | |
Kansas City Southern Railway, Sr Nt, 8.000%, 06/01/15 | | | 500 | | | 395,000 | | 0.7 | |
| | | | | | | | | |
SEMICONDUCTORS & SEMICONDUCTOR EQUIPMENT — 2.9% | |
Amkor Technology, Inc.,
7.125%, 03/15/11 | | | 500 | | | 336,250 | | 0.6 | |
Freescale Semiconductor, Inc., Sr Nt, 8.875%, 12/15/14 | | | 450 | | | 198,000 | | 0.4 | |
| | | | | | | | | |
| Description | | Par (000) | | Value | | Percent
of Net
Assets* | |
| | | | | | | | | |
SEMICONDUCTORS & SEMICONDUCTOR EQUIPMENT (continued) | |
MagnaChip Semiconductor S.A./MagnaChip Semiconductor Finance Co., Sec’d Nt, (Luxembourg), VAR, 6.070%, 12/15/111,4 | | $ | 735 | | $ | 25,725 | | 0.0 | %12 |
6.875%, 12/15/111,4,10 | | | 750 | | | 26,250 | | 0.1 | |
NXP BV/NXP Funding LLC, Sr Nt, (Netherlands), VAR,
7.503%, 10/15/13 | | | 400 | | | 133,000 | | 0.3 | |
7.875%, 10/15/14 | | | 1,640 | | | 639,600 | | 1.2 | |
Spansion, Inc., Private Placement, VAR, 5.327%, 06/01/132,4 | | | 1,000 | | | 180,000 | | 0.3 | |
| | | | | | | | | |
| | | | | | 1,538,825 | | 2.9 | |
SPECIALTY RETAIL — 2.4% | | | | | | | | | |
ACE Hardware Corp., Private Placement, Sr Nt,
9.125%, 06/01/162 | | | 250 | | | 165,000 | | 0.3 | |
Collective Brands, Inc.,
8.250%, 08/01/13 | | | 500 | | | 377,500 | | 0.7 | |
General Nutrition Centers, Inc., PIK, 7.584%, 03/15/14 | | | 461 | | | 258,160 | | 0.5 | |
PEP Boys-Manny Moe & Jack, Sr Nt, 7.500%, 12/15/14 | | | 200 | | | 77,000 | | 0.1 | |
Southern States Coop, Inc., Private Placement, Sr Nt,
11.000%, 11/01/102,9 | | | 500 | | | 415,000 | | 0.8 | |
| | | | | | | | | |
| | | | | | 1,292,660 | | 2.4 | |
TEXTILES, APPAREL & LUXURY GOODS — 1.1% | |
Broder Bros. Co., Sr Nt,
11.250%, 10/15/1010 | | | 835 | | | 217,100 | | 0.4 | |
Hanesbrands, Inc., Sr Nt, VAR, 5.697%, 12/15/14 | | | 500 | | | 352,500 | | 0.7 | |
| | | | | | | | | |
| | | | | | 569,600 | | 1.1 | |
TOBACCO — 1.6% | | | | | | | | | |
Alliance One International, Inc., Sr Nt, | | | | | | | | | |
11.000%, 05/15/1210 | | | 900 | | | 747,000 | | 1.4 | |
12.750%, 11/15/12 | | | 150 | | | 109,500 | | 0.2 | |
| | | | | | | | | |
| | | | | | 856,500 | | 1.6 | |
TRANSPORTATION SERVICES — 1.1% | |
IdleAire Technologies Corp., Sr Disc Nt, SUB, 13.000%, 12/15/121,3,4,9 | | | 1,415 | | | 14,150 | | 0.0 | 12 |
Quality Distribution LLC/QD Capital Corp., Co Guar,
9.000%, 11/15/109 | | | 750 | | | 240,000 | | 0.5 | |
VAR, 9.253%, 01/15/129 | | | 850 | | | 314,500 | | 0.6 | |
| | | | | | | | | |
| | | | | | 568,650 | | 1.1 | |
9
PACHOLDER HIGH YIELD FUND, INC.
Statement of Net Assets Applicable to Common Stockholders (continued)
As of December 31, 2008
| | | | | | | | | |
| Description | | Par (000) | | Value | | Percent
of Net
Assets* | |
| | | | | | | | | |
WIRELESS TELECOMMUNICATION SERVICES — 2.8% | |
iPCS, Inc., Sr Nt, VAR,
5.317%, 05/01/13 | | $ | 440 | | $ | 312,400 | | 0.6 | % |
MetroPCS Wireless, Inc., Sr Nt, 9.250%, 11/01/14 | | | 750 | | | 671,250 | | 1.2 | |
Sprint Nextel Corp., Nt,
6.000%, 12/01/16 | | | 750 | | | 528,750 | | 1.0 | |
| | | | | | | | | |
| | | | | | 1,512,400 | | 2.8 | |
Total Corporate Bonds | | | | | | | | | |
(Cost $127,000,386) | | | | | | 74,733,107 | | 139.6 | |
| | | | | | | | | |
LOAN PARTICIPATIONS & ASSIGNMENTS — 29.5% | |
AIRLINES — 0.6% | | | | | | | | | |
Delta Airlines, Inc., 1st Lien Term Loan, 4.850%, 04/30/14 | | | 27 | | | 17,952 | | 0.0 | 12 |
Delta Airlines, Inc., 1st Lien Term Loan B, 3.899%, 04/30/14 | | | 468 | | | 306,768 | | 0.6 | |
| | | | | | | | | |
| | | | | | 324,720 | | 0.6 | |
AUTOMOBILES — 1.4% | | | | | | | | | |
Ford Motor Co., Term Loan B, Initial Tranche B-3, 5.000%, 12/15/13 | | | 1,965 | | | 787,601 | | 1.4 | |
| | | | | | | | | |
CHEMICALS — 1.9% | | | | | | | | | |
Lyondell Chemical, Term Loan B, 7.000%, 12/20/14 | | | 497 | | | 216,906 | | 0.4 | |
Millennium Inorganic Chemicals, Inc., 1st Lien Term Loan B,
3.709%, 05/15/149 | | | 899 | | | 531,939 | | 1.0 | |
Millennium Inorganic Chemicals, Inc., 2nd Lien Term Loan,
7.209%, 05/15/149 | | | 500 | | | 250,000 | | 0.5 | |
| | | | | | | | | |
| | | | | | 998,845 | | 1.9 | |
COMMERCIAL SERVICES & SUPPLIES — 0.9% | |
Clarke American Corp., Contract 2, Term Loan, 3.959%, 05/01/14 | | | 356 | | | 177,946 | | 0.3 | |
Clarke American Corp., Contract 3, Term Loan, 3.935%, 05/01/14 | | | 125 | | | 62,379 | | 0.1 | |
Clarke American Corp., Contract 4, Term Loan, 3.935%, 05/01/14 | | | 111 | | | 55,417 | | 0.1 | |
Clarke American Corp., Contract 6, Letter of Credit, 3.959%, 05/01/14 | | | 205 | | | 102,479 | | 0.2 | |
Clarke American Corp., Term Loan, 3.959%, 05/01/14 | | | 191 | | | 95,517 | | 0.2 | |
| | | | | | | | | |
| | | | | | 493,738 | | 0.9 | |
CONSUMER PRODUCTS — 0.7% | |
Spectrum Brands, Inc., Term Loan B, 6.035%, 03/30/13 | | | 48 | | | 25,790 | | 0.0 | 12 |
6.149%, 03/30/13 | | | 55 | | | 29,475 | | 0.1 | |
| | | | | | | | | |
| Description | | Par (000) | | Value | | Percent
of Net
Assets* | |
| | | | | | | | | |
CONSUMER PRODUCTS (continued) | |
Spectrum Brands, Inc., Term Loan, Line of Credit, | | | | | | | | | |
1.751%, 03/30/13 | | $ | 24 | | $ | 12,960 | | 0.0 | %12 |
Spectrum Brands, Inc., Term Loan | | | | | | | | | |
6.035%, 03/30/13 | | | 412 | | | 220,693 | | 0.4 | |
Spectrum Brands, Inc., Tranche 4, Term Loan B, 8.320%, 03/30/13 | | | 155 | | | 82,898 | | 0.2 | |
| | | | | | | | | |
| | | | | | 371,816 | | 0.7 | |
DIVERSIFIED MANUFACTURING — 1.4% | |
BOC Edwards, Term Loan,
2.461%, 05/31/14 | | | 1,209 | | | 749,526 | | 1.4 | |
| | | | | | | | | |
ELECTRONIC EQUIPMENT, INSTRUMENTS & COMPONENTS — 1.3% | |
Isola Group S.A.R.L., 1st Lien Term Loan B, 9.210%, 12/18/129 | | | 445 | | | 333,799 | | 0.6 | |
Isola Group S.A.R.L., Contract 1, 2nd Lien, Initial Term Loan,
15.670%, 12/18/139 | | | 250 | | | 150,000 | | 0.3 | |
Sirius Computer Solutions, 2nd Lien Term Loan, 7.459%, 05/30/13 | | | 1,000 | | | 200,000 | | 0.4 | |
| | | | | | | | | |
| | | | | | 683,799 | | 1.3 | |
GAMING — 1.4% | |
Fontainebleau Las Vegas Holdings LLC, Initial Tranche B-1, Term Loan, 5.443%, 06/06/14 | | | 333 | | | 88,321 | | 0.2 | |
Venetian Macau, Initial Tranche B-2, Term Loan B, 2.720%, 05/25/13 | | | 1,333 | | | 660,000 | | 1.2 | |
| | | | | | | | | |
| | | | | | 748,321 | | 1.4 | |
HEALTH CARE PROVIDERS & SERVICES — 0.7% | |
HCA, Inc., Initial Tranche B-1, Term Loan, 3.709%, 11/18/13 | | | 490 | | | 382,337 | | 0.7 | |
| | | | | | | | | |
HOTELS, RESTAURANTS & LEISURE — 1.2% | |
ARAMARK Corp., Term Loan,
3.334%, 01/26/14 | | | 470 | | | 387,526 | | 0.7 | |
ARAMARK Corp., Term Loan,
5.468%, 01/26/14 | | | 30 | | | 24,619 | | 0.1 | |
Outback Restaurant Partners, Inc., 1st | | | | | | | | | |
Lien Term Loan, 2.751%, 06/14/14 | | | 1 | | | 280 | | 0.0 | 12 |
Outback Restaurant Partners, Inc., 2nd Lien Term Loan, 2.813%, 06/14/14 | | | 447 | | | 194,633 | | 0.4 | |
Outback Restaurant Partners, Inc., Tranche B-1, Dollar Term Loan, 1.816%, 06/14/14 | | | 5 | | | 2,056 | | 0.0 | 12 |
| | | | | | | | | |
| | | | | | 609,114 | | 1.2 | |
HOUSEHOLD DURABLES — 0.9% | |
Jacuzzi Brands, Inc., Term Loan, 1.359%, 02/07/149 | | | 40 | | | 19,818 | | 0.0 | 12 |
6.961%, 02/07/149 | | | 1,091 | | | 238,265 | | 0.5 | |
10
PACHOLDER HIGH YIELD FUND, INC.
Statement of Net Assets Applicable to Common Stockholders (continued)
As of December 31, 2008
| | | | | | | | | |
| Description | | Par (000) | | Value | | Percent
of Net
Assets* | |
| | | | | | | | | |
HOUSEHOLD DURABLES (continued) | |
Jacuzzi Brands, Inc., Term Loan B, 2.711%, 02/07/149 | | $ | 445 | | $ | 221,486 | | 0.4 | % |
| | | | | | | | | |
| | | | | | 479,569 | | 0.9 | |
INDEPENDENT POWER PRODUCERS & ENERGY TRADERS — 5.1% | |
Calpine Corp., Term Loan,
4.335%, 03/29/14 | | | 2,434 | | | 1,787,905 | | 3.3 | |
Texas Competitive Electric Holdings Co. LLC, Letter of Credit,
5.888%, 10/10/14 | | | 421 | | | 290,436 | | 0.6 | |
Texas Competitive Electric Holdings Co. LLC, Term Loan B,
3.961%, 10/10/14 | | | 5 | | | 3,446 | | 0.0 | 12 |
5.368%, 10/10/14 | | | 561 | | | 386,673 | | 0.7 | |
TPF Generation Holdings, 2nd Lien Term Loan B, 5.709%, 12/15/14 | | | 500 | | | 287,500 | | 0.5 | |
| | | | | | | | | |
| | | | | | 2,755,960 | | 5.1 | |
IT SERVICES — 3.4% | | | | | | | | | |
Compucom Systems, Inc., First Priority Lien, Term Loan,
3.970%, 08/23/149 | | | 988 | | | 641,875 | | 1.2 | |
First Data Corp, Tranche B-1 Term Loan, 3.211%, 09/24/14 | | | 24 | | | 14,889 | | 0.0 | 12 |
3.211%, 09/24/14 | | | 371 | | | 235,004 | | 0.4 | |
First Data Corp., Tranche B-3 Term Loan, | | | | | | |
3.211%, 09/24/14 | | | 88 | | | 55,819 | | 0.1 | |
3.211%, 09/24/14 | | | 644 | | | 406,673 | | 0.8 | |
3.211%, 09/24/14 | | | 751 | | | 474,351 | | 0.9 | |
| | | | | | | | | |
| | | | | | 1,828,611 | | 3.4 | |
LEISURE EQUIPMENT & PRODUCTS — 0.1% | | | | | | |
True Temper Sports, Inc., Term Loan B, 9.334%, 06/30/119 | | | 77 | | | 30,798 | | 0.1 | |
| | | | | | | | | |
MEDIA — 4.2% | | | | | | | | | |
High Plains Broadcasting, Initial Tranche B-3, Term Loan,
8.000%, 09/14/16 | | | 194 | | | 63,753 | | 0.1 | |
Idearc, Inc., Delayed Draw Term Loan B, 3.460%, 11/17/14 | | | 474 | | | 143,796 | | 0.3 | |
Idearc, Inc., Initial Tranche B-3, Term Loan, 2.470%, 11/17/14 | | | 21 | | | 6,456 | | 0.0 | 12 |
Newport Television LLC, 1st Lien Term Loan B, 8.000%, 09/14/16 | | | 734 | | | 240,978 | | 0.5 | |
Sirius Satellite Radio, Term Loan B, 5.438%, 12/20/12 | | | 494 | | | 257,984 | | 0.5 | |
Univision Communications, Inc., 1st Lien Term Loan, Contract 4, 2.711%, 09/29/14 | | | 1,409 | | | 575,118 | | 1.0 | |
| | | | | | | | | | |
| Description | | Par (000) | | | Value | | Percent
of Net
Assets* | |
| | | | | | | | | | |
MEDIA (continued) | | | | | | | | | | |
Univision Communications, Inc., 2nd Lien Term Loan, 2.961%, 03/29/09 | | $ | 771 | | | $ | 523,940 | | 1.0 | % |
Univision Communications, Inc., Initial Tranche B-2 Term Loan,
2.711%, 09/29/14 | | | 91 | | | | 36,972 | | 0.1 | |
WMG Acquisition Corp., 1st Lien Term Loan, | | | |
4.196%, 02/28/11 | | | 108 | | | | 82,693 | | 0.2 | |
5.541%, 02/28/11 | | | 71 | | | | 54,301 | | 0.1 | |
WMG Acquisition Corp., 2nd Lien Term Loan, | | | | | | | |
3.876%, 02/28/11 | | | 45 | | | | 34,455 | | 0.1 | |
3.890%, 02/28/11 | | | 36 | | | | 27,564 | | 0.0 | 12 |
4.153%, 02/28/11 | | | 108 | | | | 82,693 | | 0.2 | |
WMG Acquisition Corp., Initial Tranche B-2 Term Loan, 5.834%, 02/28/11 | | | 36 | | | | 27,562 | | 0.0 | 12 |
WMG Acquisition Corp., Term Loan, 2.471%, 02/28/11 | | | 35 | | | | 26,401 | | 0.0 | 12 |
3.825%, 02/28/11 | | | 57 | | | | 43,253 | | 0.1 | |
| | | | | | | | | | |
| | | | | | | 2,227,919 | | 4.2 | |
MULTILINE RETAIL — 1.4% | | | | | | | | | | |
Dollar General Corp., Term Loan, 4.518%, 07/03/14 | | | 55 | | | | 40,284 | | 0.1 | |
Dollar General Corp., Contract 2, Term Loan B, 3.211%, 07/03/14 | | | 146 | | | | 106,531 | | 0.2 | |
Dollar General Corp., Term Loan B, | | | | | | | | | | |
3.211%, 07/03/14 | | | 104 | | | | 76,094 | | 0.1 | |
3.711%, 07/03/14 | | | 64 | | | | 46,731 | | 0.1 | |
6.170%, 07/03/14 | | | 421 | | | | 324,345 | | 0.6 | |
Dollar General Corp., 1st Lien Term Loan, | | | | | | | |
3.211%, 07/03/14 | | | 210 | | | | 161,492 | | 0.3 | |
5.000%, 07/03/14 | | | — | 11 | | | 340 | | 0.0 | 12 |
| | | | | | | | | | |
| | | | | | | 755,817 | | 1.4 | |
PAPER & FOREST PRODUCTS — 1.7% | | | |
Abitibi-Consolidated Co. of Canada, Term Loan, (Canada), 11.500%, 03/30/09 | | | 694 | | | | 464,844 | | 0.8 | |
NewPage Corp., 1st Lien Term Loan, 0.000%, 12/21/14 | | | 2 | | | | 1,191 | | 0.0 | 12 |
NewPage Corp., 1st Lien Term Loan, Letter of Credit, | | | | | | | | | | |
5.313%, 12/21/14 | | | 743 | | | | 471,488 | | 0.9 | |
| | | | | | | | | | |
| | | | | | | 937,523 | | 1.7 | |
11
PACHOLDER HIGH YIELD FUND, INC.
Statement of Net Assets Applicable to Common Stockholders (continued)
As of December 31, 2008
| | | | | | | | | | |
| Description | | Shares/
Par (000) | | | Value | | Percent
of Net
Assets* | |
| | | | | | | | | | |
PROPERTY & CASUALTY — 0.7% | |
Swett & Crawford Group, 2nd Lien Term Loan, 6.800%, 04/03/14 | | $ | 693 | | | $ | 263,333 | | 0.5 | % |
Swett & Crawford, Term Loan,
2.711%, 04/03/14 | | | 290 | | | | 110,017 | | 0.2 | |
| | | | | | | | | | |
| | | | | | | 373,350 | | 0.7 | |
SEMICONDUCTORS & SEMICONDUCTOR EQUIPMENT — 0.5% | |
Freescale Semiconductor, Inc., Initial Tranche B-1 Term Loan,
3.931%, 11/29/13 | | | 499 | | | | 290,259 | | 0.5 | |
| | | | | | | | | | |
Total Loan Participations & Assignments | | | | | | | |
(Cost $27,637,375) | | | | | | | 15,829,623 | | 29.5 | |
| | | | | | | | | | |
ASSET-BACKED SECURITIES — 2.8% | | | |
Countrywide Asset-Backed Certificates, Series 2004-13, Class MV8, VAR, 2.171%, 01/25/359 | | | 115 | | | | 7,636 | | 0.0 | 12 |
Long Beach Mortgage Loan Trust, Series 2004-5, Class M6, VAR, 2.971%, 09/25/349 | | | 76 | | | | 13,584 | | 0.0 | 12 |
Unipac IX LLC,
13.000%, 04/11/133,9 | | | 1,500 | | | | 1,458,514 | | 2.8 | |
| | | | | | | | | | |
Total Asset-Backed Securities | | | | | | | | | | |
(Cost $1,642,237) | | | | | | | 1,479,734 | | 2.8 | |
| | | | | | | | | | |
Total Fixed Income Investments | | | | | | | | | | |
(Cost $156,279,998) | | | | | | | 92,042,464 | | 171.9 | |
| | | | | | | | | | |
COMMON STOCKS — 0.8% | | | | | | | | | | |
BUILDING PRODUCTS — 0.1% | | | | | | | | | | |
Lexington Coal Co.1,3 | | | 25 | | | | 26,323 | | 0.1 | |
| | | | | | | | | | |
CONTAINERS & PACKAGING — 0.0% | | | | | | | |
Glasstech, Inc., Class C1,3,9 | | | — | 11 | | | — | | 0.0 | |
| | | | | | | | | | |
DIVERSIFIED TELECOMMUNICATION SERVICES — 0.1% | |
AboveNet, Inc.1 | | | 3 | | | | 74,327 | | 0.1 | |
XO Holdings, Inc.1 | | | 1 | | | | 85 | | 0.0 | 12 |
| | | | | | | | | | |
| | | | | | | 74,412 | | 0.1 | |
INDEPENDENT POWER PRODUCERS & ENERGY TRADERS — 0.0%12 | |
Mirant Corp.1 | | | 1 | | | | 17,625 | | 0.0 | 12 |
| | | | | | | | | | |
MEDIA — 0.6% | | | | | | | | | | |
Adelphia Recovery Trust1,3 | | | 157 | | | | 2 | | 0.0 | 12 |
Time Warner Cable, Inc., Class A1 | | | 15 | | | | 330,231 | | 0.6 | |
| | | | | | | | | | |
| | | | | | | 330,233 | | 0.6 | |
| | | | | | | | | |
| Description | | Shares (000) | | | Value | | Percent
of Net
Assets* | |
| | | | | | | | | |
TEXTILES, APPAREL & LUXURY GOODS — 0.0% | |
Westpoint Stevens, Inc.1,3,9 | | 14 | | | $ | — | | 0.0 | % |
| | | | | | | | | |
Total Common Stocks | | | | | | | | | |
(Cost $2,133,856) | | | | | | 448,593 | | 0.8 | |
| | | | | | | | | |
PREFERRED STOCKS — 1.4% | | | | | | | | | |
AUTOMOBILES — 0.0%12 | | | | | | | | | |
General Motors Corp., Pfd, 5.250%, Series B | | 4 | | | | 14,000 | | 0.0 | 12 |
| | | | | | | | | |
CONTAINERS & PACKAGING — 0.0% | | | | | | | |
Glasstech, Inc., Pfd, Series C 3 | | — | 11 | | | — | | 0.0 | |
| | | | | | | | | |
DIVERSIFIED FINANCIAL SERVICES — 1.2% | |
Bank of America Corp., Pfd, 7.250%, Series L | | 1 | | | | 553,563 | | 1.0 | |
| Preferred Blocker, Inc. (GMAC LLC), Private Placement, Pfd, 7.000%1,2 | | — | 11 | | | 78,702 | | 0.2 | |
| | | | | | | | | |
| | | | | | 632,265 | | 1.2 | |
MEDIA — 0.2% | | | | | | | | | |
Spanish Broadcasting System, Pfd, 10.750%, Series B, PIK, 3 | | — | 11 | | | 76,507 | | 0.2 | |
| | | | | | | | | |
Total Preferred Stocks | | | | | | | | | |
(Cost $1,120,350) | | | | | | 722,772 | | 1.4 | |
| | | | | | | | | |
RIGHTS — 0.0% | | | | | | | | | |
TEXTILES, APPAREL & LUXURY GOODS — 0.0% | |
Westpoint Stevens, Inc., expiring 04/25/141,3,9
(Cost $184,476) | | 13 | | | | — | | 0.0 | |
| | | | | | | | | |
WARRANTS — 0.0%12 | | | | | | | | | |
DIVERSIFIED TELECOMMUNICATION SERVICES — 0.0%12 | |
AboveNet, Inc., expiring 09/08/101,3,9 (Strike Price $24.00) | | 1 | | | | 3,915 | | 0.0 | 12 |
XO Holdings, Inc., Series A, expiring 01/16/101
(Strike Price $6.25) | | 1 | | | | 4 | | 0.0 | 12 |
XO Holdings, Inc., Series B, expiring 01/16/101
(Strike Price $7.50) | | 1 | | | | 6 | | 0.0 | 12 |
XO Holdings, Inc., Series C, expiring 01/16/101
(Strike Price $10.00) | | 1 | | | | — | | 0.0 | |
| | | | | | | | | |
| | | | | | 3,925 | | 0.0 | 12 |
TRANSPORTATION SERVICES — 0.0% | | | | | | | |
IdleAire Technologies Corp., expiring 12/15/151,3 | | 1 | | | | — | | 0.0 | |
| | | | | | | | | |
Total Warrants | | | | | | | | | |
(Cost $208,600) | | | | | | 3,925 | | 0.0 | 12 |
| | | | | | | | | |
12
PACHOLDER HIGH YIELD FUND, INC.
Statement of Net Assets Applicable to Common Stockholders (concluded)
As of December 31, 2008
| | | | | | | | | |
| Description | | Shares (000) | | Value | | | Percent
of Net
Assets* | |
| | | | | | | | | |
Total Equity Investments | | | | | | | | | |
(Cost $3,647,282) | | | | $ | 1,175,290 | | | 2.2 | % |
| | | | | | | | | |
SHORT-TERM INVESTMENT — 2.8% | | | | | | | |
INVESTMENT COMPANY — 2.8% | | | | | | | | | |
JPMorgan Prime Money Market Fund, Institutional Class Shares 5
(Cost 1,531,027) | | 1,531 | | | 1,531,027 | | | 2.8 | |
| | | | | | | | | |
INVESTMENTS OF CASH COLLATERAL FOR SECURITIES ON LOAN — 0.4% | |
INVESTMENT COMPANY — 0.4% | | | | | | | | | |
JPMorgan Prime Money Market Fund, Capital Shares 5
(Cost $203,963) | | 204 | | | 203,963 | | | 0.4 | |
| | | | | | | | | |
TOTAL INVESTMENTS | | | | | | | | | |
(Cost $161,662,270) | | | | | 94,952,744 | | | 177.3 | |
| | | | | | | | | |
Payable Upon Return of Securities Loaned | | | (203,963 | ) | | (0.4 | ) |
Payable to Advisor | | | (70,909 | ) | | (0.1 | ) |
Payable to Administrator | | | (3,805 | ) | | (0.0 | )12 |
Payable to Directors | | | | | (1,079 | ) | | (0.0 | )12 |
Payable for Excise Tax | | | | | (69,200 | ) | | (0.1 | ) |
Unrealized Depreciation on Unfunded Commitments | | | (105,545 | ) | | (0.2 | ) |
Unrealized Depreciation on Swap Agreements | | | (1,270,348 | ) | | (2.4 | ) |
Other Assets in Excess of Other Liabilities | | | 3,309,456 | | | 6.2 | |
Less: Outstanding Preferred Stock (1,720 shares at $25,000 per share) at liquidation value. | | | (43,000,000 | ) | | (80.3 | ) |
| | | | | | | | | |
Net Assets Applicable to Common Stockholders | | | | $ | 53,537,351 | | | | |
| | | | | | | | | |
| | | | | | | | |
Description | | | | Value | | | |
Net Assets Applicable to Common Stockholders: | | | | | | | | |
Common Stock, $.01 par value; 49,996,320 shares authorized 12,948,411 shares issued and outstanding | | | | $ | 129,484 | | | |
Capital in excess of par value | | | | | 172,766,937 | | | |
Undistributed net investment income/loss | | | | | 2,699,219 | | | |
Accumulated net realized loss from security transactions | | | | | (53,972,870 | ) | | |
Net unrealized depreciation on investments | | | | | (68,085,419 | ) | | |
| | | | | | | | |
Net Assets Applicable to Common Stockholders | | | | $ | 53,537,351 | | | |
| | | | | | | | |
Net Asset Value Per Common Share
($53,537,351/12,948,411) | | $ | 4.14 | | | |
| | | | | | | | |
| * | | Applicable to common stockholders. |
1 | | Non-income producing security. |
2 | | Security is exempt from registration under Rule 144A of the Securities Act of 1933. Unless otherwise indicated, this security has been determined to be liquid under procedures established by the Board of Directors and may be resold in transactions exempt from registration, normally to qualified institutional buyers. These securities amounted to $16,358,823 and 30.6% of net assets applicable to common stockholders. |
3 | | Fair valued security. These securities amounted to $2,386,844 and 4.5% of net assets applicable to common stockholders. |
5 | | Investment in affiliate. Money market fund registered under the Investment Company Act of 1940, as amended, and advised by J.P. Morgan Investment Management Inc. or JPMorgan Investment Advisors Inc. |
6 | | All or a portion of the security is on loan. Securities on loan have a fair market value of $197,703. |
7 | | Step-up bond. Interest rate is effective rate as of December 31, 2008. |
8 | | Restricted security. These securities amounted to $1,551,937 and 2.9% of net assets applicable to common stockholders. |
9 | | Security deemed to be illiquid. These securities amounted to $9,883,969 and 18.5% of net assets applicable to common stockholders. |
10 | | All or a portion of the security is reserved for current or potential holdings of swaps, TBAs, when-issued securities and delayed delivery securities. |
11 | | Amount rounds to less than 1,000 shares. |
12 | | Amount rounds to less than 0.1%. |
| VAR | | Variable Rate Security. The interest rate shown is the rate in effect as of December 31, 2008. |
13
PACHOLDER HIGH YIELD FUND, INC.
Statement of Operations
For the Year Ended December 31, 2008
| | | | |
| | | | |
INVESTMENT INCOME: | | | | |
Interest | | $ | 16,234,485 | |
Dividends | | | 151,504 | |
Dividend income from affiliates | | | 93 | |
Securities lending (net) | | | 103,823 | |
| | | | |
Total Income | | | 16,489,905 | |
| | | | |
EXPENSES: | | | | |
Investment advisory fees (Note 6) | | | 48,158 | |
Administrative fees (Note 6) | | | 162,104 | |
Printing fees | | | 110,608 | |
Stock exchange listing fees | | | 19,995 | |
Custodian and accounting fees (Note 6) | | | 43,676 | |
Transfer agent fees | | | 19,335 | |
Legal fees | | | 102,365 | |
Directors' fees and expenses | | | 89,398 | |
Audit fee | | | 76,551 | |
Excise tax expense | | | 69,200 | |
Insurance | | | 42,455 | |
| | | | |
Operating Expenses | | | 783,845 | |
Commissions on auction rate preferred stock | | | 168,402 | |
| | | | |
Total Expenses | | | 952,247 | |
| | | | |
Less earnings credits | | | (786 | ) |
| | | | |
Net Expenses | | | 951,461 | |
| | | | |
Net Investment Income | | | 15,538,444 | |
| | | | |
NET REALIZED AND UNREALIZED GAIN/(LOSS) ON INVESTMENTS: | | | | |
Net realized gain/(loss): | | | | |
Investments | | | (10,526,349 | ) |
Swaps | | | (482,669 | ) |
| | | | |
Net realized gain/(loss) on investments | | | (11,009,018 | ) |
| | | | |
Net change in unrealized appreciation/(depreciation): | | | | |
Investments | | | (54,960,696 | ) |
Unfunded commitments | | | (118,569 | ) |
Swaps | | | (842,900 | ) |
| | | | |
Net change in unrealized appreciation/(depreciation) on investments | | | (55,922,165 | ) |
| | | | |
Net realized and unrealized gain/(loss) on investments | | | (66,931,183 | ) |
| | | | |
Net Increase/(Decrease) Resulting from Operations | | | (51,392,739 | ) |
DISTRIBUTIONS TO PREFERRED STOCKHOLDERS FROM NET INVESTMENT INCOME | | | (2,124,511 | ) |
| | | | |
NET INCREASE/(DECREASE) IN NET ASSETS APPLICABLE TO COMMON STOCKHOLDERS RESULTING FROM OPERATIONS | | $ | (53,517,250 | ) |
| | | | |
See accompanying Notes to Financial Statements.
Statements of Changes in Net Assets Applicable to Common Stockholders
| | | | | | | | |
| | | For the Year
Ended
December 31,
2008 | | | For the Year
Ended
December 31,
2007 | |
INCREASE/(DECREASE) IN NET ASSETS: | | | | | | | | |
Operations: | | | | | | | | |
Net investment income | | $ | 15,538,444 | | | $ | 15,617,664 | |
Net realized gain/(loss) on investments | | | (11,009,018 | ) | | | (631,522 | ) |
Net change in unrealized appreciation/(depreciation) on investments | | | (55,922,165 | ) | | | (10,146,360 | ) |
Distributions to preferred stockholders from net investment income | | | (2,124,511 | ) | | | (3,515,352 | ) |
| | | | | | | | |
Net increase/(decrease) in net assets resulting from operations applicable to common stockholders | | | (53,517,250 | ) | | | 1,324,430 | |
| | | | | | | | |
DISTRIBUTIONS TO COMMON STOCKHOLDERS FROM: | | | | | | | | |
Net investment income | | | (11,391,518 | ) | | | (11,647,388 | ) |
| | | | | | | | |
Total distributions to common stockholders | | | (11,391,518 | ) | | | (11,647,388 | ) |
| | | | | | | | |
FUND SHARE TRANSACTIONS (NOTE 2): | | | | | | | | |
Value of 6,196 and 1,347 shares issued in reinvestment of dividends to common stockholders in 2008 and 2007, respectively | | | 43,683 | | | | 13,523 | |
| | | | | | | | |
Total increase in net assets derived from fund share transactions | | | 43,683 | | | | 13,523 | |
| | | | | | | | |
Total net increase/(decrease) in net assets applicable to common stockholders | | | (64,865,085 | ) | | | (10,309,435 | ) |
NET ASSETS APPLICABLE TO COMMON STOCKHOLDERS: | | | | | | | | |
Beginning of period | | $ | 118,402,436 | | | $ | 128,711,871 | |
| | | | | | | | |
End of period | | $ | 53,537,351 | | | $ | 118,402,436 | |
| | | | | | | | |
Undistributed Net Investment Income | | $ | 2,699,219 | | | $ | 1,075,430 | |
| | | | | | | | |
See accompanying Notes to Financial Statements.
14
PACHOLDER HIGH YIELD FUND, INC.
Statement of Cash Flows
For the year ended December 31, 2008
| | | | |
INCREASE (DECREASE) IN CASH | | | | |
Cash flows provided (used) by operating activities: | | | | |
Net decrease in net assets from operations | | $ | (51,392,739 | ) |
Adjustments to reconcile net increase/decrease in net assets from operations to net cash provided (used) by operating activities: | | | | |
Purchase of investment securities | | | (57,150,430 | ) |
Proceeds from disposition of investment securities | | | 79,046,867 | |
Purchases of short-term investments, net | | | (204,612 | ) |
Decrease in unrealized appreciation/depreciation on swap contracts | | | 842,900 | |
Decrease in unrealized appreciation/depreciation on investments | | | 54,960,696 | |
Decrease in unrealized appreciation/depreciation on unfunded commitments | | | 118,569 | |
Realized gain/loss on investments | | | 10,526,349 | |
Increase in receivable for investments sold | | | (167,900 | ) |
Decrease in interest and dividends receivable | | | 797,058 | |
Increase in payable for investments purchased | | | 108,208 | |
Increase in excise tax payable | | | 69,200 | |
Decrease in dividends and distributions payable | | | (53,884 | ) |
Decrease in accrued expenses and other liabilities | | | (728,969 | ) |
Net amortization/accretion of income | | | (1,011,892 | ) |
| | | | |
Net cash provided (used) by operating activities | | | 35,759,421 | |
| | | | |
Cash flows provided (used) by financing activities: | | | | |
Decrease in outstanding preferred stock | | | (23,000,000 | ) |
Cash distributions paid to common stockholders (net of reinvestments of $43,683) | | | (11,347,835 | ) |
Cash distributions paid to preferred stockholders | | | (2,124,511 | ) |
| | | | |
Net cash provided (used) by financing activities | | | (36,472,346 | ) |
| | | | |
Net decrease in cash | | | (712,925 | ) |
| | | | |
Cash: | | | | |
Beginning of period | | | 1,263,234 | |
| | | | |
End of period | | $ | 550,309 | |
| | | | |
For purposes of reporting the Statement of Cash Flows, the Fund considers all cash accounts that are not subject to withdrawal restrictions or penalties to be cash equivalents.
15
PACHOLDER HIGH YIELD FUND, INC.
Financial Highlights
(Contained below is per share operating performance data for a share of common stock outstanding, total return performance, ratios to average net assets and other supplemental data. This information has been derived from information provided in the financial statements calculated using average shares outstanding and market price data for the Fund's shares.)
| | | | | | | | | | | | | | | | | | | | |
| | | For the Year Ended December 31, | |
| | | 2008 | | | 2007 | | | 2006 | | | 2005 | | | 2004 | |
Net asset value, beginning of period | | $ | 9.15 | | | $ | 9.95 | | | $ | 8.94 | | | $ | 9.55 | | | $ | 8.59 | |
| | | | | | | | | | | | | | | | | | | | |
Net investment income | | | 1.21 | | | | 1.21 | | | | 1.09 | | | | 1.12 | | | | 1.08 | |
Net realized and unrealized gain/(loss) on investments | | | (5.18 | ) | | | (0.84 | ) | | | 1.07 | | | | (0.67 | ) | | | 0.93 | |
Cumulative effect on change in fixed income valuation (Note 1) | | | — | | | | — | | | | — | | | | — | | | | (0.07 | ) |
Distributions to preferred stockholders from net investment income | | | (0.16 | ) | | | (0.27 | ) | | | (0.25 | ) | | | (0.16 | ) | | | (0.08 | ) |
| | | | | | | | | | | | | | | | | | | | |
Net increase/(decrease) in net asset value resulting from operations | | | (4.13 | ) | | | 0.10 | | | | 1.91 | | | | 0.29 | | | | 1.86 | |
| | | | | | | | | | | | | | | | | | | | |
Distributions to Common Stockholders from: | | | | | | | | | | | | | | | | | | | | |
Net investment income | | | (0.88 | ) | | | (0.90 | ) | | | (0.90 | ) | | | (0.90 | ) | | | (0.90 | ) |
| | | | | | | | | | | | | | | | | | | | |
Net asset value, end of period | | $ | 4.14 | | | $ | 9.15 | | | $ | 9.95 | | | $ | 8.94 | | | $ | 9.55 | |
| | | | | | | | | | | | | | | | | | | | |
Market value per share, end of period | | $ | 3.68 | | | $ | 8.10 | | | $ | 9.80 | | | $ | 8.50 | | | $ | 9.82 | |
| | | | | | | | | | | | | | | | | | | | |
TOTAL INVESTMENT RETURN(1): | | | | | | | | | | | | | | | | | | | | |
Based on market value per common share(2) | | | (47.76 | )% | | | (9.01 | )% | | | 26.78 | % | | | (4.46 | )% | | | 18.67 | % |
Based on net asset value per common share(3)(4) | | | (47.98 | )% | | | 1.24 | % | | | 22.38 | % | | | 3.33 | % | | | 22.79 | % |
RATIOS TO AVERAGE NET ASSETS(5)(10): | | | | | | | | | | | | | | | | | | | | |
Expenses (prior to expenses related to leverage)(6)(9) | | | 0.49 | % | | | 1.18 | % | | | 1.86 | % | | | 1.50 | % | | | 1.83 | % |
Applicable to common stockholders only(7)(9) | | | 0.82 | % | | | 1.79 | % | | | 2.87 | % | | | 2.34 | % | | | 2.88 | % |
Expenses (including expenses related to leverage)(6)(9) | | | 0.59 | % | | | 1.27 | % | | | 1.95 | % | | | 1.59 | % | | | 1.92 | % |
Applicable to common stockholders only(7)(9) | | | 0.99 | % | | | 1.92 | % | | | 3.01 | % | | | 2.48 | % | | | 3.03 | % |
Net investment income(7) | | | 16.22 | % | | | 12.18 | % | | | 11.61 | % | | | 12.39 | % | | | 12.14 | % |
SUPPLEMENTAL DATA: | | | | | | | | | | | | | | | | | | | | |
Net assets at end of period, net of preferred stock (000) | | $ | 53,537 | | | $ | 118,402 | | | $ | 128,712 | | | $ | 115,429 | | | $ | 123,180 | |
Portfolio turnover rate | | | 36 | % | | | 64 | % | | | 75 | % | | | 95 | % | | | 73 | % |
SENIOR SECURITIES: | | | | | | | | | | | | | | | | | | | | |
Number of preferred shares outstanding at end of period | | | 1,720 | | | | 2,640 | | | | 2,640 | | | | 2,640 | | | | 2,640 | |
Asset coverage per share of preferred stock outstanding at end of period(8) | | $ | 56,126 | | | $ | 69,849 | | | $ | 73,755 | | | $ | 68,723 | | | $ | 71,660 | |
Involuntary liquidation preference and average market value per share of preferred stock | | $ | 25,000 | | | $ | 25,000 | | | $ | 25,000 | | | $ | 25,000 | | | $ | 25,000 | |
1 | | Total investment return excludes the effects of commissions. Dividends and distributions to common stockholders, if any, are assumed, for purposes of this calculation, to be reinvested at prices obtained under the Fund's dividend reinvestment plan. Rights offerings, if any, are assumed, for purposes of this calculation, to be fully subscribed under the terms of the rights offering. |
2 | | Assumes an investment at the common share market value at the beginning of the period indicated and sale of all shares at the closing common share market value at the end of the period indicated. Dividends and distributions are assumed, for purposes of this calculation, to be reinvested at prices obtained under the Fund's dividend reinvestment plan. |
3 | | Assumes an investment at the common share net asset value at the beginning of the period indicated and sale of all shares at the closing common share net asset value at the end of the period indicated. Dividends and distributions are assumed, for purposes of this calculation, to be reinvested at prices obtained under the Fund's dividend reinvestment plan. |
4 | | Includes adjustments in accordance with accounting principles generally accepted in the United States of America and as such, the net asset value for financial reporting purposes and the returns based upon those net asset values may differ from the net asset value and returns for common stockholder transactions |
5 | | Ratios do not include the effect of dividends to preferred stock. |
6 | | Ratios calculated relative to the average net assets of both common and preferred stockholders. |
7 | | Ratios calculated relative to the average net assets of common stockholders only. |
8 | | Calculated by subtracting the Fund's total liabilities (not including the preferred stock) from the Fund's total assets, and dividing this by the number of preferred shares outstanding. |
9 | | Includes earnings credits and interest expense, each of which is less than 0.01%, if applicable or unless otherwise noted. |
10 | | See Note 6 in the Notes to Financial Statements. |
See accompanying Notes to Financial Statements.
16
PACHOLDER HIGH YIELD FUND, INC.
Notes to Financial Statements
| 1. | | SIGNIFICANT ACCOUNTING POLICIES — Pacholder High Yield Fund, Inc. (the “Fund”) is a closed-end, diversified management investment company with a leveraged capital structure. The Fund’s investment objective is to provide a high level of total return through current income and capital appreciation. Under normal circumstances, the Fund invests at least 80% of the value of its assets in high yield debt securities. The Fund invests primarily in fixed income securities of domestic companies. The Fund was incorporated under the laws of the State of Maryland in August 1988. |
The following is a summary of significant accounting policies followed by the Fund in the preparation of its financial statements. The policies are in accordance with accounting principles generally accepted in the United States of America. The preparation of financial statements requires management to make estimates and assumptions that affect the reported amounts of assets and liabilities at the date of the financial statements and the reported amounts of income and expenses for the period. Actual results could differ from those estimates.
| | A. | | SECURITY VALUATIONS — Fixed income securities (other than certain short-term investments maturing in 60 days or less) are valued each day based on readily available market quotations received from third party broker-dealers of comparable securities or independent or affiliated pricing services approved by the Board of Directors. Such pricing services and broker-dealers will generally provide bid-side quotations. Certain investments of the Fund may, depending upon market conditions, trade in relatively thin markets and/or in markets that experience significant volatility. As a result of these conditions, the prices used by the Fund to value securities may differ from the value that would be realized if these securities were sold and the differences could be significant. Short-term investments, other than certain high yield securities, with remaining maturities of 60 days or less are valued at amortized cost. Listed securities are valued at the last sale price on the exchange on which they are primarily traded. The value of National Market System equity securities quoted by the NASDAQ Stock Market LLC shall generally be the NASDAQ Official Closing Price. Investments in other open-end investment companies are valued at such investment company’s current day closing net asset value per share. |
Equity securities listed on a North American, Central American, South American or Caribbean securities exchange shall generally be valued at the last sale price on the exchange on which the security is principally traded that is reported before the time when the net assets of the Fund are valued.
Swaps are valued daily primarily using independent or affiliated pricing services approved by the Board of Directors. If valuations are not available from such services or values received are deemed not representative of market value, values will be obtained from a third party broker-dealer or counterparty.
Securities or other assets for which market quotations are not readily available or for which market quotations do not represent the value at the time of pricing (including certain illiquid securities) are fair valued in accordance with procedures established and monitored by the Board of Directors. Valuations may be based upon current market prices of securities that are comparable in coupon, rating, maturity and industry. It is possible that the estimated values may differ significantly from the values that would have been used had a ready market for the investments existed, and such differences could have been material. At December 31, 2008, there were fair-valued securities of $2,386,844.
Valuations reflected in this report are as of the report date. As a result, changes in valuation due to significant market events and/or issuer related events after the report date and prior to issuance of the report are not reflected herein.
During the period, the Fund adopted Statement of Financial Accounting Standards No. 157 — Fair Value Measurements —(“SFAS 157”). SFAS 157 defines fair value, establishes a framework for measuring fair value and expands disclosures about fair value measurements. SFAS 157 requires disclosure surrounding the various inputs that are used in determining the fair value of the Fund’s investments. These inputs are summarized into the three broad levels listed below.
| | • | | Level 1 — quoted prices in active markets for identical securities |
| | • | | Level 2 — other significant observable inputs (including quoted prices for similar securities, interest rates, prepayment speeds, credit risk, etc.) |
| | • | | Level 3 — significant unobservable inputs (including the Fund’s own assumptions in determining the fair value of investments) |
The inputs or methodology used for valuing securities are not necessarily an indication of the risk associated with investing in those securities.
17
PACHOLDER HIGH YIELD FUND, INC.
Notes to Financial Statements (continued)
The following is a summary of the inputs used as of December 31, 2008 in valuing the Fund’s assets and liabilities carried at fair value:
| | | | | | | | | | |
Valuation Inputs | | Investments in
Securities | | Appreciation
in Other
Financial
Instruments* | | Depreciation
in Other
Financial
Instruments* | |
Level 1 — Quoted prices | | $ | 2,157,267 | | $ | — | | $ | — | |
Level 2 — Other significant observable inputs | | | 90,408,633 | | | — | | | (1,270,348 | ) |
Level 3 — Significant unobservable inputs | | | 2,386,844 | | | — | | | — | |
| | | | | | | | | | |
Total | | $ | 94,952,744 | | $ | — | | $ | (1,270,348 | ) |
| | | | | | | | | | |
| * | | Other financial instruments may include futures, forwards and swap contracts. |
SFAS 157 also requires a reconciliation of assets and liabilities for which significant unobservable inputs (Level 3) were used in determining fair value:
| | | | | | | |
| | | Investments in
Securities | | | Other Financial
Instruments* |
Balance as of 12/31/07 | | $ | 287,782 | | | $ | — |
| | | | | | | |
Realized gain (loss) | | | (2,398,344 | ) | | | — |
Change in unrealized appreciation (depreciation) | | | 2,295,541 | | | | — |
Net amortization/accretion | | | 633 | | | | |
Net purchases (sales) | | | (85,373 | ) | | | — |
Net transfers in (out) of Level 3 | | | 2,286,605 | | | | — |
| | | | | | | |
Balance as of 12/31/08 | | $ | 2,386,844 | | | $ | — |
| | | | | | | |
| * | | Other financial instruments may include futures, forwards and swap contracts. |
Transfers into Level 3 are valued utilizing values as of the end of the period and transfers out of Level 3 are valued utilizing values as of the beginning of the period.
| | B. | | REPURCHASE AGREEMENTS — Each repurchase agreement is valued at amortized cost. In connection with transactions in repurchase agreements, it is the Fund’s policy that a tri-party custodian take possession of the underlying collateral securities in a manner sufficient to enable the Fund to obtain collateral in the event of a counterparty default. If the counterparty defaults and the fair value of the collateral declines, realization of the collateral by the Fund may be delayed or limited. The repurchase agreements are fully collateralized by U.S. Government agency securities. |
| | C. | | FEDERAL TAXES — It is the Fund’s policy to make distributions to stockholders of net investment income and net realized capital gains to comply with the requirements of the Internal Revenue Code of 1986, as amended, applicable to regulated investment companies. |
The Fund intends to continue to qualify as a regulated investment company by complying with the appropriate provisions of the Internal Revenue Code and to distribute to stockholders each year substantially all of its taxable income, if any, including realized gains on investments.
The Fund reserves the right to retain investment company taxable income and/or net capital gains. As such, excise taxes may be recognized and paid on undistributed income and capital gain amounts. For the tax year ended 2008, the Fund retained approximately $1,700,000 in income and incurred an excise tax of approximately $69,200.
The Fund seeks to maintain a level monthly dividend. Distributions paid by the Fund are subject to recharacterization for tax purposes. A portion of dividends paid may consist of net realized gains. To the extent that capital loss carryforwards are available to offset the distribution of capital gains but are not utilized at the end of the Fund’s fiscal year, such capital gain distributions may be taxable to stockholders as ordinary income.
The amount of dividends and distributions from net investment income and net realized capital gains is determined in accordance with Federal income tax regulations, which may differ from accounting principles generally accepted in the United States of America. To the extent these “book/tax” differences are permanent in nature (i.e., that they result from other than timing of recognition — “temporary differences”), such amounts are reclassified within the capital accounts based on their Federal tax-basis treatment.
18
PACHOLDER HIGH YIELD FUND, INC.
Notes to Financial Statements (continued)
The following amounts were reclassified within the capital accounts:
| | | | | | | |
Capital in Excess
of Par Value | | Accumulated
Undistributed/
(Overdistributed) Net
Investment Income | | | Accumulated Net
Realized Loss From
Security Transactions |
$(4,815,744) | | $ | (398,626 | ) | | $ | 5,214,370 |
The reclassification for the Fund relates primarily to expiration of capital loss carryforwards, non-deductible expenses and swap periodic payments.
The tax character of distributions paid during the years ended December 31, 2008 and 2007 was as follows:
| | | | | | |
| | | 2008 | | 2007 |
Common Stockholder Ordinary Income | | $ | 11,391,518 | | $ | 11,647,388 |
Preferred Stockholder Ordinary Income | | $ | 2,124,511 | | $ | 3,515,352 |
Financial Accounting Standards Board (the “FASB”) Interpretation No. 48, “Accounting for Uncertainty in Income Taxes — an Interpretation of FASB Statement No. 109” (the “Interpretation”) establishes for all entities, including pass-through entities such as the Funds, a minimum threshold for financial statement recognition of the benefit of positions taken in filing tax returns (including whether an entity is taxable in a particular jurisdiction), and requires certain expanded tax disclosures. The Fund has recorded no tax liabilities pursuant to the Interpretation. However, the conclusions regarding the Interpretation may be subject to review and adjustment at a later date based on factors including, but not limited to, further interpretation from FASB, new tax laws, regulations and interpretations thereof. The Fund is not aware of any tax positions for which it is reasonably possible that the total amounts of unrecognized tax benefits will significantly change in the next twelve months. The Fund’s federal tax returns for the prior three fiscal years remain subject to examination by the Internal Revenue Service.
| | D. | | SECURITIES TRANSACTIONS AND INVESTMENT INCOME — Securities transactions are accounted for on the date the securities are purchased or sold (trade date). Realized gains and losses on securities transactions are determined on an identified cost basis. Interest income is determined on the basis of coupon interest accrued using the effective interest method adjusted for amortization of premiums and accretion of discounts. Dividend income is recorded on the ex-dividend date. |
| | E. | | SECURITIES LENDING — To generate additional income, the Fund may lend its securities, through JPMorgan Chase Bank, N.A. (“JPMCB”) as lending agent (an affiliate of J.P. Morgan Investment Management Inc. (“JPMIM”)), to approved brokers and receives cash as collateral to secure the loans. JPMCB serves as lending agent to the Fund pursuant Securities Lending Agreement approved by the Board of Directors (the “Securities Lending Agreement”). At the inception of a loan, securities are exchanged for collateral equal to at least 102% of the value of loaned U.S. securities plus accrued interest. The JPMCB Securities Lending Agreement, requires that JPMCB daily mark to market the loaned security and request additional cash if the amount of cash received from the borrower was less than 100% of the value of the loaned security. During the term of the loan, the Fund receives payments from borrowers equivalent to the dividends and interest that would have been earned on securities lent while simultaneously seeking to earn income on the investment of collateral in accordance with investment guidelines contained in the JPMCB Securities Lending Agreement. The Fund retains the interest on cash collateral investments but is required to pay the borrower a rebate for the use of the cash collateral. Risks of delay in recovery of securities or even loss of rights in the securities may occur should the borrower of the securities fail financially. Risks may also arise to the extent that the value of the securities loaned increases above the value of the collateral received. JPMCB will indemnify the Fund from losses resulting from a borrower’s failure to return a loaned security when due. Such indemnification does not extend to losses associated with declines in the value of cash collateral investments. Loans are subject to termination by the Fund or the borrower at any time, and are, therefore, not considered to be illiquid investments. As of December 31, 2008, the Fund loaned securities having a value of $197,703. Collateral is marked to market daily to provide a level of collateral at not less than 100% of the value of loaned securities. The cash collateral of $203,963 received by the Fund at December 31, 2008, was invested in the JPMorgan Prime Money Market Fund. Information on the investment of cash collateral is shown in the Statement of Net Assets Applicable to Common Stockholders. |
During the year the Fund invested a portion of the cash collateral it received in the JPMorgan Prime Money Market Fund. The Advisor of the Fund waived $16 of its fee, which offsets the shareholder
19
PACHOLDER HIGH YIELD FUND, INC.
Notes to Financial Statements (continued)
servicing fees and other expenses, excluding advisory fees, incurred by JPMorgan Prime Money Market Fund on the Fund’s investment in JPMorgan Prime Money Market Fund. A portion of the reimbursement is voluntary.
Effective July 1, 2008, under the Securities Lending Agreement, JPMCB is entitled to a fee paid monthly in arrears equal to: (i) 0.03% of the average dollar value of the loans of U.S. Securities outstanding during the given month; and (ii) 0.09% of the average dollar value of loans of non-U.S. securities outstanding during a given month.
Prior to July 1, 2008, under the Securities Lending Agreement, JPMCB was entitled to a fee paid monthly in arrears equal to: (i) 0.06% of the average dollar value of loans of U.S. Securities outstanding during a given month; and (ii) 0.1142% of the average dollar value of loans of non-U.S. securities outstanding during a given month. During the period January 1, 2008 through February 29, 2008, the fees were voluntarily reduced to 0.05% and 0.10%, respectively. During the period March 1, 2008 through June 30, 2008, the fees were voluntarily reduced to 0.03% and 0.09%, respectively. JPMCB received $6,328 in fees for services rendered in lending of securities during the year ended December 31, 2008.
| | F. | | EXPENSES AND DISTRIBUTIONS — Expenses are accrued as incurred. Dividends to common stockholders are paid from net investment income monthly and distributions of net realized capital gains, if any, are paid at least annually. Dividends to preferred stockholders are accrued daily based on a variable interest rate set at weekly auctions or, in the absence of a successful auction, at a maximum rate as calculated in accordance with the Fund’s Articles Supplementary for Auction Rate Cumulative Preferred Stock and are paid weekly from net investment income. Distributions are determined in accordance with federal income tax regulations which may differ from generally accepted accounting principles. |
| | G. | | WHEN, AS AND IF ISSUED SECURITIES — The Fund may engage in “when-issued” or “delayed delivery” transactions. The Fund records when-issued securities on the trade date and maintains security positions such that sufficient liquid assets will be available to make payment for the securities purchased. Securities purchased on a when-issued or delayed delivery basis begin earning interest on the settlement date. |
The Fund had no when-issued or delayed-delivery purchase commitments as of December 31, 2008.
| | H. | | LOAN PARTICIPATIONS AND ASSIGNMENTS — The Fund may invest in loan participations and assignments of all or a portion of the loans. When the Fund purchases a loan participation, the Fund typically enters into a contractual relationship with the lender or third party selling such participations (“Selling Participant”), but not the borrower. In contrast, the Fund has direct rights against the borrower on a loan when it purchases an assignment; provided, however, that the Fund’s rights may be more limited than the obligor from which it acquired the assignment and the Fund may be able to enforce its rights only through an administrative agent. As a result, the Fund assumes the credit risk of the Borrower and the Selling Participant and any other persons interpositioned between the Fund and the Borrower (“Intermediate Participants”). Although certain loan assignments or participations are secured by collateral, the Fund could experience delays or limitations in realizing on such collateral or have its interest subordinated to other indebtedness of the obligor. In addition, loan assignments and participations are vulnerable to market conditions such that economic conditions or other events may reduce the demand for loan assignments and participations and certain loan assignments and participations which were liquid, when purchased, may become illiquid. |
| | I. | | UNFUNDED COMMITMENTS — The Fund may enter into commitments to buy and sell investments including commitments to buy loan assignments and participations to settle on future dates as part of their normal investment activities. The unrealized appreciation/depreciation from unfunded commitments is reported in the financial statements. Market risk exists on these commitments to buy to the same extent as if the loans were owned on a settled basis and gains and losses are recorded and reported in the same manner. However, during the commitment period, these investments earn no interest or dividends. |
At December 31, 2008 the Fund had the following unfunded loan commitments which could be extended at the option of the borrower:
| | | | | | | | | | | | | |
Security Description | | Term | | Maturity
Date | | Rate | | | Commitment |
| | | | | Amount | | Value |
Fontainbleau Las
Vegas | | Tranche B-1 Term Loan | | 06/06/14 | | 2.000 | % | | $ | 126,702 | | $ | 44,179 |
Ford Motor Co. | | Initial Tranche B-3 Term Loan | | 12/15/13 | | 5.000 | | | | 193,375 | | | 170,353 |
| | | | | | | | | | | | | |
| | | | | | | | | | | | $ | 214,532 |
| | | | | | | | | | | | | |
| 2. | | COMMON STOCK — At December 31, 2008, there were 49,996,320 shares of common stock with a $.01 par value authorized and |
20
PACHOLDER HIGH YIELD FUND, INC.
Notes to Financial Statements (continued)
| | 12,948,411 shares outstanding. During the years ended December 31, 2008 and December 31, 2007, the Fund issued 6,196 and 1,347 shares of common stock, respectively, in connection with its dividend reinvestment plan. |
| 3. | | PREFERRED STOCK — On June 29, 2001, the Fund issued 3,680 shares of Series W Auction Rate Cumulative Preferred Stock (“ARPS”) at an offering price of $25,000 per share. During 2002, the Fund redeemed a total of $26,000,000 or 1,040 shares of ARPS at various intervals. Dividends on these shares are paid weekly at an annual rate determined by a weekly auction or, in the absence of a successful auction, at a maximum rate as calculated in accordance with the Fund’s Articles Supplementary for Auction Rate Cumulative Preferred Stock. In general, the holders of the ARPS and the common stock vote together as a single class, except that the ARPS stockholders, as a separate class, vote to elect two members of the Board of Directors. The ARPS has a liquidation value of $25,000 per share, plus accumulated and unpaid dividends. At December 31, 2008, accrued ARPS dividends were $3,044. |
The Fund is subject to certain limitations and restrictions associated with outstanding shares of ARPS, including maintaining an asset coverage ratio of 200% for such shares. Failure to comply with these limitations and restrictions could preclude the Fund from declaring any dividends or distributions to common stockholders or repurchasing common shares and/or could trigger the mandatory redemption of Preferred Stock at their liquidation value.
On November 26, 2008 the Fund announced that it was not permitted to pay the monthly dividend for November to common stockholders, because the Fund’s asset coverage for outstanding ARPS was less than the 200% requirement.
In order to meet the 200% asset coverage ratio and resume the declaration and payment of monthly dividends, on December 10, 2008 and December 18, 2008, the Fund announced the voluntary redemption of 800 and 120 shares of ARPS, respectively. The Fund irrevocably deposited the redemption proceeds of $23,000,000 with the Fund’s paying agent in December and on the date of such deposits, the 920 Preferred Shares were no longer deemed to be outstanding and all rights of the holders of the redeemed shares, except the right to receive the redemption proceeds, were terminated.
The Fund declared a dividend to common stockholders on December 11, 2008, which consisted of the cancelled November 2008 dividend as well the December 2008 dividend.
The weekly auction for the ARPS issued by the Fund has failed since February 13, 2008, due to insufficient demand (bids to buy shares) to meet supply (shares offered for sale) at the auction. Holders of preferred shares who wish to sell will not be able to do so until there is a successful auction with sufficient demand for the shares. Failed auctions are not considered a default by the Fund and do not alter the credit quality of the ARPS. However, failed auctions may increase the cost of the Fund’s leverage and decrease the income available for common stockholders. ARPS holders have continued to receive dividends at the “maximum rate” set on the date of the failed auction, and the redemption price of $25,000 per share (plus accumulated but unpaid dividends, if any) is unaffected. Based on the rating assigned to the Fund's ARPS, the maximum rate may range from 150%-275% of the "AA" Financial Composite Commercial Paper Rate as of a given auction date. The maximum rate as of the February 18, 2009 failed auction was 0.422%, which is 150% of the "AA" Financial Composite Commercial Paper Rate on that date.
| 4. | | INTEREST RATE SWAPS — Interest rate swap agreements involve the exchange by the Fund with another party of their respective commitments to pay or receive interest, e.g., an exchange of floating rate payments for fixed rate payments with respect to the notional amount of principal. The types of interest rate swap agreements the Fund may invest in are: (1) interest rate caps, under which, in return for a premium, one party agrees to make payments to the other to the extent that interest rates exceed a specified rate or “cap”, (2) interest rate floors, under which, in return for a premium, one party agrees to make payments to the other to the extent that interest rates fall below a specified rate or “floor”, (3) interest rate collars, under which a party sells a cap and purchases a floor or vice versa in an attempt to protect itself against interest rate movements exceeding given minimum or maximum levels, and (4) callable interest rate swaps, under which a counterparty may terminate the swap transaction in whole at zero cost by a predetermined date and time prior to expiration date. |
The Fund entered into interest payment swap arrangements with Citibank, N. A. New York (Citibank) for the purpose of partially hedging its dividend payment obligations with respect to the ARPS. Pursuant to each of the swap arrangements, the Fund makes payments to Citibank on a monthly basis at fixed annual rates. In exchange for such payments Citibank makes payments to the Fund on a monthly basis at a variable rate determined with reference to the one month London Interbank Offered Rate (LIBOR). The variable rates ranged from 0.436% to 4.588% during the year ended December 31, 2008.
21
PACHOLDER HIGH YIELD FUND, INC.
Notes to Financial Statements (continued)
The effective date, notional contract amount, maturity, fixed and floating annual rates and unrealized appreciation/depreciation of the swaps are as follows:
| | | | | | | | | | | | | | | | | | |
Effective Date | | Upfront
Premiums
(Paid)/
Received | | Notional
Contract
Amount | | Maturity | | Payments
Made by
the Fund | | Payments
Received
by the
Fund | | Floating
Annual
Rate* | | | Unrealized
Appreciation/
(Depreciation) | |
11/30/2007 | | — | | $ | 5 million | | 6/1/2011 | | 4.000%
monthly | | 1 month
LIBOR
monthly | | 0.436 | % | | $ | (317,417 | ) |
6/1/2005 | | — | | | 5 million | | 6/1/2009 | | 4.150%
monthly | | 1 month
LIBOR
monthly | | 0.436 | % | | | (80,919 | ) |
12/1/2005 | | — | | | 5 million | | 12/1/2009 | | 4.740%
monthly | | 1 month
LIBOR
monthly | | 0.436 | % | | | (189,025 | ) |
12/1/2006 | | — | | | 5 million | | 12/1/2010 | | 5.010%
monthly | | 1 month
LIBOR
monthly | | 0.436 | % | | | (372,552 | ) |
8/14/2006 | | — | | | 5 million | | 6/1/2010 | | 5.255%
monthly | | 1 month
LIBOR
monthly | | 0.436 | % | | | (310,435 | ) |
Total | | | | | | | | | | | | | | | | $ | (1,270,348 | ) |
| | | | | | | | | | | | | | | | | | |
| * | | Represents rate in effect at December 31, 2008. |
Swap transactions, which involve future settlement, give rise to credit risk. Credit risk is the amount of loss the Fund would incur in the event counterparties failed to perform according to the terms of the contractual commitments. The Fund is exposed to credit loss in the event of nonperformance by the counterparty on interest rate swaps. While notional contract amounts are used to express the volume of interest rate swap agreements, the amounts potentially subject to credit risk, in the event of nonperformance by counterparties, are substantially smaller.
The Fund may also be exposed to market risk related to unfavorable changes in interest rates, liquidity risks related to lack of a liquid market for these contracts allowing the Fund to close out of its position and documentation risk related to a disagreement on meaning of contract terms.
For the year ended December 31, 2008, the Fund’s receipts under the swap agreements were less than the amount paid and accrued to Citibank by $482,669 and are shown in realized loss in the accompanying Statement of Operations.
The estimated fair value of the interest rate swap agreements at December 31, 2008, amounted to approximately $1,270,348 in net unrealized depreciation and is included in the accompanying Statement of Net Assets Applicable to Common Stockholders. Swap transactions present risk of loss in excess of the related amounts included in the Statement of Net Assets Applicable to Common Stockholders.
| 5. | | PURCHASES AND SALES OF SECURITIES — Purchases and sales of securities (excluding short-term securities) for the year ended December 31, 2008 aggregated $57,150,430 and $79,046,867 respectively. During the year ended December 31, 2008, there were no purchases or sales of U.S. Government securities. |
| 6. | | TRANSACTIONS WITH INVESTMENT ADVISOR, ADMINISTRATOR, ACCOUNTING SERVICES AGENT AND CUSTODIAN — JPMIM, an indirect, wholly-owned subsidiary of JPMorgan Chase & Co. serves as investment advisor to the Fund under an investment advisory agreement effective as of January 1, 2007. The agreement provides that the Fund will pay a “fulcrum fee” to JPMIM under which the rate at which JPMIM is compensated varies in proportion to the performance of the Fund relative to the Credit Suisse First Boston High Yield Index, Developed Countries Only index over a rolling twelve month period. The annual fee rate is 90 basis points (“bp”) if the performance of the Fund equals the index and is subject to a performance adjustment of +/-50bp. The fee rate is calculated monthly based on the performance of the Fund compared to the index during the rolling twelve month period. This rate is applied to the average net assets (defined as the total assets of the Fund minus liabilities plus the principal amount of any outstanding senior securities representing indebtedness and includes the liquidation preference of the ARPS) during the entire twelve month period. As a result, fees recorded in a single month will also include adjustments, if necessary, relating to the previous 11 month period. Therefore, amounts recorded in the financial statements may be greater or less than the maximum/minimum rate of the performance fee. For January, 2008, the advisory fee rate calculated based on the rolling 12 month period then ended was an annual rate of 0.40%, as compared to the annual rate of 0.78% calculated in the previous month, resulting in a reduction to previously accrued fees. The advisory fee rate calculated for each of the rolling 12 month periods ended February through December of 2008 was also 0.40%. Advisory fees calculated for the year ended December 31, 2008 resulted in a net expense to the Fund of $48,158. |
The Fund may invest in one or more money market funds advised by the Advisor or its affiliates. The Advisor and Administrator reimburse to the Fund an amount sufficient to offset the advisory, administration, distribution and shareholder servicing fees each charged to the affiliated money market fund on the Fund’s investment in such affiliated money market fund. A portion of the reimbursement is voluntary.
The amount of these waivers/reimbursements resulting from investments in the money market funds for the year ended December 31, 2008 was $16.
22
PACHOLDER HIGH YIELD FUND, INC.
Notes to Financial Statements (continued)
The Fund has an administrative services agreement with JPMorgan Funds Management, Inc. (the “Administrator”) (an affiliate of JPMIM) pursuant to which the Administrator provides administrative services to the Fund. Under the agreement, the Administrator receives from the Fund a fee, accrued at least weekly and paid monthly, at the annual rate of 0.10% of the average weekly net assets of the Fund. At December 31, 2008, accrued administrative fees were $3,805.
J.P. Morgan Investor Services, Co. (“JPMIS”), an indirect, wholly-owned subsidiary of JPMorgan Chase & Co., is the Fund’s sub-administrator. For its services as sub-administrator, JPMIS receives a portion of the fees payable to the Administrator.
The Fund has a Global Custody and Fund Accounting Agreement (the “Agreement”) with JPMCB. For providing custody services under the Agreement, JPMCB is entitled to a fee from the Fund, accrued weekly and paid monthly. The amounts paid directly to JPMCB by the Fund for custody and accounting services are included in custodian and accounting fees in the Statement of Operations. The custodian fees may be reduced by credits earned by the Fund, based on uninvested cash balances held by the custodian. Such earnings credits are presented separately in the Statement of Operations.
Interest expense, if any, paid to the custodian related to cash overdrafts is included in Interest expense in the Statement of Operations.
The Fund is a party to loan participations and assignments that were transacted with JPMorgan Chase & Co. or its affiliates through the normal course of business.
| 7. | | COMPONENTS OF ACCUMULATED EARNINGS (LOSSES) — At December 31, 2008, the components of net assets applicable to common stockholders (excluding paid in capital) on a tax basis were as follows: |
| | | | |
| | | December 31,
2008 | |
Gross unrealized appreciation on investments | | $ | 377,650 | |
Gross unrealized depreciation on investments | | | (66,512,572 | ) |
| | | | |
Net unrealized appreciation/(depreciation) on investments | | $ | (66,134,922 | ) |
| | | | |
Cost of investments for Federal Tax purposes | | $ | 161,087,666 | |
The difference between the book-basis and tax basis unrealized appreciation/(depreciation) is attributable primarily to market discount accretion.
At December 31, 2008, the components of net assets (excluding paid in capital) on a tax basis were as follows:
| | | | | | | | | |
| | | Current
Distributable
Ordinary
Income | | Current
Distributable
Long Term
Capital Gain
or (Tax Basis
Capital Loss
Carryover) | | | Unrealized
Appreciation
(Depreciation) |
| | $ | 2,038,951 | | $ | (44,687,817 | ) | | $(67,510,815) |
The cumulative timing differences primarily consist of swap accruals, market discount accretion and post October losses.
Net capital losses incurred after October 31 and within the taxable year are deemed to arise on the first business day of the Funds’ next taxable year. For the period ended December 31, 2008, the Fund deferred to January 1, 2009 post October capital losses of $9,285,050.
At December 31, 2008, the Fund had available a capital loss carryforward of $44,687,817, of which $4,438,792 expires in 2009, $8,135,473 expires in 2010, $20,873,746 expires in 2011, $2,030,683 expires in 2012, $6,916,560 expires in 2013, $416,016 expires in 2015 and $1,876,547 expires in 2016, to offset any future net capital gains.
During the year ended December 31, 2008, $4,746,544 of the Fund’s capital loss carryovers expired.
| 8. | | SCHEDULE OF RESTRICTED SECURITIES — A restricted security is a security which has been purchased through a private offering and cannot be resold to the general public without prior registration under the Securities Act of 1933 (the “Act”) or pursuant to the resale limitations provided by rule under the Act, or an exemption from the registration requirements of the Act. At December 31, 2008, the Fund held restricted securities representing 2.9% of the Fund’s net assets. The restricted securities held as of December 31, 2008 are identified below: |
| | | | | | | |
Security | | Description | | Acquisition
Date | | Cost of
Security |
Golden State Foods Corp.,
Private Placement, Sr Sub NT,
9.240%, 01/10/12 | | Bond | | 2/26/2004 | | $ | 1,554,403 |
23
PACHOLDER HIGH YIELD FUND, INC.
Notes to Financial Statements (concluded)
| 9. | | ILLIQUID SECURITIES — The Fund may invest in securities that are subject to legal or contractual restrictions on resale or are illiquid. An illiquid security is a security which cannot be disposed of promptly (within seven days) and in the usual course of business at approximately its fair value and includes, but is not limited to, repurchase agreements maturing in excess of seven days, time deposits with a withdrawal penalty, non-negotiable instruments and instruments for which no market exists. Disposal of these securities may involve time-consuming negotiations and expense, and prompt sale at the current valuation may be difficult. At December 31, 2008, the Fund held illiquid securities representing 18.5% of net assets. |
| 10. | | RECENT ACCOUNTING PRONOUNCEMENT — In March 2008, Statement of Financial Accounting Standards No. 161, “Disclosures about Derivative Instruments and Hedging Activities” (“SFAS 161”) was issued and is effective for fiscal years and interim periods beginning after November 15, 2008. SFAS 161 requires enhanced disclosures about a fund's/portfolio’s derivative and hedging activities. Management is currently evaluating the impact the adoption of SFAS 161 will have on the Fund's financial statement disclosures. |
| 11. | | RISKS, CONCENTRATIONS AND INDEMNIFICATIONS — The Fund invests at least 80% of its assets in high yield debt securities. Investments in lower-rated securities or unrated securities of comparable quality tend to be more sensitive to economic conditions than higher rated securities. These securities involve a greater risk of default by the issuer because such securities are generally unsecured and are often subordinated to other creditors’ claims. |
The ability of the issuers of debt and asset-backed securities, including sub-prime securities, along with counterparties to swap and option agreements, to meet their obligations may be affected by the economic and political developments in a specific industry or region. The value of asset-backed securities, including sub-prime securities, can be significantly affected by changes in interest rates or rapid principal payments including prepayments.
The Fund’s officers and directors are indemnified against certain liabilities arising out of the performance of their duties to the Fund. In addition, in the normal course of business, the Fund enters into contracts with its vendors and others that provide for general indemnifications. The Fund’s maximum exposure under these arrangements is unknown, as this would involve future claims that may be made against the Fund. However, based on experience, the Fund expects the risk of loss to be remote.
The Fund is party to a derivative contract governed by International Swaps and Derivatives Association Master Agreements (ISDA agreements) with a counterparty. The Fund’s ISDA agreement, which is separately negotiated with the dealer counterparty, may contain provisions allowing, absent other considerations, the counterparty to exercise rights, to the extent not otherwise waived, against the Fund in the event the Fund’s net assets decline over time by a pre-determined percentage or fall below a pre-determined floor. Such rights often include the ability to terminate (i.e., close out) open contracts at prices which may favor the counterparty, which could have an adverse impact on the Fund.
On December 9, 2008 and January 12, 2009, Citigroup and Morgan Stanley, respectively, became a beneficial owner of a significant portion of the Fund’s outstanding ARPS and based on such ownership, could be deemed to be affiliates of the Fund. Morgan Stanley has informed the Fund it intends to comply with a No Action Letter that will enable it not to be deemed an affiliate. These parties could have an impact on matters that affect the Funds’ shareholders due to the voting rights associated with the ARPS, as detailed in the “Preferred Stock” note, included in this report.
As of December 31, 2008, the Fund is a party to interest rate swaps, and certain securities loans and loan participations and assignments that were transacted with either Citigroup or Morgan Stanley in the normal course of business, prior to their potential affiliation.
24
PACHOLDER HIGH YIELD FUND, INC.
Report of Independent Registered Public Accounting Firm
To the Board of Directors and Shareholders of
Pacholder High Yield Fund, Inc.:
In our opinion, the accompanying statement of net assets, and the related statements of operations, of changes in net assets and of cash flows and the financial highlights present fairly, in all material respects, the financial position of Pacholder High Yield Fund, Inc. (hereafter referred to as the “Fund”) at December 31, 2008, and the results of its operations and cash flows for the year then ended, the changes in its net assets for each of the two years in the period then ended and the financial highlights for each of the five years in the period then ended, in conformity with accounting principles generally accepted in the United States of America. These financial statements and financial highlights (hereafter referred to as “financial statements”) are the responsibility of the Fund’s management. Our responsibility is to express an opinion on these financial statements based on our audits. We conducted our audits of these financial statements in accordance with the standards of the Public Company Accounting Oversight Board (United States). Those standards require that we plan and perform the audit to obtain reasonable assurance about whether the financial statements are free of material misstatement. An audit includes examining, on a test basis, evidence supporting the amounts and disclosures in the financial statements, assessing the accounting principles used and significant estimates made by management, and evaluating the overall financial statement presentation. We believe that our audits, which included confirmation of securities at December 31, 2008 by correspondence with the custodian and brokers, provide a reasonable basis for our opinion.
PricewaterhouseCoopers LLP
New York, New York
February 27, 2009
25
PACHOLDER HIGH YIELD FUND, INC.
Tax Letter (Unaudited)
Certain tax information for the Fund is required to be provided to shareholders based upon the Fund’s income and distributions for the taxable year ended December 31, 2008. The information and distributions reported is this letter may differ from the information and taxable distributions reported to the shareholders for the calendar year ending December 31, 2008. The information necessary to complete your income tax returns for the calendar year ending December 31, 2008 will be received under separate cover.
Dividends Received Deductions (DRD)
0.96% of ordinary income distributions qualified for the 70% dividend received deduction for corporate shareholders for the Fund’s fiscal year ended December 31, 2008.
26
PACHOLDER HIGH YIELD FUND, INC.
Biographical Information Regarding Directors (Unaudited)
| | | | | | | | |
Name, Address
and Birth Year | | Positions held with
the Fund, Term of Office,
and Length of Time Served | | Principal Occupation(s)
During Past 5 Years | | Number of
Portfolios in Fund
Complex (2)
Overseen by
Nominee (3) | | Other Directorships
Held by Nominee (4) |
Non-Interested Directors | | | | | | | | |
Cheryl Ballenger 1956 | | Chairperson and
Director since 2008 Elected at 2008 Shareholder Meeting | | Mathematics Teacher, Vernon Hills High School (August 2004-Present); Mathematics Teacher, Round Lake High School (2003-2004) and formerly Executive Vice President and Chief Financial Officer, Galileo International Inc. (travel technology) | | 11 | | None |
| | | | |
Jerry B. Lewis 1939 | | Director, Elected at 2008 Shareholder Meeting | | Retired; formerly President, Lewis Investments Inc. (investment adviser); previously, various managerial and executive positions at Ford Motor Company (Treasurer’s Office, Controller’s Office, Auditing and Corporate Strategy) | | 11 | | None |
| | | | |
John R. Rettberg 1937 | | Director, Elected at 2008 Shareholder Meeting | | Retired; formerly Corporate Vice President and Treasurer, Northrop Grumman Corporation (defense contractor) | | 11 | | None |
| | | | |
Kenneth Whipple, Jr. 1934 | | Director, Elected at 2008 Shareholder Meeting | | Chairman (2002-Present) and CEO (2002-2004), CMS Energy; previously Executive Vice President of Ford Motor Company, Chairman of Ford of Europe and Chairman and CEO of Ford Credit | | 11 | | Director of CMS Energy and Korn Ferry International (executive recruitment) |
| | | | |
John F. Williamson 1938 | | Director; Elected annually; Chairman of the Board from 2004 through 2008 and Director since 1991 | | Retired; Chairman and President, Williamson Associates, Inc. (investment adviser) January 1997 to June 2002; Director of ICO Inc. (energy company), April 1995 to May 2002, Chairman from June 2001 to May 2002 | | 11 | | None |
| | | | |
Interested Directors | | | | | | | | |
John F. Ruffle(1) 1937 | | Director, Elected at 2008 Shareholder Meeting | | Retired; formerly Vice Chairman, J.P. Morgan Chase & Co. Inc. and Morgan Guaranty Trust Co. of NY | | 11 | | Trustee of Johns Hopkins University and Director of American Shared Hospital Services |
| (1) | The Board has designated Mr. Ruffle as an “interested person” at his request because, until his retirement in 1993, he was an executive officer of the parent company of JPMIM. |
| (2) | “Fund Complex” comprises the Fund and the 11 funds of the registered investment companies overseen by the Alternative Products Board. As private investment funds, the seven funds of JPMorgan Private Funds are not included. If the Nominees are elected, they will oversee all funds in the Fund Complex and JPMorgan Private Funds. |
| (3) | The 11 funds include the Fund as well as the 10 registered investment companies overseen by the Alternative Products Board. As of the date of this proxy statement, Mr. Williamson serves as a director of the Fund only and the other Nominees serve as trustees/directors of 10 funds. If all Nominees are elected as directors of the Fund, as directors/trustees they will oversee 11 funds as well as the seven funds of JPMorgan Private Funds. |
| (4) | Includes a company with a class of securities registered under the Securities Exchange Act of 1934, as amended (“Exchange Act”), or subject to the requirements of Section 15(d) of the Exchange Act, other than the Fund. |
| | The contact address for each Director is 245 Park Avenue, New York, NY 10167. |
27
PACHOLDER HIGH YIELD FUND, INC.
Biographical Information Regarding Officers (Unaudited)
| | | | | | |
Name, Address
and Birth Year | | Position(s) Held
with the Fund | | Length of Time Served | | Principal Occupation(s)
During Past 5 Years |
Gary J. Madich, CFA 1111 Polaris Parkway, Columbus, OH 43240 1955 | | President | | Position held since 2006 | | Managing Director and Chief Investment Officer of JPMorgan Investment Advisors Inc. (formerly Banc One Investment Advisors Corporation). |
| | | |
Robert L. Young 1111 Polaris Parkway Columbus, OH 43240 1963 | | Senior Vice President | | Position held since 2008 | | Director and Vice President, JPMorgan Distribution Services, Inc. and JPMorgan Funds Management, Inc.; Chief Operating Officer, JPMorgan Funds since 2005, and One Group Mutual Funds from 2001 until 2005. Mr. Young was Vice President and Treasurer, JPMorgan Funds Management, Inc. (formerly One Group Administrative Services), and Vice President and Treasurer, JPMorgan Distribution Services, Inc. (formerly One Group Dealer Services, Inc.) from 1999 to 2005. |
| | | |
Patricia A. Maleski 245 Park Avenue New York, NY 10167 1960 | | Vice President and Chief Administrative Officer | | Positions held since 2007 | | Managing Director, JPMorgan Funds Management, Inc.; Head of Funds Administration and Board Liaison; Ms. Maleski has been with JPMorgan Chase & Co. since 2001. |
| | | |
| | Treasurer | | Position held since 2008 | | |
| | | |
Jessica K. Ditullio 1111 Polaris Parkway Columbus, OH 43240 1962 | | Secretary | | Position held since 2006 | | Vice President and Assistant General Counsel, JPMorgan Chase & Co. since 2005; Ms. Ditullio has served as an attorney with various titles for JPMorgan Chase & Co. (formerly Bank One Corporation) since 1990. |
| | | |
Stephen M. Ungerman 245 Park Avenue New York, NY 10167 1953 | | Chief Compliance Officer | | Position held since 2008 | | Managing Director, JPMorgan Chase; Mr. Ungerman was head of Fund Administration — Pooled Vehicles from 2000 to 2004. Mr. Ungerman has been with JPMorgan Chase since 2000. |
28
PACHOLDER HIGH YIELD FUND, INC.
Board Approval of Investment Advisory Agreement (Unaudited)
Consideration by the Board of Directors
The Board of Directors met in person in December 2008 to consider the renewal of the investment advisory agreement (the “Advisory Agreement”) between the Fund and J.P. Morgan Investment Management Inc. (“JPMIM”, or the “Advisor”). At the meeting, the Directors reviewed and considered performance and expense information for the Fund, as well as information about JPMIM. On December 11, 2008, the Directors, including a majority of the Directors who are not “interested persons” (as defined in the Investment Company Act of 1940) of any party to the Advisory Agreement or any of their affiliates, approved the Advisory Agreement through December 31, 2009.
In preparation for the December meeting, the Directors requested and evaluated comprehensive materials from JPMIM, including performance and expense information compiled by Lipper Inc. (“Lipper”), an independent provider of investment company data. Prior to voting, the Directors reviewed the proposed approval of the Advisory Agreement with representatives of the Advisor and with counsel to the Fund and received a memorandum from independent counsel to the Directors discussing the legal standards applicable to their consideration of the proposed approval. The Directors also discussed the proposed approval in a private session with independent counsel at which no representatives of the Advisor were present.
The Directors determined that the overall arrangement between the Fund and the Advisor, as provided in the Advisory Agreement, was fair and reasonable in light of the services performed, expenses incurred and such other matters as the Directors considered relevant in the exercise of their business judgment and that approval of the Advisory Agreement was in the best interests of the Fund and its shareholders. On this basis, the Directors unanimously approved the Advisory Agreement. In reaching their determination with respect to approval of the Advisory Agreement, the Directors considered all factors they believed relevant including: (1) the nature and quality of services provided and to be provided; (2) the investment performance of the Fund; (3) the advisory fees and total expenses; (4) costs of services and the estimated profitability of the Advisor; (5) possible economies of scale; and (6) fall out benefits.
In their deliberations, each Director may have attributed different weights to the various factors, and no factor alone was considered determinative. The matters discussed below were considered and discussed by the Directors in reaching their conclusions:
Nature, Extent and Quality of Services Provided by the Advisor.
The Directors received and considered information regarding the nature, extent and quality of the services provided to the Fund under the Advisory Agreement including information concerning the qualification and experience of the portfolio management team. The Directors noted that the management and oversight services provided by the Advisor were viewed as being of high quality and that the Board had a reasonable expectation that the services, and personnel providing them, will continue with no significant change. The Directors also considered JPMorgan’s commitment of resources to the fund management business, and the dedication of resources to addressing issues arising from the current market turmoil. The Directors also considered JPMorgan’s continued investments in the business in 2008 and the expected investments in 2009, including the development of technology and infrastructure.
The Directors also considered the benefits to the Fund of being part of the larger JPMorgan fund complex. They noted that Management had provided information about the Advisor and its affiliates and the financial strength of the organization. The Directors also considered shareholder expectations that JPMIM would be managing the Fund.
Based on these considerations and other factors, the Directors concluded that the Advisor’s services are of a nature, quality and extent that are sufficient for renewal.
Fund Performance
The Directors received and considered relative performance and expense information for the Fund in a report prepared by Lipper. The Directors considered the total return performance information, which included the Fund’s ranking within a performance universe made up of funds with the same Lipper investment classification and objective (the “Universe Group”) for the one-, three-, five- and ten- year periods reflected in the materials. The Directors also considered the Fund’s performance in comparison to the performance results of a group (the “Peer Group”) of funds. The Directors reviewed a description of Lipper’s methodology for selecting closed end funds in the Fund’s Peer Group and Universe Group. The Directors noted that the Fund’s performance had declined such that 1 year performance was in the 4th quintile, but 3, 5 and 10 year performance remained in the 1st quintile and that short term performance appeared to be improving.
Based on the foregoing, the Directors concluded that within the overall context of their deliberations about the Fund, performance of the Fund was sufficient for renewal, taking into account the improving performance of the Fund and the Fund’s excellent long-term performance record.
Advisory Fees and Total Expenses
With respect to advisory fee and total expenses, the Board considered that actual advisory fees are in the 1st quintile and total expenses are in the
29
PACHOLDER HIGH YIELD FUND, INC.
Board Approval of Investment Advisory Agreement (Unaudited) (concluded)
3rd quintile. The Board also found that the Performance Fee was effective to align the Advisor’s interests with the interests of fund shareholders, and to provide a level of compensation tied to investment performance.
The Board noted that the investment advisory fee schedule for the Fund does not contain breakpoints. The Board found that based on the size of the Fund, breakpoints were not yet warranted for the Fund. The Board considered that, although the Advisor manages other high yield accounts, the Advisor does not manage other funds or accounts in the same style as the Fund. The Board also noted that the Fund’s fee rate is higher than the Advisor’s published fee schedule for high yield assets by virtue of the performance based fee; but, at the lowest fee rate, the Fund’s fee is approximately the same as the published fee schedule. The Directors also considered that management had agreed that the administration fee and certain expenses will not increase prior to December 31, 2012 and that management continues to invest significantly in the business.
Based on the foregoing, the Directors concluded that after giving effect to expense caps and within the context of their deliberations about the Fund’s advisory arrangement, the advisory fee of the Fund was reasonable.
Cost of Services and Estimated Profitability
At the request of the Directors, the Advisor provided information regarding the estimated profitability to the Advisor in providing services to the Fund. The Board considered that the data represents the Advisor’s determination of its revenues from the contractual services provided to the Fund, less expenses of providing such services. The Board considered pre-tax profitability for advisory services and administrative services separately and on a combined basis, and for advisory services, profitability also was considered without the inclusion of the amortization expense of the integration of funds managed by Bank One Corporation affiliates with funds managed by JPMorgan Chase & Co. affiliates.
The Board concluded that the Advisor’s estimated profitability in respect of the Advisory Agreement was reasonable.
Possible Economies of Scale
The Directors also considered possible economies of scale. The Directors noted management’s agreement to not increase administration fees and certain expenses prior to December 31, 2012. The Directors also considered management’s investment in the business and that certain fees are negotiated on a complex-wide basis, permitting the Fund to share in the scale of the organization.
In light of all of the foregoing and under the circumstances, the Board concluded that there was an acceptable sharing of any economies of scale at the present time.
Fall-Out Benefits
The Directors also considered fall-out benefits to the Advisor and its affiliates including management’s profits on fees from administration, custody and fund accounting, and securities lending arrangements with the Fund. The Board concluded, in light of all of the foregoing, and under the circumstances, fallout benefits were acceptable at the present time.
30
PACHOLDER HIGH YIELD FUND, INC.
Supplemental Information (Unaudited)
Portfolio Holdings Information
No sooner than 10 days after the end of each month, the Fund’s uncertified complete schedule of its portfolio holdings as well as certain other fund facts and statistical information will be available on our website (www.phf-hy.com). In addition, the Fund files it’s certified, complete schedule of its portfolio holdings with the U.S. Securities and Exchange Commission (“SEC”) for the first and third quarters of each fiscal year on Form N-Q. The Fund’s Form N-Qs are available, without charge, on the SEC’s website at www.sec.gov. The Fund’s Form N-Qs may be reviewed and copied at the SEC’s Public Reference Room in Washington, DC. Information on the operation of the Public Reference Room may be obtained by calling 1-800-SEC-0330.
Proxy Voting
A description of the policies and procedures used by the Fund to vote proxies relating to portfolio securities, as well as information regarding how the Fund voted proxies relating to portfolio securities during the most recent 12-month period ended December 31, is available (i) without charge, on the Fund’s website at www.phf-hy.com and (ii) on the SEC’s website at www.sec.gov.
Dividend Reinvestment Plan
The Fund’s Dividend Reinvestment Plan offers you an automatic way to reinvest your dividends and capital gains distributions in additional shares of the Fund. For an enrollment form and detailed information about the Plan, please contact Computershare Investor Services, P.O. Box 43036, Providence, RI 02940-3036, (888) 294-8217, and www.computershare.com.
Privacy Policy
Respecting and protecting customer privacy is vital to Pacholder High Yield Fund, Inc. This Policy explains what Pacholder High Yield Fund, Inc. does to keep our customer information private and secure.
Q. Who is covered by the Privacy Policy?
A. This Privacy Policy applies to consumers who are customers or former customers of Pacholder High Yield Fund, Inc. through record ownership of Fund shares. Our Privacy Policy is provided to customers when they open a new account. We also send it to current customers yearly. We may change our Policy. We will send you a new privacy policy if we broaden our information sharing practices about you.
Q. What information do you have about me?
A. To provide services and to help meet your needs, we collect information about you from various sources.
| | • | | We get information from you on applications or other forms, on our web site, or through other means. |
| | • | | We get information from transactions, correspondence, or other communications with us. |
Q. How do you safeguard information about me?
A. We take a number of steps to protect the privacy of information about you. Here are some examples:
| | • | | We keep information under physical, electronic and procedural controls that comply with or exceed governmental standards. |
| | • | | We authorize our employees, agents and contractors to get information about you only when they need it to do their work for us. |
| | • | | We require companies working for us to protect information. They agree to use it only to provide the services we ask them to perform for us. |
Q. Is information about me shared with others?
A. We do not share personally identifiable information about you except as noted below.
Q. Is information about me shared with service providers?
A. Yes, as permitted by law. We may share information about you with outside companies that work for us. These may include firms that help us maintain and service accounts. For instance, we will share information with the transfer agent for Pacholder High Yield Fund, Inc. The transfer agent needs this information to process your purchase and sale transactions, to pay dividends to you and to update your account.
Q. Is information about me shared in any other ways?
A. Yes. We may also share information about you in other ways, as required or permitted by law. Here are some examples of ways that we share information.
| | • | | To protect against fraud. |
| | • | | To protect against practices that may harm Pacholder High Yield Fund, Inc. or its shareholders. |
| | • | | To respond to a subpoena. |
31
PACHOLDER HIGH YIELD FUND, INC.
Supplemental Information (Unaudited) (concluded)
| | • | | With regulatory authorities and law enforcement officials who have jurisdiction over us. |
| | • | | To service your account. |
Special Notice for California Residents.
In order to comply with California law, if your account has a California mailing address, we will not share information about you with third parties unless we first provide you with further privacy choices or unless otherwise permitted by law such as servicing your account.
Special Notice for Vermont Residents.
In order to comply with Vermont law, if we disclose information about you to other financial institutions with which we have joint marketing agreements, we will only disclose your name, contact information and information about your transactions.
THE PACHOLDER HIGH YIELD FUND, INC. PRIVACY COMMITMENT. Pacholder High Yield Fund, Inc. is committed to protecting the privacy of our customers, but we understand that the best protection requires a partnership with you. We encourage you to find out how you can take steps to further protect your own privacy by visiting us online at www.phf-hy.com.
32
ITEM 2. CODE OF ETHICS.
Disclose whether, as of the end of the period covered by the report, the registrant has adopted a code of ethics that applies to the registrant’s principal executive officer, principal financial officer, principal accounting officer or controller, or persons performing similar functions, regardless of whether these individuals are employed by the registrant or a third party. If the registrant has not adopted such a code of ethics, explain why it has not done so.
The registrant must briefly describe the nature of any amendment, during the period covered by the report, to a provision of its code of ethics that applies to the registrant’s principal executive officer, principal financial officer, principal accounting officer or controller, or persons performing similar functions, regardless of whether these individuals are employed by the registrant or a third party, and that relates to any element of the code of ethics definition enumerated in paragraph (b) of this Item. The registrant must file a copy of any such amendment as an exhibit pursuant to Item 12(a)(1), unless the registrant has elected to satisfy paragraph (f) of this Item by positing its code of ethics on its website pursuant to paragraph (f)(2) of this Item, or by undertaking to provide its code of ethics to any person without charge, upon request, pursuant to paragraph (f)(3) of this Item.
If the registrant has, during the period covered by the report, granted a waiver, including an implicit waiver, from a provision of the code of ethics that applies to the registrant’s principal executive officer, principal financial officer, principal accounting officer or controller, or persons performing similar functions, regardless of whether these individuals are employed by the registrant or third party, that relates to one or more items set forth in paragraph (b) of this Item, the registrant must briefly describe the nature of the waiver, the name of the person to whom the waiver was granted, and the date of the waiver.
The Registrant has adopted a code of ethics that applies to the Registrant’s principal executive officer and principal financial officer. There were no amendments to the code of ethics or waivers granted with respect to the code of ethics in the period covered by the report.
ITEM 3. AUDIT COMMITTEE FINANCIAL EXPERT.
(a) (1) Disclose that the registrant’s board of directors has determined that the registrant either:
(i) Has at least one audit committee financial expert serving on its audit committee; or
(ii) Does not have an audit committee financial expert serving on its audit committee.
The Registrant’s Board of Directors has determined that the Registrant has at least one audit committee financial expert serving on its audit committee. The Securities and Exchange Commission has stated that the designation or identification of a person as an audit committee financial expert pursuant to this Item 3 of Form N-CSR does not impose on such person any duties, obligations or liabilities that are greater than the duties, obligations and liabilities imposed on such person as a member of the Audit Committee and the Board of Directors in the absence of such designation or identification.
(2) If the registrant provides the disclosure required by paragraph (a)(1)(i) of this Item, it must disclose the name of the audit committee financial expert and whether that person is “independent.” In order to be considered “independent” for purposes of this Item, a member of an audit committee may not, other than in his or her capacity as a member of the audit committee, the board of directors, or any other board committee:
(i) Accept directly or indirectly any consulting, advisory, or other compensatory fee from the issuer; or
(ii) Be an “interested person” of the investment company as defined in Section 2(a)(19) of the Act (15 U.S.C. 80a-2(a)(19)).
The audit committee financial expert is Jerry B. Lewis. He is not an “interested person” of the Registrant and is also “independent” as defined by the U.S. Securities and Exchange Commission for purposes of audit committee financial expert determinations.
(3) If the registrant provides the disclosure required by paragraph (a)(1)(ii) of this Item, it must explain why it does not have an audit committee financial expert.
Not applicable.
ITEM 4. PRINCIPAL ACCOUNTANT FEES AND SERVICES.
(a) Disclose, under the caption Audit Fees, the aggregate fees billed for each of the last two fiscal years for professional services rendered by the principal accountant for the audit of the registrant’s annual financial statements or services that are normally provided by the accountant in connection with statutory and regulatory filings or engagements for those fiscal years.
|
AUDIT FEES |
2008 – $56,500 |
2007 – $61,400 |
(b) Disclose, under the caption Audit-Related Fees, the aggregate fees billed in each of the last two fiscal years for assurance and related services by the principal accountant that are reasonably related to the performance of the audit of the registrant’s financial statements and are not reported under paragraph (a) of this Item. Registrants shall describe the nature of the services comprising the fees disclosed under this category.
|
AUDIT-RELATED FEES (On a calendar year basis) |
2008 – $9,000 |
2007 – $9,000 |
The audit-related fees consist of aggregate fees billed for assurance and related services by the independent registered public accounting firm to the Registrant’s investment adviser (not including any sub-adviser whose role is primarily portfolio management and is subcontracted with or overseen by another investment adviser), and any entity controlling, controlled by or under common control with the investment adviser that provides ongoing services to the Registrant (“Service Affiliates”), that were reasonably related to the performance of the annual audit of the Registrant’s financial statements.
(c) Disclose, under the caption Tax Fees, the aggregate fees billed in each of the last two fiscal years for professional services rendered by the principal accountant for tax compliance, tax advice, and tax planning. Registrants shall describe the nature of the services comprising the fees disclosed under this category.
|
TAX FEES |
2008 – $4,500 |
2007 – $4,500 |
The tax fees consist of fees billed in connection with preparing the federal regulated investment company income tax returns for the Registrant for the tax years ended December 31, 2008 and 2007.
For the last fiscal year, no tax fees were required to be approved pursuant to paragraph (c)(7)(ii) of Rule 2-01 of Regulation S-X.
(d) Disclose, under the caption All Other Fees, the aggregate fees billed in each of the last two fiscal years for products and services provided by the principal accountant, other than the services reported in paragraphs (a) through (c) of this Item. Registrants shall describe the nature of the services comprising the fees disclosed under this category.
|
ALL OTHER FEES |
| 2008 – Not applicable |
| 2007 – Not applicable |
(e) (1) Disclose the audit committee’s pre-approval policies and procedures described in paragraph (c)(7) of Rule 2-01 of Regulation S-X.
Pursuant to the Registrant’s Audit Committee Charter and written policies and procedures for the pre-approval of audit and non-audit services (the “Pre-approval Policy”), the Audit Committee pre-approves all audit and non-audit services performed by the Registrant’s independent public registered accounting firm for the Registrant. In addition, the Audit Committee pre-approves the auditor’s engagement for non-audit services with the Registrant’s investment adviser (not including a sub-adviser whose role is primarily portfolio management and is sub-contracted or overseen by another investment adviser) and any Service Affiliate in accordance with paragraph (c)(7)(ii) of Rule 2-01 of Regulation S-X, if the engagement relates directly to the operations and financial reporting of the Registrant. Proposed services may be pre-approved either 1) without consideration of specific case-by-case services or 2) require the specific pre-approval of the
Audit Committee. Therefore, initially the Pre-approval Policy listed a number of audit and non-audit services that have been approved by the Audit Committee, or which were not subject to pre-approval under the transition provisions of Sarbanes-Oxley Act of 2002 (the “Pre-approval List”). The Audit Committee annually reviews and pre-approves the services included on the Pre-approval List that may be provided by the independent public registered accounting firm without obtaining additional specific pre-approval of individual services from the Audit Committee. The Audit Committee adds to, or subtracts from, the list of general pre-approved services from time to time, based on subsequent determinations. All other audit and non-audit services not on the Pre-approval List must be specifically pre-approved by the Audit Committee.
One or more members of the Audit Committee may be appointed as the Committee’s delegate for the purposes of considering whether to approve such services. Any pre-approvals granted by the delegate will be reported, for informational purposes only, to the Audit Committee at its next scheduled meeting. The Audit Committee’s responsibilities to pre-approve services performed by the independent public registered accounting firm are not delegated to management.
(2) Disclose the percentage of services described in each of paragraphs (b) through (d) of this Item that were approved by the audit committee pursuant to paragraph (c)(7)(i)(C) of Rule 2-01 of Regulation S-X.
(f) If greater than 50 percent, disclose the percentage of hours expended on the principal accountant’s engagement to audit the registrant’s financial statements for the most recent fiscal year that were attributed to work performed by persons other than the principal accountant’s full-time, permanent employees.
None.
(g) Disclose the aggregate non-audit fees billed by the registrant’s accountant for services rendered to the registrant, and rendered to the registrant’s investment adviser (not including any sub-adviser whose role is primarily portfolio management and is subcontracted with or overseen by another investment adviser), and any entity controlling, controlled by, or under common control with the adviser that provides ongoing services to the registrant for each of the last two fiscal years of the registrant.
The aggregate non-audit fees billed by the independent registered public accounting firm for services rendered to the Registrant, and rendered to Service Affiliates, for the last two calendar year ends were $24.8 million in 2008 and $19.9 million in 2007.
(h) Disclose whether the registrant’s audit committee of the board of directors has considered whether the provision of non-audit services that were rendered to the registrant’s investment adviser (not including any subadviser whose role is primarily portfolio management and is subcontracted with or overseen by another investment adviser), and any entity controlling, controlled by, or under common control with the investment adviser that provides ongoing services to the registrant that were not pre-approved pursuant to paragraph (c)(7)(ii) of Rule 2-01 of Regulation S-X is compatible with maintaining the principal accountant’s independence.
The Registrant’s Audit Committee has considered whether the provision of the non-audit services that were rendered to Service Affiliates that were not pre-approved (not requiring pre-approval) is compatible with maintaining the independent public registered accounting firm’s independence. All services provided by the independent public registered accounting firm to the Registrant or to Service Affiliates that were required to be pre-approved were pre-approved as required.
ITEM 5. AUDIT COMMITTEE OF LISTED REGISTRANTS.
(a) If the registrant is a listed issuer as defined in Rule 10A-3 under the Exchange Act (17CFR 240.10A-3), state whether or not the registrant has a separately-designated standing audit committee established in accordance with Section 3(a)(58)(A) of the Exchange Act (15 U.S.C. 78c(a)(58)(A)). If the registrant has such a committee, however designated, identify each committee member. If the entire board of directors is acting as the registrant’s audit committee as specified in Section 3(a)(58)(B) of the Exchange Act (15 U.S.C. 78c(a)(58)(B)), so state.
The Registrant has a separately-designated standing Audit Committee established by the Board of Directors of the Registrant in accordance with Section 3(a)(58)(A) of the Securities Exchange Act of 1934, as amended. It is composed of the following Directors, each of whom is not an “interested person” as defined in the Investment Company Act of 1940, as amended:
Cheryl Ballenger
Jerry B. Lewis
John R. Rettberg
Ken Whipple, Jr.
John F. Williamson
(b) If applicable, provide the disclosure required by Rule 10A-3(d) under the Exchange Act (17CFR 240.10A-3(d)) regarding an exemption from the listing standards for all audit committees.
Not applicable.
ITEM 6. SCHEDULE OF INVESTMENTS.
File Schedule I – Investments in securities of unaffiliated issuers as of the close of the reporting period as set forth in Section 210.12-12 of Regulation S-X, unless the schedule is included as part of the report to shareholders filed under Item 1 of this Form.
Included in Item 1.
ITEM 7. DISCLOSURE OF PROXY VOTING POLICIES AND PROCEDURES FOR CLOSED-END MANAGEMENT INVESTMENT COMPANIES.
A closed-end management investment company that is filing an annual report on this Form N-CSR must, unless it invests exclusively in non-voting securities, describe the policies and procedures that it uses to determine how to vote proxies relating to portfolio securities, including the procedures that the company uses when a vote presents a conflict between the interests of its shareholders, on the one hand, and those of the company’s investment adviser; principal underwriter; or any affiliated person (as defined in Section 2(a)(3) of the Investment Company Act of 1940 (15 U.S.C. 80a-2(a)(3)) and the rules thereunder) of the company, its investment adviser, or its principal underwriter, on the other. Include any policies and procedures of the company’s investment adviser, or any other third party, that the company uses, or that are used on the company’s behalf, to determine how to vote proxies relating to portfolio securities.
The Registrant has adopted proxy voting policies and procedures, as defined in Item 7 of Form N-CSR. A copy of the policies and procedures is filed as Exhibit 12(a)(3) to this Form. The Board of Directors has delegated to the Fund’s investment adviser (the “Adviser”), proxy voting authority with respect to the Fund’s portfolio securities. To ensure that the proxies of portfolio companies are voted in the best interests of the Fund, the Fund’s Board of Directors has adopted the Adviser’s detailed proxy voting procedures (the “Procedures”) that incorporate guidelines (“Guidelines”) for voting proxies on specific types of issues.
The Adviser and its affiliated advisers are part of a global asset management organization with the capability to invest in securities of issuers located around the globe. Because the regulatory framework and the business cultures and practices vary from region to region, the Guidelines are customized for each region to take into account such variations. Separate Guidelines cover the regions of (1) North America, (2) Europe, Middle East, Africa, Central America and South America, (3) Asia (ex-Japan) and (4) Japan, respectively.
Notwithstanding the variations among the Guidelines, all of the Guidelines have been designed with the uniform objective of encouraging corporate action that enhances shareholder value. As a general rule, in voting proxies of a particular security, the Adviser will apply the Guidelines of the region in which the issuer of such security is organized. Except as noted below, proxy voting decisions will be made in accordance with the Guidelines covering a multitude of both routine and non-routine matters that the Adviser and its affiliated advisers have encountered globally, based on many years of collective investment management experience.
To oversee and monitor the proxy-voting process, the Adviser has established a proxy committee and appointed a proxy administrator in each global location where proxies are voted. The primary function of each proxy committee is to review periodically general proxy-voting matters, review and approve the Guidelines annually, and provide advice and recommendations on general proxy-voting matters as well as on specific voting issues. The procedures permit an independent voting service, currently Institutional Shareholder Services, Inc. (“ISS”) in the United States, to perform certain services otherwise carried out or coordinated by the proxy administrator.
Although for many matters the Guidelines specify the votes to be cast, for many others, the Guidelines contemplate case-by-case determinations. In addition, there will undoubtedly be proxy matters that are not contemplated by the Guidelines. For both of these categories of matters and to override the Guidelines, the Procedures require a certification and review process to be completed before the vote is cast. That process is designed to identify actual or potential material conflicts of interest (between the Fund on the one hand, and the Fund’s investment adviser or an affiliate of any of the foregoing, on the other hand) and ensure that the proxy vote is cast in the best interests of the Fund. When a potential material conflict of interest has been identified, the proxy administrator and a subgroup of proxy committee members (composed of a member from the Investment Department and one or more members from the Legal, Compliance or Risk Management Departments) will evaluate the potential conflict of interest and determine whether such conflict actually exists, and if so, will recommend how the Adviser will vote the proxy. In addressing any material conflict, the Adviser may take one or more of the following measures (or other appropriate action): removing or “walling off” from the proxy voting process certain Adviser personnel with knowledge of the conflict, voting in accordance with any applicable Guideline if the application of the Guideline would objectively result in the casting of a proxy vote in a predetermined manner, or deferring the vote to ISS, which will vote in accordance with its own recommendation.
The following summarizes some of the more noteworthy types of proxy voting policies of the non-U.S. Guidelines:
| | • | | Corporate governance procedures differ among the countries. Because of time constraints and local customs, it is not always possible for the Adviser to receive and review all proxy materials in connection with each item submitted for a vote. Many proxy statements are in foreign languages. Proxy materials are generally mailed by the issuer to the sub-custodian which holds the securities for the client in the country where the portfolio company is organized, and there may not be sufficient time for such materials to be transmitted to the Adviser in time for a vote to be cast. In some countries, proxy statements are not mailed at all, and in some locations, the deadline for voting is two to four days after the initial announcement that a vote is to be solicited. The Adviser also considers the cost of voting in light of the expected benefit of the vote. |
| | • | | Where proxy issues concern corporate governance, takeover defense measures, compensation plans, capital structure changes and so forth, the Adviser pays particular attention to management’s arguments for promoting the prospective change. The Adviser’s sole criterion in determining its voting stance is whether such changes will be to the economic benefit of the beneficial owners of the shares. |
| | • | | The Adviser is in favor of a unitary board structure of the type found in the United Kingdom as opposed to tiered board structures. Thus, the Adviser will generally vote to encourage the gradual phasing out of tiered board structures, in favor of unitary boards. However, since tiered boards are still very prevalent in markets outside of the United Kingdom, local market practice will always be taken into account. |
| | • | | The Adviser will use its voting powers to encourage appropriate levels of board independence, taking into account local market practice. |
| | • | | The Adviser will usually vote against discharging the board from responsibility in cases of pending litigation, or if there is evidence of wrongdoing for which the board must be held accountable. |
| | • | | The Adviser will vote in favor of increases in capital which enhance a company’s long-term prospects. The Adviser will also vote in favor of the partial suspension of preemptive rights if they are for purely technical |
| | reasons (e.g., rights offers which may not be legally offered to shareholders in certain jurisdictions). However, the Adviser will vote against increases in capital which would allow the company to adopt “poison pill” takeover defense tactics, or where the increase in authorized capital would dilute shareholder value in the long term. |
| | • | | The Adviser will vote in favor of proposals which will enhance a company’s long-term prospects. The Adviser will vote against an increase in bank borrowing powers which would result in the company reaching an unacceptable level of financial leverage, where such borrowing is expressly intended as part of a takeover defense, or where there is a material reduction in shareholder value. |
| | • | | The Adviser reviews shareholder rights plans and poison pill proposals on a case-by-case basis; however, the Adviser will generally vote against such proposals and vote for revoking existing plans. |
| | • | | Where social or environmental issues are the subject of a proxy vote, the Adviser will consider the issue on a case-by-case basis, keeping in mind at all times the best economic interests of its clients. |
| | • | | With respect to Asia, for routine proxies (e.g., in respect of voting at the Annual General Meeting of Shareholders) the Adviser’s position is to neither vote in favor or against. For Extraordinary General Meetings of Shareholders, however, where specific issues are put to a shareholder vote, these issues are analyzed by the respective country specialist concerned. A decision is then made based on his or her judgment. |
The following summarizes some of the more noteworthy types of proxy voting policies of the U.S. Guidelines:
| | • | | The Adviser considers votes on director nominees on a case-by-case basis. Votes generally will be withheld from directors who: (a) attend less than 75% of board and committee meetings without a valid excuse; (b) implement or renew a dead-hand poison pill; (c) are affiliated directors who serve on audit, compensation or nominating committees or are affiliated directors and the full board serves on such committees or the company does not have such committees; or (d) ignore a shareholder proposal that is approved for two consecutive years by a majority of either the shares outstanding or the votes cast. |
| | • | | The Adviser votes proposals to classify boards on a case-by-case basis, but will vote in favor of such proposal if the issuer’s governing documents contain each of eight enumerated safeguards (for example, a majority of the board is composed of independent directors and the nominating committee is composed solely of such directors). |
| | • | | The Adviser also considers management poison pill proposals on a case-by-case basis, looking for shareholder-friendly provisions before voting in favor. |
| | • | | The Adviser votes against proposals for a super-majority vote to approve a merger. |
| | • | | The Adviser considers proposals to increase common and/or preferred shares and to issue shares as part of a debt restructuring plan on a case-by-case basis, taking into account the extent of dilution and whether the transaction will result in a change in control. |
| | • | | The Adviser votes proposals on a stock option plan based primarily on a detailed, quantitative analysis that takes into account factors such as estimated dilution to shareholders’ equity and dilution to voting power. The Adviser generally considers other management compensation proposals on a case-by-case basis. |
| | • | | The Adviser also considers on a case-by-case basis proposals to change an issuer’s state of incorporation, mergers and acquisitions and other corporate restructuring proposals and certain social and environmental issue proposals. |
ITEM 8. PORTFOLIO MANAGERS OF CLOSED-END MANAGEMENT INVESTMENT COMPANIES.
PORTFOLIO MANAGEMENT TEAM
The portfolio management team for the Fund is led by William J. Morgan, Managing Director. Mr. Morgan has been the lead portfolio manager for the Fund since June 2000 and has been part of the team responsible for management of the Fund since its inception. Currently, Mr. Morgan is a high-yield team leader and the portfolio manager for accounts in the high yield, aggressive income high yield, and insurance asset BB styles. Mr. Morgan earned a B.A. from Kenyon College and an M.B.A. from Xavier University. James P. Shanahan, Jr., Managing Director, also serves as portfolio manager for the Fund focusing primarily on investments in distressed debt. Mr. Shanahan has been part of the team responsible for the management of the Fund since 1988. Mr. Shanahan holds a B.A. from Xavier University and a J.D. from the University of Cincinnati College of Law. James E. Gibson, Vice President, is primarily responsible for trading on behalf of the Fund and has been part of the portfolio management team for the Fund since 1988. Mr. Gibson is one of the principal high yield traders in the Adviser’s U.S. Fixed Income Group. Mr. Gibson holds a B.S. from the University of Cincinnati College of Business Administration in finance. Mr. Morgan, Mr. Shanahan, and Mr. Gibson were officers of the Fund’s former adviser, Pacholder & Company, LLC, since its inception in 1998 and have been officers of and/or associated with the Adviser since March 1, 2005.
OTHER ACCOUNTS MANAGED
As of December 31, 2008, Mr. Morgan was part of the portfolio management team for four mutual funds with a total of approximately $2.2 billion in assets; six pooled investment vehicles with a total of approximately $644 million in assets; and seven other accounts with a total of approximately $722 million in assets. As of December 31, 2008, Mr. Shanahan was part of the portfolio management team for three mutual funds with a total of approximately $3 billion in assets; five pooled investment vehicles with a total of approximately $662 million in assets; and seven other accounts with a total of approximately $444 million in assets. As of December 31, 2008, Mr. Gibson was part of the portfolio management team for one mutual fund with a total of approximately $1.9 billion in assets. The Adviser is not paid a performance based fee in connection with the mutual funds, the pooled investment vehicles or the other accounts.
POTENTIAL CONFLICTS OF INTEREST
The potential for conflicts of interest exists when a portfolio manager manages other accounts with similar investment objectives and strategies as the Fund (“Similar Accounts”). Potential conflicts may include, for example, conflicts between investment strategies and conflicts in the allocation of investment opportunities.
Responsibility for managing the Adviser’s and its affiliates’ clients’ portfolios is organized according to investment strategies within asset classes. Generally, client portfolios with similar strategies are managed by portfolio managers in the same portfolio management group using the same objectives, approach and philosophy. Underlying sectors or strategy allocations within a larger portfolio are likewise managed by portfolio managers who use the same approach and philosophy as similarly managed portfolios. Therefore, portfolio holdings, relative position sizes and industry and sector exposures tend to be similar across similar portfolios and strategies, which minimizes the potential for conflicts of interest.
The Adviser and/or its affiliates may receive more compensation with respect to certain Similar Accounts than that received with respect to the Fund or may receive compensation based in part on the performance of certain Similar Accounts. This may create a potential conflict of interest for the Adviser and its affiliates or a portfolio manager by providing an incentive to favor these Similar Accounts when, for example, placing securities transactions. In addition, the Adviser or its affiliates could be viewed as having a conflict of interest to the extent that the Adviser or an affiliate has a proprietary investment in Similar Accounts, a portfolio manager has personal investments in Similar Accounts or the Similar Accounts are investment options in the Adviser’s or its affiliates’ employee benefit plans. Potential conflicts of interest may arise with both the aggregation and allocation of securities transactions and allocation of investment opportunities because of market factors or investment restrictions imposed upon the Adviser and its affiliates by law, regulation, contract or internal policies. Allocations of aggregated trades, particularly trade orders that were only partially completed due to limited availability and allocation of investment opportunities generally, could raise a potential conflict of interest, as the Adviser or its affiliates may have an incentive to allocate securities that are expected to increase in value to favored accounts. Initial public offerings, in particular, are frequently of very limited availability. The Adviser and its affiliates may be perceived as causing accounts they manage to participate in an offering to increase the Adviser’s and its affiliates’ overall allocation of securities in that offering. A potential conflict of interest also may be perceived to arise if transactions in one account closely follow related transactions in a different account, such as when a purchase increases the value of securities previously purchased by another account, or when a sale in one account lowers the sale price received in a sale by a second account. If the Adviser or its affiliates manage accounts that engage in short sales of securities of the type in which the Fund invests, the Adviser or its affiliates could be seen as harming the performance of the Fund for the benefit of the accounts engaging in short sales if the short sales cause the market value of the securities to fall.
As an internal policy matter, the Adviser or its affiliates may from time to time maintain certain overall investment limitations on the securities positions or positions in other financial instruments the Adviser or its affiliates will take on behalf of its various clients due to, among other things, liquidity concerns and regulatory restrictions. Such policies may preclude the Fund from purchasing particular securities or financial instruments, even if such securities or financial instruments would otherwise meet the Fund’s objectives.
The goal of the Adviser and its affiliates is to meet their fiduciary obligation with respect to all clients. The Adviser and its affiliates have policies and procedures that seek to manage conflicts. The Adviser and its affiliates monitor a variety of areas, including compliance with fund guidelines, review of allocation decisions and compliance with the Adviser’s Codes of Ethics and JPMorgan Chase & Co.’s Code of Conduct. With respect to the allocation of investment opportunities, the Adviser and its affiliates also have certain policies designed to achieve fair and equitable allocation of investment opportunities among its clients over time. For example:
Orders for the same equity security traded through a single trading desk or system are aggregated on a continual basis throughout each trading day consistent with the Adviser’s and its affiliates’ duty of best execution for its clients. If aggregated trades are fully executed, accounts participating in the trade will be allocated their pro rata share on an average price basis. Partially completed orders generally will be allocated among the participating accounts on a pro-rata average price basis, subject to certain limited exceptions. For example, accounts that would receive a de minimis allocation relative to their size may be excluded from the order. Another exception may occur when thin markets or price volatility require that an aggregated order be completed in multiple executions over several days. If partial completion of the order would result in an uneconomic allocation to an account due to fixed transaction or custody costs, the Adviser and its affiliates may exclude small orders until 50% of the total order is completed. Then the small orders will be executed. Following this procedure, small orders will lag in the early execution of the order, but will be completed before completion of the total order.
Purchases of money market instruments and fixed income securities cannot always be allocated pro-rata across the accounts with the same investment strategy and objective. However, the Adviser and its affiliates attempt to mitigate any potential unfairness by basing non-pro rata allocations traded through a single trading desk or system upon an objective predetermined criteria for the selection of investments and a disciplined process for allocating securities with similar duration, credit quality and liquidity in the good faith judgment of the Adviser or its affiliates so that fair and equitable allocation will occur over time.
PORTFOLIO MANAGER COMPENSATION
The portfolio managers’ total compensation program includes a base salary fixed from year to year and a variable performance bonus consisting of cash incentives and restricted stock and may include mandatory notional investments (as described below) in selected funds advised by the Adviser or its affiliates. These elements reflect individual performance and the performance of the Adviser’s business as a whole.
The portfolio managers’ performance is formally evaluated annually based on a variety of factors including the aggregate size and blended performance of the portfolios a portfolio manager manages. Individual contribution relative to client goals carries the highest impact. Portfolio manager compensation is primarily driven by meeting or exceeding clients’ risk and return objectives, relative performance to competitors or competitive indices and compliance with firm policies and regulatory requirements. In evaluating a portfolio manager’s performance with respect to the funds he manages, the funds’ pre-tax performance is compared to the appropriate market peer group and to each fund’s benchmark over one, three and five year periods (or such shorter time as the portfolio manager has managed a fund). Investment performance is generally more heavily weighted to the long-term.
Awards of restricted stock are granted as part of an employee’s annual performance bonus and comprise from 0% to 35% of a portfolio manager’s total bonus. As the level of incentive compensation increases, the percentage of compensation awarded in restricted stock also increases. Up to 50% of the restricted stock portion of a portfolio manager’s bonus may instead be subject to mandatory notional investment in selected mutual funds advised by the Adviser or its affiliates. When these awards vest over time, the portfolio manager receives cash equal to the market value of the notional investment in the selected funds.
SECURITIES OWNERSHIP OF PORTFOLIO MANAGEMENT TEAM
Information concerning ownership of securities of the Fund owned by Mr. Morgan, Mr. Shanahan and Mr. Gibson as of December 31, 2008 is set forth below:
William J. Morgan: $100,001 – $500,000
James P. Shanahan, Jr.: $100,001 – $500,000
James E. Gibson: $50,001 – $100,000
ITEM 9. PURCHASE OF EQUITY SECURITIES BY CLOSED-END MANAGEMENT INVESTMENT COMPANY AND AFFILIATED PURCHASERS.
(a) If the registrant is a closed-end management investment company, provide the information specified in paragraph (b) of this Item with respect to any purchase made by or on behalf of the registrant or any “affiliated purchaser,” as defined in Rule 10b-18(a)(3) under the Exchange Act (17 CFR 240.10b-18(a)(3)), of shares or other units of any class of the registrant’s equity securities that is registered by the registrant pursuant to Section 12 of the Exchange Act (15 U.S.C. 781).
There were no purchases covered by this Item during the period covered by this report.
ITEM 10. SUBMISSION OF MATTERS TO A VOTE OF SECURITY HOLDERS.
Describe any material changes to the procedures by which shareholders may recommend nominees to the registrant’s board of directors, where those changes were implemented after the registrant last provided disclosure in response to the requirements of Item 7(d)(2)(ii)(G) of Schedule 14A (17 CFR 240.14a-101), or this Item.
No material changes to report.
ITEM 11. CONTROLS AND PROCEDURES.
(a) Disclose the conclusions of the registrant’s principal executive and principal financial officers, or persons performing similar functions, regarding the effectiveness of the registrant’s disclosure controls and procedures (as defined in Rule 30a-3(c) under the Act (17 CFR 270.30a-3(c))) as of a date within 90 days of the filing date of the report that includes the disclosure required by this paragraph, based on the evaluation of these controls and procedures required by Rule 30a-3(b) under the Act (17 CFR 270.30a-3(b)) and Rules 13a-15(b) or 15d-15(b) under the Exchange Act (17 CFR 240.13a-15(b) or 240.15d-15(b)).
The Registrant’s principal executive and principal financial officers have concluded, based on their evaluation of the Registrant’s disclosure controls and procedures as of a date within 90 days of the filing date of this report, that the Registrant’s disclosure controls and procedures are reasonably designed to ensure that information required to be disclosed by the Registrant on Form N-CSR is recorded, processed, summarized and reported within the required time periods and that information required to be disclosed by the Registrant in the reports that it files or submits on Form N-CSR is accumulated and communicated to the Registrant’s management, including its principal executive and principal financial officers, as appropriate to allow timely decisions regarding required disclosure.
(b) Disclose any change in the registrant’s internal control over financial reporting (as defined in Rule 30a-3(d) under the Act (17 CFR 270.30a-3(d)) that occurred during the registrant’s second fiscal quarter of the period covered by this report that has materially affected, or is reasonably likely to materially affect, the registrant’s internal control over financial reporting.
There were no changes in the Registrant’s internal control over financial reporting that occurred during the last fiscal quarter covered by this report that have materially affected, or are reasonably likely to materially affect, the Registrant’s internal control over financial reporting.
ITEM 12. EXHIBITS.
(a) File the exhibits listed below as part of this Form. Letter or number the exhibits in the sequence indicated.
(a)(1) Any code of ethics, or amendment thereto, that is the subject of the disclosure required by Item 2, to the extent that the registrant intends to satisfy the Item 2 requirements through filing of an exhibit.
Code of Ethics applicable to its Principal Executive and Principal Financial Officers pursuant to Section 406 of the Sarbanes-Oxley Act of 2002 attached hereto.
The Registrant has adopted proxy voting policies and procedures, as defined in Item 7 of Form N-CSR. A copy of the policies and procedures is filed as Exhibit 12(a)(3) to this Form.
(a)(2) A separate certification for each principal executive officer and principal financial officer of the registrant as required by Rule 30a-2(a) under the Act (17 CFR 270.30a-2).
Certifications pursuant to Rule 30a-2(a) under the Investment Company Act of 1940 are attached hereto.
(a)(3) Any written solicitation to purchase securities under Rule 23c-1 under the Act (17 CFR 270.23c-1) sent or given during the period covered by the report by or on behalf of the registrant to 10 or more persons.
Not applicable.
(b) A separate or combined certification for each principal executive officer and principal officer of the registrant as required by Rule 30a-2(b) under the Act of 1940.
Certifications pursuant to Rule 30a-2(b) under the Investment Company Act of 1940 are attached hereto.
SIGNATURES
Pursuant to the requirements of the Securities Exchange Act of 1934 and the Investment Company Act of 1940, the registrant has duly caused this report to be signed on its behalf by the undersigned, thereunto duly authorized.
Pacholder High Yield Fund, Inc.
| | |
| |
| By: | | /s/ Gary J. Madich |
| | Gary J. Madich President and Principal Executive Officer March 6, 2009 |
Pursuant to the requirements of the Securities Exchange Act of 1934 and the Investment Company Act of 1940, this report has been signed below by the following persons on behalf of the registrant and in the capacities and on the dates indicated.
| | |
| |
| By: | | /s/ Gary J. Madich |
| | Gary J. Madich President and Principal Executive Officer March 6, 2009 |
| | |
| |
| By: | | /s/ Patricia A. Maleski |
| | Patricia A. Maleski Treasurer and Principal Financial Officer March 6, 2009 |