UNITED STATES
SECURITIES AND EXCHANGE COMMISSION
Washington, D.C. 20549
FORM N-CSR
CERTIFIED SHAREHOLDER REPORT OF REGISTERED
MANAGEMENT INVESTMENT COMPANIES
Investment Company Act file number | 811-05642 |
|
Nuveen Multi-Market Income Fund |
(Exact name of registrant as specified in charter) |
|
Nuveen Investments
333 West Wacker Drive
Chicago, IL 60606 |
(Address of principal executive offices) (Zip code) |
|
Kevin J. McCarthy Nuveen Investments 333 West Wacker Drive Chicago, IL 60606 |
(Name and address of agent for service) |
|
Registrant’s telephone number, including area code: | (312) 917-7700 | |
|
Date of fiscal year end: | June 30 | |
|
Date of reporting period: | December 31, 2014 | |
| | | | | | |
Form N-CSR is to be used by management investment companies to file reports with the Commission not later than 10 days after the transmission to stockholders of any report that is required to be transmitted to stockholders under Rule 30e-1 under the Investment Company Act of 1940 (17 CFR 270.30e-1). The Commission may use the information provided on Form N-CSR in its regulatory, disclosure review, inspection, and policymaking roles.
A registrant is required to disclose the information specified by Form N-CSR, and the Commission will make this information public. A registrant is not required to respond to the collection of information contained in Form N-CSR unless the Form displays a currently valid Office of Management and Budget ("OMB") control number. Please direct comments concerning the accuracy of the information collection burden estimate and any suggestions for reducing the burden to Secretary, Securities and Exchange Commission, 450 Fifth Street, NW, Washington, DC 20549-0609. The OMB has reviewed this collection of information under the clearance requirements of 44 U.S.C. ss. 3507.
ITEM 1. REPORTS TO STOCKHOLDERS.

Nuveen Investments
Closed-End Funds
Semi-Annual Report December 31, 2014
JMM
Nuveen Multi-Market Income Fund
NUVEEN INVESTMENTS ACQUIRED BY TIAA-CREF
On October 1, 2014, TIAA-CREF completed its previously announced acquisition of Nuveen Investments, Inc., the parent company of your fund's investment adviser, Nuveen Fund Advisors, LLC ("NFAL") and the Nuveen affiliates that act as sub-advisers to the majority of the Nuveen Funds. TIAA-CREF is a national financial services organization with approximately $851 billion in assets under management as of December 31, 2014 and is a leading provider of retirement services in the academic, research, medical and cultural fields. Nuveen is operating as a separate subsidiary within TIAA-CREF's asset management business.

Chairman's Letter to Shareholders | | | 4 | | |
Portfolio Managers' Comments | | | 5 | | |
Fund Leverage | | | 8 | | |
Share Information | | | 9 | | |
Risk Considerations | | | 11 | | |
Performance Overview and Holding Summaries | | | 12 | | |
Shareholder Meeting Report | | | 14 | | |
Portfolio of Investments | | | 17 | | |
Statement of Assets & Liabilities | | | 25 | | |
Statement of Operations | | | 26 | | |
Statement of Changes in Net Assets | | | 27 | | |
Statement of Cash Flows | | | 28 | | |
Financial Highlights | | | 30 | | |
Notes to Financial Statements | | | 32 | | |
Additional Fund Information | | | 41 | | |
Glossary of Terms Used in this Report | | | 42 | | |
Reinvest Automatically, Easily and Conveniently | | | 43 | | |
Annual Investment Agreement Approval Process | | | 44 | | |
Nuveen Investments
3
Chairman's Letter
to Shareholders

Dear Shareholders,
A pattern of divergence has emerged in the past year. Steady and moderate growth in the U.S. economy helped sustain the stock market's bull run another year. U.S. bonds also performed well, amid subdued inflation, interest rates that remained unexpectedly low and concerns about the economic well-being of the rest of the world. The stronger domestic economy enabled the U.S. Federal Reserve (Fed) to gradually reduce its large scale bond purchases, known as quantitative easing (QE), without disruption to the markets, as well as begin to set expectations for a transition into tightening mode.
The story outside the U.S., however, was different. European growth was stagnating and Japan fell into a recession, contributing to the bouts of volatility in their markets. China's economy decelerated and, despite running well above the rate of other major global economies, investors feared it looked slow by China's standards. Compounding these concerns were a surprisingly steep decline in oil prices, the U.S. dollar's rally and an increase in geopolitical tensions, including the Russia-Ukraine crisis and terrorist attacks across the Middle East and Africa, as well as more recently in Europe.
While a backdrop of healthy economic growth in the U.S. and the continuation of accommodative monetary policy (with the central banks of Japan and potentially Europe stepping in where the Fed has left off) bodes well for the markets, the global outlook has become more uncertain. Indeed, volatility is likely to feature more prominently in the investment landscape going forward. Such conditions underscore the importance of professional investment management. Experienced investment teams have weathered the market's ups and downs in the past and emerged with a better understanding of the sensitivities of their asset class and investment style, particularly in times of turbulence. We recognize the importance of maximizing gains, while striving to minimize volatility.
And, the same is true for investors like you. Maintaining an appropriate time horizon, diversification and relying on practiced investment teams are among your best strategies for achieving your long-term investment objectives. Additionally, I encourage you to communicate with your financial consultant if you have questions about your investment in a Nuveen Fund. On behalf of the other members of the Nuveen Fund Board, we look forward to continuing to earn your trust in the months and years ahead.

William J. Schneider
Chairman of the Board
February 23, 2015
Nuveen Investments
4
Portfolio Managers'
Comments
Nuveen Multi-Market Income Fund (JMM)
Nuveen Multi-Market Income Fund (JMM) is advised by Nuveen Fund Advisors, LLC (NFAL) and features portfolio management by Nuveen Asset Management, LLC (NAM). Prior to September 8, 2014, the Fund was named American Income Fund, Inc. (MRF), and was advised by U.S. Bancorp Asset Management, Inc. (USBAM) and sub-advised by NFAL and NAM. The Fund's investment strategy and portfolio management team remained unchanged after the transition from USBAM to NFAL.
The Fund's performance, distribution and pricing history dates back to the Fund's inception on December 30, 1988.
All three members of the Fund's current portfolio management team previously served as managers for MRF. The portfolio management team includes Jason J. O'Brien, CFA, Chris J. Neuharth, CFA, and John T. Fruit, CFA. Here they discuss their management strategy and the performance of the Fund for the six-month reporting period ended December 31, 2014.
What key strategies were used to manage the Fund during this six-month reporting period ended December 31, 2014?
The Fund's investment objective is to achieve high monthly income consistent with prudent risk to capital. The management team invests the Fund's assets primarily in taxable fixed income securities including, but not limited to: U.S. agency and privately issued mortgage-backed securities; high yield and investment grade corporate bonds; and asset-backed securities.
How did the Fund perform during this six-month reporting period ended December 31, 2014?
The table in the Performance Overview and Holding Summaries section of this report provides total return performance for the Fund for the six-month, one-year, five-year and ten-year periods ended December 31, 2014. For the six-month reporting period ended December 31, 2014, the Fund's total return at net asset value (NAV) modestly underperformed its blended benchmark, which is composed of 75% Barclays U.S. Government/Mortgage Index and 25% Barclays High Yield Index.
Global growth concerns, ongoing geopolitical unrest and the sharp drop in commodity prices led to volatile financial markets, especially in the final months of this reporting period. In the bond market, risk assets had a difficult period as the market focused on the negative impact of a decline in oil prices on energy related corporate and sovereign credits. Corporate market spreads widened significantly, while Treasury rates declined. The Treasury yield curve flattened led by a strong move lower in 30-year yields and a modest increase in short rates, as the Federal Reserve (Fed) affirmed its intention to remove policy accommodation, even with low inflation and declining inflation expectations. This move
Certain statements in this report are forward-looking statements. Discussions of specific investments are for illustration only and are not intended as recommendations of individual investments. The forward-looking statements and other views expressed herein are those of the portfolio managers as of the date of this report. Actual future results or occurrences may differ significantly from those anticipated in any forward-looking statements and the views expressed herein are subject to change at any time, due to numerous market and other factors. The Fund disclaims any obligation to update publicly or revise any forward-looking statements or views expressed herein.
Ratings shown are the highest rating given by one of the following national rating agencies: Standard & Poor's (S&P), Moody's Investors Service, Inc. (Moody's) or Fitch, Inc. (Fitch). Credit ratings are subject to change. AAA, AA, A and BBB are investment grade ratings; BB, B, CCC, CC, C and D are below investment grade ratings. Certain bonds backed by U.S. Government or agency securities are regarded as having an implied rating equal to the rating of such securities. Holdings designated N/R are not rated by these national rating agencies.
Refer to the Glossary of Terms Used in this Report for further definition of the terms used within this section.
Nuveen Investments
5
Portfolio Managers' Comments (continued)
helped longer maturity Treasuries post the strongest returns among various fixed income asset classes during the six-month period. The high yield segment lagged as the average spread versus Treasuries widened dramatically by 145 basis points, led by the severe weakness seen among energy issuers. Not surprisingly, the higher quality, BB-rated portion of the high yield market vastly outperformed the lower quality CCC-rated segment, particularly after an October sell-off as risk aversion grew and interest rates trended lower, supporting the more rate-sensitive BB sector.
Spreads for investment grade credit versus Treasuries widened throughout the reporting period to their cheapest levels of 2014 as growing geopolitical concerns and a heavy new issue calendar caused the corporate market to weaken. Liquidity was challenged as dealers managed their balance sheets tightly as the end of the year approached. Also, issuer specific risk was heightened and the market had little tolerance for negative news or downgrades. Spread volatility was magnified and all credit sectors and quality buckets underperformed Treasuries. Not surprisingly, energy was the worst performer, lagging Treasuries by more than 600 basis points, followed closely by the metals and mining sectors. Financial names held up fairly well relative to industrials as fundamental credit trends remained intact and the sector traded with better liquidity and lower volatility than the broad credit market.
Securitized sectors were seemingly far enough removed from the downdraft in oil and other commodity prices and posted solid results. Agency mortgage-backed securities (MBS) issued by government agencies such as Fannie Mae, Ginnie Mae and Freddie Mac struggled to keep pace with Treasuries early in the reporting period as concerns about Fed tapering and policy normalization pushed spreads wider. After widening in July and August, agency MBS spreads were attractive enough, particularly against a backdrop of stable rates and positive technicals, to attract buying interest from relative value investors. As the reporting period progressed, technicals were more balanced as the Fed's reinvestment of pay downs offset supply, while money managers added agency MBS exposure to escape volatility in the corporate market. Improving credit metrics and continued modest improvements in home prices created a positive fundamental backdrop for non-agency MBS. This sector was quite stable and outperformed other higher volatility fixed income risk sectors during the reporting period. Risk premiums for commercial mortgage-backed securities (CMBS) were fairly stable, capping a solid year for the sector overall. Driven by improving commercial real estate fundamentals and relative immunity from energy related spread volatility, investor demand for CMBS was strong, absorbing the heavy amount of new issuance during the reporting period. CMBS outpaced investment grade credit and performed in line with mortgage-backed securities (MBS), while posting negative excess returns versus Treasuries.
The Fund's performance benefited from our continued exposure to non-agency MBS and mortgage-related asset-backed securities (ABS), which are not included in the blended benchmark but represent approximately one-third and one-tenth of the portfolio's net assets, respectively. Non-agency MBS and ABS were the only two spread sectors that offered positive excess returns over Treasuries during the reporting period. Both sectors were well insulated from the negative effects of falling oil prices, while the non-agency MBS market also had additional technical support in the form of a lack of new issuance in this market. In addition, the Fund benefited from a neutral weight to a modest underweight in the high yield sector, compared to the 25% weighting in the blended benchmark. Within the Fund's high yield exposure, our emphasis on higher quality, lower volatility names from the energy sector also proved helpful.
On the other hand, the Fund's out-of-index exposures to investment grade corporate bonds and CMBS slightly detracted during the reporting period. As mentioned, the investment grade corporate sector was dragged down by dramatically falling oil prices; therefore, our exposure to the sector detracted versus the benchmark. Excess returns for CMBS were modestly negative, but held up much better than the corporate segments. Our interest rate strategy also hindered the Fund's performance during the reporting period. We positioned the Fund with a defensive duration strategy with an underweight to the long (20- to 30-year) end of the yield curve. This strategy proved detrimental during the reporting period as interest rates fell, especially on the long end of the curve, and prices rose, particularly for longer maturities. Our agency MBS exposure, which was basically in line with the index weight, was a non-factor in the Fund's overall results.
Nuveen Investments
6
As of the end of the reporting period, we continued to maintain the Fund's overweights to the investment grade corporate, non-agency MBS and CMBS sectors, which are not included in the benchmark. As has historically been the case, we continue to look for bottom-up opportunities across all security types. We are maintaining the Fund's short duration strategy, as we believe that rates to may move higher as the Fed moves toward normalizing monetary policy in 2015.
We used U.S. Treasury futures as part of an overall portfolio construction strategy to manage portfolio duration and yield curve exposure. The effect of these activities in the period was negative. These derivative exposures are integrated with the overall portfolio construction and as such losses and gains may be naturally related to/may offset impacts elsewhere in the portfolio.
Nuveen Investments
7
IMPACT OF THE FUND'S LEVERAGE STRATEGY ON PERFORMANCE
One important factor impacting the returns of the Fund relative to its benchmark was the Fund's use of leverage through the use of reverse repurchase agreements and mortgage dollar rolls. The Fund uses leverage because our research has shown that, over time, leveraging provides opportunities for additional income and total return for common shareholders. However, use of leverage also can expose shareholders to additional volatility. For example, as the prices of securities held by a Fund decline, the negative impact of these valuation changes on NAV and total return is magnified by the use of leverage. Conversely, leverage may enhance common share returns during periods when the prices of securities held by the Fund generally are rising. The Fund's use of leverage had a positive impact on performance during this reporting period.
As of December 31, 2014, the Fund's percentages of leverage are shown in the accompanying table.
| | JMM | |
Effective Leverage* | | | 29.28 | % | |
Regulatory Leverage* | | | 0.00 | % | |
* Effective leverage is a Fund's effective economic leverage, and includes both regulatory leverage and the leverage effects of certain derivative and other investments in a Fund's portfolio that increase the Fund's investment exposure. Regulatory leverage consists of preferred shares issued or borrowings of a Fund. Both of these are part of a Fund's capital structure. Regulatory leverage is subject to asset coverage limits set forth in the Investment Company Act of 1940.
Nuveen Investments
8
DISTRIBUTION INFORMATION
The following information regarding the Fund's distributions is current as of December 31, 2014. The Fund's distribution levels may vary over time based on the Fund's investment activities and portfolio investment value changes.
During the current reporting period, the Fund's distributions to shareholders were as shown in the accompanying table.
Ex-Dividend Date | | Per
Share
Amounts | |
July 2014 | | $ | 0.0400 | | |
August | | | 0.0400 | | |
September | | | 0.0400 | | |
October | | | 0.0400 | | |
November | | | 0.0400 | | |
December 2014 | | | 0.0400 | | |
Current Distribution Rate* | | | 6.26 | % | |
* Current distribution rate is based on the Fund's current annualized monthly distribution divided by the Fund's current market price. The Fund's monthly distributions to its shareholders may be comprised of ordinary income, net realized capital gains and, if at the end of the fiscal year the Fund's cumulative net ordinary income and net realized gains are less than the amount of the Fund's distributions, a return of capital for tax purposes.
The Fund seeks to pay regular monthly dividends out of its net investment income at a rate that reflects its past and projected net income performance. To permit the Fund to maintain a more stable monthly dividend, the Fund may pay dividends at a rate that may be more or less than the amount of net income actually earned by the Fund during the period. If the Fund has cumulatively earned more than it has paid in dividends, it will hold the excess in reserve as undistributed net investment income (UNII) as part of the Fund's NAV. Conversely, if the Fund has cumulatively paid in dividends more than it has earned, the excess will constitute a negative UNII that will likewise be reflected in the Fund's NAV. The Fund will, over time, pay all its net investment income as dividends to shareholders.
As of December 31, 2014, the Fund had a positive UNII balance (based upon our best estimate) for income tax purposes and a positive UNII balance for financial reporting purposes.
All monthly dividends paid by the Fund during the six months ended December 31, 2014 were paid from net investment income. If a portion of the Fund's monthly distributions was sourced from or comprised of elements other than net investment income, including capital gains and/or a return of capital, the Fund's shareholders would have received a notice to that effect. The composition and per share amounts of the Fund's monthly dividends for the reporting period are presented in the Statement of Changes in Net Assets and Financial Highlights, respectively (for financial reporting purposes) and in Note 6 – Income Tax Information within the accompany Notes to Financial Statements (for income tax purposes), later in this report.
SHARE REPURCHASES
During September 2014, the Fund's Board of Trustees authorized the Fund to participate in Nuveen's closed-end fund complex-wide share repurchase program. Under the share repurchase program, the Fund may repurchase up to 10% of its outstanding shares as of the authorization date (approximately 945,000 shares) in open-market transactions at the Adviser's discretion.
Nuveen Investments
9
Share Information (continued)
As of December 31, 2014, and since the inception of the Fund's repurchase program, the Fund did not repurchase any of its outstanding shares.
OTHER SHARE INFORMATION
As of December 31, 2014, and during the current reporting period, the Fund's common share price was trading at premium/(discount) to its NAV as shown in the accompanying table.
NAV | | $ | 8.52 | | |
Share Price | | $ | 7.67 | | |
Premium/(Discount) to NAV | | | (9.98 | )% | |
6-Month Average Premium/(Discount) to NAV | | | (11.31 | )% | |
Nuveen Investments
10
Fund shares are not guaranteed or endorsed by any bank or other insured depository institution, and are not federally insured by the Federal Deposit Insurance Corporation. Shares of closed-end funds are subject to investment risks, including the possible loss of principal invested. Past performance is no guarantee of future results. Fund common shares are subject to a variety of risks, including:
Investment, Market and Price Risk. An investment in common shares is subject to investment risk, including the possible loss of the entire principal amount that you invest. Your investment in common shares represents an indirect investment in the corporate securities owned by the Fund, which generally trade in the over-the-counter markets. Shares of closed-end investment companies like the Fund frequently trade at a discount to their NAV. Your common shares at any point in time may be worth less than your original investment, even after taking into account the reinvestment of Fund dividends and distributions.
Tax Risk. The tax treatment of Fund distributions may be affected by new IRS interpretations of the Internal Revenue Code and future changes in tax laws and regulations. This is particularly true for funds employing a managed distribution program.
Issuer Credit Risk: This is the risk that a security in a Fund's portfolio will fail to make dividend or interest payments when due.
Interest Rate Risk: Fixed-income securities such as bonds, preferred, convertible and other debt securities will decline in value if market interest rates rise.
Call Risk or Prepayment Risk: Issuers may exercise their option to prepay principal earlier than scheduled, forcing the Fund to reinvest in lower-yielding securities.
Derivatives Strategy Risk: Derivative securities, such as calls, puts, warrants, swaps and forwards, carry risks different from, and possibly greater than, the risks associated with the underlying investments.
Dividend Income Risk: There is no guarantee that the issuers of common stocks in which the Fund invests will declare dividends in the future or that, if declared, they will remain at current levels or increase over time.
Leverage Risk: Each Fund's use of leverage creates the possibility of higher volatility for the Fund's per share NAV, market price, distributions and returns. There is no assurance that a Fund's leveraging strategy will be successful.
Illiquid Securities Risk: This is the risk that the Fund may not be able to sell securities in its portfolio at the time or price desired by the Fund.
Default Risk: The event in which a bond issuer is unable to make the required payments on their debt obligations.
Mortgage-Backed Securities Risk: Investing in MBS entails various risks, including credit risks inherent in the underlying collateral, the risk that the servicer fails to perform its duties, liquidity risks, interest rate risks, structure risks, and geographical concentration risks.
Nuveen Investments
11
Nuveen Multi-Market Income Fund
Performance Overview and Holding Summaries as of December 31, 2014
Refer to the Glossary of Terms Used in this Report for further definition of the terms used within this section.
Average Annual Total Returns as of December 31, 2014
| | | Cumulative | | Average Annual | |
| | 6-Month | | 1-Year | | 5-Year | | 10-Year | |
JMM at NAV | | | 0.46 | % | | | 5.85 | % | | | 9.16 | % | | | 6.59 | % | |
JMM at Share Price | | | 1.83 | % | | | 10.77 | % | | | 8.25 | % | | | 6.91 | % | |
JMM Blended Benchmark | | | 0.85 | % | | | 4.68 | % | | | 5.05 | % | | | 5.43 | % | |
Past performance is not predictive of future results. Current performance may be higher or lower than the data shown. Returns do not reflect the deduction of taxes that shareholders may have to pay on Fund distributions or upon the sale of Fund shares. Returns at NAV are net of Fund expenses, and assume reinvestment of distributions. Comparative index return information is provided for the Fund's shares at NAV only. Indexes are not available for direct investment.
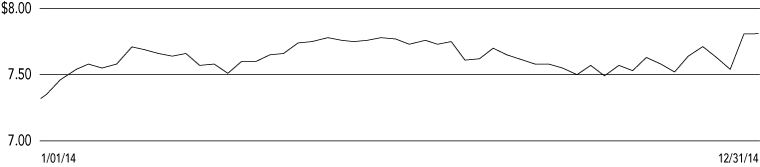
Share Price Performance — Weekly Closing Price
Nuveen Investments
12
This data relates to the securities held in the Fund's portfolio of investments as of the end of the reporting period. It should not be construed as a measure of performance for the Fund itself. Holdings are subject to change.
Ratings shown are the highest rating given by one of the following national rating agencies: Standard & Poor's Group, Moody's Investors Service, Inc. or Fitch, Inc. Credit ratings are subject to change. AAA, AA, A and BBB are investment grade ratings; BB, B, CCC, CC, C and D are below-investment grade ratings. Certain bonds backed by U.S. Government or agency securities are regarded as having an implied rating equal to the rating of such securities. Holdings designated N/R are not rated by these national rating agencies.
Fund Allocation
(% of net assets)
Convertible Preferred Securities | | | 0.3 | % | |
$25 Par (or similar)
Retail Preferred | | | 1.4 | % | |
Corporate Bonds | | | 31.4 | % | |
$1,000 Par (or similar)
Institutional Preferred | | | 0.6 | % | |
Asset-Backed and
Mortgage-Backed Securities | | | 104.8 | % | |
Investment Companies | | | 0.6 | % | |
Sovereign Debt | | | 0.2 | % | |
Total Long-Term Investments | | | 139.3 | % | |
Short-Term Investments | | | 0.9 | % | |
Other Assets Less Liabilities | | | (12.0 | )% | |
Net Assets Plus Reverse
Repurchase Agreements | | | 128.2 | % | |
Reverse Repurchase Agreements | | | (28.2 | )% | |
Net Assets | | | 100 | % | |
Portfolio Composition
(% of total investments)1
Asset-Backed and
Mortgage-Backed Securities | | | 74.8 | % | |
Oil, Gas & Consumable Fuels | | | 2.9 | % | |
Metals & Mining | | | 1.9 | % | |
Banks | | | 1.8 | % | |
Media | | | 1.3 | % | |
Diversified Telecommunication
Services | | | 1.1 | % | |
Wireless Telecommunication
Services | | | 1.1 | % | |
Other | | | 14.5 | % | |
Short-Term Investments | | | 0.6 | % | |
Total | | | 100 | % | |
Portfolio Credit Quality
(% of total long-term investments)
AAA/U.S. Guaranteed | | | 33.9 | % | |
AA | | | 4.1 | % | |
A | | | 14.2 | % | |
BBB | | | 15.6 | % | |
BB or Lower | | | 29.9 | % | |
N/R (not rated) | | | 1.9 | % | |
N/A (not applicable) | | | 0.4 | % | |
Total | | | 100 | % | |
1 Excluding reverse repurchase agreements and investments in derivatives.
Nuveen Investments
13
Shareholder
Meeting Report
A special shareholder meeting was held in the offices of U.S. Bancorp Asset Management, Inc. on July 28, 2014 for the American Income Fund, LLC; at this meeting the shareholders were asked to vote to approve an investment management agreement between the Fund and Nuveen Fund Advisors, to approve a sub-advisory agreement between Nuveen Fund Advisors and Nuveen Asset Management, LLC, to approve an Agreement and Plan of Reorganization in connection with the change of domicile of the Fund, to approve an amendment to the Articles of Incorporation of the Fund to change the name to Nuveen Multi-Market Income Fund, Inc., to approve a new sub-advisory agreement between USBAM and Nuveen Fund Advisors, to approve a new sub-advisory agreement between USBAM and Nuveen Asset Management, to approve a new investment management agreement between the Fund and Nuveen Fund Advisors, to approve a new sub-advisory agreement between Nuveen Fund Advisors and Nuveen Asset Management and to elect directors to the Board of Directors of the Fund. This meeting was subsequently adjourned to September 30, 2014 for the American Income Fund, LLC.
An annual shareholder meeting was held in the offices of U.S. Bancorp Asset Management, Inc. on July 28, 2014 for American Income Fund, LLC; at this meeting the shareholders were asked to vote to elect directors to the Board of Directors of the Fund.
| | | American
Income
Fund, Inc. | |
To approve an investment management agreement between the Fund and Nuveen Fund Advisors. | |
For | | | 5,292,057 | | |
Against | | | 280,418 | | |
Abstain | | | 145,947 | | |
Total | | | 5,718,422 | | |
To approve a sub-advisory agreement between Nuveen Fund Advisors and Nuveen Asset Management, LLC. | |
For | | | 5,271,648 | | |
Against | | | 272,522 | | |
Abstain | | | 174,252 | | |
Total | | | 5,718,422 | | |
To approve an Agreement and Plan of Reorganization in connection with the change of domicile of the Fund. | |
For | | | 6,331,955 | | |
Against | | | 347,945 | | |
Abstain | | | 358,087 | | |
Total | | | 7,037,987 | | |
To approve an amendment to the Articles of Incorporation of the Fund to change the name to Nuveen Multi-Market Income Fund, Inc. | |
For | | | 5,294,385 | | |
Against | | | 276,277 | | |
Abstain | | | 147,760 | | |
Total | | | 5,718,422 | | |
To approve a new sub-advisory agreement between USBAM and Nuveen Fund Advisors. | |
For | | | 5,274,801 | | |
Against | | | 294,560 | | |
Abstain | | | 149,061 | | |
Broker Non-Votes | | | — | | |
Total | | | 5,718,422 | | |
To approve a new sub-advisory agreement between USBAM and Nuveen Asset Management. | |
For | | | 5,271,888 | | |
Against | | | 296,334 | | |
Abstain | | | 150,200 | | |
Total | | | 5,718,422 | | |
To approve a new investment management agreement between the Fund and Nuveen Fund Advisors. | |
For | | | 5,261,628 | | |
Against | | | 303,934 | | |
Abstain | | | 152,860 | | |
Total | | | 5,718,422 | | |
To approve a new sub-advisory agreement between Nuveen Fund Advisors and Nuveen Asset Management. | |
For | | | 5,264,163 | | |
Against | | | 299,095 | | |
Abstain | | | 155,164 | | |
Total | | | 5,718,422 | | |
Nuveen Investments
14
| | | American
Income
Fund, Inc. | |
Approval of the Board Members was reached as follows: | |
William Adams IV | |
For | | | 5,392,079 | | |
Withhold | | | 320,276 | | |
Total | | | 5,712,355 | | |
Robert P. Bremner | |
For | | | 5,391,437 | | |
Withhold | | | 320,918 | | |
Total | | | 5,712,355 | | |
Jack B. Evans | |
For | | | 5,398,082 | | |
Withhold | | | 314,273 | | |
Total | | | 5,712,355 | | |
William C. Hunter | |
For | | | 5,384,764 | | |
Withhold | | | 327,591 | | |
Total | | | 5,712,355 | | |
David J. Kundert | |
For | | | 5,384,848 | | |
Withhold | | | 327,507 | | |
Total | | | 5,712,355 | | |
John K. Nelson | |
For | | | 5,388,704 | | |
Withhold | | | 323,651 | | |
Total | | | 5,712,355 | | |
William J. Schneider | |
For | | | 5,386,413 | | |
Withhold | | | 325,942 | | |
Total | | | 5,712,355 | | |
Thomas S. Schreier, Jr. | |
For | | | 5,385,645 | | |
Withhold | | | 326,710 | | |
Total | | | 5,712,355 | | |
Judith M. Stockdale | |
For | | | 5,390,157 | | |
Withhold | | | 322,198 | | |
Total | | | 5,712,355 | | |
Carole E. Stone | |
For | | | 5,389,042 | | |
Withhold | | | 323,313 | | |
Total | | | 5,712,355 | | |
Virginia L. Stringer | |
For | | | 5,391,515 | | |
Withhold | | | 320,840 | | |
Total | | | 5,712,355 | | |
Terence J. Toth | |
For | | | 5,391,515 | | |
Withhold | | | 320,840 | | |
Total | | | 5,712,355 | | |
Roger A. Gibson | |
For | | | 7,751,034 | | |
Withhold | | | 421,696 | | |
Total | | | 8,172,730 | | |
John P. Kayser | |
For | | | 7,745,576 | | |
Withhold | | | 427,154 | | |
Total | | | 8,172,730 | | |
Nuveen Investments
15
Shareholder Meeting Report (continued)
| | | American
Income
Fund, Inc. | |
Leonard W. Kedrowski | |
For | | | 7,737,936 | | |
Withhold | | | 434,794 | | |
Total | | | 8,172,730 | | |
Richard K. Riederer | |
For | | | 7,732,073 | | |
Withhold | | | 440,657 | | |
Total | | | 8,172,730 | | |
James M. Wade | |
For | | | 7,720,560 | | |
Withhold | | | 452,170 | | |
Total | | | 8,172,730 | | |
Nuveen Investments
16
Nuveen Multi-Market Income Fund
Portfolio of Investments December 31, 2014 (Unaudited)
Shares | |
Description (1) | |
Coupon | | | |
Ratings (2) | |
Value | |
| | | LONG-TERM INVESTMENTS – 139.3% (99.4% of Total Investments) | |
| | | CONVERTIBLE PREFERRED SECURITIES – 0.3% (0.2% of Total Investments) | |
| | | Banks – 0.3% | |
| | 200 | | | Bank of America Corporation | | | 7.250 | % | | | | | | BB | | $ | 232,594 | | |
| | Total Convertible Preferred Securities (cost $159,350) | | | 232,594 | | |
| | | $25 PAR (OR SIMILAR) RETAIL PREFERRED – 1.4% (1.0% of Total Investments) | |
| | | Banks – 0.7% | |
| | 19,000 | | | Bank of America Corporation | | | 4.000 | % | | | | | | BB | | $ | 383,040 | | |
| | 8,000 | | | First Niagara Finance Group | | | 8.625 | % | | | | | | BB | | | 216,000 | | |
| | | Total Banks | | | 599,040 | | |
| | | Capital Markets – 0.4% | |
| | 12,000 | | | Goldman Sachs Group, Inc. | | | 5.500 | % | | | | | | BB | | | 292,800 | | |
| | | Metals & Mining – 0.2% | |
| | 7,500 | | | ArcelorMittal | | | 6.000 | % | | | | | | BB– | | | 129,750 | | |
| | | Real Estate Investment Trust – 0.1% | |
| | 5,000 | | | LaSalle Hotel Properties | | | 7.500 | % | | | | | | N/R | | | 131,350 | | |
| | | Total $25 Par (or similar) Retail Preferred (cost $1,105,506) | | | 1,152,940 | | |
Principal
Amount (000) | |
Description (1) | |
Coupon | |
Maturity | |
Ratings (2) | |
Value | |
| | | CORPORATE BONDS – 31.4% (22.4% of Total Investments) | |
| | | Aerospace & Defense – 0.2% | |
$ | 200 | | | Bombardier Inc., 144A | | | 4.750 | % | | 4/15/19 | | BB– | | $ | 200,750 | | |
| | | Airlines – 0.3% | |
| | 200 | | | Air Canada, 144A | | | 6.750 | % | | 10/01/19 | | BB | | | 208,000 | | |
| | | Auto Components – 0.2% | |
| | 200 | | | Gestamp Funding Luxembourg SA, 144A | | | 5.625 | % | | 5/31/20 | | BB | | | 202,000 | | |
| | | Automobiles – 0.2% | |
| | 100 | | | Ford Motor Company | | | 7.450 | % | | 7/16/31 | | BBB– | | | 135,760 | | |
| | | Banks – 1.4% | |
| | 500 | | | Bank of America Corporation | | | 5.000 | % | | 5/13/21 | | A | | | 557,927 | | |
| | 500 | | | Citigroup Inc. | | | 4.500 | % | | 1/14/22 | | A | | | 546,379 | | |
| | 1,000 | | | Total Banks | | | | | | | | | | | | | | | 1,104,306 | | |
| | | Beverages – 0.3% | |
| | 250 | | | Cott Beverages USA Inc., 144A | | | 6.750 | % | | 1/01/20 | | B– | | | 250,000 | | |
| | | Building Products – 0.5% | |
| | 250 | | | Associated Asphalt Partners LLC, 144A | | | 8.500 | % | | 2/15/18 | | B– | | | 237,500 | | |
| | 150 | | | Building Materials Holdings Corporation, 144A | | | 9.000 | % | | 9/15/18 | | B– | | | 157,500 | | |
| | 400 | | | Total Building Products | | | | | | | | | | | | | | | 395,000 | | |
| | | Capital Markets – 0.7% | |
| | 500 | | | Goldman Sachs Group, Inc. | | | 5.750 | % | | 1/24/22 | | A | | | 578,394 | | |
Nuveen Investments
17
Nuveen Multi-Market Income Fund
Portfolio of Investments (continued) December 31, 2014 (Unaudited)
Principal
Amount (000) | |
Description (1) | |
Coupon | |
Maturity | |
Ratings (2) | |
Value | |
| | | Chemicals – 0.8% | |
$ | 100 | | | Hexion US Finance | | | 6.625 | % | | 4/15/20 | | B3 | | $ | 98,000 | | |
| | 375 | | | NOVA Chemicals Corporation, 144A | | | 5.000 | % | | 5/01/25 | | BB+ | | | 372,188 | | |
| | 150 | | | Taminco Global Chemical Corporation, 144A | | | 9.750 | % | | 3/31/20 | | N/R | | | 164,250 | | |
| | 625 | | | Total Chemicals | | | | | | | | | | | | | | | 634,438 | | |
| | | Commercial Services & Supplies – 0.9% | |
| | 175 | | | ADT Corporation | | | 6.250 | % | | 10/15/21 | | BBB– | | | 179,813 | | |
| | 275 | | | Clean Harbors Inc. | | | 5.250 | % | | 8/01/20 | | BB+ | | | 276,375 | | |
| | 250 | | | Covanta Energy Corporation | | | 6.375 | % | | 10/01/22 | | Ba3 | | | 265,000 | | |
| | 700 | | | Total Commercial Services & Supplies | | | | | | | | | | | | | | | 721,188 | | |
| | | Construction Materials – 0.5% | |
| | 385 | | | Norbord Inc., 144A | | | 5.375 | % | | 12/01/20 | | Ba2 | | | 373,450 | | |
| | | Consumer Finance – 0.5% | |
| | 250 | | | Covenant Surgical Partners Inc., 144A | | | 8.750 | % | | 8/01/19 | | B– | | | 252,500 | | |
| | 162 | | | First Data Corporation | | | 6.750 | % | | 11/01/20 | | BB– | | | 172,935 | | |
| | 412 | | | Total Consumer Finance | | | | | | | | | | | | | | | 425,435 | | |
| | | Containers & Packaging – 0.2% | |
| | 200 | | | Ardagh Packaging Finance / MP HD USA, 144A | | | 6.750 | % | | 1/31/21 | | CCC+ | | | 199,000 | | |
| | | Diversified Consumer Services – 0.2% | |
| | 200 | | | Nine West Holdings Incorporated, 144A | | | 8.250 | % | | 3/15/19 | | CCC | | | 167,000 | | |
| | | Diversified Financial Services – 0.5% | |
| | 200 | | | Jefferies Finance LLC Corporation, 144A | | | 6.875 | % | | 4/15/22 | | B1 | | | 183,000 | | |
| | 250 | | | Nationstar Mortgage LLC Capital Corporation | | | 7.875 | % | | 10/01/20 | | B+ | | | 240,000 | | |
| | 450 | | | Total Diversified Financial Services | | | | | | | | | | | | | | | 423,000 | | |
| | | Diversified Telecommunication Services – 1.6% | |
| | 250 | | | CenturyLink Inc. | | | 6.750 | % | | 12/01/23 | | BB+ | | | 273,750 | | |
| | 200 | | | CenturyLink Inc. | | | 7.650 | % | | 3/15/42 | | BB+ | | | 199,000 | | |
| | 410 | | | IntelSat Jackson Holdings | | | 6.625 | % | | 12/15/22 | | B– | | | 421,275 | | |
| | 390 | | | SBA Tower Trust, 144A | | | 3.598 | % | | 4/15/43 | | BBB | | | 390,954 | | |
| | 1,250 | | | Total Diversified Telecommunication Services | | | | | | | | | | | | | | | 1,284,979 | | |
| | | Electric Utilities – 0.9% | |
| | 225 | | | FirstEnergy Corporation | | | 4.250 | % | | 3/15/23 | | Baa3 | | | 232,158 | | |
| | 350 | | | Intergen NV, 144A | | | 7.000 | % | | 6/30/23 | | B+ | | | 332,500 | | |
| | 200 | | | RJS Power Holdings LLC, 144A | | | 5.125 | % | | 7/15/19 | | BB– | | | 197,500 | | |
| | 775 | | | Total Electric Utilities | | | | | | | | | | | | | | | 762,158 | | |
| | | Energy Equipment & Services – 0.8% | |
| | 250 | | | Compressco Partners LP / Compressco Finance Corporation, 144A | | | 7.250 | % | | 8/15/22 | | B | | | 215,000 | | |
| | 500 | | | Drill Rigs Holdings Inc., 144A | | | 6.500 | % | | 10/01/17 | | B | | | 412,500 | | |
| | 750 | | | Total Energy Equipment & Services | | | | | | | | | | | | | | | 627,500 | | |
| | | Food Products – 0.2% | |
| | 200 | | | JBS Investments GmbH, 144A | | | 7.250 | % | | 4/03/24 | | BB | | | 196,500 | | |
| | | Gas Utilities – 0.9% | |
| | 250 | | | Ferrellgas LP | | | 6.750 | % | | 1/15/22 | | B+ | | | 244,375 | | |
| | 250 | | | LBC Tank Terminals Holdings Netherlands BV, 144A | | | 6.875 | % | | 5/15/23 | | B | | | 251,250 | | |
| | 250 | | | Suburban Propane Partners LP | | | 5.500 | % | | 6/01/24 | | BB– | | | 241,250 | | |
| | 750 | | | Total Gas Utilities | | | | | | | | | | | | | | | 736,875 | | |
| | | Health Care Equipment & Supplies – 0.4% | |
| | 350 | | | Tenet Healthcare Corporation | | | 6.875 | % | | 11/15/31 | | B3 | | | 329,000 | | |
Nuveen Investments
18
Principal
Amount (000) | |
Description (1) | |
Coupon | |
Maturity | |
Ratings (2) | |
Value | |
| | | Health Care Providers & Services – 1.5% | |
$ | 500 | | | Community Health Systems, Inc. | | | 6.875 | % | | 2/01/22 | | B | | $ | 529,688 | | |
| | 400 | | | Mallinckrodt International Finance SA, 144A | | | 5.750 | % | | 8/01/22 | | BB– | | | 411,000 | | |
| | 250 | | | Select Medical Corporation | | | 6.375 | % | | 6/01/21 | | B– | | | 253,750 | | |
| | 1,150 | | | Total Health Care Providers & Services | | | | | | | | | | | | | | | 1,194,438 | | |
| | | Hotels, Restaurants & Leisure – 0.5% | |
| | 200 | | | Aramark Corporation | | | 5.750 | % | | 3/15/20 | | BB– | | | 206,500 | | |
| | 200 | | | Wynn Macau Limited, 144A | | | 5.250 | % | | 10/15/21 | | BB | | | 188,000 | | |
| | 400 | | | Total Hotels, Restaurants & Leisure | | | | | | | | | | | | | | | 394,500 | | |
| | | Household Durables – 0.9% | |
| | 250 | | | Brookfield Residential Properties Inc., 144A | | | 6.500 | % | | 12/15/20 | | BB– | | | 261,250 | | |
| | 250 | | | KB Home | | | 7.000 | % | | 12/15/21 | | B+ | | | 262,969 | | |
| | 200 | | | William Lyon Homes Incorporated | | | 8.500 | % | | 11/15/20 | | B– | | | 215,500 | | |
| | 700 | | | Total Household Durables | | | | | | | | | | | | | | | 739,719 | | |
| | | Independent Power & Renewable Electricity Producers – 0.9% | |
| | 200 | | | AES Corporation | | | 5.500 | % | | 3/15/24 | | BB | | | 202,960 | | |
| | 200 | | | Dynegy Inc. | | | 5.875 | % | | 6/01/23 | | B+ | | | 190,000 | | |
| | 300 | | | GenOn Energy Inc. | | | 9.500 | % | | 10/15/18 | | B | | | 298,500 | | |
| | 700 | | | Total Independent Power & Renewable Electricity Producers | | | | | | | | | | | | | | | 691,460 | | |
| | | Machinery – 0.3% | |
| | 250 | | | Commercial Vehicle Group | | | 7.875 | % | | 4/15/19 | | B | | | 258,125 | | |
| | | Media – 1.8% | |
| | 200 | | | Altice S.A, 144A | | | 7.750 | % | | 5/15/22 | | B | | | 200,375 | | |
| | 300 | | | DIRECTV Holdings LLC | | | 3.800 | % | | 3/15/22 | | BBB | | | 305,211 | | |
| | 200 | | | Midcontinent Communications Finance Company, 144A | | | 6.250 | % | | 8/01/21 | | B– | | | 202,000 | | |
| | 200 | | | Quebecor Media Inc. | | | 5.750 | % | | 1/15/23 | | B+ | | | 204,500 | | |
| | 250 | | | Sinclair Television Group | | | 5.375 | % | | 4/01/21 | | B+ | | | 248,125 | | |
| | 300 | | | WMG Acquisition Group, 144A | | | 6.000 | % | | 1/15/21 | | B+ | | | 300,000 | | |
| | 1,450 | | | Total Media | | | | | | | | | | | | | | | 1,460,211 | | |
| | | Metals & Mining – 2.6% | |
| | 350 | | | Alcoa Inc. | | | 5.400 | % | | 4/15/21 | | BBB– | | | 379,062 | | |
| | 200 | | | Anglogold Holdings PLC | | | 5.125 | % | | 8/01/22 | | Baa3 | | | 182,503 | | |
| | 200 | | | Coeur d'Alene Mines Corporation | | | 7.875 | % | | 2/01/21 | | B+ | | | 157,500 | | |
| | 200 | | | Eldorado Gold Corporation, 144A | | | 6.125 | % | | 12/15/20 | | BB | | | 194,000 | | |
| | 500 | | | Freeport McMoRan, Inc. | | | 3.550 | % | | 3/01/22 | | BBB | | | 472,555 | | |
| | 200 | | | Lundin Mining Corporation, 144A | | | 7.500 | % | | 11/01/20 | | Ba2 | | | 198,000 | | |
| | 300 | | | Vale Overseas Limited | | | 4.375 | % | | 1/11/22 | | A– | | | 287,552 | | |
| | 200 | | | Vedanta Resources PLC, 144A | | | 6.000 | % | | 1/31/19 | | BB | | | 195,000 | | |
| | 2,150 | | | Total Metals & Mining | | | | | | | | | | | | | | | 2,066,172 | | |
| | | Oil, Gas & Consumable Fuels – 4.1% | |
| | 150 | | | Antero Resources Finance Corporation, 144A | | | 5.125 | % | | 12/01/22 | | BB | | | 141,375 | | |
| | 250 | | | Blue Racer Midstream LLC / Blue Racer Finance Corporation, 144A | | | 6.125 | % | | 11/15/22 | | B | | | 241,250 | | |
| | 200 | | | Chesapeake Energy Corporation | | | 6.875 | % | | 11/15/20 | | BB+ | | | 215,000 | | |
| | 240 | | | Concho Resources Inc. | | | 5.500 | % | | 10/01/22 | | BB+ | | | 242,400 | | |
| | 150 | | | Energy XXI Gulf Coast Inc., 144A | | | 9.250 | % | | 12/15/17 | | B | | | 97,500 | | |
| | 125 | | | Gastar Exploration Inc. | | | 8.625 | % | | 5/15/18 | | B– | | | 111,250 | | |
| | 200 | | | Gibson Energy, 144A | | | 6.750 | % | | 7/15/21 | | BB | | | 199,500 | | |
| | 100 | | | Hiland Partners LP/ Hiland Partners Finance Corp., 144A | | | 5.500 | % | | 5/15/22 | | B | | | 88,000 | | |
| | 200 | | | Niska Gas Storage Canada ULC Finance Corporation, 144A | | | 6.500 | % | | 4/01/19 | | B | | | 150,500 | | |
| | 250 | | | PBF Holding Company LLC | | | 8.250 | % | | 2/15/20 | | BB+ | | | 251,250 | | |
| | 125 | | | PetroBakken Energy Limited, 144A | | | 8.625 | % | | 2/01/20 | | B– | | | 87,500 | | |
| | 175 | | | Rose Rock Midstream LP / Rose Rock Finance Corporation | | | 5.625 | % | | 7/15/22 | | B1 | | | 163,625 | | |
| | 250 | | | Sanchez Energy Corporation | | | 7.750 | % | | 6/15/21 | | B– | | | 232,500 | | |
| | 100 | | | Tesoro Logistics LP Finance Corporation, 144A | | | 6.250 | % | | 10/15/22 | | BB | | | 99,750 | | |
| | 500 | | | Transocean Inc. | | | 3.800 | % | | 10/15/22 | | BBB– | | | 405,162 | | |
| | 150 | | | Vanguard Natural Resources Finance | | | 7.875 | % | | 4/01/20 | | B | | | 129,412 | | |
Nuveen Investments
19
Nuveen Multi-Market Income Fund
Portfolio of Investments (continued) December 31, 2014 (Unaudited)
Principal
Amount (000) | |
Description (1) | |
Coupon | |
Maturity | |
Ratings (2) | |
Value | |
| | | Oil, Gas & Consumable Fuels (continued) | |
$ | 450 | | | Western Refining Inc. | | | 6.250 | % | | 4/01/21 | | B+ | | $ | 438,750 | | |
| | 3,615 | | | Total Oil, Gas & Consumable Fuels | | | | | | | | | | | | | | | 3,294,724 | | |
| | | Paper & Forest Products – 1.3% | |
| | 250 | | | Domtar Corporation | | | 4.400 | % | | 4/01/22 | | BBB– | | | 256,593 | | |
| | 200 | | | Millar Western Forest Products Ltd | | | 8.500 | % | | 4/01/21 | | B– | | | 207,000 | | |
| | 375 | | | Resolute Forest Products | | | 5.875 | % | | 5/15/23 | | BB– | | | 356,250 | | |
| | 200 | | | Sappi Papier Holding GMBH, 144A | | | 6.625 | % | | 4/15/21 | | BB | | | 205,000 | | |
| | 1,025 | | | Total Paper & Forest Products | | | | | | | | | | | | | | | 1,024,843 | | |
| | | Personal Products – 0.3% | |
| | 250 | | | Albea Beauty Holdings SA, 144A | | | 8.375 | % | | 11/01/19 | | B+ | | | 262,500 | | |
| | | Real Estate Investment Trust – 0.7% | |
| | 300 | | | CommomWealth REIT | | | 5.875 | % | | 9/15/20 | | BBB– | | | 330,038 | | |
| | 225 | | | Realogy Group LLC / Realogy Co-Issuer Corporation, 144A | | | 4.500 | % | | 4/15/19 | | B | | | 222,750 | | |
| | 525 | | | Total Real Estate Investment Trust | | | | | | | | | | | | | | | 552,788 | | |
| | | Real Estate Management & Development – 0.3% | |
| | 250 | | | Mattamy Group Corporation, 144A | | | 6.500 | % | | 11/15/20 | | BB | | | 251,250 | | |
| | | Road & Rail – 0.3% | |
| | 250 | | | Watco Companies LLC Finance, 144A | | | 6.375 | % | | 4/01/23 | | B3 | | | 247,500 | | |
| | | Semiconductors & Semiconductor Equipment – 0.3% | |
| | 250 | | | Micron Technology, Inc., 144A | | | 5.875 | % | | 2/15/22 | | BB | | | 262,500 | | |
| | | Software – 1.3% | |
| | 1,000 | | | Computer Sciences Corporation | | | 4.450 | % | | 9/15/22 | | BBB+ | | | 1,022,912 | | |
| | | Specialty Retail – 0.5% | |
| | 150 | | | Neiman Marcus Mariposa Borrower / Merger Sub LLC, 144A | | | 8.000 | % | | 10/15/21 | | CCC+ | | | 158,625 | | |
| | 200 | | | The Men's Warehouse Inc., 144A | | | 7.000 | % | | 7/01/22 | | B2 | | | 205,500 | | |
| | 350 | | | Total Specialty Retail | | | | | | | | | | | | | | | 364,125 | | |
| | | Wireless Telecommunication Services – 1.6% | |
| | 175 | | | FairPoint Communications Inc., 144A | | | 8.750 | % | | 8/15/19 | | B | | | 175,875 | | |
| | 250 | | | Frontier Communications Corporation | | | 8.500 | % | | 4/15/20 | | BB | | | 278,750 | | |
| | 200 | | | Frontier Communications Corporation | | | 7.625 | % | | 4/15/24 | | BB | | | 206,000 | | |
| | 200 | | | Sprint Corporation | | | 7.250 | % | | 9/15/21 | | BB– | | | 198,250 | | |
| | 200 | | | T-Mobile USA Inc. | | | 6.731 | % | | 4/28/22 | | BB | | | 206,000 | | |
| | 200 | | | Wind Acquisition Finance SA, 144A | | | 4.750 | % | | 7/15/20 | | Ba3 | | | 187,000 | | |
| | 1,225 | | | Total Wireless Telecommunication Services | | | | | | | | | | | | | | | 1,251,875 | | |
$ | 25,437 | | | Total Corporate Bonds (cost $25,795,138) | | | | | | | | | | | | | | | 25,294,375 | | |
Principal
Amount (000) | |
Description (1) | |
Coupon | |
Maturity | |
Ratings (2) | |
Value | |
| | | $1,000 PAR (OR SIMILAR) INSTITUTIONAL PREFERRED – 0.6% (0.5% of Total Investments) | |
| | | Banks – 0.1% | |
$ | 100 | | | Lloyd's Banking Group PLC | | | 7.500 | % | | | N/A (3) | | | BB | | $ | 101,750 | | |
| | | Insurance – 0.5% | |
| | 250 | | | Genworth Financial Inc. | | | 6.150 | % | | 11/15/66 | | Ba1 | | | 153,750 | | |
| | 250 | | | Lincoln National Corporation | | | 6.050 | % | | 4/20/67 | | BBB | | | 250,000 | | |
| | | Total Insurance | | | 403,750 | | |
| | | Total $1,000 Par (or similar) Institutional Preferred (cost $550,231) | | | | | | | | | | | | | | | 505,500 | | |
Nuveen Investments
20
Principal
Amount (000) | |
Description (1) | |
Coupon | |
Maturity | |
Ratings (2) | |
Value | |
| | | ASSET-BACKED AND MORTGAGE-BACKED SECURITIES – 104.8% (74.8% of Total Investments) | |
$ | 500 | | | 321 Henderson Receivables LLC, Series 2012-1A | | | 7.140 | % | | 2/15/67 | | Baa2 | | $ | 619,688 | | |
| | 461 | | | 321 Henderson Receivables LLC., Series 2010-1A | | | 9.310 | % | | 7/15/61 | | Aa2 | | | 597,684 | | |
| | 500 | | | 321 Henderson Receivables Trust Series 2012-2A | | | 6.770 | % | | 10/17/61 | | Baa2 | | | 609,922 | | |
| | 424 | | | ACE Securities Corporation, Manufactured Housing Trust Series 2003-MH1 | | | 6.500 | % | | 8/15/30 | | AA | | | 466,073 | | |
| | 405 | | | AmeriCold LLC Trust, Series 2010 | | | 6.811 | % | | 1/14/29 | | A+ | | | 469,168 | | |
| 500
| | | Bank of America Commercial Mortgage Inc., Commercial Mortgage
Pass-Through Certificates, Series 2005-4 | | | 4.997
| % | | 7/10/45
| | AAA
| | | 508,940
| | |
| | 308 | | | Bank of America Funding Trust, Mortgage Pass-Through Certificates, Series 2007-4 | | | 5.500 | % | | 6/25/37 | | C | | | 79,918 | | |
| | 689 | | | Barclays BCAP LLC Trust, Resecuritized Series 2009-RR14 | | | 6.000 | % | | 5/26/37 | | BBB | | | 731,888 | | |
| | 234 | | | Bayview Financial Acquisition Trust 2003-AA | | | 6.072 | % | | 2/25/33 | | A+ | | | 234,778 | | |
| | 293 | | | Bayview Financial Acquisition Trust Series 2006-C | | | 5.852 | % | | 11/28/36 | | CCC | | | 290,766 | | |
| | 239 | | | Bayview Financial Acquisition Trust, Series 2006-C | | | 5.638 | % | | 11/28/36 | | Ba1 | | | 240,451 | | |
| | 183 | | | Bayview Financial Acquisition Trust, Series 2006-D | | | 5.660 | % | | 12/28/36 | | Aaa | | | 183,214 | | |
| 750
| | | Bayview Financial Mortgage Pass-Through Trust, Mortgage Pass-Through
Certificate Series 2005-D | | | 5.500 | % | |
12/28/35 | |
BB | | | 738,083 | | |
| 441
| | | Bayview Financial Mortgage Pass-Through Trust, Mortgage Pass-Through
Certificate Series 2006-A | | | 5.704 | % | |
2/28/41 | |
AAA | | | 454,659 | | |
| 500
| | | Bear Stearns Commercial Mortgage Securities Trust, Commercial Mortgage
Pass-Through Certificates, Series 2006-PW13 AM | | | 5.582 | % | |
9/11/41 | |
AAA | | | 528,064 | | |
| | 324 | | | CAM Mortgage Trust 2013-1 | | | 5.500 | % | | 12/15/53 | | N/R | | | 323,948 | | |
| 500
| | | CarFinance Capital Auto Trust, Automobile Receivables-Backed Notes,
Series 2013-1, 144A | | | 3.450
| % | | 3/15/19
| | Baa1
| | | 505,230
| | |
| | 301 | | | Chase Funding Mortgage Loan Asset-Backed Certificates, Series 2003-3 | | | 4.660 | % | | 3/25/33 | | A+ | | | 310,157 | | |
| 500
| | | Citigroup Commercial Mortgage Trust, Commercial Mortgage Pass-Through
Certificates, Series 2006-CD3 | | | 5.688
| % | | 10/15/48
| | B+
| | | 486,655
| | |
| | 352 | | | CountryWide Alternative Loan Trust 2005-86CB A10 | | | 5.500 | % | | 2/25/36 | | Caa3 | | | 312,337 | | |
| | 246 | | | Countrywide Alternative Loan Trust, Mortgage Pass Through Certificates, Series 2004-J2 | | | 6.500 | % | | 3/25/34 | | A+ | | | 258,957 | | |
| | 322 | | | Countrywide Alternative Loan Trust, Mortgage Pass-Through Certificates, Series 2005-47CB | | | 5.500 | % | | 10/25/35 | | Caa3 | | | 293,442 | | |
| | 987 | | | Countrywide Alternative Loan Trust, Mortgage Pass-Through Certificates, Series 2007-6 A4 | | | 5.750 | % | | 4/25/47 | | Ca | | | 846,566 | | |
| | 496 | | | Countrywide Asset Backed Certificates, Series 2007-4 A2 | | | 5.530 | % | | 4/25/47 | | Caa1 | | | 488,134 | | |
| | 1,158 | | | Credit Suisse Commercial Mortgage Trust 2009-3R | | | 6.000 | % | | 1/27/37 | | BBB | | | 1,211,987 | | |
| | 494 | | | Credit Suisse CSMC Mortgage-Backed Trust, Pass-Through Certificates, Series 2006-7 | | | 6.000 | % | | 8/25/36 | | Caa3 | | | 428,410 | | |
| 753
| | | Credit Suisse First Boston Mortgage Securities Corporation, Mortgage-Backed
Pass-Through Certificates, Series 2003-8 | | | 6.186
| % | | 4/25/33
| | A
| | | 722,993
| | |
| 861
| | | Credit Suisse First Boston Mortgage Securities Corporation, Mortgage-Backed
Pass-Through Certificates, Series 2005-11 6A7 | | | 6.000
| % | | 12/25/35
| | CC
| | | 313,704
| | |
| 519
| | | Credit Suisse First Boston Mortgage Securities, Home Equity Mortgage Pass- Through
Certificates, Series 2004-6 | | | 5.821
| % | | 4/25/35
| | BB+
| | | 530,485
| | |
| | 1,325 | | | Credit-Based Asset Servicing and Securitization Pool 2007-SP1 | | | 6.020 | % | | 12/25/37 | | A+ | | | 1,386,268 | | |
| | 500 | | | Fannie Mae Connecticut Avenue Securities , Series 2014-C04 | | | 5.068 | % | | 11/25/24 | | N/R | | | 507,797 | | |
| | 30 | | | Fannie Mae Mortgage Pool, (5) | | | 7.000 | % | | 7/01/17 | | Aaa | | | 31,417 | | |
| | 55 | | | Fannie Mae Mortgage Pool, (5) | | | 5.000 | % | | 11/01/18 | | Aaa | | | 57,995 | | |
| | 96 | | | Fannie Mae Mortgage Pool, (5) | | | 5.000 | % | | 2/01/21 | | Aaa | | | 103,078 | | |
| | 1,891 | | | Fannie Mae Mortgage Pool, (5) | | | 3.500 | % | | 12/01/26 | | Aaa | | | 2,000,711 | | |
| | 1,815 | | | Fannie Mae Mortgage Pool, (5) | | | 3.500 | % | | 1/01/27 | | Aaa | | | 1,920,446 | | |
| | — | (4) | | Fannie Mae Mortgage Pool | | | 3.078 | % | | 7/01/27 | | Aaa | | | 368 | | |
| | 75 | | | Fannie Mae Mortgage Pool, (5) | | | 6.000 | % | | 5/01/29 | | Aaa | | | 86,571 | | |
| | 40 | | | Fannie Mae Mortgage Pool, (5) | | | 7.000 | % | | 9/01/31 | | Aaa | | | 46,368 | | |
| | 51 | | | Fannie Mae Mortgage Pool, (5) | | | 5.500 | % | | 6/01/33 | | Aaa | | | 56,949 | | |
| | 100 | | | Fannie Mae Mortgage Pool, (5) | | | 6.000 | % | | 1/01/34 | | Aaa | | | 113,439 | | |
| | 256 | | | Fannie Mae Mortgage Pool, (5) | | | 5.500 | % | | 2/01/34 | | Aaa | | | 289,974 | | |
| | 148 | | | Fannie Mae Mortgage Pool, (5) | | | 6.000 | % | | 3/01/34 | | Aaa | | | 167,242 | | |
| | 156 | | | Fannie Mae Mortgage Pool, (5) | | | 6.000 | % | | 1/01/35 | | Aaa | | | 178,543 | | |
| | 127 | | | Fannie Mae Mortgage Pool, (5) | | | 5.000 | % | | 7/01/35 | | Aaa | | | 140,141 | | |
| | 64 | | | Fannie Mae Mortgage Pool, (5) | | | 5.500 | % | | 3/01/36 | | Aaa | | | 71,410 | | |
| | 237 | | | Fannie Mae Mortgage Pool, (5) | | | 6.000 | % | | 6/01/36 | | Aaa | | | 270,531 | | |
| | 197 | | | Fannie Mae Mortgage Pool, (5) | | | 5.500 | % | | 4/01/37 | | Aaa | | | 220,446 | | |
| | 225 | | | Fannie Mae Mortgage Pool, (5) | | | 5.000 | % | | 6/01/37 | | Aaa | | | 248,620 | | |
| | 196 | | | Fannie Mae Mortgage Pool, (5) | | | 5.500 | % | | 6/01/38 | | Aaa | | | 218,805 | | |
| | 2,888 | | | Fannie Mae Mortgage Pool, (5) | | | 3.500 | % | | 2/01/44 | | Aaa | | | 3,013,731 | | |
| | 162 | | | Fannie Mae REMIC Pass-Through Certificates | | | 6.509 | % | | 2/25/42 | | Aaa | | | 189,244 | | |
| | 754 | | | Fannie Mae REMIC Pass-Through Certificates | | | 4.436 | % | | 12/25/42 | | B1 | | | 625,744 | | |
| | 801 | | | Fannie Mae REMIC Pass-Through Certificates | | | 5.613 | % | | 7/25/44 | | CC | | | 315,819 | | |
| | 2,975 | | | Fannie Mae TBA Mortgage Pool, (MDR), (WI/DD) | | | 4.500 | % | | TBA | | Aaa | | | 3,229,270 | | |
| | 4,605 | | | Fannie Mae TBA Mortgage Pool, (MDR), (WI/DD) | | | 4.000 | % | | TBA | | Aaa | | | 4,914,704 | | |
Nuveen Investments
21
Nuveen Multi-Market Income Fund
Portfolio of Investments (continued) December 31, 2014 (Unaudited)
Principal
Amount (000) | |
Description (1) | |
Coupon | |
Maturity | |
Ratings (2) | |
Value | |
| | | ASSET-BACKED AND MORTGAGE-BACKED SECURITIES (continued) | |
$ | 2,500 | | | Fannie Mae TBA Mortgage Pool, (MDR), (WI/DD) | | | 3.000 | % | | TBA | | Aaa | | $ | 2,528,906 | | |
| | 4,539 | | | Federa Home Loan Mortgage Corporation, Mortgage Pool, (5) | | | 3.000 | % | | 4/01/43 | | Aaa | | | 4,593,320 | | |
| 345
| | | First Horizon Alternative Mortgage Securities Trust, Pass-Through
Certificates, Series 2005-FA5 | | | 5.500
| % | | 8/25/35
| | C
| | | 28,879
| | |
| | 3,635 | | | Freddie Mac Gold Mortgage Pool, (5) | | | 3.000 | % | | 1/01/29 | | Aaa | | | 3,777,374 | | |
| | 50 | | | Freddie Mac Mortgage Pool, Various, (5) | | | 6.500 | % | | 11/01/28 | | Aaa | | | 56,665 | | |
| | 2,493 | | | Freddie Mac Mortgage Pool, (5) | | | 3.500 | % | | 1/01/44 | | Aaa | | | 2,594,469 | | |
| | 2,495 | | | Freddie Mac Mortgage Pool, (5) | | | 3.500 | % | | 2/01/44 | | Aaa | | | 2,596,608 | | |
| | 282 | | | Freddie Mac Mortgage Trust 2012-K708 | | | 3.759 | % | | 2/25/45 | | A | | | 289,967 | | |
| | 644 | | | Freddie Mac Mortgage Trust 2013-KF02 | | | 3.169 | % | | 12/25/45 | | Baa3 | | | 663,973 | | |
| 255
| | | Freddie Mac Mortgage Trust, Multifamily Mortgage Pass-Through Certificates,
Series 2012-K706 | | | 4.027
| % | | 11/25/44
| | A2
| | | 265,283
| | |
| 500
| | | Freddie Mac Mortgage Trust, Multifamily Mortgage Pass-Through Certificates,
Series 2012-K711 | | | 3.562
| % | | 8/25/45
| | A–
| | | 510,940
| | |
| 750
| | | Freddie Mac Mortgage Trust, Multifamily Mortgage-Pass Through Certificates,
Series 2012-K709 | | | 3.741
| % | | 4/25/45
| | BBB
| | | 754,318
| | |
| | 235 | | | Freddie Mac Mortgage Trust, Series 2010-K7 | | | 5.435 | % | | 4/25/20 | | A3 | | | 261,701 | | |
| | 500 | | | Freddie Mac Multifamily Mortgage Trust, Series 2011-K704, 144A | | | 4.533 | % | | 10/25/30 | | Baa1 | | | 528,597 | | |
| | — | (4) | | Freddie Mac Non Gold Participation Certificates | | | 2.111 | % | | 9/01/18 | | Aaa | | | 7 | | |
| | 500 | | | GMAT Trust Mortgage Pool 2013-1A | | | 5.000 | % | | 11/25/43 | | N/R | | | 473,807 | | |
| 1,000
| | | Goldman Sachs Mortgage Securities Corporation II, Commercial Mortgage
Pass -Through Certificates, Series 2014-GSFL | | | 2.417
| % | | 7/15/31
| | A–
| | | 995,584
| | |
| 451
| | | Goldman Sachs Mortgage Securities Corporation II, Commercial Mortgage
Pass-Through Certificates, Series 2007-GG10 | | | 5.796
| % | | 8/10/45
| | A
| | | 488,686
| | |
| 146
| | | Goldman Sachs Mortgage Securities Corporation, GSMPS Mortgage Pass
Through Certificates, Series 2001-2 | | | 7.500
| % | | 6/19/32
| | B
| | | 153,511
| | |
| 1,346
| | | Goldman Sachs Mortgage Securities Corporation, GSMPS Mortgage Pass Through
Certificates, Series 2006-RP2 B1 | | | 6.032
| % | | 4/25/36
| | CC
| | | 220,760
| | |
| 1,161
| | | Goldman Sachs Mortgage Securities Corporation, GSMPS Mortgage Pass Through
Certificates, Series 2006-RP2 B2 | | | 6.032
| % | | 4/25/36
| | CC
| | | 64,574
| | |
| 1,223
| | | Goldman Sachs Mortgage Securities Corporation, Mortgage Pass-Through Certificates,
Series 2003-1 B2 | | | 6.643
| % | | 3/25/43
| | Caa2
| | | 32,523
| | |
| 128
| | | Goldman Sachs Mortgage Securities Corporation, Mortgage Pass-Through Certificates,
Series 2003-10 1A1 | | | 2.553
| % | | 10/25/33
| | BBB+
| | | 127,735
| | |
| 516
| | | Goldman Sachs Mortgage Securities Corporation, Mortgage Pass-Through Certificates,
Series 2005-RP2 1A2 | | | 7.500
| % | | 3/25/35
| | B1
| | | 535,583
| | |
| 514
| | | Goldman Sachs Mortgage Securities Corporation, Mortgage Pass-Through Certificates,
Series 2005-RP3 1A2 | | | 7.500
| % | | 9/25/35
| | B1
| | | 534,799
| | |
| | 98 | | | Government National Mortgage Association Pool, (5) | | | 1.625 | % | | 12/20/22 | | Aaa | | | 101,657 | | |
| | 385 | | | Government National Mortgage Association Pool, (5) | | | 5.500 | % | | 8/15/33 | | Aaa | | | 439,090 | | |
| | 229 | | | Government National Mortgage Association Pool, (5) | | | 6.000 | % | | 7/15/34 | | Aaa | | | 266,682 | | |
| 210
| | | Greenwich Capital Commercial Funding Corporation, Commercial Mortgage Pass Through
Certificates, Series 2007-GG11 | | | 5.736
| % | | 12/10/49
| | AAA
| | | 227,440
| | |
| | 900 | | | Home Loan Servicing Solutions, HLSS Servicer Advance Receivables Backed Notes 2012-T1 | | | 4.458 | % | | 1/15/48 | | BBB | | | 902,250 | | |
| | 750 | | | Home Loan Servicing Solutions, HLSS Servicer Advance Receivables Backed Notes 2012-T2 | | | 4.940 | % | | 10/15/45 | | BBB | | | 760,650 | | |
| | 376 | | | Impac Secured Assets Corporation, Mortgage Pass-Through Certificates, Series 2000-3 | | | 8.000 | % | | 10/25/30 | | CCC | | | 364,440 | | |
| | 888 | | | IndyMac INDX Mortgage Loan Trust, Series 2006-AR13 A3 | | | 4.669 | % | | 7/25/36 | | Caa1 | | | 803,595 | | |
| 509
| | | IndyMac MBS Inc., Residential Asset Securitization Trust, Mortgage Pass Through Certificates,
Series 2003-A15 | | | 4.250
| % | | 2/25/34
| | A
| | | 509,546
| | |
| | 108 | | | Jeffries & Company Securitization Trust 2009-R4 | | | 5.750 | % | | 1/26/36 | | A | | | 108,766 | | |
| | 516 | | | JP Morgan Alternative Loan Trust 2006-S1, Mortgage Pass-Through Certificates | | | 6.500 | % | | 3/25/36 | | D | | | 455,219 | | |
| 750
| | | JP Morgan Chase Commercial Mortgage Securities Corporation, Commercial Mortgage
Pass-Through Certificates, Series 2011-C4 C | | | 5.277
| % | | 7/15/46
| | A
| | | 833,549
| | |
| | 270 | | | Lavender Trust, Mortgage Pass Through Certificates, Series 2010-R10A | | | 6.250 | % | | 9/26/36 | | Caa2 | | | 276,541 | | |
| 451
| | | LB-UBS Commercial Mortgage Trust, Commercial Mortgage Pass-Through Certificates,
Series 2007-C7 | | | 5.866
| % | | 9/15/45
| | AAA
| | | 495,421
| | |
| 210
| | | LB-UBS Commercial Mortgage Trust, Commercial Mortgage Pass-Through Certificates,
Series 2008-C1 AM | | | 6.158
| % | | 4/15/41
| | BBB–
| | | 231,591
| | |
| | 211 | | | Lehman ABS Manufactured Houing Contract Asset Backed Certificates, Series 2001B | | | 4.350 | % | | 4/15/40 | | AA | | | 221,893 | | |
| | 92 | | | Lehman Mortgage Trust, Mortgage Pass Through Certificates, Series 2008-6 | | | 5.581 | % | | 7/25/47 | | BB+ | | | 93,706 | | |
| | 572 | | | Master RePerforming Loan Trust 2005-1 | | | 7.500 | % | | 8/25/34 | | Ba3 | | | 585,243 | | |
| | 743 | | | Master Resecuritization Trust 2009-1 | | | 6.000 | % | | 10/25/36 | | A | | | 787,774 | | |
| | 514 | | | Merrill Lynch Alternative Note Asset, 2007-F1 2A7 | | | 6.000 | % | | 3/25/37 | | Caa3 | | | 413,849 | | |
| | 802 | | | Mid-State Capital Corporation Trust Notes, Series 2004-1 A | | | 6.005 | % | | 8/15/37 | | AAA | | | 839,087 | | |
| | 1,006 | | | Mid-State Capital Corporation Trust Notes, Series 2005-1 | | | 5.745 | % | | 1/15/40 | | AA | | | 1,083,717 | | |
| | 297 | | | Mid-State Trust 2010-1 | | | 7.000 | % | | 12/15/45 | | A | | | 319,423 | | |
Nuveen Investments
22
Principal
Amount (000) | |
Description (1) | |
Coupon | |
Maturity | |
Ratings (2) | |
Value | |
| | | ASSET-BACKED AND MORTGAGE-BACKED SECURITIES (continued) | |
$ | 1,212 | | | Mid-State Trust 2010-1 | | | 5.250 | % | | 12/15/45 | | AA | | $ | 1,256,257 | | |
| | 380 | | | Mid-State Trust XI | | | 5.598 | % | | 7/15/38 | | A+ | | | 399,587 | | |
| 250
| | | Morgan Stanley Capital I Trust, Commercial Mortgage Pass-Through Certificates,
Series 2011-C1 C | | | 5.251 | % | |
9/15/47 | |
A+ | | | 275,746 | | |
| | 245 | | | Morgan Stanley Mortgage Loan Trust, Pass Through Certificates, 2006-2 | | | 5.750 | % | | 2/25/36 | | Caa2 | | | 231,221 | | |
| | 500 | | | Morgan Stanley Re REMIC Trust Series 2009-GG10 | | | 5.796 | % | | 8/12/45 | | A | | | 538,074 | | |
| 551
| | | Mortgage Asset Securitization Transaction Inc., Adjustable Rate Mortgage Pass-Through
Certificates, Series 2003-5 | | | 2.094
| % | | 11/25/33
| | A+
| | | 528,005
| | |
| 377
| | | Mortgage Asset Securitization Transaction Inc., Alternative Loan Trust Mortgage
Pass-Through Certificates Series 2004-1 | | | 7.000 | % | |
1/25/34 | |
BBB+ | | | 389,728 | | |
| 658
| | | Mortgage Asset Securitization Transaction Inc., Alternative Loan Trust Mortgage
Pass-Through Certificates, 2004-5 6A1 | | | 7.000
| % | | 6/25/34
| | A+
| | | 708,627
| | |
| 203
| | | Mortgage Asset Securitization Transaction Inc., Mortgage Pass Through Certificates,
Series 2003-5 | | | 5.000
| % | | 6/25/18
| | AA
| | | 210,022
| | |
| | 525 | | | Nationstar Agency Fund Trust, Series 2013-T2A | | | 7.385 | % | | 2/18/48 | | A | | | 524,722 | | |
| | 350 | | | Nationstar Agency Fund Trust, Series 2013-T2A | | | 4.212 | % | | 2/18/48 | | BBB | | | 350,091 | | |
| | 1,400 | | | Nationstar Mortgage Advance Receivables Trust 2013-T3 | | | 3.819 | % | | 6/22/48 | | BBB | | | 1,396,220 | | |
| | 676 | | | Nomura Asset Acceptance Corporation, Series 2004-R2, (6) | | | 6.740 | % | | 10/25/34 | | Ca | | | 442,895 | | |
| | 195 | | | Origen Manufactured Housing Contract Trust Collateralized Notes Series 2004-B MI | | | 5.730 | % | | 11/15/35 | | AA | | | 203,834 | | |
| | 414 | | | Origen Manufactured Housing Contract Trust Collaterlized Notes Series 2005B | | | 5.990 | % | | 1/15/37 | | A+ | | | 434,223 | | |
| | 479 | | | Origen Manufactured Housing Contract Trust Notes, Series 2004A | | | 6.640 | % | | 1/15/35 | | A | | | 520,177 | | |
| | 552 | | | Renaissance Home Equity Loan Trust Asset Backed Certificates, Series 2005-4 A6 | | | 5.749 | % | | 2/25/36 | | Caa1 | | | 508,811 | | |
| 540
| | | Residential Asset Mortgage Products Inc., Mortgage Asset-Backed Pass-Through
Certificates, Series 2003-SL1 M2 | | | 7.356
| % | | 4/25/31
| | CC
| | | 15,148
| | |
| 850
| | | Residential Asset Securities Corporation , Home Equity Mortgage Asset Backed Pass
Through Certificates, Series 2004-KS1 | | | 5.221
| % | | 2/25/34
| | BBB–
| | | 883,856
| | |
| | 240 | | | Residential Funding Mortgage Securities II, Inc., Home Loan Backed Notes Trust 2003-HI4 | | | 6.030 | % | | 2/25/29 | | A+ | | | 253,357 | | |
| | 397 | | | Residential Funding Mortgage Trust I, 2007-S9 | | | 6.000 | % | | 10/25/37 | | D | | | 337,838 | | |
| 373
| | | Salomon Brothers Commercial Mortgage Trust Pass-Through VII Certificates,
Series 2003-1 A2 | | | 6.000
| % | | 9/25/33
| | BB
| | | 369,715
| | |
| | 500 | | | Springleaf Mortgage Loan Trust 2013-2A | | | 3.520 | % | | 12/25/65 | | AA | | | 510,120 | | |
| | 750 | | | Springleaf Mortgage Loan Trust, Series 2012-3 | | | 5.300 | % | | 12/25/59 | | BBB | | | 773,596 | | |
| | 770 | | | Springleaf Mortgage Loan Trust, Series 2013-1A | | | 4.440 | % | | 6/25/58 | | BBB | | | 778,042 | | |
| | 500 | | | V Mortgage LLC, Pass Through Certificate , Series 2014-NPL1 | | | 4.750 | % | | 4/25/54 | | CCC | | | 480,749 | | |
| | 500 | | | Vericrest Opportunity Loan Transferee, Series 2014-NPL7 | | | 4.750 | % | | 8/27/57 | | N/R | | | 490,802 | | |
| 267
| | | Wachovia Bank Commercial Mortgage Trust, Commercial Mortgage Pass-Through
Certificates, Series 2007-C30 | | | 5.246
| % | | 12/15/43
| | AAA
| | | 271,962
| | |
| | 594 | | | Walter Investment Management Company Capital Trust, Series 2012-AA | | | 4.549 | % | | 10/16/50 | | BBB | | | 600,882 | | |
| 221
| | | Washington Mutual Mortgage Securities Corporation, Mortgage Pass-Through Certificates,
Series 2003-AR3 B1 | | | 2.347
| % | | 6/25/33
| | B
| | | 202,858
| | |
| 67
| | | Washington Mutual Mortgage Securities Corporation, Mortgage Pass-Through Certificates,
Series 2004-RA3 | | | 6.385
| % | | 8/25/38
| | AA
| | | 69,735
| | |
| 751
| | | Wells Fargo-RBS Commercial Mortgage Trust, Commercial Mortgage Pass-Through
Certificates, Series 2011-C3 | | | 5.335
| % | | 3/15/44
| | A2
| | | 817,260
| | |
| 251
| | | WF-RBS Commercial Mortgage Trust, Commercial Mortgage Pass-Through Certificates,
Series 2011-C2 | | | 5.392
| % | | 2/15/44
| | A2
| | | 274,064
| | |
| | 87,642 | | | Total Asset-Backed and Mortgage-Backed Securities (cost $84,982,777) | | | | | | | | | | | | | | | 84,439,854 | | |
| Shares | | Description (1), (7) | | | | | | | | Value | |
| | | INVESTMENT COMPANIES – 0.6% (0.4% of Total Investments) | |
| | 32,000 | | | Blackrock Credit Allocation Income Trust IV | | | | | | | | | | | | | | $ | 413,440 | | |
| | 7,000 | | | Pioneer Floating Rate Trust | | | | | | | | | | | | | | | 79,660 | | |
| | | | | Total Investment Companies (cost $486,936) | | | 493,100 | | |
Principal
Amount (000) | | Description (1) | | Coupon | | Maturity | | Ratings (2) | | Value | |
| | | SOVEREIGN DEBT – 0.2% (0.1% of Total Investments) | |
| | | Uruguay – 0.2% | |
$ | 123 | | | Republic of Uruguay | | | 8.000 | % | | 11/18/22 | | Baa2 | | $ | 161,577 | | |
| | 123 | | | Total Sovereign Debt (cost $126,062) | | | | | | | | | | | | | | | 161,577 | | |
| | | Total Long-Term Investments (cost $113,206,000) | | | 112,279,940 | | |
Nuveen Investments
23
Nuveen Multi-Market Income Fund
Portfolio of Investments (continued) December 31, 2014 (Unaudited)
Principal
Amount (000) | |
Description (1) | |
Coupon | |
Maturity | | | |
Value | |
| | | SHORT-TERM INVESTMENTS – 0.9% (0.6% of Total Investments) | |
$ | 737
| | | Repurchase Agreement with State Street Bank, dated 12/31/14,
repurchase price $737,300, collateralized by $540,000 U.S. Treasury Bonds,
8.000%, due 11/15/21, value $756,005 | | | 0.000
| % | | 1/02/14
| |
| | $ | 737,300
| | |
| | | Total Short-Term Investments (cost $737,300) | | | 737,300 | | |
| | | Total Investments (cost $113,943,300) – 140.2% | | | 113,017,240 | | |
| | | Reverse Repurchase Agreements – (28.2)% | | | (22,697,000 | ) | |
| | | Other Assets Less Liabilities – (12.0)% (8) | | | (9,705,308 | ) | |
| | | Net Assets – 100% | | $ | 80,614,932 | | |
Investments in Derivatives as of December 31, 2014
Futures Contracts outstanding:
Description | | Contract
Position | | Number of
Contracts | | Contract
Expriation | | Notional
Amount at
Value | | Unrealized
Appreciation
(Depreciation) | |
U.S. Treasury 2-Year Note | | Short | | | (3 | ) | | 3/15 | | $ | (655,781 | ) | | $ | 963 | | |
U.S. Treasury 5-Year Note | | Short | | | (112 | ) | | 3/15 | | | (13,320,125 | ) | | | (5,131 | ) | |
U.S. Treasury 10-Year Note | | Short | | | (82 | ) | | 3/15 | | | (10,397,344 | ) | | | (62,617 | ) | |
U.S. Treasury Long Bond | | Short | | | (15 | ) | | 3/15 | | | (2,168,438 | ) | | | (53,543 | ) | |
| | | | | | | | | $ | (26,541,688 | ) | | $ | (120,328 | ) | |
For Fund portfolio compliance purposes, the Fund's industry classifications refer to any one or more of the industry sub-classifications used by one or more widely recognized market indexes or ratings group indexes, and/or as defined by Fund management. This definition may not apply for purposes of this report, which may combine industry sub-classifications into sectors for reporting ease.
(1) All percentages shown in the Portfolio of Investments are based on net assets applicable to Common shares unless otherwise noted.
(2) Ratings: Using the highest of Standard & Poor's Group ("Standard & Poor's"), Moody's Investors Service, Inc. ("Moody's") or Fitch, Inc. ("Fitch") rating. Ratings below BBB by Standard & Poor's, Baa by Moody's or BBB by Fitch are considered to be below investment grade. Holdings designated N/R are not rated by any of these national rating agencies.
(3) Perpetual security. Maturity date is not applicable.
(4) Principal Amount (000) rounds to less than $1,000.
(5) Investment, or portion of investment, has been pledged to collateralize the net payment obligations for investments in reverse repurchase agreements.
(6) At or subsequent to the end of the reporting period, this security is non-income producing. Non-income producing, in the case of a fixed-income security, generally denotes that the issuer has (1) defaulted on the payment of principal or interest, (2) is under the protection of the Federal Bankruptcy Court or (3) the Fund's Adviser has concluded that the issue is not likely to meet its future interest payment obligations and has directed the Fund's custodian to cease accruing additional income on the Fund's records.
(7) A copy of the most recent financial statements for these investment companies in which the Fund invests can be obtained directly from the Securities and Exchange Commission on its website at http://www.sec.gov.
(8) Other assets less liabilities includes the unrealized appreciation (depreciation) of the over-the-counter derivatives as presented on the Statement of Assets and Liabilities. The unrealized appreciation (depreciation) of exchange-cleared and exchange-traded derivatives is recognized as part of the receivable or payable for variation margin as presented on the Statement of Assets and Liabilities.
N/A Not applicable.
TBA To be announced. Maturity date not known prior to settlement of this transaction.
WI/DD Investment, or portion of investment, purchased on a when-issued or delayed delivery basis.
144A Investment is exempt from registration under Rule 144A of the Securities Act of 1933, as amended. These investments may only be resold in transactions exempt from registration, which are normally those transactions with qualified institutional buyers.
REIT Real Estate Investment Trust.
MDR Denotes investment is subject to dollar roll transactions.
See accompanying notes to financial statements.
Nuveen Investments
24
Statement of
Assets and Liabilities December 31, 2014 (Unaudited)
Assets | |
Long-term investments, at value (cost $113,206,000) | | $ | 112,279,940 | | |
Short-term investments, at value (cost approximates value) | | | 737,300 | | |
Cash collateral at brokers(1) | | | 275,000 | | |
Receivable for: | |
Dividends | | | 11,742 | | |
Interest | | | 773,528 | | |
Investments sold | | | 500,000 | | |
Paydowns | | | 74,565 | | |
Total assets | | | 114,652,075 | | |
Liabilities | |
Reverse repurchase agreements | | | 22,697,000 | | |
Payable for: | |
Investments purchased | | | 11,155,669 | | |
Variation margin on futures contracts | | | 39,797 | | |
Accrued expenses: | |
Interest | | | 9,798 | | |
Management fees | | | 63,860 | | |
Trustees fees | | | 507 | | |
Other | | | 70,512 | | |
Total liabilities | | | 34,037,143 | | |
Net assets | | $ | 80,614,932 | | |
Shares outstanding | | | 9,464,150 | | |
Net asset value ("NAV") per share outstanding | | $ | 8.52 | | |
Net assets consist of: | |
Shares, $0.01 par value per share | | $ | 94,642 | | |
Paid-in surplus | | | 82,360,818 | | |
Undistributed (Over-distribution of) net investment income | | | 151,697 | | |
Accumulated net realized gain (loss) | | | (946,337 | ) | |
Net unrealized appreciation (depreciation) | | | (1,045,888 | ) | |
Net assets | | $ | 80,614,932 | | |
Authorized shares | | | Unlimited | | |
(1) Cash pledged to collateralize the net payment obligations for investments in derivatives.
See accompanying notes to financial statements.
Nuveen Investments
25
Statement of
Operations (Unaudited)
| | Six Months
Ended
12/31/14 | |
Investment Income | |
Dividends from investments | | $ | 64,946 | | |
Interest from investments | | | 2,836,771 | | |
Total investment income | | | 2,901,717 | | |
Expenses | |
Management fees | | | 412,875 | | |
Interest expense | | | 47,551 | | |
Administration fees | | | 18,333 | | |
Shareholder servicing agent fees and expenses | | | 7,885 | | |
Custodian fees and expenses | | | 21,362 | | |
Directors/Trustees fees and expenses | | | 14,296 | | |
Professional fees | | | 30,724 | | |
Shareholder reporting expenses | | | 27,350 | | |
Stock exchange listing fees | | | 21,990 | | |
Investor relations expenses | | | 5,037 | | |
Other expenses | | | 14,095 | | |
Total expenses before expense reimbursement | | | 621,498 | | |
Fee waiver/expense reimbursement | | | (105,964 | ) | |
Net expenses | | | 515,534 | | |
Net investment income (loss) | | | 2,386,183 | | |
Realized and Unrealized Gain (Loss) | |
Net realized gain (loss) from: | |
Investments | | | 50,858 | | |
Futures contracts | | | (370,154 | ) | |
Change in net unrealized appreciation (depreciation) of: | |
Investments | | | (1,569,474 | ) | |
Futures contracts | | | (168,690 | ) | |
Net realized and unrealized gain (loss) | | | (2,057,460 | ) | |
Net increase (decrease) in net assets from operations | | $ | 328,723 | | |
See accompanying notes to financial statements.
Nuveen Investments
26
Statement of
Changes in Net Assets (Unaudited)
| | Six Months
Ended
12/31/14 | | Ten Months
Ended
6/30/14 | | Year
Ended
8/31/13 | |
Operations | |
Net investment income (loss) | | $ | 2,386,183 | | | $ | 3,815,802 | | | $ | 5,023,348 | | |
Net realized gain (loss) from: | |
Investments | | | 50,858 | | | | 2,196,299 | | | | 1,057,050 | | |
Futures contracts | | | (370,154 | ) | | | (935,053 | ) | | | 794,371 | | |
Change in net unrealized appreciation (depreciation) of: | |
Investments | | | (1,569,474 | ) | | | 2,325,767 | | | | (3,025,776 | ) | |
Futures contracts | | | (168,690 | ) | | | 113,785 | | | | 29,936 | | |
| Net increase (decrease) in net assets from operations | | | 328,723 | | | | 7,516,600 | | | | 3,878,929 | | |
Distributions to Shareholders | |
From net investment income | | | (2,271,396 | ) | | | (3,861,373 | ) | | | (5,207,765 | ) | |
From accumulated net realized gains | | | — | | | | — | | | | (134,748 | ) | |
Decrease in net assets from distributions to shareholders | | | (2,271,396 | ) | | | (3,861,373 | ) | | | (5,342,513 | ) | |
Net increase (decrease) in net assets | | | (1,942,673 | ) | | | 3,655,227 | | | | (1,463,584 | ) | |
Net assets at the beginning of period | | | 82,557,605 | | | | 78,902,378 | | | | 80,365,962 | | |
Net assets at the end of period | | $ | 80,614,932 | | | $ | 82,557,605 | | | $ | 78,902,378 | | |
Undistributed (Over-distribution of) net investment income at the end of period | | $ | 151,697 | | | $ | 36,910 | | | $ | (7,843 | ) | |
See accompanying notes to financial statements.
Nuveen Investments
27
Statement of
Cash Flows (Unaudited)
| | Six Months
Ended
12/31/14 | | Ten Months
Ended
6/30/14 | |
Cash Flows from Operating Activities: | |
Net Increase (Decrease) In Net Assets from Operations | | $ | 328,723 | | | $ | 7,516,600 | | |
Adjustments to reconcile the net increase (decrease) in net
assets from operations to net cash provided by (used in) operating activities: | |
Purchases of investments | | | (76,723,716 | ) | | | (294,274,148 | ) | |
Proceeds from sales and maturities of investments | | | 78,175,015 | | | | 275,475,012 | | |
Proceeds from (Purchase of) short-term investments, net | | | 702,979 | | | | 224,265 | | |
Proceeds from (Payments for) miscellaneous investment transactions | | | 156,008 | | | | — | | |
Amortization (Accretion) of premiums and discounts, net | | | (31,573 | ) | | | (97,251 | ) | |
(Increase) Decrease in: | |
Cash collateral at brokers | | | — | | | | (20,000 | ) | |
Receivable for dividends and interest | | | (68,470 | ) | | | 60,087 | | |
Receivable for investments sold | | | (500,000 | ) | | | — | | |
Receivable for paydowns | | | (74,565 | ) | | | — | | |
Other assets | | | 461 | | | | 35,500 | | |
Increase (Decrease) in: | |
Payable for investments purchased | | | (73,393 | ) | | | — | | |
Payable for variation margin on futures contracts | | | 19,867 | | | | (798,236 | ) | |
Accrued interest | | | 3,411 | | | | — | | |
Accrued management fees | | | 20,779 | | | | — | | |
Accrued Trustees fees | | | 507 | | | | — | | |
Accrued other expenses | | | (22,190 | ) | | | 26,126 | | |
Net realized gain (loss) from: | |
Investments | | | (50,858 | ) | | | (1,261,246 | ) | |
Paydowns | | | 44,914 | | | | — | | |
Change in net unrealized appreciation (depreciation) of investments | | | 1,569,474 | | | | (2,439,552 | ) | |
Net cash provided by (used in) operating activities | | | 3,477,373 | | | | (15,552,843 | ) | |
Cash Flows from Financing Activities: | |
Increase (decrease) in cash overdraft | | | (977 | ) | | | 216 | | |
Net borrowings through reverse repurchase agreements | | | (1,205,000 | ) | | | 19,414,000 | | |
Cash distributions paid to shareholders | | | (2,271,396 | ) | | | (3,861,373 | ) | |
Net cash provided by (used in) financing activities | | | (3,477,373 | ) | | | 15,552,843 | | |
Net Increase (Decrease) in Cash | | | — | | | | — | | |
Cash at the beginning of period | | | — | | | | — | | |
Cash at the end of period | | $ | — | | | $ | — | | |
Supplemental Disclosure of Cash Flow Information | |
Cash paid for interest | | $ | 44,140 | | | $ | 31,469 | | |
See accompanying notes to financial statements.
Nuveen Investments
28
THIS PAGE INTENTIONALLY LEFT BLANK
Nuveen Investments
29
Financial
Highlights (Unaudited)
Selected data for a share outstanding throughout each period:
| | | | |
| | | | | Investment Operations | | Less Distributions | | | | | |
| | | Beginning
NAV | | Net
Investment
Income
(Loss)(a) | | Net
Realized/
Unrealized
Gain (Loss) | |
Total | | From Net
Investment
Income | | From
Accumulated
Net Realized
Gains | | Return of
Capital | |
Total | | Ending
NAV | | Ending
Market
Value | |
Year Ended 6/30: | |
| 2015(g) | | $ | 8.72 | | | $ | 0.25 | | | $ | (0.21 | ) | | $ | 0.04 | | | $ | (0.24 | ) | | | — | | | $ | — | | | $ | (0.24 | ) | | $ | 8.52 | | | $ | 7.67 | | |
| 2014(f) | | | 8.34 | | | | 0.40 | | | | 0.39 | | | | 0.79 | | | | (0.41 | ) | | | — | | | | — | | | | (0.41 | ) | | | 8.72 | | | | 7.77 | | |
Year Ended 8/31: | |
2013 | | | 8.49 | | | | 0.53 | | | | (0.12 | ) | | | 0.41 | | | | (0.56 | ) | | | — | | | | — | | | | (0.56 | ) | | | 8.34 | | | | 7.25 | | |
2012 | | | 8.42 | | | | 0.59 | | | | 0.10 | | | | 0.69 | | | | (0.60 | ) | | | — | | | | (0.02 | ) | | | (0.62 | ) | | | 8.49 | | | | 8.10 | | |
2011 | | | 8.37 | | | | 0.63 | | | | 0.08 | | | | 0.71 | | | | (0.66 | ) | | | — | | | | — | | | | (0.66 | ) | | | 8.42 | | | | 7.72 | | |
2010 | | | 7.50 | | | | 0.71 | | | | 0.91 | | | | 1.62 | | | | (0.72 | ) | | | — | | | | (0.03 | ) | | | (0.75 | ) | | | 8.37 | | | | 8.64 | | |
2009 | | | 7.51 | | | | 0.65 | | | | (0.03 | ) | | | 0.62 | | | | (0.63 | ) | | | — | | | | — | | | | (0.63 | ) | | | 7.50 | | | | 7.15 | | |
Nuveen Investments
30
| | | | | Ratios/Supplemental Data | |
| | | Total Returns | | | | Ratios to Average Net Assets
Before Reimbursement(c) | | Ratios to Average Net Assets
After Reimbursement(c)(d) | | | |
| | | Based
on
NAV(b) | | Based
on
Market
Value(b) | | Ending Net
Assets (000) | |
Expenses | | Net
Investment
Income (Loss) | |
Expenses | | Net
Investment
Income (Loss) | | Portfolio
Turnover
Rate(e) | |
Year Ended 6/30: | |
| 2015(g) | | | 0.46 | % | | | 1.83 | % | | $ | 80,615 | | | | 1.51 | %* | | | 5.55 | %* | | | 1.26 | %* | | | 5.81 | %* | | | 65 | % | |
| 2014(f) | | | 9.68 | | | | 13.10 | | | | 82,558 | | | | 1.22 | * | | | 5.68 | * | | | 1.22 | * | | | 5.68 | * | | | 251 | | |
Year Ended 8/31: | |
2013 | | | 4.93 | | | | (4.19 | ) | | | 78,902 | | | | 1.18 | | | | 6.20 | | | | 1.18 | | | | 6.20 | | | | 310 | | |
2012 | | | 8.56 | | | | 13.58 | | | | 80,366 | | | | 1.25 | | | | 7.05 | | | | 1.25 | | | | 7.05 | | | | 260 | | |
2011 | | | 8.75 | | | | (3.15 | ) | | | 79,671 | | | | 1.17 | | | | 7.37 | | | | 1.17 | | | | 7.37 | | | | 265 | | |
2010 | | | 22.59 | | | | 32.84 | | | | 79,122 | | | | 1.11 | | | | 8.88 | | | | 1.11 | | | | 8.88 | | | | 273 | | |
2009 | | | 9.64 | | | | 10.70 | | | | 70,891 | | | | 1.56 | | | | 9.55 | | | | 1.56 | | | | 9.55 | | | | 140 | | |
(a) Per share Net Investment Income (Loss) is calculated using the average daily shares method.
(b) Total Return Based on Market Value is the combination of changes in the market price per share and the effect of reinvested dividend income and reinvested capital gains distributions, if any, at the average price paid per share at the time of reinvestment. The last dividend declared in the period, which is typically paid on the first business day of the following month, is assumed to be reinvested at the ending market price. The actual reinvestment for the last dividend declared in the period may take place over several days, and in some instances may not be based on the market price, so the actual reinvestment price may be different from the price used in the calculation. Total returns are not annualized.
Total Return Based on NAV is the combination of changes in NAV, reinvested dividend income at NAV and reinvested capital gains distributions at NAV, if any. The last dividend declared in the period, which is typically paid on the first business day of the following month, is assumed to be reinvested at the ending NAV. The actual reinvest price for the last dividend declared in the period may often be based on the Fund's market price (and not its NAV), and therefore may be different from the price used in the calculation. Total returns are not annualized.
(c) • Net investment Income (Loss) ratios reflect income earned and expenses incurred on assets attributable to reverse repurchase agreements, where applicable, as described in Note 3 – Portfolio Securities and Investments in Derivatives, Reverse Repurchase Agreements.
• Each ratio includes the effect of all interest expenses paid and other costs related to reverse repurchase agreements, where applicable, as follows:
| | | Ratios of Interest Expense to
Average Net Assets | |
Year Ended 6/30: | |
| 2015(g) | | | 0.12 | %* | |
| 2014(f) | | | 0.06 | * | |
Year Ended 8/31: | |
2013 | | | 0.04 | | |
2012 | | | 0.06 | | |
2011 | | | 0.06 | | |
2010 | | | 0.08 | | |
2009 | | | 0.50 | | |
(d) After fee waiver and/or expense reimbursement from the Adviser, where applicable.
(e) Portfolio Turnover Rate is calculated based on the lesser of long-term purchases or sales (as disclosed in Note 5—Investment Transactions) divided by the average long-term market value during the period.
(f) For the ten months ended June 30, 2014.
(g) For the six months ended December 31, 2014.
* Annualized.
See accompanying notes to financial statements.
Nuveen Investments
31
Notes to
Financial Statements (Unaudited)
1. General Information and Significant Accounting Policies
General Information
Fund Information
Nuveen Multi-Market Income Fund (the "Fund") is registered under the Investment Company Act of 1940, as amended, as a diversified closed-end registered investment company. The Fund's shares are listed on the New York Stock Exchange ("NYSE") and trade under the ticker symbol "JMM." The Fund was organized as a Massachusetts business trust on May 27, 2014.
The end of the reporting period for the Fund is December 31, 2014, and the period covered by these Notes to Financial Statements is the six months ended December 31, 2014 ("the current fiscal period").
The Fund was previously named American Income Fund, Inc. (MRF) and was advised by U.S. Bancorp Asset Management, Inc. ("USBSM") and sub-advised by Nuveen Fund Advisors, LLC ("NFAL") and Nuveen Asset Management, LLC ("NAM"). On September 8, 2014, NFAL (the "Adviser"), a wholly-owned subsidiary of Nuveen Investments, Inc. ("Nuveen"), became the Fund's investment adviser and assumed management responsibility for the Fund, and NAM became the sole sub-adviser to the Fund (the "Transition"). At the same time, the Fund's name was changed to Nuveen Multi-Market Income Fund (JMM) and the trustees who oversee the funds in the Nuveen Fund complex became trustees of the Fund. The Fund's investment strategy and portfolio management team remained unchanged after the Transition. In conjunction with the Transition, a change-of-domicile transaction converting the Fund from a Virginia corporation to a Massachusetts business trust occurred on November 19, 2014.
Investment Objective and Principal Investment Strategies
The Fund seeks to provide high monthly income consistent with prudent risk to capital. The Fund will invest primarily in debt securities, including, but not limited to, U.S. agency and privately issued mortgage-backed securities, corporate debt securities, and asset-backed securities. Under normal market conditions, at least 65% of the Fund's total assets must be invested in securities that, at the time of purchase, are rated investment-grade or of comparable quality. No more than 35% of the Fund's total assets may be held in high-yield issues. The Fund is authorized to borrow funds or issue senior securities in amounts not exceeding 33 1/3% of its total assets. The Fund may utilize derivatives including options; futures contracts; options on futures contracts; interest-rate caps, collars and floors; interest-rate, total return, and credit default swap agreements; and options on the foregoing type of swap agreements.
Significant Accounting Policies
The Fund is an investment company and follows accounting and reporting guidance under Financial Accounting Standards Board (FASB) Accounting Standards Codification (ASC) Topic 946 "Financial Services – Investment Companies." The following is a summary of significant accounting policies followed by the Fund in the preparation of its financial statements in accordance with U.S. generally accepted accounting principles ("U.S. GAAP").
Investment Transactions
Investment transactions are recorded on a trade date basis. Realized gains and losses from investment transactions are determined on the specific identification method, which is the same basis used for federal income tax purposes. Investments purchased on a when-issued/delayed delivery basis may have extended settlement periods. Any investments so purchased are subject to market fluctuation during this period. The Fund has instructed the custodian to earmark securities in the Fund's portfolio with a current value at least equal to the amount of the when-issued/delayed delivery purchase commitments.
As of the end of the reporting period, the Fund's outstanding when-issued/delayed delivery purchase commitments were as follows:
Outstanding when-issued/delayed delivery purchase commitments | | $ | 10,629,024 | | |
Investment Income
Dividend income is recorded on the ex-dividend date or, for foreign securities, when information is available. Interest income, which reflects the amortization of premiums and includes accretion of discounts for financial reporting purposes, is recorded on an accrual basis. Interest income also reflects paydown gains and losses, if any.
Professional Fees
Professional fees presented on the Statement of Operations consist of legal fees incurred in the normal course of operations, audit fees, tax consulting fees and, in some cases, workout expenditures. Workout expenditures are incurred in an attempt to protect or enhance an investment or to pursue other
Nuveen Investments
32
claims or legal actions on behalf of Fund shareholders. If a refund is received for workout expenditures paid in a prior reporting period, such amounts will be recognized as "Legal fee refund" on the Statement of Operations.
Dividends and Distributions to Shareholders
Dividends from net investment income are declared monthly. Net realized capital gains and/or market discount from investment transactions, if any, are distributed to shareholders at least annually. Furthermore, capital gains are distributed only to the extent they exceed available capital loss carryforwards.
Distributions to shareholders of net investment income, net realized capital gains and/or market discount, if any, are recorded on the ex-dividend date. The amount and timing of distributions are determined in accordance with federal income tax regulations, which may differ from U.S. GAAP.
Share Repurchase Program
On September 28, 2014, the Board authorized the Fund to participate in Nuveen's closed-end fund complex-wide share repurchase program. Under the share repurchase program, the Fund may repurchase up to 10% of its outstanding shares as of the authorization date (approximately 945,000 shares) in open-market transactions at the Adviser's discretion.
Indemnifications
Under the Fund's organizational documents, its officers and trustees are indemnified against certain liabilities arising out of the performance of their duties to the Fund. In addition, in the normal course of business, the Fund enters into contracts that provide general indemnifications to other parties. The Fund's maximum exposure under these arrangements is unknown as this would involve future claims that may be made against the Fund that have not yet occurred. However, the Fund has not had prior claims or losses pursuant to these contracts and expects the risk of loss to be remote.
Netting Agreements
In the ordinary course of business, the Fund may enter into transactions subject to enforceable master repurchase agreements, International Swaps and Derivative Association, Inc. ("ISDA") master agreements or other similar arrangements ("netting agreements"). Generally, the right to offset in netting agreements allows the Fund to offset any exposure to a specific counterparty with any collateral received or delivered to that counterparty based on the terms of the agreements. Generally, the Fund manages its cash collateral and securities collateral on a counterparty basis.
The Fund's investments subject to netting agreements as of the end of the reporting period, if any, are further described in Note 3 – Portfolio Securities and Investments in Derivatives.
Use of Estimates
The preparation of financial statements in conformity with U.S. GAAP requires management to make estimates and assumptions that affect the reported amounts of assets and liabilities at the date of the financial statements and the reported amounts of increases and decreases in net assets from operations during the reporting period. Actual results may differ from those estimates.
2. Investment Valuation and Fair Value Measurements
The fair valuation input levels as described below are for fair value measurement purposes.
Investment Valuation
Common stocks and other equity-type securities are valued at the last sales price on the securities exchange on which such securities are primarily traded and are generally classified as Level 1. Securities primarily traded on the NASDAQ National Market ("NASDAQ") are valued at the NASDAQ Official Closing Price and are generally classified as Level 1. However, securities traded on a securities exchange or NASDAQ for which there were no transactions on a given day or securities not listed on a securities exchange or NASDAQ are valued at the quoted bid price and are generally classified as Level 2.
Prices of fixed-income securities are provided by a pricing service approved by the Fund's Board of Trustees (the "Board"). The pricing service establishes a security's fair value using methods that may include consideration of the following: yields or prices of investments of comparable quality, type of issue, coupon, maturity and rating, market quotes or indications of value from security dealers, evaluations of anticipated cash flows or collateral, general market conditions and other information and analysis, including the obligor's credit characteristics considered relevant. These securities are generally classified as Level 2. In pricing certain securities, particularly less liquid and lower quality securities, the pricing service may consider information about a security, its issuer or market activity provided by the Adviser. These securities are generally classified as Level 2 or Level 3 depending on the priority of the significant inputs.
Investments in investment companies are valued at their respective net asset value ("NAV") on valuation date and are generally classified as Level 1.
Futures contracts are valued using the closing settlement price or, in the absense of such a price, the last traded price, and are generally classified as Level 1.
Nuveen Investments
33
Notes to Financial Statements (Unaudited) (continued)
Repurchase agreements are valued at contract amount plus accrued interest, which approximates market value. These securities are generally classified as Level 2.
Certain securities may not be able to be priced by the pre-established pricing methods as described above. Such securities may be valued by the Board and/or its appointee at fair value. These securities generally include, but are not limited to, restricted securities (securities which may not be publicly sold without registration under the Securities Act of 1933, as amended) for which a pricing service is unable to provide a market price; securities whose trading has been formally suspended; debt securities that have gone into default and for which there is no current market quotation; a security whose market price is not available from a pre-established pricing source; a security with respect to which an event has occurred that is likely to materially affect the value of the security after the market has closed but before the calculation of the Fund's NAV (as may be the case in non-U.S. markets on which the security is primarily traded) or make it difficult or impossible to obtain a reliable market quotation; and a security whose price, as provided by the pricing service, is not deemed to reflect the security's fair value. As a general principle, the fair value of a security would appear to be the amount that the owner might reasonably expect to receive for it in a current sale. A variety of factors may be considered in determining the fair value of such securities, which may include consideration of the following: yields or prices of investments of comparable quality, type of issue, coupon, maturity and rating, market quotes or indications of value from security dealers, evaluations of anticipated cash flows or collateral, general market conditions and other information and analysis, including the obligor's credit characteristics considered relevant. These securities are generally classified as Level 2 or Level 3 depending on the priority of the significant inputs. Regardless of the method employed to value a particular security, all valuations are subject to review by the Board and/or its appointee.
Fair Value Measurements
Fair value is defined as the price that would be received upon selling an investment or transferring a liability in an orderly transaction to an independent buyer in the principal or most advantageous market for the investment. A three-tier hierarchy is used to maximize the use of observable market data and minimize the use of unobservable inputs and to establish classification of fair value measurements for disclosure purposes. Observable inputs reflect the assumptions market participants would use in pricing the asset or liability. Observable inputs are based on market data obtained from sources independent of the reporting entity. Unobservable inputs reflect the reporting entity's own assumptions about the assumptions market participants would use in pricing the asset or liability. Unobservable inputs are based on the best information available in the circumstances. The following is a summary of the three-tiered hierarchy of valuation input levels.
Level 1 – Inputs are unadjusted and prices are determined using quoted prices in active markets for identical securities.
Level 2 – Prices are determined using other significant observable inputs (including quoted prices for similar securities, interest rates, prepayment speeds, credit risk, etc.).
Level 3 – Prices are determined using significant unobservable inputs (including management's assumptions in determining the fair value of investments).
The inputs or methodologies used for valuing securities are not an indication of the risks associated with investing in those securities. The following is a summary of the Fund's fair value measurements as of the end of the reporting period:
| | | Level 1 | | Level 2 | | Level 3 | | Total | |
Long-Term Investments*: | |
Convertible Preferred Securities | | $ | 232,594 | | | $ | — | | | $ | — | | | $ | 232,594 | | |
$25 Par (or similar) Retail Preferred | | | 1,152,940 | | | | — | | | | — | | | | 1,152,940 | | |
Corporate Bonds | | | — | | | | 25,294,375 | | | | — | | | | 25,294,375 | | |
$1,000 Par (or similar) Institutional Preferred | | | — | | | | 505,500 | | | | — | | | | 505,500 | | |
Asset-Backed and Mortgage-Backed Securities | | | — | | | | 84,439,854 | | | | — | | | | 84,439,854 | | |
Investment Companies | | | 493,100 | | | | — | | | | — | | | | 493,100 | | |
Sovereign Debt | | | — | | | | 161,577 | | | | — | | | | 161,577 | | |
Short-Term Investments: | |
Repurchase Agreements | | | — | | | | 737,300 | | | | — | | | | 737,300 | | |
Investments in Derivatives: | |
Futures Contracts** | | | (120,328 | ) | | | — | | | | — | | | | (120,328 | ) | |
Total | | $ | 1,758,306 | | | $ | 111,138,606 | | | $ | — | | | $ | 112,896,912 | | |
* Refer to the Fund's Portfolio of Investments for industry and country classifications, where applicable.
** Represents net unrealized appreciation (depreciation) as reported in the Fund's Portfolio of Investments.
The Board is responsible for the valuation process and has appointed the oversight of the daily valuation process to the Adviser's Valuation Committee. The Valuation Committee, pursuant to the valuation policies and procedures adopted by the Board, is responsible for making fair value determinations, evaluating the effectiveness of the Fund's pricing policies and reporting to the Board. The Valuation Committee is aided in its efforts by the Adviser's dedicated Securities Valuation Team, which is responsible for administering the daily valuation process and applying fair value methodologies as approved by the Valuation Committee. When determining the reliability of independent pricing services for investments owned by the Fund, the Valuation Committee,
Nuveen Investments
34
among other things, conducts due diligence reviews of the pricing services and monitors the quality of security prices received through various testing reports conducted by the Securities Valuation Team.
The Valuation Committee will consider pricing methodologies it deems relevant and appropriate when making a fair value determination, based on the facts and circumstances specific to the portfolio instrument. Fair value determinations generally will be derived as follows, using public or private market information:
(i) If available, fair value determinations shall be derived by extrapolating from recent transactions or quoted prices for identical or comparable securities.
(ii) If such information is not available, an analytical valuation methodology may be used based on other available information including, but not limited to: analyst appraisals, research reports, corporate action information, issuer financial statements and shelf registration statements. Such analytical valuation methodologies may include, but are not limited to: multiple of earnings, discount from market value of a similar freely-traded security, discounted cash flow analysis, book value or a multiple thereof, risk premium/yield analysis, yield to maturity and/or fundamental investment analysis.
The purchase price of a portfolio instrument will be used to fair value the instrument only if no other valuation methodology is available or deemed appropriate, and it is determined that the purchase price fairly reflects the instrument's current value.
For each portfolio security that has been fair valued pursuant to the policies adopted by the Board, the fair value price is compared against the last available and next available market quotations. The Valuation Committee reviews the results of such testing and fair valuation occurrences are reported to the Board.
3. Portfolio Securities and Investments in Derivatives
Portfolio Securities
Dollar Roll Transactions
The Fund is authorized to enter into dollar roll transactions ("dollar rolls") in which the Fund purchases or sells mortgage-backed securities ("MBS") for delivery in the future and simultaneously contracts to sell or repurchase a substantially similar (same type, coupon, and maturity) MBS on a different specified future date. Dollar rolls are identified in the Portfolio of Investments as "MDR", when applicable. During the roll period, the Fund foregoes principal and interest paid on the MBS. The Fund is compensated by fee income or the difference between the current sales price and the lower forward price for the future purchase. Such compensation is amortized over the life of the dollar rolls, which is recognized as a component of "Investment income" on the Statement of Operations. Dollar rolls are valued daily.
Dollar rolls involve the risk that the market value of the MBS the Fund is obligated to repurchase under an agreement may decline below the repurchase price. These transactions also involve some risk to the Fund if the other party should default on its obligation and the Fund is delayed or prevented from completing the transaction. In the event that the buyer of securities under a dollar roll files for bankruptcy or becomes insolvent, the Fund's use of proceeds of the dollar roll may be restricted pending a determination by the other party, or its trustee or receiver, whether to enforce the Fund's obligation to repurchase the securities.
Repurchase Agreements
In connection with transactions in repurchase agreements, it is the Fund's policy that its custodian take possession of the underlying collateral securities, the fair value of which exceeds the principal amount of the repurchase transaction, including accrued interest, at all times. If the counterparty defaults, and the fair value of the collateral declines, realization of the collateral may be delayed or limited.
The following table presents the repurchase agreements for the Fund that are subject to netting agreements as of the end of the reporting period, and the collateral delivered related to those repurchase agreements.
Counterparty | | Short-Term
Investments, at Value | | Collateral
Pledged (From)
Counterparty* | | Net
Exposure | |
State Street Bank | | $ | 737,300 | | | $ | (737,300 | ) | | $ | — | | |
* As of the end of the reporting period, the value of the collateral pledged from the counterparty exceeded the value of the repurchase agreements. Refer to the Fund's Portfolio of Investments for details on the repurchase agreements.
Reverse Repurchase Agreements
In a reverse repurchase agreement, the Fund sells to the counterparty a security that it holds with a contemporaneous agreement to repurchase the same security at an agreed-upon price and date, with the Fund retaining the risk of loss that is associated with that security. The Fund will segregate assets determined to be liquid by the Adviser to cover its obligations under reverse repurchase agreements. Securities sold under reverse repurchase agreements are recorded and recognized as "Reverse repurchase agreements" on the Statement of Assets and Liabilities.
Nuveen Investments
35
Notes to Financial Statements (Unaudited) (continued)
Interest payments made on reverse repurchase agreements are recognized as a component of "Interest expense" on the Statement of Operations. In periods of increased demand for the security, the Fund received a fee for use of the security by the counterparty, which may result in interest income to the Fund.
As of the end of the reporting period, the Fund's outstanding balances on its reverse repurchase agreements were as follows:
| Counterparty | | Coupon | | Principal
Amount | | Maturity | | Value | | Value and
Accrued Interest | |
Goldman Sachs | | | 0.42 | % | | $ | (22,697,000 | ) | | 1/23/15 | | $ | (22,697,000 | ) | | $ | (22,706,798 | ) | |
During the current fiscal period, the average daily balance outstanding and weighted average interest rate on the Fund's reverse repurchase agreements were as follows:
Average daily balance outstanding | | $ | 23,125,679 | | |
Weighted average interest rate | | | 0.40 | % | |
The following table presents the reverse repurchase agreements, which are subject to netting agreements, as well as the collateral delivered related to those reverse repurchase agreements.
| Counterparty | | Reverse Repurchase*
Agreements | | Collateral Pledged
to Counterparty | | Net
Exposure | |
Goldman Sachs | | $ | (22,706,798 | ) | | $ | 21,571,458 | | | $ | 1,135,340 | | |
* Represents gross value and accrued interest for the counterparty as reported in the preceding table.
Zero Coupon Securities
A zero coupon security does not pay a regular interest coupon to its holders during the life of the security. Income to the holder of the security comes from accretion of the difference between the original purchase price of the security at issuance and the par value of the security at maturity and is effectively paid at maturity. The market prices of zero coupon securities generally are more volatile than the market prices of securities that pay interest periodically.
Investment in Derivatives
The Fund is authorized to invest in certain derivative instruments, such as futures, options and swap contracts. The Fund limits its investments in futures, options on futures and swap contracts to the extent necessary for the Adviser to claim the exclusion from registration by the Commodity Futures Trading Commission as a commodity pool operator with respect to the Fund. The Fund records derivative instruments at fair value, with changes in fair value recognized on the Statement of Operations, when applicable. Even though the Fund's investments in derivatives may represent economic hedges, they are not considered to be hedge transactions for financial reporting purposes.
Futures Contracts
Upon execution of a futures contract, the Fund is obligated to deposit cash or eligible securities, also known as "initial margin," into an account at its clearing broker equal to a specified percentage of the contract amount. Cash held by the broker to cover initial margin requirements on open futures contracts, if any, is recognized as "Cash collateral at brokers" on the Statement of Assets and Liabilities. Investments in futures contracts obligate the Fund and the clearing broker to settle monies on a daily basis representing changes in the prior days "mark-to-market" of the open contracts. If the Fund has unrealized appreciation the clearing broker would credit the Fund's account with an amount equal to appreciation and conversely if the Fund has unrealized depreciation the clearing broker would debit the Fund's account with an amount equal to depreciation. These daily cash settlements are also known as "variation margin." Variation margin is recognized as a receivable and/or payable for "Variation margin on futures contracts" on the Statement of Assets and Liabilities.
During the period the futures contract is open, changes in the value of the contract are recognized as an unrealized gain or loss by "marking-to-market" on a daily basis to reflect the changes in market value of the contract, which is recognized as a component of "Change in net unrealized appreciation (depreciation) of futures contracts" on the Statement of Operations. When the contract is closed or expired, the Fund records a realized gain or loss equal to the difference between the value of the contract on the closing date and value of the contract when originally entered into, which is recognized as a component of "Net realized gain (loss) from futures contracts" on the Statement of Operations.
Risks of investments in futures contracts include the possible adverse movement in the price of the securities or indices underlying the contracts, the possibility that there may not be a liquid secondary market for the contracts and/or that a change in the value of the contract may not correlate with a change in the value of the underlying securities or indices.
During the current fiscal period, the Fund used U.S. Treasury futures as part of an overall portfolio construction strategy to manage portfolio duration and yield curve exposure.
Nuveen Investments
36
The average notional amount of futures contracts outstanding during the current fiscal period was as follows:
Average notional amount of futures contracts outstanding* | | $ | 27,421,941 | | |
* The average notional amount is calculated based on the absolute aggregate notional amount of contracts outstanding at the beginning of the fiscal year and at the end of each quarter within the current fiscal year.
The following table presents the fair value of all futures contracts held by the Fund as of the end of the reporting period, the location of these instruments on the Statement of Assets and Liabilities and the primary underlying risk exposure.
| | | | | Location on the Statement of Assets and Liabilities | |
Underlying | | Derivative | | Asset Derivatives | | (Liability) Derivatives | |
Risk Exposure | | Instrument | | Location | | Value | | Location | | Value | |
Interest rate | | Futures contracts | | | — | | | $ | — | | | Payable for variation margin on futures contracts* | | $ | (120,328 | ) | |
* Value represents unrealized appreciation (depreciation) of futures contracts as reported on the Fund's Portfolio of Investments and not cash collateral at brokers, if any, or the receivable or payable for variation margin on futures contracts presented on the Statement of Assets and Liabilities.
The following table presents the amount of net realized gain (loss) and change in net unrealized appreciation (depreciation) recognized on futures contracts on the Statement of Operations during the current fiscal period, and the primary underlying risk exposure.
Underlying
Risk Exposure | | Derivative
Instrument | | Net Realized
Gain (Loss) from
Futures Contracts | | Change in Net Unrealized
Appreciation (Depreciation) of
Futures Contracts | |
Interest rate | | Futures contracts | | $ | (370,154 | ) | | $ | (168,690 | ) | |
Market and Counterparty Credit Risk
In the normal course of business the Fund may invest in financial instruments and enter into financial transactions where risk of potential loss exists due to changes in the market (market risk) or failure of the other party to the transaction to perform (counterparty credit risk). The potential loss could exceed the value of the financial assets recorded on the financial statements. Financial assets, which potentially expose the Fund to counterparty credit risk, consist principally of cash due from counterparties on forward, option and swap transactions, when applicable. The extent of the Fund's exposure to counterparty credit risk in respect to these financial assets approximates their carrying value as recorded on the Statement of Assets and Liabilities.
The Fund helps manage counterparty credit risk by entering into agreements only with counterparties the Adviser believes have the financial resources to honor their obligations and by having the Adviser monitor the financial stability of the counterparties. Additionally, counterparties may be required to pledge collateral daily (based on the daily valuation of the financial asset) on behalf of the Fund with a value approximately equal to the amount of any unrealized gain above a pre-determined threshold. Reciprocally, when the Fund has an unrealized loss, the Fund has instructed the custodian to pledge assets of the Fund as collateral with a value approximately equal to the amount of the unrealized loss above a pre-determined threshold. Collateral pledges are monitored and subsequently adjusted if and when the valuations fluctuate, either up or down, by at least the pre-determined threshold amount.
4. Fund Shares
The Fund did not have any transactions in shares during the six months ended December 31, 2014, ten months ended June 30, 2014 and fiscal year ended August 31, 2013.
5. Investment Transactions
Long-term purchases and sales (including maturities and dollar roll transactions, but excluding derivative transactions) during the six months ended December 31, 2014, aggregated $76,723,716 and $78,175,015, respectively.
6. Income Tax Information
The Fund intends to distribute substantially all of its net investment company taxable income to shareholders and to otherwise comply with the requirements of Subchapter M of the Internal Revenue Code applicable to regulated investment companies. Therefore, no federal income tax provision is required.
For all open tax years and all major taxing jurisdictions, management of the Fund has concluded that there are no significant uncertain tax positions that would require recognition in the financial statements. Open tax years are those that are open for examination by taxing authorities (i.e., generally the last four tax year ends and the interim tax period since then). Furthermore, management of the Fund is also not aware of any tax positions for which it is reasonably possible that the total amounts of unrecognized tax benefits will significantly change in the next twelve months.
The following information is presented on an income tax basis. Differences between amounts for financial statement and federal income tax purposes are primarily due to the recognition of premium amortization, and timing differences in recognizing certain gains and losses on investment transactions. To
Nuveen Investments
37
Notes to Financial Statements (Unaudited) (continued)
the extent that differences arise that are permanent in nature, such amounts are reclassified within the capital accounts as detailed below. Temporary differences do not require reclassification. Temporary and permanent differences do not impact the NAV of the Fund.
As of December 31, 2014, the cost and unrealized appreciation (depreciation) of investments (excluding investments in derivatives), as determined on a federal income tax basis, were as follows:
Cost of investments | | $ | 113,965,084 | | |
Gross unrealized: | |
Appreciation | | $ | 4,116,738 | | |
Depreciation | | | (5,064,582 | ) | |
Net unrealized appreciation (depreciation) of investments | | $ | (947,844 | ) | |
Permanent differences, primarily due to paydowns, complex securities character adjustments and REIT adjustments, resulted in reclassifications among the Fund's components of net assets as of June 30, 2014, the Fund's last tax year end, as follows:
Paid-in surplus | | $ | (4,332 | ) | |
Undistributed (Over-distribution of) net investment income | | | 90,324 | | |
Accumulated net realized gain (loss) | | | (85,992 | ) | |
The tax components of undistributed net ordinary income and net long-term capital gains as of June 30, 2014, the Fund's last tax year end, were as follows:
Undistributed net ordinary income1 | | $ | 42,145 | | |
| Undistributed net long-term capital gains | | | 1,333 | | |
1 Net ordinary income consists of net taxable income derived from dividends and interest, and net short-term capital gains.
The tax character of distributions paid by the Fund during the ten month period ended June 30, 2014 and the year ended August 31, 2013, was designated for purposes of the dividends paid deduction as follows:
Ten months ended June 30, 2014 | |
Distributions from net ordinary income1 | | $ | 3,861,373 | | |
Distributions from net long-term capital gains | | | — | | |
Return of capital | | | — | | |
1 Net ordinary income consists of net taxable income derived from dividends and interest, and net short-term capital gains.
Year ended August 31, 2013 | |
Distributions from net ordinary income1 | | $ | 5,207,765 | | |
Distributions from net long-term capital gains | | | — | | |
Return of capital | | | 134,748 | | |
As of June 30, 2014, the Fund's last tax year end, the Fund did not have any unused capital loss carryforwards available for federal income tax purposes to be applied against future capital gains, if any.
During the ten month period ended June 30, 2014, the Fund utilized $1,349,009 of its capital loss carryforwards.
7. Management Fees and Other Transactions with Affiliates
Investment Advisory Fees
Prior to the Transition, pursuant to an investment advisory agreement (the "Agreement"), USBAM, a subsidiary of U.S. Bank National Association ("U.S. Bank"), managed the Fund's assets and furnished related office facilities, equipment, research, and personnel. The Agreement provided USBAM with a monthly investment advisory fee in an amount equal to an annualized rate of 0.65% of the Fund's average weekly net assets. For its fee, USBAM provided investment advice and, in general, conducted the management and investment activities of the Fund. NFAL and NAM each served as an investment sub-advisor to the Fund pursuant to separate investment sub-advisory agreements with USBAM.
Effective September 8, 2014, NFAL became the Fund's investment advisor pursuant to a new investment advisory agreement (the "New Agreement"). Under the New Agreement, the Fund's management fee consists of two components – a fund-level fee, based only on the amount of assets within the Fund, and a complex-level fee, based on the aggregate amount of all eligible fund assets managed by NFAL. This pricing structure enables Fund shareholders to benefit from growth in the assets within the Fund as well as from growth in the amount of complex-wide assets managed by NFAL. The management fee compensates NFAL for the overall investment advisory and administrative services and general office facilities it provides for the Fund.
Nuveen Investments
38
Also effective September 8, 2014, NFA entered into a new sub-advisory agreement with NAM, and NAM will be compensated for its services to the Fund from the management fees paid to NFAL.
The annual fund-level fee, payable monthly, is calculated according to the following schedule:
Average Daily Managed Assets* | | Fund-Level Fee Rate | |
For the first $125 million | | | 0.7000 | % | |
For the next $125 million | | | 0.6875 | | |
For the next $250 million | | | 0.6750 | | |
For the next $500 million | | | 0.6625 | | |
For managed assets over $1 billion | | | 0.6500 | | |
The annual complex-level fee, payable monthly, is calculated according to the following schedule:
Complex-Level Managed Asset Breakpoint Level* | | Effective Rate at Breakpoint Level | |
| $55 billion | | | 0.2000 | % | |
| $56 billion | | | 0.1996 | | |
| $57 billion | | | 0.1989 | | |
| $60 billion | | | 0.1961 | | |
| $63 billion | | | 0.1931 | | |
| $66 billion | | | 0.1900 | | |
| $71 billion | | | 0.1851 | | |
| $76 billion | | | 0.1806 | | |
| $80 billion | | | 0.1773 | | |
| $91 billion | | | 0.1691 | | |
| $125 billion | | | 0.1599 | | |
| $200 billion | | | 0.1505 | | |
| $250 billion | | | 0.1469 | | |
| $300 billion | | | 0.1445 | | |
* For the fund-level and complex-level fees, managed assets include closed-end fund assets managed by the Adviser that are attributable to certain types of leverage. For these purposes, leverage includes the funds' use of preferred stock and borrowings and certain investments in the residual interest certificates (also called inverse floating rate securities) in tender option bond (TOB) trusts, including the portion of assets held by a TOB trust that has been effectively financed by the trust's issuance of floating rate securities, subject to an agreement by the Adviser as to certain funds to limit the amount of such assets for determining managed assets in certain circumstances. The complex-level fee is calculated based upon the aggregate daily managed assets of all Nuveen funds that constitute "eligible assets." Eligible assets do not include assets attributable to investments in other Nuveen funds and assets in excess of $2 billion added to the Nuveen fund complex in connection with the Adviser's assumption of the management of the former First American Funds effective January 1, 2011. As of December 31, 2014, the complex-level fee rate for the Fund was 0.1639%.
NFAL has agreed to waive fees and/or reimburse expenses of the Fund through September 8, 2016, so that total annual operating expenses, after fee waivers and/or expense reimbursements and excluding any costs of leverage, do not exceed 1.15% of the Fund's average net assets.
Prior to the Transition, if the Fund invested in money market funds advised by USBAM, in order to avoid the payment of duplicative investment advisory fees to USBAM, which also acted as the investment advisor to the Fund, USBAM reimbursed the Fund an amount equal to that portion of USBAM's investment advisory fee received from the related money market funds that was attributable to the assets of the Fund. These reimbursements, if any, are recognized as a component of "Fee waivers/expense reimbursements" on the Statement of Operations and terminated with respect to the Fund on September 8, 2014, in connection with the Transition.
Prior to the Transition, independent directors of the Fund may have participated and elected to defer receipt of part or all of their annual compensation under a deferred compensation plan (the "Plan"). Deferred amounts were treated as though equivalent dollar amounts had been invested in shares of selected funds managed by USBAM as designated by each director. All amounts in the Plan were 100% vested and accounts under the Plan were obligations of the Fund. Deferred amounts remain in the Fund until distributed in accordance with the Plan.
Effective September 8, 2014, independent trustees of the Fund may elect to defer receipt of all or a portion of the annual compensation they are entitled to receive from certain funds advised by NFAL. Under the plan, deferred amounts are treated as though equal dollar amounts had been invested in shares of select funds advised by NFAL.
Administration Fees
Prior to the Transition, USBAM served as the Fund's administrator pursuant to an administration agreement between USBAM and the Fund. Under this administration agreement, USBAM received a monthly administration fee equal to an annualized rate of 0.10% of the Fund's average weekly net assets. For its fee, USBAM provided numerous services to the Fund including, but not limited to, handling the general business affairs, financial and regulatory reporting, and various other services.
Pursuant to a sub-administration agreement between USBAM and NFAL, USBAM also paid NFAL an annual fee, calculated weekly and paid monthly, equal to 0.05% of the average weekly net assets of the Fund for certain administrative and other services that NFAL provided to the Fund.
Nuveen Investments
39
Notes to Financial Statements (Unaudited) (continued)
Effective September 8, 2014, USBAM and NFAL no longer serve as the Fund's administrator and sub-administrator, respectively.
Custodian Fees
Prior to the Transition, U.S. Bank served as the Fund's custodian pursuant to a custodian agreement with the Fund. The custodian fee charged to the Fund was equal to an annual rate of 0.005% of average weekly net assets. These fees were computed weekly and paid monthly.
Under this agreement, interest earned on uninvested cash balances was used to reduce a portion of the Fund's custodian expenses. These credits, if any, are disclosed as "Custodian fee credit" on the Statement of Operations. Conversely, the custodian charged a fee for any cash overdrafts incurred, which would increase the Fund's custodian expenses. Effective September 8, 2014, U.S. Bank no longer serves as the Fund's custodian.
Nuveen Investments
40
Additional
Fund Information
Board of Trustees
William Adams IV* | | Jack B. Evans | | William C. Hunter | | David J. Kundert | | John K. Nelson | | William J. Schneider | |
Thomas S. Schreier, Jr.* | | Judith M. Stockdale | | Carole E. Stone | | Virginia L. Stringer | | Terence J. Toth | | | |
* Interested Board Member.
Fund Manager
Nuveen Fund Advisors, LLC
333 West Wacker Drive
Chicago, IL 60606 | | Custodian
State Street Bank
& Trust Company
Boston, MA 02111 | | Legal Counsel
Chapman and Cutler LLP
Chicago, IL 60603 | | Independent Registered
Public Accounting Firm**
KPMG LLP
Chicago, IL 60601 | | Transfer Agent and
Shareholder Services
State Street Bank
& Trust Company
Nuveen Funds
P.O. Box 43071
Providence, RI 02940-3071
(800) 257-8787 | |
** The Board of Trustees of the Fund, upon recommendation of the Audit Committee, engaged KPMG LLP as the Fund's independent registered public accounting firm during the fiscal year end June 30, 2015. On October 6, 2014, Ernst & Young, LLP ("Ernst & Young") completed its work on the June 30, 2014 audit and resigned as the independent registered public accounting firm of the Fund.
Ernst & Young's report on the Fund's financial statements for the most recent fiscal year contained no adverse opinion or disclaimer of opinion, and was not qualified or modified as to uncertainty, audit scope or accounting principles. For the most recent fiscal year and through October 6, 2014, there were no disagreements with Ernst & Young on any matter of accounting principles, financial statement disclosure or auditing scope or procedures, which disagreements, if not resolved to the satisfaction of Ernst & Young, would have caused it to make reference to the subject matter of the disagreements in connection with its reports on the Fund's financial statements.
Quarterly Form N-Q Portfolio of Investments Information
The Fund is required to file its complete schedule of portfolio holdings with the Securities and Exchange Commission (SEC) for the first and third quarters of each fiscal year on Form N-Q. You may obtain this information directly from the SEC. Visit the SEC on-line at http://www.sec.gov or in person at the SEC's Public Reference Room in Washington, D.C. Call the SEC toll-free at (800) SEC-0330 for room hours and operation.
Nuveen Funds' Proxy Voting Information
You may obtain (i) information regarding how each fund voted proxies relating to portfolio securities held during the most recent twelve-month period ended June 30, without charge, upon request, by calling Nuveen Investments toll-free at (800) 257-8787 or on Nuveen's website at www.nuveen.com and (ii) a description of the policies and procedures that each fund used to determine how to vote proxies relating to portfolio securities without charge, upon request, by calling Nuveen Investments toll free at (800) 257-8787. You may also obtain this information directly from the SEC. Visit the SEC on-line at http://www.sec.gov.
CEO Certification Disclosure
The Fund's Chief Executive Officer (CEO) has submitted to the New York Stock Exchange (NYSE) the annual CEO certification as required by Section 303A.12(a) of the NYSE Listed Company Manual. The Fund has filed with the SEC the certification of its CEO and Chief Financial Officer required by Section 302 of the Sarbanes-Oxley Act.
Share Repurchases
The Fund intends to repurchase, through its open-market share repurchase program, shares of its own common stock at such times and in such amounts as is deemed advisable. During the period covered by this report, the Fund repurchased shares of its common stock, as shown in the accompanying table. Any future repurchases will be reported to shareholders in the next annual or semi-annual report.
FINRA BrokerCheck
The Financial Industry Regulatory Authority (FINRA) provides information regarding the disciplinary history of FINRA member firms and associated investment professionals. This information as well as an investor brochure describing FINRA BrokerCheck is available to the public by calling the FINRA BrokerCheck Hotline number at (800) 289-9999 or by visiting www.FINRA.org.
Nuveen Investments
41
Glossary of Terms
Used in this Report
n Average Annual Total Return: This is a commonly used method to express an investment's performance over a particular, usually multi-year time period. It expresses the return that would have been necessary each year to equal the investment's actual cumulative performance (including change in NAV or market price and reinvested dividends and capital gains distributions, if any) over the time period being considered.
n Beta: A measure of the variability of the change in the share price for a fund in relation to a change in the value of the fund's market benchmark. Securities with betas higher than 1.0 have been, and are expected to be, more volatile than the benchmark; securities with betas lower than 1.0 have been, and are expected to be, less volatile than the benchmark.
n Duration: Duration is a measure of the expected period over which a bond's principal and interest will be paid, and consequently is a measure of the sensitivity of a bond's or bond fund's value to changes when market interest rates change. Generally, the longer a bond's or fund's duration, the more the price of the bond or fund will change as interest rates change.
n Effective Leverage: Effective leverage is a fund's effective economic leverage, and includes both regulatory leverage (see below) and the leverage effects of certain derivative investments in the fund's portfolio.
n Gross Domestic Product (GDP): The total market value of all final goods and services produced in a country/region in a given year, equal to total consumer, investment and government spending, plus the value of exports, minus the value of imports.
n JMM Blended Benchmark: A two index blend comprised of weightings approximating the Fund's proposed portfolio: 25% Barclays High-Yield Index and 75% Barclays U.S. Government/Mortgage Index. 1) Barclays U.S. Corporate High Yield Debt Bond Index: An unmanaged index that covers the universe of domestic fixed-rate non-investment grade debt; and 2) Barclays U.S. Government/Mortgage Index: An unmanaged index considered representative of U.S. government treasury securities and agency mortgage-back securities. Benchmark returns assume reinvestment of distributions, but do not reflect any applicable sales charges or management fees.
n Leverage: Leverage is created whenever a fund has investment exposure (both reward and/or risk) equivalent to more than 100% of the investment capital.
n Net Asset Value (NAV) Per Share: A fund's Net Assets is equal to its total assets (securities, cash, accrued earnings and receivables) less its total liabilities. NAV per share is equal to the fund's Net Assets divided by its number of shares outstanding.
n Regulatory Leverage: Regulatory leverage consists of preferred shares issued by or borrowings of the fund. Both of these are part of the fund's capital structure. Regulatory leverage is subject to asset coverage limits set in the Investment Company Act of 1940.
Nuveen Investments
42
Reinvest Automatically,
Easily and Conveniently
Nuveen makes reinvesting easy. A phone call is all it takes to set up your reinvestment account.
Nuveen Closed-End Funds Automatic Reinvestment Plan
Your Nuveen Closed-End Fund allows you to conveniently reinvest distributions in additional Fund shares.
By choosing to reinvest, you'll be able to invest money regularly and automatically, and watch your investment grow through the power of compounding. Just like distributions in cash, there may be times when income or capital gains taxes may be payable on distributions that are reinvested.
It is important to note that an automatic reinvestment plan does not ensure a profit, nor does it protect you against loss in a declining market.
Easy and convenient
To make recordkeeping easy and convenient, each quarter you'll receive a statement showing your total distributions, the date of investment, the shares acquired and the price per share, and the total number of shares you own.
How shares are purchased
The shares you acquire by reinvesting will either be purchased on the open market or newly issued by the Fund. If the shares are trading at or above net asset value at the time of valuation, the Fund will issue new shares at the greater of the net asset value or 95% of the then-current market price. If the shares are trading at less than net asset value, shares for your account will be purchased on the open market. If the Plan Agent begins purchasing Fund shares on the open market while shares are trading below net asset value, but the Fund's shares subsequently trade at or above their net asset value before the Plan Agent is able to complete its purchases, the Plan Agent may cease open-market purchases and may invest the uninvested portion of the distribution in newly-issued Fund shares at a price equal to the greater of the shares' net asset value or 95% of the shares' market value on the last business day immediately prior to the purchase date. Distributions received to purchase shares in the open market will normally be invested shortly after the distribution payment date. No interest will be paid on distributions awaiting reinvestment. Because the market price of the shares may increase before purchases are completed, the average purchase price per share may exceed the market price at the time of valuation, resulting in the acquisition of fewer shares than if the distribution had been paid in shares issued by the Fund. A pro rata portion of any applicable brokerage commissions on open market purchases will be paid by Plan participants. These commissions usually will be lower than those charged on individual transactions.
Flexible
You may change your distribution option or withdraw from the Plan at any time, should your needs or situation change.
You can reinvest whether your shares are registered in your name, or in the name of a brokerage firm, bank, or other nominee. Ask your investment advisor if his or her firm will participate on your behalf. Participants whose shares are registered in the name of one firm may not be able to transfer the shares to another firm and continue to participate in the Plan.
The Fund reserves the right to amend or terminate the Plan at any time. Although the Fund reserves the right to amend the Plan to include a service charge payable by the participants, there is no direct service charge to participants in the Plan at this time.
Call today to start reinvesting distributions
For more information on the Nuveen Automatic Reinvestment Plan or to enroll in or withdraw from the Plan, speak with your financial advisor or call us at (800) 257-8787.
Nuveen Investments
43
Annual Investment
Management Agreement Approval Process
NUVEEN MULTI-MARKET INCOME FUND (JMM)
The Board of Trustees (the "Board," and each Trustee, a "Board Member") of the Fund, including the Board Members who are not parties to the Fund's advisory or sub-advisory agreement or "interested persons" of any such parties (the "Independent Board Members"), is responsible for approving advisory arrangements and, at a meeting held on November 17-19, 2014 (the "Meeting"), was asked to approve the advisory arrangements for the Fund. The Fund was formerly known as the American Income Fund, Inc. (the "Predecessor Fund"). Previously, U.S. Bancorp Asset Management, Inc. ("USBAM") served as the investment adviser to the Predecessor Fund. Nuveen Fund Advisors, LLC ("NFA") and Nuveen Asset Management, LLC ("NAM") each began serving as investment sub-adviser to the Predecessor Fund in 2011. Subsequently, USBAM determined to discontinue the portion of its business involving the provision of asset management services to closed-end funds, including the Predecessor Fund. To provide for continuity of portfolio management, in 2014, the Predecessor Fund's Board of Directors approved, and recommended that shareholders approve, the appointment of NFA as investment adviser and NAM as investment sub-adviser to the Predecessor Fund, along with certain other proposals designed to integrate the Predecessor Fund into the Nuveen funds. These proposals included the election of the Board Members, an amendment to the Articles of Incorporation of the Predecessor Fund to change its name, and a reorganization of the Predecessor Fund into the Fund in order to effect a change of domicile of the Predecessor Fund from a Virginia corporation to a newly created Massachusetts business trust (the "Reorganization"). The shareholders of the Predecessor Fund approved the foregoing proposals, and, in conjunction with approving the Reorganization, were deemed to authorize the Predecessor Fund, as sole initial shareholder of the Fund, to approve the Advisory Agreements (as defined below) and the election of the Board Members. Accordingly, at the Meeting, the Fund's Board Members, including the Independent Board Members, considered and approved the investment management agreement (the "Investment Management Agreement") between the Fund and NFA (the "Adviser") and the sub-advisory agreement (the "Sub-Advisory Agreement") between the Adviser and NAM (the "Sub-Adviser"), on behalf of the Fund. The Sub-Adviser and the Adviser are each hereafter a "Fund Adviser." The Investment Management Agreement and the Sub-Advisory Agreement are each hereafter an "Advisory Agreement."
To assist the Board in its evaluation of an Advisory Agreement with a Fund Adviser at the Meeting, the Independent Board Members had received, in adequate time in advance of the Meeting or at prior meetings, materials which outlined, among other things:
• the nature, extent and quality of the services expected to be provided by the Fund Adviser;
• the organization of the Fund Adviser, including the responsibilities of various departments and key personnel;
• the expertise and background of the Fund Adviser with respect to the Fund's investment strategy;
• certain performance-related information (as described below);
• the profitability of Nuveen Investments, Inc. and its affiliates ("Nuveen") for their advisory activities;
• the proposed management fees of the Fund Adviser, including comparisons of such fees with the management fees of comparable funds;
Nuveen Investments
44
• the expected expenses of the Fund, including comparisons of the Fund's expected expense ratio with the expense ratios of comparable funds; and
• the soft dollar practices of the Fund Adviser, if any.
At the Meeting, the Adviser made a presentation to and responded to questions from the Board of the Fund. During the Meeting, the Independent Board Members also met privately with their legal counsel to, among other things, review the Board's duties under the Investment Company Act of 1940 (the "1940 Act"), the general principles of state law in reviewing and approving advisory contracts, the standards used by courts in determining whether investment company boards of directors have fulfilled their duties, factors to be considered in voting on advisory contracts and an adviser's fiduciary duty with respect to advisory agreements and compensation. It is with this background that the Independent Board Members considered the Advisory Agreements. As outlined in more detail below, the Independent Board Members considered all factors they believed relevant with respect to the Fund, including among other things: (a) the nature, extent and quality of the services to be provided by the Fund Advisers; (b) investment performance, as described below; (c) the advisory fees and costs of the services to be provided to the Fund and the profitability of the Fund Advisers; (d) the extent of any anticipated economies of scale; (e) any benefits expected to be derived by the Fund Advisers from their relationships with the Fund; and (f) other factors. Each Board Member may have accorded different weight to the various factors in reaching his or her conclusions with respect to the Fund's Advisory Agreements.
A. Nature, Extent and Quality of Services
The Independent Board Members considered the nature, extent and quality of the respective Fund Adviser's services, including portfolio management services and administrative services. As the Adviser and the Sub-Adviser already serve as adviser and sub-adviser, respectively, to other Nuveen funds overseen by the Board Members, the Board has a good understanding of each such Fund Adviser's organization, operations, personnel and services. As the Independent Board Members meet regularly throughout the year to oversee the Nuveen funds, including funds currently advised by the Fund Advisers, the Independent Board Members have relied upon their knowledge from their meetings and any other interactions throughout the year with the respective Fund Adviser in evaluating the Advisory Agreements.
At the Meeting and/or at prior meetings, the Independent Board Members reviewed materials outlining, among other things, the respective Fund Adviser's organization and business; the types of services that such Fund Adviser or its affiliates provide to the Nuveen funds and provide and/or are expected to provide to the Fund; and the investment experience of the respective Fund Adviser. Further, the Independent Board Members have evaluated the background and experience of the relevant investment personnel. In this regard, they noted that the portfolio managers had served as portfolio managers to the Predecessor Fund.
In considering the services that were expected to be provided by the Fund Advisers, the Board recognized that the Adviser would provide a myriad of investment management, administrative, compliance, oversight and other services for the Fund, and the Sub-Adviser would generally provide the portfolio advisory services to the Fund under the oversight of the Adviser. The Board considered the wide range of services provided by the Adviser to the Nuveen funds beginning with developing the fund and monitoring and analyzing its performance to providing or overseeing the services necessary to support a fund's daily operations. The Board recognized the Adviser, among other things, provides: (a) product management (such as analyzing ways to better position a fund in the marketplace, maintaining relationships to gain access to distribution platforms and setting dividends); (b) fund administration (such as preparing a fund's tax returns, regulatory filings and shareholder communications; managing fund budgets and expenses; overseeing a fund's various service providers; and supporting and analyzing new and existing funds); (c) Board administration (such as supporting the Board and its committees, in relevant part, by organizing and administering the Board and committee meetings and preparing the necessary reports to assist the Board in its duties); (d) compliance (such as monitoring adherence to a
Nuveen Investments
45
Annual Investment Management Agreement Approval Process (continued)
fund's investment policies and procedures and applicable law; reviewing the compliance program periodically and developing new policies or updating existing compliance policies and procedures as considered necessary or appropriate; responding to regulatory requests; and overseeing compliance testing of sub-advisers); (e) legal support (such as preparing or reviewing fund registration statements, proxy statements and other necessary materials; interpreting regulatory requirements and compliance thereof; and maintaining applicable registrations); and (f) investment services (such as overseeing and reviewing sub-advisers and their investment teams; analyzing performance of the funds; overseeing investment and risk management; overseeing the daily valuation process for portfolio securities and developing and recommending valuation policies and methodologies and changes thereto; and participating in fund development, leverage management and the development of investment policies and parameters). With respect to closed-end funds, the Adviser also monitors asset coverage levels on leveraged funds, manages leverage, negotiates the terms of leverage, evaluates alternative forms and types of leverage, promotes an orderly secondary market for common shares and maintains an asset maintenance system for compliance with certain rating agency criteria. Further, the Board Members recognized the Sub-Adviser's investment experience (including, as noted above, with respect to the Predecessor Fund).
In addition, the Independent Board Members have also noted Nuveen's continued commitment to supporting the secondary market for the common shares of its closed-end funds through a comprehensive communication program designed to further educate the investor and analyst about closed-end funds. Nuveen's support services have included, among other things, maintaining and enhancing a closed-end fund website, creating marketing campaigns and educational materials, communicating with financial advisers, sponsoring and participating in conferences, providing educational seminars and programs and evaluating the results of these marketing efforts.
Based on their review, the Independent Board Members found that, overall, the nature, extent and quality of services expected to be provided to the Fund under each Advisory Agreement were satisfactory.
B. Investment Performance
The Board reviewed the Predecessor Fund's performance history, including returns on net asset value and price for the Predecessor Fund for the following periods as of September 30, 2014: year-to-date, one year, three years, five years, ten years, and since the Fund's initial public offering.
C. Fees, Expenses and Profitability
1. Fees and Expenses
In evaluating the management fees and expenses that the Fund was expected to bear, the Independent Board Members considered, among other things, the Fund's proposed management fee structure, the rationale for its proposed fee levels, and its expected expense ratio in absolute terms as well as compared with the fees and expense ratios of comparable funds. Accordingly, the Independent Board Members reviewed, among other things, the proposed gross management fee and estimated gross and net expense ratios for the Fund, as well as comparative fee and expense data pertaining to the Fund's peers in the Lipper category in which the Fund is classified. In addition, they reviewed comparative fee and expense data pertaining to two other Nuveen closed-end funds that are classified in the same Lipper category. Further, the Independent Board Members considered the proposed sub-advisory fee rate for the Fund (as a percentage of the fees paid by the Fund to the Adviser).
In addition, the Independent Board Members considered the fund-level breakpoint schedule and the complex-wide breakpoint schedule (described in further detail below) and any applicable fee waivers and expense reimbursements expected to be provided. In this regard, Nuveen was acquired by TIAA-CREF on October 1, 2014 (the "TIAA-CREF Transaction") and, in connection with the TIAA-CREF Transaction, Nuveen relied upon the provisions of Section 15(f) of the 1940 Act. The Independent Board Members recognized that in order to prevent an "unfair burden" under Section 15(f) from being imposed on the Predecessor
Nuveen Investments
46
Fund and the Fund, the Adviser had agreed to cap fund expenses (excluding the costs of leverage) for two years after the closing of the TIAA-CREF Transaction and were provided with materials pertaining to the establishment of this cap.
Based on their review of the fee and expense information provided, the Independent Board Members determined that the Fund's management fees (as applicable) to each Fund Adviser were reasonable in light of the nature, extent and quality of services to be provided to the Fund.
2. Comparisons with the Fees of Other Clients
The Board recognized that, like all Nuveen funds, the Fund would have a sub-adviser (which, in the case of the Fund, would be an affiliated sub-adviser) and, therefore, the overall fund management fee can be divided into two components, the fee retained by the Adviser and the fee paid to the Sub-Adviser. In general terms, the fee to the Adviser will reflect the administrative and other services it will provide to support the Fund, and, while some administrative services may occur at the sub-adviser level, the fee to the Sub-Adviser will generally reflect the portfolio management services provided by the Sub-Adviser. The Independent Board Members considered the fees a Fund Adviser was expected to assess to the Fund compared to that of other clients. Such other clients of a Fund Adviser may include: separately managed accounts (both retail and institutional accounts), foreign investment funds offered by Nuveen, collective trust funds and funds that are not offered by Nuveen but are sub-advised by one of Nuveen's investment management teams.
The Independent Board Members have reviewed the nature of services provided by the Adviser, including through its affiliated sub-advisers and the average fee the affiliated sub-advisers assessed such clients as well as the range of fees assessed to the different types of separately managed accounts (such as retail, institutional or wrap accounts) to the extent applicable to the respective sub-adviser. In their review, the Independent Board Members have considered the differences in the product types, including, but not limited to: the services provided, the structure and operations, portfolio investment policies, investor profiles, account sizes and regulatory requirements. In evaluating the comparisons of fees, the Independent Board Members have noted that the fee rates charged to the Nuveen funds and other clients vary, among other things, because of the different services involved and the additional regulatory and compliance requirements associated with registered investment companies, such as the Fund. The Independent Board Members have noted that, as a general matter, higher fee levels reflect higher levels of service, increased investment management complexity, greater product management requirements and higher levels of risk or a combination of the foregoing. The Independent Board Members have further noted, in particular, that the range of services provided to a fund (such as those to be provided to the Fund, as described above) is generally much more extensive than that provided to separately managed accounts. Many of the additional administrative services to be provided by the Adviser are not required for institutional clients. The Independent Board Members have also recognized that the management fee rates of the foreign funds advised by the Adviser may vary due to, among other things, differences in the client base, governing bodies, operational complexities and services covered by the management fee. Given the inherent differences in the various products, particularly the extensive services to be provided to the Fund, the Independent Board Members believe such facts justify the different levels of fees.
3. Profitability of Fund Advisers
In conjunction with their review of fees at the Meeting or at prior meetings, the Independent Board Members have considered the profitability of Nuveen for its advisory activities and its financial condition. At the Meeting or at prior meetings, the Independent Board Members reviewed the revenues and expenses of Nuveen's advisory activities, the allocation methodology used in preparing the profitability data and an analysis of the key drivers behind the changes in revenues and expenses that impacted profitability. Certain Nuveen financial information included in a report dated August 13, 2014 and Nuveen's June 30, 2014 consolidated financial statements had also been available. The Independent Board Members noted this information supplemented the profitability information requested and received during the year to help keep them apprised of developments
Nuveen Investments
47
Annual Investment Management Agreement Approval Process (continued)
affecting profitability (such as changes in fee waivers and expense reimbursement commitments). In this regard, the Independent Board Members noted that two Independent Board Members served as point persons to review the profitability analysis and methodologies employed, and any changes thereto, and to keep the Board apprised of such changes. The Independent Board Members have also considered Nuveen's revenues for advisory activities, expenses and profit margin compared to that of various unaffiliated management firms.
In reviewing profitability, the Independent Board Members have noted the Adviser's continued investment in its business with expenditures to, among other things, upgrade its investment technology and compliance systems and provide for additional personnel and other resources. The Independent Board Members have recognized the Adviser's continued commitment to its business should enhance the Adviser's capacity and capabilities in providing the services necessary to meet the needs of the Nuveen funds as they grow or change over time. In addition, in evaluating profitability, the Independent Board Members have also noted the subjective nature of determining profitability which may be affected by numerous factors, including the allocation of expenses and that various allocation methodologies may each be reasonable but yield different results. Further, the Independent Board Members have recognized the difficulties in making comparisons as the profitability of other advisers generally is not publicly available, and the profitability information that is available for certain advisers or management firms may not be representative of the industry and may be affected by, among other things, an adviser's particular business mix, capital costs, size, types of funds managed and expense allocations. Notwithstanding the foregoing, the Independent Board Members have noted that the Adviser's adjusted operating margin appears to be reasonable in relation to other investment advisers and sufficient to operate as a viable investment management firm meeting its obligations to the Nuveen funds. Based on their review, the Independent Board Members concluded that the Adviser's level of profitability for its advisory activities was reasonable in light of the services provided.
With respect to the Sub-Adviser, which is affiliated with Nuveen, the Independent Board Members have previously reviewed its revenues, expenses and profitability margins (pre- and post-tax) for its advisory activities and the methodology used for allocating expenses among the internal sub-advisers. Based on their review, the Independent Board Members were satisfied that the Sub-Adviser's level of profitability was reasonable in light of the services provided.
In evaluating the reasonableness of the compensation, the Independent Board Members also considered other amounts expected to be paid to a Fund Adviser by the Fund as well as indirect benefits (such as soft dollar arrangements), if any, the respective Fund Adviser and its affiliates are expected to receive that are directly attributable to the management of the Fund. See Section E below for additional information on indirect benefits a Fund Adviser may receive as a result of its relationship with the Fund. Based on their review of the overall fee arrangements of the Fund, the Independent Board Members determined that the advisory fees and expected expenses of the Fund were reasonable.
D. Economies of Scale and Whether Fee Levels Reflect These Economies of Scale
With respect to economies of scale, the Independent Board Members have recognized the potential benefits resulting from the costs of a fund being spread over a larger asset base, although economies of scale are difficult to measure and predict with precision, particularly on a fund-by-fund basis. The Independent Board Members considered whether the Fund could be expected to benefit from any economies of scale. One method to help ensure that the shareholders share in these benefits is to include breakpoints in the advisory fee schedule. Generally, management fees for funds in the Nuveen complex are comprised of a fund-level component and a complex-level component. Accordingly, the Independent Board Members reviewed and considered the schedule of proposed advisory fees for the Fund, including fund-level breakpoints thereto. In this regard, however, given that the Fund is a closed-end fund, the Independent Board Members recognized that although closed-end funds (such as the Fund) may from time to
Nuveen Investments
48
time make additional share offerings, the growth of their assets will occur primarily through the appreciation of such funds' investment portfolios.
In addition to fund-level advisory fee breakpoints, the Board also considered the Nuveen funds' complex-wide fee arrangement. Pursuant to the complex-wide fee arrangement, the fees of the funds in the Nuveen complex are generally reduced as the assets in the fund complex reach certain levels. In evaluating the complex-wide fee arrangement, the Independent Board Members have considered that such arrangement seeks to provide the benefits of economies of scale to fund shareholders when total fund complex assets increase, even if assets of a particular fund are unchanged or have decreased. The approach reflects the notion that some of Nuveen's costs are attributable to services provided to all its funds in the complex and therefore all funds benefit if these costs are spread over a larger asset base.
Based on their review, the Independent Board Members concluded that the breakpoint schedule and complex-wide fee arrangement (as applicable) were acceptable and reflect economies of scale to be shared with the Fund's shareholders when assets under management increase.
E. Indirect Benefits
In evaluating fees, the Independent Board Members considered information received at the Meeting or at prior meetings regarding potential "fall out" or ancillary benefits that a Fund Adviser or its affiliates may receive as a result of its relationship with the Fund. In this regard, with respect to closed-end funds, the Independent Board Members recognized that affiliates of the Adviser may receive revenues for serving as co-manager in an initial public offering of new closed-end funds as well as revenues received in connection with secondary offerings.
In addition to the above, the Independent Board Members considered whether the Fund Advisers will receive any benefits from soft dollar arrangements whereby a portion of the commissions paid by the Fund for brokerage may be used to acquire research that may be useful to a Fund Adviser in managing the assets of the Fund and other clients. The Fund's portfolio transactions will be allocated by the Sub-Adviser. Accordingly, the Independent Board Members considered that the Sub-Adviser may benefit from its soft dollar arrangements pursuant to which it receives research from brokers that execute the Fund's portfolio transactions. With respect to any fixed income securities, however, the Board recognized that such securities generally trade on a principal basis that does not generate soft dollar credits. Similarly, the Board recognized that the research received pursuant to soft dollar arrangements by the Sub-Adviser may also benefit the Fund and its shareholders to the extent the research enhances the ability of the Sub-Adviser to manage the Fund. The Independent Board Members noted that the Sub-Adviser's profitability may be somewhat lower if it did not receive the research services pursuant to the soft dollar arrangements and had to acquire such services directly.
Based on their review, the Independent Board Members concluded that any indirect benefits expected to be received by a Fund Adviser as a result of its relationship with the Fund were reasonable and within acceptable parameters.
F. Approval
The Independent Board Members did not identify any single factor discussed previously as all-important or controlling. The Board Members, including a majority of the Independent Board Members, concluded that the terms of the Investment Management Agreement and Sub-Advisory Agreement were fair and reasonable, that the respective Fund Adviser's fees are reasonable in light of the services to be provided to the Fund and that the Investment Management Agreement and Sub-Advisory Agreement should be and were approved on behalf of the Fund.
Nuveen Investments
49

Nuveen Investments:
Serving Investors for Generations
Since 1898, financial advisors and their clients have relied on Nuveen Investments to provide dependable investment solutions through continued adherence to proven, long-term investing principles. Today, we offer a range of high quality equity and fixed-income solutions designed to be integral components of a well-diversified core portfolio.
Focused on meeting investor needs.
Nuveen Investments provides high-quality investment services designed to help secure the long-term goals of institutional and individual investors as well as the consultants and financial advisors who serve them. Nuveen Investments markets a wide range of specialized investment solutions which provide investors access to capabilities of its high-quality boutique investment affiliates—Nuveen Asset Management, Symphony Asset Management, NWQ Investment Management Company, Santa Barbara Asset Management, Tradewinds Global Investors, Winslow Capital Management and Gresham Investment Management. In total, Nuveen Investments managed $230 billion as of December 31, 2014.
Find out how we can help you.
To learn more about how the products and services of Nuveen Investments may be able to help you meet your financial goals, talk to your financial advisor, or call us at (800) 257-8787. Please read the information provided carefully before you invest. Investors should consider the investment objective and policies, risk considerations, charges and expenses of any investment carefully. Where applicable, be sure to obtain a prospectus, which contains this and other relevant information. To obtain a prospectus, please contact your securities representative or Nuveen Investments, 333 W. Wacker Dr., Chicago, IL 60606. Please read the prospectus carefully before you invest or send money.
Learn more about Nuveen Funds at: www.nuveen.com/cef
Distributed by Nuveen Securities, LLC | 333 West Wacker Drive | Chicago, IL 60606 | www.nuveen.com/cef
ESA-A-1214D 6254-INV-B02/16
ITEM 2. CODE OF ETHICS.
Not applicable to this filing.
ITEM 3. AUDIT COMMITTEE FINANCIAL EXPERT.
Not applicable to this filing.
ITEM 4. PRINCIPAL ACCOUNTANT FEES AND SERVICES.
Not applicable to this filing.
ITEM 5. AUDIT COMMITTEE OF LISTED REGISTRANTS.
Not applicable to this filing.
ITEM 6. SCHEDULE OF INVESTMENTS.
(a) See Portfolio of Investments in Item 1.
(b) Not applicable.
ITEM 7. DISCLOSURE OF PROXY VOTING POLICIES AND PROCEDURES FOR CLOSED-END MANAGEMENT INVESTMENT COMPANIES.
Not applicable to this filing.
ITEM 8. PORTFOLIO MANAGERS OF CLOSED-END MANAGEMENT INVESTMENT COMPANIES.
Not applicable to this filing.
ITEM 9. PURCHASES OF EQUITY SECURITIES BY CLOSED-END MANAGEMENT INVESTMENT COMPANY AND AFFILIATED PURCHASERS.
Not applicable.
ITEM 10. SUBMISSION OF MATTERS TO A VOTE OF SECURITY HOLDERS.
There have been no material changes to the procedures by which shareholders may recommend nominees to the registrant’s Board implemented after the registrant last provided disclosure in response to this Item.
ITEM 11. CONTROLS AND PROCEDURES.
(a) The registrant’s principal executive and principal financial officers, or persons performing similar functions, have concluded that the registrant’s disclosure controls and procedures (as defined in Rule 30a-3(c) under the Investment Company Act of 1940, as amended (the “1940 Act”) (17 CFR 270.30a-3(c))) are effective, as of a date within 90 days of the filing date of this report that includes the disclosure required by this paragraph, based on their evaluation of the controls and procedures required by Rule 30a-3(b) under the 1940 Act (17 CFR 270.30a-3(b)) and Rules 13a-15(b) or 15d-15(b) under the Securities Exchange Act of 1934, as amended (the “Exchange Act”)(17 CFR 240.13a-15(b) or 240.15d-15(b)).
(b) There were no changes in the registrant’s internal control over financial reporting (as defined in Rule 30a-3(d) under the 1940 Act (17 CFR 270.30a-3(d)) that occurred during the second fiscal quarter of the period covered by this report that has materially affected, or is reasonably likely to materially affect, the registrant’s internal control over financial reporting.
ITEM 12. EXHIBITS.
File the exhibits listed below as part of this Form.
(a)(1) | Any code of ethics, or amendment thereto, that is the subject of the disclosure required by Item 2, to the extent that the registrant intends to satisfy the Item 2 requirements through filing of an exhibit: Not applicable to this filing. |
| |
(a)(2) | A separate certification for each principal executive officer and principal financial officer of the registrant as required by Rule 30a-2(a) under the 1940 Act (17 CFR 270.30a-2(a)) in the exact form set forth below: See Ex-99.CERT attached hereto. |
| |
(a)(3) | Any written solicitation to purchase securities under Rule 23c-1 under the 1940 Act (17 CFR 270.23c-1) sent or given during the period covered by the report by or on behalf of the registrant to 10 or more persons: Not applicable. |
| |
(b) | If the report is filed under Section 13(a) or 15(d) of the Exchange Act, provide the certifications required by Rule 30a-2(b) under the 1940 Act (17 CFR 270.30a-2(b)); Rule 13a-14(b) or Rule 15d-14(b) under the Exchange Act (17 CFR 240.13a-14(b) or 240.15d-14(b)), and Section 1350 of Chapter 63 of Title 18 of the United States Code (18 U.S.C. 1350) as an exhibit. A certification furnished pursuant to this paragraph will not be deemed “filed” for purposes of Section 18 of the Exchange Act (15 U.S.C. 78r), or otherwise subject to the liability of that section. Such certification will not be deemed to be incorporated by reference into any filing under the Securities Act of 1933 or the Exchange Act, except to the extent that the registrant specifically incorporates it by reference: See Ex-99.906 CERT attached hereto. |
SIGNATURES
Pursuant to the requirements of the Securities Exchange Act of 1934 and the Investment Company Act of 1940, the registrant has duly caused this report to be signed on its behalf by the undersigned, thereunto duly authorized.
(Registrant) Nuveen Multi-Market Income Fund
By (Signature and Title) | /s/ Kevin J. McCarthy | |
| Kevin J. McCarthy | |
| (Vice President and Secretary) | |
Date: March 6, 2015
Pursuant to the requirements of the Securities Exchange Act of 1934 and the Investment Company Act of 1940, this report has been signed below by the following persons on behalf of the registrant and in the capacities and on the dates indicated.
By (Signature and Title) | /s/ Gifford R. Zimmerman | |
| Gifford R. Zimmerman | |
| Chief Administrative Officer | |
| (principal executive officer) | |
Date: March 6, 2015
By (Signature and Title) | /s/ Stephen D. Foy | |
| Stephen D. Foy | |
| Vice President and Controller | |
| (principal financial officer) | |
Date: March 6, 2015