UNITED STATES
SECURITIES AND EXCHANGE COMMISSION
Washington, D.C. 20549
FORM N-CSR
CERTIFIED SHAREHOLDER REPORT OF REGISTERED
MANAGEMENT INVESTMENT COMPANIES
| | |
| Investment Company Act file number | | 811-05642 |
Nuveen Multi-Market Income Fund
(Exact name of registrant as specified in charter)
Nuveen Investments
333 West Wacker Drive, Chicago, IL 60606
(Address of principal executive offices) (Zip code)
Gifford R. Zimmerman
Nuveen Investments
333 West Wacker Drive, Chicago, IL 60606
(Name and address of agent for service)
Registrant’s telephone number, including area code: (312) 917-7700
Date of fiscal year end: June 30
Date of reporting period: December 31, 2016
Form N-CSR is to be used by management investment companies to file reports with the Commission not later than 10 days after the transmission to stockholders of any report that is required to be transmitted to stockholders under Rule 30e-1 under the Investment Company Act of 1940 (17 CFR 270.30e-1). The Commission may use the information provided on Form N-CSR in its regulatory, disclosure review, inspection, and policy making roles.
A registrant is required to disclose the information specified by Form N-CSR, and the Commission will make this information public. A registrant is not required to respond to the collection of information contained in Form N-CSR unless the Form displays a currently valid Office of Management and Budget (“OMB”) control number. Please direct comments concerning the accuracy of the information collection burden estimate and any suggestions for reducing the burden to Secretary, Securities and Exchange Commission, 450 Fifth Street, NW, Washington, DC 20549-0609. The OMB has reviewed this collection of information under the clearance requirements of 44 U.S.C. ss.3507.
ITEM 1. REPORTS TO STOCKHOLDERS.
| | |
| | |  |
| Closed-End Funds | |
| | | | | | |
| | | | | | | Semi-Annual Report December 31, 2016 |
| | | |
| | | | | | |
| | | | | | | |
| JMM | | | | | | |
| Nuveen Multi-Market Income Fund | | |
| | | | | | | | | | | | |
| | | | | | |
| | | | |
| | | | | | | | |
| |
| | Life is Complex |
| |
| | Nuveen makes things e-simple. It only takes a minute to sign up for e-Reports. Once enrolled, you’ll receive an e-mail as soon as your Nuveen Fund information is ready – no more waiting for delivery by regular mail. Just click on the link within the e-mail to see the report and save it on your computer if you wish. |
| | |
| | Free e-Reports right to your e-mail! |
| |
| | www.investordelivery.com If you receive your Nuveen Fund dividends and statements from your financial advisor or brokerage account. |
| |
| or | | www.nuveen.com/accountaccess If you receive your Nuveen Fund dividends and statements directly from Nuveen. |
Table
of Contents
Chairman’s Letter
to Shareholders

Dear Shareholders,
The past year saw a striking shift in the markets’ tone. The start of 2016 was beset by China’s economic woes, growing recession fears in the U.S. and oil prices sinking to lows not seen in more than a decade. World stock markets plunged, while bonds and other safe-haven assets rallied. But, by the end of the year, optimism had taken root. Economic outlooks were more upbeat, commodity prices stabilized, equity markets rebounded and bonds retreated. Despite the initial shocks of the Brexit referendum in the U.K. and Donald Trump’s win in the U.S. presidential election, and the uncertainties posed by the implications of these votes, sentiment continued to swing toward the positive as 2016 ended.
In between the year’s turbulent start and exuberant end, markets were soothed by improving economic data out of China, as the government’s stimulus measures appeared to be working, and a recovery in the energy and commodity-related sectors. The U.S. Federal Reserve backed off its more aggressive projections from the beginning of the year, only raising the fed funds rate once during the year, in December. The central banks in Europe and Japan maintained their accommodative stances. Global economic growth remained lackluster overall, as the pace of U.S. growth remained consistently mediocre. China appeared to moderate its slowdown and low growth in Europe and Japan persisted.
Will 2017 be the year of accelerating global growth and rising inflation that the markets are expecting? President Trump’s business-friendly, pro-growth agenda has been well received by the markets, but the policy details and the timeline have yet to take shape. Furthermore, there could be potential downside risks if “Trumponomics” were to trigger a steeper rise in inflation or a trade war. Outside the U.S., political dynamics in Europe are also in flux this year, with Brexit negotiations ongoing and elections in Germany, France and the Netherlands, and possibly a snap election in Italy.
Given the slate of policy unknowns and the range of possible outcomes, we believe volatility will remain a fixture this year. In this environment, Nuveen remains committed to both managing downside risks and seeking upside potential. If you’re concerned about how resilient your investment portfolio might be, we encourage you to talk to your financial advisor. On behalf of the other members of the Nuveen Fund Board, we look forward to continuing to earn your trust in the months and years ahead.
Sincerely,

William J. Schneider
Chairman of the Board
February 23, 2017
Portfolio Managers’
Comments
Nuveen Multi-Market Income Fund (JMM)
Nuveen Multi-Market Income Fund (JMM) is advised by Nuveen Fund Advisors, LLC (NFAL) and features portfolio management by Nuveen Asset Management, LLC (NAM). Throughout the reporting period, the portfolio management team has included Jason J. O’Brien, CFA, Chris J. Neuharth, John T. Fruit, CFA and Peter L. Agrimson, CFA.
On December 21, 2016, a primary benchmark change was approved for the Nuveen Multi-Market Income Fund (JMM). Effective December 31, 2016, the Bloomberg Barclays U.S. Government/Mortgage Bond Index is the new primary benchmark as it more closely aligns with the Fund’s mandate. The JMM Blended Benchmark is the Fund’s secondary benchmark.
In the following paragraphs, the portfolio management team discusses their management strategy and the performance of the Fund for the six-month reporting period ended December 31, 2016.
What key strategies were used to manage the Fund during this six-month reporting period ended December 31, 2016?
The Fund’s investment objective is to achieve high monthly income consistent with prudent risk to capital. The management team invests the Fund’s assets primarily in taxable fixed income securities including, but not limited to: U.S. agency and privately issued mortgage-backed securities; high yield and investment grade corporate bonds; and asset-backed securities.
How did the Fund perform during this six-month reporting period ended December 31, 2016?
The table in the Performance Overview and Holding Summaries section of this report provides total return performance for the Fund for the six-month, one-year, five-year and ten-year periods ended December 31, 2016. The Fund’s total return at net asset value (NAV) is compared with the performance of a corresponding market index. For the six-month reporting period ended December 31, 2016, JMM outperformed the Bloomberg Barclays U.S. Government/Mortgage Bond Index and its blended benchmark, which is composed of 75% Bloomberg Barclays U.S. Government/Mortgage Index and 25% Bloomberg Barclays U.S. Corporate High-Yield Index.
The U.S. economy showed continued strength during the reporting period and consumer confidence hit a 15-year high, according to the Conference Board’s Consumer Confidence Index. A number of factors contributed to the sense of optimism, including higher gross domestic product (GDP) figures, an improved manufacturing outlook, falling unemployment, rising wages and Donald Trump’s surprise victory in the November presidential election. Investors anticipated that his business-friendly policies including tax cuts, fewer regulations and increased infrastructure spending
Certain statements in this report are forward-looking statements. Discussions of specific investments are for illustration only and are not intended as recommendations of individual investments. The forward-looking statements and other views expressed herein are those of the portfolio managers as of the date of this report. Actual future results or occurrences may differ significantly from those anticipated in any forward-looking statements and the views expressed herein are subject to change at any time, due to numerous market and other factors. The Fund disclaims any obligation to update publicly or revise any forward-looking statements or views expressed herein.
For financial reporting purposes, the ratings disclosed are the highest rating given by one of the following national rating agencies: Standard & Poor’s (S&P), Moody’s Investors Service, Inc. (Moody’s) or Fitch, Inc. (Fitch). This treatment of split-rated securities may differ from that used for other purposes, such as for Fund investment policies. Credit ratings are subject to change. AAA, AA, A and BBB are investment grade ratings; BB, B, CCC, CC, C and D are below investment grade ratings. Certain bonds backed by U.S. Government or agency securities are regarded as having an implied rating equal to the rating of such securities. Holdings designated N/R are not rated by these national rating agencies.
Refer to the Glossary of Terms Used in this Report for further definition of the terms used within this section.
Portfolio Managers’ Comments (continued)
would further boost economic growth and increase company profits. The Federal Reserve (Fed) opted to leave interest rates unchanged at its July and September 2016 meetings given macro uncertainties and a benign inflation environment, but as widely expected, raised rates by 0.25% at the December 2016 meeting, citing improving labor market and inflation conditions. More importantly, the Fed signaled the likelihood for three more rate hikes in 2017, while remaining accommodative and sensitive to any adverse shocks. Oil prices ended 2016 with their largest annual gain since 2009, supported by an agreement by the Organization of the Petroleum Exporting Countries (OPEC) to cut production and lessen oversupply.
Treasury rates rose dramatically, mostly in the second half of the reporting period as investors braced for strong fiscal stimulus and factored in a higher risk of inflation, while remaining concerned about the possibility of reduced accommodation by global central banks. Ten-year Treasury rates rose by nearly 1% during the reporting period, while shorter-term rates rose around 25 basis points, causing the Treasury yield curve to steepen.
Around the world, accommodative monetary policy kept global rates at extremely low levels, resulting in strong demand for U.S. securities with incremental income. That technical underpinning, combined with the improved economic outlook and strong fundamentals, led high yield and investment grade corporate bonds to perform strongly during the reporting period, despite record issuance driven by mergers and acquisitions. The sectors provided excess returns over Treasuries, with lower rated securities in both segments performing the best. High yield bonds in particular enjoyed strong performance during the reporting period helped along by the continued accommodative Fed policy, which in turn drove more inflows into the market. The segment’s performance was even more impressive considering that high yield had its worst start to a year on record in the first six weeks of 2016. High yield spreads continued to compress during the reporting period, coming close to the tightest level that they have reached during this credit cycle. The basic materials and energy sectors performed best, along with other cyclical sectors, which have bounced back sharply after the oil price collapse in 2014 and 2015.
In the securitized sectors of the bond market, mortgage-backed securities (MBS) issued by government agencies such as Fannie Mae (FNMA), Ginnie Mae (GNMA) and Freddie Mac (FHLMC) performed well earlier in the reporting period due to continued bank and foreign purchases of the securities, the range-bound rate environment and lower levels of volatility. However, the sharp rise in interest rates and volatility in the final months of the reporting period proved to be a difficult environment for these securities. That being said, during the reporting period agency MBS managed to post modestly positive excess returns versus duration-matched Treasuries as mortgage delinquencies continued to decline and housing market fundamentals remained broadly supportive of this segment of the market. The commercial mortgage-backed securities (CMBS) sector performed well during the reporting period, finishing with positive excess returns versus Treasuries, despite high levels of issuance particularly toward the end of 2016. Global central bank support, the “risk-on” environment following the election and strong demand for high quality, non-government securities all contributed to the tightening of risk premiums in the CMBS segment. Traditional consumer asset-backed securities (ABS) also modestly outperformed versus Treasuries for the reporting period due to solid consumer credit metrics.
The most significant driver of the Fund’s outperformance relative to its benchmark was its broad overweight to the securitized and corporate sectors and corresponding underweight to Treasuries. The securitized sectors had the most impact on the Fund’s performance during the reporting period. The leading contributor was security selection in the ABS sector, where our emphasis on non-government mortgage-related securities in the sector benefited results. The Fund’s overweight exposure to the MBS sector also had a favorable impact on returns. Both the Fund’s agency MBS and non-agency MBS exposure benefited from the continued strength in the housing market during the reporting period, and therefore contributed to performance. Our exposure to the CMBS sector also aided results, especially our overweight to securities rated below AAA because lower rated investment grade securities in this sector outperformed higher rated securities.
We held modest overweights to both the high yield and investment grade credit sectors during the reporting period, which was beneficial to performance. Additionally, our security selection was helpful, including exposure to high yield credits in the metals/mining and energy sectors, areas that led the high yield market during the reporting period. The contribution from investment grade credit was also split between our overweight to the sector versus the benchmark and gains from security selection. In terms of security selection, the Fund’s exposure to cyclical credits and a meaningful position in bank preferred securities were the main contributors. Our substantial weighting in BBB rated securities also added as quality spreads contracted amid a strengthening economy and investor optimism about growth.
As a whole, our interest rate strategy benefited the Fund’s results during the reporting period. We had positioned the Fund defensively to limit its sensitivity to rising rates because we anticipated the Fed would continue to normalize monetary policy and rates would be pressured higher. This included keeping the Fund’s duration, or interest rate sensitivity, shorter than the benchmark at around 3.75 years, while structuring the portfolio to benefit from a flatter yield curve. The shorter duration stance worked to the Fund’s favor because rates rose sharply during the reporting period, but the yield curve positioning modestly detracted because the Treasury curve actually steepened.
Despite the high levels of rate volatility we saw after the election, we maintained the Fund’s key strategic themes. We continued to expect U.S. and global growth to remain on track, although slow, accompanied by contained inflation and supportive financial conditions. In this environment, we remained focused on generating above-market income for the Fund by maintaining its broad exposures across the securitized and corporate sectors of the bond market, with an emphasis on individual security selection. We still believe the current economic, government policy and market backdrop remains favorable for non-government, yield-oriented sectors, particularly corporate credit and should help keep spreads firm. Although we modestly reduced the Fund’s investment grade and high yield credit exposures after the bout of strength during the reporting period, we believe our outlook still warrants significant exposure to these segments. We continue to like the high yield sector because of the incremental yield these securities provide; however, we are keeping this exposure well diversified and being more selective going forward as a way to minimize risk.
We have maintained the Fund’s exposure to non-agency MBS and mortgage-related ABS as those sectors should continue to benefit from the strengthening economy and solid fundamentals of the housing market. However, we believe agency MBS could struggle because of the increased volatility surrounding the move higher in interest rates. Faster U.S. economic growth could cause the Fed to end its MBS reinvestment program sooner, although at the end of the reporting period, the market did not appear to be pricing in this factor. We have passively let the Fund’s agency MBS weighting drift lower by not reinvesting pay downs back into the mortgage market. At the same time, we have maintained the Fund’s overweight in the non-agency CMBS sector because the credit fundamentals remain sound, although price appreciation has recently been more muted in commercial real estate. As always, we will continually evaluate relative value opportunities and shift the Fund’s exposures toward the segments of the market where we see the best long-term risk/reward equation.
With two to three federal funds rate hikes in 2017 now the market consensus, we maintained the Fund’s defensive duration positioning as the period drew to a close. Given the likelihood that short-term rates will be pressured higher, we believed it was prudent to keep the Fund’s duration shorter than the benchmark at around 3.75 years.
We used U.S. Treasury futures as part of an overall portfolio construction strategy to manage portfolio duration and yield curve exposure. These derivative positions had a positive impact on performance during the reporting period.
The Fund may also purchase securities on a when-issued or forward commitment basis. Delivery and payment for securities that have been purchased in this manner can take place a month or more after the transaction date. Such securities do not earn interest, are subject to market fluctuation and may increase or decrease in value prior to their delivery. The purchase of securities on a when-issued or forward commitment basis may increase the volatility of the Fund’s net asset value if the Fund makes such purchases while remaining substantially fully invested.
Fund
Leverage
IMPACT OF THE FUND’S LEVERAGE STRATEGY ON PERFORMANCE
One important factor impacting the returns of the Fund relative to its comparative benchmarks was the Fund’s use of leverage through the use of reverse repurchase agreements and mortgage dollar rolls. The Fund uses leverage because our research has shown that, over time, leveraging provides opportunities for additional income and total return for common shareholders. However, use of leverage also can expose shareholders to additional volatility. For example, as the prices of securities held by the Fund decline, the negative impact of these valuation changes on NAV and total return is magnified by the use of leverage. Conversely, leverage may enhance common share returns during periods when the prices of securities held by the Fund generally are rising. The Fund’s use of leverage had a positive impact on performance during this reporting period.
As of December 31, 2016, the Fund’s percentages of leverage are shown in the accompanying table.
| | | | |
| | | JMM | |
Effective Leverage* | | | 28.27 | % |
Regulatory Leverage* | | | 0.00 | % |
| * | Effective leverage is a Fund’s effective economic leverage, and includes both regulatory leverage and the leverage effects of certain derivative and other investments in a Fund’s portfolio that increase the Fund’s investment exposure. Regulatory leverage consists of preferred shares issued or borrowings of a Fund. A Fund, however, may from time to time borrow on a typically transient basis in connection with its day-to-day operations, primarily in connection with the need to settle portfolio trades. Such incidental borrowings are excluded from the calculation of a Fund’s effective leverage ratio. Both of these are part of a Fund’s capital structure. Regulatory leverage is subject to asset coverage limits set forth in the Investment Company Act of 1940. |
THE FUND’S LEVERAGE
Reverse Repurchase Agreements
As noted above, the Fund utilized reverse repurchase agreements. The Fund’s transactions in reverse repurchase agreements are as shown in the accompanying table.
| | | | | | | | | | | | | | | | | | | | | | | | | | | | | | | | | | |
| Current Reporting Period | | | | | | Subsequent to the Close of
the Reporting Period | |
| July 1, 2016 | | | Purchases | | | Sales | | | December 31, 2016 | | | Average Balance Outstanding | | | | | | Purchases | | | Sales | | | February 27, 2017 | |
| | $20,317,000 | | | | $67,000 | | | | $(2,931,000) | | | | $17,453,000 | | | | $19,759,864 | | | | | | | | $2,089,000 | | | | $ — | | | | $19,542,000 | |
Share
Information
DISTRIBUTION INFORMATION
The following information regarding the Fund’s distributions is current as of December 31, 2016. The Fund’s distribution levels may vary over time based on the Fund’s investment activity and portfolio investment value changes.
During the current reporting period, the Fund’s distributions to shareholders were as shown in the accompanying table.
| | | | |
| Monthly Distributions (Ex-Dividend Date) | | Per
Share
Amounts | |
July 2016 | | $ | 0.0360 | |
August | | | 0.0360 | |
September | | | 0.0360 | |
October | | | 0.0360 | |
November | | | 0.0360 | |
Decemeber 2016 | | | 0.0360 | |
Total Distributions from Net Investment Income | | $ | 0.2160 | |
| |
Current Distribution Rate* | | | 5.92 | % |
| * | Current distribution rate is based on the Fund’s current annualized monthly distribution divided by the Fund’s current market price. The Fund’s monthly distributions to its shareholders may be comprised of ordinary income, net realized capital gains and, if at the end of the fiscal year the Fund’s cumulative net ordinary income and net realized gains are less than the amount of the Fund’s distributions, a return of capital for tax purposes. |
The Fund seeks to pay regular monthly dividends out of its net investment income at a rate that reflects its past and projected net income performance. To permit the Fund to maintain a more stable monthly dividend, the Fund may pay dividends at a rate that may be more or less than the amount of net income actually earned by the Fund during the period. If the Fund has cumulatively earned more than it has paid in dividends, it will hold the excess in reserve as undistributed net investment income (UNII) as part of the Fund’s net asset value. Conversely, if the Fund has cumulatively paid in dividends more than it has earned, the excess will constitute a negative UNII that will likewise be reflected in the Fund’s net asset value. The Fund will, over time, pay all its net investment income as dividends to shareholders.
As of December 31, 2016, the Fund had a positive UNII balances based upon our best estimate, for tax purposes and a negative UNII balance for financial reporting purposes.
All monthly dividends paid by the Fund during the current reporting period were paid from net investment income. If a portion of the Fund’s monthly distributions was sourced from or comprised of elements other than net investment income, including capital gains and/or a return of capital, shareholders would have received a notice to that effect. For financial reporting purposes, the composition and per share amounts of the Fund’s dividends for the reporting period are presented in this report’s Statement of Changes in Net Assets and Financial Highlights, respectively. For income tax purposes, distribution information for the Fund as of its most recent tax year end is presented in Note 6 – Income Tax Information within the Notes to Financial Statements of this report.
Share Information (continued)
SHARE REPURCHASES
During August 2016, the Fund’s Board of Trustees reauthorized an open-market share repurchase program, allowing the Fund to repurchase an aggregate up to approximately 10% of its outstanding shares.
As of December 31, 2016, and since the inception of the Fund’s repurchase program, the Fund has cumulatively repurchased and retired its outstanding shares as shown in the accompanying table.
| | | | |
| | | JMM | |
Shares cummulatively repurchased and retired | | | 1,800 | |
Shares authorized for repurchase | | | 945,000 | |
During the current reporting period, the Fund did not repurchase any of its outstanding shares.
OTHER SHARE INFORMATION
As of December 31, 2016, and during the current reporting period, the Fund’s share price was trading at premium/(discount) to its NAV as shown in the accompanying table.
| | | | |
NAV | | $ | 8.05 | |
Share price | | $ | 7.30 | |
Premium/(Discount) to NAV | | | (9.32 | )% |
6-month average premium/(discount) to NAV | | | (9.18 | )% |
Risk
Considerations
Fund shares are not guaranteed or endorsed by any bank or other insured depository institution, and are not federally insured by the Federal Deposit Insurance Corporation.
Nuveen Multi-Market Income Fund (JMM)
Investing in closed-end funds involves risk; principal loss is possible. There is no guarantee the Fund’s investment objectives will be achieved. Closed-end fund shares may frequently trade at a discount or premium to their net asset value. Investing in mortgage-backed securities entails credit risk, the risk that the servicer fails to perform its duties, liquidity risks, interest rate risks, structure risks, pre-payment risk, and geographical concentration risks. Leverage increases return volatility and magnifies the Fund’s potential return and its risks; there is no guarantee a fund’s leverage strategy will be successful. These and other risk considerations including hedging risk are described in more detail on the Fund’s web page at www.nuveen.com/JMM.
JMM
Nuveen Multi-Market Income Fund
Performance Overview and Holding Summaries as of December 31, 2016
Refer to the Glossary of Terms Used in this Report for further definition of the terms used within this section.
Average Annual Total Returns as of December 31, 2016
| | | | | | | | | | | | | | | | |
| | | Cumulative | | | Average Annual | |
| | | 6-Month | | | 1-Year | | | 5-Year | | | 10-Year | |
| JMM at NAV | | | 2.56% | | | | 6.56% | | | | 5.68% | | | | 6.18% | |
| JMM at Share Price | | | 0.47% | | | | 9.34% | | | | 5.58% | | | | 6.39% | |
Bloomberg Barclays U.S. Government/Mortgage Bond Index | | | (2.90)% | | | | 1.31% | | | | 1.57% | | | | 4.04% | |
| Blended Benchmark | | | (0.40)% | | | | 5.11% | | | | 3.03% | | | | 5.02% | |
Past performance is not predictive of future results. Current performance may be higher or lower than the data shown. Returns do not reflect the deduction of taxes that shareholders may have to pay on Fund distributions or upon the sale of Fund shares. Returns at NAV are net of Fund expenses, and assume reinvestment of distributions. Comparative index return information is provided for the Fund’s shares at NAV only. Indexes are not available for direct investment.
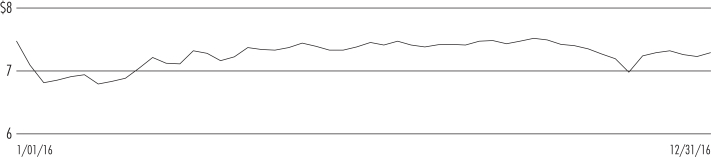
Share Price Performance — Weekly Closing Price
This data relates to the securities held in the Fund’s portfolio of investments as of the end of the reporting period. It should not be construed as a measure of performance for the Fund itself. Holdings are subject to change.
For financial reporting purposes, the ratings disclosed are the highest rating given by one of the following national rating agencies: Standard & Poor’s Group, Moody’s Investors Service, Inc. or Fitch, Inc. This treatment of split-rated securities may differ from that used for other purposes, such as for Fund investment policies. Credit ratings are subject to change. AAA, AA, A and BBB are investment grade ratings; BB, B, CCC, CC, C and D are below-investment grade ratings. Certain bonds backed by U.S. Government or agency securities are regarded as having an implied rating equal to the rating of such securities. Holdings designated N/R are not rated by these national rating agencies.
Fund Allocation
(% of net assets)
| | | | |
| Convertible Preferred Securities | | | 0.3% | |
| Corporate Bonds | | | 32.3% | |
| $1,000 Par (or similar) Institutional Preferred | | | 0.7% | |
| Asset-Backed and Mortgage-Backed Securities | | | 102.1% | |
| Investment Companies | | | 0.7% | |
| Sovereign Debt | | | 0.2% | |
| Repurchase Agreements | | | 2.0% | |
| Other Assets Less Liabilities | | | (15.4)% | |
| Net Assets Plus Reverse Repurchase Agreements | | | 122.9% | |
| Reverse Repurchase Agreements | | | (22.9)% | |
| Net Assets | | | 100% | |
Portfolio Composition
(% of total investments)1
| | | | |
| Asset-Backed And Mortgaged-Backed Securities | | | 73.8% | |
| Diversified Telecommunication Services | | | 3.2% | |
| Oil, Gas & Consumable Fuels | | | 1.8% | |
| Metals & Mining | | | 1.7% | |
| Chemicals | | | 1.6% | |
| Health Care Providers & Services | | | 1.3% | |
| Other | | | 15.1% | |
| Repurchase Agreements | | | 1.5% | |
Total | | | 100% | |
Portfolio Credit Quality
(% of total long-term
investments)1
| | | | |
AAA/U.S. Guaranteed | | | 18.6% | |
AA | | | 7.2% | |
A | | | 14.5% | |
BBB | | | 15.7% | |
BB or Lower | | | 28.1% | |
N/R (not rated) | | | 15.4% | |
N/A (not applicable) | | | 0.5% | |
Total | | | 100% | |
| 1 | Excluding investments in derivatives. |
JMM
| | |
Nuveen Multi-Market Income Fund | | |
Portfolio of Investments | | December 31, 2016 (Unaudited) |
| | | | | | | | | | | | | | | | | | | | |
| Shares | | | Description (1) | | Coupon | | | | | | Ratings (2) | | | Value | |
| |
| | | | LONG-TERM INVESTMENTS – 136.3% (98.5% of Total Investments) | |
| |
| | | | CONVERTIBLE PREFERRED SECURITIES – 0.3% (0.2% of Total Investments) | |
| | | | | |
| | | | Banks – 0.3% | | | | | | | | | | | | |
| | | | | |
| | 200 | | | Bank of America Corporation, (5) | | | 7.250% | | | | | | | | BB+ | | | $ | 233,360 | |
| | | | Total Convertible Preferred Securities (cost $159,350) | | | | | | | | | | | | | | | 233,360 | |
| | | | | |
Principal
Amount (000) | | | Description (1) | | Coupon | | | Maturity | | | Ratings (2) | | | Value | |
| |
| | | | CORPORATE BONDS – 32.3% (23.4% of Total Investments) | |
| | | | | |
| | | | Aerospace & Defense – 0.8% | | | | | | | | | | | | |
| | | | | |
| $ | 300 | | | Bombardier Inc., 144A | | | 8.750% | | | | 12/01/21 | | | | B | | | $ | 318,375 | |
| | 300 | | | Triumph Group Inc. | | | 4.875% | | | | 4/01/21 | | | | B1 | | | | 281,400 | |
| | 600 | | | Total Aerospace & Defense | | | | | | | | | | | | | | | 599,775 | |
| | | | | |
| | | | Automobiles – 0.2% | | | | | | | | | | | | |
| | | | | |
| | 100 | | | Ford Motor Company | | | 7.450% | | | | 7/16/31 | | | | BBB | | | | 125,287 | |
| | | | | |
| | | | Banks – 0.7% | | | | | | | | | | | | |
| | | | | |
| | 500 | | | Citigroup Inc. | | | 4.500% | | | | 1/14/22 | | | | A | | | | 532,574 | |
| | | | | |
| | | | Capital Markets – 0.7% | | | | | | | | | | | | |
| | | | | |
| | 500 | | | Goldman Sachs Group, Inc. | | | 5.750% | | | | 1/24/22 | | | | A | | | | 561,575 | |
| |
| | | | Chemicals – 2.2% | |
| | | | | |
| | 200 | | | CF Industries Inc. | | | 3.450% | | | | 6/01/23 | | | | BB+ | | | | 179,800 | |
| | 100 | | | CVR Partners LP / CVR Nitrogen Finance Corp., 144A | | | 9.250% | | | | 6/15/23 | | | | B+ | | | | 103,000 | |
| | 100 | | | Hexion Inc. | | | 6.625% | | | | 4/15/20 | | | | B3 | | | | 88,500 | |
| | 200 | | | Huntsman International LLC | | | 4.875% | | | | 11/15/20 | | | | B1 | | | | 207,250 | |
| | 200 | | | Kissner Group Holdings LP, 144A | | | 8.375% | | | | 12/01/22 | | | | B | | | | 202,000 | |
| | 200 | | | Momentive Performance Materials Inc., (3), (4) | | | 8.875% | | | | 10/15/20 | | | | N/R | | | | — | |
| | 200 | | | Momentive Performance Materials Inc. | | | 3.880% | | | | 10/24/21 | | | | B | | | | 188,000 | |
| | 375 | | | NOVA Chemicals Corporation, 144A | | | 5.000% | | | | 5/01/25 | | | | BBB– | | | | 367,384 | |
| | 150 | | | Platform Specialty Products Corporation, 144A | | | 10.375% | | | | 5/01/21 | | | | B+ | | | | 166,125 | |
| | 200 | | | Platform Specialty Products Corporation, 144A | | | 6.500% | | | | 2/01/22 | | | | B+ | | | | 201,500 | |
| | 1,925 | | | Total Chemicals | | | | | | | | | | | | | | | 1,703,559 | |
| |
| | | | Commercial Services & Supplies – 0.5% | |
| | | | | |
| | 150 | | | APX Group, Inc. | | | 8.750% | | | | 12/01/20 | | | | CCC+ | | | | 151,125 | |
| | 240 | | | International Lease Finance Corporation | | | 6.250% | | | | 5/15/19 | | | | BBB– | | | | 258,000 | |
| | 390 | | | Total Commercial Services & Supplies | | | | | | | | | | | | | | | 409,125 | |
| |
| | | | Construction Materials – 0.4% | |
| | | | | |
| | 250 | | | Norbord Inc., 144A | | | 6.250% | | | | 4/15/23 | | | | Ba2 | | | | 258,750 | |
| |
| | | | Consumer Finance – 0.2% | |
| | | | | |
| | 150 | | | Constellis Holdings LLC / Constellis Finance Corporation, 144A | | | 9.750% | | | | 5/15/20 | | | | B | | | | 153,750 | |
| |
| | | | Containers & Packaging – 0.3% | |
| | | | | |
| | 250 | | | Cascades Inc., 144A | | | 5.500% | | | | 7/15/22 | | | | BB– | | | | 253,750 | |
| |
| | | | Diversified Financial Services – 0.6% | |
| | | | | |
| | 200 | | | James Hardie International Finance Limited, 144A | | | 5.875% | | | | 2/15/23 | | | | BBB– | | | | 207,000 | |
| | 225 | | | Nationstar Mortgage LLC Capital Corporation | | | 7.875% | | | | 10/01/20 | | | | B+ | | | | 232,875 | |
| | 425 | | | Total Diversified Financial Services | | | | | | | | | | | | | | | 439,875 | |
| | | | | | | | | | | | | | | | | | | | |
Principal
Amount (000) | | | Description (1) | | Coupon | | | Maturity | | | Ratings (2) | | | Value | |
| | | | | |
| | | | Diversified Telecommunication Services – 4.4% | | | | | | | | | | | | |
| | | | | |
| $ | 300 | | | AT&T, Inc. | | | 3.800% | | | | 3/15/22 | | | | A– | | | $ | 307,233 | |
| | 250 | | | CenturyLink Inc. | | | 6.750% | | | | 12/01/23 | | | | BB+ | | | | 255,625 | |
| | 300 | | | CenturyLink Inc. | | | 7.650% | | | | 3/15/42 | | | | BB+ | | | | 262,500 | |
| | 250 | | | Frontier Communications Corporation | | | 8.500% | | | | 4/15/20 | | | | BB | | | | 262,500 | |
| | 350 | | | GCI Inc. | | | 6.875% | | | | 4/15/25 | | | | BB– | | | | 355,250 | |
| | 100 | | | IntelSat Jackson Holdings | | | 7.500% | | | | 4/01/21 | | | | CCC | | | | 76,250 | |
| | 200 | | | Level 3 Financing Inc., 144A | | | 5.250% | | | | 3/15/26 | | | | BB | | | | 198,000 | |
| | 350 | | | Neptune Finco Corporation, 144A | | | 10.125% | | | | 1/15/23 | | | | B+ | | | | 404,250 | |
| | 275 | | | Qualitytech LP/QTS Finance Corp. | | | 5.875% | | | | 8/01/22 | | | | BB | | | | 279,812 | |
| | 500 | | | Qwest Corporation | | | 6.750% | | | | 12/01/21 | | | | BBB– | | | | 542,500 | |
| | 390 | | | SBA Tower Trust, 144A | | | 3.598% | | | | 4/15/43 | | | | BBB | | | | 391,439 | |
| | 3,265 | | | Total Diversified Telecommunication Services | | | | | | | | | | | | | | | 3,335,359 | |
| |
| | | | Electric Utilities – 0.5% | |
| | | | | |
| | 300 | | | Intergen NV, 144A | | | 7.000% | | | | 6/30/23 | | | | B1 | | | | 267,000 | |
| | 100 | | | Talen Energy Supply LLC | | | 6.500% | | | | 6/01/25 | | | | BB– | | | | 77,250 | |
| | 400 | | | Total Electric Utilities | | | | | | | | | | | | | | | 344,250 | |
| |
| | | | Energy Equipment & Services – 0.1% | |
| | | | | |
| | 100 | | | Noble Holding International Limited | | | 7.750% | | | | 1/15/24 | | | | BB– | | | | 94,060 | |
| |
| | | | Equity Real Estate Investment Trusts – 1.5% | |
| | | | | |
| | 300 | | | CommomWealth REIT | | | 5.875% | | | | 9/15/20 | | | | BBB– | | | | 320,392 | |
| | 250 | | | iStar Inc. | | | 7.125% | | | | 2/15/18 | | | | B+ | | | | 257,500 | |
| | 200 | | | Realogy Group LLC / Realogy Co-Issuer Corporation, 144A | | | 5.250% | | | | 12/01/21 | | | | B+ | | | | 205,000 | |
| | 320 | | | Vereit Operating Partner | | | 3.000% | | | | 2/06/19 | | | | BBB– | | | | 319,200 | |
| | 1,070 | | | Total Equity Real Estate Investment Trusts | | | | | | | | | | | | | | | 1,102,092 | |
| | | | | |
| | | | Food & Staples Retailing – 0.3% | | | | | | | | | | | | |
| | | | | |
| | 250 | | | Pomegranate Merger Sub, Inc., 144A | | | 9.750% | | | | 5/01/23 | | | | B | | | | 213,750 | |
| |
| | | | Food Products – 0.4% | |
| | | | | |
| | 200 | | | Pilgrim’s Pride Corporation, 144A | | | 5.750% | | | | 3/15/25 | | | | BB | | | | 200,000 | |
| | 100 | | | Pinnacle Foods Finance LLC | | | 5.875% | | | | 1/15/24 | | | | B+ | | | | 106,000 | |
| | 300 | | | Total Food Products | | | | | | | | | | | | | | | 306,000 | |
| |
| | | | Gas Utilities – 0.9% | |
| | | | | |
| | 250 | | | AmeriGas Partners LP/AmeriGas Finance Corporation | | | 5.500% | | | | 5/20/25 | | | | BB | | | | 252,500 | |
| | 300 | | | Ferrellgas LP | | | 6.750% | | | | 1/15/22 | | | | B | | | | 297,000 | |
| | 150 | | | Suburban Propane Partners LP | | | 5.750% | | | | 3/01/25 | | | | BB– | | | | 152,250 | |
| | 700 | | | Total Gas Utilities | | | | | | | | | | | | | | | 701,750 | |
| |
| | | | Health Care Equipment & Supplies – 0.4% | |
| | | | | |
| | 350 | | | Tenet Healthcare Corporation | | | 6.875% | | | | 11/15/31 | | | | B– | | | | 269,937 | |
| |
| | | | Health Care Providers & Services – 1.8% | |
| | | | | |
| | 300 | | | Acadia Healthcare | | | 5.625% | | | | 2/15/23 | | | | B | | | | 300,000 | |
| | 225 | | | Community Health Systems, Inc. | | | 6.875% | | | | 2/01/22 | | | | B | | | | 156,375 | |
| | 175 | | | HCA Inc. | | | 5.250% | | | | 6/15/26 | | | | BBB– | | | | 180,906 | |
| | 300 | | | Iasis Healthcare Capital Corporation | | | 8.375% | | | | 5/15/19 | | | | CCC+ | | | | 261,000 | |
| | 275 | | | Kindred Healthcare Inc. | | | 6.375% | | | | 4/15/22 | | | | B– | | | | 245,437 | |
| | 250 | | | Select Medical Corporation | | | 6.375% | | | | 6/01/21 | | | | B– | | | | 250,000 | |
| | 1,525 | | | Total Health Care Providers & Services | | | | | | | | | | | | | | | 1,393,718 | |
| | | | | |
| | | | Hotels, Restaurants & Leisure – 0.5% | | | | | | | | | | | | |
| | | | | |
| | 200 | | | Grupo Posadas SAB de CV, 144A | | | 7.875% | | | | 6/30/22 | | | | B+ | | | | 198,000 | |
| | 200 | | | Wynn Macau Limited, 144A | | | 5.250% | | | | 10/15/21 | | | | Ba3 | | | | 201,500 | |
| | 400 | | | Total Hotels, Restaurants & Leisure | | | | | | | | | | | | | | | 399,500 | |
| | | | |
| JMM | | Nuveen Multi-Market Income Fund |
| | Portfolio of Investments (continued) | | December 31, 2016 (Unaudited) |
| | | | | | | | | | | | | | | | | | | | |
Principal
Amount (000) | | | Description (1) | | Coupon | | | Maturity | | | Ratings (2) | | | Value | |
| | | | | |
| | | | Household Durables – 1.6% | | | | | | | | | | | | |
| | | | | |
| $ | 250 | | | Brookfield Residential Properties Inc., 144A | | | 6.500% | | | | 12/15/20 | | | | B+ | | | $ | 255,625 | |
| | 250 | | | KB Home | | | 7.000% | | | | 12/15/21 | | | | B+ | | | | 263,750 | |
| | 250 | | | PulteGroup Inc. | | | 4.250% | | | | 3/01/21 | | | | BB+ | | | | 255,625 | |
| | 250 | | | Rialto Holdings LLC-Rialto Corporation, 144A | | | 7.000% | | | | 12/01/18 | | | | B1 | | | | 253,125 | |
| | 200 | | | William Lyon Homes Incorporated | | | 8.500% | | | | 11/15/20 | | | | B– | | | | 209,000 | |
| | 1,200 | | | Total Household Durables | | | | | | | | | | | | | | | 1,237,125 | |
| |
| | | | Independent Power & Renewable Electricity Producers – 0.2% | |
| | | | | |
| | 255 | | | GenOn Energy Inc. | | | 9.500% | | | | 10/15/18 | | | | CCC+ | | | | 180,253 | |
| | | | | |
| | | | Insurance – 0.1% | | | | | | | | | | | | |
| | | | | |
| | 130 | | | Genworth Holdings Inc. | | | 4.800% | | | | 2/15/24 | | | | Ba3 | | | | 105,950 | |
| | | | | |
| | | | Internet Software & Services – 0.6% | | | | | | | | | | | | |
| | | | | |
| | 250 | | | Donnelley Financial Solutions, Inc., 144A | | | 8.250% | | | | 10/15/24 | | | | B | | | | 254,375 | |
| | 200 | | | Inception Merger Sub Inc / Rackspace Hosting Inc., 144A | | | 8.625% | | | | 11/15/24 | | | | BB– | | | | 211,690 | |
| | 450 | | | Total Internet Software & Services | | | | | | | | | | | | | | | 466,065 | |
| | | | | |
| | | | IT Services – 0.5% | | | | | | | | | | | | |
| | | | | |
| | 350 | | | Zayo Group LLC / Zayo Capital Inc. | | | 6.000% | | | | 4/01/23 | | | | B– | | | | 364,000 | |
| |
| | | | Machinery – 0.3% | |
| | | | | |
| | 200 | | | BlueLine Rental Finance Corporation, 144A | | | 7.000% | | | | 2/01/19 | | | | B+ | | | | 195,000 | |
| | | | | |
| | | | Media – 1.7% | | | | | | | | | | | | |
| | | | | |
| | 200 | | | Altice S.A, 144A | | | 7.750% | | | | 5/15/22 | | | | B | | | | 213,500 | |
| | 300 | | | Charter Communications Operating LLC/ Charter Communications Operating Capital Corporation | | | 4.908% | | | | 7/23/25 | | | | BBB– | | | | 315,786 | |
| | 300 | | | Numericable Group SA, 144A | | | 7.375% | | | | 5/01/26 | | | | B+ | | | | 306,375 | |
| | 200 | | | Quebecor Media Inc. | | | 5.750% | | | | 1/15/23 | | | | B+ | | | | 207,500 | |
| | 250 | | | Tribune Media Company | | | 5.875% | | | | 7/15/22 | | | | BB– | | | | 253,437 | |
| | 1,250 | | | Total Media | | | | | | | | | | | | | | | 1,296,598 | |
| | | | | |
| | | | Metals & Mining – 2.4% | | | | | | | | | | | | |
| | | | | |
| | 120 | | | Alcoa Inc. | | | 5.400% | | | | 4/15/21 | | | | BBB– | | | | 127,200 | |
| | 250 | | | Alcoa Nederland Holding BV, 144A | | | 6.750% | | | | 9/30/24 | | | | BB– | | | | 271,250 | |
| | 175 | | | Allegheny Technologies Inc. | | | 5.950% | | | | 1/15/21 | | | | B | | | | 169,312 | |
| | 300 | | | Eldorado Gold Corporation, 144A | | | 6.125% | | | | 12/15/20 | | | | BB– | | | | 304,500 | |
| | 200 | | | Hudbay Minerals, Inc., 144A | | | 7.625% | | | | 1/15/25 | | | | B | | | | 207,876 | |
| | 250 | | | IAMGOLD Corporation, 144A | | | 6.750% | | | | 10/01/20 | | | | B+ | | | | 243,750 | |
| | 200 | | | Lundin Mining Corporation, 144A | | | 7.500% | | | | 11/01/20 | | | | BB– | | | | 212,750 | |
| | 300 | | | Vale Overseas Limited | | | 4.375% | | | | 1/11/22 | | | | BBB | | | | 294,750 | |
| | 1,795 | | | Total Metals & Mining | | | | | | | | | | | | | | | 1,831,388 | |
| | | | | |
| | | | Multiline Retail – 0.2% | | | | | | | | | | | | |
| | | | | |
| | 150 | | | J.C. Penney Company Inc. | | | 8.125% | | | | 10/01/19 | | | | B+ | | | | 162,000 | |
| | | | | |
| | | | Oil, Gas & Consumable Fuels – 2.5% | | | | | | | | | | | | |
| | | | | |
| | 120 | | | Calumet Specialty Products | | | 7.625% | | | | 1/15/22 | | | | CCC+ | | | | 101,700 | |
| | 200 | | | Energy Transfer Equity LP | | | 5.500% | | | | 6/01/27 | | | | BB+ | | | | 195,000 | |
| | 200 | | | Genesis Energy LP | | | 5.750% | | | | 2/15/21 | | | | B+ | | | | 202,000 | |
| | 200 | | | Genesis Energy LP | | | 5.625% | | | | 6/15/24 | | | | B+ | | | | 196,500 | |
| | 200 | | | Gibson Energy, 144A | | | 6.750% | | | | 7/15/21 | | | | BB | | | | 207,500 | |
| | 100 | | | Oasis Petroleum Inc. | | | 6.875% | | | | 3/15/22 | | | | B+ | | | | 102,500 | |
| | 175 | | | Rose Rock Midstream LP / Rose Rock Finance Corporation | | | 5.625% | | | | 7/15/22 | | | | B+ | | | | 171,937 | |
| | 300 | | | Sunoco LP / Sunoco Finance Corp. | | | 6.250% | | | | 4/15/21 | | | | BB– | | | | 305,625 | |
| | 500 | | | Transocean Inc. | | | 5.550% | | | | 10/15/22 | | | | BB– | | | | 438,750 | |
| | 1,995 | | | Total Oil, Gas & Consumable Fuels | | | | | | | | | | | | | | | 1,921,512 | |
| | | | | | | | | | | | | | | | | | | | |
Principal
Amount (000) | | | Description (1) | | Coupon | | | Maturity | | | Ratings (2) | | | Value | |
| | | | | |
| | | | Paper & Forest Products – 0.9% | | | | | | | | | | | | |
| | | | | |
| $ | 250 | | | Domtar Corporation | | | 4.400% | | | | 4/01/22 | | | | BBB– | | | $ | 256,971 | |
| | 300 | | | Resolute Forest Products | | | 5.875% | | | | 5/15/23 | | | | B+ | | | | 270,000 | |
| | 200 | | | Tembec Industries, Inc., 144A | | | 9.000% | | | | 12/15/19 | | | | B– | | | | 187,000 | |
| | 750 | | | Total Paper & Forest Products | | | | | | | | | | | | | | | 713,971 | |
| | | | | |
| | | | Personal Products – 0.3% | | | | | | | | | | | | |
| | | | | |
| | 250 | | | Albea Beauty Holdings SA, 144A | | | 8.375% | | | | 11/01/19 | | | | B | | | | 260,000 | |
| |
| | | | Real Estate Management & Development – 0.7% | |
| | | | | |
| | 250 | | | Kennedy-Wilson Holdings Incorporated | | | 5.875% | | | | 4/01/24 | | | | BB– | | | | 254,687 | |
| | 300 | | | Mattamy Group Corporation, 144A | | | 6.875% | | | | 12/15/23 | | | | BB | | | | 303,750 | |
| | 550 | | | Total Real Estate Management & Development | | | | | | | | | | | | | | | 558,437 | |
| | | | | |
| | | | Road & Rail – 0.9% | | | | | | | | | | | | |
| | | | | |
| | 200 | | | Avis Budget Car Rental, 144A | | | 6.375% | | | | 4/01/24 | | | | BB– | | | | 199,750 | |
| | 200 | | | Herc Rentals, Inc., 144A | | | 7.500% | | | | 6/01/22 | | | | B+ | | | | 210,750 | |
| | 250 | | | Watco Companies LLC Finance, 144A | | | 6.375% | | | | 4/01/23 | | | | B– | | | | 258,750 | |
| | 650 | | | Total Road & Rail | | | | | | | | | | | | | | | 669,250 | |
| | | | | |
| | | | Specialty Retail – 0.2% | | | | | | | | | | | | |
| | | | | |
| | 155 | | | L Brands, Inc. | | | 6.875% | | | | 11/01/35 | | | | BB+ | | | | 158,100 | |
| | | | | |
| | | | Technology Hardware, Storage & Peripherals – 0.2% | | | | | | | | | | | | |
| | | | | |
| | 175 | | | NCR Corporation | | | 4.625% | | | | 2/15/21 | | | | BB | | | | 178,150 | |
| | | | | |
| | | | Textiles, Apparel & Luxury Goods – 0.3% | | | | | | | | | | | | |
| | | | | |
| | 225 | | | Levi Strauss & Company | | | 5.000% | | | | 5/01/25 | | | | BB+ | | | | 225,000 | |
| | | | | |
| | | | Thrifts & Mortgage Finance – 0.4% | | | | | | | | | | | | |
| | | | | |
| | 250 | | | Radian Group Inc. | | | 7.000% | | | | 3/15/21 | | | | BB | | | | 278,125 | |
| | | | | |
| | | | Wireless Telecommunication Services – 0.9% | | | | | | | | | | | | |
| | | | | |
| | 200 | | | Digicel Limited, 144A | | | 6.000% | | | | 4/15/21 | | | | B1 | | | | 180,842 | |
| | 250 | | | Hughes Satellite Systems Corporation, 144A | | | 6.625% | | | | 8/01/26 | | | | BB– | | | | 251,250 | |
| | 200 | | | Sprint Corporation | | | 7.250% | | | | 9/15/21 | | | | B+ | | | | 212,500 | |
| | 650 | | | Total Wireless Telecommunication Services | | | | | | | | | | | | | | | 644,592 | |
| $ | 24,880 | | | Total Corporate Bonds (cost $24,630,176) | | | | | | | | | | | | | | | 24,643,952 | |
| | | | | |
Principal
Amount (000) | | | Description (1) | | Coupon | | | Maturity | | | Ratings (2) | | | Value | |
| |
| | | | $1,000 PAR (OR SIMILAR) INSTITUTIONAL PREFERRED – 0.7% (0.5% of Total Investments) | |
| | | | | |
| | | | Banks – 0.4% | | | | | | | | | | | | |
| | | | | |
| $ | 100 | | | Lloyd’s Banking Group PLC, (5) | | | 7.500% | | | | N/A (6) | | | | BB+ | | | $ | 103,000 | |
| | 200 | | | Societe Generale, 144A, (5) | | | 7.375% | | | | N/A (6) | | | | BB+ | | | | 199,664 | |
| | | | Total Banks | | | | | | | | | | | | | | | 302,664 | |
| | | | | |
| | | | Commercial Services & Supplies – 0.3% | | | | | | | | | | | | |
| | | | | |
| | 200 | | | AerCap Global Aviation Trust, 144A | | | 6.500% | | | | 6/15/45 | | | | BB | | | | 201,750 | |
| | | | Total $1,000 Par (or similar) Institutional Preferred (cost $508,601) | | | | | | | | 504,414 | |
| | | | | |
Principal
Amount (000) | | | Description (1) | | Coupon | | | Maturity | | | Ratings (2) | | | Value | |
| |
| | | | ASSET-BACKED AND MORTGAGED-BACKED SECURITIES – 102.1% (73.8% of Total Investments) | |
| | | | | |
| $ | 1,186 | | | 321 Henderson Receivables LLC, Series 2012-1A, 144A | | | 7.140% | | | | 2/15/67 | | | | A3 | | | $ | 1,295,757 | |
| | | | |
| JMM | | Nuveen Multi-Market Income Fund |
| | Portfolio of Investments (continued) | | December 31, 2016 (Unaudited) |
| | | | | | | | | | | | | | | | | | | | |
Principal
Amount (000) | | | Description (1) | | Coupon | | | Maturity | | | Ratings (2) | | | Value | |
| |
| | | | ASSET-BACKED AND MORTGAGED-BACKED SECURITIES (continued) | |
| | | | | |
| $ | 500 | | | 321 Henderson Receivables LLC, Series 2016-1A, 144A | | | 5.190% | | | | 6/17/69 | | | | Baa2 | | | $ | 499,746 | |
| | 366 | | | 321 Henderson Receivables LLC., Series 2010-1A, 144A | | | 9.310% | | | | 7/15/61 | | | | Aa2 | | | | 432,121 | |
| | 484 | | | 321 Henderson Receivables Trust Series 2012-2A, 144A | | | 6.770% | | | | 10/17/61 | | | | Baa1 | | | | 516,494 | |
| | 340 | | | ACE Securities Corporation, Manufactured Housing Trust Series 2003-MH1, 144A | | | 6.500% | | | | 8/15/30 | | | | AA | | | | 378,355 | |
| | 750 | | | American Homes 4 Rent, Series 2015-SFR2, 144A | | | 5.036% | | | | 10/17/45 | | | | Baa2 | | | | 780,795 | |
| | 1,729 | | | American Homes 4 Rent, Series 2015-SFR2, 144A | | | 0.000% | | | | 10/17/45 | | | | N/R | | | | 17 | |
| | 405 | | | AmeriCold LLC Trust, Series 2010, 144A | | | 6.811% | | | | 1/14/29 | | | | A+ | | | | 452,700 | |
| | 500 | | | Bank of America Commercial Mortgage Inc. , Commercial Mortgage Pass-Through Certificates, Series 2015-UBS7 | | | 3.167% | | | | 9/15/48 | | | | BBB– | | | | 377,550 | |
| | 103 | | | Bank of America Funding Trust, Mortgage Pass-Through Certificates, Series 2007-4 | | | 5.500% | | | | 6/25/37 | | | | C | | | | 17,968 | |
| | 112 | | | Bank of America Funding Trust, Series 2003-3 | | | 4.750% | | | | 10/25/18 | | | | AA+ | | | | 112,481 | |
| | 359 | | | Bank of America Mortgage Securities Inc. , Mortgage Pass-Through Certificates Series 2004-1 | | | 6.500% | | | | 9/25/33 | | | | BB | | | | 350,263 | |
| | 175 | | | Barclays BCAP LLC Trust, Resecuritized Series 2009-RR14, 144A | | | 6.000% | | | | 5/26/37 | | | | BBB | | | | 179,479 | |
| | 500 | | | Barclays Commercial Mortgage, Mortgage Pass-Through Certificates, Series 2015-STP, 144A | | | 4.427% | | | | 9/10/28 | | | | BBB– | | | | 490,705 | |
| | 117 | | | Bayview Financial Acquisition Trust 2003-AA, 144A | | | 6.072% | | | | 2/25/33 | | | | A+ | | | | 117,091 | |
| | 114 | | | Bayview Financial Acquisition Trust Series 2006C | | | 5.852% | | | | 11/28/36 | | | | CCC | | | | 111,435 | |
| | 127 | | | Bayview Financial Acquisition Trust, Series 2006-C | | | 5.638% | | | | 11/28/36 | | | | Ba1 | | | | 126,420 | |
| | 209 | | | Bayview Financial Acquisition Trust, Series 2006-D | | | 5.932% | | | | 12/28/36 | | | | A2 | | | | 207,217 | |
| | 114 | | | Bayview Financial Acquisition Trust, Series 2007-A | | | 6.205% | | | | 5/28/37 | | | | AA+ | | | | 118,451 | |
| | 630 | | | Bayview Financial Mortgage Pass-Through Trust, Mortgage Pass-Through Certificate Series 2005-D | | | 5.500% | | | | 12/28/35 | | | | BB+ | | | | 624,177 | |
| | 23 | | | Bayview Financial Mortgage Pass-Through Trust, Mortgage Pass-Through Certificate Series 2006-A | | | 5.704% | | | | 2/28/41 | | | | AAA | | | | 23,921 | |
| | 500 | | | CAM Mortgage Trust 2015-1, 144A | | | 4.750% | | | | 7/15/64 | | | | N/R | | | | 495,044 | |
| | 198 | | | Chase Funding Mortgage Loan Asset-Backed Certificates, Series 2003-3 | | | 5.160% | | | | 3/25/33 | | | | BBB– | | | | 201,764 | |
| | 500 | | | Citigroup Commercial Mortgage Trust, Commercial Mortgage Pass-Through Certificates, Series 2006-CD3 | | | 5.688% | | | | 10/15/48 | | | | B– | | | | 271,250 | |
| | 275 | | | Commercial Mortgage Pass-Through Certificates 2015-CR22 | | | 4.126% | | | | 3/10/48 | | | | A– | | | | 262,732 | |
| | 511 | | | Commercial Mortgage Pass-Through Certificates, Series 2015-CR26 | | | 4.495% | | | | 10/10/48 | | | | A– | | | | 484,475 | |
| | 555 | | | Conns Receivables Funding Trust II, Series 2016-B, 144A | | | 3.730% | | | | 10/15/18 | | | | BBB | | | | 556,380 | |
| | 228 | | | CountryWide Alternative Loan Trust 2005-86CB A10 | | | 5.500% | | | | 2/25/36 | | | | Caa3 | | | | 195,989 | |
| | 214 | | | Countrywide Alternative Loan Trust, Mortgage Pass Through Certificates, Series 2003-J3 | | | 5.250% | | | | 11/25/33 | | | | A+ | | | | 213,480 | |
| | 214 | | | Countrywide Alternative Loan Trust, Mortgage Pass Through Certificates, Series 2004-J2 | | | 6.500% | | | | 3/25/34 | | | | AA | | | | 221,596 | |
| | 393 | | | Countrywide Alternative Loan Trust, Mortgage Pass-Through Certificates, Series 2004-J1 | | | 6.000% | | | | 2/25/34 | | | | A+ | | | | 396,685 | |
| | 209 | | | Countrywide Alternative Loan Trust, Mortgage Pass-Through Certificates, Series 2005-47CB | | | 5.500% | | | | 10/25/35 | | | | Caa3 | | | | 178,304 | |
| | 747 | | | Countrywide Alternative Loan Trust, Mortgage Pass-Through Certificates, Series 2007-6 A4 | | | 5.750% | | | | 4/25/47 | | | | Ca | | | | 614,783 | |
| | 408 | | | Countrywide Asset-Backed Certificates Trust, Series 2004-13 | | | 4.851% | | | | 5/25/35 | | | | AA+ | | | | 416,275 | |
| | 413 | | | Credit Suisse Commercial Mortgage Trust 2009-3R, 144A | | | 6.000% | | | | 1/27/37 | | | | A | | | | 417,414 | |
| | 364 | | | Credit Suisse Commercial Mortgage Trust, 2006-9 | | | 6.000% | | | | 11/25/36 | | | | Caa2 | | | | 344,413 | |
| | 287 | | | Credit Suisse CSMC Mortgage-Backed Trust, Pass-Through Certificates, Series 2006-7 | | | 6.000% | | | | 8/25/36 | | | | Caa3 | | | | 241,520 | |
| | 574 | | | Credit Suisse First Boston Mortgage Securities Corporation, Mortgage-Backed Pass-Through Certificates, Series 2003-8 | | | 6.181% | | | | 4/25/33 | | | | A | | | | 569,782 | |
| | 573 | | | Credit Suisse First Boston Mortgage Securities Corporation, Mortgage-Backed Pass-Through Certificates, Series 2005-11 6A7 | | | 6.000% | | | | 12/25/35 | | | | D | | | | 114,832 | |
| | 278 | | | Credit Suisse First Boston Mortgage Securities, Home Equity Mortgage Pass-Through Certificates, Series 2004-6 | | | 5.821% | | | | 4/25/35 | | | | B1 | | | | 281,191 | |
| | 883 | | | Credit-Based Asset Servicing and Securitization Pool 2007-SP1, 144A | | | 6.020% | | | | 12/25/37 | | | | A+ | | | | 915,124 | |
| | 3 | | | Fannie Mae Mortgage Pool, (7) | | | 7.000% | | | | 7/01/17 | | | | Aaa | | | | 3,228 | |
| | 16 | | | Fannie Mae Mortgage Pool, (7) | | | 5.000% | | | | 11/01/18 | | | | Aaa | | | | 16,853 | |
| | 45 | | | Fannie Mae Mortgage Pool, (7) | | | 5.000% | | | | 2/01/21 | | | | Aaa | | | | 47,463 | |
| | 1,155 | | | Fannie Mae Mortgage Pool, (7) | | | 3.500% | | | | 12/01/26 | | | | Aaa | | | | 1,205,079 | |
| | | | | | | | | | | | | | | | | | | | |
Principal
Amount (000) | | | Description (1) | | Coupon | | | Maturity | | | Ratings (2) | | | Value | |
| |
| | | | ASSET-BACKED AND MORTGAGED-BACKED SECURITIES (continued) | |
| | | | | |
| $ | 1,089 | | | Fannie Mae Mortgage Pool, (7) | | | 3.500% | | | | 1/01/27 | | | | Aaa | | | $ | 1,135,637 | |
| | 48 | | | Fannie Mae Mortgage Pool, (7) | | | 6.000% | | | | 5/01/29 | | | | Aaa | | | | 55,295 | |
| | 26 | | | Fannie Mae Mortgage Pool, (7) | | | 7.000% | | | | 9/01/31 | | | | Aaa | | | | 29,214 | |
| | 32 | | | Fannie Mae Mortgage Pool, (7) | | | 5.500% | | | | 6/01/33 | | | | Aaa | | | | 36,193 | |
| | 94 | | | Fannie Mae Mortgage Pool, (7) | | | 6.000% | | | | 1/01/34 | | | | Aaa | | | | 106,815 | |
| | 155 | | | Fannie Mae Mortgage Pool, (7) | | | 5.500% | | | | 2/01/34 | | | | Aaa | | | | 175,897 | |
| | 104 | | | Fannie Mae Mortgage Pool, (7) | | | 6.000% | | | | 3/01/34 | | | | Aaa | | | | 113,711 | |
| | 108 | | | Fannie Mae Mortgage Pool, (7) | | | 6.000% | | | | 1/01/35 | | | | Aaa | | | | 123,475 | |
| | 64 | | | Fannie Mae Mortgage Pool, (7) | | | 5.000% | | | | 7/01/35 | | | | Aaa | | | | 69,809 | |
| | 30 | | | Fannie Mae Mortgage Pool, (7) | | | 5.500% | | | | 3/01/36 | | | | Aaa | | | | 32,807 | |
| | 96 | | | Fannie Mae Mortgage Pool, (7) | | | 6.000% | | | | 6/01/36 | | | | Aaa | | | | 109,269 | |
| | 105 | | | Fannie Mae Mortgage Pool, (7) | | | 5.500% | | | | 4/01/37 | | | | Aaa | | | | 117,493 | |
| | 92 | | | Fannie Mae Mortgage Pool, (7) | | | 5.000% | | | | 6/01/37 | | | | Aaa | | | | 100,245 | |
| | 105 | | | Fannie Mae Mortgage Pool, (7) | | | 5.500% | | | | 6/01/38 | | | | Aaa | | | | 117,438 | |
| | 1,830 | | | Fannie Mae Mortgage Pool, (7) | | | 3.500% | | | | 2/01/44 | | | | Aaa | | | | 1,883,961 | |
| | 119 | | | Fannie Mae REMIC Pass-Through Certificates | | | 6.181% | | | | 2/25/42 | | | | Aaa | | | | 135,527 | |
| | 591 | | | Fannie Mae REMIC Pass-Through Certificates | | | 3.958% | | | | 12/25/42 | | | | AAA | | | | 214,004 | |
| | 738 | | | Fannie Mae REMIC Pass-Through Certificates | | | 5.394% | | | | 7/25/44 | | | | Aaa | | | | 106,047 | |
| | 2,975 | | | Fannie Mae TBA Mortgage Pool, (MDR), (WI/DD) | | | 4.500% | | | | TBA | | | | N/R | | | | 3,198,720 | |
| | 4,605 | | | Fannie Mae TBA Mortgage Pool, (MDR), (WI/DD) | | | 4.000% | | | | TBA | | | | N/R | | | | 4,838,934 | |
| | 2,000 | | | Fannie Mae TBA Mortgage Pool, (MDR), (WI/DD) | | | 3.500% | | | | TBA | | | | N/R | | | | 2,048,600 | |
| | 2,500 | | | Fannie Mae TBA Mortgage Pool, (MDR), (WI/DD) | | | 3.000% | | | | TBA | | | | N/R | | | | 2,481,750 | |
| | 3,632 | | | FederalHome Loan Mortgage Corporation, Mortgage Pool, (7) | | | 3.000% | | | | 4/01/43 | | | | Aaa | | | | 3,628,467 | |
| | 2,455 | | | Freddie Mac Gold Mortgage Pool, (7) | | | 3.000% | | | | 1/01/29 | | | | Aaa | | | | 2,520,378 | |
| | 3,089 | | | Freddie Mac Gold Mortgage Pool, (7) | | | 3.000% | | | | 6/01/46 | | | | Aaa | | | | 3,068,136 | |
| | 33 | | | Freddie Mac Mortgage Pool, Various, (7) | | | 6.500% | | | | 11/01/28 | | | | Aaa | | | | 37,687 | |
| | 1,606 | | | Freddie Mac Mortgage Pool, (7) | | | 3.500% | | | | 1/01/44 | | | | Aaa | | | | 1,651,877 | |
| | 1,545 | | | Freddie Mac Mortgage Pool, (7) | | | 3.500% | | | | 2/01/44 | | | | Aaa | | | | 1,589,214 | |
| | 199 | | | Freddie Mac Mortgage Trust 2013-KF02, 144A | | | 3.531% | | | | 12/25/45 | | | | Baa3 | | | | 200,085 | |
| | 255 | | | Freddie Mac Mortgage Trust, Multifamily Mortgage Pass-Through Certificates, Series 2012-K706, 144A | | | 4.169% | | | | 11/25/44 | | | | A1 | | | | 262,537 | |
| | 282 | | | Freddie Mac Mortgage Trust, Multifamily Mortgage Pass-Through Certificates, Series 2012-K708, 144A | | | 3.751% | | | | 2/25/45 | | | | A | | | | 288,753 | |
| | 750 | | | Freddie Mac Mortgage Trust, Multifamily Mortgage Pass-Through Certificates, Series 2013-K712, 144A | | | 3.365% | | | | 5/25/45 | | | | A | | | | 750,166 | |
| | 750 | | | Freddie Mac Mortgage Trust, Multifamily Mortgage-Pass Through Certificates, Series 2012-K709, 144A | | | 3.872% | | | | 4/25/45 | | | | BBB | | | | 758,369 | |
| | 250 | | | Freddie Mac MultiFamily Mortgage Trust, Structured Pass Through Certificates, Series 2015-K714, 144A | | | 3.981% | | | | 1/25/47 | | | | Baa3 | | | | 241,659 | |
| | 494 | | | GMAC Mortgage Corporation, Mortgage Pass-Through Certificates, Series 2004-J6 | | | 5.500% | | | | 2/25/35 | | | | B | | | | 494,153 | |
| | 500 | | | GMAT Trust Mortgage Pool 2013-1A, 144A | | | 5.000% | | | | 11/25/43 | | | | N/R | | | | 478,334 | |
| | 1,000 | | | Goldman Sachs Mortgage Securities Corporation II, Commercial Mortgage Pass -Through Certificates, Series 2014-GSFL, 144A | | | 2.954% | | | | 7/15/31 | | | | A– | | | | 991,861 | |
| | 114 | | | Goldman Sachs Mortgage Securities Corporation, GSMPS Mortgage Pass Through Certificates, Series 2001-2, 144A | | | 7.500% | | | | 6/19/32 | | | | B | | | | 115,031 | |
| | 742 | | | Goldman Sachs Mortgage Securities Corporation, GSMPS Mortgage Pass Through Certificates, Series 2003-3, 144A | | | 7.000% | | | | 6/25/43 | | | | BBB | | | | 780,722 | |
| | 1,257 | | | Goldman Sachs Mortgage Securities Corporation, GSMPS Mortgage Pass Through Certificates, Series 2006-RP2 B1 | | | 5.948% | | | | 4/25/36 | | | | CC | | | | 95,912 | |
| | 84 | | | Goldman Sachs Mortgage Securities Corporation, Mortgage Pass-Through Certificates, Series 2003-10 1A1 | | | 2.928% | | | | 10/25/33 | | | | BBB+ | | | | 84,312 | |
| | 595 | | | Goldman Sachs Mortgage Securities Corporation, Mortgage Pass-Through Certificates, Series 2005-RP1, 144A | | | 8.500% | | | | 1/25/35 | | | | B2 | | | | 678,352 | |
| | 423 | | | Goldman Sachs Mortgage Securities Corporation, Mortgage Pass-Through Certificates, Series 2005-RP2 1A2, 144A | | | 7.500% | | | | 3/25/35 | | | | B1 | | | | 457,686 | |
| | 406 | | | Goldman Sachs Mortgage Securities Corporation, Mortgage Pass-Through Certificates, Series 2005-RP3 1A2, 144A | | | 7.500% | | | | 9/25/35 | | | | B3 | | | | 439,846 | |
| | 500 | | | Goldman Sachs Mortgage Securities Trust, Mortgage Pass Through Certificates, Series 2015-GC32 | | | 3.345% | | | | 7/10/48 | | | | BBB– | | | | 371,619 | |
| | 297 | | | Government National Mortgage Association Pool, (7) | | | 5.500% | | | | 8/15/33 | | | | Aaa | | | | 343,534 | |
| | 215 | | | Government National Mortgage Association Pool, (7) | | | 6.000% | | | | 7/15/34 | | | | Aaa | | | | 253,255 | |
| | | | |
| JMM | | Nuveen Multi-Market Income Fund |
| | Portfolio of Investments (continued) | | December 31, 2016 (Unaudited) |
| | | | | | | | | | | | | | | | | | | | |
Principal
Amount (000) | | | Description (1) | | Coupon | | | Maturity | | | Ratings (2) | | | Value | |
| |
| | | | ASSET-BACKED AND MORTGAGED-BACKED SECURITIES (continued) | |
| | | | | |
| $ | 1,210 | | | Green Tree Agency Advance Funding Trust, Manufactured Housing Contract Pass Through Certificates, Series 2015-T2, 144A | | | 4.669% | | | | 10/15/48 | | | | BBB | | | $ | 1,206,019 | |
| | 329 | | | Impac Secured Assets Corporation, Mortgage Pass-Through Certificates, Series 2000-3 | | | 8.000% | | | | 10/25/30 | | | | CCC | | | | 309,446 | |
| | 90 | | | IndyMac MBS Inc., Residential Asset Securitization Trust, Mortgage Pass Through Certificates, Series 2004-A2 | | | 4.000% | | | | 5/25/34 | | | | A+ | | | | 90,523 | |
| | 371 | | | JPMorgan Alternative Loan Trust 2006-S1, Mortgage Pass-Through Certificates | | | 6.500% | | | | 3/25/36 | | | | D | | | | 323,577 | |
| | 750 | | | JPMorgan Chase Commercial Mortgage Securities Corporation, Commercial Mortgage Pass-Through Certificates, Series 2011-C4 C, 144A | | | 5.397% | | | | 7/15/46 | | | | A | | | | 806,496 | |
| | 4 | | | Lavender Trust, Mortgage Pass Through Certificates, Series 2010-R10A, 144A | | | 6.250% | | | | 9/26/36 | | | | N/R | | | | 4,275 | |
| | 99 | | | Lehman ABS Manufactured Housing Contract Asset Backed Certificates, Series 2001B | | | 4.350% | | | | 4/15/40 | | | | AA | | | | 101,058 | |
| | 23 | | | Lehman Mortgage Trust, Mortgage Pass Through Certificates, Series 2008-6 | | | 5.295% | | | | 7/25/47 | | | | A+ | | | | 23,026 | |
| | 442 | | | Master RePerforming Loan Trust 2005-1, 144A | | | 7.500% | | | | 8/25/34 | | | | B1 | | | | 445,530 | |
| | 253 | | | Master Resecuritization Trust 2009-1, 144A | | | 6.000% | | | | 10/25/36 | | | | A | | | | 259,945 | |
| | 404 | | | Merrill Lynch Alternative Note Asset, 2007-F1 2A7 | | | 6.000% | | | | 3/25/37 | | | | Caa3 | | | | 306,582 | |
| | 1,342 | | | Mid-State Capital Corporation Trust Notes, Series 2004-1 A | | | 6.005% | | | | 8/15/37 | | | | AA+ | | | | 1,453,621 | |
| | 1,079 | | | Mid-State Capital Corporation Trust Notes, Series 2005-1 | | | 5.745% | | | | 1/15/40 | | | | AA | | | | 1,155,169 | |
| | 92 | | | Mid-State Trust 2004-A | | | 8.900% | | | | 8/15/37 | | | | BBB | | | | 100,905 | |
| | 230 | | | Mid-State Trust 2010-1, 144A | | | 7.000% | | | | 12/15/45 | | | | A | | | | 254,336 | |
| | 938 | | | Mid-State Trust 2010-1, 144A | | | 5.250% | | | | 12/15/45 | | | | AA | | | | 991,862 | |
| | 270 | | | Mid-State Trust VI | | | 7.790% | | | | 7/01/35 | | | | Baa1 | | | | 283,326 | |
| | 325 | | | Mid-State Trust XI | | | 5.598% | | | | 7/15/38 | | | | A+ | | | | 349,994 | |
| | 500 | | | Morgan Stanley Bank of America Merrill Lynch Trust, Series 2014-C16, 144A | | | 4.757% | | | | 6/15/47 | | | | BBB– | | | | 402,704 | |
| | 350 | | | Morgan Stanley Bank of America Merrill Lynch Trust, Series 2015-C22, 144A | | | 4.242% | | | | 4/15/48 | | | | BBB– | | | | 268,914 | |
| | 500 | | | Morgan Stanley Bank of America Merrill Lynch Trust, Series 2016-C28 | | | 4.595% | | | | 1/15/49 | | | | A3 | | | | 493,238 | |
| | 250 | | | Morgan Stanley Capital I Trust, Commercial Mortgage Pass-Through Certificates, Series 2011-C1 C, 144A | | | 5.432% | | | | 9/15/47 | | | | AA+ | | | | 272,628 | |
| | 137 | | | Morgan Stanley Mortgage Loan Trust, Pass Through Certificates, 2006-2 | | | 5.750% | | | | 2/25/36 | | | | Caa2 | | | | 129,096 | |
| | 500 | | | Morgan Stanley Re REMIC Trust Series 2009-GG10, 144A | | | 5.793% | | | | 8/12/45 | | | | A | | | | 502,814 | |
| | 359 | | | Mortgage Asset Securitization Transaction Inc., Alternative Loan Trust Mortgage Pass-Through Certificates Series 2004-1 | | | 7.000% | | | | 1/25/34 | | | | BBB– | | | | 365,431 | |
| | 479 | | | Mortgage Asset Securitization Transaction Inc., Alternative Loan Trust Mortgage Pass-Through Certificates, 2004-5 6A1 | | | 7.000% | | | | 6/25/34 | | | | A+ | | | | 502,125 | |
| | 77 | | | Mortgage Asset Securitization Transaction Inc., Mortgage Pass Through Certificates, Series 2003-5 | | | 5.000% | | | | 6/25/18 | | | | A | | | | 78,975 | |
| | 418 | | | Mortgage Asset Securitization Transactions Inc., Mortgage Pass Through Certificates, Series 2003-11 | | | 5.250% | | | | 12/25/33 | | | | A | | | | 422,022 | |
| | 500 | | | New Residential Advance Receivable Trust , Series 2016-T1, 144A | | | 4.377% | | | | 6/15/49 | | | | BBB | | | | 499,999 | |
| | 204 | | | New Residential Mortgage Loan Trust, Mortgage Pass Through Certificates, Series 2014-2A, 144A | | | 3.750% | | | | 5/25/54 | | | | AAA | | | | 208,702 | |
| | 44 | | | Oakwood Mortgage Investors Inc., Series 1999-A | | | 6.090% | | | | 4/15/29 | | | | A1 | | | | 44,727 | |
| | 500 | | | OMART Receivables Trust, Series 2015-T3, 144A | | | 4.687% | | | | 11/15/47 | | | | BBB | | | | 503,750 | |
| | 500 | | | OMART Receivables Trust, Series 2016-T2, 144A | | | 4.560% | | | | 8/16/49 | | | | BBB | | | | 498,594 | |
| | 298 | | | Origen Manufactured Housing Contract Trust Collateralized Notes Series 2005B | | | 5.990% | | | | 1/15/37 | | | | A+ | | | | 304,915 | |
| | 355 | | | Renaissance Home Equity Loan Trust Asset Backed Certificates, Series 2005-4 A6 | | | 5.749% | | | | 2/25/36 | | | | Caa1 | | | | 336,161 | |
| | 750 | | | Residential Asset Securities Corporation , Home Equity Mortgage Asset Backed Pass Through Certificates, Series 2004-KS1 | | | 5.721% | | | | 2/25/34 | | | | BB+ | | | | 770,379 | |
| | 115 | | | Residential Funding Mortgage Securities II, Inc., Home Loan Backed Notes Trust 2003-HI4 | | | 6.030% | | | | 2/25/29 | | | | A+ | | | | 118,970 | |
| | 295 | | | Residential Funding Mortgage Trust I, 2007-S9 | | | 6.000% | | | | 10/25/37 | | | | D | | | | 242,278 | |
| | 251 | | | Salomon Brothers Commercial Mortgage Trust Pass-Through VII Certificates, Series 2003-1 A2, 144A | | | 6.000% | | | | 9/25/33 | | | | BB | | | | 248,196 | |
| | 570 | | | Springleaf Mortgage Loan Trust 2013-2A, 144A | | | 4.480% | | | | 12/25/65 | | | | A+ | | | | 571,469 | |
| | | | | | | | | | | | | | | | | | | | |
Principal
Amount (000) | | | Description (1) | | Coupon | | | Maturity | | | Ratings (2) | | | Value | |
| |
| | | | ASSET-BACKED AND MORTGAGED-BACKED SECURITIES (continued) | |
| | | | | |
| $ | 500 | | | Springleaf Mortgage Loan Trust 2013-2A, 144A | | | 3.520% | | | | 12/25/65 | | | | AA | | | $ | 501,536 | |
| | 801 | | | Springleaf Mortgage Loan Trust, Series 2013-3A, 144A | | | 5.000% | | | | 9/25/57 | | | | BBB | | | | 800,916 | |
| | 500 | | | SPS Servicer Advance Receivables Trust, Series 2015-T3, 144A | | | 4.430% | | | | 7/15/47 | | | | BBB | | | | 499,063 | |
| | 275 | | | Structured Asset Securities Corporation, Mortgage Pass-Through Certificates, Series 2003-29 | | | 5.250% | | | | 9/25/33 | | | | A | | | | 279,268 | |
| | 500 | | | V Mortgage LLC, Pass Through Certificate , Series 2014-NPL1, 144A | | | 4.750% | | | | 4/27/54 | | | | N/R | | | | 492,156 | |
| | 496 | | | Vericrest Opportunity Loan Transferee, Series 2014-NPL7, 144A | | | 4.750% | | | | 8/27/57 | | | | N/R | | | | 487,970 | |
| | 498 | | | Vericrest Opportunity Loan Transferee, Series 2015-NLP4, 144A | | | 4.250% | | | | 2/25/55 | | | | N/R | | | | 488,609 | |
| | 500 | | | Vericrest Opportunity Loan Transferee, Series 2015-NP13, 144A | | | 4.875% | | | | 10/25/45 | | | | N/R | | | | 481,766 | |
| | 500 | | | Vericrest Opportunity Loan Transferee, Series 2015-NP14, 144S | | | 4.875% | | | | 11/27/45 | | | | N/R | | | | 476,285 | |
| | 192 | | | Walter Investment Management Company Capital Trust, Series 2012-AA, 144A | | | 4.549% | | | | 10/16/50 | | | | A | | | | 192,412 | |
| | 47 | | | Washington Mutual Mortgage Securities Corporation, Mortgage Pass-Through Certificates, Series 2003-MS1 | | | 5.250% | | | | 2/25/18 | | | | N/R | | | | 46,752 | |
| | 491 | | | Washington Mutual Mortgage Securities Corporation, Mortgage Pass-Through Certificates, Series 2003-MS4 | | | 5.500% | | | | 2/25/33 | | | | AA+ | | | | 494,399 | |
| | 467 | | | Washington Mutual Mortgage Securities Corporation, Mortgage Pass-Through Certificates, Series 2003-S8 | | | 5.000% | | | | 9/25/18 | | | | AA | | | | 469,507 | |
| | 41 | | | Washington Mutual Mortgage Securities Corporation, Mortgage Pass-Through Certificates, Series 2004-RA3 | | | 6.316% | | | | 8/25/38 | | | | AA | | | | 43,345 | |
| | 500 | | | Wells Fargo Commercial Mortgage Trust, Commercial Mortgage-Pass Through Certificates, Series 2015-C26, 144A | | | 3.586% | | | | 2/15/48 | | | | BBB– | | | | 352,472 | |
| | 750 | | | Wells Fargo-RBS Commercial Mortgage Trust, Commercial Mortgage Pass-Through Certificates, Series 2011-C3, 144A | | | 5.335% | | | | 3/15/44 | | | | A1 | | | | 786,419 | |
| | 750 | | | Wells Fargo-RBS Commercial Mortgage Trust, Commercial Mortgage Pass-Through Certificates, Series 2013-C15, 144A | | | 4.480% | | | | 8/15/46 | | | | BBB– | | | | 655,250 | |
| | 250 | | | WF-RBS Commercial Mortgage Trust, Commercial Mortgage Pass-Through Certificates, Series 2011-C2, 144A | | | 5.392% | | | | 2/15/44 | | | | Aa2 | | | | 267,158 | |
| $ | 81,626 | | | Total Asset-Backed and Mortgaged-Backed Securities (cost $78,369,018) | | | | 77,758,645 | |
| | | | | |
| Shares | | | Description (1), (8) | | | | | | | | | | | Value | |
| | | |
| | | | INVESTMENT COMPANIES – 0.7% (0.5% of Total Investments) | | | | | | | |
| | | | | |
| | 32,000 | | | Blackrock Credit Allocation Income Trust IV | | | | | | | | | | | | | | $ | 415,040 | |
| | 7,036 | | | Pioneer Floating Rate Trust | | | | | | | | | | | | | | | 83,517 | |
| | | | Total Investment Companies (cost $485,277) | | | | | | | | | | | | | | | 498,557 | |
| | | | | |
Principal
Amount (000) | | | Description (1) | | Coupon | | | Maturity | | | Ratings (2) | | | Value | |
| | | | | |
| | | | SOVEREIGN DEBT – 0.2% (0.1% of Total Investments) | | | | | | | | | | | | | | | | |
| | | | | |
| | | | Uruguay – 0.2% | | | | | | | | | | | | |
| | | | | |
| $ | 123 | | | Republic of Uruguay | | | 8.000% | | | | 11/18/22 | | | | BBB | | | $ | 152,072 | |
| $ | 123 | | | Total Sovereign Debt (cost $124,266) | | | | | | | | | | | | | | | 152,072 | |
| | | | Total Long-Term Investments (cost $104,276,688) | | | | | | | | | | | | | | | 103,791,000 | |
| | | | |
| JMM | | Nuveen Multi-Market Income Fund |
| | Portfolio of Investments (continued) | | December 31, 2016 (Unaudited) |
| | | | | | | | | | | | | | | | | | | | |
Principal
Amount (000) | | | Description (1) | | Coupon | | | Maturity | | | | | | Value | |
| |
| | | | SHORT-TERM INVESTMENTS – 2.0% (1.5% of Total Investments) | |
| |
| | | | REPURCHASE AGREEMENTS – 2.0% (1.5% of Total Investments) | |
| | | | | |
| $ | 1,558 | | | Repurchase Agreement with State Street Bank,
dated 12/30/16, repurchase price $1,558,294,
collateralized by $1,555,000 U.S. Treasury Notes,
2.250%, due 7/31/21, value $1,591,267 | | | 0.010% | | | | 1/03/17 | | | | | | | $ | 1,558,292 | |
| | | | Total Short-Term Investments (cost $1,558,292) | | | | | �� | | | | | | | | | | 1,558,292 | |
| | | | Total Investments (cost $105,834,980) – 138.3% | | | | | | | | | | | | | | | 105,349,292 | |
| | | | Reverse Repurchase Agreements – (22.9)% | | | | | | | | | | | | | | | (17,453,000 | ) |
| | | | Other Assets Less Liabilities – (15.4)% (9) | | | | | | | | | | | | | | | (11,719,062 | ) |
| | | | Net Assets – 100% | | | | | | | | | | | | | | $ | 76,177,230 | |
Investments in Derivatives as of December 31, 2016
Futures Contracts
| | | | | | | | | | | | | | | | | | | | | | | | |
| Description | | Contract
Position | | | Number of
Contracts | | | Contract
Expiration | | | Notional
Amount
at Value | | | Variation Margin
Receivable/(Payable) | | | Unrealized
Appreciation
(Depreciation) | |
U.S. Treasury 2-Year Note | | | Short | | | | (1 | ) | | | 3/17 | | | $ | (216,688 | ) | | $ | (63 | ) | | $ | 91 | |
U.S. Treasury 5-Year Note | | | Short | | | | (48 | ) | | | 3/17 | | | | (5,647,875 | ) | | | (7,875 | ) | | | 17,158 | |
U.S. Treasury 10-Year Note | | | Short | | | | (33 | ) | | | 3/17 | | | | (4,101,281 | ) | | | (11,343 | ) | | | 21,599 | |
U.S. Treasury Ultra Bond | | | Long | | | | 2 | | | | 3/17 | | | | 320,500 | | | | 1,938 | | | | (4,171 | ) |
| | | | | | | | | | | | | | | $ | (9,645,344 | ) | | $ | (17,343 | ) | | $ | 34,677 | |
For Fund portfolio compliance purposes, the Fund’s industry classifications refer to any one or more of the industry sub-classifications used by one or more widely recognized market indexes or ratings group indexes, and/or as defined by Fund management. This definition may not apply for purposes of this report, which may combine industry sub-classifications into sectors for reporting ease.
| (1) | All percentages shown in the Portfolio of Investments are based on net assets. |
| (2) | For financial reporting purposes, the ratings disclosed are the highest of Standard & Poor’s Group (“Standard & Poor’s”), Moody’s Investors Service, Inc. (“Moody’s”) or Fitch, Inc. (“Fitch”) rating. This treatment of split-rated securities may differ from that used for other purposes, such as for Fund investment policies. Ratings below BBB by Standard & Poor’s, Baa by Moody’s or BBB by Fitch are considered to be below investment grade. Holdings designated N/R are not rated by any of these national rating agencies. |
| (3) | As of, or subsequent to, the end of the reporting period this security is non-income producing. Non-income producing, in the case of a fixed-income security, generally denotes that the issuer has (1) defaulted on the payment of principal or interest, (2) is under the protection of the Federal Bankruptcy Court or (3) the Fund’s Adviser has concluded that the issue is not likely to meet its future interest payment obligations and has ceased accruing additional income on the Fund’s records. |
| (4) | Investment valued at fair value using methods determined in good faith by, or at the discretion of, the Board. For fair value measurement disclosure purposes, investment classified as Level 3. See Notes to Financial Statements, Note 2 – Investment Valuation and Fair Value Measurements for more information. |
| (5) | Contingent Capital Securities (“CoCos”) are debt or preferred securities with loss absorption characteristics built into the terms of the security for the benefit of the issuer, for example an automatic write-down of principal or a mandatory conversion into the issuer’s common stock under certain adverse circumstances, such as the issuer’s capital ratio falling below a specified level. As of the end of the reporting period, the Fund’s total investment in CoCos was $536,024, representing 0.7% and 0.5% of Net Assets and Total Investments, respectively. |
| (6) | Perpetual security. Maturity date is not applicable. |
| (7) | Investment, or portion of investment, has been pledged to collateralize the net payment obligations for investments in reverse repurchase agreements. |
| (8) | A copy of the most recent financial statements for these investment companies can be obtained directly from the Securities and Exchange Commission on its website at http://www.sec.gov. |
| (9) | Other assets less liabilities includes the unrealized appreciation (depreciation) of certain over-the-counter (“OTC”) derivatives as presented on the Statement of Assets and Liabilities, when applicable. The unrealized appreciation (depreciation) of OTC-cleared and exchange-traded derivatives is recognized as part of the cash collateral at brokers and/or the receivable or payable for variation margin as presented on the Statement of Assets and Liabilities, when applicable. |
| MDR | Denotes investment is subject to dollar roll transactions. |
| REIT | Real Estate Investment Trust |
| TBA | To be announced. Maturity date not known prior to settlement of this transaction. |
| 144A | Investment is exempt from registration under Rule 144A of the Securities Act of 1933, as amended. These investments may only be resold in transactions exempt from registration, which are normally those transactions with qualified institutional buyers. |
| (WI/DD) | Investment, or portion of investment, purchased on a when-issued or delayed delivery basis. |
See accompanying notes to financial statements.
| | | | | | |
Statement of Assets and Liabilities | | December 31, 2016 (Unaudited) |
| | | | |
Assets | | | | |
Long-term investments, at value (cost $104,276,688) | | $ | 103,791,000 | |
Short-term investments, at value (cost approximates value) | | | 1,558,292 | |
Cash | | | 10,718 | |
Cash collateral at broker[1] | | | 248,166 | |
Receivable for: | | | | |
Dividends | | | 6,303 | |
Interest | | | 636,335 | |
Investments sold | | | 360,500 | |
Variation margin on futures contracts | | | 1,938 | |
Other assets | | | 944 | |
Total assets | | | 106,614,196 | |
Liabilities | | | | |
Reverse repurchase agreements (including accrued interest) | | | 17,455,159 | |
Payable for: | | | | |
Investments purchased | | | 12,793,409 | |
Variation margin on futures contracts | | | 19,281 | |
Accrued expenses: | | | | |
Management fees | | | 77,190 | |
Trustees fees | | | 638 | |
Other | | | 91,289 | |
Total liabilities | | | 30,436,966 | |
Net assets | | $ | 76,177,230 | |
Shares outstanding | | | 9,462,350 | |
Net asset value (“NAV”) per share outstanding | | $ | 8.05 | |
Net assets consist of: | | | | |
Shares, $0.01 par value per share | | $ | 94,624 | |
Paid-in surplus | | | 82,347,967 | |
Undistributed (Over-distribution of) net investment income | | | (54,338 | ) |
Accumulated net realized gain (loss) | | | (5,760,012 | ) |
Net unrealized appreciation (depreciation) | | | (451,011 | ) |
Net assets | | $ | 76,177,230 | |
Authorized shares | | | Unlimited | |
| (1) | Cash pledged to collateralize the net payment obligations for investments in derivatives. |
See accompanying notes to financial statements.
| | | | | | |
Statement of Operations | | Six Months Ended December 31, 2016 (Unaudited) |
| | | | |
Investment Income | | | | |
Dividends | | $ | 35,184 | |
Interest | | | 2,419,801 | |
Total investment income | | | 2,454,985 | |
Expenses | | | | |
Management fees | | | 472,965 | |
Interest expense | | | 72,877 | |
Custodian fees | | | 36,607 | |
Trustees fees | | | 1,650 | |
Professional fees | | | 22,194 | |
Shareholder reporting expenses | | | 21,528 | |
Shareholder servicing agent fees | | | 4,267 | |
Stock exchange listing fees | | | 3,938 | |
Investor relations expense | | | 6,806 | |
Other | | | 12,235 | |
Total expenses before fee waiver/expense reimbursement | | | 655,067 | |
Fee waiver/expense reimbursement | | | (53,329 | ) |
Net expenses | | | 601,738 | |
Net investment income (loss) | | | 1,853,247 | |
Realized and Unrealized Gain (Loss) | | | | |
Net realized gain (loss) from: | | | | |
Investments | | | (859,446 | ) |
Futures contracts | | | 62,413 | |
Change in net unrealized appreciation (depreciation) of: | | | | |
Investments | | | 462,150 | |
Futures contracts | | | 353,210 | |
Net realized and unrealized gain (loss) | | | 18,327 | |
Net increase (decrease) in net assets from operations | | $ | 1,871,574 | |
See accompanying notes to financial statements.
| | | | | | |
Statement of Changes in Net Assets | | (Unaudited) |
| | | | | | | | |
| | | Six Months
Ended
12/31/16 | | | Year
Ended
6/30/16 | |
Operations | | | | | | | | |
Net investment income (loss) | | $ | 1,853,247 | | | $ | 3,860,842 | |
Net realized gain (loss) from: | | | | | | | | |
Investments | | | (859,446 | ) | | | (2,007,244 | ) |
Futures contracts | | | 62,413 | | | | (456,958 | ) |
Change in net unrealized appreciation (depreciation) of: | | | | | | | | |
Investments | | | 462,150 | | | | 382,315 | |
Futures contracts | | | 353,210 | | | | (410,220 | ) |
Net increase (decrease) in net assets from operations | | | 1,871,574 | | | | 1,368,735 | |
Distributions to Shareholders | | | | | | | | |
From net investment income | | | (2,043,867 | ) | | | (4,504,138 | ) |
Decrease in net assets from distributions to shareholders | | | (2,043,867 | ) | | | (4,504,138 | ) |
Capital Share Transactions | | | | | | | | |
Cost of shares repurchased and retired | | | — | | | | (12,867 | ) |
Net increase (decrease) in net assets from capital share transactions | | | — | | | | (12,867 | ) |
Net increase (decrease) in net assets | | | (172,293 | ) | | | (3,148,270 | ) |
Net assets at the beginning of period | | | 76,349,523 | | | | 79,497,793 | |
Net assets at the end of period | | $ | 76,177,230 | | | $ | 76,349,523 | |
Undistributed (Over-distribution of) net investment income at the end of period | | $ | (54,338 | ) | | $ | 136,282 | |
See accompanying notes to financial statements.
| | | | | | |
Statement of Cash Flows | | Six Months Ended December 31, 2016 (Unaudited) |
| | | | |
Cash Flows from Operating Activities: | | | | |
Net Increase (Decrease) in Net Assets from Operations | | $ | 1,871,574 | |
Adjustments to reconcile the net increase (decrease) in net assets from
operations to net cash provided by (used in) operating activities: | | | | |
Purchases of investments | | | (70,962,362 | ) |
Proceeds from sales and maturities of investments | | | 74,903,099 | |
Proceeds from (Purchases of) short-term investments, net | | | (743,903 | ) |
Amortization (Accretion) of premiums and discounts, net | | | (53,433 | ) |
(Increase) Decrease in: | | | | |
Cash collateral at broker | | | (120,166 | ) |
Receivable for dividends | | | (2,678 | ) |
Receivable for interest | | | 98,699 | |
Receivable for investments sold | | | (15,831 | ) |
Receivable for paydowns | | | 6,273 | |
Receivable for variation margin on futures | | | 1,734 | |
Other assets | | | 3,995 | |
Increase (Decrease) in: | | | | |
Payable for investments purchased | | | (311,969 | ) |
Payable for variation margin on futures contracts | | | 13,609 | |
Accrued management fees | | | 10,790 | |
Accrued Trustees fees | | | 65 | |
Accrued other expenses | | | (11,075 | ) |
Net realized (gain) loss from: | | | | |
Investments | | | 859,446 | |
Paydowns | | | 37,882 | |
Change in net unrealized appreciation (depreciation) of investments | | | (462,150 | ) |
Net cash provided by (used in) operating activities | | | 5,123,599 | |
Cash Flows from Financing Activities: | | | | |
Net borrowings through reverse repurchase agreements | | | (2,865,091 | ) |
Cash distributions paid to shareholders | | | (2,361,919 | ) |
Net cash provided by (used in) financing activities | | | (5,227,010 | ) |
Net Increase (Decrease) in Cash | | | (103,411 | ) |
Cash at the beginning of period | | | 114,129 | |
Cash at the end of period | | $ | 10,718 | |
| |
| Supplemental Disclosures of Cash Flow Information | | | |
Cash paid for interest | | $ | 73,968 | |
See accompanying notes to financial statements.
THIS PAGE INTENTIONALLY LEFT BLANK
Financial
Highlights (Unaudited)
Selected data for a share outstanding throughout each period:
| | | | | | | | | | | | | | | | | | | | | | | | | | | | | | | | | | | | | | | | | | | | |
| | | | | | |
| | | | | | Investment Operations | | | Less Distributions | | | | | | | | | | |
| | | Beginning
NAV | | | Net
Investment
Income
(Loss)(a) | | | Net
Realized/
Unrealized
Gain (Loss) | | | Total | | | From
Net
Investment
Income | | | From
Accumulated
Net Realized
Gains | | | Return
of
Capital | | | Total | | | Discount
From
Shares
Repurchase
and Retired | | | Ending
NAV | | | Ending
Share
Price | |
Year Ended 6/30: | | | | | | | | | | | | | | | | | | | | | | | | | | | | | | | | | | | | | | | | | | | | |
2017(g) | | $ | 8.07 | | | $ | 0.20 | | | $ | — | ** | | $ | 0.20 | | | $ | (0.22 | ) | | $ | — | | | $ | — | | | $ | (0.22 | ) | | $ | — | | | $ | 8.05 | | | $ | 7.30 | |
2016 | | | 8.40 | | | | 0.41 | | | | (0.26 | ) | | | 0.15 | | | | (0.48 | ) | | | — | | | | — | | | | (0.48 | ) | | | — | ** | | | 8.07 | | | | 7.48 | |
2015 | | | 8.72 | | | | 0.47 | | | | (0.31 | ) | | | 0.16 | | | | (0.48 | ) | | | — | | | | — | | | | (0.48 | ) | | | — | | | | 8.40 | | | | 7.21 | |
2014(f) | | | 8.34 | | | | 0.40 | | | | 0.39 | | | | 0.79 | | | | (0.41 | ) | | | — | | | | — | | | | (0.41 | ) | | | — | | | | 8.72 | | | | 7.77 | |
Year Ended 8/31: | | | | | | | | | | | | | | | | | | | | | | | | | | | | | | | | | | | | | | | | | | | | |
2013 | | | 8.49 | | | | 0.53 | | | | (0.12 | ) | | | 0.41 | | | | (0.56 | ) | | | — | | | | — | | | | (0.56 | ) | | | — | | | | 8.34 | | | | 7.25 | |
2012 | | | 8.42 | | | | 0.59 | | | | 0.10 | | | | 0.69 | | | | (0.60 | ) | | | — | | | | (0.02 | ) | | | (0.62 | ) | | | — | | | | 8.49 | | | | 8.10 | |
2011 | | | 8.37 | | | | 0.63 | | | | 0.08 | | | | 0.71 | | | | (0.66 | ) | | | — | | | | — | | | | (0.66 | ) | | | — | | | | 8.42 | | | | 7.72 | |
| | | | | | | | | | | | | | | | | | | | | | | | | | | | | | |
| | | | | | | Ratios/Supplemental Data | | | | |
| Total Returns | | | | | | Ratios to Average Net Assets
Before Reimbursement(c) | | | Ratios to Average Net Assets
After Reimbursement(c)(d) | | | | |
Based
on
NAV(b) | | |
Based
on
Share
Price(b) | | | Ending
Net
Assets
(000) | | | Expenses | | | Net
Investment
Income (Loss) | | | Expenses | | | Net
Investment
Income (Loss) | | | Portfolio
Turnover
Rate(e) | |
| | | | | | | | | | | | | | | | | | | | | | | | | | | | | | |
| | 2.56 | % | | | 0.47 | % | | $ | 76,177 | | | | 1.69 | %* | | | 4.65 | %* | | | 1.55 | %* | | | 4.79 | %* | | | 74 | % |
| | 1.89 | | | | 10.86 | | | | 76,350 | | | | 1.68 | | | | 4.66 | | | | 1.30 | | | | 5.05 | | | | 205 | |
| | 1.88 | | | | (1.24 | ) | | | 79,498 | | | | 1.60 | | | | 5.14 | | | | 1.26 | | | | 5.47 | | | | 143 | |
| | 9.68 | | | | 13.10 | | | | 82,558 | | | | 1.22 | * | | | 5.68 | * | | | 1.22 | * | | | 5.68 | * | | | 251 | |
| | | | | | | | | | | | | | | | | | | | | | | | | | | | | | |
| | 4.93 | | | | (4.19 | ) | | | 78,902 | | | | 1.18 | | | | 6.20 | | | | 1.18 | | | | 6.20 | | | | 310 | |
| | 8.56 | | | | 13.58 | | | | 80,366 | | | | 1.25 | | | | 7.05 | | | | 1.25 | | | | 7.05 | | | | 260 | |
| | 8.75 | | | | (3.15 | ) | | | 79,671 | | | | 1.17 | | | | 7.37 | | | | 1.17 | | | | 7.37 | | | | 265 | |
| (a) | Per share Net Investment Income (Loss) is calculated using the average daily shares method. |
| (b) | Total Return Based on NAV is the combination of changes in NAV, reinvested dividend income at NAV and reinvested capital gains distributions at NAV, if any. The last dividend declared in the period, which is typically paid on the first business day of the following month, is assumed to be reinvested at the ending NAV. The actual reinvest price for the last dividend declared in the period may often be based on the Fund’s market price (and not its NAV), and therefore may be different from the price used in the calculation. Total returns are not annualized. |
Total Return Based on Share Price is the combination of changes in the market price per share and the effect of reinvested dividend income and reinvested capital gains distributions, if any, at the average price paid per share at the time of reinvestment. The last dividend declared in the period, which is typically paid on the first business day of the following month, is assumed to be reinvested at the ending market price. The actual reinvestment for the last dividend declared in the period may take place over several days, and in some instances may not be based on the market price, so the actual reinvestment price may be different from the price used in the calculation. Total returns are not annualized.
| (c) • | Net Investment Income (Loss) ratios reflect income earned and expenses incurred on assets attributable to reverse repurchase agreements (as described in Note 8 – Fund Leverage, Reverse Repurchase Agreements), where applicable. |
| | • | Each ratio includes the effect of all interest expenses paid and other costs related to reverse repurchase agreements, where applicable, as follows: |
| | | | |
Ratios of Interest Expense to Average Net Assets | |
Year Ended 6/30: | |
2017(g) | | | 0.19 | %* |
2016 | | | 0.15 | |
2015 | | | 0.12 | |
2014(f) | | | 0.06 | * |
Year Ended 8/31: | | | | |
2013 | | | 0.04 | |
2012 | | | 0.06 | |
2011 | | | 0.06 | |
| (d) | After fee waiver and/or expense reimbursement from the Adviser, where applicable. As of September 8, 2016, the Adviser is no longer contractually reimbursing the Fund for any fees and expenses. |
| (e) | Portfolio Turnover Rate is calculated based on the lesser of long-term purchases or sales (as disclosed in Note 5 – Investment Transactions) divided by the average long-term market value during the period. |
| (f) | For the ten months ended June 30, 2014. |
| (g) | For the six months ended December 31, 2016. |
| ** | Rounds to less than $0.01 per share. |
See accompanying notes to financial statements.
Notes to
Financial Statements (Unaudited)
1. General Information and Significant Accounting Policies
General Information
Fund Information
Nuveen Multi-Market Income Fund (the “Fund”) is registered under the Investment Company Act of 1940, as amended, as a diversified closed-end management investment company. The Fund’s shares are listed on the New York Stock Exchange (“NYSE”) and trade under the ticker symbol “JMM.” The Fund was organized as a Massachusetts business trust on May 27, 2014.
The end of the reporting period for the Fund is December 31, 2016, and the period covered by these Notes to Financial Statements is the six months ended December 31, 2016 (the “current fiscal period”).
Investment Adviser
The Fund’s investment adviser is Nuveen Fund Advisors, LLC (the “Adviser”), a subsidiary of Nuveen, LLC (“Nuveen”). Nuveen is the investment management arm of Teachers Insurance and Annuity Association of America (TIAA). The Adviser has overall responsibility for management of the Fund, oversees the management of the Fund’s portfolios, manages the Fund’s business affairs and provides certain clerical, bookkeeping and other administrative services, and, if necessary, asset allocation decisions. The Adviser has entered into a sub-advisory agreement with Nuveen Asset Management, LLC (the “Sub-Adviser”), a subsidiary of the Adviser, under which the Sub-Adviser manages the Fund’s investment portfolio.
Investment Objective and Principal Investment Strategies
The Fund seeks to provide high monthly income consistent with prudent risk to capital. The Fund will invest primarily in debt securities, including, but not limited to, U.S. agency and privately issued mortgage-backed securities, corporate debt securities, and asset-backed securities. Under normal market conditions, at least 65% of the Fund’s total assets must be invested in securities that, at the time of purchase, are rated investment-grade or of comparable quality. No more than 35% of the Fund’s total assets may be held in high-yield issues. The Fund is authorized to borrow funds or issue senior securities in amounts not exceeding 33 1⁄3% of its total assets. The Fund may utilize derivatives including options; futures contracts; options on futures contracts; interest-rate caps, collars and floors; interest-rate, total return, and credit default swap agreements; and options on the foregoing type of swap agreements.
Significant Accounting Policies
The Fund is an investment company and follows accounting and reporting guidance under Financial Accounting Standards Board (FASB) Accounting Standards Codification (ASC) Topic 946 “Financial Services – Investment Companies.” The following is a summary of significant accounting policies followed by the Fund in the preparation of its financial statements in accordance with U.S. generally accepted accounting principles (“U.S. GAAP”).
Investment Transactions
Investment transactions are recorded on a trade date basis. Realized gains and losses from investment transactions are determined on the specific identification method, which is the same basis used for federal income tax purposes. Investments purchased on a when-issued/delayed delivery basis may have extended settlement periods. Any investments so purchased are subject to market fluctuation during this period. The Fund has earmarked securities in its portfolio with a current value at least equal to the amount of the when-issued/delayed delivery purchase commitments.
As of the end of the reporting period, the Fund’s outstanding when-issued/delayed delivery purchase commitments were as follows:
| | | | |
Outstanding when-issued/delayed delivery purchase commitments | | | $12,580,601 | |
Investment Income
Dividend income is recorded on the ex-dividend date or, for foreign securities, when information is available. Interest income, which reflects the amortization of premiums and includes accretion of discounts for financial reporting purposes, is recorded on an accrual basis. Interest income also reflects paydown gains and losses, if any.
Professional Fees
Professional fees presented on the Statement of Operations consist of legal fees incurred in the normal course of operations, audit fees, tax consulting fees and, in some cases, workout expenditures. Workout expenditures are incurred in an attempt to protect or enhance an investment or to pursue other claims or legal actions on behalf of Fund shareholders. If a refund is received for workout expenditures paid in a prior reporting period, such amounts will be recognized as “Legal fee refund” on the Statement of Operations.
Dividends and Distributions to Shareholders
Dividends from net investment income are declared monthly. Net realized capital gains from investment transactions, if any, are distributed to shareholders at least annually. Furthermore, capital gains are distributed only to the extent they exceed available capital loss carryforwards.
Distributions to shareholders are recorded on the ex-dividend date. The amount and timing of distributions are determined in accordance with federal income tax regulations, which may differ from U.S. GAAP.
Indemnifications
Under the Fund’s organizational documents, its officers and trustees are indemnified against certain liabilities arising out of the performance of their duties to the Fund. In addition, in the normal course of business, the Fund enters into contracts that provide general indemnifications to other parties. The Fund’s maximum exposure under these arrangements is unknown as this would involve future claims that may be made against the Fund that have not yet occurred. However, the Fund has not had prior claims or losses pursuant to these contracts and expects the risk of loss to be remote.
Netting Agreements
In the ordinary course of business, the Fund may enter into transactions subject to enforceable master repurchase agreements, International Swaps and Derivative Association, Inc. (“ISDA”) master agreements or other similar arrangements (“netting agreements”). Generally, the right to offset in netting agreements allows the Fund to offset certain securities and derivatives with a specific counterparty, when applicable, as well as any collateral received or delivered to that counterparty based on the terms of the agreements. Generally, the Fund manages its cash collateral and securities collateral on a counterparty basis.
The Fund’s investments subject to netting agreements as of the end of the reporting period, if any, are further described in Note 3 – Portfolio Securities and Investments in Derivatives.
Use of Estimates
The preparation of financial statements in conformity with U.S. GAAP requires management to make estimates and assumptions that affect the reported amounts of assets and liabilities at the date of the financial statements and the reported amounts of increases and decreases in net assets from operations during the current fiscal period. Actual results may differ from those estimates.
2. Investment Valuation and Fair Value Measurements
The fair valuation input levels as described below are for fair value measurement purposes.
Fair value is defined as the price that would be received upon selling an investment or transferring a liability in an orderly transaction to an independent buyer in the principal or most advantageous market for the investment. A three-tier hierarchy is used to maximize the use of observable market data and minimize the use of unobservable inputs and to establish classification of fair value measurements for disclosure purposes. Observable inputs reflect the assumptions market participants would use in pricing the asset or liability. Observable inputs are based on market data obtained from sources independent of the reporting entity. Unobservable inputs reflect the reporting entity’s own assumptions about the assumptions market participants would use in pricing the asset or liability. Unobservable inputs are based on the best information available in the circumstances. The following is a summary of the three-tiered hierarchy of valuation input levels.
| | |
| Level 1 – | | Inputs are unadjusted and prices are determined using quoted prices in active markets for identical securities. |
| Level 2 – | | Prices are determined using other significant observable inputs (including quoted prices for similar securities, interest rates, prepayment speeds, credit risk, etc.). |
| Level 3 – | | Prices are determined using significant unobservable inputs (including management’s assumptions in determining the fair value of investments). |
Common stocks and other equity-type securities are valued at the last sales price on the securities exchange on which such securities are primarily traded and are generally classified as level 1. Securities primarily traded on the NASDAQ National Market (“NASDAQ”) are valued at the NASDAQ Official Closing price and are generally classified as Level 1. However, securities traded on a securities exchange or NASDAQ for which there were no transactions on a given day or securities not listed on a securities exchange or NASDAQ are valued at the quoted bid price and are generally classified as Level 2.
Prices of fixed-income securities are provided by an independent pricing service (“pricing service”) approved by the Fund’s Board of Trustees (the “Board”). The pricing service establishes a security’s fair value using methods that may include consideration of the following: yields or prices of investments of comparable quality, type of issue, coupon, maturity and rating, market quotes or indications of value from security dealers, evaluations of anticipated cash flows or collateral, general market conditions and other information and analysis, including the obligor’s credit characteristics considered relevant. These securities are generally classified as Level 2. In pricing certain securities, particularly less liquid and lower quality securities, the pricing service may consider information about a security, its issuer or market activity, provided by the Adviser. These securities are generally classified as Level 2 or Level 3 depending on the observability of the significant inputs.
Investments in investment companies are valued at their respective net asset value (“NAV”) on valuation date and are generally classified as Level 1.
Notes to Financial Statements (Unaudited) (continued)
Futures contracts are valued using the closing settlement price or, in the absence of such a price, the last traded price, and are generally classified as Level 1.
Repurchase agreements are valued at contract amount plus accrued interest, which approximates market value. These securities are generally classified as Level 2.
Certain securities may not be able to be priced by the pre-established pricing methods as described above. Such securities may be valued by the Board and/or its appointee at fair value. These securities generally include, but are not limited to, restricted securities (securities which may not be publicly sold without registration under the Securities Act of 1933, as amended) for which a pricing service is unable to provide a market price; securities whose trading has been formally suspended; debt securities that have gone into default and for which there is no current market quotation; a security whose market price is not available from a pre-established pricing source; a security with respect to which an event has occurred that is likely to materially affect the value of the security after the market has closed but before the calculation of the Fund’s NAV (as may be the case in non-U.S. markets on which the security is primarily traded) or make it difficult or impossible to obtain a reliable market quotation; and a security whose price, as provided by the pricing service, is not deemed to reflect the security’s fair value. As a general principle, the fair value of a security would appear to be the amount that the owner might reasonably expect to receive for it in a current sale. A variety of factors may be considered in determining the fair value of such securities, which may include consideration of the following: yields or prices of investments of comparable quality, type of issue, coupon, maturity and rating, market quotes or indications of value from security dealers, evaluations of anticipated cash flows or collateral, general market conditions and other information and analysis, including the obligor’s credit characteristics considered relevant. These securities are generally classified as Level 2 or Level 3 depending on the observability of the significant inputs. Regardless of the method employed to value a particular security, all valuations are subject to review by the Board and/or its appointee.
The inputs or methodologies used for valuing securities are not an indication of the risks associated with investing in those securities. The following is a summary of the Fund’s fair value measurements as of the end of the reporting period:
| | | | | | | | | | | | | | | | |
| | | Level 1 | | | Level 2 | | | Level 3 | | | Total | |
Long-Term Investments*: | | | | | | | | | | | | | | | | |
Convertible Preferred Securities | | $ | 233,360 | | | $ | — | | | $ | — | | | $ | 233,360 | |
Corporate Bonds | | | — | | | | 24,643,952 | | | | — | *** | | | 24,643,952 | |
$1,000 Par (or similar) Institutional Preferred | | | — | | | | 504,414 | | | | — | | | | 504,414 | |
Asset-Backed and Mortgage-Backed Securities | | | — | | | | 77,758,645 | | | | — | | | | 77,758,645 | |
Investment Companies | | | 498,557 | | | | — | | | | — | | | | 498,557 | |
Sovereign Debt | | | — | | | | 152,072 | | | | — | | | | 152,072 | |
| | | | |
Short-Term Investments: | | | | | | | | | | | | | | | | |
Repurchase Agreements | | | — | | | | 1,558,292 | | | | — | | | | 1,558,292 | |
| | | | |
Investments in Derivatives: | | | | | | | | | | | | | | | | |
Futures Contracts** | | | 34,677 | | | | — | | | | — | | | | 34,677 | |
Total | | $ | 766,594 | | | $ | 104,617,375 | | | $ | — | | | $ | 105,383,969 | |
| * | Refer to the Fund’s Portfolio of Investments for industry and country classifications, where applicable. |
| ** | Represents net unrealized appreciation (depreciation) as reported in the Fund’s Portfolio of Investments. |
| *** | Refer to Fund’s Portfolio of Investments for securities classified as Level 3. Value equals zero as of the end of the reporting period. |
The Board is responsible for the valuation process and has appointed the oversight of the daily valuation process to the Adviser’s Valuation Committee. The Valuation Committee, pursuant to the valuation policies and procedures adopted by the Board, is responsible for making fair value determinations, evaluating the effectiveness of the Fund’s pricing policies and reporting to the Board. The Valuation Committee is aided in its efforts by the Adviser’s dedicated Securities Valuation Team, which is responsible for administering the daily valuation process and applying fair value methodologies as approved by the Valuation Committee. When determining the reliability of independent pricing services for investments owned by the Fund, the Valuation Committee, among other things, conducts due diligence reviews of the pricing services and monitors the quality of security prices received through various testing reports conducted by the Securities Valuation Team.
The Valuation Committee will consider pricing methodologies it deems relevant and appropriate when making a fair value determination, based on the facts and circumstances specific to the portfolio instrument. Fair value determinations generally will be derived as follows, using public or private market information:
| | (i) | If available, fair value determinations shall be derived by extrapolating from recent transactions or quoted prices for identical or comparable securities. |
| | (ii) | If such information is not available, an analytical valuation methodology may be used based on other available information including, but not limited to: analyst appraisals, research reports, corporate action information, issuer financial statements and shelf registration statements. Such analytical valuation methodologies may include, but are not limited to: multiple of earnings, discount from market value of a similar freely-traded security, discounted cash flow analysis, book value or a multiple thereof, risk premium/yield analysis, yield to maturity and/or fundamental investment analysis. |
The purchase price of a portfolio instrument will be used to fair value the instrument only if no other valuation methodology is available or deemed appropriate, and it is determined that the purchase price fairly reflects the instrument’s current value.
For each portfolio security that has been fair valued pursuant to the policies adopted by the Board, the fair value price is compared against the last available and next available market quotations. The Valuation Committee reviews the results of such testing and fair valuation occurrences are reported to the Board.
3. Portfolio Securities and Investments in Derivatives
Portfolio Securities
Dollar Roll Transactions
The Fund is authorized to enter into dollar roll transactions (“dollar rolls”) in which the Fund purchases or sells mortgage-backed securities (“MBS”) for delivery in the future and simultaneously contracts to sell or repurchase a substantially similar (same type, coupon, and maturity) MBS on a different specified future date. Dollar rolls are identified in the Portfolio of Investments as “MDR”, when applicable. During the roll period, the Fund foregoes principal and interest paid on the MBS. The Fund is compensated by the difference between the current sales price and the lower forward price for the future purchase. Such compensation is recognized as a component of “Net realized gain (loss) from investments” on the Statement of Operations. Dollar rolls are valued daily.
Dollar rolls involve the risk that the market value of the MBS the Fund is obligated to repurchase under an agreement may decline below the repurchase price. These transactions also involve some risk to the Fund if the other party should default on its obligation and the Fund is delayed or prevented from completing the transaction. In the event that the buyer of securities under a dollar roll files for bankruptcy or becomes insolvent, the Fund’s use of proceeds of the dollar roll may be restricted pending a determination by the other party, or its trustee or receiver, whether to enforce the Fund’s obligation to repurchase the securities.
Repurchase Agreements
In connection with transactions in repurchase agreements, it is the Fund’s policy that its custodian take possession of the underlying collateral securities, the fair value of which exceeds the principal amount of the repurchase transaction, including accrued interest, at all times. If the counterparty defaults, and the fair value of the collateral declines, realization of the collateral may be delayed or limited.
The following table presents the repurchase agreements for the Fund that are subject to netting agreements as of the end of the reporting period, and the collateral delivered related to those repurchase agreements.
| | | | | | | | | | | | |
| Counterparty | | Short-Term
Investments, at Value | | | Collateral
Pledged (From)
Counterparty* | | | Net
Exposure | |
State Street Bank | | $ | 1,558,292 | | | $ | (1,558,292 | ) | | $ | — | |
| * | As of the end of the reporting period, the value of the collateral pledged from the counterparty exceeded the value of the repurchase agreements. Refer to the Fund’s Portfolio of Investments for details on the repurchase agreements. |
Zero Coupon Securities
A zero coupon security does not pay a regular interest coupon to its holders during the life of the security. Income to the holder of the security comes from accretion of the difference between the original purchase price of the security at issuance and the par value of the security at maturity and is effectively paid at maturity. The market prices of zero coupon securities generally are more volatile than the market prices of securities that pay interest periodically.
Investment in Derivatives
The Fund is authorized to invest in certain derivative instruments, such as futures, options and swap contracts. The Fund limits its investments in futures, options on futures and swap contracts to the extent necessary for the Adviser to claim the exclusion from registration by the Commodity Futures Trading Commission as a commodity pool operator with respect to the Fund. The Fund records derivative instruments at fair value, with changes in fair value recognized on the Statement of Operations, when applicable. Even though the Fund’s investments in derivatives may represent economic hedges, they are not considered to be hedge transactions for financial reporting purposes.
Futures Contracts
Upon execution of a futures contract, the Fund is obligated to deposit cash or eligible securities, also known as “initial margin,” into an account at its clearing broker equal to a specified percentage of the contract amount. Cash held by the broker to cover initial margin requirements on open futures contracts, if any, is recognized as “Cash collateral at brokers” on the Statement of Assets and Liabilities. Investments in futures contracts obligate the
Notes to Financial Statements (Unaudited) (continued)
Fund and the clearing broker to settle monies on a daily basis representing changes in the prior days “mark-to-market” of the open contracts. If the Fund has unrealized appreciation the clearing broker would credit the Fund’s account with an amount equal to appreciation and conversely if the Fund has unrealized depreciation the clearing broker would debit the Fund’s account with an amount equal to depreciation. These daily cash settlements are also known as “variation margin.” Variation margin is recognized as a receivable and/or payable for “Variation margin on futures contracts” on the Statement of Assets and Liabilities.
During the period the futures contract is open, changes in the value of the contract are recognized as an unrealized gain or loss by “marking-to-market” on a daily basis to reflect the changes in market value of the contract, which is recognized as a component of “Change in net unrealized appreciation (depreciation) of futures contracts” on the Statement of Operations. When the contract is closed or expired, the Fund records a realized gain or loss equal to the difference between the value of the contract on the closing date and value of the contract when originally entered into, which is recognized as a component of “Net realized gain (loss) from futures contracts” on the Statement of Operations.
Risks of investments in futures contracts include the possible adverse movement in the price of the securities or indices underlying the contracts, the possibility that there may not be a liquid secondary market for the contracts and/or that a change in the value of the contract may not correlate with a change in the value of the underlying securities or indices.
During the current fiscal period, the Fund used U.S. Treasury futures as part of an overall portfolio construction strategy to manage duration and overall portfolio yield curve exposure.
The average notional amount of futures contracts outstanding during the current fiscal period was as follows:
| | | | |
Average notional amount of futures contracts outstanding* | | | $12,631,715 | |
| * | The average notional amount is calculated based on the absolute aggregate national amount of contracts outstanding at the beginning of the fiscal period and at the end of each quarter within the current fiscal period. |
The following table presents the fair value of all futures contracts held by the Fund as of the end of the reporting period, the location of these instruments on the Statement of Assets and Liabilities and the primary underlying risk exposure.
| | | | | | | | | | | | | | | | | | |
| | | | | Location on the Statement of Assets and Liabilities | |
Underlying Risk Exposure | | Derivative Instrument | | Asset Derivatives | | | | | | (Liability) Derivatives | |
| | | Location | | Value | | | | | | Location | | Value | |
| Interest rate | | Futures contracts | | Receivable for variation margin on futures contracts* | | $ | (4,171 | ) | | | | | | Payable for variation margin on futures contracts* | | $ | 38,848 | |
| * | Value represents unrealized appreciation (depreciation) of futures contracts as reported in the Fund’s Portfolio of Investments and not the asset and/or liability derivative location as described in the table above. |
The following table presents the amount of net realized gain (loss) and change in net unrealized appreciation (depreciation) recognized on futures contracts on the Statement of Operations during the current fiscal period, and the primary underlying risk exposure.
| | | | | | | | | | |
Underlying Risk Exposure | | Derivative Instrument | | Net Realized
Gain (Loss) from
Futures Contracts | | | Change in Net Unrealized
Appreciation (Depreciation) of
Futures Contracts | |
Interest rate | | Futures contracts | | $ | 62,413 | | | $ | 353,210 | |
Market and Counterparty Credit Risk
In the normal course of business the Fund may invest in financial instruments and enter into financial transactions where risk of potential loss exists due to changes in the market (market risk) or failure of the other party to the transaction to perform (counterparty credit risk). The potential loss could exceed the value of the financial assets recorded on the financial statements. Financial assets, which potentially expose the Fund to counterparty credit risk, consist principally of cash due from counterparties on forward, option and swap transactions, when applicable. The extent of the Fund’s exposure to counterparty credit risk in respect to these financial assets approximates their carrying value as recorded on the Statement of Assets and Liabilities.
The Fund helps manage counterparty credit risk by entering into agreements only with counterparties the Adviser believes have the financial resources to honor their obligations and by having the Adviser monitor the financial stability of the counterparties. Additionally, counterparties may be required to pledge collateral daily (based on the daily valuation of the financial asset) on behalf of the Fund with a value approximately equal to the amount of any unrealized gain above a pre-determined threshold. Reciprocally, when the Fund has an unrealized loss, the Fund has instructed the custodian to pledge assets of the Fund as collateral with a value approximately equal to the amount of the unrealized loss above a pre-determined threshold. Collateral pledges are monitored and subsequently adjusted if and when the valuations fluctuate, either up or down, by at least the pre-determined threshold amount.
4. Fund Shares
Share Transactions
Transactions in shares during the current and prior fiscal period were as follows:
| | | | | | | | |
| | | Six Months Ended 12/31/16 | | | Year Ended
6/30/16 | |
Shares repurchased and retired | | | — | | | | (1,800 | ) |
Weighted average: | | | | | | | | |
Price per share repurchased and retired | | | $ — | | | $ | 7.13 | |
Discount per share repurchased and retired | | | — | % | | | 14.62 | % |
5. Investment Transactions
Long-term purchases and sales (including maturities and dollar roll transactions, but excluding derivative transactions) during the current fiscal period aggregated $70,962,362 and $74,903,099 respectively.
6. Income Tax Information
The Fund intends to distribute substantially all of its net investment company taxable income to shareholders and to otherwise comply with the requirements of Subchapter M of the Internal Revenue Code applicable to regulated investment companies. Therefore, no federal income tax provision is required.
For all open tax years and all major taxing jurisdictions, management of the Fund has concluded that there are no significant uncertain tax positions that would require recognition in the financial statements. Open tax years are those that are open for examination by taxing authorities (i.e., generally the last four tax year ends and the interim tax period since then). Furthermore, management of the Fund is also not aware of any tax positions for which it is reasonably possible that the total amounts of unrecognized tax benefits will significantly change in the next twelve months.
The following information is presented on an income tax basis. Differences between amounts for financial statement and federal income tax purposes are primarily due to timing differences in recognizing certain gains and losses on investment transactions. To the extent that differences arise that are permanent in nature, such amounts are reclassified within the capital accounts as detailed below. Temporary differences do not require reclassification. Temporary and permanent differences do not impact the NAV of the Fund.
As of December 31, 2016, the cost and unrealized appreciation (depreciation) of investments (excluding investments in derivatives), as determined on a federal income tax basis, were as follows:
| | | | |
Cost of investments | | $ | 106,074,913 | |
Gross unrealized: | | | | |
Appreciation | | $ | 2,118,081 | |
Depreciation | | | (2,843,702 | ) |
Net unrealized appreciation (depreciation) of investments | | $ | (725,621 | ) |
Permanent differences, primarily due to paydowns and bond premium amortization adjustments, resulted in reclassifications among the Fund’s components of net assets as of June 30, 2016, the Fund’s last tax year end, as follows:
| | | | |
Paid-in surplus | | $ | — | |
Undistributed (Over-distribution of) net investment income | | | 858,280 | |
Accumulated net realized gain (loss) | | | (858,280 | ) |
|
| The tax components of undistributed net ordinary income and net long-term capital gains as of June 30, 2016, the Fund’s last tax year end, were as follows: | |
Undistributed net ordinary income1 | | $ | 697,627 | |
Undistributed net long-term capital gains | | | — | |
1 Net ordinary income consists of net taxable income derived from dividends and interest, and net short-term capital gains, if any. | |
| The tax character of distributions paid during the Fund’s last tax year ended June 30, 2016 was designated for purposes of the dividends paid deduction as follows: | |
| |
| | | | |
Distributions from net ordinary income1 | | $ | 4,542,059 | |
Distributions from net long-term capital gains | | | — | |
| 1 | Net ordinary income consists of net taxable income derived from dividends and interest, and net short-term capital gains, if any. |
Notes to Financial Statements (Unaudited) (continued)
As of June 30, 2016, the Fund’s last tax year end, the Fund had unused capital losses carrying forward available for federal income tax purposes to be applied against future capital gains, if any. The capital losses are not subject to expiration.
| | | | |
Capital losses to be carried forward – not subject to expiration | | | $ 5,257,851 | |
7. Management Fees and Other Transactions with Affiliates
Management Fees
The Fund’s management fee compensates the Adviser for overall investment advisory and administrative services and general office facilities. The Sub-Adviser is compensated for its services to the Fund from the management fees paid to the Adviser.
The Fund’s management fee consists of two components – a fund-level fee, based only on the amount of assets within the Fund, and a complex-level fee, based on the aggregate amount of all eligible fund assets managed by the Adviser. This pricing structure enables Fund shareholders to benefit from growth in the assets within the Fund as well as from growth in the amount of complex-wide assets managed by the Adviser.
For the period July 1, 2016 through July 31, 2016, the annual Fund-level fee, payable monthly, was calculated according to the following schedule:
| | | | |
| Average Daily Managed Assets* | | Fund-Level Fee | |
For the first $125 million | | | 0.7000 | % |
For the next $125 million | | | 0.6875 | |
For the next $250 million | | | 0.6750 | |
For the next $500 million | | | 0.6625 | |
For managed assets over $1 billion | | | 0.6500 | |
Effective August 1, 2016, the annual Fund-level fee, payable monthly, is calculated according to the following schedule:
| | | | |
| Average Daily Managed Assets* | | Fund-Level Fee | |
For the first $125 million | | | 0.7000 | % |
For the next $125 million | | | 0.6875 | |
For the next $150 million | | | 0.6750 | |
For the next $600 million | | | 0.6625 | |
For managed assets over $1 billion | | | 0.6500 | |
The annual complex-level fee, payable monthly, is calculated by multiplying the current complex-wide fee rate, determined according to the following schedule by the Fund’s daily managed assets:
| | | | |
| Complex-Level Managed Asset Breakpoint Level* | | Effective Rate at Breakpoint Level | |
$55 billion | | | 0.2000 | % |
$56 billion | | | 0.1996 | |
$57 billion | | | 0.1989 | |
$60 billion | | | 0.1961 | |
$63 billion | | | 0.1931 | |
$66 billion | | | 0.1900 | |
$71 billion | | | 0.1851 | |
$76 billion | | | 0.1806 | |
$80 billion | | | 0.1773 | |
$91 billion | | | 0.1691 | |
$125 billion | | | 0.1599 | |
$200 billion | | | 0.1505 | |
$250 billion | | | 0.1469 | |
$300 billion | | | 0.1445 | |
| * | For the complex-level fees, managed assets include closed-end fund assets managed by the Adviser that are attributable to certain types of leverage. For these purposes, leverage includes the funds’ use of preferred stock and borrowings and certain investments in the residual interest certificates (also called inverse floating rate securities) in tender option bond (TOB) trusts, including the portion of assets held by a TOB trust that has been effectively financed by the trust’s issuance of floating rate securities, subject to an agreement by the Adviser as to certain funds to limit the amount of such assets for determining managed assets in certain circumstances. The complex-level fee is calculated based upon the aggregate daily managed assets of all Nuveen funds that constitute “eligible assets.” Eligible assets do not include assets attributable to investments in other Nuveen funds or assets in excess of a determined amount (originally $2 billion) added to the Nuveen fund complex in connection with the Adviser’s assumption of the management of the former First American Funds effective January 1, 2011. As of December 31, 2016, the complex-level fee for the Fund was 0.1625%. |
The Adviser has agreed to waive fees and/or reimburse expenses of the Fund through September 8, 2016, so that total annual Fund operating expenses, after fee waivers and/or expense reimbursements and excluding any costs of leverage, do not exceed 1.15% of the Fund’s average net assets.
Other Transactions with Affiliates
The Fund pays no compensation directly to those of its trustees who are affiliated with the Adviser or to its officers, all of whom receive remuneration for their services to the Fund from the Adviser or its affiliates. The Board has adopted a deferred compensation plan for independent trustees that enables trustees to elect to defer receipt of all or a portion of the annual compensation they are entitled to receive from certain Nuveen-advised funds. Under the plan, deferred amounts are treated as though equal dollar amounts had been invested in shares of select Nuveen-advised funds.
9. Fund Leverage
Reverse Repurchase Agreements
During the current fiscal period, the Fund entered into reverse repurchase agreements as a means of leverage.
In a reverse repurchase agreement, the Fund sells to the counterparty a security that it holds with a contemporaneous agreement to repurchase the same security at an agreed-upon price and date, with the Fund retaining the risk of loss that is associated with that security. The Fund will segregate assets determined to be liquid by the Adviser to cover its obligations under reverse repurchase agreements. Securities sold under reverse repurchase agreements are recorded and recognized as “Reverse repurchase agreements (including accrued interest)” on the Statement of Assets and Liabilities.
Interest payments made on reverse repurchase agreements are recognized as a component of “Interest expense” on the Statement of Operations. In periods of increased demand for the security, the Fund received a fee for use of the security by the counterparty, which may result in interest income to the Fund, which is recognized as a component of “Interest income” on the Statement of Operations.
As of the end of the reporting period, the Fund’s outstanding balances on its reverse repurchase agreements were as follows:
| | | | | | | | | | | | | | | | | | | | |
| Counterparty | | Coupon | | | Principal
Amount | | | Maturity | | | Value | | | Value and
Accrued Interest | |
BNP Paribas | | | 1.04 | % | | $ | (9,418,000 | ) | | | 1/27/17 | | | $ | (9,418,000 | ) | | $ | (9,419,088 | ) |
Goldman Sachs | | | 1.20 | | | | (8,035,000 | ) | | | 1/27/17 | | | | (8,035,000 | ) | | | (8,036,071 | ) |
| | | | | | | $ | (17,453,000 | ) | | | | | | $ | (17,453,000 | ) | | $ | (17,455,159 | ) |
During the current fiscal period, the average daily balance outstanding and weighted average interest rate on the Fund’s reverse repurchase agreements were as follows:
| | | | |
Average daily balance outstanding | | | $19,759,864 | |
Weighted average interest rate | | | 0.70 | % |
The following table presents the reverse repurchase agreements subject to netting agreements and the collateral delivered related to those reverse repurchase agreements.
| | | | | | | | | | | | |
| Counterparty | | Reverse Repurchase* Agreements | | | Collateral Pledged
to Counterparty | | | Net
Exposure | |
BNP Paribas | | $ | (9,419,088 | ) | | $ | 8,948,134 | | | $ | (470,954 | ) |
Goldman Sachs | | | (8,036,071 | ) | | | 7,634,267 | | | | (401,804 | ) |
| | | $ | (17,455,159 | ) | | $ | 16,582,401 | | | $ | (872,758 | ) |
| * | Represents gross value and accrued interest for the counterparty as reported in the preceding table |
Additional
Fund Information
| | | | | | | | | | |
| Board of Trustees | | | | | | | | | | |
| William Adams IV* | | Margo Cook* | | Jack B. Evans | | William C. Hunter | | David J. Kundert | | Albin F. Moschner |
| John K. Nelson | | William J. Schneider | | Judith M. Stockdale | | Carole E. Stone | | Terence J. Toth | | Margaret L. Wolff |
| * | Interested Board Member. |
| | | | | | | | |
| | | | | |
Fund Manager Nuveen Fund Advisors, LLC 333 West Wacker Drive Chicago, IL 60606 | | Custodian State Street Bank
& Trust Company One Lincoln Street Boston, MA 02111 | | Legal Counsel Chapman and Cutler LLP Chicago, IL 60603 | | Independent Registered
Public Accounting Firm KPMG LLP 200 East Randolph Drive Chicago, IL 60601 | | Transfer Agent and
Shareholder Services State Street Bank
& Trust Company
Nuveen Funds P.O. Box 43071 Providence, Rl 02940-3071 (800) 257-8787 |
Quarterly Form N-Q Portfolio of Investments Information
The Fund is required to file its complete schedule of portfolio holdings with the Securities and Exchange Commission (SEC) for the first and third quarters of each fiscal year on Form N-Q. You may obtain this information directly from the SEC. Visit the SEC on-line at http://www.sec.gov or in person at the SEC’s Public Reference Room in Washington, D.C. Call the SEC toll-free at (800) SEC-0330 for room hours and operation.
Nuveen Funds’ Proxy Voting Information
You may obtain (i) information regarding how each fund voted proxies relating to portfolio securities held during the most recent twelve-month period ended June 30, without charge, upon request, by calling Nuveen toll-free at (800) 257-8787 or on Nuveen’s website at www.nuveen.com and (ii) a description of the policies and procedures that each fund used to determine how to vote proxies relating to portfolio securities without charge, upon request, by calling Nuveen toll free at (800) 257-8787. You may also obtain this information directly from the SEC. Visit the SEC on-line at http://www.sec.gov.
CEO Certification Disclosure
The Fund’s Chief Executive Officer (CEO) has submitted to the New York Stock Exchange (NYSE) the annual CEO certification as required by Section 303A.12(a) of the NYSE Listed Company Manual. The Fund has filed with the SEC the certification of its CEO and Chief Financial Officer required by Section 302 of the Sarbanes-Oxley Act.
Share Repurchases
The Fund intends to repurchase, through its open-market share repurchase program, shares of its own common stock at such times and in such amounts as is deemed advisable. During the period covered by this report, the Fund repurchased shares of its common stock, as shown in the accompanying table. Any future repurchases will be reported to shareholders in the next annual or semi-annual report.
FINRA BrokerCheck
The Financial Industry Regulatory Authority (FINRA) provides information regarding the disciplinary history of FINRA member firms and associated investment professionals. This information as well as an investor brochure describing FlNRA BrokerCheck is available to the public by calling the FINRA BrokerCheck Hotline number at (800) 289-9999 or by visiting www.FINRA.org.
Glossary of Terms
Used in this Report
| ∎ | | Average Annual Total Return: This is a commonly used method to express an investment’s performance over a particular, usually multi-year time period. It expresses the return that would have been necessary each year to equal the investment’s actual cumulative performance (including change in NAV or market price and reinvested dividends and capital gains distributions, if any) over the time period being considered. |
| ∎ | | Beta: A measure of the variability of the change in the share price for a fund in relation to a change in the value of the fund’s market benchmark. Securities with betas higher than 1.0 have been, and are expected to be, more volatile than the benchmark; securities with betas lower than 1.0 have been, and are expected to be, less volatile than the benchmark. |
| ∎ | | Bloomberg Barclays U.S. Government/Mortgage Bond Index: The index measures the performance of U.S. government bonds and mortgage-related securities. Index returns assume reinvestment of distributions, but do not include the effects of any applicable sales charges or management fees. |
| ∎ | | Duration: Duration is a measure of the expected period over which a bond’s principal and interest will be paid, and consequently is a measure of the sensitivity of a bond’s or bond fund’s value to changes when market interest rates change. Generally, the longer a bond’s or fund’s duration, the more the price of the bond or fund will change as interest rates change. |
| ∎ | | Effective Leverage: Effective leverage is a fund’s effective economic leverage, and includes both regulatory leverage (see below) and the leverage effects of certain derivative investments in the fund’s portfolio. |
| ∎ | | Blended Benchmark: A two index blend comprised of weightings approximating the Fund’s proposed portfolio: 25% Bloomberg Barclays U.S. Corporate High-Yield Index and 75% Bloomberg Barclays U.S. Government/Mortgage Index. 1) Bloomberg Barclays U.S. Corporate High-Yield Index: An unmanaged index that covers the universe of domestic fixed-rate non-investment grade debt; and 2) Bloomberg Barclays U.S. Government/Mortgage Index: An unmanaged index considered representative of U.S. government treasury securities and agency mortgage-back securities. Benchmark returns assume reinvestment of distributions, but do not reflect any applicable sales charges or management fees. |
| ∎ | | Leverage: Leverage is created whenever a fund has investment exposure (both reward and/or risk) equivalent to more than 100% of the investment capital. |
| ∎ | | Net Asset Value (NAV) Per Share: A fund’s Net Assets is equal to its total assets (securities, cash, accrued earnings and receivables) less its total liabilities. NAV per share is equal to the fund’s Net Assets divided by its number of shares outstanding. |
| ∎ | | Regulatory Leverage: Regulatory leverage consists of preferred shares issued by or borrowings of the fund. Both of these are part of the fund’s capital structure. Regulatory leverage is subject to asset coverage limits set in the Investment Company Act of 1940. |
Reinvest Automatically,
Easily and Conveniently
Nuveen makes reinvesting easy. A phone call is all it takes to set up your reinvestment account.
Nuveen Closed-End Funds Automatic Reinvestment Plan
Your Nuveen Closed-End Fund allows you to conveniently reinvest distributions in additional Fund shares.
By choosing to reinvest, you’ll be able to invest money regularly and automatically, and watch your investment grow through the power of compounding. Just like distributions in cash, there may be times when income or capital gains taxes may be payable on distributions that are reinvested.
It is important to note that an automatic reinvestment plan does not ensure a profit, nor does it protect you against loss in a declining market.
Easy and convenient
To make recordkeeping easy and convenient, each quarter you’ll receive a statement showing your total distributions, the date of investment, the shares acquired and the price per share, and the total number of shares you own.
How shares are purchased
The shares you acquire by reinvesting will either be purchased on the open market or newly issued by the Fund. If the shares are trading at or above net asset value at the time of valuation, the Fund will issue new shares at the greater of the net asset value or 95% of the then-current market price. If the shares are trading at less than net asset value, shares for your account will be purchased on the open market. If the Plan Agent begins purchasing Fund shares on the open market while shares are trading below net asset value, but the Fund’s shares subsequently trade at or above their net asset value before the Plan Agent is able to complete its purchases, the Plan Agent may cease open-market purchases and may invest the uninvested portion of the distribution in newly-issued Fund shares at a price equal to the greater of the shares’ net asset value or 95% of the shares’ market value on the last business day immediately prior to the purchase date. Distributions received to purchase shares in the open market will normally be invested shortly after the distribution payment date. No interest will be paid on distributions awaiting reinvestment. Because the market price of the shares may increase before purchases are completed, the average purchase price per share may exceed the market price at the time of valuation, resulting in the acquisition of fewer shares than if the distribution had been paid in shares issued by the Fund. A pro rata portion of any applicable brokerage commissions on open market purchases will be paid by Plan participants. These commissions usually will be lower than those charged on individual transactions.
Flexible
You may change your distribution option or withdraw from the Plan at any time, should your needs or situation change.
You can reinvest whether your shares are registered in your name, or in the name of a brokerage firm, bank, or other nominee. Ask your investment advisor if his or her firm will participate on your behalf. Participants whose shares are registered in the name of one firm may not be able to transfer the shares to another firm and continue to participate in the Plan.
The Fund reserves the right to amend or terminate the Plan at any time. Although the Fund reserves the right to amend the Plan to include a service charge payable by the participants, there is no direct service charge to participants in the Plan at this time.
Call today to start reinvesting distributions
For more information on the Nuveen Automatic Reinvestment Plan or to enroll in or withdraw from the Plan, speak with your financial advisor or call us at (800) 257-8787.
Notes
Notes
Notes
| | | | | | | | | | | | | | |
| | | | | | | | |
| | | | |
| | | | | | | | |
| | | | | | | | |
| | |
| | Nuveen: | | |
| | | | Serving Investors for Generations | | |
| | |
| | | | |
| | | | Since 1898, financial advisors and their clients have relied on Nuveen to provide dependable investment solutions through continued adherence to proven, long-term investing principles. Today, we offer a range of high quality equity and fixed-income solutions designed to be integral components of a well-diversified core portfolio. | | |
| | | |
| | | | | | |
| | | | | | Focused on meeting investor needs. Nuveen helps secure the long-term goals of individual investors and the advisors who serve them, providing access to investment expertise from leading asset managers and solutions across traditional and alternative asset classes. Built on more than a century of industry leadership, Nuveen’s teams of experts align with clients’ specific financial needs and goals, demonstrating commitment to advisors and investors through market perspectives and wealth management and portfolio advisory services. Nuveen manages $236 billion in assets as of December 31, 2016. | | |
| | | | |
| | | | | | | | |
| | | | | | Find out how we can help you. To learn more about how the products and services of Nuveen may be able to help you meet your financial goals, talk to your financial advisor, or call us at (800) 257-8787. Please read the information provided carefully before you invest. Investors should consider the investment objective and policies, risk considerations, charges and expenses of any investment carefully. Where applicable, be sure to obtain a prospectus, which contains this and other relevant information. To obtain a prospectus, please contact your securities representative or Nuveen, 333 W. Wacker Dr., Chicago, IL 60606. Please read the prospectus carefully before you invest or send money. Learn more about Nuveen Funds at: www.nuveen.com/cef | | |
| | | | | | |
| | | | | | | | | | | | |
Securities offered through Nuveen Securities, LLC, Member FINRA and SIPC | 333 West Wacker Drive | Chicago, IL 60606 | www.nuveen.com/cef
ESA-A-1216D 23211-INV-Y-03/18
Item 2. Code of Ethics.
Not applicable to this filing.
Item 3. Audit Committee Financial Expert.
Not applicable to this filing.
Item 4. Principal Accountant Fees and Services.
Not applicable to this filing.
Item 5. Audit Committee of Listed Registrants.
Not applicable to this filing.
Item 6. Schedule of Investments.
(a) See Portfolio of Investments in Item 1.
(b) Not applicable.
Item 7. Disclosure of Proxy Voting Policies and Procedures for Closed-End Management Investment Companies.
Not applicable to this filing.
Item 8. Portfolio Managers of Closed-End Management Investment Companies.
Not applicable to this filing.
Item 9. Purchases of Equity Securities by Closed-End Management Investment Company and Affiliated Purchasers.
Not applicable.
Item 10. Submission of Matters to a Vote of Security Holders.
There have been no material changes to the procedures by which shareholders may recommend nominees to the registrant’s Board implemented after the registrant last provided disclosure in response to this item.
Item 11. Controls and Procedures.
| (a) | The registrant’s principal executive and principal financial officers, or persons performing similar functions, have concluded that the registrant’s disclosure controls and procedures (as defined in Rule 30a-3(c) under the Investment Company Act of 1940, as amended (the “1940 Act”) (17 CFR 270.30a-3(c))) are effective, as of a date within 90 days of the filing date of this report that includes the disclosure required by this paragraph, based on their evaluation of the controls and procedures required by Rule 30a-3(b) under the 1940 Act (17 CFR 270.30a-3(b)) and Rules 13a-15(b) or 15d-15(b) under the Securities Exchange Act of 1934, as amended (the “Exchange Act”) (17 CFR 240.13a-15(b) or 240.15d-15(b)). |
| (b) | There were no changes in the registrant’s internal control over financial reporting (as defined in Rule 30a-3(d) under the 1940 Act (17 CFR 270.30a-3(d)) that occurred during the second fiscal quarter of the period covered by this report that has materially affected, or is reasonably likely to materially affect, the registrant’s internal control over financial reporting. |
Item 12. Exhibits.
File the exhibits listed below as part of this Form.
(a)(1) Any code of ethics, or amendment thereto, that is the subject of the disclosure required by Item 2, to the extent that the registrant intends to satisfy the Item 2 requirements through filing of an exhibit: Not applicable to this filing.
(a)(2) A separate certification for each principal executive officer and principal financial officer of the registrant as required by Rule 30a-2(a) under the 1940 Act (17 CFR 270.30a-2(a)) in the exact form set forth below: See EX-99.CERT attached hereto.
(a)(3) Any written solicitation to purchase securities under Rule 23c-1 under the 1940 Act (17 CFR 270.23c-1) sent or given during the period covered by the report by or on behalf of the registrant to 10 or more persons: Not applicable.
(b) If the report is filed under Section 13(a) or 15(d) of the Exchange Act, provide the certifications required by Rule 30a-2 (b) under the 1940 Act (17 CFR 270.30a-2(b)), Rule 13a-14(b) or Rule 15d-14(b) under the Exchange Act (17 CFR 240.13a-14(b) or 240.15d-14(b)), and Section 1350 of Chapter 63 of Title 18 of the United States Code (18 U.S.C. 1350) as an Exhibit. A certification furnished pursuant to this paragraph will not be deemed “filed” for purposes of Section 18 of the Exchange Act (15 U.S.C. 78r), or otherwise subject to the liability of that section. Such certification will not be deemed to be incorporated by reference into any filing under the Securities Act of 1933 or the Exchange Act, except to the extent that the registration specifically incorporates it by reference: See EX-99.906 CERT attached hereto.
SIGNATURES
Pursuant to the requirements of the Securities Exchange Act of 1934 and the Investment Company Act of 1940, the registrant has duly caused this report to be signed on its behalf by the undersigned, thereunto duly authorized.
(Registrant) Nuveen Multi-Market Income Fund
| | | | |
| By (Signature and Title) | | /s/ Gifford R. Zimmerman | | |
| | Gifford R. Zimmerman | | |
| | Vice President and Secretary | | |
Date: March 9, 2017
Pursuant to the requirements of the Securities Exchange Act of 1934 and the Investment Company Act of 1940, this report has been signed below by the following persons on behalf of the registrant and in the capacities and on the dates indicated.
| | | | |
| By (Signature and Title) | | /s/ Cedric H. Antosiewicz | | |
| | Cedric H. Antosiewicz | | |
| | Chief Administrative Officer | | |
| | (principal executive officer) | | |
Date: March 9, 2017
| | | | |
| By (Signature and Title) | | /s/ Stephen D. Foy | | |
| | Stephen D. Foy | | |
| | Vice President and Controller | | |
| | (principal financial officer) | | |
Date: March 9, 2017