UNITED STATES
SECURITIES AND EXCHANGE COMMISSION
Washington, D.C. 20549
FORM N-CSR
CERTIFIED SHAREHOLDER REPORT OF REGISTERED
MANAGEMENT INVESTMENT COMPANIES
| | |
| Investment Company Act file number | | 811-05642 |
Nuveen Multi-Market Income Fund
(Exact name of registrant as specified in charter)
Nuveen Investments
333 West Wacker Drive, Chicago, IL 60606
(Address of principal executive offices) (Zip code)
Gifford R. Zimmerman
Nuveen Investments
333 West Wacker Drive, Chicago, IL 60606
(Name and address of agent for service)
Registrant’s telephone number, including area code: (312) 917-7700
Date of fiscal year end: June 30
Date of reporting period: December 31, 2018
Form N-CSR is to be used by management investment companies to file reports with the Commission not later than 10 days after the transmission to stockholders of any report that is required to be transmitted to stockholders under Rule 30e-1 under the Investment Company Act of 1940 (17 CFR 270.30e-1). The Commission may use the information provided on Form N-CSR in its regulatory, disclosure review, inspection, and policy making roles.
A registrant is required to disclose the information specified by Form N-CSR, and the Commission will make this information public. A registrant is not required to respond to the collection of information contained in Form N-CSR unless the Form displays a currently valid Office of Management and Budget (“OMB”) control number. Please direct comments concerning the accuracy of the information collection burden estimate and any suggestions for reducing the burden to Secretary, Securities and Exchange Commission, 450 Fifth Street, NW, Washington, DC 20549-0609. The OMB has reviewed this collection of information under the clearance requirements of 44 U.S.C. ss.3507.
ITEM 1. REPORTS TO STOCKHOLDERS.

Closed-End Funds
31 December 2018
Nuveen Closed-End Funds
| | |
| JMM | | Nuveen Multi-Market Income Fund |
Beginning on January 1, 2021, as permitted by regulations adopted by the Securities and Exchange Commission, paper copies of the Fund’s annual and semi-annual shareholder reports will no longer be sent by mail, unless you specifically request paper copies of the reports. Instead, the reports will be made available on the Fund’s website (www.nuveen.com), and you will be notified by mail each time a report is posted and provided with a website link to access the report.
If you have already elected to receive shareholder reports electronically, you will not be affected by this change and you need not take any action. You may elect to receive shareholder reports and other communications from the Fund electronically anytime by contacting the financial intermediary (such as a broker-dealer or bank) through which you hold your Fund shares or, if you are a direct investor, by enrolling at www.nuveen.com/e-reports.
You may elect to receive all future shareholder reports in paper free of charge at any time by contacting your financial intermediary or, if you are a direct investor, (i) by calling 800-257-8787 and selecting option #2 or (ii) by logging into your Investor Center account at www.computershare.com/investor and clicking on “Communication Preferences.” Your election to receive reports in paper will apply to all funds held in your account with your financial intermediary or, if you are a direct investor, to all your directly held Nuveen Funds and any other directly held funds within the same group of related investment companies.
Semi-Annual Report
Life is Complex.
Nuveen makes things e-simple.
It only takes a minute to sign up for e-Reports. Once enrolled, you’ll receive an e-mail as soon as your Nuveen Fund information is ready—no more waiting for delivery by regular mail. Just click on the link within the e-mail to see the report and save it on your computer if you wish.
Free e-Reports right to your e-mail!
www.investordelivery.com
If you receive your Nuveen Fund dividends and statements from your financial advisor or brokerage account.
or
www.nuveen.com/client-access
If you receive your Nuveen Fund dividends and statements directly from Nuveen.
NOT FDIC INSURED MAY LOSE VALUE NO BANK GUARANTEE
Table
of Contents
3
Chairman’s Letter to Shareholders

Dear Shareholders,
The global economy seemed to reach a turning point in 2018. Growth was peaking in the U.S. and slowing elsewhere. Deregulation and tax law changes, which lowered corporate and individual tax rates and encouraged companies to repatriate overseas profits, helped boost U.S. economic growth and amplify corporate earnings during 2018. Meanwhile, a weakening housing market and a flattening yield curve in the U.S. and disappointing economic growth across Europe, China and Japan signaled caution. As the year developed, future corporate profit growth was looking less certain than at the start of the year. Adding to the uncertainty were the removal of U.S. central bank monetary stimulus, rising interest rates, a stronger U.S. dollar, trade negotiations and unpredictable politics, including Brexit and a prolonged U.S. government shutdown. Bearish sentiment intensified at the end of 2018, pressuring stocks, corporate bonds and commodities alike.
Although downside risks have been rising, the likelihood of a near-term recession remains low. Global growth is indeed slowing, but it’s still positive. The U.S. economy remains strong, even in the face of late-cycle pressures. Low unemployment and firming wages should continue to support consumer spending, and the Novembermid-term elections resulted in change, but no major surprises. In China, the government remains committed to using fiscal stimulus to offset softening exports. Europe also remains vulnerable to trade policy as well as Brexit uncertainty, but underlying strengths in European economies, including low unemployment that drives domestic demand, remain supportive of a mild expansion. In a slower growth environment, there are opportunities for investors who seek them more selectively.
We expect volatility and challenging conditions to persist in 2019 but also think there is potential for upside. You can prepare your investment portfolio by working with your financial advisor to review your goals, timeline and risk tolerance. On behalf of the other members of the Nuveen Fund Board, we look forward to continuing to earn your trust in the months and years ahead.
Sincerely,

Terence J. Toth
Chairman of the Board
February 22, 2018
4
Portfolio Managers’
Comments
Nuveen Multi-Market Income Fund (JMM)
Nuveen Multi-Market Income Fund (JMM) is advised by Nuveen Fund Advisors, LLC (NFAL) and features portfolio management by Nuveen Asset Management, LLC (NAM). Throughout the reporting period, the portfolio management team has included Jason J. O’Brien, CFA, and Peter L. Agrimson, CFA. John T. Fruit, CFA, also managed the Fund until his retirement from NAM on December 31, 2018.
Here the Funds’ portfolio management team discusses key investment strategies and the Fund’s performance for the six-month reporting period December 31, 2018.
What key strategies were used to manage the Fund during this six-month reporting period ended December 31, 2018?
The Fund’s investment objective is to achieve high monthly income consistent with prudent risk to capital. The management team invests the Fund’s assets primarily in taxable fixed income securities including, but not limited to: U.S. agency and privately issued mortgage-backed securities; high yield and investment grade corporate bonds; and asset-backed securities.
How did the Fund perform during this six-month reporting period ended December 31, 2018?
The table in the Performance Overview and Holding Summaries section of this report provides total return performance for the Fund for the six-month, one-year, five-year and ten-year periods ended December 31, 2018. The Fund’s total return at net asset value (NAV) is compared with the performance of a corresponding market index. For the six-month reporting period ended December 31, 2018, JMM underperformed the Bloomberg Barclays U.S. Government/Mortgage Bond Index and its blended benchmark, which is composed of 75% Bloomberg Barclays U.S. Government/Mortgage Index and 25% Bloomberg Barclays U.S. Corporate High-Yield Index.
Citing strong economic growth and job gains, the Federal Reserve (Fed) raised interest rates two times in September and in December 2018, despite increased market volatility and tightening financial conditions as the reporting period progressed. At the September meeting, the Fed removed the long-standing “accommodative” language from its interest rate positioning statement, marking the end of an era of easy U.S. monetary policy. In December, however, policymakers acknowledged some headwinds and lowered projections for U.S. gross domestic product (GDP) and inflation, while signaling the likelihood for fewer rate hikes in 2019. For the six-month reporting period as a whole, Treasury yields increased for the shortest maturities at the front end of the yield curve, driven by the Fed rate hikes. However, investors
This material is not intended to be a recommendation or investment advice, does not constitute a solicitation to buy or sell securities, and is not provided in a fiduciary capacity. The information provided does not take into account the specific objectives or circumstances of any particular investor, or suggest any specific course of action. Investment decisions should be made based on an investor’s objectives and circumstances and in consultation with his or her advisors.
Certain statements in this report are forward-looking statements. Discussions of specific investments are for illustration only and are not intended as recommendations of individual investments. The forward-looking statements and other views expressed herein are those of the portfolio managers as of the date of this report. Actual future results or occurrences may differ significantly from those anticipated in any forward-looking statements and the views expressed herein are subject to change at any time, due to numerous market and other factors. The Fund disclaims any obligation to update publicly or revise any forward-looking statements or views expressed herein.
For financial reporting purposes, the ratings disclosed are the highest rating given by one of the following national rating agencies: Standard & Poor’s (S&P), Moody’s Investors Service, Inc. (Moody’s) or Fitch, Inc. (Fitch). This treatment of split-rated securities may differ from that used for other purposes, such as for Fund investment policies. Credit ratings are subject to change. AAA, AA, A and BBB are investment grade ratings; BB, B, CCC, CC, C and D are below investment grade ratings. Holdings designated N/R are not rated by these national rating agencies.
Refer to the Glossary of Terms Used in this Report for further definition of the terms used within this section.
5
Portfolio Managers’ Comments(continued)
priced in expectations for the Fed to reverse course and ease next year for securities with maturities of one year or more, helping to drive an inversion at the front end of the Treasury yield curve. For example, the yield on one-yearT-bills ended the reporting period at 2.63%, which was above the yield on five-year securities, which ended at 2.51%. After reaching as high as 3.24% in early November 2018, the yield on the 10-year Treasury fell sharply to end the reporting period at 2.69%.
Early in the reporting period, investment grade credit had rebounded from a difficult first half of 2018, posting strong excess returns versus Treasuries. The segment was able to overcome a negative technical backdrop that included sharply declining demand from non-U.S. investors as European quantitative easing slowed. However, financial conditions tightened as equity volatility rose sharply in the final months of the reporting period, stock markets declined significantly and spreads moved wider in response to weakening global growth, trade worries, Fed action, lower oil prices and investor outflows from risk assets. In the end, excess returns were negative for investment grade credit versus Treasuries during the reporting period.
Overall during the reporting period, the mortgage-backed securities (MBS) underperformed duration-matched Treasuries. Earlier in the reporting period, the net supply of MBS rose as summer seasonal issuance increased, while demand slowed from banks as well as foreign buyers, due to increased dollar-hedging costs. Despite these factors, the segment performed well because demand from money managers increased, while range-bound rates and low levels of volatility provided a favorable backdrop for MBS. However, in the final months of 2018, interest rate and broad market volatility proved to be a tough environment for the MBS sector, which underperformed duration-matched Treasuries. Soft fundamentals and negative technicals weighed on the segment.
Securitized sectors posted mixed performance overall for the reporting period as valuations improved for asset-backed securities (ABS), while valuations overall in the commercial mortgage-backed securities (CMBS) segment declined. Strong job growth and solid corporate earnings provided support for consumer ABS and the commercial real estate market. Within the securitized sectors, investors continued to move down in quality in search of cheaper bonds and higher yields early in the reporting period. However, these sectors were not immune to the volatility that overshadowed the fixed income markets in the final months of 2018. Although both the CMBS and ABS sectors posted negative excess returns in the fourth quarter, a strong third quarter for ABS and lower rated CMBS allowed these segments to produce positive excess returns overall for the six-month reporting period.
In the first few months of the reporting period, high yield credit performed well and the supply technical remained highly supportive. Adding to the positive backdrop were a healthy earnings environment and continued supportive financing markets, which helped keep default rates well contained. However, near the end of the reporting period, the high yield market sold off sharply after risk sentiment turned negative amid concerns about economic growth, Fed rate hikes, trade tensions, a slowdown in the rate of earnings growth, and questions regarding the length of the credit cycle. The high yield market saw large investor outflows, accelerating into year end, which drove prices lower despite the positive technical of limited issuance. Nonetheless, credit fundamentals remained intact as high yield companies continue to demonstrate discipline through terming out debt (transferring short-term debt to long-term debt) and maintaining solid balance sheet leverage and coverage metrics, while inflation remained moderate and the labor market and consumer spending were still strong. From an industry standpoint, the weakest spots within the U.S. high yield market were energy and finance companies, whereas the non-cyclical and communications industries performed best, although still in negative territory. Unlike earlier in 2018, lower quality, CCC rated securities underperformed higher quality BB and single-B rated bonds during the sell-off due to credit worries and lower liquidity within the segment. High yield spreads widened sharply by 163 basis points over the six-month reporting period to end the reporting period at 526 basis points over Treasuries.
Results from our interest rate positioning for the Fund were mixed during the reporting period. On the positive side, we structured the Fund’s portfolio with an underweighting to longer maturity securities, which underperformed during the
6
reporting period. At the same time, however, we kept the Fund’s duration, or interest rate sensitivity, defensively positioned at around 5.04 years versus 5.19 years for the benchmark, which modestly detracted from results. Hedging activity for future liabilities against higher rates hurt overall performance as rates rallied into the end of the reporting period.
The Fund’s high yield exposure was the primary area that detracted during the reporting period. We positioned the Fund with a small overweight to high yield, which was a modest drag on results given the sharp sell-off within the segment. More importantly, however, our security selection detracted within the sector due to a small number of less liquid credits we owned in the consumer products and environmental sectors. These credits experienced a steeper sell-off than the broader market as investors attempted to bolster liquidity for what seemed like an imminent recession, but was not driven by actual credit concerns.
Despite the significant spike in market volatility toward the end of the reporting period, we continued to manage the Fund with many of the same overarching investment themes. We continue to focus on generating income through broad exposure to the securitized and corporate sectors of the bond market, with an emphasis on security selection. From a positioning standpoint, we maintained the Fund’s overweights to CMBS, non-agency MBS and ABS. Portfolio management was bottom up in nature so we rotated out of CMBS in favor of ABS early in the reporting period and then sold select ABS as they reached spread targets. As of the end of the reporting period, we also maintained a small overweight in high yield credit and very modest exposure to investment grade credit. We continued to hold a large underweight in Treasuries, given our constructive economic view and the relatively unattractive duration and yield profile of the sector.
At the end of the reporting period, the Fund’s duration remained shorter than the benchmark index because Treasury yields are still low and the yield curve is flat, making duration risk unattractive. The upside to rates is limited by economic and structural factors; therefore, credit and sector positioning will likely remain the more significant factors driving portfolio performance. In terms of yield curve positioning, we are maintaining the Fund’s modest underweight to the long end of the yield curve in the near term.
We used U.S. Treasury futures as part of an overall portfolio construction strategy to manage portfolio duration and yield curve exposure. These future positions had a negligible impact on performance during the reporting period. The Fund also used interest rate swaps as part of an overall portfolio construction strategy to manage duration and overall portfolio yield curve exposure. The swap positions had a positive impact on performance during the reporting period.
The Fund may also purchase securities on a when-issued or forward commitment basis. Delivery and payment for securities that have been purchased in this manner can take place a month or more after the transaction date. Such securities do not earn interest, are subject to market fluctuation and may increase or decrease in value prior to their delivery. The purchase of securities on a when-issued or forward commitment basis may increase the volatility of the Fund’s net asset value if the Fund makes such purchases while remaining substantially fully invested.
7
Fund
Leverage
IMPACT OF THE FUND’S LEVERAGE STRATEGY ON PERFORMANCE
One important factor impacting the returns of the Fund’s common shares relative to their comparative benchmarks was the Fund’s use of leverage through the use of reverse repurchase agreements and mortgage dollar rolls. The Fund uses leverage because our research has shown that, over time, leveraging provides opportunities for additional income and total return, particularly in the recent market environment where short-term market rates are at or near historical lows, meaning that the short-term rates the Fund has been paying on its leveraging instruments in recent years have been much lower than the interest the Fund has been earning on its portfolio securities that it has bought with the proceeds of that leverage.
However, use of leverage can expose Fund common shares to additional price volatility. When the Fund uses leverage, the Fund common shares will experience a greater increase in their net asset value if the securities acquired through the use of leverage increase in value, but will also experience a correspondingly larger decline in their net asset value if the securities acquired through leverage decline in value, which will make the shares’ net asset value more volatile, and total return performance more variable, over time.
In addition, common share income in levered funds will typically decrease in comparison to unlevered funds when short-term interest rates increase and increase when short-term interest rates decrease. Over the last few quarters, short-term interest rates have indeed increased from their extended lows after the 2007-09 financial crisis. This increase has reduced common share net income, and also reduced potential for long-term total returns. Nevertheless, the ability to effectively borrow at current short-term rates is still resulting in enhanced common share income, and management believes that the advantages of continuation of leverage outweigh the associated increase in risk and volatility described above. The Fund’s use of leverage had a positive impact on total return performance during this reporting period.
As of December 31, 2018, the Fund’s percentages of leverage are shown in the accompanying table.
| | | | |
| | | JMM | |
Effective Leverage* | | | 29.86 | % |
Regulatory Leverage* | | | 0.00 | % |
| * | Effective leverage is a Fund’s effective economic leverage, and includes both regulatory leverage and the leverage effects of certain derivative and other investments in the Fund’s portfolio that increase the Fund’s investment exposure. Regulatory leverage consists of preferred shares issued or borrowings of a Fund. Both of these are part of a Fund’s capital structure. The Fund, however, may from time to time borrow on a typically transient basis in connection with its day-to-day operations, primarily in connection with the need to settle portfolio trades. Such incidental borrowings are excluded from the calculation of the Fund’s effective leverage ratio. Regulatory leverage is subject to asset coverage limits set forth in the Investment Company Act of 1940. |
THE FUND’S LEVERAGE
Reverse Repurchase Agreements
As noted above, the Fund employs leverage through the use of reverse repurchase agreements. The Fund’s transactions in reverse repurchase agreements are as shown in the accompanying table.
| | | | | | | | | | | | | | | | | | | | | | | | | | | | | | | | | | |
| Current Reporting Period | | | | | | Subsequent to the Close of
the Reporting Period | |
| July 1, 2018 | | | Purchases | | | Sales | | | December 31, 2018 | | | Average Balance Outstanding | | | | | | Purchases | | | Sales | | | February 28, 2019 | |
| | $20,434,000 | | | | $81,000 | | | | $(1,413,000) | | | | $19,102,000 | | | | $19,680,679 | | | | | | | | $ — | | | | $(82,504) | | | | $19,019,496 | |
Refer to Notes to Financial Statements, Note 8 – Fund Leverage for further details.
8
Common Share
Information
DISTRIBUTION INFORMATION
The following information regarding the Fund’s distributions is current as of December 31, 2018. The Fund’s distribution levels may vary over time based on the Fund’s investment activity and portfolio investment value changes.
During the current reporting period, the Fund’s distributions to shareholders were as shown in the accompanying table.
| | | | |
| Monthly Distributions (Ex-Dividend Date) | | Per
Share
Amounts | |
July 2018 | | $ | 0.0300 | |
August | | | 0.0300 | |
September | | | 0.0300 | |
October | | | 0.0300 | |
November | | | 0.0300 | |
December 2018 | | | 0.0300 | |
Total Distributions from Net Investment Income | | $ | 0.1800 | |
| |
Current Distribution Rate* | | | 5.26 | % |
| * | Current distribution rate is based on the Fund’s current annualized monthly distribution divided by the Fund’s current market price. The Fund’s monthly distributions to its shareholders may be comprised of ordinary income, net realized capital gains and, if at the end of the fiscal year the Fund’s cumulative net ordinary income and net realized gains are less than the amount of the Fund’s distributions, a return of capital for tax purposes. |
The Fund seeks to pay regular monthly dividends out of its net investment income at a rate that reflects its past and projected net income performance. To permit the Fund to maintain a more stable monthly dividend, the Fund may pay dividends at a rate that may be more or less than the amount of net income actually earned by the Fund during the period. Distributions to shareholders are determined on a tax basis, which may differ from amounts recorded in the accounting records. In instances where the monthly dividend exceeds the earned net investment income, the Fund would report a negative undistributed net ordinary income. Refer to Note 6 – Income Tax Information for additional information regarding the amounts of undistributed net ordinary income and undistributed net long-term capital gains and the character of the actual distributions paid by the Fund during the period.
All monthly dividends paid by the Fund during the current reporting period were paid from net investment income. If a portion of the Fund’s monthly distributions is sourced from or comprised of elements other than net investment income, including capital gains and/or a return of capital, shareholders will be notified of those sources. For financial reporting purposes, per share amounts of the Fund’s distributions for the reporting period are presented in this report’s Financial Highlights. For income tax purposes, distribution information for the Fund as of its most recent tax year end is presented in Note 6 – Income Tax Information within the Notes to Financial Statements of this report.
COMMON SHARE REPURCHASES
During August 2018, the Fund’s Board of Trustees reauthorized an open-market common share repurchase program, allowing the Fund to repurchase an aggregate of up to approximately 10% of its outstanding common shares.
As of December 31, 2018, and since the inception of the Fund’s repurchase program, the Fund has cumulatively repurchased and retired its outstanding common shares as shown in the accompanying table.
| | | | |
| | | JMM | |
Common shares cummulatively repurchased and retired | | | 1,800 | |
Common shares authorized for repurchase | | | 945,000 | |
9
Common Share Information(continued)
During the current reporting period, the Fund did not repurchase any of its outstanding common shares.
OTHER SHARE INFORMATION
As of December 31, 2018, and during the current reporting period, the Fund’s common share price was trading at premium/(discount) to its NAV as shown in the accompanying table.
| | | | |
Common share NAV | | $ | 7.78 | |
Common share price | | $ | 6.85 | |
Premium/(Discount) to NAV | | | (11.95 | )% |
6-month average premium/(discount) to NAV | | | (12.22 | )% |
10
Risk
Considerations
Fund shares are not guaranteed or endorsed by any bank or other insured depository institution, and are not federally insured by the Federal Deposit Insurance Corporation.
Nuveen Multi-Market Income Fund (JMM)
Investing in closed-end funds involves risk; principal loss is possible. There is no guarantee the Fund’s investment objectives will be achieved. Closed-end fund shares may frequently trade at a discount or premium to their net asset value. Investing inmortgage-backed securities entails credit risk, the risk that the servicer fails to perform its duties, liquidity risks, interest rate risks, structure risks, pre-payment risk, and geographical concentration risks.Leverage increases return volatility and magnifies the Fund’s potential return and its risks; there is no guarantee a fund’s leverage strategy will be successful. These and other risk considerations includinghedgingrisk are described in more detail on the Fund’s web page at www.nuveen.com/JMM.
11
| | |
| JMM | | Nuveen Multi-Market Income Fund Performance Overview and Holding Summaries as of December 31, 2018 |
Refer to the Glossary of Terms Used in this Report for further definition of the terms used within this section.
Average Annual Total Returns as of December 31, 2018
| | | | | | | | | | | | | | | | |
| | | Cumulative | | | Average Annual | |
| | | 6-Month | | | 1-Year | | | 5-Year | | | 10-Year | |
| JMM at Common Share NAV | | | (0.14)% | | | | 0.18% | | | | 3.62% | | | | 9.08% | |
| JMM at Common Share Price | | | 0.37% | | | | (5.38)% | | | | 4.57% | | | | 8.98% | |
Bloomberg Barclays U.S. Government/Mortgage Bond Index | | | 1.96% | | | | 0.93% | | | | 2.22% | | | | 2.61% | |
| Blended Benchmark | | | 0.90% | | | | 0.18% | | | | 2.64% | | | | 4.70% | |
Past performance is not predictive of future results. Current performance may be higher or lower than the data shown. Returns do not reflect the deduction of taxes that shareholders may have to pay on Fund distributions or upon the sale of Fund shares. Returns at NAV are net of Fund expenses, and assume reinvestment of distributions. Comparative index return information is provided for the Fund’s shares at NAV only. Indexes are not available for direct investment.
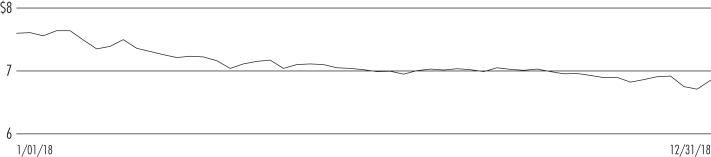
Common Share Price Performance —Weekly Closing Price
12
This data relates to the securities held in the Fund’s portfolio of investments as of the end of the reporting period. It should not be construed as a measure of performance for the Fund itself. Holdings are subject to change.
For financial reporting purposes, the ratings disclosed are the highest rating given by one of the following national rating agencies: Standard & Poor’s Group, Moody’s Investors Service, Inc. or Fitch, Inc. This treatment of split-rated securities may differ from that used for other purposes, such as for Fund investment policies. Credit ratings are subject to change. AAA, AA, A and BBB are investment grade ratings; BB, B, CCC, CC, C and D are below-investment grade ratings. Holdings designated N/R are not rated by these national rating agencies.
Fund Allocation
(% of net assets)
| | | | |
| Asset-Backed andMortgage-Backed Securities | | | 109.2% | |
| Corporate Bonds | | | 27.1% | |
| Sovereign Debt | | | 1.4% | |
| Investment Companies | | | 0.5% | |
| Contingent Capital Securities | | | 0.5% | |
| $1,000 Par (or similar) Institutional Preferred | | | 0.3% | |
| Repurchase Agreements | | | 2.2% | |
| Other Assets Less Liabilities | | | (15.2)% | |
Net Assets Plus Reverse Repurchase Agreements | | | 126.0% | |
| Reverse Repurchase Agreements | | | (26.0)% | |
Net Assets | | | 100% | |
Portfolio Composition
(% of total investments)
| | | | |
| Asset-Backed andMortgage-Backed Securities | | | 77.4% | |
Metals & Mining | | | 1.8% | |
| Media | | | 1.8% | |
Commercial Services & Supplies | | | 1.6% | |
Diversified Telecommunication Services | | | 1.5% | |
Chemicals | | | 1.5% | |
| Other | | | 12.9% | |
| Repurchase Agreements | | | 1.5% | |
Total | | | 100% | |
Portfolio Credit Quality
(% of total long-term
investments)
| | | | |
AAA | | | 1.4% | |
AA | | | 6.2% | |
A | | | 6.2% | |
BBB | | | 24.2% | |
BB or Lower | | | 23.6% | |
| U.S. Treasury/Agency | | | 31.6% | |
N/R (not rated) | | | 6.5% | |
N/A (not applicable) | | | 0.3% | |
Total | | | 100% | |
13
| | |
| JMM | | Nuveen Multi-Market Income Fund Portfolio of Investments December 31, 2018 |
| | | (Unaudited) |
| | | | | | | | | | | | | | | | | | | | |
Principal
Amount (000) | | | Description (1) | | Coupon | | | Maturity | | | Ratings (2) | | | Value | |
| |
| | | | LONG-TERM INVESTMENTS – 139.0% (98.5% of Total Investments) | |
| |
| | | | ASSET-BACKED AND MORTGAGE-BACKED SECURITIES – 109.2% (77.4% of Total Investments) | |
| | | | | |
| $ | 1,004 | | | 321 Henderson Receivables LLC, Series2012-1A, 144A | | | 7.140% | | | | 2/15/67 | | | | A2 | | | $ | 1,163,578 | |
| | 500 | | | 321 Henderson Receivables LLC, Series2016-1A, 144A | | | 5.190% | | | | 6/17/69 | | | | Baa2 | | | | 530,253 | |
| | 285 | | | 321 Henderson Receivables LLC., Series2010-1A, 144A | | | 9.310% | | | | 7/15/61 | | | | Aaa | | | | 330,800 | |
| | 418 | | | 321 Henderson Receivables Trust Series2012-2A, 144A | | | 6.770% | | | | 10/17/61 | | | | A2 | | | | 434,391 | |
| | 261 | | | ACE Securities Corporation, Manufactured Housing TrustSeries 2003-MH1, 144A | | | 6.500% | | | | 8/15/30 | | | | AA | | | | 280,533 | |
| | 500 | | | Adams Outdoor Advertising LP, Series ADMSO2018-1 B, 144A | | | 5.653% | | | | 11/15/48 | | | | BBB | | | | 515,051 | |
| | 750 | | | American Homes 4 Rent, Series 2015-SFR2, 144A | | | 5.036% | | | | 10/17/45 | | | | Aa3 | | | | 801,250 | |
| | 1,694 | | | American Homes 4 Rent, Series 2015-SFR2, 144A | | | 0.000% | | | | 10/17/45 | | | | N/R | | | | 17 | |
| | 405 | | | AmeriCold LLC Trust, Series 2010, 144A | | | 6.811% | | | | 1/14/29 | | | | AA+ | | | | 429,417 | |
| | 500 | | | Bank of America Commercial Mortgage Inc. , Commercial Mortgage Pass-Through Certificates, Series 2015-UBS7 | | | 3.167% | | | | 9/15/48 | | | | BBB– | | | | 413,637 | |
| | 13 | | | Bank of America Funding Trust, Mortgage Pass-Through Certificates, Series2007-4 | | | 5.500% | | | | 6/25/37 | | | | C | | | | 516 | |
| | 500 | | | Barclays Commercial Mortgage, Mortgage Pass-Through Certificates, Series2015-STP, 144A | | | 4.284% | | | | 9/10/28 | | | | BBB– | | | | 496,487 | |
| | 1 | | | Bayview Financial Acquisition Trust2003-AA, 144A | | | 6.072% | | | | 2/25/33 | | | | AAA | | | | 1,439 | |
| | 63 | | | Bayview Financial Acquisition Trust Series 2006C | | | 5.852% | | | | 11/28/36 | | | | Caa3 | | | | 60,556 | |
| | 62 | | | Bayview Financial Acquisition Trust, Series2006-C | | | 5.638% | | | | 11/28/36 | | | | Ba1 | | | | 62,971 | |
| | 67 | | | Bayview Financial Acquisition Trust, Series2006-D | | | 5.932% | | | | 12/28/36 | | | | Aa1 | | | | 67,965 | |
| | 40 | | | Bayview Financial Acquisition Trust, Series2007-A | | | 6.205% | | | | 5/28/37 | | | | AAA | | | | 40,872 | |
| | 486 | | | Bayview Financial Mortgage Pass-Through Trust, Mortgage Pass-Through Certificate Series2005-D | | | 5.500% | | | | 12/28/35 | | | | Aa3 | | | | 489,554 | |
| | 147 | | | Chase Funding Mortgage Loan Asset-Backed Certificates,Series 2003-3 | | | 5.160% | | | | 3/25/33 | | | | BB+ | | | | 149,727 | |
| | 500 | | | CHL GMSR Issuer Trust, 144A, (1-Month LIBOR reference rate + 2.750% spread), (10) | | | 5.065% | | | | 5/25/23 | | | | N/R | | | | 500,197 | |
| | 600 | | | Citigroup Commercial Mortgage Trust2016-P5, Series CGCMT2016-P5 D, 144A | | | 3.000% | | | | 10/10/49 | | | | BBB– | | | | 485,694 | |
| | 450 | | | Citigroup Commercial Mortgage Trust, Commercial Mortgage Pass-Through Certificates, Series2017-CD5, 144A, (1-Month LIBOR reference rate + 1.800% spread), (10) | | | 4.255% | | | | 12/15/36 | | | | BBB– | | | | 443,303 | |
| | 775 | | | Commercial Mortgage Pass-Through Certificates 2015-CR22 | | | 4.121% | | | | 3/10/48 | | | | A– | | | | 753,186 | |
| | 511 | | | Commercial Mortgage Pass-Through Certificates, Series 2015-CR26 | | | 4.483% | | | | 10/10/48 | | | | A– | | | | 505,063 | |
| | 500 | | | Commercial Mortgage Pass-Through Certificates, Series 2016-SAVA, 144A, (1-Month LIBOR reference rate + 3.000% spread), (10) | | | 5.455% | | | | 10/15/34 | | | | A– | | | | 499,714 | |
| | 500 | | | Commonbond Student Loan Trust, Series2017-BGC, 144A | | | 4.440% | | | | 9/25/42 | | | | Baa1 | | | | 502,865 | |
| | 129 | | | Countrywide Alternative Loan Trust, Mortgage Pass Through Certificates, Series2003-J3 | | | 5.250% | | | | 11/25/33 | | | | BBB | | | | 128,420 | |
| | 150 | | | Countrywide Alternative Loan Trust, Mortgage Pass Through Certificates, Series2004-J2 | | | 6.500% | | | | 3/25/34 | | | | AA+ | | | | 154,727 | |
| | 258 | | | Countrywide Asset-Backed Certificates Trust, Series2004-13 | | | 4.775% | | | | 5/25/35 | | | | Aaa | | | | 260,885 | |
| | 160 | | | Credit Suisse CSMC Mortgage-Backed Trust, Pass-Through Certificates, Series2006-7 | | | 6.000% | | | | 8/25/36 | | | | Caa3 | | | | 127,380 | |
| | 480 | | | Credit Suisse First Boston Mortgage Securities Corporation, Mortgage-Backed Pass-Through Certificates, Series2003-8 | | | 6.180% | | | | 4/25/33 | | | | BB | | | | 494,392 | |
| | 103 | | | Credit Suisse First Boston Mortgage Securities Corporation, Mortgage-Backed Pass-Through Certificates, Series2005-11 6A7 | | | 6.000% | | | | 12/25/35 | | | | D | | | | 6,307 | |
| | 104 | | | Credit Suisse First Boston Mortgage Securities, Home Equity Mortgage Pass-Through Certificates, Series2004-6 | | | 5.821% | | | | 4/25/35 | | | | Baa1 | | | | 104,597 | |
| | 465 | | | Credit-Based Asset Servicing and Securitization Pool2007-SP1, 144A | | | 5.556% | | | | 12/25/37 | | | | AA | | | | 472,423 | |
| | 488 | | | Dominos Pizza Master Issuer LLC, Series2015-1A, 144A | | | 4.474% | | | | 10/25/45 | | | | BBB+ | | | | 492,029 | |
| | 123 | | | Domino’s Pizza Master Issuer LLC, Series DPABS2017-1A A2II, 144A | | | 3.082% | | | | 7/25/47 | | | | BBB+ | | | | 120,265 | |
| | 757 | | | Driven Brands Funding LLC, HONK2015-1A, 144A | | | 5.216% | | | | 7/20/45 | | | | BBB– | | | | 785,608 | |
| | 617 | | | Driven Brands Funding LLC, HONK 2018-1A, 144A | | | 4.739% | | | | 4/20/48 | | | | BBB– | | | | 627,992 | |
| | 30 | | | Fannie Mae Mortgage Pool, (3) | | | 6.000% | | | | 5/01/29 | | | | N/R | | | | 32,418 | |
| | 17 | | | Fannie Mae Mortgage Pool, (3) | | | 7.000% | | | | 9/01/31 | | | | N/R | | | | 18,047 | |
| | 17 | | | Fannie Mae Mortgage Pool, (3) | | | 5.500% | | | | 6/01/33 | | |
| N/R
|
| | | 18,068 | |
| | 14 | | | Fannie Mae Mortgage Pool, (3) | | | 5.000% | | | | 2/01/21 | | | | N/R | | | | 13,963 | |
14
| | | | | | | | | | | | | | | | | | | | |
Principal
Amount (000) | | | Description (1) | | Coupon | | | Maturity | | | Ratings (2) | | | Value | |
| | | | |
| | | | ASSET-BACKED AND MORTGAGE-BACKED SECURITIES (continued) | | | | | | | | | | | | | |
| | | | | |
| $ | 92 | | | Fannie Mae Mortgage Pool, (3) | | | 6.000% | | | | 3/01/34 | | | | N/R | | | $ | 98,486 | |
| | 46 | | | Fannie Mae Mortgage Pool, (3) | | | 6.000% | | | | 1/01/34 | | | | N/R | | | | 49,169 | |
| | 80 | | | Fannie Mae Mortgage Pool, (3) | | | 5.500% | | | | 2/01/34 | | | | N/R | | | | 85,110 | |
| | 69 | | | Fannie Mae Mortgage Pool, (3) | | | 6.000% | | | | 1/01/35 | | | | N/R | | | | 75,738 | |
| | 39 | | | Fannie Mae Mortgage Pool, (3) | | | 5.000% | | | | 7/01/35 | | | | N/R | | | | 40,880 | |
| | 18 | | | Fannie Mae Mortgage Pool, (3) | | | 5.500% | | | | 3/01/36 | | | | N/R | | | | 18,988 | |
| | 27 | | | Fannie Mae Mortgage Pool, (3) | | | 6.000% | | | | 6/01/36 | | | | N/R | | | | 29,122 | |
| | 64 | | | Fannie Mae Mortgage Pool, (3) | | | 5.500% | | | | 4/01/37 | | | | N/R | | | | 69,016 | |
| | 696 | | | Fannie Mae Mortgage Pool, (3) | | | 3.500% | | | | 12/01/26 | | | | N/R | | | | 704,357 | |
| | 63 | | | Fannie Mae Mortgage Pool, (3) | | | 5.500% | | | | 6/01/38 | | | | N/R | | | | 68,220 | |
| | 682 | | | Fannie Mae Mortgage Pool, (3) | | | 3.500% | | | | 1/01/27 | | | | N/R | | | | 690,314 | |
| | 1,358 | | | Fannie Mae Mortgage Pool, (3) | | | 3.500% | | | | 2/01/44 | | | | N/R | | | | 1,364,861 | |
| | 2,914 | | | Fannie Mae Mortgage Pool, (3) | | | 3.500% | | | | 3/01/48 | | | | N/R | | | | 2,915,432 | |
| | 2,406 | | | Fannie Mae Mortgage Pool, (3) | | | 3.000% | | | | 2/01/47 | | | | N/R | | | | 2,347,491 | |
| | 1,912 | | | Fannie Mae Mortgage Pool, (3) | | | 3.500% | | | | 5/01/46 | | | | N/R | | | | 1,917,963 | |
| | 94 | | | Fannie Mae REMIC Pass-Through Certificates | | | 7.500% | | | | 2/25/42 | | | | N/R | | | | 101,834 | |
| | 458 | | | Fannie Mae REMIC Pass-Through Certificates | | | 3.541% | | | | 12/25/42 | | | | AAA | | | | 154,764 | |
| | 2,975 | | | Fannie Mae TBA, (MDR), (WI/DD) | | | 4.500% | | | | 1/14/49 | | | | N/R | | | | 3,082,073 | |
| | 4,605 | | | Fannie Mae TBA, (MDR), (WI/DD) | | | 4.000% | | | | 1/14/49 | | | | N/R | | | | 4,695,756 | |
| | 2,000 | | | Fannie Mae TBA, (MDR), (WI/DD) | | | 3.500% | | | | 1/14/49 | | | | N/R | | | | 2,000,278 | |
| | 2,500 | | | Fannie Mae TBA, (MDR), (WI/DD) | | | 3.000% | | | | 1/14/49 | | | | N/R | | | | 2,439,534 | |
| | 2,895 | | | Federal Home Loan Mortgage Corporation, Mortgage Pool, (3) | | | 3.000% | | | | 4/01/43 | | | | N/R | | | | 2,844,923 | |
| | 400 | | | Finance of America Structured Security Trust, Series2017-HB1, 144A | | | 3.624% | | | | 11/25/27 | | | | Baa2 | | | | 398,396 | |
| | 500 | | | Finance of America Structured Securities, Series 2018-HB1, 144A | | | 4.392% | | | | 9/25/28 | | | | Baa3 | | | | 499,375 | |
| | 1,285 | | | Focus Brands Funding LLC, Asset Backed Security, 144A | | | 5.093% | | | | 4/30/47 | | | | BBB | | | | 1,302,675 | |
| | 1,645 | | | Freddie Mac Gold Mortgage Pool, (3) | | | 3.000% | | | | 1/01/29 | | | | N/R | | | | 1,646,483 | |
| | 2,602 | | | Freddie Mac Gold Mortgage Pool, (3) | | | 3.000% | | | | 6/01/46 | | | | N/R | | | | 2,539,505 | |
| | 1,196 | | | Freddie Mac Mortgage Pool, (3) | | | 3.500% | | | | 1/01/44 | | | | N/R | | | | 1,204,722 | |
| | 1,156 | | | Freddie Mac Mortgage Pool, (3) | | | 3.500% | | | | 2/01/44 | | | | N/R | | | | 1,164,178 | |
| | 22 | | | Freddie Mac Mortgage Pool, (3) | | | 6.500% | | | | 11/01/28 | | | | N/R | | | | 24,239 | |
| | 250 | | | Freddie Mac MultiFamily Mortgage Trust, Structured Pass Through Certificates, Series 2015-K714, 144A | | | 3.986% | | | | 1/25/47 | | | | A3 | | | | 251,661 | |
| | 500 | | | Freddie Mac MultiFamily Mortgage Trust, Structured Pass Through Certificates, Series 2017-K724, 144A | | | 3.601% | | | | 11/25/23 | | | | BBB– | | | | 480,301 | |
| | 500 | | | GMAT Trust Mortgage Pool2013-1A, 144A | | | 5.000% | | | | 11/25/43 | | | | N/R | | | | 341,645 | |
| | 92 | | | Goldman Sachs Mortgage Securities Corporation, GSMPS Mortgage Pass Through Certificates, Series2001-2, 144A | | | 7.500% | | | | 6/19/32 | | | | D | | | | 89,081 | |
| | 524 | | | Goldman Sachs Mortgage Securities Corporation, GSMPS Mortgage Pass Through Certificates, Series2003-3, 144A | | | 7.000% | | | | 6/25/43 | | | | BBB | | | | 574,628 | |
| | 50 | | | Goldman Sachs Mortgage Securities Corporation, MortgagePass-Through Certificates, Series2003-10 1A1 | | | 4.416% | | | | 10/25/33 | | | | A | | | | 49,996 | |
| | 439 | | | Goldman Sachs Mortgage Securities Corporation, MortgagePass-Through Certificates, Series2005-RP1, 144A | | | 8.500% | | | | 1/25/35 | | | | B2 | | | | 486,031 | |
| | 631 | | | Goldman Sachs Mortgage Securities Corporation, MortgagePass-Through Certificates, Series2005-RP2 1A2, 144A | | | 7.500% | | | | 3/25/35 | | | | B1 | | | | 669,880 | |
| | 673 | | | Goldman Sachs Mortgage Securities Corporation, MortgagePass-Through Certificates, Series2005-RP3 1A2, 144A | | | 7.500% | | | | 9/25/35 | | | | B3 | | | | 704,103 | |
| | 418 | | | Goldman Sachs Mortgage Securities Corporation, MortgagePass-Through Certificates, Series2005-RP3 1A2, 144A | | | 8.000% | | | | 9/25/35 | | | | B3 | | | | 449,712 | |
| | 500 | | | Goldman Sachs Mortgage Securities Trust, Mortgage Pass Through Certificates, Series 2013-GC16, 144A | | | 5.311% | | | | 11/10/46 | | | | Baa3 | | | | 513,073 | |
| | 500 | | | Goldman Sachs Mortgage Securities Trust, Mortgage Pass Through Certificates, Series 2015-GC32 | | | 3.345% | | | | 7/10/48 | | | | BBB– | | | | 426,037 | |
| | 205 | | | Government National Mortgage Association Pool, (3) | | | 5.500% | | | | 8/15/33 | | | | Aaa | | | | 225,903 | |
| | 97 | | | Government National Mortgage Association Pool, (3) | | | 6.000% | | | | 7/15/34 | | | | Aaa | | | | 103,731 | |
| | 1,012 | | | Honor Automobile Trust Securitization2016-1A, Series HATS2016-1A B, 144A | | | 5.760% | | | | 4/15/21 | | | | BBB | | | | 1,011,430 | |
| | 263 | | | Impac Secured Assets Corporation, Mortgage Pass-Through Certificates, Series2000-3 | | | 8.000% | | | | 10/25/30 | | | | CCC | | | | 257,295 | |
| | 1 | | | IndyMac MBS Inc., Residential Asset Securitization Trust, Mortgage Pass Through Certificates, Series2004-A2 | | | 4.000% | | | | 5/25/34 | | | | AA+ | | | | 1,433 | |
| | 741 | | | Jimmy Johns Funding LLC, 144A | | | 4.846% | | | | 7/30/47 | | | | BBB | | | | 750,046 | |
| | 500 | | | JPMDB Commercial Mortgage Securities Trust, Series2017-C7, 144A | | | 3.000% | | | | 10/15/50 | | | | BBB– | | | | 390,728 | |
| | 298 | | | JPMorgan Alternative Loan Trust2006-S1, Mortgage Pass-Through Certificates | | | 6.500% | | | | 3/25/36 | | | | D | | | | 253,558 | |
15
| | |
| |
| JMM | | Nuveen Multi-Market Income Fund(continued) |
| | Portfolio of Investments December 31, 2018 |
| | (Unaudited) |
| | | | | | | | | | | | | | | | | | | | |
Principal
Amount (000) | | | Description (1) | | Coupon | | | Maturity | | | Ratings (2) | | | Value | |
| | | | |
| | | | ASSET-BACKED AND MORTGAGE-BACKED SECURITIES(continued) | | | | | | | | | | | | | |
| | | | | |
| $ | 500 | | | JPMorgan Chase Commercial Mortgage Securities Corporation,Series 2016-JP4, 144A | | | 3.457% | | | | 12/15/49 | | | | BBB– | | | $ | 410,178 | |
| | 500 | | | JPMorgan Chase Commercial Mortgage Securities Trust 2018-BCON, 144A | | | 3.756% | | | | 1/05/31 | | | | BBB– | | | | 492,166 | |
| | 11 | | | Lehman ABS Manufactured Housing Contract Asset Backed Certificates, Series 2001B | | | 4.350% | | | | 4/15/40 | | | | Aaa | | | | 10,922 | |
| | 355 | | | Master RePerforming Loan Trust2005-1, 144A | | | 7.500% | | | | 8/25/34 | | | | C | | | | 351,158 | |
| | 1,010 | | | Mid-State Capital Corporation Trust Notes, Series2004-1 A | | | 6.005% | | | | 8/15/37 | | | | AA+ | | | | 1,080,382 | |
| | 835 | | | Mid-State Capital Corporation Trust Notes, Series2005-1 | | | 5.745% | | | | 1/15/40 | | | | AA | | | | 892,574 | |
| | 69 | | | Mid-State Trust2004-A | | | 8.900% | | | | 8/15/37 | | | | A1 | | | | 77,675 | |
| | 511 | | | Mid-State Trust2010-1, 144A | | | 7.000% | | | | 12/15/45 | | | | A | | | | 541,129 | |
| | 597 | | | Mid-State Trust2010-1, 144A | | | 5.250% | | | | 12/15/45 | | | | AA | | | | 618,682 | |
| | 264 | | | Mid-State Trust XI | | | 5.598% | | | | 7/15/38 | | | | BBB | | | | 282,227 | |
| | 500 | | | Morgan Stanley Bank of America Merrill Lynch Trust, Series2014-C16, 144A | | | 4.754% | | | | 6/15/47 | | | | BBB– | | | | 446,409 | |
| | 500 | | | Morgan Stanley Bank of America Merrill Lynch Trust, Series2015-C22, 144A | | | 4.237% | | | | 4/15/48 | | | | BBB– | | | | 431,538 | |
| | 500 | | | Morgan Stanley Bank of America Merrill Lynch Trust, Series2016-C28 | | | 4.594% | | | | 1/15/49 | | | | A3 | | | | 500,824 | |
| | 88 | | | Morgan Stanley Mortgage Loan Trust, Pass Through Certificates,2006-2 | | | 5.750% | | | | 2/25/36 | | | | N/R | | | | 86,472 | |
| | 308 | | | Mortgage Asset Securitization Transaction Inc., Alternative Loan Trust Mortgage Pass-Through Certificates Series2004-1 | | | 7.000% | | | | 1/25/34 | | | | BBB– | | | | 310,649 | |
| | 297 | | | Mortgage Asset Securitization Transaction Inc., Alternative Loan Trust Mortgage Pass-Through Certificates,2004-5 6A1 | | | 7.000% | | | | 6/25/34 | | | | AA+ | | | | 305,742 | |
| | 289 | | | Mortgage Asset Securitization Transactions Inc., Mortgage Pass Through Certificates, Series2003-11 | | | 5.250% | | | | 12/25/33 | | | | A | | | | 287,966 | |
| | 500 | | | New Residential Advance Receivable Trust, Series2017-T1, 144A | | | 4.002% | | | | 2/15/51 | | | | BBB | | | | 493,448 | |
| | 440 | | | New Residential Mortgage LLC 2018-FNT2,Series NZES 2018-FNT2 D, 144A | | | 4.920% | | | | 7/25/54 | | | | N/R | | | | 442,704 | |
| | 421 | | | New Residential Mortgage LLC, 144A | | | 4.690% | | | | 5/25/23 | | | | N/R | | | | 423,448 | |
| | 506 | | | New Residential Mortgage Loan Trust, Mortgage Pass Through Certificates, Series2014-1A, 144A | | | 6.039% | | | | 1/25/54 | | | | BBB | | | | 535,103 | |
| | 390 | | | NRZ Excess Spread-Collateralized Notes Series 2018-PLS1, 144A | | | 4.374% | | | | 1/25/23 | | | | N/R | | | | 388,319 | |
| | 402 | | | NRZ Excess Spread-Collateralized Notes Series 2018-PLS2, 144A | | | 4.593% | | | | 2/25/23 | | | | N/R | | | | 401,205 | |
| | 500 | | | Oak Hill Advisors Residential Loan Trust 2017-NPLA, Series OHART 2017-NPL1 A2, 144A | | | 5.000% | | | | 6/25/57 | | | | N/R | | | | 491,388 | |
| | 500 | | | Ocwen Master Advance Receivables Trust,Series OMART 2018-T2 DT2, 144A | | | 4.532% | | | | 8/15/50 | | | | BBB | | | | 501,165 | |
| | 500 | | | OMART Receivables Trust, Series2016-T2, 144A | | | 4.446% | | | | 8/16/49 | | | | BBB | | | | 500,012 | |
| | 499 | | | Planet Fitness Master Issuer LLC, Series PLNT2018-1A A2II, 144A | | | 4.666% | | | | 9/05/48 | | | | BBB– | | | | 505,079 | |
| | 500 | | | PNMAC GMSR ISSUER TRUST2018-GT1, 144A, (1-Month LIBOR reference rate + 2.350% spread), (10) | | | 4.665% | | | | 4/25/23 | | | | N/R | | | | 501,875 | |
| | 500 | | | PNMAC GMSR ISSUER TRUST2018-GT1, 144A, (1-Month LIBOR reference rate + 2.850% spread), (10) | | | 5.165% | | | | 2/25/23 | | | | N/R | | | | 501,074 | |
| | 500 | | | PNMAC GMSR ISSUER TRUST2018-GT2, Series PNMSR2018-GT2 A, 144A,(1-Month LIBOR reference rate + 2.650% spread), (10) | | | 4.965% | | | | 8/25/25 | | | | N/R | | | | 501,045 | |
| | 500 | | | Progress Residential Trust, Series 2017- SFR2, 144A | | | 3.595% | | | | 12/17/34 | | | | Baa2 | | | | 494,454 | |
| | 433 | | | RALI Series 2005-QS12 Trust, Series RALI 2005-QS12 A7 | | | 5.500% | | | | 8/25/35 | | | | Caa2 | | | | 408,919 | |
| | 210 | | | Renaissance Home Equity Loan Trust Asset Backed Certificates,Series 2005-4 A6 | | | 5.749% | | | | 2/25/36 | | | | Caa1 | | | | 210,312 | |
| | 460 | | | Residential Asset Securities Corporation , Home Equity Mortgage Asset Backed Pass Through Certificates, Series2004-KS1 | | | 5.721% | | | | 2/25/34 | | | | Aa2 | | | | 467,441 | |
| | 500 | | | RMF Buyout Issuance, Series RBIT2018-1M3, 144A | | | 4.448% | | | | 11/25/28 | | | | Baa3 | | | | 500,520 | |
| | 159 | | | Salomon Brothers Commercial Mortgage Trust Pass-Through VII Certificates, Series2003-1 A2, 144A | | | 6.000% | | | | 9/25/33 | | | | BB | | | | 157,584 | |
| | 571 | | | Sonic Capital LLC, 144A | | | 3.750% | | | | 7/20/43 | | | | BBB | | | | 568,352 | |
| | 500 | | | Sonic Capital LLC, 144A | | | 4.026% | | | | 2/20/48 | | | | BBB | | | | 493,418 | |
| | 500 | | | SPS Servicer Advance Receivables, Series SPART2018-T1 DT1, 144A | | | 4.500% | | | | 10/17/50 | | | | BBB | | | �� | 500,920 | |
| | 289 | | | Structured Receivables Finance2010-A LLC, 144A | | | 5.218% | | | | 1/16/46 | | | | AAA | | | | 295,541 | |
| | 500 | | | STWD2018-URB Mortgage Trust, Series STWD2018-URB D, 144A,(1-Month LIBOR reference rate + 2.050% spread), (10) | | | 4.505% | | | | 5/15/35 | | | | Baa3 | | | | 489,317 | |
| | 616 | | | Taco Bell Funding LLC, 144A | | | 4.970% | | | | 5/25/46 | | | | BBB | | | | 632,795 | |
| | 500 | | | Verus Securitization Trust, Series2017-1A, 144A | | | 5.273% | | | | 1/25/47 | | | | A | | | | 500,181 | |
| | 750 | | | VOLT LXIX LLC, Series VOLT 2018-NPL5 A2, 144A | | | 5.804% | | | | 8/25/48 | | | | N/R | | | | 751,265 | |
| | 500 | | | VOLT LXX LLC, Series VOLT 2018-NPL6 A2, 144A | | | 5.805% | | | | 9/25/48 | | | | N/R | | | | 503,042 | |
16
| | | | | | | | | | | | | | | | | | | | |
Principal
Amount (000) | | | Description (1) | | Coupon | | | Maturity | | | Ratings (2) | | | Value | |
| | | | |
| | | | ASSET-BACKED AND MORTGAGE-BACKED SECURITIES(continued) | | | | | | | | | | | | | |
| | | | | |
| $ | 500 | | | VOLT LXXIV LLC, Series VOLT2018-NP10 A2, 144A | | | 6.414% | | | | 11/25/48 | | | | N/R | | | $ | 504,540 | |
| | 327 | | | Washington Mutual Mortgage Securities Corporation, Mortgage Pass-Through Certificates, Series2003-MS4 | | | 5.500% | | | | 2/25/33 | | | | N/R | | | | 327,247 | |
| | 25 | | | Washington Mutual Mortgage Securities Corporation, Mortgage Pass-Through Certificates, Series2004-RA3 | | | 6.253% | | | | 8/25/38 | | | | AA | | | | 25,615 | |
| | 500 | | | Wells Fargo Commercial Mortgage Trust, Commercial Mortgage Pass-Through Certificates, Series2015-C30, 144A | | | 4.497% | | | | 9/15/58 | | | | BBB– | | | | 462,745 | |
| | 500 | | | Wells Fargo Commercial Mortgage Trust, Commercial Mortgage-Pass Through Certificates, Series2015-C26, 144A | | | 3.586% | | | | 2/15/48 | | | | BBB– | | | | 430,149 | |
| | 750 | | | WellsFargo-RBS Commercial Mortgage Trust, Commercial Mortgage Pass-Through Certificates, Series2011-C3, 144A | | | 5.335% | | | | 3/15/44 | | | | A1 | | | | 764,204 | |
| | 895 | | | Wendy’s Funding LLC, Series2015-1A, 144A | | | 4.080% | | | | 6/15/45 | | | | BBB | | | | 894,347 | |
| | 250 | | | WF-RBS Commercial Mortgage Trust, Commercial Mortgage Pass-Through Certificates, Series2011-C2, 144A | | | 5.392% | | | | 2/15/44 | | | | Aa2 | | | | 255,504 | |
| $ | 82,464 | | | Total Asset-Backed and Mortgage-Backed Securities (cost $80,202,426) | | | | 80,371,681 | |
| | | | | |
Principal
Amount (000) | | | Description (1) | | Coupon | | | Maturity | | | Ratings (2) | | | Value | |
| | |
| | | | CORPORATE BONDS – 27.1% (19.2% of Total Investments) | | | | | |
| | | | |
| | | | Aerospace & Defense – 0.4% | | | | | | | | | | |
| | | | | |
| $ | 150 | | | Triumph Group Inc. | | | 4.875% | | | | 4/01/21 | | | | CCC+ | | | $ | 134,625 | |
| | 150 | | | Triumph Group Inc. | | | 5.250% | | | | 6/01/22 | | | | CCC+ | | | | 130,500 | |
| | 300 | | | Total Aerospace & Defense | | | | | | | | | | | | | | | 265,125 | |
| | | | | |
| | | | Auto Components – 0.3% | | | | | | | | | | | | |
| | | | | |
| | 250 | | | American Axle & Manufacturing Inc. | | | 6.250% | | | | 4/01/25 | | | | B | | | | 227,500 | |
| | | | | |
| | | | Automobiles – 0.3% | | | | | | | | | | | | |
| | | | | |
| | 100 | | | Ford Motor Co | | | 7.450% | | | | 7/16/31 | | | | BBB | | | | 103,168 | |
| | 200 | | | Jaguar Land Rover Automotive PLC, 144A | | | 4.500% | | | | 10/01/27 | | | | BB | | | | 149,000 | |
| | 300 | | | Total Automobiles | | | | | | | | | | | | 252,168 | |
| | | | | |
| | | | Banks – 0.2% | | | | | | | | | | | | |
| | | | | |
| | 140 | | | CIT Group Inc. | | | 5.800% | | | | N/A (4) | | | | Ba3 | | | | 126,700 | |
| | | | | |
| | | | Building Products – 0.2% | | | | | | | | | | | | |
| | | | | |
| | 200 | | | American Woodmark Corp, 144A | | | 4.875% | | | | 3/15/26 | | | | BB | | | | 177,000 | |
| | | | | |
| | | | Capital Markets – 0.6% | | | | | | | | | | | | |
| | | | | |
| | 200 | | | Donnelley Financial Solutions Inc. | | | 8.250% | | | | 10/15/24 | | | | B | | | | 198,500 | |
| | 225 | | | Jefferies Finance LLC / JFINCo-Issuer Corp, 144A | | | 7.250% | | | | 8/15/24 | | | | BB– | | | | 208,125 | |
| | 425 | | | Total Capital Markets | | | | | | | | | | | | | | | 406,625 | |
| | | | | |
| | | | Chemicals – 2.1% | | | | | | | | | | | | |
| | | | | |
| | 200 | | | CF Industries Inc. | | | 3.450% | | | | 6/01/23 | | | | BB+ | | | | 186,000 | |
| | 250 | | | Chemours Co/The | | | 5.375% | | | | 5/15/27 | | | | BB– | | | | 225,000 | |
| | 100 | | | CVR Partners LP / CVR Nitrogen Finance Corp, 144A | | | 9.250% | | | | 6/15/23 | | | | B+ | | | | 104,000 | |
| | 200 | | | FXI Holdings inc., 144A | | | 7.875% | | | | 11/01/24 | | | | B | | | | 171,500 | |
| | 100 | | | Hexion Inc. | | | 6.625% | | | | 4/15/20 | | | | CCC+ | | | | 79,750 | |
| | 375 | | | NOVA Chemicals Corp, 144A | | | 5.000% | | | | 5/01/25 | | | | BBB– | | | | 337,500 | |
| | 250 | | | OCI NV, 144A | | | 6.625% | | | | 4/15/23 | | | | BB– | | | | 245,624 | |
| | 200 | | | Platform Specialty Products Corp, 144A | | | 6.500% | | | | 2/01/22 | | | | B+ | | | | 200,000 | |
| | 1,675 | | | Total Chemicals | | | | | | | | | | | | 1,549,374 | |
| | | | | |
| | | | Commercial Services & Supplies – 2.0% | | | | | | | | | | | | |
| | | | | |
| | 150 | | | APX Group Inc. | | | 8.750% | | | | 12/01/20 | | | | CCC | | | | 142,875 | |
| | 250 | | | Brink’s Co/The, 144A | | | 4.625% | | | | 10/15/27 | | | | BB+ | | | | 228,182 | |
| | 225 | | | Covanta Holding Corp | | | 5.875% | | | | 7/01/25 | | | | B1 | | | | 207,000 | |
| | 250 | | | Hulk Finance Corp, 144A | | | 7.000% | | | | 6/01/26 | | | | CCC+ | | | | 218,125 | |
17
| | |
| |
| JMM | | Nuveen Multi-Market Income Fund(continued) |
| | Portfolio of Investments December 31, 2018 |
| | (Unaudited) |
| | | | | | | | | | | | | | | | | | | | |
| | | | | |
Principal
Amount (000) | | | Description (1) | | Coupon | | | Maturity | | | Ratings (2) | | | Value | |
| | | | | |
| | | | Commercial Services & Supplies(continued) | | | | | | | | | | | | |
| | | | | |
| $ | 250 | | | Iron Mountain inc., 144A | | | 5.250% | | | | 3/15/28 | | | | BB– | | | $ | 220,625 | |
| | 78 | | | RR Donnelley & Sons Co | | | 7.875% | | | | 3/15/21 | | | | B– | | | | 78,000 | |
| | 200 | | | Staples inc., 144A | | | 8.500% | | | | 9/15/25 | | | | B– | | | | 180,440 | |
| | 250 | | | Waste Pro USA inc., 144A | | | 5.500% | | | | 2/15/26 | | | | B+ | | | | 230,000 | |
| | 1,653 | | | Total Commercial Services & Supplies | | | | | | | | | | | | 1,505,247 | |
| | | | | |
| | | | Consumer Finance – 0.2% | | | | | | | | | | | | |
| | | | | |
| | 200 | | | Curo Group Holdings Corp, 144A | | | 8.250% | | | | 9/01/25 | | | | B– | | | | 157,000 | |
| | | | | |
| | | | Diversified Financial Services – 0.6% | | | | | | | | | | | | |
| | | | | |
| | 220 | | | Park Aerospace Holdings Ltd, 144A | | | 5.500% | | | | 2/15/24 | | | | BB | | | | 212,300 | |
| | 225 | | | Quicken Loans inc., 144A | | | 5.250% | | | | 1/15/28 | | | | Ba1 | | | | 199,125 | |
| | 445 | | | Total Diversified Financial Services | | | | | | | | | | | | 411,425 | |
| | | | | |
| | | | Diversified Telecommunication Services – 2.1% | | | | | | | | | | | | |
| | | | | |
| | 99 | | | Frontier Communications Corp | | | 8.500% | | | | 4/15/20 | | | | B | | | | 87,615 | |
| | 350 | | | GCI LLC | | | 6.875% | | | | 4/15/25 | | | | B+ | | | | 339,500 | |
| | 500 | | | Qwest Corp | | | 6.750% | | | | 12/01/21 | | | | BBB– | | | | 511,204 | |
| | 200 | | | Sprint Capital Corp | | | 6.875% | | | | 11/15/28 | | | | B+ | | | | 189,000 | |
| | 200 | | | Telenet Finance Luxembourg Notes Sarl, 144A | | | 5.500% | | | | 3/01/28 | | | | BB+ | | | | 181,000 | |
| | 300 | | | Zayo Group LLC / Zayo Capital inc., 144A | | | 5.750% | | | | 1/15/27 | | | | B | | | | 267,750 | |
| | 1,649 | | | Total Diversified Telecommunication Services | | | | | | | | 1,576,069 | |
| | |
| | | | Electric Utilities – 0.2% | | | | |
| | | | | |
| | 200 | | | Talen Energy Supply LLC | | | 6.500% | | | | 6/01/25 | | | | B+ | | | | 142,000 | |
| | | | | |
| | | | Electrical Equipment – 0.3% | | | | | | | | | | | | |
| | | | | |
| | 250 | | | Energizer Gamma Acquisition inc., 144A | | | 6.375% | | | | 7/15/26 | | | | BB– | | | | 229,375 | |
| | | | | |
| | | | Energy Equipment & Services – 0.8% | | | | | | | | | | | | |
| | | | | |
| | 250 | | | Ensco PLC | | | 7.750% | | | | 2/01/26 | | | | B | | | | 185,000 | |
| | 200 | | | SESI LLC | | | 7.125% | | | | 12/15/21 | | | | BB– | | | | 170,000 | |
| | 200 | | | Transocean inc., 144A | | | 9.000% | | | | 7/15/23 | | | | B | | | | 199,000 | |
| | 650 | | | Total Energy Equipment & Services | | | | | | | | | | | | 554,000 | |
| | | |
| | | | Equity Real Estate Investment Trusts – 0.9% | | | | | | | |
| | | | | |
| | 200 | | | CoreCivic Inc. | | | 4.750% | | | | 10/15/27 | | | | Ba1 | | | | 165,500 | |
| | 300 | | | Equity Commonwealth | | | 5.875% | | | | 9/15/20 | | | | Baa2 | | | | 307,272 | |
| | 250 | | | GEO Group Inc. | | | 6.000% | | | | 4/15/26 | | | | B+ | | | | 219,375 | |
| | 750 | | | Total Equity Real Estate Investment Trusts | | | | | | | | | | | | 692,147 | |
| | | | |
| | | | Food Products – 0.3% | | | | | | | | | | |
| | | | | |
| | 200 | | | Post Holdings inc., 144A | | | 5.625% | | | | 1/15/28 | | | | B+ | | | | 184,000 | |
| | | | |
| | | | Gas Utilities – 0.8% | | | | | | | | | | |
| | | | | |
| | 250 | | | AmeriGas Partners LP / AmeriGas Finance Corp | | | 5.500% | | | | 5/20/25 | | | | BB | | | | 228,750 | |
| | 150 | | | Ferrellgas LP / Ferrellgas Finance Corp | | | 6.750% | | | | 1/15/22 | | | | Caa2 | | | | 122,250 | |
| | 55 | | | NGL Energy Partners LP / NGL Energy Finance Corp | | | 6.125% | | | | 3/01/25 | | | | B+ | | | | 47,300 | |
| | 200 | | | Suburban Propane Partners LP/Suburban Energy Finance Corp | | | 5.875% | | | | 3/01/27 | | | | BB– | | | | 177,000 | |
| | 655 | | | Total Gas Utilities | | | | | | | | | | | | 575,300 | |
| | | | |
| | | | Health Care Providers & Services – 0.2% | | | | | | | | | | |
| | | | | |
| | 175 | | | HCA Inc. | | | 5.250% | | | | 6/15/26 | | | | BBB– | | | | 173,688 | |
| | | | |
| | | | Health Care Technology – 0.3% | | | | | | | | | | |
| | | | | |
| | 200 | | | Exela Intermediate LLC / Exela Finance inc., 144A | | | 10.000% | | | | 7/15/23 | | | | B | | | | 191,000 | |
| | | | |
| | | | Hotels, Restaurants & Leisure – 0.6% | | | | | | | | | | |
| | | | | |
| | 250 | | | Carlson Travel inc., 144A | | | 6.750% | | | | 12/16/23 | | | | B2 | | | | 240,938 | |
| | 250 | | | Viking Cruises Ltd, 144A | | | 5.875% | | | | 9/15/27 | | | | B | | | | 233,125 | |
| | 500 | | | Total Hotels, Restaurants & Leisure | | | | | | | | | | | | 474,063 | |
18
| | | | | | | | | | | | | | | | | | | | |
| | | | | |
Principal
Amount (000) | | | Description (1) | | Coupon | | | Maturity | | | Ratings (2) | | | Value | |
| | | | |
| | | | Household Durables – 1.5% | | | | | | | | | | |
| | | | | |
| $ | 200 | | | Beazer Homes USA Inc. | | | 5.875% | | | | 10/15/27 | | | | B– | | | $ | 158,000 | |
| | 250 | | | Brookfield Residential Properties inc., 144A | | | 6.500% | | | | 12/15/20 | | | | B+ | | | | 249,688 | |
| | 250 | | | M/I Homes Inc. | | | 5.625% | | | | 8/01/25 | | | | BB– | | | | 228,750 | |
| | 300 | | | Mattamy Group Corp, 144A | | | 6.500% | | | | 10/01/25 | | | | BB | | | | 268,500 | |
| | 250 | | | William Lyon Homes Inc. | | | 5.875% | | | | 1/31/25 | | | | B+ | | | | 212,500 | |
| | 1,250 | | | Total Household Durables | | | | | | | | | | | | 1,117,438 | |
| | | | |
| | | | Industrial Conglomerates – 0.3% | | | | | | | | | | |
| | | | | |
| | 250 | | | General Electric Company | | | 3.375% | | | | 3/11/24 | | | | BBB+ | | | | 233,512 | |
| | | | |
| | | | Insurance – 0.6% | | | | | | | | | | |
| | | | | |
| | 250 | | | Genworth Holdings Inc. | | | 4.800% | | | | 2/15/24 | | | | B | | | | 206,250 | |
| | 250 | | | Nationstar Mortgage Holdings inc., 144A | | | 8.125% | | | | 7/15/23 | | | | B+ | | | | 243,750 | |
| | 500 | | | Total Insurance | | | | | | | | | | | | | | | 450,000 | |
| | | | |
| | | | Leisure Products – 0.3% | | | | | | | | | | |
| | | | | |
| | 250 | | | Mattel inc., 144A | | | 6.750% | | | | 12/31/25 | | | | BB– | | | | 223,048 | |
| | | | |
| | | | Machinery – 0.5% | | | | | | | | | | |
| | | | | |
| | 200 | | | Mueller Water Products inc., 144A | | | 5.500% | | | | 6/15/26 | | | | BB | | | | 194,000 | |
| | 150 | | | Navistar International Corp, 144A | | | 6.625% | | | | 11/01/25 | | | | B– | | | | 144,750 | |
| | 350 | | | Total Machinery | | | | | | | | | | | | 338,750 | |
| | | | | |
| | | | Media – 2.5% | | | | | | | | | | | | |
| | | | | |
| | 500 | | | Altice France SA/France, 144A | | | 7.375% | | | | 5/01/26 | | | | B | | | | 458,750 | |
| | 250 | | | CBS Radio inc., 144A | | | 7.250% | | | | 11/01/24 | | | | B– | | | | 232,500 | |
| | 300 | | | Charter Communications Operating LLC / Charter Communications Operating Capital | | | 4.908% | | | | 7/23/25 | | | | BBB– | | | | 298,172 | |
| | 200 | | | National CineMedia LLC | | | 6.000% | | | | 4/15/22 | | | | Ba3 | | | | 200,250 | |
| | 250 | | | Nielsen Finance LLC / Nielsen Finance Co, 144A | | | 5.000% | | | | 4/15/22 | | | | BB | | | | 238,750 | |
| | 200 | | | Quebecor Media Inc. | | | 5.750% | | | | 1/15/23 | | | | B+ | | | | 201,000 | |
| | 200 | | | VTR Finance BV, 144A | | | 6.875% | | | | 1/15/24 | | | | BB– | | | | 200,000 | |
| | 1,900 | | | Total Media | | | | | | | | | | | | | | | 1,829,422 | |
| | | | |
| | | | Metals & Mining – 2.6% | | | | | | | | | | |
| | | | | |
| | 250 | | | Alcoa Nederland Holding BV, 144A | | | 6.125% | | | | 5/15/28 | | | | BB+ | | | | 239,375 | |
| | 120 | | | Arconic Inc. | | | 5.400% | | | | 4/15/21 | | | | BBB– | | | | 121,169 | |
| | 175 | | | Allegheny Technologies Inc. | | | 5.950% | | | | 1/15/21 | | | | B | | | | 171,500 | |
| | 300 | | | Eldorado Gold Corp, 144A | | | 6.125% | | | | 12/15/20 | | | | B | | | | 273,000 | |
| | 150 | | | Freeport-McMoRan Inc. | | | 3.875% | | | | 3/15/23 | | | | BB+ | | | | 138,750 | |
| | 250 | | | SunCoke Energy Partners LP / SunCoke Energy Partners Finance Corp, 144A | | | 7.500% | | | | 6/15/25 | | | | BB– | | | | 236,875 | |
| | 150 | | | Taseko Mines Ltd, 144A | | | 8.750% | | | | 6/15/22 | | | | B | | | | 135,000 | |
| | 200 | | | United States Steel Corp | | | 6.250% | | | | 3/15/26 | | | | BB– | | | | 175,000 | |
| | 200 | | | Warrior Met Coal inc., 144A | | | 8.000% | | | | 11/01/24 | | | | BB– | | | | 198,500 | |
| | 250 | | | Tronox inc., 144A | | | 6.500% | | | | 4/15/26 | | | | B– | | | | 207,500 | |
| | 2,045 | | | Total Metals & Mining | | | | | | | | | | | | 1,896,669 | |
| | | | |
| | | | Oil, Gas & Consumable Fuels – 1.1% | | | | | | | | | | |
| | | | | |
| | 200 | | | Genesis Energy LP / Genesis Energy Finance Corp | | | 5.625% | | | | 6/15/24 | | | | B+ | | | | 171,500 | |
| | 275 | | | PBF Holding Co LLC / PBF Finance Corp | | | 7.250% | | | | 6/15/25 | | | | BB | | | | 258,500 | |
| | 200 | | | Southwestern Energy Co | | | 7.500% | | | | 4/01/26 | | | | BB | | | | 189,000 | |
| | 250 | | | Whiting Petroleum Corp | | | 6.625% | | | | 1/15/26 | | | | BB | | | | 214,375 | |
| | 925 | | | Total Oil, Gas & Consumable Fuels | | | | | | | | | | | | 833,375 | |
| | | | |
| | | | Pharmaceuticals – 0.3% | | | | | | | | | | |
| | | | | |
| | 220 | | | Teva Pharmaceutical Finance Netherlands III BV | | | 6.750% | | | | 3/01/28 | | | | BB | | | | 213,279 | |
| | | |
| | | | Real Estate Management & Development – 0.6% | | | | | | | |
| | | | | |
| | 250 | | | Hunt Cos inc., 144A | | | 6.250% | | | | 2/15/26 | | | | BB– | | | | 213,600 | |
| | 250 | | | Kennedy-Wilson Inc. | | | 5.875% | | | | 4/01/24 | | | | BB | | | | 233,750 | |
| | 500 | | | Total Real Estate Management & Development | | | | | | | | 447,350 | |
19
| | |
| |
| JMM | | Nuveen Multi-Market Income Fund(continued) |
| | Portfolio of Investments December 31, 2018 |
| | (Unaudited) |
| | | | | | | | | | | | | | | | | | | | |
| | | | | |
Principal
Amount (000) | | | Description (1) | | Coupon | | | Maturity | | | Ratings (2) | | | Value | |
| | | | |
| | | | Road & Rail – 0.6% | | | | | | | | | | |
| | | | | |
| $ | 200 | | | Avis Budget Car Rental LLC / Avis Budget Finance inc., 144A | | | 6.375% | | | | 4/01/24 | | | | BB | | | $ | 191,000 | |
| | 250 | | | United Rentals North America Inc. | | | 4.875% | | | | 1/15/28 | | | | BB | | | | 219,375 | |
| | 450 | | | Total Road & Rail | | | | | | | | | | | | 410,375 | |
| | | | |
| | | | Software – 0.3% | | | | | | | | | | |
| | | | | |
| | 200 | | | CDK Global Inc. | | | 5.875% | | | | 6/15/26 | | | | BB+ | | | | 200,810 | |
| | | | |
| | | | Specialty Retail – 1.2% | | | | | | | | | | |
| | | | | |
| | 250 | | | GameStop Corp, 144A | | | 6.750% | | | | 3/15/21 | | | | Ba1 | | | | 249,374 | |
| | 205 | | | L Brands Inc. | | | 6.875% | | | | 11/01/35 | | | | Ba1 | | | | 171,216 | |
| | 225 | | | Levi Strauss & Co | | | 5.000% | | | | 5/01/25 | | | | BB+ | | | | 219,938 | |
| | 250 | | | PGT Escrow Issuer inc., 144A | | | 6.750% | | | | 8/01/26 | | | | B | | | | 246,250 | |
| | 930 | | | Total Specialty Retail | | | | | | | | | | | | 886,778 | |
| | | |
| | | | Technology Hardware, Storage & Peripherals – 0.2% | | | | | | | |
| | | | | |
| | 175 | | | NCR Corp | | | 4.625% | | | | 2/15/21 | | | | BB | | | | 170,625 | |
| | | | |
| | | | Tobacco – 0.3% | | | | | | | | | | |
| | | | | |
| | 250 | | | Vector Group Ltd, 144A | | | 6.125% | | | | 2/01/25 | | | | BB– | | | | 212,500 | |
| | | |
| | | | Wireless Telecommunication Services – 0.8% | | | | | | | |
| | | | | |
| | 200 | | | Digicel Ltd, 144A | | | 6.000% | | | | 4/15/21 | | | | B3 | | | | 179,500 | |
| | 250 | | | Hughes Satellite Systems Corp | | | 6.625% | | | | 8/01/26 | | | | BB– | | | | 229,062 | |
| | 200 | | | Level 3 Financing Inc. | | | 5.250% | | | | 3/15/26 | | | | BB | | | | 183,000 | |
| | 650 | | | Total Wireless Telecommunication Services | | | | | | | | 591,562 | |
| $ | 21,662 | | | Total Corporate Bonds (cost $21,554,800) | | | | | | | | | | | | 19,925,299 | |
| | | | | |
Principal
Amount (000) | | | Description (1) | | Coupon | | | Maturity | | | Ratings (2) | | | Value | |
| | |
| | | | SOVEREIGN DEBT – 1.4% (1.0% of Total Investments) | | | | | |
| | | | |
| | | | Argentina – 0.2% | | | | | | | | | | |
| | | | | |
| $ | 200 | | | Argentine Republic Government International Bond | | | 4.625% | | | | 1/11/23 | | | | B | | | $ | 158,000 | |
| | | | | |
| | | | Egypt – 0.5% | | | | | | | | | | | | |
| | | | | |
| | 400 | | | Arab Republic of Egypt, 144A | | | 5.875% | | | | 6/11/25 | | | | B | | | | 363,830 | |
| | | | |
| | | | El Salvador – 0.1% | | | | | | | | | | |
| | | | | |
| | 100 | | | Republic of El Salvador, 144A | | | 5.875% | | | | 1/30/25 | | | | B– | | | | 92,125 | |
| | | | | |
| | | | Oman – 0.3% | | | | | | | | | | | | |
| | | | | |
| | 250 | | | Oman Government International Bond., 144A | | | 4.125% | | | | 1/17/23 | | | | Baa3 | | | | 229,000 | |
| | | | |
| | | | Sri Lanka – 0.3% | | | | | | | | | | |
| | | | | |
| | 250 | | | Republic of Sri Lanka, 144A | | | 6.125% | | | | 6/03/25 | | | | B | | | | 224,411 | |
| $ | 1,200 | | | Total Sovereign Debt (cost $1,158,778) | | | | | | | | | | | | 1,067,366 | |
| | | | |
| Shares | | | Description (1), (5) | | | | | | | | | Value | |
| | |
| | | | INVESTMENT COMPANIES – 0.5% (0.4% of Total Investments) | | | | | |
| | | |
| | 32,000 | | | Blackrock Credit Allocation Income Trust IV | | | | | | | $ | 357,760 | |
| | | | Total Investment Companies (cost $395,555) | | | | | | | | 357,760 | |
20
| | | | | | | | | | | | | | | | | | | | |
| | | | | |
Principal
Amount (000) | | | Description (1), (6) | | Coupon | | | Maturity | | | Ratings (2) | | | Value | |
| |
| | | | CONTINGENT CAPITAL SECURITIES – 0.5% (0.3% of Total Investments) | |
| | | | | |
| | | | Banks – 0.5% | | | | | | | | | | | | |
| | | | | |
| $ | 200 | | | Banco Bilbao Vizcaya Argentaria SA | | | 6.125% | | | | N/A (4) | | | | Ba2 | | | $ | 167,500 | |
| | 200 | | | Societe Generale SA, 144A | | | 6.750% | | | | N/A (4) | | | | BB+ | | | | 170,050 | |
| $ | 400 | | | Total Contingent Capital Securities (cost $400,000) | | | | | | | | 337,550 | |
| | | | | |
Principal
Amount (000) | | | Description (1) | | Coupon | | | Maturity | | | Ratings (2) | | | Value | |
| |
| | | | $1,000 PAR (OR SIMILAR) INSTITUTIONAL PREFERRED – 0.3% (0.2% of Total Investments) | |
| | | | |
| | | | Commercial Services & Supplies – 0.3% | | | | | | | | | | |
| | | | | |
| $ | 200 | | | AerCap Global Aviation Trust, 144A | | | 6.500% | | | | 6/15/45 | | | | Ba1 | | | $ | 194,000 | |
| $ | 200 | | | Total $1,000 Par (or similar) Institutional Preferred (cost $203,135) | | | | | | | | | | | | | | | 194,000 | |
| | | | Total Long-Term Investments (cost $103,914,694) | | | | | | | | 102,253,656 | |
| | | | | |
Principal
Amount (000) | | | Description (1) | | Coupon | | | Maturity | | | | | | Value | |
| | |
| | | | SHORT-TERM INVESTMENTS – 2.2% (1.5% of Total Investments) | | | | | |
| |
| | | | REPURCHASE AGREEMENTS – 2.2% (1.5% of Total Investments) | |
| | | | | |
| $ | 1,595 | | | Repurchase Agreement with Fixed Income Clearing Corporation, dated 12/31/18, repurchase price $1,595,525, collateralized by $1,460,000 U.S. Treasury Bonds, 3.625%, due 2/15/44, value $1,631,559 | | | 1.200% | | | | 1/02/19 | | | | | | | $ | 1,595,419 | |
| | | | Total Short-Term Investments (cost $1,595,419) | | | | | | | | | | | | | | | 1,595,419 | |
| | | | Total Investments (cost $105,510,113) – 141.2% | | | | | | | | 103,849,075 | |
| | | | Reverse Repurchase Agreements – (26.0)% (7) | | | | | | | | (19,102,000 | ) |
| | | | Other Assets Less Liabilities – (15.2)% (8) | | | | | | | | | | | | (11,174,080 | ) |
| | | | Net Assets Applicable to Common Shares – 100% | | | | | | | | | | | $ | 73,572,995 | |
Investments in Derivatives
Futures Contracts
| | | | | | | | | | | | | | | | | | | | | | | | | | | | |
| Description | | Contract
Position | | | Number of
Contracts | | | Expiration
Date | | | Notional
Amount* | | | Value | | | Unrealized
Appreciation
(Depreciation) | | | Variation
Margin
Receivable/
(Payable) | |
U.S. Treasury2-Year Note | | | Short | | | | (24 | ) | | | 3/19 | | | $ | (5,059,818 | ) | | $ | (5,095,500 | ) | | $ | (35,682 | ) | | $ | (3,375 | ) |
U.S. Treasury5-Year Note | | | Short | | | | (12 | ) | | | 3/19 | | | | (1,365,922 | ) | | | (1,376,250 | ) | | | (10,328 | ) | | | (3,000 | ) |
U.S. Treasury10-Year Note | | | Short | | | | (34 | ) | | | 3/19 | | | | (4,046,882 | ) | | | (4,148,531 | ) | | | (101,649 | ) | | | (13,281 | ) |
U.S. Treasury10-Year Ultra Note | | | Short | | | | (37 | ) | | | 3/19 | | | | (4,659,619 | ) | | | (4,812,891 | ) | | | (153,271 | ) | | | (17,344 | ) |
U.S. Treasury Long Bond | | | Short | | | | (9 | ) | | | 3/19 | | | | (1,252,664 | ) | | | (1,314,000 | ) | | | (61,336 | ) | | | (4,219 | ) |
U.S. Treasury Ultra Bond | | | Long | | | | 13 | | | | 3/19 | | | | 2,011,908 | | | | 2,088,531 | | | | 76,623 | | | | 7,719 | |
| | | | | | | | | | | | | | | $ | (14,372,997 | ) | | $ | (14,658,641 | ) | | $ | (285,643 | ) | | $ | (33,500 | ) |
Total receivable for variation margin on futures contracts | | | $ | 7,719 | |
Total payable for variation margin on futures contracts | | | $ | (41,219 | ) |
| * | The aggregate amount of long and short positions is $2,011,908 and $(16,384,905), respectively. |
Interest Rate Swaps – OTC Uncleared
| | | | | | | | | | | | | | | | | | | | | | | | | | | | | | | | | | | | | | | | |
| Counterparty | | Notional
Amount | | | Fund
Pay/Receive
Floating Rate | | | Floating Rate
Index | | | Fixed Rate
(Annualized) | | | Fixed Rate
Payment
Frequency | | | Effective
Date (9) | | | Optional
Termination
Date | | | Maturity
Date | | | Value | | | Unrealized
Appreciation
(Depreciation) | |
Morgan Stanley Capital Services LLC | | $ | 17,000,000 | | | | Receive | | | | 1-Month LIBOR | | | | 1.994 | % | | | Monthly | | | | 6/01/18 | | | | 7/01/25 | | | | 7/01/27 | | | $ | 382,575 | | | $ | 382,575 | |
21
| | |
| |
| JMM | | Nuveen Multi-Market Income Fund(continued) |
| | Portfolio of Investments December 31, 2018 |
| | (Unaudited) |
For Fund portfolio compliance purposes, the Fund’s industry classifications refer to any one or more of the industrysub-classifications used by one or more widely recognized market indexes or ratings group indexes, and/or as defined by Fund management. This definition may not apply for purposes of this report, which may combine industrysub-classifications into sectors for reporting ease.
| (1) | All percentages shown in the Portfolio of Investments are based on net assets applicable to common shares unless otherwise noted. |
| (2) | For financial reporting purposes, the ratings disclosed are the highest of Standard & Poor’s Group (“Standard & Poor’s”), Moody’s Investors Service, Inc. (“Moody’s”) or Fitch, Inc. (“Fitch”) rating. This treatment of split-rated securities may differ from that used for other purposes, such as for Fund investment policies. Ratings below BBB by Standard & Poor’s, Baa by Moody’s or BBB by Fitch are considered to be below investment grade. Holdings designated N/R are not rated by any of these national rating agencies. |
| (3) | Investment, or portion of investment, has been pledged to collateralize the net payment obligations for investments in reverse repurchase agreements. |
| (4) | Perpetual security. Maturity date is not applicable. |
| (5) | A copy of the most recent financial statements for these investment companies can be obtained directly from the Securities and Exchange Commission on its website at http://www.sec.gov. |
| (6) | Contingent Capital Securities (“CoCos”) are hybrid securities with loss absorption characteristics built into the terms for the benefit of the issuer. For example the terms may specify an automatic write-down of principal or a mandatory conversion into the issuer’s common stock under certain adverse circumstances, such as the issuer’s capital ratio falling below a specified level. |
| (7) | Reverse Repurchase Agreements as a percentage of Total Investments is 18.4% |
| (8) | Other assets less liabilities includes the unrealized appreciation (depreciation) of certainover-the-counter (“OTC”) derivatives as presented on the Statement of Assets and Liabilities, when applicable. The unrealized appreciation (depreciation) of OTC cleared and exchange-traded derivatives is recognized as part of the cash collateral at brokers and/or the receivable or payable for variation margin as presented on the Statement of Assets and Liabilities, when applicable. |
| (9) | Effective date represents the date on which both the Fund and counterparty commence interest payment accruals on each contract. |
| (10) | Variable rate security. The rate shown is the coupon as of the end of the reporting period. |
| 144A | Investment is exempt from registration under Rule 144A of the Securities Act of 1933, as amended. These investments may only be resold in transactions exempt from registration, which are normally those transactions with qualified institutional buyers. |
| LIBOR | London Inter-Bank Offered Rate |
| MDR | Denotes investment is subject to dollar roll transactions. |
| REIT | Real Estate Investment Trust |
| TBA | To be announced. Maturity date not known prior to settlement of this transaction. |
| WI/DD | Investment, or portion of investment, purchased on a when-issued or delayed delivery basis. |
See accompanying notes to financial statements.
22
Statement of Assets and Liabilities
December 31, 2018
(Unaudited)
| | | | |
Assets | | | | |
Long-term investments, at value (cost $103,914,694) | | $ | 102,253,656 | |
Short-term investments, at value (cost approximates value) | | | 1,595,419 | |
Cash collateral at broker for investments in futures contracts(1) | | | 126,617 | |
Unrealized appreciation on interest rate swaps | | | 382,575 | |
Receivable for: | | | | |
Dividends | | | 2,144 | |
Interest | | | 605,909 | |
Paydowns | | | 2,649 | |
Reclaims | | | 1,615 | |
Variation margin on futures contracts | | | 7,719 | |
Other assets | | | 964 | |
Total assets | | | 104,979,267 | |
Liabilities | | | | |
Reverse repurchase agreements | | | 19,102,000 | |
Payable for: | | | | |
Investments purchased | | | 12,089,403 | |
Variation margin on futures contracts | | | 41,219 | |
Accrued expenses: | | | | |
Interest | | | 20,184 | |
Management fees | | | 78,261 | |
Trustees fees | | | 672 | |
Other | | | 74,533 | |
Total liabilities | | | 31,406,272 | |
Net Assets applicable to common shares | | $ | 73,572,995 | |
Common shares outstanding | | | 9,462,350 | |
Net asset value (“NAV”) per common share outstanding | | $ | 7.78 | |
Net assets applicable to common shares consist of: | | | | |
Common shares, $0.01 par value per share | | $ | 94,624 | |
Paid-in-surplus | | | 82,347,966 | |
Total distributable earnings | | | (8,869,595 | ) |
Net assets applicable to common shares | | $ | 73,572,995 | |
Authorized common shares | | | Unlimited | |
| (1) | Cash pledged to collateralize the net payment obligations for investments in futures contracts. |
See accompanying notes to financial statements.
23
Statement of Operations
Six Months Ended December 31, 2018
(Unaudited)
| | | | |
| | | | |
Investment Income | | | | |
Dividends | | $ | 16,697 | |
Interest | | | 2,315,784 | |
Total investment income | | | 2,332,481 | |
Expenses | | | | |
Management fees | | | 464,200 | |
Interest expense | | | 236,008 | |
Custodian fees | | | 54,849 | |
Trustees fees | | | 1,631 | |
Professional fees | | | 20,306 | |
Shareholder reporting expenses | | | 22,282 | |
Shareholder servicing agent fees | | | 3,327 | |
Stock exchange listing fees | | | 3,413 | |
Investor relations expense | | | 4,024 | |
Other | | | 11,051 | |
Total expenses | | | 821,091 | |
Net investment income (loss) | | | 1,511,390 | |
Realized and Unrealized Gain (Loss) | | | | |
Net realized gain (loss) from: | | | | |
Investments | | | (194,032 | ) |
Futures contracts | | | (12,576 | ) |
Swaps | | | 15,116 | |
Change in net unrealized appreciation (depreciation) of: | | | | |
Investments | | | (771,025 | ) |
Futures contracts | | | (304,593 | ) |
Swaps | | | (376,398 | ) |
Net realized and unrealized gain (loss) | | | (1,643,508 | ) |
Net increase (decrease) in net assets applicable to common shares from operations | | $ | (132,118 | ) |
See accompanying notes to financial statements.
24
Statement of Changes in Net Assets
(Unaudited)
| | | | | | | | |
| | | Six Months
Ended
12/31/18 | | | Year Ended
6/30/18(1) | |
Operations | | | | | | | | |
Net investment income (loss) | | $ | 1,511,390 | | | $ | 3,273,609 | |
Net realized gain (loss) from: | | | | | | | | |
Investments | | | (194,032 | ) | | | (605,598 | ) |
Futures contracts | | | (12,576 | ) | | | 588,717 | |
Swaps | | | 15,116 | | | | — | |
Change in net unrealized appreciation (depreciation) of: | | | | | | | | |
Investments | | | (771,025 | ) | | | (1,907,296 | ) |
Futures contracts | | | (304,593 | ) | | | (10,221 | ) |
Swaps | | | (376,398 | ) | | | 697,635 | |
Net increase (decrease) in net assets applicable to common shares from operations | | | (132,118 | ) | | | 2,036,846 | |
Distributions to Common Shareholders(2) | | | | | | | | |
Dividends(3) | | | (1,703,223 | ) | | | (3,775,478 | ) |
Decrease in net assets applicable to common shares from distributions to common shareholders | | | (1,703,223 | ) | | | (3,775,478 | ) |
Net increase (decrease) in net assets applicable to common shares | | | (1,835,341 | ) | | | (1,738,632 | ) |
Net assets applicable to common shares at the beginning of period | | | 75,408,336 | | | | 77,146,968 | |
Net assets applicable to common shares at the end of period | | $ | 73,572,995 | | | $ | 75,408,336 | |
| (1) | Prior period amounts have been conformed to current year presentation. See Notes to Financial Statements, Note 10 – New Accounting Pronouncements for further details. |
| (2) | The composition and per share amounts of the Fund’s distributions are presented in the Financial Highlights. The distribution information for the Fund as of its most recent tax year end is presented within the Notes to Financial Statements, Note 6 – Income Tax Information. |
| (3) | For the fiscal year ended June 30, 2018, the Fund’s distributions to common shareholders were paid from net investment income. |
See accompanying notes to financial statements.
25
Statement of Cash Flows
Six Months Ended December 31, 2018
(Unaudited)
| | | | |
Cash Flows from Operating Activities: | | | | |
Net Increase (Decrease) in Net Assets Applicable to Common Shares from Operations | | $ | (132,118 | ) |
Adjustments to reconcile the net increase (decrease) in net assets applicable to common shares
from operations to net cash provided by (used in) operating activities: | | | | |
Purchases of investments | | | (85,036,040 | ) |
Proceeds from sales and maturities of investments | | | 87,198,753 | |
Proceeds from (Purchases of) short-term investments, net | | | (163,526 | ) |
Proceeds from litigation settlement | | | 8,531 | |
Amortization (Accretion) of premiums and discounts, net | | | (5,401 | ) |
(Increase) Decrease in: | | | | |
Receivable for dividends | | | (2,144 | ) |
Receivable for interest | | | 35,339 | |
Receivable for investments sold | | | 596,678 | |
Receivable for paydowns | | | (1,058 | ) |
Receivable for reclaims | | | 53 | |
Receivable for variation margin on futures contracts | | | (6,172 | ) |
Other assets | | | 2,848 | |
Increase (Decrease) in: | | | | |
Payable for investments purchased | | | (570,556 | ) |
Payable for variation margin on futures contracts | | | 39,000 | |
Accrued interest | | | 6,037 | |
Accrued management fees | | | 3,495 | |
Accrued Trustees fees | | | 18 | |
Accrued other expenses | | | (29,966 | ) |
Net realized (gain) loss from: | | | | |
Investments | | | 194,032 | |
Paydowns | | | 34,945 | |
Change in net unrealized appreciation (depreciation) of: | | | | |
Investments | | | 771,025 | |
Swaps | | | 376,398 | |
Net cash provided by (used in) operating activities | | | 3,320,171 | |
Cash Flows from Financing Activities: | | | | |
Net borrowings through reverse repurchase agreements | | | (1,332,000 | ) |
Cash distributions paid to common shareholders | | | (1,970,021 | ) |
Net cash provided by (used in) financing activities | | | (3,302,021 | ) |
Net Increase (Decrease) in Cash and Cash Collateral at Brokers | | | 18,150 | |
Cash and cash collateral at brokers at the beginning of period | | | 108,467 | |
Cash and cash collateral at brokers at the end of period | | $ | 126,617 | |
| |
| Supplemental Disclosures of Cash Flow Information | | | |
Cash paid for interest | | $ | 229,971 | |
See accompanying notes to financial statements.
26
THIS PAGE INTENTIONALLY LEFT BLANK
27
Financial Highlights
(Unaudited)
Selected data for a common share outstanding throughout each period:
| | | | | | | | | | | | | | | | | | | | | | | | | | | | | | | | | | | | | | | | | | | | |
| | | | |
| | | | | | Investment Operations | | |
Less Distributions to
Common Shareholders | | | Common Share | |
| | | Beginning Common Share NAV | | | Net
Investment
Income
(Loss)(a) | | | Net
Realized/
Unrealized
Gain (Loss) | | | Total | | | From
Net
Investment
Income | | | From
Accumulated
Net Realized
Gains | | | Return
of
Capital | | | Total | | | Discount
From
Shares
Repurchase
and Retired | | | Ending
NAV | | | Ending
Share
Price | |
Year Ended 6/30: | | | | | | | | | | | | | | | | | | | | | | | | | | | | | | | | | | | | | | | | | | | | |
2019(g) | | $ | 7.97 | | | $ | 0.16 | | | $ | (0.17 | ) | | $ | (0.01 | ) | | $ | (0.18 | ) | | $ | — | | | $ | — | | | $ | (0.18 | ) | | $ | — | | | $ | 7.78 | | | $ | 6.85 | |
2018 | | | 8.15 | | | | 0.35 | | | | (0.13 | ) | | | 0.22 | | | | (0.40 | ) | | | — | | | | — | | | | (0.40 | ) | | | — | | | | 7.97 | | | | 7.00 | |
2017 | | | 8.07 | | | | 0.39 | | | | 0.12 | | | | 0.51 | | | | (0.43 | ) | | | — | | | | — | | | | (0.43 | ) | | | — | | | | 8.15 | | | | 7.49 | |
2016 | | | 8.40 | | | | 0.41 | | | | (0.26 | ) | | | 0.15 | | | | (0.48 | ) | | | — | | | | — | | | | (0.48 | ) | | | — | ** | | | 8.07 | | | | 7.48 | |
2015 | | | 8.72 | | | | 0.47 | | | | (0.31 | ) | | | 0.16 | | | | (0.48 | ) | | | — | | | | — | | | | (0.48 | ) | | | — | | | | 8.40 | | | | 7.21 | |
2014(f) | | | 8.34 | | | | 0.40 | | | | 0.39 | | | | 0.79 | | | | (0.41 | ) | | | — | | | | — | | | | (0.41 | ) | | | — | | | | 8.72 | | | | 7.77 | |
Year Ended 8/31: | | | | | |
2013 | | | 8.49 | | | | 0.53 | | | | (0.12 | ) | | | 0.41 | | | | (0.56 | ) | | | — | | | | — | | | | (0.56 | ) | | | — | | | | 8.34 | | | | 7.25 | |
28
| | | | | | | | | | | | | | | | | | | | | | | | | | | | | | |
| | | | | | | Ratios/Supplemental Data Applicable to Common Shares | |
Common Share
Total Returns | | | | | | Ratios to Average
Net Assets Before
Reimbursement(c) | | | Ratios to Average
Net Assets After
Reimbursement(c)(d) | | | | |
Based
on
NAV(b) | | |
Based
on
Share
Price(b) | | | Ending
Net Assets
(000) | | | Expenses | | | Net
Investment
Income (Loss) | | | Expenses | | | Net
Investment
Income (Loss) | | | Portfolio
Turnover
Rate(e) | |
| | | | | | | | | | | | | | | | | | | | | | | | | | | | | | |
| | (0.14 | )% | | | 0.37 | % | | $ | 73,573 | | | | 2.17 | %* | | | 4.00 | %* | | | 2.17 | %* | | | 4.00 | %* | | | 81 | % |
| | 2.60 | | | | (1.37 | ) | | | 75,408 | | | | 1.88 | | | | 4.28 | | | | 1.88 | | | | 4.28 | | | | 165 | |
| | 6.62 | | | | 6.08 | | | | 77,147 | | | | 1.71 | | | | 4.72 | | | | 1.64 | | | | 4.79 | | | | 191 | |
| | 1.89 | | | | 10.86 | | | | 76,350 | | | | 1.68 | | | | 4.66 | | | | 1.30 | | | | 5.05 | | | | 205 | |
| | 1.88 | | | | (1.24 | ) | | | 79,498 | | | | 1.60 | | | | 5.14 | | | | 1.26 | | | | 5.47 | | | | 143 | |
| | 9.68 | | | | 13.10 | | | | 82,558 | | | | 1.22 | * | | | 5.68 | * | | | 1.22 | * | | | 5.68 | * | | | 251 | |
| | | | | | | | | | | | | | | | | | | | | | | | | | | | | | |
| | 4.93 | | | | (4.19 | ) | | | 78,902 | | | | 1.18 | | | | 6.20 | | | | 1.18 | | | | 6.20 | | | | 310 | |
| (a) | Per share Net Investment Income (Loss) is calculated using the average daily shares method. |
| (b) | Total Return Based on Common Share NAV is the combination of changes in common share NAV, reinvested dividend income at NAV and reinvested capital gains distributions at NAV, if any. The last dividend declared in the period, which is typically paid on the first business day of the following month, is assumed to be reinvested at the ending NAV. The actual reinvest price for the last dividend declared in the period may often be based on the Fund’s market price (and not its NAV), and therefore may be different from the price used in the calculation. Total returns are not annualized. |
Total Return Based on Common Share Price is the combination of changes in the market price per share and the effect of reinvested dividend income and reinvested capital gains distributions, if any, at the average price paid per common share at the time of reinvestment. The last dividend declared in the period, which is typically paid on the first business day of the following month, is assumed to be reinvested at the ending market price. The actual reinvestment for the last dividend declared in the period may take place over several days, and in some instances may not be based on the market price, so the actual reinvestment price may be different from the price used in the calculation. Total returns are not annualized.
| (c) • | Net Investment Income (Loss) ratios reflect income earned and expenses incurred on assets attributable to reverse repurchase agreements (as described in Note 8 – Fund Leverage, Reverse Repurchase Agreements), where applicable. |
| | • | Each ratio includes the effect of all interest expenses paid and other costs related to reverse repurchase agreements, where applicable, as follows: |
| | | | |
Ratios of Interest Expense
to Average Net Assets
Applicable to Common Shares | |
Year Ended 6/30: | |
2019(g) | | | 0.62 | %* |
2018 | | | 0.41 | |
2017 | | | 0.23 | |
2016 | | | 0.15 | |
2015 | | | 0.12 | |
2014(f) | | | 0.06 | * |
Year Ended 8/31: | |
2013 | | | 0.04 | |
| (d) | After fee waiver and/or expense reimbursement from the Adviser, where applicable. As of September 8, 2016, the Adviser is no longer contractually reimbursing the Fund for any fees and expenses. |
| (e) | Portfolio Turnover Rate is calculated based on the lesser of long-term purchases or sales (as disclosed in Note 5 – Investment Transactions) divided by the average long-term market value during the period. |
| (f) | For the ten months ended June 30, 2014. |
| (g) | For the six months ended December 31, 2018. |
| ** | Rounds to less than $0.01 per common share. | |
See accompanying notes to financial statements.
29
Notes to
Financial Statements
(Unaudited)
1. General Information and Significant Accounting Policies
General Information
Fund Information
Nuveen Multi-Market Income Fund (the “Fund”) is registered under the Investment Company Act of 1940, as amended, as a diversified closed-end management investment company. The Fund’s shares are listed on the New York Stock Exchange (“NYSE”) and trade under the ticker symbol “JMM.” The Fund was organized as a Massachusetts business trust on May 27, 2014 (previously organized as a Virginia corporation).
The end of the reporting period for the Fund is December 31, 2018, and the period covered by these Notes to Financial Statements is the six months ended December 31, 2018 (the “current fiscal period”).
Investment Adviser
The Fund’s investment adviser is Nuveen Fund Advisors, LLC (the “Adviser”), a subsidiary of Nuveen, LLC (“Nuveen”). Nuveen is the investment management arm of Teachers Insurance and Annuity Association of America (TIAA). The Adviser has overall responsibility for management of the Fund, oversees the management of the Fund’s portfolio, manages the Fund’s business affairs and provides certain clerical, bookkeeping and other administrative services, and, if necessary, asset allocation decisions. The Adviser has entered into a sub-advisory agreement with Nuveen Asset Management, LLC (the “Sub-Adviser”), a subsidiary of the Adviser, under which theSub-Adviser manages the Fund’s investment portfolio.
Investment Objective and Principal Investment Strategies
The Fund seeks to provide high monthly income consistent with prudent risk to capital. The Fund will invest primarily in debt securities, including, but not limited to, U.S. agency and privately issued mortgage-backed securities, corporate debt securities, and asset-backed securities. Under normal market conditions, at least 65% of the Fund’s total assets must be invested in securities that, at the time of purchase, are rated investment-grade or of comparable quality. No more than 35% of the Fund’s total assets may be held in high-yield issues. The Fund is authorized to borrow funds or issue senior securities in amounts not exceeding 331⁄3% of its total assets. The Fund may utilize derivatives including options; futures contracts; options on futures contracts; interest-rate caps, collars and floors; interest-rate, total return, and credit default swap agreements; and options on the foregoing type of swap agreements.
Significant Accounting Policies
The Fund is an investment company and follows accounting and reporting guidance under Financial Accounting Standards Board (“FASB”) Accounting Standards Codification (ASC) Topic 946 “Financial Services – Investment Companies.” The following is a summary of significant accounting policies followed by the Fund in the preparation of its financial statements in accordance with U.S. generally accepted accounting principles (“U.S. GAAP”).
Investment Transactions
Investment transactions are recorded on a trade date basis. Realized gains and losses from investment transactions are determined on the specific identification method, which is the same basis used for federal income tax purposes. Investments purchased on a when-issued/delayed delivery basis may have extended settlement periods. Any investments so purchased are subject to market fluctuation during this period. The Fund has earmarked securities in its portfolio with a current value at least equal to the amount of the when-issued/delayed delivery purchase commitments.
As of the end of the reporting period, the Fund’s outstanding when-issued/delayed delivery purchase commitments were as follows:
| | | | |
Outstanding when-issued/delayed delivery purchase commitments | | $ | 12,089,403 | |
Investment Income
Dividend income is recorded on the ex-dividend date or, for foreign securities, when information is available. Non-cash dividends received in the form of stock, if any, are recognized on the ex-dividend date and recorded at fair value. Interest income, which reflects the amortization of premiums and includes accretion of discounts for financial reporting purposes, is recorded on an accrual basis. Interest income also reflects payment-in-kind (“PIK”) interest, fees earned from reverse repurchase agreements and paydown gains and losses, if any. PIK interest represents income received in the form of securities in lieu of cash. Fees earned from reverse repurchase agreements are further described in Note 8 – Fund Leverage, Reverse Repurchase Agreements.
30
Professional Fees
Professional fees presented on the Statement of Operations consist of legal fees incurred in the normal course of operations, audit fees, tax consulting fees and, in some cases, workout expenditures. Workout expenditures are incurred in an attempt to protect or enhance an investment or to pursue other claims or legal actions on behalf of Fund shareholders. If a refund is received for workout expenditures paid in a prior reporting period, such amounts will be recognized as “Legal fee refund” on the Statement of Operations.
Dividends and Distributions to Common Shareholders
Dividends from net investment income, if any, are declared monthly. Net realized capital gains from investment transactions, if any, are declared and distributed to shareholders at least annually. Furthermore, capital gains are distributed only to the extent they exceed available capital loss carryforwards.
Distributions to common shareholders are recorded on the ex-dividend date. The amount and timing of distributions are determined in accordance with federal income tax regulations, which may differ from U.S. GAAP.
Compensation
The Fund pays no compensation directly to those of its trustees who are affiliated with the Adviser or to its officers, all of whom receive remuneration for their services to the Fund from the Adviser or its affiliates. The Fund’s Board of Trustees (the “Board”) has adopted a deferred compensation plan for independent trustees that enables trustees to elect to defer receipt of all or a portion of the annual compensation they are entitled to receive from certain Nuveen-advised funds. Under the plan, deferred amounts are treated as though equal dollar amounts had been invested in shares of select Nuveen-advised funds.
Indemnifications
Under the Fund’s organizational documents, its officers and trustees are indemnified against certain liabilities arising out of the performance of their duties to the Fund. In addition, in the normal course of business, the Fund enters into contracts that provide general indemnifications to other parties. The Fund’s maximum exposure under these arrangements is unknown as this would involve future claims that may be made against the Fund that have not yet occurred. However, the Fund has not had prior claims or losses pursuant to these contracts and expects the risk of loss to be remote.
Netting Agreements
In the ordinary course of business, the Fund may enter into transactions subject to enforceable master repurchase agreements, International Swaps and Derivatives Association, Inc. (ISDA) master agreements or other similar arrangements (“netting agreements”). Generally, the right to offset in netting agreements allows the Fund to offset certain securities and derivatives with a specific counterparty, when applicable, as well as any collateral received or delivered to that counterparty based on the terms of the agreements. Generally, the Fund manages its cash collateral and securities collateral on a counterparty basis.
The Fund’s investments subject to netting agreements as of the end of the reporting period, if any, are further described in Note 3 – Portfolio Securities and Investments in Derivatives.
Use of Estimates
The preparation of financial statements in conformity with U.S. GAAP requires management to make estimates and assumptions that affect the reported amounts of assets and liabilities at the date of the financial statements and the reported amounts of increases and decreases in net assets applicable to common shares from operations during the current fiscal period. Actual results may differ from those estimates.
2. Investment Valuation and Fair Value Measurements
The fair valuation input levels as described below are for fair value measurement purposes.
Fair value is defined as the price that would be received upon selling an investment or transferring a liability in an orderly transaction to an independent buyer in the principal or most advantageous market for the investment. A three-tier hierarchy is used to maximize the use of observable market data and minimize the use of unobservable inputs and to establish classification of fair value measurements for disclosure purposes. Observable inputs reflect the assumptions market participants would use in pricing the asset or liability. Observable inputs are based on market data obtained from sources independent of the reporting entity. Unobservable inputs reflect the reporting entity’s own assumptions about the assumptions market participants would use in pricing the asset or liability. Unobservable inputs are based on the best information available in the circumstances. The following is a summary of the three-tiered hierarchy of valuation input levels.
| | |
| Level 1 – | | Inputs are unadjusted and prices are determined using quoted prices in active markets for identical securities. |
| Level 2 – | | Prices are determined using other significant observable inputs (including quoted prices for similar securities, interest rates, credit spreads, etc.). |
| Level 3 – | | Prices are determined using significant unobservable inputs (including management’s assumptions in determining the fair value of investments). |
31
Notes to Financial Statements(continued)
(Unaudited)
Common stocks and other equity-type securities are valued at the last sales price on the securities exchange on which such securities are primarily traded and are generally classified as Level 1. Securities primarily traded on the Nasdaq National Market (“Nasdaq”) are valued at the Nasdaq Official Closing Price and are generally classified as Level 1. However, securities traded on a securities exchange or Nasdaq for which there were no transactions on a given day or securities not listed on a securities exchange or Nasdaq are valued at the quoted bid price and are generally classified as Level 2.
Prices of fixed-income securities are provided by an independent pricing service (“pricing service”) approved by the Board. The pricing service establishes a security’s fair value using methods that may include consideration of the following: yields or prices of investments of comparable quality, type of issue, coupon, maturity and rating, market quotes or indications of value from security dealers, evaluations of anticipated cash flows or collateral, general market conditions and other information and analysis, including the obligor’s credit characteristics considered relevant. These securities are generally classified as Level 2. In pricing certain securities, particularly less liquid and lower quality securities, the pricing service may consider information about a security, its issuer or market activity, provided by the Adviser. These securities are generally classified as Level 2 or Level 3 depending on the observability of the significant inputs.
Investments in investment companies are valued at their respective net asset value (“NAV”) on valuation date and are generally classified as Level 1.
Prices of swap contracts are also provided by a pricing service approved by the Board using the same methods as described above and are generally classified as Level 2.
Futures contracts are valued using the closing settlement price or, in the absence of such a price, the last traded price and are generally classified as Level 1.
Repurchase agreements are valued at contract amount plus accrued interest, which approximates market value. These securities are generally classified as Level 2.
Certain securities may not be able to be priced by the pre-established pricing methods as described above. Such securities may be valued by the Board and/or its appointee at fair value. These securities generally include, but are not limited to, restricted securities (securities which may not be publicly sold without registration under the Securities Act of 1933, as amended) for which a pricing service is unable to provide a market price; securities whose trading has been formally suspended; debt securities that have gone into default and for which there is no current market quotation; a security whose market price is not available from apre-established pricing source; a security with respect to which an event has occurred that is likely to materially affect the value of the security after the market has closed but before the calculation of the Fund’s NAV (as may be the case in non-U.S. markets on which the security is primarily traded) or make it difficult or impossible to obtain a reliable market quotation; and a security whose price, as provided by the pricing service, is not deemed to reflect the security’s fair value. As a general principle, the fair value of a security would appear to be the amount that the owner might reasonably expect to receive for it in a current sale. A variety of factors may be considered in determining the fair value of such securities, which may include consideration of the following: yields or prices of investments of comparable quality, type of issue, coupon, maturity and rating, market quotes or indications of value from security dealers, evaluations of anticipated cash flows or collateral, general market conditions and other information and analysis, including the obligor’s credit characteristics considered relevant. These securities are generally classified as Level 2 or Level 3 depending on the observability of the significant inputs. Regardless of the method employed to value a particular security, all valuations are subject to review by the Board and/or its appointee.
The inputs or methodologies used for valuing securities are not an indication of the risks associated with investing in those securities. The following is a summary of the Fund’s fair value measurements as of the end of the reporting period:
| | | | | | | | | | | | | | | | |
| | | Level 1 | | | Level 2 | | | Level 3 | | | Total | |
Long-Term Investments*: | | | | | | | | | | | | | | | | |
Asset-Backed and Mortgage-Backed Securities | | $ | — | | | $ | 80,371,681 | | | $ | — | | | $ | 80,371,681 | |
Corporate Bonds | | | — | | | | 19,925,299 | | | | — | | | | 19,925,299 | |
Sovereign Debt | | | — | | | | 1,067,366 | | | | — | | | | 1,067,366 | |
Investment Companies | | | 357,760 | | | | — | | | | — | | | | 357,760 | |
Contingent Capital Securities | | | — | | | | 337,550 | | | | — | | | | 337,550 | |
$1,000 Par (or similar) Institutional Preferred | | | — | | | | 194,000 | | | | — | | | | 194,000 | |
| | | | |
Short-Term Investments: | | | | | | | | | | | | | | | | |
Repurchase Agreements | | | — | | | | 1,595,419 | | | | — | | | | 1,595,419 | |
| | | | |
Investments in Derivatives: | | | | | | | | | | | | | | | | |
Futures Contracts** | | | (285,643 | ) | | | — | | | | — | | | | (285,643 | ) |
Interest Rate Swaps** | | | — | | | | 382,575 | | | | — | | | | 382,575 | |
Total | | $ | 72,117 | | | $ | 103,873,890 | | | $ | — | | | $ | 103,946,007 | |
| * | Refer to the Fund’s Portfolio of Investments for industry and country classifications, where applicable. |
| ** | Represents net unrealized appreciation (depreciation) as reported in the Fund’s Portfolio of Investments. |
32
3. Portfolio Securities and Investments in Derivatives
Portfolio Securities
Dollar Roll Transactions
The Fund is authorized to enter into dollar roll transactions (“dollar rolls”) in which the Fund purchases or sells mortgage-backed securities (“MBS”) for delivery in the future and simultaneously contracts to sell or repurchase a substantially similar (same type, coupon, and maturity) MBS on a different specified future date. Dollar rolls are identified in the Portfolio of Investments as “MDR”, when applicable. During the roll period, the Fund foregoes principal and interest paid on the MBS. The Fund is compensated by the difference between the current sales price and the lower forward price for the future purchase. Such compensation is recognized as a component of “Net realized gain (loss) from investments” on the Statement of Operations. Dollar rolls are valued daily.
Dollar rolls involve the risk that the market value of the MBS the Fund is obligated to repurchase under an agreement may decline below the repurchase price. These transactions also involve some risk to the Fund if the other party should default on its obligation and the Fund is delayed or prevented from completing the transaction. In the event that the buyer of securities under a dollar roll files for bankruptcy or becomes insolvent, the Fund’s use of proceeds of the dollar roll may be restricted pending a determination by the other party, or its trustee or receiver, whether to enforce the Fund’s obligation to repurchase the securities.
Repurchase Agreements
In connection with transactions in repurchase agreements, it is the Fund’s policy that its custodian take possession of the underlying collateral securities, the fair value of which exceeds the principal amount of the repurchase transaction, including accrued interest, at all times. If the counterparty defaults, and the fair value of the collateral declines, realization of the collateral may be delayed or limited.
The following table presents the repurchase agreements for the Fund that are subject to netting agreements as of the end of the reporting period, and the collateral delivered related to those repurchase agreements.
| | | | | | | | | | | | |
| Counterparty | | Short-Term
Investments, at Value | | | Collateral
Pledged (From)
Counterparty* | | | Net
Exposure | |
Fixed Income Clearing Corporation | | $ | 1,595,419 | | | $ | (1,595,419 | ) | | $ | — | |
| * | As of the end of the reporting period, the value of the collateral pledged from the counterparty exceeded the value of the repurchase agreements. Refer to the Fund’s Portfolio of Investments for details on the repurchase agreements. |
Zero Coupon Securities
A zero coupon security does not pay a regular interest coupon to its holders during the life of the security. Income to the holder of the security comes from accretion of the difference between the original purchase price of the security at issuance and the par value of the security at maturity and is effectively paid at maturity. The market prices of zero coupon securities generally are more volatile than the market prices of securities that pay interest periodically.
Investment in Derivatives
The Fund is authorized to invest in certain derivative instruments, such as futures, options and swap contracts. The Fund limits its investments in futures, options on futures and swap contracts to the extent necessary for the Adviser to claim the exclusion from registration by the Commodity Futures Trading Commission as a commodity pool operator with respect to the Fund. The Fund records derivative instruments at fair value, with changes in fair value recognized on the Statement of Operations, when applicable. Even though the Fund’s investments in derivatives may represent economic hedges, they are not considered to be hedge transactions for financial reporting purposes.
Futures Contracts
Upon execution of a futures contract, the Fund is obligated to deposit cash or eligible securities, also known as “initial margin,” into an account at its clearing broker equal to a specified percentage of the contract amount. Cash held by the broker to cover initial margin requirements on open futures contracts, if any, is recognized as “Cash collateral at brokers for investments in futures contracts” on the Statement of Assets and Liabilities. Investments in futures contracts obligate the Fund and the clearing broker to settle monies on a daily basis representing changes in the prior days “mark-to-market” of the open contracts. If the Fund has unrealized appreciation the clearing broker will credit the Fund’s account with an amount equal to appreciation. Conversely, if the Fund has unrealized depreciation the clearing broker will debit the Fund’s account with an amount equal to depreciation. These daily cash settlements are also known as “variation margin.” Variation margin is recognized as a receivable and/or payable for “Variation margin on futures contracts” on the Statement of Assets and Liabilities.
During the period the futures contract is open, changes in the value of the contract are recognized as an unrealized gain or loss by “marking-to-market” on a daily basis to reflect the changes in market value of the contract, which is recognized as a component of “Change in net unrealized appreciation
33
Notes to Financial Statements(continued)
(Unaudited)
(depreciation) of futures contracts” on the Statement of Operations. When the contract is closed or expired, a Fund records a realized gain or loss equal to the difference between the value of the contract on the closing date and value of the contract when originally entered into, which is recognized as a component of “Net realized gain (loss) from futures contracts” on the Statement of Operations.
Risks of investments in futures contracts include the possible adverse movement in the price of the securities or indices underlying the contracts, the possibility that there may not be a liquid secondary market for the contracts and/or that a change in the value of the contract may not correlate with a change in the value of the underlying securities or indices.
During the current fiscal period, the Fund used U.S. Treasury futures as part of an overall portfolio construction strategy to manage portfolio duration and yield curve exposure.
The average notional amount of futures contracts outstanding during the current fiscal period was as follows:
| | | | |
Average notional amount of futures contracts outstanding* | | | $21,489,429 | |
| * | The average notional amount is calculated based on the absolute aggregate notional amount of contracts outstanding at the beginning of the current fiscal period and at the end of each fiscal quarter within the current fiscal period. |
The following table presents the fair value of all futures contracts held by the Fund as of the end of the reporting period, the location of these instruments on the Statement of Assets and Liabilities and the primary underlying risk exposure.
| | | | | | | | | | | | | | | | | | |
| | | | | Location on the Statement of Assets and Liabilities | |
Underlying
Risk Exposure | | Derivative
Instrument | | Asset Derivatives | | | | | | (Liability) Derivatives | |
| | Location | | Value | | | | | | Location | | Value | |
| Interest rate | | Futures contracts | | Receivable for variation margin on futures contracts* | | $ | 76,623 | | | | | | | Payable for variation margin on futures contracts* | | $ | (362,266 | ) |
| * | Value represents unrealized appreciation (depreciation) of futures contracts as reported in the Fund’s Portfolio of Investments and not the asset and/or liability derivative location as described in the table above. |
The following table presents the amount of net realized gain (loss) and change in net unrealized appreciation (depreciation) recognized on futures contracts on the Statement of Operations during the current fiscal period, and the primary underlying risk exposure.
| | | | | | | | | | |
| Underlying Risk Exposure | | Derivative Instrument | | Net Realized
Gain (Loss)
from Futures
Contracts | | | Change in Net
Unrealized
Appreciation
(Depreciation) of
Futures Contracts | |
| Interest rate | | Futures contracts | | $ | (12,576 | ) | | $ | (304,593 | ) |
Interest Rate Swap Contracts
Interest rate swap contracts involve the Fund’s agreement with the counterparty to pay or receive a fixed rate payment in exchange for the counterparty receiving or paying a variable rate payment. Forward interest rate swap contracts involve the Fund’s agreement with a counterparty to pay, in the future, a fixed or variable rate payment in exchange for the counterparty paying the Fund a variable or fixed rate payment, the accruals for which would begin at a specified date in the future (the “effective date”).
The amount of the payment obligation for an interest rate swap is based on the notional amount and the termination date of the contract. Interest rate swap contracts do not involve the delivery of securities or other underlying assets or principal. Accordingly, the risk of loss with respect to the swap counterparty on such transactions is limited to the net amount of interest payments that the Fund is to receive.
Interest rate swap contracts are valued daily. Upon entering into an interest rate swap contract (and beginning on the effective date for a forward interest rate swap contract), the Fund accrues the fixed rate payment expected to be paid or received and the variable rate payment expected to be received or paid on the interest rate swap contracts on a daily basis, and recognizes the daily change in the fair value of the Fund’s contractual rights and obligations under the contracts. For anover-the-counter (“OTC”) swap that is not cleared through a clearing house (“OTC Uncleared”), the amount recorded on these transactions is recognized on the Statement of Assets and Liabilities as a component of “Unrealized appreciation or depreciation on interest rate swaps.”
Upon the execution of an OTC swap cleared through a clearing house (“OTC Cleared”), the Fund is obligated to deposit cash or eligible securities, also known as “initial margin,” into an account at its clearing broker equal to a specified percentage of the contract amount. Cash deposited by the Fund to cover initial margin requirements on open swap contracts, if any, is recognized as a component of “Cash collateral at brokers for investments in swaps” on the Statement of Assets and Liabilities. Investments in OTC Cleared swaps obligate the Fund and the clearing broker to settle monies on a daily basis representing changes in the prior day’s“mark-to-market” of the swap contract. If the Fund has unrealized appreciation, the clearing broker will credit the
34
Fund’s account with an amount equal to the appreciation. Conversely, if the Fund has unrealized depreciation, the clearing broker will debit the Fund’s account with an amount equal to the depreciation. These daily cash settlements are also known as “variation margin.” Variation margin for OTC Cleared swaps is recognized as a receivable and/or payable for “Variation margin on swap contracts” on the Statement of Assets and Liabilities. Upon the execution of an OTC Uncleared swap, neither the Fund nor the counterparty is required to deposit initial margin as the trades are recorded bilaterally between both parties to the swap contract, and the terms of the variation margin are subject to a predetermined threshold negotiated by the Fund and the counterparty. Variation margin for OTC Uncleared swaps is recognized as a component of “Unrealized appreciation or depreciation on interest rate swaps” as described in the preceding paragraph.
The net amount of periodic payments settled in cash are recognized as a component of “Net realized gain (loss) from swaps” on the Statement of Operations, in addition to the net realized gain or loss recorded upon the termination of the swap contract. For tax purposes, payments expected to be received or paid on the swap contracts are treated as ordinary income or expense, respectively. Changes in the value of the swap contracts during the fiscal period are recognized as a component of “Change in net unrealized appreciation (depreciation) of swaps” on the Statement of Operations. In certain instances, payments are made or received upon entering into the swap contract to compensate for differences between the stated terms of the swap agreements and prevailing market conditions (credit spreads, currency exchange rates, interest rates, and other relevant factors). Payments received or made at the beginning of the measurement period, if any, are recognized as “Interest rate swaps premiums received and/or paid” on the Statement of Assets and Liabilities.
During the current fiscal period, the Fund used interest rate swap contracts as part of an overall portfolio construction strategy to manage duration and overall portfolio yield curve exposure.
The average notional amount of interest rate swap contracts outstanding during the current fiscal period was as follows:
| | | | |
Average notional amount of interest rate swap contracts outstanding* | | $ | 17,000,000 | |
| * | The average notional amount is calculated based on the outstanding notional at the beginning of the current fiscal period and at the end of each fiscal quarter within the current fiscal period. |
The following table presents the fair value of all swap contracts held by the Fund as of the end of the reporting period, the location of these instruments on the Statement of Assets and Liabilities and the primary underlying risk exposure.
| | | | | | | | | | | | | | | | | | |
| | | | | Location on the Statements of Assets and Liabilities | |
Underlying Risk Exposure | | Derivative Instrument | | Asset Derivatives | | | | | | (Liability) Derivatives | |
| | Location | | Value | | | | | | Location | | Value | |
| Interest rate | | Swaps (OTC Uncleared) | | Unrealized appreciation on interest rate swaps** | | $ | 382,575 | | | | | | | — | | $ | — | |
| ** | Some swap contracts require a counterparty to pay or receive a premium, which is disclosed on the Statement of Assets and Liabilities, when applicable, and is not reflected in the cumulative unrealized appreciation (depreciation) presented above. |
The following table presents the swap contracts subject to netting agreements and the collateral delivered related to those swap contracts as of the end of the reporting period.
| | | | | | | | | | | | | | | | | | | | | | |
| | | | | | | | | | | Gross Amounts not
offset on the Statement of
Assets and Liabilities | | | | |
| Counterparty | | Gross
Unrealized
Appreciation
on Interest
Rate Swaps*** | | Gross
Unrealized
(Depreciation)
on Interest
Rate Swaps*** | | | Net Unrealized
Appreciation
(Depreciation) on
Interest Rate
Swaps | | | Interest
Rate Swaps
Premiums Paid | | | Collateral
Pledged to (from)
Counterparty | | | Net
Exposure | |
Morgan Stanley Capital Services LLC | | $382,575 | | $ | — | | | $ | 382,575 | | | $ | — | | | $ | (381,000 | ) | | $ | 1,575 | |
| *** | Represents gross unrealized appreciation (depreciation) for the counterparty as reported in the Fund’s Portfolio of Investments. |
The following table presents the amount of net realized gain (loss) and change in net unrealized appreciation (depreciation) recognized on swap contracts on the Statement of Operations during the current fiscal period, and the primary underlying risk exposure.
| | | | | | | | | | | | |
Underlying Risk Exposure | | Derivative
Instrument | | Net Realized
Gain (Loss)
from Swaps | | | Change in Net
Unrealized
Appreciation
(Depreciation)
of Swaps | |
| Interest rate | | | | Swaps | | $ | 15,116 | | | $ | (376,398 | ) |
35
Notes to Financial Statements(continued)
(Unaudited)
Market and Counterparty Credit Risk
In the normal course of business the Fund may invest in financial instruments and enter into financial transactions where risk of potential loss exists due to changes in the market (market risk) or failure of the other party to the transaction to perform (counterparty credit risk). The potential loss could exceed the value of the financial assets recorded on the financial statements. Financial assets, which potentially expose the Fund to counterparty credit risk, consist principally of cash due from counterparties on forward, option and swap transactions, when applicable. The extent of the Fund’s exposure to counterparty credit risk in respect to these financial assets approximates their carrying value as recorded on the Statement of Assets and Liabilities.
The Fund helps manage counterparty credit risk by entering into agreements only with counterparties the Adviser believes have the financial resources to honor their obligations and by having the Adviser monitor the financial stability of the counterparties. Additionally, counterparties may be required to pledge collateral daily (based on the daily valuation of the financial asset) on behalf of the Fund with a value approximately equal to the amount of any unrealized gain above apre-determined threshold. Reciprocally, when the Fund has an unrealized loss, the Fund has instructed the custodian to pledge assets of the Fund as collateral with a value approximately equal to the amount of the unrealized loss above apre-determined threshold. Collateral pledges are monitored and subsequently adjusted if and when the valuations fluctuate, either up or down, by at least the pre-determined threshold amount.
4. Fund Shares
Common Share Transactions
The Fund did not have any transactions in common shares during the current and prior fiscal period.
5. Investment Transactions
Long-term purchases and sales (including maturities and dollar roll transactions, but excluding derivative transactions) during the current fiscal period aggregated $85,036,040 and $87,198,753 respectively.
6. Income Tax Information
The Fund intends to distribute substantially all of its net investment company taxable income to common shareholders and to otherwise comply with the requirements of Subchapter M of the Internal Revenue Code applicable to regulated investment companies. Therefore, no federal income tax provision is required.
For all open tax years and all major taxing jurisdictions, management of the Fund has concluded that there are no significant uncertain tax positions that would require recognition in the financial statements. Open tax years are those that are open for examination by taxing authorities (i.e., generally the last four tax year ends and the interim tax period since then). Furthermore, management of the Fund is also not aware of any tax positions for which it is reasonably possible that the total amounts of unrecognized tax benefits will significantly change in the next twelve months.
The following information is presented on an income tax basis. Differences between amounts for financial statement and federal income tax purposes are primarily due to timing differences in recognizing certain gains and losses on investment transactions. To the extent that differences arise that are permanent in nature, such amounts are reclassified within the capital accounts as detailed below. Temporary differences do not require reclassification. Temporary and permanent differences do not impact the common share NAV of the Fund.
The tables below present the cost and unrealized appreciation (depreciation) of the Fund’s investment portfolio, as determined on a federal income tax basis as of December 31, 2018.
For purposes of this disclosure, derivative tax cost is generally the sum of any upfront fees or premiums exchanged and any amounts unrealized for income statement reporting but realized in income and/or capital gains for tax reporting. If a particular derivative category does not disclose any tax unrealized appreciation or depreciation, the change in value of those derivatives have generally been fully realized for tax purposes.
| | | | |
Tax cost of investments | | $ | 105,741,549 | |
Gross unrealized: | | | | |
Appreciation | | $ | 1,160,925 | |
Depreciation | | | (3,053,399 | ) |
Net unrealized appreciation (depreciation) of investments | | $ | (1,892,474 | ) |
| | | | |
Tax cost of futures contracts | | $ | (285,643) | |
Net unrealized appreciation (depreciation) of futures contracts | | | — | |
| | | | |
Tax cost of swaps | | $ | — | |
Net unrealized appreciation (depreciation) of swaps | | | 382,575 | |
36
| | | | |
| Permanent differences, primarily due to paydowns, bond premium amortization adjustments, treatment of notional principal contracts and complex securities character adjustments, resulted in reclassifications among the Fund’s components of net assets as of June 30, 2018, the Fund’s last tax year end, as follows: | |
Paid-in surplus | | $ | — | |
Undistributed (Over-distribution of) net investment income | | | 318,658 | |
Accumulated net realized gain (loss) | | | (318,658 | ) |
|
| The tax components of undistributed net ordinary income and net long-term capital gains as of June 30, 2018, the Fund’s last tax year end, were as follows: | |
Undistributed net ordinary income1 | | $ | 434,067 | |
Undistributed net long-term capital gains | | | — | |
| 1 | Net ordinary income consists of net taxable income derived from dividends, interest, and net short-term capital gains, if any. |
The tax character of distributions paid during the Fund’s last tax year ended June 30, 2018, was designated for purposes of the dividends paid deduction as follows:
| | | | |
Distributions from net ordinary income1 | | | $3,832,252 | |
Distributions from net long-term capital gains | | | — | |
| 1 | Net ordinary income consists of net taxable income derived from dividends, interest, and net short-term capital gains, if any. |
As of June 30, 2018, the Fund’s last tax year end, the Fund had unused capital losses carrying forward available for federal income tax purposes to be applied against future capital gains, if any. The capital losses are not subject to expiration.
| | | | |
Not subject to expiration: | | | | |
Short-term | | $ | 424,151 | |
Long-term | | | 6,395,782 | |
Total | | $ | 6,819,933 | |
7. Management Fees
The Fund’s management fee compensates the Adviser for overall investment advisory and administrative services and general office facilities. TheSub-Adviser is compensated for its services to the Fund from the management fees paid to the Adviser.
The Fund’s management fee consists of two components – a fund-level fee, based only on the amount of assets within the Fund, and a complex-level fee, based on the aggregate amount of all eligible fund assets managed by the Adviser. This pricing structure enables Fund shareholders to benefit from growth in the assets within the Fund as well as from growth in the amount of complex-wide assets managed by the Adviser.
The annual fund-level fee, payable monthly, is calculated according to the following schedule:
| | | | |
| Average Daily Managed Assets* | | Fund-Level Fee Rate | |
For the first $125 million | | | 0.7000 | % |
For the next $125 million | | | 0.6875 | |
For the next $150 million | | | 0.6750 | |
For the next $600 million | | | 0.6625 | |
For managed assets over $1 billion | | | 0.6500 | |
37
Notes to Financial Statements(continued)
(Unaudited)
The annual complex-level fee, payable monthly, is calculated by multiplying the current complex-wide fee rate, determined according to the following schedule by the Fund’s daily managed assets:
| | | | |
| Complex-Level Eligible Asset Breakpoint Level* | | Effective Complex-Level Fee Rate at Breakpoint Level | |
$55 billion | | | 0.2000 | % |
$56 billion | | | 0.1996 | |
$57 billion | | | 0.1989 | |
$60 billion | | | 0.1961 | |
$63 billion | | | 0.1931 | |
$66 billion | | | 0.1900 | |
$71 billion | | | 0.1851 | |
$76 billion | | | 0.1806 | |
$80 billion | | | 0.1773 | |
$91 billion | | | 0.1691 | |
$125 billion | | | 0.1599 | |
$200 billion | | | 0.1505 | |
$250 billion | | | 0.1469 | |
$300 billion | | | 0.1445 | |
| * | For the complex-level fees, managed assets include closed-end fund assets managed by the Adviser that are attributable to certain types of leverage. For these purposes, leverage includes the funds’ use of preferred stock and borrowings and certain investments in the residual interest certificates (also called inverse floating rate securities) in tender option bond (TOB) trusts, including the portion of assets held by a TOB trust that has been effectively financed by the trust’s issuance of floating rate securities, subject to an agreement by the Adviser as to certain funds to limit the amount of such assets for determining managed assets in certain circumstances. The complex-level fee is calculated based upon the aggregate daily managed assets of all Nuveen open-end and closed-end Funds that constitute “eligible assets.” Eligible assets do not include assets attributable to investments in other Nuveen funds or assets in excess of a determined amount (originally $2 billion) added to the Nuveen fund complex in connection with the Adviser’s assumption of the management of the former First American Funds effective January 1, 2011. As of December 31, 2018, the complex-level fee for the Fund was 0.1602%. |
8. Fund Leverage
Reverse Repurchase Agreements
During the current fiscal period, the Fund entered into reverse repurchase agreements as a means of leverage.
In a reverse repurchase agreement, the Fund sells to the counterparty a security that it holds with a contemporaneous agreement to repurchase the same security at an agreed-upon price and date, with the Fund retaining the risk of loss that is associated with that security. The Fund will segregate assets determined to be liquid by the Adviser to cover its obligations under reverse repurchase agreements. Securities sold under reverse repurchase agreements are recorded as a liability and recognized as “Reverse repurchase agreements” on the Statement of Assets and Liabilities.
Interest payments made on reverse repurchase agreements are recognized as a component of “Interest expense” on the Statement of Operations. In periods of increased demand for the security, the Fund receives a fee for use of the security by the counterparty. This results in interest income to the Fund, which is recognized as a component of “Interest income” on the Statement of Operations.
As of the end of the reporting period, the Fund’s outstanding balances on its reverse repurchase agreements were as follows:
| | | | | | | | | | | | | | | | | | | | |
| Counterparty | | Coupon | | | Principal
Amount | | | Maturity | | | Value | | | Value and
Accrued Interest | |
| BNP Paribas | | | 2.85 | % | | $ | (13,293,000 | ) | | | 1/22/19 | | | $ | (13,293,000 | ) | | $ | (13,306,681 | ) |
| Goldman Sachs | | | 3.10 | | | | (5,809,000 | ) | | | 1/22/19 | | | | (5,809,000 | ) | | | (5,815,503 | ) |
| | | | | | | $ | (19,102,000 | ) | | | | | | $ | (19,102,000 | ) | | $ | (19,122,184 | ) |
During the current fiscal period, the average daily balance outstanding and average interest rate on the Fund’s reverse repurchase agreements were as follows:
| | | | |
| Average daily balance outstanding | | $ | 19,675,217 | |
| Average interest rate | | | 2.33 | % |
38
The following table presents the reverse repurchase agreements subject to netting agreements and the collateral delivered related to those reverse repurchase agreements.
| | | | | | | | | | | | |
| Counterparty | | Reverse Repurchase Agreements* | | | Collateral Pledged
to Counterparty** | | | Net
Exposure | |
| BNP Paribas | | $ | (13,306,681 | ) | | $ | 13,306,681 | | | | $ — | |
| Goldman Sachs | | | (5,815,503 | ) | | | 5,815,503 | | | | — | |
| | | $ | (19,122,184 | ) | | $ | 19,122,184 | | | $ | — | |
| * | Represents gross value and accrued interest for the counterparty as reported in the preceding table. |
| ** | As of the end of the reporting period, the value of the collateral pledged to the counterparty exceeded the value of the reverse repurchase agreements. |
9. Borrowing Arrangements
Inter-Fund Borrowing and Lending
The Securities and Exchange Commission (“SEC”) has granted an exemptive order permitting registered open-end and closed-end Nuveen funds to participate in an inter-fund lending facility whereby the Nuveen funds may directly lend to and borrow money from each other for temporary purposes (e.g., to satisfy redemption requests or when a sale of securities “fails,” resulting in an unanticipated cash shortfall) (the “Inter-Fund Program”). The closed-end Nuveen funds, including the Fund covered by this shareholder report, will participate only as lenders, and not as borrowers, in the Inter-Fund Program because such closed-end funds rarely, if ever, need to borrow cash to meet redemptions. The Inter-Fund Program is subject to a number of conditions, including, among other things, the requirements that (1) no fund may borrow or lend money through the Inter-Fund Program unless it receives a more favorable interest rate than is typically available from a bank or other financial institution for a comparable transaction; (2) no fund may borrow on an unsecured basis through the Inter-Fund Program unless the fund’s outstanding borrowings from all sources immediately after the inter-fund borrowing total 10% or less of its total assets; provided that if the borrowing fund has a secured borrowing outstanding from any other lender, including but not limited to another fund, the inter-fund loan must be secured on at least an equal priority basis with at least an equivalent percentage of collateral to loan value; (3) if a fund’s total outstanding borrowings immediately after an inter-fund borrowing would be greater than 10% of its total assets, the fund may borrow through the inter-fund loan on a secured basis only; (4) no fund may lend money if the loan would cause its aggregate outstanding loans through the Inter-Fund Program to exceed 15% of its net assets at the time of the loan; (5) a fund’s inter-fund loans to any one fund shall not exceed 5% of the lending fund’s net assets; (6) the duration of inter-fund loans will be limited to the time required to receive payment for securities sold, but in no event more than seven days; and (7) each inter-fund loan may be called on one business day’s notice by a lending fund and may be repaid on any day by a borrowing fund. In addition, a Nuveen fund may participate in the Inter-Fund Program only if and to the extent that such participation is consistent with the fund’s investment objective and investment policies. The Board is responsible for overseeing the Inter-Fund Program.
The limitations detailed above and the other conditions of the SEC exemptive order permitting the Inter-Fund Program are designed to minimize the risks associated with Inter-Fund Program for both the lending fund and the borrowing fund. However, no borrowing or lending activity is without risk. When a fund borrows money from another fund, there is a risk that the loan could be called on one day’s notice or not renewed, in which case the fund may have to borrow from a bank at a higher rate or take other actions to payoff such loan if an inter-fund loan is not available from another fund. Any delay in repayment to a lending fund could result in a lost investment opportunity or additional borrowing costs.
During the current reporting period, the Fund did not enter into any inter-fund loan activity.
10. New Accounting Pronouncements
FASB Accounting Standards Update (“ASU”) 2017-08 (“ASU 2017-08”) Premium Amortization on Purchased Callable Debt Securities
The FASB has issued ASU 2017-08, which shortens the premium amortization period for purchased non-contingently callable debt securities. ASU 2017-08 specifies that the premium amortization period ends at the earliest call date, for purchased non-contingently callable debt securities. ASU 2017-08 is effective for fiscal years, and interim periods within those fiscal years, beginning after December 15, 2018. Management is currently evaluating the implications of ASU 2017-08, if any.
Disclosure Update and Simplification
During August 2018, the SEC issued Final Rule Release No. 33-10532, Disclosure Update and Simplification (“Final Rule Release No. 33-10532”). Final Rule Release No. 33-10532 amends certain financial statement disclosure requirements to conform to U.S. GAAP. The amendments to Rule 6-04.17 of Regulation S-X (balance sheet) remove the requirement to separately state the book basis components of net assets: undistributed (over-distribution of) net investment income (“UNII”), accumulated undistributed net realized gains (losses), and net unrealized appreciation (depreciation) at the balance sheet date. Instead, consistent with U.S. GAAP, funds will be required to disclose total distributable earnings. The amendments to Rule 6-09 of Regulation S-X (statement of changes in net assets) remove the requirement to separately state the sources of distributions paid. Instead, consistent with U.S. GAAP,
39
Notes to Financial Statements(continued)
(Unaudited)
funds will be required to disclose the total amount of distributions paid, except that any tax return of capital must be separately disclosed. The amendments also remove the requirement to parenthetically state the book basis amount of UNII on the statement of changes in net assets.
The requirements of Final Rule Release No. 33-10532 are effective November 5, 2018, and the Funds’ Statement of Assets and Liabilities and Statement of Changes in Net Assets for the current reporting period have been modified accordingly. In addition, certain amounts within each Fund’s Statement of Changes in Net Assets for the prior fiscal period have been modified to conform to Final Rule Release No. 33-10532.
For the prior fiscal period, the total amount of distributions paid to shareholders from net investment income and from accumulated net realized gains, if any, are recognized as “Dividends” on the Statement of Changes in Net Assets.
As of June 30, 2018, the Funds’ Statement of Changes in Net Assets reflected the following UNII balances.
| | | | |
UNII at the end of period | | | $(62,147) | |
Fair Value Measurement: Disclosure Framework
During August 2018, the FASB issuedASU 2018-13(“ASU 2018-13”),Fair Value Measurement: Disclosure Framework – Changes to the Disclosure Requirements for Fair Value Measurements.ASU 2018-13 modifies the disclosures required by Topic 820,Fair Value Measurements. The amendments inASU 2018-13 are effective for all entities for fiscal years, and interim periods within those fiscal years, beginning after December 15, 2019. During the current reporting period, management early implemented this guidance. This implementation did not have a material impact on the Fund’s financial statements.
40
Additional Fund
Information
| | | | | | | | | | |
| Board of Trustees | | | | | | | | | | |
| Margo Cook* | | Jack B. Evans | | William C. Hunter | | Albin F. Moschner | | John K. Nelson | | William J. Schneider** |
| Judith M. Stockdale | | Carole E. Stone | | Terence J. Toth | | Margaret L. Wolff | | Robert L. Young | | |
| * | Interested Board Member. |
| ** | Retired from the Funds’ Board of Trustees effective December 31, 2018. |
| | | | | | | | |
| | | | | |
Fund Manager Nuveen Fund Advisors, LLC 333 West Wacker Drive Chicago, IL 60606 | | Custodian State Street Bank
& Trust Company One Lincoln Street Boston, MA 02111 | | Legal Counsel Chapman and Cutler LLP Chicago, IL 60603 | | Independent Registered
Public Accounting Firm KPMG LLP 200 East Randolph Street Chicago, IL 60601 | | Transfer Agent and
Shareholder Services Computershare Trust
Company, N.A.
250 Royall Street Canton, MA 02021 (800) 257-8787 |
Portfolio of Investments Information
The Fund is required to file its complete schedule of portfolio holdings with the Securities and Exchange Commission (SEC) for the first and third quarters of each fiscal year as an exhibit to its report on Form N-PORT. You may obtain this information on the SEC’s website at http://www.sec.gov.
Nuveen Funds’ Proxy Voting Information
You may obtain (i) information regarding how each fund voted proxies relating to portfolio securities held during the most recent twelve-month period ended June 30, without charge, upon request, by calling Nuveen toll-free at (800) 257-8787 or on Nuveen’s website at www.nuveen.com and (ii) a description of the policies and procedures that each fund used to determine how to vote proxies relating to portfolio securities without charge, upon request, by calling Nuveen toll free at (800) 257-8787. You may also obtain this information directly from the SEC. Visit the SEC on-line at http://www.sec.gov.
CEO Certification Disclosure
The Fund’s Chief Executive Officer (CEO) has submitted to the New York Stock Exchange (NYSE) the annual CEO certification as required by Section 303A.12(a) of the NYSE Listed Company Manual. The Fund has filed with the SEC the certification of its CEO and Chief Financial Officer required by Section 302 of the Sarbanes-Oxley Act.
Common Share Repurchases
The Fund intends to repurchase, through its open-market share repurchase program, shares of its own common stock at such times and in such amounts as is deemed advisable. During the period covered by this report, the Fund repurchased shares of its common stock, as shown in the accompanying table. Any future repurchases will be reported to shareholders in the next annual or semi-annual report.
| | | | |
| | | JMM | |
Common shares repurchased | | | — | |
FINRA BrokerCheck
The Financial Industry Regulatory Authority (FINRA) provides information regarding the disciplinary history of FINRA member firms and associated investment professionals. This information as well as an investor brochure describing FlNRA BrokerCheck is available to the public by calling the FINRA BrokerCheck Hotline number at (800) 289-9999 or by visiting www.FINRA.org.
41
Glossary of Terms
Used in this Report
| ∎ | | Average Annual Total Return: This is a commonly used method to express an investment’s performance over a particular, usually multi-year time period. It expresses the return that would have been necessary each year to equal the investment’s actual cumulative performance (including change in NAV or market price and reinvested dividends and capital gains distributions, if any) over the time period being considered. |
| ∎ | | Beta: A measure of the variability of the change in the share price for a fund in relation to a change in the value of the fund’s market benchmark. Securities with betas higher than 1.0 have been, and are expected to be, more volatile than the benchmark; securities with betas lower than 1.0 have been, and are expected to be, less volatile than the benchmark. |
| ∎ | | Blended Benchmark: A two index blend comprised of weightings approximating the Fund’s proposed portfolio: 25% Bloomberg Barclays U.S. Corporate High-Yield Index and 75% Bloomberg Barclays U.S. Government/Mortgage Index. 1) Bloomberg Barclays U.S. Corporate High-Yield Index: An unmanaged index that covers the universe of domestic fixed-rate non-investment grade debt; and 2) Bloomberg Barclays U.S. Government/Mortgage Index: An unmanaged index considered representative of U.S. government treasury securities and agencymortgage-back securities. Benchmark returns assume reinvestment of distributions, but do not reflect any applicable sales charges or management fees. |
| ∎ | | Bloomberg Barclays U.S. Government/Mortgage Bond Index: The index measures the performance of U.S. government bonds and mortgage-related securities. Index returns assume reinvestment of distributions, but do not include the effects of any applicable sales charges or management fees. |
| ∎ | | Contingent Capital Securities (CoCos): CoCos are debt or capital securities of primarily non-U.S. issuers with loss absorption contingency mechanisms built into the terms of the security, for example a mandatory conversion into common stock of the issuer, or a principal write-down, which if triggered would likely cause the CoCo investment to lose value. Loss absorption mechanisms would become effective upon the occurrence of a specified contingency event, or at the discretion of a regulatory body. Specified contingency events, as identified in the CoCo’s governing documents, usually reference a decline in the issuer’s capital below a specified threshold level, and/or certain regulatory events. A loss absorption contingency event for CoCos would likely be the result of, or related to, the deterioration of the issuer’s financial condition and/or its status as a going concern. In such a case, with respect to CoCos that provide for conversion into common stock upon the occurrence of the contingency event, the market price of the issuer’s common stock received by the Acquiring Fund will have likely declined, perhaps substantially, and may continue to decline after conversion. CoCos rated below investment grade should be considered high yield securities, or “junk,” but often are issued by entities whose more senior securities are rated investment grade. CoCos are a relatively new type of security; and there is a risk that CoCo security issuers may suffer the sort of future financial distress that could materially increase the likelihood (or the market’s perception of the likelihood) that an automatic write-down or conversion event on those issuers’ CoCos will occur. Additionally, the trading behavior of a given issuer’s CoCo may be strongly impacted by the trading behavior of other issuers’ CoCos, such that negative information from an unrelated CoCo security may cause a decline in value of one or more CoCos held by the Fund. Accordingly, the trading behavior of CoCos may not follow the trading behavior of other types of debt and preferred securities. Despite these concerns, the prospective reward vs. risk characteristics of at least certain CoCos may be very attractive relative to other fixed-income alternatives. |
| ∎ | | Duration: Duration is a measure of the expected period over which a bond’s principal and interest will be paid, and consequently is a measure of the sensitivity of a bond’s or bond fund’s value to changes when market interest rates change. Generally, the longer a bond’s or fund’s duration, the more the price of the bond or fund will change as interest rates change. |
| ∎ | | Effective Leverage: Effective leverage is a fund’s effective economic leverage, and includes both regulatory leverage (see below) and the leverage effects of certain derivative investments in the fund’s portfolio. |
42
| ∎ | | Leverage: Leverage is created whenever a fund has investment exposure (both reward and/or risk) equivalent to more than 100% of the investment capital. |
| ∎ | | Net Asset Value (NAV) Per Share: A fund’s Net Assets is equal to its total assets (securities, cash, accrued earnings and receivables) less its total liabilities. NAV per share is equal to the fund’s Net Assets divided by its number of shares outstanding. |
| ∎ | | Regulatory Leverage: Regulatory leverage consists of preferred shares issued by or borrowings of the fund. Both of these are part of the fund’s capital structure. Regulatory leverage is subject to asset coverage limits set in the Investment Company Act of 1940. |
43
Reinvest Automatically,
Easily and Conveniently
Nuveen makes reinvesting easy. A phone call is all it takes to set up your reinvestment account.
Nuveen Closed-End Funds Automatic Reinvestment Plan
Your Nuveen Closed-End Fund allows you to conveniently reinvest distributions in additional Fund shares.
By choosing to reinvest, you’ll be able to invest money regularly and automatically, and watch your investment grow through the power of compounding. Just like distributions in cash, there may be times when income or capital gains taxes may be payable on distributions that are reinvested.
It is important to note that an automatic reinvestment plan does not ensure a profit, nor does it protect you against loss in a declining market.
Easy and convenient
To make recordkeeping easy and convenient, each quarter you’ll receive a statement showing your total distributions, the date of investment, the shares acquired and the price per share, and the total number of shares you own.
How shares are purchased
The shares you acquire by reinvesting will either be purchased on the open market or newly issued by the Fund. If the shares are trading at or above net asset value at the time of valuation, the Fund will issue new shares at the greater of the net asset value or 95% of the then-current market price. If the shares are trading at less than net asset value, shares for your account will be purchased on the open market. If the Plan Agent begins purchasing Fund shares on the open market while shares are trading below net asset value, but the Fund’s shares subsequently trade at or above their net asset value before the Plan Agent is able to complete its purchases, the Plan Agent may cease open-market purchases and may invest the uninvested portion of the distribution in newly-issued Fund shares at a price equal to the greater of the shares’ net asset value or 95% of the shares’ market value on the last business day immediately prior to the purchase date. Distributions received to purchase shares in the open market will normally be invested shortly after the distribution payment date. No interest will be paid on distributions awaiting reinvestment. Because the market price of the shares may increase before purchases are completed, the average purchase price per share may exceed the market price at the time of valuation, resulting in the acquisition of fewer shares than if the distribution had been paid in shares issued by the Fund. A pro rata portion of any applicable brokerage commissions on open market purchases will be paid by Plan participants. These commissions usually will be lower than those charged on individual transactions.
Flexible
You may change your distribution option or withdraw from the Plan at any time, should your needs or situation change.
You can reinvest whether your shares are registered in your name, or in the name of a brokerage firm, bank, or other nominee. Ask your investment advisor if his or her firm will participate on your behalf. Participants whose shares are registered in the name of one firm may not be able to transfer the shares to another firm and continue to participate in the Plan.
The Fund reserves the right to amend or terminate the Plan at any time. Although the Fund reserves the right to amend the Plan to include a service charge payable by the participants, there is no direct service charge to participants in the Plan at this time.
Call today to start reinvesting distributions
For more information on the Nuveen Automatic Reinvestment Plan or to enroll in or withdraw from the Plan, speak with your financial advisor or call us at (800) 257-8787.
44
Notes
45
Notes
46
Notes
47
Nuveen:
Serving Investors for Generations
Since 1898, financial advisors and their clients have relied on Nuveen to provide
dependable investment solutions through continued adherence to proven, long-term investing
principles. Today, we offer a range of high quality solutions designed to
be integral components of a well-diversified core portfolio.
Focused on meeting investor needs.
Nuveen is the investment manager of TIAA. We have grown into one of the world’s premier global asset managers, with specialist knowledge across all major asset classes and particular strength in solutions that provide income for investors and that draw on our expertise in alternatives and responsible investing. Nuveen is driven not only by the independent investment processes across the firm, but also the insights, risk management, analytics and other tools and resources that a truly world-class platform provides. As a global asset manager, our mission is to work in partnership with our clients to create solutions which help them secure their financial future.
Find out how we can help you.
To learn more about how the products and services of Nuveen may be able to help you meet your financial goals, talk to your financial advisor, or call us at(800) 257-8787. Please read the information provided carefully before you invest. Investors should consider the investment objective and policies, risk considerations, charges and expenses of any investment carefully.
Learn more about Nuveen Funds at:www.nuveen.com/closed-end-funds
| | | | |
| Nuveen Securities, LLC, member FINRA and SIPC | 333 West Wacker Drive Chicago, IL 60606 | www.nuveen.com | |  | | ESA-A-1218D
741800-INV-B-02/19 |
Item 2. Code of Ethics.
Not applicable to this filing.
Item 3. Audit Committee Financial Expert.
Not applicable to this filing.
Item 4. Principal Accountant Fees and Services.
Not applicable to this filing.
Item 5. Audit Committee of Listed Registrants.
Not applicable to this filing.
Item 6. Schedule of Investments.
(a) See Portfolio of Investments in Item 1.
(b) Not applicable.
Item 7. Disclosure of Proxy Voting Policies and Procedures for Closed-End Management Investment Companies.
Not applicable to this filing.
Item 8. Portfolio Managers of Closed-End Management Investment Companies.
Not applicable to this filing.
Item 9. Purchases of Equity Securities by Closed-End Management Investment Company and Affiliated Purchasers.
Not applicable.
Item 10. Submission of Matters to a Vote of Security Holders.
There have been no material changes to the procedures by which shareholders may recommend nominees to the registrant’s Board implemented after the registrant last provided disclosure in response to this item.
Item 11. Controls and Procedures.
| (a) | The registrant’s principal executive and principal financial officers, or persons performing similar functions, have concluded that the registrant’s disclosure controls and procedures (as defined in Rule 30a-3(c) under the Investment Company Act of 1940, as amended (the “1940 Act”) (17 CFR 270.30a-3(c))) are effective, as of a date within 90 days of the filing date of this report that includes the disclosure required by this paragraph, based on their evaluation of the controls and procedures required by Rule 30a-3(b) under the 1940 Act (17 CFR 270.30a-3(b)) and Rules 13a-15(b) or 15d-15(b) under the Securities Exchange Act of 1934, as amended (the “Exchange Act”) (17 CFR 240.13a-15(b) or 240.15d-15(b)). |
| (b) | There were no changes in the registrant’s internal control over financial reporting (as defined in Rule 30a-3(d) under the 1940 Act (17 CFR 270.30a-3(d)) that occurred during the period covered by this report that has materially affected, or is reasonably likely to materially affect, the registrant’s internal control over financial reporting. |
Item 12. Disclosure of Securities Lending Activity for Closed-End Management Investment Companies.
Not applicable.
Item 13. Exhibits.
File the exhibits listed below as part of this Form.
(a)(1) Any code of ethics, or amendment thereto, that is the subject of the disclosure required by Item 2, to the extent that the registrant intends to satisfy the Item 2 requirements through filing of an exhibit: Not applicable to this filing.
(a)(2) A separate certification for each principal executive officer and principal financial officer of the registrant as required by Rule 30a-2(a) under the 1940 Act (17 CFR 270.30a-2(a)) in the exact form set forth below: See EX-99.CERT attached hereto.
(a)(3) Any written solicitation to purchase securities under Rule 23c-1 under the 1940 Act (17 CFR 270.23c-1) sent or given during the period covered by the report by or on behalf of the registrant to 10 or more persons: Not applicable.
(a)(4) Change in registrant’s independent public accountant. Not applicable.
(b) If the report is filed under Section 13(a) or 15(d) of the Exchange Act, provide the certifications required by Rule 30a-2 (b) under the 1940 Act (17 CFR 270.30a-2(b)), Rule 13a-14(b) or Rule 15d-14(b) under the Exchange Act (17 CFR 240.13a-14(b) or 240.15d-14(b)), and Section 1350 of Chapter 63 of Title 18 of the United States Code (18 U.S.C. 1350) as an Exhibit. A certification furnished pursuant to this paragraph will not be deemed “filed” for purposes of Section 18 of the Exchange Act (15 U.S.C. 78r), or otherwise subject to the liability of that section. Such certification will not be deemed to be incorporated by reference into any filing under the Securities Act of 1933 or the Exchange Act, except to the extent that the registration specifically incorporates it by reference: See EX-99.906 CERT attached hereto.
SIGNATURES
Pursuant to the requirements of the Securities Exchange Act of 1934 and the Investment Company Act of 1940, the registrant has duly caused this report to be signed on its behalf by the undersigned, thereunto duly authorized.
(Registrant) Nuveen Multi-Market Income Fund
| | | | |
| By (Signature and Title) | | /s/ Gifford R. Zimmerman | | |
| | Gifford R. Zimmerman | | |
| | Vice President and Secretary | | |
Date: March 8, 2019
Pursuant to the requirements of the Securities Exchange Act of 1934 and the Investment Company Act of 1940, this report has been signed below by the following persons on behalf of the registrant and in the capacities and on the dates indicated.
| | | | |
| By (Signature and Title) | | /s/ Cedric H. Antosiewicz | | |
| | Cedric H. Antosiewicz | | |
| | Chief Administrative Officer | | |
| | (principal executive officer) | | |
Date: March 8, 2019
| | | | |
| By (Signature and Title) | | /s/ Stephen D. Foy | | |
| | Stephen D. Foy | | |
| | Vice President and Controller | | |
| | (principal financial officer) | | |
Date: March 8, 2019