Trade payables are generally not interest-bearing but interest may be charged by suppliers on overdue accounts.
Derivative financial instruments are held in relation to the Group’s financial risk management policy which is described in note 33. The Group does not hold or issue derivatives for speculative purposes.
The carrying amount of derivative financial instruments held by the Group was as follows:
| 
| 107 |
| Group Financial Statements | |
B. Currency derivatives
As at 2 January 2010, the notional principal amount of outstanding foreign exchange contracts that are used to manage the currency profile of the Group’s net assets was $796.6 million (3 January 2009: $888.7 million). Where necessary, the Group has designated these contracts as net investment hedges. During 2009, the net fair value loss of $3.1 million (2008: net gain of $57.2 million; 2007: net loss of $31.0 million) in relation to designated net investment hedges was recognised in other comprehensive income.
Prior to the change in its presentation currency at the beginning of 2008, the Group also designated as net investment hedges the US dollar borrowings under the multi-currency revolving credit facility and, before their redemption in July 2007, the Company’s US dollar denominated preference shares. During 2007, the net currency translation gain of $3.8 million arising on these instruments was recognised in other comprehensive income.
The currency profile of the Group’s net assets after taking into account translation hedges is presented in note 33.
Also during 2009, a net fair value gain of $12.2 million (2008: net loss of $9.4 million; 2007: net loss of $4.0 million) was recognised within operating profit in respect of currency derivatives that were held to provide an economic hedge of transactional currency exposures but were not designated as hedges for accounting purposes.
C. Interest rate swaps
Interest rate swaps are used to swap borrowings under the Group’s EMTN Programme from fixed interest rates to floating interest rates. As at 2 January 2010, the nominal value of the contracts outstanding was £400 million (3 January 2009: £400 million). The Group has designated these contracts as fair value hedges in relation to the borrowings.
During 2009, the Group recognised a net fair value loss of $13.3 million (2008: net gain of $75.7 million; 2007: net gain of $7.0 million) in relation to these contracts and the carrying amount of the hedged borrowings was decreased by $12.3 million (2008: increased by $75.6 million; 2007: increased by $5.4 million) to reflect the change in the fair value of the borrowings attributable to the hedged risk and the amortisation of the transitional adjustment that was recognised on adoption of IAS 39. During 2009, a net loss of $1.0 million (2008: net gain of $0.1 million; 2007: net gain of $1.6 million) was, therefore, recognised within other finance expense in relation to these hedges.
Until December 2009, when the remaining contracts matured, interest rate swaps were held to restrict the amount of floating rate US dollar debt. During 2009, a net fair value gain of $2.3 million (2008: net loss of $2.1 million; 2007: net loss of $3.8 million) was recognised within other finance expense in relation to these contracts that did not qualify for hedge accounting under IAS 39.
The profile of interest rate swaps held by the Group was as follows:
| | | | | | | | | | | | Interest rate | |
| | | | | | Payable | | | | Receivable | | | |
| | Notional
principal amount
million | | Variable | | Fixed | | Variable | | Fixed | | Variable
rate index | |
As at 2 January 2010 | | | | | | | | | | | | | |
Maturity date: | | | | | | | | | | | | | |
– December 2011 | | £150.0 | | 3.4% | | – | | – | | 8.0% | | 6 month LIBOR | |
– September 2015 | | £250.0 | | 1.7% | | – | | – | | 6.1% | | 3 month LIBOR | |
As at 3 January 2009 | | | | | | | | | | | | | |
Maturity date: | | | | | | | | | | | | | |
– December 2011 | | £150.0 | | 5.7% | | – | | – | | 8.0% | | 6 month LIBOR | |
– September 2015 | | £250.0 | | 4.0% | | – | | – | | 6.1% | | 3 month LIBOR | |
– December 2009 | | $65.0 | | – | | 4.6% | | 1.5% | | – | | 3 month LIBOR | |
D. Currency translation loss on hedging instruments
Certain of the translational hedging instruments held by the Group are denominated in sterling but the Group is unable to apply hedge accounting to the gains and losses that arise on the translation of the carrying amount of those instruments into US dollars. During 2009, a net currency translation loss of $1.6 million (2008: net loss of $17.9 million; 2007: net loss of $3.0 million) was recognised within other finance expense in relation to those instruments.
NOTES TO THE FINANCIAL STATEMENTS (CONTINUED)
33. Financial risk management
A. Risk management policies
The Group’s central treasury function is responsible for procuring the Group’s capital resources and maintaining an efficient capital structure, together with managing the Group’s liquidity, foreign exchange and interest rate exposures.
All treasury operations are conducted within strict policies and guidelines that are approved by the Board. Compliance with those policies and guidelines is monitored by the regular reporting of treasury activities to the Board.
A key element of the Group’s treasury philosophy is that funding, interest rate and currency decisions and the location of cash and debt balances are determined independently from each other. The Group’s borrowing requirements are met by raising funds in the most favourable markets. Management aims to retain net debt in proportion to the currencies in which the net assets of the Group’s operations are denominated. The desired currency profile of net debt is achieved by entering into currency derivative contracts. The proportion of investments in foreign operations effectively funded by shareholders’ equity is not hedged. While the net income of foreign operations is not hedged, the effect of currency fluctuations on the Group’s reported net income is partly offset by interest payable on net debt denominated in foreign currencies.
From time to time, the Group also enters into currency derivative contracts to manage currency transaction exposures.
Where necessary, the desired interest rate profile of net debt in each currency is achieved by entering into interest rate derivative contracts.
The Group’s portfolio of cash and cash equivalents is managed such that there is no significant concentration of credit risk in any one bank or other financial institution. Management monitors closely the credit quality of the institutions with which it holds deposits. Similar considerations are given to the Group’s portfolio of derivative financial instruments.
The Group’s borrowing facilities are monitored against forecast requirements and timely action is taken to put in place, renew or replace credit lines. Management’s policy is to reduce liquidity risk by diversifying the Group’s funding sources and by staggering the maturity of its borrowings.
The Group has established long-term credit ratings of Baa3 Stable with Moody’s and BBB Stable with Standard & Poor’s and short-term credit ratings of P-3 with Moody’s and A-2 with Standard & Poor’s. Management aims to achieve an appropriate mix of debt and equity to ensure an efficient capital structure and to preserve these ratings.
Disclosures about the Group’s capital are set out in note 40.
B. Financial assets and liabilities
The following table analyses financial assets and liabilities by the categories defined in IAS 39. Financial instruments held at fair value, have been categorised into one of three levels to reflect the degree to which observable inputs are used in determining the fair values:
– | ‘Level 1’ fair value measurements are those derived without adjustment from quoted prices in active markets for identical assets or liabilities. |
– | ‘Level 2’ fair value measurements are those derived from inputs other than quoted prices included within Level 1 that are observable for the asset or liability, either directly (i.e. as prices) or indirectly (i.e. derived from prices). |
– | ‘Level 3’ fair value measurements are those derived from valuation techniques that include inputs for the asset or liability that are not based on observable market data (unobservable inputs). |
During 2009, there were no transfers of financial instruments between Level 1 and Level 2.
|
| 109 |
| Group Financial Statements |
| | | | | | | | Fair value
through profit or loss | | | | | | |
| | Loans and
receivables
$ million | | Available-
for-sale
$ million | | Liabilities
at amortised
cost
$ million | | Designated
hedging
relationships
$ million | | Trading
$ million | | Total
carrying
value
$ million | | | Fair
value
$ million | |
As at 2 January 2010 | | | | | | | | | | | | | | | | |
Financial assets not held at fair value | | | | | | | | | | | | | | | | |
Trade and other receivables: | | | | | | | | | | | | | | | | |
– Non-derivative assets | | 722.1 | | – | | – | | – | | – | | 722.1 | | | 722.1 | |
Cash and cash equivalents | | 445.0 | | – | | – | | – | | – | | 445.0 | | | 445.0 | |
| | 1,167.1 | | – | | – | | – | | – | | 1,167.1 | | | 1,167.1 | |
Financial assets held at fair value | | | | | | | | | | | | | | | | |
Level 1: | | | | | | | | | | | | | | | | |
– Available-for-sale investments | | – | | 1.2 | | – | | – | | – | | 1.2 | | | 1.2 | |
Level 2: | | | | | | | | | | | | | | | | |
– Trade and other receivables: | | | | | | | | | | | | | | | | |
Derivative assets | | – | | – | | – | | 56.9 | | 1.2 | | 58.1 | | | 58.1 | |
| | – | | 1.2 | | – | | 56.9 | | 1.2 | | 59.3 | | | 59.3 | |
Total financial assets | | 1,167.1 | | 1.2 | | – | | 56.9 | | 1.2 | | 1,226.4 | | | 1,226.4 | |
| | | | | | | | | | | | | | | | |
Financial liabilities not held at fair value | | | | | | | | | | | | | | | | |
Trade and other payables: | | | | | | | | | | | | | | | | |
– Non-derivative liabilities | | – | | – | | (506.2 | ) | – | | – | | (506.2 | ) | | (506.2 | ) |
Bank overdrafts | | – | | – | | (4.8 | ) | – | | – | | (4.8 | ) | | (4.8 | ) |
Bank and other loans: | | | | | | | | | | | | | | | | |
– Current | | – | | – | | (11.2 | ) | – | | – | | (11.2 | ) | | (10.2 | ) |
– Non-current | | – | | – | | (642.3 | ) | (45.0 | ) | – | | (687.3 | ) | | (655.3 | ) |
Obligations under finance leases | | – | | – | | (4.6 | ) | – | | – | | (4.6 | ) | | (4.6 | ) |
| | – | | – | | (1,169.1 | ) | (45.0 | ) | – | | (1,214.1 | ) | | (1,181.1 | ) |
| | | | | | | | | | | | | | | | |
Financial liabilities held at fair value | | | | | | | | | | | | | | | | |
Level 2: | | | | | | | | | | | | | | | | |
– Trade and other payables: | | | | | | | | | | | | | | | | |
Derivative liabilities | | – | | – | | – | | (3.6 | ) | (2.6 | ) | (6.2 | ) | | (6.2 | ) |
| | – | | – | | – | | (3.6 | ) | (2.6 | ) | (6.2 | ) | | (6.2 | ) |
Total financial liabilities | | – | | – | | (1,169.1 | ) | (48.6 | ) | (2.6 | ) | (1,220.3 | ) | | (1,187.3 | ) |
| | 1,167.1 | | 1.2 | | (1,169.1 | ) | 8.3 | | (1.4 | ) | 6.1 | | | 39.1 | |
NOTES TO THE FINANCIAL STATEMENTS (CONTINUED)
33. Financial risk management (continued)
| | | | | | | | Fair value
through profit or loss | | | | | | |
| | Loans and
receivables
$ million | | Available-
for-sale
$ million | | Liabilities
at amortised
cost
$ million | | Designated
hedging
relationships
$ million | | Trading
$ million | | Total
carrying
value
$ million | | | Fair
value
$ million | |
As at 3 January 2009 | | | | | | | | | | | | | | | | |
Financial assets not held at fair value | | | | | | | | | | | | | | | | |
Trade and other receivables: | | | | | | | | | | | | | | | | |
– Non-derivative assets | | 757.7 | | – | | – | | – | | – | | 757.7 | | | 757.7 | |
Cash and cash equivalents | | 291.9 | | – | | – | | – | | – | | 291.9 | | | 291.9 | |
| | 1,049.6 | | – | | – | | – | | – | | 1,049.6 | | | 1,049.6 | |
Financial assets held at fair value | | | | | | | | | | | | | | | | |
Level 1: | | | | | | | | | | | | | | | | |
– Available-for-sale investments | | – | | 0.8 | | – | | – | | – | | 0.8 | | | 0.8 | |
Level 2: | | | | | | | | | | | | | | | | |
– Trade and other receivables: | | | | | | | | | | | | | | | | |
Derivative assets | | – | | – | | – | | 73.4 | | 1.1 | | 74.5 | | | 74.5 | |
| | – | | 0.8 | | – | | 73.4 | | 1.1 | | 75.3 | | | 75.3 | |
Total financial assets | | 1,049.6 | | 0.8 | | – | | 73.4 | | 1.1 | | 1,124.9 | | | 1,124.9 | |
| | | | | | | | | | | | | | | | |
Financial liabilities not held at fair value | | | | | | | | | | | | | | | | |
Trade and other payables: | | | | | | | | | | | | | | | | |
– Non-derivative liabilities | | – | | – | | (452.4 | ) | – | | – | | (452.4 | ) | | (452.4 | ) |
Bank overdrafts | | – | | – | | (13.7 | ) | – | | – | | (13.7 | ) | | (13.7 | ) |
Bank and other loans: | | | | | | | | | | | | | | | | |
– Current | | – | | – | | (29.5 | ) | – | | – | | (29.5 | ) | | (29.0 | ) |
– Non-current | | – | | – | | (711.0 | ) | (51.9 | ) | – | | (762.9 | ) | | (583.4 | ) |
Obligations under finance leases | | – | | – | | (6.9 | ) | – | | – | | (6.9 | ) | | (6.9 | ) |
| | – | | – | | (1,213.5 | ) | (51.9 | ) | – | | (1,265.4 | ) | | (1,085.4 | ) |
| | | | | | | | | | | | | | | | |
Financial liabilities held at fair value | | | | | | | | | | | | | | | | |
Level 2: | | | | | | | | | | | | | | | | |
– Trade and other payables: | | | | | | | | | | | | | | | | |
Derivative liabilities | | – | | – | | – | | (32.5 | ) | (13.6 | ) | (46.1 | ) | | (46.1 | ) |
| | – | | – | | – | | (32.5 | ) | (13.6 | ) | (46.1 | ) | | (46.1 | ) |
Total financial liabilities | | – | | – | | (1,213.5 | ) | (84.4 | ) | (13.6 | ) | (1,311.5 | ) | | (1,131.5 | ) |
| | 1,049.6 | | 0.8 | | (1,213.5 | ) | (11.0 | ) | (12.5 | ) | (186.6 | ) | | (6.6 | ) |
Available-for-sale investments are listed and are valued by reference to quoted market prices.
Cash and cash equivalents and current bank and other loans largely attract floating interest rates. Accordingly, their carrying amounts are considered to approximate to fair value.
Non-current bank and other loans principally comprise any borrowings under the Group’s multi-currency revolving credit facility that attract floating interest rates, the carrying amount of which is considered to approximate to fair value, and the listed bonds issued under the EMTN Programme, the fair value of which is based on their quoted market prices.
Finance lease obligations attract fixed interest rates that are implicit in the lease rentals and their fair value has been assessed by reference to prevailing market interest rates.
Derivative assets and liabilities represent the fair value of foreign currency derivatives and interest rate derivatives held by the Group at the balance sheet date. Foreign currency derivatives are valued by reference to prevailing forward exchange rates. Interest rate derivatives are valued by discounting the related cash flows using prevailing market interest rates.
|
| 111 |
| Group Financial Statements |
C. Credit risk
Credit risk is the risk that a counterparty will default on its contractual obligations resulting in financial loss to the Group.
Management considers the Group’s maximum exposure to credit risk to be as follows:
| | As at
2 January
2010
$ million | | | As at
3 January
2009
$ million | |
Trade and other receivables: | | | | | | |
– Derivative assets | | 58.1 | | | 74.5 | |
– Non-derivative assets | | 722.1 | | | 757.7 | |
| | 780.2 | | | 832.2 | |
Cash and cash equivalents | | 445.0 | | | 291.9 | |
| | 1,225.2 | | | 1,124.1 | |
As at 2 January 2010, 94% (3 January 2009: 92%) of the Group’s cash and cash equivalents were held with institutions rated at least A-1 by Standard & Poor’s and P-1 by Moody’s. Credit risk disclosures with respect to trade receivables are set out in note 25.
D. Liquidity risk
Liquidity risk is the risk that an entity will encounter difficulty in meeting obligations associated with financial liabilities.
As at 2 January 2010, the Group had undrawn committed borrowing facilities of $645.0 million (3 January 2009: $455.1 million) available under the multi-currency revolving credit facility that expires on 8 August 2010. Borrowings under this facility are at prevailing LIBOR rates, plus an agreed margin, dependent on the period of drawdown. During 2009, the Group entered into a $450 million forward-start facility that will commence on expiry of the existing facility and will itself expire in May 2012.
In addition, the Group had uncommitted borrowing facilities of $381.2 million (3 January 2009: $495.4 million), of which $6.0 million (3 January 2009: $34.7 million) had been drawn down for cash. Consequently, the Group’s committed borrowing headroom was $639.0 million (3 January 2009: $420.4 million) in addition to cash and cash equivalents of $445.0 million (3 January 2009: $291.9 million). The Group also had outstanding performance bonds, letters of credit and bank guarantees amounting to $80.3 million (3 January 2009: $164.5 million).
The Group is subject to covenants, representations and warranties commonly associated with investment grade borrowings in respect of its committed borrowing facilities and bonds issued under the EMTN Programme.
The Group is subject to two financial covenants in respect of its committed borrowing facilities that are calculated by applying UK GAAP extant as at 31 December 2002. The ratio of net debt to consolidated earnings before interest, tax, depreciation and amortisation must not exceed 2.5 times (at the end of 2009, the ratio was 0.6 times). The ratio of consolidated operating profit to the consolidated net interest charge must not be less than 3.0 times (for 2009, the ratio was 5.5 times).
The Group complied with the borrowing covenants throughout each of the periods presented in the financial statements. Any future non-compliance with the borrowing covenants could, if not waived, constitute an event of default and may, in certain circumstances, lead to an acceleration of the maturity of borrowings drawn down and the inability to access committed facilities.
NOTES TO THE FINANCIAL STATEMENTS (CONTINUED)
33. Financial risk management (continued)
D. Liquidity risk (continued)
Contractual cash flows related to the Group’s financial liabilities are as follows:
| | Within
1 year
$ million | | Between
1 and 2
years
$ million | | Between
2 and 3
years
$ million | | Between
3 and 4
years
$ million | | Between
4 and 5
years
$ million | | After
5 years
$ million | | Total
$ million | |
As at 2 January 2010 | | | | | | | | | | | | | | | |
Bank overdrafts | | (4.8 | ) | – | | – | | – | | – | | – | | (4.8 | ) |
Bank and other loans: | | | | | | | | | | | | | | | |
– Principal | | (0.6 | ) | (241.8 | ) | (0.3 | ) | (0.3 | ) | – | | (403.1 | ) | (646.1 | ) |
– Interest payments | | (44.4 | ) | (44.0 | ) | (24.7 | ) | (24.7 | ) | (24.7 | ) | (24.7 | ) | (187.2 | ) |
Finance lease obligations | | (1.3 | ) | (0.8 | ) | (0.4 | ) | (0.4 | ) | (0.4 | ) | (3.3 | ) | (6.6 | ) |
Trade and other payables: | | | | | | | | | | | | | | | |
– Non-derivative liabilities | | (491.9 | ) | (14.3 | ) | – | | – | | – | | – | | (506.2 | ) |
Cash flows on non-derivative liabilities | | (543.0 | ) | (300.9 | ) | (25.4 | ) | (25.4 | ) | (25.1 | ) | (431.1 | ) | (1,350.9 | ) |
| | | | | | | | | | | | | | | |
Cash flows on derivative liabilities: | | | | | | | | | | | | | | | |
– Payments | | (255.7 | ) | (1.8 | ) | – | | – | | – | | – | | (257.5 | ) |
– Receipts | | 255.6 | | – | | – | | – | | – | | – | | 255.6 | |
| | (0.1 | ) | (1.8 | ) | – | | – | | – | | – | | (1.9 | ) |
Cash flows on financial liabilities | | (543.1 | ) | (302.7 | ) | (25.4 | ) | (25.4 | ) | (25.1 | ) | (431.1 | ) | (1,352.8 | ) |
| | | | | | | | | | | | | | | |
Cash flows on related derivative assets: | | | | | | | | | | | | | | | |
– Payments | | (612.7 | ) | (28.9 | ) | (20.6 | ) | (22.6 | ) | (23.8 | ) | (17.5 | ) | (726.1 | ) |
– Receipts | | 635.4 | | 44.0 | | 24.8 | | 24.6 | | 24.7 | | 24.7 | | 778.2 | |
| | 22.7 | | 15.1 | | 4.2 | | 2.0 | | 0.9 | | 7.2 | | 52.1 | |
| | (520.4 | ) | (287.6 | ) | (21.2 | ) | (23.4 | ) | (24.2 | ) | (423.9 | ) | (1,300.7 | ) |
| | Within
1 year
$ million | | Between
1 and 2
years
$ million | | Between
2 and 3
years
$ million | | Between
3 and 4
years
$ million | | Between
4 and 5
years
$ million | | After
5 years
$ million | | Total
$ million | |
As at 3 January 2009 | | | | | | | | | | | | | | | |
Bank overdrafts | | (13.6 | ) | – | | – | | – | | – | | – | | (13.6 | ) |
Bank and other loans: | | | | | | | | | | | | | | | |
– Principal | | (20.9 | ) | (129.3 | ) | (219.2 | ) | (0.3 | ) | (0.3 | ) | (365.4 | ) | (735.4 | ) |
– Interest payments | | (41.6 | ) | (39.9 | ) | (39.9 | ) | (22.4 | ) | (22.4 | ) | (38.2 | ) | (204.4 | ) |
Finance lease obligations | | (1.9 | ) | (1.5 | ) | (1.1 | ) | (0.8 | ) | (0.6 | ) | (3.6 | ) | (9.5 | ) |
Trade and other payables: | | | | | | | | | | | | | | | |
– Non-derivative liabilities | | (434.7 | ) | (17.7 | ) | – | | – | | – | | – | | (452.4 | ) |
Cash flows on non-derivative liabilities | | (512.7 | ) | (188.4 | ) | (260.2 | ) | (23.5 | ) | (23.3 | ) | (407.2 | ) | (1,415.3 | ) |
| | | | | | | | | | | | | | | |
Cash flows on derivative liabilities: | | | | | | | | | | | | | | | |
– Payments | | (677.0 | ) | (5.9 | ) | – | | – | | – | | – | | (682.9 | ) |
– Receipts | | 655.9 | | 7.9 | | – | | – | | – | | – | | 663.8 | |
| | (21.1 | ) | 2.0 | | – | | – | | – | | – | | (19.1 | ) |
Cash flows on financial liabilities | | (533.8 | ) | (186.4 | ) | (260.2 | ) | (23.5 | ) | (23.3 | ) | (407.2 | ) | (1,434.4 | ) |
| | | | | | | | | | | | | | | |
Cash flows on related derivative assets: | | | | | | | | | | | | | | | |
– Payments | | (328.8 | ) | (27.2 | ) | (29.2 | ) | (17.3 | ) | (18.2 | ) | (31.7 | ) | (452.4 | ) |
– Receipts | | 353.9 | | 39.8 | | 39.9 | | 22.4 | | 22.4 | | 44.5 | | 522.9 | |
| | 25.1 | | 12.6 | | 10.7 | | 5.1 | | 4.2 | | 12.8 | | 70.5 | |
| | (508.7 | ) | (173.8 | ) | (249.5 | ) | (18.4 | ) | (19.1 | ) | (394.4 | ) | (1,363.9 | ) |
|
| 113 |
| Group Financial Statements | |
Information on the Group’s exposure to liquidity risk analysed by currency is presented below.
| | Within
1 year
$ million | | Between
1 and 2
years
$ million | | Between
2 and 3
years
$ million | | Between
3 and 4
years
$ million | | Between
4 and 5
years
$ million | | After
5 years
$ million | | Total
$ million | |
As at 2 January 2010 | | | | | | | | | | | | | | | |
Cash flows on financial liabilities: | | | | | | | | | | | | | | | |
– US dollar | | (380.2 | ) | (10.7 | ) | – | | – | | – | | – | | (390.9 | ) |
– Sterling | | 75.0 | | (287.9 | ) | (25.0 | ) | (24.7 | ) | (24.7 | ) | (427.8 | ) | (715.1 | ) |
– Euro | | (68.2 | ) | (1.2 | ) | (0.4 | ) | (0.4 | ) | (0.4 | ) | (3.3 | ) | (73.9 | ) |
– Canadian dollar | | (37.9 | ) | – | | – | | – | | – | | – | | (37.9 | ) |
– Other | | (131.8 | ) | (2.9 | ) | – | | (0.3 | ) | – | | – | | (135.0 | ) |
| | (543.1 | ) | (302.7 | ) | (25.4 | ) | (25.4 | ) | (25.1 | ) | (431.1 | ) | (1,352.8 | ) |
| | | | | | | | | | | | | | | |
Cash flows on related financial assets: | | | | | | | | | | | | | | | |
– US dollar | | (330.1 | ) | – | | – | | – | | – | | – | | (330.1 | ) |
– Sterling | | 479.4 | | 15.1 | | 4.2 | | 2.0 | | 0.9 | | 7.2 | | 508.8 | |
– Euro | | (44.2 | ) | – | | – | | – | | – | | – | | (44.2 | ) |
– Canadian dollar | | (62.3 | ) | – | | – | | – | | – | | – | | (62.3 | ) |
– Other | | (20.1 | ) | – | | – | | – | | – | | – | | (20.1 | ) |
| | 22.7 | | 15.1 | | 4.2 | | 2.0 | | 0.9 | | 7.2 | | 52.1 | |
| | Within
1 year
$ million | | Between
1 and 2
years
$ million | | Between
2 and 3
years
$ million | | Between
3 and 4
years
$ million | | Between
4 and 5
years
$ million | | After
5 years
$ million | | Total
$ million | |
As at 3 January 2009 | | | | | | | | | | | | | | | |
Cash flows on financial liabilities: | | | | | | | | | | | | | | | |
– US dollar | | (771.2 | ) | (114.6 | ) | (0.4 | ) | (0.4 | ) | (0.2 | ) | – | | (886.8 | ) |
– Sterling | | 480.0 | | (75.8 | ) | (259.1 | ) | (22.7 | ) | (22.4 | ) | (403.5 | ) | (303.5 | ) |
– Euro | | (39.6 | ) | 6.4 | | (0.7 | ) | (0.4 | ) | (0.4 | ) | (3.7 | ) | (38.4 | ) |
– Canadian dollar | | (37.8 | ) | – | | – | | – | | – | | – | | (37.8 | ) |
– Other | | (165.2 | ) | (2.4 | ) | – | | – | | (0.3 | ) | – | | (167.9 | ) |
| | (533.8 | ) | (186.4 | ) | (260.2 | ) | (23.5 | ) | (23.3 | ) | (407.2 | ) | (1,434.4 | ) |
| | | | | | | | | | | | | | | |
Cash flows on related financial assets: | | | | | | | | | | | | | | | |
– US dollar | | 289.6 | | – | | – | | – | | – | | – | | 289.6 | |
– Sterling | | 2.0 | | 12.6 | | 10.7 | | 5.1 | | 4.2 | | 12.8 | | 47.4 | |
– Euro | | (97.8 | ) | – | | – | | – | | – | | – | | (97.8 | ) |
– Canadian dollar | | (105.6 | ) | – | | – | | – | | – | | – | | (105.6 | ) |
– Other | | (63.1 | ) | – | | – | | – | | – | | – | | (63.1 | ) |
| | 25.1 | | 12.6 | | 10.7 | | 5.1 | | 4.2 | | 12.8 | | 70.5 | |
Maturities in all of the liquidity tables above are based on the earliest date on which the Group could be required to settle the liabilities.
Floating interest payments and payments and receipts on interest rate derivatives are estimated based on market interest rates prevailing at the balance sheet date.
NOTES TO THE FINANCIAL STATEMENTS (CONTINUED)
33. Financial risk management (continued)
E. Interest rate risk
Interest rate risk is the risk that the fair value of, or future cash flows associated with, a financial instrument will fluctuate because of changes in market interest rates.
The interest rate profile of the Group’s financial assets and liabilities, after taking into account the effect of the Group’s interest rate hedging activities, was as follows:
| | As at 2 January 2010 | | | As at 3 January 2009 | |
| | Interest-bearing | | | | | | | Interest-bearing | | | | | |
| | Floating
rate
$ million | | Fixed
rate
$ million | | Non-interest
bearing
$ million | | Total
$ million | | | Floating
rate
$ million | | Fixed
rate
$ million | | Non-interest
bearing
$ million | | Total
$ million | |
Financial assets | | | | | | | | | | | | | | | | | | |
Trade and other receivables | | 16.0 | | – | | 764.2 | | 780.2 | | | 3.8 | | – | | 828.4 | | 832.2 | |
Available-for-sale investments | | – | | – | | 1.2 | | 1.2 | | | – | | – | | 0.8 | | 0.8 | |
Cash and cash equivalents (see note 27) | | 378.9 | | – | | 66.1 | | 445.0 | | | 252.0 | | – | | 39.9 | | 291.9 | |
| | 394.9 | | – | | 831.5 | | 1,226.4 | | | 255.8 | | – | | 869.1 | | 1,124.9 | |
Financial liabilities | | | | | | | | | | | | | | | | | | |
Trade and other payables | | – | | – | | (512.4 | ) | (512.4 | ) | | – | | – | | (498.5 | ) | (498.5 | ) |
Borrowings (see note 29) | | (701.3 | ) | (0.3 | ) | (1.7 | ) | (703.3 | ) | | (739.4 | ) | (65.3 | ) | (1.4 | ) | (806.1 | ) |
Obligations under finance leases | | – | | (4.6 | ) | – | | (4.6 | ) | | – | | (6.9 | ) | – | | (6.9 | ) |
| | (701.3 | ) | (4.9 | ) | (514.1 | ) | (1,220.3 | ) | | (739.4 | ) | (72.2 | ) | (499.9 | ) | (1,311.5 | ) |
| | (306.4 | ) | (4.9 | ) | 317.4 | | 6.1 | | | (483.6 | ) | (72.2 | ) | 369.2 | | (186.6 | ) |
On the assumption that the change in interest rates is applied to the risk exposures in existence at the balance sheet date and that designated fair value hedges are 100% effective, an increase/decrease of 100 basis points in the interest rates applying to financial assets and liabilities would increase/decrease the Group’s profit before tax by $2.7 million (3 January 2009: $4.0 million). No amounts would be taken directly to equity.
F. Currency risk
Currency risk is the risk that the fair value or future cash flows of a financial instrument will fluctuate because of changes in foreign exchange rates. Currency risk arises on financial assets and liabilities that are denominated in a currency other than the functional currency of the entity by which they are held.
The Group’s exposure to currency risk was as follows:
| | Net foreign currency financial assets/(liabilities) | |
| | US dollar
$ million | | Sterling
$ million | | Euro
$ million | | Canadian dollar
$ million | | Other
$ million | | Total
$ million | |
As at 2 January 2010 | | | | | | | | | | | | | |
Functional currency of entity: | | | | | | | | | | | | | |
– US dollar | | – | | (12.5 | ) | (1.1 | ) | – | | (1.8 | ) | (15.4 | ) |
– Sterling | | 1.8 | | – | | (2.6 | ) | – | | (3.7 | ) | (4.5 | ) |
– Euro | | (2.7 | ) | (0.2 | ) | – | | (0.1 | ) | (0.1 | ) | (3.1 | ) |
– Canadian dollar | | (3.0 | ) | – | | – | | – | | (0.2 | ) | (3.2 | ) |
– Other | | (5.1 | ) | (0.9 | ) | 15.2 | | (0.6 | ) | – | | 8.6 | |
| | (9.0 | ) | (13.6 | ) | 11.5 | | (0.7 | ) | (5.8 | ) | (17.6 | ) |
| | | | | | | | | | | | | |
As at 3 January 2009 | | | | | | | | | | | | | |
Functional currency of entity: | | | | | | | | | | | | | |
– US dollar | | – | | (7.0 | ) | (1.4 | ) | – | | 6.4 | | (2.0 | ) |
– Sterling | | 3.7 | | – | | 0.5 | | – | | 12.3 | | 16.5 | |
– Euro | | (2.3 | ) | (0.1 | ) | – | | (0.6 | ) | – | | (3.0 | ) |
– Canadian dollar | | (1.4 | ) | – | | – | | – | | (0.1 | ) | (1.5 | ) |
– Other | | (11.2 | ) | (0.7 | ) | 19.7 | | 31.7 | | – | | 39.5 | |
| | (11.2 | ) | (7.8 | ) | 18.8 | | 31.1 | | 18.6 | | 49.5 | |
|
| 115 |
| Group Financial Statements | |
Currency exposures shown above take into account the effect of the Group’s transaction hedging activities.
On the assumption that the change in exchange rates is applied to the risk exposures in existence at the balance sheet date and that designated net investment hedges are 100% effective, an increase/decrease of 10% in the value of the functional currencies of the entities concerned against the currencies in which the financial assets and liabilities are denominated would increase/decrease the Group’s profit before tax by $1.8 million (3 January 2009: $5.0 million).
Currency exposures on the Group’s net assets, after taking into account the translation hedges applied to the Group’s borrowings, were as follows:
| | As at 2 January 2010 | | | As at 3 January 2009 | |
| | Net assets
excluding net
(debt)/funds
$ million | | Net
(debt)/funds
$ million | | Net
assets
$ million | | | Net assets
excluding net
(debt)/funds
$ million | | Net
(debt)/funds
$ million | | Net
Assets
$ million | |
Currency: | | | | | | | | | | | | | | |
– US dollar | | 930.8 | | (343.6 | ) | 587.2 | | | 1,164.2 | | (305.8 | ) | 858.4 | |
– Sterling | | 76.2 | | 87.8 | | 164.0 | | | 101.9 | | (12.7 | ) | 89.2 | |
– Euro | | 150.6 | | (33.4 | ) | 117.2 | | | 229.9 | | (94.6 | ) | 135.3 | |
– Canadian dollar | | 137.7 | | (42.8 | ) | 94.9 | | | 171.6 | | (104.4 | ) | 67.2 | |
– Other | | 590.2 | | 124.5 | | 714.7 | | | 548.1 | | 41.1 | | 589.2 | |
| | 1,885.5 | | (207.5 | ) | 1,678.0 | | | 2,215.7 | | (476.4 | ) | 1,739.3 | |
34. Post-employment benefit obligations
A. Background
The Group operates pension plans throughout the world, covering the majority of its employees. The plans are structured to accord with local conditions and practices in each country and include defined contribution plans and defined benefit plans.
The Group provides defined contribution pension benefits in most of the countries in which it operates; in particular, the majority of the Group’s employees in the US are entitled to such benefits. Contributions payable by the Group to these plans amounted to $33.4 million (2008: $37.9 million; 2007: $47.6 million). At the balance sheet date, the Group had not paid over to the plans contributions due amounting to $14.8 million (3 January 2009: $15.1 million). All amounts due for the period were paid over subsequent to the balance sheet date.
The Group operates defined benefit pension plans in several countries; in particular, in the US and the UK. Generally, the pension benefits provided under these plans are based upon pensionable salary and the period of service of the individual employees. The assets of the plans are held separately from those of the Group in funds that are under the control of trustees. All of the defined benefit pension plans operated by the Group are closed to new entrants. In addition to the funded defined benefit pension plans, the Group has unfunded defined benefit obligations to certain current and former employees.
The Group also provides other post-employment benefits, principally health and life insurance cover, to certain of its employees in North America. These plans, which are unfunded, are defined benefit plans.
As discussed in note 7, during 2009, the Group recognised a gain of $63.0 million on the amendment of pension and post-retirement healthcare plans in North America.
NOTES TO THE FINANCIAL STATEMENTS (CONTINUED)
34. Post-employment benefit obligations (continued)
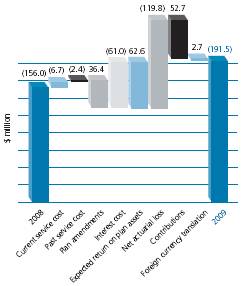
B. Summary of financial effect
An analysis of the effect of providing post-employment benefits on the Group’s results is set out below.
Year ended 2 January 2010
| | Pensions | | Other post-employment benefits | |
| | Operating | | Finance | | | | Operating | | Finance | | | |
| | profit | | charges | | Total | | profit | | charges | | Total | |
| | $ million | | $ million | | $ million | | $ million | | $ million | | $ million | |
Defined contribution plans | | 33.4 | | – | | 33.4 | | – | | – | | – | |
| | | | | | | | | | | | | |
Defined benefit plans | | | | | | | | | | | | | |
Recognised in profit or loss: | | | | | | | | | | | | | |
– Current service cost | | 6.7 | | – | | 6.7 | | 0.4 | | – | | 0.4 | |
– Past service cost | | 2.7 | | – | | 2.7 | | – | | – | | – | |
– Negative past service cost | | (0.3 | ) | – | | (0.3 | ) | (17.2 | ) | – | | (17.2 | ) |
– Settlement and curtailments | | (36.4 | ) | – | | (36.4 | ) | (10.5 | ) | – | | (10.5 | ) |
– Interest cost | | – | | 61.0 | | 61.0 | | – | | 9.0 | | 9.0 | |
– Expected return on plan assets | | – | | (62.6 | ) | (62.6 | ) | – | | – | | – | |
| | (27.3 | ) | (1.6 | ) | (28.9 | ) | (27.3 | ) | 9.0 | | (18.3 | ) |
Recognised in equity: | | | | | | | | | | | | | |
– Net actuarial loss | | | | | | 119.8 | | | | | | 24.0 | |
– Effect of the asset ceiling | | | | | | (18.6 | ) | | | | | – | |
| | | | | | 101.2 | | | | | | 24.0 | |
| | | | | | 72.3 | | | | | | 5.7 | |
Year ended 3 January 2009
| | Pensions | | Other post-employment benefits | |
| | Operating | | Finance | | | | Operating | | Finance | | | |
| | profit | | charges | | Total | | profit | | charges | | Total | |
| | $ million | | $ million | | $ million | | $ million | | $ million | | $ million | |
Defined contribution plans | | 37.9 | | – | | 37.9 | | – | | – | | – | |
| | | | | | | | | | | | | |
Defined benefit plans | | | | | | | | | | | | | |
Recognised in profit or loss: | | | | | | | | | | | | | |
– Current service cost | | 8.7 | | – | | 8.7 | | 0.5 | | – | | 0.5 | |
– Past service cost | | – | | – | | – | | 0.6 | | – | | 0.6 | |
– Settlement and curtailments | | (2.4 | ) | – | | (2.4 | ) | – | | – | | – | |
– Interest cost | | – | | 67.9 | | 67.9 | | – | | 10.5 | | 10.5 | |
– Expected return on plan assets | | – | | (75.5 | ) | (75.5 | ) | – | | – | | – | |
| | 6.3 | | (7.6 | ) | (1.3 | ) | 1.1 | | 10.5 | | 11.6 | |
Recognised in equity: | | | | | | | | | | | | | |
– Net actuarial loss/(gain) | | | | | | 122.4 | | | | | | (23.6 | ) |
– Effect of the asset ceiling | | | | | | (12.3 | ) | | | | | – | |
| | | | | | 110.1 | | | | | | (23.6 | ) |
| | | | | | 108.8 | | | | | | (12.0 | ) |
|
| 117 |
| Group Financial Statements | |
Year ended 29 December 2007
| | Pensions | | Other post-employment benefits | |
| | | | | | Loss from | | | | | | | | | |
| | Operating | | Finance | | discontinued | | | | Operating | | Finance | | | |
| | profit | | charges | | operations | | Total | | profit | | charges | | Total | |
| | $ million | | $ million | | $ million | | $ million | | $ million | | $ million | | $ million | |
Defined contribution plans | | 46.8 | | – | | 0.8 | | 47.6 | | – | | – | | – | |
| | | | | | | | | | | | | | | |
Defined benefit plans | | | | | | | | | | | | | | | |
Recognised in profit or loss: | | | | | | | | | | | | | | | |
– Current service cost | | 11.6 | | – | | 0.2 | | 11.8 | | 0.4 | | – | | 0.4 | |
– Past service cost | | 0.2 | | – | | – | | 0.2 | | – | | – | | – | |
– Settlement and curtailments | | (3.8 | ) | – | | (2.4 | ) | (6.2 | ) | – | | – | | – | |
– Interest cost | | – | | 66.1 | | 1.0 | | 67.1 | | – | | 10.2 | | 10.2 | |
– Expected return on plan assets | | – | | (75.0 | ) | (1.2 | ) | (76.2 | ) | – | | – | | – | |
| | 8.0 | | (8.9 | ) | (2.4 | ) | (3.3 | ) | 0.4 | | 10.2 | | 10.6 | |
Recognised in equity: | | | | | | | | | | | | | | | |
– Net actuarial gain | | | | | | | | (89.9 | ) | | | | | (6.0 | ) |
– Effect of the asset ceiling | | | | | | | | 43.8 | | | | | | – | |
| | | | | | | | (46.1 | ) | | | | | (6.0 | ) |
| | | | | | | | (49.4 | ) | | | | | 4.6 | |
The net liability recognised in the Group’s balance sheet in respect of defined benefit plans was as follows:
| | As at 2 January 2010 | | | As at 3 January 2009 | |
| | Pensions | | Other benefits | | Total | | | Pensions | | Other benefits | | Total | |
| | $ million | | $ million | | $ million | | | $ million | | $ million | | $ million | |
Present value of the benefit obligation: | | | | | | | | | | | | | | |
– Funded | | 1,071.7 | | – | | 1,071.7 | | | 978.9 | | – | | 978.9 | |
– Unfunded | | 44.3 | | 142.1 | | 186.4 | | | 39.2 | | 147.7 | | 186.9 | |
| | 1,116.0 | | 142.1 | | 1,258.1 | | | 1,018.1 | | 147.7 | | 1,165.8 | |
Fair value of plan assets | | (924.5 | ) | – | | (924.5 | ) | | (862.1 | ) | – | | (862.1 | ) |
| | 191.5 | | 142.1 | | 333.6 | | | 156.0 | | 147.7 | | 303.7 | |
Effect of the asset ceiling | | 8.6 | | – | | 8.6 | | | 24.6 | | – | | 24.6 | |
Net liability | | 200.1 | | 142.1 | | 342.2 | | | 180.6 | | 147.7 | | 328.3 | |
The net liability is presented in the Group’s balance sheet as follows:
| | As at 2 January 2010 | | | As at 3 January 2009 | |
| | Pensions | | Other benefits | | Total | | | Pensions | | Other benefits | | Total | |
| | $ million | | $ million | | $ million | | | $ million | | $ million | | $ million | |
Surpluses | | (1.3 | ) | – | | (1.3 | ) | | (5.3 | ) | – | | (5.3 | ) |
Deficits | | 201.4 | | 142.1 | | 343.5 | | | 185.9 | | 147.7 | | 333.6 | |
Net liability | | 200.1 | | 142.1 | | 342.2 | | | 180.6 | | 147.7 | | 328.3 | |
NOTES TO THE FINANCIAL STATEMENTS (CONTINUED)
34. Post-employment benefit obligations (continued)
C. Pensions
The principal assumptions used in the actuarial valuations of the defined benefit pension plans were as follows:
| | | | | | Other | |
| | UK | | US | | countries | |
| | % per annum | | % per annum | | % per annum | |
Valuation as at 2 January 2010 | | | | | | | |
Salary increases | | 4.50% | | 3.36% | | 3.70% | |
Increase to pensions in payment | | 3.50% | | n/a | | n/a | |
Increase to deferred pensions | | 3.50% | | n/a | | n/a | |
Long-term rate of return on plan assets | | 6.31% | | 7.75% | | 6.02% | |
Discount rate | | 5.75% | | 5.75% | | 4.80% | |
Inflation rate | | 3.50% | | n/a | | 1.39% | |
Valuation as at 3 January 2009 | | | | | | | |
Salary increases | | 4.00% | | 5.65% | | 3.28% | |
Increase to pensions in payment | | 3.00% | | n/a | | n/a | |
Increase to deferred pensions | | 3.00% | | n/a | | n/a | |
Long-term rate of return on plan assets | | 6.64% | | 8.00% | | 5.97% | |
Discount rate | | 6.50% | | 5.88% | | 5.95% | |
Inflation rate | | 3.00% | | 0.00% | | 1.34% | |
The current life expectancies underlying the benefit obligations of the Group’s principal pension plans were as follows:
| | | UK | | US | | Other countries | |
As at 2 January 2010 | | | | | | | | |
Current pensioners (at age 65) | – male | | 21.2 years | | 17.7 years | | 19.1 years | |
| – female | | 24.2 years | | 20.3 years | | 21.6 years | |
Future pensioners (at age 65) | – male | | 22.2 years | | 17.7 years | | 19.1 years | |
| – female | | 25.2 years | | 20.3 years | | 21.6 years | |
As at 3 January 2009 | | | | | | | | |
Current pensioners (at age 65) | – male | | 21.2 years | | 17.7 years | | 19.1 years | |
| – female | | 24.2 years | | 20.3 years | | 21.6 years | |
Future pensioners (at age 65) | – male | | 22.2 years | | 17.7 years | | 19.1 years | |
| – female | | 25.2 years | | 20.3 years | | 21.6 years | |
The net liability recognised in the Group’s balance sheet in respect of defined benefit pension plans was as follows:
| | As at 2 January 2010 | | | As at 3 January 2009 | |
| | | | | | Other | | | | | | | | | Other | | | |
| | UK | | US | | countries | | Total | | | UK | | US | | countries | | Total | |
| | $ million | | $ million | | $ million | | $ million | | | $ million | | $ million | | $ million | | $ million | |
Present value of benefit obligation: | | | | | | | | | | | | | | | | | | |
– Funded | | 366.7 | | 565.3 | | 139.7 | | 1,071.7 | | | 280.5 | | 586.5 | | 111.9 | | 978.9 | |
– Unfunded | | 0.1 | | 36.6 | | 7.6 | | 44.3 | | | 5.1 | | 32.4 | | 1.7 | | 39.2 | |
| | 366.8 | | 601.9 | | 147.3 | | 1,116.0 | | | 285.6 | | 618.9 | | 113.6 | | 1,018.1 | |
Fair value of plan assets | | (353.7 | ) | (458.1 | ) | (112.7 | ) | (924.5 | ) | | (294.0 | ) | (479.5 | ) | (88.6 | ) | (862.1 | ) |
| | 13.1 | | 143.8 | | 34.6 | | 191.5 | | | (8.4 | ) | 139.4 | | 25.0 | | 156.0 | |
Effect of the asset ceiling | | 8.6 | | – | | – | | 8.6 | | | 24.6 | | – | | – | | 24.6 | |
Net liability | | 21.7 | | 143.8 | | 34.6 | | 200.1 | | | 16.2 | | 139.4 | | 25.0 | | 180.6 | |
|
| 119 |
| Group Financial Statements |
Changes in the present value of the benefit obligation were as follows:
| | Year ended 2 January 2010 | | | Year ended 3 January 2009 | |
| | UK
$ million | | US
$ million | | Other
countries
$ million | | Total
$ million | | | UK
$ million | | US
$ million | | Other
countries
$ million | | Total
$ million | |
At the beginning of the period | | 285.6 | | 618.9 | | 113.6 | | 1,018.1 | | | 433.2 | | 617.8 | | 145.5 | | 1,196.5 | |
Transfer of plans | | (5.0 | ) | 5.0 | | – | | – | | | – | | – | | – | | – | |
Current service cost | | 0.6 | | 2.0 | | 4.1 | | 6.7 | | | 1.1 | | 2.9 | | 4.7 | | 8.7 | |
Past service cost | | – | | – | | 2.7 | | 2.7 | | | – | | – | | – | | – | |
Negative past service cost | | – | | (0.3 | ) | – | | (0.3 | ) | | – | | – | | – | | – | |
Curtailments | | – | | (29.1 | ) | (7.3 | ) | (36.4 | ) | | (0.6 | ) | (2.0 | ) | – | | (2.6 | ) |
Settlements | | – | | (0.3 | ) | – | | (0.3 | ) | | – | | (0.4 | ) | (3.4 | ) | (3.8 | ) |
Interest cost | | 19.5 | | 34.6 | | 6.9 | | 61.0 | | | 23.4 | | 37.3 | | 7.2 | | 67.9 | |
Special termination benefits | | – | | – | | – | | – | | | – | | 0.2 | | – | | 0.2 | |
Net actuarial loss/(gain) | | 54.1 | | 22.6 | | 24.7 | | 101.4 | | | (35.2 | ) | 28.5 | | (16.4 | ) | (23.1 | ) |
| | 354.8 | | 653.4 | | 144.7 | | 1,152.9 | | | 421.9 | | 684.3 | | 137.6 | | 1,243.8 | |
Disposal of subsidiaries | | – | | – | | – | | – | | | – | | (15.9 | ) | – | | (15.9 | ) |
Employees’ contributions | | 0.1 | | – | | 0.2 | | 0.3 | | | 0.2 | | – | | 0.2 | | 0.4 | |
Benefits paid | | (17.2 | ) | (51.5 | ) | (8.2 | ) | (76.9 | ) | | (19.8 | ) | (49.5 | ) | (6.4 | ) | (75.7 | ) |
Foreign currency translation | | 29.1 | | – | | 10.6 | | 39.7 | | | (116.7 | ) | – | | (17.8 | ) | (134.5 | ) |
At the end of the period | | 366.8 | | 601.9 | | 147.3 | | 1,116.0 | | | 285.6 | | 618.9 | | 113.6 | | 1,018.1 | |
Changes in the fair value of plan assets were as follows:
| | Year ended 2 January 2010 | | | Year ended 3 January 2009 | |
| | UK
$ million | | US
$ million | | Other
countries
$ million | | Total
$ million | | | UK
$ million | | US
$ million | | Other
countries
$ million | | Total
$ million | |
At the beginning of the period | | 294.0 | | 479.5 | | 88.6 | | 862.1 | | | 449.8 | | 558.8 | | 116.4 | | 1,125.0 | |
Expected return on plan assets | | 21.2 | | 35.5 | | 5.9 | | 62.6 | | | 29.3 | | 39.4 | | 6.8 | | 75.5 | |
Settlements | | – | | (0.3 | ) | – | | (0.3 | ) | | – | | (0.4 | ) | (3.4 | ) | (3.8 | ) |
Net actuarial gain/(loss) | | 6.5 | | (31.8 | ) | 6.9 | | (18.4 | ) | | (49.6 | ) | (79.1 | ) | (16.8 | ) | (145.5 | ) |
| | 321.7 | | 482.9 | | 101.4 | | 906.0 | | | 429.5 | | 518.7 | | 103.0 | | 1,051.2 | |
Disposal of subsidiaries | | – | | – | | – | | – | | | – | | (16.2 | ) | – | | (16.2 | ) |
Employer’s contributions | | 18.7 | | 26.7 | | 7.3 | | 52.7 | | | 8.5 | | 26.5 | | 10.4 | | 45.4 | |
Employees’ contributions | | 0.1 | | – | | 0.2 | | 0.3 | | | 0.2 | | – | | 0.2 | | 0.4 | |
Benefits paid | | (17.2 | ) | (51.5 | ) | (8.2 | ) | (76.9 | ) | | (19.8 | ) | (49.5 | ) | (6.4 | ) | (75.7 | ) |
Foreign currency translation | | 30.4 | | – | | 12.0 | | 42.4 | | | (124.4 | ) | – | | (18.6 | ) | (143.0 | ) |
At the end of the period | | 353.7 | | 458.1 | | 112.7 | | 924.5 | | | 294.0 | | 479.5 | | 88.6 | | 862.1 | |
The fair value of plan assets by asset category was as follows:
| | As at 2 January 2010 | | | As at 3 January 2009 | |
| | UK
$ million | | US
$ million | | Other
Countries
$ million | | Total
$ million | | | UK
$ million | | US
$ million | | Other
countries
$ million | | Total
$ million | |
Equity instruments | | 166.2 | | 288.7 | | 44.1 | | 499.0 | | | 151.5 | | 268.9 | | 32.8 | | 453.2 | |
Debt instruments | | 187.4 | | 153.0 | | 46.9 | | 387.3 | | | 141.4 | | 184.7 | | 36.9 | | 363.0 | |
Other assets | | 0.1 | | 16.4 | | 21.7 | | 38.2 | | | 1.1 | | 25.9 | | 18.9 | | 45.9 | |
| | 353.7 | | 458.1 | | 112.7 | | 924.5 | | | 294.0 | | 479.5 | | 88.6 | | 862.1 | |
NOTES TO THE FINANCIAL STATEMENTS (CONTINUED)
34. Post-employment benefit obligations (continued)
C. Pensions (continued)
Plan assets do not include any of the Group’s own financial instruments, nor any property occupied by, or other assets used by, the Group.
The return and risk expectations for each asset class incorporate assumptions about historical return relationships, current financial market conditions and the degree of global capital market integration. The assumptions used have been derived from rigorous historical performance analysis combined with forward-looking views of the financial markets as revealed through the yield on long-term bonds and the price earnings ratios of the major stock market indices. The actuaries review analyses of historical risk and the correlation of the return on asset classes and apply subjective judgment based on their knowledge of the Group’s plans. The result of this analysis is incorporated into a risk matrix from which expected long-term risk premiums for each asset class are developed. The nominal return expectations are determined by combining the asset class risk premiums with expected inflation and real risk-free rate assumptions. As a final consideration, the nominal return assumptions are blended with current market conditions to develop long-term equilibrium expectations.
The Group’s investment strategy for pension plan assets includes diversification to minimise interest and market risks. Accordingly, the interest rate risk inherent in the benefit obligation of the Group’s US funded pension plans is hedged using a combination of bonds and interest rate swaps with a combined average duration of 10.1 years. In general, the investment strategy for the Group’s pension plans outside the US does not involve the use of derivative financial instruments.
Plan assets are rebalanced periodically to maintain target asset allocations. Maturities of investments are not necessarily related to the timing of expected future benefit payments, but adequate liquidity to make immediate and medium-term benefit payments is ensured.
The weighted averages of the expected returns on plan assets were as follows:
| | As at 2 January 2010 | | | As at 3 January 2009 | | As at 29 December 2007 | |
| | UK | | US | | Other
countries | | | UK | | US | | Other
countries | | UK | | US | | Other
countries | |
Equity instruments | | 7.80% | | 8.70% | | 8.80% | | | 8.00% | | 9.51% | | 9.13% | | 7.95% | | 9.31% | | 9.39% | |
Debt instruments | | 4.92% | | 5.20% | | 5.31% | | | 4.83% | | 6.40% | | 4.87% | | 5.65% | | 6.30% | | 5.11% | |
Other assets | | 4.20% | | 3.30% | | 2.00% | | | 4.30% | | 3.90% | | 1.00% | | 4.85% | | 4.80% | | 1.00% | |
The actual return on plan assets was as follows:
| | Year ended
2 January
2010
Number | | | Year ended
3 January
2009
Number | | Year ended
29 December
2007
Number | |
UK | | 9.4% | | | (4.5)% | | 6.0% | |
US | | 0.8% | | | (7.1)% | | 8.3% | |
Other countries | | 7.1% | | | (8.6)% | | 3.1% | |
Actuarial gains and losses recognised in relation to defined benefit pension plans were as follows:
| | Year ended
2 January
2010
$ million | | | Year ended
3 January
2009
$ million | | Year ended
29 December
2007
$ million | | Year ended
30 December
2006
$ million | | Year ended
31 December
2005
$ million | |
At the end of the period: | | | | | | | | | | | | |
Present value of benefit obligation | | 1,116.0 | | | 1,018.1 | | 1,196.5 | | 1,270.0 | | 1,216.9 | |
Fair value of plan assets | | (924.5 | ) | | (862.1 | ) | (1,125.0 | ) | (1,041.8 | ) | (904.9 | ) |
Deficit in the plans | | 191.5 | | | 156.0 | | 71.5 | | 228.2 | | 312.0 | |
Recognised in the period: | | | | | | | | | | | | |
– Net actuarial (loss)/gain on plan assets | | (18.4 | ) | | (145.5 | ) | (3.0 | ) | 15.1 | | 25.9 | |
– Net actuarial (loss)/gain on benefit obligation | | (101.4 | ) | | 23.1 | | 92.9 | | 25.6 | | (104.7 | ) |
| | (119.8 | ) | | (122.4 | ) | 89.9 | | 40.7 | | (78.8 | ) |
As at 2 January 2010, the cumulative net actuarial loss recognised in other comprehensive income amounted to $213.8 million (3 January 2009: loss of $94.0 million).
The Group expects to contribute approximately $40 million to defined benefit pension plans in 2010.
|
| 121 |
| Group Financial Statements |
D. Other post-employment benefits
The weighted averages of the principal assumptions used in the actuarial valuations of the other post-employment benefit plans were as follows:
| | As at
2 January
2010
% per annum | | | As at
3 January
2009
% per annum | | As at
29 December
2007
% per annum | |
Discount rate | | 5.63% | | | 6.08% | | 6.28% | |
Medical cost inflation rate | | 12.64% | | | 8.20% | | 7.13% | |
The Group’s other post-employment benefit plans are unfunded. Accordingly, the liability recognised in the Group’s balance sheet in respect of these plans represents the present value of the benefit obligation.
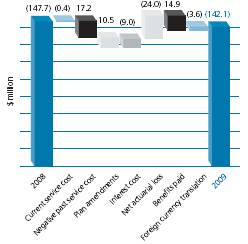
Changes in the present value of the benefit obligation were as follows:
| | Year ended
2 January
2010
$ million | | | Year ended
3 January
2009
$ million | |
At the beginning of the period | | 147.7 | | | 180.8 | |
Current service cost | | 0.4 | | | 0.5 | |
Past service cost | | – | | | 0.6 | |
Negative past service cost | | (17.2 | ) | | – | |
Curtailments | | (10.5 | ) | | – | |
Interest cost | | 9.0 | | | 10.5 | |
Net actuarial loss/(gain) | | 24.0 | | | (23.6 | ) |
| | 153.4 | | | 168.8 | |
Disposal of subsidiaries | | – | | | (2.2 | ) |
Benefits paid | | (14.9 | ) | | (13.0 | ) |
Foreign currency translation | | 3.6 | | | (5.9 | ) |
At the end of the period | | 142.1 | | | 147.7 | |
Actuarial gains and losses recognised in relation to other post-employment benefit plans were as follows:
| | Year ended
2 January
2010
$ million | | | Year ended
3 January
2009
$ million | | Year ended
29 December
2007
$ million | | Year ended
30 December
2006
$ million | | Year ended
31 December
2005
$ million | |
At the end of the period: | | | | | | | | | | | | |
Present value of benefit obligation | | 142.1 | | | 147.7 | | 180.8 | | 189.7 | | 193.5 | |
| | | | | | | | | | | | |
Recognised in the period: | | | | | | | | | | | | |
– Actuarial (loss)/gain on benefit obligation | | (24.0 | ) | | 23.6 | | 6.0 | | (2.7 | ) | 3.1 | |
As at 2 January 2010, the cumulative net actuarial gain recognised in other comprehensive income amounted to $51.7 million (3 January 2009: net gain of $75.7 million).
Sensitivity to change in the assumed medical cost inflation rate used in the actuarial valuations as at 2 January 2010 is as follows:
| | Increase of one
percentage point
$ million | | Decrease of one
percentage point
$ million | |
Effect on the aggregate of the current service cost and the interest cost | | 0.5 | | (0.5 | ) |
Effect on the accumulated benefit obligation | | 9.1 | | (7.7 | ) |
NOTES TO THE FINANCIAL STATEMENTS (CONTINUED)
35. Share-based incentives
A. Background
The Company operates a number of share-based compensation arrangements to provide incentives to the Group’s senior executives and other eligible employees.
Although the Company’s ordinary shares are denominated in US dollars, they are quoted in sterling on the London Stock Exchange.
B. Share options
Options are granted from time to time under the Company’s Sharesave Scheme, which is restricted to employees who are resident for tax purposes in the UK. It offers eligible employees the option to buy ordinary shares in Tomkins plc after a period of three, five or seven years, funded from the proceeds of a savings contract to which employees may contribute up to £250 per month.
Vested options are still outstanding under the Company’s executive share option schemes which lapsed for the purpose of new awards in 2005. The final unvested options under these schemes vested during 2007.
In 2009, the compensation expense recognised in respect of share options was $1.0 million (2008: $0.8 million; 2007: $3.1 million).
Changes in the total number of share options outstanding during the period were as follows:
| | Year ended 2 January 2010 | | | Restated*
Year ended 3 January 2009 |
|
| | Options
Number | | Weighted
average
exercise price
Pence | | | Options
Number | | Weighted
average
exercise price
Pence | |
Outstanding at the beginning of the period | | 18,131,583 | | 238.60 | | | 19,602,926 | | 242.71 | |
Granted during the period | | 2,228,492 | | 96.00 | | | 803,274 | | 140.20 | |
Cancelled during the period | | (634,716 | ) | 157.70 | | | (391,195 | ) | 206.68 | |
Forfeited during the period | | (34,770 | ) | 202.88 | | | (98,587 | ) | 198.79 | |
Exercised during the period | | (45,000 | ) | 170.50 | | | (45,000 | ) | 170.50 | |
Lapsed during the period | | (2,397,288 | ) | 232.61 | | | (1,739,835 | ) | 250.65 | |
Outstanding at the end of the period | | 17,248,301 | | 224.24 | | | 18,131,583 | | 238.60 | |
| | | | | | | | | | |
Exercisable at the end of the period | | 14,544,405 | | 245.19 | | | 16,341,128 | | 244.64 | |
On the date on which options were exercised during 2009, the market price of the Company’s ordinary shares was 178.90p per share (2008: 184.00p per share).
The fair value of options granted under the Sharesave Scheme was measured at their respective grant dates using the Black-Scholes option pricing formula based on the following assumptions:
| | Year ended
2 January
2010 | | | Year ended
3 January
2009 | | Year ended
29 December
2007 | |
Weighted average fair value | | 68.34p | | | 37.99p | | 73.81p | |
Weighted average assumptions: | | | | | | | | |
– Share price | | 161.75p | | | 176.75p | | 264.25p | |
– Exercise price | | 96.00p | | | 140.20p | | 211.40p | |
– Expected volatility | | 33.44% | | | 24.59% | | 25.40% | |
– Expected life | | 4.47 years | | | 4.57 years | | 4.66 years | |
– Risk-free interest rate | | 3.76% | | | 4.55% | | 5.23% | |
– Expected dividends | | 6.25p | | | 13.89p | | 13.89p | |
Expected volatility was determined based on the historical volatility of the market price of the Company’s ordinary shares over the expected life of the options. Adjustments have been made to the expected life used in the model to reflect the effects of non-transferability, exercise restrictions and behavioural considerations.
|
| 123 |
| Group Financial Statements |
The weighted average contractual life of share options outstanding at the end of the period was as follows:
| | As at 2 January 2010 | | | As at 3 January 2009 | | As at 29 December 2007 | |
| | Outstanding
Number | | Weighted
average
remaining
contractual life
Years | | | Outstanding
Number | | Weighted
average
remaining
contractual life
Years | | Outstanding
Number | | Weighted
average
remaining
contractual life
Years | |
Range of exercise prices: | | | | | | | | | | | | | | |
– Less than 100p | | 2,186,005 | | 4.13 | | | – | | – | | – | | – | |
– 100p to 150p | | 287,096 | | 3.21 | | | 723,947 | | 4.23 | | – | | – | |
– 151p to 200p | | 3,242,072 | | 2.06 | | | 3,454,072 | | 2.99 | | 3,519,072 | | 3.94 | |
– 201p to 250p | | 5,909,124 | | 4.08 | | | 7,773,617 | | 4.61 | | 9,244,600 | | 5.39 | |
– 251p to 300p | | 4,608,776 | | 3.31 | | | 5,164,719 | | 4.35 | | 5,821,026 | | 5.01 | |
– 301p and higher | | 1,015,228 | | 2.11 | | | 1,015,228 | | 3.10 | | 1,018,228 | | 4.11 | |
| | 17,248,301 | | | | | 18,131,583 | | | | 19,602,926 | | | |
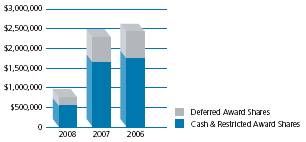
C. Other awards
The Group’s principal ongoing share-based compensation arrangements are the ABIP and the PSP. Both are restricted to the Group’s senior executives. In 2009, the IBP was introduced as a temporary, one-year substitute for the ABIP.
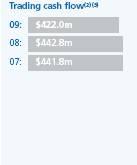
The ABIP provides awards of Restricted Award Shares and Deferred Award Shares based on the ‘bonusable profit’ of the business for which the participants have responsibility. Restricted Award Shares normally vest after a period of three years. Dividends are paid on the Restricted Award Shares. Deferred Award Shares normally vest after a period of three years, conditional on the participant’s continued employment with the Group. Dividends are not paid on the Deferred Award Shares until they have vested. During 2009, awards were granted over 999,108 ordinary shares (2008: 1,789,628 ordinary shares; 2007: 1,727,352 ordinary shares) under the ABIP in relation to bonuses earned in 2008. The IBP differs from the ABIP only in that awards made under the plan are based on the trading cash flow of the business for which the participants have responsibility and on the attainment of strategic achievement milestones that are set for each of the participants. Awards over shares under the IBP are expected to be made in March 2010. In 2009, an accrual of $2.0 million was recognised in respect of the Restricted Award Shares to be awarded under the IBP.
The PSP provides awards of shares which vest after a period of three years, conditional on the Group’s total shareholder return relative to its cost of equity over the vesting period and the participant’s continued employment with the Group. During 2009, awards were granted over 6,864,193 ordinary shares under the PSP (2008: 7,115,194 ordinary shares; 2007: 5,852,671 ordinary shares).
The fair value of awards made under the ABIP is measured based on the market price of the Company’s ordinary shares on the date of the award. Where the awards do not attract dividends during the vesting period, the market price is reduced by the present value of the dividends expected to be paid during the expected life of the awards. The weighted average fair value of awards made under these schemes during the period was 130.46p (2008: 125.66p; 2007: 211.93p).
The fair value of awards made under the PSP was measured at their respective grant dates using a Monte Carlo valuation model based on the following assumptions:
| | Year ended
2 January
2010 | | | Year ended
3 January
2009 | | Year ended
29 December
2007 | |
Weighted average fair value | | 41.92p | | | 43.92p | | 66.45p | |
Weighted average assumptions: | | | | | | | | |
– Expected volatility | | 45.36% | | | 36.41% | | 27.67% | |
– Expected life | | 3.00 years | | | 3.00 years | | 3.00 years | |
– Risk-free interest rate | | 2.00% | | | 4.71% | | 4.88% | |
– Dividend yield | | 4.87% | | | 8.84% | | 5.00% | |
Expected volatility was determined based on the historical volatility of the market price of the Company’s ordinary shares over the expected life of the awards.
In 2009, the compensation expense recognised in respect of other awards was $10.3 million (2008: $11.2 million; 2007: $13.2 million).
NOTES TO THE FINANCIAL STATEMENTS (CONTINUED)
36. Deferred tax
Movements in the net deferred tax assets and (liabilities) recognised by the Group were as follows:
| | Post-
Employment
benefits
$ million | | Tax
losses
$ million | | Net
investment in
subsidiaries
$ million | | Accrued
expenses
$ million | | Long-lived
assets
$ million | | Inventories
$ million | | Other
items
$ million | | Total
$ million | |
As at 29 December 2007 | | 90.7 | | 9.6 | | (2.8 | ) | 45.4 | | (122.4 | ) | (40.8 | ) | 23.3 | | 3.0 | |
Disposal of subsidiaries | | (0.8 | ) | – | | – | | (1.7 | ) | 5.2 | | 0.8 | | (1.2 | ) | 2.3 | |
(Charge)/credit to profit or loss | | (16.9 | ) | (4.2 | ) | (0.5 | ) | (0.4 | ) | 19.9 | | (4.3 | ) | 5.2 | | (1.2 | ) |
Credited outside profit or loss | | 25.3 | | – | | – | | – | | – | | – | | 5.8 | | 31.1 | |
Currency translation differences | | (0.6 | ) | (0.8 | ) | – | | (1.3 | ) | 1.4 | | 0.2 | | 1.0 | | (0.1 | ) |
As at 3 January 2009 | | 97.7 | | 4.6 | | (3.3 | ) | 42.0 | | (95.9 | ) | (44.1 | ) | 34.1 | | 35.1 | |
Acquisition of subsidiaries | | – | | – | | – | | – | | (6.9 | ) | – | | – | | (6.9 | ) |
(Charge)/credit to profit or loss | | (15.5 | ) | 11.5 | | (2.0 | ) | 0.3 | | 2.5 | | 15.0 | | 1.9 | | 13.7 | |
Credited outside profit or loss | | 14.9 | | – | | – | | – | | – | | – | | 0.7 | | 15.6 | |
Currency translation differences | | 0.1 | | 0.4 | | – | | 0.6 | | (0.8 | ) | 0.1 | | (0.3 | ) | 0.1 | |
As at 2 January 2010 | | 97.2 | | 16.5 | | (5.3 | ) | 42.9 | | (101.1 | ) | (29.0 | ) | 36.4 | | 57.6 | |
Deferred tax assets and liabilities presented in the Group’s balance sheet are as follows:
| | As at
2 January
2010
$ million | | | As at
3 January
2009
$ million | |
Deferred tax assets | | 82.9 | | | 64.8 | |
Deferred tax liabilities | | (25.3 | ) | | (29.7 | ) |
| | 57.6 | | | 35.1 | |
As at 2 January 2010, the Group had operating tax losses amounting to $1,918.6 million, of which $1,654.1 million can be carried forward indefinitely and $264.5 million have expiry dates between 2010 and 2029. As at 2 January 2010, the Group recognised a deferred tax asset of $16.2 million in respect of these losses.
As at 2 January 2010, the Group had capital tax losses amounting to $838.8 million, of which $449.3 million can be carried forward indefinitely, $3.1 million expire in 2012 and $386.4 million expire in 2013. As at 2 January 2010, the Group recognised a deferred tax asset of $0.3 million in respect of these losses.
As at 2 January 2010, the Group had foreign and other tax credits amounting to $35.3 million, of which $10.2 million can be carried forward indefinitely and $25.1 million expire between 2013 and 2027. As at 2 January 2010, the Group recognised a deferred tax asset in respect of these tax credits of $5.2 million.
Deferred tax is not provided on the undistributed earnings of foreign subsidiaries where management has the ability, and intends, to reinvest such amounts indefinitely. As at 2 January 2010, the Group’s share of the undistributed earnings of foreign subsidiaries on which deferred tax was not provided was $3,225.7 million (3 January 2009: $3,180.5 million). A determination of the amount of the unrecognised deferred tax liability has not been made because it is not practical to do so. A portion of these earnings can be distributed without incurring additional taxes.
|
| 125 |
| Group Financial Statements |
37. Provisions
| | Restructuring
costs
$ million | | Environmental
remediation
$ million | | Workers’
compensation
$ million | | Warranty
provisions
$ million | | Product
liability
provisions
$ million | | Insurance
provisions
$ million | | Total
$ million | |
As at 29 December 2007 | | 10.0 | | 9.1 | | 28.9 | | 15.2 | | 7.5 | | 8.2 | | 78.9 | |
Charge/(credit) for the period | | 15.6 | | 2.6 | | 13.6 | | 4.8 | | 8.3 | | (2.2 | ) | 42.7 | |
Utilised during the period | | (9.5 | ) | (4.1 | ) | (16.5 | ) | (8.0 | ) | (8.3 | ) | – | | (46.4 | ) |
Acquisition of subsidiaries | | – | | – | | – | | 0.3 | | – | | – | | 0.3 | |
Disposal of subsidiaries | | – | | – | | (0.4 | ) | – | | (0.1 | ) | – | | (0.5 | ) |
Foreign currency translation | | (0.2 | ) | (0.2 | ) | (0.1 | ) | (0.8 | ) | – | | (1.7 | ) | (3.0 | ) |
As at 3 January 2009 | | 15.9 | | 7.4 | | 25.5 | | 11.5 | | 7.4 | | 4.3 | | 72.0 | |
Charge for the period | | 117.8 | | 4.4 | | 8.9 | | 5.3 | | 15.6 | | – | | 152.0 | |
Utilised during the period | | (58.4 | ) | (5.6 | ) | (11.1 | ) | (4.7 | ) | (11.7 | ) | – | | (91.5 | ) |
Released during the period | | (8.1 | ) | (0.1 | ) | (1.4 | ) | (1.1 | ) | (1.4 | ) | (4.1 | ) | (16.2 | ) |
Foreign currency translation | | 1.7 | | 0.4 | | 0.1 | | 0.3 | | 0.1 | | 0.6 | | 3.2 | |
As at 2 January 2010 | | 68.9 | | 6.5 | | 22.0 | | 11.3 | | 10.0 | | 0.8 | | 119.5 | |
Provisions are presented in the Group’s balance sheet as follows:
| | As at
2 January
2010
$ million | | | As at
3 January
2009
$ million | |
Ongoing businesses: | | | | | | |
– Current liabilities | | 100.3 | | | 48.8 | |
– Non-current liabilities | | 19.2 | | | 23.2 | |
| | 119.5 | | | 72.0 | |
Provisions for restructuring costs principally relate to the restructuring initiatives under projects Eagle and Cheetah and are expected largely to be utilised during 2010.
NOTES TO THE FINANCIAL STATEMENTS (CONTINUED)
38. Share capital and reserves
A. Authorised and issued, fully paid shares
| | Ordinary shares of 9c each | | Ordinary shares of 5p each | | Deferred shares of £1 each | |
| | Authorised
Number
of shares | | Issued
Number of
shares | | Authorised
Number
of shares | | Issued
Number of
shares | | Authorised
Number
of shares | | Issued
Number of
shares | |
As at 30 December 2006 | | – | | – | | 1,585,164,220 | | 858,209,522 | | – | | – | |
Year ended 29 December 2007 | | | | | | | | | | | | | |
Shares issued during the period: | | | | | | | | | | | | | |
– Conversion of preference shares | | – | | – | | – | | 25,411,499 | | – | | – | |
– Exercise of employee share options | | – | | – | | – | | 485,751 | | – | | – | |
| | – | | – | | – | | 25,897,250 | | – | | – | |
As at 29 December 2007 | | – | | – | | 1,585,164,220 | | 884,106,772 | | – | | – | |
| | | | | | | | | | | | | |
Year ended 3 January 2009 | | | | | | | | | | | | | |
Shares issued before redenomination: | | | | | | | | | | | | | |
– Exercise of employee share options | | – | | – | | – | | 45,000 | | – | | – | |
Redenomination: | | | | | | | | | | | | | |
– Cancellation of 5p ordinary shares | | – | | – | | (1,585,164,220 | ) | (884,151,772 | ) | – | | – | |
– Issue of 9c ordinary shares | | 1,585,164,220 | | 884,151,772 | | – | | – | | – | | – | |
– Issue of deferred shares | | – | | – | | – | | – | | 50,000 | | 50,000 | |
As at 3 January 2009 | | 1,585,164,220 | | 884,151,772 | | – | | – | | 50,000 | | 50,000 | |
| | | | | | | | | | | | | |
Year ended 2 January 2010 | | | | | | | | | | | | | |
Shares issued during the period: | | | | | | | | | | | | | |
– Exercise of employee share options | | – | | 45,000 | | – | | – | | – | | – | |
Cancellation of deferred shares | | – | | – | | – | | – | | (50,000 | ) | (50,000 | ) |
As at 2 January 2010 | | 1,585,164,220 | | 884,196,772 | | – | | – | | – | | – | |
B. Ordinary shares
On 22 May 2008, the Company’s ordinary shares were redenominated from sterling to US dollars. The redenomination did not affect the rights of the holders of ordinary shares.
Ordinary shareholders have no entitlement to share in the profits of the Company, except for dividends that have been declared and in the event of the liquidation of the Company.
Ordinary shareholders have the right to attend, and vote at, general meetings of the Company or to appoint a proxy to attend and vote at such meetings on their behalf. Ordinary shareholders have one vote for every share held.
Ordinary share capital represents the nominal value of ordinary shares issued.
C. Deferred shares
When the Company redenominated its ordinary shares from sterling to US dollars, it was required by law to have a minimum share capital of £50,000 denominated in sterling. The deferred shares were issued to meet this requirement, which was removed on the implementation of section 542 of the Companies Act 2006 on 1 October 2009. Accordingly, the Company bought back and cancelled the deferred shares on 16 December 2009 and transferred the nominal amount of the shares to the capital redemption reserve in accordance with the applicable capital maintenance rules.
The deferred shares were not listed on any investment exchange and had extremely limited rights such that they effectively had no value.
D. Share premium account
The share premium account records the difference between the nominal value of shares issued and the fair value of the consideration received. The share premium account is not distributable but may be used for certain purposes specified by UK law, including to write off expenses on any issue of shares or debentures and to pay up fully paid bonus shares. The share premium account may be reduced by special resolution of the Company’s shareholders and with the approval of the court.
E. Capital redemption reserve
The capital redemption reserve records the cost of shares purchased by the Company for cancellation or redeemed in excess of the proceeds of any fresh issue of shares made specifically to fund the purchase or redemption. The capital redemption reserve is not distributable but may be reduced by special resolution of the Company’s shareholders and with the approval of the court.
|
| 127 |
| Group Financial Statements |
39. Own shares
| | Year ended
2 January
2010
Number of shares | | | Year ended
3 January
2009
Number of shares | | Year ended
29 December
2007
Number of shares | |
At the beginning of the period | | 3,658,550 | | | 4,205,841 | | 4,205,248 | |
Own shares purchased | | 636,762 | | | 1,506,518 | | 1,597,500 | |
Transfer of own shares | | (1,752,118 | ) | | (2,053,809 | ) | (1,596,907 | ) |
At the end of the period | | 2,543,194 | | | 3,658,550 | | 4,205,841 | |
Own shares represent the cost of the Company’s ordinary shares acquired to meet the Group’s expected obligations under employee share schemes. Dividends relating to own shares held have been waived with the exception of those that are payable to participants in the relevant schemes.
As at 2 January 2010, 904,632 ordinary shares (3 January 2009: 1,143,076 ordinary shares) were held in trust and 1,638,562 ordinary shares (3 January 2009: 2,515,474 ordinary shares) were held as treasury shares.
As at 2 January 2010, the market value of own shares held was $7.9 million (3 January 2009: $7.1 million).
40. Capital
Management considers that the Group’s capital comprises shareholders’ equity plus net debt.
The Group’s capital was as follows:
| | As at
2 January
2010
$ million | | | As at
3 January
2009
$ million | | As at
29 December
2007
$ million | |
Shareholders’ equity | | 1,536.6 | | | 1,610.8 | | 2,137.8 | |
Net debt: | | | | | | | | |
– Cash and cash equivalents | | (445.0 | ) | | (291.9 | ) | (295.9 | ) |
– Collateralised cash | | (2.1 | ) | | (3.8 | ) | (5.8 | ) |
– Bank overdrafts | | 4.8 | | | 13.7 | | 15.7 | |
– Bank and other loans | | 698.5 | | | 792.4 | | 860.3 | |
– Obligations under finance leases | | 4.6 | | | 6.9 | | 9.6 | |
– Derivatives hedging translational exposures | | (53.3 | ) | | (40.9 | ) | 7.6 | |
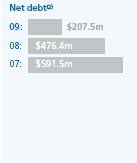
| | 207.5 | | | 476.4 | | 591.5 | |
| | 1,744.1 | | | 2,087.2 | | 2,729.3 | |
We manage the Group’s capital structure to maximise shareholder value whilst retaining flexibility to take advantage of opportunities that arise to grow the Group’s business.
NOTES TO THE FINANCIAL STATEMENTS (CONTINUED)
41. Acquisitions
A. Current year acquisitions
Industrial & Automotive
Fluid Power
On 7 July 2009, the Group acquired a 100% interest in Hydrolink, a fluid engineering services provider to the oil and gas and marine sectors in the Middle East. Provisional goodwill of $16.5 million was recognised on the acquisition, which represents the expected benefits to the Group from accelerating the market penetration of its products in this high-growth region. Goodwill is provisional pending the finalisation of the fair valuation of acquired intangible assets.
Building Products
Air Distribution
On 7 July 2009, the Group acquired the remaining 40% minority interest in Rolastar Pvt Ltd, a duct manufacturer based in India. Goodwill of $4.6 million was recognised on the acquisition of the minority interest. Overall, the Group recognised goodwill of $8.5 million on the acquisition of its 100% interest in the business, which represents the expected benefits from the expansion of its air distribution business in India.
B. Prior year acquisitions
2008
Industrial & Automotive
Fluid Power
On 3 March 2008, the Group acquired a 100% interest in A.E. Hydraulic (Pte) Ltd., a Singapore-based provider of hydraulic and industrial hose solutions and services for the oil exploration industry in Asia. Goodwill of $8.1 million was recognised on the acquisition which represents the expected benefits to the Group from the acceleration of its expansion into the high-growth oil and gas exploration market made possible by the acquisition.
Building Products
Air Distribution
On 22 February 2008, the Group acquired a 60% interest in Rolastar Pvt Ltd, a duct manufacturer based in India. Goodwill of $0.9 million was recognised on the acquisition.
On 20 June 2008, the Group acquired a 100% interest in Trion Inc., a manufacturer of commercial, industrial and residential indoor air quality products. Trion is headquartered in Sanford, North Carolina, with manufacturing facilities there and also in Suzhou, China. Goodwill of $2.4 million was recognised on the acquisition which represents the expected synergies from the integration of the business within Air Distribution.
2007
Industrial & Automotive
Fluid Systems
On 8 March 2007, the Group acquired the remaining 40% minority interest in Schrader Engineered Products (Kunshan) Co Ltd, a manufacturer of valves and fittings based in China.
On 26 September 2007, the Group acquired 100% of Swindon Silicon Systems Ltd, a company that designs, develops and supplies integrated circuits based in the UK.
C. Adjustment in respect of prior year acquisitions
On the completion of the initial accounting for acquisitions completed in 2008, the attributable goodwill was increased by $5.7 million as follows:
| | Provisional goodwill
$ million | | Adjustment
$ million | | | Final goodwill
$ million | |
A.E. Hydraulic (Pte) Ltd. | | 8.1 | | 1.6 | | | 9.7 | |
Rolastar Pvt Ltd (acquisition of initial 60% interest) | | 0.9 | | 3.0 | | | 3.9 | |
Trion Inc. | | 2.4 | | 1.1 | | | 3.5 | |
| | | | 5.7 | | | | |
Comparative information has not been restated to reflect these adjustments, which principally arose due to revisions to the fair value of acquired property, plant and equipment and the recognition of additional deferred tax liabilities, because they are not material to the Group’s results or financial position.
|
| 129 |
| Group Financial Statements |
D. Financial effect of acquisitions
| | Year ended 2 January 2010 | | | | | | |
| | Acquiree’s
carrying amount
in accordance
with IFRS
$ million | | Fair value
adjustments
$ million | | Provisional
fair
value
$ million | | | Year ended
3 January
2009
$ million | | Year ended
29 December
2007
$ million | |
Net assets acquired | | | | | | | | | | | | |
Intangible assets | | – | | 5.9 | | 5.9 | | | 37.4 | | 11.0 | |
Property, plant and equipment | | 9.3 | | (1.3 | ) | 8.0 | | | 9.2 | | 7.0 | |
Deferred tax assets | | – | | – | | – | | | – | | 0.2 | |
Inventories | | 10.6 | | (3.2 | ) | 7.4 | | | 12.4 | | 2.6 | |
Trade and other receivables | | 8.6 | | (1.4 | ) | 7.2 | | | 11.5 | | 7.6 | |
Income tax recoverable | | – | | – | | – | | | 1.2 | | – | |
Cash and cash equivalents | | 0.4 | | – | | 0.4 | | | 0.1 | | – | |
Bank and other loans | | (7.4 | ) | – | | (7.4 | ) | | (0.4 | ) | – | |
Obligations under finance leases | | (0.4 | ) | – | | (0.4 | ) | | (0.4 | ) | – | |
Trade and other payables | | (10.3 | ) | – | | (10.3 | ) | | (8.9 | ) | (4.4 | ) |
Income tax liabilities | | (0.4 | ) | – | | (0.4 | ) | | (0.9 | ) | (0.8 | ) |
Deferred tax liabilities | | – | | (6.9 | ) | (6.9 | ) | | – | | – | |
Provisions | | – | | – | | – | | | (0.3 | ) | – | |
Minority interest | | 4.6 | | 2.0 | | 6.6 | | | (8.2 | ) | 1.0 | |
| | 15.0 | | (4.9 | ) | 10.1 | | | 52.7 | | 24.2 | |
Goodwill on current year acquisitions | | | | | | 21.1 | | | 11.4 | | 6.2 | |
Adjustments to goodwill on prior year acquisitions | | | | | | 5.7 | | | (3.0 | ) | (14.2 | ) |
Consideration (including transaction costs) | | | | | | 36.9 | | | 61.1 | | 16.2 | |
The net cash outflow on acquisitions during the period was as follows:
| | Year ended
2 January
2010
$ million | | | Year ended
3 January
2009
$ million | | Year ended
29 December
2007
$ million | |
Consideration paid on current period acquisitions | | 25.5 | | | 65.5 | | 15.2 | |
Cash and cash equivalents acquired | | (0.4 | ) | | (0.1 | ) | – | |
Deferred consideration | | 1.4 | | | – | | – | |
Adjustment to consideration on prior period acquisitions | | – | | | (0.4 | ) | 1.8 | |
| | 26.5 | | | 65.0 | | 17.0 | |
Businesses acquired during 2009 contributed $10.9 million to the Group’s sales and reduced the Group’s profit for the year by $2.0 million. If these businesses had been acquired at the beginning of 2009, it is estimated that the Group’s sales would have been $16.0 million higher, at $4,196.1 million, in 2009, but it is not practicable to estimate what the Group’s profit for the year would have been because they did not prepare balance sheets in accordance with IFRS as at 3 January 2009.
NOTES TO THE FINANCIAL STATEMENTS (CONTINUED)
42. Disposals
A. Disposals
2008
Industrial & Automotive
Fluid Systems
On 19 June 2008, the Group sold Stant Manufacturing, Inc., a manufacturer of automotive closure caps and its subsidiary, Standard-Thomson Corporation, a manufacturer of automotive thermostats. A gain of $43.2 million was recognised on the disposal.
2007
Industrial & Automotive
Other Industrial & Automotive
On 19 November 2007, the Group sold Tridon Electronics’ indicator and side object detection businesses. On 23 November 2007, the Group sold Dearborn Mid-West, a manufacturer of automotive assembly lines and materials handling equipment.
Building Products
Other Building Products
On 23 February 2007, the Group sold the business and assets of Lasco Fittings Inc., a manufacturer of injection-moulded fittings.
Discontinued operations
Wiper Systems
On 29 June 2007, the Group completed the sale of Trico, which constituted the Group’s former Wiper Systems business segment.
B. Financial effect of disposals
| | Year ended
2 January
2010
$ million | | | Year ended
3 January
2009
$ million | | Year ended
29 December
2007
$ million | |
Proceeds | | | | | | | | |
Cash | | – | | | 108.1 | | 233.9 | |
Deferred | | – | | | – | | 17.6 | |
Loan notes | | – | | | 11.8 | | 16.8 | |
| | – | | | 119.9 | | 268.3 | |
Net assets disposed of | | | | | | | | |
Intangible assets | | – | | | (1.0 | ) | (0.6 | ) |
Property, plant and equipment | | – | | | (35.7 | ) | (63.5 | ) |
Investments in associates | | – | | | (1.9 | ) | – | |
Inventories | | – | | | (16.7 | ) | (94.2 | ) |
Trade and other receivables | | – | | | (43.3 | ) | (181.1 | ) |
Income tax recoverable | | – | | | – | | (1.0 | ) |
Cash and cash equivalents | | – | | | (0.3 | ) | (9.2 | ) |
Trade and other payables | | – | | | 25.5 | | 120.4 | |
Finance lease obligations | | – | | | – | | 6.1 | |
Deferred tax liabilities | | – | | | 2.3 | | 1.2 | |
Post-employment benefit obligations | | – | | | 1.9 | | 3.8 | |
Provisions | | – | | | 0.5 | | 4.6 | |
| | – | | | (68.7 | ) | (213.5 | ) |
Disposal costs | | – | | | (3.3 | ) | (7.2 | ) |
Curtailment gain on retained pension plan | | – | | | 2.0 | | – | |
Currency translation loss transferred from other comprehensive income | | – | | | (6.7 | ) | (28.8 | ) |
Gain on disposal | | – | | | 43.2 | | 18.8 | |
| | | | | | | | |
Attributable to: | | | | | | | | |
– Continuing operations | | – | | | 43.2 | | 76.0 | |
– Discontinued operations | | – | | | – | | (57.2 | ) |
| | – | | | 43.2 | | 18.8 | |
|
| 131 |
| Group Financial Statements |
The net cash inflow on disposals during the period was as follows:
| | Year ended
2 January
2010
$ million | | | Year ended
3 January
2009
$ million | | Year ended
29 December
2007
$ million | |
Proceeds received on current period disposals | | – | | | 108.1 | | 233.9 | |
Disposal costs paid | | – | | | (4.3 | ) | (9.0 | ) |
Cash and cash equivalents disposed of | | – | | | (0.3 | ) | (9.2 | ) |
Proceeds received on prior period disposals | | 0.7 | | | 21.1 | | 0.6 | |
| | 0.7 | | | 124.6 | | 216.3 | |
43. Contingencies
The Group is, from time to time, party to legal proceedings and claims, which arise in the ordinary course of business. Management does not anticipate that the outcome of any current proceedings or known claims, either individually or in aggregate, will have a material adverse effect upon the Group’s financial position.
44. Operating leases
The Group rents certain office premises and plant, equipment and vehicles under operating lease arrangements. All leases are on a fixed repayment basis and no arrangements have been entered into for contingent rental payments. During 2009, the operating lease rental expense was $59.5 million (2008: $55.1 million; 2007: $53.8 million).
As at 2 January 2010, the Group had outstanding commitments under non-cancellable operating leases of $241.0 million (3 January 2009: $229.5 million), falling due as follows:
| | As at
2 January
2010
$ million | | | As at
3 January
2009
$ million | |
Payments to be made: | | | | | | |
– Within one year | | 46.2 | | | 41.3 | |
– In the second to fifth years, inclusive | | 112.0 | | | 111.1 | |
– After more than five years | | 82.8 | | | 77.1 | |
| | 241.0 | | | 229.5 | |
45. Capital commitments
As at 2 January 2010, the Group had entered into contractual commitments for the purchase of property, plant and equipment amounting to $20.8 million (3 January 2009: $18.7 million) and for the purchase of non-integral computer software amounting to $0.7 million (3 January 2009: $4.1 million).
NOTES TO THE FINANCIAL STATEMENTS (CONTINUED)
46. Related party transactions
Transactions between the Company and its subsidiaries, which are related parties of the Company, have been eliminated on consolidation and, therefore, are not required to be disclosed in these financial statements. Details of transactions between the Group and other related parties are disclosed below.
A. Post-employment benefit plans
During 2009, the Group paid employer’s contributions amounting to $86.2 million (2008: $84.9 million; 2007: $113.4 million) to pension plans established for the benefit of its employees. As at 2 January 2010, an amount of $14.8 million (3 January 2009: $15.1 million) in respect of contributions due was included in other payables. In addition, during 2009, the Group paid benefits of $15.1 million (2008: $13.0 million; 2007: $15.6 million) to other post-employment benefit plans.
B. Compensation and interests of key management personnel
For the purposes of these disclosures, the Group regards its key management personnel as the Directors of the Company together with those persons who, in accordance with the Listing Rules of the UKLA, are regarded as discharging management responsibility.
Compensation paid or payable to key management personnel in respect of their services to the Group was as follows:
| | Year ended
2 January
2010
$’000 | | | Year ended
3 January
2009
$’000 | | Year ended
29 December
2007
$’000 | |
Short-term employee benefits: | | | | | | | | |
– Salaries and fees | | 4,928 | | | 6,064 | | 6,667 | |
– Bonus cash | | 3,397 | | | 1,504 | | 4,080 | |
– Benefits-in-kind | | 168 | | | 308 | | 308 | |
– Social security contributions | | 425 | | | 509 | | 1,110 | |
– Termination benefits | | 755 | | | 37 | | 2,253 | |
| | 9,673 | | | 8,422 | | 14,418 | |
Share-based incentives: | | | | | | | | |
– Bonus shares | | 829 | | | 324 | | 930 | |
– Deferred shares | | 1,659 | | | 647 | | 1,775 | |
| | 2,488 | | | 971 | | 2,705 | |
Pension contributions | | 1,260 | | | 2,603 | | 1,979 | |
| | 13,421 | | | 11,996 | | 19,102 | |
As at 24 February 2010, the interests of key management personnel in the Company’s ordinary shares were as follows:
| | Ordinary
shares | | Ordinary shares
held as ADSs | | Total | |
Directors | | 3,118,808 | | 108,364 | | 3,227,172 | |
Other executive officers | | 1,119,566 | | 170,600 | | 1,290,166 | |
| | 4,238,374 | | 278,964 | | 4,517,338 | |
All of the above interests are beneficially owned and in aggregate comprise less than 1% of the Company’s issued ordinary shares.
|
| 133 |
| Group Financial Statements |
As at 24 February 2010, key management personnel held the following options over the Company’s ordinary shares:
| | | | | | | | Number of options held | |
Scheme | | Grant date | | Expiry date | | Exercise
price | | Directors | | Other
executive
officers | | Total | |
Premium Priced Option | | 11 February 2002 | | 10 February 2012 | | 197.00p | | 2,538,072 | | – | | 2,538,072 | |
Premium Priced Option | | 11 February 2002 | | 10 February 2012 | | 276.00p | | 1,522,842 | | – | | 1,522,842 | |
Premium Priced Option | | 11 February 2002 | | 10 February 2012 | | 345.00p | | 1,015,228 | | – | | 1,015,228 | |
Ongoing Option | | 11 February 2002 | | 10 February 2012 | | 197.00p | | 550,000 | | – | | 550,000 | |
ESOS 4 | | 17 January 2003 | | 16 January 2013 | | 208.25p | | 1,440,576 | | – | | 1,440,576 | |
ESOS 4 | | 18 July 2003 | | 17 July 2013 | | 246.50p | | – | | 200,000 | | 200,000 | |
ESOS 4 | | 1 September 2003 | | 31 August 2013 | | 262.75p | | – | | 150,000 | | 150,000 | |
ESOS 4 | | 12 December 2003 | | 11 December 2013 | | 265.75p | | 1,228,880 | | 335,000 | | 1,563,880 | |
ESOS 4 | | 29 November 2004 | | 28 November 2014 | | 248.75p | | 1,331,030 | | 440,000 | | 1,771,030 | |
Sharesave scheme | | 24 April 2009 | | 30 November 2012 | | 96.00p | | 9,531 | | – | | 9,531 | |
Sharesave scheme | | 24 April 2009 | | 30 November 2014 | | 96.00p | | – | | 16,302 | | 16,302 | |
| | | | | | | | 9,636,159 | | 1,141,302 | | 10,777,461 | |
With the exception of options held under the Sharesave scheme, all options shown above have vested.
C. Associates
Sales to and purchases from associates were as follows:
| | Year ended
2 January
2010
$ million | | | Year ended
3 January
2009
$ million | | Year ended
29 December
2007
$ million | |
Sales | | 4.3 | | | 1.0 | | 0.6 | |
Purchases | | (15.2 | ) | | (20.0 | ) | (12.0 | ) |
Amounts outstanding in respect of these transactions were as follows:
| | As at
2 January
2010
$ million | | | As at
3 January
2009
$ million | |
Receivables | | 0.8 | | | 0.1 | |
Payables | | (1.2 | ) | | (1.0 | ) |
D. Entities controlled by minority shareholders
Sales to and purchases from entities controlled by minority shareholders were as follows:
| | Year ended
2 January
2010
$ million | | | Year ended
3 January
2009
$ million | | Year ended
29 December
2007
$ million | |
Sales | | 26.3 | | | 45.2 | | 46.4 | |
Purchases | | (39.1 | ) | | (58.7 | ) | (61.4 | ) |
Amounts outstanding in respect of these transactions were as follows:
| | As at
2 January
2010
$ million | | | As at
3 January
2009 $ million | |
Receivables | | 2.7 | | | 2.9 | |
Payables | | (2.7 | ) | | (4.7 | ) |
NOTES TO THE FINANCIAL STATEMENTS (CONTINUED)
46. Related party transactions (continued)
E. Other related parties
Yantai Winhere Auto Part Manufacturing Co Ltd (‘Winhere’)
Dexon Investments Limited (‘Dexon’) is the minority shareholder in the Group’s 60% owned subsidiary, Winhere LLC. During 2008, Gates Winhere Automotive Pump Products (Yantai) Co Ltd, a wholly-owned subsidiary of Winhere LLC, purchased land and buildings for $1.8 million from Winhere, a fellow subsidiary of Dexon. At 3 January 2009, there was a nil balance outstanding in respect of this transaction.
Schrader Duncan Limited (‘Schrader Duncan’)
Schrader Duncan is an associate in which the Group holds a 50% interest. During the year, Tomkins plc and Cosmopolitan Investments (a fellow shareholder) each issued a guarantee in favour of the State Bank of India (‘the Bank’) in relation to any principal sum up to a maximum of 480 million Indian rupees ($10.2 million), together with interest and any other costs and charges due to the Bank in respect of credit facilities provided to Schrader Duncan. The Company and Cosmopolitan Investments are jointly and severally liable for the guaranteed amounts.
47. Exchange rates
The principal exchange rates used for translation purposes were as follows:
| | Average rate | | Closing rate | |
| | Year ended
2 January
2010
$1= | | | Year ended
3 January
2009
$1= | | Year ended
29 December
2007
$1= | | As at
2 January
2010
$1= | | | As at
3 January
2009
$1= | | As at
29 December
2007
$1= | |
Sterling | | 0.62 | | | 0.52 | | 0.50 | | 0.62 | | | 0.68 | | 0.50 | |
Canadian dollar | | 1.11 | | | 1.05 | | 1.06 | | 1.05 | | | 1.22 | | 0.98 | |
Euro | | 0.71 | | | 0.67 | | 0.73 | | 0.70 | | | 0.72 | | 0.68 | |
Mexican peso | | 13.51 | | | 11.13 | | 10.92 | | 13.09 | | | 13.75 | | 10.90 | |
Chinese yuan renminbi | | 6.84 | | | 6.95 | | 7.62 | | 6.83 | | | 6.85 | | 7.30 | |
Indian rupee | | 47.02 | | | 39.87 | | 41.35 | | 46.90 | | | 50.10 | | 39.43 | |
48. Subsequent event
On 26 February 2010, the Group acquired a 100% interest in Koch Filter Corporation (‘Koch’) for a total cash consideration of $35.5 million. Koch is a leading manufacturer of air filters for the non-residential filtration replacement market in the US.
|
| 135 |
| Company Financial Statements | |
INDEPENDENT AUDITORS’ REPORT
To the members of Tomkins plc
We have audited the individual financial statements of Tomkins plc (‘the Company’) for the year ended 2 January 2010 (‘the Company’s financial statements’) which comprise the Company’s balance sheet and the related notes 1 to 18. These financial statements have been prepared in accordance with applicable law and United Kingdom accounting standards (United Kingdom Generally Accepted Accounting Practice).
This report is made solely to the Company’s members, as a body, in accordance with Chapter 3 of Part 16 of the Companies Act 2006. Our audit work has been undertaken so that we might state to the Company’s members those matters we are required to state to them in an auditors’ report and for no other purpose. To the fullest extent permitted by law, we do not accept or assume responsibility to anyone other than the Company and the Company’s members as a body, for our audit work, for this report, or for the opinions we have formed.
Respective responsibilities of Directors and auditors
As explained more fully in the Statement of Directors’ Responsibilities, the Directors are responsible for the preparation of the Company’s financial statements and for being satisfied that they give a true and fair view. Our responsibility is to audit the Company’s financial statements in accordance with applicable law and International Standards on Auditing (UK and Ireland). Those standards require us to comply with the Auditing Practices Board’s Ethical Standards for Auditors.
Scope of the audit of the Company’s financial statements
An audit involves obtaining evidence about the amounts and disclosures in the Company’s financial statements sufficient to give reasonable assurance that the Company’s financial statements are free from material misstatement, whether caused by fraud or error. This includes an assessment of:
– | whether the accounting policies are appropriate to the Company’s circumstances and have been consistently applied and adequately disclosed; |
– | the reasonableness of significant accounting estimates made by the Directors; and |
– | the overall presentation of the Company’s financial statements. |
Opinion on the Company’s financial statements
In our opinion the Company’s financial statements:
– | give a true and fair view of the state of the Company’s affairs as at 2 January 2010; |
– | have been properly prepared in accordance with United Kingdom Generally Accepted Accounting Practice; and |
– | have been prepared in accordance with the requirements of the Companies Act 2006. |
Opinion on other matters prescribed by the Companies Act 2006
In our opinion:
– | the part of the Remuneration Committee report to be audited has been properly prepared in accordance with the Companies Act 2006; and |
– | the information given in the Directors’ Report for the financial year for which the Company’s financial statements are prepared is consistent with those financial statements. |
Matters on which we are required to report by exception
We have nothing to report in respect of the following matters where the Companies Act 2006 requires us to report to you if, in our opinion:
– | adequate accounting records have not been kept by the Company, or returns adequate for our audit have not been received from branches not visited by us; or |
– | the Company’s financial statements and the part of the Remuneration Committee report required to be audited are not in agreement with the accounting records and returns; or |
– | certain disclosures of Directors’ remuneration specified by law are not made; or |
– | we have not received all the information and explanations we require for our audit. |
Other matter
We have reported separately on the consolidated financial statements of Tomkins plc and its subsidiaries for the year ended 2 January 2010.
John Murphy (Senior Statutory Auditor)
for and on behalf of Deloitte LLP
Chartered Accountants and Statutory Auditors
London, United Kingdom
26 February 2010
COMPANY BALANCE SHEET
| | | | As at | | | As at | |
| | | | 2 January | | | 3 January | |
| | | | 2010 | | | 2009 | |
| | Note | | $ million | | | $ million | |
Fixed assets | | | | | | | | |
Tangible assets | | 5 | | 0.3 | | | 0.6 | |
Investments in subsidiaries | | 6 | | 3,154.0 | | | 3,129.5 | |
| | | | 3,154.3 | | | 3,130.1 | |
Current assets
| | | | | | | | |
Debtors: | | | | | | | | |
– Amounts falling due within one year | | 7 | | 14.0 | | | 1.4 | |
– Amounts falling due after more than one year | | 7 | | 22.5 | | | 204.6 | |
| | | | 36.5 | | | 206.0 | |
Creditors: amounts falling due within one year | | 8 | | (21.5 | ) | | (47.8 | ) |
Net current assets | | | | 15.0 | | | 158.2 | |
Total assets less current liabilities | | | | 3,169.3 | | | 3,288.3 | |
Creditors: amounts falling due after more than one year | | 9 | | (276.9 | ) | | (330.8 | ) |
Net assets before net pension liability | | | | 2,892.4 | | | 2,957.5 | |
Net pension liability | | 11 | | (12.1 | ) | | (5.5 | ) |
Net assets | | | | 2,880.3 | | | 2,952.0 | |
Capital and reserves | | | | | | | | |
Ordinary share capital | | 14 | | 79.6 | | | 79.6 | |
Share premium account | | 14 | | 799.2 | | | 799.1 | |
Deferred shares | | 15 | | – | | | 0.1 | |
Own shares | | 16 | | (8.2 | ) | | (14.9 | ) |
Capital redemption reserve | | 17 | | 921.8 | | | 921.7 | |
Merger reserve | | 17 | | 230.0 | | | 230.0 | |
Capital reserve | | 17 | | 112.6 | | | 112.6 | |
Profit and loss account reserve | | 17 | | 745.3 | | | 823.8 | |
Shareholders’ funds | | | | 2,880.3 | | | 2,952.0 | |
Approved by the Board on 26 February 2010 and signed on its behalf by:
J Nicol Director | J W Zimmerman Director |
|
| 137 |
| Company Financial Statements | |
NOTES TO THE FINANCIAL STATEMENTS
1. Principal accounting policies
A. Basis of preparation
The financial statements of Tomkins plc have been prepared on a going concern basis in accordance with applicable law and United Kingdom accounting standards (‘UK GAAP’) and, except as described under the heading ‘Financial instruments’, under the historical cost convention.
Except as noted below, the Company’s principal accounting policies are unchanged compared with the year ended 3 January 2009.
At the beginning of the current period, the Company adopted the following pronouncements that are relevant to its operations, none of which had any significant impact on its results or financial position:
– | Amendments to FRS 8 ‘Related Party Disclosures’ |
– | Amendment to FRS 20 ‘Share-based Payment – Vesting Conditions and Cancellations’ |
– | ‘Improvements to Financial Reporting Standards 2008’ |
Retrospective application of the amendment to FRS 20 had the effect of decreasing profit for the period by $0.1 million to $322.3 million in 2008, and there was a corresponding increase in the credit to equity in relation to share-based incentives (there were no tax effects).
The Company is exempt from applying FRS 29 (IFRS 7) ‘Financial Instruments: Disclosures’ because the required disclosures are provided in the consolidated financial statements of the Company and its subsidiaries.
B. Accounting period
The Company’s annual financial statements are drawn up to the Saturday nearest 31 December. These financial statements cover the 52-week period from 4 January 2009 to 2 January 2010 (‘2009’) with comparative figures for the 53-week period from 30 December 2007 to 3 January 2009 (‘2008’).
C. Investments in subsidiaries
A subsidiary is an entity controlled, either directly or indirectly, by the Company, where control is the power to govern the financial and operating policies of the entity so as to obtain benefit from its activities. Investments in subsidiaries represent interests in the Company’s subsidiaries that are directly owned by the Company and are stated at cost less any provision for impairment.
D. Foreign currency translation
Transactions denominated in foreign currencies are translated into the Company’s functional currency at the exchange rate ruling on the date of the transaction. Monetary assets and liabilities denominated in foreign currencies are retranslated at the exchange rate ruling on the balance sheet date. Currency translation differences are recognised in the profit and loss account.
E. Tangible fixed assets
Tangible fixed assets are stated at cost less accumulated depreciation and any provision for impairment. Plant, equipment and vehicles are depreciated on a straight-line basis over their expected useful lives, which are in the range 2 to 20 years.
F. Financial instruments
(i) Bank and other loans
Bank and other loans are initially measured at fair value, net of directly attributable transaction costs, if any, and are subsequently measured at amortised cost using the effective interest rate method.
(ii) Derivative financial instruments
The Company uses derivative financial instruments to manage its exposure to exchange rate and interest rate movements. The Company does not hold or issue derivatives for speculative purposes.
Derivative financial instruments are recognised as assets and liabilities measured at their fair value at the balance sheet date. Changes in their fair value are recognised in the profit and loss account and this is likely to cause volatility in situations where the carrying value of the hedged item is not normally adjusted to reflect fair value changes arising from the hedged risk. Provided the conditions specified by FRS 26 (IAS 39) ‘Financial Instruments: Recognition and Measurement’ are met, hedge accounting may be used to mitigate such volatility.
Management has designated certain hedging relationships as fair value hedges whereby the carrying amount of the hedged asset or liability is adjusted by the change in its fair value attributable to the hedged risk and the resulting gain or loss is recognised in the profit and loss account where, to the extent that the hedge is effective, it offsets the change in the fair value of the hedging instrument.
Derivative financial instruments are classified as current assets or liabilities unless they qualify for hedge accounting under FRS 26 and the hedged item is classified as a non-current asset or liability.
(iii) Financial guarantee contracts
Financial guarantees issued by the Company to third parties in respect of the obligations of certain of its subsidiaries are measured at fair value on initial recognition. Over the term of the guarantee, the initial fair value is recognised as revenue. Subsequent to initial recognition, guarantees are measured at the higher of their initial fair value less amounts recognised as revenue and the best estimate of the amount that the Company will be required to pay to settle the obligation.
(iv) Embedded derivatives
Derivatives embedded in non-derivative host contracts are recognised separately as derivative financial instruments when their risks and characteristics are not closely related to those of the host contract and the host contract is not stated at its fair value with changes in its fair value recognised in the profit and loss account.
(v) Own shares
Own shares represent the Company’s ordinary shares that are held by the Company in treasury or by sponsored ESOP trusts in relation to the Group’s employee share schemes. Own shares are measured at cost and are presented as a deduction from shareholders’ funds. Gains or losses on the sale or transfer of own shares are recognised directly in reserves.
NOTES TO THE FINANCIAL STATEMENTS (CONTINUED)
1. Principal accounting policies (continued)
G. Retirement benefits
Retirement benefits comprise pension benefits provided to employees in the UK.
For defined contribution plans, the pension cost represents the Company’s contributions to the plans and is recognised in the profit and loss account in the period in which the contributions fall due.
For defined benefit plans, the pension cost is determined based on actuarial valuations of each of the plans that are carried out annually at the Company’s balance sheet date by independent qualified actuaries. Plan assets are measured at their fair value at the balance sheet date. Benefit obligations are measured on an actuarial basis using the projected unit credit method.
The cost of defined benefit plans recognised in the profit and loss account comprises the net total of the current service cost, the past service cost, the expected return on plan assets, the interest cost and the effect of curtailments or settlements. The current service cost represents the increase in the present value of the plan liabilities expected to arise from employee service in the current period. The past service cost is the change in the benefit obligation that results from changes in the benefits payable in respect of employee service in prior periods. The past service cost may be either positive or negative and is recognised in the profit and loss account on a straight-line basis over the vesting period, or immediately if the benefits have vested. The expected return on plan assets is based on market expectations, at the beginning of the period, of future returns over the life of the benefit obligation. The interest cost represents the increase in the benefit obligation due to the passage of time. The discount rate used is determined at the balance sheet date by reference to market yields on high-quality corporate bonds. Gains or losses on curtailments or settlements are recognised in the profit and loss account in the period in which the curtailment or settlement occurs.
Actuarial gains and losses, which represent differences between the expected and actual returns on the plan assets and the effect of changes in actuarial assumptions, are included in other recognised gains and losses in the period in which they occur.
The net pension liability or asset recognised in the balance sheet comprises the net total for each plan of the present value of the benefit obligation at the balance sheet date, minus any past service costs not yet recognised, minus the fair value of the plan assets, at the balance sheet date and is stated net of deferred tax. Where a plan is in surplus, the asset recognised is limited to the present value of any amounts that the Company expects to recover by way of refunds or a reduction in future contributions.
H. Share-based incentives
Share-based incentives are provided to certain employees under the Company’s share option, bonus and other share award schemes. The Company recognises a compensation expense in respect of these schemes that is based on the fair value of the awards, measured using either the Black-Scholes option-pricing formula or the Monte Carlo valuation model. Fair value is determined at the date of grant and reflects market performance conditions and all non-vesting conditions. Fair value is not subsequently remeasured unless the conditions on which the award was granted are modified.
Generally, the compensation expense is recognised on a straight-line basis over the vesting period. Adjustments are made to reflect expected and actual forfeitures during the vesting period due to failure to satisfy a service condition or a non-market performance condition. In the event of a cancellation, whether by the Company or by a participating employee, the compensation expense that would have been recognised over the remainder of the vesting period is recognised immediately in the profit and loss account.
When the Company grants rights over its own shares to the employees of a subsidiary, it recognises the compensation expense recognised by the subsidiary, less any amounts charged to the subsidiary, as a capital contribution to the subsidiary.
I. Taxation
Deferred tax is recognised on a full provision basis on timing differences between the recognition of gains and losses in the financial statements and their recognition for tax purposes. Deferred tax assets are recognised only to the extent that it is considered more likely than not that future taxable profits will be available against which the asset can be utilised. Deferred tax is determined using the tax rates that have been enacted or substantially enacted at the balance sheet date and are expected to apply in the periods in which the timing differences are expected to reverse. Deferred tax assets and liabilities are not discounted.
J. Dividends on ordinary shares
Dividends payable on ordinary shares are recognised in the financial statements when they have been appropriately authorised and are no longer at the Company’s discretion. Accordingly, interim dividends are recognised when they are paid and final dividends are recognised when they are declared following approval by shareholders at the Company’s AGM. Dividends on ordinary shares are recognised as an appropriation of shareholders’ funds.
|
| 139 |
| Company Financial Statements | |
2. Profit for the period
As permitted by section 408 of the Companies Act 2006, the Directors have elected not to present the profit and loss account of the Company. The Company’s loss for the period was $35.5 million (2008: profit of $322.3 million).
3. Dividends on ordinary shares
| | Year ended
2 January
2010
per share | | | Year ended
3 January
2009
per share | |
Paid or proposed in respect of the period | | | | | | |
Interim dividend | | 3.50c | | | 11.02c | |
Final dividend | | 6.50c | | | 2.00c | |
| | 10.00c | | | 13.02c | |
| | | | | | |
| | Year ended
2 January
2010
$ million | | | Year ended
3 January
2009
$ million | |
Recognised in the period | | | | | | |
Interim dividend for the period of 3.50c (2008: 11.02c) per share | | 30.9 | | | 97.1 | |
Final dividend for the prior period of 2.00c (2008: 16.66c) per share | | 17.4 | | | 149.1 | |
| | 48.3 | | | 246.2 | |
Since 2008, the Company’s dividends have been declared in US dollars. The final dividend for 2007 was declared and paid in sterling and has been translated into US dollars at the exchange rate on the date of payment.
The Directors propose a final dividend for 2009 of 6.50c per share that, subject to approval by shareholders, will be paid on 10 June 2010 to shareholders on the register on 7 May 2010.
Based on the number of ordinary shares currently in issue, the final dividend for 2009 is expected to amount to $57.4 million.
4. Auditors’ remuneration
Fees payable to the Company’s auditors, Deloitte LLP, in respect of the audit of the Company’s accounts were $60,000 (2008: $65,000).
Fees payable to Deloitte LLP in respect of the audit of the Company’s associated pension schemes were $48,800 (2008: $51,600).
Fees payable to Deloitte LLP and its associates for non-audit services to the Company and its associated pension schemes are not presented in these accounts because they are included in the disclosures that are presented in the consolidated financial statements of the Company and its subsidiaries.
NOTES TO THE FINANCIAL STATEMENTS (CONTINUED)
5. Tangible fixed assets
| | Long
leasehold
property
$ million | | Plant,
equipment
and vehicles
$ million | | Total
$ million | |
Cost | | | | | | | |
As at 3 January 2009 and 2 January 2010 | | 0.2 | | 4.4 | | 4.6 | |
| | | | | | | |
Accumulated depreciation | | | | | | | |
As at 3 January 2009 | | – | | 4.0 | | 4.0 | |
Depreciation charge for the period | | – | | 0.3 | | 0.3 | |
As at 2 January 2010 | | – | | 4.3 | | 4.3 | |
| | | | | | | |
Net book value | | | | | | | |
As at 3 January 2009 | | 0.2 | | 0.4 | | 0.6 | |
As at 2 January 2010 | | 0.2 | | 0.1 | | 0.3 | |
6. Investments in subsidiaries
| | $ million | |
Cost and net book value | | | |
As at 3 January 2009 | | 3,129.5 | |
Additions | | 24.5 | |
As at 2 January 2010 | | 3,154.0 | |
Details of the Company’s principal subsidiaries are set out on page 150. A complete list of the Company’s subsidiaries will be filed with the Company’s next annual return.
7. Debtors
| | As at
2 January
2010
$ million | | | As at
3 January
2009
$ million | |
Amounts falling due within one year | | | | | | |
Amounts owed by subsidiaries | | 13.0 | | | 0.2 | |
Other taxes and social security | | 0.2 | | | 0.1 | |
Prepayments and accrued income | | 0.5 | | | 0.5 | |
Other debtors | | 0.3 | | | 0.6 | |
| | 14.0 | | | 1.4 | |
Amounts falling due after more than one year | | | | | | |
Amounts owed by subsidiaries | | 5.9 | | | 188.5 | |
Derivative financial instruments (see note 10) | | 16.6 | | | 16.1 | |
| | 22.5 | | | 204.6 | |
| | 36.5 | | | 206.0 | |
The amounts owed by Group undertakings classified as falling due after more than one year have no specified terms of repayment and are intended to be settled on a net basis. The Company has given an undertaking to the counterparties that it will not require settlement within one year of the balance sheet date. Generally, these amounts bear interest at floating rates based on prevailing market interest rates applicable to the currencies in which they are denominated.
|
| 141 |
| Company Financial Statements | |
8. Creditors: amounts falling due within one year
| | As at
2 January
2010
$ million | | | As at
3 January
2009
$ million | |
Trade creditors | | 1.1 | | | 0.5 | |
Bank overdrafts – unsecured | | 1.0 | | | 1.0 | |
Loan notes – unsecured | | 0.3 | | | 0.3 | |
Other loans – unsecured (see note 9) | | 1.8 | | | 1.6 | |
Amounts owed to subsidiaries | | – | | | 16.6 | |
Other taxes and social security | | 0.3 | | | 0.3 | |
Accruals and deferred income | | 10.3 | | | 14.9 | |
Other creditors | | 6.7 | | | 12.6 | |
| | 21.5 | | | 47.8 | |
The loan notes must be repaid at par, by the Company on 30 June 2012. Until that time, in certain circumstances, the noteholders have the right to require full or part repayment, at par, half-yearly on 30 June and 31 December and for this reason they are classified as current liabilities.
9. Creditors: amounts falling due after more than one year
| | As at
2 January
2010
$ million | | | As at
3 January
2009
$ million | |
Other loans – unsecured | | 254.7 | | | 231.8 | |
Amounts owed to subsidiaries | | 12.5 | | | 94.1 | |
Accruals and deferred income | | 5.3 | | | 4.9 | |
Other creditors | | 4.4 | | | – | |
| | 276.9 | | | 330.8 | |
Other loans
Other loans comprise a £150 million bond drawn down by the Company under the Group’s EMTN Programme. The bond is repayable at par on 20 December 2011 and bears interest at a fixed rate of 8% per annum.
The carrying amount of other loans may be analysed as follows:
| | As at
2 January
2010
$ million | | | As at
3 January
2009
$ million | |
Maturity analysis: | | | | | | |
– Within one year | | 1.8 | | | 1.6 | |
– Between one and two years | | 254.7 | | | 0.9 | |
– Between two and five years | | – | | | 230.9 | |
| | 256.5 | | | 233.4 | |
NOTES TO THE FINANCIAL STATEMENTS (CONTINUED)
9. Creditors: amounts falling due after more than one year (continued)
The carrying amount of other loans may be reconciled to the principal amount outstanding as follows:
| | As at
2 January
2010
$ million | | | As at
3 January
2009
$ million | |
Carrying amount | | 256.5 | | | 233.4 | |
Accrued interest payable | | (0.7 | ) | | (0.7 | ) |
Unamortised transaction costs | | 0.2 | | | 0.3 | |
Fair value hedge adjustment (see note 10) | | (14.1 | ) | | (13.8 | ) |
Principal amount | | 241.9 | | | 219.2 | |
Amounts owed to subsidiaries
Amounts owed to subsidiaries classified as falling due after more than one year have no specified terms of repayment and are intended to be settled on a net basis. The Company has received an undertaking from the counterparties that they will not require settlement within one year of the balance sheet date. Generally, these amounts bear interest at floating rates based on prevailing market interest rates applicable to the currencies in which they are denominated.
10. Derivative financial instruments
The Company holds derivative financial instruments in accordance with the Group’s policy in relation to financial risk management. Details of that policy are set out in note 33 of the consolidated financial statements of the Company and its subsidiaries.
The carrying value of derivative financial instruments held by the Company was as follows:
| | As at 2 January 2010 | | | As at 3 January 2009 | |
| | Assets
$ million | | Liabilities
$ million | | | Assets
$ million | | Liabilities
$ million | |
Carrying value | | | | | | | | | | |
Interest rate swaps | | 16.6 | | – | | | 16.1 | | – | |
Interest rate swaps are used to swap borrowings by the Company under the Group’s EMTN Programme from fixed interest rates to floating interest rates. These contracts have been designated as fair value hedges in relation to the borrowings but they ceased to be effective for accounting purposes during 2009.
During 2009, the Company recognised a fair value loss of $1.4 million (2008: gain of $18.9 million) in relation to these contracts and the carrying amount of the hedged borrowings was decreased by $1.1 million (2008: increased by $20.1 million) to reflect the change in the fair value of the borrowings attributable to the hedged risk while the hedges were effective and the amortisation of the transitional adjustment that was recognised on adoption of FRS 26. During 2009, a net loss of $0.3 million (2008: net loss of $1.2 million) was, therefore, recognised in the profit and loss account in relation to these hedges.
The profile of interest rate swaps held by the Company was as follows:
| | | | Interest rate | |
| | Notional
principal amount
£ million | | Payable
Variable | | Receivable
Fixed | | Variable rate
index | |
As at 2 January 2010 | | | | | | | | | |
Maturity date – December 2011 | | 150.0 | | 3.4% | | 8.0% | | 6 month LIBOR | |
| | | | | | | | | |
As at 3 January 2009 | | | | | | | | | |
Maturity date – December 2011 | | 150.0 | | 5.7% | | 8.0% | | 6 month LIBOR | |
|
| 143 |
| Company Financial Statements | |
11. Pensions
A. Defined benefit plans
The Company operates a number of funded defined benefit pension plans in the UK that provide benefits based upon final pensionable salary and the period of service of the individual employees. The plan assets are held separately from the Company’s assets in funds that are under the control of trustees. Day-to-day management of the plan assets is carried out by independent investment managers who, at the request of the Company, are prohibited by the trustees from investing directly in the Company.
The defined benefit pension plans operated by the Company are closed to new entrants.
The principal assumptions used in the actuarial valuations of the defined benefit pension plans were as follows:
| | As at
2 January
2010
% per annum | | | As at
3 January
2009
% per annum | |
Salary increases | | 4.50% | | | 4.00% | |
Increase to pensions in payment | | 3.50% | | | 3.00% | |
Increase to deferred pensions | | 3.50% | | | 3.00% | |
Long-term rate of return on plan assets | | 6.31% | | | 6.31% | |
Discount rate | | 5.75% | | | 6.50% | |
Inflation rate | | 3.50% | | | 3.00% | |
The current life expectancies underlying the value of accrued liabilities were as follows:
| | | | As at
2 January
2010 | | | As at
3 January
2009 | |
Current pensioners (at age 65) | | – male | | 21.5 years | | | 21.5 years | |
| | – female | | 24.5 years | | | 24.5 years | |
Future pensioners (at age 65) | | – male | | 22.5 years | | | 22.5 years | |
| | – female | | 25.5 years | | | 25.5 years | |
The fair value of the plan assets and the expected rates of return were as follows:
| | As at 2 January 2010 | | | As at 3 January 2009 | | As at 29 December 2007 | |
| | Long-term
expected
rate of return
% per annum | | Fair value
$ million | | | Long-term
expected
rate of return
% per annum | | Fair value
$ million | | Long-term
expected
rate of return
% per annum | | Fair value
$ million | |
Equities | | 7.80% | | 108.9 | | | 8.00% | | 100.9 | | 7.95% | | 160.0 | |
Bonds | | 5.00% | | 139.1 | | | 5.15% | | 106.8 | | 5.25% – 5.75% | | 153.7 | |
Other assets | | 4.20% | | – | | | 4.30% | | 0.6 | | 4.85% | | 1.2 | |
| | | | 248.0 | | | | | 208.3 | | | | 314.9 | |
The actual return on plan assets was 7.7% (2008: loss of 5.1%).
The net pension liability may be analysed as follows:
| | As at
2 January
2010
$ million | | | As at
3 January
2009
$ million | |
Present value of plan liabilities: | | | | | | |
– Funded | | 251.4 | | | 193.0 | |
– Unfunded | | 0.1 | | | 0.1 | |
| | 251.5 | | | 193.1 | |
Fair value of plan assets | | (248.0 | ) | | (208.3 | ) |
Deficit/(surplus) in the plans | | 3.5 | | | (15.2 | ) |
Unrecognised surplus | | 8.6 | | | 20.7 | |
Net pension liability | | 12.1 | | | 5.5 | |
NOTES TO THE FINANCIAL STATEMENTS (CONTINUED)
11. Pensions (continued)
A. Defined benefit plans (continued)
Changes in the present value of the benefit obligation were as follows:
| | Year ended
2 January
2010
$ million | | | Year ended
3 January
2009
$ million | |
At the beginning of the period | | 193.1 | | | 290.6 | |
Current service cost | | 0.5 | | | 0.9 | |
Interest cost | | 13.4 | | | 15.7 | |
Net actuarial loss/(gain) | | 36.4 | | | (22.4 | ) |
| | 243.4 | | | 284.8 | |
Employees’ contributions | | 0.1 | | | 0.1 | |
Benefits paid | | (11.9 | ) | | (13.5 | ) |
Foreign currency translation | | 19.9 | | | (78.3 | ) |
At the end of the period | | 251.5 | | | 193.1 | |
Changes in the fair value of plan assets were as follows:
| | Year ended
2 January
2010
$ million | | | Year ended
3 January
2009
$ million | |
At the beginning of the period | | 208.3 | | | 314.9 | |
Expected return on plan assets | | 13.1 | | | 16.1 | |
Net actuarial gain/(loss) | | 2.9 | | | (32.1 | ) |
| | 224.3 | | | 298.9 | |
Employer’s contributions | | 12.6 | | | 5.6 | |
Employees’ contributions | | – | | | 0.1 | |
Benefits paid | | (11.9 | ) | | (13.5 | ) |
Foreign currency translation | | 23.0 | | | (82.8 | ) |
At the end of the period | | 248.0 | | | 208.3 | |
Plan assets do not include any of the Company’s or the Group’s own financial instruments, nor any property or other assets used by the Company or the Group.
The return and risk expectations for each asset class incorporate assumptions about historical return relationships, current financial market conditions and the degree of global capital market integration. The assumptions used have been derived from rigorous historical performance analysis combined with forward-looking views of the financial markets as revealed through the yield on long-term bonds and the price earnings ratios of the major stock market indices. The actuaries review analyses of historical risk and the correlation of the return on asset classes and apply subjective judgment based on their knowledge of the Company’s plans. The result of this analysis is incorporated into a risk matrix from which expected long-term risk premiums for each asset class are developed. The nominal return expectations are determined by combining the asset class risk premiums with expected inflation and real risk-free rate assumptions. As a final consideration, the nominal return assumptions are blended with current market conditions to develop long-term equilibrium expectations.
|
| 145 |
| Company Financial Statements | |
Actuarial gains and losses recognised in relation to the defined benefit plans were as follows:
| | Year ended
2 January
2010
$ million | | | Year ended
3 January
2009
$ million | | Year ended
29 December
2007
$ million | | Year ended
30 December
2006
$ million | | Year ended
31 December
2005
$ million | |
At the end of the period | | | | | | | | | | | | |
Present value of the benefit obligation | | 251.5 | | | 193.1 | | 290.6 | | 302.4 | | 276.9 | |
Fair value of plan assets | | (248.0 | ) | | (208.3 | ) | (314.9 | ) | (300.6 | ) | (260.8 | ) |
Deficit/(surplus) in the plan | | 3.5 | | | (15.2 | ) | (24.3 | ) | 1.8 | | 16.1 | |
| | | | | | | | | | | | |
Recognised in the period | | | | | | | | | | | | |
Net actuarial gain/(loss) on plan assets | | 2.9 | | | (32.1 | ) | 0.6 | | (3.3 | ) | 21.5 | |
Net actuarial (loss)/gain on benefit obligation | | (36.4 | ) | | 22.4 | | 20.1 | | 12.9 | | (32.4 | ) |
| | (33.5 | ) | | (9.7 | ) | 20.7 | | 9.6 | | (10.9 | ) |
As at 2 January 2010, the cumulative net actuarial loss recognised in the statement of total recognised gains and losses amounted to $49.0 million (3 January 2009: $15.5 million).
The Company expects to contribute approximately $12.5 million to the defined benefit pension plans in 2010.
B. Defined contribution schemes
The Company makes contributions to the personal pension arrangements of employees who are not eligible, or chose not, to participate in its deferred benefit plans. Contributions payable by the Company to these arrangements amounted to $0.1 million (2008: $nil). At the balance sheet date, the Group had not paid over to the plans contributions due amounting to $0.1 million (3 January 2009: $nil). All amounts due for the period were paid over subsequent to the balance sheet date.
12. Share-based incentives
A. Background
The Company operates a number of share-based compensation arrangements to provide incentives to the Group’s senior executives and other eligible employees. Details of the schemes in respect of which options and awards are outstanding are set out in the Remuneration Committee report.
Although the Company’s ordinary shares are denominated in US dollars, they are quoted in sterling on the London Stock Exchange.
The information provided below relates only to options and awards that were granted to persons who are employees of the Company.
B. Share options
Following a review by the Board in 2004, it was decided that the Company’s executive share option schemes would not be renewed when they lapsed for the purposes of new awards in May 2005. Awards granted under these schemes were subject to a performance condition that the rate of increase in the Group’s earnings per share must exceed the growth in the UK Retail Prices Index by an average of 2% per annum over any three-year period after the options were granted. The final unvested options under these schemes vested during 2007.
Options continue to be granted from time to time under the Company’s Sharesave Scheme, which is restricted to employees who are resident for tax purposes in the UK. It offers eligible employees the option to buy ordinary shares in Tomkins plc after a period of three, five or seven years, funded from the proceeds of a savings contract to which employees may contribute up to £250 per month.
NOTES TO THE FINANCIAL STATEMENTS (CONTINUED)
12. Share-based incentives (continued)
B. Share options (continued)
In 2009, the compensation expense recognised in respect of share options was $0.1 million (2008: $nil).
Changes in the total number of share options outstanding to employees of the Company during the period were as follows:
| | Year ended 2 January 2010 | | | Year ended 3 January 2009 | |
| | Options
Number | | Weighted average
exercise price
Pence | | | Options
Number | | | Weighted average
exercise price
Pence | |
Outstanding at the beginning of the period | | 9,802,658 | | 241.34 | | | 10,602,911 | | | 243.06 | |
Granted during the period | | 220,281 | | 96.00 | | | 117,551 | | | 140.20 | |
Forfeited during the period | | – | | – | | | (32,872 | ) | | 225.28 | |
Cancelled during the period | | (103,473 | ) | 138.56 | | | (76,406 | ) | | 208.47 | |
Lapsed during the period | | (58,628 | ) | 205.39 | | | (808,526 | ) | | 252.96 | |
Outstanding at the end of the period | | 9,860,838 | | 239.39 | | | 9,802,658 | | | 241.34 | |
Exercisable at the end of the period
| | 9,623,128 | | 242.73 | | | 9,623,128 | | | 242.73 | |
No options were exercised during 2009 or 2008.
The fair value of options granted under the Sharesave Scheme was measured at their respective grant dates using the Black-Scholes option-pricing formula based on the following assumptions:
| | Year ended
2 January
2010 | | | Year ended
3 January
2009 | |
Weighted average fair value | | 68.20p | | | 37.66p | |
Weighted average assumptions: | | | | | | |
– Share price | | 161.75p | | | 176.75p | |
– Exercise price | | 96.00p | | | 140.20p | |
– Expected volatility | | 33.39% | | | 24.46% | |
– Expected life | | 4.42 years | | | 4.47 years | |
– Risk-free interest rate | | 3.74% | | | 4.55% | |
– Expected dividends | | 6.25p | | | 13.89p | |
Expected volatility was determined based on the historical volatility of the market price of the Company’s ordinary shares over the expected life of the options. Adjustments have been made to the expected life used in the model to reflect the effects of non-transferability, exercise restrictions and behavioural considerations.
The weighted average contractual life of share options outstanding to the Company’s employees at the end of the period was as follows:
| | As at 2 January 2010 | | | As at 3 January 2009 | |
| | Outstanding
Number | | Weighted average
remaining
contractual life
Years | | | Outstanding
Number | | | Weighted average
remaining
contractual life
Years | |
Range of exercise prices: | | | | | | | | | | | |
– Less than 100p | | 203,979 | | 4.02 | | | – | | | – | |
– 100p to 150p | | 27,426 | | 2.76 | | | 107,948 | | | 4.16 | |
– 151p to 200p | | 3,088,072 | | 2.11 | | | 3,088,072 | | | 3.10 | |
– 201p to 250p | | 2,769,411 | | 3.93 | | | 2,832,842 | | | 4.84 | |
– 251p to 300p | | 2,756,722 | | 2.93 | | | 2,758,568 | | | 3.92 | |
– 301p and higher | | 1,015,228 | | 2.11 | | | 1,015,228 | | | 3.10 | |
| | 9,860,838 | | | | | 9,802,658 | | | | |
|
| 147 |
| Company Financial Statements | |
C. Other awards
The Company’s principal ongoing share-based compensation arrangements are the ABIP and the PSP. Both are restricted to the Company’s senior executives. In 2009, the IBP was introduced as a temporary, one-year substitute for the ABIP.
The ABIP provides awards of Restricted Award Shares and Deferred Award Shares based on the ‘bonusable profit’ of the business for which the participants have responsibility. Restricted Award Shares normally vest after a period of three years. Dividends are paid on the Restricted Award Shares. Deferred Award Shares normally vest after a period of three years, conditional on the participant’s continued employment with the Group. Dividends are not paid on the Deferred Award Shares until they have vested. During 2009, awards were granted over 173,711 ordinary shares (2008: 180,348 ordinary shares) under the ABIP in relation to bonuses earned in 2008. The IBP differs from the ABIP only in that awards made under the plan are based on the trading cash flow of the business for which the participants have responsibility and on the attainment of strategic achievement milestones that are set for each of the participants. Awards over shares under the IBP are expected to be made in March 2010. In 2009, an accrual of $0.4 million was recognised in respect of the Restricted Award Shares to be awarded under the IBP.
The PSP provides awards of shares which vest after a period of three years, conditional on the Group’s total shareholder return relative to its cost of equity over the vesting period and the participant’s continued employment with the Group. During 2009, awards were granted over 1,838,839 ordinary shares under the PSP (2008: 2,103,039 ordinary shares).
The fair value of awards made under the ABIP is measured based on the market price of the Company’s ordinary shares on the date of the award. Where the awards do not attract dividends during the vesting period, the market price is reduced by the present value of the dividends expected to be paid during the expected life of the awards. The weighted average fair value of awards made under these schemes during the period was 130.46p (2008: 129.34p).
The fair value of awards made under the PSP was measured at their respective grant dates using the Monte Carlo valuation model based on the following assumptions:
| | Year ended
2 January
2010 | | | Year ended
3 January
2009 | |
Weighted average fair value | | 53.40p | | | 34.20p | |
Weighted average assumptions: | | | | | | |
– Expected volatility | | 46.38% | | | 37.49% | |
– Expected life | | 3.00 years | | | 3.00 years | |
– Risk-free interest rate | | 2.17% | | | 4.57% | |
– Dividend yield | | 3.88% | | | 9.97% | |
Expected volatility was determined based on the historical volatility of the market price of the Company’s ordinary shares over the expected life of the awards.
In 2009, the compensation expense recognised in respect of other awards was $2.4 million (2008: $2.3 million).
13. Deferred tax
At present, the Company does not recognise deferred tax assets because their future recoverability is uncertain due to the extent of forecast tax losses available for surrender within the UK tax group to which the Company belongs. Deferred tax assets will be recognised when it is considered more likely than not that they will be recovered.
Deferred tax assets not recognised were as follows:
| | As at
2 January
2010
$ million | | | As at
3 January
2009
$ million | |
Depreciation in excess of tax allowances | | 1.2 | | | 1.6 | |
Share-based incentives | | 0.4 | | | 0.3 | |
Pensions | | 3.4 | | | 1.5 | |
Other timing differences | | 1.2 | | | 1.5 | |
| | 6.2 | | | 4.9 | |
NOTES TO THE FINANCIAL STATEMENTS (CONTINUED)
14. Ordinary shares
| | Number
of shares | | Nominal
value
$ million | |
Ordinary shares of 9c each | | | | | |
Authorised | | | | | |
As at 3 January 2009 and 2 January 2010 | | 1,585,164,220 | | 142.7 | |
Allotted, issued and fully paid shares
| | Number
of shares | | Ordinary
share
capital
$ million | | Share
premium
account
$ million | | Total
$ million | |
As at 3 January 2009 | | 884,151,772 | | 79.6 | | 799.1 | | 878.7 | |
Shares issued during the period: | | | | | | | | | |
– Exercise of employee share options | | 45,000 | | – | | 0.1 | | 0.1 | |
As at 2 January 2010 | | 884,196,772 | | 79.6 | | 799.2 | | 878.8 | |
15. Deferred shares
| | Authorised | | Allotted, issued and fully paid | |
| | Number
of shares | | Nominal
value
£ | | Number
of shares | | Share
capital
$ million | |
Deferred shares of £1 each | | | | | | | | | |
As at 3 January 2009 | | 50,000 | | 50,000 | | 50,000 | | 0.1 | |
Cancellation of deferred shares | | (50,000 | ) | (50,000 | ) | (50,000 | ) | (0.1 | ) |
As at 2 January 2010 | | – | | – | | – | | – | |
When the Company redenominated its ordinary shares from sterling to US dollars in 2008, it was required by law to have a minimum share capital of £50,000 denominated in sterling. The deferred shares were issued to meet this requirement, which was removed on the implementation of section 542 of the Companies Act 2006 on 1 October 2009. Accordingly, the Company bought back and cancelled the deferred shares on 16 December 2009 and transferred the nominal amount of the shares to the capital redemption reserve in accordance with the applicable capital maintenance rules.
16. Own shares
| | Number
of shares | | $ million | |
As at 3 January 2009 | | 3,658,550 | | 14.9 | |
Own shares purchased | | 636,762 | | 1.4 | |
Transfer of own shares | | (1,752,118 | ) | (8.1 | ) |
As at 2 January 2010 | | 2,543,194 | | 8.2 | |
Own shares represent the cost of the Company’s ordinary shares acquired to meet the Group’s expected obligations under employee share schemes. Dividends relating to own shares held have been waived with the exception of those that are payable to participants in the relevant schemes.
As at 2 January 2010, 904,632 ordinary shares (3 January 2009: 1,143,076 ordinary shares) were held in trust and 1,638,562 ordinary shares (3 January 2009: 2,515,474 ordinary shares) were held as treasury shares.
As at 2 January 2010, the market value of own shares held was $7.9 million (3 January 2009: $7.1 million).
|
| 149 |
| Company Financial Statements | |
17. Other reserves
| | Capital
redemption
reserve
$ million | | Merger
reserve
$ million | | Capital
reserve
$ million | | Profit and
loss account reserve
$ million | | Total
$ million | |
As at 3 January 2009 | | 921.7 | | 230.0 | | 112.6 | | 823.8 | | 2,088.1 | |
Loss for the period attributable to equity shareholders | | – | | – | | – | | (35.5 | ) | (35.5 | ) |
Other recognised gains and losses: | | | | | | | | | | | |
– Retirement benefits | | | | | | | | | | | |
Net actuarial loss | | – | | – | | – | | (33.5 | ) | (33.5 | ) |
Adjustment for unrecognised surplus | | – | | – | | – | | 15.2 | | 15.2 | |
| | – | | – | | – | | (18.3 | ) | (18.3 | ) |
Total recognised gains and losses | | – | | – | | – | | (53.8 | ) | (53.8 | ) |
Other changes in shareholders’ funds: | | | | | | | | | | | |
– Transfer of own shares | | – | | – | | – | | (2.0 | ) | (2.0 | ) |
– Loss on cancellation of deferred shares | | 0.1 | | – | | – | | – | | 0.1 | |
– Cost of share-based incentives | | – | | – | | – | | 2.5 | | 2.5 | |
– Capital contribution to subsidiaries | | – | | – | | – | | 23.1 | | 23.1 | |
– Dividends paid on ordinary shares | | – | | – | | – | | (48.3 | ) | (48.3 | ) |
| | 0.1 | | – | | – | | (24.7 | ) | (24.6 | ) |
As at 2 January 2010 | | 921.8 | | 230.0 | | 112.6 | | 745.3 | | 2,009.7 | |
18. Guarantees
The Company has guaranteed the borrowing facilities of certain subsidiaries. As at 2 January 2010, these facilities totalled $1,371.1 million (3 January 2009: $1,348.3 million) against which $509.8 million (3 January 2009: $676.0 million) had been drawn.
The Company has also guaranteed certain property leases and performance bonds entered into in the ordinary course of business by certain of its subsidiaries.
PRINCIPAL SUBSIDIARIES AND ASSOCIATES
Details of the Company’s principal trading subsidiaries and associates as at 2 January 2010 are set out below. Each entity is wholly owned by the Group and is registered in England and Wales, unless otherwise stated. A complete list of the Company’s subsidiaries and associates will be filed with the Company’s annual return.
Industrial & Automotive | | | | | | |
A.E. Hydraulic (Pte) Ltd | | Gates Fleximak Ltd | | Gates (U.K.) Ltd | | Hydrolink Co. LLC |
Hydraulic and industrial hose | | Flexible fluid transfer products | | Belts and couplings | | Fluid engineering services |
solutions and services | | British Virgin Islands | | Scotland | | provider |
Singapore | | | | | | United Arab Emirates |
| | Gates Fluid Power | | Gates Unitta Asia | | |
Dexter Axle Company Inc | | Technologies (Changzhou) Ltd | | Kabushikikaishu | | Ideal Internacional SA* |
Manufactured housing, mobile | | Hose | | (ordinary shares – 51% owned) | | (ordinary shares – 40% owned) |
home and trailer products | | China | | Belts | | Hose clamps |
US | | | | Japan | | Mexico |
| | Gates (India) Private Ltd | | | | |
Dexter Chassis Group Inc. | | Hose | | Gates Unitta Asia Trading | | Plews Inc |
Recreational vehicle frames | | India | | Company Pte Ltd | | Lubrication tools |
US | | | | (ordinary shares – 51% owned) | | US |
| | Gates Korea Company Ltd | | Belts | | |
Eifeler Maschinenbau GmbH | | (ordinary shares – 51% owned) | | Singapore | | Pyung Hwa CMB Co Ltd* |
Hydraulic tube fittings | | Belts | | | | (ordinary shares – 21% owned) |
Germany | | Korea | | Gates Unitta India | | Belts |
| | | | Company Private Ltd | | Korea |
Epicor Industries Inc | | Gates Mectrol Inc | | (ordinary shares – 51% owned) | | |
Hose clamps | | Belts | | Belts | | Schrader SAS |
US | | US | | India | | Valves and fittings |
| | | | | | France |
Gates GmbH | | Gates de Mexico SA de CV | | Gates Unitta Korea | | |
Belts | | Belts and hose | | Company Ltd | | Schrader Bridgeport Brasil Ltd |
Germany | | Mexico | | (ordinary shares – 51% owned) | | Valves and fittings |
| | | | Belts | | Brazil |
Gates SAS | | Gates Polska S.p.z.o.o. | | Korea | | |
Belts, hose and couplings | | Belts | | | | Schrader-Bridgeport |
France | | Poland | | Gates Unitta Power | | International Inc |
| | | | Transmission (Shanghai) Ltd | | Valves and fittings |
Gates Argentina SA | | Gates PT Spain SA | | (ordinary shares – 51% owned) | | US |
Belt and hose distributor | | Belts and hose | | Belts | | |
Argentina | | Spain | | China | | Schrader Duncan Ltd* |
| | | | | | (ordinary shares – 50% owned) |
Gates Australia Pty Ltd | | The Gates Corporation | | Gates Unitta Power | | Valves and fittings |
Belt and hose distributor | | Belts and hose | | Transmission (Suzhou) Ltd | | India |
Australia | | US | | (ordinary shares – 51% owned) | | |
| | | | Belts | | Schrader Electronics Ltd |
Gates do Brasil Industria | | Gates Powertrain Plastik | | China | | Automotive electronics |
e Comercio Ltda | | Metal ve Makina Sanayi | | | | Northern Ireland |
Belts and hose | | ve Ticaret Limited Sirketi | | Gates Unitta (Thailand) | | |
Brazil | | Oil pumps and tensioners | | Company Ltd | | Schrader Engineered Products |
| | Turkey | | (ordinary shares – 51% owned) | | (Kunshan) Co Ltd |
Gates Canada Inc | | | | Belts | | Valves and fittings |
Belts, hose, and powertrain | | Gates Rubber Company | | Thailand | | China |
components, systems and | | (Singapore) Pte Ltd | | | | |
assemblies | | Hose distributor | | Gates Winhere Automotive | | |
Canada | | Singapore | | Pump Products (Yantai) Co Ltd | | |
| | | | (ordinary shares – 60% owned) | | |
Gates Europe NV | | Gates Rubber (Shanghai) Co Ltd | | Automotive pumps | | |
Belts and hose | | Hose distributor | | China | | |
Belgium | | China | | | | |
| | | | | | |
| | | | | | |
Building Products | | | | | | |
Air System Components Inc | | NRG Industries Inc | | Ruskin Company | | Ruskin (Thailand) Co Ltd |
Heating, ventilating and air | | Commercial air conditioning | | Air, fire and smoke dampers, | | Commercial and industrial air, |
conditioning components | | components | | louvres and fibreglass products | | fire/smoke and control dampers |
US | | US | | US | | Thailand |
| | | | | | |
Hart & Cooley Inc | | Rolastar Pvt Ltd | | Ruskin Air Management Ltd | | Selkirk Americas LP |
Heating, ventilating and air | | Duct manufacturer | | Air handling products and louvred | | Chimney, venting and air |
conditioning components | | India | | windows | | distribution products |
US | | | | US | | US |
| | | | | | |
Aquatic Co. (formerly Lasco | | | | | | |
Bathware Inc) | | | | | | |
Fibreglass and acrylic baths and | | | | | | |
whirlpools | | | | | | |
US | | | | | | |
| | | | | | *Associate |
|
| 151 |
| | |
EXPLANATION OF KEY PERFORMANCE MEASURES
Background
We assess the financial performance of our businesses using a variety of measures. Certain of these measures are particularly important and we have termed them ‘key performance measures’. We refer to these measures in the Directors’ Report and use them in presentations to investors.
A summary of the key performance measures is presented on pages 12 and 13. In this section, we explain the relevance of each of the key performance measures and, if they cannot be derived directly from the consolidated financial statements, show how they are calculated. Some of these measures are termed ‘non-GAAP measures’ because they exclude amounts that are included in, or include amounts that are excluded from, the most directly comparable measure calculated and presented in accordance with IFRS, or are calculated using financial measures that are not calculated in accordance with IFRS. We present below a reconciliation of each of the non-GAAP measures to the most directly comparable measure calculated and presented in accordance with IFRS and discuss its limitations. We do not regard these non-GAAP measures as a substitute for, or superior to, the equivalent measures calculated and presented in accordance with IFRS or those calculated using financial measures that are calculated in accordance with IFRS. The non-GAAP measures described below may not be directly comparable with similarly-titled measures used by other companies.
We assess the non-financial performance of our businesses using measures that are discussed under the heading ‘Corporate Social Responsibility’ on pages 38 and 39.
Adjusted operating profit
Adjusted operating profit is the measure used by the Board to assess the trading performance of our businesses and is therefore the measure of segment profit that we present under IFRS.
Adjusted operating profit is also presented on a consolidated basis because management believes it is important to consider the Group’s profitability on a basis consistent with that of its operating segments. When presented on a consolidated basis, adjusted operating profit is a non-GAAP measure.
Adjusted operating profit represents operating profit before specific items that are considered to hinder comparison of the trading performance of our businesses either year-on-year or with other businesses. Management believes that adjusted operating profit should, therefore, be made available to investors to assist in their assessment of the trading performance of our businesses.
During the periods under review, the items excluded from operating profit in arriving at adjusted operating profit were:
(a) | the amortisation of intangible assets arising on acquisitions; |
(b) | impairments, comprising impairments of goodwill and intangible assets arising on acquisitions and material impairments of other assets; |
(d) | the net gain or loss on disposals and on the exit of businesses; and |
(e) | in 2009, the gain recognised on amendments to certain post-employment benefit plans in North America. |
Goodwill and intangible assets arising on acquisitions are assets that are recognised only as a consequence of the required accounting for business combinations under IFRS. We, therefore, exclude the amortisation and any impairment of these assets from adjusted operating profit because these items hinder comparison of the trading performance of businesses that we have acquired with that of our other businesses.
Other items are excluded from adjusted operating profit because they are individually or collectively material items that are not considered to be representative of the trading performance of our businesses during the periods under review. Restructuring costs and the net gain or loss on disposals and on the exit of businesses reflect specific actions taken by management to improve the Group’s future profitability; impairments of long-lived assets represent the excess of their carrying amount over the amount that is expected to be recovered from them in the future; and the gain recognised on the amendments to certain post-employment benefit plans in North America represents reductions in the benefit obligations recognised in respect of the past service of participating employees.
Adjusted operating profit excludes items that can have a significant effect on the Group’s profit or loss and should, therefore, be used in conjunction with, not as a substitute for, operating profit. Management compensates for these limitations by separately monitoring the items that are excluded from operating profit in arriving at adjusted operating profit.
| | 2009
$m | | | 2008
$m | | 2007
$m | |
Total operations | | | | | | | | |
Adjusted operating profit: | | | | | | | | |
– Continuing operations | | 249.8 | | | 402.9 | | 530.2 | |
– Discontinued operations | | – | | | – | | 3.7 | |
| | 249.8 | | | 402.9 | | 533.9 | |
Reconciliation of operating profit to adjusted operating profit for the Group’s continuing operations are presented on page 154.
Adjusted operating margin
Adjusted operating margin represents adjusted operating profit expressed as a percentage of sales and is a non-GAAP measure when presented on a consolidated basis.
We use adjusted operating margin to measure the success of our businesses in managing their cost base and improving profitability.
| | 2009
$m | | | 2008
$m | | 2007
$m | |
Continuing operations | | | | | | | | |
Sales | | 4,180.1 | | | 5,515.9 | | 5,886.1 | |
Adjusted operating profit | | 249.8 | | | 402.9 | | 530.2 | |
Adjusted operating margin | | 6.0 | % | | 7.3 | % | 9.0 | % |
EXPLANATION OF KEY PERFORMANCE MEASURES (CONTINUED)
Underlying change in sales and adjusted operating profit
We use the underlying change in sales and adjusted operating profit to measure the organic growth of our businesses relative to each other, to our end markets and to our competitors.
We define the underlying change in a performance measure as the year-on-year change excluding the effect of exchange rate fluctuations on the translation into US dollars of the results of certain of the Group’s operations and the contribution before organic growth of businesses that were acquired or disposed of during the current and prior years.
Underlying changes in sales and adjusted operating profit are non-GAAP measures. Reconciliations identifying the underlying change in sales and adjusted operating profit for the Group’s continuing operations are presented on pages 156 to 158.
| | 2009
% | | | 2008
% | | 2007
% | |
Continuing operations | | | | | | | | |
Underlying change: | | | | | | | | |
– Sales | | (20.0 | ) | | (5.6 | ) | 0.9 | |
– Adjusted operating profit | | (32.3 | ) | | (25.7 | ) | (4.2 | ) |
Underlying changes in sales and adjusted operating profit do not reflect the potentially significant effect on the Group’s profit or loss of exchange rate fluctuations and recent acquisitions and disposals. Accordingly, management uses these measures in conjunction with, not as substitutes for, sales and operating profit reported in accordance with IFRS.
Adjusted earnings per share
Adjusted earnings per share is a non-GAAP measure that is based on earnings from continuing operations adjusted for the specific items excluded from operating profit in arriving at adjusted operating profit and the tax effects of those items.
As explained under the heading ‘Adjusted operating profit’ above, management considers that the items excluded in arriving at adjusted operating profit hinder comparison of the trading performance of our businesses. Management, therefore, believes that adjusted earnings per share is useful to investors in assessing the Group’s ability to generate earnings and provides a basis for assessing the value of the Company’s ordinary shares (for example, by way of price earnings multiples).
Adjusted basic and diluted earnings per share are calculated using the average number of shares that would be used in calculating the equivalent measures under IFRS, as described in note 15 to the consolidated financial statements.
Reconciliations of adjusted basic and diluted earnings per share to basic and diluted earnings per share calculated under IFRS are presented on page 154.
Adjusted earnings per share measures do not reflect items that can have a significant effect on the Group’s profit or loss and should, therefore, be used in conjunction with, not as substitutes for, the earnings per share measures defined under IFRS.
| | 2009 | | | 2008 | | 2007 | |
Continuing operations | | | | | | | | |
Adjusted EPS: | | | | | | | | |
– Basic | | 14.86c | | | 26.03c | | 37.55c | |
– Diluted | | 14.81c | | | 25.96c | | 37.10c | |
Trading cash flow (previously referred to as ‘operating cash flow’)
Trading cash flow is a non-GAAP measure that we use as a measure of the cash generated by our businesses from their trading activities.
Trading cash flow represents cash generated from operations less net capital expenditure (cash outflows on the purchase of property, plant and equipment and non-integral computer software, less proceeds on the disposal of property, plant and equipment).
A reconciliation of cash generated from operations to trading cash flow is presented in the analysis of the movement in net debt on page 159
| | 2009
$m | | | 2008
$m | | 2007
$m | |
Total operations | | | | | | | | |
Trading cash flow | | 422.0 | | | 442.8 | | 441.8 | |
Trading cash flow reflects net capital expenditure which may fluctuate considerably from one year to another in an individual business, depending on the timing of capital projects and asset disposals. Management, therefore, uses trading cash flow in conjunction with, not as a substitute for, cash generated from operations in assessing the cash generation of the Group’s businesses.
Cash conversion
Cash conversion is a non-GAAP measure that we use as a measure of the efficiency of our businesses in converting their trading results into cash.
Cash conversion represents trading cash flow before cash outflows relating to restructuring projects, expressed as a percentage of adjusted operating profit.
$ million, unless stated otherwise | | 2009 | | | 2008 | | 2007 | |
Total operations | | | | | | | | |
Trading cash flow | | 422.0 | | | 442.8 | | 441.8 | |
Adjusted for: | | | | | | | | |
– Cash outflow on | | | | | | | | |
restructuring costs | | 69.3 | | | 16.3 | | 1.2 | |
| | 491.3 | | | 459.1 | | 443.0 | |
Adjusted operating profit: | | | | | | | | |
– Continuing operations | | 249.8 | | | 402.9 | | 530.2 | |
– Discontinued operations | | – | | | – | | 3.7 | |
| | 249.8 | | | 402.9 | | 533.9 | |
Cash conversion | | 196.7 | % | | 113.9 | % | 83.0 | % |
|
| 153 |
| Explanation of Key
Performance Measures | |
Cash conversion reflects trading cash flow which may fluctuate considerably from one year to another in an individual business and affect comparison of cash conversion from one year to another and with other businesses. Management, therefore, uses cash conversion in conjunction with, not as a substitute for, cash generated from operations as a percentage of adjusted operating profit in assessing cash generation of the Group’s businesses.
Average operating working capital as a percentage of sales
We use average operating working capital as a percentage of sales to measure the efficiency of our businesses in managing their working capital levels.
Average operating working capital is the thirteen-month end average of operating working capital which is defined as inventories and the net amount of trade and other receivables and payables that relate to items that comprise adjusted operating profit (so excludes, for example, interest payable and receivable, income taxes payable and receivable and amounts payable and receivable in relation to restructuring initiatives).
$ million, unless stated otherwise | | 2009 | | | 2008 | | 2007 | |
Total operations | | | | | | | | |
Sales: | | | | | | | | |
– Continuing operations | | 4,180.1 | | | 5,515.9 | | 5,886.1 | |
– Discontinued operations | | – | | | – | | 157.6 | |
| | 4,180.1 | | | 5,515.9 | | 6,043.7 | |
Average operating | | | | | | | | |
working capital | | 834.0 | | | 1,022.5 | | 1,056.4 | |
Average operating working | | | | | | | | |
capital as a percentage | | | | | | | | |
of sales | | 20.0 | % | | 18.5 | % | 17.5 | % |
Net capital expenditure: depreciation
We use net capital expenditure expressed as a multiple of the depreciation expense for property, plant and equipment and the amortisation expense for non-integral computer software to monitor the level of replacement of productive assets of our businesses in accordance with our capital allocation strategy.
$ million, unless stated otherwise | | 2009 | | | 2008 | | 2007 | |
Total operations | | | | | | | | |
Capital expenditure | | 123.0 | | | 193.8 | | 236.5 | |
Disposal proceeds | | (12.9 | ) | | (7.9 | ) | (39.6 | ) |
Net capital expenditure | | 110.1 | | | 185.9 | | 196.9 | |
Depreciation | | 186.3 | | | 218.3 | | 229.1 | |
Net capital expenditure: | | | | | | | | |
depreciation | | 0.6 | x | | 0.9 | x | 0.9 | x |
Free cash flow
Free cash flow is a non-GAAP measure that we use as a measure of the cash generated from the Group’s operations that is available to return to shareholders, to fund strategic acquisitions or to reduce borrowings.
Free cash flow represents trading cash flow net of cash flows in relation to tax, interest and certain other items (principally dividends received from associates and cash flows involving minority shareholders).
A reconciliation of cash generated from operations to free cash flow is presented in the analysis of the movement in net debt on page 159.
| | 2009
$m | | | 2008
$m | | 2007
$m | |
Total operations | | | | | | | | |
Free cash flow | | 358.0 | | | 300.9 | | 290.0 | |
Free cash flow does not reflect any restrictions on the transfer of cash and cash equivalents within the Group or any requirement to repay the Group’s borrowings and does not take into account cash flows that are available from disposals or the issue of shares. Management, therefore, takes such factors into account in addition to free cash flow when determining the resources available for acquisitions and for distribution to shareholders.
Net debt
Net debt represents the net total of bank overdrafts, bank and other loans, finance lease obligations and the carrying amount of derivatives used to hedge the Group’s translational exposures, less cash and cash equivalents and collateralised cash (included in trade and other receivables).
Management considers net debt to be a component of the Group’s capital. An analysis of net debt is, therefore, presented in note 40 to the consolidated financial statements.
Management uses net debt, rather than the narrower measure of cash and cash equivalents which forms the basis for the consolidated cash flow statement, as a measure of the Group’s liquidity and in assessing the strength of the Group’s balance sheet. On page 159, we, therefore, present an analysis of the movement in net debt that, for ease of reconciliation, shows the effect on net debt of each of the items presented in the consolidated cash flow statement.
| | | 2009
$m | | | 2008
$m | | 2007
$m |
Total operations | | | | | | | | |
Net debt | | | 207.5 | | | 476.4 | | 591.5 |
EXPLANATION OF KEY PERFORMANCE MEASURES (CONTINUED)
Supplementary reconciliations (unaudited)
Continuing operations – Reconciliation of operating profit to adjusted operating profit
| | 2009
$ million | | | 2008
$ million | | 2007
$ million | |
Operating profit | | 84.7 | | | 66.9 | | 586.0 | |
Adjusted for: | | | | | | | | |
– Amortisation of intangibles arising on acquisitions | | 11.2 | | | 10.6 | | 7.2 | |
– Restructuring costs | | 144.1 | | | 26.0 | | 27.6 | |
– Net gain on disposals and on the exit of businesses | | (0.2 | ) | | (43.0 | ) | (91.4 | ) |
– Impairments | | 73.0 | | | 342.4 | | 0.8 | |
– Gain on amendment of post-employment benefits | | (63.0 | ) | | – | | – | |
| | 165.1 | | | 336.0 | | (55.8 | ) |
Adjusted operating profit | | 249.8 | | | 402.9 | | 530.2 | |
Continuing operations – Reconciliation of earnings per share to adjusted earnings per share
$ million, unless stated otherwise | | 2009 | | | 2008 | | 2007 | |
(Loss)/earnings for basic earnings per share | | (11.7 | ) | | (64.6 | ) | 360.2 | |
Adjusted for: | | | | | | | | |
– Adjustments made to operating profit (see above) | | 165.1 | | | 336.0 | | (55.8 | ) |
– Tax effect of adjustments | | (22.5 | ) | | (42.4 | ) | 22.4 | |
Earnings for adjusted basic earnings per share | | 130.9 | | | 229.0 | | 326.8 | |
Dividends payable on preference shares | | – | | | – | | 1.2 | |
Earnings for adjusted diluted earnings per share | | 130.9 | | | 229.0 | | 328.0 | |
| | | | | | | | |
Weighted average number of ordinary shares | | | | | | | | |
For calculating basic earnings per share | | 880,799,900 | | | 879,727,725 | | 870,297,953 | |
For calculating diluted earnings per share | | 883,593,394 | | | 881,993,293 | | 884,031,113 | |
| | | | | | | | |
Adjusted earnings per share | | | | | | | | |
Basic | | 14.86c | | | 26.03c | | 37.55c | |
Diluted | | 14.81c | | | 25.96c | | 37.10c | |
Continuing operations – Reconciliation of operating profit to adjusted operating profit
2009
| | Operating
profit/(loss)
$ million | | Amortisation
of intangibles
arising on
acquisitions
$ million | | Restructuring
costs
$ million | | (Gain)/loss on
disposals and
on the exit of
businesses
$ million | | Impairments
$ million | | Gain on
amendment
of post-
employment
benefits
$ million | | Adjusted
operating profit/(loss)
$ million | |
Industrial & Automotive: | | | | | | | | | | | | | | | |
– Power Transmission | | 143.0 | | 0.3 | | 75.6 | | – | | 23.2 | | (29.7 | ) | 212.4 | |
– Fluid Power | | (22.8 | ) | 3.9 | | 26.0 | | – | | 12.5 | | (31.4 | ) | (11.8 | ) |
– Sensors & Valves | | (3.5 | ) | 0.4 | | 3.2 | | – | | – | | – | | 0.1 | |
– Other I&A | | 13.8 | | 0.7 | | 12.2 | | (0.3 | ) | 0.7 | | (1.7 | ) | 25.4 | |
| | 130.5 | | 5.3 | | 117.0 | | (0.3 | ) | 36.4 | | (62.8 | ) | 226.1 | |
Building Products: | | | | | | | | | | | | | | | |
– Air Distribution | | 48.2 | | 5.9 | | 5.1 | | – | | 18.6 | | – | | 77.8 | |
– Bathware | | (12.8 | ) | – | | 1.6 | | – | | 2.5 | | – | | (8.7 | ) |
| | 35.4 | | 5.9 | | 6.7 | | – | | 21.1 | | – | | 69.1 | |
Corporate | | (48.2 | ) | – | | 0.5 | | 0.1 | | 15.5 | | (0.2 | ) | (32.3 | ) |
Total ongoing segments | | 117.7 | | 11.2 | | 124.2 | | (0.2 | ) | 73.0 | | (63.0 | ) | 262.9 | |
Exited segments | | (33.0 | ) | – | | 19.9 | | – | | – | | – | | (13.1 | ) |
Continuing operations | | 84.7 | | 11.2 | | 144.1 | | (0.2 | ) | 73.0 | | (63.0 | ) | 249.8 | |
|
| 155 |
| Explanation of Key
Performance Measures | |
Continuing operations – Reconciliation of operating profit to adjusted operating profit (continued)
2008
| | Operating
profit/(loss)
$ million | | Amortisation
of intangibles
arising on
acquisitions
$ million | | Restructuring
costs
$ million | | (Gain)/loss on
disposals and
on the exit of
businesses
$ million | | Impairments
$ million | | Gain on
amendment
of post-
employment
benefits
$ million | | Adjusted
operating
profit/(loss)
$ million | |
Industrial & Automotive: | | | | | | | | | | | | | | | |
– Power Transmission | | (70.6 | ) | 0.3 | | 13.8 | | – | | 284.6 | | – | | 228.1 | |
– Fluid Power | | 29.0 | | 3.6 | | 1.9 | | – | | 11.7 | | – | | 46.2 | |
– Sensors & Valves | | 27.7 | | 0.6 | | 0.2 | | – | | 1.1 | | – | | 29.6 | |
– Other I&A | | 41.6 | | 0.7 | | 3.2 | | – | | – | | – | | 45.5 | |
| | 27.7 | | 5.2 | | 19.1 | | – | | 297.4 | | – | | 349.4 | |
Building Products: | | | | | | | | | | | | | | | |
– Air Distribution | | 61.2 | | 5.4 | | 3.6 | | – | | 34.0 | | – | | 104.2 | |
– Bathware | | (14.2 | ) | – | | 2.2 | | 0.2 | | – | | – | | (11.8 | ) |
| | 47.0 | | 5.4 | | 5.8 | | 0.2 | | 34.0 | | – | | 92.4 | |
Corporate | | (37.3 | ) | – | | 0.3 | | – | | – | | – | | (37.0 | ) |
Total ongoing segments | | 37.4 | | 10.6 | | 25.2 | | 0.2 | | 331.4 | | – | | 404.8 | |
Exited segments | | 29.5 | | – | | 0.8 | | (43.2 | ) | 11.0 | | – | | (1.9 | ) |
Continuing operations | | 66.9 | | 10.6 | | 26.0 | | (43.0 | ) | 342.4 | | – | | 402.9 | |
2007
| | Operating
profit/(loss)
$ million | | Amortisation
of intangibles
arising on
acquisitions
$ million | | Restructuring
costs
$ million | | (Gain)/loss on
disposals and
on the exit of
businesses
$ million | | Impairments
$ million | | Gain on
Amendment
of post-
employment
benefits
$ million | | Adjusted
operating
profit/(loss)
$ million | |
Industrial & Automotive: | | | | | | | | | | | | | | | |
– Power Transmission | | 261.8 | | 0.3 | | 6.0 | | (0.2 | ) | – | | – | | 267.9 | |
– Fluid Power | | 60.0 | | 2.4 | | 8.6 | | – | | – | | – | | 71.0 | |
– Sensors & Valves | | 28.4 | | – | | (0.2 | ) | 2.8 | | 0.8 | | – | | 31.8 | |
– Other I&A | | 73.4 | | 0.7 | | – | | – | | – | | – | | 74.1 | |
| | 423.6 | | 3.4 | | 14.4 | | 2.6 | | 0.8 | | – | | 444.8 | |
Building Products: | | | | | | | | | | | | | | | |
– Air Distribution | | 91.3 | | 3.8 | | 7.4 | | – | | – | | – | | 102.5 | |
– Bathware | | 4.0 | | – | | 1.8 | | – | | – | | – | | 5.8 | |
| | 95.3 | | 3.8 | | 9.2 | | – | | – | | – | | 108.3 | |
Corporate | | (39.3 | ) | – | | 1.0 | | (15.4 | ) | – | | – | | (53.7 | ) |
Total ongoing segments | | 479.6 | | 7.2 | | 24.6 | | (12.8 | ) | 0.8 | | – | | 499.4 | |
Exited segments | | 106.4 | | – | | 3.0 | | (78.6 | ) | – | | – | | 30.8 | |
Continuing operations | | 586.0 | | 7.2 | | 27.6 | | (91.4 | ) | 0.8 | | – | | 530.2 | |
EXPLANATION OF KEY PERFORMANCE MEASURES (CONTINUED)
Continuing operations – Underlying change in sales and adjusted operating profit
2009 compared with 2008
| | 2008
$ million | | Exchange
rate effect
$ million | | Disposals
$ million | | Like-for-like basis
$ million | | Acquisitions
$ million | | Underlying
change
$ million | | 2009
$ million | | Underlying
change*
% |
|
Sales | | | | | | | | | | | | | | | | | |
Industrial & Automotive: | | | | | | | | | | | | | | | | | |
– Power Transmission | | 2,125.2 | | (150.6 | ) | – | | 1,974.6 | | – | | (211.2 | ) | 1,763.4 | | (10.7 | )% |
– Fluid Power | | 832.3 | | (34.1 | ) | – | | 798.2 | | 14.2 | | (223.7 | ) | 588.7 | | (28.0 | )% |
– Sensors & Valves | | 421.0 | | (42.8 | ) | – | | 378.2 | | – | | (64.6 | ) | 313.6 | | (17.1 | )% |
– Other I&A | | 602.1 | | (4.5 | ) | – | | 597.6 | | – | | (134.2 | ) | 463.4 | | (22.5 | )% |
| | 3,980.6 | | (232.0 | ) | – | | 3,748.6 | | 14.2 | | (633.7 | ) | 3,129.1 | | (16.9 | )% |
Building Products: | | | | | | | | | | | | | | | | | |
– Air Distribution | | 1,112.3 | | (14.8 | ) | – | | 1,097.5 | | 12.2 | | (235.5 | ) | 874.2 | | (21.5 | )% |
– Bathware | | 208.2 | | – | | – | | 208.2 | | – | | (67.9 | ) | 140.3 | | (32.6 | )% |
| | 1,320.5 | | (14.8 | ) | – | | 1,305.7 | | 12.2 | | (303.4 | ) | 1,014.5 | | (23.2 | )% |
Total ongoing segments | | 5,301.1 | | (246.8 | ) | – | | 5,054.3 | | 26.4 | | (937.1 | ) | 4,143.6 | | (18.5 | )% |
Exited segments | | 214.8 | | (0.6 | ) | (79.5 | ) | 134.7 | | – | | (98.2 | ) | 36.5 | | (72.9 | )% |
Continuing operations | | 5,515.9 | | (247.4 | ) | (79.5 | ) | 5,189.0 | | 26.4 | | (1,035.3 | ) | 4,180.1 | | (20.0 | )% |
| | | | | | | | | | | | | | | | | |
Adjusted operating profit/(loss) | | | | | | | | | | | | | | | | | |
Industrial & Automotive: | | | | | | | | | | | | | | | | | |
– Power Transmission | | 228.1 | | (14.4 | ) | – | | 213.7 | | – | | (1.3 | ) | 212.4 | | (0.6 | )% |
– Fluid Power | | 46.2 | | (0.5 | ) | – | | 45.7 | | (1.3 | ) | (56.2 | ) | (11.8 | ) | (123.0 | )% |
– Sensors & Valves | | 29.6 | | (4.0 | ) | – | | 25.6 | | – | | (25.5 | ) | 0.1 | | (99.6 | )% |
– Other I&A | | 45.5 | | (0.6 | ) | – | | 44.9 | | – | | (19.5 | ) | 25.4 | | (43.4 | )% |
| | 349.4 | | (19.5 | ) | – | | 329.9 | | (1.3 | ) | (102.5 | ) | 226.1 | | (31.1 | )% |
Building Products: | | | | | | | | | | | | | | | | | |
– Air Distribution | | 104.2 | | (1.6 | ) | – | | 102.6 | | (0.3 | ) | (24.5 | ) | 77.8 | | (23.9 | )% |
– Bathware | | (11.8 | ) | – | | – | | (11.8 | ) | – | | 3.1 | | (8.7 | ) | 26.3 | % |
| | 92.4 | | (1.6 | ) | – | | 90.8 | | (0.3 | ) | (21.4 | ) | 69.1 | | (23.6 | )% |
Corporate | | (37.0 | ) | – | | – | | (37.0 | ) | – | | 4.7 | | (32.3 | ) | 12.7 | % |
Total ongoing segments | | 404.8 | | (21.1 | ) | – | | 383.7 | | (1.6 | ) | (119.2 | ) | 262.9 | | (31.1 | )% |
Exited segments | | (1.9 | ) | – | | (10.3 | ) | (12.2 | ) | – | | (0.9 | ) | (13.1 | ) | 7.4 | % |
Continuing operations | | 402.9 | | (21.1 | ) | (10.3 | ) | 371.5 | | (1.6 | ) | (120.1 | ) | 249.8 | | (32.3 | )% |
* | The underlying percentage change is the underlying change as a percentage of the like-for-like basis |
|
| 157 |
| Explanation of Key
Performance Measures | |
Continuing operations – Underlying change in sales and adjusted operating profit
2008 compared with 2007
| | 2007
$ million | | Exchange
rate effect
$ million | | Disposals
$ million | | Like-for-like
basis
$ million | | Acquisitions
$ million | | Underlying
change
$ million | | 2008
$ million | | Underlying
change*
% |
|
Sales | | | | | | | | | | | | | | | | | |
Industrial & Automotive: | | | | | | | | | | | | | | | | | |
– Power Transmission | | 2,078.6 | | 138.8 | | – | | 2,217.4 | | – | | (92.2 | ) | 2,125.2 | | (4.2 | )% |
– Fluid Power | | 769.1 | | 13.4 | | – | | 782.5 | | 17.9 | | 31.9 | | 832.3 | | 4.1 | % |
– Sensors & Valves | | 413.5 | | 3.1 | | – | | 416.6 | | 4.5 | | (0.1 | ) | 421.0 | | (0.0 | )% |
– Other I&A | | 717.5 | | 2.1 | | – | | 719.6 | | – | | (117.5 | ) | 602.1 | | (16.3 | )% |
| | 3,978.7 | | 157.4 | | – | | 4,136.1 | | 22.4 | | (177.9 | ) | 3,980.6 | | (4.3 | )% |
Building Products: | | | | | | | | | | | | | | | | | |
– Air Distribution | | 1,083.6 | | (1.3 | ) | – | | 1,082.3 | | 41.1 | | (11.1 | ) | 1,112.3 | | (1.0 | )% |
– Bathware | | 275.5 | | – | | – | | 275.5 | | – | | (67.3 | ) | 208.2 | | (24.4 | )% |
| | 1,359.1 | | (1.3 | ) | – | | 1,357.8 | | 41.1 | | (78.4 | ) | 1,320.5 | | (5.8 | )% |
Total ongoing segments | | 5,337.8 | | 156.1 | | – | | 5,493.9 | | 63.5 | | (256.3 | ) | 5,301.1 | | (4.7 | )% |
Exited segments | | 548.3 | | 1.8 | | (268.7 | ) | 281.4 | | – | | (66.6 | ) | 214.8 | | (23.7 | )% |
Continuing operations | | 5,886.1 | | 157.9 | | (268.7 | ) | 5,775.3 | | 63.5 | | (322.9 | ) | 5,515.9 | | (5.6 | )% |
| | | | | | | | | | | | | | | | | |
Adjusted operating profit/(loss) | | | | | | | | | | | | | | | | | |
Industrial & Automotive: | | | | | | | | | | | | | | | | | |
– Power Transmission | | 267.9 | | 17.6 | | – | | 285.5 | | – | | (57.4 | ) | 228.1 | | (20.1 | )% |
– Fluid Power | | 71.0 | | 1.2 | | – | | 72.2 | | 4.5 | | (30.5 | ) | 46.2 | | (42.2 | )% |
– Sensors & Valves | | 31.8 | | (0.4 | ) | – | | 31.4 | | 2.7 | | (4.5 | ) | 29.6 | | (14.3 | )% |
– Other I&A | | 74.1 | | 0.4 | | – | | 74.5 | | – | | (29.0 | ) | 45.5 | | (38.9 | )% |
| | 444.8 | | 18.8 | | – | | 463.6 | | 7.2 | | (121.4 | ) | 349.4 | | (26.2 | )% |
Building Products: | | | | | | | | | | | | | | | | | |
– Air Distribution | | 102.5 | | (0.2 | ) | – | | 102.3 | | 3.1 | | (1.2 | ) | 104.2 | | (1.2 | )% |
– Bathware | | 5.8 | | – | | – | | 5.8 | | – | | (17.6 | ) | (11.8 | ) | (303.4 | )% |
| | 108.3 | | (0.2 | ) | – | | 108.1 | | 3.1 | | (18.8 | ) | 92.4 | | (17.4 | )% |
Corporate | | (53.7 | ) | 1.7 | | – | | (52.0 | ) | – | | 15.0 | | (37.0 | ) | 28.8 | % |
Total ongoing segments | | 499.4 | | 20.3 | | – | | 519.7 | | 10.3 | | (125.2 | ) | 404.8 | | (24.1 | )% |
Exited segments | | 30.8 | | 0.1 | | (22.1 | ) | 8.8 | | – | | (10.7 | ) | (1.9 | ) | (121.6 | )% |
Continuing operations | | 530.2 | | 20.4 | | (22.1 | ) | 528.5 | | 10.3 | | (135.9 | ) | 402.9 | | (25.7 | )% |
* | The underlying percentage change is the underlying change as a percentage of the like-for-like basis |
EXPLANATION OF KEY PERFORMANCE MEASURES (CONTINUED)
Continuing operations – Underlying change in sales and adjusted operating profit 2007 compared with 2006
| | 2006
$ million | | Exchange
rate effect
$ million | | Disposals
$ million | | Like-for-like
basis
$ million | | Acquisitions
$ million | | Underlying
change
$ million | | 2007
$ million | | Underlying
change*
% |
Sales | | | | | | | | | | | | | | | | |
Industrial & Automotive: | | | | | | | | | | | | | | | | |
– Power Transmission | | 1,852.8 | | 88.9 | | – | | 1,941.7 | | 11.1 | | 125.8 | | 2,078.6 | | 6.5% |
– Fluid Power | | 709.4 | | 20.8 | | – | | 730.2 | | 10.7 | | 28.2 | | 769.1 | | 3.9% |
– Sensors & Valves | | 284.8 | | 18.0 | | – | | 302.8 | | 1.3 | | 109.4 | | 413.5 | | 36.1% |
– Other I&A | | 767.9 | | 5.7 | | – | | 773.6 | | 0.5 | | (56.6 | ) | 717.5 | | (7.3)% |
| | 3,614.9 | | 133.4 | | – | | 3,748.3 | | 23.6 | | 206.8 | | 3,978.7 | | 5.5% |
Building Products: | | | | | | | | | | | | | | | | |
– Air Distribution | | 1,070.6 | | 5.4 | | – | | 1,076.0 | | 40.9 | | (33.3 | ) | 1,083.6 | | (3.1)% |
– Bathware | | 344.7 | | – | | – | | 344.7 | | – | | (69.2 | ) | 275.5 | | (20.1)% |
| | 1,415.3 | | 5.4 | | – | | 1,420.7 | | 40.9 | | (102.5 | ) | 1,359.1 | | (7.2)% |
Total ongoing segments | | 5,030.2 | | 138.8 | | – | | 5,169.0 | | 64.5 | | 104.3 | | 5,337.8 | | 2.0% |
Exited segments | | 715.9 | | 1.7 | | (116.8 | ) | 600.8 | | – | | (52.5 | ) | 548.3 | | (8.7)% |
Continuing operations | | 5,746.1 | | 140.5 | | (116.8 | ) | 5,769.8 | | 64.5 | | 51.8 | | 5,886.1 | | 0.9% |
| | | | | | | | | | | | | | | | |
Adjusted operating profit/(loss) | | | | | | | | | | | | | | | | |
Industrial & Automotive: | | | | | | | | | | | | | | | | |
– Power Transmission | | 257.6 | | 10.9 | | – | | 268.5 | | 0.8 | | (1.4 | ) | 267.9 | | (0.5)% |
– Fluid Power | | 64.4 | | 1.7 | | – | | 66.1 | | 2.1 | | 2.8 | | 71.0 | | 4.2% |
– Sensors & Valves | | 10.4 | | 0.8 | | – | | 11.2 | | 1.1 | | 19.5 | | 31.8 | | 174.1% |
– Other I&A | | 90.0 | | 0.7 | | – | | 90.7 | | 0.6 | | (17.2 | ) | 74.1 | | (19.0)% |
| | 422.4 | | 14.1 | | – | | 436.5 | | 4.6 | | 3.7 | | 444.8 | | 0.8% |
Building Products: | | | | | | | | | | | | | | | | |
– Air Distribution | | 106.3 | | 0.6 | | – | | 106.9 | | 1.9 | | (6.3 | ) | 102.5 | | (5.9)% |
– Bathware | | 30.9 | | – | | – | | 30.9 | | – | | (25.1 | ) | 5.8 | | (81.2)% |
| | 137.2 | | 0.6 | | – | | 137.8 | | 1.9 | | (31.4 | ) | 108.3 | | (22.8)% |
Corporate | | (52.8 | ) | (4.2 | ) | – | | (57.0 | ) | – | | 3.3 | | (53.7 | ) | (5.8)% |
Total ongoing segments | | 506.8 | | 10.5 | | – | | 517.3 | | 6.5 | | (24.4 | ) | 499.4 | | (4.7)% |
Exited segments | | 38.3 | | 0.1 | | (9.3 | ) | 29.1 | | – | | 1.7 | | 30.8 | | 5.8% |
Continuing operations | | 545.1 | | 10.6 | | (9.3 | ) | 546.4 | | 6.5 | | (22.7 | ) | 530.2 | | (4.2)% |
* | The underlying percentage change is the underlying change as a percentage of the like-for-like basis |
|
| 159 |
| Explanation of Key
Performance Measures | |
Analysis of movements in net debt
| | 2009
$ million | | | 2008
$ million | | 2007
$ million | |
Cash generated from operations: | | | | | | | | |
– Before cash outflow on restructurings | | 601.4 | | | 645.0 | | 639.9 | |
– Cash outflow on restructurings | | (69.3 | ) | | (16.3 | ) | (1.2 | ) |
Cash generated from operations | | 532.1 | | | 628.7 | | 638.7 | |
Capital expenditure: | | | | | | | | |
– Purchase of property, plant and equipment | | (115.2 | ) | | (183.2 | ) | (231.3 | ) |
– Purchase of computer software | | (7.8 | ) | | (10.6 | ) | (5.2 | ) |
| | (123.0 | ) | | (193.8 | ) | (236.5 | ) |
Disposal of property, plant and equipment | | 12.9 | | | 7.9 | | 39.6 | |
Trading cash flow | | 422.0 | | | 442.8 | | 441.8 | |
Tax: | | | | | | | | |
– Income taxes paid | | (50.3 | ) | | (116.3 | ) | (110.4 | ) |
– Income taxes received | | 31.2 | | | 31.8 | | 24.2 | |
| | (19.1 | ) | | (84.5 | ) | (86.2 | ) |
Interest and preference dividends: | | | | | | | | |
– Interest element of finance lease rental payments | | (0.4 | ) | | (0.5 | ) | (1.4 | ) |
– Interest received | | 3.6 | | | 11.2 | | 12.2 | |
– Interest paid | | (37.5 | ) | | (55.0 | ) | (64.8 | ) |
– Preference dividend paid | | – | | | – | | (2.0 | ) |
| | (34.3 | ) | | (44.3 | ) | (56.0 | ) |
Other movements: | | | | | | | | |
– Capitalisation of development costs | | (0.6 | ) | | (0.6 | ) | (0.4 | ) |
– Dividends received from associates | | 0.3 | | | 0.6 | | 1.4 | |
– Financing costs paid | | (6.3 | ) | | – | | – | |
– Investment by a minority shareholder in a subsidiary | | 4.7 | | | 0.4 | | 3.8 | |
– Dividend paid to a minority shareholder in a subsidiary | | (8.7 | ) | | (13.5 | ) | (14.4 | ) |
| | (10.6 | ) | | (13.1 | ) | (9.6 | ) |
Free cash flow | | 358.0 | | | 300.9 | | 290.0 | |
Ordinary dividends | | (48.3 | ) | | (246.2 | ) | (247.3 | ) |
Acquisitions and disposals: | | | | | | | | |
– Purchase of subsidiaries, net of cash acquired | | (26.5 | ) | | (65.0 | ) | (17.0 | ) |
– Sales of businesses and subsidiaries, net of cash disposed | | 0.7 | | | 124.6 | | 216.3 | |
– Leases disposed of on sale of businesses | | – | | | – | | 6.1 | |
– Purchase of available-for-sale investments | | – | | | (0.1 | ) | (0.2 | ) |
– Sale of available-for-sale investments | | – | | | 1.6 | | 0.6 | |
– Debt acquired on acquisition of subsidiaries | | (7.8 | ) | | (0.8 | ) | – | |
– Investment in associates | | (2.7 | ) | | (10.4 | ) | (3.8 | ) |
| | (36.3 | ) | | 49.9 | | 202.0 | |
Ordinary share movements: | | | | | | | | |
– Issue of ordinary shares | | 0.1 | | | 0.2 | | 2.4 | |
– Purchase of own shares | | (1.4 | ) | | (4.7 | ) | (6.9 | ) |
| | (1.3 | ) | | (4.5 | ) | (4.5 | ) |
Foreign currency movements: | | | | | | | | |
– Cash and cash equivalents | | 4.8 | | | (21.2 | ) | 19.5 | |
– Other net debt | | (48.1 | ) | | 215.9 | | (42.5 | ) |
– Receipts/(payments) on foreign currency derivatives | | 39.6 | | | (178.6 | ) | (16.3 | ) |
| | (3.7 | ) | | 16.1 | | (39.3 | ) |
Cash movement in net debt | | 268.4 | | | 116.2 | | 200.9 | |
Non-cash movements | | 0.5 | | | (1.1 | ) | (1.6 | ) |
Conversion of preference shares | | – | | | – | | 130.0 | |
Decrease in net debt | | 268.9 | | | 115.1 | | 329.3 | |
FIVE-YEAR SUMMARY (UNAUDITED)
$ million, unless stated otherwise | | Year ended
2 January
2010 | (1) | Year ended
3 January
2009 | (1) (2) | Year ended
29 December
2007 | (1) (2) | Year ended
30 December
2006 | (1) (2) | Year ended
31 December
2005 | (1) (2) |
Consolidated income statement data | | | | | | | | | | | |
Sales | | 4,180.1 | | 5,515.9 | | 5,886.1 | | 5,746.1 | | 5,380.2 | |
Adjusted operating profit(3) | | 249.8 | | 402.9 | | 530.2 | | 545.1 | | 547.2 | |
Amortisation of intangible assets arising on acquisitions | | (11.2 | ) | (10.6 | ) | (7.2 | ) | (5.0 | ) | (0.4 | ) |
Impairment | | (73.0 | ) | (342.4 | ) | (0.8 | ) | (2.9 | ) | (0.4 | ) |
Restructuring costs | | (144.1 | ) | (26.0 | ) | (27.6 | ) | (23.9 | ) | (7.6 | ) |
Net gain on disposals and on the exit of businesses | | 0.2 | | 43.0 | | 91.4 | | 5.7 | | 15.4 | |
Gain on amendment of post-employment benefits | | 63.0 | | – | | – | | – | | – | |
Operating profit | | 84.7 | | 66.9 | | 586.0 | | 519.0 | | 554.2 | |
Profit/(loss) before tax | | 38.4 | | (8.1 | ) | 525.1 | | 448.4 | | 483.8 | |
Profit/(loss) from continuing operations | | 9.9 | | (46.5 | ) | 385.2 | | 382.8 | | 374.9 | |
Loss from discontinued operations | | (3.9 | ) | – | | (66.7 | ) | (21.3 | ) | (9.8 | ) |
Profit/(loss) for the period | | 6.0 | | (46.5 | ) | 318.5 | | 361.5 | | 365.1 | |
Minority interests | | (21.6 | ) | (18.1 | ) | (25.0 | ) | (20.5 | ) | (16.3 | ) |
(Loss)/profit attributable to equity shareholders | | (15.6 | ) | (64.6 | ) | 293.5 | | 341.0 | | 348.8 | |
| | | | | | | | | | | |
(Loss)/earnings per ordinary share | | | | | | | | | | | |
Basic | | | | | | | | | | | |
Continuing operations | | (1.33 | )c | (7.34 | )c | 41.38 | c | 43.19 | c | 46.49 | c |
Discontinued operations | | (0.44 | )c | – | c | (7.66 | )c | (2.54 | )c | (1.27 | )c |
Total operations | | (1.77 | )c | (7.34 | )c | 33.72 | c | 40.65 | c | 45.22 | c |
Diluted | | | | | | | | | | | |
Continuing operations | | (1.33 | )c | (7.34 | )c | 40.88 | c | 42.11 | c | 44.30 | c |
Discontinued operations | | (0.44 | )c | – | c | (7.54 | )c | (2.41 | )c | (1.12 | )c |
Total operations | | (1.77 | )c | (7.34 | )c | 33.34 | c | 39.70 | c | 43.18 | c |
Average number of ordinary shares (millions) | | | | | | | | | | | |
Basic | | 880.8 | | 879.7 | | 870.3 | | 838.9 | | 771.4 | |
Diluted | | 880.8 | | 879.7 | | 884.0 | | 883.8 | | 876.4 | |
Dividends for the period | | | | | | | | | | | |
Per ordinary share (4) | | 10.00 | c | 13.02 | c | 27.68 | c | 27.25 | c | 24.09 | c |
Per ADS (4) | | 40.00 | c | 52.08 | c | 110.72 | c | 109.00 | c | 96.36 | c |
| | | | | | | | | | | |
| | As at
2 January
2010 | (1) | As at
3 January
2009 | (1) (2) | As at
29 December
2007 | (1) (2) | As at
30 December
2006 | (1) (2) | As at
31 December
2005 | (1) (2) |
Consolidated balance sheet data | | | | | | | | | | | |
Goodwill and other intangible assets | | 514.0 | | 524.7 | | 753.1 | | 731.4 | | 586.3 | |
Property, plant and equipment | | 1,122.8 | | 1,167.3 | | 1,414.4 | | 1,360.3 | | 1,427.9 | |
Other non-current assets | | 185.9 | | 196.3 | | 97.2 | | 91.4 | | 216.5 | |
Current assets | | 1,839.0 | | 1,882.4 | | 2,117.3 | | 2,085.2 | | 2,172.7 | |
Assets held for sale | | 11.9 | | – | | 90.9 | | 297.5 | | 23.0 | |
Total assets | | 3,673.6 | | 3,770.7 | | 4,472.9 | | 4,565.8 | | 4,426.4 | |
Current liabilities | | (810.1 | ) | (761.5 | ) | (874.9 | ) | (843.4 | ) | (935.8 | ) |
Non-current liabilities | | (1,185.5 | ) | (1,269.9 | ) | (1,315.1 | ) | (1,728.8 | ) | (2,266.7 | ) |
Liabilities associated with assets held for sale | | – | | – | | (28.1 | ) | (125.5 | ) | – | |
Total liabilities | | (1,995.6 | ) | (2,031.4 | ) | (2,218.1 | ) | (2,697.7 | ) | (3,202.5 | ) |
Net assets | | 1,678.0 | | 1,739.3 | | 2,254.8 | | 1,868.1 | | 1,223.9 | |
| | | | | | | | | | | |
Share capital | | 79.6 | | 79.7 | | 65.5 | | 62.9 | | 55.7 | |
Other reserves | | 1,457.0 | | 1,531.1 | | 2,072.3 | | 1,706.2 | | 1,085.1 | |
Shareholders’ equity | | 1,536.6 | | 1,610.8 | | 2,137.8 | | 1,769.1 | | 1,140.8 | |
Minority interests | | 141.4 | | 128.5 | | 117.0 | | 99.0 | | 83.1 | |
Total equity | | 1,678.0 | | 1,739.3 | | 2,254.8 | | 1,868.1 | | 1,223.9 | |
(1) | The selected financial data set out above has been extracted from the Group’s consolidated financial statements for the relevant year prepared in accordance with IFRS. |
(2) | Restated for the retrospective application of an amendment to IFRS 2 ‘Share-based Payment’ (see note 2 to the Group’s consolidated financial statements). |
(3) | Adjusted operating profit is a non-GAAP measure that is discussed under the heading ‘Explanation of Key Performance Measures’ on pages 151 to 159. |
(4) | Dividends in respect of 2007 and prior years were declared and paid in sterling and have been translated into US dollars at the exchange rate on their respective payment dates. |
|
| 161 |
| | |
SHAREHOLDER INFORMATION
History and development of the Company
Tomkins plc was incorporated in England in 1925 as F.H. Tomkins Buckle Company Limited, a small manufacturer of buckles and fasteners, which it remained until the 1980s. It was converted from a private company into a public company in March 1950, re-registered as a public limited company in February 1982, and changed its name to Tomkins plc in 1988.
In the late 1980s, the Company made a number of acquisitions of engineering companies in both the UK and the US. In 1992, the Group diversified into food manufacturing, with the acquisition of Ranks Hovis McDougall plc in the UK.
In 1996, the Group established the Industrial & Automotive business group with the acquisition of The Gates Corporation in the US.
In 1997, management embarked on a long-term programme of disposing of non-core businesses and enhancing its remaining core businesses through a number of bolt-on acquisitions. In the early 2000s, the Group disposed of its Food Manufacturing and Professional, Garden and Leisure Products business groups and became focused on its two remaining business groups: Industrial & Automotive and Building Products.
Industrial & Automotive manufactures a wide range of systems and components for car, truck and industrial equipment manufacturing markets, and industrial and automotive aftermarkets throughout the world. Industrial & Automotive is comprised of four ongoing operating segments: Power Transmission, Fluid Power, Sensors & Valves and Other Industrial & Automotive.
Industrial & Automotive acquired Stant Corporation and its subsidiaries (1997), Schrader-Bridgeport (1998), ACD Tridon (1999) and Stackpole (2003), and disposed of Trico (2007) and Stant Corporation (2008).
Building Products is comprised of two ongoing operating segments: Air Distribution and Bathware. Air Distribution supplies the industrial and residential HVAC market, mainly in North America. Bathware manufactures bath tubs, shower enclosures and an extensive range of luxury whirlpools, principally for the dealer/distributor market in the US.
Building Products was based on the acquisition of Philips Industries (1990) and acquired Hart & Cooley (1999), Ruskin Air Management (2000) and Selkirk (2006), and disposed of Lasco Fittings (2007) and closed the Philips Doors & Windows business (2009).
Incorporation
Tomkins plc is incorporated in England and Wales and is registered with the Registrar of Companies in England & Wales under number 203531.
The Company operates under English law.
Website
The Company’s website address is www.tomkins.co.uk. All of the Company’s recent results announcements and press releases are accessible on our website, together with this and previous annual reports and it provides direct links to the websites of the Group’s main operating companies. The Company’s website is not incorporated by reference into the Company’s Annual Report on Form 20-F for 2009.
The price of the Company’s ordinary shares and its ADRs is also available, with a 20-minute delay. In addition, the site also provides historic share price information, index comparators and a shareholding calculator tool.
ADR holders
Ordinary shares in Tomkins plc are listed on the London Stock Exchange and, in the form of ADSs, on the NYSE. ADSs, each representing four ordinary shares, are evidenced by ADRs issued by JPMorgan Chase Bank, N.A., as Depositary, pursuant to a sponsored ADR programme. The Company’s ADSs have been listed on the NYSE since February 1995, prior to which they were quoted on NASDAQ from November 1988.
Tomkins is subject to the regulations of the SEC as they apply to foreign companies and files with the SEC its Annual Report on Form 20-F and provides other information as required. ADR holders are not members of the Company but may instruct the Depositary as to the exercise of voting rights pertaining to the number of ordinary shares represented by their ADRs. ADR holders with queries about their holdings should contact the Depositary, whose contact details are provided on page 172.
SHAREHOLDER INFORMATION (CONTINUED)
Fees payable by ADR holders
Under the terms of the Depositary Agreement between the Depositary and the Company, the Depositary may charge holders of ADRs for certain services performed, as follows:
Nature of the service | | Associated fee |
(a) Depositing or substituting the underlying shares Issue of ADRs by the Depositary (including deposits and issuances in respect of share distributions, rights and other distributions). | | $5.00 for each 100 ADSs (or portion thereof) evidenced by the new ADRs delivered. |
(b) Receiving or distributing cash dividends made pursuant to the DepositaryAgreement | | $0.02 or less per ADS. |
(c) Selling or exercising rights | | $5.00 for each 100 ADSs (or portion thereof). |
(d) Withdrawing an underlying security Acceptance by the Depositary of ADRs surrendered for withdrawal of deposited securities. | | $5.00 for each 100 ADSs (or portion thereof) evidenced by the ADRs surrendered. |
(e) Transferring, splitting or combining ADRs | | $1.50 per ADR. |
(f) General depositary services | | $0.02 per ADS |
At the sole discretion of the Depositary, an annual charge may be levied on ADR holders for administering the ADRs. The charges may be billed separately or deducted from one or more cash dividends or other cash distributions. | | (or portion thereof). |
(g) Expenses of the Depositary | | Expenses are payable by billing |
Including expenses incurred in relation to foreign exchange control regulations or any law or regulation relating to foreign investment; or in connection with the Depositary’s (or its custodian’s) compliance with applicable law, rule or regulation, stock transfer or other taxes and other governmental charges, cable, telex, fax, or delivery charges incurred at the request of the holder, transfer or registration fees for the registration of the underlying security on any applicable register in connection with the deposit or withdrawal of ADSs, expenses of the Depositary in connection with the conversion of foreign currency into US dollars (which are paid out of such foreign currency) and any other charge payable by the Depositary or its agents. | | holders or by deducting charges from one or more cash dividends or other cash distributions. |
Note that the actual amounts charged by the Depositary (or its agents) may differ from those set out above, but may not exceed these levels.
Fees paid by the Depositary to the Company
During the year, the Company received the following amounts (directly and indirectly) from the Depositary:
Category of income | | Amount received
$ | |
Direct payments | | | |
Legal and accounting fees incurred in connection with the preparation of the Form 20-F and ongoing SEC compliance and listing requirements | | 76,138 | |
Investor relations (1) | | 123,530 | |
| | 199,668 | |
Indirect payments | | | |
Annual maintenance fee waived | | 50,000 | |
Waiver of costs incurred by the Depositary on the Company’s behalf (2) | | 20,000 | |
Waiver of investor relations services fees | | 135,000 | |
| | 205,000 | |
| | 404,668 | |
(1) | Includes professional service fees, shareholder services and out-of-pocket expenses. |
(2) | Includes costs in relation to the distribution of dividends, tax and regulatory compliance and annual meeting services. |
|
| 163 |
| Shareholder Information | |
Trading symbols
On the London Stock Exchange, the Company’s SEDOL number is 0896265 (ISIN code GB0008962655) and its trading symbol is ‘TOMK’. On the NYSE, the Company’s trading symbol for its ADRs is ‘TKS’.
Share price information
The high and low closing prices of the ordinary shares on the London Stock Exchange and the ADSs on the NYSE for the periods indicated are set out below. The tables do not reflect trading after the daily official close of the London Stock Exchange for which no official quotations exist.
Five-year annual prices
| | Pence per ordinary share | | US dollars per ADS | |
| | High | | Low | | High | | Low | |
2005 | | 302.50 | | 242.00 | | 22.43 | | 18.51 | |
2006 | | 343.75 | | 229.75 | | 25.36 | | 17.61 | |
2007 | | 302.50 | | 172.50 | | 23.92 | | 13.75 | |
2008 | | 194.75 | | 93.50 | | 15.09 | | 5.29 | |
2009 | | 197.90 | | 105.75 | | 12.85 | | 5.90 | |
Two-year quarterly prices
| | Pence per ordinary share | | US dollars per ADS | |
| | High | | Low | | High | | Low | |
2008 | | | | | | | | | |
Q1 | | 189.50 | | 150.75 | | 15.01 | | 12.19 | |
Q2 | | 194.75 | | 151.25 | | 15.09 | | 12.01 | |
Q3 | | 172.25 | | 115.50 | | 12.67 | | 9.32 | |
Q4 | | 154.75 | | 93.50 | | 11.07 | | 5.29 | |
2009 | | | | | | | | | |
Q1 | | 141.00 | | 105.75 | | 8.37 | | 5.90 | |
Q2 | | 182.50 | | 127.00 | | 10.99 | | 7.39 | |
Q3 | | 195.70 | | 143.25 | | 12.85 | | 9.30 | |
Q4 | | 197.90 | | 156.50 | | 12.84 | | 10.10 | |
2010 | | | | | | | | | |
Q1 (1) | | 212.00 | | 178.70 | | 13.65 | | 11.13 | |
(1) | Covering the period up to and including 24 February 2010. |
Most recent monthly prices
| | Pence per ordinary share | | US dollars per ADS | |
| | High | | Low | | High | | Low | |
August | | 190.10 | | 171.30 | | 12.59 | | 11.10 | |
September | | 195.70 | | 171.30 | | 12.85 | | 10.94 | |
October | | 195.70 | | 143.25 | | 12.19 | | 10.10 | |
November | | 190.30 | | 156.50 | | 12.52 | | 10.76 | |
December | | 187.40 | | 163.20 | | 12.84 | | 11.55 | |
January | | 212.00 | | 186.90 | | 13.65 | | 11.93 | |
February (1) | | 192.40 | | 178.70 | | 12.23 | | 11.13 | |
(1) | Covering the period up to and including 24 February 2010. |
Substantial shareholdings
The Company’s issued share capital as at 2 January 2010 consisted of 884,196,772 ordinary shares with a nominal value of 9 cents each.
As at 24 February 2010, 884,199,235 ordinary shares were in issue. As at that date, 923,267 ordinary shares were held by 63 registered holders with a registered address in the US and 57,821 ADRs were held by 141 registered holders with a registered address in the US. Since certain of the ordinary shares and ADRs were held by brokers and nominees, the number of record holders in the US may not be representative of the number of beneficial holders or of where the beneficial holders are resident.
Ordinary shareholders of the Company have equal voting rights.
To the Company’s knowledge, no person or entity other than those shown below is the owner of more than 5% of its outstanding ordinary shares, nor is the Company directly or indirectly owned or controlled by any corporation, by any government or by any other natural or legal person or persons, severally or jointly.
Based on an analysis of our share register as at 26 February 2010, the shareholders holding more than 5% of the Company’s outstanding ordinary shares were as follows:
| | Number of
ordinary
shares held | | Percentage
of issued
ordinary shares
held | |
Schroders plc | | 80,265,499 | | 9.08% | |
Massachusetts Financial | | | | | |
Services Company | | 67,629,214 | | 7.65% | |
This information has been based on an analysis of the shares held on Tomkins’ share register and differs from the table of substantial shareholdings on page 46 which shows voting rights officially notified under section 792 of the Companies Act 2006 by the relevant shareholders.
Significant changes in shareholders owning more than 5% of the ordinary share capital of the Company over the past three years were as follows:
Invesco Limited decreased their holding to 0.04% at 26 February 2010 from 0.83% at 19 February 2009 and from 7.17% at 3 April 2008, having held 5.15% as at 13 April 2007.
Nuveen Investment LLC decreased their holding to 0.09% at 26 February 2010 from 4.57% at 19 February 2009 and from 6.44% at 3 April 2008, having held 10.40% at 13 April 2007.
Sprucegrove Investments Management Ltd decreased their holding to 3.82% at 26 February 2010 from 4.83% at 19 February 2009 and from 5.11% at 3 April 2008, having held 5.89% as at 13 April 2007.
BlackRock, Inc. increased their holding during the year from 0.48% at 19 February 2009 to a maximum of 5.40% in December 2009. BlackRock, Inc. held 3.77% at 26 February 2010.
There are no arrangements currently known to the Company that would result in a change in control of the Company.
SHAREHOLDER INFORMATION (CONTINUED)
Analysis of ordinary shareholdings as at 24 February 2010
| | Number of
shareholders | | Number
of shares
‘000s | | % of share
capital | |
By type: | | | | | | | |
– Individuals | | 16,055 | | 51,979 | | 5.89 | |
– Financial institutions | | | | | | | |
and other corporates | | 2,194 | | 830,507 | | 94.11 | |
Total(1) | | | | 882,486 | | 100.00 | |
By size: | | | | | | | |
– 1 to 500 | | 4,854 | | 1,132 | | 0.13 | |
– 501 to 2,500 | | 8,566 | | 11,022 | | 1.25 | |
– 2,501 to 5,000 | | 2,418 | | 8,602 | | 0.97 | |
– 5,001 to 20,000 | | 1,609 | | 14,873 | | 1.69 | |
– 20,001 to 50,000 | | 302 | | 9,658 | | 1.09 | |
– 50,001 to 100,000 | | 110 | | 8,181 | | 0.93 | |
– 100,001 to 500,000 | | 202 | | 49,133 | | 5.57 | |
– Over 500,000 | | 188 | | 779,884 | | 88.37 | |
Total (1) | | | | 882,486 | | 100.00 | |
(1) | Excludes own shares held |
Purchases of ordinary shares
The table below sets out details of shares repurchased by the Company and affiliated purchasers in 2009 under publicly-announced plans or programmes.
| | Number
of shares
purchased | | Average
price paid
per share | | Maximum
number of
shares that
may yet be
purchased | |
April 2009 | | 632,500 | | 143.84p | | 88,415,177 | |
Total | | 632,500 | | | | | |
At the Company’s AGM on 1 May 2008, shareholders approved a resolution allowing the Company to repurchase up to 88,410,677 ordinary shares of the Company. This approval expired at the next AGM of the Company held on 1 June 2009, at which shareholders approved a resolution allowing the Company to repurchase up to 88,415,177 ordinary shares of the Company. This approval will expire on 1 June 2010.
All shares repurchased in the period were purchased in order that they can, at the relevant time, be allocated to employees under the Company’s ABIP. As at 3 January 2009, the Company held 3,658,550 ordinary shares purchased for this purpose. During 2009, 1,752,118 ordinary shares were transferred to employees under the Company’s ABIP. As at 2 January 2010, the Company held 2,543,194 of its own ordinary shares.
Directors’ Report and Accounts – Companies House
Subject to the passing of the resolution to receive the financial statements that will be proposed at the Company’s AGM on 1 June 2010, a copy of the Annual Report, omitting photographic representations and with such further modifications as may be necessary, will be lodged with the Registrar of Companies in England & Wales in accordance with the Companies Act 2006. Further copies of the Annual Report in the form sent to shareholders will be available from the Company Secretary upon request.
Documents on display
The Company is subject to the information requirements of the Exchange Act and in accordance therewith files reports and other information with the SEC. These reports and other information can be inspected and copied at the public reference facilities maintained by the SEC, 100 F Street, N.E., Washington, D.C. 20549, and at the SEC’s regional office at Citicorp Center, 500 West Madison Street, Suite 1400, Chicago, Illinois 60661. You may request copies of all or a portion of these documents from the Public Reference Section of the SEC at 100 F Street, N.E., Washington, D.C. 20549, at prescribed rates. Reports filed by the Company with the SEC since August 2002 are available on the SEC’s website, at www.sec.gov.
As a foreign private issuer, the Company is exempt under the Exchange Act from, among other things, the rules prescribing the furnishing and content of proxy statements and the reporting and ‘short-swing’ profit recovery provisions contained in section 16 of the Exchange Act.
Memorandum and Articles of Association
General
The rights of the shareholders are set out in the Articles of the Company and are provided by applicable English law. The following summary of key provisions of the Articles is qualified in its entirety by reference to the Articles filed as Exhibit 1.1 to the Company’s Annual Report on Form 20-F for 2009.
The main objects and purposes of the Company, set out in Articles 4(a) to (c) of the Memorandum of Association, are as follows:
– | to co-ordinate and manage the business activities of the Company and generally to carry out the function of a group holding company; |
– | to carry on the business of hardware manufacture and the manufacture of and dealing in minerals and metals, and all kinds of other connected goods; and |
– | to carry on any other business of a similar nature which the Directors deem convenient for the Company to carry on, or consider will enhance or render more profitable the value of the Company’s property. |
On 1 October 2009, elements of the Companies Act 2006 took effect so that, despite the Company’s objects clause being found within its Memorandum of Association, they are deemed from that date to be part of the Articles of Association.
|
| 165 |
| Shareholder Information | |
Board of Directors
The Articles provide for a minimum of two and a maximum of 15 Directors. The shareholders may change these limits by passing an ordinary resolution. The Articles do not contain any requirement for a Director to hold qualification shares. At each AGM, the following shall retire:
– | any Director appointed by the Board since the last general meeting; |
– | any Director who held office at the time of the two preceding AGMs and who did not retire at either of them; and |
– | any Director who has been in office, other than as a Director holding an executive position, for a continuous period of nine years or more at the date of the meeting. |
Subject to the provisions of the Companies Act 2006, the Board may from time to time appoint one or more Directors to an executive office on such terms and for such period as it may determine. The Articles contain no age limit requirements for the retirement or non-retirement of Directors.
The Articles allow the Directors to authorise conflicts of interest and potential conflicts of interest, where appropriate, and contain other provisions for dealing with Directors’ conflicts of interest to avoid a breach of duty.
There are safeguards which will apply when the Directors decide whether to authorise a conflict or potential conflict. First, only Directors who have no interest in the matter being considered will be able to take the relevant decision and, secondly, in taking the decision, the Directors must act in a way they consider, in good faith, will be most likely to promote the Company’s success. The Directors are able to impose limits or conditions when giving authorisation if they think this is appropriate.
The Articles contain provisions relating to confidential information, attendance at Board meetings and availability of Board papers to protect a Director being in breach of duty if a conflict of interest or potential conflict of interest arises. These provisions will only apply where the position giving rise to the potential conflict has previously been authorised by the Directors.
A Director who has disclosed to the Board that he or she has an interest in any transaction or arrangement with the Company, may participate in such transaction or arrangement, but may not vote in respect of any such transaction. A Director may not be counted in the quorum of a meeting in relation to any resolution on which he is barred from voting.
Directors’ basic fees (other than the Chairman or an Executive Director) may not exceed £250,000 per annum as the Board (or any duly authorised committee thereof) may from time to time determine or such greater amount as the Company may, upon the recommendation of the Board, from time to time by ordinary resolution determine. Any Director who (by arrangement with the Board) performs or renders any special duties or services outside his ordinary duties as a Director may be awarded extra remuneration (in addition to fees or ordinary remuneration) by way of salary or commission or participation in profits or otherwise.
The Board may exercise all the powers of the Company to borrow money, mortgage property and assets and issue debentures and other securities. The Articles require the Board to restrict aggregate borrowings of the Company to one and a half times the share capital of the Company plus capital reserves (calculated as set forth in the Articles).
Share capital, dividends and voting rights
The authorised share capital of the Company is $142,664,780 divided into 1,585,164,220 ordinary shares with a nominal value of 9 cents each.
Under section 21 of the Companies Act 2006, the Company may by special resolution at a general meeting of shareholders alter its Articles and thereby alter the rights of the shareholders of the Company. For a special resolution to be passed, at least three-quarters of the votes cast must be in favour of the resolution. Whenever the share capital of the Company is divided into different classes of shares, the rights attached to any class may only be varied or abrogated either with the consent in writing of the holders of three-quarters of the issued shares of that class or with the sanction of a special resolution passed at a separate meeting of such holders. The Articles provide that the necessary quorum for a general meeting at which such a special resolution may be passed is at least two persons holding or representing by proxy no less than one-third in nominal amount of the issued shares of that class.
The Company in a general meeting of shareholders may declare dividends on the ordinary shares in its discretion by reference to an amount in sterling or in a foreign currency, but dividends may not exceed the amount recommended by the Board. Dividends remaining unclaimed for 12 years after having been declared are forfeited and revert to the Company.
Other than in specific circumstances set out in the Companies Act 2006, on a show of hands, each holder of ordinary shares, and proxies, present at a general meeting of the Company is entitled to one vote. On a poll, the holders of ordinary shares are entitled to one vote per share. Cumulative voting is not permitted.
Multiple proxies may be appointed provided that each proxy is appointed to exercise the rights attached to a different share or shares held by the shareholder.
There are no provisions in the Articles discriminating against an existing or prospective holder of securities as a result of such shareholder owning a substantial number of shares.
General meetings
The Company shall in each year hold a general meeting of shareholders within six months of its accounting reference date. The Board may call an extraordinary general meeting whenever it determines appropriate. In addition, members holding not less than one-tenth of the voting rights of the share capital entitled to vote at a general meeting of the Company can require an extraordinary general meeting to be convened.
Only shareholders registered in accordance with the Articles may be recognised as valid shareholders. There are no other limitations on the rights to own securities.
SHAREHOLDER INFORMATION (CONTINUED)
There are no provisions in the Articles that would have the effect of delaying, deferring or preventing a change of control of the Company and that would operate only with respect to a merger, acquisition or corporate restructuring involving the Company or any of its subsidiaries.
Disclosure of ownership
There are no provisions in the Articles relating to the ownership threshold above which shareholder ownership must be disclosed. The Disclosure and Transparency Rules require a shareholder to notify the Company if, as a result of an acquisition or disposal of shares or financial instruments, the percentage of voting rights held by the shareholder reaches, exceeds or falls below 3% or any 1% threshold above 3%, subject to certain exemptions.
Changes in capital
There are no conditions imposed by the Articles governing changes in capital that are more stringent than those conditions that would be required by governing English law.
Proposed amendment of the Articles
The Company will shortly seek shareholder approval to amend the Articles, primarily to reflect further provisions of the Companies Act 2006 that took effect on 1 October 2009. An explanation of the main differences between the Articles and the New Articles is set out below:
The Company’s objects
The provisions regulating the operations of the Company are currently set out in the Company’s Articles. The Company’s Memorandum of Association contains, among other things, the objects clause which sets out the scope of the activities the Company is authorised to undertake. This is drafted to give a wide scope.
The Companies Act 2006 significantly reduces the constitutional significance of a company’s memorandum of association. The Companies Act 2006 provides that a memorandum of association will record only the names of subscribers and the number of shares each subscriber has agreed to take in the company. Under the Companies Act 2006, the objects clause and all other provisions which are contained in a company’s memorandum of association, for existing companies at 1 October 2009, are deemed to be contained in the company’s articles of association but the company can remove these provisions by special resolution.
Further, the Companies Act 2006 states that, unless a company’s articles of association provide otherwise, a company’s objects are unrestricted. This abolishes the need for companies to have objects clauses. For this reason, the Company is proposing to remove its objects clause together with all other provisions of its Memorandum of Association which, by virtue of the Companies Act 2006, are treated as forming part of the Company’s Articles of Association from 1 October 2009, and replace them with an unrestricted objects clause within the New Articles. As the effect of this resolution will be to remove the statement currently in the Company’s Memorandum of Association regarding limited liability, the New Articles also contain an express statement regarding the limited liability of shareholders.
Use of seals
Under the Companies Act 1985, a company required authority in its articles of association to have an official seal for use abroad. Under the Companies Act 2006, such authority will no longer be required. Accordingly, the relevant authorisation has been removed in the New Articles.
The New Articles provide an alternative option for execution of documents (other than share certificates). Under the New Articles, when the seal is affixed to a document it may be signed by one Director in the presence of a witness, whereas previously the requirement was for signature by either a Director and the Company Secretary or two Directors or such other person or persons as the Directors may approve.
Voting by proxies on a show of hands
The Shareholders’ Rights Regulations have amended the Companies Act 2006 so that it now provides that each proxy appointed by a member has one vote on a show of hands unless the proxy is appointed by more than one member, in which case the proxy has one vote for and one vote against if the proxy has been instructed by one or more members to vote for the resolution and by one or more members to vote against the resolution. The New Articles reflect these changes.
Change of name
Under the Companies Act 1985, a company could only change its name by special resolution. Under the Companies Act 2006, a company is able to change its name by other means provided for by its articles of association. To take advantage of this provision, the New Articles will enable the Directors to pass a resolution to change the Company’s name.
Authorised share capital and unissued shares
The Companies Act 2006 abolishes the requirement for a company to have an authorised share capital. The New Articles reflect this change, though Directors will still be limited as to the number of shares they can at any time allot because allotment authority continues to be required under the Companies Act 2006, save in respect of employee share schemes.
Redeemable shares
Under the Companies Act 1985, if a company wished to issue redeemable shares, it had to include in its articles of association the terms and manner of redemption. The Companies Act 2006 enables directors to determine such matters instead, provided they are so authorised by the articles of association. The New Articles contain such an authorisation. The Company has no plans to issue redeemable shares, but if it did so, the Directors would need shareholders’ authority to issue new shares in the usual way.
|
| 167 |
| Shareholder Information | |
Authority to purchase own shares, consolidate and sub-divide shares, and reduce share capital
Under the Companies Act 1985, a company required specific enabling provisions in its articles of association to purchase its own shares, to consolidate or sub-divide its shares and to reduce its share capital or other undistributable reserves as well as shareholder authority to undertake the relevant action. The Articles include these enabling provisions. Under the Companies Act 2006, a company will only require shareholder authority to do any of these things and it will no longer be necessary for articles of association to contain enabling provisions. Accordingly, the relevant enabling provisions have been removed in the New Articles.
Vacation of office by Directors
The Articles specify the circumstances in which a Director must vacate office. The New Articles update these provisions to treat physical illness in the same manner as mental illness.
Adjournments for lack of quorum
Under the Companies Act 2006 as amended by the Shareholders’ Rights Regulations, general meetings adjourned for lack of quorum must be held at least ten clear days after the original meeting. The New Articles reflect this requirement.
Deferred shares
All reference to deferred shares in the Articles have been removed in the New Articles, following their cancellation on 16 December 2009.
General
Generally, the opportunity has been taken to bring clearer language into the New Articles and in some areas to conform the language of the New Articles with that used in the model articles of association for public companies produced by the UK Government’s Department for Business, Innovation and Skills.
Articles of association which duplicate statutory provisions
Provisions in the Articles which replicate provisions contained in the Companies Act 2006 are, in the main, to be removed in the New Articles. This is in line with the approach advocated by the UK Government that statutory provisions should not be duplicated in a company’s constitution.
Registrar
Administrative enquiries concerning shareholdings in Tomkins plc, such as loss of a share certificate, dividend payment instructions, or a change of address, or the amalgamation of multiple holdings should be notified direct to the Company’s Registrar, Equiniti Limited, whose contact details for general enquiries are provided on page 172.
Any correspondence with the Registrar should refer to Tomkins plc, quoting the reference 0398, and state the registered name and address of the shareholder.
Payment of dividends
Dividends are declared and paid in US dollars although, unless they elect otherwise, shareholders in the UK and the Republic of Ireland will receive dividends in sterling. Shareholders who have mandated their dividends to be credited to a nominated bank or building society account should note that dividends are paid automatically to their account through the Bankers’ Automated Clearing Services (‘BACS’) with the associated tax voucher being sent direct to shareholders at their registered address unless requested otherwise. If the nominated account is with a bank or building society which is not a member of BACS, both the payment and tax voucher are sent to the account holding branch.
Shareholders who do not currently mandate their dividends and who wish to have their dividend paid direct to a bank or building society account should complete a dividend mandate instruction form obtainable from the Company’s Registrar, whose contact details with regard to the payment of dividends are provided on page 172.
Dividend Reinvestment Plan
The Company offers a Dividend Reinvestment Plan. This allows shareholders to invest their cash dividend in purchasing shares of the Company in the market. The Company’s Registrar arranges, on behalf of participants, through the agency of a suitably authorised stockbroking business, the purchase of the maximum whole number of ordinary shares possible on, or as soon as reasonably practicable after, the dividend payment date. Favourable dealing costs have been arranged. For further details or an application form, please contact the Registrar’s Dividend Reinvestment Plan team, whose contact details are provided on page 172.
SHAREHOLDER INFORMATION (CONTINUED)
Individual Savings Accounts (ISAs)
A Tomkins ISA enables UK residents to invest in the Company in a tax-efficient manner. You can obtain more information on ISAs from our corporate ISA provider, Equiniti Limited, whose contact details are provided on page 172.
Patents, trademarks and contracts
Trademarks and trade names are identified with a number of the Group’s products and services and are of importance in the sale and marketing of those products and services. However, the Group is not dependent to any significant degree upon these trademarks and trade names, nor on any single or series of related patents, licenses, financial or commercial contracts.
Government laws and regulations
The Company’s subsidiaries and many of our products are regulated by government authorities in a number of countries.
The Company’s subsidiaries are subject to regulation under various and changing local, national and international laws and regulations relating to the environment, business practice and employee health and safety. Permits may be required for certain operations (particularly air emission permits) and these permits are subject to renewal, modification and, in certain circumstances, revocation. Some of the applicable regulations allow local or national authorities to mandate product recalls or seize products.
Our products are subject to regulations relating to production (including environmental regulations), sale, advertising, safety, labelling and raw materials.
Management believes that the Company’s subsidiaries are in substantial compliance with applicable laws and regulations and that appropriate controls have been implemented by subsidiaries to minimise the risk of non-compliance.
Exchange controls
There is currently no English law, decree or regulation that restricts the export or import of capital, including, but not limited to, UK foreign exchange controls, or that affects the remittance of dividends (except as otherwise set out under ‘Taxation’ below) or other payments to holders of ordinary shares. There are no limitations under English law or the Company’s Articles on the rights of persons who are neither residents nor nationals of the UK from freely holding, voting or transferring ordinary shares in the same manner as UK residents or nationals.
Taxation
The following is a summary of the principal US federal income and UK tax consequences of the purchase, ownership and disposition of ordinary shares or ADSs by certain US Holders (as defined below) and not a complete analysis or listing of all of the possible tax consequences of such purchase, ownership or disposition. Furthermore, this summary does not address the tax consequences under state, local, or non-US or non-UK tax law of such purchase, ownership or disposition, or the US federal estate or gift tax consequences thereof.
Certain US Holders with special status (e.g. banks and financial institutions, insurance companies, tax-exempt entities, dealers in securities, and traders in securities that mark-to-market) or in special tax situations (e.g. whose functional currency is not the US dollar, who hold their ordinary shares or ADSs as part of a straddle, appreciated financial position, hedge, conversion transaction or other integrated investment, who hold (directly, indirectly or through attribution) 10% or more of the voting power of the Company’s shares, or who are subject to the alternative minimum tax) will be subject to special rules not described below. This summary is limited to US Holders that hold their ordinary shares or ADSs as capital assets and does not address the tax treatment of US Holders that are partnerships or pass-through entities that are not partnerships or the tax treatment of the holders of interests in such entities. The following summary of US federal income and UK tax consequences is not exhaustive of all possible tax considerations and should not be considered legal or tax advice. Prospective investors are, therefore, advised to consult their own professional tax advisers with respect to the tax consequences of the purchase, ownership and disposition of ordinary shares or ADSs, including specifically the consequences under state, local and tax laws.
This summary is based upon the Code, Treasury regulations promulgated under the Code, the Tax Convention, and administrative and judicial interpretations thereof, all as in effect as of the date of this Annual Report and all of which are subject to change, possibly with retroactive effect. Statements regarding UK tax laws and practices set out below are based on those UK laws and published practices of HM Revenue & Customs as of the date of this Annual Report which UK laws and practices are subject to change, again possibly with retroactive effect. As used herein, a US Holder is a beneficial owner of ordinary shares or ADSs that, for US federal tax purposes, is:
– | a citizen or resident of the US; |
– | a corporation or other entity treated as a corporation for US federal income tax purposes, that is created or organised in the US or under the laws of the US or any state thereof (or the District of Columbia); |
– | an estate the income of which is subject to US federal income taxation regardless of its source; |
– | a trust if a court within the US is able to exercise primary supervision over the administration of the trust and one or more US persons have the authority to control all substantial decisions of the trust; or |
– | a trust if it has a valid election in effect to be treated as a US person under the Code. |
|
| 169 |
| Shareholder Information | |
HM Revenue & Customs should treat US Holders of ADSs as the owners of the underlying ordinary shares for the purpose of the taxation of dividend payments under the Tax Convention. US Holders of ADSs are also treated as the owners of the underlying shares for the purposes of the Code.
Taxation of dividends
The gross amount of distributions in respect of the Company’s ordinary shares or ADSs will be included in the gross income of US Holders and treated as dividends to the extent of the Company’s current and accumulated earnings and profits, as determined under US federal income tax principles. Such dividends will not qualify for the dividends received deduction available in certain circumstances to corporate holders. Distributions in excess of current and accumulated earnings and profits will be treated as a return of capital to the extent of a US Holder’s adjusted tax basis in the ordinary shares or ADSs and, thereafter, as capital gains.
For taxable years that begin before 2011, ‘qualified dividend income’ (as defined below) paid by the Company generally will be taxable to non-corporate US Holders at the 15% reduced rate. For this purpose, except as described below, dividends paid by the Company will be ‘qualified dividend income’ and taxable at the reduced rate, if shares in the Company are readily tradable on an established securities market in the US, including NYSE and NASDAQ, or if the Company is eligible for benefits of a comprehensive income tax treaty with the US which the US Secretary of the Treasury has determined is satisfactory for this purpose and which includes a provision for the exchange of information. The US Secretary of the Treasury has determined that the Tax Convention qualifies as a comprehensive income tax treaty for this purpose. Dividends paid by a foreign corporation will not constitute qualified dividend income, however, if that corporation is treated, for the tax year in which the dividend is paid or the preceding tax year, as a PFIC for US federal income tax purposes. In addition, US Holders will be eligible for the reduced rate only if they have held the ordinary shares or ADSs for more than 60 days during the 121-day period beginning 60 days before the ex-dividend date and satisfy certain other requirements.
US Holders will not be subject to UK withholding tax on any dividends paid in respect of ordinary shares. Provided that dividends paid in respect of ADSs are treated as distributions for UK tax purposes, such dividends will not be subject to UK withholding tax.
Foreign currency dividends
For US federal income tax purposes, any dividend paid in foreign currency will be included in income in a US dollar amount equal to the US dollar value of such foreign currency calculated by reference to the exchange rate in effect on the day the dividends are actually or constructively received by the US Holders, regardless of whether the foreign currency is converted into US dollars at that time. US Holders will generally have a basis in the foreign currency equal to its US dollar value on the date of actual or constructive receipt. Any gain or loss realised by the US Holders on subsequent conversion or other disposition of the foreign currency will be treated as US source ordinary income or loss.
PFIC status
The Company believes that it will not be considered a PFIC for US federal income tax purposes. However, since the Company’s status as a PFIC depends on the composition of its income and assets and the market value of its assets from time to time, there can be no assurance that it will not be considered a PFIC in any taxable year.
US shareholders in a company classified as a PFIC have certain federal income tax consequences. In determining a company’s PFIC status for a taxable year, two tests must be applied, as well as certain look-through rules. If 75% or more of a company’s gross income (including the pro-rata gross income of any company in which such company is considered to own 25% or more of the stock by value) for the taxable year is passive, it is considered a PFIC. Alternatively, if 50% or more of its gross assets (including the pro-rata value of the assets of any company in which such company is considered to own 25% or more of the stock by value) during the taxable year, based on their average value, are either held for the production of or produce passive income, it is considered a PFIC. In this instance, passive income commonly includes dividends, interest, royalties, rents, annuities, gains from commodities and securities transactions, and the excess of gains over losses from the disposition of assets which produce passive income (unless the 25% look-through rules otherwise apply).
If the Company were treated as a PFIC in a taxable year, a US Holder may be subject to particular adverse tax consequences. The receipt of certain ‘excess distributions’, as well as the disposition of ordinary shares or ADSs, could trigger increased tax liability. ‘Gain’ or excess distribution would be allocated among the tax years of the shareholder’s holding period from the time the entity was determined to be a PFIC. The portion allocable to prior years would be taxed at the highest marginal US federal tax rate and would be subject to an interest charge.
Certain elections may enable the shareholder in a PFIC to avoid some of these adverse tax consequences. Under the QEF election, a US shareholder is taxed currently on its share of the company’s ordinary income. Under the mark-to-market election, a US shareholder recognises gains or losses each year for the difference between the fair market value and the adjusted basis of his or her shares. US Holders should consult their tax advisers for further details of the restrictions and coverage of each election and the potential tax consequences arising from the ownership and disposition of an interest in a PFIC.
Taxation of capital gains
Corporate US Holders that are resident in the US and not resident in the UK for UK tax purposes will not generally be liable for UK corporation tax on capital gains realised on the sale or other disposal of ordinary shares or ADSs unless a specific Corporate US Holder carries on a trade in the UK through a permanent establishment and the ordinary shares or ADSs are or have been used, held or acquired for the purposes of such trade through such permanent establishment. Non-corporate US Holders that are resident in the US and are neither resident nor ordinarily resident in the UK for UK tax purposes will not generally be liable for UK tax on capital gains realised on the sale or other disposal of ordinary shares or ADSs unless a specific non-corporate US Holder carries on a trade, profession or vocation in the UK through a branch or agency and the ordinary shares or ADSs are or have been used, held or acquired for the purposes of such trade, profession or vocation through such branch or agency.
SHAREHOLDER INFORMATION (CONTINUED)
Notwithstanding the foregoing, an individual US Holder who is neither resident nor ordinarily resident in the UK for UK tax purposes for a period of less than five years, but who was previously resident or ordinarily resident in the UK, and who disposes of ordinary shares or ADSs during the period of nonresidence may also be liable on returning to the UK for UK tax on capital gains despite the fact that the individual was not resident or ordinarily resident in the UK for UK tax purposes at the time of the disposal.
Subject to the PFIC rules discussed above, US Holders will generally recognise capital gain or loss for US federal income tax purposes upon the sale or other disposal of such US Holders’ ordinary shares or ADSs in an amount equal to the difference between the US dollar value of the amount realised on the sale or other disposal and the US Holders’ adjusted tax basis, determined in US dollars, in such ordinary shares or ADSs. Such gains or losses will be eligible for long-term capital gain or loss treatment if the ordinary shares or ADSs have been held for more than one year at the time of such sale or disposal. Long-term capital gains of individuals are eligible for reduced rates of taxation. The deductibility of capital losses is subject to limitations. In general, any gain or loss recognised by a US Holder on the sale or other disposition of ordinary shares or ADSs will be US-source income or loss for the purposes of the US federal foreign tax credit limitation.
UK inheritance tax
Under the Estate and Gift Tax Convention, ordinary shares or ADSs will generally not be subject to UK inheritance tax upon an individual’s death or on a transfer of the ordinary shares or ADSs during the individual’s lifetime if it is held by an individual who is domiciled in the US and is not treated as domiciled in the UK and is not a national of the UK. In certain other cases where the individual is domiciled in the US and is treated as domiciled in the UK, the individual may be subject to UK inheritance tax. Also, an individual will be subject to UK inheritance tax in the exceptional case in which ordinary shares or ADSs are part of the business property of a UK permanent establishment or pertains to a fixed base of the individual in the UK used for the performance of independent personal services. In the unusual case where ordinary shares or ADSs are subject to both the UK inheritance tax and the US federal estate and gift tax, the Estate and Gift Tax Convention generally provides for a tax credit under the rules enumerated in the Estate and Gift Tax Convention.
UK stamp duty or SDRT
UK stamp duty or SDRT is not generally payable on the issuance of ordinary shares (except see below regarding the issue of ordinary shares to the custodian of the Depositary). The transfer of ordinary shares will generally give rise to a liability to UK stamp duty at the rate of 0.5% (rounded up to the next multiple of £5) of the amount or value of the consideration paid. SDRT is generally chargeable at the same rate on entering into an unconditional agreement to transfer ordinary shares (or upon a conditional agreement to transfer ordinary shares becoming unconditional). However, such SDRT is cancelled or repaid if the agreement is completed within six years of the date of the unconditional agreement (or the date on which the conditional agreement became unconditional) by a duly stamped transfer instrument. Where an instrument of transfer of ordinary shares is executed where there is no change of beneficial ownership, it will generally not be subject to UK stamp duty or to the principal 0.5% SDRT charge.
The issuance of ordinary shares to the custodian of the Depositary will generally give rise to an SDRT liability at 1.5% of the issue price. The transfer of ordinary shares to the custodian of the Depositary will generally give rise to either UK stamp duty at the rate of 1.5% of the value of the ordinary shares transferred (rounded up to the next multiple of £5) or, in the unlikely event that there is no transfer instrument on which UK stamp duty is chargeable, to SDRT at the rate of 1.5% of the value of the ordinary shares transferred.
In accordance with the terms of the Deposit Agreement, any tax or duty payable by the Depositary or the custodian of the Depositary on deposits of ordinary shares will be charged by the Depositary to the party to whom the ADSs are delivered against such deposits.
Following the issue or transfer of ordinary shares to the custodian of the Depositary, no SDRT will generally be payable on the issue of ADSs or on an agreement to transfer ADSs, nor should UK stamp duty be payable on a transfer of ADSs, provided, amongst other things, that the instrument of transfer is executed and retained outside the UK. A transfer of ordinary shares by the Depositary or its nominee to the relevant ADS holder when the ADS holder is not transferring beneficial ownership will generally not be liable to a stamp duty charge or to the principal 0.5% SDRT charge.
US backup withholding and information reporting
Payments of dividends and other proceeds with respect to ordinary shares or ADSs made within the US by a US paying agent or other US intermediary will be reported to the IRS and to the US Holders as may be required under applicable regulations unless a specific US Holder is a corporation or otherwise establishes a basis for exemption. Backup withholding may apply to reportable payments if the US Holders fail to provide an accurate taxpayer identification number or otherwise fail to comply with, or establish an exemption from, such backup withholding requirements. The amount of any backup withholding from a payment to a US Holder will be allowed as a credit against his or her US federal income tax liability and any excess amounts will be refundable if the US Holder provides the required information to the IRS. US Holders should consult their tax advisers as to their qualification for exemption from backup withholding and the procedure for obtaining an exemption.
Share dealing
For UK residents, internet and telephone share dealing services have been arranged through Equiniti Limited, which provide a simple way to buy or sell the Company’s ordinary shares. For internet dealing, please log on to www.shareview.co.uk/dealing, where full information is provided. You will need your account number shown on your share certificate or tax voucher. The commission rate for internet dealing is 1% with a minimum charge of £25. For telephone dealing, please call 0845 603 7037, or +44 (0)121 415 7560 from outside the UK, between 8.30 am and 4.30 pm Monday to Friday. The commission rate for share transactions by telephone is 1.5%, with a minimum charge of £25.
A weekly postal dealing service is also available and a form, together with terms and conditions, can be obtained by calling 0871 384 2248, or +44 (0)121 415 7172 from outside the UK. Calls to this number cost 8p per minute from a BT landline. Other providers’ costs vary. Lines are open 8.30am to 5.30pm Monday to Friday. The commission rate is 1% with a minimum charge of £20.
|
| 171 |
| Shareholder Information | |
Contact details for Equiniti Limited with regard to share dealing are provided on page 172.
Global Invest Direct
A simple dealing service is available to US residents only for buying and selling Tomkins ADRs. Details can be obtained from JPMorgan Chase Bank, N.A., whose contact details are provided on page 172.
ShareGift
The Company supports ShareGift, the charity share donation scheme (registered charity number 1052686). Through ShareGift, shareholders who have only a very small number of shares, which might be considered uneconomic to sell, are able to donate them to charity. Donated shares are aggregated and sold by ShareGift, the proceeds being passed on to a wide range of UK charities. Donating shares to charity gives rise neither to a gain nor a loss for UK Capital Gains Tax purposes and UK taxpayers may also be able to claim income tax relief on the value of the donation.
ShareGift transfer forms specifically for the Company’s shareholders are available from the Company’s Registrar and, even if the share certificate has been lost or destroyed, the gift can be completed. The service is generally free. However, there may be an indemnity charge for a lost or destroyed share certificate where the value of the shares exceeds £100. ShareGift’s contact details are provided on page 172.
Electronic communication
The Company’s Registrar operates a share register internet enquiry service to provide shareholders with details of their shareholdings. To register for the service, please go to www.shareview.co.uk. You will need your shareholder reference (which can be found on your share certificate or tax voucher) and you will be asked to select your own PIN. A user ID will then be posted to you. Once registered, shareholders may elect to receive future shareholder information and Company documents in electronic format. The main benefits of this system are speed and ease of use while saving money for your Company and reducing the demand on natural resources. A visit to www.shareview.co.uk will also provide you with more details of the service and practical help and information on other share registration matters.
As permitted by the provisions of the Companies Act 2006 relating to electronic communications, the Company now supplies all shareholders with shareholder documents by making them available on its website, except where a shareholder has specifically requested that the Company continues to provide him or her with hard copies. Shareholders will be informed by post or email whenever a shareholder document is made available on the website. Shareholders can, at any time, change their decision on how they wish to receive shareholder documents by advising the Company’s Registrar, whose contact details with regard to electronic communication are provided on page 172.
Electronic proxy voting
Shareholders may register their voting instructions for the forthcoming AGM via the internet. If you have registered for the shareview service offered by the Company’s Registrar, you may submit your voting instructions by logging on to your shareview portfolio and accessing the Company Meetings –Tomkins site. If you have not registered with shareview, you may still register your vote electronically by going to www.sharevote.co.uk. You will be required to key in the three security numbers printed on your form of proxy to access the voting site.
USEFUL CONTACTS
Address | | Telephone | | Website |
Tomkins plc – Registered office | | | | |
East Putney House
84 Upper Richmond Road
London
SW15 2ST | | +44 (0)20 8871 4544 | | www.tomkins.co.uk |
Company’s Registrar
Equiniti Limited
Aspect House
Spencer Road
Lancing
West Sussex
BN99 6DA | | General enquiries/
Electronic communication
0871 384 2811 from within UK
+44 121 415 7047 from outside UK
Textel
0871 384 2255
| | www.shareview.co.uk |
| Payment of dividends
0871 384 2811 from within UK
+44 121 415 7047 from outside UK
Textel
0871 384 2255
| | |
| | Dividend Reinvestment Plan
0871 384 2268 from within UK
+44 121 415 7173 from outside UK | | |
| | Share dealing services
(UK residents only)
0845 603 7037 from within UK
+44 121 415 7560 from outside UK | | www.shareview.co.uk/dealing |
Equiniti Investment Account & ISA | | | | |
Equiniti
PO Box 4605
Aspect House
Spencer Road
Worthing
BN99 6QY | | 0845 300 0430 from within UK +44 121 415 7572 from outside UK | | |
ADR general enquiries & Global Invest Direct | | | | |
JPMorgan Chase & Co.
PO Box 64504
St. Paul
MN 55164-0504
US | | General enquiries
+1 800 990 1135 from within the US
+1 651 453 2128 from outside the US Global Invest Direct
+1 800 428 4237 from within the US | | www.ADR.com
email:
jpmorgan.adr@wellsfargo.com |
ShareGift | | | | |
17 Carlton House Terrace, London
SW1Y 5AH | | +44 (0)20 7930 3737 | | www.ShareGift.org |
|
| 173 |
| | |
FINANCIAL CALENDAR
2010 | |
Interim Management Statement – Q1 2010 | 6 May 2010 |
AGM 2010 | 1 June 2010 |
2009 Final dividend payment | 10 June 2010 |
2010 Half Yearly Report | 9 August 2010 |
Interim Management Statement – Q3 2010 | 8 November 2010 |
2010 Interim dividend payment | November 2010 |
2011 | |
2010 Preliminary Results Announcement | February 2011 |
Interim Management Statement – Q1 2011 | May 2011 |
AGM 2011 | 1 June 2011 |
2010 Final dividend payment | June 2011 |
CROSS-REFERENCE TO FORM 20-F
Certain of the information in this document that is referenced in the following table is included in the Company’s Annual Report on Form 20-F for 2009 (the ‘2009 Form 20-F’) filed with the SEC. No other information in this document is included in the 2009 Form 20-F or incorporated by reference into any filings by the Company under the Securities Act. The 2009 Form 20-F has not been approved or disapproved by the SEC nor has the SEC passed judgement upon the adequacy or accuracy of the 2009 Form 20-F.
Item | | Description | | Location | Page | |
1 | | Identity of Directors, senior management | | | | |
| | and advisers | | Not applicable | n/a | |
2 | | Offer statistics and expected timetable | | Not applicable | n/a | |
3 | | Key Information | | | | |
| | 3A Selected financial data | | Five-year summary | 160 | |
| | 3B Capitalisation and indebtedness | | Not applicable | n/a | |
| | 3C Reasons for the offer and use of proceeds | | Not applicable | n/a | |
| | 3D Risk factors | | Principal risks and uncertainties | 34-37 | |
4 | | Information on the Company | | | | |
| | 4A History and development of the Company | | Registered office and contact details | Outside back cover | |
| | | | Shareholder Information – History and development | | |
| | | | of the Company | 161 | |
| | | | Note 41 – Acquisitions | 128-129 | |
| | | | Note 42 – Disposals | 130-131 | |
| | 4B Business overview | | Industrial & Automotive | 8-9 | |
| | | | Building Products | 10-11 | |
| | | | OFR – Operating results | 14-22 & 29-33 | |
| | | | Shareholder Information – Government laws and regulations | 168 | |
| | | | Shareholder Information – Patents, trademarks and contracts | 168 | |
| | 4C Organisational structure | | Note 1 – Nature of operations | 70 | |
| | | | Principal subsidiaries and associates | 150 | |
| | 4D Property, plant and equipment | | OFR – Property, plant and equipment | 25-26 | |
| | 4A Unresolved staff comments | | Not applicable | n/a | |
5 | | Operating and financial review and prospects | | | | |
| | 5A Operating results | | OFR – Operating results | 14-22 & 29-33 | |
| | | | Explanation of key performance measures | 151-159 | |
| | | | Shareholder Information – Government laws and regulations | 168 | |
| | 5B Liquidity and capital resources | | OFR – Liquidity and capital resources | 22-25 | |
| | | | OFR – Going concern | 28 | |
| | | | Note 29 – Borrowings | 104-105 | |
| | | | Note 33 – Financial risk management | 108-115 | |
| | | | Note 32 – Derivatives | 106-107 | |
| | | | Note 27 – Cash and cash equivalents | 103 | |
| | | | Note 45 – Capital commitments | 131 | |
| | 5C Research and development, patents | | | | |
| | and licences etc | | OFR – Other intangible assets | 25 | |
| | | | Note 14 – Operating profit for the period | 91 | |
| | 5D Trend information | | OFR – Operating results | 14-22 & 29-33 | |
| | | | Market overview | 4-5 | |
| | | | Chairman’s Statement and Chief Executive’s review – Outlook | 7 | |
| | 5E Off-balance sheet arrangements | | OFR – Off-balance sheet arrangements | 28 | |
| | | | Note 44 – Operating leases | 131 | |
| | 5F Tabular disclosure of contractual obligations | | OFR – Contractual obligations | 28 | |
| | 5G Safe harbour | | Special note regarding forward-looking statements | Inside front cover | |
6 | | Directors, senior management and employees | | | | |
| | 6A Directors and senior management | | Board of Directors | 40-41 | |
| | 6B Compensation | | Remuneration Committee report | 52-61 | (1) |
| | | | Note 46 – Related party transactions | 132-134 | |
| | 6C Board practices | | Key governance principles | 42-47 | |
| | 6D Employees | | Note 8 – Employees | 85-86 | |
| | | | Corporate Social Responsibility – Our workplace: employees | 38-39 | |
| | 6E Share ownership | | Remuneration Committee report | 52-61 | (1) |
| | | | Note 35 – Share-based incentives | 122-123 | |
|
| 175 |
| Cross-Reference to
Form 20-F | |
Item | | Description | | Location | Page | |
7 | | Major shareholders and related | | | | |
| | party transactions | | | | |
| | 7A Major shareholders | | Shareholder information – Substantial shareholdings | 163 | |
| | 7B Related party transactions | | Note 46 – Related party transactions | 132-134 | |
| | 7C Interests of experts and counsel | | Not applicable | n/a | |
8 | | Financial information | | | | |
| | 8A Consolidated statements and | | | | |
| | other financial information | | Item 18 – Financial statements | 64-134 | |
| | | | Auditors’ report | (2 | ) |
| | | | Note 43 – Contingencies | 131 | |
| | | | Chairman’s Statement and Chief Executive’s review – Dividend | 6 | |
| | | | OFR – Dividend | 16 | |
| | 8B Significant changes | | Not applicable | n/a | |
9 | | The Offer and listing | | | | |
| | 9A Offer and listing details | | Shareholder information – Share price information | 163 | |
| | 9B Plan of distribution | | Not applicable | n/a | |
| | 9C Markets | | Shareholder information – Trading symbols | 163 | |
| | 9D Selling shareholders | | Not applicable | n/a | |
| | 9E Dilution | | Not applicable | n/a | |
| | 9F Expenses of the issue | | Not applicable | n/a | |
10 | | Additional information | | | | |
| | 10A Share capital | | Not applicable | n/a | |
| | 10B Memorandum and Articles of Association | | Shareholder information – Memorandum and | | |
| | | | Articles of Association | 164-167 | |
| | 10C Material contracts | | None | n/a | |
| | 10D Exchange controls | | Shareholder information – Exchange controls | 168 | |
| | 10E Taxation | | Shareholder information – Taxation | 168-170 | |
| | 10F Dividends and paying agents | | Not applicable | n/a | |
| | 10G Statements by experts | | Not applicable | n/a | |
| | 10H Documents on display | | Shareholder information – Documents on display | 164 | |
| | 10I Subsidiary information | | Principal subsidiaries and associates | 150 | |
11 | | Quantitative and qualitative disclosures | | | | |
| | about market risk | | Note 33 – Financial risk management | 108-115 | |
| | | | Note 32 – Derivatives | 106-107 | |
12 | | Description of securities other than | | | | |
| | equity securities | | | | |
| | Debt securities | | Not applicable | n/a | |
| | Warrants and rights | | Not applicable | n/a | |
| | Other securities | | Not applicable | n/a | |
| | American depositary shares | | Shareholder Information – Fees payable by ADR holders | 162 | |
| | | | Shareholder Information – Fees paid by the Depositary to the Company | 162 | |
13 | | Defaults, dividend arrearages | | | | |
| | and delinquencies | | None | n/a | |
14 | | Material modifications to the rights | | | | |
| | of security holders and the use of proceeds | | None | n/a | |
15 | | Controls and procedures | | Internal control | 48-49 | |
| | | | Management’s annual report on internal control over financial reporting | (2 | ) |
| | | | Attestation report of the registered public accounting firm | (2 | ) |
| | | | Internal control – Sarbanes-Oxley | 49 | |
Item | | Description | | Location | Page | |
16 | | Reserved | | | | |
| | 16A Audit committee financial expert | | Audit Committee report – Membership and appointment | 50 | |
| | 16B Code of ethics | | Key governance principles – 1.A. The Board | 42 | |
| | 16C Principal accountant fees and services | | Note 17 – Auditors’ remuneration | 93-94 | |
| | | | Audit Committee report – Work of the Committee | 50-51 | |
| | 16D Exemptions from the listing standards | | | | |
| | for audit committees | | None | n/a | |
| | 16E Purchase of equity securities by the issuer | | | | |
| | or affiliated purchasers | | Shareholder information – Purchases of ordinary shares | 164 | |
| | 16F Change in a registrant’s certifying accountant | | Not applicable | n/a | |
| | 16G Corporate governance | | Key governance principles – Compliance statement | 47 | |
17 | | Financial statements | | Not applicable | n/a | |
18 | | Financial statements | | Consolidated financial statements | 64-134 | |
19 | | Exhibits | | | (2 | ) |
(1) | For the purposes of the Form 20-F, sections of the Remuneration Committee report that are marked ‘audited’ are not required to be audited in accordance with PCAOB standards and are not considered audited in the Form 20-F. |
(2) | Filed separately with the SEC as an exhibit to the Form 20-F. For the purposes of the Form 20-F, the auditors’ report on page 63 of this annual report is not considered to be filed with the SEC. |
| 
| 177 |
| | |
GLOSSARY
$, US dollar, cents, c | | US dollar ($) and cents, the currency of the US |
£, sterling, pence, p | | Pound sterling (£) and pence, the currency of the UK |
Euro | | The currency of certain member states of the European Union |
ABIP | | The Tomkins Annual Bonus Incentive Plan (a variable compensation plan for management) |
accident rate | | The number of reportable incidents per 100 workers over a period of one year |
Adjusted earnings per share | | See ‘Explanation of key performance measures’ on page 152 |
Adjusted operating profit | | See ‘Explanation of key performance measures’ on page 151 |
Adjusted operating margin | | See ‘Explanation of key performance measures’ on page 151 |
ADR | | American Depositary Receipt, a negotiable certificate evidencing an ADS |
ADS | | American Depositary Share (representing four ordinary shares) held by the Depositary |
AGM | | Annual General Meeting |
Articles | | The current Memorandum and Articles of Association of Tomkins plc |
Average operating working capital as a percentage of sales | | See ‘Explanation of key performance measures’ on page 153 |
the Board | | The Board of Directors of Tomkins plc |
The Case-Shiller Index | | A monthly house prices index calculated from data on repeat sales of single family homes in the US |
Cash conversion | | See ‘Explanation of key performance measures’ on page 152 |
CGU | | Cash-generating unit |
the Code | | The US Internal Revenue Code of 1986, as amended |
the Combined Code | | The Combined Code on Corporate Governance issued by the UK Financial Reporting Council in June 2006 |
Companies Act 1985 | | The Companies Act of England and Wales 1985, as amended |
Companies Act 2006 | | The Companies Act of England and Wales 2006 |
the Company | | Tomkins plc |
CSM | | Database of automotive information and analysis prepared by CSM Worldwide, a provider of automotive market forecasting services and strategic advisory solutions to automotive manufacturers, suppliers and financial organisations |
CSR | | Corporate Social Responsibility |
Deferred Award Shares | | Deferred award shares acquired under the ABIP or the IBP |
deferred shares | | The deferred shares of £1 each in the capital of the Company, created pursuant to Resolution 16 at the Company’s AGM on 1 May 2008 and cancelled on 16 December 2009 |
Depositary | | JPMorgan Chase Bank, N.A |
Detroit Three | | General Motors, Ford and Chrysler, automotive OEMs |
Director | | A director of Tomkins plc |
EMTN Programme | | The Euro Medium Term Note Programme |
EPS | | Earnings Per Share |
ESOP | | Employee Share Ownership Plan |
ESOS 3 and ESOS 4 | | The Tomkins Executive Share Option Scheme No. 3 and the Tomkins Executive Share Option Scheme No. 4, which both lapsed for grant purposes in 2005 |
the Estate and Gift Tax Convention | | The convention between the US and the UK for the avoidance of double taxation and the prevention of fiscal evasion with respect to taxes on estates of deceased persons and on gifts |
the Exchange Act | | US Securities Exchange Act of 1934 |
Free cash flow | | See ‘Explanation of key performance measures’ on page 153 |
GLOSSARY (CONTINUED)
Gates | | The businesses and operations of the Gates Corporation, a subsidiary of the Company |
Gates E&S | | Gates Engineering & Services |
the Group | | The Company together with its subsidiaries |
H1 | | The first half of a financial year |
H2 | | The second half of a financial year |
HSE | | Health, safety and the environment |
HVAC | | Heating, Ventilation and Air Conditioning |
I&A | | Industrial & Automotive |
IASB | | International Accounting Standards Board |
IBP | | Interim Bonus Plan |
Ideal | | The business and operations of Epicor Industries Inc, a subsidiary of the Company, trading as Ideal |
IFRIC | | International Financial Reporting Interpretations Committee |
IFRS | | International Financial Reporting Standards |
Independent auditors | | Deloitte LLP |
ISIN | | International Securities Identification Number |
LEED | | Leadership in Energy and Environmental Design |
NAHB | | National Association of Homebuilders, a trade association of the residential construction industry and related activities in the US |
NAPA | | National Automotive Parts Association, a co-operative that distributes automotive parts to retail outlets principally in the US |
Net capital expenditure: depreciation | | See ‘Explanation of key performance measures’ on page 153 |
Net debt | | See ‘Explanation of key performance measures’ on page 153 |
New Articles | | The proposed Memorandum and Articles of Association of Tomkins plc that will come into effect following the Company’s AGM on 1 June 2010 subject to shareholder approval |
Non-GAAP measure | | A measure of historical or future financial performance, financial position or cash flows which is adjusted to exclude or include amounts that would not be so adjusted in the most comparable measure prescribed by IFRS |
NYSE | | The New York Stock Exchange |
OE | | Original equipment |
OEM | | Original equipment manufacturer |
OFR | | Operating and financial review |
Ordinary shares | | The ordinary shares in the capital of the Company that, with effect from 22 May 2008, have a nominal value of 9 cents each |
PFIC | | Passive Foreign Investment Company |
Preference shares | | The convertible cumulative preference shares of $50 each in the capital of the Company, of which the remaining shares outstanding were redeemed in 2007 |
Project Eagle | | A three-year performance improvement programme announced in 2008 to address the cost base and improve competitiveness |
Project Cheetah | | A more extensive set of actions than Project Eagle announced in 2009 to reset the Group’s manufacturing footprint to lower-cost locations and further take advantage of opportunities in higher growth markets |
PSP | | The Tomkins 2006 Performance Share Plan |
| 
| 179 |
| Glossary | |
QEF | | Qualified Electing Fund |
Registrar | | Equiniti Limited |
Restricted Award Shares | | Restricted award shares acquired under the ABIP or the IBP |
Restructuring initiatives | | Expenses incurred in major projects undertaken to rationalise and improve the cost competitiveness of the Group and consequential gains and losses arising on the exit and disposal of businesses or on the disposal of assets |
RPI | | UK Retail Prices Index |
Sarbanes-Oxley | | The US Sarbanes-Oxley Act of 2002 |
SAYE 2 | | The Tomkins Savings Related Share Option Scheme No. 2, that lapsed for grant purposes in 2005 |
SDRT | | Stamp Duty Reserve Tax, payable on paperless transactions for shares in the UK |
SEC | | US Securities and Exchange Commission |
the Securities Act | | US Securities Act of 1933, as amended |
SEDOL | | Stock Exchange Daily Official List, a list of security identifiers used in the UK for clearing purposes |
Severity rate | | Average number of lost workdays per 100 employees over a period of one year |
Sharesave scheme | | The Tomkins 2005 Sharesave Scheme |
Stamp Duty | | A tax payable on paper transactions for shares in the UK |
subsidiary | | An entity that is controlled, either directly or indirectly, by the Company |
the Tax Convention | | The convention between the government of the US and the government of the UK for the avoidance of double taxation and the prevention of fiscal evasion with respect to taxes on income and capital gains dated 24 July 2001, as ratified on 31 March 2003 and amended |
TPMS | | Tyre Pressure Monitoring System |
Trading cash flow | | See ‘Explanation of key performance measures’ on page 152 |
Trico | | Trico Products Corporation and its related businesses, which constituted the Group’s former Wiper Systems business segment (sold during 2007) |
TSR | | Total Shareholder Return, comprising dividends paid on ordinary shares and the increase or decrease in the market price of ordinary shares |
UK GAAP | | United Kingdom Generally Accepted Accounting Practice |
UK | | The United Kingdom of Great Britain and Northern Ireland |
UKLA | | United Kingdom Listing Authority |
Underlying change in sales and adjusted operating profit | | See ‘Explanation of key performance measures’ on page 152 |
US | | The United States of America, its territories and possessions, any state of the United States and the District of Columbia |
Designed and produced by MAGEE
www.magee.co.uk
Printed by Fulmar Colour Fulmar Colour is FSC certified, PEFC certified and ISO 14001 certified showing that it is committed to all round excellence and improving environmental performance is an important part of this strategy. We aim to reduce at source the effect our operations have on the environment, and are committed to continual improvement, prevention of pollution and compliance with any legislation or industry standards. Fulmar Colour is a Carbon Neutral Printing Company. | | 
|
The paper used in this report is produced with FSC mixed sources pulp which is fully recyclable, biodegradable, pH Neutral, heavy metal absence and acid-free. It is manufactured within a mill which complies with the international environmental ISO 14001 standard. | | |
SIGNATURE
Tomkins plc hereby certifies that it meets all of the requirements for filing on Form 20-F, and that it has duly caused and authorised the undersigned to sign this Annual Report on its behalf.
Tomkins plc
/s/ John Zimmerman
By: John Zimmerman
Chief Financial Officer
15 April 2010
Exhibits
| 1.1 | Memorandum and Articles of Association of the Company. (1) |
| 4.1 | The rules of the Tomkins Executive Share Option Scheme No. 3. (2) |
| 4.2 | The rules of the Tomkins Executive Share Option Scheme No. 4. (2) |
| 4.3 | Service Agreement - James Nicol, dated 11 February 2002. (3) |
| 4.4 | Amended Service Agreement - James Nicol, dated 24 February 2010. |
| 4.5 | Third Supplemental Trust Deed relating to the £750,000,000 EMTN Program dated 28 August 2003. (4) |
| 4.6 | Facility Agreement relating to the £400,000,000 multi-currency revolving credit agreement dated 9 February 2004. (4) |
| 4.7 | The rules of the Tomkins 2005 Sharesave Scheme. (5) |
| 4.8 | Terms and conditions of employment - John W. Zimmerman, dated 31 October 2007. (6) |
| 4.9 | Amended terms and conditions of employment - John W. Zimmerman, dated 24 February 2010. |
| 4.10 | The rules of the Tomkins 2006 Performance Share Plan. |
| 8.1 | List of principal trading subsidiaries of the Company. (7) |
| 12.1 | Certification of CEO pursuant to Rule 13a-14(a) of the Securities Exchange Act of 1934. |
| 12.2 | Certification of CFO pursuant to Rule 13a-14(a) of the Securities Exchange Act of 1934. |
| 13.1 | Certification of CEO and CFO pursuant to Rule 13a-14 (b) of the Securities Exchange Act of 1934 and 18 USC. Section 1350, as adopted pursuant to Section 906 of the Sarbanes-Oxley Act of 2002. |
| 15.1 | Management’s Annual Report on Internal Control Over Financial Reporting |
| 15.2 | Attestation Report of Registered Public Accounting Firm |
| 15.3 | Report of Independent Registered Public Accounting Firm |
| 15.4 | Consent of Independent Registered Public Accounting Firm. |
| (1) | Incorporated by reference to the Company’s Annual Report on Form 20-F for the fiscal year ended 3 January 2009. |
| (2) | Incorporated by reference to the Company’s Annual Report on Form 20-F for the fiscal year ended 30 April 2001. |
| (3) | Incorporated by reference to the Company’s Annual Report on Form 20-F for the fiscal year ended 30 April 2002. |
| (4) | Incorporated by reference to the Company’s Annual Report on Form 20-F for the fiscal year ended 3 January 2004. |
| (5) | Incorporated by reference to the Company’s Annual Report on Form 20-F for the fiscal year ended 1 January 2005. |
| (6) | Incorporated by reference to the Company’s Annual Report on Form 20-F for the fiscal year ended 29 December 2007. |
| (7) | Incorporated by reference to the section of the Company’s Annual Report on Form 20-F for the fiscal year ended 2 January 2010 entitled “Principal subsidiaries and associates”. |