SECURITIES AND EXCHANGE COMMISSION
WASHINGTON, D.C. 20549
FORM 20-F
| ¨ | REGISTRATION STATEMENT PURSUANT TO SECTION 12(b) OR (g) OF THE SECURITIES EXCHANGE ACT OF 1934 |
OR
| x | ANNUAL REPORT PURSUANT TO SECTION 13 OR 15(d) OF THE SECURITIES EXCHANGE ACT OF 1934 |
OR
| ¨ | TRANSITION REPORT PURSUANT TO SECTION 13 OR 15(d) OF THE SECURITIES EXCHANGE ACT OF 1934 |
OR
| ¨ | SHELL COMPANY REPORT PURSUANT TO SECTION 13 OR 15(d) OF THE SECURITIES EXCHANGE ACT OF 1934 |
FOR THE FISCAL YEAR ENDED DECEMBER 29, 2007
COMMISSION FILE NUMBER: 0-17140
Tomkins plc
(Exact name of Registrant as specified in its charter)
England
(Jurisdiction of incorporation or organization)
East Putney House, 84 Upper Richmond Road
London SW15 2ST, United Kingdom
(Address of principal executive offices)
Contact details of Company Contact Person:
| | |
| Name | | John Zimmerman |
| E-mail | | jzimmerman@tomkins.co.uk |
| Telephone | | +44 (0) 208 877 5155 |
| Address | | Tomkins plc East Putney House 84 Upper Richmond Road London SW15 2ST United Kingdom |
Securities registered or to be registered pursuant to Section 12(b) of the Act:
| | |
Title of each class | | Name of each exchange on which registered |
| Ordinary Shares, nominal value 5p per share | | New York Stock Exchange * |
| |
American Depositary Shares (each of which represents four Ordinary Shares) | | New York Stock Exchange |
Securities registered or to be registered pursuant to Section 12(g) of the Act
None.
Securities for which there is a reporting obligation pursuant to Section 15(d) of the Act
None.
Indicate the number of outstanding shares of each of the issuer’s classes of capital or common stock as of the close of the period covered by the annual report:
| | |
Ordinary Shares, nominal value 5p per share | | 884,106,772 |
| * | Not for trading, but only in connection with the registration of American Depositary Shares representing such Ordinary Shares |
Indicate by check mark if the registrant is a well-known seasoned issuer, as defined in Rule 405 of the Securities Act. Yes x No ¨
If this report is an annual or transition report, indicate by check mark if the registrant is not required to file reports pursuant to Section 13 or 15(d) of the Securities Exchange Act of 1934. Yes ¨ No x
Indicate by check mark whether the registrant (1) has filed all reports required to be filed by Section 13 or 15(d) of the Securities Exchange Act of 1934 during the preceding 12 months (or for such shorter period that the registrant was required to file such reports), and (2) has been subject to such filing requirements for the past 90 days: Yes x No ¨
Indicate by check mark whether the registrant is a large accelerated filer, an accelerated filer, or a non-accelerated filer. See definition of “accelerated filer and large accelerated filer” in Rule 12b-2 of the Exchange Act. (Check one):
Large accelerated filer x Accelerated filer ¨ Non-accelerated filer ¨
Indicate by a check mark which basis of accounting the registrant has used to prepare the financial statements included in this filing:
| | |
| US GAAP | | ¨ |
| International Financial Reporting Standards as issued by the International Accounting Standards Board | | x |
| Other | | ¨ |
If “Other” has been checked in response to the previous question, indicate by check mark which financial statement item the Registrant has elected to follow: Item 17 ¨ Item 18 ¨
If this is an annual report, indicate by check mark whether the registrant is a shell company (as defined in Rule 12b-2 of the Exchange Act). Yes ¨ No x
TABLE OF CONTENTS
1
In this annual report (the “Annual Report”) on Form 20-F for the fiscal year ended December 29, 2007 (“fiscal 2007”), all references to “Tomkins”, the “Tomkins Group”, the “Group”, the “Company”, “we”, “us” and “our” include Tomkins plc and its consolidated subsidiaries, unless the context otherwise requires.
The consolidated financial statements of Tomkins plc appearing in this Annual Report are presented in pounds sterling (“£”) and are prepared in accordance with International Financial Reporting Standards (“IFRS”) as issued by the International Accounting Standards Board (“IASB”).
In this Annual Report, references to “US dollars”, “$” and “cents” are to United States currency, references to “pounds sterling”, “£”, “pence” and “p” are to British currency, references to “Canadian dollars” are to Canadian currency, and “Euros” are to the currency of certain member states of the European Union.
Certain terms and acronyms used in this document are defined in the glossary on page 84.
Special Note Regarding Forward-Looking Statements
This Annual Report contains forward-looking statements within the meaning of Section 27A of the Securities Act of 1933 and Section 21E of the Securities Exchange Act of 1934, including assumptions, anticipations, expectations and forecasts concerning the Company’s future business plans, products, services, financial results, performance, future events and information relevant to our business, industries and operating environments. When used in this document, the words “anticipate”, “believe”, “estimate”, “assume”, “could”, “should”, “expect” and similar expressions, as they relate to the Company or its management, are intended to identify forward-looking statements. Such statements reflect the current views of management with respect to future events and are subject to certain risks, uncertainties and assumptions. The forward-looking statements contained herein represent a good-faith assessment of our future performance for which we believe there is a reasonable basis. Many factors could cause the actual results, performance or achievements of the Company to be materially different from any future results, performance or achievements that may be expressed or implied by such forward-looking statements, including, among others, adverse changes or uncertainties in general economic conditions in the markets we serve, regulatory developments adverse to us or difficulties we may face in maintaining necessary licenses or other governmental approvals, changes in the competitive position or introduction of new competitors or new competitive products, lack of acceptance of new products or services by the Company’s targeted customers, changes in business strategy, any management level or large-scale employee turnover, any major disruption in production at our key facilities, adverse changes in foreign exchange rates, and acts of terrorism or war, and other risks described in Item 3D “Key Information – Risk factors”. Should one or more of these risks or uncertainties materialize, or should underlying assumptions prove incorrect, actual results may vary materially from those described herein as anticipated, believed, estimated or expected.
These forward-looking statements represent our view only as of the date they are made, and we disclaim any obligation to update forward-looking statements contained herein, except as may be otherwise required by law.
2
PART I
Item 1. Identity of Directors, Senior Management and Advisers
Not applicable.
Item 2. Offer Statistics and Expected Timetable
Not applicable.
3
Item 3. Key Information
A. Selected financial data
The selected financial data set out below as at and for fiscal 2007, fiscal 2006, fiscal 2005 and fiscal 2004 has been derived from the Group’s audited consolidated financial statements prepared in accordance with IFRS. The selected financial data set forth below should be read in conjunction with, and is qualified in its entirety by reference to, such consolidated financial statements and notes thereto and Item 5 “Operating and Financial Review and Prospects”.
The Group adopted IFRS with a transition date of January 4, 2004. Accordingly the Group’s consolidated balance sheet as at January 3, 2004 and January 1, 2005 and its consolidated income statement and consolidated cash flow statement for fiscal 2003 that were originally reported in accordance with UK GAAP were restated in accordance with IFRS. However, the Group was not required to restate its consolidated financial statements for periods ended before January 4, 2004 in accordance with IFRS and is therefore unable to provide in the tables below selected financial data for fiscal 2003 prepared in accordance with IFRS.
Consolidated income statement data
| | | | | | | | | | | | |
| | | Fiscal 2007
(364 days) | | | Fiscal 2006(1)
(364 days) | | | Fiscal 2005(1)
(364 days) | | | Fiscal 2004(1)
(364 days) | |
| | | £ million | | | £ million | | | £ million | | | £ million | |
Sales | | 2,941.9 | | | 3,133.8 | | | 2,963.3 | | | 2,736.6 | |
Operating profit | | 293.0 | | | 283.2 | | | 305.6 | | | 283.1 | |
Profit for the period from continuing operations | | 192.7 | | | 208.9 | | | 206.6 | | | 206.6 | |
(Loss)/profit for the period from discontinued operations | | (33.3 | ) | | (11.6 | ) | | (5.4 | ) | | 3.5 | |
| | | | | | | | | | | | |
Total profit for the period from operations | | 159.4 | | | 197.3 | | | 201.2 | | | 210.1 | |
| | | | | | | | | | | | |
Profit for the period attributable to equity shareholders | | 146.9 | | | 186.1 | | | 192.2 | | | 184.4 | |
| | | | | | | | | | | | |
Earnings per share | | | | | | | | | | | | |
Basic | | | | | | | | | | | | |
Continuing operations | | 20.71 | p | | 23.57 | p | | 25.62 | p | | 25.5 | 0 p |
Discontinued operations | | (3.83 | )p | | (1.39 | )p | | (0.70 | )p | | 0.45 | p |
| | | | | | | | | | | | |
Total operations | | 16.88 | p | | 22.18 | p | | 24.92 | p | | 25.95 | p |
| | | | | | | | | | | | |
Diluted | | | | | | | | | | | | |
Continuing operations | | 20.45 | p | | 22.98 | p | | 24.41 | p | | 24.19 | p |
Discontinued operations | | (3.77 | )p | | (1.31 | )p | | (0.62 | )p | | 0.40 | p |
| | | | | | | | | | | | |
Total operations | | 16.68 p | | | 21.67 | p | | 23.79 | p | | 24.59 | p |
| | | | | | | | | | | | |
Earnings per ADS(2) | | | | | | | | | | | | |
Basic | | 67.52 | p | | 88.72 | p | | 99.68 | p | | 103.80 | p |
Diluted | | 66.72 | p | | 86.68 | p | | 95.16 | p | | 98.36 | p |
| | | | | | | | | | | | |
Average number of Ordinary Shares outstanding (‘000s) | | | | | | | | | | | | |
Basic | | 870,298 | | | 838,894 | | | 771,417 | | | 770,717 | |
Diluted | | 884,031 | | | 883,826 | | | 876,385 | | | 876,817 | |
| | | | | | | | | | | | |
(1) | These fiscal years have been re-presented for the reclassification of Tridon from discontinued operations to continuing operations. Refer to “Discontinued operations” below. |
(2) | Earnings per ADS represents earnings per Ordinary Share multiplied by four, as discussed in Item 9C “Markets.” |
Consolidated balance sheet data
| | | | | | | | |
| | | As at |
| | | December 29,
2007 | | December
30, 2006 | | December
31, 2005 | | January 1,
2005 |
| | | £ million | | £ million | | £ million | | £ million |
| | | | | | | | |
Total assets | | 2,244.4 | | 2,332.8 | | 2,578.3 | | 2,212.6 |
Net assets | | 1,131.4 | | 954.5 | | 712.9 | | 845.3 |
Ordinary share capital | | 44.2 | | 42.9 | | 38.7 | | 38.7 |
Share premium account | | 397.3 | | 332.1 | | 95.8 | | 94.0 |
Shareholders’ equity | | 1,072.7 | | 903.9 | | 664.5 | | 466.5 |
4
Discontinued operations
During fiscal 2006, the Group classified Trico as a discontinued operation. The sale of Trico was completed on June 29, 2007.
Management intended that Tridon, a manufacturer of automotive indicator lights, would be included within the Trico sale and it was therefore included within discontinued operations in fiscal 2006. However, Tridon has been retained by the Group and no longer meets the conditions to be classified as held for sale. Accordingly, the Group’s consolidated income statements for fiscal 2006, fiscal 2005 and fiscal 2004 have been re-presented to reflect the re-classification of Tridon to continuing operations in fiscal 2007. During fiscal 2006, Tridon’s revenue was £9.2 million (fiscal 2005: £14.9 million; fiscal 2004: £16.1 million) and it incurred an operating loss of £0.1 million (fiscal 2005: operating profit of £3.6 million; fiscal 2004: operating profit of £4.0 million).
Acquisitions and disposals
Acquisitions and disposals during the three most recent fiscal years are detailed in “Principal acquisitions, disposals, and capital expenditures” under Item 4A “History and development of the Company”.
Foreign exchange rates
The Noon Buying Rate between the US dollar and pound sterling on the Convenience Date was $1.9965 per one pound sterling. The table below sets out the high and low Noon Buying Rate for pound sterling for each month during the previous six months:
| | | | | | | | | | | | | | | | | | |
£1 = | | March
2008 | | February
2008 | | January
2008 | | December
2007 | | November
2007 | | October
2007 |
High | | $ | 2.0311 | | $ | 1.9923 | | $ | 1.9895 | | $ | 2.0658 | | $ | 2.1104 | | $ | 2.0777 |
Low | | $ | 1.9823 | | $ | 1.9405 | | $ | 1.9515 | | $ | 1.9774 | | $ | 2.0478 | | $ | 2.0279 |
The annual average US dollar/pound sterling exchange rates for each fiscal period for which selected financial data has been presented above, are set out in the table below. The rates have been calculated as the average of the month-end Noon Buying Rates for each month during each respective fiscal year.
| | | | | | | | | | | | | | | |
£1 = | | Fiscal
2007 | | Fiscal
2006 | | Fiscal
2005 | | Fiscal
2004 | | Fiscal
2003 |
Annual average | | $ | 2.0080 | | $ | 1.8582 | | $ | 1.8147 | | $ | 1.8356 | | $ | 1.6455 |
Dividends
The Company has paid cash dividends on its Ordinary Shares in respect of every fiscal year since being first listed on the LSE in 1950.
Dividends are paid to shareholders as of record dates that are fixed after consultation between the Company and the LSE. For fiscal 2007, an interim dividend was declared by the Board in August 2007 and was paid in November 2007. A final dividend was recommended by the Board following the end of fiscal 2007 and will, subject to approval by the shareholders at the Company’s annual general meeting on May 1, 2008, be paid on May 15, 2008 to shareholders on the register on April 18, 2008.
The table below sets forth the amounts of interim, final and total dividends paid in respect of each fiscal year indicated.
| | | | | | | | | | | | | | | | | | | | | | | | |
Fiscal year ended | | Pence per Ordinary
Share | | Pence per ADS | | Cents per Ordinary
Share(1) | | Cents per ADS(1) |
| | Interim | | Final | | Total | | Interim | | Final | | Total | | Interim | | Final | | Total | | Interim | | Final | | Total |
January 3, 2004 | | 4.60 | | 7.40 | | 12.00 | | 18.40 | | 29.60 | | 48.00 | | 7.70 | | 13.12 | | 20.82 | | 30.80 | | 52.49 | | 83.29 |
January 1, 2005 | | 4.83 | | 7.77 | | 12.60 | | 19.32 | | 31.08 | | 50.40 | | 8.96 | | 14.15 | | 23.11 | | 35.84 | | 56.60 | | 92.44 |
December 31, 2005 | | 5.07 | | 8.16 | | 13.23 | | 20.28 | | 32.64 | | 52.92 | | 8.80 | | 15.29 | | 24.09 | | 35.20 | | 61.16 | | 96.36 |
December 30, 2006 | | 5.32 | | 8.57 | | 13.89 | | 21.28 | | 34.28 | | 55.56 | | 10.14 | | 17.11 | | 27.25 | | 40.56 | | 68.44 | | 109.00 |
December 29, 2007 | | 5.32 | | 8.57 | | 13.89 | | 21.28 | | 34.28 | | 55.56 | | 10.90 | | 17.11 | | 28.01 | | 43.60 | | 68.44 | | 112.04 |
(1) | Translated from pounds sterling into US dollars at the Noon Buying Rate on the date the dividend was paid (or, if not yet paid, translated at the Noon Buying Rate on the Convenience Date). |
The Company expects to continue to pay dividends in the future. The total amounts of future dividends will be determined by the Board and will depend on the Company’s results of operations, cash flow, financial and economic conditions and other factors. Management expects dividend payments to follow the same pattern in future years and anticipates the weighting of these payments to be approximately 40 percent for the interim dividend and 60 percent for the final dividend. Cash dividends are currently paid by the Company in pounds sterling, and fluctuations in the exchange rate between pounds sterling and US dollars will affect the US dollar amounts received by holders of ADRs upon conversion by the Depositary of such dividends. Moreover, fluctuations in the exchange rates between the pound sterling and the US dollar will affect the US dollar equivalents of the pound sterling price of the Ordinary Shares on the LSE and, as a result, are likely to affect the market prices of the ADSs which are quoted in US dollars.
Subject to the consent of the High Court of Justice in England and Wales, the Company’s Ordinary Shares will be re-denominated in US dollars and future dividends will be declared and paid in US dollars although, unless they elect otherwise, UK shareholders would continue to receive dividends in pounds sterling. It is expected that re-denomination will take place before declaration of the interim dividend for fiscal 2008 in August 2008. The Company’s Ordinary Shares will remain listed on the LSE, where they will continue to be quoted in pounds sterling. The Company will remain listed on the NYSE, where its ADRs will continue to be quoted in US dollars. The Company will continue to have its headquarters in the United Kingdom.
5
B. Capitalization and indebtedness
Not applicable.
C. Reasons for the offer and use of proceeds
Not applicable.
D. Risk factors
The Group operates globally in varied markets and is affected by a number of risks inherent in its activities, not all of which are within its control. This section highlights specific areas where we are particularly sensitive to business risk. Our financial condition or results of operations could be materially adversely affected by any of these risks. Additional risks not currently known to us, or risks that we currently regard as immaterial, could also have a material adverse effect on our financial condition and/or the results of operations.
The Group has categorized its risks as those relating to:
| • | | the markets within which the Group operates; |
| • | | the competitive position of the Group and its businesses; and |
| • | | the financial position of the Group. |
The principal risks and uncertainties faced by the Group are set out below.
1. Risks relating to the markets within which the Group operates
There are a number of risks in the markets in which the Group operates which could have a material adverse effect on the Group’s business, financial condition or results of operations:
(a) Cyclical nature of markets
Operating in global markets subjects the Group to risks associated with changes in global economic conditions. The current economic malaise driven by the state of US credit markets may spread globally, dampen demand, increase price pressure, reduce margins and accelerate customer consolidation. These pricing pressures and declining demand risks are particularly acute in our housing, commercial construction and automotive markets, where demand is ultimately affected by consumer spending and consumer preferences. Trends in these markets can be difficult to predict. In fiscal 2007, approximately 21 percent of the Group’s sales were to the automotive OE market. Because the production volumes of automotive OEMs depend on general economic conditions and consumer spending levels, automotive production and sales can be highly cyclical. The volume of automotive production in the United States, the Group’s principal geographic segment, has fluctuated, sometimes significantly, from year to year, and such fluctuations give rise to fluctuations in the demand for the Group’s products.
In fiscal 2007, 22.1 percent of the Group’s sales were to the residential and non-residential construction markets in North America, predominantly the United States. The construction industry in the United States was depressed throughout 2007 and is expected to continue facing challenges in 2008 with the NAHB forecasting that housing starts in 2008 will be down approximately 20 percent in the United States from their 2007 level of 1.4 million. The timing of a recovery in the US residential housing market now seems unlikely to occur until 2009, with this end-market showing greater weakness in the first quarter than commentators had predicted.
(b) Loss of market share by US vehicle manufacturers
In recent years, the Detroit Three have seen a decline in their market share for vehicle sales, particularly in North America, with Asian automobile manufacturers increasing their market share. The automotive industry is characterized by overcapacity and fierce competition. In North America it is also affected by significant pension and healthcare liabilities. In fiscal 2007, the Group derived 10 percent of its worldwide sales from the Detroit Three and therefore if this trend of market share loss by the North American manufacturers continues and the Group’s share of business with other vehicle manufacturers does not increase, it may result in lost market share, lower sales and/or lower profitability.
(c) Improvement in vehicle component life
The greater quality, performance and reliability of the components that the Group manufactures improves service life which could reduce demand for the products the Group sells through the aftermarket business segment.
(d) Regulatory environment
The Group is subject to a variety of environmental regulations in the industries in which it operates, particularly relating to waste water discharges, air emissions, solid waste management and hazardous chemical disposal. The Group may not at all times be in complete compliance with all of these regulations, and it may incur material costs to comply with, or liabilities in connection with, these regulations.
(e) Operations in foreign and emerging markets
The Group operates in a number of geographic regions of the world, including emerging markets, and approximately 41 percent of its sales originate outside the United States. Operations in foreign and emerging markets may subject the Group to the risks inherent in operating in such markets, such as economic and political instability, other disruption of markets, restrictive laws and actions of certain governments, difficulty in obtaining distribution and logistical resources, potential adverse tax consequences and inability to effectively protect intellectual property rights. If we are unable to manage successfully the risks inherent in our international activities, our business, financial condition and results of operations could be materially and adversely affected.
6
2. Risks relating to the competitive position of the Group and its businesses
There are a number of risks to the Group’s competitive position that could have a material adverse effect on its business, financial condition or results of operations.
(a) Industry consolidation may result in more powerful competitors and fewer customers
Some of the Group’s customers and some of its competitors in a number of markets, particularly in the automotive aftermarket, and to a lesser extent in the markets of the Air Systems Components segment, are consolidating to achieve greater scale or market share. Such changes could affect the negotiating leverage of the Group’s customers and their relationship with the Group. As the Group’s customers become larger and more concentrated, they could exert pricing pressure on all suppliers, including the Group, which may materially and adversely affect the Group’s margins.
(b) Significance of revenues generated from the Detroit Three
Approximately 10 percent of the Industrial & Automotive business group’s sales in fiscal 2007 came from direct sales to the Detroit Three. These customers have strong purchasing power as a result of high market concentration and the Group’s reliance on them subjects it to potential pressures on its sale prices that may reduce the Group’s profitability.
(c) Price reductions by customers
It is normal practice for customers to seek reductions in their costs from their suppliers over the duration of any committed supply arrangement. To meet such requests for price reductions whilst maintaining profit margins, the Company has had to achieve corresponding cost savings in the business by strategic sourcing of raw materials and by improving production and manufacturing efficiencies. The Group may be unable to achieve such cost reductions in the future, which could result in lower margins or the loss of customers.
(d) Increased competition from low-cost producers
The Group increasingly faces competition from low-cost sources in the developing economies of the world, which may lead to loss of market share and/or reduced margins.
(e) Increasing raw material and energy costs
Steel, aluminum, oil based resins and energy are a significant part of the Group’s costs. If costs of these raw materials and energy increase, the Group may be unable to sustain margins if it is unable to pass such increases on to its customers. Fiscal 2007 saw no softening of the challenging cost environment for raw materials that has existed for the past three years.
(f) Reliance on certain raw materials and suppliers of key components
The Group’s businesses compete globally for certain raw materials, energy and other key components. Disruptions due to the lack of availability of raw material and energy supplies, particularly as a result of rising demand from rapidly-developing economies, may adversely affect our ability to service our customers and may erode our margins.
(g) Dependence on strong relationships with manufacturers’ representatives, distributors and wholesalers
A significant portion of our sales, particularly in the Power Transmission segment and Building Products business group, is made through manufacturers’ representatives, distributors and wholesalers. A deterioration in the relationships with manufacturers’ representatives, distributors and wholesalers or a change in the Group’s products’ distribution channels could materially and adversely affect the Group’s sales.
(h) Inherent supply chain risks
The Group operates in highly competitive markets and the failure to deliver products within acceptable timeframes could have an adverse effect on the business. Customer driven reductions in lead times, carrier consolidation, reduced capacity from driver shortages, fuel availability/cost and longer supply chains concomitant with sourcing from low-cost countries may all impact service levels resulting in loss of customers or missed opportunities. Additionally, short lead time horizons in many of our businesses exposed to the US consumer can impair forecasting accuracy. This may result in the inability to predict abrupt changes in our US driven end markets.
(i) Product liability claims due to the nature of the Group’s products
The nature of the Group’s products means that we face an inherent risk of product liability claims, including claims for injury, property damage or consequential loss. Fewer suppliers due to vendor consolidation and a less qualified offshore supplier base increase the likelihood of receiving defective components for our products, increasing the risk of product failure and resultant liability claims.
(j) Technological changes
The markets for the Group’s products and services are characterized by evolving industry standards and changing technology which may lead to commoditization of its products, allowing for low switching costs and increased pricing pressures, which could result in loss of customers and reduced margins. Continual development of advanced technologies for new products and product enhancements is an important way in which the Group maintains acceptable pricing levels. If the Group’s core products are displaced or made obsolete, the Group may lose customers, which would have an adverse effect on its results of operations.
(k) Dependence on investment and divestment decisions
The Group is involved in activities and plans relating to restructuring, rationalization, investments and acquisitions. These represent important steps in the expansion of our businesses into attractive markets and improvement in their competitive position. If the Group were to make inappropriate investment and divestment decisions or fail to implement major projects, such as systems development, product development or plant closures, there may be destruction of value, returns below expectations and/or business interruption.
7
(l) Dependence on human resources strategy
If the Group is unable to timely identify, attract and retain excellent non-management, management and executive talent, it may not be able to effectively implement its business strategy, or it may experience delays in the development of, or face difficulty in selling, its products and services.
(m) Dependence on the continued operation of the Group’s manufacturing facilities
While the Group is not heavily dependent on any single manufacturing facility, major disruptions at a number of the Group’s manufacturing facilities, due to labor unrest, natural disasters or mechanical failure of the Group’s facilities, could result in significant interruption of the Group’s business and potential loss of customers and sales.
(n) Capacity, reliability and security of the Group’s computer hardware, software and telecommunications infrastructure
The Group currently secures its networks by means of back up, hardware, virus protection and other measures, but any systems interruption could lead to a reduction in performance or loss of services. The Group’s systems are vulnerable to damage or interruption caused by human error, network failure, natural disasters, sabotage, computer viruses and similar disruptive events. A breach of network security could result in a loss of customers and reduced revenues.
(o) Intellectual property rights
The Group’s proprietary technology is protected by patents and trade secrets which could be at risk if:
| | • | | competitors are able to develop similar technology independently; |
| | • | | patent applications are not approved; |
| | • | | steps taken to prevent misappropriation or infringement of intellectual property are not successful; or |
| | • | | the Group does not adequately protect its intellectual property. |
(p) Work stoppages or other labor issues at our facilities or at our customers’ facilities
Some of the Group’s employees are members of labor unions. While the Group considers its relations with its employees and labor unions to be good, if the Group is unable to maintain these relations, there may be disputes and work stoppages that could affect production of the Group’s products. Some of the Group’s customers, particularly in the automotive industry, have highly unionized workforces and have been involved in major disputes in the past. If any of our customers experiences a work stoppage, that customer may halt or limit the purchase of the Group’s products which could, in turn, force the Group to shut down its own production facilities supplying these products.
3. Financial Risks
Certain financial risks could have a material adverse effect on the Group’s business, financial condition or results of operations.
(a) Pension plans
The Group operates defined benefit pension plans, the majority of which are in the United States and the United Kingdom. The defined benefit schemes were in deficit by £60.7 million as at December 29, 2007. Deterioration in the market value of the assets held by these plans or a reduction in long-term interest rates could lead to an increase in the deficit or give rise to an additional funding requirement.
(b) Health care and workers’ compensation
Healthcare and workers’ compensation are provided by certain subsidiaries to current and former employees in the United States. Healthcare costs in the United States are increasing at a faster rate than general cost inflation and these cost increases have to be absorbed by the business. In fiscal 2007, the medical cost inflation rate relating to the Group’s plans was 7.1 percent.
(c) The Group is subject to multiple tax jurisdictions
The Group operates within multiple tax jurisdictions and is subject to audit in those jurisdictions. These audits can involve complex issues, which may require an extended period of time for resolution. Although provision has been made for such issues, the ultimate resolution may result in additional tax charges and cash outflows.
(d) Funding growth
The Group may require capital to expand its business, implement its strategic initiatives and remain competitive. At present, the Group’s established sources of funding are through equity, corporate bond markets (through the EMTN Program), bank debt and cash flow from operations. Management believes that the sources of funding currently available will be sufficient to fund the Group’s operations. If management’s plans or assumptions regarding the funding requirements change, the Group may need to seek other sources of financing, such as additional lines of credit with commercial banks or vendors or public financing, or to renegotiate existing bank facilities. It is possible that additional funding may not be available on commercially acceptable terms or at all.
(e) Bondholders’ rights
The Group has an EMTN Program under which it has £400 million in principal bonds outstanding and it may issue bonds in the future. The Group’s bondholders have the right to require the Group to redeem its outstanding bonds, at par, in the event of a change of control of the Company and also in the event that the Group’s credit rating falls below investment grade as a result of the Group making either acquisitions or disposals that comprise more than 25 percent of the Group’s operating profit in a twelve calendar month period. The Group may not have sufficient funds to repurchase such notes as required.
8
(f) Fluctuations in currency exchange rates
The Group has manufacturing facilities in, and sells products to customers in, many countries worldwide. The principal currencies in which the Group trades are US dollars, Canadian dollars, Euros and pounds sterling. Currency exchange movements can give rise to the following risks:
| | • | | Transaction risk:arises where sales or purchases are denominated in foreign currencies and exchange rates can change between entering into a purchase or sale commitment and completing the transaction; |
| | • | | Translation risk:arises where the currency in which the results of an entity are reported differs from the underlying currency in which business is transacted; and |
| | • | | Economic risk:arises where the manufacturing cost base of a business is denominated in a currency different from the currency of the market into which the products are sold. |
4. Risks related to the securities market and ownership of ADSs
Holders of ADSs may be restricted in their ability to exercise voting rights
Holders of ADSs will generally have the right under the deposit agreement to instruct the Depositary for the ADSs to exercise their voting rights for the registered shares represented by ADSs. At management’s request, the Depositary will mail to holders of ADSs any notice of any shareholders’ meeting received from the Company together with information explaining how to instruct the Depositary to exercise the voting rights of the securities represented by ADSs. If the Depositary receives voting instructions for a holder of ADSs on a timely basis, it is obligated to endeavor to vote the securities representing the holder’s ADSs in accordance with those voting instructions. The ability of the Depositary to carry out voting instructions, however, may be limited by practical limitations, such as time zone differences and delays in mailing.
ADS holders may be unable to participate in rights offerings and similar transactions in the future
US securities laws may restrict the ability of US persons who hold ADSs to participate in certain rights offerings or share or warrant dividend alternatives which the Company may undertake in the future in the event that the Company does not register such offerings under the US securities laws and is unable to rely on an exemption from registration under these laws. If the Company issues any securities of this nature in the future, it may issue such securities to the Depositary, which may sell those securities for the benefit of the holders of the ADSs. However, the Depositary is not obligated to do so. Management cannot offer any assurance as to the value, if any, the Depositary would receive upon the sale of those securities or if it would sell the securities at all.
9
Item 4. Information on the Company
A. History and development of the Company
General
The Company was incorporated in England in 1925, converted from a private company into a public company in March 1950 and re-registered as a public limited company in February 1982. The Company’s Ordinary Shares are listed on the LSE and have been listed on the NYSE in the form of ADSs evidenced by ADRs since February 1995. Prior to listing on the NYSE, the ADSs had been quoted on the Nasdaq National Market since November 1988. The Company is registered in England and Wales No. 203531 and operates under English law. The Company’s registered office is East Putney House, 84 Upper Richmond Road, London SW15 2ST, United Kingdom (Telephone: +44 (0) 20 8871 4544) and its website is www.tomkins.co.uk.
The Company is the ultimate parent of a large number of subsidiaries that are organized in two business groups:
| • | | Industrial & Automotive |
Industrial & Automotive manufactures a wide range of systems and components for car, truck and industrial equipment manufacturing markets, and industrial and automotive aftermarkets throughout the world. During fiscal 2007, Industrial & Automotive operated through five business segments: Power Transmission, Fluid Power, Wiper Systems, Fluid Systems and Other Industrial & Automotive. Trico, which constituted the Wiper Systems business segment, was classified as a discontinued operation during fiscal 2006 and was sold on June 29, 2007.
Building Products is comprised of two business segments: Air Systems Components and Other Building Products. Air Systems Components supplies the industrial and residential HVAC market mainly in North America. Other Building Products manufactures a variety of products for the building and construction industries mainly in North America.
The Group is geographically diverse, operating 142 manufacturing facilities and 55 distribution centers in 24 different countries across the Americas, Europe, Asia, and Australia.
The Industrial & Automotive business group operates in all 24 countries in which the Group operates, while the Building Products business group is located in the United States, Canada, Mexico, the United Kingdom, India and Thailand. Overall, 63 percent of sales in fiscal 2007 was derived from the United States, 16 percent from Europe, and 21 percent from the rest of the world.
Group sales in fiscal 2007 were to the following end markets:
| | | |
| | | Percentage of
total sales | |
Automotive OE | | 20.4 | % |
Automotive aftermarket | | 20.0 | % |
Industrial OE | | 17.4 | % |
Industrial aftermarket | | 13.1 | % |
Residential construction | | 10.5 | % |
Non-residential construction | | 14.2 | % |
Other markets | | 4.4 | % |
History
The Company was founded in 1925 as F.H. Tomkins Buckle Company Limited, a small British manufacturer of buckles and fasteners, which it remained until the 1980s. In the late 1980s, the Company made a number of acquisitions of engineering companies in both the United Kingdom and the United States. In 1992, the Group diversified into food manufacturing, with the acquisition of Ranks Hovis McDougall plc in the United Kingdom.
In fiscal 1996, the Group established the Industrial & Automotive business group with the acquisition of The Gates Corporation.
Between 1997 and 2007, management embarked on a program of disposing of non-core businesses and enhanced its remaining core businesses through a number of bolt-on acquisitions. In the early 2000s, the Group disposed of its Food Manufacturing and Professional, Garden and Leisure Products business groups and became focused on its two remaining business groups: Industrial & Automotive and Building Products. The Industrial & Automotive business group acquired Stant Corporation (1997), ACD Tridon (1999) and Stackpole (2003), and disposed of Trico (2007). The Building Products business group acquired Hart & Cooley (1999) and Selkirk (2006) and disposed of Lasco Fittings (2007).
Principal acquisitions, disposals, and capital expenditures
This section should be read in conjunction with Item 5 “Operating and Financial Review and Prospects” and with Notes 43 and 44 to the Group’s consolidated financial statements.
Acquisitions and disposals
Fiscal 2007
In fiscal 2007, the Industrial & Automotive business group increased its interest in Schrader Engineered Products (Kunshan) Co Ltd, a manufacturer of valves and fittings, from 60 percent to 100 percent, and it also acquired Swindon Silicon Systems Ltd, a UK company that designs, develops and supplies integrated circuits.
10
During fiscal 2007, the Industrial & Automotive business group sold Dearborn, a manufacturer of automotive assembly lines and materials handling equipment and Tridon’s indicator and side object detection businesses. The Building Products business group sold the business and assets of Lasco Fittings Inc., a manufacturer of injection moulded fittings. Also during fiscal 2007, the Group completed the sale of Trico, which constituted the Group’s discontinued Wiper Systems segment.
Fiscal 2006
In fiscal 2006, the Industrial & Automotive business group acquired a 60 percent interest in Gates Winhere (which, through a wholly-owned subsidiary, acquired the business and assets of a water pump manufacturer in China) and a 100 percent interest in ENZED Fleximak Ltd, a supplier of engineering, fabrication, testing and service operations for flexible fluid transfer products in the Arabian Gulf region. The Building Products business group acquired Selkirk Americas L.P., a manufacturer of chimney, venting and air distribution products, Eastern Sheet Metal, a manufacturer of commercial HVAC systems and Heat-Fab Inc, a US-based manufacturer of high efficiency residential and commercial venting systems. The Group also acquired a 20 percent interest in e-business and logistics services provider, CoLinx LLC, which paved the way for the launch of an online store for industrial power transmission products in January 2007.
No businesses were sold in fiscal 2006.
Fiscal 2005
In fiscal 2005, the Industrial & Automotive business group acquired L.E. Technologies, a recreational vehicle frame manufacturer and EMB, a manufacturer of high-performance hydraulic tube fittings, adapters and accessories. The Building Products business group acquired Milcor Inc, a multi-brand manufacturer of building products and NRG Industries Inc., a multi brand manufacturer of commercial building accessories.
In fiscal 2005, the Industrial & Automotive business group sold Unified Industries, Inc, the Air Springs division and the business and assets of the North American Curved Hose business. The Building Products business group sold the business and assets of Gutter Helmet, part of the Hart & Cooley residential construction business.
Disposals in each of the above fiscal years were executed as part of management’s program to dispose of all non-core businesses.
Capital expenditure
Due to the diverse nature of the business, there is no individual item of capital expenditure that has had a material impact on the position of the Company and no individually significant capital expenditure project that is currently in progress.
11
B. Business overview
Segment analysis
The segment information presented below is prepared in accordance with IFRS.
The Group determines its reportable segments based on the structure of the internal financial reports that are used by senior management for decision-making purposes and its primary segment reporting format is by business segment. The Group is organized for management reporting purposes into two principal business groups: Industrial & Automotive and Building Products.
During fiscal 2007, Industrial & Automotive operated through five business segments: Power Transmission, Fluid Power, Wiper Systems, Fluid Systems and Other Industrial & Automotive. Trico, which constituted the Wiper Systems business segment, was classified as a discontinued operation during fiscal 2006 and was sold on June 29, 2007.
Building Products is comprised of two business segments: Air Systems Components and Other Building Products.
Additional segmental information is provided in Note 4 to the Group’s consolidated financial statements.
| | | | | | |
Analysis by business segment | | Fiscal
2007 | | Fiscal
2006 | | Fiscal
2005 |
| | | £ million | | £ million | | £ million |
Sales | | | | | | |
Industrial & Automotive | | | | | | |
Power Transmission | | 1,031.2 | | 1,009.6 | | 969.9 |
Fluid Power | | 374.0 | | 383.8 | | 358.0 |
Fluid Systems | | 291.8 | | 244.0 | | 245.2 |
Other Industrial & Automotive | | 458.5 | | 535.4 | | 506.4 |
| | | | | | |
| | 2,155.5 | | 2,172.8 | | 2,079.5 |
| | | | | | |
Building Products | | | | | | |
Air Systems Components | | 541.6 | | 583.9 | | 485.4 |
Other Building Products | | 244.8 | | 377.1 | | 398.4 |
| | | | | | |
| | 786.4 | | 961.0 | | 883.8 |
| | | | | | |
| | 2,941.9 | | 3,133.8 | | 2,963.3 |
| | | | | | |
Segment result | | | | | | |
Industrial & Automotive | | | | | | |
Power Transmission | | 130.1 | | 137.5 | | 127.9 |
Fluid Power | | 28.7 | | 30.0 | | 38.4 |
Fluid Systems | | 25.5 | | 9.5 | | 20.4 |
Other Industrial & Automotive | | 49.7 | | 53.5 | | 56.7 |
| | | | | | |
| | 234.0 | | 230.5 | | 243.4 |
| | | | | | |
Building Products | | | | | | |
Air Systems Components | | 45.6 | | 53.8 | | 57.3 |
Other Building Products | | 32.2 | | 25.9 | | 29.2 |
| | | | | | |
| | 77.8 | | 79.7 | | 86.5 |
| | | | | | |
| | 311.8 | | 310.2 | | 329.9 |
| | | | | | |
| | | |
Analysis by geographical origin | | Fiscal
2007 | | Fiscal
2006 | | Fiscal
2005 |
| | | £ million | | £ million | | £ million |
Sales | | | | | | |
United States | | 1,727.8 | | 2,028.1 | | 1,961.5 |
United Kingdom | | 204.0 | | 140.0 | | 130.9 |
Rest of Europe | | 366.8 | | 349.7 | | 312.6 |
Rest of the World | | 643.3 | | 616.0 | | 558.3 |
| | | | | | |
| | 2,941.9 | | 3,133.8 | | 2,963.3 |
| | | | | | |
12
Reconciliation of the total segment result to operating profit:
| | | | | | | | | |
| | | Fiscal
2007 | | | Fiscal
2006 | | | Fiscal
2005 | |
| | | £ million | | | £ million | | | £ million | |
Segment result | | 311.8 | | | 310.2 | | | 329.9 | |
| | | | | | | | | |
Unallocated corporate activities | | (19.5 | ) | | (28.7 | ) | | (25.3 | ) |
Gain on available-for-sale investments | | 0.3 | | | 0.2 | | | 0.4 | |
Share of profit of associates | | 0.4 | | | 1.5 | | | 0.6 | |
| | | | | | | | | |
Operating profit | | 293.0 | | | 283.2 | | | 305.6 | |
| | | | | | | | | |
Industrial & Automotive
| | | | | | | | |
Sales by end markets | | | Sales by major product category | |
Automotive OE | | 27.9 | % | | Power Transmission: | | | |
Automotive aftermarket | | 27.4 | % | | Belts and tensioners | | 41 | % |
Industrial OE | | 23.8 | % | | Powertrain | | 6 | % |
Industrial aftermarket | | 18.0 | % | | Fluid Power: | | | |
Other | | 2.9 | % | | Hydraulics and hose | | 17 | % |
| | | | | Fluid Systems: | | | |
| | | | | Remote Tire Pressure Monitoring System | | 6 | % |
| | | | | Other Fluid Systems | | 8 | % |
| | | | | Other | | | |
| | | | | Utility trailers | | 6 | % |
| | | | | Other | | 16 | % |
| | | | | | | | |
| | 100 | % | | | | 100 | % |
| | | | | | | | |
The Industrial & Automotive business group has corporate offices in the United States and Canada. It supplies industrial and automotive parts, components and systems, serving a wide variety of industries, including the industrial and automotive OE and replacement markets, transportation, energy and natural resources and agricultural markets.
The Industrial & Automotive business group operates 79 manufacturing facilities and 46 distribution centers in 24 countries. It has businesses in North America, Europe, Asia, South America, Australia and the Middle East, with more than half of the manufacturing facilities located in North America and Mexico. European operations include 16 manufacturing facilities and the Asian businesses operate 13 facilities, seven of which are in China.
The Industrial & Automotive business group employed on average 21,296 people around the world in fiscal 2007. Its products are sold directly to industrial and automotive OEMs and, through a network of approximately 150,000 distributors worldwide, to the industrial and automotive replacement markets.
Power Transmission
| | | | | | | | | | | | |
Brands | |  |
| | | | |
Products | | Gates: Synchronous drive belts, V-belts, pulleys, tensioners, engine modules, and electromechanical drive systems |
| |
| | Gates Mectrol:Polyurethane timing belts and motion control components |
| |
| | Stackpole:Planetary carrier systems, powder metal power transmission and pump components, engine and transmission oil pumps |
| | | | | | | | | | | | |
Manufacturing facilities | | 34 | | % of business group sales | | 47.8% | | % of Group sales | | 35.1% | | |
Power Transmission produces a comprehensive global product line ranging from automotive synchronous belt and accessory belt drive systems to heavy-duty industrial belt drives. A variety of process and material technologies are used to design, manufacture, market, and distribute complete power transmission systems to both OEM and replacement markets. Power Transmission is globally integrated to standardize product and process technology, maximizing resource utilization. The segment supports and supplies customers globally through regional management in the Americas, Europe and Asia.
Gates is the world’s largest manufacturer of power transmission belts for problem-solving applications, with manufacturing and research facilities in 20 countries. Its products are sold directly to industrial and automotive OEMs and through a global network of dealers.
Gates Mectrol was acquired by the business group in December 2004 and currently employs more than 180 people operating manufacturing and sales facilities in the United States, Germany and Mexico.
Stackpole is a Canadian-based manufacturer of powertrain components, systems and assemblies primarily for use in automotive engines and transmissions. The company has more than 1,500 employees at six operating facilities in Canada and the United Kingdom.
13
Fluid Power
| | | | |
Brands | |  |
| | |
| Products | | Gates Automotive: | | Moulded hoses, curved radiator hoses, coolant hoses, fuel line and oil system hoses, air and defroster system hoses, vacuum line hose and tubing |
| | |
| | Gates Industrial: | | Hoses for handling oil, water, air, grease sprays, paraffin waxes, salt solutions and an assortment of chemicals |
| | |
| |
| | EMB: cutting rings, flared coupling systems, sealing elements, and total hydraulic systems solutions |
| | | | | | | | | | |
| | | | | |
Manufacturing facilities | | 13 | | % of business group sales | | 17.4% | | % of Group sales | | 12.7% |
The Fluid Power segment is a manufacturer of engineered hose, fittings and accessories for hydraulic power transmission systems used in both mobile and stationary industrial equipment, focusing primarily on the petroleum, chemical and food/beverage sectors. The segment also produces a wide range of products used in engine cooling, power steering, braking and fuel system applications. The development of next-generation products is focused on evolving the existing product line into a full port-to-port sub-system capable of providing systems and design concepts that reduce leaks, warranty and assembly labor costs.
The segment serves customers in North America, South America, Europe and Asia. The fiscal 2005 acquisition of German-based EMB, a manufacturer of hydraulic tube connection systems for a variety of applications, has resulted in an expanded product range and geographic presence in Eastern Europe and Asia.
Fluid Systems
| | | | | | |
Brands | | 
|
| | | |
Products | | Other brands include: | | | | Lev-R-Vent, Pre-Vent, Weir-Stat, Superstat, Amflo, Camel, Tru-Flate, Syracuse |
| | | | |
| | |
| | Schrader Electronics: | | Remote Tire Pressure Monitoring Systems |
| | | | | | |
| | | |
| | Other: | | | | Gas caps, closure caps, automotive thermostats, on-board refueling vapor recovery (ORVR) valves, tire valves and gauges, fuel delivery system components, air conditioning components, automotive chassis components, air-conditioning and injection valves and connectors, industrial valves, inflating gauges, and tire repair pieces |
| | | | | | | | | | |
| | | | | |
Manufacturing facilities | | 14 | | % of business group sales | | 13.5% | | % of Group sales | | 9.9% |
The Fluid Systems segment is a designer, manufacturer and distributor of a broad range of automotive fluid conveyance and fluid management components and modules. Applications include fuel delivery, emission control, engine management, braking, power steering, coolant, air conditioning and windshield washing. Products are sold primarily for use as original equipment by manufacturers of cars and trucks and in the automotive replacement market as repair parts and accessories. Fluid Systems’ products are also sold in wholesale and retail automotive parts and distribution outlets in North America, Europe and Latin America including the service departments of OEM dealers.
Through Schrader Electronics, the Fluid Systems segment is the technology leader in RTPMS, a driver information and passenger security system that is economically and ergonomically integrated into vehicle electronic information systems. Stant Manufacturing designs, manufactures and markets a variety of valves and fuel, oil and radiator closure caps. Standard-Thomson is a manufacturer of engine thermostats used in automotive cooling systems. Schrader-Bridgeport International provides a wide range of tire valve, hardware and specialty valve products worldwide.
14
Other Industrial & Automotive
| | | | | | | | | | | | |
Brands | |  |
| |
| | Other brands include: LubriMatic, Tru-Flate, Tridon, |
| | | | | | | | | | | | |
Products | | DexterAxle: | | High specification non-drive axles and wheels, frames and trailers |
| | | | | | | | | | | | |
| | Dexter Chassis Group: | | Trailer chassis and components, fabricated metal parts, and high-end coatings for military and general industries |
| | | | | | | | | | | | |
| | Aftermarket: | | Automotive accessories, grease guns, power steering hose assemblies, air power pneumatic components and systems, lubrication equipment, stainless and carbon steel hose clamps, tire repair products, air line products, brass and plastic fittings, brake lines, oils and greases |
| | | | | | | | | | | | |
Manufacturing facilities | | 18 | | % of business group sales | | 21.3% | | % of Group sales | | 15.6% | | |
Other Industrial & Automotive includes the trailer axles, materials handling and aftermarket businesses.
Dexter Axle and the Dexter Chassis Group produce and market their products primarily in the United States directly to OEMs and through distributors. The product line is focused on the general utility, recreational vehicle, highway trailer and manufactured housing markets.
Dearborn designs, fabricates and installs various conveyor systems for the automotive, industrial and utilities industries. During fiscal 2006, Dearborn was classified as held for sale, and its sale was completed on November 23, 2007.
The aftermarket business integrates the manufacture, marketing, sales and distribution of products destined for both the aftermarket and OE markets, under a variety of brands. Ideal is a designer and clamp manufacturer based in the United States, with additional operations in Mexico and China. Also based in the United States, Plews-Edelmann is a designer, manufacturer and distributor of a broad range of automotive parts and tools that are sold worldwide.
Building Products
| | | | | | | | |
Sales by end markets | | | Sales by major product category | |
Residential construction | | 39 | % | | Air handling components | | | |
Commercial Construction | | 46 | % | | Grilles, registers and diffusers | | 22 | % |
Other | | 15 | % | | Venting/ducts | | 17 | % |
| | | | | Dampers | | 9 | % |
| | | | | Hydraulics and hose | | 21 | % |
| | | | | Bathtubs, showers and whirlpools | | 18 | % |
| | | | | Doors and windows | | 12 | % |
| | | | | Other | | 1 | % |
| | | | | | | | |
| | 100 | % | | | | 100 | % |
| | | | | | | | |
The Building Products business group manufactures a range of products for residential and commercial buildings, supplying both the new-build and refurbishment sectors. Its product portfolio comprises air systems components (manufacturing a wide range of components for the HVAC markets, principally in North America), bathware (manufacturing a range of baths, shower cubicles and luxury whirlpools for the North American residential market), and doors and windows (manufacturing uPVC doors and windows for the residential and manufactured housing markets in North America).
The Building Products business group operates 63 manufacturing facilities and nine distribution centers in six countries. 59 of the manufacturing facilities are in the United States, Mexico and Canada, with two in the United Kingdom and one in Thailand and India, respectively. The distribution centers are all based in Canada and the United States.
15
Air Systems Components
| | | | | | | | | | | | |
| Brands | |  |
| | | | | | | | | | |
| |
| Other brands include: | | Industrial Air, Bayley, Supreme Fan, Classics, Rezzin, J & J Register, AmeriVent, AmeriFlow, AMPCO, Home Details, Ward, Milcor, Portals Plus, Roof Products & Systems (RPS), Eastern Sheet Metal, Swartwout, Lau, Rooftop Systems, National Duct Systems and Glass Master, Supervent, Superpro |
| | | | | | | | | | |
| |
| Products Air Systems: | | Grilles, registers, diffusers, terminal units, fan coils and related products, dampers, power roof ventilators, inline duct fans, ceiling fans, food service ventilators, blower and cabinet fans, centrifugal inline roof/wall fans, propeller roof/wall fans, louvers, dampers, fan accessories and axial fans |
| | | | | | | | | | |
| |
| Hart & Cooley: | | Vents, grilles, registers, diffusers, all-fuel chimneys, chimney liners, dampers, louvers vents, flexible ducts, duct systems, duct connection systems, fire dampers, ductwork vanes & rails, ductwork slips & drives, ductwork access doors, roof & floor access hatches, rooftop heat & smoke vents, wall & ceiling access doors, custom roof curbs & supports, rooftop adapter curbs, roof drains, roof flashing systems, expansion joint systems, vents and breathers |
| | | | | | | | | | |
| |
| Selkirk: | | Gas vents, chimney vents and grilles, registers and diffusers |
| | | | | | | | | | |
| |
| Ruskin: | | Louvers, dampers, air measuring stations, OEM axial prop fans, OEM centrifugal fans, sunshades, free-cooling economizers, roof curbs, curb adapters, energy recovery ventilators, concentric diffusers, metal ductwork for sheet metal contractors and specialty equipment used for cutting, forming, and assembling fiberglass ductwork |
| | | | | | | | | | |
| |
| Ruskin Air Management: | | Fire, smoke & control dampers, airside and waterside control fan coil units, grilles, registers and diffusers, glass/metal louvres and Brise Soleil (sunscreens) |
| | | | | | | | | | |
| | | | | |
Manufacturing facilities | | 46 | | % of business group sales | | 68.9% | | % of Group sales | | 18.4% |
Air Systems Components designs and manufactures products for industrial, commercial and residential applications that are primarily sold in the United States, Canada, Mexico and the United Kingdom. Slightly less than half of the segment’s sales pass through manufacturers’ representatives and approximately 35 percent are sold through wholesalers, principally in the residential market. The balance of sales is direct to OEMs, national accounts and retail customers.
Air Systems designs and manufactures a range of air system products for industrial, institutional and commercial applications. These products are sold primarily to manufacturers’ representatives for resale to contractors. Hart & Cooley and Selkirk supply the residential and light commercial markets in the United States, Canada and Mexico, marketing their products primarily through wholesale distributors and retail customers.
Ruskin produces and markets commercial and industrial air system components that are sold directly to manufacturers of HVAC equipment and to contractors and commercial users principally through manufacturers’ representatives. Ruskin Air Management, a United Kingdom business, markets its products principally in the United Kingdom and continental Europe.
Other Building Products
| | | | |
Brands | |  |
| | | | |
| | |
| | Other brands include: | | Ventadome, Northern Breeze |
| | | | |
| | |
Products | | Lasco Bathware: | | Luxury whirlpool baths, tub/showers, showers, steam baths, shower bases, door enclosures |
| | | | |
| | |
| | Philips Products: | | Aluminum and vinyl windows and doors, exhaust hoods, bathroom fans, roof vents and monitoring systems |
| | | | | | | | | | |
| | | | | |
Manufacturing facilities | | 17 | | % of business group sales | | 31.1% | | % of Group sales | | 8.3% |
Lasco Bathware manufactures one quarter of all baths in the United States as well as an extensive range of luxury whirlpools. It operates from nine facilities across the United States with national distribution to home centers and wholesalers. Products are also sold directly to builders who use the company installation services. Aquatic Industries, a division of Lasco Bathware, produces up-market acrylic whirlpools, principally for the dealer/distributor market in the United States and also supplies standard and customized products for hotel and resort developments internationally.
16
Lasco Fittings manufactures plastic fittings used in irrigation, water works, swimming pools and spas, for commercial and industrial applications as well as for residential plumbing. Lasco Fittings was classified as held for sale during fiscal 2006, and was sold on February 23, 2007.
Philips Products is based in the United States and produces windows, doors and venting products for the residential, manufactured housing, recreational vehicle and specialty trailer markets. Its products are manufactured in seven plants across the United States and are sold primarily through distributors to builders in the new housing and refurbishment sectors. The business has received Florida/coastal state building code and hurricane approvals for its current residential vinyl window products allowing for growth in these regional coastal markets.
Raw Materials and Energy Supplies
The Group purchases a broad range of raw materials, components and products from around the world in connection with its activities. The ability of the Group’s suppliers to meet performance and quality specifications and delivery schedules is important to its operations, but the Company is not dependent on any single source of supply for critical materials. The energy and materials required for the Group’s manufacturing operations tend to be readily available, however, basic raw materials such as steel, aluminum, nickel, polymers and resins can be subject to significant fluctuations in price.
Generally, the Group has secured sales price increases that have enabled it to pass on the increased cost of raw materials to its customers. The ability to procure lower-cost materials and to re-source materials used in our products is an ongoing priority, particularly with the challenging cost environment for raw materials that has existed for the past three years. We have established functions in both China and India to source low-cost materials for businesses across the Group and the Group engages in multiple-source and geographically diverse procurement policies, strategic customer pricing reviews and expanded geographic diversity in buying.
Seasonality
Industrial & Automotive
Sales to Automotive OEMs do not tend to exhibit seasonal patterns. Sales into the aftermarket are generally stronger during the winter months reflecting higher levels of demand for replacement parts for vehicles during this period. Sales to Industrial OEMs are strongest from October to April for outdoor power equipment and from February to June for agricultural equipment.
In the Fluid Power OEM segment, moderate seasonality is primarily driven by consumer demand and crop-related seasonal activities. Production of construction equipment declines in the summer months followed by a resurgence of activity in the late fall, early winter and spring. Farm equipment production levels are driven by purchases prior to the relevant planting and harvesting seasons. The remaining markets served by the Fluid Power segment do not exhibit significant seasonal patterns.
Building Products
Sales to the construction industry generally slow down in November and December before the Thanksgiving, Christmas and New Year holiday season and are generally stronger in the spring and summer months. Sales can also be affected regionally by severe weather. Heating product sales are more concentrated in the fall and cooling product sales in the spring.
Patents and Trademarks
Management believes that the Group’s operations are not dependent to any significant degree upon any single or series of related patents or licenses, or any single commercial or financial contract. Management also believes that the Group’s operations are not dependent upon any single trademark or trade name, although trademarks and trade names are identified with a number of the Group’s products and services and are of importance in the sale and marketing of such products and services.
Governmental Regulation
The Company’s subsidiaries are regulated by governmental authorities in a number of countries. Many of the products produced by the Company’s subsidiaries are subject to governmental regulation regarding their production (including environmental regulations), sale, advertising, safety, labeling and raw materials. Management believes that the Company’s subsidiaries have taken sufficient measures to comply with applicable local, federal and/or national regulations.
Some of the regulations applicable to the Company’s subsidiaries include regulations that would allow local, national or federal authorities to mandate product recalls, or provide for the seizure of products, as well as other sanctions. Management believes that the controls implemented by subsidiaries minimize the risk of the occurrence of such events and that such risks do not pose a material threat to the Company. It is standard practice for contracts with OEMs to limit compensation arising from product recalls to direct costs (recall notification and replacement). Warranty limitations and exclusions are printed on all customer-facing material.
The Company maintains worldwide insurance coverage for product liability claims and believes that its level of insurance coverage is adequate.
The Company’s subsidiaries are subject to regulation under various and changing federal, state and local laws and regulations relating to the environment and to employee health and safety. These environmental laws and regulations govern the generation, storage, transportation, disposal and emission of various substances. Permits are required for operation of certain businesses carried out by the Company’s subsidiaries (particularly air emission permits) and these permits are subject to renewal, modification and, in certain circumstances, revocation. Management believes that the Company’s subsidiaries are in substantial compliance with laws and regulations that could allow regulatory authorities to compel (or seek reimbursement for) clean-up of environmental contamination at its subsidiary-owned sites and at facilities where its waste is stored or disposed of.
17
C. Organizational structure
The Company is the parent of a large number of subsidiaries that are organized into two principal business groups managed through a Corporate Center. The Group’s organizational structure is as follows:
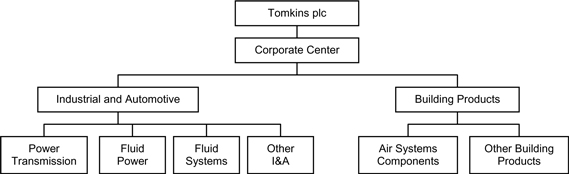
A list of the Company’s principal subsidiaries, including their name, country of incorporation and the Group’s ownership interest, is set forth in Exhibit 8.1.
D. Property, plant and equipment
The Group’s principal executive offices are located in London, England. The Group’s plants, warehouses and offices are located in various countries throughout the world, with a large proportion in North America. The Group owns many of these properties and continues to improve and replace properties when considered appropriate to meet the needs of its individual operations. There are no individually significant properties that were under-utilized during fiscal 2007.
The net book value as at December 29, 2007 of the Group’s property, plant and equipment was £709.7 million, of which £6.3 million related to assets held under finance leases. The table below provides an analysis of the geographic spread of the Group’s total property, plant and equipment. As at December 29, 2007, the Group operated 142 manufacturing facilities and 63 sales offices or distribution centers in 24 countries across the Americas, Europe, Asia, and Australia. With the exception of assets held under finance leases with a carrying amount of £6.3 million, which are secured by a lessor’s charge over the leased assets, there were no encumbrances over the Group’s property, plant and equipment as at December 29, 2007.
| | | | | |
| | | Net book
value
£ million | | Percentage
of total
net book value | |
United States | | 286.7 | | 40.4 | % |
United Kingdom | | 60.9 | | 8.6 | % |
Rest of Europe | | 102.4 | | 14.4 | % |
Rest of the World | | 259.7 | | 36.6 | % |
| | | | | |
Total | | 709.7 | | 100.0 | % |
| | | | | |
Included in “Rest of the World” in the table above are assets with a net book value of £147.3 million and £31.9 million located in Canada and China respectively.
Due to the diverse nature of the business, management believes that there is no individual fixed asset at December 29, 2007, the loss of which would have a material impact on the position of the Group as a whole. Similarly there are no plans to construct, expand or improve facilities that would, on completion or cancellation, significantly affect the Group’s operations.
Item 4A. Unresolved Staff Comments
None.
18
Item 5. Operating and Financial Review and Prospects
A. Operating results
Basis of preparation
The Group’s consolidated financial statements set out on pages F-2 to F-62 of this document are prepared in accordance with IFRS. Selected financial data, also prepared in accordance with IFRS, is set forth in Item 3A “Selected Financial Data”.
The operating and financial review presented below refers to adjusted operating profit. This is a non-GAAP measure used by management and the Board for the purposes of making decisions about allocating resources within the Group and assessing the performance of each segment.
Reconciliations are provided below for the Group and each business group of segment result to operating profit (both GAAP measures) and of operating profit to adjusted operating profit.
Additional segment information is provided in Note 4 to the Group’s consolidated financial statements.
Fiscal 2007 results compared with fiscal 2006 results
Group overview
The diversity of the Group, particularly as it has grown in new markets around the world, gives the Group both strength and resilience. This diversity enabled the Group to maintain a strong operating profit margin in fiscal 2007, despite the challenging end markets. Highlights in fiscal 2007 included:
| • | | continued rationalization of some of the older facilities in North America and Europe and investment in new plants and equipment, especially in Asia and Eastern Europe; |
| • | | completion of the disposal of three non-core businesses (Lasco Fittings, Trico and Dearborn); |
| • | | completion of a bolt-on acquisition for Schrader Electronics; and |
| • | | continued disposal of non-productive real estate. |
| | | | | | | | | | | | |
Analysis of movements from fiscal 2006 to fiscal 2007 | | Sales | | | Adjusted operating profit | |
| | | £ million | | | Change | | | £ million | | | Change | |
Fiscal 2006 | | 3,133.8 | | | | | | 295.8 | | | | |
Exchange rate effect | | (191.9 | ) | | | | | (19.3 | ) | | | |
Disposals | | (58.4 | ) | | | | | (4.7 | ) | | | |
Acquisitions | | 32.4 | | | | | | 3.3 | | | | |
| | | | | | | | | | | | |
Underlying change(1) | | 26.0 | | | 0.9 | % | | (10.4 | ) | | (3.8 | )% |
| | | | | | | | | | | | |
Fiscal 2007 | | 2,941.9 | | | | | | 264.7 | | | | |
| | | | | | | | | | | | |
Reconciliation of segment result to adjusted operating profit
| | | | | | |
| | | Fiscal
2007 | | | Fiscal
2006 | |
Segment result | | 311.8 | | | 310.2 | |
– Unallocated corporate activities | | (19.5 | ) | | (28.7 | ) |
– Gain on sale of available-for-sale investments | | 0.3 | | | 0.2 | |
– Share of results of associates | | 0.4 | | | 1.5 | |
| | | | | | |
Operating profit | | 293.0 | | | 283.2 | |
– Restructuring costs | | 13.8 | | | 13.0 | |
– Disposals and exit of businesses | | (45.7 | ) | | (3.1 | ) |
– Amortization of intangible assets arising on acquisition | | 3.6 | | | 2.7 | |
| | | | | | |
Adjusted operating profit | | 264.7 | | | 295.8 | |
| | | | | | |
| | |
Operating margin(2) | | 9.0 | % | | 9.4 | % |
| | | | | | |
(1) | Underlying change excludes the effect of currency fluctuations and acquisitions and disposals |
(2) | Operating margin is the adjusted operating profit expressed as a percentage of sales |
Sales were £2,941.9 million for fiscal 2007, a decrease of £191.9 million (6.1 percent) from sales of £3,133.8 million for fiscal 2006. Cost of sales dropped from £2,272.0 million in fiscal 2006 (representing 72.5 percent of sales) to £2,141.5 million for fiscal 2007 (representing 72.8 percent of sales). Distribution and administration expenses decreased by 5.3 percent to £539.7 million in fiscal 2007 from £570.2 million in fiscal 2006, representing 18.3 percent of sales for fiscal 2007 and 18.2 percent of sales for fiscal 2006.
Adjusted operating profit was £264.7 million (fiscal 2006: £295.8 million), reflecting the economic weakness across a number of the Group’s markets. This translated into a 0.4 percent decrease in the Group’s operating margin from 9.4 percent in fiscal 2006 to 9.0 percent in fiscal 2007.
19
Restructuring initiatives
Management has undertaken various restructuring activities to streamline operations, consolidate and take advantage of available capacity and resources, and ultimately to achieve net cost reductions. Restructuring activities include efforts to integrate and rationalize the Group’s businesses and to relocate manufacturing operations to lower cost markets. During fiscal 2007 there was a gain of £31.9 million from restructuring initiatives compared with a loss of £9.9 million in fiscal 2006. Restructuring initiatives comprise restructuring costs and gains/losses on disposals and exits of businesses.
Restructuring costs
In fiscal 2007, the restructuring costs of £13.8 million principally related to the rationalization of production facilities within the Lasco Bathware and Philips Products businesses in the United States (£2.4 million), the outsourcing of information technology services (£2.7 million), and the initiatives within the Fluid Power and Air Systems Components segments that began in fiscal 2006 (£7.4 million). The fiscal 2006 restructuring costs were lower at £13.0 million, and included the transfer of the activities of Fluid Power’s facility at St. Neots in the United Kingdom to a new facility in the Czech Republic, the closure of Air Systems Components’ Holland, Michigan facility and the cost-saving initiatives within Stackpole and the Air Systems Components segment that began in fiscal 2005.
On May 3, 2007, management announced that Stackpole was to be integrated into the Gates group to enable the Group to further exploit the available synergies from the combined technologies, products and market positions of Gates and Stackpole and leverage the global reach of the Gates business. As part of this restructuring, during the second quarter of fiscal 2007 management carried out an assessment of the carrying value of certain assets of the Stackpole business, taking into account the outlook for its markets and customers. This assessment, as well as the normal year end strategic assessment of the Group’s businesses, supported the existing carrying values of the business based on projected cash flows. Further information on the carrying value of the Stackpole business as at December 29, 2007 can be found under “Critical Accounting Estimates – Impairment of non-current assets” below.
Gains/losses on disposals and exit of businesses
In fiscal 2007, the Group recognized gains on disposals and exit of businesses of £45.7 million, including a gain of £32.6 million on the disposal of Lasco Fittings Inc., a gain of £6.7 million on the disposal of Dearborn and a loss of £1.3 million on the disposal of Tridon’s indicator and side object detection businesses. Also during fiscal 2007, the Group recognized a gain of £7.7 million on the disposal of corporate property. In fiscal 2006, the Group recognized a gain of £3.1 million on the sale of property, plant and equipment relating to businesses sold in previous years.
Net finance costs
Net interest expense for fiscal 2007 was £27.6 million compared with £37.8 million in fiscal 2006. This movement of £10.2 million was driven by lower levels of debt during fiscal 2007, conversion or redemption of all outstanding Preference Shares, and a higher expected return on defined benefit plan assets during fiscal 2007.
Other finance expense largely represents fair value gains and losses arising on financial instruments held by the Company to hedge its translational exposures where either the economic hedging relationship does not qualify for hedge accounting or to the extent that there is deemed to be ineffectiveness in a qualifying hedging relationship. The expense has increased from £0.7 million in fiscal 2006 to £2.8 million in fiscal 2007, due primarily to movements in foreign currency markets.
Income tax expense
The tax charge attributable to continuing operations of £69.9 million for 2007 (fiscal 2006: £35.8 million) represents an effective tax rate of 26.6 percent (fiscal 2006: 14.6 percent) applied to profit before tax from continuing operations of £262.6 million (fiscal 2006: 244.7 million).
During fiscal 2007, the effective tax rate was impacted by non-recurring tax benefits of £12.9 million. Prior to these adjustments the total tax charge for fiscal 2007 would have been £82.8 million representing an effective tax rate of 31.5 percent applied to profit before tax from continuing operations.
In fiscal 2006 the effective tax rate was impacted by the release of provisions for uncertain tax positions of £50.6 million. This followed the successful resolution of outstanding tax issues in the United States, the change in certain tax laws and the change in views on the likely outcome of challenges of the various tax authorities. In addition during fiscal 2006 there were other non-recurring tax charges of £7.2 million included in arriving at the overall charge for the Group. Prior to these adjustments the total tax charge for fiscal 2006 would have been £79.2 million representing an effective tax rate of 32.4 percent applied to profit before tax from continuing operations.
The Group recognizes provisions in respect of uncertain tax positions where additional current tax may become payable in future periods following the audit by the tax authorities of previously filed tax returns. Provisions for uncertain tax positions are based upon management’s assessment of the likely outcome of issues associated with assumed permanent differences, interest that may be applied to temporary differences and the possible disallowance of tax credits and penalties. As at December 29, 2007, the Group holds a provision for uncertain tax positions amounting to £33.9 million. This provision is reviewed regularly and adjusted to reflect events such as the expiry of limitation periods for assessing tax, administrative guidance given by the tax authorities and court decisions.
Discontinued operations
The loss from discontinued operations in fiscal 2007 was £33.3 million, compared with a loss of £11.6 million in fiscal 2006. In fiscal 2006, the loss from discontinued operations included an impairment loss of £26.6 million on assets classified as held for sale of which £5.7 million related to goodwill, and £20.9 million related to property, plant and equipment. In fiscal 2007, an impairment loss of £17.2 million was included in the loss on disposal of discontinued operations, forming part of the £29.8 million loss recognized on the sale of Trico in June 2007. The Group recognized a total loss on disposal of discontinued operations of £32.6 million in fiscal 2007 (after a tax charge of £4.0 million) and a loss of £2.1 million (after a tax benefit of £20.4 million) in fiscal 2006.
Minority interest
Minority interest in the profit for the period was £12.5 million in fiscal 2007, compared with £11.2 million for fiscal 2006. Minority interests in the Company’s subsidiaries are set forth in Note 40 to the Group’s consolidated financial statements.
20
Profit for the period
The Group’s fiscal 2007 profit for the period attributable to equity shareholders was £146.9 million, representing a 21.1 percent decrease from the fiscal 2006 profit of £186.1 million. This decrease is primarily attributable to the £29.8 million loss on the disposal of Trico and a higher tax charge resulting from a reduction of £30.5 million in non-recurring tax benefits compared to fiscal 2006. These losses were partially offset by an £8.1 million reduction in the net interest charge (due to lower levels of bank borrowings and the redemption of the Preference Shares in July 2007) and a £9.8 million increase in operating profit.
The improvement in operating profit resulted from a £42.6 million increase in gains on disposals and on the exit of businesses (including a gain of £32.6 million on the sale of Lasco Fittings in February 2007) and savings of £30.5 million in distribution and administrative costs (driven by a focus on cost management and lower sales volumes). These gains were offset by a £61.4 million decline in gross profit tracking the drop in sales volumes.
Dividends of £122.0 were paid to ordinary shareholders during fiscal 2007, compared with £115.3 million in fiscal 2006.
Goodwill impairment tests were completed as at December 29, 2007 and December 30, 2006. There was no impairment recognized at either date on continuing operations.
Details of the acquisitions and disposals during fiscal 2007, fiscal 2006 and fiscal 2005 are set forth in the “Principal acquisitions, disposals and capital expenditures” section of Item 4A “History and development of the Company”.
Outlook
The outlook for fiscal 2008 for a number of the Group’s end markets, particularly in North America, remains challenging. CSM auto database expects North American automotive production for 2008 to be approximately 14.4 million units, which is below the 2007 production level of 15.0 million units. Given uncertainty in credit markets, the US residential construction market will continue to be challenging. NAHB is forecasting this market to be down by approximately 20 percent in 2008 compared to 2007. Management does not anticipate that this market will recover prior to 2009. The management team continues to be focused on protecting profitability and generating cash through tightening costs, headcount adjustments and reducing capital expenditure where appropriate. The acceleration of our performance improvement initiatives are expected to help us to significantly improve our cost base over a three-year period. In addition, the Group is focused on driving growth, through expansion in emerging markets and through product development.
Segment overview
Industrial & Automotive
| | | | | | | | | | | | |
Analysis of movements from fiscal 2006 to fiscal 2007 | | Sales | | | Adjusted operating profit | |
| | | £ million | | | Change | | | £ million | | | Change | |
Fiscal 2006 | | 2,172.8 | | | | | | 240.7 | | | | |
Exchange rate effect | | (114.1 | ) | | | | | (13.5 | ) | | | |
Disposals | | (13.3 | ) | | | | | (0.3 | ) | | | |
Acquisitions | | 11.8 | | | | | | 2.3 | | | | |
| | | | | | | | | | | | |
Underlying change(1) | | 98.3 | | | 4.8 | % | | 9.0 | | | 4.0 | % |
| | | | | | | | | | | | |
Fiscal 2007 | | 2,155.5 | | | | | | 238.2 | | | | |
| | | | | | | | | | | | |
Reconciliation of segment result to adjusted operating profit
| | | | | | |
| | | Fiscal
2007 | | | Fiscal
2006 | |
Segment result | | 234.0 | | | 230.5 | |
– Gain on sale of available-for-sale investments | | 0.3 | | | 0.2 | |
– Share of results of associates | | 0.4 | | | 1.5 | |
| | | | | | |
Operating profit | | 234.7 | | | 232.2 | |
– Restructuring costs | | 7.2 | | | 9.8 | |
– Disposals and exit of businesses | | (5.4 | ) | | (3.1 | ) |
– Amortization of intangible assets arising on acquisition | | 1.7 | | | 1.8 | |
| | | | | | |
Adjusted operating profit | | 238.2 | | | 240.7 | |
| | | | | | |
Analysis by segment
| | | | | | | | | | | | | | |
| | | Fiscal
2007 | | Sales | | Adjusted operating profit | | Operating margin(2) | |
| | | | Fiscal
2006 | | Fiscal
2007 | | Fiscal
2006 | | Fiscal
2007 | | | Fiscal
2006 | |
– Power Transmission | | 1,031.2 | | 1,009.6 | | 133.3 | | 140.8 | | 12.9 | % | | 13.9 | % |
– Fluid Power | | 374.0 | | 383.8 | | 33.8 | | 34.4 | | 9.0 | % | | 9.0 | % |
– Fluid Systems | | 291.8 | | 244.0 | | 27.1 | | 10.9 | | 9.3 | % | | 4.5 | % |
– Other Industrial & Automotive | | 458.5 | | 535.4 | | 44.0 | | 54.6 | | 9.6 | % | | 10.2 | % |
| | | | | | | | | | | | | | |
| | 2,155.5 | | 2,172.8 | | 238.2 | | 240.7 | | 11.1 | % | | 11.1 | % |
| | | | | | | | | | | | | | |
(1) | Underlying change excludes the effect of currency fluctuations and acquisitions and disposals |
(2) | Operating margin is the adjusted operating profit expressed as a percentage of sales |
21
Overview
During fiscal 2007, the Industrial & Automotive business group was characterized by challenging North American automotive OE and recreational vehicle markets, strong industrial growth, continuing expansion of operations into India and China, and the completion of the strategic bolt-on acquisition of Swindon Silicon Systems.
Sales and adjusted profit from operations for fiscal 2007 were down by 0.8 percent and 1.0 percent, respectively, compared to fiscal 2006. Underlying sales increased by 4.8 percent due principally to higher volumes, particularly in emerging markets, and sales growth from the Schrader Electronics business. Underlying adjusted profit from operations increased by 4.0 percent driven by the increase in underlying sales. This solid underlying performance was offset by the impact of exchange rates, leading to the operating margin being maintained at 11.1 percent in fiscal 2007.
Global automotive production, which is a useful indicator of the automotive OE market, increased by around 3.0 percent in fiscal 2007 compared to fiscal 2006 according to CSM auto database. Production growth in Europe was positive and there was continued strong growth in Latin America and other emerging markets, including China and India, which grew by 19.1 percent and 13.1 percent respectively, per CSM auto database. As these emerging markets grow, the Group’s exposure to the Detroit Three is steadily declining with North American sales to these customers now standing at approximately 7 percent of Group sales, and total worldwide sales at approximately 10 percent of Group sales.
Technology drove record levels of business awards in the automotive OE segment (which represented 27.9 percent of business group sales in fiscal 2007). Schrader Electronics’ tire pressure monitoring systems, Gates/Stackpole’s variable vane technology for oil pumps and Gates’ new hybrid technology all address safety and environmental concerns.
The global automotive aftermarket (which represented 27.4 percent of business group sales in fiscal 2007) showed steady growth in fiscal 2007, despite its susceptibility to factors such as stock rebalancing, consumer sentiment, disposable income and the price of fuel. The Group’s automotive aftermarket in North America and Europe outperformed the market with new products, new distribution and promotional efforts focused on educating professional installers. Efforts in Asia continued to increase with the pace of the market.
In fiscal 2007, the industrial OE market (which represented 23.8 percent of business group sales in fiscal 2007) continued to show good year-on-year growth in all regions. Global agricultural markets and domestic durable goods led to industrial OE sales growth for power transmission and fluid power products. The oilfield, mining and agricultural markets showed good growth, especially outside of North America.
The industrial aftermarket (which represented 18.0 percent of business group sales in fiscal 2007) performed strongly in fiscal 2007 following the strength of the OE market. Increases in energy production, mining and oilfield operations generated growth for this market.
Sales from the manufactured housing/recreational vehicles businesses comprise 2.8 percent of the business group’s sales in fiscal 2007. Wholesale shipments of all towable recreational vehicles declined by 10.9 percent in fiscal 2007, and manufactured home shipments fell by 18.5 percent in the United States in fiscal 2007. These decreases were driven by falling consumer confidence and a weaker residential housing market which suppressed the demand for manufactured housing, particularly the high volume multi-section manufactured homes.
As a business group, lean process implementation continued to drive manufacturing efficiencies, material cost reductions and increased output in facilities. Internal successes led to initiatives with key customers to further eliminate waste in shipping and product handling. The business group also continued its focus on innovative technology development.
Industrial & Automotive grew in geographic product reach and extended its manufacturing and distribution capability. In Eastern Europe, where market growth has been double digit, a sales office was added in Moscow to respond to increased market demand. Activities in India, the Middle East and South Africa continued to focus on building local presence and developing staff to support growth. In markets where oilfield and mining operations are strong, such as in Australia, the Gulf Area and Canada, the business group grew through Heavy-duty belt and oilfield hose products supporting these industries. Gates Winhere is expanding its manufacturing capacity by constructing a new plant in Yantai, China.
The business group acquired Swindon Silicon Systems, thereby accelerating Schrader’s product development capability based on ASIC technology with a view to expanding the product offering into new industrial applications. Subsequent to the end of fiscal 2007, the business group acquired A.E. Hydraulic (Pte) Ltd., a Singapore-based provider of hydraulic and industrial hose solutions and services for the oil exploration industry in Asia.
The Industrial & Automotive business group plans to continue to expand and leverage its diverse global position and strong brands by focusing on customer service, delivery of new products, geographic expansion and entering new, undeveloped market segments. Strategic initiatives will promote solutions in the areas of mass transit, energy savings and environment. The priority for fiscal 2008 is to grow the industrial business with products and services adjacent to its core processes and product offering and expand its reach in emerging markets.
In fiscal 2007, 18.9 percent of Industrial & Automotive sales came from products launched in the past five years.
Power Transmission
Power Transmission experienced strong underlying growth in sales of £61.6 million during fiscal 2007. The underlying movement in adjusted operating profit was a decrease of £1.0 million, largely due to the sales growth being offset by the weakness in the North American automotive OE market and higher raw material costs. During fiscal 2007, record automotive OE programs of $186 million were concluded, with 70 percent of these programs being outside of North America.
Power Transmission launched Poly Chain® GT® Carbon™ belts in the industrial markets. Demand for improved fuel economy and reduced emissions propelled Electro-Mechanical Drive™ technology and spurred numerous automotive application projects in Asia.
During fiscal 2007, the segment opened a new manufacturing facility in Chennai, India and expanded hose production in Chandigarh, India. In Suzhou, China, investment was made to increase capacity at the clamp manufacturing facility. Investment in other geographic regions includes Aachen, Germany; Glade Springs, Virginia; and Springfield, Tennessee. The integration of Stackpole into Gates is progressing well with Stackpole returning to profitability in fiscal 2007.
22
Fluid Power
Fluid Power, which serves primarily the industrial OE and replacement markets, produced good results in most of its geographic markets. Underlying growth in adjusted operating profit was £1.5 million, driven by a 3.3 percent growth in underlying sales. Fluid Power capitalized on the strong growth of many of its end markets including agriculture, oil and gas and mining. The relocation of manufacturing from the St. Neots facility in the United Kingdom to Karvina in the Czech Republic is expected to be completed in fiscal 2008 and is expected to position Fluid Power for improved performance and a stronger competitive position in Europe. In order to support the high-growth hydraulic market in India, the segment increased the manufacturing capacity at its facility in Chandigarh, India and established a manufacturing capacity in China in order to grow its business in Asia.
The Quick-lok® family of products has attracted customer interest due to the leak-preventing technology and consequent warranty cost reductions for customers. New awards with revenue of approximately £8 million were launched in fiscal 2007 in both North America and Europe.
Fluid Power engineers continued to drive innovation through hose connector interface technology that provides customers with added product safety, reliability and core product enhancements such as the new Xtreme™ Heat hose. New operations in India are well positioned to manufacture belt and tensioner products as well as hoses for local markets.
In March 2008, the segment acquired A.E. Hydraulic (Pte) Ltd., a Singapore-based provider of hydraulic and industrial hose solutions and services for the oil exploration industry in Asia. This acquisition builds on the Fleximak business and is expected to enable Gates to accelerate its market expansion into the high-growth oil and gas exploration market.
Fluid Systems
Fluid Systems had a strong year primarily due to the successful ramp-up of RTPMS at Schrader Electronics as the US legislative mandate for RTPMS on new vehicles became effective. Sales volumes for the Schrader Electronics business doubled during fiscal 2007, driving an increase in the segment’s operating margin from 4.5 percent in fiscal 2006 to 9.3 percent in fiscal 2007. Underlying growth in adjusted operating profit was £16.3 million, from a base of £10.3 million in fiscal 2006. Outside of North America, momentum grows for similar mandatory use of RTPMS, particularly in Europe where there is a major focus on lowering CO2 emissions and improving safety. Several European vehicle manufacturers are adopting RTPMS as an option. Sales of RTPMS retrofit kits to the aftermarket started to come through in the second quarter of fiscal 2007 and the business saw good growth over the balance of the year.
During fiscal 2007, the business had contract wins for its snap-in RTPMS with several major OEMs. It also pioneered new fuel sensing technology, which detects fuel level and type, and signed its first contract with a major German OEM. During the fourth quarter, Schrader Electronics acquired UK-based Swindon Silicon Systems, which designs, develops and supplies integrated circuits. This acquisition will provide a technology platform for new applications.
Opportunities for growth are expected to continue, especially as alternative fuel use increases. Schrader Electronics anticipates further growth from its snap-in applications and remains the first and only supplier of this technology.
Other Industrial & Automotive
Other Industrial & Automotive includes the Dexter Axle, Plews, Gates Fleximak, Gates Winhere and Ideal businesses. Gates Fleximak and the Gates Winhere water pump businesses, which were acquired in fiscal 2006, made positive contributions in fiscal 2007 and demonstrate the successful expansion of the Gates platform into new markets in fiscal 2007. The water pump line drove significant growth for the business group’s automotive aftermarket, with product implementation at NAPA, one of North America’s largest automotive distributors, and the first water pump awards in Australia and Canada. The Ideal Clamp business continues to expand its small but growing presence in Europe and China.
These improvements during fiscal 2007 were offset by volume losses in the Dexter Axle and Dexter Chassis businesses, driven by weaker volumes in the manufactured housing and recreational vehicle markets. The segment’s underlying sales and adjusted operating profit decreased by 6.9 percent and 15.6 percent respectively.
Dearborn, a manufacturer of automotive assembly lines and materials handling equipment, was identified as a non-core business during fiscal 2006 and was sold in November 2007.
23
Building Products
| | | | | | | | | | | | |
Analysis of movements from fiscal 2006 to fiscal 2007 | | Sales | | | Adjusted operating
profit | |
| | | £ million | | | Change | | | £ million | | | Change | |
Fiscal 2006 | | 961.0 | | | | | | 83.8 | | | | |
Exchange rate effect | | (77.8 | ) | | | | | (7.0 | ) | | | |
Disposals | | (45.1 | ) | | | | | (4.4 | ) | | | |
Acquisitions | | 20.6 | | | | | | 1.0 | | | | |
| | | | | | | | | | | | |
Underlying change(1) | | (72.3 | ) | | (8.6 | )% | | (20.2 | ) | | (27.9 | )% |
| | | | | | | | | | | | |
Fiscal 2007 | | 786.4 | | | | | | 53.2 | | | | |
| | | | | | | | | | | | |
Reconciliation of segment result to adjusted operating profit
| | | | | |
| | | Fiscal
2007 | | | Fiscal
2006 |
Segment result and operating profit | | 77.8 | | | 79.7 |
– Restructuring costs | | 6.1 | | | 3.2 |
– Disposals and exit of businesses | | (32.6 | ) | | — |
– Amortization of intangible assets arising on acquisition | | 1.9 | | | 0.9 |
| | | | | |
Adjusted operating profit | | 53.2 | | | 83.8 |
| | | | | |
Analysis by segment
| | | | | | | | | | | | | | |
| | | Sales | | Adjusted operating profit | | Operating margin(2) | |
| | | Fiscal
2007 | | Fiscal
2006 | | Fiscal
2007 | | Fiscal
2006 | | Fiscal
2007 | | | Fiscal
2006 | |
– Air Systems Components | | 541.6 | | 583.9 | | 51.2 | | 58.0 | | 9.5 | % | | 9.9 | % |
– Other Building Products | | 244.8 | | 377.1 | | 2.0 | | 25.8 | | 0.8 | % | | 6.8 | % |
| | | | | | | | | | | | | | |
| | 786.4 | | 961.0 | | 53.2 | | 83.8 | | 6.8 | % | | 8.7 | % |
| | | | | | | | | | | | | | |
(1) | Underlying change excludes the effect of currency fluctuations and acquisitions and disposals |
(2) | Operating margin is the adjusted operating profit expressed as a percentage of sales |
Overview
Fiscal 2007 has seen a further weakening of demand in some of the business group’s end markets, particularly in the US residential sector. The weakness seen in this market in the second half of fiscal 2006 continued into fiscal 2007, with housing starts down by 24.8 percent from fiscal 2006 at a rate of 1.4 million, a 16-year low. The US non-residential construction market as a whole has remained flat compared to fiscal 2006, but the public buildings and office segments areas, to which the business group is primarily exposed, showed increases of 38.1 percent and 4.2 percent respectively.
Sales and adjusted profit from operations for fiscal 2007 were down by 18.2 percent and 36.5 percent respectively compared to fiscal 2006. Underlying sales decreased by 8.6 percent and underlying adjusted operating profit decreased by 27.9 percent, driven by the continuing weakness in the US residential construction market. The softer year-on-year performance has been exacerbated by the impact of exchange rates, leading to the operating margin falling from 8.7 percent to 6.8 percent in fiscal 2007.
To cope with the difficult market conditions, the business group continued to focus on restructuring the production and distribution network to meet increasing demand for shorter lead times and the lowest possible delivered cost. Accordingly, there was a continued focus on lean manufacturing, strengthening of regional manufacturing where lead times and shipping costs are critical, and relocation of production to lower cost facilities when possible. A number of high-volume products are sourced in China, and other production has been moved to existing and new facilities in Mexico.
The group also adjusted capacity in anticipation of continued weakness in the residential markets in the United States. Manufacturing facilities have been closed in Pennsylvania, Texas, Georgia and California. The average monthly headcount for fiscal 2007 was reduced by 947 compared to fiscal 2006, in line with the reduction in sales.
The businesses are developing new products with emphasis on the needs of specific market areas. The business group operates 12 independent laboratories, which continuously introduce new products to maintain its leadership role in both residential and non-residential markets. Our brands are well positioned to take advantage of green building initiatives driven by end customers around the world.
An increased emphasis was placed on Asia and the Middle East as those markets continued to significantly expand in their non-residential construction sectors. In fiscal 2007, the business group entered into a joint venture with Caryaire, a manufacturer and distributor of HVAC products in India to service that expanding market, and shortly after the end of fiscal 2007, it purchased a majority stake in Rolastar, a duct manufacturer, also based in India.
After servicing the Chinese market from offshore for a number of years, the business group began production in China and is looking to expand that presence in the near future.
24
With the continuing issues related to the credit markets and residential construction, we expect another difficult residential market in fiscal 2008 with further declines from fiscal 2007. Some softness is also expected in non-residential markets. The primary focus going forward is on operating costs, with further adjustments to reduce the fixed cost base in line with market activity. Additional consolidation of manufacturing operations to lower-cost areas will be pursued, further acquisitions are anticipated, and the Asian and Middle Eastern expansion is expected to continue. The business group believes that the actions it has put in place will position the it well for an eventual recovery in its end markets.
In fiscal 2007, 10.4 percent of Building Products sales came from products launched in the past five years.
Air Systems Components
The demand for Air Systems Components’ products is driven by commercial, infrastructure and residential construction activity. Non-residential activity remained steady in fiscal 2007 and the Group’s leadership position in both brands and distribution resulted in a solid performance in this sector. Increased market shares were gained in major product categories, particularly through the focus on developing products for energy efficient or “green” buildings and focusing on growing segments such as public buildings and offices.
This performance in the non-residential sector partly offset the poor performance in residential sector businesses which were impacted by lower volumes in the US residential housing market. The businesses were able to mitigate the effect of this downturn by controlling costs and driving operational efficiencies. The net impact on underlying sales and adjusted operating profit was a decrease of £16.6 million and £3.1 million respectively.
Fiscal 2007 saw good progress in expanding the Air Systems Components offering outside of the United States into the rapidly growing Indian HVAC market. The business formed a joint venture with Caryaire, a manufacturer and distributor of HVAC products, and in January 2008 acquired a controlling stake in Rolastar, a duct profile manufacturer, both in India.
Other Building Products
Both the Lasco Bathware business and the Philips Doors and Windows business were impacted by the continuing weakness in the US residential housing market, compounded by the impact of softer manufactured housing and recreational vehicle markets during fiscal 2007. The underlying movement in sales was a decrease of £55.7 million, triggering a £17.1 million decrease in adjusted operating profit.
The demand for bathware products is driven primarily by new home construction. Although market share gains have been realized during this downturn, overall product demand has decreased significantly. The focus was therefore on realigning capacity with current demand levels and on increasing shares in the institutional and renovation markets with the introduction of new products to meet the needs of those sectors.
Philips’ sales have historically depended on manufactured housing and new residential construction. With the downturn in those markets, the focus in fiscal 2007 was on growing its market share of vinyl windows in the residential replacement and renovation markets.
Management reacted quickly to mitigate the impact of the end markets on profits by closing two Bathware facilities and two Philips facilities in addition to reducing capacity, headcount and lowering expenses. Management will continue to manage the cost base and capacity during this downturn, whilst positioning the businesses for an eventual recovery in their end markets.
Lasco Fittings, a manufacturer of injection-molded fittings, was identified as a non-core business during fiscal 2006 and was sold in February 2007.
25
Fiscal 2006 results compared with fiscal 2005 results
Group overview
Despite the challenges faced in fiscal 2006, the Group continued to make progress with its stated strategy of organic growth through innovation and operational excellence, geographic expansion and bolt-on acquisitions. Highlights included:
| • | | investment in new plant and equipment, especially in Asia and Eastern Europe, and closure of certain older facilities to further improve the operating cost base; |
| • | | a number of successful product introductions during fiscal 2006; |
| • | | revenue growth of 11 percent in Asia, albeit from a relatively small base—a sign that the investments made there by the Group in recent years are bringing good returns; and |
| • | | completion of five acquisitions in fiscal 2006, with total annualized revenue of around £135 million, strengthening the Group’s position with new products and giving it access to new market segments and geographies. |
| | | | | | | | | | | | |
Analysis of movements from fiscal 2005 to fiscal 2006 | | Sales | | | Adjusted operating profit | |
| | | £ million | | | Change | | | £ million | | | Change | |
Fiscal 2005 | | 2,963.3 | | | | | | 301.5 | | | | |
Exchange rate effect | | (12.4 | ) | | | | | (1.5 | ) | | | |
Disposals | | (1.1 | ) | | | | | — | | | | |
Acquisitions | | 116.6 | | | | | | 13.2 | | | | |
| | | | | | | | | | | | |
Underlying change(1) | | 67.4 | | | 2.3 | % | | (17.4 | ) | | (5.8 | )% |
| | | | | | | | | | | | |
Fiscal 2006 | | 3,133.8 | | | | | | 295.8 | | | | |
| | | | | | | | | | | | |
Reconciliation of segment result to adjusted operating profit
| | | | | | |
| | | Fiscal
2006 | | | Fiscal
2005 | |
Segment result | | 310.2 | | | 329.9 | |
– Unallocated corporate activities | | (28.7 | ) | | (25.3 | ) |
– Gain on sale of available-for-sale investments | | 0.2 | | | 0.4 | |
– Share of results of associates | | 1.5 | | | 0.6 | |
| | | | | | |
Operating profit | | 283.2 | | | 305.6 | |
– Restructuring costs | | 13.0 | | | 4.2 | |
– Disposals and exit of businesses | | (3.1 | ) | | (8.5 | ) |
– Amortization of intangible assets arising on acquisition | | 2.7 | | | 0.2 | |
| | | | | | |
Adjusted operating profit | | 295.8 | | | 301.5 | |
| | | | | | |
Operating margin(2) | | 9.4 | % | | 10.2 | % |
| | | | | | |
(1) | Underlying change excludes the effect of currency fluctuations and acquisitions and disposals |
(2) | Operating margin is the adjusted operating profit expressed as a percentage of sales |
Sales were £3,133.8 million for fiscal 2006, with an underlying increase of £67.4 million (2.3 percent) from sales of £2,963.3 million for fiscal 2005. Cost of sales rose from £2,105.6 million in fiscal 2005 (representing 71.1 percent of sales) to £2,272.0 million for fiscal 2006 (representing 72.5 percent of sales). Distribution and administration expenses increased by 2.4 percent to £570.2 million in fiscal 2006 from £557.0 million in fiscal 2005, representing 18.2 percent of sales for fiscal 2006 and 18.8 percent of sales for fiscal 2005.
Adjusted operating profit was £295.8 million in fiscal 2006 (fiscal 2005: £301.5 million), with an underlying decrease of 5.8 percent from fiscal 2006, reflecting the difficult conditions in a number of the Group’s end markets. This translated into a 0.8 percent decrease in the Group’s operating margin from 10.2 percent in fiscal 2005 to 9.4 percent in fiscal 2006.
Restructuring costs
During fiscal 2006 there were £13.0 million of restructuring costs, compared with £4.2 million in fiscal 2005. Major restructuring projects during both fiscal 2006 and fiscal 2005 included costs related to the closure of Stackpole’s pump components facility and the rationalization of production facilities within Air Systems Components. Additionally, in fiscal 2006, restructuring costs included the restructuring of Fluid Power’s facility at St. Neots, United Kingdom and the transfer of its machining, coupling assembly and testing equipment operations to a new facility at Karvina, Czech Republic. Management undertook various restructuring activities to streamline operations, consolidate and take advantage of available capacity and resources, and ultimately to achieve net cost reductions. Restructuring activities included efforts to integrate and rationalize the Group’s businesses and to relocate manufacturing operations to lower-cost markets.
Gains on disposals and exit of businesses
In fiscal 2006, the Group recognized a gain of £3.1 million on the sale of property, plant and equipment relating to businesses sold in previous years. In fiscal 2005, the Group recognized a gain of £8.5 million on the disposal of businesses, principally in relation to the sale of the business and assets of Gutter Helmet, which was part of Hart & Cooley’s residential business.
26
Income tax expense
Income tax expense in fiscal 2006 was £35.8 million after the release of provisions for uncertain tax positions of £50.6 million, which compared with the income tax expense for fiscal 2005 of £60.0 million, after the release of provisions for uncertain tax positions of £58.7 million. The Group recognizes provisions in respect of uncertain tax positions whereby additional current tax may become payable in future periods following the audit by the tax authorities of previously filed tax returns. Provisions for uncertain tax positions are based upon management’s assessment of the likely outcome of issues associated with assumed permanent differences, interest that may be applied to temporary differences and the possible disallowance of tax credits and penalties. Provisions for uncertain tax positions are reviewed regularly and are adjusted to reflect events such as the expiry of limitation periods for assessing tax, administrative guidance given by the tax authorities and court decisions. As at December 30, 2006, the Group recognized a provision for uncertain tax positions amounting to £36.3 million.
Discontinued operations
Trico was classified as a discontinued operation during fiscal 2006. As discussed in Item 3A “Selected financial data”, Tridon, part of the Trico businesses, was reclassified as a continuing operation during fiscal 2007. Fiscal 2006 and fiscal 2005 have therefore been re-presented. The loss from the discontinued operations in fiscal 2006 was £11.6 million, compared with a loss of £5.4 million in fiscal 2005. In fiscal 2006, the loss from discontinued operations included an impairment loss of £26.6 million on assets classified as held for sale of which £5.7 million related to goodwill, and £20.9 million related to property, plant and equipment. In fiscal 2005, there was no impairment loss recognized on discontinued operations. The Group recognized a loss on disposal of discontinued operations of £2.1 million (after a tax benefit of £20.4 million) and a gain of £2.5 million (after a tax charge of £0.9 million) in fiscal 2005.
Minority interest
Minority interest in the profit for the period was £11.2 million in fiscal 2006, compared with £9.0 million for fiscal 2005. Minority interests in the Company’s subsidiaries are set forth in Note 40 to the Group’s consolidated financial statements.
Profit for the period
The Group’s profit for the period attributable to equity shareholders for fiscal 2006 was £186.1 million, representing a 3.2 percent decrease from the fiscal 2005 profit of £192.2 million, driven by higher administration and restructuring costs and a softer performance from discontinued operations, largely offset by higher non-recurring tax benefits. Dividends of £115.3 million were paid to ordinary shareholders during fiscal 2006, compared with £99.4 million in fiscal 2005.
Goodwill impairment tests were completed as at December 30, 2006 and December 31, 2005. There was no impairment recognized on continuing operations at either date.
Segment overview
Industrial & Automotive
| | | | | | | | | | | | |
Analysis of movements from fiscal 2005 to fiscal 2006 | | Sales | | | Adjusted operating profit | |
| | | £ million | | | Change | | | £ million | | | Change | |
Fiscal 2005 | | 2,079.5 | | | | | | 248.2 | | | | |
Exchange rate effect | | (4.0 | ) | | | | | (0.7 | ) | | | |
Disposals | | (1.1 | ) | | | | | — | | | | |
Acquisitions | | 29.8 | | | | | | 3.3 | | | | |
| | | | | | | | | | | | |
Underlying change | | 68.6 | | | 3.3 | % | | (10.1 | ) | | (4.1 | )% |
| | | | | | | | | | | | |
Fiscal 2006 | | 2,172.8 | | | | | | 240.7 | | | | |
| | | | | | | | | | | | |
Reconciliation of segment result to adjusted operating profit
| | | | | |
| | | Fiscal
2006 | | | Fiscal
2005 |
Segment result | | 230.5 | | | 243.4 |
– Gain on sale of available-for-sale investments | | 0.2 | | | 0.4 |
– Share of results of associates | | 1.5 | | | 0.6 |
| | | | | |
Operating profit | | 232.2 | | | 244.4 |
– Restructuring costs | | 9.8 | | | 2.6 |
– Disposals and exit of businesses | | (3.1 | ) | | 1.0 |
– Amortization of intangible assets arising on acquisition | | 1.8 | | | 0.2 |
| | | | | |
Adjusted operating profit | | 240.7 | | | 248.2 |
| | | | | |
Analysis by segment
| | | | | | | | | | | | | | |
| | | Sales | | Adjusted operating profit | | Operating margin(2) | |
| | | Fiscal
2006 | | Fiscal
2005 | | Fiscal
2006 | | Fiscal
2005 | | Fiscal
2006 | | | Fiscal
2005 | |
– Power Transmission | | 1,009.6 | | 969.9 | | 140.8 | | 129.7 | | 13.9 | % | | 13.4 | % |
– Fluid Power | | 383.8 | | 358.0 | | 34.4 | | 36.7 | | 9.0 | % | | 10.3 | % |
– Fluid Systems | | 244.0 | | 245.2 | | 10.9 | | 20.7 | | 4.5 | % | | 8.4 | % |
– Other Industrial & Automotive | | 535.4 | | 506.4 | | 54.6 | | 61.1 | | 10.2 | % | | 12.1 | % |
| | | | | | | | | | | | | | |
| | 2,172.8 | | 2,079.5 | | 240.7 | | 248.2 | | 11.1 | % | | 11.9 | % |
| | | | | | | | | | | | | | |
(1) | Underlying change excludes the effect of currency fluctuations and acquisitions and disposals |
(2) | Operating margin is the adjusted operating profit expressed as a percentage of sales |
27
Overview
In the Industrial & Automotive business group, sales and adjusted operating profit for fiscal 2006 were up by 5.8 percent and down by 0.4 percent respectively compared to fiscal 2005. Underlying sales increased by 3.3 percent due principally to higher volumes. Underlying adjusted operating profit decreased by 4.1 percent as the impact of the increase in sales was offset by higher raw material prices and selling and distribution costs. Reflecting these changes, operating margin fell slightly from 11.9 percent in fiscal 2005 to 11.1 percent in fiscal 2006.
Demand from automotive OEMs in North America, which amounted to 9.2 percent of the Group’s total sales in fiscal 2006 (fiscal 2005: 12.0 percent), was weaker than anticipated through most of fiscal 2006 as the Detroit Three continued to lose market share to Asian manufacturers. Overall, the automotive aftermarket remained steady in the United States in fiscal 2006, despite some monthly fluctuations caused by a combination of weather, oil prices and customer consolidation and de-stocking. In Europe and in Asia the Company’s aftermarket business grew in the developing regions.
China’s growing importance for the Industrial & Automotive business group was reflected in a 46.1 percent increase in sales in fiscal 2006 compared to fiscal 2005, albeit from a relatively small base, which contributed to an overall sales increase in Asia of 11.5 percent. Europe also performed well, with sales up 12.4 percent, driven by expansion into Eastern Europe.
During fiscal 2006, the Industrial & Automotive business group acquired ENZED Fleximak Ltd., and a 60 percent interest in Gates Winhere. In total, the sales added by these businesses in fiscal 2006 were approximately £4 million. In addition, the Company acquired a 20 percent interest in an e-business and logistics services provider, CoLinx LLC, which has paved the way for the launch of Gates’ online store for industrial power transmission products in January 2007.
During fiscal 2006, the Wiper Systems segment was identified as non-core to the Group’s future operations and was classified as a discontinued operation. The business also completed the restructuring of the Pontypool facility in Wales with production having moved to facilities in China and Mexico, leaving a small distribution facility for the United Kingdom and European aftermarket. The business was sold during fiscal 2007.
In fiscal 2006, 14.0 percent of Industrial & Automotive sales came from products launched in the past five years.
Power Transmission
Underlying Power Transmission sales grew by 3.9 percent and underlying adjusted operating profit increased by 8.5 percent, driven by expansion into Asia. Sales in the region grew strongly due to new business awards with large automotive customers in China and Korea. Strong economic growth in China also resulted in increased opportunities to supply belts for white goods and for electrical products such as printers and photocopiers. Power Transmission sales in fiscal 2006 in Asia represented approximately 6.6 percent of total Group sales.
Successful product introductions such as the new Micro-V® XF belt for the automotive aftermarket and the CabRunner™ Integrated power system in Asia, Europe and South America have bolstered sales. At Stackpole, the product launches for variable vane technology oil pumps and carrier systems for the new six-speed transmission programs continue to be on track and new business development has progressed well, with Gates being awarded an important first contract for variable vane oil pumps in Europe, using Stackpole technology. Stackpole also started a development program with a Korean OEM, as part of its strategy to grow outside its existing market place and with new customers.
These gains were offset by weak sales in North America in the automotive OE market due to the severe cutbacks at the Detroit Three. This affected Stackpole’s performance, which was also hampered by higher raw material costs from the sharp increases in the cost of certain base metals. The Pump Components facility in Ontario, Canada was closed in fiscal 2006 with production transferred to the recently constructed facility in Ancaster, Canada.
Fluid Power
Fluid Power saw underlying sales increase by £15.0 million, driven by strength in the European industrial markets and the full year contribution from EMB which was acquired in July 2005. There was good progress in India and South East Asia, with double-digit growth led by new awards and expansion into new industry segments. Sales in Asia of Fluid Power products for fiscal 2006 represented approximately 0.5 percent of total Group sales. In North America, sales of hydraulic OE softened during the second half of the year with the major construction OE manufacturers slowing their order rate.
The Group’s focus in fiscal 2006 was to build the competitiveness of the Fluid power segment outside of North America, with relocation of production to low-cost areas and expansion in Asia. Construction started on a new facility in Chennai, India where there is significant potential for sales to local customers, and the initial transfer of hydraulic operations from the United Kingdom to the facility at Karvina, Czech Republic was completed. Capacity was increased at the Karvina plant to address growing demand for hydraulic equipment in Eastern Europe.
Fluid Systems
The Fluid Systems segment experienced a combination of weaker automotive OE volumes in North America due to lower customer demand, deferred revenues due to the delay in the TREAD Act (which requires that 70 percent of new passenger vehicles are fitted with RTPMS), and rising raw material prices. This contributed to the underlying decline in adjusted operating profit of £9.7 million in fiscal 2006. This decline was somewhat mitigated by the significant ramp-up in production at Schrader Electronics that started in September 2006 and continued successfully during the final quarter of fiscal 2006. Schrader Electronics’ production volumes at the end of fiscal 2006 were double the level at the start of fiscal 2006.
The business won its first award of an RTPMS motorcycle contract with BMW in fiscal 2006 and the development of the latest “snap-in” valve sensor and Wireless Auto Location technology has secured the award of approximately £90 million of new business with a major OE manufacturer in Europe and North America. Schrader Electronics’ RTPMS technology will be fitted to all of this particular customer’s vehicles for model years 2009 to 2011 inclusive. Fluid Systems also expanded its sensor technology into the area of fuel level sensors.
28
Other Industrial & Automotive
In Other Industrial & Automotive, underlying sales were up by 3.3 percent, but the underlying movement in adjusted operating profit was a decrease of 13.1 percent. The Dexter Axle business experienced a difficult market environment with pricing pressure and some competition from offshore components imported from Asia. In fiscal 2005, Dexter had benefited from additional volume associated with the US Federal Emergency Management Agency demand following the hurricanes in the United States, which did not recur in fiscal 2006. Dearborn saw increased sales in the year, with good volumes from its higher-margin bulk handling business. The mix of work changed as awards on the automotive side of the business were impacted by the difficulties at the Detroit Three. Dearborn was identified as a non-core business during fiscal 2006 and was sold during fiscal 2007.
Plews showed an improved performance during fiscal 2006, benefiting from some product initiatives that were implemented in fiscal 2005. Ideal continued to look to expand its business in high-growth regions following the opening of a new facility at Suzhou, China. Ideal was impacted by sharp increases in the price of certain base metals, particularly nickel.
During fiscal 2006, Winhere, a manufacturer of automotive water pumps in China, was acquired, giving the Gates business access to supply the large North American water pump market using a low-cost production source. The acquisition of Fleximak, a distributor and fabricator of flexible fluid transfer products, provided the Gates business with an established infrastructure in the Middle East with which to accelerate the market penetration of its Fluid Power and Power Transmission products.
Building Products
| | | | | | | | | | | | |
Analysis of movements from fiscal 2005 to fiscal 2006 | | Sales | | | Adjusted operating profit | |
| | | £ million | | | Change | | | £ million | | | Change | |
Fiscal 2005 | | 883.8 | | | | | | 78.6 | | | | |
Exchange rate effect | | (8.4 | ) | | | | | (0.9 | ) | | | |
Disposals | | — | | | | | | — | | | | |
Acquisitions | | 86.8 | | | | | | 9.9 | | | | |
| | | | | | | | | | | | |
Underlying change(1) | | (1.2 | ) | | (0.1 | )% | | (3.8 | ) | | (4.9 | )% |
| | | | | | | | | | | | |
Fiscal 2006 | | 961.0 | | | | | | 83.8 | | | | |
| | | | | | | | | | | | |
Reconciliation of segment result to adjusted operating profit
| | | | | |
| | | Fiscal
2006 | | Fiscal
2005 | |
Segment result | | 79.7 | | 86.5 | |
– Gain on sale of available-for-sale investments | | — | | — | |
– Share of results of associates | | — | | — | |
| | | | | |
Operating profit | | 79.7 | | 86.5 | |
– Restructuring costs | | 3.2 | | 1.6 | |
– Disposals and exit of businesses | | — | | (9.5 | ) |
– Amortization of intangible assets arising on acquisition | | 0.9 | | — | |
| | | | | |
Adjusted operating profit | | 83.8 | | 78.6 | |
| | | | | |
Analysis by segment
| | | | | | | | | | | | | | |
| | | Fiscal
2006 | | Sales | | Adjusted operating profit | | Operating margin(2) | |
| | | Fiscal
2005 | | Fiscal
2006 | | Fiscal
2005 | | Fiscal
2006 | | | Fiscal
2005 | |
– Air Systems Components | | 583.9 | | 485.4 | | 58.0 | | 50.0 | | 9.9 | % | | 10.3 | % |
– Other Building Products | | 377.1 | | 398.4 | | 25.8 | | 28.6 | | 6.8 | % | | 7.2 | % |
| | | | | | | | | | | | | | |
| | 961.0 | | 883.8 | | 83.8 | | 78.6 | | 8.7 | % | | 8.9 | % |
| | | | | | | | | | | | | | |
(1) | Underlying change excludes the effect of currency fluctuations and acquisitions and disposals |
(2) | Operating margin is the adjusted operating profit expressed as a percentage of sales |
Overview
During fiscal 2006, there was a decrease in underlying sales of £1.2 million and the underlying change in adjusted operating profit was a decrease of £3.8 million. The business group benefited from strong contributions from acquisitions made in fiscal 2006, although much of this benefit was offset by the significant weakness in the residential construction market during the second half of fiscal 2006. Reflecting these changes, the operating margin declined slightly from 8.9 percent in fiscal 2005 to 8.7 percent in fiscal 2006.
The residential new-build market in North America weakened slightly during the first half of fiscal 2006 from the record level seen in fiscal 2005, then experienced a sharp and sudden decline in the latter half of August and September. Demand has since remained weak, with excess housing inventory levels in the supply chain. New building permits issued in December 2006 stood at 1.596 million, almost 25 percent lower than in December 2005.
The non-residential construction market experienced solid growth in fiscal 2006 and within the commercial segment, the hotels and offices sector showed good growth.
In fiscal 2006, 10.6 percent of Building Products sales came from products launched in the past five years.
29
Air Systems Components
Underlying sales improved by 3.3 percent, due to a healthy non-residential construction market and higher pricing levels on certain products. The order book and backlog also remained at a healthy level for the non-residential market. However, there was an underlying decrease in adjusted operating profit of 2.6 percent, reflecting the performance of the Hart & Cooley business, which was adversely impacted by the weakness in the residential market.
The acquisition of Selkirk, in March 2006, increased the existing product range and provided a well-established market presence in the Canadian market. The addition of Heat-Fab and Eastern Sheet Metal, in October 2006, added further product lines. These three bolt-on acquisitions helped to consolidate the Group’s market position and strengthen relationships with the major distributor customers. The acquisitions contributed £86.8 million to the Air Systems Components segment’s sales for fiscal 2006.
The rationalization of production facilities continued during fiscal 2006, with the decision to close the Holland, Michigan facility and transfer operations to a low-cost facility in Mexico.
Other Building Products
Both Lasco Bathware and Philips Doors and Windows experienced weaker sales during fiscal 2006, due to the slowdown in the residential construction market. This led to a decrease in underlying sales of 4.4 percent, and an 8.8 percent decrease in underlying adjusted operating profit.
Lasco Bathware saw strong sales of its new “FreedomLine” range of assisted care products that are targeted at the ageing population in the United States, providing them with barrier-free bathing products. Despite the weak residential marketplace, sales of “FreedomLine” achieved double-digit growth as a new range of shower products was introduced to meet growing demand.
In the first half of fiscal 2006, Lasco Bathware introduced new robotics technology at its fiberglass manufacturing plant in Moapa, Nevada. The new technology provides an automated spray deposition process that significantly improves material transfer efficiencies, resulting in greater product quality and consistency, as well as a reduction in overspray waste.
Lasco Fittings was identified as a non-core business during fiscal 2006 and was sold during fiscal 2007.
The Philips doors and windows business continued its new product development program in fiscal 2006, with its hurricane-resistant window opening up good potential in the new-build market in regions susceptible to hurricanes.
Effect of Inflation
Management does not believe that inflation has had a material effect on the Company’s financial condition or results of operations during fiscal 2007, fiscal 2006 or fiscal 2005.
Effect of Foreign Currency
For further discussion see Item 11 “Quantitative and Qualitative Disclosures about Market Risk” and Notes 31 and 32F to the Group’s consolidated financial statements.
Critical Accounting Estimates
Details of the Group’s significant accounting policies are set out in Note 2 to the Group’s consolidated financial statements.
When applying the Group’s accounting policies, management must make assumptions and estimates concerning the future that affect the carrying amounts of assets and liabilities at the balance sheet date, the disclosure of contingencies that existed at the balance sheet date and the amounts of revenue and expenses recognized during the accounting period. Management makes these assumptions and estimates based on factors such as historical experience, the observance of trends in the industries in which the Group operates and information available from the Group’s customers and other outside sources. Due to the inherent uncertainty involved in making assumptions and estimates, actual outcomes could differ from those assumptions and estimates. An analysis of the key sources of estimation uncertainty at the balance sheet date that have a significant risk of causing a material adjustment to the carrying amounts of the Group’s assets and liabilities within the next fiscal year is provided below.
Pension and other post-retirement benefits
The Group operates pension plans throughout the world, covering the majority of its employees. Pension benefits are provided by way of both defined contribution plans and defined benefit plans. The Group’s defined benefit pension plans are closed to new entrants. The Group also provides other post-employment benefits, principally health and life insurance cover, to certain of its employees in North America by way of unfunded defined benefit plans.
The Group accounts for post-employment benefits in accordance with IAS 19 “Employee Benefits”. For defined contribution plans, the cost of providing the benefits represents the Group’s contributions to the plans and is recognized in income in the period in which the contributions fall due. For defined benefit plans, the cost is determined based on actuarial valuations of the plans that are carried out annually at the Group’s balance sheet date. The actuarial valuations are dependent on assumptions about the future. If actual experience differs from these assumptions, there could be a material change in the amounts recognized by the Group in respect of defined benefit plans in the next financial year.
As at December 29, 2007, the present value of the benefit obligation was £691.1 million. The benefit obligation is calculated using a number of assumptions including future salary increases, increases to pension benefits, mortality rates and, in the case of post-employment medical benefits, the expected rate of increase in medical costs. The present value of the benefit obligation is calculated by discounting the benefit obligation using market yields on high-quality corporate bonds at the balance sheet date.
30
Effects of changes in the actuarial assumptions underlying the benefit obligation, effects of changes in the discount rate applicable to the benefit obligation and effects of differences between the expected and actual return on the plan assets are classified as actuarial gains and losses and are recognized directly in equity. During fiscal 2007, the Group recognized a net actuarial gain of £48.1 million. Further actuarial gains and losses may be recognized during the next fiscal year.
It is estimated that a 0.5 percent decrease in the discount rate would have the following impact on the projected benefit obligation and on the components of expense that are affected by a discount rate change:
| | | | | | |
| | | UK Plans | | US Plans | | Rest of World Plans |
Projected benefit obligation | | 9.7 percent increase | | 4.7 percent increase | | 5.7 percent increase |
Service cost | | 13.4 percent increase | | 6.7 percent increase | | 8.5 percent increase |
Interest cost | | 0.3 percent increase | | 3.3 percent decrease | | 3.3 percent decrease |
The service cost represents the present value of benefits attributed to services rendered by employees during the period. The interest cost represents the increase in the projected benefit obligation (which is the present value of accrued benefits including assumed future salary increases) due to the passage of time. The discount rate used reflects the rates available on high-quality fixed-income debt instruments at the date of the plan valuation. Prior service costs resulting from plan amendments are recognized on a straight-line basis over the remaining service lives of participating employees.
As at December 29, 2007, the fair value of the plan assets was £564.5 million. The plan assets consist largely of listed securities and their fair values are subject to fluctuation in response to changes in market conditions. Plan assets are measured at a fair value. As at December 29, 2007, the Group was unable to recognize a surplus of £24.8 million due to the effect of the asset ceiling.
It is estimated that a 0.5 percent decrease in the expected rate of return on plan assets would have the following impact:
| | | | | | |
| | | UK Plans | | US Plans | | Rest of
World Plans |
Percentage reduction in plan assets | | 7.3 percent | | 6.6 percent | | 7.8 percent |
Impairment of non-current assets
Goodwill, intangible assets and property, plant and equipment are tested for impairment whenever events or circumstances indicate that their carrying amounts might be impaired. Such events and circumstances include the effects of restructurings and new product development initiated by management. Additionally, goodwill and capitalized development expenditure relating to a product that is not yet in full production are subject to an annual impairment test. Impairment testing of goodwill requires the calculation of the value in use of the cash-generating units to which the goodwill is allocated. Due to the nature of the Group’s operations, it is generally not possible to estimate the recoverable amount for individual items of property, plant and equipment and impairment testing of these assets is also usually based on the value in use of the cash-generating unit to which the asset belongs.
Value in use represents the net present value of the cash flows expected to arise from the relevant cash-generating unit and its calculation requires management to estimate those cash flows and to apply a suitable discount rate to them. Management bases the estimated cash flows on assumptions such as the future growth in sales volumes, future changes in selling prices, and expected changes in material prices, salaries and other costs. Discount rates used are based on current market interest rates.
As at December 29, 2007, the aggregate carrying amount of goodwill, intangible assets and property, plant and equipment was £1,087.6 million. Impairment losses may be recognized on these assets within the next financial year if changes are necessary to the assumptions underlying the estimated future cash flows of cash-generating units or if there are changes in market interest rates that affect the discount rates that are applied to those cash flows.
The recoverable amount of Stackpole is based on financial budgets approved by management covering a three-year period. Stackpole’s cash flows beyond the three-year period are extrapolated for a further two years using 5 percent growth and thereafter using a steady 2 percent, which does not exceed the long-term growth rate for the market in which it operates. All cash flows are discounted at a rate of 8 percent. The calculation shows that the recoverable amount marginally exceeds the carrying amount of Stackpole. Management has determined that the recoverable amount calculations are most sensitive to changes in the discount rate and operating margin assumptions. The sensitivity of the recoverable amount to changes in those assumptions (assuming all other assumptions remain unchanged) is as follows:
| | | | | | |
| | | Increase of one
percentage point | | | Decrease of one
percentage point | |
| | | £ million | | | £ million | |
Effect of a change in: | | | | | | |
– Discount rate | | (29.1 | ) | | 40.4 | |
– Operating margin | | 25.7 | | | (25.7 | ) |
| | | | | | |
Assets that are classified as held for sale are measured at the lower of their carrying amount and fair value less costs to sell. As at December 29, 2007, the carrying value of assets held for sale was £45.6 million. Impairment losses may be recognized in the next financial year if the amounts realized on the sale of these assets differs from management’s estimates.
Inventory
Inventories are stated at the lower of cost and net realizable value, with due allowance for excess, obsolete or slow moving items. Net realizable value is based on current assessments of future demand, market conditions and new product development initiatives. As at December 29, 2007, the carrying value of inventories was £401.3 million, net of allowances of £3.8 million. Impairment losses may be recognized on inventory within the next financial year if management needs to revise its estimates in response to changing circumstances.
31
Financial instruments
Derivative financial instruments that the Group holds for the purpose of hedging its currency and interest rate exposures are recognized as assets and liabilities in the Group’s balance sheet measured at their fair value at the balance date. As at December 29, 2007, the Group recognized a net liability of £4.8 million in respect of derivatives. The fair value of derivatives continually changes in response to changes in prevailing market conditions. Where permissible under IAS 39 “Financial Instruments: Recognition and Measurement”, the Group uses hedge accounting to mitigate the impact of changes in the fair value of derivatives on the income statement but the Group’s results may be affected by changes in the fair values of derivatives where hedge accounting cannot be applied or due to hedge ineffectiveness.
Workers’ compensation
Provision is made for claims for compensation for injuries sustained by the Group’s employees while at work. The Group’s liability for claims made but not fully settled is calculated on an actuarial basis. Historical data trends are used to estimate the liability for unreported incidents. As at December 29, 2007, the workers’ compensation provision amounted to £14.5 million. Further provision may be necessary within the next financial year if the actual cost of settling claims exceeds management’s estimates.
Environmental liabilities
Provision is made for the estimated cost of known environmental remediation obligations in relation to the Group’s current and former manufacturing facilities. Cost estimates include the expenditure expected to be incurred in the initial remediation effort and, where appropriate, in the long-term monitoring of the relevant sites. Management monitors for each remediation project the costs incurred to date against expected total costs to complete and operates procedures to identify possible remediation obligations that are presently unknown.
As at December 29, 2007, the provision for environmental remediation costs amounted to £4.6 million. Further provision may be necessary within the next financial year if actual remediation costs exceed expected costs, new remediation obligations are identified or there are changes in the circumstances determining the Group’s legal or constructive remediation obligations.
Product warranties
Provision is made for the estimated cost of future warranty claims on the Group’s products. Management bases the provision on historical experience of the nature, frequency and average cost of warranty claims and takes into account recent trends that might suggest that the historical claims experience may differ from future claims. As at December 29, 2007, the Group’s provision for warranty claims amounted to £7.6 million. Further provision may be necessary within the next financial year if actual claims experience differs from management’s estimates.
Taxation
The Group is subject to income tax in each of the jurisdictions in which it operates. Management is required to exercise significant judgment in determining the Group’s provision for income taxes.
Estimation is required of taxable profit in order to determine the Group’s current tax liability. Management’s judgment is required in relation to uncertain tax positions whereby additional current tax may become payable in the future following the audit by the tax authorities of previously filed tax returns. As at December 29, 2007, the Group holds a provision for uncertain tax positions amounting to £33.9 million. It is possible that the final outcome of these uncertain tax positions may differ from management’s estimates.
Estimation is also required of temporary differences between the carrying amount of assets and liabilities and their tax base. Deferred tax liabilities are recognized for all taxable temporary differences, but where there exist deductible temporary differences management’s judgment is required as to whether a deferred tax asset should be recognized based on the availability of future taxable profits. As at December 29, 2007, the Group recognized net deferred tax assets amounting to £1.5 million. It is possible that the deferred tax assets actually recoverable may differ from the amounts recognized if actual taxable profits differ from management’s estimates.
As at December 29, 2007, deferred tax liabilities were not recognized on retained profits of foreign subsidiaries and associates amounting to £1,971.0 million because the Group is able to control the remittance of those profits to the United Kingdom and it is probable that they will not be remitted in the foreseeable future. Income tax may be payable on these amounts if circumstances change and either their remittance can no longer be controlled by the Group or they are actually remitted to the United Kingdom.
Share-based payments
Share-based compensation is provided to employees under the Company’s share option, bonus and other share award schemes. The Company accounts for share-based compensation plans using the fair value method prescribed by IFRS 2 “Share-based Payment”. IFRS 2 was applied retrospectively to all awards that were outstanding but had not vested as at January 1, 2005, except those equity-settled awards that were granted on or before November 7, 2002.
The compensation expense recognized in the Group’s consolidated financial statements has been based on the fair value of the awards, where appropriate measured using an option-pricing model. In measuring the fair value of the awards, management is required to make a number of assumptions, the most significant of which are expected volatility and the expected life of the awards. Expected volatility is determined based on the historical volatility of the market price of the Company’s Ordinary Shares over the shorter of the expected life of the awards and the period since the beginning of the Company’s fiscal year ended April 30, 2002 when, following a period of significant demerger activity, the Company was refocused on its remaining core businesses. Adjustments have been made to the expected life to reflect the effects of non-transferability, exercise restrictions and behavioral considerations, where available based on historical experience of similar awards.
32
Recently issued accounting pronouncements
A. Pronouncements adopted in fiscal 2007
During the period, the Group adopted the following accounting pronouncements that are relevant to its operations, none of which had any impact on its results or financial position:
IFRS 7 “Financial Instruments: Disclosures” and the related amendment to IAS 1 “Presentation of Financial Statements – Capital Disclosures”
IFRIC 7 “Applying the Restatement Approach under IAS 29 Financial Reporting in Hyperinflationary Economies”
IFRIC 8 “Scope of IFRS 2”
IFRIC 9 “Reassessment of Embedded Derivatives”
IFRIC 10 “Interim Financial Reporting and Impairment”
IFRIC 11 “Group and Treasury Share Transactions”
B. Pronouncements not yet adopted
Recently-issued accounting pronouncements that are relevant to the Group’s operations but have not yet been adopted are outlined below. With the exception of the revisions to IAS 23 and those to IFRS 3 and IAS 27, management does not expect that the adoption of these pronouncements will have a material impact on the Group’s results or financial position.
IFRS 8 “Operating Segments”
IFRS 8 replaces IAS 14 “Segment Reporting” and aligns segment reporting with the requirements of the equivalent US accounting standard. IFRS 8 requires an entity to adopt a “management approach” whereby the segment information reported will be what management uses internally for evaluating segment performance and deciding how to allocate resources to operating segments.
IFRS 8 is effective for annual periods commencing on or after January 1, 2009.
IAS 23 Revised “Borrowing Costs”
In March 2007, the IASB published a revised version of IAS 23 that changes the permitted treatment of borrowing costs relating to “qualifying assets”, i.e. assets that necessarily take a substantial period of time to get ready for their intended use or sale. Under the existing standard, the Group recognizes all borrowing costs as an expense in the period in which they are incurred. Under the revised standard, borrowing costs that are directly attributable to the acquisition, construction or production of a qualifying asset must be capitalized as part of the cost of that asset.
IAS 23 Revised must be applied to borrowing costs relating to qualifying assets for which capitalization commences in annual periods beginning on or after January 1, 2009.
Management expects that IAS 23 Revised will have an initial positive impact on the Group’s results and financial position because borrowing costs that would have been expensed as incurred will be capitalized as part of the cost of qualifying assets. However, this initial positive impact will be offset over time by the higher depreciation expense that will be recognized in respect of the qualifying assets. Management is not yet able to estimate reliably the effect of IAS 23 Revised as this will depend on the level of expenditure on qualifying assets and prevailing market interest rates.
IAS 1 Revised “Presentation of Financial Statements”
In September 2007, the IASB published a revised version of IAS 1 which provides for a number of presentational changes to financial statements, including the option to present a single statement of comprehensive income (rather than an income statement and a separate statement of other comprehensive income), the requirement to disclose income tax relating to each component of other comprehensive income, and the requirement to present a balance sheet as at the beginning of the earliest comparative period when an entity applies a change of accounting policy retrospectively or makes a retrospective restatement.
IAS 1 Revised is effective for annual periods beginning on or after January 1, 2009.
IFRS 3 Revised “Business Combinations” and IAS 27 Revised “Consolidated and Separate Financial Statements”
In January 2008, the IASB issued revised versions of IFRS 3 and IAS 27 that introduce a number of changes that will affect the accounting for future business combinations and the accounting in the event of the loss of control over a subsidiary.
Where a business combination involves a minority interest, the Group will be able to choose for each business combination whether to measure the minority interest at fair value or, as at present, at the minority’s share of the fair value of the net assets of the acquired entity. In step acquisitions, previously held interests will be re-measured at fair value and any gain or loss arising will be recognized in the income statement. On the loss of control of a subsidiary, any retained interest will be re-measured at fair value and any gain or loss will be reflected in the gain or loss on loss of control.
Other significant changes are that acquisition costs will be expensed and adjustments to contingent consideration will be recognized in the income statement.
IFRS 3 Revised and IAS 27 Revised are effective for annual periods commencing on or after July 1, 2009.
The financial effect of IFRS 3 Revised and IAS 27 Revised will be dependent on the circumstances surrounding the future transactions to which they will apply, that are at present unknown.
33
Amendment to IFRS 2 “Share-based Payment – Vesting Conditions and Cancellations”
In January 2008, the IASB published an amendment to IFRS 2 which clarifies that only service conditions and performance conditions attaching to a share-based incentive are vesting conditions and specifies that all cancellations, whether by the Group or by the participant, should receive the same accounting treatment. It is expected that the principal impact of the amendment will be in relation to the Group’s savings-related share option scheme. At present, if a participant in that scheme forfeits an award by ceasing to make payments to the savings contract the event is treated as a forfeiture. On adoption of the amendment, that event will be treated as a cancellation unless a subsequent award is identified as a replacement in which case it will be treated as a modification.
The amendment to IFRS 2 is effective for annual periods beginning on or after January 1, 2009.
IFRIC 14 “IAS 19 – The Limit on a Defined Benefit Asset, Minimum Funding Requirements and their Interaction”
IFRIC 14 clarifies when refunds or reductions in future contributions may be regarded as available to the sponsoring employer in assessing the amount of the surplus in a post-employment benefit plan that can be recognized as an asset by the sponsoring employer. IFRIC 14 also clarifies how a defined benefit asset or liability may be affected where there is a minimum funding requirement, i.e. the sponsoring employer is required to provide a minimum amount or level of contributions to a post-employment benefit plan over a given period to improve the security of the benefit obligations to members of the plan.
IFRIC 14 is effective for annual periods beginning on or after January 1, 2008.
B. Liquidity and capital resources
Treasury responsibilities and philosophy
The primary responsibilities of the central treasury function are to procure the Group’s capital resources, maintain an efficient capital structure, and manage the Group’s liquidity, foreign exchange, interest rate, insurance and pensions risks on a Group-wide basis.
The central treasury function operates within strict policies and guidelines approved by the Board. Compliance with these policies and guidelines is monitored through the regular reporting of treasury activities.
A key element of our treasury philosophy is that funding, interest rate and currency risk decisions and the location of cash and debt balances are determined independently from each other. For example, the Group’s debt requirements are met by raising funds in the most favorable markets, with the desired currency profile of net debt being achieved by entering into foreign exchange contracts where necessary. Similarly, the desired interest rate maturity of net debt is achieved by taking account of all debt and cash balances together with any foreign exchange transactions used to manage the currency profile of net debt. We operate systems to ensure that all relevant assets and liabilities are taken into account on a Group-wide basis when making these decisions. This portfolio approach to financial risk management enables our activities in these areas to be carried out effectively and efficiently and with a high degree of visibility.
Borrowing facilities
Borrowing facilities are monitored against forecast requirements and timely action is taken to put in place, renew or replace credit lines. Our policy is to reduce financing risk by diversifying our funding sources and by staggering the maturity of our borrowings.
It is our policy to retain sufficient liquidity throughout the capital expenditure cycle to maintain our financial flexibility and to preserve our investment grade credit rating. We do not anticipate any material long-term deterioration in our overall liquidity position in the foreseeable future. Management believes that the current level of working capital is sufficient for the Group’s present requirements.
Two bonds have been drawn under the Group’s EMTN Program. Our initial £150 million bond has a 10-year maturity and is due in December 2011. In September 2003, we issued a further £250 million bond with a 12-year maturity. Our committed bank borrowing facility is a multi-currency revolving credit facility of £400 million, which matures in August 2010.
Details of our committed and uncommitted borrowing facilities are set out below:
| | | | | | | | |
| | | Facility | | Drawings | | | Headroom | |
| | | £ million | | £ million | | | £ million | |
EMTN Program | | 400.0 | | (400.0 | ) | | — | |
Multi-currency revolving credit facility | | 400.0 | | (18.0 | ) | | 382.0 | |
Finance leases | | 4.8 | | (4.8 | ) | | — | |
| | | | | | | | |
Total committed facilities | | 804.8 | | (422.8 | ) | | 382.0 | |
| | | | | | | | |
Uncommitted facilities | | 254.7 | | (22.5 | ) | | 232.2 | |
Bonds, standby letters of credit, bank guarantees(1) | | — | | (92.4 | ) | | (92.4 | ) |
| | | | | | | | |
Total uncommitted facilities | | 254.7 | | (114.9 | ) | | 139.8 | |
| | | | | | | | |
Total | | 1,059.5 | | (537.7 | ) | | 521.8 | |
| | | | | | | | |
Less uncommitted facilities | | | | | | | (254.7 | ) |
| | | | | | | | |
Total committed (minimum) headroom | | | | | | | 267.1 | |
| | | | | | | | |
Cash balances (including collateralised cash of £2.9 million) | | | | | | | 151.2 | |
| | | | | | | | |
(1) | These were issued primarily in favour of insurance companies to cover potential workers’ compensation claims in the United States in the course of normal business, in addition to other contractual counterparties for operational purposes. |
The terms of the bonds entitle the holders to require redemption where there is a change of control of the Company combined with a ratings downgrade. In addition, under the Group’s £400 million multi-currency revolving credit facility, the lenders are entitled, on a change of control, to require prepayment of amounts outstanding.
34
The Group is subject to covenants, representations and warranties commonly associated with investment grade borrowings in respect of its committed borrowing facilities and borrowings under the EMTN Program.
Borrowing covenants
The Group is subject to two financial covenants in respect of its committed £400 million multi-currency revolving credit facility. The ratio of net debt to consolidated EBITDA must not exceed 2.5 times and the ratio of consolidated profit from operations to consolidated net interest charge must not be less than 3.0 times. Throughout fiscal 2007, we have been comfortably within these limits. These financial covenants are calculated by applying UK GAAP extant as at December 31, 2002 and are therefore unaffected by the subsequent transition to IFRS.
Any future non-compliance with the borrowing covenants could, if not waived, constitute an event of default and may, in certain circumstances lead to an acceleration of the maturity of borrowings drawn down and the inability to access committed facilities.
Credit rating
In December 2001, we established long-term credit ratings with Moody’s and Standard & Poor’s. Our current ratings are Baa3 Stable and BBB Stable respectively. They cover our EMTN Program and the two bonds issued thereunder. We also have a short-term rating of P-3 with Moody’s. Our aim is to manage the Group’s capital structure to maintain investment grade credit ratings.
Levels of borrowing and seasonality
Management believes that net debt provides useful information regarding the level of the Group’s indebtedness by reflecting the amount of indebtedness assuming cash balances are used to repay debt. Net debt is a non-GAAP measure defined as total debt less cash, cash equivalents, and restricted cash. The analysis of total debt and a reconciliation of total debt to net debt at carrying value are provided in the table below.
| | | | | | |
| | | As at
December 29,
2007 | | | As at
December 30,
2006 | |
| | | £ million | | | £ million | |
Unsecured loans | | | | | | |
Bank overdrafts | | 7.9 | | | 5.7 | |
Bank loans | | 32.4 | | | 171.5 | |
Unsecured loan notes | | 0.2 | | | 0.3 | |
Other unsecured loans | | 399.0 | | | 396.3 | |
| | | | | | |
| | 439.5 | | | 573.8 | |
| | | | | | |
Secured loans | | | | | | |
Bank loans | | 0.1 | | | — | |
| | | | | | |
| | 439.6 | | | 573.8 | |
| | | | | | |
Capital leases | | 4.8 | | | 9.3 | |
Derivative financial instruments hedging translational exposures | | 3.8 | | | (3.5 | ) |
Preference Shares | | — | | | 67.5 | |
| | | | | | |
Total debt | | 448.2 | | | 647.1 | |
| | | | | | |
Less: | | | | | | |
Cash and cash equivalents | | (148.5 | ) | | (172.5 | ) |
Restricted cash | | (2.9 | ) | | (4.1 | ) |
| | | | | | |
Net debt | | 296.8 | | | 470.5 | |
| | | | | | |
During fiscal 2007, our total debt decreased from £647.1 million in fiscal 2006 to £448.2 million in fiscal 2007 following the repayment of part of the Group’s unsecured bank loans and the redemption of the outstanding Preference Shares. The peak level of net debt in fiscal 2007 (excluding Preference Shares) was £426.5 million. As the majority of the Group’s debt is denominated in currencies other than sterling, reported net debt also increased by £12.1 million, largely as a result of the strengthening of the Canadian dollar during the period.
Our weighted average cost of net debt at December 29, 2007 was 7.7 percent (December 30, 2006: 7.0 percent).
We operate in a wide range of markets and geographic locations and as a result the seasonality of our borrowing requirements is low. Underlying cyclicality before capital expenditure is driven principally by the timing of our ordinary dividends and interest payments.
Funding requirements for investment commitments and authorizations
At December 29, 2007, the Group had surplus cash balances in excess of the operational needs of the Group’s businesses. Accordingly, the Group’s present policy is to fund new investments first from existing cash resources and then from borrowings sourced centrally. It is management’s intention to maintain surplus un-drawn borrowing facilities sufficient to enable the investment grade credit ratings to be maintained and to enable the Group to manage its liquidity through the operating and investment cycle. A regular dialogue is maintained with the rating agencies and the potential impact on our credit rating is taken into consideration when making capital allocation decisions.
Maximizing returns on cash balances
Our central treasury function is responsible for maximizing the return on surplus cash balances within liquidity and counterparty credit constraints imposed by our Board-approved liquid funds policy. This is done, where practical, by controlling directly all surplus cash balances and pooling arrangements on an ongoing basis and by reviewing the efficiency of all other cash balances across the Group on a weekly basis.
35
Our policy is to apply funds from one part of the Group to meet the obligations of another part wherever possible, to ensure maximum efficiency of the Group’s funds. No material restrictions apply that limit the application of this policy. It is anticipated that surplus cash in excess of that required for operating purposes held in operating companies will be repatriated or reinvested in new investments during fiscal 2008.
At December 29, 2007, our total cash and investments were £151.2 million (including collateralized cash and before interest accruals), of which £138.2 million was interest earning. Of the total cash and investments balance, £37.4 million was invested in short-term deposits by our treasury department, £4.4 million of cash was held in our captive insurance company, Tomkins Insurance Limited, £32.1 million of cash was held in our Asian Unitta companies and £77.3 million of cash was held in centrally-controlled pooling arrangements and with local operating companies. At December 29, 2007, £57.0 million of our cash balance was under the direct control of the Group treasury.
Interest earned on bank deposits during fiscal 2007 was £4.2 million (fiscal 2006: £4.8 million).
C. Research and development, patents and licenses, etc.
Applied research and development is important to the Group’s manufacturing businesses. The Group maintains development centers in Japan, Europe and the United States. Businesses within the Group are encouraged to review their products regularly and to develop them in accordance with perceived market trends. The Group’s expenditure on research and development for continuing operations was £49.4 million in fiscal 2007 (fiscal 2006: £46.8 million; fiscal 2005: £40.9 million).
D. Trend information
Markets
When considering the trends affecting the Group, it is important to bear in mind that the Group is diversified, both in terms of end market exposure and geography. The outlook for a number of the Group’s end markets, particularly in North America, remains challenging.
The Industrial OE market (17.4 percent of Group sales in fiscal 2007) is expected to show continuing modest growth in 2008 globally. The North American market is expected to show a moderate slowdown, whilst Eastern Europe and Asia are expected to show good growth in 2008. The industrial replacement market (13.1 percent of Group sales in fiscal 2007) is expected to follow the industrial OE market with softness in North America and growth outside of North America.
The automotive OE market (20.4 percent of Group sales in fiscal 2007) is driven by global automotive production. According to CSM auto database, a total of 54.9 million light vehicles were manufactured globally during fiscal 2007, representing an increase of around 3.0 percent compared to fiscal 2006. 15.0 million of these vehicles were produced in North America (compared to 15.3 million vehicles in fiscal 2006). According to Ward’s Autos, production volumes in North America at General Motors and Ford were down in fiscal 2007 compared to fiscal 2006 by approximately 7 percent and 6 percent respectively, whereas Chrysler kept volumes flat. The Group’s Automotive OE exposure in North America as a percentage of our sales has been steadily declining and is now at approximately 10 percent, with exposure to the Detroit Three in North America now standing at approximately 7 percent of Group sales.
In fiscal 2007, in Europe, automotive production increased by 5.6 percent to 21.5 million units, and in Japan and Korea automotive production grew by 2.3 percent. There was continued strong growth in Latin America and other emerging markets, including China and India, which grew by 19.1 percent and 13.1 percent respectively.
Looking ahead to 2008, CSM auto database is forecasting North American automotive production to decline further, to 14.4 million units, the lowest level in nearly 15 years. European automotive production is expected to increase by 1.7 percent due to strong demand from Eastern Europe, and automotive production in China, India and Latin America is forecast to increase in 2008 compared to 2007 by 12.2 percent, 33.2 percent and 10.9 percent respectively.
In fiscal 2008, we expect the automotive aftermarket (20.0 percent of Group sales in fiscal 2007) in North America and Europe to grow in line with GDP. There is some risk to the aftermarket in North America from increased gasoline prices. Growth is expected to be above GDP in regions such as Eastern Europe and Asia because of their rapidly developing car parks.
Both the manufactured housing and recreational vehicle markets (3.7 percent of Group sales in fiscal 2007) are expected to remain weak in fiscal 2008, following the trend for the past two years.
Dodge, an industry forecasting service, estimates that the non-residential construction market (14.2 percent of Group sales in fiscal 2007) will fall by about 7 percent in square footage terms in fiscal 2008.
The Group’s residential construction businesses (10.5 percent of Group sales) are based in the United States and market trends are aligned with the number of new housing starts. The NAHB is forecasting a continued downward trend in housing starts in the United States, with an expected drop of around 20 percent to 1.0 million units in 2008, compared to 1.4 million in 2007 and 1.8 million in 2006. With sales of new homes at their lowest in over a decade, inventory levels of existing homes at a 20-year high and the sub-prime mortgage crisis tightening lending standards, this market is not expected to recover prior to 2009.
Residential sales in the US are approximately 10 percent of our Group sales.
Currency translation
The Group’s principal operations are based in the United States and in fiscal 2007 58.7 percent of the Group’s sales originated in the United States. When reported in sterling, the Group’s results are therefore materially exposed to fluctuations in the value of the US dollar. The US dollar has weakened significantly against the pound sterling over the past two years, with the Noon Buying Rate of one pound sterling moving from $1.7188 at the end of fiscal 2005 to $1.9929 at the end of fiscal 2007. Overall, the effect of currency movements was to reduce the Group’s reported sales by £191 million in fiscal 2007 compared with fiscal 2006, of which £161 million arose from the further depreciation of the US dollar against the pound sterling.
In order to reduce the effect of currency fluctuations on the Group’s reported results in the future, the Board has decided to present the Group’s consolidated financial statements in US dollars with effect from the beginning of fiscal 2008.
36
E. Off-balance sheet arrangements
Management does not believe that the Company has any material off-balance sheet arrangements.
F. Tabular disclosure of contractual obligations
The Company’s consolidated contractual obligations and commercial commitments are summarized in the following table which includes aggregate information about the Company’s contractual obligations as at December 29, 2007 and the periods in which payments are due, based on the earliest date on which the Group could be required to settle the liabilities.
Floating interest payments and payments and receipts on interest rate derivatives are estimated based on market interest rates prevailing at the balance sheet date. Amounts in respect of operating leases and purchase obligations are items that the Company is obligated to pay in the future, but they are not required to be included on the consolidated balance sheet.
| | | | | | | | | | | | | | | |
Contractual obligations | | Total | | | Less than 1 year | | | 1 - 3 years | | | 3 - 5 years | | | After 5 years | |
| | | £ million | | | £ million | | | £ million | | | £ million | | | £ million | |
Bank overdrafts | | 7.9 | | | 7.9 | | | — | | | — | | | — | |
Bank and other loans | | | | | | | | | | | | | | | |
– Principal | | 440.6 | | | 22.6 | | | 18.0 | | | 150.0 | | | 250.0 | |
– Interest payments(1) | | 175.7 | | | 29.7 | | | 56.8 | | | 43.3 | | | 45.9 | |
Derivative financial instruments: | | | | | | | | | | | | | | | |
– Payments | | 820.1 | | | 667.4 | | | 64.8 | | | 42.1 | | | 45.8 | |
– Receipts | | (815.5 | ) | | (659.4 | ) | | (66.7 | ) | | (43.5 | ) | | (45.9 | ) |
Capital lease obligations | | 6.4 | | | 1.2 | | | 1.9 | | | 1.0 | | | 2.3 | |
Operating lease obligations | | 116.8 | | | 18.9 | | | 30.1 | | | 22.7 | | | 45.1 | |
Post-employment benefit obligations(2) | | 33.3 | | | 33.3 | | | — | | | — | | | — | |
Purchase obligations(3) | | 18.0 | | | 15.2 | | | 1.4 | | | 0.5 | | | 0.9 | |
| | | | | | | | | | | | | | | |
Total | | 803.3 | | | 136.8 | | | 106.3 | | | 216.1 | | | 344.1 | |
| | | | | | | | | | | | | | | |
(1) | Future interest payments include payments on fixed and floating rate debt and are presented before the effect of interest rate derivatives. Interest payments on floating rate debt are calculated using the interest rates applicable as at December 29, 2007. Future interest payments are presented on a basis consistent with the maturity profile of the Group’s financial instruments for financial reporting purposes, which is analyzed in Note 32 to the Group’s consolidated financial statements. |
(2) | Post-employment benefit obligations represent the Group’s expected cash contributions to its defined benefit pension and other post-employment benefit plans in fiscal 2008. It is not practicable to present expected cash contributions for subsequent years because they are determined annually on an actuarial basis to provide for current and future benefits in accordance with federal law and other regulations. |
(3) | A purchase obligation is defined as an agreement to purchase goods or services that is enforceable and legally binding on the Group and that specifies all significant terms, including: fixed or minimum quantities to be purchased; fixed, minimum or variable price provisions; and the approximate timing of the transaction. |
As at December 29, 2007, the Company held a provision for uncertain tax positions of £33.9 million. The table above does not include this provision as it is not practicable to reliably estimate the timing of the related cash outflows in future years as these cash flows will only be determined after final audit by the tax authorities of previously filed tax returns.
G. Safe Harbor
See the “Special Note Regarding Forward-Looking Statements” on page 2.
37
Item 6. Directors, Senior Management and Employees
A. Directors and senior management
The Directors and executive officers of the Company as at April 18, 2008 are as follows:
| | | | |
Name | | Date of birth | | Title |
Executive Directors | | | | |
J. Nicol | | February 18, 1954 | | Chief Executive |
J.W. Zimmerman | | April 22, 1963 | | Finance Director |
| | |
Non-Executive Directors | | | | |
D.B. Newlands | | September 13, 1946 | | Non-Executive Chairman |
R.D. Gillingwater | | July 21, 1956 | | Non-Executive Director |
J. McDonough | | November 8, 1951 | | Non-Executive Director |
L.M. Quinn | | December 13, 1956 | | Non-Executive Director |
D.H. Richardson | | June 2, 1951 | | Non-Executive Director |
D.D.S. Robertson | | December 11, 1949 | | Non-Executive Director |
| | |
Executive officers | | | | |
R. Bell | | May 7, 1948 | | Chief Operating Officer – Industrial & Automotive |
D.P. Burton | | September 14, 1959 | | Company Secretary |
D.J. Carroll | | April 20, 1957 | | Executive Vice President, CorporateDevelopment |
T.J. O’Halloran | | November 20, 1947 | | Chief Operating Officer - Building Products |
G.S. Pappayliou | | March 28, 1954 | | General Counsel |
M.P. Woryk | | March 24, 1959 | | Vice President – Human Resources |
There are no family relationships between any Director or executive officer and any other Director or executive officer or any arrangement or understanding between any Director or executive officer and any other person pursuant to which such Director or executive officer was so elected or appointed.
The Articles of Association of the Company provide that, unless otherwise determined by the shareholders at a general meeting, the number of Directors will not be less than two or more than fifteen. Directors may be appointed by the shareholders at a general meeting or by the Board itself, provided that any Director appointed by the Board is required to retire from office (but is eligible to stand for re-appointment by the shareholders) at the annual general meeting of the Company following his appointment. At every annual general meeting, not less than one-third of the Directors are required to retire from office and are eligible to stand for re-appointment at such meeting.
Subject to the provisions of the Companies Act 1985, the Board may from time to time appoint one or more Directors to an executive office on such terms and for such period as it may determine. No Director or executive officer has a service contract with the Company of more than two years’ duration.
Executive Directors
James Nicol
Appointed to the Board in February 2002. Former President and Chief Operating Officer of Magna International Inc., the Canadian automotive parts company. He joined Magna in 1987 as Vice-President, Special Projects, following a career as a commercial lawyer. He left in 1992 to set up TRIAM Automotive Inc. and returned to Magna as Vice-Chairman when Magna acquired TRIAM in 1998.
John Zimmerman
Appointed to the Board in October 2007. He is a Chartered Accountant (S.A.) and practised for a number of years at Deloitte in South Africa. He joined Braxton Associates in Toronto in 1990 and then became a partner at Orenda Corporate Finance in 1994. He joined the Group as Vice President of Corporate Development in 1999.
Non-Executive Directors
David Newlands
Appointed to the Board in August 1999 and became Chairman in June 2000. He is Chairman of KESA Electricals plc and PayPoint plc, and a Director of a number of other companies. He was formerly Finance Director of The General Electric Company, p.l.c., Chairman of Britax International plc and Deputy Chairman of Standard Life Assurance.
Richard Gillingwater
Appointed to the Board in December 2005. He is Dean of Cass Business School in the City of London and previously held senior appointments in Government and the City of London, as Chairman of the Shareholder Executive, the body responsible for the Government’s shareholdings in major public-owned businesses, and at CSFB, BZW and Kleinwort Benson.
John McDonough
Appointed to the Board in June 2007. He is the Group Chief Executive of Carillion plc having been appointed in 2001. He was previously Vice President, Integrated Facilities Management, Europe, the Middle East and Africa of Johnson Controls Inc and is currently Services Vice Chairman of the CBI’s Public Strategy Board and a member of the CBI’s President’s Committee.
38
Leo Quinn
Appointed to the Board in July 2007. He is Group Chief Executive of De La Rue plc. Previously he was Chief Operating Officer of Invensys plc’s Production Management Division. Prior to this, he spent 16 years with Honeywell Inc. in a variety of senior management roles in the United States, Europe, the Middle East and Africa.
David Richardson
Appointed to the Board in March 2006. He is a Non-Executive Director of The Restaurant Group PLC, Serco Group plc, Dairy Crest Group plc and Forth Ports PLC and he has been Chairman of De Vere Group plc and Sports Direct International plc. Previously he held a number of senior financial management and strategic planning positions in Whitbread PLC from 1983 to 2005 becoming Group Finance Director in 2001. Prior to his time at Whitbread, he had worked for ICL plc and Touche Ross & Co. (now Deloitte & Touche LLP).
Struan Robertson
Appointed to the Board in December 2005. He is currently a Non-Executive Director of Forth Ports PLC, Henderson TR Pacific Investment Trust plc, International Power plc and Salamander Energy plc. He was Group Chief Executive of Wates Group Limited between 2000 and 2004, having previously spent 25 years with BP plc in a number of senior positions. He was the Senior Independent Director at WS Atkins plc from 2000 to 2005.
Executive officers
R. Bellwas appointed to the new role of Chief Operating Officer - Industrial & Automotive in May 2007. He came to Gates with the Uniroyal acquisition in 1986 and held management positions in Asia and Europe prior to moving to the United States in 1996, where he continued to hold management positions.
D.P. Burtonwas appointed Company Secretary in November 2007. She joined the Company in May 1989 as Assistant Company Secretary and subsequently was Deputy Company Secretary for over ten years.
D.J. Carroll was appointed Executive Vice President, Corporate Development in October 2007, having previously had executive responsibilities for four business units within the Group since joining in 2003. He joined the Group from Magna International Inc. where he had operated in various sales and planning roles since 1984 becoming Executive Vice President, Marketing and Corporate Planning in 2002.
T.J. O’Halloran was appointed to the new role of Chief Operating Officer – Building Products in May 2007, having served as the President – Building Products since January 2007, and having been Group President – Air Systems Components Division since 1999. He has had 22 years experience with the Group in the Building Products business group, including his roles as President of Air Systems Components Limited Partners and President of Ruskin.
G.S. Pappayliou was appointed General Counsel on April 9, 2003. He joined the Group in August 1990 with the acquisition of Philips Industries. Thereafter he served as the General Counsel of Tomkins Industries and later as the Group’s General Counsel – North America.
M.P. Worykwas appointed Vice President – Human Resources on May 1, 2006. She joined the Group in October 1993 and prior to her current appointment served as Assistant General Counsel.
Board changes
Seven of the Directors served for only part of 2007. These Directors were Jack Keenan (retired June 13, 2007), Ken Lever (resigned as a Director on October 1, 2007, with his employment ceasing on October 31, 2007), John McDonough (appointed June 14, 2007), Iain Napier (appointed June 14, 2007 and resigned December 13, 2007), Sir Brian Pitman (retired June 13, 2007), Leo Quinn (appointed July 6, 2007), and John Zimmerman (appointed October 1, 2007).
Executive officer changes
Denise Burton became an executive officer on her appointment as Company Secretary of the Company in November 2007 following her predecessor Norman Porter’s retirement. John Zimmerman became a Director in October 2007 and his previous role as an executive officer was taken by Dave Carroll. Dave Carroll’s prior responsibilities were absorbed by Richard Bell. Mike Jones retired at the end of fiscal 2007.
B. Compensation
1. Remuneration Committee
This section sets out the membership of the Remuneration Committee and the names of the advisers who provided services to the Remuneration Committee during fiscal 2007. The policies that have been followed by the Remuneration Committee in fiscal 2007 in determining the elements of executive remuneration are also set out, together with the policies and principles to be followed by the Remuneration Committee over the next two years.
The Board keeps under review the terms of reference for the Remuneration Committee, which are based on current best practice contained in the model terms of reference set out in the Guidance Note produced by the Institute of Chartered Secretaries and Administrators. The principal responsibility of the Committee is to determine the framework or broad policy for the Company’s executive remuneration and the remuneration of the Chairman of the Board, for approval by the Board. The remuneration of Non-Executive Directors is a matter for the Board itself. The terms of reference of the Remuneration Committee can be found under “Governance” in the “Responsibilities” area of the Company’s website, www.tomkins.co.uk. In addition, the Company takes full account of the guidelines published by the Association of British Insurers and the National Association of Pension Funds.
39
In fiscal 2007, the Remuneration Committee was required to discuss and finalize John Zimmerman’s remuneration package following his appointment as Finance Director on October 1, 2007, as well as assessing and approving awards under the PSP. The Committee reviewed calculations relating to awards made to Directors under the ABIP and approved the granting of awards under The Tomkins 2005 Sharesave Scheme. The Committee was also required to test that performance targets in relation to the Tomkins Executive Share Option Schemes had been met on the last grant of awards dated November 29, 2004 and, having established that the targets had been achieved, declared the options exercisable. The annual base salary review for executives within the ABIP was carried out using the 12-month average RPI for UK executives (4.2 percent) and CPI for US executives (2.3 percent).
Details of the emoluments, bonuses, benefits-in-kind, incentive arrangements (including share options and other long-term incentives), pensions and service contracts applicable to each Director who served during fiscal 2007 are given in this section.
2. Membership of the Remuneration Committee and Advisers
The Remuneration Committee is made up exclusively of Non-Executive Directors whom the Board determined to be independent, as each was found to be free from any material business or other relationship with the Company (either directly or as a partner, shareholder or officer of an organization that has a relationship with the Company). Accordingly, the Board believes that there are no such relationships that could materially interfere with the exercise of their independent judgment. Richard Gillingwater and David Newlands served on the Committee throughout 2007. Jack Keenan ceased to be a member of the Committee upon his retirement from the Board on June 13, 2007. Leo Quinn was appointed to the Committee on July 31, 2007. Iain Napier was appointed to the Committee and as Chairman on July 31, 2007 and stood down on December 13, 2007 upon his resignation from the Board. John McDonough was appointed Chairman of the Committee on December 13, 2007.
There were no other changes to the membership of the Remuneration Committee in fiscal 2007.
The members of the Remuneration Committee as at December 29, 2007 were:
| • | | J. McDonough (Chairman) |
The Committee consults with the Chief Executive concerning matters of executive remuneration. The Committee appointed PA Consulting Group to provide independent verification of the cost of capital in respect of the PSP, assistance with the remuneration arrangements in respect of John Zimmerman and a review of the fees of the Chairman and Non-Executive Directors. PA Consulting Group also provided support during a corporate strategy review. Mercer Human Resource Consulting provided professional advice to the Company and to the trustees of the pension schemes of the Company and some of its subsidiaries in respect of their respective pension arrangements and provided advice to the Company in respect of the placement and operation of life assurance.
Other than those consulting services mentioned above, PA Consulting Group and Mercer Human Resources had no connections with the Company.
3. Statement of Company’s policy on Directors’ remuneration
The policies operated by the Company in fiscal 2007 and those to be applied over the next two years, are set out below:
(i) Executive remuneration
The Company’s policy on executive remuneration is that the Remuneration Committee and the Board should each satisfy itself that executives, including Executive Directors, are fairly rewarded for their individual contributions to the Group’s performance. The Remuneration Committee has sought to ensure that Executive Directors receive a level of remuneration that is appropriate to their scale of responsibility and performance, and which will attract, motivate and retain individuals of the necessary caliber. The only pensionable element of Executive Directors’ remuneration is basic salary. This policy applies whether or not an Executive Director is a member of the Tomkins Retirement Benefits Plan or has a personal pension arrangement.
(ii) Annual remuneration for executives
The Board recognizes that one of its key objectives is to grow the value of the business for the benefit of shareholders and that such growth is strongly related, amongst other things, to the degree of entrepreneurial spirit in the Group. In order to create the necessary entrepreneurial impetus within an organization, compensation arrangements are required which are similar to those that an owner of a business would seek. This has led to the adoption of a remuneration policy under which the levels of total remuneration are set in order to attract, retain and motivate executives. The executive rewards of the Group have a standard composition, made up of three principal elements:
These standard elements form part of a carefully-designed system put in place between 2003 and 2006 to create an entrepreneurial focus on value creation. The process had three stages:
| • | | first, we agreed a clear set of principles to guide system design; |
| • | | secondly, we drafted system structures which would embody these principles; and |
| • | | finally we calibrated each element of the system to ensure enhanced rewards for above-target performance – and reduced rewards for below-target performance. |
40
Remuneration is benchmarked against a series of comparable UK companies as well as North American auto-component manufacturers and is provided through a combination of base salaries at median level or below and annual bonuses that have a direct and proportionate link to total value created for shareholders. This provides the incentive for executives to act like owners of the business. The Remuneration Committee and the Board believe that this more closely aligns the interests of shareholders and management whereby executives only receive substantial rewards when they have created exceptional value in the business.
Over time and subject to the achievement of value-creating performance targets, this policy is likely to lead to a realignment of the component parts of total executive remuneration, so that a greater part of the total package received by executives is made up of incentive pay with the remainder coming from base salaries at the median level or below. The performance targets for the Company’s ABIP and PSP ensure that a substantial proportion of total remuneration is directly related to actual measurable performance. Further details of the ABIP and the PSP are set out in section 5 “Current schemes” below.
(iii) Non-Executive Directors’ fees and Chairman’s remuneration
The executive members of the Board review the fees of Non-Executive Directors, who play no part in determining their own remuneration. The Chairman’s remuneration is determined by the Remuneration Committee and is approved by the Board. The Chairman takes no part in the discussions and decisions relating to his own remuneration. The review of Non-Executive Directors’ fees and the Chairman’s remuneration takes place every two years.
(iv) Service contracts
The Company’s policy on Directors’ service contracts is that service contracts and letters of appointment for Executive Directors normally provide for notice periods of no longer than 12 months. On appointment, a longer notice period may apply, but it will be reduced over time to the normal 12 months’ notice period. Notwithstanding the provisions in an Executive Director’s service contract or letter of appointment concerning termination payments, the Company will seek to reduce any compensation that may be payable to reflect the departing Director’s obligation to mitigate loss.
(v) External appointments
The Company’s policy on external appointments is that, with the approval of the Chairman of the Board, Executive Directors are permitted to hold appointments outside the Company. Any fees payable in connection with such appointments are normally retained by Directors unless otherwise agreed. In fiscal 2007, Ken Lever served as a Non-Executive Director on the Board of iSOFT Group plc until October 30, 2007, for which he received fees of £50,000, which he retained and from June 14, 2007 he served as a Non-Executive Director on the Board of Wolsey Group Limited for which he received no fees whilst an Executive Director of the Company. James Nicol and John Zimmerman hold no external directorships.
(vi) Long-term incentives and share options
The Company has operated a number of share-based long-term incentive schemes in the past but, following a review of executive remuneration, the Remuneration Committee and Board expect the number of plans and schemes to be reduced over time as they lapse and are not renewed or replaced. As previously reported, the Remuneration Committee and the Board decided not to continue with an executive share option scheme beyond May 9, 2005, the date on which the Company’s Executive Share Option Schemes lapsed. Following shareholder approval, The PSP was introduced, a summary of which is set out in section 5 “Current schemes” below.
The Company operates an employee savings related share option scheme, the Tomkins 2005 Sharesave Scheme, which applies to all UK employees.
(vii) Retirement benefits
The Company’s defined benefit pension plans were closed to new members in April 2002 and, since that time, the Company’s policy has been that new employees, including Executive Directors and senior executives, will receive a payment from the Company to enable them to make contributions to pension plans of their choice on behalf of themselves and their dependants. No change to this policy is expected over the next two years.
41
4. Elements of remuneration
(i) Basic salary, fees, bonuses and benefits-in-kind for fiscal 2007
| | | | | | | | | | | | | | | | | | | |
| | | | | | | | | | | | | | | | | Total emoluments
(excluding retirement benefits) | |
| | | Basic
salary/fees | | Bonus
cash(1) | | Bonus
shares(1) | | Bonus
deferred
shares(2) | | Benefits-
in-kind(3) | | Pension
contribution (4) | | Compensation
for loss of
office(5) | | Fiscal
2007 | | Fiscal
2006 | |
| | | £000 | | £000 | | £000 | | £000 | | £000 | | £000 | | £000 | | £000 | | £000 | |
Chairman | | | | | | | | | | | | | | | | | | | |
D.B. Newlands(6) | | 190 | | — | | — | | — | | — | | — | | — | | 190 | | 191 | |
| | | | | | | | | | | | | | | | | | | |
| | | | | | | | | |
Executive Directors | | | | | | | | | | | | | | | | | | | |
| | | | | | | | | |
J. Nicol | | 879 | | 653 | | 163 | | 326 | | 45 | | 330 | | — | | 2,396 | | 2,539 | |
K. Lever (to October 1, 2007) | | 317 | | 296 | | 34 | | 32 | | 18 | | 119 | | 1,006 | | 1,822 | | 1,209 | |
J.W. Zimmerman (from October 1, 2007) | | 68 | | 57 | | 14 | | 28 | | 2 | | 21 | | — | | 190 | | — | |
| | | | | | | | | | | | | | | | | | | |
| | | | | | | | | |
Non-Executive Directors | | | | | | | | | | | | | | | | | | | |
| | | | | | | | | |
R.D. Gillingwater(6) | | 71 | | — | | — | | — | | — | | — | | — | | 71 | | 26 | (7) |
J.M.J. Keenan (to June 13, 2007) | | 25 | | — | | — | | — | | — | | — | | — | | 25 | | 61 | |
J. McDonough(6) (from June 14, 2007) | | 34 | | — | | — | | — | | — | | — | | — | | 34 | | — | |
I.J.G. Napier(6) (from June 14, 2007 to December 13, 2007) | | 30 | | — | | — | | — | | — | | — | | — | | 30 | | — | |
Sir Brian Pitman (to June 13, 2007) | | 26 | | — | | — | | — | | — | | — | | — | | 26 | | 63 | |
L.M. Quinn(6) (from July 6, 2007) | | 31 | | — | | — | | — | | — | | — | | — | | 31 | | — | |
D.H. Richardson(6) (from March 1, 2006) | | 62 | | — | | — | | — | | — | | — | | — | | 62 | | 52 | |
D.D.S. Robertson(6) | | 66 | | — | | — | | — | | — | | — | | — | | 66 | | 62 | |
N.N. Broadhurst (to May 22, 2006) | | — | | — | | — | | — | | — | | — | | — | | — | | 26 | |
K.J. Minton (to May 22, 2006) | | — | | — | | — | | — | | — | | — | | — | | — | | 33 | |
M.F. Wallach (to May 1, 2006) | | — | | — | | — | | — | | — | | — | | — | | — | | 16 | |
| | | | | | | | | | | | | | | | | | | |
| | 1,799 | | 1,006 | | 211 | | 386 | | 65 | | 470 | | 1,006 | | 4,943 | | 4,278 | |
| | | | | | | | | | | | | | | | | | | |
(1) | Details of bonus payments in accordance with the ABIP are given in section 5(i) “Current schemes – (i) Annual Bonus Incentive Plan” below. |
(2) | Deferred shares are held under the ABIP. |
(3) | Benefits-in-kind include medical cover, car and fuel benefits, and other benefits in accordance with the Directors’ service contracts. |
(4) | See section 7 “Retirement benefits” below for more details. |
(5) | The compensation for loss of office payment to Ken Lever includes contractual salary, pension contributions and car allowance in respect of his 51-week notice period, together with a payment of £61,000 as compensation for the loss of his employment. |
(6) | On August 7, 2007, 2,000 shares were purchased for each of the Non-Executive Directors at a market price of 244p per share. The cost of these shares formed part of their remuneration. |
(7) | Richard Gillingwater, in accordance with Cabinet Office guidelines, waived his fees for the period January 1, 2006 to September 1, 2006, when he was able to accept his fees. |
In fiscal 2007, no Director exercised share options. During fiscal 2006, James Nicol and Ken Lever benefited from gains of £1,333,000 and £1,155,000 respectively on the exercise of share options.
Chairman’s remuneration
With the assistance of PA Consulting, and having taken into consideration comparative remuneration data, the contribution made by the Chairman to the Company’s affairs, the time he devotes to the Company’s business, and the extra responsibilities placed upon him arising from the changes in corporate governance requirements in the United Kingdom and the United States, the Remuneration Committee recommended to the Board that his remuneration should be increased from £185,000 plus 2,000 Ordinary Shares per annum, to £205,000 plus 5,000 Ordinary Shares per annum with effect from January 1, 2008. These recommendations were approved by the Board.
42
Non-Executive Directors’ fees
With the assistance of PA Consulting, the executive members of the Board reviewed the fees paid to Non-Executive Directors and having taken into consideration comparative remuneration data, the contribution made by individual Non-Executive Directors to the Company’s affairs, the time they devote to the Company’s business, and the extra responsibilities placed upon them arising from the changes in corporate governance requirements in the United Kingdom and the United States, approved an increase in the fees, to the following with effect from January 1, 2008, which represents an RPI increase over the period since the last review:
Basic fee
£45,815 per annum (previously £42,500 per annum); plus 2,000 Ordinary Shares per annum (unchanged)
Additional fees
| | |
|
| Audit Committee |
| |
| Chairman: | | £16,170 per annum (previously £15,000 per annum) |
| |
| Other members: | | £8,085 per annum (previously £7,500 per annum) |
|
| Remuneration Committee |
| |
| Chairman: | | £10,780 per annum (previously £10,000 per annum) |
| |
| Other members: | | £5,390 per annum (previously £5,000 per annum) |
|
| CSR Committee |
| |
| Chairman: | | £13,475 per annum (previously £12,500 per annum) |
| |
| Other members: | | £5,390 per annum (previously £5,000 per annum) plus £1,617 per meeting day (previously £1,500 per meeting day) |
|
Senior Independent Director |
|
£16,170 per annum (previously £15,000 per annum) |
Total compensation paid to Directors and executive officers
The following table shows emoluments paid or payable to all Directors and all executive officers of the Company as a group for fiscal 2007:
| | |
| | | £000 |
Short-term employee benefits: | | |
– Salaries and fees | | 3,332 |
– Bonus cash | | 2,039 |
– Benefits-in-kind | | 154 |
– Social security contributions | | 555 |
– Termination benefits | | 1,126 |
| | |
| | 7,206 |
| | |
Share-based incentives: | | |
– Bonus shares | | 465 |
– Deferred shares | | 887 |
| | |
| | 1,352 |
Pension contributions | | 989 |
| | |
| | 9,547 |
| | |
5. Current schemes
Movements in share options held by Directors are included under Item 6E “Share ownership” below.
(i) Annual Bonus Incentive Plan
The Executive Directors and senior executives participate in the Company’s ABIP. Each participant in the ABIP receives a percentage of “bonusable profit” of the business for which he or she has responsibility. Bonusable profit is based on operating profit less a charge for tax, certain exceptional items and a charge for invested capital. The objective of the ABIP is to reward the senior executives for increasing the overall value created in the business, based on the margin of the after-tax return on invested capital in excess of the weighted average cost of capital. Accordingly, bonusable profit may increase at a faster rate than operating profit where the margin of the return over the cost of capital increases. This aligns the interests of management and shareholders. In arriving at bonusable profit, adjustments may be made for restructuring charges relating to strategic manufacturing initiatives to match the costs of the strategic manufacturing initiatives to the benefits over a period of up to three years. The charge for taxation reflects the ongoing charge for tax excluding any benefit from exceptional adjustments to tax provisions. The charge for invested capital is based on applying the estimated weighted average cost of capital to the average invested capital in the Group. The estimated weighted average cost of capital takes into account the capital structure of the Group and the costs associated with each element of capital. The method of calculation has been agreed by the Remuneration Committee and is subject to review each year. The invested capital is based on the book value of the Group’s assets, excluding goodwill relating to acquisitions made prior to December 30, 1999. The cost of capital used in the calculation of bonusable profit for the year under review was 8.35 percent.
43
The Remuneration Committee carries out a detailed review of the computations involved and ensures that the rules are applied consistently. Furthermore, the independent auditors are asked to perform agreed-upon procedures on behalf of the Remuneration Committee on the calculations which underlie the computation of the bonusable profit. The incentive bonus of the Executive Directors is based on a percentage of the bonusable profit of the Group which, for fiscal 2007, was £96.0 million (fiscal 2006: £111.3 million) and the respective bonusable profit percentages were: James Nicol (0.85 percent), Ken Lever (0.4 percent) and John Zimmerman (0.4 percent). James Nicol received £1,142,000 (fiscal 2006: £1,324,000), and, while serving as Executive Directors, Ken Lever received £362,000 (fiscal 2006: £623,000) and John Zimmerman received £99,000 (fiscal 2006: £nil). Although there is no limit to the bonusable profit on which bonuses are calculated, inordinate growth in bonusable profit in any one year is unlikely to arise due to the nature of the Group’s business.
The bonus awards are payable to senior participants, including Executive Directors, as to four-sevenths in cash, one-seventh in bonus shares and two-sevenths in deferred shares. The bonus awards payable to the remaining participants are as to three-quarters in cash, one-twelfth in bonus shares and one-sixth in deferred shares. The bonus is paid at the end of June, September and December based on 75 percent of the bonus earned to the end of the previous quarter, with the balance of the full entitlement to the bonus for the calendar year paid at the end of March following the calendar year-end. Bonus shares are restricted and vest only after a period of three years from the initial bonus award. Dividends are paid on the bonus shares. Deferred shares are awarded at the time of the initial bonus award but the vesting of the shares is conditional on continued employment with the Group for three years after the award. Dividends are not paid on the deferred shares until they have vested. On leaving the Company, the bonus shares will normally vest in full. In good leaver circumstances the deferred shares will vest on a pro-rata basis.
As a condition of continued participation in the ABIP, senior participants, including Executive Directors, are required to retain shares with a purchase cost equivalent to one year’s total after-tax remuneration including bonus, based on an average of the previous three years. Remaining participants are required to hold shares with a purchase cost equivalent to one-half of one year’s total after-tax remuneration including bonus, based on an average of the previous three years. Increases in annual base salary of all participants, including Executive Directors, are restricted to the equivalent rate of increase in the RPI (in the United Kingdom) or equivalent index in the country in which a participant works. The restrictions on the increases in salary, together with the growth in bonus, assuming increases in bonusable profit, will result in the incentive pay element of remuneration increasing over time. The share awards will increase the investment each of the participants, including Executive Directors, has in Ordinary Shares.
(ii) The Tomkins 2006 Performance Share Plan
The PSP is a long-term incentive plan. The purpose of the PSP is two-fold. First, to provide a share-based long-term incentive arrangement for senior executives that more closely aligns the interests of executives with shareholders. Secondly, the PSP is in substitution of the Company’s legal obligation to the Chief Executive to provide annual grants of options, which had previously been satisfied by the Executive Share Option Scheme that lapsed in May 2005. The Remuneration Committee considered the alternatives and, with the agreement of the Chief Executive and the assistance of PA Consulting Group, devised a plan that achieves those aims. The PSP will provide rewards in future years only if shareholders have seen value created over the preceding three years. The Remuneration Committee and Board believe that this creates a better alignment between executive reward and the creation of shareholder value than a standard executive share option scheme. The PSP has four key features: (i) the performance baseline is established which is equal to the cost of equity and if the total shareholder return (comprising dividends and increase in the share price) over three years does not exceed the cost of equity over the same three-year period, no award of shares will be made; (ii) the award of shares will be proportional to the degree of performance over the baseline; (iii) there is a “cap” on the quantum of share awards; and (iv) subject to performance, awards will be made at the end of each three-year performance period. The following maximum awards of Ordinary Shares have been made to James Nicol, Ken Lever, John Zimmerman and the executive officers under the PSP:
| | | | | | | | | |
| | | Date of award | | Vesting date | | Maximum number of
Ordinary Shares | | | Ordinary Share price
required for full vesting |
James Nicol | | November 22, 2005 | | November 22, 2008 | | 1,041,666 | | | 384p |
| | November 22, 2006 | | November 22, 2009 | | 1,152,737 | | | 347p |
| | November 22, 2007 | | November 22, 2010 | | 1,606,296 | | | 249p |
John Zimmerman | | November 22, 2005 | | November 22, 2008 | | 208,333 | | | 384p |
| | November 22, 2006 | | November 22, 2009 | | 230,547 | | | 347p |
| | November 22, 2007 | | November 22, 2010 | | 481,889 | | | 249p |
Ken Lever | | November 22, 2005 | | November 22, 2008 | | 312,500 | | | 384p |
| | November 22, 2006 | | November 22, 2009 | | 345,821 | * | | 347p |
Executive officers | | November 22, 2005 | | November 22, 2008 | | 781,248 | | | 384p |
| | May 25, 2006 | | May 25, 2009 | | 191,326 | | | 392p |
| | November 22, 2006 | | November 22, 2009 | | 806,915 | | | 347p |
| | May 25,2007 | | May 25, 2010 | | 194,124 | | | 387p |
| | November 22, 2007 | | November 22, 2010 | | 1,124,407 | | | 249p |
| * | Ken Lever’s PSP award granted on November 22, 2006 was forfeited on the cessation of his employment with the Company on October 31, 2007. |
Awards with a performance period commencing on November 22, 2005 were approved by shareholders at the annual general meeting on May 22, 2006.
The net value of outstanding awards based on the share price as at December 29, 2007 was £nil (December 30, 2006: £nil).
(iii) The Tomkins 2005 Sharesave Scheme
This is a standard HM Revenue and Customs-approved savings related share option scheme, which is open to employees who are resident for tax purposes in the United Kingdom. It offers eligible employees the option to buy Ordinary Shares after a period of three, five or seven years funded from the proceeds of a savings contract to which employees may contribute up to £250 per month.
44
6. Closed schemes
(i) ESOS 3 and ESOS 4
ESOS 3 and ESOS 4 lapsed for grant purposes on May 9, 2005 and the Remuneration Committee and the Board decided not to continue with an executive share option scheme beyond that date.
ESOS 3 was an HM Revenue & Customs-approved scheme. ESOS 4 was not approved by HM Revenue & Customs. The options under both schemes matured after three years. All outstanding ESOS 4 options were granted to participants within the limit of four times their annual earnings. The performance condition for all outstanding options under ESOS 3 and ESOS 4 required that the growth in the Group’s earnings per share had to exceed the growth in the RPI by an average of 2 percent per annum over a three-year period before an option could be exercised, which was in accordance with contemporary practice when the schemes were introduced in 1995.
The Tomkins Savings Related Share Option Scheme No. 2
This was a standard HM Revenue & Customs-approved savings related share option scheme, which lapsed for grant purposes on May 9, 2005.
The Tomkins Share Matching Scheme
Awards which had been made under a now expired scheme known as The Tomkins Restricted Share Plan and which had vested, were eligible for matching awards for the same number of shares under the SMS. Such awards could be for up to two conditional share matching awards vesting a further two years and four years respectively after the end of the original restricted period. The final grant of SMS awards vested during 2007 and the SMS has therefore now expired. With shareholder approval, this share scheme was introduced in 1996 with no performance conditions attached and, accordingly, it did not comply with Schedule A of the Combined Code.
The interests of the Directors in Ordinary Shares held within the SMS that are yet to vest and yet to be included in Directors’ remuneration were as follows:
| | | | | | | | | | |
Director | | As at
December 29,
2007
Number | | Awarded
Number | | Vested
Number | | As at
December 30,
2006
Number | | Vesting
date |
K. Lever | | — | | — | | 1,809 | | 1,809 | | 2007 |
J.W. Zimmerman | | — | | — | | 2,252 | | 2,252 | | 2007 |
| | | | | | | | | | |
The value of entitlements held under the SMS for current Directors at December 29, 2007 was £nil (December 30, 2006: £4,000). No shares were awarded to Directors during fiscal 2007 (fiscal 2006: nil).
During fiscal 2007, 4,061 shares worth £7,000 vested under the SMS (fiscal 2006: nil).
As no SMS awards remain outstanding, no current Director was required to retain shares in this respect at December 29, 2007 (December 30, 2006: 3,618 shares required to be retained by Ken Lever in order to allow the SMS award that vested in fiscal 2007 to vest).
Tomkins Premium Priced Option
This was an option specifically and solely granted to James Nicol as part of the incentive package to ensure he joined the Company. No performance conditions were attached to this option and it therefore does not comply with Schedule A of the Combined Code. It consists of a non-transferable option to acquire 5,076,142 shares. The exercise price was 197p per share in respect of 2,538,072 shares (A option shares), 276p per share in respect of 1,522,842 shares (B option shares) and 345p per share in respect of 1,015,228 shares (C option shares). The options have all vested and will lapse on February 11, 2012 or earlier in certain circumstances.
Ongoing option
This is an option specifically and solely granted to James Nicol on February 11, 2002 as part of the incentive package to attract him to the Company. It consists of a non-transferable option to acquire 1,522,842 shares at 197p per share, which became exercisable on February 18, 2005 provided the rate of increase of earnings per share over any three-year period was equal to or greater than the rate of increase of the Retail Prices Index plus 9 percent. This performance condition was met and the option has been exercised in respect of 972,842 shares. The option will lapse on February 11, 2012 or earlier in certain circumstances. If there is a variation in the share capital of the Company, the Remuneration Committee may adjust the number of shares in either the Tomkins Premium Priced Option or the Ongoing Option as it reasonably deems appropriate to take account of the variation.
7. Retirement benefits
James Nicol and Ken Lever were not entitled to any retirement benefits defined in terms of final or average salary but they received a payment at an annual rate of 37.5 percent of their basic salary to enable them to make contributions to retirement benefit schemes of their choice on behalf of themselves and their dependants. For fiscal 2007, this amounted to £330,000 (fiscal 2006: £318,000) for James Nicol and £119,000 (fiscal 2006: £153,000) for Ken Lever while he served as an Executive Director of the Company. At the time he joined the Company, Ken Lever was given the option to elect at any time to become a member of the Tomkins Retirement Benefits Plan or any other replacement pension scheme nominated by the Company, but did not do so during the period to October 31, 2007 when his employment ceased with the Company.
John Zimmerman received a payment at an annual rate of approximately 12 percent of total compensation for the period from October 1, 2007 to December 29, 2007 amounting to £22,000. His bonus was pensionable in accordance with his previous arrangements for the period to January 1, 2008. In 2008 both James Nicol and John Zimmerman will receive a payment equal to 37.5 percent of their basic salary.
45
8. Payments made to and interests of former Directors
Ken Lever stood down from the Board as Finance Director on October 1, 2007, but agreed to remain in the Company’s employment until October 31, 2007 to assist with an orderly transition of responsibilities. Following his resignation from the Board on October 1, 2007, he was paid the sum of £76,000, representing entitlements due in respect of his employment for the month of October 2007, comprising salary, pension contributions, bonus and benefits. The amounts paid to Ken Lever while serving as an Executive Director and in respect of compensation for loss of office are set out in the table in section 4(i) “Elements of remuneration – (i) Basic salary, fees, bonuses and benefits-in-kind for fiscal 2007” above.
No other payments were made to former Directors during fiscal 2007 (fiscal 2006: £nil).
9. Sums paid to third parties in respect of a Director’s services
During fiscal 2007, no amounts were paid to third parties in respect of a Director’s services to any company within the Group (fiscal 2006: £nil).
C. Board practices
The Board of Directors
The Company is controlled through the Board. The Board’s main roles are to:
| • | | create value for shareholders |
| • | | provide leadership of the Company |
| • | | approve the Company’s strategic objectives, |
| • | | ensure that the necessary financial and other resources are made available to the management to enable them to meet those objectives |
| • | | operate within a framework of effective controls which enables the assessment and management of principal business risks. |
The Board, which has reserved certain specific matters to itself for decision (set out in a Schedule of Reserved Matters), is responsible for approving overall Group strategy and financial policy, acquisition and divestment policy and major capital expenditure projects. It also appoints and removes members of the Board and Board Committees, reviews recommendations of the Audit Committee, Remuneration Committee and Nomination Committee, and the appointment of the independent auditor. It also reviews the financial performance and operation of each of the Company’s businesses. In fiscal 2007, the Company granted qualifying third party indemnities to the Directors which remain in force at the time of this report.
The Board sets the standards and values of the Company and much of this has been embodied in the Company’s Code of Conduct and Ethics and Human Rights Policy which can be found on the Company’s website (www.tomkins.co.uk, under “Responsibilities” / “Corporate Social Responsibilities” / “Policies & Publications”). The Code of Conduct and Ethics applies to all directors, officers and employees, including the principal executive, financial and accounting officers, as required by section 406 of the SOX Act, the related rules of the SEC and the rules of the NYSE. The Code contains provisions (Reporting of Violations) under which employees can report violations of company policy or any applicable law, rule or regulation, including those of the SEC. Employees in the United States have the added protection of section 806 of the SOX Act, which prohibits the discrimination by a company or others against an employee where such violations are reported. The current procedure, which is set out in the Company’s Code of Conduct and Ethics, provides for information to be given anonymously or by named employees under conditions of confidentiality. Those employees who come forward and give their name are assured that they will receive the full protection of section 806 and no retaliation will take place. The Company ensures that the principles are applied, subject to compliance with local employment and other laws. For further information regarding the Code of Conduct and Ethics, refer to Item 16B “Code of Ethics”.
The Board has delegated to the Chief Executive responsibility for the day-to-day management of the Group subject to certain financial limits above which Board approval is required. The delegated authority includes such matters as operations, acquisitions and divestitures, investments, capital expenditure, borrowing facilities and foreign currency transactions.
The Board comprises a Non-Executive Chairman, five additional Non-Executive Directors and two executive Directors who together, with their different financial, commercial, technical and operational expertise and cultures, bring with them a wide range of experience to the Company.
The Board has determined that David Newlands, Richard Gillingwater, John McDonough, Leo Quinn, David Richardson and Struan Robertson are independent, as they are independent of the Company’s executive management and free from any material business or other relationship with the Company (either directly or as a partner, shareholder or officer of an organization that has a relationship with the Company). In December 2000, at the request of the Board, the Non-Executive Chairman, David Newlands, temporarily assumed certain executive responsibilities until the recruitment of James Nicol as Chief Executive in February 2002. It is the Board’s view that this short-term arrangement did not affect Mr Newlands’ independence. Accordingly, the Board believes that there are no such relationships that could materially interfere with the exercise of their independent judgment.
Non-Executive Directors are normally appointed for a minimum period of two years, which is renewable by agreement with the Board and is subject to approval by shareholders at the annual general meeting. The terms and conditions of appointment of Non-Executive Directors are summarized under “Service contracts” below, and are available for inspection at the Company’s registered office during normal business hours on weekdays and will also be available for inspection at the place of the annual general meeting from 15 minutes before the meeting until it ends. The Combined Code recommends the appointment of a Senior Independent Director and Sir Brian Pitman served in this capacity until his retirement from the Board at the conclusion of the annual general meeting on June 13, 2007 whereupon Richard Gillingwater was appointed Senior Independent Director.
46
The role of the Non-Executive Directors is to:
| • | | scrutinize the performance of management in meeting the agreed objectives; |
| • | | help develop proposals on strategy; and |
| • | | monitor the reporting of performance, including satisfying themselves as to the integrity of financial information and that financial controls and systems of risk management put in place by the Company are robust and effective. |
They meet together from time to time in the absence of management and the Chairman normally presides over such meetings.
On appointment, Non-Executive Directors receive a range of information about the Group via an induction program, which aims to provide an understanding of the Group as a whole, including its strategy, structure, geographical spread of operations, financial position, markets, products, technologies and people, as well as their legal responsibilities as a Director and, where appropriate, any training that is necessary for them to carry out their duties effectively. The Board and its Committees receive, in a timely manner, detailed information concerning the matters to be discussed to enable them to make informed decisions. The Directors have access to the advice and services of the Company Secretary, whose removal may be effected only with the approval of the Board, and can obtain independent professional advice at the Company’s expense in furtherance of their duties, if required.
The Board ordinarily meets not less than five times a year, and will hold additional meetings when circumstances require. During fiscal 2007, the Board met on five occasions. Between meetings, the Chairman and Chief Executive update the Non-Executive Directors on current matters and there is frequent contact to progress the affairs of the Company. With the encouragement of the Chief Executive, the Non-Executive Directors have regular contact with senior management through their presentations at Board meetings, at strategic reviews and on other occasions.
Attendance by each individual Director at Board and principal Committee meetings held during fiscal 2007 is set out in the table below.
| | | | | | | | | | |
| | | Board | | Audit
Committee | | Remuneration
Committee | | Nomination
Committee | | Corporate Social
Responsibility
Committee |
Meetings held in fiscal 2007 | | 5 | | 5 | | 3 | | 1 | | 4 |
| | | | | | | | | | |
Meetings attended: | | | | | | | | | | |
Richard Gillingwater | | 4 | | 4 | | 3 | | 1 | | n/a |
Jack Keenan | | 3 | | 3 | | 2 | | 1 | | n/a |
Ken Lever | | 4 | | n/a | | n/a | | n/a | | n/a |
John McDonough | | 2 | | 2 | | n/a | | — | | 1 |
Iain Napier | | 2 | | n/a | | 1 | | — | | n/a |
David Newlands | | 5 | | n/a | | 3 | | 1 | | n/a |
James Nicol | | 5 | | n/a | | n/a | | n/a | | 4 |
Sir Brian Pitman | | 2 | | n/a | | n/a | | 1 | | n/a |
Leo Quinn | | 2 | | 2 | | 1 | | — | | n/a |
David Richardson | | 5 | | 5 | | n/a | | 1 | | n/a |
Struan Robertson | | 5 | | n/a | | n/a | | 1 | | 4 |
John Zimmerman | | 1 | | n/a | | n/a | | n/a | | n/a |
n/a = not applicable (where a Director is not a member of a Committee).
Seven of the Directors served for only part of 2007. These Directors were Jack Keenan (retired June 13, 2007), Ken Lever (resigned as a Director on October 1, 2007, with his employment ceasing on October 31, 2007), John McDonough (appointed June 14, 2007), Iain Napier (appointed June 14, 2007 and resigned December 13, 2007), Sir Brian Pitman (retired June 13, 2007), Leo Quinn (appointed July 6, 2007), and John Zimmerman (appointed October 1, 2007). Richard Gillingwater was unable to attend one Board meeting and one Audit Committee meeting. Sir Brian Pitman was unable to attend one Board meeting and John McDonough was unable to attend one meeting of the Corporate Social Responsibility Committee. The remaining Directors attended all Board and Committee meetings for the periods in fiscal 2007 in which they held their directorships. During fiscal 2007, other Directors have attended meetings of the Audit Committee, Remuneration Committee, Nomination Committee and Corporate Social Responsibility Committee by invitation. These details are not included in the table above. On the rare occasion when a Director cannot attend a meeting, he will normally, prior to the meeting, make his views on the agenda items known to the Chairman or, in respect of Committee meetings, to the Chairman of the respective Committee.
Service Contracts
A summary of the service contract or letter of appointment of each of the Directors is set forth below.
James Nicol and David Richardson will retire from the Board by virtue of length of service at the Company’s forthcoming annual general meeting, and will seek reappointment. John McDonough, Leo Quinn and John Zimmerman, having been appointed during fiscal 2007, will retire in accordance with the Articles of Association and will seek reappointment.
There are no service contracts between the directors and the Company or any of its subsidiaries that provide for benefits upon the termination of employment.
47
James Nicol – Chief Executive
The Company and James Nicol entered into a contract dated February 11, 2002, which set out the terms and conditions under which he joined the Company as Chief Executive Officer on February 18, 2002. The contract remains in force until terminated by either party giving notice of not less than 12 months.
John Zimmerman – Finance Director (from October 1, 2007)
John Zimmerman’s contract was signed on February 18, 2008 with an effective start date of October 1, 2007. The contract can be terminated by John Zimmerman by giving six months’ notice or by the Company with immediate effect. Termination by the Company would under normal circumstances result in the equivalent of 12 months’ salary and bonus being due to Mr Zimmerman in lieu of a notice period.
Non-Executive Directors
None of the Non-Executive Directors has a service contract with the Company, their terms of engagement being set out in a letter of appointment. Ordinarily, Non-Executive Directors serve for a period of two years but subject to agreement with the Board, a Non-Executive Director can be reappointed for a further term of up to three years. The appointment of Non-Executive Directors may be terminated before the conclusion of their two-year term by, and at the discretion of, either party upon two weeks’ written notice.
In the case of David Newlands, the appointment is for a term of two years and may be terminated at any time by either party giving one month’s written notice. None of the Non-Executive Directors are entitled to compensation for loss of office.
The dates from which the respective letters of appointment are effective are as follows:
| | |
• Richard Gillingwater: | | December 20, 2007; |
• David Newlands: | | February 18, 2007; |
• John McDonough: | | June 14, 2007; |
• Leo Quinn: | | July 6, 2007; |
• Iain Napier: | | June 14, 2007 (resigned December 13, 2007); |
• David Richardson: | | March 1, 2006; and |
• Struan Robertson: | | December 20, 2007. |
Chairman and Chief Executive
There is a clear division of responsibility between the Chairman and the Chief Executive, with neither having unfettered powers of decision with respect to substantial matters. The Chairman is responsible for running the Board and ensuring that all Directors receive sufficient relevant information on financial, business and corporate matters to enable them to participate effectively in Board decisions. In advance of each meeting, the Board is provided with comprehensive briefing papers on items under consideration.
The Chairman, David Newlands, is also Chairman of KESA Electricals plc and PayPoint plc. Whilst these are important appointments, the Board believes that the Chairman continues to be able to carry out his duties and responsibilities effectively for the Company.
The Chief Executive’s primary role is the running of the Company’s businesses and the development and implementation of strategy. The Non-Executive Directors have the opportunity to meet with the Chairman and with the Chief Executive periodically, either together or separately, to consider and discuss a wide range of matters affecting the Company, its business, strategy and other matters.
Board Committees
The Board has established a number of Committees and receives reports of their proceedings. Each Committee has its own delegated authority as defined in its terms of reference, which are reviewed periodically by the Board. The Board is satisfied that its Committees have written terms of reference which conform with best corporate governance practice. The terms of reference for all Board Committees can be found under “Governance” in the “Responsibilities” area on the Company’s website, www.tomkins.co.uk, or a copy can be obtained by application to the Company Secretary at the Company’s registered office.
The Board appoints the chairmen and members of all Board Committees upon the recommendation of the Nomination Committee. The Company Secretary is Secretary to all Board Committees. All Directors that retired or resigned in fiscal 2007 stood down from their respective Committee memberships at the date of retirement or resignation. The principal Committees, their membership and a brief description of their duties are set out below.
1. Audit Committee
D.H. Richardson (Chairman), R.D. Gillingwater, J. McDonough (appointed July 30, 2007), L.M. Quinn (appointed July 30, 2007)
Terms of reference
The Audit Committee’s terms of reference are reviewed from time to time and approved by the Board. They are based on the model terms of reference set out in the Guidance Note produced by the Institute of Chartered Secretaries and Administrators and take account of the requirements of the SOX Act and the Guidance Notes set out in Sir Robert Smith’s Report published in January 2003. The terms of reference cover membership and appointment, meetings, duties and responsibilities, authority and a number of other matters.
Membership and appointment
The Audit Committee comprises four independent Non-Executive Directors: David Richardson, Richard Gillingwater, John McDonough and Leo Quinn. Jack Keenan ceased to be a member of the Audit Committee upon his retirement from the Board on June 13, 2007.
The Board has determined that all four members of the Audit Committee are independent for the purposes of the Combined Code and rule 10A.3(b)(1) under the Exchange Act and section 303A of the NYSE’s Listed Company Manual. The members bring wide-ranging financial, commercial and managerial experience to the work of the Audit Committee.
48
The Chairman of the Audit Committee, David Richardson, is a Chartered Accountant (FCA), having previously held a number of senior financial management and strategic planning positions in Whitbread plc from 1983 to 2005 (in the United Kingdom and United States), becoming Group Finance Director in 2001. Prior to 1983, he held financial positions in ICL plc and Touche Ross & Co. In accordance with section 407 of the SOX Act, the Board has determined that David Richardson is an “audit committee financial expert” as that term is defined under the rules of the SEC, having significant, relevant and up-to-date United Kingdom and United States financial and accounting knowledge and experience.
Meetings
The Audit Committee meets at least four times a year and on other occasions when circumstances require. The quorum for a meeting of the Audit Committee is two members. The Finance Director and representatives from the independent auditor and the internal auditor attend meetings under a standing invitation. The Chairman of the Board, the Chief Executive and other Directors are able to attend meetings of the Audit Committee under the practice that any Director may attend any meeting of a Board Committee provided that they have no conflict of interest in respect of business to be discussed. It is usual practice for the Chief Executive to attend meetings of the Audit Committee. Other finance and business risk executives attend meetings and the Company Secretary is Secretary to the Audit Committee. The Audit Committee Chairman reports regularly to the Board on its activities. Five meetings were held during 2007.
Work of the Audit Committee
The Audit Committee has established an “agenda framework” which the Company believes is vital for maintaining an appropriate focus on the objectives of the Audit Committee. The agenda sets out all of the operational duties and responsibilities outlined in the Audit Committee’s terms of reference and is based on four regular meetings, in February, April, July and November, which coincide with the announcement of the quarterly results. The areas covered by the “agenda framework” are as follows:
| 1. | Corporate Governance, including the regular review of the Audit Committee’s terms of reference and annual evaluation, regulatory issues, review of delegated authorities and review of auditor independence. |
| 2. | Internal Audit, including the review of the internal audit charter, internal audit review reports on the Group’s internal control and risk assessment processes, compliance with auditing standards and progress against its internal audit plan, functional developments and key performance measures. |
| 3. | Confidential sessions with the independent auditors and the head of Internal Audit, in the absence of Directors and Company executives. |
| 4. | Financial Reporting, including current accounting and financial reporting matters and review of interim and annual statements prior to their submission to the Board for approval, which includes the consistency of judgments adopted. |
| 5. | Independent Auditors, including appointment, audit plan and scope, review of audit fees, cost effectiveness, approval of non-audit fees, reports on interim and annual financial statements, status reports, management letters and the nature and extent of non-audit services. |
The audit plan and scope sets out details of the areas to be covered and how the audit is to be conducted. The Chairman of the Audit Committee meets periodically with the independent auditors to discuss progress on the audit and the major points to arise, and has the opportunity to assess the effectiveness of the process. The Audit Committee is also able to assess the effectiveness of the auditors and the process through reports made to the Audit Committee by the independent auditors.
In addition to the items considered by the Audit Committee under the “agenda framework”, during fiscal 2007 other important issues considered included regular reviews of the internal control systems and the statement to be made in the Directors’ Report in respect of internal controls, Group risk profile, Group tax reports, updates on compliance with the Combined Code and approval of Form 20-F. The Audit Committee received reports on the Company’s efforts in countering potential fraud in the Group. Changes to the Internal Audit Charter were approved. Work on compliance with section 404 of the SOX Act was completed during the early part of fiscal 2007 and was the focus of attention of the Internal Audit function during that period. The Internal Audit function is actively engaged in assessing the adequacy and effectiveness of the Group’s system of internal control and risk management processes. Each quarter, the Audit Committee receives a summary of reviews of the businesses risk management processes; any significant related financial exposures are also highlighted. The risk assessment process and risk mitigation plans are an important part of the development of business strategies. Business risks are considered at the quarterly reviews with the businesses, where all of the major strategic, operational, compliance and financial risks are discussed. Confidential meetings with representatives of the independent auditors and internal audit functions took place during fiscal 2007 in the absence of executives.
In determining its policy on the extent of non-audit services provided by the independent auditors, the Audit Committee has taken account of the rules of the SEC which regulate and, in certain circumstances, prohibit the provision of, certain types of non-audit services by the independent auditors. Non-audit services require the approval of the Chairman of the Audit Committee. In fiscal 2007, certain projects requiring tax services were awarded to the firm of the independent auditors. In those cases where the work was awarded to the independent auditors, it was concluded that the firm of the independent auditors was best placed to supply such tax services in a cost-effective manner due to the experience and qualifications of the individuals providing such services, the independent auditors’ knowledge of the Company and its tax affairs and that the best interests of the Company were served by engaging the firm of the independent auditors. The previous adoption of certain other rules by the Audit Committee, including those relating to audit partner rotation, relevant ethical guidance issued by the professional bodies in the Consultative Committee of Accountancy Bodies (in particular that the independent auditors should not audit their own firm’s work, make management decisions for the Company, create a mutuality of interest nor be put in the position of advocate for the Company), when taken together provide adequate protection of auditor independence. All fees proposed by the independent auditors must be reported to and approved by the Audit Committee or, between meetings, the Chairman of the Audit Committee. Details of fees paid to the Company’s independent auditors, Deloitte & Touche LLP, are set forth in Item 16C “Principal accountant fees and services”.
The Company’s practice, in accordance with English company law and the Combined Code, in relation to the appointment and termination of appointment of the independent auditors, involves a recommendation from the Audit Committee to the Board, which will then make a recommendation to shareholders in a general meeting. This differs from the procedure in the United States, where the independent auditors are accountable to the Audit Committee, which has the authority to appoint or dismiss the independent auditors without reference to shareholders.
49
With the approval of the Board, the Audit Committee has established guidelines for the recruitment of employees or former employees of the independent auditors. The Group will not engage, on a part-time or full-time basis, any person who is or was an employee of the Company’s independent auditors, where that person has worked on the Group’s audit either as a principal or partner at any time during a period of not less than three years prior to the proposed date of joining the Group. Certain less stringent conditions apply to other employees or former employees of the independent auditors.
A “whistleblowing” procedure has been established for the confidential and anonymous submission by employees of concerns regarding accounting, internal controls or auditing matters, in accordance with the requirements of section 301 of the SOX Act. Should a call be received on the dedicated telephone line, the Company Secretary or the General Counsel would immediately report to the applicable management all concerns raised. A course of action is agreed and a report is prepared for review at the next meeting of the Audit Committee, including details of actions taken to deal with the matters raised. The Chairman of the Audit Committee will report, if appropriate, “whistleblowing” claims to the Audit Committee and the Board. The Company’s Code of Conduct and Ethics includes the “whistleblowing” procedure. Calls to the designated telephone number, as well as direct contacts with management, are made from time to time, but no issues material to the Company were dealt with by the Audit Committee during fiscal 2007.
Shareholders are given the opportunity at the annual general meeting to ask the Chairman of the Audit Committee questions on this report and any other related matter.
2. Remuneration Committee
J. McDonough (appointed and became Chairman on December 13, 2007), R.D. Gillingwater, D.B. Newlands, L.M. Quinn (appointed July 31, 2007)
The Remuneration Committee, which meets at least twice a year, is made up exclusively of Non-Executive Directors whom the Board determined to be independent, as each was found to be free from any material business or other relationship with the Company (either directly or as a partner, shareholder or officer of an organization that has a relationship with the Company). Accordingly, the Board believes that there are no such relationships that could materially interfere with the exercise of their independent judgment.
Jack Keenan ceased to be a member of the Remuneration Committee upon his retirement from the Board on June 13, 2007. Iain Napier was appointed to the Remuneration Committee and appointed as Chairman on July 31, 2007 and stood down on December 13, 2007 upon his resignation from the Board. John McDonough was appointed Chairman of the Remuneration Committee on December 13, 2007. The members of the Remuneration Committee at December 29, 2007 were John McDonough (Chairman), Richard Gillingwater, David Newlands and Leo Quinn. There were no other changes to the membership of the Remuneration Committee during 2007.
In June 2006, the Financial Reporting Council published an updated version of the Combined Code on Corporate Governance that, amongst other things, included a provision that permitted a company chairman to sit on the Remuneration Committee if considered independent on appointment. The Board is satisfied that the Chairman of the Board continues to be independent and David Newlands served as a member of the Remuneration Committee during 2007.
For more information refer to Item 6B “Compensation” above.
3. Nomination Committee
D.B. Newlands (Chairman), R.D. Gillingwater, J. McDonough (appointed July 31, 2007), L.M. Quinn (appointed July 31, 2007), D.D.S Robertson, D.H. Richardson
The Nomination Committee makes recommendations to the Board on all proposed appointments of Directors through a formal and transparent procedure. The Nomination Committee meets as and when required. During fiscal 2007, the Nomination Committee met on one occasion. Sir Brian Pitman and Jack Keenan ceased to be members of the Nomination Committee upon their retirement from the Board on June 13, 2007.
In accordance with the Company’s Articles of Association, Directors are subject to reappointment at the annual general meeting immediately following the date of their appointment, and thereafter they have to seek reappointment no more than three years from the date they were last reappointed. The Nomination Committee recommends to the Board the names of the Directors who are to seek reappointment at the annual general meeting in accordance with the Company’s Articles of Association.
In fiscal 2007, four new Board appointments were made. The Nomination Committee was central to the recruitment process, including the appointment of professional advisers and conducting interviews with potential candidates, and the Nomination Committee and Board are aware of, and support, the principles set out in section A.4 of the Combined Code relating to appointments to the Board.
4. Corporate Social Responsibility Committee
D.D.S. Robertson (Chairman), J. McDonough (appointed June 14, 2007), J. Nicol,
The Corporate Social Responsibility Committee meets at least three times a year. It is chaired by an independent Non-Executive Director and its membership includes the Chief Executive. Its principal role is to determine, on behalf of the Board, the framework or broad policy and objectives in the areas of HSE and to propose any amendments to existing policies for approval by the Board. It also reviews management’s performance in the achievement of HSE objectives and reviews HSE reports produced by business units for compliance with all local HSE codes of practice, legislation and relevant industry practice.
More details of the work of the Corporate Social Responsibility Committee can be found in the Corporate Responsibility Report to shareholders available on the Company’s website www.tomkins.co.uk, under “Responsibilities” / “Corporate Social Responsibilities” / “Policies & Publications”.
5. Disclosure Committee
D.B. Newlands (Chairman), J. Nicol, J.W. Zimmerman
The Disclosure Committee meets as and when required for the purpose of, inter alia, reviewing and approving for release all price-sensitive information relating to the Company and compliance with the Disclosure and Transparency Rules of the Financial Services Authority.
50
6. General Purposes Committee
J. Nicol, J.W. Zimmerman, E.H. Lewzey, J.E. Middleton, D.P. Burton, K.A. Sullivan, N.P. Wilkinson
The General Purposes Committee meets as and when required. It comprises Executive Directors and senior executives and the quorum requires the presence of at least one Executive Director. The General Purposes Committee deals principally with day-to-day matters of a routine nature and matters delegated to it by the Board.
Board, Committee and Chairman Evaluations
Under the direction of the Senior Independent Director, Richard Gillingwater, evaluations of the effectiveness of the Board, its Committees and Chairman were conducted during fiscal 2007. The evaluation processes continued with the same approach as the previous year which drew on the experiences of the previous evaluations of the Board and its Committees and concentrated on six key elements:“
| • | | the optimum mix of skills and knowledge amongst the Directors; |
| • | | clarity of goals and processes; |
| • | | tailoring the evaluation to the specific circumstances of the Group; |
| • | | the culture of candor that encourages constructive evaluation; |
| • | | regular reviews of assessment criteria; and |
| • | | full disclosure of procedures and criteria to the Board. |
Board and Committee
The fifth Board performance evaluation took place during fiscal 2007, which continued the processes developed in the first four years. A report was prepared and considered by the Board. The overall view of the Directors was that the Board is the right size and has the right mix of skills to ensure its optimum effectiveness, particularly after the recent changes to membership of the Board. A number of suggestions were made relating to the following:
| • | | Dedicated strategy sessions were felt to be of particular use, as a way of ensuring the Board’s involvement in the development of strategy; |
| • | | It was also felt that the Board’s methods of measuring management performance could be improved in the following ways: |
| | • | | while the numbers were analyzed and the operations explained, it was felt that it would be helpful to see some key performance indicators which were regularly reported on outside the pure financial numbers; |
| | • | | the budgeting and reporting process could be simplified; and |
| | • | | by questioning the trends in return on invested capital and considering the extent of organic growth compared to acquisition. |
Additional comments were made in relation to the number, duration and timing of Board meetings and positive comments were made on the quality of operating and financial reporting, supported by high-quality papers and presentations. The Board considered the matters raised by the evaluation and arrangements were made to address each of those matters raised.
The fourth Board Committee performance evaluation reinforced the positive messages that were highlighted in the first three evaluations. The Committees were acknowledged to function well and be well led with strong and experienced members who were well-informed. There were some suggestions on improving particular aspects of the work of the Committees, including the distribution of papers and in relation to the Remuneration Committee, the following points in particular were raised:
| • | | There was a preference to have a greater degree of formal Human Resources (HR) representation and input; |
| • | | It was felt that the supporting processes for the Committee might be improved by more regular updates on market trends in remuneration and more frequent reference to external market data. |
These concerns have been addressed and the January 1, 2008 review of Non-Executive Directors’ fees and Chairman’s remuneration drew on advice and data supplied by PA Consulting, which took account of the above suggestions. Overall, the Directors continue to believe that the Committees function well.
Chairman
For the evaluation of the Chairman, the more formal approach adopted in previous years continued, including completion of a questionnaire that sought views across a broad range of the Chairman’s responsibilities. There was considerable positive feedback from Directors on the role of the Chairman and his leadership of the Board. A small number of suggestions were made and the Senior Independent Director discussed these with the Chairman. The Non-Executive Directors discussed the evaluation report with the Senior Independent Director in the absence of executives.
Comparison of Corporate Governance
The Company has placed on its website (www.tomkins.co.uk, under “Responsibilities” / “Governance” / “UK & US Governance”) a general summary of the significant ways in which the Company’s corporate governance differs from that followed by domestic US companies under the NYSE’s listing standards, as required by section 303A.11 of the NYSE’s Listed Company Manual.
51
D. Employees
The average number of persons employed by the Group was as follows:
| | | | | | | | | | | | | | | |
| | | Fiscal 2007 | | | Fiscal 2006(1) | | | Fiscal 2005(1) | |
| | | Average
number | | Percentage
of total | | | Average
number | | Percentage
of total | | | Average
number | | Percentage
of total | |
Industrial & Automotive | | 21,296 | | 59.3 | % | | 20,888 | | 54.5 | % | | 20,959 | | 56.1 | % |
Building Products | | 12,444 | | 34.7 | % | | 13,247 | | 34.6 | % | | 11,750 | | 31.5 | % |
Corporate Center | | 145 | | 0.4 | % | | 145 | | 0.4 | % | | 135 | | 0.4 | % |
| | | | | | | | | | | | | | | |
Total in continuing operations | | 33,885 | | 94.4 | % | | 34,280 | | 89.5 | % | | 32,844 | | 88.0 | % |
| | | | | | | | | | | | | | | |
Wiper Systems (discontinued in fiscal 2006 and sold in fiscal 2007) | | 2,009 | | 5.6 | % | | 4,019 | | 10.5 | % | | 4,480 | | 12.0 | % |
| | | | | | | | | | | | | | | |
Total | | 35,894 | | 100.0 | % | | 38,299 | | 100.0 | % | | 37,324 | | 100.0 | % |
| | | | | | | | | | | | | | | |
(1) | Re-presented (see “Discontinued operations” under Item 3A “Selected financial data”). |
During fiscal 2007, 60.2 percent of the Group’s total employees were located in North America, 14.3 percent in Mexico, 8.1 percent in Continental Europe, 5.3 percent in the United Kingdom, and 12.1 percent in the rest of the world (the geographical location of employees in fiscal 2007 is broadly consistent with fiscal 2006 and fiscal 2005). There have been no significant work stoppages or labor disputes involving the Group’s employees in any of the last five years.
Each company in the Group is encouraged to implement comprehensive employment policies designed to motivate employees and to determine ways in which their knowledge and skills can best contribute towards the Company’s success. Schemes are introduced to ensure that loyalty and performance are properly rewarded. Some of the Group’s employees are members of labor unions and over many years the Group has been able to maintain successful relationships with the unions and employment organizations. Management believes that it has a good relationship with the Group’s employees.
Employee involvement and communication programs continue to be developed and are designed to provide equal opportunity to all, irrespective of sex, race, religion or color. Each company in the Group endeavors to provide equality of opportunity in recruiting, training, promoting and developing the careers of disabled persons.
E. Share ownership
As at April 18, 2008, the Directors of the Company, and the Directors and officers of the Company as a group owned the number of Ordinary Shares and the percentage of such total number of shares outstanding on such date as set forth below.
The executive Directors, as potential beneficiaries, are technically deemed to have an interest in all Ordinary Shares held by or in which the trustees of the Share Trust are interested. The table includes, however, only those Share Trust shares which are specifically allocated to the individual Director under the terms of the ABIP and the SMS.
| | | | | |
| | | Number of Ordinary Shares
owned |
| | | Beneficial | | | Non-beneficial |
Executive Directors | | | | | |
J. Nicol | | 2,225,336 | (1) | | — |
J.W. Zimmerman | | 272,360 | | | — |
| | | | | |
Non-Executive Directors | | | | | |
R.D. Gillingwater | | 9,000 | | | — |
J. McDonough | | 7,000 | | | — |
D.B. Newlands | | 322,515 | | | — |
L.M. Quinn | | 22,000 | | | — |
D.H. Richardson | | 15,729 | | | — |
D.D.S. Robertson | | 8,500 | | | — |
| | | | | |
Executive officers | | 1,511,731 | (2) | | — |
| | | | | |
Directors and officers as a Group | | | | | |
(14 persons) | | 4,394,171 | (3) | | — |
| | | | | |
(1) | Held as 26,000 ADSs and 2,121,336 Ordinary Shares. |
(2) | Held as 10,850 ADSs and 1,468,331 Ordinary Shares. |
(3) | Held as 36,850 ADSs and 4,246,771 Ordinary Shares. |
All shareholdings in the table above are less than 1 percent of the total Ordinary Shares in issue as at April 18, 2008.
52
Share Options
Share options are outstanding under the following share option schemes (which are described under Item 6B “Compensation” above):
| • | | Tomkins 2005 Sharesave Scheme |
| • | | Tomkins Premium Priced Option * |
| * | Closed for the purpose of new awards. |
Non-Executive Directors are not eligible to receive awards of share options.
Movements in Directors’ Share Options during fiscal 2007
| | | | | | | | | | | | | | | | |
| | | As at
December 30, 2006 | | Granted or
exercised in
the year | | Cancelled
in the year | | As at
December 29,
2007 | | Period of exercise |
| | | Number | | Number | | Exercise
price | | Number | | Exercise
price | | Number | | From | | To |
J. Nicol | | 9,409,642 | | — | | — | | — | | — | | 9,409,642 | | Dec 30, 2007 | | Nov 28, 2014 |
J.W. Zimmerman | | 225,000 | | — | | — | | — | | — | | 225,000 | | Dec 30, 2007 | | Nov 28, 2014 |
The table below details the weighted average price each Director would have had to pay to exercise his options and how much they were worth in monetary terms at the year-end and prior year-end.
| | | | | | | | | | | | |
| | | As at December 29, 2007 | | As at December 30, 2006 | | Net value of unexercised
options |
| | | Exercise price
exceeds market
price | | Market price
exceeds exercise
price | | Exercise price
exceeds
market price | | Market price
exceeds exercise
price | | As at
December 29,
2007 | | As at
December 30,
2006 |
| | | | | | | | | | | £000 | | £000 |
J. Nicol | | 242.36p | | — | | 281.26p | | 200.58p | | — | | 2,049 |
J.W. Zimmerman | | 256.31p | | — | | 256.31p | | — | | — | | — |
The closing mid-market price of each Ordinary Share as at December 29, 2007 was 179.75 pence with a range of closing prices during the year December 31, 2006 to December 29, 2007 of 172.50 pence to 302.50 pence.
Options included in the above table at December 29, 2007 relate to ESOS 4 (James Nicol 3,775,486 shares, John Zimmerman 225,000 shares and Ken Lever 450,000 shares) and, in the case of James Nicol, the SAYE 2 (8,014 shares), the Premium Price Option (5,076,142 shares) and the Ongoing Option (550,000 shares).
Officers’ options over Ordinary Shares as at April 18, 2008 were:
| | | | | | | | | | |
| | | Scheme | | Dates of grant | | Dates of expiry | | Exercise price | | Number |
James Nicol | | Prem. Priced | | February 11, 2002 | | February 10, 2012 | | 197.00p | | 2,538,072 |
| | Prem. Priced | | February 11, 2002 | | February 10, 2012 | | 276.00p | | 1,522,842 |
| | Prem. Priced | | February 11, 2002 | | February 10, 2012 | | 345.00p | | 1,015,228 |
| | Ongoing | | February 11, 2002 | | February 10, 2012 | | 197.00p | | 550,000 |
| | ESOS 4 | | January 17, 2003 | | January 16, 2013 | | 208.25p | | 1,440,576 |
| | ESOS 4 | | December 12, 2003 | | December 11, 2013 | | 265.75p | | 1,128,880 |
| | SAYE 2 | | April 19, 2004 | | November 30, 2009 | | 204.00p | | 8,014 |
| | ESOS 4 | | November 29, 2004 | | November 28, 2014 | | 248.75p | | 1,206,030 |
| | | | | | | | | | |
| | | | | | | | | | 9,409,642 |
| | | | | | | | | | |
John Zimmerman | | ESOS 4 | | December 12, 2003 | | December 11, 2013 | | 265.75p | | 100,000 |
| | ESOS 4 | | November 29, 2004 | | November 28, 2014 | | 248.75p | | 125,000 |
| | | | | | | | | | |
| | | | | | | | | | 225,000 |
| | | | | | | | | | |
Other executive officers(1) | | ESOS 4 | | July 18, 2003 | | July 17, 2013 | | 246.50p | | 200,000 |
| | ESOS 4 | | September 1, 2003 | | August 31, 2013 | | 262.75p | | 150,000 |
| | ESOS 4 | | December 12, 2003 | | December 11, 2013 | | 265.75p | | 485,000 |
| | SAYE 2 | | April 19, 2004 | | November 30, 2009 | | 204.00p | | 16,028 |
| | ESOS 4 | | November 29, 2004 | | November 28, 2014 | | 248.75p | | 605,000 |
| | | | | | | | | | |
| | | | | | | | | | 1,456,028 |
| | | | | | | | | | |
(1) | Officers whose compensation information is not publicly disclosed on an individual basis. |
53
As at April 18, 2008 options, including options granted to Directors and officers, to subscribe for 17,915,128 Ordinary Shares were outstanding and exercisable under the Company’s executive share option schemes at prices ranging from 170.5 pence to 345 pence. The exercise dates for the options range from April 18, 2008 to November 28, 2014.
As at April 18, 2008 options, including options granted to Directors and officers, to subscribe for 1,281,886 Ordinary Shares were outstanding under the Company’s SAYE 2 option scheme at prices ranging from 204.00 pence to 269.40 pence. At that date, no options were exercisable. The exercise dates for the options range from June 1, 2009 to November 30, 2013.
Options outstanding in the names of former Directors as at April 18, 2008 were as follows:
| | | | | | | | | | |
| | | Scheme | | Dates of grant | | Dates of expiry | | Exercise price | | Number |
Ken Lever | | ESOS 4 | | December 12, 2003 | | December 11, 2013 | | 265.75p | | 200,000 |
| | ESOS 4 | | November 29, 2004 | | November 28, 2014 | | 248.75p | | 250,000 |
| | | | | | | | | | |
| | | | | | | | | | 450,000 |
| | | | | | | | | | |
Long-term incentive plans
As at April 18, 2008, 3,105,709 Ordinary Shares were held in treasury to satisfy current and future awards under the ABIP.
Employee Share Plans
Employees who are resident for tax purposes in the United Kingdom are encouraged to acquire an interest in Ordinary Shares in the Company through participation in the Tomkins 2005 Sharesave Scheme.
54
Item 7. Major Shareholders and Related Party Transactions
A. Major shareholders
The Company’s issued share capital as at December 29, 2007 consisted of 884,106,772 Ordinary Shares each with a nominal value of 5 pence per share.
As at April 18, 2008, 884,106,772 Ordinary Shares were outstanding. As at that date, 1,019,451 Ordinary Shares were held by 78 registered holders with a registered address in the United States and 450,895 ADRs were held by 146 registered holders with a registered address in the United States. Since certain of the Ordinary Shares and ADRs were held by brokers and nominees, the number of record holders in the United States may not be representative of the number of beneficial holders or of where the beneficial holders are resident.
Shareholders of the Company do not have different voting rights.
At the beginning of fiscal 2007, the Company had in issue 2,625,138 Preference Shares each with a nominal value of $50 that were convertible into Ordinary Shares on the basis of 9.77 Ordinary Shares for every Preference Share held. On May 21,2007, the Company gave notice that it would exercise its right to redeem all of the Preference Shares that remained in issue and outstanding as at July 24, 2007. During the period from the beginning of fiscal 2007 to the redemption date, 2,600,973 Preference Shares were converted into 25,411,499 Ordinary Shares. On the redemption date, there remained 24,165 Preference Shares in issue and outstanding that were redeemed for £0.6 million in cash.
To the Company’s knowledge, no person or entity other than those shown below is the owner of more than 5 percent of its outstanding Ordinary Shares, nor is the Company directly or indirectly owned or controlled by any corporation, by any government or by any other natural or legal person or persons, severally or jointly.
Major shareholders at April 3, 2008
| | | | |
| | | Number of Ordinary
Shares held at
April 3, 2008 | | Percentage of
outstanding Ordinary
Shares held |
AIM Trimark Investments | | 63,352,401 | | 7.17 |
Nuveen Investment LLC | | 56,904,724 | | 6.44 |
Sprucegrove Investment Management Ltd | | 45,198,967 | | 5.11 |
Significant changes in shareholders owning more than 5 percent of the Ordinary Share capital of the Company over the past three years were as follows:
| • | | AIM Trimark Investments increased their holding to 7.17 percent at April 3, 2008 from 5.15 percent as at April 13, 2007 having been 0.66 percent at April 24, 2006 and 0.05 percent at June 6, 2005. |
| • | | Nuveen Investment LLC decreased their holding to 6.44 percent at April 3, 2008 from 10.40 percent at April 13, 2007 having been 4.91 percent at April 24, 2006 and 1.02 percent at June 6, 2005. |
| • | | Sprucegrove Investments Management Ltd decreased their holding to 5.11 percent at April 3, 2008 from 5.89 percent as at April 13, 2007 having been 4.96 percent at April 24, 2006 and 4.64 percent at June 6, 2005. |
| • | | Legal & General Investment Management Ltd increased their holding to 4.60 percent at April 3, 2008 from 3.67 percent as at April 13, 2007, having been 0.41 percent as at April 24, 2006 and 5.86 percent at June 6, 2005. |
| • | | Schroder Investment Management Limited increased their holding to 3.99 percent at April 3, 2008 from 2.68 percent as at April 13, 2007 having been 4.34 percent at April 24, 2006 and 8.01 percent at June 6, 2005. |
| • | | Bear Creek Inc.’s deemed interest in Ordinary Shares remained at zero percent at April 3, 2008 as it was at April 13, 2007, having been 2.84 percent as at April 24, 2006 and 10.45 percent at June 6, 2005. |
There are no arrangements currently known to the Company that would result in a change in control of the Company.
B. Related party transactions
Transactions with related parties that are material to the Company or to a related party are presented in Note 48 to the Group’s consolidated financial statements.
C. Interests of experts and counsel
Not applicable.
55
Item 8. Financial Information
A. Consolidated statements and other financial information
The Group’s consolidated financial statements are set out on pages F-2 to F-62 of this document (refer to Item 18 “Financial Statements”).
Adoption of IFRS
Following the publication of SEC Release 33-8879,Acceptance From Foreign Private Issuers of Financial Statements Prepared in Accordance With International Financial Reporting Standards Without Reconciliation to U.S. GAAP, the Group has included, for the first time in Form 20-F, consolidated financial statements prepared in accordance with IFRS as issued by the IASB. In previous years, the Group’s consolidated financial statements filed on Form 20-F were prepared in accordance with US GAAP.
An explanation of the significant differences between IFRS and US GAAP that are relevant to the Group’s consolidated financial statements is presented below together with tabular reconciliations for fiscal 2006 and fiscal 2005 of the Group’s consolidated net income and consolidated shareholders’ equity previously reported in accordance with US GAAP to the equivalent measures restated in accordance with IFRS.
The Group adopted IFRS as its home country GAAP with a transition date of January 4, 2004. Previously the Group’s home country GAAP had been UK GAAP. As a general rule, the Group applied IFRS extant as at January 1, 2005 retrospectively but, as described below, used certain exemptions from retrospective application permitted by IFRS 1 “First-time Adoption of IFRS”.
Exemptions from retrospective application of IFRS
(a) Goodwill
The Group elected not to apply IFRS 3 “Business Combinations” to business combinations that were recognized on or before January 3, 2004. As a result, the carrying amount of goodwill recognized as an asset under UK GAAP was brought forward unadjusted as the cost of goodwill recognized under IFRS as at January 3, 2004 and goodwill that was written-off directly to reserves under UK GAAP is not taken into account in determining the gain or loss on the disposal of acquired businesses on or after January 4, 2004.
(b) Share-based incentives
The Group applied IFRS 2 “Share-based Payment” retrospectively to all awards that were outstanding but had not vested as at January 1, 2005, except those equity-settled awards that were granted on or before November 7, 2002.
(c) Cumulative translation differences
The Group elected to deem the cumulative currency translation differences on its net investment in foreign operations to be nil as at January 3, 2004. Accordingly, the gain or loss recognised on the disposal of a foreign operation does not include currency translation differences that arose before January 4, 2004.
(d) Financial instruments
The Group elected to apply IAS 32 “Financial Instruments: Disclosure and Presentation” and IAS 39 “Financial Instruments: Recognition and Measurement” prospectively from January 2, 2005.
Significant differences between IFRS and US GAAP
(a) Goodwill
Under both IFRS and US GAAP, goodwill is not amortised but is tested at least annually for impairment. However, a significant difference exists between the carrying amounts of goodwill due largely to historical differences in the initial measurement and subsequent accounting for goodwill arising on past acquisitions.
As a consequence of the decision not to apply IFRS 3 retrospectively, on the transition date the Group recognized goodwill amounting to £216.7 million which represented the carrying amount of goodwill that was recognised as an asset under UK GAAP as at January 3, 2004 on acquisitions completed on or after May 3, 1998. Goodwill arising on acquisitions completed before May 3, 1998 amounting to £1,054.8 million had been written off to reserves under UK GAAP and was not reinstated on adoption of IFRS. Under US GAAP, the carrying amount of goodwill as at January 3, 2004 was £953.4 million.
As at December 30, 2006 and December 31, 2005, the difference between the carrying value of goodwill under IFRS and that under US GAAP represented the difference between the carrying values as at January 3, 2004 adjusted for the effect of subsequent currency exchange rate movements.
(b) Acquired intangible assets
Under both IFRS and US GAAP, an intangible resource acquired in a business combination is recognized as an intangible asset if it is separable from the acquired business or arises from contractual or legal rights. However, a significant difference exists between the carrying amounts of acquired intangible assets due largely to the differing treatment of intangible resources acquired in past acquisitions.
As a consequence of the decision not to apply IFRS 3 retrospectively, intangible resources acquired in business combinations completed before January 4, 2004 are not recognized as intangible assets under IFRS.
Under US GAAP, the carrying amount of acquired intangible assets as at January 3, 2004 was £22.8 million.
56
As at December 30, 2006 and December 31, 2005, the difference between the carrying value of acquired intangible assets under IFRS and that under US GAAP represented the difference between the carrying values as at January 3, 2004 adjusted for the effect of subsequent amortization and currency exchange rate movements.
(c) Product development costs
Under IFRS, certain product development costs are capitalized when the conditions specified by IAS 38 “Intangible Assets” are met. Capitalized development costs are amortized to the income statement over the expected life of the resulting product.
Under US GAAP, all product development costs are charged to the income statement in the period in which they are incurred.
(d) Restructuring costs
Under IFRS, a restructuring plan is viewed as a whole and the related expenses are recognized when there exists an obligation to carry out the restructuring, which is generally when a detailed formal restructuring plan is announced.
Under US GAAP, each component of a restructuring plan must be examined separately to determine when the related expenses may be recognized. Termination benefits that are provided to employees that are involuntarily terminated under the terms of a one-time benefit arrangement are recognized when management has committed to a detailed termination plan and has communicated the plan to employees. Other restructuring expenses are generally recognized when they are incurred.
(e) Capitalisation of interest
Under IFRS, the Group does not capitalize any element of its interest expense. Under US GAAP, interest expense allocated to the construction of major items of property, plant and equipment is capitalized and amortized over the estimated useful life of the asset concerned.
(f) Inventory
Under IFRS, inventories are stated at the lower of cost and net realizable value. Cost is generally determined on a first in, first out (“FIFO”) basis. Use of the last in, first out (“LIFO”) basis is prohibited under IFRS.
Under US GAAP, inventories are stated at the lower of cost and market. Cost is generally determined on a FIFO basis, but a LIFO basis is used to determine the cost of inventory held by certain US subsidiaries.
(g) Post-employment benefits
Under both IFRS and US GAAP, the cost of defined benefit plans is calculated using the projected unit credit method and is recognized over the average expected remaining service lives of participating employees, but differences exist, principally with regard to the valuation of plan assets and benefit obligations and the methods of recognizing gains and losses.
Income statement
Under IFRS, actuarial gains and losses are recognized in equity in the period in which they occur and are not subsequently transferred to the income statement. Under US GAAP, actuarial gains and losses are amortized over the remaining service lives of participating employees to the extent that, measured at the beginning of each fiscal year, they exceed 10% of the greater of the market related value of the plan assets or the projected benefit obligation.
Classification of the net periodic benefit cost within the income statement also differs between IFRS and US GAAP. Under IFRS, the service cost, past service cost and gains and losses on settlements and curtailments are included within operating income, but the interest cost is included in interest expense and the expected return on plan assets is included in interest income. Under US GAAP, the net periodic pension cost is charged wholly to operating income.
Balance sheet
Under IFRS, the funded status of each plan is recognized in the Group’s balance sheet except that prior service costs or credits are recognized over their respective vesting periods and, where a plan is in surplus, the asset recognized is limited to the amount of any unrecognized prior service costs and the present value of any amount which the Group expects to recover by way of refunds or a reduction in future contributions.
Under US GAAP, the amounts recognized in the Group’s balance sheet as at December 30, 2006 and December 31, 2005 differ substantially because the Group adopted the recognition provisions of SFAS 158 “Employers’ Accounting for Defined Benefit Pension and Other Postretirement Plans – an amendment of FASB Statements No. 87, 88, 106, and 132(R)” effective December 30, 2006. SFAS 158 cannot be applied retrospectively.
As at December 31, 2005, the Group’s balance sheet under US GAAP reflected the net total for each plan of the fair value of the plan assets (if any) less the projected benefit obligation adjusted for the unrecognized net prior service cost or credit, the unrecognized net actuarial gain or loss and the unrecognized net transition asset or obligation. An additional liability was recognized to the extent that the accumulated benefit obligation (the projected benefit obligation without allowance for future salary increases) exceeded the fair value of the plan assets. Where an additional minimum liability was recognized, an intangible asset was recognized up to the amount of any unrecognized prior service cost and any unrecognized transition obligation. Any amount not recognized as an intangible asset was reported in other comprehensive income.
As at December 30, 2006, the Group’s balance sheet under US GAAP reflected the funded status of each plan.
As at December 30, 2006, the Group had not adopted the measurement provisions of SFAS 158. Consequently, while under IFRS the Group measures plan assets and benefit obligations as at its fiscal year end date, under US GAAP the Group measured plan assets and benefit obligations as at a date not more than 90 days prior to the fiscal year-end date (in fiscal 2006, for example, the measurement date was September 30). The Group would have adopted the measurement provisions of SFAS 158 by the end of fiscal 2008.
57
(h) Share-based incentives
Under both IFRS and US GAAP, the Group recognises a compensation expense in respect of share-based incentives that is based on the fair value of the awards. However, differences existed between the compensation expense recognized under IFRS and that recognized under US GAAP principally because awards granted under certain of the Group’s share option plans were classified as equity-settled under IFRS but were classified as liabilities under US GAAP until such time as they vested when they were reclassified as equity-settled.
(i) Derivatives and hedge accounting
Under both IFRS and US GAAP, derivative financial instruments are recognized as assets and liabilities measured at their fair values at the balance sheet date and, in the absence of hedge accounting, changes in their fair values are reflected immediately in the Group’s net income.
Under IFRS, the Group does not generally apply hedge accounting to transactional foreign currency hedging relationships. It does, however, apply hedge accounting to translational foreign currency hedging relationships and to hedges of its interest rate exposures where it is permissible to do so under IAS 39 “Financial Instruments: Recognition and Measurement”.
Under US GAAP, the Group applies hedge accounting to translational hedging relationships where it is permissible to do so under SFAS 133 “Accounting for Derivative Instruments and Hedging Activities”. While the Group achieves hedge accounting under US GAAP for those hedges of its interest rate exposures that qualify for hedge accounting under IFRS, it is not possible for it to achieve hedge accounting under US GAAP for certain translational foreign currency hedging relationships that qualify for hedge accounting as net investment hedges under IFRS.
(j) Preference shares
Under IFRS, the Preference Shares were classified as non-current liabilities and were retranslated into Sterling at the exchange rate ruling at the balance sheet date. The Preference Shares were designated as a net investment hedge and, to the extent the hedge was effective, currency translation differences were recognized directly in equity. Dividends payable on the Preference Shares were included within interest payable.
Under US GAAP, the Preference Shares were classified as shareholders’ equity and were translated into Sterling at the exchange rate ruling at the date of issue. Dividends payable on the Preference Shares were treated as an appropriation of shareholders’ equity.
(k) Loss on disposal of discontinued operations
Differences between the gain or loss recognized on the disposal of a business under IFRS and that recognized under US GAAP arise principally because of differences in the carrying values of the assets and liabilities of the business concerned and, if that business was previously acquired, due to differences in the carrying amount of goodwill recognized in respect of the business and/or, if the business is a foreign operation, due to differences in the cumulative currency translation differences that are recycled to the income statement on disposal of the business.
During fiscal 2006, the loss recognised on the planned disposal of the Group’s Wiper Systems business segment was £86.6 million higher under US GAAP than under IFRS, principally due to the recognition of an additional impairment loss of £85.0 million in relation to goodwill that was recognized under US GAAP but was not recognized under IFRS.
(l) Presentational differences
Discontinued operations
Under IFRS, an operation is classified as discontinued if it has been sold or is classified as held for sale at the balance sheet date, and itself represents, or its sale is part of a single plan to dispose of, a separate major line of business or geographical area of operations. Under US GAAP, discontinued operations include all components of the Group’s businesses that have identifiable operations and cash flows and have been sold or are classified as held for sale at the balance sheet date.
Statement of cash flows
Under IFRS, cash flow represents increases or decreases in cash and cash equivalents, which comprise cash in hand, deposits available on demand and other short-term highly liquid investments with a maturity on acquisition of three months or less, and bank overdrafts. Under US GAAP, cash flow is as defined under IFRS, except it excludes increases or decreases in bank overdrafts.
Under IFRS, dividends received from associates have been classified as cash flows from investing activities whereas under US GAAP they are classified as cash flows from operating activities.
Under IFRS, interest received is included within cash flows from investing activities and interest paid is included within cash flows from financing activities whereas under US GAAP both are included within cash flows from operating activities.
58
Tabular reconciliations of US GAAP to IFRS
Net income
| | | | | | | | | |
| | | Note(1) | | | Fiscal
2006 | | | Fiscal
2005 | |
| | | | | | £ million | | | £ million | |
Net income under US GAAP | | | | | 137.9 | | | 172.4 | |
| | | | | | | | | |
IFRS adjustments: | | | | | | | | | |
– Amortization of acquired intangibles | | (b | ) | | 2.7 | | | 2.8 | |
– Impairment of acquired intangibles | | (b | ) | | 2.6 | | | — | |
– Product development costs | | (c | ) | | 0.3 | | | 0.4 | |
– Restructuring costs | | (d | ) | | 0.4 | | | 0.5 | |
– Capitalized interest | | (e | ) | | 1.9 | | | (5.3 | ) |
– Inventory | | (f | ) | | 3.7 | | | 4.7 | |
– Post-employment benefits | | (g | ) | | 13.6 | | | 12.9 | |
– Share-based incentives | | (h | ) | | 0.6 | | | 1.4 | |
– Derivatives and hedge accounting | | (i | ) | | (56.7 | ) | | 40.1 | |
– Preference dividends | | (j | ) | | (5.4 | ) | | (16.3 | ) |
– Loss on disposal of discontinued operations | | (k | ) | | 85.7 | | | — | |
Income tax on IFRS adjustments | | | | | (0.4 | ) | | (21.4 | ) |
Minority interest in IFRS adjustments | | | | | (0.8 | ) | | — | |
| | | | | | | | | |
Net income under IFRS | | | | | 186.1 | | | 192.2 | |
Minority interests | | | | | 11.2 | | | 9.0 | |
| | | | | | | | | |
Profit for the period under IFRS | | | | | 197.3 | | | 201.2 | |
| | | | | | | | | |
Shareholders’ equity
| | | | | | | | | |
| | | Note(1) | | | As at
December 30,
2006 | | | As at
December 31,
2005 | |
| | | | | | £ million | | | £ million | |
Shareholders’ equity under US GAAP | | | | | 1,577.4 | | | 1,767.5 | |
| | | | | | | | | |
IFRS adjustments: | | | | | | | | | |
– Goodwill (net) | | (a | ) | | (593.3 | ) | | (766.8 | ) |
– Acquired intangibles (net) | | (b | ) | | (14.9 | ) | | (25.3 | ) |
– Product development costs | | (c | ) | | 0.7 | | | 0.4 | |
– Restructuring costs | | (d | ) | | — | | | (0.4 | ) |
– Capitalized interest (net) | | (e | ) | | (20.2 | ) | | (24.4 | ) |
– Inventory | | (f | ) | | 10.7 | | | 8.3 | |
– Post-employment benefits | | (g | ) | | 12.1 | | | 1.6 | |
– Share-based incentives | | (h | ) | | 1.6 | | | — | |
– Derivatives and hedge accounting | | (i | ) | | (4.8 | ) | | (5.6 | ) |
– Preference shares | | (j | ) | | (67.1 | ) | | (304.7 | ) |
– Assets held for sale | | (k | ) | | 1.6 | | | — | |
Income tax on IFRS adjustments | | | | | (0.3 | ) | | 13.9 | |
Minority interest in IFRS adjustments | | | | | 0.4 | | | — | |
| | | | | | | | | |
Shareholders’ equity under IFRS | | | | | 903.9 | | | 664.5 | |
| | | | | | | | | |
(1) | Refer to “Significant differences between IFRS and US GAAP” above. |
Legal Proceedings
The group is, from time to time, party to legal proceedings and claims, which arise in the ordinary course of the business. The Directors do not anticipate that the outcome of any of the above proceedings and claims, either individually or in aggregate, will have a material adverse effect upon the group’s financial position.
Dividend policy
See Item 3A “Selected financial data”.
B. Significant changes
Significant changes occurring between December 29, 2007 and February 20, 2008, the date on which the Group’s consolidated financial statements were signed, are detailed in Note 50 to the Group’s consolidated financial statements. There have been no significant changes subsequent to February 20, 2008.
59
Item 9. The Offer and Listing
A. Offer and listing details
The high and low closing prices of the ADSs on the NYSE for the periods indicated are set forth below.
| | | | | | |
Fiscal Period | | | | US dollars per ADS |
| | | High | | Low |
2003 | | Q1: January – March | | 13.43 | | 11.16 |
| | Q2: April – June | | 16.20 | | 11.25 |
| | Q3: July – September | | 17.80 | | 15.11 |
| | Q4: October - December | | 19.32 | | 16.97 |
| | Year | | 19.32 | | 11.16 |
2004 | | Q1: January - March | | 20.14 | | 18.10 |
| | Q2: April - June | | 20.53 | | 17.96 |
| | Q3: July - September | | 19.87 | | 17.98 |
| | Q4: October - December | | 20.39 | | 18.29 |
| | Year | | 20.53 | | 17.96 |
2005 | | Q1: January - March | | 22.43 | | 19.64 |
| | Q2: April - June | | 21.19 | | 18.51 |
| | Q3: July - September | | 21.52 | | 18.83 |
| | Q4: October - December | | 21.12 | | 18.86 |
| | Year | | 22.43 | | 18.51 |
2006 | | Q1: January - March | | 23.85 | | 21.59 |
| | Q2: April - June | | 25.36 | | 19.64 |
| | Q3: July - September | | 22.41 | | 17.81 |
| | Q4: October - December | | 19.50 | | 17.61 |
| | Year | | 25.36 | | 17.61 |
2007 | | Q1: January - March | | 22.35 | | 18.97 |
| | Q2: April - June | | 23.92 | | 19.96 |
| | Q3: July - September | | 21.65 | | 17.12 |
| | Q4: October - December | | 18.97 | | 13.75 |
| | October 2007 | | 18.97 | | 17.18 |
| | November 2007 | | 18.27 | | 14.54 |
| | December 2007 | | 16.49 | | 13.75 |
| | Year | | 23.92 | | 13.75 |
2008 | | Q1: January - March | | 15.01 | | 12.19 |
| | January 2008 | | 14.27 | | 12.19 |
| | February 2008 | | 15.01 | | 13.49 |
| | March 2008 | | 14.59 | | 12.23 |
| | Q2: April 1, 2008 – April 18, 2008 | | 14.87 | | 13.10 |
| | Year | | 15.01 | | 12.19 |
60
The following table sets forth, for the fiscal periods indicated, the closing high and low middle market quotations for the Company’s Ordinary Shares on the LSE. The table does not reflect trading after the daily official close of the LSE for which no official quotations exist.
| | | | | | |
Fiscal Period | | | | Pence per Ordinary Share |
| | | High | | Low |
2003 | | Q1: January – March | | 208.25 | | 168.75 |
| | Q2: April – June | | 245.00 | | 177.00 |
| | Q3: July – September | | 278.75 | | 225.75 |
| | Q4: October - December | | 288.50 | | 250.00 |
| | Year | | 288.50 | | 168.75 |
2004 | | Q1: January - March | | 269.00 | | 245.25 |
| | Q2: April - June | | 287.50 | | 253.75 |
| | Q3: July - September | | 269.75 | | 241.75 |
| | Q4: October - December | | 275.00 | | 245.00 |
| | Year | | 287.50 | | 241.75 |
2005 | | Q1: January - March | | 290.00 | | 258.75 |
| | Q2: April - June | | 276.25 | | 242.00 |
| | Q3: July - September | | 289.25 | | 263.75 |
| | Q4: October - December | | 302.50 | | 260.50 |
| | Year | | 302.50 | | 242.00 |
2006 | | Q1: January - March | | 340.50 | | 300.00 |
| | Q2: April - June | | 343.75 | | 260.00 |
| | Q3: July - September | | 293.75 | | 233.75 |
| | Q4: October - December | | 252.50 | | 229.75 |
| | Year | | 343.75 | | 229.75 |
2007 | | Q1: January - March | | 280.50 | | 244.50 |
| | Q2: April - June | | 302.50 | | 253.75 |
| | Q3: July - September | | 267.50 | | 214.50 |
| | Q4: October - December | | 233.50 | | 172.50 |
| | October 2007 | | 233.50 | | 209.25 |
| | November 2007 | | 219.25 | | 175.50 |
| | December 2007 | | 202.25 | | 172.50 |
| | Year | | 302.50 | | 176.25 |
2008 | | Q1: January - March | | 189.50 | | 150.75 |
| | January 2008 | | 179.50 | | 154.00 |
| | February 2008 | | 189.50 | | 170.00 |
| | March 2008 | | 182.50 | | 150.75 |
| | Q2: April 1, 2008 – April 18, 2008 | | 187.00 | | 166.50 |
| | Year | | 189.50 | | 150.75 |
The Preference Shares are registered shares but are not traded on any exchange.
B. Plan of distribution
Not applicable.
C. Markets
The principal trading market for the Company’s Ordinary Shares is the LSE.
ADSs, each representing four Ordinary Shares and evidenced by ADRs, have been issued pursuant to a sponsored ADR program, with the Depositary. The Company’s ADSs are listed on the NYSE, under the symbol “TKS”.
D. Selling shareholders
Not applicable.
E. Dilution
Not applicable.
F. Expenses of the issue
Not applicable.
61
Item 10. Additional Information
A. Share Capital
Not applicable.
B. Memorandum and Articles of Association
General
The rights of the shareholders are set forth in the Articles of the Company and are provided by applicable English law. The following summary of key provisions of the Articles is qualified in its entirety by reference to the Articles filed as Exhibit 1.1 hereto.
The Company is incorporated in England and registered at Companies House under company number 203531. The main objects and purposes of the Company, set forth in Articles 4(a) to (c), are as follows:
| • | | to co-ordinate and manage the business activities of the Company and generally to carry out the function of a group holding company; |
| • | | to carry on the business of hardware manufacture and the manufacture of and dealing in minerals and metals, and all kinds of other connected goods; and |
| • | | to carry on any other business of a similar nature which the Directors deem convenient for the Company to carry on, or consider will enhance or render more profitable the value of the Company’s property. |
Board of Directors
The Articles provide for a minimum of two and a maximum of 15 Directors. At every annual general meeting, no less than one-third of the Directors are required to retire from office and are eligible to stand for re-appointment at such meeting. Subject to the provisions of the Companies Act 1985, the Board may from time to time appoint one or more Directors to an executive office on such terms and for such period as it may determine. No Director or executive officer has a service contract with the Company for more than two years’ duration. The Articles contain no age limit requirements for the retirement or non-retirement of directors.
A Director who has disclosed to the Board that he or she has an interest in any transaction or arrangement with the Company, may participate in such transaction or arrangement, but may not vote in respect of any such transaction. A Director may not be counted in the quorum of a meeting in relation to any resolution on which he is barred from voting.
The ordinary remuneration of the Directors (other than a Managing Director or an Executive Director) may not exceed an aggregate amount of £250,000 per annum as the Board (or any duly authorized committee thereof) may from time to time determine or such greater amount as the Company may, upon the recommendation of the Board, from time to time by ordinary resolution determine, to be divided among them in such proportion and manner as the Directors may determine or, failing agreement, equally. Any Director who (by arrangement with the Board) performs or renders any special duties or services outside his ordinary duties as a Director may be awarded extra remuneration (in addition to fees or ordinary remuneration) by way of a lump sum or salary or commission or participation in profits or otherwise. Directors are required to hold at least 5,000 Ordinary Shares each.
The Board may exercise all the powers of the Company to borrow money, mortgage property and assets and issue debentures and other securities. The Articles require the Board to restrict aggregate borrowings of the Company to one and a half times the share capital of the Company plus capital reserves (calculated as set forth in the Articles).
Share Capital, Dividends and Voting Rights
The authorized share capital of the Company is £79,258,211 divided into 1,585,164,220 Ordinary Shares, nominal value 5p per share and $696,000,000 divided into 13,920,000 US dollar-denominated voting Preference Shares, nominal value $50 per share. As at December 29, 2007, there were no Preference Shares in issue.
Under Section 9 of the Companies Act 1985, the Company may by special resolution at a general meeting of shareholders alter its Articles and thereby alter the rights of the shareholders of the Company. A special resolution is a resolution that can only be passed by a majority of no less than three-fourths of the shares entitled to vote that are voted. Whenever the share capital of the Company is divided into different classes of shares, the rights attached to any class may only be varied or abrogated either with the consent in writing of the holders of three-fourths of the issued shares of that class or with the sanction of an extraordinary resolution passed at a separate meeting of such holders. The Articles provide that the necessary quorum for a general meeting at which such an extraordinary general resolution may be passed is at least two persons holding or representing by proxy no less than one-third in nominal amount of the issued shares of that class.
The Company in a general meeting of shareholders may declare dividends on the Ordinary Shares in its discretion by reference to an amount in pounds sterling or in a foreign currency, but dividends may not exceed the amount recommended by the Board. Dividends remaining unclaimed for 12 years after having been declared are forfeited and revert to the Company.
On a show of hands, each holder of Ordinary Shares present at a general meeting of the Company is entitled to one vote. On a poll, the holders of Ordinary Shares are entitled to one vote per share. Cumulative voting is not permitted.
The liquidator on any winding-up of the Company, may, with the authority of an extraordinary resolution, divide among the shareholders in kind the whole or any part of the assets of the Company and for such purposes may set such value as he deems fair upon any one or more class or classes of property, and may determine how such division shall be carried out as between shareholders or classes of shareholders.
There are no provisions in the Articles discriminating against an existing or prospective holder of securities as a result of such shareholder owning a substantial number of shares.
62
General Meetings
The Company shall in each year hold a general meeting of shareholders within 15 months of the previous year’s annual general meeting of shareholders. The Board may call an extraordinary general meeting whenever it determines appropriate. In addition, members holding not less than one-tenth of the paid up share capital entitled to vote at a general meeting of the Company can require an extraordinary general meeting to be convened.
Only shareholders registered in accordance with the Articles may be recognized as valid shareholders. There are no other limitations on the rights to own securities.
There are no provisions in the Articles that would have the effect of delaying, deferring or preventing a change of control of the Company and that would operate only with respect to a merger, acquisition, or corporate restructuring involving the Company or any of its subsidiaries.
Disclosure of Ownership
There are no provisions in the Articles relating to the ownership threshold above which shareholder ownership must be disclosed. The Companies Act 1985 requires a shareholder to notify the Company in respect of a three percent holding subject to certain exemptions, and there is an additional obligation to notify the Company when a ten percent threshold is reached which is not subject to any exemptions.
Changes in Capital
There are no conditions imposed by the Articles governing changes in capital that are more stringent than those conditions that would be required by governing English law.
Proposed amendment of the Articles
The Company will shortly seek shareholder approval to amend the Articles, primarily to reflect the provisions of the Companies Act 2006. An explanation of the main differences between the Articles and the New Articles is set out below.
| 1. | Articles which duplicate statutory provisions |
Provisions in the Articles which replicate provisions contained in the Companies Act 2006 are in the main to be removed in the New Articles. This is in line with the approach advocated by the UK Government that statutory provisions should not be duplicated in a company’s constitution. Certain examples of such provisions include provisions as to the form of resolutions, the requirement to keep accounting records and provisions regarding the period of notice required to convene general meetings. The main changes made to reflect this approach are detailed below.
Convening extraordinary and annual general meetings
The provisions in the Articles dealing with the convening of general meetings and the length of notice required to convene general meetings are being removed in the New Articles because the relevant matters are provided for in the Companies Act 2006. In particular an extraordinary general meeting to consider a special resolution can be convened on 14 days’ notice whereas previously 21 days’ notice was required.
Votes of members
Under the Companies Act 2006, proxies are entitled to vote on a show of hands as well as on a poll, whereas under the Articles, proxies are entitled to vote only on a poll. The New Articles reflect the position under the Companies Act 2006 by permitting Shareholders present in person or by proxy to vote on a show of hands as well as on a poll.
Under the New Articles, multiple proxies may be appointed provided that each proxy is appointed to exercise the rights attached to a different share or shares held by the shareholder.
| 3. | Directors, Directors’ duties and Board proceedings |
General
The minimum and maximum number of Directors remains the same under the New Articles (two and 15 respectively). However, the New Articles also allow the shareholders to change these limits by passing an ordinary resolution.
The New Articles do not contain any requirement for a Director to hold qualification shares. The Articles require a Director to hold at least 5,000 Ordinary Shares of the Company.
Retirement of Directors
The Articles provide that one third of all Directors should retire from office each year (not taking into account any Director who has been appointed by the Board to fill a vacancy, who will also be required to retire). In order to bring the Company’s constitution more in line with the provisions of the Combined Code, the New Articles will provide that at each annual general meeting, the following shall retire:
| | A. | any Director appointed by the Board since the last general meeting; |
| | B. | any Director who held office at the time of the two preceding annual general meetings and who did not retire at either of them; and |
| | C. | any Director who has been in office, other than as a Director holding an executive position, for a continuous period of nine years or more at the date of the meeting. |
63
Conflicts of interest
The Companies Act 2006 sets out directors’ general duties which largely codify the existing law but with some changes. Under the Companies Act 2006, from October 1, 2008 a director must avoid a situation where he has, or can have, a direct or indirect interest that conflicts, or possibly may conflict, with the company’s interests. The requirement is very broad and could apply, for example, if a director becomes a director of another company or a trustee of another organization. The Companies Act 2006 allows directors of public companies to authorize conflicts and potential conflicts, where appropriate, where the articles of association contain a provision to this effect. The Companies Act 2006 also allows the articles of association to contain other provisions for dealing with directors’ conflicts of interest to avoid a breach of duty. The New Articles give the Directors authority to approve such situations and to include other provisions to allow conflicts of interest to be dealt with in a similar way to the current position.
There are safeguards which will apply when the Directors decide whether to authorize a conflict or potential conflict. First, only Directors who have no interest in the matter being considered will be able to take the relevant decision, and secondly, in taking the decision the Directors must act in a way they consider, in good faith, will be most likely to promote the Company’s success. The Directors will be able to impose limits or conditions when giving authorization if they think this is appropriate.
It is also proposed that the New Articles should contain provisions relating to confidential information, attendance at Board meetings and availability of Board papers to protect a Director being in breach of duty if a conflict of interest or potential conflict of interest arises. These provisions will only apply where the position giving rise to the potential conflict has previously been authorized by the Directors. It is the Board’s intention to report annually on the Company’s procedures for ensuring that the Board’s powers to authorize conflicts are operated effectively.
Notice of board meetings
Under the Articles, when a Director is abroad he is not entitled to receive notice while he is away. This provision has been removed, as modern communications mean that there may be no particular obstacle to giving notice to a Director who is abroad.
Borrowing powers of Directors
The Company will continue to have the same borrowing powers once the New Articles have been adopted. However, to reflect the change of the Company’s reporting currency to US dollars, references to pounds sterling in the current provisions relating to the borrowing powers of Directors have been replaced with references to US dollars in the New Articles.
Distribution of assets otherwise than in cash
The Articles contain provisions dealing with the distribution of assets in kind in the event of the Company going into liquidation. These provisions have been removed in the New Articles on the grounds that a provision about the powers of liquidators is a matter for insolvency law rather than the articles of association of a company, and that the Insolvency Act 1986 confers powers on the liquidator which would enable it to do what is envisaged by the Articles.
| 5. | Shares and share capital |
Authorized share capital
As there are no longer any Preference Shares outstanding, the provisions of the Articles specifying the rights of the Perpetual Convertible Shares and Redeemable Convertible Shares have been removed. Provisions have been added specifying the rights of the Deferred Shares (see paragraph 9 below).
Transfers of shares
The Articles contain the right for the Board, in its absolute discretion and without giving any reason, to refuse to register a transfer of any certificate share. However, from April 6, 2008 the Companies Act 2006 will require that where such a power is exercised, reasons must be given. This provision has been amended accordingly in the New Articles. Other provisions of the Articles relating to the transfer of shares have been deleted in the New Articles, as they duplicate statutory provisions (see paragraph 1 above).
The New Articles will permit the declaration and payment of dividends by the Company in any currency (the Articles permit dividends to be declared only by reference to an amount in pound sterling). This will give the Company the flexibility to declare dividends in US dollars following the proposed re-denomination.
The provision in the Articles requiring the Board to keep accounting records has been removed as this requirement is contained in the Companies Act 2006.
| 8. | Electronic and web communications |
A resolution was passed at the 2007 annual general meeting of the Company to permit the Company to take advantage of the provisions of the Companies Act 2006 which came into force in January 2007 and which permit companies to communicate with members by electronic and/or website communications. The New Articles incorporate provisions reflecting this resolution and permitting electronic and/or website communications with shareholders.
| 9. | Changes associated with the proposed re-denomination |
The New Articles include the rights of the Deferred Shares to be issued to the Company Secretary in order to ensure that the Company continues to comply with the requirements of the Companies Act 1985 following the proposed re-denomination.
Generally the opportunity has been taken to bring clearer language into the New Articles.
64
C. Material Contracts
During the two years preceding the end of fiscal 2007, there have been no material contracts, other than contracts entered into in the ordinary course of business, to which the Company or any member of the Group is a party.
D. Exchange controls
There is currently no English law, decree or regulation that restricts the export or import of capital, including, but not limited to, UK foreign exchange controls, or that affects the remittance of dividends (except as otherwise set forth under Item 10E “Taxation”) or other payments to holders of Ordinary Shares. There are no limitations under English law or the Company’s Articles on the rights of persons who are neither residents nor nationals of the United Kingdom from freely holding, voting or transferring Ordinary Shares in the same manner as UK residents or nationals.
E. Taxation
The following is a summary of the principal US federal income and UK tax consequences of the purchase, ownership and disposition of Ordinary Shares or ADSs by certain “US Holders” (as defined below) and not a complete analysis or listing of all of the possible tax consequences of such purchase, ownership or disposition. Furthermore, this summary does not address the tax consequences under state, local, or non-US or non-UK tax law of such purchase, ownership or disposition, or the US federal estate or gift tax consequences thereof. Certain US Holders with special status (e.g., banks and financial institutions, insurance companies, tax-exempt entities, dealers in securities, and traders in securities that mark-to-market) or in special tax situations (e.g., whose functional currency is not the US dollar, who hold their Ordinary Shares or ADSs as part of a straddle, appreciated financial position, hedge, conversion transaction or other integrated investment, who hold (directly, indirectly or through attribution) 10 percent or more of the voting power of the Company’s stock, or who are subject to the alternative minimum tax) will be subject to special rules not described below. This summary is limited to US Holders that hold their Ordinary Shares or ADSs as capital assets and does not address the tax treatment of US Holders that are partnerships or pass-through entities that are not partnerships or the tax treatment of the holders of interests in such entities. The following summary of US federal income and UK tax consequences is not exhaustive of all possible tax considerations and should not be considered legal or tax advice. Prospective investors are therefore advised to consult their own tax advisors with respect to the tax consequences of the purchase, ownership and disposition of Ordinary Shares or ADSs, including specifically the consequences under state, local and tax laws.
This summary is based upon the Code, Treasury regulations promulgated under the Code, the Tax Convention, and administrative and judicial interpretations thereof, all as in effect as of the date of this Annual Report and all of which are subject to change, possibly with retroactive effect. Statements regarding UK tax laws and practices set out below are based on those UK laws and published practices of HM Revenue & Customs as at the date of this Annual Report which UK laws and practices are subject to change, again with possibly retroactive effect. As used herein, a “US Holder” is a beneficial owner of Ordinary Shares or ADSs that, for United States federal tax purposes, is:
| • | | a citizen or resident of the United States; |
| • | | a corporation, or other entity treated as a corporation for US federal income tax purposes created or organized in the United States or under the laws of the United States or any state thereof (or the District of Columbia); |
| • | | an estate the income of which is subject to US federal income taxation regardless of its source; |
| • | | a trust if a court within the United States is able to exercise primary supervision over the administration of the trust and one or more United States persons have the authority to control all substantial decisions of the trust; or |
| • | | a trust if it has a valid election in effect to be treated as a United States person under the Code. |
HM Revenue & Customs should treat US Holders of ADSs as the owners of the underlying Ordinary Shares for the purpose of the taxation of dividend payments under the Tax Convention. US Holders of ADSs are also treated as the owners of the underlying shares for the purposes of the Code.
Taxation of Dividends
The gross amount of distributions in respect of the Company’s Ordinary Shares or ADSs will be included in the gross income of US Holders and treated as dividends to the extent of the Company’s current and accumulated earnings and profits, as determined under US federal income tax principles. Such dividends will not qualify for the dividends received deduction available in certain circumstances to corporate holders. Distributions in excess of current and accumulated earnings and profits will be treated as a return of capital to the extent of a US Holder’s adjusted tax basis in the Ordinary Shares or ADSs and, thereafter, as capital gains.
For taxable years that begin before 2011, “qualified dividend income” (as defined below) paid by the Company generally will be taxable to non-corporate US Holders at the 15 percent reduced rate. For this purpose, except as described below, dividends paid by the Company will be “qualified dividend income”, and taxable at the reduced rate, if shares in the company are readily tradable on an established securities market in the United States, including NYSE and NASDAQ, or if the Company is eligible for benefits of a comprehensive income tax treaty with the United States which the Secretary of the Treasury has determined is satisfactory for this purpose and which includes a provision for the exchange of information. The Secretary of Treasury has determined that the Tax Convention qualifies as a comprehensive income tax treaty for this purpose. Dividends paid by a foreign corporation will not constitute qualified dividend income, however, if that corporation is treated, for the tax year in which the dividend is paid or the preceding tax year, as a PFIC for US federal income tax purposes. In addition, US Holders will be eligible for the reduced rate only if they have held the Ordinary Shares or ADSs for more than 60 days during the 121-day period beginning 60 days before the ex dividend date and satisfy certain other requirements.
US Holders will not be subject to UK withholding tax on any dividends paid in respect of Ordinary shares. Provided that dividends paid in respect of ADSs are treated as distributions for UK tax purposes, such dividends will not be subject to UK withholding tax.
65
Foreign Currency Dividends
For US federal income tax purposes, any dividend paid in foreign currency will be included in income in a US dollar amount equal to the US dollar value of such foreign currency calculated by reference to the exchange rate in effect on the day the dividends are actually or constructively received by the US Holders, regardless of whether the foreign currency is converted into US dollars at that time. US Holders will generally have a basis in the foreign currency equal to its US dollar value on the date of actual or constructive receipt. Any gain or loss realized by the US Holders on subsequent conversion or other disposition of the foreign currency will be treated as US source ordinary income or loss.
PFIC Status
The Company believes that it will not be considered a PFIC for US federal income tax purposes. However, since the Company’s status as a PFIC depends on the composition of its income and assets and the market value of its assets from time to time, there can be no assurance that it will not be considered a PFIC in any taxable year.
US shareholders in a company classified as a PFIC have certain federal income tax consequences. In determining a company’s PFIC status for a taxable year, two tests must be applied, as well as certain look-through rules. If 75 percent or more of a company’s gross income (including the pro-rata gross income of any company in which such company is considered to own 25 percent or more of the stock by value) for the taxable year is passive, it is considered a PFIC. Alternatively, if 50 percent or more of its gross assets (including the pro-rata value of the assets of any company in which such company is considered to own 25 percent or more of the stock by value) during the taxable year, based on their average value, are either held for the production of or produce passive income, it is considered a PFIC. In this instance, passive income commonly includes dividends, interest, royalties, rents, annuities, gains from commodities and securities transactions, and the excess of gains over losses from the disposition of assets which produce passive income (unless the 25 percent look-through rules otherwise apply).
If the Company were treated as a PFIC in a taxable year, a US Holder may be subject to particular adverse tax consequences. The receipt of certain “excess distributions”, as well as the disposition of Ordinary Shares or ADSs, could trigger increased tax liability. “Gain” or excess distribution would be allocated among the tax years of the shareholder’s holding period from the time the entity was determined to be a PFIC. The portion allocable to prior years would be taxed at the highest marginal US federal tax rate and would be subject to an interest charge.
Certain elections may enable the shareholder in a PFIC to avoid some of these adverse tax consequences. Under the QEF election, a US shareholder is taxed currently on its share of the company’s ordinary income. Under the mark-to-market election a US shareholder recognizes gains or losses each year for the difference between the fair market value and the adjusted basis of his or her shares. US Holders should consult their tax advisers for further details of the restrictions and coverage of each election and the potential tax consequences arising from the ownership and disposition of an interest in a PFIC.
Taxation of Capital Gains
Corporate US Holders that are resident in the United States and not resident in the United Kingdom for UK tax purposes will not generally be liable for UK corporation tax on capital gains realized on the sale or other disposal of Ordinary Shares or ADSs unless a specific Corporate US Holder carries on a trade in the United Kingdom through a permanent establishment and the Ordinary Shares or ADSs are or have been used, held or acquired for the purposes of such trade through such permanent establishment. Non-corporate US Holders that are resident in the United States and are neither resident nor ordinarily resident in the United Kingdom for UK tax purposes will not generally be liable for UK tax on capital gains realized on the sale or other disposal of Ordinary Shares or ADSs unless a specific non-corporate US Holder carries on a trade, profession or vocation in the United Kingdom through a branch or agency and the Ordinary Shares or ADSs are or have been used, held or acquired for the purposes of such trade, profession or vocation through such branch or agency.
Notwithstanding the foregoing, an individual US Holder who is neither resident nor ordinarily resident in the United Kingdom for UK tax purposes for a period of less than five years, but who was previously resident or ordinarily resident in the United Kingdom, and who disposes of Ordinary Shares or ADSs during the period of non-residence may also be liable on returning to the United Kingdom for UK tax on capital gains despite the fact that the individual was not resident or ordinarily resident in the United Kingdom for UK tax purposes at the time of the disposal.
US Holders will generally recognize capital gain or loss for US federal income tax purposes upon the sale or other disposal of such US Holders’ Ordinary Shares or ADSs in an amount equal to the difference between the US dollar value of the amount realized on the sale or other disposal and the US Holders’ adjusted tax basis, determined in US dollars, in such Ordinary Shares or ADSs. Such gains or losses will be eligible for long-term capital gain or loss treatment if the Ordinary Shares or ADSs have been held for more than one year at the time of such sale or disposal. Long-term capital gains of individuals are eligible for reduced rates of taxation. The deductibility of capital losses is subject to limitations. In general, any gain or loss recognized by a US holder on the sale or other disposition of Ordinary Shares or ADSs will be US-source income or loss for purposes of US federal foreign tax credit limitation.
UK Inheritance Tax
Under the Estate and Gift Tax Convention, Ordinary Shares or ADSs will generally not be subject to UK inheritance tax upon an individual’s death or on a transfer of the Ordinary Shares or ADSs during the individual’s lifetime if it is held by an individual who is domiciled in the United States and is not treated as domiciled in the United Kingdom. In certain other cases where the individual is domiciled in the United States and is treated as domiciled in the United Kingdom, the individual may be subject to UK inheritance tax. Also, an individual will be subject to UK inheritance tax in the exceptional case in which Ordinary Shares or ADSs are part of the business property of a UK permanent establishment or pertains to a fixed base of the individual in the United Kingdom used for the performance of independent personal services. In the unusual case where Ordinary Shares or ADSs are subject to both the UK inheritance tax and the US federal estate and gift tax, the Estate and Gift Tax Convention generally provides for a tax credit under the rules enumerated in the Estate and Gift Tax Convention.
66
UK stamp duty and SDRT
UK stamp duty or SDRT is not generally payable on the issuance of Ordinary Shares (except see below regarding the issue of Ordinary Shares to the custodian of the Depositary). The transfer of Ordinary Shares will generally give rise to a liability to UK stamp duty at the rate of 0.5 percent (rounded up to the next multiple of £5) of the amount or value of the consideration paid. SDRT is generally chargeable at the same rate on entering into an unconditional agreement to transfer Ordinary Shares (or upon a conditional agreement to transfer Ordinary Shares becoming unconditional). However, such SDRT is cancelled or repaid if the agreement is completed within six years of the date of the unconditional agreement (or the date on which the conditional agreement became unconditional) by a duly stamped transfer instrument. Where an instrument of transfer of Ordinary Shares is executed where there is no change of beneficial ownership it will generally not be subject to UK fixed rate stamp duty of £5.
The issuance of Ordinary Shares to the custodian of the Depositary will generally give rise to an SDRT liability at 1.5 percent of the issue price. The transfer of Ordinary Shares to the custodian of the Depositary will generally give rise to either UK stamp duty at the rate of 1.5 percent of the value of the Ordinary Shares transferred (rounded up to the next multiple of £5), or, in the unlikely event that there is no transfer instrument on which UK stamp duty is chargeable, to SDRT at the rate of 1.5 percent of the value of the Ordinary Shares transferred.
In accordance with the terms of the Deposit Agreement, any tax or duty payable by the Depositary or the custodian of the Depositary on deposits of Ordinary Shares will be charged by the Depositary to the party to whom the ADSs are delivered against such deposits.
Following the issue or transfer of Ordinary Shares to the custodian of the Depositary, no SDRT will generally be payable on the issue of ADSs or on an agreement to transfer ADSs, nor should UK stamp duty be payable on a transfer of ADSs, provided, amongst other things, that the instrument of transfer is executed and retained outside the United Kingdom. A transfer of Ordinary Shares by the Depositary or its nominee to the relevant ADS holder when the ADS holder is not transferring beneficial ownership will attract UK fixed rate stamp duty of £5 but will generally not be liable to a stamp duty charge or to the principal 0.5 percent SDRT charge.
US Backup Withholding and Information Reporting
Payments of dividends and other proceeds with respect to Ordinary Shares or ADSs made within the US by a US paying agent or other US intermediary will be reported to the IRS and to the US Holders as may be required under applicable regulations unless a specific US Holder is a corporation or otherwise establishes a basis for exemption. Backup withholding may apply to reportable payments if the US Holders fail to provide an accurate taxpayer identification number or otherwise fails to comply with, or establish an exemption from, such backup withholding requirements. The amount of any backup withholding from a payment to a US Holder will be allowed as a credit against his or her US federal income tax liability and any excess amounts will be refundable, if the US Holder provides the required information to the IRS. US Holders should consult their tax advisers as to their qualification for exemption from backup withholding and the procedure for obtaining an exemption.
F. Dividends and paying agents
Not applicable.
G. Statement by experts
Not applicable.
H. Documents on display
The Company is subject to the information requirements of the Exchange Act and in accordance therewith files reports and other information with the SEC. These reports and other information can be inspected and copied at the public reference facilities maintained by the SEC, 100 F Street, N.E., Washington, D.C. 20549, and at the SEC’s regional office at Citicorp Center, 500 West Madison Street, Suite 1400, Chicago, Illinois 60661. You may request copies of all or a portion of these documents from the Public Reference Section of the SEC at 100 F Street, N.E., Washington, D.C. 20549, at prescribed rates. From August 2002, reports filed by the Company with the Commission are available on the SEC’s website at www.sec.gov. As a foreign private issuer, the Company is exempt under the Exchange Act from, among other things, the rules prescribing the furnishing and content of proxy statements and the “short-swing” profit recovery provisions contained in Section 16 of the Exchange Act.
I. Subsidiary information
See Exhibit 8.1.
67
Item 11. Quantitative and Qualitative Disclosures about Market Risk
Risk management policy
The Group’s central treasury function is responsible for procuring the Group’s capital resources and maintaining an efficient capital structure, together with managing the Group’s liquidity, foreign exchange and interest rate exposures.
All treasury operations are conducted within strict policies and guidelines that are approved by the Board. Compliance with those policies and guidelines is monitored by the regular reporting of treasury activities to the Board.
A key element of the Group’s treasury philosophy is that funding, interest rate and currency decisions and the location of cash and debt balances are determined independently of each other. The Group’s borrowing requirements are met by raising funds in the most favorable markets. Management aims to retain net debt in proportion to the currencies in which the net assets of the Group’s operations are denominated. The desired currency profile of net debt is achieved by entering into currency derivative contracts. The proportion of overseas investments effectively funded by shareholders’ equity is not hedged. The net income of foreign operations is not hedged but the effect of currency fluctuations on the Group’s reported net income is partly offset by interest payable on net debt denominated in foreign currencies.
From time to time, the Group also enters into currency derivative contracts to manage currency transaction exposures.
The Group’s interest rate profile is managed within the policy established by the Board. The desired interest rate profile of net debt in each currency is achieved by entering into interest rate derivative contracts.
The Group’s portfolio of cash and cash equivalents is managed such that there is no significant concentration of credit risk in any one bank or other financial institution. Management monitors closely the credit quality of the institutions with which it holds deposits. Similar considerations are given to the Group’s portfolio of derivative financial instruments.
The Group’s borrowing facilities are monitored against forecast requirements and timely action is taken to put in place, renew or replace credit lines. Management’s policy is to reduce liquidity risk by diversifying the Group’s funding sources and by staggering the maturity of its borrowings.
The Group has established long-term credit ratings of Baa3 Stable with Moody’s and BBB Stable with Standard & Poors and a short-term credit rating of P-2 with Moody’s. Management aims to achieve an appropriate mix of debt and equity to ensure an efficient capital structure and to preserve these ratings.
The Group does not hold or issue derivatives for speculative or trading purposes.
Credit risk
Credit risk is the risk that a counterparty will default on its contractual obligations resulting in financial loss to the Group. Information on the Group’s exposure to credit risk is presented in Note 32C to the Group’s consolidated financial statements.
Liquidity risk
Liquidity risk is the risk that an entity will encounter difficulty in meeting obligations associated with financial liabilities.
Information on the Group’s exposure to liquidity risk analysed by category of financial instrument is presented in Note 32D to the Group’s consolidated financial statements.
Information on the Group’s exposure to liquidity risk analysed by currency is presented below.
| | | | | | | | | | | | | | | | | | | | | |
As at December 29, 2007 | | Within
1 year | | | Between
1 and 2
years | | | Between
2 and 3
years | | | Between
3 and 4
years | | | Between
4 and 5
years | | | After
5 years | | | Total | |
| | | £ million | | | £ million | | | £ million | | | £ million | | | £ million | | | £ million | | | £ million | |
Cash flows related to financial liabilities: | | | | | | | | | | | | | | | | | | | | | |
– Canadian dollar | | (110.8 | ) | | — | | | — | | | — | | | — | | | — | | | (110.8 | ) |
– Euro | | (111.6 | ) | | (6.1 | ) | | (4.8 | ) | | (0.4 | ) | | (0.2 | ) | | (2.1 | ) | | (125.2 | ) |
– Pounds sterling | | 375.9 | | | (23.5 | ) | | (42.4 | ) | | (178.0 | ) | | (15.3 | ) | | (295.9 | ) | | (179.2 | ) |
– US dollar | | (388.0 | ) | | (7.5 | ) | | (0.3 | ) | | (0.2 | ) | | (0.2 | ) | | (0.2 | ) | | (396.4 | ) |
– Other | | (90.6 | ) | | (2.1 | ) | | — | | | — | | | — | | | — | | | (92.7 | ) |
| | | | | | | | | | | | | | | | | | | | | |
Cash flows on financial liabilities | | (325.1 | ) | | (39.2 | ) | | (47.5 | ) | | (178.6 | ) | | (15.7 | ) | | (298.2 | ) | | (904.3 | ) |
| | | | | | | | | | | | | | | | | | | | | |
Cash flows on related financial assets: | | | | | | | | | | | | | | | | | | | | | |
– Canadian dollar | | 0.2 | | | — | | | — | | | — | | | — | | | — | | | 0.2 | |
– Euro | | (2.0 | ) | | — | | | — | | | — | | | — | | | — | | | (2.0 | ) |
– Pounds sterling | | (0.3 | ) | | 1.3 | | | 1.3 | | | 1.3 | | | 0.1 | | | 0.1 | | | 3.8 | |
– US dollar | | (8.1 | ) | | — | | | — | | | — | | | — | | | — | | | (8.1 | ) |
– Other | | 9.7 | | | — | | | — | | | — | | | — | | | — | | | 9.7 | |
| | | | | | | | | | | | | | | | | | | | | |
Cash flows on financial assets | | (0.5 | ) | | 1.3 | | | 1.3 | | | 1.3 | | | 0.1 | | | 0.1 | | | 3.6 | |
| | | | | | | | | | | | | | | | | | | | | |
68
| | | | | | | | | | | | | | | | | | | | | |
As at December 30, 2006 | | Within
1 year | | | Between
1 and 2
years | | | Between
2 and 3
years | | | Between
3 and 4
years | | | Between
4 and 5
years | | | After
5 years | | | Total | |
| | | £ million | | | £ million | | | £ million | | | £ million | | | £ million | | | £ million | | | £ million | |
Cash flows related to financial liabilities: | | | | | | | | | | | | | | | | | | | | | |
– Canadian dollar | | (17.0 | ) | | — | | | — | | | — | | | — | | | — | | | (17.0 | ) |
– Euro | | (101.3 | ) | | (0.7 | ) | | (0.5 | ) | | (0.5 | ) | | (0.3 | ) | | (1.2 | ) | | (104.5 | ) |
– Pounds sterling | | 0.4 | | | (36.5 | ) | | (35.9 | ) | | (50.7 | ) | | (176.2 | ) | | (309.6 | ) | | (608.5 | ) |
– US dollar | | (134.8 | ) | | (7.2 | ) | | (1.0 | ) | | (128.2 | ) | | (0.7 | ) | | (2.7 | ) | | (274.6 | ) |
– Other | | (76.1 | ) | | (2.2 | ) | | — | | | — | | | — | | | — | | | (78.3 | ) |
| | | | | | | | | | | | | | | | | | | | | |
Cash flows on financial liabilities | | (328.8 | ) | | (46.6 | ) | | (37.4 | ) | | (179.4 | ) | | (177.2 | ) | | (313.5 | ) | | (1,082.9 | ) |
| | | | | | | | | | | | | | | | | | | | | |
Cash flows on related financial assets: | | | | | | | | | | | | | | | | | | | | | |
– Canadian dollar | | (90.9 | ) | | — | | | — | | | — | | | — | | | — | | | (90.9 | ) |
– Pounds sterling | | 313.5 | | | — | | | — | | | — | | | — | | | — | | | 313.5 | |
– US dollar | | (197.2 | ) | | 0.9 | | | 0.2 | | | — | | | — | | | — | | | (196.1 | ) |
– Other | | (21.7 | ) | | — | | | — | | | — | | | — | | | — | | | (21.7 | ) |
| | | | | | | | | | | | | | | | | | | | | |
Cash flows on financial assets | | 3.7 | | | 0.9 | | | 0.2 | | | — | | | — | | | — | | | 4.8 | |
| | | | | | | | | | | | | | | | | | | | | |
Interest rate risk
Interest rate risk is the risk that the fair value of or future cash flows associated with a financial instrument will fluctuate because of changes in market interest rates. Information on the Group’s exposure to interest rate risk is presented in Note 32E to the Group’s consolidated financial statements, and information on the Group’s interest rate profile is presented in Note 31 to those financial statements.
Currency risk
Currency risk is the risk that the fair value or future cash flows of a financial instrument will fluctuate because of changes in foreign exchange rates. Currency risk arises on financial assets and liabilities that are denominated in a currency other than the functional currency of the entity by which they are held. Information on the Group’s exposure to currency risk is presented in Notes 26, 28, 31 and 32F to the Group’s consolidated financial statements.
Item 12. Description of Securities Other than Equity Securities
Not applicable.
69
PART II
Item 13. Defaults, Dividend Arrearages and Delinquencies
None.
Item 14. Material Modifications to the Rights of Security Holders and Use of Proceeds
None.
Item 15. Controls and Procedures
A. Disclosure Controls and Procedures
SOX Act certifications
The certifications of the CEO and CFO required under section 302 of the SOX Act, and the related rules of the SEC are filed as Exhibits 12.1 and 12.2.
The CEO and the CFO have evaluated the effectiveness of the Company’s disclosure controls and procedures (as such term is defined in Rules 13a – 15(e) and 15d – 15(e) under the Exchange Act) as at December 29, 2007. Based on such evaluation, those officers have concluded that, as of December 29, 2007, the Company’s disclosure controls and procedures are effective in alerting them on a timely basis to material information relating to the Company (including its consolidated subsidiaries) required to be included in the periodic filings under the Exchange Act.
Internal control
The Directors have overall responsibility for the Group’s system of internal control and for reviewing its effectiveness. To fulfill this responsibility the Directors have established a Performance Management Framework within which each of the Group’s businesses operates. Within this framework, the management of each of the businesses considers strategic, operational, commercial and financial risks, and identifies risk mitigation actions. Whilst acknowledging the overall responsibility for the system of internal control, the Directors are aware that the system is designed to manage rather than eliminate the risk of failure to achieve business objectives and can provide reasonable and not absolute assurance against material misstatement or loss.
During fiscal 2007, the Directors were not aware of any control breakdowns that resulted in a material loss to the Group.
Performance management framework
The Performance Management Framework was in place throughout fiscal 2007 and constitutes the Group’s control environment. The key components of the Performance Management Framework are discussed below.
Risk assessment
An ongoing process is in place for identifying, evaluating and managing the significant risks faced by the Group. Each business unit’s management identifies and assesses the key business risks affecting the achievement of its objectives. Business unit management also identifies the risk management processes used to mitigate the key risks to an acceptable level and, where appropriate, additional actions required to further manage and mitigate them. The risk summaries developed out of this process are updated at least annually. In addition, Corporate Center management considers those risks to the Group’s strategic objectives that may not be identified and managed at the business unit level.
In connection with quarterly business reviews, relevant executives discuss risk management activities with Corporate Center management. The key risks and mitigation strategies are also discussed at least annually with the Audit Committee as well as the full Board. The risk management processes described above are applied to major decision-making processes such as acquisitions as well as operational risks within the business including environmental, health and safety.
Business strategy reviews
Each business is required to prepare a strategic position assessment taking into account the current and likely future market environment and competitive position of the business with specific consideration given to strategic risk. The Corporate Center management reviews the strategy with each business and the Board is presented with a summary of the plans.
Business reviews
On a quarterly basis, Corporate Center management performs extensive reviews with each business. These reviews consider current and projected financial and operating results, and address the progress of key strategic and operating initiatives, the risks affecting their achievement and the actions being taken by business unit management to manage the risks and achieve their objectives.
Financial plans
Each business prepares financial plans in accordance with a defined format, which includes consideration of risks. Management at the Corporate Center reviews the financial plans with the business units and a summary is presented to the Board for approval.
70
Balance sheet reviews
Business unit and Corporate Center financial management conduct periodic, on-site reviews of underlying rationale and support for the significant line item components comprising the balance sheets for each business in the Group.
Investment project authorization
All significant investment project expenditures are subject to a formal investment project authorization process, which takes into account, inter alia, operational, financial and technical risks. For significant investment projects a post-investment analysis is completed to facilitate continuous improvement in the investment planning process, including risk identification and mitigation.
Reporting, analysis and forecasts
All businesses are required to report monthly to the Corporate Center on financial performance. Comparisons are made with plan, forecast and prior year and significant variances and changes in the business environment are explained. Each business reassesses its forecast for the financial year on a monthly basis. Quarterly, each business prepares a forecast for the following 18 months and reviews projections for the current and following year.
Financial strategy
The financial strategy includes assessment of the major financial risks related to interest rate exposure, foreign currency exposure, debt maturity and liquidity. There is a comprehensive global insurance program using the external insurance market and some limited use of an internal captive insurance company. Group Treasury manages hedging activities, relating to financial risks, with external cover for net currency transaction exposures. The Group Tax function manages tax compliance and tax risks associated with the Group’s activities. The Audit Committee, through periodic direct reports from the Group Treasurer and Group Vice-President, Tax, oversees the financial strategy as well as the tax strategy, and considers the associated risks and risk management techniques being used by the Group.
Reporting certifications
In connection with the preparation of the annual financial statements, senior business general management and financial management sign a certificate which includes a declaration regarding the existence of internal controls, the proper recording of transactions and the identification and evaluation of significant business risks.
Internal audit
The Group has an established internal audit function; the Vice President – Internal Audit directs the activities of the internal auditors on a day-to-day basis and has a direct reporting line to the Chairman of the Audit Committee of the Board. Internal Audit’s responsibilities include performing independent objective assurance activities in order to evaluate the adequacy and effectiveness of the Group’s system of internal control and risk management processes. The Internal Audit plan is constructed to provide geographic coverage on a cyclical basis while tailoring to address specific risk concerns. In fiscal 2007, it reported regularly to the Audit Committee on its internal audit reviews of the Group’s operations.
B. Management’s annual report on internal control over financial reporting
The management of Tomkins plc is responsible for establishing and maintaining adequate internal control over financial reporting, as such term is defined in Rule 13a-15(f) of the Securities Exchange Act of 1934 for Tomkins plc. Under the supervision and with the participation of our management, including our principal executive officer and principal financial officer, we conducted an evaluation of the effectiveness of our internal control over financial reporting based principally on the framework and criteria established in Internal Control – Integrated Framework issued by the Committee of Sponsoring Organizations of the Treadway Commission as of the end of the period covered by this report. Based on that evaluation, our management has concluded that our internal control over financial reporting was effective as of December 29, 2007 at providing reasonable assurance regarding the reliability of financial reporting and the preparation of financial statements for external purposes in accordance with generally accepted accounting principles.
Deloitte & Touche LLP, an independent registered public accounting firm, has audited the consolidated financial statements included in this annual report on Form 20-F and, as part of the audit, has issued a report, included herein, on the effectiveness of our internal control over financial reporting.
| | | | | | | | | | |
/s/ James Nicol | | | | | | /s/ John Zimmerman |
| By: | | James Nicol | | | | | | By: | | John Zimmerman |
| Chief Executive Officer | | | | | | Chief Financial Officer |
February 20, 2008
71
C. Attestation report of the registered public accounting firm
The attestation report received from the Company’s independent Auditors is set out below:
To the Board of Directors and Shareholders of Tomkins plc
We have audited the internal control over financial reporting of Tomkins plc and subsidiaries (the “Company”) as of December 29, 2007, based on the criteria established in Internal Control—Integrated Framework issued by the Committee of Sponsoring Organizations of the Treadway Commission. The Company’s management is responsible for maintaining effective internal control over financial reporting and for its assessment of the effectiveness of internal control over financial reporting, included in the accompanying “Management’s Annual Report on Internal Control over Financial Reporting”. Our responsibility is to express an opinion on the Company’s internal control over financial reporting based on our audit.
We conducted our audit in accordance with the standards of the Public Company Accounting Oversight Board (United States). Those standards require that we plan and perform the audit to obtain reasonable assurance about whether effective internal control over financial reporting was maintained in all material respects. Our audit included obtaining an understanding of internal control over financial reporting, assessing the risk that a material weakness exists, testing and evaluating the design and operating effectiveness of internal control based on the assessed risk, and performing such other procedures as we considered necessary in the circumstances. We believe that our audit provides a reasonable basis for our opinion.
A company’s internal control over financial reporting is a process designed by, or under the supervision of, the company’s principal executive and principal financial officers, or persons performing similar functions, and effected by the company’s board of directors, management, and other personnel to provide reasonable assurance regarding the reliability of financial reporting and the preparation of financial statements for external purposes in accordance with generally accepted accounting principles. A company’s internal control over financial reporting includes those policies and procedures that (1) pertain to the maintenance of records that, in reasonable detail, accurately and fairly reflect the transactions and dispositions of the assets of the company; (2) provide reasonable assurance that transactions are recorded as necessary to permit preparation of financial statements in accordance with generally accepted accounting principles, and that receipts and expenditures of the company are being made only in accordance with authorizations of management and directors of the company; and (3) provide reasonable assurance regarding prevention or timely detection of unauthorized acquisition, use, or disposition of the company’s assets that could have a material effect on the financial statements.
Because of the inherent limitations of internal control over financial reporting, including the possibility of collusion or improper management override of controls, material misstatements due to error or fraud may not be prevented or detected on a timely basis. Also, projections of any evaluation of the effectiveness of the internal control over financial reporting to future periods are subject to the risk that the controls may become inadequate because of changes in conditions, or that the degree of compliance with the policies or procedures may deteriorate.
In our opinion, the Company maintained, in all material respects, effective internal control over financial reporting as of December 29, 2007, based on the criteria established in Internal Control—Integrated Framework issued by the Committee of Sponsoring Organizations of the Treadway Commission.
We have also audited, in accordance with the standards of the Public Company Accounting Oversight Board (United States), the consolidated financial statements as of and for the year ended December 29, 2007 of the Company and our report dated February 20, 2008 expressed an unqualified opinion on those financial statements.
DELOITTE & TOUCHE LLP
London, United Kingdom
February 20, 2008
D. Changes in internal control over financial reporting
During fiscal 2007, there have not been any changes in the Company’s internal controls over financial reporting that have materially affected, or are reasonably likely to materially affect, the Company’s internal controls over financial reporting.
72
Item 16A. Audit committee financial expert
The Board has determined that David Richardson is independent as that term is defined in the listing standards applicable to the Company and that he is an “audit committee financial expert” as that term is defined under the rules of the SEC. Refer to Item 6A “Directors and senior management” for a brief list of David Richardson’s relevant experience.
Item 16B. Code of Ethics
Code of Conduct and Ethics
The Company has adopted a Code of Conduct and Ethics which sets out the policies and principles of conduct to be followed by all companies in the Group and applies to all Directors, officers and employees who are expected to conduct Company business with integrity and in compliance with the laws of the countries in which the Group operates. The Code of Conduct and Ethics covers a number of important areas including fair competition and compliance with anti-trust and competition laws, employee health and safety laws and environmental laws. It also reaffirms the Company’s commitment to fair treatment of all employees, ethical and lawful behavior and sets out some general principles, which are important in dealing with suppliers and customers, and with governments and government agencies. The Code of Conduct and Ethics emphasizes the importance of employees protecting the Company’s intellectual property. Any waivers to the Code of Conduct and Ethics require the approval of the Board and are published on the Company’s website. During fiscal 2007 there have been no amendments to the code of ethics and no waivers have been either sought or granted. A complete copy of the Code of Conduct and Ethics can be viewed on the Company’s website (www.tomkins.co.uk) or a printed copy is available by application to the Company Secretary at the Company’s registered office.
The Company has also placed on its website (www.tomkins.co.uk) a general summary of the significant ways in which the Company’s corporate governance differs from that followed by domestic US companies under the NYSE.
Item 16C. Principal Accountant Fees and Services
The following table sets forth the aggregate fees billed to the Company for fiscal 2007 and fiscal 2006 by the Company’s principal accounting firm, Deloitte & Touche.
| | | | |
| | | Fiscal
2007 | | Fiscal
2006 |
| | | £ million | | £ million |
Audit fees | | 3.0 | | 3.9 |
| | | | |
Tax fees: | | | | |
– Compliance services | | 0.3 | | 0.2 |
– Advisory services | | 0.6 | | 0.4 |
| | | | |
| | 0.9 | | 0.6 |
| | | | |
All other fees(1) | | 0.3 | | 0.5 |
| | | | |
Total fees | | 4.2 | | 5.0 |
| | | | |
(1) | Other fees paid relate to advice on accounting matters and non-statutory reporting. |
The Audit Committee has adopted a policy regarding audit and non-audit services in consultation with its independent auditors Deloitte & Touche. This policy is designed to ensure the independence of the Company’s independent auditors by expressly setting forth all services that the independent auditors may not perform and reinforcing the principle of independence regardless of the type of work performed. The Audit Committee or, between meetings, the Chairman of the Audit Committee, pre-approves the engagement terms and fees of Deloitte & Touche for all audit and non-audit services, including tax services, unless such approval is not required under the Exchange Act. The Audit Committee approved the engagement terms and fees of Deloitte & Touche for all services for fiscal 2007 and fiscal 2006.
Item 16D. Exemption from the Listing Standards for Audit Committees
Not applicable.
73
Item 16E. Purchases of Equity Securities by the Issuer and Affiliated Purchasers
The table below sets forth details on shares repurchased by the Company and affiliated purchasers in fiscal 2007.
| | | | | | | | |
| | | Total
number of
shares
purchased | | Average
price paid
per share | | Total number of
shares purchased
as part of publicly
announced plans
or programs | | Maximum number
of shares that may
yet be purchased
under the plans or
programs |
March 1 – 31, 2007 | | 740,000 | | 261.42p | | 740,000 | | 76,711,900 |
June 1 – 30, 2007 | | 186,000 | | 274.42p | | 186,000 | | 85,643,110 |
September 1 – 30, 2007 | | 327,000 | | 225.65p | | 327,000 | | 85,316,110 |
December 1 – 29, 2007 | | 344,500 | | 184.21p | | 344,500 | | 84,971,610 |
| | | | | | | | |
Total | | 1,597,500 | | | | 1,597,500 | | |
| | | | | | | | |
At the Company’s annual general meeting on May 22, 2006, shareholders approved a resolution allowing the Company to repurchase up to 77,451,900 Ordinary Shares of the Company. This approval expired at a further annual general meeting of the Company held on June 13, 2007, at which shareholders approved a resolution allowing the Company to repurchase a further 85,829,110 Ordinary Shares of the Company. This approval will expire on May 1, 2008 when the Company holds its next annual general meeting. All shares repurchased in the period were purchased in order that they can, at the relevant time, be allocated to employees under the Company’s ABIP.
As at December 31, 2006, the Company held 4,205,248 Ordinary Shares purchased as part of its publicly announced plan. During fiscal 2007, 1,596,907 Ordinary Shares were sold or transferred to plan participants. As at December 29, 2007 the Company held 4,205,841 of its own Ordinary Shares.
74
PART III
Item 17. Financial Statements
Not applicable.
Item 18. Financial Statements
Consolidated financial statements (as referred to by Item 8A)
75
Item 19. Exhibits
| | |
1.1 | | Memorandum and Articles of Association of the Company. (1) |
| |
4.1 | | The rules of the Tomkins Executive Share Option Scheme No. 3.(2) |
| |
4.2 | | The rules of the Tomkins Executive Share Option Scheme No. 4.(2) |
| |
4.3 | | Service Agreement, dated February 11, 2002 between Tomkins plc and James Nicol.(3) |
| |
4.4 | | Third Supplemental Trust Deed relating to the £750,000,000 EMTN Program dated August 28, 2003.(1) |
| |
4.5 | | Facility Agreement relating to the £400,000,000 multi-currency revolving credit agreement dated February 9, 2004.(1) |
| |
4.6 | | The rules of the Tomkins 2005 Sharesave Scheme.(4) |
| |
4.7 | | Terms and Conditions of Employment - John W. Zimmerman, dated October 31, 2007. |
| |
8.1 | | List of principal trading subsidiaries of the Company. |
| |
12.1 | | Certification of CEO pursuant to Rule 13 (a) – 14(a) of the Securities Exchange Act of 1934. |
| |
12.2 | | Certification of CFO pursuant to Rule 13 (a) – 14(a) of the Securities Exchange Act of 1934. |
| |
13.1 | | Certification of CEO and CFO pursuant to Rule 13(a) – 14 (b) of the Securities Exchange Act of 1934 and 18 USC. Section 1350, as adopted pursuant to Section 906 of the Sarbanes-Oxley Act of 2002. |
| |
23.1 | | Consent of Independent Registered Public Accounting Firm. |
(1) | Incorporated by reference to the Company’s Annual Report on Form 20-F for the fiscal year ended January 3, 2004. |
(2) | Incorporated by reference to the Company’s Annual Report on Form 20-F for the fiscal year ended April 30, 2001. |
(3) | Incorporated by reference to the Company’s Annual Report on Form 20-F for the fiscal year ended April 30, 2002. |
(4) | Incorporated by reference to the Company’s Annual Report on Form 20-F for the fiscal year ended January 1, 2005. |
76
Report of Independent Registered Public Accounting Firm
To the Board of Directors and Shareholders of Tomkins plc
We have audited the accompanying consolidated balance sheets of Tomkins plc and subsidiaries (the “Company”) as of December 29, 2007 and December 30, 2006, and the related consolidated income statements, consolidated statements of recognized income and expense, reconciliation of changes in consolidated shareholders’ equity and consolidated cash flows for each of the three years in the period ended December 29, 2007. These financial statements are the responsibility of the Company’s management. Our responsibility is to express an opinion on these financial statements based on our audits.
We conducted our audits in accordance with standards of the Public Company Accounting Oversight Board (United States). Those standards require that we plan and perform the audit to obtain reasonable assurance about whether the financial statements are free of material misstatement. An audit includes examining, on a test basis, evidence supporting the amounts and disclosures in the financial statements. An audit also includes assessing the accounting principles used and significant estimates made by management, as well as evaluating the overall financial statement presentation. We believe that our audits provide a reasonable basis for our opinion.
In our opinion, such consolidated financial statements present fairly, in all material respects, the financial position of Tomkins plc and subsidiaries as of December 29, 2007 and December 30, 2006, and the results of their operations and their cash flows for each of the three years in the period ended December 29, 2007, in conformity with International Financial Reporting Standards (“IFRS”) as adopted for use in the European Union and IFRS as issued by the International Accounting Standards Board.
We have also audited, in accordance with the standards of the Public Company Accounting Oversight Board (United States), the effectiveness of the Company’s internal control over financial reporting as of December 29, 2007, based on the criteria established inInternal Control—Integrated Frameworkissued by the Committee of Sponsoring Organizations of the Treadway Commission and our report dated February 20, 2008 expressed an unqualified opinion on the effectiveness of the Company’s internal control over financial reporting.
|

Deloitte & Touche LLP |
|
London, England |
February 20, 2008 |
F-1
Consolidated income statement
| | | | | | | | | | | | | |
| | | Note | | | | Year ended
29 December
2007 | | | Re-presented*
Year ended
30 December
2006 | | | Re-presented*
Year ended
31 December
2005 | |
| | | | | | | £ million | | | £ million | | | £ million | |
Continuing operations | | | | | | | | | | | | | |
Sales | | 4 | | | | 2,941.9 | | | 3,133.8 | | | 2,963.3 | |
Cost of sales | | | | | | (2,141.5 | ) | | (2,272.0 | ) | | (2,105.6 | ) |
| | | | | | | | | | | | | |
Gross profit | | | | | | 800.4 | | | 861.8 | | | 857.7 | |
Distribution costs | | | | | | (289.1 | ) | | (307.7 | ) | | (310.8 | ) |
Administrative expenses | | | | | | (250.6 | ) | | (262.5 | ) | | (246.2 | ) |
Restructuring costs | | 5 | | | | (13.8 | ) | | (13.0 | ) | | (4.2 | ) |
Gain on disposals and on the exit of businesses | | 5 | | | | 45.7 | | | 3.1 | | | 8.5 | |
Restructuring initiatives | | | | | | 31.9 | | | (9.9 | ) | | 4.3 | |
Share of profit of associates | | | | | | 0.4 | | | 1.5 | | | 0.6 | |
| | | | | | | | | | | | | |
Operating profit | | | | | | 293.0 | | | 283.2 | | | 305.6 | |
Interest payable | | 7 | | | | (71.0 | ) | | (77.8 | ) | | (78.4 | ) |
Investment income | | 8 | | | | 43.4 | | | 40.0 | | | 35.2 | |
Other finance (expense)/income | | 9 | | | | (2.8 | ) | | (0.7 | ) | | 4.2 | |
Net finance costs | | | | | | (30.4 | ) | | (38.5 | ) | | (39.0 | ) |
| | | | | | | | | | | | | |
Profit before tax | | | | | | 262.6 | | | 244.7 | | | 266.6 | |
Income tax expense | | 11 | | | | (69.9 | ) | | (35.8 | ) | | (60.0 | ) |
| | | | | | | | | | | | | |
Profit for the period from continuing operations | | | | | | 192.7 | | | 208.9 | | | 206.6 | |
Discontinued operations | | | | | | | | | | | | | |
Loss for the period from discontinued operations | | 10 | | | | (33.3 | ) | | (11.6 | ) | | (5.4 | ) |
| | | | | | | | | | | | | |
Profit for the period | | 12 | | | | 159.4 | | | 197.3 | | | 201.2 | |
Minority interests | | | | | | (12.5 | ) | | (11.2 | ) | | (9.0 | ) |
| | | | | | | | | | | | | |
Profit for the period attributable to equity shareholders | | | | | | 146.9 | | | 186.1 | | | 192.2 | |
| | | | | | | | | | | | | |
Earnings per share | | | | | | | | | | | | | |
Basic | | | | | | | | | | | | | |
Continuing operations | | | | | | 20.71 | p | | 23.57 | p | | 25.62 | p |
Discontinued operations | | | | | | (3.83 | )p | | (1.39 | )p | | (0.70 | )p |
| | | | | | | | | | | | | |
Total operations | | 13 | | | | 16.88 | p | | 22.18 p | | | 24.92 | p |
| | | | | | | | | | | | | |
Diluted | | | | | | | | | | | | | |
Continuing operations | | | | | | 20.45 | p | | 22.98 | p | | 24.41 | p |
Discontinued operations | | | | | | (3.77 | )p | | (1.31 | )p | | (0.62 | )p |
| | | | | | | | | | | | | |
Total operations | | 13 | | | | 16.68 | p | | 21.67 | p | | 23.79 | p |
| | | | | | | | | | | | | |
Dividends per ordinary share | | 14 | | | | 13.89 | p | | 13.89 | p | | 13.23 | p |
| | | | | | | | | | | | | |
F-2
Consolidated cash flow statement
| | | | | | | | | | | |
| | | Note | | Year ended
29 December
2007 | | | Year ended
30 December
2006 | | | Year ended
31 December
2005 | |
| | | | | £ million | | | £ million | | | £ million | |
Operating activities | | | | | | | | | | | |
Cash generated from operations | | 16 | | 319.2 | | | 331.5 | | | 336.5 | |
Income taxes paid | | | | (55.2 | ) | | (82.8 | ) | | (79.5 | ) |
Income taxes received | | | | 12.1 | | | 5.1 | | | 9.0 | |
| | | | | | | | | | | |
Net cash inflow from operating activities | | | | 276.1 | | | 253.8 | | | 266.0 | |
| | | | | | | | | | | |
Investing activities | | | | | | | | | | | |
Purchase of property, plant and equipment | | | | (115.6 | ) | | (105.7 | ) | | (128.5 | ) |
Purchase of intangible assets | | | | (2.6 | ) | | (20.9 | ) | | (14.8 | ) |
Capitalisation of development costs | | | | (0.2 | ) | | (0.3 | ) | | (0.4 | ) |
Disposal of property, plant and equipment | | | | 19.8 | | | 14.1 | | | 23.8 | |
Purchase of available-for-sale investments | | | | (0.1 | ) | | (0.1 | ) | | (0.1 | ) |
Sale of available-for-sale investments | | | | 0.3 | | | 0.3 | | | 0.1 | |
Purchase of interests in associates | | | | (1.9 | ) | | (1.9 | ) | | — | |
Purchase of subsidiaries, net of cash acquired | | 43 | | (8.5 | ) | | (109.6 | ) | | (101.3 | ) |
Sale of businesses and subsidiaries, net of cash disposed | | 44 | | 108.1 | | | 6.8 | | | 29.3 | |
Interest received | | | | 6.1 | | | 10.2 | | | 5.8 | |
Dividends received from associates | | | | 0.7 | | | 0.3 | | | 0.3 | |
| | | | | | | | | | | |
Net cash inflow/(outflow) from investing activities | | | | 6.1 | | | (206.8 | ) | | (185.8 | ) |
| | | | | | | | | | | |
Financing activities | | | | | | | | | | | |
Issue of ordinary shares | | | | 1.2 | | | 14.9 | | | 0.4 | |
Redemption of convertible cumulative preference shares | | | | (0.6 | ) | | — | | | — | |
Draw-down of bank and other loans | | | | 4.2 | | | 55.9 | | | 185.4 | |
Repayment of bank and other loans | | | | (144.9 | ) | | (27.9 | ) | | (49.1 | ) |
Capital element of finance lease rental payments | | | | (1.6 | ) | | (2.1 | ) | | (2.8 | ) |
Interest element of finance lease rental payments | | | | (0.7 | ) | | (0.6 | ) | | (0.7 | ) |
Decrease/(increase) in collateralised cash | | | | 1.2 | | | 1.4 | | | (0.5 | ) |
Purchase of own shares | | | | (3.8 | ) | | (4.8 | ) | | (2.4 | ) |
Sale of own shares | | | | — | | | — | | | 2.9 | |
Interest paid | | | | (32.4 | ) | | (38.8 | ) | | (26.1 | ) |
Equity dividend paid | | | | (122.0 | ) | | (115.3 | ) | | (99.4 | ) |
Preference dividend paid | | | | (1.0 | ) | | (7.1 | ) | | (16.1 | ) |
Investment by a minority shareholder in a subsidiary | | | | 1.9 | | | 3.2 | | | — | |
Dividend paid to a minority shareholder in a subsidiary | | | | (7.2 | ) | | (8.0 | ) | | (5.9 | ) |
| | | | | | | | | | | |
Net cash outflow from financing activities | | | | (305.7 | ) | | (129.2 | ) | | (14.3 | ) |
| | | | | | | | | | | |
Net (decrease)/increase in cash and cash equivalents | | | | (23.5 | ) | | (82.2 | ) | | 65.9 | |
Cash and cash equivalents at the beginning of the period | | | | 166.8 | | | 220.5 | | | 178.9 | |
Foreign currency translation | | | | (2.7 | ) | | 28.5 | | | (24.3 | ) |
| | | | | | | | | | | |
Cash and cash equivalents at the end of the period | | | | 140.6 | | | 166.8 | | | 220.5 | |
| | | | | | | | | | | |
Cash and cash equivalents for the purposes of the cash flow statement comprise:
| | | | | | | | | |
| | | As at
29 December
2007 | | | As at
30 December
2006 | | | As at
31 December
2005 | |
| | | £ million | | | £ million | | | £ million | |
Cash and cash equivalents | | 148.5 | | | 172.5 | | | 230.9 | |
Bank overdrafts | | (7.9 | ) | | (5.7 | ) | | (10.4 | ) |
| | | | | | | | | |
| | 140.6 | | | 166.8 | | | 220.5 | |
| | | | | | | | | |
F-3
Consolidated balance sheet
| | | | | | | | |
| | | Note | | As at
29 December
2007 | | | As at
30 December
2006 | |
| | | | | £ million | | | £ million | |
Non-current assets | | | | | | | | |
Goodwill | | 17 | | 331.2 | | | 325.6 | |
Other intangible assets | | 18 | | 46.7 | | | 48.1 | |
Property, plant and equipment | | 19 | | 709.7 | | | 695.0 | |
Investments in associates | | 20 | | 8.9 | | | 7.0 | |
Trade and other receivables | | 22 | | 12.5 | | | 2.5 | |
Deferred tax assets | | 35 | | 23.8 | | | 36.3 | |
Post-employment benefit surpluses | | 33 | | 3.6 | | | 0.9 | |
| | | | | | | | |
| | | | 1,136.4 | | | 1,115.4 | |
| | | | | | | | |
Current assets | | | | | | | | |
Inventories | | 21 | | 401.3 | | | 393.8 | |
Trade and other receivables | | 22 | | 496.3 | | | 475.2 | |
Income tax recoverable | | | | 14.8 | | | 21.8 | |
Available-for-sale investments | | 25 | | 1.5 | | | 2.1 | |
Cash and cash equivalents | | 26 | | 148.5 | | | 172.5 | |
| | | | | | | | |
| | | | 1,062.4 | | | 1,065.4 | |
| | | | | | | | |
Assets held for sale | | 27 | | 45.6 | | | 152.0 | |
| | | | | | | | |
Total assets | | | | 2,244.4 | | | 2,332.8 | |
| | | | | | | | |
Current liabilities | | | | | | | | |
Bank overdrafts | | 28 | | (7.9 | ) | | (5.7 | ) |
Bank and other loans | | 28 | | (20.0 | ) | | (31.8 | ) |
Obligations under finance leases | | 29 | | (0.9 | ) | | (1.4 | ) |
Trade and other payables | | 30 | | (370.6 | ) | | (353.3 | ) |
Income tax liabilities | | | | (14.4 | ) | | (12.0 | ) |
Provisions | | 36 | | (25.2 | ) | | (26.3 | ) |
Convertible cumulative preference shares | | 41 | | — | | | (0.4 | ) |
| | | | | | | | |
| | | | (439.0 | ) | | (430.9 | ) |
| | | | | | | | |
Non-current liabilities | | | | | | | | |
Bank and other loans | | 28 | | (411.7 | ) | | (536.3 | ) |
Obligations under finance leases | | 29 | | (3.9 | ) | | (7.9 | ) |
Trade and other payables | | 30 | | (21.7 | ) | | (11.7 | ) |
Post-employment benefit obligations | | 33 | | (153.8 | ) | | (205.8 | ) |
Deferred tax liabilities | | 35 | | (21.2 | ) | | (4.3 | ) |
Income tax liabilities | | | | (33.9 | ) | | (36.3 | ) |
Provisions | | 36 | | (13.7 | ) | | (13.9 | ) |
| | | | | | | | |
| | | | (659.9 | ) | | (816.2 | ) |
| | | | | | | | |
Convertible cumulative preference shares | | 41 | | — | | | (67.1 | ) |
| | | | | | | | |
| | | | (659.9 | ) | | (883.3 | ) |
| | | | | | | | |
Liabilities directly associated with assets held for sale | | 27 | | (14.1 | ) | | (64.1 | ) |
| | | | | | | | |
Total liabilities | | | | (1,113.0 | ) | | (1,378.3 | ) |
| | | | | | | | |
Net assets | | | | 1,131.4 | | | 954.5 | |
| | | | | | | | |
Capital and reserves | | | | | | | | |
Ordinary share capital | | 37 | | 44.2 | | | 42.9 | |
Share premium account | | 37 | | 397.3 | | | 332.1 | |
Own shares | | 38 | | (11.2 | ) | | (11.7 | ) |
Capital redemption reserve | | 39 | | 462.5 | | | 461.9 | |
Currency translation reserve | | 39 | | (6.1 | ) | | (60.2 | ) |
Available-for-sale reserve | | 39 | | (0.1 | ) | | 0.1 | |
Retained profit | | 39 | | 186.1 | | | 138.8 | |
| | | | | | | | |
Shareholders’ equity | | | | 1,072.7 | | | 903.9 | |
Minority interests | | 40 | | 58.7 | | | 50.6 | |
| | | | | | | | |
Total equity | | | | 1,131.4 | | | 954.5 | |
| | | | | | | | |
Approved by the Board on 20 February 2008 and signed on its behalf by:
|
J Nicol, Director |
J W Zimmerman, Director |
F-4
Consolidated statement of recognised income and expense
| | | | | | | | | |
| | | Year ended
29 December
2007 | | | Year ended
30 December
2006 | | | Year ended
31 December
2005 | |
| | | £ million | | | £ million | | | £ million | |
Profit for the period | | 159.4 | | | 197.3 | | | 201.2 | |
| | | | | | | | | |
Net income/(expense)recognised directly in equity | | | | | | | | | |
(Loss)/gain on available-for-sale investments | | (0.4 | ) | | 0.6 | | | 0.7 | |
Post-employment benefits: | | | | | | | | | |
– Actuarial gain/(loss) | | 48.1 | | | 19.4 | | | (44.1 | ) |
– Effect of the asset ceiling | | (22.0 | ) | | (0.8 | ) | | (0.3 | ) |
Currency translation differences on foreign operations: | | | | | | | | | |
– Subsidiaries | | 54.6 | | | (166.4 | ) | | 136.2 | |
– Associates | | 0.3 | | | (0.5 | ) | | 0.4 | |
(Loss)/gain on net investment hedges | | (13.6 | ) | | 69.6 | | | (72.6 | ) |
Tax on items taken directly to equity | | (6.3 | ) | | (1.0 | ) | | 16.2 | |
| | | | | | | | | |
| | 60.7 | | | (79.1 | ) | | 36.5 | |
| | | | | | | | | |
Transfers from equity to the income statement | | | | | | | | | |
Gain realised on the sale of available-for-sale investments | | (0.3 | ) | | (0.2 | ) | | (0.4 | ) |
Currency translation differences on foreign operations sold | | 14.2 | | | — | | | — | |
| | | | | | | | | |
Total recognised income and expense for the period | | 234.0 | | | 118.0 | | | 237.3 | |
| | | | | | | | | |
Attributable to: | | | | | | | | | |
– Equity shareholders | | 220.1 | | | 111.1 | | | 224.6 | |
– Minority interests | | 13.9 | | | 6.9 | | | 12.7 | |
| | | | | | | | | |
| | 234.0 | | | 118.0 | | | 237.3 | |
| | | | | | | | | |
Reconciliation of changes in consolidated shareholders’ equity
| | | | | | | | | |
| | | Year ended
29 December
2007 | | | Year ended
30 December
2006 | | | Year ended
31 December
2005 | |
| | | £ million | | | £ million | | | £ million | |
Shareholders’ equity at the beginning of the period | | 903.9 | | | 664.5 | | | 466.5 | |
Adoption of IAS 32 and IAS 39 | | — | | | — | | | 63.1 | |
| | | | | | | | | |
| | 903.9 | | | 664.5 | | | 529.6 | |
| | | | | | | | | |
Total recognised income and expense attributable to equity shareholders | | 220.1 | | | 111.1 | | | 224.6 | |
Dividends on ordinary shares | | (122.0 | ) | | (115.3 | ) | | (99.4 | ) |
Ordinary shares issued: | | | | | | | | | |
– Conversion of convertible cumulative preference shares | | 65.3 | | | 225.6 | | | 1.4 | |
– Exercise of employee share options | | 1.2 | | | 14.9 | | | 0.4 | |
Purchase of own shares | | (3.8 | ) | | (4.8 | ) | | (2.4 | ) |
Gain on disposal of own shares | | — | | | — | | | 2.9 | |
Cost of share-based incentives | | 8.0 | | | 7.9 | | | 7.4 | |
| | | | | | | | | |
Net addition to shareholders’ equity during the period | | 168.8 | | | 239.4 | | | 134.9 | |
| | | | | | | | | |
Shareholders’ equity at the end of the period | | 1,072.7 | | | 903.9 | | | 664.5 | |
| | | | | | | | | |
F-5
Notes to the financial statements
1. Nature of operations
Tomkins plc (“the Company”) and its subsidiaries (together, “the Group”) comprise a global engineering and manufacturing business. The Group is organised for management reporting purposes into two business groups: Industrial & Automotive and Building Products.
Industrial & Automotive manufactures a wide range of systems and components for car, truck and industrial equipment manufacturing markets, and industrial and automotive aftermarkets throughout the world. During the year, Industrial & Automotive operated through five business segments: Power Transmission, Fluid Power, Wiper Systems, Fluid Systems and Other Industrial & Automotive. Wiper Systems is classified as a discontinued operation and was sold on 29 June 2007.
Building Products is comprised of two business segments: Air Systems Components and Other Building Products. Air Systems Components supplies the industrial and residential heating, ventilation and air conditioning market mainly in North America. Other Building Products manufactures a variety of products for the building and construction industries mainly in North America.
2. Principal accounting policies
A. Basis of preparation
The consolidated financial statements on pages F-2 to F-62 have been prepared in accordance with International Financial Reporting Standards (“IFRS”) adopted for use in the European Union and, except as described under the heading “Financial instruments”, under the historical cost convention.
From the Group’s perspective, there are no applicable differences between IFRS adopted for use in the European Union and IFRS as issued by the International Accounting Standards Board (“IASB”) and therefore the financial statements also comply with IFRS as issued by the IASB.
The Group’s principal accounting policies are unchanged compared with the year ended 30 December 2006.
During the period, the Group adopted the following accounting pronouncements that are relevant to its operations, none of which had any impact on its results or financial position:
| • | | IFRS 7 “Financial Instruments: Disclosures” and the related amendment to IAS 1 “Presentation of Financial Statements – Capital Disclosures” |
| • | | IFRIC 7 “Applying the Restatement Approach under IAS 29 Financial Reporting in Hyperinflationary Economies” |
| • | | IFRIC 8 “Scope of IFRS 2” |
| • | | IFRIC 9 “Reassessment of Embedded Derivatives” |
| • | | IFRIC 10 “Interim Financial Reporting and Impairment” |
| • | | IFRIC 11 “Group and Treasury Share Transactions” |
The Group’s annual financial statements are drawn up to the Saturday nearest 31 December. These financial statements cover the financial year from 31 December 2006 to 29 December 2007 (“2007”) with comparative figures for the financial years from 1 January 2006 to 30 December 2006 (“2006”) and from 2 January 2005 to 31 December 2005 (“2005”).
B. Basis of consolidation
The consolidated financial statements include the results, cash flows and assets and liabilities of the Company and its subsidiaries, and the Group’s share of the results and net assets of its associates.
A subsidiary is an entity controlled, either directly or indirectly, by the Company, where control is the power to govern the financial and operating policies of the entity so as to obtain benefit from its activities. The results of a subsidiary acquired during the period are included in the Group’s results from the effective date of acquisition. The results of a subsidiary sold during the period are included in the Group’s results up to the effective date of disposal.
Where accumulated losses applicable to a minority interest in a subsidiary exceed the minority’s interest in the equity of the subsidiary, the excess is allocated to the Group’s interest in the subsidiary, except to the extent that the minority has a binding obligation and is able to make an additional investment to cover its share of the accumulated losses.
Intra-Group transactions and balances, and any unrealised gains and losses arising from intra-Group transactions, are eliminated on consolidation.
C. Associates
An associate is an entity over which the Company, either directly or indirectly, is in a position to exercise significant influence by participating in, but not controlling or jointly controlling, the financial and operating policies of the entity.
Associates are accounted for using the equity method. Losses of an associate in excess of the Group’s interest in the entity are not recognised, except to the extent that the Group has incurred obligations on behalf of the entity. Profits and losses recognised by the Company or its subsidiaries on transactions with an associate are eliminated to the extent of the Group’s interest in the associate concerned.
D. Foreign currency translation
At entity level, transactions denominated in foreign currencies are translated into the entity’s functional currency at the exchange rate ruling on the date of the transaction. Monetary assets and liabilities denominated in foreign currencies are retranslated at the exchange rate ruling on the balance sheet date. Currency translation differences are recognised in the income statement.
On consolidation, the results of foreign operations are translated into the Group’s presentation currency at the average exchange rate for the period and their assets and liabilities are translated into the Group’s presentation currency at the exchange rate ruling on the balance sheet date. Currency translation differences are recognised directly in equity in the currency translation reserve.
F-6
Notes to the financial statements continued
2. Principal accounting policies continued
In the event that a foreign operation is sold, the gain or loss on disposal recognised in the income statement is determined after taking into account the cumulative currency translation differences that are attributable to the operation. On adoption of IFRS, the Group elected to deem cumulative currency translation differences to be £nil. Accordingly, the gain or loss recognised on disposal of a foreign operation does not include currency translation differences that arose before 4 January 2004.
In the cash flow statement, the cash flows of foreign operations are translated into the Group’s presentation currency at the average exchange rate for the period.
E. Revenue
Revenue from the sale of goods is measured at the invoiced amount net of returns, early settlement discounts, rebates and sales taxes and is recognised only where there is persuasive evidence of a sales agreement, the delivery of goods has occurred, the sale price is fixed or determinable and the collectability of revenue is reasonably assured.
Revenue from long-term contracts is recognised by the percentage-of-completion method determined by comparing, for each contract, costs incurred for work performed to date to estimated total costs. Losses on contracts, if any, are recognised in the period when such losses become probable and can be reasonably estimated.
Interest income is accrued on a time basis using the effective interest method.
Dividend income is recognised when payment is received.
F. Restructuring initiatives
Restructuring initiatives comprise expenses incurred in major projects undertaken to rationalise and improve the cost competitiveness of the Group and consequential gains and losses arising on the exit and disposal of businesses or on the disposal of assets.
G. Goodwill
Business combinations are accounted for using the purchase method.
Goodwill arises on the acquisition of interests in subsidiaries and associates. Goodwill represents any excess of the cost of acquisition over the interest acquired by the Group in the fair value of the entity’s identifiable assets, liabilities and contingent liabilities at the date of acquisition.
Goodwill in respect of an acquired subsidiary is recognised as an intangible asset. Goodwill in respect of an acquired interest in an associate is included within investments in associates. Goodwill is not amortised but tested at least annually for impairment and carried at cost less any recognised impairment losses.
Where the interest acquired by the Group in the fair value of the entity’s assets, liabilities and contingent liabilities exceeds the cost of acquisition, the excess is recognised immediately as a gain in the income statement.
H. Other intangible assets
Other intangible assets are stated at cost less accumulated amortisation and any recognised impairment losses. All intangible assets recognised by the Group are considered to have finite useful lives.
(i) Assets acquired in business combinations
An intangible resource acquired in a business combination is recognised as an intangible asset if it is separable from the acquired business or arises from contractual or legal rights. An acquired intangible asset is amortised on a straight-line basis so as to charge its cost, which represents its fair value at the date of acquisition, to the income statement over its expected useful life, which is in the range 2 to 15 years.
(ii) Product development costs
All research expenditure is charged to the income statement in the period in which it is incurred.
Development expenditure is charged to the income statement in the period in which it is incurred unless it relates to the development of a new or significantly improved product and it is incurred after the technical feasibility of the product has been proven and customer orders have been received that are expected to provide income sufficient to cover the further development expenditure that will be incurred prior to the product going into full production. Capitalised development expenditure is amortised on a straight-line basis such that it is charged to the income statement over the expected life of the resulting product.
(iii) Computer software
Computer software that is not integral to an item of property, plant and equipment is recognised separately as an intangible asset. Amortisation is provided on a straight-line basis so as to charge the cost of the software to the income statement over its expected useful life, which is in the range three to five years.
I. Property, plant and equipment
Property, plant and equipment is stated at cost less accumulated depreciation and any recognised impairment losses. Freehold land and assets under construction are not depreciated. Depreciation of property, plant and equipment, other than freehold land and assets under construction, is generally provided on a straight-line basis so as to charge the depreciable amount to the income statement over the expected useful life of the asset concerned, which is in the following ranges:
| | |
Freehold buildings and long leasehold property | | 10 to 50 years |
Short leasehold property | | Length of lease |
Plant, equipment and vehicles | | 2 to 20 years |
Borrowing costs attributable to assets under construction are charged to the income statement in the period in which they are incurred.
J. Leases
Leases that confer rights and obligations similar to those that attach to owned assets are classified as finance leases. All other leases are classified as operating leases.
F-7
Notes to the financial statements continued
2. Principal accounting policies continued
Assets held under finance leases are included within property, plant and equipment, initially measured at their fair value or, if lower, the present value of the minimum lease payments, and a corresponding liability is recognised within obligations under finance leases. Subsequently, the assets are depreciated on a basis consistent with similar owned assets or over the term of the lease, if shorter. At inception of the lease, the lease rentals are apportioned between an interest element and a capital element so as to produce a constant periodic rate of interest on the outstanding liability. Thereafter, the interest element is recognised as an expense in the income statement while the capital element is applied to reduce the outstanding liability.
Operating lease rentals, and any incentives receivable, are recognised in the income statement on a straight-line basis over the term of the lease.
K. Impairment of non-current assets
Non-current assets are tested for impairment whenever events or circumstances indicate that their carrying amounts might be impaired. Additionally, goodwill and capitalised development expenditure relating to a product that is not yet in full production are subject to an annual impairment test.
An impairment loss is recognised to the extent that an asset’s carrying value exceeds its recoverable amount, which represents the higher of the asset’s fair value less costs to sell and its value in use. An asset’s value in use represents the present value of the future cash flows expected to be derived from the asset. Where it is not possible to estimate the recoverable amount of an individual asset, the impairment test is conducted for the cash-generating unit to which it belongs. Similarly, the recoverable amount of goodwill is determined by reference to the discounted future cash flows of the cash-generating units to which it is allocated.
Impairment losses are recognised in the income statement. Impairment losses recognised in previous periods for an asset other than goodwill are reversed if there has been a change in the estimates used to determine the asset’s recoverable amount, but only to the extent that the carrying amount of the asset does not exceed its carrying amount had no impairment loss been recognised in previous periods. Impairment losses recognised in respect of goodwill are not reversed.
L. Inventories
Inventories are valued at the lower of cost and net realisable value, with due allowance for any excess, obsolete or slow-moving items. Cost represents the expenditure incurred in bringing inventories to their existing location and condition, which may include the cost of raw materials, direct labour costs, other direct costs and related production overheads. Cost is generally determined on a first in, first out basis. Net realisable value is the estimated selling price less costs to complete and sell.
From time to time, the Group enters into forward purchase contracts to fix the price of commodities purchased for use in its manufacturing operations. As used by the Group, such derivative contracts do not fall within the scope of IAS 39 and therefore are not recognised as assets or liabilities.
M. Grants
Grants received relating to property, plant and equipment are treated as deferred income and recognised as income in equal instalments over the expected useful lives of the assets concerned. Other grants received are recognised as income on a systematic basis so as to match them with the costs they are intended to compensate or, if those costs have already been recognised, the grants are recognised as income in the period in which they are received.
N. Financial instruments
(i) Investments
Listed investments are classified as available-for-sale and are measured at fair value. Changes in their fair values are recognised in a separate component of equity except to the extent that they represent an other than temporary impairment in which case the impairment loss is recognised in the income statement. Realised gains and losses are transferred from equity to the income statement in the event of the disposal of the investments.
(ii) Trade receivables
Trade receivables represent the amount of sales of goods to customers for which payment has not been received, less an allowance for doubtful accounts that is estimated based on factors such as the credit rating of the customer, historical trends, the current economic environment and other information.
(iii) Cash and cash equivalents
Cash and cash equivalents comprise cash in hand, deposits available on demand and other short-term highly liquid investments with a maturity on acquisition of three months or less, and bank overdrafts. Bank overdrafts are presented as current liabilities to the extent that there is no right of offset with cash balances.
(iv) Trade payables
Trade payables represent the amount of invoices received from suppliers for purchases of goods and services for which payment has not been made.
(v) Bank and other loans
Bank and other loans are initially measured at fair value, net of directly attributable transaction costs, if any, and are subsequently measured at amortised cost using the effective interest rate method.
(vi) Derivative financial instruments
The Group uses derivative financial instruments, principally foreign currency swaps, forward foreign currency contracts and interest rate swaps, to reduce its exposure to exchange rate and interest rate movements. The Group does not hold or issue derivatives for speculative or trading purposes.
Derivative financial instruments are recognised as assets and liabilities measured at their fair values at the balance sheet date. Changes in their fair values are recognised in the income statement and this is likely to cause volatility in situations where the carrying value of the hedged item is either not adjusted to reflect fair value changes arising from the hedged risk or is so adjusted but that adjustment is not recognised in the income statement. Provided the conditions specified by IAS 39 “Financial Instruments: Recognition and Measurement” are met, hedge accounting may be used to mitigate this volatility.
F-8
Notes to the financial statements continued
2. Principal accounting policies continued
The Group does not generally apply hedge accounting to transactional foreign currency hedging relationships, such as hedges of forecast or committed transactions. It does, however, apply hedge accounting to translational foreign currency hedging relationships and to hedges of its interest rate exposures where it is permissible to do so under IAS 39. When hedge accounting is used, the relevant hedging relationships are classified as a fair value hedge, a cash flow hedge or, in the case of a hedge of the Group’s net investment in a foreign operation, a net investment hedge.
Where the hedging relationship is classified as a fair value hedge, the carrying amount of the hedged asset or liability is adjusted by the increase or decrease in its fair value attributable to the hedged risk and the resulting gain or loss is recognised in the income statement where, to the extent that the hedge is effective, it offsets the change in the fair value of the hedging instrument.
Where the hedging relationship is classified as a cash flow hedge or as a net investment hedge, to the extent the hedge is effective, changes in the fair value of the hedging instrument are recognised directly in equity rather than in the income statement. When the hedged item in a cash flow hedge is recognised in the financial statements, the accumulated gains and losses recognised in equity are either recycled to the income statement or, if the hedged item results in a non-financial asset, are recognised as adjustments to its initial carrying amount. Accumulated gains and losses recognised in equity in relation to a net investment hedge are recycled to the income statement on disposal of the foreign operation.
Derivative financial instruments are classified as current assets or liabilities unless they are in a designated hedging relationship and the hedged item is classified as a non-current asset or liability.
Derivative financial instruments that are not in a designated hedging relationship are classed as trading.
(vii) Embedded derivatives
Derivatives embedded in non-derivative host contracts are recognised separately as derivative financial instruments when their risks and characteristics are not closely related to those of the host contract and the host contract is not stated at its fair value with changes in its fair value recognised in the income statement.
(viii) Preference shares
Prior to redemption, the Company’s US dollar denominated 5.56% convertible cumulative preference shares were classified as non-current liabilities and translated into sterling at the exchange rate ruling at the balance sheet date. Dividends payable on the preference shares were included in interest payable.
(ix) Own shares
Own shares represent the Company’s ordinary shares that are held by the Company, its subsidiaries and sponsored ESOP trusts in relation to the Group’s employee share schemes. Own shares are deducted at cost in arriving at shareholders’ equity and gains and losses on their sale or transfer are recognised directly in equity.
O. Post-employment benefits
Post-employment benefits comprise pension benefits provided to employees throughout the world and other benefits, mainly healthcare, provided to certain employees in North America.
For defined contribution plans, the cost of providing the benefits represents the Group’s contributions to the plans and is recognised in the income statement in the period in which the contributions fall due.
For defined benefit plans, the cost of providing the benefits is determined based on actuarial valuations of each of the plans that are carried out annually at the Group’s balance sheet date by independent qualified actuaries. Plan assets (if any) are measured at their fair values at the balance sheet date. Benefit obligations are measured using the projected unit credit method.
The cost of defined benefit plans recognised in the income statement comprises the net total of the current service cost, the past service cost, the expected return on plan assets, the interest cost and the effect of curtailments and settlements. The current service cost represents the increase in the present value of the plan liabilities expected to arise from employee service in the current period. Past service costs resulting from enhanced benefits are recognised in the income statement on a straight-line basis over the vesting period, or immediately if the benefits have vested. The expected return on plan assets is based on market expectations, at the beginning of the period, for returns over the life of the benefit obligation. The interest cost represents the increase in the benefit obligation due to the passage of time. The discount rate used is determined by reference to market yields on high-quality corporate bonds, where available, or government bonds at the balance sheet date. Gains and losses on curtailments or settlements are recognised in the income statement in the period in which the curtailment or settlement occurs.
Actuarial gains and losses, which represent differences between the expected and actual returns on the plan assets and the effect of changes in actuarial assumptions, are recognised in the statement of recognised income and expense in the period in which they occur.
The defined benefit liability or asset recognised in the balance sheet comprises the net total for each plan of the present value of the benefit obligation, minus any past service costs not yet recognised, minus the fair value of the plan assets, if any, at the balance sheet date. Where a plan is in surplus, the asset recognised is limited to the amount of any unrecognised past service costs and the present value of any amounts that the Group expects to recover by way of refunds or a reduction in future contributions. The net total for all plans in surplus is classified as a non-current asset. The net total for all plans in deficit is classified as a non-current liability.
F-9
Notes to the financial statements continued
2. Principal accounting policies continued
P. Share-based incentives
Share-based incentives are provided to employees under the Group’s share option, bonus and other share award schemes. All existing schemes are classified as equity-settled. The Group recognises a compensation expense in respect of these schemes that is based on the fair value of the awards, where appropriate measured using an option-pricing model. Fair value is determined at the date of grant and is not subsequently remeasured unless the conditions on which the award was granted are modified. Generally, the compensation expense is recognised on a straight-line basis over the vesting period. Adjustments are made to reduce the compensation expense to reflect expected and actual forfeitures during the vesting period due to failure to satisfy service conditions or non-market performance conditions. In the event of a cancellation, the compensation expense that would have been recognised over the remainder of the vesting period is recognised immediately in the income statement.
In accordance with IFRS 1 “First-time Adoption of IFRS”, the Group has not applied this policy to awards that were granted on or before 7 November 2002.
Q. Provisions
A provision is a liability of uncertain timing or amount and is recognised when the Group has a present obligation as a result of a past event, it is probable that payment will be made to settle the obligation and the payment can be estimated reliably.
Provision is made for warranty claims when the relevant products are sold, based on historical experience of the nature, frequency and average cost of warranty claims.
Provision is made for the cost of product recalls if management consider it probable that it will be necessary to recall a specific product and the amount can be reasonably estimated.
Provision is made for restructuring costs when a detailed formal plan for the restructuring has been determined and the plan has been communicated to the affected parties. Gains from the expected disposal of assets are not taken into account in measuring these provisions and provision is not made for future operating losses.
Provision is made for claims for compensation for injuries sustained by the Group’s employees while at work. The provision represents management’s best estimate of the liability for claims made but not yet fully settled and for incidents which have occurred, but have not yet been reported to the Group. The Group’s liability for claims made but not yet fully settled is calculated on an actuarial basis by a third party administrator. Historical data trends are used to estimate the liability for unreported incidents.
R. Taxation
Current tax is the amount of tax payable or recoverable in respect of the taxable profit or loss for the period. Taxable profit differs from accounting profit because it excludes items of income or expense recognised for accounting purposes that are either not taxable or deductible for tax purposes or are taxable or deductible in other periods. Current tax is calculated using tax rates that have been enacted or substantively enacted at the balance sheet date.
The Group recognises provisions in respect of uncertain tax positions whereby additional current tax may become payable in future periods following the audit by the tax authorities of previously filed tax returns. Provisions for uncertain tax positions are based upon management’s assessment of the likely outcome of issues associated with assumed permanent differences, interest that may be applied to temporary differences, the possible disallowance of tax credits and penalties. Provisions for uncertain tax positions are reviewed regularly and are adjusted to reflect events such as the expiry of limitation periods for assessing tax, administrative guidance given by the tax authorities and court decisions.
Deferred tax is tax expected to be payable or recoverable on differences between the carrying amount of an asset or a liability and its tax base used in the computation of taxable profit. Deferred tax is accounted for using the liability method, whereby deferred tax liabilities are generally recognised for all taxable temporary differences and deferred tax assets are recognised to the extent that it is probable that taxable profits will be available against which deductible temporary differences can be utilised.
Deferred tax assets and liabilities are not recognised if the temporary difference arises from the initial recognition of goodwill or from the initial recognition of other assets and liabilities in a transaction other than a business combination that affects neither accounting profit nor taxable profit.
Deferred tax is provided on temporary differences arising on investments in foreign subsidiaries and associates, except where the Group is able to control the reversal of the temporary difference and it is probable that the temporary difference will not reverse in the foreseeable future.
Deferred tax is calculated using the tax rates that are expected to apply in the period in which the liability is settled or the asset is realised.
Tax assets and liabilities are offset when there is a legally enforceable right to set off current tax assets against current tax liabilities and when they relate to income taxes levied by the same taxation authority and the Group intends to settle its current tax assets and liabilities on a net basis.
Current and deferred tax is recognised in the income statement unless it relates to an item recognised directly in equity, in which case it is recognised directly in equity.
S. Assets held for sale and discontinued operations
Assets are classified as held for sale if their carrying amount will be recovered by sale rather than by continuing use in the business. For this to be the case, the asset must be available for immediate sale in its present condition, management must be committed to and have initiated a plan to sell the asset which, when initiated, was expected to result in a completed sale within 12 months. An extension of the period required to complete the sale does not preclude the asset from being classified as held for sale, provided the delay was for reasons beyond the Group’s control and management remains committed to its plan to sell the asset. Assets that are classified as held for sale are measured at the lower of their carrying amount and fair value less costs to sell.
F-10
Notes to the financial statements continued
2. Principal accounting policies continued
A discontinued operation is a component of an entity that has either been disposed of, or satisfies the criteria to be classified as held for sale, and represents a separate major line of business or geographical area of operations, is part of a single co-ordinated plan to dispose of a separate major line of business or geographical area of operations or is a subsidiary acquired exclusively with a view to disposal.
T. Dividends on ordinary shares
Dividends payable on ordinary shares are recognised in the financial statements when they have been appropriately authorised and are no longer at the Company’s discretion. Accordingly, interim dividends are recognised when they are paid and final dividends are recognised when they are declared following approval by shareholders at the Company’s Annual General Meeting. Dividends on ordinary shares are recognised as an appropriation of shareholders’ equity.
U. Accounting pronouncements not yet adopted
Recently-issued accounting pronouncements that are relevant to the Group’s operations but have not yet been adopted are outlined below. With the exception of the revisions to IAS 23 and those to IFRS 3 and IAS 27, management does not expect that the adoption of these pronouncements will have a material impact on the Group’s results or financial position.
IFRS 8 “Operating Segments”
IFRS 8 replaces IAS 14 “Segment Reporting” and aligns segment reporting with the requirements of the equivalent US accounting standard. IFRS 8 requires an entity to adopt a “management approach” whereby the segment information reported will be what management uses internally for evaluating segment performance and deciding how to allocate resources to operating segments.
IFRS 8 is effective for annual periods commencing on or after 1 January 2009.
IAS 23 Revised “Borrowing Costs”
In March 2007, the IASB published a revised version of IAS 23 that changes the permitted treatment of borrowing costs relating to “qualifying assets”, i.e. assets that necessarily take a substantial period of time to get ready for their intended use or sale. Under the existing standard, the Group recognises all borrowing costs as an expense in the period in which they are incurred. Under the revised standard, borrowing costs that are directly attributable to the acquisition, construction or production of a qualifying asset must be capitalised as part of the cost of that asset.
IAS 23 Revised must be applied to borrowing costs relating to qualifying assets for which capitalisation commences in annual periods beginning on or after 1 January 2009.
Management expects that IAS 23 Revised will have an initial positive impact on the Group’s results and financial position because borrowing costs that would have been expensed as incurred will be capitalised as part of the cost of qualifying assets. However, this initial positive impact will be offset over time by the higher depreciation expense that will be recognised in respect of the qualifying assets. Management is not yet able to estimate reliably the effect of IAS 23 Revised as this will depend on the level of expenditure on qualifying assets and prevailing market interest rates.
IAS 1 Revised “Presentation of Financial Statements”
In September 2007, the IASB published a revised version of IAS 1 which provides for a number of presentational changes to financial statements, including the option to present a single statement of comprehensive income (rather than an income statement and a separate statement of other comprehensive income), the requirement to disclose income tax relating to each component of other comprehensive income, and the requirement to present a balance sheet as at the beginning of the earliest comparative period when an entity applies a change of accounting policy retrospectively or makes a retrospective restatement.
IAS 1 Revised is effective for annual periods beginning on or after 1 January 2009.
IFRS 3 Revised “Business Combinations” and IAS 27 Revised “Consolidated and Separate Financial Statements”
In January 2008, the IASB issued revised versions of IFRS 3 and IAS 27 that introduce a number of changes that will affect the accounting for future business combinations and the accounting in the event of the loss of control over a subsidiary.
Where a business combination involves a minority interest, the Group will be able to choose for each business combination whether to measure the minority interest at fair value or, as at present, at the minority’s share of the fair value of the net assets of the acquired entity. In step acquisitions, previously held interests will be remeasured at fair value and any gain or loss arising will be recognised in the income statement. On the loss of control of a subsidiary, any retained interest will be remeasured at fair value and any gain or loss will be reflected in the gain or loss on loss of control.
Other significant changes are that acquisition costs will be expensed and adjustments to contingent consideration will be recognised in the income statement.
IFRS 3 Revised and IAS 27 Revised are effective for annual periods commencing on or after 1 July 2009.
The financial effect of IFRS 3 Revised and IAS 27 Revised will be dependent on the circumstances surrounding the future transactions to which they will apply, that are at present unknown.
Amendment to IFRS 2 “Share-based Payment – Vesting Conditions and Cancellations”
In January 2008, the IASB published an amendment to IFRS 2 which clarifies that only service conditions and performance conditions attaching to a share-based incentive are vesting conditions and specifies that all cancellations, whether by the Group or by the participant, should receive the same accounting treatment. It is expected that the principal impact of the amendment will be in relation to the Group’s savings-related share option scheme. At present, if a participant in that scheme forfeits an award by ceasing to make payments to the savings contract the event is treated as a forfeiture. On adoption of the amendment, that event will be treated as a cancellation unless a subsequent award is identified as a replacement in which case it will be treated as a modification.
F-11
Notes to the financial statements continued
2. Principal accounting policies continued
The amendment to IFRS 2 is effective for annual periods beginning on or after 1 January 2009.
IFRIC 14 “IAS 19 – The Limit on a Defined Benefit Asset, Minimum Funding Requirements and their Interaction”
IFRIC 14 clarifies when refunds or reductions in future contributions may be regarded as available to the sponsoring employer in assessing the amount of the surplus in a post-employment benefit plan that can be recognised as an asset by the sponsoring employer. IFRIC 14 also clarifies how a defined benefit asset or liability may be affected where there is a minimum funding requirement, i.e. the sponsoring employer is required to provide a minimum amount or level of contributions to a post-employment benefit plan over a given period to improve the security of the benefit obligations to members of the plan.
IFRIC 14 is effective for annual periods beginning on or after 1 January 2008.
3. Critical accounting estimates
A. Background
When applying the Group’s accounting policies, management must make assumptions and estimates concerning the future that affect the carrying amounts of assets and liabilities at the balance sheet date, the disclosure of contingencies that existed at the balance sheet date and the amounts of revenue and expenses recognised during the accounting period. Such assumptions and estimates are based on factors such as historical experience, the observance of trends in the industries in which the Group operates and information available from the Group’s customers and other outside sources.
Due to the inherent uncertainty involved in making assumptions and estimates, actual outcomes could differ from those assumptions and estimates. An analysis of the key sources of estimation uncertainty at the balance sheet date that have a significant risk of causing a material adjustment to the carrying amounts of the Group’s assets and liabilities within the next financial year is presented below.
B. Post-employment benefits
The Group operates pension plans throughout the world, covering the majority of its employees. Pension benefits are provided by way of both defined contribution plans and defined benefit plans. The Group’s defined benefit pension plans are closed to new entrants. The Group also provides other post-employment benefits, principally health and life insurance cover, to certain of its employees in North America by way of unfunded defined benefit plans.
The Group accounts for post-employment benefits in accordance with IAS 19 “Employee Benefits”, whereby the cost of defined benefit plans is determined based on actuarial valuations of the plans that are carried out annually at the Group’s balance sheet date. The actuarial valuations are dependent on assumptions about the future that are made by management on the advice of independent qualified actuaries. If actual experience differs from these assumptions, there could be a material change in the amounts recognised by the Group in respect of defined benefit plans in the next financial year.
As at 29 December 2007, the present value of the benefit obligation was £691.1 million. The benefit obligation is calculated using a number of assumptions including future salary increases, increases to pension benefits, mortality rates and, in the case of post-employment medical benefits, the expected rate of increase in medical costs. The present value of the benefit obligation is calculated by discounting the benefit obligation using market yields on high-quality corporate bonds at the balance sheet date. As at 29 December 2007, the fair value of the plan assets was £564.5 million. The plan assets consist largely of listed securities and their fair values are subject to fluctuation in response to changes in market conditions. As at 29 December 2007, the Group was unable to recognise a surplus of £24.8 million due to the effect of the asset ceiling.
Effects of changes in the actuarial assumptions underlying the benefit obligation, effects of changes in the discount rate applicable to the benefit obligation and effects of differences between the expected and actual return on the plan assets are classified as actuarial gains and losses and are recognised directly in equity. During 2007, the Group recognised a net actuarial gain of £48.1 million. Further actuarial gains and losses will be recognised during the next financial year.
C. Impairment of non-current assets
Goodwill, intangible assets and property, plant and equipment are tested for impairment whenever events or circumstances indicate that their carrying amounts might be impaired. Such events and circumstances include the effects of restructurings and new product development initiated by management. Additionally, goodwill and capitalised development expenditure relating to a product that is not yet in full production are subject to an annual impairment test. Impairment testing of goodwill requires the calculation of the value in use of the cash-generating units to which the goodwill is allocated. Due to the nature of the Group’s operations, it is generally not possible to estimate the recoverable amount for individual items of property, plant and equipment and impairment testing of these assets is also usually based on the value in use of the cash-generating unit to which the asset belongs.
Value in use represents the net present value of the cash flows expected to arise from the relevant cash-generating unit and its calculation requires management to estimate those cash flows and to apply a suitable discount rate to them. Management bases the estimated cash flows on assumptions such as the future growth in sales volumes, future changes in selling prices, and expected changes in material prices, salaries and other costs. Discount rates used are based on current market interest rates.
As at 29 December 2007, the aggregate carrying amount of goodwill, intangible assets and property, plant and equipment was £1,087.6 million. Impairment losses may be recognised on these assets within the next financial year if changes are necessary to the assumptions underlying the estimated future cash flows of cash-generating units or if there are changes in market interest rates that affect the discount rates that are applied to those cash flows.
F-12
Notes to the financial statements continued
3. Critical accounting estimates continued
D. Assets held for sale
Assets that are classified as held for sale are measured at the lower of their carrying amount and fair value less costs to sell. As at 29 December 2007, the carrying value of assets held for sale was £45.6 million. Impairment losses may be recognised in the next financial year if the amounts realised on the sale of these assets differs from management’s estimates.
E. Inventory
Inventories are stated at the lower of cost and net realisable value, with due allowance for excess, obsolete or slow moving items. Net realisable value is based on current assessments of future demand, market conditions and new product development initiatives. As at 29 December 2007, the carrying value of inventories was £401.3 million, net of allowances of £3.8 million. Impairment losses may be recognised on inventory within the next financial year if management needs to revise its estimates in response to changing circumstances.
F. Financial instruments
Derivative financial instruments that the Group holds for the purpose of hedging its currency and interest rate exposures are recognised as assets and liabilities in the Group’s balance sheet measured at their fair value at the balance date. As at 29 December 2007, the Group recognised a net liability of £4.8 million in respect of derivatives. The fair value of derivatives continually changes in response to changes in prevailing market conditions. Where permissible under IAS 39, the Group uses hedge accounting to mitigate the impact of changes in the fair value of derivatives on the income statement but the Group’s results may be affected by changes in the fair values of derivatives where hedge accounting cannot be applied or due to hedge ineffectiveness.
G. Workers’ compensation
Provision is made for claims for compensation for injuries sustained by the Group’s employees while at work. The Group’s liability for claims made but not fully settled is calculated on an actuarial basis by a third party administrator. Historical data trends are used to estimate the liability for unreported incidents. As at 29 December 2007, the workers’ compensation provision amounted to £14.5 million. Further provision may be necessary within the next financial year if the actual cost of settling claims exceeds management’s estimates.
H. Environmental liabilities
Provision is made for the estimated cost of known environmental remediation obligations in relation to the Group’s current and former manufacturing facilities. Cost estimates include the expenditure expected to be incurred in the initial remediation effort and, where appropriate, in the long-term monitoring of the relevant sites. Management monitors for each remediation project the costs incurred to date against expected total costs to complete and operates procedures to identify possible remediation obligations that are presently unknown.
As at 29 December 2007, the provision for environmental remediation costs amounted to £4.6 million. Further provision may be necessary within the next financial year if actual remediation costs exceed expected costs, new remediation obligations are identified or there are changes in the circumstances determining the Group’s legal or constructive remediation obligations.
I. Product warranties
Provision is made for the estimated cost of future warranty claims on the Group’s products. Management bases the provision on historical experience of the nature, frequency and average cost of warranty claims and takes into account recent trends that might suggest that the historical claims experience may differ from future claims. As at 29 December 2007, the Group’s provision for warranty claims amounted to £7.6 million. Further provision may be necessary within the next financial year if actual claims experience differs from management’s estimates.
J. Taxation
The Group is subject to income tax in each of the jurisdictions in which it operates. Management is required to exercise significant judgement in determining the Group’s provision for income taxes.
Estimation is required of taxable profit in order to determine the Group’s current tax liability. Management’s judgement is required in relation to uncertain tax positions whereby additional current tax may become payable in the future following the audit by the tax authorities of previously filed tax returns. As at 29 December 2007, the Group holds a provision for uncertain tax positions amounting to £33.9 million. It is possible that the final outcome of these uncertain tax positions may differ from management’s estimates.
Estimation is also required of temporary differences between the carrying amount of assets and liabilities and their tax base. Deferred tax liabilities are recognised for all taxable temporary differences, but where there exist deductible temporary differences management’s judgement is required as to whether a deferred tax asset should be recognised based on the availability of future taxable profits. As at 29 December 2007, the Group recognised net deferred tax assets amounting to £1.5 million. It is possible that the deferred tax assets actually recoverable may differ from the amounts recognised if actual taxable profits differ from management’s estimates.
As at 29 December 2007, deferred tax liabilities were not recognised on retained profits of foreign subsidiaries and associates amounting to £1,971.0 million because the Group is able to control the remittance of those profits to the UK and it is probable that they will not be remitted in the foreseeable future. Income tax may be payable on these amounts if circumstances change and either their remittance can no longer be controlled by the Group or they are actually remitted to the UK.
F-13
Notes to the financial statements continued
4. Segment information
A. Background
The Group’s businesses are grouped for management reporting purposes according to the nature of their products. The Group’s primary format for reporting segment information is therefore by business segment.
The Group’s business segments are described in note 1.
B. Segment revenue and results – continuing operations
| | | | | | | | | | | | |
| | | Segment revenue | | Segment result |
| | | Year ended
29 December
2007 | | Year ended
30 December
2006* | | Year ended
31 December
2005* | | Year ended
29 December
2007 | | Year ended
30 December
2006* | | Year ended 31
December
2005* |
| | | £ million | | £ million | | £ million | | £ million | | £ million | | £ million |
By business segment | | | | | | | | | | | | |
Industrial & Automotive: | | | | | | | | | | | | |
– Power Transmission | | 1,031.2 | | 1,009.6 | | 969.9 | | 130.1 | | 137.5 | | 127.9 |
– Fluid Power | | 374.0 | | 383.8 | | 358.0 | | 28.7 | | 30.0 | | 38.4 |
– Fluid Systems | | 291.8 | | 244.0 | | 245.2 | | 25.5 | | 9.5 | | 20.4 |
– Other Industrial & Automotive | | 458.5 | | 535.4 | | 506.4 | | 49.7 | | 53.5 | | 56.7 |
| | | | | | | | | | | | |
| | 2,155.5 | | 2,172.8 | | 2,079.5 | | 234.0 | | 230.5 | | 243.4 |
| | | | | | | | | | | | |
Building Products: | | | | | | | | | | | | |
– Air Systems Components | | 541.6 | | 583.9 | | 485.4 | | 45.6 | | 53.8 | | 57.3 |
– Other Building Products | | 244.8 | | 377.1 | | 398.4 | | 32.2 | | 25.9 | | 29.2 |
| | | | | | | | | | | | |
| | 786.4 | | 961.0 | | 883.8 | | 77.8 | | 79.7 | | 86.5 |
| | | | | | | | | | | | |
| | 2,941.9 | | 3,133.8 | | 2,963.3 | | 311.8 | | 310.2 | | 329.9 |
| | | | | | | | | | | | |
By origin | | | | | | | | | | | | |
US | | 1,727.8 | | 2,028.1 | | 1,961.5 | | 189.8 | | 187.0 | | 232.8 |
UK | | 204.0 | | 140.0 | | 130.9 | | 13.4 | | 15.6 | | 12.6 |
Rest of Europe | | 366.8 | | 349.7 | | 312.6 | | 31.0 | | 32.3 | | 28.1 |
Rest of the World | | 643.3 | | 616.0 | | 558.3 | | 77.6 | | 75.3 | | 56.4 |
| | | | | | | | | | | | |
| | 2,941.9 | | 3,133.8 | | 2,963.3 | | 311.8 | | 310.2 | | 329.9 |
| | | | | | | | | | | | |
By destination | | | | | | | | | | | | |
US | | 1,855.5 | | 2,094.4 | | 2,054.1 | | | | | | |
UK | | 74.7 | | 73.2 | | 66.9 | | | | | | |
Rest of Europe | | 404.7 | | 373.7 | | 331.6 | | | | | | |
Rest of the World | | 607.0 | | 592.5 | | 510.7 | | | | | | |
| | | | | | | | | | | | |
| | 2,941.9 | | 3,133.8 | | 2,963.3 | | | | | | |
| | | | | | | | | | | | |
| * | Re-presented (see note 10) |
Inter-segment sales were not significant.
The aggregate segment result of continuing operations includes a net gain of £31.9 million arising from restructuring initiatives (2006: net loss of £9.9 million; 2005: net gain of £4.3 million) and the amortisation of intangible assets arising on acquisition of £3.6 million (2006: £2.7 million; 2005: £0.2 million).
Restructuring initiatives are analysed by business segment in note 5.
Amortisation of intangible assets arising on acquisition may be analysed by business segment as follows: Fluid Power £0.8 million (2006: £1.3 million; 2005: £nil); Other Industrial & Automotive £0.9 million (2006: £0.5 million; 2005: £0.2 million); Air Systems Components £1.9 million (2006: £0.9 million; 2005: £nil).
Segmental analysis of the revenue and results of discontinued operations is presented in note 10.
F-14
Notes to the financial statements continued
4. Segment information continued
Reconciliation of the aggregate segment result of continuing operations to the profit for the period:
| | | | | | | | | |
| | | Year ended
29 December
2007 | | | Year ended
30 December
2006* | | | Year ended
31 December
2005* | |
| | | £ million | | | £ million | | | £ million | |
Segment result | | 311.8 | | | 310.2 | | | 329.9 | |
Unallocated corporate activities | | (19.5 | ) | | (28.7 | ) | | (25.3 | ) |
Gain on sale of available-for-sale investments | | 0.3 | | | 0.2 | | | 0.4 | |
Share of profit of associates | | 0.4 | | | 1.5 | | | 0.6 | |
| | | | | | | | | |
Operating profit | | 293.0 | | | 283.2 | | | 305.6 | |
Interest payable | | (71.0 | ) | | (77.8 | ) | | (78.4 | ) |
Investment income | | 43.4 | | | 40.0 | | | 35.2 | |
Other finance (expense)/income | | (2.8 | ) | | (0.7 | ) | | 4.2 | |
| | | | | | | | | |
Profit before tax | | 262.6 | | | 244.7 | | | 266.6 | |
Income tax expense | | (69.9 | ) | | (35.8 | ) | | (60.0 | ) |
| | | | | | | | | |
Profit for the period from continuing operations | | 192.7 | | | 208.9 | | | 206.6 | |
Loss for the period from discontinued operations | | (33.3 | ) | | (11.6 | ) | | (5.4 | ) |
| | | | | | | | | |
Profit for the period | | 159.4 | | | 197.3 | | | 201.2 | |
| | | | | | | | | |
| * | Re-presented (see note 10) |
C. Segment assets and liabilities
| | | | | | | | | | |
| | | Segment assets | | Segment liabilities | |
| | | As at
29 December
2007 | | As at
30 December
2006 | | As at
29 December
2007 | | | As at
30 December
2006 | |
| | | £ million | | £ million | | £ million | | | £ million | |
By business segment | | | | | | | | | | |
Continuing operations | | | | | | | | | | |
Industrial & Automotive: | | | | | | | | | | |
– Power Transmission | | 852.8 | | 789.9 | | (242.5 | ) | | (252.9 | ) |
– Fluid Power | | 283.0 | | 269.5 | | (96.7 | ) | | (114.0 | ) |
– Fluid Systems | | 200.7 | | 163.4 | | (60.7 | ) | | (51.6 | ) |
– Other Industrial & Automotive | | 229.9 | | 243.1 | | (66.7 | ) | | (80.8 | ) |
| | | | | | | | | | |
| | 1,566.4 | | 1,465.9 | | (466.6 | ) | | (499.3 | ) |
| | | | | | | | | | |
Building Products: | | | | | | | | | | |
– Air Systems Components | | 385.4 | | 402.0 | | (75.2 | ) | | (80.2 | ) |
– Other Building Products | | 75.8 | | 104.9 | | (25.4 | ) | | (35.1 | ) |
| | | | | | | | | | |
| | 461.2 | | 506.9 | | (100.6 | ) | | (115.3 | ) |
| | | | | | | | | | |
| | 2,027.6 | | 1,972.8 | | (567.2 | ) | | (614.6 | ) |
| | | | | | | | | | |
Discontinued operations | | | | | | | | | | |
Industrial & Automotive: | | | | | | | | | | |
– Wiper Systems | | — | | 99.5 | | — | | | (38.0 | ) |
| | | | | | | | | | |
| | 2,027.6 | | 2,072.3 | | (567.2 | ) | | (652.6 | ) |
| | | | | | | | | | |
By location of assets | | | | | | | | | | |
US | | 1,003.7 | | 1,140.0 | | | | | | |
UK | | 135.4 | | 134.5 | | | | | | |
Rest of Europe | | 274.0 | | 234.6 | | | | | | |
Rest of the World | | 627.8 | | 574.4 | | | | | | |
| | | | | | | | | | |
| | 2,040.9 | | 2,083.5 | | | | | | |
| | | | | | | | | | |
F-15
Notes to the financial statements continued
4. Segment information continued
Reconciliation of aggregate segment assets to consolidated total assets:
| | | | |
| | | As at
29 December
2007 | | As at
30 December
2006 |
| | | £ million | | £ million |
Segment assets allocated to business segments | | 2,027.6 | | 2,072.3 |
Unallocated corporate assets | | 13.3 | | 11.2 |
| | | | |
Segment assets allocated to geographical segments | | 2,040.9 | | 2,083.5 |
Investments in associates | | 8.9 | | 7.0 |
Available-for-sale investments | | 1.5 | | 2.1 |
Cash and cash equivalents | | 148.5 | | 172.5 |
Collateralised cash | | 2.9 | | 4.1 |
Derivatives hedging translational exposures | | 3.1 | | 4.0 |
Income tax assets: | | | | |
– Ongoing businesses | | 38.6 | | 58.1 |
– Businesses to be sold (note 27) | | — | | 1.5 |
| | | | |
Consolidated total assets | | 2,244.4 | | 2,332.8 |
| | | | |
Reconciliation of aggregate segment liabilities to consolidated total liabilities:
| | | | | | |
| | | As at
29 December
2007 | | | As at
30 December
2006 | |
| | | £ million | | | £ million | |
Segment liabilities allocated to business segments | | (567.2 | ) | | (652.6 | ) |
Unallocated corporate liabilities | | (23.9 | ) | | (22.0 | ) |
Bank overdrafts | | (7.9 | ) | | (5.7 | ) |
Bank and other loans | | (431.7 | ) | | (568.1 | ) |
Obligations under finance leases | | (4.8 | ) | | (9.3 | ) |
Derivatives hedging translational exposures | | (6.9 | ) | | (0.5 | ) |
Income tax liabilities: | | | | | | |
– Ongoing businesses | | (69.5 | ) | | (52.6 | ) |
– Businesses to be sold (note 27) | | (1.1 | ) | | — | |
Convertible cumulative preference shares | | — | | | (67.5 | ) |
| | | | | | |
Consolidated total liabilities | | (1,113.0 | ) | | (1,378.3 | ) |
| | | | | | |
F-16
Notes to the financial statements continued
4. Segment information continued
D. Additional segment information
Analysis by segment of certain changes in the carrying value of property, plant and equipment and intangible assets:
| | | | | | | | | | | | | | | | | | |
| | | Year ended 29 December 2007 | | Year ended 30 December 2006* | | Year ended 31 December 2005* |
| | | Additions | | Depreciation
and
amortisation | | Impairment
loss | | Additions | | Depreciation
and
amortisation | | Impairment
loss | | Additions | | Depreciation
and
amortisation | | Impairment
loss |
| | | £ million | | £ million | | £ million | | £ million | | £ million | | £ million | | £ million | | £ million | | £ million |
By business segment | | | | | | | | | | | | | | | | | | |
Continuing operations | | | | | | | | | | | | | | | | | | |
Industrial & Automotive: | | | | | | | | | | | | | | | | | | |
– Power Transmission | | 45.8 | | 54.2 | | — | | 53.5 | | 50.9 | | 0.4 | | 67.9 | | 47.9 | | — |
– Fluid Power | | 18.5 | | 16.0 | | — | | 14.6 | | 15.9 | | — | | 20.5 | | 13.1 | | — |
– Fluid Systems | | 21.2 | | 15.6 | | — | | 18.9 | | 15.3 | | — | | 16.0 | | 15.2 | | — |
– Other Industrial & Automotive | | 14.4 | | 9.4 | | 0.4 | | 9.7 | | 10.4 | | — | | 8.8 | | 9.6 | | — |
| | | | | | | | | | | | | | | | | | |
| | 99.9 | | 95.2 | | 0.4 | | 96.7 | | 92.5 | | 0.4 | | 113.2 | | 85.8 | | — |
| | | | | | | | | | | | | | | | | | |
Building Products: | | | | | | | | | | | | | | | | | | |
– Air Systems Components | | 11.8 | | 15.4 | | — | | 13.4 | | 16.3 | | — | | 12.9 | | 14.0 | | — |
– Other Building Products | | 4.4 | | 6.8 | | — | | 11.7 | | 9.5 | | — | | 10.9 | | 9.5 | | — |
| | | | | | | | | | | | | | | | | | |
| | 16.2 | | 22.2 | | — | | 25.1 | | 25.8 | | — | | 23.8 | | 23.5 | | — |
| | | | | | | | | | | | | | | | | | |
Unallocated corporate assets | | 0.1 | | 0.4 | | — | | 0.5 | | 0.5 | | — | | — | | 0.5 | | — |
| | | | | | | | | | | | | | | | | | |
| | 116.2 | | 117.8 | | 0.4 | | 122.3 | | 118.8 | | 0.4 | | 137.0 | | 109.8 | | — |
| | | | | | | | | | | | | | | | | | |
Discontinued operations | | | | | | | | | | | | | | | | | | |
Industrial & Automotive: | | | | | | | | | | | | | | | | | | |
– Wiper Systems | | 2.2 | | — | | — | | 4.6 | | 7.2 | | 27.1 | | 6.3 | | 9.3 | | 5.3 |
| | | | | | | | | | | | | | | | | | |
| | 118.4 | | 117.8 | | 0.4 | | 126.9 | | 126.0 | | 27.5 | | 143.3 | | 119.1 | | 5.3 |
| | | | | | | | | | | | | | | | | | |
By location of assets | | | | | | | | | | | | | | | | | | |
US | | 45.5 | | 51.6 | | 0.4 | | 56.9 | | 65.2 | | 26.9 | | 62.8 | | 62.9 | | — |
UK | | 15.6 | | 11.8 | | — | | 12.9 | | 10.1 | | 0.2 | | 10.2 | | 11.4 | | 5.3 |
Rest of Europe | | 17.5 | | 14.7 | | — | | 14.0 | | 13.9 | | — | | 15.1 | | 11.7 | | — |
Rest of the World | | 39.8 | | 39.7 | | — | | 43.1 | | 36.8 | | 0.4 | | 55.2 | | 33.1 | | — |
| | | | | | | | | | | | | | | | | | |
| | 118.4 | | 117.8 | | 0.4 | | 126.9 | | 126.0 | | 27.5 | | 143.3 | | 119.1 | | 5.3 |
| | | | | | | | | | | | | | | | | | |
| * | Re-presented (see note 10) |
5. Restructuring initiatives
| | | | | | | | | | | | | | | | | | | | | | | | | | | |
| | | Year ended 29 December 2007 | | | Year ended 30 December 2006 | | | Year ended 31 December 2005 | |
| | | Restructuring
costs | | | Disposals
and exit of
businesses | | | Total | | | Restructuring
costs | | | Disposals
and exit of
businesses | | | Total | | | Restructuring
costs | | | Disposals
and exit of
businesses | | | Total | |
| | | £ million | | | £ million | | | £ million | | | £ million | | | £ million | | | £ million | | | £ million | | | £ million | | | £ million | |
By business segment | | | | | | | | | | | | | | | | | | | | | | | | | | | |
Industrial & Automotive: | | | | | | | | | | | | | | | | | | | | | | | | | | | |
– Power Transmission | | (3.0 | ) | | 0.1 | | | (2.9 | ) | | (6.4 | ) | | 3.2 | | | (3.2 | ) | | (1.1 | ) | | — | | | (1.1 | ) |
– Fluid Power | | (4.3 | ) | | — | | | (4.3 | ) | | (3.1 | ) | | — | | | (3.1 | ) | | 0.9 | | | 0.8 | | | 1.7 | |
– Fluid Systems | | 0.1 | | | (1.4 | ) | | (1.3 | ) | | — | | | — | | | — | | | — | | | — | | | — | |
– Other Industrial & Automotive | | — | | | 6.7 | | | 6.7 | | | (0.3 | ) | | (0.1 | ) | | (0.4 | ) | | (2.4 | ) | | (1.8 | ) | | (4.2 | ) |
| | | | | | | | | | | | | | | | | | | | | | | | | | | |
| | (7.2 | ) | | 5.4 | | | (1.8 | ) | | (9.8 | ) | | 3.1 | | | (6.7 | ) | | (2.6 | ) | | (1.0 | ) | | (3.6 | ) |
| | | | | | | | | | | | | | | | | | | | | | | | | | | |
Building Products: | | | | | | | | | | | | | | | | | | | | | | | | | | | |
– Air Systems Components | | (3.7 | ) | | — | | | (3.7 | ) | | (3.2 | ) | | (0.1 | ) | | (3.3 | ) | | (1.7 | ) | | 9.0 | | | 7.3 | |
– Other Building Products | | (2.4 | ) | | 32.6 | | | 30.2 | | | — | | | 0.1 | | | 0.1 | | | 0.1 | | | 0.5 | | | 0.6 | |
| | | | | | | | | | | | | | | | | | | | | | | | | | | |
| | (6.1 | ) | | 32.6 | | | 26.5 | | | (3.2 | ) | | — | | | (3.2 | ) | | (1.6 | ) | | 9.5 | | | 7.9 | |
| | | | | | | | | | | | | | | | | | | | | | | | | | | |
Unallocated corporate activities | | (0.5 | ) | | 7.7 | | | 7.2 | | | — | | | — | | | — | | | — | | | — | | | — | |
| | | | | | | | | | | | | | | | | | | | | | | | | | | |
| | (13.8 | ) | | 45.7 | | | 31.9 | | | (13.0 | ) | | 3.1 | | | (9.9 | ) | | (4.2 | ) | | 8.5 | | | 4.3 | |
| | | | | | | | | | | | | | | | | | | | | | | | | | | |
F-17
Notes to the financial statements continued
5. Restructuring initiatives continued
A. Restructuring costs
In 2007, restructuring costs principally related to the rationalisation of production facilities within the Lasco Bathware and Philips Products businesses in the US (£2.4 million), the outsourcing of information technology services (£2.7 million), and the initiatives within the Fluid Power and Air Systems Components business groups that began in 2006 (£7.4 million).
In 2006, restructuring costs related to the transfer of the activities of Fluid Power’s facility at St. Neots, UK to a new facility in the Czech Republic, the closure of Air Systems Components’ Holland, Michigan facility and the initiatives within Stackpole and the Air Systems Components business group that began in 2005. In 2005, restructuring costs primarily related to the closure of Stackpole’s pump components facility and Air Systems Components’ facilities at Englewood, Ohio and Tabor City, North Carolina.
B. Disposals and exit of businesses
In 2007, the Group recognised a gain of £32.6 million on the disposal of Lasco Fittings Inc., a gain of £6.7 million on the disposal of Dearborn Mid-West Conveyor Company and a loss of £1.3 million on the disposal of Tridon Electronics’ indicator and side object detection businesses. Also during the year, the Group recognised a gain of £7.7 million on the disposal of Corporate property.
In 2006, the Group recognised a gain of £3.1 million on the sale of property, plant and equipment relating to businesses sold in previous years. In 2005, the Group recognised a gain of £8.5 million on the disposal of businesses, principally in relation to the sale of the business and assets of Gutter Helmet, which was part of Hart & Cooley’s residential business.
6. Staff costs
The monthly average number of persons employed by the Group, excluding the Company’s Non-Executive Directors, was as follows:
| | | | | | |
| | | Year ended
29 December
2007 | | Year ended
30 December
2006* | | Year ended
31 December
2005* |
| | | Number | | Number | | Number |
By business segment | | | | | | |
Continuing operations | | | | | | |
Industrial & Automotive: | | | | | | |
– Power Transmission | | 9,298 | | 9,102 | | 9,168 |
– Fluid Power | | 4,819 | | 4,656 | | 4,754 |
– Fluid Systems | | 3,133 | | 3,105 | | 3,108 |
– Other Industrial & Automotive | | 4,046 | | 4,025 | | 3,929 |
| | | | | | |
| | 21,296 | | 20,888 | | 20,959 |
| | | | | | |
Building Products: | | | | | | |
– Air Systems Components | | 8,836 | | 8,692 | | 7,081 |
– Other Building Products | | 3,608 | | 4,555 | | 4,669 |
| | | | | | |
| | 12,444 | | 13,247 | | 11,750 |
| | | | | | |
Corporate | | 145 | | 145 | | 135 |
| | | | | | |
| | 33,885 | | 34,280 | | 32,844 |
| | | | | | |
Discontinued operations | | | | | | |
Industrial & Automotive: | | | | | | |
– Wiper Systems | | 2,009 | | 4,019 | | 4,480 |
| | | | | | |
| | 35,894 | | 38,299 | | 37,324 |
| | | | | | |
| * | Re-presented (see note 10) |
F-18
Notes to the financial statements continued
6. Staff costs continued
Staff costs recognised in profit for the period were as follows:
| | | | | | | | |
| | | Year ended
29 December
2007 | | Year ended
30 December
2006* | | | Year ended
31 December
2005* | |
| | | £ million | | £ million | | | £ million | |
Wages and salaries | | 641.5 | | 685.0 | | | 680.4 | |
Social security costs | | 73.8 | | 79.5 | | | 75.0 | |
Pensions (note 33) | | 26.7 | | 37.0 | | | 31.2 | |
Other post-employment benefits (note 33) | | 0.2 | | (0.4 | ) | | (5.9 | ) |
Share-based incentives (note 34) | | 8.0 | | 7.9 | | | 7.7 | |
Termination benefits | | 3.4 | | 5.2 | | | 4.8 | |
| | | | | | | | |
| | 753.6 | | 814.2 | | | 793.2 | |
| | | | | | | | |
Continuing operations | | 736.5 | | 766.3 | | | 740.6 | |
Discontinued operations | | 17.1 | | 47.9 | | | 52.6 | |
| | | | | | | | |
| | 753.6 | | 814.2 | | | 793.2 | |
| | | | | | | | |
| * | Re-presented (see note 10) |
7. Interest payable
| | | | | | | | | |
| | | Year ended
29 December
2007 | | | Year ended
30 December
2006 | | | Year ended
31 December
2005 | |
| | | £ million | | | £ million | | | £ million | |
Borrowings: | | | | | | | | | |
– Interest on bank overdrafts | | 0.8 | | | 2.1 | | | 1.5 | |
– Interest on loans | | 28.7 | | | 34.6 | | | 27.2 | |
– Interest on interest rate swaps in designated hedging relationships: | | | | | | | | | |
Payable | | 30.9 | | | 27.9 | | | 25.1 | |
Receivable | | (27.3 | ) | | (27.3 | ) | | (27.3 | ) |
– Interest on interest rate swaps classed as held for trading: | | | | | | | | | |
Payable | | 4.3 | | | 4.7 | | | 4.7 | |
Receivable | | (5.2 | ) | | (6.1 | ) | | (5.2 | ) |
| | | | | | | | | |
| | 32.2 | | | 35.9 | | | 26.0 | |
Interest element of finance lease rentals | | 0.7 | | | 0.6 | | | 0.7 | |
| | | | | | | | | |
| | 32.9 | | | 36.5 | | | 26.7 | |
Dividends payable on convertible cumulative preference shares | | 0.6 | | | 5.4 | | | 16.3 | |
| | | | | | | | | |
| | 33.5 | | | 41.9 | | | 43.0 | |
Post-employment benefits: | | | | | | | | | |
– Interest cost on benefit obligation (note 33) | | 38.6 | | | 39.7 | | | 40.5 | |
| | | | | | | | | |
| | 72.1 | | | 81.6 | | | 83.5 | |
| | | | | | | | | |
Continuing operations | | 71.0 | | | 77.8 | | | 78.4 | |
Discontinued operations | | 1.1 | | | 3.8 | | | 5.1 | |
| | | | | | | | | |
| | 72.1 | | | 81.6 | | | 83.5 | |
| | | | | | | | | |
Interest rate swaps are used to manage the interest rate profile of the Group’s borrowings. Accordingly, net interest payable or receivable on interest rate swaps is included in interest payable.
F-19
Notes to the financial statements continued
8. Investment income
| | | | | | |
| | | Year ended
29 December
2007 | | Year ended
30 December
2006 | | Year ended
31 December
2005 |
| | | £ million | | £ million | | £ million |
Interest on bank deposits | | 4.2 | | 4.8 | | 4.1 |
Other interest receivable | | 1.7 | | 2.1 | | 1.6 |
| | | | | | |
| | 5.9 | | 6.9 | | 5.7 |
Post-employment benefits: | | | | | | |
– Expected return on plan assets (note 33) | | 38.1 | | 36.1 | | 34.6 |
| | | | | | |
| | 44.0 | | 43.0 | | 40.3 |
| | | | | | |
Continuing operations | | 43.4 | | 40.0 | | 35.2 |
Discontinued operations | | 0.6 | | 3.0 | | 5.1 |
| | | | | | |
| | 44.0 | | 43.0 | | 40.3 |
| | | | | | |
9. Other finance (expense)/income
| | | | | | | | |
| | | Year ended
29 December
2007 | | | Year ended
30 December
2006 | | | Year ended
31 December
2005 |
| | | £ million | | | £ million | | | £ million |
Hedging activities | | | | | | | | |
Fair value gain on derivatives in designated hedging relationships | | 0.8 | | | 0.9 | | | — |
Fair value (loss)/gain on derivatives classed as held for trading | | (1.9 | ) | | (0.9 | ) | | 3.3 |
(Loss)/gain on other instruments not qualifying for hedge accounting | | (1.5 | ) | | (0.7 | ) | | 0.9 |
| | | | | | | | |
| | (2.6 | ) | | (0.7 | ) | | 4.2 |
Other items | | | | | | | | |
Fair value loss on embedded derivatives | | (0.2 | ) | | — | | | — |
| | | | | | | | |
| | (2.8 | ) | | (0.7 | ) | | 4.2 |
| | | | | | | | |
Other finance (expense)/income principally represents fair value gains and losses arising on financial instruments held by the Group to hedge its translational exposures where either the economic hedging relationship does not qualify for hedge accounting or to the extent that there is deemed to be ineffectiveness in a designated hedging relationship.
Other finance (expense)/income is wholly attributable to continuing operations.
10. Discontinued operations
A. Background
Discontinued operations represent Trico Products Corporation and its related businesses (“Trico”), which constituted the Group’s former Wiper Systems business segment.
The sale of Trico was completed on 29 June 2007.
During 2007, the Group recognised a loss of £29.8 million before tax on the disposal of Trico (including an impairment loss of £17.2 million that was recognised in the first quarter of 2007). Also during the period, the Group recognised a gain of £1.2 million before tax on the receipt of contingent consideration in relation to the disposal of the Group’s Valves, Taps and Mixers businesses in 2004. After the attributable tax expense of £4.0 million, a loss of £32.6 million was recognised in 2007 on the disposal of these businesses.
B. Re-presentation of prior year results
Management intended that Tridon Electronics (“Tridon”), a manufacturer of automotive indicator lights, would be included within the Trico sale and it was therefore included within discontinued operations in 2006. However, Tridon has been retained by the Group and no longer meets the conditions to be classified as held for sale. Accordingly, the Group’s income statements for 2006 and 2005 and the analysis of segment assets and liabilities as at 30 December 2006 have been re-presented to reflect the re-classification of Tridon to continuing operations in 2007. During 2006, Tridon’s revenue was £9.2 million (2005: £14.9 million) and it incurred an operating loss of £0.1 million (2005: operating profit of £3.6 million). As at 30 December 2006, Tridon’s segment assets were £5.2 million and its segment liabilities were £1.2 million.
F-20
Notes to the financial statements continued
10. Discontinued operations continued
C. Results and cash flows
The loss for the period from discontinued operations may be analysed as follows:
| | | | | | | | | |
| | | Year ended
29 December
2007 | | | Year ended
30 December
2006* | | | Year ended
31 December
2005* | |
| | | £ million | | | £ million | | | £ million | |
Loss for the period of discontinued operations | | | | | | | | | |
Sales | | 79.9 | | | 187.5 | | | 219.1 | |
Cost of sales | | (66.5 | ) | | (162.0 | ) | | (183.3 | ) |
| | | | | | | | | |
Gross profit | | 13.4 | | | 25.5 | | | 35.8 | |
Distribution costs | | (6.5 | ) | | (13.4 | ) | | (15.6 | ) |
Administrative expenses | | (5.0 | ) | | (11.5 | ) | | (13.0 | ) |
Restructuring costs | | (0.8 | ) | | (6.5 | ) | | (16.1 | ) |
| | | | | | | | | |
Operating profit/(loss) | | 1.1 | | | (5.9 | ) | | (8.9 | ) |
Interest payable | | (1.1 | ) | | (3.8 | ) | | (5.1 | ) |
Investment income | | 0.6 | | | 3.0 | | | 5.1 | |
| | | | | | | | | |
Profit/(loss) before tax | | 0.6 | | | (6.7 | ) | | (8.9 | ) |
Income tax (expense)/benefit | | (1.3 | ) | | (2.8 | ) | | 1.0 | |
| | | | | | | | | |
Loss after tax | | (0.7 | ) | | (9.5 | ) | | (7.9 | ) |
| | | | | | | | | |
(Loss)/profit on disposal of discontinued operations | | | | | | | | | |
(Loss)/profit before tax | | (28.6 | ) | | (22.5 | ) | | 3.4 | |
Income tax (expense)/benefit | | (4.0 | ) | | 20.4 | | | (0.9 | ) |
| | | | | | | | | |
(Loss)/profit after tax | | (32.6 | ) | | (2.1 | ) | | 2.5 | |
| | | | | | | | | |
Loss for the period from discontinued operations | | (33.3 | ) | | (11.6 | ) | | (5.4 | ) |
| | | | | | | | | |
Restructuring costs in each period relate to the transfer of manufacturing activities from the Wiper Systems facility at Pontypool, UK to more cost competitive locations.
Cash flows arising from discontinued operations during the period were as follows:
| | | | | | | | | |
| | | Year ended
29 December
2007 | | | Year ended 30
December 2006* | | | Year ended
31 December
2005* | |
| | | £ million | | | £ million | | | £ million | |
Cash inflow/(outflow) from operating activities | | 3.7 | | | (0.4 | ) | | 17.9 | |
Cash (outflow)/inflow from investing activities | | (1.3 | ) | | 1.7 | | | 4.4 | |
Cash outflow from financing activities | | (0.6 | ) | | (1.4 | ) | | (0.7 | ) |
| | | | | | | | | |
Net increase/(decrease) in cash and cash equivalents from discontinued operations | | 1.8 | | | (0.1 | ) | | 21.6 | |
| | | | | | | | | |
F-21
Notes to the financial statements continued
10. Discontinued operations continued
D. Segment revenue and results
The segment revenue and result of discontinued operations may be analysed as follows:
| | | | | | | | | | | | | | | |
| | | Segment revenue | | Segment result | |
| | | Year ended
29 December
2007 | | Year ended
30 December
2006* | | Year ended
31 December
2005* | | Year ended
29 December
2007 | | | Year ended
30 December
2006* | | | Year ended
31 December
2005* | |
| | | £ million | | £ million | | £ million | | £ million | | | £ million | | | £ million | |
By business segment | | | | | | | | | | | | | | | |
Industrial & Automotive: | | | | | | | | | | | | | | | |
– Wiper Systems | | 79.9 | | 187.5 | | 219.1 | | 1.1 | | | (5.9 | ) | | (8.9 | ) |
| | | | | | | | | | | | | | | |
By origin | | | | | | | | | | | | | | | |
US | | 62.4 | | 142.4 | | 161.3 | | 2.3 | | | 4.2 | | | 13.0 | |
UK | | 6.9 | | 22.8 | | 32.3 | | (1.2 | ) | | (7.4 | ) | | (22.5 | ) |
Rest of Europe | | — | | 0.1 | | — | | — | | | — | | | — | |
Rest of the World | | 10.6 | | 22.2 | | 25.5 | | — | | | (2.7 | ) | | 0.6 | |
| | | | | | | | | | | | | | | |
| | 79.9 | | 187.5 | | 219.1 | | 1.1 | | | (5.9 | ) | | (8.9 | ) |
| | | | | | | | | | | | | | | |
By destination | | | | | | | | | | | | | | | |
US | | 57.6 | | 127.0 | | 137.5 | | | | | | | | | |
UK | | 3.8 | | 7.9 | | 9.8 | | | | | | | | | |
Rest of Europe | | 4.7 | | 15.8 | | 22.1 | | | | | | | | | |
Rest of the World | | 13.8 | | 36.8 | | 49.7 | | | | | | | | | |
| | | | | | | | | | | | | | | |
| | 79.9 | | 187.5 | | 219.1 | | | | | | | | | |
| | | | | | | | | | | | | | | |
Reconciliation of the aggregate segment result of discontinued operations to the loss for the period from discontinued operations:
| | | | | | | | | |
| | | Year ended
29 December
2007 | | | Year ended
30 December
2006* | | | Year ended
31 December
2005* | |
| | | £ million | | | £ million | | | £ million | |
Segment result | | 1.1 | | | (5.9 | ) | | (8.9 | ) |
Interest payable | | (1.1 | ) | | (3.8 | ) | | (5.1 | ) |
Investment income | | 0.6 | | | 3.0 | | | 5.1 | |
| | | | | | | | | |
Profit/(loss) before tax | | 0.6 | | | (6.7 | ) | | (8.9 | ) |
Income tax (expense)/benefit | | (1.3 | ) | | (2.8 | ) | | 1.0 | |
| | | | | | | | | |
Loss for the period of discontinued operations | | (0.7 | ) | | (9.5 | ) | | (7.9 | ) |
(Loss)/profit on disposal of discontinued operations | | (32.6 | ) | | (2.1 | ) | | 2.5 | |
| | | | | | | | | |
Loss for the period from discontinued operations | | (33.3 | ) | | (11.6 | ) | | (5.4 | ) |
| | | | | | | | | |
F-22
Notes to the financial statements continued
11. Income tax expense
| | | | | | | | | |
| | | Year ended
29 December
2007 | | | Year ended
30 December
2006* | | | Year ended
31 December
2005* | |
| | | £ million | | | £ million | | | £ million | |
Current tax | | | | | | | | | |
UK corporation tax on profits for the period | | 1.1 | | | (1.1 | ) | | 1.3 | |
Decrease in provision for uncertain tax positions | | — | | | (19.3 | ) | | (6.0 | ) |
Adjustments in respect of prior periods | | — | | | 0.4 | | | (0.3 | ) |
| | | | | | | | | |
Total UK tax | | 1.1 | | | (20.0 | ) | | (5.0 | ) |
| | | | | | | | | |
Overseas tax on profits for the period | | 54.7 | | | 55.6 | | | 76.7 | |
Decrease in provision for uncertain tax positions | | (2.0 | ) | | (31.3 | ) | | (52.7 | ) |
Adjustments in respect of prior periods | | (4.1 | ) | | (0.3 | ) | | — | |
| | | | | | | | | |
Total overseas tax | | 48.6 | | | 24.0 | | | 24.0 | |
| | | | | | | | | |
Total current tax | | 49.7 | | | 4.0 | | | 19.0 | |
| | | | | | | | | |
Deferred tax | | | | | | | | | |
Origination or reversal of temporary differences | | (64.0 | ) | | 15.7 | | | 44.2 | |
Utilisation of previously unrecognised tax losses | | (4.9 | ) | | (28.2 | ) | | (40.3 | ) |
Tax losses in the period not recognised | | 93.7 | | | 20.1 | | | 14.4 | |
Other changes in unrecognised deferred tax assets | | 2.8 | | | 4.5 | | | 14.9 | |
Adjustments in respect of prior periods | | (2.1 | ) | | 2.1 | | | 7.7 | |
| | | | | | | | | |
Total deferred tax | | 25.5 | | | 14.2 | | | 40.9 | |
| | | | | | | | | |
Income tax expense for the period | | 75.2 | | | 18.2 | | | 59.9 | |
| | | | | | | | | |
Continuing operations | | 69.9 | | | 35.8 | | | 60.0 | |
Discontinued operations (note 10) | | 5.3 | | | (17.6 | ) | | (0.1 | ) |
| | | | | | | | | |
| | 75.2 | | | 18.2 | | | 59.9 | |
| | | | | | | | | |
| * | Re-presented (see note 10) |
During 2006, there was a release of provisions for uncertain tax positions of £50.6 million as a result of tax planning, the clarification of tax legislation, the performance of certain studies and the change of views on the likely outcome of challenges by various tax authorities. During 2005, there was a similar release of £58.7 million.
The income tax expense for the period recognised in the income statement differs from the product of the profit before tax for the period and the rate of UK corporation tax as follows:
| | | | | | | | | |
| | | Year ended
29 December
2007 | | | Year ended
30 December
2006* | | | Year ended
31 December
2005* | |
| | | £ million | | | £ million | | | £ million | |
Profit before tax | | | | | | | | | |
Continuing operations | | 262.6 | | | 244.7 | | | 266.6 | |
Discontinued operations | | (28.0 | ) | | (29.2 | ) | | (5.5 | ) |
| | | | | | | | | |
| | 234.6 | | | 215.5 | | | 261.1 | |
| | | | | | | | | |
UK corporation tax at 30% (2006: 30%; 2005: 30%) on profit before tax | | 70.4 | | | 64.7 | | | 78.3 | |
Permanent differences | | (1.7 | ) | | 13.7 | | | 45.6 | |
Adjustment in respect of prior periods | | (6.2 | ) | | 2.2 | | | 7.4 | |
Decrease in provisions for uncertain tax positions | | (2.0 | ) | | (50.6 | ) | | (58.7 | ) |
Effect of different tax rates on overseas profits | | 10.3 | | | 13.1 | | | 12.4 | |
Foreign tax credits | | (6.9 | ) | | 1.4 | | | (14.1 | ) |
Temporary differences on investment in subsidiaries | | (80.3 | ) | | (22.7 | ) | | — | |
Tax losses in the period not recognised | | 93.7 | | | 20.1 | | | 14.4 | |
Utilisation of previously unrecognised tax losses | | (4.9 | ) | | (28.2 | ) | | (40.3 | ) |
Other changes in unrecognised deferred tax assets | | 2.8 | | | 4.5 | | | 14.9 | |
| | | | | | | | | |
Income tax expense for the period | | 75.2 | | | 18.2 | | | 59.9 | |
| | | | | | | | | |
| * | Re-presented (see note 10) |
In addition to the income tax expense recognised in the income statement, an income tax expense of £6.3 million (2006: expense of £1.0 million; 2005: benefit of £16.2 million) was recognised directly in equity.
F-23
Notes to the financial statements continued
12. Profit for the period
Profit for the period is stated after charging/(crediting):
| | | | | | | | | |
| | | Continuing
operations | | | Discontinued
operations | | | Total | |
| | | £ million | | | £ million | | | £ million | |
Year ended 29 December 2007 | | | | | | | | | |
Inventories: | | | | | | | | | |
– Cost of inventories | | 1,987.4 | | | 64.5 | | | 2,051.9 | |
– Write-down of inventories | | 3.5 | | | 0.3 | | | 3.8 | |
Staff costs (note 6) | | 736.5 | | | 17.1 | | | 753.6 | |
Goodwill (note 17): | | | | | | | | | |
– Impairment loss (recognised in operating profit) | | 0.4 | | | — | | | 0.4 | |
Other intangible assets (note 18): | | | | | | | | | |
– Amortisation | | 10.3 | | | — | | | 10.3 | |
Property, plant and equipment (note 19): | | | | | | | | | |
– Depreciation | | 107.5 | | | — | | | 107.5 | |
– Impairment loss (recognised in operating profit) | | 0.4 | | | — | | | 0.4 | |
Research and development costs | | 49.4 | | | 2.3 | | | 51.7 | |
Government grants: | | | | | | | | | |
– Revenue | | (1.0 | ) | | (0.1 | ) | | (1.1 | ) |
– Capital | | (0.2 | ) | | — | | | (0.2 | ) |
Net foreign exchange gains | | (0.5 | ) | | (0.3 | ) | | (0.8 | ) |
| | | | | | | | | |
Year ended 30 December 2006* | | | | | | | | | |
Inventories: | | | | | | | | | |
– Cost of inventories | | 2,035.0 | | | 156.7 | | | 2,191.7 | |
– Write-down of inventories | | 0.9 | | | 1.3 | | | 2.2 | |
Staff costs (note 6) | | 766.3 | | | 47.9 | | | 814.2 | |
Goodwill (note 17): | | | | | | | | | |
– Impairment loss (recognised in operating profit) | | 1.6 | | | — | | | 1.6 | |
– Impairment loss (recognised in loss on disposal of discontinued operations) | | — | | | 4.1 | | | 4.1 | |
Other intangible assets (note 18): | | | | | | | | | |
– Amortisation | | 13.2 | | | 0.1 | | | 13.3 | |
– Impairment loss (recognised in loss on disposal of discontinued operations) | | — | | | 0.2 | | | 0.2 | |
Property, plant and equipment (note 19): | | | | | | | | | |
– Depreciation | | 105.6 | | | 7.1 | | | 112.7 | |
– Impairment loss (recognised in operating profit) | | 0.4 | | | 0.5 | | | 0.9 | |
– Impairment loss (recognised in loss on disposal of discontinued operations) | | – | | | 20.7 | | | 20.7 | |
Research and development costs | | 46.8 | | | 5.7 | | | 52.5 | |
Government grants: | | | | | | | | | |
– Revenue | | (2.2 | ) | | (0.3 | ) | | (2.5 | ) |
– Capital | | (0.2 | ) | | — | | | (0.2 | ) |
Net foreign exchange gains | | (1.2 | ) | | (0.7 | ) | | (1.9 | ) |
| | | | | | | | | |
Year ended 31 December 2005* | | | | | | | | | |
Inventories: | | | | | | | | | |
– Cost of inventories | | 2,026.7 | | | 244.3 | | | 2,271.0 | |
– Write-down of inventories | | 0.3 | | | 0.9 | | | 1.2 | |
Staff costs (note 6) | | 740.6 | | | 52.6 | | | 793.2 | |
Other intangible assets (note 18): | | | | | | | | | |
– Amortisation | | 2.2 | | | 0.2 | | | 2.4 | |
Property, plant and equipment (note 19): | | | | | | | | | |
– Depreciation | | 112.9 | | | 3.8 | | | 116.7 | |
– Impairment loss (recognised in operating profit) | | — | | | 5.3 | | | 5.3 | |
Research and development costs | | 40.9 | | | 5.8 | | | 46.7 | |
Government grants: | | | | | | | | | |
– Revenue | | (0.8 | ) | | (0.5 | ) | | (1.3 | ) |
– Capital | | (0.3 | ) | | — | | | (0.3 | ) |
Net foreign exchange losses/(gains) | | 1.7 | | | (0.1 | ) | | 1.6 | |
| | | | | | | | | |
| * | Re-presented (see note 10) |
F-24
Notes to the financial statements continued
13. Earnings per share
Basic earnings per share is calculated by dividing the profit for the period attributable to equity shareholders by the weighted average number of the Company’s ordinary shares in issue during the period. The weighted average number of ordinary shares in issue during the period excludes 4,331,018 shares (2006: 3,759,701 shares; 2005: 2,888,908 shares), being the weighted average number of own shares held during the period.
Diluted earnings per share takes into account the dilutive effect of options and awards outstanding under the Group’s employee share schemes and the dilutive effect of the potential conversion of the Company’s preference shares into the Company’s ordinary shares. The weighted average number of the Company’s ordinary shares used in the calculation of diluted earnings per share excludes the effect of options and awards over 9,318,429 shares (2006: 1,229,593 shares; 2005: 2,549,390 shares) that were anti-dilutive for the periods presented but could dilute earnings per share in the future.
| | | | | | | | | |
| | | Year ended
29 December
2007 | | | Year ended
30 December
2006* | | | Year ended
31 December
2005* | |
| | | £ million | | | £ million | | | £ million | |
Continuing operations | | | | | | | | | |
Profit for the period | | 192.7 | | | 208.9 | | | 206.6 | |
Minority interests | | (12.5 | ) | | (11.2 | ) | | (9.0 | ) |
| | | | | | | | | |
Earnings for calculating basic earnings per share | | 180.2 | | | 197.7 | | | 197.6 | |
Effect of dilutive potential ordinary shares: | | | | | | | | | |
– Dividends payable on preference shares | | 0.6 | | | 5.4 | | | 16.3 | |
| | | | | | | | | |
Earnings for calculating diluted earnings per share | | 180.8 | | | 203.1 | | | 213.9 | |
| | | | | | | | | |
Discontinued operations | | | | | | | | | |
Loss for the period, being earnings for calculating basic and diluted earnings per share | | (33.3 | ) | | (11.6 | ) | | (5.4 | ) |
| | | | | | | | | |
Continuing and discontinued operations | | | | | | | | | |
Profit for the period | | 159.4 | | | 197.3 | | | 201.2 | |
Minority interests | | (12.5 | ) | | (11.2 | ) | | (9.0 | ) |
| | | | | | | | | |
Earnings for calculating basic earnings per share | | 146.9 | | | 186.1 | | | 192.2 | |
Effect of dilutive potential ordinary shares: | | | | | | | | | |
– Dividends payable on preference shares | | 0.6 | | | 5.4 | | | 16.3 | |
| | | | | | | | | |
Earnings for calculating diluted earnings per share | | 147.5 | | | 191.5 | | | 208.5 | |
| | | | | | | | | |
| | | |
| | | Year ended
29 December
2007
Number | | | Year ended
30 December
2006
Number | | | Year ended
31 December
2005
Number | |
Weighted average number of ordinary shares | | | | | | | | | |
For calculating basic earnings per share | | 870,297,953 | | | 838,893,502 | | | 771,416,964 | |
Effect of dilutive potential ordinary shares: | | | | | | | | | |
– Share options and awards | | 4,018,619 | | | 5,173,658 | | | 2,593,300 | |
– Preference shares | | 9,714,541 | | | 39,759,222 | | | 102,375,159 | |
| | | | | | | | | |
For calculating diluted earnings per share | | 884,031,113 | | | 883,826,382 | | | 876,385,423 | |
| | | | | | | | | |
| * | Re-presented (see note 10) |
F-25
Notes to the financial statements continued
14. Dividends on ordinary shares
| | | | | | |
| | | Year ended
29 December
2007
Per share | | Year ended
30 December
2006
Per share | | Year ended
31 December
2005
Per share |
Paid or proposed in respect of the period | | | | | | |
Interim dividend | | 5.32p | | 5.32p | | 5.07p |
Final dividend | | 8.57p | | 8.57p | | 8.16p |
| | | | | | |
| | 13.89p | | 13.89p | | 13.23p |
| | | | | | |
| | | |
| | | Year ended
29 December
2007 | | Year ended
30 December
2006 | | Year ended
31 December
2005 |
| | | £ million | | £ million | | £ million |
Recognised in the period | | | | | | |
Interim dividend for the period of 5.32p (2006: 5.32p; 2005: 5.07p) per share | | 46.8 | | 45.5 | | 39.4 |
Final dividend for the prior period of 8.57p (2006: 8.16p; 2005: 7.77p) per share | | 75.2 | | 69.8 | | 60.0 |
| | | | | | |
| | 122.0 | | 115.3 | | 99.4 |
| | | | | | |
The Directors propose a final dividend for 2007 of 8.57p per share that, subject to approval by shareholders, will be paid on 15 May 2008 to shareholders on the register on 18 April 2008.
Based on the number of ordinary shares currently in issue, the final dividend for 2007 is expected to absorb £75.5 million.
15. Auditors’ remuneration
Fees payable by the Group to the Company’s auditors, Deloitte & Touche LLP (“Deloitte”) and its associates were as follows:
| | | | | | |
| | | Year ended
29 December
2007 | | Year ended
30 December
2006 | | Year ended
31 December
2005 |
| | | £ million | | £ million | | £ million |
Statutory services: | | | | | | |
– Audit of the Company’s accounts | | 0.4 | | 0.4 | | 0.4 |
– Audit of the accounts of the Company’s subsidiaries | | 2.5 | | 2.2 | | 1.9 |
– Other statutory services | | 0.1 | | 1.3 | | 0.6 |
| | | | | | |
| | 3.0 | | 3.9 | | 2.9 |
Tax services: | | | | | | |
– Compliance services | | 0.3 | | 0.2 | | 0.3 |
– Advisory services | | 0.6 | | 0.4 | | 1.8 |
| | | | | | |
| | 0.9 | | 0.6 | | 2.1 |
Other services | | 0.3 | | 0.5 | | 0.3 |
| | | | | | |
Total fees | | 4.2 | | 5.0 | | 5.3 |
| | | | | | |
Fees for the audit of the Company’s accounts represent fees payable to Deloitte in respect of the audit of the Company’s individual financial statements and the Group’s consolidated financial statements prepared in accordance with IFRS.
Other statutory services include the review of the Group’s interim financial statements and, in 2006 and 2005, the audit of the Group’s consolidated financial statements prepared in accordance with US GAAP and fees associated with section 404 of the Sarbanes-Oxley Act of 2002 (“SOX 404”). In 2007, fees associated with SOX 404 are included in audit fees.
Tax advisory services in 2005 included advice provided in relation to the tax benefits available to the Group under the American Jobs Creation Act of 2004 in the United States and for certain tax planning projects.
Other services include advice on accounting matters and non-statutory reporting.
Fees relating to all services must be reported to and approved by the Audit Committee or, between meetings, the Chairman of the Audit Committee.
Fees payable by associated pension schemes to Deloitte and its associates were as follows:
| | | | | | |
| | | Year ended
29 December
2007 | | Year ended
30 December
2006 | | Year ended
31 December
2005 |
| | | £ million | | £ million | | £ million |
Statutory services: | | | | | | |
– Audit of the pension schemes of the Company’s subsidiaries | | — | | 0.2 | | 0.2 |
| | | | | | |
F-26
Notes to the financial statements continued
16. Cash flow
A. Reconciliation of profit for the period to cash generated from operations
| | | | | | | | | |
| | | Year ended
29 December
2007 | | | Year ended
30 December
2006 | | | Year ended
31 December
2005 | |
| | | £ million | | | £ million | | | £ million | |
Profit for the period | | 159.4 | | | 197.3 | | | 201.2 | |
Interest payable | | 72.1 | | | 81.6 | | | 83.5 | |
Investment income | | (44.0 | ) | | (43.0 | ) | | (40.3 | ) |
Other finance expense/(income) | | 2.8 | | | 0.7 | | | (4.2 | ) |
Income tax expense | | 75.2 | | | 18.2 | | | 59.9 | |
| | | | | | | | | |
Profit from continuing and discontinued operations | | 265.5 | | | 254.8 | | | 300.1 | |
Share of profit of associates | | (0.4 | ) | | (1.5 | ) | | (0.6 | ) |
Amortisation of intangible assets | | 10.3 | | | 13.3 | | | 2.4 | |
Depreciation of property, plant and equipment | | 107.5 | | | 112.7 | | | 116.7 | |
Impairment of property, plant and equipment | | 0.4 | | | 0.9 | | | 5.3 | |
Impairment of goodwill | | 0.4 | | | 1.6 | | | — | |
Cost of share-based incentives | | 8.0 | | | 7.9 | | | 7.4 | |
(Gain)/loss on sale of property, plant and equipment | | (5.6 | ) | | 2.9 | | | (0.1 | ) |
Gain on available-for-sale investments | | (0.3 | ) | | (0.2 | ) | | — | |
(Gain)/loss on disposal of businesses: | | | | | | | | | |
– Continuing operations | | (38.0 | ) | | (3.1 | ) | | (8.5 | ) |
– Discontinued operations | | 28.6 | | | 22.5 | | | (3.4 | ) |
Decrease in post-employment benefit obligations | | (37.1 | ) | | (34.8 | ) | | (55.4 | ) |
Decrease in provisions | | (1.2 | ) | | (9.7 | ) | | (2.6 | ) |
| | | | | | | | | |
Operating cash flows before movements in working capital | | 338.1 | | | 367.3 | | | 361.3 | |
Increase in inventories | | (10.0 | ) | | (20.4 | ) | | (22.3 | ) |
Increase in receivables | | (37.0 | ) | | (10.1 | ) | | (22.3 | ) |
Increase/(decrease) in payables | | 28.1 | | | (5.3 | ) | | 19.8 | |
| | | | | | | | | |
Cash generated from operations | | 319.2 | | | 331.5 | | | 336.5 | |
| | | | | | | | | |
17. Goodwill
| | | |
| | | £ million | |
Cost | | | |
As at 31 December 2005 | | 319.5 | |
Acquisition of subsidiaries | | 53.9 | |
Impairment loss | | (1.6 | ) |
Transfer to assets held for sale | | (4.1 | ) |
Foreign currency translation | | (42.1 | ) |
| | | |
As at 30 December 2006 | | 325.6 | |
Acquisition of subsidiaries – current period | | 3.1 | |
Acquisition of subsidiaries – adjustments to prior period | | (7.1 | ) |
Impairment loss | | (0.4 | ) |
Foreign currency translation | | 10.0 | |
| | | |
As at 29 December 2007 | | 331.2 | |
| | | |
F-27
Notes to the financial statements continued
17. Goodwill (continued)
The carrying amount of goodwill was allocated to the following groups of cash-generating units:
| | | | |
| | | As at
29 December
2007 | | As at
30 December
2006 |
| | | £ million | | £ million |
Industrial & Automotive | | | | |
Power Transmission: | | | | |
– Stackpole | | 88.5 | | 75.3 |
– Mectrol | | 18.8 | | 19.0 |
| | | | |
| | 107.3 | | 94.3 |
Fluid Power | | 9.6 | | 8.8 |
Fluid Systems | | 2.7 | | — |
Other Industrial & Automotive: | | | | |
– Ideal | | 10.5 | | 10.7 |
– Dexter Group | | 25.5 | | 25.9 |
– Fleximak | | 8.5 | | 8.5 |
– Winhere | | 1.1 | | 1.1 |
| | | | |
| | 45.6 | | 46.2 |
| | | | |
| | 165.2 | | 149.3 |
| | | | |
Building Products | | | | |
Air Systems Components: | | | | |
– Air Systems Components | | 32.4 | | 33.0 |
– Hart & Cooley | | 73.3 | | 74.7 |
– Ruskin | | 14.5 | | 18.1 |
– Ruskin Air Management | | 4.9 | | 4.9 |
– Selkirk | | 36.3 | | 40.9 |
| | | | |
| | 161.4 | | 171.6 |
Other Building Products: | | | | |
– Bathware | | 4.6 | | 4.7 |
| | | | |
| | 166.0 | | 176.3 |
| | | | |
| | 331.2 | | 325.6 |
| | | | |
The Group tests goodwill annually for impairment, or more frequently if there are indications that goodwill might be impaired.
The recoverable amounts of the cash-generating units to which goodwill has been allocated are determined from value in use calculations in which the principal assumptions are those regarding discount rates, growth rates and expected changes to selling prices and direct costs. Management uses discount rates that reflect current market assessments of the time value of money. Growth rates are based on industry growth forecasts. Changes in selling prices and direct costs are based on past practices and expectations of future changes in the market in which the cash-generating units operate.
The Group prepares cash flow forecasts derived from the most recent financial plans approved by management for the next three years and extrapolates cash flows for the following seven years based on management’s assessment of industry growth rates.
The rate used to discount the forecast cash flows resulting from these projections was 8.0% (2006: 8.0%).
The recoverable amount of Stackpole is based on financial budgets approved by management covering a three-year period. Stackpole’s cash flows beyond the three-year period are extrapolated for a further two years using 5% growth and thereafter using a steady 2%, which does not exceed the long-term growth rate for the market in which it operates. All cash flows are discounted at a rate of 8%. The calculation shows that the recoverable amount marginally exceeds the carrying amount of Stackpole. Management have determined that the recoverable amount calculations are most sensitive to changes in the discount rate and operating margin assumptions. The sensitivity of the recoverable amount to changes in those assumptions (assuming all other assumptions remain unchanged) is as follows:
| | | | | | |
| | | Increase of one
percentage point | | | Decrease of one
percentage point | |
| | | £ million | | | £ million | |
Effect of a change in: | | | | | | |
– Discount rate | | (29.1 | ) | | 40.4 | |
– Operating margin | | 25.7 | | | (25.7 | ) |
| | | | | | |
F - 28
Notes to the financial statements continued
18. Other intangible assets
| | | | | | | | | | | |
| | | Development
costs | | Assets
arising on
acquisition | | | Computer
software | | | Total | |
| | | £ million | | £ million | | | £ million | | | £ million | |
Cost | | | | | | | | | | | |
As at 31 December 2005 | | 0.4 | | 3.9 | | | 53.7 | | | 58.0 | |
Additions | | 0.3 | | — | | | 20.9 | | | 21.2 | |
Acquisition of subsidiaries | | — | | 22.2 | | | 0.4 | | | 22.6 | |
Transfer to assets held for sale | | — | | — | | | (3.2 | ) | | (3.2 | ) |
Disposals | | — | | — | | | (2.1 | ) | | (2.1 | ) |
Foreign currency translation | | — | | (1.9 | ) | | (6.5 | ) | | (8.4 | ) |
| | | | | | | | | | | |
As at 30 December 2006 | | 0.7 | | 24.2 | | | 63.2 | | | 88.1 | |
Additions | | 0.2 | | — | | | 2.6 | | | 2.8 | |
Acquisition of subsidiaries | | — | | 5.4 | | | 0.1 | | | 5.5 | |
Transfer to assets held for sale | | — | | — | | | (1.4 | ) | | (1.4 | ) |
Disposals | | — | | — | | | (2.5 | ) | | (2.5 | ) |
Foreign currency translation | | — | | 1.2 | | | (0.3 | ) | | 0.9 | |
| | | | | | | | | | | |
As at 29 December 2007 | | 0.9 | | 30.8 | | | 61.7 | | | 93.4 | |
| | | | | | | | | | | |
Accumulated amortisation | | | | | | | | | | | |
As at 31 December 2005 | | — | | 0.2 | | | 35.8 | | | 36.0 | |
Amortisation charge for the period | | — | | 2.7 | | | 10.6 | | | 13.3 | |
Transfer to assets held for sale | | — | | — | | | (2.9 | ) | | (2.9 | ) |
Disposals | | — | | — | | | (2.0 | ) | | (2.0 | ) |
Foreign currency translation | | — | | (0.1 | ) | | (4.3 | ) | | (4.4 | ) |
| | | | | | | | | | | |
As at 30 December 2006 | | — | | 2.8 | | | 37.2 | | | 40.0 | |
Amortisation charge for the period | | 0.1 | | 3.6 | | | 6.6 | | | 10.3 | |
Transfer to assets held for sale | | — | | — | | | (1.2 | ) | | (1.2 | ) |
Disposals | | — | | — | | | (2.5 | ) | | (2.5 | ) |
Foreign currency translation | | — | | 0.3 | | | (0.2 | ) | | 0.1 | |
| | | | | | | | | | | |
As at 29 December 2007 | | 0.1 | | 6.7 | | | 39.9 | | | 46.7 | |
| | | | | | | | | | | |
Carrying amount | | | | | | | | | | | |
As at 30 December 2006 | | 0.7 | | 21.4 | | | 26.0 | | | 48.1 | |
| | | | | | | | | | | |
As at 29 December 2007 | | 0.8 | | 24.1 | | | 21.8 | | | 46.7 | |
| | | | | | | | | | | |
All intangible assets included above have finite useful lives.
F - 29
Notes to the financial statements continued
19. Property, plant and equipment
| | | | | | | | | | | | |
| | | Land and
buildings | | | Plant,
equipment
and vehicles | | | Assets under
construction | | | Total | |
| | | £ million | | | £ million | | | £ million | | | £ million | |
Cost | | | | | | | | | | | | |
As at 31 December 2005 | | 426.8 | | | 1,428.3 | | | 80.6 | | | 1,935.7 | |
Additions | | 4.7 | | | 54.4 | | | 46.6 | | | 105.7 | |
Acquisition of subsidiaries | | 5.5 | | | 10.8 | | | — | | | 16.3 | |
Transfer from assets under construction | | 8.3 | | | 67.5 | | | (75.8 | ) | | — | |
Transfer to assets held for sale | | (39.1 | ) | | (119.8 | ) | | (4.3 | ) | | (163.2 | ) |
Disposals | | (12.1 | ) | | (86.7 | ) | | (0.1 | ) | | (98.9 | ) |
Foreign currency translation | | (41.6 | ) | | (137.9 | ) | | (4.7 | ) | | (184.2 | ) |
| | | | | | | | | | | | |
As at 30 December 2006 | | 352.5 | | | 1,216.6 | | | 42.3 | | | 1,611.4 | |
Additions | | 2.9 | | | 27.7 | | | 80.8 | | | 111.4 | |
Acquisition of subsidiaries | | 0.6 | | | 2.9 | | | — | | | 3.5 | |
Disposal of subsidiaries | | — | | | (3.0 | ) | | — | | | (3.0 | ) |
Transfer from assets under construction | | 7.0 | | | 65.3 | | | (72.3 | ) | | — | |
Transfer to assets held for sale | | (6.7 | ) | | (37.1 | ) | | — | | | (43.8 | ) |
Disposals | | (13.9 | ) | | (43.9 | ) | | (0.6 | ) | | (58.4 | ) |
Foreign currency translation | | 8.6 | | | 57.9 | | | 2.3 | | | 68.8 | |
| | | | | | | | | | | | |
As at 29 December 2007 | | 351.0 | | | 1,286.4 | | | 52.5 | | | 1,689.9 | |
| | | | | | | | | | | | |
Accumulated depreciation and impairment losses | | | | | | | | | | | | |
As at 31 December 2005 | | 146.7 | | | 957.3 | | | — | | | 1,104.0 | |
Depreciation charge for the period | | 12.6 | | | 100.1 | | | — | | | 112.7 | |
Transfers | | 0.7 | | | (0.7 | ) | | — | | | — | |
Transfer to assets held for sale | | (17.1 | ) | | (90.6 | ) | | — | | | (107.7 | ) |
Disposals | | (4.7 | ) | | (82.9 | ) | | — | | | (87.6 | ) |
Impairment loss recognised in the period | | – | | | 0.9 | | | — | | | 0.9 | |
Foreign currency translation | | (14.8 | ) | | (91.1 | ) | | — | | | (105.9 | ) |
| | | | | | | | | | | | |
As at 30 December 2006 | | 123.4 | | | 793.0 | | | — | | | 916.4 | |
Depreciation charge for the period | | 11.1 | | | 96.4 | | | — | | | 107.5 | |
Disposal of subsidiaries | | – | | | (1.9 | ) | | — | | | (1.9 | ) |
Transfer to assets held for sale | | (3.4 | ) | | (28.5 | ) | | — | | | (31.9 | ) |
Disposals | | (6.5 | ) | | (39.1 | ) | | — | | | (45.6 | ) |
Impairment loss recognised in the period | | – | | | 0.4 | | | — | | | 0.4 | |
Foreign currency translation | | 2.3 | | | 33.0 | | | — | | | 35.3 | |
| | | | | | | | | | | | |
As at 29 December 2007 | | 126.9 | | | 853.3 | | | — | | | 980.2 | |
| | | | | | | | | | | | |
Carrying amount | | | | | | | | | | | | |
As at 30 December 2006 | | 229.1 | | | 423.6 | | | 42.3 | | | 695.0 | |
| | | | | | | | | | | | |
As at 29 December 2007 | | 224.1 | | | 433.1 | | | 52.5 | | | 709.7 | |
| | | | | | | | | | | | |
Land and buildings include freehold land with a carrying value of £34.1 million (30 December 2006: £33.5 million) that is not depreciated.
As at 29 December 2007, the carrying amount of property, plant and equipment included £6.3 million (30 December 2006: £7.0 million) in respect of assets held under finance leases. The Group’s obligations under finance leases, which are analysed in note 29, are secured by a lessor’s charge over the leased assets.
F - 30
Notes to the financial statements continued
20. Investments in associates
| | | | | | | | | |
| | | Year ended
29 December
2007 | | | Year ended
30 December
2006 | | | Year ended
31 December
2005 | |
| | | £ million | | | £ million | | | £ million | |
Carrying amount | | | | | | | | | |
At the beginning of the period | | 7.0 | | | 4.4 | | | 3.7 | |
Share of profit of associates | | 0.4 | | | 1.5 | | | 0.6 | |
Dividends received from associates | | (0.7 | ) | | (0.3 | ) | | (0.3 | ) |
| | | | | | | | | |
| | 6.7 | | | 5.6 | | | 4.0 | |
Additions | | 1.9 | | | 1.9 | | | — | |
Foreign currency translation | | 0.3 | | | (0.5 | ) | | 0.4 | |
| | | | | | | | | |
At the end of the period | | 8.9 | | | 7.0 | | | 4.4 | |
| | | | | | | | | |
On 3 August 2007, the Group acquired a 50% interest in Caryaire Air System Components Private Ltd (“CASC”). CASC is located in India and is engaged in the manufacture, assembly and marketing of air distribution and HVAC products for commercial applications.
Summarised financial information in respect of the Group’s associates:
| | | | | | |
| | | As at
29 December
2007 | | | As at
30 December
2006 | |
| | | £ million | | | £ million | |
Total assets | | 39.6 | | | 41.6 | |
Total liabilities | | (20.7 | ) | | (24.7 | ) |
| | | | | | |
Net assets | | 18.9 | | | 16.9 | |
| | | | | | |
Group’s share of associates’ net assets | | 8.9 | | | 7.0 | |
Segment analysis of the Group’s share of associates’ profit/(loss) for the period and of its investments in associates:
| | | | | | | | | | | |
| | | Investments in associates | | Share of profit/(loss) of associates |
| | | As at
29 December
2007 | | As at
30 December
2006 | | Year ended
29 December
2007 | | Year ended
30 December
2006 | | | Year ended
31 December
2005 |
| | | £ million | | £ million | | £ million | | £ million | | | £ million |
By business segment | | | | | | | | | | | |
Industrial & Automotive: | | | | | | | | | | | |
– Power Transmission | | 3.5 | | 3.5 | | — | | (0.1 | ) | | 0.3 |
– Fluid Systems | | 3.2 | | 3.1 | | 0.2 | | 1.4 | | | 0.3 |
– Other Industrial & Automotive | | 0.3 | | 0.4 | | 0.2 | | 0.2 | | | — |
| | | | | | | | | | | |
| | 7.0 | | 7.0 | | 0.4 | | 1.5 | | | 0.6 |
| | | | | | | | | | | |
Building Products: | | | | | | | | | | | |
– Air Systems Components | | 1.9 | | — | | — | | — | | | — |
| | | | | | | | | | | |
| | 8.9 | | 7.0 | | 0.4 | | 1.5 | | | 0.6 |
| | | | | | | | | | | |
By location | | | | | | | | | | | |
US | | 1.7 | | 1.8 | | | | | | | |
Rest of the World | | 7.2 | | 5.2 | | | | | | | |
| | | | | | | | | | | |
| | 8.9 | | 7.0 | | | | | | | |
| | | | | | | | | | | |
Schrader Duncan Limited, an associate in which the Group owns a 50% interest, is listed on the Mumbai Stock Exchange. As at 29 December 2007, the fair value of the Group’s investment based on the quoted market price of the associate’s shares was £6.4 million (30 December 2006: £3.6 million).
F - 31
Notes to the financial statements continued
21. Inventories
| | | | |
| | | As at
29 December
2007 | | As at
30 December
2006 |
| | | £ million | | £ million |
Raw materials and supplies | | 132.6 | | 128.9 |
Work in progress | | 47.4 | | 46.0 |
Finished goods and goods held for resale | | 221.3 | | 218.9 |
| | | | |
| | 401.3 | | 393.8 |
| | | | |
22. Trade and other receivables
| | | | |
| | | As at
29 December
2007 | | As at
30 December
2006 |
| | | £ million | | £ million |
Current assets | | | | |
Financial assets: | | | | |
– Trade receivables (note 23) | | 430.8 | | 417.4 |
– Derivative financial instruments (note 31) | | 2.8 | | 2.8 |
– Other receivables | | 37.1 | | 27.9 |
– Collateralised cash | | 2.9 | | 4.1 |
| | | | |
| | 473.6 | | 452.2 |
| | | | |
Non-financial assets: | | | | |
– Prepayments | | 22.7 | | 23.0 |
| | | | |
| | 496.3 | | 475.2 |
| | | | |
Non-current assets | | | | |
Financial assets: | | | | |
– Derivative financial instruments (note 31) | | 3.1 | | 2.5 |
– Other receivables | | 9.4 | | — |
| | | | |
| | 12.5 | | 2.5 |
| | | | |
The Group is the beneficiary of a number of corporate-owned life assurance policies against which it borrows from the relevant life assurance company. As at 29 December 2007, the surrender value of the policies was £235.3 million (30 December 2006: £216.2 million) and the amount outstanding on the related loans was £234.3 million (30 December 2006: £214.6 million). For accounting purposes, these amounts are offset and the net receivable of £1.0 million (30 December 2006: £1.6 million) is included in other receivables.
Collateralised cash represents cash given as collateral under letters of credit for insurance and regulatory purposes.
23. Trade receivables
Trade receivables amounted to £430.8 million (30 December 2006: £417.4 million), net of an allowance of £5.5 million (30 December 2006: £5.2 million) for doubtful debts.
The Group has a significant concentration of customers in the US, who accounted for 63.1% (2006: 66.8%; 2005: 69.3%) of the Group’s sales during the period, and in the industrial and automotive industry, which accounted for 73.3% (2006: 69.3%; 2005: 70.2%) of the Group’s sales during the period. However, no single customer accounted for more than 10% of the Group’s sales and there were no significant amounts due from any one customer.
Before accepting a new customer, the Group assesses the potential customer’s credit quality and establishes a credit limit. Credit quality is assessed by using data maintained by reputable credit rating agencies, by checking of references included in credit applications and, where they are available, by reviewing the customer’s recent financial statements. Credit limits are subject to multiple levels of authorisation and are reviewed on a regular basis.
Trade receivables are regularly reviewed for bad and doubtful debts. Bad debts are written-off and an allowance is established for specific doubtful debts.
F - 32
Notes to the financial statements continued
23. Trade receivables continued
Trade receivables may be analysed as follows:
| | | | | | |
| | | As at
29 December
2007 | | | As at
30 December
2006 | |
| | | £ million | | | £ million | |
Amounts neither past due nor impaired | | 370.3 | | | 356.7 | |
| | | | | | |
Amounts past due but not impaired: | | | | | | |
– Less than 30 days old | | 4.6 | | | 4.1 | |
– Between 30 and 60 days old | | 27.0 | | | 28.4 | |
– Between 60 and 90 days old | | 11.2 | | | 11.0 | |
– More than 90 days old | | 14.6 | | | 15.7 | |
| | | | | | |
| | 57.4 | | | 59.2 | |
Amounts impaired: | | | | | | |
– Total amounts that have been impaired | | 8.6 | | | 6.7 | |
– Allowance for doubtful debts | | (5.5 | ) | | (5.2 | ) |
| | | | | | |
| | 3.1 | | | 1.5 | |
| | | | | | |
| | 430.8 | | | 417.4 | |
| | | | | | |
Movements in the allowance for doubtful debts were as follows:
| | | | | | | | | |
| | | Year ended
29 December
2007 | | | Year ended
30 December
2006 | | | Year ended
31 December
2005 | |
| | | £ million | | | £ million | | | £ million | |
At the beginning of the period | | 5.2 | | | 7.9 | | | 6.1 | |
Charge for the period | | 0.9 | | | 0.9 | | | 3.0 | |
Transfer to assets held for sale | | — | | | (1.5 | ) | | — | |
Utilised during the period | | (0.7 | ) | | (1.7 | ) | | (1.6 | ) |
Foreign currency translation | | 0.1 | | | (0.4 | ) | | 0.4 | |
| | | | | | | | | |
At the end of the period | | 5.5 | | | 5.2 | | | 7.9 | |
| | | | | | | | | |
Trade receivables are not generally interest-bearing although interest may be charged to customers on overdue accounts.
Trade receivables with a carrying value of £0.1 million (30 December 2006: £nil) have been pledged as security for amounts outstanding under secured bank loans.
24. Long-term contracts
Long-term contracts were entered into by Dearborn Mid-West Conveyor Company which was sold on 23 November 2007.
Revenue recognised on long-term contracts during 2007 prior to completion of the sale amounted to £80.0 million (2006: £112.6 million; 2005: £76.4 million).
Amounts recognised in respect of contracts in progress were as follows:
| | | | | |
| | | As at
29 December
2007 | | As at
30 December
2006 | |
| | | £ million | | £ million | |
Costs incurred to date | | — | | 180.7 | |
Recognised profits less recognised losses to date | | — | | 12.3 | |
| | | | | |
| | — | | 193.0 | |
Progress billings to date | | — | | (195.9 | ) |
| | | | | |
Net amount due to customers | | — | | (2.9 | ) |
| | | | | |
Gross amount due from customers included in trade and other receivables | | — | | 4.1 | |
Gross amount due to customers included in trade and other payables | | — | | (7.0 | ) |
| | | | | |
Net amount due to customers | | — | | (2.9 | ) |
| | | | | |
Retentions held by customers | | — | | 3.4 | |
| | | | | |
As at 30 December 2006, there were no unpaid progress billings and no advances received from customers.
F-33
Notes to the financial statements continued
25. Available-for-sale investments
| | | |
| | | £ million | |
Carrying amount | | | |
As at 31 December 2005 | | 2.2 | |
Additions | | 0.1 | |
Fair value gain recognised directly in equity | | 0.6 | |
Disposals | | (0.3 | ) |
Foreign currency translation | | (0.5 | ) |
| | | |
As at 30 December 2006 | | 2.1 | |
Additions | | 0.1 | |
Fair value loss recognised directly in equity | | (0.4 | ) |
Disposals | | (0.3 | ) |
Foreign currency translation | | — | |
| | | |
As at 29 December 2007 | | 1.5 | |
| | | |
Available-for-sale investments comprise listed equities.
26. Cash and cash equivalents
| | | | |
| | | As at
29 December
2007 | | As at
30 December
2006 |
| | | £ million | | £ million |
Cash on hand and demand deposits | | 115.8 | | 153.7 |
Term deposits | | 32.7 | | 18.8 |
| | | | |
| | 148.5 | | 172.5 |
| | | | |
As at 29 December 2007, the carrying amount of cash and cash equivalents included accrued interest receivable of £0.2 million (30 December 2006: £0.2 million).
The currency and interest rate profile of cash and cash equivalents was as follows:
| | | | | | | | |
| | | Floating interest rate | | Non-interest
bearing
£ million | | Total
£ million |
| | | £ million | | Weighted
average
interest rate
% | | |
As at 29 December 2007 | | | | | | | | |
Currency: | | | | | | | | |
– Sterling | | 9.0 | | 4.9 | | 1.1 | | 10.1 |
– US dollar | | 40.0 | | 3.6 | | 3.1 | | 43.1 |
– Euro | | 11.3 | | 3.0 | | 0.6 | | 11.9 |
– Canadian dollar | | 7.8 | | 3.6 | | — | | 7.8 |
– Other | | 67.4 | | 3.4 | | 8.2 | | 75.6 |
| | | | | | | | |
| | 135.5 | | | | 13.0 | | 148.5 |
| | | | | | | | |
As at 30 December 2006 | | | | | | | | |
Currency: | | | | | | | | |
– Sterling | | 5.2 | | 3.3 | | 1.2 | | 6.4 |
– US dollar | | 67.8 | | 4.1 | | 12.4 | | 80.2 |
– Euro | | 12.4 | | 1.6 | | 11.8 | | 24.2 |
– Canadian dollar | | 5.1 | | 2.6 | | 4.3 | | 9.4 |
– Other | | 41.7 | | 2.7 | | 10.6 | | 52.3 |
| | | | | | | | |
| | 132.2 | | | | 40.3 | | 172.5 |
| | | | | | | | |
F - 34
Notes to the financial statements continued
27. Assets held for sale
Management has an ongoing programme of identifying non-core businesses for disposal. During the fourth quarter of 2006, management approved the disposal of the following businesses whose assets and liabilities were classified as held for sale as at 30 December 2006:
| | • | | Trico Products Corporation and its related businesses (“Trico”), which constituted the Group’s Wiper Systems business segment, that are classed as discontinued operations; |
| | • | | Lasco Fittings Inc., a manufacturer of injection moulded fittings that was included within the Other Building Products business segment; and |
| | • | | Dearborn Mid-West Conveyor Company, a manufacturer of automotive assembly lines and materials handling equipment that was included within the Other Industrial & Automotive business segment. |
All of these businesses were sold during 2007.
As at 29 December 2007, the assets and liabilities of the following businesses for which management began actively seeking prospective buyers during the second quarter of 2007 were classified as held for sale:
| | • | | Stant Manufacturing, Inc. (“Stant”), a manufacturer of automotive closure caps; and |
| | • | | Standard-Thomson Corporation, a manufacturer of automotive thermostats. |
Both Stant and Standard-Thomson Corporation are included within the Fluid Systems business segment.
Assets held for sale also include vacant properties no longer required by the Group for manufacturing operations.
Assets classified as held for sale and directly associated liabilities were as follows:
| | | | | | |
| | | As at
29 December
2007 | | | As at
30 December
2006 | |
| | | £ million | | | £ million | |
Assets held for sale | | | | | | |
Intangible assets | | 0.3 | | | 0.1 | |
Property, plant and equipment | | 17.9 | | | 34.7 | |
Deferred tax assets (note 35) | | — | | | 1.5 | |
Inventories | | 7.8 | | | 42.4 | |
Trade and other receivables | | 19.6 | | | 73.3 | |
| | | | | | |
| | 45.6 | | | 152.0 | |
| | | | | | |
Liabilities directly associated with assets held for sale | | | | | | |
Trade and other payables | | (11.1 | ) | | (49.3 | ) |
Post employment benefit obligations (note 33) | | (1.2 | ) | | (11.4 | ) |
Deferred tax liabilities (note 35) | | (1.1 | ) | | — | |
Provisions (note 36) | | (0.7 | ) | | (3.4 | ) |
| | | | | | |
| | (14.1 | ) | | (64.1 | ) |
| | | | | | |
| | 31.5 | | | 87.9 | |
| | | | | | |
In 2006, the Group recognised an impairment loss of £26.6 million on assets classified as held for sale.
As at 29 December 2007, cumulative currency translation differences recognised directly in equity in relation to foreign operations classified as held for sale amounted to £2.8 million (30 December 2006: £9.1 million).
28. Borrowings
| | | | | | | | | | | | |
| | | As at 29 December 2007 | | As at 30 December 2006 |
| | | Current
liabilities | | Non-current
liabilities | | Total | | Current
liabilities | | Non-current
liabilities | | Total |
| | | £ million | | £ million | | £million | | £ million | | £ million | | £million |
Carrying amount | | | | | | | | | | | | |
Bank overdrafts | | 7.9 | | — | | 7.9 | | 5.7 | | — | | 5.7 |
Bank and other loans | | | | | | | | | | | | |
Bank loans – secured | | 0.1 | | — | | 0.1 | | — | | — | | — |
– unsecured | | 14.4 | | 18.0 | | 32.4 | | 26.2 | | 145.3 | | 171.5 |
Other loans – unsecured | | 5.3 | | 393.7 | | 399.0 | | 5.3 | | 391.0 | | 396.3 |
Unsecured loan notes | | 0.2 | | — | | 0.2 | | 0.3 | | – | | 0.3 |
| | | | | | | | | | | | |
| | 20.0 | | 411.7 | | 431.7 | | 31.8 | | 536.3 | | 568.1 |
| | | | | | | | | | | | |
| | 27.9 | | 411.7 | | 439.6 | | 37.5 | | 536.3 | | 573.8 |
| | | | | | | | | | | | |
F - 35
Notes to the financial statements continued
28. Borrowings continued
The carrying amount of borrowings may be reconciled to the principal amount outstanding as follows:
| | | | | | |
| | | As at
29 December
2007 | | | As at
30 December
2006 | |
| | | £ million | | | £ million | |
Carrying amount | | 439.6 | | | 573.8 | |
Accrued interest payable | | (4.9 | ) | | (5.3 | ) |
Unamortised transaction costs | | 2.2 | | | 2.7 | |
Fair value hedge adjustment (note 31) | | 3.7 | | | 6.4 | |
| | | | | | |
Principal amount | | 440.6 | | | 577.6 | |
| | | | | | |
The maturity analysis of the principal amount outstanding is presented in note 32.
Bank loans
Bank loans include amounts drawn down under the Group’s £400 million multi-currency revolving credit facility amounting to £18.0 million (30 December 2006: £145.8 million). Borrowings under the facility attract interest at floating rates determined by reference to LIBOR and the facility expires on 8 August 2010.
Other loans
The Group has a Euro Medium Term Note Programme under which it may borrow up to a total maximum principal amount of £750 million. So far, two bonds have been issued under this programme: £150 million repayable at par on 20 December 2011 that bears interest at a fixed rate of 8%; and £250 million repayable at par on 16 September 2015 that bears interest at a fixed rate of 6.125%.
Unsecured loan notes
The unsecured loan notes must be repaid, at par, on 30 June 2012. Until that time, in certain circumstances the noteholders have the right to require full or part repayment, at par, half yearly on 30 June and 31 December and for this reason they are classified as current liabilities. The unsecured loan notes bear interest at a fixed rate of 2.6%.
Currency and interest rate profile
The currency and interest rate profile of outstanding borrowings, after taking into account the effect of the Group’s currency and interest rate hedging activities, was as follows:
| | | | | | | | | | | | | | |
| | | Floating interest rate | | Fixed interest rate | | Interest free | | |
| | | £ million | | Weighted
average
interest rate
% | | £ million | | Weighted
average
interest rate
% | | Weighted
average period
for which rate is
fixed Years | | £ million | | Total
£ million |
As at 29 December 2007 | | | | | | | | | | | | | | |
Currency: | | | | | | | | | | | | | | |
– Sterling | | 17.9 | | 5.6 | | — | | — | | — | | 0.6 | | 18.5 |
– US dollar | | 221.2 | | 7.7 | | 32.6 | | 7.7 | | 4.8 | | 0.2 | | 254.0 |
– Euro | | 47.8 | | 7.7 | | 3.3 | | 2.5 | | 3.0 | | — | | 51.1 |
– Canadian dollar | | 84.4 | | 7.7 | | — | | — | | — | | — | | 84.4 |
– Other | | 30.4 | | 8.1 | | 1.2 | | 13.1 | | 2.6 | | — | | 31.6 |
| | | | | | | | | | | | | | |
| | 401.7 | | | | 37.1 | | | | | | 0.8 | | 439.6 |
| | | | | | | | | | | | | | |
As at 30 December 2006 | | | | | | | | | | | | | | |
Currency: | | | | | | | | | | | | | | |
– Sterling | | 39.3 | | 6.4 | | — | | — | | — | | — | | 39.3 |
– US dollar | | 223.6 | | 5.0 | | 107.3 | | 4.1 | | 2.5 | | — | | 330.9 |
– Euro | | 66.6 | | 5.0 | | — | | — | | — | | — | | 66.6 |
– Canadian dollar | | 92.2 | | 4.2 | | — | | — | | — | | — | | 92.2 |
– Other | | 42.9 | | 5.6 | | 1.9 | | 8.6 | | 1.4 | | — | | 44.8 |
| | | | | | | | | | | | | | |
| | 464.6 | | | | 109.2 | | | | | | — | | 573.8 |
| | | | | | | | | | | | | | |
F-36
Notes to the financial statements continued
29. Obligations under finance leases
| | | | | | | | | | |
| | | Minimum lease payments | | | Carrying amount |
| | | As at
29 December
2007 | | | As at
30 December
2006 | | | As at
29 December
2007 | | As at
30 December
2006 |
| | | £ million | | | £ million | | | £ million | | £ million |
Amounts payable under finance leases | | | | | | | | | | |
Within one year | | 1.2 | | | 1.9 | | | 0.9 | | 1.4 |
In the second to fifth years, inclusive | | 2.9 | | | 5.7 | | | 2.3 | | 4.4 |
After more than five years | | 2.3 | | | 3.9 | | | 1.6 | | 3.5 |
| | | | | | | | | | |
| | 6.4 | | | 11.5 | | | 4.8 | | 9.3 |
Less: Future finance charges | | (1.6 | ) | | (2.2 | ) | | — | | — |
| | | | | | | | | | |
| | 4.8 | | | 9.3 | | | 4.8 | | 9.3 |
| | | | | | | | | | |
The Group leases certain of its plant, equipment and vehicles under finance leases. All leases are on a fixed repayment basis and no arrangements have been entered into for contingent rental payments. As at 29 December 2007, the average effective interest rate was 6.4% (30 December 2006: 6.0%).
All finance leases are held by the Group’s ongoing businesses.
The Group’s obligations under finance leases are secured by the lessors’ title to the leased assets.
30. Trade and other payables
| | | | |
| | | As at
29 December
2007 | | As at
30 December
2006 |
| | | £ million | | £ million |
Current liabilities | | | | |
Financial liabilities: | | | | |
– Trade payables | | 217.2 | | 217.5 |
– Other taxes and social security | | 18.0 | | 15.5 |
– Derivative financial instruments (note 31) | | 1.7 | | 0.1 |
– Other payables | | 21.0 | | 17.8 |
| | | | |
| | 257.9 | | 250.9 |
| | | | |
Non-financial liabilities: | | | | |
– Accruals and deferred income | | 112.7 | | 102.4 |
| | | | |
| | 370.6 | | 353.3 |
| | | | |
Non-current liabilities | | | | |
Financial liabilities: | | | | |
– Derivative financial instruments (note 31) | | 6.6 | | 0.5 |
– Other payables | | 9.3 | | 8.5 |
| | | | |
| | 15.9 | | 9.0 |
| | | | |
Non-financial liabilities: | | | | |
– Accruals and deferred income | | 5.8 | | 2.7 |
| | | | |
| | 21.7 | | 11.7 |
| | | | |
Trade payables are generally not interest-bearing, but interest may be charged by suppliers on overdue accounts.
F-37
Notes to the financial statements continued
31. Derivative financial instruments
A. Summary
Derivative financial instruments are held in relation to the Group’s financial risk management policy which is described in note 32. The Group does not hold or issue derivatives for speculative or trading purposes.
The carrying amount of derivative financial instruments held by the Group was as follows:
| | | | | | | | | | | | | | | |
| | | As at 29 December 2007 | | | As at 30 December 2006 |
| | | Assets | | Liabilities | | | Net | | | Assets | | Liabilities | | | Net |
| | | £ million | | £ million | | | £ million | | | £ million | | £ million | | | £ million |
Hedging activities | | | | | | | | | | | | | | | |
Translational hedges: | | | | | | | | | | | | | | | |
– Currency forwards | | — | | (6.6 | ) | | (6.6 | ) | | 2.5 | | (0.2 | ) | | 2.3 |
– Interest rate swaps | | 3.1 | | (0.3 | ) | | 2.8 | | | 1.5 | | (0.3 | ) | | 1.2 |
| | | | | | | | | | | | | | | |
| | 3.1 | | (6.9 | ) | | (3.8 | ) | | 4.0 | | (0.5 | ) | | 3.5 |
Transactional hedges: | | | | | | | | | | | | | | | |
– Currency forwards and swaps | | 0.3 | | (1.4 | ) | | (1.1 | ) | | 1.3 | | (0.1 | ) | | 1.2 |
| | | | | | | | | | | | | | | |
| | 3.4 | | (8.3 | ) | | (4.9 | ) | | 5.3 | | (0.6 | ) | | 4.7 |
| | | | | | | | | | | | | | | |
Other items | | | | | | | | | | | | | | | |
Embedded derivatives | | 2.5 | | — | | | 2.5 | | | — | | — | | | — |
| | | | | | | | | | | | | | | |
| | 5.9 | | (8.3 | ) | | (2.4 | ) | | 5.3 | | (0.6 | ) | | 4.7 |
| | | | | | | | | | | | | | | |
Classified as: | | | | | | | | | | | | | | | |
– Current | | 2.8 | | (1.7 | ) | | 1.1 | | | 2.8 | | (0.1 | ) | | 2.7 |
– Non-current | | 3.1 | | (6.6 | ) | | (3.5 | ) | | 2.5 | | (0.5 | ) | | 2.0 |
| | | | | | | | | | | | | | | |
| | 5.9 | | (8.3 | ) | | (2.4 | ) | | 5.3 | | (0.6 | ) | | 4.7 |
| | | | | | | | | | | | | | | |
B. Currency derivatives
As at 29 December 2007, the notional principal amount of outstanding foreign exchange contracts that are used to manage the currency profile of the Group’s net assets was £585.8 million (30 December 2006: £384.5 million). The Group has designated these contracts as net investment hedges. During 2007, the net fair value loss of £15.5 million (2006: net gain of £43.5 million; 2005: net loss of £35.6 million) in relation to these contracts was recognised directly in equity.
The Group also designated as net investment hedges the US dollar denominated preference shares and US dollar borrowings under the multi-currency revolving credit facility. During 2007, the net currency translation gain of £1.9 million (2006: net gain of £26.1 million; 2005: net loss of £37.0 million) arising on these instruments was recognised directly in equity.
The currency profile of the Group’s net assets after taking into account translation hedges is presented in note 32.
During 2007, a net loss of £1.5 million (2006: net loss of £0.7 million; 2005: net gain of £0.9 million) was recognised within other finance (expense)/income in respect of currency translation hedges that did not qualify for hedge accounting under IAS 39.
Also during 2007, a net fair value loss of £2.0 million (2006: net loss of £0.7 million; 2005: net gain of £0.4 million) was recognised within operating profit in respect of currency derivatives that were held to provide an economic hedge of transactional currency exposures but were not designated as hedges for accounting purposes.
C. Interest rate swaps
Interest rate swaps are used to swap borrowings under the Group’s Euro Medium Term Note Programme from fixed interest rates to floating interest rates. As at 29 December 2007, the nominal value of the contracts outstanding was £400 million (30 December 2006: £400 million). The Group has designated these contracts as fair value hedges in relation to the borrowings. During 2007, the Group recognised a net fair value gain of £3.5 million (2006: net loss of £19.9 million; 2005: net gain of £8.6 million) in relation to these contracts and the carrying amount of the hedged borrowings was increased by £2.7 million (2006: reduced by £20.7 million; 2005: increased by £8.6 million) to reflect the change in the fair value of the borrowings attributable to the hedged risk and the amortisation of the transitional adjustment that was recognised on initial adoption of IAS 39. During 2007, a net gain of £0.8 million (2006: net gain of £0.9 million; 2005: £nil) was therefore recognised within other finance (expense)/income in relation to these hedges.
Interest rate swaps are also used to restrict the amount of floating rate US dollar debt. As at 29 December 2007, the nominal value of these contracts held was US$130 million (30 December 2006: US$275 million), including contracts with a nominal value of US$65 million (30 December 2006: US$65 million) that commence on the maturity of equivalent contracts that are currently in force. During 2007, a net fair value loss of £1.9 million (2006: net loss of £0.9 million; 2005: net gain of £3.3 million) was recognised within other finance (expense)/income in relation to these contracts that did not qualify for hedge accounting under IAS 39.
F-38
Notes to the financial statements continued
31. Derivative financial instruments continued
The profile of interest rate swaps held by the Group was as follows:
| | | | | | | | | | | | | | | | | |
| | | Notional
principal
amount
million | | Interest rate |
| | | | Payable | | | Receivable | | | Variable
rate index |
| | | | Variable | | | Fixed | | | Variable | | | Fixed | | |
As at 29 December 2007 | | | | | | | | | | | | | | | | | |
Maturity date: | | | | | | | | | | | | | | | | | |
– December 2011 | | £ | 150.0 | | 8.6 | % | | — | | | — | | | 8.0 | % | | 6 month LIBOR |
– September 2015 | | £ | 250.0 | | 7.2 | % | | — | | | — | | | 6.1 | % | | 3 month LIBOR |
– June 2008 | | US$ | 65.0 | | — | | | 3.8 | % | | 4.9 | % | | — | | | 3 month LIBOR |
– December 2009 (commences June 2008) | | US$ | 65.0 | | — | | | 4.6 | % | | — | | | — | | | 3 month LIBOR |
| | | | | | |
As at 30 December 2006 | | | | | | | | | | | | | | | | | |
Maturity date: | | | | | | | | | | | | | | | | | |
– December 2011 | | £ | 150.0 | | 8.0 | % | | — | | | — | | | 8.0 | % | | 6 month LIBOR |
– September 2015 | | £ | 250.0 | | 6.4 | % | | — | | | — | | | 6.1 | % | | 3 month LIBOR |
– June 2008 | | US$ | 65.0 | | — | | | 3.8 | % | | 5.4 | % | | — | | | 3 month LIBOR |
– December 2007 | | US$ | 145.0 | | — | | | 4.2 | % | | 5.4 | % | | — | | | 3 month LIBOR |
– December 2009 (commences June 2008) | | US$ | 65.0 | | — | | | 4.6 | % | | — | | | — | | | 3 month LIBOR |
32. Financial risk management
A. Risk management policies
The Group’s central treasury function is responsible for procuring the Group’s capital resources and maintaining an efficient capital structure, together with managing the Group’s liquidity, foreign exchange and interest rate exposures.
All treasury operations are conducted within strict policies and guidelines that are approved by the Board. Compliance with those policies and guidelines is monitored by the regular reporting of treasury activities to the Board.
A key element of the Group’s treasury philosophy is that funding, interest rate and currency decisions and the location of cash and debt balances are determined independently of each other. The Group’s borrowing requirements are met by raising funds in the most favourable markets. Management aims to retain net debt in proportion to the currencies in which the net assets of the Group’s operations are denominated. The desired currency profile of net debt is achieved by entering into currency derivative contracts. The proportion of overseas investments effectively funded by shareholders’ equity is not hedged. The net income of foreign operations is not hedged but the effect of currency fluctuations on the Group’s reported net income is partly offset by interest payable on net debt denominated in foreign currencies.
From time to time, the Group also enters into currency derivative contracts to manage currency transaction exposures.
The Group’s interest rate profile is managed within the policy established by the Board. The desired interest rate profile of net debt in each currency is achieved by entering into interest rate derivative contracts.
The Group’s portfolio of cash and cash equivalents is managed such that there is no significant concentration of credit risk in any one bank or other financial institution. Management monitors closely the credit quality of the institutions with which it holds deposits. Similar considerations are given to the Group’s portfolio of derivative financial instruments.
The Group’s borrowing facilities are monitored against forecast requirements and timely action is taken to put in place, renew or replace credit lines. Management’s policy is to reduce liquidity risk by diversifying the Group’s funding sources and by staggering the maturity of its borrowings.
The Group has established long-term credit ratings of Baa3 Stable with Moody’s and BBB Stable with Standard & Poors and a short-term credit rating of P-2 with Moody’s. Management aims to achieve an appropriate mix of debt and equity to ensure an efficient capital structure and to preserve these ratings.
Disclosures about the Group’s capital are set out in note 42.
F-39
Notes to the financial statements continued
32. Financial risk management continued
B. Financial assets and liabilities
Financial assets and liabilities analysed by the categories defined in IAS 39 were as follows:
| | | | | | | | | | | | | | | | | | | | |
| | | | | | | | | | | Fair value through profit or loss | | | | | | | |
| | | Loans and
receivables | | | Available
-for-sale | | Amortised
cost | | | Designated
hedging
relationships | | | Trading | | | Total
carrying
value | | | Fair
value | |
| | | £ million | | | £ million | | £million | | | £ million | | | £ million | | | £ million | | | £ million | |
As at 29 December 2007 | | | | | | | | | | | | | | | | | | | | |
Financial assets | | | | | | | | | | | | | | | | | | | | |
Trade and other receivables: | | | | | | | | | | | | | | | | | | | | |
– Non-derivative assets | | 480.2 | | | — | | — | | | — | | | — | | | 480.2 | | | 480.2 | |
– Derivative assets | | — | | | — | | — | | | 3.1 | | | 2.8 | | | 5.9 | | | 5.9 | |
| | | | | | | | | | | | | | | | | | | | |
| | 480.2 | | | — | | — | | | 3.1 | | | 2.8 | | | 486.1 | | | 486.1 | |
Available-for-sale investments | | — | | | 1.5 | | — | | | — | | | — | | | 1.5 | | | 1.5 | |
Cash and cash equivalents | | 148.5 | | | — | | — | | | — | | | — | | | 148.5 | | | 148.5 | |
| | | | | | | | | | | | | | | | | | | | |
| | 628.7 | | | 1.5 | | — | | | 3.1 | | | 2.8 | | | 636.1 | | | 636.1 | |
| | | | | | | | | | | | | | | | | | | | |
Financial liabilities | | | | | | | | | | | | | | | | | | | | |
Trade and other payables: | | | | | | | | | | | | | | | | | | | | |
– Non-derivative liabilities | | (265.5 | ) | | — | | — | | | — | | | — | | | (265.5 | ) | | (265.5 | ) |
– Derivative liabilities | | — | | | — | | — | | | (6.6 | ) | | (1.7 | ) | | (8.3 | ) | | (8.3 | ) |
| | | | | | | | | | | | | | | | | | | | |
| | (265.5 | ) | | — | | — | | | (6.6 | ) | | (1.7 | ) | | (273.8 | ) | | (273.8 | ) |
Bank overdrafts | | — | | | — | | (7.9 | ) | | — | | | — | | | (7.9 | ) | | (7.9 | ) |
Bank and other loans: | | | | | | | | | | | | | | | | | | | | |
– Current | | — | | | — | | (20.0 | ) | | — | | | — | | | (20.0 | ) | | (20.0 | ) |
– Non-current | | — | | | — | | (415.4 | ) | | 3.7 | | | — | | | (411.7 | ) | | (415.2 | ) |
Obligations under finance leases | | — | | | — | | (4.8 | ) | | — | | | — | | | (4.8 | ) | | (4.8 | ) |
| | | | | | | | | | | | | | | | | | | | |
| | (265.5 | ) | | — | | (448.1 | ) | | (2.9 | ) | | (1.7 | ) | | (718.2 | ) | | (721.7 | ) |
| | | | | | | | | | | | | | | | | | | | |
| | 363.2 | | | 1.5 | | (448.1 | ) | | 0.2 | | | 1.1 | | | (82.1 | ) | | (85.6 | ) |
| | | | | | | | | | | | | | | | | | | | |
| | | | | | |
| | | | | | | | | | | Fair value through profit or loss | | | | | | | |
| | | Loans and
receivables | | | Available
-for-sale | | Amortised
cost | | | Designated
hedging
relationships | | | Trading | | | Total
carrying
value | | | Fair
value | |
| | | £ million | | | £ million | | £ million | | | £ million | | | £ million | | | £ million | | | £ million | |
As at 30 December 2006 | | | | | | | | | | | | | | | | | | | | |
Financial assets | | | | | | | | | | | | | | | | | | | | |
Trade and other receivables: | | | | | | | | | | | | | | | | | | | | |
– Non-derivative assets | | 449.4 | | | — | | — | | | — | | | — | | | 449.4 | | | 449.4 | |
– Derivative assets | | — | | | — | | — | | | 2.5 | | | 2.8 | | | 5.3 | | | 5.3 | |
| | | | | | | | | | | | | | | | | | | | |
| | 449.4 | | | — | | — | | | 2.5 | | | 2.8 | | | 454.7 | | | 454.7 | |
Available-for-sale investments | | — | | | 2.1 | | — | | | — | | | — | | | 2.1 | | | 2.1 | |
Cash and cash equivalents | | 172.5 | | | — | | — | | | — | | | — | | | 172.5 | | | 172.5 | |
| | | | | | | | | | | | | | | | | | | | |
| | 621.9 | | | 2.1 | | — | | | 2.5 | | | 2.8 | | | 629.3 | | | 629.3 | |
| | | | | | | | | | | | | | | | | | | | |
Financial liabilities | | | | | | | | | | | | | | | | | | | | |
Trade and other payables: | | | | | | | | | | | | | | | | | | | | |
– Non-derivative liabilities | | (259.3 | ) | | — | | — | | | — | | | — | | | (259.3 | ) | | (259.3 | ) |
– Derivative liabilities | | — | | | — | | — | | | (0.5 | ) | | (0.1 | ) | | (0.6 | ) | | (0.6 | ) |
| | | | | | | | | | | | | | | | | | | | |
| | (259.3 | ) | | — | | — | | | (0.5 | ) | | (0.1 | ) | | (259.9 | ) | | (259.9 | ) |
Bank overdrafts | | — | | | — | | (5.7 | ) | | — | | | — | | | (5.7 | ) | | (5.7 | ) |
Bank and other loans: | | | | | | | | | | | | | | | | | | | | |
– Current | | — | | | — | | (31.8 | ) | | — | | | — | | | (31.8 | ) | | (31.8 | ) |
– Non-current | | — | | | — | | (542.7 | ) | | 6.4 | | | — | | | (536.3 | ) | | (550.8 | ) |
Obligations under finance leases | | — | | | — | | (9.3 | ) | | — | | | — | | | (9.3 | ) | | (9.3 | ) |
Preference shares | | — | | | — | | (67.5 | ) | | — | | | — | | | (67.5 | ) | | (65.8 | ) |
| | | | | | | | | | | | | | | | | | | | |
| | (259.3 | ) | | — | | (657.0 | ) | | 5.9 | | | (0.1 | ) | | (910.5 | ) | | (923.3 | ) |
| | | | | | | | | | | | | | | | | | | | |
| | 362.6 | | | 2.1 | | (657.0 | ) | | 8.4 | | | 2.7 | | | (281.2 | ) | | (294.0 | ) |
| | | | | | | | | | | | | | | | | | | | |
F-40
Notes to the financial statements continued
32. Financial risk management continued
Available-for-sale investments are listed and are valued by reference to quoted market prices.
Cash and cash equivalents and current bank and other loans largely attract floating interest rates. Accordingly, their carrying amounts are considered to approximate to fair value.
Non-current bank and other loans principally comprise borrowings under the Group’s multi-currency revolving credit facility that attract floating interest rates, the carrying amount of which is considered to approximate to fair value, and the listed bonds issued under the Group’s Euro Medium Term Note Programme, the fair value of which is based on their quoted market prices.
Finance lease obligations attract fixed interest rates that are implicit in the lease rentals and their fair value has been assessed by reference to prevailing market interest rates.
Derivative assets and liabilities represent the fair value of foreign currency derivatives and interest rate derivatives held by the Group at the balance sheet date. Foreign currency derivatives are valued by reference to prevailing forward exchange rates. Interest rate derivatives are valued by discounting the related cash flows using prevailing market interest rates.
Preference shares were not traded in an organised market and their fair value was assessed using a valuation model that took into account prevailing market interest rates and the existence of the holders’ conversion option.
C. Credit risk
Credit risk is the risk that a counterparty will default on its contractual obligations resulting in financial loss to the Group.
Management considers the Group’s maximum exposure to credit risk to be as follows:
| | | | |
| | | As at
29 December
2007 | | As at
30 December
2006 |
| | | £ million | | £ million |
Trade and other receivables: | | | | |
– Derivative assets | | 5.9 | | 5.3 |
– Non-derivative assets | | 480.2 | | 449.4 |
Add: Allowance for doubtful debts | | 5.5 | | 5.2 |
| | | | |
| | 491.6 | | 459.9 |
Cash and cash equivalents | | 148.5 | | 172.5 |
| | | | |
| | 640.1 | | 632.4 |
| | | | |
As at 29 December 2007, 86% (30 December 2006: 86%) of the Group’s cash and cash equivalents were held with institutions rated at least A-1 by Standard & Poor’s and P-1 by Moody’s.
Credit risk disclosures with respect to trade receivables are set out in note 23.
D. Liquidity risk
Liquidity risk is the risk that an entity will encounter difficulty in meeting obligations associated with financial liabilities.
As at 29 December 2007, the Group had undrawn committed borrowing facilities of £382.0 million (30 December 2006: £254.2 million) available under the multi-currency revolving credit facility that expires on 8 August 2010. Borrowings under this facility will be at prevailing LIBOR rates, plus an agreed margin, dependent on the period of drawdown. In addition, the Group had uncommitted borrowing facilities of £254.7 million (30 December 2006: £255.8 million), of which £22.5 million (30 December 2006: £31.8 million) had been drawn down for cash and £92.4 million (30 December 2006: £86.4 million) had been utilised through the issuance of bank guarantees and standby letters of credit. Consequently, the Group’s committed borrowing headroom was £267.1 million (30 December 2006: £136.0 million) in addition to cash and cash equivalents of £148.5 million (30 December 2006: £172.5 million).
The Group is subject to covenants, representations and warranties commonly associated with investment grade borrowings in respect of its committed borrowing facilities and borrowings under the Euro Medium Term Note Programme.
The Group is subject to two financial covenants in respect of its committed borrowing facilities. The ratio of net debt to consolidated earnings before interest, tax, depreciation and amortisation must not exceed 2.5 times, and the ratio of consolidated operating profit to the consolidated net interest charge must not be less than 3.0 times. The financial covenants are calculated by applying UK GAAP extant as at 31 December 2002.
The Group complied with the borrowing covenants throughout each of the periods presented in the financial statements. Any future non-compliance with the borrowing covenants could, if not waived, constitute an event of default and may, in certain circumstances lead to an acceleration of the maturity of borrowings drawn down and the inability to access committed facilities.
F-41
Notes to the financial statements continued
32. Financial risk management continued
Contractual cash flows related to the Group’s financial liabilities are as follows:
| | | | | | | | | | | | | | | | | | | | | |
| | | Within
1 year | | | Between
1 and 2
years | | | Between
2 and 3
years | | | Between
3 and 4
years | | | Between
4 and 5
years | | | After
5 years | | | Total | |
| | | £ million | | | £ million | | | £ million | | | £ million | | | £ million | | | £ million | | | £ million | |
As at 29 December 2007 | | | | | | | | | | | | | | | | | | | | | |
Bank overdrafts | | (7.9 | ) | | — | | | — | | | — | | | — | | | — | | | (7.9 | ) |
Bank and other loans: | | | | | | | | | | | | | | | | | | | | | |
– Principal | | (22.6 | ) | | — | | | (18.0 | ) | | (150.0 | ) | | — | | | (250.0 | ) | | (440.6 | ) |
– Interest payments | | (29.7 | ) | | (28.4 | ) | | (28.4 | ) | | (28.0 | ) | | (15.3 | ) | | (45.9 | ) | | (175.7 | ) |
Finance lease obligations | | (1.2 | ) | | (1.0 | ) | | (0.9 | ) | | (0.6 | ) | | (0.4 | ) | | (2.3 | ) | | (6.4 | ) |
Trade and other payables: | | | | | | | | | | | | | | | | | | | | | |
– Non-derivative liabilities | | (256.2 | ) | | (9.3 | ) | | — | | | — | | | — | | | — | | | (265.5 | ) |
– Derivative liabilities | | | | | | | | | | | | | | | | | | | | | |
Payments | | (621.3 | ) | | (6.8 | ) | | (4.2 | ) | | — | | | — | | | — | | | (632.3 | ) |
Receipts | | 613.8 | | | 6.3 | | | 4.0 | | | — | | | — | | | — | | | 624.1 | |
| | | | | | | | | | | | | | | | | | | | | |
Cash flows on financial liabilities | | (325.1 | ) | | (39.2 | ) | | (47.5 | ) | | (178.6 | ) | | (15.7 | ) | | (298.2 | ) | | (904.3 | ) |
| | | | | | | | | | | | | | | | | | | | | |
Related financial assets: | | | | | | | | | | | | | | | | | | | | | |
– Derivative assets | | | | | | | | | | | | | | | | | | | | | |
Payments | | (46.1 | ) | | (26.9 | ) | | (26.9 | ) | | (26.9 | ) | | (15.2 | ) | | (45.8 | ) | | (187.8 | ) |
Receipts | | 45.6 | | | 28.2 | | | 28.2 | | | 28.2 | | | 15.3 | | | 45.9 | | | 191.4 | |
| | | | | | | | | | | | | | | | | | | | | |
Cash flows on related financial assets | | (0.5 | ) | | 1.3 | | | 1.3 | | | 1.3 | | | 0.1 | | | 0.1 | | | 3.6 | |
| | | | | | | | | | | | | | | | | | | | | |
| | | | | | | |
| | | Within
1 year | | | Between
1 and 2
years | | | Between
2 and 3
years | | | Between
3 and 4
years | | | Between
4 and 5
years | | | After
5 years | | | Total | |
| | | £ million | | | £ million | | | £ million | | | £ million | | | £ million | | | £ million | | | £ million | |
As at 30 December 2006 | | | | | | | | | | | | | | | | | | | | | |
Bank overdrafts | | (5.7 | ) | | — | | | — | | | — | | | — | | | — | | | (5.7 | ) |
Bank and other loans: | | | | | | | | | | | | | | | | | | | | | |
– Principal | | (32.3 | ) | | — | | | — | | | (145.3 | ) | | (150.0 | ) | | (250.0 | ) | | (577.6 | ) |
– Interest payments | | (37.4 | ) | | (35.5 | ) | | (35.5 | ) | | (32.8 | ) | | (27.3 | ) | | (61.2 | ) | | (229.7 | ) |
Finance lease obligations | | (1.9 | ) | | (1.8 | ) | | (1.5 | ) | | (1.4 | ) | | (1.0 | ) | | (3.9 | ) | | (11.5 | ) |
Trade and other payables: | | | | | | | | | | | | | | | | | | | | | |
– Non-derivative liabilities | | (250.8 | ) | | (8.5 | ) | | — | | | — | | | — | | | — | | | (259.3 | ) |
– Derivative liabilities | | | | | | | | | | | | | | | | | | | | | |
Payments | | (95.6 | ) | | (29.0 | ) | | (28.6 | ) | | (28.1 | ) | | (27.1 | ) | | (59.7 | ) | | (268.1 | ) |
Receipts | | 94.9 | | | 28.2 | | | 28.2 | | | 28.2 | | | 28.2 | | | 61.3 | | | 269.0 | |
| | | | | | | | | | | | | | | | | | | | | |
Cash flows on financial liabilities | | (328.8 | ) | | (46.6 | ) | | (37.4 | ) | | (179.4 | ) | | (177.2 | ) | | (313.5 | ) | | (1,082.9 | ) |
| | | | | | | | | | | | | | | | | | | | | |
Related financial assets: | | | | | | | | | | | | | | | | | | | | | |
– Derivative assets | | | | | | | | | | | | | | | | | | | | | |
Payments | | (374.7 | ) | | (4.5 | ) | | (1.5 | ) | | — | | | — | | | — | | | (380.7 | ) |
Receipts | | 378.4 | | | 5.4 | | | 1.7 | | | — | | | — | | | — | | | 385.5 | |
| | | | | | | | | | | | | | | | | | | | | |
Cash flows on related financial assets | | 3.7 | | | 0.9 | | | 0.2 | | | — | | | — | | | — | | | 4.8 | |
| | | | | | | | | | | | | | | | | | | | | |
Maturities in the above table are based on the earliest date on which the Group could be required to settle the liabilities.
Floating interest payments and payments and receipts on interest rate derivatives are estimated based on market interest rates prevailing at the balance sheet date.
F-42
Notes to the financial statements continued
32. Financial risk management continued
E. Interest rate risk
Interest rate risk is the risk that the fair value of or future cash flows associated with a financial instrument will fluctuate because of changes in market interest rates.
The interest rate profile of the Group’s financial assets and liabilities, after taking into account the effect of the Group’s interest rate hedging activities, was as follows:
| | | | | | | | | | | | | | | | | | | | | | | | |
| | | As at 29 December 2007 | | | As at 30 December 2006 | |
| | | Interest-bearing | | | | | | | | | Interest-bearing | | | | | | | |
| | | Floating
rate | | | Fixed
rate | | | Non-interest
bearing | | | Total | | | Floating
rate | | | Fixed
rate | | | Non-interest
bearing | | | Total | |
| | | £ million | | | £ million | | | £ million | | | £ million | | | £ million | | | £ million | | | £ million | | | £ million | |
Financial assets | | | | | | | | | | | | | | | | | | | | | | | | |
Trade and other receivables | | — | | | — | | | 486.1 | | | 486.1 | | | — | | | — | | | 454.7 | | | 454.7 | |
Available-for-sale investments | | — | | | — | | | 1.5 | | | 1.5 | | | — | | | — | | | 2.1 | | | 2.1 | |
Cash and cash equivalents (note 26) | | 135.5 | | | — | | | 13.0 | | | 148.5 | | | 132.2 | | | — | | | 40.3 | | | 172.5 | |
| | | | | | | | | | | | | | | | | | | | | | | | |
| | 135.5 | | | — | | | 500.6 | | | 636.1 | | | 132.2 | | | — | | | 497.1 | | | 629.3 | |
Financial liabilities | | | | | | | | | | | | | | | | | | | | | | | | |
Trade and other payables | | — | | | — | | | (273.8 | ) | | (273.8 | ) | | — | | | — | | | (259.9 | ) | | (259.9 | ) |
Borrowings (note 28) | | (401.7 | ) | | (37.1 | ) | | (0.8 | ) | | (439.6 | ) | | (464.6 | ) | | (109.2 | ) | | — | | | (573.8 | ) |
Obligations under finance leases | | — | | | (4.8 | ) | | — | | | (4.8 | ) | | — | | | (9.3 | ) | | — | | | (9.3 | ) |
| | | | | | | | | | | | | | | | | | | | | | | | |
| | (401.7 | ) | | (41.9 | ) | | (274.6 | ) | | (718.2 | ) | | (464.6 | ) | | (118.5 | ) | | (259.9 | ) | | (843.0 | ) |
| | | | | | | | | | | | | | | | | | | | | | | | |
| | (266.2 | ) | | (41.9 | ) | | 226.0 | | | 82.1 | | | (332.4 | ) | | (118.5 | ) | | 237.2 | | | (213.7 | ) |
| | | | | | | | | | | | | | | | | | | | | | | | |
On the assumption that the change in interest rates is applied to the risk exposures in existence at the balance sheet date and that designated fair value hedges are highly effective, an increase/decrease of 100 basis points in the interest rates applying to financial assets and liabilities would increase/decrease the Group’s profit before tax by £3.1 million (2006: increase/decrease by £3.7 million). No amounts would be taken directly to equity.
F. Currency risk
Currency risk is the risk that the fair value or future cash flows of a financial instrument will fluctuate because of changes in foreign exchange rates. Currency risk arises on financial assets and liabilities that are denominated in a currency other than the functional currency of the entity by which they are held.
The Group’s exposure to currency risk was as follows:
| | | | | | | | | | | | | | | | | | |
| | | Net foreign currency financial assets/(liabilities) | | | | |
| | | Sterling | | | US dollar | | | Euro | | | Canadian dollar | | | Other | | | Total | |
| | | £ million | | | £ million | | | £ million | | | £ million | | | £ million | | | £ million | |
As at 29 December 2007 | | | | | | | | | | | | | | | | | | |
Functional currency of entity: | | | | | | | | | | | | | | | | | | |
– Sterling | | — | | | 12.2 | | | 5.2 | | | — | | | 0.1 | | | 17.5 | |
– US dollar | | (0.1 | ) | | — | | | (1.6 | ) | | 0.1 | | | 3.2 | | | 1.6 | |
– Euro | | (0.1 | ) | | (2.2 | ) | | — | | | — | | | — | | | (2.3 | ) |
– Canadian dollar | | (0.2 | ) | | 1.5 | | | (0.1 | ) | | — | | | (0.2 | ) | | 1.0 | |
– Other | | (3.7 | ) | | (12.2 | ) | | 1.4 | | | (1.1 | ) | | — | | | (15.6 | ) |
| | | | | | | | | | | | | | | | | | |
| | (4.1 | ) | | (0.7 | ) | | 4.9 | | | (1.0 | ) | | 3.1 | | | 2.2 | |
| | | | | | | | | | | | | | | | | | |
As at 30 December 2006 | | | | | | | | | | | | | | | | | | |
Functional currency of entity: | | | | | | | | | | | | | | | | | | |
– Sterling | | — | | | 12.7 | | | 6.4 | | | 2.1 | | | (0.2 | ) | | 21.0 | |
– US dollar | | (0.2 | ) | | — | | | (0.3 | ) | | — | | | 1.2 | | | 0.7 | |
– Euro | | (0.2 | ) | | (1.1 | ) | | — | | | (0.2 | ) | | (0.1 | ) | | (1.6 | ) |
– Canadian dollar | | (0.2 | ) | | 3.9 | | | (0.1 | ) | | — | | | (0.8 | ) | | 2.8 | |
– Other | | (1.9 | ) | | (1.9 | ) | | (0.5 | ) | | (0.5 | ) | | — | | | (4.8 | ) |
| | | | | | | | | | | | | | | | | | |
| | (2.5 | ) | | 13.6 | | | 5.5 | | | 1.4 | | | 0.1 | | | 18.1 | |
| | | | | | | | | | | | | | | | | | |
Currency exposures shown above take into account the effect of the Group’s transaction hedging activities.
F-43
Notes to the financial statements continued
32. Financial risk management continued
The currency exposures on the Group’s net assets, after taking into account the translation hedges applied to the Group’s borrowings, were as follows:
| | | | |
| | | As at
29 December
2007 | | As at
30 December
2006 |
| | | £ million | | £ million |
Currency: | | | | |
– Canadian dollar | | 181.9 | | 134.7 |
– Euro | | 78.2 | | 78.2 |
– Pounds sterling | | 79.0 | | 43.4 |
– US dollar | | 482.6 | | 461.3 |
– Other | | 309.7 | | 236.9 |
| | | | |
| | 1,131.4 | | 954.5 |
| | | | |
33. Post-employment benefit obligations
A. Background
The Group operates pension plans throughout the world, covering the majority of its employees. The plans are structured to accord with local conditions and practices in each country and include defined contribution plans and defined benefit plans.
The Group provides defined contribution pension benefits in most of the countries in which it operates; in particular, the majority of the Group’s employees in the United States of America are entitled to such benefits. The expense recognised in the income statement in respect of these plans represents the contributions payable by the Group for the period at rates that are specified in the rules of the plans. At the balance sheet date, the Group had not paid over to the plans contributions due amounting to £7.5 million (30 December 2006: £7.1 million). All amounts due for the period were paid over subsequent to the balance sheet date.
The Group operates defined benefit pension plans in several countries; in particular, in the United Kingdom and the United States of America. Generally, the pension benefits provided under these plans are based upon pensionable salary and the period of service of the individual employees. The assets of the plans are held separately from those of the Group in funds that are under the control of trustees. The majority of the defined benefit pension plans operated by the Group are closed to new entrants. In addition to the funded defined benefit pension plans, the Group has unfunded defined benefit obligations to certain employees.
The Group also provides other post-employment benefits, principally health and life insurance cover, to certain of its employees in North America. These plans, which are unfunded, are defined benefit plans.
B. Summary of financial effect
An analysis of the effect of providing post-employment benefits on the Group’s results is set out below.
| | | | | | | | | | | | | | | | | | | | | |
| | | Pensions | | | Other post-employment benefits | |
Year ended 29 December 2007 | | Operating
profit | | | Finance
charges | | | Loss from
discontinued
operations | | | Total | | | Operating
profit | | Finance
charges | | Loss from
discontinued
operations | | Total | |
| | | £ million | | | £ million | | | £ million | | | £ million | | | £ million | | £ million | | £ million | | £ million | |
Defined contribution plans | | 23.4 | | | — | | | 0.4 | | | 23.8 | | | — | | — | | — | | — | |
| | | | | | | | | | | | | | | | | | | | | |
Defined benefit plans | | | | | | | | | | | | | | | | | | | | | |
Recognised in the income statement: | | | | | | | | | | | | | | | | | | | | | |
– Current service cost | | 5.8 | | | — | | | 0.1 | | | 5.9 | | | 0.2 | | — | | — | | 0.2 | |
– Past service cost | | 0.1 | | | — | | | — | | | 0.1 | | | — | | — | | — | | — | |
– Settlement and curtailments | | (1.9 | ) | | — | | | (1.2 | ) | | (3.1 | ) | | — | | — | | — | | — | |
– Interest cost | | — | | | 33.0 | | | 0.5 | | | 33.5 | | | — | | 5.1 | | — | | 5.1 | |
– Expected return on plan assets | | — | | | (37.5 | ) | | (0.6 | ) | | (38.1 | ) | | — | | — | | — | | — | |
| | | | | | | | | | | | | | | | | | | | | |
| | 4.0 | | | (4.5 | ) | | (1.2 | ) | | (1.7 | ) | | 0.2 | | 5.1 | | — | | 5.3 | |
| | | | | | | | | | | | | | | | | | | | | |
Recognised in equity: | | | | | | | | | | | | | | | | | | | | | |
– Actuarial gain | | | | | | | | | | | (45.1 | ) | | | | | | | | (3.0 | ) |
– Effect of the asset ceiling | | | | | | | | | | | 22.0 | | | | | | | | | – | |
| | | | | | | | | | | | | | | | | | | | | |
| | | | | | | | | | | (23.1 | ) | | | | | | | | (3.0 | ) |
| | | | | | | | | | | | | | | | | | | | | |
| | | | | | | | | | | (24.8 | ) | | | | | | | | 2.3 | |
| | | | | | | | | | | | | | | | | | | | | |
F-44
Notes to the financial statements continued
33. Post-employment benefit obligations continued
| | | | | | | | | | | | | | | | | | | | | | |
| | | Pensions | | | Other post-employment benefits | |
Year ended 30 December 2006 | | Operating
profit | | | Finance
charges | | | Loss from
discontinued
operations | | | Total | | | Operating
profit | | | Finance
charges | | Loss from
discontinued
operations | | Total | |
| | | £ million | | | £ million | | | £ million | | | £ million | | | £ million | | | £ million | | £ million | | £ million | |
Defined contribution plans | | 27.8 | | | — | | | 1.4 | | | 29.2 | | | — | | | — | | — | | — | |
| | | | | | | | | | | | | | | | | | | | | | |
Defined benefit plans | | | | | | | | | | | | | | | | | | | | | | |
Recognised in the income statement: | | | | | | | | | | | | | | | | | | | | | | |
– Current service cost | | 6.9 | | | — | | | 0.4 | | | 7.3 | | | 0.2 | | | — | | — | | 0.2 | |
– Past service cost | | 0.4 | | | — | | | — | | | 0.4 | | | — | | | — | | — | | — | |
– Settlement and curtailments | | 0.1 | | | — | | | — | | | 0.1 | | | (0.6 | ) | | — | | — | | (0.6 | ) |
– Interest cost | | — | | | 31.5 | | | 2.7 | | | 34.2 | | | — | | | 5.4 | | 0.1 | | 5.5 | |
– Expected return on plan assets | | — | | | (33.3 | ) | | (2.8 | ) | | (36.1 | ) | | — | | | — | | — | | — | |
| | | | | | | | | | | | | | | | | | | | | | |
| | 7.4 | | | (1.8 | ) | | 0.3 | | | 5.9 | | | (0.4 | ) | | 5.4 | | 0.1 | | 5.1 | |
| | | | | | | | | | | | | | | | | | | | | | |
Recognised in equity: | | | | | | | | | | | | | | | | | | | | | | |
– Actuarial (gain)/loss | | | | | | | | | | | (20.8 | ) | | | | | | | | | 1.4 | |
– Effect of the asset ceiling | | | | | | | | | | | 0.8 | | | | | | | | | | — | |
| | | | | | | | | | | | | | | | | | | | | | |
| | | | | | | | | | | (20.0 | ) | | | | | | | | | 1.4 | |
| | | | | | | | | | | | | | | | | | | | | | |
| | | | | | | | | | | (14.1 | ) | | | | | | | | | 6.5 | |
| | | | | | | | | | | | | | | | | | | | | | |
| | |
| | | Pensions | | | Other post-employment benefits | |
Year ended 31 December 2005 | | Operating
profit | | | Finance
charges | | | Loss from
discontinued
operations | | | Total | | | Operating
profit | | | Finance
charges | | Loss from
discontinued
operations | | Total | |
| | | £ million | | | £ million | | | £ million | | | £ million | | | £ million | | | £ million | | £ million | | £ million | |
Defined contribution plans | | 25.3 | | | — | | | 1.4 | | | 26.7 | | | — | | | — | | — | | — | |
| | | | | | | | | | | | | | | | | | | | | | |
Defined benefit plans | | | | | | | | | | | | | | | | | | | | | | |
Recognised in the income statement: | | | | | | | | | | | | | | | | | | | | | | |
– Current service cost | | 5.8 | | | — | | | 0.3 | | | 6.1 | | | 0.4 | | | — | | — | | 0.4 | |
– Past service cost | | 0.3 | | | — | | | — | | | 0.3 | | | (0.7 | ) | | — | | — | | (0.7 | ) |
– Settlement and curtailments | | (1.9 | ) | | — | | | — | | | (1.9 | ) | | (5.6 | ) | | — | | — | | (5.6 | ) |
– Interest cost | | — | | | 31.1 | | | 2.9 | | | 34.0 | | | — | | | 6.4 | | 0.1 | | 6.5 | |
– Expected return on plan assets | | — | | | (31.4 | ) | | (3.2 | ) | | (34.6 | ) | | — | | | — | | — | | — | |
| | | | | | | | | | | | | | | | | | | | | | |
| | 4.2 | | | (0.3 | ) | | — | | | 3.9 | | | (5.9 | ) | | 6.4 | | 0.1 | | 0.6 | |
| | | | | | | | | | | | | | | | | | | | | | |
Recognised in equity: | | | | | | | | | | | | | | | | | | | | | | |
– Actuarial loss/(gain) | | | | | | | | | | | 45.9 | | | | | | | | | | (1.8 | ) |
– Effect of the asset ceiling | | | | | | | | | | | 0.3 | | | | | | | | | | – | |
| | | | | | | | | | | | | | | | | | | | | | |
| | | | | | | | | | | 46.2 | | | | | | | | | | (1.8 | ) |
| | | | | | | | | | | | | | | | | | | | | | |
| | | | | | | | | | | 50.1 | | | | | | | | | | (1.2 | ) |
| | | | | | | | | | | | | | | | | | | | | | |
F-45
Notes to the financial statements continued
33. Post-employment benefit obligations continued
The net liability recognised in the Group’s balance sheet in respect of defined benefit plans was as follows:
| | | | | | | | | | | | | | | | |
| | | As at 29 December 2007 | | | As at 30 December 2006 | |
| | | Pensions | | | Other benefits | | Total | | | Pensions | | | Other benefits | | Total | |
| | £ million | | | £ million | | £ million | | | £ million | | | £ million | | £ million | |
Present value of the benefit obligation: | | | | | | | | | | | | | | | | |
– Funded | | 579.5 | | | — | | 579.5 | | | 625.0 | | | — | | 625.0 | |
– Unfunded | | 20.9 | | | 90.7 | | 111.6 | | | 23.9 | | | 96.9 | | 120.8 | |
| | | | | | | | | | | | | | | | |
| | 600.4 | | | 90.7 | | 691.1 | | | 648.9 | | | 96.9 | | 745.8 | |
Fair value of plan assets | | (564.5 | ) | | — | | (564.5 | ) | | (532.3 | ) | | — | | (532.3 | ) |
| | | | | | | | | | | | | | | | |
| | 35.9 | | | 90.7 | | 126.6 | | | 116.6 | | | 96.9 | | 213.5 | |
Effect of the asset ceiling | | 24.8 | | | — | | 24.8 | | | 2.8 | | | — | | 2.8 | |
| | | | | | | | | | | | | | | | |
Net liability | | 60.7 | | | 90.7 | | 151.4 | | | 119.4 | | | 96.9 | | 216.3 | |
| | | | | | | | | | | | | | | | |
Amounts recognised in the consolidated balance sheet: | | | | | | | | | | | | | | | | |
Ongoing businesses: | | | | | | | | | | | | | | | | |
– Surpluses | | (3.6 | ) | | — | | (3.6 | ) | | (0.9 | ) | | — | | (0.9 | ) |
– Deficits | | 64.3 | | | 89.5 | | 153.8 | | | 110.4 | | | 95.4 | | 205.8 | |
| | | | | | | | | | | | | | | | |
| | 60.7 | | | 89.5 | | 150.2 | | | 109.5 | | | 95.4 | | 204.9 | |
| | | | | | | | | | | | | | | | |
Businesses to be sold (note 27): | | | | | | | | | | | | | | | | |
– Deficits | | — | | | 1.2 | | 1.2 | | | 9.9 | | | 1.5 | | 11.4 | |
| | | | | | | | | | | | | | | | |
| | — | | | 1.2 | | 1.2 | | | 9.9 | | | 1.5 | | 11.4 | |
| | | | | | | | | | | | | | | | |
Net liability | | 60.7 | | | 90.7 | | 151.4 | | | 119.4 | | | 96.9 | | 216.3 | |
| | | | | | | | | | | | | | | | |
C. Pensions
The principal assumptions used in the actuarial valuations of the defined benefit pension plans were as follows:
| | | | | | |
| | | UK
% per annum | | US
% per annum | | Other countries
% per annum |
Valuation as at 29 December 2007 | | | | | | |
Salary increases | | 4.25% | | 3.00% - 5.92% | | 1.00% - 3.50% |
Increase to pensions in payment | | 3.25% | | n/a | | n/a |
Increase to deferred pensions | | 3.25% | | n/a | | n/a |
Long-term rate of return on plan assets | | 5.25% - 7.00% | | 8.00% | | 1.00% - 7.00% |
Discount rate | | 5.75% | | 6.375% | | 2.00% - 6.00% |
Inflation rate | | 3.25% | | 0.00% | | 0.50% - 3.50% |
| | | | | | |
Valuation as at 30 December 2006 | | | | | | |
Salary increases | | 4.00% | | 3.00% - 5.92% | | 2.00% - 3.80% |
Increase to pensions in payment | | 2.90% - 3.00% | | n/a | | n/a |
Increase to deferred pensions | | 2.90% - 3.00% | | n/a | | n/a |
Long-term rate of return on plan assets | | 5.00% - 7.00% | | 8.00% | | 5.50% - 7.00% |
Discount rate | | 5.125% | | 5.75% | | 2.00% - 6.00% |
Inflation rate | | 2.90% - 3.00% | | 0.00% | | 0.00% - 2.00% |
| | | | | | |
|
| The current life expectancies underlying the value of the accrued liabilities for the main plans operated by the Group were as follows: |
| | | |
| | | UK | | US | | Other
countries |
| | | |
As at 29 December 2007 | | | | | | |
Current pensioners (at age 65) – male | | 20.5 years | | 17.7 years | | 19.1 years |
– female | | 23.4 years | | 20.2 years | | 21.6 years |
Future pensioners (at age 65) – male | | 22.2 years | | 17.7 years | | 19.1 years |
– female | | 25.0 years | | 20.2 years | | 21.6 years |
| | | | | | |
As at 30 December 2006 | | | | | | |
Current pensioners (at age 65) – male | | 19.1 years | | 17.7 years | | 18.4 years |
– female | | 22.0 years | | 20.2 years | | 21.4 years |
Future pensioners (at age 65) – male | | 20.4 years | | 17.7 years | | 18.4 years |
– female | | 23.3 years | | 20.2 years | | 21.4 years |
| | | | | | |
F-46
Notes to the financial statements continued
33. Post-employment benefit obligations continued
The net liability recognised in the Group’s balance sheet in respect of defined benefit pension plans was as follows:
| | | | | | | | | | | | | | | | | | | | | | | | |
| | | As at 29 December 2007 | | | As at 30 December 2006 | |
| | | UK | | | US | | | Other
countries | | | Total | | | UK | | | US | | | Other
countries | | | Total | |
| | | £ million | | | £ million | | | £ million | | | £ million | | | £ million | | | £ million | | | £ million | | | £ million | |
Present value of benefit obligation: | | | | | | | | | | | | | | | | | | | | | | | | |
– Funded | | 213.5 | | | 294.1 | | | 71.9 | | | 579.5 | | | 230.3 | | | 325.5 | | | 69.2 | | | 625.0 | |
– Unfunded | | 3.9 | | | 15.9 | | | 1.1 | | | 20.9 | | | 3.9 | | | 18.5 | | | 1.5 | | | 23.9 | |
| | | | | | | | | | | | | | | | | | | | | | | | |
| | 217.4 | | | 310.0 | | | 73.0 | | | 600.4 | | | 234.2 | | | 344.0 | | | 70.7 | | | 648.9 | |
Fair value of plan assets | | (225.7 | ) | | (280.4 | ) | | (58.4 | ) | | (564.5 | ) | | (218.5 | ) | | (265.1 | ) | | (48.7 | ) | | (532.3 | ) |
| | | | | | | | | | | | | | | | | | | | | | | | |
| | (8.3 | ) | | 29.6 | | | 14.6 | | | 35.9 | | | 15.7 | | | 78.9 | | | 22.0 | | | 116.6 | |
Effect of the asset ceiling | | 22.9 | | | 1.9 | | | — | | | 24.8 | | | 2.8 | | | — | | | — | | | 2.8 | |
| | | | | | | | | | | | | | | | | | | | | | | | |
Net liability | | 14.6 | | | 31.5 | | | 14.6 | | | 60.7 | | | 18.5 | | | 78.9 | | | 22.0 | | | 119.4 | |
| | | | | | | | | | | | | | | | | | | | | | | | |
|
| Changes in the present value of the benefit obligation were as follows: | |
| | |
| | | Year ended 29 December 2007 | | | Year ended 30 December 2006 | |
| | | UK | | | US | | | Other
countries | | | Total | | | UK | | | US | | | Other
countries | | | Total | |
| | | £ million | | | £ million | | | £ million | | | £ million | | | £ million | | | £ million | | | £ million | | | £ million | |
At the beginning of the period | | 234.2 | | | 344.0 | | | 70.7 | | | 648.9 | | | 243.4 | | | 388.6 | | | 76.8 | | | 708.8 | |
Current service cost | | 0.6 | | | 2.6 | | | 2.7 | | | 5.9 | | | 1.0 | | | 3.2 | | | 3.1 | | | 7.3 | |
Past service cost | | 0.1 | | | — | | | — | | | 0.1 | | | — | | | 0.1 | | | 0.3 | | | 0.4 | |
Curtailments | | (1.2 | ) | | (2.0 | ) | | — | | | (3.2 | ) | | — | | | — | | | (0.5 | ) | | (0.5 | ) |
Settlements | | (0.7 | ) | | (0.2 | ) | | — | | | (0.9 | ) | | (0.2 | ) | | (0.3 | ) | | (0.1 | ) | | (0.6 | ) |
Interest cost | | 11.7 | | | 18.6 | | | 3.2 | | | 33.5 | | | 11.3 | | | 19.8 | | | 3.1 | | | 34.2 | |
Special termination benefits | | — | | | 0.1 | | | — | | | 0.1 | | | — | | | — | | | — | | | — | |
Actuarial gain | | (16.8 | ) | | (21.4 | ) | | (8.4 | ) | | (46.6 | ) | | (10.6 | ) | | (2.5 | ) | | — | | | (13.1 | ) |
| | | | | | | | | | | | | | | | | | | | | | | | |
| | 227.9 | | | 341.7 | | | 68.2 | | | 637.8 | | | 244.9 | | | 408.9 | | | 82.7 | | | 736.5 | |
Acquisition of subsidiaries | | — | | | — | | | — | | | — | | | — | | | 10.9 | | | — | | | 10.9 | |
Disposal of subsidiaries | | — | | | (0.5 | ) | | — | | | (0.5 | ) | | — | | | — | | | — | | | — | |
Employees’ contributions | | 0.2 | | | — | | | 0.1 | | | 0.3 | | | 0.3 | | | — | | | 0.2 | | | 0.5 | |
Benefits paid | | (10.7 | ) | | (25.0 | ) | | (4.9 | ) | | (40.6 | ) | | (11.0 | ) | | (27.2 | ) | | (3.2 | ) | | (41.4 | ) |
Foreign currency translation | | — | | | (6.2 | ) | | 9.6 | | | 3.4 | | | — | | | (48.6 | ) | | (9.0 | ) | | (57.6 | ) |
| | | | | | | | | | | | | | | | | | | | | | | | |
At the end of the period | | 217.4 | | | 310.0 | | | 73.0 | | | 600.4 | | | 234.2 | | | 344.0 | | | 70.7 | | | 648.9 | |
| | | | | | | | | | | | | | | | | | | | | | | | |
|
| Changes in the fair value of plan assets were as follows: | |
| | |
| | | Year ended 29 December 2007 | | | Year ended 30 December 2006 | |
| | | UK | | | US | | | Other
countries | | | Total | | | UK | | | US | | | Other
countries | | | Total | |
| | | £ million | | | £ million | | | £ million | | | £ million | | | £ million | | | £ million | | | £ million | | | £ million | |
| | | | | | | | | | | | | | | | | | | | | | | | |
At the beginning of the period | | 218.5 | | | 265.1 | | | 48.7 | | | 532.3 | | | 212.7 | | | 266.5 | | | 47.9 | | | 527.1 | |
Expected return on plan assets | | 14.7 | | | 20.2 | | | 3.2 | | | 38.1 | | | 13.8 | | | 19.3 | | | 3.0 | | | 36.1 | |
Settlements | | (0.7 | ) | | (0.2 | ) | | — | | | (0.9 | ) | | (0.2 | ) | | (0.3 | ) | | (0.7 | ) | | (1.2 | ) |
Actuarial (loss)/gain | | (1.5 | ) | | 1.7 | | | (1.7 | ) | | (1.5 | ) | | (1.1 | ) | | 6.4 | | | 2.4 | | | 7.7 | |
| | | | | | | | | | | | | | | | | | | | | | | | |
| | 231.0 | | | 286.8 | | | 50.2 | | | 568.0 | | | 225.2 | | | 291.9 | | | 52.6 | | | 569.7 | |
Acquisition of subsidiaries | | — | | | — | | | — | | | — | | | — | | | 11.3 | | | — | | | 11.3 | |
Employer’s contributions | | 5.2 | | | 23.3 | | | 5.5 | | | 34.0 | | | 4.0 | | | 24.0 | | | 5.3 | | | 33.3 | |
Employees’ contributions | | 0.2 | | | — | | | 0.1 | | | 0.3 | | | 0.3 | | | — | | | 0.2 | | | 0.5 | |
Benefits paid | | (10.7 | ) | | (25.0 | ) | | (4.9 | ) | | (40.6 | ) | | (11.0 | ) | | (27.2 | ) | | (3.2 | ) | | (41.4 | ) |
Foreign currency translation | | — | | | (4.7 | ) | | 7.5 | | | 2.8 | | | — | | | (34.9 | ) | | (6.2 | ) | | (41.1 | ) |
| | | | | | | | | | | | | | | | | | | | | | | | |
At the end of the period | | 225.7 | | | 280.4 | | | 58.4 | | | 564.5 | | | 218.5 | | | 265.1 | | | 48.7 | | | 532.3 | |
| | | | | | | | | | | | | | | | | | | | | | | | |
F-47
Notes to the financial statements continued
33. Post-employment benefit obligations continued
The fair value of plan assets by asset category was as follows:
| | | | | | | | | | | | | | | | |
| | | As at 29 December 2007 | | As at 30 December 2006 |
| | | UK | | US | | Other
countries | | Total | | UK | | US | | Other
countries | | Total |
| | | £ million | | £ million | | £ million | | £ million | | £ million | | £ million | | £ million | | £ million |
Equity instruments | | 119.0 | | 170.4 | | 25.2 | | 314.6 | | 123.3 | | 160.0 | | 24.5 | | 307.8 |
Debt instruments | | 105.8 | | 93.5 | | 24.1 | | 223.4 | | 94.5 | | 91.7 | | 15.9 | | 202.1 |
Other assets | | 0.9 | | 16.5 | | 9.1 | | 26.5 | | 0.7 | | 13.4 | | 8.3 | | 22.4 |
| | | | | | | | | | | | | | | | |
| | 225.7 | | 280.4 | | 58.4 | | 564.5 | | 218.5 | | 265.1 | | 48.7 | | 532.3 |
| | | | | | | | | | | | | | | | |
Plan assets do not include any of the Group’s own financial instruments, nor any property occupied by, or other assets used by, the Group.
The return and risk expectations for each asset class incorporate assumptions about historical return relationships, current financial market conditions and the degree of global capital market integration. The assumptions used have been derived from rigorous historical performance analysis combined with forward-looking views of the financial markets as revealed through (a) the yield on long-term bonds and (b) the price earnings ratios of the major stock market indices. The actuaries review analyses of historical risk and the correlation of the return on asset classes and apply subjective judgment based on their knowledge of the Group’s plans. The result of this analysis is incorporated into a risk matrix from which expected long-term risk premiums for each asset class are developed. The nominal return expectations are determined by combining the asset class risk premiums with expected inflation and real risk-free rate assumptions. As a final consideration, the nominal return assumptions are blended with current market conditions to develop long-term equilibrium expectations.
The Group’s investment strategy for pension plan assets includes diversification to minimise interest and market risks. Accordingly, the interest rate risk inherent in £269.7 million of the benefit obligation of the Group’s US pension plans is hedged by an investment in fixed income assets amounting to £91.1 million and through the use of US dollar floating to fixed interest rate swaps with a combined average duration of 12.7 years. In general, the investment strategy for the Group’s pension plans outside the US does not involve the use of derivative financial instruments.
Plan assets are rebalanced periodically to maintain target asset allocations. Maturities of investments are not necessarily related to the timing of expected future benefit payments, but adequate liquidity to make immediate and medium-term benefit payments is ensured.
The weighted average expected return on plan assets was as follows:
| | | | | | | | | | | | | | | | | | | | | | | | | | | |
| | | As at 29 December 2007 | | | As at 30 December 2006 | | | As at 31 December 2005 | |
| | | UK | | | US | | | Other
countries | | | UK | | | US | | | Other
countries | | | UK | | | US | | | Other
countries | |
Equity instruments | | 7.95 | % | | 9.31 | % | | 9.39 | % | | 7.90 | % | | 9.61 | % | | 8.20 | % | | 8.00 | % | | 9.93 | % | | 9.60 | % |
Debt instruments | | 5.65 | % | | 6.30 | % | | 5.11 | % | | 5.00 | % | | 5.70 | % | | 5.04 | % | | 4.50 | % | | 4.70 | % | | 5.19 | % |
Other assets | | 4.85 | % | | 4.80 | % | | 1.00 | % | | 4.20 | % | | 3.80 | % | | — | | | 3.73 | % | | 3.80 | % | | — | |
| | | | | | | | | | | | | | | | | | | | | | | | | | | |
The actual return on plan assets was as follows:
| | | | | | | | | |
| | | Year ended
29 December
2007 | | | Year ended
30 December
2006 | | | Year ended
31 December
2005 | |
UK | | 6.0 | % | | 6.0 | % | | 16.4 | % |
US | | 8.3 | % | | 9.6 | % | | 7.0 | % |
Other countries | | 3.1 | % | | 11.3 | % | | 10.2 | % |
| | | | | | | | | |
Actuarial gains and losses recognised in relation to defined benefit pension plans since the adoption of IFRS are as follows:
| | | | | | | | | | | | |
| | | Year ended
29 December
2007 | | | Year ended
30 December
2006 | | | Year ended
31 December
2005 | | | Year ended
1 January
2005 | |
| | | £ million | | | £ million | | | £ million | | | £ million | |
At the end of the period: | | | | | | | | | | | | |
Present value of benefit obligation | | 600.4 | | | 648.9 | | | 708.8 | | | 605.4 | |
Fair value of plan assets | | (564.5 | ) | | (532.3 | ) | | (527.1 | ) | | (441.7 | ) |
| | | | | | | | | | | | |
Deficit in the plans | | 35.9 | | | 116.6 | | | 181.7 | | | 163.7 | |
| | | | | | | | | | | | |
Recognised in the period: | | | | | | | | | | | | |
– Actuarial (loss)/gain on plan assets | | (1.5 | ) | | 7.7 | | | 15.1 | | | 4.7 | |
– Actuarial gain/(loss) on benefit obligation | | 46.6 | | | 13.1 | | | (61.0 | ) | | (16.9 | ) |
| | | | | | | | | | | | |
As at 29 December 2007, the cumulative net actuarial gain recognised in the statement of recognised income and expense amounted to £7.8 million.
F-48
Notes to the financial statements continued
The Group expects to contribute approximately £24 million to defined benefit pension plans in 2008.
33. Post-employment benefit obligations continued
D. Other post-employment benefits
The principal assumptions used in the actuarial valuations of the other post-employment benefit plans were as follows:
| | | | | | | | | |
| | | As at
29 December
2007
% per annum | | | As at
30 December
2006
% per annum | | | As at
31 December
2005
% per annum | |
Discount rate | | 6.28 | % | | 5.65 | % | | 5.44 | % |
Medical cost inflation rate | | 7.13 | % | | 7.94 | % | | 8.68 | % |
| | | | | | | | | |
The Group’s other post-retirement benefit plans are unfunded. Accordingly, the liability recognised in the Group’s balance sheet in respect of these plans represents the present value of the benefit obligation.
Changes in the present value of the benefit obligation were as follows:
| | | | | | | | | |
| | | Year ended
29 December
2007 | | | Year ended
30 December
2006 | | | Year ended
31 December
2005 | |
| | | £ million | | | £ million | | | £ million | |
At the beginning of the period | | 96.9 | | | 112.7 | | | 111.2 | |
Current service cost | | 0.2 | | | 0.2 | | | 0.4 | |
Past service cost | | — | | | — | | | (0.7 | ) |
Settlements | | — | | | — | | | (5.6 | ) |
Interest cost | | 5.1 | | | 5.5 | | | 6.5 | |
Actuarial (gain)/loss | | (3.0 | ) | | 1.4 | | | (1.8 | ) |
| | | | | | | | | |
| | 99.2 | | | 119.8 | | | 110.0 | |
Acquisition of subsidiaries | | — | | | 0.2 | | | — | |
Disposal of subsidiaries | | (1.4 | ) | | — | | | — | |
Benefits paid | | (7.8 | ) | | (9.5 | ) | | (10.3 | ) |
Foreign currency translation | | 0.7 | | | (13.6 | ) | | 13.0 | |
| | | | | | | | | |
At the end of the period | | 90.7 | | | 96.9 | | | 112.7 | |
| | | | | | | | | |
Actuarial gains and losses recognised in relation to other post-employment benefit plans since the adoption of IFRS are as follows:
| | | | | | | | | |
| | | Year ended
29 December
2007 | | Year ended
30 December
2006 | | | Year ended
31 December
2005 | | Year ended
1 January
2005 |
| | | £ million | | £ million | | | £ million | | £ million |
At the end of the period: | | | | | | | | | |
Present value of benefit obligation | | 90.7 | | 96.9 | | | 112.7 | | 111.2 |
| | | | | | | | | |
Recognised in the period: | | | | | | | | | |
Actuarial gains/(losses) on benefit obligation | | 3.0 | | (1.4 | ) | | 1.8 | | 23.8 |
| | | | | | | | | |
As at 29 December 2007, the cumulative net actuarial gain recognised in the statement of recognised income and expense amounted to £27.2 million.
Sensitivity to change in the assumed medical cost inflation rate used in the actuarial valuations as at 29 December 2007 is as follows:
| | | | | |
| | | Increase of one
percentage point | | Decrease of one
percentage point | |
| | | £ million | | £ million | |
Effect on the aggregate of the current service cost and the interest cost | | 0.3 | | (0.2 | ) |
Effect on the accumulated benefit obligation | | 4.3 | | (3.7 | ) |
| | | | | |
F-49
Notes to the financial statements continued
34. Share-based incentives
A. Background
The Company operates a number of share-based compensation arrangements to provide incentives to the Group’s senior executives and other eligible employees. Details of the schemes in respect of which options and awards are outstanding are set out below.
B. Share options
Following a review by the Board in 2004, it was decided that the Tomkins Executive Share Option Scheme No. 3 and the Tomkins Executive Share Option Scheme No. 4 would not be renewed when they lapsed for the purposes of new grants in May 2005. Awards granted under ESOS 3 and ESOS 4 were subject to a performance condition that the rate of increase in the Group’s earnings per share must exceed the growth in the UK Retail Prices Index by an average of 2% per annum over any three-year period after the options were granted. The final unvested options under these schemes vested during 2007.
Options were granted to James Nicol in 2002 as part of the incentive package to attract him to the Company. The final tranche of the Tomkins Premium Priced Option vested in 2005 and the Ongoing Option, which was subject to the performance condition that the rate of increase of the Company’s earnings per share must be equal to or greater than the rate of increase of the UK Retail Prices Index plus 9% over any three-year period after the option was granted, vested in 2006.
Options continue to be granted from time to time under the Tomkins 2005 Sharesave Scheme, a savings-related share option scheme, which is restricted to employees who are resident for tax purposes in the UK. It offers eligible employees the option to buy ordinary shares in Tomkins plc after a period of three, five or seven years funded from the proceeds of a savings contract to which employees may contribute up to £250 per month.
In 2007, the compensation expense recognised in respect of share options was £1.4 million (2006: £2.7 million; 2005: £3.9 million).
Changes in the total number of share options outstanding during the period were as follows:
| | | | | | | | | | |
| | | Year ended 29 December 2007 | | Year ended 30 December 2006 |
| | | Options
Number | | | Weighted average
exercise price
Pence | | Options
Number | | | Weighted average
exercise price
Pence |
Outstanding at the beginning of the period | | 20,495,555 | | | 243.10 | | 28,429,132 | | | 234.03 |
Granted during the period | | 272,695 | | | 211.40 | | 233,939 | | | 269.40 |
Forfeited during the period | | (679,573 | ) | | 243.08 | | (1,026,815 | ) | | 227.95 |
Exercised during the period | | (485,751 | ) | | 241.19 | | (7,140,701 | ) | | 210.02 |
Expired during the period | | — | | | — | | — | | | ��� |
| | | | | | | | | | |
Outstanding at the end of the period | | 19,602,926 | | | 242.71 | | 20,495,555 | | | 243.10 |
| | | | | | | | | | |
Exercisable at the end of the period | | 12,455,986 | | | 245.11 | | 13,743,098 | | | 243.91 |
| | | | | | | | | | |
On the dates on which options were exercised during 2007, the weighted average market price of the Company’s ordinary shares was 277.83p per share (2006: 333.60p per share).
The compensation expense recognised in respect of share options is based on their fair value at the grant date calculated using the Black-Scholes option pricing formula.
Assumptions made in calculating the fair values of options granted during the period were as follows:
| | | | | | | | | |
| | | Year ended
29 December
2007 | | | Year ended
30 December
2006 | | | Year ended
31 December
2005 | |
Weighted average fair value | | 73.81p | | | 106.61p | | | 87.24p | |
Weighted average assumptions: | | | | | | | | | |
– Share price | | 264.25p | | | 336.75p | | | 273.00p | |
– Exercise price | | 211.40p | | | 269.40p | | | 218.40p | |
– Expected volatility | | 25.40 | % | | 28.94 | % | | 30.46 | % |
– Expected life | | 4.66 years | | | 4.55 years | | | 5.25 years | |
– Risk-free interest rate | | 5.23 | % | | 4.50 | % | | 3.84 | % |
– Expected dividends | | 13.89p | | | 13.00p | | | 12.60p | |
| | | | | | | | | |
Expected volatility was determined based on the historical volatility of the market price of the Company’s ordinary shares over the shorter of the expected life of the options and the period since the beginning of the Group’s financial year ended 30 April 2002 when, following a period of significant demerger activity, the Group was refocused on its remaining core businesses. Adjustments have been made to the expected life used in the model to reflect the effects of non-transferability, exercise restrictions and behavioural considerations.
F-50
Notes to the financial statements continued
34. Share-based incentives continued
The weighted average contractual life of share options outstanding at the end of the period was as follows:
| | | | | | | | | | | | |
| | | As at 29 December 2007 | | As at 30 December 2006 | | As at 31 December 2005 |
| | | Outstanding
Number | | Weighted average
remaining
contractual life
Years | | Outstanding
Number | | Weighted average
remaining
contractual life
Years | | Outstanding
Number | | Weighted average
remaining
contractual life
Years |
Range of exercise prices | | | | | | | | | | | | |
150p to 200p | | 3,519,072 | | 3.94 | | 3,563,072 | | 4.98 | | 6,165,914 | | 5.78 |
201p to 250p | | 9,244,600 | | 5.39 | | 9,641,668 | | 6.59 | | 15,073,768 | | 7.06 |
251p to 300p | | 5,821,026 | | 5.01 | | 6,272,587 | | 6.41 | | 6,171,222 | | 7.49 |
301p and higher | | 1,018,228 | | 4.11 | | 1,018,228 | | 5.11 | | 1,018,228 | | 6.10 |
| | | | | | | | | | | | |
| | 19,602,926 | | | | 20,495,555 | | | | 28,429,132 | | |
| | | | | | | | | | | | |
C. Other awards
The Group’s principal ongoing share-based compensation arrangements are the Annual Bonus Incentive Plan (“ABIP”) and the Performance Share Plan (“PSP”). Both are restricted to the Group’s senior executives.
ABIP provides an award of bonus shares and deferred shares based on the profit of the business for which the participants have responsibility. Bonus shares are restricted and vest after a period of three years. Dividends are paid on the bonus shares. Deferred shares vest after a period of three years conditional on the participant’s continued employment with the Group. Dividends are not paid on the deferred shares until they have vested. During 2007, awards were granted over 1,727,352 ordinary shares (2006: 1,643,031 ordinary shares; 2005: 1,415,047 ordinary shares) under the ABIP.
PSP provides awards of shares which vest after a period of three years conditional on the Group’s total shareholder return relative to its cost of equity over the vesting period and the participant’s continued employment with the Group. During 2007, awards were granted over 5,852,671 ordinary shares under the PSP (2006: 7,866,573 ordinary shares).
The fair value of awards made under the ABIP is measured based on the market price of the Company’s ordinary shares on the date of the award. Where the awards do not attract dividends during the vesting period, the market price is reduced by the present value of the dividends expected to be paid during the expected life of the awards. The weighted average fair value of awards made under these schemes during the period was 211.93p (2006: 266.60p).
The fair value of awards made under the PSP is measured using a Monte-Carlo valuation model.
Assumptions made in calculating the fair values of awards granted under the PSP were as follows:
| | | | | | |
| | | Year ended
29 December
2007 | | | Year ended
30 December
2006 | |
Weighted average fair value | | 66.45p | | | 87.19p | |
Weighted average assumptions: | | | | | | |
– Expected volatility | | 27.67 | % | | 23.01 | % |
– Expected life | | 3.00 years | | | 2.78 years | |
– Risk-free interest rate | | 4.88 | % | | 4.75 | % |
– Dividend yield | | 5.00 | % | | 4.73 | % |
| | | | | | |
Expected volatility was determined based on the historical volatility of the market price of the Company’s ordinary shares over the expected life of the awards.
In 2007, the compensation expense recognised in respect of other awards was £6.6 million (2006: £5.2 million; 2005: £4.1 million). In 2005, the compensation expense included £0.6 million in respect of the Deferred Matching Share Purchase Plan which was a plan introduced for James Nicol as part of the incentive package to attract him to the Company. Under the terms of his contract, Mr Nicol was entitled to elect to receive a cash payment in lieu of shares and for this reason the award to him under this plan was classified as a cash-settled transaction.
F-51
Notes to the financial statements continued
35. Deferred tax
Movements in the net deferred tax assets and (liabilities) recognised by the Group were as follows:
| | | | | | | | | | | | | | | | | | | | | | | | |
| | | Post-
employment
benefits | | | Tax
losses | | | Net
investment in
subsidiaries | | | Accrued
expenses | | | Long-lived
assets | | | Inventories | | | Other
items | | | Total | |
| | | £ million | | | £ million | | | £ million | | | £ million | | | £ million | | | £ million | | | £ million | | | £ million | |
As at 31 December 2005 | | 98.0 | | | 16.3 | | | — | | | 26.8 | | | (69.3 | ) | | (28.2 | ) | | 8.3 | | | 51.9 | |
Reclassification of valuation allowances | | (6.7 | ) | | (2.0 | ) | | — | | | — | | | (6.7 | ) | | (0.1 | ) | | 15.5 | | | — | |
Acquisition of subsidiaries | | — | | | — | | | — | | | — | | | (2.1 | ) | | — | | | — | | | (2.1 | ) |
(Charge)/credit to the income statement | | (28.0 | ) | | (2.7 | ) | | 16.9 | | | (1.9 | ) | | 9.7 | | | (1.5 | ) | | (6.7 | ) | | (14.2 | ) |
(Charge)/credit directly to equity | | (2.0 | ) | | — | | | — | | | — | | | — | | | — | | | 0.9 | | | (1.1 | ) |
Currency translation differences | | (1.9 | ) | | (0.7 | ) | | (1.1 | ) | | (3.0 | ) | | 4.3 | | | 3.5 | | | (2.1 | ) | | (1.0 | ) |
| | | | | | | | | | | | | | | | | | | | | | | | |
As at 30 December 2006 | | 59.4 | | | 10.9 | | | 15.8 | | | 21.9 | | | (64.1 | ) | | (26.3 | ) | | 15.9 | | | 33.5 | |
Acquisition of subsidiaries | | — | | | — | | | — | | | — | | | — | | | — | | | 0.1 | | | 0.1 | |
Disposal of subsidiaries | | (0.3 | ) | | (0.3 | ) | | — | | | (0.2 | ) | | (1.5 | ) | | 3.4 | | | (0.5 | ) | | 0.6 | |
(Charge)/credit to the income statement | | (6.4 | ) | | (6.5 | ) | | (16.8 | ) | | 0.6 | | | 4.9 | | | 1.9 | | | (3.2 | ) | | (25.5 | ) |
(Charge)/credit directly to equity | | (7.4 | ) | | — | | | — | | | — | | | — | | | — | | | 0.1 | | | (7.3 | ) |
Currency translation differences | | 0.2 | | | 0.7 | | | (0.4 | ) | | 0.5 | | | (0.7 | ) | | 0.5 | | | (0.7 | ) | | 0.1 | |
| | | | | | | | | | | | | | | | | | | | | | | | |
As at 29 December 2007 | | 45.5 | | | 4.8 | | | (1.4 | ) | | 22.8 | | | (61.4 | ) | | (20.5 | ) | | 11.7 | | | 1.5 | |
| | | | | | | | | | | | | | | | | | | | | | | | |
Deferred tax assets and liabilities presented in the Group’s balance sheet are as follows:
| | | | | | |
| | | As at
29 December
2007 | | | As at
30 December
2006 | |
| | | £ million | | | £ million | |
Deferred tax assets: | | | | | | |
– Ongoing businesses | | 23.8 | | | 36.3 | |
– Businesses to be sold (note 27) | | — | | | 1.5 | |
| | | | | | |
| | 23.8 | | | 37.8 | |
Deferred tax liabilities: | | | | | | |
– Ongoing businesses | | (21.2 | ) | | (4.3 | ) |
– Businesses to be sold (note 27) | | (1.1 | ) | | — | |
| | | | | | |
| | 1.5 | | | 33.5 | |
| | | | | | |
As at 29 December 2007, the Group had operating tax losses amounting to £923.5 million, of which £890.6 million can be carried forward indefinitely and £32.9 million have expiry dates between 2008 and 2019. As at 29 December 2007, the Group recognised a deferred tax asset of £4.2 million in respect of these losses.
As at 29 December 2007, the Group had capital tax losses amounting to £296.7 million, of which £284.2 million can be carried forward indefinitely and £12.5 million expire in 2012. As at 29 December 2007, the Group recognised a deferred tax asset of £0.6 million in respect of these losses.
As at 29 December 2007, the Group had foreign and other tax credits amounting to £26.7 million, of which £18.5 million can be carried forward indefinitely and £8.2 million expire between 2014 and 2017. As at 29 December 2007, the Group had not recognised a deferred tax asset in respect of these tax credits.
As at 29 December 2007, the undistributed earnings of foreign subsidiaries amounted to £1,971.0 million (30 December 2006: £1,708.8 million). No income taxes have been provided on the Company’s share of these undistributed earnings due to management’s ability and intent to reinvest such amounts indefinitely. A determination of the amount of the unrecognised deferred tax liability has not been made because it is not practical to do so. A portion of these earnings can be distributed without incurring additional taxes.
F-52
Notes to the financial statements continued
36. Provisions
| | | | | | | | | | | | | | | |
| | | Restructuring
costs | | | Environmental
remediation | | | Workers’
compensation | | | Other | | | Total | |
| | | £ million | | | £ million | | | £ million | | | £ million | | | £ million | |
As at 1 January 2005 | | 10.8 | | | 5.6 | | | 18.4 | | | 24.6 | | | 59.4 | |
Charge for the period | | 5.1 | | | 1.1 | | | 7.6 | | | 2.0 | | | 15.8 | |
Acquisition of subsidiaries | | — | | | — | | | — | | | 0.3 | | | 0.3 | |
Utilised during the period | | (5.9 | ) | | (1.0 | ) | | (6.3 | ) | | (7.7 | ) | | (20.9 | ) |
Foreign currency translation | | 0.7 | | | 0.5 | | | 2.2 | | | 1.5 | | | 4.9 | |
| | | | | | | | | | | | | | | |
As at 31 December 2005 | | 10.7 | | | 6.2 | | | 21.9 | | | 20.7 | | | 59.5 | |
Charge for the period | | 8.5 | | | 0.2 | | | 10.5 | | | 3.8 | | | 23.0 | |
Acquisition of subsidiaries | | — | | | — | | | — | | | 0.1 | | | 0.1 | |
Utilised during the period | | (14.2 | ) | | (2.0 | ) | | (10.8 | ) | | (7.2 | ) | | (34.2 | ) |
Foreign currency translation | | (0.4 | ) | | (0.5 | ) | | (2.6 | ) | | (1.3 | ) | | (4.8 | ) |
| | | | | | | | | | | | | | | |
As at 30 December 2006 | | 4.6 | | | 3.9 | | | 19.0 | | | 16.1 | | | 43.6 | |
Charge for the period | | 7.7 | | | 2.0 | | | 6.3 | | | 6.3 | | | 22.3 | |
Utilised during the period | | (7.4 | ) | | (1.4 | ) | | (8.8 | ) | | (6.3 | ) | | (23.9 | ) |
Disposal of subsidiaries | | (0.1 | ) | | — | | | (1.7 | ) | | (0.5 | ) | | (2.3 | ) |
Foreign currency translation | | 0.2 | | | 0.1 | | | (0.3 | ) | | (0.1 | ) | | (0.1 | ) |
| | | | | | | | | | | | | | | |
As at 29 December 2007 | | 5.0 | | | 4.6 | | | 14.5 | | | 15.5 | | | 39.6 | |
| | | | | | | | | | | | | | | |
Provisions are presented in the Group’s balance sheet as follows:
| | | | |
| | | As at
29 December
2007 | | As at
30 December
2006 |
| | | £ million | | £ million |
Ongoing businesses: | | | | |
– Current liabilities | | 25.2 | | 26.3 |
– Non-current liabilities | | 13.7 | | 13.9 |
| | | | |
| | 38.9 | | 40.2 |
Businesses to be sold (note 27) | | 0.7 | | 3.4 |
| | | | |
| | 39.6 | | 43.6 |
| | | | |
Other provisions comprise warranty provisions of £7.6 million (30 December 2006: £5.7 million), product liability provisions of £3.8 million (30 December 2006: £4.4 million) and insurance provisions of £4.1 million (30 December 2006: £6.0 million).
F-53
Notes to the financial statements continued
37. Ordinary shares
| | | | | | | | |
| | | Year ended 29 December 2007 | | Year ended 30 December 2006 |
| | | Number
of shares | | £ million | | Number
of shares | | £ million |
Ordinary shares of 5p each | | | | | | | | |
Authorised | | | | | | | | |
At the beginning and end of the period | | 1,585,164,220 | | 79.2 | | 1,585,164,220 | | 79.2 |
| | | | | | | | |
| | | | | | | | |
| | | Number
of shares | | Share
capital
£ million | | Share
premium
account
£ million | | Total
£ million |
Allotted and fully paid | | | | | | | | |
As at 1 January 2005 | | 773,889,884 | | 38.7 | | 94.0 | | 132.7 |
Shares issued during the period: | | | | | | | | |
– Conversion of preference shares | | 429,356 | | — | | 1.4 | | 1.4 |
– Exercise of employee share options | | 175,884 | | — | | 0.4 | | 0.4 |
| | 605,240 | | — | | 1.8 | | 1.8 |
| | | | | | | | |
As at 31 December 2005 | | 774,495,124 | | 38.7 | | 95.8 | | 134.5 |
Shares issued during the period: | | | | | | | | |
– Conversion of preference shares | | 76,573,697 | | 3.8 | | 221.8 | | 225.6 |
– Exercise of employee share options | | 7,140,701 | | 0.4 | | 14.5 | | 14.9 |
| | 83,714,398 | | 4.2 | | 236.3 | | 240.5 |
| | | | | | | | |
As at 30 December 2006 | | 858,209,522 | | 42.9 | | 332.1 | | 375.0 |
Shares issued during the period: | | | | | | | | |
– Conversion of preference shares | | 25,411,499 | | 1.3 | | 64.0 | | 65.3 |
– Exercise of employee share options | | 485,751 | | — | | 1.2 | | 1.2 |
| | 25,897,250 | | 1.3 | | 65.2 | | 66.5 |
| | | | | | | | |
As at 29 December 2007 | | 884,106,772 | | 44.2 | | 397.3 | | 441.5 |
| | | | | | | | |
Ordinary shareholders have no entitlement to share in the profits of the Company, except for dividends that have been declared and in the event of the liquidation of the Company.
Ordinary shareholders have the right to attend, and vote at, general meetings of the Company or to appoint a proxy to attend and vote at such meetings on their behalf. Ordinary shareholders have one vote for every share held.
Share capital represents the nominal value of ordinary shares issued.
The share premium account records the difference between the nominal value of ordinary shares issued and the fair value of the consideration received. The share premium account is not distributable but may be used for certain purposes specified by UK law, including to write off expenses on any issue of shares or debentures and to pay up fully paid bonus shares. The share premium account may be reduced by special resolution of the Company’s shareholders and with the approval of the court.
38. Own shares
| | | | | | | | | | | | | | | | | | |
| | | Year ended 29 December 2007 | | | Year ended 30 December 2006 | | | Year ended 31 December 2005 | |
| | | Number
of shares | | | £ million | | | Number
of shares | | | £ million | | | Number
of shares | | | £ million | |
At the beginning of the period | | 4,205,248 | | | 11.7 | | | 3,230,402 | | | 8.7 | | | 3,500,040 | | | 8.9 | |
Own shares purchased | | 1,597,500 | | | 3.8 | | | 1,647,013 | | | 4.8 | | | 860,338 | | | 2.4 | |
Sale or transfer of own shares | | (1,596,907 | ) | | (4.3 | ) | | (672,167 | ) | | (1.8 | ) | | (1,129,976 | ) | | (2.6 | ) |
| | | | | | | | | | | | | | | | | | |
At the end of the period | | 4,205,841 | | | 11.2 | | | 4,205,248 | | | 11.7 | | | 3,230,402 | | | 8.7 | |
| | | | | | | | | | | | | | | | | | |
Own shares represent the cost of the Company’s ordinary shares acquired to meet the Group’s expected obligations under the employee share schemes. Dividends relating to own shares held have been waived with the exception of those that are payable to participants in the relevant schemes.
As at 29 December 2007, 1,376,975 ordinary shares (30 December 2006: 1,833,151 ordinary shares) were held in trust and 2,828,866 ordinary shares (30 December 2006: 2,372,097 ordinary shares) were held as treasury shares.
As at 29 December 2007, the market value of own shares held was £7.6 million (30 December 2006: £10.3 million).
F-54
Notes to the financial statements continued
39. Other reserves
| | | | | | | | | | | | | | |
| | | Capital
redemption
reserve | | Currency
translation
reserve | | | Available-
for- sale
reserve | | | Retained
profit/
(losses) | | | Total | |
| | | £ million | | £ million | | | £ million | | | £ million | | | £ million | |
As at 1 January 2005 | | 461.9 | | (27.6 | ) | | — | | | (91.6 | ) | | 342.7 | |
Adoption of IAS 32 and IAS 39 | | — | | — | | | 0.1 | | | 63.0 | | | 63.1 | |
| | | | | | | | | | | | | | |
| | 461.9 | | (27.6 | ) | | 0.1 | | | (28.6 | ) | | 405.8 | |
Year ended 31 December 2005 | | | | | | | | | | | | | | |
Total recognised income and expense attributable to equity shareholders | | — | | 60.1 | | | (0.1 | ) | | 164.6 | | | 224.6 | |
Other changes in shareholders’ equity: | | | | | | | | | | | | | | |
– Gain on sale or transfer of own shares | | — | | — | | | — | | | 0.3 | | | 0.3 | |
– Cost of share-based incentives | | — | | — | | | — | | | 7.4 | | | 7.4 | |
– Dividends paid on ordinary shares | | — | | — | | | — | | | (99.4 | ) | | (99.4 | ) |
| | — | | — | | | — | | | (91.7 | ) | | (91.7 | ) |
| | | | | | | | | | | | | | |
As at 31 December 2005 | | 461.9 | | 32.5 | | | — | | | 44.3 | | | 538.7 | |
| | | | | | | | | | | | | | |
Year ended 30 December 2006 | | | | | | | | | | | | | | |
Total recognised income and expense attributable to equity shareholders | | — | | (92.7 | ) | | 0.1 | | | 203.7 | | | 111.1 | |
Other changes in shareholders’ equity: | | | | | | | | | | | | | | |
– Loss on transfer of own shares | | — | | — | | | — | | | (1.8 | ) | | (1.8 | ) |
– Cost of share-based incentives | | — | | — | | | — | | | 7.9 | | | 7.9 | |
– Dividends paid on ordinary shares | | — | | — | | | — | | | (115.3 | ) | | (115.3 | ) |
| | — | | — | | | — | | | (109.2 | ) | | (109.2 | ) |
| | | | | | | | | | | | | | |
As at 30 December 2006 | | 461.9 | | (60.2 | ) | | 0.1 | | | 138.8 | | | 540.6 | |
| | | | | | | | | | | | | | |
Year ended 29 December 2007 | | | | | | | | | | | | | | |
Total recognised income and expense attributable to equity shareholders | | — | | 54.1 | | | (0.2 | ) | | 166.2 | | | 220.1 | |
Other changes in shareholders’ equity: | | | | | | | | | | | | | | |
– Loss on transfer of own shares | | — | | — | | | — | | | (4.3 | ) | | (4.3 | ) |
– Redemption of preference shares | | 0.6 | | — | | | — | | | (0.6 | ) | | — | |
– Cost of share-based incentives | | — | | — | | | — | | | 8.0 | | | 8.0 | |
– Dividends paid on ordinary shares | | — | | — | | | — | | | (122.0 | ) | | (122.0 | ) |
| | 0.6 | | — | | | — | | | (118.9 | ) | | (118.3 | ) |
| | | | | | | | | | | | | | |
As at 29 December 2007 | | 462.5 | | (6.1 | ) | | (0.1 | ) | | 186.1 | | | 642.4 | |
| | | | | | | | | | | | | | |
The capital redemption reserve records the cost of shares purchased by the Company for cancellation or redeemed in excess of the proceeds of any fresh issue of shares made specifically to fund the purchase or redemption. The capital redemption reserve is not distributable but may be reduced by special resolution of the Company’s shareholders and with the approval of the court.
40. Minority interests
| | | | | | | | | |
| | | Year ended
29 December
2007 | | | Year ended
30 December
2006 | | | Year ended
31 December
2005 | |
| | | £ million | | | £ million | | | £ million | |
At the beginning of the period | | 50.6 | | | 48.4 | | | 41.6 | |
Total recognised income and expense attributable to minority interests | | 13.9 | | | 7.0 | | | 12.7 | |
Other changes in equity attributable to minority interests: | | | | | | | | | |
– Shares issued by a subsidiary to minority shareholders | | 1.9 | | | 3.2 | | | — | |
– Purchase of a minority shareholding | | (0.5 | ) | | — | | | — | |
– Dividends paid to minority shareholders | | (7.2 | ) | | (8.0 | ) | | (5.9 | ) |
| | (5.8 | ) | | (4.8 | ) | | (5.9 | ) |
| | | | | | | | | |
At the end of the period | | 58.7 | | | 50.6 | | | 48.4 | |
| | | | | | | | | |
F-55
Notes to the financial statements continued
41. Convertible cumulative preference shares
| | | | | | | | |
| | | Year ended 29 December 2007 | | Year ended 30 December 2006 |
| | | Number
of shares | | Nominal value
US$ million | | Number
of shares | | Nominal value
US$ million |
Convertible cumulative preference shares of US$50 each | | | | | | | | |
Authorised | | | | | | | | |
At the beginning and end of the period | | 13,920,000 | | 696.0 | | 13,920,000 | | 696.0 |
| | | | | | | | |
| | | | | | | | | | | | |
| | | | | | Carrying amount | |
| | | Number
of shares | | | Nominal
Value
£ million | | | Accrued
Dividend
payable
£ million | | | Total
£ million | |
Allotted and fully paid | | | | | | | | | | | | |
As at 1 January 2005 | | 10,506,721 | | | 337.2 | | | — | | | 337.2 | |
Adoption of IAS 32 and IAS 39 | | — | | | (63.6 | ) | | 1.9 | | | (61.7 | ) |
| | | | | | | | | | | | |
| | 10,506,721 | | | 273.6 | | | 1.9 | | | 275.5 | |
Shares converted | | (43,947 | ) | | (1.4 | ) | | — | | | (1.4 | ) |
Foreign currency translation | | — | | | 32.5 | | | 0.2 | | | 32.7 | |
| | | | | | | | | | | | |
As at 31 December 2005 | | 10,462,774 | | | 304.7 | | | 2.1 | | | 306.8 | |
Shares converted | | (7,837,636 | ) | | (225.6 | ) | | — | | | (225.6 | ) |
Charge for the period | | — | | | — | | | 5.4 | | | 5.4 | |
Dividend paid | | — | | | — | | | (7.1 | ) | | (7.1 | ) |
Foreign currency translation | | — | | | (12.0 | ) | | — | | | (12.0 | ) |
| | | | | | | | | | | | |
As at 30 December 2006 | | 2,625,138 | | | 67.1 | | | 0.4 | | | 67.5 | |
Shares converted | | (2,600,973 | ) | | (65.3 | ) | | — | | | (65.3 | ) |
Shares redeemed | | (24,165 | ) | | (0.6 | ) | | — | | | (0.6 | ) |
Dividend accrued for the period | | — | | | — | | | 0.6 | | | 0.6 | |
Dividend paid | | — | | | — | | | (1.0 | ) | | (1.0 | ) |
Foreign currency translation | | — | | | (1.2 | ) | | — | | | (1.2 | ) |
| | | | | | | | | | | | |
As at 29 December 2007 | | — | | | — | | | — | | | — | |
| | | | | | | | | | | | |
On 29 July 1996, the Company issued 10,532,732 convertible cumulative preference shares of US$50 each (“the preference shares”) in connection with the acquisition of The Gates Corporation. The preference shares were issued on terms that they could be converted at any time, at the shareholder’s option, into fully paid ordinary shares of 5p each in the Company on the basis of 9.77 ordinary shares for every one preference share so converted. With effect from 26 July 2006, the Company had the option to redeem at par at any time all or any of the issued and outstanding preference shares.
On 21 May 2007, the Company gave notice that it would exercise its right to redeem all of the preference shares that remained in issue and outstanding as at 24 July 2007.
During the period from 30 December 2006 to the redemption date, 2,600,973 preference shares were converted into 25,411,499 ordinary shares in the Company. On the redemption date, there remained 24,165 preference shares in issue and outstanding that were redeemed for £0.6 million in cash.
Holders of the preference shares had a right to receive dividends at an annual rate of 5.560% in preference to the holders of the Company’s ordinary shares.
F-56
Notes to the financial statements continued
42. Capital
Management considers that the Group’s capital comprises shareholders’ equity plus the principal amount of the Group’s borrowings (including preference shares), less cash and cash equivalents and collateralised cash.
The Group’s capital was as follows:
| | | | | | |
| | | As at
29 December
2007 | | | As at
30 December
2006 | |
| | | £ million | | | £ million | |
Shareholders’ equity | | 1,072.7 | | | 903.9 | |
Cash and cash equivalents | | (148.3 | ) | | (172.3 | ) |
Collateralised cash | | (2.9 | ) | | (4.1 | ) |
Borrowings | | 440.6 | | | 577.6 | |
Obligations under finance leases | | 4.8 | | | 9.3 | |
Preference shares | | — | | | 67.1 | |
| | | | | | |
| | 1,366.9 | | | 1,381.5 | |
| | | | | | |
The Group maintains an appropriate mix of equity and debt to ensure an efficient capital structure consistent with its desired investment grade financial profile.
43. Acquisitions
A. Current year acquisitions
Industrial & Automotive
Fluid Systems
On 8 March 2007, the Group acquired the 40% minority interest in Schrader Engineered Products (Kunshan) Co Ltd. Goodwill of £0.4 million was recognised on the acquisition.
On 26 September 2007, the Group acquired 100% of Swindon Silicon Systems Ltd (“SSSL”). SSSL is located in the UK and designs, develops and supplies integrated circuits. Provisional goodwill of £2.7 million has been recognised, which represents benefits from the further development of Schrader Electronics’ RTPMS made possible by the acquisition.
B. Adjustments in respect of prior year acquisitions
On the completion of initial accounting for acquisitions completed in 2006, attributable goodwill at the date of acquisition was reduced by £7.1 million, at the acquisition date exchange rates, as follows:
| | | | | | | |
| | | Provisional
goodwill | | Adjustment | | | Final
goodwill |
| | | £ million | | £ million | | | £ million |
Heat-Fab Inc | | 6.2 | | (4.0 | ) | | 2.2 |
Eastern Sheet Metal | | 4.4 | | (3.2 | ) | | 1.2 |
ENZED Fleximak Ltd | | 8.8 | | 0.1 | | | 8.9 |
| | | | | | | |
| | | | (7.1 | ) | | |
| | | | | | | |
Adjustments to goodwill principally reflect the allocation of additional amounts to identifiable intangible assets.
Comparative information has not been restated to reflect these adjustments because they are not material to the Group’s results or financial position.
F-57
Notes to the financial statements continued
43. Acquisitions continued
C. Financial effect of acquisitions
| | | | | | | | | | | | | | | |
| | | Year ended 29 December 2007 | | | Year ended | | | Year ended | |
| | | Acquiree’s
carrying amount
in accordance
with IFRS | | | Fair value
adjustments | | | Fair
value | | | 30 December
2006
Fair
value | | | 31 December
2005
Fair
value | |
| | | £ million | | | £ million | | | £ million | | | £ million | | | £ million | |
Net assets acquired | | | | | | | | | | | | | | | |
Intangible assets | | 0.1 | | | 5.4 | | | 5.5 | | | 22.6 | | | 3.6 | |
Property, plant and equipment | | 0.7 | | | 2.8 | | | 3.5 | | | 16.3 | | | 18.0 | |
Deferred tax assets | | — | | | 0.1 | | | 0.1 | | | — | | | — | |
Pension surplus | | — | | | — | | | — | | | 0.2 | | | — | |
Inventories | | 1.2 | | | 0.1 | | | 1.3 | | | 16.8 | | | 17.1 | |
Trade and other receivables | | 3.8 | | | — | | | 3.8 | | | 14.9 | | | 14.3 | |
Income tax recoverable | | — | | | — | | | — | | | 0.6 | | | — | |
Cash and cash equivalents | | — | | | — | | | — | | | 2.8 | | | 1.7 | |
Trade and other payables | | (2.0 | ) | | (0.2 | ) | | (2.2 | ) | | (13.5 | ) | | (10.1 | ) |
Income tax liabilities | | (0.4 | ) | | — | | | (0.4 | ) | | — | | | — | |
Deferred tax liabilities | | — | | | — | | | — | | | (2.1 | ) | | (1.3 | ) |
Provisions | | — | | | — | | | — | | | (0.1 | ) | | — | |
Minority interest | | 0.5 | | | — | | | 0.5 | | | — | | | — | |
| | | | | | | | | | | | | | | |
| | 3.9 | | | 8.2 | | | 12.1 | | | 58.5 | | | 43.3 | |
Goodwill on current year acquisitions | | | | | | | | 3.1 | | | 61.6 | | | 58.9 | |
Adjustments to goodwill on prior year acquisitions | | | | | | | | (7.1 | ) | | (7.7 | ) | | 0.8 | |
| | | | | | | | | | | | | | | |
Consideration (including transaction costs) | | | | | | | | 8.1 | | | 112.4 | | | 103.0 | |
| | | | | | | | | | | | | | | |
The net cash outflow on acquisitions during the period was as follows:
| | | | | | | | |
| | | Year ended
29 December
2007 | | Year ended
30 December
2006 | | | Year ended
31 December
2005 | |
| | | £ million | | £ million | | | £ million | |
Consideration paid on current period acquisitions | | 7.6 | | 112.2 | | | 103.3 | |
Cash and cash equivalents acquired | | — | | (2.8 | ) | | (1.7 | ) |
Adjustment to consideration on prior period acquisitions | | 0.9 | | 0.2 | | | (0.3 | ) |
| | | | | | | | |
| | 8.5 | | 109.6 | | | 101.3 | |
| | | | | | | | |
Businesses acquired during the year contributed £0.7 million to the Group’s sales and £0.3 million to the Group’s profit for the year ended 29 December 2007. If the businesses had been acquired on 31 December 2006, it is estimated that they would have contributed £8.7 million to the Group’s sales and £0.8 million to the Group’s profit for the year ended 29 December 2007.
44. Disposals
A. Continuing operations
Industrial & Automotive
Other Industrial & Automotive
On 23 November 2007, the Group sold Dearborn Mid-West Conveyor Company (“Dearborn”), a manufacturer of automotive assembly lines and materials handling equipment. A gain of £6.7 million was recognised on the disposal.
On 19 November 2007, the Group sold Tridon Electronics’ indicator and side object detection businesses. A loss of £1.3 million was recognised on the disposal.
Building Products
Other Building Products
On 23 February 2007, the Group sold the business and assets of Lasco Fittings Inc., a manufacturer of injection moulded fittings. A gain of £32.6 million was recognised on the disposal.
F-58
Notes to the financial statements continued
44. Disposals continued
B. Discontinued operations
Industrial & Automotive
Wiper Systems
On 29 June 2007, the Group completed the sale of Trico Products Corporation and its related businesses (“Trico”), which constituted the Group’s former Wiper Systems business segment. The Group recognised a loss of £29.8 million on the disposal (including an impairment loss of £17.2 million that was recognised in the first quarter of 2007).
Valves, Taps and Mixers
During 2007, the Group recognised a gain of £1.2 million on the receipt of contingent consideration in relation to the disposal of the Group’s Valves, Taps and Mixers businesses in 2004.
C. Financial effect of disposals
| | | | | | | | | |
| | | Year ended
29 December
2007 | | | Year ended
30 December
2006 | | | Year ended
31 December
2005 | |
| | | £ million | | | £ million | | | £ million | |
Proceeds | | | | | | | | | |
Cash | | 116.9 | | | 6.8 | | | 29.3 | |
Deferred | | 8.8 | | | — | | | 2.4 | |
Loan notes | | 8.4 | | | — | | | — | |
| | | | | | | | | |
| | 134.1 | | | 6.8 | | | 31.7 | |
| | | | | | | | | |
Net assets disposed of | | | | | | | | | |
Intangible assets | | (0.3 | ) | | — | | | — | |
Property, plant and equipment | | (31.8 | ) | | (3.7 | ) | | (11.2 | ) |
Inventories | | (47.1 | ) | | — | | | (4.0 | ) |
Trade and other receivables | | (90.5 | ) | | — | | | (9.2 | ) |
Income tax recoverable | | (0.5 | ) | | — | | | — | |
Cash and cash equivalents | | (4.6 | ) | | — | | | — | |
Trade and other payables | | 60.2 | | | — | | | 0.6 | |
Finance lease obligations | | 3.1 | | | — | | | — | |
Deferred tax liabilities | | 0.6 | | | — | | | — | |
Post-employment benefit obligations | | 1.9 | | | — | | | — | |
Provisions | | 2.3 | | | — | | | — | |
| | | | | | | | | |
| | (106.7 | ) | | (3.7 | ) | | (23.8 | ) |
| | | | | | | | | |
Disposal costs | | (3.6 | ) | | — | | | — | |
Utilisation of provision | | — | | | — | | | 4.0 | |
Currency translation differences transferred from equity | | (14.4 | ) | | — | | | — | |
| | | | | | | | | |
Gain on disposal | | 9.4 | | | 3.1 | | | 11.9 | |
| | | | | | | | | |
Attributable to: | | | | | | | | | |
– Continuing operations | | 38.0 | | | 3.1 | | | 8.5 | |
– Discontinued operations | | (28.6 | ) | | — | | | 3.4 | |
| | | | | | | | | |
| | 9.4 | | | 3.1 | | | 11.9 | |
| | | | | | | | | |
The net cash inflow on disposals during the period was as follows:
| | | | | | | |
| | | Year ended
29 December
2007 | | | Year ended
30 December
2006 | | Year ended
31 December
2005 |
| | | £ million | | | £ million | | £ million |
Proceeds received on current period disposals | | 116.9 | | | — | | 18.9 |
Disposal costs paid | | (4.5 | ) | | — | | — |
Cash and cash equivalents disposed of | | (4.6 | ) | | — | | — |
Proceeds received on prior period disposals | | 0.3 | | | 6.8 | | 10.4 |
| | | | | | | |
| | 108.1 | | | 6.8 | | 29.3 |
| | | | | | | |
F-59
Notes to the financial statements continued
45. Contingencies
The Group is, from time to time, party to legal proceedings and claims, which arise in the ordinary course of business. Management does not anticipate that the outcome of any current proceedings or known claims, either individually or in aggregate, will have a material adverse effect upon the Group’s financial position.
46. Operating leases
The Group rents certain office premises and plant, equipment and vehicles under operating lease arrangements. All leases are on a fixed repayment basis and no arrangements have been entered into for contingent rental payments. During the period, the Group recognised as an expense operating lease rentals of £26.9 million (2006: £27.3 million; 2005: £20.7 million).
As at 29 December 2007, the Group had outstanding commitments under non-cancellable operating leases of £116.8 million (30 December 2006: £142.8 million), falling due as follows:
| | | | |
| | | As at
29 December
2007 | | As at
30 December
2006 |
| | | £ million | | £ million |
Payments to be made | | | | |
Within one year | | 18.9 | | 24.7 |
In the second to fifth years, inclusive | | 52.8 | | 63.8 |
After more than five years | | 45.1 | | 54.3 |
| | | | |
| | 116.8 | | 142.8 |
| | | | |
47. Capital commitments
As at 29 December 2007, the Group had entered into contractual commitments for the purchase of property, plant and equipment amounting to £36.8 million (30 December 2006: £20.0 million), and for the purchase of non-integral computer software amounting to £5.7 million.
48. Related party transactions
Transactions between the Company and its subsidiaries, which are related parties of the Company, have been eliminated on consolidation and therefore are not required to be disclosed in these financial statements. Details of transactions between the Group and other related parties are disclosed below.
Post-employment benefit plans
During the period, the Group paid employer’s contributions amounting to £56.7 million (2006: £61.9 million; 2005: £69.9 million) in total to defined benefit and defined contribution pension plans established for the benefit of its employees. As at 29 December 2007, an amount of £7.5 million (30 December 2006: £7.1 million) in respect of employer’s contributions due was included in trade payables. In addition, during the period, the Group paid benefits of £7.8 million (2006: £9.5 million; 2005: £10.3 million) to other post-employment benefit plans.
Associates
Sales to and purchases from associates were as follows:
| | | | | | | | | |
| | | Year ended
29 December
2007 | | | Year ended
30 December
2006 | | | Year ended
31 December
2005 | |
| | | £ million | | | £ million | | | £ million | |
Sales | | 0.3 | | | 0.3 | | | 0.2 | |
Purchases | | (6.0 | ) | | (5.5 | ) | | (5.2 | ) |
| | | | | | | | | |
Amounts outstanding in respect of these transactions were as follows:
| | | | | | |
| | | As at
29 December
2007 | | | As at
30 December
2006 | |
| | | £ million | | | £ million | |
Receivables | | 0.1 | | | 0.1 | |
Payables | | (1.5 | ) | | (1.0 | ) |
| | | | | | |
F-60
Notes to the financial statements continued
48. Related party transactions continued
Entities controlled by minority shareholders
Sales to and purchases from entities controlled by minority shareholders were as follows:
| | | | | | | | | |
| | | Year ended
29 December
2007 | | | Year ended
30 December
2006 | | | Year ended
31 December
2005 | |
| | | £ million | | | £ million | | | £ million | |
Sales | | 23.2 | | | 26.3 | | | 23.3 | |
Purchases | | (30.7 | ) | | (31.7 | ) | | (32.3 | ) |
| | | | | | | | | |
Amounts outstanding in respect of these transactions were as follows:
| | | | | | |
| | | As at
29 December
2007 | | | As at
30 December
2006 | |
| | | £ million | | | £ million | |
Receivables | | 0.4 | | | 0.2 | |
Payables | | (1.0 | ) | | (0.7 | ) |
| | | | | | |
Compensation of key management personnel
For the purposes of these disclosures, the Group regards its key management personnel as the Directors of the Company together with those persons who, in accordance with the Listing Rules of the London Stock Exchange, are regarded as discharging management responsibility. Compensation paid or payable to key management personnel in respect of their services to the Group was as follows:
| | | | | | |
| | | Year ended
29 December
2007
£’000 | | Year ended
30 December
2006
£’000 | | Year ended
31 December
2005
£’000 |
Short-term employee benefits: | | | | | | |
– Salaries and fees | | 3,332 | | 3,686 | | 3,549 |
– Bonus cash | | 2,039 | | 2,690 | | 2,686 |
– Benefits-in-kind | | 154 | | 128 | | 161 |
– Social security contributions | | 555 | | 542 | | 1,030 |
– Termination benefits | | 1,126 | | — | | — |
| | | | | | |
| | 7,206 | | 7,046 | | 7,426 |
| | | | | | |
Share-based incentives: | | | | | | |
– Bonus shares | | 465 | | 660 | | 665 |
– Deferred shares | | 887 | | 1,320 | | 1,330 |
– Long-term incentive plans | | — | | — | | 4,193 |
– Notional gains on the exercise of share options | | — | | 3,952 | | 17 |
| | | | | | |
| | 1,352 | | 5,932 | | 6,205 |
| | | | | | |
Pension contributions | | 989 | | 889 | | 978 |
| | | | | | |
| | 9,547 | | 13,867 | | 14,609 |
| | | | | | |
Other related parties
Dexon Investments Limited
Dexon Investments Limited (“Dexon”) is the minority shareholder in the Group’s 60% owned subsidiary, Winhere LLC, that was incorporated during 2006. On 19 July 2006, Winhere LLC, through its wholly-owned subsidiary, Gates Winhere Automotive Pump Products (Yantai) Co Ltd (“Gates Winhere”), acquired the business and assets of the water pump manufacturing operations of Winhere Auto Part Manufacturing Co Ltd (“Winhere”), a fellow subsidiary of Dexon, for £4.7 million in cash.
IGC, LLC
During the period, the Group purchased aviation services under an agreement with IGC, LLC and GForce Aviation, LLC. IGC, LLC is wholly owned by the Gates family, certain of whom had an interest in the Company’s convertible cumulative preference shares. The agreement was entered into on an arm’s length basis and the services provided are used strictly for corporate travel to the Group’s diverse locations within North America and only if there is no lower cost alternative available to the Group’s employees. The agreement permits the Group to purchase an unlimited number of aircraft flying hours at the rate of US$3,300 per flying hour, plus US$1,600 per day for crew, plus US$2,300 per month to cover insurance costs. During the period prior to the redemption of the preference shares on 24 July 2007 (when IGC, LLC ceased to be a related party), the Group recognised an expense of £67,377 (2006: £53,938; 2005: £81,444) in respect of these services. As at 24 July 2007, £nil was payable to IGC, LLC in respect of these transactions (30 December 2006: £8,174).
F-61
Notes to the financial statements continued
49. Exchange rates
The principal exchange rates used for translation purposes were as follows:
| | | | | | | | | | | | |
| | | Average rate | | Closing rate |
| | | Year ended
29 December
2007
£1= | | Year ended
30 December
2006
£1= | | Year ended
31 December
2005
£1= | | As at
29 December
2007
£1= | | As at
30 December
2006
£1= | | As at
31 December
2005
£1= |
US dollar | | 2.00 | | 1.83 | | 1.82 | | 1.99 | | 1.96 | | 1.72 |
Canadian dollar | | 2.12 | | 2.08 | | 2.17 | | 1.95 | | 2.28 | | 2.01 |
Euro | | 1.47 | | 1.47 | | 1.46 | | 1.36 | | 1.48 | | 1.46 |
Mexican peso | | 21.84 | | 20.19 | | 19.82 | | 21.73 | | 21.19 | | 18.26 |
Chinese yuan renminbi | | 15.25 | | 14.77 | | 14.98 | | 14.56 | | 15.28 | | 13.85 |
Indian rupee | | 82.73 | | 83.34 | | 80.11 | | 78.57 | | 86.62 | | 77.27 |
| | | | | | | | | | | | |
50. Subsequent event
Subsequent to the year end, the Group acquired a 60% interest in Rolastar Pvt Ltd (“Rolastar”), a duct manufacturer based in India that will be included within the Air Systems Components business segment.
Rolastar’s annual sales are approximately £9.0 million. At this early stage, it is not possible to reliably estimate the amount of goodwill that will be recognised on the acquisition.
F-62
Glossary of terms
| | |
| £, pound sterling, pence, p | | Pound sterling (£) and pence, the currency of the United Kingdom |
| $, US dollar, cents, c | | US dollar ($) and cents, the currency of the United States of America |
| ABIP | | The Tomkins Annual Bonus Incentive Plan |
| Adjusted operating profit | | Operating profit from continuing operations before restructuring costs, gains and losses on the disposal and exit of businesses and the amortization of intangible assets arising on acquisition (a non-GAAP measure) |
| ADR | | American Depositary Receipt |
| ADS | | American Depositary Share (representing four Ordinary Shares) |
| Annual Report | | This document, filed on Form 20-F |
| Articles | | The current Memorandum and Articles of Association of Tomkins plc |
| ASIC | | Application Specific Integrated Circuit |
| the Board | | The Board of Directors of Tomkins plc |
| Canadian dollar | | The currency of Canada |
| Caryaire | | Caryaire Air Systems Components Private Ltd |
| CEO | | Chief Executive Officer |
| CFO | | Chief Financial Officer |
| the Code | | The Internal Revenue Code of 1986, as amended |
| the Combined Code | | The Combined Code on Corporate Governance issued by the UK Financial Reporting Council in June 2006 |
| Companies Act 1985 | | The Companies Act of England and Wales 1985, as amended |
| Companies Act 2006 | | The Companies Act of England and Wales 2006 |
| the Company | | Tomkins plc, unless the context otherwise requires |
| the Convenience Date | | April 18, 2008 |
| CPI | | US Consumer price index |
| CSM auto database | | Database of automotive information and analysis prepared by CSM Worldwide, a provider of automotive market forecasting services and strategic advisory solutions to automotive manufacturers, suppliers and financial organizations |
| Dearborn | | Dearborn Mid-West Conveyor Company |
| Deferred Shares | | The deferred shares of £1 each in the capital of Tomkins plc, to be created pursuant to Resolution 16 at the Company’s annual general meeting on May 1, 2008 |
| Deloitte & Touche | | Collectively, the member firms of Deloitte Touche Tohmatsu and their respective affiliates |
| the Depositary | | The Bank of New York |
| Detroit Three | | General Motors, Ford and Chrysler |
| Dexter Axle | | Dexter Axle Company Inc |
| EBITDA | | Earnings before interest, tax, depreciation and amortization (a non-GAAP measure) |
| EMB | | Eifeler Maschinenbau GmbH |
| EMTN | | Euro Medium Term Note |
| ESOS 3 | | The Tomkins Executive Share Option Scheme No. 3 |
| ESOS 4 | | The Tomkins Executive Share Option Scheme No. 4 |
| the Estate and Gift Tax Convention | | The convention that entered into force on November 11, 1979 between the United States and the United Kingdom for the avoidance of double taxation and the prevention of fiscal evasion with respect to taxes on estates of deceased persons and on gifts |
| Euro | | The currency of certain member states of the European Union |
| the Exchange Act | | The Securities Exchange Act of 1934 |
| Fiscal 2003 | | Year ended January 3, 2004 |
| Fiscal 2004 | | Year ended January 1, 2005 |
| Fiscal 2005 | | Year ended December 31, 2005 |
| Fiscal 2006 | | Year ended December 30, 2006 |
| Fiscal 2007 | | Year ended December 29, 2007 |
| Fiscal 2008 | | Year ending January 3, 2009 |
| Fleximak or Gates Fleximak | | Gates Fleximak Ltd |
1
| | |
| GAAP | | Generally accepted accounting principles |
| Gates or the Gates group | | The Gates Corporation and its related businesses |
| GDP | | Gross Domestic Product |
| the Group | | Tomkins plc and its consolidated subsidiaries |
| HSE | | Health, safety and the environment |
| HVAC | | Heating, Ventilation and Air Conditioning |
| I&A | | Industrial and Automotive |
| IASB | | International Accounting Standards Board |
| Ideal | | Epicor Industries Inc and its related businesses, trading as Ideal |
| IFRIC | | International Financial Reporting Interpretations Committee |
| IFRS | | International Financial Reporting Standards |
| Independent Auditors | | Deloitte & Touche LLP, a member firm of Deloitte Touche Tohmatsu |
| LSE | | The London Stock Exchange plc |
| NAHB | | National Association of Homebuilders |
| NAPA | | National Automotive Parts Association |
| Net debt | | Total borrowings (bank overdrafts, bank and other loans, obligations under finance leases and outstanding Preference Shares), less cash and cash equivalents and collateralized cash, adjusted for the fair value of derivatives hedging translational exposures(a non-GAAP measure |
| New Articles | | The new Articles of Association of Tomkins plc to be adopted pursuant to Resolution 15 at the annual general meeting on May 1, 2008 |
| New products | | New products represent new product ranges and significant design changes or refinement to existing products introduced to the market during the last five years |
| Noon Buying Rate | | The noon buying rate in New York City for cable transfers in foreign currencies as certified for customs purposes by the Federal Reserve Bank in New York |
| Non-GAAP measure | | A measure of historical or future financial performance, financial position or cash flows which is adjusted to exclude or include amounts that would not be so adjusted in the most comparable measure prescribed by GAAP |
| NYSE | | The New York Stock Exchange |
| OE | | Original equipment |
| OEM | | Original equipment manufacturer |
| Operating margin | | Adjusted operating profit expressed as a percentage of sales |
| Ordinary Shares | | Ordinary shares of 5 pence each in the capital of Tomkins plc |
| PFIC | | Passive Foreign Investment Company |
| Plews | | Plews Inc and its related businesses |
| Preference Shares | | 5.56 percent convertible cumulative preference shares of $50 each in the capital of the Tomkins plc |
| QEF | | Qualified Electing Fund |
| Restructuring initiatives | | Major projects undertaken to rationalize and improve the cost competitiveness of the Group. Income and expenses classified as restructuring initiatives comprise expenses incurred in the course of strategic cost management and restructuring projects and gains and losses arising on the exit and disposal of businesses and assets as a result of restructuring initiatives |
| Rolastar | | Rolastar Pvt Ltd |
| RPI | | UK Retail Prices Index |
| PSP | | The Tomkins 2006 Performance Share Plan |
| RTPMS | | Remote tire pressure monitoring system |
| SAYE 2 | | The Tomkins Savings Related Share Option Scheme No. 2 |
| SDRT | | Stamp Duty Reserve Tax |
| SEC | | US Securities and Exchange Commission |
| SMS | | The Tomkins Share Matching Scheme |
| the SOX Act | | US Sarbanes-Oxley Act of 2002 |
| Stackpole | | The businesses and operations of Stackpole Limited |
| Swindon Silicon Systems | | Swindon Silicon Systems Limited |
2
| | |
| the Tax Convention | | The Convention Between the Government of the United States and the Government of the United Kingdom for the Avoidance of Double Taxation and the Prevention of Fiscal Evasion with respect to Taxes on Income and Capital Gains dated July 24, 2001, as ratified on March 31, 2003 and amended |
| TREAD Act | | US Transportation Recall Enhancement, Accountability, and Documentation Act |
| Trico | | Trico Products Corporation and its related businesses, which constituted the Group’s former Wiper Systems business segment |
| Tridon | | Tridon Electronics (formerly a related business of Trico) |
| Share Trust | | Tomkins Employee Share Trust |
| UK GAAP | | Generally accepted accounting practice in the United Kingdom |
| United Kingdom or UK | | The United Kingdom of Great Britain and Northern Ireland |
| United States or US | | The United States of America, its territories and possessions, any state of the United States and the District of Columbia |
| US GAAP | | Generally accepted accounting principles in the United States of America |
| uPVC | | Unplasticized Poly Vinyl Chloride |
| Winhere or Gates Winhere | | Gates Winhere LLC and its related businesses |
3
Signature
Tomkins plc hereby certifies that it meets all of the requirements for filing on Form 20-F, and that it has duly caused and authorized the undersigned to sign this Annual Report on its behalf.
| | |
| TOMKINS plc |
|
/s/ John Zimmerman |
| By: | | John Zimmerman |
| Chief Financial Officer |
April 30, 2008
Exhibit Index
1.1 | Memorandum and Articles of Association of the Company. (1) |
4.1 | The rules of the Tomkins Executive Share Option Scheme No. 3.(2) |
4.2 | The rules of the Tomkins Executive Share Option Scheme No. 4.(2) |
4.3 | Service Agreement, dated February 11, 2002 between Tomkins plc and James Nicol.(3) |
4.4 | Third Supplemental Trust Deed relating to the £750,000,000 EMTN Program dated August 28, 2003.(1) |
4.5 | Facility Agreement relating to the £400,000,000 multi-currency revolving credit agreement dated February 9, 2004.(1) |
4.6 | The rules of the Tomkins 2005 Sharesave Scheme.(4) |
| 4.7 | Terms and conditions of employment - John W. Zimmerman, dated October 31, 2007 |
| 8.1 | List of principal trading subsidiaries of the Company. |
| 12.1 | Certification of CEO pursuant to Rule 13 (a) – 14(a) of the Securities Exchange Act of 1934. |
| 12.2 | Certification of CFO pursuant to Rule 13 (a) – 14(a) of the Securities Exchange Act of 1934. |
| 13.1 | Certification of CEO and CFO pursuant to Rule 13(a) – 14 (b) of the Securities Exchange Act of 1934 and 18 USC. Section 1350, as adopted pursuant to Section 906 of the Sarbanes-Oxley Act of 2002. |
| 23.1 | Consent of Independent Registered Public Accounting Firm |
(1) | Incorporated by reference to the Company’s Annual Report on Form 20-F for the fiscal year ended January 3, 2004. |
(2) | Incorporated by reference to the Company’s Annual Report on Form 20-F for the fiscal year ended April 30, 2001. |
(3) | Incorporated by reference to the Company’s Annual Report on Form 20-F for the fiscal year ended April 30, 2002. |
(4) | Incorporated by reference to the Company’s Annual Report on Form 20-F for the fiscal year ended January 1, 2005. |