SECURITIES AND EXCHANGE COMMISSION
WASHINGTON, D.C. 20549
FORM 20-F
| ¨ | REGISTRATION STATEMENT PURSUANT TO SECTION 12(b) OR (g) OF THE SECURITIES EXCHANGE ACT OF 1934 |
OR
| x | ANNUAL REPORT PURSUANT TO SECTION 13 OR 15(d) OF THE SECURITIES EXCHANGE ACT OF 1934 |
OR
| ¨ | TRANSITION REPORT PURSUANT TO SECTION 13 OR 15(d) OF THE SECURITIES EXCHANGE ACT OF 1934 |
FOR THE FISCAL YEAR ENDED: JANUARY 1, 2005
COMMISSION FILE NUMBER: 0-17140
Tomkins plc
(Exact name of Registrant as specified in its charter)
England
(Jurisdiction of incorporation or organization)
East Putney House, 84 Upper Richmond Road
London SW15 2ST, United Kingdom
(Address of principal executive offices)
Securities registered or to be registered pursuant to Section 12(b) of the Act:
| | |
Title of each class
| | Name of each exchange
|
| Ordinary Shares, nominal value 5p per share | | New York Stock Exchange * |
| |
American Depositary Shares, each of which represents four Ordinary Shares | | New York Stock Exchange |
Securities registered or to be registered pursuant to Section 12(g) of the Act
None.
Securities for which there is a reporting obligation pursuant to Section 15(d) of the Act
None.
Indicate the number of outstanding shares of each of the issuer’s classes of capital or common stock as of the close of the period covered by the Annual Report:
| | |
Ordinary Shares, nominal value 5p per share | | 773,889,884 |
Convertible Cumulative Preference Shares, nominal value US$ 50 per share | | 10,506,721 |
Indicate by check mark whether the Registrant (1) has filed all reports required to be filed by Section 13 or 15(d) of the Securities Exchange Act of 1934 during the preceding 12 months (or for such shorter period that the Registrant was required to file such reports), and (2) has been subject to such filing requirements for the past 90 days: Yes x No ¨
Indicate by check mark which financial statement item the Registrant has elected to follow: Item 17 ¨ Item 18 x
| * | Not for trading, but only in connection with the registration of American Depositary Shares representing such Ordinary Shares |
TABLE OF CONTENTS
In this Annual Report (the “Annual Report”) on Form 20-F for the Fiscal year ended January 1, 2005 (“Fiscal 2004”), all references to “Tomkins”, the “Tomkins Group”, the “Group”, the “Company”, “we”, “us” and “our” include Tomkins plc and its consolidated subsidiaries, unless the context otherwise requires.
The consolidated financial statements of Tomkins plc appearing in this Annual Report are presented in US dollars (“$”) and are prepared in accordance with accounting principles generally accepted in the United States of America (“US GAAP”).
In this Annual Report, references to “US dollars”, “$”, “cents” and “c” are to United States currency, references to “pounds sterling”, “£”, “pence” and “p” are to British currency and references to “Cdn” are to Canadian currency.
Special Note Regarding Forward-Looking Statements
Pursuant to the meaning of forward-looking statements in Section 27A of the Securities Act of 1933 and Section 21E of the Securities Exchange Act of 1934 (the “Exchange Act”), this Annual Report contains assumptions, anticipations, expectations and forecasts concerning the Company’s future business plans, products, services, financial results, performance, future events and information relevant to our business, industries and operating environments. When used in this document, the words “anticipate”, “believe”, “estimate”, “assume”, “could”, “should”, “expect” and similar expressions, as they relate to the Company or its management, are intended to identify forward-looking statements. Such statements reflect the current views of Tomkins with respect to future events and are subject to certain risks, uncertainties and assumptions. The forward-looking statements contained herein represent a good-faith assessment of our future performance for which we believe there is a reasonable basis. Many factors could cause the actual results, performance or achievements of Tomkins to be materially different from any future results, performance or achievements that may be expressed or implied by such forward-looking statements, including, among others, adverse changes or uncertainties in general economic conditions in the markets we serve, regulatory developments adverse to us or difficulties we may face in maintaining necessary licenses or other governmental approvals, changes in the competitive position or introduction of new competitors or new competitive products, lack of acceptance of new products or services by the Company’s targeted customers, changes in business strategy, any management level or large-scale employee turnover, any major disruption in production at our key facilities, adverse changes in foreign exchange rates, and acts of terrorism or war, and various other factors, both referenced and not referenced in this Annual Report. Should one or more of these risks or uncertainties materialize, or should underlying assumptions prove incorrect, actual results may vary materially from those described herein as anticipated, believed, estimated or expected. For more discussion of the risks affecting us, please refer to Item 3.D. “Key Information – Risk factors”.
These forward-looking statements represent our view only as of the date they are made, and we disclaim any obligation to update forward-looking statements contained herein, except as may be otherwise required by law.
PART I
Item 1. Identity of Directors, Senior Management and Advisers
Not applicable.
Item 2. Offer Statistics and Expected Timetable
Not applicable.
Item 3. Key Information
A. Selected financial data
The selected financial data set out below as of and for the Fiscal years ended January 1, 2005 and January 3, 2004, the eight-month Transition Period ended December 31, 2002 and for the Fiscal year ended April 30, 2002 has been derived from the audited consolidated financial statements of the Company, which appear elsewhere in this Form 20-F. The selected financial data as of and for the Fiscal years ended April 30, 2001 and April 29, 2000 have not been subject to audit. The selected financial data set forth below should be read in conjunction with, and are qualified in their entirety by reference to, such consolidated financial statements and Notes thereto and Item 5 – “Operating and Financial Review and Prospects”.
Consolidated income statement data
| | | | | | | | | | | | | | | | | | | | | | | | |
| | | Fiscal Year Ended
| |
| | | January 1,
2005 (364 days)
| | | January 3,
2004(1) (368 days)
| | | December 31,
2002(2) (245 days)
| | | April 30,
2002(3) (365 days)
| | | April 30,
2001(4) (366 days)
| | | April 29,
2000(5) (364 days)
| |
| | | $ million | | | $ million | | | $ million | | | $ million | | | $ million | | | $ million | |
Net sales | | | 5,356.1 | | | | 4,847.4 | | | | 2,981.6 | | | | 4,374.7 | | | | 4,737.7 | | | | 4,499.1 | |
Operating income from continuing operations | | | 477.1 | | | | 385.6 | | | | 192.0 | | | | 332.4 | | | | 368.7 | | | | 687.6 | |
Income from continuing operations before cumulative effect of change in accounting principle | | | 380.2 | | | | 486.6 | | | | 169.9 | | | | 209.5 | | | | 241.7 | | | | 333.9 | |
(Loss)/income from discontinued operations, net of taxes | | | (13.5 | ) | | | (109.5 | ) | | | (3.0 | ) | | | (0.7 | ) | | | 99.5 | | | | 333.2 | |
Gain/(loss) on disposal of discontinued operations, net of taxes | | | 11.0 | | | | 49.6 | | | | (0.8 | ) | | | 3.2 | | | | (238.5 | ) | | | (355.9 | ) |
Cumulative effect of change in accounting principle, net of taxes | | | — | | | | — | | | | (47.3 | ) | | | 2.6 | | | | — | | | | — | |
| | |
|
|
| |
|
|
| |
|
|
| |
|
|
| |
|
|
| |
|
|
|
Net income | | | 377.7 | | | | 426.7 | | | | 118.8 | | | | 214.6 | | | | 102.7 | | | | 311.2 | |
| | |
|
|
| |
|
|
| |
|
|
| |
|
|
| |
|
|
| |
|
|
|
| | | $ | | | $ | | | $ | | | $ | | | $ | | | $ | |
Net income per common share | | | | | | | | | | | | | | | | | | | | | | | | |
Basic | | | | | | | | | | | | | | | | | | | | | | | | |
Income from continuing operations before cumulative effect of change in accounting principle | | | 0.46 | | | | 0.59 | | | | 0.17 | | | | 0.20 | | | | 0.19 | | | | 0.28 | |
(Loss)/income from discontinued operations, net of taxes | | | (0.02 | ) | | | (0.14 | ) | | | — | | | | — | | | | 0.14 | | | | 0.36 | |
Gain/(loss) on disposal of discontinued operations, net of taxes | | | 0.01 | | | | 0.06 | | | | — | | | | — | | | | (0.28 | ) | | | (0.37 | ) |
| | |
|
|
| |
|
|
| |
|
|
| |
|
|
| |
|
|
| |
|
|
|
Income before cumulative effect of change in accounting principle | | | 0.45 | | | | 0.51 | | | | 0.17 | | | | 0.20 | | | | 0.05 | | | | 0.27 | |
Cumulative effect of change in accounting principle, net of taxes | | | — | | | | — | | | | (0.06 | ) | | | — | | | | — | | | | — | |
| | |
|
|
| |
|
|
| |
|
|
| |
|
|
| |
|
|
| |
|
|
|
Net income | | $ | 0.45 | | | $ | 0.51 | | | $ | 0.11 | | | $ | 0.20 | | | $ | 0.05 | | | $ | 0.27 | |
| | |
|
|
| |
|
|
| |
|
|
| |
|
|
| |
|
|
| |
|
|
|
Diluted | | | | | | | | | | | | | | | | | | | | | | | | |
Income from continuing operations before cumulative effect of change in accounting principle | | | 0.43 | | | | 0.51 | | | | 0.17 | | | | 0.20 | | | | 0.19 | | | | 0.28 | |
(Loss)/income from discontinued operations, net of taxes | | | (0.01 | ) | | | (0.12 | ) | | | — | | | | — | | | | 0.14 | | | | 0.36 | |
Gain/(loss) on disposal of discontinued operations, net of taxes | | | 0.01 | | | | 0.06 | | | | — | | | | — | | | | (0.28 | ) | | | (0.37 | ) |
| | |
|
|
| |
|
|
| |
|
|
| |
|
|
| |
|
|
| |
|
|
|
Income before cumulative effect of change in accounting principle | | | 0.43 | | | | 0.45 | | | | 0.17 | | | | 0.20 | | | | 0.05 | | | | 0.27 | |
Cumulative effect of change in accounting principle, net of taxes | | | — | | | | — | | | | (0.05 | ) | | | — | | | | — | | | | — | |
| | |
|
|
| |
|
|
| |
|
|
| |
|
|
| |
|
|
| |
|
|
|
Net income | | $ | 0.43 | | | $ | 0.45 | | | $ | 0.12 | | | $ | 0.20 | | | $ | 0.05 | | | $ | 0.27 | |
| | |
|
|
| |
|
|
| |
|
|
| |
|
|
| |
|
|
| |
|
|
|
| (1) | Tomkins acquired Stackpole Limited on June 18, 2003. |
| (2) | Change in accounting principle relates to Tomkins transitional adjustment in respect of the adoption of SFAS No. 142 on May 1, 2002. |
| (3) | Change in accounting principle relates to Tomkins transitional adjustment in respect of the adoption of SFAS No. 133 on May 1, 2001. |
| (4) | The sale of the Food Manufacturing business segment was completed on August 31, 2000. |
| (5) | Tomkins acquired ACD Tridon Inc. and Hart & Cooley on June 25, 1999 and December 30, 1999 respectively. |
3
Consolidated income statement data (continued)
| | | | | | | | | | | | |
| | | Fiscal Year Ended
|
| | | January 1,
2005 (364 days)
| | January 3,
2004(1) (368 days)
| | December 31,
2002(2) (245 days)
| | April 30,
2002(3) (365
days)
| | April 30,
2001(4) (366
days)
| | April 29,
2000(5) (364
days)
|
| | | $ | | $ | | $ | | $ | | $ | | $ |
Net income per common share (continued) | | | | | | | | | | | | |
Net income per ADS(6) | | | | | | | | | | | | |
Basic | | 1.80 | | 2.04 | | 0.44 | | 0.80 | | 0.40 | | 1.20 |
Diluted | | 1.72 | | 1.80 | | 0.48 | | 0.80 | | 0.40 | | 1.20 |
| |
| | | Number (in thousands)
|
Average number of ordinary shares outstanding (‘000) – basic | | 770,717 | | 771,037 | | 770,927 | | 773,464 | | 857,686 | | 947,774 |
Average number of ordinary shares outstanding (‘000) – diluted(7) | | 877,299 | | 953,989 | | 996,607 | | 774,017 | | 857,712 | | 949,793 |
| | | | | | |
| Consolidated balance sheet data | | | | | | | | | | | | |
| |
| | | As of
|
| | | January 1,
2005
| | January 3,
2004
| | December 31,
2002
| | April 30, 2002
| | April 30,
2001
| | April 29,
2000
|
| | | $ million | | $ million | | $ million | | $ million | | $ million | | $ million |
Total assets | | 5,736.0 | | 5,462.6 | | 5,202.6 | | 5,250.8 | | 5,501.6 | | 8,870.1 |
Ordinary share capital | | 74.3 | | 69.3 | | 62.3 | | 56.3 | | 56.2 | | 74.3 |
Shareholders’ equity | | 2,923.1 | | 2,697.0 | | 2,412.5 | | 2,555.7 | | 2,606.9 | | 3,516.7 |
Net assets | | 3,003.9 | | 2,756.6 | | 3,095.7 | | 3,227.2 | | 3,294.8 | | 4,183.3 |
| (1) | Tomkins acquired Stackpole Limited on June 18, 2003. |
| (2) | Change in accounting principle relates to Tomkins transitional adjustment in respect of the adoption of SFAS No. 142 on May 1, 2002. |
| (3) | Change in accounting principle relates to Tomkins transitional adjustment in respect of the adoption of SFAS No. 133 on May 1, 2001. |
| (4) | The sale of the Food Manufacturing business segment was completed on August 31, 2000. |
| (5) | Tomkins acquired ACD Tridon Inc. and Hart & Cooley on June 25, 1999 and December 30, 1999 respectively. |
| (6) | Net income and dividend per ADS is calculated per Ordinary Share multiplied by four, as discussed in Item 9.C. “Markets.” |
| (7) | In Fiscal year ended April 30, 2002, the preference shares were anti-dilutive and were therefore excluded from the calculation. |
Dividends
The Company has paid cash dividends on its ordinary shares, nominal value 5p per share (“Ordinary Shares”), in respect of every Fiscal year since being first listed on the London Stock Exchange Limited (the “London Stock Exchange”) in 1950.
Dividends are paid to shareholders as of record dates that are fixed after consultation between the Company and the London Stock Exchange. For the year ended January 1, 2005, an interim dividend was declared by the Board of Directors (the “Board”) in August 2004 and was paid in November 2004. A final dividend was recommended by the Board following the end of the Fiscal year and was subject to approval by the shareholders at the Company’s annual general meeting. This was paid on 26 May 2005. In normal circumstances we expect dividend payments to follow the same pattern in future years and anticipate the weighting of these payments to be approximately 40 percent for the interim dividend and 60 percent for the final dividend.
The table below sets forth the amounts of interim, final and total dividends paid in respect of each Fiscal year indicated and the Transition Period ending December 31, 2002. The amounts are shown in US cents per Ordinary Share and in US cents per American Depositary Share (each representing four Ordinary Shares). These have been translated from sterling at the Noon Buying Rate on each of the respective payment dates for such interim and final dividends.
| | | | | | | | | | | | | | | | | |
Fiscal Year Ended
| | Cents per Ordinary Share(1)
| | Cents per ADS(1)
|
| | | Interim
| | Second
Interim
| | Final
| | Total
| | Interim
| | Second
Interim
| | | Final
| | Total
|
April 29, 2000 | | 7.28 | | — | | 18.61 | | 25.89 | | 29.12 | | — | | | 74.44 | | 103.56 |
April 30, 2001 | | 6.62 | | — | | 10.95 | | 17.57 | | 26.46 | | — | | | 43.79 | | 70.25 |
April 30, 2002 | | 6.58 | | — | | 11.58 | | 18.16 | | 26.33 | | — | | | 46.30 | | 72.63 |
May 1, 2002 – December 31, 2002(2) | | 7.13 | | 5.27 | | — | | 12.40 | | 28.52 | | 21.08 | (2) | | — | | 49.60 |
January 3, 2004 | | 7.70 | | — | | 13.12 | | 20.82 | | 30.80 | | — | | | 52.49 | | 83.29 |
January 1, 2005 | | 8.96 | | — | | 14.15 | | 23.11 | | 35.84 | | — | | | 56.60 | | 92.44 |
| (1) | Translated at the noon buying rate on the date the dividend was paid. |
| (2) | The Company’s Fiscal year end changed from April 30 to December 31 with effect for the year ended December 31, 2002. The change to our accounting reference date gave rise to an eight-month accounting period, which represented two-thirds of a normal twelve-month accounting period. In accordance with market practice in these circumstances, the Board elected to declare two interim dividends in lieu of an interim and a final dividend. |
The Company expects to continue to pay dividends in the future. The total amounts of future dividends will be determined by the Board and will depend on the Company’s results of operations, cash flow, financial and economic conditions and other factors.
4
Cash dividends are paid by the Company in pounds sterling, and fluctuations in the exchange rate between pounds sterling and US dollars will affect the US dollar amounts received by holders of American Depository Receipts (“ADRs”) upon conversion by The Bank of New York (the “Depositary”) of such dividends. Moreover, fluctuations in the exchange rates between the pound sterling and the US dollar will affect the dollar equivalents of the pound sterling price of the Ordinary Shares on the London Stock Exchange and, as a result, are likely to affect the market prices of the American Depositary Shares (“ADSs”) in the United States. For a discussion of the historic effects of exchange rate fluctuations on the Company’s financial condition and results of operations, see Item 11 “Quantitative and Qualitative Disclosures about Market Risk” and Note 16 to the consolidated financial statements.
B. Capitalization and indebtedness
Not applicable.
C. Reasons for the offer and use of proceeds
Not applicable.
D. Risk factors
In addition to the other information contained in this Annual Report, investors in our securities should consider carefully the risks described below. Our financial condition or results of operations could be materially adversely affected by any of these risks. Additional risks not currently known to us, or risks that we currently regard as immaterial could also have a material adverse effect on our financial condition or results of operations.
The following discussion contains a number of forward-looking statements. Please refer to the “Forward-Looking Statements” discussion at the front of this Annual Report for cautionary information.
As a part of the planning, control and performance management framework of the Group, each business considers strategic, operational, commercial and financial risks and identifies risk mitigation actions. The Group has categorized the foregoing risks as those relating to:
| | • | | the markets within which the Group operates; |
| | • | | the competitive position of the Group and its businesses; |
| | • | | the financial position of the Group; and |
| | • | | the securities markets and ownership of ADSs and registered shares. |
Risk can be considered either as downside risk, the risk that something can go wrong and result in a financial loss or financial exposure for the Group, or volatility risk. Volatility risk is the risk associated with uncertainty, which means there may be an opportunity for financial gain as well as potential for loss.
The risks listed primarily relate to potential downside risks. The nature of the Group’s business means that risks will change as a result of controllable and uncontrollable events occurring in the future.
Risks relating to the markets within which the Group operates
The cyclical nature of the markets that we serve could adversely affect our business.
Approximately 25 percent of our net sales are to automotive manufacturers in various parts of the world. Sales and production in the automotive industry are cyclical and depend on general economic conditions and other factors, including consumer spending and preferences. Approximately 33 percent of our net sales are generated within construction related industries and within industrial equipment markets. Sales and production in these markets are cyclical and depend on general economic conditions and other factors, including consumer spending and preferences.
A significant reduction in these markets could have an adverse effect on our business, financial condition or results of operations.
A continuing improvement in vehicle component life could adversely affect our important aftermarket business.
The success of component manufacturers including ourselves in improving product quality and performance and the demand from the automotive original equipment makers for ever greater service life and reliability could lower demand in the aftermarket business segment which could have an adverse effect on our business, financial condition or results of operations.
A potentially changing regulatory environment could limit our business opportunities and profitability.
Changes in existing laws, regulations, licenses, decisions, policies or interpretations thereof by the courts, or by regulators, may have a material adverse impact on our business, financial condition or results of operations.
In particular, the industries in which we operate are subject to a variety of environmental regulations, particularly relating to waste water discharges, air emissions, solid waste management and hazardous chemical disposal. These regulations have generally become stricter in recent years and may continue to become more stringent in the future. Any future changes to existing environmental legislation or regulation could have a material adverse effect on our business, financial condition or results of operations. There is a risk that our activities will not continue to be in substantial compliance in the future with applicable environmental legislation or regulation and we are unable to predict the costs of compliance with changes in legislation or regulation.
In certain countries we are required to secure and maintain operating licenses. If we experience difficulties or delays in obtaining or maintaining licenses in the future or if the cost of such licenses increases significantly, this could adversely affect our business, financial condition or results of operations.
5
Our operations in foreign and emerging markets expose us to risks associated with conditions in those markets.
We operate principally in the automotive, industrial and construction related markets in a number of geographic regions of the world, including emerging markets. Operations in emerging markets present risks that are not encountered in countries with more developed economic and political systems, including: economic and political instability within these markets; boycotts and embargoes imposed by the international community; significant fluctuations in interest rates and currency exchange rates; the imposition of unexpected taxes or other levies on our revenues in these markets; the inability to expatriate revenues or dividends; limitations on foreign investments and foreign capital participation in certain industries or regions; and the introduction of exchange, customs or trade controls and other restrictions by foreign governments.
In addition, the legal and regulatory systems of foreign and emerging markets identified above are often less formalized and less consistently enforced than in industrialized countries. Therefore, our ability to protect our intellectual property and our contractual and other legal rights in those regions could be limited. Changes in demand in any of these markets may have an adverse affect on our business, financial condition or results of operations.
Risks relating to the competitive position of the Group and its businesses
Industry consolidation could result in more powerful competitors and fewer customers.
Some of our customers and some of our competitors in a number of our markets, especially in the automotive aftermarket, and to a lesser extent in the markets of the Air Systems Components group, are consolidating to achieve greater scale or market share. Such changes could affect our customers and their relationship with us. As our customers become larger and more concentrated, they could exert pricing pressure on all suppliers, including ourselves.
Some of our customers are experiencing lower levels of business.
Lower levels of economic activity have resulted in a number of our customers reducing demand compared to past years for some of our products and some rescheduling of orders. Our Industrial & Automotive business segment is directly impacted by global automotive production. The automotive industry is characterized by overcapacity and fierce competition. In North America it is also affected by significant pension and healthcare liabilities. North American automobile manufacturers have recently announced production cuts for a number of platforms.
Lower levels of demand resulting from lower levels of business that may be experienced by our customers could have an adverse effect on our business, financial condition or results of operations.
Our automotive customers may seek to obtain price reductions from their suppliers and we may be unable to achieve corresponding reductions in costs.
Approximately a quarter of our sales are to automotive manufacturers. It is normal practice for such customers to seek reductions in their costs from their suppliers over the duration of any committed supply arrangement. To meet any such requests for price reductions whilst maintaining our profit margins, we would have to achieve corresponding cost savings in our business by strategic sourcing of raw materials and by improving production and manufacturing efficiencies. The failure to achieve future cost savings to meet the committed price reductions could adversely affect our business, financial condition or results of operations.
We may be unable to fully recover increasing raw material costs from our customers.
Increasing steel and other raw material costs have had a significant impact on our results and those of others in our industry in 2004. As a result of limited capacity and high demand, steel suppliers began assessing price surcharges and increasing base prices during the fourth quarter of 2003, with the increased costs continuing during 2004. The net impact of increases in raw materials that we were unable to pass on to customers and was therefore absorbed by the Group in 2004 was $33 million.
Reliance on certain raw materials and suppliers for key components could erode our profit margins and destabilize our productivity levels.
To the extent not reflected in prices for our products, an unexpected increase in the cost of certain raw materials, especially steel, aluminum, polymers and chemical resins, could lead to lower profit margins. The failure of our key suppliers to maintain and increase production levels could result in our inability to fulfill orders, which could damage relationships with current and prospective customers and have an adverse effect on our business, financial condition or results of operations.
Our business could be adversely affected if we are unable to obtain adequate supplies or equipment in a timely manner from our current suppliers or any alternative supplier, or if there were significant increases in the costs of such equipment.
We are dependent upon our strong relationships with manufacturers’ representatives, distributors and wholesalers.
Many of our businesses have strong established relationships with manufacturers’ representatives, distributors and wholesalers and these relationships are an important ingredient of our strong competitive positions in a number of our markets. Deterioration in these relationships, or a change in our product’s route to market, could have an adverse effect on our business, financial condition or results from operations.
Product liability claims may arise due to the nature of our products.
We face an inherent business risk of exposure to product liability claims in the event that a failure of a product results in, or is alleged to result in, bodily injury, property damage or consequential loss. Any material product liability losses in the future or costs to defend any alleged failures of our products may have a material adverse effect on our business, financial condition or results of operations.
If we are unable to implement our strategic initiatives successfully, our ability to achieve optimal market performance may be impaired.
We are pursuing a number of strategic initiatives aimed to ensure that we continue to focus on value creating areas, provide the appropriate value offerings to our customers, achieve superior execution of business processes and maintain a low cost position. A number of initiatives are also in place to achieve future growth by developing relationships with global customers, investing in product innovation, expanding into new geographic regions and product adjacent markets. The success of the strategic initiatives depends in part on the changing competitive dynamics of the markets in which we operate and management can provide no assurance that each of the strategic initiatives will be successful in achieving improvement in our financial performance.
6
If we experience difficulty in implementing our strategic initiatives it may have an adverse effect on our business, financial condition or results from operations.
We operate in very competitive markets and could be adversely affected if we fail to keep pace with technological changes.
We operate in very competitive environments in several geographical markets and product areas. The markets for our products and services are characterized by evolving industry standards, rapidly changing technology and increased competition. The continual development of advanced technologies for new products and product enhancements is an important way in which we maintain acceptable pricing levels. If we fail to keep pace with technological changes in the industrial sectors that we serve, we may experience price erosion and lower margins.
Our success is dependent in large part on our ability to:
| | • | | anticipate our customers’ needs and provide products and services to meet those needs; |
| | • | | develop new products and services that are accepted by our customers; |
| | • | | enhance and upgrade our existing products and services; and |
| | • | | price our products and services competitively. |
Many of our competitors are sophisticated companies with many resources that may develop products and services that are superior to our products and services or may adapt more quickly than we do to new technologies, industry changes or evolving customer requirements. Our failure to anticipate or respond adequately to technological developments or customer requirements, and any delay in accomplishing these goals, could adversely affect our business, financial condition or results of operations.
We are dependent on the continued operation of our manufacturing facilities.
Our manufacturing facilities are located principally in the United States and Europe. A major disruption of our critical manufacturing facilities could result in significant interruption of our business and potential loss of customers and sales, which could have an adverse effect on our business, financial condition or results of operations.
Our ability to operate successfully is based on the capacity, reliability and security of our computer hardware, software and telecommunications infrastructure. We currently secure our networks by means of back up, hardware, virus protection and other measures, but any systems interruption could lead to a reduction in performance or loss of services. A breach of network security could result in reduced revenues and could have an adverse effect on our businesses, financial condition or results from operations. Our systems are vulnerable to damage or interruption caused by human error, network failure, natural disasters, sabotage, computer viruses and similar disruptive events. We might not be able to provide effectively a backup to our systems.
If we are unable to protect our intellectual property rights, the future success of our business could suffer.
Our proprietary technology is protected by patents and trade secrets which could be at risk if:
| | • | | competitors are able to develop similar technology independently; |
| | • | | our patent applications are not approved; |
| | • | | steps taken to prevent misappropriation or infringement of our intellectual property are not successful; or |
| | • | | we do not adequately protect our intellectual property. |
From time to time we may need to litigate in order to enforce our patents, copyrights or other intellectual property rights, to protect our trade secrets, to determine the validity and scope of the proprietary rights of others or to defend against significant claims of infringement. Any such litigation, the outcome of which will be uncertain, or its threat, could result in costs and a diversion of our resources.
We have a number of businesses in the various regions of the world, which provide additional management challenges.
We operate in many countries around the world, which requires us to take account of cultural and language differences and to assimilate different business practices. Failure to effectively manage our geographically diverse operations could have an adverse effect on our operations, financial condition or results from operations.
We have a number of employees who are members of trade unions or other employment organizations.
Some of our employees are members of trade unions and over many years we have been able to maintain successful relationships with the unions and employment organizations. A deterioration of these relationships in the future may have an adverse effect on our business, financial condition or results from operations.
Risks relating to the financial position and results of operations of the Group
Tomkins plc is a holding company that is dependent upon cash flow from its subsidiaries to meet its obligations.
Tomkins plc is a holding company with no independent operations or significant assets other than investments in, and advances to, subsidiaries. Accordingly, it depends upon the receipt of sufficient funds from its subsidiaries to meet its obligations, including its ability to repay any amounts it borrows under its Medium Term Note program or to pay its dividends. The ability of Tomkins plc to access that cash flow may be limited in some circumstances. For instance, the terms of existing and future indebtedness of its subsidiaries and the laws and jurisdictions under which those subsidiaries are organized may limit the payment of dividends, loan repayments and other distributions to Tomkins plc.
7
Approximately 28 percent of our total revenues are generated from 10 major customers in the Industrial & Automotive business.
Approximately 28 percent of our total revenues come from the top ten customers of our Industrial & Automotive business. The loss of, or a significant decrease in demand from, one or more of these customers could result in an adverse effect on our business, financial condition or results of operations.
We operate pension plans throughout the world, covering the majority of our employees, which expose us to the risk of fluctuations in the world’s financial markets.
We operate both defined benefit and defined contribution pension plans, the majority of which are in the United States of America and the United Kingdom. The schemes were in deficit by $307 million as of January 1, 2005 as detailed in Note 14 to the consolidated financial statements. Deterioration in asset prices or changes to long-term interest rates could lead to an increase in the deficit or give rise to an additional funding requirement, which could have an adverse effect on our financial condition or results of operations.
The rising costs of providing health care and workers compensation may erode margins.
Healthcare is provided by certain US subsidiaries to current and former employees. We strive to cover increases in this expense and in the cost of workers compensation by reducing overheads in other areas. If the cost of heath care and workers compensation increases, to the extent that we are unable to achieve adequate savings in other areas of our business, operating margins will be eroded.
Our tax provisions may not be sufficient to cover our future tax liabilities
Tomkins operates within multiple tax jurisdictions and is subject to audit in those jurisdictions. These audits can involve complex issues, which may require an extended period of time for resolution. Although we believe that adequate provision has been made for such issues, there is a possibility that the ultimate resolution of such issues could have an adverse effect on the earnings of the Company.
We may not be able to raise sufficient additional capital necessary to fund our growth.
We may require significant amounts of capital to expand our business, implement our strategic initiatives and remain competitive. At present, our established sources of funding are through equity, corporate bond markets (through the Medium Term Note program) bank debt and cash flow from operations. We believe that the sources of funding currently available will be sufficient to fund our operations. If our plans or assumptions regarding our funding requirements change, however, we may need to seek other sources of financing, such as additional lines of credit with commercial banks or vendors or public financing, or to renegotiate existing bank facilities. There is a risk that we will not be able to obtain financing from these or other sources, or renegotiate our existing financing on a timely basis, on acceptable terms, or at all. If we are unable to obtain financing from these sources, or unable to renegotiate our existing financing on a timely basis or on acceptable terms, we may have to delay or abandon some of our development plans or strategic initiatives. Any or all of these developments could have an adverse affect on our business, financial condition or results of operations.
Our Bondholders have the right to require us to redeem our outstanding bonds in certain circumstances.
We have a Euro Medium Term Note Program under which Tomkins may issue bonds. Our bondholders have the right to require us to redeem our outstanding bonds at par, in the event of a change of control of Tomkins plc and also in the event that our credit rating falls below investment grade as a result of us making either acquisitions or disposals that comprise more than 25% of the group’s operating profits in a twelve calendar month period.
If our bondholders were to exercise this redemption right in such circumstances, there is a risk that we would not be able to obtain replacement financing from other sources on reasonable terms or at all. The extent to which we would be able to obtain replacement financing would determine our ability to meet the ongoing financing needs of the business.
Our international operations expose us to the risk of fluctuations in currency exchange rates.
We have manufacturing facilities in, and sell products to, many countries worldwide. Consequently, our results can be affected by changes in the currency exchange rates. The principal currencies in which we trade are US dollars, Canadian dollars, Euros and pounds sterling. Currency exchange movements can give rise to the following risks:
Transaction risk –this arises where sales or purchases are denominated in foreign currencies and exchange rates can change between entering into a purchase or sale commitment and completing the transaction;
Translation risk – this arises where the currency in which the results of an entity are reported differs from the underlying currency in which business is transacted; and
Economic risk – this arises where the manufacturing cost base of a business is denominated in a currency different from the currency of the market into which the products are sold.
Short-term volatility and long-term realignments of currency exchange rates may have an adverse affect on our business, financial condition or results of operations.
Risks related to the securities market and ownership of ADSs and registered shares
Holders of ADSs may be restricted in their ability to exercise voting rights.
Holders of ADSs will generally have the right under the deposit agreement to instruct the Depositary to exercise their voting rights for the registered shares represented by ADSs.
At our request, the Depositary will mail to holders of ADSs any notice of any shareholders’ meeting received from us together with information explaining how to instruct the Depositary to exercise the voting rights of the securities represented by ADSs. If the
8
Depositary receives voting instructions for a holder of ADSs on a timely basis, it is obligated to endeavor to vote the securities representing the holder’s ADSs in accordance with those voting instructions. The ability of the Depositary to carry out voting instructions, however, may be limited by practical limitations, such as time zone differences and delays in mailing.
ADS holders may be unable to participate in rights offerings and similar transactions in the future.
US securities laws may restrict the ability of US persons who hold ADSs to participate in certain rights offerings or share or warrant dividend alternatives which we may undertake in the future in the event we are unable to, or choose not to, register those securities under the US securities laws and are unable to rely on an exemption from registration under these laws. If we issue any securities of this nature in the future, we may issue such securities to the Depositary for the ADSs, which may sell those securities for the benefit of the holders of the ADSs. We cannot offer any assurance as to the value, if any, the Depositary would receive upon the sale of those securities.
9
Item 4. Information on the Company
A. History and development of the Company
General
Tomkins plc was incorporated in England in 1925, converted from a private company into a public company in March 1950 and re-registered as a public limited company in February 1982. The Company’s Ordinary Shares are listed on the London Stock Exchange and have been listed on the New York Stock Exchange (the “NYSE”) in the form of ADSs evidenced by ADRs since February 1995. Prior to listing on the NYSE, the ADSs had been quoted on the Nasdaq National Market since November 1988. Tomkins plc is registered in England and Wales No. 203531. Its registered office is East Putney House, 84 Upper Richmond Road, London SW15 2ST (Telephone: +44 (0) 20 8871 4544).
Tomkins is the ultimate parent of a large number of subsidiaries that are organized into three separate business segments;
Industrial & Automotive
The Industrial & Automotive segment manufactures a wide range of systems and components for the industrial and automotive markets through five business areas, Powertrain (which comprises Power Transmission and Stackpole), Fluid Power, Wiper Systems, Fluid Systems and Aftermarket manufactured products, selling to original equipment manufacturers (“OEMs”) and replacement markets throughout the world. In addition the Group has a number of discrete businesses that manufacture products primarily for the automotive replacement markets. Its brands include Gates, Stackpole, Stant, Schrader and Trico.
Air Systems Components
The Air Systems Components segment manufactures air handling components in North America, supplying the heating, ventilation and air conditioning market. Products include fans, grilles, registers, diffusers, variable air volume units, fan coils and terminal units for residential and commercial applications and dampers for commercial and industrial use. Residential products are sold under the brand names of Hart & Cooley, Milcor and American Metal Products and the industrial and commercial products are sold under the brand names of Titus, Ruskin, Krueger and Actionair.
Engineered & Construction Products
The Engineered & Construction Products segment manufactures products for a variety of end markets primarily related to the building, construction, truck and trailer and automotive industries. Over 97 percent of the sales are within North America. Each of the business areas has a good competitive position as a result of a strong branded product offering and a low manufacturing cost base. Long established relationships in the channels to market also provide competitive strength.
In 2005 the segmental reporting of the group was realigned. Dexter and Dearborn Mid-West were moved into the Industrial & Automotive segment as they largely serve industrial markets. A Building Products segment was established, which includes Air Systems Components and also the remaining Engineered & Construction Products businesses, Lasco Bathware, Lasco Fittings and Philips. The results for FY 2005 will be reported under the new business segments.
The Tomkins group is geographically diverse operating 131 manufacturing facilities and eight research and development facilities in 18 different countries across the Americas, Europe, Asia, and Australia.
The Industrial & Automotive business operates in all 18 countries. Air Systems Components is located in the United States, the UK and Thailand, while Engineered & Construction Products is entirely based in the United States. Overall, 67.4 per cent of revenue in FY 2004 came from the United States, 15.2 per cent from Europe and 17.4 per cent from the rest of the world.
Our sales are to the following end markets:
| | | |
| | | Percentage of total sales
| |
North America automotive original equipment | | 14.5 | % |
Rest of World automotive original equipment | | 10.2 | % |
North America automotive aftermarket | | 13.2 | % |
Rest of World automotive aftermarket | | 8.2 | % |
Residential construction | | 11.3 | % |
Commercial & industrial construction | | 11.8 | % |
Industrial original equipment | | 10.0 | % |
Industrial aftermarket | | 11.2 | % |
Industrial/utility | | 4.9 | % |
Manufactured housing | | 1.5 | % |
Recreational vehicles | | 1.9 | % |
Other markets | | 1.3 | % |
10
History
In fiscal 1984, Tomkins was a manufacturer and distributor of buckles and fasteners in the United Kingdom with net sales of $34.6 million. In the late 1980s the Group made a number of acquisitions of engineering companies in both the United Kingdom and the United States. In 1992 Tomkins diversified into Food Manufacturing, with the acquisition of the United Kingdom based Ranks Hovis McDougall plc.
In fiscal 1996 the Group moved into the Industrial & Automotive business segment, with the acquisition of The Gates Corporation for $1,160 million. This was satisfied by the issue of $633.4 million of 4.344 percent (net) redeemable convertible cumulative preference shares and $526.6 million of 5.56 percent (net) convertible cumulative perpetual preference shares. Stant Corporation was added to this segment in 1997 and ACD Tridon in 1999.
The redeemable convertible preference shares, issued as part consideration for the acquisition of The Gates Corporation, were redeemed in August 2003.
Between 1999 and 2004 a number of ‘add on acquisitions’ have been made in the Industrial & Automotive and Air Systems Components business segments, the Food Manufacturing business was sold and a number of divestments were made as part of a program to dispose of non-core businesses.
Principal acquisitions, disposals, and capital expenditures
This section should be read in conjunction with Item 5. “Operating and Financial Review and Prospects” and with Note 4 to the consolidated financial statements.
Acquisitions and disposals
All of the disposals mentioned below were disposed of as part of our program to dispose of all non-core businesses.
Fiscal 2004
In fiscal 2004 Tomkins completed its exit from the valves, taps and mixers business with the disposal of the business and assets of Hattersley Newman Hender, and Pegler Limited. In addition Mayfran International Inc. was sold. All of these disposals were included in the Engineering and Construction Products group. In the Industrial & Automotive Group, the sale of the European curved hose business in Nevers, France, was completed in November 2004 and the related closure of the European curved hose business in St Just, Spain was also completed in the year.
Acquisitions in the year included the polyurethane power transmission and motion control belt business, assets and liabilities of Mectrol Corporation, which has been included in the Industrial & Automotive group. This acquisition brings a new technology to the Power Transmission business, extending the business group’s product and customer base.
Fiscal 2003
The company acquired the business, assets and liabilities of Stackpole Limited in June 2003. The acquisition, which added to the Industrial & Automotive group, brought the Company expertise in powder metal and engineered components for powertrain.
During the year Tomkins sold Gates Formed-Fibre Products, Inc. from the Industrial and Automotive group. The business and assets of Milliken Valve Company Inc. and the Groups 62.4% investment in the business and assets of Cobra Investments (Pty) Limited were divested from the Engineered and Construction Products group.
Fiscal 2002
During fiscal 2002, Tomkins sold the consumer and industrial division of Gates (U.K.) Limited and the business and assets of Fedco Automotive Components Inc. Both of these disposals were included in the Industrial and Automotive group. Lasco Composites was divested from the Engineered and Construction Products group.
Acquisitions included the business, assets and liabilities of Ward Industries Inc. and the heating, ventilating and air conditioning dampers division of Johnson Controls Inc. The acquisition of Ward provided the Air Systems Components group with a new, expanded product offering in duct accessories and is in line with its strategy of growth in niche markets. The acquisition of Johnson Controls opened up new distribution channels, extended our damper product range for the commercial market and provided access to a wider customer base around the world. Both acquisitions were included in the Air Systems Components group.
Fiscal 2002/01
Tomkins acquired American Metal Products Company and the business and assets of Superior Rex in fiscal 2002/01. The acquisition of American Metal Products broadened our product offering by the inclusion of venting and gutter protection ranges, strengthened our manufacturing base with plants in Mississippi and Mexico and expanded our distribution capabilities, particularly into the important US West Coast market. The acquisition of the fan coil business of Superior Rex expanded our Titus product range. Both acquisitions were included in the Air Systems Components group.
Smith & Wesson Corp. was divested from the Professional, Garden & Leisure group, Sunvic Controls Limited from the Engineered and Construction Products group and Totectors Limited and The Northern Rubber Company Limited from the Industrial and Automotive group.
Capital expenditures
Due to the diverse nature of the business, there is no individual item of capital expenditure which has had a material impact on the position of the Company
11
B. Business overview
Segment contribution to net sales and operating income before restructuring costs
The contribution of each segment to the Company’s net sales and operating income is set out below.
The segment information is stated in UK GAAP, in accordance with Statements on Financial Accounting Standards (“SFAS”) No. 131 “‘Disclosure about Segments of an Enterprise and Related Information”, which requires us to determine and review our segments as reflected in the management information systems reports that our business managers use in making decisions. The chief operating decision maker evaluates our segment performance based on the consolidated financial information prepared in UK GAAP.
The company’s reportable segments are based upon the nature of the products and services produced by each segment.
| | | | | | | | | | | | |
Analysis by business segment (UK GAAP)
| | Year ended
January 1, 2005
$ million
| | | Year ended
January 3, 2004
$ million
| | | Eight
months ended
December 31,
2002 $
million
| | | Year ended
April 30, 2002
$ million
| |
Net sales | | | | | | | | | | | | |
Industrial & Automotive | | 3,529.0 | | | 3,224.0 | | | 1,938.2 | | | 2,845.9 | |
Air Systems Components | | 772.3 | | | 730.3 | | | 499.5 | | | 740.0 | |
Engineered & Construction Products | | 1,128.6 | | | 1,057.0 | | | 680.4 | | | 1,110.4 | |
Discontinued operations | | 11.3 | | | 125.7 | | | 98.0 | | | 138.4 | |
| | |
|
| |
|
| |
|
| |
|
|
| | | 5,441.2 | | | 5,137.0 | | | 3,216.1 | | | 4,834.7 | |
| | |
|
| |
|
| |
|
| |
|
|
Operating income, before restructuring costs(1) | | | | | | | | | | | | |
Industrial & Automotive | | 356.5 | | | 309.6 | | | 176.3 | | | 247.9 | |
Air Systems Components | | 86.2 | | | 69.0 | | | 51.8 | | | 77.1 | |
Engineered & Construction Products | | 108.1 | | | 103.2 | | | 67.2 | | | 104.2 | |
Central costs(2) | | (43.3 | ) | | (39.1 | ) | | (23.3 | ) | | (18.1 | ) |
Discontinued operations | | 0.2 | | | 0.5 | | | 8.0 | | | 7.3 | |
| | |
|
| |
|
| |
|
| |
|
|
| | | 507.7 | | | 443.2 | | | 280.0 | | | 418.4 | |
| | |
|
| |
|
| |
|
| |
|
|
| Reconciliation of UK GAAP segmental information to US GAAP | | | | | | | | | | | | |
| Net sales (UK GAAP) | | 5,441.2 | | | 5,137.0 | | | 3,216.1 | | | 4,834.7 | |
Discontinued operations | | (85.1 | ) | | (289.6 | ) | | (234.5 | ) | | (460.0 | ) |
| | |
|
| |
|
| |
|
| |
|
|
| Net sales (US GAAP) | | 5,356.1 | | | 4,847.4 | | | 2,981.6 | | | 4,374.7 | |
| | |
|
| |
|
| |
|
| |
|
|
| Operating income before restructuring costs (UK GAAP) | | 507.7 | | | 443.2 | | | 280.0 | | | 418.4 | |
Restructuring costs | | (31.9 | ) | | (58.5 | ) | | (49.1 | ) | | (37.4 | ) |
| | |
|
| |
|
| |
|
| |
|
|
| Operating income (UK GAAP) | | 475.8 | | | 384.7 | | | 230.9 | | | 381.0 | |
Impairment of goodwill | | — | | | (12.5 | ) | | (47.8 | ) | | — | |
Amortization of goodwill | | — | | | — | | | — | | | (48.0 | ) |
Amortization of intangible asset | | (5.3 | ) | | (2.6 | ) | | (0.2 | ) | | (1.1 | ) |
Valuation of net assets acquired in a business combination | | — | | | (0.3 | ) | | — | | | — | |
Inventories | | (1.6 | ) | | (4.1 | ) | | — | | | — | |
Discontinued operations | | 6.6 | | | 21.9 | | | (5.2 | ) | | (4.0 | ) |
Classification differences | | (1.9 | ) | | (1.5 | ) | | (1.1 | ) | | 1.0 | |
Pensions | | 0.9 | | | 5.5 | | | 10.5 | | | 11.0 | |
Share options | | 2.6 | | | (6.5 | ) | | 5.8 | | | (3.2 | ) |
Capitalized interest | | (3.5 | ) | | (3.1 | ) | | (0.9 | ) | | — | |
Restructuring costs | | (2.2 | ) | | 3.4 | | | — | | | (4.3 | ) |
Disposal of fixed assets | | 5.7 | | | 0.7 | | | — | | | — | |
| | |
|
| |
|
| |
|
| |
|
|
| Operating income from continuing operations (US GAAP) | | 477.1 | | | 385.6 | | | 192.0 | | | 332.4 | |
| | |
|
| |
|
| |
|
| |
|
|
| (1) | Operating income includes the group’s share of the income from associates and is before goodwill amortization. The split of the income from associates analyzed by reportable segment is Industrial & Automotive $1.1 million (January 2004 – $1.1 million; December 2002 – $0.5 million; April 2002 – loss of $1.0 million), Air Systems Components $nil (January 2004 – $nil; December 2002 – $nil; April 2002 – $nil), and Engineered & Construction Products $0.7 million (January 2004 – $0.3 million; December 2002 – $0.6 million; April 2002 – $nil). |
| (2) | Includes the cost of the corporate center, which carries out corporate functions for the Company as a whole. |
12
| | | | | | | | |
Analysis by geographical origin (US GAAP)
| | Year ended
January 1, 2005
$ million
| | Year ended
January 3, 2004
$ million
| | Eight
months ended
December 31,
2002 $
million
| | Year ended
April 30, 2002
$ million
|
Net sales | | | | | | | | |
United States of America | | 3,489.7 | | 3,287.6 | | 2,151.8 | | 3,225.8 |
United Kingdom | | 323.3 | | 258.6 | | 132.8 | | 178.6 |
Rest of Europe | | 539.5 | | 468.1 | | 252.7 | | 343.6 |
Rest of the World | | 1,003.6 | | 833.1 | | 444.3 | | 626.7 |
| | |
| |
| |
| |
|
| | | 5,356.1 | | 4,847.4 | | 2,981.6 | | 4,374.7 |
| | |
| |
| |
| |
|
Tomkins exited the Food Manufacturing and Professional, Garden and Leisure Products segments during the year ended April 30, 2001 with the disposal of the Red Wing Company Inc. on July, 14, 2000 and the sale of the remainder of the Food Manufacturing business segment on August 31, 2000. The Professional, Garden and Leisure Products segment was disposed of on October 5, 2000.
Notes 5(a) and 5(b) of the consolidated financial statements provide more detailed business segment and geographic information concerning the Company’s operations.
Industrial & Automotive
| | | | | | | | |
Sales by end markets
| | | Sales by major product category
| |
| Automotive original equipment | | 38 | % | | Synchronous belts | | 18 | % |
| Automotive aftermarket | | 28 | % | | Other belts | | 23 | % |
| Industrial aftermarket | | 17 | % | | Hydraulic & automotive hose | | 18 | % |
| Industrial original equipment | | 12 | % | | Wiper systems | | 13 | % |
| Service sales original equipment | | 5 | % | | Other | | 28 | % |
The Industrial & Automotive segment has corporate offices in Denver, Colorado, Rochester Hills, Michigan and Toronto, Canada. It supplies industrial and automotive parts, components and systems, serving a wide variety of industries, including the industrial and automotive original equipment and replacement markets, transportation, agricultural, mining, forestry, construction, office equipment, computer, and the food processing and handling markets.
In total, the segment operates 73 factories and 34 distribution centers in 18 countries. It has development centers and manufacturing operations in North America, Europe, Asia and South America.
The segment operates 34 manufacturing plants in Canada and the US, and a further 13 in Latin America. European operations include 15 manufacturing plants and 9 distribution centers, which provide customers with Tomkins products and technology. There are also operations in Asia and the Pacific Rim including Singapore, Australia and India, with joint venture manufacturing facilities in South Korea, Japan, China, and Thailand.
The Industrial & Automotive group operates five global strategic enterprise groups: Powertrain, Fluid Power, Wiper Systems, Fluid Systems and other aftermarket products. These groups include divisions integrated from the acquisitions of Gates, Stant, Trico, Tridon, Schrader and Stackpole. Together, these operations employed on average 23,515 people around the world in Fiscal 2004. Products are sold directly to industrial and automotive original equipment manufacturers and through a network of approximately 150,000 distributors, dealers and jobbers worldwide, to the industrial and automotive replacement markets.
Powertrain
The Powertrain group comprises Power Transmission and Stackpole.
Power Transmission produces a comprehensive global product line ranging from synchronous belt and accessory belt drive systems for automotive applications to heavy-duty industrial belt drives. Its eight major product lines include V-belts, multi V-ribbed belts, synchronous belts, sheaves/sprockets, pulleys, tensioners, idlers, and crankshaft dampers.
Power Transmission is globally integrated in order to standardize products, process technology, and to maximize resource utilization across the group. Product and materials teams join forces with the enabling technology group in the development and commercialization of products. While focusing on customer needs, the group selects the right innovative technology to create a sustainable competitive advantage in the market. There are three Automotive Technical Centers (“ATCs”) located at Aachen in Germany, Rochester Hills in the USA and Nara in Japan, which lead product and systems design and engineering. The ATCs also perform customer specific component or system testing.
Power Transmission supports and supplies customers on a global basis. Regional management in the Americas, Europe and Asia work to leverage the group’s market strengths from one area to another utilizing common processes and global product lines.
Stackpole Limited, which was acquired during Fiscal 2003, is a manufacturer of highly engineered, technologically differentiated powertrain components, systems and assemblies, primarily for the automotive original equipment market. Headquartered in Toronto, Canada, and employing around 1,500 employees globally, Stackpole operates from six facilities in Canada and one facility in the UK.
13
Fluid Power
The Fluid Power group is a manufacturer of highly engineered hose, fittings and accessories for hydraulic power transmission systems used in both mobile and stationary industrial equipment. The group also manufactures industrial hose used to convey both liquids and bulk powder type materials, focused primarily in the petroleum, chemical and food/beverage sectors. The group also produces a wide range of automotive hoses used in engine cooling, power steering and fuel system applications.
The group recently commissioned a new global Customer Solutions (Technology) Center in Denver, Colorado to develop next generation products with a strong emphasis in evolving the existing hose/connector product line to a full port-to-port sub-system capability, which will focus on elimination of leak paths and removal of installation labor for customers.
The group has a global reach, serving customers in North America, Europe, Brazil and India. The existing Asia presence is being augmented with expansion plans being implemented over the next 24 to 36 months.
Wiper Systems
The Wiper Systems group operates under both the Trico and Tridon brands, manufacturing automotive windshield wiping systems and systems components, producing a wide array of arms, blades, linkage mechanisms, modules, motors and electronic components tailored for individual vehicle use. Modular systems combine the linkages, arms, blades, motors and electronic circuitry produced by the Wiper Systems group with plastic housings, manifold assemblies and other components purchased from supplier partners. Systems are sold directly to OEMs as ready-to-install modules. Wiper blades are produced in sizes ranging from 10 to 40 inches with application specific features for optimal performance with accompanying different types of wiper arms, and are manufactured for OE, OES and aftermarket applications. Wiper blades are sold for use as original equipment and in the aftermarket under the “Trico,” name as well as many private brands.
Fluid Systems
The Automotive Fluid Systems group, made up of divisions acquired as Stant Corporation and Schrader-Bridgeport International, is a designer, manufacturer and distributor of a broad range of automotive fluid conveyance and fluid management components and modules. This includes the latest technology in tire pressure monitoring components and fuel vapor management valves. Products are sold primarily for use as original equipment by manufacturers of cars and trucks and in the automotive replacement market as repair parts and accessories. Major customers include DaimlerChrysler, Ford, General Motors, Nissan, Renault and PSA, as well as a number of other major international OEMs. Products from Tomkins Automotive Fluid Systems group are also sold in a vast majority of wholesale and retail automotive parts and distribution outlets in North America, Europe and Latin America including the service departments of OEM dealers.
Through Schrader Electronics, the Automotive Fluid Systems group is the technology leader in Remote Tire Pressure Monitoring Systems (“RTPMS”), a driver information and passenger security system that is economically and ergonomically integrated into vehicle electronic information systems. The company also designs, manufactures and markets a variety of fuel vapor management valves and fuel, oil and radiator closure caps at its Stant Manufacturing Division. Standard-Thomson is the leading manufacturer of engine thermostats used in automotive cooling systems. Schrader-Bridgeport International provides a wide range of tire valve, hardware and specialty valve products worldwide. RTPMS, tire, and specialty valve products are sold under the “Schrader-Bridgeport” and “Schrader Electronics” trademarks. Closure cap and fuel management valve products are sold under the “Stant,” “Lev-R-Vent” and “Pre-Vent” trademarks. Engine thermostats are sold under the “Stant,” “Weir-stat,” and “Superstat” brand names. Many of these products are also sold to various private label customers bearing their unique brand names.
Other
The Aftermarket group integrates the sales, marketing, distribution and manufacture of products destined for both the Industrial and Automotive original equipment and Aftermarket and sold under the Gates, Stant, Trico, Tridon, Ideal, Schrader, Plews Edelmann and numerous private brands. It designs and sells aftermarket automotive tools and fittings, power steering hose, lubrication equipment, stainless and carbon steel hose clamps for both original equipment and parts applications.
The Aftermarket group also manufactures and distributes specialist components for the automotive industry. Schrader-brand products include precision control valving and associated fluid conveyance and control modules for vehicle fluid system applications in fuel delivery, emission control, engine management, brake, steering, power transmission, coolant, air conditioning, windshield washing, PVC air hose, and ride control. Schrader, a leading brand of wheel valving for cars, medium- and heavy-duty trucks, agricultural vehicles and construction equipment, offers a full range of products including tubeless tire valves, valves for inner tubes, cores, tubeless valves for large wheels and an assortment of specialty valving for virtually all global applications.
Wheel care products, air power pneumatic components and systems, and pressure-measuring devices are marketed to automotive channels worldwide. Wheel care products include “Camel” brand tire patch products, tools, chemicals and “Schrader” brand tire valves and cores. Air power systems include “Amflo” pneumatic couplers and plugs. The Aftermarket group’s “Syracuse” brand of pressure-measuring devices is a recognized market standard in North America. The Aftermarket group supplies “Amflo” pneumatic accessories to the home improvement retailer segment.
14
Air Systems Components
| | | | | | | | |
Sales by end markets
| | | Sales by major product category
| |
| Commercial & industrial construction | | 64 | % | | Grilles, registers, diffusers | | 36 | % |
| Residential construction | | 36 | % | | Dampers, louvers | | 21 | % |
| | | | | | Flex duct & accessories | | 10 | % |
| | | | | | Vents | | 9 | % |
| | | | | | Other | | 24 | % |
The Air Systems Components segment’s products are primarily sold throughout the United States, Canada and the United Kingdom. Competition is based principally on price, quality, service and breadth of product line. Just under half our sales pass through manufacturers’ representatives and approximately 35 percent are sold through wholesalers, principally in the residential market. The balance of sales is direct to OEMs and national accounts.
Hart & Cooley
Hart & Cooley supplies the residential and light commercial markets in the U.S., Canada and Mexico with grilles, registers and diffusers (“GRD”). It also produces flexible air duct, chimney and gas venting systems, and duct connection systems, which are marketed primarily through wholesale distributors.
Air Systems
Air Systems design and manufacture diffusers, variable air volume terminal boxes (with or without fan power), grilles, registers and fan coils for use in heating, ventilating and air conditioning systems in industrial, institutional and commercial applications. Air Systems also produces a comprehensive line of centrifugal and axial fans for both commercial and industrial applications. This line comprises power roof ventilators, inline duct fans, ceiling fans, cabinet fans, propeller roof and wall fans and fan accessories. These products are sold primarily to manufacturers’ representatives for resale to contractors.
Ruskin
Ruskin produces and markets commercial and industrial air control dampers, fire and smoke dampers, architectural louvers, sound absorbers, and air measuring stations for use in air conditioning, heating, ventilating and pollution control systems contained in office buildings, hotels, shopping centers, power plants, paper mills and other manufacturing plants. Ruskin also manufactures and supplies fans and blowers for residential forced air heating systems and air conditioners. These products are sold directly to manufacturers of heating, ventilating and air conditioning equipment and to contractors and commercial users principally through manufacturers’ representatives. The Conaire division provides aftermarket distribution of spare parts primarily for the residential heating and air conditioning market. Ruskin Air Management, a U.K. business, markets its damper, louver, grille, register, diffuser and fan coil products principally in the United Kingdom and continental Europe. This business gives the Company an important entry to these markets for its other air distribution products.
Engineered & Construction Products
| | | | | | | | |
Sales by end markets
| | | Sales by major product category
| |
Residential construction | | 31 | % | | Doors, windows, venting | | 20 | % |
Commercial & industrial construction | | 13 | % | | Material handling | | 11 | % |
Manufactured housing | | 7 | % | | Industrial/utility | | 24 | % |
Truck & trailer | | 24 | % | | Bathware & fittings | | 36 | % |
Automotive & industrial | | 9 | % | | Other | | 9 | % |
Other | | 16 | % | | | | | |
Lasco
Lasco Bathware designs, manufactures and markets fiberglass and acrylic showers, bathtubs, tub/shower combinations and whirlpools used in residential (including manufactured) housing and some commercial construction. Included in the product line are assisted care showers and tub/shower combinations designed to meet the needs of senior citizens and the special requirements of the disabled. Products are sold primarily through distributors but also directly to builders and through home improvement channels in the United States. Aquatic Industries, a division of Lasco Bathware, is a maker of up-market acrylic whirlpools, principally for the dealer/distributor market.
Lasco Fittings manufactures plastic fittings used in agricultural irrigation, turf irrigation, water works, swimming pools and spas, for commercial and industrial applications as well as for residential plumbing. These products are sold through distributors and, to a lesser extent, retail outlets.
Trailer Axles
Dexter Axle produces and markets its products primarily in the United States directly to OEMs and distributors. Dexter’s product line consists of a wide variety or trailer axles for the general utility, recreational vehicle, highway trailer and manufactured housing markets. Competition is based on price, quality, product performance and customer service.
Dexter’s trailer axles are available in capacities from 800 pounds to 30,000 pounds and specific trailer applications within its markets include horse and livestock trailers, equipment hauling trailers, enclosed cargo trailers, heavy hauling trailers, recreational vehicles, manufactured homes, portable equipment and highway trailers.
Doors and Windows
Philips Products is a US producer of vinyl windows and sliding glass doors for the residential markets, principally for use in new on-site construction. These products are sold primarily through distributors. Philips Products also produces aluminum and vinyl
15
windows, doors and venting products for the manufactured housing, recreational vehicle, specialty trailer and construction markets. The majority of these products are sold to OEMs of manufactured housing, recreational vehicles, specialty trailers and specialty buildings.
Material Handling
Dearborn Mid-West Conveyor Co. designs, fabricates and installs overhead conveyor systems and inverted power and free conveyor systems, skillet systems, automatic electrified monorail systems for the automotive industry, conveyors for bulk materials and various unit handling systems for parcel movement applications.
Valves, Taps and Mixers
Tomkins completed its exit from the valves, taps and mixers business with the disposal of Pegler Limited and the business and assets of Hattersley Newman Hender Limited in January 2004. The operations of these companies have been classified as discontinued.
Raw Materials and Energy Supplies
The Company purchases a broad range of raw materials, components and products from around the world in connection with its activities. The ability of the Company’s suppliers to meet performance and quality specifications and delivery schedules is important to its operations, but the Company is not dependent on any single source of supply for critical materials. In the past, the energy and materials required for the Company’s manufacturing operations have been readily available. However, basic raw materials such as steel, aluminum, polymers and resins used in the production of the Company’s products, can be subject to significant fluctuations in price. Where appropriate, the Company’s subsidiaries may seek to minimize the effect of fluctuations in prices of raw materials by entering into forward purchase contracts or options to fix the input cost of the raw material or product.
Seasonality
Industrial & Automotive
Sales to Automotive OEMs do not tend to exhibit any constant seasonal pattern but sales into the aftermarket are generally stronger during the winter months reflecting higher levels of demand for replacement parts for vehicles during this period.
In the Fluid Power OEM segment, there is a moderate amount of seasonality driven primarily by weather patterns. Construction equipment generally is influenced by a decline in activity during the coldest winter months and a resurgence of activity in the spring. Farm equipment is generally driven by two weather related peaks each year, spring planting and fall harvesting. Remaining markets served by the Fluid Power group do not exhibit any significant seasonal patterns.
Air Systems Components
Sales to the construction industry slow down in November and December before the Thanksgiving, Christmas and New Year holiday season. Sales can also be affected regionally by severe weather. Heating product sales are more concentrated in the fall and cooling products in the spring.
Engineered and Construction Products
Sales into the housing construction markets are generally stronger in the spring and summer months, as are sales of fittings to the irrigation markets.
Patents and Trademarks
Tomkins management believes that the Company’s operations are not dependent to any significant degree upon any single or series of related patents or licenses, or any single commercial or financial contract. Tomkins management also believes that the Company’s operations are also not dependent upon any single trademark or trade name, although trademarks and trade names are identified with a number of the Company’s products and services and are of importance in the sale and marketing of such products and services. The more important trademarks and trade names owned by or licensed to the Company are:
Industrial & Automotive
“Adapta Flex”, “Amflo”, “BladeRunner”, “Blue Stripe (design)”, “Boost”, “Bridgeport”, “Camel”, “CapAlert”, “Charter”, “Combo Coupler”, “Connected”, “Design Flex”, “Design OHL”, “Design View”‘, “DesignConnect”, “Diradia”, “Douglas”, “Drivealign”, “ECR”, “Edelmann”, “Eliminator”, “Etensioner”, “Eurogrip”, “Exact Fit”, “ExtraDrive”, “EZ Align”, “FleetRunner”, “Fibergrip”, “Flex Gear”, “Flex-Weave”, “Food Beverage Master”, “Food Master”, “FormFlo”, “Gates”, “Gates Compass”, “Gatesfacts”, “Gates In an Oval (design)”, “GEM”, “Green Stripe”, “GT”, “HC”, “Heatguard”, “Hi-Power”, “HTD”, “Hy-Gear”, “Ideal”, “InStant”, “Lev-R-Vent”, “Liberty”, “Liftpower”, “LightLogic”, “LubriMatic”, “M2T”, “Mectrol”, “Mega3000”, “Megacrimp”, “Megaflex”, “Megaspiral”, “Megasys”, “Megatuff”, “Megavac”, “Micro-Gear”, “Micro-Seal”, “Micro-V®”, “Microflex”, “Mobilecrimp”, “Nitro Air”, “No-Hub Classic”, “Omnicrimp”, “Optimizer”, “Petrobelt”, “Pistol-Matic”, “Plews”, , “Polarflex”, “Polarseal”, “Poly Chain”, “Poly Chain XT”, “PolyFlex”, “Power Crimp”, “Power Curve”, “Powerback”, “Powered”, “Power-Master”, “Powerlink”, “Powerpro”, “Powerated”, “Powerband”, “Powerbraid”, “Powercraft”, “Pow’r Gear”, “Powergrip”, “Powergrip HTD”, , , “Pre-Vent”, “Pro Tuff”, “QL”, “QLD”, “QLH”, “QMT”, “Quick-lok”, ���Rain Pro”, “Roberk (and arrow design)”, “Safety Stripe”, “Schrader”, “Schrader Smart Valve”, “Shark”, “Silentdrive”, , , “Smartdrive”, “Snaplock”, “Speedflex”, “Sportline”, “Stackpole”, “Stant”, “Stretch Fit”, “Super HC”, “Superstat”, “Superior”, “SupraDrive”, “Synchro-Power”, , “Techpro”, “Tensioflex”, , “Texrope”, , “Thermoblend”, “Transmotion”, “Trico”, “Tridon”, “Tri-Power”, “Tru-Flate”, “Truflex”, “Tru-power”, “Tru-Temp”, “Tubemedic”, “Tuffcoat”, “Tufflex”, “Turn-Key”, “Twin Power”, , “Ultra Lube”, “Unitta”, “V80”, “VSBD”, “Vari-Matic”, “Vextra”, “Vibraflex”, “Visionall”, “Vulco”, “Vulco-Flex”, “Vulcoplus”, “Vulcopower”, “Weir-Stat”, “Windspoiler”, “Winterblade”, “Wiper World (design)”, “World Class”, “XL”, “Xtratuff” and “Xtreme”.
16
Air Systems Components
“Agitair”, “Air-Lens”, “Air-Trac”, “Ameri-Bucket”, “American Metal Products”, “Ameri-Flow”, “Amerivent”, “AMPCO Vent”, “Barry Blower”, “Big Smokey” “Debothezat”, “Decoraire”, “Designaire”, “Designflo”, “Eclipse”, “Enviro-master, “Fantom IQ”, “Flocross”, “Gutter Helmet”, “H & C” “Hart & Cooley”, “Industrial Air”, “J&J Register”, “Know”, “Krueger”, “Lau”, “Lau Parts Division”, “Leigh Register”, “Lima Register”, “Metlvent”, “Milcor”, “Never Clean Your Gutters Again!” “Omnivent”, “Penn”, “PennBarry”, “Portals Plus”, “Radian”, “Reliable”, “Rink”, “Rink Sound Control”, :Roof Product Systems (RPS)”, “Roto-Jet”, “Royalaire”, “Ruskin”, “Sky Blast”, “Steriflo System”, “Stripline”, “Summitair”, “Supreme”, “Surfaire”, “Swartwout”, “Teledor”, “Tensor”, “Titus”, “Tri-Vent”, “Tuttle & Bailey”, “Vapor-Air”, “Vector”, “Venturi-Flo”, “Ward”, and “Z-Com”.
Engineered & Construction Products
, “Accuflo”, “A Aquatic Industries and Design”, “Airflex Light Trailer Suspension System”, “Carefree”, “Champagne Series”, “Crystal Mountain”, “D and Design”, , “Dexter”, “Discovery lll”, “DMW Dearborn Mid-West Conveyor Co. and Design”, “DMW Design”, “E-Z Lube”, “Enviro-seal”, “Insta-Curb”, “Jet-Flo”, “Keating Koupling”, “Lasco”, “Northern Breeze”, “Nose Forward”, “Philips Products”, “Poly Armor”, “Predator DX2”, “Predator Series”, “Santa Cruz”, “Serenity”, “Solitude” “Surfaire”, “Swirl-Design”, “Terrier”, “Thermaguard ll”, “Torflex” and “Ventadome”..
Competitive position
The tables below set out market share by product for each business segment
Industrial & Automotive
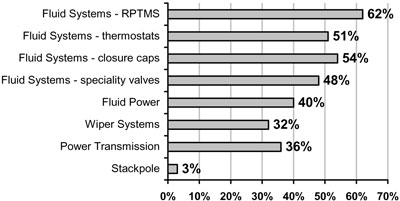
Air Systems Components
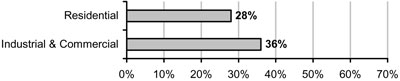
Engineered & Construction Products
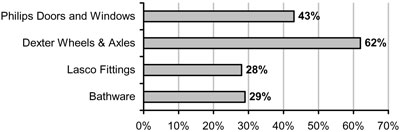
Data source: Internal business group information
17
Governmental Regulation
The Company’s operating subsidiaries are regulated by governmental authorities in a number of countries. Many of the products produced by the Company’s subsidiaries are subject to governmental regulation regarding their production, sale, advertising, safety, labeling and raw materials. The Company believes that its subsidiaries have taken sufficient measures to comply with applicable local or national regulations.
Some of the regulations applicable to the Company’s subsidiaries include regulations that would allow local, national or federal authorities to mandate product recalls, or provide for the seizure of products, as well as other sanctions. The Company believes that the controls implemented by its subsidiaries minimize the risk of the occurrence of such events and that such risks do not pose a material threat to the Company.
The Company maintains worldwide insurance coverage for product liability claims and believes that its level of insurance coverage is adequate.
The Company’s subsidiaries are subject to regulation under various and changing federal, state and local laws and regulations relating to the environment and to employee safety and health. These environmental laws and regulations govern the generation, storage, transportation, disposal and emission of various substances. Permits are required for operation of certain businesses carried out by the Company’s subsidiaries (particularly air emission permits) and these permits are subject to renewal, modification and, in certain circumstances, revocation. The Company believes that its subsidiaries are in substantial compliance with laws and regulations which could allow regulatory authorities to compel (or seek reimbursement for) clean up of environmental contamination at its subsidiary-owned sites and at facilities where its waste is stored or disposed of.
C. Organizational structure
Tomkins plc is the parent of a large number of subsidiaries that are organized into three business segments managed through our Corporate Center. Note 22 to the consolidated financial statements contains a list of the Company’s significant subsidiaries, including name, country of incorporation and proportion of ownership.
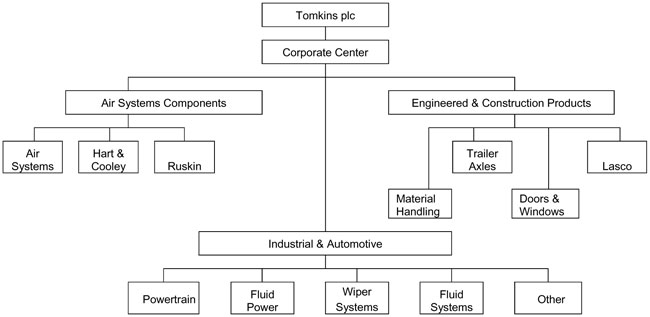
In 2005 the organizational structure of the group was realigned. Trailer Axles and Material Handling were moved into the Industrial & Automotive segment as they largely serve industrial markets. A Building Products segment was established, which includes Air Systems Components and also the remaining Engineered & Construction Products businesses, Lasco and Doors and Windows. The results for FY 2005 will be reported under the new business segments.
D. Property, plants and equipment
Tomkins’ principal executive offices are located in London, England. The Company’s plants, warehouses and offices are located in various countries throughout the world, with a large number in North America. The Company owns many of these properties in the United Kingdom and the United States. The Company continues to improve and replace properties when considered appropriate to meet the needs of its individual operations.
The net book value as of January 1, 2005 of the Company’s property, plant and equipment was $1,461.6 million, of which $132.7 million represented property, plant and equipment located in the United Kingdom, $724.0 million located in the United States and $165.7 million located in continental Europe, with the balance of $439.2 million in the rest of the world. Due to the diverse nature of the business, there is no individual fixed asset, the loss of which would have a material impact on the position of the Company.
18
Item 5. Operating and Financial Review and Prospects
A. Operating results
General
Tomkins operations cover three business segments: (i) Industrial & Automotive, (ii) Air Systems Components, and (iii) Engineered & Construction Products. For information on the contribution of each reporting unit to the Company’s net sales and operating income, see Item 4.B. “Business overview” and Note 5 of the Notes to the consolidated financial statements.
The Company’s consolidated financial statements are prepared in accordance with US GAAP, however the business segment section of this item includes discussion of operating income, including share of income from associates and before restructuring costs and goodwill amortization for each of our segments, prepared under UK GAAP. This measure is used by Tomkins chief decision makers to review segment profitability and as such, we believe that discussion of this measure is necessary to an understanding of the business. This is the measure of segment profit or loss disclosed in Note 5 to the consolidated financial statements under Statement of Financial Accounting Standard No. 131, “Disclosures about Segments of an Enterprise and Related Information”.
Note 5 to the consolidated financial statements includes a reconciliation and a discussion of the main differences between UK GAAP and US GAAP that materially affect the financial results of the Company.
Overview (US GAAP)
The Company’s net sales, were $5,356.1 million in Fiscal 2004, $4,847.4 million in Fiscal 2003, $2,981.6 in the eight-month period ended December 31, 2002 and $4,374.7 million in Fiscal 2002. Income for continuing operations before taxes, minority interest, equity in net income of associates and cumulative effect of change in accounting principle was $497.7 million in Fiscal 2004, $426.0 million in Fiscal 2003, $210.2 million in the eight-month period ended December 31, 2002 and $352.8 million in Fiscal 2002.
A more detailed discussion of the Company’s operations by segment is set forth below.
Acquisitions & Disposals
Details of the acquisitions and disposals during Fiscal 2004, Fiscal 2003, the eight-month period ended December 31, 2002 and during the period ended April 30, 2002, are set forth in the “Principal acquisitions, disposals and capital expenditures” section of Item 4.A. “Information on the Company”.
Year ended January 1, 2005 (“Fiscal 2004”) compared with the year ended January 3, 2004 (“Fiscal 2003”)
This commentary compares the results for Fiscal 2004 with the results for Fiscal 2003.
Group (US GAAP)
Net sales were $5,356.1 million for Fiscal 2004, an increase of $508.7 million (10.5 percent) from sales of $4,847.4 million for fiscal 2003.
Cost of sales increased from $3,452.6 million for Fiscal 2003, which was 71.2 percent of net sales, to $3,806.4 million for Fiscal 2004, which is 71.1 percent of net sales. Selling, general and administrative expenses increased by 8.3 percent to $1,038.5 million for Fiscal 2004 from $958.7 million for Fiscal 2003, representing 19.4 percent of net sales for Fiscal 2004 and 19.8 percent of net sales for Fiscal 2003.
Goodwill impairment tests were completed as of January 1, 2005 and January 3, 2004. There was no impairment at January 1, 2005, whilst there was an impairment of $12.5 million at January 3, 2004, which arose from the erosion of value of companies within the Lasco division of the Engineered and Construction Products segment due to a downturn in trading.
During Fiscal 2004 there were $34.1 million of restructuring costs charged to the consolidated income statement compared with $38.0 million in Fiscal 2003. The major projects included the relocation of wiper blade production and the rationalization of manufacturing capacity in North America. We have undertaken the various restructuring activities to streamline operations, consolidate and take advantage of available capacity and resources, and ultimately to achieve net cost reductions. Restructuring activities include efforts to integrate and rationalize the Company’s businesses and to relocate manufacturing operations to lower cost markets.
Operating income from continuing operations was $477.1 million for Fiscal 2004 compared with $385.6 million for Fiscal 2003. Overall the Company’s operating margin was 8.9 percent. This compared with 8.0 percent for Fiscal 2003.
The net interest expense for the period was $23.4 million compared with $14.4 million in Fiscal 2003. This consisted of interest expense on bank loans, overdrafts, bills discounted, capital lease interest and other loans, partially offset by bank interest income. Other income was $44.0 million compared with $54.8 million in Fiscal 2003.
A tax charge of $103.2 million (Fiscal 2003: credit of $72.2 million) was recognized during the year. This was after an exceptional release of provision of $24.7 million, which arose as a result of the closure of a number of previously open tax years. The tax credit in Fiscal 2003 was principally due to an exceptional release of other tax provisions of $147.9 million arising as a result of an ongoing review of Group tax exposures.
Minority interest in net income, which relates to Unitta Company Limited, Gates Nitta Belt Company (Suzhou) Limited, GNAPCO Pte Limited and Gates Korea Company Limited, was $15.2 million, compared with $12.4 million for Fiscal 2003.
A loss of $13.5 arose from discontinued operations, net of tax, in Fiscal 2004, compared with $109.5 million in Fiscal 2003. The Company incurred a gain on disposal of subsidiaries of $11.0 million in Fiscal 2004 compared to $49.6 million in Fiscal 2003.
19
In Fiscal 2004, dividends of $28.5 million compared with $29.5 million in Fiscal 2003 were payable to convertible cumulative preference shareholders. In Fiscal 2003 $17.6 million was payable to redeemable convertible cumulative preference shareholders, up until their early redemption in August 2003. The early redemption gave rise to a net gain of $17.4 million in Fiscal 2003.
As a result of the above, the Company’s net income attributable to common shareholders for Fiscal 2004 was $349.2 million, a decrease of 12.0 percent from net income of $397.0 million for Fiscal 2003.
The following paragraphs discuss the results by segment (see table in Item 4.B. “Business Overview”).
Industrial & Automotive (UK GAAP)
| | | | | | | | | | | | |
| | | Sales(1)
| | | Operating income (2)
| |
Analysis of movements from Fiscal 2003 to Fiscal 2004: | | $ million
| | | Change
| | | $ million
| | | Change
| |
Fiscal 2003 | | 3,224.0 | | | | | | 309.6 | | | | |
Exchange rate effect | | 105.7 | | | | | | 7.2 | | | | |
Disposals | | (51.3 | ) | | | | | (5.7 | ) | | | |
2003 acquisitions | | 103.5 | | | | | | 8.9 | | | | |
| | |
|
| | | | |
|
| | | |
| | | 3,381.9 | | | | | | 320.0 | | | | |
2004 acquisitions | | 2.0 | | | | | | — | | | | |
Underlying change | | 145.1 | | | 4.3 | % | | 36.5 | | | 11.4 | % |
| | |
|
| | | | |
|
| | | |
Fiscal 2004 | | 3,529.0 | | | | | | 356.5 | | | | |
| | |
|
| | | | |
|
| | | |
| (1) | Prepared under UK GAAP |
| (2) | Prepared under UK GAAP, including share of income from associates and before restructuring costs and goodwill amortization |
| (3) | Adjustment to bring acquisitions made in 2003 to a comparable basis |
In the Industrial & Automotive business segment, net sales and operating income including income from associates and before restructuring costs and goodwill amortization for Fiscal 2004 were up by 9.5 percent and 15.1 percent respectively compared to Fiscal 2003. After adjusting for the effect of exchange and acquisitions and disposals, underlying net sales and operating income including income from associates and before restructuring costs and goodwill amortization increased by 4.3 percent and 11.4 percent respectively. The majority of the growth in sales was due to increased volumes.
On a global basis the group’s automotive original equipment (“OE”) sales were up by 2.3 per cent and industrial OE sales rose by an impressive 12.7 per cent. All regions performed well with sales up year-on-year. Aftermarket sales were up 5.3 per cent on a global basis, with automotive replacement up by 1.9 per cent despite some weakness in North America. Industrial replacement was ahead by 11.5 per cent, driven by strong demand from North America in particular. Aftermarket sales in Asia were particularly strong, up 33.3 per cent year-on-year.
The net impact of increases in raw material costs absorbed by the Industrial & Automotive business group amounted to around $12.4 million for the year. Savings from lean manufacturing totaled $35.2 million in 2004.
Powertrain (Net sales: Fiscal 2004 $1,668.2 million; Fiscal 2003 $1,452.0 million)
Powertrain sales grew by 2.9 per cent and operating income by 5.6 per cent on an underlying basis. All areas contributed to the increase with the exception of North America, which was down 2.5 per cent, impacted by lower OE demand. Asia performed strongly with sales up by 17.8 per cent. Europe was ahead by 3.7 per cent, driven in particular by good automotive OE demand.
Key developments during the year included the first sales of our Electro-mechanical Drive™ system (stop-start technology) on the new Citroën C3 vehicle in France. Availability is expected to widen this year and trials of the technology on urban delivery vehicles are currently underway. Sales of the newly launched Fleetrunner™ heavy-duty belts and the Eliminator™ belts were encouraging. In December 2004, we completed the acquisition of Mectrol, a US and German-based manufacturer of polyurethane timing belts. The company has been integrated into the industrial belts business of Gates. The transaction benefits include a new unique product portfolio for Gates, access to new markets and customers, and multiple avenues for growth.
Stackpole’s sales declined 5.0 per cent in 2004, impacted by declining production volumes at one of its key customers, resulting in lower margins. However, significant business, amounting to C$98 million ($78.0 million), was awarded during the year. This new business mainly relates to the 2006 to 2008 production years. Near-booked business ended the year at C$102 million ($84.7 million) while new product development activity continued to progress in an impressive way. New programs under development at the year-end totaled C$124 million ($103.1 million).
The construction of the two new Stackpole facilities in Canada and the extension of a third site progressed well and production has now started at all sites. The full volume launch at the Carrier Systems facility occurred in March 2005. The Powder Metal group will launch 46 new part numbers on 18 different platforms in 2005.
Fluid Power (Net sales: Fiscal 2004 $591.0 million; Fiscal 2003 $501.1 million)
Fluid Power’s underlying sales were up 16.1 per cent, driven by robust global demand especially in the construction and agricultural equipment markets.
All regions outperformed last year, with strong sales and operating profit growth coming from North America and Europe as well as significant operational improvement in Europe. Global sales to industrial OEMs were up 24.8 per cent although fluid power sales to automotive OEMs were lower by 1.2 per cent. The new Technical Center in Denver (CO) was completed at the end of the year. New product development initiatives progressed with the Quick-Lok™ family of products gaining success in the industrial OE marketplace.
20
In July 2003, we announced the phased exit from the European automotive curved hose business. During 2004 we completed the closure of the St Just facility and the sale of the business in Nevers.
Wiper Systems (Net sales: Fiscal 2004 $463.0 million; Fiscal 2003 $463.3 million)
2004 was a disappointing year for the Wiper Systems business, with sales declining 2.4 per cent on the back of a tough OE environment and lower aftermarket demand. Rising input costs also affected profitability. While Trico was successful in increasing prices in the aftermarket, the automotive OEMs continued to reject steel-related price increases from the supply base. Aftermarket demand started to improve in December of 2004 and has shown continued strength into January 2005. Our new Beam Blade was successfully launched at an industry show. It was selected as one of the twelve best new products in the show and is doing very well in the market place.
Trico’s Asian strategy, for both the aftermarket and OEM business, continues to take shape. A production location in Suzhou, China has been selected and we are now progressing plans for the construction of a 70,000 square feet facility. Initial production is scheduled in the fourth quarter of 2005.
Fluid Systems (Net sales: Fiscal 2004 $416.3 million; Fiscal 2003 $361.7 million)
Fluid Systems had a very successful year, with underlying sales and operating income exceeding the previous year by 10.4 per cent and 14.9 per cent respectively. A strong operating profit performance was achieved by Stant, Schrader Electronics and Schrader France. This was slightly offset by weaker results at Schrader Brazil and Standard-Thomson.
Schrader Electronics delivered a strong performance. New business awarded during the year amounted to $122.3 million. In order to meet increased levels of demand, the new production facility at Carrickfergus in Northern Ireland commenced production in late January 2005. Customer acceptance of the “Snap In” sensor design continues to grow, with business of over 6 million sensors already awarded for 2008. New product research is opening up new non-automotive applications.
Schrader-Bridgeport’s 36,000 square feet valve-manufacturing facility in China was completed in January 2005. The start-up of the new Stant plant in Karvina, Czech Republic, has also progressed well. Production will commence at the end of the first quarter 2005. The development activity for Stant’s new Carbon Canister advanced, with the product being newly engineered for two new platforms in 2005.
Other industrial & automotive (Net sales: Fiscal 2004 $390.5 million; Fiscal 2003 $445.9 million)
These businesses manufacture a range of products mainly for the automotive aftermarket. In October 2004 we announced our intention to exit our small Gates AirSprings business. This exit was completed in February 2005 with the sale of the assets to Vibracoustic NA, L.P.
Air Systems Components (UK GAAP)
| | | | | | | | | | |
| Analysis of movements from Fiscal 2003 to Fiscal 2004: | | Sales(1)
| | | Operating income (2)
| |
| | | $ million
| | Change
| | | $ million
| | Change
| |
Fiscal 2003 | | 730.3 | | | | | 69.0 | | | |
Exchange rate effect | | 3.5 | | | | | — | | | |
| | |
| | | | |
| | | |
| | | 733.8 | | | | | 69.0 | | | |
Underlying change | | 38.5 | | 5.3 | % | | 17.2 | | 24.9 | % |
| | |
| | | | |
| | | |
Fiscal 2004 | | 772.3 | | | | | 86.2 | | | |
| | |
| | | | |
| | | |
| (1) | Prepared under UK GAAP |
| (2) | Prepared under UK GAAP, including share of income from associates and before restructuring costs and goodwill amortization |
Of the underlying change in sales, a $5.3 million decrease was due to there being less production days in Fiscal 2004 than in Fiscal 2003 and a decrease of $1.5 million resulted from plant closures. Of the remaining increase of $45.5 million, 47% was due to volume and 53% was due to price increases.
Air Systems Components performed strongly in 2004 with sales and operating income including income from associates and before restructuring costs and goodwill amortization, up by 5.8 percent and 24.9 percent, respectively, compared to Fiscal 2003. After adjusting for the effect of exchange and disposals, underlying net sales increased by 5.3 percent and underlying operating income including income from associates and before restructuring costs and goodwill amortization increased by 24.9 percent. The non-residential construction market saw the first signs of a recovery with square footage built in the US slightly ahead of the prior year, with sales growing by 3.7 per cent on 2003. Our sales to the residential construction market rose by 8.4 per cent, supported by strong demand.
Several new products such as the Fantom IQ™, duct access doors from Hart & Cooley and a new Ruskin damper for marine applications were successfully launched during 2004. Significant new business wins included Titus products destined for the University of Nebraska and the Hearst headquarters in New York as well as a large contract for Ruskin’s industrial tunnel dampers and acoustic silencers for the New York City Transit system.
Ruskin announced plans to build a new manufacturing facility in Monterrey, Mexico. Manufacturing is expected to commence late in 2005.
21
In January 2005, we completed the acquisition of Milcor Inc. The company is a multi-brand manufacturer of building and roofing products, selling to the US residential and commercial construction markets. Milcor’s annual sales are approximately $47 million. It will be integrated into our residential business, Hart & Cooley.
Business efficiency measures continued, with Hart & Cooley completing the closure of its Monessen (PA) facility and transferring production of duct accessories to Huntsville (AL). Savings generated from lean manufacturing amounted to $8.4 million in 2004.
The net impact of rising raw material costs amounted to approximately $7.7 million for the year.
Engineered & Construction Products (UK GAAP)
| | | | | | | | | | | | |
| Analysis of movements from Fiscal 2003 to Fiscal 2004: | | Sales(1)
| | | Operating income (2)
| |
| | | $ million
| | | Change
| | | $ million
| | | Change
| |
Fiscal 2003 | | 1,057.0 | | | | | | 103.2 | | | | |
Exchange rate effect | | 3.4 | | | | | | (0.1 | ) | | | |
Disposals | | (39.3 | ) | | | | | 0.4 | | | | |
| | |
|
| | | | |
|
| | | |
| | | 1,021.1 | | | | | | 103.5 | | | | |
Underlying change | | 107.5 | | | 10.5 | % | | 4.6 | | | 4.4 | % |
| | |
|
| | | | |
|
| | | |
Fiscal 2004 | | 1,128.6 | | | | | | 108.1 | | | | |
| | |
|
| | | | |
|
| | | |
| (1) | Prepared under UK GAAP |
| (2) | Prepared under UK GAAP, including share of income from associates and before restructuring costs and goodwill amortization |
The Engineered & Construction Products group’s sales and operating income including income from associates and before restructuring costs and goodwill amortization, increased by 6.8 percent and 4.8 percent, respectively, compared to Fiscal 2003. After adjusting for the effect of exchange and disposals, underlying net sales increased by 10.5 percent and underlying operating income including income from associates and before restructuring costs and goodwill amortization increased by 4.4 percent.
Of the underlying change in sales, a $1.6 million decrease was due to there being less production days in Fiscal 2004 than in Fiscal 2003 and a decrease of $6.3 million resulted from plant closures. Of the remaining increase of $115.5 million, 76% was due to volume and 24% was due to price increases
The net impact of raw material price increases on the business group, in particular steel and oil-based chemical derivatives, was approximately $14.0 million for the year. Savings from lean manufacturing, which aims to make the manufacturing process more efficient, totaled $2.7 million in 2004.
Trailer Axles (Net sales: Fiscal 2004 $331.7 million; Fiscal 2003 $285.7 million)
Demand for Dexter’s axles was particularly strong in 2004 across all its end-markets. Hurricanes in the South East of the United States tempered demand in the third quarter, however, sales increased in the fourth quarter as replacement demand grew. In June 2004, the business disposed of its steel wheels and rims business. A project to expand capacity at its Elkhart (IN) facility got underway during the year. This additional capacity will allow Dexter Axle to meet demand for rubber torsion axles.
In March 2005, we acquired L.E. Technologies, a company that manufactures recreational vehicle (“RV”) frames and fabricated metal components. The acquisition will allow Dexter Axle to expand into the RV frame business, a market which is adjacent to Dexter Axle’s current markets. It also provides sales, manufacturing and purchasing synergies, in addition to accessing a new customer base. L.E. Technologies employs over 490 people in Southern Michigan and Northern Indiana and generated approximately $85.6 million of revenue in 2004.
Materials Handling (Net sales: Fiscal 2004 $149.5 million; Fiscal 2003 $164.8 million)
We disposed of two businesses in the Material Handling group. Mayfran was sold in June and we completed the disposal of Unified Industries on 2 January 2005. The remaining material handling business, Dearborn Mid-West, saw a pick-up in demand, especially from automotive programs and finished the year with a healthy order book.
Lasco (Net sales: Fiscal 2004 $393.1 million; Fiscal 2003 $361.7 million)
Lasco Bathware saw its volumes increasing by 7.6 percent as its new Home Depot contract commenced at the half-year. New product development activities continued to gain momentum. The acrylic modular shower, incorporating a body shower, steam unit and seat, that was introduced at the Kitchen and Bath Show was launched formally at the Builders’ Show in January 2005. Lasco’s efforts to grow acrylic sales continued to show results with acrylic sales for the year increasing by around 15 per cent.
Lasco Fittings showed a 12.6 percent improvement in year on year sales, but suffered the effects of substantial increases in the cost of its major raw material. An investment project for large-diameter pipe fittings was initiated in the third quarter. This will enable Lasco to penetrate new markets such as water reclamation and aqua-culture. Initial production commenced towards the end of the year with volumes ramping up in January 2005.
Philips Doors & Windows (Net sales: Fiscal 2004 $254.3 million; Fiscal 2003 $244.8 million)
Philips saw continued development of its share of the residential doors and windows market, with sales to this market up 5.1 per cent.
22
Year ended January 3, 2004 (“Fiscal 2003”) compared with the year ended December 31, 2002 (“December 2002”)
Following the year ended April 30, 2002 the Board of Tomkins changed the Company’s fiscal year end from April 30 to December 31, which resulted in an accounting period of eight months ended December 31, 2002. In order to draw a meaningful comparison, this commentary compares the results for Fiscal 2003 with unaudited results for the fiscal year ended December 31, 2002.
Group (US GAAP)
Net sales were $4,847.4 million for Fiscal 2003, an increase of $353.8 million (7.9 percent) from sales of $4,493.6 million for December 2002.
Cost of sales increased from $3,189.5 million for Fiscal 2002, which was 71.0 percent of net sales, to $3,452.6 million for Fiscal 2003, which is 71.2 percent of net sales. Selling, general and administrative expenses increased by 9.5 percent to $958.7 million for Fiscal 2003 from $875.2 million for December 2002, representing 19.8 percent of net sales for Fiscal 2003 and 19.5 percent of net sales for Fiscal 2002. Goodwill amortization of $30.9 million was excluded from the comparative charge for December 2002 as following the adoption of SFAS 142, “Goodwill and Other Intangible Assets,” in May 2002, no goodwill amortization was recorded in the year ended January 3, 2004.
Goodwill impairment tests were completed as of January 3, 2004 and December 31, 2002. These reviews resulted in impairments of $12.5 million and $47.8 million respectively. The Fiscal 2003 impairment arose from the erosion of value of companies within the Lasco division of the Engineered and Construction Products segment. The majority of the December 2002 impairment related to companies within the Valves, taps and mixers division, which is disclosed within discontinued operations. The exit from Valves, taps and mixers was completed with the sale of Pegler Limited and the business and assets of Hattersley Newman Hender Limited in January 2004.
During Fiscal 2003 there were $38.0 million of restructuring costs charged to the consolidated income statement compared with $66.7 million in December 2002. The major projects included the relocation of wiper blade production, the rationalization of manufacturing capacity in North America and the restructuring of the UK valves, taps and mixers business.
Operating income from continuing operations was $385.6 million for Fiscal 2003 compared with $331.3 million for December 2002. Overall the Company’s operating margin was 8.0 percent. This compared with 7.4 percent for Fiscal 2002.
The net interest expense for the period was $14.4 million compared with net income of $6.9 million in December 2002. This consisted of interest expense on bank loans, overdrafts, bills discounted, capital lease interest and other loans, partially offset by bank interest income. The net movement on the year was primarily due to increased debt arising from debt incurred in connection with the early redemption of the redeemable convertible preference shares in August 2003. Other income was $54.8 million compared with $1.2 million in December 2002.
A tax credit of $72.2 million (Fiscal 2002: charge of $56.5 million) was recognized during the year. The tax credit was principally due to an exceptional release of other tax provisions of $147.9 million arising as a result of an ongoing review of Group tax exposures.
Minority interest in net income, which relate to Unitta Company Limited, Gates Nitta Belt Company (Suzhou) Limited, GNAPCO Pte Limited and Gates Korea Company Limited, was $12.4 million, compared with $10.3 million for December 2002, when it also related to Cobra Investments (PTY) Limited which was sold during Fiscal 2003.
A loss of $109.5 arose from discontinued operations, net of tax, in Fiscal 2003, compared with $22.0 million in December 2002. The Company incurred a gain on disposal of subsidiaries of $49.6 million in Fiscal 2003 compared to a loss of $5.2 million in December 2002.
In Fiscal 2003 dividends of $29.5 million were payable to convertible cumulative preference shareholders compared with $29.8 million in December 2002. In Fiscal 2003 $17.6 million was payable to redeemable convertible cumulative preference shareholders, up until their early redemption in August 2003, compared with $27.6 million in December 2002. The early redemption gave rise to a net gain of $17.4 million in Fiscal 2003.
As a result of the above, the Company’s net income attributable to common shareholders for Fiscal 2003 was $397.0 million, a decrease of 172.7 percent from net income of $139.9 million for Fiscal 2002.
The following paragraphs discuss the results by segment (see table in Item 4.B. “Business Overview”).
Industrial & Automotive (UK GAAP)
| | | | | | | | | | | | |
| Analysis of movements from December 2002 to Fiscal 2003: | | Sales(1)
| | | Operating income (2)
| |
| | | $ million
| | | Change
| | | $ million
| | | Change
| |
December 2002 | | 2,919.9 | | | | | | 272.1 | | | | |
Exchange rate effect | | 77.2 | | | | | | 5.3 | | | | |
Disposals | | (65.1 | ) | | | | | (3.1 | ) | | | |
| | |
|
| | | | |
|
| | | |
| | | 2,932.0 | | | | | | 274.3 | | | | |
Acquisitions | | 106.8 | | | | | | 8.2 | | | | |
Underlying change | | 185.2 | | | 6.3 | % | | 27.1 | | | 9.9 | % |
| | |
|
| | | | |
|
| | | |
Fiscal 2003 | | 3,224.0 | | | | | | 309.6 | | | | |
| | |
|
| | | | |
|
| | | |
| (1) | Prepared under UK GAAP |
| (2) | Prepared under UK GAAP, including share of income from associates and before restructuring costs and goodwill amortization |
23
Against a background of overall flat original equipment, aftermarket and replacement markets, net sales and operating income including income from associates and before restructuring costs and goodwill amortization for Fiscal 2003 were up by 10.4 percent and 13.8 percent respectively compared to December 2002. After adjusting for the effect of exchange and acquisitions and disposals, underlying net sales and operating income including income from associates and before restructuring costs and goodwill amortization increased by 6.3 percent and 9.9 percent respectively. The majority of the growth arose from increased volume.
The implementation of strategic manufacturing initiatives (“SMIs”) (reorganizations of productive capacity to improve cost competitiveness of the business) resulted in costs of $33.8 million, an underlying decrease of $21.2 million compared to December 2002.
In automotive original equipment, North American and Western European production fell by 2.9 percent and 3.4 percent respectively in 2003 while, in the rest of the world, production increased by 6.7 percent. The automotive aftermarket across the world generally remained at levels similar to 2002, although there were some notable exceptions such as the strong growth in the Chinese market. Sales of industrial original equipment and replacement products remained at low levels with little improvement in demand from the construction, agriculture and mining markets.
Powertrain (Net sales: Fiscal 2003 $1,452.0 million; December 2002 $1,194.2 million)
Net sales and operating income including income from associates and before restructuring costs and goodwill amortization for Fiscal 2003, were up by 21.6 percent and 16.1 percent, respectively, compared to December 2002.
For net sales, period on period currency fluctuations resulted in a decrease of $58.2 million. Excluding currency fluctuations and the effect of acquisitions, the increase in sales was 7.4 percent and operating income including income from associates and before restructuring costs and goodwill amortization, increased by 8.4 percent.
Within Powertrain, Power Transmission recorded a very strong performance, reflecting market share gains driven by product innovation and the operational benefits arising from strategic manufacturing initiatives and lean manufacturing. It also produced good growth in the aftermarket, particularly in Europe where sales rose by 10.0 percent. Notable new business wins during the year included our first QMT Micro-V® belt, a molded front end accessory drive belt with exceptional noise and efficiency characteristics which went into production in July 2004 in North America.
Amongst the many awards received by Power Transmission during the year, our Asian operations gained the Honda Technology Award and our North American businesses were made “GM Supplier of the Year” for the second year running. As part of its focus upon broadening its geographic reach, Power Transmission began the construction of a new facility in Suzhou, China. The previous facility, which opened in 1997 and had been expanded twice, was running at full capacity. The $82 million investment, in conjunction with our partner, will create production capacity for the industrial market and the existing facility will then focus exclusively on the automotive market. Escalating foreign direct investment, transplant manufacturing and high GDP growth are driving the rapid development of the Chinese industrial and automotive markets. 2003 was a record year for Chinese automotive demand, and sales are expected to triple by 2010 (Source: CSM Worldwide).
The integration of Stackpole, acquired in June 2003, has progressed well and it began construction of two new facilities required to fulfill new business awarded prior to acquisition. New business gains since acquisition have amounted to Cdn$16 million per annum and a further Cdn$96 million per annum of business that is awaiting final order confirmation, including transmission oil pumps, variable valve timing components and transmission modules. Operating margins in Q4 2003 returned to double digits following the effect of the power outage in North America in August 2003, adverse product mix within its automotive gear business and the loss of the protection of currency hedges against the weak US dollar as these were marked-to-market when Stackpole was acquired. Going forward, the business continues to invest to support its pipeline of over Cdn$500 million of business under development and quotation.
Fluid Power (Net sales: Fiscal 2003 $501.1 million; December 2002 $488.9 million)
Net sales and operating income including income from associates and before restructuring costs and goodwill amortization for Fiscal 2003, were down by 5.8 percent and 21.2 percent respectively compared to December 2002.
For net sales, period on period currency fluctuations resulted in a decrease of $3.5 million. Excluding currency fluctuations, the increase in sales was 3.2 percent and operating income including income from associates and before restructuring costs and goodwill amortization, decreased by 14.3 percent.
Fluid Power had a difficult year with low levels of activity in its main markets for construction, mining and agricultural equipment. Although it achieved a small increase in underlying sales, profitability was affected by a weak performance by its European operations
Wiper Systems (Net sales: Fiscal 2003 $463.3 million; 2002 $423.6 million)
Net sales and operating income including income from associates and before restructuring costs and goodwill amortization for Fiscal 2003, were up by 9.4 percent and 49.3 percent, respectively, compared to December 2002.
For net sales, period on period currency fluctuations resulted in an increase of $4.6 million. Excluding currency fluctuations, the increase in sales was 8.2 percent and operating income including income from associates and before restructuring costs and goodwill amortization, increased by 52.6 percent.
Wiper Systems produced a strong result driven by market share gains and a good performance in the automotive aftermarket. In particular, the range of aftermarket Teflon® blades (registered trademark of E.I. du Pont de Nemours Company) has been well received in both the USA and Europe and new platform wins have helped to improve original equipment margins. The consolidation of its manufacturing base continued with the closure of the plant in Buffalo, New York State with the transfer of activity to our existing facilities in Texas and Mexico, where all rubber extrusion is concentrated. In Europe, an improved aftermarket performance was offset in part by the effect of production problems at the Pontypool facility following the relocation of a production line from Dunstable in the UK.
24
Fluid Systems (Net sales: Fiscal 2003 $361.7 million; December 2002 $323.1 million)
Net sales for Fiscal 2003 were up by 11.9 percent and operating income including income from associates and before restructuring costs and goodwill amortization increased by 8.3 percent compared to December 2002.
For net sales, period on period currency fluctuations resulted in an increase of $7.1 million. Excluding currency fluctuations, the increase in sales was 9.5 percent and operating income including income from associates and before restructuring costs and goodwill amortization, increased by 6.9 percent.
Schrader Electronics maintained its global market leadership in remote tire pressure monitoring systems with sales up by over two thirds compared with 2002. In order to meet the ramp up of demand for its products, it constructed a new facility in Northern Ireland, with production commencing in May 2004.
The group also manufactures fuel vapor management systems required to meet increasingly stringent emission regulations across the world. Stant recently maintained its position as principal supplier of fuel closure caps to Ford with a new design that meets all present and anticipated legislation in the US and Europe. The team responsible for this product received our Charles C Gates Award as recognition for product innovation.
Other industrial & automotive (Net sales: Fiscal 2003 $445.9 million; December 2002 $490.1 million)
These businesses manufacture a range of products mainly for the automotive aftermarket. Lower sales reflected the disposal of Gates Formed-Fibre earlier in the year. Underlying sales and operating profit were ahead of last year.
Air Systems Components (UK GAAP)
| | | | | | | | | | | | |
| Analysis of movements from December 2002 to Fiscal 2003: | | Sales(1)
| | | Operating income (2)
| |
| | | $ million
| | | Change
| | | $ million
| | | Change
| |
December 2002 | | 749.8 | | | | | | 76.2 | | | | |
Exchange rate effect | | (6.1 | ) | | | | | 0.1 | | | | |
| | |
|
| | | | |
|
| | | |
| | | 743.7 | | | | | | 76.3 | | | | |
Underlying change | | (13.4 | ) | | (1.8 | )% | | (7.3 | ) | | (9.6 | )% |
| | |
|
| | | | |
|
| | | |
Fiscal 2003 | | 730.3 | | | | | | 69.0 | | | | |
| | |
|
| | | | |
|
| | | |
| (1) | Prepared under UK GAAP |
| (2) | Prepared under UK GAAP, including share of income from associates and before restructuring costs and goodwill amortization |
Net sales and operating income including income from associates and before restructuring costs and goodwill amortization for Fiscal 2003, were down by 2.6 percent and 9.4 percent, respectively, compared to December 2002. After adjusting for the effect of exchange, underlying net sales and operating income decreased by 1.8 percent and 9.6 percent respectively.
New business accounted for a $10.8 million increase in sales, whilst a reduction in some of our markets caused a decrease of $23.8 million. A number of other factors resulted in the remaining decrease of $0.4 million.
Results for the first half of the year were affected by additional costs incurred in maintaining supply to customers during the closure and subsequent transfer of production from five facilities to other plants within the group. However, operating margins returned to double-digit levels in the second half. Air Systems Components continued to reduce its cost base through the group wide implementation of lean manufacturing. During 2003, this resulted in freeing up sufficient capacity to enable it to close its Junction City facility in December 2003 and to announce that a further facility will be closed in 2004. These closures gave rise to restructuring costs of $6.7 million during the year.
Significant and high profile new business gained during the year included Titus’s contracts for Visteon Village, Detroit, Miami International Airport and a major headquarters building in the United Arab Emirates.
Engineered & Construction Products (UK GAAP)
| | | | | | | | | | | | |
Analysis of movements from December 2002 to Fiscal 2003: | | Sales(1)
| | | Operating income (2)
| |
| | $ million
| | | Change
| | | $ million
| | | Change
| |
December 2002 | | 1,052.8 | | | | | | 100.4 | | | | |
Exchange rate effect | | (5.6 | ) | | | | | (0.3 | ) | | | |
Disposals | | (14.3 | ) | | | | | (1.5 | ) | | | |
| | |
|
| | | | |
|
| | | |
| | | 1,032.9 | | | | | | 98.6 | | | | |
Underlying change | | 24.1 | | | 2.3 | % | | 4.6 | | | 4.6 | % |
| | |
|
| | | | |
|
| | | |
Fiscal 2003 | | 1,057.0 | | | | | | 103.2 | | | | |
| | |
|
| | | | |
|
| | | |
| (1) | Prepared under UK GAAP |
| (2) | Prepared under UK GAAP, including share of income from associates and before restructuring costs and goodwill amortization |
Net sales and operating income including income from associates and before restructuring costs and goodwill amortization for Fiscal
25
2003 were up by 0.4 percent and 2.8 percent, respectively, compared to December 2002. After adjusting for the effect of exchange and disposals, underlying net sales increased by 2.3 percent and underlying operating income including income from associates and before restructuring costs and goodwill amortization increased by 4.6 percent.
Of the underlying increase of $24.1 million in sales, $17.8 million arose from variances in volume. New business accounted for $2.0 million of the increase and a number of other factors resulted in the remaining increase of $4.3 million.
Lasco (Net sales: 2003 $361.7 million; 2002 $389.0 million)
Net sales and operating income including income from associates and before restructuring costs and goodwill amortization for Fiscal 2003, were down by 7.0 percent and 24.6 percent, respectively, compared to December 2002.
For net sales, period on period the disposal of Lasco Composites in May 2002 resulted in a decrease of $14.3 million. Excluding this, the decrease in sales was 3.5 percent and operating income including income from associates and before restructuring costs and goodwill amortization, decreased by 22.0 percent.
Overall, Lasco’s underlying sales were slightly down on last year. In the residential construction market Lasco’s sales were down on last year, although it made significant progress in replacing sales lost when a key original equipment customer decided to exit the business earlier in the year. Lasco Fittings achieved sales similar to last year but margins were reduced by further rises in PVC raw material prices, which it was unable to pass on in full to customers.
Trailer Axles (Net sales: 2003 $285.7 million; 2002 $278.4 million)
Net sales and operating income including income from associates and before restructuring costs and goodwill amortization for Fiscal 2003 were down by 2.5 percent, and up by 12.2 percent, respectively, compared to December 2002. Increased demand in the industrial and utility and recreational vehicle markets more than offset a significant decline in manufactured housing.
Philips Doors and Windows (Net sales: 2003 $244.8 million; 2002 $237.1 million)
Net sales and operating income including income from associates and before restructuring costs and goodwill amortization for Fiscal 2003 were up by 3.2 percent and 5.7 percent, respectively, compared to December 2002. The increase was down to strong growth in sales to the residential construction market, which more than compensated for a further decline in manufactured housing. For the first time, residential construction became Philips largest market segment.
Material handling (Net sales: 2003 $164.8 million; 2002 $148.3 million)
Net sales and operating income including income from associates and before restructuring costs and goodwill amortization for Fiscal 2003 were up by 11.1 percent and 148.6 percent, respectively, compared to December 2002.
The return to profit was down to increased sales, better order intake and improved contract margins, as well as the lower fixed costs due to a plant closure in the previous year all contributed to the turnaround in performance.
Discontinued operations
Valves, taps and mixers (Net sales: 2003 $125.7 million; 2002 $140.4 million)
During the year, Milliken Valve Co Inc. was sold for $7.3 million and the business and assets of Cobra were sold for $12.5 million. The remaining valves, taps and mixers businesses, Hattersley Newman Hender and Pegler, were sold in January 2004 for $23.7 million before costs. The businesses have been treated as discontinued in the financial information.
Eight months ended December 31, 2002 (“2002 Transition Period”) compared with the eight months ended December 31, 2001 (“2001 Transition Period”)
Following the year ended April 30, 2002 the Board of Tomkins changed the Company’s fiscal year end from April 30 to December 31, which resulted in an accounting period of eight months ended December 31, 2002. In order to draw a meaningful comparison, this commentary compares the results the 2002 Transition Period with unaudited results for the 2001 Transition Period.
Group (US GAAP)
Net sales were $2,981.6 million for the 2002 Transition Period, an increase of $97.6 million (3.4 percent) from sales of $2,884.0 million for the 2001 Transition Period.
Cost of sales increased from $2,076.0 million for the 2001 Transition Period, which was 72.0 percent of net sales, to $2,104.7 million for the 2002 Transition Period, which is 70.6 percent of net sales. Selling, general and administrative expenses increased by 2.4 percent to $590.5 million for the 2002 Transition Period from $576.6 million for the 2001 Transition Period, representing 19.8 percent of net sales and 20.0 percent of net sales respectively. Selling, general and administrative expenses for the 2001 Transition Period include $34.8m of goodwill amortization, which was not repeated in the 2002 Transition Period following the adoption of SFAS 142 “Goodwill and Other Intangible Assets”. Further details are given below.
Tomkins adopted SFAS 142 “Goodwill and Other Intangible Assets” effective May 1, 2002. The required impairment tests of goodwill were performed as of May 1, 2002 and it was determined that a total goodwill impairment of $47.3 million should be recorded. Additionally, an annual impairment test was also completed as of December 31, 2002. This review resulted in an additional total goodwill impairment of $47.8 million, the majority of which related to companies within the Valves, taps and mixers division, which is disclosed within discontinued operations. The exit from Valves, taps and mixers was completed with the sale of Pegler Limited and the business and assets of Hattersley Newman Hender Limited in January 2004.
During the 2002 Transition Period there were $46.6 million of restructuring costs charged to the consolidated income statement compared with $21.5 million for the 2001 Transition Period. The major projects included moving a cord treatment facility from Denver, Colorado to Columbia, Missouri and finalizing the arrangements for the closure of our Wiper Systems factory in Dunstable, England. The closure of the Wiper Systems plant in Buffalo, New York was provided for in December 2002. In Air Systems
26
Components the Company closed, or announced the closure of, seven plants with manufacturing being transferred to other existing facilities, particularly in Mexicali, Mexico. Dearborn Mid-West, within Engineered & Construction Products, announced the closure of its Kansas City facility in response to reduced levels of business.
Operating income from continuing operations was $192.0 million for the 2002 Transition Period compared with $209.9 million for the 2001 Transition Period. Overall the Company’s operating margin was 6.4 percent. This compared with 7.3 percent for the 2001 Transition Period.
The net interest expense for the period was $2.1 million compared with net interest income of $10.9 million in the 2001 Transition Period. This consisted of interest expense on bank loans, overdrafts, bills discounted, capital lease interest and other loans, partially offset by bank interest income. The net movement on the year was primarily due the incurrence of $9.3 of net interest income in the 2001 Transition Period associated with the previous balance sheet hedging arrangements. Other income was $16.1 million compared with $19.9 million for the 2001 Transition Period.
A tax charge of $32.2 million (2001 Transition Period: $111.8 million) was recognized during the year.
Minority interest in net income, which relate to Cobra Investments (PTY) Limited, Unitta Company Limited, Gates Nitta Belt Company (Suzhou) Limited, GNAPCO Pte Limited and Gates Korea Company Limited, was $8.1 million, compared with $4.0 million for the 2001 Transition Period.
A loss of $3.0 arose from discontinued operations, net of tax, in the 2002 Transition Period, compared with $1.0 million in the 2001 Transition Period. The Company incurred a loss on disposal of subsidiaries of $0.8 million in the 2002 Transition Period, compared with a gain of $8.2 million in the 2001 Transition Period.
In the 2002 Transition period, dividends of $19.5 million were payable to convertible cumulative preference shareholders compared with $18.9 million in the 2001 Transition Period. In the 2002 Transition Period $18.1 million was payable to redeemable convertible cumulative preference shareholders, compared with $17.6 million in the 2001 Transition Period.
As a result of the above, the Company’s net income attributable to common shareholders for the 2002 Transition Period was $81.2 million, a decrease of 15.6 percent from net income of $96.2 million for the 2001 Transition Period.
The following paragraphs discuss the results by segment (see table in Item 4.B. “Business Overview”).
Industrial & Automotive (UK GAAP)
| | | | | | | | | | | | |
| Analysis of movements from the 2001 Transition Period to the 2002 Transition Period: | | Sales(1)
| | | Operating income (2)
| |
| | | $ million
| | | Change
| | | $ million
| | | Change
| |
2001 Transition Period (Unaudited) | | 1,865.2 | | | | | | 152.5 | | | | |
Exchange rate effect | | 18.0 | | | | | | (0.6 | ) | | | |
Disposals | | (59.8 | ) | | | | | (2.3 | ) | | | |
| | |
|
| | | | |
|
| | | |
| | | 1,823.4 | | | | | | 149.6 | | | | |
Underlying change | | 114.8 | | | 6.3 | % | | 26.7 | | | 17.8 | % |
| | |
|
| | | | |
|
| | | |
2002 Transition Period | | 1,938.2 | | | | | | 176.3 | | | | |
| | |
|
| | | | |
|
| | | |
| (1) | Prepared under UK GAAP |
| (2) | Prepared under UK GAAP, including share of income from associates and before restructuring costs and goodwill amortization |
Net sales and operating income including income from associates and before restructuring costs and goodwill amortization for the 2002 Transition Period were up by 3.9 percent and up by 15.6 percent, respectively, compared to 2001. After adjusting for the effect of exchange and disposals, underlying sales increased by 6.3 percent and underlying operating income including income from associates and before restructuring costs and goodwill amortization increased by 17.8 percent. Of the underlying increase in sales of $114.9 million, $104.6 million arose from variances in volume and new business accounted for $11.7 million. A number of other factors resulted in the remaining decrease of $1.4 million.
Automotive production around the world was strong during the 2002 Transition Period, especially in the USA, and product innovation and cost competitiveness enabled the group to achieve substantial improvements in market share across many of Tomkins businesses.
The automotive aftermarket also grew as the number of light vehicles worldwide continued to expand in response to demographic changes. Global industrial original equipment production, however, was lower, although there was some improvement in replacement sales, due in part to restocking by distributors.
Power Transmission (Net sales: 2002 $796.8m; 2001 $742.6m)
Net sales and operating income including income from associates and before restructuring costs and goodwill amortization for the 2002 Transition Period were up by 7.3 percent and 10.3 percent respectively compared to the 2001 Transition Period.
For net sales, period on period currency fluctuations resulted in an increase of $14.2 million. Excluding currency fluctuations, the increase in sales was 5.3 percent and operating income including income from associates and before goodwill amortization and restructuring costs, increased by 10.2 percent.
27
The increase in net sales, excluding the effect of currency fluctuations and restructuring charges in Power Transmission reflected the growth in market share achieved by our worldwide automotive original equipment customers. In addition, our lean manufacturing initiatives, particularly in North America, have improved margins. Sales in our European aftermarket also increased and our operations in developing economies, such as Brazil and China, continued to gain strength. Landmark awards that we received in the 2002 Transition Period include our first major Micro-V® belt and tensioner order from Renault and an order for a General Motors (Opel) engine to be built in Brazil. By contrast, Power Transmission’s industrial markets experienced a decline in the period. This is the result of more tightly managed inventories among our distributors and a general reduction in capital spending.
Fluid Power (Net sales: 2002 $318.4m; 2001 $302.6m)
Net sales and operating income including income from associates and before restructuring costs and goodwill amortization for the 2002 Transition Period were up by 5.2 percent and up by 58.0 percent, respectively, compared to the 2001 Transition Period.
For net sales, period on period currency fluctuations resulted in a decrease of $1.7 million. After adjusting for this, the underlying increase in sales was 5.8 percent. After adjusting for currency fluctuations, operating income including income from associates and before goodwill amortization and before restructuring costs, increased by 61.5 percent.
The trading environment remained difficult in the key markets of construction, mining and agriculture equipment. Market share gains in the OEM market and some restocking by distributors drove a recovery in Fluid Power’s net sales against the same period last year. Our commitment to tighter cost control, together with advances in manufacturing performance and an improved sales mix, have combined to deliver a significant gain in operating income.
The division has initiated two restructuring projects, one in North America and the other in Europe. In North America, it is migrating this year from a mixed product manufacturing base to a set of three product-focused units, resulting in the exit from one US facility and the expansion of its state-of-the-art hydraulic hose facility in Atlacomulco, Mexico. In Europe, manufacturing activities were eliminated in one facility and combined into the division’s existing UK manufacturing site, reducing its locations from three to two. In addition, European distribution locations were reduced from four to two.
Wiper Systems (Net sales: 2002 $293.0m; 2001 $256.3m)
Net sales and operating income including income from associates and before restructuring costs and goodwill amortization for the 2002 Transition Period were up by 14.3 percent and 21.7 percent respectively compared to the 2001 Transition Period.
For net sales, period on period currency fluctuations resulted in a decrease of $1.4 million. After adjusting for this, the underlying increase in net sales was 15.0 percent. After adjusting for currency fluctuations, operating income including income from associates and before goodwill amortization and restructuring charges increased by 24.0 percent.
Strong performance in both the automotive original equipment market and automotive aftermarket delivered gains for Wiper Systems. Changes to product mix continued to deliver small improvements to margins. In particular, the beam blade continues to gain ground in the OEM market and a heavy-duty winter blade has been added to the Teflon® blade range for the aftermarket.
The consolidation of Wiper Systems’ manufacturing base continued with the announcement of the closure of our plant in Buffalo, New York and a corresponding transfer of activity to existing facilities in Texas and Mexico. In addition, the closure of the Dunstable plant in the UK and transfer of its production to Mexico and Pontypool, Wales was completed in January 2003.
Fluid Systems (Net sales: 2002 $235.7m; 2001 $228.2m)
Net sales and operating income including income from associates and before restructuring costs and goodwill amortization for the 2002 Transition Period were up by 3.3 percent and up by 1.7 percent, respectively, compared to the 2001 Transition Period.
For net sales, period on period currency fluctuations resulted in an increase of $4.3 million. After adjusting for currency fluctuations, the underlying increase in net sales was 1.4 percent and operating income including income from associates and before goodwill amortization, increased by 3.6 percent.
Fluid Systems’ Schrader Electronics maintained its global market leadership in RTPMS during the period. Schrader has a contract to supply approximately one-third of DaimlerChrysler’s RTPMS requirements from model-year 2005 onwards, and now holds significant contracts to supply RTPMS to most of the world’s major car manufacturers.
Standard-Thomson, Schrader-Bridgeport and Stant also performed well, securing a variety of new contracts, and Stant extended its reach with several new European vapor management programs.
Other industrial & automotive (Net sales: 2002 $294.3m; 2001 $335.5m)
The other industrial and automotive sales businesses manufacture products primarily for the automotive aftermarkets. In May 2002, the UK-based Gates Consumer and Industrial business was sold to the Rutland Fund for £25 million. Just before the period end, Fedco Automotive, which manufactures automotive heater cores, was sold to TransPro, Inc. for $8 million in cash. Adjusting for the disposal of these businesses, net sales and operating income were comparable to last year.
28
Air Systems Components (UK GAAP)
| | | | | | | | | | | | |
| Analysis of movements from the 2001 Transition Period to the 2002 Transition Period: | | Sales(1)
| | | Operating income (2)
| |
| | | $ million
| | | Change
| | | $ million
| | | Change
| |
2001 Transition Period (Unaudited) | | 489.9 | | | | | | 52.6 | | | | |
Exchange rate effect | | 1.1 | | | | | | 0.2 | | | | |
| | |
|
| | | | |
|
| | | |
| | | 491.0 | | | | | | 52.8 | | | | |
Acquisitions | | 37.0 | | | | | | 1.8 | | | | |
Underlying change | | (28.5 | ) | | (5.8 | )% | | (2.8 | ) | | (5.3 | )% |
| | |
|
| | | | |
|
| | | |
2002 Transition Period | | 499.5 | | | | | | 51.8 | | | | |
| | |
|
| | | | |
|
| | | |
| (1) | Prepared under UK GAAP |
| (2) | Prepared under UK GAAP, including share of income from associates and before restructuring costs and goodwill amortization |
Net sales and operating income including income from associates and before restructuring costs and goodwill amortization for the 2002 Transition Period were up by 2.0 percent and down by 1.8 percent respectively compared to the 2001 Transition Period.
After adjusting for the effect of exchange and disposals, underlying sales and operating income including income from associates and before restructuring costs and goodwill amortization decreased by 5.8 percent and 5.3 percent respectively.
Much of the competitive strength of the Air Systems Components business is built on the strong branded product offering to the building and construction industry and the management of the relationships in the channels to market.
These results were affected a significant decline in activity in the segments major market, US non-residential construction. Statistics from Dodge show that the US residential construction market, buoyed by low interest rates, grew by around 3 percent during calendar year 2002. In contrast the much larger US non-residential construction market, which represents around 60 percent of the segment’s net sales, declined by around 16 percent and is now some 25 percent below its peak in 2000.
Our focus on creating efficiencies – including the adoption of lean manufacturing practices, combined with strict cost control – has helped mitigate the effects of reduced volume in the non-residential construction market and to maintain operating margins before operating exceptional items and goodwill amortization at over 10 percent for the 2002 Transition Period.
Also in September 2002, a drive to reduce our cost base by rationalizing manufacturing capacity continued, with the closure of two US plants and the transfer of production to other facilities. These strategic manufacturing initiatives gave rise to operating exceptional items of $12.5 million in the 2002 Transition Period. As part of the Company’s overall initiative to create a more efficient cost base, there has been an acceleration of the closure program for other sites in the current year and a further five facilities have been closed.
Tomkins built on its market-leading positions in the US residential and commercial construction markets with two acquisitions in September 2002. These acquisitions have now been successfully integrated into existing businesses. The purchase of the assets of duct accessory manufacturer Ward Industries Inc., now a part of Hart & Cooley, has extended the Group’s product offering in the residential and commercial construction markets. The Group is now able to offer customers a full range of ductwork connectors, access doors, fire dampers, gaskets, sealants, hangers and ductwork tools.
At the same time Ruskin acquired the HVAC dampers business of Johnson Controls Inc. This acquisition opens up new distribution channels, extends Tomkins damper product range for the commercial market and, through a marketing agreement with Johnson Controls Inc., provides access to a wider customer base around the world. The combined consideration for these two acquisitions was $17.6 million.
The Company’s efforts to expand internationally continued this year. Significant new contracts in Korea and China were awarded to our Far East facility in Thailand, while Krueger (ASC) recently completed work on the Nan Kang Software Park II in Taiwan.
In the USA, Tomkins was involved in a number of high-profile projects in the 2002 Transition Period. Krueger (ASC) worked on repairs to the Pentagon, Lau provided ventilation fans for the new Houston Texans NFL stadium and Ruskin secured a major order for fire and smoke dampers for the UCLA hospital in California.
29
Engineered & Construction Products (UK GAAP)
| | | | | | | | | | | | |
| Analysis of movements from the 2001 Transition Period to the 2002 Transition Period: | | Sales(1)
| | | Operating income (2)
| |
| | | $ million
| | | Change
| | | $ million
| | | Change
| |
2001 Transition Period (Unaudited) | | 738.4 | | | | | | 69.4 | | | | |
Exchange rate effect | | 2.9 | | | | | | 0.2 | | | | |
Disposals | | (18.4 | ) | | | | | (2.3 | ) | | | |
| | |
|
| | | | |
|
| | | |
| | | 722.9 | | | | | | 67.3 | | | | |
Underlying change | | (42.5 | ) | | (5.9 | )% | | (0.1 | ) | | (0.1 | )% |
| | |
|
| | | | |
|
| | | |
2002 Transition Period | | 680.4 | | | | | | 67.2 | | | | |
| | |
|
| | | | |
|
| | | |
| (1) | Prepared under UK GAAP |
| (2) | Prepared under UK GAAP, including share of income from associates and before restructuring costs and goodwill amortization |
Net sales and operating income including income from associates and before restructuring costs and goodwill amortization for the 2002 Transition Period were down by 7.9 percent and 3.2 percent, respectively, compared to the 2001 Transition Period. After adjusting for the effect of exchange and disposals, underlying sales and operating income including income from associates and before restructuring costs and goodwill amortization decreased by 5.9 percent and 0.1 percent respectively. Of the underlying decrease in sales of $40.5 million, $42.8 million arose from variances in volume against an increase of $2.3 million due to price increases.
Lasco Bathware and Fittings (Net sales: 2002 $246.9m; 2001 $265.9m)
Net sales and operating income including income from associates and before restructuring costs and goodwill amortization for the 2002 Transition Period were down by 7.1 percent and 13.1 percent respectively compared to the 2001 Transition Period.
For net sales, the effect of the disposal of Lasco Composites, which was sold at the start of the period, was a decrease of 7.7 percent, leaving an underlying increase in sales of 0.6 percent. Disposals resulted in a decrease of 6.3 percent in operating income from associates and before restructuring costs and goodwill amortization, leaving an underlying decrease of 7.3 percent.
Lasco Fittings benefited from improved export sales, receiving its largest ever export order from China, and the expansion of its Swing Joint irrigation product range, despite intense price competition. However, significant increases in PVC prices resulted in profits below the 2001 Transition Period. Lasco Bathware experienced improvements in the original equipment and retail markets that helped to balance out a further decline in manufactured housing.
Trailers & Axles (Net sales: 2002 $178.8m; 2001 $161.4m)
Dexter supplies non-drive axles and wheels for a variety of trailer applications. The recent recovery in the recreational vehicle market – along with the enduring strength of the industrial and utility markets – offset declines in the manufactured housing market, enabling Dexter to produce continued strong results.
Philips Doors and Windows (Net sales: 2002 $162.1m; 2001 $165.4m)
Net sales and operating income including income from associates and before restructuring costs and goodwill amortization for the 2002 Transition Period were down by 2.0 percent and up 5.3 percent, respectively, compared to the 2001 Transition Period.
In a depressed manufactured housing market, Philips experienced some pricing pressure from competitors seeking to maintain market share. However, its market share of vinyl windows to the residential construction market increased and the company also benefited from the recovery in recreational vehicle sales.
Material handling (Net sales: 2002 $92.6m; 2001 $145.7m)
The severe downturn in the US and European capital equipment markets strongly affected the performance of our Material Handling businesses in the 2002 Transition Period. Mayfran’s net sales were down by 27.0 percent while Dearborn Mid-West suffered a 44.6 percent decline. Rigorous cost control helped to limit the decline in profitability. The result was a net loss of $4.4m in the 2002 Transition Period compared to a net income of $2.3m in the 2001 Transition Period. The closure of Dearborn Mid-West’s Kansas City facility was included in restructuring costs at $2.5 million, though a number of new contracts provided the company with an improved order pipeline.
Discontinued operations
Valves, taps and mixers (Net sales: 2002 $98.0m; 2001 $97.1m)
Our US and South African operations showed continued improvements last year, while sales and profits of our UK businesses were in line with the previous year despite the disruption caused by a fire at one of the major UK plants. Since the period end our US operation, Milliken Valve Co Inc. has been sold for $7.3 million. The company completed its exit from valves, taps and mixers with the sale of Pegler Limited and the business and assets of Hattersley Newman Hender Limited in January 2004.
Effect of Inflation
We do not believe that inflation has had a material effect on the Company’s financial condition or results of operations during Fiscal 2004, Fiscal 2003, the transition period and the year ended April 30, 2002.
Effect of Foreign Currency
For further discussion see Item 11, “Quantitative and Qualitative Disclosures about Market Risk”, Item 5, “Operating and Financial Review and Prospects” and Note 16 of Notes to the consolidated financial statements.
30
Critical accounting estimates
Our significant accounting policies are more fully described in the Notes to the consolidated financial statements. Certain of our accounting policies require the application of significant judgment by management in selecting the appropriate assumptions for calculating financial estimates. By their nature, these judgments are subject to an inherent degree of uncertainty. These judgments are based on our historical experience, terms of existing contracts, our observance of trends in the industry, information provided by our customers and information available from other outside sources, as appropriate. Our significant accounting policies include:
Pension and Other Post retirement Benefits
The Company operates pension plans throughout the world, covering the majority of employees. These plans are structured to accord with local conditions and practices in each country and include defined contribution and defined benefit plans. The Company accounts for its pension plans and its other post-retirement benefit plans using actuarial models required by SFAS No. 87, “Employers’ Accounting for Pensions” and SFAS 106, “Employers’ Accounting for Post-retirement Benefits other than Pensions”, respectively. These models use an attribution approach that generally spreads individual events over the service lives of the employees in the plan. Examples of ‘events’ are plan amendments and changes in actuarial assumptions such as discount rate, rate of compensation increases and mortality. The principle underlying the required attribution approach is that employees render service over their service lives on a relatively smooth basis and therefore, the income statement effects of pensions or non-pension post-retirement benefit plans are earned in, and should follow the same pattern.
One of the main components of the net periodic pension calculation is the expected long-term rate of return on plan assets. The required use of expected long-term rate of return on plan assets may result in recognized pension income that is greater or less than the actual returns of those plan assets in any given year. Over time, however, the expected long-term returns are designed to approximate the actual long-term returns and therefore, result in a pattern of income and expense recognition that more closely matches the pattern of the services provided by the employees. Actuarial gains and losses (to the extent that they exceed 10 per cent of the greater of market related value of the assets or the projected benefit obligation at the start of the period) are recognized in the net periodic pension calculation over the remaining average service lifetimes of active members.
The expected long-term rate of return on plan assets is established based upon our expectations of asset returns over the expected period to fund participant benefits and the current investment mix of our plans (with some reliance on historical asset returns for our plans). We further validated this assumption by loading our current asset mix into an asset return generation model (provided by our independent actuaries), which projected future asset returns using simulation and asset class correlation.
It is estimated that a 0.25 percent decrease in the expected rate of return on plan assets would have had the following impact.
| | | | | | | | | |
| | | UK Plans
| | US Plans
| | Rest of World Plans
|
US$ decrease in net income | | $ | 0.8 million | | $ | 1.0 million | | $ | 0.2 million |
Percentage reduction in plan assets | | | 3.4 percent | | | 3.1 percent | | | 3.9 percent |
The discount rate assumptions used for pension and non-pension post-retirement benefit plan accounting reflect the rates available on high-quality fixed-income debt instruments on a date three months before the year end each year, which was October 1, 2004 for Fiscal 2004. The rate of compensation increase is another significant assumption used in the actuarial model for pension accounting and is determined by the Company based upon its long-term plans for such increases. For retiree medical plan accounting, the Company reviews external data and its own historical trends for health care costs to determine the health care cost trend rates.
It is estimated that a 0.25 percent decrease in the discount rate would have had the following impact on the projected benefit obligation and on the components of expense that are affected by a discount rate change.
| | | | | | |
| | | UK Plans
| | US Plans
| | Rest of World Plans
|
Projected benefit obligation | | 3.7 percent increase | | 2.5 percent increase | | 2.5 percent increase |
Service cost | | 8.0 percent increase | | 4.4 percent increase | | 3.5 percent increase |
Interest cost | | 0.8 percent decrease | | 1.9 percent decrease | | 1.7 percent decrease |
Gain/loss amortization | | 20.0 percent increase | | 26.4 percent increase | | 9.3 percent increase |
If the unfunded accumulated benefit obligation exceeds the fair value of the plan assets, the Company recognizes a minimum liability that is at least equal to the unfunded accumulated benefit obligation. Where an additional minimum liability is recognized, an intangible asset is recognized up to the amount of any unrecognized prior service cost and the balance is recognized through other comprehensive income.
Impairment and disposal of Long-Lived Assets
The Company accounts for the impairment and disposal of long-lived assets or asset groups in accordance with SFAS 144 “Accounting for the Impairment and Disposal of Long-lived Assets”. The Company periodically evaluates the carrying value of long-lived assets to be held and used, including intangible assets, when events or circumstances indicate that the carrying amount of an asset may not be recoverable. The carrying value of a long-lived asset is considered impaired when the anticipated separately identifiable undiscounted cash flows from such an asset are less than the carrying value of the asset. In that event, a loss is recognized based on the amount by which the carrying value exceeds the fair value of the long-lived asset, fair value is determined primarily using the anticipated cash flows discounted at a rate commensurate with the risk involved. Long lived-assets are classified as held-for-sale when certain criteria are met. The Company measures long-lived assets to be disposed of by sale at the lower of carrying amount and fair value less cost to sell and no longer depreciates such assets. Fair value is determined using quoted market
31
prices or the anticipated cash flows discounted at a rate commensurate with the risk involved. The Company classifies and presents certain entities as discontinued operations in accordance with SFAS No. 144, “Accounting for the Impairment or Disposal of Long-Lived Assets”, The earnings from discontinued operations include impairment charges to reduce these businesses to fair value less costs to sell. The Company classifies an asset or asset group that will be disposed of other than by sale as held and used until the disposal transaction occurs. The asset or asset group continues to be depreciated based on revisions to its estimated useful life until the date of disposal or abandonment.
Environmental Commitments
We accrue for environmental liabilities based on estimates of known environmental remediation exposures. The liabilities include accruals for sites owned and formerly owned by Tomkins. Our cost estimates include remediation and the long term monitoring of relevant sites and may be affected by changing determinations of what constitutes an environmental liability or an acceptable level of remediation. An ongoing monitoring and identification process is in place to assess how the activities with respect to the known exposures are progressing against the accrued cost estimates, as well as to identify other potential remediation sites that are presently unknown. Environmental provisions totaling $15.6 million were included in the consolidated balance sheet at January 1,2005.
Product warranties
Provision is made for warranty claims on various products depending on specific market expectations and the type of product. These estimates are established using historical information on the nature, frequency and average cost of warranty claims. Management believes that the warranty reserve is appropriate; however, actual claims incurred could differ from the original estimates requiring adjustments to the reserve. As of January 1, 2005 and January 3, 2004, the Company’s product warranty liability recorded in other accrued liabilities was $10.8 million and $12.8 million respectively.
Inventory
Inventories are stated at the lower of cost or market value. Cost determined by the last-in, first-out (LIFO) method was 37 per cent of the inventory at both January 1, 2005 and January 3, 2004. The remaining inventories are recorded using the first-in, first-out (FIFO) method. Inventories are reduced by an allowance for excess and obsolete inventories based on management’s review of on-hand inventories compared to historical and estimated future sales and usage. The replacement cost of inventory valued under LIFO exceeded the stated LIFO values by $1.6 million and $4.1 million at January 1, 2005 and January 3, 2004, respectively.
Tax
The Company recognizes deferred tax assets and liabilities using enacted rates to calculate temporary differences between the financial statement carrying amounts of assets and liabilities and their respective tax bases. The effect on deferred tax assets and liabilities of changes in tax rates is recognized in the consolidated statement of income in the period in which the enactment date occurs. Deferred tax assets are reduced through the establishment of a valuation allowance at such time as, based on available evidence, it is more likely than not that the deferred tax asset will not be realized.
Tomkins operates within multiple tax jurisdictions and is subject to audit in those jurisdictions. These audits can involve complex issues, which may require an extended time period of time for resolution. Although we believe that adequate provision has been made for such issues, there is a possibility that the ultimate resolution of such issues could have an effect on the earnings of the Company. Conversely, if these issues are resolved favorably in the future, the related provisions would be reduced, resulting in a positive impact on earnings.
Financial Instruments
The carrying values of financial instruments (cash and cash equivalents, accounts receivable, accounts payable, an interest rate swap obligation, and debt) as of January 1, 2005 and January 3, 2004 approximate fair value. Fair value was based on expected cash flows and current market conditions. Effective May 1, 2001, Tomkins adopted SFAS 133, “Accounting for Derivative Instruments and Hedging Activities”, and its related amendments, which requires that all derivative instruments be reported on the balance sheet at their fair value and establishes criteria for designation and determining effectiveness of transactions entered into for hedging purposes. Derivatives that are not designated as hedges must be adjusted to fair value through income. If the derivative is designated as a hedge, depending on the nature of the hedge, changes in the fair value of derivatives that are considered to be effective, as defined, will either offset the change in fair value of the hedged assets, liabilities, or firm commitments through earnings or will be recorded in other comprehensive income until the hedged item is recorded in earnings. Gains and losses on derivative instruments that will be reported in other comprehensive income will be reclassified to income in the periods in which income is affected by the variability in the cash flows of the hedged items. Any portion of a change in a derivative’s fair value that is considered to be ineffective, as defined, will have to be immediately recorded in earnings. Any portion of a change in a derivative’s fair value that Tomkins has elected to exclude from its measure of effectiveness will be recorded in earnings. Tomkins has chosen not to adopt the hedge accounting provisions of SFAS 133. The cumulative effect of adopting SFAS No. 133 was to increase net income by $4.2 million, before tax ($2.6 million, after tax). Assets increased by $4.9 million and liabilities by $0.7 million as a result of recording all derivatives on the balance sheet at fair value at the date of adoption.
Recently Issued Accounting Standards
| (a) | Accounting pronouncements adopted during the year |
The Company has adopted Financial Accounting Standards Board Interpretation No. 46R, (“FIN 46R”), “Consolidation of Variable Interest Entities” during the period, which requires that the assets, liabilities and results of operations of a variable interest entity be included in the consolidated financial statements if the Company is the primary beneficiary of the variable interest entity.
In December 2003, the FASB issued a revision to Interpretation No. 46, “Consolidation of Variable Interest Entities, an Interpretation of ARB No. 51” (“FIN 46R” or the “Interpretation”). FIN 46R clarifies the application of ARB No. 51, “Consolidated Financial Statements,” to certain entities in which equity investors do not have the characteristics of a controlling financial interest or do not have sufficient equity at risk for the entity to finance its activities without additional subordinated financial support. FIN 46R requires the consolidation of these entities, known as variable interest entities (“VIEs”), by the primary beneficiary of the entity. The primary beneficiary is the entity, if any, that will absorb a majority of the entity’s expected losses, receive a majority of the entity’s expected residual returns, or both.
32
Among other changes, the revisions of FIN 46R (a) clarified some requirements of the original FIN 46, which had been issued in January 2003, (b) eased some implementation problems, and (c) added new scope exceptions. FIN 46R deferred the effective date of the Interpretation for public companies, to the end of the first reporting period ending after March 15, 2004, except that all public companies must at a minimum apply the provisions of the Interpretation to entities that were previously considered “special-purpose entities” under the FASB literature prior to the issuance of FIN 46R by the end of the first reporting period ending after December 15, 2003. The Company has adopted the standard during the year and it has had no material impact on its financial position, cash flows and results of operations.
(b) New accounting pronouncements not yet adopted
In December 2004, the FASB issued Statement of Financial Accounting Standards (“SFAS”) No. 123 (revised 2004), “Share-Based Payments” or SFAS 123R. This statement eliminates the option to apply the intrinsic value measurement provisions of Accounting Principles Board (“APB”) Opinion No. 25, “Accounting for Stock Issued to Employees” to stock compensation awards issued to employees. Rather, SFAS 123R requires companies to measure the cost of employee services received in exchange for an award of equity instruments based on the grant-date fair value of the award. That cost will be recognized over the period during which an employee is required to provide services in exchange for the award - the requisite service period (usually the vesting period). SFAS 123R applies to all awards granted after the required effective date and to awards modified, repurchased, or cancelled after that date. Tomkins will adopt SFAS 123R using the modified prospective method with an effective date of January 2, 2005, whereby SFAS 123R will be applied prospectively to the unvested portion of awards that were outstanding as of January 1, 2005 and all awards granted, modified or settled on or after January 2, 2005.
B. Liquidity and capital resources
Treasury responsibilities and philosophy
The primary responsibilities of the central treasury function are to procure the Group’s capital resources and to maintain an efficient capital structure, together with management of the Group’s liquidity, foreign exchange and interest rate risks on a Group-wide basis.
The central treasury function operates within strict policies and guidelines approved by the Board. Compliance with these policies and guidelines is monitored through the regular reporting of treasury activities.
A key element of our treasury philosophy is that funding, interest rate and currency risk decisions and the location of cash and debt balances are determined independently from each other. For example, the Group’s debt requirements are met by raising funds in the most favorable markets, with the desired currency profile of net debt being achieved by entering into foreign exchange contracts where necessary. Similarly, the desired interest rate maturity of net debt is achieved by taking account of all debt and cash balances together with any foreign exchange transactions used to manage the currency profile of net debt. We operate systems to ensure that all relevant assets and liabilities are taken into account on a Group-wide basis when making these decisions. This portfolio approach to financial risk management enables our activities in these areas to be carried out effectively and efficiently and with a high degree of visibility.
Details of corporate bonds and EMTN program
We have a Euro Medium Term Note Program under which Tomkins may issue bonds up to a total maximum principal amount of £750 million. Our initial bond under the program in December 2001 was for £150 million with a ten-year maturity and was issued at a coupon of 8 per cent.
In September 2003 we issued a further £250 million bond with a twelve-year maturity at a coupon of 6.125 per cent. The proceeds of this bond issue were used to finance the early redemption of the redeemable convertible cumulative preference shares, which took place in August 2003.
Credit rating
In December 2001 we established long-term credit ratings with Moody’s and S&P. Our ratings have remained unchanged since this date at Baa2 and BBB respectively and cover our Euro Medium Term Note Program and £250 million bond issued by Tomkins Finance plc, a directly owned subsidiary of Tomkins plc that carries out all of the Group’s central treasury activities, together with our £150 million bond issued by Tomkins plc. We also have a short-term rating of P-2 with Moody’s. Our aim is to manage the Group’s capital structure to preserve these ratings.
Our committed bank borrowing facilities mainly comprise a multi-currency revolving credit facility of £400 million maturing in February 2009. Borrowing facilities are monitored against forecast requirements and timely action is taken to put in place, renew or replace credit lines. Our policy is to reduce financing risk by diversifying our funding sources and by staggering the maturity of our borrowings.
33
Net debt
At January 1, 2005 and January 3, 2004 our total debt was $834.8 million and £795.0 million respectively. Net debt, a non-GAAP measure defined as total debt less cash, cash equivalents and restricted cash, at such dates was $469.4 million and $473.9 million. The breakdown of total debt and a reconciliation of total debt to net debt at carrying value is provided in the table below.
| | | | | | |
| | | January 1,
2005 $ million
| | | January 3,
2004 $ million
| |
Unsecured loans | | | | | | |
Overdrafts | | 25.5 | | | 24.3 | |
Bank loans, 2005, 5.0% to 25.0% | | 12.1 | | | 18.3 | |
Unsecured loan notes, 2005, 2.6% | | 0.6 | | | 0.7 | |
Other unsecured loans, 2011, 8.00% | | 288.0 | | | 268.5 | |
Other unsecured loans, 2015, 6.125% | | 480.0 | | | 447.5 | |
| | |
|
| |
|
|
| | | 806.2 | | | 759.3 | |
| | |
|
| |
|
|
Secured loans | | | | | | |
Bank loans, 2005 to 2007, 3.2% to 21.1% | | 5.4 | | | 6.3 | |
| | |
|
| |
|
|
| | | 5.4 | | | 6.3 | |
| | |
|
| |
|
|
| Capital leases | | 23.2 | | | 29.4 | |
| | |
|
| |
|
|
| Total debt | | 834.8 | | | 795.0 | |
Less cash, cash equivalents and restricted cash | | (365.4 | ) | | (321.1 | ) |
| | |
|
| |
|
|
| Net debt | | 469.4 | | | 473.9 | |
| | |
|
| |
|
|
We believe net debt provides useful information regarding the level of our indebtedness by reflecting the amount of indebtedness assuming cash and investments are used to repay debt.
Levels of borrowings and seasonality
During 2004 our gross and net borrowings remained stable, with gross and net debt of $834.8 million and $469.4 million on January 1, 2005 and $795.0 million and $473.9 million on January 3, 2004 respectively. In general the group experiences a build up of working capital in the middle of the fiscal year, which then falls in the final quarter. The peak level of gross debt during the year was $840.4 million and the peak level of net debt during the year was $530.5 million.
We operate in a wide range of markets and geographic locations and as a result the seasonality of our borrowing requirements is low. Underlying cyclicality before capital expenditure is driven principally by the timing of our ordinary and preference dividends and interest payments.
| | | | | | | | | |
| | | Committed
$ million
| | | Uncommitted
$ million
| | | Total $ million
| |
Available borrowing facilities | | 1,565.9 | | | 421.2 | | | 1,987.1 | |
Cash drawings | | (791.0 | ) | | (30.5 | ) | | (821.5 | ) |
Bonds, standby letters of credit, bank guarantees | | — | | | (127.7 | ) | | (127.7 | ) |
| | |
|
| |
|
| |
|
|
Total headroom | | | | | | | | 1,037.9 | |
Less uncommitted facilities | | | | | | | | (421.2 | ) |
| | | | | | | | |
|
|
Committed headroom | | | | | | | | 616.7 | |
| | | | | | | | |
|
|
Cash balances | | | | | | | | 365.4 | |
| | | | | | | | |
|
|
Funding requirements for investment commitments and authorizations
At January 1, 2005 we had surplus cash balances in excess of those required to be held in the businesses for operational purposes. Accordingly, our present policy is to fund new investments firstly from existing cash resources and then from borrowings sourced centrally by Tomkins Finance plc. It is our intention to maintain surplus un-drawn borrowing facilities sufficient to enable our credit ratings to be maintained and to enable us to manage the Group’s liquidity through the operating and investment cycle. We maintain a regular dialogue with the rating agencies and the potential impact on our credit rating is taken into consideration when making capital allocation decisions.
Current versus prospective liquidity
At January 1, 2005 our committed 2009 £400 million bank credit facility was un-drawn and we had a further $444.5 million of other, mainly uncommitted, credit facilities and finance leases, of which $30.5 million was drawn for cash and $127.7 million was utilized through the issuance of bank guarantees and standby letters of credit. Total headroom under the facilities was $1,037.9 million in addition to cash balances of $365.4 million. If all of our uncommitted credit facilities were to become unavailable, our total committed borrowing headroom would be $616.7 million, in addition to our cash balances.
It is our policy to retain sufficient liquidity throughout the capital expenditure cycle to maintain our financial flexibility and to preserve our investment grade credit rating.
34
Maximizing returns on cash balances
Our central treasury function is responsible for maximizing the return on surplus cash balances within liquidity and counter party credit constraints imposed by our Board-approved liquid funds policy. This is done, where practical, by controlling directly all surplus cash balances and pooling arrangements on an ongoing basis and by reviewing the efficiency of all other cash balances across the Group on a weekly basis. At January 1, 2005, $237.9 million of cash was under the direct control of Group treasury.
Cost and location of debt
Our weighted average cost of debt at January 1, 2005 was 6.5 per cent (Fiscal 2003: 6.2 per cent). The rise in the cost of debt is primarily due to higher interest rates applying in the currencies in which our net debt is denominated at the end of 2004 compared to 2003.
The net interest charge for the year to January 1, 2005 of $23.4 million was $9.0 million higher than the charge for the previous year. This increase was principally due to additional interest costs from the redemption of the preference shares in August 2003 and the acquisition of Stackpole in July 2003, combined with the impact of fixing our US dollar interest rates for up to five years in August 2003, offset by lower underlying net debt throughout the year.
At January 1, 2005, our total cash balances were $356.0 million. Of this amount $144.6 million was invested in short-term deposits by our treasury department, $40.5 million of cash was held in our captive insurance company, Tomkins Insurance Limited, $67.0 million of cash was held in our Asian Unitta companies and $113.3 million of cash was held in centrally controlled pooling arrangements and with local operating companies. $327.2 million of our cash was interest earning. Our policy is to apply funds from one part of the Group to meet the obligations of another part wherever possible, to ensure maximum efficiency of the Group’s funds. No material restrictions apply which limit the application of this policy. It is anticipated that surplus cash in excess of that required for operating purposes held in operating companies will be repatriated or reinvested in new investments during 2005.
Cash flow and net debt
We do not anticipate any material long-term deterioration in our overall liquidity position in the foreseeable future.
Financial commitments
At January 1, 2005, we had $127.7 million of bank and insurance company issued bonds, guarantees and standby letters of credit in issue. These were issued primarily in favor of insurance companies for the fronting of workers’ compensation claims in the US, in addition to other contractual counter parties for operational purposes. Our annual operating lease rentals were $39.3 million in Fiscal 2004 (Fiscal 2003: $35.6 million).
Borrowing covenants
We are subject to covenants, representations and warranties commonly associated with investment grade borrowings on our £400 million committed 2009 bank facility, our £150 million 2011 bond and our £250 million 2015 bond.
We are subject to two financial covenants under our £400 million committed bank facility. The ratio of net debt to consolidated EBITDA must not exceed 2.5 times and the ratio of consolidated operating profit to consolidated net interest charge must not be less than 3.0 times. Throughout 2004 we have been comfortably within these limits. These financial covenants are calculated by applying UK GAAP frozen as at December 31 2002 and are therefore unaffected by accounting changes associated with the transition to International Financial Reporting Standards.
C. Research and development, patents and licenses, etc.
Applied research and development is important to the Company’s manufacturing businesses. The Company does not have a group wide research and development program, although it maintains development centers in Japan, Europe and the United States. Companies within the Group are encouraged to review regularly their products and to develop them in accordance with perceived market trends. The Company’s measured expenditure on research and development was $93.7 million for the year ended January 1, 2005, $95.6 million for the year ended January 3, 2004, $52.6 million for the eight-month period ended December 31, 2002 and $77.7 million for the year ended April 30, 2002. Research and development expenditure is expensed in the period in which it is incurred.
D. Trend information
With around 35 percent of the Company’s profits derived from outside the United States, any changes in the value of the US dollar against other currencies is likely to effect reported earnings in US dollars.
Overall, we expect our main markets to show some improvements in 2005. The global industrial and automotive aftermarket, our most profitable market (around 33 percent of Group sales in 2004), is expected to show further modest growth in 2005 but we expect to outperform that market through new product introductions and geographical expansion. According to CSM Auto, a leading industry forecaster, the global automotive original equipment market (around 25 percent of Group sales in 2004) is expected to grow in 2005 by 2.7 percent to 61.4 million units, with a slight decline in North American production, flat production in Western Europe and 11 percent growth in Emerging Markets’ production.
The industrial original equipment market in North America, South America and Europe showed good year-on-year growth in 2004. Total industrial production, as measured by the US Federal Reserve, was 4.4 percent higher compared to 2003, with particularly strong growth in the construction, agriculture and mining sectors. Further strong growth is forecast to continue in the industrial markets in 2005.
35
The US commercial construction market (around 12 percent of Group sales) has experienced a significant decline since its peak in 2000 but the current Dodge Industry forecast indicates it should grow by around 3 percent in 2005.The US residential construction market (around 11 percent of Group sales), which measured by new housing starts grew by 5.7 percent in 2004, is forecast by the National Association of Home Builders to be another record year, growing 1.0 percent in 2005.
See also Item 5 “Operating and Financial Review and Prospects - Operating Results” and in Item 4. “Information on the Company”.
E. Off balance sheet arrangements
The Company does not believe that it has any material off balance sheet arrangements.
F. Tabular disclosure of contractual obligations
Contractual obligations and commercial commitments
The Company’s consolidated contractual obligations and commercial commitments are summarized below, and are fully disclosed in the notes to the consolidated financial statements. The following table includes aggregate information about the Company’s contractual obligations as of January 1, 2005 and the periods in which payments are due. Amounts in respect of operating leases and purchase obligations are items that the Company is obligated to pay in the future, but they are not required to be included on the consolidated balance sheet. The table does not include any potential obligations that may arise in respect of the Company’s pension schemes.
| | | | | | | | | | |
Contractual obligations
| | Total $ million
| | Less than 1 year $ million
| | 1-3 years
$ million
| | 4-5 years
$ million
| | After 5 years
$ million
|
Debt(1) | | 811.6 | | 40.0 | | 3.5 | | — | | 768.1 |
Capital lease obligations | | 29.9 | | 7.6 | | 7.1 | | 5.8 | | 9.4 |
Operating lease obligations | | 189.1 | | 31.3 | | 48.0 | | 35.1 | | 74.7 |
Purchase obligations(2) | | 129.0 | | 82.5 | | 33.7 | | 4.3 | | 8.5 |
| | |
| |
| |
| |
| |
|
Total | | 1,159.6 | | 161.4 | | 92.3 | | 45.2 | | 860.7 |
| | |
| |
| |
| |
| |
|
| (1) | Substantially all of contractual debt obligations are made up of bonds issued under The Euro Medium Term Note Program. The initial bond issued under the program in December 2001 was for £150 million with a ten-year maturity and was issued at a coupon of 8 per cent. In September 2003 we issued a further £250 million bond with a twelve-year maturity at a coupon of 6.125 per cent. |
| (2) | Purchase obligations are defined as an agreement to purchase goods or services that is enforceable and legally binding on the company that specifies all significant terms, including: fixed or minimum quantities to be purchased; fixed, minimum or variable price provisions; and the appropriate timing of the transaction. |
G. Safe Harbor
See special note regarding forward-looking statements.
36
Item 6. Directors, Senior Management and Employees
A. Directors and senior management
The directors and executive officers of Tomkins plc as of June 6, 2005 are as follows:
| | | | |
| | | Age as of
June 6, 2005
| | Detail
|
| Executive directors | | | | |
| | |
| J. Nicol | | 51 | | Chief Executive Officer |
| | |
| K. Lever | | 51 | | Chief Financial Officer |
| | |
| Non-executive directors | | | | |
| | |
| D.B. Newlands | | 58 | | Non-executive Chairman |
| | |
| N.N. Broadhurst | | 63 | | Non-executive director |
| | |
| J.M.J. Keenan | | 68 | | Non-executive director |
| | |
| K.J. Minton | | 68 | | Non-executive director |
| | |
| Sir Brian Pitman | | 73 | | Non-executive director |
| | |
| M.F. Wallach | | 62 | | Non-executive director |
| | |
| Executive officers | | | | |
| | |
| R. Bell | | 57 | | President - The Gates Rubber Company |
| | |
| D.J. Carroll | | 48 | | Executive Vice President |
| | |
| W.M. Jones | | 55 | | President – Dexter Axle Company |
| | |
| T.J. O’Halloran | | 57 | | President - Air Systems Components Division |
| | |
| G.S. Pappayliou | | 51 | | General Counsel |
| | |
| N.C. Porter | | 53 | | Company Secretary |
| | |
| M.T. Swain | | 51 | | Executive Vice President – Human Resources |
| | |
| J.W. Zimmerman | | 42 | | Vice President – Corporate Development |
Executive directors
J. Nicol was appointed Chief Executive on February 18, 2002. He was formerly President and Chief Operating Officer of Magna International Inc., the Canadian automotive parts company. He joined Magna in 1987 as Vice President, Special Projects, following a successful career as a commercial lawyer. He left in 1992 to set up TRIAM Automotive Inc. and returned to Magna as Vice-Chairman when Magna acquired TRIAM in 1998.
K. Lever was appointed Chief Financial Officer on November 1, 1999. He is a non-executive director of Vega Group PLC. Ken is a Chartered Accountant and a member of the ICAEW Financial Reporting Committee and Chairman of the Hundred Group Financial Reporting Committee. He has held executive directorships at Albright and Wilson plc, Alfred McAlpine PLC and Corton Beach plc and was a partner at Arthur Andersen.
Non-executive directors
D.B. Newlands was appointed a non-executive director of the Company in August 1999, and became Chairman in June 2000. He is non-executive Chairman of KESA Electricals plc, PayPoint plc, Deputy Chairman of The Standard Life Assurance Company and a director of a number of other companies. He was formerly finance director of The General Electric Company p.l.c. and Chairman of Britax International plc.
N.N. Broadhurst was appointed a non-executive director of the Company in December 2000. He is currently Chairman of Chloride Group PLC and Freightliner Limited. He is also a non-executive director of Cattles plc, Old Mutual plc and United Utilities PLC. He was Group Finance Director of Railtrack PLC from 1994 to 2000.
J.M.J. Keenanwas appointed a non-executive director of the Company in November 2001. He is presently a non-executive director of Marks and Spencer Group p.l.c.and the Body Shop International plc and is the patron of the Centre for International Business and Management at Cambridge University. Previously he was Chairman of Kraft International, Chief Executive of Guinness United Distillers & Vintners Limited and an executive director of Diageo plc until he retired in October 2001.
37
K.J. Minton was appointed a non-executive director of the Company in December 2000. He is Executive Chairman of 4Imprint Group plc and a non-executive director of Solvay SA. He spent most of his career at Laporte plc where he was Managing Director for five years and then Chief Executive for ten years. Subsequently he was Executive Chairman of Arjo Wiggins Appleton PLC. He was also non-executive Chairman of John Mowlem & Company PLC and SGB Group Plc.
Sir Brian Pitman was appointed a non-executive director of the Company in June 2000. He is also a non-executive director of the Carphone Warehouse Group PLC, Singapore Airlines, Virgin Atlantic Airways Limited and ITV plc, and is a senior adviser to Morgan Stanley. He retired in April 2001 from Lloyds TSB Group plc where he was Chief Executive for 13 years and Chairman for four years. He was also non-executive Chairman of Next Group plc from 1998 until May 2002.
M.F. Wallach was appointed a non-executive director of the Company in August 1999. He is an investment banker, based in Denver, Colorado. He advises the Gates family on its interests in the Group’s perpetual preference shares.
Executive officers
R. Bellwas appointed President of The Gates Rubber Company on May 27, 2002, in addition to his role as Group President Worldwide Power Transmission Division. He came to Gates with the Uniroyal acquisition in 1986 and has held management positions in Asia and Europe prior to moving to the United States of America in 1996.
D.J. Carroll was appointed Executive Vice President on July 1, 2003 and has executive responsibilities for four business units within the Tomkins Group. He joined Tomkins from Magna International Inc. where he had operated in various sales and planning roles since 1984 becoming Executive Vice President, Marketing and Corporate Planning in 2002.
W.M. Jonesjoined the Tomkins Group with the acquisition of Philips Industries in 1990. Having spent 10 years with General Motors he joined Philips Industries in 1979 becoming President – Dexter Axle Company in 1985. He has had executive responsibility for both Dexter Axle Company and Philips Products Inc. since 1996.
T.J. O’Halloran was appointed President – Air Components Division in 1999. He has had eighteen years experience with Tomkins in the ASC group, including his present role as President of Air Systems Components Limited Partners and responsibility as President of Ruskin.
G.S. Pappayliou was appointed General Counsel on April 9, 2003. He joined the Group in August 1990 with the acquisition of Philips Industries. Thereafter he served as the General Counsel of Tomkins Industries and later as the Group’s General Counsel – North America.
N.C. Porter was appointed Company Secretary on August 1, 2002. Previously he was Company Secretary at Marconi plc and before that at its predecessor, The General Electric Company p.l.c.
M.T. Swainwas appointed Executive Vice President – Human Resources in August 2004. He joined Tomkins in January 1986 and filled a number of financial control roles until appointed as Vice President – Special projects in 2002 where he had executive responsibilities for four business units. He is a Chartered Management Accountant.
J.W. Zimmermanwas appointed Vice President – Corporate Development in July 1999. He is a Chartered Accountant (S.A.). Previously he was a Principal at Braxton Associates in Canada and a Senior Manager at Deloitte & Touche in South Africa.
Board changes
All of the above were directors throughout Fiscal 2004.
Executive officer changes
W.M. Jones has been added as an executive officer.
There are no family relationships between any director or executive officer and any other director or executive officer or any arrangement or understanding between any director or executive officer and any other person pursuant to which such director or executive officer was so elected or appointed.
The Articles of Association of the Company provide that, unless otherwise determined by the shareholders at a general meeting, the number of directors will not be less than two or more than fifteen. Directors may be appointed by the shareholders at a general meeting or by the Board itself, provided that any director appointed by the Board is required to retire from office (but is eligible to stand for re-appointment by the shareholders) at the annual general meeting of the Company following his appointment. At every annual general meeting, not less than one-third of the directors are required to retire from office and are eligible to stand for re-appointment at such meeting. Subject to the provisions of the Companies Act 1985, the Board may from time to time appoint one or more directors to an executive office on such terms and for such period as it may determine. No director or executive officer has a service contract with the Company of more than two years’ duration.
38
B. Compensation
Remuneration Committee
This section sets out the membership of the Remuneration Committee and the names of the advisers who provided services to the Committee during the year to 1 January 2005. The policies that have been followed by the Remuneration Committee during the year in determining the elements of executive remuneration are also set out, together with the policies and principles to be followed by the Committee over the next two years.
The Board keeps under review the terms of reference for the Remuneration Committee, which are based on current best practice contained in the model terms of reference set out in the Guidance Note produced by the Institute of Chartered Secretaries and Administrators. The principal responsibility of the Committee is to determine the framework or broad policy for the Company’s executive remuneration and the remuneration of the Chairman of the Board, for approval by the Board. The remuneration of non-executive Directors is a matter for the Board itself. The terms of reference of the Remuneration Committee can be found in the corporate governance area on the Company’s website, www.tomkins.co.uk.
Details of the emoluments, bonuses, benefits-in-kind, incentive arrangements (including share options and other long-term incentives), pensions and service contracts applicable to each Director who served during the year to January 1, 2005 are given in this section, which will be put to the vote of shareholders at the forthcoming Annual General Meeting.
Membership of the Remuneration Committee and Advisers
The Remuneration Committee is made up exclusively of non-executive Directors whom the Board determined to be independent as each was found to be free from any material business or other relationship with the Company (either directly or as a partner, shareholder or officer of an organization that has a relationship with the Company). Accordingly, the Board believes that there are no such relationships that could materially interfere with the exercise of their independent judgment. The members of the Committee who served throughout the year were:
K J Minton (Chairman)
N N Broadhurst
J M J Keenan
There were no changes to the membership of the Committee during the year.
The Committee consults with the Chairman of the Board and the Chief Executive Officer concerning matters of executive remuneration. The Committee also received advice from external advisers, PA Consulting, concerning the Company’s Annual Bonus Incentive Plan. PA Consulting also provided consulting services during the year in support of strategic projects undertaken by two of Tomkins’ US subsidiaries. Mercer Human Resource Consulting provided pension advice in respect of Executive Directors and senior executives and provided professional services in the area of pension scheme advice. Other than those consulting services mentioned above, PA Consulting and Mercer Human Resources had no connections with the Company.
Statement of Company’s policy on Directors’ remuneration
The policies operated by the Company during the year and those to be applied over the next two years, are set out below:
Executive remuneration
The Company’s policy on executive remuneration is that the Remuneration Committee and the Board should each satisfy itself that executives, including executive Directors, are fairly rewarded for their individual contributions to the Group’s performance. The Remuneration Committee has sought to ensure that executive Directors receive a level of remuneration that is appropriate to their scale of responsibility and performance and which will attract, motivate and retain individuals of the necessary caliber. The only pensionable element of executive Directors’ remuneration is basic salary. This policy applies whether or not an executive Director is a member of the Tomkins Retirement Benefits Plan or has a personal pension arrangement.
Annual remuneration for executives
The Board recognizes that one of its key objectives is to grow the value of the business for the benefit of shareholders and that such growth is strongly related, amongst other things, to the degree of entrepreneurial spirit in the Group. In order to create the necessary entrepreneurial impetus within an organization, compensation arrangements are required which are similar to those that an owner of a business would seek. This has led to the adoption of a remuneration policy under which the levels of total remuneration are set in order to attract, retain and motivate executives, and remuneration is provided through a combination of base salaries at median level or below and annual bonuses that have a direct and proportionate link to total value created for shareholders. This provides the incentive for executives to act like owners of the business. The Remuneration Committee and the Board believe that this more closely aligns the interests of shareholders and management whereby executives only receive substantial rewards when they have created high value in the business.
Over time and subject to the achievement of value-creating performance targets, this policy is likely to lead to a realignment of the component parts of total executive remuneration, so that a greater part of the total package received by executives is made up of incentive pay with the remainder coming from base salaries at the median level or below. The performance targets for the Company’s executive share option scheme and the Annual Bonus Incentive Plan ensure that a substantial proportion of total remuneration is directly related to actual measurable performance.
Non-executive Directors’ fees and Chairman’s remuneration
The executive members of the Board review from time-to-time the fees of non-executive Directors, who play no part in determining their own remuneration. The Chairman’s remuneration is determined by the Remuneration Committee (in the absence of the Chairman) and is approved by the Board. In future, the review of non-executive Directors’ fees and the Chairman’s remuneration will take place every two years.
39
Service contracts
The Company’s policy on Directors’ service contracts is that service contracts and letters of appointment for executive Directors normally provide for notice periods of no longer than twelve months. On appointment, a longer notice period may apply, but this will reduce over time to the normal twelve months’ notice period. Notwithstanding the provisions in an executive Director’s service contract or letter of appointment concerning termination payments, the Company will seek to reduce any compensation that may be payable to reflect the departing Director’s obligation to mitigate loss.
External appointments
The Company’s policy on external appointments is that, with the approval of the Chairman of the Board, executive Directors are permitted to hold appointments outside the Company. Any fees payable in connection with such appointments are normally retained by Directors unless otherwise agreed.
Long-term incentives and share options
The Company has operated a number of share-based long-term incentive schemes in the past but, following a review of executive remuneration, the Remuneration Committee and Board expect the number of plans and schemes to reduce over time as they lapse and are not renewed or replaced.
The Remuneration Committee and the Board have decided at this time not to continue with an executive share option scheme beyond May 9, 2005, the date on which the Company’s Executive Share Option Schemes No. 3 and No. 4 lapsed and will, therefore, did not seek shareholder approval at the Annual General Meeting to introduce a new scheme.
The Company’s employee savings related share option scheme, which applies to all UK employees, also lapsed on May 9, 2005 and the introduction of a new scheme was approved by shareholders at the Annual General Meeting for the introduction of a new scheme.
Retirement benefits
The Company’s retirement benefit plan was closed to new members in April 2002 and, since that time, the Company’s policy has been that new employees, including executive Directors and senior executives, will receive a payment from the Company to enable them to make contributions to retirement benefit schemes of their choice on behalf of themselves and their dependants. No change to this policy is expected over the next two years. The normal retirement age of the Directors is 60.
Performance graph
The graph set out below plots Total Shareholder Return on a holding in the Company’s shares for each of the past five years ended December 31, measured against the performance of the FTSE Engineering and Machinery Index. This index was chosen because its major constituents are, like Tomkins, moderately diversified engineering groups with a significant manufacturing presence outside the home UK market.
Total shareholder return (December 1999 to December 2004)
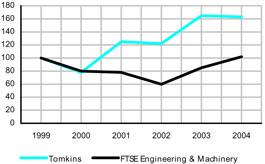
40
Basic salary, fees, bonuses and benefits in kind for the year ended January 1, 2005
| | | | | | | | | | | | | | |
| | | | | | | | | | | | | Total emoluments
(excluding retirement benefits)
|
Directors’ emoluments
| | Basic salary/fees
$000
| | Bonus cash(1)
$000
| | Bonus shares(1)
$000
| | Bonus deferred
shares(2) $000
| | Benefits-in-kind(3)
$000
| | Year ended
January 1,
2005 $000
| | Year ended
January 3,
2004 $000
|
Chairman | | | | | | | | | | | | | | |
D B Newlands(4) | | 329 | | — | | — | | — | | — | | 329 | | 253 |
| | | | | | | |
Executive Directors | | | | | | | | | | | | | | |
J Nicol | | 1,462 | | 1,378 | | 345 | | 688 | | 917 | | 4,790 | | 4,032 |
K Lever | | 734 | | 528 | | 131 | | 263 | | 20 | | 1,676 | | 1,195 |
A J Reading(5) | | — | | 268 | | — | | — | | — | | 268 | | 1,738 |
| | | | | | | |
Non-executive Directors | | | | | | | | | | | | | | |
N N Broadhurst(4) | | 119 | | — | | — | | — | | — | | 119 | | 65 |
J M J Keenan(4) | | 106 | | — | | — | | — | | — | | 106 | | 60 |
K J Minton(4) | | 152 | | — | | — | | — | | — | | 152 | | 73 |
Sir Brian Pitman(4) | | 82 | | — | | — | | — | | — | | 82 | | 57 |
M F Wallach(4) | | 100 | | — | | — | | — | | — | | 100 | | 60 |
| | |
| |
| |
| |
| |
| |
| |
|
| | | 3,084 | | 2,174 | | 476 | | 951 | | 937 | | 7,622 | | 7,533 |
| | |
| |
| |
| |
| |
| |
| |
|
| (1) | Details of bonus payments in accordance with the Annual Bonus Incentive Plan are given in b below. |
| (2) | Deferred shares are held under the Annual Bonus Incentive Plan. |
| (3) | Benefits-in-kind include company car and related costs, medical cover and life assurance. |
Benefits-in-kind for James Nicol for the year to January 1, 2005 included the following elements:
| | (a) | buy-out bonus payment and relocation allowance of $43,000 per month for a period of three years commencing February 18, 2002 (such payments have now ceased); |
| | (b) | a cash payment under the Deferred Matching Share Purchase Plan equivalent to the net dividend payable on 1,015,228 shares of Tomkins plc (such payments ceased upon the vesting of the award on February 18, 2005); |
| | (c) | on April 26, 2002, the Company entered into a short-term lease, since terminated, on a property that was occupied by James Nicol and his family from June 1, 2002 to June 30, 2004; and |
| | (d) | other benefits in accordance with the terms of his contract. |
| (4) | On July 23, 2004, 2,000 shares were purchased for each of the non-executive Directors at a market price of 254 pence per share. The cost of these shares formed part of their remuneration. |
| (5) | Anthony Reading stepped down from the Board on December 31, 2003, and the bonus paid formed part of his termination arrangements. In addition, an amount of $146,000 was reimbursed during the current year. This was payable in respect of benefits set out in his termination agreement. |
During the year no Director exercised any options and accordingly no gains or losses were made on exercise (year to January 3, 2004 – £nil).
Chairman’s remuneration
Up to January 1, 2004, David Newlands’ remuneration as non-executive Chairman had not increased. Having taken into consideration comparative remuneration data, the contribution made by the Chairman to the Company’s affairs and the time he devotes to the Company’s business and the extra responsibilities placed upon him arising from the changes in corporate governance requirements in the UK and the US, the Remuneration Committee recommended to the Board that his remuneration should be increased from $245,000 to $319,000 per annum plus 2,000 Tomkins plc shares, with effect from January 1, 2004. His remuneration would be further reviewed every two years. These recommendations were approved by the Board.
Non-executive Directors’ fees
The executive members of the Board reviewed the fees paid to non-executive Directors and noted that the basic fee paid to non-executive Directors of $55,000 plus 2,000 Tomkins plc shares was last reviewed in 2000. Having taken into consideration comparative remuneration data, the contribution made by individual non-executive Directors to the Company’s affairs, the time they devote to the Company’s business, and the extra responsibilities placed upon them arising from the changes in corporate governance requirements in the UK and the US, the executive Directors concluded that the basic fee should be increased to $73,000 plus 2,000 Tomkins plc shares commencing January 1, 2004. At the same time, the additional fee paid to the Chairman of the Audit Committee was increased to $27,000 per annum, the additional fee paid to the Chairman of the Remuneration Committee was increased to $18,000 per annum and the additional fee paid to the Chairman of the Health, Safety and Environment Committee was increased to $23,000 per annum. Members of the Audit Committee will receive an additional fee of $14,000 per annum, members of the Remuneration Committee will receive an additional fee of $9,000 per annum and non-executive members of the Health, Safety and Environment Committee will receive $9,000 per annum and $3,000 per meeting day, all with effect from January 1, 2004. In future, non-executive Directors’ fees will be reviewed every two years.
41
The following table shows emoluments paid or payable to all directors and all executive officers of Tomkins plc as a group for the year ended January 1, 2005.
| | | | | | | | | | | | | | | | |
| | | Basic salary/fees
| | Bonus cash
| | Bonus
shares
| | Bonus deferred
shares
| | Benefits in
kind
| | Total
emoluments
(excluding
pension
contributions)
| | Pension
contributions
| | Gains made
on the
exercise of
share options
|
| | | $000 | | $000 | | $000 | | $000 | | $000 | | $000 | | $000 | | $000 |
Total for all directors and other executive officers | | 6,160 | | 4,653 | | 1,082 | | 2,166 | | 1,157 | | 15,217 | | 1,720 | | 4 |
Annual Bonus Incentive Plan
The executive Directors and senior executives participate in the Company’s Annual Bonus Incentive Plan (the “Plan”). Each participant in the Plan receives a percentage of “bonusable profit” of the business for which he or she has responsibility. Bonusable profit is based on operating profit less a charge for tax, certain exceptional items and a charge for invested capital. The objective of the Plan is to reward the senior executives for increasing the overall value created in the business, based on the margin of the after-tax return on invested capital in excess of the weighted average cost of capital. Accordingly, bonusable profit may increase at a faster rate than operating profit where the margin of the return over the cost of capital increases. This aligns the interests of management and shareholders.
In arriving at bonusable profit, adjustments may be made for operating exceptional items relating to strategic manufacturing initiatives to match the costs of the strategic manufacturing initiatives to the benefits over a period of up to three years. With the approval of the Remuneration Committee, adjustments are also made for non-operating exceptional items. The charge for taxation reflects the ongoing charge for tax excluding any benefit from exceptional adjustments to tax provisions. The charge for invested capital is based on applying the estimated weighted average cost of capital to the average invested capital in the Group. The estimated weighted average cost of capital takes into account the capital structure of the Group and the costs associated with each element of capital. The method of calculation has been agreed by the Remuneration Committee and is subject to review each year. The invested capital is based on the book value of assets in the Group excluding goodwill relating to acquisitions made prior to December 30, 1999. The cost of capital used in the calculation of bonusable profit for the year under review was approximately 8.35 per cent.
The Remuneration Committee carries out a detailed review of the computations involved and ensures that the rules are applied consistently. Furthermore, the independent auditor is asked to perform agreed-upon procedures on behalf of the Remuneration Committee and to review the calculations that underlie the computation of the bonusable profit.
The incentive bonus of the executive Directors is based on a percentage of the bonusable profit of the Group which, for the year ended January 1, 2005, was $202.7 million (January 3, 2004 – $157.0 million)). James Nicol received the sum of $2.4 million (January 3, 2004 – $1.9 million) and Ken Lever received the sum of $922,000 (January 3, 2004 – $550,000). Ken Lever’s percentage of bonusable profit increased during the year in accordance with the levels approved by the Remuneration Committee at the time the Plan was introduced. In respect of the 51 weeks from January 1, 2004, Anthony Reading was entitled to receive a bonus as part of his termination arrangements and received the sum of $268,000 (January 3, 2004 – $261,000), which took account of the businesses for which he had responsibility prior to him stepping down from the Board. Although there is no limit to the bonusable profit on which bonuses are calculated, inordinate growth in bonusable profit in any one year is unlikely to arise due to the nature of the Group’s business.
The bonus awards are payable to the senior participants, including executive Directors, as to four-sevenths in cash, one-seventh in bonus shares and two-sevenths in deferred shares. The bonus awards payable to the remaining participants are as to three-quarters in cash, one-twelfth in bonus shares and one sixth in deferred shares. The bonus is paid at the end of June, September and December based on 75 per cent of the bonus earned to the end of the previous quarter, with the balance of the full entitlement to the bonus for the calendar year paid at the end of March following the calendar year-end.
Bonus shares are restricted and vest only after a period of three years after the initial bonus award. Dividends are paid on the bonus shares. Deferred shares are awarded at the time of the initial bonus award but the vesting of the shares is conditional on continued employment with the Group for three years after the award. Dividends are not paid on the deferred shares until they have vested.
As a condition of continued participation in the Plan, senior participants, including executive Directors, are required to hold shares with a purchase cost equivalent to one year’s total after tax remuneration including bonus, based on an average of the previous three years. Remaining participants are required to hold shares with a purchase cost equivalent to one half of one year’s total after-tax remuneration including bonus, based on an average of the previous three years. Increases in annual base salary of all participants, including executive Directors, are restricted to the equivalent rate of increase in the Retail Prices Index (in the UK) or equivalent index in the country in which a participant works. The restrictions on the increases in salary, together with the growth in bonus, assuming increases in bonusable profit, will result in the incentive pay element of remuneration increasing over time. The share awards will increase the investment each of the participants, including executive Directors, has in Tomkins plc shares.
42
Closed schemes
Details of The Tomkins Restricted Share Plan (“RSP”), The Tomkins Share Matching Scheme (“SMS”) and The Tomkins Long Term Loyalty Plan (“LTLP”) are set out in Section E. below. Director’s’ current interest in Tomkins shares is also set out in Section E. and where appropriate, these include shares held through their participation in the RSP and SMS (together the “Schemes”). The interests of the Directors in Tomkins ordinary shares held within the Schemes that are yet to vest and yet to be included in Directors’ remuneration were as follows:
| | | | | | | | | | | | |
Director
| | Scheme or Plan
| | 1 January 2005
Number
| | Awarded
Number
| | Vested
Number
| | 3 January 2004
Number
| | Vesting
Period
|
K Lever | | RSP | | — | | — | | 100,000 | | 100,000 | | 2004 |
| | | SMS | | 1,809 | | — | | — | | 1,809 | | 2005 |
| (1) | During the year, Ken Lever’s RSP award of 100,000 shares vested, but was not eligible for a matching award under the SMS. |
| (2) | Within the RSP, the value of entitlements for current Directors and Executive Officers at January 1, 2005 was £nil (January 3, 2004 – $439,000). During the year 100,000 shares vested under the RSP at 270.75 pence per share, market value $489,000, in respect of Ken Lever (year ended January 3, 2004 – $8,000 in respect of Ken Lever). |
| (3) | For the SMS, the value of entitlements for current Directors at January 1, 2005 was $9,000 (January 3, 2004 – $8,000). No Director received an award under the SMS during the year (year ended January 3, 2004 – $8,000 in respect of Ken Lever). No shares awarded to Directors vested under the SMS during the year (year ended January 3, 2004 – $75,000 in respect of former director Anthony Reading). At January 1, 2005, 1,809 shares were required to be retained by Ken Lever in order to allow the SMS award in the above table to vest in the relevant vesting period (January 3, 2004 – 1,809 shares required to be retained by Ken Lever). No other current Director was required to retain shares in this respect at January 1, 2005. The value of entitlements for Executive officers at January 1, 2005 was $29,000. 2,046 shares at a value of $9,000 awarded to Executive Officers vested under the SMS during the year. |
| (4) | During the year, no shares awarded to Directors vested under the LTLP (year ended January 3, 2004 – $437,000, in respect of former director, Anthony Reading). 185,000 shares awarded to Executive Officers at a value of $896,000 vested during the year (year ended January 3, 2004, $ nil). |
Retirement benefits
James Nicol and Ken Lever are not entitled to any retirement benefits defined in terms of final or average salary but they receive a payment at an annual rate of 37.5 per cent of their basic salary to enable them to make contributions to retirement benefit schemes of their choice on behalf of themselves and their dependants. For the year ended January 1, 2005, this amounted to $548,000 (year to January 3, 2004 – $478,000) for James Nicol, and $263,000 (year to January 3, 2004 – $230,000) for Ken Lever. At the time he joined the Company, Ken Lever was given the option to elect at any time to become a member of the Tomkins Retirement Benefits Plan (the “RBP”) or any other replacement pension scheme nominated by the Company, but did not do so during the year ended January 1, 2005. The normal retirement age of the Directors is 60.
Service Contracts
A summary of the service contract or letter of appointment of each of the Directors is as follows:
James Nicol – Chief Executive Officer
The Company and James Nicol entered into a contract dated February 11, 2002, which set out the terms and conditions under which he joined the Company as Chief Executive Officer on February 18, 2002. The contract remains in force until terminated by either party giving notice of not less than twelve months.
Ken Lever – Finance Director
On November 1, 1999, Ken Lever and the Company entered into a Memorandum which set out the terms and conditions of employment under which Ken Lever joined the Company as Finance Director on that date. The terms of the Memorandum remain in force until terminated by either party giving notice of 51 weeks.
Non-executive Directors
None of the non-executive Directors has a service contract with the Company, their terms of engagement being set out in a letter of appointment. Ordinarily, non-executive Directors serve for a period of two years but, subject to agreement with the Board, a non-executive Director can be re-appointed for a further term of two years. The appointment of non-executive Directors may be terminated before the conclusion of their two-year term by, and at the discretion of, either party upon two weeks’ written notice. In the case of David Newlands, the appointment is for a term of three years and may be terminated at any time by either party serving written notice upon the other, such notice to take effect from the date of receipt thereof. None of the non-executive Directors is entitled to compensation for loss of office. The dates from which the respective letters of appointment are effective are as follows: Norman Broadhurst – December 11, 2004; Jack Keenan – November 1, 2003; Ken Minton – December 11, 2004; David Newlands – February 18, 2004; Sir Brian Pitman – June 30, 2004; Marshall Wallach – August 1, 2003.
Payments made to and interests of former Directors
Anthony Reading ceased employment with Tomkins on December 31, 2003 and full details of the value of his accrued pension benefits were disclosed in last year’s report. Mr Reading was entitled to pension benefits under the Tomkins Retirement Benefits Plan (the “RBP”) which provides pension benefits within Inland Revenue limits. As his total benefits were greater than these limits, the excess benefits were unfunded. During the year, Mr Reading decided to draw his excess benefits and, in accordance with prior agreements, the unfunded benefits were exchanged for a lump sum of $3.9 million. The basis of exchange was agreed prior to Mr Reading’s departure and was in accordance with advice from an independent actuary. Mr Reading has not yet drawn his RBP pension, which amounts to $63,000 as at December 31, 2004.
Sums paid to third parties in respect of a Director’s services
No amounts are paid to third parties in respect of a Director’s services to the Company.
Sums received by executive Directors from other external directorships
During the year, Ken Lever served as a non-executive Director on the Board of Vega Group plc, for which he receives a non-executive directors’ fee of $54,000 per annum, which Mr Lever retains. James Nicol holds no external directorships.
43
C. Board practices
1. The Board of Directors
The Company is controlled through its Board of Directors. The Board’s main roles are to create value for shareholders, to provide leadership of the Company, to approve the Company’s strategic objectives, to ensure that the necessary financial and other resources are made available to the management to enable them to meet those objectives and to operate within a framework of effective controls which enables the assessment and management of principal business risks. The Board, which has reserved certain specific matters to itself for decision, is responsible for approving overall Group strategy and financial policy, acquisition and divestment policy and major capital expenditure projects. It also appoints and removes members of the Board and Board Committees, and reviews recommendations of the Audit Committee, Remuneration Committee and Nomination Committee and the appointment of the independent auditor and the financial performance and operation of each of the Company’s businesses.
The Board has delegated to the Chief Executive Officer responsibility for the day-to-day management of the Group subject to certain financial limits above which Board approval is required. Such delegated authority includes such matters as operations, acquisitions and divestitures, investments, capital expenditure, borrowing facilities and foreign currency transactions.
The Board of Directors is comprised of a non-executive Chairman, five additional non-executive Directors and two executive Directors who together, with their different ages, financial, commercial, technical and operational expertise and cultures, bring with them a wide range of experience to the Company.
The Board has determined that David Newlands, Norman Broadhurst, Jack Keenan, Ken Minton and Sir Brian Pitman are independent, as they are independent of the Company’s executive management and free from any material business or other relationship with the Company (either directly or as a partner, shareholder or officer of an organisation that has a relationship with the Company). In December 2000, at the request of the Board, the non-executive Chairman, David Newlands, temporarily assumed certain executive responsibilities until the recruitment of James Nicol as Chief Executive in February 2002. It is the Board’s view that this short-term arrangement did not affect Mr Newlands’ independence. Accordingly, the Board believes that there are no such relationships that could materially interfere with the exercise of their independent judgment. Marshall Wallach is the only non-executive Director deemed not to be independent as a result of his advisory capacity to the Gates family who are substantial preference shareholders in the Company.
Non-executive directors are normally appointed for a period of two years, which is renewable by agreement with the Board. The terms and conditions of appointment of non-executive Directors are available for inspection at the Company’s registered office during normal business hours on weekdays and will also be available for inspection at the place of the Annual General Meeting from 15 minutes before the meeting until it ends. The Combined Code recommends the appointment of a senior independent non-executive Director and Sir Brian Pitman has served in such capacity during the year under review. The roles of non-executive Directors are to scrutinize the performance of management in meeting agreed objectives, help develop proposals on strategy and monitor the reporting of performance, including satisfying themselves as to the integrity of financial information and that financial controls and systems of risk management put in place by the Company are robust and effective. They meet together from time to time in the absence of management and the Chairman normally presides over such meetings.
Directors receive a range of information about the Company upon appointment and, where appropriate, any training that is necessary for them to carry out their duties effectively. An induction program is available which aims to provide an understanding of the Company as a whole, including its strategy, structure, geographical spread of operations, financial position, markets, products, technologies and people, as well as their legal responsibilities as a Director. The Directors have access to the advice and services of the Company Secretary whose removal may be effected only with the approval of the Board. There is an approved procedure by which all Directors can obtain independent professional advice at the Company’s expense in furtherance of their duties, if required; this procedure is reviewed periodically.
The Board meets not less than five times a year, and will hold additional meetings when circumstances require. During the year to 1 January 2005, the Board met on six occasions, including a meeting held solely to consider and approve Group strategy. Between meetings, the Chairman and Chief Executive Officer update the non-executive Directors on current matters and there is frequent contact to progress the affairs of the Company. Attendance by each individual Director at Board and Committee meetings held during 2004 is set out in the table below:
| | | | | | | | | | | | | | | | | | | | |
Director
| | Board
Meetings
held
| | Meetings
attended
| | Audit
Committee
Meetings
held
| | Meetings
attended
| | Remuneration
Committee
Meetings held
| | Meetings
attended
| | Nomination
Committee
Meetings
held
| | Meetings
attended
| | Health, Safety
and
Environment
Committee
Meetings held
| | Meetings
attended
|
David Newlands | | 6 | | 6 | | N/A | | N/A | | N/A | | N/A | | 1 | | 1 | | N/A | | N/A |
Norman Broadhurst | | 6 | | 6 | | 4 | | 4 | | 2 | | 2 | | 1 | | 1 | | N/A | | N/A |
Jack Keenan | | 6 | | 6 | | 4 | | 3 | | 2 | | 2 | | 1 | | 1 | | N/A | | N/A |
Ken Lever | | 6 | | 6 | | N/A | | N/A | | N/A | | N/A | | N/A | | N/A | | N/A | | N/A |
Ken Minton | | 6 | | 6 | | 4 | | 4 | | 2 | | 2 | | 1 | | 1 | | 4 | | 4 |
James Nicol | | 6 | | 6 | | N/A | | N/A | | N/A | | N/A | | N/A | | N/A | | 4 | | 4 |
Sir Brian Pitman | | 6 | | 6 | | N/A | | N/A | | N/A | | N/A | | 1 | | 1 | | N/A | | N/A |
Marshall Wallach | | 6 | | 6 | | N/A | | N/A | | N/A | | N/A | | 1 | | 1 | | 4 | | 3 |
Notes:
| (1) | N/A = Not applicable (where a Director is not a member of a Committee). |
| (2) | During the year, other Directors have attended meetings of the Audit Committee, Remuneration Committee, Nomination Committee and Health, Safety and Environment Committee by invitation. These details are not included in the above table. |
| (3) | On the rare occasion where a Director cannot attend a meeting, he will normally, prior to the meeting, make his views on the agenda items known to the Chairman or, in respect of Committee meetings, to the chairman of the respective Committee. |
44
The Board sets the standards and values of the Company and much of this has been embodied in the Company’s Code of Conduct and Ethics and Human Rights Policy which can be found on the Company’s website, www.tomkins.co.uk. The Code of Conduct and Ethics applies to all Directors, officers and employees, including the principal executive, financial and accounting officers, as required by section 406 of the US Sarbanes-Oxley Act of 2002, the related rules of the US Securities and Exchange Commission and the rules of the New York Stock Exchange. The Code contains provisions (in paragraph XVI) under which employees can report violations of company policy or any applicable law, rule or regulation including those of the US Securities and Exchange Commission. US employees have the added protection of section 806 of the Sarbanes-Oxley Act of 2002, which prohibits the discrimination by a company or others against an employee where such violations are reported. The current procedure, which is set out in Tomkins’ Code of Conduct and Ethics, provides for information to be given anonymously or by named employees under conditions of confidentiality. Those employees who come forward and give their name are assured that they will receive the full protection of section 806 and no retaliation will take place. This is predominantly a US requirement but the principles are applied in other jurisdictions, subject to compliance with local employment and other law.
Re-appointment of Directors
At the forthcoming Annual General Meeting of the Company, James Nicol, Jack Keenan and Norman Broadhurst will stand for re-appointment. Details of their terms of appointment can be found in the Remuneration Committee Report. The Board strongly supports their re-appointment and recommends that shareholders vote in favor of their re-appointment. Jack Keenan brings to the Board and the affairs of the Company considerable international and management experience having been Chairman of Kraft International, Chief Executive of Guinness United Distillers and Vintners and an executive director of Diageo plc.Norman Broadhurst brings substantial international financial experience to the Board having previously been group finance director of Railtrack PLC and joint deputy chief executive and finance director of VSEL Consortium PLC.
2. Chairman and Chief Executive Officer
There is a clear division of responsibility between the Chairman and the Chief Executive Officer, with neither having unfettered powers of decision with respect to substantial matters. The Chairman is responsible for running the Board and ensures that all Directors receive sufficient relevant information on financial, business and corporate matters to enable them to participate effectively in Board decisions. In advance of each meeting, the Board is provided with comprehensive briefing papers on items under consideration.
The Chairman, David Newlands, is Chairman of Kesa Electrical plc and PayPoint plc and Deputy Chairman of The Standard Life Assurance Company. Whilst these are important appointments, the Board of Tomkins believes that the Chairman continues to be able to carry out his duties and responsibilities effectively for the Company.
The Chief Executive Officer’s primary role is the running of the Company’s businesses and the development and implementation of strategy. The non-executive Directors have the opportunity to meet with the Chairman and with the Chief Executive Officer periodically, either together or separately, to consider and discuss a wide range of matters affecting the Company, its business, strategy and other matters.
3. Board Committees
The Board has established a number of Committees and receives reports of their proceedings. Each Committee has its own delegated authority as defined in its terms of reference, which are reviewed periodically by the Board. The Board is satisfied that its Committees have written terms of reference which conform to best corporate governance practice. The terms of reference for all Board Committees can be found on the Company’s website, www.tomkins.co.uk, or a copy can be obtained by application to the Company Secretary at the Company’s registered office.
The Board appoints the chairmen and members of all Board Committees upon the recommendation of the Nomination Committee.
The Company Secretary is Secretary to all Board Committees.
The principal Committees, their membership, a brief description of their terms of reference and their duties are as follows:
a) Audit Committee
N N Broadhurst (Chairman), K J Minton, J M J Keenan
The Board has determined that all three members of the Audit Committee are independent for the purposes of the Combined Code and rule 10A.3(b)(1) under the US Securities Exchange Act of 1934 and section 303A of the New York Stock Exchange’s Listed Company Manual. The members have wide-ranging financial, commercial and management experience that they bring to the work of the Audit Committee. Biographical details are set out in the Annual Review, a separate report to shareholders.
The Chairman of the Committee, Norman Broadhurst, is a Chartered Accountant (FCA) and a Fellow of the Institute of Corporate Treasurers, having previously been group finance director of Railtrack PLC (1994 to 2000) and joint deputy chief executive and finance director of VSEL Consortium PLC (1990 to 1994). In accordance with section 407 of the Sarbanes-Oxley Act of 2002, the Board has determined that Norman Broadhurst is an “audit committee financial expert” as that term is defined under the rules of the US Securities and Exchange Commission, having significant, relevant and up-to-date UK and US financial and accounting knowledge and experience. Ken Minton has held a number of senior management positions having been Managing Director and then Chief Executive of Laporte PLC and Jack Keenan has held a number of senior management positions in international companies having been Chairman of Kraft International, Chief Executive of Guinness United Distillers and Vintners and an executive Director of Diageo plc. Both have extensive financial experience.
Meetings
The Audit Committee meets at least four times a year and on other occasions when circumstances require. The quorum for a meeting of the Committee is two members. The Finance Director and representatives from the independent auditor and the internal auditor attend meetings under a standing invitation. The Chairman of the Board, Chief Executive Officer and other Directors are able to attend meetings of the Committee under the practice that any Director may attend any meeting of a Board Committee provided that they have no conflict of interest
45
in respect of business to be discussed. It is usual practice for the Chief Executive Officer to attend meetings of the Audit Committee. Other finance and business risk executives attend meetings and the Company Secretary is Secretary to the Committee. The Committee Chairman reports regularly to the Board on its activities. Full attendance was recorded during the year except for one meeting where two out of the three members were present.
Work of the Committee
The Committee has established an “agenda framework” which Tomkins believes is vital for maintaining an appropriate focus on the objectives of the Committee. The agenda sets out all of the operational duties and responsibilities outlined in the Committee’s terms of reference and is based on four regular meetings, in February, May, August and November, which coincide with the announcement of the quarterly results.
The areas covered by the “agenda framework” are as follows:
| | (1) | Corporate Governance, including the regular review of the Committee’s terms of reference and annual evaluation, regulatory issues, review of delegated authorities and review of auditor independence; |
| | (2) | Business Risk and internal audit, including the review of the internal audit charter, update on Business Risk Assurance, status of current audit plan and risk assessment and internal audit plans for the new financial year, progress against internal audit business plan and compliance with Auditing Standards; |
| | (3) | Confidential sessions with the Audit Committee, in the absence of Directors and Company executives; |
| | (4) | Financial Reporting, including current accounting and financial reporting matters and review of quarterly, interim and annual statements including earnings releases; and |
| | (5) | Independent Audit including audit plan and scope, review of audit fees, cost effectiveness, reports on interim and annual financial statements, status reports, management letters and the nature and extent of non-audit services. The audit plan and scope sets out details of the areas to be covered and how the audit is to be conducted. The Chairman of the Audit Committee meets periodically with the independent auditor to discuss progress on the audit and the major points to arise, and has the opportunity to assess the effectiveness of the process. The Committee is also able to assess the effectiveness of the process through reports made to the Committee by the independent auditor. |
In addition to the items considered by the Committee under the “agenda framework”, during 2004 other important issues considered included regular reviews of the internal control systems and the statement to be made in the Directors’ Report and Accounts in respect of internal controls, Group risk profile, Group tax reports, the rules governing the employment of present and former employees of the independent auditor (see below), audit partner rotation, “whistleblowing” procedures (see below), updates on compliance with the Combined Code, review of tax services provided by the independent auditor and update of IT systems. Confidential meetings with representatives of the independent audit and internal audit functions, in the absence of executives, took place during the year. Considerable time and emphasis have been placed by the Committee on compliance with section 404 of the Sarbanes-Oxley Act of 2002 and detailed progress reports were received by the Committee at each of its meetings. This has been the focus of attention of the Business Risk Assurance and internal audit function during the year, with a commensurate amount of resources applied to these responsibilities.
There is a close liaison with the Business Risk Assurance and internal audit function which is actively engaged in the business risk assessment processes in the Group’s businesses and also provides guidance and assistance in the development of risk mitigation plans. Each quarter, the Committee receives a summary of the review of the business risks and any related financial exposures which it considers. The risk assessment process and risk mitigation plans are an important part of the development of the business strategies. Business Risk Assurance is considered at the quarterly reviews with the businesses, where all of the major risks are discussed.
In determining its policy on the extent of non-audit services provided by the independent auditor, the Committee has taken account of the rules of the US Securities and Exchange Commission which regulate and, in certain circumstances, prohibit the provision of certain types of non-audit services by the independent auditor. Non-audit services are ordinarily put out to tender and require the approval of the Chairman of the Audit Committee above certain levels. During the year, specific projects requiring tax services were the subject of a tender process and in a number of cases the work was not awarded to the firm of the independent auditor. Certain other rules were considered and adopted by the Committee during the year, including those relating to audit partner rotation, and relevant ethical guidance issued by the professional bodies in the Consultative Committee of Accountancy Bodies, in particular that the external auditor should not audit its own firm’s work, make management decisions for the Company, create a mutuality of interest nor be put in the position of advocate for the Company. The Committee believes that, taken together, the adoption of these rules and regulations provides adequate protection of auditor independence. All fees proposed by the external auditor must be reported to the Audit Committee and prior approval is required from the Chairman of the Audit Committee for any projects above specified limits.
The Company’s practice, in accordance with the Companies Act 1985 and the Combined Code, in relation to the appointment and termination of the independent auditor, involves a recommendation from the Audit Committee to the Board, which will then make a recommendation to shareholders in general meeting. This differs from the procedure in the US, where the independent auditor is accountable to the Audit Committee, which has the authority to appoint or dismiss the independent auditor without reference to shareholders.
With the approval of the Board, the Committee has established guidelines for the recruitment of employees or former employees of the independent auditor. Tomkins will not engage, on a part-time or full-time basis, any person who is or was an employee of the Company’s independent auditor, where that person has worked on the Group’s audit either as a principal or partner at any time during a period of not less than three years prior to the proposed date of joining the Tomkins Group. In addition, though Tomkins may employ an employee of the Company’s independent auditor where such person has never worked on the Group’s audit either as a principal or partner, a period of not less than one year must elapse prior to the proposed date of that person joining the Company. Any former employee of the independent auditor who joined the Company before the independent auditor was appointed will remain unaffected.
46
During the year, the Committee and the Board approved the “whistleblowing” procedure for the confidential and anonymous submission by employees of concerns regarding accounting, internal controls or auditing matters, in accordance with the requirements of section 301 of the Sarbanes-Oxley Act of 2002. When a call is received on the dedicated telephone line, the Vice-President, Business Risk Assurance immediately reports to the Chairman of the Audit Committee all concerns raised. A course of action is agreed and a report is prepared for review at the next meeting of the Audit Committee, including details of actions taken to deal with the matters raised. The Chairman of the Committee will report all cases of “whistleblowing” to the Board. The Company’s Code of Conduct and Ethics includes the “whistleblowing” procedure. No reports were received by the Committee during the year.
Shareholders are given the opportunity at the Annual General Meeting to ask the Chairman of the Committee questions on this report and any other related matter.
b) Remuneration Committee
K J Minton (Chairman), N N Broadhurst, J M J Keenan
The Remuneration Committee, which meets at least twice a year and on other occasions when circumstances require, comprises independent non-executive Directors and has responsibility for determining Company policy on executive remuneration for approval by the Board. It also determines specific remuneration packages and compensation packages on employment or early termination of office for each of the executive Directors of the Company. The Committee takes independent advice from consultants as and when required. All decisions of the Remuneration Committee in respect of remuneration packages of executive Directors are referred to the Board. No executive Director takes part in any discussion or decision concerning his own remuneration. The Remuneration Committee also monitors the compensation packages of other senior executives in the Group below Board level.
c) Nomination Committee
D B Newlands (Chairman), N N Broadhurst, J M J Keenan, K J Minton, Sir Brian Pitman, M F Wallach
The Nomination Committee makes recommendations to the Board on all proposed appointments of Directors through a formal and transparent procedure. The Committee meets as and when required.
In accordance with the Company’s Articles of Association, Directors are subject to re-appointment at the Annual General Meeting immediately following the date of their appointment, and thereafter they have to seek re-appointment no more than three years from the date they were last re-appointed. The Committee recommends to the Board the names of the Directors who are to seek re-appointment at the Annual General Meeting in accordance with the Company’s Articles of Association.
During the year, no new Board appointments were made. Accordingly, the Nomination Committee was not called upon to initiate a recruitment process, but the Committee and Board are aware of, and support, the principles set out in section A.4 of the Combined Code relating to appointments to the Board.
d) Health, Safety and Environment Committee
K J Minton (Chairman), J Nicol, M F Wallach
The Health, Safety and Environment Committee meets at least four times a year. The Committee is chaired by an independent non-executive Director and its membership also includes the Chief Executive Officer. Its principal role is to determine, on behalf of the Board, the framework or broad policy and objectives in the areas of health, safety and the environment (“HSE”) and propose any amendments to existing policies for approval by the Board. It also reviews management’s performance in the achievement of HSE objectives and reviews HSE reports produced by business units for compliance with all local health, safety and environmental codes of practice, legislation and relevant industry practice. More details of the work of the Health, Safety and Environment Committee can be found in the Corporate Social Responsibility report in the Annual Review, a separate report to shareholders.
e) General Purposes Committee
J Nicol (Chairman), K Lever, E H Lewzey, J E Middleton, N C Porter, K A Sullivan, M T Swain, N P Wilkinson
The General Purposes Committee meets as and when required. It comprises executive Directors and senior executives and the quorum requires the presence of at least one executive Director. The Committee deals principally with day-to-day matters of a routine nature and matters delegated to it by the Board.
4. Board, Committee and individual evaluations
Under the direction of the Chairman, evaluations of the effectiveness of the Board, its Committees and individual Directors were conducted during the year. The evaluation processes built on the experiences of the previous year’s Board evaluation and concentrated on six key elements: (i) the optimum mix of skills and knowledge amongst the Directors; (ii) clarity of goals and processes; (iii) tailoring the evaluation to the specific circumstances of Tomkins; (iv) the culture of candor that encourages constructive evaluation; (v) regular reviews of assessment criteria; and (vi) full disclosure of procedures and criteria to the Board.
a) Board evaluation
The results of the second Board evaluation were that progress continues to be made in improving the effectiveness of the Board and that a number of small changes to processes and procedures may improve performance even further. In line with 2003, the evaluation found that the wide range of skills and experience of the present group of Directors provided a sound basis for an effective Board. The current Board structure was felt to serve the Company well and with the matter of succession under periodic review, no change to the structure was felt necessary. Directors considered that financial and operational reporting to the Board were of a high standard, and suggestions were made on improving the reporting even further. The matters identified in the Board performance evaluation have been considered by the Board and action has been taken to address them.
b) Committee evaluations
This was the first year that a formal evaluation of Board Committees has taken place. The Committees evaluated were the Audit Committee, the Remuneration Committee and the Nomination Committee. The Health, Safety and Environment Committee and the General Purposes Committee were not included in the evaluation this year, but consideration will be given as to whether these committees should be included in future evaluations. The process of evaluation included inviting all Directors to give their views on the effectiveness of the respective Board committees and, in the case of the Audit Committee, the views of a number of other parties were sought. There was general agreement that each Committee carries out its duties and obligations effectively, is made up of independent
47
non-executive Directors, and has the appropriate mix of skills and experience and, in the case of the Audit Committee, recent and relevant financial experience. Committee members acknowledged that they receive concise background material of appropriate quality and detail in sufficient time to allow for proper consideration and preparation. Committees met often enough during the course of the year to deal with their respective business and meetings were conducted in a manner that encouraged open communication, meaningful participation and the proper resolution of issues. It was generally recognized that the chairman of each Committee facilitated but did not overly influence Committee meetings. Suggestions were made in respect of improvements to reports to the Audit Committee (e.g. corporate governance) and to the Remuneration Committee (e.g. the latest developments in executive remuneration).
c) Individual evaluations
Individual evaluations of both the executive and non-executive Directors were conducted by the Chairman. The evaluations built upon comments made in respect of the Board and Committee evaluations and Directors were able to express more personal views to the Chairman. The Chairman has concluded that each Director continues to make an effective contribution to the work of the Board, they are well prepared and informed concerning items to be considered by the Board, have a good understanding of the Company’s businesses and their commitment to the role remains strong (evidenced by the attendance records set out in this report). The performance of the Chairman is ordinarily reviewed annually by the Board in his absence, led by the senior independent Director.
5. Accountability and audit
1. Financial reporting
The Board, through the Business, Operating and Financial reviews, seeks to provide a detailed understanding of each business of the Group. In conjunction with the Chairman’s statement, the Chief Executive’s statement, the Overview of principal markets and the Directors’ report, the Board seeks to present a balanced and understandable assessment of the Company’s position and prospects.
The above statements are included in the Annual Review, a separate report to shareholders.
2. Internal control
Further information on the internal control environment within which Tomkins operates may be found on page 49.
3. Going concern
The Directors are confident, on the basis of current financial projections and facilities available, that the Company and the Group have adequate financial resources to continue in operation for the foreseeable future. For this reason, the Directors continue to adopt the going concern basis in preparing the financial statements.
4. “Whistleblower” reporting procedures
Under section 301 of the Sarbanes-Oxley Act of 2002, all public companies, including non-US public companies such as Tomkins, acting through the Audit Committee of the Board, must provide a procedure for the receipt, retention and treatment of complaints received by the Company regarding accounting, internal controls or auditing matters. The Audit Committee and the Board have agreed a procedure for the confidential and anonymous submission by employees of concerns regarding these matters.
6. Relations with shareholders
The Company places a high degree of importance on maintaining good relationships and communications with both institutional and private investors and ensures that shareholders are kept informed of significant Company developments.
In order to assist members of the Board to gain an understanding of the views of institutional shareholders, at each of its meetings the Board receives an Investor Relations Report, which covers a wide range of matters including a commentary on the perception of the Company and views expressed by the investment community. Analysts’ reports are also made available to all Directors. The announcement of quarterly, interim and final results provides opportunities for the Company to answer questions from institutional shareholders covering a wide range of topics. The Chairman, Chief Executive Officer and Finance Director hold a regular dialogue with institutional shareholders to ensure the mutual understanding of objectives. Regular reports are made to non-executive Directors by the Chairman, Chief Executive Officer and Finance Director of the key points to emerge from meetings they have had with substantial shareholders. The Chief Executive Officer participates in industry conferences organized by investment banks, which are attended by existing and potential shareholders, and he holds regular meetings with analysts and institutional shareholders. The Company exercises care to ensure that all price-sensitive information is released to all shareholders at the same time, as required by the Listing Rules of the Financial Services Authority and Regulation FD in the US.
The Company’s website provides shareholders and potential investors with information about the Company, including annual and interim reports, trading updates, recent announcements, investor presentations, share price information, Group policies and the terms of reference of its Board Committees. Shareholders are also able to put questions to the Company via its website.
The Company aims to deal expeditiously with all enquiries from shareholders on a wide range of matters. Shareholders also have the opportunity to attend the Annual General Meeting to put questions to the Chairman and to the chairmen of Board Committees. The Chief Executive Officer gives a presentation to shareholders covering a wide range of matters affecting the Company and its business and shareholders have the opportunity to ask him questions. The Company indicates the level of proxy votes lodged in respect of each resolution proposed at its Annual General Meeting following each vote on a show of hands. In the event of a poll being called, the result will be published as soon as possible after the conclusion of the Annual General Meeting. Directors also meet informally with shareholders before and after the meeting. The Company keeps under review ways in which it can communicate more effectively with its shareholders throughout the year, as well as at the Annual General Meeting.
It has been the Company’s practice to send the Notice of the Annual General Meeting and related papers to shareholders at least 20 working days before the meeting and to propose separate resolutions on each substantially separate issue.
Institutional shareholders
The Board notes that Section 2 of the Combined Code seeks to encourage more active participation by institutional shareholders including entering into a dialogue with companies and making considered use of their votes – principles which the Company supports.
48
Compliance statement
The Listing Rules of the Financial Services Authority require the Board to report on compliance with the provisions contained in Section 1 of the Combined Code. Tomkins considers that throughout the year to January 1, 2005 the Company has been in compliance with the Code provisions set out in Section 1 of the July 2003 FRC Combined Code on Corporate Governance, except for those matters indicated in the Remuneration Committee Report.
The certifications of the Chief Executive Officer and Finance Director required under section 302 of the US Sarbanes-Oxley Act of 2002, and the related rules of the US Securities and Exchange Commission, will be filed as exhibits to this document. In July 2005, Mr. Nicol will certify to the New York Stock Exchange, pursuant to Section 303A.12(b), that he is unaware of any violations by the Company of the New York Stock Exchange’s corporate governance listing standards.
The Company has placed on its website a general summary of the significant ways in which the Company’s corporate governance differs from that followed by domestic US companies under the New York Stock Exchange’s listing standards, as required by section 303A.11
Internal Control
The Directors have overall responsibility for the Group’s system of internal control and for reviewing its effectiveness. To fulfill this responsibility the Directors have established a planning, control and performance management framework within which each of the Group’s businesses operates. Within this framework, the management of each of the businesses considers strategic, operational, commercial and financial risks and identifies risk mitigation actions. Whilst acknowledging the overall responsibility for the system of internal control, the Directors are aware that the system is designed to manage rather than eliminate the risk of failure to achieve business objectives and can provide reasonable and not absolute assurance against material misstatement or loss.
During the period under review, the Directors were not aware of any control breakdowns which resulted in a material loss.
The planning, control and performance management framework, which includes an ongoing process for identifying, evaluating and managing the significant risks faced by the Group, has been in place throughout the financial year and up to the approval date of the Directors’ Report and Accounts. Each business unit’s management identifies and assesses the key business risks affecting the achievement of its objectives. Business unit management also identifies the risk management processes used to mitigate the key risks to an acceptable level and, where appropriate, additional actions required to further manage and mitigate them. The risk summaries developed out of this process are updated at least annually. In addition, Corporate Center management considers those risks to the Group’s strategic objectives that may not be identified and managed at the business unit level.
In connection with quarterly business reviews, relevant executives discuss risk management activities with Corporate Center management. The key risks and mitigation strategies are also discussed at least annually with the Audit Committee as well as the full Board.
The risk management processes described above are applied to major decision-making processes such as acquisitions as well as operational risks within the business including environmental, health and safety. The other key elements of the Performance Management System, which constitutes the control environment, are:
Business strategy reviews– each business is required to prepare a strategic position assessment taking into account the current and likely future market environment and competitive position of the business with specific consideration given to strategic risk. The Corporate Center management reviews the strategy with each business and the Board is presented with a summary of the plans.
Business reviews – on a quarterly basis, Corporate Center management performs extensive reviews with each business. These reviews consider current and projected financial and operating results, and address the progress of key strategic and operating initiatives, the risks affecting their achievement and the actions being taken by business unit management to manage the risks and achieve their objectives.
Financial plans– each business prepares financial plans in accordance with a defined format, which includes consideration of risks. To the extent risks are both reasonably estimable and likely to occur, they are reflected specifically in the respective business’ plan. Management at the Corporate Center reviews the financial plans with the business units and a summary is presented to the Board for approval.
Balance sheet reviews – business unit and Corporate Center financial management conduct periodic, on-site reviews of underlying rationale and support for the significant line item components comprising the balance sheets for each business in the Group.
Capital authorization approval– all significant capital expenditures are subject to a formal capital authorization process, which takes into account, inter alia, operational, financial and technical risks. For significant capital projects, a post-investment analysis is completed to facilitate continuous improvement in the capital planning process, including risk identification and mitigation.
Reporting, analysis and forecasts– all businesses are required to report monthly to the Corporate Center on financial performance. Comparisons are made with plan, forecast and prior year and significant variances and changes in the business environment are explained. Each business reassesses its forecast for the financial year on a monthly basis. Quarterly, each business prepares a forecast for the following eighteen months and reviews projections for the current and following year.
49
Financial strategy– the financial strategy includes assessment of the major financial risks related to interest rate exposure, foreign currency exposure, debt maturity and liquidity. There is a comprehensive global insurance program using the external insurance market and some limited use of an internal captive insurance company. Group Treasury manages hedging activities, relating to financial risks, with external cover for net currency transaction exposures. The Group Tax function manages tax compliance and tax risks associated with the Group’s activities. The Audit Committee, through the Finance Committee, oversees the financial strategy as well as the tax strategy and considers the associated risks and risk management techniques being used by the Group.
Reporting certifications – in connection with the preparation of the annual and quarterly financial statements, senior business general management and financial management sign a certificate which includes a declaration regarding the existence of internal controls, the proper recording of transactions and the identification and evaluation of significant business risks. These certifications were expanded to encompass Section 302 of the Sarbanes-Oxley Act of 2002 in support of statements required to be made by Tomkins’ Chief Executive and Chief Financial Officers. See further discussion of Sarbanes-Oxley overleaf.
Sarbanes-Oxley – as a foreign private issuer (FPI) listed on the NYSE in the US, the Group is subject to the provisions of the Sarbanes-Oxley Act of 2002 (the “Act”). In particular, Section 404 of the Act requires certifications by management regarding the effectiveness of internal controls over financial reporting and requires the independent auditors to express an opinion on the Board’s assertions regarding such internal controls. Accordingly, the Group has undertaken a project to ensure Tomkins is in compliance with the requirements of Section 404 of the Act by December 31, 2006 (the effective date for the Group as a FPI). While the certification and external audit opinion on internal controls over financial reporting will be reported in Tomkins’ US SEC filings, the results of Tomkins’ compliance with the Act will serve to further strengthen the internal control framework for the Group.
The Group has an established internal audit function; the Vice President – Business Risk Assurance directs the activities of the internal auditors on a day-to-day basis and reports directly to the Audit Committee of the Board at least four times a year. Due to the importance and significance of the effort required to achieve Sarbanes-Oxley compliance, during 2004 the Board has directed substantially all internal audit resources towards supporting the Sarbanes-Oxley project described above. As a result, internal audit is primarily focused on risks and controls over financial reporting.
In 2004, internal audit’s support has primarily been assisting management in completing controls documentation, assessing design effectiveness and developing test plans. Internal audit’s support is expected to continue in 2005 and 2006 but will shift to testing the operating effectiveness of controls in higher risk areas and providing the Board with assurance over management’s testing process in other risk areas. However, with the recently announced one-year Sarbanes-Oxley compliance extension for FPIs, it is likely that some proportion of internal audit resources will be deployed to perform internal audit reviews in areas other than financial reporting controls in 2005 and 2006.
As part of their financial audit responsibilities, the independent auditors also provide reports to the Audit Committee on the operation of internal controls affecting key financial processes. The Directors confirm that the effectiveness of the system of internal control for the year ended 1 January 2005 has been reviewed in line with the criteria set out in the guidance for directors in the Combined Code “Internal Control” document issued in September 1999.
D. Employees
The number of employees at period end within each of Tomkins’ business segments was as follows:
| | | | | | | | | | | | | | | | |
| | | Fiscal 2004
| | Fiscal 2003
| | Eight months to
December 31, 2002
| | Fiscal 2002
|
| | | Period
end
number
| | percent of
Tomkins
employees
| | Period
end number
| | percent of
Tomkins
employees
| | Period
end
number
| | percent of
Tomkins
employees
| | Period
end number
| | percent of
Tomkins
employees
|
Air Systems Components | | 6,334 | | 17.4 | | 6,313 | | 16.8 | | 6,594 | | 16.7 | | 6,970 | | 17.5 |
Engineered & Construction Products | | 6,273 | | 17.2 | | 7,722 | | 20.6 | | 10,083 | | 25.6 | | 9,974 | | 25.0 |
Industrial & Automotive | | 23,772 | | 65.2 | | 23,380 | | 62.4 | | 22,695 | | 57.5 | | 22,820 | | 57.3 |
Center | | 60 | | 0.2 | | 68 | | 0.2 | | 70 | | 0.2 | | 61 | | 0.2 |
| | |
| |
| |
| |
| |
| |
| |
| |
|
Total | | 36,439 | | 100.0 | | 37,483 | | 100.0 | | 39,442 | | 100.0 | | 39,825 | | 100.0 |
| | |
| |
| |
| |
| |
| |
| |
| |
|
As of January 1, 2005, 55 percent of the Company’s employees were located in the United States, 5 percent in the United Kingdom, 8 percent in continental Europe and 32 percent in the rest of the world. As of January 3, 2004, 56 percent of the Company’s employees were located in the United States, 7 percent in the United Kingdom, 8 percent in continental Europe and 29 percent in the rest of the world. As of December 31, 2002, 58 percent of the Company’s employees were located in the United States, 8 percent in the United Kingdom, 8 percent in continental Europe and 26 percent in the rest of the world. As of April 30, 2002, 57 percent of the Company’s employees were located in the United States, 9 percent in the United Kingdom, 8 percent in continental Europe, and 26 percent in the rest of the world. There have been no significant work stoppages or labor disputes by Tomkins’ employees in any of the last five years.
Each Group company is encouraged to implement comprehensive employment policies designed to identify employees with its achievements and also determine ways in which their knowledge and skills can best contribute towards the Company’s success. Schemes are introduced to ensure that loyalty and performance are properly rewarded.
Employee involvement and communication programs continue to be developed and are designed to provide equal opportunity to all, irrespective of sex, race, religion or color. Each Group company endeavors to provide equality of opportunity in recruiting, training, promoting and developing the careers of disabled persons.
50
E. Share ownership
As of June 6, 2005, the directors of the Company, and the directors and officers of the Company as a group owned the number of Ordinary Shares and the percentage of such total number of shares outstanding on such date as set forth below.
The executive directors, as potential beneficiaries, are technically deemed to have an interest in all Ordinary Shares held by or in which the trustees of the Tomkins Employee Share Trust (the “Trust”) are interested. The table includes, however, only those Trust shares which are specifically allocated to the individual director under the terms of the ABIP, RSP, the SMS and the LTLP.
| | | | | | | | | |
Identity of Person or Group
| | Amount Owned
| | Percent of Class
|
| | Beneficial
| | | Non-beneficial
| | Beneficial
| | Non-beneficial
|
Ordinary Shares | | | | | | | | | |
Executive directors | | | | | | | | | |
J. Nicol | | 1,478,305 | (1) | | — | | * | | — |
K. Lever | | 377,022 | | | — | | * | | — |
| | | | |
Non-executive directors | | | | | | | | | |
D.B. Newlands | | 306,515 | | | 20,000 | | * | | * |
N.N. Broadhurst | | 12,000 | | | — | | * | | — |
J.M.J Keenan | | 15,185 | | | — | | * | | — |
K.J. Minton | | 108,000 | | | — | | * | | — |
Sir Brian Pitman | | 13,717 | | | — | | * | | — |
M.F. Wallach | | 117,000 | (2) | | — | | * | | — |
| | | | |
Executive officers | | 1,097,987 | (3) | | — | | * | | — |
| | | | |
Directors and officers as a Group (sixteen persons) | | 3,525,731 | | | 20,000 | | * | | — |
| | | | |
Preference shares | | | | | | | | | |
M.F. Wallach | | | | | | | | | |
- $50 convertible cumulative | | 240,244 | | | 112,537 | | 2.29 | | 1.07 |
| (1) | Held as 26,000 ADSs and 1,374,305 Ordinary Shares. |
| (2) | Held as 27,000 ADSs and 9,000 Ordinary Shares. |
| (3) | Held as 8,850 ADSs and 1,062,587 Ordinary Shares. |
Since 1984, the Company has operated executive share option schemes that give its senior employees the right to subscribe for shares in the future at prices fixed when the rights are granted. The Company also operates savings related share option schemes for the general body of employees in the United Kingdom. Such schemes are approved by shareholders and options may not be granted under a scheme more than ten years after its approval by shareholders.
The Tomkins Executive Share Option Scheme (No. 2) (“ESOS 2”), The Tomkins Executive Share Option Scheme No. 3 (“ESOS 3”) and The Tomkins Executive Share Option Scheme No. 4 (“ESOS 4”)
ESOS 2 has expired for grant purposes, and the last options that remained outstanding were exercised in accordance with the rules of the scheme during the year. ESOS 3 is an Inland Revenue-approved scheme. ESOS 4 is not approved by the Inland Revenue and the options under both schemes mature after three years. ESOS 4 options in excess of four times a participant’s annual earnings are only exercisable after five years subject to the achievement of more stringent performance conditions, namely that growth in the Company’s earnings per share over the five-year period must be such that it would place the Company in the top quartile of a league table for companies in the FTSE 100 index. The performance condition for ESOS 3 and ESOS 4 requires that the growth in Tomkins’ earnings per share must exceed the growth in the Retail Prices Index by an average of 2 per cent per annum over a three-year period before an option can be exercised, which was in accordance with contemporary practice when the schemes were introduced in 1995.
As stated above, ESOS 3 and ESOS 4 lapsed on May 9, 2005 and the Remuneration Committee and the Board have decided, at this time, not to continue with an executive share option scheme beyond that date. The final general grant of options under ESOS 4 was made in November 2004 and, having taken account of the comments made by Research Recommendations Electronic Voting (representing the National Association of Pension Funds and ISS) in their 2004 Annual Report on Tomkins concerning the conditions under which options are granted, the conditions of the final grant of options were amended so that no re-testing of the performance condition in respect of that grant will be permitted.
Tomkins Premium Priced Option
This was an option specifically and solely granted to James Nicol as part of the incentive package on his joining Tomkins. No performance conditions were attached to this option in order to attract him to the Company and retain his services and this therefore does not comply with Schedule A of the Combined Code. It consists of a non-transferable option to acquire 5,076,142 shares granted on February 11, 2002. The exercise price is 197 pence per share in respect of 2,538,072 shares (A option shares), 276 pence per share in respect of 1,522,842 shares (B option shares) and 345 pence per share in respect of 1,015,228 shares (C option shares). The options have all vested and will lapse on 11 February 2012 or earlier in certain circumstances.
51
Ongoing Option
This was an option specifically and solely granted to James Nicol on 11 February 2002 as part of the incentive package to attract him to the Company. It consisted of a non-transferable option to acquire 1,522,842 shares at 197 pence per share, which was not capable of exercise until on or after 18 February 2005 provided the rate of increase of earnings per share over any three-year period is equal to or greater than the rate of increase of the Retail Prices Index plus 9 per cent. There are provisions for waiving or amending the performance condition in certain circumstances and, if there is a change of control of the Company, the option is exercisable immediately, regardless of whether the performance condition is satisfied. The option will lapse on 11 February 2012 or earlier in certain circumstances.
If there is a variation in the share capital of the Company the Remuneration Committee may adjust the number of shares in either the Premium Priced Option or the Ongoing Option as it reasonably deems appropriate to take account of the variation.
At June 6, 2005, options, including options granted to directors and officers, to subscribe for 27,652,694 Ordinary Shares were outstanding under the Company’s executive share option schemes at prices ranging from 150 pence to 345 pence. At that date, options over 5,079,142 of those shares were exercisable. The exercise dates for the options range from June 6, 2005 to November 28, 2014.
Director’s options over Ordinary Shares as of June 6, 2005, were:
| | | | | | | | | | | |
| | | Scheme
| | Dates of grant
| | Dates of expiry
| | Price
| | June 6, 2005 Number
|
J. Nicol | | Prem. Priced (1) | | February 11, 2002 | | February 10, 2012 | | 197.00p | | | 2,538,072 |
| | | Prem. Priced(1) | | February 11, 2002 | | February 10, 2012 | | 276.00p | | | 1,522,842 |
| | | Prem. Priced(1) | | February 11, 2002 | | February 10, 2012 | | 345.00p | | | 1,015,228 |
| | | Ongoing(1) | | February 11, 2002 | | February 10, 2012 | | 197.00p | | | 1,522,842 |
| | | ESOS 4 | | January 17, 2003 | | January 16, 2013 | | 208.25p | | | 1,440,576 |
| | | ESOS 4 | | December 12, 2003 | | December 11, 2013 | | 265.75p | | | 1,128,880 |
| | | SAYE 2 | | April 19, 2004 | | November 30, 2009 | | 204.00p | | | 8,014 |
| | | ESOS 4 | | November 29, 2004 | | November 28, 2004 | | 248.75p | | | 1,206,030 |
| | | | | | | | | | |
|
|
| | | | | | | | | | | | 10,382,484 |
| | | | | | | | | | |
|
|
K. Lever | | ESOS 3 | | November 8, 1999 | | November 7, 2009 | | 215.00p | | | 13,950 |
| | | ESOS 4 | | November 8, 1999 | | November 7, 2009 | | 215.00p | | | 235,050 |
| | | ESOS 4 | | January 19, 2001 | | January 18, 2011 | | 171.00p | | (2) | 329,000 |
| | | ESOS 4 | | July 3, 2002 | | July 2, 2012 | | 244.75p | | | 150,000 |
| | | ESOS 4 | | January 17, 2003 | | January 16, 2013 | | 208.25p | | | 150,000 |
| | | ESOS 4 | | December 12, 2003 | | December 11, 2013 | | 265.75p | | | 200,000 |
| | | SAYE 2 | | April 19, 2004 | | November 30, 2009 | | 204.00p | | | 8,014 |
| | | ESOS 4 | | November 29, 2004 | | November 28, 2004 | | 248.75p | | | 250,000 |
| | | | | | | | | | |
|
|
| | | | | | | | | | | | 1,336,014 |
| | | | | | | | | | |
|
|
Other executive | | ESOS 4 | | February 3, 1999 | | February 2, 2009 | | 247.50p | | | 200,000 |
officers(3) | | ESOS 4 | | November 8, 1999 | | November 7, 2009 | �� | 215.00p | | | 90,000 |
| | | ESOS 4 | | February 19, 2001 | | February 18, 2011 | | 170.50p | | | 296,000 |
| | | ESOS 4 | | July 3, 2002 | | July 2, 2012 | | 244.75p | | | 354,000 |
| | | ESOS 3 | | January 17, 2003 | | January 16, 2013 | | 208.25p | | | 14,405 |
| | | ESOS 4 | | January 17, 2003 | | January 16, 2013 | | 208.25p | | | 404,595 |
| | | ESOS 4 | | July 18, 2003 | | July 17, 2013 | | 246.50p | | | 200,000 |
| | | ESOS 4 | | September 1, 2003 | | August 31, 2013 | | 262.75p | | | 150,000 |
| | | ESOS 4 | | December 12, 2003 | | December 11, 2013 | | 265.75p | | | 755,000 |
| | | SAYE 2 | | April 19, 2004 | | November 30, 2009 | | 204.00p | | | 16,028 |
| | | ESOS 4 | | November 29, 2004 | | November 28, 2004 | | 248.75p | | | 975,000 |
| | | | | | | | | | |
|
|
| | | | | | | | | | | | 3,455,028 |
| | | | | | | | | | |
|
|
| 1. | See details in section B. Compensation; J. Nicol. |
| 2. | The grant to K. Lever of 329,000 shares on January 19, 2001 fulfilled an obligation under his terms of appointment on November 1, 1999. |
| 3. | Officers whose compensation information is not publicly disclosed on an individual basis. |
52
Former director’s options over Ordinary Shares as of June 6, 2005, were:
| | | | | | | | | | |
| | | Scheme
| | Dates of grant
| | Dates of expiry
| | Price
| | June 6, 2005 Number
|
A.J. Reading | | ESOS 4 | | July 3, 2002 | | January 2, 2006 | | 244.75p | | 150,000 |
| | | ESOS 4 | | January 17, 2003 | | July 16, 2006 | | 208.25p | | 150,000 |
| | | | | | | | | | |
|
| | | | | | | | | | | 300,000 |
| | | | | | | | | | |
|
Employee Share Plans
The Tomkins Savings Related Share Option Scheme No. 2 (“SAYE 2”)/Tomkins 2005 Sharesave Scheme
These are standard Inland Revenue-approved savings related share option schemes, which are open to employees who are resident for tax purposes in the United Kingdom. Options over 1,514,732 shares were granted under SAYE 2 during the year. SAYE 2 expired on May 9, 2005 and was replaced by the Tomkins 2005 Sharesave Scheme, which was approved by shareholders on May 19, 2005.
At June 6, 2005, options, including options granted to directors and officers, to subscribe for 1,612,869 Ordinary Shares were outstanding under the Company’s savings related share option scheme at prices ranging from 204.00p to 218.40p. At that date, no options were exercisable. The exercise dates for the options range from June 1, 2009 to November 30, 2010.
Non-executive directors are not eligible for the grant of share options.
Long term incentive plans
Deferred Matching Share Purchase Plan
This was specifically and solely introduced for James Nicol as part of the incentive package to attract him to the Company. Under this Plan, 3,045,684 shares (“Matching Shares”) were awarded on February 11, 2002 following the purchase by James Nicol of 1,015,228 Tomkins plc shares. On February 18, 2005, the award vested in respect of 1,015,228 Matching Shares and of the remaining 2,030,456 Matching Shares, 454,752 vested and the balance lapsed. The number of shares which vested was calculated on the basis of the highest price of a Tomkins share sustained over a five-day period during the six-month period ended February 18, 2005 (285.25 pence), to the extent that, for every 1 penny that the share price increased over 197 pence, being the market price on February 18, 2002, up to a maximum of 591 pence, James Nicol was entitled to receive 5,153 shares. Under the terms of his contract, Mr Nicol elected to receive a cash payment of $7.7 million (subject to statutory deductions) in lieu of shares.
Closed schemes
The Tomkins Restricted Share Plan (“RSP”), The Tomkins Share Matching Scheme (“SMS”) and The Tomkins Long Term Loyalty Plan (“LTLP”)
The RSP closed in July 2001. It required either an element of annual cash bonus to be taken in restricted shares in the form of a Trustee Award, or employees could acquire further shares in the Company in the form of a Company Award, using cash bonuses already paid to them. No further awards will be made under the RSP, though existing obligations in respect of the RSP will be honored.
Trustee or Company Awards which had been made under the RSP and which had vested, were eligible for matching awards under the SMS. Such awards could be for up to two conditional share matching awards vesting a further two years and four years respectively after the end of the RSP restricted period. Each award was for the same number of ordinary shares vesting under the RSP, with proportionate reductions to the matching awards on a disposal of any vested shares. When existing commitments to match RSP awards have been satisfied, the SMS will close.
The LTLP vested in full in 2004 and the scheme is now closed.
With shareholder approval, these share schemes were introduced in 1995 and 1996 with no performance conditions attached and accordingly they do not comply with Schedule A of the Combined Code.
As of June 6, 2005, the Trustees held no shares under the RSP. As of June 6, 2005, the Trustees held 78,820 Ordinary Shares on behalf of 13 participants including directors and officers under the Share Matching Scheme. 67,451 shares allocated on November 25, 2003 will be released on November 25, 2005 and 11,369 Ordinary Shares allocated on October 14, 2004 will be released on October 14, 2006 if not forfeited or vested before those dates. In addition 2,540,388 Ordinary shares were held in Treasury or by the trustees on June 6, 2005 in order to satisfy current and future awards under the Annual Bonus Incentive Plan .
53
Item 7. Major Shareholders and Related Party Transactions
A. Major shareholders
The Company’s issued share capital as of January 1, 2005 consisted of 773,889,884 Ordinary Shares, nominal value 5p per share, and 10,506,721 convertible cumulative preference shares, nominal value US$50 per share.
As of June 6, 2005, 774,361,143 Ordinary Shares and 10,476,256 convertible cumulative preference shares were outstanding. As of that date, 1,189,558 Ordinary Shares were held by 201 registered holders with a registered address in the United States; 10,129,293 ADRs were held of record by 135 registered holders with a registered address in the United States; and 10,465,420 convertible cumulative preference shares were held by 28 registered holders with a registered address in the United States. Since certain of the Ordinary Shares and ADRs were held by brokers and nominees, the number of record holders in the United States may not be representative of the number of beneficial holders or of where the beneficial holders are resident.
The convertible cumulative preference shares are convertible at any time at the shareholder’s option into fully paid Ordinary Shares at a rate of 9.77 Ordinary Shares per convertible cumulative preference share. The Company has the option (i) to redeem all but not some only of the convertible cumulative preference shares at any time that the total amount of convertible cumulative preference shares issued and outstanding is less than 10 percent of the amount originally issued and (ii) to redeem, on or after July 29, 2006, all or any of the convertible cumulative preference shares outstanding at that time.
At the date of issue, the conversion price of the preference shares was 334p per Ordinary Share.
Upon liquidation of the Company or otherwise (other than on redemption or repurchase of shares), the assets of the Company available to shareholders will be applied first to repay paid-in or credited capital together with all arrears and accruals of dividend to the holders of the convertible cumulative preference shares and any other classes of shares ranking pari passu with the convertible cumulative preference shares as to capital.
Until such time as the shares are converted or redeemed, the convertible cumulative preference shares have a right to receive dividends, at an annual rate of 5.560 percent, in preference to the holders of the Ordinary Shares.
The holders of the convertible cumulative preference shares are entitled to vote at a general meeting of the Company on the following basis:
| | • | | on a show of hands, each holder will have one vote; and |
| | • | | on a poll, each holder will have one vote in respect of every seven fully paid Ordinary Shares to which the holder would be entitled on the full exercise of his conversion rights; provided that if two or more consecutive quarterly dividends are in arrears, each holder shall have one vote on a poll in respect of every fully paid Ordinary Share to which the holder would be entitled on the full exercise of his conversion rights until such time as any arrears of dividends have been paid in full. |
Except as set forth above with respect to holders of convertible cumulative preference shares, shareholders of the Company do not have different voting rights.
To the Company’s knowledge, no person or entity, other than those shown below is the owner of more than 3 percent of its outstanding Ordinary Shares, nor is the Company directly or indirectly owned or controlled by any corporation, by any government or by any other natural or legal person or persons, severally or jointly.
| | | | |
Identity of Person or Group
| | Number of Ordinary Shares (as of June 6, 2005)
| | Percent of Tomkins Ordinary
Share capital
|
Schroder Investment Management Limited and Schroders Plc(1) | | 62,022,171 | | 8.01 |
Legal & General Investment Management Ltd(1) | | 45,368,978 | | 5.86 |
Bear Creek Inc.(2) | | 90,399,455 | | 10.45 |
| (1) | Based solely on analysis of the share register on May 2, 2005. |
| (2) | Consists of 9,252,759 convertible cumulative preference shares which are convertible into Ordinary Shares at any time at the election of the shareholder on the basis of 9.77 Ordinary Shares for each convertible cumulative preference share, based solely on amendment No 1 to schedule 13D filed by Bear Creek Inc. According to that filing, Bear Creek inc. serves as the trustee of approximately 73 trusts owned by Charles Gates and other former shareholders of the Gates Corporation, which the Company acquired in July 1996 in exchange for convertible cumulative preference shares. The percentage figures for Bear Creek Inc. have accounted for the impact on share capital of the conversion of preference shares into Ordinary Shares through which they are deemed to have an interest in Ordinary Shares. |
Significant changes in shareholders owning more than 5 percent of the Ordinary Share Capital of Tomkins over the past three years are as follows; Schroder Investment Management Limited increased their holding to 8.01 percent at June 6, 2005 from 7.46 percent at May 10 2004 having been 8.14 percent at May 19, 2003, 7.52 percent as of October 11, 2002 and 12.86 percent as of August 9, 2001. Legal & General Investment Management Ltd increased their holding to 5.86 percent as of June 6, 2005 from 4.41 percent as of May 10, 2004 and 3.55 percent as of May 19, 2003. Bear Creek Inc.’s deemed interest in Ordinary Shares decreased to 10.45 percent as of June 6, 2005 from 10.47 percent as of May 10,2004, 20.61 percent as of June 6, 2003 and October 11, 2002 having been 20.62 percent as of October 5, 2001.(2)
There are no arrangements currently known to the Company that would result in a change in control of the Company.
54
B. Related party transactions
In the current year the Company entered into an agreement with ICG, LLC and GForce Aviation, LLC to obtain an indefinite number of aircraft flying hours at the rate of $1,500 per hour, plus $1,300 per day crew, plus $1,700 per month insurance fee, for use by the employees for corporate purposes in circumstances where no other equivalent services are available, except at greater cost. ICG, LLC is owned by Charles Gates. Mr. Charles Gates’ interest and those of other family members in the preference shares of the Company are disclosed in the Directors Report. The Company entered into this transaction after careful consideration of all of the options available to reach the diverse locations of the Group in the United States. This transaction has been entered into on an arm’s length basis and in the normal course of business. During fiscal 2004 the Company purchased $145,705 of services from ICG, LLC under the arrangement. At January 1, 2005 a balance of $1,700 due to ICG, LLC was included in accounts payable.
There are no further transactions or proposed transactions with related parties that are material to the Company or to a related party.
C. Interests of experts and counsel
Not applicable.
55
Item 8. Financial Information
A. Consolidated statements and other financial information
See Item 18. “Financial Statements”.
Legal Proceedings
The group is, from time to time, party to legal proceedings and claims, which arise in the ordinary course of the business. The directors do not anticipate that the outcome of any of the above proceedings and claims, either individually or in aggregate, will have a material adverse effect upon the group’s financial position.
Dividend policy
See Item 3 - “Key Information – Dividends”.
B. Significant changes
For a description of significant changes occurring since January 1, 2005, see Note 21 to our consolidated financial statements included in this Annual Report.
56
Item 9. The Offer and Listing
A. Offer and listing details
The high and low closing prices of the ADSs on the New York Stock Exchange for the periods indicated are set forth below.
| | | | | | |
Fiscal Period
| | | | U.S. dollars per ADS
|
| | | | High
| | Low
|
2000 | | Year | | 19.00 | | 10.13 |
2001 | | Year | | 14.00 | | 7.75 |
April 2002 | | Year | | 15.59 | | 7.80 |
| | | Q1: May – July | | 11.50 | | 7.90 |
| | | Q2: August – October | | 12.10 | | 7.80 |
| | | Q3: November – January | | 12.70 | | 9.70 |
| | | Q4: February – April | | 15.59 | | 11.06 |
December 2002 | | Eight months | | 15.60 | | 12.10 |
| | | Q1: May – July | | 15.60 | | 13.78 |
| | | Q2: August – October | | 15.34 | | 12.12 |
| | | Two months to December 31, 2002 | | 13.60 | | 12.10 |
2003 | | Year | | 19.32 | | 11.16 |
| | | Q1: January – March | | 13.43 | | 11.16 |
| | | Q2: April – June | | 16.20 | | 11.25 |
| | | Q3: July – September | | 17.80 | | 15.11 |
| | | Q4: October - December | | 19.32 | | 16.97 |
2004 | | Year | | 20.53 | | 18.10 |
| | | Q1: January - March | | 20.14 | | 18.10 |
| | | Q2: April - June | | 20.53 | | 17.96 |
| | | Q3: July - September | | 19.87 | | 17.98 |
| | | Q4: October - December | | 20.39 | | 18.29 |
2005 | | Year | | 22.43 | | 18.51 |
| | | Q1: January - March | | 22.43 | | 19.64 |
| | | Q2: through June 6, 2005 | | 21.19 | | 18.51 |
| | | December 2004 | | 19.85 | | 19.22 |
| | | January 2005 | | 20.74 | | 19.64 |
| | | February 2005 | | 22.43 | | 20.90 |
| | | March 2005 | | 22.09 | | 20.05 |
| | | April 2005 | | 21.19 | | 18.60 |
| | | May 2005 | | 19.95 | | 18.51 |
| | | June 2005 through June 6, 2005 | | 19.89 | | 19.67 |
57
The following table sets forth, for the Fiscal periods indicated, the closing high and low middle market quotations for the Company’s Ordinary Shares on the London Stock Exchange. The table does not reflect trading after the daily official close of the London Stock Exchange for which no official quotations exist.
| | | | | | |
Fiscal Period
| | | | Pence per Ordinary Share
|
| | | | High
| | Low
|
2000 | | Year | | 299.50 | | 156.50 |
2001 | | Year | | 233.25 | | 138.00 |
April 2002 | | Year | | 271.00 | | 134.00 |
| | | Q1: May – July | | 206.75 | | 147.25 |
| | | Q2: August – October | | 211.00 | | 134.00 |
| | | Q3: November – January | | 223.00 | | 167.00 |
| | | Q4: February – April | | 271.00 | | 196.75 |
December 2002 | | Eight months | | 270.50 | | 187.50 |
| | | Q1: May – July | | 270.50 | | 218.00 |
| | | Q2: August – October | | 251.50 | | 190.50 |
| | | November and December | | 219.00 | | 187.50 |
2003 | | Year | | 288.50 | | 168.75 |
| | | Q1: January – March | | 208.25 | | 168.75 |
| | | Q2: April – June | | 245.00 | | 177.00 |
| | | Q3: July – September | | 278.75 | | 225.75 |
| | | Q4: October - December | | 288.50 | | 250.00 |
2004 | | Year | | 287.50 | | 241.75 |
| | | Q1: January - March | | 269.00 | | 245.25 |
| | | Q2: April – June | | 287.50 | | 253.75 |
| | | Q3: July - September | | 269.75 | | 241.75 |
| | | Q4: October - December | | 275.00 | | 245.00 |
2005 | | Year | | 290.00 | | 242.00 |
| | | Q1: January - March | | 290.00 | | 258.75 |
| | | Q2: through June 6, 2005 | | 276.25 | | 242.00 |
| | | November 2004 | | 267.75 | | 246.00 |
| | | December 2004 | | 254.25 | | 245.00 |
| | | January 2005 | | 271.00 | | 258.75 |
| | | February 2005 | | 290.00 | | 275.50 |
| | | March 2005 | | 280.50 | | 259.75 |
| | | April 2005 | | 276.25 | | 242.00 |
| | | May 2005 | | 271.25 | | 245.00 |
| | | June 2005 through June 6, 2005 | | 271.00 | | 266.25 |
The preference shares are not traded on any exchange. The shares are registered shares.
B. Plan of distribution
Not applicable.
C. Markets
The principal trading market for the Company’s Ordinary Shares is the London Stock Exchange.
ADSs, each representing four Ordinary Shares and evidenced by ADRs, have been issued pursuant to a sponsored ADR program, with The Bank of New York as depositary. The Company’s ADSs are listed on the New York Stock Exchange, under the symbol “TKS”.
D. Selling shareholders
Not applicable.
E. Dilution
Not applicable.
F. Expenses of the issue
Not applicable.
58
Item 10. Additional Information
A. Share Capital
Not applicable.
B. Memorandum and Articles of Association
General
The rights of the shareholders are set forth in the Memorandum and Articles of Association (together, the “Articles”) of the Company and are provided by applicable English law. The following summary of key provisions of the Articles is qualified in its entirety by reference to the Articles filed as an exhibit hereto.
The Company is incorporated in England and registered at Companies House under company number 203531. The main objects and purposes of the Company, set forth in Articles 4(a) to (c), are as follows:
| | • | | to co-ordinate and manage the business activities of the Company and generally to carry out the function of a group holding company; |
| | • | | to carry on the business of hardware manufacture and the manufacture of and dealing in minerals and metals, and all kinds of other connected goods; and |
| | • | | to carry on any other business of a similar nature which the Directors deem convenient for the Company to carry on, or consider will enhance or render more profitable the value of the Company’s property. |
Board of Directors
The Articles provide for a minimum of 2 and a maximum of 15 Directors. At every annual general meeting, no less than one-third of the Directors are required to retire from office and are eligible to stand for re-appointment at such meeting. Subject to the provisions of the Companies Act, the Board may from time to time appoint one or more Directors to an executive office on such terms and for such period as it may determine. No Director or executive officer has a service contract with the Company for more than two years’ duration.
A Director who has disclosed to the Board that he has an interest in any transaction or arrangement with the Company, may participate in such transaction or arrangement, but may not vote in respect of any such transaction. A Director may not be counted in the quorum of a meeting in relation to any resolution on which he is barred from voting.
The ordinary remuneration of the Directors (other than a Managing Director or an Executive Director) may not exceed an aggregate amount of £250,000 per annum as the Board (or any duly authorized committee thereof) may from time to time determine or such greater amount as the Company may, upon the recommendation of the Board, from time to time by ordinary resolution determine, to be divided among them in such proportion and manner as the Directors may determine or, failing agreement, equally. Any Director who (by arrangement with the Board) performs or renders any special duties or services outside his ordinary duties as a Director may be awarded extra remuneration (in addition to fees or ordinary remuneration) by way of a lump sum or salary or commission or participation in profits or otherwise. Directors are required to hold at least 5,000 Ordinary Shares each.
The Board may exercise all the powers of the Company to borrow money, mortgage property and assets and issue debentures and other securities. The Articles require the Board to restrict aggregate borrowings of the Company to one and a half times the share capital of the company plus capital reserves (calculated as set forth in the Articles).
Share Capital, Dividends and Voting Rights
The share capital of the Company is £79,258,211 divided into 1,585,164,220 Ordinary Shares, nominal value 5p per share and $1,956,000,000 divided into 13,920,000 U.S. dollar denominated voting Convertible Cumulative Preference Shares, nominal value $50 per share (“Perpetual Convertible Shares”) and 25,200,000 U.S. dollar denominated voting Convertible Cumulative Redeemable Preference Shares, nominal value $50 per share (“Redeemable Convertible Shares”).
Under Section 9 of the Companies Act, the Company may by special resolution at a general meeting of shareholders alter its Articles and thereby alter the rights of the shareholders of the Company. A special resolution is a resolution which can only be passed by a majority of no less than three-fourths of the shares entitled to vote which are voted. Whenever the share capital of the Company is divided into different classes of shares, the rights attached to any class may only be varied or abrogated either with the consent in writing of the holders of three-fourths of the issued shares of that class or with the sanction of an extraordinary resolution passed at a separate meeting of such holders. The Articles provide that the necessary quorum for a general meeting at which such an extraordinary general resolution may be passed is at least two persons holding or representing by proxy no less than one-third in nominal amount of the issued shares of that class.
The Perpetual Convertible Shares and the Redeemable Convertible Shares are entitled to be paid, in priority to any payment of dividend on any other class of shares, a fixed cumulative preferential dividend at a rate per annum per such share held fixed by the Board on issue of the shares, payable quarterly. Dividends are at the discretion of the Board. The Company in a general meeting of shareholders may declare dividends on the Ordinary Shares in its discretion by reference to an amount in pounds sterling or in a foreign currency, but dividends may not exceed the amount recommended by the Board. Dividends remaining unclaimed for 12 years after having been declared are forfeited and revert to the Company.
On a show of hands, each holder of Ordinary Shares, Perpetual Convertible Shares or Redeemable Convertible Shares present at a general meeting of the Company is entitled to one vote. On a poll, the holders of Ordinary Shares are entitled to one vote per share, and the holders of the Perpetual Convertible Shares and the Redeemable Convertible Shares are entitled to one vote for every seven Ordinary Shares into which such Perpetual Convertible Shares or Redeemable Convertible Shares, as the case may be, are convertible. If two or more quarterly dividends on the Perpetual Convertible Shares and the Redeemable Convertible Shares are in arrears and there is a poll vote, the holders of the Perpetual Convertible Shares and the Redeemable Convertible Shares are entitled to one vote for every one Ordinary Share into which such Perpetual Convertible Shares or Redeemable Convertible Shares, as the case may be, are convertible. Cumulative voting is not permitted.
59
The liquidator on any winding-up of the Company, may, with the authority of an extraordinary resolution, divide among the shareholders in kind the whole or any part of the assets of the Company and for such purposes may set such value as he deems fair upon any one or more class or classes of property, and may determine how such division shall be carried out as between shareholders or classes of shareholders. On a return of assets on liquidation or otherwise (other than on a redemption or a repurchase), the assets of the Company available to shareholders shall be applied first in repaying to the holders of the Perpetual Convertible Shares and the Redeemable Convertible Shares all amounts paid up thereon together with all arrears and accruals of dividend to be calculated down to the relevant date and to be payable whether or not such dividend has become due and payable, in priority to any other class of shares.
The Company is entitled to redeem all or any Perpetual Convertible Shares on or after July 29, 2006 upon written notice. In the case of any notice given for redemption of either class of such shares, the holders are entitled to opt for all of their remaining Perpetual Convertible Shares to be converted into Ordinary Shares. Upon redemption, all amounts paid up, plus all arrears and accruals of dividend down to the date of redemption are to be paid.
Following the passing of a Special Resolution at an Extraordinary General Meeting of the Company and at a separate class meeting of the holders of the Redeemable Convertible Shares held on 11 August 2003 the Articles of Association of the Company were amended so that the redemption date for the Redeemable Convertible Shares became 26 August 2003 at a price of $48.50.
There are no provisions in the Articles discriminating against an existing or prospective holder of securities as a result of such shareholder owning a substantial number of shares.
General Meetings
The Company shall in each year hold a general meeting of shareholders within 15 months of the previous year’s annual general meeting of shareholders. The Board may call an extraordinary general meeting whenever it determines appropriate. In addition, members holding not less than one-tenth of the paid up share capital entitled to vote at a general meeting of the Company can require an extraordinary general meeting to be convened.
Only shareholders registered in accordance with the Articles may be recognized as valid shareholders. There are no other limitations on the rights to own securities.
There are no provisions in the Articles that would have the effect of delaying, deferring or preventing a change of control of the Company and that would operate only with respect to a merger, acquisition, or corporate restructuring involving the Company or any of its subsidiaries.
Disclosure of Ownership
There are no provisions in the Articles relating to the ownership threshold above which shareholder ownership must be disclosed. The Companies Act requires a shareholder to notify the Company in respect of a three percent holding subject to certain exemptions, and there is an additional obligation to notify the Company when a ten percent threshold is reached which is not subject to any exemptions.
Changes in Capital
There are no conditions imposed by the Articles governing changes in capital which are more stringent than those conditions which would be required by governing English law.
C. Material Contracts
Lock –up Agreement Relating to the Offer to Purchase Stackpole Limited
Tomkins plc announced on June 18, 2003 the offer by Ontario Inc. (the “Offeror”), an indirect wholly owned subsidiary of Tomkins plc, to acquire all the outstanding common shares of Stackpole Limited. In connection with this offer, certain significant shareholders of Stackpole Limited agreed with the Offeror to tender their shares in the offer pursuant to a lock-up agreement entered into prior to commencement of the offer. The Offeror acquired acquired in excess of 97% of the outstanding common shares of Stackpole Limited (on a fully diluted basis) in the offer and acquired the remaining common shares of Stackpole Limited not deposited to the offer by exercise of the Offeror’s compulsory acquisition right under the Ontario Business Corporations Act. Shareholders of Stackpole Limited who did not tender in the offer received Cdn $33.25 per common share, the same price that was offered to shareholders under the original offer.
Support Agreement
On April 29, 2003, the Company entered into a support agreement with 2023103 Ontario Inc. and Stackpole Limited, setting forth the terms and conditions of the offer described in the “Lock-up Agreement Relating to the Offer to purchase Stackpole Limited” above.
Euro Medium Term Note Program
On August 28, 2003, the Company entered into a trust deed relating to the £750,000,000 Euro Medium Term Note Program whereby it irrevocably guaranteed the obligations of notes issued by its subsidiary company Tomkins Finance plc (“Finance”) under the programmed. The programme allows Finance to issue debt in the form of loan notes up to a maximum aggregate principal amount of £750,000,000. As at May 10, 2004, notes for an aggregate nominal amount of £400,000,000 have been issued at interest rates ranging between 6.125 percent and 8 percent.
Multicurrency Revolving Credit Agreement
A £400,000,000 multicurrency revolving credit agreement was arranged on February 9, 2004, under which the company acts as guarantor to Finance, the borrower under the facility. A total of eight banks have committed to providing Finance an aggregate sum of £400,000,000 that may be drawn on at any point until February 9, 2009, should the funds be required. The credit agreement contains certain financial covenants.
60
Employee Stock Option Plans
A description of our stock option plans and other equity-based compensation plans is contained in Item 6.B. “Compensation”.
D. Exchange controls
There is currently no U.K. law, decree or regulation which restricts the export or import of capital, including, but not limited to, U.K. foreign exchange controls, or that affects the remittance of dividends (except as otherwise set forth below, see “Taxation”) or other payments to holders of Ordinary Shares. There are no limitations under U.K. law or the Company’s Memorandum and Articles of Association on the rights of persons who are neither residents nor nationals of the United Kingdom from freely holding, voting or transferring Ordinary Shares in the same manner as U.K. residents or nationals.
E. Taxation
The following is a summary of the principal US federal income and UK tax consequences of the purchase, ownership and disposition of Ordinary Shares or ADRs by certain US Holders (as defined below) and not a complete analysis or listing of all of the possible tax consequences of such purchase, ownership or disposition. Furthermore, this summary does not address the tax consequences under state, local, or non-US or non-UK tax law of such purchase, ownership or disposition. Certain US Holders with special status (e.g., financial institutions, insurance companies, tax-exempt entities, dealers in securities, and traders in securities that mark-to-market) or in special tax situations (e.g., whose functional currency is not the US dollar, who hold their Ordinary Shares or ADRs as part of a straddle, appreciated financial position, hedge, conversion transaction or other integrated investment, who hold 10 percent or more of the voting power of Tomkins’s stock or the Ordinary Shares or ADRs, or who are subject to the alternative minimum tax) will be subject to special rules not described below. This summary is limited to US Holders that hold their Ordinary Shares or ADRs as capital assets and does not address the tax treatment of US Holders that are partnerships or pass-through entities that are not partnerships or the tax treatment of the holders of interests in such entities. Prospective investors are therefore advised to consult their own tax advisors with respect to the tax consequences of the purchase, ownership and disposition of Ordinary Shares or ADRs, including specifically the consequences under state, local and non-US and non-UK tax laws.
This summary is based upon the Internal Revenue Code of 1986, as amended (the “Code”), Treasury regulations promulgated under the Code, the Convention Between the Government of the United States of America and the Government of the United Kingdom of Great Britain and Northern Ireland for the Avoidance of Double Taxation and the Prevention of Fiscal Evasion with respect to Taxes on Income and Capital Gains dated December 31, 1975, as amended (the “Income Tax Convention”), the New Income Tax Convention (as defined below), and administrative and judicial interpretations of the Code, the Income Tax Convention and the New Income Tax Convention, all as in effect as of the date of this Annual Report and all of which are subject to change, possibly with retroactive effect. Statements regarding UK tax laws and practices set out below are based on those UK laws and published practices of the Inland Revenue as in force on the date of this Annual Report which UK laws and practices are subject to change. As used herein, a “US Holder” is a beneficial owner of Ordinary Shares or ADRs that, for United States federal tax purposes, is:
| | • | | a citizen or resident of the United States; |
| | • | | a corporation created or organized in the United States or under the laws of the United States or any state (or the District of Columbia); |
| | • | | an estate the income of which is subject to US federal income taxation regardless of its source; |
| | • | | a trust if a court within the United States is able to exercise primary supervision over the administration of the trust and one or more United States persons have the authority to control all substantial decisions of the trust; or |
| | • | | a trust if it has a valid election in effect to be treated as a United States person under the Code. |
On March 31, 2003, the United States and the United Kingdom ratified a new income tax treaty (the “New Income Tax Convention”) to replace the Income Tax Convention. The New Income Tax Convention generally became effective with respect to withholding taxes on May 1, 2003, UK income and capital gains tax on April 6, 2003 and UK corporation tax on April 1, 2003. Taxpayers may elect to have the Income Tax Convention apply for a twelve month period from the date on which the New Income Tax Convention would otherwise apply. US Holders should consult their tax advisors regarding the potential application of the New Income Tax Convention, including the relevant effective dates of the New Income Tax Convention.
The Inland Revenue treats US Holders of ADRs as the owners of the underlying Ordinary Shares for the purpose of the taxation of dividend payments under the Income Tax Convention and should treat them as such under the New Income Tax Convention. US Holders of ADRs are also treated as the owners of the underlying shares for the purposes of the Code.
Taxation of Dividends
Distributions paid in respect of the Ordinary Shares or ADRs will be treated as dividends to the extent of Tomkins’s current and accumulated earnings and profits, as calculated under US federal income tax principles. Distributions in excess of current and accumulated earnings and profits will be treated as a return of capital to the extent of the US holder’s adjusted tax basis in the Ordinary Shares or ADRs and, thereafter, as capital gains.
Under UK law, there is no UK withholding tax on dividends paid. Under the terms of the Income Tax Convention, a US Holder of Ordinary Shares or ADRs who is a resident of the United States for the purposes of the Income Tax Convention will generally be entitled to receive, in addition to any dividend received, a payment of certain UK tax credits equal to one-ninth of the cash dividend paid (a “Related Tax Credit”), subject to a notional withholding tax (not to exceed the amount of the Related Tax Credit) of 15 percent of the sum of the dividend paid and such Related Tax Credit. However, a US Holder will not be entitled to any actual payment in respect of the Related Tax Credit as the notional withholding tax of 15 percent under the Income Tax Convention exceeds, and therefore will be limited to, the Related Tax Credit. Hence, a net dividend of 100p paid by Tomkins to a US Holder gives rise to a receipt of 100p after deduction of the notional withholding tax of 11.11p. In Revenue Procedure 2000-13, 2000-6 I.R.B. 515, the Internal Revenue Service (the “IRS”) confirmed that a US Holder will continue to be entitled to claim the US dollar value of such
61
notional withholding tax as a credit against the US Holder’s US federal income tax liability, subject to certain conditions and limitations. To qualify for the credit, a US Holder should make an election on IRS Form 8833 (Treaty-Based Return Position Disclosure Under Section 6114 or 7701(b)) and file the completed Form 8833 with its US federal income tax return.
Dividends and amounts in respect of the Related Tax Credit will be income to a US Holder for US federal income tax purposes but will generally not be eligible for the dividends received deduction allowed to corporate holders. The amount includible in income with respect to dividends paid in pounds sterling and the Related Tax Credit will be the US dollar value of the payment at the spot rate of exchange on the date that the dividend is actually or constructively received, regardless of whether the payment is in fact converted into US dollars. Pounds sterling received by US holders will have an adjusted tax basis equal to their US dollar value at such spot rate. Gains or losses, if any, realized on a subsequent sale or disposition of the pounds sterling distributed will be ordinary income or loss and will generally be treated as derived from sources within the United States for foreign tax credit purposes.
A US Holder will be denied a foreign tax credit (and should instead be allowed a deduction) for foreign taxes imposed on a dividend if the US Holder has not held the Ordinary Shares or ADRs for at least 16 days in the 30 day holding period beginning 15 days before the ex-dividend date. Any days during which a US holder has substantially diminished its risk of loss on the Ordinary Shares or ADRs are not counted toward meeting the 16-day holding period required by the statute. A US Holder that is under an obligation to make related payments with respect to the Ordinary Shares or ADRs (or substantially similar or related property) also is not entitled to claim a foreign tax credit with respect to a foreign tax imposed on a dividend.
A US Holder who is a resident of the United States for purposes of the Income Tax Convention will nonetheless not be entitled to the Related Tax Credit and consequently will not be entitled to a credit against US tax liability for the notional withholding tax thereon, if (a) the holding of Ordinary Shares or ADRs is (i) effectively connected with a permanent establishment situated in the United Kingdom through which the holder carries on business in the United Kingdom or (ii) effectively connected with a fixed base in the United Kingdom from which the holder performs independent personal services or (b) in the case of a US Holder that is a corporation, the US Holder (i) is also a resident of the United Kingdom for purposes of the Income Tax Convention or (ii) is, in certain circumstances, an investment or holding company at least 25 percent of the capital of which is held, directly or indirectly, by persons who are neither individual residents of the United States nor citizens of the United States. Furthermore, special rules may apply in respect of the Related Tax Credit if the US Holder (a) owns at least 10 percent of the class of shares in respect of which the dividend is paid (or, in the case of a US Holder that is a corporation, controls, alone or with one or more associated corporations, at least 10 percent of the voting stock of Tomkins) or (b) is exempt from tax in the United States on dividends paid by Tomkins. In addition, if a US Holder is a trust or estate, the Related Tax Credit will be available only to the extent that the income derived by such trust or estate is subject to US tax as the income of a resident either in its hands or in the hands of its beneficiaries.
Under the New Income Tax Convention, the Related Tax Credit and the notional UK withholding tax discussed above are eliminated and it would therefore not be possible to claim a foreign tax credit for a notional UK withholding tax in respect of any dividend payment made by the Company. As stated above, taxpayers may elect to have the Income Tax Convention apply for a twelve month period from the date on which the New Income Tax Convention would otherwise apply.
Taxation of Capital Gains
A US Holder that is resident in the United States and not resident, ordinarily resident or a temporary non-resident for UK tax purposes in the United Kingdom will not be liable for UK tax on gains realized or accrued on the sale or other disposal of Ordinary Shares or ADRs unless that US Holder carries on a trade, profession or vocation in the United Kingdom through a permanent establishment, branch or agency and the Ordinary Shares or ADRs are or have been used, held or acquired for the purposes of such trade, profession or vocation through such permanent establishment, branch or agency. A US Holder will generally recognize capital gain or loss for US federal income tax purposes upon the sale or other disposal of such US Holder’s Ordinary Shares or ADRs in an amount equal to the difference between the amount realized on the sale or other disposal and the US Holder’s adjusted tax basis in such Ordinary Shares or ADRs. Such gains or losses will be eligible for long-term capital gain or loss treatment if the Ordinary Shares or ADRs have been held for more than one year at the time of such sale or disposal.
A US Holder who is (a) a US citizen who is resident, ordinarily resident or a temporary non-resident in the United Kingdom for UK tax purposes, (b) a corporation that is resident in the United Kingdom for UK tax purposes by reason of being incorporated or managed and controlled in the United Kingdom, or (c) a US citizen who, or corporation that, is trading or carrying on a profession or vocation in the United Kingdom through a permanent establishment, branch or agency and has used, held or acquired Ordinary Shares or ADRs for the purposes of such trade, profession or vocation through such permanent establishment branch or agency, may, in each case, be liable for both UK and US tax on a gain on the disposal of Ordinary Shares or ADRs. Such a person will generally be entitled, subject to certain limitations, to a tax credit against any US federal tax liability for the amount of any UK tax (namely, capital gains tax in the case of an individual and corporation tax on chargeable gains in the case of a corporation) which is paid in respect of such gain.
Under the New Income Tax Convention, a US Holder who is a resident of the United States for the purposes of the New Income Tax Convention will not be subject to UK tax on gains derived from the sale or other disposal of the Ordinary Shares or ADRs unless such Ordinary Shares or ADRs form part of the business property of a permanent establishment of an enterprise in the United Kingdom, regardless of whether that permanent establishment exists at the time of the sale or other disposal. Notwithstanding the foregoing, under the New Income Tax Convention, the United Kingdom may tax an individual who is a resident of the United States on gains derived from the sale or other disposal of Ordinary Shares or ADRs if such individual has been a resident of the United Kingdom at any time during the six years immediately preceding the sale or other disposition of the Ordinary Shares or ADRs.
Inheritance Tax
Under the convention entered into force on November 11, 1979 between the United States and the United Kingdom for the avoidance of double taxation and the prevent of Fiscal evasion with respect to taxes on estates of deceased persons and on gifts (the “Estate and Gift Tax Convention”), an Ordinary Share or ADR held by an individual who is domiciled in the United States and is not a national of the United Kingdom will not be subject to UK inheritance tax upon the individual’s death or on a transfer of the Ordinary Share or ADR during the individual’s lifetime, except in certain cases in which the Ordinary Share or ADR is placed in trust
62
by a settler not domiciled in the United States and in the exceptional case where the Ordinary Share or ADR is part of the business property of a UK permanent establishment or pertains to a fixed base of the individual in the United Kingdom used for the performance of independent personal services. In the unusual case where Ordinary Shares or ADRs are subject to both the UK inheritance tax and the US federal estate and gift tax, the Estate and Gift Tax Convention generally provides for a tax credit under the rules enumerated in the Estate and Gift Tax Convention.
Stamp duty and stamp duty reserve tax (“S.D.R.T.”)
UK stamp duty or S.D.R.T. is not generally payable on the issuance of Ordinary Shares unless these are issued into a clearance service or a depositary receipt system (or a nominee for either) in which case a liability at 1.5 percent will arise (but see the comments below in relation to transfers of the Ordinary Shares to the custodian of the Depositary).
The transfer of Ordinary Shares will generally give rise to a liability for UK stamp duty normally at the rate of 0.5 percent (rounded up to the nearest multiple of £5) of the actual consideration paid. S.D.R.T. is chargeable immediately on entering into an unconditional agreement to transfer Ordinary Shares at the rate of 0.5 percent of the actual consideration paid (which S.D.R.T. is cancelled or repaid if the agreement is completed within six years of the agreement by a duly stamped transfer). If Ordinary Shares have been transferred into a clearance service or a depositary receipt system, provided the higher rate 1.5 percent charge has been paid, subsequent transfers within the respective service or system would not be liable to S.D.R.T. However, there is no liability to stamp duty on the transfer of shares into CREST, the paperless trading system introduced in July 1996, unless such transfer involves a change in beneficial ownership. Where the Ordinary Shares are transferred into the account of a clearance service or a depositary receipt system (or a nominee for either) a liability at 1.5 percent will arise. Subsequent transfers within CREST will not give rise to a liability to stamp duty as there will be no stampable document, and consequently, the S.D.R.T. chargeable on such transfers will not be repaid. An instrument of transfer of Ordinary Shares where there is no change of beneficial ownership will generally be subject to fixed rate stamp duty of £5 per transfer.
An instrument of transfer or issuance of Ordinary Shares to the custodian of the Depositary where there is no transfer or issuance of beneficial ownership will generally give rise to UK stamp duty at the rate of 1.5 percent rounded up to the nearest multiple of £5, or to S.D.R.T. at the rate of 1.5 percent, of the value of the shares at the time of transfer or issuance. In accordance with the terms of the Deposit Agreement, any tax or duty payable by the Depositary or the custodian of the Depositary on deposits of Ordinary Shares will be charged by the Depositary to the party to whom the ADRs are delivered against such deposits. No S.D.R.T. will be payable on an agreement to transfer ADRs, nor will UK stamp duty be payable on a transfer of ADRs, provided that the instrument of transfer is executed outside the United Kingdom and subsequently remains at all times outside the United Kingdom. A transfer of Ordinary Shares by the Depositary or its nominee to the relevant ADR holder when the ADR holder is not transferring beneficial ownership will give rise to stamp duty at the rate of £5 per instrument of transfer.
Passive foreign investment company (“PFIC”) status
We believe that we will not be considered a PFIC for US federal income tax purposes. However, since our status as a PFIC depends on the composition of our income and assets and the market value of our assets from time to time, there can be no assurance that we will not be considered a PFIC in any taxable year. If we were treated as a PFIC in any taxable year during which you held Ordinary Shares or ADRs, you may be subject to certain adverse consequences, including the imposition of tax at higher rates than would otherwise apply to income derived from the Ordinary Shares or ADRs as well as additional tax form filing requirements.
F. Dividends and paying agents
Not applicable.
G. Statement by experts
Not applicable.
H. Documents on display
Tomkins is subject to the information requirements of the Exchange Act and in accordance therewith files reports and other information with the United States Securities and Exchange Commission (the “Commission”). These reports and other information can be inspected and copied at the public reference facilities maintained by the Commission, 450 Fifth Street, N.W., Judiciary Plaza, Room 1024, Washington, D.C. 20549, and at the Commission’s regional office at Citicorp Center, 500 West Madison Street, Suit 1400, Chicago, Illinois 60661. You may request copies of all or a portion of these documents from the Public Reference Section of the Commission at 450 Fifth Street, N.W., Washington, D.C. 20549, at prescribed rates. From August 2002, reports filed by the Company with the Commission are available on the Commissions website atwww.sec.gov. As a foreign private issuer, Tomkins is exempt under the Exchange Act from, among other things, the rules prescribing the furnishing and content of proxy statements and the “short-swing” profit recovery provisions contained in Section 16 of the Exchange Act.
I. Subsidiary information
See Item 4. “Information on the Company – C. Organizational Structure”.
63
Item 11. Quantitative and Qualitative Disclosures about Market Risk
The financial risk management of the Company, which includes currency risk, interest rate risk and liquidity risk, is the responsibility of the Company’s central treasury function, which operates within strict guidelines approved by the Board.
Derivative financial instruments are held to reduce exposure to foreign exchange risk and interest rate movements. None are held for speculative purposes.
To qualify as a hedge, a financial instrument must be related to actual foreign currency assets or liabilities or to a probable commitment. It must involve the same currency or similar currencies as the hedged item and must also reduce the risk of foreign currency exchange movements on the Group’s operations. Under US GAAP derivative instruments are not regarded as hedges and any unrealized gains or losses arising at the period end are taken to income. Derivatives entered into to hedge the net investment in overseas entities do not qualify as a hedge under US GAAP and any gains or losses are charged to the income statement.
Borrowing facilities are monitored against forecast requirements and timely action is taken to put in place, renew or replace credit lines. Our policy is to reduce financing risk by diversifying our funding sources and by staggering the maturity of our borrowings.
Foreign currency transaction exposures
The foreign currency transaction exposures in the business are protected with forward currency purchases and sales. These are put in place when foreign currency trading transactions are committed or when there is a high likelihood of such transactions arising. All foreign exchange contracts are carried out by our central treasury function except in cases where this is prohibited by local regulations. In these cases, local transactions are reported to central treasury on a systematic basis.
Our transaction exposures arise in currency pairs with the main currency pair exposures for the year ended January 1, 2005 being USD to MXN ($70.5), USD to GBP ($53.6million), and GBP to EUR ($82.0 million). The total loss on major transaction exposures during the year as a result of the movement of average exchange rates from 2003 to 2004, was $1.1 million. The impact of our hedging activities during 2004 was a net loss of $0.2 million.
Foreign currency translation exposures
To the extent that Tomkins is funded by shareholders’ equity, overseas investments are not hedged. The Group’s net borrowings are generally retained in proportion to the currencies in which the Group’s assets are denominated, to hedge the foreign currency translation exposure arising from the Group’s overseas investments. The net debt position comprises principally US dollars, Canadian dollars and Euros.
Dividends are funded by converting the foreign currency cash flows generated by overseas investments at the time of payment of the dividend. Interest payments on foreign currency net borrowings are funded with cash flows generated by the corresponding foreign currency investments.
We do not hedge foreign currency profit and loss translation exposures and we are subject to the risk of currency fluctuation. We estimate a movement of 10 per cent in the US dollar to sterling exchange rate has an impact on reported operating profits of around 7 to 8 per cent. This risk is partly offset to the extent that interest arises on foreign currency net borrowings.
Information on our use of derivatives and financial instruments is given in note 16 to the Consolidated financial statements
Interest rate risk management
Our central treasury function ensures that the interest rate profile desired by the Board is maintained and manages interest rate gaps in each currency in which the Group has an exposure. This is achieved by considering the portfolio of all of our interest bearing assets and liabilities across the Group. Our net desired interest rate profile in each currency is then managed by entering into interest rate swaps, options and forward rate agreements. At January 1, 2005, the interest rate maturity profile of our Canadian dollar, Euro and sterling net debt was less than 3 months.
The graph below shows our US dollar interest rate maturity profile as at January 1, 2005.
US Dollar Interest Rate Maturity Profile

64
Interest and Exchange Rate Information
The tables below provide information as at January 1, 2005 and as at January 3, 2004, about the Company’s financial instruments and derivative instruments that are sensitive to changes in interest rates and exchange rates. For borrowings, cash and deposits, the tables present principal cash flows, while for derivatives the tables present the notional amounts used to calculate payments to be exchanged under the contracts. Instruments shown as bearing interest at floating rates, are instruments where the interest rate is reset periodically by reference to short term benchmark interest rates, such as LIBOR in the relevant currency. The information is presented in pounds sterling equivalents, with the instruments grouped by the actual currency in which their cash flows are denominated.
| | | | | | | | | | | | | | | | | | | | | | | | |
| | | Expected Maturity Date
| | | Total
$ million
| | | Fair
Value
$ million
| |
As at January 1, 2005
| | Within
1 year
$ million
| | | 1 - 2
years
$ million
| | | 2 - 3
years
$ million
| | | 3 - 4
years
$ million
| | | 4 - 5
Years
$ million
| | | Over 5
years
$ million
| | | |
POUNDS STERLING | | | | | | | | | | | | | | | | | | | | | | | | |
Financial Assets | | | | | | | | | | | | | | | | | | | | | | | | |
Cash and Deposits | | 43.1 | | | — | | | — | | | — | | | — | | | — | | | 43.1 | | | 43.1 | |
Other | | 0.3 | | | — | | | — | | | 10.6 | | | — | | | — | | | 10.9 | | | 10.9 | |
| | |
|
| |
|
| |
|
| |
|
| |
|
| |
|
| |
|
| |
|
|
Total | | 43.4 | | | — | | | — | | | 10.6 | | | — | | | — | | | 54.0 | | | 54.0 | |
| | |
|
| |
|
| |
|
| |
|
| |
|
| |
|
| |
|
| |
|
|
Fixed rate | | — | | | — | | | — | | | 10.6 | | | — | | | — | | | 10.6 | | | | |
Floating rate | | 38.6 | | | — | | | — | | | — | | | — | | | — | | | 38.6 | | | | |
Interest Free | | 4.8 | | | — | | | — | | | — | | | — | | | — | | | 4.8 | | | | |
| | | | | | | | |
Financial Liabilities Borrowings | | (2.7 | ) | | — | | | — | | | — | | | — | | | (768.0 | ) | | (770.7 | ) | | (829.9 | ) |
| | | — | | | — | | | — | | | — | | | — | | | — | | | — | | | — | |
| | |
|
| |
|
| |
|
| |
|
| |
|
| |
|
| |
|
| |
|
|
Total | | (2.7 | ) | | — | | | — | | | — | | | — | | | (768.0 | ) | | (770.7 | ) | | (829.9 | ) |
| | |
|
| |
|
| |
|
| |
|
| |
|
| |
|
| |
|
| |
|
|
Fixed rate | | — | | | — | | | — | | | — | | | — | | | — | | | — | | | | |
Floating rate | | (2.7 | ) | | — | | | — | | | — | | | — | | | (768.0 | ) | | (770.7 | ) | | | |
| | | | | | | | |
Interest rate swaps (weighted average rate received : fixed 6.8%, weighted average rate paid : floating 6.5%): | | | | | | | | | | | | | | | | | | | | | | | | |
Notional amount | | — | | | — | | | — | | | — | | | — | | | 768.0 | | | 768.0 | | | 768.0 | |
Book value | | — | | | — | | | — | | | — | | | — | | | 7.7 | | | 7.7 | | | 18.6 | |
Transaction exposure derivatives | | — | | | — | | | — | | | — | | | — | | | — | | | — | | | 0.6 | |
Off balance sheet hedging contracts (weighted average rate : N/a) | | 700.8 | | | — | | | — | | | — | | | — | | | — | | | 700.8 | | | 700.8 | |
| | |
|
| |
|
| |
|
| |
|
| |
|
| |
|
| |
|
| |
|
|
US DOLLAR | | | | | | | | | | | | | | | | | | | | | | | | |
Financial Assets | | | | | | | | | | | | | | | | | | | | | | | | |
Cash and Deposits | | 155.9 | | | — | | | — | | | — | | | — | | | — | | | 155.9 | | | 155.9 | |
Other | | 25.1 | | | 9.2 | | | — | | | — | | | 3.5 | | | 0.8 | | | 38.6 | | | 38.6 | |
| | |
|
| |
|
| |
|
| |
|
| |
|
| |
|
| |
|
| |
|
|
Total | | 181.0 | | | 9.2 | | | — | | | — | | | 3.5 | | | 0.8 | | | 194.5 | | | 194.5 | |
| | |
|
| |
|
| |
|
| |
|
| |
|
| |
|
| |
|
| |
|
|
Fixed rate | | 25.1 | | | — | | | — | | | — | | | 3.5 | | | — | | | 28.6 | | | | |
Floating rate | | 135.6 | | | 9.2 | | | — | | | — | | | — | | | 0.8 | | | 145.6 | | | | |
Interest free | | 20.3 | | | — | | | — | | | — | | | — | | | — | | | 20.3 | | | | |
| | | | | | | | |
Financial Liabilities Borrowings | | (19.7 | ) | | (2.2 | ) | | (1.9 | ) | | (1.8 | ) | | (1.2 | ) | | (6.5 | ) | | (33.3 | ) | | (33.3 | ) |
| | |
|
| |
|
| |
|
| |
|
| |
|
| |
|
| |
|
| |
|
|
Total | | (19.7 | ) | | (2.2 | ) | | (1.9 | ) | | (1.8 | ) | | (1.2 | ) | | (6.5 | ) | | (33.3 | ) | | (33.3 | ) |
| | |
|
| |
|
| |
|
| |
|
| |
|
| |
|
| |
|
| |
|
|
Fixed rate | | (6.1 | ) | | (2.2 | ) | | (1.9 | ) | | (1.8 | ) | | (1.2 | ) | | (6.5 | ) | | (19.7 | ) | | | |
Floating rate | | (13.6 | ) | | — | | | — | | | — | | | — | | | — | | | (13.6 | ) | | | |
Interest free | | — | | | — | | | — | | | — | | | — | | | — | | | — | | | | |
| | | | | | | | |
Interest rate swaps (weighted average rate received : fixed 2.5%, weighted average rate paid : floating 3.1%): | | | | | | | | | | | | | | | | | | | | | | | | |
Notional amount | | — | | | 145.0 | | | — | | | 65.0 | | | — | | | — | | | 210.0 | | | 208.4 | |
Book value | | — | | | — | | | — | | | — | | | — | | | — | | | — | | | 0.6 | |
Transaction exposure derivatives | | — | | | — | | | — | | | — | | | — | | | — | | | — | | | (0.4 | ) |
Off balance sheet hedging contracts (weighted average pay rate : 1.5899) | | (437.9 | ) | | — | | | — | | | — | | | — | | | — | | | (437.9 | ) | | (437.9 | ) |
| | |
|
| |
|
| |
|
| |
|
| |
|
| |
|
| |
|
| |
|
|
EURO | | | | | | | | | | | | | | | | | | | | | | | | |
Financial Assets | | | | | | | | | | | | | | | | | | | | | | | | |
Cash and Deposits | | 32.1 | | | — | | | — | | | — | | | — | | | — | | | 32.1 | | | 32.1 | |
Other | | 0.2 | | | — | | | — | | | — | | | — | | | — | | | 0.2 | | | 0.2 | |
| | |
|
| |
|
| |
|
| |
|
| |
|
| |
|
| |
|
| |
|
|
Total | | 32.3 | | | — | | | — | | | — | | | — | | | — | | | 32.3 | | | 32.3 | |
| | |
|
| |
|
| |
|
| |
|
| |
|
| |
|
| |
|
| |
|
|
Floating rate | | 31.6 | | | — | | | — | | | — | | | — | | | — | | | 31.6 | | | | |
Interest free | | 0.7 | | | — | | | — | | | — | | | — | | | — | | | 0.7 | | | | |
| | | | | | | | |
Financial Liabilities Borrowings | | (3.0 | ) | | (0.5 | ) | | (0.5 | ) | | (0.6 | ) | | (0.6 | ) | | (1.0 | ) | | (6.2 | ) | | (6.2 | ) |
| | |
|
| |
|
| |
|
| |
|
| |
|
| |
|
| |
|
| |
|
|
Total | | (3.0 | ) | | (0.5 | ) | | (0.5 | ) | | (0.6 | ) | | (0.6 | ) | | (1.0 | ) | | (6.2 | ) | | (6.2 | ) |
| | |
|
| |
|
| |
|
| |
|
| |
|
| |
|
| |
|
| |
|
|
Fixed rate | | (0.4 | ) | | (0.5 | ) | | (0.5 | ) | | (0.6 | ) | | (0.6 | ) | | (1.0 | ) | | (3.6 | ) | | | |
Floating rate | | (2.6 | ) | | — | | | — | | | — | | | — | | | — | | | (2.6 | ) | | | |
65
| | | | | | | | | | | | | | | | | | | | | | | | |
| | | Expected Maturity Date
| | | | | | | |
As at January 1, 2005 (continued)
| | Within 1 year
$ million
| | | 1 - 2
years
$ million
| | | 2 - 3
years
$ million
| | | 3 - 4
years
$ million
| | | 4 - 5
Years
$ million
| | | Over 5
years
$ million
| | | Total
$ million
| | | Fair
Value
$ million
| |
Transaction exposure derivatives | | — | | | — | | | — | | | — | | | — | | | — | | | — | | | — | |
Off balance sheet hedging contracts (weighted average pay rate : 1.5613) | | (75.5 | ) | | — | | | — | | | — | | | — | | | — | | | (75.5 | ) | | (75.5 | ) |
| | | | | | | | |
CANADIAN DOLLAR | | | | | | | | | | | | | | | | | | | | | | | | |
Financial Assets | | | | | | | | | | | | | | | | | | | | | | | | |
Cash and Deposits | | 51.3 | | | — | | | — | | | — | | | — | | | — | | | 51.3 | | | 51.3 | |
| | |
|
| |
|
| |
|
| |
|
| |
|
| |
|
| |
|
| |
|
|
Total | | 51.3 | | | — | | | — | | | — | | | — | | | — | | | 51.3 | | | 51.3 | |
| | |
|
| |
|
| |
|
| |
|
| |
|
| |
|
| |
|
| |
|
|
Floating rate | | 47.5 | | | — | | | — | | | — | | | — | | | — | | | 47.5 | | | | |
Interest free | | 3.8 | | | — | | | — | | | — | | | — | | | — | | | 3.8 | | | | |
| | | | | | | | |
Financial Liabilities Borrowings | | (6.4 | ) | | — | | | — | | | — | | | — | | | — | | | (6.4 | ) | | (6.4 | ) |
| | | — | | | — | | | — | | | — | | | — | | | — | | | — | | | — | |
| | |
|
| |
|
| |
|
| |
|
| |
|
| |
|
| |
|
| |
|
|
Total | | (6.4 | ) | | — | | | — | | | — | | | — | | | — | | | (6.4 | ) | | (6.4 | ) |
| | |
|
| |
|
| |
|
| |
|
| |
|
| |
|
| |
|
| |
|
|
Fixed rate | | — | | | — | | | — | | | — | | | — | | | — | | | — | | | | |
Floating rate | | (6.4 | ) | | — | | | — | | | — | | | — | | | — | | | (6.4 | ) | | | |
Transaction exposure derivatives | | 0.2 | | | — | | | — | | | — | | | — | | | — | | | 0.2 | | | 0.8 | |
Off balance sheet hedging contracts (weighted average pay rate : 2.4734) | | (157.3 | ) | | — | | | — | | | — | | | — | | | — | | | (157.3 | ) | | (157.3 | ) |
| | |
|
| |
|
| |
|
| |
|
| |
|
| |
|
| |
|
| |
|
|
OTHER | | | | | | | | | | | | | | | | | | | | | | | | |
Financial Assets | | | | | | | | | | | | | | | | | | | | | | | | |
Cash and Deposits | | 83.1 | | | — | | | — | | | — | | | — | | | — | | | 83.1 | | | 83.1 | |
Other | | 2.7 | | | — | | | — | | | — | | | — | | | — | | | 2.7 | | | 2.7 | |
| | |
|
| |
|
| |
|
| |
|
| |
|
| |
|
| |
|
| |
|
|
Total | | 85.8 | | | — | | | — | | | — | | | — | | | — | | | 85.8 | | | 85.8 | |
| | |
|
| |
|
| |
|
| |
|
| |
|
| |
|
| |
|
| |
|
|
Floating rate | | 77.5 | | | — | | | — | | | — | | | — | | | — | | | 77.5 | | | | |
Interest free | | 8.3 | | | — | | | — | | | — | | | — | | | — | | | 8.3 | | | | |
| | | | | | | | |
Financial Liabilities Borrowings | | (14.8 | ) | | (1.7 | ) | | (1.7 | ) | | — | | | — | | | — | | | (18.2 | ) | | (18.2 | ) |
| | | — | | | — | | | — | | | — | | | — | | | — | | | — | | | — | |
| | |
|
| |
|
| |
|
| |
|
| |
|
| |
|
| |
|
| |
|
|
Total | | (14.8 | ) | | (1.7 | ) | | (1.7 | ) | | — | | | — | | | — | | | (18.2 | ) | | (18.2 | ) |
| | |
|
| |
|
| |
|
| |
|
| |
|
| |
|
| |
|
| |
|
|
Fixed rate | | — | | | (1.7 | ) | | (1.7 | ) | | — | | | — | | | — | | | (3.4 | ) | | (3.4 | ) |
Floating rate | | (14.8 | ) | | — | | | — | | | — | | | — | | | — | | | (14.8 | ) | | (14.8 | ) |
| | | | | | | | |
Transaction exposure derivatives | | — | | | — | | | — | | | — | | | — | | | — | | | — | | | 2.1 | |
Off balance sheet hedging contracts (weighted average rate : N/a) | | (30.1 | ) | | — | | | — | | | — | | | — | | | — | | | (30.1 | ) | | (30.1 | ) |
| | |
|
| |
|
| |
|
| |
|
| |
|
| |
|
| |
|
| |
|
|
TOTAL | | | | | | | | | | | | | | | | | | | | | | | | |
Financial Assets | | | | | | | | | | | | | | | | | | | | | | | | |
Cash and Deposits | | 365.5 | | | — | | | — | | | — | | | — | | | — | | | 365.5 | | | 365.5 | |
Other | | 28.3 | | | 9.2 | | | — | | | 10.6 | | | 3.5 | | | 0.8 | | | 52.4 | | | 52.4 | |
| | |
|
| |
|
| |
|
| |
|
| |
|
| |
|
| |
|
| |
|
|
Total | | 393.8 | | | 9.2 | | | — | | | 10.6 | | | 3.5 | | | 0.8 | | | 417.9 | | | 417.9 | |
| | |
|
| |
|
| |
|
| |
|
| |
|
| |
|
| |
|
| |
|
|
Fixed rate | | 25.1 | | | — | | | — | | | 10.6 | | | 3.5 | | | — | | | 39.2 | | | | |
Floating rate | | 330.8 | | | 9.2 | | | — | | | — | | | — | | | 0.8 | | | 340.8 | | | | |
Interest free | | 37.9 | | | — | | | — | | | — | | | — | | | — | | | 37.9 | | | | |
| | | | | | | | |
Financial Liabilities Borrowings | | (46.6 | ) | | (4.4 | ) | | (4.1 | ) | | (2.4 | ) | | (1.8 | ) | | (775.5 | ) | | (834.8 | ) | | (894.0 | ) |
| | |
|
| |
|
| |
|
| |
|
| |
|
| |
|
| |
|
| |
|
|
Total | | (46.6 | ) | | (4.4 | ) | | (4.1 | ) | | (2.4 | ) | | (1.8 | ) | | (775.5 | ) | | (834.8 | ) | | (894.0 | ) |
| | |
|
| |
|
| |
|
| |
|
| |
|
| |
|
| |
|
| |
|
|
Fixed rate | | (6.5 | ) | | (4.4 | ) | | (4.1 | ) | | (2.4 | ) | | (1.8 | ) | | (7.5 | ) | | (26.7 | ) | | | |
Floating rate | | (40.1 | ) | | — | | | — | | | — | | | — | | | (768.0 | ) | | (808.1 | ) | | | |
Interest free | | — | | | — | | | — | | | — | | | — | | | — | | | — | | | | |
| | | | | | | | |
Interest rate swaps | | | | | | | | | | | | | | | | | | | | | | | | |
Notional amount | | — | | | 145.0 | | | — | | | 65.0 | | | — | | | 768.0 | | | 978.0 | | | 976.4 | |
Book value | | — | | | — | | | — | | | — | | | — | | | 7.7 | | | 7.7 | | | 19.2 | |
Transaction exposure derivatives | | 0.2 | | | — | | | — | | | — | | | — | | | — | | | 0.2 | | | 3.1 | |
Off balance sheet hedging contracts | | — | | | — | | | — | | | — | | | — | | | — | | | — | | | — | |
66
| | | | | | | | | | | | | | | | | | | | | | | | |
| | | Expected Maturity Date
| | | Total
$ million
| | | Fair
Value
$ million
| |
As at January 3, 2004
| | Within 1 year
$ million
| | | 1 - 2
years
$ million
| | | 2 - 3
years
$ million
| | | 3 - 4
years
$ million
| | | 4 - 5
Years
$ million
| | | Over 5
years
$ million
| | | |
POUNDS STERLING | | | | | | | | | | | | | | | | | | | | | | | | |
Financial Assets | | | | | | | | | | | | | | | | | | | | | | | | |
Cash and Deposits | | 106.5 | | | — | | | — | | | — | | | — | | | — | | | 106.5 | | | 106.5 | |
Other | | 0.4 | | | — | | | — | | | — | | | — | | | — | | | 0.4 | | | 0.4 | |
| | |
|
| |
|
| |
|
| |
|
| |
|
| |
|
| |
|
| |
|
|
Total | | 106.9 | | | — | | | — | | | — | | | — | | | — | | | 106.9 | | | 106.9 | |
| | |
|
| |
|
| |
|
| |
|
| |
|
| |
|
| |
|
| |
|
|
Floating rate | | 106.9 | | | — | | | — | | | — | | | — | | | — | | | 106.9 | | | | |
| | | | | | | | |
Financial Liabilities | | | | | | | | | | | | | | | | | | | | | | | | |
Borrowings | | (1.6 | ) | | — | | | — | | | — | | | — | | | (716.0 | ) | | (717.6 | ) | | (754.9 | ) |
| | | — | | | — | | | — | | | — | | | — | | | — | | | — | | | — | |
| | |
|
| |
|
| |
|
| |
|
| |
|
| |
|
| |
|
| |
|
|
Total | | (1.6 | ) | | — | | | — | | | — | | | — | | | (716.0 | ) | | (717.6 | ) | | (754.9 | ) |
| | |
|
| |
|
| |
|
| |
|
| |
|
| |
|
| |
|
| |
|
|
Fixed rate | | — | | | — | | | — | | | — | | | — | | | (716.0 | ) | | (716.0 | ) | | | |
Floating rate | | (1.6 | ) | | — | | | — | | | — | | | — | | | — | | | (1.6 | ) | | | |
| | | | | | | | |
Interest rate swaps (weighted average rate received : fixed 6.8%, weighted average rate paid : floating 5.7%): | | | | | | | | | | | | | | | | | | | | | | | | |
Notional amount | | — | | | — | | | — | | | — | | | — | | | 716.0 | | | 716.0 | | | 716.6 | |
Book value | | — | | | — | | | — | | | — | | | — | | | 7.7 | | | 7.7 | | | 7.7 | |
Transaction exposure derivatives | | — | | | — | | | — | | | — | | | — | | | — | | | — | | | 0.7 | |
Off balance sheet hedging contracts
(weighted average rate : N/a) | | 596.1 | | | — | | | — | | | — | | | — | | | — | | | 596.1 | | | 596.1 | |
| | |
|
| |
|
| |
|
| |
|
| |
|
| |
|
| |
|
| |
|
|
US DOLLAR | | | | | | | | | | | | | | | | | | | | | | | | |
Financial Assets | | | | | | | | | | | | | | | | | | | | | | | | |
Cash and Deposits | | 117.8 | | | — | | | — | | | — | | | — | | | — | | | 117.8 | | | 117.8 | |
Other | | — | | | — | | | 8.1 | | | — | | | — | | | 27.0 | | | 35.1 | | | 37.4 | |
| | |
|
| |
|
| |
|
| |
|
| |
|
| |
|
| |
|
| |
|
|
Total | | 117.8 | | | — | | | 8.1 | | | — | | | — | | | 27.0 | | | 152.9 | | | 155.2 | |
| | |
|
| |
|
| |
|
| |
|
| |
|
| |
|
| |
|
| |
|
|
Fixed rate | | — | | | — | | | — | | | — | | | — | | | 27.0 | | | 27.0 | | | | |
Floating rate | | 95.6 | | | — | | | 8.1 | | | — | | | — | | | — | | | 103.7 | | | | |
Interest free | | 22.2 | | | — | | | — | | | — | | | — | | | — | | | 22.2 | | | | |
| | | | | | | | |
Financial Liabilities | | | | | | | | | | | | | | | | | | | | | | | | |
Borrowings | | (24.7 | ) | | (6.1 | ) | | (2.1 | ) | | (1.8 | ) | | (1.8 | ) | | (7.9 | ) | | (44.4 | ) | | (44.4 | ) |
| | |
|
| |
|
| |
|
| |
|
| |
|
| |
|
| |
|
| |
|
|
Total | | (24.7 | ) | | (6.1 | ) | | (2.1 | ) | | (1.8 | ) | | (1.8 | ) | | (7.9 | ) | | (44.4 | ) | | (44.4 | ) |
| | |
|
| |
|
| |
|
| |
|
| |
|
| |
|
| |
|
| |
|
|
Floating rate | | (24.7 | ) | | (6.1 | ) | | (2.1 | ) | | (1.8 | ) | | (1.8 | ) | | (7.9 | ) | | (44.4 | ) | | | |
| | | | | | | | |
Interest rate swaps (weighted average rate received : floating 1.2%, weighted average rate paid : fixed 3.1%): | | | | | | | | | | | | | | | | | | | | | | | | |
Notional amount | | — | | | — | | | 145.0 | | | — | | | 65.0 | | | — | | | 210.0 | | | 208.4 | |
Book value | | — | | | — | | | (0.2 | ) | | — | | | (0.2 | ) | | — | | | (0.4 | ) | | (0.4 | ) |
Transaction exposure derivatives | | — | | | — | | | — | | | — | | | — | | | — | | | — | | | (0.7 | ) |
Off balance sheet hedging contracts
(weighted average pay rate : 1.7564) | | (389.7 | ) | | — | | | — | | | — | | | — | | | — | | | (389.7 | ) | | (389.7 | ) |
| | |
|
| |
|
| |
|
| |
|
| |
|
| |
|
| |
|
| |
|
|
EURO | | | | | | | | | | | | | | | | | | | | | | | | |
Financial Assets | | | | | | | | | | | | | | | | | | | | | | | | |
Cash and Deposits | | 21.8 | | | — | | | — | | | — | | | — | | | — | | | 21.8 | | | 21.8 | |
Other | | 0.4 | | | — | | | — | | | — | | | — | | | — | | | 0.4 | | | 0.4 | |
| | |
|
| |
|
| |
|
| |
|
| |
|
| |
|
| |
|
| |
|
|
Total | | 22.2 | | | — | | | — | | | — | | | — | | | — | | | 22.2 | | | 22.2 | |
| | |
|
| |
|
| |
|
| |
|
| |
|
| |
|
| |
|
| |
|
|
Floating rate | | 22.0 | | | — | | | — | | | — | | | — | | | — | | | 22.0 | | | | |
Interest free | | 0.2 | | | — | | | — | | | — | | | —�� | | | — | | | 0.2 | | | | |
| | | | | | | | |
Financial Liabilities | | | | | | | | | | | | | | | | | | | | | | | | |
Borrowings | | (3.1 | ) | | (0.5 | ) | | (0.5 | ) | | (0.5 | ) | | (0.5 | ) | | (1.5 | ) | | (6.6 | ) | | (6.6 | ) |
| | |
|
| |
|
| |
|
| |
|
| |
|
| |
|
| |
|
| |
|
|
Total | | (3.1 | ) | | (0.5 | ) | | (0.5 | ) | | (0.5 | ) | | (0.5 | ) | | (1.5 | ) | | (6.6 | ) | | (6.6 | ) |
| | |
|
| |
|
| |
|
| |
|
| |
|
| |
|
| |
|
| |
|
|
Floating rate | | (3.1 | ) | | (0.5 | ) | | (0.5 | ) | | (0.5 | ) | | (0.5 | ) | | (1.5 | ) | | (6.6 | ) | | | |
| | | | | | | | |
Off balance sheet hedging contracts
(weighted average pay rate : 1.4222) | | (77.5 | ) | | — | | | — | | | — | | | — | | | — | | | (77.5 | ) | | (77.5 | ) |
67
| | | | | | | | | | | | | | | | | | | | | | | | |
| | | Expected Maturity Date
| | | Total
$ million
| | | Fair
Value
$ million
| |
As at January 3, 2004 (continued)
| | Within
1 year
$ million
| | | 1 - 2
years
$ million
| | | 2 - 3
years
$ million
| | | 3 - 4
years
$ million
| | | 4 - 5
Years
$ million
| | | Over 5
years
$ million
| | | |
CANADIAN DOLLAR | | | | | | | | | | | | | | | | | | | | | | | | |
Financial Assets | | | | | | | | | | | | | | | | | | | | | | | | |
Cash and Deposits | | 20.1 | | | — | | | — | | | — | | | — | | | — | | | 20.1 | | | 20.1 | |
Other | | 15.2 | | | — | | | — | | | — | | | — | | | — | | | 15.2 | | | 15.2 | |
| | |
|
| |
|
| |
|
| |
|
| |
|
| |
|
| |
|
| |
|
|
Total | | 35.3 | | | — | | | — | | | — | | �� | — | | | — | | | 35.3 | | | 35.3 | |
| | |
|
| |
|
| |
|
| |
|
| |
|
| |
|
| |
|
| |
|
|
Floating rate | | 34.4 | | | — | | | — | | | — | | | — | | | — | | | 34.4 | | | | |
Interest free | | 0.9 | | | — | | | — | | | — | | | — | | | — | | | 0.9 | | | | |
| | | | | | | | |
Financial Liabilities | | | | | | | | | | | | | | | | | | | | | | | | |
Borrowings | | (1.8 | ) | | — | | | — | | | — | | | — | | | — | | | (1.8 | ) | | (1.8 | ) |
Other | | (3.0 | ) | | — | | | — | | | — | | | — | | | — | | | (3.0 | ) | | (3.0 | ) |
| | |
|
| |
|
| |
|
| |
|
| |
|
| |
|
| |
|
| |
|
|
Total | | (4.8 | ) | | — | | | — | | | — | | | — | | | — | | | (4.8 | ) | | (4.8 | ) |
| | |
|
| |
|
| |
|
| |
|
| |
|
| |
|
| |
|
| |
|
|
Floating rate | | (4.8 | ) | | — | | | — | | | — | | | — | | | — | | | (4.8 | ) | | | |
| | | | | | | | |
Off balance sheet hedging contracts
(weighted average pay rate : 2.3462) | | (99.0 | ) | | — | | | — | | | — | | | — | | | — | | | (99.0 | ) | | (99.0 | ) |
| | |
|
| |
|
| |
|
| |
|
| |
|
| |
|
| |
|
| |
|
|
OTHER | | | | | | | | | | | | | | | | | | | | | | | | |
Financial Assets | | | | | | | | | | | | | | | | | | | | | | | | |
Cash and Deposits | | 55.0 | | | — | | | — | | | — | | | — | | | — | | | 55.0 | | | 55.0 | |
Other | | 1.2 | | | — | | | — | | | — | | | — | | | — | | | 1.2 | | | 1.2 | |
| | |
|
| |
|
| |
|
| |
|
| |
|
| |
|
| |
|
| |
|
|
Total | | 56.2 | | | — | | | — | | | — | | | — | | | — | | | 56.2 | | | 56.2 | |
| | |
|
| |
|
| |
|
| |
|
| |
|
| |
|
| |
|
| |
|
|
Floating rate | | 47.4 | | | — | | | — | | | — | | | — | | | — | | | 47.4 | | | | |
Interest free | | 8.8 | | | — | | | — | | | — | | | — | | | — | | | 8.8 | | | | |
| | | | | | | | |
Financial Liabilities | | | | | | | | | | | | | | | | | | | | | | | | |
Borrowings | | (22.9 | ) | | — | | | (1.6 | ) | | — | | | — | | | — | | | (24.5 | ) | | (24.5 | ) |
| | |
|
| |
|
| |
|
| |
|
| |
|
| |
|
| |
|
| |
|
|
Total | | (22.9 | ) | | — | | | (1.6 | ) | | — | | | — | | | — | | | (24.5 | ) | | (24.5 | ) |
| | |
|
| |
|
| |
|
| |
|
| |
|
| |
|
| |
|
| |
|
|
Fixed rate | | (2.9 | ) | | — | | | (1.6 | ) | | — | | | — | | | — | | | (4.5 | ) | | | |
Floating rate | | (20.0 | ) | | — | | | — | | | — | | | — | | | — | | | (20.0 | ) | | | |
| | | | | | | | |
Transaction exposure derivatives | | (0.2 | ) | | — | | | — | | | — | | | — | | | — | | | (0.2 | ) | | 0.2 | |
Off balance sheet hedging contracts
(weighted average rate : N/a) | | (29.9 | ) | | — | | | — | | | — | | | — | | | — | | | (29.9 | ) | | (29.9 | ) |
| | |
|
| |
|
| |
|
| |
|
| |
|
| |
|
| |
|
| |
|
|
TOTAL | | | | | | | | | | | | | | | | | | | | | | | | |
Financial Assets | | | | | | | | | | | | | | | | | | | | | | | | |
Cash and Deposits | | 321.2 | | | — | | | — | | | — | | | — | | | — | | | 321.2 | | | 321.2 | |
Other | | 17.2 | | | — | | | 8.1 | | | — | | | — | | | 27.0 | | | 52.3 | | | 54.6 | |
| | |
|
| |
|
| |
|
| |
|
| |
|
| |
|
| |
|
| |
|
|
Total | | 338.4 | | | — | | | 8.1 | | | — | | | — | | | 27.0 | | | 373.5 | | | 375.8 | |
| | |
|
| |
|
| |
|
| |
|
| |
|
| |
|
| |
|
| |
|
|
Fixed rate | | — | | | — | | | — | | | — | | | — | | | 27.0 | | | 27.0 | | | | |
Floating rate | | 306.3 | | | — | | | 8.1 | | | — | | | — | | | — | | | 314.4 | | | | |
Interest free | | 32.1 | | | — | | | — | | | — | | | — | | | — | | | 32.1 | | | | |
| | | | | | | | |
Financial Liabilities | | | | | | | | | | | | | | | | | | | | | | | | |
Borrowings | | (54.1 | ) | | (6.6 | ) | | (4.2 | ) | | (2.3 | ) | | (2.3 | ) | | (725.4 | ) | | (794.9 | ) | | (832.2 | ) |
Other | | (3.0 | ) | | — | | | — | | | — | | | — | | | — | | | (3.0 | ) | | (3.0 | ) |
| | |
|
| |
|
| |
|
| |
|
| |
|
| |
|
| |
|
| |
|
|
Total | | (57.1 | ) | | (6.6 | ) | | (4.2 | ) | | (2.3 | ) | | (2.3 | ) | | (725.4 | ) | | (797.9 | ) | | (835.2 | ) |
| | |
|
| |
|
| |
|
| |
|
| |
|
| |
|
| |
|
| |
|
|
Fixed rate | | (2.9 | ) | | — | | | (1.6 | ) | | — | | | — | | | (716.0 | ) | | (720.5 | ) | | | |
Floating rate | | (54.2 | ) | | (6.6 | ) | | (2.6 | ) | | (2.3 | ) | | (2.3 | ) | | (9.4 | ) | | (77.4 | ) | | | |
| | | | | | | | |
Interest rate swaps | | | | | | | | | | | | | | | | | | | | | | | | |
Notional amount | | — | | | — | | | 145.0 | | | — | | | 65.0 | | | 716.0 | | | 926.0 | | | 925.0 | |
Book value | | — | | | — | | | (0.2 | ) | | — | | | (0.2 | ) | | 7.7 | | | 7.3 | | | 7.3 | |
Transaction exposure derivatives | | (0.2 | ) | | — | | | — | | | — | | | — | | | — | | | (0.2 | ) | | 0.2 | |
Off balance sheet hedging contracts | | | | | | | | | | | | | | | | | | | | | | | | |
68
Debt Instruments
The following table shows principal amounts and the respective weighted average interest rates for the significant elements of debt:
| | | | | | | | | | | | |
| | | January 1, 2005
| | | January 3, 2004
| |
| | | Principal
Amount
| | Weighted
average rate
| | | Principal
amount
| | Weighted
average rate
| |
£150 Bond | | £ | 150.0 | | 8.0 | % | | £ | 150.0 | | 8.0 | % |
£250 Bond | | £ | 250.0 | | 6.1 | % | | £ | 250.0 | | 6.1 | % |
Leases | | $ | 23.2 | | 7.2 | % | | $ | 29.4 | | 7.0 | % |
Bank Loans and Overdraft | | $ | 43.0 | | 4.6 | % | | $ | 48.9 | | 5.0 | % |
To a large extent, the Company’s use of borrowings in currencies other than pounds sterling together with its use of derivative currency contracts (as shown in the table above) is for the purpose of managing the variability in shareholders’ funds resulting from the re-translation of its foreign net investments at current exchange rates.
The following table identifies the net exchange rate translation exposure remaining after taking account of such borrowings and currency derivatives:
January 1, 2005
| | | | | | | |
Currency
| | Net assets excluding net funds $ million
| | Net (debt)/funds $ million
| | | Net assets $ million
|
Pounds Sterling | | 107.8 | | (26.9 | ) | | 80.9 |
U.S. Dollar | | 2,396.7 | | (315.2 | ) | | 2,081.5 |
Euro | | 242.7 | | (49.7 | ) | | 193.0 |
Canadian Dollar | | 371.3 | | (112.3 | ) | | 259.0 |
Other | | 354.8 | | 34.7 | | | 389.5 |
| | |
| |
|
| |
|
Total | | 3,473.3 | | (469.4 | ) | | 3,003.9 |
| | |
| |
|
| |
|
January 3, 2004
| | | | | | | |
Currency
| | Net assets excluding net funds $ million
| | Net (debt)/funds $ million
| | | Net assets $ million
|
Pounds Sterling | | 20.0 | | (15.0 | ) | | 5.0 |
U.S. Dollar | | 2,363.5 | | (316.3 | ) | | 2,047.2 |
Euro | | 206.0 | | (62.3 | ) | | 143.7 |
Canadian Dollar | | 350.0 | | (80.8 | ) | | 269.2 |
Other | | 291.0 | | 0.5 | | | 291.5 |
| | |
| |
|
| |
|
Total | | 3,230.5 | | (473.9 | ) | | 2,756.6 |
| | |
| |
|
| |
|
Further disclosures regarding Tomkins use of derivatives and other financial instruments are given in Note 16 to the consolidated financial statements.
Item 12. Description of Securities Other than Equity Securities
Not applicable.
69
PART II
Item 13. Defaults, Dividend Arrearages and Delinquencies
None.
Item 14. Material Modifications to the Rights of Security Holders and Use of Proceeds
None.
Item 15. Controls and Procedures
Evaluation of Disclosure Controls and Procedures
Our Chief Executive Officer and Chief Financial Officer have evaluated the effectiveness of our disclosure controls and procedures (as such term is defined in Rules 13a – 15(e) and 15d – 15(e) under the Exchange Act) as of January 1, 2005 (“the Evaluation Date”). Based on such evaluation, those officers have concluded that, as of the Evaluation Date, our disclosure controls and procedures are effective in alerting them on a timely basis to material information relating to the Company (including its consolidated subsidiaries) required to be included in our periodic filings under the Exchange Act.
Changes in Internal Controls over Financial Reporting
During the year ended January 1, 2005, there have not been any significant changes in our internal controls over financial reporting that have materially affected, or are reasonably likely to materially affect, our internal controls over financial reporting.
Item 16.
A. Audit committee financial expert
The members of the Audit Committee are all independent, non-executive members of the Board. The Board has determined that Mr. N.N Broadhurst qualifies as the Audit Committee Financial Expert.
B. Code of ethics
Code of Conduct and Ethics
The Company has adopted a Code of Conduct and Ethics which sets out the policies and principles of conduct to be followed by all our companies and applies to all directors, officers and employees who are expected to conduct Company business with integrity and in compliance with the laws of the countries in which we operate. The Code covers a number of important areas including fair competition and compliance with anti-trust and competition laws, employee health and safety laws and environmental laws. It also reaffirms our commitment to fair treatment of all employees, ethical and lawful behavior and sets out some general principles, which are important in dealing with suppliers and customers, and with governments and government agencies. The Code emphasizes the importance of employees protecting our intellectual property. Any waivers to the Code require the approval of the Board and will be published on the Company’s website. During 2004 no waivers have been either sought or granted. A complete copy of the Code can be viewed on our website www.tomkins.co.uk or a printed copy is available by application to the Company Secretary at the Company’s registered office.
The Company has also placed on its website, www.tomkins.co.uk, a general summary of the significant ways in which the Company’s corporate governance differs from that followed by domestic US companies under the New York Stock Exchange’s listing standards.
70
C. Principal accountant fees and services
The following table sets forth the aggregate fees billed to the Company for Fiscal 2004 and Fiscal 2003 by the Company’s principal accounting firm, Deloitte & Touche LLP, the member firms of Deloitte Touche Tohmatsu and their respective affiliates (collectively, “Deloitte & Touche”).
| | | | | | | | |
| | | Year ended January 1, 2005
| | Year ended January 3, 2004
|
| | | $ million | | $ million | | $ million | | $ million |
Audit services(1) | | | | | | | | |
Audit fees | | | | 4.3 | | | | 3.6 |
Tax fees(2) | | | | | | | | |
Compliance services | | 1.1 | | | | 0.2 | | |
Advisory services | | 1.5 | | | | 3.2 | | |
| | |
| | | |
| | |
| | | | | 2.6 | | | | 3.4 |
All other fees(3) | | | | 0.7 | | | | 1.0 |
| | | | |
| | | |
|
Total fees | | | | 7.6 | | | | 8.0 |
| | | | |
| | | |
|
| (1) | Audit fees include the review of the half year financial statements and work in connection with the filing of this Annual report on Form20-F. |
| (2) | Compliance services are carried out as part of the statutory audit. Tax advisory services must be reported to the Audit Committee as set out below. |
| (3) | All other fees include advice on accounting matters and non-regulatory reporting. All such fees must be reported to the Audit Committee and prior approval is required from the Chairman of the Audit Committee for any projects above specified limits. |
The Audit Committee has adopted a policy regarding audit and non-audit services in consultation with its independent auditors Deloitte & Touche LLP. This policy is designed to ensure the independence of our independent auditors by expressly setting forth all services that the independent auditors may not perform and reinforcing the principle of independence regardless of the type of work performed. The Audit Committee pre-approves the engagement terms and fees of Deloitte & Touche LLP for all audit and non-audit services, including tax services, unless such pre-approval is not required under the Securities and Exchange Act of 1934. The Audit Committee pre-approved the engagement terms and fees of Deloitte & Touche for all services for the fiscal year ended January 1, 2005.
71
PART III
Item 17. Financial Statements
Not applicable.
Item 18. Financial Statements
72
Item 19. Exhibits
| | |
| |
| 1.1 | | Memorandum and Articles of Association of the Company.(4) |
| |
| 4.1 | | The rules of the Tomkins Executive Share Option Scheme No. 3.(1) |
| |
| 4.2 | | The rules of the Tomkins Executive Share Option Scheme No. 4.(1) |
| |
| 4.3 | | Service Agreement, dated February 11, 2002 between Tomkins plc and James Nicol(2) |
| |
| 4.4 | | Support Agreement, dated April, 29, 2003, between Tomkins plc, 2023103 Ontario Inc., and Stackpole Limited.(3) |
| |
| 4.5 | | Lock-up Agreement, dated April 29, 2003, between The Stackpole Corporation, Tomkins plc, and 2023103 Ontario Inc.(3) |
| |
| 4.6 | | Third Supplemental Trust Deed relating to the £750,000,000 Euro Medium Term Note Programme dated August 28, 2003.(4) |
| |
| 4.7 | | Facility Agreement relating to the £400,000,000 multicurrency revolving credit agreement dated February 9, 2004.(4) |
| |
| 4.8 | | The rules of the Tomkins 2005 Sharesave Scheme* |
| |
| 8.1 | | List of subsidiaries of the Company*. |
| |
| 12.1 | | Certification of CEO pursuant to Rule 13 (a) – 14(a) of the Securities Exchange Act of 1934* |
| |
| 12.2 | | Certification of CFO pursuant to Rule 13 (a) – 14(a) of the Securities Exchange Act of 1934* |
| |
| 13.1 | | Certification of CEO and CFO pursuant to Rule 13(a) – 14 (b) of the Securities and Exchange act of 1934 and 18 USC. Section 1350, as adopted pursuant to Section 906 of the Sarbanes-Oxley Act of 2002*. |
| (1) | Incorporated by reference to the Company’s Annual Report on Form 20-F for the fiscal year ended April 30, 2001. |
| (2) | Incorporated by reference to the Company’s Annual Report on Form 20-F for the fiscal year ended April 30, 2002. |
| (3) | Incorporated by reference to the Company’s Transition Report on Form 20-F for the eight months ended December 31, 2002. |
| (4) | Incorporated by reference to the Company’s Annual Report on Form 20-F for the fiscal year ended January 3, 2004. |
73
Report of independent registered public accounting firm
To the Board of Directors and shareholders of Tomkins plc
We have audited the accompanying consolidated balance sheets of Tomkins plc and subsidiaries (“Tomkins plc”) as of January 1, 2005 and January 3, 2004, and the related consolidated statements of income, cash flows and changes in shareholders’ equity for the years ended January 1, 2005 and January 3, 2004, the eight months to December 31, 2002 and the year ended April 30, 2002. These financial statements are the responsibility of the Company’s management. Our responsibility is to express an opinion on the financial statements based on our audits.
We conducted our audits in accordance with standards of the Public Company Accounting Oversight Board (United States). Those standards require that we plan and perform the audit to obtain reasonable assurance about whether the financial statements are free of material misstatement. The Company is not required to have, nor were we engaged to perform, an audit of its internal control over financial reporting. An audit includes consideration of internal control over financial reporting as a basis for designing audit procedures that are appropriate in the circumstances, but not for the purpose of expressing an opinion on the effectiveness of the combined businesses’ internal control over financial reporting. Accordingly, we express no such opinion. An audit includes examining, on a test basis, evidence supporting the amounts and disclosures in the financial statements. An audit also includes assessing the accounting principles used and significant estimates made by management, as well as evaluating the overall financial statement presentation. We believe that our audits provide a reasonable basis for our opinion.
In our opinion, such consolidated financial statements present fairly, in all material respects, the financial position of Tomkins plc as of January 1, 2005 and January 3, 2004 and the results of its operations and its cash flows for the years ended January 1, 2005, January 3, 2004, the eight months ended December 31, 2002 and for the year ended April 30, 2002, in conformity with accounting principles generally accepted in the United States of America.
On May 1, 2002, the Company changed its method of accounting for goodwill and other intangible assets to conform to Statement of Financial Accounting Standards No. 142, “Goodwill and Other Intangible Assets”. This is discussed in Note 9 to the financial statements.
On May 1, 2001, the Company adopted Statement of Financial Accounting Standards No. 133, ‘Accounting for Derivative Instruments and Hedging Activities’, and its related amendments. This is discussed in Note 2 to the financial statements.
/s/ Deloitte & Touche LLP
Deloitte & Touche LLP
London, United Kingdom
March 18, 2005
F-1
Consolidated statements of income
All numbers below are in millions USD, except per share data
| | | | | | | | | | | | | | | | |
| | | Year ended
January 1,
2005
| | | Year ended
January 3, 2004
| | | Eight
months ended
December 31,
2002
| | | Year ended
April 30, 2002
| |
Net sales | | | 5,356.1 | | | | 4,847.4 | | | | 2,981.6 | | | | 4,374.7 | |
Cost of sales | | | (3,806.4 | ) | | | (3,452.6 | ) | | | (2,104.7 | ) | | | (3,140.6 | ) |
| | |
|
|
| |
|
|
| |
|
|
| |
|
|
|
Gross profit | | | 1,549.7 | | | | 1,394.8 | | | | 876.9 | | | | 1,234.1 | |
Selling, general and administrative expenses | | | (1,038.5 | ) | | | (958.7 | ) | | | (590.5 | ) | | | (860.0 | ) |
Goodwill impairment | | | — | | | | (12.5 | ) | | | (47.8 | ) | | | — | |
Restructuring expenses | | | (34.1 | ) | | | (38.0 | ) | | | (46.6 | ) | | | (41.7 | ) |
| | |
|
|
| |
|
|
| |
|
|
| |
|
|
|
Operating income from continuing operations | | | 477.1 | | | | 385.6 | | | | 192.0 | | | | 332.4 | |
Interest income | | | 11.5 | | | | 15.8 | | | | 27.4 | | | | 74.2 | |
Interest expense | | | (34.9 | ) | | | (30.2 | ) | | | (25.3 | ) | | | (59.8 | ) |
Other income net | | | 44.0 | | | | 54.8 | | | | 16.1 | | | | 6.0 | |
| | |
|
|
| |
|
|
| |
|
|
| |
|
|
|
Income from continuing operations before taxes, minority interest, equity in net income of associates and cumulative effect of change in accounting principle | | | 497.7 | | | | 426.0 | | | | 210.2 | | | | 352.8 | |
Income tax (expense)/benefit | | | (103.2 | ) | | | 72.2 | | | | (32.2 | ) | | | (135.8 | ) |
Minority interest in net income | | | (15.2 | ) | | | (12.4 | ) | | | (8.1 | ) | | | (6.4 | ) |
Equity in net income/(loss) of associates | | | 0.9 | | | | 0.8 | | | | — | | | | (1.1 | ) |
| | |
|
|
| |
|
|
| |
|
|
| |
|
|
|
Income from continuing operations before cumulative effect of change in accounting principle | | | 380.2 | | | | 486.6 | | | | 169.9 | | | | 209.5 | |
Loss from discontinued operations, net of tax charge of $4.2 million (2003 – tax credit of $14.5 million, 2002 - $5.4 million, 2001/02 – tax credit of $1.1 million) | | | (13.5 | ) | | | (109.5 | ) | | | (3.0 | ) | | | (0.7 | ) |
Gain/(loss) on disposal of discontinued operations, net of tax credit of $6.8 million (2003 – tax charge of $11.9 million, 2002 – tax charge of $13.2 million, 2001/02 – tax charge of $0.6 million) | | | 11.0 | | | | 49.6 | | | | (0.8 | ) | | | 3.2 | |
| | |
|
|
| |
|
|
| |
|
|
| |
|
|
|
Income before cumulative effect of change in accounting principle | | | 377.7 | | | | 426.7 | | | | 166.1 | | | | 212.0 | |
Cumulative effect of change in accounting principle, net of tax of $nil (2003 - $nil, 2002 -$nil, 2001/02 - $nil) | | | — | | | | — | | | | (47.3 | ) | | | 2.6 | |
| | |
|
|
| |
|
|
| |
|
|
| |
|
|
|
Net income | | | 377.7 | | | | 426.7 | | | | 118.8 | | | | 214.6 | |
Gain on redemption of redeemable convertible cumulative preference shares | | | — | | | | 17.4 | | | | — | | | | — | |
Preference dividend | | | (28.5 | ) | | | (47.1 | ) | | | (37.6 | ) | | | (56.3 | ) |
| | |
|
|
| |
|
|
| |
|
|
| |
|
|
|
Net income attributable to common shareholders | | $ | 349.2 | | | $ | 397.0 | | | $ | 81.2 | | | $ | 158.3 | |
| | |
|
|
| |
|
|
| |
|
|
| |
|
|
|
Net income per common share | | | | | | | | | | | | | | | | |
Basic | | | | | | | | | | | | | | | | |
Income from continuing operations before cumulative effect of change in accounting principle | | | 0.46 | | | | 0.59 | | | | 0.17 | | | | 0.20 | |
Loss from discontinued operations | | | (0.02 | ) | | | (0.14 | ) | | | — | | | | — | |
Gain/(loss) on disposal of discontinued operations | | | 0.01 | | | | 0.06 | | | | — | | | | — | |
| | |
|
|
| |
|
|
| |
|
|
| |
|
|
|
Income before cumulative effect of change in accounting principle | | | 0.45 | | | | 0.51 | | | | 0.17 | | | | 0.20 | |
Cumulative effect of change in accounting principle | | | — | | | | — | | | | (0.06 | ) | | | — | |
| | |
|
|
| |
|
|
| |
|
|
| |
|
|
|
Net income | | $ | 0.45 | | | $ | 0.51 | | | $ | 0.11 | | | $ | 0.20 | |
| | |
|
|
| |
|
|
| |
|
|
| |
|
|
|
Diluted | | | | | | | | | | | | | | | | |
Income from continuing operations before cumulative effect of change in accounting principle | | | 0.43 | | | | 0.51 | | | | 0.17 | | | | 0.20 | |
Loss from discontinued operations | | | (0.01 | ) | | | (0.12 | ) | | | — | | | | — | |
Gain/(loss) on disposal of discontinued operations | | | 0.01 | | | | 0.06 | | | | — | | | | — | |
| | |
|
|
| |
|
|
| |
|
|
| |
|
|
|
Income before cumulative effect of change in accounting principle | | | 0.43 | | | | 0.45 | | | | 0.17 | | | | 0.20 | |
Cumulative effect of change in accounting principle | | | — | | | | — | | | | (0.05 | ) | | | — | |
| | |
|
|
| |
|
|
| |
|
|
| |
|
|
|
Net income | | $ | 0.43 | | | $ | 0.45 | | | $ | 0.12 | | | $ | 0.20 | |
| | |
|
|
| |
|
|
| |
|
|
| |
|
|
|
The accompanying Notes form an integral part of these consolidated financial statements.
F-2
Consolidated statements of cash flows
All numbers below are in millions USD
| | | | | | | | | | | | | | | | |
| | | Year ended
January 1,
2005
| | | Year ended
January 3,
2004
| | | Eight
months ended
December 31,
2002
| | | Year ended
April 30,
2002
| |
Cash flow from operating activities | | | | | | | | | | | | | | | | |
Adjustments to reconcile net income to cash provided by operating activities: | | | | | | | | | | | | | | | | |
Net income | | | 377.7 | | | | 426.7 | | | | 118.8 | | | | 214.6 | |
Equity in net (loss)/income of associates | | | (0.9 | ) | | | (0.8 | ) | | | — | | | | 1.1 | |
Depreciation and amortization | | | 216.2 | | | | 196.6 | | | | 121.8 | | | | 219.3 | |
Impairment of goodwill | | | — | | | | 12.5 | | | | 47.8 | | | | — | |
Cumulative effect of change in accounting principle | | | — | | | | — | | | | 47.3 | | | | (2.6 | ) |
Loss from discontinued operations | | | 13.5 | | | | 109.5 | | | | 3.0 | | | | 0.7 | |
(Gain)/loss on disposal of discontinued operations | | | (11.0 | ) | | | (49.6 | ) | | | 0.8 | | | | (3.2 | ) |
(Gain)/loss on sale of property, plant and equipment | | | (3.3 | ) | | | — | | | | 1.1 | | | | (15.9 | ) |
Stock based compensation | | | 6.6 | | | | 10.6 | | | | (3.2 | ) | | | 8.2 | |
Deferred income taxes | | | 33.6 | | | | (7.2 | ) | | | (9.3 | ) | | | 28.5 | |
Minority interest | | | 15.2 | | | | 12.4 | | | | 8.1 | | | | 6.4 | |
Changes in assets and liabilities net of effects of businesses acquired or sold | | | | | | | | | | | | | | | | |
Increase/(decrease) in taxes payable | | | (5.9 | ) | | | (112.5 | ) | | | (49.7 | ) | | | 52.9 | |
(Increase)/decrease in accounts receivable | | | (93.5 | ) | | | (32.9 | ) | | | 78.4 | | | | 104.1 | |
(Increase)/decrease in prepaid expenses and other assets | | | 20.8 | | | | 14.1 | | | | (37.7 | ) | | | (5.3 | ) |
(Increase)/decrease in inventory | | | (59.0 | ) | | | (4.5 | ) | | | (44.2 | ) | | | 47.7 | |
Increase/(decrease) in accounts payable | | | 117.4 | | | | 17.9 | | | | (32.6 | ) | | | (16.2 | ) |
Increase/(decrease) in current liabilities net | | | (101.0 | ) | | | (41.9 | ) | | | (19.2 | ) | | | (11.4 | ) |
| | |
|
|
| |
|
|
| |
|
|
| |
|
|
|
Net cash provided by operating activities | | | 526.4 | | | | 550.9 | | | | 231.2 | | | | 628.9 | |
| | |
|
|
| |
|
|
| |
|
|
| |
|
|
|
Cash flows from investing activities | | | | | | | | | | | | | | | | |
Purchases of property, plant and equipment | | | (283.2 | ) | | | (209.0 | ) | | | (154.0 | ) | | | (175.5 | ) |
Proceeds from the sale of property, plant and equipment | | | 15.5 | | | | 32.0 | | | | 12.6 | | | | 28.2 | |
Proceeds from the sale of discontinued operations | | | 30.0 | | | | 64.6 | | | | 82.7 | | | | 6.0 | |
New business acquisitions, net of cash acquired | | | (46.0 | ) | | | (240.0 | ) | | | (17.7 | ) | | | (43.3 | ) |
Dividends received from non controlled affiliates | | | 0.7 | | | | 0.8 | | | | 0.8 | | | | 1.1 | |
Changes in restricted cash | | | (2.0 | ) | | | (3.8 | ) | | | 0.3 | | | | 10.2 | |
| | |
|
|
| |
|
|
| |
|
|
| |
|
|
|
Net cash used in investing activities | | | (285.0 | ) | | | (355.4 | ) | | | (75.3 | ) | | | (173.3 | ) |
| | |
|
|
| |
|
|
| |
|
|
| |
|
|
|
Cash flows from financing activities | | | | | | | | | | | | | | | | |
Bank loans repayment | | | (16.6 | ) | | | (83.8 | ) | | | (84.2 | ) | | | (459.4 | ) |
Bank loans drawn down | | | 3.3 | | | | 498.0 | | | | 1.8 | | | | 220.1 | |
Issuance of common stock | | | 2.2 | | | | 1.1 | | | | 1.7 | | | | 1.4 | |
Redemption of redeemable convertible cumulative preference shares | | | — | | | | (604.5 | ) | | | — | | | | — | |
Buyback of common stock | | | — | | | | — | | | | — | | | | (28.4 | ) |
Payments to acquire treasury stock | | | (7.5 | ) | | | (4.0 | ) | | | — | | | | — | |
Dividend payments | | | (203.1 | ) | | | (204.5 | ) | | | (131.7 | ) | | | (189.8 | ) |
Dividends paid to subsidiary companies’ minority shareholders | | | (4.9 | ) | | | (6.3 | ) | | | (6.7 | ) | | | (11.7 | ) |
Investment by/(repayment of capital to) minority shareholder | | | 7.1 | | | | (1.3 | ) | | | 4.9 | | | | 7.2 | |
| | |
|
|
| |
|
|
| |
|
|
| |
|
|
|
Net cash used in financing activities | | | (219.5 | ) | | | (405.3 | ) | | | (214.2 | ) | | | (460.6 | ) |
| | |
|
|
| |
|
|
| |
|
|
| |
|
|
|
Effect of exchange rate changes on cash and cash equivalents | | | 16.7 | | | | 2.5 | | | | 29.7 | | | | (7.4 | ) |
| | |
|
|
| |
|
|
| |
|
|
| |
|
|
|
Net cash (used)/provided by discontinued operations | | | 3.1 | | | | (28.2 | ) | | | 1.5 | | | | 14.0 | |
| | |
|
|
| |
|
|
| |
|
|
| |
|
|
|
Net increase/(decrease) in cash and cash equivalents | | | 41.7 | | | | (235.5 | ) | | | (27.1 | ) | | | 1.6 | |
Cash and cash equivalents at beginning of period | | | 314.3 | | | | 549.8 | | | | 576.9 | | | | 575.3 | |
| | |
|
|
| |
|
|
| |
|
|
| |
|
|
|
Cash and cash equivalents at end of period | | $ | 356.0 | | | $ | 314.3 | | | $ | 549.8 | | | $ | 576.9 | |
| | |
|
|
| |
|
|
| |
|
|
| |
|
|
|
Supplemental schedule of investing and financing activities: | | | | | | | | | | | | | | | | |
Cash paid during the period for interest | | | (35.6 | ) | | | (32.3 | ) | | | (42.0 | ) | | | (64.8 | ) |
Cash paid during the period for income taxes | | | (102.4 | ) | | | (97.8 | ) | | | (103.4 | ) | | | (96.3 | ) |
Non cash investing and financing activities: | | | | | | | | | | | | | | | | |
Capital lease additions | | | — | | | | (7.0 | ) | | | — | | | | — | |
The accompanying Notes form an integral part of these consolidated financial statements.
F-3
Consolidated balance sheets
All numbers below are in millions USD, except share and per share data
| | | | | | | | |
| | | January 1,
2005
| | | January 3,
2004
| |
Assets | | | | | | | | |
Current assets | | | | | | | | |
Cash and cash equivalents | | | 356.0 | | | | 314.3 | |
Restricted cash | | | 9.4 | | | | 6.8 | |
Accounts receivable | | | 825.9 | | | | 714.1 | |
Inventories | | | 703.8 | | | | 609.9 | |
Deferred income taxes | | | 80.1 | | | | 106.9 | |
Prepaid expenses and other assets | | | 128.1 | | | | 167.9 | |
Assets held for sale | | | 61.8 | | | | 136.6 | |
| | |
|
|
| |
|
|
|
Total current assets | | | 2,165.1 | | | | 2,056.5 | |
Long term assets | | | | | | | | |
Property, plant and equipment | | | 1,461.6 | | | | 1,393.4 | |
Goodwill | | | 1,752.3 | | | | 1,706.7 | |
Intangible assets | | | 49.1 | | | | 44.2 | |
Deferred income taxes | | | 237.6 | | | | 216.3 | |
Other long term assets | | | 70.3 | | | | 45.5 | |
| | |
|
|
| |
|
|
|
Total assets | | $ | 5,736.0 | | | $ | 5,462.6 | |
| | |
|
|
| |
|
|
|
Liabilities and shareholders’ equity | | | | | | | | |
Current liabilities | | | | | | | | |
Bank loans and overdrafts, other loans and capital leases, current portion | | | 46.5 | | | | 54.1 | |
Accounts payable | | | 450.8 | | | | 355.5 | |
Other current liabilities | | | 351.1 | | | | 416.1 | |
Taxes payable | | | 290.7 | | | | 290.7 | |
Deferred income taxes | | | 41.8 | | | | 30.0 | |
Liabilities related to assets held for sale | | | 0.6 | | | | 41.4 | |
| | |
|
|
| |
|
|
|
Total current liabilities | | | 1,181.5 | | | | 1,187.8 | |
Long term liabilities | | | | | | | | |
Bank loans, other loans and capital leases, less current portion | | | 788.3 | | | | 740.9 | |
Pension obligations | | | 272.7 | | | | 290.4 | |
Post retirement obligations other than pensions | | | 286.1 | | | | 292.0 | |
Deferred income taxes | | | 163.6 | | | | 139.4 | |
Other long term liabilities | | | 39.9 | | | | 55.5 | |
| | |
|
|
| |
|
|
|
Total liabilities | | | 2,732.1 | | | | 2,706.0 | |
| | |
|
|
| |
|
|
|
Minority interest | | | 80.8 | | | | 59.6 | |
Shareholders’ equity | | | | | | | | |
Common stock, par value 5p, authorized shares – 1,585,164,220; issued and outstanding shares – 773,889,884 (January 3, 2004: 773,262,360) | | | 74.3 | | | | 69.3 | |
Convertible cumulative preference stock of $50; Authorized shares – 13,920,000; Issued and outstanding shares – 10,506,721 (January 3, 2004: 10,506,721) | | | 647.4 | | | | 603.6 | |
Treasury stock | | | (17.1 | ) | | | (11.5 | ) |
Additional paid-in capital | | | 208.0 | | | | 190.3 | |
Restricted reserves | | | 886.8 | | | | 826.8 | |
Retained earnings | | | 1,697.8 | | | | 1,521.1 | |
Accumulated other comprehensive loss | | | (574.1 | ) | | | (502.6 | ) |
| | |
|
|
| |
|
|
|
Total shareholders’ equity | | | 2,923.1 | | | | 2,697.0 | |
| | |
|
|
| |
|
|
|
Total liabilities and shareholders’ equity | | $ | 5,736.0 | | | $ | 5,462.6 | |
| | |
|
|
| |
|
|
|
The accompanying Notes form an integral part of these consolidated financial statements.
F-4
Consolidated statements of changes in shareholders’ equity
| | | | | | | | | | | | | | | | | | | | | | | | | | | |
| | | Common stock
| | | Convertible cumulative
preferred stock
| | Treasury stock
| | | | | | |
| | | Number
of shares
thousands
| | | $ million
| | | Number of shares
thousands
| | | $ million
| | Number
of shares
thousands
| | | $ million
| | | Additional
paid-in capital
$ million
| | | Restricted
reserves $ million
|
At May 1, 2001 | | 782,523 | | | | 56.2 | | | 10,508 | | | | 484.5 | | 2,028 | | | | (5.2 | ) | | | 139.2 | | | | 93.1 |
Common stock issued under employee plans | | | | | | | | | | | | | | | | | | | | | | | | | | | |
Stock based compensation | | — | | | | — | | | — | | | | — | | — | | | | — | | | | 8.2 | | | | — |
Treasury stock vested under stock option plans | | — | | | | — | | | — | | | | — | | (564) | | | | 2.3 | | | | (2.3 | ) | | | — |
Buy back of common stock | | (11,233 | ) | | | (0.8 | ) | | — | | | | — | | — | | | | — | | | | (1.8 | ) | | | 2.6 |
Common stock issued pursuant to options exercised | | 409 | | | | 0.1 | | | — | | | | — | | — | | | | — | | | | 1.3 | | | | — |
Dividends on common stock – 12.0p per share | | — | | | | — | | | — | | | | — | | — | | | | — | | | | — | | | | — |
Dividends on preferred stock(1) | | — | | | | — | | | — | | | | — | | — | | | | — | | | | — | | | | — |
Net income | | — | | | | — | | | — | | | | — | | — | | | | — | | | | — | | | | — |
Minimum pension liability adjustments | | — | | | | — | | | — | | | | — | | — | | | | — | | | | — | | | | — |
Exchange translation adjustments | | — | | | | 0.8 | | | — | | | | 6.9 | | — | | | | (2.9 | ) | | | 1.2 | | | | 1.4 |
| | |
|
| |
|
|
| |
|
| |
|
| |
|
| |
|
|
| |
|
|
| |
|
|
At April 30, 2002 | | 771,699 | | | | 56.3 | | | 10,508 | | | | 491.4 | | 1,464 | | | | (5.8 | ) | | | 145.8 | | | | 97.1 |
Common stock issued under employee plans | | | | | | | | | | | | | | | | | | | | | | | | | | | |
Stock based compensation | | — | | | | — | | | — | | | | — | | — | | | | — | | | | (3.2 | ) | | | — |
Allotments to treasury stock | | 795 | | | | 0.1 | | | — | | | | — | | 795 | | | | (2.8 | ) | | | 2.7 | | | | — |
Treasury stock vested under stock option plans | | — | | | | — | | | — | | | | — | | (432 | ) | | | 2.6 | | | | (2.6 | ) | | | — |
Common stock issued pursuant to options exercised /conversion of preferred stock | | 479 | | | | 0.1 | | | (1 | ) | | | — | | — | | | | — | | | | 1.6 | | | | — |
Dividends on common stock – 7.4p per share | | — | | | | — | | | — | | | | — | | — | | | | — | | | | — | | | | — |
Dividends on preferred stock(1) | | — | | | | — | | | — | | | | — | | — | | | | — | | | | — | | | | — |
Net income | | — | | | | — | | | — | | | | — | | — | | | | — | | | | — | | | | — |
Minimum pension liability adjustments | | — | | | | — | | | — | | | | — | | — | | | | — | | | | — | | | | — |
Exchange translation adjustments | | — | | | | 5.8 | | | — | | | | 51.5 | | — | | | | (0.6 | ) | | | 17.2 | | | | 10.1 |
| | |
|
| |
|
|
| |
|
| |
|
| |
|
| |
|
|
| |
|
|
| |
|
|
At December 31, 2002 | | 772,973 | | | | 62.3 | | | 10,507 | | | | 542.9 | | 1,827 | | | | (6.6 | ) | | | 161.5 | | | | 107.2 |
Common stock issued under employee plans | | | | | | | | | | | | | | | | | | | | | | | | | | | |
Stock based compensation | | — | | | | — | | | — | | | | — | | — | | | | — | | | | 10.6 | | | | — |
Investment in treasury stock | | — | | | | — | | | — | | | | — | | 899 | | | | (4.0 | ) | | | — | | | | — |
Treasury stock vested under stock option plans | | — | | | | — | | | — | | | | — | | (97 | ) | | | 0.3 | | | | (0.3 | ) | | | — |
Transfer to restricted reserves upon redemption of Redeemable convertible cumulative preference shares | | — | | | | — | | | — | | | | — | | — | | | | — | | | | — | | | | 621.9 |
Common stock issued pursuant to options exercised | | 289 | | | | — | | | — | | | | — | | — | | | | — | | | | 1.1 | | | | — |
Dividends on common stock – 12.6p per share | | — | | | | — | | | — | | | | — | | — | | | | — | | | | — | | | | — |
Dividends on preferred stock(1) | | — | | | | — | | | — | | | | — | | — | | | | — | | | | — | | | | — |
Gain on redemption of preference shares | | — | | | | — | | | — | | | | — | | — | | | | — | | | | — | | | | — |
Net income | | — | | | | — | | | — | | | | — | | — | | | | — | | | | — | | | | — |
Minimum pension liability adjustments | | — | | | | — | | | — | | | | — | | — | | | | — | | | | — | | | | — |
Exchange translation adjustments | | — | | | | 7.0 | | | — | | | | 60.7 | | — | | | | (1.2 | ) | | | 17.4 | | | | 97.7 |
| | |
|
| |
|
|
| |
|
| |
|
| |
|
| |
|
|
| |
|
|
| |
|
|
At January 3, 2004 | | 773,262 | | | | 69.3 | | | 10,507 | | | | 603.6 | | 2,629 | | | | (11.5 | ) | | | 190.3 | | | | 826.8 |
Common stock issued under employee plans | | | | | | | | | | | | | | | | | | | | | | | | | | | |
Stock based compensation | | — | | | | — | | | — | | | | — | | — | | | | — | | | | 6.6 | | | | — |
Investment in treasury stock | | — | | | | — | | | — | | | | — | | 1,583 | | | | (7.5 | ) | | | — | | | | — |
Treasury stock vested under stock option plans | | — | | | | — | | | — | | | | — | | (712) | | | | 2.9 | | | | (2.9 | ) | | | — |
Common stock issued pursuant to options exercised | | 628 | | | | — | | | — | | | | — | | — | | | | — | | | | 2.2 | | | | — |
Dividends on common stock – 12.2p per share | | — | | | | — | | | — | | | | — | | — | | | | — | | | | — | | | | — |
Dividends on preferred stock – 5.56 per cent | | — | | | | — | | | — | | | | — | | — | | | | — | | | | — | | | | — |
Net income | | — | | | | — | | | — | | | | — | | — | | | | — | | | | — | | | | — |
Minimum pension liability adjustments | | — | | | | — | | | — | | | | — | | — | | | | — | | | | — | | | | — |
Exchange translation adjustments | | — | | | | 5.0 | | | — | | | | 43.8 | | — | | | | (1.0 | ) | | | — | | | | 60.0 |
| | |
|
| |
|
|
| |
|
| |
|
| |
|
| |
|
|
| |
|
|
| |
|
|
At January 1, 2005 | | 773,890 | | | $ | 74.3 | | | 10,507 | | | $ | 647.4 | | 3,500 | | | $ | (17.1 | ) | | $ | 208.0 | | | $ | 886.8 |
| | |
|
| |
|
|
| |
|
| |
|
| |
|
| |
|
|
| |
|
|
| |
|
|
| (1) | Convertible cumulative preference stock 5.56 per cent, Redeemable convertible cumulative preference stock 4.344 per cent. |
F-5
Consolidated statements of changes in shareholders’ equity
continued
| | | | | | | | | | | | | | | | | | | | | | | | |
| | | Comprehensive income
| | | | |
| | | | | | Accumulated other comprehensive income
| | | | | | Shareholders’
equity
| |
| | | Retained
earnings
$ million
| | | Exchange
translation
$ million
| | | Minimum
pension liability
$ million
| | | Tax effect
$ million
| | | Total $ million
| | | Total $ million
| |
At May 1, 2001 | | | 1,914.6 | | | | (75.5 | ) | | | — | | | | — | | | | 1,839.1 | | | | 2,606.9 | |
Common stock issued under employee plans | | | | | | | | | | | | | | | | | | | | | | | | |
Stock based compensation | | | — | | | | — | | | | — | | | | — | | | | — | | | | 8.2 | |
Treasury stock vested under stock option plans | | | — | | | | — | | | | — | | | | — | | | | — | | | | — | |
Buy back of common stock | | | (28.2 | ) | | | — | | | | — | | | | — | | | | (28.2 | ) | | | (28.2 | ) |
Common stock issued pursuant to options exercised | | | — | | | | — | | | | — | | | | — | | | | — | | | | 1.4 | |
Dividends on common stock – 12.0p per share | | | (133.5 | ) | | | — | | | | — | | | | — | | | | (133.5 | ) | | | (133.5 | ) |
Dividends on preferred stock(1) | | | (56.3 | ) | | | — | | | | — | | | | — | | | | (56.3 | ) | | | (56.3 | ) |
Net income | | | 214.6 | | | | — | | | | — | | | | — | | | | 214.6 | | | | 214.6 | |
Minimum pension liability adjustments | | | — | | | | — | | | | (58.0 | ) | | | 23.0 | | | | (35.0 | ) | | | (35.0 | ) |
Exchange translation adjustments | | | — | | | | (29.8 | ) | | | — | | | | — | | | | (29.8 | ) | | | (22.4 | ) |
| | |
|
|
| |
|
|
| |
|
|
| |
|
|
| |
|
|
| |
|
|
|
At April 30, 2002 | | | 1,911.2 | | | | (105.3 | ) | | | (58.0 | ) | | | 23.0 | | | | 1,770.9 | | | | 2,555.7 | |
Common stock issued under employee plans | | | | | | | | | | | | | | | | | | | | | | | | |
Stock based compensation | | | — | | | | — | | | | — | | | | — | | | | — | | | | (3.2 | ) |
Allotments to treasury stock | | | — | | | | — | | | | — | | | | — | | | | — | | | | — | |
Treasury stock vested under stock option plans | | | — | | | | — | | | | — | | | | — | | | | — | | | | — | |
Common stock issued pursuant to options exercised /conversion of preferred stock | | | — | | | | — | | | | — | | | | — | | | | — | | | | 1.7 | |
Dividends on common stock – 7.4p per share | | | (87.6 | ) | | | — | | | | — | | | | — | | | | (87.6 | ) | | | (87.6 | ) |
Dividends on preferred stock(1) | | | (37.6 | ) | | | — | | | | — | | | | — | | | | (37.6 | ) | | | (37.6 | ) |
Net income | | | 118.8 | | | | — | | | | — | | | | — | | | | 118.8 | | | | 118.8 | |
Minimum pension liability adjustments | | | — | | | | — | | | | (203.4 | ) | | | 70.1 | | | | (133.3 | ) | | | (133.3 | ) |
Exchange translation adjustments | | | — | | | | (86.0 | ) | | | — | | | | — | | | | (86.0 | ) | | | (2.0 | ) |
| | |
|
|
| |
|
|
| |
|
|
| |
|
|
| |
|
|
| |
|
|
|
At December 31, 2002 | | | 1,904.8 | | | | (191.3 | ) | | | (261.4 | ) | | | 93.1 | | | | 1,545.2 | | | | 2,412.5 | |
Common stock issued under employee plans | | | | | | | | | | | | | | | | | | | | | | | | |
Stock based compensation | | | — | | | | — | | | | — | | | | — | | | | — | | | | 10.6 | |
Investment in treasury stock | | | — | | | | — | | | | — | | | | — | | | | — | | | | (4.0 | ) |
Treasury stock vested under stock option plans | | | — | | | | — | | | | — | | | | — | | | | — | | | | — | |
Transfer to restricted reserves upon redemption of Redeemable convertible cumulative preference shares | | | (621.9 | ) | | | — | | | | — | | | | — | | | | (621.9 | ) | | | — | |
Common stock issued pursuant to options exercised | | | — | | | | — | | | | — | | | | — | | | | — | | | | 1.1 | |
Dividends on common stock – 12.6p per share | | | (158.8 | ) | | | — | | | | — | | | | — | | | | (158.8 | ) | | | (158.8 | ) |
Dividends on preferred stock(1) | | | (47.1 | ) | | | — | | | | — | | | | — | | | | (47.1 | ) | | | (47.1 | ) |
Gain on redemption of preference shares | | | 17.4 | | | | — | | | | — | | | | — | | | | 17.4 | | | | 17.4 | |
Net income | | | 426.7 | | | | — | | | | — | | | | — | | | | 426.7 | | | | 426.7 | |
Minimum pension liability adjustments | | | — | | | | — | | | | 38.9 | | | | (7.7 | ) | | | 31.2 | | | | 31.2 | |
Exchange translation adjustments | | | — | | | | (174.2 | ) | | | — | | | | — | | | | (174.2 | ) | | | 7.4 | |
| | |
|
|
| |
|
|
| |
|
|
| |
|
|
| |
|
|
| |
|
|
|
At January 3, 2004 | | | 1,521.1 | | | | (365.5 | ) | | | (222.5 | ) | | | 85.4 | | | | 1,018.5 | | | | 2,697.0 | |
Common stock issued under employee plans | | | | | | | | | | | | | | | | | | | | | | | | |
Stock based compensation | | | — | | | | — | | | | — | | | | — | | | | — | | | | 6.6 | |
Investment in treasury stock | | | — | | | | — | | | | — | | | | — | | | | — | | | | (7.5 | ) |
Treasury stock vested under stock option plans | | | — | | | | — | | | | — | | | | — | | | | — | | | | — | |
Common stock issued pursuant to options exercised | | | — | | | | — | | | | — | | | | — | | | | — | | | | 2.2 | |
Dividends on common stock – 12.2p per share | | | (172.5 | ) | | | — | | | | — | | | | — | | | | (172.5 | ) | | | (172.5 | ) |
Dividends on preferred stock – 5.56 per cent | | | (28.5 | ) | | | — | | | | — | | | | — | | | | (28.5 | ) | | | (28.5 | ) |
Net income | | | 377.7 | | | | — | | | | — | | | | — | | | | 377.7 | | | | 377.7 | |
Minimum pension liability adjustments | | | — | | | | — | | | | 13.7 | | | | (8.0 | ) | | | 5.7 | | | | 5.7 | |
Exchange translation adjustments | | | — | | | | (77.2 | ) | | | — | | | | — | | | | (77.2 | ) | | | 42.4 | |
| | |
|
|
| |
|
|
| |
|
|
| |
|
|
| |
|
|
| |
|
|
|
At January 1, 2005 | | $ | 1,697.8 | | | $ | (442.7 | ) | | $ | (208.8 | ) | | $ | 77.4 | | | $ | 1,123.7 | | | $ | 2,923.1 | |
| | |
|
|
| |
|
|
| |
|
|
| |
|
|
| |
|
|
| |
|
|
|
The accompanying notes form an integral part of these consolidated financial statements.
F-6
Notes to the consolidated financial statements
1. NATURE OF OPERATIONS
Tomkins plc and its subsidiaries (the “Company”) is a global engineering and manufacturing group. Its activities report in three business segments: Industrial & Automotive which supplies car, truck and industrial equipment manufacturing markets, as well as industrial and automotive aftermarkets, throughout the world; Air Systems Components which supplies the heating, ventilation and air conditioning market mainly in North America; and Engineered & Construction Products which supplies the building, construction, truck and trailer and automotive industries mainly in North America.
2. SUMMARY OF SIGNIFICANT ACCOUNTING POLICIES
(i)Basis of consolidation
The consolidated financial statements include the accounts of Tomkins plc and its subsidiaries that are majority owned and controlled. Intercompany transactions and balances have been eliminated. The Company’s share of the earnings or losses of non-controlled affiliates, over which Tomkins exercises significant influence, but not control (generally a 20 per cent to 50 per cent ownership interest) is included in the consolidated operating results using the equity method of accounting. Investments in non-listed entities in which the Company has less than a 20 per cent ownership interest are accounted for under the cost method.
(ii)Accounting period
During 2002, the Company changed its accounting reference date from April 30 to December 31. Under UK Company Law, the Company must present annual financial statements for periods ending within seven days either side of its accounting reference date. Accordingly, these financial statements are for the 364 days ended January 1, 2005 (fiscal 2004), the 368 days ended January 3, 2004 (fiscal 2003), the 245 days ended December 31, 2002 (fiscal 2002) and the 365 days ended April 30, 2002 (fiscal 2001/02).
(iii)Use of estimates
The preparation of financial statements in conformity with accounting principles generally accepted in the United States of America (“US GAAP”) requires management to make estimates and assumptions that affect the reported amounts of assets and liabilities, the disclosure of contingent assets and liabilities at the date of the financial statements, and reported amounts of revenues and expenses during the reporting period. Due to the inherent uncertainty in making estimates, actual results reported in future periods could differ from those estimates.
(iv)Revenue recognition
In accordance with the Securities and Exchange Commission Staff Accounting Bulletin No. 104 “Revenue Recognition in Financial Statements”, the Company recognizes sales only when there is persuasive evidence of a sales agreement, the delivery of goods has occurred, the sales price is fixed or determinable and the collectibility of revenue is reasonably assured. Revenue is reported net of sales returns, early settlement discounts, rebates and sales taxes.
Revenue recognition on long-term contracts is recognized by the percentage-of-completion method. Losses on contracts, if any, are recognized in the period when such losses first become probable of occurrence and are reasonably estimable.
The Company accrues for rebates pursuant to specific arrangements with certain of its customers, primarily in the aftermarket. Rebates generally provide for price reductions based upon the achievement of specified purchase volumes and are recorded as a reduction of revenue.
(v)Research and development
Research and development expenditure is charged in the consolidated statement of income in the period in which it is incurred. Research and development expenses were $93.7 million in fiscal 2004, $95.6 million in fiscal 2003, $52.6 million in fiscal 2002, and $77.7 million in fiscal 2001/02.
(vi)Cash and cash equivalents
Cash and cash equivalents are defined as cash in hand, deposits available on demand and other short-term, highly liquid investments with original maturities of 90 days or less.
(vii)Restricted cash
Cash balances pledged or advanced as collateral are considered to be restricted cash.
(viii)Inventory
Inventories are stated at the lower of cost or market value. Cost determined by the last-in, first-out (LIFO) method was 37 per cent of the inventory at both January 1, 2005 and January 3, 2004. The remaining inventories are recorded using the first-in, first-out (FIFO) method. Inventories are reduced by an allowance for excess and obsolete inventories based on management’s review of on-hand inventories compared to historical and estimated future sales and usage. The replacement cost of inventory valued under LIFO exceeded the stated LIFO values by $1.6 million and $4.1 million at January 1, 2005 and January 3, 2004, respectively.
(ix)Property, plant and equipment
Property, plant and equipment are stated at cost less accumulated depreciation and any impairment write-offs. Major improvements are capitalized. Expenditures for repairs and maintenance are charged to expense as incurred.
Freehold land and assets under construction are not depreciated. Depreciation of property, plant and equipment, other than freehold land and assets under construction, is provided on the straight-line basis over estimated useful lives:
| | |
Freehold buildings and long leasehold land and buildings | | Ten to fifty years |
Short leasehold land and buildings | | Length of lease |
Plant, equipment and vehicles | | Two to twenty years |
Interest expense incurred while constructing major projects is capitalized within fixed assets and amortized over the life of the related assets. The interest capitalized is determined by reference to the average interest rate on outstanding borrowings. In fiscal 2004, fiscal 2003, fiscal 2002 and fiscal 2001/02, interest costs of $11.7 million, $7.2 million, $4.3 million and $5.0 million have been capitalized respectively.
(x)Financial Instruments
The carrying values of financial instruments (cash and cash equivalents, accounts receivable, accounts payable, an interest rate swap obligation, and debt) as of January 1, 2005 and January 3, 2004 approximate fair value. Fair value was based on expected cash flows and current market conditions. Effective May 1, 2001, Tomkins adopted SFAS 133, “Accounting for Derivative Instruments and Hedging Activities”, and its related amendments, which requires that all derivative instruments be reported on the balance sheet at their fair value and establishes criteria for designation and determining effectiveness of transactions entered into for hedging purposes. Derivatives that are not designated as hedges must be adjusted to fair value through income. If the derivative is designated as a hedge, depending on the nature of the hedge, changes in the fair value of derivatives that are considered to be effective, as defined, will either offset the change in fair value of the hedged assets, liabilities, or firm commitments through earnings or will be recorded in other comprehensive income until the hedged item is recorded in earnings. Gains and losses on derivative instruments that will be reported in other comprehensive income will be reclassified to income in the periods in which income is affected by the variability in the cash flows of the hedged items. Any portion of a change in a derivative’s fair value that is considered to be ineffective, as defined, will have to be immediately recorded in earnings. Any portion of a change in a derivative’s fair value that Tomkins has elected to exclude from its measure of effectiveness will be recorded in earnings. Tomkins has chosen not to adopt the hedge accounting provisions of SFAS
F-7
Notes to the consolidated financial statements
continued
2. SUMMARY OF SIGNIFICANT ACCOUNTING POLICIES (CONTINUED)
133. The cumulative effect of adopting SFAS No. 133 was to increase net income by $4.2 million, before tax ($2.6 million, after tax). Assets increased by $4.9 million and liabilities by $0.7 million as a result of recording all derivatives on the balance sheet at fair value at the date of adoption.
(xi)Acquisitions
The Company accounts for acquisitions in accordance with Statements on Financial Accounting Standards (“SFAS”) No. 141 “Business Combinations”, which was issued in July 2001. SFAS 141 requires that the purchase method of accounting be used for all business combinations initiated after June 30, 2001. SFAS 141 also specifies the criteria that intangible assets acquired in a purchase method business combination must meet to be recognized and reported apart from goodwill, noting that any purchase price allocable to an assembled workforce may not be accounted for separately.
(xii)Impairment and disposal of long-lived assets other than goodwill
The Company accounts for the impairment and disposal of long-lived assets or asset groups in accordance with SFAS 144 “Accounting for the Impairment and Disposal of Long-lived Assets”. The Company periodically evaluates the carrying value of long-lived assets to be held and used, including intangible assets, when events or circumstances indicate that the carrying amount of an asset may not be recoverable. The carrying value of a long-lived asset is considered impaired when the anticipated separately identifiable undiscounted cash flows from such an asset are less than the carrying value of the asset. In that event, a loss is recognized based on the amount by which the carrying value exceeds the fair value of the long-lived asset, fair value is determined primarily using the anticipated cash flows discounted at a rate commensurate with the risk involved. Long lived-assets are classified as held-for-sale when certain criteria are met. The Company measures long-lived assets to be disposed of by sale at the lower of carrying amount and fair value less cost to sell and no longer depreciates such assets. Fair value is determined using quoted market prices or the anticipated cash flows discounted at a rate commensurate with the risk involved. The Company classifies and presents certain entities as discontinued operations in accordance with SFAS No. 144, “Accounting for the Impairment or Disposal of Long-Lived Assets”, The earnings from discontinued operations include impairment charges to reduce these businesses to fair value less costs to sell. The Company classifies an asset or asset group that will be disposed of other than by sale as held and used until the disposal transaction occurs. The asset or asset group continues to be depreciated based on revisions to its estimated useful life until the date of disposal or abandonment.
(xiii)Goodwill and other intangibles
Goodwill represents the excess of the purchase price of net tangible and intangible assets acquired in business combinations over their estimated fair value. Other intangibles mainly represent patents & technology, customer relationships and intellectual property acquired in business combinations.
The Company adopted SFAS 142 “Goodwill and Other Intangible Assets” during fiscal 2002. SFAS 142 requires that goodwill and intangible assets with indefinite useful lives no longer be amortized, but instead tested for impairment at least annually in accordance with the provisions of SFAS 142. The Company has not identified any intangible assets for which it will adopt an indefinite useful life, nor has it revised the amortization periods for any intangible assets. Intangible assets are carried at cost and are amortized on a straight-line basis over their estimated useful life. The estimated useful lives of the intangible assets range from 8 to 15 years. The weighted average amortization period is 11 years.
Prior to the adoption of SFAS 142, goodwill was capitalized and amortized using the straight-line method over its estimated useful life. The Company periodically evaluated the recoverability of goodwill and other intangible assets by comparing the net book value of such assets to expected future cash flows, on an undiscounted basis, over the remaining amortization period of the asset.
(xiv)Minority interests
As of January 1, 2005 and January 3, 2004, the $80.8 million and $59.6 million minority interests balance consists primarily of a 49 per cent outside ownership interest in Gates Korea Company Limited, a 49 per cent outside ownership interest in Gates Nitta Belt Company (Suzhou) Limited, a 49 per cent outside ownership interest in Gates Unitta Asia Company Limited, a 49 per cent outside ownership interest in Gates Unitta Asia Trading Company Pte Limited, a 60 per cent outside ownership interest in Ideal International SA and a 50 per cent outside ownership interest in Schrader Duncan Limited.
(xv)Leases
Those assets that meet the criteria in SFAS 13 “Accounting for Leases” to be recognized as a capital lease are recorded as an asset and an obligation at an amount equal to the present value at the inception of the lease of the minimum lease payments during the lease term. All other leases are expensed to the profit and loss account on a straight-line basis. The gross cost of assets under capital leases was $64.9 million and $68.6 million in fiscal 2004 and fiscal 2003 respectively. Total accumulated depreciation in respect of these assets was $40.5 million and $38.3 million respectively at January 1, 2005 and January 3, 2004.
(xvi)Pensions and other post-retirement benefits
The Company operates pension plans throughout the world, covering the majority of employees. These plans are structured to accord with local conditions and practices in each country and include defined contribution and defined benefit plans. The Company accounts for its pension plans and its other post-retirement benefit plans using actuarial models required by SFAS No. 87, “Employers’ Accounting for Pensions” and SFAS 106, “Employers’ Accounting for Post-retirement Benefits other than Pensions”, respectively. These models use an attribution approach that generally spreads individual events over the service lives of the employees in the plan. Examples of ‘events’ are plan amendments and changes in actuarial assumptions such as discount rate, rate of compensation increases and mortality. The principle underlying the required attribution approach is that employees render service over their service lives on a relatively smooth basis and therefore, the income statement effects of pensions or non-pension post-retirement benefit plans are earned in, and should follow the same pattern.
One of the main components of the net periodic pension calculation is the expected long-term rate of return on plan assets. The required use of expected long-term rate of return on plan assets may result in recognized pension income that is greater or less than the actual returns of those plan assets in any given year. Over time, however, the expected long-term returns are designed to approximate the actual long-term returns and therefore, result in a pattern of income and expense recognition that more closely matches the pattern of the services provided by the employees. Actuarial gains and losses (to the extent that they exceed 10 per cent of the greater of market related value of the assets or the projected benefit obligation at the start of the period) are recognized in the net periodic pension calculation over the remaining average service lifetimes of active members.
The expected long-term rate of return on plan assets is established based upon our expectations of asset returns over the expected period to fund participant benefits and the current investment mix of our plans (with some reliance on historical asset returns for our plans). We further validated this assumption by loading our current asset mix into an asset return generation model (provided by our independent actuaries), which projected future asset returns using simulation and asset class correlation.
The discount rate assumptions used for pension and non-pension post-retirement benefit plan accounting reflect the rates available on high-quality fixed-income debt instruments on a date three months before the year end each year, which was October 1, 2004 for fiscal 2004. The rate of compensation increase is another significant assumption used in the actuarial model for pension accounting and is determined by the Company based upon its long-term plans for such increases. For retiree medical plan accounting, the
F-8
Notes to the consolidated financial statements
continued
2. SUMMARY OF SIGNIFICANT ACCOUNTING POLICIES (CONTINUED)
Company reviews external data and its own historical trends for health care costs to determine the health care cost trend rates.
If the unfunded accumulated benefit obligation exceeds the fair value of the plan assets, the Company recognizes a minimum liability that is at least equal to the unfunded accumulated benefit obligation. Where an additional minimum liability is recognized, an intangible asset is recognized up to the amount of any unrecognized prior service cost and the balance is recognized through other comprehensive income.
(xvii)Income taxes
The Company recognizes deferred tax assets and liabilities using enacted rates to calculate temporary differences between the financial statement carrying amounts of assets and liabilities and their respective tax bases. The effect on deferred tax assets and liabilities of changes in tax rates is recognized in the consolidated statement of income in the period in which the enactment date occurs. Deferred tax assets are reduced through the establishment of a valuation allowance at such time as, based on available evidence, it is more likely than not that the deferred tax asset will not be realized.
(xviii)Foreign currency
The functional currency of each of Tomkins plc’s subsidiaries is the local currency in which each subsidiary is located. Transactions in currencies other than the functional currency are translated at the exchange rate in effect at the date of each transaction. Differences in exchange rates during the period between the date a transaction denominated in a foreign currency is consummated and the date on which it is either settled or translated for inclusion in a consolidated balance sheet are recognized in the statement of income for that period.
Net income and cash flows of non-US dollar subsidiaries and equity investments are translated from their functional currencies at actual exchange rates or weighted average rates of exchange during the year. The assets and liabilities of such entities are translated at year-end rates of exchange. Translation adjustments are included within other comprehensive income as a separate component of shareholders’ equity.
(xix)Stock based compensation
Employees of the Company participate in a number of stock option plans whereby they receive rights over shares in Tomkins plc. The Company accounts for its stock option and stock-based compensation plans using the intrinsic-value method prescribed in Accounting Principles Board Opinion No. 25, (“APB 25”), “Accounting for Stock Issued to Employees”.
Had compensation cost for the employee share plans been determined consistent with the fair value methodology of SFAS 123, “Accounting for Stock-Based Compensation”, the Company’s net income would have been as follows:
| | | | | | | | | | | | | | | | |
| | | Year
ended
January 1,
2005 $ million
| | | Year
ended
January 3,
2004 $ million
| | | Eight months
ended
December 31,
2002 $ million
| | | Year
ended
April 30,
2002 $ million
| |
Reported net income | | | 377.7 | | | | 426.7 | | | | 118.8 | | | | 214.6 | |
Deduct total stock-based employee compensation determined under FAS 123, net of tax | | | (6.8 | ) | | | (4.9 | ) | | | (1.7 | ) | | | (1.3 | ) |
Add back total stock-based employee compensation determined under APB 25, net of tax | | | 4.2 | | | | 7.2 | | | | (2.2 | ) | | | 5.2 | |
| | |
|
|
| |
|
|
| |
|
|
| |
|
|
|
Pro forma net income | | | 375.1 | | | | 429.0 | | | | 114.9 | | | | 218.5 | |
| | |
|
|
| |
|
|
| |
|
|
| |
|
|
|
Pro forma net income per common share | | | | | | | | | | | | | | | | |
Basic | | $ | 0.45 | | | $ | 0.52 | | | $ | 0.10 | | | $ | 0.21 | |
Diluted | | $ | 0.43 | | | $ | 0.45 | | | $ | 0.12 | | | $ | 0.21 | |
(xx)Earnings per share
Basic earnings per common share is calculated by dividing net income by the weighted average number of common shares outstanding during the year. Diluted earnings per common share is calculated by adding back the preference dividend to net income (except in fiscal 2001/2002, where the preference shares were anti-dilutive) and adjusting weighted average outstanding shares, assuming conversion of all potentially dilutive stock options and awards.
(xxi)Product warranties
Provision is made for warranty claims on various products depending on specific market expectations and the type of product. These estimates are established using historical information on the nature, frequency and average cost of warranty claims. Management believes that the warranty reserve is appropriate; however, actual claims incurred could differ from the original estimates requiring adjustments to the reserve.
FASB Interpretation No. 45, “Guarantor’s Accounting and Disclosure Requirements for Guarantees, Including Indirect Guarantees of Indebtedness of Others” (“FIN 45”), requires that upon issuance of a guarantee, the guarantor must disclose and recognize a liability for the fair value of the obligation it assumes under that guarantee.
The requirements of FIN 45 are applicable to the Company’s product warranty liability and certain guarantees. The Company’s guarantees issued subject to the recognition and disclosure requirements of FIN 45 as of January 1, 2005 and January 3, 2004 were not material. As of January 1, 2005 and January 3, 2004, the Company’s product warranty liability recorded in other accrued liabilities was $10.8 million and $12.8 million respectively. The following table summarizes the activity related to the product warranty liability during fiscal 2004 and 2003.
| | | | | | |
| | | January 1,
2005 $ million
| | | January 3,
2004 $ million
| |
Balance at beginning of fiscal year | | 12.8 | | | 14.4 | |
Foreign exchange | | 0.4 | | | 0.5 | |
Provision for warranties issued | | 2.0 | | | 2.6 | |
Payments | | (4.4 | ) | | (4.7 | ) |
| | |
|
| |
|
|
Balance at end of fiscal year | | 10.8 | | | 12.8 | |
| | |
|
| |
|
|
(xxii)Non-statutory accounts
The accompanying financial statements do not comprise statutory accounts within the meaning of Section 240 of the Companies Act 1985. The Company’s statutory accounts for fiscal 2004 prepared in accordance with accounting principles generally accepted in the United Kingdom (“UK GAAP”) will be delivered to the Registrar of Companies for England and Wales.
F-9
Notes to the consolidated financial statements
continued
3. RECENTLY ISSUED ACCOUNTING PRONOUNCEMENTS
(a)Accounting pronouncements adopted during the year
The Company has adopted Financial Accounting Standards Board Interpretation No. 46R, (“FIN 46R”), “Consolidation of Variable Interest Entities” during the period, which requires that the assets, liabilities and results of operations of a variable interest entity be included in the consolidated financial statements if the Company is the primary beneficiary of the variable interest entity.
In December 2003, the FASB issued a revision to Interpretation No. 46, “Consolidation of Variable Interest Entities, an Interpretation of ARB No. 51” (“FIN 46R” or the “Interpretation”). FIN 46R clarifies the application of ARB No. 51, “Consolidated Financial Statements,” to certain entities in which equity investors do not have the characteristics of a controlling financial interest or do not have sufficient equity at risk for the entity to finance its activities without additional subordinated financial support. FIN 46R requires the consolidation of these entities, known as variable interest entities (“VIEs”), by the primary beneficiary of the entity. The primary beneficiary is the entity, if any, that will absorb a majority of the entity’s expected losses, receive a majority of the entity’s expected residual returns, or both.
Among other changes, the revisions of FIN 46R (a) clarified some requirements of the original FIN 46, which had been issued in January 2003, (b) eased some implementation problems, and (c) added new scope exceptions. FIN 46R deferred the effective date of the Interpretation for public companies, to the end of the first reporting period ending after March 15, 2004, except that all public companies must at a minimum apply the provisions of the Interpretation to entities that were previously considered “special-purpose entities” under the FASB literature prior to the issuance of FIN 46R by the end of the first reporting period ending after December 15, 2003. The Company has adopted the standard during the year and it has had no material impact on its financial position, cash flows and results of operations.
(b)New accounting pronouncements not yet adopted
In December 2004, the FASB issued Statement of Financial Accounting Standards (“SFAS”) No. 123 (revised 2004), “Share-Based Payments” or SFAS 123R. This statement eliminates the option to apply the intrinsic value measurement provisions of Accounting Principles Board (“APB”) Opinion No. 25, “Accounting for Stock Issued to Employees” to stock compensation awards issued to employees. Rather, SFAS 123R requires companies to measure the cost of employee services received in exchange for an award of equity instruments based on the grant-date fair value of the award. That cost will be recognized over the period during which an employee is required to provide services in exchange for the award - the requisite service period (usually the vesting period). SFAS 123R applies to all awards granted after the required effective date and to awards modified, repurchased, or cancelled after that date. SFAS 123R will be effective for interim periods beginning after July 1, 2005. We have not yet quantified the effect of the future adoption of SFAS 123R on the Company’s financial position or results of operations.
F-10
Notes to the consolidated financial statements
continued
4. ACQUISITIONS AND DISPOSALS
Discontinued operations
In addition to the disposals mentioned below, the results of Unified Industries Inc. and of the AirSprings division of the Company have been treated as a discontinued operation for all years presented and its assets are treated as held for sale as at January 1, 2005. Unified Industries Inc. was sold on January 2, 2005 and the AirSprings division was sold on February 9, 2005.
Dearborn Mid-West Conveyor Company is no longer treated as discontinued since there is no longer an active program to locate a buyer and the company is not currently being actively marketed for sale.
Disposals
Fiscal 2004
On January 30, 2004 and January 31, 2004 respectively, the business and assets of Hattersley Newman Hender, and Pegler Limited were sold for a combined consideration, before costs, of $23.7 million of which $10.5 million is deferred. Further net proceeds of $0.9 million were received after related closure costs and disposal of the vacant site. There was a loss on sale of $17.0 million before the release of a provision for impairment of $39.1 million, which was provided in Fiscal 2003. On June 1, 2004 Mayfran International Inc. was sold for a total consideration of $12.7 million of which $4.2 million is deferred. There was a loss on sale of $11.0 million. Costs of $1.5 million relating to disposals from prior years were incurred during the period. All of these disposals were included in the Engineering and Construction Products group.
In the Industrial & Automotive Group, the sale of the European curved hose business in Nevers, France, was completed on 17 November 2004 and the related closure of the European curved hose business in St Just, Spain was also completed in the year. Net sales proceeds after costs totaled $4.2 million, resulting in a profit on disposal of $1.9 million.
Costs on prior year disposals resulted in losses of $1.6 million being recognized in the year. Deferred consideration, net of these costs, resulted in additional proceeds of $2.2 million being received during the year and $1.0 million was received in advance, relating to the post year end disposal of Unified Industries Inc.
The post year end disposals of Unified Industries Inc and the AirSprings division are estimated to result in a total loss on disposal of $7.2 million. A provision for this loss has been recognized in fiscal 2004.
Fiscal 2003
On August 22, 2003 Tomkins sold Gates Formed-Fibre Products, Inc., for a cash consideration of $47.0 million. There was a net loss on disposal of $2.2 million, after charging $11.7 million of goodwill and costs of $2.2 million. This disposal was included in the Industrial and Automotive group. On January 27, 2003 Tomkins sold the business and assets of Milliken Valve Company Inc. for a cash consideration of $7.3 million, resulting in a gain on disposal of $4.0 million after costs of $0.3 million. On June 30, 2003 Tomkins sold its 62.4% investment in the business and assets of Cobra Investments (Pty) Limited for a cash consideration of $12.5 million of which $2.8 million was deferred. All of the deferred consideration has now been received. A loss of $5.3 million arose on the disposal. The disposal of Milliken and Cobra were included in the Engineered and Construction Products group. During the year, a provision for disposal of operations and related warranties amounting to $55.4 million was reversed, relating to a disposal in fiscal 2002/01. Costs of $0.7 million relating to the ongoing sale of companies were incurred during the year.
Fiscal 2002
On May 15, 2002, Tomkins sold the consumer and industrial division of Gates (U.K.) Limited for a cash consideration of $35.4 million. There was a loss on sale, after pension and disposal costs, of $6.3 million and after charging $6.4 million of goodwill. On December 30, 2002, Tomkins sold the business and assets of Fedco Automotive Components Inc. for a cash consideration of $8.0 million. $1.6 million of goodwill was written off to the profit and loss account, resulting in a loss on sale of $4.6 million. Both of these disposals were included in the Industrial and Automotive group. On May 24, 2002, Lasco Composites was sold for an adjusted cash consideration of $43.1 million. After disposal related costs of $3.9 million and $8.9 million of goodwill there was a profit on sale of $24.8 million. Lasco was included in the Engineered and Construction Products group. Costs of $1.5 million relating to the ongoing sale of companies were incurred during the year.
Fiscal 2002/01
Sunvic Controls Limited was sold on July 27, 2001 for a total consideration, net of costs, of $2.6 million. After $1.1 million of goodwill, a loss on sale of $1.7 million was recorded. This disposal was included in the Engineered and Construction Products group. Totectors Limited and The Northern Rubber Company Limited were sold on May 25, 2001 and September 11, 2001 respectively, for a total consideration, net of costs, of $33.0 million. After $4.8 million of goodwill, a profit on sale of $7.1 million was recorded. Totectors and Northern Rubber were included in the Industrial and Automotive group. On May 11, 2001 Tomkins sold Smith & Wesson Corp. for a consideration of $15.0 million. The purchaser also paid $20.0 million of an outstanding loan of $73.8 million due from Smith & Wesson Corp. to Tomkins Corporation. Of the remaining $53.8 million, $30.0 million was due to be repaid on an amortizing basis over the seven years commencing in May 2004 and $23.8 million was included in the equity capital acquired by the purchaser. Full settlement of the outstanding balance was achieved post the year ended January 1, 2005. There was a loss on sale of $34.0 million of which a provision of $34.2 million was made in the year ended April 30, 2001. Smith and Wesson was included in the Professional, Garden and Leisure Products group. Costs of $1.2 million relating to the ongoing sale of companies were incurred during the year and $62.1 million was included in assets disposed.
All of the disposals mentioned were disposed of as part of our program to dispose of all non-core businesses.
The results of these businesses have been shown as discontinued operations for all years presented.
F-11
Notes to the consolidated financial statements
continued
4. ACQUISITIONS AND DISPOSALS (CONTINUED)
A summary of operating results of all discontinued businesses is set forth below:
| | | | | | | | | | | | |
| | | Year ended January 1,
2005 $ million
| | | Year ended January 3,
2004 $ million
| | | Eight
months ended
December 31,
2002 $ million
| | | Year ended
April 30,
2002 $
million
| |
Net sales | | 85.1 | | | 289.6 | | | 234.5 | | | 460.0 | |
| | |
|
| |
|
| |
|
| |
|
|
Operating income | | (10.6 | ) | | (123.9 | ) | | 3.2 | | | (0.2 | ) |
| | |
|
| |
|
| |
|
| |
|
|
Income before taxes, minority interest and equity in net income of associates | | (9.8 | ) | | (123.5 | ) | | 3.4 | | | (0.2 | ) |
Income taxes | | (4.2 | ) | | 14.5 | | | (5.4 | ) | | 1.1 | |
Minority interest | | — | | | (0.7 | ) | | (1.3 | ) | | (1.3 | ) |
Equity in net income/(loss) of associates net of tax | | 0.5 | | | 0.2 | | | 0.3 | | | (0.3 | ) |
| | |
|
| |
|
| |
|
| |
|
|
Loss from discontinued operations | | (13.5 | ) | | (109.5 | ) | | (3.0 | ) | | (0.7 | ) |
| | |
|
| |
|
| |
|
| |
|
|
Net assets of assets held for sale are as follows:
| | | | | | |
| | | January 1,
2005 $
million
| | | January 3,
2004 $
million
| |
Assets: | | | | | | |
Accounts receivable | | 1.2 | | | 24.7 | |
Inventories | | 3.8 | | | 37.6 | |
Prepaid expenses and other assets | | 0.2 | | | 15.8 | |
Investments | | — | | | 4.1 | |
Property, plant and equipment | | 56.6 | | | 54.4 | |
| | |
|
| |
|
|
Total assets held for sale | | 61.8 | | | 136.6 | |
Liabilities: | | | | | | |
Accounts payable | | (0.4 | ) | | (8.1 | ) |
Other current liabilities | | (0.2 | ) | | (33.3 | ) |
| | |
|
| |
|
|
Total liabilities held for sale | | (0.6 | ) | | (41.4 | ) |
| | |
|
| |
|
|
Net assets of discontinued operations | | 61.2 | | | 95.2 | |
| | |
|
| |
|
|
Net assets held for sale at January 1, 2005 consist of AirSprings and Unified Industries Inc, and other property held for sale at a total net book value of $61.2 million (Industrial & Automotive $45.0 million; Air Systems Components $6.0 million; Engineered & Construction Products $10.2 million).
Acquisitions
Fiscal 2004
On December 1, 2004, Tomkins acquired the polyurethane power transmission and motion control belt business, assets and liabilities of Mectrol Corporation for a provisional cash consideration, including costs, of $46.0 million. Provisional goodwill of $35.5 million arising on the acquisition has been capitalized. The fair value of the assets acquired is still being assessed. As a result, the calculation of goodwill is provisional and may be amended. The acquisition, which has been included in the Industrial & Automotive group, brings a new technology to the Power Transmission business, extending the business group’s product and customer base.
Fiscal 2003
The company acquired the business, assets and liabilities of Stackpole Limited on June 18, 2003 for a cash consideration of $257.9 million (Cdn$349.1 million). Goodwill of $110.1 million arising on the acquisition was capitalized. The acquisition has been included in the Industrial & Automotive group. The acquisition brought the Company expertise in powder metal and engineered components for powertrain. Deferred consideration of $0.7 million in respect of a prior period acquisition made by the Air Systems Components group was paid during the year. Revisions to the fair value of assets acquired in the past resulted in a reduction of $0.8 million in the related goodwill.
Fiscal 2002
Tomkins acquired the business, assets and liabilities of Ward Industries Inc. and of the heating, ventilating and air conditioning dampers division of Johnson Controls Inc. on September 11, 2002 and September 30, 2002 respectively, for a combined cash consideration of $17.6 million of which $0.7 million was paid in Fiscal 2003. Goodwill of $11.0 million arising on these acquisitions was capitalized. The acquisition of Ward provided the Air Systems Components group with a new, expanded product offering in duct accessories and is in line with its strategy of growth in niche markets. The acquisition of Johnson Controls opened up new distribution channels, extended our damper product range for the commercial market and provided access to a wider customer base around the world. Both acquisitions were included in the Air Systems Components group.
Fiscal 2002/01
Tomkins acquired American Metal Products Company and the business and assets of Superior Rex on November 13, 2001 and November 19, 2001 respectively, for a combined consideration of $45.0 million. The acquisition of American Metal Products broadened our product offering by the inclusion of venting and gutter protection ranges, strengthened our manufacturing base with plants in Mississippi and Mexico and expanded our distribution capabilities, particularly into the important US West Coast market. The acquisition of the fan coil business of Superior Rex expanded our Titus product range. Both acquisitions were included in the Air Systems Components group.
F-12
Notes to the consolidated financial statements
continued
4. ACQUISITIONS AND DISPOSALS (CONTINUED)
A summary of the estimated fair values of the net assets acquired and liabilities assumed from the business acquired and the purchase price allocation is set forth below:
| | | | | | | | | | | | |
| | | Fair value to the Company
| |
| | | Year ended
January 1,
2005 $ million
| | | Year ended
January 3,
2004 $
million
| | | Eight
months ended
December 31,
2002 $ million
| | | Year ended
April 30,
2002 $
million
| |
Current assets | | 7.0 | | | 52.1 | | | 5.6 | | | 26.7 | |
Property plant and equipment | | 4.0 | | | 119.1 | | | 2.9 | | | 22.6 | |
Intangible assets | | — | | | 41.6 | | | — | | | — | |
Current liabilities | | (1.5 | ) | | (26.6 | ) | | (1.0 | ) | | (11.3 | ) |
Long term liabilities | | — | | | (44.3 | ) | | — | | | — | |
Cash | | — | | | 18.5 | | | — | | | — | |
Overdrafts | | — | | | — | | | (0.6 | ) | | (1.8 | ) |
Debt | | — | | | (4.7 | ) | | — | | | — | |
| | |
|
| |
|
| |
|
| |
|
|
Net assets | | 9.5 | | | 155.7 | | | 6.9 | | | 36.2 | |
Goodwill capitalized | | 35.5 | | | 102.8 | | | 11.0 | | | 9.1 | |
| | |
|
| |
|
| |
|
| |
|
|
Consideration | | 45.0 | | | 258.5 | | | 17.9 | | | 45.3 | |
| | |
|
| |
|
| |
|
| |
|
|
Cash consideration | | 45.3 | | | 258.5 | | | 16.9 | | | 45.0 | |
Costs | | 0.7 | | | — | | | 0.3 | | | 0.3 | |
Deferred consideration | | — | | | — | | | 0.7 | | | — | |
Provisional adjustment to purchase price | | (1.0 | ) | | — | | | — | | | — | |
| | |
|
| |
|
| |
|
| |
|
|
| | | 45.0 | | | 258.5 | | | 17.9 | | | 45.3 | |
| | |
|
| |
|
| |
|
| |
|
|
In the year ended April 30, 2002 cash of $3.8 million was received relating to acquisitions completed in prior periods
5. SEGMENT INFORMATION
The segment information that follows is stated in UK GAAP, in accordance with Statements on Financial Accounting Standards (“SFAS”) No. 131 “‘Disclosure about Segments of an Enterprise and Related Information”, which requires us to determine and review our segments as reflected in the management information systems reports that our business managers use in making decisions. The chief operating decision maker evaluates our segment performance based on the consolidated financial information prepared in UK GAAP.
The company’s reportable segments are based upon the nature of the products and services produced by each segment (see Note 1).
| | | | | | | | | | | | |
| | | Year ended
January 1,
2005 $
million
| | | Year ended
January 3,
2004 $
million
| | | Eight
months ended
December 31,
2002 $ million
| | | Year ended
April 30,
2002 $
million
| |
| (a) Analysis by business segment (UK GAAP) | | | | | | | | | | | | |
Net sales | | | | | | | | | | | | |
Industrial & Automotive | | 3,529.0 | | | 3,224.0 | | | 1,938.2 | | | 2,845.9 | |
Air Systems Components | | 772.3 | | | 730.3 | | | 499.5 | | | 740.0 | |
Engineered & Construction Products | | 1,128.6 | | | 1,057.0 | | | 680.4 | | | 1,110.4 | |
Discontinued operations | | 11.3 | | | 125.7 | | | 98.0 | | | 138.4 | |
| | |
|
| |
|
| |
|
| |
|
|
| | | 5,441.2 | | | 5,137.0 | | | 3,216.1 | | | 4,834.7 | |
| | |
|
| |
|
| |
|
| |
|
|
Operating income, before restructuring costs* | | | | | | | | | | | | |
Industrial & Automotive | | 356.5 | | | 309.6 | | | 176.3 | | | 247.9 | |
Air Systems Components | | 86.2 | | | 69.0 | | | 51.8 | | | 77.1 | |
Engineered & Construction Products | | 108.1 | | | 103.2 | | | 67.2 | | | 104.2 | |
Central costs | | (43.3 | ) | | (39.1 | ) | | (23.3 | ) | | (18.1 | ) |
Discontinued operations | | 0.2 | | | 0.5 | | | 8.0 | | | 7.3 | |
| | |
|
| |
|
| |
|
| |
|
|
| | | 507.7 | | | 443.2 | | | 280.0 | | | 418.4 | |
| | |
|
| |
|
| |
|
| |
|
|
| * | Operating income includes the group’s share of the income from associates and is before goodwill amortization. The split of the income from associates analyzed by reportable segment is Industrial & Automotive $1.1 million (January 2004 – $1.1 million; December 2002 – $0.5 million; April 2002 – loss of $1.0 million), Air Systems Components $nil (January 2004 – $nil; December 2002 – $nil; April 2002 – $nil), and Engineered & Construction Products $0.7 million (January 2004 – $0.3 million; December 2002 – $0.6 million; April 2002 – $nil). |
F-13
Notes to the consolidated financial statements
continued
5. SEGMENT INFORMATION (CONTINUED)
| | | | | | | | | | | | |
| | | Year ended
January 1,
2005
$ million
| | | Year ended
January 3,
2004
$ million
| | | Eight
months ended
December 31,
2002
$ million
| | | Year ended
April 30,
2002
$ million
| |
| (a) Analysis by business segment continued (UK GAAP) | | | | | | | | | | | | |
Operating net assets including goodwill | | | | | | | | | | | | |
Industrial & Automotive | | 1,822.0 | | | 1,557.5 | | | 1,233.0 | | | 1,174.1 | |
Air Systems Components | | 378.0 | | | 392.4 | | | 422.6 | | | 433.8 | |
Engineered & Construction Products | | 219.6 | | | 233.3 | | | 253.1 | | | 283.9 | |
Central costs | | (8.8 | ) | | (27.4 | ) | | (88.4 | ) | | (87.3 | ) |
Discontinued operations | | (7.5 | ) | | 23.6 | | | 72.1 | | | 63.5 | |
| | |
|
| |
|
| |
|
| |
|
|
| | | 2,403.3 | | | 2,179.4 | | | 1,892.4 | | | 1,868.0 | |
| | |
|
| |
|
| |
|
| |
|
|
Depreciation | | | | | | | | | | | | |
Industrial & Automotive | | 158.1 | | | 147.9 | | | 87.4 | | | 124.2 | |
Air Systems Components | | 26.7 | | | 26.4 | | | 19.0 | | | 25.7 | |
Engineered & Construction Products | | 26.3 | | | 34.9 | | | 22.7 | | | 36.1 | |
Central costs | | 0.5 | | | 0.5 | | | 0.3 | | | 0.4 | |
| | |
|
| |
|
| |
|
| |
|
|
| | | 211.6 | | | 209.7 | | | 129.4 | | | 186.4 | |
| | |
|
| |
|
| |
|
| |
|
|
Expenditures for additions to long-lived assets | | | | | | | | | | | | |
Industrial & Automotive | | 245.9 | | | 181.0 | | | 126.3 | | | 141.0 | |
Air Systems Components | | 14.6 | | | 14.0 | | | 14.0 | | | 23.1 | |
Engineered & Construction Products | | 26.7 | | | 33.8 | | | 21.8 | | | 23.4 | |
Central costs | | 0.7 | | | 1.3 | | | 0.1 | | | 0.1 | |
| | |
|
| |
|
| |
|
| |
|
|
| | | 287.9 | | | 230.1 | | | 162.2 | | | 187.6 | |
| | |
|
| |
|
| |
|
| |
|
|
| (b) Analysis by geographical origin (US GAAP) | | | | | | | | | | | | |
Net sales | | | | | | | | | | | | |
United States of America | | 3,489.7 | | | 3,287.6 | | | 2,151.8 | | | 3,225.8 | |
United Kingdom | | 323.3 | | | 258.6 | | | 132.8 | | | 178.6 | |
Rest of Europe | | 539.5 | | | 468.1 | | | 252.7 | | | 343.6 | |
Rest of the World | | 1,003.6 | | | 833.1 | | | 444.3 | | | 626.7 | |
| | |
|
| |
|
| |
|
| |
|
|
| | | 5,356.1 | | | 4,847.4 | | | 2,981.6 | | | 4,374.7 | |
| | |
|
| |
|
| |
|
| |
|
|
Long-lived assets | | | | | | | | | | | | |
United States of America | | 724.0 | | | 769.0 | | | 806.1 | | | 816.1 | |
United Kingdom | | 132.7 | | | 127.0 | | | 128.0 | | | 114.4 | |
Rest of Europe | | 165.7 | | | 156.1 | | | 131.9 | | | 106.7 | |
Rest of the World | | 439.2 | | | 341.3 | | | 204.2 | | | 214.3 | |
| | |
|
| |
|
| |
|
| |
|
|
| | | 1,461.6 | | | 1,393.4 | | | 1,270.2 | | | 1,251.5 | |
| | |
|
| |
|
| |
|
| |
|
|
There were no material sales or transfers between segments in any period.
The Company has a significant concentration of customers in North America (72 per cent for fiscal 2004; 72 per cent for fiscal 2003; 74 per cent for fiscal 2002 and 74 per cent for fiscal 2001/02), and in the industrial and automotive industry (64.9 per cent for fiscal 2004; 62.8 per cent for fiscal 2003; 60.3 per cent for fiscal 2002 and 58.9 per cent for fiscal 2001/02). No single customer accounted for more than 10 per cent of the Company’s sales, and there were no significant accounts receivables from a single customer. The Company reviews a customer’s credit history before extending credit. The Company establishes an allowance for doubtful accounts based upon factors surrounding the credit risk of specific customers, historical trends, and other information.
F-14
Notes to the consolidated financial statements
continued
5. SEGMENT INFORMATION (CONTINUED)
| | | | | | | | | | | | |
| | | Year ended
January 1,
2005
$ million
| | | Year ended
January 3,
2004
$ million
| | | Eight
months ended
December 31,
2002 $ million
| | | Year ended
April 30,
2002
$ million
| |
| Reconciliation of UK GAAP segmental information to US GAAP | | | | | | | | | | | | |
Net sales (UK GAAP) | | 5,441.2 | | | 5,137.0 | | | 3,216.1 | | | 4,834.7 | |
Discontinued operations | | (85.1 | ) | | (289.6 | ) | | (234.5 | ) | | (460.0 | ) |
| | |
|
| |
|
| |
|
| |
|
|
Net sales (US GAAP) | | 5,356.1 | | | 4,847.4 | | | 2,981.6 | | | 4,374.7 | |
| | |
|
| |
|
| |
|
| |
|
|
Operating income before restructuring costs (UK GAAP) | | 507.7 | | | 443.2 | | | 280.0 | | | 418.4 | |
Restructuring costs | | (31.9 | ) | | (58.5 | ) | | (49.1 | ) | | (37.4 | ) |
| | |
|
| |
|
| |
|
| |
|
|
Operating income (UK GAAP) | | 475.8 | | | 384.7 | | | 230.9 | | | 381.0 | |
Impairment of goodwill(a) | | — | | | (12.5 | ) | | (47.8 | ) | | — | |
Amortization of goodwill(a) | | — | | | — | | | — | | | (48.0 | ) |
Amortization of intangible asset(a) | | (5.3 | ) | | (2.6 | ) | | (0.2 | ) | | (1.1 | ) |
Valuation of net assets acquired in a business combination | | — | | | (0.3 | ) | | — | | | — | |
Inventories(b) | | (1.6 | ) | | (4.1 | ) | | — | | | — | |
Discontinued operations(c) | | 6.6 | | | 21.9 | | | (5.2 | ) | | (4.0 | ) |
Classification differences(d) | | (1.9 | ) | | (1.5 | ) | | (1.1 | ) | | 1.0 | |
Pensions(e) | | 0.9 | | | 5.5 | | | 10.5 | | | 11.0 | |
Share options(f) | | 2.6 | | | (6.5 | ) | | 5.8 | | | (3.2 | ) |
Capitalized interest(g) | | (3.5 | ) | | (3.1 | ) | | (0.9 | ) | | — | |
Restructuring costs(h) | | (2.2 | ) | | 3.4 | | | — | | | (4.3 | ) |
Disposal of fixed assets(i) | | 5.7 | | | 0.7 | | | — | | | — | |
| | |
|
| |
|
| |
|
| |
|
|
Operating income from continuing operations (US GAAP) | | 477.1 | | | 385.6 | | | 192.0 | | | 332.4 | |
Interest income | | 11.5 | | | 15.8 | | | 27.4 | | | 74.2 | |
Interest expense | | (34.9 | ) | | (30.2 | ) | | (25.3 | ) | | (59.8 | ) |
Other income net | | 44.0 | | | 54.8 | | | 16.1 | | | 6.0 | |
| | |
|
| |
|
| |
|
| |
|
|
Income from continuing operations before taxes, minority interest, equity in net income of associates and cumulative effect of change in accounting principle (US GAAP) | | 497.7 | | | 426.0 | | | 210.2 | | | 352.8 | |
| | |
|
| |
|
| |
|
| |
|
|
Depreciation (UK GAAP) | | 211.6 | | | 209.7 | | | 129.4 | | | 186.4 | |
Capitalized interest (net) | | 3.5 | | | 3.0 | | | 0.9 | | | — | |
Discontinued operations | | (4.2 | ) | | (17.4 | ) | | (8.7 | ) | | (16.5 | ) |
Restructuring | | — | | | (1.3 | ) | | — | | | — | |
| | |
|
| |
|
| |
|
| |
|
|
Depreciation (US GAAP) | | 210.9 | | | 194.0 | | | 121.6 | | | 169.9 | |
| | |
|
| |
|
| |
|
| |
|
|
F-15
Notes to the consolidated financial statements
continued
5. SEGMENT INFORMATION (CONTINUED)
| | | | | | | | | | | | |
| | | Year ended
January 1,
2005
$ million
| | | Year ended
January 3,
2004
$ million
| | | Eight
months ended
December 31,
2002 $ million
| | | Year ended
April 30,
2002
$ million
| |
Operating assets including goodwill (UK GAAP) | | 2,403.3 | | | 2,179.4 | | | 1,892.4 | | | 1,868.0 | |
Goodwill and intangibles(a) | | 1,390.2 | | | 1,362.7 | | | 1,399.8 | | | 1,491.5 | |
Inventories(b) | | (5.8 | ) | | (4.1 | ) | | — | | | — | |
Pension liabilities(e) | | (194.2 | ) | | (227.8 | ) | | (253.9 | ) | | (79.0 | ) |
Share options(f) | | 2.7 | | | 1.3 | | | 1.1 | | | — | |
Capitalized interest(g) | | 32.8 | | | 24.2 | | | 20.6 | | | 17.2 | |
Restructuring(h) | | 1.5 | | | 23.3 | | | — | | | — | |
Derivative instruments(j) | | 14.6 | | | (0.9 | ) | | 8.0 | | | (4.7 | ) |
Dividend creditor(k) | | (3.6 | ) | | (3.9 | ) | | (7.1 | ) | | (11.8 | ) |
Investments(k) | | 10.2 | | | 13.2 | | | 13.2 | | | 12.7 | |
| | |
|
| |
|
| |
|
| |
|
|
Operating assets including goodwill (US GAAP) | | 3,651.7 | | | 3,367.4 | | | 3,074.1 | | | 3,293.9 | |
| | |
|
| |
|
| |
|
| |
|
|
Operating assets including goodwill is made up of the following assets/liabilities under US GAAP: | | | | | | | | | | | | |
Current assets excluding cash and taxes | | 1,719.6 | | | 1,628.5 | | | 1,480.8 | | | 1,481.9 | |
Long term assets excluding taxes | | 3,333.3 | | | 3,189.8 | | | 2,989.4 | | | 3,060.6 | |
Current liabilities excluding debt and taxes | | (802.5 | ) | | (813.0 | ) | | (737.7 | ) | | (780.0 | ) |
Long term liabilities excluding debt and taxes | | (598.7 | ) | | (637.9 | ) | | (658.4 | ) | | (468.6 | ) |
| | |
|
| |
|
| |
|
| |
|
|
| | | 3,651.7 | | | 3,367.4 | | | 3,074.1 | | | 3,293.9 | |
| | |
|
| |
|
| |
|
| |
|
|
Description of differences in generally accepted accounting principles in the United States from accounting policies in the United Kingdom are as follows:
(a) Goodwill and intangible assets
Under UK GAAP, goodwill arising on acquisitions subsequent to May 3, 1998 is capitalized and amortized through the statement of income over its estimated useful economic life, which is estimated not to exceed a maximum of 20 years. Goodwill arising on acquisitions made on or before May 2, 1998 was charged directly to reserves and is recaptured through the profit and loss on disposal. Provision is made for any impairment. Under US GAAP, effective May 1, 2002 Tomkins adopted SFAS 142 “Goodwill and Other Intangible Assets”. In accordance with this statement, goodwill and intangible assets with an indefinite life are no longer amortized but are subject to an impairment test annually and whenever a triggering event occurs.
(b) Inventories
Under UK GAAP, inventory is stated at the lower of cost, determined on a first in first out (“FIFO”) basis, and net realizable value. The last in first out (“LIFO”) method is prohibited. Under US GAAP, inventory is stated at the lower of cost or market. Tomkins adopts the LIFO method for determining the cost of inventory for a number of its US subsidiaries.
(c) Discontinued operations
Under UK GAAP discontinued operations are defined as those where the sale or termination is completed either in the period or before the earlier of three months after the year end or the date of approval of the financial statements. The disposal must have a material effect on the nature of operations resulting from its withdrawal from a particular market or from a material reduction in turnover from continuing markets. Sales and operating profit are disclosed separately on the face of the profit and loss account. Assets and liabilities are not separately distinguished. Under US GAAP, the results of a component of an entity that has been disposed of or is classified as held for sale are separately reported in a single caption. Accordingly, revenues and expenses reported under US GAAP will be different from those reported under UK GAAP. Furthermore the assets and liabilities of a disposal group classified as held for sale are presented separately in the balance sheet.
(d) Classification differences
In addition to the recognition and measurement differences between UK and US GAAP there are a number of differences in the manner in which amounts are presented and classified in the accounts. The principal presentation and classification differences are summarized below:
UK GAAP requires assets to be presented in ascending order of liquidity in accordance with the requirements of the Companies Act 1985, whereas under US GAAP assets are presented in descending order of liquidity. In addition current assets under UK GAAP include amounts that fall due after more than one year, whereas under US GAAP, such assets are classified as non-current assets. Under UK GAAP assets and liabilities relating to different plans are not offset in presentation. Under US GAAP, assets and liabilities of different plans are offset in presentation. UK GAAP requires profits and losses in relation to the disposal of fixed assets to be shown separately on the face of the profit and loss account below operating profit. In addition, items that result from the ongoing activities of the business but are significant because of their size or nature may be separately highlighted on the face of the profit and loss account. Under US GAAP, the items described above are included in operating income. Items that form part of operating activities and are significant in size or nature may be separately highlighted on the face of the profit and loss account or in the accompanying notes. Under UK GAAP, equity in net income/(loss) of associates before taxes is reported as part of operating profit, whereas under US GAAP it is reported after operating profit.
F-16
Notes to the consolidated financial statements
continued
5. SEGMENT INFORMATION (CONTINUED)
(e) Pensions
Under UK GAAP, pension costs are accounted for in accordance with UK Statement of Standard Accounting Practice No. 24 “Accounting for Pension Costs”, with costs being charged to income over employees’ estimated working lives. Under US GAAP, pension costs are determined in accordance with the requirements of SFAS No. 87 – “Employers’ Accounting for Pensions” and SFAS No. 88 – “Employers’ Accounting for Settlements and Curtailments of Defined Benefit Pension Plans and for Termination Benefits”. Key differences between the UK and US GAAP figures arise from the requirement to use different methods and assumptions for valuing scheme assets and scheme liabilities, as well as a different method of amortizing surpluses or deficits.
Under UK GAAP, the effect of the variations in cost can be accumulated at successive valuations and amortized on an aggregate basis. Under US GAAP, the amortization of the transition asset and the costs of past service benefit improvements are separately tracked. Experience gains / losses are dealt with on an aggregate basis but amortized only to the extent that they exceed 10 per cent of the greater of the plan assets or the projected benefit obligation at the beginning of the fiscal year. UK GAAP allows measurements of plan assets and liabilities to be based on the results of the latest actuarial valuation, whereas US GAAP requires measurement of plan assets and liabilities to be made at the date of the financial statements or up to three months prior to that date. US GAAP also requires that a minimum pension liability be recorded for the amount by which the plan is under funded (ignoring projected future salary increases). A corresponding amount is recorded as an intangible asset, to the extent of unrecognized prior service cost, and the balance is recorded in other comprehensive income, net of tax.
(f) Share options
Under UK GAAP, the difference between the exercise price and the market price of the shares at the grant date is recorded as compensation expense in the income statement. As described within Note 2 to these financial statements, under US GAAP, stock based compensation is accounted for in accordance with APB 25, “Accounting for Stock Issued to Employees.” Under APB 25, the Company recognizes compensation expense for the difference between the exercise price and market price at the measurement date over the vesting period. The measurement date is the first date on which the employer knows the number of shares that an employee is entitled to receive and the exercise price is known. Where the measurement date occurs after the grant date, as in the case of performance related options, compensation cost is recorded over the vesting period for the difference between the share price at the balance sheet date and the exercise price and is adjusted in subsequent periods up to the measurement date. Where the performance condition is such that management cannot make a reasonable estimate because the company cannot control the outcome of the performance conditions, such as the achievement of a target share price, no compensation cost is recognized until the performance condition is satisfied.
Under UK GAAP, the compensation costs relating to share options granted to employees under annual bonus plans that vest in future periods are recognized on the grant date. Under US GAAP, the compensation cost relating to such grants are recognized over the future vesting period.
(g) Capitalization of interest
Under UK GAAP, interest expense is not capitalized whereas under US GAAP, the estimated amount of interest expense incurred while constructing major projects is included in fixed assets and amortized over the estimated useful lives of the related assets.
(h) Restructuring costs
Under UK GAAP, restructuring costs are recognized when there is an unavoidable obligation as a result of a past event and a reliable estimate of the obligation can be made. Under US GAAP, restructuring costs and one time termination benefits are recognized as incurred.
(i) Exceptional items
UK GAAP requires profits and losses in relation to the disposal of fixed assets to be shown separately on the face of the profit and loss account below operating profit. In addition, items that result from the ongoing activities of the business but are significant because of their size or nature may be separately highlighted on the face of the profit and loss account. Under US GAAP, the items described above are included in operating income. Items that form part of operating activities and are significant in size or nature may be separately highlighted on the face of the profit and loss account or in the accompanying notes.
(j) Derivative instruments
Tomkins has entered into derivative financial instrument contracts in order to reduce exposure to foreign exchange risk and interest rate movements. Under UK GAAP, where there are derivative instruments that qualify as a hedge, gains and losses are deferred and recognized in the income statement, or as adjustments to the carrying amount of assets and liabilities, only when the hedged transaction has itself settled and been reflected in the Company’s accounts. If an instrument ceases to be accounted for as a hedge, the instrument is marked to market and any resulting profit or loss recognized at that time. Derivatives entered into to hedge the net investment in overseas entities are recorded directly to shareholders’ equity. The Company has determined that under US GAAP their derivative instruments are not regarded as hedges and any unrealized gains or losses arising at the period end are taken to income. Derivatives entered into to hedge the net investment in overseas entities do not qualify as a hedge under US GAAP and any gains or losses are charged to the income statement.
(k) Dividend creditor and investments
Under UK GAAP, accruals for dividends on preferred stock and investments are excluded from net operating assets. These are included for the US GAAP measure.
F-17
Notes to the consolidated financial statements
continued
6. INCOME TAXES
Income tax expense (benefit) by location of taxing jurisdiction is as follows:
| | | | | | | | | | | | |
| | | Year ended
January 1,
2005 $
million
| | | Year ended
January 3,
2004 $
million
| | | Eight
months ended
December 31, 2002 $ million
| | | Year ended
April 30,
2002 $
million
| |
Current tax: | | | | | | | | | | | | |
United Kingdom | | (30.9 | ) | | (148.8 | ) | | (4.9 | ) | | (1.7 | ) |
United States – Federal taxes | | 43.5 | | | 29.9 | | | 18.5 | | | 69.7 | |
United States – State taxes | | 5.2 | | | 5.2 | | | 5.6 | | | 13.9 | |
Foreign taxes | | 51.8 | | | 48.7 | | | 22.3 | | | 25.4 | |
| | |
|
| |
|
| |
|
| |
|
|
Total current tax | | 69.6 | | | (65.0 | ) | | 41.5 | | | 107.3 | |
| | |
|
| |
|
| |
|
| |
|
|
Deferred tax: | | | | | | | | | | | | |
United Kingdom | | 0.2 | | | (14.7 | ) | | (0.1 | ) | | 2.0 | |
United States – Federal taxes | | 31.7 | | | 16.4 | | | (4.9 | ) | | 23.0 | |
United States – State taxes | | 4.7 | | | 3.3 | | | (1.1 | ) | | 3.1 | |
Foreign taxes | | (3.0 | ) | | (12.2 | ) | | (3.2 | ) | | 0.4 | |
| | |
|
| |
|
| |
|
| |
|
|
Total deferred tax | | 33.6 | | | (7.2 | ) | | (9.3 | ) | | 28.5 | |
| | |
|
| |
|
| |
|
| |
|
|
Total income tax expense (benefit) | | 103.2 | | | (72.2 | ) | | 32.2 | | | 135.8 | |
| | |
|
| |
|
| |
|
| |
|
|
The tax effects of temporary differences that give rise to the Group’s deferred tax assets and (liabilities) are as follows:
| | | | | | |
| | | January 1,
2005 $
million
| | | January 3,
2004 $
million
| |
Deferred tax assets: | | | | | | |
Net operating losses | | 552.1 | | | 15.7 | |
Pension and other post retirement obligations | | 165.0 | | | 187.1 | |
Capital loss carry forwards | | 159.8 | | | 215.9 | |
Accrued expenses and other | | 80.8 | | | 102.3 | |
Tax credits | | 13.3 | | | 3.8 | |
Accounts receivable | | 5.7 | | | 6.8 | |
Other | | 10.1 | | | 18.4 | |
| | |
|
| |
|
|
| | | 986.8 | | | 550.0 | |
Valuation allowance | | (684.9 | ) | | (230.0 | ) |
| | |
|
| |
|
|
Total deferred tax assets | | 301.9 | | | 320.0 | |
| | |
|
| |
|
|
Deferred tax liabilities: | | | | | | |
Property, plant and equipment | | (105.6 | ) | | (99.9 | ) |
Inventories | | (38.8 | ) | | (29.9 | ) |
Intangible assets | | (28.7 | ) | | (23.6 | ) |
Other | | (16.5 | ) | | (12.8 | ) |
| | |
|
| |
|
|
Total deferred tax liabilities | | (189.6 | ) | | (166.2 | ) |
| | |
|
| |
|
|
Net deferred tax assets | | 112.3 | | | 153.8 | |
| | |
|
| |
|
|
The Company has total net operating losses carried forward amounting to $1,815 million arising mainly in foreign jurisdictions. This gives rise to deferred tax assets of $552.1 million. $531.1 million of this amount can be carried forward indefinitely. The remaining $21.0 million has expiration dates between 2006 and 2019. A valuation allowance of $530.4 million has been established against those assets where, based on available evidence, it is more likely than not that the deferred tax asset will not be realized.
F-18
Notes to the consolidated financial statements
continued
6. INCOME TAXES (CONTINUED)
A reconciliation of income taxes at the UK statutory tax rates to the provision/(benefit) for income taxes in the consolidated statement of operations follows:
| | | | | | | | | | | | |
| | | Year ended
January 1,
2005 $
million
| | | Year ended
January 3,
2004 $
million
| | | Eight
months ended
December 31,
2002 $
million
| | | Year ended
April 30,
2002 $
million
| |
Tax at United Kingdom statutory rate (30%) | | 149.3 | | | 127.8 | | | 63.0 | | | 105.8 | |
Tax effect of: | | | | | | | | | | | | |
Non-deductible goodwill impairment/amortization | | — | | | 4.3 | | | 14.7 | | | 15.8 | |
Other permanent differences | | (18.5 | ) | | (28.9 | ) | | (32.5 | ) | | 1.5 | |
Effect of overseas tax rates | | 0.8 | | | (11.4 | ) | | 9.8 | | | 6.7 | |
Release of contingency | | (27.4 | ) | | (147.9 | ) | | — | | | — | |
Deferred tax valuation adjustment | | (1.0 | ) | | (8.6 | ) | | (14.8 | ) | | 14.0 | |
Foreign tax credits | | — | | | (7.5 | ) | | (8.0 | ) | | (8.0 | ) |
| | |
|
| |
|
| |
|
| |
|
|
Income tax expense/(benefit) | | 103.2 | | | (72.2 | ) | | 32.2 | | | 135.8 | |
| | |
|
| |
|
| |
|
| |
|
|
Undistributed earnings of foreign subsidiaries approximate to $2.8 billion at January 1, 2005. No income taxes have been provided on the Company’s share of these undistributed net earnings due to management’s intent to reinvest such amounts indefinitely. A determination of the amount of unrecognized deferred tax liability has not been made because it is not practicable to do so.
On October 22, 2004 the United States enacted the American Jobs Creation Act of 2004 (the “Act”). The Act creates a temporary incentive by providing an 85 per cent dividends received deduction for certain dividends received by US companies from their overseas subsidiaries. The deduction is subject to the number of limitations and, as of today, uncertainty remains as to how to interpret numerous provisions in the Act. As of January 1, 2005 management had not decided on whether, and to what extent, the Company might repatriate foreign earnings to our US companies. Accordingly, the financial statements do not reflect any taxes with regard to the repatriation provision under the Act. The Company expects that a determination can be made with regard to the repatriation provision within a reasonable period of time following the publication of additional clarifying language.
7. INCOME PER COMMON SHARE
Basic income per common share was calculated using income for the period divided by the weighted average number of common shares outstanding during the period. Diluted income per common share considers the effect of potential common shares, unless the inclusion of the potential common shares would have an anti-dilutive effect.
| | | | | | | | |
| | | Year ended
January 1,
2005 number 000
| | Year ended
January 3,
2004
number 000
| | Eight
months ended
December 31,
2002 number 000
| | Year ended
April 30,
2002 number 000
|
Weighted average shares used to calculate basic earnings per share | | 770,717 | | 771,037 | | 770,927 | | 773,464 |
Assumed conversion of preference shares | | 102,651 | | 180,917 | | 224,182 | | — |
Assumed exercise of share options | | 3,931 | | 2,034 | | 1,498 | | 553 |
| | |
| |
| |
| |
|
Adjusted weighted average shares used to calculate diluted earnings per share | | 877,299 | | 953,988 | | 996,607 | | 774,017 |
| | |
| |
| |
| |
|
The preference shares were anti-dilutive in fiscal 2001/2002 (number: 224,338,369) and were therefore excluded from the diluted income per common share calculation. Stock options numbering 8,226,950, (fiscal 2003 12,941,950, fiscal 2002 10,409,020, fiscal 2001/2 9,846,970) with an exercise price higher than the average market price during the fiscal year or period since issuance, were excluded in computing diluted earnings per share since the impact would be anti-dilutive. For the purposes of diluted earnings per share the income is increased for the preference dividend of $28.5 million (fiscal 2003 $47.1 million; fiscal 2002 $37.6 million).
8. INVENTORIES
Inventories consist of:
| | | | | | |
| | | January 1,
2005 $
million
| | | January 3,
2004 $
million
| |
Raw materials and supplies | | 237.9 | | | 202.1 | |
Work in progress | | 87.0 | | | 74.8 | |
Finished goods and goods held for resale | | 384.6 | | | 337.1 | |
| | |
|
| |
|
|
Total inventories – current cost | | 709.5 | | | 614.0 | |
Less excess of FIFO over LIFO cost | | (5.7 | ) | | (4.1 | ) |
| | |
|
| |
|
|
| | | 703.8 | | | 609.9 | |
| | |
|
| |
|
|
F-19
Notes to the consolidated financial statements
continued
9. GOODWILL
| | | | | | | | | | | | |
| | | Industrial &
Automotive
$ million
| | | Air Systems
Components
$ million
| | | Engineered &
Construction
Products $ million
| | | Total $ million
| |
Balance at December 31, 2002 | | 1,135.2 | | | 332.8 | | | 193.2 | | | 1,661.2 | |
Goodwill acquired | | 103.6 | | | (0.8 | ) | | — | | | 102.8 | |
Goodwill disposed | | (11.7 | ) | | — | | | — | | | (11.7 | ) |
Impairment – continuing operations | | — | | | — | | | (12.5 | ) | | (12.5 | ) |
Impairment – discontinued operations | | — | | | — | | | (41.4 | ) | | (41.4 | ) |
Foreign exchange | | 4.3 | | | 1.0 | | | 3.0 | | | 8.3 | |
| | |
|
| |
|
| |
|
| |
|
|
Balance at January 3, 2004 | | 1,231.4 | | | 333.0 | | | 142.3 | | | 1,706.7 | |
Goodwill acquired | | 35.5 | | | — | | | — | | | 35.5 | |
Foreign exchange | | 9.3 | | | 0.8 | | | — | | | 10.1 | |
| | |
|
| |
|
| |
|
| |
|
|
Balance at January 1, 2005 | | 1,276.2 | | | 333.8 | | | 142.3 | | | 1,752.3 | |
| | |
|
| |
|
| |
|
| |
|
|
The initial impairment review was performed on May 1, 2002 on adoption of SFAS 142, and resulted in an impairment of $47.3 million, which was treated as a cumulative change in accounting principle. The fair value of goodwill is calculated using discounted cash flows derived from financial plans prepared annually by subsidiaries. Impairments have arisen as a result of an expectation of a deterioration in certain markets in which our subsidiaries operate. Amortization expense was $52.3 million for fiscal 2001/02. The Company will continue to perform its annual tests for impairment as required under the rules of SFAS 142 as of December 31.
The following table contains a pro forma presentation of net income and related per share amounts, calculated as if SFAS 142 had been in effect throughout the periods presented.
| | | | | | | | | | | | |
| | | Year ended
January 1,
2005
$ million
| | Year ended
January 3,
2004
$ million
| | Eight
months ended
December 31,
2002 $ million
| | Year ended
April 30,
2002
$ million
|
Reported net income | | | 377.7 | | | 426.7 | | | 118.8 | | | 214.6 |
Add back amortization of goodwill (net of tax) | | | — | | | — | | | — | | | 52.3 |
| | |
|
| |
|
| |
|
| |
|
|
Pro forma net income | | | 377.7 | | | 426.7 | | | 118.8 | | | 266.9 |
| | |
|
| |
|
| |
|
| |
|
|
Reported net income per common share | | | | | | | | | | | | |
Basic | | $ | 0.45 | | $ | 0.51 | | $ | 0.11 | | $ | 0.20 |
Diluted | | $ | 0.43 | | $ | 0.45 | | $ | 0.12 | | $ | 0.20 |
Pro forma net income per common share | | | | | | | | | | | | |
Basic | | $ | 0.45 | | $ | 0.51 | | $ | 0.11 | | $ | 0.27 |
Diluted | | $ | 0.43 | | $ | 0.45 | | $ | 0.12 | | $ | 0.27 |
10. INTANGIBLE ASSETS
| | | | | | | | | | | | | | |
| | | January 1, 2005
| | January 3, 2004
|
| | | Cost $ million
| | Accumulated
amortization
$ million
| | | Net $ million
| | Cost $ million
| | Accumulated
amortization
$ million
| | | Net $ million
|
Patents & technology | | 9.1 | | (9.1 | ) | | — | | 9.1 | | (8.9 | ) | | 0.2 |
Customer relationship | | 30.0 | | (6.3 | ) | | 23.7 | | 25.7 | | (2.0 | ) | | 23.7 |
Intellectual property | | 20.3 | | (2.2 | ) | | 18.1 | | 17.7 | | (0.7 | ) | | 17.0 |
| | |
| |
|
| |
| |
| |
|
| |
|
| | | 59.4 | | (17.6 | ) | | 41.8 | | 52.5 | | (11.6 | ) | | 40.9 |
Pension intangible asset not subject to amortization | | 7.3 | | — | | | 7.3 | | 3.3 | | — | | | 3.3 |
| | |
| |
|
| |
| |
| |
|
| |
|
Total intangible assets | | 66.7 | | (17.6 | ) | | 49.1 | | 55.8 | | (11.6 | ) | | 44.2 |
| | |
| |
|
| |
| |
| |
|
| |
|
Amortization expense was $5.3 million for fiscal 2004; $2.6 million for fiscal 2003; $0.2 for fiscal 2002 and $1.1 million for fiscal 2001/02. Estimated amortization expense for the following five years is as follows:
| | |
| | | $ million
|
| Fiscal year ending: | | |
2005 | | 5.2 |
2006 | | 5.2 |
2007 | | 5.2 |
2008 | | 5.2 |
2009 | | 5.2 |
| | |
|
F-20
Notes to the consolidated financial statements
continued
11. PROPERTY, PLANT AND EQUIPMENT
Property, plant and equipment consists of:
| | | | | | |
| | | January 1,
2005 $ million
| | | January 3,
2004 $ million
| |
Cost | | | | | | |
Freehold land and long leasehold land and buildings | | 583.5 | | | 560.1 | |
Short leasehold land and buildings | | 18.6 | | | 18.6 | |
Plant, equipment and vehicles | | 2,109.2 | | | 2,021.4 | |
Assets under construction | | 200.2 | | | 176.5 | |
| | |
|
| |
|
|
| | | 2,911.5 | | | 2,776.6 | |
Less: accumulated depreciation | | (1,449.9 | ) | | (1,383.2 | ) |
| | |
|
| |
|
|
Total | | 1,461.6 | | | 1,393.4 | |
| | |
|
| |
|
|
Freehold land amounting to $75.4 million (January 1, 2004 – $85.6 million) is not depreciated. Depreciation expense was $210.9 million for fiscal 2004; $194.0 million for fiscal 2003; $121.6 million for fiscal 2002 and $169.9 million for fiscal 2001/02.
12. BANK LOANS AND OVERDRAFTS, OTHER LOANS AND CAPITAL LEASES
The following is a summary of the Company’s loans:
| | | | | | |
| | | January 1,
2005 $ million
| | | January 3,
2004 $ million
| |
Unsecured loans | | | | | | |
Overdrafts | | 25.5 | | | 24.3 | |
Bank loans, 2005, 5.0% to 25.0% | | 12.1 | | | 18.3 | |
Unsecured loan notes, 2005 2.6% | | 0.6 | | | 0.7 | |
Other unsecured loans, 2011, 8.00% | | 288.0 | | | 268.5 | |
Other unsecured loans, 2015, 6.125% | | 480.0 | | | 447.5 | |
| | |
|
| |
|
|
| | | 806.2 | | | 759.3 | |
| | |
|
| |
|
|
Secured loans | | | | | | |
Bank loans, 2005 to 2007, 3.2% to 21.1% | | 5.4 | | | 6.3 | |
| | |
|
| |
|
|
| | | 5.4 | | | 6.3 | |
| | |
|
| |
|
|
Capital leases | | 23.2 | | | 29.4 | |
| | |
|
| |
|
|
Total obligations | | 834.8 | | | 795.0 | |
Current maturities of debt | | (46.5 | ) | | (54.1 | ) |
| | |
|
| |
|
|
Total long term debt | | 788.3 | | | 740.9 | |
| | |
|
| |
|
|
The Medium Term Note program under which the other unsecured loans are issued contains certain covenants including negative pledge and event of default.
The security for the $5.4 million secured loans (January 3, 2004 – $6.3 million) consists of $3.5 million fixed assets (January 3 2004 – $4.3 million) and $1.9 million trade receivables (January 3, 2004 – $2.0 million).
The following table sets forth the principal payments on all long-term debt agreements and unsecured loans (excluding capital leases) for the next five years based upon the amounts outstanding at January 1, 2005:
| | |
| | | $ million
|
Fiscal year ending: | | |
2005 | | 40.0 |
2006 | | 1.7 |
2007 | | 1.8 |
Beyond 2009 | | 768.1 |
| | |
|
Long term debt (excluding capital leases), including current maturities | | 811.6 |
| | |
|
Undrawn committed facilities:
The Company had a $767.8 million undrawn committed facility available at January 1, 2005, maturing in 2009. This facility includes certain financial covenants and warranties. The financial covenants consist of the ratio of net borrowings to earnings before interest, tax, depreciation and amortization (“EBITDA”) and operating profit to net interest payable. Non financial covenants include subsidiary indebtedness, negative pledge and material adverse change clauses.
F-21
Notes to the consolidated financial statements
continued
13. STOCK BASED COMPENSATION
The Company operates a number of stock based compensation schemes. These are as follows;
(i) The Tomkins Executive Share Option Scheme No. 2 (“ESOS 2”), The Tomkins Executive Share Option Scheme No.3 (“ESOS 3”) and The Tomkins Executive Share Option Scheme No. 4 (“ESOS 4”)
ESOS 2 has expired for grant purposes, though options already granted remain outstanding and can be exercised in accordance with the rules of the scheme. ESOS 3 is an Inland Revenue-approved scheme under which Tomkins employees who are resident in the United Kingdom for tax purposes are able to receive options with an aggregate exercise price not exceeding £30,000 that attract favorable tax treatment. ESOS 4 is not approved by the Inland Revenue and is a scheme under which options granted do not attract favorable tax treatment in the United Kingdom. There is a limit to the number of options that can be granted under the ESOS 4 scheme of four times annual remuneration (which includes annual bonuses and certain benefits-in-kind). Under ESOS 4, options granted in excess of four times a participant’s annual earnings (“super options”) will only be exercisable if at least five years have elapsed since the date of grant and then only if, over a five-year period following the grant of the option, the growth in the Company’s earnings per share is such that it would be in the top quartile of a league table for growth in earnings per share over a five-year period for companies in the FTSE 100 index. ESOS 3 and ESOS 4 will continue and their current performance condition will remain in place until they lapse for grant purposes in 2005. The performance condition is based upon the growth in Tomkins earnings per share, which must exceed the growth in the Retail Price Index by an average of 2 per cent per annum over a three-year period before an option can be exercised. When the schemes were introduced in 1995, the earnings per share performance condition was widely adopted and the choice of 2 per cent was in accordance with contemporary practice. In determining whether or not the growth in earnings per share performance condition has been met, a simple arithmetic calculation is made annually when the Company’s results are known.
(ii) Tomkins Premium Priced Option
This was an option specifically and solely granted to James Nicol as part of the incentive package on his joining Tomkins. No performance conditions were attached to this option in order to attract him to the Company and retain his services and this therefore does not comply with Schedule A of the Combined Code. It consists of a non-transferable option to acquire 5,076,142 shares with an aggregate market value of £10 million, granted on 11 February 2002. The price per share payable on the exercise of the option will be 197 pence in respect of 2,538,072 shares (A option shares), 276 pence in respect of 1,522,842 shares (B option shares) and 345 pence in respect of 1,015,228 shares (C option shares). The options vested as to one-third of A, B and C option shares on 18 February 2003, one-third of A, B and C option shares on 18 February 2004 and as to one-third of A, B and C option shares on 18 February 2005. The option will lapse on 11 February 2012 or earlier in certain circumstances.
(iii) Ongoing Option
This was also an option specifically and solely granted to James Nicol on 11 February 2002, as part of the incentive package to attract him to the Company. It consisted of a non-transferable option to acquire 1,522,842 shares at 197 pence, which could not be exercised before 18 February 2005 and unless and until the performance condition has been satisfied or waived. The performance condition will be achieved if, on or after the third anniversary of the date of grant, the rate of increase of earnings per share over any three-year period is equal to or greater than the rate of increase of the Retail Price Index plus 9 per cent. The performance condition may be waived or amended by the Remuneration Committee. If there is a change of control of the Company then the option is exercisable immediately regardless of whether the performance condition is satisfied. The same lapsing events for the Premium Priced Option apply to this option.
(iv) The Tomkins Savings Related Share Option Scheme No. 2
This is a standard Inland Revenue-approved savings related share option scheme, which is open to employees who are resident for tax purposes in the United Kingdom.
(v) Deferred Matching Share Purchase Plan
This was specifically and solely introduced for James Nicol as part of the incentive package to attract him to the Company. Under this Plan 3,045,684 shares (“Matching Shares”) were awarded on February 11, 2002 following the purchase by James Nicol of 1,015,228 Tomkins plc shares (the “Purchased Shares”). On February 18, 2005, the award vested in respect of 1,015,228 Matching Shares and of the remaining 2,030,456 Matching Shares, 454,752 vested and the balance lapsed. The number of shares which vested was calculated on the basis of the highest price of a Tomkins share sustained over a five-day period during the six-month period ended February 18, 2005 (285.25 pence), to the extent that, for every 1 penny that the share price increased over 197 pence, being the market price on February 18, 2002, up to a maximum of 591 pence, James Nicol was entitled to receive 5,153 shares. Under the terms of his contract, Mr Nicol elected to receive a cash payment of £4,193,000 (subject to statutory deductions) in lieu of shares.
(vi) Annual Bonus Incentive Plan
The executive Directors and senior executives participate in the Company’s Annual Bonus Incentive Plan. Bonus shares are restricted and vest only after a period of three years after the initial bonus award. Deferred shares are awarded at the time of the initial bonus award but the vesting of the shares is conditional on continued employment with the Group three years after the award. Dividends are not paid on the deferred shares.
Under FAS 123, the fair value of each option is estimated on the date of grant using the Black Scholes option-pricing model with the following weighted-average assumptions:
| | | | | | | | | | | | |
| | | January 1,
2005
| | | January 3,
2004
| | | December 31,
2002
| | | April 30,
2002
| |
Risk free interest rate | | 4.51 | % | | 4.43 | % | | 5.02 | % | | 4.85 | % |
Expected life (years) | | 5.8 | | | 6 | | | 6 | | | 6 | |
Assumed volatility | | 31.50 | % | | 31.50 | % | | 31.50 | % | | 31.50 | % |
Expected dividends | | 12 | p | | 12 | p | | 12 | p | | 12 | p |
F-22
Notes to the consolidated financial statements
continued
13. STOCK BASED COMPENSATION (CONTINUED)
A summary of options granted at market, less than market and more than market is set forth below:
| | | | | | | | |
| | | January 1,
2005
| | January 3,
2004
| | December 31,
2002
| | April 30,
2002
|
Options granted at market value on grant date: | | | | | | | | |
Options granted | | 5,339,030 | | 9,721,456 | | 2,511,804 | | 4,208,334 |
Weighted average exercise price | | 454.14 | | 389.08 | | 375.18 | | 281.21 |
Weighted average fair value | | 113.19 | | 92.99 | | 95.00 | | 37.53 |
Options granted at less than market value on grant date: | | | | | | | | |
Options granted | | 1,514,732 | | — | | — | | — |
Weighted average exercise price | | 372.44 | | — | | — | | — |
Weighted average fair value | | 118.67 | | — | | — | | — |
Options granted at more than market value on grant date: | | | | | | | | |
Options granted | | — | | — | | — | | 2,538,070 |
Weighted average exercise price | | — | | — | | — | | 435.06 |
Weighted average fair value | | — | | — | | — | | 34.11 |
A summary of stock option transactions in fiscal periods 2004, 2003, 2002 and 2001/02 is as follows:
| | | | | |
| | | Number of
shares
| | | Weighted average
exercise price
per share (cents)
|
Options outstanding at April 30, 2001 | | 16,339,317 | | | 394.61 |
Options issued | | 6,746,404 | | | 339.09 |
Options forfeited | | (3,854,059 | ) | | 395.80 |
Options exercised | | (408,927 | ) | | 344.25 |
Options lapsed | | (229,142 | ) | | 310.83 |
| | |
|
| |
|
Options outstanding at April 30, 2002 | | 18,593,593 | | | 341.68 |
Options issued | | 2,511,804 | | | 375.18 |
Options forfeited | | (1,311,025 | ) | | 446.74 |
Options exercised | | (462,422 | ) | | 340.94 |
Options lapsed | | (411,575 | ) | | 365.26 |
| | |
|
| |
|
Options outstanding at December 31, 2002 | | 18,920,375 | | | 366.54 |
Options issued | | 9,721,456 | | | 389.08 |
Options forfeited | | (2,558,108 | ) | | 514.70 |
Options exercised | | (212,350 | ) | | 392.04 |
Options lapsed | | (597,931 | ) | | 425.42 |
| | |
|
| |
|
Options outstanding at January 3, 2004 | | 25,273,442 | | | 382.06 |
Options issued | | 6,853,762 | | | 436.09 |
Options forfeited | | (1,141,855 | ) | | 401.03 |
Options exercised | | (627,524 | ) | | 349.32 |
Options lapsed | | (24,059 | ) | | 350.23 |
| | |
|
| |
|
Options outstanding at January 1, 2005 | | 30,333,766 | | | 431.76 |
| | |
|
| |
|
A summary of non-vested stock issued during the period is set forth below:
| | | | | | | | |
| | | January 1,
2005
| | January 3,
2004
| | December 31,
2002
| | April 30,
2002
|
Number of shares | | 1,337,672 | | 670,462 | | 30,732 | | 241,335 |
The following table summarizes information about the stock options outstanding under the Company’s option plans as at January 1, 2005:
| | | | | | | | | | |
| | | Options outstanding
| | Options exercisable
|
| | | Number outstanding
at January 1, 2005
| | Weighted average
remaining
contractual life
| | Weighted average
exercise price
(cents)
| | Number exercisable
at January 1, 2005
| | Weighted average
exercise price
(cents)
|
Range of exercise prices: | | | | | | | | | | |
Up to $3.00 | | 76,666 | | 6.72 | | 273.86 | | — | | — |
$3.01 to $4.00 | | 12,516,816 | | 6.93 | | 359.70 | | 1,697,409 | | 359.61 |
$4.01 to $5.00 | | 14,246,714 | | 8.60 | | 462.65 | | 159,000 | | 441.82 |
$5.01 to $6.00 | | 1,522,842 | | 7.11 | | 503.89 | | 1,015,228 | | 503.89 |
$6.01 and higher | | 1,970,728 | | 3.72 | | 616.59 | | 1,508,318 | | 614.77 |
F-23
Notes to the consolidated financial statements
continued
14. EMPLOYEE BENEFIT PLANS
A. Pensions and other benefits plans
The Company has defined benefit and defined contribution plans covering substantially all employees of the Company and its domestic and international subsidiaries. Benefits under defined benefit plans on a worldwide basis are generally based on years of service and employees’ compensation during the last years of employment. In the United States, the Company also provides various post retirement health and life insurance benefits for certain of its employees.
The Company contributes to multi-employer plans for certain collective bargaining United States employees. In addition, various other defined contribution plans are sponsored worldwide.
| | | | | | | | |
| | | Year ended
January 1,
2005 $ million
| | Year ended
January 3,
2004 $ million
| | Eight months ended
December 31, 2002 $ million
| | Year ended
April 30,
2002 $ million
|
Multi-employer plan expense | | 7.3 | | 7.3 | | 4.2 | | 6.1 |
Defined contribution plan expense | | 40.7 | | 39.7 | | 23.1 | | 34.1 |
| | |
| |
| | | | |
Accrued liability for multi-employer and defined contribution plans at the end of the year | | 10.8 | | 9.5 | | | | |
| | |
| |
| | | | |
The components of net periodic benefit cost for defined benefit plans are as follows:
| | | | | | | | | | | | |
| | | UK Pension Plans
| |
| | | Year ended January 1, 2005 $ million
| | | Year ended January 3, 2004 $ million
| | | Eight months ended December 31, 2002 $ million
| | | Year ended April 30, 2002 $ million
| |
Service cost | | 3.1 | | | 6.7 | | | 3.6 | | | 7.2 | |
Interest cost | | 19.9 | | | 18.8 | | | 11.6 | | | 16.0 | |
Expected return on plan assets | | (23.8 | ) | | (19.8 | ) | | (14.7 | ) | | (26.3 | ) |
Amortization of prior service cost | | 0.4 | | | — | | | — | | | — | |
Amortization of transition obligation | | (1.4 | ) | | (1.6 | ) | | (1.0 | ) | | (1.4 | ) |
Amortization of actuarial (gain) loss | | 1.7 | | | 2.4 | | | 0.2 | | | (5.0 | ) |
Settlement/Curtailment (gain) loss | | (0.6 | ) | | 1.0 | | | — | | | — | |
| | |
|
| |
|
| |
|
| |
|
|
Net periodic benefit (income) expense | | (0.7 | ) | | 7.5 | | | (0.3 | ) | | (9.5 | ) |
| | |
|
| |
|
| |
|
| |
|
|
Weighted average assumptions used to determine net periodic benefit costs: | | | | | | | | | | | | |
Discount rate | | 5.75 | % | | 5.99 | % | | 6.23 | % | | 6.49 | % |
Rate of compensation increase | | 4.00 | % | | 4.01 | % | | 3.69 | % | | 3.72 | % |
Expected return on plan assets | | 7.23 | % | | 7.73 | % | | 7.93 | % | | 8.01 | % |
| |
| | | Non UK Pension Plans
| |
| | | Year ended
January 1,
2005 $ million
| | | Year ended
January 3,
2004 $ million
| | | Eight months ended
December 31,
2002 $ million
| | | Year ended
April 30,
2002 $ million
| |
Service cost | | 9.7 | | | 10.6 | | | 7.4 | | | 10.1 | |
Interest cost | | 43.8 | | | 45.6 | | | 30.9 | | | 45.8 | |
Expected return on plan assets | | (38.2 | ) | | (45.4 | ) | | (34.6 | ) | | (55.0 | ) |
Amortization of prior service cost | | 0.5 | | | 1.2 | | | 1.3 | | | 1.7 | |
Amortization of transition asset | | 0.5 | | | 0.4 | | | 0.3 | | | 0.3 | |
Amortization of actuarial (gain) loss | | 12.1 | | | 4.6 | | | 0.8 | | | (2.3 | ) |
Settlement/Curtailment (gain) loss | | (2.8 | ) | | 1.9 | | | 7.2 | | | 4.9 | |
| | |
|
| |
|
| |
|
| |
|
|
Net periodic pension (income) expense | | 25.6 | | | 18.9 | | | 13.3 | | | 5.5 | |
| | |
|
| |
|
| |
|
| |
|
|
Weighted average assumptions used to determine net periodic benefit costs: | | | | | | | | | | | | |
Discount rate | | 5.95 | % | | 6.75 | % | | 7.25 | % | | 7.91 | % |
Rate of compensation increase | | 5.39 | % | | 5.75 | % | | 5.83 | % | | 5.93 | % |
Expected return on plan assets | | 8.16 | % | | 9.13 | % | | 9.47 | % | | 9.36 | % |
F-24
Notes to the consolidated financial statements
continued
14. EMPLOYEE BENEFIT PLANS (CONTINUED)
The components of net periodic benefit cost for other post retirement benefits are as follows:
| | | | | | | | | | | | |
| | | Other Post retirement benefits
| |
| | | Year ended
January 1,
2005 $ million
| | | Year ended
January 3,
2004 $ million
| | | Eight
months ended
December 31,
2002 $ million
| | | Year ended
April 30,
2002 $ million
| |
Service cost | | 0.8 | | | 1.1 | | | 0.8 | | | 1.4 | |
Interest cost | | 13.7 | | | 19.0 | | | 13.1 | | | 21.4 | |
Amortization of prior service cost | | (1.5 | ) | | (1.2 | ) | | (0.8 | ) | | (1.2 | ) |
Amortization of actuarial (gain) loss | | — | | | — | | | 0.1 | | | 0.2 | |
Settlement / Curtailment (gain) loss | | (2.1 | ) | | 2.0 | | | 1.2 | | | 1.4 | |
| | |
|
| |
|
| |
|
| |
|
|
Net periodic benefit (income) expense | | 10.9 | | | 20.9 | | | 14.4 | | | 23.2 | |
| | |
|
| |
|
| |
|
| |
|
|
Weighted average assumptions used to determine net periodic benefit costs: | | | | | | | | | | | | |
Discount rate | | 6.15 | % | | 6.75 | % | | 7.23 | % | | 7.72 | % |
Ultimate medical trend rate | | 4.50 | % | | 5.03 | % | | 5.48 | % | | 5.65 | % |
The Company generally uses a measurement date three months before the year end for the majority of its plans, which was October 1, 2004 for fiscal 2004. The changes in the pension and other post retirement benefit obligations, fair value of plan assets as well as amounts recognized in the Consolidated Balance Sheets, are shown below:
| | | | | | | | | | | | | | | | | | |
| | | Pension benefits
| | | Other benefits
| |
| | | UK Plans
| | | Non-UK Plans
| | | All Plans
| |
| | | January 1,
2005 $ million
| | | January 3,
2004 $ million
| | | January 1,
2005 $ million
| | | January 3,
2004 $ million
| | | January 1,
2005 $ million
| | | January 3,
2004 $ million
| |
Change in benefit obligation: | | | | | | | | | | | | | | | | | | |
Benefit obligation at end of prior year | | 350.9 | | | 318.9 | | | 753.5 | | | 700.6 | | | 276.7 | | | 289.2 | |
Service cost | | 3.1 | | | 6.8 | | | 9.7 | | | 10.5 | | | 0.8 | | | 1.1 | |
Interest cost | | 19.9 | | | 19.0 | | | 43.8 | | | 45.4 | | | 13.7 | | | 19.0 | |
Plan amendments | | — | | | — | | | 7.5 | | | (7.8 | ) | | (10.3 | ) | | (4.2 | ) |
Actuarial (gain) loss | | 4.0 | | | (16.2 | ) | | 16.4 | | | 44.4 | | | (45.0 | ) | | (6.5 | ) |
Acquisitions | | — | | | 8.1 | | | — | | | 19.1 | | | — | | | — | |
Divestitures | | — | | | — | | | (2.8 | ) | | (20.6 | ) | | (2.6 | ) | | (0.5 | ) |
Curtailments | | (5.9 | ) | | — | | | — | | | 1.5 | | | — | | | 1.3 | |
Settlements | | (11.6 | ) | | — | | | (14.6 | ) | | (0.5 | ) | | — | | | — | |
Special termination benefits | | — | | | — | | | — | | | 0.5 | | | — | | | 2.5 | |
Disbursements / benefits paid | | (19.1 | ) | | (20.8 | ) | | (67.4 | ) | | (54.4 | ) | | (21.0 | ) | | (28.2 | ) |
Contributions by participants | | 0.2 | | | — | | | 0.2 | | | — | | | — | | | — | |
Foreign currency exchange rate changes | | 24.9 | | | 35.1 | | | 7.4 | | | 14.8 | | | 1.5 | | | 3.0 | |
| | |
|
| |
|
| |
|
| |
|
| |
|
| |
|
|
Benefit obligation at end of year | | 366.4 | | | 350.9 | | | 753.7 | | | 753.5 | | | 213.8 | | | 276.7 | |
| | |
|
| |
|
| |
|
| |
|
| |
|
| |
|
|
Change in plan assets: | | | | | | | | | | | | | | | | | | |
Fair value of plan assets at end of prior year | | 316.1 | | | 251.4 | | | 441.4 | | | 416.2 | | | — | | | — | |
Actual return on plan assets | | 24.6 | | | 30.7 | | | 57.3 | | | 66.4 | | | — | | | — | |
Acquisitions | | — | | | 5.3 | | | — | | | 11.5 | | | — | | | — | |
Divestitures | | — | | | — | | | — | | | (26.9 | ) | | — | | | — | |
Settlements | | (11.6 | ) | | — | | | (5.9 | ) | | — | | | — | | | — | |
Disbursements / benefits paid | | (19.1 | ) | | (20.8 | ) | | (67.3 | ) | | (54.5 | ) | | (21.0 | ) | | (28.2 | ) |
Company contributions | | 13.1 | | | 18.2 | | | 36.0 | | | 20.1 | | | 21.0 | | | 28.2 | |
Contributions by participants | | 0.2 | | | 0.1 | | | 0.2 | | | — | | | — | | | — | |
Foreign currency exchange rate changes | | 23.3 | | | 31.2 | | | 4.4 | | | 8.6 | | | — | | | — | |
| | |
|
| |
|
| |
|
| |
|
| |
|
| |
|
|
Fair value of plan assets at end of plan year | | 346.6 | | | 316.1 | | | 466.1 | | | 441.4 | | | — | | | — | |
| | |
|
| |
|
| |
|
| |
|
| |
|
| |
|
|
F-25
Notes to the consolidated financial statements
continued
14. EMPLOYEE BENEFIT PLANS (CONTINUED)
| | | | | | | | | | | | | | | | | | |
| | | Pension benefits
| | | Other benefits
| |
| | | UK Plans
| | | Non-UK Plans
| | | All Plans
| |
| | | January 1,
2005 $ million
| | | January 3,
2004 $ million
| | | January 1,
2005 $ million
| | | January 3,
2004 $ million
| | | January 1,
2005 $ million
| | | January 3,
2004 $ million
| |
Funded status-assets (less than) in excess of benefit obligation | | (19.7 | ) | | (30.1 | ) | | (287.6 | ) | | (316.8 | ) | | (213.8 | ) | | (276.7 | ) |
Contributions after measurement date | | 1.2 | | | 2.8 | | | 4.5 | | | 7.8 | | | 5.0 | | | 3.0 | |
Unrecognized net actuarial loss (gain) | | 34.8 | | | 35.5 | | | 229.9 | | | 255.0 | | | (56.6 | ) | | (6.4 | ) |
Unrecognized net (asset) liability at transition | | (1.8 | ) | | (4.1 | ) | | 5.7 | | | 1.1 | | | — | | | — | |
Unrecognized prior service cost | | 1.0 | | | — | | | 2.6 | | | (2.0 | ) | | (20.7 | ) | | (11.9 | ) |
| | |
|
| |
|
| |
|
| |
|
| |
|
| |
|
|
Net amount recognized | | 15.5 | | | 4.1 | | | (44.9 | ) | | (54.9 | ) | | (286.1 | ) | | (292.0 | ) |
| | |
|
| |
|
| |
|
| |
|
| |
|
| |
|
|
Amounts recognized in the Consolidated Balance Sheet: | | | | | | | | | | | | | | | | | | |
Prepaid benefit cost | | 13.5 | | | 2.9 | | | 2.9 | | | 1.4 | | | — | | | — | |
Accrued benefit liability | | (25.6 | ) | | (26.2 | ) | | (236.3 | ) | | (254.7 | ) | | (286.1 | ) | | (292.0 | ) |
Intangible asset | | 0.9 | | | 0.1 | | | 6.4 | | | 3.2 | | | — | | | — | |
Accumulated other comprehensive income | | 26.7 | | | 27.3 | | | 182.1 | | | 195.2 | | | — | | | — | |
| | |
|
| |
|
| |
|
| |
|
| |
|
| |
|
|
Net amount recognized | | 15.5 | | | 4.1 | | | (44.9 | ) | | (54.9 | ) | | (286.1 | ) | | (292.0 | ) |
| | |
|
| |
|
| |
|
| |
|
| |
|
| |
|
|
The accumulated benefit obligation for all defined benefit pension plans was $1,058.6 million at January 1, 2005 and $1,040.1 million at January 3, 2004. The Accumulated Benefit Obligation has been calculated in accordance with Approach 1 described in EITF 88-1.
During the year, certain assets and liabilities of one of the Group’s Japanese pension arrangements were transferred to the Japanese government. The value of liabilities transferred exceeded the amount of assets transferred by $8.7 million. The impact of this government subsidy is reflected in the above figures.
| | | | | | | | | | | | | | | | |
| | | Pension benefits
| | | Other benefits
|
| | | UK Plans
| | | Non-UK Plans
| | | All Plans
|
| | | January 1,
2005 $ million
| | | January 3,
2004 $ million
| | | January 1,
2005 $ million
| | | January 3,
2004 $ million
| | | January 1,
2005 $ million
| | January 3,
2004 $ million
|
Increase in minimum liability included in other comprehensive income | | (0.6 | ) | | (26.0 | ) | | (13.1 | ) | | (12.9 | ) | | n/a | | n/a |
Information regarding pension plans in which projected benefit obligations (inclusive of anticipated future compensation increases) and accumulated benefit obligations exceed plan assets:
| | | | | | | | | | | | |
| | | UK Plans
| | | Non-UK Plans
| |
| | | January 1,
2005 $ million
| | | January 3,
2004 $ million
| | | January 1,
2005 $ million
| | | January 3,
2004 $ million
| |
Projected benefit obligation | | (140.1 | ) | | (191.9 | ) | | (737.4 | ) | | (756.4 | ) |
Accumulated benefit obligation | | (134.6 | ) | | (182.8 | ) | | (687.0 | ) | | (705.6 | ) |
Fair value of plan assets | | 112.9 | | | 160.8 | | | 452.3 | | | 439.9 | |
The major assumptions used in valuing year end pension and post-retirement plan obligations were as follows:
| | | | | | | | | | | | | | | | | | |
| | | Pension benefits
| | | Other benefits
| |
| | | UK Plans
| | | Non-UK Plans
| | | All Plans
| |
| | | January 1,
2005
| | | January 3,
2004
| | | January 1,
2005
| | | January 3,
2004
| | | January 1,
2005
| | | January 3,
2004
| |
Weighted average assumptions used to determine benefit obligations at year end: | | | | | | | | | | | | | | | | | | |
Discount rate | | 5.75 | % | | 5.75 | % | | 5.87 | % | | 5.95 | % | | 6.0 | % | | 6.15 | % |
Rate of compensation increase | | 4.00 | % | | 4.00 | % | | 5.39 | % | | 5.39 | % | | n/a | | | n/a | |
Ultimate medical trend rate | | n/a | | | n/a | | | n/a | | | n/a | | | 4.50 | % | | 4.50 | % |
F-26
Notes to the consolidated financial statements
continued
14. EMPLOYEE BENEFIT PLANS (CONTINUED)
Pension plan assets
Plan assets are invested in equity securities, bonds and other fixed income securities, money market instruments, and insurance contracts. The Company’s weighted-average worldwide actual asset allocations at January 1, 2005 and January 3, 2004 by asset category are as follows:
| | | | | | | | | |
| | | Plan assets
| | | | |
| | | January 1,
2005
| | | January 3,
2004
| | | Target
allocation
| |
Asset category | | | | | | | | | |
Equity securities | | 61 | % | | 65 | % | | 65-75 | % |
Fixed income securities | | 35 | % | | 30 | % | | 27-33 | % |
Other | | 4 | % | | 5 | % | | 0-10 | % |
| | |
|
| |
|
| |
|
|
Total | | 100 | % | | 100 | % | | 100 | % |
| | |
|
| |
|
| |
|
|
The Company’s investment strategy for pension plan assets includes diversification to minimize interest and market risks, and generally does not involve the use of derivative financial instruments. Plan assets are rebalanced periodically to maintain target asset allocations. Maturities of investments are not necessarily related to the timing of expected future benefit payments, but adequate liquidity to make immediate and medium term benefit payments is ensured.
Contributions
The Company’s funding policy for its defined benefit plans is to contribute amounts determined annually on an actuarial basis to provide for current and future benefits in accordance with federal law and other regulations. Post retirement health and life insurance benefits are funded as incurred. The Company expects to contribute approximately $74.3 million to its pension plans during fiscal 2005.
The following benefit payments, which reflect expected future service as appropriate, are expected to be paid:
| | | | | | |
| | | Pension Benefits
| | Other Benefits
|
| | | UK Plans $ million
| | Non-UK Plans $ million
| | All Plans $ million
|
2005 | | 17.1 | | 54.2 | | 22.3 |
2006 | | 19.0 | | 54.6 | | 21.7 |
2007 | | 20.0 | | 54.8 | | 22.2 |
2008 | | 21.5 | | 55.8 | | 22.7 |
2009 | | 21.2 | | 55.6 | | 23.0 |
2010-2014 | | 119.0 | | 280.0 | | 113.8 |
B. Health care cost trends and the impact of the Medicare Prescription Act of 2004
The weighted average annual rate of increase in the per-capita cost of covered benefits (i.e., health care cost trend rate) is assumed to be 9.74% for 2005, reducing gradually to 4.5% by 2011 and remaining at that level thereafter. A one percentage point change in the assumed health care cost trend rate would have the following effects as of January 1, 2005:
| | | | |
| | | 1 % Point
increase $
million
| | 1 % Point
decrease
$ million
|
Effect on the total of service and interest cost | | 1.2 | | 1.2 |
Effect on the post retirement benefit obligation | | 19.0 | | 18.3 |
In December 2003, the Medicare Prescription Drug, Improvement and Modernization Act of 2003 (the “Act”) was signed into law. The Act introduced a plan sponsor subsidy based on a percentage of a beneficiary’s annual prescription drug benefits, within defined limits, and the opportunity for a retiree to obtain prescription drug benefits under Medicare.
In January 2004, the FASB issued Staff Position FAS 106-1, “Accounting and Disclosure Requirements related to the Medicare Prescription Drug, Improvement and Modernization Act of 2003” (the “Act”, or “FSP FAS 106-1”). FSP FAS 106-1 allows for current recognition or a one-time deferral of the effects of the Act. The deferral suspends the application of SFAS No. 106’s, “Employer’s Accounting for Post retirement Benefits Other Than Pensions,” measurement requirements, and it revised SFAS 132’s disclosure requirements for pensions and other post retirement plans for the effects of the Act. In May 2004, the FASB issued Staff Position FAS 106-2, “Accounting and Disclosure Requirements related to the Medicare Prescription Drug, Improvement and Modernization Act of 2003” (the Act, or “FSP FAS 106-2”), which supercedes FSP FAS 106-1 and provides guidance on the accounting for the effects of the Act and requires employers that sponsor post retirement healthcare plans that provide prescription drug benefits to provide certain disclosures regarding the effect of the federal subsidy included in the Act. FSP FAS 106-2 was effective for the first interim or annual period beginning after June 15, 2004 and the Company has elected to take the one-time deferral, the impact of which has not had a material impact on the Company’s results of operations, cash flows or financial position.
F-27
Notes to the consolidated financial statements
continued
15. COMMITMENTS AND CONTINGENCIES
(a) Obligations under operating and capital leases
Future minimum lease payments under operating and capital leases that have initial or remaining non-cancelable lease terms in excess of one year at January 1, 2005 are as follows:
| | | | | |
| | | Operating
$ million
| | Capital
$ million
| |
Fiscal Year ending: | | | | | |
2005 | | 31.3 | | 7.6 | |
2006 | | 25.3 | | 3.8 | |
2007 | | 22.7 | | 3.3 | |
2008 | | 19.0 | | 3.3 | |
2009 | | 16.1 | | 2.5 | |
Thereafter | | 74.7 | | 9.4 | |
| | |
| |
|
|
Total minimum payments | | 189.1 | | 29.9 | |
Less interest on capital leases | | — | | (6.7 | ) |
| | |
| |
|
|
Total principal payable on capital leases | | 189.1 | | 23.2 | |
| | |
| |
|
|
The rent expense for land and buildings under operating leases was $26.5 million in fiscal 2004; $20.4 million in fiscal 2003; $11.8 million in fiscal 2002 and $16.3 million in fiscal 2001/02. The rent expense for plant and machinery under operating leases was $12.8 million in fiscal 2004; $15.2 million in fiscal 2003; $5.8 million in fiscal 2002 and $14.0 million in fiscal 2001/02.
(b) Litigation
The Company is, from time to time, party to legal proceedings and claims, which arise in the ordinary course of business. The Directors do not anticipate that the outcome of any of the above proceedings and claims, either individually or in aggregate, will have a material adverse effect upon the Group’s financial position.
16. DERIVATIVE FINANCIAL INSTRUMENTS
The Company enters into derivative transactions pursuant to its risk management policies to manage market risks such as fluctuations in foreign currency exchange rates and changes in interest rates. The Company does not hold or issue derivative financial instruments for trading purposes.
The estimated fair values of the Company’s financial instruments are summarized below:
| | | | | | | | | | | | |
| | | January 1, 2005
| | | January 3, 2004
| |
| | | Book value
$ million
| | | Fair value
$ million
| | | Book value
$ million
| | | Fair value
$ million
| |
Assets/(liabilities) | | | | | | | | | | | | |
Long term debt, including current portion | | (788.3 | ) | | (847.4 | ) | | (740.9 | ) | | (778.2 | ) |
Short term borrowings and current portion of long term borrowings | | (46.5 | ) | | (46.5 | ) | | (54.1 | ) | | (54.1 | ) |
Cash and cash equivalents and restricted cash | | 365.4 | | | 365.4 | | | 321.1 | | | 321.1 | |
Other financial assets | | 52.4 | | | 52.4 | | | 52.3 | | | 54.6 | |
Other financial liabilities | | — | | | — | | | (3.0 | ) | | (3.0 | ) |
| | | | |
Derivative instruments | | | | | | | | | | | | |
Currency forwards hedging net investments | | (13.1 | ) | | (13.1 | ) | | 2.5 | | | 2.5 | |
Interest rate swaps | | 7.7 | | | 19.2 | | | 7.3 | | | 6.3 | |
Other currency forwards and swaps | | 0.2 | | | 3.1 | | | (0.2 | ) | | 0.2 | |
Deposits are short-term bank deposits and investments in short term money market securities. Therefore fair values closely approximate to book values. Borrowings mainly consist of the £150 million 8 per cent sterling bond, and the £250 million 6.125 per cent bond, the fair values of which have been determined by reference to their respective market prices at January 1, 2005. The remaining borrowings are at floating interest rates and fair values have been determined by reference to market rates. The preference shares are not traded on an organized market and as such, fair values are not readily available.
Derivative instruments, principally interest rate swaps and spot and forward foreign exchange contracts are used to assist in the management of currency and interest rate risks.
Transaction exposure contracts are for a period equal to the exposure and as such are not speculative.
Foreign currency derivatives are used to ensure that the Company’s net borrowings are retained in proportion to the currencies in which the Company’s assets are denominated. This aims to match the shareholders’ required currency exposure to the actual exposure. All foreign exchange contracts will mature in the next year.
Interest rate swaps are used to manage interest rate risk and to achieve the desired combination of fixed and floating rate debt. Swaps are used to convert the fixed rate on both the 2011 and 2015 bonds (8 per cent and 6.125 per cent respectively) to floating rate (at 6 month LIBOR + 255 basis points and 3 month LIBOR + 108 basis points respectively). The duration of the swaps matches the duration of the underlying debt.
F-28
Notes to the consolidated financial statements
continued
16. DERIVATIVE FINANCIAL INSTRUMENTS (CONTINUED)
Interest rate swaps are also held to restrict the amount of floating rate debt held in US dollars, and the corresponding exposure to movements in the US dollar interest rate. $210 million of debt is swapped from floating to fixed rate, over a combination of 1.5 and 3.5 year maturities.
The fair-values of these contracts represent the estimated amount that would be paid or received if the contract was terminated. The Company is not party to any leveraged contracts.
Risk of counterparty default is limited by the use of policy limits. Counterparties are assigned a ranking according to credit rating and other financial information. Limits are set for each level of ranking. This policy applies to cash and liquid funds, foreign exchange and interest rate derivatives.
At January 1, 2005 the Company had the following interest rate swap profile:
| | | | | | | | | | | |
Maturity Dates:
| | Notional
principal amount
(in currency of
swap) (million)
| | Interest rate
| | | Variable rate index
|
| | | Paid
| | | Received
| | |
December 2011 | | £ | 150.0 | | (a | )7.5% | | (b | )8.0% | | 6m LIBOR |
December 2015 | | £ | 250.0 | | (a | )6.0% | | (b | )6.1% | | 3m LIBOR |
June 2006 | | $ | 145.0 | | (b | )2.8% | | (a | )2.5% | | 3m LIBOR |
June 2008 | | $ | 65.0 | | (b | )3.8% | | (a | )2.5% | | 3m LIBOR |
17. RESTRUCTURING
The Company defines restructuring expense to include charges incurred with exit or disposal activities accounted for in accordance with SFAS No. 146, employee severance costs incurred as a result of an exit or disposal activity accounted for in accordance with SFAS Nos. 88 and 112, and pension and other post employment benefit costs incurred as a result of an exit or disposal activity accounted for in accordance with SFAS Nos. 87 and 106.
The Company has undertaken various restructuring activities to streamline its operations, consolidate and take advantage of available capacity and resources, and ultimately achieve net cost reductions. Restructuring activities include efforts to integrate and rationalize the Company’s businesses and to relocate manufacturing operations to lower cost markets.
During Fiscal 2004 there were $34.1 million of restructuring costs charged to the consolidated income statement compared with $38.0 million in December 2003. The major projects included the relocation of wiper blade production and the rationalization of manufacturing capacity in North America.
Restructuring costs include the following:
| | | | | | | | | | | | |
| | | Employee
related $ million
| | | Fixed asset
write-downs $ million
| | | Other costs $ million
| | | Total $ million
| |
Balance as at December 31, 2002 | | 20.2 | | | — | | | 10.9 | | | 31.1 | |
Foreign exchange | | 0.2 | | | — | | | — | | | 0.2 | |
Cash expenditure | | (23.0 | ) | | — | | | (16.2 | ) | | (39.2 | ) |
Non cash expenditure | | — | | | (6.8 | ) | | (3.9 | ) | | (10.7 | ) |
Income statement expense | | 14.1 | | | 6.8 | | | 17.1 | | | 38.0 | |
| | |
|
| |
|
| |
|
| |
|
|
Balance as at January 3, 2004 | | 11.5 | | | — | | | 7.9 | | | 19.4 | |
Foreign exchange | | 0.1 | | | — | | | — | | | 0.1 | |
Cash expenditure | | (7.6 | ) | | — | | | (23.5 | ) | | (31.1 | ) |
Non cash expenditure | | — | | | (9.0 | ) | | (1.4 | ) | | (10.4 | ) |
Income statement expense | | 6.2 | | | 9.0 | | | 18.9 | | | 34.1 | |
| | |
|
| |
|
| |
|
| |
|
|
Balance as at January 1, 2005 | | 10.2 | | | — | | | 1.9 | | | 12.1 | |
| | |
|
| |
|
| |
|
| |
|
|
Other costs include the costs incurred in the closing of production plants and the relocation to lower cost areas.
Restructuring costs incurred in the eight months ended December 31, 2002 totaled $46.6 million (employee related $22.0 million, fixed asset write-downs $9.4 million and other costs $15.2 million). Restructuring costs incurred in the year ended April 30, 2002 totaled $41.7 million (employee related $26.1 million, fixed asset write-downs $2.7 million and other costs $12.9 million). The restructuring projects in those years were similar in nature to those in Fiscal 2004 and 2003.
Segmental analysis of income statement expense:
| | | | | | | | |
| | | Year ended
January 1,
2005 $ million
| | Year ended
January 3,
2004 $ million
| | Eight
months ended
December 31,
2002 $ million
| | Year ended
April 30,
2002 $ million
|
Industrial & Automotive | | 29.2 | | 30.3 | | 34.0 | | 41.7 |
Air Systems Components | | 1.8 | | 6.6 | | 12.6 | | — |
Engineered & Construction Products | | 3.1 | | 1.1 | | — | | — |
| | |
| |
| |
| |
|
| | | 34.1 | | 38.0 | | 46.6 | | 41.7 |
| | |
| |
| |
| |
|
F-29
Notes to the consolidated financial statements
continued
18. CAPITAL STRUCTURE
During fiscal 2004, 54,000 and 573,524 common stock of 5p each were allotted pursuant to options exercised under the executive share option schemes and savings related share option schemes respectively, for total consideration of $2.2 million.
The convertible cumulative preferred stock was issued on terms that it could be converted at any time, at the shareholder’s option, into fully paid ordinary shares of 5p each of the Company on the basis of 9.77 ordinary shares of 5p each for every convertible cumulative preferred stock share so converted. The Company has the option, at any time when the total amount of convertible cumulative preferred stock issued and outstanding is less than 10% of the amount originally issued and in any event on or after 29 July 2006 to redeem, in the first case, all but not some only and, in the second case, all or any of the convertible cumulative preferred stock which remain issued and outstanding at that time. At the date of issue the conversion terms of the convertible cumulative preferred stock were equivalent to an ordinary share price of 334p. On a return of assets on liquidation or otherwise (other than on redemption or repurchase of shares) the assets of the Company available to shareholders will be applied first in repaying the capital paid up or credited as paid up thereon together with all arrears and accruals of dividend to the holders of the convertible cumulative preferred stock and any other classes of shares ranking pari passu with the convertible cumulative preferred stock as to capital.
Until such time as the shares are converted or redeemed the holders of the convertible cumulative preferred stock have a right to receive dividends at an annual rate of 5.560% in preference to the holders of the ordinary shares. As of January 1, 2005 and January 3, 2004 respectively, the Company has no dividends payable in arrears.
The holders of the convertible cumulative preferred stock are entitled to vote at a general meeting of the Company where, on a show of hands, each holder will have one vote and, on a poll, each holder will have one vote in respect of every seven fully paid ordinary shares to which the holder would be entitled on the full exercise of his conversion rights except if two or more consecutive quarterly dividends are in arrears whereupon, on a poll, each holder shall have one vote in respect of every fully paid ordinary share to which the holder would be entitled on the full exercise of his conversion rights; such voting rights to continue until such time as any arrears of dividends as described above have been paid in full.
Restricted Reserves
Under UK GAAP, under which rules the principal consolidated statutory financial statements are prepared, there is a concept of a Capital Redemption Reserve, which is used to maintain the capital of a company when there is a purchase of own shares. This is a restricted reserve, as it cannot be distributed to shareholders. On August 26, 2003 all outstanding redeemable convertible cumulative preferred stock was redeemed and $621.9 million was transferred into restricted reserves.
19. RELATED PARTY TRANSACTIONS
In the current year the Company entered into an agreement with ICG, LLC and GForce Aviation, LLC to obtain an indefinite number of aircraft flying hours at the rate of $1,500 per hour, plus $1,300 per day crew, plus $1,700 per month insurance fee, for use by the employees for corporate purposes in circumstances where no other equivalent services are available, except at greater cost. ICG, LLC is owned by Charles Gates. Mr. Charles Gates’ interest and those of other family members in the preference shares of the Company are disclosed in the Directors Report. The Company entered into this transaction after careful consideration of all of the options available to reach the diverse locations of the Group in the United States. This transaction has been entered into on an arm’s length basis and in the normal course of business. During fiscal 2004 the Company purchased $145,705 of services from ICG, LLC under the arrangement. At January 1, 2005 a balance of $1,700 due to ICG, LLC was included in accounts payable.
There are no further transactions or proposed transactions with related parties that are material to the Company or to a related party.
20. ALLOWANCE FOR DOUBTFUL ACCOUNTS
The movements in the allowance for doubtful account are as follows.
| | | | | | | | | | | | |
| | | Year ended
January 1,
2005 $ million
| | | Year ended
January 3,
2004 $ million
| | | Eight
months ended
December 31,
2002 $ million
| | | Year ended
April 30,
2002 $ million
| |
Balance at the beginning of the year | | 15.8 | | | 16.7 | | | 17.6 | | | 20.0 | |
Profit and loss charge/(credit) | | 1.3 | | | 0.7 | | | 4.3 | | | 4.2 | |
Additions charged to other accounts * | | (1.3 | ) | | (1.0 | ) | | (2.1 | ) | | (0.3 | ) |
Utilized | | (4.9 | ) | | (2.3 | ) | | (4.8 | ) | | (6.4 | ) |
Foreign exchange | | 0.8 | | | 1.7 | | | 1.7 | | | 0.1 | |
| | |
|
| |
|
| |
|
| |
|
|
Balance at the end of the year | | 11.7 | | | 15.8 | | | 16.7 | | | 17.6 | |
| | |
|
| |
|
| |
|
| |
|
|
| * | Includes the currency retranslation of opening balances and movements arising from the acquisition and disposal of subsidiaries |
21. SUBSEQUENT EVENTS
On January 2, 2005, Unified Industries, Inc., a business in the Materials Handling division, was sold for $1.0 million. This will result in a loss currently estimated to be $2.1 million. On February 9, 2005, the business and assets of the AirSprings division were sold for provisional consideration of $12.8 million, of which $5.5 million is deferred. This will result in a loss currently estimated to be $5.8 million. The total loss of $7.9 million has been provided in the year to January 1, 2005.
On January 27, 2005, Tomkins acquired Milcor Inc, a multi-brand manufacturer of building products, which will be reported within Air Systems Components. On February 22, 2005 Tomkins signed an agreement to acquire L.E. Technologies, a recreational vehicle frame manufacturer, which will be reported within Engineered and Construction Products. This acquisition was completed on 17 March 2005.
F-30
Signature
Tomkins Plc hereby certifies that it meets all of the requirements for filing on Form 20-F, and that it has duly caused and authorized the undersigned to sign this Annual Report on its behalf.
|
| TOMKINS plc |
|
/s/ Kenneth Lever
|
| By: Kenneth Lever |
| Chief Financial Officer |
June 24, 2005
Exhibit Index
| | |
| 1.1 | | Memorandum and Articles of Association of the Company.(4) |
| |
| 4.1 | | The rules of the Tomkins Executive Share Option Scheme No. 3.(1) |
| |
| 4.2 | | The rules of the Tomkins Executive Share Option Scheme No. 4.(1) |
| |
| 4.3 | | Service Agreement, dated February 11, 2002 between Tomkins plc and James Nicol(2) |
| |
| 4.4 | | Support Agreement, dated April, 29, 2003, between Tomkins plc, 2023103 Ontario Inc., and Stackpole Limited.(3) |
| |
| 4.5 | | Lock-up Agreement, dated April 29, 2003, between The Stackpole Corporation, Tomkins plc, and 2023103 Ontario Inc.(3) |
| |
| 4.6 | | Third Supplemental Trust Deed relating to the £750,000,000 Euro Medium Term Note Programme dated August 28, 2003.(4) |
| |
| 4.7 | | Facility Agreement relating to the £400,000,000 multicurrency revolving credit agreement dated February 9, 2004.(4) |
| |
| 4.8 | | The rules of the Tomkins 2005 Sharesave Scheme* |
| |
| 8.1 | | List of subsidiaries of the Company*. |
| |
| 12.1 | | Certification of CEO pursuant to Rule 13 (a) – 14(a) of the Securities Exchange Act of 1934* |
| |
| 12.2 | | Certification of CFO pursuant to Rule 13 (a) – 14(a) of the Securities Exchange Act of 1934* |
| |
| 13.1 | | Certification of CEO and CFO pursuant to Rule 13(a) – 14 (b) of the Securities and Exchange act of 1934 and 18 USC. Section 1350, as adopted pursuant to Section 906 of the Sarbanes-Oxley Act of 2002*. |
| (1) | Incorporated by reference to the Company’s Annual Report on Form 20-F for the fiscal year ended April 30, 2001. |
| (2) | Incorporated by reference to the Company’s Annual Report on Form 20-F for the fiscal year ended April 30, 2002. |
| (3) | Incorporated by reference to the Company’s Transition Report on Form 20-F for the eight months ended December 31, 2002. |
| (4) | Incorporated by reference to the Company’s Annual Report on Form 20-F for the fiscal year ended January 3, 2004. |