SECURITIES AND EXCHANGE COMMISSION
WASHINGTON, D.C. 20549
FORM 20-F
| ¨ | | REGISTRATION STATEMENT PURSUANT TO SECTION 12(b) OR (g) OF THE SECURITIES EXCHANGE ACT OF 1934 |
OR
| ¨ | | ANNUAL REPORT PURSUANT TO SECTION 13 OR 15(d) OF THE SECURITIES EXCHANGE ACT OF 1934 |
OR
| x | | TRANSITION REPORT PURSUANT TO SECTION 13 OR 15(d) OF THE SECURITIES EXCHANGE ACT OF 1934 |
FOR THE TRANSITION PERIOD FROM MAY 1, 2002 TO DECEMBER 31, 2002
COMMISSION FILE NUMBER: 0-17140
Tomkins plc
(Exact name of Registrant as specified in its charter)
England
(Jurisdiction of incorporation or organization)
East Putney House, 84 Upper Richmond Road
London SW15 2ST, United Kingdom
(Address of principal executive offices)
Securities registered or to be registered pursuant to Section 12(b) of the Act:
| Title of each class | | Name of each exchange |
| Ordinary Shares, nominal value 5p per share | | New York Stock Exchange * |
| American Depositary Shares, each of which represents four Ordinary Shares | | New York Stock Exchange |
Securities registered or to be registered pursuant to Section 12(g) of the Act
None.
Securities for which there is a reporting obligation pursuant to Section 15(d) of the Act
None.
Indicate the number of outstanding shares of each of the issuer’s classes of capital or common stock as of the close of the period covered by the Transition report:
Ordinary Shares, nominal value 5p per share | | 772,973,339 |
Convertible Cumulative Preference Shares, nominal value US$50 per share | | 10,507,478 |
Redeemable Convertible Cumulative Preference Shares, nominal value US$50 per share | | 12,438,282 |
Indicate by check mark whether the Registrant (1) has filed all reports required to be filed by Section 13 or 15(d) of the Securities Exchange Act of 1934 during the preceding 12 months (or for such shorter period that the Registrant was required to file such reports), and (2) has been subject to such filing requirements for the past 90 days: Yes x No ¨
Indicate by check mark which financial statement item the Registrant has elected to follow: Item 17 x Item 18 ¨
| * | | Not for trading, but only in connection with the registration of American Depositary Shares representing such Ordinary Shares |
TABLE OF CONTENTS
In this Transition Report (the “Transition Report”) on Form 20-F for the eight month period from May 1, 2002 to December 31, 2002 (“eight months ended December 31, 2002”), all references to “Tomkins”, the “Tomkins Group”, the “Group”, the “Company”, “we”, “us” and “our” include Tomkins plc and its consolidated subsidiaries, unless the context otherwise requires.
The consolidated financial statements of Tomkins plc appearing in this Transition Report are presented in pounds sterling (“£”) and are prepared in accordance with accounting principles generally accepted in the United Kingdom (“U.K. GAAP”). U.K. GAAP differs in certain respects from accounting principles generally accepted in the United States of America (“U.S. GAAP”). The significant differences between U.K. GAAP and U.S. GAAP relevant to Tomkins plc are explained in Note 27 of Notes to the consolidated financial statements.
In this Transition Report, references to “U.S. dollars”, “$”, “cents” and “c” are to United States currency and references to “pounds sterling”, “£”, “pence” and “p” are to British currency. Solely for the convenience of the reader, this Transition Report contains translations of certain pound sterling amounts into U.S. dollars. These translations should not be construed as representations that the pound sterling amounts actually represent such U.S. dollar amounts or could be converted into U.S. dollars at the rates indicated or at any other rates. Unless otherwise stated, the translations of pounds sterling into U.S. dollars have been made at $1.6095 to £1.00, the noon buying rate in New York City for cable transfers in pounds sterling as certified for customs purposes by the Federal Reserve Bank of New York (the “Noon Buying Rate”) on December 31, 2002, provided, however, that the amounts associated with acquisitions and dispositions are translated at the Noon Buying Rate on the date of completion. On June 6, 2003, the Noon Buying Rate was $1.6622 to £1.00.
Pursuant to the meaning of forward-looking statements in Section 27A of the Securities Act of 1933 and Section 21E of the Securities Exchange Act of 1934 (the “Exchange Act”), this Transition Report contains assumptions, anticipations, expectations and forecasts concerning the Company’s future business plans, products, services, financial results, performance, future events and information relevant to our business, industries and operating environments. When used in this document, the words “anticipate”, “believe”, “estimate”, “assume”, “could”, “should”, “expect” and similar expressions, as they relate to the Company or its management, are intended to identify forward-looking statements. Such statements reflect the current views of Tomkins with respect to future events and are subject to certain risks, uncertainties and assumptions. The forward-looking statements contained herein represent a good-faith assessment of our future performance for which we believe there is a reasonable basis. Many factors could cause the actual results, performance or achievements of Tomkins to be materially different from any future results, performance or achievements that may be expressed or implied by such forward-looking statements, including, among others, adverse changes or uncertainties in general economic conditions in the markets we serve, regulatory developments adverse to us or difficulties we may face in maintaining necessary licenses or other governmental approvals, changes in the competitive position or introduction of new competitors or new competitive products, lack of acceptance of new products or services by the Company’s targeted customers, changes in business strategy, any management level or large-scale employee turnover, any major disruption in production at our key facilities, adverse changes in foreign exchange rates, and acts of terrorism or war, and various other factors, both referenced and not referenced in this Transition Report. Should one or more of these risks or uncertainties materialize, or should underlying assumptions prove incorrect, actual results may vary materially from those described herein as anticipated, believed, estimated or expected. For more discussion of the risks affecting us, please refer to Item 3.D. “Key Information—Risk factors”.
These forward-looking statements represent our view only as of the date they are made, and we disclaim any obligation to update forward-looking statements contained herein, except as may be otherwise required by law.
1
PART I
Item 1. Identity of Directors, Senior Management and Advisers
Not applicable.
Item 2. Offer Statistics and Expected Timetable
Not applicable.
Item 3. Key Information
A. Selected financial data
The selected financial data set out below as of and for the eight month Transition Period ended December 31, 2002 and for the fiscal years ended April 30, 2002 and April 30, 2001 has been derived from the audited consolidated financial statements of the Company, which appear elsewhere in this Form 20-F. The selected financial data as of and for the fiscal years ended April 29, 2000, May 1, 1999 and May 2, 1998 has been derived from the audited financial statements of the Company appearing in our historical annual reports as filed with the Securities and Exchange Commission (the “SEC”). The selected financial data set forth below should be read in conjunction with, and are qualified in their entirety by reference to, such consolidated financial statements and Notes thereto and Item 5 – “Operating and Financial Review and Prospects”. The selected financial data does not comprise “statutory accounts” within the meaning of Section 240 of the Companies Act 1985 of England and Wales (the “Companies Act”), but have been based upon the full published accounts of the Company for the eight month period ended December 31, 2002 and the five fiscal years ended April 30, 2002. The published accounts for the eight month period ended December 31, 2002 and for the five fiscal years ended April 30, 2002, upon which unqualified auditors’ reports have been given, have each been delivered to the Registrar of Companies in England and Wales with the exception of the accounts for the eight month period ended December 31, 2002, which will be delivered prior to the relevant filing deadline of July 31, 2003. The consolidated financial statements of the Company are prepared in accordance with U.K. GAAP, which differs in certain significant respects from U.S. GAAP. The principal differences between U.K. GAAP and U.S. GAAP, as they relate to the Company, are presented in Note 27 to the consolidated financial statements.
Consolidated income statement data
| | | Fiscal Year Ended
| |
| | | December 31, 2002(1)
(245 days)
| | | December 31,
2002 (245 days)
| | | April 30,
2002 (365 days)
| | | April 30,
2001
(366 days)
| | | April 29,
2000 (364 days)
| | | May 1, 1999 (364
days)
| | | May 2, 1998 (364
days)
| |
| | | (In millions except per Ordinary Share and per ADS data) | |
| | | $ | | | £ | | | £ | | | £ | | | £ | | | £ | | | £ | |
Amounts in accordance with U.K.GAAP | | | | | | | | | | | | | | | | | | | | | |
Net sales | | | | | | | | | | | | | | | | | | | | | |
Continuing operations | | 3,375.4 | | | 2,097.2 | | | 3,373.8 | | | 3,335.1 | | | 3,161.7 | | | 2,818.2 | | | 2,710.2 | |
Discontinued operations | | — | | | — | | | — | | | 770.4 | | | 2,478.7 | | | 2,541.1 | | | 2,351.9 | |
| | |
|
| |
|
| |
|
| |
|
| |
|
| |
|
| |
|
|
| | | 3,375.4 | | | 2,097.2 | | | 3,373.8 | | | 4,105.5 | | | 5,640.4 | | | 5,359.3 | | | 5,062.1 | |
| | |
|
| |
|
| |
|
| |
|
| |
|
| |
|
| |
|
|
Operating income | | | | | | | | | | | | | | | | | | | | | |
Continuing operations | | 230.3 | | | 143.1 | | | 256.1 | | | 299.2 | | | 336.5 | | | 298.7 | | | 281.5 | |
Discontinued operations | | — | | | — | | | — | | | 11.2 | | | 182.9 | | | 196.6 | | | 195.8 | |
| | |
|
| |
|
| |
|
| |
|
| |
|
| |
|
| |
|
|
| | | 230.3 | | | 143.1 | | | 256.1 | | | 310.4 | | | 519.4 | | | 495.3 | | | 477.3 | |
| | |
|
| |
|
| |
|
| |
|
| |
|
| |
|
| |
|
|
Income before taxes and minority interests | | 246.4 | | | 153.1 | | | 264.4 | | | 144.0 | | | 252.6 | | | 461.6 | | | 500.4 | |
| | |
|
| |
|
| |
|
| |
|
| |
|
| |
|
| |
|
|
Income before preference dividend | | 189.6 | | | 117.8 | | | 187.5 | | | 53.3 | | | 105.1 | | | 296.7 | | | 316.7 | |
Preference share dividend | | (39.4 | ) | | (24.5 | ) | | (39.3 | ) | | (37.6 | ) | | (34.4 | ) | | (34.2 | ) | | (34.5 | ) |
| | |
|
| |
|
| |
|
| |
|
| |
|
| |
|
| |
|
|
Net income attributable to Ordinary Shareholders | | 150.2 | | | 93.3 | | | 148.2 | | | 15.7 | | | 70.7 | | | 262.5 | | | 282.2 | |
| | |
|
| |
|
| |
|
| |
|
| |
|
| |
|
| |
|
|
Basic net income: | | | | | | | | | | | | | | | | | | | | | |
Per ordinary share | | 19.48 | c | | 12.10 | p | | 19.16 | p | | 1.83 | p | | 7.46 | p | | 22.69 | p | | 23.80 | p |
Per ADS(2) | | 77.90 | c | | 48.40 | p | | 76.64 | p | | 7.32 | p | | 29.84 | p | | 90.76 | p | | 95.20 | p |
Diluted net income: | | | | | | | | | | | | | | | | | | | | | |
Per ordinary share | | 19.02 | c | | 11.82 | p | | 18.78 | p | | 1.83 | p | | 11.07 | p | | 21.44 | p | | 22.30 | p |
Per ADS(2) | | 76.10 | c | | 47.28 | p | | 75.12 | p | | 7.32 | p | | 44.28 | p | | 85.76 | p | | 89.20 | p |
Dividends: | | | | | | | | | | | | | | | | | | | | | |
Per ordinary share | | 12.88 | c | | 8.00 | p | | 12.00 | p | | 12.00 | p | | 17.45 | p | | 15.15 | p | | 13.17 | p |
Per ADS(2) | | 51.50 | c | | 32.00 | p | | 48.00 | p | | 48.00 | p | | 69.80 | p | | 60.60 | p | | 52.68 | p |
| |
| | | (in thousands) | |
Average number of ordinary shares outstanding—basic | | 770,927 | | | 770,927 | | | 773,464 | | | 857,686 | | | 947,774 | | | 1,156,877 | | | 1,185,873 | |
Average number of ordinary shares outstanding—diluted | | 996,607 | | | 996,607 | | | 998,355 | | | 857,712 | | | 949,793 | | | 1,383,752 | | | 1,420,178 | |
| (1) | | The Noon Buying Rate on December 31, 2002 of $1.6095 = £1.00 has been used to provide a convenience translation into U.S. dollars solely for the convenience of the reader. |
| (2) | | Net income and dividend per ADS is calculated per Ordinary Share multiplied by four, as discussed in Item 9.C. “Markets.” |
2
Consolidated income statement data (continued)
| | | Fiscal Year Ended
| |
| | | December 31, 2002(1) (245 days)
| | | December 31, 2002(6) (245 days)
| | | April 30,
2002(5) (365 days)
| | | April 30,
2001(4) (366 days)
| | | April 29,
2000(3) (364 days)
| | | May 1, 1999 (364 days)
| | | May 2, 1998 (364 days)
| |
| | | (In millions except per Ordinary Share and per ADS data) | |
| | | $ | | | £ | | | £ | | | £ | | | £ | | | £ | | | £ | |
Amounts in accordance with U.S.GAAP | | | | | | | | | | | | | | | | | | | | | |
Net sales | | 3,375.4 | | | 2,097.2 | | | 3,373.8 | | | 4,105.5 | | | 5,640.4 | | | 5,359.3 | | | 5,062.1 | |
| | |
|
| |
|
| |
|
| |
|
| |
|
| |
|
| |
|
|
Operating income from continuing operations | | 274.9 | | | 170.8 | | | 228.6 | | | 284.8 | | | 323.8 | | | 275.7 | | | 261.6 | |
| | |
|
| |
|
| |
|
| |
|
| |
|
| |
|
| |
|
|
Operating income | | 274.9 | | | 170.8 | | | 228.6 | | | 296.0 | | | 479.4 | | | 455.1 | | | 420.4 | |
| | |
|
| |
|
| |
|
| |
|
| |
|
| |
|
| |
|
|
Income before change in accounting principle | | 176.7 | | | 109.8 | | | 147.8 | | | 64.4 | | | 193.5 | | | 256.7 | | | 259.6 | |
| | |
|
| |
|
| |
|
| |
|
| |
|
| |
|
| |
|
|
Effects of change in accounting principle, net of tax | | (52.6 | ) | | (32.7 | ) | | 1.8 | | | — | | | — | | | — | | | — | |
| | |
|
| |
|
| |
|
| |
|
| |
|
| |
|
| |
|
|
Net income | | 124.1 | | | 77.1 | | | 149.6 | | | 64.4 | | | 193.5 | | | 256.7 | | | 259.6 | |
| | |
|
| |
|
| |
|
| |
|
| |
|
| |
|
| |
|
|
Income per Ordinary Share | | | | | | | | | | | | | | | | | | | | | |
Basic: | | | | | | | | | | | | | | | | | | | | | |
Income from continuing operations before change in accounting principle | | 17.80 | c | | 11.06 | p | | 14.03 | p | | 16.27 | p | | 13.04 | p | | 10.78 | p | | 9.59 | p |
| | |
|
| |
|
| |
|
| |
|
| |
|
| |
|
| |
|
|
Income before change in accounting principle | | 17.80 | c | | 11.06 | p | | 14.03 | p | | 3.12 | p | | 16.79 | p | | 19.23 | p | | 18.98 | p |
| | |
|
| |
|
| |
|
| |
|
| |
|
| |
|
| |
|
|
Cumulative effect of change in accounting principle | | (6.82 | )c | | (4.24 | )p | | 0.23 | p | | — | | | — | | | — | | | — | |
| | |
|
| |
|
| |
|
| |
|
| |
|
| |
|
| |
|
|
Net income | | 10.98 | c | | 6.82 | p | | 14.26 | p | | 3.12 | p | | 16.79 | p | | 19.23 | p | | 18.98 | p |
| | |
|
| |
|
| |
|
| |
|
| |
|
| |
|
| |
|
|
Diluted: | | | | | | | | | | | | | | | | | | | | | |
Income from continuing operations before change in accounting principle | | 17.74 | c | | 11.02 | p | | 14.02 | p | | 16.27 | p | | 13.01 | p | | 10.75 | p | | 9.52 | p |
| | |
|
| |
|
| |
|
| |
|
| |
|
| |
|
| |
|
|
Income before change in accounting principle | | 17.74 | c | | 11.02 | p | | 14.02 | p | | 3.12 | p | | 16.75 | p | | 19.17 | p | | 18.84 | p |
| | |
|
| |
|
| |
|
| |
|
| |
|
| |
|
| |
|
|
Cumulative effect of change in accounting principle | | (5.28 | )c | | (3.28 | )p | | 0.23 | p | | — | | | — | | | — | | | — | |
| | |
|
| |
|
| |
|
| |
|
| |
|
| |
|
| |
|
|
Net income | | 12.46 | c | | 7.74 | p | | 14.25 | p | | 3.12 | p | | 16.75 | p | | 19.17 | p | | 18.84 | p |
| | |
|
| |
|
| |
|
| |
|
| |
|
| |
|
| |
|
|
Income per ADS(2) | | | | | | | | | | | | | | | | | | | | | |
Basic: | | | | | | | | | | | | | | | | | | | | | |
Income from continuing operations before change in accounting principle | | 71.20 | c | | 44.24 | p | | 56.12 | p | | 65.08 | p | | 52.16 | p | | 43.12 | p | | 38.36 | p |
| | |
|
| |
|
| |
|
| |
|
| |
|
| |
|
| |
|
|
Income before change in accounting principle | | 71.20 | c | | 44.24 | p | | 56.12 | p | | 12.48 | p | | 67.16 | p | | 76.92 | p | | 75.92 | p |
| | |
|
| |
|
| |
|
| |
|
| |
|
| |
|
| |
|
|
Cumulative effect of change in accounting principle | | (27.30 | c) | | (16.96 | )p | | 0.92 | p | | — | | | — | | | — | | | — | |
| | |
|
| |
|
| |
|
| |
|
| |
|
| |
|
| |
|
|
Net income | | 43.90 | c | | 27.28 | p | | 57.04 | p | | 12.48 | p | | 67.16 | p | | 76.92 | p | | 75.92 | p |
| | |
|
| |
|
| |
|
| |
|
| |
|
| |
|
| |
|
|
Diluted: | | | | | | | | | | | | | | | | | | | | | |
Income from continuing operations before change in accounting principle | | 70.95 | c | | 44.08 | p | | 56.08 | p | | 65.08 | p | | 52.04 | p | | 43.00 | p | | 38.08 | p |
| | |
|
| |
|
| |
|
| |
|
| |
|
| |
|
| |
|
|
Income before change in accounting principle | | 70.95 | c | | 44.08 | p | | 56.08 | p | | 12.48 | p | | 67.00 | p | | 76.68 | p | | 75.36 | p |
| | |
|
| |
|
| |
|
| |
|
| |
|
| |
|
| |
|
|
Cumulative effect of change in accounting principle | | (21.12 | )c | | (13.12 | )p | | 0.92 | p | | — | | | — | | | — | | | — | |
| | |
|
| |
|
| |
|
| |
|
| |
|
| |
|
| |
|
|
Net income | | 49.83 | c | | 30.96 | p | | 57.00 | p | | 12.48 | p | | 67.00 | p | | 76.68 | p | | 75.36 | p |
| | |
|
| |
|
| |
|
| |
|
| |
|
| |
|
| |
|
|
Dividends per ordinary share | | 12.88 | c | | 8.00 | p | | 12.00 | p | | 12.00 | p | | 17.45 | p | | 15.15 | p | | 13.17 | p |
Dividends per ADS(2) | | 51.50 | c | | 32.00 | p | | 48.00 | p | | 48.00 | p | | 69.80 | p | | 60.60 | p | | 52.68 | p |
| |
| | | (in thousands) | |
Average number of ordinary shares outstanding—basic | | 770,927 | | | 770,927 | | | 773,464 | | | 857,686 | | | 947,774 | | | 1,156,877 | | | 1,185,873 | |
Average number of ordinary shares outstanding—diluted(7) | | 996,607 | | | 996,607 | | | 774,017 | | | 857,712 | | | 949,793 | | | 1,383,752 | | | 1,420,178 | |
| (1) | | The Noon Buying Rate on December 31, 2002 of $1.6095 = £1.00 has been used to provide a convenience translation into U.S. dollars solely for the convenience of the reader. |
| (2) | | Net income and dividend per ADS is calculated per Ordinary Share multiplied by four, as discussed in Item 9.C. “Markets.” |
| (3) | | Tomkins acquired ACD Tridon Inc. and Hart & Cooley on June 25, 1999 and December 30, 1999 respectively. |
| (4) | | The sale of the Food Manufacturing business segment was completed on August 31, 2000. |
| (5) | | Change in accounting principle relates to Tomkins transitional adjustment in respect of the adoption of SFAS No. 133 on May 1, 2001. |
| (6) | | Change in accounting principle relates to Tomkins transitional adjustment in respect of the adoption of SFAS No. 142 on May 1, 2002. |
| (7) | | In fiscal year ended April 30, 2002, the preference shares were anti-dilutive and were therefore excluded from the calculation. |
3
Consolidated balance sheet data
| | | As of
|
| | | December 31, 2002(1)
| | December 31,
2002
| | April 30,
2002
| | April 30,
2001
| | April 29,
2000
| | May 1, 1999
| | May 2, 1998
|
| | | (In millions) |
| | | $ | | £ | | £ | | £ | | £ | | £ | | £ |
Amounts in accordance with U.K. GAAP | | | | | | | | | | | | | | |
Net assets | | 1,734.2 | | 1,077.5 | | 1,141.1 | | 1,118.9 | | 760.4 | | 675.1 | | 1,092.6 |
Total assets | | 3,751.4 | | 2,330.8 | | 2,564.7 | | 2,765.7 | | 3,885.1 | | 3,289.9 | | 3,151.8 |
Ordinary share capital | | 62.3 | | 38.7 | | 38.6 | | 39.1 | | 47.5 | | 47.5 | | 58.8 |
Shareholders’ funds | | 1,673.1 | | 1,039.5 | | 1,106.9 | | 1,084.9 | | 726.4 | | 646.8 | | 1,073.9 |
| | | | | | | |
Amounts in accordance with U.S. GAAP | | | | | | | | | | | | | | |
Net assets | | 2,371.4 | | 1,473.4 | | 1,805.8 | | 1,866.1 | | 2,280.9 | | 2,245.7 | | 2,712.6 |
Total assets | | 5,173.1 | | 3,214.1 | | 3,602.9 | | 3,794.9 | | 5,641.1 | | 5,095.2 | | 5,013.0 |
Shareholders’ equity | | 2,438.1 | | 1,514.8 | | 1,771.6 | | 1,832.7 | | 2,247.4 | | 2,217.7 | | 2,693.9 |
| (1) | | The Noon Buying Rate on December 31, 2002 of $1.6095 = £1.00 has been used to provide a convenience translation into U.S. dollars solely for the convenience of the reader. |
Dividends
The Company has paid cash dividends on its ordinary shares, nominal value 5p per share (“Ordinary Shares”), in respect of every fiscal year since being first listed on the London Stock Exchange Limited (the “London Stock Exchange”) in 1950.
Dividends are paid to shareholders as of record dates that are fixed after consultation between the Company and the London Stock Exchange. Prior to changing our fiscal year end, an interim dividend was normally declared by the Board of Directors (the “Board”) in January of each year and paid in March or April. A final dividend is recommended by the Board following the end of each fiscal year and is subject to approval by the shareholders at the Company’s annual general meeting. The final dividend was paid in October. For the current year ending on December 31, 2003 and thereafter, we intend to pay an interim dividend in November and a final dividend in the following May, in accordance with market practice. In normal circumstances we anticipate the weighting of these payments to be approximately 40 percent for the interim dividend and 60 percent for the final dividend.
The table below sets forth the amounts of interim, final and total dividends paid in respect of each fiscal year indicated and the Transition Period ending December 31, 2002. The amounts are shown both in pence per Ordinary Share and translated, solely for convenience, into U.S. cents per American Depositary Share (each representing four Ordinary Shares) at the Noon Buying Rate on each of the respective payment dates for such interim and final dividends.
Fiscal Year Ended
| | Pence per Ordinary Share
| | Translated into U.S. cents per ADS(2)
|
| | | Interim
| | | Second
Interim
| | Final
| | Total
| | Interim
| | Second
Interim
| | Final
| | Total
|
May 2, 1998 | | 3.50 | (1) | | — | | 9.67 | | 13.17 | | 23.48 | | — | | 66.47 | | 89.95 |
May 1, 1999 | | 4.00 | (1) | | — | | 11.15 | | 15.15 | | 25.83 | | — | | 73.69 | | 99.52 |
April 29, 2000 | | 4.60 | | | — | | 12.85 | | 17.45 | | 29.12 | | — | | 74.44 | | 103.56 |
April 30, 2001 | | 4.60 | | | — | | 7.40 | | 12.00 | | 26.46 | | — | | 43.79 | | 70.25 |
April 30, 2002 | | 4.60 | | | — | | 7.40 | | 12.00 | | 26.33 | | — | | 46.30 | | 72.63 |
May 1, 2002 – December 31, 2002 | | 4.60 | | | 3.40 | | — | | 8.00 | | 28.52 | | 21.08 | | — | | 49.60 |
| (1) | | Of which 3.06p was paid in the form of a foreign income dividend. |
| (2) | | Translated at the noon buying rate on the date the dividend was paid. |
The Company expects to continue to pay dividends in the future. The total amounts of future dividends will be determined by the Board and will depend on the Company’s results of operations, cash flow, financial and economic conditions and other factors.
The Company’s fiscal year end changed from April 30 to December 31 with effect for the year ending December 31, 2002. The change to our accounting reference date has given rise to an eight month accounting period, which represents two-thirds of a normal twelve month accounting period. In accordance with market practice in these circumstances, the Board has elected to declare two interim dividends in lieu of an interim and a final dividend.
4
The first interim dividend of 4.6 pence per ordinary share was declared on January 14, 2003. The Board declared a second interim dividend of 3.4 pence per ordinary share on March 4, 2003 in lieu of a final dividend. Taken together, these interim dividends bring the total dividend payable for this eight month accounting period to 8.0 pence per ordinary share, which represents two-thirds of the total dividends paid in respect of the last fiscal year ended April 30, 2002. Both the first and the second interim dividends were paid on April 7, 2003 to shareholders of record on March 14, 2003. Tomkins ordinary shares went ex-dividend on the London Stock Exchange in respect of both dividends on March 12, 2003.
The Board has decided not to offer a dividend reinvestment plan option for the first and second interim dividends due to the change in the dividend timetable. We will consider whether to offer such an option for dividends payable in respect of the year ending December 31, 2003.
Cash dividends are paid by the Company in pounds sterling, and fluctuations in the exchange rate between pounds sterling and U.S. dollars will affect the U.S. dollar amounts received by holders of American Depository Receipts (“ADRs”) upon conversion by The Bank of New York (the “Depositary”) of such dividends. Moreover, fluctuations in the exchange rates between the pound sterling and the U.S. dollar will affect the dollar equivalents of the pound sterling price of the Ordinary Shares on the London Stock Exchange and, as a result, are likely to affect the market prices of the American Depositary Shares (“ADSs”) in the United States. For information regarding the exchange rates for pounds sterling into U.S. dollars for the five most recent fiscal years, see “Exchange Rates” below. For a discussion of the historic effects of exchange rate fluctuations on the Company’s financial condition and results of operations, see Item 11. “Quantitative and Qualitative Disclosures about Market Risk” and Note 26 to the consolidated financial statements.
Exchange Rates
The following table sets forth, for the fiscal years indicated, the average, high, low and period end Noon Buying Rates for pounds sterling, expressed in U.S. dollars per £1.00:
Fiscal Year Ended
| | Average*
| | High
| | Low
| | Period End
|
May 2, 1998 | | 1.65 | | 1.70 | | 1.58 | | 1.67 |
May 1, 1999 | | 1.64 | | 1.72 | | 1.59 | | 1.61 |
April 29, 2000 | | 1.60 | | 1.68 | | 1.55 | | 1.56 |
April 30, 2001 | | 1.47 | | 1.56 | | 1.40 | | 1.43 |
April 30, 2002 | | 1.43 | | 1.48 | | 1.37 | | 1.46 |
Eight months ended December 31, 2002 | | 1.55 | | 1.61 | | 1.45 | | 1.61 |
Jan 1, 2003 through June 6, 2003 | | 1.62 | | 1.66 | | 1.55 | | 1.62 |
| * | | The average of the Noon Buying Rates on the last day of each month during the period. |
The following table sets forth, for the months indicated high and low Noon Buying Rates for pounds sterling, expressed in U.S. dollars per £1.00:
Month
| | High
| | Low
|
December 2002 | | 1.6044 | | 1.5555 |
January 2003 | | 1.6482 | | 1.5975 |
February 2003 | | 1.6480 | | 1.5727 |
March 2003 | | 1.6129 | | 1.5624 |
April 2003 | | 1.6000 | | 1.5500 |
May 2003 | | 1.6484 | | 1.5930 |
June 2003 (through June 6, 2003) | | 1.6622 | | 1.6278 |
See “Operating results” in Item 5. “Operating and Financial Review and Prospects” concerning the effect of fluctuations in the exchange rate between the pound sterling and the U.S. dollar on the Company’s results of operations.
B. Capitalization and indebtedness
Not applicable.
C. Reasons for the offer and use of proceeds
Not applicable.
5
D. Risk factors
In addition to the other information contained in this Transition Report, investors in our securities should consider carefully the risks described below. Our financial condition or results of operations could be materially adversely affected by any of these risks. The risks described below are not the only risks facing us. Additional risks not currently known to us, or risks that we currently regard as immaterial could also have a material adverse effect on our financial condition or results of operations.
The following discussion contains a number of forward-looking statements. Please refer to the “Forward-Looking Statements” discussion at the front of this Transition Report for cautionary information.
As a part of the planning, control and performance management framework of the Group, each business considers strategic, operational, commercial and financial risks and identifies risk mitigation actions. The Group has categorized the foregoing risks as those relating to:
| | • | | the markets within which the Group operates; |
| | • | | the competitive position of the Group and its businesses; |
| | • | | the financial position of the Group; and |
| | • | | the securities markets and ownership of ADSs and registered shares. |
Risk can be considered either as downside risk, the risk that something can go wrong and result in a financial loss or financial exposure for the Group, or volatility risk. Volatility risk is the risk associated with uncertainty, which means there may be an opportunity for financial gain as well as potential for loss.
The risks listed primarily relate to potential downside risks. The nature of the Group’s business means that risks will change as a result of controllable and uncontrollable events occurring in the future.
Risks relating to the markets within which the Group operates
The cyclical nature of automotive production and sales could adversely affect our business.
Approximately a quarter of our net sales are to automotive manufacturers in various parts of the world. Sales and production in the automotive industry are cyclical and depend on general economic conditions and other factors, including consumer spending and preferences. A significant reduction in automotive production and sales by our customers could have an adverse effect on our business, financial condition or results of operations.
A continuing improvement in vehicle component life could adversely affect our important aftermarket business.
The success of component manufacturers including ourselves in improving product quality and performance and the demand from the automotive original equipment makers for ever greater service life and reliability could lower demand in the aftermarket business segment which could have an adverse effect on our business, financial condition or results of operations.
A potentially changing regulatory environment could limit our business opportunities and profitability.
Changes in existing laws, regulations, licenses, decisions, policies or interpretations thereof by the courts, or by regulators, may have a material adverse impact on our business, financial condition or results of operations.
In particular, the industries in which we operate are subject to a variety of environmental regulations, particularly relating to waste water discharges, air emissions, solid waste management and hazardous chemical disposal. These regulations have generally become stricter in recent years and may continue to become more stringent in the future. Any future changes to existing environmental legislation or regulation could have a material adverse effect on our business, financial condition or results of operations. There is a risk that our activities will not continue to be in substantial compliance in the future with applicable environmental legislation or regulation and we are unable to predict the costs of compliance with changes in legislation or regulation.
In certain countries we are required to secure and maintain operating licenses. If we experience difficulties or delays in obtaining or maintaining licenses in the future or if the cost of such licenses increases significantly, this could adversely affect our business, financial condition or results of operations.
Our operations in foreign and emerging markets expose us to risks associated with conditions in those markets.
We operate principally in the automotive, industrial and construction related markets in a number of geographic regions of the world, including emerging markets. Operations in emerging markets present risks that are not encountered in countries with better established economic and political systems, including: economic and political instability within these markets; boycotts and embargoes imposed by the international community; significant fluctuations in interest rates and currency exchange rates; the imposition of unexpected taxes or other levies on our revenues in these markets; the inability to expatriate revenues or dividends; limitations on foreign
6
investments and foreign capital participation in certain industries or regions; and the introduction of exchange, customs or trade controls and other restrictions by foreign governments.
In addition, the legal and regulatory systems of foreign and emerging markets identified above are often less formalized and less consistently enforced than in industrialized countries. Therefore, our ability to protect our intellectual property and our contractual and other legal rights in those regions could be limited. Changes in demand in any of these markets may have an adverse affect on our business, financial condition or results of operations.
Public health issues, in particular SARS may adversely impact our business and particularly the operations of our customers in East Asia.
The recent Severe Acute Respiratory Syndrome (“SARS”) outbreak has been most notable in Asia, in particular China and Singapore. While the long-term impact of the SARS outbreak is unclear at this time, the prolonged existence of the SARS outbreak, or the perception that the SARS outbreak has not been contained, may have an adverse effect on the trade and industries as well as on the economies and financial markets of certain countries in Asia. Since a number of our customers are located in Asia, the commercialization of our products could suffer from any economic downturn resulting therefrom. In addition, our business could also be harmed if travel to or from Asia is restricted or inadvisable.
Risks relating to the competitive position of the Group and its businesses
Industry consolidation could result in more powerful competitors and fewer customers.
Our customers and competitors in some of our markets, especially in the automotive aftermarket, and to a lesser extent in the markets of the Air Systems Components group, are consolidating to achieve greater scale or market share. Such changes could affect our customers and their relationship with us. If one of our competitors acquires any of our customers, we may lose its business. Additionally, as our customers become larger and more concentrated, they could exert pricing pressure on all suppliers, including us.
Some of our customers are experiencing lower levels of business.
Lower levels of economic activity have resulted in a number of our customers reducing demand compared to past years levels for some of our products and some rescheduling of orders. Lower levels of demand resulting from lower levels of business that may be experienced by our customers could have an adverse effect on our business, financial condition or results of operations.
Our automotive customers may seek to obtain price reductions from their suppliers and we may be unable to achieve corresponding reductions in costs.
Approximately a quarter of our sales are to automotive manufacturers. It is normal practice for such customers to seek reductions in their costs from their suppliers over the duration of any committed supply arrangement. To meet any such requests for price reductions, we would have to achieve corresponding cost savings in our business by strategic sourcing of raw materials and by improving production and manufacturing efficiencies. The failure to achieve future cost savings to meet the committed price reductions could adversely affect our business, financial condition or results of operations.
Reliance on certain raw materials and suppliers for key components could destabilize our productivity levels.
To the extent not reflected in prices for our products, an unexpected increase in the cost of certain raw materials, especially polymers, steel, aluminum and chemical resins, could lead to lower profit margins. The failure of our key suppliers to maintain and increase production levels could result in our inability to fulfill orders, which could damage relationships with current and prospective customers and have an adverse effect on our business, financial condition or results of operations.
Our business could be adversely affected if we are unable to obtain adequate supplies or equipment in a timely manner from our current suppliers or any alternative supplier, or if there were significant increases in the costs of such equipment.
We are dependent upon our strong relationships with manufacturers’ representatives, distributors and wholesalers.
Many of our businesses have strong established relationships with manufacturers’ representatives, distributors and wholesalers and these relationships are an important ingredient of our strong competitive positions in a number of our markets. Deterioration in these relationships, or a change in our product’s route to market, could have an adverse effect on our business, financial condition or results from operations.
Product liability claims may arise due to the nature of our products.
We face an inherent business risk of exposure to product liability claims in the event that a failure of a product results in, or is alleged to result in, bodily injury, property damage or result in consequential losses as a result of a product recall. Any material product liability losses in the future or costs to defend any alleged failures of our products may have a material adverse effect on our business, financial condition or results of operations.
7
If we are unable to implement our strategic initiatives successfully, our ability to achieve optimal market performance may be impaired.
We are pursuing a number of strategic initiatives aimed to ensure that we continue to focus on value creating areas, provide the appropriate value offerings to our customers, achieve superior execution of business processes and maintain a low cost position. A number of initiatives are also in place to achieve future growth by developing relationships with global customers, investing in product innovation, expanding into new geographic regions and product adjacent markets. The success of the strategic initiatives depends in part on the changing competitive dynamics of the markets in which we operate and management can provide no assurance that each of the strategic initiatives will be successful in achieving improvement in our financial performance.
If we experience difficulty in implementing our strategic initiatives it may have an adverse effect on our business, financial condition or results from operations.
We operate in very competitive markets and could be adversely affected if we fail to keep pace with technological changes.
We operate in very competitive environments in several geographical markets and product areas. The markets for our products and services are characterized by evolving industry standards, rapidly changing technology and increased competition. The continual development of advanced technologies for new products and product enhancements is an important way in which we maintain acceptable pricing levels. If we fail to keep pace with technological changes in the industrial sectors that we serve, we may experience price erosion and lower margins.
Our success is dependent in large part on our ability to:
| | • | | anticipate our customers’ needs and provide products and services to meet those needs; |
| | • | | develop new products and services that are accepted by our customers; |
| | • | | enhance and upgrade our existing products and services; and |
| | • | | price our products and services competitively. |
Many of our competitors are sophisticated companies with many resources that may develop products and services that are superior to our products and services or may adapt more quickly than we do to new technologies, industry changes or evolving customer requirements. Our failure to anticipate or respond adequately to technological developments or customer requirements, and any delay in accomplishing these goals, could adversely affect our business, financial condition or results of operations.
We are dependent on the continued operation of our manufacturing facilities.
Our manufacturing facilities are based principally in the United States and Europe. A major disruption of our critical manufacturing facilities could result in significant interruption of our business and potential loss of customers and sales, which could have an adverse effect on our business, financial condition or results of operations.
If we are unable to protect our intellectual property rights, the future success of our business could suffer.
Our proprietary technology is protected by patents and trade secrets which could be at risk if:
| | • | | competitors are able to develop similar technology independently; |
| | • | | our patent applications are not approved; |
| | • | | steps taken to prevent misappropriation or infringement of our intellectual property are not successful; or |
| | • | | we do not adequately protect our intellectual property. |
From time to time we may need to litigate in order to enforce our patents, copyrights or other intellectual property rights, to protect our trade secrets, to determine the validity and scope of the proprietary rights of others or to defend against significant claims of infringement. Any such litigation, the outcome of which will be uncertain, or its threat, could result in costs and a diversion of our resources.
We have a number of businesses in the various regions of the world, which provide additional management challenges.
We operate in many countries around the world, which requires us to take account of cultural and language differences and to assimilate different business practices. Failure to effectively manage our geographically diverse operations could have an adverse effect on our operations, financial condition or results from operations.
We have a number of employees who are members of trade unions or other employment organizations.
Some of our employees are members of trade unions and over many years we have been able to maintain successful relationships with the unions and employment organizations. A deterioration of these relationships in the future may have an adverse effect on our business, financial condition or results from operations.
8
Risks relating to the financial position of the Group
Tomkins plc is a holding company that is dependent upon cash flow from its subsidiaries to meet its obligations.
Tomkins plc is a holding company with no independent operations or significant assets other than investments in, and advances to, subsidiaries. Accordingly, it depends upon the receipt of sufficient funds from its subsidiaries to meet its obligations, including its ability to repay any amounts it borrows under its Medium Term Note program or to pay its dividends. The ability of Tomkins plc to access that cash flow may be limited in some circumstances. For instance, the terms of existing and future indebtedness of its subsidiaries and the laws and jurisdictions under which those subsidiaries are organized may limit the payment of dividends, loan repayments and other distributions to Tomkins plc. Any such limitations could have an adverse affect on our business, financial condition or results of operations.
Approximately 25 percent of our total revenues are generated from 10 major customers.
Approximately 25 percent of our total revenues come from the top ten customers of our Industrial & Automotive business. The loss of, or a significant decrease in demand from, one or more of these customers could result in an adverse effect on our business, financial condition or results of operations.
We operate pension plans throughout the world, covering the majority of employees, which expose us to the risk of fluctuations in the world’s financial markets.
We operate both defined benefit and defined contribution schemes, the majority of which are in the United States of America and the United Kingdom. The schemes were in deficit by £194.8 million as of December 31, 2002 as detailed in Note 24 to the consolidated financial statements. Deterioration in asset prices or changes to long term interest rates could adversely affect the deficit and have an adverse effect on our business, financial condition or results of operations.
The rising costs of providing health care and workers compensation may erode margins.
Healthcare is provided by certain US subsidiaries to current and former employees. We strive to cover increases in this expense and in the cost of workers compensation, by reducing overheads in other areas. If the cost of heath care and workers compensation increases to the extent that we are unable to achieve adequate savings elsewhere, operating margins may be eroded
Deferred consideration in respect of disposals may not be repaid in accordance with original terms.
In May 2001, we disposed of Smith & Wesson Corp. through a stock purchase agreement, which contains deferred terms in respect of $30 million of the proceeds from disposal, which will be repaid over the seven years commencing in May 2004. If the purchaser is unable to fulfill its payment obligations in the future, a provision against the deferred consideration receivable would be charged to the income statement of the Company.
We may not be able to raise sufficient additional capital necessary to fund our growth.
We may require significant amounts of capital to expand our business, implement our strategic initiatives and remain competitive. At present, our established sources of funding are through equity, corporate bond markets (through the Medium Term Note program) bank debt and cash flow from operations. We believe that the sources of funding currently available will be sufficient to fund our operations. If our plans or assumptions regarding our funding requirements change, however, we may need to seek other sources of financing, such as additional lines of credit with commercial banks or vendors or public financing, or to renegotiate existing bank facilities. There is a risk that we will not be able to obtain financing from these or other sources, or renegotiate our existing financing on a timely basis, on favorable terms, or at all. If we are unable to obtain financing from these sources, or unable to renegotiate our existing financing on a timely basis or on favorable terms, we may have to delay or abandon some of our development plans or strategic initiatives. Any or all of these developments could have an adverse affect on our business, financial condition or results of operations.
Our international operations expose us to the risk of fluctuations in currency exchange rates.
We have manufacturing facilities in, and sell products to, many countries worldwide. Consequently, our results can be affected by changes in the currency exchange rates. The principal currencies in which we trade are U.S. Dollars, Euros and Pounds Sterling. Currency exchange movements can give rise to the following risks:
Transaction risk—this arises where sales or purchases are denominated in foreign currencies and exchange rates can change between entering into a purchase or sale commitment and completing the transaction;
Translation risk—this arises where the currency in which the results of an entity are reported differs from the underlying currency in which business is transacted; and
Economic risk—this arises where the manufacturing cost base of a business is denominated in a currency different from the currency of the market into which the products are sold.
9
Short-term volatility and long-term realignments of currency exchange rates may have an adverse affect on our business, financial condition or results of operations.
Risks related to the securities market and ownership of ADSs and registered shares
Holders of ADSs may be restricted in their ability to exercise voting rights.
Holders of ADSs will generally have the right under the deposit agreement to instruct the Depositary to exercise their voting rights for the registered shares represented by ADSs.
At our request, the Depositary will mail to holders of ADSs any notice of any shareholders’ meeting received from us together with information explaining how to instruct the Depositary to exercise the voting rights of the securities represented by ADSs. If the Depositary receives voting instructions for a holder of ADSs on a timely basis, it is obligated to endeavor to vote the securities representing the holder’s ADSs in accordance with those voting instructions. The ability of the Depositary to carry out voting instructions, however, may be limited by practical limitations, such as time zone differences and delays in mailing.
ADS holders may be unable to participate in rights offerings and similar transactions in the future.
U.S. securities law may restrict the ability of U.S. persons who hold ADSs to participate in certain rights offerings or share or warrant dividend alternatives which we may undertake in the future in the event we are unable to, or choose not to, register those securities under the U.S. securities laws and are unable to rely on an exemption from registration under these laws. If we issue any securities of this nature in the future, we may issue such securities to the Depositary for the ADSs, which may sell those securities for the benefit of the holders of the ADSs. We cannot offer any assurance as to the value, if any, the Depositary would receive upon the sale of those securities.
10
Item 4. Information on the Company
A. History and development of the Company
General
Tomkins plc was incorporated in England in 1925, converted from a private company into a public company in March 1950 and re-registered as a public limited company in February 1982. The Company’s Ordinary Shares are listed on the London Stock Exchange and have been listed on the New York Stock Exchange (the “NYSE”) in the form of ADSs evidenced by ADRs since February 1995. Prior to listing on the NYSE, the ADSs had been quoted on the Nasdaq National Market since November 1988. Tomkins plc is registered in England and Wales No. 203531. Its registered office is East Putney House, 84 Upper Richmond Road, London SW15 2ST (Telephone: +44 (0) 20 8871 4544).
Tomkins is a global engineering and manufacturing group with market and technical leadership. Its activities report in three business segments:
Industrial & Automotive
The Industrial & Automotive segment manufactures systems and components for the industrial and automotive markets. The segment has four main business areas: Power Transmission; Fluid Power; Wiper Systems; and Fluid Systems. Sales are to original equipment manufacturers (“OEMs”) and the replacement markets around the world under leading brand names such as Gates, Trico, Stant and Schrader. We also have a number of discrete businesses that manufacture products primarily for the automotive replacement markets.
Air Systems Components
The Air Systems Components segment is the leading manufacturer of air handling components in North America. We supply the heating, ventilation and air conditioning (HVAC) market with a range of products including fans, grilles, registers, diffusers, fan coils and terminal units for residential and commercial applications, as well as dampers for architectural, commercial and industrial use. Our products are sold under the industry’s leading brand names: Hart & Cooley, Ruskin, Lau, Titus, Krueger and Actionair.
Engineered & Construction Products
The Engineered & Construction Products segment manufactures products for a range of markets including construction, truck and trailer and automotive industries. It is divided into five main business areas: Lasco, Philips Doors & Windows, Material Handling, Dexter Wheels & Axles and Valves, Taps and Mixers. Each benefits from long-established relationships in its channels to market, a strongly branded product offering and a low manufacturing cost base. Over 90 percent of the segment’s sales are within North America.
The Company’s continuing operating units manufacture and distribute products throughout the world, including the United States, the United Kingdom, Canada, France, Belgium, the Republic of South Africa, Germany, Mexico, Brazil, Spain, The Netherlands, Korea, Australia, Singapore, Argentina, India, Japan, China, Poland and Thailand. The Company’s operating units are based principally in North America, Europe and Asia, employing approximately 40,000 people on average, worldwide, during the eight month period ended December 31, 2002.
Strategy
During the eight month period ended December 31, 2002, Tomkins focused on a number of strategic initiatives aimed at modernizing its business, implementing new technologies and manufacturing practices and expanding its markets. These initiatives include:
Technology and product innovation
The Company is committed to identifying, developing and applying new technologies with the commercial potential to realize tangible benefits for its customers.
Manufacturing excellence
The Company recognizes the importance of becoming the lowest-cost manufacturer of quality products in its market places. Progress is being made through a combination of lean manufacturing (which focuses on production efficiency and quality), and strategic manufacturing initiatives (“SMIs”) (that rationalize capacity and relocate productive capacity to low cost areas).
Industrial & automotive aftermarket
Tomkins already has a significant presence in the global industrial and automotive aftermarkets. Sales in these markets are typically more stable and achieve higher margins than in the original equipment market.
11
The Company aims to build on this platform by cutting its logistics costs, reducing inventory and increasing the rate of new product introductions. It is also aiming to increase further its presence outside the North American market, particularly in Europe and Asia.
Acquisitions and disposals
Tomkins recently strengthened its corporate finance team with a view to making further value-enhancing acquisitions and extending its technology. An overriding criteria is that acquisitions must add value to the Group by providing a return in excess of our weighted average cost of capital. The Company will also continue to dispose of non-core businesses where we believe that they can achieve higher returns elsewhere.
Role of the Corporate Center
The role of the Corporate Center at Tomkins is to assist the attainment of growth in value. The center supports operations as well as maintaining the framework of efficient financial reporting. It encourages the Company-wide implementation of best practice in manufacturing and other areas such as purchasing and human resource management. It develops incentive schemes for managers that aligns their compensation with the interests of shareholders, making them act more as owners of their businesses. It also directs the allocation of resources by ensuring that we only invest in opportunities that add value by providing returns in excess of our weighted average cost of capital.
The road ahead
Going forward Tomkins will be concentrating on:
| | • | | bringing innovative new products to market; |
| | • | | extending the Company’s product offering and geographic presence in both the industrial and automotive aftermarkets; |
| | • | | reducing the Company’s cost base still further through strategic manufacturing initiatives and lean manufacturing; and |
| | • | | using the Company’s financial strength to make value-enhancing acquisitions to its existing businesses. |
Principal acquisitions, disposals, and capital expenditures
This section should be read in conjunction with Item 5. “Operating and Financial Review and Prospects” and with Note 3 to the consolidated financial statements.
May 1, 2002 to December 31, 2002
Tomkins acquired the business, assets and liabilities of Ward Industries Inc. and the heating, ventilating and air conditioning dampers division of Johnson Controls Inc. on September 11, 2002 and September 30, 2002, respectively, for a combined cash consideration of $17.6 million (£11.3 million) of which $0.7 million (£0.4 million) is deferred. Goodwill of £6.9 million arising on these acquisitions was capitalized. The value of the assets acquired is still being assessed and therefore the calculation of goodwill is provisional. These acquisitions were included within the Air Systems Components group.
The consumer and industrial division of Gates (U.K.) Limited, and the business and assets of Fedco Automotive Components Inc. were sold on May 15, 2002 and December 30, 2002 respectively for a total cash consideration of £33.0 million. Lasco Composites was sold on May 24, 2002 for an adjusted cash consideration of $43.1 million (£29.6 million).
Fiscal 2002
On May 11, 2001 Tomkins sold Smith & Wesson Corp. for consideration of $15.0 million (£10.6 million). The purchaser also paid $20.0 million (£14.1 million) of an outstanding loan of $73.8 million (£52.0 million) due from Smith & Wesson Corp. to Tomkins Corporation. Of the remaining $53.8 million (£37.9 million), $30 million (£21 million) will be repaid on an amortizing basis over the seven years commencing in May 2004 and $23.8 million (£16.8 million) was included in the equity capital acquired by the purchaser. Interest on the outstanding loan balance will continue at nine percent per annum.
Totectors Limited and The Northern Rubber Company Limited were sold on May 25, 2001 and September 11, 2001, respectively, for a total consideration, net of costs, of £23.0 million. Sunvic Controls Limited was sold on July 27, 2001 for total consideration, net of costs, of £1.8 million.
Tomkins acquired American Metal Products Company and the business and assets of Superior Rex on November 13, 2001 and November 19, 2001, respectively, for combined consideration of $45.0 million (£31.2 million). These acquisitions were included within the Air Systems Components group.
On December 17, 2001, Tomkins sold the bellows business of Standard-Thomson Corporation for cash consideration, net of costs, of $1.6 million (£1.1 million).
12
Fiscal 2001
The Company sold the Red Wing Company Inc. on July 14, 2000 for cash consideration, net of costs, of $140.9 million (£93.8 million). The Company completed the sale of the remaining Food Manufacturing business segment on August 31, 2000 for total cash consideration of £1,138.0 million. The loss on disposal totaled £216.8 million, of which £215.0 million had been provided for in fiscal 2000.
The Company sold Murray Inc and Hayter Limited on October 5, 2000 for consideration of $219.3 million (£148.3 million). Of the proceeds, the Company has received $206.3 million (£139.5 million) in cash and $13.0 million (£8.8 million) in a secured subordinated loan note, repayable in 2006. The loss on disposal was £76.2 million.
On November 3, 2000, the Company acquired the business and net assets of Care Free Aluminum Products, Inc. for a cash consideration of $11.2 million (£7.8 million). The Company sold Homer of Redditch Limited, Twiflex Limited and T. A. Knight Limited on May 18, 2000, June 23, 2000 and February 16, 2001, respectively, for total cash consideration, net of costs, of £3.1 million. The loss on disposal totaled £1.8 million.
Fiscal 2000
Tomkins sold Shipham and Company Limited and The Premier Screw and Repetition Company Limited on April 17, 2000 and April 27, 2000, respectively, for total consideration of £2.6 million.
On June 25, 1999, the Company completed the acquisition of ACD Tridon, a manufacturer of fully integrated windshield wiper systems, for CAD$159 million (£68.7 million) including acquired debt of CAD$105 million (£45.2 million) and on August 9, 1999 completed the acquisition of Hayden’s Bakeries Limited, a high quality patisserie and dessert manufacturer, for £5.2 million, including the repayment of £1.7 million debt.
On November 10, 1999, Tomkins acquired the 14 percent of the ordinary shares in Anand Gates (India) Private Limited held by a minority shareholder of that company for cash consideration of £0.8 million.
On December 30, 1999, Tomkins acquired the assets of Hart & Cooley, a leading U.S. producer of grilles, registers and diffusers used in residential and light commercial applications, for cash consideration of $322 million (£197.5 million) including acquired debt. On January 9, 2000, the Company completed the acquisition of Air Diffusion Limited, and the business of Actionair, both of which have a leading position market in the U.K. air handling industry for cash consideration of £8.0 million and acquired debt of £2.8 million.
Recent events
On January 27, 2003, Tomkins sold Milliken Valve Company Inc. for a cash consideration of $7.3 million (£4.5 million), resulting in a small gain on disposal.
Tomkins plc announced on April 30, 2003, the planned transfer of the valve production from Ormskirk, Lancashire to an existing manufacturing facility in Doncaster. The integration of these two facilities will provide a more competitive cost base whilst preserving the market-leading brand of Hattersley Newman Hender.
Tomkins plc announced on June 18, 2003 that, at the expiry on June 17, 2003 of the offer dated May 12, 2003, made by Ontario Inc. (the “Offeror”), an indirect wholly owned subsidiary of Tomkins plc, to acquire all the outstanding common shares of Stackpole Limited, in excess of 97% of the outstanding common shares of Stackpole Limited (on a fully diluted basis) had been deposited to the offer. In addition, the other conditions to the offer had been satisfied or waived and 2023103 Ontario Inc. had instructed its depository to take up and pay for the common shares deposited to the offer. Tomkins plc also announced that the Offeror intends to acquire the remaining common shares of Stackpole Limited not deposited to the offer by exercise of the Offeror’s compulsory acquisition right under the Ontario Business Corporations Act. Shareholders of Stackpole Limited who did not tender to the offer will be offered Cdn $33.25 per common share, the same price that was offered to shareholders under the original offer.
13
B. Business overview
Segment contribution to net sales and operating income
The contribution of each segment to the Company’s net sales and operating income under U.K. GAAP is set out below.
| | | Transition Period Ended
| | Fiscal Year Ended
|
By Business Segment
| | December 31
2002 (245 days)
| | April 30, 2002 (365 days)
| | April 30, 2001 (366 days)
| | April 29, 2000 (364 days)
|
| | | In £ millions |
| | | | | | | | | |
Industrial & Automotive | | | | | | | | |
Net Sales | | 1,263.9 | | 1,985.9 | | 1,968.3 | | 1,921.3 |
Operating Income | | 91.6 | | 146.1 | | 190.2 | | 198.2 |
Air Systems Components | | | | | | | | |
Net Sales | | 325.7 | | 516.4 | | 487.9 | | 321.6 |
Operating Income | | 20.0 | | 45.2 | | 47.7 | | 39.9 |
Engineered & Construction Products | | | | | | | | |
Net Sales | | 507.6 | | 871.5 | | 878.9 | | 918.8 |
Operating Income | | 46.7 | | 77.4 | | 85.3 | | 119.7 |
Food Manufacturing | | | | | | | | |
Net Sales | | — | | — | | 562.1 | | 1,898.6 |
Operating Income | | — | | — | | 25.5 | | 160.5 |
Professional, Garden & Leisure Products | | | | | | | | |
Net Sales | | — | | — | | 208.3 | | 580.1 |
Operating (Loss)/Income | | — | | — | | (14.3) | | 22.4 |
Central Costs (1) | | | | | | | | |
Net Sales | | — | | — | | — | | — |
Operating Loss | | (15.2) | | (12.6) | | (24.0) | | (21.3) |
Total | | | | | | | | |
Net Sales | | 2,097.2 | | 3,373.8 | | 4,105.5 | | 5,640.4 |
Operating Income | | 143.1 | | 256.1 | | 310.4 | | 519.4 |
| | | | | | | | |
By Geographic Region
| | Net Sales
| | % of Total
| | Net Sales
| | % of Total
| | Net Sales
| | % of Total
| | Net Sales
| | % of Total
|
United States | | 1,470.1 | | 70.1 | | 2,380.5 | | 70.6 | | 2,498.1 | | 60.9 | | 2,884.3 | | 51.1 |
United Kingdom | | 125.6 | | 6.0 | | 237.7 | | 7.0 | | 787.4 | | 19.2 | | 1,908.6 | | 33.8 |
Rest of Europe | | 191.1 | | 9.1 | | 290.3 | | 8.6 | | 309.8 | | 7.5 | | 341.0 | | 6.1 |
Rest of World | | 310.4 | | 14.8 | | 465.3 | | 13.8 | | 510.2 | | 12.4 | �� | 506.5 | | 9.0 |
| | |
| |
| |
| |
| |
| |
| |
| |
|
| | | 2,097.2 | | 100.0 | | 3,373.8 | | 100.0 | | 4,105.5 | | 100.0 | | 5,640.4 | | 100.0 |
| (1) | | Includes the cost of the corporate center, which carries out corporate functions for the Company as a whole. |
Tomkins exited the Food Manufacturing and Professional, Garden and Leisure Products segments during the year ended April 30, 2001 with the disposal of the Red Wing Company Inc. on July, 14, 2000 and the sale if the remainder of the Food Manufacturing business segment on August 31, 2000. The Professional, Garden and Leisure Products segment was disposed of on October 5, 2000.
Notes 5(a), 5(b) and 5(c) of the consolidated financial statements provide more detailed business segment and geographic information concerning the Company’s operations.
14
Industrial & Automotive
Business unit
| | Proportion of
net sales for
the eight
months
ended
December 31,
2002
| | Products
| | Primary markets
|
Power
Transmission | | 41% | | • Synchronous belts, V-belts, multi V-ribbed belts, accessory drive systems, synchronous drive systems | | • Automotive original equipment and aftermarket (timing and accessory drives); industrial original equipment and aftermarket (outdoor power equipment, office machines etc.) |
| | | |
Fluid Power | | 17% | | • High pressure fluid power connectors, hose and assemblies • Industrial transfer and automotive coolant hoses | | • Mobile original equipment (construction, agriculture, etc.); industrial aftermarket (mobile and MRO); automotive original equipment and aftermarket (coolant hose) |
| | | |
Wiper
Systems | | 15% | | • Wiper systems and components | | • Automotive original equipment and aftermarket |
| | | |
Fluid Systems | | 12% | | • Fuel products • Valve products • Thermostats • Automotive hose | | • Automotive and industrial—fuel valves/caps and radiator caps for cars and trucks; curved hose for mobile markets |
| | | |
Other | | 15% | | • Automotive accessories, radiator cores • Clamps and formed fiber | | • Automotive and industrial aftermarkets |
The Industrial & Automotive segment has corporate offices in Denver, Colorado, Rochester Hills, Michigan and Dayton, Ohio. It is one of the world’s largest suppliers of automotive parts, components and systems, serving a wide variety of industries, including the industrial and automotive original equipment and replacement markets, transportation, agricultural, mining, forestry, construction, office equipment, computer, and the food processing and handling markets.
In total, the segment operates 67 factories and 33 distribution centers in 21 countries. It is the only non-tire polymer-based products company with development centers and manufacturing operations in North America, Europe, Asia and South America. No other belt and hose company has significant operations in all of the world’s major automotive development centers.
The segment operates 36 manufacturing plants in Canada and the U.S., and a further 12 in Latin America. European operations include 14 manufacturing plants and 8 distribution centers, which provide customers with Tomkins products and technology. There are also operations in Asia and the Pacific Rim including Singapore, Australia and India, with joint venture manufacturing facilities in South Korea, Japan, China, and Thailand.
The Industrial & Automotive group operates five global strategic enterprise groups: power transmission, fluid power, wiper systems, fluid systems and other aftermarket products. These groups include divisions integrated from the acquisitions of Gates, Stant, Trico, Tridon and Schrader. Together, these operations employed on average 22,637 people around the world in the eight month period ended December 31, 2002. Products are sold directly to industrial and automotive original equipment manufacturers and through a network of approximately 150,000 distributors, dealers and jobbers worldwide, to the industrial and automotive replacement markets.
Power Transmission
The Power Transmission group produces a comprehensive global product line ranging from synchronous belt and accessory belt drive systems for automotive applications to heavy-duty industrial belt drives. Its eight major product lines include V-belts, multi V-ribbed belts, synchronous belts, sheaves/sprockets, pulleys, tensioners, idlers, and crankshaft dampers.
Power Transmission is globally integrated in order to standardize products, process technology, and to maximize resource utilization across the group. Core technology centers (“CTCs”) associated with each product line are responsible for global product development. Manufacturing development centers are responsible for the commercialization process and for implementing best practices throughout the group’s facilities in their respective regions for a particular product line. Two global research centers are responsible for identifying new technologies and locating materials to meet the CTCs’ requirements. There are three Automotive Technical Centers (“ATCs”) located at Aachen in Germany, Rochester Hills in the USA and Nara in Japan, which lead
15
product and systems design and engineering. The ATCs also perform customer specific component or system testing.
Power Transmission supports and supplies customers on a regional and global basis. Regional management in the Americas, Europe and Asia work to leverage the group’s market strengths from one area to another utilizing common processes and global product lines.
Fluid Power
The Fluid Power group is a leading manufacturer of high-pressure connectors, hoses and assemblies for mobile equipment and heavy industrial applications. The group also produces a wide range of Industrial hoses for the transfer of liquids, gases and solids (petroleum, chemical, food/beverage materials etc.). In addition, the group produces a complete range of Automotive cooling system hoses.
The group has major strength in the North American market, and also has a significant presence in European and Brazilian markets. The existing Asian presence is being augmented with expansion plans being implemented over the next 24 to 36 months.
The Fluid Power group is focused on delivering value added design, engineering and logistics support with a complete range of fluid power connectors, hoses and assemblies to mobile equipment manufacturers globally.
Wiper Systems
The Wiper Systems group comprises Trico and Tridon operations and is one of the world’s largest manufacturers of automotive windshield wiping systems and systems components, producing arms, blades, linkage mechanisms, modules, motors and electronic components. Modular systems combine the linkages, arms, blades, motors and electronic circuitry produced by the Wiper Systems group with plastic housings, manifold assemblies and other components purchased from supplier partners. Systems are sold directly to OEMs as ready-to-install modules. Wiper blades are produced in sizes ranging from 10 to 40 inches and over 50 different types of wiper arms are manufactured. Wiper blades and arms are sold for use as original equipment and in the aftermarket under the “Trico,” “Roberk,” and “Tridon” brand names. Over 25 different types of linkages are produced and sold for use as original equipment.
Fluid Systems
The Automotive Fluid Systems group, made up of divisions acquired as Stant Corporation and Schrader-Bridgeport International, is a leading designer, manufacturer and distributor of a broad range of automotive fluid conveyance and fluid management components and modules. This includes the latest technology in tire pressure monitoring components and fuel vapor management valves. Products are sold primarily for use as original equipment by manufacturers of cars and trucks and in the automotive replacement market as repair parts and accessories. Major customers include DaimlerChrysler, Ford, General Motors, Nissan, Renault and PSA, as well as a number of other major international OEMs. Products from Tomkins Automotive Fluid Systems group are also sold in a vast majority of wholesale and retail automotive parts and distribution outlets in North America, Europe and Latin America including the service departments of OEM dealers.
Through Schrader Electronics, the Automotive Fluid Systems group is the technology and market leader in Remote Tire Pressure Monitoring Systems (“RTPMS”), a driver information and passenger security system that is economically and ergonomically integrated into vehicle electronic information systems. The company also designs, manufactures and markets a variety of fuel vapor management valves and fuel, oil and radiator closure caps at its Stant Manufacturing Division. Standard-Thomson is the leading manufacturer of engine thermostats used in automotive cooling systems. Schrader-Bridgeport International provides a wide range of tire valve, hardware and specialty valve products worldwide. RTPMS, tire, and specialty valve products are sold under the “Schrader-Bridgeport” and “Schrader Electronics” trademarks. Closure cap and fuel management valve products are sold under the “Stant,” “Lev-R-Vent” and “Pre-Vent” trademarks. Engine thermostats are sold under the “Stant,” “Weir-stat,” and “Superstat” brand names. Many of these products are also sold to various private label customers bearing their unique brand names.
Other
The Aftermarket group integrates the sales, marketing, distribution and manufacture of products destined for both the Industrial and Automotive original equipment and Aftermarket and sold under the Gates, Stant, Trico, Tridon, Ideal, Schrader and numerous private brands. It designs and sells aftermarket automotive tools and fittings, power steering hose, lubrication equipment, stainless and carbon steel hose clamps for both original equipment and parts applications.
The Aftermarket group also manufactures and distributes specialist components for the automotive industry. Schrader-brand products include precision control valving and associated fluid conveyance and control modules for vehicle fluid system applications in fuel delivery, emission control, engine management, brake, steering, power transmission, coolant, air conditioning, windshield washing, PVC air hose, and ride control. Schrader, a leading brand of wheel valving for cars, medium- and heavy-duty trucks, agricultural vehicles and construction
16
equipment, offers a full range of products including tubeless tire valves, valves for inner tubes, cores, tubeless valves for large wheels and an assortment of specialty valving for virtually all global applications.
Wheel care products, air power pneumatic components and systems, and pressure-measuring devices are marketed to automotive channels worldwide. Wheel care products include “Camel” brand tire patch products, tools, chemicals and “Schrader” brand tire valves and cores. Air power systems include “Amflo” pneumatic couplers and plugs, “Douglas” air compressors, fitted hose, recoil hose, blowguns and inflators. The Aftermarket group’s “Syracuse” brand of pressure-measuring devices is a recognized market standard in North America. The Aftermarket group supplies “Amflo” pneumatic accessories to the home improvement retailer segment including Home Depot and Lowe’s, its key customers.
Gates Formed-Fibre Products, Inc. (“GFFP”) is one of the largest producers of molded automotive trunk liners in the world. GFFP and its licensees supply trunk trim, door panels and parcel shelves to automotive OEMs in North America, Europe, Asia and Australia. The firm’s Fiber Extrusion, Inc. facility produces polyester fiber for company use and for sale to external customers.
Air Systems Components
Business unit
| | Proportion of net
sales for the eight
months ended
December 31,
2002
| | Products
| | Primary markets
|
Hart & Cooley | | 38% | | • Grilles, registers and diffusers • Flex ducting and venting • Duct connections and accessories | | • Residential and commercial construction |
| | | |
Air Systems | | 24% | | • Grilles, registers and diffusers • Terminal boxes • Fan coils | | • Commercial and industrial construction |
| | | |
Ruskin | | 21% | | • Louvers, dampers, outdoor grilles and screens • Fire, smoke and air control dampers and waterside control fan coil units • Air measuring stations and silencers | | • Commercial and industrial construction |
| | | |
Lau | | 17% | | • Axial and centrifugal fan components and systems • Exhaust fans | | • Heating, ventilating and air-conditioning manufacturers and commercial and industrial construction |
The Air Systems Components segment’s products are primarily sold throughout the United States, Canada and the United Kingdom. Competition is based principally on price, quality, service and breadth of product line. Just under half our sales pass through manufacturers’ representatives and approximately 35 percent are sold through wholesalers, principally in the residential market. The balance of sales is direct to OEMs and national accounts.
Hart & Cooley
Hart & Cooley is a market leader in the U.S., in residential and light commercial grilles, registers, and diffusers (“GRD”). Hart & Cooley also produces flexible duct, chimney and gas venting systems, and duct connection systems which are marketed primarily through wholesale distribution with the GRD products.
Air Systems
Air Systems design and manufacture diffusers, variable air volume terminal boxes (with or without fan power) (“VAV boxes”), grilles, registers and fan coils for use in heating, ventilating and air conditioning systems in industrial, institutional and commercial applications. It also sells digital controls with its lines of VAV boxes. These products are sold primarily to manufacturers’ representatives for resale to contractors.
Ruskin
Ruskin produces and markets commercial and industrial air control dampers, fire and smoke dampers, architectural louvers, sound absorbers, and air measuring stations for use in air conditioning, heating, ventilating and pollution control systems contained in office buildings, hotels, shopping centers, power plants, paper mills and other manufacturing plants. These products are sold directly to manufacturers of heating, ventilating and air conditioning equipment and to contractors and commercial users principally through manufacturers’ representatives. Ruskin Air Management, a U.K. business, markets its damper, louver, grille, register, diffuser and fan coil products principally in the United Kingdom and continental Europe. This business gives the Company an important entry to these markets for its other air distribution products.
17
Lau
Lau manufactures and supplies fans and blowers for residential forced air heating systems and air conditioners, fans for commercial and industrial use and central heating humidifiers for use with home and light commercial heating equipment. Lau’s Conaire division provides aftermarket distribution of spare parts primarily for the residential heating and air conditioning market. These products are sold directly to OEMs, contractors and manufacturers’ representatives. Lau also produces a comprehensive line of centrifugal and axial fans for both commercial and industrial applications. The lines comprise power roof ventilators, inline duct fans, ceiling fans, cabinet fans, propeller roof and wall fans, and fan accessories. Products are marketed primarily through manufacturers’ representatives to the commercial and industrial sectors. Lau’s Barry Blower and Supreme divisions produce heavy-duty axial and centrifugal fans and blowers and food service exhausters.
Engineered & Construction Products
Business unit
| | Proportion of
net sales for
the eight
months ended
December 31,
2002
| | Products
| | Primary markets
|
Lasco | | 32% | | • Baths and whirlpools • PVC, CPVC and HDPE pipe fittings | | • Residential, manufactured housing • Commercial, residential and industrial construction |
| | | |
Wheels and Axles | | 23% | | • Non-drive axles and wheels | | • Industrial and general utility, manufactured housing and recreational vehicles |
| | | |
Doors and Windows | | 21% | | • Vinyl and aluminum windows, venting and doors | | • Residential construction, manufactured housing and recreational vehicles |
| | | |
Material Handling | | 12% | | • Automotive conveyors • Scrap handling systems and conveyor belts | | • Automotive factories, parcel/postal facilities • Automotive and industrial primary metal working |
| | | |
Valves, Taps and Mixers | | 12% | | • Valves and pumps | | • Commercial, industrial, residential and institutional construction |
Lasco
Lasco Bathware designs, manufactures and markets fiberglass and acrylic showers, bathtubs, tub/shower combinations and whirlpools used in residential (including manufactured) housing and some commercial construction. Included in the product line are assisted care showers and tub/shower combinations designed to meet the needs of senior citizens and the special requirements of the disabled. Products are sold primarily through distributors but also directly to builders and through home improvement channels in the United States. Aquatic Industries, a division of Lasco Bathware, is a maker of up-market acrylic whirlpools, principally for the dealer/distributor market.
Lasco Fittings manufactures plastic fittings used in agricultural irrigation, turf irrigation, water works, swimming pools and spas, for commercial and industrial applications as well as for residential plumbing. These products are sold through distributors and, to a lesser extent, retail outlets.
In the United States, there are at least four principal producers, including Lasco, in each of the bathware and fittings businesses. Competition is based on price, quality, availability and service.
Wheels and Axles
Dexter Axle produces and markets its products primarily in the United States directly to OEMs and distributors. Dexter has two product lines, trailer axles for the general utility, recreational vehicle, highway trailer and manufactured housing markets and steel wheels and rims for incorporation in its products or for sale as components. Competition is based on price, quality, product performance and customer service.
Dexter’s trailer axles are available in capacities from 800 pounds to 30,000 pounds and specific trailer applications within its markets include horse and livestock trailers, equipment hauling trailers, enclosed cargo trailers, heavy hauling trailers, recreational vehicles, manufactured homes, portable equipment and highway trailers. Steel trailer wheels are manufactured in a variety of sizes and configurations from 12 inch diameter
18
through 16.75 inch diameter.
Doors and Windows
Philips Products is a U.S. producer of aluminum and vinyl windows, doors and venting products for the manufactured housing and recreational vehicle markets. The majority of these products are sold to OEMs of manufactured housing and recreational vehicles. Philips Products also produces vinyl windows for the residential markets, principally for use in new on-site construction and in the replacement and remodeling markets. These products are sold primarily to distributors and mass merchandisers.
Material Handling
Dearborn Mid-West Conveyor Company designs, fabricates and installs overhead conveyor systems and inverted power and free conveyor systems, skillet systems, automatic electrified monorail systems for the automotive industry, conveyors for bulk materials and various unit handling systems for parcel movement applications.
Mayfran America and Mayfran Europe manufacture and market conveyor and material handling systems principally for the movement of scrap generated in metal working industries. Conveyor systems are also manufactured for the solid waste processing and recycling industries.
Valves, Taps and Mixers
Hattersley Newman Hender Limited manufactures heating, ventilating and air conditioning valves for the commercial, industrial, residential and institutional construction industries. The company supplies its products, directly and through distributors, to end users, including utilities, local authorities, industrial and commercial users, contractors and heating engineers. Sales of valves in the United Kingdom, represented 69 percent of total valve sales in the eight months to December 31, 2002, with other sales being made principally in the Middle and Far East, the Americas, Africa and the rest of Europe. Investment will continue in new product development, product cost reduction in order to ensure that quality and price competitiveness are maintained.
On May 2, 2003, Tomkins announced that the proposed transfer of the manufacturing operations of Hattersley Newman Hender to Pegler Limited and the closure of it’s manufacturing site.
Pegler Limited is a United Kingdom based manufacturer of thermostatic and manual radiator valves as well as faucets and mixers for the United Kingdom and international markets. Faucets, mixers and valves are marketed under brand names such as “Bulldog”, “Terrier”, “Sequel” and “Recollections”. The company traditionally operates via distributor trade routes. Although its major focus remains in the U.K. heating market, Pegler generates sales to all major continents and has significant sales in the Middle and Far East markets.
Cobra Investments (Pty) Limited, a 62.4 percent owned subsidiary, is a manufacturer of non-ferrous plumbing products in South Africa and a major supplier to all sectors of the housing and commercial markets.
Raw Materials and Energy Supplies
The Company purchases a broad range of raw materials, components and products from around the world in connection with its activities. The ability of the Company’s suppliers to meet performance and quality specifications and delivery schedules is important to its operations, but the Company is not dependent on any single source of supply for critical materials. In the past, the energy and materials required for the Company’s manufacturing operations have been readily available. However, basic raw materials such as aluminum, polymers and resins used in the production of the Company’s products, can be subject to significant fluctuations in price. Where appropriate, the Company’s subsidiaries seek to minimize the effect of fluctuations in prices of raw materials by entering into forward purchase contracts or options to fix the input cost of the raw material or product.
Seasonality
Industrial & Automotive
Sales to Automotive OEMs do not tend to exhibit any constant seasonal pattern but sales into the aftermarket are generally stronger during the winter months reflecting higher levels of demand for replacement parts for vehicles during this period.
In the Fluid Power OEM segment, there is a moderate amount of seasonality driven primarily by weather patterns. Construction equipment generally is influenced by a decline in activity during the coldest winter months and a resurgence of activity in the spring. Farm equipment is generally driven by two weather related peaks each year, spring planting and fall harvesting. Remaining markets served by the Fluid Power group do not exhibit any significant seasonal patterns.
19
Air Systems Components
Sales to the construction industry slow down in November and December before the Thanksgiving, Christmas and New Year holiday season. Sales can also be affected regionally by severe weather. Heating product sales are more concentrated in the fall and cooling products in the spring.
Engineered and Construction Products
Sales into the housing construction markets are generally stronger in the spring and summer months, as are sales of fittings to the irrigation markets.
Patents and Trademarks
Tomkins management believes that the Company’s operations are not dependent to any significant degree upon any single or series of related patents or licenses, or any single commercial or financial contract. Tomkins management also believes that the Company’s operations are also not dependent upon any single trademark or trade name, although trademarks and trade names are identified with a number of the Company’s products and services and are of importance in the sale and marketing of such products and services. The more important trademarks and trade names owned by or licensed to the Company are:
Industrial & Automotive
“Adapta Flex”, “Amflo”, “Blue Stripe (design)”, “Boost”, “Bridgeport”, “Camel”, “Con-Form”, “Connected”, “Design Flex”, “Design OHL”, “Design View”‘, “Diradia”, “Drivealign”, “ECR”, “Edelmann”, “Etensioner”, “Eurogrip”, “Exact Fit”, “EZ Align”, “Fibregrip”, “Flex Gear”, “Flex-Weave”, “Food Beverage Master”, “Food Master”, “Gates”, “Gates Compass”, “Gatesfacts”, “Gates In an Oval (design)”, “GEM”, “Green Stripe”, “GT”, “HC”, “Hi-Power”, “HTD”, “Ideal”, “InStant”, “Lev-R-Vent”, “Liberty”, “Line-Lite”, “LubriMatic”, “M2T”, “Mat-Form”, “Mega3000”, “Megacrimp”, “Megaflex”, “Megaspiral”, “Megasys”, “Megatuff”, “Megavac”, “Micro-V”, “Mobilecrimp”, “Omnicrimp”, “Optimizer”, “Pistol-Matic”, “Plews”, “Plews LubriMatic”, “Polarflex”, “Polarseal”, “Poly Chain”, “Poly Chain XT”, “PolyFlex”, “Power Crimp”, “Powerlink”, “Powerpro”, “Powerated”, “Powerband”, “Powerbraid”, “Powercraft”, “Pow’r Gear”, “Powergrip”, “Powergrip HTD”, “Pro Tuff”, “Quick-lok”, “Rain Pro”, “Roberk (and arrow design)”, “Safety Stripe”, “Schrader”, “Schrader Smart Valve”, “Shark”, “Smartdrive”, “Speedflex”, “Sportline”, “Stant”, “Stretch Fit”, “Super HC”, “Superstat”, “Superior”, “Synchro-Power”, “Syracuse”, “Tensioflex”, “Tara-Lock”, “Teflon”, “Texrope”, “3-X”, “Trico”, “Tridon”, “Tri-Power”, “Tru-Flate”, “Truflex”, “Tru-power”, “Tuffcoat”, “Tufflex”, “Twin Power”, “Ultimate”, “Ultra Lube”, “Unitta”, “Vari-Matic”, “Vextra”, “Vibraflex”, “Visionall”, “Vulco”, “Vulco-Flex”, “Weir-Stat”, “Windspoiler”, “Winterblade”, “Wiper World (design)”, “World Class”, “XL”, “Xtratuff” and “Xtreme”.
Air Systems Components
“Actionair”, “Agitair”, “Air-Lens”, “Air-Trac”, “Ameri-Bucket”, “American Metal Products”, “Ameri-flow”, “Barry Blower”, “Debothezat”, “Designaire”, “Designflo”, “Eclipse”, “Enviro-master”, “Fibre-Aire”, “Flip-Top”, “Flocross”, “Flow-cross”, “Flowbar”, “Hart & Cooley”, “Industrial Air”, “J&J Register”, “Know”, “Krueger”, “Lau”, “Metlvent”, “Naco”, “Omnivent”, “Penn”, “Radian”, “Reliable”, “Rink”, “Rink Sound Control”, “Roto-Jet”, “Royalaire”, “Ruskin”, “Sky Blast”, “Slyde-Out”, “Steriflo System”, “Stripline”, “Summitair”, “Supreme”, “Surfaire”, “Swartwout”, “Tensor”, “Titus”, “Tuttle & Bailey”, “Woodwinds”, “Valley”, “Vapor-Air”, “Vector”, “Venturi-Flo”, and “Z-Com”.
Engineered & Construction Products
“Ace Service”, “Accuflo”, “Belmont”, “Bulldog”, “Carefree”, “Champagne Series”, “D and Design”, “DBM Design”, “Delflo”, “Deltherm”, “Dexstar”, “Dexter”, “Discovery lll”, “DMW Dearborn Mid-West Conveyor Co. and Design”, “DMW Design”, “DQM”, “Duravent”, “Dynamark”, “E-Z Lube”, “Enviro-seal”, “GrooveEnd”, “H and Stork Device”, “Insta-Curb”, “Jet-Flo”, “Lasco”, “Mayfran”, “Mercia”, “Mid-West”, “Never Clean Your Gutters Again”, “Northern Breeze”, “Pegler”, “Philips Products”, “Poly Armor”, “Prestex”, “Propellair”, “Regis”, “Sani-Top”, “Serenity”, “Surfaire”, “Swirl-Design”, “Terrier”, “Thermaguard ll”, “Torflex”, “Traditions”, “Tri-Set”, “Ultravent”, “Unified”, “Ventadome”, “Weatherbeater” and “Z-Pan”.
20
Competitive position
Industrial & Automotive
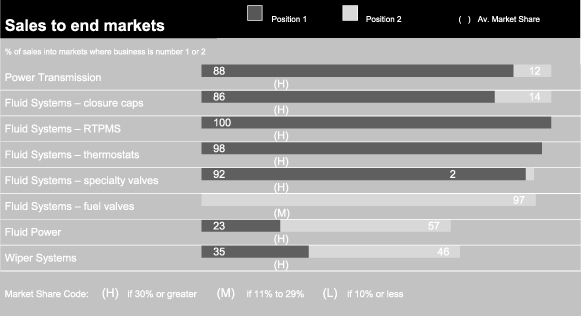
Air Systems Components
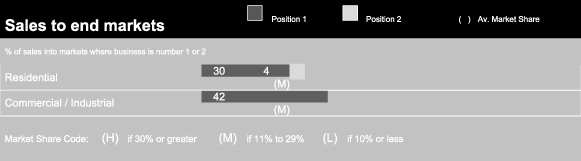
Engineered & Construction Products
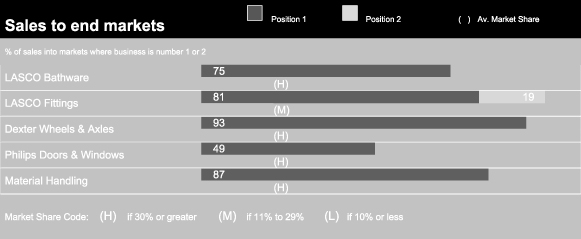
Governmental Regulation
The Company’s operating subsidiaries are regulated by governmental authorities in a number of countries. Many of the products produced by the Company’s subsidiaries are subject to governmental regulation regarding their production, sale, advertising, safety, labeling and raw materials. The Company believes that its subsidiaries have taken sufficient measures to comply with applicable local or national regulations.
21
Some of the regulations applicable to the Company’s subsidiaries include regulations that would allow local, national or federal authorities to mandate product recalls, or provide for the seizure of products, as well as other sanctions. The Company believes that the controls implemented by its subsidiaries minimize the risk of the occurrence of such events and that such risks do not pose a material threat to the Company.
The Company maintains worldwide insurance coverage for product liability claims and believes that its level of insurance coverage is adequate.
The Company’s subsidiaries are subject to regulation under various and changing federal, state and local laws and regulations relating to the environment and to employee safety and health. These environmental laws and regulations govern the generation, storage, transportation, disposal and emission of various substances. Permits are required for operation of certain businesses carried out by the Company’s subsidiaries (particularly air emission permits) and these permits are subject to renewal, modification and, in certain circumstances, revocation. The Company believes that its subsidiaries are in substantial compliance with laws and regulations which could allow regulatory authorities to compel (or seek reimbursement for) clean up of environmental contamination at its subsidiary-owned sites and at facilities where its waste is stored or disposed of.
C. Organizational structure
Tomkins plc is the parent of a large number of subsidiaries that are organized into three business segments and a Corporate Center function. This includes a list of the Company’s principal operating subsidiaries and associates, categorized by business segment. Note 29 to the consolidated financial statements contains a list of the Company’s significant subsidiaries, including name, country of incorporation and proportion of ownership.
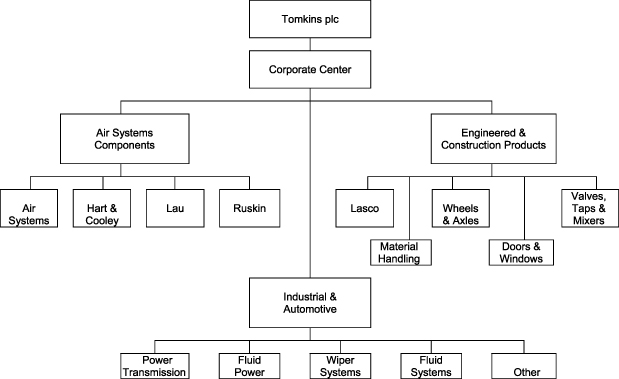
D. Property, plants and equipment
Tomkins’ principal executive offices are located in London, England. The Company’s plants, warehouses and offices are located in various countries throughout the world, with a large number in North America. The Company owns many of these properties in the United Kingdom and the United States. The Company continues to improve and replace properties when considered appropriate, to meet the needs of its individual operations.
The net book value as of December 31, 2002 of the Company’s property, plant and equipment was £787.6 million, of which £61.1 million represented property, plant and equipment located in the United Kingdom, £517.1 million located in the United States and £84.5 million located in continental Europe, with the balance of £124.9 million in the rest of the world. Due to the diverse nature of the business, there is no individual fixed asset, the loss of which would have a material impact on the position of the Company.
22
Item 5. Operating and Financial Review and Prospects
A. Operating results
General
Tomkins operations cover three business segments: (i) Industrial & Automotive, (ii) Air Systems Components, and (iii) Engineered & Construction Products. For information on the contribution of each reporting unit to the Company’s net sales and operating income, see Item 4.B. “Business overview” and Note 5 of the Notes to the consolidated financial statements.
The Company’s consolidated financial statements are prepared in accordance with U.K. GAAP, which differ in certain significant respects from U.S. GAAP. For a discussion of the main differences between U.K. GAAP and U.S. GAAP which materially affect the financial results of the Company, see Note 27 of the Notes to the consolidated financial statements. The following discussion and analysis relates to the consolidated financial statements prepared under U.K. GAAP.
The Board of Tomkins has changed the Company’s fiscal year end from April 30 to December 31, which resulted in an accounting period of eight months ended December 31, 2002. Tomkins commenced quarterly reporting with the three month period ended April 5, 2003.
This item includes discussion of operating income, including share of income from associates, before goodwill amortization. This measure is used by the Tomkins chief decision makers to review segment profitability, and as such we believe that discussion of this measure is necessary to an understanding of the business. The tables below reconcile this measurement with operating income for each reporting period discussed below.
Overview
The Company’s net sales were £2,097.2 in the eight month period ended December 31, 2002, £3,373.8 million in fiscal 2002, £4,105.5 million in fiscal 2001 and £5,640.4 million in fiscal 2000. Of total net sales, £2,097.2 million, £3,373.8 million, £3,335.1 million and £3,161.7 million, respectively, related to continuing operations. Income before taxes was £153.1 in the eight month period ended December 31, 2002, £264.4 million in fiscal 2002, £144.0 million in fiscal 2001 and £252.6 million in fiscal 2000.
A more detailed discussion of the Company’s operations by segment is set forth below.
Acquisitions & Disposals
Details of the acquisitions and disposals during the eight month period ended December 31, 2002 and during the three-year period ended April 30, 2002, are set forth in the “Principal acquisitions, disposals and capital expenditures” section of Item 4.A. “Information on the Company”.
23
Eight months ended December 31, 2002 (“2002 Transition Period”) compared with the eight months ended December 22, 2001 (“2001 Transition Period”)
This commentary compares the results for the 2002 Transition Period with the unaudited results for the 2001 Transition Period. The consolidated statement of income, and the relevant segmental analysis for the two periods are set out below.
Consolidated statement of income
| | | 2002
Transition
Period
| | | 2001 Transition
Period
| |
| | | | | | (unaudited) | |
| | | £ million | | | £ million | |
Net sales | | 2,097.2 | | | 2,225.6 | |
Cost of sales | | (1,496.2 | ) | | (1,615.1 | ) |
| | |
|
| |
|
|
Gross profit | | 601.0 | | | 610.5 | |
Distribution expenses | | (254.3 | ) | | (267.3 | ) |
Administrative expenses | | (203.6 | ) | | (176.7 | ) |
| | |
|
| |
|
|
Operating income | | 143.1 | | | 166.5 | |
Share of income from associates | | 0.7 | | | 0.4 | |
| | |
|
| |
|
|
Operating income including associates | | 143.8 | | | 166.9 | |
Net profit/(loss) on disposal of subsidiary companies | | 7.1 | | | (65.4 | ) |
Reversal of provision for loss on disposal of business | | 3.5 | | | 66.0 | |
Profit on disposal of fixed assets | | — | | | 8.3 | |
| | |
|
| |
|
|
| | | 154.4 | | | 175.8 | |
Interest income | | 18.2 | | | 34.6 | |
Interest expense | | (19.5 | ) | | (29.9 | ) |
| | |
|
| |
|
|
Income before taxes | | 153.1 | | | 180.5 | |
Taxes on income | | (29.2 | ) | | (55.8 | ) |
| | |
|
| |
|
|
Income before minority interests | | 123.9 | | | 124.7 | |
Equity minority interest | | (6.1 | ) | | (3.4 | ) |
| | |
|
| |
|
|
Income before preference dividend | | 117.8 | | | 121.3 | |
Preference dividend | | (24.5 | ) | | (25.5 | ) |
| | |
|
| |
|
|
Net income attributable to Ordinary Shareholders | | 93.3 | | | 95.8 | |
| | |
|
| |
|
|
Basic income per Ordinary Share | | 12.10 | p | | 12.35 | p |
| | |
|
| |
|
|
Diluted income per Ordinary Share | | 11.82 | p | | 12.13 | p |
| | |
|
| |
|
|
Segmental Analysis
| | | Industrial &
Automotive £ million
| | | Air Systems
Components £ million
| | | Engineered &
Construction
Products £ million
| | | Central
Costs £ million
| | | Total £ million
| |
2002 Transition Period | | | | | | | | | | | | | | | |
Net sales | | 1,263.9 | | | 325.7 | | | 507.6 | | | — | | | 2,097.2 | |
| | |
|
| |
|
| |
|
| |
|
| |
|
|
Operating income | | 91.6 | | | 20.0 | | | 46.7 | | | (15.2 | ) | | 143.1 | |
Share of income from associates | | 0.3 | | | — | | | 0.4 | | | — | | | 0.7 | |
| | |
|
| |
|
| |
|
| |
|
| |
|
|
Operating income including associates | | 91.9 | | | 20.0 | | | 47.1 | | | (15.2 | ) | | 143.8 | |
Add back: Goodwill amortization | | 0.9 | | | 5.6 | | | 0.3 | | | — | | | 6.8 | |
| | |
|
| |
|
| |
|
| |
|
| |
|
|
Operating income, including associates, before goodwill amortization | | 92.8 | | | 25.6 | | | 47.4 | | | (15.2 | ) | | 150.6 | |
| | |
|
| |
|
| |
|
| |
|
| |
|
|
Operating Margin | | 7.3 | % | | 6.1 | % | | 9.2 | % | | — | | | 6.8 | % |
Operating Margin (including income from associates, before goodwill amortization) | | 7.3 | % | | 7.9 | % | | 9.3 | % | | — | | | 7.2 | % |
| | | | | |
2001 Transition Period (unaudited) | | | | | | | | | | | | | | | |
| | | | | |
Net sales | | 1,301.1 | | | 341.7 | | | 582.8 | | | — | | | 2,225.6 | |
| | |
|
| |
|
| |
|
| |
|
| |
|
|
Operating income | | 93.1 | | | 31.1 | | | 54.0 | | | (11.7 | ) | | 166.5 | |
Share of income from associates | | 0.3 | | | — | | | 0.1 | | | — | | | 0.4 | |
| | |
|
| |
|
| |
|
| |
|
| |
|
|
Operating income including associates | | 93.4 | | | 31.1 | | | 54.1 | | | (11.7 | ) | | 166.9 | |
Add back: Goodwill amortization | | 1.0 | | | 5.6 | | | 0.3 | | | — | | | 6.9 | |
| | |
|
| |
|
| |
|
| |
|
| |
|
|
Operating income, including associates, before goodwill amortization | | 94.4 | | | 36.7 | | | 54.4 | | | (11.7 | ) | | 173.8 | |
| | |
|
| |
|
| |
|
| |
|
| |
|
|
Operating Margin | | 7.2 | % | | 9.1 | % | | 9.3 | % | | — | | | 7.5 | % |
Operating Margin (including income from associates, before goodwill amortization) | | 7.3 | % | | 10.7 | % | | 9.3 | % | | — | | | 7.8 | % |
24
Movements in exchange rates, our restructuring initiatives, and acquisitions and disposals affect sales and operating income. Around 70 percent of our sales are US dollar denominated and so the weakening of the dollar in the period has reduced our turnover and operating income when translated into pounds sterling. The average exchange rate was £1.00=$1.53 in the eight month period ended December 31, 2002, compared to a rate of £1.00=$1.43 for the eight month period ended December 22, 2001. The period ended December 22, 2001 has been used for the 2001 Transition Period since December 22, 2001 was the Company’s internal reporting period end. The eight month period ended December 31, 2002 consists of 245 days compared with 236 days in the period ended December 22, 2001.
The Company’s net sales were £2,097.2 million for the 2002 Transition Period compared to £2,225.6 million for the 2001 Transition Period. Period on period currency fluctuations resulted in a decrease of 5.9 percent, the effect of acquisitions and disposals was a decrease of 1.4 percent, leaving an underlying increase of 1.5 percent.
Cost of sales decreased from £1,615.1 million for the 2001 Transition Period, which represented 72.6 percent of net sales, to £1,496.2 million for the 2002 Transition Period, which is 71.3 percent of net sales. Distribution costs and administration expenses increased by 3.1 percent to £457.9 million for the 2002 Transition Period from £444.0 million for the 2001 Transition Period, representing 21.8 percent of net sales for the 2002 Transition Period and 19.9 percent of net sales for the 2001 Transition Period. The decline in cost of sales is largely attributable to the disposition of non-core business lines. Distribution costs have declined accordingly, but this has been offset by an increase in administration expenses arising from the development of central functions and the appointment of the new chief executive officer in February 2002.
Operating income was £143.1 million for the 2002 Transition Period compared with £166.5 million for the 2001 Transition Period. This includes goodwill amortization of £6.8 million in the 2002 Transition Period and £6.9 million in the 2001 Transition Period. Income from associates was £0.7 million in the 2002 Transition period and £0.4 million in the 2001 Transition Period.
Operating income including income from associates and before goodwill amortization was £150.6 million for the 2002 Transition Period, compared with £173.8 million for the 2001 Transition Period. Period on period currency fluctuations resulted in a decrease of 7.6 percent, the effect of acquisitions and disposals was a decrease of 1.1 percent and increased restructuring charges resulted in a decrease of 12.5 percent, leaving an underlying increase of 7.3 percent.
Overall the Company’s operating margin (Operating margin, as used herein is defined as operating income, including income from associates and before goodwill amortization, as a percentage of sales) was 7.2 percent. This compared with 7.8 percent in the 2001 Transition Period. The Industrial & Automotive operating margin before non-operating exceptional items stood at 7.3 percent (2001 Transition Period: 7.3 percent), Air Systems Components at 7.9 percent (2001 Transition Period: 10.7 percent) and Engineered & Construction Products at 9.3 percent (2001 Transition Period: 9.3 percent).
During the 2002 Transition Period there were £32.0 million of restructuring costs charged to the profit and loss account, classified as operating exceptional items, compared with £12.0 million in the 2001 Transition Period. The major projects included moving a cord treatment facility from Denver, Colorado to Columbia, Missouri and finalizing the arrangements for the closure of our Wiper Systems factory in Dunstable, England. The closure of the Wiper Systems plant in Buffalo, New York was provided for in December 2002. In Air Systems Components the Company closed, or announced the closure of, seven plants with manufacturing being transferred to other existing facilities, particularly in Mexicali, Mexico. Dearborn Mid-West, within Engineered & Construction Products, announced the closure of its Kansas City facility in response to reduced levels of business.
The £32.0 million of restructuring costs include the following:
| | | £’m |
Restructuring Costs | | |
Severance costs | | 7.3 |
Pension costs | | 8.0 |
Plant closure costs | | 2.8 |
Fixed asset writedowns | | 6.1 |
Other | | 7.8 |
| | |
|
Total | | 32.0 |
| | |
|
The movement on restructuring provisions is as follows:
| | | £’m |
Restructuring Provision | | |
Balance as at April 30, 2002 | | 22.3 |
Foreign Exchange | | (1.5) |
Utilized in eight months ended December 31, 2002 | | (6.0) |
Expenditure in period | | (25.4) |
Profit & loss charge | | 32.0 |
| | |
|
Balance as at December 31, 2002 | | 21.4 |
| | |
|
25
We have continued to identify strategic cost management projects aimed at improving our cost competitiveness. These projects will generally relate to further rationalization of productive capacity in North America and the relocation of manufacturing facilities into low cost areas.
The Company’s operating margin calculated before restructuring costs was 8.7 percent. This compared with 8.3 percent in the comparable period. The Industrial & Automotive operating margin before operating exceptional items stood at 9.1 percent (2001 Transition Period: 8.2 percent), Air Systems Components at 10.4 percent (2001 Transition Period: 10.7 percent) and Engineered & Construction Products at 9.7 percent (2001 Transition Period: 9.3 percent).
The Company incurred a net gain on disposal of subsidiaries of £7.1 million in the 2002 Transition Period. This was net of losses of £11.2 million, of which £3.5 million was provided for in fiscal 2002. In the 2001 Transition Period, a gain of £8.3 million was recorded on the disposal of fixed assets. No such gain was recorded in the 2002 Transition Period.
The net interest charge for the period was £1.3 million compared with net interest income of £4.7 million in the 2001 Transition period. This consisted of interest expense on bank loans, overdrafts, bills discounted, capital lease interest and other loans, partially offset by bank interest income. Net movement in the period was primarily due to the incurrence of £6.5 million of net interest income in the 2001 Transition Period associated with the previous balance sheet hedging arrangements.
Income before tax was £153.1 million (2001 Transition Period: £180.5 million) and basic earnings per share were 12.10 pence (2001 Transition Period: 12.35 pence).
The net tax rate on total profit for the period was 19.1 percent (2001 Transition Period: 30.9 percent). This relatively low rate of tax arose due to capital loss carry forwards being available to offset gains on disposals in the current year, deferred tax assets not previously recognized which have now been recognized against future projected profits in accordance with FRS 19 “Deferred Tax”, and certain favorable adjustments to tax provisions made in prior years.
Minority interests, which relate to Cobra Investments (Pty) Limited, Unitta Company Limited, Gates Nitta Belt Company (Suzhou) Limited, GNAPCO Pte Limited and Gates Korea Company Limited, were £6.1 million, compared to £3.4 million for the 2001 Transition Period. In the 2002 Transition Period, dividends of £12.7 million compared with £13.2 million in the 2001 Transition Period were payable to convertible cumulative preference shareholders and £11.8 million compared with £12.3 million in the 2001 Transition Period to redeemable convertible cumulative preference shareholders.
As a result of the above, the Company’s net income attributable to Ordinary Shareholders for the 2002 Transition Period was £93.3 million, a decrease of 2.6 percent from net income of £95.8 million for the 2001 Transition Period.
The following paragraphs discuss the results by segment (see table in Item 4.B. “Business Overview”).
Industrial & Automotive
Net sales and operating income including income from associates and before goodwill amortization for the 2002 Transition Period were down by 2.9 percent and 1.7 percent respectively compared to the 2001 Transition Period. For sales, period on period currency fluctuations resulted in a decrease of £73.1 million. Acquisitions and disposals resulted in a decrease of 3.2 percent, leaving an underlying increase of 6.1 percent. For operating income including income from associates and before goodwill amortization, period on period currency fluctuations resulted in a decrease of £7.3 million. Acquisitions and disposals resulted in a decrease of 1.7 percent and increased restructuring charges resulted in a decrease of 11.7 percent, leaving an underlying increase of 20.0 percent.
Automotive production around the world was strong, especially in the USA, and product innovation and cost competitiveness enabled the group to achieve substantial improvements in market share across many of Tomkins businesses.
The automotive aftermarket, an area that has traditionally seen higher margin business, also grew as the world’s car park continued to expand in response to demographic changes. Global industrial original equipment production, however, was lower, although there was some improvement in replacement sales, due in part to restocking by distributors.
Restructuring costs during the 2002 Transition Period amounted to £22.2 million (2001 Transition Period: £12.0 million). These items are primarily associated with the rationalization of our belt manufacturing and cord treatment facilities in the USA, and the closure of Wiper Systems plants in Buffalo, New York State, and
26
Dunstable in the UK. We estimate that these, and other recent restructuring projects, have benefited operating income during the period by approximately £3.1 million.
Power Transmission (Net sales: 2002 £519.6m; 2001 £518.0m)
Net sales and operating income including income from associates and before goodwill amortization for the 2002 Transition Period were up by 0.3 percent and down by 5.3 percent respectively compared to the 2001 Transition Period.
For net sales, period on period currency fluctuations resulted in a decrease of £24.5 million. Excluding currency fluctuations, the increase in sales was 5.3 percent and operating income including income from associates and before goodwill amortization, increased by 1.1 percent. Of this, one-off restructuring charges resulted in a decrease of 9.1 percent, leaving an underlying increase of 10.2 percent.
The increase in net sales, excluding the effect of currency fluctuations and restructuring charges in Power Transmission reflected the growth in market share achieved by our worldwide automotive original equipment customers. In addition, our lean manufacturing initiatives, particularly in North America, have improved margins. Sales in our European aftermarket also increased and our operations in developing economies, such as Brazil and China, continued to gain strength. Landmark awards that we received in the 2002 Transition Period include our first major MICRO-V® belt and tensioner order from Renault and an order for a General Motors (Opel) engine to be built in Brazil. By contrast, Power Transmission’s industrial markets experienced a decline in the period. This is the result of more tightly managed inventories among our distributors and a general reduction in capital spending.
Fluid Power (Net sales: 2002 £207.6m; 2001 £211.1m)
Net sales and operating income including income from associates and before goodwill amortization for the 2002 Transition Period were down by 1.7 percent and up by 17.7 percent respectively compared to the 2001 Transition Period.
For net sales, period on period currency fluctuations resulted in a decrease of £14.9 million. After adjusting for this, the underlying increase in sales was 5.8 percent. After adjusting for currency fluctuations, operating income including income from associates and before goodwill amortization, increased by 28.4 percent. Of this, one-off restructuring charges resulted in a decrease of 33.0 percent, leaving an underlying increase of 61.4 percent.
The trading environment remained difficult in the key markets of construction, mining and agriculture equipment. Market share gains in the OEM market and some restocking by distributors drove a recovery in Fluid Power’s net sales against the same period last year. Our commitment to tighter cost control, together with advances in manufacturing performance and an improved sales mix, have combined to deliver a significant gain in operating income.
The division has initiated two restructuring projects, one in North America and the other in Europe. In North America, it is migrating this year from a mixed product manufacturing base to a set of three product-focused units, resulting in the exit from one US facility and the expansion of its state-of-the-art hydraulic hose facility in Atlacomulco, Mexico. In Europe, manufacturing activities were eliminated in one facility and combined into the division’s existing UK manufacturing site, reducing its locations from three to two. In addition, European distribution locations were reduced from four to two.
The division is expanding its manufacturing presence in Asia with the opening during 2003 of a hydraulic hose and coupling assembly facility in Shanghai, China.
Wiper Systems (Net sales: 2002 £191.1m; 2001 £178.8m)
Net sales and operating income including income from associates and before goodwill amortization for the 2002 Transition Period were up by 6.9 percent and 15.2 percent respectively compared to the 2001 Transition Period.
For net sales, period on period currency fluctuations resulted in a decrease of £12.6 million. After adjusting for this, the underlying increase in net sales was 15.0 percent. After adjusting for currency fluctuations, operating income including income from associates and before goodwill amortization, increased by 25.0 percent. After adjusting for one-off restructuring charges, the underlying increase was 23.5 percent.
Strong performance in both the automotive original equipment market and automotive aftermarket delivered gains for Wiper Systems. Changes to product mix continued to deliver small but significant improvements to margins. In particular, the beam blade continues to gain ground in the OEM market and a heavy-duty winter blade has been added to the Teflon® blade range for the aftermarket.
The consolidation of Wiper Systems’ manufacturing base continued with the announcement of the closure of our plant in Buffalo, New York and a corresponding transfer of activity to existing facilities in Texas and Mexico. In addition, the closure of the Dunstable plant in the UK and transfer of its production to Mexico and Pontypool,
27
Wales was completed in January 2003.
Fluid Systems (Net sales: 2002 £153.7m; 2001 £159.2m)
Net sales and operating income including income from associates and before goodwill amortization for the 2002 Transition Period were down by 3.5 percent and 5.0 percent, respectively, compared to the 2001 Transition Period.
For net sales, period on period currency fluctuations resulted in a decrease of £7.6 million. After adjusting for currency fluctuations, the underlying increase in net sales was 1.4 percent and operating income including income from associates and before goodwill amortization, increased by 3.6 percent.
Fluid Systems’ Schrader Electronics maintained its global market leadership in RTPMS during the period. Most recently, Schrader secured a contract to supply approximately one-third of DaimlerChrysler’s RTPMS requirements from model-year 2005 onwards, and now holds significant contracts to supply RTPMS to most of the world’s major car manufacturers.
Standard-Thomson, Schrader-Bridgeport and Stant also performed well, securing a variety of new contracts, and Stant extended its reach with several new European vapor management programs.
Other industrial & automotive (Net sales: 2002 £191.9m; 2001 £234.0m)
The other industrial and automotive sales businesses manufacture products primarily for the automotive aftermarkets. In May 2002, the UK-based Gates Consumer and Industrial business was sold to the Rutland Fund for £25 million. Just before the period end, Fedco Automotive, which manufactures automotive heater cores, was sold to TransPro, Inc. for $8 million in cash. Adjusting for the disposal of these businesses, net sales and operating income were comparable to last year.
Air Systems Components
Net sales and operating income including income from associates and before goodwill amortization for the 2002 Transition Period were down by 4.7 percent and 30.2 percent respectively compared to the 2001 Transition Period.
Much of the competitive strength of the Air Systems Components business is built on the strong branded product offering to the building and construction industry and the management of the relationships in the channels to market.
For net sales, period on period currency fluctuations resulted in a decrease of £21.5 million. After adjusting for this, the effect of acquisitions was an increase of 7.5 percent, leaving an underlying decrease of 5.8 percent. For operating income including income from associates and before goodwill amortization, period on period currency fluctuations resulted in a decrease of £2.3 million. After adjusting for this, the effect of acquisitions and disposals was an increase of 3.5 percent and increased restructuring charges resulted in a decrease of 23.8 percent, leaving an underlying decrease of 5.2 percent. These results were despite a significant decline in activity in its major market, US non-residential construction.
Statistics from Dodge show that the US residential construction market, buoyed by low interest rates, grew by around 3 percent during calendar year 2002. In contrast the much larger US non-residential construction market, which represents around 60 percent of the segment’s net sales, declined by around 16 percent and is now some 25 percent below its peak in 2000.
Our focus on creating efficiencies—including the adoption of lean manufacturing practices, combined with strict cost control – has helped mitigate the effects of reduced volume in the non-residential construction market and to maintain operating margins before operating exceptional items and goodwill amortization at over 10 percent.
At the same time, a drive to reduce our cost base by rationalizing manufacturing capacity continued, with the closure of two US plants and the transfer of production to other facilities. These strategic manufacturing initiatives gave rise to operating exceptional items of £8.2 million in the 2002 Transition Period. As part of the Company’s overall initiative to create a more efficient cost base, there has been an acceleration of the closure program for other sites in the current year and a further five facilities have been closed.
Tomkins built on its market-leading positions in the US residential and commercial construction markets with two acquisitions in September 2002. These acquisitions have now been successfully integrated into existing businesses. The purchase of the assets of duct accessory manufacturer Ward Industries Inc., now a part of Hart & Cooley, has extended the Group’s product offering in the residential and commercial construction markets. The Group is now able to offer customers a full range of ductwork connectors, access doors, fire dampers, gaskets, sealants, hangers and ductwork tools.
28
At the same time Ruskin acquired the HVAC dampers business of Johnson Controls Inc. This acquisition opens up new distribution channels, extends Tomkins damper product range for the commercial market and, through a marketing agreement with Johnson Controls Inc., provides access to a wider customer base around the world. The combined consideration for these two acquisitions was $17.6 million.
The Company’s efforts to expand internationally continued this year. Significant new contracts in Korea and China were awarded to our Far East facility in Thailand, while Krueger (ASC) recently completed work on the Nan Kang Software Park II in Taiwan.
In the USA, Tomkins was involved in a number of high-profile projects in the 2002 Transition Period. Krueger (ASC) worked on repairs to the Pentagon, Lau provided ventilation fans for the new Houston Texans NFL stadium and Ruskin secured a major order for fire and smoke dampers for the UCLA hospital in California.
Engineered & Construction Products
Net sales and operating income including income from associates and before goodwill amortization for the 2002 Transition Period were both down by 12.9 percent compared to the 2001 Transition Period.
For net sales, period on period currency fluctuations resulted in a decrease of £35.7 million. After adjusting for currency fluctuations, the effect of disposals was a decrease of 2.7 percent, leaving an underlying decrease of 4.6 percent. For operating income including income from associates and before goodwill amortization, period on period currency fluctuations resulted in a decrease of £3.8 million. After adjusting for currency fluctuations, the effect of acquisitions and disposals was a decrease of 2.8 percent and restructuring charges resulted in a decrease of 3.2 percent, leaving an underlying decrease of 0.4 percent.
Lasco Bathware and Fittings (Net sales: 2002 £161.0m; 2001 £185.5m)
Net sales and operating income including income from associates and before goodwill amortization for the 2002 Transition Period were down by 13.2 percent and 18.8 percent respectively compared to the 2001 Transition Period.
For net sales, period on period currency fluctuations resulted in a decrease of £11.8 million. After adjusting for currency fluctuations, the effect of disposals was a decrease of 7.8 percent, leaving an underlying increase in sales of 0.5 percent. After adjusting for currency fluctuations, operating income including income from associates and before goodwill amortization, decreased by 13.0 percent. Of this, disposals resulted in a decrease of 6.3 percent, leaving an underlying decrease of 6.7 percent.
Lasco Fittings benefited from improved export sales, receiving its largest ever export order from China, and the expansion of its Swing Joint irrigation product range, despite intense price competition. However, significant increases in PVC prices resulted in profits below the 2001 Transition Period. Lasco Bathware experienced improvements in the original equipment and retail markets that helped to balance out a further decline in manufactured housing.
Dexter Wheels & Axles (Net sales: 2002 £116.6m; 2001 £112.6m)
Dexter supplies non-drive axles and wheels for a variety of trailer applications. The recent recovery in the recreational vehicle market – along with the enduring strength of the industrial and utility markets—offset declines in the manufactured housing market, enabling Dexter to produce continued strong results.
Philips Doors and Windows (Net sales: 2002 £105.7m; 2001 £115.4m)
Net sales and operating income including income from associates and before goodwill amortization for the 2002 Transition Period were down by 8.4 percent and 1.9 percent respectively compared to the 2001 Transition Period.
For net sales, period on period currency fluctuations resulted in a decrease of £7.5 million. After adjusting for currency fluctuations, the underlying decrease in net sales was 2.0 percent and operating income including income from associates and before goodwill amortization, was marginally ahead of the corresponding period last year. In a depressed manufactured housing market, Philips experienced some pricing pressure from competitors seeking to maintain market share. However, its market share of vinyl windows to the residential construction market increased and the company also benefited from the recovery in recreational vehicle sales.
Material handling (Net sales: 2002 £60.4m; 2001 £101.6m)
The severe downturn in the US and European capital equipment markets strongly affected the performance of our Material Handling businesses. Mayfran’s net sales was down by 27.0 percent while Dearborn Mid-West suffered a 44.6 percent fall. Rigorous cost control helped to limit the decline in profitability. The result was a net loss of £2.9m in the 2002 Transition Period compared to a net income of £1.6m in the 2001 Transition Period. The closure of Dearborn Mid-West’s Kansas City facility created an exceptional item of £1.6 million, though a number of new contracts provided the company with an improved order pipeline.
29
Valves, taps and mixers (Net sales: 2002 £63.9m; 2001 £67.7m)
Our US and South African operations showed continued improvements last year, while sales and profits of our UK businesses were in line with the previous year despite the disruption caused by a fire at one of the major UK plants. Since the period end our US operation, Milliken Valve Co Inc. has been sold for $7.3 million.
Year Ended April 30, 2002 Compared with the Year Ended April 30, 2001
Segmental Analysis
| | Industrial &
Automotive
| | | Air Systems
Components
| | | Engineered
&
Construction
Products
| | | Food
Manufacturing
| | | Professional,
Garden &
Leisure
Products
| | | Central
Costs
| | | Total
| |
| | | £ million | |
Fiscal 2002 | | | | | | | | | | | | | | | | | | | | | |
Net sales | | 1,985.9 | | | 516.4 | | | 871.5 | | | — | | | — | | | — | | | 3,373.8 | |
| | |
|
| |
|
| |
|
| |
|
| |
|
| |
|
| |
|
|
Operating income | | 146.1 | | | 45.2 | | | 77.4 | | | — | | | — | | | (12.6 | ) | | 256.1 | |
Share of income from associates | | (0.7 | ) | | — | | | — | | | — | | | — | | | — | | | (0.7 | ) |
| | |
|
| |
|
| |
|
| |
|
| |
|
| |
|
| |
|
|
Operating income including associates | | 145.4 | | | 45.2 | | | 77.4 | | | — | | | — | | | (12.6 | ) | | 255.4 | |
Add back: Goodwill amortization | | 1.5 | | | 8.6 | | | 0.4 | | | — | | | — | | | — | | | 10.5 | |
| | |
|
| |
|
| |
|
| |
|
| |
|
| |
|
| |
|
|
Operating income, including associates, before goodwill amortization | | 146.9 | | | 53.8 | | | 77.8 | | | — | | | — | | | (12.6 | ) | | 265.9 | |
| | |
|
| |
|
| |
|
| |
|
| |
|
| |
|
| |
|
|
Operating Margin | | 7.4 | % | | 8.8 | % | | 8.9 | % | | — | | | — | | | — | | | 7.6 | % |
Operating Margin (including income from associates, before goodwill amortization) | | 7.4 | % | | 10.4 | % | | 8.9 | % | | — | | | — | | | — | | | 7.9 | % |
Fiscal 2001 | | | | | | | | | | | | | | | | | | | | | |
Net sales | | 1,968.3 | | | 487.9 | | | 878.9 | | | 562.1 | | | 208.3 | | | — | | | 4,105.5 | |
| | |
|
| |
|
| |
|
| |
|
| |
|
| |
|
| |
|
|
Operating income | | 190.2 | | | 47.7 | | | 85.3 | | | 25.5 | | | (14.3 | ) | | (24.0 | ) | | 310.4 | |
Share of income from associates | | 0.3 | | | — | | | (0.3 | ) | | 0.3 | | | (0.2 | ) | | — | | | 0.1 | |
| | |
|
| |
|
| |
|
| |
|
| |
|
| |
|
| |
|
|
Operating income including associates | | 190.5 | | | 47.7 | | | 85.0 | | | 25.8 | | | (14.5 | ) | | (24.0 | ) | | 310.5 | |
Add back: Goodwill amortization | | 1.3 | | | 7.6 | | | 0.4 | | | 0.2 | | | — | | | — | | | 9.5 | |
| | |
|
| |
|
| |
|
| |
|
| |
|
| |
|
| |
|
|
Operating income, including associates, before goodwill amortization | | 191.8 | | | 55.3 | | | 85.4 | | | 26.0 | | | (14.5 | ) | | (24.0 | ) | | 320.0 | |
| | |
|
| |
|
| |
|
| |
|
| |
|
| |
|
| |
|
|
Operating Margin | | 9.7 | % | | 9.8 | % | | 9.7 | % | | 4.5 | % | | — | | | — | | | 7.6 | % |
Operating Margin (including income from associates, before goodwill amortization) | | 9.7 | % | | 11.3 | % | | 9.7 | % | | 4.6 | % | | — | | | — | | | 7.8 | % |
The Company’s net sales were £3,373.8 million in Fiscal 2002 compared to £4,105.5 million in fiscal 2001. In the continuing business segments, net sales grew by 1.2 percent to £3,373.8 million in fiscal 2002 compared to £3,335.1 million in fiscal 2001. Year on year currency fluctuations resulted in an increase of 6.5 percent and a decrease of 0.5 percent arose from the net effect of acquisitions and disposals, leaving an underlying decrease of 4.8 percent from continuing businesses.
Cost of sales decreased from £2,985.8 million in fiscal 2001, which represented 72.7 percent of net sales, to £2,443.0 million in fiscal 2002, which is 72.4 percent of net sales. Distribution costs and administration expenses decreased by 16.6 percent to £674.7 million in fiscal 2002 from £809.3 million in fiscal 2001, representing 20.0 percent of net sales in fiscal 2002 and 19.7 percent of net sales in fiscal 2001. The decline in cost of sales and distribution and administration expenses is largely attributable to the disposition of non-core business lines.
Operating income including income from associates and before goodwill amortization was £265.9 million in 2002, a decrease of 16.9 percent compared to £320.0 million in 2001. In fiscal 2001 operating income including income from associates and before goodwill amortization from continuing businesses was £308.5 million. Of this decrease, 5.0 percent arose from the net effect of acquisitions and disposals, 7.4 percent from a decrease in continuing businesses and 11.4 percent due to restructuring costs classified as operating exceptional items. These were offset by a 6.9 percent increase arising from year on year currency fluctuations. The effect of exchange rate movements between fiscal 2001 and fiscal 2002 is detailed below.
30
A loss on disposal of subsidiaries of £68.5 million was incurred in fiscal 2002, of which £66.0 million was provided for in fiscal 2001. In addition, a loss of £3.5 million was provided for the impairment of goodwill on the post year-end disposal of the consumer and industrial division of Gates (UK) Limited. In addition, in fiscal 2002, a profit of £8.4 million arose on the disposal of fixed assets.
Restructuring costs of £26.1 million incurred during Fiscal 2002 have been treated as an operating exceptional item. These costs related primarily to the closure of our Wiper Systems facility in Dunstable and the rationalization of manufacturing capacity in North America.
Net interest income of £6.6 million, consisted of bank interest income, partially offset by interest expense on bank loans, overdrafts, bills discounted, capital lease interest and other loans. Interest income includes £9.2 million relating to the impact of foreign currency balance sheet hedging, which was unwound during fiscal 2002. In fiscal 2001, net interest expense, excluding exceptional interest income on the settlement of the Bando action (detailed in Note 4 of Notes to the consolidated financial statements) of £4.1 million, totaled £24.8 million. The Company had an average cash balance of £52.0 million during fiscal 2002 due primarily to operating cash flow and the receipt of proceeds from disposals.
The net tax charge was £71.5 million in fiscal 2002, corresponding to an effective tax rate, based on profits before goodwill amortization and exceptional items, of 26.4 percent in fiscal 2002 versus 29.0 percent in fiscal 2001. Due to the adoption of FRS 19 “Deferred Tax”, the tax charge for fiscal 2002 was reduced by £6.7 million. Minority interests, which relate to Cobra Investments (Pty) Limited, Unitta Company Limited, Gates Nitta Belt Company (Suzhou) Limited, GNAPCO Pte Limited and Gates Korea Company Limited, were £5.4 million in fiscal 2002, compared to £3.8 million in fiscal 2001. In fiscal 2002, dividends of £20.4 million compared to £19.7 million in fiscal 2001 were paid to convertible cumulative preference shareholders and dividends of £18.9 million versus £17.9 million in fiscal 2001 were paid to redeemable convertible cumulative preference shareholders.
As a result of the above, the Company’s net income attributable to Ordinary Shareholders for 2002 was £148.2 million, compared to net income of £15.7 million in fiscal 2001.
Industrial & Automotive
During fiscal 2002, the world’s automotive manufacturers produced a mixed performance with estimated production down around 10 percent in North America, flat in Europe and slightly lower in the Far East. In the USA, production levels were better than might have been the case after the tragic events of September 11, 2001, as customer incentives stimulated sales.
During the year ended April 30, 2002, the Industrial & Automotive group reported sales in line with the previous year at £1,985.9 million (2001 - £1,968.3 million). Operating income including income from associates and before goodwill amortization of £146.9 million (2001—£191.8 million) included charges of £26.1 million for restructuring costs across a number of its businesses (2001—after crediting exceptional income of £18.7 million on the Bando settlement and charging restructuring costs of £9.4 million). Excluding the effects of currency translation, disposals and the exceptional restructuring costs and income, sales and operating income including income from associates and before goodwill amortization were down 2.0 percent and 3.3 percent respectively compared to the previous year. Operating margin before restructuring costs was 8.7 percent (2001—9.3 percent before restructuring costs and other operating exceptional items) with cost savings and product and market mix largely mitigating the effect of operational gearing from lower volumes and pricing pressures.
During fiscal 2002, manufacturing cost improvement programs contributed approximately £15 million in cost savings and head count was reduced by approximately 6.5 percent. We have also made significant progress in improving efficiencies across many of our plants by the use of lean manufacturing and six sigma techniques.
Power Transmission (40 percent of business group’s net sales in fiscal 2002)
Although the reduction in world automotive production affected sales to OEMs, this decline was offset by sales in the less cyclical aftermarket. Therefore net sales during fiscal 2002 were down approximately 1.8 percent compared with fiscal 2001 and operating income including income from associates and before goodwill amortization was higher by 4.0 percent.
North America, which comprises just over half of the Power Transmission business, saw net sales slightly down but reported profits ahead of fiscal 2001. In Europe, a small increase in net sales produced lower profits mainly due to the short-term effect of supplying inventory from the USA during the transfer of some production from Belgium to Poland. In the Far East, the businesses benefited from earlier reorganizations and performed satisfactorily despite difficult market conditions.
A number of power transmission product developments saw good progress during fiscal 2002. The Gates Engine Module, which consolidates an engine’s front-end systems into a single assembly, has attracted considerable interest from manufacturers.
31
Fluid Power (16 percent of business group’s net sales in fiscal 2002)
This business, which supplies the construction, mining, agricultural and other industrial equipment markets, faced difficult market conditions as many of its customers cut back significantly on production. However its rapid and focused response to this downturn mitigated the decline in sales and profits, with sales and profits down by only 9.6 percent and 2.6 percent, respectively.
New product initiatives continued with sales being achieved for Tuff Coat, a patented plating process, Xtra Tuff, an abrasion resistant covering for hose and Jiffy-Tite Coupling and Nylon Air-Brake hose for the truck and bus program.
Wiper Systems (14 percent of business group’s net sales in fiscal 2002)
Overall sales in this division declined by approximately 4.1 percent in fiscal 2002, mainly due to the effect of the division’s current dependence upon the weaker North American market, lower production volumes of some of its major platforms such as the Ford Explorer and pricing pressures, offset by an increase in aftermarket sales resulting from the launch of the Teflon blade. Although the division benefited from cost improvement programs, particularly in Europe and Australia, the operational gearing effect of the reduced sales caused profits to fall by 13.0 percent.
In fiscal 2002, the Company decided to close the Dunstable facility in England, with production moving to Pontypool in Wales and to Mexico. A charge of £13.2 million was incurred during Fiscal 2002 for the restructuring cost of the project.
Some of the recent new product developments in the Wiper Systems business entered commercial production in fiscal 2002. The innovative Beam Blade will be launched shortly on the Dodge Viper and the Ford Crown Victoria. The Vision Module, which incorporates all the elements of a vehicle’s wiper system in a single module, is being delivered for automotive assembly in Australia. The Teflon blade was successfully launched in fiscal 2002.
Fluid Systems (12 percent of business group’s net sales in fiscal 2002)
As in our other divisions, Fluid Systems was affected by the decline in the North American automotive original equipment production. However, sales of its innovative and market leading RTPMS contributed to a 1.9 percent increase in divisional sales in fiscal 2002. Operating income including income from associates and before goodwill amortization increased by 6.3 percent, with lower profits in North America and France offsetting the benefits from remote tire pressure monitoring.
The division has been quick to respond to the opportunities created by stricter environmental and safety legislation and this has led to substantial new business during fiscal 2002. Stant has developed a range of new advanced valves for use in automotive fuel systems to prevent vapor leakage during filling up. In the U.S., final TREAD Act 2000 regulations have been published, which will gradually make direct or indirect tire pressure monitoring compulsory for all vehicles sold there. In Europe the product is being promoted as an important safety feature and is being adopted without legislation. Schrader Electronics has been awarded the largest single contract so far for this technology with an order for its direct RTPMS system from General Motors, supplying all its light truck platforms sold into the U.S. market. In addition Ford in the U.S. has confirmed Schrader Electronics as their only direct RTPMS system supplier through to 2005 with substantial volume on the entire Ford sport utility vehicle range confirming Schrader as the lead supplier of this technology. Schrader now supplies a long list of vehicle manufacturers including GM, Ford, Daimler-Chrysler, Renault, PSA, Nissan, and Opel, with several others in development contract stage.
Other industrial & automotive sales (18 percent of business group’s net sales in fiscal 2002)
Sales and operating income of other industrial & automotive products, which are primarily aftermarket products, were substantially unchanged. Since the end of fiscal 2002, the U.K. based Gates consumer and industrial products division, which included Tredaire carpet underlay and Hunter wellingtons, was sold for £24 million in cash.
32
Air Systems Components
Operating mainly within North America, these businesses faced contrasting market conditions in fiscal 2002, with weaker commercial and industrial construction activity and a volatile but stronger than expected residential market. In the calendar year 2001, U.S. non-residential construction spending was down by approximately 7 percent (a reduction in square footage of approximately 12 percent) but residential housing starts increased by approximately 4 percent. Sales in fiscal 2002 were ahead of fiscal 2001 at £516.4 million (2001 - £487.9 million) but operating income including income from associates and before goodwill amortization was lower at £53.8 million (2001—£55.3 million). Adjusting for currency fluctuations and acquisitions, net sales and operating income including income from associates and before goodwill amortization was lower by 7.7 percent and 9.8 percent respectively. Lower operating margins of 10.4 percent in fiscal 2002 (2001—11.3 percent) reflected the operational gearing effect of lower volumes and some pricing pressures in the residential market, offset by a favorable product mix and the benefit of cost reduction initiatives.
Strict control of discretionary spending, implementation of further lean manufacturing initiatives and other productivity and efficiency measures helped to mitigate some of the effects of these difficult trading conditions. Further rationalization resulted in the closure of three manufacturing facilities. Overall headcount was reduced by 5 percent (excluding the effect of the acquisition of American Metal Products) with resulting cost savings of approximately £6.0 million in fiscal 2002.
Sales and profits in the U.S. residential market in fiscal 2002 were in line with fiscal 2001 despite strong competitive pricing pressures. American Metal Products, which was acquired November 2001, was fully integrated in fiscal 2002. This acquisition broadened our product offering by the inclusion of venting and gutter protection ranges, strengthened our manufacturing base with plants in Mississippi and Mexico, and expanded our distribution capabilities, particularly into the important U.S. west coast market.
Sales of components to OEMs in the commercial heating, ventilation and air conditioning market were lower in fiscal 2002. Weakened markets, coupled with several customers reducing their levels of inventory, led to sales and profits being substantially lower than fiscal 2001. The industrial and commercial markets experienced operating income similar to last year, helped by continued improvements in efficiency and some market share gains. The Titus product range was expanded by the acquisition of the fan coil business of Superior Rex in November 2001. The new manufacturing facility in Thailand was commissioned during fiscal 2002 and its initial product range, which included comfort control dampers, fire dampers and smoke dampers which were installed in Bangkok’s new mass rapid transport system, has been expanded.
The development of new products has been stimulated by the continual strengthening of regulations for improved indoor air quality, customers’ requirements for reduced building energy consumption and the architects’ demands for components that blend into a building’s design. Several have been brought to the market during fiscal 2002 including a storm-proof louver with an outside air measuring station, a high temperature restaurant exhaust blower with enhanced grease extraction capabilities, a round architectural diffuser for use with increasingly popular exposed ductwork applications and a specialized fan for air conditioning trucks at overnight stops. In addition, our research facilities have developed sophisticated computational fluid dynamics software to enable architects and engineers to model accurately the flow of air around a building, thereby optimizing the configuration of the air handling system.
Engineered & Construction Products
Overall net sales were in line with fiscal 2001 at £871.5 million (2001 - £878.9 million) but operating income including income from associates and before goodwill amortization was reduced to £77.8 million (2001 - £85.4 million). In constant currencies, and adjusting for disposals, sales were down 8.2 percent and operating income including income from associates and before goodwill amortization was down 15.2 percent. Lower operating margins of 8.9 percent (2001—9.7 percent) reflected the low margins on contract revenues in material handling, the operational gearing effect of lower volumes, some pricing pressures in the Lasco pipe fittings business and the plant closure costs in the Philips doors and windows business. Cost reduction initiatives in the businesses have contributed approximately £3.0 million of cost savings in fiscal 2002 and overall the headcount has been reduced by 5 percent.
Lasco Bathware and Fittings (33 percent of business group’s net sales in fiscal 2002)
Overall sales in local currencies increased by 6.4 percent compared with fiscal 2001 and operating income including income from associates and before goodwill amortization increased by 5.1 percent compared with fiscal 2001. Bathware performance in fiscal 2002 was helped by relatively buoyant U.S. residential construction and home improvement markets and its relationship to supply own label products to Whirlpool. Fittings’ important irrigation market was weaker in fiscal 2002 and PVC raw material price increases cut into margins. After the end of fiscal 2002, Lasco Composites was sold to Crane Co. for $43.5 million in cash.
Dexter Wheels & Axles (21 percent of business group’s net sales in fiscal 2002)
Dexter, which supplies wheels and non-drive axles for recreational vehicles, manufactured housing and truck and other trailers experienced a 4.1 percent decrease in sales in fiscal 2002. The decrease in sales, which was
33
caused by the depressed state of some of Dexter’s major markets was mitigated by improvements in manufacturing efficiency and strict cost control. In particular, Dexter did well in the utility and industrial market and in the improving recreational vehicle market.
Philips Doors and Windows (19 percent of business group’s net sales in fiscal 2002)
Sales of doors and windows were down by 5.2 percent but profits showed improvement even after incurring costs of £2.3 million to exit from the Cucamonga aluminum window business in California. Its core business of supplying the manufactured housing and recreational vehicle market picked up towards the end of the year after difficult trading conditions. However good progress has been made in building a position in the residential vinyl door and window market with the launch of its high specification, thermally efficient Marquee range.
Material handling (16 percent of business group’s net sales in fiscal 2002)
Dearborn Mid West, whose principal customers are the large U.S. automobile manufacturers and the U.S. Postal Service, had sales and profits substantially lower than in fiscal 2001. Automotive manufacturers significantly reduced their capital investment and refurbishment projects and the U.S. Postal Service diverted investment towards the detection of dangerous contaminants in the mail following the tragic events of September 11, 2001. Mayfran, which supplies waste handling systems to the engineering industry around the world, did well in a weak market with sales and profits similar to last year.
Valves, taps and mixers (11 percent of business group’s net sales in fiscal 2002)
The U.K. business was affected by the slowdown in the U.K. construction market and the consequent inventory reduction by distributors resulting in lower sales and operating income. In South Africa and North America trading performance in fiscal 2002 was marginally ahead of fiscal 2001, despite weak markets.
Professional, Garden & Leisure Products
The Company completed its exit of its Professional, Garden & Leisure Products business with the disposal of Smith & Wesson on May 11, 2001.
34
Year ended April 30, 2001 Compared with the year ended April 29, 2000
Segmental Analysis
| | Industrial &
Automotive
| | | Air Systems
Components
| | | Engineered
&
Construction
Products
| | | Food
Manufacturing
| | | Professional,
Garden &
Leisure
Products
| | | Central
Costs
| | | Total
| |
| | | £ million | |
Fiscal 2001 | | | | | | | | | | | | | | | | | | | | | |
Net sales | | 1,968.3 | | | 487.9 | | | 878.9 | | | 562.1 | | | 208.3 | | | — | | | 4,105.5 | |
| | |
|
| |
|
| |
|
| |
|
| |
|
| |
|
| |
|
|
Operating income | | 190.2 | | | 47.7 | | | 85.3 | | | 25.5 | | | (14.3 | ) | | (24.0 | ) | | 310.4 | |
Share of income from associates | | 0.3 | | | — | | | (0.3 | ) | | 0.3 | | | (0.2 | ) | | — | | | 0.1 | |
| | |
|
| |
|
| |
|
| |
|
| |
|
| |
|
| |
|
|
Operating income including associates | | 190.5 | | | 47.7 | | | 85.0 | | | 25.8 | | | (14.5 | ) | | (24.0 | ) | | 310.5 | |
Goodwill amortization | | 1.3 | | | 7.6 | | | 0.4 | | | 0.2 | | | — | | | — | | | 9.5 | |
| | |
|
| |
|
| |
|
| |
|
| |
|
| |
|
| |
|
|
Operating income, including associates, before goodwill amortization | | 191.8 | | | 55.3 | | | 85.4 | | | 26.0 | | | (14.5 | ) | | (24.0 | ) | | 320.0 | |
| | |
|
| |
|
| |
|
| |
|
| |
|
| |
|
| |
|
|
Operating Margin | | 9.7 | % | | 9.8 | % | | 9.7 | % | | 4.5 | % | | — | | | — | | | 7.6 | % |
Operating Margin (including income from associates, before goodwill amortization) | | 9.7 | % | | 11.3 | % | | 9.7 | % | | 4.6 | % | | — | | | — | | | 7.8 | % |
| | | | | | | |
Fiscal 2000 | | | | | | | | | | | | | | | | | | | | | |
Net sales | | 1,921.3 | | | 321.6 | | | 918.8 | | | 1,898.6 | | | 580.1 | | | — | | | 5,640.4 | |
| | |
|
| |
|
| |
|
| |
|
| |
|
| |
|
| |
|
|
Operating income | | 196.5 | | | 39.5 | | | 119.0 | | | 160.5 | | | 22.4 | | | (18.8 | ) | | 519.4 | |
Share of income from associates | | 0.6 | | | — | | | 0.3 | | | 1.0 | | | — | | | — | | | 1.9 | |
| | |
|
| |
|
| |
|
| |
|
| |
|
| |
|
| |
|
|
Operating income including associates | | 197.1 | | | 39.5 | | | 119.3 | | | 161.5 | | | 22.4 | | | (18.8 | ) | | 521.0 | |
Goodwill amortization | | 1.6 | | | 2.5 | | | 0.4 | | | 0.5 | | | — | | | — | | | 5.0 | |
| | |
|
| |
|
| |
|
| |
|
| |
|
| |
|
| |
|
|
Operating income, including associates, before goodwill amortization | | 198.7 | | | 42.0 | | | 119.7 | | | 162.0 | | | 22.4 | | | (18.8 | ) | | 526.0 | |
| | |
|
| |
|
| |
|
| |
|
| |
|
| |
|
| |
|
|
Operating Margin | | 10.2 | % | | 12.3 | % | | 13.0 | % | | 8.5 | % | | — | | | — | | | 9.2 | % |
Operating Margin (including income from associates, before goodwill amortization) | | 10.3 | % | | 13.1 | % | | 13.0 | % | | 8.5 | % | | — | | | — | | | 9.3 | % |
Group net sales in fiscal 2001 were £4,105.5 million compared to £5,640.4 million in fiscal 2000. In the continuing business segments, net sales increased by 5.5 percent to £3,335.1 million in fiscal 2001 compared to £3,161.7 million in fiscal 2000. Of this increase, 4.9 percent arose from the net effect of acquisitions and disposals, (0.7) percent from a decrease in existing businesses and 1.3 percent from year on year currency fluctuations.
Cost of sales decreased from £4,011.6 million in fiscal 2000, which represented 71.1 percent of net sales, to £2,985.8 million in fiscal 2001, which represented 72.7 percent of net sales. Distribution costs and administration expenses decreased by 27.0 percent to £809.3 million in fiscal 2001 from £1,109.4 million in fiscal 2000, representing 19.7 percent of net sales for both fiscal 2001 and fiscal 2000. The decline in cost of sales and distribution and administration expenses is largely attributable to the disposition of non-core business lines.
Operating income including income from associates and before goodwill amortization was £320.0 million in fiscal 2001, a decrease of 39.2 percent compared to £526.0 million in fiscal 2000. For continuing businesses, operating income including income from associates and before goodwill amortization was £308.5 million in fiscal 2001, a decrease of 9.6 percent compared to £341.6 million in fiscal 2000. The difference in U.S. dollar to pound sterling exchange rate between fiscal 2001 and fiscal 2000 did not have a material effect on operating income as a result of our foreign currency hedging policy.
A loss on disposal of subsidiaries of £294.8 million was incurred in fiscal 2001, of which £215.0 million was provided for in fiscal 2000. In addition, a loss of £66.0 million was provided for on the disposal of Smith & Wesson. This consisted of £42.2 million for the impairment of goodwill and £23.8 million for payments directly related to the proposed disposal. In fiscal 2000, a loss on disposal of subsidiaries of £6.3 million was incurred, and £215.0 million was provided for a loss on disposal of the Food Manufacturing business segment. This consisted of £171.4 million for the impairment of goodwill and £43.6 million for payments directly related to the disposal.
35
Net interest expense of £20.7 million, consisted of interest expense on bank loans, overdrafts, bills discounted, capital lease interest and other loans, partially offset by bank interest income. Exceptional interest income on the settlement of the Bando action of £4.1 million was also included in fiscal 2001. Net interest expense, excluding the Bando interest, totaled £24.8 million in fiscal 2001, compared to £47.4 million in fiscal 2000. This decrease is due to the change in capital structure resulting from the sale of the Food Manufacturing businesses, offset by the share buy back program.
The net tax charge was £86.9 million in 2001, corresponding to an effective tax rate, based on profits before goodwill amortization and exceptional items, of 29.0 percent versus 29.6 percent in fiscal 2000. Minority interests, which relate to Cobra Investments (Pty) Limited, Unitta Company Limited, Gates Nitta Belt Company (Suzhou) Limited, GNAPCO Pte Limited and Gates Korea Company Limited, were £3.8 million, compared to £5.8 million in fiscal 2000. In fiscal 2001, dividends of £19.7 million compared to £18.0 million in fiscal 2000, were paid to convertible cumulative preference shareholders and £17.9 million compared to £16.4 million paid in fiscal 2000, to redeemable convertible cumulative preference shareholders.
The Company’s net income attributable to Ordinary Shareholders for fiscal 2001 was £15.7 million, a decrease of 77.8 percent from net income of £70.7 million in fiscal 2000.
Industrial & Automotive
Net sales of the Industrial & Automotive group increased by 2 percent to £1,968.3 million in fiscal 2001 from £1,921.3 million in fiscal 2000. Of this increase, £20.0 million was from acquisitions and £31.7 million due to exchange rate movements leaving an underlying decrease of £4.7 million representing 0.2 percent of sales. Operating income including income from associates and before goodwill amortization was 4.5 percent lower at £191.8 million in fiscal 2001 from £200.8 million in fiscal 2000.
Although initially running at higher levels, sales volumes to automotive OEMs declined in North America towards the end of fiscal 2001 as the major manufacturers reduced production. Automotive aftermarket sales were erratic with some improvement driven by weather changes offset by inventory reductions in the distribution channel. The inventory reductions effect was made worse by liquidity concerns among end users, who cut back on purchases in fiscal 2001. Industrial markets also showed declines, which were more marked in the second half of fiscal 2001. Outside of North America, overall performance in fiscal 2001 was good particularly in Latin America and in Europe, with Asia showing some recovery after the end of the labor dispute in Korea which adversely affected the profit of the Power Transmission business by £4 million overall during fiscal 2001.
Power Transmission
Although there was little overall growth in Power Transmission’s principal global markets there were regional variations which, together with greater market penetration and new product sales, gave rise to an overall sales growth of approximately 5 percent. The effect of the Korean labor dispute and the impact of the operational difficulties in the pulley and damper facility, which have since been resolved, reduced margins slightly. New product sales included crankshaft dampers, compact mechanical synchronous belt tensioners and extreme mountain snow v-belts, all showing strong growth.
Customer gains in fiscal 2001 included accessory drive belt systems for Ford and DaimlerChrysler and the General Motors GMT 800-truck platform. Yamaha Motorcycles also commenced purchases of the Polychain motorcycle belt in fiscal 2001.
Geographic expansion into China continued in fiscal 2001 with increased sales of scooter belts through our recently established manufacturing facility there. In Eastern Europe, sales efforts continued in Poland ahead of commissioning the new production facility that began production in April 2001. Costs associated with the move, which were charged against revenue, were £9.4 million in fiscal 2001.
Fluid Power
Overall, the markets for the Fluid Power business in North America and Europe were flat to declining. Volumes in the principal industrial markets, agriculture, construction and mobile equipment were already at lower levels than in previous years. The automotive aftermarket was also relatively flat but some products experienced more pronounced weakness. Our market shares in these lower markets remained broadly constant in fiscal 2001. A combination of product mix and price pressures resulted in lower margins, on sales that were down approximately 3 percent in fiscal 2001.
During fiscal 2001 there was further progress in standardization of global products and processes allowing for improved utilization of worldwide manufacturing capacity. The product development of higher pressure hydraulic hoses for demanding construction and mining applications was successful and commercialization continued in the area of proprietary, problem-solving coupling products to improve system reliability and ease of installation. We successfully developed Tuff Coat™, a significantly improved corrosion resistant process for hydraulic couplings, and expanded our thermoplastic hose manufacturing capacity in Mexico to support sales growth in the truck and bus markets.
36
Tomkins position as a preferred global supplier to key global original equipment customers JC Bamford, John Deere, Ingersoll Rand and JLG Industries was reinforced by supporting their global manufacturing expansion initiatives.
The Group applied its systems selling approach for value added markets to South East Asia, to promote growth of sales in the region. Also we continued the introduction of higher performance fluid power products into Brazil and Asia in fiscal 2001. A coupling presence in India was established through a technical alliance with a local manufacturer and high volume production of several key global hydraulic hose products commenced at Tomkins India facility, providing an efficient low cost source of product for North American and European markets.
In this segment we achieved significant reductions in manufacturing fixed costs in fiscal 2001 through restructuring waste elimination and yield improvement initiatives.
Fluid Systems
Although the overall automotive original equipment market showed no growth in fiscal 2001, increased penetration into the markets for fuel valves, air conditioning valves and remote tire pressure monitoring increased original equipment manufacturer volumes. However, the aftermarket showed some decline due to the effect of inventory reductions from customer consolidation. Overall, net sales for the aftermarket business increased by 4 percent in fiscal 2001.
During fiscal 2001 there were a number of successful initiatives in the Fluid Systems business, including new vapor emission control applications, new remote tire pressure monitoring applications and new valve products. In an attempt to move existing products into new markets, existing wax technology has been applied to oil cooler and transmission applications.
There were a number of customer gains during fiscal 2001, including remote tire pressure monitoring business for Ford, Renault and Nissan. Efforts to increase penetration into new geographic areas were also successful with sales of thermostats to customers in Brazil and South Africa, remote tire pressure monitoring in the U.S. and Europe and fuel caps and valves into Europe.
Cost reduction projects included the implementation of six sigma initiatives and improved process automation. We also established a manufacturing facility in Tijuana, Mexico in fiscal 2001.
Wiper Systems
Net sales to the automotive OEMs were lower in North America reflecting their reduced production levels and were lower in Europe due to reduced sales to Rover and General Motors. Volumes were higher in South America with the launch of new General Motors and Ford models. Aftermarket sales edged ahead against a weaker market due to the harsher winter weather. Overall sales in the Wiper Systems business were down by approximately 15 percent but the more favorable sales mix and cost action taken partly mitigated the effect on operating margins.
Further corrective action is planned in this business to address the high cost base in the United Kingdom where losses increased slightly in fiscal 2001.
The Beam Blade™ continued to gain acceptance and Ford and DaimlerChrysler automotive OEMs committed programs for the 2002/03 model years. The revolutionary Teflon® Blade was introduced, with its exclusive Teflon® wiping edge for longer life and smoother wipe.
During fiscal 2001, Wiper Systems obtained significant new commitments from automotive manufacturers with a number of programs, which started in fiscal 2002. Also, in South America there were a number of successful product launches.
Cost reduction efforts continued throughout the business during fiscal 2001 and the manufacturing facilities were consolidated with the closure of the Corsham, Lawrenceburg and Turin facilities. The Group continued to develop its strategy for Europe, which is the area where Tomkins has the weaker geographic presence and a higher cost base.
Other Industrial and automotive
A number of smaller businesses that manufacture a range of rubber based and miscellaneous products are included within this division. Sales of these businesses amounted to £86.3 million and operating income including income from associates and before goodwill amortization amounted to £5.9 million during fiscal 2001.
Air Systems Components
Net sales of the Air Systems Components group increased by 51.7 percent to £487.9 million in fiscal 2001, compared to £321.6 million in fiscal 2000. Of this increase, £150.2 million was due to the effect of the acquisition
37
in fiscal 2001, of Hart & Cooley, Air Diffusion and Actionair and £4.9 million was due to exchange rate movements leaving an underlying increase of £11.2 million representing 3.5 percent. Operating income including income from associates and before goodwill amortization rose by 30.4 percent to £55.3 million, compared to £42.4 million in fiscal 2000.
Although the industrial, commercial and residential construction markets in North America passed a peak some time ago, the impact on sales volumes only became apparent in the final quarter of fiscal 2001 as many of the segments products are supplied late in the building cycle. Tomkins managed to maintain or improve its market share in each of the segments markets, due to its recognized strong product offering in the industry.
Profit margins in this segment declined in fiscal 2001, reflecting, in part, pricing pressures but also the inclusion of the lower margin Hart & Cooley business.
Product developments
New product initiatives in fiscal 2001 were focused on developing higher value added engineered solutions for customers, responding to the demands of increasingly exacting standards of energy and noise specification. The Group’s investment in laboratory testing facilities has created an environment where we can establish product partnerships with customers to ensure the products developed respond precisely to their changing needs.
In fiscal 2001, just under half the segment’s sales passed through manufacturers’ representatives and around 30 percent were sold through wholesalers, principally in the residential market. The balance of sales was directed to OEMs. Working closely with architects and engineers we are able to remain in touch with the changing requirements of the contractors selling into the commercial and residential end markets.
During fiscal 2001, the successful integration of the Hart & Cooley brands into the segment’s product portfolio has further developed the Group’s relationships with the major U.S. wholesalers.
Cost initiatives
Integration of the Hart & Cooley business has involved a number of projects to rationalize production capability and consolidate distribution arrangements to reduce operating costs.
E-commerce initiatives have been vigorously pursued to ensure that the group responds quickly to the changing needs of the market place.
Engineered & Construction Products
Net sales of the Engineered & Construction Products group decreased by over 4 percent to £878.9 million in fiscal 2001 from £918.8 million in fiscal 2000. Operating income including income from associates and before goodwill amortization fell by approximately 29.1 percent to £85.4 million, from £120.4 million in fiscal 2000.
Each of the business areas in this group was affected by a slowdown in the markets in the United States in fiscal 2001. In particular the manufactured housing and recreational vehicles markets, which together accounted for around 13 percent of this group’s net sales in fiscal 2001, were lower year on year by 33 percent and 11 percent, respectively. These businesses were also affected by the decline in the housing and construction markets generally.
The manufactured housing market was affected by significant inventory reduction by the manufacturers and distributors as end demand for the product fell due in part to the impact of constraints on financing being provided to the buyers in this low cost housing market place.
The recreational vehicle market saw a more gradual contraction over fiscal 2001, worsening in the first quarter of calendar year 2001. Lower levels of discretionary spending in a tightening economy affect this market. Higher fuel costs during the year were also a factor.
Lasco
In the Bathware business, volumes came under pressure in fiscal 2001 due to the gradual decline in the residential housing market. This was more pronounced in some of the key regional markets and the lower manufactured housing market and because of de-stocking by wholesalers and retail home centers. Against this background, strong brand recognition, regional competitiveness and additional volumes from the new contract with Whirlpool helped the group to increase market share and overcome the impact of market contraction. Gains in market share were achieved in fiscal 2001 with new product introductions, expansion of business with some existing retail center customers and the new National Builder Programs. This changing mix of customers did reduce margins however. A stronger and more robust shower product was introduced during fiscal year 2001.
The PVC pipefittings business was adversely affected in fiscal 2001 by contraction in demand in the construction and industrial markets, as well as a slow down in demand for irrigation systems in the golf course market. Market
38
shares improved slightly in fiscal 2001 as sales to mass merchandisers in new geographic areas increased along with new export opportunities in Central America. There was some margin erosion as a result of competition, which was in part offset by aggressive cost reduction initiatives.
In the Composites business volumes declined due to lower demand in the truck and trailer and the recreational vehicles markets. The construction market, which is the other significant market for the business, also experienced reduced volumes.
Cost reduction initiatives partly offset the impact on the margin of volume declines. Tomkins has developed a higher-strength/lighter-weight product for the transportation market and this new product adds value to both the trailer manufacturer and fleet buyer in added strength plus fuel savings.
Philips Doors and Windows
The doors and windows business is heavily exposed to the manufactured housing and recreational vehicle markets and was affected by their downturn during fiscal 2001. Volumes and margins were lower in the business. In addition, continuing disappointing performance from the wooden doors and windows business resulted in its closure at the end of fiscal 2001 with a cost of £4.3 million. Acquisition of the business and assets of Care Free Aluminum Products, Inc. during the year provided an improved competitive position in the vinyl residential market and added to market share.
Material Handling
Although volumes in the business held up well during fiscal 2001, the overall backlog of work for fiscal 2002 was lower compared with fiscal 2001 primarily as a result of the reduction in the capital spend of the major automotive OEM’s. Dearborn Mid-West maintained its Q1 status with Ford, won its thirteenth Pentastar Award from DaimlerChrysler and received its first ISO-14001 environmental certification, well ahead of its competition and any customer required mandatory dates.
Dexter Wheels and Axles
General contraction in demand due to higher fuel costs, reduced discretionary spending activity and inventory reductions reduced volumes in fiscal 2001 versus fiscal 2000. Action taken to preserve price levels and margins resulted in a slight reduction in market shares in the manufactured housing and recreational vehicle markets while market share was steady in the larger utility and industrial markets. Prompt action to reduce costs further mitigated the overall profit decline from the volume reduction. The business already has significant market shares and so growth opportunities are driven by new product development.
Other businesses
Tomkins has a number of smaller businesses, which manufacture a range of taps, mixers and valves. In fiscal 2001, sales of these businesses amounted to £112.5 million and operating income including income from associates and before goodwill amortization amounted to £15.3 million.
Food Manufacturing
The Company completed its exit from Food Manufacturing on August 31, 2000 with the disposal of Ranks Hovis McDougall. Net sales of the Food Manufacturing Business for fiscal 2001, through August 31, 2000, were £562.1 million and operating income including income from associates and before goodwill amortization amounted to £26.0 million. Net sales for fiscal 2000 were £1,898.6 million and operating income including income from associates and before goodwill amortization was £162.0 million.
Professional, Garden & Leisure Products
The Company exited the major component of the Professional, Garden & Leisure Products business with the disposal of Murray and Hayter with effect from the end of September 2000. On May 11, 2001, we completed the sale of Smith & Wesson. Net sales for Professional, Garden & Leisure Products for fiscal 2001 were £208.3 million and the operating loss including income from associates and before goodwill amortization totaled £14.5 million compared to sales of £580.1 million and operating income including income from associates and before goodwill amortization of £22.4 million in fiscal 2000.
Net sales of garden products and bicycles were £164.2 million in fiscal 2001, which included only the five months up to the date of disposal, compared to £510.7 million for the full year in fiscal 2000. Trading for the five months up to disposal was adversely affected by the seasonal nature of the business and the impact of under recovery of overheads as production was restricted to reduce inventory levels.
Net sales of handguns and handcuffs decreased by 36.5 percent from £69.4 million in fiscal 2000 to £44.1 million in fiscal 2001. This reduction reflected general market weakness during the period before the election of the U.S. President and the impact of market reaction to Smith & Wesson signing the Settlement Agreement.
39
U.S. GAAP Reconciliation
Net income under U.S. GAAP for the 2002 Transition Period was £77.1 million, compared to a net income for the same period of £117.8 million under U.K. GAAP. The primary differences between the net income amount under U.S. GAAP and U.K. GAAP related to an impairment of goodwill (£30.9 million: Industrial & Automotive segment—£18.7 million, Engineered & Construction Products segment—£12.2 million), as well as differences in accounting for pension costs, goodwill amortization, share options and derivatives under U.S. GAAP. Tomkins adopted US Statements of Financial Accounting Standards No. 142, “Goodwill and Other Intangible Assets” with effect from May 1, 2002. On adoption of this standard, an initial impairment of £32.7 million was recognized (Industrial & Automotive segment—£4.1 million, Engineered & Construction Products segment—£28.6 million). There was no goodwill amortization charged to operating profit in the 2002 Transition Period. Net income under US GAAP is subject to additional adjustments relating to capitalized interest and deferred tax. Shareholders equity under US GAAP was £1,514.8 million at December 31,2002. The adjustments from UK GAAP reflect the cumulative effect of adjustments noted above, together with the reclassification of Tomkins own shares, held in trust under employee share ownership plans, into shareholders equity and the reclassification of the redeemable convertible cumulative preference shares out of shareholders equity.
Net income under U.S. GAAP for fiscal Year 2002 was £149.6 million, compared to a net income for the same period of £187.5 million under U.K. GAAP. The primary differences between the net income amount under U.S. GAAP and U.K. GAAP related to additional amortization of goodwill (£26.8 million) primarily resulting from acquisitions completed before March 31, 1998, as well as differences in accounting for pension costs, loss on disposal of operations and derivatives under U.S. GAAP.
Net income under U.S. GAAP for fiscal Year 2001 was £64.4 million, compared to net income for the same period of £53.3 million under U.K. GAAP. The primary differences between the net income amount under U.S. GAAP and U.K. GAAP related to additional amortization of goodwill (£25.4 million) primarily resulting from acquisitions completed before March 31, 1998, as well as differences in accounting for pension costs, deferred income taxes and impaired goodwill under U.S. GAAP.
Net income under U.S. GAAP for fiscal Year 2000 was £193.5 million, compared to net income for the same period of £105.1 million under U.K. GAAP. The primary differences between the net income amount under U.S. GAAP and U.K. GAAP related to additional amortization of goodwill (£49.8 million) primarily resulting from acquisitions completed before March 31, 1998, as well as differences in accounting for pension costs, deferred income taxes and impaired goodwill under U.S. GAAP.
U.S. GAAP also affects the accounting for certain share option and capitalized interest costs. In addition, differences exist in the presentation of certain financial statement line items such as cost of goods sold, exceptional items, gain on sale of business, operating costs, dividends, investment in own shares and preference shares.
We use derivatives in the normal course of business to manage our exposure to fluctuations in interest and foreign currency rates. Effective May 1, 2001, we have accounted for derivatives under US GAAP as assets or liabilities at fair value in accordance with SFAS No. 133, “Accounting for Derivative Instruments and Hedging Activities”.
For a further explanation of the differences between U.K. GAAP and U.S. GAAP, including a summary of the impact of recently issued U.S. accounting standards, please refer to Note 27 to our consolidated financial statements included elsewhere in this report.
Effect of Inflation
We do not believe that inflation has had a material effect on the Company’s financial condition or results of operations during the eight month period ended December 31, 2002 and the three years ended April 30, 2002.
Effect of Foreign Currency
See Item 11. “Quantitative and Qualitative Disclosures about Market Risk”, and also Note 26 of Notes to the consolidated financial statements for further discussion.
40
B. Liquidity and capital resources
The following summary highlights the principal movements affecting the net cash position. The Company continued to generate positive cash flow in the 2002 Transition Period and as of December 31, 2002, the net cash position of the Company was £157.6 million, compared to £150.8 million as of April 30, 2002.
| | | December 2002
| | | Unaudited December 2001
| |
| | | £ million | |
Net cash inflow from operating activities (see note 9 to the Financial Statements) | | 217.9 | | | 288.1 | |
Capital expenditure (net) | | (94.6 | ) | | (64.6 | ) |
Tax paid (net) | | (59.5 | ) | | (35.3 | ) |
Interest (paid)/received (net) | | (4.4 | ) | | 1.5 | |
Preference dividends paid | | (27.8 | ) | | (29.3 | ) |
Ordinary dividends paid | | (57.2 | ) | | (57.3 | ) |
Share issues/ (buy backs) | | 1.1 | | | (19.7 | ) |
Acquisitions and disposals | | 44.9 | | | (33.4 | ) |
Other movements | | (0.8 | ) | | (0.2 | ) |
Translation | | (12.8 | ) | | (2.7 | ) |
| | |
|
| |
|
|
Net funds movement | | 6.8 | | | 47.1 | |
| | |
|
| |
|
|
Details of net cash inflow from operating activities for the 2002 Transition Period are set forth in Note 9 to the consolidated financial statements.
The Group’s net cash position improved from £150.8 million as of April 30, 2002 to £157.6 million as of December 31, 2002. Our cash performance in this period benefited from strict financial control and was affected by an outflow of £25.4 million relating to our strategic manufacturing initiatives, while the April 30, 2002 cash balance benefited from the receipt of £29.1 million following the Bando litigation settlement arising in fiscal 2001. Of the net capital expenditure in the 2002 Transition Period, £22.0 million was associated with our various restructuring projects.
| | | Pounds
Sterling
| | | U.S.
dollar
| | | Euro
| | | Other
| | | Total
| |
| | | £ million | |
Cash and deposits | | 97.9 | | | 173.0 | | | 22.0 | | | 50.1 | | | 343.0 | |
| | |
|
| |
|
| |
|
| |
|
| |
|
|
Borrowings | | (150.5 | ) | | (19.9 | ) | | (2.5 | ) | | (12.5 | ) | | (185.4 | ) |
| | |
|
| |
|
| |
|
| |
|
| |
|
|
Tomkins plc is a holding company whose primary source of cash is operating cash inflows from its subsidiaries. There is a risk that a decrease in demand for the products of these subsidiaries, and therefore a decreased amount of cash inflows from these subsidiaries, could limit the Company’s ability to meet its obligations. In the event that such a decline in demand occurred, the Company expects it would be able to meet its obligations in the short term through additional financing currently available as described below.
In management’s opinion, working capital is sufficient for the Company’s present requirements.
Capital structure and financing
The Company’s debt capacity is based on maintaining a level of interest and preference dividend cover of five times in the medium term. Long-term debt finance requirements are defined with this parameter in mind and with an understanding of the Company’s future financing needs for capital investment, acquisitions and dividends.
The Company has a Global Medium Term Note Program under which Tomkins may issue term notes in each of the main currencies, including US Dollars, Euros and Sterling, up to a total maximum principal amount of £750 million. The initial bond under the program was for £150 million and was issued at a coupon of 8 percent. This was swapped into a floating interest rate.
In the immediate future the Company’s debt requirements will continue to be sourced from its credit facilities. Bank debt facilities mainly comprise multi-currency facilities of £400 million maturing in April 2005. These facilities are subject to certain covenants relating to interest cover and net debt to EBITDA, which as we currently have net cash are not applicable.
41
Although the Company currently has a net cash position, the medium term aim is to maintain an appropriate mix of equity and debt to ensure an efficient capital structure consistent with our investment grade financial profile.
Tomkins financial risk management is the responsibility of the central treasury function, which operates within strict policies and guidelines approved by the Board. Compliance with these policies and guidelines is monitored through the regular reporting of treasury activities to the Board.
In the Company’s opinion, working capital is sufficient for the company’s present requirements.
Interest rates
Interest rate exposures are managed by using interest rate swaps, options and forward rate agreements. The Company currently has a net cash position with interest rates fixed for periods of less than 12 months. A degree of fixed rate cover appropriate to the Company’s ongoing operations and capital structure will be reinstated should we have net borrowings.
The net cash position comprises principally Sterling and US Dollars.
Liquidity
Borrowing facilities are monitored against forecast requirements and timely action is taken to put in place, renew or replace credit lines. Our policy is to reduce financing risk by diversifying our funding sources and by staggering the maturity of our borrowings.
We operate in a wide range of markets and geographic locations and as a result the seasonality of our borrowing requirements is low. Our policy is to apply funds from one part of the Company to meet the obligations of another part wherever possible, to ensure maximum efficiency of the use of the Company’s funds. No material restrictions apply which limit the application of this policy.
Contractual obligations and commercial commitments
The Company’s consolidated contractual obligations and commercial commitments are summarized below, and are fully disclosed in the notes to the consolidated financial statements.
The following table includes aggregate information about the Company’s contractual obligations as of December 31, 2002 and the periods in which payments are due. Contractual commitments are items that the Company could be obligated to pay in the future. They are not required to be included on the consolidated balance sheet.
Contractual obligations
| | Total
| | Less than 1 year
| | 1-3 years
| | 4-5 years
| | After 5 years
|
| | | £ million |
Debt | | 167.9 | | 13.7 | | 1.7 | | — | | 152.5 |
Capital lease obligations | | 17.5 | | 3.6 | | 6.7 | | 1.9 | | 5.3 |
Operating leases | | 56.9 | | 12.7 | | 17.5 | | 10.9 | | 15.8 |
Redeemable convertible cumulative preference shares | | 386.3 | | — | | — | | 386.3 | | — |
The following table includes aggregate information about the Company’s other commercial commitments as of December 31, 2002.
Other commercial commitments
| | Total amounts
committed
| | Less than 1 year
| | 1-3 years
| | 4-5 years
| | After 5 years
|
| | | £ million |
Guarantees / Standby letters of credit | | 63.8 | | 56.6 | | 2.4 | | 1.5 | | 3.3 |
| | |
| |
| |
| |
| |
|
Off Balance Sheet Transactions
The Company is the beneficiary of a number of corporate owned life assurance policies. At December 31, 2002, the surrender value of the policies was £165.1 million (April 30, 2002—£169.6 million) and loans due to the life assurance company totaled £163.6 million (April 30, 2002—£166.6 million). The net debtor of £1.5 million (April 30, 2002—£3.0 million) is included in other debtors. These balances are offset in accordance with FRS 5.
42
C. Research and development, patents and licenses, etc.
Applied research and development is important to the Company’s manufacturing businesses. The Company does not have a group wide research and development program, although it maintains development centers in Japan, Europe and the United States. Companies are encouraged to review regularly their products and to develop them in accordance with perceived market trends. The Company’s measured expenditure on research and development was £34.3 million for the eight month period ended December 31, 2002, £54.1 million for the year ended April 30, 2002, £46.0 million for the year ended April 30, 2001 and £48.1 million for the year ended April 29, 2000. Research and development expenditure is written off in the period in which it is incurred.
D. Trend information
Activity within our major markets is not significantly different from the expectations set out in “Operating Results” and in Item 4. “Information on the Company”, except that US commercial construction is weaker (down 11 percent by the end of April 2003) and US residential construction is slightly stronger (up 2.4 percent by the end of April compared with our expectations). These changes, if reflected in the outturn for the remainder of the current year, are not expected to have any material effect upon the Company’s overall results for 2003.
With around 74 percent of the Company’s profits derived from the United States, the devaluation of the US dollar against sterling since the end of the Transition Period is likely to reduce reported earnings in sterling.
E. Critical accounting estimates
Our significant accounting policies are more fully described in the Notes to the consolidated financial statements. Certain of our accounting policies require the application of significant judgment by management in selecting the appropriate assumptions for calculating financial estimates. By their nature, these judgments are subject to an inherent degree of uncertainty. These judgments are based on our historical experience, terms of existing contracts, our observance of trends in the industry, information provided by our customers and information available from other outside sources, as appropriate. Our significant accounting policies include:
Warranty—Our warranty reserve is established based on our best estimate of the amounts necessary to settle future and existing claims on products sold as of the balance sheet date. While we believe that our warranty reserve is adequate and that the judgment applied is appropriate, such amounts estimated to be due and payable could differ materially from what will actually transpire in the future.
Pension and Other Postretirement Benefits—The determination of our obligation and expense for pension and other postretirement benefits is dependent on our selection of certain assumptions used by actuaries in calculating such amounts. Those assumptions are described in Note 24 to the consolidated financial statements and include, among others, the discount rate, expected long-term rate of return on plan assets and rates of increase in compensation, healthcare costs and other economic and demographic factors. In accordance with accounting principles generally accepted in the United Kingdom, actual results that differ from our assumptions are accumulated and amortized over future periods and therefore, generally affect our recognized expense and recorded obligation in such future periods. While we believe that our assumptions are appropriate, significant differences in our actual experience or significant changes in our assumptions may materially affect our pension and other post retirement obligations and our future expense.
Tomkins operates pension plans throughout the world. Over 65 percent of Tomkins employees are either in the UK or in the US. In the UK the majority of plans are based on final pensionable salary and there are a small number of defined contribution plans. A number of defined benefit plans are operated by a number of the Group’s US subsidiaries, however, defined contribution plans, which include profit sharing plans, cover most of Tomkins US employees. Both defined benefit and defined contribution plans are operated for employees in the rest of the world.
On December 31, 2002, the present value of scheme liabilities for the Group’s defined benefit plans exceeded the market value of scheme assets by £194.8 million, compared to £103.5 million at April 30, 2002. The increase in the underfunded status of the plans is primarily due to the impact of the unfavorable asset return environment and a reduction in the market value of scheme assets.
Valuation of Long-Lived Assets and Investments—We periodically review the carrying value of our long-lived assets and investments for continued appropriateness and when events and changes in circumstances occur that would be more likely than not reduce the fair value of the Company’s reporting units below their carrying value. This review is based upon our projections of anticipated future cash flows. These valuation techniques are based on a number of estimates and assumptions, including the projected future operating results of the reporting unit, discount rate, long-term growth rate and appropriate market comparables. While we believe that our estimates of future cash flows are reasonable, different assumptions regarding such cash flows could materially affect our evaluations. The Company’s assessments of impairment of long-lived assets, including goodwill and purchased intangible assets, and its periodic review of the remaining useful lives of its long-lived assets are an integral part of the Company’s ongoing strategic review of the business and operations, and are
43
also performed in conjunction with the Company’s periodic restructuring actions. Therefore future changes in the Company’s strategy could impact the projected future operating results that are inherent in the Company’s estimates of fair value resulting in impairments in the future. Additionally, other changes in the estimates and assumptions, including discount rate and expected long-term growth rate, which drive the valuation techniques employed to estimate the fair value of long-lived assets and goodwill could change and, therefore, impact the assessments of impairment in the future.
Recently Issued Accounting Standards
SFAS No. 143, ‘Accounting for Asset Retirement Obligations’
SFAS No. 143 addresses financial accounting and reporting for obligations associated with the retirement of tangible long-lived assets and the associated asset retirement costs. It applies to legal obligations associated with the retirement of long-lived assets that result from the acquisition, construction, development, and (or) the normal operation of a long-lived asset, except for certain obligations of lessees. This Statement requires that the fair value of a liability for an asset retirement obligation be recognized in the period in which it is incurred if a reasonable estimate of fair value can be made. The associated asset retirement costs are capitalized as part of the carrying amount of the long-lived asset. SFAS No. 143 amends SFAS No. 19, ‘Financial Accounting and Reporting by Oil and Gas Producing Companies’ and certain other pronouncements. SFAS No. 143 is effective for financial statements issued for fiscal years beginning after June 15, 2002. Tomkins has assessed the potential impact of the adoption of SFAS No. 143 and concluded that there is no impact.
SFAS No. 145, ‘Rescission of FASB Statements No. 4, 44 and 64, Amendment of FASB Statement No. 13, and Technical Corrections’
SFAS No. 145 was issued in April 2002 and is applicable to fiscal years beginning after May 15, 2002. One of the provisions of this technical statement is the rescission of SFAS No. 4, “Reporting Gains and Losses from Extinguishment of Debt”, whereby any gain or loss on the early extinguishment of debt that was classified as an extraordinary item in prior periods in accordance with SFAS No. 4, which does not meet the criteria of an extraordinary item as defined by APB Opinion 30, shall be reclassified. Tomkins is adopting SFAS No. 145 for its fiscal year ending December 31, 2003 and Tomkins has concluded that there is no material impact on its financial position or results of operations.
SFAS No. 146, ‘Accounting for Costs Associated with Exit or Disposal Activities’
In June 2002, SFAS No. 146 was issued. SFAS No. 146 addresses financial accounting and reporting for costs associated with exit or disposal activities and nullifies EITF Issue No 94-3 ‘Liability Recognition for Certain Employee Termination Benefits and Other Costs to Exit an Activity (including certain costs incurred in a restructuring)’ (“EITF 94-3”). SFAS No. 146 requires recognition of a liability for a cost associated with an exit or disposal activity when the liability is incurred as opposed to when the entity commits to an exit plan under EITF 94-3. Under SFAS No. 146, fair value is the objective for initial measurement of the liability. SFAS No. 146 is effective for exit or disposal activities that are initiated after December 31, 2002, with early application encouraged. Tomkins adopted FAS 146 effective January 1, 2003. No significant exit or disposal activities have been initiated since this date.
SFAS No. 148, ‘Accounting for Stock-Based Compensation —Transition and Disclosure, an amendment of FASB Statement No. 123’
In December 2002, the FASB issued SFAS 148. SFAS 148 amends SFAS No. 123 Accounting for Stock-Based Compensation, or SFAS 123, and provides alternative methods for accounting for a change by registrants to the fair value method of accounting for stock-based compensation. The statement is effective for fiscal years beginning after December 15, 2002. Tomkins did not adopt the fair value method of accounting for stock-based compensation for the eight month period ended December 31, 2002. Tomkins has not yet decided on what course of action to take in response to this standard but management recognizes that a change to the fair value method of accounting from the current intrinsic value method may be required at some future date. It is not possible at present to assess the impact that any such change may have on its results of operations or the financial position.
SFAS No. 149, ‘Amendment of SFAS No. 133 on Derivative Instruments and Hedging Activities’
In April 2003 the FASB issued SFAS No. 149. The Statement amends and clarifies accounting for derivative instruments, including certain derivative instruments embedded in other contracts, and for hedging activities under SFAS No. 133. In particular, it (1) clarifies under what circumstances a contract with an initial net investment meets the characteristic of a derivative as discussed in SFAS No. 133, (2) clarifies when a derivative contains a financing component, (3) amends the definition of an underlying to conform it to the language used in FASB Interpretation No. 45, Guarantor Accounting and Disclosure Requirements for Guarantees, Including Indirect Guarantees of Indebtedness of Others and (4) amends certain other existing pronouncements. SFAS No. 149 is effective for contracts entered into or modified after 30 June 2003, except as stated below and for hedging relationships designated after 30 June 2003. The provisions of SFAS No. 149 that relate to SFAS No. 133 Implementation Issues that have been effective for fiscal quarters that began prior to 15 June 2003 should continue to be applied in accordance with their respective effective dates. In addition, certain provisions relating to forward purchases or sales of when-issued securities or other securities that do not yet exist, should be
44
applied to existing contracts as well as new contracts entered into after 30 June 2003. SFAS No. 149 should be applied prospectively. Tomkins is currently evaluating the effect of this statement.
SFAS No. 150, ‘Accounting for Certain Financial Instruments with Characteristics of both Liabilities and Equity’
In May 2003, the FASB issued SFAS No. 150. SFAS 150 modifies the accounting for certain financial instruments that, under previous guidance, issuers could account for as equity. The Statement requires that those instruments be classified as liabilities in statements of financial position. SFAS 150 affects an issuer’s accounting for three types of freestanding financial instruments, namely:
| | - | | mandatorily redeemable shares, which the issuing company is obligated to buy back in exchange for cash or other assets. |
| | - | | Instruments, other than outstanding shares, that do or may require the issuer to buy back some of its shares in exchange for cash or other assets. These instruments include put options and forward purchase contracts. |
| | - | | obligations that can be settled with shares, the monetary value of which is fixed, tied solely or predominantly to a variable such as a market index, or varies inversely with the value of the issuers’ shares. |
SFAS 150 does not apply to features embedded in financial instruments that are not derivatives in their entirety. In addition to its requirements for the classification and measurement of financial instruments within its scope, SFAS 150 also requires disclosures about alternative ways of settling those instruments and the capital structure of entities, all of whose shares are mandatorily redeemable. SFAS 150 is effective for financial instruments entered into or modified after 31 May 2003, and otherwise is effective at the beginning of the first interim period beginning after 15 June 2003. It is to be implemented by reporting the cumulative effect of a change in an accounting principle for financial instruments created before the issuance date of the Statement and still existing at the beginning of the interim period of adoption. Restatement is not permitted. Tomkins is currently evaluating the effects of this statement.
FASB Interpretation (“FIN”) No. 45, ‘Guarantor’s Accounting and Disclosure Requirements for Guarantees, Including Indirect Guarantees and Indebtedness of Others (an interpretation of FASB Statements No. 5, 57 and 107 and Rescission of Interpretation No. 34)’
In November 2002, the FASB issued FIN 45. This interpretation elaborates on the disclosures to be made by a guarantor in its financial statements about its obligations under certain guarantees that it has issued. It also clarifies that a guarantor is required to recognize, at the inception of a guarantee, a liability for the fair value of the obligation undertaken in issuing the guarantee. This interpretation does not prescribe a specific approach for subsequently measuring the guarantor’s recognized liability over the term of the related guarantee. This interpretation also incorporates, without change, the guidance in FASB Interpretation No. 34, “Disclosure of Indirect Guarantees of Indebtedness to Others”, which is being superseded. The initial recognition and initial measurement provisions of this interpretation are applicable on a prospective basis to guarantees issued or modified after December 31, 2002, irrespective of the guarantor’s fiscal year-end. Tomkins is assessing, but at this point does not believe the adoption of the recognition and initial measurement requirements of FIN 45 will have a material impact on its financial position or results of operations.
FIN No. 46 ‘Consolidation of Variable Interest Entities, an interpretation of ARB No. 51’
In January 2003, the FASB issued FIN 46. This interpretation requires certain variable interest entities to be consolidated by the primary beneficiary of the entity if the equity investors in the entity do not have the characteristics of a controlling financial interest or do not have sufficient equity at risk for the entity to finance its activities without additional subordinated financial support from other parties. FIN 46 is effective for all new variable interest entities created or acquired after January 31, 2003. For variable interest entities created or acquired prior to February 1, 2003, the provisions of FIN 46 must be applied for the first interim or annual period beginning after June 15, 2003. Tomkins does not currently believe that it will be required to consolidate or disclose any variable interest entities on adoption of FIN 46.
FRS 17—Retirement Benefits
In November 2000, the Accounting Standards Board issued FRS 17 ‘Retirement Benefits’, which replaces SSAP 24, UITF 6 and UITF 18, relating to pension costs and other post-retirement benefits. The FRS makes changes in respect of accounting for defined benefit schemes, leading to increased volatility in the balance sheet as actuarial gains and losses are recognized immediately and scheme assets are valued at fair values. As permitted by the transitional arrangements of FRS 17, Tomkins has elected to defer full implementation of the standard until the year ended December 31, 2005. The phased transitional disclosures required under FRS 17 are set out in Note 24 to the financial statements. Implementation of the standard for the 2002 Transition Period would result in a reduction to net assets of £142.1 million and a reduction of £136.4 million to the profit and loss account.
45
Item 6. Directors, Senior Management and Employees
A. Directors and senior management
The directors and executive officers of Tomkins plc as of June 6, 2003 are as follows:
| | | Age as of June 6, 2003
| | Detail
|
Executive directors | | | | |
| | |
J. Nicol | | 49 | | Chief Executive Officer |
| | |
K. Lever | | 49 | | Chief Financial Officer |
| | |
A.J. Reading | | 59 | | Chairman, Tomkins Corporation |
| | |
Non-executive directors | | | | |
| | |
D.B. Newlands | | 56 | | Non-executive Chairman |
| | |
N.N. Broadhurst | | 61 | | Non-executive director |
| | |
J.M.J. Keenan | | 66 | | Non-executive director |
| | |
K.J. Minton | | 66 | | Non-executive director |
| | |
Sir Brian Pitman | | 71 | | Non-executive director |
| | |
M.F. Wallach | | 60 | | Non-executive director |
| | |
Executive officers | | | | |
| | |
R. Bell | | 55 | | President —The Gates Rubber Company |
| | |
T.J. O’Halloran | | 55 | | President —Air Systems Components Division |
| | |
G.S. Pappayliou | | 49 | | General Counsel |
| | |
N.C. Porter | | 51 | | Company Secretary |
Executive directors
J. Nicol was appointed Chief Executive on February 18, 2002. He was formerly President and Chief Operating Officer of Magna International Inc., the Canadian automotive parts company. He joined Magna in 1987 as Vice President, Special Projects, following a successful career as a commercial lawyer. He left in 1992 to set up TRIAM Automotive Inc. and returned to Magna as Vice-Chairman when Magna acquired TRIAM in 1998.
K. Lever was appointed Chief Financial Officer on November 1, 1999. He is a non-executive director of Vega Group PLC. Ken is a Chartered Accountant and a member of the ICAEW Financial Reporting Committee. He has held executive directorships at Albright and Wilson plc, Alfred McAlpine PLC and Corton Beach plc and was a partner at Arthur Andersen.
A.J. Reading was appointed to the Board in December 1992. He joined the Group in 1990 from Pepe Group. He has many years of experience in manufacturing industries worldwide including roles as Divisional Group Chief Executive at BTR, Group Executive at Thomas Tilling and Managing Director at Donaldson Europe. He is resident in the United States of America.
Non-executive directors
D.B. Newlands was appointed a non-executive director of the Company in August 1999, and became Chairman in June 2000. He is a non-executive director of several companies, including the Standard Life Assurance Company. He was formerly finance director of The General Electric Company p.l.c. and non-executive Chairman of Britax International plc.
46
N.N. Broadhurst was appointed a non-executive director of the Company in December 2000. He is currently Chairman of Chloride Group PLC, and Freightliner Limited. He is also a non-executive director of Cattles plc, Old Mutual plc, Taylor Woodrow plc and United Utilities PLC. He was Group Finance Director of Railtrack PLC from 1994 to 2000.
J.M.J. Keenanwas appointed a non-executive director of the Company in November 2001. He is presently a non-executive director of Marks and Spencer Group p.l.c. and the Body Shop International plc and is a patron of the advisory board of the Cambridge Centre for International Business and Management. He was Deputy Chief Executive of Guinness United Distillers & Vintners Limited and an executive director of Diageo plc until he retired in October 2001.
K.J. Minton was appointed a non-executive director of the Company in December 2000. He is a non-executive director of Solvay SA. He spent most of his career at Laporte plc where he was Managing Director for five years and then Chief Executive for ten years. He has also held non-executive directorships at John Mowlem & Company PLC, SGB Group Plc and Arjo Wiggins Appleton PLC.
Sir Brian Pitman was appointed a non-executive director of the Company in June 2000. He is also a non-executive director of Carlton Communications Plc and the Carphone Warehouse Group PLC and is a senior adviser to Morgan Stanley. He retired in April 2001 from Lloyds TSB Group plc where he was Chief Executive for 13 years and Chairman for four years. He was also non-executive Chairman of Next Group plc from 1998 until May 2002.
M.F. Wallach was appointed a non-executive director of the Company in August 1999. He is an investment banker, based in Denver, Colorado. He advises the Gates family on its interests in the Group’s redeemable and perpetual preference shares.
Executive officers
R. Bellwas appointed President of The Gates Rubber Company on May 27, 2002, in addition to his role as Group President Worldwide Power Transmission Division. He came to Gates with the Uniroyal acquisition in 1986 and has held management positions in Asia and Europe prior to moving to the United States of America in 1996.
T.J. O’Halloran was appointed President—Air Components Division in 1999. He has had eighteen years experience with Tomkins in the ASC group, including his present role as President of Air Systems Components Limited Partners and responsibility as President of Ruskin.
G.S. Pappayliou was appointed General Counsel on April 9, 2003. He joined the Group in August 1990 with the acquisition of Philips Industries. Thereafter he served as the General Counsel of Tomkins Industries and later as the Group’s General Counsel—North America.
N.C. Porter was appointed Company Secretary on August 1, 2002. Previously he was Company Secretary at Marconi plc and before that at its predecessor, The General Electric Company p.l.c.
Board changes
All of the above were directors throughout the 2002 Transition Period. D.J. Snowdon resigned as a director on June 30, 2002 and R.N. Marchant retired as a director on July 31, 2002.
Executive officer changes
J.D. Wiggins was replaced by R. Bell as an executive officer on May 27, 2002. N.C. Porter was appointed Company Secretary on August 1, 2002. G.S. Pappayliou was appointed General Counsel on April 9, 2003.
There are no family relationships between any director or executive officer and any other director or executive officer or any arrangement or understanding between any director or executive officer and any other person pursuant to which such director or executive officer was so elected or appointed.
The Articles of Association of the Company provide that, unless otherwise determined by the shareholders at a general meeting, the number of directors will not be less than two nor more than fifteen. Directors may be appointed by the shareholders at a general meeting or by the Board itself, provided that any director appointed by the Board is required to retire from office (but is eligible to stand for re-appointment by the shareholders) at the annual general meeting of the Company following his appointment. At every annual general meeting, not less than one-third of the directors are required to retire from office and are eligible to stand for re-appointment at such meeting. Subject to the provisions of the Companies Act 1985, the Board may from time to time appoint one or more directors to an executive office on such terms and for such period as it may determine. No director or executive officer has a service contract with the Company of more than two years’ duration.
47
B. Compensation
Remuneration Committee
During the eight month period ended December 31, 2002, the Board modified the terms of reference for the Remuneration Committee to reflect current best practice. The principal responsibility of the Remuneration Committee is to determine the framework or broad policy for the Company’s executive remuneration and the remuneration of the Chairman of the Board, for approval by the Board. The remuneration of non-executive Directors is determined by the Board itself.
Details of the emoluments, bonuses, benefits-in-kind, incentive arrangements (including share options and other long term incentives), pensions and service contracts applicable to each Director who served during the period are set forth below.
Membership of the Remuneration Committee and Advisers
The Remuneration Committee is made up exclusively of non-executive Directors who are each considered by the Board to be independent and free from any business or other relationship that could materially interfere with the exercise of their independent judgment. Members of the Committee who served throughout the period were:
K J Minton (Chairman)
N N Broadhurst
J M J Keenan
There were no changes to the membership of the Committee during the period.
The Committee consults with the Chairman of the Board and Chief Executive Officer concerning matters of executive remuneration. The Committee also received advice from external advisers who were appointed by the Company, namely Mercer Human Resource Consulting relating to a review of executive Directors’ remuneration and from PA Consulting concerning the establishment of a new executive bonus scheme. Mercer Human Resource Consulting also provided professional services in the area of pension scheme advice; PA Consulting provided no other professional services to the Tomkins Group during the period.
Statement of Company’s policy on Directors’ remuneration
Current policies
The policies operated by the Company for the period are set forth below:
Executive remuneration
The Company’s policy on executive remuneration during the period has been that each of the Remuneration Committee and Board should satisfy itself that executives, including executive Directors, are fairly rewarded for their individual contributions to the Group’s performance. The Remuneration Committee has sought to ensure that executive Directors receive a level of remuneration that is appropriate to their scale of responsibility and performance and which will attract, motivate and retain individuals of the necessary caliber. Executive Directors’ are also entitled to pension benefits based upon their basic salary. This policy applies whether or not an executive Director is a member of the Tomkins Retirement Benefits Plan or has a personal pension arrangement.
Service contracts
The Company’s policy on Directors’ service contracts is that service contracts and letters of appointment for executive Directors normally provide for notice periods of no longer than twelve months. On appointment, a longer notice period may apply, but this will reduce over time to the normal twelve months’ notice period. Notwithstanding the provisions in an executive Director’s service contract or letter of appointment concerning termination payments, the Company will seek to reduce any compensation that may be payable to reflect the departing Director’s obligations to mitigate loss.
External appointments
The Company’s policy on external appointments is that with the approval of the Chairman of the Board, executive Directors are permitted to hold appointments outside the Company. Any fees payable in connection with such appointments are retained by Directors unless otherwise agreed.
Options—Performance conditions and vesting
The Company’s policy on performance conditions and vesting is to align the interests of scheme participants with those of shareholders by setting appropriate performance conditions at levels that encourage and stretch management to maximize value creation. In addition, performance conditions are selected that take account of current industry practice. Performance conditions, where applicable, for each of the schemes operated by the Company are given below. The Company has operated a policy of phasing the grant of options and recognizes that in exceptional cases, it may be necessary to increase initial grants to attract and retain senior executives and employees with specialist skills.
48
Other than options granted under the employees’ savings related share option scheme, no options are granted at a discount to the market price. No amount is payable by the employee on the grant of an option.
Long term incentives
The Company has operated a number of share-based incentive schemes in the past but following the review of executive remuneration, the Remuneration Committee and Board expect the number of plans and schemes to reduce over time as they lapse and are not renewed or replaced. This affects The Tomkins Restricted Share Plan (“RSP”) and The Tomkins Long Term Loyalty Plan. Existing obligations in respect of those schemes will be honored but no new commitments will be entered into. No further awards will be made under the Group’s share-based incentive plans, other than The Tomkins Share Matching Scheme, which in due course will also phase out, as awards cease to vest under the RSP.
New policies
Annual remuneration for executives
During the period, the Remuneration Committee has undertaken, with the assistance of PA Consulting, a review of executive remuneration in the Group. The Board recognizes that one of its key objectives is to grow the value of the business for the benefit of shareholders and that such growth is strongly related to the degree of entrepreneurial spirit in the Group. In order to create the necessary entrepreneurial impetus within an organization, compensation arrangements (among other things) are required which are similar to those that an owner of a business would seek. This has led to a change in remuneration policy that will provide levels of total remuneration that attract, retain and motivate executives, to be provided through a combination of base salaries at median level or below and annual bonuses that have a direct and proportionate link to total value created. This will provide the incentive for executives to act like owners of the business. The Remuneration Committee and the Board believe that this will more closely align the interests of shareholders and management whereby executives only receive substantial rewards when they have created substantial value in the business.
Over time and subject to the achievement of value-creating performance targets, the new policy is likely to lead to a realignment of the component parts of total executive remuneration, so that a greater part of the total package received by executives will be made up of incentive pay with the remainder coming from base salaries at the median level or below. Taking performance targets relating to the Company’s executive share option schemes and the new incentive pay arrangements, a substantial proportion of total remuneration in the current and future years will be directly related to actual measurable performance (“Bonusable Profit”). Bonusable Profit is based upon post-tax operating income, less a charge for invested capital used in the business. Managers will receive a fixed percentage of the income they create and so, if income increases bonuses will increase and conversely, if income decreases so too will bonuses.
Under the new scheme, bonuses will be paid partly in cash and partly in shares already in issue (which will be purchased in the market). This is intended to increase share ownership and as part of the new incentive arrangements, participants in the new scheme will be required to hold Tomkins shares equal in value to the average over three years of total annual remuneration after tax. Other than the policy relating to executive remuneration, we intend to continue current remuneration policies.
Performance graph
The graph set out below plots Total Shareholder Return on a holding in the Company’s shares for each of the past five years ended December 31, measured against the performance of the FTSE Engineering and Machinery Index. This index was chosen because its major constituents are, like Tomkins, moderately diversified engineering groups with a significant manufacturing presence outside of the home UK market.
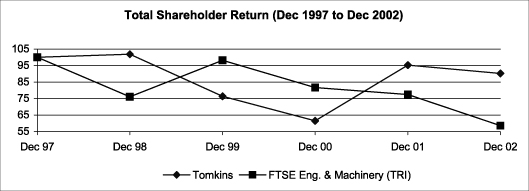
Source of data : UBS Limited
49
Elements of remuneration
Basic salary, fees, bonuses and benefits in kind for the eight month period ended December 31, 2002:
| | | Total emoluments (excluding pension contributions)
| |
| | | Basic
salary/fees
| | Bonus
| | Benefits in
kind(2)
| | Eight months
ended
December 31,
2002
| | Year ended April 30,
2002
| |
| | | £000 | |
Chairman | | | | | | | | | | | |
D.B. Newlands(3) | | 105 | | — | | — | | 105 | | 312 | |
Executive Directors | | | | | | | | | | | |
J. Nicol(4) | | 500 | | 500 | | 467 | | 1,467 | | 351 | * |
K. Lever(4) | | 232 | | 116 | | 20 | | 368 | | 443 | |
R.N. Marchant (to July 31, 2002)(5) | | 37 | | 48 | | 6 | | 91 | | 243 | |
A.J. Reading(5)(6)(7) | | 313 | | 141 | | 11 | | 465 | | 634 | |
D.J. Snowdon (to June 30, 2002)(5)(8) | | 515 | | — | | 8 | | 523 | | 542 | |
Non-executive Directors | | | | | | | | | | | |
N.N. Broadhurst(3) | | 28 | | — | | — | | 28 | | 38 | |
J.M.J. Keenan(3) | | 26 | | — | | — | | 26 | | 16 | ** |
K.J. Minton(3) | | 29 | | — | | — | | 29 | | 38 | |
Sir Brian Pitman(3) | | 25 | | — | | — | | 25 | | 34 | |
M.F. Wallach(3) | | 25 | | — | | — | | 25 | | 32 | |
| | | 1,835 | | 805 | | 512 | | 3,152 | | 2,683 | |
| 1 | | Bonus payments are calculated by reference to the achievement of three individually graduated performance measurements against the Group’s budget. They are: operating income; return on invested capital after tax; and net cash flow after tax and financing. The respective weighting of each performance measurement is 40 percent, 20 percent and 40 percent. In the eight month period ended December 31, 2002, all three measurements were either reached or were in the region of their maximum threshold. The bonus paid to Richard Marchant during the period was a special bonus paid on his retirement to reflect his long service to the Group. |
| 2 | | Benefits-in-kind include company car and related costs, medical cover and life insurance. |
Benefits in kind for James Nicol for the period May 1, 2002 to December 31, 2002 included the following:
(a) a buy-out bonus payment and relocation allowance of £23,333 per month for a period of three years commencing February 18, 2002, such payments to cease on termination of employment, if sooner;
(b) a cash payment under the Deferred Matching Share Purchase Plan equivalent to the net dividend payable on 1,015,228 shares of Tomkins plc (see Section E.).
In the case of Richard Marchant, benefits in kind included the use of a Company flat up to the date of his retirement, following which it was sold by the Company at a profit. On April 26, 2002, the Company entered into a short-term lease on a property that will be occupied by James Nicol and his family from June 1, 2002 to June 30, 2004. James Nicol has provided an indemnity to ensure that the Company’s commitment as to the cost of such property is limited to that provided in his service contract.
No Director has received an expense allowance from the Company in the eight months to December 31, 2002.
| 3 | | Non-executive Directors are paid a basic fee at the rate of £30,000 per annum, plus 2,000 Tomkins shares. On July 31, 2002, 2,000 shares were purchased for each of them and the cost of these shares forms part of their remuneration. In addition, the Chairmen of the Audit Committee, Remuneration Committee and the Health, Safety and Environment Committee are each paid an additional £5,000 per annum. As a member of the Health, Safety and Environment Committee, Marshall Wallach is paid an additional £2,500 per annum. As a member of the Remuneration and Audit Committees, Jack Keenan is paid an additional £2,000 per annum. |
| 4 | | James Nicol and Ken Lever are not entitled to any retirement benefits defined in terms of final or average salary, however, in addition to the figures above, they receive a payment at an annual rate of 37.5 percent of their basic salary, which for the period ending December 31, 2002 amounted to £188,000 (year ended April 30, 2002—£57,000) and £88,000 (year ended April 30, 2002—£115,000), respectively, to enable them to make contributions to retirement benefits schemes of their choice on behalf of themselves and their dependants. All payments made by Tomkins plc were for the period ending December 31, 2002. |
| 5 | | In addition to the amounts in the table above, in respect of the long-term incentive compensation during the eight month period ended December 31, 2002, Richard Marchant received £123,000 (year ended April 30, 2002—£4,000), Anthony Reading received £25,000 (year ended April 30, 2002—£13,000) and David Snowdon received £422,000 (year ended April 30, 2002—£20,000) (see below). |
| 6 | | Anthony Reading works predominantly in the United States and his pay is denominated in US dollars. During the period ended December 31, 2002, additional remuneration of £4,000, which is included in basic salary/fees in the table above, was paid to compensate him for US Federal Insurance Contributions. |
| 7 | | During the period the only gains on exercise of share options were by Anthony Reading of £22,825 (year ended April 30, 2002 – £58,000). The market prices at the dates of exercise were 242.00 pence (7,422 shares) and 227.50 pence (54,224 shares). Gains on exercise represent the difference between the market price on the date of exercise and the subscription price of the shares and are not included in the above table. |
| 8 | | David Snowdon’s basic salary included £450,000 paid in connection with the early termination of his employment representing 51 weeks’ salary plus compensation for loss of benefits and bonus for the two-month period ended June 30, 2002. |
50
The following table shows emoluments paid or payable to all directors and all executive officers of Tomkins plc as a group for the eight months ended December 31, 2002.
| | | Basic
salary/fees
| | Annual
Bonuses
| | Benefits
in kind
| | Total
emoluments
(excluding
pension
contributions)
| | Pension
contributions
| | Gains made
on the
exercise of
share options
|
| | | £000 | | £000 | | £000 | | £000 | | £000 | | £000 |
Total for all directors and other executive officers | | 2,262 | | 1,031 | | 546 | | 3,839 | | 529 | | 23 |
Long term incentive plans
Directors’ interests in Tomkins shares as of December 31, 2002:
The Directors’ interests in Tomkins shares are set out in section E. below and in the case of the executive Directors, where appropriate these include shares held through their participation in long-term incentive arrangements consisting of one or more of the Tomkins Restricted Share Plan (“RSP”), the Tomkins Share Matching Scheme (“SMS”) and the Tomkins Long-Term Loyalty Plan (“LTLP”) (together the “Schemes”).
The interests of the Directors in Tomkins ordinary shares held within the Schemes that are yet to vest and yet to be included in Directors’ remuneration were as follows:
Director
| | Scheme or
Plan
| | Number as of
December 31, 2002
| | Number
awarded in the
eight months
to December 31,
2002
| | Number
vested in the
eight months
to December 31,
2002
| | | Number as of
April 30, 2002
| | Vesting
Period
|
K Lever | | RSP | | 101,869 | | — | | — | | | 101,869 | | 2003-2004 |
| | | SMS | | — | | — | | — | | | — | | — |
| | | LTLP | | — | | — | | — | | | — | | — |
R N Marchant | | RSP | | — | | — | | (2,440 | ) | | 2,440 | | — |
(through July 31, 2002) | | SMS | | — | | — | | (9,808 | ) | | 9,808 | | — |
| | | LTLP | | — | | — | | (40,000 | ) | | 40,000 | | — |
A J Reading | | RSP | | — | | — | | (10,544 | ) | | 10,544 | | — |
| | | SMS | | 17,320 | | 10,544 | | — | | | 6,776 | | 2003-2004 |
| | | LTLP | | 100,000 | | — | | — | | | 100,000 | | 2004 |
D J Snowdon | | RSP | | — | | — | | (12,000 | ) | | 12,000 | | — |
(through June 30, 2002) | | SMS | | — | | — | | (54,530 | ) | | 54,530 | | — |
| | | LTLP | | — | | — | | (100,000 | ) | | 100,000 | | — |
| 1 | | Of Ken Lever’s total RSP awards, 100,000 will vest at the end of the three-year restricted period, but will not be eligible for a matching award under the SMS. |
| 2 | | Within the RSP, the value of entitlements for current Directors as of December 31, 2002 was £194,000 (April 30, 2002—£335,000). During the period, 24,984 shares vested under the RSP: 12,000 at 253.50 pence per share, market value £30,000 (year ended April 30, 2002—£20,000) in respect of David Snowdon; 2,440 at 234.00 pence per share, market value £6,000 (year ended April 30, 2002—£1,000) in respect of Richard Marchant; and 10,544 at 235.00 pence per share, market value £25,000 (year ended April 30, 2002—£13,000) in respect of Anthony Reading. |
| 3 | | For the SMS, the value of entitlements for current Directors as of December 31, 2002 was £33,000 (April 30, 2002—£188,000). 10,544 shares were awarded to Anthony Reading on September 25, 2002 (in relation to the vesting of the RSP award made in August 1999) with a market value of £24,000 when the market price per share was 225.50 pence (year ended April 30, 2002—£13,000). No other Director received an award under the SMS during the period (year ended April 30, 2002—Richard Marchant, £17,000; David Snowdon, £83,000). During the period 64,338 shares vested under the SMS: 54,530 at 253.50 pence per share, market value £138,000 (year ended April 30, 2002—£nil) in respect of David Snowdon; and 9,808 at 234.00 pence per share, market value £23,000 (year ended April 30, 2002—£3,000) in respect of Richard Marchant. |
| 4 | | Within the LTLP, the value of entitlements for current Directors at December 31, 2002 was £190,000 (April 30, 2002—£634,000). During the period, 140,000 shares vested under the LTLP: 100,000 at 253.50 pence per share, market value £254,000 (year ended April 30, 2002—£nil) in respect of David Snowdon; and 40,000 at 234.00 pence per share, market value £94,000 (year ended April 30, 2002—£nil) in respect of Richard Marchant. |
| 5 | | As of December 31, 2002, 117,320 shares were required to be retained by Anthony Reading in order to allow the SMS and LTLP awards in the above table to vest in the relevant vesting periods (April 30, 2002— 106,776 shares). No other current Director was required to retain shares in this respect as of December 31, 2002 (April 30, 2002—David Snowdon, 154,530 shares; Richard Marchant, 50,889 shares). |
| 6 | | Richard Marchant’s remaining entitlement to 7,762 shares held as Company Awards within the RSP vested on retirement at a market price of 234.00p. The vesting shares had already been disclosed as Directors’ remuneration in prior years. At the period end, Richard Marchant held no further entitlement to amounts due under the long term incentive compensation schemes which had already been included in Directors’ remuneration (April 30, 2002—£20,000). |
51
Retirement benefits
Retirement benefits, defined in final salary terms, accrued during the period ending December 31, 2002 for David Snowdon, Anthony Reading, and Richard Marchant. The Tomkins Retirement Benefits Plan (the “RBP”) provides pension and other benefits within Inland Revenue limits. Total benefits for David Snowdon and Anthony Reading are in excess of prescribed limits. The excess benefits for David Snowdon are funded in the Tomkins Funded Unapproved Retirement Benefits Scheme and those for Anthony Reading are unfunded.
The Directors’ accrued benefit entitlements and transfer values were:
Name of director
| | Age as of
December 31,
2002
| | Accumulated total of accrued
pension as of December 31, 2002
| | Transfer
Value of accrued pension as of
December 31, 2002
| | Accumulated
total of accrued pension as of April 30, 2002
| | Transfer Value of accrued
pension as of April 30, 2002 valued as of April 30, 2002
| | Increase in
transfer
value over
period
|
| | | | | £000 pa | | £000 | | £000 pa | | £000 | | £000 |
R N Marchant | | 56 | | 101 | | 1,551 | | 109 | | 1,280 | | 271 |
A J Reading | | 59 | | 103 | | 1,475 | | 97 | | 1,342 | | 133 |
D J Snowdon | | 58 | | 111 | | 1,791 | | 103 | | 1,454 | | 337 |
The transfer values are the full cash equivalent of the accrued pension, at the stated date, calculated in accordance with Actuarial Guidance Note GN11 Version 8.1.
The increase in transfer value for David Snowdon and Richard Marchant takes into account that Tomkins has consented to their early retirement. The terms of early retirement in this event are set forth in the Rules of the RBP. On Richard Marchant’s retirement, his accrued pension of £114,374 per annum was accordingly reduced to £100,935 per annum.
David Snowdon
Accrual of benefits for David Snowdon ceased on June 30, 2002. Pensionable earnings comprised basic annual salary only. His accrual was augmented by £15,260 equating to the benefit he would have accrued during his notice period. Tomkins plc consented to his early retirement on June 30, 2002. During the eight month period ended December 31, 2002, the benefit due from a previous employer has been updated; this benefit is offset from the benefit accruing from his employment as a Director of Tomkins plc. This means the total accrual of £102,785 per annum in the accounts for the year ended April 30, 2002 represents an overstatement. The re-calculated accrual to April 30, 2002 would be £91,425 per annum. Taking account of the £15,260 and the re-calculated accrual to April 30, 2002, the increase in accrual for David Snowdon in the period, after allowing for inflation, amounted to £18,948; the transfer value of the increase, before any allowance for early retirement terms, amounts to £288,000.
Anthony Reading
Anthony Reading continues to accrue benefits. Pensionable earnings comprise basic salary and a three-year average of the cash element of annual pensionable bonuses, all based on notional U.K. earnings. Bonuses for 2001 and any subsequent bonuses are not pensionable and therefore no longer form part of pensionable earnings. For Anthony Reading the increase in accrual in the period amounted to £4,509; the transfer value of the increase amounts to £74,000.
Richard Marchant
Accrual of benefits for Richard Marchant ceased on July 31, 2002 when he retired with the consent of Tomkins plc. Pensionable earnings comprised basic salary and a three-year average of the cash element of pensionable bonuses and benefits in kind. Bonuses and benefits in kind for 2001 and subsequent years were not pensionable and therefore no longer formed part of pensionable earnings. For Richard Marchant the increase in accrual in the period amounted to £5,109; the transfer value of the increase, before any allowance for early retirement terms, amounted to £75,000.
The inclusion of fluctuating emoluments in pensionable earnings for Richard Marchant and Anthony Reading, in accordance with their contractual arrangements, does not comply with Schedule A of the Combined Code.
The normal retirement age of the Directors is 60, except for Anthony Reading, for whom the age is 62.
52
Service contracts
A summary of the service contract or letter of appointment of individual executive Directors and non-executive Directors is as follows:
James Nicol—Chief Executive Officer
The Company and James Nicol entered into a contract dated February 11, 2002, which set forth the terms and conditions under which he joined the Company as Chief Executive Officer on February 18, 2002. The contract remains in force until terminated by either party giving notice of not less than twelve months and in the event that the contract is terminated in certain circumstances within the first eighteen months from February 18, 2002, James Nicol will be entitled to receive two years’ basic salary, twice the annual value of cash and other non-cash benefits, a cash bonus pro rata to the date of termination and a bonus equal to 50 percent of basic salary for the two following years. These compensation arrangements for early termination were provided as part of the remuneration package necessary to attract James Nicol to the Company.
Ken Lever—Chief Financial Officer
On November 1, 1999, Ken Lever and the Company entered into an agreement which set out the terms and conditions of employment under which Ken Lever joined the Company as Chief Financial Officer on that date. The terms of the Memorandum remain in force until terminated by either party giving notice of 51 weeks.
Anthony Reading—Chairman, Tomkins Corporation
Anthony Reading, who joined the Company on October 1, 1990, entered into an agreement with the Company on July 31, 1999, which updated the terms and conditions of his employment with the Company. The terms of the Memorandum remain in force until terminated by either party giving notice of 51 weeks.
David Snowdon —formerly Chief Operating Officer
David Snowdon, who joined the Company on April 1, 1996, entered into an agreement with the Company on July 31, 1999, which updated the terms and conditions of his employment with the Company. He stood down from the Board upon leaving the Company on June 30, 2002 and was paid a sum of £450,000 (gross) in connection with the early termination of his employment representing 51 weeks’ salary plus compensation for loss of benefits and bonus for the two-month period ended June 30, 2002.
Richard Marchant—formerly Administration Director and Company Secretary
Richard Marchant, who joined the Company on February 1, 1979, entered into an agreement with the Company on July 31, 1999, which updated the terms and conditions of his employment with the Company. Richard Marchant left the Board upon his retirement from the Company on July 31, 2002 and no additional compensation was awarded to him other than the bonus specified in the Directors’ emoluments table disclosed above.
Non-executive Directors
None of the non-executive Directors has a service contract with the Company, their terms of engagement are set forth in a letter of appointment. Ordinarily, non-executive Directors serve for a period of two years but subject to agreement with the Board, a non-executive Director can be re-appointed for a further term of two years. The appointment of non-executive Directors may be terminated before the conclusion of their two-year term by, and at the discretion of, either party upon two weeks’ written notice. In the case of David Newlands, the appointment may be terminated at any time by either party serving written notice upon the other, such notice to take effect from the date of receipt thereof. None of the non-executive Directors is entitled to compensation for loss of office. The dates from which the respective letters of appointment are effective, are as follows: Norman Broadhurst—December 11, 2002; Jack Keenan—November 1, 2001; Ken Minton—December 11, 2002; David Newlands—February 18, 2002; Sir Brian Pitman—June 30, 2002; Marshall Wallach—August 1, 2001.
With the exception of James Nicol, no Director is entitled to any payment on early termination of his service contract.
Payments made to and interests of former Directors
Ian Duncan retained an interest in the long term incentive compensation schemes following his resignation as a Director of the Company on July 12, 1999. During the period to December 31, 2002, Ian Duncan’s remaining interest in 30,060 shares under the RSP vested at a market price of 223 pence per share. The compensation received during the period in respect of the vesting shares was £67,000 (April 2002—£44,000).
As of December 31, 2002, Ian Duncan held no further entitlement to amounts due under the long term incentive compensation schemes which had yet to be included in Directors’ remuneration (April 30, 2002—£79,000).
Sums paid to third parties in respect of a Director’s services
No amounts are paid to third parties in respect of a Director’s services to the Company.
53
C. Board practices
The Board of Directors
The Company is managed by its Board of Directors, which comprises a non-executive Chairman, five non-executive Directors and three executive Directors who together, with their different ages, financial, commercial and technical expertise and cultures, bring with them a wide range of experience to the Company. The Board considers all of the non-executive Directors, with the exception of Marshall Wallach, to be independent as they are independent of the Company’s executive management and free from any business or other relationship that could materially interfere with the exercise of their independent judgment. Marshall Wallach is deemed not to be independent as a result of his advisory capacity to the Gates family, who are substantial preference shareholders in the Company. Non-executive directors are normally appointed for a period of two years, which is renewable by agreement with the Board. There is a clear division of responsibility between the Chairman and the Chief Executive with no single individual having unfettered powers of decision. The Chairman is responsible for running the Board and ensures that all Directors receive sufficient relevant information on financial, business and corporate matters to enable them to participate effectively in Board decisions. The Chief Executive’s primary role is the running of the Company’s businesses and the development and implementation of strategy. The Combined Code recommends the appointment of a senior independent non-executive Director and Sir Brian Pitman has served in that capacity during the period.
The Board meets not less than five times a year, and holds additional meetings when circumstances require. During the eight month period ended December 31, 2002, the Board met on four occasions. Between meetings, the Chairman and Chief Executive update the non-executive Directors on current matters and there is frequent contact to progress the affairs of the Company. Attendance at Board and Committee meetings was in the region of 92 percent during the period. The non-executive Directors have the opportunity to meet with the Chairman and Chief Executive periodically to consider and discuss a wide range of matters affecting the Company, its business strategy and other matters.
Directors receive a range of information about the Company upon appointment and where appropriate, any training that is necessary for them to carry out their duties effectively. An induction program is available which aims to provide an understanding of the Company, its strategy, structure, geographical spread of operations, financial position, the markets in which it operates, its products and technologies, its people and a Directors’ legal responsibilities. The Directors have access to the advice and services of the Company Secretary whose removal may only be effected with the approval of the Board. There is an approved procedure by which all Directors can obtain professional advice at the Company’s expense in furtherance of their duties, if required; this procedure is reviewed periodically.
The Board, which has reserved certain specific matters to itself for decision, is responsible for approving overall Group strategy and financial policy, acquisition and divestment policy and approval of major capital expenditure projects, and it reviews the financial performance and strategic direction of the operating businesses. It also appoints and removes members of the Board, and reviews recommendations of the Remuneration Committee and the appointment of auditors.
Details of directors service contracts in Tomkins are summarized in “B. Compensation – Service Contracts” above.
Board Performance Evaluation
A process for evaluating the effectiveness of the Board has been introduced, which will, in future, take place annually. The evaluation process concentrates on six key elements comprising the optimum mix of skills and knowledge amongst the Directors, clarity and goals of processes, tailoring the evaluation to the specific circumstances of Tomkins, the culture of frankness that encourages constructive evaluation, regular reviews of assessment criteria and full disclosure of procedures and criteria to the Board. The results of the first evaluation are currently being reviewed.
Board Committees
The Board has established a number of committees (“the Committees”) with defined terms of reference, which are reviewed periodically, and receives reports of their proceedings. During the period, a review of the terms of reference was undertaken and changes made. The Board is satisfied that its Committees have written terms of reference which conform to best corporate governance practice. The Board appoints the chairmen and members of Committees. The Company Secretary is Secretary to all Board Committees.
The principal Committees, their membership and a brief description of their terms of reference are as follows:
54
Audit Committee
N N Broadhurst (Chairman), K J Minton, J M J Keenan
The Audit Committee which meets at least four times a year and on other occasions when circumstances require, comprises independent non-executive Directors and reviews the Company’s financial statements and reports before they are submitted to the Board for approval. It reviews the Company’s financial and corporate controls, accounting policies, internal audit and business risk assurance activities and it monitors compliance with statutory requirements for financial reporting. It also keeps under review the effectiveness of the Group’s internal control systems (including financial, operational and compliance controls and risk management procedures). It considers reports from the external auditors, internal auditors, business risk assurance executive and from management and reports and makes recommendations to the Board. In addition, the Audit Committee keeps under review the scope and results of the external audit, its cost effectiveness, the independence and objectivity of the auditor and the nature and extent of non-audit services supplied to the Group by the external auditor, seeking to balance the maintenance of objectivity and value for money.
All non-statutory audit, non-assurance or non-tax compliance services provided by the external auditor must be reported to the Audit Committee and prior approval is required from the Chairman of the Audit Committee for any projects above specified limits. The Committee met twice in the eight month period ended December 31, 2002. The Company’s internal and external auditors attend meetings and have the opportunity to raise matters or concerns in the absence of executive Directors and other senior executives.
Remuneration Committee
K J Minton (Chairman), N N Broadhurst, J M J Keenan
The Remuneration Committee, which meets at least twice a year and on other occasions when circumstances require, comprises independent non-executive Directors and has responsibility for determining Company policy on executive remuneration for approval by the Board. It also determines specific remuneration packages on employment or early termination of office for each of the executive Directors of the Company. The Committee takes independent advice from consultants as and when required. All decisions of the Remuneration Committee in respect of remuneration packages of executive Directors are referred to the Board. No executive Director takes part in any discussion or decision concerning his own remuneration. The Remuneration Committee also monitors the compensation packages of other senior executives in the Group below Board level.
Nomination Committee
D B Newlands (Chairman), N N Broadhurst, J M J Keenan, K J Minton, Sir Brian Pitman, M F Wallach
The Nomination Committee makes recommendations to the Board on all proposed appointments of Directors through a formal and transparent procedure. The Committee meets as and when required. In accordance with the Company’s Articles of Association, Directors are subject to re-appointment at the Annual General Meeting immediately following the date of their appointment, and thereafter they have to seek re-appointment no more than three years from the date they were last re-appointed. The Nomination Committee recommends to the Board the names of the Directors who are to seek appointment or re-appointment at the Annual General Meeting.
Health, Safety and Environment Committee
K J Minton (Chairman), J Nicol, M F Wallach
The Health, Safety and Environment Committee was formed during the period and meets at least four times a year. The Committee is chaired by an independent non-executive Director and its membership also includes the Chief Executive. Its principal role is to determine on behalf of the Board the framework or broad policy and objectives in the areas of health, safety and the environment (“HSE”) and propose any amendments to existing policies for approval by the Board. It also reviews management’s performance in the achievement of HSE objectives and reviews HSE reports produced by business units for compliance with all health, safety and environmental local codes of practice, legislation and relevant industry practice.
Relations with Shareholders
The Company places a high importance on maintaining a good relationship and good communications with both institutional and private investors and ensures that shareholders are kept informed of significant Company developments. The announcement of interim and final results provides opportunities for the Company to answer questions from institutional shareholders covering a wide range of topics. With effect from January 1, 2003, the Company reports results quarterly in both UK and US GAAP. The Chief Executive participates in industry conferences organized by investment banks, which are attended by existing and potential shareholders and holds regular meetings with analysts and institutional shareholders. The Chairman also maintains regular contact with a number of the Company’s major shareholders. The Company exercises care to ensure that all price-sensitive information is released to all shareholders at the same time, as required by the Listing Rules of the
55
Financial Services Authority.
The Company’s website, www.tomkins.co.uk, provides shareholders and potential investors with information about the Company including annual and interim reports, trading updates, recent announcements, investor presentations and share price information. Shareholders are able to put questions to the Company via its website.
The Company aims to deal expeditiously with all enquiries from individual shareholders on a wide range of matters. Individual shareholders also have the opportunity of attending the Annual General Meeting to put questions to the Chairman and chairmen of Board committees. The Company indicates the level of proxy votes lodged in respect of each resolution proposed at its Annual General Meeting following each vote on a show of hands. In the event of a poll being called, the result is published as soon as possible after the conclusion of the Annual General Meeting. Directors also meet informally with shareholders before and after the meeting. The Company keeps under review ways in which it can communicate more effectively with its shareholders throughout the year, as well as at the Annual General Meeting.
It has been the Company’s practice to send the Notice of the Annual General Meeting and related papers to shareholders at least 20 working days before the meeting and to propose separate resolutions on each substantially separate issue.
D. Employees
The average number of employees within each of Tomkins’ business segments was as follows:
| | | Eight months to
December 31, 2002
| | Fiscal 2002
| | Fiscal 2001
|
| | | Average
number
| | percent of
Tomkins
employees
| | Average
number
| | percent of
Tomkins
employees
| | Average
number
| | percent of
Tomkins
employees
|
Air Systems Components | | 6,942 | | 17.5 | | 6,909 | | 17.0 | | 7,129 | | 13.5 |
Engineered & Construction Products | | 9,953 | | 25.1 | | 10,104 | | 24.8 | | 10,915 | | 20.7 |
Industrial & Automotive | | 22,637 | | 57.2 | | 23,596 | | 58.0 | | 25,400 | | 48.2 |
Food Manufacturing | | — | | — | | — | | — | | 7,269 | | 13.8 |
Professional, Garden & Leisure Products | | — | | — | | — | | — | | 1,965 | | 3.7 |
Central costs | | 64 | | 0.2 | | 61 | | 0.2 | | 77 | | 0.1 |
| | |
| |
| |
| |
| |
| |
|
Total | | 39,596 | | 100.0 | | 40,670 | | 100.0 | | 52,755 | | 100.0 |
| | |
| |
| |
| |
| |
| |
|
As of December 31, 2002, 58 percent of the Company’s employees were located in the United States, 8 percent in the United Kingdom, 8 percent in continental Europe and 26 percent in the rest of the world. As of April 30, 2002, 57 percent of the Company’s employees were located in the United States, 9 percent in the United Kingdom, 8 percent in continental Europe, and 26 percent in the rest of the world. As of April 30, 2001, 58 percent of the Company’s employees were located in the United States, 10 percent in the United Kingdom, 8 percent in continental Europe, and 24 percent in the rest of the world. As of April 29, 2000,43 percent of the Company’s employees were located in the United States, 36 percent in the United Kingdom, 7 percent in continental Europe, and 14 percent in the rest of the world. There have been no significant work stoppages or labor disputes by Tomkins’ employees in any of the last five years.
Each Group company is encouraged to implement comprehensive employment policies designed to identify employees with its achievements and also determine ways in which their knowledge and skills can best contribute towards the Company’s success. Schemes are introduced to ensure that loyalty and performance are properly rewarded.
Employee involvement and communication programs continue to be developed and are designed to provide equal opportunity to all, irrespective of sex, race, religion or color. Each Group company endeavors to provide equality of opportunity in recruiting, training, promoting and developing the careers of disabled persons.
56
E. Share ownership
As of June 6, 2003, the directors of the Company, and the directors and officers of the Company as a group owned the number of Ordinary Shares and the percentage of such total number of shares outstanding on such date as set forth below.
The executive directors, as potential beneficiaries, are technically deemed to have an interest in all Ordinary Shares held by or in which the trustees of the Tomkins Employee Share Trust (the “Trust”) are interested. The table includes, however, only those Trust shares which are specifically allocated to the individual director under the terms of the RSP, the SMS and the LTLP.
Identity of Person or Group
| | Amount Owned
| | Percent of Class
|
| | | Beneficial
| | | Non-beneficial
| | Beneficial
| | Non-beneficial
|
Ordinary Shares | | | | | | | | | |
Executive directors | | | | | | | | | |
J. Nicol | | 1,015,230 | (1) | | — | | * | | — |
K. Lever | | 234,244 | | | — | | * | | — |
A.J. Reading | | 492,966 | | | — | | * | | — |
| | | | |
Non-executive directors | | | | | | | | | |
D.B. Newlands | | 292,515 | | | 20,000 | | * | | * |
N.N. Broadhurst | | 8,000 | | | — | | * | | — |
J.M.J Keenan | | 7,000 | | | — | | * | | — |
K.J. Minton | | 104,000 | | | — | | * | | — |
Sir Brian Pitman | | 9,717 | | | — | | * | | — |
M.F. Wallach | | 113,000 | (2) | | — | | * | | — |
| | | | |
Executive officers | | 301,400 | (3) | | — | | * | | — |
| | | | |
Directors and officers as a Group | | | | | | | | | |
(thirteen persons) | | 2,578,072 | | | 20,000 | | * | | * |
| | | | |
Preference shares | | | | | | | | | |
M.F. Wallach | | | | | | | | | |
—$50 convertible cumulative | | 240,244 | | | 112,537 | | 2.29 | | 1.07 |
—$50 redeemable convertible cumulative | | 216,664 | | | 289,978 | | 1.74 | | 2.33 |
Executive officers | | | | | | | | | |
—$50 redeemable convertible cumulative | | 5,307 | | | — | | * | | — |
| (1) | | Held as 26,000 ADSs and 911,230 Ordinary Shares. |
| (2) | | Held as 27,000 ADSs and 5,000 Ordinary Shares. |
| (3) | | Held as 7,850 ADSs and 270,000 Ordinary Shares. |
Since 1984, the Company has operated executive share option schemes that give its senior employees the right to subscribe for shares in the future at prices fixed when the rights are granted. The Company also operates savings related share option schemes for the general body of employees in the United Kingdom. Such schemes are approved by shareholders and options may not be granted under a scheme more than ten years after its approval by shareholders.
The Tomkins Executive Share Option Scheme (No. 2) (“ESOS 2”), The Tomkins Executive Share Option Scheme No. 3 (“ESOS 3”) and The Tomkins Executive Share Option Scheme No. 4 (“ESOS 4”)
ESOS 2 has now expired and no new options may be granted, though options already granted remain outstanding and can be exercised in accordance with the rules of the scheme. ESOS 3 and ESOS 4 were introduced in 1995 following shareholder approval. ESOS 3 is an Inland Revenue-approved scheme under which Tomkins employees, who are resident in the United Kingdom for tax purposes, are able to receive options with an aggregate exercise price not exceeding £30,000 that benefit from favorable tax treatment. ESOS 4 is a scheme not approved by the Inland Revenue, under which options granted do not benefit from favorable tax treatment in the United Kingdom. There is a limit to the number of options that can be granted under the ESOS 4 scheme of four times annual remuneration (which includes annual bonuses and certain benefits-in-kind). Under ESOS 4, options granted in excess of four times a participant’s annual earnings (“super options”) will only be exercisable if at least five years have elapsed since the date of grant and then only if, over a five-year period following the grant of the option, the growth in the Company’s earnings per share is such that it would be in the top quartile of a league table for growth in earnings per share over a five-year period for companies in the FTSE 100 index.
It is intended that the ESOS 3 and ESOS 4 schemes will continue and their current performance condition will remain in place for the remainder of the life of the schemes. The performance condition is based upon the growth in Tomkins earnings per share, which must exceed the growth in the retail prices index, by an average of
57
2 percent per annum over a three-year period before an option can be exercised. When the schemes were introduced in 1995, the earnings per share performance condition was widely adopted. The choice of 2 percent was made because it was in accordance with contemporary practice. In determining whether or not the growth in earnings per share performance condition has been met, a simple arithmetic calculation is made annually when the Company’s results are known, which has been pro rated to take account of the change in year end.
Tomkins Premium Priced Option
This was an option specifically and solely granted to James Nicol as part of the incentive package on his joining Tomkins. No performance conditions were attached to this option in order to attract him to the Company and retain his services and this therefore does not comply with Schedule A of the Combined Code (The “Combined Code” is a framework of principles and provisions demonstrating good corporate governance and best practice and was derived from the Greenbury and Cadbury reports. With respect to companies it deals with the constitution of the board, directors remuneration, relations with shareholders, accountability and relations with the auditors. The London Stock Exchange requires listed companies to report on how it applies the principles in the Combined Code and provide explanations where it does not comply with its provisions.) It consists of a non-transferable option to acquire 5,076,142 shares with an aggregate market value of £10 million, granted on February 11, 2002. The price per share payable on the exercise of the option will be 197 pence in respect of 2,538,072 shares (A option shares), 276 pence in respect of 1,522,842 shares (B option shares) and 345 pence in respect of 1,015,228 shares (C option shares). The options vested as to one-third of A, B and C options shares on February 18, 2003, will vest as to one-third of A, B and C option shares on February 18, 2004 and as to one-third of A, B and C option shares on February 18, 2005. The option will lapse on February 11, 2012 or earlier in certain circumstances.
Ongoing Option
This was also an option specifically and solely granted to James Nicol on February 11, 2002 as part of the incentive package to attract him to the Company. It consisted of a non-transferable option to acquire 1,522,842 shares at 197 pence per share, which may not be exercised before February 18, 2005 and unless and until the performance condition has been satisfied or waived. The performance condition will be achieved if, on or after the third anniversary of the date of grant, the rate of increase of earnings per share over any three-year period is equal to or greater than the rate of increase of the Retail Price Index plus 9 percent. The performance condition may be waived or amended by the Remuneration Committee. If there is a change of control of the Company then the option is exercisable immediately regardless of whether the performance condition is satisfied. The same lapsing events for the Premium Priced Option, apply to this option.
If there is a variation in the share capital of the Company the Remuneration Committee may adjust the number of shares in either the Premium Priced Option or the Ongoing Option as it reasonably deems appropriate to take account of the variation.
At June 6, 2003, options, including options granted to directors and officers, to subscribe for 21,388,784 Ordinary Shares were outstanding under the Company’s executive share option schemes at prices ranging from 150 pence to 330 pence. At that date, options over 2,848,500 of those shares were exercisable. The exercise dates for the options range from June 6, 2003 to January 16, 2013.
At June 6, 2003, options, including options granted to directors and officers, to subscribe for 886,268 Ordinary Shares were outstanding under the Company’s savings related share option scheme at prices ranging from 187.60p to 266.20p. At that date, options over 243,078 shares were exercisable. The exercise dates for the options range from June 6, 2003 to October 31, 2004.
Non-executive directors are not eligible for the grant of share options.
58
Director’s options over Ordinary Shares as of June 6, 2003, were:
| | | Scheme
| | Dates of grant
| | Dates of expiry
| | Price
| | | June 6, 2003 Number
| |
J. Nicol | | Prem. Priced (1) Prem. Priced (1) Prem. Priced (1) Ongoing (1) ESOS 4 | | February 11, 2002 February 11, 2002 February 11, 2002 February 11, 2002 January 17, 2003 | | February 10, 2012 February 10, 2012 February 10, 2012 February 10, 2012 January 16, 2013 | | 197.00 276.00 345.00 197.00 208.25 | p p p p p | | 2,538,072 1,522,842 1,015,228 1,522,842 1,440,576 | |
| | | | | | | | | | | |
|
|
| | | | | | | | | | | | 8,039,560 | |
| | | | | | | | | | | |
|
|
K. Lever | | ESOS 3 ESOS 4 ESOS 4 ESOS 4 ESOS 4 | | November 8, 1999 November 8, 1999 January 19, 2001 July 3, 2002 January 17, 2003 | | November 7, 2009 November 7, 2009 January 18, 2011 July 2, 2012 January 16, 2013 | | 215.00 215.00 171.00 244.75 208.25 | p p p p p | | 13,950 235,050 329,000 150,000 150,000 | (2) |
| | | | | | | | | | | |
|
|
| | | | | | | | | | | | 878,000 | |
| | | | | | | | | | | |
|
|
A.J. Reading | | ESOS 3 ESOS 4 ESOS 4 ESOS 4 ESOS 4 | | May 9, 1995 August 6, 1998 August 20, 1999 July 3, 2002 January 17, 2003 | | May 8, 2005 August 5, 2008 August 19, 2009 July 2, 2012 January 16, 2013 | | 242.00 293.50 275.25 244.75 208.25 | p p p p p | | 201,000 102,000 50,000 150,000 150,000 | (3) |
| | | | | | | | | | | |
|
|
| | | | | | | | | | | | 653,000 | |
| | | | | | | | | | | |
|
|
Other executive officers (4) | | ESOS 2 ESOS 4 ESOS 4 ESOS 4 ESOS 4 ESOS 4 ESOS 4 | | July 27, 1994 July 31, 1996 February 10, 1998 February 3, 1999 February 19, 2001 July 3, 2002 January 17, 2003 | | July 16, 2004 July 30, 2003 February 9, 2005 February 2, 2009 February 18, 2011 July 2, 2012 January 16, 2013 | | 226.00 249.00 330.00 247.50 170.50 244.75 208.25 | p p p p p p p | | 9,000 15,000 134,000 115,000 146,000 162,000 225,000 | |
| | | | | | | | | | | |
|
|
| | | | | | | | | | | | 806,000 | |
| | | | | | | | | | | |
|
|
Former director’s options over Ordinary Shares as of June 6, 2003, were:
| | | Scheme
| | Dates of grant
| | Dates of expiry
| | Price
| | | June 6, 2003 Number
| |
D.J. Snowdon | | ESOS 4 ESOS 4 ESOS 4 ESOS 4 | | July 31, 1996 August 12, 1997 August 6, 1998 August 6, 1998 | | June 29, 2003 June 29, 2003 June 29, 2003 June 29, 2003 | | 249.00 330.00 293.50 293.50 | p p p p | | 200,000 498,000 193,000 212,000 | (3) |
| | | | | | | | | | | |
|
|
| | | | | | | | | | | | 1,103,000 | |
| | | | | | | | | | | |
|
|
R.N. Marchant | | ESOS 3 ESOS 4 ESOS 4 ESOS 4 ESOS 4 | | May 9, 1995 July 31, 1996 August 12, 1997 August 6, 1998 August 20, 1999 | | July 30, 2003 July 30, 2003 July 30, 2003 July 30, 2003 July 30, 2003 | | 242.00 249.00 330.00 293.50 275.25 | p p p p p | | 49,500 27,000 102,000 51,000 50,000 | (3) |
| | | | | | | | | | | |
|
|
| | | | | | | | | | | | 279,500 | |
| | | | | | | | | | | |
|
|
| 1. | | See details in section B. Compensation; J. Nicol. |
| 2. | | The grant to K. Lever of 329,000 shares on January 19, 2001 fulfilled an obligation under his terms of appointment on November 1, 1999. |
| 3. | | Options granted in excess of four times a participant’s annual earnings (‘super options’). |
| 4. | | Officers whose compensation information is not publicly disclosed on an individual basis. |
Employee Share Plans
Each company in the Group is encouraged to implement comprehensive employment policies designed to identify employees with its achievements and determine ways in which their knowledge and skills can best contribute towards its success. Schemes are introduced to ensure that loyalty and performance are properly rewarded.
The Tomkins Savings Related Share Option Scheme No. 2
This is a standard Inland Revenue-approved savings related share option scheme, which is open to employees who are resident for tax purposes in the United Kingdom. No grants under this scheme were made during the period.
The Tomkins Restricted Share Plan (“RSP”)
Under the RSP, an element of annual cash bonus had to be taken in restricted shares in the form of a Trustee
59
Award which was made subject to a condition that the shares would not vest absolutely until the end of a specified period, normally the third anniversary of the date of the award. At the invitation of the Remuneration Committee, employees could acquire further shares in the Company via market purchase or exercise of options up to a cost equal to the gross amount of aggregate cash bonuses already paid to them. Such acquired shares became subject to a Company Award under the rules of the RSP. If an employee left the Company before the end of the three-year period, he would usually forfeit the Company Award shares; they only vest absolutely in the employee at the end of the three-year restricted period. No new awards have been made under the RSP since July 2001 and the Remuneration Committee has frozen all future awards under the RSP.
The Tomkins Share Matching Scheme (“SMS”)
The Remuneration Committee administers the SMS and may make recommendations regarding the award of shares. When shares subject to a Trustee Award or a Company Award vest under the RSP (see above), participants may be invited to apply for an award under the SMS. This incentive takes the form of up to two conditional share matching awards vesting a further two years and four years respectively after the end of the RSP restricted period. Each of the matching awards is for the same number of ordinary shares as vested under the RSP (both the Trustee and the Company Award) with proportionate reductions to the matching awards on a disposal of any vested shares.
The Tomkins Long Term Loyalty Plan (“LTLP”)
Participation in the LTLP was by invitation of the Remuneration Committee. Participants used their own funds to acquire Tomkins shares which were then matched with conditional awards of shares on a one for one basis up to a maximum of 100,000 matched shares per employee; the sale or transfer of any of the shares purchased by the employee at any time during a seven year restricted period would result in the forfeiture of the matched shares. No new awards have been made under the LTLP since July 1997 and the Remuneration Committee has frozen all future awards under the LTLP.
With shareholder approval, these share schemes were introduced in 1995 and 1996 with no performance conditions attached and accordingly they do not comply with Schedule A of the Combined Code.
Deferred Matching Share Purchase Plan
This was specifically and solely introduced for James Nicol as part of the incentive package to attract him to the Company. Under the Deferred Matching Share Purchase Plan 3,045,684 shares (“Matching Shares”) were awarded on February 11, 2002 following the purchase by James Nicol of 1,015,228 shares of the Company (the “Purchased Shares”). After three years from February 18, 2002, or earlier in certain circumstances, the award will vest in respect of 1,015,228 Matching Shares. The remaining 2,030,456 Matching Shares will vest according to the share price at that time, to the extent that, for every 1 pence that the share price increases over 197 pence, being the market price on February 8, 2002, up to a maximum of 591 pence, James Nicol will receive 5,153 shares. He may elect at any time prior to the vesting of the award to receive either the shares, or at his option, a cash payment equal to the market value on the date of the award. The award is conditional upon James Nicol (or his relatives or trustees of a trust fund) holding the Purchased Shares for at least three years. Until the award vests in respect of at least one-third of the Matching Shares, James Nicol is entitled to receive a cash payment equal to the net dividends payable on the Purchased Shares. The cash payment shall reduce pro rata to the extent of any vesting of the award up to one-third of the Matching Shares.
The aggregate value of entitlement of James Nicol in respect of 1,015,228 Matching Shares as of December 31, 2002 amounted to £1,929,000 (April 30, 2002—£3,592,000, which included a further 345,251 Matching Shares derived from 5,153 shares multiplied by the difference in the market price at April 30, 2002 of 264 pence and 197 pence).
As of June 6, 2003, the Trustees held 123,398 Ordinary Shares on behalf of 24 participants, including directors and officers, under the RSP. 23,398 shares allocated on August 15, 2000 will be released on August 15, 2003 and 100,000 shares allocated on July 2, 2001 will be released on July 2, 2004, if not forfeited or vested before those dates.
As of June 6, 2003, the Trustees held 101,021 Ordinary Shares on behalf of 18 participants including directors and officers under the Share Matching Scheme. 70,656 shares allocated on August 15, 2001 will be released on August 20, 2003; and 30,365 shares allocated on September 25, 2002 will be released on September 25, 2004, if not forfeited or vested before those dates.
As of June 6, 2003, 12 participants had been conditionally allocated 575,000 shares under the terms of the LTLP.
In addition the trustees held 9,307 unallocated shares on June 6, 2003.
60
Item 7. Major Shareholders and Related Party Transactions
A. Major shareholders
The Company’s issued share capital as of December 31, 2002 consisted of 772,973,339 Ordinary Shares, nominal value 5p per share, 10,507,478 convertible cumulative preference shares, nominal value US$50 per share, and 12,438,282 redeemable convertible cumulative preference shares, nominal value US$50 per share.
As of June 6, 2003, 772,989,877 Ordinary Shares, 10,507,478 convertible cumulative preference shares and 12,438,282 redeemable convertible cumulative preference shares were outstanding. As of that date, 2,456,548 Ordinary Shares were held by 65 registered holders with a registered address in the United States; 11,881,364 ADRs were held of record by 117 registered holders with a registered address in the United States; 10,491,252 convertible cumulative preference shares were held by 36 registered holders with a registered address in the United States and 12,418,408 redeemable convertible cumulative preference shares were held by 44 registered holders with a registered address in the United States. Since certain of the Ordinary Shares and ADRs were held by brokers and nominees, the number of record holders in the United States may not be representative of the number of beneficial holders or of where the beneficial holders are resident.
The convertible cumulative preference shares are convertible at any time at the shareholder’s option into fully paid Ordinary Shares at a rate of 9.77 Ordinary Shares per convertible cumulative preference share. The Company has the option (i) to redeem all but not some only of the convertible cumulative preference shares at any time that the total amount of convertible cumulative preference shares issued and outstanding is less than 10percent of the amount originally issued and (ii) to redeem, on or after July 29, 2006, all or any of the convertible cumulative preference shares outstanding at that time.
The redeemable convertible cumulative preference shares are convertible at any time at the shareholder’s option into fully paid Ordinary Shares at a rate of 9.77 Ordinary Shares per redeemable convertible cumulative preference share. The Company will be required to redeem all of the redeemable convertible cumulative preference shares outstanding on July 29, 2006. At the date of issue, the conversion terms of the preference shares were equivalent to an Ordinary Share price of 334p.
Upon liquidation of the Company or otherwise (other than on redemption or repurchase of shares), the assets of the Company available to shareholders will be applied first to repay paid-in or credited capital together with all arrears and accruals of dividend to the holders of the convertible cumulative preference shares, the redeemable convertible cumulative preference shares and any other classes of shares ranking pari passu with the convertible cumulative preference shares and the redeemable convertible cumulative preference shares as to capital.
Until such time as the shares are converted or redeemed, the convertible cumulative preference shares and the redeemable convertible cumulative preference shares have a right to receive dividends, at an annual rate of 5.560 percent and 4.344 percent respectively, in preference to the holders of the Ordinary Shares.
The holders of the convertible cumulative preference shares and the redeemable convertible cumulative preference shares are entitled to vote at a general meeting of the Company on the following basis:
| | • | | on a show of hands, each holder will have one vote; and |
| | • | | on a poll, each holder will have one vote in respect of every seven fully paid Ordinary Shares to which the holder would be entitled on the full exercise of his conversion rights; provided that if two or more consecutive quarterly dividends are in arrears, each holder shall have one vote on a poll in respect of every fully paid Ordinary Share to which the holder would be entitled on the full exercise of his conversion rights until such time as any arrears of dividends have been paid in full. |
Except as set forth above with respect to holders of convertible cumulative preference shares and redeemable convertible cumulative preference shares and redeemable convertible cumulative preference shares, shareholders of the Company do not have different voting rights.
61
To the Company’s knowledge, no person or entity, other than those shown below is the owner of more than 3 percent of its outstanding Ordinary Shares, nor is the Company directly or indirectly owned or controlled by any corporation, by any government or by any other natural or legal person or persons, severally or jointly.
Identity of Person or Group
| | Number of Ordinary Shares (as of June 6, 2003)
| | percent of Tomkins Ordinary
Share capital
|
Schroder Investment Management Limited and Schroders Plc(1) | | 62,931,452 | | 8.14 |
Sprucegrove Investment Management(1) | | 34,380,947 | | 4.45 |
Legal & General Investment Management Ltd(1) | | 27,436,569 | | 3.55 |
Barclays Global Investors(1) | | 26,993,505 | | 3.49 |
Wellington Management Co.(1) | | 26,096,047 | | 3.38 |
| (1) | | Based solely on analysis of the share register on May 19, 2003. |
Significant changes in shareholders owning more than 3 percent of the Ordinary Share Capital of Tomkins over the past three years are as follows; Lens Investment Management reduced its shareholding to 1.37 percent as of October 11, 2002, from 4.02 percent as of October 6, 2000. Schroder Investment Management Limited increased their holding to 8.14 percent at May 19, 2003 from 7.52 percent as of October 11, 2002 having been 12.86 percent as of August 9, 2001. Brandes Investment Partners have reduced their holding to approximately 0 percent from 2.70 percent as of October 11, 2002, having been at 5.09 percent as of October 20, 2000. T. Rowe Price Inc. reduced their holding to 2.54 percent as of May 19, 2003 from 3.97 percent as of June 5, 2001 having been 4.03 percent as of August 15, 2000. Barclays Global Investors increased their holding to 3.49 percent as of May 19, 2003 from 3.00 percent as of June 25, 2002. Alliance Capital Management (including its subsidiary company Sanford C. Bernstein & Co. Inc.) had reduced its shareholding to 0 percent as of October 11, 2002 from 5.09 percent at October 6, 2000.
There are no arrangements currently known to the Company that would result in a change in control of the Company.
B. Related party transactions
There are no transactions or proposed transactions with related parties that are material to the Company or to a related party.
C. Interests of experts and counsel
Not applicable.
62
Item 8. Financial Information
A. Consolidated statements and other financial information
See Item 17. “Financial Statements”.
Legal Proceedings
The group is, from time to time, party to legal proceedings and claims, which arise in the ordinary course of the business. The directors do not anticipate that the outcome of any of the above proceedings and claims, either individually or in aggregate, will have a material adverse effect upon the group’s financial position.
Dividend policy
See Item 3—“Key Information—Dividends”.
B. Significant changes
For a description of significant changes occurring since December 31, 2002, see Note 28 to our consolidated financial statements included in this Transition Report.
63
Item 9. The Offer and Listing
A. Offer and listing details
The high and low closing prices of the ADSs on the New York Stock Exchange for the periods indicated are set forth below.
Fiscal
Period
| | | | U.S. dollars per ADS
|
| | | | High
| | Low
|
1998 | | Year | | 26.69 | | 17.00 |
1999 | | Year | | 23.88 | | 13.81 |
2000 | | Year | | 19.00 | | 10.13 |
April 2001 | | Year | | 14.00 | | 7.75 |
| | | Q1: May – July | | 13.25 | | 11.06 |
| | | Q2: August – October | | 14.00 | | 8.94 |
| | | Q3: November – January | | 10.13 | | 7.75 |
| | | Q4: February – April | | 10.25 | | 7.90 |
April 2002 | | Year | | 15.59 | | 7.80 |
| | | Q1: May – July | | 11.50 | | 7.90 |
| | | Q2: August – October | | 12.10 | | 7.80 |
| | | Q3: November – January | | 12.70 | | 9.70 |
| | | Q4: February – April | | 15.59 | | 11.06 |
December 2002 | | Eight months | | 15.60 | | 12.10 |
| | | Q1: May – July | | 15.60 | | 13.78 |
| | | Q2: August – October | | 15.34 | | 12.12 |
| | | Two months to December 31, 2002 | | 13.60 | | 12.10 |
2003 | | Q1: January – March | | 13.43 | | 11.16 |
| | | Q2: through June 6, 2003 | | 16.20 | | 11.25 |
| | | January 2003 | | 13.43 | | 12.20 |
| | | February 2003 | | 13.38 | | 11.90 |
| | | March 2003 | | 12.67 | | 11.16 |
| | | April 2003 | | 13.40 | | 11.25 |
| | | May 2003 | | 15.70 | | 13.70 |
| | | June 2003 (through June 6, 2003) | | 16.20 | | 15.49 |
The following table sets forth, for the fiscal periods indicated, the closing high and low middle market quotations for the Company’s Ordinary Shares on the London Stock Exchange. The table does not reflect trading after the daily official close of the London Stock Exchange for which no official quotations exist.
Fiscal
Period
| | | | Pence per Ordinary Share
|
| | | | High
| | Low
|
1998 | | Year | | 378.25 | | 256.00 |
1999 | | Year | | 363.25 | | 200.00 |
2000 | | Year | | 299.50 | | 156.50 |
April 2001 | | Year | | 233.25 | | 138.00 |
| | | Q1: May – July | | 222.50 | | 186.25 |
| | | Q2: August – October | | 233.25 | | 157.75 |
| | | Q3: November – January | | 172.00 | | 138.00 |
| | | Q4: February – April | | 176.50 | | 145.00 |
April 2002 | | Year | | 271.00 | | 134.00 |
| | | Q1: May – July | | 206.75 | | 147.25 |
| | | Q2: August – October | | 211.00 | | 134.00 |
| | | Q3: November – January | | 223.00 | | 167.00 |
| | | Q4: February – April | | 271.00 | | 196.75 |
December 2002 | | Eight months | | 270.50 | | 187.50 |
| | | Q1: May – July | | 270.50 | | 218.00 |
| | | Q2: August – October | | 251.50 | | 190.50 |
| | | November and December | | 219.00 | | 187.50 |
2003 | | Q1: January – March | | 208.25 | | 168.75 |
| | | Q2: through June 6, 2003 | | 245.00 | | 177.00 |
| | | January 2003 | | 208.25 | | 181.50 |
| | | February 2003 | | 203.75 | | 187.00 |
| | | March 2003 | | 200.50 | | 168.75 |
| | | April 2003 | | 212.00 | | 177.00 |
| | | May 2003 | | 240.00 | | 210.00 |
| | | June 2003 (through June 6, 2003) | | 245.00 | | 237.00 |
The preference shares are not traded on any exchange. The shares are registered shares.
64
B. Plan of distribution
Not applicable.
C. Markets
The principal trading market for the Company’s Ordinary Shares is the London Stock Exchange.
ADSs, each representing four Ordinary Shares and evidenced by ADRs, have been issued pursuant to a sponsored ADR program, with The Bank of New York as depositary. The Company’s ADSs are listed on the New York Stock Exchange, under the symbol “TKS”.
D. Selling shareholders
Not applicable.
E. Dilution
Not applicable.
F. Expenses of the issue
Not applicable.
65
Item 10. Additional Information
A. Share Capital
Not applicable.
B. Memorandum and articles of association
General
The rights of the shareholders are set forth in the Memorandum and Articles of Association (together, the “Articles”) of the Company and are provided by applicable English law. The Articles have been previously filed with the Commission as an exhibit to the Company’s Annual Report on Form 20-F for fiscal year 2000. The following summary of key provisions of the Articles is qualified in its entirety by reference to the Articles previously filed with the Commission.
The Company is incorporated in England and registered at Companies House under company number 203531. The main objects and purposes of the Company, set forth in Articles 4(a) to (c), are as follows:
| | • | | to co-ordinate and manage the business activities of the Company and generally to carry out the function of a group holding company; |
| | • | | to carry on the business of hardware manufacture and the manufacture of and dealing in minerals and metals, and all kinds of other connected goods; and |
| | • | | to carry on any other business of a similar nature which the Directors deem convenient for the Company to carry on, or consider will enhance or render more profitable the value of the Company’s property. |
Board of Directors
The Articles provide for a minimum of 2 and a maximum of 15 Directors. At every annual general meeting, no less than one-third of the Directors are required to retire from office and are eligible to stand for re-appointment at such meeting. Subject to the provisions of the Companies Act, the Board may from time to time appoint one or more Directors to an executive office on such terms and for such period as it may determine. No Director or executive officer has a service contract with the Company for more than two years’ duration.
A Director who has disclosed to the Board that he has an interest in any transaction or arrangement with the Company, may participate in such transaction or arrangement, but may not vote in respect of any such transaction. A Director may not be counted in the quorum of a meeting in relation to any resolution on which he is barred from voting.
The ordinary remuneration of the Directors (other than a Managing Director or an Executive Director) may not exceed an aggregate amount of £250,000 per annum as the Board (or any duly authorized committee thereof) may from time to time determine or such greater amount as the Company may, upon the recommendation of the Board, from time to time by ordinary resolution determine, to be divided among them in such proportion and manner as the Directors may determine or, failing agreement, equally. Any Director who (by arrangement with the Board) performs or renders any special duties or services outside his ordinary duties as a Director may be awarded extra remuneration (in addition to fees or ordinary remuneration) by way of a lump sum or salary or commission or participation in profits or otherwise. Directors are required to hold at least 5,000 Ordinary Shares each.
The Board may exercise all the powers of the Company to borrow money, mortgage property and assets and issue debentures and other securities. The Articles require the Board to restrict aggregate borrowings of the Company to one and a half times the share capital of the company plus capital reserves (calculated as set forth in the Articles).
Share Capital, Dividends and Voting Rights
The share capital of the Company is £79,258,211 divided into 1,585,164,220 Ordinary Shares, nominal value 5p per share and $1,956,000,000 divided into 13,920,000 U.S. dollar denominated voting Convertible Cumulative Preference Shares, nominal value $50 per share (“Perpetual Convertible Shares”) and 25,200,000 U.S. dollar denominated voting Convertible Cumulative Redeemable Preference Shares, nominal value $50 per share (“Redeemable Convertible Shares”).
Under Section 9 of the Companies Act, the Company may by special resolution at a general meeting of shareholders alter its Articles and thereby alter the rights of the shareholders of the Company. A special resolution is a resolution which can only be passed by a majority of no less than three-fourths of the shares entitled to vote which are voted. Whenever the share capital of the Company is divided into different classes of shares, the rights attached to any class may only be varied or abrogated either with the consent in writing of the holders of three-fourths of the issued shares of that class or with the sanction of an extraordinary resolution passed at a separate meeting of such holders. The Articles provide that the necessary quorum for a general
66
meeting at which such an extraordinary general resolution may be passed is at least two persons holding or representing by proxy no less than one-third in nominal amount of the issued shares of that class.
The Perpetual Convertible Shares and the Redeemable Convertible Shares are entitled to be paid, in priority to any payment of dividend on any other class of shares, a fixed cumulative preferential dividend at a rate per annum per such share held fixed by the Board on issue of the shares, payable quarterly. Dividends are at the discretion of the Board. The Company in a general meeting of shareholders may declare dividends on the Ordinary Shares in its discretion by reference to an amount in pounds sterling or in a foreign currency, but dividends may not exceed the amount recommended by the Board. Dividends remaining unclaimed for 12 years after having been declared are forfeited and revert to the Company.
On a show of hands, each holder of Ordinary Shares, Perpetual Convertible Shares or Redeemable Convertible Shares present at a general meeting of the Company is entitled to one vote. On a poll, the holders of Ordinary Shares are entitled to one vote per share, and the holders of the Perpetual Convertible Shares and the Redeemable Convertible Shares are entitled to one vote for every seven Ordinary Shares into which such Perpetual Convertible Shares or Redeemable Convertible Shares, as the case may be, are convertible. If two or more quarterly dividends on the Perpetual Convertible Shares and the Redeemable Convertible Shares are in arrears and there is a poll vote, the holders of the Perpetual Convertible Shares and the Redeemable Convertible Shares are entitled to one vote for every one Ordinary Share into which such Perpetual Convertible Shares or Redeemable Convertible Shares, as the case may be, are convertible. Cumulative voting is not permitted.
The liquidator on any winding-up of the Company, may, with the authority of an extraordinary resolution, divide among the shareholders in kind the whole or any part of the assets of the Company and for such purposes may set such value as he deems fair upon any one or more class or classes of property, and may determine how such division shall be carried out as between shareholders or classes of shareholders. On a return of assets on liquidation or otherwise (other than on a redemption or a repurchase), the assets of the Company available to shareholders shall be applied first in repaying to the holders of the Perpetual Convertible Shares and the Redeemable Convertible Shares all amounts paid up thereon together with all arrears and accruals of dividend to be calculated down to the relevant date and to be payable whether or not such dividend has become due and payable, in priority to any other class of shares.
The Company is entitled to redeem all or any Perpetual Convertible Shares and Redeemable Convertible Shares on or after July 29, 2006 upon written notice. In the case of any notice given for redemption of either class of such shares, the holders are entitled to opt for all of their remaining Perpetual Convertible Shares or Redeemable Convertible Shares as the case may be to be converted into Ordinary Shares. Upon redemption, all amounts paid up, plus all arrears and accruals of dividend down to the date of redemption are to be paid.
There are no provisions in the Articles discriminating against an existing or prospective holder of securities as a result of such shareholder owning a substantial number of shares.
General Meetings
The Company shall in each year hold a general meeting of shareholders within 15 months of the previous year’s annual general meeting of shareholders. The Board may call an extraordinary general meeting whenever it determines appropriate. In addition, members holding not less than one-tenth of the paid up share capital entitled to vote at a general meeting of the Company can require an extraordinary general meeting to be convened.
Only shareholders registered in accordance with the Articles may be recognized as valid shareholders. There are no other limitations on the rights to own securities.
There are no provisions in the Articles that would have the effect of delaying, deferring or preventing a change of control of the Company and that would operate only with respect to a merger, acquisition, or corporate restructuring involving the Company or any of its subsidiaries.
Disclosure of Ownership
There are no provisions in the Articles relating to the ownership threshold above which shareholder ownership must be disclosed. The Companies Act requires a shareholder to notify the Company in respect of a three percent holding subject to certain exemptions, and there is an additional obligation to notify the Company when a ten percent threshold is reached which is not subject to any exemptions.
Changes in Capital
There are no conditions imposed by the Articles governing changes in capital which are more stringent than those conditions which would be required by governing English law.
67
C. Material Contracts
Service agreement with James Nicol
On February 11, 2002, the Company’s chief executive officer James Nicol entered into an employment agreement with the Company, terminable by either party on not less than 12 months’ notice. The agreement entitles Mr. Nicol to a fixed salary of £750,000 per year plus an annual cash bonus of up to 100 percent of that fixed salary (there is a guaranteed bonus of 50 percent of the fixed salary for the eight month period ending December 31, 2002). The Company also pays to Mr. Nicol a salary supplement of an amount equal to 37.5 percent of his fixed salary to allow Mr. Nicol to contribute to a personal pension scheme. The agreement also provides for certain share based incentive plans set up specifically for Mr. Nicol. Pursuant to the service agreement Mr. Nicol is subject to confidentiality, non-competition and non-solicitation provisions. For more information on the agreement with Mr. Nicol, see Item 6.B. “Compensation—J. Nicol”.
Offer to Purchase Stackpole Limited
Tomkins plc announced on June 18, 2003 that, at the expiry on June 17, 2003 of the offer dated May 12, 2003, made by Ontario Inc. (the “Offeror”), an indirect wholly owned subsidiary of Tomkins plc, to acquire all the outstanding common shares of Stackpole Limited, in excess of 97% of the outstanding common shares of Stackpole Limited (on a fully diluted basis) had been deposited to the offer. In addition, the other conditions to the offer had been satisfied or waived and 2023103 Ontario Inc. had instructed its depository to take up and pay for the common shares deposited to the offer. Tomkins plc also announced that the Offeror intends to acquire the remaining common shares of Stackpole Limited not deposited to the offer by exercise of the Offeror’s compulsory acquisition right under the Ontario Business Corporations Act. Shareholders of Stackpole Limited who did not tender to the offer will be offered Cdn $33.25 per common share, the same price that was offered to shareholders under the original offer.
Employee Stock Option Plans
A description of our stock option plans and other equity-based compensation plans is contained in Item 6.B. “Compensation”.
D. Exchange controls
There is currently no U.K. law, decree or regulation which restricts the export or import of capital, including, but not limited to, U.K. foreign exchange controls, or that affects the remittance of dividends (except as otherwise set forth below, see “Taxation”) or other payments to holders of Ordinary Shares. There are no limitations under U.K. law or the Company’s Memorandum and Articles of Association on the rights of persons who are neither residents nor nationals of the United Kingdom from freely holding, voting or transferring Ordinary Shares in the same manner as U.K. residents or nationals.
E. Taxation
The following is a summary of the principal US federal income and UK tax consequences of the purchase, ownership and disposition of Ordinary Shares or ADRs by certain US Holders (as defined below) and not a complete analysis or listing of all of the possible tax consequences of such purchase, ownership or disposition. Furthermore, this summary does not address the tax consequences under state, local, or non-US or non-UK tax law of such purchase, ownership or disposition. Certain US Holders with special status (e.g., financial institutions, insurance companies, tax-exempt entities, dealers in securities, and traders in securities that mark-to-market) or in special tax situations (e.g., whose functional currency is not the US dollar, who hold their Ordinary Shares or ADRs as part of a straddle, appreciated financial position, hedge, conversion transaction or other integrated investment, who hold 10 percent or more of the voting power of Tomkins’s stock or the Ordinary Shares, or who are subject to the alternative minimum tax) will be subject to special rules not described below. This summary is limited to US Holders that hold their Ordinary Shares or ADRs as capital assets and does not address the tax treatment of US Holders that are partnerships or pass-through entities that are not partnerships or the tax treatment of the holders of interests in such entities. Prospective investors are therefore advised to consult their own tax advisors with respect to the tax consequences of the purchase, ownership and disposition of Ordinary Shares or ADRs, including specifically the consequences under state, local and non-US and non-UK tax laws.
This summary is based upon the Internal Revenue Code of 1986, as amended (the “Code”), Treasury regulations promulgated under the Code, the Convention Between the Government of the United States of America and the Government of the United Kingdom of Great Britain and Northern Ireland for the Avoidance of Double Taxation and the Prevention of Fiscal Evasion with respect to Taxes on Income and Capital Gains dated December 31, 1975, as amended (the “Income Tax Convention”), the New Income Tax Convention (as defined below), and administrative and judicial interpretations of the Code, the Income Tax Convention and the New Income Tax Convention, all as in effect as of the date of this Annual Report and all of which are subject to change, possibly with retroactive effect. Statements regarding UK tax laws and practices set out below are based on those UK laws and published practices of the Inland Revenue as in force on the date of this Annual Report which UK laws and practices are subject to change. As used herein, a “US Holder” is a beneficial owner of Ordinary Shares or ADRs that, for United States federal tax purposes, is:
68
| | • | | a citizen or resident of the United States; |
| | • | | a corporation created or organized in the United States or under the laws of the United States or any state (or the District of Columbia); |
| | • | | an estate the income of which is subject to US federal income taxation regardless of its source; |
| | • | | a trust if a court within the United States is able to exercise primary supervision over the administration of the trust and one or more United States persons have the authority to control all substantial decisions of the trust; or |
| | • | | a trust if it has a valid election in effect to be treated as a United States person under the Code. |
On March 31, 2003, the United States and the United Kingdom ratified a new income tax treaty (the “New Income Tax Convention”) to replace the Income Tax Convention. The New Income Tax Convention generally becomes effective with respect to withholding taxes on May 1, 2003, UK income and capital gains tax on April 6, 2003 and UK corporation tax on April 1, 2003. Taxpayers may elect to have the Income Tax Convention apply for a twelve month period from the date on which the New Income Tax Convention would otherwise apply. US Holders should consult their tax advisors regarding the potential application of the New Income Tax Convention, including the relevant effective dates of the New Income Tax Convention.
The Inland Revenue treats US Holders of ADRs as the owners of the underlying Ordinary Shares for the purpose of the taxation of dividend payments under the Income Tax Convention and should treat them as such under the New Income Tax Convention. US Holders of ADRs are also treated as the owners of the underlying shares for the purposes of the Code.
Taxation of Dividends
Distributions paid in respect of the Ordinary Shares or ADRs will be treated as dividends to the extent of Tomkins’s current and accumulated earnings and profits, as calculated under US federal income tax principles. Distributions in excess of current and accumulated earnings and profits will be treated as a return of capital to the extent of the US holder’s adjusted tax basis in the Ordinary Shares or ADRs and, thereafter, as capital gains.
Under UK law, there is no UK withholding tax on dividends paid. Under the terms of the Income Tax Convention, a US Holder of Ordinary Shares or ADRs who is a resident of the United States for the purposes of the Income Tax Convention will generally be entitled to receive, in addition to any dividend received, a payment of certain UK tax credits equal to one-ninth of the cash dividend paid (a “Related Tax Credit”), subject to a notional withholding tax (not to exceed the amount of the Related Tax Credit) of 15% of the sum of the dividend paid and such Related Tax Credit. However, a US Holder will not be entitled to any actual payment in respect of the Related Tax Credit as the notional withholding tax of 15 percent under the Income Tax Convention exceeds, and therefore will be limited to, the Related Tax Credit. Hence, a net dividend of 100p paid by Tomkins to a US Holder gives rise to a receipt of 100p after deduction of the notional withholding tax of 11.11p. In Revenue Procedure 2000-13, 2000-6 I.R.B. 515, the Internal Revenue Service (the “IRS”) confirmed that a US Holder will continue to be entitled to claim the US dollar value of such notional withholding tax as a credit against the US Holder’s US federal income tax liability, subject to certain conditions and limitations. To qualify for the credit, a US Holder should make an election on IRS Form 8833 (Treaty-Based Return Position Disclosure Under Section 6114 or 7701(b)) and file the completed Form 8833 with its US federal income tax return.
Dividends and amounts in respect of the Related Tax Credit will be income to a US Holder for US federal income tax purposes but will generally not be eligible for the dividends received deduction allowed to corporate holders. The amount includible in income with respect to dividends paid in pounds sterling and the Related Tax Credit will be the US dollar value of the payment at the spot rate of exchange on the date that the dividend is actually or constructively received, regardless of whether the payment is in fact converted into US dollars. Pounds sterling received by US holders will have an adjusted tax basis equal to their US dollar value at such spot rate. Gains or losses, if any, realized on a subsequent sale or disposition of the pounds sterling distributed will be ordinary income or loss and will generally be treated as derived from sources within the United States for foreign tax credit purposes.
A US Holder will be denied a foreign tax credit (and should instead be allowed a deduction) for foreign taxes imposed on a dividend if the US Holder has not held the Ordinary Shares or ADRs for at least 16 days in the 30 day holding period beginning 15 days before the ex-dividend date. Any days during which a US holder has substantially diminished its risk of loss on the Ordinary Shares or ADRs are not counted toward meeting the 16-day holding period required by the statute. A US Holder that is under an obligation to make related payments with respect to the Ordinary Shares or ADRs (or substantially similar or related property) also is not entitled to claim a foreign tax credit with respect to a foreign tax imposed on a dividend.
A US Holder who is a resident of the United States for purposes of the Income Tax Convention will nonetheless not be entitled to the Related Tax Credit and consequently will not be entitled to a credit against US tax liability for the notional withholding tax thereon, if (a) the holding of Ordinary Shares or ADRs is (i) effectively connected
69
with a permanent establishment situated in the United Kingdom through which the holder carries on business in the United Kingdom or (ii) effectively connected with a fixed base in the United Kingdom from which the holder performs independent personal services or (b) in the case of a US Holder that is a corporation, the US Holder (i) is also a resident of the United Kingdom for purposes of the Income Tax Convention or (ii) is, in certain circumstances, an investment or holding company at least 25 percent of the capital of which is held, directly or indirectly, by persons who are neither individual residents of the United States nor citizens of the United States. Furthermore, special rules may apply in respect of the Related Tax Credit if the US Holder (a) owns at least 10 percent of the class of shares in respect of which the dividend is paid (or, in the case of a US Holder that is a corporation, controls, alone or with one or more associated corporations, at least 10 percent of the voting stock of Tomkins) or (b) is exempt from tax in the United States on dividends paid by Tomkins. In addition, if a US Holder is a trust or estate, the Related Tax Credit will be available only to the extent that the income derived by such trust or estate is subject to US tax as the income of a resident either in its hands or in the hands of its beneficiaries.
Under the New Income Tax Convention, the Related Tax Credit and the notional UK withholding tax discussed above are eliminated and it would therefore not be possible to claim a foreign tax credit for a notional UK withholding tax in respect of any dividend payment made by the Company. As stated above, taxpayers may elect to have the Income Tax Convention apply for a twelve month period from the date on which the New Income Tax Convention would otherwise apply.
Taxation of Capital Gains
A US Holder that is resident in the United States and not resident, ordinarily resident or a temporary non-resident for UK tax purposes in the United Kingdom will not be liable for UK tax on gains realized or accrued on the sale or other disposal of Ordinary Shares or ADRs unless that US Holder carries on a trade, profession or vocation in the United Kingdom through a branch or agency and the Ordinary Shares or ADRs are or have been used, held or acquired for the purposes of such trade, profession or vocation or such branch or agency. A US Holder will generally recognize capital gain or loss for US federal income tax purposes upon the sale or other disposal of such US Holder’s Ordinary Shares or ADRs in an amount equal to the difference between the amount realized on the sale or other disposal and the US Holder’s adjusted tax basis in such Ordinary Shares or ADRs. Such gains or losses will be eligible for long-term capital gain or loss treatment if the Ordinary Shares or ADRs have been held for more than one year at the time of such sale or disposal.
A US Holder who is (a) a US citizen who is resident, ordinarily resident or a temporary non-resident in the United Kingdom for UK tax purposes, (b) a corporation that is resident in the United Kingdom for UK tax purposes by reason of being incorporated or managed and controlled in the United Kingdom, or (c) a US citizen who, or corporation that, is trading or carrying on a profession or vocation in the United Kingdom through a branch or agency and has used, held or acquired Ordinary Shares or ADRs for the purposes of such trade, profession or vocation or such branch or agency, may, in each case, be liable for both UK and US tax on a gain on the disposal of Ordinary Shares or ADRs. Such a person will generally be entitled, subject to certain limitations, to a tax credit against any US federal tax liability for the amount of any UK tax (namely, capital gains tax in the case of an individual and corporation tax on chargeable gains in the case of a corporation) which is paid in respect of such gain.
Under the New Income Tax Convention, a US Holder who is a resident of the United States for the purposes of the New Income Tax Convention will not be subject to UK tax on gains derived from the sale or other disposal of the Ordinary Shares or ADRs unless such Ordinary Shares or ADRs form part of the business property of a permanent establishment of an enterprise in the United Kingdom, regardless of whether that permanent establishment exists at the time of the sale or other disposal. Notwithstanding the foregoing, under the New Income Tax Convention, the United Kingdom may tax an individual who is a resident of the United States on gains derived from the sale or other disposal of Ordinary Shares or ADRs if such individual has been a resident of the United Kingdom at any time during the six years immediately preceding the sale or other disposition of the Ordinary Shares or ADRs.
Inheritance Tax
Under the convention entered into force on November 11, 1979 between the United States and the United Kingdom for the avoidance of double taxation and the prevent of fiscal evasion with respect to taxes on estates of deceased persons and on gifts (the “Estate and Gift Tax Convention”), an Ordinary Share or ADR held by an individual who is domiciled in the United States and is not a national of the United Kingdom will not be subject to UK inheritance tax upon the individual’s death or on a transfer of the Ordinary Share or ADR during the individual’s lifetime, except in certain cases in which the Ordinary Share or ADR is placed in trust by a settler not domiciled in the United States and in the exceptional case where the Ordinary Share or ADR is part of the business property of a UK permanent establishment or pertains to a fixed base of the individual in the United Kingdom used for the performance of independent personal services. In the unusual case where Ordinary Shares or ADRs are subject to both the UK inheritance tax and the US federal estate and gift tax, the Estate and Gift Tax Convention generally provides for a tax credit under the rules enumerated in the Estate and Gift Tax Convention.
70
Stamp duty and stamp duty reserve tax (“S.D.R.T.”)
UK stamp duty or S.D.R.T. is not generally payable on the issuance of Ordinary Shares unless these are issued into a clearance service or a depositary receipt system (or a nominee for either) in which case a liability at 1.5 percent will arise (but see the comments below in relation to transfers of the Ordinary Shares to the custodian of the Depositary).
The transfer of Ordinary Shares will generally give rise to a liability for UK stamp duty normally at the rate of 0.5 percent (rounded up to the nearest multiple of £5) of the actual consideration paid. S.D.R.T. is chargeable immediately on entering into an unconditional agreement to transfer Ordinary Shares at the rate of 0.5 percent of the actual consideration paid (which S.D.R.T. is cancelled or repaid if the agreement is completed within six years of the agreement by a duly stamped transfer). If Ordinary Shares have been transferred into a clearance service or a depositary receipt system, provided the higher rate 1.5 percent charge has been paid, subsequent transfers within the respective service or system would not be liable to S.D.R.T. However, there is no liability to stamp duty on the transfer of shares into CREST, the paperless trading system introduced in July 1996, unless such transfer involves a change in beneficial ownership. Where the Ordinary Shares are transferred into the account of a clearance service or a depositary receipt system (or a nominee for either) a liability at 1.5 percent will arise. Subsequent transfers within CREST will not give rise to a liability to stamp duty as there will be no stampable document, and consequently, the S.D.R.T. chargeable on such transfers will not be repaid. An instrument of transfer of Ordinary Shares where there is no change of beneficial ownership will generally be subject to fixed rate stamp duty of £5 per transfer.
An instrument of transfer or issuance of Ordinary Shares to the custodian of the Depositary where there is no transfer or issuance of beneficial ownership will generally give rise to UK stamp duty at the rate of 1.5 percent rounded up to the nearest multiple of £5, or to S.D.R.T. at the rate of 1.5 percent, of the value of the shares at the time of transfer or issuance. In accordance with the terms of the Deposit Agreement, any tax or duty payable by the Depositary or the custodian of the Depositary on deposits of Ordinary Shares will be charged by the Depositary to the party to whom the ADRs are delivered against such deposits. No S.D.R.T. will be payable on an agreement to transfer ADRs, nor will UK stamp duty be payable on a transfer of ADRs, provided that the instrument of transfer is executed outside the United Kingdom and subsequently remains at all times outside the United Kingdom. A transfer of Ordinary Shares by the Depositary or its nominee to the relevant ADR holder when the ADR holder is not transferring beneficial ownership will give rise to stamp duty at the rate of £5 per instrument of transfer.
Passive foreign investment company (“PFIC”) status
We believe that we will not be considered a PFIC for US federal income tax purposes. However, since our status as a PFIC depends on the composition of our income and assets and the market value of our assets from time to time, there can be no assurance that we will not be considered a PFIC in any taxable year. If we were treated as a PFIC in any taxable year during which you held Ordinary Shares or ADRs, you may be subject to certain adverse consequences, including the imposition of tax at higher rates than would otherwise apply to income derived from the Ordinary Shares or ADRs as well as additional tax form filing requirements.
F. Dividends and paying agents
Not applicable.
G. Statement by experts
Not applicable.
H. Documents on display
Tomkins is subject to the information requirements of the Exchange Act and in accordance therewith files reports and other information with the United States Securities and Exchange Commission (the “Commission”). These reports and other information can be inspected and copied at the public reference facilities maintained by the Commission, 450 Fifth Street, N.W., Judiciary Plaza, Room 1024, Washington, D.C. 20549, and at the Commission’s regional office at Citicorp Center, 500 West Madison Street, Suit 1400, Chicago, Illinois 60661. You may request copies of all or a portion of these documents from the Public Reference Section of the Commission at 450 Fifth Street, N.W., Washington, D.C. 20549, at prescribed rates. From August 2002, reports filed by the Company with the Commission are available on the Commissions website at www.sec.gov. As a foreign private issuer, Tomkins is exempt under the Exchange Act from, among other things, the rules prescribing the furnishing and content of proxy statements and the “short-swing” profit recovery provisions contained in Section 16 of the Exchange Act.
I. Subsidiary information
See Item 4. “Information on the Company—C. Organizational Structure”.
71
Item 11. Quantitative and Qualitative Disclosures about Market Risk
The financial risk management of the Company, which includes currency risk, interest rate risk and liquidity risk, is the responsibility of the Company’s central treasury function, which operates within strict guidelines approved by the Board.
The foreign exchange transaction risks in the businesses are protected with forward currency purchases and sales put in place when foreign currency trading transactions are committed or where there is a high likelihood of such transactions arising. The currency translation risk on overseas profits is only covered to the extent there is interest on foreign currency borrowings set against the operating income. To the extent that the profits are not covered in this way they are subject to the risk of currency fluctuation. The primary translation exposure for sterling reporting results is on profits earned in the U.S. businesses.
To the extent that Tomkins is funded by shareholders’ equity, overseas investments are not hedged.
Should the group have net borrowings these will be generally retained in the currencies in which the Group’s assets are denominated, to hedge the foreign currency translation exposure arising from the Group’s overseas investments. The Company currently has a net cash position.
Dividends are funded by converting the foreign currency cash flows generated by overseas investments at the time of payment of the dividend. Interest payments on foreign currency net borrowings will be funded with cash flows generated by the corresponding foreign currency investments.
Tomkins does not hedge foreign currency profit and loss translation exposures and are subject to the risk of currency fluctuation. We estimate a movement of 10 percent in the £/$ exchange rate has an impact on reported operating income of around 7 percent. This risk may be mitigated to the extent that interest arises on foreign currency net borrowings.
Information on our use of financial instruments and derivatives is given in Note 26 to the consolidated financial statements.
Interest rate exposures are managed by using interest rate swaps, options and forward rate agreements. The Company currently has a net cash position with interest rates fixed for periods of less than 12 months. A degree of fixed rate cover appropriate to the Company’s ongoing operations and capital structure will be reinstated should the Company have net borrowings.
Borrowing facilities are monitored against forecast requirements and timely action is taken to put in place, renew or replace credit lines. Our policy is to reduce financing risk by diversifying our funding sources and by staggering the maturity of our borrowings.
72
Interest Rate Sensitivity
The table below provides information as at December 31, 2002, about the Company’s financial instruments that are sensitive to changes in interest rates. Instruments shown as bearing interest at floating rates are instruments where the interest rate is reset periodically by reference to short term benchmark interest rates such as LIBOR and the U.K. Bank Base Rate. The information is presented in pounds sterling equivalents, with the instruments grouped by the actual currency in which their cash flows are denominated.
| | | Expected Maturity Date
| | | Total
| | | Fair value
| |
| | Within 1 year
| | | Between 1
& 2 years
| | | Between 2
& 3 years
| | | Between 3
& 4 years
| | | Between 4
& 5 years
| | | Over 5
years
| | | |
| | | £ million | |
POUNDS STERLING | | | | | | | | | | | | | | | | | | | | | | | | |
Cash & Deposits | | 97.9 | | | — | | | — | | | — | | | — | | | — | | | 97.9 | | | 97.9 | |
Borrowings | | (0.5 | ) | | — | | | — | | | — | | | — | | | (150.0 | ) | | (150.5 | ) | | (150.5 | ) |
Deposits/loans offset | | — | | | — | | | — | | | — | | | — | | | — | | | — | | | — | |
Interest rate swaps | | — | | | — | | | — | | | — | | | — | | | 0.1 | | | 0.1 | | | 6.6 | |
| | |
|
| |
|
| |
|
| |
|
| |
|
| |
|
| |
|
| |
|
|
Net | | 97.4 | | | — | | | — | | | — | | | — | | | (149.9 | ) | | (52.5 | ) | | (46.0 | ) |
| | |
|
| |
|
| |
|
| |
|
| |
|
| |
|
| |
|
| |
|
|
Interest rate | | Floating | | | Floating | | | Floating | | | Floating | | | Floating | | | Floating | | | Floating | | | Floating | |
| | | | | | | | |
U.S DOLLAR | | | | | | | | | | | | | | | | | | | | | | | | |
Cash & Deposits | | 173.0 | | | — | | | — | | | — | | | — | | | — | | | 173.0 | | | 173.0 | |
Borrowings | | (5.6 | ) | | (2.9 | ) | | (3.2 | ) | | (0.8 | ) | | (0.6 | ) | | (6.8 | ) | | (19.9 | ) | | (19.9 | ) |
Deposits/loans offset | | — | | | — | | | — | | | — | | | — | | | — | | | — | | | — | |
Interest rate swaps | | — | | | — | | | — | | | — | | | — | | | — | | | — | | | — | |
| | |
|
| |
|
| |
|
| |
|
| |
|
| |
|
| |
|
| |
|
|
Net | | 167.4 | | | (2.9 | ) | | (3.2 | ) | | (0.8 | ) | | (0.6 | ) | | (6.8 | ) | | 153.1 | | | 153.1 | |
| | |
|
| |
|
| |
|
| |
|
| |
|
| |
|
| |
|
| |
|
|
Interest rate | | Floating | | | Floating | | | Floating | | | Floating | | | Floating | | | Floating | | | Floating | | | Floating | |
| | | | | | | | |
EURO | | | | | | | | | | | | | | | | | | | | | | | | |
Cash & Deposits | | 22.0 | | | — | | | — | | | — | | | — | | | — | | | 22.0 | | | 22.0 | |
Borrowings | | (0.4 | ) | | (0.3 | ) | | (0.3 | ) | | (0.2 | ) | | (0.3 | ) | | (1.0 | ) | | (2.5 | ) | | (2.5 | ) |
Deposits/loans offset | | — | | | — | | | — | | | — | | | — | | | — | | | — | | | — | |
Interest rate swaps | | — | | | — | | | — | | | — | | | — | | | — | | | — | | | — | |
Net | | 21.6 | | | (0.3 | ) | | (0.3 | ) | | (0.2 | ) | | (0.3 | ) | | (1.0 | ) | | 19.5 | | | 19.5 | |
Interest rate | | Floating | | | Floating | | | Floating | | | Floating | | | Floating | | | Floating | | | Floating | | | Floating | |
| | | | | | | | |
OTHER CURRENCIES | | | | | | | | | | | | | | | | | | | | | | | | |
Cash & Deposits | | 50.1 | | | — | | | — | | | — | | | — | | | — | | | 50.1 | | | 50.1 | |
Borrowings | | (10.8 | ) | | (1.7 | ) | | — | | | — | | | — | | | — | | | (12.5 | ) | | (12.5 | ) |
Deposits/loans offset | | — | | | — | | | — | | | — | | | — | | | — | | | — | | | — | |
Interest rate swaps | | — | | | — | | | — | | | — | | | — | | | — | | | — | | | — | |
| | |
|
| |
|
| |
|
| |
|
| |
|
| |
|
| |
|
| |
|
|
Net | | 39.3 | | | (1.7 | ) | | — | | | — | | | — | | | — | | | 37.6 | | | 37.6 | |
| | |
|
| |
|
| |
|
| |
|
| |
|
| |
|
| |
|
| |
|
|
Interest rate | | Floating | | | Floating | | | Floating | | | Floating | | | Floating | | | Floating | | | Floating | | | Floating | |
73
Exchange Rate Sensitivity
The following table provides information, as at December 31, 2002, about financial instruments and derivative instruments sensitive to exchange rate movements. For borrowings, cash and deposits the tables present principal cash flows while for derivatives the table presents the notional amounts used to calculate payments to be exchanged under the contracts. All of the instruments bear interest at variable (i.e. floating) rates which are determined by reference to short-term benchmark rates such as LIBOR and the U.K. Bank Base Rate.
| | | Expected Maturity Date
| | | | | | | |
| | | Within 1 year
| | | Between 1 & 2 years
| | | Between 2 & 3 years
| | | Between 3 & 4 years
| | | Between 4 & 5 years
| | | Over 5 Years
| | | Total
| | | Fair Value
| |
| | | | | | | | |
| | | £ million | |
POUNDS STERLING | | | | | | | | | | | | | | | | | | | | | | | | |
Cash & Deposits | | 97.9 | | | — | | | — | | | — | | | — | | | | | | 97.9 | | | 97.9 | |
Borrowings | | (0.5 | ) | | — | | | — | | | — | | | — | | | (150.0 | ) | | (150.5 | ) | | (150.5 | ) |
Exchange rate derivatives | | — | | | — | | | — | | | — | | | — | | | — | | | — | | | — | |
—Forward foreign exchange contracts | | 117.0 | | | — | | | — | | | — | | | — | | | — | | | 117.0 | | | (0.5 | ) |
| | |
|
| |
|
| |
|
| |
|
| |
|
| |
|
| |
|
| |
|
|
Net | | 214.4 | | | — | | | — | | | — | | | — | | | (150.0 | ) | | 64.4 | | | (53.1 | ) |
| | |
|
| |
|
| |
|
| |
|
| |
|
| |
|
| |
|
| |
|
|
| | | | | | | | |
U.S. DOLLAR | | | | | | | | | | | | | | | | | | | | | | | | |
Cash & Deposits | | 173.0 | | | — | | | — | | | — | | | — | | | — | | | 173.0 | | | 173.0 | |
Borrowings | | (5.6 | ) | | (2.9 | ) | | (3.2 | ) | | (0.8 | ) | | (0.6 | ) | | (6.8 | ) | | (19.9 | ) | | (19.9 | ) |
Exchange rate derivatives | | — | | | — | | | — | | | — | | | — | | | — | | | — | | | — | |
-Forward foreign exchange contracts | | 42.2 | | | — | | | — | | | — | | | — | | | — | | | 42.2 | | | (0.4 | ) |
| | |
|
| |
|
| |
|
| |
|
| |
|
| |
|
| |
|
| |
|
|
Net | | 209.6 | | | (2.9 | ) | | (3.2 | ) | | (0.8 | ) | | (0.6 | ) | | (6.8 | ) | | 195.3 | | | 152.7 | |
| | |
|
| |
|
| |
|
| |
|
| |
|
| |
|
| |
|
| |
|
|
| | | | | | | | |
EURO | | | | | | | | | | | | | | | | | | | | | | | | |
Cash & Deposits | | 22.0 | | | — | | | — | | | — | | | — | | | — | | | 22.0 | | | 22.0 | |
Borrowings | | (0.4 | ) | | (0.3 | ) | | (0.3 | ) | | (0.2 | ) | | (0.3 | ) | | (1.0 | ) | | (2.5 | ) | | (2.5 | ) |
Exchange rate derivatives | | — | | | — | | | — | | | — | | | — | | | — | | | — | | | — | |
—Forward foreign exchange contracts | | 3.6 | | | — | | | — | | | — | | | — | | | — | | | 3.6 | | | (0.6 | ) |
| | |
|
| |
|
| |
|
| |
|
| |
|
| |
|
| |
|
| |
|
|
Net | | 25.2 | | | (0.3 | ) | | (0.3 | ) | | (0.2 | ) | | (0.3 | ) | | (1.0 | ) | | 23.1 | | | 18.9 | |
| | |
|
| |
|
| |
|
| |
|
| |
|
| |
|
| |
|
| |
|
|
| | | | | | | | |
OTHER CURRENCIES | | | | | | | | | | | | | | | | | | | | | | | | |
Cash & Deposits | | 50.1 | | | — | | | — | | | — | | | — | | | — | | | 50.1 | | | 50.1 | |
Borrowings | | (10.8 | ) | | (1.7 | ) | | — | | | — | | | — | | | — | | | (12.5 | ) | | (12.5 | ) |
Exchange rate derivatives | | — | | | — | | | — | | | — | | | — | | | — | | | — | | | — | |
—Forward foreign exchange contracts | | — | | | — | | | — | | | — | | | — | | | — | | | — | | | — | |
| | |
|
| |
|
| |
|
| |
|
| |
|
| |
|
| |
|
| |
|
|
Net | | 39.3 | | | (1.7 | ) | | — | | | — | | | — | | | — | | | 37.6 | | | 37.6 | |
| | |
|
| |
|
| |
|
| |
|
| |
|
| |
|
| |
|
| |
|
|
To a large extent, the Company’s use of borrowings in currencies other than pounds sterling and its use of derivative currency contracts (as shown in the table above) is for the purpose of managing the variability in shareholders’ funds resulting from the re-translation of its foreign net investments at current exchange rates.
The following table identifies the net exchange rate exposure remaining after taking account of such borrowings and currency derivatives. The currency profile of the Company’s net assets at December 31, 2002 was as follows:
Currency
| | Net assets excluding net funds
| | | Net funds
| | Net assets
| |
| | | £ million | |
Pounds Sterling | | (147.3 | ) | | 27.0 | | (120.3 | ) |
U.S. Dollar | | 772.4 | | | 85.4 | | 857.8 | |
Euro | | 113.5 | | | 5.4 | | 118.9 | |
Other | | 181.3 | | | 39.8 | | 221.1 | |
| | |
|
| |
| |
|
|
Total | | 919.9 | | | 157.6 | | 1,077.5 | |
| | |
|
| |
| |
|
|
Further disclosures regarding Tomkins use of derivatives and other financial instruments are given in Note 26 to the consolidated financial statements.
74
Item 12. Description of Securities Other than Equity Securities
Not applicable.
PART II
Item 13. Defaults, Dividend Arrearages and Delinquencies
None.
Item 14. Material Modifications to the Rights of Security Holders and Use of Proceeds
None.
Item 15. Controls and Procedures
Evaluation of Disclosure Controls and Procedures
Our Chief Executive Officer and Chief Financial Officer have evaluated the effectiveness of our disclosure controls and procedures (as such term is defined in Rules 13a—14(c) and 15d—14(c) under the Exchange Act) as of a date within 90 days prior to filing date of this Transition Report (“the Evaluation Date”). Based on such evaluation, such officers have concluded that, as of the Evaluation Date, our disclosure controls and procedures are effective in alerting them on a timely basis to material information relating to the Company (including its consolidated subsidiaries) required to be included in our periodic filings under the Exchange Act.
Changes in Internal Controls
Since the Evaluation Date, there have not been any significant changes in our internal controls or in other factors that could significantly affect such controls.
Item 16. Reserved
PART III
Item 17. Financial Statements
Item 18. Financial Statements
Not applicable.
75
Item 19. Exhibits
| |
| 1.1 | | Memorandum and Articles of Association of the Company.(1) |
| |
| 4.1 | | Agreement, dated October 23, 1999 for £1.3 billion multi-currency revolving credit and bill facility, as amended. (1) |
| |
| 4.2 | | The rules of the Tomkins Executive Share Option Scheme No. 3.(2) |
| |
| 4.3 | | The rules of the Tomkins Executive Share Option Scheme No. 4.(2) |
| |
| 4.4 | | Service Agreement, dated February 11, 2002 between Tomkins plc and James Nicol(3) |
| |
| 4.5 | | Support Agreement, dated April 29, 2003, between Tomkins plc, 2023103 Ontario Inc., and Stackpole Limited*. |
| |
| 4.6 | | Lock-up Agreement, dated April 29, 2003, between The Stackpole Corporation, Tomkins plc, and 2023103 Ontario Inc*. |
| |
| 8.1 | | List of subsidiaries of the Company*. |
| |
| 10.1 | | Consent of Deloitte & Touche, independent auditors*. |
| |
| 10.2 | | Certification of CEO and Chief Financial Officer pursuant to 18 U.S.C. Section 1350, as adopted pursuant to Section 906 of the Sarbanes-Oxley Act of 2002,*. |
| (1) | | Incorporated by reference to the Company’s Annual Report on Form 20-F for the fiscal year ended April 29, 2000. |
| (2) | | Incorporated by reference to the Company’s Annual Report on Form 20-F for the fiscal year ended April 30, 2001. |
| (3) | | Incorporated by reference to the Company’s Annual Report on Form 20-F for the fiscal year ended April 30, 2002. |
76
Tomkins plc
Report of independent auditors
To the Board of Directors and shareholders of Tomkins plc
London, United Kingdom.
We have audited the accompanying consolidated balance sheets of Tomkins plc and subsidiaries (“Tomkins plc”) as of December 31, 2002, April 30, 2002 and April 30, 2001, and the related consolidated statements of income, cash flows, reconciliation of net cash flow to movement in net funds, total recognized gains and losses, and changes in shareholders’ equity for the eight months to December 31, 2002 and for each of the three years in the period ended April 30, 2002, all expressed in pounds sterling. Our audits also included the financial statement schedule listed in the Index at Item 17 of the Form 20-F. These financial statements and financial statement schedule are the responsibility of the Company’s management. Our responsibility is to express an opinion on the financial statements and financial statement schedule based on our audits.
We conducted our audits in accordance with auditing standards generally accepted in the United States of America. Those standards require that we plan and perform the audit to obtain reasonable assurance about whether the financial statements are free of material misstatement. An audit includes examining, on a test basis, evidence supporting the amounts and disclosures in the financial statements. An audit also includes assessing the accounting principles used and significant estimates made by management, as well as evaluating the overall financial statement presentation. We believe that our audits provide a reasonable basis for our opinion.
In our opinion, such consolidated financial statements present fairly, in all material respects, the financial position of Tomkins plc as of December 31, 2002, April 30, 2002 and April 30, 2001, and the results of its operations and its cash flows for the eight months ended December 31, 2002 and for each of the three years in the period ended April 30, 2002, in conformity with accounting principles generally accepted in the United Kingdom. Also, in our opinion, such financial statement schedule, when considered in relation to the basic consolidated financial statements taken as a whole, presents fairly in all material respects the information set forth therein.
As discussed in Note 2 to the consolidated financial statements, in 2002, Tomkins plc changed its method of accounting for income taxes to conform to Financial Reporting Standard No. 19 “Deferred Tax” and, retroactively, restated the 2001 and 2000 financial statements for the change.
Accounting principles generally accepted in the United Kingdom vary in certain significant respects from accounting principles generally accepted in the United States of America. The application of the latter would have affected the determination of net income for the eight months to December 31, 2002 and for each of the three years in the period ended April 30, 2002 and the determination of shareholders’ equity and financial position as of December 31, 2002, April 30, 2002 and April 30, 2001, to the extent summarized in Note 27.
/s/ DELOITTE & TOUCHE
|
Deloitte & Touche London, United Kingdom |
March 4, 2003, except for Note 27, as to which the date is June 20, 2003
F-1
Tomkins plc
Consolidated statements of income
For the eight months ended December 31, 2002 and fiscal years ended April 30, 2002, April 30, 2001 and April 29, 2000.
| | | Eight months ended December 31, 2002
| | | Year ended April 30, 2002
| | | Year ended April 30,
2001
| | | Year ended April 29,
2000
| |
| | | £ million | |
Net sales | | 2,097.2 | | | 3,373.8 | | | 4,105.5 | | | 5,640.4 | |
Cost of sales | | (1,496.2 | ) | | (2,443.0 | ) | | (2,985.8 | ) | | (4,011.6 | ) |
| | |
|
| |
|
| |
|
| |
|
|
Gross profit | | 601.0 | | | 930.8 | | | 1,119.7 | | | 1,628.8 | |
Distribution expenses | | (254.3 | ) | | (406.3 | ) | | (521.5 | ) | | (718.9 | ) |
Administrative expenses | | (203.6 | ) | | (268.4 | ) | | (287.8 | ) | | (390.5 | ) |
| | |
|
| |
|
| |
|
| |
|
|
Operating income | | 143.1 | | | 256.1 | | | 310.4 | | | 519.4 | |
Share of income from associates | | 0.7 | | | (0.7 | ) | | 0.1 | | | 1.9 | |
| | |
|
| |
|
| |
|
| |
|
|
Operating income including associates | | 143.8 | | | 255.4 | | | 310.5 | | | 521.3 | |
Net loss on disposal of subsidiary companies | | 7.1 | | | (68.5 | ) | | (294.8 | ) | | (6.3 | ) |
Reversal of provision for loss on disposal of business | | 3.5 | | | 66.0 | | | 215.0 | | | — | |
Provision for loss on disposal of business to be discontinued post year end: | | | | | | | | | | | | |
Impairment of goodwill | | — | | | (3.5 | ) | | (42.2 | ) | | (171.4 | ) |
Impairment of assets | | — | | | — | | | (23.8 | ) | | — | |
Payments directly related to the proposed disposal | | — | | | — | | | — | | | (43.6 | ) |
Profit on disposal of fixed assets | | — | | | 8.4 | | | — | | | — | |
| | |
|
| |
|
| |
|
| |
|
|
| | | 154.4 | | | 257.8 | | | 164.7 | | | 300.0 | |
Interest income | | 18.2 | | | 52.4 | | | 73.6 | | | 66.9 | |
Interest expense | | (19.5 | ) | | (45.8 | ) | | (94.3 | ) | | (114.3 | ) |
| | |
|
| |
|
| |
|
| |
|
|
Income before taxes | | 153.1 | | | 264.4 | | | 144.0 | | | 252.6 | |
Taxes on income | | (29.2 | ) | | (71.5 | ) | | (86.9 | ) | | (141.7 | ) |
| | |
|
| |
|
| |
|
| |
|
|
Income before minority interests | | 123.9 | | | 192.9 | | | 57.1 | | | 110.9 | |
Equity minority interest | | (6.1 | ) | | (5.4 | ) | | (3.8 | ) | | (5.8 | ) |
| | |
|
| |
|
| |
|
| |
|
|
Income before preference dividend | | 117.8 | | | 187.5 | | | 53.3 | | | 105.1 | |
Preference dividend | | (24.5 | ) | | (39.3 | ) | | (37.6 | ) | | (34.4 | ) |
| | |
|
| |
|
| |
|
| |
|
|
Net income attributable to Ordinary Shareholders | | 93.3 | | | 148.2 | | | 15.7 | | | 70.7 | |
| | |
|
| |
|
| |
|
| |
|
|
Basic income per Ordinary Share | | 12.10 | p | | 19.16 | p | | 1.83 | p | | 7.46 | p |
| | |
|
| |
|
| |
|
| |
|
|
Diluted income per Ordinary Share | | 11.82 | p | | 18.78 | p | | 1.83 | p | | 11.07 | p |
| | |
|
| |
|
| |
|
| |
|
|
The accompanying Notes form an integral part of these consolidated financial statements.
F-2
Tomkins plc
Consolidated statements of cash flows
For the eight months ended December 31, 2002 and fiscal years ended April 30, 2002, April 30, 2001 and April 29, 2000.
| | | Eight months ended December 31, 2002
| | | Year ended April 30, 2002
| | | Year ended April 30, 2001
| | | Year ended April 29, 2000
| |
| | | £ million | |
Net cash inflow from operating activities | | 217.9 | | | 492.1 | | | 388.2 | | | 578.0 | |
Dividends received from associated undertakings | | 0.5 | | | 0.8 | | | 0.5 | | | 0.7 | |
Returns on investments and servicing of finance | | (33.4 | ) | | (34.4 | ) | | (64.6 | ) | | (77.2 | ) |
Tax paid (net) | | (59.5 | ) | | (43.2 | ) | | (83.9 | ) | | (62.9 | ) |
Capital expenditure (net) | | (94.6 | ) | | (111.2 | ) | | (138.9 | ) | | (228.9 | ) |
Financial investment | | (0.1 | ) | | — | | | (0.1 | ) | | (0.2 | ) |
Acquisitions & disposals | | 44.9 | | | (22.2 | ) | | 1,258.5 | | | (241.1 | ) |
Equity dividends paid | | (57.2 | ) | | (93.3 | ) | | (152.8 | ) | | (149.4 | ) |
| | |
|
| |
|
| |
|
| |
|
|
Net cash inflow/(outflow) before use of liquid resources and financing | | 18.5 | | | 188.6 | | | 1,206.9 | | | (181.0 | ) |
| | |
|
| |
|
| |
|
| |
|
|
Financing | | | | | | | | | | | | |
Share issues (net of costs) | | 1.1 | | | 1.0 | | | 2.8 | | | 4.3 | |
Buy back of own shares | | — | | | (19.9 | ) | | (340.9 | ) | | (6.3 | ) |
Mark to market of hedging instruments | | — | | | (4.4 | ) | | (104.3 | ) | | (21.0 | ) |
Cash flow (decreasing)/increasing debt & lease financing | | (19.9 | ) | | (164.5 | ) | | (843.3 | ) | | 277.0 | |
| | |
|
| |
|
| |
|
| |
|
|
Net cash (outflow)/inflow from financing | | (18.8 | ) | | (187.8 | ) | | (1,285.7 | ) | | 254.0 | |
| | |
|
| |
|
| |
|
| |
|
|
Management of liquid resources | | | | | | | | | | | | |
Cash flow decreasing/(increasing) cash on deposit and collateralized cash | | 109.4 | | | 15.0 | | | (27.4 | ) | | (24.9 | ) |
| | |
|
| |
|
| |
|
| |
|
|
Increase/(Decrease) in cash in the year | | 109.1 | | | 15.8 | | | (106.2 | ) | | 48.1 | |
| | |
|
| |
|
| |
|
| |
|
|
The accompanying Notes form an integral part of these consolidated financial statements.
Reconciliation of net cash flow to movement in net funds
For the eight months ended December 31, 2002 and fiscal years ended April 30, 2002, April 30, 2001 and April 29 2000.
| | | Eight months
ended
December 31,
2002
| | | Year
ended April 30, 2002
| | | Year
ended April 30,
2001
| | | Year
ended April 29,
2000
| |
| | | £ million | |
Increase/(decrease) in cash in the period | | 109.1 | | | 15.8 | | | (106.2 | ) | | 48.1 | |
Cash flow decreasing/(increasing) debt & lease financing | | 19.9 | | | 164.5 | | | 843.3 | | | (277.0 | ) |
Cash flow (decreasing)/increasing cash on deposit and collateralized cash | | (109.4 | ) | | (15.0 | ) | | 27.4 | | | 24.9 | |
| | |
|
| |
|
| |
|
| |
|
|
Change in net funds resulting from cash flows | | 19.6 | | | 165.3 | | | 764.5 | | | (204.0 | ) |
Loans & capital leases (acquired)/disposed with subsidiaries | | — | | | (3.6 | ) | | 18.9 | | | (46.9 | ) |
Translation difference | | (12.8 | ) | | (4.7 | ) | | 12.5 | | | (5.2 | ) |
| | |
|
| |
|
| |
|
| |
|
|
Increase/(decrease) in net funds in the period | | 6.8 | | | 157.0 | | | 795.9 | | | (256.1 | ) |
Net funds/(debt) at beginning of period | | 150.8 | | | (6.2 | ) | | (802.1 | ) | | (546.0 | ) |
| | |
|
| |
|
| |
|
| |
|
|
Net funds/(debt) at end of period | | 157.6 | | | 150.8 | | | (6.2 | ) | | (802.1 | ) |
| | |
|
| |
|
| |
|
| |
|
|
The accompanying Notes form an integral part of these consolidated financial statements.
F-3
Tomkins plc
Consolidated balance sheets
At December 31, 2002, April 30, 2002 and April 30, 2001
| | | December 31, 2002
| | | April 30, 2002
| | | April 30, 2001
| |
| | | £ million | |
Capital employed | | | | | | | | | |
Fixed assets | | | | | | | | | |
Goodwill | | 168.4 | | | 185.1 | | | 192.2 | |
Property, plant and equipment | | 787.6 | | | 864.3 | | | 903.0 | |
Investments | | 8.4 | | | 9.3 | | | 12.2 | |
| | |
|
| |
|
| |
|
|
| | | 964.4 | | | 1,058.7 | | | 1,107.4 | |
| | |
|
| |
|
| |
|
|
Current assets | | | | | | | | | |
Inventory | | 400.4 | | | 413.0 | | | 473.5 | |
Accounts receivable and prepayments | | 624.5 | | | 697.1 | | | 784.4 | |
Cash | | 341.5 | | | 395.9 | | | 400.4 | |
| | |
|
| |
|
| |
|
|
| | | 1,366.4 | | | 1,506.0 | | | 1,658.3 | |
| | | |
Current liabilities | | | | | | | | | |
Accounts payable: amounts falling due within one year | | (490.2 | ) | | (889.1 | ) | | (933.5 | ) |
| | |
|
| |
|
| |
|
|
Net current assets | | 876.2 | | | 616.9 | | | 724.8 | |
| | |
|
| |
|
| |
|
|
Total assets less current liabilities | | 1,840.6 | | | 1,675.6 | | | 1,832.2 | |
Accounts payable: amounts falling due after more than one year | | (243.3 | ) | | (255.3 | ) | | (425.8 | ) |
Provisions for liabilities & charges | | (519.8 | ) | | (279.2 | ) | | (287.5 | ) |
| | |
|
| |
|
| |
|
|
| | | 1,077.5 | | | 1,141.1 | | | 1,118.9 | |
| | |
|
| |
|
| |
|
|
Capital & Reserves | | | | | | | | | |
Called up share capital | | | | | | | | | |
Ordinary Shares of 5p; Authorized shares—1,585,164,220; Issued and outstanding shares—772,973,339 (fiscal 2002; 771,698,555, fiscal 2001; 782,522,750) | | 38.7 | | | 38.6 | | | 39.1 | |
Convertible cumulative preference shares of $50; Authorized shares—13,920,000; Issued and outstanding shares—10,507,478 (fiscal 2002; 10,508,499, fiscal 2001; 10,508,499) | | 337.2 | | | 337.2 | | | 337.2 | |
Redeemable convertible cumulative preference shares of $50; Authorized shares—25,200,000; Issued and outstanding shares—12,438,282 (fiscal 2002; 12,439,527, fiscal 2001; 12,259,755) | | 386.3 | | | 426.8 | | | 426.7 | |
| | |
|
| |
|
| |
|
|
| | | 762.2 | | | 802.6 | | | 803.0 | |
Share premium account | | 92.2 | | | 89.4 | | | 89.7 | |
Capital redemption reserve | | 66.6 | | | 66.6 | | | 64.8 | |
Retained income | | 118.5 | | | 148.3 | | | 127.4 | |
| | |
|
| |
|
| |
|
|
Shareholders’ Funds | | 1,039.5 | | | 1,106.9 | | | 1,084.9 | |
Equity minority interest | | 38.0 | | | 34.2 | | | 34.0 | |
| | |
|
| |
|
| |
|
|
| | | 1,077.5 | | | 1,141.1 | | | 1,118.9 | |
| | |
|
| |
|
| |
|
|
Shareholders’ Funds | | | | | | | | | |
Equity | | 316.0 | | | 342.9 | | | 321.0 | |
Non-equity | | 723.5 | | | 764.0 | | | 763.9 | |
| | |
|
| |
|
| |
|
|
| | | 1,039.5 | | | 1,106.9 | | | 1,084.9 | |
| | |
|
| |
|
| |
|
|
The accompanying Notes form an integral part of these consolidated financial statements.
F-4
Tomkins plc
Statements of total recognized gains & losses
For the eight months ended December 31, 2002 and fiscal years ended April 30, 2002, April 30, 2001 and April 29, 2000
| | | December 31,
2002
| | | April 30,
2002
| | | April 30,
2001
| | | April 29,
2000
| |
| | | £ million | |
Profit attributable to shareholders | | | | | 117.8 | | | | | | 187.5 | | | | | | 53.3 | | | | | | 105.1 | |
Foreign exchange translation | | | | | | | | | | | | | | | | | | | | | | | | |
—group | | (112.1 | ) | | | | | (33.5 | ) | | | | | (4.4 | ) | | | | | (0.7 | ) | | | |
—associated undertakings | | (0.3 | ) | | | | | (0.4 | ) | | | | | (0.1 | ) | | | | | 0.1 | | | | |
| | |
|
| | | | |
|
| | | | |
|
| | | | |
|
| | | |
| | | | | | (112.4 | ) | | | | | (33.9 | ) | | | | | (4.5 | ) | | | | | (0.6 | ) |
| | | | | |
|
| | | | |
|
| | | | |
|
| | | | |
|
|
Total recognized gains and losses for the year | | | | | 5.4 | | | | | | 153.6 | | | | | | 48.8 | | | | | | 104.5 | |
Prior year adjustment (see accounting policies) | | | | | — | | | | | | 32.9 | | | | | | — | | | | | | — | |
| | | | | |
|
| | | | |
|
| | | | |
|
| | | | |
|
|
Total recognized gains and losses since last annual report | | | | | 5.4 | | | | | | 186.5 | | | | | | 48.8 | | | | | | 104.5 | |
| | | | | |
|
| | | | |
|
| | | | |
|
| | | | |
|
|
The accompanying Notes form an integral part of these consolidated financial statements.
Consolidated statements of changes in shareholders’ equity
For the eight months ended December 31, 2002 and fiscal years ended April 30, 2002, April 30, 2001 and April 29, 2000
| | | Ordinary
Shares
| | | Convertible
Cumulative
Preference
Shares
| | | Redeemable
Convertible
Cumulative
Preference
Shares
| | | Share
Premium
Account
| | | Capital
Redemption
reserve
| | Retained
Income
| | | Total
| |
| | | £ million | |
At May 1, 1999 | | 47.5 | | | 337.5 | | | 381.1 | | | 100.7 | | | 36.8 | | (256.8 | ) | | 646.8 | |
Net income | | | | | | | | | | | | | | | | 105.1 | | | 105.1 | |
Issue/conversion of shares | | 0.1 | | | (0.1 | ) | | (0.3 | ) | | 5.4 | | | | | (0.8 | ) | | 4.3 | |
Ordinary dividends | | | | | | | | | | | | | | | | (165.8 | ) | | (165.8 | ) |
Preference dividends | | | | | | | | | | | | | | | | (34.4 | ) | | (34.4 | ) |
Buy back of own shares | | (0.1 | ) | | | | | | | | (0.1 | ) | | 0.2 | | (2.6 | ) | | (2.6 | ) |
Exchange translation | | | | | | | | 11.0 | | | | | | | | (11.6 | ) | | (0.6 | ) |
Goodwill written back | | | | | | | | | | | | | | | | 2.2 | | | 2.2 | |
Write back of impaired goodwill on proposed disposal | | | | | | | | | | | | | | | | 171.4 | | | 171.4 | |
| | |
|
| |
|
| |
|
| |
|
| |
| |
|
| |
|
|
At April 29, 2000 | | 47.5 | | | 337.4 | | | 391.8 | | | 106.0 | | | 37.0 | | (193.3 | ) | | 726.4 | |
| | | | | | | |
Net income | | | | | | | | | | | | | | | | 53.3 | | | 53.3 | |
Issue/conversion of shares | | 0.1 | | | (0.2 | ) | | (0.1 | ) | | 3.0 | | | | | | | | 2.8 | |
Ordinary dividends | | | | | | | | | | | | | | | | (95.3 | ) | | (95.3 | ) |
Preference dividends | | | | | | | | | | | | | | | | (37.6 | ) | | (37.6 | ) |
Buy back of own shares | | (8.5 | ) | | | | | | | | (19.3 | ) | | 27.8 | | (341.2 | ) | | (341.2 | ) |
Exchange translation | | | | | | | | 35.0 | | | | | | | | (39.5 | ) | | (4.5 | ) |
Goodwill written back | | | | | | | | | | | | | | | | 732.2 | | | 732.2 | |
Adjustment to prior year dividends in respect of share buy backs | | | | | | | | | | | | | | | | 6.6 | | | 6.6 | |
Write back of impaired goodwill on proposed disposal | | | | | | | | | | | | | | | | 42.2 | | | 42.2 | |
| | |
|
| |
|
| |
|
| |
|
| |
| |
|
| |
|
|
At April 30, 2001 | | 39.1 | | | 337.2 | | | 426.7 | | | 89.7 | | | 64.8 | | 127.4 | | | 1,084.9 | |
| | |
|
| |
|
| |
|
| |
|
| |
| |
|
| |
|
|
F-5
Tomkins plc
Consolidated statements of changes in shareholders’ equity (continued)
For the eight months ended December 31, 2002,fiscal years ended April 30, 2002, April 30, 2001 and April 29, 2000
| | | Ordinary
Shares
| | | Convertible
Cumulative
Preference
Shares
| | Redeemable
Convertible
Cumulative
Preference
Shares
| | | Share
Premium
Account
| | | Capital
Redemption
Reserve
| | Retained
Income
| | | Total
| |
| | | £ million | |
At April 30, 2001 | | 39.1 | | | 337.2 | | 426.7 | | | 89.7 | | | 64.8 | | 127.4 | | | 1,084.9 | |
Net income | | | | | | | | | | | | | | | 187.5 | | | 187.5 | |
Issue/conversion of shares | | 0.1 | | | | | 6.3 | | | 1.0 | | | | | | | | 7.4 | |
Ordinary dividends | | | | | | | | | | | | | | | (39.3 | ) | | (39.3 | ) |
Preference dividends | | | | | | | | | | | | | | | (92.6 | ) | | (92.6 | ) |
Buy back of own shares | | (0.6 | ) | | | | | | | (1.3 | ) | | 1.8 | | (19.7 | ) | | (19.8 | ) |
Exchange translation | | | | | | | (6.2 | ) | | | | | | | (27.7 | ) | | (33.9 | ) |
Goodwill written back | | | | | | | | | | | | | | | 9.3 | | | 9.3 | |
Adjustment to prior year dividends in respect of share buy backs | | | | | | | | | | | | | | | 0.2 | | | 0.2 | |
Write back of impaired goodwill on proposed disposal | | | | | | | | | | | | | | | 3.2 | | | 3.2 | |
| | |
|
| |
| |
|
| |
|
| |
| |
|
| |
|
|
At April 30, 2002 | | 38.6 | | | 337.2 | | 426.8 | | | 89.4 | | | 66.6 | | 148.3 | | | 1,106.9 | |
Net income | | | | | | | | | | | | | | | 117.8 | | | 117.8 | |
Issue/conversion of shares | | 0.1 | | | | | (0.1 | ) | | 2.8 | | | | | | | | 2.8 | |
Ordinary dividends | | | | | | | | | | | | | | | (61.9 | ) | | (61.9 | ) |
Preference dividends | | | | | | | | | | | | | | | (24.5 | ) | | (24.5 | ) |
Exchange translation | | | | | | | (40.4 | ) | | | | | | | (72.0 | ) | | (112.4 | ) |
Goodwill written back | | | | | | | | | | | | | | | 10.8 | | | 10.8 | |
| | |
|
| |
| |
|
| |
|
| |
| |
|
| |
|
|
At December 31, 2002 | | 38.7 | | | 337.2 | | 386.3 | | | 92.2 | | | 66.6 | | 118.5 | | | 1,039.5 | |
| | |
|
| |
| |
|
| |
|
| |
| |
|
| |
|
|
The accompanying Notes form an integral part of these consolidated financial statements.
Following a review carried out during the year ended May 3, 1997, the directors determined that the value of the goodwill relating to a number of proposed disposals was permanently impaired. As a result goodwill to the value of £39.5 million was written off through the consolidated profit and loss account for that year. Of this, £29.0 million related to companies disposed of between May 4, 1997 and December 31, 2002.
In addition to the above, the goodwill arising since March 1, 1973 on the acquisition of subsidiary and associated undertakings owned at December 31, 2002 has been written off against reserves and totaled £1,136.1 million (April 30, 2002—£1,146.9 million; 2001—£1,159.4 million; 2000—£1,989.3 million).
F-6
Tomkins plc
Notes to the consolidated financial statements
The accompanying financial statements do not comprise “statutory accounts” within the meaning of Section 240 of the Companies Act 1985 of England and Wales (the “Companies Act”), but have been based upon the full published accounts of the Company for the eight months ended December 31, 2002 and the three fiscal years to April 30, 2002 which have been delivered to the Registrar of Companies in England and Wales upon which unqualified audit reports have been given.
These financial statements are presented under the historical cost convention and in accordance with applicable U.K. Generally Accepted Accounting Principles (“U.K. GAAP”). These principles differ in certain significant respects from accounting principles generally accepted in the United States of America (“U.S. GAAP”); see Note 27.
(a) Basis of consolidation
The financial statements include the results of all subsidiary undertakings (“subsidiaries”). The results of subsidiaries acquired or sold are consolidated for the periods from the effective dates of acquisition or to the effective dates of sale.
(b) Accounting period
The financial statements are for the 245 days ended December 31, 2002, the 365 days ended April 30, 2002, the 366 days ended April 30, 2001 and the 364 days ended April 29, 2000.
(c) Foreign currencies
Trading results denominated in foreign currencies are translated into pounds sterling at the average rates of exchange ruling throughout the period, or at composite rates at which forward cover exists.
Assets and liabilities are translated at the rates of exchange ruling at the balance sheet date, or at composite rates specified in related forward contracts.
Foreign exchange differences arising on the translation of the opening net assets of foreign subsidiaries, the translation of foreign subsidiaries’ income statements from average or composite rates to closing rates and from transactions executed solely for the purpose of hedging foreign currency translation exposure are taken to reserves. Other exchange differences are recognized when they arise.
(d) Financial instruments
Derivative financial instruments are held to reduce exposure to foreign exchange risk and interest rate movements. None are held for speculative purposes.
To qualify as a hedge, a financial instrument must be related to actual foreign currency assets or liabilities or to a probable commitment. It must involve the same currency or similar currencies as the hedged item and must also reduce the risk of foreign currency exchange movements on the group’s operations. Gains and losses arising on these contracts are deferred and recognized in the income statement, or as adjustments to the carrying amount of fixed assets, only when the hedged transaction has itself been reflected in the group’s financial statements.
If an instrument ceases to be accounted for as a hedge, for example, because the underlying hedged position is eliminated, the instrument is marked to market and any resulting profit or loss recognized at that time.
(e) Property, plant & equipment
Property, plant & equipment are stated at cost less accumulated depreciation and any provision for impairment.
Freehold land and assets under construction are not depreciated. Depreciation of property, plant & equipment, other than freehold land and assets under construction, is provided on the straight-line basis over anticipated useful lives:
Freehold buildings and long leasehold land & buildings | | Ten to fifty years |
Short leasehold land & buildings | | Length of lease |
Plant, equipment & vehicles | | Two to twenty years |
F-7
Tomkins plc
Notes to the consolidated financial statements—(continued)
(f) Capital leases
Assets held under leases which confer rights and obligations similar to those attaching to owned assets are capitalized at fair value as property, plant & equipment and the corresponding liability to pay rentals is shown net of interest in the financial statements as obligations under capital leases. The capitalized values of the assets are written off on the straight-line basis over the shorter of the period of the lease or the useful life of the asset concerned. The interest element of the lease payments is allocated so as to produce a constant periodic rate of charge.
(g) Investments
An associated undertaking (“associate”) is an investment in which the group has substantial long-term minority equity interest and in which it participates in commercial and financial policy decisions. The consolidated income statement includes the group’s share of the results of associates. Investments in associates, all of which were acquired before May 2, 1998, are incorporated in the consolidated balance sheet at cost, less goodwill written off, plus the group’s share of post acquisition reserves.
Other investments are stated at the lower of cost or net realizable value.
(h) Inventory
Inventory is valued at the lower of cost or net realizable value with due allowance for any obsolete or slow moving items. Net realizable value is the estimated selling price less costs to complete and sell. Work in progress, finished goods & goods held for resale include an appropriate proportion of overhead expense. Long-term contracts are valued at cost plus attributable profit less provisions for foreseeable loss. If the outcome of a contract can be assessed with reasonable certainty, profit is taken by the percentage of completion method, otherwise profit is taken at the conclusion of each contract.
Certain commodities used by operating companies are purchased or sold by way of forward contracts in order to fix the purchase price of the underlying raw material or product. Where such an arrangement exists, commodities are accounted for at the cost fixed by the forward contract.
(i) Goodwill
Goodwill, being the excess of the cost of an acquisition over the fair values attributed to the net tangible assets at acquisition, is capitalized and is being amortized over a finite life not exceeding twenty years. Provision is made for any impairment.
Goodwill arising on acquisitions made on or before May 2, 1998 was charged directly to reserves. The profit or loss on disposal or closure of a business includes any attributable goodwill previously charged to reserves.
(j) Net sales
Net sales include sales in the ordinary course of business to external customers for goods supplied and services provided, exclusive of sales related taxes.
(k) Research & development
Expenditure on research & development and on patents and trademarks is written off in the year in which it is incurred.
(l) Operating leases
Operating lease rentals are charged to the income statement on the straight-line basis over the periods of the leases.
(m) Employee share schemes
The cost of awards to employees that take the form of shares or rights to shares (including conditional rights) are charged to the income statement over the period to which the employees’ performance relates.
(n) Pensions & other post-retirement benefits
The costs of pension plans & other post-retirement benefits are charged to the income statement so as to spread the costs over the employees’ working lives with the Company.
F-8
Tomkins plc
Notes to the consolidated financial statements—(continued)
(o) Government grants
Government grants relating to property, plant & equipment are treated as deferred income and credited to the income statement in equal installments over the anticipated useful lives of the assets to which the grants relate. Other grants are credited to the income statement when they are received.
(p) Tax
The tax charge is based on the profit for the year and takes into account tax deferred due to timing differences between the treatment of certain items for tax and accounting purposes. Deferred tax is provided in full on all liabilities. In accordance with FRS19, deferred tax assets are recognized to the extent it is regarded that it is more likely than not that they will be recovered. Deferred tax assets and liabilities have not been discounted.
(q) Estimates and assumptions
The preparation of financial statements in conformity with generally accepted accounting principles requires management to make estimates and assumptions that affect the reported amounts of assets and liabilities, the disclosure of contingent liabilities and assets at the date of the financial statements and the reported amounts of revenues and expenses during the reporting period. Actual results could vary from those estimates.
| 3 | | Acquisitions and disposals |
In the eight months to December 31, 2002 and the three-year period ended April 30, 2002 the Company acquired and disposed of the following businesses, the results of which are included in the consolidated financial statements from their respective dates of acquisition or to the effective date of sale.
Acquisitions during the period ended December 31, 2002
Tomkins acquired the business, assets and liabilities of Ward Industries Inc. and of the heating, ventilating and air conditioning dampers division of Johnson Controls Inc. on September 11, 2002 and September 30, 2002 respectively, for a combined cash consideration of $17.6 million (£11.3 million) of which $0.7 million (£0.4 million) is deferred. Goodwill of £6.9 million arising on these acquisitions was capitalized. The value of the assets acquired is still being assessed and therefore the calculation of goodwill is provisional. These acquisitions are included in the Air Systems Components group.
Disposals during the period ended December 31, 2002
Industrial & Automotive
On May 15, 2002, Tomkins sold the consumer and industrial division of Gates (U.K.) Limited for a cash consideration of £25.0 million. There was a loss on sale, after pension and disposal costs, of £4.5 million of which £3.5 million was provided for in the year ended April 30, 2002. The £1.0 million loss charged in the period ended December 31, 2002 was after charging £1.4 million of goodwill previously written off to reserves.
On December 30, 2002, Tomkins sold the business and assets of Fedco Automotive Components Inc. for a cash consideration of $8.0 million (£5.0 million). £4.6 million of goodwill previously written off to reserves was written off to the profit and loss account, resulting in a loss on sale of £6.6 million.
Engineered & Construction Products
On May 24, 2002, Lasco Composites was sold for an adjusted cash consideration of $43.1 million (£29.6 million). £4.8 million of goodwill previously written off to reserves was written off to the profit and loss account. After disposal related costs of $3.6 million (£2.5 million) there was a profit on sale of £18.3 million.
Costs of £0.1 million relating to the ongoing sale of companies were incurred during the period.
Acquisitions during the period ended April 30, 2002
Tomkins acquired American Metal Products Company and the business and assets of Superior Rex on November 13, 2001 and November 19, 2001 respectively, for combined consideration of $45.0 million (£31.2 million). These acquisitions are included within the Air Systems Components group.
In addition, cash of £2.4 million was received during the year that related to acquisitions made in earlier years.
F-9
Tomkins plc
Notes to the consolidated financial statements—(continued)
Disposals during the period ended April 30, 2002
Industrial & Automotive
Totectors Limited and The Northern Rubber Company Limited were sold on May 25, 2001 and September 11, 2001 respectively for a total consideration, net of costs, of £23.0 million. £5.3 million of goodwill previously written off to reserves was written off to the income statement, resulting in a profit on sale of £4.2 million.
On December 17, 2001, the bellows business of Standard-Thomson Corporation was sold for a cash consideration, net of costs, of $1.6 million (£1.1 million) resulting in a loss on sale of £1.0 million.
Engineered & Construction Products
Sunvic Controls Limited was sold on July 27, 2001 for a total consideration, net of costs, of £1.8 million. £4.0 million of goodwill previously written off to reserves was written off to the income statement, resulting in a loss on sale of £4.5 million.
Professional, Garden & Leisure Products
On May 11, 2001 Tomkins sold Smith & Wesson Corp. for a consideration of $15.0 million (£10.6 million). The purchaser also paid $20.0 million (£14.1 million) of an outstanding loan of $73.8 million (£52.0 million) due from Smith & Wesson Corp. to Tomkins Corporation. Of the remaining $53.8 million (£37.9 million), $30 million (£21 million) will be repaid on an amortizing basis over the seven years commencing in May 2004 and $23.8 million (£16.8 million) was included in the equity capital acquired by the purchaser. Interest on the outstanding loan balance will continue at nine percent per annum. There was a loss on sale of £65.8 million of which a provision of £66.0 million was made in the year ended April 30, 2001.
Costs of £1.4 million relating to the ongoing sale of companies were incurred during the year.
Acquisitions during the period ended April 30, 2001
Industrial & Automotive:
A £3.3 million reduction in the purchase consideration of ACD Tridon Inc. was agreed and received during the year.
Air Systems Components:
Additional purchase consideration of £1.0 million on the acquisitions of Air Diffusion Limited and Hart & Cooley was paid during the year.
Engineered & Construction Products:
On November 3, 2000, the business and net assets of Care Free Aluminum Products, Inc. were acquired for a cash consideration of $11.2 million (£7.8 million). The acquisition is not material to the Engineered & Construction Products business segment.
Disposals during the period ended April 30, 2001
Engineered & Construction Products:
Homer of Redditch Limited, Twiflex Limited and T. A. Knight Limited were sold on May 18, 2000, June 23, 2000 and February 16, 2001 respectively for total cash consideration, net of costs, of £3.1 million. £1.0 million of goodwill previously written off to reserves was written off to the income statement resulting in a loss on sale of £1.8 million.
Food Manufacturing:
The Red Wing Company Inc was sold on July 14, 2000 for cash consideration, net of costs, of $140.9 million (£93.8 million). The sale of the remaining Food Manufacturing business segment was completed on August 31, 2000 for total cash consideration of £1,138.0 million. £171.4 million of the £828.7 million of goodwill previously written off to reserves on acquisition of the businesses was included in the write-off of the impaired goodwill in the year ended April 29, 2000 and the remaining £657.3 million was charged to the income statement. Costs of the sale were offset by the reversal of the £43.6 million provision established at April 29, 2000 for payments directly related to the disposal, which included a provision of £25.0 million for pension payments arising as a result of the transaction. The net loss on sale charged to the income statement for the year ended April 30, 2001 was £1.8 million.
F-10
Tomkins plc
Notes to the consolidated financial statements—(continued)
Professional, Garden & Leisure Products:
Murray Inc and Hayter Limited were sold on the October 5, 2000 for consideration of $219.3 million (£148.3 million). Of the proceeds, $206.3 million (£139.5 million) has been received in cash and $13.0 million (£8.8 million) in a secured subordinated loan note, repayable in 2006. There was a loss on sale of £76.2 million after charging £73.9 million of goodwill, previously written off to reserves and £2.1 million costs of disposal.
Deferred consideration of £1.0 million relating to disposals made in prior years was received during the year.
Acquisitions during the period ended April 29, 2000
Goodwill of £182.0 million, arising on acquisitions during fiscal 2000, has been capitalized and is being amortized over a finite life not exceeding twenty years.
Industrial & Automotive:
On June 25, 1999, Tomkins acquired ACD Tridon Inc. for cash consideration of £23.5 million. The fair value of the net assets on acquisition was £41.5 million, excluding debt of £45.2 million. A reduction in the purchase consideration of £3.3 million was agreed and received after the year-end. Goodwill of £26.1 million arose after acquisition costs of £2.2 million. Certain elements of the ACD Tridon business have been integrated with Tomkins’ existing businesses. As a result, the individual results of the acquired company are not separately identifiable.
On November 10, 1999, Tomkins acquired the shares in Gates India held by the minority shareholder for cash consideration of £0.8 million. Goodwill of £0.9 million arose on the transaction.
Air Systems Components:
On December 30, 1999, Tomkins acquired the assets of Hart & Cooley for a cash consideration of £197.0 million. The fair value of assets on acquisition was £56.2 million, excluding net debt of £0.5 million. After costs of £1.5 million, goodwill of £142.8 million arose on the acquisition.
On January 9, 2000, Tomkins acquired Air Diffusion Limited and the business of Actionair for cash consideration of £8.0 million and inherited debt of £2.8 million. Net assets of £5.3 million (excluding net debt) were acquired resulting in goodwill of £6.0 million after costs of £0.5 million.
Food Manufacturing:
On May 28, 1999, Tomkins acquired the trademarks and certain assets of Frank Cooper for cash consideration of £3.5 million. The fair value of the assets acquired was £0.1 million. Goodwill of £3.4 million arose on the acquisition.
On August 9, 1999, Tomkins acquired Haydens Bakeries Limited for a consideration of £3.5 million of which £0.5 million was paid in cash and £3.0 million was met by the issue of loan notes. The estimated fair value of net assets on the acquisition was £2.4 million, excluding net debt of £1.7 million. Goodwill of £2.8 million arose on the acquisition.
Disposals during period ended April 29,2000
Engineered & Construction Products:
Shipham and Company Limited and The Premier Screw & Repetition Company Limited were sold on April 17, 2000 and April 27, 2000 respectively for a total consideration of £2.6 million. £2.2 million of goodwill, previously written off to reserves, was written off to the income statement resulting in a loss on sale of £6.3 million.
Deferred consideration of £1.8 million, relating to disposals made in the prior years was received during the year.
F-11
Tomkins plc
Notes to the consolidated financial statements—(continued)
Fair value of assets and liabilities acquired
The fair value of assets and liabilities of the subsidiaries acquired during the period ended April 30, 2001 was not material. The fair value of the assets and liabilities of the subsidiaries acquired during the eight month period ended December 31, 2002 and the fiscal years ended April 30, 2002 and April 29, 2000 were as follows:
| | | December 31,
2002
| | | April 30, 2002
| | | April 29, 2000
| |
| | | £ million | |
Property, plant & equipment | | 1.8 | | | 15.5 | | | 71.5 | |
Inventory | | 1.2 | | | 8.1 | | | 38.3 | |
Receivables | | 2.3 | | | 10.2 | | | 56.0 | |
Payables | | (0.6 | ) | | (7.6 | ) | | (58.9 | ) |
Tax | | — | | | (0.1 | ) | | (2.8 | ) |
Deferred tax | | — | | | — | | | 7.4 | |
Provisions | | — | | | — | | | (6.0 | ) |
Net debt | | (0.3 | ) | | (1.2 | ) | | (50.2 | ) |
Minority interest | | — | | | — | | | (0.1 | ) |
| | |
|
| |
|
| |
|
|
| | | 4.4 | | | 24.9 | | | 55.2 | |
Goodwill—capitalized | | 6.9 | | | 6.3 | | | 182.0 | |
| | |
|
| |
|
| |
|
|
Consideration | | 11.3 | | | 31.2 | | | 237.2 | |
| | |
|
| |
|
| |
|
|
Details of all acquisitions during the period ended December 31, 2002, including the fair value adjustments made to the assets and liabilities acquired, are set out below:
| | | Book value
| | | Accounting
policy
alignment
| | | Fair value
adjustments
| | | Fair value
to the
group
| |
| | | £ million | |
Tangible fixed assets | | 1.8 | | | — | | | — | | | 1.8 | |
Stock | | 1.4 | | | (0.2 | )(a) | | — | | | 1.2 | |
Debtors | | 2.4 | | | — | | | (0.1 | )(b) | | 2.3 | |
Creditors | | (0.6 | ) | | — | | | — | | | (0.6 | ) |
Net debt | | (0.3 | ) | | — | | | — | | | (0.3 | ) |
| | |
|
| |
|
| |
|
| |
|
|
Net assets | | 4.7 | | | (0.2 | ) | | (0.1 | ) | | 4.4 | |
| | |
|
| |
|
| |
|
| | | |
Goodwill capitalized (see note 12) | | | | | | | | | | | 6.9 | |
| | | | | | | | | | | |
|
|
Consideration | | | | | | | | | | | 11.3 | |
| | | | | | | | | | | |
|
|
Cash consideration | | | | | | | | | | | 10.9 | |
| | | | | | | | | | | |
|
|
Deferred consideration | | | | | | | | | | | 0.4 | |
| | | | | | | | | | | |
|
|
Acquisition costs included in the consideration are £0.1 million.
| Notes: | | (a) Alignment of stock carrying value and provisioning policies. |
| | | (b) Allowance for doubtful debts |
F-12
Tomkins plc
Notes to the consolidated financial statements—(continued)
Details of all acquisitions in fiscal 2002, including the fair value adjustments made to the assets and liabilities acquired, are set out below:
| | | Book value
| | | Accounting policy alignment
| | | Fair value adjustments
| | | Fair value to
the group
| |
| | | £ million | |
Tangible fixed assets | | 11.2 | | | — | | | 4.3 | (b) | | 15.5 | |
Inventory | | 10.6 | | | (2.5 | )(a) | | — | | | 8.1 | |
Receivables | | 10.2 | | | — | | | — | | | 10.2 | |
Payables | | (7.6 | ) | | — | | | — | | | (7.6 | ) |
Tax | | (0.1 | ) | | — | | | — | | | (0.1 | ) |
Net debt | | (1.2 | ) | | — | | | — | | | (1.2 | ) |
| | |
|
| |
|
| |
|
| |
|
|
Net assets | | 23.1 | | | (2.5 | ) | | 4.3 | | | 24.9 | |
| | |
|
| |
|
| |
|
| | | |
Goodwill capitalized | | | | | | | | | | | 6.3 | |
| | | | | | | | | | | |
|
|
Cash consideration | | | | | | | | | | | 31.2 | (c) |
| | | | | | | | | | | |
|
|
| Notes: | | (a) Alignment of inventory carrying value and provisioning policies. |
(b) Revaluation of fixed assets at directors’ valuation.
(c) Acquisition costs included in the consideration are £0.2 million.
The profit after tax of American Metal Products Company for the year ended December 31, 2000 was £0.3 million and the loss after tax for the period from January 1, 2001 to November 13, 2001 was £0.3 million. The profit after tax of Superior Rex for the year ended December 31, 2000 was £0.2 million and the profit after tax for the period from January 1, 2001 to November 19, 2001 was £0.2 million. Both acquisitions during the year have been integrated into existing businesses and it is not possible to calculate their impact on the Group’s cash flows.
F-13
Tomkins plc
Notes to the consolidated financial statements—(continued)
Details of all acquisitions during fiscal 2000, including the fair value adjustments made to the assets and liabilities acquired, are set out below:
| | | Book value
| | | Accounting policy alignment
| | | Fair value Adjustments
| | | Fair value to the group
| |
| | | £ million | |
Intangible fixed assets | | 21.6 | | | — | | | (21.6 | )(c) | | — | |
Property, plant & equipment | | 72.5 | | | (5.1 | )(a) | | 4.1 | (d) | | 71.5 | |
Associated undertakings | | 0.9 | | | — | | | (0.9 | )(e) | | — | |
Inventory | | 43.1 | | | (4.8 | )(b) | | — | | | 38.3 | |
Receivables | | 59.8 | | | — | | | (3.8 | )(f) | | 56.0 | |
Payables | | (56.6 | ) | | — | | | (2.3 | )(g) | | (58.9 | ) |
Provisions | | (6.0 | ) | | — | | | — | | | (6.0 | ) |
Tax | | (0.6 | ) | | — | | | (2.2 | )(h) | | (2.8 | ) |
Deferred tax | | 5.7 | | | — | | | 1.7 | (i) | | 7.4 | |
Net overdrafts | | (6.3 | ) | | — | | | — | | | (6.3 | ) |
Other net debt | | (43.9 | ) | | — | | | — | | | (43.9 | ) |
Minority interest | | (0.1 | ) | | — | | | — | | | (0.1 | ) |
| | |
|
| |
|
| |
|
| |
|
|
Net assets | | 90.1 | | | (9.9 | ) | | (25.0 | ) | | 55.2 | |
| | |
|
| |
|
| |
|
| | | |
Goodwill—capitalized | | | | | | | | | | | 182.0 | |
| | | | |
Consideration(k) | | | | | | | | | | | | |
—satisfied by cash | | | | | | | | 237.5 | | | | |
—loan notes | | | | | | | | 3.0 | | | | |
—receivable from vendors | | | | | | | | (3.3 | ) | | | |
| | | | | | | | | | | |
|
|
| | | | | | | | | | | | 237.2 | |
| | | | | | | | | | | |
|
|
Notes:
| (a) | | Alignment of depreciation and capitalization policies. |
| (b) | | Alignment of inventory carrying values and provisional policies |
| (c) | | Write off of intangible assets. |
| (d) | | Revaluation of fixed assets ((g)£8.2 million) and write off of obsolete assets ((g)£4.1 million). ACD Tridon land and buildings were adjusted to open market value. The valuation was undertaken by an independent qualified firm of valuers, and was assessed on an existing use or open market value basis. Hart & Cooley fixed assets were adjusted to the directors’ best estimate of open market value. |
| (e) | | Write off due to lack of significant influence over operational and financial policies. |
| (f) | | Write off of deferred costs. |
| (g) | | Liabilities on onerous contracts. |
| (h) | | Unprovided current tax. |
| (i) | | Deferred tax on fair value adjustments. |
| (k) | | Acquisition costs included in the consideration are £4.2 million. |
The loss after tax of ACD Tridon for the year ended July 31, 1998 was £0.1 million and for the period from August 1, 1998 to June 24, 1999 was a loss of £11.2 million. The profit after tax of Hayden’s Bakeries for the year ended October 31, 1998 was £0.1 million and for the period from November 1, 1998 to August 8, 1999 was a loss of £0.1 million. The profit after tax of Hart & Cooley for the year ended December 31, 1999 was £8.3 million. The profit after tax of Air Diffusion for the year ended December 31, 1999 was £0.2 million. The loss after tax of Actionair for the year ended March 27, 1999 was £0.4 million and for the period March 28, 1999 to January 8, 2000 was a profit of £0.3 million.
Excluding ACD Tridon, the subsidiary undertakings acquired during the year contributed £9.7 million to the group’s net operating cash flows, paid £nil in respect of tax, paid £0.7 million in respect of net capital expenditure, contributed £nil in respect of management of liquid resources and contributed £22.4 million in respect of net financing.
F-14
Tomkins plc
Notes to the consolidated financial statements—(continued)
Disposals
The total net assets disposed of in the period to December 31, 2002, the aggregate consideration and profit on sale are set out below:
Total net assets sold
| | Total
| |
| | | £ million | |
Tangible fixed assets | | 18.5 | |
Stock | | 11.0 | |
Debtors | | 18.9 | |
Creditors | | (13.1 | ) |
Provisions | | (0.2 | ) |
Tax | | (0.7 | ) |
Deferred tax | | (0.5 | ) |
Net cash | | 0.1 | |
| | |
|
|
Net assets | | 34.0 | |
Goodwill—provision for impairment at 30 April 2002 | | 3.5 | |
Goodwill | | 10.8 | |
| | |
|
|
| | | 48.3 | |
| | |
|
|
Aggregate consideration | | | |
Cash | | (56.2 | ) |
Provision for costs arising on disposal | | 0.8 | |
| | |
|
|
| | | (55.4 | ) |
| | |
|
|
Profit on disposal | | 7.1 | |
Provision made in the year to 30 April 2002 | | 3.5 | |
| | |
|
|
Profit credited in the period | | 10.6 | |
| | |
|
|
The total net assets disposed of in fiscal 2002, the aggregate consideration and loss on sale are set out below:
Total net assets sold
| | Total
| |
| | | £ million | |
Tangible fixed assets | | 24.4 | |
Investments | | (0.2 | ) |
Inventory | | 26.0 | |
Receivables | | 9.1 | |
Payables | | (14.2 | ) |
Provisions | | (1.4 | ) |
Tax | | (1.3 | ) |
Deferred tax | | (0.4 | ) |
Net cash | | 39.6 | |
Collateralized cash | | 3.6 | |
| | |
|
|
Net assets | | 85.2 | |
Goodwill—provision for impairment at April 30, 2001 | | 42.2 | |
Goodwill | | 9.3 | |
| | |
|
|
| | | 136.7 | |
| | |
|
|
Aggregate consideration: | | | |
Cash | | (51.2 | ) |
Deferred consideration | | (20.8 | ) |
Costs | | 3.8 | |
| | |
|
|
| | | (68.2 | ) |
| | |
|
|
Loss on disposal | | 68.5 | |
Provision made in 2001 | | (66.0 | ) |
| | |
|
|
Loss charged in the year | | 2.5 | |
| | |
|
|
F-15
Tomkins plc
Notes to the consolidated financial statements—(continued)
The total net assets disposed of in fiscal 2001, the aggregate consideration and loss on sale are set out below:
| | | Food
Manufacturing
| | | Professional
Garden &
Leisure
Products
| | | Engineered
&
Construction
Components
| | | Total
| |
| | | £ million | |
Total net assets sold: | | | | | | | | | | | | |
Intangible assets | | 10.4 | | | — | | | — | | | 10.4 | |
Tangible fixed assets | | 545.6 | | | 52.5 | | | 2.3 | | | 600.4 | |
Investments | | 4.2 | | | — | | | — | | | 4.2 | |
Inventory | | 135.7 | | | 91.7 | | | 0.9 | | | 228.3 | |
Receivables | | 262.7 | | | 69.6 | | | 2.3 | | | 334.6 | |
Payables | | (295.6 | ) | | (48.3 | ) | | (1.2 | ) | | (345.1 | ) |
Provisions | | — | | | (30.8 | ) | | — | | | (30.8 | ) |
Tax | | (80.4 | ) | | (1.2 | ) | | (0.1 | ) | | (81.7 | ) |
Deferred tax | | (51.1 | ) | | 13.9 | | | (0.3 | ) | | (37.5 | ) |
Net cash | | 73.0 | | | 0.2 | | | — | | | 73.2 | |
Other net debt | | (19.8 | ) | | 0.9 | | | — | | | (18.9 | ) |
Minority interest | | (0.3 | ) | | — | | | — | | | (0.3 | ) |
| | |
|
| |
|
| |
|
| |
|
|
Net assets | | 584.4 | | | 148.5 | | | 3.9 | | | 736.8 | |
Goodwill—provision for impairment at April 29, 2000 | | 171.4 | | | — | | | — | | | 171.4 | |
Goodwill | | 657.3 | | | 73.9 | | | 1.0 | | | 732.2 | |
| | |
|
| |
|
| |
|
| |
|
|
| | | 1,413.1 | | | 222.4 | | | 4.9 | | | 1,640.4 | |
| | |
|
| |
|
| |
|
| |
|
|
Aggregate consideration: | | | | | | | | | | | | |
Cash | | (1,233.7 | ) | | (139.5 | ) | | (3.1 | ) | | (1,376.3 | ) |
Deferred consideration | | — | | | (8.8 | ) | | — | | | (8.8 | ) |
Costs | | 37.4 | | | 2.1 | | | — | | | 39.5 | |
| | |
|
| |
|
| |
|
| |
|
|
| | | (1,196.3 | ) | | (146.2 | ) | | (3.1 | ) | | (1,345.6 | ) |
| | |
|
| |
|
| |
|
| |
|
|
Loss on disposal | | 216.8 | | | 76.2 | | | 1.8 | | | 294.8 | |
Provision made in 2000 | | (215.0 | ) | | — | | | — | | | (215.0 | ) |
| | |
|
| |
|
| |
|
| |
|
|
Loss charged in the year | | 1.8 | | | 76.2 | | | 1.8 | | | 79.8 | |
| | |
|
| |
|
| |
|
| |
|
|
The discontinued operations contributed £55.6 million to the group’s operating cash flows, paid £0.3 million in respect of net returns on investments and servicing of finance, paid £8.8 million in respect of tax, paid £17.0 million in respect of net capital expenditure, contributed £2.1 million in respect of management of liquid resources and paid £67.1 million in respect of net financing.
F-16
Tomkins plc
Notes to the consolidated financial statements—(continued)
The total net assets disposed of in fiscal 2000, the aggregate consideration and loss on sale are set out below:
| | | £ million | |
Aggregate consideration: | | | | | | |
Cash | | | | | 1.8 | |
Deferred consideration | | | | | 0.8 | |
| | | | | |
|
|
| | | | | | 2.6 | |
| | |
Total net assets sold: | | | | | | |
Property, plant & equipment | | 3.8 | | | | |
Inventory | | 2.4 | | | | |
Receivables | | 2.6 | | | | |
Payables | | (1.8 | ) | | | |
Tax | | 0.2 | | | | |
Deferred tax | | (0.5 | ) | | | |
| | |
|
| | | |
| | | | | | (6.7 | ) |
Goodwill | | | | | (2.2 | ) |
| | | | | |
|
|
Loss on disposals | | | | | (6.3 | ) |
| | | | | |
|
|
The results or cash flows of the companies to the dates of their disposal have not had a material impact on the results of the group and have not been separately identified.
Disposal of business to be discontinued:
As a result of the agreements signed relating to the sale of the Food manufacturing business segment a provision of £171.4 million for the impairment of goodwill was charged to the income statement. In addition, a provision of £25.0 million was made for pension payments arising as a result of the transaction and £18.6 million was provided for other related disposal costs.
| 4 | | Operating exceptional items |
| | | December 31,
2002
| | | April 30, 2002
| | | April 30, 2001
| | | April 29, 2000
|
| | | £ million |
Operating income is after (charging)/crediting the following operating exceptional items: | | | | | | | | | | | |
| | | | |
Industrial & Automotive: | | | | | | | | | | | |
Settlement of action against Bando Chemical Industries of Japan | | — | | | — | | | 18.7 | | | — |
Restructuring costs | | (32.0 | ) | | (26.1 | ) | | (9.4 | ) | | — |
Central costs: | | | | | | | | | | | |
Strategic review costs | | — | | | — | | | (5.9 | ) | | — |
| | |
|
| |
|
| |
|
| |
|
Total before tax | | (32.0 | ) | | (26.1 | ) | | 3.4 | | | — |
Tax attributable | | 12.5 | | | 6.2 | | | (1.5 | ) | | — |
| | |
|
| |
|
| |
|
| |
|
Total after tax | | (19.5 | ) | | (19.9 | ) | | 1.9 | | | — |
| | |
|
| |
|
| |
|
| |
|
The restructuring costs of £32.0 million (April 30 2002—£26.1 million) primarily relate to the closure of the Wiper Systems facility in Dunstable, United Kingdom and the rationalization of manufacturing capacity in North America. Net cash flow from operating activities includes £25.4 million (April 30 2002—£5.1 million) outflow in respect of the above restructuring costs.
F-17
Tomkins plc
Notes to the consolidated financial statements—(continued)
In January 1992, Gates filed an action, alleging copyright infringement, misappropriation of trade secrets and unfair competition against Bando Chemical Industries of Japan, as well as certain individual defendants. A settlement was agreed during the year ended April 30, 2001, resulting in an award in favor of the group of $41.8 million (£29.1 million) including interest of $5.8 million (£4.1 million). The funds were received in May and June 2001. Tomkins had agreed to issue further redeemable convertible cumulative preference shares to the former shareholders of Gates, equal to 80 percent of the proceeds (net of costs of litigation since December 1995 and after tax) of the action. Provision has been made for the issue of redeemable convertible cumulative preference shares with a nominal value $9.0 million (£6.3 million) to the former shareholders of Gates. Of the balance of $32.8 million (£22.8 million), $27.0 million (£18.7 million) has been credited to operating income and $5.8 million (£4.1 million) to interest.
The restructuring costs of £9.4 million in the year ended April 30, 2000 relate to the relocation of certain production from the Industrial & Automotive facility in Belgium to a new plant in Eastern Europe.
In the year ended April 30, 2001, costs of £5.9 million were incurred on a strategic review of the Group. Operating cash flows include £1.8 million (2001—£4.1 million) outflow in respect of these costs.
| | | December 31,
2002
| | | April 30, 2002
| | | April 30,
2001
| | | April 29,
2000
| |
| | | £ million | |
(a) Analysis by business segment | | | | | | | | | | | | |
Net sales | | | | | | | | | | | | |
Industrial & Automotive | | 1,263.9 | | | 1,985.9 | | | 1,968.3 | | | 1,921.3 | |
Air Systems Components | | 325.7 | | | 516.4 | | | 487.9 | | | 321.6 | |
Engineered & Construction Products | | 507.6 | | | 871.5 | | | 878.9 | | | 918.8 | |
Food Manufacturing | | — | | | — | | | 562.1 | | | 1,898.6 | |
Professional, Garden & Leisure Products | | — | | | — | | | 208.3 | | | 580.1 | |
| | |
|
| |
|
| |
|
| |
|
|
| | | 2,097.2 | | | 3,373.8 | | | 4,105.5 | | | 5,640.4 | |
| | |
|
| |
|
| |
|
| |
|
|
Operating income* | | | | | | | | | | | | |
Industrial & Automotive | | 92.8 | | | 146.9 | | | 191.8 | | | 200.8 | |
Air Systems Components | | 25.6 | | | 53.8 | | | 55.3 | | | 42.4 | |
Engineered & Construction Products | | 47.4 | | | 77.8 | | | 85.4 | | | 120.4 | |
Food Manufacturing | | — | | | — | | | 26.0 | | | 162.0 | |
Professional, Garden & Leisure Products | | — | | | — | | | (14.5 | ) | | 22.4 | |
Central costs | | (15.2 | ) | | (12.6 | ) | | (24.0 | ) | | (21.3 | ) |
| | |
|
| |
|
| |
|
| |
|
|
| | | 150.6 | | | 265.9 | | | 320.0 | | | 526.0 | |
Goodwill amortization | | (6.8 | ) | | (10.5 | ) | | (9.5 | ) | | (4.7 | ) |
| | |
|
| |
|
| |
|
| |
|
|
| | | 143.8 | | | 255.4 | | | 310.5 | | | 521.3 | |
| | |
|
| |
|
| |
|
| |
|
|
There were no material sales or transfers between segments in any period.
The segmental presentation has been adjusted to provide a more meaningful analysis of operations and to identify corporate costs separately from the business activities.
| * | | Operating income includes the group’s share of the income from associates and is before goodwill amortization. The split of the income from associates analyzed by class of business is Industrial & Automotive £0.3 million (April 2002—loss of £0.7 million, April 2001—£0.3 million, April 2000—£0.6 million), Air Systems Components £nil (April 2002—£nil, April 2001—£nil, April 2000—£nil), Engineered & Construction Products £0.4 million (April 2002—£nil, April 2001—loss of £0.3 million, April 2000—£0.3 million), Food Manufacturing £nil (April 2002—£nil, April 2001—£0.3 million, April 2000—£1.0 million) and Professional, Garden & Leisure Products loss £nil (April 2002—£nil, April 2001 –-£(0.2) million, 2000—£nil). The split of the goodwill amortization charged for the year, analyzed by class of business is Industrial & Automotive £0.9 million (April 2002—£1.5 million, April 2001—£1.3 million, April 2000—£1.6 million) Air Systems Components £5.6 million (April 2002—£8.6 million, April 2001—£7.6 million, April 2000—£2.5 million), Engineered & Construction Products £0.3 million (April 2002—£0.4 million, April 2001—£0.4 million, April 2000—£0.4 million), Food Manufacturing £nil (April 2002—£nil, April 2001—£0.2 million, April 2000—£0.5 million) and Professional, Garden & Leisure Products £nil (April 2002—£nil, April 2001—£nil, April 2000—£nil). |
Comparative figures for goodwill amortization have been restated. See accounting policies.
Details of businesses acquired and disposed of by segment are disclosed in Note 3.
F-18
Tomkins plc
Notes to the consolidated financial statements—(continued)
| | | December 31,
2002
| | | April 30, 2002
| | | April 30,
2001
| | | April 29,
2000
| |
| | | £ million | |
(a) Analysis by business segment (continued) | | | | | | | | | | | | |
Identifiable assets | | | | | | | | | | | | |
Industrial & Automotive | | 1,232.3 | | | 1,324.2 | | | 1,420.9 | | | 1,277.3 | |
Air Systems Components | | 189.3 | | | 217.3 | | | 211.1 | | | 197.9 | |
Engineered & Construction Products | | 297.1 | | | 351.3 | | | 376.9 | | | 362.1 | |
Food Manufacturing | | — | | | — | | | — | | | 913.3 | |
Professional, Garden & Leisure Products | | — | | | — | | | 36.1 | | | 404.6 | |
Central costs | | 13.0 | | | 18.3 | | | 28.8 | | | 39.4 | |
| | |
|
| |
|
| |
|
| |
|
|
| | | 1,731.7 | | | 1,911.1 | | | 2,073.8 | | | 3,194.6 | |
| | |
|
| |
|
| |
|
| |
|
|
Capital expenditure | | | | | | | | | | | | |
Industrial & Automotive | | 82.4 | | | 98.4 | | | 104.6 | | | 87.8 | |
Air Systems Components | | 9.1 | | | 16.1 | | | 12.4 | | | 9.8 | |
Engineered & Construction Products | | 14.2 | | | 16.3 | | | 20.7 | | | 38.3 | |
Food Manufacturing | | — | | | — | | | 16.2 | | | 103.1 | |
Professional, Garden & Leisure Products | | — | | | — | | | 3.0 | | | 6.4 | |
Central costs | | 0.1 | | | 0.1 | | | 0.2 | | | 1.5 | |
| | |
|
| |
|
| |
|
| |
|
|
| | | 105.8 | | | 130.9 | | | 157.1 | | | 246.9 | |
| | |
|
| |
|
| |
|
| |
|
|
Depreciation | | | | | | | | | | | | |
Industrial & Automotive | | 58.4 | | | 86.8 | | | 78.9 | | | 80.2 | |
Air Systems Components | | 12.7 | | | 18.5 | | | 13.9 | | | 9.1 | |
Engineered & Construction Products | | 13.5 | | | 25.3 | | | 23.0 | | | 20.0 | |
Food Manufacturing | | — | | | — | | | 24.7 | | | 69.8 | |
Professional, Garden & Leisure Products | | — | | | — | | | 7.3 | | | 16.9 | |
Central costs | | (0.1 | ) | | (1.3 | ) | | (0.6 | ) | | 1.7 | |
| | |
|
| |
|
| |
|
| |
|
|
| | | 84.5 | | | 129.3 | | | 147.2 | | | 197.7 | |
| | |
|
| |
|
| |
|
| |
|
|
(b) Analysis by geographical origin | | | | | | | | | | | | |
Net sales | | | | | | | | | | | | |
United States of America** | | 1,470.1 | | | 2,380.5 | | | 2,498.1 | | | 2,884.3 | |
United Kingdom | | 125.6 | | | 237.7 | | | 787.4 | | | 1,908.6 | |
Rest of Europe | | 191.1 | | | 290.3 | | | 309.8 | | | 341.0 | |
Rest of the World | | 310.4 | | | 465.3 | | | 510.2 | | | 506.5 | |
| | |
|
| |
|
| |
|
| |
|
|
| | | 2,097.2 | | | 3,373.8 | | | 4,105.5 | | | 5,640.4 | |
| | |
|
| |
|
| |
|
| |
|
|
Operating income* | | | | | | | | | | | | |
United States of America** | | 123.3 | | | 225.6 | | | 237.1 | | | 291.8 | |
United Kingdom | | (6.4 | ) | | (7.6 | ) | | 28.4 | | | 167.5 | |
Rest of Europe | | 1.6 | | | 5.3 | | | 13.1 | | | 15.9 | |
Rest of the World | | 32.1 | | | 42.6 | | | 41.4 | | | 50.8 | |
| | |
|
| |
|
| |
|
| |
|
|
| | | 150.6 | | | 265.9 | | | 320.0 | | | 526.0 | |
Goodwill amortization | | (6.8 | ) | | (10.5 | ) | | (9.5 | ) | | (4.7 | ) |
| | |
|
| |
|
| |
|
| |
|
|
| | | 143.8 | | | 255.4 | | | 310.5 | | | 521.3 | |
| | |
|
| |
|
| |
|
| |
|
|
Identifiable assets | | | | | | | | | | | | |
United States of America** | | 1,102.8 | | | 1,232.8 | | | 1,319.9 | | | 1,647.2 | |
United Kingdom | | 126.1 | | | 181.4 | | | 233.3 | | | 1,043.2 | |
Rest of Europe | | 218.5 | | | 199.2 | | | 201.6 | | | 202.3 | |
Rest of the World | | 284.3 | | | 297.7 | | | 319.0 | | | 301.9 | |
| | |
|
| |
|
| |
|
| |
|
|
| | | 1,731.7 | | | 1,911.1 | | | 2,073.8 | | | 3,194.6 | |
| | |
|
| |
|
| |
|
| |
|
|
| * | | Operating income includes the group’s share of the income from associates and is before goodwill amortization. |
| ** | | Translated at the weighted average weekly rate of £1 = $1.5335 (April 2002—£1 = $1.4330, April 2001—hedged rate of £1 = $1.59; April 2000—hedged rate of £1 = $1.61). |
F-19
Tomkins plc
Notes to the consolidated financial statements—(continued)
| | | December 31,
2002
| | April 30, 2002
| | April 30,
2001
| | April 29,
2000
|
| | | £ million |
Capital expenditure | | | | | | | | |
United States of America** | | 64.6 | | 71.3 | | 75.6 | | 96.1 |
United Kingdom | | 7.5 | | 13.4 | | 25.7 | | 110.2 |
Rest of Europe | | 16.0 | | 25.6 | | 24.6 | | 15.8 |
Rest of the World | | 18.4 | | 20.6 | | 31.2 | | 24.8 |
| | |
| |
| |
| |
|
| | | 106.5 | | 130.9 | | 157.1 | | 246.9 |
| | |
| |
| |
| |
|
Depreciation | | | | | | | | |
United States of America** | | 59.7 | | 90.9 | | 86.0 | | 85.4 |
United Kingdom | | 5.2 | | 10.5 | | 36.9 | | 78.6 |
Rest of Europe | | 6.6 | | 8.9 | | 6.6 | | 18.4 |
Rest of the World | | 12.3 | | 19.0 | | 17.7 | | 15.3 |
| | |
| |
| |
| |
|
| | | 83.8 | | 129.3 | | 147.2 | | 197.7 |
| | |
| |
| |
| |
|
(c) Analysis by geographical destination | | | | | | | | |
Net sales | | | | | | | | |
United States of America** | | 1,442.3 | | 2,332.7 | | 2,464.0 | | 2,845.4 |
United Kingdom | | 80.4 | | 169.1 | | 692.8 | | 1,761.1 |
Rest of Europe | | 215.9 | | 333.1 | | 384.1 | | 471.8 |
Rest of the World | | 358.6 | | 538.9 | | 564.6 | | 562.1 |
| | |
| |
| |
| |
|
| | | 2,097.2 | | 3,373.8 | | 4,105.5 | | 5,640.4 |
| | |
| |
| |
| |
|
| * | | Operating income includes the group’s share of the income from associates and is before goodwill amortization. |
| ** | | Translated at the weighted average weekly rate of £1 = $1.5335 (April 2002—£1 = $1.4330, April 2001—hedged rate of £1 = $1.59; April 2000—hedged rate of £1 = $1.61). |
Tax on profit on ordinary activities
| | | December 31,
2002
| | | April 30, 2002
| | | April 30,
2001
| | | April 29,
2000
| |
| | | £ million | |
Analysis of charge for the year | | | | | | | | | | | | |
Current tax: | | | | | | | | | | | | |
U.K. Corporation tax on profits for the year | | 5.9 | | | 17.8 | | | 22.5 | | | 60.0 | |
Prior year adjustments | | (8.5 | ) | | (8.6 | ) | | 1.8 | | | (23.4 | ) |
| | |
|
| |
|
| |
|
| |
|
|
Total U.K. Corporation tax | | (2.6 | ) | | 9.2 | | | 24.3 | | | 36.6 | |
| | |
|
| |
|
| |
|
| |
|
|
Overseas tax on profit for the year | | 50.5 | | | 75.9 | | | 65.0 | | | 106.3 | |
Prior year adjustments | | (14.0 | ) | | (7.1 | ) | | (1.7 | ) | | 8.4 | |
| | |
|
| |
|
| |
|
| |
|
|
Total overseas tax | | 36.5 | | | 68.8 | | | 63.3 | | | 114.7 | |
| | |
|
| |
|
| |
|
| |
|
|
Total current tax | | 33.9 | | | 78.0 | | | 87.6 | | | 151.3 | |
| | |
|
| |
|
| |
|
| |
|
|
| | | | |
Deferred tax: | | | | | | | | | | | | |
Timing differences originating in the year | | (4.0 | ) | | (1.5 | ) | | (0.7 | ) | | (4.9 | ) |
Deferred tax asset recognized in the year | | (2.4 | ) | | (10.8 | ) | | — | | | (10.7 | ) |
Prior year adjustments | | 1.2 | | | 5.5 | | | — | | | 5.5 | |
| | |
|
| |
|
| |
|
| |
|
|
Total deferred tax | | (5.2 | ) | | (6.8 | ) | | (0.7 | ) | | (10.1 | ) |
Associate income tax | | 0.5 | | | 0.3 | | | — | | | 0.5 | |
| | |
|
| |
|
| |
|
| |
|
|
Tax on profit of ordinary activities | | 29.2 | | | 71.5 | | | 86.9 | | | 141.7 | |
| | |
|
| |
|
| |
|
| |
|
|
The tax charge on exceptional profits is £8.6 million (April 2002—£2.8 million; April 2001—£nil; April 2000—£nil).
F-20
Tomkins plc
Notes to the consolidated financial statements—(continued)
Factors affecting the tax charge for the year
| | | December 31,
2002
| | | April 30, 2002
| | | April 30,
2001
| | | April 29,
2000
| |
| | | £ million | |
Profit on ordinary activities before tax | | 153.1 | | | 264.4 | | | 144.0 | | | 252.3 | |
| | |
|
| |
|
| |
|
| |
|
|
Tax at the standard rate of corporation tax in the UK of 30% (2001—30%; 2000—30%) | | 45.9 | | | 79.3 | | | 43.2 | | | 75.7 | |
Effect of: | | | | | | | | | | | | |
Permanent differences | | (3.1 | ) | | 4.3 | | | (6.2 | ) | | 1.5 | |
Non deductible exceptional items | | 3.5 | | | 1.5 | | | 43.8 | | | 66.4 | |
Timing differences originating in the year | | 4.0 | | | 1.5 | | | 0.7 | | | 4.9 | |
Higher tax rates on overseas earnings | | 6.1 | | | 7.1 | | | 6.0 | | | 17.8 | |
Adjustments to current tax charge in respect of prior years | | (22.5 | ) | | (15.7 | ) | | 0.1 | | | (15.0 | ) |
| | |
|
| |
|
| |
|
| |
|
|
Current tax charge for the year | | 33.9 | | | 78.0 | | | 87.6 | | | 151.3 | |
| | |
|
| |
|
| |
|
| |
|
|
Provision for deferred tax
| | | December 31,
2002
| | | April 30, 2002
| | | April 30,
2001
| |
| | | £ million | |
The deferred tax balance comprises: | | | | | | | | | |
Excess of tax depreciation over book depreciation | | 57.0 | | | 54.4 | | | 43.7 | |
Other timing differences | | (98.4 | ) | | (94.4 | ) | | (77.0 | ) |
| | |
|
| |
|
| |
|
|
Net deferred tax asset | | (41.4 | ) | | (40.0 | ) | | (33.3 | ) |
| | |
|
| |
|
| |
|
|
The balance is made up of: | | | | | | | | | |
Deferred tax asset | | (46.7 | ) | | (49.3 | ) | | (43.3 | ) |
Deferred tax liability | | 5.3 | | | 9.3 | | | 10.0 | |
| | |
|
| |
|
| |
|
|
| | | (41.4 | ) | | (40.0 | ) | | (33.3 | ) |
| | |
|
| |
|
| |
|
|
| | | December 31,
2002
| |
| | | £ million | |
The movements in the net deferred tax asset were as follows | | | |
Balance at April 30, 2002 | | (40.0 | ) |
Foreign exchange translation | | 4.3 | |
Charge for the year (see above) | | (5.2 | ) |
Disposals | | (0.5 | ) |
| | |
|
|
Balance at December 31, 2002 | | (41.4 | ) |
| | |
|
|
Factors that may affect future tax charges
There are other deferred tax assets in relation to capital losses carried forward of £129.3 million (April 2002—£61.8 million; April 2001—£22.4 million) and other losses carried forward and other timing differences of £27.8 million (April 2002—£35.9 million; April 2001—£38.1 million), totaling £157.1 million (April 2002—£97.9 million; April 2001—£60.5 million), that have not been recognized on the basis that their future economic benefit is uncertain. These assets will be recognized when it is regarded as more likely than not that they will be recovered.
F-21
Tomkins plc
Notes to the consolidated financial statements—(continued)
| | | December 31,
2002
| | | April 30, 2002
| | | April 30,
2001
| | | April 29,
2000
| |
| | | £ million | |
Ordinary dividends | | | | | | | | | | | | |
Interim dividend | | 35.6 | | | 35.5 | | | 37.4 | | | 43.7 | |
Second interim dividend | | 26.3 | | | — | | | — | | | — | |
Final dividend | | — | | | 57.1 | | | 57.9 | | | 122.1 | |
| | |
|
| |
|
| |
|
| |
|
|
| | | 61.9 | | | 92.6 | | | 95.3 | | | 165.8 | |
| | |
|
| |
|
| |
|
| |
|
|
Preference dividends | | | | | | | | | | | | |
Convertible cumulative | | 12.7 | | | 20.4 | | | 19.7 | | | 18.0 | |
Redeemable convertible cumulative | | 11.8 | | | 18.9 | | | 17.9 | | | 16.4 | |
| | |
|
| |
|
| |
|
| |
|
|
| | | 24.5 | | | 39.3 | | | 37.6 | | | 34.4 | |
| | |
|
| |
|
| |
|
| |
|
|
Total dividends | | 86.4 | | | 131.9 | | | 132.9 | | | 200.2 | |
| | |
|
| |
|
| |
|
| |
|
|
Dividend per Ordinary Share | | | | | | | | | | | | |
Interim dividend | | 4.60 | p | | 4.60 | p | | 4.60 | p | | 4.60 | p |
Second interim dividend | | 3.40 | p | | nil | | | nil | | | nil | |
Final dividend | | nil | | | 7.40 | p | | 7.40 | p | | 12.85 | p |
| | |
|
| |
|
| |
|
| |
|
|
| | | 8.0 | p | | 12.00 | p | | 12.00 | p | | 17.45 | p |
| | |
|
| |
|
| |
|
| |
|
|
The interim dividends for the eight months ended December 31, 2002, were paid on April 7, 2003.
| 8 | | Income per Ordinary Share |
| | | December 31,
2002
| | | April 30, 2002
| | | April 30,
2001
| | | April 29,
2000
| |
| | | £ million | |
Basic | | | | | | | | | | | | |
Net income | | 117.8 | | | 187.5 | | | 53.3 | | | 105.1 | |
Preference dividend | | (24.5 | ) | | (39.3 | ) | | (37.6 | ) | | (34.4 | ) |
| | |
|
| |
|
| |
|
| |
|
|
Net income attributable to Ordinary Shareholders | | 93.3 | | | 148.2 | | | 15.7 | | | 70.7 | |
| | |
|
| |
|
| |
|
| |
|
|
Weighted average number of shares (000s) | | 770,927 | | | 773,464 | | | 857,686 | | | 947,774 | |
| | |
|
| |
|
| |
|
| |
|
|
Income per share | | 12.10 | p | | 19.16 | p | | 1.83 | p | | 7.46 | p |
| | |
|
| |
|
| |
|
| |
|
|
Diluted | | | | | | | | | | | | |
Net income | | 117.8 | | | 187.5 | | | 53.3 | | | 105.1 | |
Preference dividend | | (24.5 | ) | | (39.3 | ) | | (37.6 | ) | | (34.4 | ) |
| | |
|
| |
|
| |
|
| |
|
|
| | | 93.3 | | | 148.2 | | | 15.7 | | | 70.7 | |
| | |
|
| |
|
| |
|
| |
|
|
Weighted average number of shares, basic (000s) | | 770,928 | | | 773,464 | | | 857,686 | | | 947,774 | |
Options (000s) | | 1,498 | | | 553 | | | 26 | | | 2,019 | |
Convertible preference shares (000s) | | 224,181 | | | 224,338 | | | — | | | — | |
| | |
|
| |
|
| |
|
| |
|
|
Weighted average number of shares, diluted (000s) | | 996,607 | | | 998,355 | | | 857,712 | | | 949,793 | |
| | |
|
| |
|
| |
|
| |
|
|
Income per share | | 11.82 | p | | 18.78 | p | | 1.83 | p | | 11.07 | p |
| | |
|
| |
|
| |
|
| |
|
|
Income per Ordinary Share is calculated in accordance with FRS14.
In fiscal 2001 and 2000, the preference shares are anti-dilutive and therefore have been excluded from the calculation.
F-22
Tomkins plc
Notes to the consolidated financial statements—(continued)
| 9 | | Reconciliation of operating income to operating cash flows |
| | | December 31,
2002
| | | April 30, 2002
| | | April 30,
2001
| | | April 29,
2000
| |
| | | £ million | |
Operating income | | 143.1 | | | 256.1 | | | 310.4 | | | 519.4 | |
Depreciation (net of capital government grants) | | 84.4 | | | 130.1 | | | 145.7 | | | 197.9 | |
Loss/(profit) on sale of property, plant & equipment | | (0.7 | ) | | (1.0 | ) | | 1.1 | | | (1.0 | ) |
Amortization of goodwill | | 6.8 | | | 10.5 | | | 9.5 | | | 4.7 | |
Amortization of long term loyalty plan shares | | 0.4 | | | 0.8 | | | 1.0 | | | 1.3 | |
Post retirement benefits | | (2.0 | ) | | (1.1 | ) | | (0.4 | ) | | (5.6 | ) |
Other provisions | | 1.0 | | | 20.0 | | | (1.2 | ) | | (0.2 | ) |
Decrease/(increase) in inventories | | (28.0 | ) | | 33.1 | | | 28.6 | | | (64.4 | ) |
Decrease/(increase) in receivables | | 27.1 | | | 74.1 | | | 66.1 | | | (73.2 | ) |
Decrease in payables | | (14.2 | ) | | (30.5 | ) | | (172.6 | ) | | (0.9 | ) |
| | |
|
| |
|
| |
|
| |
|
|
Net cash inflow from operating activities | | 217.9 | | | 492.1 | | | 388.2 | | | 578.0 | |
| | |
|
| |
|
| |
|
| |
|
|
| 10 | | Analysis of cash flows for headings netted in the consolidated cash flow statement |
| | | December 31,
2002
| | | April 30, 2002
| | | April 30,
2001
| | | April 29,
2000
| |
| | | £ million | |
Returns on investments & servicing of finance: | | | | | | | | | | | | |
Interest received | | 23.0 | | | 53.1 | | | 71.6 | | | 69.8 | |
Interest paid | | (26.6 | ) | | (43.7 | ) | | (94.2 | ) | | (108.9 | ) |
Interest element of capital lease rental payments | | (0.8 | ) | | (1.5 | ) | | (1.8 | ) | | (2.1 | ) |
Preference dividends paid | | (27.8 | ) | | (39.1 | ) | | (37.8 | ) | | (34.4 | ) |
Investment by minority shareholder | | 3.2 | | | 5.0 | | | 0.9 | | | 1.5 | |
Dividend paid to subsidiary company minority shareholder | | (4.4 | ) | | (8.2 | ) | | (3.3 | ) | | (3.1 | ) |
| | |
|
| |
|
| |
|
| |
|
|
Net cash outflow from returns on investments & servicing of finance | | (33.4 | ) | | (34.4 | ) | | (64.6 | ) | | (77.2 | ) |
| | |
|
| |
|
| |
|
| |
|
|
Tax paid: | | | | | | | | | | | | |
Tax paid | | (67.4 | ) | | (67.2 | ) | | (103.9 | ) | | (129.0 | ) |
Tax received | | 7.9 | | | 24.0 | | | 20.0 | | | 66.1 | |
| | |
|
| |
|
| |
|
| |
|
|
Net cash outflow from tax paid | | (59.5 | ) | | (43.2 | ) | | (83.9 | ) | | (62.9 | ) |
| | |
|
| |
|
| |
|
| |
|
|
Capital expenditure: | | | | | | | | | | | | |
Purchase of property, plant & equipment | | (105.8 | ) | | (130.9 | ) | | (157.1 | ) | | (246.9 | ) |
Sale of property, plant & equipment | | 11.2 | | | 19.7 | | | 18.2 | | | 18.0 | |
| | |
|
| |
|
| |
|
| |
|
|
Net cash outflow from capital expenditure | | (94.6 | ) | | (111.2 | ) | | (138.9 | ) | | (228.9 | ) |
| | |
|
| |
|
| |
|
| |
|
|
Financial investment: | | | | | | | | | | | | |
Purchase of fixed asset investments | | (0.2 | ) | | — | | | (0.1 | ) | | (0.2 | ) |
Sale of fixed asset investments | | 0.1 | | | — | | | — | | | — | |
| | |
|
| |
|
| |
|
| |
|
|
| | | (0.1 | ) | | — | | | (0.1 | ) | | (0.2 | ) |
| | |
|
| |
|
| |
|
| |
|
|
F-23
Tomkins plc
Notes to the consolidated financial statements—(continued)
| | | December 31,
2002
| | | April 30, 2002
| | | April 30,
2001
| | | April 29,
2000
| |
| | | £ million | |
Acquisitions & disposals: | | | | | | | | | | | | |
Purchase of subsidiary undertakings | | (10.9 | ) | | (28.8 | ) | | (5.5 | ) | | (237.5 | ) |
Net overdrafts with subsidiary undertakings | | (0.3 | ) | | (1.2 | ) | | — | | | (6.3 | ) |
Purchase of associated undertakings | | — | | | — | | | (0.6 | ) | | (0.9 | ) |
Sale of subsidiary undertakings | | 56.2 | | | 47.4 | | | 1,337.8 | | | 3.6 | |
Net cash disposed with subsidiary undertakings | | (0.1 | ) | | (39.6 | ) | | (73.2 | ) | | — | |
| | |
|
| |
|
| |
|
| |
|
|
Net cash inflow/(outflow) from acquisitions & disposals | | 44.9 | | | (22.2 | ) | | 1,258.5 | | | (241.1 | ) |
| | |
|
| |
|
| |
|
| |
|
|
Financing: | | | | | | | | | | | | |
Share issues (net of costs) | | 1.1 | | | 1.0 | | | 2.8 | | | 4.3 | |
Buy back of own shares | | — | | | (19.9 | ) | | (340.9 | ) | | (6.3 | ) |
Mark to market of hedging instruments | | — | | | (4.4 | ) | | (104.3 | ) | | (21.0 | ) |
Debt due within one year: | | | | | | | | | | | | |
Decrease in short term borrowings | | (7.1 | ) | | (139.4 | ) | | (60.8 | ) | | (687.8 | ) |
Additional bank loans | | 1.2 | | | 2.9 | | | 3.9 | | | 58.1 | |
Repayment of other loans | | (1.5 | ) | | (2.1 | ) | | (2.6 | ) | | (37.0 | ) |
Debt due after more than one year: | | | | | | | | | | | | |
Additional bank loans | | — | | | 150.7 | | | — | | | 1,103.1 | |
Repayment of bank and other loans | | (11.5 | ) | | (172.9 | ) | | (783.3 | ) | | (153.3 | ) |
Capital element of capital lease rental payments | | (1.0 | ) | | (3.7 | ) | | (0.5 | ) | | (6.1 | ) |
Cash flow (decreasing)/increasing debt and lease financing | | (19.9 | ) | | (164.5 | ) | | (843.3 | ) | | 277.0 | |
| | |
|
| |
|
| |
|
| |
|
|
Net cash (outflow)/inflow from financing | | (18.8 | ) | | (187.8 | ) | | (1,285.7 | ) | | 254.0 | |
| | |
|
| |
|
| |
|
| |
|
|
Management of liquid resources: | | | | | | | | | | | | |
Decrease/(increase) in cash deposits | | 109.2 | | | 11.5 | | | (29.0 | ) | | (24.7 | ) |
Decrease/(increase) in collateralized cash | | 0.2 | | | 3.5 | | | 1.6 | | | (0.2 | ) |
| | |
|
| |
|
| |
|
| |
|
|
Cash flow decreasing/(increasing) cash on deposit and collateralized cash | | 109.4 | | | 15.0 | | | (27.4 | ) | | (24.9 | ) |
| | |
|
| |
|
| |
|
| |
|
|
| | | December 31,
2002
| | | Cash flow
| | | Exchange
movement
| | | April 30, 2002
| |
| | | £ million | |
Cash on demand | | 198.9 | | | 75.3 | | | (10.5 | ) | | 134.1 | |
Overdrafts | | (1.8 | ) | | 33.8 | | | 2.3 | | | (37.9 | ) |
| | | | | |
|
| | | | | | |
| | | | | | 109.1 | | | | | | | |
| | | | | |
|
| | | | | | |
Debt due after more than one year | | (154.1 | ) | | 11.5 | | | 1.0 | | | (166.6 | ) |
Debt due within one year | | (12.0 | ) | | 7.4 | | | 2.9 | | | (22.3 | ) |
Capital leases | | (17.5 | ) | | 1.0 | | | 1.5 | | | (20.0 | ) |
| | | | | |
|
| | | | | | |
| | | | | | 19.9 | | | | | | | |
| | | | | |
|
| | | | | | |
Cash on deposit | | 142.6 | | | (109.2 | ) | | (10.0 | ) | | 261.8 | |
Collateralized cash | | 1.5 | | | (0.2 | ) | | — | | | 1.7 | |
| | | | | |
|
| | | | | | |
| | | | | | (109.4 | ) | | | | | | |
| | |
|
| |
|
| |
|
| |
|
|
Net debt | | 157.6 | | | 19.6 | | | (12.8 | ) | | 150.8 | |
| | |
|
| |
|
| |
|
| |
|
|
F-24
Tomkins plc
Notes to the consolidated financial statements—(continued)
| | | December 31,
2002
| | | April 30, 2002
| | | April 30,
2001
| |
| | | £ million | |
Cost | | 197.6 | | | 210.5 | | | 207.1 | |
Amortization | | (29.2 | ) | | (25.4 | ) | | (14.9 | ) |
| | |
|
| |
|
| |
|
|
| | | 168.4 | | | 185.1 | | | 192.2 | |
| | |
|
| |
|
| |
|
|
| 13 | | Property, plant and equipment |
| | | December 31,
2002
| | | April 30, 2002
| | | April 30,
2001
| |
| | | £ million | |
Cost | | | | | | | | | |
Freehold land and buildings | | 455.4 | | | 484.8 | | | 525.5 | |
Long leasehold property | | 0.5 | | | 6.5 | | | 6.5 | |
Short leasehold property | | 9.3 | | | 10.3 | | | 11.6 | |
Plant and equipment | | 1,356.8 | | | 1,471.2 | | | 1,496.8 | |
| | |
|
| |
|
| |
|
|
| | | 1,822.0 | | | 1,972.8 | | | 2,040.4 | |
Less: accumulated depreciation | | (1,034.4 | ) | | (1,108.5 | ) | | (1,137.4 | ) |
| | |
|
| |
|
| |
|
|
| | | 787.6 | | | 864.3 | | | 903.0 | |
| | |
|
| |
|
| |
|
|
The net book value of property, plant & equipment includes £19.0 million (April 30, 2002—£21.9 million; April 30, 2001—£25.8 million) in respect of assets held under capital leases.
Freehold land amounting to £51.7 million (April 30, 2002—£57.7 million; April 30, 2001—£66.1 million) is not depreciated. Total property, plant & equipment include assets under construction of £87.6 million (April 30 2002—£62.0 million; April 30, 2001—£77.7 million), which are also not depreciated.
The investments represent:
| | | Associated companies
| | | Own shares
| |
| | | December 31,
2002
| | | April 30, 2002
| | | April 30,
2001
| | | December 31,
2002
| | | April 30, 2002
| | | April 30,
2001
| |
| | | £ million | |
Beginning of year | | 6.7 | | | 8.7 | | | 12.5 | | | 0.6 | | | 1.4 | | | 2.3 | |
Foreign exchange translation | | (0.3 | ) | | (0.4 | ) | | 0.2 | | | — | | | — | | | 0.1 | |
Additions | | 0.1 | | | — | | | 0.6 | | | — | | | — | | | — | |
Share of profit in excess of distribution | | (0.3 | ) | | (1.8 | ) | | (0.4 | ) | | — | | | — | | | — | |
Amortization | | — | | | — | | | — | | | (0.4 | ) | | (0.8 | ) | | (1.0 | ) |
Subsidiaries disposed | | — | | | 0.2 | | | (4.2 | ) | | — | | | — | | | — | |
| | |
|
| |
|
| |
|
| |
|
| |
|
| |
|
|
End of year | | 6.2 | | | 6.7 | | | 8.7 | | | 0.2 | | | 0.6 | | | 1.4 | |
| | |
|
| |
|
| |
|
| |
|
| |
|
| |
|
|
| | | Listed investments
| |
| | | December 31,
2002
| | | April 30, 2002
| | | April 30,
2001
| |
| | | £ million | |
Beginning of year | | 2.0 | | | 2.1 | | | 2.2 | |
Foreign exchange translation | | (0.1 | ) | | (0.1 | ) | | (0.2 | ) |
Additions | | 0.2 | | | — | | | 0.1 | |
Subsidiaries disposed | | (0.1 | ) | | — | | | — | |
| | |
|
| |
|
| |
|
|
End of year | | 2.0 | | | 2.0 | | | 2.1 | |
| | |
|
| |
|
| |
|
|
F-25
Tomkins plc
Notes to the consolidated financial statements—(continued)
The own shares represent the cost, less amortization, of 1,827,382 (April 30, 2002—1,464,285; April 30, 2001—2,027,522) Ordinary Shares of 5p each acquired by the Trustees of the Tomkins Employee Share Trust, in the open market. The shares have been acquired to meet the requirements of The Tomkins Restricted Share Plan, The Tomkins Share Matching Scheme, The Long Term Loyalty Plan and stock appreciation rights. The market value of the shares at December 31, 2002 was £3.5 million (April 30, 2002—£3.9 million; April 30, 2001—£3.2 million). The dividends relating to the shares have not been waived and are paid to the participants in the relevant schemes.
The market value of the listed investments at December 31, 2002 was £2.0 million (April 30 2002—£2.2 million; April 30, 2001—£2.0 million).
| | | December 31,
2002
| | April 30, 2002
| | April 30,
2001
|
| | | £ million |
Raw materials and consumables | | 129.0 | | 130.9 | | 146.0 |
Work in progress | | 65.7 | | 72.4 | | 85.6 |
Finished goods and goods held for resale | | 205.7 | | 209.7 | | 241.9 |
| | |
| |
| |
|
| | | 400.4 | | 413.0 | | 473.5 |
| | |
| |
| |
|
| 16 | | Accounts receivable and prepayments |
| | | December 31,
2002
| | | April 30,
2002
| | | April 30,
2001
| |
| | | £ million | |
Trade accounts | | 416.0 | | | 511.6 | | | 539.4 | |
Less: Allowance for doubtful accounts | | (10.4 | ) | | (12.1 | ) | | (13.9 | ) |
Prepayments and accrued income | | 55.9 | | | 56.0 | | | 63.9 | |
Other receivables | | 163.0 | | | 141.6 | | | 195.0 | |
| | |
|
| |
|
| |
|
|
| | | 624.5 | �� | | 697.1 | | | 784.4 | |
| | |
|
| |
|
| |
|
|
| 17 | | Accounts payable: amounts falling due within one year |
| | | December 31,
2002
| | April 30, 2002*
| | April 30,
2001
|
| | | £ million |
Current portion of long-term debt | | 13.7 | | 60.2 | | 62.7 |
Trade payables | | 193.6 | | 236.9 | | 270.8 |
Income taxes | | 5.0 | | 17.8 | | 272.0 |
Accruals and deferred income | | 128.7 | | 136.7 | | 152.0 |
Capital leases | | 3.6 | | 4.0 | | 3.8 |
Dividends proposed and accrued | | 66.3 | | 65.2 | | 65.8 |
Other accounts payable | | 79.3 | | 98.2 | | 106.4 |
| | |
| |
| |
|
| | | 490.2 | | 619.0 | | 933.5 |
| | |
| |
| |
|
| * | | £270.1 million previously included in corporation tax has been reclassified as Provisions for liabilities and charges (see note 20). |
F-26
Tomkins plc
Notes to the consolidated financial statements—(continued)
| 18 | | Accounts payable: amounts falling due after more than one year |
| | | December 31,
2002
| | April 30,
2002
| | April 30,
2001
|
| | | £ million |
Long-term debt, less current portion | | 154.2 | | 166.6 | | 328.7 |
Capital leases | | 13.9 | | 16.0 | | 20.2 |
Other liabilities | | 75.2 | | 72.7 | | 76.9 |
| | |
| |
| |
|
| | | 243.3 | | 255.3 | | 425.8 |
| | |
| |
| |
|
The following is a summary of the Company’s long-term debt:
| | | December 31,
2002
| | | April 30,
2002
| | | April 30,
2001
| |
| | | £ million | |
Unsecured loans | | | | | | | | | |
Bank loans & overdrafts | | 10.5 | | | 57.1 | | | 373.8 | |
Unsecured loan notes, 2002 to 2012, 2.24% to 3.99% | | 0.4 | | | 1.8 | | | 3.9 | |
Other unsecured loans, 2002 to 2011, interest free to 8.00% | | 150.5 | | | 150.9 | | | 0.3 | |
| | | |
Secured loans | | | | | | | | | |
Bank loans | | 4.0 | | | 3.5 | | | 2.5 | |
Industrial development bonds, 2010, 3.41% to 3.45% | | — | | | 10.7 | | | 10.9 | |
Other secured loans, 2021, 1.20% to 1.95% | | 2.5 | | | 2.8 | | | — | |
| | |
|
| |
|
| |
|
|
| | | 167.9 | | | 226.8 | | | 391.4 | |
Less: Current portion | | (13.7 | ) | | (60.2 | ) | | (62.7 | ) |
| | |
|
| |
|
| |
|
|
| | | 154.2 | | | 166.6 | | | 328.7 | |
| | |
|
| |
|
| |
|
|
Maturities of long-term debt are as follows:
| | | £ million |
Fiscal year ending | | |
2003 | | 13.7 |
2004 | | 1.7 |
2005 | | — |
2006 | | — |
2007 | | — |
Thereafter | | 152.5 |
| | |
|
| | | 167.9 |
| | |
|
The security for the £6.5 million secured loans (April 30 2002—£17.0 million; April 31, 2001—£13.4 million) consists of £5.1 million fixed assets (April 30 2002—£16.3 million; April 30, 2001—£13.1 million) and £1.4 million trade receivables (April 30 2002—£0.7 million; April 30, 2001—£0.3 million).
F-27
Tomkins plc
Notes to the consolidated financial statements—(continued)
| 20 | | Provisions for liabilities & charges |
| | | Post-
retirement
benefits
| | | Other
provisions
| | | Deferred
tax
| | | Other tax
provisions
| | | Total
| |
| | | £ million | |
At April 30, 2002* | | 205.3 | | | 64.6 | | | 9.3 | | | 270.1 | | | 549.3 | |
Foreign exchange translation | | (19.4 | ) | | (2.2 | ) | | (0.4 | ) | | (10.3 | ) | | (32.3 | ) |
Charge/(credit) for the year | | 7.8 | | | 24.3 | | | (1.3 | ) | | 22.6 | | | 53.4 | |
Prior year credit | | — | | | — | | | (1.5 | ) | | (15.8 | ) | | (17.3 | ) |
Subsidiaries disposed | | (0.1 | ) | | (0.1 | ) | | (0.8 | ) | | — | | | (1.0 | ) |
Utilized during the year | | (9.8 | ) | | (22.5 | ) | | — | | | — | | | (32.3 | ) |
| | |
|
| |
|
| |
|
| |
|
| |
|
|
At December 31, 2002 | | 183.8 | | | 64.1 | | | 5.3 | | | 266.6 | | | 519.8 | |
| | |
|
| |
|
| |
|
| |
|
| |
|
|
| * | | £270.1million previously included in Accounts payable: amounts falling due within one year, has been reclassified as Provisions for liabilities and charges. |
Post-retirement benefits other than pensions:
Other post-retirement benefits, mainly healthcare, are provided by certain U.S. subsidiaries to current and former employees. The cost relating to the benefits is assessed in accordance with the advice of qualified actuaries and the provision in the accounts for the accrued cost of the benefits at December 31, 2002 is based on an actuarial valuation at that date. The assumption which has the most significant effect on the cost relating to the benefits is the weighted average annual rate of increase in the per capita cost of health care benefits of approximately 6.5 percent.
Other provisions:
Other provisions include provisions for disposals and warranties. Provision is made for warranty claims on various products depending on specific market expectations and the type of product. The period of warranty can extend indefinitely, however, the majority of relevant sales have warranty periods of two years. Provision has been made for warranties based on actual and anticipated claims.
Deferred tax provision:
For details of the balance see Note 6.
Provision has not been made for tax which would arise in the event of distributions being made out of residual profits of overseas subsidiaries unless such distributions are anticipated; there is no other unprovided deferred tax.
| | | Authorized
| | Issued and fully paid
|
| | | December 31,
2002
| | April 30, 2002
| | April 30,
2001
| | December 31,
2002
| | April 30, 2002
| | April 30,
2001
|
| | | £ million |
Ordinary Shares of 5p each | | 79.2 | | 79.2 | | 79.2 | | 38.7 | | 38.6 | | 39.1 |
Convertible Cumulative Preference Shares of US$50 each | | 696.0 | | 696.0 | | 696.0 | | 337.2 | | 337.2 | | 337.2 |
Redeemable Convertible Cumulative Preference shares of US$50 each | | 1,260.0 | | 1,260.0 | | 1,260.0 | | 386.3 | | 426.8 | | 426.7 |
| | |
| |
| |
| |
| |
| |
|
| | | 2,035.2 | | 2,035.2 | | 2,035.2 | | 762.2 | | 802.6 | | 803.0 |
| | |
| |
| |
| |
| |
| |
|
During the period 142,913 and 314,733 ordinary shares of 5p each were allotted pursuant to options exercised under the executive share option schemes and savings related share option schemes respectively, for total consideration of £1,096,715.
During the period 795,000 ordinary shares of 5p each were allotted at 220p per share to the Tomkins Employee Share Trust.
F-28
Tomkins plc
Notes to the consolidated financial statements—(continued)
During the period 1,021 of the US dollar denominated 5.560 percent voting convertible cumulative preference shares of US$50 each (‘the perpetual convertible shares’) were converted into 9,975 ordinary shares of 5p each. The perpetual convertible shares were issued on terms that they could be converted at any time, at the shareholder’s option, into fully paid ordinary shares of 5p each of the Company on the basis of 9.77 ordinary shares of 5p each for every perpetual convertible share so converted. The Company has the option, at any time when the total amount of perpetual convertible shares issued and outstanding is less than 10 percent of the amount originally issued and in any event on or after July 29, 2006 to redeem, in the first case, all but not some only and, in the second case, all or any of the perpetual convertible shares which remain issued and outstanding at that time.
During the period, 1,245 of the US dollar denominated 4.344 percent voting redeemable cumulative preference shares of US$50 each (‘the redeemable convertible shares’) were converted into 12,163 ordinary shares of 5p each. The redeemable convertible shares were issued on terms that they could be converted at any time, at the shareholder’s option, into fully paid ordinary shares of 5p each in the Company on the basis of 9.77 ordinary shares of 5p each for every redeemable convertible share so converted. The Company will be required to redeem all of the redeemable convertible shares which remain issued and outstanding on July 29, 2006.
At the date of issue, the conversion terms of the perpetual convertible shares and the redeemable convertible shares were equivalent to an ordinary share price of 334p.
On a return of assets on liquidation or otherwise (other than on redemption or repurchase of shares) the assets of the Company available to shareholders will be applied first in repaying the capital paid up thereon together with all arrears and accruals of dividend to the holders of the perpetual convertible shares, the redeemable convertible shares and any other classes of shares ranking pari passu with the perpetual convertible shares as to capital.
Until such time as the shares are converted or redeemed the holders of the perpetual convertible shares and of the redeemable convertible shares have a right to receive dividends at an annual rate of 5.560 percent and 4.344 percent respectively in preference to the holders of the ordinary shares.
The holders of the perpetual convertible shares and the redeemable convertible shares are entitled to vote at a general meeting of the Company where, on a show of hands, each holder will have one vote and, on a poll, each holder will have one vote and, on a poll, each holder will have one vote in respect of every seven fully paid ordinary shares to which the holder would be entitled on the full exercise of his conversion of his conversion rights except if two or more consecutive quarterly dividends are in arrears whereupon, on a poll, each holder shall have one vote in respect of every fully paid ordinary share to which the holder would be entitled on the full exercise of his conversion rights; such voting rights to continue until such time as any arrears of dividends as described above have been paid in full.
F-29
Tomkins plc
Notes to the consolidated financial statements—(continued)
Options in existence at the end of the year over Ordinary Shares of 5p each were:
Date of grant
| | Subscription
price
| | | Number of shares
|
| | | December 31,
2002
| | April 30,
2002
| | April 30,
2001
|
Executive share option schemes: | | | | | | | | | |
| | | | |
November 8, 1991 | | 188.57 | p | | — | | — | | 29,039 |
February 17, 1992 | | 204.70 | p | | — | | — | | 5,012 |
July 21, 1992 | | 203.32 | p | | — | | — | | 28,194 |
August 12, 1992 | | 186.72 | p | | — | | 79,913 | | 79,913 |
March 3, 1993 | | 262.00 | p | | 41,646 | | 41,646 | | 144,146 |
July 14, 1993 | | 219.00 | p | | 10,000 | | 10,000 | | 26,000 |
February 9, 1994 | | 259.00 | p | | 23,000 | | 30,000 | | 97,500 |
July 27, 1994 | | 226.00 | p | | 120,000 | | 120,000 | | 120,000 |
May 9, 1995 | | 242.00 | p | | 432,000 | | 785,000 | | 2,081,200 |
February 26, 1996 | | 268.00 | p | | 275,000 | | 275,000 | | 529,000 |
April 11, 1996 | | 259.00 | p | | 400,000 | | 400,000 | | 400,000 |
July 31, 1996 | | 249.00 | p | | 548,000 | | 632,000 | | 1,028,000 |
August 12, 1997 | | 330.00 | p | | 600,000 | | 600,000 | | 699,000 |
February 10, 1998 | | 330.00 | p | | 1,254,500 | | 1,408,500 | | 2,869,500 |
August 6, 1998 | | 293.50 | p | | 558,000 | | 558,000 | | 558,000 |
February 3, 1999 | | 247.50 | p | | 1,138,000 | | 1,879,000 | | 1,906,000 |
August 20, 1999 | | 275.25 | p | | 100,000 | | 100,000 | | 100,000 |
November 8, 1999 | | 215.00 | p | | 399,000 | | 399,000 | | 399,000 |
January 19, 2001 | | 171.00 | p | | 329,000 | | 329,000 | | 329,000 |
February 19, 2001 | | 170.50 | p | | 2,520,000 | | 2,686,000 | | 2,727,000 |
September 20, 2001 | | 150.00 | p | | 76,666 | | 76,666 | | — |
February 11, 2002 | | 197.00 | p | | 2,538,072 | | 2,538,072 | | — |
February 11, 2002 | | 276.00 | p | | 1,522,842 | | 1,522,842 | | — |
February 11, 2002 | | 345.00 | p | | 1,015,228 | | 1,015,228 | | — |
February 11, 2002 | | 197.00 | p | | 1,522,842 | | 1,522,842 | | — |
February 12, 2002 | | 202.75 | p | | 70,754 | | 70,754 | | — |
July 3, 2002 | | 244.75 | p | | 2,484,500 | | — | | — |
August 19, 2002 | | 230.00 | p | | 16,304 | | — | | — |
| | | | | |
| |
| |
|
| | | | | | 17,995,354 | | 17,079,463 | | 14,155,504 |
| | | | | |
| |
| |
|
| Date of grant | | Subscription
price
| | | Number of shares
|
| | | December 31,
2002
| | April 30,
2002
| | April 30,
2001
|
Savings related share option schemes: | | | | | | | | | |
| | | | |
March 12, 1996 | | 220.00 | p | | — | | — | | 230,090 |
March 10, 1997 | | 232.40 | p | | 1,780 | | 469,153 | | 550,790 |
March 12, 1998 | | 266.20 | p | | 247,353 | | 285,574 | | 368,819 |
March 24, 1999 | | 187.60 | p | | 675,888 | | 759,403 | | 1,028,176 |
| | | | | |
| |
| |
|
| | | | | | 925,021 | | 1,514,130 | | 2,177,875 |
| | | | | |
| |
| |
|
F-30
Tomkins plc
Notes to the consolidated financial statements—(continued)
At December 31, 2002, 204 participants (April 30, 2002—240; April 30, 2001—326) held options under the Company’s executive share option schemes and 519 participants (April 30, 2002—683; April 30, 2001—981) held options under the savings related share option scheme. Options are exercisable between January 1, 2003 and August 18, 2012 under the executive share option schemes and between January 1, 2003 and October 31, 2004 under the savings related share option scheme.
Following is a summary of the movements in the number of shares subject to options during the last three fiscal years.
| | | Number of shares
| |
Balance Outstanding at May 1, 1999 | | 42,692,606 | |
—Granted | | 914,000 | |
—Exercised | | (2,041,662 | ) |
—Lapsed/ forfeited | | (6,240,762 | ) |
| | |
|
|
Balance Outstanding at April 29, 2000 | | 35,324,182 | |
—Granted | | 3,056,000 | |
—Exercised | | (1,556,582 | ) |
—Lapsed/ forfeited | | (20,490,221 | ) |
| | |
|
|
Balance Outstanding at April 30, 2001 | | 16,333,379 | |
—Granted | | 6,746,404 | |
—Exercised | | (408,927 | ) |
—Lapsed/ forfeited | | (4,077,263 | ) |
| | |
|
|
Balance Outstanding at April 30, 2002 | | 18,593,593 | |
—Granted | | 2,511,804 | |
—Exercised | | (462,422 | ) |
—Lapsed/ forfeited | | (1,722,600 | ) |
| | |
|
|
Balance Outstanding at December 31, 2002 | | 18,920,375 | |
| | |
|
|
| 22 | | Share premium account and capital redemption reserve |
Details of the share premium account and capital redemption reserve are analyzed in the Consolidated Statements of Changes in Shareholders’ Equity.
Assets held under operating leases include manufacturing facilities, warehouses, delivery equipment and computer equipment. The hire of plant and machinery under operating leases was £3.8 million for the eight months ended December 31, 2002, £9.8 million in fiscal 2002, £11.3 million in fiscal 2001 and £14.5 million in fiscal 2000. Rents under other operating leases were £7.7 million for the eight months ended December 31, 2002, £11.4 million in fiscal 2002, £17.2 million in fiscal 2001 and £24.8 million in fiscal 2000.
F-31
Tomkins plc
Notes to the consolidated financial statements—(continued)
| 24 | | Employee benefit plans |
The Group has continued to account for pensions in accordance with Statement of Standard Accounting Practice No. 24 ‘Accounting for Pension Costs’ (‘SSAP 24’) and the disclosures given in (a) comply with that standard. As permitted by the transitional arrangements of FRS 17 the Group has elected to defer full implementation of the standard until the year ended 31 December 2005. The phased transitional disclosures required under FRS 17, to the extent not given under (a), are set out in (b) for funded defined benefit schemes and in (c) for unfunded defined benefit schemes. The disclosures in respect of post retirement benefits other than pensions are set out in note 20.
(a) The Group operates pension plans throughout the world, covering the majority of employees. These plans are structured to accord with local conditions and practices in each country and include defined contribution and defined benefit plans.
At December 31, 2002, pension related assets of £23.6 million (30 April 2002—£26.4 million) and pension related liabilities of £43.8 million (30 April 2002—£47.5 million) were included in debtors and creditors respectively
United Kingdom:
The majority of plans in the UK provide benefits based on final pensionable salary. The assets of the plans are held by trustees in separate pension funds and day to day management of those assets is carried out by independent professional investment managers who, at the request of the Company, are prohibited by the trustees from investing directly in Tomkins. All plan assets are held by custodians who are independent of the investment managers and of Tomkins. At December 31, 2002 total plan assets had a market value of approximately £160.5 million (30 April 2002—£178.1 million).
The pension cost for the defined benefit pension plans, which amounted to £ 4.1 million (30 April 2002—£3.9 million), is determined by independent qualified actuaries, using the projected unit method and is charged to the profit and loss account so as to spread the cost over the average remaining service lives of employees. The latest actuarial valuations and formal reviews of the plans were between May 2001 and September 2002. The principal assumptions used in the valuations of the liabilities, over the long term, were an investment return of 6 percent per annum, earnings increases of 4 percent per annum and the rate of inflation of 2.5 percent. The market value of the assets of the plans at the dates of the latest actuarial valuations and formal reviews was £160.5 million and the actuarial valuations of the assets were sufficient to cover 81 percent (30 April 2002—102 percent) of the liabilities for benefits that had accrued to members, allowing for projected future earnings increases.
An accrued liability of £1.8 million (30 April 2002—£1.7 million) is included in the balance sheet for ‘capped’ employees, i.e. those whose benefits exceed Inland Revenue limits for approved plans.
There are a small number of defined contribution plans where contributions are charged to the profit and loss account in the period in which they fall due. The total charge to the profit and loss account amounted to £0.8 million (30 April 2002—£1.4 million).
United States of America:
Both defined benefit and defined contribution plans are operated in the US. Assets are held in trustee administered funds independent of the assets of the companies.
Defined benefit plans are operated by a number of the Group’s US subsidiaries providing benefits based upon pensionable salary and length of service. The contribution rate is calculated on the projected unit method and actuarial valuations of the assets and liabilities are performed annually by independent consulting actuaries. The market value of the assets of the plans amounted to £226.1 million (30 April 2002—£300.6 million) and the actuarial valuation of the assets was 78 percent (30 April 2002—91 percent) of the accrued benefits allowing as appropriate for projected future earnings increases. The principal actuarial assumptions were an average projected investment return of 8 percent per annum and pay inflation of 5 percent per annum. The net charge to the profit and loss account so as to spread the cost over the average remaining service lives of employees, amounted to £6.3 million (30 April 2002—£0.8 million).
Defined contribution plans, which include profit sharing plans, cover most of Tomkins US employees. Contributions are charged to the profit and loss account in the period in which they fall due. The total charge to the profit and loss account amounted to £13.4 million (30 April 2002—£23.4 million).
F-32
Tomkins plc
Notes to the consolidated financial statements—(continued)
Other countries
Over 65 percent of Tomkins employees are either in the UK or in the USA. For the balance, both defined benefit and defined contribution plans are operated. Where these are not available, state benefits are considered adequate. Full provision is made for liabilities arising under defined benefit schemes, as calculated in accordance with actuarial advice and contributions to defined contribution plans are accounted for in the period in which they fall due. The total charge to the profit and loss account amounted to £2.8 million (30 April 2002—£5.5 million).
(b) The scheme valuations used for FRS 17 disclosures have been based on an actuarial review at December 31, 2002.
The major assumptions used by the actuaries were:
31 December, 31 2002
| | United Kingdom
| | United States of
America
| | Other countries
|
Salary increases | | 3.5% -4.2% | | 4% - 5.5% | | 3% - 12% |
Increase to pensions in payment | | 0% - 2.5% | | n/a | | 7.6% |
Increase to deferred pensions | | 2.5% | | n/a | | 7.6% |
Discount rate | | 5.75% | | 6.5% | | 2% - 13% |
Inflation rate | | 2.5% | | 3% | | 0% -5.4% |
| | | |
At April 30, 2002
| | United Kingdom
| | United States of
America
| | Other countries
|
Salary increases | | 3.5% -4.5% | | 4% - 5.5% | | 3% - 8.12% |
Increase to pensions in payment | | 0% - 2.5% | | n/a | | n/a |
Increase to deferred pensions | | 0% - 2.5% | | n/a | | n/a |
Discount rate | | 6% | | 7.16% | | 3% - 12.36% |
Inflation rate | | 3% | | 3% | | 1.5% - 10% |
The assets in the scheme and the expected rates of return were:
| | | United Kingdom
| | United States of America
| | Other countries
| | Total
|
At December 31, 2002:
| | Long term rate of return
expected at
December 31,
2002
| | December 31,
2002
| | Long term rate of return
expected at
December 31,
2002
| | December 31,
2002
| | Long term rate of return
expected at
December 31,
2002
| | December 31,
2002
| | Long term rate of return
expected at
December 31,
2002
| | December 31,
2002
|
| | | % p.a. | | £ million | | % p.a. | | £ million | | % p.a. | | £ million | | % p.a. | | £ million |
Equities | | 8.75 | | 125.9 | | 9.00 | | 136.8 | | 3.5 -14.0 | | 24.4 | | 3.5 - 14.0 | | 287.1 |
Bonds | | 6.00 | | 15.5 | | 6.25 | | 70.1 | | 3.5 -14.0 | | 4.6 | | 3.5 - 14.0 | | 90.2 |
Other | | 4.00 | | 19.1 | | 3.5 -7.0 | | 19.2 | | 3.5 -14.0 | | 10.6 | | 3.5 - 14.0 | | 48.9 |
| | | | |
| | | |
| | | |
| | | |
|
Total market value of assets | | | | 160.5 | | | | 226.1 | | | | 39.6 | | | | 426.2 |
| | | | |
| | | |
| | | |
| | | |
|
| | | | |
| | | United Kingdom
| | United States of America
| | Other countries
| | Total
|
At April 30, 2002:
| | Long term rate of return
expected at
April 30, 2002
| | 30 April 2002
| | Long term rate of return
expected at
30 April 2002
| | 30 April 2002
| | Long term
rate of return
expected at
30 April 2002
| | 30 April 2002
| | Long term
rate of return
expected at
30 April 2002
| | 30 April 2002
|
| | | % p.a. | | £ million | | % p.a. | | £ million | | % p.a. | | £ million | | % p.a. | | £ million |
Equities | | 8.75 | | 146.7 | | 8.50 | | 184.6 | | 3.5 - 7.5 | | 13.0 | | 3.5 - 8.75 | | 344.3 |
Bonds | | 6.00 | | 17.0 | | 6.40 | | 84.2 | | 3.5 - 7.5 | | 6.0 | | 3.5 - 7.5 | | 107.2 |
Other | | 4.00 | | 16.4 | | 4.2 -7.0 | | 22.0 | | 3.5 - 7.5 | | 10.1 | | 3.5 - 7.5 | | 48.5 |
| | | | |
| | | |
| | | |
| | | |
|
Total market value of assets | | | | 180.1 | | | | 290.8 | | | | 29.1 | | | | 500.0 |
| | | | |
| | | |
| | | |
| | | |
|
F-33
Tomkins plc
Notes to the consolidated financial statements—(continued)
The amounts that would be charged to operating income under FRS 17 are as follows:
| | | Eight months
ended
December 31,
2002
| |
| | | £ million | |
Current service cost | | (6.7 | ) |
Gains or losses on settlements or curtailments | | (2.7 | ) |
| | |
|
|
Total included within operating income | | (9.4 | ) |
| | |
|
|
The amounts that would be credited to other finance income under FRS 17 are as follows:
| | | Eight months
ended
December 31,
2002
| |
| | | £ million | |
Expected return on scheme assets | | 25.1 | |
Interest cost (discount) on scheme liabilities | | (25.9 | ) |
| | |
|
|
Net finance (charge)/return | | (0.8 | ) |
| | |
|
|
The amounts that would be taken to the statement of total recognized gains and losses under FRS 17 are as follows:
| | | Eight months
ended
December 31,
2002
| | | % of scheme
assets at
December 31,
2002
| | | % of present
value of
scheme
liabilities at
December 31,
2002
| |
| | | £ million | | | | | | | |
Difference between actual and expected return on assets | | (54.2 | ) | | (12.7 | ) | | | |
Experience gains arising on scheme liabilities | | (13.9 | ) | | | | | (2.2 | ) |
Effects of changes in assumptions underlying the present value of scheme liabilities | | (39.5 | ) | | | | | | |
| | |
|
| | | | | | |
Total actuarial gain or loss | | (107.6 | ) | | | | | (17.3 | ) |
| | |
|
| | | | | | |
Reconciliation of scheme assets and liabilities to the balance sheet
| | | United
Kingdom
| | | United States
of America
| | | Other
countries
| | | Total
| |
At December 31, 2002;
| | December 31,
2002
| | | December 31,
2002
| | | December 31,
2002
| | | December 31,
2002
| |
| | | £ million | |
The Group | | | | | | | | | | | | |
Total market value of assets | | 160.5 | | | 226.1 | | | 39.6 | | | 426.2 | |
Present value of scheme liabilities | | (202.4 | ) | | (360.6 | ) | | (58.0 | ) | | (621.0 | ) |
| | |
|
| |
|
| |
|
| |
|
|
Deficit in the scheme | | (41.9 | ) | | (134.5 | ) | | (18.4 | ) | | (194.8 | ) |
Related deferred tax asset(1) | | 12.6 | | | 40.3 | | | 5.5 | | | 58.4 | |
| | |
|
| |
|
| |
|
| |
|
|
Net pension liability(1) | | (29.3 | ) | | (94.2 | ) | | (12.9 | ) | | (136.4 | ) |
| | |
|
| |
|
| |
|
| |
|
|
| (1) | | The related deferred tax asset is calculated at a notional rate of 30% of the FRS 17 deficit. This assumes that any future pension contributions required to fund the deficit would be allowable at this rate for tax purposes. The related deferred tax asset at 30 April 2002, for both the Group and the Company, has been recalculated on this basis. |
F-34
Tomkins plc
Notes to the consolidated financial statements—(continued)
| | | United Kingdom
| | | United States of
America
| | | Other countries
| | | Total
| |
At 30 April 2002:
| | 30 April 2002
| | | 30 April 2002
| | | 30 April 2002
| | | 30 April 2002
| |
| | | £ million | |
Total market value of assets | | 180.1 | | | 290.8 | | | 29.1 | | | 500.0 | |
Present value of scheme liabilities | | (185.7 | ) | | (369.3 | ) | | (48.5 | ) | | (603.5 | ) |
| | |
|
| |
|
| |
|
| |
|
|
Deficit in the scheme | | (5.6 | ) | | (78.5 | ) | | (19.4 | ) | | (103.5 | ) |
Related deferred tax asset(1) | | 1.7 | | | 23.6 | | | 5.8 | | | 31.1 | |
| | |
|
| |
|
| |
|
| |
|
|
Net pension liability(1) | | (3.9 | ) | | (54.9 | ) | | (13.6 | ) | | (72.4 | ) |
| | |
|
| |
|
| |
|
| |
|
|
Analysis of the movement in the scheme deficit during the period:
| | | £ million | |
Opening deficit in the scheme | | (103.5 | ) |
Current service cost | | (6.7 | ) |
Contributions | | 10.3 | |
Other finance income | | (0.8 | ) |
Actuarial losses | | (107.6 | ) |
Curtailments/settlements | | (2.7 | ) |
Adjustment due to exchange rate differences | | 16.2 | |
| | |
|
|
Closing deficit in the scheme | | (194.8 | ) |
| | |
|
|
If FRS 17 had been adopted for the financial statements the net assets and the profit and loss account would be as follows:
| | | December 31,
2002
| | | April 30, 2002
| |
| | | £ million | |
Net assets | | 1,077.5 | | | 1,141.1 | |
Less: SSAP 24 pension prepayments | | (23.6 | ) | | (26.4 | ) |
Add: SSAP 24 liabilities included in creditors | | 17.9 | | | 17.1 | |
| | |
|
| |
|
|
Net assets excluding pension assets and liabilities | | 1,071.8 | | | 1,131.8 | |
Net pension liability | | (136.4 | ) | | (72.4 | ) |
| | |
|
| |
|
|
Net assets including pension assets and liabilities | | 935.4 | | | 1,059.4 | |
Profit and loss reserve excluding pension assets and liabilities | | 118.5 | | | 148.3 | |
Pension liability reserve | | (136.4 | ) | | (72.4 | ) |
| | |
|
| |
|
|
Profit and loss reserve including pension assets and liabilities | | (17.9 | ) | | 75.9 | |
| | |
|
| |
|
|
| (1) | | The related deferred tax asset at 30 April 2002, for both the Group and the Company, has been recalculated on the basis described on page 26. The net pension liability, Net assets including the pension assets and liabilities, the pension liability reserve and the profit and loss reserve including pension assets and liabilities have been adjusted accordingly. |
(c) The Group has unfunded defined benefit schemes with present value of scheme liabilities of £24.1 million, which are already provided for. Accordingly, no adjustment for these schemes is necessary. The assumptions used to derive the present value of scheme liabilities are broadly similar to those used for the funded schemes
F-35
Tomkins plc
Notes to the consolidated financial statements—(continued)
| 25 | | Commitments and contingencies |
(a) Future capital expenditure
Capital expenditure authorized by the directors at the year end but not provided for in the financial statements was:
| | | December 31,
2002
| | April 30, 2002
| | April 30,
2001
|
| | | £ million |
Contracts placed | | 29.8 | | 29.3 | | 19.4 |
| | |
| |
| |
|
(b) Obligations under operating leases
There are obligations under operating leases to pay rentals during the next year, which expire:
| | | Land and buildings
| | Other
|
| | | December 31,
2002
| | April 30, 2002
| | April 30,
2001
| | December 31,
2002
| | April 30, 2002
| | April 30,
2001
|
| | | £ million |
Within one year | | 1.4 | | 2.0 | | 3.5 | | 1.3 | | 2.0 | | 2.8 |
Between one and five years | | 3.9 | | 3.2 | | 5.3 | | 2.4 | | 3.0 | | 6.8 |
Over five years | | 2.9 | | 3.4 | | 2.9 | | 0.9 | | 1.0 | | 0.7 |
| | |
| |
| |
| |
| |
| |
|
| | | 8.2 | | 8.6 | | 11.7 | | 4.6 | | 6.0 | | 10.3 |
| | |
| |
| |
| |
| |
| |
|
(c) Contingent liabilities
Tomkins plc guarantees the bank facilities of certain subsidiaries and the group provides cash as security for letters of credit in order to reduce their cost. The maximum amount covered by these arrangements at December 31, 2002 was £122.6 million (April 30, 2002—£117.6 million; April 30, 2000—£124.0 million) and £1.5 million (April 30, 2002—£1.7 million; April 30, 2000—£5.2 million) respectively. The Company has also guaranteed certain property leases and performance bonds entered into in the ordinary course of business by certain of its subsidiaries.
The Company and several of its subsidiaries are, from time to time, parties to legal proceedings and claims which arise in the ordinary course of business.
The directors do not anticipate that the outcome of any of the above proceedings and claims, either individually or in aggregate, will have a material adverse effect upon the group’s financial position.
F-36
Tomkins plc
Notes to the consolidated financial statements—(continued)
| 26 | | Derivatives & other financial instruments |
As permitted by FRS 13, short-term debtors and creditors have been omitted from all disclosures other than the currency analysis. The disclosures also exclude the Company’s preference shares.
Interest rate and currency profile at December 31, 2002
| | | Pounds
Sterling
| | | U.S.
dollar
| | | Euro
| | | Other
| | | Total
| |
| | | £ million | |
Financial assets | | | | | | | | | | | | | | | |
Cash and deposits | | 97.9 | | | 173.0 | | | 22.0 | | | 50.1 | | | 343.0 | |
Other | | 0.2 | | | 23.8 | | | 0.2 | | | 3.0 | | | 27.2 | |
| | |
|
| |
|
| |
|
| |
|
| |
|
|
| | | 98.1 | | | 196.8 | | | 22.2 | | | 53.1 | | | 370.2 | |
| | |
|
| |
|
| |
|
| |
|
| |
|
|
Floating rate | | 97.8 | | | 171.9 | | | 21.9 | | | 43.4 | | | 335.0 | |
Fixed rate | | — | | | 18.6 | | | — | | | — | | | 18.6 | |
Interest free | | 0.3 | | | 6.3 | | | 0.3 | | | 9.7 | | | 16.6 | |
| | | | | |
Weighted average fixed interest rate (%) | | — | | | 9.0 | | | — | | | — | | | — | |
Weighted average period for which rate is fixed (years) | | — | | | 8.3 | | | — | | | — | | | — | |
Weighted average period for which no interest received (years) | | — | | | — | | | — | | | — | | | — | |
| | | | | |
Financial liabilities | | | | | | | | | | | | | | | |
Borrowings | | (150.5 | ) | | (19.9 | ) | | (2.5 | ) | | (12.5 | ) | | (185.4 | ) |
| | |
|
| |
|
| |
|
| |
|
| |
|
|
| | | | | |
Floating rate | | (150.5 | ) | | (19.7 | ) | | (2.5 | ) | | (10.7 | ) | | (183.4 | ) |
Fixed rate | | — | | | — | | | — | | | (1.8 | ) | | (1.8 | ) |
Interest free | | — | | | (0.2 | ) | | — | | | — | | | (0.2 | ) |
Weighted average fixed interest rate (%) | | — | | | — | | | — | | | 12.2 | | | | |
Weighted average period for which rate is fixed (years) | | — | | | — | | | — | | | 1.4 | | | | |
Weighted average period for which no interest received (years) | | — | | | 3.3 | | | — | | | — | | | | |
Off balance sheet hedging contracts | | 79.6 | | | (67.7 | ) | | (14.1 | ) | | 2.2 | | | — | |
| | |
|
| |
|
| |
|
| |
|
| |
|
|
Net total | | 27.2 | | | 109.2 | | | 5.6 | | | 42.8 | | | 184.8 | |
| | |
|
| |
|
| |
|
| |
|
| |
|
|
Floating rate | | 26.9 | | | 84.5 | | | 5.3 | | | 34.9 | | | 151.6 | |
Fixed rate | | — | | | 18.6 | | | — | | | (1.8 | ) | | 16.8 | |
Interest free | | 0.3 | | | 6.1 | | | 0.3 | | | 9.7 | | | 16.4 | |
F-37
Tomkins plc
Notes to the consolidated financial statements—(continued)
Interest rate and currency profile at April 30, 2002
| | | Pounds
Sterling
| | | U.S.
dollar
| | | Euro
| | | Other
| | | Total
| |
| | | £ million | |
Financial assets | | | | | | | | | | | | | | | |
Cash and deposits | | 85.9 | | | 237.9 | | | 18.8 | | | 55.0 | | | 397.6 | |
Deposits offset in accordance with FRS5 | | — | | | — | | | — | | | — | | | — | |
Other | | 0.3 | | | 30.4 | | | 0.2 | | | 3.0 | | | 33.9 | |
| | |
|
| |
|
| |
|
| |
|
| |
|
|
| | | 86.2 | | | 268.3 | | | 19.0 | | | 58.0 | | | 431.5 | |
| | |
|
| |
|
| |
|
| |
|
| |
|
|
| | | | | |
Floating rate | | 86.2 | | | 243.6 | | | 19.0 | | | 58.0 | | | 406.8 | |
Fixed rate | | — | | | 20.6 | | | — | | | — | | | 20.6 | |
Interest free | | — | | | 4.1 | | | — | | | — | | | 4.1 | |
| | | | | |
Weighted average fixed interest rate (%) | | — | | | 9.0 | | | — | | | — | | | | |
Weighted average period for which rate is fixed (years) | | — | | | 9.0 | | | — | | | — | | | | |
Weighted average period for which no interest received (years) | | — | | | 1.8 | | | — | | | — | | | | |
| | | | | |
Financial liabilities | | | | | | | | | | | | | | | |
Borrowings | | (152.1 | ) | | (57.5 | ) | | (13.9 | ) | | (23.3 | ) | | (246.8 | ) |
Loans offset in accordance with FRS5 | | — | | | — | | | — | | | — | | | — | |
| | |
|
| |
|
| |
|
| |
|
| |
|
|
| | | (152.1 | ) | | (57.5 | ) | | (13.9 | ) | | (23.3 | ) | | (246.8 | ) |
| | |
|
| |
|
| |
|
| |
|
| |
|
|
Floating rate | | (152.1 | ) | | (57.3 | ) | | (13.9 | ) | | (23.3 | ) | | (246.6 | ) |
Fixed rate | | — | | | — | | | — | | | — | | | — | |
Interest free | | — | | | (0.2 | ) | | — | | | — | | | (0.2 | ) |
| | | | | |
Weighted average fixed interest rate (%) | | — | | | — | | | — | | | — | | | | |
Weighted average period for which rate is fixed (years) | | — | | | — | | | — | | | — | | | | |
Weighted average period for which no interest received (years) | | — | | | 1.7 | | | — | | | — | | | | |
| | | | | |
Net total | | (65.9 | ) | | 210.8 | | | 5.1 | | | 34.7 | | | 184.7 | |
| | |
|
| |
|
| |
|
| |
|
| |
|
|
Floating rate | | (65.9 | ) | | 186.3 | | | 5.1 | | | 34.7 | | | 160.2 | |
Fixed rate | | — | | | 20.6 | | | — | | | — | | | 20.6 | |
Interest free | | — | | | 3.9 | | | — | | | — | | | 3.9 | |
F-38
Tomkins plc
Notes to the consolidated financial statements—(continued)
Interest rate and currency profile at April 30, 2001
| | | Pounds
Sterling
| | | U.S. dollar
| | | Euro
| | | Other
| | | Total
| |
| | | £ million | |
Financial assets | | | | | | | | | | | | | | | |
Cash and deposits | | 161.4 | | | 170.9 | | | 31.6 | | | 45.3 | | | 409.2 | |
Deposits offset in accordance with FRS5 | | 815.5 | | | | | | | | | — | | | 815.5 | |
Other | | 0.3 | | | — | | | 0.2 | | | 1.1 | | | 1.6 | |
| | |
|
| |
|
| |
|
| |
|
| |
|
|
| | | 977.2 | | | 170.9 | | | 31.8 | | | 46.4 | | | 1,226.3 | |
| | |
|
| |
|
| |
|
| |
|
| |
|
|
Floating rate | | 977.2 | | | 170.9 | | | 31.8 | | | 46.4 | | | 1,226.3 | |
Fixed rate | | — | | | — | | | — | | | — | | | — | |
| | | | | |
Financial liabilities | | | | | | | | | | | | | | | |
Borrowings | | (42.4 | ) | | (312.7 | ) | | (42.2 | ) | | (18.1 | ) | | (415.4 | ) |
Loans offset in accordance with FRS5 | | — | | | (815.5 | ) | | — | | | — | | | (815.5 | ) |
| | |
|
| |
|
| |
|
| |
|
| |
|
|
| | | (42.4 | ) | | (1,128.2 | ) | | (42.2 | ) | | (18.1 | ) | | (1,230.9 | ) |
| | |
|
| |
|
| |
|
| |
|
| |
|
|
Floating rate | | (42.4 | ) | | (1,128.2 | ) | | (42.2 | ) | | (18.1 | ) | | (1,230.9 | ) |
Fixed rate | | — | | | | | | | | | — | | | — | |
| | | | | |
Weighted average fixed interest rate (%) | | — | | | | | | | | | — | | | — | |
Weighted average period for which rate is fixed (years) | | — | | | | | | | | | — | | | — | |
Net total | | 934.8 | | | (957.3 | ) | | (10.4 | ) | | 28.3 | | | (4.6 | ) |
| | |
|
| |
|
| |
|
| |
|
| |
|
|
Floating rate | | 934.8 | | | (957.3 | ) | | (10.4 | ) | | 28.3 | | | (4.6 | ) |
Fixed rate | | — | | | | | | | | | — | | | — | |
The above analysis is shown after taking account of interest rate swaps and forward rate agreements. Interest payments on floating rate assets and liabilities are determined mainly by reference to LIBOR in the relevant currency. The drawings are for periods up to three months.
F-39
Tomkins plc
Notes to the consolidated financial statements—(continued)
Currency analysis
The table below shows the group’s currency exposures that give rise to net currency gains and losses that are recognized in the income statement. Such exposures comprise monetary assets/liabilities that are not denominated in the functional currency of the group company involved.
The amounts shown below take into account the effect of any forward exchange contracts entered into to manage these currency exposures.
| | | Net foreign currency monetary assets/liabilities
| |
Functional currency of group operation
| | Pounds
Sterling
| | | U.S. dollar
| | | Euro
| | | Canadian
dollar
| | Other
| | | Total
| |
| | | £ million | |
December 31, 2002 | | | | | | | | | | | | | | | | | |
Pounds Sterling | | — | | | 1.7 | | | 5.4 | | | — | | — | | | 7.1 | |
U.S. dollar | | (0.5 | ) | | — | | | (0.1 | ) | | — | | — | | | (0.6 | ) |
Euro | | 0.2 | | | (2.4 | ) | | — | | | — | | 0.1 | | | (2.1 | ) |
Canadian dollar | | — | | | (0.8 | ) | | (0.1 | ) | | — | | (0.1 | ) | | (1.0 | ) |
Other | | (2.4 | ) | | (0.5 | ) | | (0.9 | ) | | — | | — | | | (3.8 | ) |
| | |
|
| |
|
| |
|
| |
| |
|
| |
|
|
| | | (2.7 | ) | | (2.0 | ) | | 4.3 | | | — | | — | | | (0.4 | ) |
| | |
|
| |
|
| |
|
| |
| |
|
| |
|
|
| | | Net foreign currency monetary assets/liabilities
| |
Functional currency of group operation
| | Pounds
Sterling
| | | U.S. dollar
| | | Euro
| | | Canadian
dollar
| | | Other
| | | Total
| |
| | | £ million | |
April 30, 2002 | | | | | | | | | | | | | | | | | | |
Pounds Sterling | | — | | | 0.5 | | | 5.7 | | | 0.1 | | | — | | | 6.3 | |
U.S. dollar | | (0.4 | ) | | — | | | 0.2 | | | 0.1 | | | 2.4 | | | 2.3 | |
Euro | | 2.2 | | | (1.6 | ) | | — | | | (0.1 | ) | | 0.1 | | | 0.6 | |
Canadian dollar | | — | | | (2.7 | ) | | — | | | — | | | (0.1 | ) | | (2.8 | ) |
Other | | (0.9 | ) | | 5.2 | | | (1.2 | ) | | (0.1 | ) | | — | | | 3.0 | |
| | |
|
| |
|
| |
|
| |
|
| |
|
| |
|
|
| | | 0.9 | | | 1.4 | | | 4.7 | | | — | | | 2.4 | | | 9.4 | |
| | |
|
| |
|
| |
|
| |
|
| |
|
| |
|
|
| |
| | | Net foreign currency monetary assets/liabilities
| |
Functional currency of group operation
| | Pounds
Sterling
| | | U.S. dollar
| | | Euro
| | | Canadian
dollar
| | | Other
| | | Total
| |
| | | £ million | |
April 30, 2001 | | | | | | | | | | | | | | | | | | |
Pounds Sterling | | — | | | 5.7 | | | 1.0 | | | 0.7 | | | (0.9 | ) | | 6.5 | |
U.S. dollar | | (5.3 | ) | | — | | | 1.7 | | | (0.3 | ) | | (0.4 | ) | | (4.3 | ) |
Euro | | (0.2 | ) | | (3.9 | ) | | — | | | (0.2 | ) | | (0.9 | ) | | (5.2 | ) |
Canadian dollar | | — | | | (7.2 | ) | | — | | | — | | | — | | | (7.2 | ) |
Other | | (1.2 | ) | | (3.2 | ) | | (0.3 | ) | | (0.1 | ) | | — | | | (4.8 | ) |
| | |
|
| |
|
| |
|
| |
|
| |
|
| |
|
|
| | | (6.7 | ) | | (8.6 | ) | | 2.4 | | | 0.1 | | | (2.2 | ) | | (15.0 | ) |
| | |
|
| |
|
| |
|
| |
|
| |
|
| |
|
|
F-40
Tomkins plc
Notes to the consolidated financial statements—(continued)
The currency profile of the group’s net assets at December 31, 2002 was as follows:
Currency
| | Net assets
excluding net funds
| | | Net funds
| | Net assets
| |
| | | £ million | |
Pounds Sterling | | (147.3 | ) | | 27.0 | | (120.3 | ) |
U.S. Dollar | | 772.4 | | | 85.4 | | 857.8 | |
Euro | | 113.5 | | | 5.4 | | 118.9 | |
Other | | 181.3 | | | 39.8 | | 221.1 | |
| | |
|
| |
| |
|
|
Total | | 919.9 | | | 157.6 | | 1,077.5 | |
| | |
|
| |
| |
|
|
The currency profile of the group’s net assets at April 30, 2002 was as follows:
Currency
| | Net assets
excluding
borrowings
| | | Borrowings
| | | Net assets
| |
| | | £ million | |
Pounds Sterling | | (67.0 | ) | | (152.1 | ) | | (219.1 | ) |
U.S. Dollar | | 1,076.4 | | | (57.5 | ) | | 1,018.9 | |
Euro | | 130.4 | | | (13.9 | ) | | 116.5 | |
Other | | 248.1 | | | (23.3 | ) | | 224.8 | |
| | |
|
| |
|
| |
|
|
Total | | 1,387.9 | | | (246.8 | ) | | 1,141.1 | |
| | |
|
| |
|
| |
|
|
The currency profile of the group’s net assets at April 30, 2001 was as follows:
Currency
| | Net assets
excluding
borrowings
| | Borrowings
| | | Deposits/
loans offset
| | | Net
assets
| |
| | | £ million | |
Pounds Sterling | | 91.8 | | (42.4 | ) | | 815.5 | | | 864.9 | |
U.S. Dollar | | 1,039.3 | | (312.7 | ) | | (815.5 | ) | | (88.9 | ) |
Euro | | 112.2 | | (42.2 | ) | | — | | | 70.0 | |
Other | | 257.5 | | (18.1 | ) | | — | | | 239.4 | |
| | |
| |
|
| |
|
| |
|
|
Total | | 1,500.8 | | (415.4 | ) | | — | | | 1,085.4 | |
| | |
| |
|
| |
|
| |
|
|
The borrowings, loans offset and off balance sheet contracts shown against each currency are matched against the assets of that currency under the requirements of Statement of Standard Accounting Practice (“SSAP”) 20 and to that extent produce no net gain or loss on translation into pounds sterling for purposes of the group accounts.
F-41
Tomkins plc
Notes to the consolidated financial statements—(continued)
Maturity of borrowings and borrowing facilities
The maturity of the group’s borrowings is as follows:
| | | December 31,
2002
| | April 30, 2002
| | April 30,
2001
|
| | | £ million |
Within 1 year | | 17.3 | | 64.2 | | 66.5 |
Between 1 and 2 years | | 4.9 | | 5.8 | | 319.2 |
Between 2 and 5 years | | 5.4 | | 7.7 | | 12.4 |
Over 5 years | | 157.8 | | 169.1 | | 17.3 |
| | |
| |
| |
|
| | | 185.4 | | 246.8 | | 415.4 |
| | |
| |
| |
|
Undrawn committed facilities:
The group had the following committed facilities for which all conditions precedent had been met which expire:
| | | December 31,
2002
| | April 30, 2002
| | April 30,
2001
|
| | | £ million | | £ million | | £ million |
Within 1 year | | — | | — | | 400.0 |
Between 1 and 2 years | | — | | — | | 320.9 |
Between 2 and 3 years | | 400.0 | | 400.0 | | — |
| | |
| |
| |
|
| | | 400.0 | | 400.0 | | 720.9 |
| | |
| |
| |
|
Fair values of financial instruments
Set out below is a comparison of current and book values of all the Company’s financial instruments by category.
| | | December 31,
2002
| | | April 30, 2002
| | | April 30, 2001
| |
Assets/(liabilities)
| | Book
value
| | | Fair
Value
| | | Book
value
| | | Fair
Value
| | | Book
value
| | | Fair
Value
| |
| | | £million | |
Financial instruments held or issued to finance the group’s operations: | | | | | | | | | | | | | | | | | | |
Short-term borrowings and current portion of long-term borrowings | | (17.3 | ) | | (17.3 | ) | | (64.2 | ) | | (64.2 | ) | | (66.5 | ) | | (66.5 | ) |
Long-term borrowings | | (168.1 | ) | | (183.8 | ) | | (182.6 | ) | | (190.2 | ) | | (348.9 | ) | | (348.9 | ) |
Cash and deposits | | 343.0 | | | 343.0 | | | 397.6 | | | 397.6 | | | 409.2 | | | 409.2 | |
Other financial assets | | 27.2 | | | 28.7 | | | 33.9 | | | 34.1 | | | 1.6 | | | 1.6 | |
Other financial liabilities | | — | | | — | | | — | | | — | | | — | | | — | |
Financial instruments held to manage the interest rate and currency profile: | | | | | | | | | | | | | | | | | | |
Derivatives to manage interest rate risk | | 0.1 | | | 6.6 | | | 0.9 | | | (1.7 | ) | | — | | | — | |
Derivatives to manage currency transaction risk | | (0.6 | ) | | (2.1 | ) | | (0.2 | ) | | (0.8 | ) | | (1.7 | ) | | 1.2 | |
Derivatives to manage currency profile of net assets | | 0.6 | | | 0.6 | | | — | | | — | | | — | | | — | |
Deposits are short-term bank deposits and investments in short term money market securities. Therefore fair values closely approximate book values. Borrowings mainly consist of the £15.0 million 8 percent sterling bond, the fail value of which has been calculated by reference to its market prices at December 31, 2002. The remaining borrowings are at floating interest rates and fair values have been determined by reference to market rates.
F-42
Tomkins plc
Notes to the consolidated financial statements—(continued)
Fair value of preference shares:
The above analysis excludes the details of the fair value of the preference shares. These preference shares are not traded on an organized market and fair values are therefore not readily available. Other details of the preference shares are given in Note 21.
Hedges of future transactions
Gains and losses on derivative instruments used for hedging purposes are not recognized until the exposure that is being hedged is recognized.
A summary of such gains and losses and movement therein is as follows:
| | | 31 December
2002
| | | 30 April
2002
| | | 30 April
2001
| |
| | | £ million | |
Foreign exchange transaction exposure hedging: | | | | | | | | | |
Unrecognized gains | | 0.2 | | | 0.3 | | | 3.4 | |
| | |
|
| |
|
| |
|
|
Unrecognized losses | | (1.7 | ) | | (0.9 | ) | | (0.5 | ) |
| | |
|
| |
|
| |
|
|
| | | (1.5 | ) | | (0.6 | ) | | 2.9 | |
| | |
|
| |
|
| |
|
|
Interest rate hedging: | | | | | | | | | |
Unrecognized gains | | 6.5 | | | — | | | — | |
| | |
|
| |
|
| |
|
|
Unrecognized losses | | — | | | (2.6 | ) | | — | |
| | |
|
| |
|
| |
|
|
| | | 6.5 | | | (2.6 | ) | | — | |
| | |
|
| |
|
| |
|
|
| | | 5.0 | | | (3.2 | ) | | 2.9 | |
| | |
|
| |
|
| |
|
|
Of the unrecognized gains and losses on foreign exchange transaction exposure hedging outstanding at 30 April 2002, net losses of £0.5 million were realized in the period ended 31 December 31, 2002.
Of the unrecognized gains and losses on foreign exchange transaction exposure hedging outstanding at 31 December 31, 2002, all are expected to be realized in the year ending 31 December 2003.
The unrecognized loss on interest rate hedging at 30 April 2002 related to interest rate swaps used to hedge the Tomkins plc £150 million medium term note. At December 31, 2002, the swaps give rise to a £6.5 million unrecognized gain. This gain is expected to be realized over the life of the swaps which mature in 2011.
Market price risk and credit risk:
The group manages market price risk and credit risk by using periodic mark to market cash settlements on its derivative instruments and by dealing only with highly rated counter parties. Mark to market cash settlements during the year amounted to an outflow of £nil million (April 30, 2002—£4.4 million; April 30, 2001—£104.3 million).
F-43
Tomkins plc
Notes to the consolidated financial statements—(continued)
| 27 | | Summary of the main differences between the accounting principles generally accepted in the United Kingdom and the United States of America as they affect Tomkins’ consolidated financial statements |
The consolidated financial statements are prepared in conformity with accounting principles generally accepted in the United Kingdom (“U.K. GAAP”) which differ in certain respects from accounting principles generally accepted in the United States of America (“U.S. GAAP”). The significant areas of difference affecting the Tomkins consolidated financial statements are described below:
(a) Goodwill
Goodwill arising on acquisition subsequent to May 3, 1998 is capitalized and amortized through the profit and loss account over its estimated useful economic life which is estimated not to exceed a maximum of 20 years. Goodwill arising on acquisitions made on or before May 2, 1998 was charged directly to reserves. Under U.S. GAAP, effective May 1, 2002, Tomkins adopted U.S. Statement of Financial Accounting Standards (‘SFAS’) No. 142, ‘Goodwill and Other Intangible Assets’. This statement addresses financial accounting and reporting for acquired goodwill and other intangible assets and requires that goodwill and indefinite life intangibles no longer be amortized on a recurring basis. Instead, goodwill and intangible assets with an indefinite life are subject to an initial impairment test and an annual impairment test thereafter. As of May 1, 2002, Tomkins had goodwill with a net carrying value of approximately £1,200 million that was subject to the transition provision of SFAS No. 142. Tomkins performed the required impairment tests of goodwill as of May 1, 2002 and determined that a total goodwill impairment of £32.7 million should be recorded. Additionally, an annual impairment test has also been completed as of December 31, 2002. This review resulted in an additional total goodwill impairment of £30.9 million. In future, the annual impairment test will be performed by the Group as of December 31, 2002.
(b) Disposal of operations
Loss/(gain) on the disposal of operations is a result of the difference between assets and liabilities disposed of under U.K. GAAP and under U.S. GAAP.
(c) Pension costs
In Tomkins’ consolidated financial statements, pension costs are accounted for in accordance with U.K. Statement of Standard Accounting Practice 24 “Accounting for pension costs”, with costs being charged to income over employees’ estimated working lives. Under U.S. GAAP, pension costs are determined in accordance with the requirements of SFAS Nos. 87—“Employers’ Accounting for Pensions” and 88—“Employers’ Accounting for Settlements and Curtailments of Defined Benefit Pension Plans and for Termination Benefits”. Differences between the U.K. and U.S. GAAP figures arise from the requirement to use different methods and assumptions for valuing scheme assets and a different method of amortizing surpluses or deficits.
Under U.S. GAAP, plan assets are valued by reference to market-related values at the date of the financial statements. Liabilities, including additional minimum pension liabilities, are assessed using the rate of return obtainable on fixed or inflation-linked bonds. Under U.K. GAAP, pension plan assets and liabilities are based on the results of the latest actuarial valuation. Pension assets are valued at the discounted present value determined by expected future income. Liabilities are assessed using the expected rate of return on plan assets.
(d) Share options
In Tomkins’ consolidated financial statements, options exercised by employees under the various share option schemes during the period are credited to shareholders’ equity at the option price. For U.S. GAAP, Tomkins accounts for its share options under Accounting Principles Board Opinion 25—“Accounting for Stock Issued to Employees”. The difference between the price of the option at the measurement date and the exercise price is credited to shareholders’ equity and written off in the income statement over the vesting period. For options which have been granted and remain subject to the satisfaction of relevant performance conditions, the surplus between the market value of the shares under option at the end of the period and the exercise price is expensed to the profit & loss account over the vesting period.
(e) Capitalization of interest
In Tomkins’ consolidated financial statements, interest expense is not capitalized. To comply with U.S. GAAP, the estimated amount of interest expense incurred while constructing major projects is included in fixed assets and amortized over the estimated useful lives of the related assets. The amount of interest capitalized is determined by reference to the average interest rate on outstanding borrowings.
F-44
Tomkins plc
Notes to the consolidated financial statements—(continued)
(f) Deferred income tax
In Tomkins’ consolidated financial statements, prepared under UK GAAP, deferred tax is provided in full on all liabilities. Deferred tax assets are recognized to the extent it is regarded as more likely than not that there will be suitable taxable profits from which the future reversal of the underlying timing differences can be deducted and for this purpose Tomkins considers only future periods for which forecasts are prepared. Under U.S. GAAP, deferred taxes are provided for all temporary differences on a full asset and liability basis. A valuation allowance is established in respect of those deferred tax assets where it is more likely than not that some portion will not be realized. The look forward period is not limited to the period for which forecasts are prepared.
(g) Derivative instruments
Tomkins has entered into derivative financial instrument contracts in order to reduce exposure to foreign exchange risk and interest rate movements. Under U.K. GAAP, where there are derivative instruments that qualify as a hedge, gains and losses are deferred and recognized in the statement of income, or as adjustments to the carrying amount of fixed assets, only when the hedged transaction has itself settled and been reflected in the Group’s accounts. If an instrument ceases to be accounted for as a hedge, the instrument is marked to market and any resulting profit or loss recognized at that time. Under U.S. GAAP, derivative instruments are not regarded as hedges and any unrealized gains or losses arising at the period end are taken to the income statement in the current period. Trading results denominated in foreign currencies are translated at average rates.
(h) Ordinary dividends
In Tomkins consolidated financial statements, ordinary dividends are provided for in the period in respect of which they are proposed, on the basis of the recommendation by the directors. Under U.S. GAAP, ordinary dividends are not provided for until formally declared.
(i) ESOP shares held in trust
Under U.K. GAAP, shares held by an Employee Share Ownership Plan (“ESOP”), such as the Tomkins Employee Share Trust, are recorded as fixed asset investments at cost less amounts written off. Under U.S. GAAP, shares held in trust are recorded as a deduction from shareholders’ equity in the balance sheet.
(j) Redeemable convertible cumulative preference shares
In Tomkins’ consolidated financial statements, redeemable convertible cumulative preference shares are considered to be part of shareholders’ equity. Under U.S. GAAP, redeemable convertible cumulative preference shares should be classified outside of shareholders’ equity and not included in any total of shareholders’ equity in the balance sheet.
(k) Exceptional items
Exceptional items are material items within the Group’s ordinary activities which, under U.K. GAAP, are required to be disclosed separately due to their size or incidence. These items do not qualify as extraordinary under U.S. GAAP and are considered part of operating results.
(l) Cash flow statement
Under U.K. GAAP, the consolidated cash flow statement is presented in accordance with U.K. Financial Reporting Standard No. 1 (Revised) (‘FRS 1’) “Cash Flow Statements”. The statement prepared under FRS 1 presents substantially the same information as that required under SFAS No. 95 “Statement of Cash Flows”. Under U.S. GAAP, however, there are certain differences from U.K. GAAP with regard to classification of items within the cash flow statement with regard to the definition of cash.
Under SFAS No. 95 cash and cash equivalents include cash and short-term investments with original maturities of three months or less. Under FRS 1, cash comprises cash in hand and at bank (on demand) and overnight deposits, net of bank overdrafts.
(m) Concentrations of risk
Approximately 24 percent of total revenues come from automotive manufacturers, and approximately 26 percent of total revenues come from the top ten customers of the Industrial & Automotive business. No single customer accounted for a significant amount of the Company’s sales or accounts receivable. The Company reviews a customer’s credit history before extending credit, and establishes an allowance for doubtful accounts based upon factors surrounding the credit risk of specific customers, historical trends, and other information.
F-45
Tomkins plc
Notes to the consolidated financial statements—(continued)
Effect on net income of the main differences between U.K. GAAP and U.S. GAAP:
| | | Eight months
ended
December 31,
2002
| | | Year
ended April 30, 2002
| | | Year ended April 30,
2001
| | | Year ended April 29,
2000
| |
| | | £ million | |
Net income before preference dividend under U.K. GAAP | | 117.8 | | | 187.5 | | | 53.3 | | | 105.1 | |
Amortization of goodwill and intangible assets | | 6.7 | | | (26.8 | ) | | (25.4 | ) | | (49.8 | ) |
Goodwill impairment | | (30.9 | ) | | — | | | — | | | — | |
Write back of impaired goodwill previously amortized | | — | | | — | | | 11.1 | | | 140.2 | |
Gain/(loss) on disposal of operations | | (2.5 | ) | | 7.6 | | | (3.9 | ) | | — | |
Pension costs | | 6.8 | | | 7.6 | | | 9.9 | | | 9.6 | |
Share options | | 3.7 | | | (2.2 | ) | | 1.1 | | | 0.2 | |
Capitalization of interest | | 2.2 | | | 3.5 | | | 4.6 | | | 3.7 | |
Deferred income tax | | (4.5 | ) | | (23.3 | ) | | 13.7 | | | (15.5 | ) |
Derivatives | | 10.5 | | | (6.1 | ) | | — | | | — | |
| | |
|
| |
|
| |
|
| |
|
|
Net income under U.S. GAAP before change in accounting principle | | 109.8 | | | 147.8 | | | 64.4 | | | 193.5 | |
Effects of change in accounting principle, net of tax of £nil and £1.1 million respectively | | (32.7 | )** | | 1.8 | * | | — | | | — | |
| | |
|
| |
|
| |
|
| |
|
|
Net income under U.S. GAAP | | 77.1 | | | 149.6 | | | 64.4 | | | 193.5 | |
| | |
|
| |
|
| |
|
| |
|
|
| * | | Change in accounting principle relates to Tomkins’ transitional adjustment in respect of the adoption of SFAS No. 133 on May 1, 2001. |
| ** | | Change in accounting principle relates to Tomkins’ transitional adjustment in respect of the adoption of SFAS No. 142 on May 1, 2002. |
F-46
Tomkins plc
Notes to the consolidated financial statements—(continued)
Approximate effect on net income per share of the main differences between U.K. GAAP and U.S. GAAP:
Net Income per Ordinary Share under U.S. GAAP
| | Eight months
ended
December 31,
2002
| | | Year
ended April 30, 2002
| | | Year ended April 30, 2001
| | | Year ended April 29,
2000
| |
Basic: | | | | | | | | | | | | |
Net income from continuing operations before change in accounting principle | | 11.06 | p | | 14.03 | p | | 16.27 | p | | 13.04 | p |
Net income from discontinued operations | | — | | | — | | | (13.15 | )p | | 3.75 | p |
Cumulative effect of change in accounting principle | | (4.24 | )p | | 0.23 | p | | — | | | — | |
| | |
|
| |
|
| |
|
| |
|
|
Total | | 6.82 | p | | 14.26 | p | | 3.12 | p | | 16.79 | p |
| | |
|
| |
|
| |
|
| |
|
|
Weighted average number of shares (000s) | | 770,927 | | | 773,464 | | | 857,686 | | | 947,774 | |
| | | | |
Diluted: | | | | | | | | | | | | |
Net income from continuing operations before change in accounting principle | | 11.02 | p | | 14.02 | p | | 16.27 | p | | 13.01 | p |
Net income from discontinued operations | | — | | | — | | | (13.15 | )p | | 3.74 | p |
Cumulative effect of change in accounting principle | | (3.28 | )p | | 0.23 | p | | — | | | — | |
| | |
|
| |
|
| |
|
| |
|
|
Total | | 7.74 | p | | 14.25 | p | | 3.12 | p | | 16.75 | p |
| | |
|
| |
|
| |
|
| |
|
|
Weighted average number of shares (000s) | | 996,607 | | | 774,017 | | | 857,712 | | | 949,793 | |
Approximate cumulative effect on shareholders’ equity of the main differences between U.K. GAAP and U.S. GAAP:
| | | December 31,
2002
| | | April 30,
2002
| | | April 30, 2001
| | | April 29,
2000
| |
| | | £ million | |
Shareholders’ equity under U.K. GAAP | | 1,039.5 | | | 1,106.9 | | | 1084.9 | | | 726.4 | |
U.S. GAAP adjustments: | | | | | | | | | | | | |
Dividends | | 61.9 | | | 57.1 | | | 57.9 | | | 122.1 | |
Pension liabilities | | (152.1 | ) | | (36.3 | ) | | (3.0 | ) | | 6.4 | |
Share options | | 0.7 | | | — | | | — | | | — | |
Deferred income tax | | 69.6 | | | 39.2 | | | 47.1 | | | 28.3 | |
Investment in own shares | | (0.2 | ) | | (0.6 | ) | | (1.4 | ) | | (2.3 | ) |
Redeemable convertible cumulative preference shares | | (386.3 | ) | | (426.8 | ) | | (426.7 | ) | | (391.8 | ) |
Capitalized interest | | 12.8 | | | 11.8 | | | 8.3 | | | 3.7 | |
Derivatives | | 5.0 | | | (3.2 | ) | | — | | | — | |
Goodwill, net | | 863.9 | | | 1,023.5 | | | 1,065.6 | | | 1,754.6 | |
| | |
|
| |
|
| |
|
| |
|
|
Shareholders’ equity under U.S. GAAP | | 1,514.8 | | | 1,771.6 | | | 1,832.7 | | | 2,247.4 | |
| | |
|
| |
|
| |
|
| |
|
|
F-47
Tomkins plc
Notes to the consolidated financial statements—(continued)
The following statements summarize the statements of cash flows as if they had been presented in accordance with U.S. GAAP, and include the adjustments which reconcile cash and cash equivalents under U.S. GAAP to cash on demand reported under U.K. GAAP.
| | | Eight months
ended
December 31,
2002
| | | Year
ended April 30, 2002
| | | Year ended April 30, 2001
| | | Year ended April
29,
2000
| |
| | | £ million | |
Net cash provided by operating activities | | 154.0 | | | 456.8 | | | 279.9 | | | 473.9 | |
Net cash provided by/(used in) investing activities | | (49.3 | ) | | (131.2 | ) | | 1,120.9 | | | (468.0 | ) |
Net cash (used in)/provided by financing activities | | (138.8 | ) | | (330.9 | ) | | (1,476.7 | ) | | 51.5 | |
| | |
|
| |
|
| |
|
| |
|
|
Net (decrease)/increase in cash and cash equivalents | | (34.1 | ) | | (5.3 | ) | | (75.9 | ) | | 57.4 | |
Effect of exchange rate changes on cash | | (20.5 | ) | | (6.3 | ) | | 14.3 | | | 0.5 | |
Cash and cash equivalents under U.S. GAAP at beginning of year | | 397.6 | | | 409.2 | | | 470.8 | | | 412.9 | |
| | |
|
| |
|
| |
|
| |
|
|
Cash and cash equivalents under U.S. GAAP at end of year | | 343.0 | | | 397.6 | | | 409.2 | | | 470.8 | |
Short-term investments with original maturities of less than 3 months | | (144.1 | ) | | (263.5 | ) | | (286.3 | ) | | (247.0 | ) |
| | |
|
| |
|
| |
|
| |
|
|
Cash on demand under U.K. GAAP at end of year | | 198.9 | | | 134.1 | | | 122.9 | | | 223.8 | |
| | |
|
| |
|
| |
|
| |
|
|
Comprehensive Income
SFAS No. 130, “Reporting Comprehensive Income”, requires that all items that are required to be recognized as components of comprehensive income be reported in a separate financial statement. There are no material differences between total recognized gains and losses for the financial year shown in the Statements of Total Recognized Gains and Losses presented under U.K. GAAP and U.S. GAAP comprehensive income, except for the differences between UK and US GAAP net income shown above.
Recently issued U.S. Accounting Standards
SFAS No. 143, ‘Accounting for Asset Retirement Obligations’
SFAS No. 143 addresses financial accounting and reporting for obligations associated with the retirement of tangible long-lived assets and the associated asset retirement costs. It applies to legal obligations associated with the retirement of long-lived assets that result from the acquisition, construction, development, and (or) the normal operation of a long-lived asset, except for certain obligations of lessees. This Statement requires that the fair value of a liability for an asset retirement obligation be recognized in the period in which it is incurred if a reasonable estimate of fair value can be made. The associated asset retirement costs are capitalized as part of the carrying amount of the long-lived asset. SFAS No. 143 amends SFAS No. 19, ‘Financial Accounting and Reporting by Oil and Gas Producing Companies’ and certain other pronouncements. SFAS No. 143 is effective for financial statements issued for fiscal years beginning after June 15, 2002. Tomkins has assessed the potential impact of the adoption of SFAS No. 143 and concluded that there is no impact.
SFAS No. 145, ‘Rescission of FASB Statements No. 4, 44 and 64, Amendment of FASB Statement No. 13, and Technical Corrections’
SFAS No. 145 was issued in April 2002 and is applicable to fiscal years beginning after May 15, 2002. One of the provisions of this technical statement is the rescission of SFAS No. 4, “Reporting Gains and Losses from Extinguishment of Debt”, whereby any gain or loss on the early extinguishment of debt that was classified as an extraordinary item in prior periods in accordance with SFAS No. 4, which does not meet the criteria of an extraordinary item as defined by APB Opinion 30, shall be reclassified. Tomkins is adopting SFAS No. 145 for its fiscal year ending December 31, 2003 and Tomkins has concluded that there is no material impact on its financial position or results of operations.
F-48
Tomkins plc
Notes to the consolidated financial statements—(continued)
SFAS No. 146, ‘Accounting for Costs Associated with Exit or Disposal Activities’
In June 2002, SFAS No. 146 was issued. SFAS No. 146 addresses financial accounting and reporting for costs associated with exit or disposal activities and nullifies EITF Issue No 94-3 ‘Liability Recognition for Certain Employee Termination Benefits and Other Costs to Exit an Activity (including certain costs incurred in a restructuring)’ (“EITF 94-3”). SFAS No. 146 requires recognition of a liability for a cost associated with an exit or disposal activity when the liability is incurred as opposed to when the entity commits to an exit plan under EITF 94-3. Under SFAS No. 146, fair value is the objective for initial measurement of the liability. SFAS No. 146 is effective for exit or disposal activities that are initiated after December 31, 2002, with early application encouraged. Tomkins adopted FAS 146 effective January 1, 2003. No significant exit or disposal activities have been initiated since this date.
SFAS No. 148, ‘Accounting for Stock-Based Compensation—Transition and Disclosure, an amendment of FASB Statement No. 123’
In December 2002, the FASB issued SFAS 148. SFAS 148 amends SFAS No. 123 Accounting for Stock-Based Compensation, or SFAS 123, and provides alternative methods for accounting for a change by registrants to the fair value method of accounting for stock-based compensation. The statement is effective for fiscal years beginning after December 15, 2002. Tomkins did not adopt the fair value method of accounting for stock-based compensation for the eight month period ended December 31, 2002. Tomkins has not yet decided on what course of action to take in response to this standard but management recognizes that a change to the fair value method of accounting from the current intrinsic value method may be required at some future date. It is not possible at present to assess the impact that any such change may have on its results of operations or the financial position.
SFAS No. 149, ‘Amendment of SFAS No. 133 on Derivative Instruments and Hedging Activities’
In April 2003 the FASB issued SFAS No. 149. The Statement amends and clarifies accounting for derivative instruments, including certain derivative instruments embedded in other contracts, and for hedging activities under SFAS No. 133. In particular, it (1) clarifies under what circumstances a contract with an initial net investment meets the characteristic of a derivative as discussed in SFAS No. 133, (2) clarifies when a derivative contains a financing component, (3) amends the definition of an underlying to conform it to the language used in FASB Interpretation No. 45, Guarantor Accounting and Disclosure Requirements for Guarantees, Including Indirect Guarantees of Indebtedness of Others and (4) amends certain other existing pronouncements. SFAS No. 149 is effective for contracts entered into or modified after 30 June 2003, except as stated below and for hedging relationships designated after 30 June 2003. The provisions of SFAS No. 149 that relate to SFAS No. 133 Implementation Issues that have been effective for fiscal quarters that began prior to 15 June 2003 should continue to be applied in accordance with their respective effective dates. In addition, certain provisions relating to forward purchases or sales of when-issued securities or other securities that do not yet exist, should be applied to existing contracts as well as new contracts entered into after 30 June 2003. SFAS No. 149 should be applied prospectively. Tomkins is currently evaluating the effect of this statement.
SFAS No. 150, ‘Accounting for Certain Financial Instruments with Characteristics of both Liabilities and Equity’
In May 2003, the FASB issued SFAS No. 150. SFAS 150 modifies the accounting for certain financial instruments that, under previous guidance, issuers could account for as equity. The Statement requires that those instruments be classified as liabilities in statements of financial position. SFAS 150 affects an issuer’s accounting for three types of freestanding financial instruments, namely:
| | • | | mandatorily redeemable shares, which the issuing company is obligated to buy back in exchange for cash or other assets. |
| | • | | Instruments, other than outstanding shares, that do or may require the issuer to buy back some of its shares in exchange for cash or other assets. These instruments include put options and forward purchase contracts. |
| | • | | obligations that can be settled with shares, the monetary value of which is fixed, tied solely or predominantly to a variable such as a market index, or varies inversely with the value of the issuers’ shares. |
SFAS 150 does not apply to features embedded in financial instruments that are not derivatives in their entirety. In addition to its requirements for the classification and measurement of financial instruments within its scope, SFAS 150 also requires disclosures about alternative ways of settling those instruments and the capital structure of entities, all of whose shares are mandatorily redeemable. SFAS 150 is effective for financial instruments entered into or modified after 31 May 2003, and otherwise is effective at the beginning of the first interim period beginning after 15 June 2003. It is to be implemented by reporting the cumulative effect of a change in an accounting principle for financial instruments created before the issuance date of the Statement and still existing at the beginning of the interim period of adoption. Restatement is not permitted. Tomkins is currently evaluating the effects of this statement.
F-49
Tomkins plc
Notes to the consolidated financial statements—(continued)
FASB Interpretation (“FIN”) No. 45, ‘Guarantor’s Accounting and Disclosure Requirements for Guarantees, Including Indirect Guarantees and Indebtedness of Others (an interpretation of FASB Statements No. 5, 57 and 107 and Rescission of Interpretation No. 34)’
In November 2002, the FASB issued FIN 45. This interpretation elaborates on the disclosures to be made by a guarantor in its financial statements about its obligations under certain guarantees that it has issued. It also clarifies that a guarantor is required to recognize, at the inception of a guarantee, a liability for the fair value of the obligation undertaken in issuing the guarantee. This interpretation does not prescribe a specific approach for subsequently measuring the guarantor’s recognized liability over the term of the related guarantee. This interpretation also incorporates, without change, the guidance in FASB Interpretation No. 34, “Disclosure of Indirect Guarantees of Indebtedness to Others”, which is being superseded. The initial recognition and initial measurement provisions of this interpretation are applicable on a prospective basis to guarantees issued or modified after December 31, 2002, irrespective of the guarantor’s fiscal year-end. Tomkins is assessing, but at this point does not believe the adoption of the recognition and initial measurement requirements of FIN 45 will have a material impact on its financial position or results of operations.
FIN No. 46 ‘Consolidation of Variable Interest Entities, an interpretation of ARB No. 51’
In January 2003, the FASB issued FIN 46. This interpretation requires certain variable interest entities to be consolidated by the primary beneficiary of the entity if the equity investors in the entity do not have the characteristics of a controlling financial interest or do not have sufficient equity at risk for the entity to finance its activities without additional subordinated financial support from other parties. FIN 46 is effective for all new variable interest entities created or acquired after January 31, 2003. For variable interest entities created or acquired prior to February 1, 2003, the provisions of FIN 46 must be applied for the first interim or annual period beginning after June 15, 2003. Tomkins does not currently believe that it will be required to consolidate or disclose any variable interest entities on adoption of FIN 46.
| 28 | | Post balance sheet events |
On January 27, 2003 Tomkins sold Milliken Valve Company Inc for a cash consideration of $7.3 million (£4.5 million), resulting in a small gain on disposal.
Tomkins plc announced on April 30, 2003, the planned transfer of the valve production from Ormskirk, Lancashire to an existing manufacturing facility in Doncaster. The integration of these two facilities will provide a more competitive cost base whilst preserving the market-leading brand of Hattersley Newman Hender.
Tomkins plc announced on June 18, 2003 that, at the expiry on June 17, 2003 of the offer dated May 12, 2003, made by Ontario Inc. (the “Offeror”), an indirect wholly owned subsidiary of Tomkins plc, to acquire all the outstanding common shares of Stackpole Limited, in excess of 97% of the outstanding common shares of Stackpole Limited (on a fully diluted basis) had been deposited to the offer. In addition, the other conditions to the offer had been satisfied or waived and 2023103 Ontario Inc. had instructed its depository to take up and pay for the common shares deposited to the offer. Tomkins plc also announced that the Offeror intends to acquire the remaining common shares of Stackpole Limited not deposited to the offer by exercise of the Offeror’s compulsory acquisition right under the Ontario Business Corporations Act. Shareholders of Stackpole Limited who did not tender to the offer will be offered Cdn $33.25 per common share, the same price that was offered to shareholders under the original offer.
F-50
Tomkins plc
Notes to the consolidated financial statements—(continued)
| 29 | | Principal operating units |
At December 31, 2002 the principal operating units by business segment were:
Air Systems Components | | | | Industrial & Automotive | | |
Air System Components LP | | (USA) | | Gates GmbH | | (Germany) |
Hart & Cooley Inc | | (USA) | | Gates SA | | (France) |
Lau Industries Inc | | (USA) | | Gates Argentina SA | | (Argentina) |
Ruskin Company | | (USA) | | Gates Australia Pty Ltd | | (Australia) |
Ruskin Air Management Ltd | | | | Gates do Brasil Industria e Comercio Ltda | | (Brazil) |
Ruskin (Thailand) Company Ltd | | Thailand | | Gates Canada Inc | | (Canada) |
| | | | | Gates Europe NV | | (Belgium) |
| | | | | Gates Formed-Fibre Products Inc | | (USA) |
Engineered & Construction Products | | Gates (India) Private Ltd | | (India) |
Aquatic Industries Inc | | (USA) | | Gates Korea Company Ltd | | (Korea) |
Cobra Investments (Pty) Ltd | | (Republic of | | (ordinary shares—51% owned) | | |
(ordinary shares—62.4% owned) | | South Africa) | | Gates Nitta Belt Company (Suzhou) Ltd | | (China) |
Dearborn Mid-West Conveyor Company | | (USA) | | (ordinary shares—51% owned) | | |
Dexter Axle Company Inc | | (USA) | | Gates Polska S.p.z.o.o. | | (Poland) |
Hattersley Newman Hender Ltd+ | | | | The Gates Rubber Company | | (USA) |
Lasco Bathware Inc | | (USA) | | Gates Rubber Company (NSW) Pty Ltd | | (Australia) |
Lasco Fittings Inc | | (USA) | | Gates Rubber Company (Singapore) Pte Ltd | | (Singapore) |
Mayfran International Inc | | (USA) | | Gates Rubber de Mexico SA de CV | | (Mexico) |
Mayfran Europe | | (The
Netherlands) | | Gates (U.K.) Ltd | | (Scotland) |
Pegler Limited+ | | | | Gates Unitta Asia Company Ltd | | (Japan) |
Philips Products Inc | | (USA) | | (ordinary shares—51% owned) | | |
| | | | | Gates Unitta Asia Trading Company Pte Ltd | | (Singapore) |
| | | | | (ordinary shares—51% owned) | | |
| | | | | Gates Unitta (Thailand) Company Ltd. | | (Thailand) |
| | | | | Gates Vulca SA | | (Spain) |
Sold post year end: | | | | Ideal | | (USA) |
Milliken Valves Company Inc | | (USA) | | Ideal International SA* | | (Mexico) |
| | | | | (ordinary shares—40% owned) | | |
| | | | | Plews/Edelmann | | (USA) |
| | | | | Schrader Bridgeport International Inc | | (USA) |
| | | | | Schrader Bridgeport Brasil Ltda | | (Brazil) |
| | | | | Schrader Duncan Ltd * | | (India) |
| | | | | (ordinary shares—50% owned) | | |
| | | | | Schrader Electronics Ltd | | (Northern Ireland) |
| | | | | Schrader SA | | (France) |
| | | | | Standard-Thomson Corporation | | (USA) |
| | | | | Stant Manufacturing, Inc | | (USA) |
| | | | | Trico Ltd | | |
| | | | | Trico Latinoamericana, SA | | (Argentina) |
| | | | | Trico Products Corporation | | (USA) |
| | | | | Trico Pty Ltd | | (Australia) |
Unless otherwise indicated all the above subsidiaries are registered and incorporated in England, operate in their countries of incorporation and are either directly or indirectly wholly owned.
+ Directly owned by Tomkins plc
* Associated undertaking
F-51
Valuation and qualifying accounts
| | | Balance at
beginning
of period
| | Charged to
income
statement
| | Additions/charged to other accounts(a)
| | | Deductions
| | | Balance
at end of
period
|
| | | £ million |
April 29, 2000 | | | | | | | | | | | | |
Allowance for doubtful accounts | | 15.7 | | 3.0 | | 1.5 | | | (5.3 | ) | | 14.9 |
| | | | | |
April 30, 2001 | | | | | | | | | | | | |
Allowance for doubtful accounts | | 14.9 | | 5.3 | | (0.9 | ) | | (5.4 | ) | | 13.9 |
| | | | | |
April 30, 2002 | | | | | | | | | | | | |
Allowance for doubtful accounts | | 13.9 | | 2.9 | | (0.2 | ) | | (4.5 | ) | | 12.1 |
| | | | | |
December 31, 2002 | | | | | | | | | | | | |
Allowance for doubtful accounts | | 12.1 | | 2.8 | | (1.4 | ) | | (3.1 | ) | | 10.4 |
| (a) | | Includes the currency retranslation of opening balances and movements arising from the acquisition and disposal of subsidiaries |
F-52
Signature
The Registrant hereby certifies that it meets all of the requirements for filing on Form 20-F, and that it has duly caused and authorized the undersigned to sign this Transition Report on its behalf .
TOMKINS plc |
| |
| | | /s/ KENNETH LEVER |
| |
|
| | | By: Kenneth Lever Chief Financial Officer |
Date: June 20, 2003
CERTIFICATION
I, James Nicol, certify that:
| | 1) | | I have reviewed this Transition Report on Form 20-F of Tomkins plc; |
| | 2) | | Based on my knowledge, this Transition Report does not contain any untrue statement of a material fact or omit to state a material fact necessary to make the statements made, in light of the circumstances under which such statements were made, not misleading with respect to the period covered by this Transition Report; |
| | 3) | | Based on my knowledge, the financial statements, and other financial information included in this Transition Report, fairly present in all material respects the financial condition, results of operations and cash flows of the registrant as of, and for, the periods presented in this Transition Report; |
| | 4) | | The registrant’s other certifying officers and I are responsible for establishing and maintaining disclosure controls and procedures (as defined in Exchange Act Rules 13a—14 and 15d—14) for the registrant and have: |
| | a) | | designed such disclosure controls and procedures to ensure that material information relating to the registrant, including its consolidated subsidiaries, is made known to us by others within those entities, particularly during the period in which this Transition Report is being prepared; |
| | b) | | evaluated the effectiveness of the registrant’s disclosure controls and procedures as of a date within 90 days prior to the filing date of this Transition Report (the “Evaluation Date”); and |
| | c) | | presented in this Transition Report our conclusions about the effectiveness of the disclosure controls and procedures based on our evaluation as of the Evaluation date; |
| | 5) | | The registrant’s certifying officers and I have disclosed, based on our most recent evaluation, to the registrant’s auditors and the audit committee of registrant’s board of directors (or persons performing the equivalent functions): |
| | a) | | all significant deficiencies in the design or operation of internal controls which could adversely affect the registrant’s ability to record, process, summarize and report financial data and have identified for the registrant’s auditors any material weaknesses in internal controls; and |
| | b) | | any fraud, whether or not material, that involves management or other employees who have a significant role in the registrant’s internal controls; and |
| | 6) | | The registrant’s other certifying officers and I have indicated in this Transition Report whether there were significant changes in internal controls or in other factors that could significantly affect internal controls subsequent to the date of our most recent evaluation, including any corrective actions with regard to significant deficiencies and material weaknesses. |
| |
| | | /s/ JAMES NICOL |
| |
|
| | | By: James Nicol Chief Executive Officer |
June 20, 2003
CERTIFICATION
I, Kenneth Lever, certify that:
| | 1) | | I have reviewed this Transition Report on Form 20-F of Tomkins plc; |
| | 2) | | Based on my knowledge, this Transition Report does not contain any untrue statement of a material fact or omit to state a material fact necessary to make the statements made, in light of the circumstances under which such statements were made, not misleading with respect to the period covered by this Transition Report; |
| | 3) | | Based on my knowledge, the financial statements, and other financial information included in this Transition Report, fairly present in all material respects the financial condition, results of operations and cash flows of the registrant as of, and for, the periods presented in this Transition Report; |
| | 4) | | The registrant’s other certifying officers and I are responsible for establishing and maintaining disclosure controls and procedures (as defined in Exchange Act Rules 13a—14 and 15d—14) for the registrant and have: |
| | a) | | designed such disclosure controls and procedures to ensure that material information relating to the registrant, including its consolidated subsidiaries, is made known to us by others within those entities, particularly during the period in which this Transition Report is being prepared; |
| | b) | | evaluated the effectiveness of the registrant’s disclosure controls and procedures as of a date within 90 days prior to the filing date of this Transition Report (the “Evaluation Date”); and |
| | c) | | presented in this Transition Report our conclusions about the effectiveness of the disclosure controls and procedures based on our evaluation as of the Evaluation date; |
| | 5) | | The registrant’s certifying officers and I have disclosed, based on our most recent evaluation, to the registrant’s auditors and the audit committee of registrant’s board of directors (or persons performing the equivalent functions): |
| | c) | | all significant deficiencies in the design or operation of internal controls which could adversely affect the registrant’s ability to record, process, summarize and report financial data and have identified for the registrant’s auditors any material weaknesses in internal controls; and |
| | d) | | any fraud, whether or not material, that involves management or other employees who have a significant role in the registrant’s internal controls; and |
| | 6) | | The registrant’s other certifying officers and I have indicated in this Transition Report whether there were significant changes in internal controls or in other factors that could significantly affect internal controls subsequent to the date of our most recent evaluation, including any corrective actions with regard to significant deficiencies and material weaknesses. |
| |
| | | /s/ KENNETH LEVER |
| |
|
| | | By: Kenneth Lever Chief Financial Officer |
June 20, 2003
Exhibit Index
| |
| 1.1 | | Memorandum and Articles of Association of the Company. (1) |
| |
| 4.1 | | Agreement, dated October 23, 1999 for £1.3 billion multi-currency revolving credit and bill facility, as amended. (1) |
| |
| 4.2 | | The rules of the Tomkins Executive Share Option Scheme No. 3. (2) |
| |
| 4.3 | | The rules of the Tomkins Executive Share Option Scheme No. 4. (2) |
| |
| 4.4 | | Service Agreement, dated February 11, 2002 between Tomkins plc and James Nicol (3) |
| |
| 4.5 | | Support Agreement, dated April, 29, 2003, between Tomkins plc, 2023103 Ontario Inc., and Stackpole Limited*. |
| |
| 4.6 | | Lock-up Agreement, dated April 29, 2003, between The Stackpole Corporation, Tomkins plc, and 2023103 Ontario Inc*. |
| |
| 8.1 | | List of subsidiaries of the Company*. |
| |
| 10.1 | | Consent of Deloitte & Touche, Independent Auditors*. |
| |
| 10.2 | | Certification of Chief Executive Officer and Chief Financial Officer pursuant to 18 U.S.C. Section 1350, as adopted pursuant to Section 906 of the Sarbanes-Oxley Act of 2002*. |
| (1) | | Incorporated by reference to the Company’s Annual Report on Form 20-F for the fiscal year ended April 29, 2000. |
| (2) | | Incorporated by reference to the Company’s Annual Report on Form 20-F for the fiscal year ended April 30, 2001. |
| (3) | | Incorporated by reference to the Company’s Annual Report on Form 20-F for the fiscal year ended April 30, 2002. |