SECURITIES AND EXCHANGE COMMISSION
Washington, D.C. 20549
FORM N-CSR
CERTIFIED SHAREHOLDER REPORT OF REGISTERED
MANAGEMENT INVESTMENT COMPANIES
Investment Company Act file number 811-05684
|
|
|
| Alpine Equity Trust |
|
| |
|
(Exact name of registrant as specified in charter) |
|
|
|
615 East Michigan Street | ||
3rd Floor | ||
| Milwaukee, WI 53202 |
|
|
| |
(Address of principal executive offices) (Zip code) |
|
|
|
Samuel A. Lieber | ||
Alpine Woods Capital Investors, LLC | ||
2500 Westchester Avenue, Suite 215 | ||
| Purchase, NY 10577 |
|
|
| |
(Name and address of agent for service) |
|
|
|
| 1-888-785-5578 |
|
|
| |
Registrant’s telephone number, including area code |
Date of fiscal year end: 10/31/2009
Date of reporting period: 10/31/2009
Item 1. Reports to Stockholders.
REAL ESTATE FUNDS
Alpine International Real Estate Equity Fund
Alpine Realty Income & Growth Fund
Alpine Cyclical Advantage Property Fund
Alpine Emerging Markets Real Estate Fund
Alpine Global Infrastructure Fund
October 31,
2009
Annual Report
|
TABLE OF CONTENTS |
|
|
|
|
|
|
| |
|
|
|
|
| 6 |
| |
|
|
|
|
| 12 |
| |
|
|
|
|
| 18 |
| |
|
|
|
|
| 25 |
| |
|
|
|
|
| 34 |
| |
|
|
|
|
| 40 |
| |
|
|
|
|
| 50 |
| |
|
|
|
|
| 51 |
| |
|
|
|
|
| 52 |
| |
|
|
|
|
| 57 |
| |
|
|
|
|
| 62 |
| |
|
|
|
|
| 73 |
| |
Additional Alpine Funds are offered in the Alpine Series Trust and Alpine Income Trust. These funds include:
|
|
Alpine Dynamic Dividend Fund | Alpine Dynamic Transformations Fund |
|
|
Alpine Accelerating Dividend Fund | Alpine Accelerating Dividend Fund |
|
|
Alpine Dynamic Financial Services Fund | Alpine Municipal Money Market Fund |
|
|
Alpine Dynamic Innovators Fund | Alpine Ultra Short Tax Optimized Income Fund |
Alpine’s Equity and Income Funds’ investment objectives, risks, charges and expenses must be considered carefully before investing in funds of the Alpine Series Trust and Alpine Income Trust. The prospectus contains this and other important information about the investment company, and it may be obtained by calling 1-888-785-5578, or visiting www.alpinefunds.com. Read it carefully before investing.
Mutual fund investing involves risk. Principal loss is possible.
|
|
|
|
|
|
|
|
| Alpine’s Investment Outlook |
|
|
|
|
|
|
|
|
|
|
|
|
|
|
Dear Investor:
What a difference a year makes. Last year we were afflicted by a crisis of confidence which compounded a financial contraction with potentially catastrophic consequences. The speed, depth and global breadth with which wealth and capital was vanishing increased fear of a prolonged downturn. The panic in financial markets paralyzed corporate, municipal and individual investment activity. Fortunately, unprecedented government and central bank efforts around the world prevented a widely feared depression. The Federal Reserve led the way, pumping liquidity into the capital markets to “unfreeze” money markets and stimulate investment. This has partially offset the economic repercussions flowing from massive layoffs and plant closures, which is how corporations responded to collapsed consumption and decreased global trade. After falling over 45% from the Friday before Lehman Brothers’ collapse (September 12, 2008) to the market low on March 9, 2009, the S&P 500 rebounded over 55% through October 30, yet remains more than 34% below the October 2007 index peak.
From March of this year, investor psychology began to shift from depression to hope, from fear of economic collapse towards expectations of recovering cyclical activity. Along the way, some have focused on whether this recovery could follow a ‘V’ shaped temporal pattern or would trace a ‘U’, ‘L’ or ‘W’ shape. Irrespective of the form and time it takes, recognition that a new cycle was approaching has been transformative for risk/return pricing. Inevitably, economic and corporate evidence of normalizing activity has encouraged market participants to believe that this downturn, perhaps the worst in two generations, would not cripple the structural underpinnings and operation of our economic institutions, despite continuing bank closures and consolidation. In fact, signs that increased capital availability is expanding beyond equity recapitalizations in the capital markets to include bank line extensions to well capitalized companies. Limited initial public offerings (IPOs) are also coming to market and prices bid for businesses, real estate and selected assets have been on the rise. Although the appetite for taking more
risk in the search for higher returns reignited the rally in stocks during mid-summer, transaction volumes remain a fraction of previous years’ levels. Even though banks are gradually beginning to lend, they are not yet including many of the small to medium sized companies that historically have fueled economic expansion. While all is not rosy, it is apparent that we have turned the corner.
ARE HAPPY DAYS HERE AGAIN?
For the 2009 Fiscal Year ended October 30th, Alpine is very pleased with the overall strong level of comparative returns provided by our growing family of mutual funds. Unlike 2008, diversification across investment categories, geographic regions, business sectors and financial structures enabled managers with flexible mandates to outperform relevant or benchmark indices. Alpine’s different fund managers make it clear in their respective shareholder letters that many investment opportunities emerged from the risk reducing panic selling of last year. Due to the forward looking nature of the capital markets, it is not surprising that recovery in share prices began well before the upturn in the economy, as measured by Gross Domestic Product (GDP) for the third quarter. Over the next few quarters, we should see employment gains, hopefully by the middle of next year. Tentative signs are numerous, if not major. For example, recent reports of advertising spending during the early weeks of October suggest that retailers have increased such spending by close to 35% year-over-year in anticipation of a more hopeful Christmas selling season. Recent global mergers and acquisition (M&A) announcements within the first weeks of November show a dollar value greater than at any time since May of 2007. The Conference Board’s U.S. Leading Economic Indicators (LEI) Index has been positive for seven months. The LEI’s most recent consecutive monthly positive period was back in the Fall of 2006, and the previous extended period of continuous gains was in 2003-2004. Adding to these hopeful signals are more concrete data points such as job recalls at John Deere and Cummins Engine to make agricultural equipment and truck engines. Nonetheless, investors remain cautious about excessively valuing
1
|
future growth in corporate earnings despite near record non-farm productivity and net positive third quarter corporate earnings reports surpassing analyst estimates.
WHERE HAVE INVESTORS PLACED THEIR BETS? INCOME AND GROWTH
According to AMG Data Services, bond funds have attracted over $290 billion so far during 2009, while $22 billion has flowed out of equity funds. Historically low interest rates fueled by the Federal Reserve’s ‘Quantitative Easing’; negligible inflation and excess economic capacity have propelled bond returns during the past year, especially for economically sensitive high-yield bonds. Another area which enjoyed strong performance, were the emerging markets and, in particular, emerging market funds. Even though China and Brazil have resumed rapid economic growth after a weak fourth calendar quarter of 2008 and first quarter of this year, skepticism remains regarding the long term sustainability of their high relative growth rates. Beyond strong earnings trends, their potential capacity to become dominant engines of global growth has yet to be realized, but their abilities to drive domestic demand without growing exports to the U.S. or Europe are now apparent. Their fiscal situation is another contrast to budgetary deficits among many of the world’s major economies. These countries also share dramatically different demographic profiles which will also influence economic growth rates and challenge economic imperatives. However, modernizing infrastructures, improving inefficiencies in distribution, upgrading health and education availability and maintaining stable capital costs still need to be addressed in order to compete and provide rising standards of living. Such issues will no doubt impact economic and corporate growth expectations for years to come, and hence, influence long term investment patterns. We believe these dynamics will continue to favor global stock portfolios in 2010.
U.S. ECONOMIC FOCUS WILL BE ON JOBS, INCOME AND GROWTH
Alpine’s fundamental long term concern is growth in GDP per capita, which encompasses employment growth and sustainable income levels. Both influence the overall standard of living and, more importantly, influence consumption patterns. Income growth plays a critical role not only in the demand for imported goods, which influences both the balance of trade and the collection of tax revenues, impacting the government’s ability to provide services and make-up past budget deficits. However, possible secular changes to our economy may shift job opportunities and with them population
distribution for future generations. This could impact state and local politics and might even alter our national priorities, away from the pattern established following World War II.
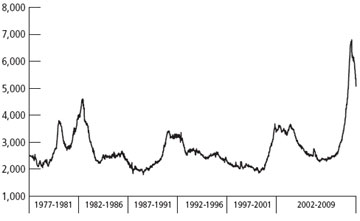
In this light, the level of unemployment is critical. Historic recoveries from recession between World War II and 1982, where the typical impact on employment was a decline of 2.5% on average, would see a return to previous employment levels in roughly 12.5 months*. (*Data based on Bureau of Labor Standards and Credit Suisse). Following the recessions of 1991 and 2001, the U.S. took longer to generate new jobs, and hence the term “Jobless Recovery” was coined. It was particularly appropriate for the 2001 recession which then took 36 months to return to prior employment levels. Please see Chart A showing U.S. continuing jobless claims over the past 30 years.
Chart A - U.S. Continuing Jobless Claims
This down cycle has seen a drop in employment of almost 5% of the workforce, or seven million people. Since the magnitude is far greater than prior cycles, it may take several years to recover lost jobs. The concern is that businesses which have grown cautious about revenues and underlying demand and, hence, their competitive position, will refrain from adding new jobs, emphasize temporary workers or outsource overseas. The impact on income levels could likely be limiting at best and perhaps even contribute to an overall deflationary trend in our economy. If incomes decline, the nation’s debt burden may exceed tax revenues, pressuring the dollar. If imported goods and materials rise in price, then the danger of stagflation could emerge. Policy makers must be diligent to prevent stagflation, which would be corrosive to our standard of living.
These are just a few of the challenges which our leaders face. While they may not be able to perfectly navigate the complexities of the evolving global economy, we
2
|
|
| |
should not be overly bearish. Even if it takes over four years to recover the employment levels of 2007, we will likely have historically cheap money as an offset which should facilitate the stabilization of the banking sector, providing a period through which long term capital can be invested at advantageous costs. This four or five year window could provide corporate America, and indeed much of the world, with the capacity to enhance productivity, create new jobs and expand the economy on a stable footing. Even moderate inflation would be welcome for all sorts of assets, most especially housing. If such an optimistic scenario occurs, then corporate earnings and stock prices could have a long way to run.
GLOBAL EXPANSION AND PRODUCTIVITY TRENDS HAVE FUELED INCOME AND GROWTH
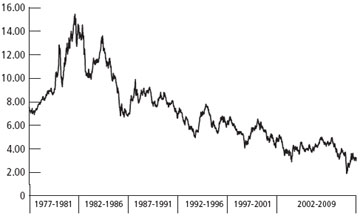
Perhaps the most influential underlying economic trend of the past generation has been the uneven decline in interest rates since 1982. Please see Chart B, showing the yield of the 10-Year U.S. Treasury Bond over 30 years. Over this period, many medium term trends
Chart B - 10-Year U.S. Treasury Bond Yield
focused on enhancing corporate profitability were also important drivers of growth. The global economy has evolved since World War II through several stages of regionally focused activity which have contributed to lower prices and higher standards of living. The so called ‘Developed Countries’ in Western Europe, North America and Japan rapidly rebuilt or modernized infrastructure while populations expanded during the 1950’s. Gradually, the globalization of production jump-started the industrialization of Latin American and Asian countries beginning in the 1970’s. During the 1980’s, inflationary pressures began to stabilize as wage and goods price pressures were mitigated by an acceleration of the global manufacturing trend. The 1990’s experienced increased need for expanding global capacity of goods producing and extraction industries
which helped to lower the cost of commodities. Finally, the productivity enhancements heralded by enhanced computer systems and communications capabilities, including the internet, created opportunities for disintermediation of goods and services from large economic or institutional aggregators to broadly distributed individual investors, producers or users. Today, you or I can buy an inexpensive product from a Japanese design or distribution firm which sources components from manufacturers in Malaysia or Taiwan for assembly and packaging in Mexico and finally, sale in the U.S. This type of business activity has lowered the costs of goods and services for many of us in the developed world and enabled many in the undeveloped or emerging countries to begin to enjoy some of the advances which have enhanced our standard of living. Taken to a different extreme, Wall Street firms, through their global offices, could sell to residents of a town in Norway, partial interests in an aggregation of mortgages underlying homes in Cape Coral, Florida and Stockton, California. So what is next? At Alpine we are investigating how this unfolding new business cycle will fit into the evolution of economic activity, through which our investments, be they regional, sectoral, or company specific, may benefit. In a similar vein, we have to investigate whether the long term economic or socio-political changes brought about by this continued economic evolution, will create future trends for investment.
ALPINE’S FOCUS EXPANDS, BUT REMAINS TARGETED ON INCOME AND GROWTH
From our vantage point, the evolution of economic activity which we described above has already highlighted several areas of potential opportunity which we believe should create long term gains for our investors and deserve special focus. Thus, one year ago as we peered into the abyss of the financial crisis, we launched three new mutual funds, capitalizing on investment expertise we had already developed in-house. Specifically, we are strong believers in the importance of capital growth from equity ownership of companies, but also believe that the income component should grow as well. While equity-income funds have long been a staple of the market and of Alpine we believe that companies which are in a particularly dynamic stage of their evolution, often accelerate their rate of growth in dividend payouts. As a result, we created the Alpine Accelerating Dividend Fund. We also launched the Alpine Emerging Markets Real Estate Fund last year because real estate values and rents could potentially create greater value in economies with higher growth rates. Emerging countries are the most in
3
|
|
| |
need of and have the lowest proportion of modern, international standard buildings, so high quality; modern properties are most in demand. Recognition that the 50 to 100 year old infrastructure of the United States needs to be reinforced if not rebuilt, at the same time as many of the world’s emerging countries have yet to create the roads, rails, ports, pipelines, transmission lines, power plants and waste treatment plants, that accompany and provide a higher standard of living, has stimulated our introduction of the Alpine Global Infrastructure Fund. We are very pleased with the first season of performance for these funds and encourage you to read our managers reports on their investment progress, in the respective booklets for either the Alpine Equity Trust or Alpine Series Trust.
Our analysts remain focused on the path of this emerging new business cycle and as well as on companies which may potentially benefit both from cyclical activity, and from opportunities in a changing market place. In this context, we are very pleased with the performance this year of both the Alpine Dynamic Innovators Fund and the Alpine Dynamic Transformations Fund which have now stood the test of time over multiple years of operation and produced very satisfactory results for fiscal 2009. Our largest open-end funds, the Alpine Dynamic Dividend Fund and the Alpine International Real Estate Fund have also bounced back very positively after the travails of last year, as are detailed in their respective shareholder reports.
WHERE TO NEXT?
We have no doubt that 2008 and 2009 will be remembered for being amongst the most challenging periods for both investors and investment managers over the past several generations. Future comparisons should be favorable, but that is not to say that 2010 will be an easy year. However, we do believe that the U.S. and Global economies may continue to transition in a positive fashion towards a multi-year cycle of relatively directional positive returns mirroring prospective global growth. We would expect economic activity to accelerate as the next decade unfolds. As the business cycle matures, Alpine will continue to look for opportunities to provide our investors with both income and growth. We appreciate your support and interest and look forward to communicating with you in the new year.
Sincerely,
President, Alpine Mutual Funds
|
The letter and those that follow represent the opinion of Alpine Funds management and are subject to change, are not guaranteed, and should not be considered recommendations to buy or sell any security.
Past performance is not a guarantee of future results.
Leading Economic Indicators (LEI) index is a summary of 10 variables used to help identify turning points—peaks and troughs—in overall economic activity. It’s produced monthly, along with two other indexes summarizing coincident and lagging indicators, by the Conference Board, a not-for-profit business membership and research organization. Every month, the Conference Board evaluates the performance of each component based on known results or estimates. Values are assigned for each and are summarized to produce the LEI index. A base-year approach is use, with the Conference Board converting the LEI’s 1996 outcome to a base figure of 100. All subsequent LEI monthly readings are relative to this base year.
Please refer to the schedule of investments for fund holding information. Fund holdings and sector allocations are subject to change and should not be considered a recommendation to buy or sell any security. Current and future portfolio holdings are subject to risk.
The Alpine Accelerating Dividend Fund, Dynamic Innovators Fund, Dynamic Dividend Fund, and Dynamic Transformations Fund invest in small, mid cap, and micro cap stocks which involve additional risks such as limited liquidity and greater volatility as compared to large cap stocks. Investing in foreign securities tends to involve greater volatility and political, economic and currency risks and differences in accounting methods. The Funds may invest in debt securities which typically decrease in value when interest rates rise. This risk is usually greater for longer-term debt securities. The Fund portfolio will involve short positions, which involves unlimited risk including the possibility that losses may exceed the original amount invested. The fund may also use options and future contracts, which have risks associated with unlimited losses of the underlying holdings due to unanticipated market movements and failure to correctly predict the direction of securities prices, interest rates and currency exchange rates. However, a mutual fund investor’s risk is limited to one’s amount of investment in a mutual fund.
4
|
|
|
|
| Alpine International Real Estate Equity Fund |
|
|
|
|
| Alpine Realty Income & Growth Fund |
|
|
|
|
| Alpine Cyclical Advantage Property Fund |
|
|
|
|
| Alpine Emerging Markets Real Estate Fund |
|
|
|
|
| Alpine Global Infrastructure Fund |
|
|
|
|
|
|
|
|
|
|
|
|
|
|
|
|
|
|
|
|
|
|
|
Comparative Annualized Returns as of 10/31/09 (Unaudited) | |||||||||||||||||||
|
| 6 Months(1) |
| 1 Year |
| 3 Year |
| 5 Year |
| 10 Year |
| Since Inception |
| ||||||
Alpine International Real Estate Equity Fund |
| 66.72 | % |
| 84.26 | % |
| -12.69 | % |
| 2.45 | % |
| 8.25 | % |
| 5.84 | % |
|
S&P Developed (ex U.S.) Property Total Return Index(2) |
| 45.91 | % |
| 38.93 | % |
| -9.34 | % |
| 5.51 | % |
| 8.93 | % |
| N/A |
|
|
GPR General Property Securities Global Index |
| 34.47 | % |
| 25.37 | % |
| -7.94 | % |
| 4.50 | % |
| 9.44 | % |
| 5.22 | % |
|
MSCI EAFE (USD) Index(3) |
| 29.25 | % |
| 23.73 | % |
| -7.83 | % |
| 2.39 | % |
| -0.20 | % |
| 2.20 | % |
|
Lipper International Real Estate Funds Average |
| 43.26 | % |
| 31.73 | % |
| -9.92 | % |
| 5.20 | % |
| 10.22 | % |
| 5.84 | % |
|
Lipper International Real Estate Funds Rank |
| N/A |
| 2/52 |
| 19/22 |
| 5/5 |
| 3/3 |
| 1/1 |
| ||||||
Gross Expense Ratio: 1.23%(4) |
|
|
|
|
|
|
|
|
|
|
|
|
|
|
|
|
|
|
|
Net Expense Ratio: 1.23%(4) |
|
|
|
|
|
|
|
|
|
|
|
|
|
|
|
|
|
|
|
|
|
| |
| (1) Not annualized. FINRA does not recognize rankings for less than one year. |
| (2) Index commenced on 7/31/1989. |
| (3) Return does not include dividends reinvested. |
| (4) As disclosed in the prospectus dated February 27, 2009. |
| |
Performance data quoted represents past performance and is not predictive of future results. Investment return and principal value of the Fund fluctuate, so that shares, when redeemed, may be worth more or less than their original cost. Performance current to the most recent month end may be lower or higher than the performance quoted and may be obtained by calling 1-888-785-5578. Performance data shown does not reflect the 1.00% redemption fee imposed on shares held for fewer than 2 months. If it did, total returns would be reduced. | |
| |
The S&P Developed (ex. U.S.) Property Total Return Index is an unmanaged market-weighted total return index available on a monthly basis. The index consists of companies from developed markets, excluding the U.S., whose floats are larger than 100 million U.S. dollars and derive more than half of its revenue from property-related activities. The GPR General Property Securities Global Index is a market weighted total return performance index, available on a monthly basis. The purpose of this index is to cover a broad range of property investment companies with a market capitalization of more than 50 million U.S. dollars. The MSCI EAFE (USD) Index is a capitalization weighted index that monitors the performance of stocks from Europe, Asia, and the Far East. This is one of the most widely used measures of international stock performance. The Lipper International Real Estate Funds Average is an average of funds that invest at least 80% of their portfolio in equity securities of domestic and foreign companies engaged in the real estate industry. Lipper rankings for the periods shown are based on Fund total returns with dividends and distributions reinvested and do not reflect sales charges. The S&P Developed (ex. U.S.) Property Total Return Index, the GPR General Property Securities Global Index, the MSCI EAFE (USD) Index and the Lipper International Real Estate Funds Average are unmanaged and do not reflect fees associated with a mutual fund, such as investment adviser fees. The performance for the International Real Estate Equity Fund reflects the deduction of fees for these value-added services. Investors cannot directly invest in an index. | |
| |
To the extent that the Fund’s historical performance resulted from gains derived from participation in initial public offerings (“IPOs”) and/or secondary offerings, there is no guarantee that these results can be replicated in future periods or that the Fund will be able to participate to the same degree in IPO/Secondary offerings in the future. |
6
|
|
Alpine International Real Estate Equity Fund | |
|
|
|
|
|
|
|
|
| |||||||
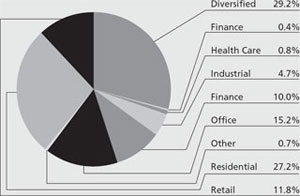
Portfolio Distributions* (Unaudited) |
| Top 10 Holdings* (Unaudited) |
|
|
| ||
| 1. |
| PDG Realty SA |
| 3.65% |
| |
| 2. |
| Stockland |
| 2.69% |
| |
| 3. |
| Segro PLC |
| 2.61% |
| |
| 4. |
| Regus PLC |
| 2.58% |
| |
| 5. |
| Cyrela Commercial Properties SA |
| 2.37% |
| |
| 6. |
| Multiplan Empreendimentos |
| 2.22% |
| |
| 7. |
| South Asian Real Estate, Ltd. |
| 2.16% |
| |
| 8. |
| Brascan Residential Properties SA |
| 2.01% |
| |
| 9. |
| MRV Engenharia |
| 1.96% |
| |
| 10. |
| Agra Empreendimentos |
| 1.90% |
| |
|
|
|
| ||||
| * Portfolio holdings and sector distributions are as of 10/31/09 and are subject to change. Portfolio holdings are not recommendations to buy or sell any securities. Portfolio Distributions and Top 10 Holdings do not include short-term investments. Portfolio Distributions percentages are based on total investments and Top 10 Holdings percentages are based on total net assets. |
| |||||
|
|
|
|
| |||
|
|
|
|
| |||
|
|
|
|
|
|
|
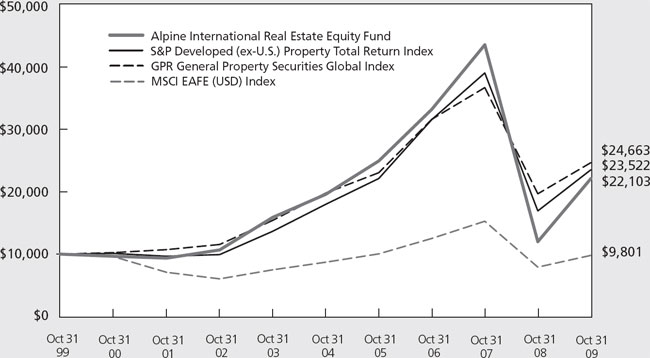
Value of a $10,000 Investment (Unaudited) |
|
|
This chart represents a comparison of a hypothetical $10,000 investment in the Fund versus similar investments in the Fund’s benchmarks. The graph and the table do not reflect the deduction of taxes that a shareholder would pay on Fund distributions or the redemption of Fund shares. The Fund’s return reflects the waiver of certain fees. Without the waiver of fees, the Fund’s total returns would have been lower.
7
|
|
Alpine International Real Estate Equity Fund | |
|
Commentary |
Dear Investor:
We are pleased to present the annual report of the Alpine International Real Estate Equity Fund for the fiscal year ended October 31, 2009. Over the past twelve months, the Fund has significantly outperformed its benchmark indices. The Fund produced a total return of +84.26%, while the S&P Developed Ex-U.S. Property Total Return index produced a gain of +38.93%, and the MSCI EAFE Index returned 23.73% for the same fiscal year period ending October 31, 2009. Meanwhile the Lipper International Real Estate Funds Average total return was 31.73%.
The key contributions to this recovery becomes clear upon examination. One year ago, the Fund had 154 positions, of which 48 were sold and 17 new holdings were added. Among the ten largest holdings from last year, two were sold, but only Regus PLC remains, in fourth position. On the other hand, Stockland, the Fund’s second largest holding, is the only new holding this year in the top 10. Rather, performance analysis of the portfolio holdings tells us that some of the Fund’s biggest losers last year were in fact some of the strongest winners this year. Portfolio repositioning was not the major driver of the Fund’s outperformance this year. Alpine believes that last year the market indiscriminately liquidated the shares of companies with either significant emerging market presence or exposure to cyclically sensitive areas of the economy. Commenting in last year’s report, we noted that the Lehman Brothers’ bankruptcy occurred in the middle of the Fund’s fiscal fourth quarter, when it declined by -57.64%, and wrote that “those declines were primarily in Asia and Latin America...in contrast with last year’s contribution (to the Fund in 2007) as a decoupled source of economic growth. Emerging markets became coupled to the contagion of chaos...” in 2008. This year, six of the top ten holdings are Brazilian, two English, one Indian and one Australian companies, all of which performed very powerfully for the portfolio. A wild card for the portfolio has been currency volatility. In the case of Brazil, the Real lost 24% in fiscal 2008, and regained over 18% this fiscal year as markets stabilized and flight to certainty subsided. We suggest that these were good companies last year and believe they are good companies this year, but market psychology was shaken to its core. The hundred year flood has receded now that restored confidence in our institutions and economic constructs has reestablished a baseline for renewed global growth.
DEVELOPED MARKETS DEBT REDUCTION VS. EMERGING MARKETS EQUITY EXPANSION
Despite volatility around the world, capital markets have resumed their appropriate function in providing capital for business. Since debt capital has been a key component of the financial crisis through which we are passing, it should not be surprising that equity recapitalization has been easier for many companies rather than piling more debt onto the balance sheets. Through November, we count 177 equity recapitalizations in 2009 that raised $60 billion to pay down debt (and generate fees for investment bankers). There were also 30 secondary transactions for existing companies which raised $9 billion primarily for new investments or developments. Of note, there were 55 Initial Public Offerings (IPOs) which raised a total of $28 billion during this same period, with proceeds primarily targeted to acquisition, expansion and debt reduction. Not surprisingly, 64% of the IPO proceeds were for Chinese development companies, and 16% were for U.S. real estate companies, primarily focused on taking advantage of weak mortgage and property markets for opportunistic acquisition. Among secondary offerings, over 80% of the proceeds were for expansionary investment by Brazilian or Chinese companies. Of the equity recapitalization for debt reduction, 68% was focused in the U.S., Australia, and the U.K., which to no one’s surprise were amongst the most heavily leveraged property markets. Singapore, Japan, India and Europe make up the bulk of the balance of refinancing needs, and we would expect those regions will continue to raise equity in order to stabilize balance sheets and prepare for the next phase of the real estate cycle. It is notable that Brazil and China are already in the next phase of the cycle.
CAPITAL FLOWS TO GROWTH
It is clear that China, India and Brazil have benefited from greater economic resilience than most observers anticipated last year. It is likely that all will provide positive Gross Domestic Product (GDP) growth for 2009, and mid- to-high single-digit growth for 2010. U.S., European and Japanese GDP growth could range from 1.5% to 2.5% in our estimation. This could lead to global growth in excess of 4%. Given the natural correlation between GDP growth, job creation and growth in real estate, demand should follow. It is understandable that the capital markets have refocused on the divergent growth potential among countries and
8
|
|
Alpine International Real Estate Equity Fund | |
even more so upon their real estate sectors. With such divergence, we believe that premium growth will be rewarded with premium valuations, especially for premium properties.
Nowhere has the growth been stronger, for longer, than in China. While residential property prices were effectively flat from 2007 through 2008, they have risen over 24% in the past year. While this seems exceptionally exuberant, it equates to about 11.6% annualized over two years, which compares to the four-year average of 13.5% from 2003 through 2007. During that same four-year period, personal disposable income grew by 12.9% while in 2008 incomes grew by almost 14.5%. With low interest rates, housing affordability has in fact improved. So far, real estate inflation appears to be running more or less in tandem with income and GDP growth, plus a modicum of inflation. Government stimulus programs have been a factor in price acceleration this year, but the concrete elements of demand are in place, specifically, job growth for a growing middle class, increased mortgage utilization, and a stable current financial climate.
Both Brazil and China are enjoying strong double-digit retail sales growth and consumption patterns. In fact, some observers believe that China is gradually switching from an export fueled economy towards a domestic consumption economy, although this may take a long time. Alpine believes that this superior growth trend should continue unabated for at least several years in Brazil, China, India, Indonesia and several other countries, while the developed economies of the U.S. and Europe attempt to reduce debt burdens without inducing a deflationary downturn in their own domestic economies. Japan is very much a wild card. There may be opportunities in the more developed markets, but it is usually easier to be sailing with the wind at one’s back.
PORTFOLIO CHANGES
Over the past year, the portfolio has shifted from a geographic split of 36.1% Asia, 38.5% Europe, and 26.8% in North and South America to 30.3% in Asia, 23.7% in Europe and 31.7% in the Americas. In addition, Australian holdings have increased from 0.5% to 5.5% for the largest proportionate change as we saw opportunities to buy cheap property stocks in Australia for the first time in a decade. Other notable country shifts include an increase in our China/Hong Kong exposure from 8.8% to 12.1% and an increase in aggregate Indian exposure from 6.1% to 9.6%. By contrast, we decreased Japanese exposure from 7.4% to 4.8% and Singapore was reduced from 8.5% to 3.6%.
The dramatic 14.8% decline in overall European exposure reflected not only a reduction in U.K. exposure from 10.4% in October 2008 to 7.9% at the end of 2009 (after increasing to 11.3% at mid year), but most notably a steady decline in our French positioning from 13% a year ago to just over 8% in April and now 3.8%. In effect, we made a conscious decision to move the portfolio from more defensive stocks towards those of growth regions over the past year. The portfolio’s largest holdings are in Brazil, where we raised our position from 14.5% last October to 23.9% in April and now 26.6%. During this time, our U.S. exposure declined from 6.5% to 3.2%, and Mexican holdings, which constituted 3.3% of last year’s portfolio, are now 0%. Within the Brazilian holdings, it is worth noting that over the past 14 months, the Fund’s exposure to commercial properties there has increased significantly to almost 40% of the 26.6% country position. These companies primarily focus on regional shopping malls, industrial or logistics facilities. This is not only designed to potentially benefit from growing consumption and consumerism in Brazil, but also significant barriers to entry which we believe should dramatically enhance the value of these properties over time.
The current portfolio holds securities in 123 different companies, reflecting 48 that were sold last year, 17 new positions added, 36 positions reduced and 7 increased. Five of the Fund’s holdings were the recipients of takeover offers, of which two have consummated so far. In Brazil, both Abyara and Klabin Segal are to be merged into Agra, and Tenda is in the process of being acquired by Gafisa in Brazil. Brookfield acquired shares in Company SA through a merger earlier in the year. The Fund’s position in China Central Properties was absorbed into Shui On Construction and Materials in Hong Kong. We would expect to see similar mergers and acquisition (M&A) related activity transpire over the next couple of years as businesses focus on either consolidation in depressed markets or expansion into growth regions and businesses.
TOP TEN HOLDINGS PERFORMANCE REVIEW
PDG Realty is the Fund’s largest holding, at 3.65% of the portfolio. As one of the strongest contributors to the portfolio this year, PDG contributed almost 6% of the Fund’s return. This was derived from nearly 170% share price total return, and 27% currency gains. PDG is primarily focused on low to mid-range price housing in Sao Paulo and Rio through its Goldfarb subsidiary. Stockland is the Fund’s largest holding in Australia and number two in the Fund because of its attractive exposure to regional malls down-under, office
9
|
|
Alpine International Real Estate Equity Fund | |
properties and notably its significant residential land development business. However, a poorly timed acquisition of a U.K. commercial property company, dividend cuts and capital raisings created an opportunity for the Fund to generate a 160.67% total return in U.S. dollars for shareholders. We also invested in Stockland’s recapitalization equity offering which subsequently provided a 42.61% return for the Fund. Our third largest holding, Segro PLC, was in fact owned by the Fund last year and then sold at the very beginning of 2009 because we feared that debt covenants would be impacted by declining valuations of their industrial and office portfolios in the U.K. A number of weeks passed before the stock collapsed, inducing us to invest again prior to the announcement of a meaningful rights issue positioned at a significant discount. This provided an overall total return to the Fund of 84.82%, contributing 4.4% to the Fund’s annual return. In fourth place is Regus PLC the temporary office provider, which was the top contributor to the Fund given its previously larger position weighting and its 127.79% total return, which contributed 6.56% to our overall annual return. Cyrela Commercial Properties at number five is a major developer of shopping malls and industrial facilities, the latter in joint venture with AMB of the U.S. This stock gained 134.80%. Number six, shopping mall owner Multiplan generated a 209.87% return. South Asian Real Estate generated a below average 70% total return for the portfolio, while Brookfield Inc. (formerly Brascan), produced 183.15%. MRV, the Brazilian low income housing specialist, contributed 4.36% to the Fund’s overall return for the year by generating a 252.73% total return. Finally, Agra, the homebuilder/consolidator soon to be known as Agre, produced a total return of 398.22%, placing it amongst the top performers for the past twelve months.
The Fund enjoyed many very strong performances from the likes of Hopson Development and Sino Ocean Land in China, Iguatemi, Rodobens, Tecnisa, and EZ Tec in Brazil, and Charter Hall Group in Australia. Notably strong results were also produced by European homebuilders such as Norway’s Block Watne Group (BWG Homes) which produced a 257.56% total return, Nexity S.A. of France, which produced a 365.11% total return, JM of Sweden, which contributed its 190.43% return and Conwert Immoblien Invest of Austria which gained 155.80%. A surprisingly strong showing at this early point of the recovery was generated by the Fund’s cautiously tiny positions in Russian stocks, such as LSR Group which gained 255%, Mirland Development Corp, up 111.39% and RGI International which rose by 221.10%. Finally, I would be remiss if I did not discuss the handful of disappointments this year, which
included the Fund’s holding in Norwegian Properties which gained only 37% and Orient-Express Hotels which declined by 30%. Both companies own excellent assets, albeit they held too much debt for bankers tastes last spring and thus found themselves pushed into highly dilutive multiple rights issues. Long term holding, Minor International, the hotel and restaurant company in Thailand, lost 15% as business slowed not only due to the economic environment but also the political uncertainty which has surrounded Thailand for the past eighteen months or so.
LOOKING AHEAD
We have been pleasantly surprised by the speed with which capital markets have recovered and real estate valuations stabilized. These are early days in the recovery process and the heavy lifting remains to be accomplished in terms of restructuring and recapitalizing real estate, particularly in the U.S. and Europe. Publicly traded real estate companies appear increasingly well positioned to do this. In prior sections of this report, we have outlined the historical pattern of recovery in valuations, occupancy rates and rent levels. Focusing on the current state of commercial real estate finance, particularly in the U.S., we also noted the important role banks have played and our belief that they will continue to be major drivers of this recapitalization process. It is Alpine’s view that the recapitalization exercise of the past year is merely a first step, to be followed by both mergers and acquisitions expanding the role of public companies in the deleveraging through re-equitizing commercial real estate in the U.S. and Europe over the next three to five years. Meanwhile, the current velocity of growth in the world’s emerging markets should provide significant opportunities in Brazil, China, India, Indonesia and other countries, where 6% to 8% plus GDP growth should enable middle-class expansion and underpin demand for real estate.
WHAT’S NEXT?
2010 AND BEYOND.
In last year’s report to shareholders, we commented that “we have already shifted from the best of times to the worst of times, perhaps we can hope to find a middle ground in due time.” We are now in that ‘middle ground’ as the markets have indeed recovered faster than we had expected. Faster primarily in terms of equity capital available, albeit slower in terms of debt capital formation and distribution. The high cost of debt has yet to induce banks to lend on a major scale in part because they are still grappling with their own equity and capital ratio problems. The commercial mortgage
10
|
|
| |
backed securities market is still effectively frozen and insurance companies remain cautious. Both private equity and Wall Street have enjoyed limited success in raising new mortgage originations. We believe these constraints should start to improve over the next year or two. Thus, well capitalized public companies have a window of a year or two in which they could increase their market share and negotiate attractive transactional terms from a position of strength.
Valuations in the strong growth markets are not compellingly cheap, nor are they historically expensive. On the other hand, since the Asian market bottom in November, 2008, it is worth noting that inflation remains low and excess global capacity suggests that cost pressures may not unduly escalate any time soon. This suggests that an unusual dynamic may benefit the world’s faster growing property markets. Interest rates could remain low for an extended time during the outset of a prospective multi-year business cycle. This could lead to significant appreciation potential. In other words, it feels like 2003 or 1995; both strong years which proceeded very strong periods for property returns around the globe. The exception would be for any real estate markets plagued by excess supply and soft demand.
Given the amount of physical demand for property in many regions and cities, relative to valuations and rents of properties during prior cycles, we do not see notable signs of excess. The increased level of market scrutiny and regulatory caution in the aftermath of the financial crisis may also provide moderating influences over the
next few years. Nonetheless, we will remain cautious for any signs of ‘excess exuberance’. Even though the volatility of the past year has subsided, we suspect that markets may remain jittery for some time, as witnessed by the transitory trauma induced by Dubai’s inability to manage their debt burden. Naturally, we will be on the lookout for any opportunities that may be created by short term distress, though this is not to suggest that we have adopted a trading mentality. Note that the Fund’s portfolio turnover has averaged about 30% over the past five years, and even this year rose only modestly to 51%. This reflects our general satisfaction with the scope and exposure of the current portfolio structure with 123 companies spread across 29 countries, albeit concentrated to balance both growth and undervalued situations, in an effort to contain excess daily volatility. This was the Fund’s profile before the tsunami uncorked by Lehman Brothers’ and the past few months suggest to us that this model may well produce solid results going forward. The hard-learned lesson of being prepared to deploy defensive countermeasures when the markets are under siege will not be forgotten, but hopefully will not be needed for the foreseeable future. The world is still working through a cathartic period of structural reorganization which hopefully could promote new opportunities for investors and a better life for many. Thank you for your interest and support,
Sincerely,
Samuel A. Lieber
Portfolio Manager
|
|
Please refer to the schedule of portfolio investments for fund holdings information. Fund holdings and sector allocations are subject to change and should not be considered a recommendation to buy or sell any security. Current and future portfolio holdings are subject to risk.
11
|
|
|
|
|
|
|
|
|
|
|
|
|
|
|
|
|
|
|
|
|
|
|
|
| ||||||||||||||||||
Comparative Annualized Returns as of 10/31/09 (Unaudited) |
| ||||||||||||||||||
|
| 6 Months(1) |
| 1 Year |
| 3 Year |
| 5 Year |
| 10 Year |
| Since Inception |
| ||||||
Alpine Realty Income & Growth Fund |
| 42.03 | % |
| 20.23 | % |
| -18.98 | % |
| -3.91 | % |
| 8.58 | % |
| 8.20 | % |
|
Morgan Stanley REIT Index |
| 27.09 | % |
| 0.47 | % |
| -15.82 | % |
| -0.68 | % |
| 9.12 | % |
| 7.93 | % |
|
S&P 500 Index |
| 20.04 | % |
| 9.80 | % |
| -7.02 | % |
| 0.33 | % |
| -0.95 | % |
| 0.07 | % |
|
Lipper Real Estate Funds Average(2) |
| 26.52 | % |
| 2.13 | % |
| -16.39 | % |
| -1.50 | % |
| 8.55 | % |
| 7.50 | % |
|
Lipper Real Estate Funds Rank(2) |
| N/A |
|
| 13/234 |
|
| 171/194 |
|
| 151/170 |
|
| 42/79 |
|
| 21/66 |
|
|
Gross Expense Ratio: 1.56%(3) |
|
|
|
|
|
|
|
|
|
|
|
|
|
|
|
|
|
|
|
Net Expense Ratio: 1.56%(3) |
|
|
|
|
|
|
|
|
|
|
|
|
|
|
|
|
|
|
|
|
|
|
|
| |||
| (1) | Not annualized. FINRA does not recognize rankings for less than one year. | |
| (2) | The since inception return and ranking represents the annualized return for the period beginning 12/31/1998. | |
| (3) | As disclosed in the prospectus dated February 27, 2009. |
Performance data quoted represents past performance and is not predictive of future results. Investment return and principal value of the Fund fluctuate, so that shares, when redeemed, may be worth more or less than their original cost. Performance current to the most recent month end may be lower or higher than the performance quoted and may be obtained by calling 1-888-785-5578. Performance data shown does not reflect the 1.00% redemption fee imposed on shares held for fewer than 2 months. If it did, total returns would be reduced.
The Morgan Stanley REIT Index (the “RMS Index”) is a total return index comprising of the most actively traded real estate investment trusts and designed to be a measure of real estate equity performance. The S&P 500 Index is designed to measure performance of the broad domestic economy through changes in the aggregate market value of 500 stocks representing all major industries. The Lipper Real Estate Funds Average is an average of funds that invest at least 80% of their portfolio in equity securities of domestic and foreign companies engaged in the real estate industry. Lipper rankings for the periods shown are based on Fund total returns with dividends and distributions reinvested and do not reflect sales charges. The Morgan Stanley REIT Index, the S&P 500 Index and the Lipper Real Estate Funds Average are unmanaged and do not reflect fees associated with a mutual fund, such as investment adviser fees. The performance for the Realty Income & Growth Fund reflects the deduction of fees for these value-added services. Investors cannot directly invest in an index.
To the extent that the Fund’s historical performance resulted from gains derived from participation in initial public offerings (“IPOs”) and/or secondary offerings, there is no guarantee that these results can be replicated in future periods or that the Fund will be able to participate to the same degree in IPO/Secondary offerings in the future.
12
|
|
Alpine Realty Income & Growth Fund | |
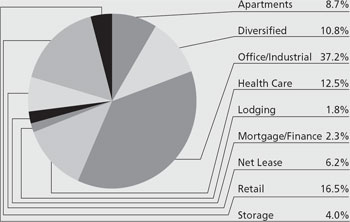
Portfolio Distributions* (Unaudited)
|
|
|
|
|
Top 10 Holdings* (Unaudited) |
|
|
| |
1. | Simon Property Group, Inc. |
| 5.30 | % |
2. | Boston Properties, Inc. |
| 5.10 | % |
3. | Vornado Realty Trust |
| 4.60 | % |
4. | Ventas, Inc. |
| 4.42 | % |
5. | Alexandria Real Estate |
| 3.59 | % |
6. | Entertainment Properties Trust |
| 3.46 | % |
7. | Entertainment Properties Trust - |
| 2.90 | % |
8. | SL Green Realty Corp. |
| 2.88 | % |
9. | Crombie Real Estate Investment |
| 2.85 | % |
10. | Mack-Cali Realty Corp. |
| 2.75 | % |
|
|
|
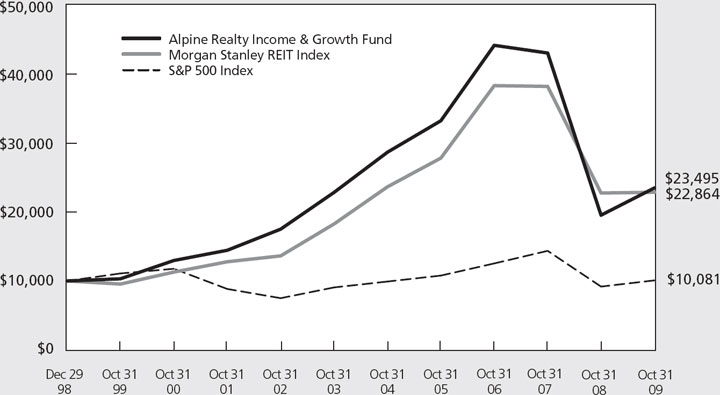
Value of a $10,000 Investment (Unaudited) |
|
|
This chart represents a comparison of a hypothetical $10,000 investment in the Fund versus similar investments in the Fund’s benchmarks. The graph and the table do not reflect the deduction of taxes that a shareholder would pay on Fund distributions or the redemption of Fund shares. The Fund’s return reflects the waiver of certain fees. Without the waiver of fees, the Fund’s total returns would have been lower.
13
|
|
Alpine Realty Income & Growth Fund | |
Dear Investor:
We are pleased to report the results of the Alpine Realty Income and Growth Fund for the fiscal annual period that ended October 31, 2009. During this period the Fund produced a total return of +20.23% which compares favorably to the +.47% return of the Morgan Stanley REIT Index (the “RMS Index”), the +2.13% return of the Lipper Real Estate Funds Average, and the +9.80% return of the Standard & Poor’s 500 Index (the “S&P”).
At October 31, 2009, the Fund’s net asset value per share had increased to $10.89 from $9.95 one year prior. During the fiscal period, the Fund paid four quarterly distributions totaling $.79 per share. Since its inception on December 29, 1998 through October 31, 2009, the Fund has produced a cumulative total return of +134.95% (+8.20% on an annualized basis) and has made cumulative distributions to shareholders of $12.57 per share. The preceding table presents the Fund’s returns for the latest six-month, one-year, three-year, five-year, and ten-year and since inception periods.
During the latest fiscal year, fears of a collapse in the banking system and a prolonged and severe global recession were replaced with growing confidence that the financial system was becoming increasingly more stable and that a synchronized global recovery was beginning to gain traction. Unprecedented government and central bank actions around the globe provided much needed liquidity to the capital markets after the bankruptcy of Lehman Brothers in September, 2008. These efforts were followed, beginning in March, by an extraordinary amount of equity recapitalizations by financial institutions, and indeed real estate companies, which served to bolster capital ratios and balance sheets and restore confidence. In our opinion, the real estate company follow-on stock offerings provided attractively priced opportunities for the Fund and, as a result, we were active participants in the equity recapitalizations that occurred, as reflected in the Fund’s increased portfolio turnover during the fiscal annual period to 111% from 23% in the previous fiscal period. With investors’ real and obsessive fears about financial collapse largely mitigated, the market view has shifted towards reading signs of improving economic metrics and calculating the pace, scale, and durability of an eventual rebound.
In large part due to the successes of public real estate companies in raising capital, investors and management teams have become more optimistic. Since mid-March, U.S. real estate entities have issued over $20 billion in new common equity and over $8 billion in unsecured corporate bonds. While much of the re-equitization
activity occurred during the March 2009 through June 2009 timeframe, the debt capital markets became more open to Real Estate Investment Trusts (REITs) commencing in August. Fixed income investors gained more confidence in the prospective stability of real estate fundamentals and sought to capture yields that were very attractive relative to Treasuries on a historic basis. The progressive improvement in the REIT bond market is best exemplified by the largest REIT, Simon Property Group’s, 2009 bond issuances. In March, Simon issued $650 million of ten-year bonds at a yield-to-maturity of 10.75%, approximately 800 basis points above similarly dated Treasuries. Two months later, Simon added $600 million of 6.75% five-year bonds, priced to yield 7.0%, at 498 basis points over Treasuries, and then on August 6th, Simon reopened their 6.75% issue and raised an additional $500 million but this time at a yield of 5.46% or only 275 basis points over Treasuries! Moreover, the bond market has not only been open to the top-rated companies such as Simon, but has allowed companies such as Developers Diversified and Brandywine Realty, rated BB and BBB-, respectively, by Standards & Poor’s, to access new debt capital. Additionally, commercial banks have demonstrated an increased willingness to renew and extend credit lines with many REIT entities, albeit at wider spreads and reduced capacities than provided in the 2006-2007 time period.
Given their proven access to capital, public real estate companies are now perceived as being part of the solution to recapitalizing an overly leveraged commercial real estate market instead of contributing to the problem. Numerous REITs such as Simon Property Group, Vornado Realty Trust, Boston Properties, and Ventas have accumulated multi-billion dollar cash positions and line of credit availabilities, war chests to take advantage of potential distressed situations of private market owners and thereby make attractive acquisitions. Additionally, four blind pool (i.e., no identified initial investment) companies have come public since August and several others are currently being marketed. The first wave of blind pool entities is targeting opportunities to fill voids in still restrictive debt markets for private owners and seek to attain equity-like returns from underwriting new mortgages and restructuring existing financings. The record wave of blind pool companies is seeking capital to make acquisitions of hotel assets whose operations have suffered dramatically, creating distress under unsustainable debt levels.
While the spotlight has largely moved away from public real estate companies’ balance sheets, the market remains focused on the looming debt maturities of
14
|
|
Alpine Realty Income & Growth Fund | |
private market participants occurring over the next five plus years. Record years of transactional activity pre-2008 combined with inappropriate underwriting on elevated real estate values, cheap debt capital, and rapid expansion of securitized debt products has resulted in significant levels of mortgage debt that cannot be refinanced in today’s environment. Whether the wave of upcoming debt maturities will prove to be a “once-in-a-lifetime” opportunity for the pools of capital waiting on the sidelines, or something less, will likely begin to play out during 2010. Currently, both bank and commercial mortgage-backed securities (“CMBS”) lenders are showing willingness to provide short term extensions, particularly if the loans remain cash flowing. However, the scale of the debt maturities remains enormous and will require both a solid fundamental recovery and significant replacement debt capital to make the problem go away.
While the U.S. economy has begun to show initial signs of improvement, commercial real estate market fundamentals are likely to remain challenged in 2010. On the positive side, unemployment claims have been slowing, factory orders have picked up, and profit forecasts for many U.S. businesses are being revised higher. Top line revenue growth for U.S. businesses,
versus operating cost reductions, is in our opinion the essential ingredient to the ultimate recovery in real estate market conditions. Without solid profit gains in corporate America, business spending leading to employment gains and, ultimately, increased consumer spending may be elusive and delayed.
Given the relative uncertainty of the pace and strength of an economic rebound placed against a backdrop of an improved but still very challenged real estate debt environment, we continue to pursue a defensive portfolio construction. In the remainder of this report, we will discuss conditions and future opportunities in individual property subsectors and present how our investments in those subsectors fared over the past fiscal year.
Consistent with our cautious stance on real estate fundamentals, we maintained the Fund’s significant allocation to REIT preferred stocks throughout the fiscal year and were rewarded for this decision. At the end of the fiscal period, the Fund held twenty-three individual preferred holdings accounting for 19.2% of assets. The sixteen issues held throughout the year produced a simple non-weighted average return of +55.05% and a median return of +51.34%. Individual returns for those sixteen preferred stocks over the fiscal period are shown below:
|
|
|
|
|
|
|
Sunstone Hotels Series A | +122.90% |
|
| PS Business Parks Series H | +47.16% |
|
CBL & Associates Series D | +99.63% |
|
| Vornado Realty Series G | +41.91% |
|
Digital Realty Series A | +78.62% |
|
| Regency Centers Series D | +40.42% |
|
SL Green Realty Series D | +70.71% |
|
| Vornado Realty Series I | +38.91% |
|
Kilroy Realty Series F | +69.44% |
|
| Public Storage Series D | +37.28% |
|
AMB Property Series O | +61.09% |
|
| Public Storage Series W | +35.94% |
|
Entertainment Properties Series D | +59.11% |
|
| Omega Healthcare Series D | +32.84% |
|
PS Business Parks Series L | +55.52% |
|
| Prime Group Realty Series B | -10.69% |
|
As of October 31, 2009, the Fund’s preferred investment portion of the portfolio had a weighted-average dividend yield of 9.12% (with a median yield of 8.93%) and traded at a weighted-average discount to an underlying $25.00 liquidation value of 20.4% (i.e. a weighted average price per share of $19.89) and a median discount of 18.0% (or median share price of $20.50). In our last report we noted that we stand ready to shift more investment to common equity when future improvement in real estate fundamentals is more apparent. We reiterate those sentiments particularly in light of REIT preferreds having now recovered much of their discount to liquidation value as risk spreads for fixed income investments tightened, though the
preferred income returns remain relatively compelling in our opinion.
The Fund’s investments in office and industrial warehouse owning companies provided a range of mostly negative returns during the fiscal period as landlords nationally struggled to maintain occupancies. According to CB Richard Ellis research, the U.S. office vacancy rate increased to 17.2% during the third quarter of 2009, up from 14.0% one year earlier, while the national industrial availability rate rose to 12.9% as of September 30, 2009, up from 10.1% in 2008. Continued job losses, cost containment, and business failures caused firms to shed space and remain hesitant
15
|
|
Alpine Realty Income & Growth Fund | |
to enter into new long term rental contracts. In the office sector, negative absorption nationally was -13.3 million square feet in the third quarter according to CB Richard Ellis, better than the -25 million square feet experienced in the second quarter, but still reflective of weak business demand. Corporate profit growth will be essential to markets returning to equilibrium and abating the pressures on rents occurring in most markets.
We have continued to bias the Fund’s holdings to those companies that we feel have the strongest asset quality and management teams, soundest balance sheets, longest average lease durations, and exposure to markets including midtown Manhattan, Washington, D.C., Boston, San Francisco, and southern California. Though these markets have suffered significant business and financial services contractions, we believe they may be among the first to rebound and should begin to show notable improvements in the latter half of 2010 and 2011.
The public companies operating in these markets should outperform their private market brethren in attracting and retaining tenancies given their superior financial strength and flexibility. Several entities, including Boston Properties and Vornado Realty Trust, may very well take advantage of attractive acquisition opportunities as properties are transferred to stronger hands. During the fiscal period, the Fund’s investments in the office and industrial group ranged in performance from the +142.05% return of DuPont Fabros, an owner and developer of state of the art data centers, and the +48.37% return of Mack-Cali Realty, the New Jersey based owner of primarily suburban office property, to the - -50.42% return of Maguire Properties, the Los Angeles based landlord suffering under the weight of excessive debt on its balance sheet. Other notable returns during the period included those of Boston Properties (-9.79%), SL Green Realty (-2.91%), Kilroy Realty (-6.79%), ProLogis (-8.31%), AMB Property (-4.27%), Alexandria Real Estate Equities (-17.85%), and Corporate Office Properties (+12.51%).
In the apartment sector, landlords have continued to experience downward pressures on rents as rising unemployment and oversupply in some markets provide challenges. In general, the public apartment REITs have done an extraordinary job at containing operating expenses and maintaining, and even in some instances, increasing occupancies throughout 2009. On average, the twelve apartment REITs have kept expenses only increasing +.6% through the third quarter while raising occupancies from 94.2% at the end of the first quarter to 95.0% at the end of the third quarter. Revenues,
however, have shown sequential weakness throughout the year with average revenues decreasing nearly -4% in the third quarter, resulting in average drops in net operating income of -5% to -6% in the latest calendar quarter. Until employment gains are achieved, we expect apartment landlords to experience similarly tough market conditions and have maintained Fund exposure to the group at less than 9% of assets. Returns delivered by the Fund’s apartment owning companies during the fiscal year were +5.03% by Home Properties, -17.92% by Essex Properties Trust, -11.28% by Equity Residential, and +6.75% from Avalon Bay.
With respect to the retail property sector, our continued concerns regarding the level of consumer spending and the economic stress on retailers, particularly “mom and pop” local stores in neighborhood centers, has kept the Fund’s allocation to the group at below average levels. To date most pressure on occupancies and rents has resulted from bankruptcies and store closures from “big box” retailers such as Circuit City, Linens and Things, Home Depot Expo, and Fortunoff’s, as well as small non-national tenants. The Fund’s common equity investment in companies owning neighborhood and community centers was limited to two entities comprising only approximately 1.25% of assets, Federal Realty and Saul Centers, both with properties located primarily in older in-fill locations within established neighborhoods with strong demographic characteristics. The Fund’s common equity regional mall and outlet mall investments were comprised of five holdings at the end of the fiscal period which accounted for the majority of our retail investments at 11.16% of assets. We noted in our last report that earlier in the year valuations for the regional mall companies reflected what we believed was an inappropriate degree of insolvency concerns and balance sheet worries. As the year progressed, however, and investors witnessed these entities’ abilities to raise both new debt and equity capital, the Fund’s regional mall investments produced above average returns with Simon increasing +7.92%, CBL rising +8.16%, Taubman decreasing slightly at -1.68%, and Macerich returning +18.82%. For the regional mall companies to outperform again in 2010 will require their retail tenants to see some top line improvement from better consumer spending since reliance on managing inventories and margins will not be a healthy long term solution.
Healthcare REIT investments provided the best overall common equity returns for the Fund during the fiscal year. Investors sought more defensive positions in these companies based on their relative stability of operations and balance sheet strength. Several of the Fund’s companies in this sector successfully tapped the equity
16
|
|
Alpine Realty Income & Growth Fund | |
markets during the year, adding to their strength, and no company cut its dividend. Returns from the Fund’s investments during the fiscal period included Ventas rising +19.23%, Health Care REIT increasing +7.31%, and Omega Healthcare Investors delivering a +8.49% return. Our current position in HCP, Inc. was acquired on their follow-on offering in early August and returned +19.56% through the end of the fiscal year.
In the lodging sector, the Fund had no common equity investments at the end of the fiscal year and only a 1.8% investment in preferred equities. Lodging fundamentals remain under intense pressure from reduced business transient, group, and leisure traveler bookings resulting in overall occupancies in the mid-50% range. Rate and resulting RevPar (Revenue Per Available Room) metrics have fallen in this cycle at an unprecedented pace causing operating cash flows to decline in many instances 35% to 40%. Nevertheless, many stocks have delivered extraordinary returns since the market bottom experienced in early March as investors sought early cyclical investments. We were perhaps too cautious of chasing a potentially premature move and did not acquire any new positions but believe current valuations at an average of approximately 15 times 2010 projected EBITDA (Earnings Before Interest, Taxes, Depreciation, and Amortization) are elevated and too optimistic regarding the pace and strength of economic prospects. We continue to monitor trends in lodging fundamentals and stand ready to invest at what
we believe to be more appropriate levels in companies which may benefit as over leveraged owners are forced to shed assets at historically depressed levels. With lodging related delinquencies in CMBS mortgage pools having grown to 8.5% from only.5% one year ago, a new period of attractive acquisition opportunities may arise in 2010.
Calling the bottom of a real estate cycle is a risky proposition. However, signs of both stabilization of financial markets and deceleration of job losses gives us optimism that we are getting closer to an upturn in real estate fundamentals. Current REIT valuations already incorporate some optimism that demand for commercial real estate space may turn positive during 2010. We remain cautious on the timing and strength of a recovery in demand but believe that the relative absence of new building over the past few years and into the foreseeable future differentiates the potential for a rebound this time from past cycles. We anticipate maintaining a conservative portfolio construction with a balance of defensive investments coupled with well-capitalized companies able to take advantage of opportunities which should arise over 2010. We look forward to providing an update on Fund performance after the end of the semi-annual period in April.
Sincerely,
Robert W. Gadsden
Portfolio Manager
|
Because the Fund concentrates its investments in the real estate industry, the portfolio may experience more volatility and be exposed to greater risk than the portfolios of many other mutual funds. |
|
Please refer to the schedule of portfolio investments for fund holdings information. Fund holdings and sector allocations are subject to change and should not be considered a recommendation to buy or sell any security. Current and future portfolio holdings are subject to risk. |
|
A basis point is one hundredth of a percentage point (0.01%). |
|
EBITDA (Earnings Before Interest, Taxes, Depreciation, and Amortization) is essentially Net Income with interest, taxes, depreciation, and amortization added back to it. EBITDA can be used to analyze and compare profitability between companies and industries because it eliminates the effects of financing and accounting decisions. However, this is a non-GAAP measure that allows a greater amount of discretion as to what is (and is not) included in the calculation. This also means that companies often change the items included in their EBITDA calculation from one reporting period to the next. |
|
Cash flow measures the cash generating capability of a company by adding non-cash charges (e.g. depreciation) and interest expense to pretax income. |
17
|
|
|
|
|
|
|
|
|
|
|
|
|
|
|
|
|
|
|
|
|
|
|
| |||||||||||||||||||
Comparative Annualized Returns as of 10/31/09 (Unaudited) | |||||||||||||||||||
|
|
|
|
|
|
|
|
|
|
|
|
|
| ||||||
|
| 6 Months(1) |
| 1 Year |
| 3 Year |
| 5 Year |
| 10 Year |
| Since Inception |
| ||||||
Alpine Cyclical Advantage Property Fund |
| 29.57 | % |
| 21.14 | % |
| -21.38 | % |
| -9.77 | % |
| 7.41 | % |
| 7.40 | % |
|
Wilshire Real Estate Securities Index |
| 28.18 | % |
| -0.11 | % |
| -16.96 | % |
| -0.94 | % |
| 9.22 | % |
| 8.01 | % |
|
S&P 500 Index |
| 20.04 | % |
| 9.80 | % |
| -7.02 | % |
| 0.33 | % |
| -0.95 | % |
| 7.12 | % |
|
S&P Developed BMI Property Index(2)(4) |
| 38.38 | % |
| 22.11 | % |
| -12.68 | % |
| 1.99 | % |
| N/A |
|
| N/A |
|
|
Lipper Real Estate Funds Average(3) |
| 26.52 | % |
| 2.13 | % |
| -16.39 | % |
| -1.50 | % |
| 8.55 | % |
| 7.91 | % |
|
Lipper Global Real Estate Funds Average(3) |
| 34.75 | % |
| 17.45 | % |
| -12.88 | % |
| 0.80 | % |
| 10.49 | % |
| 7.39 | % |
|
Lipper Global Real Estate Funds Rank(3) |
| N/A |
|
| 14/81 |
|
| 41/41 |
|
| 19/19 |
|
| 12/12 |
|
| 1/1 |
|
|
Gross Expense Ratio: 1.70%(5) |
|
|
|
|
|
|
|
|
|
|
|
|
|
|
|
|
|
|
|
Net Expense Ratio: 1.70%(5) |
|
|
|
|
|
|
|
|
|
|
|
|
|
|
|
|
|
|
|
|
|
|
|
| ||
| (1) | Not annualized. FINRA does not recognize rankings for less than one year. |
| (2) | Index commenced on 12/29/2000. |
| (3) | The since inception return and ranking represents the annualized return for the period beginning 9/2/1993. |
| (4) | The Fund changed its broad-based market index from the Wilshire Real Estate Securities Index and the S&P 500 Index to the S&P Developed BMI Property Index because we believe the S&P Developed BMI Property Index more accurately reflects the Fund’s investment program. |
| (5) | As disclosed in the prospectus dated February 27, 2009. |
Performance data quoted represents past performance and is not predictive of future results. Investment return and principal value of the Fund fluctuate, so that shares, when redeemed, may be worth more or less than their original cost. Performance current to the most recent month end may be lower or higher than the performance quoted and may be obtained by calling 1-888-785-5578. Performance data shown does not reflect the 1.00% redemption fee imposed on shares held for fewer than 2 months. If it did, total returns would be reduced.
The Wilshire Real Estate Securities Index is a market capitalization weighted performance index of listed property and real estate securities. The S&P 500 Index is designed to measure performance of the broad domestic economy through changes in the aggregate market value of 500 stocks representing all major industries. The S&P Developed BMI Property Index is an unmanaged market-weighted total return index available on a monthly basis. The Index consists of many companies from developed markets whose floats are larger than $100 million and derive more than half of their revenue from property related activities. The Lipper Real Estate Funds Average is an average of funds that invest at least 80% of their portfolio in equity securities of domestic and foreign companies engaged in the real estate industry. The Lipper Global Real Estate Funds Average is an average of funds that invest at least 25% of their equity portfolio in shares of companies engaged in the real estate industry that are strictly outside of the U.S. or whose securities are principally traded outside of the U.S. Lipper rankings for the periods shown are based on Fund total returns with dividends and distributions reinvested and do not reflect sales charges. The Wilshire Real Estate Securities Index, the S&P 500 Index, S&P Developed BMI Property Index, Lipper Real Estate Funds Average and the Lipper Global Real Estate Funds Average are unmanaged and do not reflect fees associated with a mutual fund, such as investment adviser fees. The performance for the Cyclical Advantage Property Fund reflects the deduction of fees for these value-added services. Investors cannot directly invest in an index.
To the extent that the Fund’s historical performance resulted from gains derived from participation in initial public offerings (“IPOs”) and/or secondary offerings, there is no guarantee that these results can be replicated in future periods or that the Fund will be able to participate to the same degree in IPO/Secondary offerings in the future.
18
|
|
Alpine Cyclical Advantage Property Fund | |
|
|
|
|
|
|
|
|
1. | Verde Realty |
| 6.06% |
|
2. | Cyrela Brazil Realty SA - GDR |
| 4.65% |
|
3. | ProLogis |
| 4.53% |
|
4. | Alexandria Real Estate |
|
|
|
| Equities, Inc. |
| 4.13% |
|
5. | Starwood Property Trust, Inc. |
| 3.66% |
|
6. | Orient-Express Hotels Ltd. - |
|
|
|
| Class A |
| 3.29% |
|
7. | CBL & Associates Properties, Inc. |
| 3.00% |
|
8. | Annaly Capital Management, Inc. |
| 2.95% |
|
9. | MFA Financial, Inc. |
| 2.82% |
|
10. | Chimera Investment Corp. |
| 2.80% |
|
|
|
* Portfolio holdings and sector distributions are as of 10/31/09 and are subject to change. Portfolio holdings are not recommendations to buy or sell any securities. Portfolio Distributions and Top 10 Holdings do not include short-term investments. Portfolio Distributions percentages are based on total investments and Top 10 Holdings percentages are based on total net assets. |
|
|
|
Value of a $10,000 Investment (Unaudited) |
|
|
This chart represents a comparison of a hypothetical $10,000 investment in the Fund versus similar investments in the Fund’s benchmarks. The graph and the table do not reflect the deduction of taxes that a shareholder would pay on Fund distributions or the redemption of Fund shares. The Fund’s return reflects the waiver of certain fees. Without the waiver of fees, the Fund’s total returns would have been lower.
19
|
|
Cyclical Advantage Property Fund | |
|
Commentary |
Dear Investor:
We are pleased to report that the October 31, 2009 fiscal year-end net asset value per share of $16.95 provided a +21.14% total return. For the fiscal year, the Fund significantly outperformed both the Wilshire Real Estate Securities Index and the Lipper Real Estate Funds Average returns of -0.11% and 2.13%, respectively. As of September, the Fund modified its focus to permit investments greater than the prior 20% limitation of the portfolio abroad. On a going forward basis, the Fund will be more appropriately compared to the Standard & Poor’s Global Property Index, which generated a +22.11% return during the fiscal year.
A BRAVE NEW WORLD
With all due respect for Aldous Huxley (Brave New World, published 1932), Alpine concluded that as we enter this new business cycle, it would be appropriate to reemphasize the investment focus of this Fund in light of the dramatic evolving real estate securities universe over the past decade. Since its inception in 1993, Alpine’s U.S. Real Estate Equity Fund was designed to focus domestically on early cyclical growth and recovery opportunities as well as deeply undervalued real estate situations. The international expansion of the listed real estate securities universe over the past five years now enables Alpine to extend its investment approach to multiple markets with potential cyclical variations which could offer a greater array of investment opportunities over time.
When this Fund was launched in 1993, major Real Estate Investment Trusts (REITs) of today, such as Boston Properties, Simon Properties and Vornado were not yet public as the “modern REIT era” was just beginning. The sector’s expansion has brought many new investors to the group, which in combination with the growth of index and related funds, such as ETFs, has influenced sector-wide fund flows. Sector specific or quantatively selected baskets of stocks do not require fundamental knowledge of properties, managements or business models, and thus tend to be less selective than individual companies may merit. This, also of special note, had a deleterious effect on the overall level of volatility for this group, amplifying both the past year’s sell-off and recovery. As a result, REITs lost much of their traditional low-correlative, defensive appeal. We believe opportunities for selective outperformance as a result of finding either unappreciated growth potential or dramatic undervaluation of underlying properties may
become less profitable for long term investors if fund flows continue to dominate performance. This Fund is the ninth oldest in the Real Estate sector amongst over 75 distinct mutual fund portfolios tracked by Morningstar, with probably as many abroad. We believe that many focus mostly on the biggest markets and stocks of the day, mainly in the U.S., Japan, Europe and Australia and that the similarity of many funds could lead to uniformity of returns.
We wish to emphasize Alpine’s distinctive strengths, seeking to derive benefit from the principle investment characteristics central to each Fund’s focus. In our view, Alpine’s Realty Income and Growth Fund has done a consistent job providing higher than average income from real estate securities and participating in their long term growth, while the Alpine International Real Estate Equity Fund (the first mutual fund to offer U.S. investors a way to participate in global property, beginning back in 1989), and our new Alpine Emerging Markets Property Fund, offer investors meaningful exposure to the breadth of potential real estate opportunity abroad. However, as this new business cycle unfolds, it seems appropriate for Alpine to reemphasize our fundamental belief that a properly executed investment program oriented towards capturing strong returns during periods of cyclical recovery or emerging growth could potentially provide an extended duration of such returns, especially if it can benefit from less correlated real estate cycles around the world. In similar fashion, buying undervalued companies near the bottom of varied cycles could expand potential for returns. Hence, we have relaunched the Alpine U.S. Real Estate Equity Fund as the Alpine Cyclical Advantage Property Fund.
MULTIPLE POTENTIAL CYCLES
We believe that this nascent business cycle might differ significantly from the prior two periods, following the recessions of 1991 and 2001, respectively. First, the business cycle may no longer be of extended duration over eight to ten years and may revert to the more typical four to seven year duration of prior periods. We also believe that the historical global linkage which resulted from the dominant scale and scope of the U.S. economy combined with similar European demand patterns, no longer applies to large emerging economies which are increasingly focused on their own domestic demand agendas as well as fulfilling exports. As a result, desynchronization of national or regional business cycles may permit this Fund to more actively
20
|
|
Cyclical Advantage Property Fund | |
participate in early cyclical opportunities, as they ebb and flow around the world. Thus, the importance of this Fund’s global orientation is, we think, timely given the tremendous expansion of the global property securities market over the last six years. Historically, Alpine used to emphasize sixteen to twenty countries in its international portfolios, but today, twenty-five to thirty countries offer breadth of exposure. A significant aspect of the real estate cycle is that returns from property development at the right time of the real estate cycle can become a major beneficiary of overall real estate appreciation. Since Asian companies are more development oriented than U.S. owners, this Fund’s strategy is a natural approach to these companies. Today, there appears to be many more potential opportunities for greater growth abroad. Longer term we expect to find excellent growth opportunities in the U.S., albeit selectively over the next two to three years, hence, the Fund’s emphasis on global flexibility.
THE ELEPHANT IN THE CLOSET:
RENT, DEBT AND VALUATION
Since Alpine’s perspective on real estate opportunities both in the U.S. and abroad are discussed in greater detail in the reports of the Realty Income and Growth Fund, the International Real Estate Equity Fund and our Emerging Markets Real Estate Fund, we will not spend time on these issues. Permit me instead to focus on the big questions surrounding the timing of recovery of the U.S. and some European real estate markets regards when and how the debt hangover gets resolved. Arguably, prices appear to have bottomed with regard to certain property valuation measures such as capitalization rates (initial yields upon investment) and price-to-replacement costs ratios, or even projected internal rates of return (IRR). We believe that these criteria have already been incorporated into the prices of real estate stocks in the U.S. as they recovered from the previous year’s overly pessimistic levels. Capitalization rates and IRRs are increasingly reflective of Treasury bond yields now that risk premiums have narrowed. Expectations of prospective vacancy rates, potential rents and operating costs which together produce net operating income (NOI) will remain somewhat speculative for a few quarters until business demand trends solidify. The previous property cycle enjoyed broadly positive property level NOI growth of 2% to 4% from 2004 through 2007, and the prior cycle saw NOI growth typically of 4% to 5% from the late 1990’s through 2001. NOI growth is currently negative as vacancies rise and rents fall. The stability of long term valuations will hinge on when vacancy rates bottom and rents begin to see improvement, leading to potential
growth in property level net operating income. This in turn should facilitate future dividend growth for a number of REITs.
As we see the recovery unfold, property income growth may lag the economy by several years. Historically, unemployment in the U.S. has started to improve roughly three to nine months after the recession has ended, although growth may take longer. As employment demand picks up, vacancy rates have tended to stabilize six to twelve months later, depending on the level of excess space still occupied by tenants. When new hiring and business expansion causes the absorption of unused space, net rents finally begin to improve. We believe vacancies may peak in excess of 19% for office properties and similar levels, perhaps, for retail. Note that big city urban office and major shopping malls should do better. Today, some urban markets such as New York City, Washington, D.C., Houston and Boston, are still relatively solid, while suburban markets tend to be much weaker. Such levels were last experienced during the recession of 1990, with vacancies peaking during 1992. Gradual improvement of (NOI) took place from 1993 through 1999 before landlords gained the upper hand in rent negotiations. In our estimation, a similar pattern could begin to unfold this decade. Vacancy rates in the U.S. may peak depending on the property type and region between 2010 and late 2011, and rents should begin to show meaningful improvement by 2012 through 2013 depending on the level of economic activity. Since most commercial properties emphasize leases whose average duration ranging from three to ten years, the level of existing rents rolling through a property or portfolio of properties is likely based on average rents from two to five years ago, which would be well above current market levels. If we assume such a pattern, but allow for some benefit from declining vacancies, we suspect that in most cases property level NOI may not begin to improve until 2012 - 2014.
The relevance of this type of analysis is that a great deal of mortgage maturities coming due between 2010 and 2012, to the tune of $350 to $400 billion per year, will have to be refinanced or extended from one to several years. We believe that the majority of this capital will see maturities pushed back to 2015 to 2017. This could create a window during which property cash flows may recover some of their pre-recession levels, potentially mitigating the potential number of foreclosures. However, this will require a reasonably robust level of GDP growth and probably at least 3% to 4% inflation. Thus, with a bit of luck, over the next five years, mortgage investors in the U.S. could survive all but the
21
|
|
Cyclical Advantage Property Fund | |
worst excesses of the commercial real estate financing boom from the previous five years. A critical period may loom over the sector by 2015 when annual debt maturities could run between $500-$750 billion per year. By then, a revitalized securitized mortgage sector will be essential for spreading the refinancing burden.
To put all of this in context, it is relevant to note the current level of distress in the mortgage markets. The pace of deterioration of loan performance over the past year is virtually unprecedented. In particular, delinquencies among CMBS loans (commercial mortgage backed securities) reached nearly 6% in October, nine times greater than its October 2008 level. Hotel delinquencies have reached 8%, just below their post 9/11 peak of 8.2%, and 30-day delinquencies for hotels have accelerated to 18%, although some will likely pay before 90 days. Even industrial property delinquencies which are outperforming at only 3.2% total nonperformers are showing 30-day delinquency rates upwards of 6%. There is also considerable distress for multi-family and retail related mortgages. It can be expected that if vacancies continue to rise over the next year, and rents decline over the next couple of years, that more delinquencies will occur, raising the level of real estate owned (REO) among banks as well as foreclosure sales. One troubling aspect of this situation has been the significant deterioration of so called “seasoned vintages”, representing mortgages that were made in the early part of this decade. With the exception of the year 2003, commercial real estate mortgages dating from 2001 through 2008 have shown delinquency rates in excess of 5%, up from typically less than 1% one year ago. We think this deterioration reflects the impact of rising vacancies on property NOI. While smaller in total scope, we cannot minimize the impact of construction loans held by banks which are already running 15% delinquent with rapid deterioration projected for 2010. Most of these properties do not even have significant NOI, and have burned through interest reserves. Rising vacancies, falling rents and stalled debt markets could lead to a rising tide of foreclosure sales next year.
CAN DISTRESS BECOME OPPORTUNITY?
WILL EQUITY RECAPITALIZATION LEAD TO ACQUISITIONS?
What is the significance of this mortgage mess to investors in real estate equities? The opportunity for public companies to acquire and deleverage properties could be significant. A key factor is that the vast majority of real estate investment trusts and other public real estate companies in the U.S. have effectively
recapitalized their balance sheets with new equity issuance over the past six or seven months. To date through November, there have been 71 such recaps raising over $22 billion. While many of these recap offerings were extremely dilutive to existing shareholders, investors in the recaps themselves realized that such equity offerings were potentially securing the future survivability of these companies during uncertain times and thus enhancing share values. Last April at NYU’s Annual Real Estate Conference, I opined that we might see several waves of such recapitalizations over a twelve to twenty-four month period during which the companies with the best perceived portfolios and management teams would initially raise up to $10 billion followed by a smaller second round of second tier companies, and finally a third round during which companies might come back for second helpings in order to fuel merger and acquisition (M&A) activity, feasting on the lower tiers of companies which could not raise capital. In actuality, the speed and breadth of this undertaking, spurred by investment banks seeking both fees and the repayment of outstanding bank lines has far surpassed Alpine’s original expectations. As a result, only a handful of REITs are still plagued by deficient balance sheets, and share prices have recovered with most REITs today trading at or above their underlying asset values based on current market conditions.
The benefit from the continued re-equitization of commercial real estate was recently highlighted by an announcement that Brookfield Properties and apparently Simon Property Group have acquired significant portions of the mortgage debt underlying General Growth Properties. You may recall that General Growth was a poster child for excess leverage and had to declare Chapter 11 last year in order to reorganize and restructure its extremely complicated levels of debt even though its cash flow provided “adequate” coverage. Alpine believes that while the General Growth situation illustrates the opportunity of M&A activity amongst public companies, we believe the potential role of public companies recapitalizing private companies could be quite extensive over the next three to five years. Also at the beginning of December, Simon acquired Prime Outlets for cash, stock and assumed debt of $2.9 billion. Thus, the capacity of the public market to provide both debt and equity on major scale at short notice in combination with providing investors superior transparency and proven accountability will be important factors going forward.
22
|
|
Cyclical Advantage Property Fund | |
BANKS PUSHING GLOBAL RECAPITALIZATION
This wave of recapitalization of real estate has in large part been driven by banks desires to reduce their exposure to real estate lending and generate fees. While the U.S. has been the largest market recapitalized this year, reflecting both its size and the scale of its debt problems, we have also seen significant recapitalizations since the end of last year in Australia where twenty-six recaps raised over $13 billion, and twenty-two recapitalizations in the U.K. raised over $9 billion this year. There have been thirteen recaps in Singapore raising $5 billion and twenty-three in Europe raising $4 billion. There have even been seven offerings in India, where almost $3 billion has been raised for companies that over-expanded in the heat of the last boom. Going forward we could expect to see a growing number of recapitalizations in Japan, where many REITs and developers utilized excessive short-term funding for long-term investments, as well as continued portfolio strengthening in Europe. While there have been significant secondary offerings in Brazil and China, these have been for new acquisitions and growth as opposed to restructuring balance sheets. We have even seen a number of Initial Public Offerings (IPOs), most notably in China and even in the U.S. We see a number of companies coming to market with a focus on recapitalization opportunities. This Fund has participated in several of those IPOs focused on acquiring distressed commercial real estate loans. We are currently evaluating several new lodging REITs seeking potential opportunity from the extreme duress that segment has experienced. We believe that investment bankers may continue to facilitate and encourage the expansion of the public market place in this fashion.
PORTFOLIO STRUCTURE AND PERFORMANCE
In September, 2009, we began to restructure the portfolio away from its U.S. real estate focus towards the global cyclical advantage emphasis. As of October 30th, the portfolio remains two-thirds invested in the U.S., including some of the Fund’s largest holdings including Verde Realty, Alexandria Real Estate Equities, ProLogis, Starwood Property Trust, and Orient-Express Hotels. While many of these U.S. holdings will remain in the portfolio, we anticipate that the international exposure of the portfolio will gradually increase. Given the Fund���s new global mandate, the international portion could grow from its previously limited 20% up to 80% of the portfolio, depending on market conditions. Given the newly expanded focus of the
portfolio, its past holdings are perhaps less significant, but it is useful to focus on continued holdings where the portfolio achieved outperformance this past year. Broadly speaking, there was strong performance from the mortgage and finance related segments, notably a 47.65% gain in C.B. Richard Ellis, the global real estate broker, a 56.01% total return from mortgage REIT, MFA Financial, as well as 40.30% from Annaly Capital Management. The lodging sector was also a source of strong returns with an 83.82% unrealized gain on shares of Host Hotel and Resorts, and a 46.9% return on Diamond Rock Hospitality. We believe these two companies should continue to see opportunities to consolidate this particularly distressed segment of the market place. The Fund also benefited from strong growth in its investment in Brookfield Properties Corp. in the office sector, and from the recapitalizations of a number of REITs including ProLogis, CBL, Simon Property Group. The international residential sector provided particularly strong returns, led by E-House China Holdings, up 216.32%, Cyrela Brazil Realty up 167.26%.
LOOKING AHEAD
We have been pleasantly surprised by the speed with which capital markets have recovered and real estate valuations stabilized. These are early days in the recovery process and the heavy lifting remains to be accomplished in terms of restructuring and recapitalizing real estate, particularly in the U.S. and Europe. Publicly traded real estate companies appear increasingly well positioned to do this. In prior sections of this report, we have outlined the historical pattern of recovery in valuations, occupancy rates and rent levels. Focused on the current state of commercial real estate finance, particularly in the U.S., we also noted the important role banks have played and our belief that they will continue to be major drivers of this recapitalization process. It is Alpine’s view that the recapitalization exercise of the past year is merely a first step, to be followed by both M&A and acquisitions expanding role in acquiring real estate by public entities over the next three to five years. Meanwhile, the current velocity of growth in the world’s emerging markets should provide significant opportunities in Brazil, China, India, Indonesia and other countries where 6% to 8% plus GDP growth should enable middle-class expansion and underpin demand for real estate. By balancing both growth and opportunity on a worldwide basis, we hope to re-focus the portfolio on the early cyclical sweet spot of global real estate value creation while also capitalizing on overly depressed opportunities for recovery. We look forward to reporting on our
23
|
|
| |
progress in achieving an optimized portfolio as we move forward. Thank you for your support and interest.
Sincerely,
Samuel A. Lieber
Portfolio Manager
|
|
Please refer to the schedule of portfolio investments for fund holdings information. Fund holdings and sector allocations are subject to change and should not be considered a recommendation to buy or sell any security. Current and future portfolio holdings are subject to risk.
Cash flow measures the cash generating capability of a company by adding non-cash charges (e.g. depreciation) and interest expense to pretax income.
The S&P Global Property Index defines and measures the investable universe of publicly traded property companies. With more than 500 constituents from 36 countries, the index is ideal for a range of investing activities, including benchmarking active funds and setting the foundation for passive funds. The S&P Global Property divides into two sub-indices: S&P Developed Property and S&P Emerging Property. One cannot invest directly in an index.
24
|
|
|
|
|
|
|
|
|
|
|
|
|
|
| ||||||||||
Comparative Annualized Returns as of 10/31/09 (Unaudited) | ||||||||||
|
|
|
|
|
|
|
|
|
|
|
|
| 3 Months(1) |
| 6 Months(1) |
| Since Inception |
| |||
Alpine Emerging Markets Real Estate Fund |
| 12.86 | % |
| 52.19 | % |
| 70.30 | % |
|
EPRA/NAREIT Emerging Index(2) |
| 4.07 | % |
| 46.69 | % |
| N/A |
|
|
MSCI Emerging Market Index |
| 8.86 | % |
| 40.04 | % |
| 59.75 | % |
|
S&P Developed (ex U.S.) Property Total Return Index |
| 11.32 | % |
| 45.91 | % |
| 35.67 | % |
|
Lipper Global Real Estate Funds Average(3) |
| 11.40 | % |
| 34.75 | % |
| 27.39 | % |
|
Gross Expense Ratio: 3.41%(4) |
|
|
|
|
|
|
|
|
|
|
Net Expense Ratio: 1.41%(4) |
|
|
|
|
|
|
|
|
|
|
|
|
|
| ||
| (1) Not annualized. | |
| (2) Index commenced on 1/12/2009 | |
| (3) The since inception return represents the annualized return for the period beginning 11/6/2008. | |
| (4) As disclosed in the prospectus dated February 27, 2009. |
Performance data quoted represents past performance and is not predictive of future results. Investment return and principal value of the Fund fluctuate, so that shares, when redeemed, may be worth more or less than their original cost. Performance current to the most recent month end may be lower or higher than the performance quoted and may be obtained by calling 1-888-785-5578. Performance data shown does not reflect the 1.00% redemption fee imposed on shares held for fewer than 2 months. If it did, total returns would be reduced.
The EPRA/NAREIT Emerging Index is an unmanaged index designed to track the performance of listed real estate companies in emerging countries worldwide. The MSCI Emerging Market Index is a free float-adjusted market capitalization index that is designed to measure equity market performance of global emerging markets. The S&P Developed (ex. U.S.) Property Total Return Index is an unmanaged market-weighted total return index available on a monthly basis. The index consists of companies from developed markets, excluding the U.S., whose floats are larger than 100 million U.S. dollars and derive more than half of its revenue from property-related activities. The EPRA/NAREIT Emerging Index, MSCI Emerging Market Index, S&P Developed (ex. U.S.) Property Total Return Index and the Lipper Global Real Estate Funds Average are unmanaged and do not reflect fees associated with a mutual fund, such as investment adviser fees. The performance for the Emerging Markets Real Estate Fund reflects the deduction of fees for these value-added services. Investors cannot directly invest in an index.
The adviser contractually agreed to waive a portion of its fees and to absorb certain fund expenses. This arrangement will remain in effect unless the Board of Trustees approves its modification or termination.
To the extent that the Fund’s historical performance resulted from gains derived from participation in initial public offerings (“IPOs”) and/or secondary offerings, there is no guarantee that these results can be replicated in future periods or that the Fund will be able to participate to the same degree in IPO/Secondary offerings in the future.
25
|
|
Alpine Emerging Markets Real Estate Fund | |
Portfolio Distributions* (Unaudited)
|
|
|
|
|
Top 10 Holdings* (Unaudited) |
|
| ||
1. |
| Unitech Ltd. Participation Note |
| 2.99% |
2. |
| PDG Realty SA |
| 2.89% |
3. |
| MRV Engenharia |
| 2.82% |
4. |
| Brookfield Incorporacoes SA |
| 2.37% |
5. |
| Multiplan Empreendimentos |
| 2.25% |
6. |
| Iguatemi Empresa de Shopping |
| 2.22% |
7. |
| Tecnisa SA |
| 2.19% |
8. |
| Babis Vovos International |
| 1.98% |
9. |
| General Shopping Brasil SA |
| 1.97% |
10. |
| Orascom Development |
| 1.91% |
|
|
* Portfolio holdings and sector distributions are as of 10/31/09 and are subject to change. Portfolio holdings are not recommendations to buy or sell any securities. Portfolio Distributions and Top 10 Holdings do not include short-term investments. Portfolio Distributions percentages are based on total investments and Top 10 Holdings percentages are based on total net assets. |
|
|
Value of a $10,000 Investment (Unaudited) |
|
|
This chart represents a comparison of a hypothetical $10,000 investment in the Fund versus similar investments in the Fund’s benchmarks. The EPRA/NAREIT Emerging Index commenced on January 12, 2009. It is an unmanaged index that tracks the performance of listed real estate companies in emerging markets worldwide. The MSCI Emerging Market Index measures equity market performance of global emerging markets. The securities in the Index are diversified across many industry sectors and at any time few of them may be real estate companies. Therefore, it is less relevant for comparison purposes than the EPRA/NAREIT Emerging Index. The graph and the table do not reflect the deduction of taxes that a shareholder would pay on Fund distributions or the redemption of Fund shares. The Fund’s return reflects the waiver of certain fees. Without the waiver of fees, the Fund’s total returns would have been lower.
26
|
|
Alpine Emerging Markets Real Estate Fund | |
|
Commentary |
|
Dear Investor:
We are pleased to present the annual report for the Alpine Emerging Markets Real Estate Fund. The closing NAV on October 31, 2009 was $17.03 per share, which represents a total return of 70.30% for the period since the Fund’s inception on November 3, 2008. Over the same time period the MSCI Emerging Market Index finished with a total return of 59.75% and the S&P Developed Ex-U.S. Property Total Return Index rose 35.67%. The Fund’s new benchmark index, the FTSE EPRA/NAREIT Emerging Index, began tracking performance from January 12, 2009 and has returned 79.30% adjusted in U.S. dollar terms (63.20% in base currency terms) through October 31, 2009, versus 67.12% for the Fund over the same period.
Since Fund inception, equity performance in emerging markets has certainly been a study in contrasts as investor sentiment tilted from risk aversion and extreme pessimism to renewed risk appetite and guarded optimism. The Fund was launched in the face of an extreme sell off across emerging markets, which saw the MSCI Emerging Market Index close at 454 on 27 October, 2008, its lowest point since September 2004. The Index would test that low in November and finally again in March 2009 before rallying strongly through the remainder of the year. Since sinking to the October 2008 lows, the index has rebounded more than 103%, but still remains more than 26% below the all-time high reached in October 2007 and approximately 21% below the peak in May 2008.
A TALE OF TWO RECOVERIES
While the trajectory of emerging market equities over the past year was not always a clear reflection of it, the majority of the emerging countries demonstrated impressive macro resilience in the face of what many in the developed world have coined the Great Recession. In this context, the ongoing debate surrounding the extent to which certain emerging economies have decoupled from developed countries trivializes the larger structural shift that appears to be taking place before our eyes. Given the widening gap between growth rates in the strongest emerging economies and those of the G-7 countries we may now be in the midst of a transition period where the global financial system as we know it is at an inflection point. It is very conceivable that 2009 will be remembered most as the year that emerging markets (China in particular) drove the recovery of the world economy and laid claim to spearheading the next global
economic cycle. Indeed, by some estimates the emerging markets’ contribution to growth since the start of the crisis in 2007 is over 80% in US dollar terms (versus 45% average contribution from 2000-2006). For even when a true recovery gains traction in the developed economies they may be relegated to the sidelines, as we expect to see a paradigm shift in these countries to lower growth, higher savings rates and perhaps increased regulation. It then should hardly come as a surprise that in September, 2009 the Group of Twenty (G-20) assumed the mantle of the recognized forum for global economic cooperation. Emerging market countries comprise eleven of the twenty members. No longer does it seem illustrative to view emerging market economies — particularly China’s, Brazil’s and India’s — simply in the context of leveraged plays on the developed world. This shift represents a meaningful turnaround from a litany of crises — Mexico, Asia, Russia and Argentina to name a few — that have historically tainted investor perceptions of the asset class.
The majority of emerging markets not only saw their stock markets rally, but as valuations recovered into the second half of 2009 there was a resurgence of initial public offerings (IPOs), follow-on deals, and debt offerings as companies took advantage of restored investor confidence and increased risk appetite to shore up their balance sheets, and more importantly, to provide much-needed working capital to take advantage of near-term growth opportunities. At the time of writing, Alpine tracked 55 real estate IPOs in 2009 with proceeds of more than $28 billion, with emerging companies accounting for 32 of the listings and raising approximately $17.8 billion. However, unlike 2007, the markets have been more discriminating, as a number of the deals have not been received well by investors. Emerging companies also participated in the recapitalization trend that dominated the real estate sector in developed markets. Currently we have tracked 34 secondary offerings across the BRIC (Brazil, Russia, India, China) markets alone representing an aggregate raise of $11.3 billion. The distinction here is that due to relatively low debt levels to begin with, the majority of the capital raised by companies in emerging markets was done opportunistically for new investment. This was in stark contrast to many of the deals in the developed markets which were necessary recapitalizations.
As we close the door on a decade we can’t help but look back and take note of a time period (10/29/99 through 10/30/09) where the MSCI Emerging Market Index increased by 129.11% (8.63% annualized versus -
27
|
|
Alpine Emerging Markets Real Estate Fund | |
0.95% for the S&P 500 Index and 1.26% for the Dow Jones Industrial) aided by the tailwinds of economic expansion boosting demand, large inflows of FDI (foreign direct investment), as well as across-the-board increases in global commodity prices. On a regional basis, the MSCI EM (Emerging Markets) Latin America Index was up 333% and the MSCI EM BRIC Index increased by 267% over the decade, while the MSCI Russia Index increased by 525% and the MSCI Brazil rose by 454%.
Naturally, the latest bout of strength in emerging market equities has created concerns that markets may have overshot, or skepticism that aggressive monetary and fiscal stimuli has sent a credible jolt through the patient but ultimately will fail to spark a pulse. For while it seems difficult to dispute that many developing countries are clearly testing the bounds of economic decoupling from the developed world, it remains to be seen if this extends in the near term to decoupling of share performance and perhaps of most consequence—to monetary policy. Most EM central banks (Russia and perhaps Indonesia being a notable exception) have reached the end of their easing cycles and we anticipate that many will weigh the benefits of tightening money conditions well ahead of most developed economies as concerns over reflating asset bubbles and liquidity driven inflation fears prompt central bankers to evaluate the scope and timing of exit strategies.
Our portfolio strategy remains focused on companies which we believe have the potential to benefit from clear demographic-driven demand, sustainable GDP growth and favorable government policies on the macro and micro-economic level. Looking into 2010, we observe that while there are certain exceptions, the overall outlook for many emerging markets’ fundamentals and financial markets remains robust. Yet, while risk appetite has returned to the markets, uncertainty still looms on the horizon for the majority of investors. Until these economies demonstrate consistent evidence of sustainable domestic demand and monetary/fiscal policies in line with underlying macroeconomic fundamentals we will remain careful not to interpret recent share outperformance as proof of wholesale decoupling from developed markets. Consequently, we will continue to be extremely selective in deploying investor capital.
PORTFOLIO DISCUSSION — BRAZIL
Through the twelve-month period ending October 31, 2009 we have managed the portfolio in line with our regional macro-economic theses, but also considering the evolution of micro-economic conditions on the
ground as well as the ongoing impact of government policies. Accordingly, we took the opportunity to increase our exposure to Brazil from 19% to its current portfolio weighting of 31.4%, as we continue to believe that our long-term appraisal of the macro-economy, the various government housing stimuli and the successful follow-on equity offerings should position selected companies to gain market share while driving solid earnings growth and margin expansion.
This year saw the government execute an ambitious stimulus plan for Brazil’s housing sector called Minha Casa Minha Vida (My House, My Life) geared to the low-income segment, through direct mortgage subsidies. It is difficult to overestimate the impact on volumes that the plan is expected to drive given that it targets the financing of one million units over the next 24 months and is likely to be extended once that milestone is achieved. While this program has rightly grabbed most of the headlines, the other significant policy shift enacted by FGTS (Severance Indemnity Fund for Employees) is an increase not only in the ceiling for mortgages under Minha Casa (i.e. up to the maximum R$130,000), but also for middle-income properties eligible for loans within the SFH (Housing Finance System) from R$350,000 to R$500,000 and an increase in maximum LTVs (Loan-To-Value) from 80% to 90%. In 2009, with the help of these programs, the Brazilian mortgage industry is on pace to reach close to 700,000 loans, which will exceed the historic number of annual loans achieved at the peak in 1980. As a result, we have increased positions in particular leading players in the low-income segment, such as PDG Realty and MRV, who we continue to believe have the proven execution capabilities and scale to manage unprecedented volume expansion and protect margins in the face of rising labor and input costs. We have also established new positions in mixed-use developer Brookfield and residential developer Rossi during their respective secondary offerings. Brookfield has a strong pipeline of residential projects as well as over R$2 billion worth of commercial projects for sale in prime CBD (Central Business District) locations. In addition, roughly 20% of its current landbank is located in the Barra da Tijuca area of Rio de Janeiro, which potentially could be well-positioned to benefit from infrastructure investments related to the 2014 Soccer World Cup and the 2016 Summer Olympic Games. Rossi is the most diversified play in the sector in terms of regions and income segments and is currently trading at an attractive valuation relative to peers that is unwarranted in our view. Besides the Fund’s exposure to the residential market, we have been positioning the portfolio to take possible advantage of the under-penetrated and highly-fragmented shopping mall
28
|
|
Alpine Emerging Markets Real Estate Fund | |
owner/operator segment. Not only do these names offer highly visible and recurring cash flow streams, but they have solid growth profiles as evidenced by their development pipelines and offer a more levered vehicle to benefit from the ongoing secular improvements evident throughout the greater Brazilian economy. We increased existing positions in retail operators such as BR Malls and Multiplan. We also established a position in Iguatemi Empresa, which owns one of the highest quality portfolios in the sector and has been able to manage a very aggressive development pipeline through the downturn: five greenfield and two expansion projects in its pipeline are expected to come on line by year-end 2011. Our team recently returned from an extensive trip to Brazil where we completed numerous management meetings and site visits, not only in the greater Sao Paulo region, but across many secondary cities including Belo Horizonte, Brasilia, Fortaleza, Recife and Salvador. The trip did nothing but reinforce our overwhelming conviction that Brazil is at long last on the cusp of assuming as prominent a role in the global economy as its soccer team is expected to have in the next World Cup.
CHINA
The Fund’s next largest exposure is in China with 11.8%, which reflects only a marginal increase from the 11.1% position at mid-year but does not fully represent the greater diversity of stocks in the portfolio. We now hold twelve stocks versus eight at mid-year. The Chinese government’s four trillion yuan ($584 billion) stimulus package and the dramatic increase in bank lending provided unprecedented liquidity to the system. New lending reached RMB8.6 trillion ($1,260 billion) through Q3 2009 on its way to a full-year target of RMB9-9.5 trillion ($1,350 billion), representing a 172% increase from FY 2008. Bank-funded infrastructure related investment spending accounted for 7.3% of the 7.7% average GDP growth recorded in the first three quarters of 2009. While lending and M2 (the amount of money in circulation) may slow on a relative basis in 2010, we expect each to remain very accommodative to continued economic growth. Current projections for FY 2010 are RMB7-8 trillion ($1,100 billion) implying 20% annualized loan growth. Such supportive government policy, continued high private savings rates and urbanization trends reinvigorated housing demand, leading to a sharp rebound in house prices and a drastic reduction of existing inventory in major markets. Affordability in most markets is still not a major concern as roughly 25% of property transactions do not rely on mortgage finance, and those that do have average LTVs between 40-50%. Furthermore, demand for residential property
should remain robust over the medium-term due to the expectation that real interest rates in China may actually decline as modest inflationary pressures offset any possible increase in nominal rates going forward. As a result, our focus in diversifying our exposure has been on residential developers operating primarily in the increasingly supply-constrained markets stretching north from the Pearl River Delta to the Bohai Rim region, including Guangzhou developer KWG Property, a company minority-owned by the Shenzhen government Shenzhen Investment and a developer doing high-end projects in Shanghai and Tianjin: Yanlord Land. A key concern for investors has been whether sector stimulus measures such as reduced down-payment and mortgage rate requirements will be extended into 2010. While some of the more aggressive measures such as relaxation of the second home mortgage will likely come under greater scrutiny in selected markets, it is our general view that any reaction by the government will focus more on a targeted supply response, i.e. making more land available to developers in constrained markets as well as penalizing those companies sitting on land in prime markets, versus a response geared toward blunting demand drivers in the residential market. The government is expected to remain supportive of preferential policies extended to first-time buyers, as the residential property investment cycle is a significant contributor to its 2010 growth target.
We also have exposure in the portfolio to Franshion Properties, a Shanghai-based commercial property developer and landlord, as well as Soho China in Beijing, which owns and operates the iconic Qianmen area retail project just south of Tiananmen Square. The commercial property market in China has been plagued by lagging tenant demand and fears of oversupply, however we see the potential for long-term opportunity in the space if fundamentals recover and commercial real estate becomes more institutionalized. Although it is still in its early stage, investors (both local and foreign pension funds in particular) are searching for opportunities to acquire commercial real estate, in an effort to boost risk-adjusted returns in a low interest rate environment.
INDIA
The Fund’s third largest geography in the portfolio is India with 10.2%, up from 4.4% at mid-year. India was able to weather the global recession better than its peers largely because exports constitute a relatively minor role in the economy. The mid-year election results provided a clear mandate to the ruling party, which quickly enhanced overall investor confidence in the
29
|
|
Alpine Emerging Markets Real Estate Fund | |
country. In addition, the aggressive stimulus package provided tax cuts to boost domestic demand as well as targeted increased infrastructure and rural aid spending. During the downturn, its real estate market suffered from an acute capital squeeze and demand destruction across all asset classes. The situation dramatically improved as the Reserve Bank of India (RBI) reversed 4 years of tightening in less than 12 months and housing became more affordable as mortgage rates dropped 400 basis points (bps), close to 2004 levels. Liquidity conditions improved for the corporates as more than $3 billion was raised in secondary offerings, banks became more open to rolling over existing debt and transaction activity started to thaw out. A clear beneficiary of these changes was Unitech, the largest holding across the Fund. The company was able to tap the capital markets, sell off some commercial assets and divest a majority stake in its telecom joint venture. It also is in the process of shifting its strategic focus more toward development of affordable residential projects, which saw a strong rebound over the year as demand returned. Another investment, Housing Development & Infrastructure, is a Bombay-based developer focused primarily in slum rehabilitation projects in the region and should see a strong cashflow profile based on current sales volumes and its future development pipeline. Risks that we continue to monitor in India are monetary policy moves intended to preempt any inflationary threat and the potential overhang from future equity issuances in the real estate space. The general consensus view is that the RBI could look to hike rates and reserve targets ahead of most of its peers. Furthermore, reports in the media suggest that there is a backlog of private real estate developers looking to raise in excess of $30 billion in the IPO market in the near future. If all of the deals came to the market they would represent approximately 50% of the total current sector market capitalization. While we do not see all of these deals ultimately coming to the market, we see limited listings in the space as a long-term positive as it will add some much-needed depth and breadth to the group of public companies.
EGYPT
We significantly increased our position in Egypt from 1.3% to 4.8% of the portfolio. The overwhelming demographics driving household formation, dilapidated existing housing stock, an immature mortgage market and strong suburbanization trends in Cairo in particular have the potential to offer vast opportunities for select companies with a well-positioned landbank and access to project financing. The continued commitment of the government to support infrastructure development in the new exurbs of Cairo will be critical to the trajectory of supply to the market. Talaat Mostafa Group (TMG) is
the largest developer in the country who master plans and develops mixed-use communities in the growing suburbs of Cairo. The company is also distinguished by its ability to offer financing to its customers through agreements with local banks. This is a clear advantage given that the mortgage market has been growing at more than 90% per annum for the past three years, but nevertheless still represents about 1% of GDP. TMG’s recent foray into the Saudi Arabian market should position it for further interesting diversification opportunities. The Fund also took a position in Six of October Development and Investment, a premiere developer with unique projects in the Eastown and Westown suburbs of Cairo.
INDONESIA
One significant addition to the portfolio’s country diversification was exposure to Indonesia, which now represents 2.7% of the holdings. With 235 million people, Indonesia currently has the fourth largest population in the world - and half of them are under the age of 30 years old. The United Nations forecasts that over the next ten years the working population is expected to grow by 21 million people, almost equal to the entire population of Australia. Its resource-based economy bolstered a 5.7% compounded GDP growth over the past four years and along with a Rp 73 trillion ($7.7 billion) stimulus package effectively insulated the country from the full brunt of the global recession. The sweeping reelection of President Susilo Bambang Yudhoyono, commonly known as SBY, has been seen as the necessary next step to Indonesia realizing its growth potential on par with China and India. However, while there has been much media enthusiasm regarding the possibility of “adding another ‘I’” to the BRICs acronym - or the implications of the recently-coined ‘Chindonesia’ sobriquet, we think such quick ascension to the likes of China and India is premature. Standing in SBY’s way is a marked lack of infrastructure — namely roads, power plants and ports — which currently ranks Indonesia 86th out of 133 economies (below Pakistan!) by the World Economic Forum. Overall mortgage penetration is low with roughly 1% of households having a mortgage and mortgage credit to GDP standing at 2.2%, compared to its developed neighbors Singapore at 30% and 9% for Thailand. If mortgage rates were to decrease over time we would expect Indonesia’s mortgage penetration metrics to trend more in line with its neighbors. Accordingly, we targeted companies doing township development with strategic landbank in close proximity to existing infrastructure projects such as the Jakarta Outer Ring Road West 1 Section. We began building positions in: Summarecon Agung, a mixed-use developer with large-scale projects in East and West Jakarta, which
30
|
|
Alpine Emerging Markets Real Estate Fund | |
also earns investment income from retail properties; Ciputra Development, one of the largest and the most geographically diversified developer in the space targeting all consumer segments; and Lippo Karawaci, a mixed-used developer with more than 50% of its top line derived from recurring revenues in its property management (REIT), hotel, and healthcare businesses. Our largest holding in Indonesia is Semen Gresik, a cement manufacturer that owns and operates industrial estates. Finally of note, we have been reducing our exposure to Thailand as the risk of political uncertainties outweighs the potential reward from government infrastructure stimulus in our view. We also reduced our Mexico portfolio weighting from 1.4% at mid-year to 1.0% at year-end primarily by selling down our homebuilder exposure in Homex and Urbi.
PORTFOLIO PERFORMANCE
Companies operating in Brazil, China and India not only represented the Fund’s largest holdings, but were significant contributors to overall performance. In Brazil these include residential developers such as Agra, whose shares have gained more than 370%, and has emerged as a major consolidator of the sector through its opportunistic acquisitions of Abyara and Klabin Segall. Another homebuilder, Tecnisa, saw its shares increase in excess of 352% and PDG, which continued its strong performance in its low-income subsidiary Goldfarb, finishing with returns in excess of 307%. Retail developers and operators in Brazil also experienced strong performance, such as BR Malls which grew over 227% and Multiplan at 190%. Performance in Brazil has continued apace despite the recent move by the government to implement capital controls on inflows in the form of an IOF (Imposto sobre Operações Financeiras) tax.
In China, one of the leading Beijing developers Sino Ocean gained more than 247%, CC Land, a residential developer based in the provincial capital Chongqing in Western China gained in excess of 190%, while Hopson Development increased by more than 318% over the period. The portfolio saw notable performance in its Russian holdings. Our exposure to Russia is extremely selective, targeting companies trading at low relative valuation multiples with strong balance sheets, visibility on development funding and management teams with a history of executing. These include RGI International, a developer of residential and retail projects predominantly in prime locations in the Garden Ring of Moscow, which returned more than 332%. Raven Russia, an industrial developer/operator with projects located in Moscow, St. Petersburg and a number of secondary markets across Russia saw returns in excess of 148%. In
India, Yatra Capital a property fund holding a portfolio of development projects diversified by geography and asset class saw an increase of greater than 89%, while Hirco, a mixed-use developer, returned in excess of 71%. Companies in other markets saw impressive performance over the period including the diversified developer Orascom Development in Egypt at more than 264%, Aseana Properties, a development company operating in Malaysia and Vietnam saw gains of more than 194%, KDD Group a commercial developer in Ukraine with more than 183%, Kingdom Hotel, a Saudi-based lodging company with 160% returns in the period, and Minor International a hotel and retail food owner/operator in Thailand and China with more than 99% returns in the period.
Throughout the year we aimed to diversify the portfolio on the basis of geography and asset type while continuing to hold a cash buffer reflecting the overall cautiously opportunistic stance we adopted at Fund inception. Accordingly, the number of holdings increased from 52 to 77 and the countries represented rose from 15 to 18. Our cash positioning has insulated performance against market volatility, but was a modest drag on performance versus the index when the emerging market equities gapped up from March to June. As we look into 2010, we anticipate the portfolio will continue to reflect this prudent approach, as we solidify our positions in select core markets and diversify our stock universe over time.
THE ROAD AHEAD:
EMERGING MARKETS — QUO VADIS?
The literal translation of the Latin term quo vadis is “where are you going?” With investors preparing to turn the page on the first decade of the new millennium this question could serve as an echoing refrain as markets prepare for the challenges of the next decade. Given the overall fragility of the recovery in developed countries and the uncertainty still hanging over the sustainability of the recovery of emerging markets we maintain our cautiously optimistic approach to managing the portfolio with an eye toward country, policy and credit differentiation. While risk appetite has come back to a degree, most investors in emerging markets are still paying close attention to the beating of each and every butterfly’s wing for fear that a single, random beat could be the genesis of the next hurricane. One such issue at the forefront of most investors’ concern is the threat of increased headwinds from the expected tightening measures to come. Interest rates across most emerging markets declined dramatically during the crisis and in certain economies remain at historic lows. Turkey cut its policy rate by 1,025bps,
31
|
|
Alpine Emerging Markets Real Estate Fund | |
representing the steepest absolute decline, Brazil cut by 500bps to an historic low, while Russia cut 400bps and India 425bps. Policy rate reductions in China were far less aggressive, but currency and other unorthodox measures played a bigger role in easing its economy. Exacerbating the issue is that current government policies, specifically in many Asian markets, continue to use Fed policy as their anchor when growth and inflation projections between them are exceedingly disparate. The Chinese government’s staunch defense of the U.S. dollar peg is the most glaring example of this phenomenon. In 2009 a flood of monetary and fiscal stimulus policies was targeted at trying to establish a floor for economic growth. We expect 2010 to be a year when many emerging economies will try to implement timely policies to establish a ceiling, the consequences of which could shape the bearing global markets follow next year and into the future.
The fragility of investor sentiment was further tested by the recent news that Dubai World needed to extend maturities of its debt because it was unable to service its $4.1 billion in sukuk obligations. Even though the quantum of money at risk was not systemic to the broader world financial system, it still raised significant concerns about sovereign debt in emerging markets. Coupled with rating agency downgrades in Greece, Mexico and Spain such shocks could once again provide another context in which investors will approach emerging market investing with caution. A final source of concern over the sustainability of recovery in emerging markets is centered on the numerous elections scheduled to take place in 2010 including Greece, Egypt, Hungary, Poland, Ukraine, Philippines, and yes, the United States. In Brazil alone they will have elections for a new president, governors, senators and lower-house representatives. The potential for election year noise even stretches to the composition of Central Banks as changes are expected in Brazil and ongoing in Mexico. We will closely monitor these events as they unfold in 2010.
While serious and worthy of investor concern, the majority of these issues will likely do nothing to detract from the growth profile embedded in emerging markets
or the ongoing theme of emerging market real estate asset reflation. As these economies mature they will require deeper equity and debt capital markets to ensure the efficient allocation of capital. The Chinese economy is largely expected to surpass Japan in 2010 measured in current exchange rates and the Chinese stock market capitalization is now larger than Japan’s, even though roughly a quarter of the value of Chinese corporates are publicly listed, compared with more than 70% in the US. The markets just absorbed Qatar issuing the largest emerging market bond to date - $7bln, with an order book of $27 billion of demand - and there is a crowded pipeline of emerging market borrowers behind them looking to place international bonds in 2010. The majority of these raises will not only go toward much-needed local infrastructure projects, but should shore up already stable sovereign balance sheets and perhaps more significantly boost capital market access by establishing a government yield curve. Even Russia, with $400bln in foreign reserves and higher oil prices boosting revenues has announced plans to issue their first international bonds in a decade. Trade and capital flows between emerging markets are expected to increase not only on a regional basis but globally. Asia is already becoming Latin America’s fastest growing trading partner and China recently passed the U.S. as the largest importer of Brazilian products. As these markets strive to become deeper and more integrated, we have been delighted to see the attendant improvement in corporate governance, professional management teams and greater transparency in financial reporting.
We intend to position the portfolio to take advantage of the potential opportunities discussed throughout this report over the coming 12-18 months and look forward to reporting to you on the Fund’s portfolio and our continued progress in the Fund’s semi-annual report to shareholders. Thank you for your support.
Sincerely,
Joel E.D. Wells
Samuel A. Lieber
Co-Portfolio Managers
32
|
|
Alpine Emerging Markets Real Estate Fund | |
|
|
Please refer to the schedule of portfolio investments for fund holdings information. Fund holdings and sector allocations are subject to change and should not be considered a recommendation to buy or sell any security. Current and future portfolio holdings are subject to risk.
Diversification does not assure a profit or protect against loss in a declining market.
A basis point is a value equaling one one-hundredth of a percent (1/100 of 1%). Cash Flow measures the cash generating capability of a company by adding non-cash charges (e.g. depreciation) and interest expense to pretax income.
MSCI Emerging Markets Index, The MSCI Emerging Latin America Index, MSCI Emerging BRIC Index, MSCI Russia Index, and the MSCI Brazil Index are indices created by Morgan Stanley Capital International (MSCI) that are designed to measure equity market performance in specific global emerging markets.
S&P Developed Ex-US Property Total Return Index is an unmanaged market-weighted total return index available on a monthly basis. The index consists of many companies from developed markets, excluding the U.S., whose floats are larger than $100 million and derive more than half of their revenue from property-related activities.
FTSE EPRA NAREIT Emerging Index — is an unmanaged index designed to track the performance of listed companies in emerging countries worldwide.
The Dow Jones Industrial Average is an unmanaged index of common stocks comprised of major industrial companies and assumes reinvestment of dividends. You cannot invest directly in an index.
33
|
|
|
|
|
|
|
|
|
|
|
|
|
|
| ||||||||||
Comparative Annualized Returns as of 10/31/09 (Unaudited) | ||||||||||
|
|
|
|
|
|
|
|
|
|
|
|
| 3 Months(1) |
| 6 Months(1) |
| Since Inception |
| |||
Alpine Global Infrastructure Fund |
| 10.40 | % |
| 29.53 | % |
| 33.80 | % |
|
S&P Global Infrastructure Index |
| 5.57 | % |
| 27.59 | % |
| 14.43 | % |
|
Lipper Specialty/Miscellaneous Funds Average |
| 2.95 | % |
| 13.75 | % |
| 13.34 | % |
|
Gross Expense Ratio: 3.41%(3) |
|
|
|
|
|
|
|
|
|
|
Net Expense Ratio: 1.41%(3) |
|
|
|
|
|
|
|
|
|
|
|
|
|
| ||
| (1) | Not annualized. |
| (2) | The since inception return represents the annualized return for the period beginning 11/6/2008. |
| (3) | As disclosed in the prospectus dated February 27, 2009. |
Performance data quoted represents past performance and is not predictive of future results. Investment return and principal value of the Fund fluctuate, so that shares, when redeemed, may be worth more or less than their original cost. Performance current to the most recent month end may be lower or higher than the performance quoted and may be obtained by calling 1-888-785-5578. Performance data shown does not reflect the 1.00% redemption fee imposed on shares held for fewer than 2 months. If it did, total returns would be reduced.
The Lipper Specialty/Miscellaneous Funds Average is an average of funds that limit their investments to a specific industry (e.g. transportation, retailing, or paper, etc.) or ones that have not been classified into an existing investment classification. The S&P Global Infrastructure Index is an unmanaged index that provides liquid and tradeable exposure to 75 companies from around the world that represents the listed infrastructure universe. To create diversified exposure across the global listed infrastructure market, the Index has balanced weights across three distinct infrastructure clusters: utilities, transportation, and energy. The S&P Global Infrastructure Index and the Lipper Specialty/Miscellaneous Funds Average are unmanaged and do not reflect fees associated with a mutual fund, such as investment adviser fees. The performance for the Global Infrastructure Fund reflects the deduction of fees for these value-added services. Investors cannot directly invest in an index.
The adviser contractually agreed to waive a portion of its fees and to absorb certain fund expenses. This arrangement will remain in effect unless the Board of Trustees approves its modification or termination.
To the extent that the Fund’s historical performance resulted from gains derived from participation in initial public offerings (“IPOs”) and/or secondary offerings, there is no guarantee that these results can be replicated in future periods or that the Fund will be able to participate to the same degree in IPO/Secondary offerings in the future.
34
|
|
Alpine Global Infrastructure Fund | |
|
|
Portfolio Distributions* (Unaudited) |
|
|
|
|
|
|
| |||||
Top 10 Holdings* (Unaudited) | |||||
1. |
| Cintra Concesiones de Infraestructuras |
| 3.63% |
|
2. |
| Vopak NV |
| 3.52% |
|
3. |
| Cia de Concessoes Rodoviarias |
| 2.78% |
|
4. |
| Cisco Systems, Inc. |
| 2.53% |
|
5. |
| Empresas ICA SA de CV - ADR |
| 2.45% |
|
6. |
| Vinci SA |
| 2.34% |
|
7. |
| Enbridge, Inc. |
| 2.25% |
|
8. |
| GDF Suez |
| 2.14% |
|
9. |
| American Tower Corp. - Class A |
| 2.12% |
|
10. |
| AT & T, Inc. |
| 2.04% |
|
|
|
|
| ||
* Portfolio holdings and sector distributions are as of 10/31/09 and are subject to change. Portfolio holdings are not recommendations to buy or sell any securities. Portfolio Distributions and Top 10 Holdings do not include short-term investments. Portfolio Distributions percentages are based on total investments and Top 10 Holdings percentages are based on total net assets. | ||
|
|
|
|
Value of a $10,000 Investment (Unaudited) |
|
|
This chart represents a comparison of a hypothetical $10,000 investment in the Fund versus similar investments in the Fund’s benchmarks. The graph and the table do not reflect the deduction of taxes that a shareholder would pay on Fund distributions or the redemption of Fund shares. The Fund’s return reflects the waiver of certain fees. Without the waiver of fees, the Fund’s total returns would have been lower.
35
|
|
Alpine Global Infrastructure Fund | |
Dear Investor:
We are pleased to report the results for the Alpine Global Infrastructure Fund (“AIFRX”) for the period 11/03/08 (inception date of the fund) — 10/31/09. The Fund reported a 33.80% total return versus the S&P Global Infrastructure Index which had a total return of 14.43%. Alpine outperformed its benchmark index by 1,937 basis points.
We launched the Alpine Global Infrastructure Fund because we believe that there are special opportunities that have the potential to benefit from global spending in infrastructure over the next several decades. Based upon third-party studies for projected global infrastructure spending, we have defined our infrastructure universe to include the following sub-sectors: transportation, telecommunications and information technology infrastructure, utilities, energy, water delivery and waste disposal systems. The majority of these companies develops, owns and operates long-term assets. The Fund’s mandate has a secondary focus on companies which build or provide key components or systems for infrastructure. This multi-faceted sector approach allows the Fund to invest in defensive stocks when the economy begins to slow and in expansive early cyclical stocks as the economic cycle turns positive. We believe that our process gives us the ability to be widely diversified. Other infrastructure funds that may have started as utility or telecom portfolios may be more limited due to their initial mandates.
The past year has been a volatile period for equity markets as the world’s economies suffered from the after effects of the financial crisis. Although we invest in infrastructure stocks that have had a history of stable and predictable cash flows, our portfolio of companies was not immune to the economic slowdown. During March, we began to see some stabilization amidst the deterioration of the economy. We entered the year in a defensive mode, but as we saw signs that the world economies were beginning to recover we took a more aggressive investment approach. We bought several construction companies that build infrastructure projects such as roads and airports. In the short term, these companies should benefit from the stimulus packages announced by governments. In the long term, they are poised for potential growth due to continued government and private spending on infrastructure. Although we do not believe the recovery will be v-shaped, we do believe that the long-term growth prospects for infrastructure-related companies are not currently reflected in share prices, even after the recent rise in the equity markets.
Due to the severe economic crisis that the world has suffered through, Governments around the world have announced stimulus plans with a focus on infrastructure in order to revitalize their economies. Infrastructure projects offer both a short term benefit of stimulating the economy and a long term benefit of facilitating growth. We believe this may be the beginning of a multi-decade emphasis on infrastructure spending worldwide. According to a study by CIBC World Markets, there could be as much as $35 trillion spent on infrastructure over the next 20 years. The American Society of Civil Engineers (“ASCE”) estimates the U.S. government needs to spend $2.2 trillion over the next five years to upgrade and repair the current infrastructure. America’s infrastructure received a cumulative grade of D on the 2009 ASCE’s report card. According to a joint study of the Asian Development Bank and the Asian Development Bank Institute, “between 2010 and 2020, Asia needs to invest approximately $8 trillion in overall national infrastructure.” Countries across Asia, including China, Japan, Malaysia, and Singapore have announced stimulus packages that include infrastructure spending. China has the most aggressive plan, as a majority of its almost $600-billion stimulus package that was announced in November 2008, will go towards spending on infrastructure. It has announced plans that include the construction of new railways and rural infrastructure projects. Beyond these stimulus programs, the combination of historical underinvestment in infrastructure, population growth, greater urbanization and rising standards of living should propel infrastructure improvements for decades to come. The growth of infrastructure spending over the next several years should accelerate as populations across the world continue to grow. If the trend in urbanization continues, government entities will have to make up for a lack of infrastructure spending over the past several decades, as well as accommodate new development. The world’s population is growing at a rate of 1.1% per year. According to the United Nations report on “World Urbanization Prospects,” in 1950, 29% of the world’s population lived in urban areas. By 2007, the percentage had increased to 49%, and by 2030, it is expected that 60% of the world’s population will live in urban areas. In contrast, governments have underinvested in infrastructure over the last several decades and are now using the stimulus packages to jumpstart increased spending on infrastructure. In the 1960’s, the U.S. was spending about 3% of its GDP on infrastructure. Now the U.S. spends only about 2% of its GDP on infrastructure — a decline of 33%. Governments understand that under-spending on infrastructure will
36
|
|
Alpine Global Infrastructure Fund | |
hurt their long-term prospects for economic growth and are now using the stimulus plans to begin a long period of reinvestment in infrastructure.
Even before the financial crisis began to wreak havoc on the budgets of governments and municipalities, the privatization of infrastructure assets began to take place. Now, even more so, there may be an accelerated effort to privatize these assets as public entities will likely not have the funds to maintain their current infrastructure assets nor to build new infrastructure assets to meet the needs of a growing population. Throughout the world, the owners of infrastructure are primarily government entities. However, over the last several decades, due to the large cost of building and maintaining these facilities, there has been a movement towards privatization of infrastructure assets. In Canada, Australia, the United Kingdom, and throughout Europe and Asia, roads, airports, and seaports have been privatized. These privatizations are usually through Public-Private Partnerships (PPPs), which refer to the contractual agreements formed between a public agency and a private sector entity that allow for greater private sector participation in the infrastructure assets.
We strongly believe that the private sector must participate in building and maintaining infrastructure assets throughout the world. Hence, we own Companhai de Concessoes Rodoviarias (“CCR”), the largest owner of toll roads in Brazil. The combination of higher automobile sales, lower interest rates, and reduced competition for new concessions in Brazil makes CCR a compelling investment. According to the World Bank only 6% of Brazilian roads are paved. We believe CCR is a good investment due to the required transportation infrastructure spending in Brazil. Brazil will be hosting the World Cup in 2014 and the Olympics in 2016 and will likely look toward the private sector to fund many of the capital projects such as new roads, subways, and a high speed rail system. CCR currently has proven to be a disciplined participant when bidding for new roads as demonstrated by its current portfolio of concessions which has earned an 18% IRR (Internal Rate of Return). CCR recently completed a secondary equity offering in which it raised approximately 1.1 billion Brazilian Reals (approximately $640 million). This equity raising should give it sufficient capital to bid on the new concessions as Brazil auctions additional roads, acquire roads in the secondary market, and bid on concessions for subways and high speed rail. From our initial purchase date of 8/20/09 to 10/31/09, the stock had a total return of 14.89%.
In keeping with the theme of owners, builders and operators of infrastructure assets, we also own Vinci (DG
FP). Vinci is a world-leading concession and construction company. It operates motorway concessions in France and car parks across Europe. When bidding for new infrastructure projects, Vinci leverages its expertise in construction with its ability to operate the concession. Vinci should be a beneficiary of France’s fiscal plans that were announced in December of 2008. The French plan earmarks €11 billion (approximately $14.6 billion) for infrastructure related projects. Vinci has a strong pipeline of new projects for which they are the preferred bidder. Vinci continued to be a strong generator of free cash flow even as traffic slowed on its toll roads. Traffic trends have begun to turn around as we are beginning to see traffic growth on its toll roads. This should provide operating leverage as the recovery continues. The resilience of the earnings over the past two years strengthens the investment case of Vinci’s integrated infrastructure business model. This is due to an increase in tariffs which is linked to inflation. For the period 11/3/08 - 10/31/09, Vinci had a total return of 32.45%.
Empresas ICA (“ICA”), a company that we added to portfolio in the last six months, is an example of an owner, builder, and operator of infrastructure assets in an emerging economy. ICA operates both road concessions such as tunnels, highways, and bridges, and water distribution and treatment concessions. It also owns a 49.43% stake in Groupo Aeroportuatuario del Centro Norte, an operator of several Mexican airports. We believe that infrastructure is an important sector for the Mexican government and that Mexico will continue to spend money on infrastructure projects to stimulate its economy. ICA has been awarded several projects over the past six months, including a clean gasoline plant for PEMEX and the Agua Prieta water treatment plant. We believe it is positioned to win further concessions over the next year as Mexico awards additional projects. Additionally, several of the concessions that ICA has been building will enter into operations over the next two years. These projects should have a positive impact on earnings. The combination of improving margins, a strong order backlog, and a potential of further project wins has helped ICA’s share price to appreciate 46.55% from our initial purchase date 7/10/09 to 10/31/09.
Another part of our strategy is to find infrastructure companies worldwide that have resilient cash flows and monopolistic characteristics. One of the stocks that has contributed to our outperformance is Vopak (VPK NA). For the period 11/3/08 - - 10/31/09, Vopak had a total return of 77.72%. It is the world’s largest independent bulk liquid storage company serving the oil and chemical industries. As of December 31, 2008, 80% of its
37
|
|
Alpine Global Infrastructure Fund | |
contracts had a duration of greater than one year. Vopak has indexation clauses in its contracts which help to ensure revenue growth. It also has an occupancy rate of 94%. In addition, Vopak is adding capacity over the next several years which will further strengthen its global position. This company is a good example of the unique attributes in infrastructure for which we are searching globally. Specifically, a global or regional platform leveraging scale with limited competition and contractual cash flows with inflation protection make this company very attractive.
The bear market has created opportunities to buy infrastructure-related stocks at favorable valuations. For example, Lehman Brothers was a major player in master limited partnerships. When it went bankrupt, MLP stocks were sold down and their valuations became very attractive. In selecting which of the stocks to purchase, we looked for pipeline companies that have existing stable fee-based revenue under long-term contracts, opportunities for growth, no major refinancing issues and little or no exposure to the prices of commodities. For example, we bought El Paso Pipeline Partners (“EPB”) as it fits our investment criteria. It has had stable cash flows backed by 5 -10 year contract duration, FERC regulated tariffs, and opportunities for organic growth. In addition, we believe EPB’s general partner, El Paso Corporation, will sell additional assets to EPB, generating an additional growth driver. This was another contributor to our outperformance. From our initial purchase date of 11/19/08 to 10/31/09, this stock has had a total return of 49.60%.
The Alpine Global Infrastructure Fund is a distinctive infrastructure fund in that we started our investment process by researching projected global infrastructure spending over the next 20-30 years. We believe a beneficiary of global spending will be telecommunications and information technology. ZTE Corporation (763 HK) appears to be one of the prime beneficiaries of the Chinese government’s restructuring of the telecom industries. The Chinese government has awarded three 3G licenses. Total Chinese capital expenditures on telecom equipment should increase by 20% in 2009 versus a projected decrease in telecom capital expenditures globally. ZTE has a 30% market share in China’s telecom infrastructure spending and the market share has been growing. ZTE is expanding its market share for telecom equipment outside of China, as it offers similar products to its competitors, but at a discount. In fact, in its most recent quarter, it reported overseas (ex-China) revenues grew 23%. ZTE has a cost advantage due to the fact that both the Import Bank of China and China Development Bank have granted it a
US$25bn loan credit that covers ZTE’s oversees business needs. ZTE has been one of the top performers in our Fund since inception. For the period 11/3/08 - 10/31/09, ZTE had a staggering total return of 217.23%. While we still hold a position in the company, we did take some profits as the stock went higher.
Another company that fits our criteria of companies with a history of stable cash flows, monopolistic characteristics, high barriers to entry, and growth, is American Tower Corporation (“AMT”). AMT is an owner and operator of wireless and broadcast communications sites in the United States, Mexico, Brazil and India. Its business model has a large component of fixed upfront costs to build towers, but allows for substantial operating leverage. Each new leasing agreement on an existing tower requires little incremental expense. AMT has long-term contracts with their customers that have been providing stable recurring revenues. In the past, the growth of AMT’s revenues has been driven by the wireless carriers’ needs to increase capacity and increase density to support wireless-subscriber growth and improve coverage. We believe the future growth will be driven by 3G network upgrades and rolling out 4G networks to accommodate increasing data usage. AMT is our favorite of the tower companies as we believe they have the least re-financing risk with no material short-term maturing debt. Their capital structure should allow them the flexibility to purchase assets and compete for new projects. For the period 11/3/08 -10/31/09, AMT had a total return of 12.91%.
AT&T is one of the largest telecommunications companies in the United States with over 78 million subscribers. The wireless industry in the US has many of the characteristics that we look for; namely: stable cash flow, high barriers to entry and limited competition. While AT&T’s wire-line business has been in secular decline over the past few years, due to wireless substitution and voice over internet protocol offerings, the proliferation of broadband services and increased wireless penetration have been the main drivers of growth for the company. For the next leg of growth, we expect wireless data usage and the rollout of U-verse, the company’s entry into the television subscription business, to be the drivers. AT&T’s exclusive agreement to offer Apple’s iPhone has attracted new users to the AT&T network and converted many of their existing voice subscribers to data plans, increasing the subscribers’ long term profitability to the firm. We believe that wireless margins will improve as there is less of an impact from subsidies paid by AT&T for the iPhone. We expect wireless proliferation to continue as we move from third generation to fourth generation
38
|
|
Alpine Global Infrastructure Fund | |
networks, which should be a positive for AT&T. For the period 11/3/08 - 10/31/09, AT&T had a total return of -1.62%.
“Today, the electricity we use is carried along a grid of lines and wires that dates back to Thomas Edison — a grid that can’t support the demands of clean energy. This means we’re using 19th and 20th century technologies to battle 21st century problems like climate change and energy security. It also means that places like North Dakota can produce a lot of wind energy, but can’t deliver it to communities that want it, leading to a gap between how much clean energy we are using and how much we could be using. The investment we are making today will create a newer, smarter electric grid that will allow for the broader use of alternative energy.” This quote is from the speech President Obama gave while signing the American Recovery and Reinvestment Act of 2009. The stimulus bill included $2 billion in spending for transmission grid improvements and $4.4 billion for the modernization of the electric grid. This is why we like ITC Holdings Corporation (“ITC”). ITC owns and operates approximately 6,800 miles of high voltage electric transmission systems. The current administration’s focus on green energy helps to bolster the investment case for ITC, as transmission is the key factor in transporting renewable power from remote locations to demand centers. We believe ITC is
well positioned to potentially benefit from the increased spending for the upgrade of the transmission grid. We believe that ITC may continue to have double digit earnings growth driven by the need to replace aging infrastructure and to improve regional interconnections. ITC has also benefitted from a favorable regulatory environment. For the period 11/3/08 - 10/31/09, ITC had a total return of 5.54%.
We are pleased with the structure of our portfolio and the outperformance of the Fund during its first year. We believe the Fund is positioned to take advantage of the anticipated increase in global infrastructure spending. In our first year, we demonstrated the flexibility of our investment approach in that we were defensive from the inception of the Fund until March and we took a more aggressive approach beginning in April. This allowed the Fund to outperform our benchmark by 19.37%. We will continue to adapt our investment approach as economic conditions change and look forward to discussing the portfolio and the prospects of the Fund in future communications.
Sincerely,
Joshua E. Duitz
Samuel A. Lieber
Co-Portfolio Managers
|
|
Past performance is not a guarantee of future results. |
Please refer to the schedule of portfolio investments for fund holding information. Fund holdings and sector allocations are subject to change and should not be considered a recommendation to buy or sell any security. Current and future portfolio holdings are subject to risk.
Mutual fund investing involves risk. Principal loss is possible. The Fund invests in foreign securities which will involve greater volatility and political, economic, and currency risks and differences in accounting methods. Because the Fund concentrates its investments in the infrastructure stocks, the portfolio may experience more volatility and be exposed to greater risk than portfolios of other mutual funds. The Fund may invest in smaller and mid sized companies, which involve additional risks such as limited liquidity and greater volatility. In addition, the Fund may make short sales of securities, which involves the risk that losses may exceed the original amount invested.
The S&P Global Infrastructure Index measures the performance of 75 companies in twenty two countries that run utilities, pipelines, airports, ports and highways. You cannot invest directly in an index.
A basis point is one hundredth of a percentage point (0.01%). Cash flow measures the cash generating capability of a company by adding non-cash charges (e.g. depreciation) and interest expense to pretax income. Internal Rate of Return (IRR) is the rate of return that would make the present value of future cash flows plus the final market value of an investment or business opportunity equal the current market price of the investment or opportunity.
Diversification does not assure a profit or protect against loss in a declining market.
39
|
|
Alpine International Real Estate Equity Fund |
|
Schedule of Portfolio Investments
October 31, 2009
|
|
|
|
|
|
|
Shares |
| Security |
| Value |
| |
|
|
| ||||
|
|
|
|
|
| |
Common Stocks—92.1% |
|
|
|
| ||
Asia—30.3% |
|
|
|
| ||
China—8.3% |
|
|
|
| ||
4,094,620 |
| Agile Property Holdings, Ltd. |
| $ | 5,399,476 |
|
1,144,348 |
| CapitaRetail China Trust |
|
| 922,631 |
|
16,590,100 |
| C C Land Holdings, Ltd. |
|
| 9,268,810 |
|
3830600 |
| Evergrande Real Estate Group, |
|
| 1,729,905 |
|
25,717,800 |
| Franshion Properties |
|
| 7,333,532 |
|
9,304,100 |
| Glorious Property Holdings, |
|
| 4,093,698 |
|
5,901,600 |
| Hopson Development Holdings, |
|
| 10,630,221 |
|
7,432,738 |
| KWG Property Holdings, Ltd. |
|
| 5,466,518 |
|
8,572,854 |
| New World China Land, Ltd. |
|
| 3,473,299 |
|
3,881,024 |
| Shanghai Forte Land Co. |
|
| 1,201,834 |
|
10,112,995 |
| Shenzhen Investment, Ltd. |
|
| 4,071,191 |
|
3,799,872 |
| Sino-Ocean Land Holdings, Ltd. |
|
| 3,789,968 |
|
5,508,247 |
| Soho China, Ltd. |
|
| 3,013,466 |
|
155,867 |
| Yanlord Land Group, Ltd. |
|
| 254,672 |
|
|
|
|
|
| ||
|
|
|
|
| 60,649,221 |
|
|
|
|
|
| ||
Hong Kong—3.8% |
|
|
|
| ||
5,102,200 |
| The Hongkong & Shanghai |
|
| 7,333,812 |
|
1,615,000 |
| Mandarin Oriental |
|
| 2,051,050 |
|
11,157,000 |
| Midland Holdings, Ltd. |
|
| 9,717,136 |
|
5,304,926 |
| Shui On Construction and |
|
| 8,309,696 |
|
|
|
|
|
| ||
|
|
|
|
| 27,411,694 |
|
|
|
|
|
| ||
India—5.9% |
|
|
|
| ||
2,295,373 |
| Hirco PLC (a) |
|
| 7,421,564 |
|
1,056,176 |
| Ishaan Real Estate PLC (a) |
|
| 840,725 |
|
2,000,000 |
| South Asian Real Estate, |
|
| 15,756,044 |
|
8,327,900 |
| Trikona Trinity Capital PLC (a) |
|
| 7,688,365 |
|
7,240,153 |
| Unitech Corporate Parks (a) |
|
| 2,584,538 |
|
1,491,800 |
| Yatra Capital, Ltd. (a)(e) |
|
| 8,781,622 |
|
|
|
|
|
| ||
|
|
|
|
| 43,072,858 |
|
|
|
|
|
| ||
Indonesia—0.1% |
|
|
|
| ||
1,000,000 |
| Ciputra Development (a) |
|
| 65,969 |
|
10,000,000 |
| Lippo Karawaci (a) |
|
| 680,628 |
|
3,000,000 |
| Summarecon Agung |
|
| 182,199 |
|
|
|
|
|
| ||
|
|
|
|
| 928,796 |
|
|
|
|
|
| ||
Japan—4.8% |
|
|
|
| ||
98,800 |
| Aeon Mall Co., Ltd. (a) |
|
| 2,129,334 |
|
2,163,100 |
| Daikyo, Inc. |
|
| 5,551,031 |
|
107,600 |
| GOLDCREST Co., Ltd. (a) |
|
| 3,358,951 |
|
5,683,874 |
| Haseko Corp. |
|
| 4,483,198 |
|
195,547 |
| Japan Airport Terminal Co., |
|
| 2,787,167 |
|
158,636 |
| Nomura Real Estate Holdings |
|
| 2,595,910 |
|
4,968 |
| NTT Urban Development Corp. |
|
| 4,111,715 |
|
5,790 |
| Secured Capital Japan Co., Ltd. (a) |
|
| 5,698,983 |
|
200,000 |
| Star Asia Finance, Ltd. (a)(b)(d) |
|
| 180,000 |
|
75,458 |
| Tachihi Enterprise Co., Ltd. |
|
| 4,275,242 |
|
|
|
|
|
| ||
|
|
|
|
| 35,171,531 |
|
|
|
|
|
| ||
Malaysia—0.3% |
|
|
|
| ||
5,506,000 |
| Aseana Properties, Ltd. (a) |
|
| 2,147,340 |
|
|
|
|
|
| ||
Philippines—0.2% |
|
|
|
| ||
15,668,400 |
| SM Development Corp. |
|
| 1,349,164 |
|
|
|
|
|
|
|
|
|
|
|
|
|
Shares |
| Security |
| Value |
| |
|
|
| ||||
|
|
|
|
| ||
Common Stocks—continued |
|
|
|
| ||
Asia—continued |
|
|
|
| ||
Singapore—3.6% |
|
|
|
| ||
12,079,000 |
| Banyan Tree Holdings, Ltd. (a) |
| $ | 7,023,927 |
|
14,617,994 |
| CapitaCommercial Trust |
|
| 11,159,968 |
|
2,924,300 |
| Parkway Holdings, Ltd. |
|
| 5,299,648 |
|
7,442,240 |
| Starhill Global REIT |
|
| 3,079,804 |
|
|
|
|
|
| ||
|
|
|
|
| 26,563,347 |
|
|
|
|
|
| ||
Thailand—3.3% |
|
|
|
| ||
9,342,300 |
| Central Pattana PCL |
|
| 6,065,158 |
|
24,221,550 |
| The Erawan Group PLC |
|
| 1,753,662 |
|
59,767,300 |
| Hemaraj Land & |
|
| 1,430,481 |
|
39,282,845 |
| Minor International PCL |
|
| 12,575,212 |
|
3,882,000 |
| Saha Pathana Inter-Holding PCL |
|
| 2,067,303 |
|
|
|
|
|
| ||
|
|
|
|
| 23,891,816 |
|
|
|
|
|
| ||
|
| Total Asia (Cost $275,171,003) |
|
| 221,185,767 |
|
|
|
|
|
| ||
Australia—5.5% |
|
|
|
| ||
Australia—5.5% |
|
|
|
| ||
16,848,402 |
| Charter Hall Group |
|
| 8,265,488 |
|
3,186,414 |
| FKP Property Group |
|
| 1,993,427 |
|
1,526,256 |
| Goodman Group |
|
| 851,790 |
|
2,444,356 |
| Goodman Group (b) |
|
| 1,364,173 |
|
6,205,476 |
| Mirvac Group |
|
| 8,350,830 |
|
5,801,068 |
| Stockland |
|
| 19,686,233 |
|
|
|
|
|
| ||
|
| Total Australia (Cost $25,912,967) |
|
| 40,511,941 |
|
|
|
|
|
| ||
Europe—23.7% |
|
|
|
| ||
Austria—0.9% |
|
|
|
| ||
556,475 |
| Conwert Immobilien (a) |
|
| 6,805,356 |
|
|
|
|
|
| ||
Finland—0.6% |
|
|
|
| ||
977,718 |
| Citycon OYJ |
|
| 4,330,961 |
|
|
|
|
|
| ||
France—3.8% |
|
|
|
| ||
273,136 |
| Club Mediterranee SA (a) |
|
| 5,557,100 |
|
251,928 |
| Kaufman & Broad SA |
|
| 6,135,905 |
|
166,193 |
| Nexity |
|
| 6,207,382 |
|
115,893 |
| Pierre & Vacances |
|
| 9,568,067 |
|
|
|
|
|
| ||
|
|
|
|
| 27,468,454 |
|
|
|
|
|
| ||
Germany—2.3% |
|
|
|
| ||
668,097 |
| DIC Asset AG |
|
| 8,317,906 |
|
8,092,900 |
| Sirius Real Estate, Ltd. (a) |
|
| 3,960,044 |
|
14,610,263 |
| Treveria PLC (a) |
|
| 4,407,741 |
|
|
|
|
|
| ||
|
|
|
|
| 16,685,691 |
|
|
|
|
|
| ||
Greece—0.3% |
|
|
|
| ||
319,533 |
| Babis Vovos International |
|
| 2,388,821 |
|
|
|
|
|
| ||
Italy—0.3% |
|
|
|
| ||
2,652,075 |
| Pirelli & Co. Real Estate (a) |
|
| 2,111,481 |
|
|
|
|
|
| ||
Norway—2.1% |
|
|
|
| ||
2,084,200 |
| BWG Homes ASA (a) |
|
| 4,913,935 |
|
4,932,907 |
| Norwegian Property ASA (a) |
|
| 9,390,434 |
|
3,302,082 |
| Scandinavian Property (a) |
|
| 1,032,279 |
|
|
|
|
|
| ||
|
|
|
|
| 15,336,648 |
|
|
|
|
|
| ||
Poland—1.1% |
|
|
|
| ||
180,540 |
| Atrium European Real Estate, |
|
| 1,182,327 |
|
723,246 |
| Globe Trade Centre SA (a) |
|
| 6,334,965 |
|
3,265,000 |
| Nanette Real Estate |
|
| 428,696 |
|
|
|
|
|
| ||
|
|
|
|
| 7,945,988 |
|
|
|
|
|
|
The accompanying notes are an integral part of these financial statements.
40
|
|
Alpine International Real Estate Equity Fund |
|
Schedule of Portfolio Investments—Continued
October 31, 2009
|
|
|
|
|
|
|
Shares |
| Security |
| Value |
| |
|
|
| ||||
|
|
|
|
|
|
|
Common Stocks—continued |
|
|
|
| ||
Europe—continued |
|
|
|
| ||
Russia—1.9% |
|
|
|
| ||
801,650 |
| LSR Group OJSC—ADR (a)(c) |
| $ | 6,004,358 |
|
835,805 |
| Mirland Development Corp. (a) |
|
| 2,266,848 |
|
713,228 |
| PIK Group—ADR (a)(c) |
|
| 2,817,251 |
|
1,724,911 |
| RGI International, Ltd. (a) |
|
| 3,018,594 |
|
|
|
|
|
| ||
|
|
|
|
| 14,107,051 |
|
|
|
|
|
| ||
Spain—0.2% |
|
|
|
|
|
|
189,852 |
| Sol Melia SA |
|
| 1,686,151 |
|
|
|
|
|
| ||
Sweden—2.1% |
|
|
|
|
|
|
690,787 |
| JM AB (a) |
|
| 10,494,878 |
|
1,514,248 |
| Rezidor Hotel Group AB (a) |
|
| 4,910,671 |
|
|
|
|
|
| ||
|
|
|
|
| 15,405,549 |
|
|
|
|
|
| ||
Turkey—0.1% |
|
|
|
|
|
|
920,000 |
| The Ottoman Fund, Ltd. (a) |
|
| 739,877 |
|
|
|
|
|
| ||
|
|
|
|
|
|
|
Ukraine—0.1% |
|
|
|
|
|
|
1,180,000 |
| KDD Group NV (a) |
|
| 852,139 |
|
|
|
|
|
| ||
United Kingdom—7.9% |
|
|
|
| ||
1,583,194 |
| Great Portland Estates PLC |
|
| 6,418,108 |
|
77,998 |
| Helical Bar PLC |
|
| 424,368 |
|
1,000,000 |
| Redrow PLC (a) |
|
| 2,314,169 |
|
11,283,262 |
| Regus PLC |
|
| 18,889,080 |
|
3,281,595 |
| Segro PLC |
|
| 19,012,343 |
|
1,261,791 |
| Shaftesbury PLC |
|
| 7,797,015 |
|
4,229,441 |
| Taylor Wimpey PLC (a) |
|
| 2,569,776 |
|
|
|
|
|
| ||
|
|
|
|
| 57,424,859 |
|
|
|
|
|
| ||
|
| Total Europe (Cost $305,615,002) |
|
| 173,289,026 |
|
|
|
|
|
| ||
Middle East/Africa—0.9% |
|
|
|
| ||
Egypt—0.4% |
|
|
|
|
|
|
1,954,285 |
| Palm Hills Developments SAE (a) |
|
| 3,095,862 |
|
|
|
|
|
| ||
United Arab Emirates—0.5% |
|
|
|
| ||
868,311 |
| Kingdom Hotel Investments— |
|
| 3,386,413 |
|
|
|
|
|
| ||
|
| Total Middle East/Africa |
|
| 6,482,275 |
|
|
|
|
|
| ||
North & South America—31.7% |
|
|
|
| ||
Brazil—26.6% |
|
|
|
| ||
5,100,800 |
| Agra Empreendimentos |
|
| 13,898,638 |
|
1,175,800 |
| BR Malls Participacoes SA (a) |
|
| 13,015,497 |
|
3,813,283 |
| Brascan Residential Properties SA |
|
| 14,698,111 |
|
2,408,200 |
| Brasil Brokers Participacoes |
|
| 8,339,021 |
|
339,755 |
| Camargo Correa Desenvolvimento |
|
| 1,089,700 |
|
993,800 |
| Construtora Tenda SA (a) |
|
| 2,894,070 |
|
187,500 |
| Cyrela Brazil Realty SA |
|
| 2,394,840 |
|
2,906,710 |
| Cyrela Commercial Properties SA |
|
| 17,308,917 |
|
719,582 |
| Ez Tec Empreendimentos e |
|
| 2,924,731 |
|
1,087,900 |
| General Shopping Brasil SA (a) |
|
| 4,397,053 |
|
757,600 |
| Iguatemi Empresa de Shopping |
|
| 11,482,698 |
|
33,119 |
| Invest Tur Desenvolvimento |
|
| 5,339,160 |
|
2,523,500 |
| JHSF Participacoes SA |
|
| 5,099,716 |
|
200,000 |
| LPS Brasil Consultoria de |
|
| 2,145,777 |
|
770,400 |
| MRV Engenharia |
|
| 14,335,668 |
|
|
|
|
|
|
|
| |
Shares |
| Security |
| Value |
| ||
|
|
| |||||
|
|
|
|
|
|
| |
Common Stocks—continued |
|
|
|
| |||
North & South America—continued |
|
|
|
| |||
Brazil—continued |
|
|
|
| |||
1,058,800 |
| Multiplan Empreendimentos |
| $ | 16,228,202 |
| |
3,155,200 |
| PDG Realty SA |
|
| 26,687,375 |
| |
709,146 |
| Rodobens Negocios Imobiliarios SA |
|
| 7,407,065 |
| |
1,306,984 |
| Rossi Residential SA |
|
| 8,747,355 |
| |
511,929 |
| Sao Carlos Empreendimentos |
|
| 4,794,975 |
| |
2,036,800 |
| Tecnisa SA |
|
| 11,435,032 |
| |
|
|
|
|
| |||
|
|
|
|
| 194,663,601 |
| |
|
|
|
|
| |||
Canada—1.9% |
|
|
|
|
|
| |
165,110 |
| Clublink Enterprises, Ltd. |
|
| 942,243 |
| |
386,000 |
| Crombie Real Estate Investment |
|
| 3,749,235 |
| |
180,925 |
| Killam Properties, Inc. |
|
| 1,228,962 |
| |
400,000 |
| Killam Properties, Inc. (c) |
|
| 2,717,065 |
| |
683,500 |
| Lakeview Hotel Real Estate |
|
| 202,135 |
| |
133,000 |
| Lakeview Hotel Real Estate |
|
| 39,333 |
| |
91,700 |
| Mainstreet Equity Corp. (a) |
|
| 703,396 |
| |
300,000 |
| Mainstreet Equity Corp. (a)(c) |
|
| 2,301,188 |
| |
477,700 |
| Parkbridge Lifestyles |
|
| 1,787,981 |
| |
|
|
|
|
| |||
|
|
|
|
| 13,671,538 |
| |
|
|
|
|
| |||
United States—3.2% |
|
|
|
| |||
17,950 |
| Alexander’s, Inc. (a) |
|
| 4,755,314 |
| |
618,700 |
| Orient-Express Hotels, Ltd.—Class A |
|
| 5,320,820 |
| |
282,300 |
| Sunrise Senior Living, Inc. (a) |
|
| 1,174,368 |
| |
519,696 |
| Verde Realty (a)(b)(f) |
|
| 12,056,947 |
| |
|
|
|
|
| |||
|
|
|
|
| 23,307,449 |
| |
|
|
|
|
| |||
|
| Total North & South America |
|
| 231,642,588 |
| |
|
|
|
|
| |||
|
| Total Common Stocks |
|
| 673,111,597 |
| |
|
|
|
|
| |||
Equity-Linked Structured Notes—3.7% |
|
|
|
| |||
India—3.7% |
|
|
|
| |||
48,924 |
| Housing Development Finance |
|
| 2,769,287 |
| |
1,061,900 |
| Housing Development & |
|
| 7,151,687 |
| |
180,695 |
| Housing Development & |
|
| 1,216,945 |
| |
1,190,000 |
| Phoenix Mills, Ltd.— |
|
| 3,870,382 |
| |
6,700,000 |
| Unitech, Ltd.— |
|
| 11,733,738 |
| |
|
|
|
|
| |||
|
| Total Equity-Linked Structured |
|
| 26,742,039 |
| |
|
|
|
|
| |||
Rights—0.1% |
|
|
|
|
|
| |
4,286,427 |
| New World China Land, Ltd. (a) |
|
| 293,129 |
| |
928,571 |
| Redrow PLC (a) |
|
| 537,218 |
| |
|
|
|
|
| |||
|
| Total Rights (Cost $1,292,648) |
|
| 830,347 |
| |
|
|
|
|
| |||
Warrants—0.2% |
|
|
|
| |||
11,134,400 |
| SP Setia Berhad |
|
| 1,810,869 |
| |
|
|
|
|
| |||
|
| Total Warrants (Cost $3,260,920) |
|
| 1,810,869 |
| |
|
|
|
|
| |||
The accompanying notes are an integral part of these financial statements.
41
|
|
Alpine International Real Estate Equity Fund |
|
Schedule of Portfolio Investments—Continued
October 31, 2009
|
|
|
|
|
|
| |
Shares |
| Security |
| Value |
| ||
|
|
| |||||
|
|
|
|
| |||
Short-Term Investments—3.0% |
|
|
|
| |||
21,862,665 |
| Federated Treasury Obligations |
| $ | 21,862,665 |
| |
|
|
|
|
| |||
|
| Total Short-Term Investments |
|
| 21,862,665 |
| |
|
|
|
|
| |||
|
| Total Investments |
|
| 724,357,517 |
| |
|
| Other Assets in Excess of |
|
| 6,486,053 |
| |
|
|
|
|
| |||
|
| TOTAL NET ASSETS—100.0% |
| $ | 730,843,570 |
| |
|
|
|
|
|
|
|
|
| ||
Percentages are stated as a percent of net assets. | ||
| ||
ADR—American Depository Receipt | ||
GDR—Global Depository Receipt | ||
MYR—Malaysian Ringgit | ||
| ||
(a) | Non-income producing security. | |
|
| |
(b) | Security fair valued in accordance with procedures approved by the Board of Trustees. These securities comprised 4.1% of the Fund’s net assets. | |
|
| |
(c) | Restricted under Rule 144A of the Securities Act of 1933. These securities may be resold in transactions exempt from registration, normally to qualified institutional buyers. These securities have been determined to be liquid under guidelines established by the Board of Trustees. Liquid securities restricted under Rule 144A comprised 2.4% of the Fund’s net assets. | |
|
| |
(d) | Restricted under Rule 144A of the Securities Act of 1933. These securities may be resold in transactions exempt from registration, normally to qualified institutional buyers. These securities have been determined to be illiquid under guidelines established by the Board of Trustees. Illiquid securities restricted under Rule 144A comprised 0.0% of the Fund’s net assets. | |
|
| |
(e) | Affiliated issuer. See Note 6 in the Notes to Financial Statements. | |
|
| |
(f) | Illiquid security. | |
|
| |
(g) | Private placement. |
The accompanying notes are an integral part of these financial statements.
42
|
|
Alpine Realty Income & Growth Fund |
|
Schedule of Portfolio Investments
October 31, 2009
|
|
|
|
|
|
|
|
Shares |
| Security |
| Value |
| ||
|
|
| |||||
| |||||||
Real Estate Investment Trusts—83.5% |
|
|
|
| |||
Apartments—8.9% |
|
|
|
| |||
| 10,525 |
| AvalonBay Communities, Inc. |
| $ | 723,909 |
|
| 68,360 |
| Equity Residential |
|
| 1,974,237 |
|
| 29,065 |
| Essex Property Trust, Inc. |
|
| 2,185,107 |
|
| 57,100 |
| Home Properties, Inc. |
|
| 2,237,178 |
|
| 25,740 |
| Post Properties, Inc. |
|
| 424,453 |
|
|
|
|
|
|
| ||
|
|
|
|
|
| 7,544,884 |
|
|
|
|
|
|
| ||
Diversified—9.9% |
|
|
|
| |||
| 6,200 |
| Crombie Real Estate Investment |
|
| 60,221 |
|
| 248,700 |
| Crombie Real Estate Investment |
|
| 2,415,634 |
|
| 86,364 |
| Verde Realty (a)(b)(d) |
|
| 2,003,645 |
|
| 65,480 |
| Vornado Realty Trust |
|
| 3,899,989 |
|
|
|
|
|
|
| ||
|
|
|
|
|
| 8,379,489 |
|
|
|
|
|
|
| ||
Health Care—12.0% |
|
|
|
| |||
| 70,700 |
| HCP, Inc. |
|
| 2,092,013 |
|
| 48,300 |
| Health Care REIT, Inc. |
|
| 2,143,071 |
|
| 142,047 |
| Omega Healthcare Investors, Inc. |
|
| 2,153,432 |
|
| 93,500 |
| Ventas, Inc. |
|
| 3,752,155 |
|
|
|
|
|
|
| ||
|
|
|
|
|
| 10,140,671 |
|
|
|
|
|
|
| ||
Mortgage & Finance—2.3% |
|
|
|
| |||
| 40,000 |
| Apollo Commercial Real Estate |
|
| 716,400 |
|
| 62,000 |
| Starwood Property Trust, Inc. (a) |
|
| 1,248,060 |
|
|
|
|
|
|
| ||
|
|
|
|
|
| 1,964,460 |
|
|
|
|
|
|
| ||
Net Lease—3.4% |
|
|
|
| |||
| 86,249 |
| Entertainment Properties Trust |
|
| 2,934,191 |
|
|
|
|
|
|
| ||
Office—Industrial Buildings—31.0% |
|
|
|
| |||
| 56,128 |
| Alexandria Real Estate |
|
| 3,040,454 |
|
| 80,368 |
| AMB Property Corp. |
|
| 1,766,489 |
|
| 71,111 |
| Boston Properties, Inc. |
|
| 4,321,415 |
|
| 52,600 |
| Brookfield Properties Corp. |
|
| 534,416 |
|
| 20,153 |
| Corporate Office Properties Trust |
|
| 668,878 |
|
| 176,509 |
| Douglas Emmett, Inc. |
|
| 2,082,806 |
|
| 121,781 |
| DuPont Fabros Technology, Inc. |
|
| 1,836,457 |
|
| 40,450 |
| Franklin Street Properties Corp. |
|
| 436,051 |
|
| 79,700 |
| Kilroy Realty Corp. |
|
| 2,201,314 |
|
| 62,208 |
| Liberty Property Trust |
|
| 1,827,049 |
|
| 75,300 |
| Mack-Cali Realty Corp. |
|
| 2,330,535 |
|
| 390,697 |
| Maguire Properties, Inc. (a) |
|
| 687,627 |
|
| 183,900 |
| ProLogis |
|
| 2,083,587 |
|
| 63,051 |
| SL Green Realty Corp. |
|
| 2,443,857 |
|
|
|
|
|
|
| ||
|
|
|
|
|
| 26,260,935 |
|
|
|
|
|
|
| ||
Retail Centers—13.4% |
|
|
|
| |||
| 251,911 |
| CBL & Associates Properties, Inc. |
|
| 2,055,594 |
|
| 14,100 |
| Federal Realty Investment Trust |
|
| 832,323 |
|
| 61,281 |
| The Macerich Co. |
|
| 1,826,174 |
|
| 6,917 |
| Saul Centers, Inc. |
|
| 212,767 |
|
| 66,186 |
| Simon Property Group, Inc. |
|
| 4,493,368 |
|
| 10,000 |
| Tanger Factory Outlet Centers, Inc. |
|
| 380,700 |
|
| 51,038 |
| Taubman Centers, Inc. |
|
| 1,557,169 |
|
|
|
|
|
|
| ||
|
|
|
|
|
| 11,358,095 |
|
|
|
|
|
|
| ||
Storage—2.6% |
|
|
|
| |||
| 30,665 |
| Public Storage |
|
| 2,256,944 |
|
|
|
|
|
|
| ||
|
|
| Total Real Estate Investment Trusts |
|
| 70,839,669 |
|
|
|
|
|
|
|
|
|
|
|
|
|
|
|
Shares |
| Security |
| Value |
| ||
|
|
| |||||
| |||||||
Preferred Stocks—19.2% |
|
|
|
| |||
Diversified—1.2% |
|
|
|
| |||
| 30,500 |
| Vornado Realty Trust, |
| $ | 622,505 |
|
| 18,622 |
| Vornado Realty Trust, Series I, |
|
| 381,751 |
|
|
|
|
|
|
| ||
|
|
|
|
|
| 1,004,256 |
|
|
|
|
|
|
| ||
Health Care—0.8% |
|
|
|
| |||
| 30,000 |
| Omega Healthcare Investors, Inc., |
|
| 712,500 |
|
|
|
|
|
|
| ||
Lodging—1.8% |
|
|
|
| |||
| 6,200 |
| Hospitality Properties Trust, |
|
| 145,390 |
|
| 14,500 |
| LaSalle Hotel Properties, |
|
| 282,605 |
|
| 13,400 |
| LaSalle Hotel Properties, |
|
| 263,712 |
|
| 43,400 |
| Sunstone Hotel Investors, Inc., |
|
| 846,734 |
|
|
|
|
|
|
| ||
|
|
|
|
|
| 1,538,441 |
|
|
|
|
|
|
| ||
Net Lease—2.9% |
|
|
|
| |||
| 142,800 |
| Entertainment Properties Trust, |
|
| 2,463,300 |
|
|
|
|
|
|
| ||
Office—Industrial Buildings—7.3% |
|
|
|
| |||
| 11,300 |
| AMB Property Corp., |
|
| 246,905 |
|
| 28,500 |
| Digital Realty Trust, Inc. |
|
| 702,525 |
|
| 43,700 |
| Kilroy Realty Corp., |
|
| 917,700 |
|
| 103,100 |
| Prime Group Realty Trust, |
|
| 310,331 |
|
| 82,000 |
| PS Business Parks Inc., |
|
| 1,724,460 |
|
| 24,200 |
| PS Business Parks, Inc., |
|
| 567,490 |
|
| 79,600 |
| SL Green Realty Corp., |
|
| 1,745,628 |
|
|
|
|
|
|
| ||
|
|
|
|
|
| 6,215,039 |
|
|
|
|
|
|
| ||
Retail Centers—3.7% |
|
|
|
| |||
| 97,700 |
| CBL & Associates Properties, Inc., |
|
| 1,729,290 |
|
| 13,400 |
| Developers Diversified Realty Corp., |
|
| 224,584 |
|
| 11,800 |
| Developers Diversified Realty Corp., |
|
| 198,594 |
|
| 13,300 |
| Glimcher Realty Trust, |
|
| 215,061 |
|
| 10,400 |
| Glimcher Realty Trust, |
|
| 158,288 |
|
| 26,300 |
| Regency Centers Corp., |
|
| 572,025 |
|
|
|
|
|
|
| ||
|
|
|
|
|
| 3,097,842 |
|
|
|
|
|
|
| ||
Storage—1.5% |
|
|
|
| |||
| 36,600 |
| Public Storage, Series D, 6.180% |
|
| 764,940 |
|
| 22,691 |
| Public Storage, Series W, 6.500% |
|
| 490,579 |
|
|
|
|
|
|
| ||
|
|
|
|
|
| 1,255,519 |
|
|
|
|
|
|
| ||
|
|
| Total Preferred Stocks |
|
| 16,286,897 |
|
|
|
|
|
|
|
The accompanying notes are an integral part of these financial statements.
43
|
|
Alpine Realty Income & Growth Fund |
|
Schedule of Portfolio Investments—Continued
October 31, 2009
|
|
|
|
|
|
|
|
Shares |
| Security |
| Value |
| ||
|
|
| |||||
| |||||||
Short-Term Investments—0.0% |
|
|
|
| |||
| 649 |
| Federated Treasury Obligations |
| $ | 649 |
|
| 18 |
| Milestone Funds Treasury |
|
| 18 |
|
|
|
|
|
|
| ||
|
|
| Total Short-Term Investments |
|
| 667 |
|
|
|
|
|
|
| ||
|
|
| Total Investments |
|
| 87,127,233 |
|
|
|
| Liabilities in Excess of Other |
|
| (2,331,983 | ) |
|
|
|
|
|
| ||
|
|
| TOTAL NET ASSETS—100.0% |
| $ | 84,795,250 |
|
|
|
|
|
|
|
|
|
|
| ||
Percentages are stated as a percent of net assets. | ||
|
|
|
(a) | Non-income producing security. | |
|
|
|
(b) | Security fair valued in accordance with procedures approved by the Board of Trustees. These securities comprised 2.4% of the Fund’s net assets. | |
|
|
|
(c) | Restricted under Rule 144A of the Securities Act of 1933. These securities may be resold in transactions exempt from registration, normally to qualified institutional buyers. These securities have been determined to be liquid under guidelines established by the Board of Trustees. Securities restricted under Rule 144A comprised 2.8% of the Fund’s net assets. | |
|
|
|
(d) | Illiquid security. |
The accompanying notes are an integral part of these financial statements.
44
|
|
Alpine Cyclical Advantage Property Fund |
|
Schedule of Portfolio Investments
October 31, 2009
|
|
|
|
|
|
|
|
Shares |
| Security |
| Value |
| ||
|
|
| |||||
| |||||||
Common Stocks—100.0% |
|
|
|
| |||
Asia—13.2% |
|
|
|
| |||
China—5.0% |
|
|
|
| |||
| 400,000 |
| Agile Property Holdings Ltd. |
| $ | 527,470 |
|
| 200,000 |
| Hopson Development Holdings, Ltd. |
|
| 360,249 |
|
| 600,000 |
| KWG Property Holdings Ltd. |
|
| 441,279 |
|
| 1,000,000 |
| New World China Land, Ltd. |
|
| 405,151 |
|
| 1,000,000 |
| Shenzhen Investment, Ltd. |
|
| 402,570 |
|
| 300,000 |
| Sino-Ocean Land Holdings |
|
| 299,218 |
|
| 212,745 |
| Yanlord Land Group Ltd. |
|
| 347,605 |
|
|
|
|
|
|
| ||
|
|
|
|
|
| 2,783,542 |
|
|
|
|
|
|
| ||
Hong Kong—0.8% |
|
|
|
| |||
| 500,000 |
| Midland Holdings, Ltd. |
|
| 435,473 |
|
|
|
|
|
|
| ||
Japan—3.9% |
|
|
|
| |||
| 238,900 |
| Daikyo, Inc. (a) |
|
| 613,074 |
|
| 10,000 |
| GOLDCREST Co., Ltd. |
|
| 312,170 |
|
| 408,100 |
| Haseko Corp. (a) |
|
| 321,892 |
|
| 459 |
| NTT Urban Devleopment Corp. |
|
| 379,887 |
|
| 50,000 |
| Zecs Co., Ltd. (a) |
|
| 502,139 |
|
|
|
|
|
|
| ||
|
|
|
|
|
| 2,129,162 |
|
|
|
|
|
|
| ||
Singapore—0.6% |
|
|
|
| |||
| 180,000 |
| Parkway Holdings Ltd. |
|
| 326,210 |
|
|
|
|
|
|
| ||
Thailand—2.9% |
|
|
|
| |||
| 1,000,000 |
| Central Pattana PCL |
|
| 649,214 |
|
| 1,000,000 |
| Minor International PCL |
|
| 320,120 |
|
| 3,800,000 |
| Supalai PLC |
|
| 636,649 |
|
|
|
|
|
|
| ||
|
|
|
|
|
| 1,605,983 |
|
|
|
|
|
|
| ||
|
|
| Total Asia (Cost $7,595,203) |
|
| 7,280,370 |
|
|
|
|
|
|
| ||
Australia—1.1% |
|
|
|
| |||
Australia—1.1% |
|
|
|
| |||
| 500,000 |
| Goodman Group |
|
| 279,046 |
|
| 100,000 |
| Stockland |
|
| 339,355 |
|
|
|
|
|
|
| ||
|
|
| Total Australia (Cost $600,448) |
|
| 618,401 |
|
|
|
|
|
|
| ||
Europe—4.2% |
|
|
|
| |||
Germany—1.6% |
|
|
|
| |||
| 20,000 |
| DIC Asset AG |
|
| 249,003 |
|
| 100,000 |
| TAG Immobilien AG (a) |
|
| 603,376 |
|
|
|
|
|
|
| ||
|
|
|
|
|
| 852,379 |
|
|
|
|
|
|
| ||
Greece—1.0% |
|
|
|
| |||
| 73,031 |
| Babis Vovos International |
|
| 545,978 |
|
|
|
|
|
|
| ||
Norway—0.4% |
|
|
|
| |||
| 100,000 |
| BWG Homes ASA (a) |
|
| 235,771 |
|
|
|
|
|
|
| ||
Poland—0.2% |
|
|
|
| |||
| 15,348 |
| Atrium European Real Estate, |
|
| 100,511 |
|
|
|
|
|
|
| ||
Spain—0.6% |
|
|
|
| |||
| 38,796 |
| Sol Melia SA |
|
| 344,563 |
|
|
|
|
|
|
| ||
United Kingdom—0.4% |
|
|
|
| |||
| 100,000 |
| Redrow PLC (a) |
|
| 231,417 |
|
|
|
|
|
|
| ||
|
|
| Total Europe (Cost $2,319,289) |
|
| 2,310,619 |
|
|
|
|
|
|
| ||
Middle East/Africa—1.4% |
|
|
|
| |||
Egypt—1.4% |
|
|
|
| |||
| 20,000 |
| Six Of October Development & |
|
| 354,212 |
|
| 300,000 |
| T M G Holding (a) |
|
| 401,242 |
|
|
|
|
|
|
| ||
|
|
| Total Middle East/Africa |
|
| 755,454 |
|
|
|
|
|
|
|
|
|
|
|
|
|
|
|
Shares |
| Security |
| Value |
| ||
|
|
| |||||
| |||||||
Common Stocks—continued |
|
|
| ||||
North & South America—80.1% |
|
|
| ||||
Brazil—12.4% |
|
|
|
|
|
| |
| 164,280 |
| Brookfield Incorporacoes SA |
| $ | 633,209 |
|
| 5,000 |
| Cyrela Brazil Realty SA |
|
| 1,265,250 |
|
| 10,000 |
| Cyrela Brazil Realty SA—GDR (c) |
|
| 2,561,384 |
|
| 7,500 |
| Cyrela Commercial |
|
| 180,329 |
|
| 15,000 |
| Cyrela Commercial |
|
| 360,657 |
|
| 45,000 |
| Iguatemi Empresa de Shopping |
|
| 682,050 |
|
| 300 |
| Invest Tur Desenvolmimento |
|
| 48,363 |
|
| 200,000 |
| Tecnisa SA |
|
| 1,122,843 |
|
|
|
|
|
|
| ||
|
|
|
|
|
| 6,854,085 |
|
|
|
|
|
|
| ||
Canada—1.6% |
|
|
|
| |||
| 60,491 |
| Brookfield Properties Corp. |
|
| 614,589 |
|
| 75,000 |
| Parkbridge Lifestyles |
|
| 280,717 |
|
|
|
|
|
|
| ||
|
|
|
|
|
| 895,306 |
|
|
|
|
|
|
| ||
United States—66.1% |
|
|
|
| |||
| 4,044 |
| Alexander’s, Inc. (a) |
|
| 1,071,336 |
|
| 42,000 |
| Alexandria Real Estate Equities, Inc. |
|
| 2,275,140 |
|
| 60,000 |
| Altisource Portfolio Solutions SA (a) |
|
| 915,000 |
|
| 15,000 |
| AMB Property Corp. |
|
| 329,700 |
|
| 96,000 |
| Annaly Capital Management, Inc. |
|
| 1,623,360 |
|
| 22,000 |
| Apollo Commercial Real Estate |
|
| 394,020 |
|
| 14,600 |
| Boston Properties, Inc. |
|
| 887,242 |
|
| 50,000 |
| Brookdale Senior Living, Inc. |
|
| 842,000 |
|
| 141,667 |
| CB Richard Ellis Group, Inc. (a) |
|
| 1,466,254 |
|
| 202,228 |
| CBL & Associates Properties, Inc. |
|
| 1,650,180 |
|
| 649,083 |
| Champion Enterprises, Inc. (a) |
|
| 155,780 |
|
| 441,375 |
| Chimera Investment Corp. |
|
| 1,540,399 |
|
| 88,867 |
| Cogdell Spencer, Inc. |
|
| 412,343 |
|
| 24,437 |
| Colony Financial, Inc. (a) |
|
| 475,301 |
|
| 3,750 |
| Crexus Investment Corp. (a) |
|
| 53,175 |
|
| 140,200 |
| DiamondRock Hospitality Co. (a) |
|
| 1,066,922 |
|
| 43,614 |
| Forest City Enterprises, Inc. |
|
| 380,314 |
|
| 195,699 |
| General Growth Properties, Inc. (a) |
|
| 798,452 |
|
| 150,000 |
| Host Hotels & Resorts, Inc. |
|
| 1,516,500 |
|
| 443,529 |
| Interstate Hotels & Resorts, Inc. (a) |
|
| 510,058 |
|
| 40,900 |
| Kilroy Realty Corp. |
|
| 1,129,658 |
|
| 36,365 |
| The Macerich Co. |
|
| 1,083,677 |
|
| 127,500 |
| Maguire Properties, Inc. (a) |
|
| 224,400 |
|
| 209,600 |
| MFA Financial, Inc. |
|
| 1,555,232 |
|
| 136,771 |
| Ocwen Financial Corp. (a) |
|
| 1,494,907 |
|
| 210,400 |
| Orient-Express Hotels Ltd.—Class A |
|
| 1,809,440 |
|
| 220,000 |
| ProLogis |
|
| 2,492,600 |
|
| 12,318 |
| Simon Property Group, Inc. |
|
| 836,269 |
|
| 100,000 |
| Starwood Property Trust, Inc. (a) |
|
| 2,013,000 |
|
| 150,000 |
| Sunrise Senior Living, Inc. (a) |
|
| 624,000 |
|
| 1,000 |
| Suntrust Banks, Inc. |
|
| 19,110 |
|
| 50,000 |
| Two Harbors Investment Corp. (a) |
|
| 484,500 |
|
| 143,940 |
| Verde Realty (a)(b)(d) |
|
| 3,339,408 |
|
| 15,385 |
| Vornado Realty Trust |
|
| 916,331 |
|
|
|
|
|
|
| ||
|
|
|
|
|
| 36,386,008 |
|
|
|
|
|
|
| ||
|
|
| Total North & South America |
|
| 44,135,399 |
|
|
|
|
|
|
| ||
|
|
| Total Common Stocks |
|
| 55,100,243 |
|
|
|
|
|
|
|
The accompanying notes are an integral part of these financial statements.
45
|
|
Alpine Cyclical Advantage Property Fund |
|
Schedule of Portfolio Investments—Continued
October 31, 2009
|
|
|
|
|
|
|
|
Shares |
| Security |
| Value |
| ||
|
|
| |||||
| |||||||
Equity-Linked Structured Notes—2.6% |
|
|
|
| |||
India—2.6% |
|
|
|
| |||
| 100,000 |
| Housing Development Holdings |
| $ | 673,480 |
|
| 150,000 |
| Peninsula Land, Ltd.—Macquarie |
|
| 248,643 |
|
| 300,000 |
| Unitech, Ltd.—Macquarie |
|
| 525,391 |
|
|
|
|
|
|
| ||
|
|
| Total Equity-Linked Structured |
|
| 1,447,514 |
|
|
|
|
|
|
| ||
Rights—0.2% |
|
|
|
| |||
| 500,000 |
| New World China Land, Ltd. (a) |
|
| 34,193 |
|
| 92,855 |
| Redrow PLC (a) |
|
| 53,720 |
|
|
|
|
|
|
| ||
|
|
| Total Rights (Cost $133,278) |
|
| 87,913 |
|
|
|
|
|
|
| ||
Short-Term Investments—0.0% |
|
|
|
| |||
| 300 |
| Federated Treasury Obligations |
|
| 300 |
|
|
|
|
|
|
| ||
|
|
| Total Short-Term Investments |
|
| 300 |
|
|
|
|
|
|
| ||
|
|
| Total Investments |
|
| 56,635,970 |
|
|
|
| Liabilities in Excess of Other |
|
| (1,571,612 | ) |
|
|
|
|
|
| ||
|
|
| TOTAL NET ASSETS—100.0% |
| $ | 55,064,358 |
|
|
|
|
|
|
|
|
|
|
| ||
Percentages are stated as a percent of net assets. | ||
|
|
|
ADR—American Depository Receipt | ||
GDR—Global Depository Receipt | ||
|
|
|
(a) | Non-income producing security. | |
|
|
|
(b) | Security fair valued in accordance with procedures approved by the Board of Trustees. These securities comprised 6.1% of the Fund’s net assets. | |
|
|
|
(c) | Restricted under Rule 144A of the Securities Act of 1933. These securities may be resold in transactions exempt from registration, normally to qualified institutional buyers. These securities have been determined to be liquid under guidelines established by the Board of Trustees. Securities restricted under Rule 144A comprised 5.3% of the Fund’s net assets. | |
|
|
|
(d) | llliquid security. |
The accompanying notes are an integral part of these financial statements.
46
|
Alpine Emerging Markets Real Estate Fund |
Schedule of Portfolio Investments
October 31, 2009
|
|
|
|
|
|
|
|
Shares |
| Security |
| Value |
| ||
|
|
| |||||
| |||||||
Common Stocks—81.6% |
|
|
|
| |||
Asia—29.7% |
|
|
|
| |||
China—11.8% |
|
|
|
| |||
| 12,756 |
| Agile Property Holdings, Ltd. |
| $ | 16,821 |
|
| 50,000 |
| C C Land Holdings, Ltd. |
|
| 27,935 |
|
| 90,000 |
| Franshion Properties |
|
| 25,664 |
|
| 16,500 |
| Hopson Development Holdings, Ltd. |
|
| 29,720 |
|
| 31,885 |
| KWG Property Holdings, Ltd. |
|
| 23,450 |
|
| 30,885 |
| New World China Land, Ltd. |
|
| 12,513 |
|
| 2,552 |
| Shanghai Forte Land Co. |
|
| 790 |
|
| 6,000 |
| Shangri-La Asia, Ltd. |
|
| 11,690 |
|
| 29,412 |
| Shenzhen Investment, Ltd. |
|
| 11,840 |
|
| 22,053 |
| Sino-Ocean Land Holdings, Ltd. |
|
| 21,996 |
|
| 36,500 |
| Soho China, Ltd. |
|
| 19,969 |
|
| 23,500 |
| Yanlord Land Group, Ltd. |
|
| 38,397 |
|
|
|
|
|
|
| ||
|
|
|
|
|
| 240,785 |
|
|
|
|
|
|
| ||
Hong Kong—0.3% |
|
|
|
| |||
| 5,000 |
| Mandarin Oriental |
|
| 6,350 |
|
|
|
|
|
|
| ||
India—2.5% |
|
|
|
| |||
| 5,000 |
| Hirco PLC (a) |
|
| 16,166 |
|
| 30,000 |
| Unitech Corporate Parks (a) |
|
| 10,709 |
|
| 4,000 |
| Yatra Capital, Ltd. (a) |
|
| 23,547 |
|
|
|
|
|
|
| ||
|
|
|
|
|
| 50,422 |
|
|
|
|
|
|
| ||
Indonesia—2.7% |
|
|
|
| |||
| 100,000 |
| Ciputra Development (a) |
|
| 6,597 |
|
| 100,000 |
| Lippo Karawaci (a) |
|
| 6,806 |
|
| 50,000 |
| Semen Gresik Persero |
|
| 35,864 |
|
| 100,000 |
| Summarecon Agung |
|
| 6,074 |
|
|
|
|
|
|
| ||
|
|
|
|
|
| 55,341 |
|
|
|
|
|
|
| ||
Malaysia—1.9% |
|
|
|
| |||
| 100,000 |
| Aseana Properties, Ltd. (a) |
|
| 39,000 |
|
|
|
|
|
|
| ||
Singapore—1.5% |
|
|
|
| |||
| 28,000 |
| Banyan Tree Holdings, Ltd. (a) |
|
| 16,282 |
|
| 8,600 |
| Parkway Holdings, Ltd. |
|
| 15,585 |
|
|
|
|
|
|
| ||
|
|
|
|
|
| 31,867 |
|
|
|
|
|
|
| ||
Thailand—7.5% |
|
|
|
| |||
| 50,000 |
| Central Pattana PCL |
|
| 32,461 |
|
| 240,000 |
| The Erawan Group PCL |
|
| 17,376 |
|
| 100,000 |
| Minor International PCL |
|
| 32,012 |
|
| 80,000 |
| Preuksa Real Estate PCL |
|
| 37,337 |
|
| 200,000 |
| Supalai PCL |
|
| 33,508 |
|
|
|
|
|
|
| ||
|
|
|
|
|
| 152,694 |
|
|
|
|
|
|
| ||
Vietnam—1.5% |
|
|
|
| |||
| 20,000 |
| JSM Indochina, Ltd. (a) |
|
| 14,200 |
|
| 20,000 |
| Vinaland, Ltd. (a) |
|
| 17,000 |
|
|
|
|
|
|
| ||
|
|
|
|
|
| 31,200 |
|
|
|
|
|
|
| ||
|
|
| Total Asia (Cost $388,592) |
|
| 607,659 |
|
|
|
|
|
|
| ||
Europe—11.8% |
|
|
|
| |||
Greece—2.0% |
|
|
|
|
|
| |
| 5,411 |
| Babis Vovos International |
|
| 40,453 |
|
|
|
|
|
|
| ||
Poland—2.5% |
|
|
|
| |||
| 4,000 |
| Globe Trade Centre SA (a) |
|
| 35,036 |
|
| 5,000 |
| Warimpex Finanz und |
|
| 17,473 |
|
|
|
|
|
|
| ||
|
|
|
|
|
| 52,509 |
|
|
|
|
|
|
| ||
|
|
|
|
|
|
|
|
| Shares |
| Security |
|
| Value |
|
|
|
| |||||
| |||||||
Common Stocks—continued |
|
|
|
| |||
Europe—continued |
|
|
|
| |||
Russia—5.8% |
|
|
|
| |||
| 4,000 |
| LSR Group OJSC—ADR (a)(b) |
| $ | 29,960 |
|
| 11,074 |
| Mirland Development Corp. (a) |
|
| 30,035 |
|
| 3,864 |
| PIK Group—ADR (a)(b) |
|
| 15,263 |
|
| 20,000 |
| Raven Russia, Ltd. |
|
| 14,279 |
|
| 16,000 |
| RGI International, Ltd. (a) |
|
| 28,000 |
|
|
|
|
|
|
| ||
|
|
|
|
|
| 117,537 |
|
|
|
|
|
|
| ||
Spain—0.8% |
|
|
|
| |||
| 1,940 |
| Sol Melia SA |
|
| 17,230 |
|
|
|
|
|
|
| ||
Ukraine—0.7% |
|
|
|
| |||
| 20,000 |
| KDD Group NV (a) |
|
| 14,443 |
|
|
|
|
|
|
| ||
|
|
| Total Europe (Cost $146,045) |
|
| 242,172 |
|
|
|
|
|
|
| ||
Middle East/Africa—6.7% |
|
|
|
| |||
Egypt—4.8% |
|
|
|
| |||
| 30,000 |
| Egyptian for Tourism Resorts (a) |
|
| 12,224 |
|
| 500 |
| Orascom Development Holding AG |
|
| 39,112 |
|
| 5,715 |
| Palm Hills Developments SAE (a) |
|
| 9,053 |
|
| 1,000 |
| Six Of October Development & |
|
| 17,710 |
|
| 15,000 |
| T M G Holding (a) |
|
| 20,062 |
|
|
|
|
|
|
| ||
|
|
|
|
|
| 98,161 |
|
|
|
|
|
|
| ||
United Arab Emirates—1.9% |
|
|
|
| |||
| 10,000 |
| Kingdom Hotel Investments—GDR (a) |
|
| 39,000 |
|
|
|
|
|
|
| ||
|
|
| Total Middle East/Africa |
|
| 137,161 |
|
|
|
|
|
|
| ||
North & South America—33.4% |
|
|
|
| |||
Brazil—31.4% |
|
|
|
| |||
| 12,437 |
| Agra Empreendimentos |
|
| 33,888 |
|
| 2,800 |
| BR Malls Participacoes SA (a) |
|
| 30,995 |
|
| 1,000 |
| Brasil Brokers Participacoes SA |
|
| 3,463 |
|
| 12,580 |
| Brookfield Incorporacoes SA |
|
| 48,489 |
|
| 3,338 |
| Camargo Correa Desenvolvimento |
|
| 10,706 |
|
| 9,000 |
| Construtora Tenda SA (a) |
|
| 26,209 |
|
| 3,000 |
| Cyrela Brazil Realty SA |
|
| 38,317 |
|
| 3,991 |
| Cyrela Commercial Properties SA |
|
| 23,766 |
|
| 10,000 |
| General Shopping Brasil SA (a) |
|
| 40,418 |
|
| 3,000 |
| Iguatemi Empresa de Shopping |
|
| 45,470 |
|
| 200 |
| Invest Tur Desenvolmimento |
|
| 32,242 |
|
| 10,000 |
| JHSF Participacoes SA |
|
| 20,209 |
|
| 3,100 |
| MRV Engenharia |
|
| 57,685 |
|
| 3,000 |
| Multiplan Empreendimentos |
|
| 45,981 |
|
| 7,000 |
| PDG Realty SA |
|
| 59,207 |
|
| 1,000 |
| Rodobens Negocios |
|
| 10,445 |
|
| 4,892 |
| Rossi Residential SA |
|
| 32,741 |
|
| 966 |
| Sao Carlos Empreendimentos |
|
| 9,048 |
|
| 8,000 |
| Tecnisa SA |
|
| 44,914 |
|
| 10,000 |
| Trisul SA |
|
| 28,554 |
|
|
|
|
|
|
| ||
|
|
|
|
|
| 642,747 |
|
|
|
|
|
|
| ||
Chile—1.0% |
|
|
|
| |||
| 20,000 |
| Parque Arauco SA |
|
| 20,721 |
|
|
|
|
|
|
|
The accompanying notes are an integral part of these financial statements.
47
|
Alpine Emerging Markets Real Estate Fund |
Schedule of Portfolio Investments—Continued
October 31, 2009
|
|
|
|
|
|
|
|
| Shares |
| Security |
|
| Value |
|
|
|
| |||||
| |||||||
Common Stocks—continued |
|
|
|
| |||
North & South America—continued |
|
|
|
| |||
Mexico—1.0% |
|
|
|
| |||
| 2,200 |
| Empresas ICA SA de CV—ADR (a) |
| $ | 19,184 |
|
|
|
|
|
|
| ||
|
|
| Total North & South America |
|
| 682,652 |
|
|
|
|
|
|
| ||
|
|
| Total Common Stocks |
|
| 1,669,644 |
|
|
|
|
|
|
| ||
Equity-Linked Structured Notes—7.7% |
|
|
|
| |||
| 250 |
| Housing Development Finance |
|
| 14,151 |
|
| 3,300 |
| Housing Development & |
|
| 22,225 |
|
| 805 |
| Housing Development & |
|
| 5,421 |
|
| 20,013 |
| Kolte Patil Development, Ltd.— |
|
| 19,623 |
|
| 12,000 |
| Peninsula Land, Ltd.—Macquarie |
|
| 19,891 |
|
| 5,000 |
| Phoenix Mills, Ltd.— |
|
| 16,262 |
|
| 35,000 |
| Unitech, Ltd.—Morgan Stanley |
|
| 61,296 |
|
|
|
|
|
|
| ||
|
|
| Total Equity-Linked Structured |
|
| 158,869 |
|
|
|
|
|
|
| ||
|
|
|
|
|
|
|
|
| Shares |
| Security |
|
| Value |
|
|
| ||||||
| |||||||
Rights—0.1% |
|
|
|
| |||
| 15,442 |
| New World China Land, Ltd. (a) |
| $ | 1,056 |
|
|
|
|
|
|
| ||
|
|
| Total Rights (Cost $1,698) |
|
| 1,056 |
|
|
|
|
|
|
| ||
Warrants—0.6% |
|
|
|
| |||
| 80,000 |
| SP Setia Berhad |
|
| 13,011 |
|
|
|
|
|
|
| ||
|
|
| Total Warrants (Cost $11,422) |
|
| 13,011 |
|
|
|
|
|
|
| ||
Short-Term Investments—11.5% |
|
|
|
| |||
| 235,580 |
| Federated Treasury Obligations |
|
| 235,580 |
|
|
|
|
|
|
| ||
|
|
| Total Short-Term Investments |
|
| 235,580 |
|
|
|
|
|
|
| ||
|
|
| Total Investments |
|
| 2,078,160 |
|
|
|
| Liabilities in Excess of Other |
|
| (30,981 | ) |
|
|
|
|
|
| ||
|
|
| TOTAL NET ASSETS—100.0% |
| $ | 2,047,179 |
|
|
|
|
|
|
|
|
Percentages are stated as a percent of net assets. |
|
ADR—American Depository Receipt |
GDR—Global Depository Receipt |
MYR—Malaysian Ringgit |
|
|
(a) | Non-income producing security. |
|
|
(b) | Restricted under Rule 144A of the Securities Act of 1933. These securities may be resold in transactions exempt from registration, normally to qualified institutional buyers. These securities have been determined to be liquid under guidelines established by the Board of Trustees. Securities restricted under Rule 144A comprised 2.2% of the Fund’s net assets. |
The accompanying notes are an integral part of these financial statements.
48
|
Alpine Global Infrastructure Fund |
Schedule of Portfolio Investments
October 31, 2009
|
|
|
|
|
|
|
|
| Shares |
| Security |
|
| Value |
|
|
|
| |||||
| |||||||
Common Stocks—98.5% |
|
|
|
| |||
Capital Goods—11.6% |
|
|
|
| |||
| 1,000 |
| Canadian Solar, Inc. (a) |
| $ | 14,580 |
|
| 36,000 |
| China State Construction |
|
| 14,725 |
|
| 4,000 |
| Empresas ICA SA de CV—ADR (a) |
|
| 34,880 |
|
| 300 |
| Fluor Corp. |
|
| 13,326 |
|
| 800 |
| Gamesa Corp. Tecnologica SA |
|
| 14,693 |
|
| 1,000 |
| MasTec, Inc. (a) |
|
| 11,800 |
|
| 2,600 |
| Murray & Roberts Holdings, Ltd. |
|
| 18,769 |
|
| 4,500 |
| NWS Holdings, Ltd. |
|
| 8,686 |
|
| 635 |
| Vinci SA |
|
| 33,296 |
|
|
|
|
|
|
| ||
|
|
|
|
|
| 164,755 |
|
|
|
|
|
|
| ||
Commercial & Professional Services—1.8% |
|
|
| ||||
| 2,000 |
| IESI BFC, Ltd. |
|
| 25,700 |
|
|
|
|
|
|
| ||
Energy—5.6% |
|
|
|
| |||
| 1,300 |
| El Paso Pipeline Partners LP |
|
| 28,626 |
|
| 825 |
| Enbridge, Inc. |
|
| 32,056 |
|
| 355 |
| NuStar Energy LP |
|
| 19,049 |
|
|
|
|
|
|
| ||
|
|
|
|
|
| 79,731 |
|
|
|
|
|
|
| ||
Materials—3.5% |
|
|
|
| |||
| 400 |
| HeidelbergCement AG |
|
| 23,976 |
|
| 35,000 |
| Semen Gresik Persero |
|
| 25,105 |
|
|
|
|
|
|
| ||
|
|
|
|
|
| 49,081 |
|
|
|
|
|
|
| ||
Media—2.9% |
|
|
|
| |||
| 1,500 |
| Comcast Corp. |
|
| 21,750 |
|
| 925 |
| SES SA |
|
| 20,086 |
|
|
|
|
|
|
| ||
|
|
|
|
|
| 41,836 |
|
|
|
|
|
|
| ||
Software & Services—1.5% |
|
|
|
| |||
| 750 |
| Telvent GIT SA |
|
| 21,562 |
|
|
|
|
|
|
| ||
Technology Hardware & Equipment—5.5% |
|
|
|
| |||
| 1,575 |
| Cisco Systems, Inc. (a) |
|
| 35,989 |
|
| 875 |
| CommScope, Inc. (a) |
|
| 23,643 |
|
| 3,250 |
| ZTE Corp. |
|
| 18,304 |
|
|
|
|
|
|
| ||
|
|
|
|
|
| 77,936 |
|
|
|
|
|
|
| ||
Telecommunication Services—12.1% |
|
|
|
| |||
| 820 |
| American Tower Corp.— |
|
| 30,192 |
|
| 1,125 |
| AT&T, Inc. |
|
| 28,879 |
|
| 1,100 |
| China Mobile Ltd. |
|
| 10,503 |
|
| 1,600 |
| Deutsche Telekom AG |
|
| 21,874 |
|
| 1,050 |
| Koninklijke KPN NV |
|
| 19,084 |
|
| 280 |
| Millicom International Cellular |
|
| 17,545 |
|
| 400 |
| MTN Group Ltd. |
|
| 6,018 |
|
| 425 |
| Rogers Communications, Inc. |
|
| 12,444 |
|
| 11,400 |
| Vodafone Group PLC |
|
| 25,175 |
|
|
|
|
|
|
| ||
|
|
|
|
|
| 171,714 |
|
|
|
|
|
|
| ||
Transportation—25.5% |
|
|
|
| |||
| 1,102 |
| Abertis Infraestructuras SA |
|
| 23,499 |
|
| 275 |
| Aeroports de Paris |
|
| 20,935 |
|
| 2,100 |
| All America Latina Logistica |
|
| 15,485 |
|
| 850 |
| Atlantia SPA |
|
| 20,140 |
|
| 400 |
| Canadian National Railway Co. |
|
| 19,334 |
|
|
|
|
|
|
|
|
|
| Shares |
| Security |
|
| Value |
|
|
|
| |||||
| |||||||
Common Stocks—continued |
|
|
|
| |||
Transportation—continued |
|
|
|
| |||
| 2,000 |
| Cia de Concessoes Rodoviarias |
| $ | 39,510 |
|
| 5,000 |
| Cintra Concesiones de |
|
| 51,618 |
|
| 600 |
| Hamburger Hafen Und Logistik AG |
|
| 23,399 |
|
| 37,000 |
| International Container Terminal |
|
| 15,930 |
|
| 2,000 |
| Santos Brasil Participacoes |
|
| 15,781 |
|
| 210,000 |
| Shenzhen International Holdings |
|
| 14,903 |
|
| 2,300 |
| Tegma Gestao Logistica |
|
| 16,046 |
|
| 3,300 |
| Transurban Group |
|
| 13,545 |
|
| 400 |
| Union Pacific Corp. |
|
| 22,056 |
|
| 740 |
| Vopak NV |
|
| 50,095 |
|
|
|
|
|
|
| ||
|
|
|
|
|
| 362,276 |
|
|
|
|
|
|
| ||
Utilities—28.5% |
|
|
|
| |||
| 675 |
| American Electric Power Co., Inc. |
|
| 20,398 |
|
| 1,500 |
| American Water Works Co., Inc. |
|
| 28,455 |
|
| 700 |
| Aqua America, Inc. |
|
| 10,815 |
|
| 1,400 |
| Calpine Corp. (a) |
|
| 15,736 |
|
| 4,000 |
| Cascal NV |
|
| 21,680 |
|
| 2,375 |
| Centrica PLC |
|
| 9,679 |
|
| 250 |
| E.ON AG |
|
| 9,599 |
|
| 400 |
| EDF SA |
|
| 22,369 |
|
| 1,130 |
| Enagas SA |
|
| 23,315 |
|
| 525 |
| Fortum OYJ |
|
| 12,462 |
|
| 310 |
| FPL Group, Inc. |
|
| 15,221 |
|
| 725 |
| GDF Suez |
|
| 30,413 |
|
| 3,000 |
| Iberdrola SA |
|
| 27,284 |
|
| 600 |
| ITC Holdings Corp. |
|
| 26,652 |
|
| 1,000 |
| MPX Energia SA |
|
| 13,766 |
|
| 1,800 |
| National Grid PLC |
|
| 17,918 |
|
| 1,175 |
| Northeast Utilities |
|
| 27,084 |
|
| 200 |
| RWE AG |
|
| 17,571 |
|
| 5,000 |
| Snam Rete Gas SPA |
|
| 24,282 |
|
| 350 |
| Southern Co. |
|
| 10,917 |
|
| 900 |
| Suez Environnement Co. |
|
| 20,046 |
|
|
|
|
|
|
| ||
|
|
|
|
|
| 405,662 |
|
|
|
|
|
|
| ||
|
|
| Total Common Stocks |
|
| 1,400,253 |
|
|
|
|
|
|
| ||
Equity-Linked Structured Notes—1.4% |
|
|
|
| |||
| 29,613 |
| National Hydroelectric Power |
|
| 19,231 |
|
|
|
|
|
|
| ||
|
|
| Total Equity-Linked Structure Notes |
|
| 19,231 |
|
|
|
|
|
|
| ||
Short-Term Investments—0.4% |
|
|
|
| |||
| 6,192 |
| Federated Treasury Obligations |
|
| 6,192 |
|
|
|
|
|
|
| ||
|
|
| Total Short-Term Investments |
|
| 6,192 |
|
|
|
|
|
|
| ||
|
|
| Total Investments |
|
| 1,425,676 |
|
|
|
| Liabilities in Excess of Other |
|
| (3,551 | ) |
|
|
|
|
|
| ||
|
|
| TOTAL NET ASSETS—100.00% |
| $ | 1,422,125 |
|
|
|
|
|
|
|
|
Percentages are stated as a percent of net assets. |
|
ADR—American Depository Receipt |
(a) Non-income producing security.
The accompanying notes are an integral part of these financial statements.
49
|
|
Alpine Mutual Funds |
|
Statements of Assets and Liabilities
October 31, 2009
|
|
|
|
|
|
|
|
|
|
|
|
|
|
|
|
|
|
| International |
| Realty |
| Cyclical |
| Emerging |
| Global |
| |||||
|
|
|
|
|
|
| ||||||||||
ASSETS: |
|
|
|
|
|
|
|
|
|
|
|
|
|
|
|
|
Investments, at value (1) |
|
|
|
|
|
|
|
|
|
|
|
|
|
|
|
|
Unaffiliated issuers |
| $ | 715,575,895 |
| $ | 87,127,233 |
| $ | 56,635,970 |
| $ | 2,078,160 |
| $ | 1,425,676 |
|
Affiliated issuers |
|
| 8,781,622 |
|
| — |
|
| — |
|
| — |
|
| — |
|
Cash |
|
| — |
|
| — |
|
| — |
|
| 3,288 |
|
| — |
|
Cash denominated in foreign currencies |
|
| 6,790,856 |
|
| — |
|
| — |
|
| — |
|
| — |
|
Receivable from capital shares issued |
|
| 1,981,535 |
|
| 79,147 |
|
| 16,610 |
|
| 1,255 |
|
| — |
|
Receivable from investment securities sold |
|
| 6,948,965 |
|
| 2,646,402 |
|
| 407,994 |
|
| 9,951 |
|
| 251,677 |
|
Due from Adviser |
|
| — |
|
| — |
|
| — |
|
| 1,399 |
|
| 890 |
|
Dividends and interest receivable |
|
| 559,632 |
|
| 218,901 |
|
| 14,438 |
|
| 281 |
|
| 1,658 |
|
Prepaid expenses and other assets |
|
| 13,404 |
|
| 16,938 |
|
| 14,542 |
|
| 2,635 |
|
| 2,632 |
|
|
|
|
|
|
|
| ||||||||||
Total assets |
|
| 740,651,909 |
|
| 90,088,621 |
|
| 57,089,554 |
|
| 2,096,969 |
|
| 1,682,533 |
|
|
|
|
|
|
|
| ||||||||||
LIABILITIES: |
|
|
|
|
|
|
|
|
|
|
|
|
|
|
|
|
Payable for capital shares redeemed |
|
| 2,756,790 |
|
| 43,786 |
|
| 33,635 |
|
| 37,466 |
|
| — |
|
Payable for investment securities purchased |
|
| 6,084,353 |
|
| — |
|
| 384,789 |
|
| — |
|
| 248,428 |
|
Accrued expenses and other liabilities: |
|
|
|
|
|
|
|
|
|
|
|
|
|
|
|
|
Investment advisory fees |
|
| 647,937 |
|
| 74,647 |
|
| 50,484 |
|
| — |
|
| — |
|
Line of credit |
|
| — |
|
| 5,106,000 |
|
| 1,508,000 |
|
| — |
|
| — |
|
Other |
|
| 319,259 |
|
| 68,938 |
|
| 48,288 |
|
| 12,324 |
|
| 11,980 |
|
|
|
|
|
|
|
| ||||||||||
Total liabilities |
|
| 9,808,339 |
|
| 5,293,371 |
|
| 2,025,196 |
|
| 49,790 |
|
| 260,408 |
|
|
|
|
|
|
|
| ||||||||||
Net Assets |
| $ | 730,843,570 |
| $ | 84,795,250 |
| $ | 55,064,358 |
| $ | 2,047,179 |
| $ | 1,422,125 |
|
|
|
|
|
|
|
| ||||||||||
|
|
|
|
|
|
|
|
|
|
|
|
|
|
|
|
|
Net assets represented by: |
|
|
|
|
|
|
|
|
|
|
|
|
|
|
|
|
Capital stock |
| $ | 1,867,852,430 |
| $ | 108,777,384 |
| $ | 119,898,369 |
| $ | 1,291,821 |
| $ | 1,057,869 |
|
Accumulated undistributed net investment income (loss) |
|
| 5,524,957 |
|
| — |
|
| 437,262 |
|
| (10,138 | ) |
| 20,480 |
|
Accumulated net realized gains (losses) from investments and foreign currency translation |
|
| (938,573,055 | ) |
| (28,106,647 | ) |
| (52,532,572 | ) |
| 83,114 |
|
| 119,553 |
|
Net unrealized appreciation (depreciation) on: |
|
|
|
|
|
|
|
|
|
|
|
|
|
|
|
|
Investments |
|
| (203,816,114 | ) |
| 4,123,673 |
|
| (12,740,615 | ) |
| 682,751 |
|
| 223,999 |
|
Foreign currency translation |
|
| (144,648 | ) |
| 840 |
|
| 1,914 |
|
| (369 | ) |
| 224 |
|
|
|
|
|
|
|
| ||||||||||
Total Net Assets |
| $ | 730,843,570 |
| $ | 84,795,250 |
| $ | 55,064,358 |
| $ | 2,047,179 |
| $ | 1,422,125 |
|
|
|
|
|
|
|
| ||||||||||
|
|
|
|
|
|
|
|
|
|
|
|
|
|
|
|
|
Net asset value |
|
|
|
|
|
|
|
|
|
|
|
|
|
|
|
|
Net assets |
| $ | 730,843,570 |
| $ | 84,795,250 |
| $ | 55,064,358 |
| $ | 2,047,179 |
| $ | 1,422,125 |
|
Shares of beneficial interest issued and outstanding |
|
| 32,348,854 |
|
| 7,789,770 |
|
| 3,307,450 |
|
| 120,201 |
|
| 106,251 |
|
Net asset value, offering price and redemption price per share |
| $ | 22.59 |
| $ | 10.89 |
| $ | 16.65 |
| $ | 17.03 |
| $ | 13.38 |
|
|
|
|
|
|
|
| ||||||||||
(1) Cost of investments |
|
|
|
|
|
|
|
|
|
|
|
|
|
|
|
|
Unaffiliated issuers |
| $ | 907,529,214 |
| $ | 83,003,560 |
| $ | 69,376,585 |
| $ | 1,395,409 |
| $ | 1,201,677 |
|
Affiliated issuers |
|
| 20,644,417 |
|
| — |
|
| — |
|
| — |
|
| — |
|
The accompanying notes are an integral part of these financial statements.
50
|
|
Alpine Mutual Funds |
|
Statements of Operations
For the year ended October 31, 2009
|
|
|
|
|
|
|
|
|
|
|
|
|
|
|
|
|
|
| International |
| Realty |
| Cyclical |
| Emerging |
| Global |
| |||||
|
|
|
|
|
|
| ||||||||||
INVESTMENT INCOME: |
|
|
|
|
|
|
|
|
|
|
|
|
|
|
|
|
Interest income |
| $ | 237 |
| $ | 6,355 |
| $ | 78 |
| $ | 1,050 |
| $ | 313 |
|
Dividend income* |
|
| 12,129,132 |
|
| 6,974,279 |
|
| 1,607,436 |
|
| 6,902_ |
|
| 35,710 |
|
|
|
|
|
|
|
| ||||||||||
Total investment income |
|
| 12,129,369 |
|
| 6,980,634 |
|
| 1,607,514 |
|
| 7,952 |
|
| 36,023 |
|
|
|
|
|
|
|
| ||||||||||
|
|
|
|
|
|
|
|
|
|
|
|
|
|
|
|
|
EXPENSES: |
|
|
|
|
|
|
|
|
|
|
|
|
|
|
|
|
Investment advisory fees |
|
| 5,087,652 |
|
| 700,931 |
|
| 430,837 |
|
| 13,400 |
|
| 11,550 |
|
Administration fees |
|
| 193,421 |
|
| 27,085 |
|
| 16,967 |
|
| 586 |
|
| 502 |
|
Fund accounting fees |
|
| 121,531 |
|
| 17,060 |
|
| 10,663 |
|
| 375 |
|
| 321 |
|
Audit and tax fees |
|
| 43,572 |
|
| 25,739 |
|
| 25,337 |
|
| 18,383 |
|
| 17,756 |
|
Custodian fees |
|
| 40,820 |
|
| 6,094 |
|
| 3,740 |
|
| 134 |
|
| 116 |
|
Legal fees |
|
| 43,725 |
|
| 9,563 |
|
| 9,178 |
|
| 15,014 |
|
| 11,482 |
|
Registration and filing fees |
|
| 39,521 |
|
| 26,008 |
|
| 26,568 |
|
| 5,655 |
|
| 4,497 |
|
Printing and mailing fees |
|
| 225,822 |
|
| 40,722 |
|
| 29,677 |
|
| 106 |
|
| 107 |
|
Transfer agent fees |
|
| 193,425 |
|
| 27,084 |
|
| 16,954 |
|
| 2,048 |
|
| 1,945 |
|
Trustee fees |
|
| 3,748 |
|
| 2,371 |
|
| 2,277 |
|
| 2,378 |
|
| 2,369 |
|
Interest expense |
|
| 338,178 |
|
| 85,341 |
|
| 48,349 |
|
| — |
|
| 52 |
|
Other fees |
|
| 56,570 |
|
| 8,233 |
|
| 4,954 |
|
| 285 |
|
| 318 |
|
|
|
|
|
|
|
| ||||||||||
Total expenses before expense waiver by Adviser |
|
| 6,387,985 |
|
| 976,231 |
|
| 625,501 |
|
| 58,364 |
|
| 51,015 |
|
Expense waiver by Adviser (Note 5) |
|
| — |
|
| — |
|
| — |
|
| (40,274 | ) |
| (35,371 | ) |
|
|
|
|
|
|
| ||||||||||
Net expenses |
|
| 6,387,985 |
|
| 976,231 |
|
| 625,501 |
|
| 18,090 |
|
| 15,644 |
|
|
|
|
|
|
|
| ||||||||||
Net investment income (loss) |
|
| 5,741,384 |
|
| 6,004,403 |
|
| 982,013 |
|
| (10,138 | ) |
| 20,379 |
|
|
|
|
|
|
|
| ||||||||||
|
|
|
|
|
|
|
|
|
|
|
|
|
|
|
|
|
REALIZED AND UNREALIZED GAIN (LOSS) ON INVESTMENTS: |
|
|
|
|
|
|
|
|
|
|
|
|
|
|
|
|
Net realized gain (loss) on: |
|
|
|
|
|
|
|
|
|
|
|
|
|
|
|
|
Investments |
|
| (536,889,244 | ) |
| (28,583,123 | ) |
| (26,083,383 | ) |
| 87,919 |
|
| 125,799 |
|
Foreign currency translation |
|
| (1,496,426 | ) |
| 8,775 |
|
| (28,268 | ) |
| (4,805 | ) |
| (6,247 | ) |
|
|
|
|
|
|
| ||||||||||
Net realized gain (loss) |
|
| (538,385,670 | ) |
| (28,574,348 | ) |
| (26,111,651 | ) |
| 83,114 |
|
| 119,552 |
|
|
|
|
|
|
|
| ||||||||||
Change in unrealized appreciation (depreciation) on: |
|
|
|
|
|
|
|
|
|
|
|
|
|
|
|
|
Investments |
|
| 832,301,935 |
|
| 32,843,617 |
|
| 34,116,787 |
|
| 682,751 |
|
| 223,999 |
|
Foreign currency translation |
|
| (364,294 | ) |
| (102 | ) |
| 1,914 |
|
| (369 | ) |
| 224 |
|
|
|
|
|
|
|
| ||||||||||
Net change in unrealized appreciation |
|
| 831,937,641 |
|
| 32,843,515 |
|
| 34,118,701 |
|
| 682,382 |
|
| 224,223 |
|
|
|
|
|
|
|
| ||||||||||
Net realized and unrealized gain on investments |
|
| 293,551,971 |
|
| 4,269,167 |
|
| 8,007,050 |
|
| 765,496 |
|
| 343,775 |
|
|
|
|
|
|
|
| ||||||||||
Change in net assets resulting from operations |
| $ | 299,293,355 |
| $ | 10,273,570 |
| $ | 8,989,063 |
| $ | 755,358 |
| $ | 364,154 |
|
|
|
|
|
|
|
| ||||||||||
|
|
|
|
|
|
|
|
|
|
|
|
|
|
|
|
|
* Net of foreign taxes withheld |
| $ | 900,592 |
| $ | 36,814 |
| $ | 4,347 |
| $ | 189 |
| $ | 4,691 |
|
|
|
|
|
|
|
|
(1) Fund commenced operations on November 3, 2008.
The accompanying notes are an integral part of these financial statements.
51
|
|
Alpine Mutual Funds |
|
Statements of Changes in Net Assets
|
|
|
|
|
|
|
|
|
| International Real Estate Equity Fund |
| ||||
|
|
| |||||
|
| Year Ended |
| Year Ended |
| ||
|
|
|
| ||||
OPERATIONS: |
|
|
|
|
|
|
|
Net investment income |
| $ | 5,741,384 |
| $ | 23,385,647 |
|
Net realized loss on: |
|
|
|
|
|
|
|
Investments |
|
| (536,889,244 | ) |
| (397,083,969 | ) |
Foreign currency translation |
|
| (1,496,426 | ) |
| (3,855,535 | ) |
Forward currency contracts |
|
| — |
|
| (10,062,570 | ) |
Swap contracts |
|
| — |
|
| (84,458 | ) |
Change in unrealized appreciation (depreciation) on: |
|
|
|
|
|
|
|
Investments |
|
| 832,301,935 |
|
| (1,400,661,788 | ) |
Foreign currency translation |
|
| (364,294 | ) |
| 193,642 |
|
Swap contracts |
|
| — |
|
| (246,100 | ) |
|
|
|
| ||||
Change in net assets resulting from operations |
|
| 299,293,355 |
|
| (1,788,415,131 | ) |
|
|
|
| ||||
|
|
|
|
|
|
|
|
DISTRIBUTIONS TO SHAREHOLDERS: |
|
|
|
|
|
|
|
From net investment income |
|
| — |
|
| (24,442,941 | ) |
From net realized gain on investments |
|
| — |
|
| (111,723,042 | ) |
From tax return on capital |
|
| — |
|
| (3,595,986 | ) |
|
|
|
| ||||
Change in net assets resulting from distributions to shareholders |
|
| — |
|
| (139,761,969 | ) |
|
|
|
| ||||
|
|
|
|
|
|
|
|
CAPITAL SHARE TRANSACTIONS: |
|
|
|
|
|
|
|
Proceeds from shares sold |
|
| 261,332,736 |
|
| 1,013,466,466 |
|
Dividends reinvested |
|
| — |
|
| 126,680,128 |
|
Redemption fees |
|
| 263,845 |
|
| 463,001 |
|
Cost of shares redeemed |
|
| (413,999,840 | ) |
| (1,182,612,997 | ) |
|
|
|
| ||||
Change in net assets resulting from capital share transactions |
|
| (152,403,259 | ) |
| (42,003,402 | ) |
|
|
|
| ||||
Total change in net assets |
|
| 146,890,096 |
|
| (1,970,180,502 | ) |
|
|
|
| ||||
|
|
|
|
|
|
|
|
NET ASSETS: |
|
|
|
|
|
|
|
Beginning of year |
|
| 583,953,474 |
|
| 2,554,133,976 |
|
|
|
|
| ||||
End of year* |
| $ | 730,843,570 |
| $ | 583,953,474 |
|
|
|
|
| ||||
* Including accumulated undistributed net investment income (loss) of: |
| $ | 5,524,957 |
| $ | (1,385,183 | ) |
|
|
|
|
The accompanying notes are an integral part of these financial statements.
52
|
|
Alpine Mutual Funds |
|
Statements of Changes in Net Assets—Continued
|
|
|
|
|
|
|
|
|
| Realty Income & Growth Fund |
| ||||
|
|
| |||||
|
| Year Ended |
| Year Ended |
| ||
|
|
|
| ||||
OPERATIONS: |
|
|
|
|
|
|
|
Net investment income |
| $ | 6,004,403 |
| $ | 15,796,152 |
|
Net realized gain (loss) on: |
|
|
|
|
|
|
|
Investments |
|
| (28,583,123 | ) |
| 11,474,089 |
|
Foreign currency translation |
|
| 8,775 |
|
| (5,488 | ) |
Change in unrealized appreciation (depreciation) on: |
|
|
|
|
|
|
|
Investments |
|
| 32,843,617 |
|
| (191,509,791 | ) |
Foreign currency translation |
|
| (102 | ) |
| (31,920 | ) |
|
|
|
| ||||
Change in net assets resulting from operations |
|
| 10,273,570 |
|
| (164,276,958 | ) |
|
|
|
| ||||
|
|
|
|
|
|
|
|
DISTRIBUTIONS TO SHAREHOLDERS: |
|
|
|
|
|
|
|
From net investment income |
|
| (5,089,343 | ) |
| (9,583,848 | ) |
From net realized gain on investments |
|
| — |
|
| (37,038,174 | ) |
From tax return of capital |
|
| (1,391,340 | ) |
| — |
|
|
|
|
| ||||
Change in net assets resulting from distributions to shareholders |
|
| (6,480,683 | ) |
| (46,622,022 | ) |
|
|
|
| ||||
|
|
|
|
|
|
|
|
CAPITAL SHARE TRANSACTIONS: |
|
|
|
|
|
|
|
Proceeds from shares sold |
|
| 9,534,500 |
|
| 65,719,804 |
|
Dividends reinvested |
|
| 5,999,363 |
|
| 43,907,486 |
|
Redemption fees |
|
| 20,363 |
|
| 42,370 |
|
Cost of shares redeemed |
|
| (29,822,316 | ) |
| (335,942,961 | ) |
|
|
|
| ||||
Change in net assets resulting from capital share transactions |
|
| (14,268,090 | ) |
| (226,273,301 | ) |
|
|
|
| ||||
Total change in net assets |
|
| (10,475,203 | ) |
| (437,172,281 | ) |
|
|
|
| ||||
|
|
|
|
|
|
|
|
NET ASSETS: |
|
|
|
|
|
|
|
Beginning of year |
|
| 95,270,453 |
|
| 532,442,734 |
|
|
|
|
| ||||
End of year* |
| $ | 84,795,250 |
| $ | 95,270,453 |
|
|
|
|
| ||||
* Including accumulated undistributed net investment income of: |
| $ | — |
| $ | — |
|
|
|
|
|
The accompanying notes are an integral part of these financial statements.
53
|
|
Alpine Mutual Funds |
|
Statements of Changes in Net Assets—Continued
|
|
|
|
|
|
|
|
|
| Cyclical Advantage Property Fund |
| ||||
|
|
| |||||
|
| Year Ended |
| Year Ended |
| ||
|
|
|
| ||||
OPERATIONS: |
|
|
|
|
|
|
|
Net investment income |
| $ | 982,013 |
| $ | 2,581,541 |
|
Net realized loss on: |
|
|
|
|
|
|
|
Investments |
|
| (26,083,383 | ) |
| (19,924,155 | ) |
Foreign currency translation |
|
| (28,268 | ) |
| — |
|
Change in unrealized appreciation (depreciation) on: |
|
|
|
|
|
|
|
Investments |
|
| 34,116,787 |
|
| (60,060,227 | ) |
Foreign currency translation |
|
| 1,914 |
|
| — |
|
|
|
|
| ||||
Change in net assets resulting from operations |
|
| 8,989,063 |
|
| (77,402,841 | ) |
|
|
|
| ||||
|
|
|
|
|
|
|
|
DISTRIBUTIONS TO SHAREHOLDERS: |
|
|
|
|
|
|
|
From net investment income |
|
| (411,286 | ) |
| (1,790,143 | ) |
From net realized gain on investments |
|
| — |
|
| — |
|
From tax return of capital |
|
| — |
|
| (335,086 | ) |
|
|
|
| ||||
Change in net assets resulting from distributions to shareholders |
|
| (411,286 | ) |
| (2,125,229 | ) |
|
|
|
| ||||
|
|
|
|
|
|
|
|
CAPITAL SHARE TRANSACTIONS: |
|
|
|
|
|
|
|
Proceeds from shares sold |
|
| 5,408,897 |
|
| 4,129,264 |
|
Dividends reinvested |
|
| 396,723 |
|
| 2,050,545 |
|
Redemption fees |
|
| 7,890 |
|
| 4,141 |
|
Cost of shares redeemed |
|
| (6,731,718 | ) |
| (27,882,257 | ) |
|
|
|
| ||||
Change in net assets resulting from capital share transactions |
|
| (918,208 | ) |
| (21,698,307 | ) |
|
|
|
| ||||
Total change in net assets |
|
| 7,659,569 |
|
| (101,226,377 | ) |
|
|
|
| ||||
| |||||||
NET ASSETS: |
|
|
|
|
|
|
|
Beginning of year |
|
| 47,404,789 |
|
| 148,631,166 |
|
|
|
|
| ||||
End of year* |
| $ | 55,064,358 |
| $ | 47,404,789 |
|
|
|
|
| ||||
* Including accumulated undistributed net investment income of: |
| $ | 437,262 |
| $ | — |
|
|
|
|
|
The accompanying notes are an integral part of these financial statements.
54
|
|
Alpine Mutual Funds |
|
Statements of Changes in Net Assets—Continued
|
|
|
|
|
|
|
|
| Emerging Markets |
| |||
|
|
| ||||
|
| Period Ended |
| |||
|
|
| ||||
OPERATIONS: |
|
|
|
| ||
Net investment loss |
|
| $ | (10,138 | ) |
|
Net realized gain (loss) on: |
|
|
|
|
|
|
Investments |
|
|
| 87,919 |
|
|
Foreign currency translation |
|
|
| (4,805 | ) |
|
Change in unrealized appreciation (depreciation) on: |
|
|
|
|
|
|
Investments |
|
|
| 682,751 |
|
|
Foreign currency translation |
|
|
| (369 | ) |
|
|
|
|
|
| ||
Change in net assets resulting from operations |
|
|
| 755,358 |
|
|
|
|
|
|
| ||
|
|
|
|
|
|
|
DISTRIBUTIONS TO SHAREHOLDERS: |
|
|
|
|
|
|
From net investment income |
|
|
| — |
|
|
From net realized gain on investments |
|
|
| — |
|
|
|
|
|
|
| ||
Change in net assets resulting from distributions to shareholders |
|
|
| — |
|
|
|
|
|
|
| ||
|
|
|
|
|
|
|
|
|
|
|
|
|
|
CAPITAL SHARE TRANSACTIONS: |
|
|
|
|
|
|
Proceeds from shares sold |
|
|
| 1,491,562 |
|
|
Dividends reinvested |
|
|
| — |
|
|
Redemption fees |
|
|
| 930 |
|
|
Cost of shares redeemed |
|
|
| (200,671 | ) |
|
|
|
|
|
| ||
Change in net assets resulting from capital share transactions |
|
|
| 1,291,821 |
|
|
|
|
|
|
| ||
Total change in net assets |
|
|
| 2,047,179 |
|
|
|
|
|
|
| ||
|
|
|
|
|
|
|
NET ASSETS: |
|
|
|
|
|
|
Beginning of period |
|
|
| — |
|
|
|
|
|
|
| ||
End of period* |
|
| $ | 2,047,179 |
|
|
|
|
|
|
| ||
* Including accumulated undistributed net investment loss of: |
|
| $ | (10,138 | ) |
|
|
|
|
|
|
(1) Fund commenced operations on November 3, 2008.
The accompanying notes are an integral part of these financial statements.
55
|
|
Alpine Mutual Funds |
|
Statements of Changes in Net Assets—Continued
|
|
|
|
|
|
|
|
| Global |
| |||
|
|
| ||||
|
| Period Ended |
| |||
|
|
| ||||
OPERATIONS: |
|
|
|
| ||
Net investment income |
|
| $ | 20,379 |
|
|
Net realized gain (loss) on: |
|
|
|
|
|
|
Investments |
|
|
| 125,799 |
|
|
Foreign currency translation |
|
|
| (6,247 | ) |
|
Change in unrealized appreciation on: |
|
|
|
|
|
|
Investments |
|
|
| 223,999 |
|
|
Foreign currency translation |
|
|
| 224 |
|
|
|
|
|
|
| ||
Change in net assets resulting from operations |
|
|
| 364,154 |
|
|
|
|
|
|
| ||
|
|
|
|
|
|
|
DISTRIBUTIONS TO SHAREHOLDERS: |
|
|
|
|
|
|
From net investment income |
|
|
| — |
|
|
From net realized gain on investments |
|
|
| — |
|
|
|
|
|
|
| ||
Change in net assets resulting from distributions to shareholders |
|
|
| — |
|
|
|
|
|
|
| ||
|
|
|
|
|
|
|
CAPITAL SHARE TRANSACTIONS: |
|
|
|
|
|
|
Proceeds from shares sold |
|
|
| 1,090,711 |
|
|
Dividends reinvested |
|
|
| — |
|
|
Redemption fees |
|
|
| 109 |
|
|
Cost of shares redeemed |
|
|
| (32,849 | ) |
|
|
|
|
|
| ||
Change in net assets resulting from capital share transactions |
|
|
| 1,057,971 |
|
|
|
|
|
|
| ||
Total change in net assets |
|
|
| 1,422,125 |
|
|
|
|
|
|
| ||
|
|
|
|
|
|
|
NET ASSETS: |
|
|
|
|
|
|
Beginning of period |
|
|
| — |
|
|
|
|
|
|
| ||
End of period* |
|
| $ | 1,422,125 |
|
|
|
|
|
|
| ||
* Including accumulated undistributed net investment income of: |
|
| $ | 20,480 |
|
|
|
|
|
|
|
(1) Fund commenced operations on November 3, 2008.
The accompanying notes are an integral part of these financial statements.
56
|
|
Alpine Mutual Funds |
|
Financial Highlights
(For a share outstanding throughout each period)
|
|
|
|
|
|
|
|
|
|
|
|
|
|
|
|
|
|
|
| ||||||||||||||
|
| International Real Estate Equity Fund |
| |||||||||||||
|
|
| ||||||||||||||
|
| Year Ended October 31, |
| |||||||||||||
|
|
| ||||||||||||||
|
| 2009 |
| 2008 |
| 2007 |
| 2006 |
| 2005 |
| |||||
|
|
|
|
|
|
| ||||||||||
Per Share Data: |
|
|
|
|
|
|
|
|
|
|
|
|
|
|
|
|
Net asset value per share, beginning of year |
| $ | 12.26 |
| $ | 47.58 |
| $ | 37.56 |
| $ | 28.89 |
| $ | 24.28 |
|
|
|
|
|
|
|
| ||||||||||
Income from investment operations: |
|
|
|
|
|
|
|
|
|
|
|
|
|
|
|
|
Net investment income |
|
| 0.20 |
|
| 0.35 |
|
| 0.63 |
|
| 0.50 |
|
| 0.74 | (a) |
Net realized and unrealized gains (losses) on investments |
|
| 10.12 |
|
| (33.05 | ) |
| 10.78 |
|
| 8.90 |
|
| 5.71 |
|
|
|
|
|
|
|
| ||||||||||
Total from investment operations |
|
| 10.32 |
|
| (32.70 | ) |
| 11.41 |
|
| 9.40 |
|
| 6.45 |
|
|
|
|
|
|
|
| ||||||||||
Redemption fees |
|
| 0.01 |
|
| 0.01 |
|
| 0.02 |
|
| 0.01 |
|
| — |
|
Less distributions: |
|
|
|
|
|
|
|
|
|
|
|
|
|
|
|
|
From net investment income |
|
| — |
|
| (0.45 | ) |
| (0.63 | ) |
| (0.39 | ) |
| (0.73 | ) |
From net realized gains on investments |
|
| — |
|
| (2.10 | ) |
| (0.78 | ) |
| (0.35 | ) |
| (1.11 | ) |
From tax return on capital |
|
| — |
|
| (0.08 | ) |
| — |
|
| — |
|
| — |
|
|
|
|
|
|
|
| ||||||||||
Total distributions |
|
| — |
|
| (2.63 | ) |
| (1.41 | ) |
| (0.74 | ) |
| (1.84 | ) |
|
|
|
|
|
|
| ||||||||||
Net asset value per share, end of year |
| $ | 22.59 |
| $ | 12.26 |
| $ | 47.58 |
| $ | 37.56 |
| $ | 28.89 |
|
|
|
|
|
|
|
| ||||||||||
Total return |
|
| 84.26 | % |
| –72.46 | % |
| 31.16 | % |
| 33.19 | % |
| 27.29 | % |
Ratios/Supplemental Data: |
|
|
|
|
|
|
|
|
|
|
|
|
|
|
|
|
Net Assets at end of year (000) |
| $ | 730,844 |
| $ | 583,953 |
| $ | 2,554,134 |
| $ | 771,999 |
| $ | 290,747 |
|
Ratio of total expenses to average net assets |
|
| 1.26 | % |
| 1.22 | % |
| 1.14 | % |
| 1.17 | % |
| 1.18 | % |
Ratio of interest expense to average net assets |
|
| 0.07 | % |
| 0.06 | % |
| 0.00 | % |
| 0.02 | % |
| 0.00 | %(b) |
Ratio of expenses to average net assets excluding interest expense |
|
| 1.19 | % |
| 1.16 | % |
| 1.14 | % |
| 1.15 | % |
| 1.18 | % |
Ratio of net investment income to average net assets |
|
| 1.13 | % |
| 1.29 | % |
| 1.08 | % |
| 1.16 | % |
| 1.22 | % |
Portfolio turnover |
|
| 51 | % |
| 42 | % |
| 31 | % |
| 30 | % |
| 10 | % |
|
|
|
| ||
(a) | Net investment income per share is calculated using accumulated undistributed net investment income per share at the beginning and end of the period prior to consideration of adjustments for permanent book and tax differences. | |
|
| |
(b) | The amount is less than 0.005%. |
The accompanying notes are an integral part of these financial statements.
57
|
|
Alpine Mutual Funds |
|
Financial Highlights—Continued
(For a share outstanding throughout each period)
|
|
|
|
|
|
|
|
|
|
|
|
|
|
|
|
|
|
|
| ||||||||||||||
|
| Realty Income & Growth Fund |
| |||||||||||||
|
|
| ||||||||||||||
|
| Year Ended October 31, |
| |||||||||||||
|
|
| ||||||||||||||
|
| 2009 |
| 2008 |
| 2007 |
| 2006 |
| 2005 |
| |||||
|
|
|
|
|
|
| ||||||||||
Per Share Data: |
|
|
|
|
|
|
|
|
|
|
|
|
|
|
|
|
Net asset value per share, beginning of year |
| $ | 9.95 |
| $ | 25.12 |
| $ | 27.75 |
| $ | 21.92 |
| $ | 19.97 |
|
|
|
|
|
|
|
| ||||||||||
Income from investment operations: |
|
|
|
|
|
|
|
|
|
|
|
|
|
|
|
|
Net investment income |
|
| 0.79 |
|
| 0.99 |
|
| 0.91 |
|
| 0.65 |
|
| 1.06 |
|
Net realized and unrealized gains (losses) on investments |
|
| 0.94 |
|
| (13.46 | ) |
| (1.54 | ) |
| 6.35 |
|
| 2.07 |
|
|
|
|
|
|
|
| ||||||||||
Total from investment operations |
|
| 1.73 |
|
| (12.47 | ) |
| (0.63 | ) |
| 7.00 |
|
| 3.13 |
|
|
|
|
|
|
|
| ||||||||||
Redemption fees |
|
| 0.00 | (a) |
| 0.00 | (a) |
| 0.00 | (a) |
| 0.00 | (a) |
| — |
|
Less distributions: |
|
|
|
|
|
|
|
|
|
|
|
|
|
|
|
|
From net investment income |
|
| (0.62 | ) |
| (0.99 | ) |
| (0.95 | ) |
| (0.87 | ) |
| (0.84 | ) |
From net realized gains on investments |
|
| — |
|
| (1.71 | ) |
| (1.05 | ) |
| (0.30 | ) |
| (0.34 | ) |
From tax return of capital |
|
| (0.17 | ) |
| — |
|
| — |
|
| — |
|
| — |
|
|
|
|
|
|
|
| ||||||||||
Total distributions |
|
| (0.79 | ) |
| (2.70 | ) |
| (2.00 | ) |
| (1.17 | ) |
| (1.18 | ) |
|
|
|
|
|
|
| ||||||||||
Net asset value per share, end of year |
| $ | 10.89 |
| $ | 9.95 |
| $ | 25.12 |
| $ | 27.75 |
| $ | 21.92 |
|
|
|
|
|
|
|
| ||||||||||
Total return |
|
| 20.23 | % |
| –54.62 | % |
| –2.53 | % |
| 32.91 | % |
| 15.92 | % |
Ratios/Supplemental Data: |
|
|
|
|
|
|
|
|
|
|
|
|
|
|
|
|
Net Assets at end of year (000) |
| $ | 84,795 |
| $ | 95,270 |
| $ | 532,443 |
| $ | 850,075 |
| $ | 641,224 |
|
Ratio of total expenses to average net assets: |
|
|
|
|
|
|
|
|
|
|
|
|
|
|
|
|
Before waivers |
|
| 1.39 | % |
| 1.56 | % |
| 1.29 | % |
| 1.17 | % |
| 1.18 | % |
After waivers |
|
| 1.39 | % |
| 1.43 | % |
| 1.29 | % |
| 1.17 | % |
| 1.18 | % |
Ratio of interest expense to average net assets |
|
| 0.12 | % |
| 0.40 | % |
| 0.14 | % |
| 0.01 | % |
| 0.00 | %(b) |
Ratio of expenses to average net assets excluding interest expense: |
|
|
|
|
|
|
|
|
|
|
|
|
|
|
|
|
Before waivers |
|
| 1.27 | % |
| 1.16 | % |
| 1.15 | % |
| 1.16 | % |
| 1.18 | % |
After waivers |
|
| 1.27 | % |
| 1.03 | % |
| 1.15 | % |
| 1.16 | % |
| 1.18 | % |
Ratio of net investment income to average net assets |
|
| 8.57 | % |
| 5.55 | % |
| 3.34 | % |
| 2.67 | % |
| 3.47 | % |
Portfolio turnover |
|
| 111 | % |
| 23 | % |
| 33 | % |
| 33 | % |
| 34 | % |
|
|
|
| ||
(a) | The amount is less than $0.005 per share or 0.005%. |
The accompanying notes are an integral part of these financial statements.
58
|
|
Alpine Mutual Funds |
|
Financial Highlights—Continued
(For a share outstanding throughout each period)
|
|
|
|
|
|
|
|
|
|
|
|
|
|
|
|
|
|
|
| ||||||||||||||
|
| Cyclical Advantage Property Fund |
| |||||||||||||
|
|
| ||||||||||||||
|
| Year Ended October 31, |
| |||||||||||||
|
|
| ||||||||||||||
|
| 2009 |
| 2008 |
| 2007 |
| 2006 |
| 2005 |
| |||||
|
|
|
|
|
|
| ||||||||||
Per Share Data: |
|
|
|
|
|
|
|
|
|
|
|
|
|
|
|
|
Net asset value per share, beginning of year |
| $ | 13.86 |
| $ | 34.97 |
| $ | 38.27 |
| $ | 39.45 |
| $ | 34.51 |
|
|
|
|
|
|
|
| ||||||||||
Income from investment operations: |
|
|
|
|
|
|
|
|
|
|
|
|
|
|
|
|
Net investment income (loss) |
|
| 0.26 |
|
| 0.53 |
|
| 0.15 |
|
| (0.20 | ) |
| 0.12 |
|
Net realized and unrealized gains (losses) on investments |
|
| 2.65 |
|
| (21.11 | ) |
| (0.28 | ) |
| 0.62 |
|
| 7.47 |
|
|
|
|
|
|
|
| ||||||||||
Total from investment operations |
|
| 2.91 |
|
| (20.58 | ) |
| (0.13 | ) |
| 0.42 |
|
| 7.59 |
|
|
|
|
|
|
|
| ||||||||||
Redemption fees |
|
| 0.00 | (a) |
| 0.00 | (a) |
| 0.02 |
|
| 0.00 | (a) |
| — |
|
Less distributions: |
|
|
|
|
|
|
|
|
|
|
|
|
|
|
|
|
From net investment income |
|
| (0.12 | ) |
| (0.43 | ) |
| (0.05 | ) |
| (0.03 | ) |
| (0.09 | ) |
From net realized gains on investments |
|
| — |
|
| — |
|
| (3.11 | ) |
| (1.57 | ) |
| (2.56 | ) |
From tax return on capital |
|
| — |
|
| (0.10 | ) |
| (0.03 | ) |
| — |
|
| — |
|
|
|
|
|
|
|
| ||||||||||
Total distributions |
|
| (0.12 | ) |
| (0.53 | ) |
| (3.19 | ) |
| (1.60 | ) |
| (2.65 | ) |
|
|
|
|
|
|
| ||||||||||
Net asset value per share, end of year |
| $ | 16.65 |
| $ | 13.86 |
| $ | 34.97 |
| $ | 38.27 |
| $ | 39.45 |
|
|
|
|
|
|
|
| ||||||||||
Total return |
|
| 21.14 | % |
| –59.54 | % |
| –0.88 | % |
| 0.74 | % |
| 22.18 | % |
Ratios/Supplemental Data: |
|
|
|
|
|
|
|
|
|
|
|
|
|
|
|
|
Net Assets at end of year (000) |
| $ | 55,064 |
| $ | 47,405 |
| $ | 148,631 |
| $ | 269,414 |
| $ | 556,648 |
|
Ratio of total expenses to average net assets |
|
| 1.45 | % |
| 1.70 | % |
| 1.58 | % |
| 2.01 | % |
| 1.19 | % |
Ratio of interest expense to average net assets |
|
| 0.11 | % |
| 0.50 | % |
| 0.39 | % |
| 0.82 | % |
| 0.01 | % |
Ratio of expenses to average net assets excluding interest expense |
|
| 1.34 | % |
| 1.20 | % |
| 1.19 | % |
| 1.19 | % |
| 1.18 | % |
Ratio of net investment income (loss) to average net assets |
|
| 2.28 | % |
| 2.68 | % |
| 0.42 | % |
| (0.39 | )% |
| 0.16 | % |
Portfolio turnover |
|
| 135 | % |
| 68 | % |
| 49 | % |
| 19 | % |
| 34 | % |
|
|
|
| ||
(a) | The amount is less than $0.005 per share. |
The accompanying notes are an integral part of these financial statements.
59
|
|
Alpine Mutual Funds |
|
Financial Highlights—Continued
(For a share outstanding throughout each period)
|
|
|
|
|
| ||||
| Emerging Markets | |||
| ||||
| Period Ended | |||
| ||||
Per Share Data: |
|
|
|
|
Net asset value per share, beginning of period |
| $ | 10.00 |
|
|
|
| ||
Income from investment operations: |
|
|
|
|
Net investment loss |
|
| (0.08 | ) |
Net realized and unrealized gains on investments |
|
| 7.10 |
|
|
|
| ||
Total from investment operations |
|
| 7.02 |
|
|
|
| ||
Redemption fees |
|
| 0.01 |
|
Less distributions: |
|
|
|
|
From net investment income |
|
| — |
|
From net realized gains on investments |
|
| — |
|
|
|
| ||
Total distributions |
|
| — |
|
|
|
| ||
Net asset value per share, end of period |
| $ | 17.03 |
|
|
|
| ||
Total return |
|
| 70.30 | %(b) |
Ratios/Supplemental Data: |
|
|
|
|
Net Assets at end of period (000) |
| $ | 2,047 |
|
Ratio of total expenses to average net assets: |
|
|
|
|
Before waivers |
|
| 4.36 | %(c) |
After waivers |
|
| 1.35 | %(c) |
Ratio of net investment loss to average net assets |
|
| (–0.76 | )%(c) |
Portfolio turnover |
|
| 35 | % |
|
|
|
| ||
(a) | For the period from November 3, 2008 (inception of fund) to October 31, 2009. | |
|
| |
(b) | Not annualized. | |
|
| |
(c) | Annualized. |
The accompanying notes are an integral part of these financial statements.
60
|
Alpine Mutual Funds |
Financial Highlights—Continued
(For a share outstanding throughout each period)
|
|
|
|
|
| ||||
| Global | |||
| ||||
| Period Ended | |||
| ||||
Per Share Data: |
|
|
|
|
Net asset value per share, beginning of period |
| $ | 10.00 |
|
|
|
| ||
Income from investment operations: |
|
|
|
|
Net investment income |
|
| 0.19 |
|
Net realized and unrealized gains on investments |
|
| 3.19 |
|
|
|
| ||
Total from investment operations |
|
| 3.38 |
|
|
|
| ||
Redemption fees |
|
| 0.00 | (b) |
Less distributions: |
|
|
|
|
From net investment income |
|
| — |
|
From net realized gains on investments |
|
| — |
|
|
|
| ||
Total distributions |
|
| — |
|
|
|
| ||
Net asset value per share, end of period |
| $ | 13.38 |
|
|
|
| ||
Total return |
|
| 33.80 | %(c) |
Ratios/Supplemental Data: |
|
|
|
|
Net Assets at end of period (000) |
| $ | 1,422 |
|
Ratio of total expenses to average net assets: |
|
|
|
|
Before waivers |
|
| 4.42 | %(d) |
After waivers |
|
| 1.35 | %(d) |
Ratio of interest expense to average net assets |
|
| 0.00 | %(b)(d) |
Ratio of expenses to average net assets excluding interest expense: |
|
|
|
|
Before waivers |
|
| 4.42 | %(d) |
After waivers |
|
| 1.35 | %(d) |
Ratio of net investment income to average net assets |
|
| 1.76 | %(d) |
Portfolio turnover |
|
| 258 | % |
|
|
| |
(a) For the period from November 3, 2008 (inception of fund) to October 31, 2009. | |
|
|
(b) The amount is less than $0.005 per share or 0.005%. | |
|
|
(c) Not annualized. | |
|
|
(d) Annualized. |
The accompanying notes are an integral part of these financial statements.
61
|
Alpine Mutual Funds |
Notes to Financial Statements
October 31, 2009
|
|
1. | Organization: |
|
|
| Alpine Equity Trust (the “Equity Trust”) was organized in 1988 as a Massachusetts Business Trust, and is registered under the Investment Company Act of 1940, as amended (the “1940 Act”), as an open-ended management investment company. The Alpine International Real Estate Equity Fund, Alpine Realty Income & Growth Fund, Alpine Cyclical Advantage Property Fund, Alpine Emerging Markets Real Estate Fund and Alpine Global Infrastructure Fund are five separate funds of the Equity Trust (individually referred to as a “Fund” and collectively, “the Funds”). Effective September 1, 2009, the Alpine U.S. Real Estate Equity Fund changed its name to the Alpine Cyclical Advantage Property Fund. The Alpine International Real Estate Equity Fund, Alpine Cyclical Advantage Property Fund, Alpine Emerging Markets Real Estate Fund and Alpine Global Infrastructure Fund are diversified funds. The Alpine Realty Income & Growth Fund is a non-diversified fund. Alpine Woods Capital Investors, LLC (the “Adviser”) is a Delaware limited liability company and serves as the investment manager to the Funds. The Emerging Markets Real Estate Fund and Global Infrastructure Fund commenced operations on November 3, 2008. |
|
|
2. | Significant Accounting Policies: |
|
|
| The following is a summary of significant accounting policies consistently followed by the Funds in the preparation of their financial statements. The policies are in conformity with accounting principles generally accepted in the United States of America (“GAAP”), which require management to make estimates and assumptions that affect amounts reported herein. Actual results could differ from those estimates. In preparing these financial statements, the Funds have evaluated events and transactions for potential recognition or disclosure resulting from subsequent events through December 30, 2009. This evaluation did not result in any subsequent events that necessitated disclosure and/or adjustments. |
|
|
| A. Valuation of Securities: |
|
|
| The Funds value securities for which the primary market is on a domestic or foreign exchange and over-the-counter admitted to trading on the National Association of Securities Dealers Automated Quotation Market System (“NASDAQ”) at the last quoted sales price at the end of each business day or, if no sale, at the mean of the closing bid and asked prices. Over-the-counter securities are valued at the last quoted sales price at the end of each business day or, if no sale, at the mean of the closing bid and asked prices. Securities for which market quotations are not readily available or whose values have been materially affected by events occurring before the close of U.S. markets but after the close of the securities’ primary markets, are valued at fair value as determined in good faith according to procedures approved by the Board of Trustees. |
|
|
| For example, fair value pricing may be used where: (i) a security is illiquid (restricted securities and repurchase agreements maturing in more than seven days); (ii) the market or exchange for a security is closed on an ordinary trading day and no other market prices are available; (iii) the security is so thinly traded that there have been no transactions in the stock over an extended period; or (iv) the validity of a market quotation received is questionable. In addition, fair value pricing will be used if emergency or unusual situations have occurred, such as when trading of a security on an exchange is suspended; or when an event occurs after the close of the exchange on which the security is principally traded that is likely to have changed the value of the security before the NAV is calculated (applicable to foreign securities). |
|
|
| Among those factors that may be considered when fair valuing a security are: fundamental analytical data relating to the investment in the security; evaluation of the forces that influence the market in which the security is purchased and sold; type of security or asset; financial statements of issuer; special reports prepared by analysts or the Adviser; information as to any transactions or offers with respect to the security; and the historical tendency of the security’s price to track or respond to general and specific market movements (in terms of indices, sectors, or other market measurements). |
|
|
| As of October 31, 2009, the International Real Estate Equity Fund, the Realty Income & Growth Fund, and the Cyclical Advantage Property Fund held securities that are fair valued, which comprised 4.1%, 2.4% and 6.1%, respectively, of each Fund’s net assets. |
|
|
| In accordance with GAAP, the Funds use a three-tier hierarchy to establish classification of fair value measurements for disclosure purposes. Inputs refer broadly to the assumptions that market participants would use in pricing the asset or liability, including assumptions about risk. Inputs may be observable or unobservable. Observable inputs are inputs that reflect the assumptions market participants would use in pricing the asset or liability that are developed based on market data obtained from sources independent of the reporting entity. Unobservable inputs are inputs that reflect the reporting entities own assumptions about the assumptions market participants would us in pricing the asset or liability that are developed based on the best information available. |
62
|
Alpine Mutual Funds |
Notes to Financial Statements—Continued
October 31, 2009
|
|
|
| Level 1 — | Unadjusted quoted prices in active markets for identical assets or liabilities that the Fund has the ability to access. |
|
|
|
| Level 2 — | Observable inputs other than quoted prices included in level 1 that are observable for the asset or liability, either directly or indirectly. These inputs may include quoted prices for the identical instrument on an inactive market, prices for similar instruments, interest rates, prepayment speeds, credit risk, yield curves, default rates and similar data. |
|
|
|
| Level 3 — | Unobservable inputs for the asset or liability, to the extent relevant observable inputs are not available; representing the Funds’ own assumptions about the assumptions a market participant would use in valuing the asset or liability, and would be based on the best information available. |
The availability of observable inputs can vary from security to security and is affected by a wide variety of factors, including, for example, the type of security, whether the security is new and not yet established in the marketplace, the liquidity of markets, and other characteristics particular to the security. To the extent that valuation is based on models or inputs that are less observable or unobservable in the market, the determination of fair value requires more judgment. Accordingly, the degree of judgment exercised in determining fair value is greatest for instruments categorized in level 3.
The inputs used to measure fair value may fall into different levels of the fair value hierarchy. In such cases, for disclosure purposes, the level in the fair value hierarchy within which the fair value measurement falls in its entirety, is determined based on the lowest level input that is significant to the fair value measurement in its entirety.
Various inputs are used in determining the value of the Funds’ investments as of the reporting period end. The designated input levels are not necessarily an indication of the risk or liquidity associated with these investments. These inputs are categorized in the following hierarchy under applicable financial accounting standards.
The inputs or methodology used for valuing securities are not an indication of the risk associated with investing in those securities.
63
|
Alpine Mutual Funds |
Notes to Financial Statements—Continued
October 31, 2009
The following is a summary of the inputs used to value the Funds’ net assets as of October 31, 2009:
|
|
|
|
|
|
|
|
|
|
|
|
|
|
|
|
|
|
| International |
| Realty |
| Cyclical |
| Emerging |
| Global |
| |||||
|
|
|
|
|
|
| ||||||||||
Level 1: |
|
|
|
|
|
|
|
|
|
|
|
|
|
|
|
|
Common Stocks |
|
|
|
|
|
|
|
|
|
|
|
|
|
|
|
|
Asia |
| $ | 172,600,042 |
| $ | — |
| $ | 6,311,036 |
| $ | 519,639 |
| $ | — |
|
Australia |
|
| 39,147,768 |
|
| — |
|
| 618,401 |
|
| — |
|
| — |
|
Capital Goods |
|
| — |
|
| — |
|
| — |
|
| — |
|
| 164,755 |
|
Commercial & Professional Services |
|
| — |
|
| — |
|
| — |
|
| — |
|
| 25,700 |
|
Energy |
|
| — |
|
| — |
|
| — |
|
| — |
|
| 79,731 |
|
Europe |
|
| 166,410,643 |
|
| — |
|
| 2,310,619 |
|
| 184,137 |
|
| — |
|
Materials |
|
| — |
|
| — |
|
| — |
|
| — |
|
| 49,081 |
|
Media |
|
| — |
|
| — |
|
| — |
|
| — |
|
| 41,836 |
|
Middle East/Africa |
|
| 3,095,862 |
|
| — |
|
| 755,454 |
|
| 98,161 |
|
| — |
|
North & South America |
|
| 212,266,923 |
|
| — |
|
| 37,693,621 |
|
| 682,652 |
|
| — |
|
Software & Services |
|
| — |
|
| — |
|
| — |
|
| — |
|
| 21,562 |
|
Technology Hardware & Equipment |
|
| — |
|
| — |
|
| — |
|
| — |
|
| 77,936 |
|
Telecommunication Services |
|
| — |
|
| — |
|
| — |
|
| — |
|
| 171,714 |
|
Transportation |
|
| — |
|
| — |
|
| — |
|
| — |
|
| 331,010 |
|
Utilities |
|
| — |
|
| — |
|
| — |
|
| — |
|
| 405,662 |
|
Real Estate Investment Trusts |
|
|
|
|
|
|
|
|
|
|
|
|
|
|
|
|
Apartments |
|
| — |
|
| 7,544,884 |
|
| — |
|
| — |
|
| — |
|
Diversified |
|
| — |
|
| 3,960,210 |
|
| — |
|
| — |
|
| — |
|
Health Care |
|
| — |
|
| 10,140,671 |
|
| — |
|
| — |
|
| — |
|
Mortgage & Finance |
|
| — |
|
| 1,964,460 |
|
| — |
|
| — |
|
| — |
|
Net Lease |
|
| — |
|
| 2,934,191 |
|
| — |
|
| — |
|
| — |
|
Office — Industrial Buildings |
|
| — |
|
| 26,260,935 |
|
| — |
|
| — |
|
| — |
|
Retail Centers |
|
| — |
|
| 11,358,095 |
|
| — |
|
| — |
|
| — |
|
Storage |
|
| — |
|
| 2,256,944 |
|
| — |
|
| — |
|
| — |
|
Preferred Stocks |
|
|
|
|
|
|
|
|
|
|
|
|
|
|
|
|
Diversified |
|
| — |
|
| 1,004,256 |
|
| — |
|
| — |
|
| — |
|
Health Care |
|
| — |
|
| 712,500 |
|
| — |
|
| — |
|
| — |
|
Lodging |
|
| — |
|
| 1,538,441 |
|
| — |
|
| — |
|
| — |
|
Net Lease |
|
| — |
|
| 2,463,300 |
|
| — |
|
| — |
|
| — |
|
Office — Industrial Buildings |
|
| — |
|
| 6,215,039 |
|
| — |
|
| — |
|
| — |
|
Retail Centers |
|
| — |
|
| 3,097,842 |
|
| — |
|
| — |
|
| — |
|
Storage |
|
| — |
|
| 1,255,519 |
|
| — |
|
| — |
|
| — |
|
Rights |
|
| 830,347 |
|
| — |
|
| 87,913 |
|
| 1,056 |
|
| — |
|
Warrants |
|
| 1,810,869 |
|
| — |
|
| — |
|
| 13,011 |
|
| — |
|
Short-Term Investments |
|
| 21,862,665 |
|
| 667 |
|
| 300 |
|
| 235,580 |
|
| 6,192 |
|
64
|
Alpine Mutual Funds |
Notes to Financial Statements—Continued
October 31, 2009
|
|
|
|
|
|
|
|
|
|
|
|
|
|
|
|
|
|
| International |
| Realty |
| Cyclical |
| Emerging |
| Global |
| |||||
|
|
|
|
|
|
| ||||||||||
Level 2: |
|
|
|
|
|
|
|
|
|
|
|
|
|
|
|
|
Common Stocks |
|
|
|
|
|
|
|
|
|
|
|
|
|
|
|
|
Asia |
| $ | 32,829,681 |
| $ | — |
| $ | 969,334 |
| $ | 88,020 |
| $ | — |
|
Australia |
|
| 1,364,173 |
|
| — |
|
| — |
|
| — |
|
| — |
|
Europe |
|
| 6,449,687 |
|
| — |
|
| — |
|
| 58,035 |
|
| — |
|
Middle East/Africa |
|
| 3,386,413 |
|
| — |
|
| — |
|
| 39,000 |
|
| — |
|
North & South America |
|
| 7,318,718 |
|
| — |
|
| 3,102,370 |
|
| — |
|
| — |
|
Transportation |
|
| — |
|
| — |
|
| — |
|
| — |
|
| 31,266 |
|
Real Estate Investment Trusts |
|
|
|
|
|
|
|
|
|
|
|
|
|
|
|
|
Diversified |
|
| — |
|
| 2,415,634 |
|
| — |
|
| — |
|
| — |
|
Equity-Linked Structured Notes |
|
| 26,742,039 |
|
| — |
|
| 1,447,514 |
|
| 158,869 |
|
| 19,231 |
|
Level 3: |
|
|
|
|
|
|
|
|
|
|
|
|
|
|
|
|
Common Stocks |
|
|
|
|
|
|
|
|
|
|
|
|
|
|
|
|
Asia |
|
| 15,756,044 |
|
| — |
|
| — |
|
| — |
|
| — |
|
Europe |
|
| 428,696 |
|
| — |
|
| — |
|
| — |
|
| — |
|
North America |
|
| 12,056,947 |
|
| — |
|
| 3,339,408 |
|
| — |
|
| — |
|
Real Estate Investment Trusts |
|
|
|
|
|
|
|
|
|
|
|
|
|
|
|
|
Diversified |
|
| — |
|
| 2,003,645 |
|
| — |
|
| — |
|
| — |
|
|
|
|
|
|
|
| ||||||||||
Total Investments |
| $ | 724,357,517 |
| $ | 87,127,233 |
| $ | 56,635,970 |
| $ | 2,078,160 |
| $ | 1,425,676 |
|
|
|
|
|
|
|
|
Following is a reconciliation of Level 3 assets for which significant unobservable inputs were used to determine fair value:
|
|
|
|
|
|
|
|
|
|
|
|
|
|
|
|
|
|
| International |
| Realty |
| Cyclical |
| Emerging |
| Global |
| |||||
|
|
|
|
|
|
| ||||||||||
Balance as of October 31, 2008 |
| $ | 26,481,175 |
| $ | 2,461,374 |
| $ | 4,102,290 |
| $ | — |
| $ | — |
|
Accrued discounts / premiums |
|
| — |
|
| — |
|
| — |
|
| — |
|
| — |
|
Realized gain (loss) |
|
| — |
|
| — |
|
| — |
|
| — |
|
| — |
|
Change in unrealized appreciation (depreciation) |
|
| 1,345,711 |
|
| (457,729 | ) |
| (762,882 | ) |
| — |
|
| — |
|
Net purchases (sales) |
|
| — |
|
| — |
|
| — |
|
| — |
|
| — |
|
Transfers in and / or out of Level 3 |
|
| 414,801 |
|
| — |
|
| — |
|
| — |
|
| — |
|
|
|
|
|
|
|
| ||||||||||
Balance as of October 31, 2009 |
| $ | 28,241,687 |
| $ | 2,003,645 |
| $ | 3,339,408 |
| $ | — |
| $ | — |
|
|
|
|
|
|
|
|
B. Security Transactions and Investment Income:
Securities transactions are recorded on the date a security is purchased or sold (i.e. on the trade date). Realized gains and losses are computed on the identified cost basis. Interest income is recorded on the accrual basis and includes accretion of discounts and amortization of premiums, where applicable. Dividend income is recorded on the ex-dividend date or in the case of some foreign securities, on the date thereafter when the Funds are made aware of the dividend. Foreign income may be subject to foreign withholding taxes, which are accrued as applicable. Capital gains realized on some foreign securities are subject to foreign taxes, which are accrued as applicable.
Dividends and interest from non-U.S. sources received by the Funds are generally subject to non-U.S. withholding taxes at rates ranging up to 30%. Such withholding taxes may be reduced or eliminated under the terms of applicable U.S. income tax treaties, and the Funds intend to undertake any procedural steps required to claim the benefits of such treaties.
C. Line of Credit:
Each Fund has a line of credit with U.S. Bank N.A. Loans in aggregate, whether to cover overdrafts or for investment purposes, may not exceed the maximum amount that is permitted under the 1940 Act. For the year
65
|
|
Alpine Mutual Funds |
|
Notes to Financial Statements—Continued
October 31, 2009
ended October 31, 2009, the average interest rate paid on outstanding borrowings under the line of credit was 1.35%, 1.19% and 0.97% for the International Real Estate Equity Fund, Realty Income & Growth Fund and Cyclical Advantage Property Fund, respectively. The Funds also incur interest expense on custody overdraft charges.
|
|
|
|
|
|
|
|
|
|
|
|
|
|
|
|
|
|
|
|
|
|
| International |
| Realty |
| Cyclical |
| Emerging |
|
| Global |
|
| |||||||
|
|
|
|
|
|
|
|
| ||||||||||||
Total line of credit amount available |
| $ | 246,883,970 |
| $ | 30,029,540 |
| $ | 19,029,851 |
| $ |
| 698,990 |
|
| $ |
| 560,844 |
|
|
Line of credit outstanding at October 31, 2009 |
|
| — |
|
| 5,106,000 |
|
| 1,508,000 |
|
|
| — |
|
|
|
| — |
|
|
Line of credit amount unused at October 31, 2009 |
|
| 246,883,970 |
|
| 24,923,540 |
|
| 17,521,851 |
|
|
| 698,990 |
|
|
|
| 560,844 |
|
|
Average balance outstanding during the year |
|
| 24,644,694 |
|
| 6,631,493 |
|
| 1,241,477 |
|
|
| — |
|
|
|
| — |
|
|
Interest expense incurred on line of credit during the year |
|
| 312,291 |
|
| 85,255 |
|
| 47,489 |
|
|
| — |
|
|
|
| — |
|
|
Interest expense incurred on custody overdrafts during the year |
|
| 25,887 |
|
| 86 |
|
| 860 |
|
|
| — |
|
|
|
| 52 |
|
|
|
|
|
| D. Income Taxes: | |
|
|
|
| It is each Fund’s policy to comply with the requirements of Subchapter M of the Internal Revenue Code applicable to regulated investment companies and to distribute timely, all of its investment company taxable income and net realized capital gains to shareholders. Therefore, no federal income tax provision is recorded. | |
|
|
|
| Under applicable foreign tax laws, a withholding tax may be imposed on interest, dividends, and capital gains earned on foreign investments. Where available, the Funds will file for claims on foreign taxes withheld. | |
|
|
|
| E. Dividends and Distributions: | |
|
|
|
| Each Fund intends to distribute substantially all of its net investment income and net realized capital gains, if any, throughout the year to its shareholders in the form of dividends. Distributions to shareholders are recorded at the close of business on the ex-dividend date. | |
|
|
|
| The amounts of dividends from net investment income and of distributions from net realized gains are determined in accordance with federal income tax regulations, which may differ from GAAP. These differences are either considered temporary or permanent in nature. To the extent these differences are permanent in nature, such amounts are reclassified within the composition of net assets based on their federal tax-basis treatment; temporary differences do not require reclassification. In the event dividends and distributions to shareholders exceed net investment income and net realized gains for tax purposes, they are reported as returns of capital. | |
|
|
|
| F. Foreign Currency Translation Transactions: | |
|
|
|
| The Realty Income & Growth Fund and Global Infrastructure Fund may invest up to 35% and 40%, respectively of the value of its total assets in foreign securities. The International Real Estate Equity Fund and Emerging Markets Real Estate Fund will, under normal market conditions, invest no less than 80% of its total assets in foreign securities. The Cyclical Advantage Property Fund may invest without limitation in foreign securities. The books and records of each Fund are maintained in U.S. dollars. Non-U.S. denominated amounts are translated into U.S. dollars as follows, with the resultant translation gains and losses recorded in the Statements of Operations: | |
|
|
|
| i) | market value of investment securities and other assets and liabilities at the exchange rate on the valuation date, |
|
|
|
| ii) | purchases and sales of investment securities, income and expenses at the exchange rate prevailing on the respective date of such transactions. |
|
|
|
| G. Risk Associated With Foreign Securities and Currencies: | |
|
|
|
| Investments in securities of foreign issuers carry certain risks not ordinarily associated with investments in securities of domestic issuers. Such risks include future political and economic developments and the possible imposition of exchange controls or other foreign governmental laws and restrictions. In addition, with respect to certain countries, there is a possibility of expropriation of assets, confiscatory taxation, political or social instability or diplomatic developments, which could adversely affect investments in those countries. |
66
|
|
Alpine Mutual Funds |
|
Notes to Financial Statements—Continued
October 31, 2009
|
|
| Certain countries may also impose substantial restrictions on investments in their capital markets by foreign entities, including restrictions on investments in issuers or industries deemed sensitive to relevant national interests. These factors may limit the investment opportunities available to the Funds or result in a lack of liquidity and high price volatility with respect to securities of issuers from developing countries. |
|
|
| H. Total Return Swaps: |
|
|
| The Funds may enter into total return swaps. A total return swap is an agreement between the Fund and a counterparty to exchange a market linked return for a floating rate payment, both based on a notional principal amount. Total return swaps are marked-to-market daily based upon quotations from the market makers and the change in value, if any, is recorded as an unrealized gain or loss in the Statements of Operations. Payments received or paid are recorded as a realized gain or loss. The risks of entering into a total return swap include the unfavorable fluctuation of interest rates or the price of the underlying security or index, as well as the potential inability of the counterparty to fulfill their obligations under the swap agreement. The Funds did not enter into any total return swaps during the year ended October 31, 2009. |
|
|
| I. Equity-Linked Structured Notes: |
|
|
| Certain Funds may invest in equity-linked structured notes. Equity-linked structured notes are derivative securities which are specially designed to combine the characteristics of one or more underlying securities and their equity derivatives in a single note form. The return and/or yield or income component may be based on the performance of the underlying equity securities, and equity index, and/or option positions. Equity-linked structured notes are typically offered in limited transactions by financial institutions in either registered or non-registered form. An investment in equity-linked structured notes creates exposure to the credit risk of the issuing financial institution, as well as to the market risk of the underlying securities. There is no guaranteed return of principal with these securities and the appreciation potential of these securities may be limited by a maximum payment or call right. In certain cases, equity-linked structured notes may be more volatile and less liquid than less complex securities or other types of fixed-income securities. Such securities may exhibit price behavior that does not correlate with other fixed-income securities. |
|
|
| J. Forward Currency Contracts: |
|
|
| The Funds are subject to foreign currency exchange rate risk in the normal course of pursuing its investment objectives. The Funds may use forward currency contracts to gain exposure to or hedge against changes in the value of foreign currencies. A forward currency contract (“forward”) is an agreement between two parties to buy and sell a currency at a set price on a future date. The market value of the forward contract fluctuates with changes in forward currency exchange rates. The forward contract is marked-to-market daily and the change in market value is recorded by each Fund as unrealized appreciation or depreciation. When the forward contract is closed, a Fund records a realized gain or loss equal to the fluctuation in value during the period the forward contract was open. A Fund could be exposed to risk if a counterparty is unable to meet the terms of a forward or if the value of the currency changes unfavorably. The Funds did not enter into any forward currency contracts during the year ended October 31, 2009. |
|
|
| K. Derivatives |
|
|
| The Funds have adopted authoritative standards regarding disclosure about derivatives and hedging activities and how they affect the Funds’ Statements of Assets and Liabilities and Statements of Operations. The Funds did not enter into any derivatives transactions during the year ended October 31, 2009. |
67
|
|
Alpine Mutual Funds |
|
Notes to Financial Statements—Continued
October 31, 2009
|
|
3. | Capital Share Transactions: |
|
|
| The Funds have an unlimited number of shares of beneficial interest, with $0.0001 par value, authorized. Transactions in shares and dollars of the Funds were as follows: |
|
|
| International Real Estate Equity Fund |
|
|
|
|
|
|
|
|
|
|
|
|
|
|
|
| Year Ended |
| Year Ended |
| ||||||||
|
|
|
| ||||||||||
|
| Shares |
| Amount |
| Shares |
| Amount |
| ||||
|
|
|
|
|
| ||||||||
Shares sold |
|
| 15,703,708 |
| $ | 261,332,736 |
|
| 30,851,844 |
| $ | 1,013,466,466 |
|
Shares issued in reinvestment of dividends |
|
| — |
|
| — |
|
| 3,316,234 |
|
| 126,680,128 |
|
Redemption fees |
|
| — |
|
| 263,845 |
|
| — |
|
| 463,001 |
|
Shares redeemed |
|
| (30,984,841 | ) |
| (413,999,840 | ) |
| (40,215,350 | ) |
| (1,182,612,997 | ) |
|
|
|
|
|
| ||||||||
Total net change |
|
| (15,281,133 | ) | $ | (152,403,259 | ) |
| (6,047,272 | ) | $ | (42,003,402 | ) |
|
|
|
|
|
| ||||||||
|
|
|
|
|
|
|
|
|
|
|
|
|
|
Realty Income & Growth Fund |
|
|
|
|
|
|
|
|
|
|
|
|
|
|
|
|
|
|
|
|
|
|
|
|
|
|
|
|
| Year Ended |
| Year Ended |
| ||||||||
|
|
|
| ||||||||||
|
| Shares |
| Amount |
| Shares |
| Amount |
| ||||
|
|
|
|
|
| ||||||||
Shares sold |
|
| 1,099,933 |
| $ | 9,534,500 |
|
| 3,421,889 |
| $ | 65,719,804 |
|
Shares issued in reinvestment of dividends |
|
| 728,956 |
|
| 5,999,363 |
|
| 2,266,307 |
|
| 43,907,486 |
|
Redemption fees |
|
| — |
|
| 19,224 |
|
| — |
|
| 42,370 |
|
Shares redeemed |
|
| (3,615,828 | ) |
| (29,821,177 | ) |
| (17,311,114 | ) |
| (335,942,961 | ) |
|
|
|
|
|
| ||||||||
Total net change |
|
| (1,786,939 | ) | $ | (14,268,090 | ) |
| (11,622,918 | ) | $ | (226,273,301 | ) |
|
|
|
|
|
| ||||||||
|
|
|
|
|
|
|
|
|
|
|
|
|
|
Cyclical Advantage Property Fund |
|
|
|
|
|
|
|
|
|
|
|
|
|
|
|
|
|
|
|
|
|
|
|
|
|
|
|
|
| Year Ended |
| Year Ended |
| ||||||||
|
|
|
| ||||||||||
|
| Shares |
| Amount |
| Shares |
| Amount |
| ||||
|
|
|
|
|
| ||||||||
Shares sold |
|
| 382,173 |
| $ | 5,408,897 |
|
| 164,535 |
| $ | 4,129,264 |
|
Shares issued in reinvestment of dividends |
|
| 31,662 |
|
| 396,723 |
|
| 70,104 |
|
| 2,050,545 |
|
Redemption fees |
|
| — |
|
| 7,890 |
|
| — |
|
| 4,141 |
|
Shares redeemed |
|
| (526,128 | ) |
| (6,731,718 | ) |
| (1,065,700 | ) |
| (27,882,257 | ) |
|
|
|
|
|
| ||||||||
Total net change |
|
| (112,293 | ) | $ | (918,208 | ) |
| (831,061 | ) | $ | (21,698,307 | ) |
|
|
|
|
|
| ||||||||
|
|
|
|
|
|
|
|
|
|
|
|
|
|
Emerging Markets Real Estate Fund |
|
|
|
|
|
|
|
|
|
|
|
|
|
|
|
|
|
|
|
|
|
|
|
|
|
|
|
|
| Period Ended |
|
|
|
|
|
|
| ||||
|
|
|
|
|
|
|
|
| |||||
|
| Shares |
| Amount |
|
|
|
|
|
|
| ||
|
|
|
|
|
|
|
|
|
| ||||
Shares sold |
|
| 133,198 |
| $ | 1,491,562 |
|
|
|
|
|
|
|
Shares issued in reinvestment of dividends |
|
| — |
|
| — |
|
|
|
|
|
|
|
Redemption fees |
|
| — |
|
| 930 |
|
|
|
|
|
|
|
Shares redeemed |
|
| (12,997 | ) |
| (200,671 | ) |
|
|
|
|
|
|
|
|
|
|
|
|
|
|
|
| ||||
Total net change |
|
| 120,201 |
| $ | 1,291,821 |
|
|
|
|
|
|
|
|
|
|
|
|
|
|
|
|
|
|
|
|
| (1) | Fund commenced operations on November 3, 2008. |
68
|
|
Alpine Mutual Funds |
|
Notes to Financial Statements—Continued
October 31, 2009
|
|
| Global Infrastructure Fund |
|
|
|
|
|
|
|
|
|
| Period Ended |
| ||||
|
|
| |||||
|
| Shares |
| Amount |
| ||
|
|
|
| ||||
Shares sold |
|
| 108,924 |
| $ | 1,090,711 |
|
Shares issued in reinvestment of dividends |
|
| — |
|
| — |
|
Redemption fees |
|
| — |
|
| 109 |
|
Shares redeemed |
|
| (2,673 | ) |
| (32,849 | ) |
|
|
|
| ||||
Total net change |
|
| 106,251 |
| $ | 1,057,971 |
|
|
|
|
|
|
|
|
| (1) | Fund commenced operations on November 3, 2008. |
|
|
|
4. | Purchases and Sales of Securities: | |
|
|
|
| Purchases and sales of securities (excluding short-term securities) for the year ended October 31, 2009 are as follows: |
|
|
|
|
|
|
|
|
|
|
|
|
|
|
|
| Non-U.S. Government |
| U.S. Government |
| ||||||||
|
|
|
| ||||||||||
|
| Purchases |
| Sales |
| Purchases |
| Sales |
| ||||
|
|
|
|
|
| ||||||||
International Real Estate Equity Fund |
| $ | 272,623,890 |
| $ | 471,794,409 |
| $ | — |
| $ | — |
|
Cyclical Advantage Property Fund |
|
| 59,647,896 |
|
| 59,445,066 |
|
| — |
|
| — |
|
Realty Income & Growth Fund |
|
| 88,282,209 |
|
| 98,923,762 |
|
| — |
|
| — |
|
Emerging Markets Real Estate Fund |
|
| 1,351,873 |
|
| 282,446 |
|
| — |
|
| — |
|
Global Infrastructure Fund |
|
| 3,833,276 |
|
| 2,779,560 |
|
| — |
|
| — |
|
|
|
5. | Investment Advisory Agreement and Other Affiliated Transactions: |
|
|
| Alpine Woods Capital Investors, LLC (“the Adviser”) provides investment advisory services to each of the Funds. Pursuant to the advisory agreements with the Cyclical Advantage Property Fund and the Realty Income & Growth Fund, the Adviser is entitled to an annual fee based on each Fund’s average daily net assets, in accordance with the following schedule: |
|
|
|
|
|
First $750 million |
|
| 1.00 | % |
Next $250 million |
|
| 0.90 | % |
Over $1 billion |
|
| 0.80 | % |
|
|
| The Adviser is entitled to an annual fee based on 1.00% of each Fund’s average daily net assets for the International Real Estate Equity Fund, Emerging Markets Real Estate Fund and the Global Infrastructure Fund. |
69
| |
Alpine Mutual Funds | |
Notes to Financial Statements—Continued
October 31, 2009
|
|
6. | Transactions with Affiliates |
|
|
| The following issuers are affilliated with the International Real Estate Equity Fund; that is, the Fund held 5% or more of the outstanding voting securities during the year ended October 31, 2009. As defined in Section (2)(a)(3) of the Investment Company Act of 1940, such issuers are: |
|
|
|
|
|
|
|
|
|
|
|
|
|
|
|
|
|
|
|
|
|
Fund |
| Issuer Name |
| Balance at |
| Purchases |
| Sales |
| Balance at |
| Value at |
| Realized |
| |||||
|
|
|
|
|
|
|
| |||||||||||||
International Real |
| Engel East |
|
|
|
|
|
|
|
|
|
|
|
|
|
|
|
|
|
|
Estate Equity Fund |
| Europe NV |
| 4,402,500 |
| — |
| 4,402,500 |
| — |
|
|
| $ | — |
|
| $ | (9,703,280 | ) |
International Real |
| Yatra |
|
|
|
|
|
|
|
|
|
|
|
|
|
|
|
|
|
|
Estate Equity Fund |
| Capital, Ltd. |
| 1,491,800 |
| — |
| — |
| 1,491,800 |
|
|
|
| 8,781,622 |
|
|
| — |
|
|
|
7. | Concentration of Credit Risk: |
|
|
| The Funds invest a substantial amount of their assets in the equity securities of issuers engaged in the real estate industry, including real estate investment trusts (REITs). As a result, the Funds may be more affected by economic developments in the real estate industry than would a general equity fund. |
|
|
8. | Federal Income Tax Information |
|
|
| At October 31, 2009, the components of accumulated earnings (losses) on a tax basis were as follows: |
|
|
|
|
|
|
|
|
|
|
|
|
|
|
|
|
|
|
| International |
| Realty |
| Cyclical |
| Emerging |
| Global |
| |||||
|
|
|
|
|
|
| ||||||||||
Cost of investments |
| $ | 954,294,653 |
| $ | 87,207,931 |
| $ | 70,472,616 |
| $ | 1,515,019 |
| $ | 1,206,769 |
|
|
|
|
|
|
|
| ||||||||||
Gross unrealized appreciation |
|
| 95,321,024 |
|
| 19,434,557 |
|
| 7,377,270 |
|
| 582,789 |
|
| 244,140 |
|
Gross unrealized depreciation |
|
| (325,258,160 | ) |
| (19,515,255 | ) |
| (21,213,916 | ) |
| (19,648 | ) |
| (25,233 | ) |
|
|
|
|
|
|
| ||||||||||
Net unrealized appreciation (depreciation) |
|
| (229,937,136 | ) |
| (80,698 | ) |
| (13,836,646 | ) |
| 563,141 |
|
| 218,907 |
|
|
|
|
|
|
|
| ||||||||||
Undistributed ordinary income |
|
| 24,044,819 |
|
|
|
|
| 461,355 |
|
| 192,586 |
|
| 145,131 |
|
Undistributed long-term capital gain |
|
| — |
|
| — |
|
| — |
|
| — |
|
| — |
|
|
|
|
|
|
|
| ||||||||||
Total distributable earnings |
|
| 24,044,819 |
|
| — |
|
| 461,355 |
|
| 192,586 |
|
| 145,131 |
|
|
|
|
|
|
|
| ||||||||||
Other accumulated gains (losses) |
|
| (931,116,543 | ) |
| (23,901,436 | ) |
| (51,458,720 | ) |
| (369 | ) |
| 218 |
|
|
|
|
|
|
|
| ||||||||||
Total accumulated gains (losses) |
| $ | (1,137,008,860 | ) | $ | (23,982,134 | ) | $ | (64,834,011 | ) | $ | 755,358 |
| $ | 364,256 |
|
|
|
|
|
|
|
|
The tax basis of investments for tax and financial reporting purposes differs principally due to the deferral of losses on wash sales, REIT tax adjustments, and mark-to-market cost basis adjustments for investments in passive foreign investment companies (PFICs) for tax purposes.
The tax character of distributions paid during the years ended October 31, 2009 and 2008 were as follows:
|
|
|
|
|
|
|
|
|
| 2009 |
| 2008 |
| ||
|
|
|
| ||||
International Real Estate Equity Fund |
|
|
|
|
|
|
|
Ordinary income |
| $ | — |
| $ | 57,768,770 |
|
Long-term capital gain |
|
| — |
|
| 78,397,213 |
|
Return of capital |
|
| — |
|
| 3,595,986 |
|
|
|
|
| ||||
|
| $ | — |
| $ | 139,761,969 |
|
|
|
|
| ||||
|
|
|
|
|
|
|
|
Realty Income & Growth Fund |
|
|
|
|
|
|
|
Ordinary income |
| $ | 5,089,343 |
| $ | 9,583,848 |
|
Long-term capital gain |
|
| — |
|
| 37,038,174 |
|
Return of capital |
|
| 1,391,340 |
|
| — |
|
|
|
|
| ||||
|
| $ | 6,480,683 |
| $ | 46,622,022 |
|
|
|
|
|
70
|
|
Alpine Mutual Funds |
|
Notes to Financial Statements—Continued
October 31, 2009
|
|
|
|
|
|
|
|
|
| 2009 |
| 2008 |
| ||
|
|
|
| ||||
Cyclical Advantage Property Fund |
|
|
|
|
|
|
|
Ordinary income |
| $ | 411,286 |
| $ | 1,790,143 |
|
Return of capital |
|
| — |
|
| 335,086 |
|
|
|
|
| ||||
|
| $ | 411,286 |
| $ | 2,125,229 |
|
|
|
|
| ||||
| |||||||
Emerging Markets Real Estate Fund |
|
|
|
|
|
|
|
Ordinary income |
|
| — |
|
| — |
|
Long-term capital gain |
|
| — |
|
| — |
|
|
|
|
| ||||
|
| $ | — |
| $ | — |
|
|
|
|
| ||||
Global Infrastructure Fund |
|
|
|
|
|
|
|
Ordinary income |
|
| — |
|
| — |
|
Long-term capital gain |
|
| — |
|
| — |
|
|
|
|
| ||||
|
| $ | — |
| $ | — |
|
|
|
|
|
|
|
| Capital loss carryovers as of October 31, 2009 are as follows: |
|
|
|
|
|
|
|
|
|
|
|
|
|
|
| International |
| Realty |
| Cyclical |
| |||
|
|
|
|
|
| ||||||
Expiration Date | |||||||||||
10/31/15 |
| $ | — |
| $ | — |
| $ | 5,568,140 |
| |
10/31/16 |
| $ | 384,892,332 |
| $ | — |
| $ | 19,372,953 |
| |
10/31/17 |
| $ | 546,079,563 |
| $ | 23,902,276 |
| $ | 26,519,541 |
|
|
|
| In accordance with U.S. GAAP, the Funds have previously adopted accounting standards related to the accounting for uncertain tax positions. In accordance with this guidance, the Funds analyzed all open tax years, as defined by the Statute of Limitations, for all major jurisdictions. Open tax years are those that are open for exam by taxing authorities. Major jurisdications for the Funds included Federal and the state of New York. As of October 31, 2009, open Federal and New York tax years include the tax years ended October 31, 2006 through 2009. The Funds have no examinations in progress. |
|
|
| The Funds have reviewed all open tax years and major jurisdictions and conluded that there is no impact on the Funds’ net assets and no tax liability resulting from unrecognized tax benefits relating to uncertain income tax positions taken or expected to be taken on the tax return for the fiscal year ended October 31, 2009. Also, the Funds have recognized no interest and penalties related to uncertain tax benefits. The Funds are also not aware of any tax positions for which it is reasonably possible that the total amounts of unrecognized tax benefits will significantly change in the next twelve months. |
71
|
|
Alpine Mutual Funds |
|
REPORT OF INDEPENDENT REGISTERED PUBLIC ACCOUNTING FIRM
To the Shareholders and Board of Trustees
of Alpine Equity Trust:
We have audited the accompanying statements of assets and liabilities, including the schedules of portfolio investments of Alpine Equity Trust, comprising the Alpine Cyclical Advantage Property Fund, Alpine International Real Estate Equity Fund, Alpine Realty Income & Growth Fund, Alpine Emerging Markets Real Estate Fund, and Alpine Global Infrastructure Fund (collectively the “Funds”) as of October 31, 2009, and the related statements of operations, changes in net assets, and the financial highlights for the periods indicated therein. These financial statements and financial highlights are the responsibility of the Funds’ management. Our responsibility is to express an opinion on these financial statements and financial highlights based on our audits.
We conducted our audits in accordance with the standards of the Public Company Accounting Oversight Board (United States). Those standards require that we plan and perform the audit to obtain reasonable assurance about whether the financial statements are free of material misstatement. The Funds are not required to have, nor were we engaged to perform, an audit of there internal control over financial reporting. Our audits included consideration of internal control over financial reporting as a basis for designing audit procedures that are appropriate in the circumstances, but not for the purpose of expressing an opinion on the effectiveness of the Funds’ internal control over financial reporting. Accordingly, we express no such opinion. An audit also includes examining, on a test basis, evidence supporting the amounts and disclosures in the financial statements, assessing the accounting principles used and significant estimates made by management, as well as evaluating the overall financial statement presentation. Our procedures included confirmation of securities owned as of October 31, 2009, by correspondence with the custodian and brokers; where replies where not received from brokers, we performed other auditing procedures. We believe that our audits provide a reasonable basis for our opinion.
In our opinion, the financial statements and financial highlights referred to above present fairly, in all material respects, the financial position of each of the Funds as of October 31, 2009, the results of their operations, the changes in their net assets, and the financial highlights for the periods indicated, in conformity with accounting principles generally accepted in the United States of America.
Milwaukee, WI |
December 30, 2009 |
72
|
|
Alpine Mutual Funds |
|
Additional Information (Unaudited)
Expense Examples
October 31, 2009
As a shareholder of the International Real Estate Equity Fund, the Realty Income & Growth Fund, the Cyclical Advantage Property Fund, the Emerging Markets Real Estate Fund or the Global Infrastructure Fund, you will incur two types of cost: (1) redemption fees and (2) ongoing costs, including management fees; distribution and/or service fees; and other Fund expenses. The examples below are intended to help you understand your ongoing costs (in dollars) of investing in the Funds and to compare these costs with the ongoing costs of investing in other mutual funds. The examples are based on an investment of $1,000 for the period 5/1/2009-10/31/2009.
Actual Expenses
The first line of the tables below provides information about actual account values and actual expenses. The Funds charge no sales load or transaction fees, but do assess shareholders for outgoing wire transfers, returned checks and stop payment orders at prevailing rates charged by U.S. Bancorp Fund Services, LLC, the Funds’ transfer agent. If you request a redemption by wire transfer, currently a $15.00 fee is charged by the Funds’ transfer agent. Shareholders in the Funds will be charged a redemption fee equal to 1.00% of the net amount of the redemption if they redeem their shares less than 2 months after purchase. IRA accounts will be charged a $15.00 annual maintenance fee. To the extent the Funds invest in shares of other investment companies as a part of their investment strategies, you will indirectly bear your proportionate share of any fees and expenses charged by the underlying funds in which the Funds invest in addition to the expenses of the Fund. These expenses are not included in the example below. The example below includes, but is not limited to, management fees, shareholder servicing fees, fund accounting, custody and transfer agent fees. You may use the information in this line, together with the amount you invested, to estimate the expenses that you paid over the period. Simply divide your account value by $1,000 (for example, an $8,600 account value divided by $1,000 = 8.6), then multiply the result by the number in the first line under the heading entitled “Expenses Paid During Period” to estimate the expenses you paid on your account during the period.
Hypothetical Example for Comparison Purposes
The second line of the table below provides information about hypothetical account values and hypothetical expenses based on the Funds’ actual expense ratios and an assumed rate of return of 5% per year before expenses, which does not represent the Funds’ actual returns. The hypothetical account values and expenses may not be used to estimate the actual ending account balance or expenses you paid for the period. You may use this information to compare the ongoing costs of investing in the Funds and other funds. To do so, compare this 5% hypothetical example with the 5% hypothetical examples that appear in the shareholder reports of other funds. Please note that the expenses shown in the table are meant to highlight your ongoing costs only and do not reflect any transactional costs, such as redemption fees. Therefore, the second line of the table is useful in comparing ongoing costs only, and will not help you determine the relative total costs of owning different funds. In addition, if these transactional costs were included, your costs would have been higher.
International Real Estate Equity Fund
|
|
|
|
|
|
|
|
|
| Beginning |
| Ending |
| Expenses Paid |
|
|
|
|
|
| |||
Actual (1) |
| $1,000.00 |
| $1,667.20 |
| $8.13 |
|
Hypothetical (2) |
| $1,000.00 |
| $1,019.11 |
| $6.16 |
|
|
|
|
| ||
(1) | Ending account values and expenses paid during period based on a 66.72% return. The return is considered after expenses are deducted from the Fund. | |
(2) | Ending account values and expenses paid during period based on a 5.00% annual return. The return is considered before expenses are deducted from the Fund. | |
(3) | Excluding interest expense of 0.04%, the actual and hypothetical expenses paid during the period were $7.87 and $5.96, respectively. | |
* | Expenses are equal to the Fund’s annualized expense ratio of 1.21%, multiplied by the average account value over the period, multiplied by 184/365 (to reflect the one-half year period). |
73
| |
Alpine Mutual Funds | |
Additional Information (Unaudited)—Continued
Expense Examples
October 31, 2009
Realty Income & Growth Fund
|
|
|
|
|
|
|
|
|
| Beginning |
| Ending |
| Expenses Paid |
|
|
|
|
|
| |||
Actual (1) |
| $ 1,000.00 |
| $1,420.30 |
| $8.36 |
|
Hypothetical (2) |
| $ 1,000.00 |
| $1,018.30 |
| $6.97 |
|
|
|
(1) | Ending account values and expenses paid during period based on a 42.03% return. The return is considered after expenses are deducted from the Fund. |
(2) | Ending account values and expenses paid during period based on a 5.00% annual return. The return is considered before expenses are deducted from the Fund. |
(3) | Excluding interest expense of 0.12%, the actual and hypothetical expenses paid during the period were $7.63 and $6.36, respectively. |
* | Expenses are equal to the Fund’s annualized expense ratio of 1.37%, multiplied by the average account value over the period, multiplied by 184/365 (to reflect the one-half year period). |
Cyclical Advantage Property Fund
|
|
|
|
|
|
|
|
|
| Beginning |
| Ending |
| Expenses Paid |
|
|
|
|
|
| |||
Actual (1) |
| $ 1,000.00 |
| $1,295.70 |
| $8.39 |
|
Hypothetical (2) |
| $ 1,000.00 |
| $1,017.90 |
| $7.37 |
|
|
|
(1) | Ending account values and expenses paid during period based on a 29.57% return. The return is considered after expenses are deducted from the Fund. |
(2) | Ending account values and expenses paid during period based on a 5.00% annual return. The return is considered before expenses are deducted from the Fund. |
(3) | Excluding interest expense of 0.18%, the actual and hypothetical expenses paid during the period were $7.35 and $6.46, respectively. |
* | Expenses are equal to the Fund’s annualized expense ratio of 1.45%, multiplied by the average account value over the period, multiplied by 184/365 (to reflect the one-half year period). |
Emerging Markets Real Estate Fund
|
|
|
|
|
|
|
|
|
| Beginning |
| Ending |
| Expenses Paid |
|
|
|
|
|
| |||
Actual (1) |
| $ 1,000.00 |
| $1,521.90 |
| $8.58 |
|
Hypothetical (2) |
| $ 1,000.00 |
| $1,018.40 |
| $6.87 |
|
|
|
(1) | Ending account values and expenses paid during period based on a 52.19% return. The return is considered after expenses are deducted from the Fund. |
(2) | Ending account values and expenses paid during period based on a 5.00% annual return. The return is considered before expenses are deducted from the Fund. |
* | Expenses are equal to the Fund’s annualized expense ratio of 1.35%, multiplied by the average account value over the period, multiplied by 184/365 (to reflect the one-half year period). |
74
| |
Alpine Mutual Funds | |
Additional Information (Unaudited)—Continued
Expense Examples
October 31, 2009
Global Infrastructure Fund
|
|
|
|
|
|
|
|
|
| Beginning |
| Ending |
| Expenses Paid |
|
|
|
|
|
| |||
Actual (1) |
| $ 1,000.00 |
| $1,295.30 |
| $7.87 |
|
Hypothetical (2) |
| $ 1,000.00 |
| $1,018.35 |
| $6.92 |
|
|
|
(1) | Ending account values and expenses paid during period based on a 29.53% return. The return is considered after expenses are deducted from the Fund. |
(2) | Ending account values and expenses paid during period based on a 5.00% annual return. The return is considered before expenses are deducted from the Fund. |
(3) | Excluding interest expense of 0.01%, the actual and hypothetical expenses paid during the period were $7.81 and $6.87, respectively. |
* | Expenses are equal to the Fund’s annualized expense ratio of 1.36%, multiplied by the average account value over the period, multiplied by 184/365 (to reflect the one-half year period). |
75
|
Alpine Mutual Funds |
Additional Information (Unaudited)—Continued
October 31, 2009
Information about Trustees and Officers
The business and affairs of the Funds are managed under the direction of the Trusts’ Board of Trustees. Information pertaining to the Trustees and Officers of the Funds is set forth below. The SAI includes additional information about the Funds’ Trustees and Officers and is available, without charge, upon request by calling 1-888-785-5578.
|
|
|
|
|
|
|
|
|
|
|
Independent Trustees | ||||||||||
Name and Age |
| Position(s) |
| Term of Office |
| Principal Occupation During |
| # of |
| Other Directorships |
|
|
|
|
| ||||||
Laurence B. Ashkin (81) |
| Independent |
| Indefinite, |
| Real estate developer since 1980; Founder and President of Centrum Properties, Inc. since 1980. |
| 16 |
| Board of Trustees Chairman, Perspective Charter Schools, Chicago, IL; Director, Chicago Public Radio; Trustee of each of the Alpine Trusts.* |
H. Guy Leibler (55) |
| Independent |
| Indefinite, |
| Private investor, since 2007; Vice Chair & Chief Operating Officer of L&L Acquisitions, LLC (2004-2007); President, Skidmore, Owings & Merrill LLP (2001-2004). |
| 16 |
| Chairman Emeritus, White Plains Hospital Center; Trustee, each of the Alpine Trusts.* |
Jeffrey E. Wacksman (49) |
| Independent |
| Indefinite, |
| Partner, Loeb, Block & Partners LLP, since 1994. |
| 16 |
| Director, International Succession Planning Association; Trustee, Larchmont Manor Park Society; Director, Bondi Icebergs Inc. (Women’s Sportswear); Director, MH Properties, Inc.; Trustee, each of the Alpine Trusts.* |
James A. Jacobson (64) |
| Independent |
| Indefinite, |
| Retired, since November 2008; Vice Chairman and Managing Director, Spear Leeds & Kellogg Specialists, LLC, January 2003 to November 2008. |
| 16 |
| Trustee, each of the Alpine Trusts.* |
|
|
* | The term “Fund Complex” refers to the Funds in the Alpine Equity Trust, Alpine Series Trust, and Alpine Income Trust, and Alpine Global Dynamic Dividend Fund, Alpine Total Dynamic Dividend Fund, and Alpine Global Premier Properties Fund (the “Alpine Trust”). |
76
|
Alpine Mutual Funds |
Additional Information (Unaudited)—Continued
October 31, 2009
|
|
|
|
|
|
|
|
|
|
|
Interested Trustees & Officers | ||||||||||
Name and Age |
| Position(s) |
| Term of Office |
| Principal Occupation During |
| # of |
| Other Directorships |
|
|
|
|
| ||||||
Samuel A. Lieber* (53) |
| Interested |
| Indefinite, |
| CEO of Alpine Woods Capital Investors, LLC since November 1997. President of Alpine Trusts since 1998. |
| 16 |
| Trustee, each of the Alpine Trusts. |
Stephen A. Lieber*** (84) |
| Vice President |
| Indefinite, |
| Chief Investment Officer, Alpine Woods Capital Investors, LLC since 2003; Chairman and Senior Portfolio Manager, Saxon Woods Advisors, LLC since 1999. |
| N/A |
| None |
Robert W. Gadsden (52) |
| Vice President |
| Indefinite, |
| Portfolio Manager and Senior Real Estate Analyst of Alpine Woods Capital Investors, LLC since 1999. Formerly Vice President, Prudential Realty Group (1990-1999). |
| N/A |
| None |
John Megyesi (48) |
| Chief |
| Indefinite, |
| Chief Compliance Officer, Alpine Woods Capital Investors, LLC since January 2009; Vice President and Manager, Trade Surveillance, Credit Suisse Asset Management, LLC (2006-2009); Manager, Trading and Surveillance, Allianze Global Investors (2004-2006). |
| N/A |
| None |
Meimei Li (45) |
| Treasurer |
| Indefinite, |
| Controller, Alpine Woods Capital Investors, LLC since February 2007; Senior Accountant Pinnacle Group (2005-2007); Senior Auditor, Eisner & Lubin (2001-2005). |
| N/A |
| None |
Andrew Pappert (29) |
| Secretary |
| Indefinite, |
| Director of Fund Operations, Alpine Woods Capital Investors, LLC since September 2008; Assistant Vice President, Mutual Fund Operations, Credit Suisse Asset Management, LLC (2003-2009). |
| N/A |
| None |
|
|
* | Denotes Trustees who are “interested persons” of the Trust or Fund under the 1940 Act. |
|
|
** | The term “Fund Complex” refers to the Funds in the Alpine Equity Trust, Alpine Series Trust, and Alpine Income Trust, and Alpine Global Dynamic Dividend Fund, Alpine Total Dynamic Dividend Fund, and Alpine Global Premier Properties Fund (the “Alpine Trust”). |
|
|
*** | Stephen A. Lieber is the father of Samuel A. Lieber. |
77
|
Alpine Mutual Funds |
Additional Information (Unaudited)—Continued
October 31, 2009
Tax Information
The Funds designated the following percentages of dividends declared from net investment income for the fiscal year ended October 31, 2009 as qualified dividend income under the Jobs & Growth Tax Relief Reconciliation Act of 2003.
|
|
|
|
|
International Real Estate Equity Fund |
|
| 0 | % |
Realty Income & Growth Fund |
|
| 16 | % |
Cyclical Advantage Property Fund |
|
| 24 | % |
Emerging Markets Real Estate Fund |
|
| 0 | % |
Global Infrastructure Fund |
|
| 0 | % |
The Funds designated the following percentages of dividends declared during the fiscal year ended October 31, 2009 as dividends qualifying for the dividends received deduction available to corporate shareholders.
|
|
|
|
|
International Real Estate Equity Fund |
|
| 0 | % |
Realty Income & Growth Fund |
|
| 10 | % |
Cyclical Advantage Property Fund |
|
| 17 | % |
Emerging Markets Real Estate Fund |
|
| 0 | % |
Global Infrastructure Fund |
|
| 0 | % |
The Fund designated as long-term capital gain dividend, pursuant to Internal Revenue Code Section 852(b)(3), the amount necessary to reduce the earnings and profits of the Fund related to net capital gain to zero for the tax year ended October 31, 2009.
Availability of Proxy Voting Information
Information regarding how each Fund votes proxies relating to portfolio securities is available without charge upon request by calling toll-free at 1-888-785-5578 and on the SEC’s website at www.sec.gov. Information regarding how each Fund voted proxies relating to portfolio securities during the most recent twelve month period ended June 30 is available on the SEC’s website at www.sec.gov or by calling the toll-free number listed above.
Availability of Quarterly Portfolio Schedule
Beginning with each Fund’s fiscal quarter ended July 31, 2004, each Fund filed its complete schedules of portfolio holdings on Form N-Q with the SEC. Going forward, each Fund will file Form N-Q for the first and third quarters of each fiscal year on Form N-Q. Each Fund’s Form N-Q is available on the SEC’s website at www.sec.gov and may be reviewed and copied at the SEC’s Public Reference Room in Washington, DC. Information on the operation of the Public Reference Room may be obtained by calling 1-202-551-8090.
Privacy Policy
The Funds collect non-public information about you from the following sources:
|
|
|
| • | information we receive about you on applications or other forms; |
| • | information you give us orally; and |
| • | information about your transactions with others or us. |
The Funds do not disclose any non-public personal information about our customers or former customers without the customer’s authorization, except as required by law or in response to inquiries from governmental authorities. The Funds restrict access to your personal and account information to those employees who need to know that information to provide products and services to you. The Funds also may disclose that information to unaffiliated third parties (such as to brokers or custodians) only as permitted by law and only as needed for us to provide agreed services to you. The Funds maintain physical, electronic and procedural safeguards to guard your non-public personal information.
In the event that you hold shares of the Funds through a financial intermediary, including, but not limited to a broker-dealer, bank or trust company, the privacy policy of your financial intermediary would govern how your non-public personal information would be shared with unaffiliated third parties.
78
[THIS PAGE INTENTIONALLY LEFT BLANK]
[THIS PAGE INTENTIONALLY LEFT BLANK]
|
TRUSTEES |
Samuel A. Lieber |
Laurence B. Ashkin |
James A. Jacobson |
H. Guy Leibler |
Jeffrey E. Wacksman |
|
CUSTODIAN |
U.S. Bank, N.A. |
1555 N. Rivercenter Dr. Suite 302 |
Milwaukee, WI 53212 |
|
SUB-CUSTODIAN |
The Bank of New York Mellon |
One Wall Street |
New York, NY 10286 |
|
INDEPENDENT REGISTERED |
PUBLIC ACCOUNTING FIRM |
Deloitte & Touche LLP |
555 East Wells Street |
Milwaukee, WI 53202 |
|
FUND COUNSEL |
Blank Rome LLP |
The Chrysler Building |
405 Lexington Avenue |
New York, NY 10174 |
|
DISTRIBUTOR |
Quasar Distributors, LLC |
615 East Michigan Street |
Milwaukee, WI 53202 |
|
INVESTMENT ADVISER |
Alpine Woods Capital Investors, LLC |
2500 Westchester Ave., Suite 215 |
Purchase, NY 10577 |
|
TRANSFER AGENT & |
ADMINISTRATOR |
US Bancorp Fund Services, LLC |
615 East Michigan Street |
Milwaukee, WI 53202 |
|
|
SHAREHOLDER | INVESTOR INFORMATION |
|
1(888)785.5578 |
www.alpinefunds.com |
This material must be preceded or accompanied by a current prospectus.
Item 2. Code of Ethics.
The registrant has adopted a Senior Officer Code of Ethics that applies to the registrant’s president and chief financial officer. The registrant has not made any amendments to its Senior Officer Code of Ethics during the period covered by this report. The registrant has not granted any waivers from any provisions of the code of ethics during the period covered by this report.
A copy of the registrant’s Senior Officer Code of Ethics is filed herewith.
Item 3. Audit Committee Financial Expert.
The registrant’s board of trustees has determined that there is at least one audit committee financial expert serving on its audit committee. Laurence Ashkin is the “audit committee financial expert” and is considered to be “independent” as each term is defined in Item 3 of Form N-CSR.
Item 4. Principal Accountant Fees and Services.
The registrant has engaged its principal accountant to perform audit services, audit-related services, tax services and other services during the past two fiscal years. “Audit services” refer to performing an audit of the registrant’s annual financial statements or services that are normally provided by the accountant in connection with statutory and regulatory filings or engagements for those fiscal years. “Audit-related services” refer to the assurance and related services by the principal accountant that are reasonably related to the performance of the audit. “Tax services” refer to professional services rendered by the principal accountant for tax compliance, tax advice, and tax planning. “Other services” provided by the principal accountant were for fair valuation services analysis. The following table details the aggregate fees billed or expected to be billed for each of the last two fiscal years for audit fees, audit-related fees, tax fees and other fees by the principal accountant.
|
|
|
|
|
|
|
|
|
| FYE 10/31/2009 |
| FYE 10/31/2008 |
| ||
Audit Fees |
| $ | 104,550 |
| $ | 74,050 |
|
Audit-Related Fees |
| $ | 0 |
| $ | 0 |
|
Tax Fees |
| $ | 17,425 |
| $ | 11,400 |
|
All Other Fees |
| $ | 13,545 |
| $ | 0 |
|
The audit committee has adopted pre-approval policies and procedures that require the audit committee to pre-approve all audit and non-audit services of the registrant, including services provided to any entity affiliated with the registrant.
The percentage of fees billed by Deloitte & Touche LLP applicable to non-audit services pursuant to waiver of pre-approval requirement were as follows:
|
|
|
|
|
|
|
|
|
| FYE 10/31/2009 |
| FYE 10/31/2008 |
| ||
Audit-Related Fees |
| 0 | % |
| 0 | % |
|
Tax Fees |
| 0 | % |
| 0 | % |
|
All Other Fees |
| 0 | % |
| 0 | % |
|
All of the principal accountant’s hours spent on auditing the registrant’s financial statements were attributed to work performed by full-time permanent employees of the principal accountant.
The following table indicates the non-audit fees billed or expected to be billed by the registrant’s accountant for services to the registrant and to the registrant’s investment adviser (and any other controlling entity, etc.—not sub-adviser) for the last two years. The audit committee of the board of trustees has considered whether the provision of non-audit services that were rendered to the registrant’s investment adviser is compatible with maintaining the principal accountant’s independence and has concluded that the provision of such non-audit services by the accountant has not compromised the accountant’s independence.
|
|
|
|
|
|
Non-Audit Related Fees |
| FYE 10/31/2009 |
| FYE 10/31/2008 |
|
Registrant |
| $13,545 |
| $0 |
|
Registrant’s Investment Adviser |
| $0 |
| $0 |
|
Item 5. Audit Committee of Listed Registrants.
Not applicable to registrants who are not listed issuers (as defined in Rule 10A-3 under the Securities Exchange Act of 1934).
Item 6. Investments.
Schedule of Investments is included as part of the report to shareholders filed under Item 1 of this Form.
Item 7. Disclosure of Proxy Voting Policies and Procedures for Closed-End Management Investment Companies.
Not applicable to open-end investment companies.
Item 8. Portfolio Managers of Closed-End Management Investment Companies.
Not applicable to open-end investment companies.
Item 9. Purchases of Equity Securities by Closed-End Management Investment Company and Affiliated Purchasers.
Not applicable to open-end investment companies.
Item 10. Submission of Matters to a Vote of Security Holders.
Not Applicable.
Item 11. Controls and Procedures.
|
|
(a) | The Registrant’s President and Chief Financial Officer have reviewed the Registrant’s disclosure controls and procedures (as defined in Rule 30a-3(c) under the Investment Company Act of 1940 (the “Act”)) as of a date within 90 days of the filing of this report, as required by Rule 30a-3(b) under the Act and Rules 13a-15(b) or 15d-15(b) under the Securities Exchange Act of 1934. Based on their review, such officers have concluded that the disclosure controls and procedures are effective in ensuring that information required to be disclosed in this report is appropriately recorded, processed, summarized and reported and made known to them by others within the Registrant and by the Registrant’s service provider. |
|
|
(b) | There were no changes in the Registrant’s internal control over financial reporting (as defined in Rule 30a-3(d) under the Act) that occurred during the second fiscal quarter of the period covered by this report that has materially affected, or is reasonably likely to materially affect, the Registrant’s internal control over financial reporting. |
|
|
Item 12. Exhibits. | |
| |
(a) | (1) Any code of ethics or amendment thereto, that is the subject of the disclosure required by Item 2, to the extent that the registrant intends to satisfy Item 2 requirements through filing an exhibit. Filed herewith. |
|
|
| (2) A separate certification for each principal executive and principal financial officer pursuant to Section 302 of the Sarbanes-Oxley Act of 2002. Filed herewith. |
|
|
| (3) Any written solicitation to purchase securities under Rule 23c-1 under the Act sent or given during the period covered by the report by or on behalf of the registrant to 10 or more persons. Not applicable to open-end investment companies. |
|
|
(b) | Certifications pursuant to Section 906 of the Sarbanes-Oxley Act of 2002. Furnished herewith. |
SIGNATURES
Pursuant to the requirements of the Securities Exchange Act of 1934 and the Investment Company Act of 1940, the registrant has duly caused this report to be signed on its behalf by the undersigned, thereunto duly authorized.
|
|
|
|
|
|
(Registrant) Alpine Equity Trust | |||||
|
|
|
| ||
|
| ||||
| By (Signature and Title)* /s/ Samuel A. Lieber |
| |||
|
|
|
| ||
|
|
| Samuel A. Lieber, President |
| |
|
|
|
|
| |
| Date | 1/8/2010 |
|
| |
|
|
| |||
|
|
|
Pursuant to the requirements of the Securities Exchange Act of 1934 and the Investment Company Act of 1940, this report has been signed below by the following persons on behalf of the registrant and in the capacities and on the dates indicated.
|
|
|
|
|
|
|
| ||||
| By (Signature and Title)* /s/ Samuel A. Lieber |
| |||
|
|
|
| ||
|
|
| Samuel A. Lieber, President |
| |
|
|
|
|
| |
| Date | 1/8/2010 |
|
| |
|
|
| |||
|
|
| |||
| By (Signature and Title)* /s/ Ron Palmer |
| |||
|
|
|
| ||
|
|
| Ron Palmer, Chief Financial Officer |
| |
|
|
|
|
| |
| Date | 1/8/2010 |
|
| |
|
|
|
* Print the name and title of each signing officer under his or her signature.