Exhibit 3
FORWARD-LOOKING STATEMENTS
This exhibit includes forward-looking statements. The Province of Nova Scotia has based these forward-looking statements on its current expectations and projections about future events. These forward-looking statements are subject to risks, uncertainties, and assumptions about the Province of Nova Scotia, including, among other things:
| | • | | the Province of Nova Scotia’s economic and political trends; and |
| | • | | the Province of Nova Scotia’s ability to control expense and maintain revenues. |
In light of these risks, uncertainties and assumptions, the forward-looking events discussed in this exhibit might not occur.
ECONOMIC ASSUMPTIONS
This exhibit includes economic assumptions, which are developed by the Province of Nova Scotia for, and are a necessary part of, the budget process of the Province of Nova Scotia. Actual results may differ materially from these assumptions.

December 13, 2012
Overview
Through much of 2012, the global economic recovery has slowed and even reversed in some countries. Since the preparation of the Budget, the outlook for global, national and provincial economic growth has decelerated, resulting in revisions to the forecast for 2012-2013 fiscal results.
The Province of Nova Scotia is forecasting a deficit of $277.2 million for 2012-2013, an increase of $66.0 million from the estimate at budget time. This is the result
of reductions in revenue, partially offset by savings in departmental expenses.
Total revenues, including net income from Government Business Enterprises, are forecast to be $9.2 billion, a decrease of $90.5 million from budget. Total expenses are forecast to be $9.5 billion, $26.1 million lower than budget. Changes in consolidation and accounting adjustments result in a $1.6 million negative impact to the bottom line.
| | | | | | | | | | | | | | | | |
| Fiscal Summary Fiscal 2012–2013 | | | | | | | | | | | | | | | ($ thousands) | |
| | | | |
| | | Budget | | | September
Update | | | December
Update | | | Increase (Decrease)
from Budget | |
GENERAL REVENUE FUND | | | | | | | | | | | | | | | | |
Revenue | | | | | | | | | | | | | | | | |
Ordinary Revenue | | | 8,350,830 | | | | 8,301,342 | | | | 8,251,503 | | | | (99,327 | ) |
Ordinary Recoveries | | | 568,490 | | | | 578,857 | | | | 578,764 | | | | 10,274 | |
Net Income from Government Business Enterprises | | | 350,993 | | | | 346,793 | | | | 349,593 | | | | (1,400 | ) |
| | | | | | | | | | | | | | | | |
Total - Revenue | | | 9,270,313 | | | | 9,226,992 | | | | 9,179,860 | | | | (90,453 | ) |
| | | | | | | | | | | | | | | | |
| | | | |
Expenses | | | | | | | | | | | | | | | | |
Departmental Expenses | | | 8,534,646 | | | | 8,534,640 | | | | 8,508,995 | | | | (25,651 | ) |
Tax Credits and Rebates | | | 73,500 | | | | 73,500 | | | | 73,500 | | | | — | |
Pension Valuation Adjustment | | | 71,485 | | | | 71,485 | | | | 71,485 | | | | — | |
Debt Servicing Costs | | | 881,701 | | | | 881,701 | | | | 881,267 | | | | (434 | ) |
| | | | | | | | | | | | | | | | |
Total Expenses | | | 9,561,332 | | | | 9,561,326 | | | | 9,535,247 | | | | (26,085 | ) |
| | | | | | | | | | | | | | | | |
| | | (291,019 | ) | | | (334,334 | ) | | | (355,387 | ) | | | (64,368 | ) |
| | | | | | | | | | | | | | | | |
| | | | |
Consolidation and Accounting Adjustments for Governmental Units | | | 79,819 | | | | 85,051 | | | | 78,216 | | | | (1,603 | ) |
| | | | | | | | | | | | | | | | |
| | | | |
Provincial Surplus (Deficit) | | | (211,200 | ) | | | (249,283 | ) | | | (277,171 | ) | | | (65,971 | ) |
| | | | | | | | | | | | | | | | |

2

| | |
| Ordinary Revenue Fiscal 2012 - 2013 | | ($ thousands) |
| | | | | | | | | | | | | | | | |
| | | Budget | | | September
Update | | | December
Update | | | Increase (Decrease)
from Budget | |
| | | | |
Provincial Revenue Sources | | | | | | | | | | | | | | | | |
Tax Revenue: | | | | | | | | | | | | | | | | |
Personal Income Tax | | | 2,195,300 | | | | 2,200,800 | | | | 2,133,584 | | | | (61,716 | ) |
Corporate Income Tax | | | 398,450 | | | | 387,600 | | | | 397,403 | | | | (1,047 | ) |
Harmonized Sales Tax | | | 1,642,900 | | | | 1,645,000 | | | | 1,658,197 | | | | 15,297 | |
Motive Fuel Taxes | | | 254,100 | | | | 252,900 | | | | 249,797 | | | | (4,303 | ) |
Tobacco Tax | | | 211,000 | | | | 209,600 | | | | 213,596 | | | | 2,596 | |
Other Tax Revenue | | | 157,640 | | | | 157,769 | | | | 157,180 | | | | (460 | ) |
| | | | |
Other Provincial Revenue: | | | | | | | | | | | | | | | | |
Registry of Motor Vehicles | | | 110,279 | | | | 110,279 | | | | 114,479 | | | | 4,200 | |
Royalties - Petroleum | | | 27,672 | | | | 27,672 | | | | 25,172 | | | | (2,500 | ) |
Other Provincial Sources | | | 124,576 | | | | 127,276 | | | | 126,864 | | | | 2,288 | |
TCA Cost Shared Revenue | | | 3,625 | | | | 3,383 | | | | 4,453 | | | | 828 | |
Other Fees and Charges | | | 67,598 | | | | 67,355 | | | | 63,401 | | | | (4,197 | ) |
Prior Years’ Adjustments | | | — | | | | (5,986 | ) | | | 4,023 | | | | 4,023 | |
| | | | |
Investment Income: | | | | | | | | | | | | | | | | |
Interest Revenues | | | 74,070 | | | | 72,719 | | | | 72,113 | | | | (1,957 | ) |
Sinking Fund Earnings | | | 108,348 | | | | 108,567 | | | | 108,567 | | | | 219 | |
| | | | | | | | | | | | | | | | |
Total - Provincial Revenue Sources | | | 5,375,558 | | | | 5,364,934 | | | | 5,328,829 | | | | (46,729 | ) |
| | | | | | | | | | | | | | | | |
| | | | |
Federal Revenue Sources | | | | | | | | | | | | | | | | |
Equalization Payments | | | 1,593,820 | | | | 1,593,820 | | | | 1,593,820 | | | | — | |
Canada Health Transfer | | | 796,959 | | | | 796,959 | | | | 795,017 | | | | (1,942 | ) |
Canada Social Transfer | | | 321,943 | | | | 321,943 | | | | 322,957 | | | | 1,014 | |
Offshore Oil and Gas Payments | | | 146,059 | | | | 146,059 | | | | 146,059 | | | | — | |
Crown Share | | | 19,628 | | | | 19,628 | | | | 19,628 | | | | — | |
Other Federal Sources | | | 23,712 | | | | 23,401 | | | | 20,113 | | | | (3,599 | ) |
TCA Cost Shared Revenue | | | 73,151 | | | | 34,598 | | | | 26,860 | | | | (46,291 | ) |
Prior Years’ Adjustments | | | — | | | | — | | | | (1,780 | ) | | | (1,780 | ) |
| | | | | | | | | | | | | | | | |
Total - Federal Revenue Sources | | | 2,975,272 | | | | 2,936,408 | | | | 2,922,674 | | | | (52,598 | ) |
| | | | | | | | | | | | | | | | |
Total Ordinary Revenue | | | 8,350,830 | | | | 8,301,342 | | | | 8,251,503 | | | | (99,327 | ) |
| | | | | | | | | | | | | | | | |
| | | | |
Net Income from Government Business Enterprises | | | | | | | | | | | | | | | | |
Nova Scotia Liquor Corporation | | | 224,451 | | | | 224,451 | | | | 224,451 | | | | — | |
Nova Scotia Gaming Corporation | | | 112,600 | | | | 108,400 | | | | 111,200 | | | | (1,400 | ) |
Halifax-Dartmouth Bridge Commission | | | 11,536 | | | | 11,536 | | | | 11,536 | | | | — | |
Highway 104 Western Alignment Corporation | | | 2,406 | | | | 2,406 | | | | 2,406 | | | | — | |
| | | | | | | | | | | | | | | | |
Total - Net Income from Government Business Enterprises | | | 350,993 | | | | 346,793 | | | | 349,593 | | | | (1,400 | ) |
| | | | | | | | | | | | | | | | |
3
Revenues
Total revenues, including Ordinary Recoveries of $578.8 million, and net income from Government Business Enterprises of $349.6 million, are forecast to be $9.2 billion, $90.5 million less than the 2012-2013 Budget Estimates. This represents a decrease in Ordinary Revenues of $99.3 million, an increase in Ordinary Recoveries of $10.3 million, and a decrease in Net Income from Government Business Enterprises of $1.4 million.
Personal Income Taxes are down by $61.7 million or 2.8 per cent from the 2012-2013 Budget Estimates. Nova Scotia personal taxable income is expected to decline by $508.7 million in 2012 and $614.2 million in 2013 relative to the Budget Estimates. Growth in personal income was estimated to be 4.3 per cent in both 2012 and 2013 but is now forecast to be 2.8 per cent and 3.9 per cent, respectively. In addition, the province’s yield on levels of personal taxable income is lower than Budget Estimates.
Corporate Income Taxes are down by $1.0 million or 0.3 per cent from the 2012-2013 Budget Estimates. This is primarily due to the projected growth in Nova Scotia corporate operating surplus being reduced from 7.8 per cent to 2.2 per cent in 2012 and from 5.0 per cent to 4.2 per cent in 2013. This is partially offset by a decline in the projected share of corporate taxable income being taxed at the small business rate.
Harmonized Sales Tax is forecast to increase by $15.3 million or 0.9 per cent from the 2012-2013 Budget Estimates primarily as the result of upward revisions to the size of the consumer expenditure and residential housing investment tax bases as well as a higher growth rate in residential housing investment. Consumer expenditures on goods and services accounts for over 70 per cent of the province’s tax base. The rate of growth in consumer expenditures for 2012 and 2013 is expected to be slower than projected in the Budget Estimates. In addition, nominal GDP is expected to grow at a slower rate than originally estimated.
Motive Fuel Taxes are forecast to be down $4.3 million or 1.7 per cent from the 2012-2013 Budget Estimates largely as result of a slower growth rate in labour income and higher gasoline and diesel oil prices. As a result, the projected consumption of both gasoline and diesel oil are below Budget Estimates.
Tobacco Tax revenues are forecast to increase by $2.6 million or 1.2 per cent from the 2012-2013 Budget
Estimates. Consumption of both cigarettes (-0.2 per cent) and fine cut tobacco (-3.1 per cent) are declining on a year-over-year basis, but at a slower rate than anticipated in the Budget Estimates. In addition, the growth rate in the price of tobacco products is lower than projected in Budget Estimates.
Other tax revenue is forecast to be down by $460 thousand or 0.3 per cent as a result of a $500 thousand decline in Casino Win Taxes, partially offset by $40 thousand in Health Services Tax collected at Service Nova Scotia and Municipal Relations.
Revenue from the Registry of Motor Vehicles is forecast to be up by $4.2 million or 3.8 per cent, primarily as a result of higher-than-anticipated vehicle registrations, motor vehicle inspections, and driver licenses renewals.
Offshore Royalties are forecast to decline by $2.5 million or 9.0 per cent from the 2012-2013 Budget Estimates. This reflects the fact that commencement of production on the Deep Panuke project has been delayed beyond the end of the current fiscal year.
Other Provincial Sources are forecast to be up by $2.3 million or 1.8 per cent, primarily as a result of increased revenue from the sale of lumber arising from the forestry plan at the Department of Natural Resources.
Other fees and charges are forecast to be $4.2 million or 6.2 per cent lower than budget, as a result of the Dalhousie University / Nova Scotia Agricultural College merger Dalhousie will be collecting these fees and the reduction in fee revenue is offset by reduced operating costs at the Department of Agriculture. Various other changes in fees revenue from departments result in a net increase of $800 thousand above budget. The largest of these factors is an $850 thousand increase in probate fees at Justice.
Prior Year Adjustments (PYAs) from provincial sources are forecast to be a positive $4.0 million: -$5.3 million for Personal Income Tax, -$2.2 million for Corporate Income Tax, and $11.5 million for Harmonized Sales Tax.
Interest revenue is forecast to be down by $2.0 million or 2.6 per cent, primarily because of a lower-than-expected income stream from the Nova Scotia Housing Development Corporation for long-term care facilities, and an early payout of an existing mortgage at Nova Scotia Business Inc.
4
Equalization and the Offshore Accord Payments are based upon the province’s election to receive payments calculated according to the Expert Panel approach. This is a one-estimate, one-payment approach and as a result the forecast is equal to the Budget Estimates. The province expects to receive a cumulative best-of guarantee payment of $312.3 million in 2012-2013 pursuant to the clarification reached with the federal government in October 2007. An update to this forecast will be provided by the federal government before the end of December 2012.
Canada Health Transfer is down by $1.9 million or 0.2 per cent from the 2012-2013 Budget Estimates. Revised federal estimates of Basic Federal Tax and Corporate Taxable Income bases contributed to a $4.6 million decrease but this was partially offset by new population estimates showing the province with a higher share of national population.
Canada Social Transfer is up by $1.0 million or 0.3 per cent from the 2012-2013 Budget Estimates as a result of revised federal estimates of the province’s share of national population.
Other Federal Sources are reduced by $3.6 million or 15.2 per cent, primarily ($3.3 million) as a result of reduced Building Canada funding - Communities Component grant because of lower municipal spending. The balance of the variance results from the timeline for the Personal Health Records project timeline being extended from one year to two years.
Prior Year Adjustments from federal sources are forecast to be negative $1.8 million as a result of revised estimates for the open years (2010-2011 and 2011-2012) of the Canada Health Transfer.
Tangible Capital Assets (TCA) revenue for combined federal and provincial sources is expected to be down by $45.5 million. Provincial source TCA revenue is expected to be up by $828 thousand as a result of increased recovery for École Beau Port and the Springhill Junction bridge. Federal TCA revenue is forecast to be down by $46.3 million, primarily ($36.6 million) as a result of the deferred recognition of Provincial/Territorial base funding received from the federal government to align with planned spending on the new convention centre (Nova Centre). Other reductions include $9.3 million less for highways because of project delays and changes, and $341 thousand less for Drug Information System funding because of project delays. These revenue reductions will be picked up in future years.
Total Ordinary Recoveries are $10.3 million higher than budget, primarily as a result of increased recoveries for out-of-province insured services and joint data storage agreements at the Department of Health and Wellness, recovery of RCMP costs at the Department of Justice, a higher recovery for highway and building work at Transportation and Infrastructure Renewal, and recoveries from the Nova Scotia Teachers Union and for Mi’Kmaw Kina Matnewey agreement at the Department of Education.
Net income from Government Business Enterprises is forecast to be $1.4 million lower as a result of a steeper-than-expected decline in Video Lottery Terminal revenues at the Nova Scotia Gaming Corporation after the introduction of the MyPlay system in this fiscal year, partially offset by lower than expected expenses.
5
Expenses
Total expenses for 2012-2013 are forecast to be $9.5 billion, $26.1 million lower than budget. Decreases in departmental expenses account for $25.7 million of the variance with the remainder of the reduction coming from reduced debt servicing costs.
Departmental Expenses
Total departmental expenses for 2012-2013 are forecast to be $8.5 billion, $25.7 million below budget.
The Department of Agriculture is forecasting to be under budget $5.0 million primarily due to a reduced payment for the Nova Scotia Agriculture College (NSAC) merger that is offset by a reduction in fees. Dalhousie now collects the NSAC fees, thereby reducing the province’s net payment.
Communities, Culture and Heritage is forecasting to be under budget $1.4 million due to amortization savings and reduced operating expenses.
The Department of Community Services is forecasting to be under budget by $450 thousand primarily due to lower-than-expected spending in the Family Services division due to declining caseloads which offset higher-than-expected spending in Services for Persons with Disabilities due to increased placements and costs.
Economic and Rural Development and Tourism is forecasting $6.4 million less than budget due to the delayed construction of the seawall at Queen’s Landing and new jobsHere programs being implemented part way through the year.
| | | | | | |
| Departmental Expenses Fiscal 2012 - 2013 | | ($ thousands) |
| | | | | | | | | | | | | | | | |
| | | Budget | | | September
Update | | | December
Update | | | Increase (Decrease)
from Budget | |
| | | | |
Agriculture | | | 63,949 | | | | 63,939 | | | | 58,914 | | | | (5,035 | ) |
Communities, Culture and Heritage | | | 58,665 | | | | 58,665 | | | | 57,305 | | | | (1,360 | ) |
Community Services | | | 977,924 | | | | 976,940 | | | | 977,474 | | | | (450 | ) |
Economic and Rural Development and Tourism | | | 187,353 | | | | 185,903 | | | | 180,908 | | | | (6,445 | ) |
Education | | | 1,112,830 | | | | 1,113,553 | | | | 1,112,912 | | | | 82 | |
Energy | | | 29,568 | | | | 29,568 | | | | 29,568 | | | | — | |
Environment | | | 26,385 | | | | 26,161 | | | | 26,161 | | | | (224 | ) |
Finance | | | 38,990 | | | | 38,890 | | | | 38,448 | | | | (542 | ) |
Fisheries and Aquaculture | | | 8,799 | | | | 8,789 | | | | 8,789 | | | | (10 | ) |
Health and Wellness | | | 3,861,513 | | | | 3,861,513 | | | | 3,860,813 | | | | (700 | ) |
Justice | | | 306,723 | | | | 307,579 | | | | 308,441 | | | | 1,718 | |
Labour and Advanced Education | | | 346,208 | | | | 345,761 | | | | 346,058 | | | | (150 | ) |
Assistance to Universities | | | 347,619 | | | | 347,619 | | | | 347,619 | | | | — | |
Natural Resources | | | 95,685 | | | | 95,685 | | | | 95,685 | | | | — | |
Public Service | | | 174,314 | | | | 175,166 | | | | 166,130 | | | | (8,184 | ) |
Seniors | | | 1,871 | | | | 1,871 | | | | 1,871 | | | | — | |
Service Nova Scotia and Municipal Relations | | | 275,909 | | | | 275,909 | | | | 270,716 | | | | (5,193 | ) |
Transportation and Infrastructure Renewal | | | 421,617 | | | | 422,405 | | | | 422,459 | | | | 842 | |
Restructuring Costs | | | 198,724 | | | | 198,724 | | | | 198,724 | | | | — | |
| | | | | | | | | | | | | | | | |
Total - Departmental Expenses | | | 8,534,646 | | | | 8,534,640 | | | | 8,508,995 | | | | (25,651 | ) |
| | | | | | | | | | | | | | | | |
6
The Department of Education is over budget by $82 thousand mainly due to increased funding for class size caps and other pressures, offset by less-than-anticipated spending to date in repairs for dust collectors and other savings found throughout the department.
The Department of Finance is forecasting to be under budget $542 thousand due to salary and amortization savings.
The Department of Health and Wellness is forecasting to be under budget $700 thousand primarily due to under spends in various programs that are partially offset by pressures found in other areas of the department.
The Department of Justice is forecasting to be over budget by $1.7 million primarily due to a combination of its response to the flooding in Truro, which is partially recoverable through the Disaster Financial Assistance Program, and the recent conversion of RCMP services, by three towns, to the Provincial Police Service Agreement, which is fully recoverable.
The Department of Service Nova Scotia and Municipal Relations is forecasting to be under budget by $5.2 million primarily due to lower-than-anticipated spending in both the provincial and federal share of the Building Canada Fund.
Transportation and Infrastructure Renewal is projecting to be over budget by $842 thousand primarily due to increased maintenance costs for highways and bridges, which is completely offset by increased recoveries.
Public Service
In total Public Service is expected to be under budget by $8.2 million. The breakdown of that variance is as follows.
The Office of Aboriginal Affairs is under budget by $507 thousand mainly as a result of federal funding for the Tripartite Forum no longer flowing through the Office of Aboriginal Affairs. This is fully offset by a reduction in recoveries.
Intergovernmental Affairs is under budget by $855 thousand mainly as a result of lower-than-anticipated costs associated with the Council of the Federation meeting and operational efficiencies from closing the Ottawa Office.
Nova Scotia Business Inc. is forecasting to be under budget $7.7 million primarily due to a reduction in payroll rebate payments from the Strategic Investment Fund.
The Public Prosecution Service is forecasting to be over budget by $852 thousand primarily related to salary and operational pressures.
Gross Debt Servicing Costs
Gross debt servicing costs are forecast to be $434 thousand lower than budget. The decline results from decreased floating rate interest costs, partially offset by borrowing earlier than planned, and expenses related to unwinding an interest rate hedge.
Consolidation and Accounting Adjustments
Consolidation and accounting adjustments for government units are forecast to be $78.2 million, which is a decrease of $1.6 million from budget. This is primarily due to decreased capital grants to the Waterfront Development Corporation of $4.2 million due to project delays. Other government units (28 entities) have forecasted $2.5 million in increased net income, with the largest change of $1.5 million in Nova Scotia Business Inc. for lower-than-expected bad debt expenses.
7
Capital Spending
Tangible Capital Assets
The province is forecasting Capital Purchase Requirements to be over budget by $108 million. The additional spending is primarily due to $139 million in land purchases from NewPage and the Bowater Mersey Paper Company. At the same time, capital spending in other areas is expected to be less than budget due to project timing and utilizing remaining capital contingency funding.
Capital Grants
The province is forecasting to be under budget on capital grant spending by $6.7 million primarily due to project delays in the Waterfront Development Corporation. There is also less-than-anticipated spending for the Housing Development Corporation.
| | |
| Capital Spending Forecast 2012 - 2013 | | ($ thousands) |
| | | | | | | | | | | | |
| | | Budget | | | Forecast | | | Variance | |
| | | |
Highways | | | 281,000 | | | | 265,467 | | | | (15,533 | ) |
Buildings | | | 156,216 | | | | 153,653 | | | | (2,563 | ) |
IT | | | 56,162 | | | | 42,689 | | | | (13,473 | ) |
Land Purchases | | | 12,200 | | | | 153,950 | | | | 141,750 | |
Vehicles and Equipment | | | 12,925 | | | | 15,323 | | | | 2,398 | |
Contingency | | | 5,186 | | | | 607 | | | | (4,579 | ) |
| | | | | | | | | | | | |
Total Departmental | | | 523,689 | | | | 631,689 | | | | 108,000 | |
Capital Grants | | | 86,311 | | | | 79,595 | | | | (6,716 | ) |
| | | | | | | | | | | | |
Total Capital Program | | | 610,000 | | | | 711,284 | | | | 101,284 | |
| | | | | | | | | | | | |
8
Economic Performance and Outlook: 2012 and 2013
Since the preparation of the 2012-2013 Budget Economic Assumptions, a number of economic indicators and key economic events have deviated from expectations. There remain a number of immediate challenges that will impair economic growth over the next two years. However, the province’s medium-term prospects are considerably better. Including data and assumptions up to November 19, 2012, it is expected that real GDP growth will be 1.6 per cent in 2012 and 1.8 per cent in 2013*. The Budget Assumption for real GDP was 1.7 per cent in 2012 and 1.9 per cent in 2013. The outlook for nominal GDP has more of a change from the Budget Assumption: 3.4 per cent in 2012 and 3.3 per cent in 2013.* The Budget Assumption for nominal GDP was 4.6 per cent in 2012 and 3.8 per cent in 2013.
External Conditions
Nova Scotia’s economic growth fluctuates based on imports, exports and investment. These factors depend on global trade markets as well as the financial decisions of major multinational firms. Conditions in external markets play an important role in explaining whether the province’s economic growth accelerates or slows.
Since 2008, global economic conditions have been clouded by uncertainty. Unfortunately, global forecasters have often been premature when predicting resolution of these risks. Recent revisions to global economic forecasts indicate that economic uncertainty is expected to persist for at least two more years. The European economy is still expected to be in recession through the end of 2012 and possibly into 2013. China’s growth is slowing as decelerating export volumes are not being replaced by domestic consumption. A tentative US recovery, aided by guaranteed monetary easing through 2014, remains under threat in Congressional gridlock. For 2012, this update assumes that US real GDP growth will be 2.2 per cent in 2012, followed by 2.2 per cent in 2013. The outlook for Canadian real GDP in 2012 is 2.3 per cent. However, slower domestic spending is expected to restrain Canadian growth in 2013 to 2.0 per cent.
Nova Scotia: Recent Economic Performance
In November, Statistics Canada provided an update of Nova Scotia’s economic accounts from 2007-2010 along with new results for 2011. These historical revisions and new data provide important insight into how the provincial economy performed during the recession. In revised data, Nova Scotia’s economy experienced a contraction in 2009 (-0.3 per cent real GDP growth). However, over the entire period from 2007-2010, Nova Scotia’s economic growth was faster than the Canadian average.
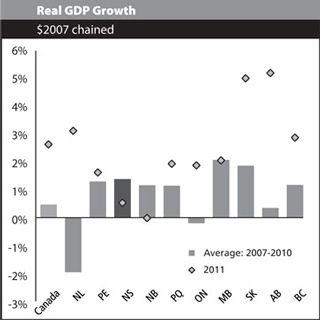
In 2011, Nova Scotia’s real GDP advanced by 0.5 per cent - slower than its recent history and slower than many other provinces (notably those exploiting energy and resources). Nova Scotia’s slower growth in 2011 was attributable to a large increase in imports of crude oil, machinery and equipment. Business investment and household expenditures slowed their contribution to real GDP expansion. Slower growth in government program spending (all levels) and exports resulted in little effect on economic growth.
9
There have been conflicting signals in Nova Scotia’s monthly and quarterly economic data received to date in 2012. Employment (0.9 per cent through November) and average weekly wages (2.8 per cent through September) have grown at close to the national pace. However, labour income (1.7 per cent through September) has fallen short of the national pace (4.1 per cent). Labour force growth has exceeded budget expectations, contributing to a higher unemployment rate than the Budget forecast with little change from the same period in 2011 (8.9 per cent). The impacts of closures in the forest sector have been visible in Nova Scotia’s trade data, with domestic forest product exports falling by over 50 per cent through the first three quarters of 2012. Overall exports are down by 17.7 per cent, but some of this is attributable to increasing use of natural gas by consumers in Canada. Residential construction activities have continued to exceed expectations, with growth of 5.5 per cent through September. Despite growth in industrial construction (50.6 per cent), non-residential structures have fallen 8.6 per cent compared with the average of January to September 2011.
Nova Scotia: Economic Outlook*
Nova Scotia’s economic growth in 2012 and 2013 is expected to be stronger than observed in 2011. However, like much of the rest of the world, Nova Scotia’s economic outlook remains clouded by uncertainties. Nova Scotia’s economy faces short-run volatility as changing trade patterns, fiscal austerity and major investment projects have significant and unpredictable effects. Most of these issues are expected to resolve in the short run and medium-term projections indicate accelerating economic growth.
Although real GDP growth is not substantially different from the Budget assumptions (0.1 percentage points slower in each of 2012 and 2013), nominal GDP growth has a stronger influence on provincial government revenues. For 2012, it is expected that nominal GDP growth will slow from the Budget assumption of 4.6 per cent to 3.4 per cent. In 2013, nominal growth is expected to slow from 3.8 per cent to 3.3 per cent.
Both compensation of employees and net operating surplus of corporations will advance slower than expected at the time of the Budget assumptions. Slower employee compensation growth (2.5 per cent in 2012) is expected to dampen growth in household consumption (2.3 per cent) and retail sales (1.5 per cent). However, residential investment is now expected to remain robust at 7.0 per cent in 2012, with a slowdown to 0.8 per cent in 2013.
Much of the 2012 calendar year’s Labour Force Survey has already been reported and employment growth is little changed from the Budget assumption. Unemployment rates have grown based on stronger labour force growth than expected. The delayed commencement of ship construction, combined with the impacts of fiscal austerity are expected to leave limited prospects for employment growth in 2013.
With changes in the forest products sector and delays in production from Deep Panuke, Nova Scotia’s international goods exports are now expected to decline by 12.5 per cent in 2012, with a rebound of 5.2 per cent as gas and forest production grows in 2013. For 2012 and 2013, this forecast assumes that imports will not repeat the unusual shocks of crude oil and machinery observed in 2011 and will return to a slower pace of growth.
Key risks
Uncertain global economic conditions have slowed investment, trade and growth for years. Like other jurisdictions around the world, Nova Scotia’s outlook is exposed to these risks. Uncertain economic prospects across industrialized and emerging economies may constrict global trade volumes and dampen prices for major export commodities. European fiscal consolidation could slow or even stall growth for many years. The US recovery could stumble over fiscal shocks. Emerging economies like Brazil and China appear unable to sustain global growth on their own. These risks have been apparent for a few years and the impact of this uncertainty is apparent in slow business investment.
In addition to these international risks, the Nova Scotia economy faces its own domestic risks. In the short run, these risks appear to be more negative. Most importantly, Nova Scotia’s labour income has been slowing since the second half of 2011 and recent data shows no recovery and their outlook could be slower than reported. Slower labour income growth could result in a downward revision to personal and sales tax revenues. With a relatively high exposure to the federal public service, the impacts of federal austerity on the provincial economy are significant unknowns. Although the provincial economic outlook makes assumptions about federal austerity impacts, their timing and distribution across the country has not been fully disclosed.
10
Some major projects such as the Nova Centre construction and the shipyard activities are assumed to commence in this fiscal update. However, the medium term Nova Scotia outlook has upside risks as some announced projects are not included in this projection: offshore exploration projects and the Maritime Link to the Lower Churchill power development.
Finally, revisions to the Provincial Economic Accounts are only available from 2007-2011. With only a limited time series on which to base forecast models, the Department of Finance has made a number of adjustments to its forecast processes. As deviations from the ordinary forecast procedure, these adjustments may themselves elevate the level of uncertainty in this economic forecast.
| | | | | | | | | | | | | | | | |
| | | 2012 | | | 2013 | |
| (% change, except where noted) | | Budget | | | Update | | | Budget | | | Update | |
| | | | |
Real GDP, $2007 | | | 1.7 | * | | | 1.6 | | | | 1.9 | * | | | 1.8 | |
Nominal GDP | | | 4.6 | * | | | 3.4 | | | | 3.8 | * | | | 3.3 | |
Compensation of Employees | | | 4.0 | * | | | 2.5 | | | | 4.0 | * | | | 3.0 | |
Household Final Consumption | | | 3.6 | * | | | 2.3 | | | | 3.6 | * | | | 3.2 | |
Retail Sales | | | 1.8 | | | | 1.5 | | | | 3.5 | | | | 4.2 | |
Consumer Price Index | | | 1.8 | | | | 1.9 | | | | 2.1 | | | | 1.5 | |
Residential Investment | | | 5.0 | * | | | 7.0 | | | | 5.0 | * | | | 0.8 | |
Net Operating Surplus: Corporations | | | 7.8 | * | | | 2.2 | | | | 5.0 | * | | | 4.2 | |
Exports of Goods to Other Countries | | | 7.1 | * | | | -12.5 | | | | 4.3 | * | | | 5.2 | |
Population (000s at July 1) | | | 943.2 | | | | 948.7 | a | | | 942.3 | | | | 942.3 | |
Employment | | | 1.0 | | | | 0.8 | | | | 0.6 | | | | -0.1 | |
Unemployment Rate (share of labour force) | | | 7.8 | | | | 9.0 | | | | 7.2 | | | | 9.0 | |
| * | With the November 19 historical revisions to the Provincial Economic Accounts, Statistics Canada has changed the structure of Nova Scotia’s accounts. The updated forecasts are presented under the new structure and definitions, while the Budget assumptions are based on the previous structure of the Provincial Economic Accounts. As such, comparisons between the Budget assumptions and the updated forecast may reflect differences of methodology. Notably: |
| | • | | Real GDP growth is now reported in chained 2007 dollars, the Budget assumption is in chained 2002 dollars. |
| | • | | Real GDP and Nominal GDP in the updated forecast reflect revised treatment of military weapons systems and research and development. Both are considered capital assets in the updated Provincial Economic Accounts. |
| | • | | Under the new structure of the economic accounts, Statistics Canada no longer reports personal income, instead it reports household income. |
| | • | | Instead of household income, the Department of Finance will now report its forecast summary based on compensation of employees (which is available quarterly, allowing for better in-year monitoring of the forecast). As there is no conceptual difference in compensation of employees, the Budget assumption and the updated forecast are comparable. |
| | • | | Under the new structure of the economic accounts, household final consumption does not include final consumption expenditures of non-profit organizations serving households and aboriginal general governments. The Budget assumption for this item includes non-profit spending and is not comparable to the updated forecast. |
| | • | | Under the new structure of the accounts, net operating surplus of corporations is defined as total output less intermediate inputs and compensation of employees, with inventory valuation adjustments. The prior structure reported corporate profits, which is shown here as the Budget assumption. Corporate profits adjusted for net interest income as well as royalties and did not adjust for inventory valuation. The Budget assumption (corporate profits) is not comparable to the updated forecast (net operating surplus of corporations). |
| | • | | Although there is no change to trade items under the new structure of the provincial economic accounts, the Department of Finance will now summarize its forecast for trade based only on international exports of goods. Comparison of this assumption against monthly merchandise trade data allows for some in-year monitoring of the forecast. |
| a | actual (the Department of Finance only revises its demographic forecast at the time of the Budget) |
11