UNITED STATES
SECURITIES AND EXCHANGE COMMISSION
Washington, D.C. 20549
FORM N-CSRS/A
CERTIFIED SHAREHOLDER REPORT OF REGISTERED MANAGEMENT
INVESTMENT COMPANIES
Investment Company Act file number 811-05742
| | | | |
Name of Fund: | | BlackRock Funds | | |
| | All-Cap Global Resources Portfolio Asset Allocation Portfolio Aurora Portfolio Capital Appreciation Portfolio Exchange Portfolio Global Opportunities Portfolio Global Resources Portfolio Global Science & Technology Opportunities Portfolio Health Sciences Opportunities Portfolio International Opportunities Portfolio Mid-Cap Value Equity Portfolio Mid-Cap Growth Equity Portfolio Money Market Portfolio Municipal Money Market Portfolio New Jersey Municipal Money Market Portfolio North Carolina Municipal Money Market Portfolio Ohio Municipal Money Market Portfolio Pennsylvania Municipal Money Market Portfolio Small Cap Core Equity Portfolio Small Cap Growth Equity Portfolio Small Cap Value Equity Portfolio Small/Mid-Cap Growth Portfolio U.S. Opportunities Portfolio U.S. Treasury Money Market Portfolio Virginia Municipal Money Market Portfolio |
| | |
Fund Address: | | 100 Bellevue Parkway, Wilmington, DE 19809 | | |
Name and address of agent for service: Donald C. Burke, Chief Executive Officer, BlackRock Funds, 800
Scudders Mill Road, Plainsboro, NJ, 08536. Mailing address: P.O. Box 9011, Princeton, NJ, 08543-9011
Registrant’s telephone number, including area code: (800) 441-7762
Date of fiscal year end: 09/30/2008
Date of reporting period: 10/01/2007 – 03/31/2008
| | | | |
| Item 1 | | – | | Report to Stockholders |
EQUITIES FIXED INCOME REAL ESTATE LIQUIDITY ALTERNATIVES BLACKROCK SOLUTIONS
| | | | |
| |
| BlackRock | |  |
| Equity Portfolios | | |
| | |
| SEMI-ANNUAL REPORT | | | MARCH 31, 2008 (UNAUDITED) | | |
Capital Appreciation
Mid-Cap Value Equity
Mid-Cap Growth Equity
Aurora
Small/Mid-Cap Growth
Small Cap Value Equity
Small Cap Core Equity
Small Cap Growth Equity
Global Science & Technology Opportunities
Global Resources
All-Cap Global Resources
Health Sciences Opportunities
U.S. Opportunities
Global Opportunities
International Opportunities
NOT FDIC INSURED
MAY LOSE VALUE
NO BANK GUARANTEE
Table of Contents
| | | | | | |
| 2 | | SEMI-ANNUAL REPORT | | MARCH 31, 2008 | | |
A Letter to Shareholders
Dear Shareholder
Financial markets endured severe bouts of volatility during the reporting period, particularly as the calendar turned to 2008. It was then that fears of an economic recession swelled and credit market strains intensified, producing calamity in the financial system and, ultimately, the demise of major Wall Street firm Bear Stearns.
The Federal Reserve Board (the “Fed”), after cutting the target federal funds rate 100 basis points (1%) between September 2007 and year-end, stepped up its efforts to support the ailing financial sector in the first three months of 2008. The central bank cut interest rates 125 basis points in January alone, and followed with another 75-basis-point cut on March 18, bringing the target rate to 2.25%. In an unprecedented move, the Fed also extended its financing operations directly to broker/dealers and assisted JPMorgan in its buyout of ill-fated Bear Stearns.
Against this backdrop, investor anxiety has been acute and equity markets have struggled. The S&P 500 Index of U.S. stocks was down in March, marking the fifth consecutive month of negative returns. International markets outperformed the U.S. for much of 2007, but that trend changed in more recent months as investors grew increasingly reluctant to take on the risks of foreign investing.
In fixed income markets, an ongoing investor flight to quality continued to drive Treasury yields lower and their prices higher. The yield on 10-year Treasury issues, which touched 5.30% in June 2007 (its highest level in five years), fell to 4.04% by year-end and to 3.45% by March 31. Investors largely shunned bonds associated with the housing and credit markets, and the riskier high yield sector landed in negative territory year-to-date. Meanwhile, the municipal bond market has struggled with concerns around the creditworthiness of monoline bond insurers and the failure of auctions for auction rate securities, driving yields higher and prices lower across the curve. At period-end, municipal bonds were trading at higher yields than their Treasury counterparts, a very unusual occurrence by historical standards.
Overall, the major benchmark indexes posted mixed results for the current reporting period, generally reflecting heightened investor risk aversion:
| | | | | | |
Total Returns as of March 31, 2008 | | 6-month | | | 12-month | |
U.S. equities (S&P 500 Index) | | (12.46 | )% | | (5.08 | )% |
Small cap U.S. equities (Russell 2000 Index) | | (14.02 | )% | | (13.00 | )% |
International equities (MSCI Europe, Australasia, Far East Index) | | (10.50 | )% | | (2.70 | )% |
Fixed income (Lehman Brothers U.S. Aggregate Index) | | 5.23 | % | | 7.67 | % |
Tax-exempt fixed income (Lehman Brothers Municipal Bond Index) | | 0.75 | % | | 1.90 | % |
High yield bonds (Lehman Brothers U.S. Corporate High Yield 2% Issuer Capped Index) | | (4.01 | )% | | (3.47 | )% |
Past performance is no guarantee of future results. Index performance shown for illustrative purposes only. You cannot invest directly in an index.
As you navigate today’s volatile markets, we encourage you to review your investment goals with your financial professional and to make portfolio changes, as needed. For more up-to-date commentary on the economy and financial markets, we invite you to visit www.blackrock.com/funds. As always, we thank you for entrusting BlackRock with your investment assets, and we look forward to continuing to serve you in the months and years ahead.
|
| Sincerely, |
|
 |
| Rob Kapito |
| President, BlackRock Advisors, LLC |
THIS PAGE NOT PART OF YOUR FUND REPORT
3
Portfolio Summary (Unaudited) | Capital Appreciation Portfolio |
Portfolio Management Commentary
How did the Portfolio perform?
| • | | Portfolio results outperformed that of the benchmark Russell 1000 Growth Index for the six-month period. |
What factors influenced performance?
| • | | Stock selection accounted for the majority of the Portfolio’s relative outperformance over the period. Selection gains were most advantageous in the healthcare sector, where the Portfolio held top performers across many sub-sectors. Pharmaceutical giant Abbott Laboratories and biotechnology firms Gilead Sciences Inc. and Celgene Corp. were the most notable contributors. |
| • | | Strength among the Portfolio’s energy holdings, namely, EOG Resources Inc. and CONSOL Energy, Inc., also enhanced results. Shares of both companies surged higher during the period, driving the Portfolio’s 30% gain in the sector. |
| • | | Additionally, favorable stock selection in materials and consumer staples boosted relative performance. Relative strength in the materials sector was attributable to long-time Portfolio holding, Monsanto, as the agricultural biotechnology company has benefited from strong global demand for its seed and trait products. Within consumer staples, our emphasis on multinational, stable growth companies has had a positive impact. Wal-Mart was the top individual contributor in this group. |
| • | | In contrast, negative stock selection in information technology and consumer discretionary limited the Portfolio’s relative gains over the past six months. Semiconductor holdings PMC-Sierra Inc. and Broadcom Corp. hindered results in information technology, while gaming operator Las Vegas Sands Corp. and footwear manufacturer Crocs Inc. accounted for much of the underperformance in the consumer discretionary sector. |
Describe recent Portfolio activity.
| • | | During the period, we increased the Portfolio’s weighting in consumer staples and energy, while we reduced the allocation to financials and industrials. |
Describe Portfolio positioning at period-end.
| • | | Throughout the six-month period, we continued to emphasize a number of the large, steady growth companies in our universe, with a focus on stocks that have non-cyclical growth potential, as we believe these firms are best suited to weather a slowdown in global growth. |
| • | | Sector weights continued to be driven by our bottom-up stock selection decisions. At period-end, the Portfolio’s largest overweights versus the benchmark Russell 1000 Growth Index were in healthcare and consumer staples, while it was relatively underexposed to the struggling consumer discretionary and financials sectors. |
Portfolio Profile as of March 31, 2008
| | | |
Ten Largest Holdings | | Percent of
Long-Term
Investments | |
Apple Computer, Inc. | | 4 | % |
The Coca-Cola Co. | | 4 | |
Wal-Mart Stores, Inc. | | 4 | |
QUALCOMM, Inc. | | 3 | |
Adobe Systems, Inc. | | 3 | |
Microsoft Corp. | | 3 | |
Philip Morris International, Inc. | | 3 | |
Google, Inc. - Class A | | 3 | |
Honeywell International, Inc. | | 3 | |
Monsanto Co. | | 3 | |
| |
Ten Largest Industries | | Percent of
Long-Term
Investments | |
Computer Software & Services | | 13 | % |
Pharmaceuticals | | 9 | |
Manufacturing | | 9 | |
Telecommunications | | 7 | |
Retail Merchandising | | 7 | |
Oil & Gas | | 7 | |
Computer & Office Equipment | | 6 | |
Medical Instruments & Supplies | | 5 | |
Beverages & Bottling | | 5 | |
Food & Agriculture | | 4 | |
For Portfolio compliance purposes, the Portfolio’s industry classifications refer to any one or more of the industry sub-classifications used by one or more widely recognized market indexes or ratings group indexes, and/or as defined by Portfolio management. This definition may not apply for purposes of this report, which may combine industry sub-classifications for reporting ease.
| | | | | | |
| 4 | | SEMI-ANNUAL REPORT | | MARCH 31, 2008 | | |
| | |
| Portfolio Summary (concluded) | | Capital Appreciation Portfolio |
Total Return Based on a $10,000 Investment
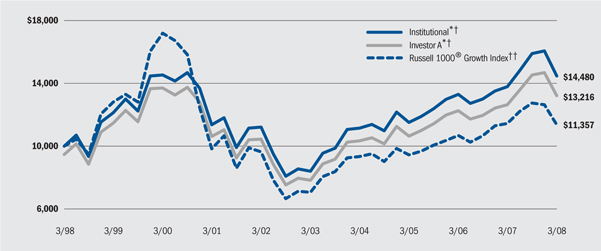
| * | Assuming maximum sales charge, if any, transaction costs and other operating expenses, including advisory fees. |
| † | Under normal market conditions, the Portfolio invests at least 80% of total assets in common and preferred stock and securities convertible into common and preferred stock of mid- and large-size companies. |
†† | An index composed of those Russell 1000® securities with greater-than-average growth orientation, generally having higher price-to-book and price-to-earnings ratios, lower dividend yields and higher forecasted growth values. |
Performance Summary for the Period Ended March 31, 2008
| | | | | | | | | | | | | | | | | | | | | |
| | | | | | Average Annual Total Returns* | |
| | | | | | 1 Year | | | 5 Years | | | 10 Years | |
| | | 6-Month
Total Returns | | | w / o sales
charge | | | w / sales
charge | | | w / o sales
charge | | | w / sales
charge | | | w / o sales
charge | | | w / sales
charge | |
Institutional | | (8.84 | )% | | 5.06 | % | | — | | | 11.46 | % | | — | | | 3.77 | % | | — | |
Investor A | | (9.05 | )% | | 4.52 | % | | (0.99 | )% | | 11.04 | % | | 9.86 | % | | 3.38 | % | | 2.83 | % |
Investor B | | (9.42 | )% | | 3.71 | % | | (0.79 | )% | | 10.22 | % | | 9.94 | % | | 2.72 | % | | 2.72 | % |
Investor C | | (9.34 | )% | | 3.92 | % | | 2.92 | % | | 10.29 | % | | 10.29 | % | | 2.65 | % | | 2.65 | % |
Russell 1000® Growth Index. | | (10.87 | )% | | (0.75 | )% | | — | | | 9.96 | % | | — | | | 1.28 | % | | — | |
| * | Assuming maximum sales charges. See “About Portfolios’ Performance” on page 34 for a detailed description of share classes, including any related sales charges and fees. |
Past performance is not indicative of future results.
Expense Example
| | | | | | | | | | | | | | | | | | |
| | | Actual | | Hypothetical** |
| | | Beginning
Account Value
October 1, 2007 | | Ending
Account Value
March 31, 2008 | | Expenses Paid
During the Period* | | Beginning
Account Value
October 1, 2007 | | Ending
Account Value
March 31, 2008 | | Expenses Paid
During the Period* |
Institutional | | $ | 1,000.00 | | $ | 911.59 | | $ | 3.35 | | $ | 1,000.00 | | $ | 1,021.46 | | $ | 3.54 |
Investor A | | $ | 1,000.00 | | $ | 909.46 | | $ | 5.73 | | $ | 1,000.00 | | $ | 1,018.93 | | $ | 6.07 |
Investor B | | $ | 1,000.00 | | $ | 905.76 | | $ | 9.92 | | $ | 1,000.00 | | $ | 1,014.46 | | $ | 10.54 |
Investor C | | $ | 1,000.00 | | $ | 906.59 | | $ | 8.95 | | $ | 1,000.00 | | $ | 1,015.49 | | $ | 9.51 |
| * | For each class of the Portfolio, expenses are equal to the annualized expense ratio for the class (0.70% for Institutional, 1.20% for Investor A, 2.08% for Investor B and 1.88% for Investor C), multiplied by the average account value over the period, multiplied by 183/366 (to reflect the one-half year period shown). |
| ** | Hypothetical 5% annual return before expenses is calculated by pro-rating the number of days in the most recent fiscal half year divided by 366. |
See “Disclosure of Expenses” on page 35 for further information on how expenses were calculated.
| | | | | | |
| | SEMI-ANNUAL REPORT | | MARCH 31, 2008 | | 5 |
| | |
Portfolio Summary (Unaudited) | | Mid-Cap Value Equity Portfolio |
Portfolio Management Commentary
How did the Portfolio perform?
| • | | The Portfolio outperformed the benchmark Russell Midcap Value Index for the six-month period ended March 31, 2008. |
What factors influenced performance?
| • | | Portfolio performance benefited from favorable stock selection in utilities, where Equitable Resources (gas utilities), Entergy Corp. (electric utilities) and Constellation Energy (independent power producers) added value. In energy, exploration & production companies performed particularly well, especially EOG Resources, Southwestern Energy, CONSOL Energy, Inc. and Massey Energy. In industrials, armored car and home security provider Brink’s was a standout performer. |
| • | | Stock selection and an underweight in financials also added value, with key contributions from People’s United Financial in thrift & mortgage finance; good stock selection and an underweight in commercial banks, particularly Cullen/Frost Bankers; stock selection in real estate investment trusts (REITs); and an underweight in insurance. |
| • | | Although an underweight and stock selection among media names added value in the consumer discretionary sector, these gains were overshadowed by disappointing performance from select specialty retailers and apparel manufacturers, specifically Borders Group and Jones Apparel Group. |
| • | | Other detractors included stock selection in information technology, healthcare and consumer staples. Stocks that disappointed included Electronics for Imaging, a producer of printing and imaging products, managed care provider Coventry Healthcare and Constellation Brands and Pilgrim’s Pride within consumer staples. |
Describe recent Portfolio activity.
| • | | During the six months, we increased the Portfolio’s exposure to materials, healthcare and consumer staples. In materials, we established a position in chemicals company Hercules. In healthcare, we added to equipment & supply manufacturers (Cooper Cos.) and healthcare providers (with new positions in Laboratory Corp. of America and DaVita). In consumer staples, we added to tobacco and personal products (with a new position in Estee Lauder) and beverage producers (Constellation Brands). |
| • | | We reduced exposure to consumer discretionary, industrials and financials. In consumer discretionary, we trimmed specialty retailers (with the sale of Office Depot and Borders Group) and apparel manufacturers. In industrials, we trimmed construction & engineering, electric equipment and aerospace & defense, and in financials, we reduced exposure to REITs and commercial banks. |
Describe Portfolio positioning at period-end.
| • | | The Portfolio ended the period overweight in healthcare (particularly healthcare providers and equipment & supply manufacturers) and consumer staples (notably tobacco, food & staples retailers). Underweights at period-end included financials (particularly REITs and insurance) and consumer discretionary (primarily household durables and media). |
Portfolio Profile as of March 31, 2008
| | | |
Ten Largest Holdings | | Percent of
Long-Term
Investments | |
Safeway, Inc. | | 2 | % |
The Brink’s Co. | | 2 | |
Grant Prideco, Inc. | | 2 | |
Simon Property Group, Inc. (REIT) | | 2 | |
The Cooper Cos., Inc. | | 2 | |
Del Monte Foods Co. | | 2 | |
People’s United Financial, Inc. | | 2 | |
Newfield Exploration Co. | | 2 | |
HCC Insurance Holdings, Inc. | | 2 | |
Edison International | | 2 | |
| |
Ten Largest Industries | | Percent of
Long-Term
Investments | |
Energy & Utilities | | 13 | % |
Insurance | | 8 | |
Oil & Gas | | 8 | |
Retail Merchandising | | 8 | |
Banks | | 7 | |
Finance | | 6 | |
Medical & Medical Services | | 5 | |
Manufacturing | | 5 | |
Chemicals | | 4 | |
Real Estate | | 3 | |
For Portfolio compliance purposes, the Portfolio’s industry classifications refer to any one or more of the industry sub-classifications used by one or more widely recognized market indexes or ratings group indexes, and/or as defined by Portfolio management. This definition may not apply for purposes of this report, which may combine industry sub-classifications for reporting ease.
| | | | | | |
| 6 | | SEMI-ANNUAL REPORT | | MARCH 31, 2008 | | |
| | |
| Portfolio Summary (concluded) | | Mid-Cap Value Equity Portfolio |
Total Return Based on a $10,000 Investment
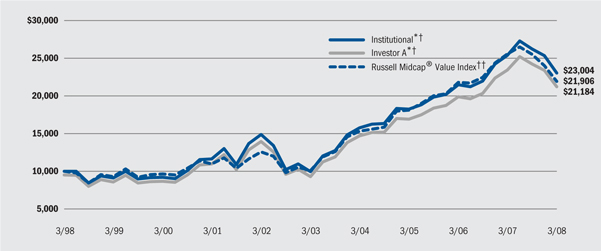
| * | Assuming maximum sales charge, if any, transaction costs and other operating expenses, including advisory fees. |
| † | The Portfolio normally invests at least 80% of its net assets in equity securities issued by U.S. mid-capitalization value companies. |
†† | An index that consists of the bottom 800 securities of the Russell 1000® Index with less-than-average growth orientation as ranked by total market capitalization. Securities in this index generally have low price-to-book and price-to-earnings ratios, higher dividend yields and lower forecasted growth values. |
Performance Summary for the Period Ended March 31, 2008
| | | | | | | | | | | | | | | | | | | | | |
| | | | | | Average Annual Total Returns* | |
| | | | | | 1 Year | | | 5 Years | | | 10 Years | |
| | | 6-Month
Total Returns | | | w / o sales
charge | | | w / sales
charge | | | w / o sales
charge | | | w / sales
charge | | | w / o sales
charge | | | w / sales
charge | |
Institutional | | (12.21 | )% | | (9.24 | )% | | — | | | 18.28 | % | | — | | | 8.69 | % | | — | |
Service | | (12.38 | )% | | (9.50 | )% | | — | | | 17.94 | % | | — | | | 8.38 | % | | — | |
Investor A | | (12.37 | )% | | (9.53 | )% | | (14.27 | )% | | 17.94 | % | | 16.68 | % | | 8.38 | % | | 7.80 | % |
Investor B | | (12.65 | )% | | (10.14 | )% | | (13.67 | )% | | 17.10 | % | | 16.88 | % | | 7.68 | % | | 7.68 | % |
Investor C | | (12.65 | )% | | (10.22 | )% | | (11.00 | )% | | 17.09 | % | | 17.09 | % | | 7.60 | % | | 7.60 | % |
Russell Midcap® Value Index | | (14.09 | )% | | (14.12 | )% | | — | | | 16.77 | % | | — | | | 8.16 | % | | — | |
| * | Assuming maximum sales charges. See “About Portfolios’ Performance” on page 34 for a detailed description of share classes, including any related sales charges and fees. |
Past performance is not indicative of future results.
Expense Example
| | | | | | | | | | | | | | | | | | |
| | | Actual | | Hypothetical** |
| | | Beginning
Account Value
October 1, 2007 | | Ending
Account Value
March 31, 2008 | | Expenses Paid
During the Period* | | Beginning
Account Value
October 1, 2007 | | Ending
Account Value
March 31, 2008 | | Expenses Paid
During the Period* |
Institutional | | $ | 1,000.00 | | $ | 877.88 | | $ | 4.41 | | $ | 1,000.00 | | $ | 1,020.24 | | $ | 4.76 |
Service | | $ | 1,000.00 | | $ | 876.18 | | $ | 5.84 | | $ | 1,000.00 | | $ | 1,018.69 | | $ | 6.31 |
Investor A | | $ | 1,000.00 | | $ | 876.30 | | $ | 5.86 | | $ | 1,000.00 | | $ | 1,018.67 | | $ | 6.33 |
Investor B | | $ | 1,000.00 | | $ | 873.52 | | $ | 9.37 | | $ | 1,000.00 | | $ | 1,014.88 | | $ | 10.12 |
Investor C | | $ | 1,000.00 | | $ | 873.49 | | $ | 9.37 | | $ | 1,000.00 | | $ | 1,014.87 | | $ | 10.13 |
| * | For each class of the Portfolio, expenses are equal to the annualized expense ratio for the class (0.94% for Institutional, 1.25% for Service, 1.25% for Investor A, 2.00% for Investor B and 2.00% for Investor C), multiplied by the average account value over the period, multiplied by 183/366 (to reflect the one-half year period shown). |
| ** | Hypothetical 5% annual return before expenses is calculated by pro-rating the number of days in the most recent fiscal half year divided by 366. |
See “Disclosure of Expenses” on page 35 for further information on how expenses were calculated.
| | | | | | |
| | SEMI-ANNUAL REPORT | | MARCH 31, 2008 | | 7 |
| | |
Portfolio Summary (Unaudited) | | Mid-Cap Growth Equity Portfolio |
Portfolio Management Commentary
How did the Portfolio perform?
| • | | The Portfolio posted strong relative returns amid a challenging investment backdrop, outperforming the benchmark Russell Mid Cap Growth Index for the six-month period. |
What factors influenced performance?
| • | | The majority of the Portfolio’s outperformance of the benchmark is attributed to strong stock selection in the energy and materials sectors. |
| • | | Within energy, exploration & production names were the most significant industry contributors. Coal companies Massey Energy and CONSOL Energy, Inc. posted outsized gains, as prices for coal increased on rising foreign demand. Additionally, oil and natural gas company EOG Resources advanced more than 60% during the period on increased production possibilities. |
| • | | Within the materials sector, chemicals company Agrium continued to post strong financial results on increasing demand for its fertilizer products. Industrials companies Joy Global and IHS Incorporated also posted double-digit returns, bolstering Portfolio performance. |
| • | | These positives were offset by weak stock selection in the information technology and financials sectors. In technology, the communications equipment industry was the most significant industry detractor. Foundry Networks and Juniper Networks accounted for much of the underperformance, as worries over decreased corporate spending pressured the stocks. Within financials, larger holding CME Group was down almost 20% for the period on news of a possible industry reorganization. |
Describe recent Portfolio activity.
| • | | We made no major changes to the Portfolio’s composition during the six-month period. We selectively trimmed and added holdings throughout the Portfolio. Among stocks added were Broadcom, Intuit and DeVry Incorporated. Notable eliminations were JCPenney, Lam Research and Precision Castparts. |
Describe Portfolio positioning at period-end.
| • | | As of March 31, 2008, the Portfolio’s most significant overweight was in the information technology sector, where we maintain a diverse group of holdings. The most significant underweight at period-end was in the financials sector. |
Portfolio Profile as of March 31, 2008
| | | |
Ten Largest Holdings | | Percent of
Long-Term
Investments | |
Thermo Electron Corp. | | 3 | % |
Pediatrix Medical Group, Inc. | | 3 | |
GameStop Corp. | | 3 | |
Ametek, Inc. | | 3 | |
Bare Escentuals, Inc. | | 2 | |
IHS, Inc. | | 2 | |
Celanese Corp. - Series A | | 2 | |
Amphenol Corp. | | 2 | |
Adobe Systems, Inc. | | 2 | |
CME Group, Inc. | | 2 | |
| |
Ten Largest Industries | | Percent of
Long-Term
Investments | |
Computer Software & Services | | 11 | % |
Oil & Gas | | 10 | |
Medical & Medical Services | | 6 | |
Electronics | | 6 | |
Retail Merchandising | | 5 | |
Business Services | | 5 | |
Telecommunications | | 5 | |
Finance | | 4 | |
Entertainment & Leisure | | 4 | |
Metal & Mining | | 4 | |
For Portfolio compliance purposes, the Portfolio’s industry classifications refer to any one or more of the industry sub-classifications used by one or more widely recognized market indexes or ratings group indexes, and/or as defined by Portfolio management. This definition may not apply for purposes of this report, which may combine industry sub-classifications for reporting ease.
| | | | | | |
| 8 | | SEMI-ANNUAL REPORT | | MARCH 31, 2008 | | |
| | |
| Portfolio Summary (concluded) | | Mid-Cap Growth Equity Portfolio |
Total Return on a $10,000 Investment
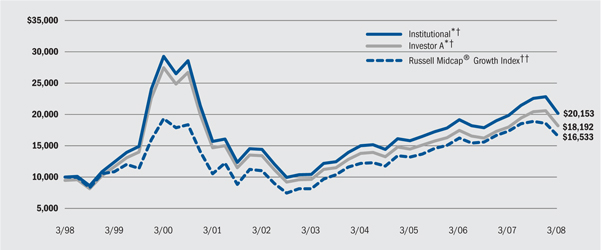
| * | Assuming maximum sales charge, if any, transaction costs and other operating expenses, including advisory fees. |
| † | The Portfolio normally invests at least 80% of its net assets in equity securities issued by U.S. mid-capitalization growth companies which the portfolio management team believes have above-average earnings growth potential. |
†† | An index that consists of the bottom 800 securities of the Russell 1000® Index with greater-than-average growth orientation as ranked by total market capitalization. Securities in this index generally have higher price-to-book and price-to-earnings ratios, lower dividend yields and higher forecasted growth values. |
Performance Summary for the Period Ended March 31, 2008
| | | | | | | | | | | | | | | | | | | | | |
| | | | | | Average Annual Total Returns* | |
| | | | | | 1 Year | | | 5 Years | | | 10 Years | |
| | | 6-Month
Total Returns | | | w / o sales
charge | | | w / sales
charge | | | w / o sales
charge | | | w / sales
charge | | | w / o sales
charge | | | w / sales
charge | |
Institutional | | (10.45 | )% | | 1.68 | % | | — | | | 14.04 | % | | — | | | 7.26 | % | | — | |
Service | | (10.68 | )% | | 1.50 | % | | — | | | 13.66 | % | | — | | | 6.94 | % | | — | |
Investor A | | (10.76 | )% | | 1.08 | % | | (4.19 | )% | | 13.48 | % | | 12.27 | % | | 6.74 | % | | 6.17 | % |
Investor B | | (11.04 | )% | | 0.40 | % | | (4.10 | )% | | 12.65 | % | | 12.40 | % | | 6.13 | % | | 6.13 | % |
Investor C | | (11.04 | )% | | 0.40 | % | | (0.60 | )% | | 12.65 | % | | 12.65 | % | | 5.97 | % | | 5.97 | % |
R | | (10.68 | )% | | 1.17 | % | | — | | | 13.45 | % | | — | | | 6.70 | % | | — | |
Russell Midcap® Growth Index | | (10.05 | )% | | (4.55 | )% | | — | | | 15.20 | % | | — | | | 5.16 | % | | — | |
| * | Assuming maximum sales charges. See “About Portfolios’ Performance” on page 34 for a detailed description of share classes, including any related sales charges and fees. |
Past performance is not indicative of future results.
Expense Example
| | | | | | | | | | | | | | | | | | |
| | | Actual | | Hypothetical** |
| | | Beginning
Account Value
October 1, 2007 | | Ending
Account Value
March 31, 2008 | | Expenses Paid
During the Period* | | Beginning
Account Value
October 1, 2007 | | Ending
Account Value
March 31, 2008 | | Expenses Paid
During the Period* |
Institutional | | $ | 1,000.00 | | $ | 895.48 | | $ | 5.07 | | $ | 1,000.00 | | $ | 1,019.59 | | $ | 5.41 |
Service | | $ | 1,000.00 | | $ | 893.18 | | $ | 6.81 | | $ | 1,000.00 | | $ | 1,017.71 | | $ | 7.29 |
Investor A | | $ | 1,000.00 | | $ | 892.43 | | $ | 7.33 | | $ | 1,000.00 | | $ | 1,017.16 | | $ | 7.84 |
Investor B | | $ | 1,000.00 | | $ | 889.57 | | $ | 11.00 | | $ | 1,000.00 | | $ | 1,013.21 | | $ | 11.79 |
Investor C | | $ | 1,000.00 | | $ | 889.57 | | $ | 10.67 | | $ | 1,000.00 | | $ | 1,013.57 | | $ | 11.43 |
R | | $ | 1,000.00 | | $ | 893.22 | | $ | 7.32 | | $ | 1,000.00 | | $ | 1,017.17 | | $ | 7.83 |
| * | For each class of the Portfolio, expenses are equal to the annualized expense ratio for the class (1.07% for Institutional, 1.44% for Service, 1.55% for Investor A, 2.33% for Investor B, 2.26% for Investor C and 1.55% for R), multiplied by the average account value over the period, multiplied by 183/366 (to reflect the one-half year period shown). |
| ** | Hypothetical 5% annual return before expenses is calculated by pro-rating the number of days in the most recent fiscal half year divided by 366. |
See “Disclosure of Expenses” on page 35 for further information on how expenses were calculated.
| | | | | | |
| | SEMI-ANNUAL REPORT | | MARCH 31, 2008 | | 9 |
| | |
Portfolio Summary (Unaudited) | | Aurora Portfolio |
Portfolio Management Commentary
How did the Portfolio perform?
| • | | Portfolio results lagged that of the benchmark Russell 2500 Value Index for the six-month period ended March 31, 2008. |
What factors influenced performance?
| • | | Stock selection in information technology (IT) and financials detracted from the Portfolio’s relative results. Within IT, key laggards included Tessera Technologies, RF Micro Devices, Trident Microsystems and PMC-Sierra (all semiconductor names), and Electronics for Imaging, a producer of printing and imaging products. Within financials, we saw disappointing results from holdings in capital markets (notably, Piper Jaffray and Affiliated Managers Group), insurance and real estate investment trusts (particularly Boardwalk Real Estate Investment Trust). |
| • | | In a challenging market for consumer-related stocks, an overweight position and stock selection in consumer discretionary also detracted from performance. Key laggards were Scientific Games, Pinnacle Entertainment, Penn National Gaming and Morgans Hotel Group (all in hotels, restaurants & leisure), as well as multiline retailer Saks. |
| • | | Bright spots during the period included stock selection in industrials and healthcare. Within industrials, top performers were Brink’s and Copart (both in commercial services), marine shipper Kirby Corp. and construction & engineering firm Chicago Bridge & Iron. Healthcare provider Kindred Healthcare performed well, as did Axcan Pharma, which was taken private by TPG Capital, and biotechnology company Dyax Corp. |
| • | | Stock selection and an overweight position in consumer staples also proved advantageous. Key contributors included food & staples retailers BJ’s Wholesale Club and Ruddick Corp., operator of the Harris Teeter supermarket chain. |
Describe recent Portfolio activity.
| • | | Over the past six months, we increased the Portfolio’s exposure to utilities, primarily electric utilities with a new position in ITC Holdings, and to consumer discretionary. In the latter sector, we established positions in restaurant operators Jack in the Box and CBRL Group. We also added Phillips-Van Heusen and Jarden Corp., while trimming exposure to specialty retailers. |
| • | | Meanwhile, we reduced exposure to industrials, financials and IT. In industrials, we trimmed construction & engineering with the sale of Chicago Bridge & Iron and URS Corp., and aerospace & defense. In financials, we trimmed commercial banks with the sale of Colonial Bancgroup and Wintrust Financial, select REITs and insurance names. In IT, we sold select underperforming semiconductor-related names including RF Micro Devices, Trident Microsystems and Tessera Technologies, and also exited our position in Electronics for Imaging. |
Describe Portfolio positioning at period-end.
| • | | The Portfolio ended the period overweight most notably in consumer discretionary, industrials, consumer staples and healthcare, and underweight primarily in financials, utilities and materials. |
Portfolio Profile as of March 31, 2008
| | | |
Ten Largest Holdings | | Percent of
Long-Term
Investments | |
The Brink’s Co. | | 4 | % |
Hain Celestial Group, Inc. | | 3 | |
Magellan Health Services, Inc. | | 3 | |
Boardwalk Real Estate Investment Trust (REIT) | | 3 | |
LKQ Corp. | | 2 | |
Copart, Inc. | | 2 | |
Scientific Games Corp. - Class A | | 2 | |
Affiliated Managers Group, Inc. | | 2 | |
BJ’s Wholesale Club, Inc. | | 2 | |
Ruddick Corp. | | 2 | |
| |
Ten Largest Industries | | Percent of
Long-Term
Investments | |
Retail Merchandising | | 13 | % |
Entertainment & Leisure | | 9 | |
Manufacturing | | 9 | |
Medical & Medical Services | | 7 | |
Oil & Gas | | 6 | |
Banks | | 6 | |
Business Services | | 5 | |
Food & Agriculture | | 5 | |
Computer Software & Services | | 5 | |
Aerospace | | 3 | |
For Portfolio compliance purposes, the Portfolio’s industry classifications refer to any one or more of the industry sub-classifications used by one or more widely recognized market indexes or ratings group indexes, and/or as defined by Portfolio management. This definition may not apply for purposes of this report, which may combine industry sub-classifications for reporting ease.
| | | | | | |
| 10 | | SEMI-ANNUAL REPORT | | MARCH 31, 2008 | | |
| | |
| Portfolio Summary (concluded) | | Aurora Portfolio |
Total Return Based on a $10,000 Investment
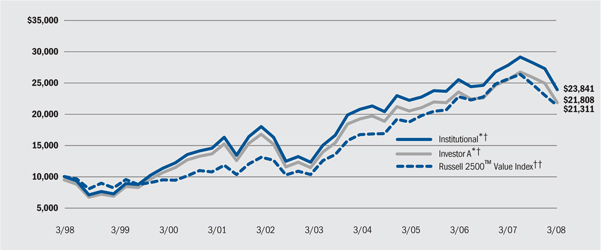
| * | Assuming maximum sales charge, if any, transaction costs and other operating expenses, including advisory fees. |
| † | Under normal market conditions, the Portfolio invests at least 80% of its total assets in small- and mid-capitalization common and preferred stocks and securities convertible into common and preferred stocks. |
†† | An index composed of the Russell 2500(TM) companies with lower price-to-book ratios and lower forecasted growth values. |
Performance Summary for the Period Ended March 31, 2008
| | | | | | | | | | | | | | | | | | | | | |
| | | | | | Average Annual Total Returns* | |
| | | | | | 1 Year | | | 5 Years | | | 10 Years | |
| | | 6-Month
Total Returns | | | w / o sales
charge | | | w / sales
charge | | | w / o sales
charge | | | w / sales
charge | | | w / o sales
charge | | | w / sales
charge | |
Institutional | | (15.36 | )% | | (14.06 | )% | | — | | | 14.17 | % | | — | | | 9.08 | % | | — | |
Investor A | | (15.50 | )% | | (14.34 | )% | | (18.83 | )% | | 13.79 | % | | 12.57 | % | | 8.70 | % | | 8.11 | % |
Investor B | | (15.83 | )% | | (15.02 | )% | | (17.94 | )% | | 12.94 | % | | 12.77 | % | | 8.00 | % | | 8.00 | % |
Investor C | | (15.86 | )% | | (15.01 | )% | | (15.66 | )% | | 12.96 | % | | 12.96 | % | | 7.90 | % | | 7.90 | % |
R | | (15.59 | )% | | (14.52 | )% | | — | | | 13.53 | % | | — | | | 8.45 | % | | — | |
Russell 2500TM Value Index | | (14.88 | )% | | (16.54 | )% | | — | | | 15.56 | % | | — | | | 7.86 | % | | — | |
| * | Assuming maximum sales charges. See “About Portfolios’ Performance” on page 34 for a detailed description of share classes, including any related sales charges and fees. |
Past performance is not indicative of future results.
Expense Example
| | | | | | | | | | | | | | | | | | |
| | | Actual | | Hypothetical** |
| | | Beginning
Account Value
October 1, 2007 | | Ending
Account Value
March 31, 2008 | | Expenses Paid
During the Period* | | Beginning
Account Value
October 1, 2007 | | Ending
Account Value
March 31, 2008 | | Expenses Paid
During the Period* |
Institutional | | $ | 1,000.00 | | $ | 846.36 | | $ | 4.85 | | $ | 1,000.00 | | $ | 1,019.68 | | $ | 5.32 |
Investor A | | $ | 1,000.00 | | $ | 845.03 | | $ | 6.64 | | $ | 1,000.00 | | $ | 1,017.71 | | $ | 7.29 |
Investor B | | $ | 1,000.00 | | $ | 841.68 | | $ | 10.08 | | $ | 1,000.00 | | $ | 1,013.92 | | $ | 11.08 |
Investor C | | $ | 1,000.00 | | $ | 841.38 | | $ | 10.07 | | $ | 1,000.00 | | $ | 1,013.93 | | $ | 11.07 |
R | | $ | 1,000.00 | | $ | 844.07 | | $ | 7.21 | | $ | 1,000.00 | | $ | 1,017.09 | | $ | 7.91 |
| * | For each class of the Portfolio, expenses are equal to the annualized expense ratio for the class (1.05% for Institutional, 1.44% for Investor A, 2.19% for Investor B, 2.19% for Investor C and 1.56% for R), multiplied by the average account value over the period, multiplied by 183/366 (to reflect the one-half year period shown). |
| ** | Hypothetical 5% annual return before expenses is calculated by pro-rating the number of days in the most recent fiscal half year divided by 366. |
See “Disclosure of Expenses” on page 35 for further information on how expenses were calculated.
| | | | | | |
| | SEMI-ANNUAL REPORT | | MARCH 31, 2008 | | 11 |
| | |
| Portfolio Summary (Unaudited) | | Small/Mid-Cap Growth Portfolio |
Portfolio Management Commentary
How did the Portfolio perform?
| • | | The Portfolio outperformed the benchmark Russell 2500 Growth Index for the six-month period. |
What factors influenced performance?
| • | | Strong stock selection in information technology and energy accounted for the majority of the Portfolio’s outperformance of the benchmark. |
| • | | Within information technology, Internet software & services was the best performing industry. Services names ExlServices and Forrester Research were lifted after posting strong financial results during the period. Top holding SkilSoft continued to execute in a tough environment, and gained more than 16% over the six months. |
| • | | Within the energy sector, exploration & production was the most significant industry contributor. Coal companies Massey Energy and CONSOL Energy, Inc. posted outsized gains for the period, as prices for coal increased on rising foreign demand. Additionally, newer holding Delta Petroleum was up more than 60% on increased production opportunities. |
| • | | Negative stock selection in healthcare and consumer discretionary hindered the Portfolio’s relative returns. Medical devices and equipment was the worst-performing industry within the healthcare sector. Our position in Cutera Incorporated fell after the company reported weaker demand for its end product of cosmetic lasers. Elsewhere in healthcare, pharmaceutical company Medicis Pharmaceutical was down more than 35% on worries over a generic filing for its top-selling acne drug. Within consumer discretionary, holdings Life Time Fitness and Scientific Games both registered sharp declines for the period. |
Describe recent Portfolio activity.
| • | | We significantly increased our underweight in the consumer discretionary sector, eliminating a variety of names, including Dick’s Sporting Goods, Life Time Fitness and Ruth’s Chris Steak House, Inc. |
| • | | Conversely, we increased the Portfolio’s weighting in information technology, adding positions in ComScore, Tivo and Intuit. |
Describe Portfolio positioning at period-end.
| • | | As of March 31, 2008, the Portfolio’s most significant overweight was in the information technology sector, where we maintain a diverse group of holdings. The most significant underweight at period-end was in the consumer discretionary sector. |
Portfolio Profile as of March 31, 2008
| | | |
Ten Largest Holdings | | Percent of
Long-Term
Investments | |
SkillSoft Plc - ADR | | 4 | % |
ExlService Holdings, Inc. | | 3 | |
Pediatrix Medical Group, Inc. | | 2 | |
IHS, Inc. | | 2 | |
CKX, Inc. | | 2 | |
SonicWALL, Inc. | | 2 | |
Sykes Enterprises, Inc. | | 2 | |
Shire Plc - ADR | | 2 | |
Delta Petroleum Corp. | | 2 | |
Quanex Corp. | | 2 | |
| |
Ten Largest Industries | | Percent of
Long-Term
Investments | |
Computer Software & Services | | 17 | % |
Business Services | | 9 | |
Oil & Gas | | 8 | |
Medical & Medical Services | | 7 | |
Medical Instruments & Supplies | | 6 | |
Pharmaceuticals | | 6 | |
Finance | | 5 | |
Manufacturing | | 5 | |
Entertainment & Leisure | | 4 | |
Electronics | | 4 | |
For Portfolio compliance purposes, the Portfolio’s industry classifications refer to any one or more of the industry sub-classifications used by one or more widely recognized market indexes or ratings group indexes, and/or as defined by Portfolio management. This definition may not apply for purposes of this report, which may combine industry sub-classifications for reporting ease.
| | | | | | |
| 12 | | SEMI-ANNUAL REPORT | | MARCH 31, 2008 | | |
| | |
| Portfolio Summary (concluded) | | Small/Mid-Cap Growth Portfolio |
Total Return Based on a $10,000 Investment
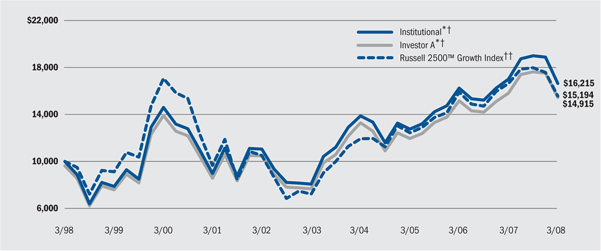
| * | Assuming maximum sales charge, if any, transaction costs and other operating expenses, including advisory fees. |
| † | Under normal market conditions, the Portfolio invests at least 80% of total assets in small-capitalization and mid-capitalization companies. |
†† | An index composed of the Russell 2500(TM) companies with higher price-to-book ratios and higher forecasted growth values. |
Performance Summary for the Period Ended March 31, 2008
| | | | | | | | | | | | | | | | | | | | | |
| | | | | | Average Annual Total Returns* | |
| | | | | | 1 Year | | | 5 Years | | | 10 Years | |
| | | 6-Month
Total Returns | | | w / o sales
charge | | | w / sales
charge | | | w / o sales
charge | | | w / sales
charge | | | w / o sales
charge | | | w / sales
charge | |
Institutional | | (11.85 | )% | | (2.02 | )% | | — | | | 14.63 | % | | — | | | 4.95 | % | | — | |
Investor A | | (11.96 | )% | | (2.20 | )% | | (7.34 | )% | | 14.31 | % | | 13.09 | % | | 4.64 | % | | 4.08 | % |
Investor B | | (12.29 | )% | | (3.04 | )% | | (6.60 | )% | | 13.46 | % | | 13.22 | % | | 4.00 | % | | 4.00 | % |
Investor C | | (12.32 | )% | | (3.09 | )% | | (3.88 | )% | | 13.44 | % | | 13.44 | % | | 3.91 | % | | 3.91 | % |
R | | (12.04 | )% | | (2.50 | )% | | — | | | 13.97 | % | | — | | | 4.33 | % | | — | |
Russell 2500TM Growth Index | | (11.38 | )% | | (6.25 | )% | | — | | | 15.46 | % | | — | | | 4.27 | % | | — | |
| * | Assuming maximum sales charges. See “About Portfolios’ Performance” on page 34 for a detailed description of share classes, including any related sales charges and fees. |
Past performance is not indicative of future results.
Expense Example
| | | | | | | | | | | | | | | | | | |
| | | Actual | | Hypothetical** |
| | | Beginning
Account Value
October 1, 2007 | | Ending
Account Value
March 31, 2008 | | Expenses Paid
During the Period* | | Beginning
Account Value
October 1, 2007 | | Ending
Account Value
March 31, 2008 | | Expenses Paid
During the Period* |
Institutional | | $ | 1,000.00 | | $ | 881.54 | | $ | 5.17 | | $ | 1,000.00 | | $ | 1,019.43 | | $ | 5.57 |
Investor A | | $ | 1,000.00 | | $ | 880.39 | | $ | 6.33 | | $ | 1,000.00 | | $ | 1,018.18 | | $ | 6.82 |
Investor B | | $ | 1,000.00 | | $ | 877.09 | | $ | 9.85 | | $ | 1,000.00 | | $ | 1,014.37 | | $ | 10.63 |
Investor C | | $ | 1,000.00 | | $ | 876.84 | | $ | 9.85 | | $ | 1,000.00 | | $ | 1,014.37 | | $ | 10.63 |
R | | $ | 1,000.00 | | $ | 879.64 | | $ | 7.47 | | $ | 1,000.00 | | $ | 1,016.96 | | $ | 8.04 |
| * | For each class of the Portfolio, expenses are equal to the annualized expense ratio for the class (1.10% for Institutional, 1.35% for Investor A, 2.10% Investor B, 2.10% for Investor C and 1.59% for R), multiplied by the average account value over the period, multiplied by 183/366 (to reflect the one-half year period shown). |
| ** | Hypothetical 5% annual return before expenses is calculated by pro-rating the number of days in the most recent fiscal half year divided by 366. |
See “Disclosure of Expenses” on page 35 for further information on how expenses were calculated.
| | | | | | |
| | SEMI-ANNUAL REPORT | | MARCH 31, 2008 | | 13 |
| | |
| Portfolio Summary (Unaudited) | | Small Cap Value Equity Portfolio |
Portfolio Management Commentary
How did the Portfolio perform?
| • | | Portfolio returns underperformed that of the benchmark Russell 2000 Value Index for the six-month period ended March 31, 2008. |
What factors influenced performance?
| • | | In terms of performance detractors, the positive impact of an underweight in information technology was overshadowed by poor stock selection. Stocks that disappointed included semiconductor names RF Micro Devices, Trident Microsystems, PNC-Sierra and Cirrus Logic; software companies Lawson Software and Guidance Software; and Electronics for Imaging, a producer of printing and imaging products. |
| • | | Stock selection in materials and financials also hindered the Portfolio’s relative results. Chemicals company H.B. Fuller detracted, as did stock selection and an underweight in metals & mining stocks, which outperformed on spiking commodity prices. In financials, key detractors were commercial banks Boston Private Financial, Sterling Financial and First Midwest Bancorp, and capital markets names Piper Jaffray and TradeStation Group. |
| • | | Contributing to the Portfolio’s relative results was favorable stock selection in the industrials, healthcare and energy sectors, in addition to stock selection and an overweight position in consumer staples. |
| • | | Within industrials, top performers included armored car and home security provider Brink’s and global human resources consulting firm Watson Wyatt Worldwide. Marine shipper Kirby Corp. and aerospace & defense firm Orbital Sciences also added value in the sector. In healthcare, healthcare provider Kindred Healthcare contributed to Portfolio returns, as did pharmaceuticals company Axcan Pharma, which was taken private by TPG Capital. |
| • | | Top stocks in energy included W-H Energy Services, Oil States International and Lufkin Industries within the equipment & services subsector, and Delta Petroleum and Swift Energy within exploration & production. In consumer staples, food and staples retailers BJ’s Wholesale Club and Ruddick Corp., operator of the Harris Teeter supermarket chain, provided positive attribution. |
Describe recent Portfolio activity.
| • | | During the six-month period, we increased exposure to utilities, primarily electric utilities, and consumer discretionary. In the latter sector, we established positions in Jack in the Box, WMS Industries and Scientific Games in the hotels, restaurants & gaming category, while also increasing our position in LeapFrog Enterprises. Meanwhile, we trimmed exposure to specialty retailers and apparel manufacturers. |
| • | | We reduced exposure to financials and information technology. Notable sales included Sterling Financial, Cathay General Bancorp, Umpqua Holdings and Boston Private Financial (all commercial banks), and LaSalle Hotel Properties and Capital Trust (two real estate investment trusts). Within IT, we sold Electronics for Imaging as well as underperforming semiconductor names RF Micro Devices, Trident Microsystems, Tessera Technologies and Cirrus Logic. |
Describe Portfolio positioning at period-end.
| • | | The Portfolio ended the period overweight most notably in consumer discretionary, consumer staples, industrials and healthcare, and underweight primarily in financials and information technology. |
Portfolio Profile as of March 31, 2008
| | | |
Ten Largest Holdings | | Percent of
Long-Term
Investments | |
The Brink’s Co. | | 4 | % |
Ruddick Corp. | | 4 | |
Magellan Health Services, Inc. | | 3 | |
LKQ Corp. | | 3 | |
Texas Industries, Inc. | | 2 | |
BJ’s Wholesale Club, Inc. | | 2 | |
Hain Celestial Group, Inc. | | 2 | |
SkillSoft Plc - ADR | | 2 | |
Piper Jaffray Cos., Inc. | | 2 | |
Silgan Holdings, Inc. | | 2 | |
| |
Ten Largest Industries | | Percent of
Long-Term
Investments | |
Retail Merchandising | | 10 | % |
Entertainment & Leisure | | 10 | |
Medical & Medical Services | | 9 | |
Banks | | 8 | |
Oil & Gas | | 7 | |
Business Services | | 6 | |
Manufacturing | | 6 | |
Computer Software & Services | | 5 | |
Insurance | | 4 | |
Real Estate | | 4 | |
For Portfolio compliance purposes, the Portfolio’s industry classifications refer to any one or more of the industry sub-classifications used by one or more widely recognized market indexes or ratings group indexes, and/or as defined by Portfolio management. This definition may not apply for purposes of this report, which may combine industry sub-classifications for reporting ease.
| | | | | | |
| 14 | | SEMI-ANNUAL REPORT | | MARCH 31, 2008 | | |
| | |
| Portfolio Summary (concluded) | | Small Cap Value Equity Portfolio |
Total Return Based on a $10,000 Investment
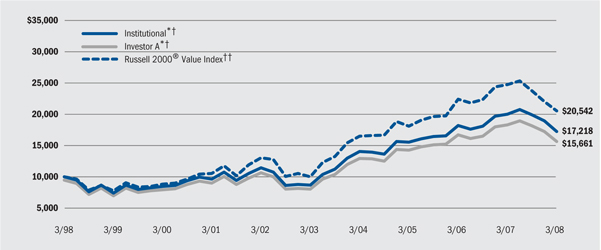
| * | Assuming maximum sales charge, if any, transaction costs and other operating expenses, including advisory fees. |
| † | The Portfolio normally invests at least 80% of its net assets in equity securities issued by U.S. small capitalization value companies (market capitalizations under $2 billion). |
| †† | An index that contains those securities with less-than-average growth orientations, generally having lower price-to-book and price-to-earnings ratios. |
The Portfolio is closed to new investors. Existing shareholders may make additional investments in current accounts. In addition, new accounts may be opened by (i) any investor if the tax ID number for the new account will be the same as that for a current account and (ii) 401(k), 403(b), 457 and other similar group retirement plan programs or certain discretionary wrap fee programs that have current accounts.
Performance Summary for the Period Ended March 31, 2008
| | | | | | | | | | | | | | | | | | | | | |
| | | | | | Average Annual Total Returns* | |
| | | | | | 1 Year | | | 5 Years | | | 10 Years | |
| | | 6-Month
Total Returns | | | w / o sales
charge | | | w / sales
charge | | | w / o sales
charge | | | w / sales
charge | | | w / o sales
charge | | | w / sales
charge | |
BlackRock | | (13.46 | )% | | (14.11 | )% | | — | | | 14.53 | % | | — | | | 5.44 | % | | — | |
Institutional | | (13.43 | )% | | (13.94 | )% | | — | | | 14.69 | % | | — | | | 5.58 | % | | — | |
Service | | (13.55 | )% | | (14.07 | )% | | — | | | 14.34 | % | | — | | | 5.27 | % | | — | |
Investor A | | (13.60 | )% | | (14.27 | )% | | (18.78 | )% | | 14.25 | % | | 13.03 | % | | 5.15 | % | | 4.59 | % |
Investor B | | (13.95 | )% | | (14.75 | )% | | (17.89 | )% | | 13.42 | % | | 13.26 | % | | 4.50 | % | | 4.50 | % |
Investor C | | (13.88 | )% | | (14.87 | )% | | (15.56 | )% | | 13.37 | % | | 13.37 | % | | 4.35 | % | | 4.35 | % |
Russell 2000® Value Index | | (13.05 | )% | | (16.88 | )% | | — | | | 15.45 | % | | — | | | 7.46 | % | | — | |
| * | Assuming maximum sales charges. See “About Portfolios’ Performance” on page 34 for a detailed description of share classes, including any related sales charges and fees. |
Past performance is not indicative of future results.
Expense Example
| | | | | | | | | | | | | | | | | | |
| | | Actual | | Hypothetical** |
| | | Beginning
Account Value
October 1, 2007 | | Ending
Account Value
March 31, 2008 | | Expenses Paid
During Period* | | Beginning
Account Value
October 1, 2007 | | Ending
Account Value
March 31, 2008 | | Expenses Paid
During Period* |
BlackRock | | $ | 1,000.00 | | $ | 865.43 | | $ | 5.13 | | $ | 1,000.00 | | $ | 1,019.43 | | $ | 5.57 |
Institutional | | $ | 1,000.00 | | $ | 865.74 | | $ | 4.18 | | $ | 1,000.00 | | $ | 1,020.46 | | $ | 4.54 |
Service | | $ | 1,000.00 | | $ | 864.46 | | $ | 5.88 | | $ | 1,000.00 | | $ | 1,018.61 | | $ | 6.39 |
Investor A | | $ | 1,000.00 | | $ | 864.00 | | $ | 6.13 | | $ | 1,000.00 | | $ | 1,018.34 | | $ | 6.66 |
Investor B | | $ | 1,000.00 | | $ | 860.54 | | $ | 10.12 | | $ | 1,000.00 | | $ | 1,013.99 | | $ | 11.01 |
Investor C | | $ | 1,000.00 | | $ | 861.20 | | $ | 10.08 | | $ | 1,000.00 | | $ | 1,014.04 | | $ | 10.96 |
| * | For each class of the Portfolio, expenses are equal to the annualized expense ratio for the class (1.10% for BlackRock, 0.90% for Institutional, 1.26% for Service, 1.32% for Investor A, 2.18% for Investor B and 2.17% for Investor C), multiplied by the average account value over the period, multiplied by 183/366 (to reflect the one-half year period shown). |
| ** | Hypothetical 5% annual return before expenses is calculated by pro-rating the number of days in the most recent fiscal half year divided by 366. |
See “Disclosure of Expenses” on page 35 for further information on how expenses were calculated.
| | | | | | |
| | SEMI-ANNUAL REPORT | | MARCH 31, 2008 | | 15 |
| | |
| Portfolio Summary (Unaudited) | | Small Cap Core Equity Portfolio |
Portfolio Management Commentary
How did the Portfolio perform?
| • | | Portfolio results lagged that of the benchmark Russell 2000 Index for the six-month period ended March 31, 2008. |
What factors influenced performance?
| • | | Stock selection and an underweight position in financials detracted from Portfolio performance, primarily within the commercial bank, insurance and capital markets categories. Key laggards included Evercore Partners and Piper Jaffray. Stock selection in industrials also hindered fund performance (led by tool manufacturer Hardinge Inc. and auto parts producer Accuride Corp.), as did stock picks in consumer staples. |
| • | | In a challenging market environment for consumer-related stocks, an underweight in consumer discretionary added value. However, these gains were overshadowed by disappointing stock selection, particularly among hotels, restaurants & leisure names, including Pinnacle Entertainment and Morgans Hotel Group, and select specialty retailers. |
| • | | Bright spots during the period included stock selection in healthcare, information technology and telecommunication services. Within healthcare, key contributors included Icon PLC and Kendle International, providers of clinical research and drug development services, healthcare provider Amedisys, biotechnology firm Dyax Corp. and Axcan Pharma, a pharmaceuticals company that was taken private by TPG Capital. In information technology, top performers included Skillsoft PLC, a provider of Web-based education and training; EMS Technologies, a communications equipment company; and Forrester Research in IT services. In telecommunications, Iowa Telecommunications Services was a standout. |
Describe recent Portfolio activity.
| • | | During the six-month period, we increased the Portfolio’s exposure to consumer discretionary, energy and information technology. Within consumer discretionary, we added new positions in specialty retailers AnnTaylor Stores, Coldwater Creek and Christopher & Banks, and household durables company Jarden. In energy, we added to existing holdings in equipment & services and established a position in Penn Virginia Corp. In information technology, we added to our software exposure and established positions in Benchmark Electronics and TTM Technologies (both in electronics equipment). |
| • | | Meanwhile, we reduced exposure to healthcare. We sold equipment & supply manufacturer DJO (upon a takeover), Kendle International and Axcan Pharma (upon the aforementioned private equity takeout). |
Describe Portfolio positioning at period-end.
| • | | The Portfolio ended the period modestly overweight in healthcare (primarily healthcare providers and healthcare technology) and consumer staples (particularly personal products). Notable underweights included financials (thrift & mortgage finance, real estate investment trusts and insurance) and materials (metals & mining and chemicals). |
Performance Profile as of March 31, 2008
| | | |
Ten Largest Holdings | | Percent of
Long-Term
Investments | |
SkillSoft Plc - ADR | | 3 | % |
Actuant Corp. - Class A | | 2 | |
Copart, Inc. | | 2 | |
Chart Industries, Inc. | | 2 | |
EMS Technologies, Inc. | | 2 | |
First Mercury Financial Corp. | | 2 | |
Blackboard, Inc. | | 2 | |
Elizabeth Arden, Inc. | | 2 | |
Gramercy Capital Corp. (REIT) | | 2 | |
Orient-Express Hotels Ltd. - Class A | | 2 | |
| |
Ten Largest Industries | | Percent of
Long-Term
Investments | |
Computer Software & Services | | 15 | % |
Manufacturing | | 10 | |
Retail Merchandising | | 8 | |
Oil & Gas | | 8 | |
Banks | | 8 | |
Real Estate | | 5 | |
Business Services | | 4 | |
Medical Instruments & Supplies | | 4 | |
Entertainment & Leisure | | 4 | |
Medical & Medical Services | | 4 | |
For Portfolio compliance purposes, the Portfolio’s industry classifications refer to any one or more of the industry sub-classifications used by one or more widely recognized market indexes or ratings group indexes, and/or as defined by Portfolio management. This definition may not apply for purposes of this report, which may combine industry sub-classifications for reporting ease.
| | | | | | |
| 16 | | SEMI-ANNUAL REPORT | | MARCH 31, 2008 | | |
| | |
| Portfolio Summary (concluded) | | Small Cap Core Equity Portfolio |
Total Return Based on a $10,000 Investment
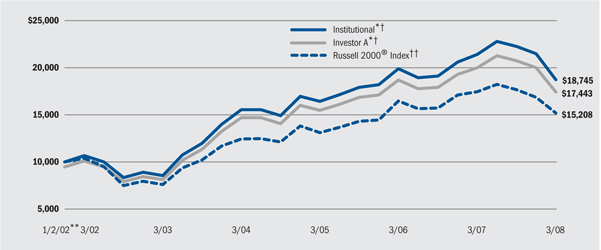
| * | Assuming maximum sales charge, if any, transaction costs and other operating expenses, including advisory fees. |
| ** | Commencement of operations. |
| † | The Portfolio normally invests at least 80% of its net assets in the equity securities of U.S. small capitalization companies (market capitalizations under $2 billion). |
†† | An index that measures the performance of the 2000 smallest companies in the Russell 3000® |
Performance Summary for the Period Ended March 31, 2008
| | | | | | | | | | | | | | | | | | | | | |
| | | | | | Average Annual Total Returns* | |
| | | | | | 1 Year | | | 5 Years | | | From Inception** | |
| | | 6-Month
Total Returns | | | w / o sales
charge | | | w / sales
charge | | | w / o sales
charge | | | w / sales
charge | | | w / o sales
charge | | | w / sales
charge | |
Institutional | | (15.95 | )% | | (12.61 | )% | | — | | | 16.95 | % | | — | | | 10.59 | % | | — | |
Service | | (16.06 | )% | | (12.87 | )% | | — | | | 16.74 | % | | — | | | 10.44 | % | | — | |
Investor A | | (16.13 | )% | | (13.01 | )% | | (17.56 | )% | | 16.51 | % | | 15.28 | % | | 10.27 | % | | 9.32 | % |
Investor B | | (16.48 | )% | | (13.70 | )% | | (17.30 | )% | | 15.72 | % | | 15.50 | % | | 9.67 | % | | 9.67 | % |
Investor C | | (16.45 | )% | | (13.63 | )% | | (14.43 | )% | | 15.76 | % | | 15.76 | % | | 9.69 | % | | 9.69 | % |
Russell 2000® Index | | (14.02 | )% | | (13.00 | )% | | — | | | 14.90 | % | | — | | | 6.94 | % | | — | |
| * | Assuming maximum sales charges. See “About Portfolios’ Performance” on page 34 for a detailed description of share classes, including any related sales charges and fees. |
| ** | The Portfolio commenced operations on 1/2/02. |
Past performance is not indicative of future results.
Expense Example
| | | | | | | | | | | | | | | | | | |
| | | Actual | | Hypothetical** |
| | | Beginning
Account Value
October 1, 2007 | | Ending
Account Value
March 31, 2008 | | Expenses Paid
During the Period* | | Beginning
Account Value
October 1, 2007 | | Ending
Account Value
March 31, 2008 | | Expenses Paid
During the Period* |
Institutional | | $ | 1,000.00 | | $ | 840.51 | | $ | 5.94 | | $ | 1,000.00 | | $ | 1,018.46 | | $ | 6.54 |
Service | | $ | 1,000.00 | | $ | 839.43 | | $ | 7.16 | | $ | 1,000.00 | | $ | 1,017.12 | | $ | 7.88 |
Investor A | | $ | 1,000.00 | | $ | 838.66 | | $ | 8.05 | | $ | 1,000.00 | | $ | 1,016.14 | | $ | 8.86 |
Investor B | | $ | 1,000.00 | | $ | 835.20 | | $ | 11.51 | | $ | 1,000.00 | | $ | 1,012.30 | | $ | 12.70 |
Investor C | | $ | 1,000.00 | | $ | 835.53 | | $ | 11.37 | | $ | 1,000.00 | | $ | 1,012.45 | | $ | 12.55 |
| * | For each class of the Portfolio, expenses are equal to the annualized expense ratio for the class (1.29% for Institutional, 1.56% for Service, 1.75% for Investor A, 2.51% for Investor B and 2.48% for Investor C), multiplied by the average account value over the period, multiplied by 183/366 (to reflect the one-half year period shown). |
| ** | Hypothetical 5% annual return before expenses is calculated by pro-rating the number of days in the most recent fiscal half year divided by 366. |
See “Disclosure of Expenses” on page 35 for further information on how expenses were calculated.
| | | | | | |
| | SEMI-ANNUAL REPORT | | MARCH 31, 2008 | | 17 |
| | |
Portfolio Summary (Unaudited) | | Small Cap Growth Equity Portfolio |
Portfolio Management Commentary
How did the Portfolio perform?
| • | | Against a challenging investment backdrop, the Portfolio posted strong relative performance, outpacing the return of the benchmark Russell 2000 Growth Index. |
What factors influenced performance?
| • | | Strong stock selection in information technology (IT) and industrials accounted for the majority of the Portfolio’s outperformance of the benchmark. IT software & services was an important contributor. Top holding SkilSoft continued to execute in a tough environment, gaining 16% during the period. Likewise, IT services was a top industry contributor, led by strong performance from ExlService and Forrester Research. |
| • | | Stock selection in industrials also boosted fund returns, as commercial services names IHS Incorporated, Watson Wyatt Worldwide and Clean Harbors all posted double-digit gains for the period. Machinery holding Bucyrus International was the largest overall contributor to the Portfolio. |
| • | | Coal company Massey Energy also added significant value, as increased coal spot prices and rising foreign demand lifted the stock. |
| • | | Stock selection in consumer discretionary and consumer staples detracted from relative returns. In consumer discretionary, the hotels and leisure industry accounted for most of the weakness. Scientific Games and Ameristar Casinos both posted significant declines for the six-month period. Within consumer staples, our holding in Green Mountain Coffee was down more than 20% on worries of decreased consumer spending and rising costs of coffee beans. |
Describe recent Portfolio activity.
| • | | During the period, we significantly increased our underweight position in the consumer discretionary sector, eliminating a variety of names, including Vail Resorts, Life Time Fitness and Pinnacle Entertainment. |
| • | | We increased our weighting in the healthcare sector, adding positions in LifeCell, Martek Biosciences and ArthroCare. |
Describe Portfolio positioning at period-end.
| • | | As of March 31, 2008, the Portfolio’s most significant overweight was in the information technology sector, with a diverse group of holdings. The most significant underweight was in the consumer discretionary sector. |
Portfolio Profile as of March 31, 2008
| | | |
Ten Largest Holdings | | Percent of
Long-Term
Investments | |
SkillSoft Plc - ADR | | 4 | % |
IHS, Inc. | | 3 | |
Sykes Enterprises, Inc. | | 3 | |
Pediatrix Medical Group, Inc. | | 3 | |
ExlService Holdings, Inc. | | 3 | |
Wright Medical Group, Inc. | | 2 | |
Atwood Oceanics, Inc. | | 2 | |
Forrester Research, Inc. | | 2 | |
Quanex Corp. | | 2 | |
Orient-Express Hotels Ltd. - Class A | | 2 | |
| |
Ten Largest Industries | | Percent of
Long-Term
Investments | |
Computer Software & Services | | 20 | % |
Business Services | | 10 | |
Medical Instruments & Supplies | | 10 | |
Medical & Medical Services | | 9 | |
Oil & Gas | | 8 | |
Manufacturing | | 7 | |
Entertainment & Leisure | | 4 | |
Semiconductors & Related Devices | | 4 | |
Finance | | 3 | |
Aerospace | | 3 | |
For Portfolio compliance purposes, the Portfolio’s industry classifications refer to any one or more of the industry sub-classifications used by one or more widely recognized market indexes or ratings group indexes, and/or as defined by Portfolio management. This definition may not apply for purposes of this report, which may combine industry sub-classifications for reporting ease.
| | | | | | |
| 18 | | SEMI-ANNUAL REPORT | | MARCH 31, 2008 | | |
| | |
| Portfolio Summary (concluded) | | Small Cap Growth Equity Portfolio |
Total Return Based on a $10,000 Investment
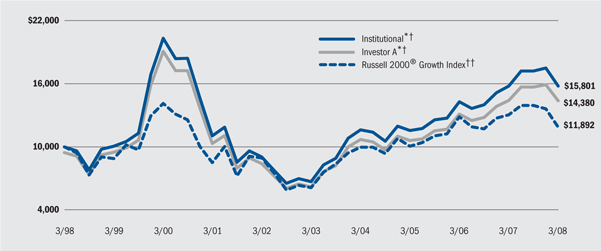
| * | Assuming maximum sales charge, if any, transaction costs and other operating expenses, including advisory fees. |
| † | The Portfolio normally invests at least 80% of its net assets in equity securities issued by U.S. small capitalization growth companies which the portfolio management team believes offer superior prospects for growth. |
| †† | An index that contains those securities with greater-than-average growth orientations, generally having higher price-to-book and price-to-earnings ratios. |
Performance Summary for the Period Ended March 31, 2008
| | | | | | | | | | | | | | | | | | | | | |
| | | | | | Average Annual Total Returns* | |
| | | | | | 1 Year | | | 5 Years | | | 10 Years | |
| | | 6-Month
Total Returns | | | w / o sales
charge | | | w / sales
charge | | | w / o sales
charge | | | w / sales
charge | | | w / o sales
charge | | | w / sales
charge | |
Institutional | | (8.31 | )% | | 0.09 | % | | — | | | 18.77 | % | | — | | | 4.68 | % | | — | |
Service | | (8.46 | )% | | (0.15 | )% | | — | | | 18.46 | % | | — | | | 4.39 | % | | — | |
Investor A | | (8.47 | )% | | (0.20 | )% | | (5.45 | )% | | 18.38 | % | | 17.11 | % | | 4.26 | % | | 3.70 | % |
Investor B | | (8.94 | )% | | (0.95 | )% | | (5.40 | )% | | 17.40 | % | | 17.19 | % | | 3.65 | % | | 3.65 | % |
Investor C | | (8.89 | )% | | (1.17 | )% | | (2.15 | )% | | 17.41 | % | | 17.41 | % | | 3.46 | % | | 3.46 | % |
Russell 2000® Growth Index | | (14.66 | )% | | (8.95 | )% | | — | | | 14.24 | % | | — | | | 1.75 | % | | — | |
| * | Assuming maximum sales charges. See “About Portfolios’ Performance” on page 34 for a detailed description of share classes, including any related sales charges and fees. |
Past performance is not indicative of future results.
Expense Example
| | | | | | | | | | | | | | | | | | |
| | | Actual | | Hypothetical** |
| | | Beginning
Account Value
October 1, 2007 | | Ending
Account Value
March 31, 2008 | | Expenses Paid
During the Period* | | Beginning
Account Value
October 1, 2007 | | Ending
Account Value
March 31, 2008 | | Expenses Paid
During the Period* |
Institutional | | $ | 1,000.00 | | $ | 916.91 | | $ | 3.79 | | $ | 1,000.00 | | $ | 1,020.99 | | $ | 4.01 |
Service | | $ | 1,000.00 | | $ | 915.41 | | $ | 5.29 | | $ | 1,000.00 | | $ | 1,019.41 | | $ | 5.59 |
Investor A | | $ | 1,000.00 | | $ | 915.35 | | $ | 5.40 | | $ | 1,000.00 | | $ | 1,019.29 | | $ | 5.71 |
Investor B | | $ | 1,000.00 | | $ | 910.58 | | $ | 10.27 | | $ | 1,000.00 | | $ | 1,014.11 | | $ | 10.89 |
Investor C | | $ | 1,000.00 | | $ | 911.10 | | $ | 9.86 | | $ | 1,000.00 | | $ | 1,014.56 | | $ | 10.44 |
| * | For each class of the Portfolio, expenses are equal to the annualized expense ratio for the class (0.79% for Institutional, 1.11% for Service, 1.13% for Investor A, 2.15% for Investor B and 2.06% for Investor C), multiplied by the average account value over the period, multiplied by 183/366 (to reflect the one-half year period shown). |
| ** | Hypothetical 5% annual return before expenses is calculated by pro-rating the number of days in the most recent fiscal half year divided by 366. |
See “Disclosure of Expenses” on page 35 for further information on how expenses were calculated.
| | | | | | |
| | SEMI-ANNUAL REPORT | | MARCH 31, 2008 | | 19 |
| | |
Portfolio Summary (Unaudited) | | Global Science & Technology Opportunities Portfolio |
Portfolio Management Commentary
How did the Portfolio perform?
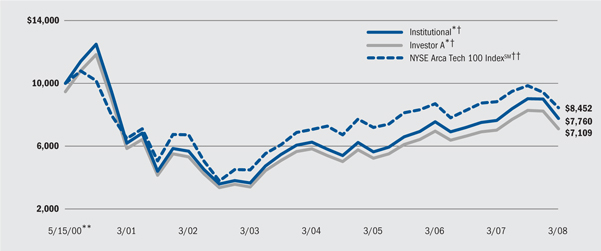
| • | | Returns for the Portfolio’s Institutional and Investor A shares were generally in line with that of the benchmark NYSE ARCA Tech 100 Index for the six-month period, while Service, Investor B and Investor C shares lagged the benchmark return. |
What factors influenced performance?
| • | | Portfolio underperformance during the reporting period was the result of negative stock selection effects, while sector allocation contributed positively to results. |
| • | | Stock selection within information technology was the biggest detractor from performance. In particular, results were weak within semiconductors and technology hardware & equipment. Within healthcare, stock selection in the life sciences tools & services hindered relative results. |
| • | | From an individual stock point of view, the Portfolio’s lack of exposure to Genzyme Corp. and Genentech Inc. proved most unfavorable, as these biotechnology stocks performed strongly in a declining market, which hurt relative comparisons. A position in Google Inc. also detracted from results during the period, as company shares declined more than 20%. |
| • | | Conversely, an underweight relative to the benchmark in information technology and an allocation to telecommunication services, which is not a component of the benchmark, contributed positively. Within information technology, relative positioning also was a positive contributor. Underweight positions in semiconductors & semiconductor equipment and data processing & outsourced services and an overweight in Internet software & services supported relative results during the period. |
| • | | Elsewhere, an overweight in healthcare equipment contributed to alpha generation. Additionally, we benefited from our stock positioning within the software & services and capital goods industry groups. |
| • | | The stocks contributing most significantly to outperformance included global pharmaceutical company Pharmion and business intelligence software developer Business Objects. Despite a weak overall market environment, these companies experienced strong gains during the period. |
Describe recent Portfolio activity.
| • | | Portfolio positioning shifted in some areas during the quarter consistent with our investment process. Specifically, we added to Portfolio holdings in healthcare equipment, systems software and computer hardware. In contrast, the Portfolio’s exposure to biotechnology, capital goods, application software and internet software & services declined over the period. |
Describe Portfolio positioning at period-end.
| • | | At the end of the reporting period, the Portfolio was most overweight relative to the benchmark in healthcare equipment and home entertainment software and had an allocation to telecommunication services, which is not included in the benchmark. Underweighted sectors included biotechnology and life science tools & services, application software and aerospace & defense. |
| • | | Geographically, approximately 20% of the Portfolio’s net assets was allocated to non-U.S. companies. |
Portfolio Profile as of March 31, 2008
| | | |
Ten Largest Holdings | | Percent of
Long-Term
Investments | |
Apple Computer, Inc. | | 5 | % |
International Business Machines Corp. | | 3 | |
Microsoft Corp. | | 2 | |
DST Systems, Inc. | | 2 | |
Hewlett-Packard Co. | | 2 | |
Lockheed Martin Corp. | | 2 | |
Gilead Sciences, Inc. | | 2 | |
Oracle Corp. | | 2 | |
Intel Corp. | | 2 | |
Becton, Dickinson & Co. | | 2 | |
| |
Ten Largest Industries | | Percent of
Long-Term
Investments | |
Computer Software & Services | | 30 | % |
Computer & Office Equipment | | 13 | |
Telecommunications | | 12 | |
Semiconductors & Related Devices | | 11 | |
Medical Instruments & Supplies | | 10 | |
Pharmaceuticals | | 7 | |
Electronics | | 4 | |
Aerospace | | 4 | |
Medical & Medical Services | | 2 | |
Manufacturing | | 2 | |
For Portfolio compliance purposes, the Portfolio’s industry classifications refer to any one or more of the industry sub-classifications used by one or more widely recognized market indexes or ratings group indexes, and/or as defined by Portfolio management. This definition may not apply for purposes of this report, which may combine industry sub-classifications for reporting ease.
| | | | | | |
| 20 | | SEMI-ANNUAL REPORT | | MARCH 31, 2008 | | |
| | |
| Portfolio Summary (concluded) | | Global Science & Technology Opportunities Portfolio |
Total Return Based on a $10,000 Investment
| * | Assuming maximum sales charge, if any, transaction costs and other operating expenses, including advisory fees. |
| ** | Commencement of operations. |
| † | The Portfolio will invest primarily in equity securities of U.S. and non-U.S. companies in all capitalization ranges selected for their rapid and sustainable growth potential from the development, advancement and use of science and/or technology. |
| †† | A price-weighted index comprised of not more than 100 individual stocks listed on the NYSE, AMEX or NASDAQ. The index is modeled to represent a broad spectrum of companies engaged principally in manufacturing products and/or providing services within technology fields. |
Performance Summary for the Period Ended March 31, 2008
| | | | | | | | | | | | | | | | | | | | | |
| | | | | | Average Annual Total Returns* | |
| | | | | | 1 Year | | | 5 Years | | | From Inception** | |
| | | 6-Month
Total Returns | | | w / o sales
charge | | | w / sales
charge | | | w / o sales
charge | | | w / sales
charge | | | w / o sales
charge | | | w / sales
charge | |
Institutional | | (14.06 | )% | | 1.44 | % | | — | | | 16.22 | % | | — | | | (3.17 | )% | | — | |
Service | | (14.27 | )% | | 0.93 | % | | — | | | 15.83 | % | | — | | | (3.47 | )% | | — | |
Investor A | | (14.19 | )% | | 1.08 | % | | (4.21 | )% | | 15.75 | % | | 14.51 | % | | (3.59 | )% | | (4.24 | )% |
Investor B | | (14.65 | )% | | 0.14 | % | | (4.36 | )% | | 14.84 | % | | 14.61 | % | | (4.34 | )% | | (4.34 | )% |
Investor C | | (14.67 | )% | | 0.00 | % | | (1.00 | )% | | 14.80 | % | | 14.80 | % | | (4.36 | )% | | (4.36 | )% |
NYSE Arca Tech 100 IndexSM | | (14.15 | )% | | (4.26 | )% | | — | | | 13.45 | % | | — | | | (2.11 | )% | | — | |
| * | Assuming maximum sales charges. See “About Portfolios’ Performance” on page 34 for a detailed description of share classes, including any related sales charges and fees. |
| ** | The Portfolio commenced operations on 5/15/00. |
Past performance is not indicative of future results.
Expense Example
| | | | | | | | | | | | | | | | | | |
| | | Actual | | Hypothetical** |
| | | Beginning
Account Value
October 1, 2007 | | Ending
Account Value
March 31, 2008 | | Expenses Paid
During the Period* | | Beginning
Account Value
October 1, 2007 | | Ending
Account Value
March 31, 2008 | | Expenses Paid
During the Period* |
Institutional | | $ | 1,000.00 | | $ | 859.36 | | $ | 6.28 | | $ | 1,000.00 | | $ | 1,018.17 | | $ | 6.83 |
Service | | $ | 1,000.00 | | $ | 857.30 | | $ | 8.04 | | $ | 1,000.00 | | $ | 1,016.24 | | $ | 8.76 |
Investor A | | $ | 1,000.00 | | $ | 858.12 | | $ | 8.13 | | $ | 1,000.00 | | $ | 1,016.14 | | $ | 8.86 |
Investor B | | $ | 1,000.00 | | $ | 853.51 | | $ | 12.25 | | $ | 1,000.00 | | $ | 1,011.61 | | $ | 13.39 |
Investor C | | $ | 1,000.00 | | $ | 853.33 | | $ | 12.00 | | $ | 1,000.00 | | $ | 1,011.89 | | $ | 13.11 |
| * | For each class of the Portfolio, expenses are equal to the annualized expense ratio for the class (1.35% for Institutional, 1.73% for Service, 1.75% for Investor A, 2.64% for Investor B and 2.59% for Investor C), multiplied by the average account value over the period, multiplied by 183/366 (to reflect the one-half year period shown). |
| ** | Hypothetical 5% annual return before expenses is calculated by pro-rating the number of days in the most recent fiscal half year divided by 366. |
See “Disclosure of Expenses” on page 35 for further information on how expenses were calculated.
| | | | | | |
| | SEMI-ANNUAL REPORT | | MARCH 31, 2008 | | 21 |
| | |
Portfolio Summary (Unaudited) | | Global Resources Portfolio |
Portfolio Management Commentary
How did the Portfolio perform?
| • | | The Portfolio produced strong absolute and relative returns, outperforming the broad-market S&P 500 Index and the Lipper Natural Resources Funds Index, its sector benchmark, for the six-month period. |
What factors influenced performance?
| • | | Amid significant market tumult, the natural resources sector remained among the strongest areas of the market, as rising prices continued to boost share prices in commodity-related segments. |
| • | | The Portfolio’s large emphasis on U.S. coal producers proved to be the leading driver of returns, as holdings in the segment rose 35% during the period. With China increasingly relying on coal imports to meet its rising power needs, global coal markets have become correspondingly tight. For the first time in many years, U.S. producers, which had been struggling with weak domestic pricing, participated in global markets and benefited from higher metallurgical and steam coal prices. |
| • | | Elsewhere within the Portfolio, complete avoidance of lagging integrated oil and refining stocks also aided relative returns. |
| • | | In contrast, the Portfolio’s exploration & production holdings, despite performing well overall, marginally detracted from relative return comparisons, as they could not keep pace with their Index counterparts. Normal winter temperatures in North America contributed to strong demand for natural gas, causing storage levels to fall below historic averages and natural gas prices to rise to their highest levels in over two years. The stronger pricing environment has been favorable for smaller exploration and production companies, most of which have some exposure to gas. |
| • | | The Portfolio’s equipment & service and drilling holdings performed in line with the broader sector, but were detractors in that they limited the fund’s relative returns. |
Describe recent Portfolio activity.
| • | | Portfolio activity was fairly limited during the period. We have significantly reduced exposure to the offshore drilling segment, feeling that many of these stocks now reflect full valuations. Proceeds from these sales have been redeployed into select natural gas-related exploration and production stocks. |
Describe Portfolio positioning at period-end.
| • | | Despite increased market volatility and concerns surrounding the U.S. economy, our long-term outlook for the energy sector remains largely unchanged. Across the energy commodity spectrum, strong demand trends and significant long-term supply constraints make higher prices inevitable. We continue to believe that commodity prices will remain at elevated levels and that related equities offer good value in nearly all instances, as the stocks continue to trade at steep discounts relative to longer-term price considerations. |
| • | | At period-end, Portfolio positioning remains largely unchanged, as we continue to emphasize coal producers, exploration & production and oil service stocks. |
Portfolio Profile as of March 31, 2008
| | | |
Ten Largest Holdings | | Percent of
Long-Term
Investments | |
CONSOL Energy, Inc. | | 8 | % |
Massey Energy Co. | | 6 | |
Arch Coal, Inc. | | 6 | |
Plains Exploration & Production Co. | | 5 | |
Newfield Exploration Co. | | 5 | |
Peabody Energy Corp. | | 4 | |
Southwestern Energy Co. | | 4 | |
Delta Petroleum Corp. | | 4 | |
Penn Virginia Corp. | | 4 | |
Transocean, Inc. | | 3 | |
| |
Industries | | Percent of
Long-Term
Investments | |
Oil & Gas | | 63 | % |
Metal & Mining | | 32 | |
Energy & Utilities | | 4 | |
Transportation | | 1 | |
For Portfolio compliance purposes, the Portfolio’s industry classifications refer to any one or more of the industry sub-classifications used by one or more widely recognized market indexes or ratings group indexes, and/or as defined by Portfolio management. This definition may not apply for purposes of this report, which may combine industry sub-classifications for reporting ease.
| | | | | | |
| 22 | | SEMI-ANNUAL REPORT | | MARCH 31, 2008 | | |
Portfolio Summary (concluded) | Global Resources Portfolio |
Total Return Based on a $10,000 Investment
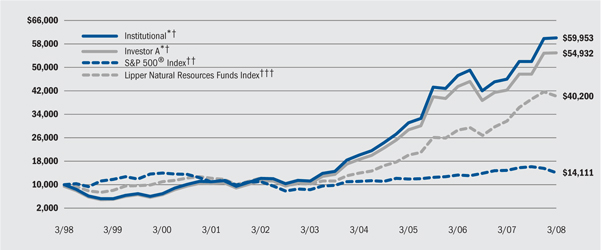
| * | Assuming maximum sales charge, if any, transaction costs and other operating expenses, including advisory fees. |
| † | Under normal market conditions, the Portfolio invests at least 80% of its total assets in securities of global energy and natural resources companies and companies in associated businesses, as well as utilities (such as gas, water, cable, electrical and telecommunications utilities). |
| †† | This unmanaged Index covers 500 industrial, utility, transportation and financial companies of the U.S. markets (mostly NYSE issues) representing about 75% of NYSE market capitalization and 30% of NYSE issues. S&P 500 is a trademark of the McGraw-Hill Companies. |
| ††† | An equally weighted index of typically the 30 largest mutual funds within its respective investment objective. |
Performance Summary for the Period Ended March 31, 2008
| | | | | | | | | | | | | | | | | | | | | |
| | | | | | Average Annual Total Returns* | |
| | | | | | 1 Year | | | 5 Years | | | 10 Years | |
| | | 6-Month
Total Returns | | | w / o sales
charge | | | w / sales
charge | | | w / o sales
charge | | | w / sales
charge | | | w / o sales
charge | | | w / sales
charge | |
Institutional | | 15.54 | % | | 30.48 | % | | — | | | 39.73 | % | | — | | | 19.61 | % | | — | |
Investor A | | 15.41 | % | | 30.19 | % | | 23.35 | % | | 39.35 | % | | 37.85 | % | | 19.21 | % | | 18.57 | % |
Investor B | | 14.96 | % | | 29.18 | % | | 24.68 | % | | 38.37 | % | | 38.26 | % | | 18.48 | % | | 18.48 | % |
Investor C | | 14.99 | % | | 29.22 | % | | 28.22 | % | | 38.36 | % | | 38.36 | % | | 18.39 | % | | 18.39 | % |
S&P 500® Index | | (12.46 | )% | | (5.08 | )% | | — | | | 11.32 | % | | — | | | 3.50 | % | | — | |
Lipper Natural Resources Funds Index | | 2.73 | % | | 26.91 | % | | — | | | 31.45 | % | | — | | | 14.93 | % | | — | |
| * | Assuming maximum sales charges. See “About Portfolios’ Performance” on page 34 for a detailed description of share classes, including any related sales charges and fees. |
Past performance is not indicative of future results.
Expense Example
| | | | | | | | | | | | | | | | | | |
| | | Actual | | Hypothetical** |
| | | Beginning
Account Value
October 1, 2007 | | Ending
Account Value
March 31, 2008 | | Expenses Paid
During the Period* | | Beginning
Account Value
October 1, 2007 | | Ending
Account Value
March 31, 2008 | | Expenses Paid
During the Period* |
Institutional | | $ | 1,000.00 | | $ | 1,155.43 | | $ | 5.55 | | $ | 1,000.00 | | $ | 1,019.78 | | $ | 5.22 |
Investor A | | $ | 1,000.00 | | $ | 1,154.14 | | $ | 6.84 | | $ | 1,000.00 | | $ | 1,018.57 | | $ | 6.43 |
Investor B | | $ | 1,000.00 | | $ | 1,149.57 | | $ | 10.95 | | $ | 1,000.00 | | $ | 1,014.68 | | $ | 10.32 |
Investor C | | $ | 1,000.00 | | $ | 1,149.90 | | $ | 10.75 | | $ | 1,000.00 | | $ | 1,014.88 | | $ | 10.12 |
| * | For each class of the Portfolio, expenses are equal to the annualized expense ratio for the class (1.03% for Institutional, 1.27% for Investor A, 2.04% Investor B and 2.00% for Investor C), multiplied by the average account value over the period, multiplied by 183/366 (to reflect the one-half year period shown). |
| ** | Hypothetical 5% annual return before expenses is calculated by pro-rating the number of days in the most recent fiscal half year divided by 366. |
See “Disclosure of Expenses” on page 35 for further information on how expenses were calculated.
| | | | | | |
| | SEMI-ANNUAL REPORT | | MARCH 31, 2008 | | 23 |
| | |
Portfolio Summary (Unaudited) | | All-Cap Global Resources Portfolio |
Portfolio Management Commentary
How did the Portfolio perform?
| • | | Portfolio results outperformed those of the broad-market S&P 500 Index and the Lipper Natural Resources Funds Index, its sector benchmark, for the six-month period. |
What factors influenced performance?
| • | | The Portfolio performed well, as commodity-related segments benefited from rising prices across the commodity spectrum. Strong global demand has persisted despite concerns of a slowdown in the U.S. economy. |
| • | | The Portfolio’s emphasis on energy producers in a rising price environment produced favorable returns, as share prices of exploration & production, integrated oil & gas and coal producers moved higher. Significant exposure to oil & gas producers was particularly beneficial. On a relative basis, avoidance of refining stocks also proved advantageous, as the group posted significant declines on falling refining margins over the period. |
| • | | While moves in crude oil prices garnered most of the attention in the first few months of the year, higher natural gas prices had the biggest positive impact on the Portfolio’s performance. Normal winter temperatures in North America contributed to strong demand for natural gas, causing storage levels to fall below historic averages and prices to rise to their highest levels in over two years. Although natural gas prices still trade at a discount relative to crude oil based on Btu equivalency, the stronger pricing environment has been favorable for natural gas producers. Port-folio holdings such as EOG Resources, Southwestern Energy Company and Range Resources Corporation generated returns in excess of 20% during the period. |
| • | | The Portfolio’s metals & mining and equipment & service holdings were the only detractors from performance. |
Describe recent Portfolio activity.
| • | | Portfolio activity was fairly limited during the period. On the margin, we reduced exposure to select offshore drilling and oil service holdings based on valuation. We increased exposure to exploration & production holdings. |
Describe Portfolio positioning at period-end.
| • | | Despite increased market volatility and concerns surrounding the U.S. economy, our long-term outlook for the energy sector remains largely unchanged. Across the energy commodity spectrum, strong demand trends and significant long-term supply constraints make higher prices inevitable. We continue to believe that commodity prices will remain at elevated levels and that related equities offer good value in nearly all instances, as the stocks continue to trade at steep discounts relative to longer-term price considerations. |
| • | | At period-end, Portfolio positioning remains largely unchanged. We continue to favor coal producers, exploration & production and metals & mining stocks. |
Portfolio Profile as of March 31, 2008
| | | |
Ten Largest Holdings | | Percent of
Long-Term
Investments | |
CONSOL Energy, Inc. | | 4 | % |
Potash Corp. of Saskatchewan, Inc. | | 4 | |
EOG Resources, Inc. | | 3 | |
Schlumberger Ltd. | | 3 | |
Hess Corp. | | 3 | |
Goldcorp, Inc. | | 3 | |
Weatherford International Ltd. | | 3 | |
Helmerich & Payne, Inc. | | 2 | |
Core Laboratories NV | | 2 | |
Range Resources Corp. | | 2 | |
| |
Industries | | Percent of
Long-Term
Investments | |
Oil & Gas | | 70 | % |
Metal & Mining | | 23 | |
Energy & Utilities | | 4 | |
Food & Agriculture | | 3 | |
For Portfolio compliance purposes, the Portfolio’s industry classifications refer to any one or more of the industry sub-classifications used by one or more widely recognized market indexes or ratings group indexes, and/or as defined by Portfolio management. This definition may not apply for purposes of this report, which may combine industry sub-classifications for reporting ease.
| | | | | | |
| 24 | | SEMI-ANNUAL REPORT | | MARCH 31, 2008 | | |
| | |
| Portfolio Summary (concluded) | | All-Cap Global Resources Portfolio |
Total Return Based on a $10,000 Investment
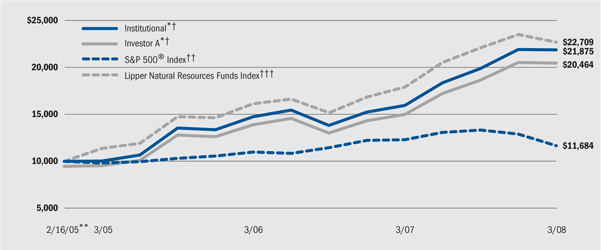
| * | Assuming maximum sales charge, if any, transaction costs and other operating expenses, including advisory fees. |
| ** | Commencement of operations. |
| † | Under normal market conditions, the Portfolio invests at least 80% of its total assets in securities of global energy and natural resources companies and companies in associated businesses, as well as utilities (such as gas, water, cable, electrical and telecommunications utilities). |
| †† | This unmanaged Index covers 500 industrial, utility, transportation and financial companies of the U.S. markets (mostly NYSE issues) representing about 75% of NYSE market capitalization and 30% of NYSE issues. S&P 500 is a trademark of the McGraw-Hill Companies. |
| ††† | An equally weighted index of typically the 30 largest mutual funds within its respective investment objective. |
Performance Summary for the Period Ended March 31, 2008
| | | | | | | | | | | | | | | |
| | | | | | Average Annual Total Returns* | |
| | | | | | 1 Year | | | From Inception** | |
| | | 6-Month
Total Returns | | | w / o sales
charge | | | w / sales
charge | | | w / o sales
charge | | | w / sales
charge | |
Institutional | | 9.95 | % | | 36.99 | % | | — | | | 28.54 | % | | — | |
Service | | 9.69 | % | | 36.42 | % | | — | | | 28.00 | % | | — | |
Investor A | | 9.73 | % | | 36.49 | % | | 29.36 | % | | 28.00 | % | | 25.82 | % |
Investor B | | 9.32 | % | | 35.53 | % | | 31.03 | % | | 27.08 | % | | 26.50 | % |
Investor C | | 9.33 | % | | 35.50 | % | | 34.50 | % | | 27.13 | % | | 27.13 | % |
S&P 500® Index | | (12.46 | )% | | (5.08 | )% | | — | | | 5.11 | % | | — | |
Lipper Natural Resources Funds Index | | 2.73 | % | | 26.91 | % | | — | | | 26.57 | % | | — | |
| * | Assuming maximum sales charges. See “About Portfolios’ Performance” on page 34 for a detailed description of share classes, including any related sales charges and fees. |
| ** | The Portfolio commenced operations on 2/16/05. |
Past performance is not indicative of future results.
Expense Example
| | | | | | | | | | | | | | | | | | |
| | | Actual | | Hypothetical** |
| | | Beginning
Account Value
October 1, 2007 | | Ending
Account Value
March 31, 2008 | | Expenses Paid
During the Period* | | Beginning
Account Value
October 1, 2007 | | Ending
Account Value
March 31, 2008 | | Expenses Paid
During the Period* |
Institutional | | $ | 1,000.00 | | $ | 1,099.46 | | $ | 4.69 | | $ | 1,000.00 | | $ | 1,020.47 | | $ | 4.53 |
Service | | $ | 1,000.00 | | $ | 1,096.90 | | $ | 6.68 | | $ | 1,000.00 | | $ | 1,018.55 | | $ | 6.45 |
Investor A | | $ | 1,000.00 | | $ | 1,097.31 | | $ | 6.56 | | $ | 1,000.00 | | $ | 1,018.67 | | $ | 6.33 |
Investor B | | $ | 1,000.00 | | $ | 1,093.15 | | $ | 10.67 | | $ | 1,000.00 | | $ | 1,014.67 | | $ | 10.33 |
Investor C | | $ | 1,000.00 | | $ | 1,093.25 | | $ | 10.55 | | $ | 1,000.00 | | $ | 1,014.79 | | $ | 10.21 |
| * | For each class of the Portfolio, expenses are equal to the annualized expense ratio for the class (0.89% for Institutional, 1.27% for Service, 1.25% Investor A, 2.04% for Investor B and 2.02% for Investor C), multiplied by the average account value over the period, multiplied by 183/366 (to reflect the one-half year period shown). |
| ** | Hypothetical 5% annual return before expenses is calculated by pro-rating the number of days in the most recent fiscal half year divided by 366. |
See “Disclosure of Expenses” on page 35 for further information on how expenses were calculated.
| | | | | | |
| | SEMI-ANNUAL REPORT | | MARCH 31, 2008 | | 25 |
| | |
Portfolio Summary (Unaudited) | | Health Sciences Opportunities Portfolio |
Portfolio Management Commentary
How did the Portfolio perform?
| • | | Portfolio results outperformed those of the broad-market S&P 500 Index and its sector benchmarks, the Russell 3000 Health Care Index and the Lipper Health/Biotechnology Funds Index, for the six-month period. |
What factors influenced performance?
| • | | The Portfolio’s outperformance during the reporting period was the result of positive stock selection and, to a lesser extent, sector allocation effects. Strong positioning within biotechnology and an overweight in the sub-sector relative to the Russell 3000 Health Care Index were the most significant contributors. The Portfolio also benefited from an underweight in the managed care sub-sector, as industry bellwethers Wellpoint and Humana lowered 2008 guidance. An overweight in healthcare equipment aided relative comparisons, as well. Given the political climate and headline risk associated with the pharmaceutical and managed care industries, this group attracted investors due to its more stable growth characteristics. |
| • | | The stocks contributing most significantly to outperformance included global pharmaceutical company Pharmion and biotechnology names BioMarin Pharmaceutical Inc. and Gilead Sciences Inc. Meaningful positions in these companies contributed strongly to results as their shares appreciated in the face of a declining market. |
| • | | Conversely, stock selection within life science tools & services hampered relative results as the Portfolio underperformed within this area. Additionally, an overweight in the healthcare supplies sub-sector and an underweight in healthcare services detracted during the period. |
| • | | A position in Johnson & Johnson was beneficial on an absolute basis, as the stock held up well during the period, however due to its large weighting in the Russell 3000 Health Care Index, it detracted from relative performance. Waters Corp., an analytical instrument manufacturer, also hurt comparisons. |
Describe recent Portfolio activity.
| • | | Portfolio positioning shifted in some areas during the quarter consistent with our investment process. Specifically, we added to the healthcare equipment sub-sector and covered some of our underweight in healthcare services. In contrast, we eliminated exposure to healthcare facilities and reduced our overweight positions in healthcare supplies, biotechnology and life science tools & services. |
Describe Portfolio positioning at period-end.
| • | | At the end of the reporting period, the Portfolio’s largest overweight position relative to the Russell 3000 Health Care Index was in healthcare equipment, while it maintained a more modest overweight in both biotechnology and life science tools & services. The Portfolio was significantly underweight relative to the benchmark in pharmaceuticals, given that sub-sector’s substantial weighting in the index, and also maintained underweight positions in managed care, healthcare distributors and healthcare services. |
| • | | Geographically, approximately 10% of the Portfolio’s net assets was allocated to non-U.S. companies. |
Portfolio Profile as of March 31, 2008
| | | |
Ten Largest Holdings | | Percent of
Long-Term
Investments | |
Becton, Dickinson & Co. | | 8 | % |
Gilead Sciences, Inc. | | 7 | |
Roche Holding AG | | 5 | |
Stryker Corp. | | 5 | |
Medtronic, Inc. | | 5 | |
Baxter International, Inc. | | 5 | |
Johnson & Johnson | | 4 | |
Alexion Pharmaceuticals, Inc. | | 4 | |
Bristol-Myers Squibb Co. | | 4 | |
CVS Caremark Corp. | | 3 | |
| |
Industries | | Percent of
Long-Term
Investments | |
Pharmaceuticals | | 43 | % |
Medical Instruments & Supplies | | 40 | |
Medical & Medical Services | | 12 | |
Retail Merchandising | | 3 | |
Insurance | | 1 | |
Manufacturing | | 1 | |
For Portfolio compliance purposes, the Portfolio’s industry classifications refer to any one or more of the industry sub-classifications used by one or more widely recognized market indexes or ratings group indexes, and/or as defined by Portfolio management. This definition may not apply for purposes of this report, which may combine industry sub-classifications for reporting ease.
| | | | | | |
| 26 | | SEMI-ANNUAL REPORT | | MARCH 31, 2008 | | |
| | |
| Portfolio Summary (concluded) | | Health Sciences Opportunities Portfolio |
Total Return Based on a $10,000 Investment
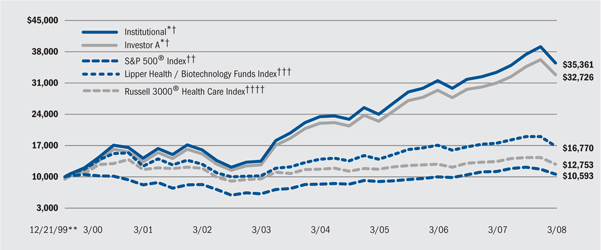
| * | Assuming maximum sales charge, if any, transaction costs and other operating expenses, including advisory fees. |
| ** | Commencement of operations. |
| † | Under normal market conditions, the Portfolio invests at least 80% of total assets in securities of companies in health sciences and related industries. |
| †† | This unmanaged Index covers 500 industrial, utility, transportation and financial companies of the U.S. markets (mostly NYSE issues) representing about 75% of NYSE market capitalization and 30% of NYSE issues. S&P 500 is a trademark of the McGraw-Hill Companies. |
| ††† | An equally weighted index of typically the 30 largest mutual funds within its respective investment objective. |
†††† | The Russell 3000® Health Care Index is an unmanaged index representative of companies involved in medical services or health care in the Russell 3000® Index, which is comprised of the 3,000 largest U.S. companies as determined by total market capitalization. |
Effective July 2, 2007, the Portfolio is closed to new investors. Existing shareholders may make additional investments in current accounts. In addition, new accounts may be opened by (i) any investor if the taxpayer identification number for the new account will be the same as that for a current account and (ii) 401(k), 403(b), 457 and other similar group retirement plan programs or certain discretionary wrap fee programs that have current accounts.
Performance Summary for the Period Ended March 31, 2008
| | | | | | | | | | | | | | | | | | | | | |
| | | | | | Average Annual Total Returns* | |
| | | | | | 1 Year | | | 5 Years | | | From Inception** | |
| | | 6-Month
Total Returns | | | w / o sales
charge | | | w / sales
charge | | | w / o sales
charge | | | w / sales
charge | | | w / o sales
charge | | | w / sales
charge | |
Institutional | | (5.13 | )% | | 6.38 | % | | — | | | 21.38 | % | | — | | | 16.49 | % | | — | |
Service | | (5.24 | )% | | 6.09 | % | | — | | | 21.07 | % | | — | | | 16.19 | % | | — | |
Investor A | | (5.28 | )% | | 6.05 | % | | 0.49 | % | | 21.00 | % | | 19.70 | % | | 16.15 | % | | 15.40 | % |
Investor B | | (5.69 | )% | | 5.17 | % | | 0.67 | % | | 20.08 | % | | 19.89 | % | | 15.34 | % | | 15.34 | % |
Investor C | | (5.65 | )% | | 5.26 | % | | 4.26 | % | | 20.15 | % | | 20.15 | % | | 15.35 | % | | 15.35 | % |
S&P 500® Index | | (12.46 | )% | | (5.08 | )% | | — | | | 11.32 | % | | — | | | 0.70 | % | | — | |
Lipper Health/Biotechnology Funds Index | | (11.49 | )% | | (4.13 | )% | | — | | | 10.46 | % | | — | | | 6.45 | % | | — | |
Russell 3000® Health Care Index | | (10.86 | )% | | (4.91 | )% | | — | | | 6.09 | % | | — | | | 2.98 | % | | — | |
| * | Assuming maximum sales charges. See “About Portfolios’ Performance” on page 34 for a detailed description of share classes, including any related sales charges and fees. |
| ** | The Portfolio commenced operations on 12/21/99. |
Past performance is not indicative of future results.
Expense Example
| | | | | | | | | | | | | | | | | | |
| | | Actual | | Hypothetical** |
| | | Beginning
Account Value
October 1, 2007 | | Ending
Account Value
March 31, 2008 | | Expenses Paid
During the Period* | | Beginning
Account Value
October 1, 2007 | | Ending
Account Value
March 31, 2008 | | Expenses Paid
During the Period* |
Institutional | | $ | 1,000.00 | | $ | 948.74 | | $ | 4.80 | | $ | 1,000.00 | | $ | 1,020.01 | | $ | 4.99 |
Service | | $ | 1,000.00 | | $ | 947.56 | | $ | 6.30 | | $ | 1,000.00 | | $ | 1,018.45 | | $ | 6.55 |
Investor A | | $ | 1,000.00 | | $ | 947.19 | | $ | 6.35 | | $ | 1,000.00 | | $ | 1,018.40 | | $ | 6.60 |
Investor B | | $ | 1,000.00 | | $ | 943.13 | | $ | 10.40 | | $ | 1,000.00 | | $ | 1,014.17 | | $ | 10.83 |
Investor C | | $ | 1,000.00 | | $ | 943.53 | | $ | 9.92 | | $ | 1,000.00 | | $ | 1,014.67 | | $ | 10.33 |
| * | For each class of the Portfolio, expenses are equal to the annualized expense ratio for the class (0.99% for Institutional, 1.29% for Service, 1.30% for Investor A, 2.14% for Investor B and 2.04% for Investor C), multiplied by the average account value over the period, multiplied by 183/366 (to reflect the one-half year period shown). |
| ** | Hypothetical 5% annual return before expenses is calculated by pro-rating the number of days in the most recent fiscal half year divided by 366. |
See “Disclosure of Expenses” on page 35 for further information on how expenses were calculated.
| | | | | | |
| | SEMI-ANNUAL REPORT | | MARCH 31, 2008 | | 27 |
| | |
Portfolio Summary (Unaudited) | | U.S. Opportunities Portfolio |
Portfolio Management Commentary
How did the Portfolio perform?
| • | | Portfolio results outperformed those of the benchmark S&P/Citigroup Extended Market Index (EMI) – U.S. for the six-month period. |
What factors influenced performance?
| • | | Portfolio outperformance during the reporting period was mainly the result of positive stock selection. Sector allocation effects contributed positively, as well. |
| • | | Strong stock selection within healthcare, industrials and materials had the greatest influence on relative results. Stock selection effects were also positive within telecommunication services, consumer staples and energy. Individual stocks that contributed most significantly to outperformance included fertilizer stock Mosaic Co. and coal miner CONSOL Energy, Inc. These companies experienced strong gains during the quarter and were among the Portfolio’s largest positions. |
| • | | Sector allocation effects also contributed to outperformance in the quarter. In a challenging market for consumer-related stocks, the Portfolio’s underweight in the consumer discretionary sector benefited results. Overweight positions in energy, materials and consumer staples also aided comparative returns. |
| • | | Conversely, stock selection within information technology proved most disadvantageous for the period. Weaker results within consumer discretionary and financials also detracted somewhat from performance. From an individual stock point of view, the Portfolio’s overweight positions in Life Time Fitness Inc. and VeriFone Holdings Inc. provided the greatest negative effect, as these companies’ shares underperformed, hampering relative results. |
| • | | The Portfolio’s underweight in the healthcare and utilities sectors and overweight in telecommunication services modestly hurt relative comparisons, as well. |
Describe recent Portfolio activity.
| • | | Sector weights shifted in some areas during the quarter consistent with our investment process. Specifically, we added to holdings in the energy, financials and materials sectors, while the Portfolio’s exposure to industrials and information technology declined over the period. |
Describe Portfolio positioning at period-end.
| • | | At the end of the reporting period, the Portfolio was overweight relative to the benchmark in the consumer staples, energy, materials and telecommunication services sectors. Underweighted sectors included consumer discretionary, financials, healthcare, industrials and information technology. |
Portfolio Profile as of March 31, 2008
| | | |
Ten Largest Holdings | | Percent of
Long-Term
Investments | |
Ishares Dow Jones U.S. Real Estate Index Fund | | 2 | % |
United Therapeutics Corp. | | 2 | |
FTI Consulting, Inc. | | 2 | |
CONSOL Energy, Inc. | | 2 | |
Atwood Oceanics, Inc. | | 1 | |
Petrohawk Energy Corp. | | 1 | |
Chesapeake Energy Corp. | | 1 | |
Newfield Exploration Co. | | 1 | |
Becton, Dickinson & Co. | | 1 | |
priceline.com, Inc. | | 1 | |
| |
Ten Largest Industries | | Percent of
Long-Term
Investments | |
Oil & Gas | | 14 | % |
Computer Software & Services | | 8 | |
Banks | | 6 | |
Metal & Mining | | 6 | |
Energy & Utilities | | 5 | |
Finance | | 5 | |
Medical Instruments & Supplies | | 4 | |
Manufacturing | | 4 | |
Telecommunications | | 4 | |
Chemicals | | 4 | |
For Portfolio compliance purposes, the Portfolio’s industry classifications refer to any one or more of the industry sub-classifications used by one or more widely recognized market indexes or ratings group indexes, and/or as defined by Portfolio management. This definition may not apply for purposes of this report, which may combine industry sub-classifications for reporting ease.
| | | | | | |
| 28 | | SEMI-ANNUAL REPORT | | MARCH 31, 2008 | | |
| | |
| Portfolio Summary (concluded) | | U.S. Opportunities Portfolio |
Total Return Based on a $10,000 Investment
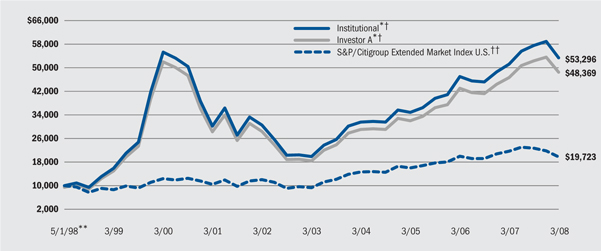
| * | Assuming maximum sales charge, if any, transaction costs and other operating expenses, including advisory fees. |
| ** | Commencement of operations. |
| † | The Portfolio normally invests at least 80% of its net assets in equity securities issued by U.S. emerging capitalization companies with relatively attractive earnings growth potential and valuation. |
| †† | An unmanaged index comprised of smaller-capitalization U.S. stocks representing the bottom 20% of available market capital, with a minimum market capitalization of at least $100 million. |
Performance Summary for the Period Ended March 31, 2008
| | | | | | | | | | | | | | | | | | | | | |
| | | | | | Average Annual Total Returns* | |
| | | | | | 1 Year | | | 5 Years | | | From Inception** | |
| | | 6-Month
Total Returns | | | w / o sales
charge | | | w / sales
charge | | | w / o sales
charge | | | w / sales
charge | | | w / o sales
charge | | | w / sales
charge | |
Institutional | | (7.26 | )% | | 4.18 | % | | — | | | 21.83 | % | | — | | | 18.38 | % | | — | |
Service | | (7.41 | )% | | 3.78 | % | | — | | | 21.38 | % | | — | | | 17.99 | % | | — | |
Investor A | | (7.48 | )% | | 3.69 | % | | (1.76 | )% | | 21.30 | % | | 20.01 | % | | 17.87 | % | | 17.23 | % |
Investor B | | (7.83 | )% | | 2.89 | % | | (1.61 | )% | | 20.41 | % | | 20.22 | % | | 17.18 | % | | 17.18 | % |
Investor C | | (7.81 | )% | | 2.96 | % | | 1.96 | % | | 20.42 | % | | 20.42 | % | | 17.01 | % | | 17.01 | % |
S&P/Citigroup Extended Market Index U.S. | | (13.00 | )% | | (9.09 | )% | | — | | | 16.18 | % | | — | | | 7.09 | % | | — | |
| * | Assuming maximum sales charges. See “About Portfolios’ Performance” on page 34 for a detailed description of share classes, including any related sales charges and fees. |
| ** | The Portfolio commenced operations on 5/1/98. |
Past performance is not indicative of future results.
Expense Example
| | | | | | | | | | | | | | | | | | |
| | | Actual | | Hypothetical** |
| | | Beginning
Account Value
October 1, 2007 | | Ending
Account Value
March 31, 2008 | | Expenses Paid
During the Period* | | Beginning
Account Value
October 1, 2007 | | Ending
Account Value
March 31, 2008 | | Expenses Paid
During the Period* |
Institutional | | $ | 1,000.00 | | $ | 927.41 | | $ | 4.82 | | $ | 1,000.00 | | $ | 1,019.94 | | $ | 5.06 |
Service | | $ | 1,000.00 | | $ | 925.89 | | $ | 6.60 | | $ | 1,000.00 | | $ | 1,018.06 | | $ | 6.94 |
Investor A | | $ | 1,000.00 | | $ | 925.23 | | $ | 6.95 | | $ | 1,000.00 | | $ | 1,017.69 | | $ | 7.31 |
Investor B | | $ | 1,000.00 | | $ | 921.67 | | $ | 10.81 | | $ | 1,000.00 | | $ | 1,013.61 | | $ | 11.39 |
Investor C | | $ | 1,000.00 | | $ | 921.95 | | $ | 10.54 | | $ | 1,000.00 | | $ | 1,013.89 | | $ | 11.11 |
| * | For each class of the Portfolio, expenses are equal to the annualized expense ratio for the class (1.00% for Institutional, 1.37% for Service, 1.44% for Investor A, 2.25% for Investor B and 2.19% for Investor C), multiplied by the average account value over the period, multiplied by 183/366 (to reflect the one-half year period shown). |
| ** | Hypothetical 5% annual return before expenses is calculated by pro-rating the number of days in the most recent fiscal half year divided by 366. |
See “Disclosure of Expenses” on page 35 for further information on how expenses were calculated.
| | | | | | |
| | SEMI-ANNUAL REPORT | | MARCH 31, 2008 | | 29 |
| | |
Portfolio Summary (Unaudited) | | Global Opportunities Portfolio |
Portfolio Management Commentary
How did the Portfolio perform?
| • | | Portfolio results outperformed those of the benchmark S&P/Citigroup Global Broad Market Index for the six-month period. |
What factors influenced performance?
| • | | Portfolio outperformance during the reporting period was a result of positive stock selection and sector allocation effects, which each contributed equally. Strong stock selection within materials had the greatest influence on relative results. On the whole, stock selection effects were positive across seven of ten economic sectors. |
| • | | The stocks contributing most significantly to outperformance included Taiwan Fertilizer Co. Ltd., Yara International ASA and Syngenta AG, as shares of these three agricultural chemical companies experienced strong gains during the period. The portfolio also benefited from positions in Barrick Gold Corp. and Kinross Gold Corp. We continue to favor the agricultural chemical and gold industries. |
| • | | The Portfolio’s underweight to financials and consumer discretionary also was positive for relative returns, as those sectors underperformed the market. Overweight positions in the consumer staples and materials sectors proved advantageous, as well. |
| • | | In contrast, stock selection within information technology was the primary detractor from relative results for the period. Weaker results within consumer staples and utilities also hampered performance. From an individual stock point of view, the Portfolio’s overweight positions in Konica Minolta Holdings Inc. and Sumitomo Corp. proved most unfavorable, as both companies’ shares underperformed over the period. |
Describe recent Portfolio activity.
| • | | Sector and regional weights shifted in some areas during the period consistent with our investment process. Specifically, we added exposure to the financials and consumer discretionary sectors, though the Portfolio remains underweight in both areas. We also increased Portfolio exposure to the energy and healthcare sectors. Conversely, exposure to industrials, information technology and materials declined over the period. |
| • | | Regionally, our relative overweight to North America increased during the period and we added exposure within emerging markets, resulting in a narrower underweight versus the benchmark. Our weightings to Western Europe and Asia declined. |
Describe Portfolio positioning at period-end.
| • | | At the end of the reporting period, the Portfolio was overweight relative to the benchmark in the consumer staples, energy, and healthcare sectors. The Portfolio was underweight in consumer discretionary, financials, information technology, materials and utilities. |
| • | | By region, the Portfolio was overweight North America and underweight Western Europe, Asia, and emerging markets. |
Portfolio Profile as of March 31, 2008
| | | |
Ten Largest Holdings | | Percent of
Long-Term
Investments | |
KBW Bank Corp. | | 2 | % |
Gilead Sciences, Inc. | | 2 | |
Taiwan Fertilizer Co. Ltd. | | 1 | |
Colgate-Palmolive Co. | | 1 | |
Ishares Dow Jones U.S. Real Estate Index Fund | | 1 | |
Nestle SA | | 1 | |
Medtronic, Inc. | | 1 | |
Becton, Dickinson & Co. | | 1 | |
Exxon Mobil Corp. | | 1 | |
The Procter & Gamble Co. | | 1 | |
| |
Ten Largest Countries | | Percent of
Long-Term
Investments | |
United States | | 63 | % |
Japan | | 5 | |
United Kingdom | | 3 | |
Hong Kong | | 3 | |
France | | 3 | |
Germany | | 3 | |
Switzerland | | 3 | |
Brazil | | 3 | |
Taiwan | | 3 | |
Canada | | 2 | |
For Portfolio compliance purposes, the Portfolio’s industry classifications refer to any one or more of the industry sub-classifications used by one or more widely recognized market indexes or ratings group indexes, and/or as defined by Portfolio management. This definition may not apply for purposes of this report, which may combine industry sub-classifications for reporting ease.
| | | | | | |
| 30 | | SEMI-ANNUAL REPORT | | MARCH 31, 2008 | | |
| | |
| Portfolio Summary (concluded) | | Global Opportunities Portfolio |
Total Return Based on a $10,000 Investment
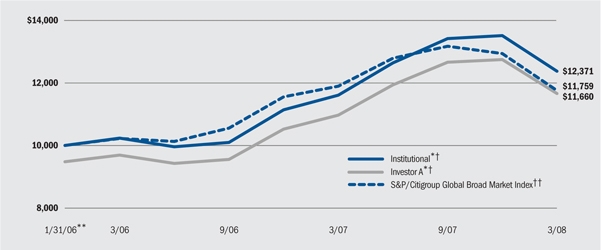
| * | Assuming maximum sales charge, if any, transaction costs and other operating expenses, including advisory fees. |
| ** | Commencement of operations. |
| † | The Portfolio will invest, under normal market conditions, at least 40% of its total assets in issuers located outside of the U.S. The Portfolio may invest up to 25% of its total assets in stocks of issuers in emerging market countries. The Portfolio may also invest up to 25% of its total assets in global fixed income securities including emerging market debt. |
| †† | The all-encompassing S&P/Citigroup Global index is known as the Broad Market Index (BMI). The BMI measures the performance of the entire universe of investable securities greater than USD 100 million. The BMI is segmented into two size components: the Primary Market Index (PMI), and the Extended Market Index (EMI). The PMI defines the large-cap universe, representing the top 80% of BMI market capitalization for each listed country. The EMI defines the small-cap universe for each country, representing the remaining 20%. |
Performance Summary for the Period Ended March 31, 2008
| | | | | | | | | | | | | | | |
| | | | | | Average Annual Total Returns* | |
| | | | | | 1 Year | | | From Inception** | |
| | | 6-Month
Total Returns | | | w / o sales
charge | | | w / sales
charge | | | w / o sales
charge | | | w / sales
charge | |
Institutional | | (7.78 | )% | | 6.55 | % | | — | | | 10.34 | % | | — | |
Investor A | | (7.90 | )% | | 6.27 | % | | 0.67 | % | | 10.06 | % | | 7.37 | % |
Investor B | | (8.35 | )% | | 5.52 | % | | 1.02 | % | | 9.28 | % | | 7.81 | % |
Investor C | | (8.27 | )% | | 5.53 | % | | 4.53 | % | | 9.32 | % | | 9.32 | % |
S&P/Citigroup Global Broad Market Index | | (11.00 | )% | | (1.17 | )% | | — | | | 7.76 | % | | — | |
| * | Assuming maximum sales charges. See “About Portfolios’ Performance” on page 34 for a detailed description of share classes, including any related sales charges and fees. |
| ** | The Portfolio commenced operations on 1/31/06. |
Past performance is not indicative of future results.
Expense Example
| | | | | | | | | | | | | | | | | | |
| | | Actual | | Hypothetical** |
| | | Beginning
Account Value
October 1, 2007 | | Ending
Account Value
March 31, 2008 | | Expenses Paid
During the Period* | | Beginning
Account Value
October 1, 2007 | | Ending
Account Value
March 31, 2008 | | Expenses Paid
During the Period* |
Institutional | | $ | 1,000.00 | | $ | 922.23 | | $ | 6.19 | | $ | 1,000.00 | | $ | 1,018.48 | | $ | 6.52 |
Investor A | | $ | 1,000.00 | | $ | 920.98 | | $ | 7.58 | | $ | 1,000.00 | | $ | 1,017.01 | | $ | 7.99 |
Investor B | | $ | 1,000.00 | | $ | 916.53 | | $ | 11.46 | | $ | 1,000.00 | | $ | 1,012.90 | | $ | 12.10 |
Investor C | | $ | 1,000.00 | | $ | 917.34 | | $ | 11.18 | | $ | 1,000.00 | | $ | 1,013.19 | | $ | 11.81 |
| * | For each class of the Portfolio, expenses are equal to the annualized expense ratio for the class (1.29% for Institutional, 1.58% for Investor A, 2.39% for Investor B and 2.33% for Investor C), multiplied by the average account value over the period, multiplied by 183/366 (to reflect the one-half year period shown). |
| ** | Hypothetical 5% annual return before expenses is calculated by pro-rating the number of days in the most recent fiscal half year divided by 366. See “Disclosure of Expenses” on page 35 for further information on how expenses were calculated. |
| | | | | | |
| | SEMI-ANNUAL REPORT | | MARCH 31, 2008 | | 31 |
| | |
Portfolio Summary (Unaudited) | | International Opportunities Portfolio |
Portfolio Management Commentary
How did the Portfolio perform?
| • | | For the six-month period, Portfolio results outperformed both those of its former benchmark, the S&P/Citigroup Extended Market Index Global ex-U.S., and those of the S&P/Citigroup Broad Market Index Global ex-U.S., its benchmark effective March 3, 2008. |
What factors influenced performance?
| • | | Portfolio outperformance during the reporting period was a result of positive stock selection and sector allocation effects. Strong stock selection within materials had the greatest influence on relative results. Stock selection effects also were positive within consumer staples, energy, financials and information technology. |
| • | | The stocks contributing most significantly to outperformance included Taiwan Fertilizer Co. Ltd, Yara International ASA, and Nihon Nohyaku Co. Ltd. These three agricultural chemical stocks experienced strong gains during the period. The Portfolio also benefited from a position in Barrick Gold Corp. We continue to favor the agricultural chemical and gold industries. |
| • | | Sector allocation effects were positive for seven of ten economic sectors. Specifically, the Portfolio’s underweight in consumer discretionary and information technology and overweight positions in energy, materials and utilities contributed positively. |
| • | | In contrast, stock selection within utilities was the biggest detractor from relative performance. Weaker results within consumer discretionary and industrials and an underweight in healthcare also impaired performance. |
| • | | From an individual stock point of view, the Portfolio’s overweight positions in JSW Steel Ltd. and Korea Investment Holdings Co. proved most unfavorable, as these companies’ shares underperformed, hampering comparative results. |
Describe recent Portfolio activity.
| • | | Sector and regional weights shifted in some areas during the quarter consistent with our investment process. Specifically, we added to the Portfolio’s consumer staples and healthcare holdings. In contrast, exposure to consumer discretionary, energy, telecommunication services and utilities declined over the period. |
| • | | Regionally, we reduced the Portfolio’s exposure to Japan and emerging markets and we increased exposure to Western Europe. |
Describe Portfolio positioning at period-end.
| • | | At the end of the reporting period, the Portfolio maintained overweight positions in consumer staples, energy, industrials and materials. Underweighted sectors relative to the benchmark included consumer discretionary, financials, information technology, telecommunication services and utilities. |
| • | | Geographically, the Portfolio was underweight Asia and Western Europe and overweight emerging markets, primarily in Asia. |
Portfolio Profile as of March 31, 2008
| | | |
Ten Largest Holdings | | Percent of
Long-Term
Investments | |
Kinross Gold Corp. | | 2 | % |
Kurita Water Industries Ltd. | | 2 | |
Taiwan Fertilizer Co. Ltd. | | 2 | |
Yara International ASA | | 1 | |
Unibanco SA - ADR | | 1 | |
Oil Search Ltd. | | 1 | |
United Internet AG | | 1 | |
Casino Guichard-Perrachon SA | | 1 | |
Hannover Rueckversicherung AG | | 1 | |
Nihon Nohyaku Co. Ltd. | | 1 | |
| |
Ten Largest Countries | | Percent of
Long-Term
Investments | |
United Kingdom | | 14 | % |
Japan | | 14 | |
Germany | | 7 | |
Canada | | 6 | |
France | | 5 | |
Norway | | 5 | |
Taiwan | | 5 | |
Switzerland | | 5 | |
Brazil | | 4 | |
Hong Kong | | 3 | |
For Portfolio compliance purposes, the Portfolio’s industry classifications refer to any one or more of the industry sub-classifications used by one or more widely recognized market indexes or ratings group indexes, and/or as defined by Portfolio management. This definition may not apply for purposes of this report, which may combine industry sub-classifications for reporting ease.
| | | | | | |
| 32 | | SEMI-ANNUAL REPORT | | MARCH 31, 2008 | | |
| | |
| Portfolio Summary (concluded) | | International Opportunities Portfolio |
Total Return Based on a $10,000 Investment
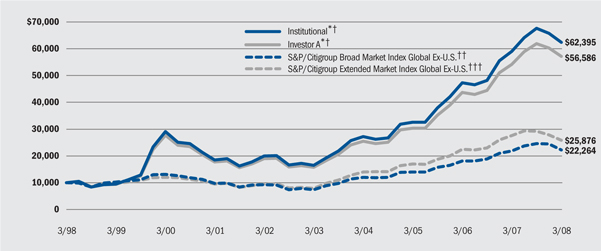
| * | Assuming maximum sales charge, if any, transaction costs and other operating expenses, including advisory fees. |
| † | The Portfolio under normal market conditions, invests at least 80% of its net assets in equity securities issued by international companies of any market capitalization. |
| †† | The S&P/Citigroup Broad Market Index (BMI) Global Ex-U.S. is an available market capitalization weighted equity index made up of 52 global developed and emerging markets, not including the U.S. The BMI is segmented into two size components: the Primary Market Index (PMI), and the Extended Market Index (EMI). The PMI defines the large-cap universe, representing the top 80% of BMI market capitalization for each listed country. The EMI defines the small-cap universe for each country, representing the remaining 20%. |
| ††† | An unmanaged index comprised of smaller-capitalization stocks of both developed and emerging market countries. Index stocks represent the bottom 20% of available market capital for each individual country, with a minimum market capitalization of at least the local equivalent of US $100 million. |
Performance Summary for the Period Ended March 31, 2008
| | | | | | | | | | | | | | | | | | | | | |
| | | | | | Average Annual Total Returns* | |
| | | | | | 1 Year | | | 5 Years | | | 10 Years | |
| | | 6-Month
Total Returns | | | w / o sales
charge | | | w / sales
charge | | | w / o sales
charge | | | w / sales
charge | | | w / o sales
charge | | | w / sales
charge | |
Institutional | | (7.71 | )% | | 5.84 | % | | — | | | 30.44 | % | | — | | | 20.09 | % | | — | |
Service | | (7.85 | )% | | 5.48 | % | | — | | | 30.06 | % | | — | | | 19.72 | % | | — | |
Investor A | | (7.86 | )% | | 5.48 | % | | (0.06 | )% | | 29.98 | % | | 28.58 | % | | 19.57 | % | | 18.92 | % |
Investor B | | (8.22 | )% | | 4.67 | % | | 0.77 | % | | 28.99 | % | | 28.85 | % | | 18.88 | % | | 18.88 | % |
Investor C | | (8.21 | )% | | 4.70 | % | | 3.83 | % | | 29.02 | % | | 29.02 | % | | 18.71 | % | | 18.71 | % |
S&P/Citigroup Broad Market Index Global Ex-U.S. | | (9.67 | )% | | 1.95 | % | | — | | | 24.78 | % | | — | | | 8.33 | % | | — | |
S&P/Citigroup Extended Market Index Global Ex-U.S. | | (11.24 | )% | | (6.38 | )% | | — | | | 26.78 | % | | — | | | 9.97 | % | | — | |
| * | Assuming maximum sales charges. See “About Portfolios’ Performance” on page 34 for a detailed description of share classes, including any related sales charges and fees. |
Past performance is not indicative of future results.
Expense Example
| | | | | | | | | | | | | | | | | | |
| | | Actual | | Hypothetical** |
| | | Beginning
Account Value
October 1, 2007 | | Ending
Account Value
March 31, 2008 | | Expenses Paid
During the Period* | | Beginning
Account Value
October 1, 2007 | | Ending
Account Value
March 31, 2008 | | Expenses Paid
During the Period* |
Institutional | | $ | 1,000.00 | | $ | 922.88 | | $ | 6.00 | | $ | 1,000.00 | | $ | 1,018.68 | | $ | 6.32 |
Service | | $ | 1,000.00 | | $ | 921.50 | | $ | 7.52 | | $ | 1,000.00 | | $ | 1,017.08 | | $ | 7.92 |
Investor A | | $ | 1,000.00 | | $ | 921.39 | | $ | 7.50 | | $ | 1,000.00 | | $ | 1,017.09 | | $ | 7.91 |
Investor B | | $ | 1,000.00 | | $ | 917.80 | | $ | 11.32 | | $ | 1,000.00 | | $ | 1,013.05 | | $ | 11.95 |
Investor C | | $ | 1,000.00 | | $ | 917.95 | | $ | 11.13 | | $ | 1,000.00 | | $ | 1,013.25 | | $ | 11.75 |
| * | For each class of the Portfolio, expenses are equal to the annualized expense ratio for the class (1.25% for Institutional, 1.56% for Service, 1.56% for Investor A, 2.36% for Investor B and 2.32% for Investor C), multiplied by the average account value over the period, multiplied by 183/366 (to reflect the one-half year period shown). |
| ** | Hypothetical 5% annual return before expenses is calculated by pro-rating the number of days in the most recent fiscal half year divided by 366. |
See “Disclosure of Expenses” on page 35 for further information on how expenses were calculated.
| | | | | | |
| | SEMI-ANNUAL REPORT | | MARCH 31, 2008 | | 33 |
About Portfolios’ Performance
| • | | BlackRock and Institutional Shares are not subject to any sales charge. These shares bear no ongoing distribution or service fees, except the BlackRock class of Small Cap Value Equity which is subject to a service fee of 0.25% per year (but no distribution fee), and are available only to eligible investors. |
| • | | Service Shares are not subject to any sales charge. These shares are subject to a service fee of 0.25% per year (but no distribution fee). |
| • | | Investor A Shares incur a maximum initial sales charge (front-end load) of 5.25% and a service fee of 0.25% per year (but no distribution fee). |
| • | | Investor B Shares are subject to a maximum contingent deferred sales charge of 4.50% declining to 0% after six years. In addition, these shares are subject to a distribution fee of 0.75% per year and a service fee of 0.25% per year. These shares automatically convert to Investor A Shares after approximately eight years. (There is no initial sales charge for automatic share conversions.) All returns for periods greater than eight years reflect this conversion. |
| • | | Investor C Shares are subject to a 1.00% contingent deferred sales charge if redeemed within one year of purchase. In addition, these shares are subject to a distribution fee of 0.75% per year and a service fee of 0.25% per year. |
| • | | R Shares are not subject to any sales charge (front-end load) or deferred sales charge. These shares are subject to a distribution fee of 0.25% per year and a service fee of 0.25% per year. R Shares are available only to certain retirement plans. |
Performance information reflects past performance and does not guarantee future results. Current performance may be lower or higher than the performance data quoted. Refer to www.blackrock.com/funds to obtain performance data current to the most recent month-end. Performance results do not reflect the deduction of taxes that a shareholder would pay on Portfolio distributions or the redemption of Portfolio shares. The Portfolios may charge a 2% redemption fee for sales or exchanges of shares within 30 days of purchase or exchange. Performance data does not reflect this potential fee. Figures shown in the performance tables on the previous pages assume reinvestment of all dividends and distributions, if any, at net asset value on the ex-dividend date. Investment return and principal value of shares will fluctuate so that shares, when redeemed, may be worth more or less than their original cost. Dividends paid to each class of shares will vary because of the different levels of service, distribution and transfer agency fees applicable to each class, which are deducted from the income available to be paid to shareholders.
The performance information on the previous pages includes information for each class of each Portfolio since the commencement of operations of such Portfolio, rather than the date such class was introduced. Performance information for each class introduced after the commencement of operations of a Portfolio is therefore based on the performance history of a predecessor class adjusted to reflect the class specific fees applicable to each class at the time of the launch of such share class. This information may be considered when assessing a Portfolio’s performance, but does not represent the actual performance of this share class.
Performance for the Capital Appreciation, Mid-Cap Value Equity, Aurora, Small/Mid-Cap Growth, Global Resources and Health Sciences Opportunities Portfolios for the periods prior to January 31, 2005 is based on performance of certain former State Street Research mutual funds that reorganized with the Portfolios on that date.
Performance information is restated to reflect the current maximum front-end sales charge (in the case of Investor A Shares) or the maximum contingent deferred sales charge (in the case of Investor B and Investor C Shares), and assumes the reinvestment of dividends and distributions. The performance information also reflects fee waivers and reimbursements that subsidize and reduce the total operating expenses of each Portfolio. The Portfolios’ returns would have been lower if there were no such waivers and reimbursements. BlackRock Advisors, LLC is under no obligation to waive or continue waiving its fees after February 1, 2009. Investment return and principal value of an investment will fluctuate so that an investor’s shares, when redeemed, may be worth more or less than their original cost.
The performance shown in the line graphs is that of Institutional Shares and Investor A Shares of the Portfolios. The actual performance of Investor B, Investor C, Service and R Shares is lower than the performance of Institutional Shares because Investor B, Investor C, Service and R Shares have higher expenses than Institutional Shares. Excluding the effects of sales charges, the actual performance of Investor B, Investor C and R Shares is lower than the performance of Investor A Shares because Investor B, Investor C and R Shares have higher expenses than Investor A Shares. Purchasers of Investor A Shares generally pay a front-end sales charge, while purchasers of Investor B and Investor C Shares may pay a contingent deferred sales charge (depending on how long they hold their shares) when they sell their shares.
| | | | | | |
| 34 | | SEMI-ANNUAL REPORT | | MARCH 31, 2008 | | |
Disclosure of Expenses
As a shareholder of a Portfolio, you incur two types of costs: (1) transaction costs, including front and back end sales charges (loads) or redemption/exchange fees, where applicable; and (2) ongoing costs, including advisory fees, distribution (12b-1) and service fees, where applicable, and other Portfolio expenses. These Expense Examples on the previous pages are intended to help you understand your ongoing costs (in dollars) of investing in a Portfolio and compare these costs with the ongoing costs of investing in other mutual funds.
The Expense Examples on the previous pages are based on an investment of $1,000 invested at the beginning of the period and held for the entire period October 1, 2007 to March 31, 2008. The information under “Actual” together with the amount you invested, allows you to estimate actual expenses incurred over the reporting period. Simply divide your account value by $1,000 (for example, an $8,600 account value divided by $1,000 = 8.60) and multiply the result by the cost shown for your share class, in the column entitled “Expenses Paid During the Period”, to estimate the expenses incurred on your account during this period.
The information under “Hypothetical” provides information about hypothetical account values and hypothetical expenses based on a Portfolio’s actual expense ratio and an assumed rate of return of 5% per year before expenses, which is not the Portfolio’s actual return. The hypothetical account values and expenses may not be used to estimate the actual ending account balance or expenses you incurred for the period. You may use this information to compare the ongoing costs of investing in a Portfolio and other funds. To do so, compare this 5% hypothetical example with the 5% hypothetical examples that appear in the shareholder reports of other funds.
Please note that the expenses shown in the tables are meant to highlight your ongoing costs only and do not reflect any transactional costs, such as front and back end sales charges (loads) or redemption fees, where applicable. Therefore, the hypothetical information is useful in comparing ongoing costs only, and will not help you determine the relative total costs of owning different funds. In addition, if these transactional costs were included, your costs would have been higher.
| | | | | | |
| | SEMI-ANNUAL REPORT | | MARCH 31, 2008 | | 35 |
| | |
| | Capital Appreciation Portfolio |
| Schedule of Investments March 31, 2008 (Unaudited) | | (Percentages shown are based on Net Assets) |
| | | | | |
| | | Shares | | Value |
| Common Stocks — 98.3% | | | | | |
| Aerospace — 1.3% | | | | | |
Northrop Grumman Corp. | | 41,500 | | $ | 3,229,115 |
| | | | | |
| Banks — 0.8% | | | | | |
JPMorgan Chase & Co. | | 45,300 | | | 1,945,635 |
| | | | | |
| Beverages & Bottling — 4.7% | | | | | |
The Coca-Cola Co. | | 150,000 | | | 9,130,500 |
PepsiCo, Inc. | | 34,400 | | | 2,483,680 |
| | | | | |
| | | | | 11,614,180 |
| | | | | |
| Business Services — 0.5% | | | | | |
Fluor Corp. | | 9,200 | | | 1,298,672 |
| | | | | |
| Computer & Office Equipment — 6.1% | | | | | |
Apple Computer, Inc.(a) | | 67,750 | | | 9,722,125 |
Cisco Systems, Inc.(a) | | 224,308 | | | 5,403,580 |
| | | | | |
| | | | | 15,125,705 |
| | | | | |
| Computer Software & Services — 12.6% | | | | | |
Activision, Inc.(a) | | 91,300 | | | 2,493,403 |
Adobe Systems, Inc.(a) | | 222,094 | | | 7,904,325 |
Google, Inc. - Class A(a) | | 14,894 | | | 6,560,360 |
International Game Technology | | 27,500 | | | 1,105,775 |
Microsoft Corp. | | 246,762 | | | 7,003,106 |
Salesforce.com, Inc.(a) | | 71,230 | | | 4,122,080 |
Sun Microsystems, Inc.(a) | | 113,000 | | | 1,754,890 |
| | | | | |
| | | | | 30,943,939 |
| | | | | |
| Energy & Utilities — 1.3% | | | | | |
Exelon Corp. | | 39,500 | | | 3,210,165 |
| | | | | |
| Entertainment & Leisure — 0.9% | | | | | |
Las Vegas Sands Corp.(a)(b) | | 29,422 | | | 2,166,636 |
| | | | | |
| Finance — 1.2% | | | | | |
The Goldman Sachs Group, Inc. | | 8,900 | | | 1,471,971 |
NYSE Euronext, Inc. | | 24,400 | | | 1,505,724 |
| | | | | |
| | | | | 2,977,695 |
| | | | | |
| Food & Agriculture — 3.5% | | | | | |
Monsanto Co. | | 54,840 | | | 6,114,660 |
Potash Corp. of Saskatchewan, Inc. | | 16,520 | | | 2,564,069 |
| | | | | |
| | | | | 8,678,729 |
| | | | | |
| Machinery & Heavy Equipment — 2.2% | | | | | |
Deere & Co. | | 11,600 | | | 933,104 |
Joy Global, Inc. | | 68,700 | | | 4,476,492 |
| | | | | |
| | | | | 5,409,596 |
| | | | | |
| Manufacturing — 8.6% | | | | | |
Corning, Inc. | | 147,793 | | | 3,552,944 |
Crocs, Inc.(a)(b) | | 70,100 | | | 1,224,647 |
Danaher Corp.(b) | | 67,500 | | | 5,132,025 |
| Common Stocks (Continued) | | | | | |
| Manufacturing (Continued) | | | | | |
Foster Wheeler Ltd.(a) | | 16,360 | | | 926,303 |
General Electric Co. | | 102,491 | | | 3,793,192 |
Honeywell International, Inc. | | 114,740 | | | 6,473,631 |
| | | | | |
| | | | | 21,102,742 |
| | | | | |
| Measuring & Controlling Devices — 2.2% | | | | | |
Thermo Electron Corp.(a)(b) | | 97,000 | | | 5,513,480 |
| | | | | |
| Medical & Medical Services — 2.7% | | | | | |
Henry Schein, Inc.(a)(b) | | 46,700 | | | 2,680,580 |
Medco Health Solutions, Inc.(a) | | 91,122 | | | 3,990,232 |
| | | | | |
| | | | | 6,670,812 |
| | | | | |
| Medical Instruments & Supplies — 4.9% | | | | | |
C.R. Bard, Inc. | | 17,400 | | | 1,677,360 |
Hologic, Inc.(a)(b) | | 99,200 | | | 5,515,520 |
Johnson & Johnson | | 76,600 | | | 4,969,042 |
| | | | | |
| | | | | 12,161,922 |
| | | | | |
| Metal & Mining — 3.4% | | | | | |
CONSOL Energy, Inc. | | 85,166 | | | 5,892,636 |
Freeport-McMoRan Copper & Gold, Inc. - Class B | | 24,537 | | | 2,360,950 |
| | | | | |
| | | | | 8,253,586 |
| | | | | |
| Oil & Gas — 6.4% | | | | | |
EOG Resources, Inc. | | 43,720 | | | 5,246,400 |
Petroleo Brasileiro SA - ADR | | 27,700 | | | 2,828,447 |
Schlumberger Ltd. | | 55,500 | | | 4,828,500 |
Transocean, Inc.(a) | | 21,805 | | | 2,948,036 |
| | | | | |
| | | | | 15,851,383 |
| | | | | |
| Pharmaceuticals — 9.3% | | | | | |
Abbott Laboratories | | 93,600 | | | 5,162,040 |
Celgene Corp.(a) | | 52,900 | | | 3,242,241 |
Elan Corp. Plc - ADR(a) | | 205,900 | | | 4,295,074 |
Genentech, Inc.(a) | | 34,000 | | | 2,760,120 |
Gilead Sciences, Inc.(a) | | 96,200 | | | 4,957,186 |
Merck & Co., Inc. | | 63,046 | | | 2,392,596 |
| | | | | |
| | | | | 22,809,257 |
| | | | | |
| Restaurants — 1.0% | | | | | |
McDonald’s Corp. | | 44,300 | | | 2,470,611 |
| | | | | |
| Retail Merchandising — 6.8% | | | | | |
Amazon.com, Inc.(a) | | 39,322 | | | 2,803,659 |
Kohl’s Corp.(a) | | 69,340 | | | 2,973,993 |
Nordstrom, Inc.(b) | | 64,267 | | | 2,095,104 |
Wal-Mart Stores, Inc. | | 170,386 | | | 8,975,934 |
| | | | | |
| | | | | 16,848,690 |
| | | | | |
| Security Brokers & Dealers — 1.7% | | | | | |
Janus Capital Group, Inc. | | 181,983 | | | 4,234,744 |
| | | | | |
Portfolios Abbreviations
To simplify the listings of Portfolios holdings in the Schedules of Investments, the names of many of the securities have been abbreviated according to the list on the right.
| | | | | | |
ADR AUD CAD CHF CZK DKK EUR GBP HKD | | American Depository Receipts Australian Dollar Canadian Dollar Swiss Francs Czechoslovakian Krone Danish Krone Euro British Pound Hong Kong Dollar | | JPY LLC LP NOK PLN REIT SEK SGD ZAR | | Japanese Yen Limited Liability Company Limited Partnership Norwegian Krone Polish Zloty Real Estate Investment Trust Swedish Krona Singapore Dollar South African Rand |
See Notes to Financial Statements.
| | | | | | |
| 36 | | SEMI-ANNUAL REPORT | | MARCH 31, 2008 | | |
| | |
| | Capital Appreciation Portfolio |
| Schedule of Investments (concluded) | | (Percentages shown are based on Net Assets) |
| | | | | | |
| | | Shares | | Value | |
| Common Stocks (Continued) | | | | | | |
| Semiconductors & Related Devices — 1.7% | | | | | | |
Broadcom Corp. - Class A(a) | | 79,500 | | $ | 1,531,965 | |
PMC-Sierra, Inc.(a) | | 449,400 | | | 2,561,580 | |
| | | | | | |
| | | | | 4,093,545 | |
| | | | | | |
| Soaps & Cosmetics — 3.3% | | | | | | |
Avon Products, Inc. | | 85,500 | | | 3,380,670 | |
The Procter & Gamble Co. | | 69,400 | | | 4,862,858 | |
| | | | | | |
| | | | | 8,243,528 | |
| | | | | | |
| Telecommunications — 7.0% | | | | | | |
American Tower Corp. - Class A(a) | | 94,214 | | | 3,694,131 | |
AT&T, Inc. | | 109,083 | | | 4,177,879 | |
QUALCOMM, Inc. | | 193,221 | | | 7,922,061 | |
Research In Motion Ltd.(a) | | 12,120 | | | 1,360,227 | |
| | | | | | |
| | | | | 17,154,298 | |
| | | | | | |
| Tobacco — 3.0% | | | | | | |
Altria Group, Inc. | | 23,238 | | | 515,884 | |
Philip Morris International, Inc.(a) | | 133,616 | | | 6,758,297 | |
| | | | | | |
| | | | | 7,274,181 | |
| | | | | | |
| Transportation — 1.2% | | | | | | |
Expeditors International of Washington, Inc.(b) | | 64,528 | | | 2,915,375 | |
| | | | | | |
| TOTAL COMMON STOCKS | | | | | | |
(Cost $212,858,618) | | | | | 242,198,221 | |
| | | | | | |
| Short Term Investments — 9.2% | | | | | | |
BlackRock Liquidity Series, LLC Money Market Series, 3.10%(c)(d)(e) | | 19,404,950 | | | 19,404,950 | |
Galileo Money Market Fund, 2.56%(e) | | 3,332,417 | | | 3,332,417 | |
| | | | | | |
| TOTAL SHORT TERM INVESTMENTS | | | | | | |
(Cost $22,737,367) | | | | | 22,737,367 | |
| | | | | | |
| TOTAL INVESTMENTS IN SECURITIES — 107.5% | | | | | | |
(Cost $235,595,985*) | | | | | 264,935,588 | |
| LIABILITIES IN EXCESS OF OTHER ASSETS — (7.5)% | | | | | (18,492,128 | ) |
| | | | | | |
| NET ASSETS — 100.0% | | | | $ | 246,443,460 | |
| | | | | | |
| * | The cost and unrealized appreciation (depreciation) of investments as of March 31, 2008, as computed for federal income tax purposes, were as follows: |
| | | | |
Aggregate cost | | $ | 236,683,015 | |
| | | | |
Gross unrealized appreciation | | $ | 39,526,045 | |
Gross unrealized depreciation | | | (11,273,472 | ) |
| | | | |
Net unrealized appreciation | | $ | 28,252,573 | |
| | | | |
| (a) | Non-income producing security. |
| (b) | Security, or a portion of security, is on loan. |
| (c) | Investments in companies considered to be an affiliate of the Portfolio, for purposes of Section 2(a)(3) of the Investment Company Act of 1940, were as follows: |
| | | | | | |
Affiliate | | Net
Activity | | Interest
Income |
BlackRock Liquidity Series, LLC Money Market Series | | $ | 19,404,950 | | $ | 55,514 |
| | | | | | |
| (d) | Security purchased with the cash proceeds from securities loans. |
| (e) | Represents current yield as of report date. |
| • | For Portfolio compliance purposes, the Portfolio’s sector and industry classifications refer to any one or more of the Standard Industry Codes as defined by the Securities Exchange Commission (“SEC”). This definition may not apply for purposes of this report, which may combine sector and industry sub-classifications for reporting ease. |
See Notes to Financial Statements.
| | | | | | |
| | SEMI-ANNUAL REPORT | | MARCH 31, 2008 | | 37 |
| | |
| | Mid-Cap Value Equity Portfolio |
| Schedule of Investments March 31, 2008 (Unaudited) | | (Percentages shown are based on Net Assets) |
| | | | | |
| | | Shares | | Value |
| Common Stocks — 96.2% | | | | | |
| Banks — 6.8% | | | | | |
The Bank of New York Mellon Corp. | | 275,300 | | $ | 11,488,269 |
Cullen/Frost Bankers, Inc. | | 174,635 | | | 9,262,641 |
First Midwest Bancorp, Inc.(a) | | 346,013 | | | 9,608,781 |
People’s United Financial, Inc. | | 876,520 | | | 15,172,561 |
Wintrust Financial Corp. | | 246,400 | | | 8,611,680 |
Zions Bancorporation(a) | | 195,100 | | | 8,886,805 |
| | | | | |
| | | | | 63,030,737 |
| | | | | |
| Beverages & Bottling — 1.2% | | | | | |
Constellation Brands, Inc.(a)(b) | | 636,300 | | | 11,243,421 |
| | | | | |
| Broadcasting — 1.3% | | | | | |
Belo Corp. | | 1,107,326 | | | 11,704,436 |
| | | | | |
| Business Services — 2.5% | | | | | |
The Brink’s Co. | | 257,400 | | | 17,292,132 |
W.W. Grainger, Inc.(a) | | 74,292 | | | 5,675,166 |
| | | | | |
| | | | | 22,967,298 |
| | | | | |
| Chemicals — 4.2% | | | | | |
Ashland, Inc. | | 292,800 | | | 13,849,440 |
Celanese Corp. - Series A | | 325,300 | | | 12,702,965 |
Hercules, Inc.(a) | | 667,200 | | | 12,203,088 |
| | | | | |
| | | | | 38,755,493 |
| | | | | |
| Computer & Office Equipment — 0.6% | | | | | |
Electronics for Imaging, Inc.(b) | | 384,800 | | | 5,741,216 |
Phase Metrics, Inc.(b)(c) | | 108,409 | | | 2,168 |
| | | | | |
| | | | | 5,743,384 |
| | | | | |
| Computer Software & Services — 1.5% | | | | | |
Tech Data Corp.(b) | | 247,800 | | | 8,127,840 |
Teradata Corp.(b) | | 270,900 | | | 5,976,054 |
| | | | | |
| | | | | 14,103,894 |
| | | | | |
| Construction — 0.5% | | | | | |
Toll Brothers, Inc.(b) | | 182,700 | | | 4,289,796 |
| | | | | |
| Containers — 2.5% | | | | | |
Owens-Illinois, Inc.(b) | | 122,200 | | | 6,895,746 |
Pactiv Corp.(b) | | 417,500 | | | 10,942,675 |
Smurfit-Stone Container Corp.(b) | | 687,700 | | | 5,295,290 |
| | | | | |
| | | | | 23,133,711 |
| | | | | |
| Electronics — 2.2% | | | | | |
Agilent Technologies, Inc.(b) | | 396,600 | | | 11,830,578 |
Intersil Corp. - Class A | | 317,500 | | | 8,150,225 |
| | | | | |
| | | | | 19,980,803 |
| | | | | |
| Energy & Utilities — 12.4% | | | | | |
Constellation Energy Group, Inc. | | 136,600 | | | 12,057,682 |
Edison International | | 302,300 | | | 14,818,746 |
Entergy Corp. | | 110,000 | | | 11,998,800 |
Equitable Resources, Inc. | | 231,500 | | | 13,635,350 |
Integrys Energy Group, Inc. | | 243,500 | | | 11,356,840 |
NRG Energy, Inc.(b) | | 317,000 | | | 12,359,830 |
PPL Corp.(a) | | 312,300 | | | 14,340,816 |
Questar Corp. | | 187,000 | | | 10,576,720 |
Wisconsin Energy Corp. | | 312,000 | | | 13,724,880 |
| | | | | |
| | | | | 114,869,664 |
| | | | | |
| Entertainment & Leisure — 1.1% | | | | | |
Pinnacle Entertainment, Inc.(b) | | 757,300 | | | 9,693,440 |
| | | | | |
| Finance — 5.3% | | | | | |
Affiliated Managers Group, Inc.(b) | | 85,100 | | | 7,721,974 |
Astoria Financial Corp. | | 322,100 | | | 8,748,236 |
Capital One Financial Corp.(a) | | 102,300 | | | 5,035,206 |
Freedom Pay, Inc.(c) | | 43,051 | | | 430 |
Invesco Ltd. | | 527,600 | | | 12,852,336 |
TD Ameritrade Holding Corp.(b) | | 888,700 | | | 14,672,437 |
| | | | | |
| | | | | 49,030,619 |
| | | | | |
| Food & Agriculture — 2.6% | | | | | |
Dean Foods Co.(a)(b) | | 457,600 | | | 9,193,184 |
Del Monte Foods Co. | | 1,600,917 | | | 15,256,739 |
| | | | | |
| | | | | 24,449,923 |
| | | | | |
| Insurance — 8.0% | | | | | |
Assurant, Inc. | | 212,000 | | | 12,902,320 |
AXIS Capital Holdings Ltd. | | 310,400 | | | 10,547,392 |
Endurance Specialty Holdings Ltd.(a) | | 317,819 | | | 11,632,175 |
HCC Insurance Holdings, Inc. | | 655,500 | | | 14,873,295 |
Lincoln National Corp. | | 218,300 | | | 11,351,600 |
W.R. Berkley Corp. | | 457,900 | | | 12,679,251 |
| | | | | |
| | | | | 73,986,033 |
| | | | | |
| Machinery & Heavy Equipment — 1.3% | | | | | |
Albany International Corp. - Class A | | 337,700 | | | 12,204,478 |
| | | | | |
| Manufacturing — 4.5% | | | | | |
Dover Corp. | | 325,500 | | | 13,599,390 |
Eaton Corp. | | 120,500 | | | 9,600,235 |
General Cable Corp.(a)(b) | | 80,800 | | | 4,772,856 |
Jones Apparel Group, Inc.(a) | | 495,100 | | | 6,644,242 |
Textron, Inc. | | 132,200 | | | 7,326,524 |
| | | | | |
| | | | | 41,943,247 |
| | | | | |
| Medical & Medical Services — 4.9% | | | | | |
Coventry Health Care, Inc.(b) | | 156,000 | | | 6,294,600 |
Covidien Ltd. | | 250,000 | | | 11,062,500 |
Davita, Inc.(b) | | 137,900 | | | 6,586,104 |
Laboratory Corp. of America Holdings(a)(b) | | 148,300 | | | 10,926,744 |
Quest Diagnostics, Inc.(a) | | 221,900 | | | 10,045,413 |
| | | | | |
| | | | | 44,915,361 |
| | | | | |
| Medical Instruments & Supplies — 2.4% | | | | | |
The Cooper Cos., Inc.,(a) | | 453,500 | | | 15,614,005 |
Hillenbrand Industries, Inc. | | 134,466 | | | 6,427,475 |
| | | | | |
| | | | | 22,041,480 |
| | | | | |
| Metal & Mining — 1.3% | | | | | |
CONSOL Energy, Inc. | | 66,200 | | | 4,580,378 |
Reliance Steel & Aluminum Co.(a) | | 124,000 | | | 7,422,640 |
| | | | | |
| | | | | 12,003,018 |
| | | | | |
| Motor Vehicles — 0.9% | | | | | |
Ford Motor Co.(a)(b) | | 1,505,314 | | | 8,610,396 |
| | | | | |
| Oil & Gas — 7.7% | | | | | |
EOG Resources, Inc. | | 111,200 | | | 13,344,000 |
Grant Prideco, Inc.(b) | | 348,100 | | | 17,133,482 |
Newfield Exploration Co.(b) | | 281,600 | | | 14,882,560 |
Noble Corp. | | 249,500 | | | 12,392,665 |
Southwestern Energy Co.(b) | | 386,600 | | | 13,024,554 |
| | | | | |
| | | | | 70,777,261 |
| | | | | |
See Notes to Financial Statements.
| | | | | | |
| 38 | | SEMI-ANNUAL REPORT | | MARCH 31, 2008 | | |
| | |
| | Mid-Cap Value Equity Portfolio |
| Schedule of Investments (concluded) | | (Percentages shown are based on Net Assets) |
| | | | | | | |
| | | Shares | | | Value | |
Common Stocks (Continued) | | | | | | | |
Publishing & Printing — 1.4% | | | | | | | |
R.R. Donnelley & Sons Co. | | 422,000 | | | $ | 12,790,820 | |
| | | | | | | |
Railroad & Shipping — 0.8% | | | | | | | |
Norfolk Southern Corp. | | 139,300 | | | | 7,566,776 | |
| | | | | | | |
Real Estate — 3.3% | | | | | | | |
Boston Properties, Inc. (REIT)(a) | | 153,600 | | | | 14,141,952 | |
Simon Property Group, Inc. (REIT) | | 171,900 | | | | 15,971,229 | |
| | | | | | | |
| | | | | | 30,113,181 | |
| | | | | | | |
Restaurants — 0.8% | | | | | | | |
Brinker International, Inc. | | 411,800 | | | | 7,638,890 | |
| | | | | | | |
Retail Merchandising — 7.5% | | | | | | | |
Advance Auto Parts, Inc. | | 262,700 | | | | 8,944,935 | |
Limited Brands, Inc. | | 746,100 | | | | 12,758,310 | |
Longs Drug Stores Corp.(a) | | 218,800 | | | | 9,290,248 | |
Macy’s, Inc. | | 364,000 | | | | 8,393,840 | |
Safeway, Inc. | | 674,000 | | | | 19,781,900 | |
The Talbots, Inc.(a) | | 934,974 | | | | 10,079,020 | |
| | | | | | | |
| | | | | | 69,248,253 | |
| | | | | | | |
Security Brokers & Dealers — 0.7% | | | | | | | |
Piper Jaffray Cos., Inc.(b) | | 177,900 | | | | 6,041,484 | |
| | | | | | | |
Semiconductors & Related Devices — 1.1% | | | | | | | |
Micron Technology, Inc.(b) | | 1,747,700 | | | | 10,433,769 | |
| | | | | | | |
Soaps & Cosmetics — 0.5% | | | | | | | |
Estee Lauder Cos., Inc. | | 91,000 | | | | 4,172,350 | |
| | | | | | | |
Telecommunications — 1.8% | | | | | | | |
Amdocs Ltd.(b) | | 326,214 | | | | 9,251,429 | |
Anixter International, Inc.(a)(b) | | 122,175 | | | | 7,824,087 | |
| | | | | | | |
| | | | | | 17,075,516 | |
| | | | | | | |
Tobacco — 2.6% | | | | | | | |
Loews Corp.-Carolina Group(a) | | 152,000 | | | | 11,027,600 | |
UST, Inc.(a) | | 244,500 | | | | 13,330,140 | |
| | | | | | | |
| | | | | | 24,357,740 | |
| | | | | | | |
TOTAL COMMON STOCKS | | | | | | | |
(Cost $859,434,633) | | | | | | 888,916,672 | |
| | | | | | | |
Short Term Investments — 21.1% | | | | | | | |
BlackRock Liquidity Series, LLC Money Market Series, 3.10%(d)(e)(f) | | 166,446,750 | | | | 166,446,750 | |
Galileo Money Market Fund, 2.56%(f) | | 29,077,071 | | | | 29,077,071 | |
| | | | | | | |
TOTAL SHORT TERM INVESTMENTS | | | | | | | |
(Cost $195,523,821) | | | | | | 195,523,821 | |
| | | | | | | |
TOTAL INVESTMENTS BEFORE OUTSTANDING OPTIONS WRITTEN — 117.3% | | | | | | | |
(Cost $1,054,958,454*) | | | | | | 1,084,440,493 | |
| | | | | | | |
| | |
| | | Contracts | | | | |
Call Options Written — 0.0% | | | | | | | |
Drinker International, Inc., Strike Price $20, Expires 4/19/08 | | (500 | ) | | | (15,000 | ) |
Frost Bankers, Inc., Strike Price $55, Expires 4/19/08 | | (200 | ) | | | (15,000 | ) |
Simon Property Group, Inc., Strike Price $100, Expires 4/19/08 | | (300 | ) | | | (22,500 | ) |
| | | | | | | |
TOTAL CALL OPTIONS WRITTEN | | | | | | | |
(Premiums received $50,960) | | | | | | (52,500 | ) |
| | | | | | | |
TOTAL INVESTMENTS NET OF OUTSTANDING OPTIONS WRITTEN — 117.3% | | | | | | | |
(Cost $1,054,907,494*) | | | | | | 1,084,387,993 | |
LIABILITIES IN EXCESS OF OTHER ASSETS — (17.3)% | | | | | | (159,994,219 | ) |
| | | | | | | |
NET ASSETS — 100.0% | | | | | $ | 924,393,774 | |
| | | | | | | |
| * | The cost and unrealized appreciation (depreciation) of investments as of March 31, 2008, as computed for federal income tax purposes, were as follows: |
| | | | |
Aggregate cost | | $ | 1,082,505,492 | |
| | | | |
Gross unrealized appreciation | | $ | 74,920,687 | |
Gross unrealized depreciation | | | (72,985,686 | ) |
| | | | |
Net unrealized appreciation | | $ | 1,935,001 | |
| | | | |
| (a) | Security, or a portion of security, is on loan. |
| (b) | Non-income producing security. |
| (c) | Security is fair valued by the Board of Trustees. |
| (d) | Investments in companies considered to be an affiliate of the Portfolio, for purposes of Section 2(a)(3) of the Investment Company Act of 1940, were as follows: |
| | | | | | |
Affiliate | | Net
Activity | | Interest
Income |
BlackRock Liquidity Series, LLC Money Market Series | | $ | 166,446,750 | | $ | 654,618 |
| | | | | | |
| (e) | Security purchased with the cash proceeds from securities loans. |
| (f) | Represents current yield as of report date. |
| • | | For Portfolio compliance purposes, the Portfolio’s sector and industry classifications refer to any one or more of the Standard Industry Codes as defined by the SEC. This definition may not apply for purposes of this report, which may combine sector and industry sub-classifications for reporting ease. |
See Notes to Financial Statements.
| | | | | | |
| | SEMI-ANNUAL REPORT | | MARCH 31, 2008 | | 39 |
| | |
| | Mid-Cap Growth Equity Portfolio |
| Schedule of Investments March 31, 2008 (Unaudited) | | (Percentages shown are based on Net Assets) |
| | | | | |
| | | Shares | | Value |
Common Stocks — 95.1% | | | | | |
Aerospace — 2.5% | | | | | |
BE Aerospace, Inc.(a) | | 119,500 | | $ | 4,176,525 |
Goodrich Corp. | | 64,800 | | | 3,726,648 |
| | | | | |
| | | | | 7,903,173 |
| | | | | |
Banks — 1.8% | | | | | |
Fidelity National Information Services, Inc. | | 146,600 | | | 5,591,324 |
| | | | | |
Broadcasting — 1.1% | | | | | |
CKX, Inc.(a) | | 353,000 | | | 3,360,560 |
| | | | | |
Business Services — 4.7% | | | | | |
DeVry, Inc. | | 110,414 | | | 4,619,722 |
Genpact Ltd.(a)(b) | | 232,400 | | | 2,846,900 |
Iron Mountain, Inc.(a)(b) | | 229,200 | | | 6,060,048 |
Strayer Education, Inc. | | 9,500 | | | 1,448,750 |
| | | | | |
| | | | | 14,975,420 |
| | | | | |
Chemicals — 3.7% | | | | | |
Agrium, Inc. | | 84,900 | | | 5,273,139 |
Celanese Corp. - Series A | | 167,400 | | | 6,536,970 |
| | | | | |
| | | | | 11,810,109 |
| | | | | |
Computer & Office Equipment — 1.2% | | | | | |
Intuit, Inc.(a) | | 142,300 | | | 3,843,523 |
| | | | | |
Computer Software & Services — 10.8% | | | | | |
ACI Worldwide, Inc.(a) | | 140,400 | | | 2,796,768 |
Adobe Systems, Inc.(a) | | 180,600 | | | 6,427,554 |
Foundry Networks, Inc.(a)(b) | | 259,400 | | | 3,003,852 |
IHS, Inc.(a) | | 111,900 | | | 7,196,289 |
International Game Technology | | 76,900 | | | 3,092,149 |
Jack Henry & Associates, Inc. | | 145,500 | | | 3,589,485 |
Juniper Networks, Inc.(a) | | 111,800 | | | 2,795,000 |
MICROS Systems, Inc.(a) | | 155,300 | | | 5,227,398 |
| | | | | |
| | | | | 34,128,495 |
| | | | | |
Electronics — 5.6% | | | | | |
Ametek, Inc. | | 174,300 | | | 7,653,513 |
Amphenol Corp. | | 174,100 | | | 6,485,225 |
Intersil Corp. - Class A | | 131,700 | | | 3,380,739 |
| | | | | |
| | | | | 17,519,477 |
| | | | | |
Energy & Utilities — 1.2% | | | | | |
Quanta Services, Inc.(a)(b) | | 158,100 | | | 3,663,177 |
| | | | | |
Entertainment & Leisure — 4.3% | | | | | |
DreamWorks Animation SKG, Inc. - Class A(a) | | 191,400 | | | 4,934,292 |
Orient-Express Hotels Ltd. - Class A | | 62,300 | | | 2,688,868 |
Scientific Games Corp. - Class A(a) | | 280,100 | | | 5,912,911 |
| | | | | |
| | | | | 13,536,071 |
| | | | | |
Finance — 4.3% | | | | | |
Affiliated Managers Group, Inc.(a) | | 23,500 | | | 2,132,390 |
AllianceBernstein Holding LP | | 42,300 | | | 2,680,974 |
CME Group, Inc. | | 13,500 | | | 6,332,850 |
Invesco Ltd. | | 79,500 | | | 1,936,620 |
Riskmetrics Group, Inc.(a) | | 25,600 | | | 495,360 |
| | | | | |
| | | | | 13,578,194 |
| | | | | |
Food & Agriculture — 1.0% | | | | | |
Panera Bread Co. - Class A(a)(b) | | 77,400 | | | 3,242,286 |
| | | | | |
Machinery & Heavy Equipment — 1.9% | | | | | |
Joy Global, Inc. | | 91,700 | | | 5,975,172 |
| | | | | |
Manufacturing — 3.4% | | | | | |
IDEX Corp.(b) | | 159,400 | | | 4,891,986 |
Quanex Corp. | | 111,889 | | | 5,789,137 |
| | | | | |
| | | | | 10,681,123 |
| | | | | |
Measuring & Controlling Devices — 2.9% | | | | | |
Thermo Electron Corp.(a) | | 160,000 | | | 9,094,400 |
| | | | | |
Medical & Medical Services — 5.6% | | | | | |
Magellan Health Services, Inc.(a) | | 94,500 | | | 3,750,705 |
Medco Health Solutions, Inc.(a) | | 133,400 | | | 5,841,586 |
Pediatrix Medical Group, Inc.(a) | | 121,700 | | | 8,202,580 |
| | | | | |
| | | | | 17,794,871 |
| | | | | |
Medical Instruments & Supplies — 2.8% | | | | | |
Hologic, Inc.(a) | | 87,900 | | | 4,887,240 |
Martek Biosciences Corp.(a)(b) | | 129,300 | | | 3,952,701 |
| | | | | |
| | | | | 8,839,941 |
| | | | | |
Metal & Mining — 4.2% | | | | | |
Century Aluminum Co.(a) | | 36,900 | | | 2,444,256 |
CONSOL Energy, Inc. | | 78,400 | | | 5,424,496 |
Massey Energy Co. | | 151,000 | | | 5,511,500 |
| | | | | |
| | | | | 13,380,252 |
| | | | | |
Miscellaneous Services — 1.9% | | | | | |
TeleTech Holdings, Inc.(a) | | 259,200 | | | 5,821,632 |
| | | | | |
Motor Vehicles — 2.0% | | | | | |
Oshkosh Truck Corp.(b) | | 173,100 | | | 6,280,068 |
| | | | | |
Oil & Gas — 9.9% | | | | | |
Acergy SA - ADR | | 197,600 | | | 4,218,760 |
Chesapeake Energy Corp. | | 109,000 | | | 5,030,350 |
EOG Resources, Inc. | | 13,800 | | | 1,656,000 |
National-Oilwell, Inc.(a) | | 68,500 | | | 3,999,030 |
Newfield Exploration Co.(a) | | 65,505 | | | 3,461,939 |
Noble Corp. | | 92,300 | | | 4,584,541 |
Plains Exploration & Production Co.(a) | | 75,100 | | | 3,990,814 |
Superior Energy Services, Inc.(a) | | 108,800 | | | 4,310,656 |
| | | | | |
| | | | | 31,252,090 |
| | | | | |
Personal Services — 0.2% | | | | | |
MSCI, Inc.(a) | | 25,100 | | | 746,725 |
| | | | | |
Pharmaceuticals — 3.9% | | | | | |
Endo Pharmaceuticals Holdings, Inc.(a) | | 118,600 | | | 2,839,284 |
Forest Laboratories, Inc.(a) | | 47,100 | | | 1,884,471 |
Medicis Pharmaceutical Corp. | | 137,100 | | | 2,699,499 |
Shire Plc - ADR | | 85,056 | | | 4,929,846 |
| | | | | |
| | | | | 12,353,100 |
| | | | | |
Real Estate — 0.1% | | | | | |
FX Real Estate and Entertainment, Inc.(a) | | 70,600 | | | 415,128 |
FX Real Estate and Entertainment, Inc., Rights expire 4/11/08(a) | | 35,300 | | | 2,824 |
| | | | | |
| | | | | 417,952 |
| | | | | |
Retail Merchandising — 5.0% | | | | | |
GameStop Corp.(a)(b) | | 149,300 | | | 7,720,303 |
TJX Cos., Inc.(b) | | 169,600 | | | 5,608,672 |
Urban Outfitters, Inc.(a) | | 76,500 | | | 2,398,275 |
| | | | | |
| | | | | 15,727,250 |
| | | | | |
See Notes to Financial Statements.
| | | | | | |
| 40 | | SEMI-ANNUAL REPORT | | MARCH 31, 2008 | | |
| | |
| | Mid-Cap Growth Equity Portfolio |
Schedule of Investments (concluded) | | (Percentages shown are based on Net Assets) |
| | | | | | | |
| | | Shares | | Value | |
Common Stocks (Continued) | | | | | | | |
Semiconductors & Related Devices — 2.2% | | | | | | | |
Broadcom Corp. - Class A(a) | | | 182,200 | | $ | 3,510,994 | |
PMC-Sierra, Inc.(a) | | | 598,600 | | | 3,412,020 | |
| | | | | | | |
| | | | | | 6,923,014 | |
| | | | | | | |
Soaps & Cosmetics — 2.3% | | | | | | | |
Bare Escentuals, Inc.(a)(b) | | | 313,700 | | | 7,346,854 | |
| | | | | | | |
Telecommunications — 4.6% | | | | | | | |
Amdocs Ltd.(a) | | | 197,600 | | | 5,603,936 | |
American Tower Corp. - Class A(a) | | | 62,600 | | | 2,454,546 | |
Harris Corp. | | | 129,781 | | | 6,298,272 | |
| | | | | | | |
| | | | | | 14,356,754 | |
| | | | | | | |
TOTAL COMMON STOCKS | | | | | | | |
(Cost $261,158,104) | | | | | | 300,143,007 | |
| | | | | | | |
| | |
| | | Par/Shares
(000) | | | |
Short Term Investments — 17.3% | | | | | | | |
BlackRock Liquidity Series, LLC Money Market Series, 3.10%(c)(d)(e) | | $ | 39,892 | | | 39,892,100 | |
Federal Home Loan Bank, Discount Notes, | | | | | | | |
1.50%, 4/01/08(f) | | | 4,800 | | | 4,800,000 | |
Galileo Money Market Fund, 2.56%(e) | | | 10,015 | | | 10,014,848 | |
| | | | | | | |
TOTAL SHORT TERM INVESTMENTS | | | | | | | |
(Cost $54,706,948) | | | | | | 54,706,948 | |
| | | | | | | |
TOTAL INVESTMENTS IN SECURITIES — 112.4% | | | | | | | |
(Cost $315,865,052*) | | | | | | 354,849,955 | |
LIABILITIES IN EXCESS OF OTHER ASSETS — (12.4)% | | | | | | (39,071,867 | ) |
| | | | | | | |
NET ASSETS — 100.0% | | | | | $ | 315,778,088 | |
| | | | | | | |
| * | The cost and unrealized appreciation (depreciation) of investments as of March 31, 2008, as computed for federal income tax purposes, were as follows: |
| | | | |
Aggregate cost | | $ | 317,338,954 | |
| | | | |
Gross unrealized appreciation | | $ | 62,513,099 | |
Gross unrealized depreciation | | | (25,002,098 | ) |
| | | | |
Net unrealized appreciation | | $ | 37,511,001 | |
| | | | |
| (a) | Non-income producing security. |
| (b) | Security, or a portion of security, is on loan. |
| (c) | Investments in companies considered to be an affiliate of the Portfolio, for purposes of Section 2(a)(3) of the Investment Company Act of 1940, were as follows: |
| | | | | | |
Affiliate | | Net
Activity | | Interest
Income |
BlackRock Liquidity Series, LLC Money Market Series | | $ | 39,892,100 | | $ | 100,419 |
| | | | | | |
| (d) | Security purchased with the cash proceeds from securities loans. |
| (e) | Represents current yield as of report date. |
| (f) | The rate shown is the effective yield at the time of purchase. |
| • | | For Portfolio compliance purposes, the Portfolio’s sector and industry classifications refer to any one or more of the Standard Industry Codes as defined by the SEC. This definition may not apply for purposes of this report, which may combine sector and industry sub-classifications for reporting ease. |
See Notes to Financial Statements.
| | | | | | |
| | SEMI-ANNUAL REPORT | | MARCH 31, 2008 | | 41 |
| | |
| | Aurora Portfolio |
| Schedule of Investments March 31, 2008 (Unaudited) | | (Percentages shown are based on Net Assets) |
| | | | | |
| | | Shares | | Value |
Common Stocks — 98.9% | | | | | |
Canada — 2.5% | | | | | |
Real Estate — 2.5% | | | | | |
Boardwalk Real Estate Investment Trust (REIT) | | 685,144 | | $ | 25,364,579 |
| | | | | |
Ireland — 0.9% | | | | | |
Computer Software & Services — 0.9% | | | | | |
SkillSoft Plc - ADR(a) | | 850,431 | | | 8,904,012 |
| | | | | |
United States — 95.5% | | | | | |
Aerospace — 3.3% | | | | | |
DRS Technologies, Inc. | | 224,200 | | | 13,066,376 |
Orbital Sciences Corp.(a) | | 463,377 | | | 11,167,386 |
Teledyne Technologies, Inc.(a) | | 193,000 | | | 9,071,000 |
| | | | | |
| | | | | 33,304,762 |
| | | | | |
Banks — 5.7% | | | | | |
Cullen/Frost Bankers, Inc.(b) | | 171,800 | | | 9,112,272 |
First Midwest Bancorp, Inc. | | 384,200 | | | 10,669,234 |
People’s United Financial, Inc.(b) | | 699,500 | | | 12,108,345 |
Sterling Bancshares, Inc. | | 1,226,511 | | | 12,191,519 |
United Bankshares, Inc. | | 260,372 | | | 6,938,914 |
Zions Bancorporation(b) | | 156,400 | | | 7,124,020 |
| | | | | |
| | | | | 58,144,304 |
| | | | | |
Business Services — 4.8% | | | | | |
The Brink’s Co. | | 579,451 | | | 38,927,518 |
Corrections Corp. of America(a) | | 370,900 | | | 10,207,168 |
| | | | | |
| | | | | 49,134,686 |
| | | | | |
Chemicals — 0.5% | | | | | |
Celanese Corp. - Series A | | 128,400 | | | 5,014,020 |
| | | | | |
Computer Software & Services — 3.6% | | | | | |
priceline.com, Inc.(a)(b) | | 85,400 | | | 10,321,444 |
Sybase, Inc.(a)(b) | | 584,522 | | | 15,372,929 |
Tech Data Corp.(a) | | 171,700 | | | 5,631,760 |
Teradata Corp.(a) | | 243,000 | | | 5,360,580 |
| | | | | |
| | | | | 36,686,713 |
| | | | | |
Construction — 2.6% | | | | | |
Perini Corp.(a) | | 210,300 | | | 7,619,169 |
Texas Industries, Inc.(b) | | 318,400 | | | 19,139,024 |
| | | | | |
| | | | | 26,758,193 |
| | | | | |
Containers — 2.4% | | | | | |
Crown Holdings, Inc.(a) | | 333,800 | | | 8,398,408 |
Pactiv Corp.(a) | | 395,200 | | | 10,358,192 |
Silgan Holdings, Inc. | | 108,400 | | | 5,379,892 |
| | | | | |
| | | | | 24,136,492 |
| | | | | |
Electronics — 0.6% | | | | | |
Intersil Corp. - Class A | | 255,400 | | | 6,556,118 |
| | | | | |
Energy & Utilities — 2.9% | | | | | |
Integrys Energy Group, Inc. | | 155,055 | | | 7,231,765 |
ITC Holdings Corp.(b) | | 220,658 | | | 11,487,456 |
Vectren Corp. | | 389,000 | | | 10,436,870 |
| | | | | |
| | | | | 29,156,091 |
| | | | | |
Entertainment & Leisure — 9.2% | | | | | |
Morgans Hotel Group Co.(a)(b) | | 1,013,593 | | | 15,021,448 |
Orient-Express Hotels Ltd. - Class A | | 341,800 | | | 14,752,088 |
Penn National Gaming, Inc.(a) | | 228,900 | | | 10,009,797 |
Pinnacle Entertainment, Inc.(a)(b) | | 1,195,334 | | | 15,300,275 |
Scientific Games Corp. - Class A(a)(b) | | 1,123,454 | | | 23,716,114 |
Vail Resorts, Inc.(a) | | 110,200 | | | 5,321,558 |
WMS Industries, Inc.(a)(b) | | 277,300 | | | 9,974,481 |
| | | | | |
| | | | | 94,095,761 |
| | | | | |
Finance — 2.3% | | | | | |
Affiliated Managers Group, Inc.(a)(b) | | 259,800 | | | 23,574,252 |
| | | | | |
Food & Agriculture — 4.5% | | | | | |
Fresh Del Monte Produce, Inc.(a) | | 189,728 | | | 6,906,099 |
Hain Celestial Group, Inc.(a)(b) | | 917,208 | | | 27,057,636 |
McCormick & Co., Inc.(b) | | 323,900 | | | 11,974,583 |
| | | | | |
| | | | | 45,938,318 |
| | | | | |
Insurance — 3.2% | | | | | |
Aspen Insurance Holdings Ltd. | | 238,600 | | | 6,294,268 |
Endurance Specialty Holdings Ltd.(b) | | 305,511 | | | 11,181,703 |
The Hanover Insurance Group, Inc. | | 200,000 | | | 8,228,000 |
Platinum Underwriters Holdings Ltd. | | 210,477 | | | 6,832,083 |
| | | | | |
| | | | | 32,536,054 |
| | | | | |
Machinery & Heavy Equipment — 2.8% | | | | | |
Albany International Corp. - Class A | | 213,000 | | | 7,697,820 |
Astec Industries, Inc.(a) | | 171,200 | | | 6,635,712 |
Lufkin Industries, Inc. | | 218,374 | | | 13,936,629 |
| | | | | |
| | | | | 28,270,161 |
| | | | | |
Manufacturing — 8.4% | | | | | |
Actuant Corp. - Class A | | 218,300 | | | 6,594,843 |
Chattem, Inc.(a)(b) | | 207,359 | | | 13,756,196 |
Elizabeth Arden, Inc.(a) | | 556,400 | | | 11,100,180 |
Fuller (H.B.) Co. | | 56,100 | | | 1,145,001 |
General Cable Corp.(a)(b) | | 241,600 | | | 14,271,312 |
Hexel Corp.(a)(b) | | 494,500 | | | 9,449,895 |
Lennox International, Inc. | | 219,300 | | | 7,888,221 |
Phillips-Van Heusen Corp. | | 272,700 | | | 10,340,784 |
Watson Wyatt Worldwide, Inc.(b) | | 192,597 | | | 10,929,880 |
| | | | | |
| | | | | 85,476,312 |
| | | | | |
Medical & Medical Services — 6.7% | | | | | |
Community Health Systems, Inc.(a)(b) | | 90,200 | | | 3,028,014 |
Davita, Inc.(a) | | 310,600 | | | 14,834,256 |
The GEO Group, Inc.(a) | | 275,800 | | | 7,843,752 |
Kindred Healthcare, Inc.(a) | | 734,975 | | | 16,073,903 |
Magellan Health Services, Inc.(a) | | 665,100 | | | 26,397,819 |
| | | | | |
| | | | | 68,177,744 |
| | | | | |
Medical Instruments & Supplies — 2.9% | | | | | |
The Cooper Cos., Inc., | | 257,200 | | | 8,855,396 |
DENTSPLY International, Inc.(b) | | 533,600 | | | 20,596,960 |
| | | | | |
| | | | | 29,452,356 |
| | | | | |
Motor Vehicles — 2.4% | | | | | |
LKQ Corp.(a)(b) | | 1,093,900 | | | 24,579,933 |
| | | | | |
Oil & Gas — 5.7% | | | | | |
Oceaneering International, Inc.(a) | | 158,800 | | | 10,004,400 |
Petrohawk Energy Corp.(a)(b) | | 603,700 | | | 12,176,629 |
Pride International, Inc.(a) | | 307,700 | | | 10,754,115 |
Southwest Gas Corp.(b) | | 449,436 | | | 12,566,230 |
Swift Energy Co.(a) | | 114,200 | | | 5,137,858 |
See Notes to Financial Statements.
| | | | | | |
| 42 | | SEMI-ANNUAL REPORT | | MARCH 31, 2008 | | |
| | |
| | Aurora Portfolio |
Schedule of Investments (concluded) | | (Percentages shown are based on Net Assets) |
| | | | | | |
| | | Shares | | Value | |
Common Stocks (Continued) | | | | | | |
United States (Continued) | | | | | | |
Oil & Gas (Continued) | | | | | | |
W-H Energy Services, Inc.(a) | | 114,300 | | $ | 7,869,555 | |
| | | | | | |
| | | | | 58,508,787 | |
| | | | | | |
Pharmaceuticals — 0.8% | | | | | | |
Dyax Corp.(a) | | 1,721,200 | | | 8,106,852 | |
| | | | | | |
Real Estate — 0.6% | | | | | | |
Alexandria Real Estate Equities, Inc. (REIT)(b) | | 63,600 | | | 5,896,992 | |
| | | | | | |
Restaurants — 1.5% | | | | | | |
CBRL Group, Inc.(b) | | 186,700 | | | 6,678,259 | |
Jack-in-the-Box, Inc.(a) | | 324,400 | | | 8,716,628 | |
| | | | | | |
| | | | | 15,394,887 | |
| | | | | | |
Retail Merchandising — 12.3% | | | | | | |
AnnTaylor Stores Corp.(a) | | 384,900 | | | 9,306,882 | |
BJ’s Wholesale Club, Inc.(a)(b) | | 651,200 | | | 23,241,328 | |
The Children’s Place Retail Stores, Inc.(a) | | 344,300 | | | 8,456,008 | |
Copart, Inc.(a) | | 617,200 | | | 23,922,672 | |
Jarden Corp.(a)(b) | | 368,500 | | | 8,011,190 | |
Ruddick Corp. | | 618,300 | | | 22,790,538 | |
Saks, Inc.(a) | | 739,318 | | | 9,219,296 | |
Sally Beauty Holdings, Inc.(a)(b) | | 1,123,200 | | | 7,750,080 | |
The Talbots, Inc.(b) | | 1,230,903 | | | 13,269,134 | |
| | | | | | |
| | | | | 125,967,128 | |
| | | | | | |
Security Brokers & Dealers — 2.0% | | | | | | |
Piper Jaffray Cos., Inc.(a)(b) | | 608,100 | | | 20,651,076 | |
| | | | | | |
Telecommunications — 2.7% | | | | | | |
Amdocs Ltd.(a) | | 717,000 | | | 20,334,120 | |
Polycom, Inc.(a) | | 341,300 | | | 7,692,902 | |
| | | | | | |
| | | | | 28,027,022 | |
| | | | | | |
Transportation — 1.1% | | | | | | |
Kirby Corp.(a) | | 191,300 | | | 10,904,100 | |
| | | | | | |
Total United States | | | | | 974,449,114 | |
| | | | | | |
TOTAL COMMON STOCKS | | | | | | |
(Cost $1,030,610,734) | | | | | 1,008,717,705 | |
| | | | | | |
Short Term Investments — 29.5% | | | | | | |
BlackRock Liquidity Series, LLC Money Market Series, 3.10%(c)(d)(e) | | 293,234,300 | | | 293,234,300 | |
Galileo Money Market Fund, 2.56%(e) | | 7,943,076 | | | 7,943,076 | |
| | | | | | |
TOTAL SHORT TERM INVESTMENTS | | | | | | |
(Cost $301,177,376) | | | | | 301,177,376 | |
| | | | | | |
TOTAL INVESTMENTS IN SECURITIES — 128.4% | | | | | | |
(Cost $1,331,788,110*) | | | | | 1,309,895,081 | |
LIABILITIES IN EXCESS OF OTHER ASSETS — (28.4)% | | | | | (289,852,175 | ) |
| | | | | | |
NET ASSETS — 100.0% | | | | $ | 1,020,042,906 | |
| | | | | | |
| * | The cost and unrealized appreciation (depreciation) of investments as of March 31, 2008, as computed for federal income tax purposes, were as follows: |
| | | | |
Aggregate cost | | $ | 1,340,806,539 | |
| | | | |
Gross unrealized appreciation | | $ | 94,620,847 | |
Gross unrealized depreciation | | | (125,532,305 | ) |
| | | | |
Net unrealized depreciation | | $ | (30,911,458 | ) |
| | | | |
| (a) | Non-income producing security. |
| (b) | Security, or a portion of security, is on loan. |
| (c) | Investments in companies considered to be an affiliate of the Portfolio, for purposes of Section 2(a)(3) of the Investment Company Act of 1940, were as follows: |
| | | | | | |
Affiliate | | Net
Activity | | Interest
Income |
BlackRock Liquidity Series, LLC Money Market Series | | $ | 293,234,300 | | $ | 1,019,520 |
| | | | | | |
| (d) | Security purchased with the cash proceeds from securities loans. |
| (e) | Represents current yield as of report date. |
| • | | For Portfolio compliance purposes, the Portfolio’s sector and industry classifications refer to any one or more of the Standard Industry Codes as defined by the SEC. This definition may not apply for purposes of this report, which may combine sector and industry sub-classifications for reporting ease. |
See Notes to Financial Statements.
| | | | | | |
| | SEMI-ANNUAL REPORT | | MARCH 31, 2008 | | 43 |
| | |
| | Small/Mid-Cap Growth Portfolio |
Schedule of Investments March 31, 2008 (Unaudited) | | (Percentages shown are based on Net Assets) |
| | | | | |
| | | Shares | | Value |
Common Stocks — 97.9% | | | | | |
Aerospace — 2.7% | | | | | |
Argon ST, Inc.(a) | | 140,300 | | $ | 2,386,503 |
BE Aerospace, Inc.(a) | | 113,200 | | | 3,956,340 |
| | | | | |
| | | | | 6,342,843 |
| | | | | |
Banks — 3.0% | | | | | |
Fidelity National Information Services, Inc. | | 88,948 | | | 3,392,477 |
Signature Bank(a) | | 67,400 | | | 1,718,700 |
UMB Financial Corp. | | 44,700 | | | 1,841,640 |
| | | | | |
| | | | | 6,952,817 |
| | | | | |
Beverages & Bottling — 0.9% | | | | | |
Green Mountain Coffee Roasters, Inc.(a)(b) | | 62,700 | | | 1,984,455 |
| | | | | |
Broadcasting — 2.1% | | | | | |
CKX, Inc.(a) | | 508,300 | | | 4,839,016 |
| | | | | |
Business Services — 8.9% | | | | | |
The Advisory Board Co.(a) | | 61,500 | | | 3,378,810 |
DeVry, Inc. | | 52,740 | | | 2,206,642 |
ExlService Holdings, Inc.(a) | | 285,108 | | | 6,546,080 |
Forrester Research, Inc.(a) | | 127,051 | | | 3,377,015 |
Gartner, Inc. - Class A(a) | | 32,500 | | | 628,550 |
Net1 UEPS Technologies, Inc.(a) | | 109,500 | | | 2,469,225 |
Strayer Education, Inc.(b) | | 12,800 | | | 1,952,000 |
| | | | | |
| | | | | 20,558,322 |
| | | | | |
Chemicals — 1.5% | | | | | |
Celanese Corp. - Series A | | 91,700 | | | 3,580,885 |
| | | | | |
Computer & Office Equipment — 1.2% | | | | | |
Intuit, Inc.(a) | | 101,900 | | | 2,752,319 |
| | | | | |
Computer Software & Services — 16.5% | | | | | |
ACI Worldwide, Inc.(a) | | 121,224 | | | 2,414,782 |
Blackboard, Inc.(a) | | 63,600 | | | 2,119,788 |
comScore, Inc.(a) | | 118,800 | | | 2,383,128 |
Foundry Networks, Inc.(a) | | 127,600 | | | 1,477,608 |
IHS, Inc.(a) | | 75,908 | | | 4,881,643 |
International Game Technology | | 42,800 | | | 1,720,988 |
Jack Henry & Associates, Inc. | | 103,446 | | | 2,552,013 |
MICROS Systems, Inc.(a) | | 77,400 | | | 2,605,284 |
SkillSoft Plc - ADR(a) | | 807,500 | | | 8,454,525 |
SonicWALL, Inc.(a) | | 577,900 | | | 4,721,443 |
Sykes Enterprises, Inc.(a) | | 265,384 | | | 4,668,105 |
| | | | | |
| | | | | 37,999,307 |
| | | | | |
Electronics — 3.5% | | | | | |
Ametek, Inc. | | 79,800 | | | 3,504,018 |
Intersil Corp. - Class A | | 78,900 | | | 2,025,363 |
TiVo, Inc.(a) | | 278,000 | | | 2,435,280 |
| | | | | |
| | | | | 7,964,661 |
| | | | | |
Energy & Utilities — 1.0% | | | | | |
Airgas, Inc. | | 52,978 | | | 2,408,910 |
| | | | | |
Entertainment & Leisure — 4.0% | | | | | |
DreamWorks Animation SKG, Inc. - Class A(a) | | 106,732 | | | 2,751,551 |
Orient-Express Hotels Ltd. - Class A | | 59,500 | | | 2,568,020 |
Scientific Games Corp. - Class A(a) | | 185,800 | | | 3,922,238 |
| | | | | |
| | | | | 9,241,809 |
| | | | | |
Finance — 5.0% | | | | | |
Affiliated Managers Group, Inc.(a) | | 21,400 | | | 1,941,836 |
CME Group, Inc. | | 5,390 | | | 2,528,449 |
Invesco Ltd. | | 116,700 | | | 2,842,812 |
Riskmetrics Group, Inc.(a) | | 18,700 | | | 361,845 |
Wright Express Corp.(a) | | 122,818 | | | 3,774,197 |
| | | | | |
| | | | | 11,449,139 |
| | | | | |
Machinery & Heavy Equipment — 1.5% | | | | | |
Joy Global, Inc. | | 53,200 | | | 3,466,512 |
| | | | | |
Manufacturing — 4.8% | | | | | |
IDEX Corp. | | 93,892 | | | 2,881,545 |
Ladish Co., Inc.(a) | | 60,900 | | | 2,192,400 |
Quanex Corp. | | 82,800 | | | 4,284,072 |
Smith & Wesson Holding Corp.(a)(b) | | 331,100 | | | 1,662,122 |
| | | | | |
| | | | | 11,020,139 |
| | | | | |
Medical & Medical Services — 7.0% | | | | | |
Arthrocare Corp.(a)(b) | | 69,700 | | | 2,324,495 |
Lifecell Corp.(a) | | 71,116 | | | 2,989,005 |
Magellan Health Services, Inc.(a) | | 79,800 | | | 3,167,262 |
MedCath Corp.(a) | | 139,400 | | | 2,537,080 |
Pediatrix Medical Group, Inc.(a) | | 77,500 | | | 5,223,500 |
| | | | | |
| | | | | 16,241,342 |
| | | | | |
Medical Instruments & Supplies — 5.9% | | | | | |
Hologic, Inc.(a) | | 72,600 | | | 4,036,560 |
SonoSite, Inc.(a) | | 108,978 | | | 3,098,244 |
Wright Medical Group, Inc.(a) | | 156,748 | | | 3,783,897 |
Zoll Medical Corp.(a) | | 102,742 | | | 2,731,910 |
| | | | | |
| | | | | 13,650,611 |
| | | | | |
Metal & Mining — 3.0% | | | | | |
CONSOL Energy, Inc. | | 50,100 | | | 3,466,419 |
Massey Energy Co. | | 92,400 | | | 3,372,600 |
| | | | | |
| | | | | 6,839,019 |
| | | | | |
Miscellaneous Services — 1.5% | | | | | |
TeleTech Holdings, Inc.(a) | | 158,340 | | | 3,556,316 |
| | | | | |
Motor Vehicles — 1.3% | | | | | |
Oshkosh Truck Corp. | | 84,600 | | | 3,069,288 |
| | | | | |
Oil & Gas — 7.5% | | | | | |
Delta Petroleum Corp.(a)(b) | | 196,018 | | | 4,418,246 |
Newfield Exploration Co.(a) | | 46,300 | | | 2,446,955 |
Noble Corp. | | 66,900 | | | 3,322,923 |
Plains Exploration & Production Co.(a) | | 68,700 | | | 3,650,718 |
Superior Energy Services, Inc.(a) | | 87,900 | | | 3,482,598 |
| | | | | |
| | | | | 17,321,440 |
| | | | | |
Pharmaceuticals — 5.4% | | | | | |
Endo Pharmaceuticals Holdings, Inc.(a) | | 123,300 | | | 2,951,802 |
Forest Laboratories, Inc.(a) | | 69,578 | | | 2,783,816 |
Medicis Pharmaceutical Corp. | | 115,600 | | | 2,276,164 |
Shire Plc - ADR | | 76,876 | | | 4,455,733 |
| | | | | |
| | | | | 12,467,515 |
| | | | | |
Publishing & Printing — 0.5% | | | | | |
Dolan Media Co.(a) | | 54,400 | | | 1,093,984 |
| | | | | |
Real Estate — 0.3% | | | | | |
FX Real Estate and Entertainment, Inc.(a)(b) | | 99,660 | | | 586,001 |
See Notes to Financial Statements.
| | | | | | |
| 44 | | SEMI-ANNUAL REPORT | | MARCH 31, 2008 | | |
| | |
| | Small/Mid-Cap Growth Portfolio |
| Schedule of Investments (concluded) | | (Percentages shown are based on Net Assets) |
| | | | | | |
| | | Shares | | Value | |
Common Stocks (Continued) | | | | | | |
Real Estate (Continued) | | | | | | |
FX Real Estate and Entertainment, Inc., Rights expire 4/11/08(a) | | 50,830 | | $ | 4,066 | |
| | | | | | |
| | | | | 590,067 | |
| | | | | | |
Retail Merchandising — 2.2% | | | | | | |
Deckers Outdoor Corp.(a) | | 11,000 | | | 1,186,020 | |
GameStop Corp.(a) | | 75,366 | | | 3,897,176 | |
| | | | | | |
| | | | | 5,083,196 | |
| | | | | | |
Semiconductors & Related Devices — 2.5% | | | | | | |
Microsemi Corp.(a) | | 111,500 | | | 2,542,200 | |
Standard Microsystems Corp.(a) | | 112,600 | | | 3,285,668 | |
| | | | | | |
| | | | | 5,827,868 | |
| | | | | | |
Telecommunications — 2.7% | | | | | | |
Amdocs Ltd.(a) | | 113,375 | | | 3,215,315 | |
Harris Corp. | | 60,900 | | | 2,955,477 | |
| | | | | | |
| | | | | 6,170,792 | |
| | | | | | |
Waste Management — 1.5% | | | | | | |
Clean Harbors, Inc.(a) | | 52,800 | | | 3,432,000 | |
| | | | | | |
TOTAL COMMON STOCKS | | | | | | |
(Cost $200,478,519) | | | | | 225,904,572 | |
| | | | | | |
Short Term Investments — 7.0% | | | | | | |
BlackRock Liquidity Series, LLC Money Market Series, 3.10%(c)(d)(e) | | 9,367,400 | | | 9,367,400 | |
Galileo Money Market Fund, 2.56%(e) | | 6,722,036 | | | 6,722,036 | |
| | | | | | |
TOTAL SHORT TERM INVESTMENTS | | | | | | |
(Cost $16,089,436) | | | | | 16,089,436 | |
| | | | | | |
TOTAL INVESTMENTS IN SECURITIES — 104.9% | | | | | | |
(Cost $216,567,955*) | | | | | 241,994,008 | |
LIABILITIES IN EXCESS OF OTHER ASSETS — (4.9)% | | | | | (11,379,859 | ) |
| | | | | | |
NET ASSETS — 100.0% | | | | $ | 230,614,149 | |
| | | | | | |
| * | The cost and unrealized appreciation (depreciation) of investments as of March 31, 2008, as computed for federal income tax purposes, were as follows: |
| | | | |
| Aggregate cost | | $ | 217,993,270 | |
| | | | |
| Gross unrealized appreciation | | $ | 39,235,904 | |
| Gross unrealized depreciation | | | (15,235,166 | ) |
| | | | |
| Net unrealized appreciation | | $ | 24,000,738 | |
| | | | |
| (a) | Non-income producing security. |
| (b) | Security, or a portion of security, is on loan. |
| (c) | Investments in companies considered to be an affiliate of the Portfolio, for purposes of Section 2(a)(3) of the Investment Company Act of 1940, were as follows: |
| | | | | | |
Affiliate | | Net
Activity | | Interest
Income |
BlackRock Liquidity Series, LLC Money Market Series | | $ | 9,367,400 | | $ | 55,996 |
| | | | | | |
| (d) | Security purchased with the cash proceeds from securities loans. |
| (e) | Represents current yield as of report date. |
| • | | For Portfolio compliance purposes, the Portfolio’s sector and industry classifications refer to any one or more of the Standard Industry Codes as defined by the SEC. This definition may not apply for purposes of this report, which may combine sector and industry sub-classifications for reporting ease. |
See Notes to Financial Statements.
| | | | | | |
| | SEMI-ANNUAL REPORT | | MARCH 31, 2008 | | 45 |
| | |
| | Small Cap Value Equity Portfolio |
| Schedule of Investments March 31, 2008 (Unaudited) | | (Percentages shown are based on Net Assets) |
| | | | | |
| | | Shares | | Value |
Common Stocks — 97.5% | | | | | |
Aerospace — 2.9% | | | | | |
Orbital Sciences Corp.(a) | | 40,900 | | $ | 985,690 |
Teledyne Technologies, Inc.(a) | | 10,500 | | | 493,500 |
| | | | | |
| | | | | 1,479,190 |
| | | | | |
Banks — 7.3% | | | | | |
First Midwest Bancorp, Inc. | | 25,873 | | | 718,493 |
First Niagara Financial Group, Inc. | | 62,100 | | | 843,939 |
KBW, Inc.(a)(b) | | 26,400 | | | 582,120 |
Sterling Bancshares, Inc. | | 55,228 | | | 548,966 |
United Bankshares, Inc. | | 22,956 | | | 611,778 |
Wintrust Financial Corp. | | 12,922 | | | 451,624 |
| | | | | |
| | | | | 3,756,920 |
| | | | | |
Business Services — 6.2% | | | | | |
The Brink’s Co. | | 32,400 | | | 2,176,632 |
Forrester Research, Inc.(a) | | 17,000 | | | 451,860 |
Hiedrick & Struggles International, Inc. | | 16,300 | | | 530,239 |
Viad Corp. | | 1,251 | | | 45,049 |
| | | | | |
| | | | | 3,203,780 |
| | | | | |
Chemicals — 1.8% | | | | | |
Sensient Technologies Corp. | | 32,000 | | | 943,680 |
| | | | | |
Computer Software & Services — 4.9% | | | | | |
Epicor Software Corp.(a) | | 30,900 | | | 346,080 |
Guidance Software, Inc.(a) | | 19,715 | | | 176,449 |
Lawson Software, Inc.(a) | | 80,500 | | | 606,165 |
SkillSoft Plc - ADR(a) | | 105,600 | | | 1,105,632 |
Tech Data Corp.(a) | | 8,400 | | | 275,520 |
| | | | | |
| | | | | 2,509,846 |
| | | | | |
Construction — 3.0% | | | | | |
Perini Corp.(a) | | 10,777 | | | 390,451 |
Texas Industries, Inc. | | 19,700 | | | 1,184,167 |
| | | | | |
| | | | | 1,574,618 |
| | | | | |
Containers — 2.0% | | | | | |
Silgan Holdings, Inc. | | 21,100 | | | 1,047,193 |
| | | | | |
Energy & Utilities — 3.4% | | | | | |
Cleco Corp. | | 18,900 | | | 419,202 |
ITC Holdings Corp. | | 14,200 | | | 739,252 |
UIL Holdings Corp. | | 20,700 | | | 623,691 |
| | | | | |
| | | | | 1,782,145 |
| | | | | |
Entertainment & Leisure — 9.7% | | | | | |
Leapfrog Enterprises, Inc.(a)(b) | | 57,993 | | | 408,851 |
Morgans Hotel Group Co.(a) | | 49,704 | | | 736,613 |
Orient-Express Hotels Ltd. - Class A | | 22,600 | | | 975,416 |
Pinnacle Entertainment, Inc.(a) | | 59,400 | | | 760,320 |
Scientific Games Corp. - Class A(a) | | 32,801 | | | 692,429 |
Vail Resorts, Inc.(a)(b) | | 19,822 | | | 957,204 |
WMS Industries, Inc.(a) | | 13,900 | | | 499,983 |
| | | | | |
| | | | | 5,030,816 |
| | | | | |
Finance — 0.5% | | | | | |
Jefferies Group, Inc. | | 15,946 | | | 257,209 |
| | | | | |
Food & Agriculture — 2.2% | | | | | |
Hain Celestial Group, Inc.(a) | | 38,200 | | | 1,126,900 |
| | | | | |
Insurance — 4.1% | | | | | |
Aspen Insurance Holdings Ltd. | | 4,800 | | | 126,624 |
Endurance Specialty Holdings Ltd. | | 9,985 | | | 365,451 |
IPC Holdings Ltd. | | 35,900 | | | 1,005,200 |
Navigators Group, Inc.(a) | | 3,462 | | | 188,333 |
Platinum Underwriters Holdings Ltd. | | 13,289 | | | 431,361 |
| | | | | |
| | | | | 2,116,969 |
| | | | | |
Machinery & Heavy Equipment — 2.9% | | | | | |
Albany International Corp. - Class A | | 12,100 | | | 437,294 |
Astec Industries, Inc.(a) | | 8,100 | | | 313,956 |
H&E Equipment Services, Inc.(a) | | 18,890 | | | 237,447 |
Lufkin Industries, Inc. | | 7,700 | | | 491,414 |
| | | | | |
| | | | | 1,480,111 |
| | | | | |
Manufacturing — 5.9% | | | | | |
Actuant Corp. - Class A | | 19,900 | | | 601,179 |
Chart Industries, Inc.(a) | | 15,300 | | | 517,752 |
Elizabeth Arden, Inc.(a) | | 35,096 | | | 700,165 |
Fuller (H.B.) Co. | | 2,800 | | | 57,148 |
The Warnaco Group, Inc.(a) | | 11,000 | | | 433,840 |
Watson Wyatt Worldwide, Inc. | | 13,300 | | | 754,775 |
| | | | | |
| | | | | 3,064,859 |
| | | | | |
Medical & Medical Services — 9.2% | | | | | |
Amedisys, Inc.(a) | | 23,300 | | | 916,622 |
Amsurg Corp.(a) | | 23,472 | | | 555,817 |
The GEO Group, Inc.(a) | | 30,100 | | | 856,044 |
Kindred Healthcare, Inc.(a) | | 38,829 | | | 849,190 |
Magellan Health Services, Inc.(a) | | 39,166 | | | 1,554,499 |
| | | | | |
| | | | | 4,732,172 |
| | | | | |
Medical Instruments & Supplies — 2.0% | | | | | |
The Cooper Cos., Inc., | | 19,600 | | | 674,828 |
Orthofix International NV(a) | | 6,400 | | | 254,528 |
Symmetry Medical, Inc.(a) | | 6,100 | | | 101,260 |
| | | | | |
| | | | | 1,030,616 |
| | | | | |
Motor Vehicles — 2.8% | | | | | |
LKQ Corp.(a) | | 64,700 | | | 1,453,809 |
| | | | | |
Oil & Gas — 6.7% | | | | | |
Cal Dive International, Inc.(a) | | 27,200 | | | 282,336 |
Delta Petroleum Corp.(a) | | 22,100 | | | 498,134 |
North American Energy Partners, Inc.(a) | | 34,100 | | | 523,094 |
Oil States International, Inc.(a) | | 10,500 | | | 470,505 |
Southwest Gas Corp. | | 21,412 | | | 598,680 |
Swift Energy Co.(a) | | 14,100 | | | 634,359 |
W-H Energy Services, Inc.(a) | | 6,600 | | | 454,410 |
| | | | | |
| | | | | 3,461,518 |
| | | | | |
Real Estate — 3.8% | | | | | |
Arbor Realty Trust, Inc. (REIT)(b) | | 49,622 | | | 748,300 |
Gramercy Capital Corp. (REIT)(b) | | 49,318 | | | 1,032,226 |
Redwood Trust, Inc. (REIT)(b) | | 5,413 | | | 196,762 |
| | | | | |
| | | | | 1,977,288 |
| | | | | |
Restaurants — 1.0% | | | | | |
Jack-in-the-Box, Inc.(a) | | 19,800 | | | 532,026 |
| | | | | |
Retail Merchandising — 10.2% | | | | | |
AnnTaylor Stores Corp.(a) | | 20,300 | | | 490,854 |
See Notes to Financial Statements.
| | | | | | |
| 46 | | SEMI-ANNUAL REPORT | | MARCH 31, 2008 | | |
| | |
| | Small Cap Value Equity Portfolio |
| Schedule of Investments (concluded) | | (Percentages shown are based on Net Assets) |
| | | | | | |
| | | Shares | | Value | |
Common Stocks (Continued) | | | | | | |
Retail Merchandising (Continued) | | | | | | |
BJ’s Wholesale Club, Inc.(a) | | 32,200 | | $ | 1,149,218 | |
The Children’s Place Retail Stores, Inc.(a) | | 14,600 | | | 358,576 | |
Longs Drug Stores Corp. | | 12,100 | | | 513,766 | |
Ruddick Corp. | | 47,300 | | | 1,743,478 | |
Sally Beauty Holdings, Inc.(a) | | 36,484 | | | 251,739 | |
The Talbots, Inc.(b) | | 68,551 | | | 738,980 | |
| | | | | | |
| | | | | 5,246,611 | |
| | | | | | |
Security Brokers & Dealers — 2.2% | | | | | | |
Piper Jaffray Cos., Inc.(a) | | 31,152 | | | 1,057,922 | |
TradeStation Group, Inc.(a) | | 10,400 | | | 88,608 | |
| | | | | | |
| | | | | 1,146,530 | |
| | | | | | |
Telecommunications — 0.8% | | | | | | |
Polycom, Inc.(a) | | 17,500 | | | 394,450 | |
| | | | | | |
Transportation — 1.4% | | | | | | |
Kirby Corp.(a) | | 12,900 | | | 735,300 | |
| | | | | | |
Waste Management — 0.6% | | | | | | |
Waste Connections, Inc.(a) | | 10,050 | | | 308,937 | |
| | | | | | |
TOTAL COMMON STOCKS | | | | | | |
(Cost $50,143,336) | | | | | 50,393,493 | |
| | | | | | |
Short Term Investments — 9.8% | | | | | | |
BlackRock Liquidity Series, LLC Money Market Series, 3.10%(c)(d)(e) | | 3,913,950 | | | 3,913,950 | |
Galileo Money Market Fund, 2.56%(e) | | 1,146,436 | | | 1,146,436 | |
| | | | | | |
TOTAL SHORT TERM INVESTMENTS | | | | | | |
(Cost $5,060,386) | | | | | 5,060,386 | |
| | | | | | |
TOTAL INVESTMENTS IN SECURITIES — 107.3% | | | | | | |
(Cost $55,203,722*) | | | | | 55,453,879 | |
LIABILITIES IN EXCESS OF OTHER ASSETS — (7.3)% | | | | | (3,759,083 | ) |
| | | | | | |
NET ASSETS — 100.0% | | | | $ | 51,694,796 | |
| | | | | | |
| * | The cost and unrealized appreciation (depreciation) of investments as of March 31, 2008, as computed for federal income tax purposes, were as follows: |
| | | | |
Aggregate cost | | $ | 55,561,596 | |
| | | | |
Gross unrealized appreciation | | $ | 4,519,580 | |
Gross unrealized depreciation | | | (4,627,297 | ) |
| | | | |
Net unrealized depreciation | | $ | (107,717 | ) |
| | | | |
| (a) | Non-income producing security. |
| (b) | Security, or a portion of security, is on loan. |
| (c) | Investments in companies considered to be an affiliate of the Portfolio, for purposes of Section 2(a)(3) of the Investment Company Act of 1940, were as follows: |
| | | | | | |
Affiliate | | Net
Activity | | Interest
Income |
BlackRock Liquidity Series, LLC Money Market Series | | $ | 3,913,950 | | $ | 52,794 |
| | | | | | |
| (d) | Security purchased with the cash proceeds from securities loans. |
| (e) | Represents current yield as of report date. |
| • | | For Portfolio compliance purposes, the Portfolio’s sector and industry classifications refer to any one or more of the Standard Industry Codes as defined by the SEC. This definition may not apply for purposes of this report, which may combine sector and industry sub-classifications for reporting ease. |
See Notes to Financial Statements.
| | | | | | |
| | SEMI-ANNUAL REPORT | | MARCH 31, 2008 | | 47 |
| | |
| | Small Cap Core Equity Portfolio |
| Schedule of Investments March 31, 2008 (Unaudited) | | (Percentages shown are based on Net Assets) |
| | | | | |
| | | Shares | | Value |
Common Stocks — 97.4% | | | | | |
Aerospace — 2.9% | | | | | |
AAR Corp.(a) | | 56,550 | | $ | 1,542,119 |
Orbital Sciences Corp.(a) | | 55,850 | | | 1,345,985 |
| | | | | |
| | | | | 2,888,104 |
| | | | | |
Banks — 7.3% | | | | | |
CoBiz, Inc.(b) | | 66,800 | | | 869,736 |
Columbia Banking System, Inc. | | 21,760 | | | 486,989 |
First State Bancorporation | | 40,400 | | | 540,956 |
KBW, Inc.(a)(b) | | 42,700 | | | 941,535 |
Prosperity Bancshares, Inc. | | 29,600 | | | 848,336 |
Sterling Bancshares, Inc. | | 75,550 | | | 750,967 |
Umpqua Holdings Corp.(b) | | 58,700 | | | 910,437 |
Westamerica Bancorp(b) | | 14,400 | | | 757,440 |
Wintrust Financial Corp. | | 34,000 | | | 1,188,300 |
| | | | | |
| | | | | 7,294,696 |
| | | | | |
Business Services — 4.2% | | | | | |
Forrester Research, Inc.(a) | | 36,950 | | | 982,131 |
Hiedrick & Struggles International, Inc. | | 15,200 | | | 494,456 |
HMS Holdings Corp.(a) | | 48,145 | | | 1,374,540 |
Martha Stewart Living Omnimedia, Inc.(a)(b) | | 108,700 | | | 807,641 |
Net1 UEPS Technologies, Inc.(a) | | 25,350 | | | 571,642 |
| | | | | |
| | | | | 4,230,410 |
| | | | | |
Chemicals — 1.2% | | | | | |
Hercules, Inc. | | 31,700 | | | 579,793 |
Minerals Technologies, Inc. | | 10,500 | | | 659,400 |
| | | | | |
| | | | | 1,239,193 |
| | | | | |
Computer Software & Services — 14.3% | | | | | |
Aladdin Knowledge Systems Ltd.(a) | | 68,900 | | | 1,311,167 |
Blackboard, Inc.(a) | | 52,400 | | | 1,746,492 |
CACI International, Inc.(a) | | 18,650 | | | 849,507 |
DemandTec, Inc.(a) | | 62,800 | | | 640,560 |
Guidance Software, Inc.(a) | | 113,535 | | | 1,016,138 |
Lawson Software, Inc.(a) | | 126,350 | | | 951,416 |
Phase Forward, Inc.(a) | | 82,100 | | | 1,402,268 |
PROS Holdings, Inc.(a) | | 68,600 | | | 860,930 |
Quality Systems, Inc.(b) | | 32,700 | | | 976,749 |
SkillSoft Plc - ADR(a) | | 303,208 | | | 3,174,588 |
The TriZetto Group, Inc.(a) | | 87,268 | | | 1,456,503 |
| | | | | |
| | | | | 14,386,318 |
| | | | | |
Containers — 1.4% | | | | | |
Silgan Holdings, Inc. | | 27,750 | | | 1,377,232 |
| | | | | |
Electronics — 2.9% | | | | | |
Benchmark Electronics, Inc.(a) | | 59,500 | | | 1,068,025 |
Brady Corp. | | 32,600 | | | 1,089,818 |
RF Micro Devices, Inc.(a) | | 78,600 | | | 209,076 |
TTM Technologies, Inc.(a) | | 50,600 | | | 572,792 |
| | | | | |
| | | | | 2,939,711 |
| | | | | |
Energy & Utilities — 2.9% | | | | | |
El Paso Electric Co.(a) | | 60,100 | | | 1,284,337 |
UIL Holdings Corp. | | 52,600 | | | 1,584,838 |
| | | | | |
| | | | | 2,869,175 |
| | | | | |
Entertainment & Leisure — 3.7% | | | | | |
Morgans Hotel Group Co.(a)(b) | | 58,950 | | | 873,639 |
Orient-Express Hotels Ltd. - Class A | | 39,035 | | | 1,684,751 |
Pinnacle Entertainment, Inc.(a) | | 91,500 | | | 1,171,200 |
| | | | | |
| | | | | 3,729,590 |
| | | | | |
Finance — 1.2% | | | | | |
Evercore Partners, Inc. | | 70,700 | | | 1,254,925 |
| | | | | |
Food & Agriculture — 1.0% | | | | | |
Diamond Foods, Inc. | | 54,500 | | | 988,630 |
| | | | | |
Insurance — 2.3% | | | | | |
First Mercury Financial Corp.(a) | | 101,300 | | | 1,763,633 |
Platinum Underwriters Holdings Ltd. | | 17,279 | | | 560,876 |
| | | | | |
| | | | | 2,324,509 |
| | | | | |
Machinery & Heavy Equipment — 1.7% | | | | | |
Altra Holdings, Inc.(a) | | 71,400 | | | 960,330 |
H&E Equipment Services, Inc.(a) | | 60,000 | | | 754,200 |
| | | | | |
| | | | | 1,714,530 |
| | | | | |
Manufacturing — 9.3% | | | | | |
Actuant Corp. - Class A | | 71,900 | | | 2,172,099 |
AptarGroup, Inc. | | 6,800 | | | 264,724 |
Chart Industries, Inc.(a)(b) | | 55,600 | | | 1,881,504 |
Chattem, Inc.(a)(b) | | 22,582 | | | 1,498,090 |
Elizabeth Arden, Inc.(a) | | 87,000 | | | 1,735,650 |
Fuller (H.B.) Co. | | 44,000 | | | 898,040 |
Hexel Corp.(a) | | 47,800 | | | 913,458 |
| | | | | |
| | | | | 9,363,565 |
| | | | | |
Medical & Medical Services — 3.7% | | | | | |
Amedisys, Inc.(a) | | 42,500 | | | 1,671,950 |
Pediatrix Medical Group, Inc.(a) | | 19,250 | | | 1,297,450 |
Sun Healthcare Group, Inc.(a) | | 56,900 | | | 747,666 |
| | | | | |
| | | | | 3,717,066 |
| | | | | |
Medical Instruments & Supplies — 4.2% | | | | | |
ev3, Inc.(a)(b) | | 89,750 | | | 730,565 |
Hologic, Inc.(a) | | 9,450 | | | 525,420 |
MWI Veterinary Supply, Inc.(a) | | 25,281 | | | 891,408 |
Orthofix International NV(a) | | 16,000 | | | 636,320 |
Symmetry Medical, Inc.(a) | | 86,000 | | | 1,427,600 |
| | | | | |
| | | | | 4,211,313 |
| | | | | |
Oil & Gas — 7.6% | | | | | |
Allis-Chalmers Energy, Inc.(a)(b) | | 48,900 | | | 674,331 |
Cal Dive International, Inc.(a) | | 46,500 | | | 482,670 |
Goodrich Petroleum Corp.(a)(b) | | 44,850 | | | 1,349,088 |
Hercules Offshore, Inc.(a)(b) | | 42,350 | | | 1,063,832 |
ION Geophysical Corp.(a) | | 96,200 | | | 1,327,560 |
Mariner Energy, Inc.(a) | | 27,900 | | | 753,579 |
Oil States International, Inc.(a) | | 30,700 | | | 1,375,667 |
Penn Virginia Corp. | | 14,100 | | | 621,669 |
| | | | | |
| | | | | 7,648,396 |
| | | | | |
Pharmaceuticals — 2.4% | | | | | |
Dyax Corp.(a) | | 282,321 | | | 1,329,732 |
ICON Plc - ADR(a) | | 16,000 | | | 1,038,240 |
| | | | | |
| | | | | 2,367,972 |
| | | | | |
Real Estate — 5.2% | | | | | |
Arbor Realty Trust, Inc. (REIT)(b) | | 64,541 | | | 973,278 |
BioMed Realty Trust, Inc. (REIT)(b) | | 48,400 | | | 1,156,276 |
California Coastal Communities, Inc.(a)(b) | | 13,552 | | | 65,592 |
Corporate Office Properties Trust (REIT) | | 33,000 | | | 1,109,130 |
Gramercy Capital Corp. (REIT)(b) | | 82,800 | | | 1,733,004 |
Redwood Trust, Inc. (REIT)(b) | | 6,000 | | | 218,100 |
| | | | | |
| | | | | 5,255,380 |
| | | | | |
See Notes to Financial Statements.
| | | | | | |
| 48 | | SEMI-ANNUAL REPORT | | MARCH 31, 2008 | | |
| | |
| | Small Cap Core Equity Portfolio |
| Schedule of Investments (concluded) | | (Percentages shown are based on Net Assets) |
| | | | | | |
| | | Shares | | Value | |
Common Stocks (Continued) | | | | | | |
Restaurants — 1.3% | | | | | | |
Carrols Restaurant Group, Inc.(a) | | 77,467 | | $ | 691,780 | |
Sonic Corp.(a) | | 27,300 | | | 601,692 | |
| | | | | | |
| | | | | 1,293,472 | |
| | | | | | |
Retail Merchandising — 7.7% | | | | | | |
AnnTaylor Stores Corp.(a) | | 53,600 | | | 1,296,048 | |
The Children’s Place Retail Stores, Inc.(a) | | 37,300 | | | 916,088 | |
Christopher & Banks Corp. | | 41,400 | | | 413,586 | |
Coldwater Creek, Inc.(a)(b) | | 84,400 | | | 426,220 | |
Copart, Inc.(a) | | 52,600 | | | 2,038,776 | |
Golfsmith International Holdings, Inc.(a) | | 50,500 | | | 106,555 | |
Jarden Corp.(a) | | 56,200 | | | 1,221,788 | |
Jos. A. Bank Clothiers, Inc.(a)(b) | | 25,100 | | | 514,550 | |
Sally Beauty Holdings, Inc.(a) | | 122,450 | | | 844,905 | |
| | | | | | |
| | | | | 7,778,516 | |
| | | | | | |
Security Brokers & Dealers — 0.8% | | | | | | |
Piper Jaffray Cos., Inc.(a) | | 22,250 | | | 755,610 | |
| | | | | | |
Semiconductors & Related Devices — 1.0% | | | | | | |
Ultra Clean Holdings, Inc.(a) | | 103,034 | | | 1,009,733 | |
| | | | | | |
Telecommunications — 3.6% | | | | | | |
EMS Technologies, Inc.(a) | | 68,300 | | | 1,853,662 | |
Iowa Telecommunications Services, Inc. | | 59,400 | | | 1,053,162 | |
iPCS, Inc. | | 31,080 | | | 725,718 | |
| | | | | | |
| | | | | 3,632,542 | |
| | | | | | |
Textiles — 1.7% | | | | | | |
Carter’s, Inc.(a) | | 62,800 | | | 1,014,220 | |
Kenneth Cole Productions, Inc. | | 39,000 | | | 660,660 | |
| | | | | | |
| | | | | 1,674,880 | |
| | | | | | |
Transportation — 0.9% | | | | | | |
Knight Transportation, Inc.(b) | | 36,200 | | | 595,852 | |
Vitran Corp., Inc.(a) | | 20,397 | | | 291,065 | |
| | | | | | |
| | | | | 886,917 | |
| | | | | | |
Waste Management — 1.0% | | | | | | |
Clean Harbors, Inc.(a) | | 15,400 | | | 1,001,000 | |
| | | | | | |
TOTAL COMMON STOCKS | | | | | | |
(Cost $100,410,215) | | | | | 97,833,385 | |
| | | | | | |
Short Term Investments — 18.8% | | | | | | |
BlackRock Liquidity Series, LLC Money Market Series, 3.10%(c)(d)(e) | | 17,951,200 | | | 17,951,200 | |
Galileo Money Market Fund, 2.56%(e) | | 970,842 | | | 970,842 | |
| | | | | | |
TOTAL SHORT TERM INVESTMENTS | | | | | | |
(Cost $18,922,042) | | | | | 18,922,042 | |
| | | | | | |
TOTAL INVESTMENTS IN SECURITIES — 116.2% | | | | | | |
(Cost $119,332,257*) | | | | | 116,755,427 | |
LIABILITIES IN EXCESS OF OTHER ASSETS — (16.2)% | | | | | (16,238,695 | ) |
| | | | | | |
NET ASSETS — 100.0% | | | | $ | 100,516,732 | |
| | | | | | |
| * | The cost and unrealized appreciation (depreciation) of investments as of March 31, 2008, as computed for federal income tax purposes, were as follows: |
| | | | |
Aggregate cost | | $ | 120,094,983 | |
| | | | |
Gross unrealized appreciation | | $ | 9,126,851 | |
Gross unrealized depreciation | | | (12,466,407 | ) |
| | | | |
Net unrealized depreciation | | $ | (3,339,556 | ) |
| | | | |
| (a) | Non-income producing security. |
| (b) | Security, or a portion of security, is on loan. |
| (c) | Investments in companies considered to be an affiliate of the Portfolio, for purposes of Section 2(a)(3) of the Investment Company Act of 1940, were as follows: |
| | | | | | |
Affiliate | | Net
Activity | | Interest
Income |
BlackRock Liquidity Series, LLC Money Market Series | | $ | 17,951,200 | | $ | 84,721 |
| | | | | | |
| (d) | Security purchased with the cash proceeds from securities loans. |
| (e) | Represents current yield as of report date. |
| • | | For Portfolio compliance purposes, the Portfolio’s sector and industry classifications refer to any one or more of the Standard Industry Codes as defined by the SEC. This definition may not apply for purposes of this report, which may combine sector and industry sub-classifications for reporting ease. |
See Notes to Financial Statements.
| | | | | | |
| | SEMI-ANNUAL REPORT | | MARCH 31, 2008 | | 49 |
| | |
| | Small Cap Growth Equity Portfolio |
| Schedule of Investments March 31, 2008 (Unaudited) | | (Percentages shown are based on Net Assets) |
| | | | | |
| | | Shares | | Value |
Common Stocks — 92.8% | | | | | |
Aerospace — 2.8% | | | | | |
Argon ST, Inc.(a) | | 549,700 | | $ | 9,350,397 |
BE Aerospace, Inc.(a) | | 461,660 | | | 16,135,017 |
| | | | | |
| | | | | 25,485,414 |
| | | | | |
Banks — 1.5% | | | | | |
Signature Bank(a)(b) | | 223,800 | | | 5,706,900 |
UMB Financial Corp.(b) | | 181,500 | | | 7,477,800 |
| | | | | |
| | | | | 13,184,700 |
| | | | | |
Beverages & Bottling — 0.9% | | | | | |
Green Mountain Coffee Roasters, Inc.(a)(b) | | 246,800 | | | 7,811,220 |
| | | | | |
Broadcasting — 2.1% | | | | | |
CKX, Inc.(a) | | 1,561,800 | | | 14,868,336 |
Outdoor Channel Holdings, Inc.(a)(b) | | 493,326 | | | 3,625,946 |
| | | | | |
| | | | | 18,494,282 |
| | | | | |
Business Services — 9.6% | | | | | |
The Advisory Board Co.(a)(b) | | 246,700 | | | 13,553,698 |
American Public Education, Inc.(a) | | 26,500 | | | 804,805 |
CommVault Systems, Inc.(a) | | 347,336 | | | 4,306,966 |
DeVry, Inc.(b) | | 239,881 | | | 10,036,621 |
Diamond Management & Technology Consultants, Inc. | | 1,209,196 | | | 7,799,314 |
ExlService Holdings, Inc.(a) | | 956,563 | | | 21,962,687 |
Forrester Research, Inc.(a) | | 707,800 | | | 18,813,324 |
Gartner, Inc. - Class A(a) | | 287,650 | | | 5,563,151 |
Healthcare Services Group, Inc.(b) | | 159,362 | | | 3,289,242 |
| | | | | |
| | | | | 86,129,808 |
| | | | | |
Chemicals — 1.2% | | | | | |
Agrium, Inc. | | 179,700 | | | 11,161,167 |
| | | | | |
Computer Software & Services — 18.6% | | | | | |
ACI Worldwide, Inc.(a)(b) | | 105,700 | | | 2,105,544 |
Aladdin Knowledge Systems Ltd.(a) | | 446,000 | | | 8,487,380 |
Blackboard, Inc.(a) | | 328,252 | | | 10,940,639 |
comScore, Inc.(a) | | 325,500 | | | 6,529,530 |
DemandTec, Inc.(a)(b) | | 690,200 | | | 7,040,040 |
Foundry Networks, Inc.(a) | | 457,000 | | | 5,292,060 |
Greenfield Online, Inc.(a) | | 575,961 | | | 6,830,898 |
i2 Technologies, Inc.(a)(b) | | 804,800 | | | 9,062,048 |
IHS, Inc.(a) | | 352,545 | | | 22,672,169 |
Jack Henry & Associates, Inc.(b) | | 576,600 | | | 14,224,722 |
Move, Inc.(a) | | 1,543,000 | | | 4,752,440 |
SkillSoft Plc - ADR(a) | | 2,943,230 | | | 30,815,618 |
SonicWALL, Inc.(a) | | 1,881,000 | | | 15,367,770 |
Sykes Enterprises, Inc.(a) | | 1,281,900 | | | 22,548,621 |
| | | | | |
| | | | | 166,669,479 |
| | | | | |
Electronics — 1.7% | | | | | |
TiVo, Inc.(a)(b) | | 1,720,300 | | | 15,069,828 |
| | | | | |
Energy & Utilities — 1.1% | | | | | |
Airgas, Inc. | | 210,800 | | | 9,585,076 |
| | | | | |
Entertainment & Leisure — 4.2% | | | | | |
Ameristar Casinos, Inc. | | 400,200 | | | 7,303,650 |
Orient-Express Hotels Ltd. - Class A | | 410,900 | | | 17,734,444 |
Scientific Games Corp. - Class A(a) | | 282,300 | | | 5,959,353 |
World Wrestling Entertainment, Inc. | | 353,200 | | | 6,573,052 |
| | | | | |
| | | | | 37,570,499 |
| | | | | |
Finance — 2.9% | | | | | |
Affiliated Managers Group, Inc.(a)(b) | | 97,100 | | | 8,810,854 |
Riskmetrics Group, Inc.(a) | | 71,700 | | | 1,387,395 |
Wright Express Corp.(a) | | 524,900 | | | 16,130,177 |
| | | | | |
| | | | | 26,328,426 |
| | | | | |
Machinery & Heavy Equipment — 1.4% | | | | | |
Bucyrus International, Inc. - Class A(b) | | 126,400 | | | 12,848,560 |
| | | | | |
Manufacturing — 6.3% | | | | | |
Kaydon Corp.(b) | | 200,300 | | | 8,795,173 |
Ladish Co., Inc.(a) | | 157,500 | | | 5,670,000 |
Quanex Corp.(b) | | 350,000 | | | 18,109,000 |
RBC Bearings, Inc.(a) | | 225,100 | | | 8,357,963 |
Smith & Wesson Holding Corp.(a)(b) | | 410,186 | | | 2,059,134 |
The Warnaco Group, Inc.(a) | | 166,653 | | | 6,572,794 |
Watson Wyatt Worldwide, Inc. | | 117,300 | | | 6,656,775 |
| | | | | |
| | | | | 56,220,839 |
| | | | | |
Medical & Medical Services — 8.0% | | | | | |
Arthrocare Corp.(a) | | 213,600 | | | 7,123,560 |
Lifecell Corp.(a)(b) | | 209,000 | | | 8,784,270 |
Magellan Health Services, Inc.(a) | | 348,600 | | | 13,835,934 |
MedCath Corp.(a) | | 456,000 | | | 8,299,200 |
Pediatrix Medical Group, Inc.(a) | | 332,900 | | | 22,437,460 |
Qiagen NV(a)(b) | | 333,560 | | | 6,938,048 |
Santarus, Inc.(a) | | 1,451,700 | | | 3,730,869 |
| | | | | |
| | | | | 71,149,341 |
| | | | | |
Medical Instruments & Supplies — 9.2% | | | | | |
Align Technology, Inc.(a) | | 91,759 | | | 1,019,443 |
Bruker BioSciences Corp.(a) | | 694,200 | | | 10,683,738 |
Hologic, Inc.(a)(b) | | 160,350 | | | 8,915,460 |
Home Diagnostics, Inc.(a) | | 174,100 | | | 1,211,736 |
Martek Biosciences Corp.(a)(b) | | 339,600 | | | 10,381,572 |
SonoSite, Inc.(a)(b) | | 457,600 | | | 13,009,568 |
Wright Medical Group, Inc.(a)(b) | | 816,581 | | | 19,712,265 |
Zoll Medical Corp.(a) | | 655,000 | | | 17,416,450 |
| | | | | |
| | | | | 82,350,232 |
| | | | | |
Metal & Mining — 1.8% | | | | | |
Massey Energy Co. | | 432,500 | | | 15,786,250 |
| | | | | |
Oil & Gas — 7.1% | | | | | |
Atwood Oceanics, Inc.(a)(b) | | 205,900 | | | 18,885,148 |
Comstock Resources, Inc.(a) | | 311,800 | | | 12,565,540 |
Dawson Geophysical Co.(a) | | 120,892 | | | 8,160,210 |
Delta Petroleum Corp.(a)(b) | | 432,300 | | | 9,744,042 |
Oceaneering International, Inc.(a) | | 116,100 | | | 7,314,300 |
Superior Energy Services, Inc.(a) | | 168,600 | | | 6,679,932 |
| | | | | |
| | | | | 63,349,172 |
| | | | | |
Personal Services — 0.2% | | | | | |
MSCI, Inc.(a) | | 66,100 | | | 1,966,475 |
| | | | | |
Pharmaceuticals — 1.2% | | | | | |
Medicis Pharmaceutical Corp. | | 565,900 | | | 11,142,571 |
| | | | | |
Publishing & Printing — 1.2% | | | | | |
Dolan Media Co.(a) | | 550,579 | | | 11,072,144 |
| | | | | |
Real Estate — 0.2% | | | | | |
FX Real Estate and Entertainment, Inc.(a) | | 312,360 | | | 1,836,677 |
See Notes to Financial Statements.
| | | | | | |
| 50 | | SEMI-ANNUAL REPORT | | MARCH 31, 2008 | | |
| | |
| | Small Cap Growth Equity Portfolio |
| Schedule of Investments (concluded) | | (Percentages shown are based on Net Assets) |
| | | | | | |
| | | Shares | | Value | |
Common Stocks (Continued) | | | | | | |
Real Estate (Continued) | | | | | | |
FX Real Estate and Entertainment, Inc., Rights expire 4/11/08(a) | | 156,180 | | $ | 12,494 | |
| | | | | | |
| | | | | 1,849,171 | |
| | | | | | |
Retail Merchandising — 0.4% | | | | | | |
Deckers Outdoor Corp.(a) | | 33,100 | | | 3,568,842 | |
| | | | | | |
Security Brokers & Dealers — 1.8% | | | | | | |
Waddell & Reed Financial, Inc. | | 497,400 | | | 15,981,462 | |
| | | | | | |
Semiconductors & Related Devices — 3.3% | | | | | | |
Microsemi Corp.(a)(b) | | 505,500 | | | 11,525,400 | |
O2Micro International Ltd. - ADR(a) | | 271,800 | | | 2,101,014 | |
Semtech Corp.(a) | | 276,300 | | | 3,959,379 | |
Standard Microsystems Corp.(a) | | 409,700 | | | 11,955,046 | |
| | | | | | |
| | | | | 29,540,839 | |
| | | | | | |
Telecommunications — 2.2% | | | | | | |
EMS Technologies, Inc.(a) | | 472,845 | | | 12,833,013 | |
Neutral Tandem, Inc.(a) | | 239,000 | | | 4,304,390 | |
Occam Networks, Inc.(a) | | 420,300 | | | 2,286,432 | |
| | | | | | |
| | | | | 19,423,835 | |
| | | | | | |
Waste Management — 1.9% | | | | | | |
Clean Harbors, Inc.(a) | | 256,400 | | | 16,666,000 | |
| | | | | | |
TOTAL COMMON STOCKS | | | | | | |
(Cost $747,322,855) | | | | | 830,405,632 | |
| | | | | | |
Short Term Investments — 26.1% | | | | | | |
BlackRock Liquidity Series, LLC Money Market Series, 3.10%(c)(d)(e) | | 171,307,500 | | | 171,307,500 | |
Galileo Money Market Fund, 2.56%(e) | | 61,986,621 | | | 61,986,621 | |
| | | | | | |
TOTAL SHORT TERM INVESTMENTS | | | | | | |
(Cost $233,294,121) | | | | | 233,294,121 | |
| | | | | | |
TOTAL INVESTMENTS IN SECURITIES — 118.9% | | | | | | |
(Cost $980,616,976*) | | | | | 1,063,699,753 | |
LIABILITIES IN EXCESS OF OTHER ASSETS — (18.9)% | | | | | (168,767,392 | ) |
| | | | | | |
NET ASSETS — 100.0% | | | | $ | 894,932,361 | |
| | | | | | |
| * | The cost and unrealized appreciation (depreciation) of investments as of March 31, 2008, as computed for federal income tax purposes, were as follows: |
| | | | |
Aggregate cost | | $ | 988,572,345 | |
| | | | |
Gross unrealized appreciation | | $ | 142,259,445 | |
Gross unrealized depreciation | | | (67,132,037 | ) |
| | | | |
Net unrealized appreciation | | $ | 75,127,408 | |
| | | | |
| (a) | Non-income producing security. |
| (b) | Security, or a portion of security, is on loan. |
| (c) | Investments in companies considered to be an affiliate of the Portfolio, for purposes of Section 2(a)(3) of the Investment Company Act of 1940, were as follows: |
| | | | | | |
Affiliate | | Net
Activity | | Interest
Income |
BlackRock Liquidity Series, LLC Money Market Series | | $ | 171,307,500 | | $ | 598,702 |
| | | | | | |
| (d) | Security purchased with the cash proceeds from securities loans. |
| (e) | Represents current yield as of report date. |
| • | | For Portfolio compliance purposes, the Portfolio’s sector and industry classifications refer to any one or more of the Standard Industry Codes as defined by the SEC. This definition may not apply for purposes of this report, which may combine sector and industry sub-classifications for reporting ease. |
See Notes to Financial Statements.
| | | | | | |
| | SEMI-ANNUAL REPORT | | MARCH 31, 2008 | | 51 |
| | |
| | Global Science & Technology Opportunities Portfolio |
| Schedule of Investments March 31, 2008 (Unaudited) | | (Percentages shown are based on Net Assets) |
| | | | | |
| | | Shares | | Value |
Common Stocks — 94.9% | | | | | |
Bermuda — 0.4% | | | | | |
Electronics — 0.4% | | | | | |
Tyco Electronics Ltd. | | 4,700 | | $ | 161,304 |
| | | | | |
Canada — 0.5% | | | | | |
Computer Software & Services — 0.5% | | | | | |
Open Text Corp.(a) | | 6,700 | | | 209,777 |
| | | | | |
China — 1.0% | | | | | |
Computer Software & Services — 1.0% | | | | | |
Baidu.Com(a) | | 700 | | | 167,741 |
Sina Corp.(a) | | 7,300 | | | 257,325 |
| | | | | |
| | | | | 425,066 |
| | | | | |
Finland — 0.6% | | | | | |
Telecommunications — 0.6% | | | | | |
Nokia Corp. - ADR | | 8,000 | | | 254,640 |
| | | | | |
France — 0.6% | | | | | |
Entertainment & Leisure — 0.6% | | | | | |
Ubisoft Entertainment | | 3,000 | | | 258,458 |
| | | | | |
Germany — 1.1% | | | | | |
Computer Software & Services — 0.9% | | | | | |
SAP AG - ADR | | 7,100 | | | 351,947 |
| | | | | |
Semiconductors & Related Devices — 0.2% | | | | | |
Infineon Technologies AG - ADR(a) | | 13,400 | | | 94,068 |
| | | | | |
Total Germany | | | | | 446,015 |
| | | | | |
Hong Kong — 1.2% | | | | | |
Semiconductors & Related Devices — 0.7% | | | | | |
ASM Pacific Technology Ltd. | | 39,000 | | | 281,376 |
| | | | | |
Telecommunications — 0.5% | | | | | |
China Mobile Ltd. | | 14,500 | | | 215,749 |
| | | | | |
Total Hong Kong | | | | | 497,125 |
| | | | | |
India — 0.9% | | | | | |
Telecommunications — 0.9% | | | | | |
Bharti Tele-Ventures Ltd. | | 19,600 | | | 403,652 |
| | | | | |
Indonesia — 0.5% | | | | | |
Telecommunications — 0.5% | | | | | |
PT Telekomunikasi Indonesia | | 186,800 | | | 195,830 |
| | | | | |
Japan — 3.7% | | | | | |
Computer Software & Services — 0.6% | | | | | |
Nintendo Co. Ltd. | | 500 | | | 257,825 |
| | | | | |
Energy & Utilities — 1.6% | | | | | |
Kurita Water Industries Ltd. | | 18,200 | | | 670,084 |
| | | | | |
Machinery & Heavy Equipment — 0.3% | | | | | |
Disco Corp. | | 2,800 | | | 120,506 |
| | | | | |
Manufacturing — 0.6% | | | | | |
Konica Corp. | | 19,200 | | | 260,803 |
| | | | | |
Metal & Mining — 0.6% | | | | | |
Sumitomo Metal Mining Co. Ltd. | | 12,200 | | | 227,036 |
| | | | | |
Total Japan | | | | | 1,536,254 |
| | | | | |
Mexico — 0.7% | | | | | |
Telecommunications — 0.7% | | | | | |
America Movil SA - ADR | | 4,700 | | | 299,343 |
| | | | | |
South Korea — 0.4% | | | | | |
Electronics — 0.4% | | | | | |
Samsung Electronics Co. Ltd. | | 300 | | | 188,721 |
| | | | | |
Switzerland — 0.9% | | | | | |
Pharmaceuticals — 0.9% | | | | | |
Roche Holding AG | | 1,600 | | | 301,118 |
Roche Holding AG - ADR | | 800 | | | 75,587 |
| | | | | |
| | | | | 376,705 |
| | | | | |
Taiwan — 2.6% | | | | | |
Computer & Office Equipment — 1.2% | | | | | |
Asustek Computer, Inc. | | 86,200 | | | 252,532 |
High Tech Computer Corp. | | 10,200 | | | 229,319 |
| | | | | |
| | | | | 481,851 |
| | | | | |
Computer Software & Services — 0.4% | | | | | |
Inventec Co. Ltd. | | 267,900 | | | 164,023 |
| | | | | |
Semiconductors & Related Devices — 1.0% | | | | | |
Av Tech Corp. | | 15,759 | | | 80,923 |
Taiwan Semiconductor Manufacturing Co. Ltd. - ADR | | 22,403 | | | 230,079 |
Vanguard International Semiconductor Corp. | | 170,858 | | | 122,606 |
| | | | | |
| | | | | 433,608 |
| | | | | |
Total Taiwan | | | | | 1,079,482 |
| | | | | |
United Kingdom — 0.7% | | | | | |
Aerospace — 0.7% | | | | | |
Meggitt Plc | | 51,100 | | | 279,652 |
| | | | | |
United States — 79.1% | | | | | |
Aerospace — 3.2% | | | | | |
Lockheed Martin Corp. | | 7,800 | | | 774,540 |
Raytheon Co. | | 8,700 | | | 562,107 |
| | | | | |
| | | | | 1,336,647 |
| | | | | |
Broadcasting — 0.6% | | | | | |
Liberty Global, Inc.(a) | | 7,900 | | | 269,232 |
| | | | | |
Computer & Office Equipment — 11.0% | | | | | |
Apple Computer, Inc.(a) | | 12,300 | | | 1,765,050 |
Cisco Systems, Inc.(a) | | 25,100 | | | 604,659 |
Dell, Inc.(a) | | 10,600 | | | 211,152 |
Hewlett-Packard Co. | | 19,900 | | | 908,634 |
International Business Machines Corp. | | 9,500 | | | 1,093,830 |
| | | | | |
| | | | | 4,583,325 |
| | | | | |
Computer Software & Services — 25.0% | | | | | |
Adobe Systems, Inc.(a) | | 9,600 | | | 341,664 |
Ariba, Inc.(a) | | 9,700 | | | 93,702 |
Automatic Data Processing, Inc. | | 5,100 | | | 216,189 |
BMC Software, Inc.(a) | | 10,800 | | | 351,216 |
CA, Inc. | | 8,400 | | | 189,000 |
Citrix Systems, Inc.(a) | | 14,700 | | | 431,151 |
Computer Sciences Corp.(a) | | 7,500 | | | 305,925 |
DST Systems, Inc.(a) | | 14,100 | | | 926,934 |
eBay, Inc.(a) | | 7,800 | | | 232,752 |
Electronic Arts, Inc.(a) | | 7,200 | | | 359,424 |
EMC Corp.(a) | | 22,000 | | | 315,480 |
Foundry Networks, Inc.(a) | | 20,000 | | | 231,600 |
Google, Inc. - Class A(a) | | 1,000 | | | 440,470 |
Ingram Micro, Inc. - Class A(a) | | 9,000 | | | 142,470 |
Juniper Networks, Inc.(a) | | 22,800 | | | 570,000 |
McAfee, Inc.(a) | | 12,500 | | | 413,625 |
Microsoft Corp. | | 32,900 | | | 933,702 |
Oracle Corp.(a) | | 36,000 | | | 704,160 |
priceline.com, Inc.(a) | | 3,500 | | | 423,010 |
See Notes to Financial Statements.
| | | | | | |
| 52 | | SEMI-ANNUAL REPORT | | MARCH 31, 2008 | | |
| | |
| | Global Science & Technology Opportunities Portfolio |
| Schedule of Investments (continued) | | (Percentages shown are based on Net Assets) |
| | | | | |
| | | Shares | | Value |
Common Stocks (Continued) | | | | | |
United States (Continued) | | | | | |
Computer Software & Services (Continued) | | | | | |
Progress Software Corp.(a) | | 6,400 | | $ | 191,488 |
Salesforce.Com, Inc.(a) | | 6,800 | | | 393,516 |
Seagate Technology, Inc. | | 17,300 | | | 362,262 |
Sun Microsystems, Inc.(a) | | 19,025 | | | 295,459 |
Sybase, Inc.(a) | | 15,800 | | | 415,540 |
Symantec Corp.(a) | | 8,700 | | | 144,594 |
Synopsys, Inc.(a) | | 7,700 | | | 174,867 |
VeriSign, Inc.(a) | | 12,300 | | | 408,852 |
Yahoo!, Inc.(a) | | 15,100 | | | 436,843 |
| | | | | |
| | | | | 10,445,895 |
| | | | | |
Electronics — 3.1% | | | | | |
Agilent Technologies, Inc.(a) | | 6,800 | | | 202,844 |
Amphenol Corp. | | 6,100 | | | 227,225 |
Flextronics International Ltd.(a) | | 19,900 | | | 186,861 |
Intel Corp. | | 32,500 | | | 688,350 |
| | | | | |
| | | | | 1,305,280 |
| | | | | |
Manufacturing — 1.3% | | | | | |
Corning, Inc. | | 22,000 | | | 528,880 |
| | | | | |
Measuring & Controlling Devices — 0.6% | | | | | |
KLA-Tencor Corp. | | 7,300 | | | 270,830 |
| | | | | |
Medical & Medical Services — 2.3% | | | | | |
Baxter International, Inc. | | 5,600 | | | 323,792 |
Covance, Inc.(a) | | 3,000 | | | 248,910 |
Integra LifeSciences Holdings Corp.(a) | | 4,500 | | | 195,615 |
Millipore Corp.(a) | | 2,600 | | | 175,266 |
| | | | | |
| | | | | 943,583 |
| | | | | |
Medical Instruments & Supplies — 9.5% | | | | | |
Alcon, Inc. | | 1,600 | | | 227,600 |
Becton, Dickinson & Co. | | 7,900 | | | 678,215 |
C.R. Bard, Inc. | | 3,400 | | | 327,760 |
Charles River Laboratories International, Inc.(a) | | 4,400 | | | 259,336 |
China Medical Technologies, Inc. - ADR | | 2,800 | | | 115,052 |
Cyberonics, Inc.(a) | | 7,500 | | | 108,750 |
Johnson & Johnson | | 2,200 | | | 142,714 |
Medtronic, Inc. | | 13,400 | | | 648,158 |
SenoRx, Inc.(a) | | 6,400 | | | 41,280 |
St. Jude Medical, Inc.(a) | | 7,800 | | | 336,882 |
Stryker Corp. | | 5,000 | | | 325,250 |
Varian Medical Systems, Inc.(a) | | 7,500 | | | 351,300 |
Waters Corp.(a) | | 1,066 | | | 59,376 |
Zimmer Holdings, Inc.(a) | | 4,200 | | | 327,012 |
| | | | | |
| | | | | 3,948,685 |
| | | | | |
Pharmaceuticals — 6.0% | | | | | |
Alexion Pharmaceuticals, Inc.(a) | | 3,900 | | | 231,270 |
Applera Corp. - Celera Genomics Group(a) | | 11,700 | | | 171,990 |
Bristol-Myers Squibb Co. | | 9,400 | | | 200,220 |
Celgene Corp.(a) | | 2,928 | | | 179,457 |
Gilead Sciences, Inc.(a) | | 15,000 | | | 772,950 |
Merck & Co., Inc. | | 9,700 | | | 368,115 |
Teva Pharmaceutical Industries Ltd. - ADR | | 6,900 | | | 318,711 |
United Therapeutics Corp.(a) | | 3,000 | | | 260,100 |
| | | | | |
| | | | | 2,502,813 |
| | | | | |
Retail Merchandising — 0.6% | | | | | |
CVS Caremark Corp. | | 5,900 | | | 239,009 |
| | | | | |
Semiconductors & Related Devices — 8.2% | | | | | |
Altera Corp. | | 9,600 | | | 176,928 |
Analog Devices, Inc. | | 7,200 | | | 212,544 |
Applied Materials, Inc. | | 21,400 | | | 417,514 |
Broadcom Corp. - Class A(a) | | 10,200 | | | 196,554 |
Cavium Networks, Inc.(a) | | 5,400 | | | 88,560 |
Kulicke & Soffa Industries, Inc.(a) | | 22,100 | | | 105,638 |
Lam Research Corp.(a) | | 4,800 | | | 183,456 |
Linear Technology Corp. | | 6,800 | | | 208,692 |
Marvell Technology Group Ltd.(a) | | 17,000 | | | 184,960 |
Maxim Integrated Products, Inc. | | 10,500 | | | 214,095 |
MEMC Electronic Materials, Inc.(a) | | 3,600 | | | 255,240 |
Microchip Technology, Inc. | | 7,000 | | | 229,110 |
Netlogic Microsystems, Inc.(a) | | 4,500 | | | 108,630 |
NVIDIA Corp.(a) | | 8,700 | | | 172,173 |
Texas Instruments, Inc. | | 11,000 | | | 310,970 |
Xilinx, Inc. | | 14,700 | | | 349,125 |
| | | | | |
| | | | | 3,414,189 |
| | | | | |
Telecommunications — 7.7% | | | | | |
American Tower Corp. - Class A(a) | | 5,900 | | | 231,339 |
AT&T, Inc. | | 9,700 | | | 371,510 |
Atheros Communications, Inc.(a) | | 8,700 | | | 181,308 |
Ciena Corp.(a) | | 6,700 | | | 206,561 |
Harris Corp. | | 7,900 | | | 383,387 |
Harris Stratex Networks, Inc.(a) | | 10,700 | | | 107,321 |
JDS Uniphase Corp.(a) | | 13,200 | | | 176,748 |
Motorola, Inc. | | 14,100 | | | 131,130 |
QUALCOMM, Inc. | | 15,400 | | | 631,400 |
Research In Motion Ltd.(a) | | 2,600 | | | 291,798 |
Syniverse Holdings, Inc.(a) | | 14,900 | | | 248,234 |
Verizon Communications, Inc. | | 7,300 | | | 266,085 |
| | | | | |
| | | | | 3,226,821 |
| | | | | |
Total United States | | | | | 33,015,189 |
| | | | | |
TOTAL COMMON STOCKS | | | | | |
(Cost $37,496,664) | | | | | 39,627,213 |
| | | | | |
Short Term Investments — 2.4% | | | | | |
Galileo Money Market Fund, 2.56%(b) | | | | | |
(Cost $994,214)(b) | | 994,214 | | | 994,214 |
| | | | | |
TOTAL INVESTMENTS IN SECURITIES — 97.3% | | | | | |
(Cost $38,490,878*) | | | | | 40,621,427 |
OTHER ASSETS IN EXCESS OF LIABILITIES — 2.7% | | | | | 1,111,725 |
| | | | | |
NET ASSETS — 100.0% | | | | $ | 41,733,152 |
| | | | | |
See Notes to Financial Statements.
| | | | | | |
| | SEMI-ANNUAL REPORT | | MARCH 31, 2008 | | 53 |
| | |
| | Global Science & Technology Opportunities Portfolio |
| Schedule of Investments (concluded) | | (Percentages shown are based on Net Assets) |
| * | The cost and unrealized appreciation (depreciation) of investments as of March 31, 2008, as computed for federal income tax purposes, were as follows: |
| | | | |
Aggregate cost | | $ | 39,075,749 | |
| | | | |
Gross unrealized appreciation | | $ | 3,760,143 | |
Gross unrealized depreciation | | | (2,214,465 | ) |
| | | | |
Net unrealized appreciation | | $ | 1,545,678 | |
| | | | |
| (a) | Non-income producing security. |
| (b) | Represents current yield as of report date. |
| • | | Investments in companies considered to be an affiliate of the Portfolio, for purposes of Section 2(a)(3) of the Investment Company Act of 1940, were as follows: |
| | | | | | |
Affiliate | | Net
Activity | | Interest
Income |
BlackRock Liquidity Series, LLC Money Market Series | | $ | — | | $ | 3,547 |
| | | | | | |
| • | | Forward foreign exchange contracts purchased as of March 31, 2008 were as follows: |
| | | | | | | | | | |
Foreign Currency Purchased | | Settlement
Date | | Unrealized
Appreciation
(Depreciation) | |
AUD | | 15,000 | | | | 04/23/08 | | $ | 616 | |
JPY | | 47,488,000 | | | | 04/23/08 | | | 23,532 | |
EUR | | 181,000 | | | | 04/23/08 | | | 724 | |
GBP | | 5,000 | | | | 04/23/08 | | | (162 | ) |
| | | | | | | | | | |
Total Net Unrealized Appreciation on Forward Foreign Exchange Contracts (USD Commitment - $761,504) | | | | $ | 24,710 | |
| | | | | | | | | | |
| • | | Forward foreign exchange contracts sold as of March 31, 2008 were as follows: |
| | | | | | | | | | |
Foreign Currency Sold | | Settlement
Date | | Unrealized
Appreciation
(Depreciation) | |
JPY | | 6,287,000 | | | | 04/01/08 | | $ | 152 | |
JPY | | 185,477,468 | | | | 04/23/08 | | | (116,436 | ) |
HKD | | 2,507,000 | | | | 04/23/08 | | | (420 | ) |
EUR | | 556,500 | | | | 04/23/08 | | | (62,119 | ) |
CHF | | 303,000 | | | | 04/23/08 | | | (28,547 | ) |
GBP | | 97,000 | | | | 04/23/08 | | | (1,452 | ) |
| | | | | | | | | | |
Total Net Unrealized Depreciation on Forward Foreign Exchange Contracts (USD Commitment - $3,415,334) | | | | $ | (208,822 | ) |
| | | | | | | | | | |
| • | | For Portfolio compliance purposes, the Portfolio’s sector and industry classifications refer to any one or more of the Standard Industry Codes as defined by the SEC. This definition may not apply for purposes of this report, which may combine sector and industry sub-classifications for reporting ease. |
See Notes to Financial Statements.
| | | | | | |
| 54 | | SEMI-ANNUAL REPORT | | MARCH 31, 2008 | | |
| | |
Schedule of Investments March 31, 2008 (Unaudited) | | Global Resources Portfolio |
| | (Percentages shown are based on Net Assets) |
| | | | | |
| | | Shares | | Value |
Common Stocks — 96.9% | | | | | |
Canada — 22.2% | | | | | |
Banks — 0.0% | | | | | |
Quest Capital Corp. | | 61,000 | | $ | 120,045 |
| | | | | |
Energy & Utilities — 0.4% | | | | | |
Epsilon Energy, Inc.(a) | | 332,500 | | | 660,821 |
MGM Energy Corp.(b) | | 15,084 | | | 11,756 |
Tanganyika Oil Co. Ltd. | | 232,700 | | | 4,112,103 |
| | | | | |
| | | | | 4,784,680 |
| | | | | |
Metal & Mining — 5.9% | | | | | |
Alexco Resource Corp.(b) | | 593,683 | | | 2,487,054 |
Aurora Energy Resources, Inc.(b) | | 246,000 | | | 1,294,169 |
Baja Mining Corp.(b) | | 3,654,800 | | | 4,842,445 |
Corriente Resources, Inc. - Class A(b) | | 982,800 | | | 4,548,005 |
Crosshair Exploration & Mining Corp.(b) | | 352,800 | | | 309,338 |
Denison Mines Corp.(b) | | 218,500 | | | 1,379,395 |
Erdene Gold, Inc. (acquired 04/12/07, cost $959,233)(c)(d) | | 1,100,000 | | | 985,922 |
European Goldfields Ltd.(b) | | 561,400 | | | 2,931,564 |
Frontier Pacific Mining Corp.(b) | | 3,024,300 | | | 1,915,140 |
Gold Reserve, Inc.(b)(e) | | 123,948 | | | 571,400 |
Goldcorp, Inc. | | 4,600 | | | 178,766 |
Golden Star Resources Ltd.(b)(e) | | 789,408 | | | 2,753,257 |
MAG Silver Corp.(b) | | 964,000 | | | 12,237,245 |
Minefinders Corp. Ltd.(b)(e) | | 250,000 | | | 3,070,000 |
Nevsun Resources Ltd. (acquired 01/20/05, cost $4,883,732)(b)(c)(f) | | 1,554,800 | | | 2,681,081 |
Northern Star Mining Corp.(b) | | 1,133,500 | | | 1,214,721 |
NovaGold Resources, Inc.(b)(e) | | 371,843 | | | 2,866,910 |
Polymet Mining Corp.(b) | | 2,250,000 | | | 7,189,829 |
Q2 Gold Resources, Inc.(d) | | 327,600 | | | 0 |
Romarco Minerals, Inc.(b) | | 223,000 | | | 34,761 |
Rusoro Mining Ltd.(b) | | 11,764 | | | 17,191 |
Selkirk Metals Corp.(b) | | 792,500 | | | 416,923 |
Southwestern Resources Corp.(b) | | 1,066,900 | | | 530,098 |
Sunridge Gold Corp.(b) | | 3,325,559 | | | 3,725,844 |
Triex Minerals Corp.(b) | | 156,050 | | | 253,888 |
Triex Minerals Corp. (acquired 12/23/05, cost $671,761)(c) | | 312,100 | | | 507,776 |
Uranium One, Inc.(b) | | 500,365 | | | 1,647,653 |
Virginia Mines, Inc.(b) | | 216,350 | | | 1,403,762 |
West Timmins Mining, Inc.(b) | | 2,160,128 | | | 1,431,036 |
X-Cal Resources Ltd.(b) | | 1,755,500 | | | 239,437 |
| | | | | |
| | | | | 63,664,610 |
| | | | | |
Motor Vehicles — 0.3% | | | | | |
Westport Innovations, Inc.(b)(f) | | 959,500 | | | 2,851,064 |
| | | | | |
Oil & Gas — 15.6% | | | | | |
Accrete Energy, Inc.(b) | | 13,690 | | | 64,152 |
Alberta Clipper Energy, Inc.(b) | | 95,415 | | | 223,095 |
Bayou Bend Petroleum Ltd.(b) | | 2,237,500 | | | 1,177,115 |
Baytex Energy Trust | | 421,948 | | | 9,364,290 |
Bow Valley Energy Ltd.(b) | | 634,600 | | | 3,115,967 |
Canadian Superior Energy, Inc.(b) | | 2,953,362 | | | 9,184,956 |
Canext Energy Ltd.(b) | | 207,829 | | | 151,855 |
Cinch Energy Corp.(b) | | 901,980 | | | 1,098,422 |
Compton Petroleum Corp.(b) | | 1,267,329 | | | 14,112,300 |
Cork Exploration, Inc.(b) | | 89,600 | | | 301,154 |
Crescent Point Energy Trust | | 102,001 | | | 2,844,044 |
Crew Energy, Inc.(b) | | 727,137 | | | 9,492,558 |
Daylight Resources Trust | | 346,361 | | | 3,026,799 |
Delphi Energy Corp.(b) | | 831,300 | | | 1,708,844 |
Ember Resources, Inc.(b) | | 274,224 | | | 376,692 |
Endev Energy, Inc.(b) | | 1,538,300 | | | 1,243,888 |
Fairborne Energy Ltd. | | 259,558 | | | 1,744,800 |
First Calgary Petroleums Ltd.(b) | | 740,786 | | | 2,085,705 |
Galleon Energy, Inc. - Class A(b) | | 1,750,482 | | | 25,239,548 |
Gastar Exploration Ltd.(b) | | 1,055,300 | | | 1,371,890 |
Heritage Oil Corp.(b) | | 252,300 | | | 12,678,293 |
Highpine Oil & Gas Ltd.(b) | | 323,650 | | | 3,058,508 |
HSE Integrated Ltd.(b) | | 28,238 | | | 24,759 |
Iteration Energy Ltd.(b) | | 226,745 | | | 1,329,828 |
Leader Energy Services Ltd.(b) | | 454,104 | | | 35,392 |
Lynden Ventures Ltd.(b) | | 200,400 | | | 156,189 |
Masters Energy, Inc.(b) | | 27,741 | | | 83,241 |
Midnight Oil Exploration Ltd.(b) | | 1,127,700 | | | 1,340,342 |
Niko Resources Ltd. (acquired 01/20/05, cost $689,948)(c) | | 39,000 | | | 3,163,086 |
Oilexco, Inc.(b) | | 673,075 | | | 8,806,466 |
Open Range Energy Corp.(b) | | 48,061 | | | 192,441 |
Pacific Rodera Energy, Inc.(b) | | 990,200 | | | 482,342 |
Pacific Rubiales Energy Corp.(b) | | 4,073,700 | | | 5,913,404 |
Pan Orient Energy Corp.(b) | | 198,600 | | | 2,238,591 |
Paramount Resources Ltd. - Class A(b) | | 377,100 | | | 5,613,608 |
Pengrowth Energy Trust | | 21,699 | | | 415,821 |
Penn West Energy Trust | | 90,263 | | | 2,532,587 |
Petro Andina Resources Inc.(a)(b) | | 49,500 | | | 581,105 |
Petrolifera Petroleum Ltd.(b) | | 392,415 | | | 3,478,958 |
ProspEx Resources Ltd.(b) | | 1,504,120 | | | 5,099,457 |
Tag Oil Ltd. (acquired 09/22/05, cost $218,247)(c) | | 198,000 | | | 16,396 |
Technicoil Corp.(b) | | 1,300,900 | | | 937,860 |
Trafalgar Energy Ltd.(b) | | 21,717 | | | 76,378 |
TransCanada Corp. | | 40,700 | | | 1,568,206 |
Trilogy Energy Trust | | 152,791 | | | 1,481,096 |
TriStar Oil & Gas Ltd.(b) | | 806,837 | | | 11,366,226 |
True Energy Trust | | 188,332 | | | 671,533 |
Tusk Energy Corp. (acquired 10/11/05 through 01/05/07, cost $8,250,724)(c) | | 2,248,186 | | | 3,723,432 |
Vero Energy, Inc.(b) | | 91,642 | | | 682,996 |
West Energy Ltd.(b) | | 291,835 | | | 966,671 |
WesternZagros Resources Ltd.(b) | | 76,800 | | | 182,563 |
| | | | | |
| | | | | 166,825,849 |
| | | | | |
Transportation — 0.0% | | | | | |
Railpower Technologies Corp.(b) | | 360,600 | | | 119,445 |
| | | | | |
Total Canada | | | | | 238,365,693 |
| | | | | |
Greece — 0.4% | | | | | |
Transportation — 0.4% | | | | | |
Navios Maritime Holdings, Inc. | | 418,700 | | | 3,885,536 |
| | | | | |
Norway — 1.1% | | | | | |
Oil & Gas — 0.5% | | | | | |
Sevan Marine ASA | | 425,800 | | | 5,435,015 |
| | | | | |
Transportation — 0.6% | | | | | |
Stolt-Nielsen SA (acquired 01/20/05 through 07/24/07, cost $3,997,892)(c) | | 296,100 | | | 6,163,481 |
| | | | | |
Total Norway | | | | | 11,598,496 |
| | | | | |
United Kingdom — 1.3% | | | | | |
Energy & Utilities — 0.0% | | | | | |
ITM Power Plc | | 525,200 | | | 648,852 |
| | | | | |
Oil & Gas — 1.3% | | | | | |
Archipelago Resources Plc (acquired 5/13/05, cost $1,453,189)(c) | | 2,247,400 | | | 1,338,083 |
Gulfsands Petroleum Plc | | 563,300 | | | 1,799,895 |
See Notes to Financial Statements.
| | | | | | |
| | SEMI-ANNUAL REPORT | | MARCH 31, 2008 | | 55 |
| | |
| | Global Resources Portfolio |
| Schedule of Investments (continued) | | (Percentages shown are based on Net Assets) |
| | | | | | |
| | | Shares | | Value | |
Common Stocks (Continued) | | | | | | |
United Kingdom (Continued) | | | | | | |
Oil & Gas (Continued) | | | | | | |
Tullow Oil Plc | | 544,198 | | $ | 7,133,642 | |
Venture Production Plc | | 289,729 | | | 3,588,047 | |
| | | | | | |
| | | | | 13,859,667 | |
| | | | | | |
Total United Kingdom | | | | | 14,508,519 | |
| | | | | | |
United States — 71.9% | | | | | | |
Energy & Utilities — 3.2% | | | | | | |
Calpine Corp.(b) | | 874,200 | | | 16,102,764 | |
Dynegy, Inc - Class A(b) | | 1,560 | | | 12,309 | |
Equitable Resources, Inc.(e) | | 256,500 | | | 15,107,850 | |
Evergreen Energy, Inc.(b)(e) | | 393,400 | | | 605,836 | |
Longview Energy Co. (acquired 01/20/05, cost $1,281,000)(c)(d) | | 85,400 | | | 1,708,000 | |
Ocean Power Technologies, Inc.(b) | | 63,900 | | | 780,858 | |
| | | | | | |
| | | | | 34,317,617 | |
| | | | | | |
Metal & Mining — 24.9% | | | | | | |
Arch Coal, Inc.(e) | | 1,324,400 | | | 57,611,400 | |
CONSOL Energy, Inc. | | 1,128,000 | | | 78,046,320 | |
Foundation Coal Holdings, Inc.(e) | | 72,000 | | | 3,623,760 | |
James River Coal Co.(b)(e) | | 131,100 | | | 2,296,872 | |
Kinross Gold Corp. | | 111,175 | | | 2,458,079 | |
Massey Energy Co. | | 1,663,040 | | | 60,700,960 | |
Patriot Coal Corp.(b) | | 88,673 | | | 4,164,971 | |
Peabody Energy Corp.(e) | | 895,436 | | | 45,667,236 | |
United States Steel Corp. | | 96,800 | | | 12,281,016 | |
| | | | | | |
| | | | | 266,850,614 | |
| | | | | | |
Oil & Gas — 43.8% | | | | | | |
American Oil & Gas, Inc.(b)(e) | | 224,088 | | | 732,768 | |
Approach Resources, Inc.(b)(e) | | 93,700 | | | 1,469,216 | |
Aventine Renewable Energy Holdings, Inc.(b)(e) | | 436,000 | | | 2,267,200 | |
Baker Hughes, Inc. | | 46,200 | | | 3,164,700 | |
BJ Services Co. | | 618,100 | | | 17,622,031 | |
Bois d’Arc Energy, Inc.(b)(e) | | 165,300 | | | 3,552,297 | |
Brigham Exploration Co.(b) | | 129,204 | | | 784,268 | |
Callon Petroleum Co.(b) | | 92,200 | | | 1,667,898 | |
CanArgo Energy Corp.(b) | | 5,184,600 | | | 1,812,018 | |
Clayton Williams Energy, Inc.(b) | | 267,021 | | | 14,015,932 | |
Complete Production Services, Inc.(b) | | 34,400 | | | 789,136 | |
Delta Petroleum Corp.(b)(e) | | 1,762,497 | | | 39,726,682 | |
Denbury Resources, Inc.(b)(e) | | 595,200 | | | 16,992,960 | |
Diamond Offshore Drilling, Inc.(e) | | 94,223 | | | 10,967,557 | |
ENSCO International, Inc. | | 94,100 | | | 5,892,542 | |
EXCO Resources, Inc.(b)(e) | | 712,800 | | | 13,186,800 | |
Gasco Energy, Inc.(b)(e) | | 927,600 | | | 2,263,344 | |
Goodrich Petroleum Corp.(b)(e) | | 163,300 | | | 4,912,064 | |
Grant Prideco, Inc.(b) | | 96,200 | | | 4,734,964 | |
Halliburton Co. | | 390,726 | | | 15,367,254 | |
Hercules Offshore, Inc.(b)(e) | | 68,900 | | | 1,730,768 | |
Marathon Oil Corp. | | 6,447 | | | 293,983 | |
Matador Resources Co. (acquired 01/20/05 through 04/19/06, cost $2,957,155)(c)(d)(f) | | 171,131 | | | 5,133,930 | |
McMoRan Exploration Co.(b)(e) | | 110,900 | | | 1,917,461 | |
Newfield Exploration Co.(b)(e) | | 959,310 | | | 50,699,534 | |
Parallel Petroleum Corp.(b) | | 107,032 | | | 2,094,616 | |
Particle Drilling Technologies, Inc.(e) | | 675,200 | | | 669,832 | |
Penn Virginia Corp. | | 896,200 | | | 39,513,458 | |
Petrohawk Energy Corp.(b) | | 306,600 | | | 6,184,122 | |
Pioneer Natural Resources Co.(e) | | 209,200 | | | 10,275,904 | |
Plains Exploration & Production Co.(b) | | 1,005,525 | | | 53,433,599 | |
Range Resources Corp. | | 200,000 | | | 12,690,000 | |
Schlumberger Ltd. | | 210,136 | | | 18,281,832 | |
Southwestern Energy Co.(b) | | 1,248,600 | | | 42,065,334 | |
Transocean, Inc.(b) | | 203,982 | | | 27,578,366 | |
Treasure Island Royalty Trust(b) | | 366,922 | | | 128,423 | |
TXCO Resources, Inc.(b)(e) | | 179,600 | | | 2,223,448 | |
Verasun Energy Corp.(b)(e) | | 383,900 | | | 2,821,665 | |
Warren Resources, Inc.(b) | | 222,282 | | | 2,638,487 | |
Weatherford International Ltd.(b) | | 377,198 | | | 27,335,539 | |
| | | | | | |
| | | | | 469,631,932 | |
| | | | | | |
Waste Management — 0.0% | | | | | | |
Republic Resources, Inc.(b) | | 28,750 | | | 158 | |
| | | | | | |
Total United States | | | | | 770,800,321 | |
| | | | | | |
TOTAL COMMON STOCKS | | | | | | |
(Cost $614,584,312) | | | | | 1,039,158,565 | |
| | | | | | |
Warrants — 0.0% | | | | | | |
Nevsun Resources Ltd. (issued/exercisable 12/18/03, 1 share for 1 warrant, expiring 12/18/08, strike price 10.00 CAD) (acquired 1/20/05, cost $2)(c) | | 250,000 | | | 29,227 | |
Point North Energy Ltd. (issued/exercisable 7/24/03, 1 share for 1 warrant, expiring 7/23/08, strike price 5.00 CAD) (acquired 7/24/03, cost $74)(c)(d)(f) | | 147,124 | | | 14 | |
| | | | | | |
TOTAL WARRANTS | | | | | | |
(Cost $76) | | | | | 29,241 | |
| | | | | | |
Short Term Investments — 16.1% | | | | | | |
BlackRock Liquidity Series, LLC Money Market Series, 3.10%(g)(h)(i) | | 140,075,000 | | | 140,075,000 | |
Galileo Money Market Fund, 2.56%(i) | | 32,527,349 | | | 32,527,349 | |
| | | | | | |
TOTAL SHORT TERM INVESTMENTS | | | | | | |
(Cost $172,602,349) | | | | | 172,602,349 | |
| | | | | | |
TOTAL INVESTMENTS IN SECURITIES — 113.0% | | | | | | |
(Cost $787,186,737*) | | | | | 1,211,790,155 | |
LIABILITIES IN EXCESS OF OTHER ASSETS — (13.0)% | | | | | (139,873,060 | ) |
| | | | | | |
NET ASSETS — 100.0% | | | | $ | 1,071,917,095 | |
| | | | | | |
See Notes to Financial Statements.
| | | | | | |
| 56 | | SEMI-ANNUAL REPORT | | MARCH 31, 2008 | | |
| | |
| | Global Resources Portfolio |
| Schedule of Investments (concluded) | | (Percentages shown are based on Net Assets) |
| * | The cost and unrealized appreciation (depreciation) of investments as of March 31, 2008, as computed for federal income tax purposes, were as follows: |
| | | | |
Aggregate cost | | $ | 787,186,777 | |
| | | | |
Gross unrealized appreciation | | $ | 480,431,544 | |
Gross unrealized depreciation | | | (55,828,166 | ) |
| | | | |
Net unrealized appreciation | | $ | 424,603,378 | |
| | | | |
| (a) | Security exempt from registration under Rule 144A of the Securities Act of 1933. These securities may be resold in transactions exempt from registration to qualified institutional investors. Unless otherwise indicated, these securities are not considered to be illiquid. |
| (b) | Non-income producing security. |
| (c) | Restricted security as to resale. As of report date the Portfolio held 2.4% of its net assets, with a current market value of $25,450,428 and an original cost of $25,362,957 in these securities. |
| (d) | Security is fair valued by the Board of Trustees. |
| (e) | Security, or a portion of security, is on loan. |
| (g) | Investments in companies considered to be an affiliate of the Portfolio, for purposes of Section 2(a)(3) of the Investment Company Act of 1940, were as follows: |
| | | | | | |
Affiliate | | Net
Activity | | Interest
Income |
BlackRock Liquidity Series, LLC Money Market Series | | $ | 140,075,000 | | $ | 567,197 |
| | | | | | |
| (h) | Security purchased with the cash proceeds from securities loans. |
| (i) | Represents current yield as of report date. |
| • | | Forward foreign exchange contracts purchased as of March 31, 2008 were as follows: |
| | | | | |
Foreign Currency Purchased | | Settlement
Date | | Unrealized
Appreciation
(Depreciation) |
CAD 265,500 | | 04/02/08 | | $ | — |
| | | | | |
Total Net Unrealized Appreciation on Forward Foreign Exchange Contracts (USD Commitment - $258,593) | | | | $ | — |
| | | | | |
| • | | For Portfolio compliance purposes, the Portfolio’s sector and industry classifications refer to any one or more of the Standard Industry Codes as defined by the SEC. This definition may not apply for purposes of this report, which may combine sector and industry sub-classifications for reporting ease. |
See Notes to Financial Statements.
| | | | | | |
| | SEMI-ANNUAL REPORT | | MARCH 31, 2008 | | 57 |
| | |
| | All-Cap Global Resources Portfolio |
| Schedule of Investments March 31, 2008 (Unaudited) | | (Percentages shown are based on Net Assets) |
| | | | | |
| | | Shares | | Value |
Common Stocks — 90.2% | | | | | |
Australia — 1.9% | | | | | |
Metal & Mining — 1.9% | | | | | |
BHP Billiton Ltd. - ADR(a) | | 280,290 | | $ | 18,457,097 |
Zinifex Ltd. | | 820,000 | | | 7,479,000 |
| | | | | |
| | | | | 25,936,097 |
| | | | | |
Bermuda — 1.0% | | | | | |
Oil & Gas — 1.0% | | | | | |
Seadrill Ltd. | | 528,800 | | | 14,174,438 |
| | | | | |
Brazil — 1.6% | | | | | |
Oil & Gas — 1.6% | | | | | |
Petroleo Brasileiro SA - ADR | | 215,300 | | | 21,984,283 |
| | | | | |
Canada — 8.3% | | | | | |
Metal & Mining — 3.1% | | | | | |
Eldorado Gold Corp.(b) | | 1,378,500 | | | 9,508,286 |
NovaGold Resources, Inc.(a)(b) | | 710,100 | | | 5,474,871 |
Teck Cominco Ltd. | | 647,460 | | | 26,549,360 |
| | | | | |
| | | | | 41,532,517 |
| | | | | |
Oil & Gas — 5.2% | | | | | |
Canadian Natural Resources Ltd. | | 202,860 | | | 13,847,224 |
Compton Petroleum Corp.(b) | | 774,280 | | | 8,621,969 |
Crescent Point Energy Trust | | 663,900 | | | 18,511,197 |
Galleon Energy, Inc. - Class A(b) | | 821,574 | | | 11,845,969 |
Heritage Oil Corp.(b) | | 57,900 | | | 2,909,525 |
Nexen, Inc. | | 358,114 | | | 10,627,066 |
Trican Well Service Ltd. | | 51,400 | | | 1,076,123 |
TriStar Oil & Gas Ltd.(b) | | 270,854 | | | 3,815,626 |
| | | | | |
| | | | | 71,254,699 |
| | | | | |
Total Canada | | | | | 112,787,216 |
| | | | | |
China — 0.4% | | | | | |
Oil & Gas — 0.4% | | | | | |
Petrochina Co. Ltd. - ADR | | 39,300 | | | 4,924,683 |
| | | | | |
France — 2.0% | | | | | |
Oil & Gas — 2.0% | | | | | |
Compagnie Gernerale de Geophysique (CGG Veritas) - ADR(b) | | 308,904 | | | 15,293,837 |
Total SA - ADR | | 153,160 | | | 11,335,372 |
| | | | | |
| | | | | 26,629,209 |
| | | | | |
Netherlands — 2.1% | | | | | |
Oil & Gas — 2.1% | | | | | |
Core Laboratories NV(b) | | 238,140 | | | 28,410,102 |
| | | | | |
Norway — 1.4% | | | | | |
Oil & Gas — 1.4% | | | | | |
Statoil ASA | | 439,952 | | | 13,183,830 |
Statoil ASA - ADR | | 185,480 | | | 5,540,287 |
| | | | | |
| | | | | 18,724,117 |
| | | | | |
United Kingdom — 3.4% | | | | | |
Oil & Gas — 3.4% | | | | | |
BG Group Plc - ADR | | 177,080 | | | 20,536,269 |
Cairn Energy Plc | | 451,398 | | | 25,388,731 |
| | | | | |
| | | | | 45,925,000 |
| | | | | |
United States — 68.1% | | | | | |
Energy & Utilities — 3.7% | | | | | |
Equitable Resources, Inc. | | 297,800 | | | 17,540,420 |
NRG Energy, Inc.(b) | | 361,400 | | | 14,090,986 |
Questar Corp. | | 318,520 | | | 18,015,491 |
| | | | | |
| | | | | 49,646,897 |
| | | | | |
Food & Agriculture — 3.1% | | | | | |
Potash Corp. of Saskatchewan, Inc. | | 272,100 | | | 42,232,641 |
| | | | | |
Metal & Mining — 15.3% | | | | | |
Agnico-Eagle Mines Ltd. | | 155,500 | | | 10,528,905 |
Arch Coal, Inc. | | 390,400 | | | 16,982,400 |
Cameco Corp. | | 90,000 | | | 2,964,600 |
CONSOL Energy, Inc. | | 636,100 | | | 44,011,759 |
Goldcorp, Inc. | | 807,602 | | | 31,294,578 |
Massey Energy Co. | | 740,729 | | | 27,036,608 |
Newmont Mining Corp. | | 272,900 | | | 12,362,370 |
Patriot Coal Corp.(b) | | 38,858 | | | 1,825,160 |
Peabody Energy Corp. | | 479,080 | | | 24,433,080 |
Silver Standard Resources, Inc.(a)(b) | | 800,990 | | | 24,294,027 |
Silver Wheaton Corp.(a)(b) | | 700,274 | | | 10,875,255 |
| | | | | |
| | | | | 206,608,742 |
| | | | | |
Oil & Gas — 46.0% | | | | | |
Apache Corp.(a) | | 225,600 | | | 27,256,992 |
Bill Barrett Corp.(a)(b) | | 212,600 | | | 10,045,350 |
Cameron International Corp.(a)(b) | | 257,600 | | | 10,726,464 |
Chesapeake Energy Corp.(a) | | 412,730 | | | 19,047,489 |
ConocoPhillips | | 104,300 | | | 7,948,703 |
Denbury Resources, Inc.(a)(b) | | 287,700 | | | 8,213,835 |
Devon Energy Corp. | | 234,800 | | | 24,496,684 |
EnCana Corp. | | 327,500 | | | 24,808,125 |
ENSCO International, Inc. | | 185,678 | | | 11,627,156 |
EOG Resources, Inc.(a) | | 310,770 | | | 37,292,400 |
Exterran Holdings, Inc.(a)(b) | | 198,280 | | | 12,796,991 |
FMC Technologies, Inc.(a)(b) | | 409,200 | | | 23,279,388 |
Forest Oil Corp.(b) | | 342,900 | | | 16,788,384 |
Helix Energy Solutions Group, Inc.(b) | | 351,600 | | | 11,075,400 |
Helmerich & Payne, Inc.(a) | | 618,300 | | | 28,979,721 |
Hess Corp.(a) | | 368,440 | | | 32,489,039 |
Hugoton Royalty Trust | | 1 | | | 28 |
Marathon Oil Corp. | | 346,100 | | | 15,782,160 |
Murphy Oil Corp. | | 161,400 | | | 13,257,396 |
Newfield Exploration Co.(b) | | 334,900 | | | 17,699,465 |
Noble Corp. | | 194,300 | | | 9,650,881 |
Noble Energy, Inc. | | 15,610 | | | 1,136,408 |
Occidental Petroleum Corp. | | 314,950 | | | 23,044,892 |
Plains Exploration & Production Co.(b) | | 281,700 | | | 14,969,538 |
Pride International, Inc.(b) | | 209,600 | | | 7,325,520 |
Quicksilver Resources, Inc.(a)(b) | | 570,800 | | | 20,851,324 |
Range Resources Corp.(a) | | 438,500 | | | 27,822,825 |
Schlumberger Ltd. | | 376,000 | | | 32,712,000 |
Smith International, Inc.(a) | | 243,300 | | | 15,627,159 |
Southwestern Energy Co.(b) | | 416,040 | | | 14,016,388 |
Suncor Energy, Inc. | | 100,630 | | | 9,695,701 |
TXCO Resources, Inc.(a)(b) | | 279,500 | | | 3,460,210 |
Unit Corp.(b) | | 435,000 | | | 24,642,750 |
Warren Resources, Inc.(b) | | 385,625 | | | 4,577,369 |
Weatherford International Ltd.(b) | | 428,780 | | | 31,073,687 |
Whiting Petroleum Corp.(b) | | 25,100 | | | 1,622,715 |
See Notes to Financial Statements.
| | | | | | |
| 58 | | SEMI-ANNUAL REPORT | | MARCH 31, 2008 | | |
| | |
| | All-Cap Global Resources Portfolio |
| Schedule of Investments (concluded) | | (Percentages shown are based on Net Assets) |
| | | | | | |
| | | Shares | | Value | |
Common Stocks (Continued) | | | | | | |
United States (Continued) | | | | | | |
Oil & Gas (Continued) | | | | | | |
XTO Energy, Inc. | | 415,791 | | $ | 25,720,831 | |
| | | | | | |
| | | | | 621,561,368 | |
| | | | | | |
Total United States | | | | | 920,049,648 | |
| | | | | | |
TOTAL COMMON STOCKS | | | | | | |
(Cost $860,039,252) | | | | | 1,219,544,793 | |
| | | | | | |
Short Term Investments — 26.7% | | | | | | |
BlackRock Liquidity Series, LLC Money Market Series, 3.10%(c)(d)(e) | | 245,015,300 | | | 245,015,300 | |
Galileo Money Market Fund, 2.56%(e) | | 115,115,638 | | | 115,115,638 | |
| | | | | | |
TOTAL SHORT TERM INVESTMENTS | | | | | | |
(Cost $360,130,938) | | | | | 360,130,938 | |
| | | | | | |
TOTAL INVESTMENTS IN SECURITIES — 116.9% | | | | | | |
(Cost $1,220,170,190*) | | | | | 1,579,675,731 | |
LIABILITIES IN EXCESS OF OTHER ASSETS — (16.9)% | | | | | (228,327,109 | ) |
| | | | | | |
NET ASSETS — 100.0% | | | | $ | 1,351,348,622 | |
| | | | | | |
| * | The cost and unrealized appreciation (depreciation) of investments as of March 31, 2008, as computed for federal income tax purposes, were as follows: |
| | | | |
Aggregate cost | | $ | 1,222,658,486 | |
| | | | |
Gross unrealized appreciation | | $ | 384,456,524 | |
Gross unrealized depreciation | | | (27,439,279 | ) |
| | | | |
Net unrealized appreciation | | $ | 357,017,245 | |
| | | | |
| (a) | Security, or a portion of security, is on loan. |
| (b) | Non-income producing security. |
| (c) | Investments in companies considered to be an affiliate of the Portfolio, for purposes of Section 2(a)(3) of the Investment Company Act of 1940, were as follows: |
| | | | | | |
Affiliate | | Net
Activity | | Interest
Income |
BlackRock Liquidity Series, LLC Money Market Series | | $ | 245,015,300 | | $ | 429,673 |
| | | | | | |
| (d) | Security purchased with the cash proceeds from securities loans. |
| (e) | Represents current yield as of report date. |
| • | | Forward foreign exchange contracts purchased as of March 31, 2008 were as follows: |
| | | | | |
Foreign Currency Purchased | | Settlement
Date | | Unrealized
Appreciation
(Depreciation) |
CAD 329,500 | | 04/02/08 | | $ | — |
| | | | | |
Total Net Unrealized Appreciation on Forward Foreign Exchange Contracts (USD Commitment - $320,928) | | | | $ | — |
| | | | | |
| • | | Forward foreign exchange contracts sold as of March 31, 2008 were as follows: |
| | | | | | |
Foreign Currency Sold | | Settlement
Date | | Unrealized
Depreciation | |
NOK 682,000 | | 04/01/08 | | $ | (156 | ) |
| | | | | | |
Total Net Unrealized Depreciation on Forward Foreign Exchange Contracts (USD Commitment - $133,770) | | | | $ | (156 | ) |
| | | | | | |
| • | | For Portfolio compliance purposes, the Portfolio’s sector and industry classifications refer to any one or more of the Standard Industry Codes as defined by the SEC. This definition may not apply for purposes of this report, which may combine sector and industry sub-classifications for reporting ease. |
See Notes to Financial Statements.
| | | | | | |
| | SEMI-ANNUAL REPORT | | MARCH 31, 2008 | | 59 |
| | |
| | Health Sciences Opportunities Portfolio |
| Schedule of Investments March 31, 2008 (Unaudited) | | (Percentages shown are based on Net Assets) |
| | | | | | | |
| | | Shares | | | Value | |
Common Stocks — 83.9% | | | | | | | |
Germany — 0.7% | | | | | | | |
Medical Instruments & Supplies — 0.7% | | | | | | | |
Fresenius Medical Care AG & Co. | | 161,700 | | | $ | 8,130,824 | |
| | | | | | | |
Switzerland — 4.2% | | | | | | | |
Pharmaceuticals — 4.2% | | | | | | | |
Roche Holding AG | | 269,600 | | | | 50,738,334 | |
| | | | | | | |
United States — 79.0% | | | | | | | |
Computer Software & Services — 0.1% | | | | | | | |
Medassets, Inc.(a) | | 123,900 | | | | 1,836,198 | |
| | | | | | | |
Insurance — 1.0% | | | | | | | |
Aetna, Inc. | | 279,900 | | | | 11,780,991 | |
| | | | | | | |
Manufacturing — 0.6% | | | | | | | |
Varian, Inc.(a)(b) | | 118,800 | | | | 6,880,896 | |
| | | | | | | |
Medical & Medical Services — 10.2% | | | | | | | |
Amgen, Inc.(a) | | 299,600 | | | | 12,517,288 | |
Baxter International, Inc. | | 790,900 | | | | 45,729,838 | |
Bioform Medical, Inc.(a) | | 79,600 | | | | 366,160 | |
Covance, Inc.(a) | | 210,800 | | | | 17,490,076 | |
Integra LifeSciences Holdings Corp.(a)(b) | | 564,100 | | | | 24,521,427 | |
Medco Health Solutions, Inc.(a) | | 135,400 | | | | 5,929,166 | |
Millipore Corp.(a) | | 219,200 | | | | 14,776,272 | |
| | | | | | | |
| | | | | | 121,330,227 | |
| | | | | | | |
Medical Instruments & Supplies — 32.9% | | | | | | | |
Alcon, Inc. | | 143,000 | | | | 20,341,750 | |
Alphatec Holdings, Inc.(a) | | 419,700 | | | | 2,106,894 | |
Becton, Dickinson & Co. | | 966,900 | | | | 83,008,365 | |
C.R. Bard, Inc.(b) | | 158,000 | | | | 15,231,200 | |
Cepheid, Inc.(a)(b) | | 457,900 | | | | 11,168,181 | |
Charles River Laboratories International, Inc.(a) | | 445,900 | | | | 26,281,346 | |
China Medical Technologies, Inc. - ADR(b) | | 309,100 | | | | 12,700,919 | |
Cyberonics, Inc.(a)(b) | | 676,100 | | | | 9,803,450 | |
Halozyme Therapeutics, Inc.(a)(b) | | 254,600 | | | | 1,619,256 | |
Johnson & Johnson | | 618,800 | | | | 40,141,556 | |
Medtronic, Inc. | | 1,025,100 | | | | 49,584,087 | |
SenoRx, Inc.(a) | | 264,900 | | | | 1,708,605 | |
St. Jude Medical, Inc.(a)(b) | | 543,300 | | | | 23,465,127 | |
Stryker Corp.(b) | | 771,600 | | | | 50,192,580 | |
Varian Medical Systems, Inc.(a)(b) | | 629,900 | | | | 29,504,516 | |
Waters Corp.(a) | | 62,293 | | | | 3,469,720 | |
Zimmer Holdings, Inc.(a) | | 158,500 | | | | 12,340,810 | |
| | | | | | | |
| | | | | | 392,668,362 | |
| | | | | | | |
Pharmaceuticals — 31.5% | | | | | | | |
Abbott Laboratories | | 464,000 | | | | 25,589,600 | |
Alexion Pharmaceuticals, Inc.(a) | | 669,400 | | | | 39,695,420 | |
Applera Corp. - Celera Genomics Group(a) | | 659,100 | | | | 9,688,770 | |
Aryx Therapeutics, Inc.(a) | | 122,000 | | | | 963,800 | |
Auxilium Pharmaceuticals, Inc.(a) | | 582,500 | | | | 15,576,050 | |
BioMarin Pharmaceutical, Inc.(a)(b) | | 410,579 | | | | 14,522,179 | |
Bristol-Myers Squibb Co. | | 1,707,300 | | | | 36,365,490 | |
Celgene Corp.(a) | | 332,337 | | | | 20,368,935 | |
Gilead Sciences, Inc.(a)(b) | | 1,444,400 | | | | 74,429,932 | |
InterMune, Inc.(a)(b) | | 326,881 | | | | 4,765,925 | |
Kosan Biosciences, Inc.(a) | | 602,587 | | | | 946,062 | |
Merck & Co., Inc. | | 763,800 | | | | 28,986,210 | |
Nanosphere, Inc.(a)(b) | | 79,600 | | | | 689,336 | |
Novartis AG - ADR | | 142,700 | | | | 7,310,521 | |
Onyx Pharmaceuticals, Inc.(a) | | 273,200 | | | | 7,930,996 | |
Pfizer, Inc. | | 942,559 | | | | 19,727,760 | |
Poniard Pharmaceuticals, Inc.(a)(b) | | 401,100 | | | | 1,343,685 | |
Rigel Pharmaceuticals, Inc.(a) | | 196,400 | | | | 3,664,824 | |
Teva Pharmaceutical Industries Ltd. - ADR | | 622,300 | | | | 28,744,037 | |
United Therapeutics Corp.(a) | | 332,300 | | | | 28,810,410 | |
Wyeth | | 126,802 | | | | 5,295,251 | |
| | | | | | | |
| | | | | | 375,415,193 | |
| | | | | | | |
Retail Merchandising — 2.7% | | | | | | | |
CVS Caremark Corp.(b) | | 787,500 | | | | 31,901,625 | |
| | | | | | | |
Total United States | | | | | | 941,813,492 | |
| | | | | | | |
TOTAL COMMON STOCKS | | | | | | | |
(Cost $914,350,747) | | | | | | 1,000,682,650 | |
| | | | | | | |
Short Term Investments — 29.2% | | | | | | | |
BlackRock Liquidity Series, LLC Money Market Series, 3.10%(c)(d)(e) | | 203,079,300 | | | | 203,079,300 | |
Galileo Money Market Fund, 2.56%(e) | | 145,829,161 | | | | 145,829,161 | |
| | | | | | | |
TOTAL SHORT TERM INVESTMENTS | | | | | | | |
(Cost $348,908,461) | | | | | | 348,908,461 | |
| | | | | | | |
TOTAL INVESTMENTS BEFORE OUTSTANDING OPTION WRITTEN — 113.1% | | | | | | | |
(Cost $1,263,259,208(a)) | | | | | | 1,349,591,111 | |
| | | | | | | |
| | |
| | | Contracts | | | | |
Put Option Written — 0.0% | | | | | | | |
Alexion Pharmaceuticals, Inc., Strike Price $55, Expires 4/19/08 | | | | | | | |
(Premiums received $181,998) | | (1,000 | ) | | | (122,500 | ) |
| | | | | | | |
TOTAL INVESTMENTS NET OF OUTSTANDING OPTION WRITTEN — 113.1% | | | | | | | |
(Cost $1,263,077,210*) | | | | | | 1,349,468,611 | |
LIABILITIES IN EXCESS OF OTHER ASSETS — (13.1)% | | | | | | (156,708,147 | ) |
| | | | | | | |
NET ASSETS — 100.0% | | | | | $ | 1,192,760,464 | |
| | | | | | | |
See Notes to Financial Statements.
| | | | | | |
| 60 | | SEMI-ANNUAL REPORT | | MARCH 31, 2008 | | |
| | |
| | Health Sciences Opportunities Portfolio |
| Schedule of Investments (concluded) | | (Percentages shown are based on Net Assets) |
| * | The cost and unrealized appreciation (depreciation) of investments as of March 31, 2008, as computed for federal income tax purposes, were as follows: |
| | | | |
Aggregate cost | | $ | 1,271,158,499 | |
| | | | |
Gross unrealized appreciation | | $ | 108,890,130 | |
Gross unrealized depreciation | | | (30,457,518 | ) |
| | | | |
Net unrealized appreciation | | $ | 78,432,612 | |
| | | | |
| (a) | Non-income producing security. |
| (b) | Security, or a portion of security, is on loan. |
| (c) | Investments in companies considered to be an affiliate of the Portfolio, for purposes of Section 2(a)(3) of the Investment Company Act of 1940, were as follows: |
| | | | | | |
Affiliate | | Net
Activity | | Interest
Income |
BlackRock Liquidity Series, LLC Money Market Series | | $ | 203,079,300 | | $ | 337,971 |
| | | | | | |
| (d) | Security purchased with the cash proceeds from securities loans. |
| (e) | Represents current yield as of report date. |
| • | Forward foreign exchange contracts purchased as of March 31, 2008 were as follows: |
| | | | | |
Foreign Currency Purchased | | Settlement
Date | | Unrealized
Appreciation |
EUR 2,137,000 | | 04/23/08 | | $ | 8,551 |
| | | | | |
Total Net Unrealized Appreciation on Forward Foreign Exchange Contracts (USD Commitment - $3,362,582) | | | | $ | 8,551 |
| | | | | |
| • | Forward foreign exchange contracts sold as of March 31, 2008 were as follows: |
| | | | | | |
Foreign Currency Sold | | Settlement
Date | | Unrealized
Depreciation | |
EUR 9,760,500 | | 04/23/08 | | $ | (1,074,534 | ) |
CHF 51,830,000 | | 04/23/08 | | | (4,825,774 | ) |
| | | | | | |
Total Net Unrealized Depreciation on Forward Foreign Exchange Contracts (USD Commitment - $61,693,919) | | | | $ | (5,900,308 | ) |
| | | | | | |
| • | For Portfolio compliance purposes, the Portfolio’s sector and industry classifications refer to any one or more of the Standard Industry Codes as defined by the SEC. This definition may not apply for purposes of this report, which may combine sector and industry sub-classifications for reporting ease. |
See Notes to Financial Statements.
| | | | | | |
| | SEMI-ANNUAL REPORT | | MARCH 31, 2008 | | 61 |
| | |
| | U.S. Opportunities Portfolio |
| Schedule of Investments March 31, 2008 (Unaudited) | | (Percentages shown are based on Net Assets) |
| | | | | |
| | | Shares | | Value |
Common Stocks — 91.3% | | | | | |
Aerospace — 2.1% | | | | | |
Alliant Techsystems, Inc.(a)(b) | | 44,600 | | $ | 4,617,438 |
Curtiss-Wright Corp. | | 115,800 | | | 4,803,384 |
Orbital Sciences Corp.(a) | | 221,100 | | | 5,328,510 |
| | | | | |
| | | | | 14,749,332 |
| | | | | |
Banks — 5.1% | | | | | |
Associated Banc-Corp | | 76,700 | | | 2,042,521 |
Commerce Bancshares, Inc. | | 82,900 | | | 3,484,287 |
Greenhill & Co., Inc.(b) | | 39,800 | | | 2,768,488 |
Hudson City Bancorp, Inc. | | 286,500 | | | 5,065,320 |
KBW Bank Corp.(b) | | 110,000 | | | 4,281,200 |
National Penn Bancshares, Inc. | | 212,900 | | | 3,872,651 |
New York Community Bancorp, Inc.(b) | | 234,000 | | | 4,263,480 |
Northern Trust Corp. | | 44,300 | | | 2,944,621 |
Old National Bancorp | | 190,600 | | | 3,430,800 |
UMB Financial Corp. | | 81,400 | | | 3,353,680 |
| | | | | |
| | | | | 35,507,048 |
| | | | | |
Beverages & Bottling — 0.9% | | | | | |
Molson Coors Brewing Co. - Class B(b) | | 117,900 | | | 6,198,003 |
| | | | | |
Broadcasting — 0.3% | | | | | |
Sinclair Broadcast Group, Inc. - Class A(b) | | 226,800 | | | 2,020,788 |
| | | | | |
Business Services — 2.7% | | | | | |
The Dun & Bradstreet Corp. | | 63,600 | | | 5,175,768 |
FTI Consulting, Inc.(a) | | 144,000 | | | 10,229,760 |
Hewitt Associates, Inc. - Class A(a) | | 79,200 | | | 3,149,784 |
| | | | | |
| | | | | 18,555,312 |
| | | | | |
Chemicals — 3.7% | | | | | |
Celanese Corp. - Series A | | 146,700 | | | 5,728,635 |
CF Industries Holdings, Inc. | | 42,400 | | | 4,393,488 |
Church & Dwight Co., Inc. | | 76,800 | | | 4,165,632 |
The Lubrizol Corp. | | 121,000 | | | 6,716,710 |
Terra Industries, Inc.(a) | | 73,000 | | | 2,593,690 |
UAP Holding Corp. | | 55,300 | | | 2,120,202 |
| | | | | |
| | | | | 25,718,357 |
| �� | | | | |
Computer & Office Equipment — 0.7% | | | | | |
Western Digital Corp.(a) | | 169,000 | | | 4,569,760 |
| | | | | |
Computer Software & Services — 7.7% | | | | | |
BMC Software, Inc.(a) | | 85,800 | | | 2,790,216 |
Citrix Systems, Inc.(a) | | 95,200 | | | 2,792,216 |
DST Systems, Inc.(a)(b) | | 102,000 | | | 6,705,480 |
Foundry Networks, Inc.(a) | | 169,200 | | | 1,959,336 |
Ingram Micro, Inc. - Class A(a) | | 155,300 | | | 2,458,399 |
McAfee, Inc.(a) | | 118,700 | | | 3,927,783 |
priceline.com, Inc.(a)(b) | | 63,100 | | | 7,626,266 |
Quest Software, Inc.(a) | | 290,100 | | | 3,791,607 |
Salesforce.Com, Inc.(a)(b) | | 114,200 | | | 6,608,754 |
Sapient Corp.(a) | | 369,500 | | | 2,571,720 |
Seagate Technology, Inc. | | 202,100 | | | 4,231,974 |
Sybase, Inc.(a) | | 99,400 | | | 2,614,220 |
VeriSign, Inc.(a)(b) | | 162,800 | | | 5,411,472 |
| | | | | |
| | | | | 53,489,443 |
| | | | | |
Containers — 0.9% | | | | | |
Owens-Illinois, Inc.(a) | | 107,200 | | | 6,049,296 |
| | | | | |
Electronics — 1.7% | | | | | |
Amphenol Corp. | | 106,000 | | | 3,948,500 |
Flextronics International Ltd.(a) | | 341,800 | | | 3,209,502 |
GrafTech International Ltd.(a)(b) | | 298,500 | | | 4,838,685 |
| | | | | |
| | | | | 11,996,687 |
| | | | | |
Energy & Utilities — 4.9% | | | | | |
Airgas, Inc. | | 106,700 | | | 4,851,649 |
DPL, Inc.(b) | | 145,000 | | | 3,717,800 |
Edison International | | 102,000 | | | 5,000,040 |
MDU Resources Group, Inc. | | 6,300 | | | 154,665 |
Mirant Corp.(a) | | 153,300 | | | 5,578,587 |
PPL Corp. | | 80,600 | | | 3,701,152 |
Questar Corp. | | 118,800 | | | 6,719,328 |
Sempra Energy | | 71,000 | | | 3,782,880 |
| | | | | |
| | | | | 33,506,101 |
| | | | | |
Entertainment & Leisure — 2.2% | | | | | |
Ameristar Casinos, Inc. | | 143,100 | | | 2,611,575 |
Gaylord Entertainment Co.(a)(b) | | 75,400 | | | 2,283,866 |
Morgans Hotel Group Co.(a)(b) | | 152,800 | | | 2,264,496 |
Penn National Gaming, Inc.(a) | | 53,400 | | | 2,335,182 |
WMS Industries, Inc.(a) | | 156,500 | | | 5,629,305 |
| | | | | |
| | | | | 15,124,424 |
| | | | | |
Finance — 1.4% | | | | | |
Invesco Ltd. | | 237,500 | | | 5,785,500 |
Investment Technology Group, Inc.(a)(b) | | 91,400 | | | 4,220,852 |
| | | | | |
| | | | | 10,006,352 |
| | | | | |
Food & Agriculture — 1.8% | | | | | |
CNH Global N.V. | | 61,000 | | | 3,173,830 |
Flowers Foods, Inc. | | 135,500 | | | 3,353,625 |
The Mosaic Co.(a) | | 57,500 | | | 5,899,500 |
| | | | | |
| | | | | 12,426,955 |
| | | | | |
Insurance — 2.9% | | | | | |
Assurant, Inc. | | 97,100 | | | 5,909,506 |
AXIS Capital Holdings Ltd. | | 162,700 | | | 5,528,546 |
Reinsurance Group of America, Inc. | | 96,000 | | | 5,226,240 |
Solera Holdings, Inc.(a) | | 127,300 | | | 3,101,028 |
| | | | | |
| | | | | 19,765,320 |
| | | | | |
Machinery & Heavy Equipment — 2.6% | | | | | |
AGCO Corp.(a) | | 87,000 | | | 5,209,560 |
Columbus Mckinnon Corp.(a) | | 182,900 | | | 5,666,242 |
Flowserve Corp. | | 48,000 | | | 5,010,240 |
Wabtec Corp. | | 52,800 | | | 1,988,448 |
| | | | | |
| | | | | 17,874,490 |
| | | | | |
Manufacturing — 4.1% | | | | | |
Energizer Holdings, Inc.(a) | | 55,600 | | | 5,030,688 |
Greif, Inc. | | 90,000 | | | 6,113,700 |
Guess?, Inc.(b) | | 124,200 | | | 5,026,374 |
VF Corp. | | 61,200 | | | 4,743,612 |
Watson Wyatt Worldwide, Inc. | | 130,900 | | | 7,428,575 |
| | | | | |
| | | | | 28,342,949 |
| | | | | |
Medical & Medical Services — 2.3% | | | | | |
Covance, Inc.(a) | | 79,800 | | | 6,621,006 |
Integra LifeSciences Holdings Corp.(a)(b) | | 84,300 | | | 3,664,521 |
Millipore Corp.(a) | | 79,400 | | | 5,352,354 |
| | | | | |
| | | | | 15,637,881 |
| | | | | |
See Notes to Financial Statements.
| | | | | | |
| 62 | | SEMI-ANNUAL REPORT | | MARCH 31, 2008 | | |
| | |
| | U.S. Opportunities Portfolio |
| Schedule of Investments (continued) | | (Percentages shown are based on Net Assets) |
| | | | | |
| | | Shares | | Value |
Common Stocks (Continued) | | | | | |
Medical Instruments & Supplies — 4.2% | | | | | |
Becton, Dickinson & Co. | | 89,000 | | $ | 7,640,650 |
C.R. Bard, Inc. | | 43,500 | | | 4,193,400 |
Charles River Laboratories International, Inc.(a) | | 86,900 | | | 5,121,886 |
St. Jude Medical, Inc.(a) | | 110,300 | | | 4,763,857 |
Varian Medical Systems, Inc.(a) | | 131,400 | | | 6,154,776 |
Waters Corp.(a) | | 17,696 | | | 985,667 |
| | | | | |
| | | | | 28,860,236 |
| | | | | |
Metal & Mining — 5.2% | | | | | |
Arch Coal, Inc. | | 118,900 | | | 5,172,150 |
CONSOL Energy, Inc. | | 142,900 | | | 9,887,251 |
Kinross Gold Corp. | | 314,500 | | | 6,953,595 |
Pan American Silver Corp.(a) | | 57,800 | | | 2,217,786 |
Schnitzer Steel Industries, Inc. - Class A | | 91,000 | | | 6,462,820 |
Silver Wheaton Corp.(a)(b) | | 131,200 | | | 2,037,536 |
Yamana Gold, Inc. | | 224,300 | | | 3,279,266 |
| | | | | |
| | | | | 36,010,404 |
| | | | | |
Motor Vehicles — 0.4% | | | | | |
TRW Automotive Holdings Corp.(a) | | 121,100 | | | 2,830,107 |
| | | | | |
Oil & Gas — 12.9% | | | | | |
AGL Resources, Inc. | | 159,200 | | | 5,463,744 |
Atwood Oceanics, Inc.(a) | | 97,800 | | | 8,970,216 |
Bill Barrett Corp.(a) | | 70,800 | | | 3,345,300 |
Chesapeake Energy Corp. | | 169,400 | | | 7,817,810 |
CVR Energy, Inc.(a)(b) | | 191,200 | | | 4,403,336 |
Diamond Offshore Drilling, Inc.(b) | | 59,500 | | | 6,925,800 |
Forest Oil Corp.(a) | | 59,200 | | | 2,898,432 |
ION Geophysical Corp.(a) | | 349,200 | | | 4,818,960 |
Layne Christensen Co.(a) | | 109,900 | | | 3,848,698 |
Newfield Exploration Co.(a) | | 146,400 | | | 7,737,240 |
Noble Energy, Inc. | | 92,400 | | | 6,726,720 |
Petrohawk Energy Corp.(a)(b) | | 411,800 | | | 8,306,006 |
Petroleum Development Corp.(a) | | 48,000 | | | 3,324,960 |
South Jersey Industries, Inc. | | 148,500 | | | 5,213,835 |
Suburban Propane Partners LP | | 79,300 | | | 3,079,219 |
Willbros Group, Inc.(a)(b) | | 200,800 | | | 6,144,480 |
| | | | | |
| | | | | 89,024,756 |
| | | | | |
Pharmaceuticals — 3.5% | | | | | |
Alexion Pharmaceuticals, Inc.(a) | | 66,600 | | | 3,949,380 |
Celgene Corp.(a) | | 31,545 | | | 1,933,393 |
Herbalife Ltd. | | 132,200 | | | 6,279,500 |
United Therapeutics Corp.(a) | | 136,100 | | | 11,799,870 |
| | | | | |
| | | | | 23,962,143 |
| | | | | |
Real Estate — 2.1% | | | | | |
Avalonbay Communities, Inc. (REIT) | | 27,700 | | | 2,673,604 |
Boston Properties, Inc. (REIT)(b) | | 41,800 | | | 3,848,526 |
The Macerich Co. (REIT)(b) | | 55,800 | | | 3,921,066 |
Taubman Centers, Inc. (REIT) | | 79,000 | | | 4,115,900 |
| | | | | |
| | | | | 14,559,096 |
| | | | | |
Restaurants — 1.1% | | | | | |
Darling International, Inc.(a) | | 289,800 | | | 3,752,910 |
Jack-in-the-Box, Inc.(a) | | 142,700 | | | 3,834,349 |
| | | | | |
| | | | | 7,587,259 |
| | | | | |
Retail Merchandising — 2.8% | | | | | |
Abercrombie & Fitch Co. - Class A | | 89,700 | | | 6,560,658 |
Asbury Automative Group, Inc. | | 154,000 | | | 2,119,040 |
Brown Shoe Co., Inc. | | 68,800 | | | 1,036,816 |
Jarden Corp.(a) | | 159,900 | | | 3,476,226 |
Nordstrom, Inc. | | 99,500 | | | 3,243,700 |
Saks, Inc.(a) | | 225,400 | | | 2,810,738 |
| | | | | |
| | | | | 19,247,178 |
| | | | | |
Security Brokers & Dealers — 0.7% | | | | | |
Waddell & Reed Financial, Inc. | | 158,000 | | | 5,076,540 |
| | | | | |
Semiconductors & Related Devices — 2.4% | | | | | |
Cavium Networks, Inc.(a)(b) | | 29,400 | | | 482,160 |
Hittite Microwave Corp.(a) | | 113,500 | | | 4,247,170 |
MEMC Electronic Materials, Inc.(a) | | 65,200 | | | 4,622,680 |
Microsemi Corp.(a) | | 206,200 | | | 4,701,360 |
NVIDIA Corp.(a) | | 129,650 | | | 2,565,774 |
| | | | | |
| | | | | 16,619,144 |
| | | | | |
Telecommunications — 4.0% | | | | | |
American Tower Corp. - Class A(a) | | 93,700 | | | 3,673,977 |
Atheros Communications, Inc.(a)(b) | | 142,000 | | | 2,959,280 |
Ciena Corp.(a) | | 72,600 | | | 2,238,258 |
Cincinnati Bell, Inc.(a) | | 655,300 | | | 2,791,578 |
Harris Corp. | | 116,300 | | | 5,644,039 |
JDS Uniphase Corp.(a)(b) | | 174,400 | | | 2,335,216 |
SBA Communications Corp.(a)(b) | | 138,000 | | | 4,116,540 |
Syniverse Holdings, Inc.(a) | | 224,100 | | | 3,733,506 |
| | | | | |
| | | | | 27,492,394 |
| | | | | |
Tires & Rubber — 1.0% | | | | | |
The Goodyear Tire & Rubber Co.(a) | | 271,600 | | | 7,007,280 |
| | | | | |
Tobacco — 1.5% | | | | | |
Loews Corp.-Carolina Group | | 47,600 | | | 3,453,380 |
UST, Inc.(b) | | 125,700 | | | 6,853,164 |
| | | | | |
| | | | | 10,306,544 |
| | | | | |
Waste Management — 1.5% | | | | | |
Metalico, Inc.(a)(b) | | 428,368 | | | 4,202,290 |
Republic Services, Inc. | | 206,700 | | | 6,043,908 |
| | | | | 10,246,198 |
TOTAL COMMON STOCKS | | | | | |
(Cost $599,741,767) | | | | | 630,367,777 |
| | | | | |
Exchange-Traded Funds — 3.7% | | | | | |
iShares Dow Jones U.S. Real Estate Index Fund(b) | | 228,600 | | | 14,881,860 |
KBW Regional Banking ETF | | 123,200 | | | 4,326,784 |
SPDR S&P Homebuilders ETF(b) | | 54,000 | | | 1,176,120 |
SPDR S&P Retail ETF(b) | | 53,300 | | | 1,702,935 |
Vanguard Consumer Discretionary ETF | | 64,400 | | | 3,158,820 |
| | | | | |
TOTAL EXCHANGE-TRADED FUNDS | | | | | |
(Cost $24,543,322) | | | | | 25,246,519 |
| | | | | |
See Notes to Financial Statements.
| | | | | | |
| | SEMI-ANNUAL REPORT | | MARCH 31, 2008 | | 63 |
| | |
| | U.S. Opportunities Portfolio |
| Schedule of Investments (concluded) | | (Percentages shown are based on Net Assets) |
| | | | | | |
| | | Shares | | Value | |
Short Term Investments — 20.3% | | | | | | |
BlackRock Liquidity Series, LLC Money Market Series, 3.10%(c)(d)(e) | | 101,483,650 | | $ | 101,483,650 | |
Galileo Money Market Fund, 2.56%(e) | | 38,596,882 | | | 38,596,882 | |
| | | | | | |
TOTAL SHORT TERM INVESTMENTS | | | | | | |
(Cost $140,080,532) | | | | | 140,080,532 | |
| | | | | | |
TOTAL INVESTMENTS IN SECURITIES — 115.3% | | | | | | |
(Cost $764,365,621*) | | | | | 795,694,828 | |
LIABILITIES IN EXCESS OF OTHER ASSETS — (15.3)% | | | | | (105,500,004 | ) |
| | | | | | |
NET ASSETS — 100.0% | | | | $ | 690,194,824 | |
| | | | | | |
| * | The cost and unrealized appreciation (depreciation) of investments as of March 31, 2008, as computed for federal income tax purposes, were as follows: |
| | | | |
Aggregate cost | | $ | 767,009,965 | |
| | | | |
Gross unrealized appreciation | | $ | 52,775,740 | |
Gross unrealized depreciation | | | (24,090,877 | ) |
| | | | |
Net unrealized appreciation | | $ | 28,684,863 | |
| | | | |
| (a) | Non-income producing security. |
| (b) | Security, or a portion of security, is on loan. |
| (c) | Investments in companies considered to be an affiliate of the Portfolio, for purposes of Section 2(a)(3) of the Investment Company Act of 1940, were as follows: |
| | | | | | |
Affiliate | | Net
Activity | | Interest
Income |
BlackRock Liquidity Series, LLC Money Market Series | | $ | 101,483,650 | | $ | 183,497 |
| | | | | | |
| (d) | Security purchased with the cash proceeds from securities loans. |
| (e) | Represents current yield as of report date. |
| • | For Portfolio compliance purposes, the Portfolio’s sector and industry classifications refer to any one or more of the Standard Industry Codes as defined by the SEC. This definition may not apply for purposes of this report, which may combine sector and industry sub-classifications for reporting ease. |
See Notes to Financial Statements.
| | | | | | |
| 64 | | SEMI-ANNUAL REPORT | | MARCH 31, 2008 | | |
| | |
| | Global Opportunities Portfolio |
| Schedule of Investments March 31, 2008 (Unaudited) | | (Percentages shown are based on Net Assets) |
| | | | | |
| | | Shares | | Value |
Common Stocks — 90.3% | | | | | |
Australia — 0.8% | | | | | |
Oil & Gas — 0.8% | | | | | |
Oil Search Ltd. | | 200,000 | | $ | 882,828 |
| | | | | |
Belgium — 0.7% | | | | | |
Telecommunications — 0.7% | | | | | |
Belgacom SA | | 16,500 | | | 730,688 |
| | | | | |
Bermuda — 0.5% | | | | | |
Oil & Gas — 0.5% | | | | | |
Seadrill Ltd. | | 20,800 | | | 557,542 |
| | | | | |
Brazil — 2.5% | | | | | |
Banks — 0.8% | | | | | |
Banco Industrial e Comercial SA | | 52,000 | | | 245,968 |
Unibanco SA - ADR | | 5,700 | | | 664,848 |
| | | | | |
| | | | | 910,816 |
| | | | | |
Energy & Utilities — 0.4% | | | | | |
Companhia Energetica de Minas Gerais- CEMIG - ADR | | 22,200 | | | 400,488 |
| | | | | |
Manufacturing — 0.5% | | | | | |
Aracruz Celulose SA | | 8,000 | | | 546,080 |
| | | | | |
Real Estate — 0.3% | | | | | |
PDG Realty SA Empreendimentos e Participacoes | | 30,400 | | | 356,893 |
| | | | | |
Telecommunications — 0.5% | | | | | |
Bovespa Holding SA | | 13,900 | | | 188,138 |
GVT Holding SA(a) | | 19,300 | | | 362,748 |
| | | | | |
| | | | | 550,886 |
| | | | | |
Total Brazil | | | | | 2,765,163 |
| | | | | |
Canada — 2.1% | | | | | |
Metal & Mining — 1.4% | | | | | |
Barrick Gold Corp. | | 10,000 | | | 434,500 |
Kinross Gold Corp. | | 36,400 | | | 812,081 |
Silver Wheaton Corp.(a) | | 18,000 | | | 279,540 |
| | | | | |
| | | | | 1,526,121 |
| | | | | |
Oil & Gas — 0.7% | | | | | |
Encana Corp. | | 9,800 | | | 746,612 |
| | | | | |
Total Canada | | | | | 2,272,733 |
| | | | | |
Chile — 0.2% | | | | | |
Banks — 0.2% | | | | | |
Banco Santander Chile SA - ADR | | 3,700 | | | 193,362 |
| | | | | |
China — 0.5% | | | | | |
Computer Software & Services — 0.5% | | | | | |
Sina Corp.(a) | | 13,900 | | | 489,975 |
| | | | | |
Finland — 0.4% | | | | | |
Manufacturing — 0.4% | | | | | |
Wartsila Oyj - Series B | | 6,100 | | | 411,700 |
| | | | | |
France — 3.0% | | | | | |
Banks — 0.2% | | | | | |
BNP Paribas SA | | 2,400 | | | 242,080 |
| | | | | |
Beverages & Bottling — 0.6% | | | | | |
LVMH Moet Hennessy Louis Vuitton SA | | 6,200 | | | 690,074 |
| | | | | |
Entertainment & Leisure — 0.3% | | | | | |
Vivendi Universal SA | | 8,100 | | | 316,501 |
| | | | | |
Insurance — 0.3% | | | | | |
AXA | | 10,000 | | | 362,956 |
| | | | | |
Manufacturing — 0.3% | | | | | |
Compagnie Generale des Etablissements Michelin - Class B | | 3,600 | | | 375,795 |
| | | | | |
Oil & Gas — 0.8% | | | | | |
Total SA | | 11,000 | | | 816,912 |
| | | | | |
Telecommunications — 0.5% | | | | | |
France Telecom SA | | 15,700 | | | 527,952 |
| | | | | |
Total France | | | | | 3,332,270 |
| | | | | |
Germany — 2.8% | | | | | |
Manufacturing — 0.7% | | | | | |
Adidas-Salomon AG | | 10,800 | | | 717,999 |
| | | | | |
Medical Instruments & Supplies — 0.5% | | | | | |
Fresenius Medical Care AG & Co. | | 10,500 | | | 527,976 |
| | | | | |
Oil & Gas — 0.5% | | | | | |
Linde AG | | 4,200 | | | 593,388 |
| | | | | |
Security Brokers & Dealers — 0.4% | | | | | |
Deutsche Boerse AG | | 3,000 | | | 483,241 |
| | | | | |
Soaps & Cosmetics — 0.7% | | | | | |
Henkel KGaA | | 17,000 | | | 785,842 |
| | | | | |
Total Germany | | | | | 3,108,446 |
| | | | | |
Greece — 0.4% | | | | | |
Banks — 0.4% | | | | | |
National Bank of Greece SA | | 8,500 | | | 448,477 |
| | | | | |
Hong Kong — 3.1% | | | | | |
Energy & Utilities — 0.3% | | | | | |
Guangdong Investment Ltd. | | 706,000 | | | 351,065 |
| | | | | |
Entertainment & Leisure — 0.6% | | | | | |
The Hongkong & Shanghai Hotels Ltd. | | 364,500 | | | 598,551 |
| | | | | |
Real Estate — 1.3% | | | | | |
Kerry Properties Ltd. | | 80,900 | | | 487,521 |
New World Development Co. Ltd. | | 130,900 | | | 317,215 |
Sun Hung Kai Properties Ltd. | | 41,000 | | | 639,551 |
| | | | | |
| | | | | 1,444,287 |
| | | | | |
Retail Merchandising — 0.5% | | | | | |
Esprit Holdings Ltd. | | 45,300 | | | 543,648 |
| | | | | |
Telecommunications — 0.4% | | | | | |
China Mobile Ltd. | | 29,700 | | | 441,914 |
| | | | | |
Total Hong Kong | | | | | 3,379,465 |
| | | | | |
Indonesia — 0.8% | | | | | |
Banks — 0.4% | | | | | |
PT Bank Mandiri | | 1,327,000 | | | 454,106 |
| | | | | |
Motor Vehicles — 0.4% | | | | | |
PT Astra International Tbk | | 170,100 | | | 448,118 |
| | | | | |
Total Indonesia | | | | | 902,224 |
| | | | | |
Italy — 0.5% | | | | | |
Telecommunications — 0.5% | | | | | |
Enel SpA | | 54,000 | | | 572,899 |
| | | | | |
Japan — 5.0% | | | | | |
Computer Software & Services — 0.8% | | | | | |
Nintendo Co. Ltd. | | 1,700 | | | 876,605 |
| | | | | |
See Notes to Financial Statements.
| | | | | | |
| | SEMI-ANNUAL REPORT | | MARCH 31, 2008 | | 65 |
| | |
| | Global Opportunities Portfolio |
| Schedule of Investments (continued) | | (Percentages shown are based on Net Assets) |
| | | | | |
| | | Shares | | Value |
Common Stocks (Continued) | | | | | |
Japan (Continued) | | | | | |
Electronics — 1.1% | | | | | |
Fanuc Ltd. | | 6,000 | | $ | 570,626 |
NGK Insulators Ltd. | | 27,300 | | | 483,118 |
Star Micronics Co. Ltd. | | 14,400 | | | 198,347 |
| | | | | |
| | | | | 1,252,091 |
| | | | | |
Energy & Utilities — 1.2% | | | | | |
Air Water, Inc. | | 40,100 | | | 383,380 |
Kurita Water Industries Ltd. | | 24,800 | | | 913,082 |
| | | | | |
| | | | | 1,296,462 |
| | | | | |
Machinery & Heavy Equipment — 0.5% | | | | | |
Daikin Industries Ltd. | | 12,000 | | | 516,453 |
| | | | | |
Manufacturing — 0.7% | | | | | |
Daihatsu Motor Co., Ltd. | | 27,000 | | | 324,227 |
Mitsubishi Electric Corp. | | 53,000 | | | 458,327 |
| | | | | |
| | | | | 782,554 |
| | | | | |
Metal & Mining — 0.4% | | | | | |
Sumitomo Metal Mining Co. Ltd. | | 22,000 | | | 409,410 |
| | | | | |
Retail Merchandising — 0.3% | | | | | |
Itochu Corp. | | 40,300 | | | 397,825 |
| | | | | |
Total Japan | | | | | 5,531,400 |
| | | | | |
Malaysia — 1.0% | | | | | |
Banks — 0.4% | | | | | |
Alliance Financial Group, Inc. | | 444,700 | | | 372,611 |
| | | | | |
Telecommunications — 0.6% | | | | | |
Telekom Malaysia Bhd | | 210,000 | | | 695,951 |
| | | | | |
Total Malaysia | | | | | 1,068,562 |
| | | | | |
Netherlands — 1.4% | | | | | |
Beverages & Bottling — 0.6% | | | | | |
Heineken Holding NV | | 13,800 | | | 693,911 |
| | | | | |
Food & Agriculture — 0.8% | | | | | |
Unilever NV | | 25,200 | | | 846,219 |
| | | | | |
Total Netherlands | | | | | 1,540,130 |
| | | | | |
Norway — 0.9% | | | | | |
Banks — 0.4% | | | | | |
DNB NOR ASA | | 29,300 | | | 444,763 |
| | | | | |
Chemicals — 0.5% | | | | | |
Yara International ASA | | 10,000 | | | 578,319 |
| | | | | |
Total Norway | | | | | 1,023,082 |
| | | | | |
Russia — 0.7% | | | | | |
Oil & Gas — 0.7% | | | | | |
Gazprom, Inc.-ADR | | 15,000 | | | 765,000 |
| | | | | |
Singapore — 0.8% | | | | | |
Air Transportation — 0.3% | | | | | |
Singapore Airlines Ltd. | | 30,000 | | | 340,005 |
| | | | | |
Banks — 0.5% | | | | | |
United Overseas Bank Ltd. | | 39,400 | | | 547,870 |
| | | | | |
Total Singapore | | | | | 887,875 |
| | | | | |
South Korea — 0.6% | | | | | |
Electronics — 0.4% | | | | | |
Samsung Electronics Co. Ltd. | | 600 | | | 377,442 |
| | | | | |
Security Brokers & Dealers — 0.2% | | | | | |
Korea Investment Holdings Co. Ltd.(a) | | 5,500 | | | 258,242 |
| | | | | |
Total South Korea | | | | | 635,684 |
| | | | | |
Spain — 0.4% | | | | | |
Banks — 0.4% | | | | | |
Banco Bilbao Vizcaya Argentaria SA | | 10,500 | | | 231,248 |
Banco Santander Spain SA - ADR | | 11,800 | | | 235,102 |
| | | | | |
| | | | | 466,350 |
| | | | | |
Switzerland — 2.6% | | | | | |
Banks — 0.5% | | | | | |
Julius Baer Holding Ltd. | | 7,300 | | | 538,073 |
| | | | | |
Chemicals — 0.6% | | | | | |
Syngenta AG | | 2,300 | | | 673,950 |
| | | | | |
Food & Agriculture — 1.0% | | | | | |
Nestle SA | | 2,300 | | | 1,149,305 |
| | | | | |
Pharmaceuticals — 0.5% | | | | | |
Roche Holding AG | | 2,900 | | | 545,776 |
| | | | | |
Total Switzerland | | | | | 2,907,104 |
| | | | | |
Taiwan — 2.3% | | | | | |
Chemicals — 1.3% | | | | | |
Taiwan Fertilizer Co. Ltd. | | 334,500 | | | 1,458,920 |
| | | | | |
Computer & Office Equipment — 0.4% | | | | | |
Asustek Computer, Inc. | | 163,000 | | | 477,526 |
| | | | | |
Telecommunications — 0.6% | | | | | |
Taiwan Mobile Co. Ltd. | | 330,619 | | | 636,654 |
| | | | | |
Total Taiwan | | | | | 2,573,100 |
| | | | | |
Thailand — 0.4% | | | | | |
Banks — 0.4% | | | | | |
Bangkok Bank Public Co. Ltd. | | 103,300 | | | 456,049 |
| | | | | |
United Kingdom — 3.1% | | | | | |
Banks — 0.4% | | | | | |
Barclays Plc | | 12,900 | | | 115,977 |
HSBC Finance Corp. | | 13,700 | | | 225,673 |
Royal Bank of Scotland Group Plc | | 17,200 | | | 115,123 |
| | | | | |
| | | | | 456,773 |
| | | | | |
Beverages & Bottling — 0.4% | | | | | |
Diageo Plc | | 21,900 | | | 441,590 |
| | | | | |
Energy & Utilities — 0.5% | | | | | |
International Power Plc | | 69,300 | | | 547,391 |
| | | | | |
Finance — 0.4% | | | | | |
ICAP Plc | | 41,000 | | | 462,996 |
| | | | | |
Oil & Gas — 0.5% | | | | | |
BP Plc | | 55,000 | | | 558,874 |
| | | | | |
Telecommunications — 0.5% | | | | | |
Vodafone Group Plc | | 175,000 | | | 524,094 |
| | | | | |
Transportation — 0.4% | | | | | |
Arriva Plc | | 28,500 | | | 388,017 |
| | | | | |
Total United Kingdom | | | | | 3,379,735 |
| | | | | |
See Notes to Financial Statements.
| | | | | | |
| 66 | | SEMI-ANNUAL REPORT | | MARCH 31, 2008 | | |
| | |
| | Global Opportunities Portfolio |
| Schedule of Investments (continued) | | (Percentages shown are based on Net Assets) |
| | | | | |
| | | Shares | | Value |
Common Stocks (Continued) | | | | | |
United States — 52.8% | | | | | |
Aerospace — 1.0% | | | | | |
Alliant Techsystems, Inc.(a) | | 4,900 | | $ | 507,297 |
Goodrich Corp. | | 10,600 | | | 609,606 |
| | | | | |
| | | | | 1,116,903 |
| | | | | |
Banks — 5.7% | | | | | |
Bank of America Corp. | | 14,000 | | | 530,740 |
BB&T Corp. | | 14,900 | | | 477,694 |
Citigroup, Inc. | | 31,400 | | | 672,588 |
Hudson City Bancorp, Inc. | | 33,500 | | | 592,280 |
JPMorgan Chase & Co. | | 12,000 | | | 515,400 |
KBW Bank Corp. | | 61,000 | | | 2,374,120 |
Old National Bancorp | | 25,800 | | | 464,400 |
U.S. Bancorp | | 8,000 | | | 258,880 |
Wells Fargo & Co. | | 12,000 | | | 349,200 |
| | | | | |
| | | | | 6,235,302 |
| | | | | |
Beverages & Bottling — 1.5% | | | | | |
Molson Coors Brewing Co. - Class B | | 14,600 | | | 767,522 |
PepsiCo, Inc. | | 12,500 | | | 902,500 |
| | | | | |
| | | | | 1,670,022 |
| | | | | |
Broadcasting — 0.5% | | | | | |
Liberty Global, Inc.(a) | | 15,200 | | | 518,016 |
| | | | | |
Business Services — 0.6% | | | | | |
FTI Consulting, Inc.(a) | | 9,000 | | | 639,360 |
| | | | | |
Chemicals — 1.1% | | | | | |
The Lubrizol Corp. | | 11,800 | | | 655,018 |
UAP Holding Corp. | | 15,000 | | | 575,100 |
| | | | | |
| | | | | 1,230,118 |
| | | | | |
Computer & Office Equipment — 1.2% | | | | | |
Cisco Systems, Inc.(a) | | 22,100 | | | 532,389 |
Hewlett-Packard Co. | | 16,200 | | | 739,692 |
| | | | | |
| | | | | 1,272,081 |
| | | | | |
Computer Software & Services — 2.0% | | | | | |
DST Systems, Inc.(a) | | 8,500 | | | 558,790 |
EMC Corp.(a) | | 26,100 | | | 374,274 |
Microsoft Corp. | | 23,400 | | | 664,092 |
Oracle Corp.(a) | | 30,100 | | | 588,756 |
| | | | | |
| | | | | 2,185,912 |
| | | | | |
Electronics — 1.0% | | | | | |
Flextronics International Ltd.(a) | | 49,500 | | | 464,805 |
Intel Corp. | | 28,400 | | | 601,512 |
| | | | | |
| | | | | 1,066,317 |
| | | | | |
Energy & Utilities — 1.6% | | | | | |
American Electric Power Co., Inc. | | 13,000 | | | 541,190 |
FPL Group, Inc. | | 6,100 | | | 382,714 |
PPL Corp. | | 10,000 | | | 459,200 |
Public Service Enterprise Group, Inc. | | 10,000 | | | 401,900 |
| | | | | |
| | | | | 1,785,004 |
| | | | | |
Finance — 0.5% | | | | | |
State Street Corp. | | 6,500 | | | 513,500 |
| | | | | |
Food & Agriculture — 2.8% | | | | | |
Archer-Daniels-Midland Co. | | 12,000 | | | 493,920 |
Bunge Ltd. | | 6,000 | | | 521,280 |
CNH Global N.V. | | 8,000 | | | 416,240 |
H.J. Heinz Co. | | 15,300 | | | 718,641 |
Kellogg Co. | | 17,500 | | | 919,800 |
| | | | | |
| | | | | 3,069,881 |
| | | | | |
Insurance — 1.7% | | | | | |
ACE Ltd. | | 8,000 | | | 440,480 |
AON Corp. | | 11,000 | | | 442,200 |
Reinsurance Group of America, Inc. | | 11,800 | | | 642,392 |
Travelers Companies, Inc. | | 8,300 | | | 397,155 |
| | | | | |
| | | | | 1,922,227 |
| | | | | |
Machinery & Heavy Equipment — 1.8% | | | | | |
AGCO Corp.(a) | | 11,400 | | | 682,632 |
Caterpillar, Inc. | | 10,000 | | | 782,900 |
Flowserve Corp. | | 4,900 | | | 511,462 |
| | | | | |
| | | | | 1,976,994 |
| | | | | |
Manufacturing — 2.6% | | | | | |
Corning, Inc. | | 30,000 | | | 721,200 |
General Electric Co. | | 19,000 | | | 703,190 |
NIKE, Inc., Class B | | 12,800 | | | 870,400 |
Reynolds American, Inc. | | 10,300 | | | 608,009 |
| | | | | |
| | | | | 2,902,799 |
| | | | | |
Medical & Medical Services — 0.7% | | | | | |
Baxter International, Inc. | | 12,700 | | | 734,314 |
| | | | | |
Medical Instruments & Supplies — 5.7% | | | | | |
Alcon, Inc. | | 3,800 | | | 540,550 |
Becton, Dickinson & Co. | | 11,700 | | | 1,004,445 |
C.R. Bard, Inc. | | 5,800 | | | 559,120 |
Johnson & Johnson | | 10,500 | | | 681,135 |
Medtronic, Inc. | | 22,000 | | | 1,064,140 |
St. Jude Medical, Inc.(a) | | 11,300 | | | 488,047 |
Stryker Corp. | | 8,700 | | | 565,935 |
Varian Medical Systems, Inc.(a) | | 11,100 | | | 519,924 |
Zimmer Holdings, Inc.(a) | | 11,000 | | | 856,460 |
| | | | | |
| | | | | 6,279,756 |
| | | | | |
Metal & Mining — 2.3% | | | | | |
Arch Coal, Inc. | | 12,900 | | | 561,150 |
Pan American Silver Corp.(a) | | 13,400 | | | 514,158 |
Peabody Energy Corp. | | 12,000 | | | 612,000 |
Schnitzer Steel Industries, Inc. - Class A | | 12,400 | | | 880,648 |
| | | | | |
| | | | | 2,567,956 |
| | | | | |
Oil & Gas — 8.9% | | | | | |
Anadarko Petroleum Corp. | | 13,000 | | | 819,390 |
Chesapeake Energy Corp. | | 20,500 | | | 946,075 |
Chevron Corp. | | 6,000 | | | 512,160 |
Diamond Offshore Drilling, Inc. | | 5,700 | | | 663,480 |
Exxon Mobil Corp. | | 11,600 | | | 981,128 |
Forest Oil Corp.(a) | | 13,900 | | | 680,544 |
Murphy Oil Corp. | | 6,000 | | | 492,840 |
Newfield Exploration Co.(a) | | 13,000 | | | 687,050 |
Occidental Petroleum Corp. | | 9,000 | | | 658,530 |
Petrohawk Energy Corp.(a) | | 48,400 | | | 976,228 |
Petroleum Development Corp.(a) | | 7,100 | | | 491,817 |
Transocean, Inc.(a) | | 2,868 | | | 387,754 |
Ultra Petroleum Corp.(a) | | 12,300 | | | 953,250 |
See Notes to Financial Statements.
| | | | | | |
| | SEMI-ANNUAL REPORT | | MARCH 31, 2008 | | 67 |
| | |
| | Global Opportunities Portfolio |
| Schedule of Investments (continued) | | (Percentages shown are based on Net Assets) |
| | | | | |
| | | Shares | | Value |
Common Stocks (Continued) | | | | | |
United States (Continued) | | | | | |
Oil & Gas (Continued) | | | | | |
XTO Energy, Inc. | | 9,750 | | $ | 603,135 |
| | | | | |
| | | | | 9,853,381 |
| | | | | |
Pharmaceuticals — 3.6% | | | | | |
Bristol-Myers Squibb Co. | | 36,800 | | | 783,840 |
Gilead Sciences, Inc.(a) | | 31,600 | | | 1,628,348 |
Merck & Co., Inc. | | 19,600 | | | 743,820 |
Teva Pharmaceutical Industries Ltd. - ADR | | 16,800 | | | 775,992 |
| | | | | |
| | | | | 3,932,000 |
| | | | | |
Railroad & Shipping — 0.5% | | | | | |
Union Pacific Corp. | | 4,400 | | | 551,672 |
| | | | | |
Restaurants — 1.1% | | | | | |
Darling International, Inc.(a) | | 41,100 | | | 532,245 |
Yum! Brands, Inc. | | 18,600 | | | 692,106 |
| | | | | |
| | | | | 1,224,351 |
| | | | | |
Retail Merchandising — 0.6% | | | | | |
CVS Caremark Corp. | | 17,400 | | | 704,874 |
| | | | | |
Soaps & Cosmetics — 2.2% | | | | | |
Colgate-Palmolive Co. | | 18,300 | | | 1,425,753 |
The Procter & Gamble Co. | | 14,000 | | | 980,980 |
| | | | | |
| | | | | 2,406,733 |
| | | | | |
Telecommunications — 0.7% | | | | | |
QUALCOMM, Inc. | | 12,600 | | | 516,600 |
Vodafone Group Plc - ADR | | 9,000 | | | 265,590 |
| | | | | |
| | | | | 782,190 |
| | | | | |
Tobacco — 0.9% | | | | | |
Altria Group, Inc. | | 5,700 | | | 126,540 |
Philip Morris International, Inc.(a) | | 5,700 | | | 288,306 |
UST, Inc. | | 11,600 | | | 632,432 |
| | | | | |
| | | | | 1,047,278 |
| | | | | |
Total United States | | | | | 58,188,941 |
| | | | | |
TOTAL COMMON STOCKS | | | | | |
(Cost $94,675,499) | | | | | 99,470,784 |
| | | | | |
Exchange-Traded Funds — 2.0% | | | | | |
iShares Dow Jones U.S. Consumer Services Sector Index Fund | | 16,000 | | | 920,640 |
iShares Dow Jones U.S. Real Estate Index Fund | | 19,100 | | | 1,243,410 |
| | | | | |
TOTAL EXCHANGE-TRADED FUNDS | | | | | |
(Cost $2,143,781) | | | | | 2,164,050 |
| | | | | |
Short Term Investments — 3.4% | | | | | |
Galileo Money Market Fund, 2.56%(b) | | | | | |
(Cost $3,720,827)(b) | | 3,720,827 | | | 3,720,827 |
| | | | | |
TOTAL INVESTMENTS IN SECURITIES — 95.6% | | | | | |
(Cost $100,540,107*) | | | | | 105,355,661 |
OTHER ASSETS IN EXCESS OF LIABILITIES — 4.4% | | | | | 4,843,624 |
| | | | | |
NET ASSETS — 100.0% | | | | $ | 110,199,285 |
| | | | | |
| * | The cost and unrealized appreciation (depreciation) of investments as of March 31, 2008, as computed for federal income tax purposes, were as follows: |
| | | | |
Aggregate cost | | $ | 101,174,590 | |
| | | | |
Gross unrealized appreciation | | $ | 8,650,727 | |
Gross unrealized depreciation | | | (4,469,656 | ) |
| | | | |
Net unrealized appreciation | | $ | 4,181,071 | |
| | | | |
| (a) | Non-income producing security. |
| (b) | Represents current yield as of report date. |
See Notes to Financial Statements.
| | | | | | |
| 68 | | SEMI-ANNUAL REPORT | | MARCH 31, 2008 | | |
| | |
| | Global Opportunities Portfolio |
| Schedule of Investments (concluded) | | (Percentages shown are based on Net Assets) |
| • | Forward foreign exchange contracts purchased as of March 31, 2008 were as follows: |
| | | | | | | | | | |
Foreign Currency Purchased | | Settlement
Date | | Unrealized
Appreciation
(Depreciation) | |
SGD | | 213,000 | | | | 04/01/08 | | $ | 198 | |
AUD | | 3,498,000 | | | | 04/23/08 | | | 143,529 | |
CAD | | 5,706,000 | | | | 04/23/08 | | | (1,946 | ) |
DKK | | 4,926,000 | | | | 04/23/08 | | | 72,044 | |
NOK | | 2,994,000 | | | | 04/23/08 | | | 26,191 | |
JPY | | 559,332,000 | | | | 04/23/08 | | | 283,891 | |
SEK | | 7,942,000 | | | | 04/23/08 | | | 88,248 | |
HKD | | 5,292,000 | | | | 04/23/08 | | | 1,071 | |
EUR | | 4,518,000 | | | | 04/23/08 | | | 426,881 | |
CHF | | 1,026,000 | | | | 04/23/08 | | | 91,129 | |
GBP | | 3,265,000 | | | | 04/23/08 | | | 14,309 | |
ZAR | | 2,463,000 | | | | 04/23/08 | | | (39,578 | ) |
PLN | | 1,000,000 | | | | 04/23/08 | | | 46,557 | |
| | | | | | | | | | |
Total Net Unrealized Appreciation on Forward Foreign Exchange Contracts (USD Commitment - $32,388,010) | | | | $ | 1,152,524 | |
| | | | | | | | | | |
| • | Forward foreign exchange contracts sold as of March 31, 2008 were as follows: |
| | | | | | | | | | |
Foreign Currency Sold | | Settlement
Date | | Unrealized
Appreciation
(Depreciation) | |
CAD | | 1,136,000 | | | | 04/01/08 | | $ | 9,932 | |
NOK | | 886,000 | | | | 04/01/08 | | | (292 | ) |
JPY | | 46,088,000 | | | | 04/01/08 | | | 1,116 | |
AUD | | 909,000 | | | | 04/23/08 | | | 16,645 | |
CAD | | 4,009,000 | | | | 04/23/08 | | | 76,111 | |
DKK | | 2,500,000 | | | | 04/23/08 | | | (1,035 | ) |
NOK | | 8,487,000 | | | | 04/23/08 | | | (85,991 | ) |
JPY | | 73,266,000 | | | | 04/23/08 | | | (15,945 | ) |
HKD | | 5,521,000 | | | | 04/23/08 | | | (950 | ) |
EUR | | 700,000 | | | | 04/23/08 | | | — | |
CHF | | 2,295,000 | | | | 04/23/08 | | | (69,952 | ) |
GBP | | 654,000 | | | | 04/23/08 | | | 4,239 | |
| | | | | | | | | | |
Total Net Unrealized Depreciation on Forward Foreign Exchange Contracts (USD Commitment - $14,758,906) | | | | $ | (66,122 | ) |
| | | | | | | | | | |
| • | For Portfolio compliance purposes, the Portfolio’s sector and industry classifications refer to any one or more of the Standard Industry Codes as defined by the SEC. This definition may not apply for purposes of this report, which may combine sector and industry sub-classifications for reporting ease. |
See Notes to Financial Statements.
| | | | | | |
| | SEMI-ANNUAL REPORT | | MARCH 31, 2008 | | 69 |
| | |
| | International Opportunities Portfolio |
| Schedule of Investments March 31, 2008 (Unaudited) | | (Percentages shown are based on Net Assets) |
| | | | | |
| | | Shares | | Value |
Common Stocks — 89.0% | | | | | |
Australia — 2.4% | | | | | |
Finance — 0.6% | | | | | |
Macquarie Airports Management Ltd. | | 2,863,600 | | $ | 8,453,061 |
| | | | | |
Metal & Mining — 0.7% | | | | | |
Lihir Gold Ltd. | | 2,993,300 | | | 9,820,732 |
| | | | | |
Oil & Gas — 1.1% | | | | | |
Oil Search Ltd. | | 3,461,900 | | | 15,281,318 |
| | | | | |
Total Australia | | | | | 33,555,111 |
| | | | | |
Belgium — 1.5% | | | | | |
Banks — 0.7% | | | | | |
Dexia SA | | 170,500 | | | 4,858,662 |
KBC Groep NV | | 37,700 | | | 4,888,899 |
| | | | | |
| | | | | 9,747,561 |
| | | | | |
Metal & Mining — 0.8% | | | | | |
Umicore | | 222,580 | | | 11,582,130 |
| | | | | |
Total Belgium | | | | | 21,329,691 |
| | | | | |
Bermuda — 0.6% | | | | | |
Oil & Gas — 0.6% | | | | | |
Seadrill Ltd. | | 330,200 | | | 8,850,982 |
| | | | | |
Brazil — 3.2% | | | | | |
Banks — 1.4% | | | | | |
Banco Industrial e Comercial SA | | 793,000 | | | 3,751,012 |
Unibanco SA - ADR | | 135,900 | | | 15,851,376 |
| | | | | |
| | | | | 19,602,388 |
| | | | | |
Energy & Utilities — 0.6% | | | | | |
Companhia Energetica de Minas Gerais- CEMIG - ADR | | 443,200 | | | 7,995,328 |
| | | | | |
Paper & Forest Products — 0.5% | | | | | |
Votorantim Celulose ADR | | 226,500 | | | 6,457,515 |
| | | | | |
Real Estate — 0.4% | | | | | |
Mrv Engenharia(a) | | 326,900 | | | 5,812,549 |
| | | | | |
Telecommunications — 0.3% | | | | | |
GVT Holding SA(a) | | 267,800 | | | 5,033,364 |
| | | | | |
Total Brazil | | | | | 44,901,144 |
| | | | | |
Canada — 5.0% | | | | | |
Banks — 0.2% | | | | | |
Royal Bank of Canada | | 56,800 | | | 2,653,378 |
| | | | | |
Metal & Mining — 2.8% | | | | | |
Kinross Gold Corp. | | 1,040,100 | | | 23,204,530 |
Silver Wheaton Corp.(a)(b) | | 227,900 | | | 3,539,287 |
Yamana Gold, Inc. | | 846,400 | | | 12,418,320 |
| | | | | |
| | | | | 39,162,137 |
| | | | | |
Oil & Gas — 2.0% | | | | | |
Canadian Natural Resources Ltd. | | 115,000 | | | 7,872,814 |
Encana Corp. | | 147,000 | | | 11,199,182 |
Suncor Energy, Inc. | | 86,000 | | | 8,312,202 |
| | | | | |
| | | | | 27,384,198 |
| | | | | |
Total Canada | | | | | 69,199,713 |
| | | | | |
Chile — 0.3% | | | | | |
Banks — 0.3% | | | | | |
Banco Santander Chile SA - ADR | | 79,100 | | | 4,133,766 |
| | | | | |
Czech Republic — 0.3% | | | | | |
Banks — 0.3% | | | | | |
Komercni Banka A.S. | | 15,000 | | | 3,584,790 |
| | | | | |
Denmark — 1.0% | | | | | |
Insurance — 0.5% | | | | | |
Trygvesta AS | | 86,400 | | | 7,591,142 |
| | | | | |
Retail Merchandising — 0.5% | | | | | |
FLSmidth & Co. A/S | | 69,800 | | | 6,908,477 |
| | | | | |
Total Denmark | | | | | 14,499,619 |
| | | | | |
Finland — 0.4% | | | | | |
Telecommunications — 0.4% | | | | | |
Elisa Oyj | | 204,800 | | | 5,115,069 |
| | | | | |
France — 4.3% | | | | | |
Banks — 0.7% | | | | | |
BNP Paribas SA | | 55,900 | | | 5,638,451 |
Societe Generale | | 47,500 | | | 4,650,937 |
| | | | | |
| | | | | 10,289,388 |
| | | | | |
Entertainment & Leisure — 0.6% | | | | | |
Ubisoft Entertainment | | 97,500 | | | 8,399,891 |
| | | | | |
Food & Agriculture — 1.1% | | | | | |
Casino Guichard-Perrachon SA | | 123,800 | | | 14,842,475 |
| | | | | |
Insurance — 0.6% | | | | | |
AXA | | 214,400 | | | 7,781,778 |
| | | | | |
Manufacturing — 0.7% | | | | | |
Compagnie Generale des Etablissements Michelin - Class B | | 95,600 | | | 9,979,432 |
| | | | | |
Oil & Gas — 0.6% | | | | | |
Total SA | | 121,000 | | | 8,986,028 |
| | | | | |
Total France | | | | | 60,278,992 |
| | | | | |
Germany — 6.6% | | | | | |
Chemicals — 0.5% | | | | | |
SGL Carbon AG | | 120,600 | | | 7,615,920 |
| | | | | |
Computer Software & Services — 1.1% | | | | | |
United Internet AG | | 704,700 | | | 15,164,050 |
| | | | | |
Durable Goods — 0.7% | | | | | |
Gerry Weber International AG | | 289,200 | | | 10,341,454 |
| | | | | |
Insurance — 1.0% | | | | | |
Hannover Rueckversicherung AG | | 276,200 | | | 14,398,453 |
| | | | | |
Manufacturing — 1.2% | | | | | |
Adidas-Salomon AG | | 131,400 | | | 8,735,659 |
K+S AG | | 24,000 | | | 7,855,007 |
| | | | | |
| | | | | 16,590,666 |
| | | | | |
Medical & Medical Services — 0.3% | | | | | |
Rhoen Klinikum AG | | 149,800 | | | 4,439,062 |
| | | | | |
Medical Instruments & Supplies — 0.7% | | | | | |
Fresenius Medical Care AG & Co. | | 179,300 | | | 9,015,811 |
| | | | | |
Miscellaneous Services — 0.6% | | | | | |
GEA Group AG | | 247,500 | | | 8,322,808 |
| | | | | |
Security Brokers & Dealers — 0.2% | | | | | |
Deutsche Boerse AG | | 17,600 | | | 2,835,017 |
| | | | | |
See Notes to Financial Statements.
| | | | | | |
| 70 | | SEMI-ANNUAL REPORT | | MARCH 31, 2008 | | |
| | |
| | International Opportunities Portfolio |
| Schedule of Investments (continued) | | (Percentages shown are based on Net Assets) |
| | | | | |
| | | Shares | | Value |
Common Stocks (Continued) | | | | | |
Germany (Continued) | | | | | |
Waste Management — 0.3% | | | | | |
Zhongde Waste Technology AG | | 85,694 | | $ | 3,458,011 |
| | | | | |
Total Germany | | | | | 92,181,252 |
| | | | | |
Greece — 0.4% | | | | | |
Banks — 0.4% | | | | | |
National Bank of Greece SA | | 98,000 | | | 5,170,679 |
| | | | | |
Hong Kong — 3.0% | | | | | |
Chemicals — 0.5% | | | | | |
Huabao International Holdings Ltd. | | 9,079,200 | | | 7,466,207 |
| | | | | |
Construction — 0.4% | | | | | |
Shenzhen Expressway Co. Ltd. | | 6,745,300 | | | 5,156,924 |
| | | | | |
Finance — 0.4% | | | | | |
Rexcapital Financial Holdings Ltd.(a) | | 49,810,300 | | | 5,568,150 |
| | | | | |
Metal & Mining — 0.4% | | | | | |
Yanzhou Coal Mining Co. Ltd. | | 4,261,700 | | | 6,034,440 |
| | | | | |
Real Estate — 1.3% | | | | | |
New World Development Co. Ltd. | | 2,810,000 | | | 6,809,583 |
Wheelock & Co. Ltd. | | 4,002,900 | | | 11,212,533 |
| | | | | |
| | | | | 18,022,116 |
| | | | | |
Total Hong Kong | | | | | 42,247,837 |
| | | | | |
India — 2.0% | | | | | |
Beverages & Bottling — 0.4% | | | | | |
United Spirits Ltd. | | 137,900 | | | 5,162,313 |
| | | | | |
Construction — 0.2% | | | | | |
Ambuja Cements Ltd. | | 1,064,500 | | | 3,211,808 |
| | | | | |
Metal & Mining — 0.6% | | | | | |
JSW Steel Ltd. | | 407,300 | | | 8,317,570 |
| | | | | |
Telecommunications — 0.8% | | | | | |
Bharti Tele-Ventures Ltd. | | 568,557 | | | 11,709,128 |
| | | | | |
Total India | | | | | 28,400,819 |
| | | | | |
Indonesia — 1.9% | | | | | |
Banks — 0.6% | | | | | |
PT Bank Mandiri | | 22,481,700 | | | 7,693,358 |
| | | | | |
Metal & Mining — 0.9% | | | | | |
PT Bumi Resources Tbk | | 19,672,700 | | | 13,250,488 |
| | | | | |
Motor Vehicles — 0.4% | | | | | |
PT Astra International Tbk | | 2,309,300 | | | 6,083,707 |
| | | | | |
Total Indonesia | | | | | 27,027,553 |
| | | | | |
Italy — 2.2% | | | | | |
Banks — 0.4% | | | | | |
Intesa Sanpaolo SpA | | 749,100 | | | 4,931,635 |
| | | | | |
Construction — 0.3% | | | | | |
Astaldi SpA | | 635,300 | | | 4,894,561 |
| | | | | |
Energy & Utilities — 1.5% | | | | | |
AEM SpA | | 3,465,000 | | | 12,732,334 |
Terna Rete Elettrica Nazionale SpA | | 2,040,900 | | | 8,707,681 |
| | | | | |
| | | | | 21,440,015 |
| | | | | |
Total Italy | | | | | 31,266,211 |
| | | | | |
Japan — 12.7% | | | | | |
Banks — 2.0% | | | | | |
Bank of Kyoto Ltd. | | 827,100 | | | 10,056,633 |
The Chiba Bank Ltd. | | 1,578,000 | | | 10,717,356 |
The Iyo Bank Ltd. | | 712,700 | | | 7,607,472 |
| | | | | |
| | | | | 28,381,461 |
| | | | | |
Chemicals — 1.6% | | | | | |
Dainippon Ink and Chemicals, Inc. | | 1,091,700 | | | 3,395,135 |
Nihon Nohyaku Co. Ltd. | | 1,541,400 | | | 14,210,941 |
Nippon Carbon Co. Ltd. | | 996,300 | | | 4,727,627 |
| | | | | |
| | | | | 22,333,703 |
| | | | | |
Durable Goods — 0.5% | | | | | |
ASICS Corp. | | 632,000 | | | 7,265,971 |
| | | | | |
Electronics — 1.8% | | | | | |
Hosiden Corp. | | 656,500 | | | 13,066,774 |
NGK Insulators Ltd. | | 332,700 | | | 5,887,668 |
Star Micronics Co. Ltd. | | 417,900 | | | 5,756,187 |
| | | | | |
| | | | | 24,710,629 |
| | | | | |
Energy & Utilities — 2.1% | | | | | |
Air Water, Inc. | | 919,200 | | | 8,788,098 |
Kurita Water Industries Ltd. | | 569,000 | | | 20,949,338 |
| | | | | |
| | | | | 29,737,436 |
| | | | | |
Finance — 0.3% | | | | | |
Shinko Securities Co. Ltd.(a) | | 1,157,400 | | | 3,367,235 |
| | | | | |
Machinery & Heavy Equipment — 0.4% | | | | | |
Miura Co. Ltd. | | 217,700 | | | 4,924,895 |
| | | | | |
Manufacturing — 1.2% | | | | | |
Taiyo Nippon Sanso Corp. | | 996,700 | | | 7,979,199 |
Uni-Charm Corp. | | 126,200 | | | 9,229,515 |
| | | | | |
| | | | | 17,208,714 |
| | | | | |
Medical Instruments & Supplies — 0.4% | | | | | |
Nihon Kohden Corp. | | 222,100 | | | 5,080,136 |
| | | | | |
Metal & Mining — 0.4% | �� | | | | |
Yamato Kogyo Co. Ltd. | | 120,900 | | | 4,875,782 |
| | | | | |
Pharmaceuticals — 0.2% | | | | | |
Towa Pharmaceuticals Co., Ltd. | | 77,200 | | | 3,276,043 |
| | | | | |
Photographic Equipment — 0.3% | | | | | |
Tamron Co. Ltd. | | 194,000 | | | 4,758,527 |
| | | | | |
Retail Merchandising — 0.6% | | | | | |
Tsuruha Holdings, Inc. | | 187,200 | | | 8,094,222 |
| | | | | |
Transportation — 0.9% | | | | | |
Hino Motors Ltd. | | 1,097,800 | | | 7,246,713 |
Kintetsu World Express, Inc. | | 216,100 | | | 5,029,615 |
| | | | | |
| | | | | 12,276,328 |
| | | | | |
Total Japan | | | | | 176,291,082 |
| | | | | |
Kazakhstan — 0.6% | | | | | |
Oil & Gas — 0.6% | | | | | |
Kamunaigaz Exploration Production, Inc. | | 328,400 | | | 8,226,420 |
| | | | | |
Luxembourg — 0.9% | | | | | |
Electronics — 0.5% | | | | | |
Arcelormittal | | 81,000 | | | 6,634,376 |
| | | | | |
See Notes to Financial Statements.
| | | | | | |
| | SEMI-ANNUAL REPORT | | MARCH 31, 2008 | | 71 |
| | |
| | International Opportunities Portfolio |
| Schedule of Investments (continued) | | (Percentages shown are based on Net Assets) |
| | | | | |
| | | Shares | | Value |
Common Stocks (Continued) | | | | | |
Luxembourg (Continued) | | | | | |
Telecommunications — 0.4% | | | | | |
SES SA | | 282,300 | | $ | 5,958,780 |
| | | | | |
Total Luxembourg | | | | | 12,593,156 |
| | | | | |
Malaysia — 0.7% | | | | | |
Entertainment & Leisure — 0.7% | | | | | |
Tanjong Plc | | 1,881,200 | | | 9,880,932 |
| | | | | |
Mexico — 1.4% | | | | | |
Beverages & Bottling — 0.6% | | | | | |
Fomento Economico Mexicano, S.A.B. de C.V. | | 200,000 | | | 8,356,000 |
| | | | | |
Telecommunications — 0.8% | | | | | |
America Movil SA - ADR | | 170,900 | | | 10,884,621 |
| | | | | |
Total Mexico | | | | | 19,240,621 |
| | | | | |
Morocco — 1.4% | | | | | |
Construction — 0.8% | | | | | |
IJM Corp. Bhd | | 5,579,800 | | | 10,641,482 |
| | | | | |
Food & Agriculture — 0.6% | | | | | |
Kuala Lumpur Kepong Bhd | | 1,814,850 | | | 9,191,987 |
| | | | | |
Total Morocco | | | | | 19,833,469 |
| | | | | |
Netherlands — 2.5% | | | | | |
Beverages & Bottling — 0.7% | | | | | |
Heineken NV | | 183,000 | | | 10,629,087 |
| | | | | |
Construction — 0.7% | | | | | |
Koninklijke Boskalis Westminster NV | | 167,300 | | | 9,635,313 |
| | | | | |
Food & Agriculture — 0.8% | | | | | |
Nutreco Holding NV | | 150,100 | | | 11,540,503 |
| | | | | |
Medical & Medical Services — 0.3% | | | | | |
Qiagen NV | | 178,500 | | | 3,691,685 |
| | | | | |
Total Netherlands | | | | | 35,496,588 |
| | | | | |
Norway — 4.4% | | | | | |
Banks — 0.5% | | | | | |
DNB NOR ASA | | 360,100 | | | 5,466,186 |
Sparebanken Rogaland | | 193,600 | | | 2,005,434 |
| | | | | |
| | | | | 7,471,620 |
| | | | | |
Chemicals — 1.3% | | | | | |
Yara International ASA | | 310,100 | | | 17,933,655 |
| | | | | |
Oil & Gas — 1.8% | | | | | |
Fred Olsen Energy ASA | | 208,500 | | | 11,832,749 |
Prosafe ASA | | 806,000 | | | 12,662,131 |
| | | | | |
| | | | | 24,494,880 |
| | | | | |
Transportation — 0.8% | | | | | |
Songa Offshore ASA | | 854,600 | | | 11,411,784 |
| | | | | |
Total Norway | | | | | 61,311,939 |
| | | | | |
Philippines — 0.6% | | | | | |
Telecommunications — 0.6% | | | | | |
Philippine Long Distance Telephone Co. - ADR(b) | | 115,500 | | | 7,676,130 |
| | | | | |
Singapore — 0.7% | | | | | |
Real Estate — 0.5% | | | | | |
CapitaCommercial Trust Management Ltd. | | 4,530,000 | | | 7,306,186 |
| | | | | |
Retail Merchandising — 0.2% | | | | | |
Hongguo International Holdings Ltd. | | 7,903,357 | | | 2,957,048 |
| | | | | |
Total Singapore | | | | | 10,263,234 |
| | | | | |
South Africa — 0.5% | | | | | |
Oil & Gas — 0.5% | | | | | |
Sasol Ltd. - ADR | | 139,000 | | | 6,726,210 |
| | | | | |
South Korea — 1.0% | | | | | |
Banks — 0.4% | | | | | |
Pusan Bank | | 480,200 | | | 6,012,500 |
| | | | | |
Security Brokers & Dealers — 0.6% | | | | | |
Korea Investment Holdings Co. Ltd.(a) | | 163,900 | | | 7,695,613 |
| | | | | |
Total South Korea | | | | | 13,708,113 |
| | | | | |
Spain — 1.4% | | | | | |
Banks — 1.4% | | | | | |
Banco Bilbao Vizcaya Argentaria SA | | 254,500 | | | 5,605,019 |
Banco Popular Espanol SA | | 264,400 | | | 4,800,366 |
Banco Santander Spain SA - ADR | | 421,600 | | | 8,399,918 |
| | | | | |
| | | | | 18,805,303 |
| | | | | |
Sweden — 1.2% | | | | | |
Banks — 0.4% | | | | | |
Nordea Bank AB | | 321,000 | | | 5,202,470 |
| | | | | |
Soaps & Cosmetics — 0.8% | | | | | |
Oriflame Cosmetics SA | | 163,054 | | | 10,825,720 |
| | | | | |
Total Sweden | | | | | 16,028,190 |
| | | | | |
Switzerland — 4.0% | | | | | |
Chemicals — 0.9% | | | | | |
Lonza Group AG | | 93,600 | | | 12,412,768 |
| | | | | |
Food & Agriculture — 1.4% | | | | | |
Barry Callebaut AG | | 10,445 | | | 9,045,111 |
Nestle SA | | 22,100 | | | 11,043,324 |
| | | | | |
| | | | | 20,088,435 |
| | | | | |
Insurance — 0.6% | | | | | |
Swiss Life Holding | | 29,300 | | | 8,142,987 |
| | | | | |
Machinery & Heavy Equipment — 0.5% | | | | | |
Meyer Burger Technology AG | | 23,800 | | | 7,309,435 |
| | | | | |
Retail Merchandising — 0.6% | | | | | |
Compagnie Financiere Richemont AG | | 145,800 | | | 8,177,485 |
| | | | | |
Total Switzerland | | | | | 56,131,110 |
| | | | | |
Taiwan — 4.2% | | | | | |
Chemicals — 2.0% | | | | | |
Polaris Securities Co., Ltd.(a) | | 9,732,100 | | | 6,951,615 |
Taiwan Fertilizer Co. Ltd. | | 4,646,800 | | | 20,266,989 |
| | | | | |
| | | | | 27,218,604 |
| | | | | |
Computer Software & Services — 0.2% | | | | | |
Geovision, Inc. | | 491,000 | | | 3,450,633 |
| | | | | |
Finance — 0.6% | | | | | |
Yuanta Financial Holding Co.(a) | | 9,172,000 | | | 8,604,552 |
| | | | | |
Semiconductors & Related Devices — 0.3% | | | | | |
Av Tech Corp. | | 69,359 | | | 356,161 |
Vanguard International Semiconductor Corp. | | 5,297,938 | | | 3,801,743 |
| | | | | |
| | | | | 4,157,904 |
| | | | | |
Telecommunications — 0.4% | | | | | |
Chunghwa Telecom Co. Ltd. | | 2,200,000 | | | 5,786,139 |
| | | | | |
See Notes to Financial Statements.
| | | | | | |
| 72 | | SEMI-ANNUAL REPORT | | MARCH 31, 2008 | | |
| | |
| | International Opportunities Portfolio |
| Schedule of Investments (continued) | | (Percentages shown are based on Net Assets) |
| | | | | |
| | | Shares | | Value |
Common Stocks (Continued) | | | | | |
Taiwan (Continued) | | | | | |
Transportation — 0.7% | | | | | |
U-Ming Marine Transport Corp. | | 3,113,224 | | $ | 9,397,213 |
| | | | | |
Total Taiwan | | | | | 58,615,045 |
| | | | | |
Thailand — 1.8% | | | | | |
Banks — 1.0% | | | | | |
Siam Commercial Bank Public Co. Ltd. | | 4,924,700 | | | 14,155,482 |
| | | | | |
Metal & Mining — 0.8% | | | | | |
Banpu Public Co. Ltd. | | 791,700 | | | 10,460,448 |
| | | | | |
Total Thailand | | | | | 24,615,930 |
| | | | | |
United Kingdom — 13.0% | | | | | |
Aerospace — 1.4% | | | | | |
Cobham Plc | | 2,249,500 | | | 8,928,891 |
Meggitt Plc | | 1,838,000 | | | 10,058,716 |
| | | | | |
| | | | | 18,987,607 |
| | | | | |
Banks — 1.0% | | | | | |
Barclays Plc | | 233,600 | | | 2,100,161 |
HSBC Finance Corp. | | 331,300 | | | 5,457,340 |
Royal Bank of Scotland Group Plc | | 311,900 | | | 2,087,608 |
Standard Chartered Plc | | 139,100 | | | 4,753,810 |
| | | | | |
| | | | | 14,398,919 |
| | | | | |
Business Services — 2.3% | | | | | |
Aegis Group Plc | | 4,531,000 | | | 9,388,011 |
De La Rue Plc | | 646,233 | | | 11,369,716 |
Intertek Group Plc | | 529,700 | | | 10,849,037 |
| | | | | |
| | | | | 31,606,764 |
| | | | | |
Energy & Utilities — 0.8% | | | | | |
International Power Plc | | 1,456,400 | | | 11,503,904 |
| | | | | |
Entertainment & Leisure — 0.6% | | | | | |
IG Group Holdings Plc | | 505,700 | | | 3,284,385 |
InterContinental Hotels Group Plc | | 313,304 | | | 4,725,645 |
| | | | | |
| | | | | 8,010,030 |
| | | | | |
Finance — 0.4% | | | | | |
ICAP Plc | | 421,100 | | | 4,755,312 |
| | | | | |
Food & Agriculture — 0.6% | | | | | |
Britvic Plc | | 1,386,600 | | | 8,771,683 |
| | | | | |
Insurance — 1.1% | | | | | |
Hiscox Ltd. | | 1,627,900 | | | 7,729,674 |
Prudential Plc | | 540,000 | | | 7,132,197 |
| | | | | |
| | | | | 14,861,871 |
| | | | | |
Machinery & Heavy Equipment — 0.9% | | | | | |
VT Group Plc | | 443,400 | | | 5,781,527 |
The Weir Group Plc | | 472,200 | | | 7,131,685 |
| | | | | |
| | | | | 12,913,212 |
| | | | | |
Measuring & Controlling Devices — 0.7% | | | | | |
Rotork Plc | | 471,312 | | | 10,092,795 |
| | | | | |
Oil & Gas — 0.6% | | | | | |
Wellstream Holdings Plc | | 319,600 | | | 8,340,922 |
| | | | | |
Publishing & Printing — 0.4% | | | | | |
United Business Media Plc | | 517,200 | | | 5,532,594 |
| | | | | |
Tobacco — 0.5% | | | | | |
Imperial Tobacco Group Plc | | 145,100 | | | 6,675,171 |
| | | | | |
Transportation — 1.3% | | | | | |
Arriva Plc | | 732,100 | | | 9,967,266 |
National Express Group Plc | | 423,700 | | | 8,450,960 |
| | | | | |
| | | | | 18,418,226 |
| | | | | |
Waste Management — 0.4% | | | | | |
Northumbrian Water Group Plc | | 813,800 | | | 5,640,734 |
| | | | | |
Total United Kingdom | | | | | 180,509,744 |
| | | | | |
United States — 0.9% | | | | | |
Metal & Mining — 0.5% | | | | | |
Pan American Silver Corp.(a) | | 162,600 | | | 6,238,962 |
| | | | | |
Oil & Gas — 0.4% | | | | | |
Novatek Oao - ADR | | 75,000 | | | 6,052,500 |
| | | | | |
Total United States | | | | | 12,291,462 |
| | | | | |
TOTAL COMMON STOCKS | | | | | |
(Cost $1,052,606,712) | | | | | 1,239,987,906 |
| | | | | |
Preferred Stock — 0.3% | | | | | |
Insurance — 0.3% | | | | | |
ING Groep NV | | | | | |
(Cost $4,208,192) | | 115,000 | | | 4,306,531 |
| | | | | |
Exchange-Traded Fund — 0.5% | | | | | |
Lyxor ETF DJ Stoxx 600 Banks | | | | | |
(Cost $6,524,259) | | 125,000 | | | 6,857,723 |
| | | | | |
Short Term Investments — 6.6% | | | | | |
BlackRock Liquidity Series, LLC Money Market Series, 3.10%, (b)(c)(d)(e) | | 6,434,800 | | | 6,434,800 |
Galileo Money Market Fund, 2.56%(e) | | 86,301,767 | | | 86,301,767 |
| | | | | |
TOTAL SHORT TERM INVESTMENTS | | | | | |
(Cost $92,736,567) | | | | | 92,736,567 |
| | | | | |
TOTAL INVESTMENTS IN SECURITIES — 96.4% | | | | | |
(Cost $1,156,075,730*) | | | | | 1,343,888,727 |
OTHER ASSETS IN EXCESS OF LIABILITIES — 3.6% | | | | | 50,007,737 |
| | | | | |
NET ASSETS — 100.0% | | | | $ | 1,393,896,464 |
| | | | | |
See Notes to Financial Statements.
| | | | | | |
| | SEMI-ANNUAL REPORT | | MARCH 31, 2008 | | 73 |
| | |
| | International Opportunities Portfolio |
| Schedule of Investments (concluded) | | (Percentages shown are based on Net Assets) |
| * | The cost and unrealized appreciation (depreciation) of investments as of March 31, 2008, as computed for federal income tax purposes, were as follows: |
| | | | |
Aggregate cost | | $ | 1,157,141,553 | |
| | | | |
Gross unrealized appreciation | | $ | 245,837,162 | |
Gross unrealized depreciation | | | (59,089,988 | ) |
| | | | |
Net unrealized appreciation | | $ | 186,747,174 | |
| | | | |
| (a) | Non-income producing security. |
| (b) | Security, or a portion of security, is on loan. |
| (c) | Investments in companies considered to be an affiliate of the Portfolio, for purposes of Section 2(a)(3) of the Investment Company Act of 1940, were as follows: |
| | | | | | |
Affiliate | | Net
Activity | | Interest
Income |
BlackRock Liquidity Series, LLC Money Market Series | | $ | 6,434,800 | | $ | 8,365 |
| | | | | | |
| (d) | Security purchased with the cash proceeds from securities loans. |
| (e) | Represents current yield as of report date. |
| • | | Forward foreign exchange contracts purchased as of March 31, 2008 were as follows: |
| | | | | | | | | | |
Foreign Currency Purchased | | Settlement
Date | | Unrealized
Appreciation
(Depreciation) | |
JPY | | 234,455,000 | | | | 4/01/08 | | $ | 5,490 | |
AUD | | 51,108,000 | | | | 4/23/08 | | | 1,474,364 | |
CAD | | 77,443,000 | | | | 4/23/08 | | | 89,679 | |
DKK | | 27,790,000 | | | | 4/23/08 | | | 406,438 | |
NOK | | 180,331,000 | | | | 4/23/08 | | | 1,381,683 | |
JPY | | 14,583,614,000 | | | | 4/23/08 | | | 5,723,079 | |
SEK | | 100,559,000 | | | | 4/23/08 | | | 1,011,316 | |
HKD | | 77,914,000 | | | | 4/23/08 | | | 11,904 | |
SGD | | 8,207,000 | | | | 4/23/08 | | | 44,275 | |
EUR | | 115,442,100 | | | | 4/23/08 | | | 12,084,277 | |
CHF | | 61,684,000 | | | | 4/23/08 | | | 5,811,506 | |
GBP | | 17,989,000 | | | | 4/23/08 | | | (9,414 | ) |
ZAR | | 86,232,000 | | | | 4/23/08 | | | (1,385,660 | ) |
PLN | | 53,974,000 | | | | 4/23/08 | | | 2,512,882 | |
| | | | | | | | | | |
Total Net Unrealized Appreciation on Forward Foreign Exchange Contracts (USD Commitment - $630,438,120) | | | | $ | 29,161,819 | |
| | | | | | | | | | |
| • | | Forward foreign exchange contracts sold as of March 31, 2008 were as follows: |
| | | | | | | | | | |
Foreign Currency Sold | | Settlement
Date | | Unrealized
Appreciation
(Depreciation) | |
AUD | | 1,497,000 | | | | 4/01/08 | | $ | 4,489 | |
CAD | | 2,766,000 | | | | 4/01/08 | | | 26,515 | |
NOK | | 37,633,000 | | | | 4/01/08 | | | (10,506 | ) |
JPY | | 6,167,000 | | | | 4/01/08 | | | 149 | |
SEK | | 15,391,000 | | | | 4/01/08 | | | (6,804 | ) |
AUD | | 12,731,000 | | | | 4/23/08 | | | 91,247 | |
CAD | | 69,257,000 | | | | 4/23/08 | | | 1,339,387 | |
DKK | | 33,326,000 | | | | 4/23/08 | | | (192,655 | ) |
NOK | | 477,630,000 | | | | 4/23/08 | | | (5,846,241 | ) |
JPY | | 11,316,338,630 | | | | 4/23/08 | | | (6,803,354 | ) |
SEK | | 23,670,000 | | | | 4/23/08 | | | (129,693 | ) |
HKD | | 42,113,000 | | | | 4/23/08 | | | (7,247 | ) |
EUR | | 73,312,000 | | | | 4/23/08 | | | (2,855,781 | ) |
CHF | | 62,204,000 | | | | 4/23/08 | | | (1,415,136 | ) |
GBP | | 14,749,500 | | | | 4/23/08 | | | 74,469 | |
CZK | | 59,090,200 | | | | 4/23/08 | | | (77,379 | ) |
| | | | | | | | | | |
Total Net Unrealized Depreciation on Forward Foreign Exchange Contracts (USD Commitment - $512,309,011) | | | | $ | (15,808,540 | ) |
| | | | | | | | | | |
| • | | Cash of $3,800,000 pledged as collateral in connection with open financial futures contracts. |
Financial futures contracts purchased as of March 31, 2008 were as follows:
| | | | | | | | | | |
Contracts | | Issue | | Expiration Date | | Notional
Amount | | Unrealized
Appreciation |
700 | | MSCI Taiwan Index | | June 2008 | | $ | 71,855,000 | | $ | 4,109,045 |
| | | | | | | | | | |
Total Net Unrealized Appreciation | | | | | | | $ | 4,109,045 |
| | | | | | | | | | |
| • | | For Portfolio compliance purposes, the Portfolio’s sector and industry classifications refer to any one or more of the Standard Industry Codes as defined by the SEC. This definition may not apply for purposes of this report, which may combine sector and industry sub-classifications for reporting ease. |
See Notes to Financial Statements.
| | | | | | |
| 74 | | SEMI-ANNUAL REPORT | | MARCH 31, 2008 | | |
Statements of Assets and Liabilities
| | | | | | | | | | | | | | | | | | | | |
March 31, 2008 (Unaudited) | | Capital
Appreciation
Portfolio | | | Mid-Cap
Value Equity
Portfolio | | | Mid-Cap
Growth Equity
Portfolio | | | Aurora
Portfolio | | | Small/Mid-Cap
Growth
Portfolio | |
Assets | | | | | | | | | | | | | | | | | | | | |
Investments at value - unaffiliated1 | | $ | 245,530,638 | | | $ | 917,993,743 | | | $ | 314,957,855 | | | $ | 1,016,660,781 | | | $ | 232,626,608 | |
Investments at value - affiliated2,3 | | | 19,404,950 | | | | 166,446,750 | | | | 39,892,100 | | | | 293,234,300 | | | | 9,367,400 | |
Foreign currency at value4 | | | — | | | | — | | | | — | | | | 728 | | | | — | |
Dividends and reclaims receivable | | | 282,965 | | | | 1,096,022 | | | | 118,497 | | | | 559,148 | | | | 72,927 | |
Interest receivable | | | — | | | | — | | | | 195 | | | | — | | | | — | |
Interest receivable - affiliated | | | — | | | | 771 | | | | — | | | | — | | | | — | |
Securities lending income receivable | | | 7,153 | | | | 102,488 | | | | 22,450 | | | | 143,985 | | | | 9,624 | |
Investments sold receivable | | | 3,619,145 | | | | 11,913,051 | | | | 1,502,697 | | | | 66,385,135 | | | | 829,999 | |
Receivable from advisor | | | 1,471 | | | | 139,875 | | | | 2,972 | | | | 62,133 | | | | 28,033 | |
Capital shares sold receivable | | | 138,773 | | | | 1,250,395 | | | | 95,751 | | | | 698,069 | | | | 225,786 | |
Prepaid expenses | | | 44,709 | | | | 104,984 | | | | 59,661 | | | | 111,836 | | | | 51,923 | |
| | | | | | | | | | | | | | | | | | | | |
Total assets | | | 269,029,804 | | | | 1,099,048,079 | | | | 356,652,178 | | | | 1,377,856,115 | | | | 243,212,300 | |
| | | | | | | | | | | | | | | | | | | | |
Liabilities | | | | | | | | | | | | | | | | | | | | |
Investments purchased payable | | | 2,521,527 | | | | 4,226,733 | | | | — | | | | 58,729,486 | | | | 2,309,006 | |
Options written at value5 | | | — | | | | 52,500 | | | | — | | | | — | | | | — | |
Collateral received at value - securities loans | | | 19,404,950 | | | | 166,446,750 | | | | 39,892,100 | | | | 293,234,300 | | | | 9,367,400 | |
Transfer agent fees payable | | | 196,297 | | | | 444,130 | | | | 408,685 | | | | 1,245,455 | | | | 250,418 | |
Capital shares redeemed payable | | | 187,985 | | | | 2,229,549 | | | | 162,074 | | | | 2,960,311 | | | | 365,166 | |
Investment advisory fees payable | | | 109,163 | | | | 611,698 | | | | 221,855 | | | | 732,777 | | | | 145,217 | |
Service and distribution fees payable | | | 34,838 | | | | 148,998 | | | | 31,852 | | | | 247,837 | | | | 22,193 | |
Administration fees payable | | | 19,031 | | | | 54,100 | | | | 26,909 | | | | 60,985 | | | | 14,491 | |
Custodian fees payable | | | 10,602 | | | | 37,854 | | | | 6,399 | | | | 23,167 | | | | 9,689 | |
Officer and Trustees fees payable | | | 4,130 | | | | 26,721 | | | | 7,864 | | | | 39,457 | | | | 4,537 | |
Foreign taxes payable | | | — | | | | — | | | | 3,816 | | | | — | | | | — | |
Other accrued expenses payable | | | 97,821 | | | | 375,272 | | | | 112,536 | | | | 539,434 | | | | 110,034 | |
| | | | | | | | | | | | | | | | | | | | |
Total liabilities | | | 22,586,344 | | | | 174,654,305 | | | | 40,874,090 | | | | 357,813,209 | | | | 12,598,151 | |
| | | | | | | | | | | | | | | | | | | | |
Net Assets | | | | | | | | | | | | | | | | | | | | |
Net Assets | | $ | 246,443,460 | | | $ | 924,393,774 | | | $ | 315,778,088 | | | $ | 1,020,042,906 | | | $ | 230,614,149 | |
| | | | | | | | | | | | | | | | | | | | |
Net Assets Consist of | | | | | | | | | | | | | | | | | | | | |
Paid-in capital | | $ | 272,303,648 | | | $ | 955,925,748 | | | $ | 427,485,432 | | | $ | 1,103,180,458 | | | $ | 213,054,408 | |
Undistributed (distributions in excess of) net investment income (loss) | | | (108,547 | ) | | | 1,754,390 | | | | (1,597,633 | ) | | | (4,069,935 | ) | | | (849,699 | ) |
Accumulated net realized loss | | | (55,091,244 | ) | | | (62,766,863 | ) | | | (149,094,614 | ) | | | (57,173,425 | ) | | | (7,016,613 | ) |
Net unrealized appreciation/depreciation | | | 29,339,603 | | | | 29,480,499 | | | | 38,984,903 | | | | (21,894,192 | ) | | | 25,426,053 | |
| | | | | | | | | | | | | | | | | | | | |
Net Assets | | $ | 246,443,460 | | | $ | 924,393,774 | | | $ | 315,778,088 | | | $ | 1,020,042,906 | | | $ | 230,614,149 | |
| | | | | | | | | | | | | | | | | | | | |
|
| |
| | | | | |
1 Investments at cost - unaffiliated | | $ | 216,191,035 | | | $ | 888,511,704 | | | $ | 275,972,952 | | | $ | 1,038,553,810 | | | $ | 207,200,555 | |
2 Investments at cost - affiliated | | | 19,404,950 | | | | 166,446,750 | | | | 39,892,100 | | | | 293,234,300 | | | | 9,367,400 | |
3 Market value of securities loans | | | 19,061,344 | | | | 162,608,465 | | | | 39,175,574 | | | | 289,635,683 | | | | 9,138,456 | |
4 Cost of foreign currency | | | — | | | | — | | | | — | | | | 727 | | | | — | |
5 Premiums received - written options | | | — | | | | 50,960 | | | | — | | | | — | | | | — | |
See Notes to Financial Statements.
| | | | | | |
| | SEMI-ANNUAL REPORT | | MARCH 31, 2008 | | 75 |
| | |
| | |
| Statements of Assets and Liabilities (continued) | | |
| | | | | | | | | | | | | | | |
March 31, 2008 (Unaudited) | | Capital
Appreciation
Portfolio | | Mid-Cap
Value Equity
Portfolio | | Mid-Cap
Growth Equity
Portfolio | | Aurora
Portfolio | | Small/Mid-Cap
Growth
Portfolio |
Institutional | | | | | | | | | | | | | | | |
Net Assets | | $ | 72,265,207 | | $ | 129,199,204 | | $ | 31,487,751 | | $ | 116,537,842 | | $ | 19,786,280 |
Shares outstanding, unlimited number of shares authorized, $0.001 par value | | | 4,352,898 | | | 11,735,713 | | | 2,606,919 | | | 5,538,332 | | | 1,469,394 |
Net Asset Value | | $ | 16.60 | | $ | 11.01 | | $ | 12.08 | | $ | 21.04 | | $ | 13.47 |
Service | | | | | | | | | | | | | | | |
Net Assets | | $ | — | | $ | 2,702,673 | | $ | 606,046 | | $ | — | | $ | — |
Shares outstanding, unlimited number of shares authorized, $0.001 par value | | | — | | | 249,230 | | | 52,509 | | | — | | | — |
Net Asset Value | | $ | — | | $ | 10.84 | | $ | 11.54 | | $ | — | | $ | — |
Investor A | | | | | | | | | | | | | | | |
Net Assets | | $ | 130,797,053 | | $ | 566,483,265 | | $ | 235,781,959 | | $ | 600,766,819 | | $ | 179,756,512 |
Shares outstanding, unlimited number of shares authorized, $0.001 par value | | | 8,188,321 | | | 52,849,029 | | | 21,049,684 | | | 31,084,503 | | | 14,270,661 |
Net Asset Value | | $ | 15.97 | | $ | 10.72 | | $ | 11.20 | | $ | 19.33 | | $ | 12.60 |
Investor B | | | | | | | | | | | | | | | |
Net Assets | | $ | 30,498,944 | | $ | 86,979,188 | | $ | 30,511,681 | | $ | 163,505,199 | | $ | 15,065,481 |
Shares outstanding, unlimited number of shares authorized, $0.001 par value | | | 2,061,137 | | | 8,842,697 | | | 3,029,406 | | | 10,560,698 | | | 1,396,486 |
Net Asset Value | | $ | 14.80 | | $ | 9.84 | | $ | 10.07 | | $ | 15.48 | | $ | 10.79 |
Investor C | | | | | | | | | | | | | | | |
Net Assets | | $ | 12,882,256 | | $ | 139,029,444 | | $ | 16,683,560 | | $ | 137,896,821 | | $ | 14,408,473 |
Shares outstanding, unlimited number of shares authorized, $0.001 par value | | | 867,674 | | | 14,175,932 | | | 1,656,963 | | | 8,913,462 | | | 1,333,553 |
Net Asset Value | | $ | 14.85 | | $ | 9.81 | | $ | 10.07 | | $ | 15.47 | | $ | 10.80 |
R | | | | | | | | | | | | | | | |
Net Assets | | $ | — | | $ | — | | $ | 707,091 | | $ | 1,336,225 | | $ | 1,597,403 |
Shares outstanding, unlimited number of shares authorized, $0.001 par value | | | — | | | — | | | 63,094 | | | 69,778 | | | 127,813 |
Net Asset Value | | $ | — | | $ | — | | $ | 11.21 | | $ | 19.15 | | $ | 12.50 |
See Notes to Financial Statements.
| | | | | | |
| 76 | | SEMI-ANNUAL REPORT | | MARCH 31, 2008 | | |
Statements of Assets and Liabilities (continued)
| | | | | | | | | | | | | | | | | | | | |
March 31, 2008 (Unaudited) | | Small Cap
Value Equity
Portfolio | | | Small Cap
Core Equity
Portfolio | | | Small Cap
Growth Equity
Portfolio | | | Global Science
& Technology
Opportunities
Portfolio | | | Global
Resources
Portfolio | |
Assets | | | | | | | | | | | | | | | | | | | | |
Investments at value - unaffiliated1 | | $ | 51,539,929 | | | $ | 98,804,227 | | | $ | 892,392,253 | | | $ | 40,621,427 | | | $ | 1,071,715,155 | |
Investments at value - affiliated2,3 | | | 3,913,950 | | | | 17,951,200 | | | | 171,307,500 | | | | — | | | | 140,075,000 | |
Foreign currency at value4 | | | — | | | | — | | | | — | | | | 1,054,807 | | | | 1,891 | |
Dividends and reclaims receivable | | | 42,357 | | | | 116,515 | | | | 173,765 | | | | 38,995 | | | | 517,459 | |
Interest receivable | | | — | | | | — | | | | 609 | | | | — | | | | — | |
Interest receivable - affiliated | | | — | | | | — | | | | — | | | | — | | | | 3,024 | |
Securities lending income receivable | | | 10,289 | | | | 14,737 | | | | 146,914 | | | | 162 | | | | 124,220 | |
Investments sold receivable | | | 683,549 | | | | 2,756,230 | | | | 1,433,399 | | | | 448,333 | | | | — | |
Receivable from advisor | | | 98 | | | | 7,462 | | | | — | | | | 4,087 | | | | — | |
Capital shares sold receivable | | | 19,922 | | | | 455,586 | | | | 15,908,920 | | | | 59,942 | | | | 4,178,563 | |
Prepaid expenses | | | 46,337 | | | | 45,284 | | | | 89,432 | | | | 49,991 | | | | 89,904 | |
Unrealized appreciation on forward foreign currency contracts | | | — | | | | — | | | | — | | | | 25,024 | | | | — | |
| | | | | | | | | | | | | | | | | | | | |
Total assets | | | 56,256,431 | | | | 120,151,241 | | | | 1,081,452,792 | | | | 42,302,768 | | | | 1,216,705,216 | |
| | | | | | | | | | | | | | | | | | | | |
Liabilities | | | | | | | | | | | | | | | | | | | | |
Investments purchased payable | | | 531,086 | | | | 986,106 | | | | 11,940,937 | | | | 3,928 | | | | 331,067 | |
Unrealized depreciation on forward foreign currency contracts | | | — | | | | — | | | | — | | | | 209,136 | | | | — | |
Collateral received at value - securities loans | | | 3,913,950 | | | | 17,951,200 | | | | 171,307,500 | | | | — | | | | 140,075,000 | |
Transfer agent fees payable | | | 24,055 | | | | 47,816 | | | | 255,998 | | | | 28,821 | | | | 264,576 | |
Capital shares redeemed payable | | | 14,686 | | | | 486,202 | | | | 2,263,014 | | | | 230,206 | | | | 2,672,046 | |
Custodian fees payable | | | 14,120 | | | | 4,526 | | | | 16,076 | | | | 13,401 | | | | 97,963 | |
Investment advisory fees payable | | | 11,845 | | | | 83,697 | | | | 405,022 | | | | 24,997 | | | | 678,651 | |
Administration fees payable | | | 4,105 | | | | 6,266 | | | | 69,375 | | | | 2,842 | | | | 82,632 | |
Service and distribution fees payable | | | 3,812 | | | | 22,896 | | | | 18,842 | | | | 9,782 | | | | 166,023 | |
Officer and Trustees fees payable | | | 1,542 | | | | 1,989 | | | | 19,421 | | | | 1,129 | | | | 22,804 | |
Foreign taxes payable | | | — | | | | — | | | | 1,755 | | | | 6,403 | | | | 64 | |
Other accrued expenses payable | | | 42,434 | | | | 43,811 | | | | 222,491 | | | | 38,971 | | | | 397,295 | |
| | | | | | | | | | | | | | | | | | | | |
Total liabilities | | | 4,561,635 | | | | 19,634,509 | | | | 186,520,431 | | | | 569,616 | | | | 144,788,121 | |
| | | | | | | | | | | | | | | | | | | | |
Net Assets | | | | | | | | | | | | | | | | | | | | |
Net Assets | | $ | 51,694,796 | | | $ | 100,516,732 | | | $ | 894,932,361 | | | $ | 41,733,152 | | | $ | 1,071,917,095 | |
| | | | | | | | | | | | | | | | | | | | |
Net Assets Consist of | | | | | | | | | | | | | | | | | | | | |
Paid-in capital | | $ | 57,183,478 | | | $ | 109,331,679 | | | $ | 1,278,367,115 | | | $ | 111,976,029 | | | $ | 583,062,629 | |
Undistributed (distributions in excess of) net investment income (loss) | | | (1,477,172 | ) | | | (241,001 | ) | | | 620,270 | | | | (342,542 | ) | | | (44,999,198 | ) |
Accumulated net realized gain (loss) | | | (4,261,667 | ) | | | (5,997,116 | ) | | | (467,137,801 | ) | | | (71,884,033 | ) | | | 108,451,390 | |
Net unrealized appreciation/depreciation | | | 250,157 | | | | (2,576,830 | ) | | | 83,082,777 | | | | 1,983,698 | | | | 425,402,274 | |
| | | | | | | | | | | | | | | | | | | | |
Net Assets | | $ | 51,694,796 | | | $ | 100,516,732 | | | $ | 894,932,361 | | | $ | 41,733,152 | | | $ | 1,071,917,095 | |
| | | | | | | | | | | | | | | | | | | | |
|
| |
| | | | | |
1 Investments at cost - unaffiliated | | $ | 51,289,772 | | | $ | 101,381,057 | | | $ | 809,309,476 | | | $ | 38,490,878 | | | $ | 647,111,737 | |
2 Investments at cost - affiliated | | | 3,913,950 | | | | 17,951,200 | | | | 171,307,500 | | | | — | | | | 140,075,000 | |
3 Market value of securities loans | | | 3,864,965 | | | | 16,657,428 | | | | 168,087,813 | | | | — | | | | 134,988,730 | |
4 Cost of foreign currency | | | — | | | | — | | | | — | | | | 1,017,003 | | | | (796,901 | ) |
See Notes to Financial Statements.
| | | | | | |
| | SEMI-ANNUAL REPORT | | MARCH 31, 2008 | | 77 |
Statements of Assets and Liabilities (continued)
| | | | | | | | | | | | | | | |
March 31, 2008 (Unaudited) | | Small Cap
Value Equity
Portfolio | | Small Cap
Core Equity
Portfolio | | Small Cap
Growth Equity
Portfolio | | Global Science
& Technology
Opportunities
Portfolio | | Global
Resources
Portfolio |
BlackRock | | | | | | | | | | | | | | | |
Net Assets | | $ | 3,181,645 | | $ | — | | $ | — | | $ | — | | $ | — |
Shares outstanding, unlimited number of shares authorized, $0.001 par value | | | 367,339 | | | — | | | — | | | — | | | — |
Net Asset Value | | $ | 8.66 | | $ | — | | $ | — | | $ | — | | $ | — |
Institutional | | | | | | | | | | | | | | | |
Net Assets | | $ | 22,751,266 | | $ | 36,735,945 | | $ | 635,209,929 | | $ | 1,789,981 | | $ | 38,239,597 |
Shares outstanding, unlimited number of shares authorized, $0.001 par value | | | 2,626,334 | | | 2,249,001 | | | 29,214,835 | | | 230,772 | | | 601,333 |
Net Asset Value | | $ | 8.66 | | $ | 16.33 | | $ | 21.74 | | $ | 7.76 | | $ | 63.59 |
Service | | | | | | | | | | | | | | | |
Net Assets | | $ | 1,725,722 | | $ | 3,632,550 | | $ | 35,904,982 | | $ | 132,503 | | $ | — |
Shares outstanding, unlimited number of shares authorized, $0.001 par value | | | 204,979 | | | 223,923 | | | 1,736,949 | | | 17,500 | | | — |
Net Asset Value | | $ | 8.42 | | $ | 16.22 | | $ | 20.67 | | $ | 7.57 | | $ | — |
Investor A | | | | | | | | | | | | | | | |
Net Assets | | $ | 18,676,088 | | $ | 25,435,233 | | $ | 194,720,487 | | $ | 24,915,902 | | $ | 795,057,208 |
Shares outstanding, unlimited number of shares authorized, $0.001 par value | | | 2,241,915 | | | 1,582,709 | | | 9,684,237 | | | 3,324,230 | | | 13,579,906 |
Net Asset Value | | $ | 8.33 | | $ | 16.07 | | $ | 20.11 | | $ | 7.50 | | $ | 58.55 |
Investor B | | | | | | | | | | | | | | | |
Net Assets | | $ | 2,728,237 | | $ | 6,666,205 | | $ | 7,392,366 | | $ | 6,782,861 | | $ | 78,478,474 |
Shares outstanding, unlimited number of shares authorized, $0.001 par value | | | 406,474 | | | 426,387 | | | 414,891 | | | 962,146 | | | 1,589,237 |
Net Asset Value | | $ | 6.71 | | $ | 15.63 | | $ | 17.82 | | $ | 7.05 | | $ | 49.38 |
Investor C | | | | | | | | | | | | | | | |
Net Assets | | $ | 2,631,838 | | $ | 28,046,799 | | $ | 21,704,597 | | $ | 8,111,905 | | $ | 160,141,816 |
Shares outstanding, unlimited number of shares authorized, $0.001 par value | | | 393,498 | | | 1,796,956 | | | 1,217,481 | | | 1,151,829 | | | 3,249,407 |
Net Asset Value | | $ | 6.69 | | $ | 15.61 | | $ | 17.83 | | $ | 7.04 | | $ | 49.28 |
See Notes to Financial Statements.
| | | | | | |
| 78 | | SEMI-ANNUAL REPORT | | MARCH 31, 2008 | | |
Statements of Assets and Liabilities (continued)
| | | | | | | | | | | | | | | | | | | | |
March 31, 2008 (Unaudited) | | All Cap Global
Resources
Portfolio | | | Health Sciences
Opportunities
Portfolio | | | U.S.
Opportunities
Portfolio | | | Global
Opportunities
Portfolio | | | International
Opportunities
Portfolio | |
Assets | | | | | | | | | | | | | | | | | | | | |
Investments at value - unaffiliated1 | | $ | 1,334,660,431 | | | $ | 1,146,511,811 | | | $ | 694,211,178 | | | $ | 105,355,661 | | | $ | 1,337,453,927 | |
Investments at value - affiliated2,3 | | | 245,015,300 | | | | 203,079,300 | | | | 101,483,650 | | | | — | | | | 6,434,800 | |
Cash on deposit for futures contracts | | | — | | | | — | | | | — | | | | — | | | | 3,800,000 | |
Foreign currency at value4 | | | 136,840 | | | | 1,749,595 | | | | — | | | | 4,469,632 | | | | 32,984,740 | |
Dividends and reclaims receivable | | | 818,396 | | | | 1,867,719 | | | | 652,759 | | | | 235,998 | | | | 4,154,595 | |
Interest receivable | | | — | | | | 245 | | | | — | | | | — | | | | — | |
Securities lending income receivable | | | 90,160 | | | | 61,162 | | | | 48,497 | | | | — | | | | 1,931 | |
Investments sold receivable | | | 18,272,510 | | | | 55,981,634 | | | | 15,508,429 | | | | 1,675,650 | | | | 4,358,615 | |
Receivable from advisor | | | 741 | | | | — | | | | 30,304 | | | | 7 | | | | 112,880 | |
Capital shares sold receivable | | | 1,733,131 | | | | 1,113,860 | | | | 4,695,926 | | | | 538,283 | | | | 8,185,053 | |
Prepaid expenses | | | 130,994 | | | | 116,251 | | | | 101,434 | | | | 45,684 | | | | 112,147 | |
Unrealized appreciation on forward foreign currency contracts | | | — | | | | 8,551 | | | | — | | | | 1,302,091 | | | | 32,093,149 | |
Margin variation receivable | | | — | | | | — | | | | — | | | | — | | | | 373,940 | |
| | | | | | | | | | | | | | | | | | | | |
Total assets | | | 1,600,858,503 | | | | 1,410,490,128 | | | | 816,732,177 | | | | 113,623,006 | | | | 1,430,065,777 | |
| | | | | | | | | | | | | | | | | | | | |
Liabilities | | | | | | | | | | | | | | | | | | | | |
Investments purchased payable | | | 1,050,412 | | | | 3,880,601 | | | | 22,154,238 | | | | 2,750,803 | | | | 4,885,046 | |
Unrealized depreciation on forward foreign currency contracts | | | 156 | | | | 5,900,308 | | | | — | | | | 215,689 | | | | 18,739,870 | |
Options written at value5 | | | — | | | | 122,500 | | | | — | | | | — | | | | — | |
Collateral received at value - securities loans | | | 245,015,300 | | | | 203,079,300 | | | | 101,483,650 | | | | — | | | | 6,434,800 | |
Capital shares redeemed payable | | | 1,601,967 | | | | 2,558,820 | | | | 1,849,559 | | | | 191,529 | | | | 3,397,676 | |
Investment advisory fees payable | | | 858,473 | | | | 765,927 | | | | 487,172 | | | | 83,580 | | | | 1,138,931 | |
Transfer agent fees payable | | | 262,553 | | | | 517,091 | | | | 227,217 | | | | 87,289 | | | | 431,714 | |
Service and distribution fees payable | | | 178,475 | | | | 268,187 | | | | 80,997 | | | | 16,894 | | | | 183,651 | |
Administration fees payable | | | 102,959 | | | | 94,422 | | | | 51,268 | | | | 8,247 | | | | 103,925 | |
Custodian fees payable | | | 35,862 | | | | 29,603 | | | | 9,525 | | | | 16,801 | | | | 184,578 | |
Foreign taxes payable | | | 31,998 | | | | 65,509 | | | | 4,574 | | | | 1,299 | | | | 134,732 | |
Officer and Trustees fees payable | | | 29,060 | | | | 32,926 | | | | 11,121 | | | | 1,874 | | | | 38,960 | |
Other accrued expenses payable | | | 342,666 | | | | 414,470 | | | | 178,032 | | | | 49,716 | | | | 495,430 | |
| | | | | | | | | | | | | | | | | | | | |
Total liabilities | | | 249,509,881 | | | | 217,729,664 | | | | 126,537,353 | | | | 3,423,721 | | | | 36,169,313 | |
| | | | | | | | | | | | | | | | | | | | |
Net Assets | | | | | | | | | | | | | | | | | | | | |
Net Assets | | $ | 1,351,348,622 | | | $ | 1,192,760,464 | | | $ | 690,194,824 | | | $ | 110,199,285 | | | $ | 1,393,896,464 | |
| | | | | | | | | | | | | | | | | | | | |
Net Assets Consist of | | | | | | | | | | | | | | | | | | | | |
Paid-in capital | | $ | 923,406,202 | | | $ | 1,058,861,144 | | | $ | 729,464,850 | | | $ | 105,389,270 | | | $ | 1,137,370,344 | |
Undistributed (distributions in excess of) net investment income (loss) | | | (1,292,799 | ) | | | (1,866,608 | ) | | | (392,791 | ) | | | (328,785 | ) | | | (5,231,174 | ) |
Accumulated net realized gain (loss) | | | 69,727,120 | | | | 55,253,182 | | | | (70,206,442 | ) | | | (887,724 | ) | | | 56,162,554 | |
Net unrealized appreciation | | | 359,508,099 | | | | 80,512,746 | | | | 31,329,207 | | | | 6,026,524 | | | | 205,594,740 | |
| | | | | | | | | | | | | | | | | | | | |
Net Assets | | $ | 1,351,348,622 | | | $ | 1,192,760,464 | | | $ | 690,194,824 | | | $ | 110,199,285 | | | $ | 1,393,896,464 | |
| | | | | | | | | | | | | | | | | | | | |
|
| |
| | | | | |
1 Investments at cost - unaffiliated | | $ | 975,154,890 | | | $ | 1,060,179,908 | | | $ | 662,881,971 | | | $ | 100,540,107 | | | $ | 1,149,640,930 | |
2 Investments at cost - affiliated | | | 245,015,300 | | | | 203,079,300 | | | | 101,483,650 | | | | — | | | | 6,434,800 | |
3 Market value of securities loans | | | 240,173,992 | | | | 199,926,149 | | | | 99,071,219 | | | | — | | | | 6,169,806 | |
4 Cost of foreign currency | | | 136,246 | | | | 1,736,493 | | | | — | | | | 4,354,845 | | | | 32,770,352 | |
5 Premiums received - written options | | | — | | | | 181,998 | | | | — | | | | — | | | | — | |
See Notes to Financial Statements.
| | | | | | |
| | SEMI-ANNUAL REPORT | | MARCH 31, 2008 | | 79 |
Statements of Assets and Liabilities (concluded)
| | | | | | | | | | | | | | | |
March 31, 2008 (Unaudited) | | All Cap Global
Resources
Portfolio | | Health Sciences
Opportunities
Portfolio | | U.S.
Opportunities
Portfolio | | Global
Opportunities
Portfolio | | International
Opportunities
Portfolio |
Institutional | | | | | | | | | | | | | | | |
Net Assets | | $ | 689,421,745 | | $ | 162,406,616 | | $ | 173,141,585 | | $ | 40,730,911 | | $ | 445,508,573 |
Shares outstanding, unlimited number of shares authorized, $0.001 par value | | | 33,200,270 | | | 5,852,550 | | | 5,038,830 | | | 3,495,289 | | | 11,334,753 |
Net Asset Value | | $ | 20.77 | | $ | 27.75 | | $ | 34.36 | | $ | 11.65 | | $ | 39.30 |
Service | | | | | | | | | | | | | | | |
Net Assets | | $ | 4,479,740 | | $ | 6,387,454 | | $ | 81,501,903 | | $ | — | | $ | 144,901,935 |
Shares outstanding, unlimited number of shares authorized, $0.001 par value | | | 217,847 | | | 234,350 | | | 2,452,425 | | | — | | | 3,819,579 |
Net Asset Value | | $ | 20.56 | | $ | 27.26 | | $ | 33.23 | | $ | — | | $ | 37.94 |
Investor A | | | | | | | | | | | | | | | |
Net Assets | | $ | 377,982,389 | | $ | 617,123,787 | | $ | 307,394,515 | | $ | 42,332,364 | | $ | 511,536,979 |
Shares outstanding, unlimited number of shares authorized, $0.001 par value | | | 18,381,915 | | | 22,693,386 | | | 9,339,071 | | | 3,639,791 | | | 13,590,531 |
Net Asset Value | | $ | 20.56 | | $ | 27.19 | | $ | 32.91 | | $ | 11.63 | | $ | 37.64 |
Investor B | | | | | | | | | | | | | | | |
Net Assets | | $ | 58,696,802 | | $ | 84,049,297 | | $ | 21,581,772 | | $ | 7,330,330 | | $ | 69,501,478 |
Shares outstanding, unlimited number of shares authorized, $0.001 par value | | | 2,903,344 | | | 3,241,591 | | | 705,205 | | | 633,323 | | | 1,969,562 |
Net Asset Value | | $ | 20.22 | | $ | 25.93 | | $ | 30.60 | | $ | 11.57 | | $ | 35.29 |
Investor C | | | | | | | | | | | | | | | |
Net Assets | | $ | 220,767,946 | | $ | 322,793,310 | | $ | 106,575,049 | | $ | 19,805,680 | | $ | 222,447,499 |
Shares outstanding, unlimited number of shares authorized, $0.001 par value | | | 10,914,472 | | | 12,470,765 | | | 3,484,418 | | | 1,711,750 | | | 6,323,334 |
Net Asset Value | | $ | 20.23 | | $ | 25.88 | | $ | 30.59 | | $ | 11.57 | | $ | 35.18 |
See Notes to Financial Statements.
| | | | | | |
| 80 | | SEMI-ANNUAL REPORT | | MARCH 31, 2008 | | |
[THIS PAGE INTENTIONALLY LEFT BLANK.]
Statements of Operations
| | | | | | | | | | | | | | | | | | | | |
Six Months Ended March 31, 2008 (Unaudited) | | Capital
Appreciation
Portfolio | | | Mid-Cap
Value
Equity
Portfolio | | | Mid-Cap
Growth
Equity
Portfolio | | | Aurora
Portfolio | | | Small/Mid-Cap
Growth
Portfolio | |
Investment Income | | | | | | | | | | | | | | | | | | | | |
Dividends and reclaims | | $ | 1,428,656 | | | $ | 8,735,632 | | | $ | 1,287,455 | | | $ | 5,090,137 | | | $ | 945,590 | |
Interest | | | — | | | | 265,188 | | | | 6,379 | | | | 232,858 | | | | 233 | |
Interest from affiliates | | | 2,875 | | | | 8,404 | | | | 6,783 | | | | 13,100 | | | | 2,376 | |
Securities lending | | | 55,514 | | | | 654,618 | | | | 100,419 | | | | 1,019,520 | | | | 55,996 | |
Foreign taxes withheld | | | (167 | ) | | | — | | | | (1,006 | ) | | | (95,937 | ) | | | — | |
| | | | | | | | | | | | | | | | | | | | |
Total investment income | | | 1,486,878 | | | | 9,663,842 | | | | 1,400,030 | | | | 6,259,678 | | | | 1,004,195 | |
| | | | | | | | | | | | | | | | | | | | |
Expenses | | | | | | | | | | | | | | | | | | | | |
Investment advisory | | | 839,049 | | | | 3,934,554 | | | | 1,516,709 | | | | 5,267,665 | | | | 975,380 | |
Transfer agent - class specific | | | 246,486 | | | | 1,082,932 | | | | 581,403 | | | | 1,676,945 | | | | 384,406 | |
Service - class specific | | | 233,676 | | | | 1,063,867 | | | | 392,223 | | | | 1,386,507 | | | | 296,064 | |
Distribution - class specific | | | 202,945 | | | | 976,007 | | | | 213,567 | | | | 1,423,019 | | | | 129,558 | |
Administration | | | 96,813 | | | | 344,467 | | | | 142,191 | | | | 419,957 | | | | 97,538 | |
Administration - class specific | | | 32,283 | | | | 118,754 | | | | 47,428 | | | | 145,564 | | | | 32,535 | |
Printing | | | 30,769 | | | | 154,395 | | | | 46,423 | | | | 220,654 | | | | 34,705 | |
Custodian | | | 18,322 | | | | 50,795 | | | | 21,753 | | | | 52,504 | | | | 34,817 | |
Registration | | | 17,544 | | | | 34,618 | | | | 23,892 | | | | 24,089 | | | | 20,985 | |
Professional | | | 21,611 | | | | 47,113 | | | | 26,566 | | | | 60,888 | | | | 22,766 | |
Officer and Trustees | | | 10,747 | | | | 31,728 | | | | 14,195 | | | | 42,397 | | | | 10,991 | |
Miscellaneous | | | 6,166 | | | | 15,654 | | | | 8,968 | | | | 20,228 | | | | 7,623 | |
| | | | | | | | | | | | | | | | | | | | |
Total expenses | | | 1,756,411 | | | | 7,854,884 | | | | 3,035,318 | | | | 10,740,417 | | | | 2,047,368 | |
Less investment advisory fees waived | | | (137,430 | ) | | | (2,834 | ) | | | — | | | | — | | | | — | |
Less administration fees waived - class specific | | | (10,891 | ) | | | (118,628 | ) | | | (5,542 | ) | | | (138,089 | ) | | | (32,322 | ) |
Less transfer agent fees waived - class specific | | | (2,476 | ) | | | (87,358 | ) | | | (12,461 | ) | | | (108,367 | ) | | | (25,851 | ) |
Less transfer agent fees reimbursed - class specific | | | (9,589 | ) | | | (709,139 | ) | | | (18,239 | ) | | | (327,608 | ) | | | (134,813 | ) |
Less fees paid indirectly | | | (600 | ) | | | (1,753 | ) | | | (1,413 | ) | | | (2,697 | ) | | | (488 | ) |
| | | | | | | | | | | | | | | | �� | | | | |
Total expenses after waivers and reimbursement | | | 1,595,425 | | | | 6,935,172 | | | | 2,997,663 | | | | 10,163,656 | | | | 1,853,894 | |
| | | | | | | | | | | | | | | | | | | | |
Net investment income (loss) | | | (108,547 | ) | | | 2,728,670 | | | | (1,597,633 | ) | | | (3,903,978 | ) | | | (849,699 | ) |
| | | | | | | | | | | | | | | | | | | | |
Realized and Unrealized Gain (Loss) | | | | | | | | | | | | | | | | | | | | |
Net realized gain (loss) from: | | | | | | | | | | | | | | | | | | | | |
Investments | | | 7,146,815 | | | | (37,619,413 | ) | | | 18,697,862 | | | | (17,138,922 | ) | | | (764,015 | ) |
Payment from affiliate | | | — | | | | — | | | | — | | | | 139,965 | | | | — | |
Written options | | | — | | | | (1,293,818 | ) | | | — | | | | — | | | | — | |
Foreign currency transactions | | | — | | | | — | | | | — | | | | 55,989 | | | | — | |
| | | | | | | | | | | | | | | | | | | | |
| | | 7,146,815 | | | | (38,913,231 | ) | | | 18,697,862 | | | | (16,942,968 | ) | | | (764,015 | ) |
| | | | | | | | | | | | | | | | | | | | |
Net change in unrealized appreciation/depreciation on: | | | | | | | | | | | | | | | | | | | | |
Investments | | | (31,308,653 | ) | | | (95,233,720 | ) | | | (59,837,434 | ) | | | (189,459,119 | ) | | | (30,880,145 | ) |
Written options | | | — | | | | 68,760 | | | | — | | | | — | | | | — | |
Foreign currency transactions | | | — | | | | — | | | | — | | | | (2,476 | ) | | | — | |
| | | | | | | | | | | | | | | | | | | | |
| | | (31,308,653 | ) | | | (95,164,960 | ) | | | (59,837,434 | ) | | | (189,461,595 | ) | | | (30,880,145 | ) |
| | | | | | | | | | | | | | | | | | | | |
Net realized and unrealized gain (loss) | | | (24,161,838 | ) | | | (134,078,191 | ) | | | (41,139,572 | ) | | | (206,404,563 | ) | | | (31,644,160 | ) |
| | | | | | | | | | | | | | | | | | | | |
Net Increase (Decrease) in Net Assets Resulting from Operations | | $ | (24,270,385 | ) | | $ | (131,349,521 | ) | | $ | (42,737,205 | ) | | $ | (210,308,541 | ) | | $ | (32,493,859 | ) |
| | | | | | | | | | | | | | | | | | | | |
See Notes to Financial Statements.
| | | | | | |
| 82 | | SEMI-ANNUAL REPORT | | MARCH 31, 2008 | | |
Statements of Operations (continued)
| | | | | | | | | | | | | | | | | | | | | | | | |
Small Cap
Value Equity
Portfolio | | Small Cap
Core Equity
Portfolio | | | Small Cap
Growth Equity
Portfolio | | | Global Science
& Technology
Opportunities
Portfolio | | | Global
Resources
Portfolio | | | All-Cap
Global
Resources
Portfolio | | | Health Sciences
Opportunities
Portfolio | |
| $434,438 | | $ | 654,339 | | | $ | 3,729,211 | | | $ | 178,455 | | | $ | 3,554,561 | | | $ | 20,378,657 | | | $ | 8,317,303 | |
| — | | | — | | | | 99,861 | | | | 1,687 | | | | 73,092 | | | | 140,031 | | | | 555,583 | |
| 251 | | | 1,198 | | | | 2,877 | | | | 697 | | | | 3,892 | | | | 5,468 | | | | 9,399 | |
| 52,794 | | | 84,721 | | | | 598,702 | | | | 3,547 | | | | 567,197 | | | | 429,673 | | | | 337,971 | |
| — | | | — | | | | (1,512 | ) | | | (3,497 | ) | | | (183,148 | ) | | | (241,334 | ) | | | (240,212 | ) |
| | | | | | | | | | | | | | | | | | | | | | | | | |
| 487,483 | | | 740,258 | | | | 4,429,139 | | | | 180,889 | | | | 4,015,594 | | | | 20,712,495 | | | | 8,980,044 | |
| | | | | | | | | | | | | | | | | | | | | | | | | |
| 159,944 | | | 528,278 | | | | 2,240,693 | | | | 192,679 | | | | 3,798,142 | | | | 4,876,577 | | | | 4,916,132 | |
| 39,128 | | | 105,979 | | | | 456,893 | | | | 65,363 | | | | 530,579 | | | | 471,993 | | | | 1,064,154 | |
| 41,778 | | | 87,591 | | | | 314,616 | | | | 50,971 | | | | 1,226,758 | | | | 808,326 | | | | 1,445,141 | |
| 24,904 | | | 144,820 | | | | 118,113 | | | | 65,741 | | | | 885,524 | | | | 1,037,846 | | | | 1,709,645 | |
| 21,811 | | | 39,621 | | | | 289,810 | | | | 16,056 | | | | 353,386 | | | | 438,517 | | | | 441,625 | |
| 7,281 | | | 13,196 | | | | 99,026 | | | | 5,346 | | | | 114,546 | | | | 156,498 | | | | 157,105 | |
| 13,230 | | | 16,985 | | | | 127,520 | | | | 9,201 | | | | 104,865 | | | | 147,448 | | | | 181,947 | |
| 29,230 | | | 12,946 | | | | 58,730 | | | | 28,598 | | | | 148,328 | | | | 73,331 | | | | 58,801 | |
| 19,795 | | | 20,751 | | | | 26,582 | | | | 15,523 | | | | 23,164 | | | | 27,313 | | | | 41,430 | |
| 15,675 | | | 17,093 | | | | 40,586 | | | | 18,694 | | | | 47,461 | | | | 54,336 | | | | 56,639 | |
| 8,189 | | | 8,767 | | | | 25,209 | | | | 7,968 | | | | 29,019 | | | | 36,093 | | | | 39,104 | |
| 5,906 | | | 5,338 | | | | 13,009 | | | | 7,566 | | | | 28,023 | | | | 24,033 | | | | 25,443 | |
| | | | | | | | | | | | | | | | | | | | | | | | | |
| 386,871 | | | 1,001,365 | | | | 3,810,787 | | | | 483,706 | | | | 7,289,795 | | | | 8,152,311 | | | | 10,137,166 | |
| (29,208) | | | (95 | ) | | | — | | | | (10,867 | ) | | | — | | | | — | | | | — | |
| (1,057) | | | (6,635 | ) | | | (884 | ) | | | (4,159 | ) | | | (7,913 | ) | | | (7,661 | ) | | | — | |
| (652) | | | (2,699 | ) | | | (154 | ) | | | (5,570 | ) | | | (2,001 | ) | | | (8,682 | ) | | | — | |
| (1,181) | | | (10,422 | ) | | | (246 | ) | | | (16,617 | ) | | | (925 | ) | | | (5,729 | ) | | | — | |
| (51) | | | (255 | ) | | | (634 | ) | | | (149 | ) | | | (823 | ) | | | (1,160 | ) | | | (1,953 | ) |
| | | | | | | | | | | | | | | | | | | | | | | | | |
| 354,722 | | | 981,259 | | | | 3,808,869 | | | | 446,344 | | | | 7,278,133 | | | | 8,129,079 | | | | 10,135,213 | |
| | | | | | | | | | | | | | | | | | | | | | | | | |
| 132,761 | | | (241,001 | ) | | | 620,270 | | | | (265,455 | ) | | | (3,262,539 | ) | | | 12,583,416 | | | | (1,155,169 | ) |
| | | | | | | | | | | | | | | | | | | | | | | | | |
| (3,759,863) | | | (5,738,680 | ) | | | 10,237,012 | | | | 1,069,656 | | | | 136,209,445 | | | | 78,750,842 | | | | 61,777,403 | |
| — | | | — | | | | — | | | | — | | | | — | | | | — | | | | — | |
| — | | | — | | | | — | | | | — | | | | 873,123 | | | | — | | | | 6,124,921 | |
| — | | | — | | | | — | | | | (257,995 | ) | | | 111,625 | | | | 42,876 | | | | (4,081,351 | ) |
| | | | | | | | | | | | | | | | | | | | | | | | | |
| (3,759,863) | | | (5,738,680 | ) | | | 10,237,012 | | | | 811,661 | | | | 137,194,193 | | | | 78,793,718 | | | | 63,820,973 | |
| | | | | | | | | | | | | | | | | | | | | | | | | |
| (5,055,011) | | | (12,682,056 | ) | | | (78,926,539 | ) | | | (6,810,998 | ) | | | 6,986,627 | | | | 27,966,590 | | | | (128,668,914 | ) |
| — | | | — | | | | — | | | | — | | | | (870,362 | ) | | | — | | | | 59,498 | |
| — | | | — | | | | — | | | | (10,056 | ) | | | (109,804 | ) | | | (11,961 | ) | | | (4,225,100 | ) |
| | | | | | | | | | | | | | | | | | | | | | | | | |
| (5,055,011) | | | (12,682,056 | ) | | | (78,926,539 | ) | | | (6,821,054 | ) | | | 6,006,461 | | | | 27,954,629 | | | | (132,834,516 | ) |
| | | | | | | | | | | | | | | | | | | | | | | | | |
| (8,814,874) | | | (18,420,736 | ) | | | (68,689,527 | ) | | | (6,009,393 | ) | | | 143,200,654 | | | | 106,748,347 | | | | (69,013,543 | ) |
| | | | | | | | | | | | | | | | | | | | | | | | | |
| $(8,682,113) | | $ | (18,661,737 | ) | | $ | (68,069,257 | ) | | $ | (6,274,848 | ) | | $ | 139,938,115 | | | $ | 119,331,763 | | | $ | (70,168,712 | ) |
| | | | | | | | | | | | | | | | | | | | | | | | | |
See Notes to Financial Statements.
| | | | | | |
| | SEMI-ANNUAL REPORT | | MARCH 31, 2008 | | 83 |
Statements of Operations (concluded)
| | | | | | | | | | | | |
Six Months Ended March 31, 2008 (Unaudited) | | U.S. Opportunities
Portfolio | | | Global Opportunities
Portfolio | | | International
Opportunities
Portfolio | |
Investment Income | | | | | | | | | | | | |
Dividends and reclaims | | $ | 3,994,702 | | | $ | 913,363 | | | $ | 10,145,916 | |
Interest | | | 118,247 | | | | 21,581 | | | | 336,223 | |
Interest from affiliates | | | 4,356 | | | | 693 | | | | 5,748 | |
Securities lending | | | 183,497 | | | | — | | | | 8,365 | |
Foreign taxes withheld | | | (1,956 | ) | | | (30,059 | ) | | | (533,617 | ) |
| | | | | | | | | | | | |
Total investment income | | | 4,298,846 | | | | 905,578 | | | | 9,962,635 | |
| | | | | | | | | | | | |
Expenses | | | | | | | | | | | | |
Investment advisory | | | 3,499,664 | | | | 492,605 | | | | 7,189,473 | |
Service - class specific | | | 584,700 | | | | 86,930 | | | | 1,249,063 | |
Transfer agent - class specific | | | 489,218 | | | | 63,768 | | | | 770,919 | |
Distribution - class specific | | | 480,072 | | | | 102,687 | | | | 1,208,724 | |
Administration | | | 231,799 | | | | 41,050 | | | | 476,760 | |
Administration - class specific | | | 79,243 | | | | 13,653 | | | | 181,335 | |
Printing | | | 73,704 | | | | 12,004 | | | | 196,589 | |
Custodian | | | 36,678 | | | | 45,299 | | | | 466,266 | |
Professional | | | 33,394 | | | | 18,717 | | | | 68,186 | |
Registration | | | 31,692 | | | | 17,729 | | | | 27,084 | |
Officer and Trustees | | | 18,578 | | | | 8,774 | | | | 44,470 | |
Miscellaneous | | | 11,937 | | | | 10,749 | | | | 50,325 | |
| | | | | | | | | | | | |
Total expenses | | | 5,570,679 | | | | 913,965 | | | | 11,929,194 | |
Less investment advisory fees waived | | | (755,995 | ) | | | — | | | | — | |
Less administration fees waived - class specific | | | (24,455 | ) | | | (1,463 | ) | | | — | |
Less transfer agent fees waived - class specific | | | (8,219 | ) | | | (234 | ) | | | — | |
Less transfer agent fees reimbursed - class specific | | | (89,415 | ) | | | (246 | ) | | | — | |
Less fees paid indirectly | | | (958 | ) | | | (148 | ) | | | (1,191 | ) |
| | | | | | | | | | | | |
Total expenses after waivers and reimbursement | | | 4,691,637 | | | | 911,874 | | | | 11,928,003 | |
| | | | | | | | | | | | |
Net investment loss | | | (392,791 | ) | | | (6,296 | ) | | | (1,965,368 | ) |
| | | | | | | | | | | | |
Realized and Unrealized Gain (Loss) | | | | | | | | | | | | |
Net realized gain (loss) from: | | | | | | | | | | | | |
Investments | | | (10,739,744 | ) | | | 681,358 | | | | 95,586,847 | |
Payment from affiliate | | | — | | | | — | | | | 112,880 | |
Foreign currency related transactions | | | — | | | | (157,126 | ) | | | (2,233,223 | ) |
| | | | | | | | | | | | |
| | | (10,739,744 | ) | | | 524,232 | | | | 93,466,504 | |
| | | | | | | | | | | | |
Net change in unrealized appreciation/depreciation on: | | | | | | | | | | | | |
Investments | | | (41,956,996 | ) | | | (10,835,804 | ) | | | (234,075,931 | ) |
Futures | | | — | | | | — | | | | 4,109,045 | |
Foreign currency transactions | | | — | | | | 1,019,604 | | | | 16,177,898 | |
| | | | | | | | | | | | |
| | | (41,956,996 | ) | | | (9,816,200 | ) | | | (213,788,988 | ) |
| | | | | | | | | | | | |
Net realized and unrealized loss | | | (52,696,740 | ) | | | (9,291,968 | ) | | | (120,322,484 | ) |
| | | | | | | | | | | | |
Net Decrease in Net Assets Resulting from Operations | | $ | (53,089,531 | ) | | $ | (9,298,264 | ) | | $ | (122,287,852 | ) |
| | | | | | | | | | | | |
See Notes to Financial Statements.
| | | | | | |
| 84 | | SEMI-ANNUAL REPORT | | MARCH 31, 2008 | | |
[THIS PAGE INTENTIONALLY LEFT BLANK.]
Statements of Changes in Net Assets
| | | | | | | | | | | | | | | | |
| | | Capital
Appreciation
Portfolio | | | Mid-Cap
Value Equity
Portfolio | |
Increase (Decrease) in Net Assets: | | Six Months
Ended
March 31, 2008
(Unaudited) | | | Year Ended
September 30,
2007 | | | Six Months
Ended
March 31, 2008
(Unaudited) | | | Year Ended
September 30,
2007 | |
Operations | | | | | | | | | | | | | | | | |
Net investment income (loss) | | $ | (108,547 | ) | | $ | (666,814 | ) | | $ | 2,728,670 | | | $ | 4,421,708 | |
Net realized gain (loss) | | | 7,146,815 | | | | 31,968,707 | | | | (38,913,231 | ) | | | 131,988,313 | |
Net change in unrealized appreciation/depreciation | | | (31,308,653 | ) | | | 17,539,588 | | | | (95,164,960 | ) | | | 25,639,634 | |
| | | | | | | | | | | | | | | | |
Net increase (decrease) in net assets resulting from operations | | | (24,270,385 | ) | | | 48,841,481 | | | | (131,349,521 | ) | | | 162,049,655 | |
| | | | | | | | | | | | | | | | |
Dividends and Distributions to Shareholders from | | | | | | | | | | | | | | | | |
Net investment income: | | | | | | | | | | | | | | | | |
Institutional | | | — | | | | — | | | | (651,188 | ) | | | (950,124 | ) |
Service | | | — | | | | — | | | | (7,027 | ) | | | (28,046 | ) |
Investor A | | | — | | | | — | | | | (1,235,390 | ) | | | (4,346,319 | ) |
Investor B | | | — | | | | — | | | | — | | | | (149,820 | ) |
Investor C | | | — | | | | — | | | | — | | | | (346,654 | ) |
Net realized gain: | | | | | | | | | | | | | | | | |
Institutional | | | — | | | | — | | | | (15,606,979 | ) | | | (10,598,964 | ) |
Service | | | — | | | | — | | | | (391,037 | ) | | | (400,184 | ) |
Investor A | | | — | | | | — | | | | (75,490,857 | ) | | | (62,756,283 | ) |
Investor B | | | — | | | | — | | | | (13,996,184 | ) | | | (16,156,916 | ) |
Investor C | | | — | | | | — | | | | (20,992,479 | ) | | | (18,615,276 | ) |
R | | | — | | | | — | | | | — | | | | — | |
| | | | | | | | | | | | | | | | |
Decrease in net assets resulting from dividends and distributions to shareholders | | | — | | | | — | | | | (128,371,141 | ) | | | (114,348,586 | ) |
| | | | | | | | | | | | | | | | |
Capital Share Transactions | | | | | | | | | | | | | | | | |
Net increase (decrease) in net assets resulting from capital share transactions | | | 4,509,244 | | | | (31,677,089 | ) | | | 109,969,494 | | | | 183,584,154 | |
| | | | | | | | | | | | | | | | |
Redemption Fees | | | | | | | | | | | | | | | | |
Redemption fees | | | — | | | | — | | | | — | | | | 1,656 | |
| | | | | | | | | | | | | | | | |
Net Assets | | | | | | | | | | | | | | | | |
Total increase (decrease) in net assets | | | (19,761,141 | ) | | | 17,164,392 | | | | (149,751,168 | ) | | | 231,286,879 | |
Beginning of period | | | 266,204,601 | | | | 249,040,209 | | | | 1,074,144,942 | | | | 842,858,063 | |
| | | | | | | | | | | | | | | | |
End of period | | $ | 246,443,460 | | | $ | 266,204,601 | | | $ | 924,393,774 | | | $ | 1,074,144,942 | |
| | | | | | | | | | | | | | | | |
End of period undistributed (distributions in excess of) net investment income (loss) | | $ | (108,547 | ) | | $ | — | | | $ | 1,754,390 | | | $ | 919,325 | |
| | | | | | | | | | | | | | | | |
See Notes to Financial Statements.
| | | | | | |
| 86 | | SEMI-ANNUAL REPORT | | MARCH 31, 2008 | | |
Statements of Changes in Net Assets (continued)
| | | | | | | | | | | | | | | | | | | | | |
Mid-Cap
Growth Equity
Portfolio | | | Aurora
Portfolio | | | Small/Mid-Cap
Growth
Portfolio | |
Six Months
Ended
March 31, 2008
(Unaudited) | | Year Ended
September 30,
2007 | | | Six Months
Ended
March 31, 2008
(Unaudited) | | | Year Ended
September 30,
2007 | | | Six Months
Ended
March 31, 2008
(Unaudited) | | | Year Ended
September 30,
2007 | |
| $ | (1,597,633) | | $ | (4,524,093 | ) | | $ | (3,903,978 | ) | | $ | (3,178,029 | ) | | $ | (849,699 | ) | | $ | (2,862,556 | ) |
| | 18,697,862 | | | 62,310,657 | | | | (16,942,968 | ) | | | 290,550,794 | | | | (764,015 | ) | | | 49,844,202 | |
| | (59,837,434) | | | 33,572,913 | | | | (189,461,595 | ) | | | (31,422,518 | ) | | | (30,880,145 | ) | | | 10,425,975 | |
| | | | | | | | | | | | | | | | | | | | | | |
| | (42,737,205) | | | 91,359,477 | | | | (210,308,541 | ) | | | 255,950,247 | | | | (32,493,859 | ) | | | 57,407,621 | |
| | | | | | | | | | | | | | | | | | | | | | |
| | — | | | — | | | | — | | | | — | | | | — | | | | — | |
| | — | | | — | | | | — | | | | — | | | | — | | | | — | |
| | — | | | — | | | | — | | | | — | | | | — | | | | — | |
| | — | | | — | | | | — | | | | — | | | | — | | | | — | |
| | — | | | — | | | | — | | | | — | | | | — | | | | — | |
| | — | | | — | | | | (31,795,565 | ) | | | (39,020,242 | ) | | | (3,835,548 | ) | | | (1,246,455 | ) |
| | — | | | — | | | | — | | | | (6,428 | ) | | | — | | | | (1,145 | ) |
| | — | | | — | | | | (168,608,397 | ) | | | (348,851,877 | ) | | | (36,072,316 | ) | | | (11,264,602 | ) |
| | — | | | — | | | | (54,791,162 | ) | | | (110,014,015 | ) | | | (3,584,103 | ) | | | (1,395,885 | ) |
| | — | | | — | | | | (46,145,945 | ) | | | (91,436,852 | ) | | | (3,000,370 | ) | | | (1,040,672 | ) |
| | — | | | — | | | | (305,399 | ) | | | (6,360 | ) | | | (221,880 | ) | | | (1,135 | ) |
| | | | | | | | | | | | | | | | | | | | | | |
| | — | | | — | | | | (301,646,468 | ) | | | (589,335,774 | ) | | | (46,714,217 | ) | | | (14,949,894 | ) |
| | | | | | | | | | | | | | | | | | | | | | |
| | (55,946,702) | | | (77,176,297 | ) | | | 29,181,980 | | | | (119,171,388 | ) | | | 24,757,286 | | | | (31,054,291 | ) |
| | | | | | | | | | | | | | | | | | | | | | |
| | — | | | (759 | ) | | | 4,065 | | | | 57,126 | | | | 9,538 | | | | 14,514 | |
| | | | | | | | | | | | | | | | | | | | | | |
| | (98,683,907) | | | 14,182,421 | | | | (482,768,964 | ) | | | (452,499,789 | ) | | | (54,441,252 | ) | | | 11,417,950 | |
| | 414,461,995 | | | 400,279,574 | | | | 1,502,811,870 | | | | 1,955,311,659 | | | | 285,055,401 | | | | 273,637,451 | |
| | | | | | | | | | | | | | | | | | | | | | |
| $ | 315,778,088 | | $ | 414,461,995 | | | $ | 1,020,042,906 | | | $ | 1,502,811,870 | | | $ | 230,614,149 | | | $ | 285,055,401 | |
| | | | | | | | | | | | | | | | | | | | | | |
| $ | (1,597,633) | | $ | — | | | $ | (4,069,935 | ) | | $ | (25,991 | ) | | $ | (849,699 | ) | | $ | — | |
| | | | | | | | | | | | | | | | | | | | | | |
See Notes to Financial Statements.
| | | | | | |
| | SEMI-ANNUAL REPORT | | MARCH 31, 2008 | | 87 |
Statements of Changes in Net Assets (continued)
| | | | | | | | | | | | | | | | |
| | | Small Cap Value
Equity Portfolio | | | Small Cap Core
Equity Portfolio | |
Increase (Decrease) in Net Assets: | | Six Months
Ended
March 31, 2008
(Unaudited) | | | Year Ended
September 30,
2007 | | | Six Months
Ended
March 31, 2008
(Unaudited) | | | Year Ended
September 30,
2007 | |
Operations | | | | | | | | | | | | | | | | |
Net investment income (loss) | | $ | 132,761 | | | $ | 212,079 | | | $ | (241,001 | ) | | $ | (1,148,210 | ) |
Net realized gain (loss) | | | (3,759,863 | ) | | | 11,328,942 | | | | (5,738,680 | ) | | | 10,368,324 | |
Net change in unrealized appreciation/depreciation | | | (5,055,011 | ) | | | (3,201,326 | ) | | | (12,682,056 | ) | | | 3,477,355 | |
| | | | | | | | | | | | | | | | |
Net increase (decrease) in net assets resulting from operations | | | (8,682,113 | ) | | | 8,339,695 | | | | (18,661,737 | ) | | | 12,697,469 | |
| | | | | | | | | | | | | | | | |
Dividends and Distributions to Shareholders from | | | | | | | | | | | | | | | | |
Net investment income: | | | | | | | | | | | | | | | | |
BlackRock | | | (91,661 | ) | | | (96,251 | ) | | | — | | | | — | |
Institutional | | | (734,053 | ) | | | (864,738 | ) | | | — | | | | — | |
Service | | | (55,160 | ) | | | (79,661 | ) | | | — | | | | — | |
Investor A | | | (569,152 | ) | | | (565,742 | ) | | | — | | | | — | |
Investor B | | | (86,359 | ) | | | (85,437 | ) | | | — | | | | — | |
Investor C | | | (73,548 | ) | | | (57,217 | ) | | | — | | | | — | |
Net realized gain: | | | | | | | | | | | | | | | | |
BlackRock | | | (468,470 | ) | | | (883,861 | ) | | | — | | | | — | |
Institutional | | | (3,365,617 | ) | | | (7,026,310 | ) | | | (2,956,776 | ) | | | (389,967 | ) |
Service | | | (277,066 | ) | | | (767,565 | ) | | | (358,504 | ) | | | (53,212 | ) |
Investor A | | | (3,077,025 | ) | | | (5,528,989 | ) | | | (2,250,029 | ) | | | (354,006 | ) |
Investor B | | | (640,834 | ) | | | (1,626,642 | ) | | | (603,710 | ) | | | (142,927 | ) |
Investor C | | | (548,273 | ) | | | (983,319 | ) | | | (2,458,205 | ) | | | (437,962 | ) |
| | | | | | | | | | | | | | | | |
Decrease in net assets resulting from dividends and distributions to shareholders | | | (9,987,218 | ) | | | (18,565,732 | ) | | | (8,627,224 | ) | | | (1,378,074 | ) |
| | | | | | | | | | | | | | | | |
Capital Share Transactions | | | | | | | | | | | | | | | | |
Net increase (decrease) in net assets resulting from capital share transactions | | | 1,454,830 | | | | (5,609,699 | ) | | | 18,482,045 | | | | 15,600,046 | |
| | | | | | | | | | | | | | | | |
Redemption Fees | | | | | | | | | | | | | | | | |
Redemption fees | | | 192 | | | | 156 | | | | 4,291 | | | | 2,573 | |
| | | | | | | | | | | | | | | | |
Net Assets | | | | | | | | | | | | | | | | |
Total increase (decrease) in net assets | | | (17,214,309 | ) | | | (15,835,580 | ) | | | (8,802,625 | ) | | | 26,922,014 | |
Beginning of period | | | 68,909,105 | | | | 84,744,685 | | | | 109,319,357 | | | | 82,397,343 | |
| | | | | | | | | | | | | | | | |
End of period | | $ | 51,694,796 | | | $ | 68,909,105 | | | $ | 100,516,732 | | | $ | 109,319,357 | |
| | | | | | | | | | | | | | | | |
End of period undistributed (distributions in excess of) net investment income (loss) | | $ | (1,477,172 | ) | | $ | — | | | $ | (241,001 | ) | | $ | — | |
| | | | | | | | | | | | | | | | |
See Notes to Financial Statements.
| | | | | | |
| 88 | | SEMI-ANNUAL REPORT | | MARCH 31, 2008 | | |
Statements of Changes in Net Assets (continued)
| | | | | | | | | | | | | | | | | | | | | |
Small Cap
Growth Equity
Portfolio | | | Global Science
& Technology
Opportunities
Portfolio | | | Global
Resources
Portfolio | |
Six Months
Ended
March 31, 2008
(Unaudited) | | Year Ended
September 30,
2007 | | | Six Months
Ended
March 31, 2008
(Unaudited) | | | Year Ended
September 30,
2007 | | | Months
Ended
March 31, 2008
(Unaudited) | | | Year Ended
September 30,
2007 | |
| $ | 620,270 | | $ | (3,622,784 | ) | | $ | (265,455 | ) | | $ | (413,529 | ) | | $ | (3,262,539 | ) | | $ | (4,118,065 | ) |
| | 10,237,012 | | | 109,493,054 | | | | 811,661 | | | | 3,315,734 | | | | 137,194,193 | | | | 118,008,870 | |
| | (78,926,539) | | | 48,459,896 | | | | (6,821,054 | ) | | | 4,689,749 | | | | 6,006,461 | | | | 76,633,096 | |
| | | | | | | | | | | | | | | | | | | | | | |
| | (68,069,257) | | | 154,330,166 | | | | (6,274,848 | ) | | | 7,591,954 | | | | 139,938,115 | | | | 190,523,901 | |
| | | | | | | | | | | | | | | | | | | | | | |
| | — | | | — | | | | — | | | | — | | | | — | | | | — | |
| | — | | | — | | | | — | | | | — | | | | (943,161 | ) | | | (407,505 | ) |
| | — | | | — | | | | — | | | | — | | | | — | | | | — | |
| | — | | | — | | | | — | | | | — | | | | (26,697,832 | ) | | | (5,480,853 | ) |
| | — | | | — | | | | — | | | | — | | | | (2,806,131 | ) | | | (90,725 | ) |
| | — | | | — | | | | — | | | | — | | | | (5,676,427 | ) | | | (84,828 | ) |
| | — | | | — | | | | — | | | | — | | | | — | | | | — | |
| | — | | | — | | | | — | | | | — | | | | (2,630,410 | ) | | | (9,325,982 | ) |
| | — | | | — | | | | — | | | | — | | | | — | | | | — | |
| | — | | | — | | | | — | | | | — | | | | (77,529,172 | ) | | | (185,047,519 | ) |
| | — | | | — | | | | — | | | | — | | | | (9,869,079 | ) | | | (26,519,774 | ) |
| | — | | | — | | | | — | | | | — | | | | (19,221,873 | ) | | | (43,361,959 | ) |
| | | | | | | | | | | | | | | | | | | | | | |
| | — | | | — | | | | — | | | | — | | | | (145,374,085 | ) | | | (270,319,145 | ) |
| | | | | | | | | | | | | | | | | | | | | | |
| | 117,770,800 | | | 35,819,149 | | | | 6,016,162 | | | | 2,995,063 | | | | 129,763,658 | | | | 73,558,234 | |
| | | | | | | | | | | | | | | | | | | | | | |
| | 55,144 | | | 38,501 | | | | 2,845 | | | | 1,818 | | | | 23,866 | | | | 17,221 | |
| | | | | | | | | | | | | | | | | | | | | | |
| | 49,756,687 | | | 190,187,816 | | | | (255,841 | ) | | | 10,588,835 | | | | 124,351,554 | | | | (6,219,789 | ) |
| | 845,175,674 | | | 654,987,858 | | | | 41,988,993 | | | | 31,400,158 | | | | 947,565,541 | | | | 953,785,330 | |
| | | | | | | | | | | | | | | | | | | | | | |
| $ | 894,932,361 | | $ | 845,175,674 | | | $ | 41,733,152 | | | $ | 41,988,993 | | | $ | 1,071,917,095 | | | $ | 947,565,541 | |
| | | | | | | | | | | | | | | | | | | | | | |
| $ | 620,270 | | $ | — | | | $ | (342,542 | ) | | $ | (77,087 | ) | | $ | (44,999,198 | ) | | $ | (5,613,108 | ) |
| | | | | | | | | | | | | | | | | | | | | | |
See Notes to Financial Statements.
| | | | | | |
| | SEMI-ANNUAL REPORT | | MARCH 31, 2008 | | 89 |
Statements of Changes in Net Assets (continued)
| | | | | | | | | | | | | | | | |
| | | All-Cap
Global
Resources
Portfolio | | | Health Sciences
Opportunities
Portfolio | |
Increase (Decrease) in Net Assets: | | Six Months
Ended
March 31, 2008
(Unaudited) | | | Year Ended
September 30,
2007 | | | Six Months
Ended
March 31, 2008
(Unaudited) | | | Year Ended
September 30,
2007 | |
Operations | | | | | | | | | | | | | | | | |
Net investment income (loss) | | $ | 12,583,416 | | | $ | (569,716 | ) | | $ | (1,155,169 | ) | | $ | (4,009,242 | ) |
Net realized gain (loss) | | | 78,793,718 | | | | 9,953,987 | | | | 63,820,973 | | | | 49,828,975 | |
Net change in unrealized appreciation/depreciation | | | 27,954,629 | | | | 340,041,790 | | | | (132,834,516 | ) | | | 131,502,266 | |
| | | | | | | | | | | | | | | | |
Net increase (decrease) in net assets resulting from operations | | | 119,331,763 | | | | 349,426,061 | | | | (70,168,712 | ) | | | 177,321,999 | |
| | | | | | | | | | | | | | | | |
Dividends and Distributions to Shareholders from | | | | | | | | | | | | | | | | |
Net investment income: | | | | | | | | | | | | | | | | |
Institutional | | | (8,885,132 | ) | | | — | | | | — | | | | — | |
Service | | | (36,728 | ) | | | — | | | | — | | | | — | |
Investor A | | | (3,502,966 | ) | | | — | | | | — | | | | — | |
Investor B | | | (191,616 | ) | | | — | | | | — | | | | — | |
Investor C | | | (875,331 | ) | | | — | | | | — | | | | — | |
Net realized gain: | | | | | | | | | | | | | | | | |
Institutional | | | (9,314,931 | ) | | | (10,090,707 | ) | | | (6,907,979 | ) | | | (1,602,984 | ) |
Service | | | (51,597 | ) | | | (62,756 | ) | | | (294,520 | ) | | | (68,118 | ) |
Investor A | | | (4,995,262 | ) | | | (7,092,333 | ) | | | (26,251,005 | ) | | | (6,106,733 | ) |
Investor B | | | (809,538 | ) | | | (1,254,323 | ) | | | (2,731,955 | ) | | | (1,146,981 | ) |
Investor C | | | (3,066,818 | ) | | | (4,033,407 | ) | | | (11,313,900 | ) | | | (3,784,320 | ) |
| | | | | | | | | | | | | | | | |
Decrease in net assets resulting from dividends and distributions to shareholders | | | (31,729,919 | ) | | | (22,533,526 | ) | | | (47,499,359 | ) | | | (12,709,136 | ) |
| | | | | | | | | | | | | | | | |
Capital Share Transactions | | | | | | | | | | | | | | | | |
Net increase (decrease) in net assets resulting from capital share transactions | | | 51,209,336 | | | | 117,285,124 | | | | (26,726,981 | ) | | | 287,573,622 | |
| | | | | | | | | | | | | | | | |
Redemption Fees | | | | | | | | | | | | | | | | |
Redemption fees | | | 25,599 | | | | 41,527 | | | | 26,076 | | | | 47,586 | |
| | | | | | | | | | | | | | | | |
Net Assets | | | | | | | | | | | | | | | | |
Total increase (decrease) in net assets | | | 138,836,779 | | | | 444,219,186 | | | | (144,368,976 | ) | | | 452,234,071 | |
Beginning of period | | | 1,212,511,843 | | | | 768,292,657 | | | | 1,337,129,440 | | | | 884,895,369 | |
| | | | | | | | | | | | | | | | |
End of period | | $ | 1,351,348,622 | | | $ | 1,212,511,843 | | | $ | 1,192,760,464 | | | $ | 1,337,129,440 | |
| | | | | | | | | | | | | | | | |
End of period undistributed (distributions in excess of) net investment income (loss) | | $ | (1,292,799 | ) | | $ | (384,442 | ) | | $ | (1,866,608 | ) | | $ | (711,439 | ) |
| | | | | | | | | | | | | | | | |
See Notes to Financial Statements.
| | | | | | |
| 90 | | SEMI-ANNUAL REPORT | | MARCH 31, 2008 | | |
Statements of Changes in Net Assets (concluded)
| | | | | | | | | | | | | | | | | | | | | |
U.S. Opportunities
Portfolio | | | Global Opportunities
Portfolio | | | International Opportunities
Portfolio | |
Six Months
Ended
March 31, 2008
(Unaudited) | | Year Ended
September 30,
2007 | | | Six Months
Ended
March 31, 2008
(Unaudited) | | | Year Ended
September 30,
2007 | | | Six Months
Ended
March 31, 2008
(Unaudited) | | | Year Ended
September 30,
2007 | |
| $ | (392,791) | | $ | (1,525,019 | ) | | $ | (6,296 | ) | | $ | 202,864 | | | $ | (1,965,368 | ) | | $ | 8,582,599 | |
| | (10,739,744) | | | 26,356,228 | | | | 524,232 | | | | 5,537,239 | | | | 93,466,504 | | | | 234,387,781 | |
| | (41,956,996) | | | 55,336,731 | | | | (9,816,200 | ) | | | 14,061,983 | | | | (213,788,988 | ) | | | 212,534,037 | |
| | | | | | | | | | | | | | | | | | | | | | |
| | (53,089,531) | | | 80,167,940 | | | | (9,298,264 | ) | | | 19,802,086 | | | | (122,287,852 | ) | | | 455,504,417 | |
| | | | | | | | | | | | | | | | | | | | | | |
| | — | | | — | | | | (516,368 | ) | | | (80,270 | ) | | | (11,844,155 | ) | | | (5,714,004 | ) |
| | — | | | — | | | | — | | | | (241 | ) | | | (3,649,556 | ) | | | (1,836,362 | ) |
| | — | | | — | | | | (438,794 | ) | | | (166,607 | ) | | | (11,746,350 | ) | | | (5,788,432 | ) |
| | — | | | — | | | | (18,976 | ) | | | (24,703 | ) | | | (1,437,329 | ) | | | (560,575 | ) |
| | — | | | — | | | | (63,696 | ) | | | (49,183 | ) | | | (3,891,839 | ) | | | (1,513,353 | ) |
| | — | | | — | | | | (1,500,686 | ) | | | — | | | | (70,893,491 | ) | | | (46,667,147 | ) |
| | — | | | — | | | | — | | | | — | | | | (25,020,162 | ) | | | (17,687,846 | ) |
| | — | | | — | | | | (1,612,774 | ) | | | — | | | | (81,040,060 | ) | | | (57,992,691 | ) |
| | — | | | — | | | | (310,579 | ) | | | — | | | | (15,320,494 | ) | | | (13,325,007 | ) |
| | — | | | — | | | | (756,979 | ) | | | — | | | | (39,325,420 | ) | | | (30,320,263 | ) |
| | | | | | | | | | | | | | | | | | | | | | |
| | — | | | — | | | | (5,218,852 | ) | | | (321,004 | ) | | | (264,168,856 | ) | | | (181,405,680 | ) |
| | | | | | | | | | | | | | | | | | | | | | |
| | 187,978,453 | | | 281,295,705 | | | | 22,677,221 | | | | 35,418,024 | | | | 201,946,123 | | | | 134,535,995 | |
| | | | | | | | | | | | | | | | | | | | | | |
| | 26,517 | | | 26,307 | | | | 3,395 | | | | 10,820 | | | | 35,337 | | | | 13,042 | |
| | | | | | | | | | | | | | | | | | | | | | |
| | 134,915,439 | | | 361,489,952 | | | | 8,163,500 | | | | 54,909,926 | | | | (184,475,248 | ) | | | 408,647,774 | |
| | 555,279,385 | | | 193,789,433 | | | | 102,035,785 | | | | 47,125,859 | | | | 1,578,371,712 | | | | 1,169,723,938 | |
| | | | | | | | | | | | | | | | | | | | | | |
| $ | 690,194,824 | | $ | 555,279,385 | | | $ | 110,199,285 | | | $ | 102,035,785 | | | $ | 1,393,896,464 | | | $ | 1,578,371,712 | |
| | | | | | | | | | | | | | | | | | | | | | |
| $ | (392,791) | | $ | — | | | $ | (328,785 | ) | | $ | 715,345 | | | $ | (5,231,174 | ) | | $ | 29,303,423 | |
| | | | | | | | | | | | | | | | | | | | | | |
See Notes to Financial Statements.
| | | | | | |
| | SEMI-ANNUAL REPORT | | MARCH 31, 2008 | | 91 |
| | |
| Financial Highlights | | Capital Appreciation Portfolio |
| | | | | | | | | | | | | | | | | | | | | | | | |
| | | Institutional | |
| | | Six Months
Ended
March 31, 2008 | | | Year Ended
September 30, | | | 11/01/04 -
9/30/05 | | | Year Ended
October 31, | |
| | (Unaudited) | | | 2007 | | | 2006 | | | | 2004 | | | 2003 | |
Per Share Operating Performance | | | | | | | | | | | | | | | | | | | | | | | | |
Net asset value, beginning of period | | $ | 18.21 | | | $ | 14.91 | | | $ | 14.19 | | | $ | 12.78 | | | $ | 12.17 | | | $ | 10.14 | |
| | | | | | | | | | | | | | | | | | | | | | | | |
Net investment income (loss) | | | 0.04 | 1 | | | 0.06 | 1 | | | — | 1,2 | | | 0.05 | 1 | | | (0.04 | ) | | | (0.02 | ) |
Net realized and unrealized gain (loss) | | | (1.65 | ) | | | 3.24 | | | | 0.72 | | | | 1.36 | | | | 0.65 | | | | 2.05 | |
| | | | | | | | | | | | | | | | | | | | | | | | |
Net increase (decrease) from investment operations | | | (1.61 | ) | | | 3.30 | | | | 0.72 | | | | 1.41 | | | | 0.61 | | | | 2.03 | |
| | | | | | | | | | | | | | | | | | | | | | | | |
Redemption fees added to paid-in capital | | | — | | | | — | 3 | | | — | 3 | | | — | 3 | | | — | | | | — | |
| | | | | | | | | | | | | | | | | | | | | | | | |
Net asset value, end of period | | $ | 16.60 | | | $ | 18.21 | | | $ | 14.91 | | | $ | 14.19 | | | $ | 12.78 | | | $ | 12.17 | |
| | | | | | | | | | | | | | | | | | | | | | | | |
Total Investment Return | | | | | | | | | | | | | | | | | | | | | | | | |
Based on net asset value | | | (8.84 | )%4 | | | 22.13 | %5 | | | 5.07 | %5 | | | 11.03 | %4,5,6 | | | 5.01 | % | | | 20.02 | % |
| | | | | | | | | | | | | | | | | | | | | | | | |
Ratios to Average Net Assets | | | | | | | | | | | | | | | | | | | | | | | | |
Total expenses, net of waivers and reimbursement | | | 0.70 | %7 | | | 0.75 | % | | | 0.95 | % | | | 1.05 | %7 | | | 1.14 | % | | | 1.08 | % |
| | | | | | | | | | | | | | | | | | | | | | | | |
Total expenses | | | 0.86 | %7 | | | 0.88 | % | | | 1.00 | % | | | 1.15 | %7 | | | 1.14 | % | | | 1.08 | % |
| | | | | | | | | | | | | | | | | | | | | | | | |
Net investment income (loss) | | | 0.45 | %7 | | | 0.38 | % | | | 0.00 | % | | | 0.43 | %7 | | | (0.31 | )% | | | (0.19 | )% |
| | | | | | | | | | | | | | | | | | | | | | | | |
Supplemental Data | | | | | | | | | | | | | | | | | | | | | | | | |
Net assets, end of period (000) | | $ | 72,265 | | | $ | 71,072 | | | $ | 48,146 | | | $ | 52,154 | | | $ | 52,399 | | | $ | 60,878 | |
| | | | | | | | | | | | | | | | | | | | | | | | |
Portfolio turnover | | | 44 | % | | | 97 | % | | | 87 | % | | | 70 | % | | | 91 | % | | | 113 | % |
| | | | | | | | | | | | | | | | | | | | | | | | |
| |
| | | Investor A | |
| | | Six Months
Ended
March 31, 2008 | | | Year Ended
September 30, | | | 11/01/04 -
9/30/05 | | | Year Ended
October 31, | |
| | (Unaudited) | | | 2007 | | | 2006 | | | | 2004 | | | 2003 | |
Per Share Operating Performance | | | | | | | | | | | | | | | | | | | | | | | | |
Net asset value, beginning of period | | $ | 17.56 | | | $ | 14.46 | | | $ | 13.82 | | | $ | 12.47 | | | $ | 11.91 | | | $ | 9.96 | |
| | | | | | | | | | | | | | | | | | | | | | | | |
Net investment income (loss) | | | — | 1,2 | | | (0.02 | )1 | | | (0.06 | )1 | | | 0.02 | 1 | | | (0.08 | ) | | | (0.05 | ) |
Net realized and unrealized gain (loss) | | | (1.59 | ) | | | 3.12 | | | | 0.70 | | | | 1.33 | | | | 0.64 | | | | 2.00 | |
| | | | | | | | | | | | | | | | | | | | | | | | |
Net increase (decrease) from investment operations | | | (1.59 | ) | | | 3.10 | | | | 0.64 | | | | 1.35 | | | | 0.56 | | | | 1.95 | |
| | | | | | | | | | | | | | | | | | | | | | | | |
Redemption fees added to paid-in capital | | | — | | | | — | 3 | | | — | 3 | | | — | 3 | | | — | | | | — | |
| | | | | | | | | | | | | | | | | | | | | | | | |
Net asset value, end of period | | $ | 15.97 | | | $ | 17.56 | | | $ | 14.46 | | | $ | 13.82 | | | $ | 12.47 | | | $ | 11.91 | |
| | | | | | | | | | | | | | | | | | | | | | | | |
Total Investment Return | | | | | | | | | | | | | | | | | | | | | | | | |
Based on net asset value8 | | | (9.05 | )%4 | | | 21.44 | %5 | | | 4.63 | %5 | | | 10.83 | %4,5,6 | | | 4.70 | % | | | 19.58 | % |
| | | | | | | | | | | | | | | | | | | | | | | | |
Ratios to Average Net Assets | | | | | | | | | | | | | | | | | | | | | | | | |
Total expenses, net of waivers and reimbursement | | | 1.20 | %7 | | | 1.28 | % | | | 1.35 | % | | | 1.31 | %7 | | | 1.44 | % | | | 1.38 | % |
| | | | | | | | | | | | | | | | | | | | | | | | |
Total expenses | | | 1.31 | %7 | | | 1.35 | % | | | 1.53 | % | | | 1.48 | %7 | | | 1.44 | % | | | 1.38 | % |
| | | | | | | | | | | | | | | | | | | | | | | | |
Net investment income (loss) | | | (0.05 | )%7 | | | (0.16 | )% | | | (0.40 | )% | | | 0.21 | %7 | | | (0.62 | )% | | | (0.47 | )% |
| | | | | | | | | | | | | | | | | | | | | | | | |
Supplemental Data | | | | | | | | | | | | | | | | | | | | | | | | |
Net assets, end of period (000) | | $ | 130,797 | | | $ | 131,712 | | | $ | 112,737 | | | $ | 120,371 | | | $ | 99,435 | | | $ | 103,247 | |
| | | | | | | | | | | | | | | | | | | | | | | | |
Portfolio turnover | | | 44 | % | | | 97 | % | | | 87 | % | | | 70 | % | | | 91 | % | | | 113 | % |
| | | | | | | | | | | | | | | | | | | | | | | | |
See Notes to Financial Statements.
| | | | | | |
| 92 | | SEMI-ANNUAL REPORT | | MARCH 31, 2008 | | |
| | |
| Financial Highlights (continued) | | Capital Appreciation Portfolio |
| | | | | | | | | | | | | | | | | | | | | | | | |
| | | Investor B | |
| | | Six Months
Ended
March 31, 2008 | | | Year Ended
September 30, | | | 11/01/04 -
9/30/05 | | | Year Ended
October 31, | |
| | | (Unaudited) | | | 2007 | | | 2006 | | | | 2004 | | | 2003 | |
Per Share Operating Performance | | | | | | | | | | | | | | | | | | | | | | | | |
Net asset value, beginning of period | | $ | 16.34 | | | $ | 13.56 | | | $ | 13.06 | | | $ | 11.86 | | | $ | 11.41 | | | $ | 9.61 | |
| | | | | | | | | | | | | | | | | | | | | | | | |
Net investment loss | | | (0.07 | )1 | | | (0.14 | )1 | | | (0.16 | )1 | | | (0.06 | )1 | | | (0.15 | ) | | | (0.12 | ) |
Net realized and unrealized gain (loss) | | | (1.47 | ) | | | 2.92 | | | | 0.66 | | | | 1.26 | | | | 0.60 | | | | 1.92 | |
| | | | | | | | | | | | | | | | | | | | | | | | |
Net increase (decrease) from investment operations | | | (1.54 | ) | | | 2.78 | | | | 0.50 | | | | 1.20 | | | | 0.45 | | | | 1.80 | |
| | | | | | | | | | | | | | | | | | | | | | | | |
Redemption fees added to paid-in capital | | | — | | | | — | 3 | | | — | 3 | | | — | 3 | | | — | | | | — | |
| | | | | | | | | | | | | | | | | | | | | | | | |
Net asset value, end of period | | $ | 14.80 | | | $ | 16.34 | | | $ | 13.56 | | | $ | 13.06 | | | $ | 11.86 | | | $ | 11.41 | |
| | | | | | | | | | | | | | | | | | | | | | | | |
Total Investment Return | | | | | | | | | | | | | | | | | | | | | | | | |
Based on net asset value8 | | | (9.42 | )%4 | | | 20.50 | %5 | | | 3.83 | %5 | | | 10.12 | %4,5,9 | | | 3.94 | % | | | 18.73 | % |
| | | | | | | | | | | | | | | | | | | | | | | | |
Ratios to Average Net Assets | | | | | | | | | | | | | | | | | | | | | | | | |
Total expenses, net of waivers and reimbursement | | | 2.08 | %7 | | | 2.07 | % | | | 2.10 | % | | | 2.05 | %7 | | | 2.14 | % | | | 2.08 | % |
| | | | | | | | | | | | | | | | | | | | | | | | |
Total expenses | | | 2.21 | %7 | | | 2.20 | % | | | 2.20 | % | | | 2.15 | %7 | | | 2.14 | % | | | 2.08 | % |
| | | | | | | | | | | | | | | | | | | | | | | | |
Net investment loss | | | (0.94 | )%7 | | | (0.95 | )% | | | (1.16 | )% | | | (0.53 | )%7 | | | (1.31 | )% | | | (1.17 | )% |
| | | | | | | | | | | | | | | | | | | | | | | | |
Supplemental Data | | | | | | | | | | | | | | | | | | | | | | | | |
Net assets, end of period (000) | | $ | 30,499 | | | $ | 48,260 | | | $ | 71,078 | | | $ | 85,465 | | | $ | 97,938 | | | $ | 108,125 | |
| | | | | | | | | | | | | | | | | | | | | | | | |
Portfolio turnover | | | 44 | % | | | 97 | % | | | 87 | % | | | 70 | % | | | 91 | % | | | 113 | % |
| | | | | | | | | | | | | | | | | | | | | | | | |
| |
| | | Investor C | |
| | | Six Months
Ended
March 31, 2008 | | | Year Ended
September 30, | | | 11/01/04 -
9/30/05 | | | Year Ended
October 31, | |
| | | (Unaudited) | | | 2007 | | | 2006 | | | | 2004 | | | 2003 | |
Per Share Operating Performance | | | | | | | | | | | | | | | | | | | | | | | | |
Net asset value, beginning of period | | $ | 16.38 | | | $ | 13.57 | | | $ | 13.06 | | | $ | 11.86 | | | $ | 11.41 | | | $ | 9.61 | |
| | | | | | | | | | | | | | | | | | | | | | | | |
Net investment loss | | | (0.06 | )1 | | | (0.12 | )1 | | | (0.15 | )1 | | | (0.06 | )1 | | | (0.15 | ) | | | (0.11 | ) |
Net realized and unrealized gain (loss) | | | (1.47 | ) | | | 2.93 | | | | 0.66 | | | | 1.26 | | | | 0.60 | | | | 1.91 | |
| | | | | | | | | | | | | | | | | | | | | | | | |
Net increase (decrease) from investment operations | | | (1.53 | ) | | | 2.81 | | | | 0.51 | | | | 1.20 | | | | 0.45 | | | | 1.80 | |
| | | | | | | | | | | | | | | | | | | | | | | | |
Redemption fees added to paid-in capital | | | — | | | | — | 3 | | | — | 3 | | | — | 3 | | | — | | | | — | |
| | | | | | | | | | | | | | | | | | | | | | | | |
Net asset value, end of period | | $ | 14.85 | | | $ | 16.38 | | | $ | 13.57 | | | $ | 13.06 | | | $ | 11.86 | | | $ | 11.41 | |
| | | | | | | | | | | | | | | | | | | | | | | | |
Total Investment Return | | | | | | | | | | | | | | | | | | | | | | | | |
Based on net asset value8 | | | (9.34 | )%4 | | | 20.71 | %5 | | | 3.91 | %5 | | | 10.12 | %4,5,9 | | | 3.94 | % | | | 18.73 | % |
| | | | | | | | | | | | | | | | | | | | | | | | |
Ratios to Average Net Assets | | | | | | | | | | | | | | | | | | | | | | | | |
Total expenses, net of waivers and reimbursement | | | 1.88 | %7 | | | 1.92 | % | | | 2.04 | % | | | 2.05 | %7 | | | 2.14 | % | | | 2.08 | % |
| | | | | | | | | | | | | | | | | | | | | | | | |
Total expenses | | | 1.98 | %7 | | | 1.99 | % | | | 2.10 | % | | | 2.15 | %7 | | | 2.14 | % | | | 2.08 | % |
| | | | | | | | | | | | | | | | | | | | | | | | |
Net investment loss | | | (0.73 | )%7 | | | (0.80 | )% | | | (1.10 | )% | | | (0.51 | )%7 | | | (1.30 | )% | | | (1.15 | )% |
| | | | | | | | | | | | | | | | | | | | | | | | |
Supplemental Data | | | | | | | | | | | | | | | | | | | | | | | | |
Net assets, end of period (000) | | $ | 12,882 | | | $ | 15,160 | | | $ | 17,079 | | | $ | 20,570 | | | $ | 23,854 | | | $ | 30,516 | |
| | | | | | | | | | | | | | | | | | | | | | | | |
Portfolio turnover | | | 44 | % | | | 97 | % | | | 87 | % | | | 70 | % | | | 91 | % | | | 113 | % |
| | | | | | | | | | | | | | | | | | | | | | | | |
1 | Based on average shares outstanding. |
2 | Net investment loss is less than $0.005 per share. |
3 | Redemption fees added to paid-in capital are less than $0.01 per share. |
4 | Aggregate total investment return. |
5 | Redemption fee of 2.00% received by the Portfolio is reflected in total return calculations. There was no impact to the return. |
6 | The total return includes an increase of 0.08% related to payments made by State Street Research & Management (SSRM) prior to January 31, 2005. |
8 | Total investment returns exclude the effects of sales charges. |
9 | The total return includes an increase of 0.09% related to payments made by SSRM prior to January 31, 2005. |
See Notes to Financial Statements.
| | | | | | |
| | SEMI-ANNUAL REPORT | | MARCH 31, 2008 | | 93 |
| | |
| Financial Highlights (continued) | | Mid-Cap Value Equity Portfolio* |
| | | | | | | | | | | | | | | | | | | | | | | | | | | | |
| | | Institutional | |
| | | Six Months
Ended
March 31, 2008 | | | Year Ended
September 30, | | | 3/01/05 -
9/30/05 | | | 7/01/04 -
2/28/05 | | | Year Ended
June 30, | |
| | | (Unaudited) | | | 2007 | | | 2006 | | | | | 2004 | | | 2003 | |
Per Share Operating Performance | | | | | | | | | | | | | | | | | | | | | | | | | | | | |
Net asset value, beginning of period | | $ | 14.35 | | | $ | 13.67 | | | $ | 13.74 | | | $ | 12.73 | | | $ | 12.14 | | | $ | 9.07 | | | $ | 10.66 | |
| | | | | | | | | | | | | | | | | | | | | | | | | | | | |
Net investment income | | | 0.06 | 1 | | | 0.11 | 1 | | | 0.12 | 1 | | | 0.04 | 1 | | | 0.11 | | | | 0.08 | | | | 0.08 | |
Net realized and unrealized gain (loss) | | | (1.66 | ) | | | 2.38 | | | | 1.23 | | | | 0.97 | | | | 1.44 | | | | 3.08 | | | | (1.21 | ) |
| | | | | | | | | | | | | | | | | | | | | | | | | | | | |
Net increase (decrease) from investment operations | | | (1.60 | ) | | | 2.49 | | | | 1.35 | | | | 1.01 | | | | 1.55 | | | | 3.16 | | | | (1.13 | ) |
| | | | | | | | | | | | | | | | | | | | | | | | | | | | |
Dividends and distributions from: | | | | | | | | | | | | | | | | | | | | | | | | | | | | |
Net investment income | | | (0.07 | ) | | | (0.15 | ) | | | (0.04 | ) | | | — | | | | (0.15 | ) | | | (0.09 | ) | | | — | |
Net realized capital gain | | | (1.67 | ) | | | (1.66 | ) | | | (1.38 | ) | | | — | | | | (0.81 | ) | | | — | | | | (0.46 | ) |
| | | | | | | | | | | | | | | | | | | | | | | | | | | | |
Total dividends and distributions | | | (1.74 | ) | | | (1.81 | ) | | | (1.42 | ) | | | — | | | | (0.96 | ) | | | (0.09 | ) | | | (0.46 | ) |
| | | | | | | | | | | | | | | | | | | | | | | | | | | | |
Redemption fees added to paid-in capital | | | — | | | | — | 2 | | | — | 2 | | | — | 2 | | | — | | | | — | | | | — | |
| | | | | | | | | | | | | | | | | | | | | | | | | | | | |
Net asset value, end of period | | $ | 11.01 | | | $ | 14.35 | | | $ | 13.67 | | | $ | 13.74 | | | $ | 12.73 | | | $ | 12.14 | | | $ | 9.07 | |
| | | | | | | | | | | | | | | | | | | | | | | | | | | | |
Total Investment Return | | | | | | | | | | | | | | | | | | | | | | | | | | | | |
Based on net asset value | | | (12.21 | )%3 | | | 19.35 | %4 | | | 10.77 | %4 | | | 7.94 | %3,4 | | | 13.07 | %3 | | | 34.83 | % | | | (10.21 | )% |
| | | | | | | | | | | | | | | | | | | | | | | | | | | | |
Ratios to Average Net Assets | | | | | | | | | | | | | | | | | | | | | | | | | | | | |
Total expenses, net of waivers and reimbursement | | | 0.94 | %5 | | | 0.95 | % | | | 0.99 | % | | | 1.00 | %5 | | | 0.99 | %5 | | | 0.98 | % | | | 0.99 | % |
| | | | | | | | | | | | | | | | | | | | | | | | | | | | |
Total expenses | | | 1.11 | %5 | | | 1.07 | % | | | 1.07 | % | | | 1.30 | %5 | | | 1.09 | %5 | | | 1.03 | % | | | 1.18 | % |
| | | | | | | | | | | | | | | | | | | | | | | | | | | | |
Net investment income | | | 1.02 | %5 | | | 0.79 | % | | | 0.88 | % | | | 0.49 | %5 | | | 1.18 | %5 | | | 0.76 | % | | | 0.93 | % |
| | | | | | | | | | | | | | | | | | | | | | | | | | | | |
Supplemental Data | | | | | | | | | | | | | | | | | | | | | | | | | | | | |
Net assets, end of period (000) | | $ | 129,199 | | | $ | 134,665 | | | $ | 80,292 | | | $ | 53,111 | | | $ | 50,383 | | | $ | 30,181 | | | $ | 26,099 | |
| | | | | | | | | | | | | | | | | | | | | | | | | | | | |
Portfolio turnover | | | 54 | % | | | 202 | % | | | 153 | % | | | 60 | % | | | 53 | % | | | 86 | % | | | 66 | % |
| | | | | | | | | | | | | | | | | | | | | | | | | | | | |
| | | | | | | | | | | | | | | | | | | | |
| | | Service | |
| | | Six Months
Ended
March 31, 2008 | | | Year Ended
September 30, | | | 3/01/05
-
9/30/05 | | | Period
Ended
2/28/056 | |
| | | (Unaudited) | | | 2007 | | | 2006 | | | |
Per Share Operating Performance | | | | | | | | | | | | | |
Net asset value, beginning of period | | $ | 14.14 | | | $ | 13.49 | | | $ | 13.61 | | | $ | 12.63 | | | $ | 12.04 | |
| | | | | | | | | | | | | | | | | | | | |
Net investment income (loss) | | | 0.04 | 1 | | | 0.10 | 1 | | | 0.08 | 1 | | | 0.02 | 1 | | | (0.01 | ) |
Net realized and unrealized gain (loss) | | | (1.64 | ) | | | 2.33 | | | | 1.21 | | | | 0.96 | | | | 0.60 | |
| | | | | | | | | | | | | | | | | | | | |
Net increase (decrease) from investment operations | | | (1.60 | ) | | | 2.43 | | | | 1.29 | | | | 0.98 | | | | 0.59 | |
| | | | | | | | | | | | | | | | | | | | |
Dividends and distributions from: | | | | | | | | | | | | | |
Net investment income | | | (0.03 | ) | | | (0.12 | ) | | | (0.03 | ) | | | — | | | | — | |
Net realized capital gain | | | (1.67 | ) | | | (1.66 | ) | | | (1.38 | ) | | | — | | | | — | |
| | | | | | | | | | | | | | | | | | | | |
Total dividends and distributions | | | (1.70 | ) | | | (1.78 | ) | | | (1.41 | ) | | | — | | | | — | |
| | | | | | | | | | | | | | | | | | | | |
Redemption fees added to paid-in capital | | | — | | | | — | 2 | | | — | 2 | | | — | 2 | | | — | |
| | | | | | | | | | | | | | | | | | | | |
Net asset value, end of period | | $ | 10.84 | | | $ | 14.14 | | | $ | 13.49 | | | $ | 13.61 | | | $ | 12.63 | |
| | | | | | | | | | | | | | | | | | | | |
Total Investment Return | | | | | | | | | | | | | |
Based on net asset value | | | (12.38 | )%3 | | | 19.10 | %4 | | | 10.45 | %4 | | | 7.76 | %3,4 | | | 4.89 | %3 |
| | | | | | | | | | | | | | | | | | | | |
Ratios to Average Net Assets | | | | | | | | | | | | | |
Total expenses, net of waivers and reimbursement | | | 1.25 | %5 | | | 1.20 | % | | | 1.25 | % | | | 1.25 | %5 | | | 1.25 | %5 |
| | | | | | | | | | | | | | | | | | | | |
Total expenses | | | 1.28 | %5 | | | 1.24 | % | | | 1.50 | % | | | 1.54 | %5 | | | 1.49 | %5 |
| | | | | | | | | | | | | | | | | | | | |
Net investment income | | | 0.69 | %5 | | | 0.68 | % | | | 0.61 | % | | | 0.20 | %5 | | | 0.39 | %5 |
| | | | | | | | | | | | | | | | | | | | |
Supplemental Data | | | | | | | | | | | | | |
Net assets, end of period (000) | | $ | 2,703 | | | $ | 3,716 | | | $ | 3,130 | | | $ | 889 | | | $ | 1,374 | |
| | | | | | | | | | | | | | | | | | | | |
Portfolio turnover | | | 54 | % | | | 202 | % | | | 153 | % | | | 60 | % | | | 53 | % |
| | | | | | | | | | | | | | | | | | | | |
See Notes to Financial Statements.
| | | | | | |
| 94 | | SEMI-ANNUAL REPORT | | MARCH 31, 2008 | | |
| | |
| Financial Highlights (continued) | | Mid-Cap Value Equity Portfolio* |
| | | | | | | | | | | | | | | | | | | | | | | | | | | | |
| | | Investor A | |
| | | Six Months
Ended
March 31, 2008 | | | Year Ended
September 30, | | | 3/01/05 -
9/30/05 | | | 7/01/04 -
2/28/05 | | | Year Ended
June 30, | |
| | | (Unaudited) | | | 2007 | | | 2006 | | | | | 2004 | | | 2003 | |
Per Share Operating Performance | | | | | | | | | | | | | | | | | | | | | | | | | | | | |
Net asset value, beginning of period | | $ | 14.00 | | | $ | 13.38 | | | $ | 13.49 | | | $ | 12.53 | | | $ | 11.92 | | | $ | 8.91 | | | $ | 10.53 | |
| | | | | | | | | | | | | | | | | | | | | | | | | | | | |
Net investment income | | | 0.04 | 1 | | | 0.08 | 1 | | | 0.08 | 1 | | | 0.02 | 1 | | | 0.07 | | | | 0.05 | | | | 0.06 | |
Net realized and unrealized gain (loss) | | | (1.62 | ) | | | 2.32 | | | | 1.21 | | | | 0.94 | | | | 1.45 | | | | 3.02 | | | | (1.22 | ) |
| | | | | | | | | | | | | | | | | | | | | | | | | | | | |
Net increase (decrease) from investment operations | | | (1.58 | ) | | | 2.40 | | | | 1.29 | | | | 0.96 | | | | 1.52 | | | | 3.07 | | | | (1.16 | ) |
| | | | | | | | | | | | | | | | | | | | | | | | | | | | |
Dividends and distributions from: | | | | | | | | | | | | | | | | | | | | | | | | | | | | |
Net investment income | | | (0.03 | ) | | | (0.12 | ) | | | (0.02 | ) | | | — | | | | (0.11 | ) | | | (0.06 | ) | | | — | |
Net realized capital gain | | | (1.67 | ) | | | (1.66 | ) | | | (1.38 | ) | | | — | | | | (0.80 | ) | | | ��� | | | | (0.46 | ) |
| | | | | | | | | | | | | | | | | | | | | | | | | | | | |
Total dividends and distributions | | | (1.70 | ) | | | (1.78 | ) | | | (1.40 | ) | | | — | | | | (0.91 | ) | | | (0.06 | ) | | | (0.46 | ) |
| | | | | | | | | | | | | | | | | | | | | | | | | | | | |
Redemption fees added to paid-in capital | | | — | | | | — | 2 | | | — | 2 | | | — | 2 | | | — | | | | — | | | | — | |
| | | | | | | | | | | | | | | | | | | | | | | | | | | | |
Net asset value, end of period | | $ | 10.72 | | | $ | 14.00 | | | $ | 13.38 | | | $ | 13.49 | | | $ | 12.53 | | | $ | 11.92 | | | $ | 8.91 | |
| | | | | | | | | | | | | | | | | | | | | | | | | | | | |
Total Investment Return | | | | | | | | | | | | | | | | | | | | | | | | | | | | |
Based on net asset value7 | | | (12.37 | )%3 | | | 19.02 | %4 | | | 10.56 | %4 | | | 7.66 | %3,4 | | | 12.98 | %3 | | | 34.51 | % | | | (10.61 | )% |
| | | | | | | | | | | | | | | | | | | | | | | | | | | | |
Ratios to Average Net Assets | | | | | | | | | | | | | | | | | | | | | | | | | | | | |
Total expenses, net of waivers and reimbursement | | | 1.25 | %5 | | | 1.25 | % | | | 1.25 | % | | | 1.25 | %5 | | | 1.24 | %5 | | | 1.28 | % | | | 1.29 | % |
| | | | | | | | | | | | | | | | | | | | | | | | | | | | |
Total expenses | | | 1.43 | %5 | | | 1.40 | % | | | 1.56 | % | | | 1.64 | %5 | | | 1.38 | %5 | | | 1.33 | % | | | 1.48 | % |
| | | | | | | | | | | | | | | | | | | | | | | | | | | | |
Net investment income | | | 0.71 | %5 | | | 0.61 | % | | | 0.62 | % | | | 0.24 | %5 | | | 0.92 | %5 | | | 0.47 | % | | | 0.65 | % |
| | | | | | | | | | | | | | | | | | | | | | | | | | | | |
Supplemental Data | | | | | | | | | | | | | | | | | | | | | | | | | | | | |
Net assets, end of period (000) | | $ | 566,483 | | | $ | 642,264 | | | $ | 497,964 | | | $ | 500,479 | | | $ | 448,237 | | | $ | 363,188 | | | $ | 194,034 | |
| | | | | | | | | | | | | | | | | | | | | | | | | | | | |
Portfolio turnover | | | 54 | % | | | 202 | % | | | 153 | % | | | 60 | % | | | 53 | % | | | 86 | % | | | 66 | % |
| | | | | | | | | | | | | | | | | | | | | | | | | | | | |
| * | The Performance prior to January 31, 2005 set forth in this table is the financial data of State Street Research Mid-Cap Value Fund, a series of a predecessor trust, State Street Research Equity Trust. BlackRock Funds acquired all of the assets and certain stated liabilities of State Street Research Mid-Cap Value Fund on January 28, 2005. The net asset values and other per share information listed have been restated to reflect the conversion ratios of 1.56483770, 1.57950264, 1.62345461 and 1.63087248 for Institutional, Investor A, Investor B and Investor C shares, respectively. |
1 | Based on average shares outstanding. |
2 | Redemption fees added to paid-in capital are less than $0.01 per share. |
3 | Aggregate total investment return. |
4 | Redemption fee of 2.00% received by the Portfolio is reflected in total return calculations. There was no impact to the return. |
6 | Commenced operations on January 28, 2005. |
7 | Total investment returns exclude the effects of sales charges. |
See Notes to Financial Statements.
| | | | | | |
| | SEMI-ANNUAL REPORT | | MARCH 31, 2008 | | 95 |
| | |
| Financial Highlights (continued) | | Mid-Cap Value Equity Portfolio* |
| | | | | | | | | | | | | | | | | | | | | | | | | | | | |
| | | Investor B | |
| | | Six Months
Ended
March 31, 2008
(Unaudited) | | | Year Ended
September 30, | | | 3/01/05 -
9/30/05 | | | 7/01/04 -
2/28/05 | | | Year Ended
June 30, | |
| | | | 2007 | | | 2006 | | | | | 2004 | | | 2003 | |
Per Share Operating Performance | | | | | | | | | | | | | | | | | | | | | | | | | | | | |
Net asset value, beginning of period | | $ | 12.92 | | | $ | 12.46 | | | $ | 12.73 | | | $ | 11.87 | | | $ | 11.28 | | | $ | 8.45 | | | $ | 10.05 | |
| | | | | | | | | | | | | | | | | | | | | | | | | | | | |
Net investment loss | | | — | 1,2 | | | (0.01 | )2 | | | (0.02 | )2 | | | (0.04 | )2 | | | (0.03 | ) | | | (0.02 | ) | | | (0.01 | ) |
Net realized and unrealized gain (loss) | | | (1.49 | ) | | | 2.15 | | | | 1.13 | | | | 0.90 | | | | 1.41 | | | | 2.85 | | | | (1.15 | ) |
| | | | | | | | | | | | | | | | | | | | | | | | | | | | |
Net increase (decrease) from investment operations | | | (1.49 | ) | | | 2.14 | | | | 1.11 | | | | 0.86 | | | | 1.38 | | | | 2.83 | | | | (1.16 | ) |
| | | | | | | | | | | | | | | | | | | | | | | | | | | | |
Dividends and distributions from: | | | | | | | | | | | | | | | | | | | | | �� | | | | | | | |
Net investment income | | | — | | | | (0.02 | ) | | | — | | | | — | | | | (0.01 | ) | | | — | | | | — | |
Net realized capital gain | | | (1.59 | ) | | | (1.66 | ) | | | (1.38 | ) | | | — | | | | (0.78 | ) | | | — | | | | (0.44 | ) |
| | | | | | | | | | | | | | | | | | | | | | | | | | | | |
Total dividends and distributions | | | (1.59 | ) | | | (1.68 | ) | | | (1.38 | ) | | | — | | | | (0.79 | ) | | | — | | | | (0.44 | ) |
| | | | | | | | | | | | | | | | | | | | | | | | | | | | |
Redemption fees added to paid-in capital | | | — | | | | — | 3 | | | — | 3 | | | — | 3 | | | — | | | | — | | | | — | |
| | | | | | | | | | | | | | | | | | | | | | | | | | | | |
Net asset value, end of period | | $ | 9.84 | | | $ | 12.92 | | | $ | 12.46 | | | $ | 12.73 | | | $ | 11.87 | | | $ | 11.28 | | | $ | 8.45 | |
| | | | | | | | | | | | | | | | | | | | | | | | | | | | |
Total Investment Return | | | | | | | | | | | | | | | | | | | | | | | | | | | | |
Based on net asset value4 | | | (12.65 | )%5 | | | 18.18 | %6 | | | 9.63 | %6 | | | 7.25 | %5,6 | | | 12.39 | %5 | | | 33.53 | %5 | | | (11.13 | )% |
| | | | | | | | | | | | | | | | | | | | | | | | | | | | |
Ratios to Average Net Assets | | | | | | | | | | | | | | | | | | | | | | | | | | | | |
Total expenses, net of waivers and reimbursement | | | 2.00 | %7 | | | 2.00 | % | | | 2.00 | % | | | 2.00 | %7 | | | 1.99 | %7 | | | 1.98 | % | | | 1.99 | % |
| | | | | | | | | | | | | | | | | | | | | | | | | | | | |
Total expenses | | | 2.26 | %7 | | | 2.23 | % | | | 2.25 | % | | | 2.29 | %7 | | | 2.09 | %7 | | | 2.03 | % | | | 2.18 | % |
| | | | | | | | | | | | | | | | | | | | | | | | | | | | |
Net investment income (loss) | | | (0.05 | )%7 | | | (0.09 | )% | | | (0.13 | )% | | | (0.52 | )%7 | | | 0.20 | %7 | | | (0.24 | )% | | | (0.05 | )% |
| | | | | | | | | | | | | | | | | | | | | | | | | | | | |
Supplemental Data | | | | | | | | | | | | | | | | | | | | | | | | | | | | |
Net assets, end of period (000) | | $ | 86,979 | | | $ | 119,768 | | | $ | 124,089 | | | $ | 131,651 | | | $ | 128,568 | | | $ | 109,815 | | | $ | 79,536 | |
| | | | | | | | | | | | | | | | | | | | | | | | | | | | |
Portfolio turnover | | | 54 | % | | | 202 | % | | | 153 | % | | | 60 | % | | | 53 | % | | | 86 | % | | | 66 | % |
| | | | | | | | | | | | | | | | | | | | | | | | | | | | |
See Notes to Financial Statements.
| | | | | | |
| 96 | | SEMI-ANNUAL REPORT | | MARCH 31, 2008 | | |
| | |
| Financial Highlights (continued) | | Mid-Cap Value Equity Portfolio* |
| | | | | | | | | | | | | | | | | | | | | | | | | | | | |
| | | Investor C | |
| | | Six Months
Ended
March 31, 2008
(Unaudited) | | | Year Ended
September 30, | | | 3/01/05 -
9/30/05 | | | 7/01/04 -
2/28/05 | | | Year Ended
June 30, | |
| | | | 2007 | | | 2006 | | | | | 2004 | | | 2003 | |
Per Share Operating Performance | | | | | | | | | | | | | | | | | | | | | | | | | | | | |
Net asset value, beginning of period | | $ | 12.90 | | | $ | 12.46 | | | $ | 12.73 | | | $ | 11.87 | | | $ | 11.28 | | | $ | 8.45 | | | $ | 10.04 | |
| | | | | | | | | | | | | | | | | | | | | | | | | | | | |
Net investment loss | | | — | 1,2 | | | (0.02 | )2 | | | (0.02 | )2 | | | (0.04 | )2 | | | (0.03 | ) | | | (0.02 | ) | | | (0.01 | ) |
Net realized and unrealized gain (loss) | | | (1.49 | ) | | | 2.15 | | | | 1.13 | | | | 0.90 | | | | 1.40 | | | | 2.85 | | | | (1.14 | ) |
| | | | | | | | | | | | | | | | | | | | | | | | | | | | |
Net increase (decrease) from investment operations | | | (1.49 | ) | | | 2.13 | | | | 1.11 | | | | 0.86 | | | | 1.37 | | | | 2.83 | | | | (1.15 | ) |
| | | | | | | | | | | | | | | | | | | | | | | | | | | | |
Dividends and distributions from: | | | | | | | | | | | | | | | | | | | | | | | | | | | | |
Net investment income | | | — | | | | (0.03 | ) | | | — | | | | — | | | | (0.01 | ) | | | — | | | | — | |
Net realized capital gain | | | (1.60 | ) | | | (1.66 | ) | | | (1.38 | ) | | | — | | | | (0.77 | ) | | | — | | | | (0.44 | ) |
| | | | | | | | | | | | | | | | | | | | | | | | | | | | |
Total dividends and distributions | | | (1.60 | ) | | | (1.69 | ) | | | (1.38 | ) | | | — | | | | (0.78 | ) | | | — | | | | (0.44 | ) |
| | | | | | | | | | | | | | | | | | | | | | | | | | | | |
Redemption fees added to paid-in capital | | | — | | | | — | 3 | | | — | 3 | | | — | 3 | | | — | | | | — | | | | — | |
| | | | | | | | | | | | | | | | | | | | | | | | | | | | |
Net asset value, end of period | | $ | 9.81 | | | $ | 12.90 | | | $ | 12.46 | | | $ | 12.73 | | | $ | 11.87 | | | $ | 11.28 | | | $ | 8.45 | |
| | | | | | | | | | | | | | | | | | | | | | | | | | | | |
Total Investment Return | | | | | | | | | | | | | | | | | | | | | | | | | | | | |
Based on net asset value4 | | | (12.65 | )%5 | | | 18.16 | %6 | | | 9.63 | %6 | | | 7.25 | %5,6 | | | 12.40 | %5 | | | 33.53 | % | | | (11.09 | )% |
| | | | | | | | | | | | | | | | | | | | | | | | | | | | |
Ratios to Average Net Assets | | | | | | | | | | | | | | | | | | | | | | | | | | | | |
Total expenses, net of waivers and reimbursement | | | 2.00 | %7 | | | 2.00 | % | | | 2.00 | % | | | 2.00 | %7 | | | 1.99 | %7 | | | 1.98 | % | | | 1.99 | % |
| | | | | | | | | | | | | | | | | | | | | | | | | | | | |
Total expenses | | | 2.19 | %7 | | | 2.21 | % | | | 2.15 | % | | | 2.29 | %7 | | | 2.09 | %7 | | | 2.03 | % | | | 2.19 | % |
| | | | | | | | | | | | | | | | | | | | | | | | | | | | |
Net investment income (loss) | | | (0.04 | )%7 | | | (0.14 | )% | | | (0.13 | )% | | | (0.50 | )%7 | | | 0.19 | %7 | | | (0.24 | )% | | | (0.04 | )% |
| | | | | | | | | | | | | | | | | | | | | | | | | | | | |
Supplemental Data | | | | | | | | | | | | | | | | | | | | | | | | | | | | |
Net assets, end of period (000) | | $ | 139,029 | | | $ | 173,731 | | | $ | 137,382 | | | $ | 103,344 | | | $ | 91,657 | | | $ | 82,758 | | | $ | 58,499 | |
| | | | | | | | | | | | | | | | | | | | | | | | | | | | |
Portfolio turnover | | | 54 | % | | | 202 | % | | | 153 | % | | | 60 | % | | | 53 | % | | | 86 | % | | | 66 | % |
| | | | | | | | | | | | | | | | | | | | | | | | | | | | |
| * | The Performance prior to January 31, 2005 set forth in this table is the financial data of State Street Research Mid-Cap Value Fund, a series of a predecessor trust, State Street Research Equity Trust. BlackRock Funds acquired all of the assets and certain stated liabilities of State Street Research Mid-Cap Value Fund on January 28, 2005. The net asset values and other per share information listed have been restated to reflect the conversion ratios of 1.56483770, 1.57950264, 1.62345461 and 1.63087248 for Institutional, Investor A, Investor B and Investor C shares, respectively. |
1 | Net investment loss is less than $0.005 per share. |
2 | Based on average shares outstanding. |
3 | Redemption fees added to paid-in capital are less than $0.01 per share. |
4 | Total investment returns exclude the effects of sales charges. |
5 | Aggregate total investment return. |
6 | Redemption fee of 2.00% received by the Portfolio is reflected in total return calculations. There was no impact to the return. |
See Notes to Financial Statements.
| | | | | | |
| | SEMI-ANNUAL REPORT | | MARCH 31, 2008 | | 97 |
| | |
| Financial Highlights (continued) | | Mid-Cap Growth Equity Portfolio |
| | | | | | | | | | | | | | | | | | | | | | | | | | | | | | | | | | | | | | | | | | | | | | | | |
| | | Institutional | | | Service | |
| | | Six Months
Ended
March 31, 2008
(Unaudited) | | | Year Ended September 30, | | | Six Months
Ended
March 31, 2008
(Unaudited) | | | Year Ended September 30, | |
| | | 2007 | | | 2006 | | | 2005 | | | 2004 | | | 20031 | | | | 2007 | | | 2006 | | | 2005 | | | 2004 | | | 20031 | |
Per Share Operating Performance | | | | | | | | | | | | | | | | | | | | | | | | | | | | | | | | | | | | | | | | | | | | | | | | |
Net asset value, beginning of period | | $ | 13.49 | | | $ | 10.70 | | | $ | 10.44 | | | $ | 8.76 | | | $ | 7.57 | | | $ | 6.06 | | | $ | 12.92 | | | $ | 10.27 | | | $ | 10.07 | | | $ | 8.46 | | | $ | 7.33 | | | $ | 5.89 | |
| | | | | | | | | | | | | | | | | | | | | | | | | | | | | | | | | | | | | | | | | | | | | | | | |
Net investment loss | | | (0.02 | )2 | | | (0.07 | )2 | | | (0.06 | )2 | | | (0.07 | )2 | | | (0.06 | )2 | | | (0.05 | ) | | | (0.04 | )2 | | | (0.09 | )2 | | | (0.11 | )2 | | | (0.07 | )2 | | | (0.08 | )2 | | | (0.07 | ) |
Net realized and unrealized gain (loss) | | | (1.39 | ) | | | 2.86 | | | | 0.45 | | | | 1.75 | | | | 1.25 | | | | 1.56 | | | | (1.34 | ) | | | 2.74 | | | | 0.44 | | | | 1.68 | | | | 1.21 | | | | 1.51 | |
| | | | | | | | | | | | | | | | | | | | | | | | | | | | | | | | | | | | | | | | | | | | | | | | |
Net increase (decrease) from investment operations | | | (1.41 | ) | | | 2.79 | | | | 0.39 | | | | 1.68 | | | | 1.19 | | | | 1.51 | | | | (1.38 | ) | | | 2.65 | | | | 0.33 | | | | 1.61 | | | | 1.13 | | | | 1.44 | |
| | | | | | | | | | | | | | | | | | | | | | | | | | | | | | | | | | | | | | | | | | | | | | | | |
Dividends and distributions from: | | | | | | | | | | | | | | | | | | | | | | | | | | | | | | | | | | | | | | | | | | | | | | | | |
Net realized capital gain | | | — | | | | — | | | | (0.13 | ) | | | — | | | | — | | | | — | | | | — | | | | — | | | | (0.13 | ) | | | — | | | | — | | | | — | |
| | | | | | | | | | | | | | | | | | | | | | | | | | | | | | | | | | | | | | | | | | | | | | | | |
Redemption fees added to paid-in capital | | | — | | | | — | 3 | | | — | 3 | | | — | 3 | | | — | 3 | | | — | 3 | | | — | | | | — | 3 | | | — | 3 | | | — | 3 | | | — | 3 | | | — | 3 |
| | | | | | | | | | | | | | | | | | | | | | | | | | | | | | | | | | | | | | | | | | | | | | | | |
Net asset value, end of period | | $ | 12.08 | | | $ | 13.49 | | | $ | 10.70 | | | $ | 10.44 | | | $ | 8.76 | | | $ | 7.57 | | | $ | 11.54 | | | $ | 12.92 | | | $ | 10.27 | | | $ | 10.07 | | | $ | 8.46 | | | $ | 7.33 | |
| | | | | | | | | | | | | | | | | | | | | | | | | | | | | | | | | | | | | | | | | | | | | | | | |
Total Investment Return | | | | | | | | | | | | | | | | | | | | | | | | | | | | | | | | | | | | | | | | | | | | | | | | |
Based on net asset value | | | (10.45 | )%4 | | | 26.08 | %5 | | | 3.75 | %5 | | | 19.18 | %5 | | | 15.72 | %5 | | | 24.92 | %5 | | | (10.68 | )%4 | | | 25.80 | %5 | | | 3.29 | %5 | | | 19.03 | %5 | | | 15.42 | %5 | | | 24.45 | %5 |
| | | | | | | | | | | | | | | | | | | | | | | | | | | | | | | | | | | | | | | | | | | | | | | | |
Ratios to Average Net Assets | | | | | | | | | | | | | | | | | | | | | | | | | | | | | | | | | | | | | | | | | | | | | | | | |
Total expenses, net of waivers and reimbursement | | | 1.07 | %6 | | | 1.05 | % | | | 1.08 | % | | | 1.23 | % | | | 1.23 | % | | | 1.21 | % | | | 1.44 | %6 | | | 1.22 | % | | | 1.53 | % | | | 1.53 | % | | | 1.53 | % | | | 1.51 | % |
| | | | | | | | | | | | | | | | | | | | | | | | | | | | | | | | | | | | | | | | | | | | | | | | |
Total expenses | | | 1.07 | %6 | | | 1.06 | % | | | 1.15 | % | | | 1.41 | % | | | 1.28 | % | | | 1.23 | % | | | 1.44 | %6 | | | 1.32 | % | | | 2.02 | % | | | 1.60 | % | | | 1.56 | % | | | 1.53 | % |
| | | | | | | | | | | | | | | | | | | | | | | | | | | | | | | | | | | | | | | | | | | | | | | | |
Net investment loss | | | (0.33 | )%6 | | | (0.59 | )% | | | (0.60 | )% | | | (0.72 | )% | | | (0.65 | )% | | | (0.52 | )% | | | (0.70 | )%6 | | | (0.76 | )% | | | (1.06 | )% | | | (0.77 | )% | | | (0.97 | )% | | | (0.80 | )% |
| | | | | | | | | | | | | | | | | | | | | | | | | | | | | | | | | | | | | | | | | | | | | | | | |
Supplemental Data | | | | | | | | | | | | | | | | | | | | | | | | | | | | | | | | | | | | | | | | | | | | | | | | |
Net assets, end of period (000) | | $ | 31,488 | | | $ | 75,577 | | | $ | 75,111 | | | $ | 75,407 | | | $ | 40,337 | | | $ | 46,970 | | | $ | 606 | | | $ | 714 | | | $ | 757 | | | $ | 1,136 | | | $ | 10,871 | | | $ | 14,115 | |
| | | | | | | | | | | | | | | | | | | | | | | | | | | | | | | | | | | | | | | | | | | | | | | | |
Portfolio turnover | | | 20 | % | | | 53 | % | | | 64 | % | | | 85 | % | | | 29 | % | | | 168 | % | | | 20 | % | | | 53 | % | | | 64 | % | | | 85 | % | | | 29 | % | | | 168 | % |
| | | | | | | | | | | | | | | | | | | | | | | | | | | | | | | | | | | | | | | | | | | | | | | | |
| | | | | | | | | | | | | | | | | | | | | | | | | | | | | | | | | | | | | | | | | | | | | | | | |
| | | Investor A | | | Investor B | |
| | | Six Months
Ended
March 31, 2008
(Unaudited) | | | Year Ended September 30, | | | Six Months
Ended
March 31, 2008
(Unaudited) | | | Year Ended September 30, | |
| | | 2007 | | | 2006 | | | 2005 | | | 2004 | | | 20031 | | | | 2007 | | | 2006 | | | 2005 | | | 2004 | | | 20031 | |
Per Share Operating Performance | | | | | | | | | | | | | | | | | | | | | | | | | | | | | | | | | | | | | | | | | | | | | | | | |
Net asset value, beginning of period | | $ | 12.55 | | | $ | 10.00 | | | $ | 9.82 | | | $ | 8.26 | | | $ | 7.17 | | | $ | 5.77 | | | $ | 11.32 | | | $ | 9.09 | | | $ | 9.00 | | | $ | 7.63 | | | $ | 6.67 | | | $ | 5.41 | |
| | | | | | | | | | | | | | | | | | | | | | | | | | | | | | | | | | | | | | | | | | | | | | | | |
Net investment loss | | | (0.05 | )2 | | | (0.12 | )2 | | | (0.11 | )2 | | | (0.11 | )2 | | | (0.09 | )2 | | | (0.07 | ) | | | (0.09 | )2 | | | (0.18 | )2 | | | (0.17 | )2 | | | (0.15 | )2 | | | (0.14 | )2 | | | (0.11 | ) |
Net realized and unrealized gain (loss) | | | (1.30 | ) | | | 2.67 | | | | 0.42 | | | | 1.67 | | | | 1.18 | | | | 1.47 | | | | (1.16 | ) | | | 2.41 | | | | 0.39 | | | | 1.52 | | | | 1.10 | | | | 1.37 | |
| | | | | | | | | | | | | | | | | | | | | | | | | | | | | | | | | | | | | | | | | | | | | | | | |
Net increase (decrease) from investment operations | | | (1.35 | ) | | | 2.55 | | | | 0.31 | | | | 1.56 | | | | 1.09 | | | | 1.40 | | | | (1.25 | ) | | | 2.23 | | | | 0.22 | | | | 1.37 | | | | 0.96 | | | | 1.26 | |
| | | | | | | | | | | | | | | | | | | | | | | | | | | | | | | | | | | | | | | | | | | | | | | | |
Dividends and distributions from: | | | | | | | | | | | | | | | | | | | | | | | | | | | | | | | | | | | | | | | | | | | | | | | | |
Net realized capital gain | | | — | | | | — | | | | (0.13 | ) | | | — | | | | — | | | | — | | | | — | | | | — | | | | (0.13 | ) | | | — | | | | — | | | | — | |
| | | | | | | | | | | | | | | | | | | | | | | | �� | | | | | | | | | | | | | | | | | | | | | | | | |
Redemption fees added to paid-in capital | | | — | | | | — | 3 | | | — | 3 | | | — | 3 | | | — | 3 | | | — | 3 | | | — | | | | — | 3 | | | — | 3 | | | — | 3 | | | — | 3 | | | — | 3 |
| | | | | | | | | | | | | | | | | | | | | | | | | | | | | | | | | | | | | | | | | | | | | | | | |
Net asset value, end of period | | $ | 11.20 | | | $ | 12.55 | | | $ | 10.00 | | | $ | 9.82 | | | $ | 8.26 | | | $ | 7.17 | | | $ | 10.07 | | | $ | 11.32 | | | $ | 9.09 | | | $ | 9.00 | | | $ | 7.63 | | | $ | 6.67 | |
| | | | | | | | | | | | | | | | | | | | | | | | | | | | | | | | | | | | | | | | | | | | | | | | |
Total Investment Return | | | | | | | | | | | | | | | | | | | | | | | | | | | | | | | | | | | | | | | | | | | | | | | | |
Based on net asset value7 | | | (10.76 | )%4 | | | 25.50 | %5 | | | 3.16 | %5 | | | 18.89 | %5 | | | 15.20 | %5 | | | 24.26 | %5 | | | (11.04 | )%4 | | | 24.53 | %5 | | | 2.44 | %5 | | | 17.96 | %5 | | | 14.39 | %5 | | | 23.29 | %5 |
| | | | | | | | | | | | | | | | | | | | | | | | | | | | | | | | | | | | | | | | | | | | | | | | |
Ratios to Average Net Assets | | | | | | | | | | | | | | | | | | | | | | | | | | | | | | | | | | | | | | | | | | | | | | | | |
Total expenses, net of waivers and reimbursement | | | 1.55 | %6 | | | 1.57 | % | | | 1.58 | % | | | 1.58 | % | | | 1.67 | % | | | 1.68 | % | | | 2.33 | %6 | | | 2.25 | % | | | 2.33 | % | | | 2.33 | % | | | 2.44 | % | | | 2.43 | % |
| | | | | | | | | | | | | | | | | | | | | | | | | | | | | | | | | | | | | | | | | | | | | | | | |
Total expenses | | | 1.55 | %6 | | | 1.60 | % | | | 1.74 | % | | | 1.78 | % | | | 1.77 | % | | | 1.71 | % | | | 2.50 | %6 | | | 2.46 | % | | | 2.54 | % | | | 2.41 | % | | | 2.45 | % | | | 2.45 | % |
| | | | | | | | | | | | | | | | | | | | | | | | | | | | | | | | | | | | | | | | | | | | | | | | |
Net investment loss | | | (0.81 | )%6 | | | (1.11 | )% | | | (1.11 | )% | | | (1.14 | )% | | | (1.09 | )% | | | (0.96 | )% | | | (1.59 | )%6 | | | (1.79 | )% | | | (1.86 | )% | | | (1.82 | )% | | | (1.86 | )% | | | (1.69 | )% |
| | | | | | | | | | | | | | | | | | | | | | | | | | | | | | | | | | | | | | | | | | | | | | | | |
Supplemental Data | | | | | | | | | | | | | | | | | | | | | | | | | | | | | | | | | | | | | | | | | | | | | | | | |
Net assets, end of period (000) | | $ | 235,782 | | | $ | 274,333 | | | $ | 257,729 | | | $ | 290,285 | | | $ | 27,777 | | | $ | 25,960 | | | $ | 30,512 | | | $ | 43,610 | | | $ | 48,635 | | | $ | 59,100 | | | $ | 31,900 | | | $ | 33,982 | |
| | | | | | | | | | | | | | | | | | | | | | | | | | | | | | | | | | | | | | | | | | | | | | | | |
Portfolio turnover | | | 20 | % | | | 53 | % | | | 64 | % | | | 85 | % | | | 29 | % | | | 168 | % | | | 20 | % | | | 53 | % | | | 64 | % | | | 85 | % | | | 29 | % | | | 168 | % |
| | | | | | | | | | | | | | | | | | | | | | | | | | | | | | | | | | | | | | | | | | | | | | | | |
See Notes to Financial Statements.
| | | | | | |
| 98 | | SEMI-ANNUAL REPORT | | MARCH 31, 2008 | | |
| | |
Financial Highlights (continued) | | Mid-Cap Growth Equity Portfolio |
| | | | | | | | | | | | | | | | | | | | | | | | | | | | | | | | |
| | | Investor C | | | R | |
| | | Six Months
Ended
March 31, 2008
(Unaudited) | | | Year Ended September 30, | | | Six Months
Ended
March 31, 2008
(Unaudited) | | | Period
Ended
9/30/078 | |
| | | | 2007 | | | 2006 | | | 2005 | | | 2004 | | | 20031 | | | |
Per Share Operating Performance | | | | | | | | | | | | | | | | | | | | | | | | | | | | | | | | |
Net asset value, beginning of period | | $ | 11.32 | | | $ | 9.09 | | | $ | 9.00 | | | $ | 7.63 | | | $ | 6.67 | | | $ | 5.41 | | | $ | 12.55 | | | $ | 9.92 | |
| | | | | | | | | | | | | | | | | | | | | | | | | | | | | | | | |
Net investment loss | | | (0.08 | )2 | | | (0.19 | )2 | | | (0.17 | )2 | | | (0.15 | )2 | | | (0.14 | )2 | | | (0.11 | ) | | | (0.04 | )2 | | | (0.13 | )2 |
Net realized and unrealized gain (loss) | | | (1.17 | ) | | | 2.42 | | | | 0.39 | | | | 1.52 | | | | 1.10 | | | | 1.37 | | | | (1.30 | ) | | | 2.76 | |
| | | | | | | | | | | | | | | | | | | | | | | | | | | | | | | | |
Net increase (decrease) from investment operations | | | (1.25 | ) | | | 2.23 | | | | 0.22 | | | | 1.37 | | | | 0.96 | | | | 1.26 | | | | (1.34 | ) | | | 2.63 | |
| | | | | | | | | | | | | | | | | | | | | | | | | | | | | | | | |
Dividends and distributions from: | | | | | | | | | | | | | | | | | | | | | | | | | | | | | | | | |
Net realized capital gain | | | — | | | | — | | | | (0.13 | ) | | | — | | | | — | | | | — | | | | — | | | | — | |
| | | | | | | | | | | | | | | | | | | | | | | | | | | | | | | | |
Redemption fees added to paid-in capital | | | — | | | | — | 3 | | | — | 3 | | | — | 3 | | | — | 3 | | | — | 3 | | | — | | | | — | 3 |
| | | | | | | | | | | | | | | | | | | | | | | | | | | | | | | | |
Net asset value, end of period | | $ | 10.07 | | | $ | 11.32 | | | $ | 9.09 | | | $ | 9.00 | | | $ | 7.63 | | | $ | 6.67 | | | $ | 11.21 | | | $ | 12.55 | |
| | | | | | | | | | | | | | | | | | | | | | | | | | | | | | | | |
Total Investment Return | | | | | | | | | | | | | | | | | | | | | | | | | | | | | | | | |
Based on net asset value | | | (11.04 | )%4,7 | | | 24.53 | %5,7 | | | 2.44 | %5,7 | | | 17.96 | %5,7 | | | 14.39 | %5,7 | | | 23.29 | %5,7 | | | (10.68 | )%4 | | | 26.51 | %4,5 |
| | | | | | | | | | | | | | | | | | | | | | | | | | | | | | | | |
Ratios to Average Net Assets | | | | | | | | | | | | | | | | | | | | | | | | | | | | | | | | |
Total expenses, net of waivers and reimbursement | | | 2.26 | %6 | | | 2.30 | % | | | 2.33 | % | | | 2.33 | % | | | 2.44 | % | | | 2.43 | % | | | 1.55 | %6 | | | 1.59 | %6 |
| | | | | | | | | | | | | | | | | | | | | | | | | | | | | | | | |
Total expenses | | | 2.26 | %6 | | | 2.31 | % | | | 2.37 | % | | | 2.41 | % | | | 2.45 | % | | | 2.45 | % | | | 1.61 | %6 | | | 1.63 | %6 |
| | | | | | | | | | | | | | | | | | | | | | | | | | | | | | | | |
Net investment loss | | | (1.52 | )%6 | | | (1.84 | )% | | | (1.86 | )% | | | (1.83 | )% | | | (1.86 | )% | | | (1.69 | )% | | | (0.68 | )%6 | | | (1.12 | )%6 |
| | | | | | | | | | | | | | | | | | | | | | | | | | | | | | | | |
Supplemental Data | | | | | | | | | | | | | | | | | | | | | | | | | | | | | | | | |
Net assets, end of period (000) | | $ | 16,684 | | | $ | 20,203 | | | $ | 18,047 | | | $ | 20,748 | | | $ | 11,269 | | | $ | 12,212 | | | $ | 707 | | | $ | 25 | |
| | | | | | | | | | | | | | | | | | | | | | | | | | | | | | | | |
Portfolio turnover | | | 20 | % | | | 53 | % | | | 64 | % | | | 85 | % | | | 29 | % | | | 168 | % | | | 20 | % | | | 53 | % |
| | | | | | | | | | | | | | | | | | | | | | | | | | | | | | | | |
1 | Audited by other auditors. |
2 | Based on average shares outstanding. |
3 | Redemption fees added to paid-in capital are less than $0.01 per share. |
4 | Aggregate total investment return. |
5 | Redemption fee of 2.00% received by the Portfolio is reflected in total return calculations. There was no impact to the return. |
7 | Total investment returns exclude the effects of sales charges. |
8 | Commenced operations on October 2, 2006. |
See Notes to Financial Statements.
| | | | | | |
| | SEMI-ANNUAL REPORT | | MARCH 31, 2008 | | 99 |
| | |
Financial Highlights (continued) | | Aurora Portfolio |
| | | | | | | | | | | | | | | | | | | | | | | | |
| | | Institutional | |
| | | Six Months
Ended
March 31, 2008
(Unaudited) | | | Year Ended September 30, | |
| | | | 2007 | | | 2006 | | | 2005 | | | 2004 | | | 2003 | |
Per Share Operating Performance | | | | | | | | | | | | | | | | | | | | | | | | |
Net asset value, beginning of period | | $ | 30.87 | | | $ | 37.15 | | | $ | 43.43 | | | $ | 40.71 | | | $ | 33.18 | | | $ | 25.05 | |
| | | | | | | | | | | | | | | | | | | | | | | | |
Net investment income (loss) | | | (0.01 | )1 | | | 0.10 | 1 | | | 0.08 | 1 | | | (0.04 | )1 | | | (0.11 | ) | | | (0.11 | ) |
Net realized and unrealized gain (loss) | | | (3.80 | ) | | | 4.82 | | | | 1.13 | | | | 6.60 | | | | 7.66 | | | | 8.39 | |
| | | | | | | | | | | | | | | | | | | | | | | | |
Net increase (decrease) from investment operations | | | (3.81 | ) | | | 4.92 | | | | 1.21 | | | | 6.56 | | | | 7.55 | | | | 8.28 | |
| | | | | | | | | | | | | | | | | | | | | | | | |
Dividends and distributions from: | | | | | | | | | | | | | | | | | | | | | | | | |
Net realized capital gain | | | (6.02 | ) | | | (11.20 | ) | | | (7.49 | ) | | | (3.84 | ) | | | (0.02 | ) | | | (0.15 | ) |
| | | | | | | | | | | | | | | | | | | | | | | | |
Redemption fees added to paid-in capital | | | — | 2 | | | — | 2 | | | — | 2 | | | — | 2 | | | — | | | | — | |
| | | | | | | | | | | | | | | | | | | | | | | | |
Net asset value, end of period | | $ | 21.04 | | | $ | 30.87 | | | $ | 37.15 | | | $ | 43.43 | | | $ | 40.71 | | | $ | 33.18 | |
| | | | | | | | | | | | | | | | | | | | | | | | |
Total Investment Return | | | | | | | | | | | | | | | | | | | | | | | | |
Based on net asset value | | | (15.36 | )%3,4 | | | 14.86 | %3 | | | 3.40 | %3 | | | 16.62 | %3 | | | 22.75 | % | | | 33.21 | % |
| | | | | | | | | | | | | | | | | | | | | | | | |
Ratios to Average Net Assets | | | | | | | | | | | | | | | | | | | | | | | | |
Total expenses, net of waivers and reimbursement | | | 1.05 | %5 | | | 1.01 | % | | | 1.06 | % | | | 1.14 | % | | | 1.10 | % | | | 1.25 | % |
| | | | | | | | | | | | | | | | | | | | | | | | |
Total expenses | | | 1.26 | %5 | | | 1.11 | % | | | 1.07 | % | | | 1.14 | % | | | 1.10 | % | | | 1.25 | % |
| | | | | | | | | | | | | | | | | | | | | | | | |
Net investment income (loss) | | | (0.08 | )%5 | | | 0.32 | % | | | 0.22 | % | | | (0.09 | )% | | | (0.27 | )% | | | (0.38 | )% |
| | | | | | | | | | | | | | | | | | | | | | | | |
Supplemental Data | | | | | | | | | | | | | | | | | | | | | | | | |
Net assets, end of period (000) | | $ | 116,538 | | | $ | 169,479 | | | $ | 153,103 | | | $ | 165,837 | | | $ | 197,475 | | | $ | 142,460 | |
| | | | | | | | | | | | | | | | | | | | | | | | |
Portfolio turnover | | | 58 | % | | | 134 | % | | | 142 | % | | | 73 | % | | | 33 | % | | | 48 | % |
| | | | | | | | | | | | | | | | | | | | | | | | |
| | | | | | | | | | | | | | | | | | | | | | | | | | | | | | | | | | | | | | | | | | | | | | | | |
| | | Investor A | | | Investor B | |
| | | Six Months
Ended
March 31, 2008
(Unaudited) | | | Year Ended September 30, | | | Six Months
Ended
March 31, 2008
(Unaudited) | | | Year Ended September 30, | |
| | | | 2007 | | | 2006 | | | 2005 | | | 2004 | | | 2003 | | | | 2007 | | | 2006 | | | 2005 | | | 2004 | | | 2003 | |
Per Share Operating Performance | | | | | | | | | | | | | | | | | | | | | | | | | | | | | | | | | | | | | | | | | | | | | | | | |
Net asset value, beginning of period | | $ | 28.75 | | | $ | 35.39 | | | $ | 41.88 | | | $ | 39.49 | | | $ | 32.28 | | | $ | 24.43 | | | $ | 24.06 | | | $ | 31.48 | | | $ | 38.32 | | | $ | 36.67 | | | $ | 30.19 | | | $ | 23.02 | |
| | | | | | | | | | | | | | | | | | | | | | | | | | | | | | | | | | | | | | | | | | | | | | | | |
Net investment income (loss) | | | (0.05 | )1 | | | 0.01 | 1 | | | (0.05 | )1 | | | (0.16 | )1 | | | (0.22 | ) | | | (0.19 | ) | | | (0.11 | )1 | | | (0.19 | )1 | | | (0.29 | )1 | | | (0.40 | )1 | | | (0.45 | ) | | | (0.36 | ) |
Net realized and unrealized gain (loss) | | | (3.49 | ) | | | 4.55 | | | | 1.05 | | | | 6.39 | | | | 7.45 | | | | 8.19 | | | | (2.80 | ) | | | 3.97 | | | | 0.94 | | | | 5.89 | | | | 6.95 | | | | 7.68 | |
| | | | | | | | | | | | | | | | | | | | | | | | | | | | | | | | | | | | | | | | | | | | | | | | |
Net increase (decrease) from investment operations | | | (3.54 | ) | | | 4.56 | | | | 1.00 | | | | 6.23 | | | | 7.23 | | | | 8.00 | | | | (2.91 | ) | | | 3.78 | | | | 0.65 | | | | 5.49 | | | | 6.50 | | | | 7.32 | |
| | | | | | | | | | | | | | | | | | | | | | | | | | | | | | | | | | | | | | | | | | | | | | | | |
Dividends and distributions from: | | | | | | | | | | | | | | | | | | | | | | | | | | | | | | | | | | | | | | | | | | | | | | | | |
Net realized capital gain | | | (5.88 | ) | | | (11.20 | ) | | | (7.49 | ) | | | (3.84 | ) | | | (0.02 | ) | | | (0.15 | ) | | | (5.67 | ) | | | (11.20 | ) | | | (7.49 | ) | | | (3.84 | ) | | | (0.02 | ) | | | (0.15 | ) |
| | | | | | | | | | | | | | | | | | | | | | | | | | | | | | | | | | | | | | | | | | | | | | | | |
Redemption fees added to paid-in capital | | | — | 2 | | | — | 2 | | | — | 2 | | | — | 2 | | | — | | | | — | | | | — | 2 | | | — | 2 | | | — | 2 | | | — | 2 | | | — | | | | — | |
| | | | | | | | | | | | | | | | | | | | | | | | | | | | | | | | | | | | | | | | | | | | | | | | |
Net asset value, end of period | | $ | 19.33 | | | $ | 28.75 | | | $ | 35.39 | | | $ | 41.88 | | | $ | 39.49 | | | $ | 32.28 | | | $ | 15.48 | | | $ | 24.06 | | | $ | 31.48 | | | $ | 38.32 | | | $ | 36.67 | | | $ | 30.19 | |
| | | | | | | | | | | | | | | | | | | | | | | | | | | | | | | | | | | | | | | | | | | | | | | | |
Total Investment Return | | | | | | | | | | | | | | | | | | | | | | | | | | | | | | | | | | | | | | | | | | | | | | | | |
Based on net asset value6 | | | (15.50 | )%3,4 | | | 14.48 | %3 | | | 2.95 | %3 | | | 16.28 | %3 | | | 22.39 | % | | | 32.90 | % | | | (15.83 | )%3,4 | | | 13.56 | %3 | | | 2.18 | %3 | | | 15.44 | %3 | | | 21.53 | % | | | 31.96 | % |
| | | | | | | | | | | | | | | | | | | | | | | | | | | | | | | | | | | | | | | | | | | | | | | | |
Ratios to Average Net Assets | | | | | | | | | | | | | | | | | | | | | | | | | | | | | | | | | | | | | | | | | | | | | | | | |
Total expenses, net of waivers and reimbursement | | | 1.44 | %5 | | | 1.39 | % | | | 1.44 | % | | | 1.40 | % | | | 1.40 | % | | | 1.55 | % | | | 2.19 | %5 | | | 2.16 | % | | | 2.19 | % | | | 2.14 | % | | | 2.10 | % | | | 2.25 | % |
| | | | | | | | | | | | | | | | | | | | | | | | | | | | | | | | | | | | | | | | | | | | | | | | |
Total expenses | | | 1.49 | %5 | | | 1.40 | % | | | 1.56 | % | | | 1.47 | % | | | 1.40 | % | | | 1.55 | % | | | 2.35 | %5 | | | 2.24 | % | | | 2.23 | % | | | 2.15 | % | | | 2.10 | % | | | 2.25 | % |
| | | | | | | | | | | | | | | | | | | | | | | | | | | | | | | | | | | | | | | | | | | | | | | | |
Net investment income (loss) | | | (0.46 | )%5 | | | 0.03 | % | | | (0.15 | )% | | | (0.36 | )% | | | (0.57 | )% | | | (0.69 | )% | | | (1.21 | )%5 | | | (0.75 | )% | | | (0.90 | )% | | | (1.10 | )% | | | (1.27 | )% | | | (1.39 | )% |
| | | | | | | | | | | | | | | | | | | | | | | | | | | | | | | | | | | | | | | | | | | | | | | | |
Supplemental Data | | | | | | | | | | | | | | | | | | | | | | | | | | | | | | | | | | | | | | | | | | | | | | | | |
Net assets, end of period (000) | | $ | 600,767 | | | $ | 871,699 | | | $ | 1,189,440 | | | $ | 1,690,497 | | | $ | 2,169,836 | | | $ | 1,682,504 | | | $ | 163,505 | | | $ | 250,672 | | | $ | 329,207 | | | $ | 436,642 | | | $ | 470,430 | | | $ | 401,016 | |
| | | | | | | | | | | | | | | | | | | | | | | | | | | | | | | | | | | | | | | | | | | | | | | | |
Portfolio turnover | | | 58 | % | | | 134 | % | | | 142 | % | | | 73 | % | | | 33 | % | | | 48 | % | | | 58 | % | | | 134 | % | | | 142 | % | | | 73 | % | | | 33 | % | | | 48 | % |
| | | | | | | | | | | | | | | | | | | | | | | | | | | | | | | | | | | | | | | | | | | | | | | | |
See Notes to Financial Statements.
| | | | | | |
| 100 | | SEMI-ANNUAL REPORT | | MARCH 31, 2008 | | |
| | |
Financial Highlights (continued) | | Aurora Portfolio |
| | | | | | | | | | | | | | | | | | | | | | | | | | | | | | | | |
| | | Investor C | | | R | |
| | | Six Months
Ended
March 31, 2008
(Unaudited) | | | Year ended September 30, | | | Six Months
Ended
March 31, 2008
(Unaudited) | | | Period
Ended
9/30/077 | |
| | | | 2007 | | | 2006 | | | 2005 | | | 2004 | | | 2003 | | | |
Per Share Operating Performance | | | | | | | | | | | | | | | | | | | | | | | | | | | | | | | | |
Net asset value, beginning of period | | $ | 24.07 | | | $ | 31.47 | | | $ | 38.32 | | | $ | 36.67 | | | $ | 30.18 | | | $ | 23.01 | | | $ | 28.70 | | | $ | 35.21 | |
| | | | | | | | | | | | | | | | | | | | | | | | | | | | | | | | |
Net investment loss | | | (0.11 | )1 | | | (0.18 | )1 | | | (0.29 | )1 | | | (0.42 | )1 | | | (0.45 | ) | | | (0.35 | ) | | | (0.06 | )1 | | | (0.16 | )1 |
Net realized and unrealized gain (loss) | | | (2.81 | ) | | | 3.98 | | | | 0.93 | | | | 5.91 | | | | 6.96 | | | | 7.67 | | | | (3.47 | ) | | | 4.85 | |
| | | | | | | | | | | | | | | | | | | | | | | | | | | | | | | | |
Net increase (decrease) from investment operations | | | (2.92 | ) | | | 3.80 | | | | 0.64 | | | | 5.49 | | | | 6.51 | | | | 7.32 | | | | (3.53 | ) | | | 4.69 | |
| | | | | | | | | | | | | | | | | | | | | | | | | | | | | | | | |
Dividends and distributions from: | | | | | | | | | | | | | | | | | | | | | | | | | | | | | | | | |
Net realized capital gain | | | (5.68 | ) | | | (11.20 | ) | | | (7.49 | ) | | | (3.84 | ) | | | (0.02 | ) | | | (0.15 | ) | | | (6.02 | ) | | | (11.20 | ) |
| | | | | | | | | | | | | | | | | | | | | | | | | | | | | | | | |
Redemption fees added to paid-in capital | | | — | 2 | | | — | 2 | | | — | 2 | | | — | 2 | | | — | | | | — | | | | — | 2 | | | — | 2 |
| | | | | | | | | | | | | | | | | | | | | | | | | | | | | | | | |
Net asset value, end of period | | $ | 15.47 | | | $ | 24.07 | | | $ | 31.47 | | | $ | 38.32 | | | $ | 36.67 | | | $ | 30.18 | | | $ | 19.15 | | | $ | 28.70 | |
| | | | | | | | | | | | | | | | | | | | | | | | | | | | | | | | |
Total Investment Return | | | | | | | | | | | | | | | | | | | | | | | | | | | | | | | | |
Based on net asset value | | | (15.86 | )%3,4,6 | | | 13.64 | %3,6 | | | 2.16 | %3,6 | | | 15.45 | %3,6 | | | 21.57 | %6 | | | 31.97 | %6 | | | (15.59 | )%3,4 | | | 14.87 | %3,4 |
| | | | | | | | | | | | | | | | | | | | | | | | | | | | | | | | |
Ratios to Average Net Assets | | | | | | | | | | | | | | | | | | | | | | | | | | | | | | | | |
Total expenses, net of waivers and reimbursement | | | 2.19 | %5 | | | 2.13 | % | | | 2.19 | % | | | 2.14 | % | | | 2.10 | % | | | 2.25 | % | | | 1.56 | %5 | | | 1.50 | %5 |
| | | | | | | | | | | | | | | | | | | | | | | | | | | | | | | | |
Total expenses | | | 2.27 | %5 | | | 2.17 | % | | | 2.22 | % | | | 2.15 | % | | | 2.10 | % | | | 2.25 | % | | | 1.68 | %5 | | | 1.50 | %5 |
| | | | | | | | | | | | | | | | | | | | | | | | | | | | | | | | |
Net investment loss | | | (1.21 | )%5 | | | (0.72 | )% | | | (0.90 | )% | | | (1.10 | )% | | | (1.27 | )% | | | (1.39 | )% | | | (0.56 | )%5 | | | (0.57 | )%5 |
| | | | | | | | | | | | | | | | | | | | | | | | | | | | | | | | |
Supplemental Data | | | | | | | | | | | | | | | | | | | | | | | | | | | | | | | | |
Net assets, end of period (000) | | $ | 137,897 | | | $ | 209,820 | | | $ | 283,562 | | | $ | 405,952 | | | $ | 493,980 | | | $ | 409,076 | | | $ | 1,336 | | | $ | 1,141 | |
| | | | | | | | | | | | | | | | | | | | | | | | | | | | | | | | |
Portfolio turnover | | | 58 | % | | | 134 | % | | | 142 | % | | | 73 | % | | | 33 | % | | | 48 | % | | | 58 | % | | | 134 | % |
| | | | | | | | | | | | | | | | | | | | | | | | | | | | | | | | |
1 | Based on average shares outstanding. |
2 | Redemption fees added to paid-in capital are less than $0.01 per share. |
3 | Redemption fee of 2.00% received by the Portfolio is reflected in total return calculations. There was no impact to the return. |
4 | Aggregate total investment return. |
6 | Total investment returns exclude the effects of sales charges. |
7 | Commenced operations on October 2, 2006. |
See Notes to Financial Statements.
| | | | | | |
| | SEMI-ANNUAL REPORT | | MARCH 31, 2008 | | 101 |
| | |
Financial Highlights (continued) | | Small/Mid-Cap Growth Portfolio |
| | | | | | | | | | | | | | | | | | | | | | | | |
| | | Institutional | |
| | | Six Months
Ended
March 31, 2008
(Unaudited) | | | Year Ended September 30, | |
| | | 2007 | | | 2006 | | | 2005 | | | 2004 | | | 2003 | |
Per Share Operating Performance | | | | | | | | | | | | | | | | | | | | | | | | |
Net asset value, beginning of period | | $ | 18.24 | | | $ | 15.51 | | | $ | 15.16 | | | $ | 12.49 | | | $ | 12.11 | | | $ | 9.06 | |
| | | | | | | | | | | | | | | | | | | | | | | | |
Net investment loss | | | (0.03 | )1 | | | (0.12 | )1 | | | (0.10 | )1 | | | (0.17 | )1 | | | (0.10 | ) | | | (0.08 | ) |
Net realized and unrealized gain (loss) | | | (1.85 | ) | | | 3.68 | | | | 1.09 | | | | 2.84 | | | | 0.48 | | | | 3.13 | |
| | | | | | | | | | | | | | | | | | | | | | | | |
Net increase (decrease) from investment operations | | | (1.88 | ) | | | 3.56 | | | | 0.99 | | | | 2.67 | | | | 0.38 | | | | 3.05 | |
| | | | | | | | | | | | | | | | | | | | | | | | |
Dividends and distributions from: | | | | | | | | | | | | | | | | | | | | | | | | |
Net realized capital gain | | | (2.89 | ) | | | (0.83 | ) | | | (0.64 | ) | | | — | | | | — | | | | — | |
| | | | | | | | | | | | | | | | | | | | | | | | |
Redemption fees added to paid-in capital | | | — | 2 | | | — | 2 | | | — | 2 | | | — | 2 | | | — | | | | — | |
| | | | | | | | | | | | | | | | | | | | | | | | |
Net asset value, end of period | | $ | 13.47 | | | $ | 18.24 | | | $ | 15.51 | | | $ | 15.16 | | | $ | 12.49 | | | $ | 12.11 | |
| | | | | | | | | | | | | | | | | | | | | | | | |
Total Investment Return | | | | | | | | | | | | | | | | | | | | | | | | |
Based on net asset value | | | (11.85 | )%3,4 | | | 23.74 | %3 | | | 6.63 | %3 | | | 21.38 | %3 | | | 3.14 | % | | | 33.66 | % |
| | | | | | | | | | | | | | | | | | | | | | | | |
Ratios to Average Net Assets | | | | | | | | | | | | | | | | | | | | | | | | |
Total expenses, net of waivers and reimbursement | | | 1.10 | %5 | | | 1.05 | % | | | 0.99 | % | | | 1.10 | % | | | 1.09 | % | | | 1.10 | % |
| | | | | | | �� | | | | | | | | | | | | | | | | | |
Total expenses | | | 1.42 | %5 | | | 1.38 | % | | | 1.06 | % | | | 1.28 | % | | | 1.28 | % | | | 1.55 | % |
| | | | | | | | | | | | | | | | | | | | | | | | |
Net investment loss | | | (0.33 | )%5 | | | (0.71 | )% | | | (0.64 | )% | | | (0.72 | )% | | | (0.80 | )% | | | (0.78 | )% |
| | | | | | | | | | | | | | | | | | | | | | | | |
Supplemental Data | | | | | | | | | | | | | | | | | | | | | | | | |
Net assets, end of period (000) | | $ | 19,786 | | | $ | 26,976 | | | $ | 23,866 | | | $ | 20,133 | | | $ | 87,520 | | | $ | 7,809 | |
| | | | | | | | | | | | | | | | | | | | | | | | |
Portfolio turnover | | | 32 | % | | | 76 | % | | | 49 | % | | | 122 | % | | | 208 | % | | | 167 | % |
| | | | | | | | | | | | | | | | | | | | | | | | |
| | | | | | | | | | | | | | | | | | | | | | | | | | | | | | | | | | | | | | | | | | | | | | | | |
| | | Investor A | | | Investor B | |
| | | Six Months
Ended
March 31, 2008
(Unaudited) | | | Year Ended September 30, | | | Six Months
Ended
March 31, 2008
(Unaudited) | | | Year Ended September 30, | |
| | | 2007 | | | 2006 | | | 2005 | | | 2004 | | | 2003 | | | | 2007 | | | 2006 | | | 2005 | | | 2004 | | | 2003 | |
Per Share Operating Performance | | | | | | | | | | | | | | | | | | | | | | | | | | | | | | | | | | | | | | | | | | | | | | | | |
Net asset value, beginning of period | | $ | 17.24 | | | $ | 14.74 | | | $ | 14.48 | | | $ | 11.96 | | | $ | 11.63 | | | $ | 8.73 | | | $ | 15.09 | | | $ | 13.10 | | | $ | 13.03 | | | $ | 10.84 | | | $ | 10.62 | | | $ | 8.03 | |
| | | | | | | | | | | | | | | | | | | | | | | | | | | | | | | | | | | | | | | | | | | | | | | | |
Net investment loss | | | (0.04 | )1 | | | (0.15 | )1 | | | (0.15 | )1 | | | (0.13 | )1 | | | (0.14 | ) | | | (0.11 | ) | | | (0.08 | )1 | | | (0.24 | )1 | | | (0.23 | )1 | | | (0.19 | )1 | | | (0.21 | ) | | | (0.16 | ) |
Net realized and unrealized gain (loss) | | | (1.74 | ) | | | 3.48 | | | | 1.05 | | | | 2.65 | | | | 0.47 | | | | 3.01 | | | | (1.51 | ) | | | 3.06 | | | | 0.94 | | | | 2.38 | | | | 0.43 | | | | 2.75 | |
| | | | | | | | | | | | | | | | | | | | | | | | | | | | | | | | | | | | | | | | | | | | | | | | |
Net increase (decrease) from investment operations | | | (1.78 | ) | | | 3.33 | | | | 0.90 | | | | 2.52 | | | | 0.33 | | | | 2.90 | | | | (1.59 | ) | | | 2.82 | | | | 0.71 | | | | 2.19 | | | | 0.22 | | | | 2.59 | |
| | | | | | | | | | | | | | | | | | | | | | | | | | | | | | | | | | | | | | | | | | | | | | | | |
Dividends and distributions from: | | | | | | | | | | | | | | | | | | | | | | | | | | | | | | | | | | | | | | | | | | | | | | | | |
Net realized capital gain | | | (2.86 | ) | | | (0.83 | ) | | | (0.64 | ) | | | — | | | | — | | | | — | | | | (2.71 | ) | | | (0.83 | ) | | | (0.64 | ) | | | — | | | | — | | | | — | |
| | | | | | | | | | | | | | | | | | | | | | | | | | | | | | | | | | | | | | | | | | | | | | | | |
Redemption fees added to paid-in capital | | | — | 2 | | | — | 2 | | | — | 2 | | | — | 2 | | | — | | | | — | | | | — | 2 | | | — | 2 | | | — | 2 | | | — | 2 | | | — | | | | — | |
| | | | | | | | | | | | | | | | | | | | | | | | | | | | | | | | | | | | | | | | | | | | | | | | |
Net asset value, end of period | | $ | 12.60 | | | $ | 17.24 | | | $ | 14.74 | | | $ | 14.48 | | | $ | 11.96 | | | $ | 11.63 | | | $ | 10.79 | | | $ | 15.09 | | | $ | 13.10 | | | $ | 13.03 | | | $ | 10.84 | | | $ | 10.62 | |
| | | | | | | | | | | | | | | | | | | | | | | | | | | | | | | | | | | | | | | | | | | | | | | | |
Total Investment Return | | | | | | | | | | | | | | | | | | | | | | | | | | | | | | | | | | | | | | | | | | | | | | | | |
Based on net asset value6 | | | (11.96 | )%3,4 | | | 23.41 | %3 | | | 6.31 | %3 | | | 21.07 | %3 | | | 2.84 | % | | | 33.22 | % | | | (12.29 | )%3,4 | | | 22.40 | %3 | | | 5.52 | %3 | | | 20.20 | %3 | | | 2.17 | % | | | 32.25 | % |
| | | | | | | | | | | | | | | | | | | | | | | | | | | | | | | | | | | | | | | | | | | | | | | | |
Ratios to Average Net Assets | | | | | | | | | | | | | | | | | | | | | | | | | | | | | | | | | | | | | | | | | | | | | | | | |
Total expenses, net of waivers and reimbursement | | | 1.35 | %5 | | | 1.26 | % | | | 1.35 | % | | | 1.37 | %* | | | 1.39 | % | | | 1.40 | % | | | 2.10 | %5 | | | 2.09 | % | | | 2.10 | % | | | 2.10 | % | | | 2.09 | % | | | 2.10 | % |
| | | | | | | | | | | | | | | | | | | | | | | | | | | | | | | | | | | | | | | | | | | | | | | | |
Total expenses | | | 1.46 | %5 | | | 1.42 | % | | | 1.66 | % | | | 1.64 | % | | | 1.56 | % | | | 1.78 | % | | | 2.45 | %5 | | | 2.40 | % | | | 2.40 | % | | | 2.30 | % | | | 2.25 | % | | | 2.54 | % |
| | | | | | | | | | | | | | | | | | | | | | | | | | | | | | | | | | | | | | | | | | | | | | | | |
Net investment loss | | | (0.58 | )%5 | | | (0.92 | )% | | | (1.00 | )% | | | (0.87 | )% | | | (1.09 | )% | | | (1.10 | )% | | | (1.33 | )%5 | | | (1.75 | )% | | | (1.75 | )% | | | (1.58 | )% | | | (1.79 | )% | | | (1.78 | )% |
| | | | | | | | | | | | | | | | | | | | | | | | | | | | | | | | | | | | | | | | | | | | | | | | |
Supplemental Data | | | | | | | | | | | | | | | | | | | | | | | | | | | | | | | | | | | | | | | | | | | | | | | | |
Net assets, end of period (000) | | $ | 179,757 | | | $ | 218,851 | | | $ | 209,646 | | | $ | 215,622 | | | $ | 268,065 | | | $ | 117,571 | | | $ | 15,065 | | | $ | 21,110 | | | $ | 23,085 | | | $ | 24,925 | | | $ | 24,880 | | | $ | 19,797 | |
| | | | | | | | | | | | | | | | | | | | | | | | | | | | | | | | | | | | | | | | | | | | | | | | |
Portfolio turnover | | | 32 | % | | | 76 | % | | | 49 | % | | | 122 | % | | | 208 | % | | | 167 | % | | | 32 | % | | | 76 | % | | | 49 | % | | | 122 | % | | | 208 | % | | | 167 | % |
| | | | | | | | | | | | | | | | | | | | | | | | | | | | | | | | | | | | | | | | | | | | | | | | |
See Notes to Financial Statements.
| | | | | | |
| 102 | | SEMI-ANNUAL REPORT | | MARCH 31, 2008 | | |
| | |
Financial Highlights (continued) | | Small/Mid-Cap Growth Portfolio |
| | | | | | | | | | | | | | | | | | | | | | | | | | | | | | | | |
| | | Investor C | | | R | |
| | | Six Months
Ended
March 31, 2008
(Unaudited) | | | Year Ended September 30, | | �� | Six Months
Ended
March 31, 2008
(Unaudited) | | | Period
Ended
9/30/077 | |
| | | 2007 | | | 2006 | | | 2005 | | | 2004 | | | 2003 | | | |
Per Share Operating Performance | | | | | | | | | | | | | | | | | | | | | | | | | | | | | | | | |
Net asset value, beginning of period | | $ | 15.12 | | | $ | 13.12 | | | $ | 13.06 | | | $ | 10.87 | | | $ | 10.64 | | | $ | 8.05 | | | $ | 17.18 | | | $ | 14.54 | |
| | | | | | | | | | | | | | | | | | | | | | | | | | | | | | | | |
Net investment loss | | | (0.08 | )1 | | | (0.24 | )1 | | | (0.23 | )1 | | | (0.20 | )1 | | | (0.21 | ) | | | (0.16 | ) | | | (0.06 | )1 | | | (0.20 | )1 |
Net realized and unrealized gain (loss) | | | (1.51 | ) | | | 3.07 | | | | 0.93 | | | | 2.39 | | | | 0.44 | | | | 2.75 | | | | (1.72 | ) | | | 3.67 | |
| | | | | | | | | | | | | | | | | | | | | | | | | | | | | | | | |
Net increase (decrease) from investment operations | | | (1.59 | ) | | | 2.83 | | | | 0.70 | | | | 2.19 | | | | 0.23 | | | | 2.59 | | | | (1.78 | ) | | | 3.47 | |
| | | | | | | | | | | | | | | | | | | | | | | | | | | | | | | | |
Dividends and distributions from: | | | | | | | | | | | | | | | | | | | | | | | | | | | | | | | | |
Net realized capital gain | | | (2.73 | ) | | | (0.83 | ) | | | (0.64 | ) | | | — | | | | — | | | | — | | | | (2.90 | ) | | | (0.83 | ) |
| | | | | | | | | | | | | | | | | | | | | | | | | | | | | | | | |
Redemption fees added to paid-in capital | | | — | 2 | | | — | 2 | | | — | 2 | | | — | 2 | | | — | | | | — | | | | — | 2 | | | — | 2 |
| | | | | | | | | | | | | | | | | | | | | | | | | | | | | | | | |
Net asset value, end of period | | $ | 10.80 | | | $ | 15.12 | | | $ | 13.12 | | | $ | 13.06 | | | $ | 10.87 | | | $ | 10.64 | | | $ | 12.50 | | | $ | 17.18 | |
| | | | | | | | | | | | | | | | | | | | | | | | | | | | | | | | |
Total Investment Return | | | | | | | | | | | | | | | | | | | | | | | | | | | | | | | | |
Based on net asset value | | | (12.32 | )%3,4,6 | | | 22.44 | %3,6 | | | 5.43 | %3,6 | | | 20.15 | %3,6 | | | 2.16 | %6 | | | 32.17 | %6 | | | (12.04 | )%3,4 | | | 24.68 | %3,4 |
| | | | | | | | | | | | | | | | | | | | | | | | | | | | | | | | |
Ratios to Average Net Assets | | | | | | | | | | | | | | | | | | | | | | | | | | | | | | | | |
Total expenses, net of waivers and reimbursement | | | 2.10 | %5 | | | 2.07 | % | | | 2.10 | % | | | 2.10 | % | | | 2.09 | % | | | 2.10 | % | | | 1.59 | %5 | | | 1.56 | %5 |
| | | | | | | | | | | | | | | | | | | | | | | | | | | | | | | | |
Total expenses | | | 2.25 | %5 | | | 2.23 | % | | | 2.30 | % | | | 2.32 | % | | | 2.26 | % | | | 2.51 | % | | | 2.00 | %5 | | | 1.81 | %5 |
| | | | | | | | | | | | | | | | | | | | | | | | | | | | | | | | |
Net investment loss | | | (1.33 | )%5 | | | (1.73 | )% | | | (1.75 | )% | | | (1.60 | )% | | | (1.79 | )% | | | (1.79 | )% | | | (0.79 | )%5 | | | (1.22 | )%5 |
| | | | | | | | | | | | | | | | | | | | | | | | | | | | | | | | |
Supplemental Data | | | | | | | | | | | | | | | | | | | | | | | | | | | | | | | | |
Net assets, end of period (000) | | $ | 14,408 | | | $ | 17,047 | | | $ | 17,041 | | | $ | 20,963 | | | $ | 29,627 | | | $ | 13,530 | | | $ | 1,597 | | | $ | 1,071 | |
| | | | | | | | | | | | | | | | | | | | | | | | | | | | | | | | |
Portfolio turnover | | | 32 | % | | | 76 | % | | | 49 | % | | | 122 | % | | | 208 | % | | | 167 | % | | | 32 | % | | | 76 | % |
| | | | | | | | | | | | | | | | | | | | | | | | | | | | | | | | |
| * | For the period October 1, 2004, through January 28, 2005, the expense ratio reflects the expenses of State Street Research Emerging Growth Fund prior to its reorganization with the Small/Mid-Cap Growth Portfolio on January 28, 2005. The expense ratio for the period October 1, 2004 through January 28, 2005 was 1.41%. The expense ratio of the Portfolio for the period January 29, 2005 through September 30, 2005 was 1.31%. |
1 | Based on average shares outstanding. |
2 | Redemption fees added to paid-in capital are less than $0.01 per share. |
3 | Redemption fee of 2.00% received by the Portfolio is reflected in total return calculations. There was no impact to the return. |
4 | Aggregate total investment return. |
6 | Total investment returns exclude the effects of sales charges. |
7 | Commenced operations on October 2, 2006. |
See Notes to Financial Statements.
| | | | | | |
| | SEMI-ANNUAL REPORT | | MARCH 31, 2008 | | 103 |
| | |
Financial Highlights (continued) | | Small Cap Value Equity Portfolio |
| | | | | | | | | | | | | | | | | | | | | | | | | | | | | | | | | | | | | | | | | | | | |
| | | BlackRock | | | Institutional | |
| | | Six Months
Ended
March 31, 2008
(Unaudited) | | | Year Ended
September 30, | | | Period
Ended
9/30/041 | | | Six Months
Ended
March 31, 2008
(Unaudited) | | | Year Ended September 30, | |
| | | 2007 | | | 2006 | | | 2005 | | | | | 2007 | | | 2006 | | | 2005 | | | 2004 | | | 20032 | |
Per Share Operating Performance | | | | | | | | | | | | | | | | | | | | | | | | | | | | | | | | | | | | | | | | | | | | |
Net asset value, beginning of period | | $ | 11.83 | | | $ | 13.46 | | | $ | 15.16 | | | $ | 15.23 | | | $ | 16.02 | | | $ | 11.86 | | | $ | 13.49 | | | $ | 15.17 | | | $ | 15.22 | | | $ | 14.17 | | | $ | 12.81 | |
| | | | | | | | | | | | | | | | | | | | | | | | | | | | | | | | | | | | | | | | | | | | |
Net investment income (loss) | | | 0.03 | 3 | | | 0.04 | 3 | | | — | 3,4 | | | 0.02 | 3 | | | — | 3,4 | | | 0.04 | 3 | | | 0.07 | 3 | | | 0.03 | 3 | | | 0.04 | 3 | | | (0.02 | )3 | | | 0.01 | |
Net realized and unrealized gain (loss) | | | (1.40 | ) | | | 1.27 | | | | 1.21 | | | | 2.90 | | | | (0.79 | ) | | | (1.40 | ) | | | 1.28 | | | | 1.21 | | | | 2.90 | | | | 2.86 | | | | 3.31 | |
| | | | | | | | | | | | | | | | | | | | | | | | | | | | | | | | | | | | | | | | | | | | |
Net increase (decrease) from investment operations | | | (1.37 | ) | | | 1.31 | | | | 1.21 | | | | 2.92 | | | | (0.79 | ) | | | (1.36 | ) | | | 1.35 | | | | 1.24 | | | | 2.94 | | | | 2.84 | | | | 3.32 | |
| | | | | | | | | | | | | | | | | | | | | | | | | | | | | | | | | | | | | | | | | | | | |
Dividends and distributions from: | | | | | | | | | | | | | | | | | | | | | | | | | | | | | | | | | | | | | | | | | | | | |
Net investment income | | | (0.29 | ) | | | (0.29 | ) | | | (0.17 | ) | | | — | | | | — | | | | (0.33 | ) | | | (0.33 | ) | | | (0.18 | ) | | | — | | | | — | | | | — | |
Net realized capital gain | | | (1.51 | ) | | | (2.65 | ) | | | (2.74 | ) | | | (2.99 | ) | | | — | | | | (1.51 | ) | | | (2.65 | ) | | | (2.74 | ) | | | (2.99 | ) | | | (1.79 | ) | | | (1.96 | ) |
| | | | | | | | | | | | | | | | | | | | | | | | | | | | | | | | | | | | | | | | | | | | |
Total dividends and distributions | | | (1.80 | ) | | | (2.94 | ) | | | (2.91 | ) | | | (2.99 | ) | | | — | | | | (1.84 | ) | | | (2.98 | ) | | | (2.92 | ) | | | (2.99 | ) | | | (1.79 | ) | | | (1.96 | ) |
| | | | | | | | | | | | | | | | | | | | | | | | | | | | | | | | | | | | | | | | | | | | |
Redemption fees added to paid-in capital5 | | | — | | | | — | | | | — | | | | — | | | | — | | | | — | | | | — | | | | — | | | | — | | | | — | | | | — | |
| | | | | | | | | | | | | | | | | | | | | | | | | | | | | | | | | | | | | | | | | | | | |
Net asset value, end of period | | $ | 8.66 | | | $ | 11.83 | | | $ | 13.46 | | | $ | 15.16 | | | $ | 15.23 | | | $ | 8.66 | | | $ | 11.86 | | | $ | 13.49 | | | $ | 15.17 | | | $ | 15.22 | | | $ | 14.17 | |
| | | | | | | | | | | | | | | | | | | | | | | | | | | | | | | | | | | | | | | | | | | | |
Total Investment Return | | | | | | | | | | | | | | | | | | | | | | | | | | | | | | | | | | | | | | | | | | | | |
Based on net asset value6 | | | (13.46 | )%7 | | | 9.90 | % | | | 9.61 | % | | | 20.60 | % | | | (4.93 | )%7 | | | (13.43 | )%7 | | | 10.20 | % | | | 9.81 | % | | | 20.77 | % | | | 20.87 | % | | | 29.96 | % |
| | | | | | | | | | | | | | | | | | | | | | | | | | | | | | | | | | | | | | | | | | | | |
Ratios to Average Net Assets | | | | | | | | | | | | | | | | | | | | | | | | | | | | | | | | | | | | | | | | | | | | |
Total expenses, net of waivers and reimbursement | | | 1.10 | %8 | | | 1.08 | % | | | 1.10 | % | | | 1.07 | % | | | 1.10 | %8 | | | 0.90 | %8 | | | 0.86 | % | | | 0.89 | % | | | 0.97 | % | | | 0.95 | % | | | 0.91 | % |
| | | | | | | | | | | | | | | | | | | | | | | | | | | | | | | | | | | | | | | | | | | | |
Total expenses | | | 1.23 | %8 | | | 1.10 | % | | | 1.12 | % | | | 1.08 | % | | | 1.33 | %8 | | | 1.00 | %8 | | | 0.87 | % | | | 0.91 | % | | | 1.00 | % | | | 0.98 | % | | | 0.94 | % |
| | | | | | | | | | | | | | | | | | | | | | | | | | | | | | | | | | | | | | | | | | | | |
Net investment income (loss) | | | 0.58 | %8 | | | 0.32 | % | | | (0.01 | )% | | | 0.16 | % | | | (0.17 | )%8 | | | 0.78 | %8 | | | 0.57 | % | | | 0.23 | % | | | 0.26 | % | | | (0.15 | )% | | | 0.09 | % |
| | | | | | | | | | | | | | | | | | | | | | | | | | | | | | | | | | | | | | | | | | | | |
Supplemental Data | | | | | | | | | | | | | | | | | | | | | | | | | | | | | | | | | | | | | | | | | | | | |
Net assets, end of period (000) | | $ | 3,182 | | | $ | 4,929 | | | $ | 4,454 | | | $ | 5,162 | | | $ | 4,787 | | | $ | 22,751 | | | $ | 27,999 | | | $ | 36,480 | | | $ | 68,880 | | | $ | 66,083 | | | $ | 69,641 | |
| | | | | | | | | | | | | | | | | | | | | | | | | | | | | | | | | | | | | | | | | | | | |
Portfolio turnover | | | 48 | % | | | 108 | % | | | 123 | % | | | 133 | % | | | 154 | % | | | 48 | % | | | 108 | % | | | 123 | % | | | 133 | % | | | 154 | % | | | 240 | % |
| | | | | | | | | | | | | | | | | | | | | | | | | | | | | | | | | | | | | | | | | | | | |
| | | | | | | | | | | | | | | | | | | | | | | | | | | | | | | | | | | | | | | | | | | | | | | | |
| | | Service | | | Investor A | |
| | | Six Months
Ended
March 31, 2008
(Unaudited) | | | Year Ended September 30, | | | Six Months
Ended
March 31, 2008
(Unaudited) | | | Year Ended September 30, | |
| | | 2007 | | | 2006 | | | 2005 | | | 2004 | | | 20032 | | | | 2007 | | | 2006 | | | 2005 | | | 2004 | | | 20032 | |
Per Share Operating Performance | | | | | | | | | | | | | | | | | | | | | | | | | | | | | | | | | | | | | | | | | | | | | | | | |
Net asset value, beginning of period | | $ | 11.57 | | | $ | 13.21 | | | $ | 14.95 | | | $ | 15.07 | | | $ | 14.09 | | | $ | 12.77 | | | $ | 11.45 | | | $ | 13.11 | | | $ | 14.86 | | | $ | 15.00 | | | $ | 14.04 | | | $ | 12.76 | |
| | | | | | | | | | | | | | | | | | | | | | | | | | | | | | | | | | | | | | | | | | | | | | | | |
Net investment income (loss) | | | 0.02 | 3 | | | 0.04 | 3 | | | (0.02 | )3 | | | — | 3,4 | | | (0.07 | )3 | | | (0.03 | ) | | | 0.02 | 3 | | | 0.02 | 3 | | | (0.03 | )3 | | | — | 3,4 | | | (0.09 | )3 | | | (0.05 | ) |
Net realized and unrealized gain (loss) | | | (1.36 | ) | | | 1.25 | | | | 1.19 | | | | 2.87 | | | | 2.84 | | | | 3.31 | | | | (1.35 | ) | | | 1.24 | | | | 1.19 | | | | 2.85 | | | | 2.84 | | | | 3.29 | |
| | | | | | | | | | | | | | | | | | | | | | | | | | | | | | | | | | | | | | | | | | | | | | | | |
Net increase (decrease) from investment operations | | | (1.34 | ) | | | 1.29 | | | | 1.17 | | | | 2.87 | | | | 2.77 | | | | 3.28 | | | | (1.33 | ) | | | 1.26 | | | | 1.16 | | | | 2.85 | | | | 2.75 | | | | 3.24 | |
| | | | | | | | | | | | | | | | | | | | | | | | | | | | | | | | | | | | | | | | | | | | | | | | |
Dividends and distributions from: | | | | | | | | | | | | | | | | | | | | | | | | | | | | | | | | | | | | | | | | | | | | | | | | |
Net investment income | | | (0.30 | ) | | | (0.28 | ) | | | (0.17 | ) | | | — | | | | — | | | | — | | | | (0.28 | ) | | | (0.27 | ) | | | (0.17 | ) | | | — | | | | — | | | | — | |
Net realized capital gain | | | (1.51 | ) | | | (2.65 | ) | | | (2.74 | ) | | | (2.99 | ) | | | (1.79 | ) | | | (1.96 | ) | | | (1.51 | ) | | | (2.65 | ) | | | (2.74 | ) | | | (2.99 | ) | | | (1.79 | ) | | | (1.96 | ) |
| | | | | | | | | | | | | | | | | | | | | | | | | | | | | | | | | | | | | | | | | | | | | | | | |
Total dividends and distributions | | | (1.81 | ) | | | (2.93 | ) | | | (2.91 | ) | | | (2.99 | ) | | | (1.79 | ) | | | (1.96 | ) | | | (1.79 | ) | | | (2.92 | ) | | | (2.91 | ) | | | (2.99 | ) | | | (1.79 | ) | | | (1.96 | ) |
| | | | | | | | | | | | | | | | | | | | | | | | | | | | | | | | | | | | | | | | | | | | | | | | |
Redemption fees added to paid-in capital5 | | | — | | | | — | | | | — | | | | — | | | | — | | | | — | | | | — | | | | — | | | | — | | | | — | | | | — | | | | — | |
| | | | | | | | | | | | | | | | | | | | | | | | | | | | | | | | | | | | | | | | | | | | | | | | |
Net asset value, end of period | | $ | 8.42 | | | $ | 11.57 | | | $ | 13.21 | | | $ | 14.95 | | | $ | 15.07 | | | $ | 14.09 | | | $ | 8.33 | | | $ | 11.45 | | | $ | 13.11 | | | $ | 14.86 | | | $ | 15.00 | | | $ | 14.04 | |
| | | | | | | | | | | | | | | | | | | | | | | | | | | | | | | | | | | | | | | | | | | | | | | | |
Total Investment Return | | | | | | | | | | | | | | | | | | | | | | | | | | | | | | | | | | | | | | | | | | | | | | | | |
Based on net asset value6 | | | (13.55 | )%7 | | | 9.92 | % | | | 9.45 | % | | | 20.46 | % | | | 20.45 | % | | | 29.70 | % | | | (13.60 | )%7,9 | | | 9.79 | %9 | | | 9.40 | %9 | | | 20.43 | %9 | | | 20.38 | %9 | | | 29.37 | %9 |
| | | | | | | | | | | | | | | | | | | | | | | | | | | | | | | | | | | | | | | | | | | | | | | | |
Ratios to Average Net Assets | | | | | | | | | | | | | | | | | | | | | | | | | | | | | | | | | | | | | | | | | | | | | | | | |
Total expenses, net of waivers and reimbursement | | | 1.26 | %8 | | | 1.10 | % | | | 1.27 | % | | | 1.24 | % | | | 1.25 | % | | | 1.21 | % | | | 1.32 | %8 | | | 1.23 | % | | | 1.29 | % | | | 1.24 | % | | | 1.35 | % | | | 1.38 | % |
| | | | | | | | | | | | | | | | | | | | | | | | | | | | | | | | | | | | | | | | | | | | | | | | |
Total expenses | | | 1.39 | %8 | | | 1.12 | % | | | 1.32 | % | | | 1.25 | % | | | 1.29 | % | | | 1.24 | % | | | 1.41 | %8 | | | 1.24 | % | | | 1.40 | % | | | 1.35 | % | | | 1.47 | % | | | 1.41 | % |
| | | | | | | | | | | | | | | | | | | | | | | | | | | | | | | | | | | | | | | | | | | | | | | | |
Net investment income (loss) | | | 0.43 | %8 | | | 0.34 | % | | | (0.18 | )% | | | (0.03 | )% | | | (0.45 | )% | | | (0.19 | )% | | | 0.36 | %8 | | | 0.17 | % | | | (0.19 | )% | | | (0.01 | )% | | | (0.55 | )% | | | (0.37 | )% |
| | | | | | | | | | | | | | | | | | | | | | | | | | | | | | | | | | | | | | | | | | | | | | | | |
Supplemental Data | | | | | | | | | | | | | | | | | | | | | | | | | | | | | | | | | | | | | | | | | | | | | | | | |
Net assets, end of period(000) | | $ | 1,726 | | | $ | 2,143 | | | $ | 3,852 | | | $ | 3,405 | | | $ | 3,288 | | | $ | 4,139 | | | $ | 18,676 | | | $ | 25,737 | | | $ | 27,943 | | | $ | 31,889 | | | $ | 35,240 | | | $ | 38,052 | |
| | | | | | | | | | | | | | | | | | | | | | | | | | | | | | | | | | | | | | | | | | | | | | | | |
Portfolio turnover | | | 48 | % | | | 108 | % | | | 123 | % | | | 133 | % | | | 154 | % | | | 240 | % | | | 48 | % | | | 108 | % | | | 123 | % | | | 133 | % | | | 154 | % | | | 240 | % |
| | | | | | | | | | | | | | | | | | | | | | | | | | | | | | | | | | | | | | | | | | | | | | | | |
See Notes to Financial Statements.
| | | | | | |
| 104 | | SEMI-ANNUAL REPORT | | MARCH 31, 2008 | | |
| | |
Financial Highlights (continued) | | Small Cap Value Equity Portfolio |
| | | | | | | | | | | | | | | | | | | | | | | | | | | | | | | | | | | | | | | | | | | | | | | | |
| | | Investor B | | | Investor C | |
| | | Six Months
Ended
March 31, 2008
(Unaudited) | | | Year Ended September 30, | | | Six Months
Ended
March 31, 2008
(Unaudited) | | | Year Ended September 30, | |
| | | 2007 | | | 2006 | | | 2005 | | | 2004 | | | 20032 | | | | 2007 | | | 2006 | | | 2005 | | | 2004 | | | 20032 | |
Per Share Operating Performance | | | | | | | | | | | | | | | | | | | | | | | | | | | | | | | | | | | | | | | | | | | | | | | | |
Net asset value, beginning of period | | $ | 9.53 | | | $ | 11.30 | | | $ | 13.28 | | | $ | 13.77 | | | $ | 13.11 | | | $ | 12.11 | | | $ | 9.50 | | | $ | 11.31 | | | $ | 13.28 | | | $ | 13.78 | | | $ | 13.11 | | | $ | 12.12 | |
| | | | | | | | | | | | | | | | | | | | | | | | | | | | | | | | | | | | | | | | | | | | | | | | |
Net investment loss | | | (0.02 | )3 | | | (0.05 | )3 | | | (0.12 | )3 | | | (0.10 | )3 | | | (0.19 | )3 | | | (0.13 | ) | | | (0.02 | )3 | | | (0.06 | )3 | | | (0.11 | )3 | | | (0.10 | )3 | | | (0.19 | )3 | | | (0.14 | ) |
Net realized and unrealized gain (loss) | | | (1.09 | ) | | | 1.07 | | | | 1.03 | | | | 2.60 | | | | 2.64 | | | | 3.09 | | | | (1.08 | ) | | | 1.05 | | | | 1.03 | | | | 2.59 | | | | 2.65 | | | | 3.09 | |
| | | | | | | | | | | | | | | | | | | | | | | | | | | | | | | | | | | | | | | | | | | | | | | | |
Net increase (decrease) from investment operations | | | (1.11 | ) | | | 1.02 | | | | 0.91 | | | | 2.50 | | | | 2.45 | | | | 2.96 | | | | (1.10 | ) | | | 0.99 | | | | 0.92 | | | | 2.49 | | | | 2.46 | | | | 2.95 | |
| | | | | | | | | | | | | | | | | | | | | | | | | | | | | | | | | | | | | | | | | | | | | | | | |
Dividends and distributions from: | | | | | | | | | | | | | | | | | | | | | | | | | | | | | | | | | | | | | | | | | | | | | | | | |
Net investment income | | | (0.20 | ) | | | (0.14 | ) | | | (0.15 | ) | | | — | | | | — | | | | — | | | | (0.20 | ) | | | (0.15 | ) | | | (0.15 | ) | | | — | | | | — | | | | — | |
Net realized capital gain | | | (1.51 | ) | | | (2.65 | ) | | | (2.74 | ) | | | (2.99 | ) | | | (1.79 | ) | | | (1.96 | ) | | | (1.51 | ) | | | (2.65 | ) | | | (2.74 | ) | | | (2.99 | ) | | | (1.79 | ) | | | (1.96 | ) |
| | | | | | | | | | | | | | | | | | | | | | | | | | | | | | | | | | | | | | | | | | | | | | | | |
Total dividends and distributions | | | (1.71 | ) | | | (2.79 | ) | | | (2.89 | ) | | | (2.99 | ) | | | (1.79 | ) | | | (1.96 | ) | | | (1.71 | ) | | | (2.80 | ) | | | (2.89 | ) | | | (2.99 | ) | | | (1.79 | ) | | | (1.96 | ) |
| | | | | | | | | | | | | | | | | | | | | | | | | | | | | | | | | | | | | | | | | | | | | | | | |
Redemption fees added to paid-in capital5 | | | — | | | | — | | | | — | | | | — | | | | — | | | | — | | | | — | | | | — | | | | — | | | | — | | | | — | | | | — | |
| | | | | | | | | | | | | | | | | | | | | | | | | | | | | | | | | | | | | | | | | | | | | | | | |
Net asset value, end of period | | $ | 6.71 | | | $ | 9.53 | | | $ | 11.30 | | | $ | 13.28 | | | $ | 13.77 | | | $ | 13.11 | | | $ | 6.69 | | | $ | 9.50 | | | $ | 11.31 | | | $ | 13.28 | | | $ | 13.78 | | | $ | 13.11 | |
| | | | | | | | | | | | | | | | | | | | | | | | | | | | | | | | | | | | | | | | | | | | | | | | |
Total Investment Return | | | | | | | | | | | | | | | | | | | | | | | | | | | | | | | | | | | | | | | | | | | | | | | | |
Based on net asset value6,9 | | | (13.95 | )%7 | | | 9.08 | % | | | 8.46 | % | | | 19.58 | % | | | 19.45 | % | | | 28.52 | % | | | (13.88 | )%7 | | | 8.80 | % | | | 8.56 | % | | | 19.49 | % | | | 19.53 | % | | | 28.42 | % |
| | | | | | | | | | | | | | | | | | | | | | | | | | | | | | | | | | | | | | | | | | | | | | | | |
Ratios to Average Net Assets | | | | | | | | | | | | | | | | | | | | | | | | | | | | | | | | | | | | | | | | | | | | | | | | |
Total expenses, net of waivers and reimbursement | | | 2.18 | %8 | | | 1.92 | % | | | 2.12 | % | | | 2.00 | % | | | 2.07 | % | | | 2.13 | % | | | 2.17 | %8 | | | 2.04 | % | | | 2.10 | % | | | 2.00 | % | | | 2.09 | % | | | 2.13 | % |
| | | | | | | | | | | | | | | | | | | | | | | | | | | | | | | | | | | | | | | | | | | | | | | | |
Total expenses | | | 2.39 | %8 | | | 2.08 | % | | | 2.23 | % | | | 2.00 | % | | | 2.09 | % | | | 2.16 | % | | | 2.27 | %8 | | | 2.05 | % | | | 2.11 | % | | | 2.00 | % | | | 2.11 | % | | | 2.16 | % |
| | | | | | | | | | | | | | | | | | | | | | | | | | | | | | | | | | | | | | | | | | | | | | | | |
Net investment loss | | | (0.51 | )%8 | | | (0.48 | )% | | | (1.01 | )% | | | (0.76 | )% | | | (1.28 | )% | | | (1.12 | )% | | | (0.49 | )%8 | | | (0.64 | )% | | | (1.00 | )% | | | (0.76 | )% | | | (1.30 | )% | | | (1.13 | )% |
| | | | | | | | | | | | | | | | | | | | | | | | | | | | | | | | | | | | | | | | | | | | | | | | |
Supplemental Data | | | | | | | | | | | | | | | | | | | | | | | | | | | | | | | | | | | | | | | | | | | | | | | | |
Net assets, end of period (000) | | $ | 2,728 | | | $ | 4,479 | | | $ | 7,373 | | | $ | 12,848 | | | $ | 15,952 | | | $ | 15,019 | | | $ | 2,632 | | | $ | 3,622 | | | $ | 4,643 | | | $ | 6,414 | | | $ | 6,715 | | | $ | 5,839 | |
| | | | | | | | | | | | | | | | | | | | | | | | | | | | | | | | | | | | | | | | | | | | | | | | |
Portfolio turnover | | | 48 | % | | | 108 | % | | | 123 | % | | | 133 | % | | | 154 | % | | | 240 | % | | | 48 | % | | | 108 | % | | | 123 | % | | | 133 | % | | | 154 | % | | | 240 | % |
| | | | | | | | | | | | | | | | | | | | | | | | | | | | | | | | | | | | | | | | | | | | | | | | |
1 | Commenced operations on April 12, 2004. |
2 | Audited by other auditors. |
3 | Based on average shares outstanding. |
4 | Net investment loss is less than $0.005 per share. |
5 | Redemption fees added to paid-in capital are less than $0.01 per share. |
6 | Redemption fee of 2.00% received by the Portfolio is reflected in total return calculations. There was no impact to the return. |
7 | Aggregate total investment return. |
9 | Total investment returns exclude the effects of sales charges. |
See Notes to Financial Statements.
| | | | | | |
| | SEMI-ANNUAL REPORT | | MARCH 31, 2008 | | 105 |
| | |
Financial Highlights (continued) | | Small Cap Core Equity Portfolio |
| | | | | | | | | | | | | | | | | | | | | | | | | | | | | | | | | | | | | | | | | | | | | | | | |
| | | Institutional | | | Service | |
| | | Six Months
Ended
March 31, 2008
(Unaudited) | | | Year Ended September 30, | | | Six Months
Ended
March 31, 2008
(Unaudited) | | | Year Ended September 30, | |
| | | 2007 | | | 2006 | | | 2005 | | | 2004 | | | 20031 | | | | 2007 | | | 2006 | | | 2005 | | | 2004 | | | 20031 | |
Per Share Operating Performance | | | | | | | | | | | | | | | | | | | | | | | | | | | | | | | | | | | | | | | | | | | | | | | | |
Net asset value, beginning of period | | $ | 21.21 | | | $ | 18.50 | | | $ | 17.62 | | | $ | 14.77 | | | $ | 11.99 | | | $ | 8.35 | | | $ | 21.05 | | | $ | 18.41 | | | $ | 17.59 | | | $ | 14.73 | | | $ | 11.99 | | | $ | 8.35 | |
| | | | | | | | | | | | | | | | | | | | | | | | | | | | | | | | | | | | | | | | | | | | | | | | |
Net investment income (loss) | | | 0.01 | 2 | | | (0.13 | )2 | | | (0.12 | )2 | | | (0.10 | )2 | | | (0.13 | )2 | | | (0.06 | ) | | | (0.02 | )2 | | | (0.18 | )2 | | | (0.18 | )2 | | | (0.13 | )2 | | | (0.20 | )2 | | | — | 3 |
Net realized and unrealized gain (loss) | | | (3.22 | ) | | | 3.15 | | | | 1.30 | | | | 3.06 | | | | 3.01 | | | | 3.70 | | | | (3.19 | ) | | | 3.13 | | | | 1.30 | | | | 3.10 | | | | 3.04 | | | | 3.64 | |
| | | | | | | | | | | | | | | | | | | | | | | | | | | | | | | | | | | | | | | | | | | | | | | | |
Net increase (decrease) from investment operations | | | (3.21 | ) | | | 3.02 | | | | 1.18 | | | | 2.96 | | | | 2.88 | | | | 3.64 | | | | (3.21 | ) | | | 2.95 | | | | 1.12 | | | | 2.97 | | | | 2.84 | | | | 3.64 | |
| | | | | | | | | | | | | | | | | | | | | | | | | | | | | | | | | | | | | | | | | | | | | | | | |
Dividends and distributions from: | | | | | | | | | | | | | | | | | | | | | | | | | | | | | | | | | | | | | | | | | | | | | | | | |
Net realized capital gain | | | (1.67 | ) | | | (0.31 | ) | | | (0.30 | ) | | | (0.11 | ) | | | (0.15 | ) | | | — | | | | (1.62 | ) | | | (0.31 | ) | | | (0.30 | ) | | | (0.11 | ) | | | (0.15 | ) | | | — | |
| | | | | | | | | | | | | | | | | | | | | | | | | | | | | | | | | | | | | | | | | | | | | | | | |
Redemption fees added to paid-in capital | | | — | 4 | | | — | 4 | | | — | 4 | | | — | 4 | | | 0.05 | | | | — | | | | — | 4 | | | — | 4 | | | — | 4 | | | — | 4 | | | 0.05 | | | | — | |
| | | | | | | | | | | | | | | | | | | | | | | | | | | | | | | | | | | | | | | | | | | | | | | | |
Net asset value, end of period | | $ | 16.33 | | | $ | 21.21 | | | $ | 18.50 | | | $ | 17.62 | | | $ | 14.77 | | | $ | 11.99 | | | $ | 16.22 | | | $ | 21.05 | | | $ | 18.41 | | | $ | 17.59 | | | $ | 14.73 | | | $ | 11.99 | |
| | | | | | | | | | | | | | | | | | | | | | | | | | | | | | | | | | | | | | | | | | | | | | | | |
Total Investment Return | | | | | | | | | | | | | | | | | | | | | | | | | | | | | | | | | | | | | | | | | | | | | | | | |
Based on net asset value | | | (15.95 | )%5,6 | | | 16.46 | %5 | | | 6.81 | %5 | | | 20.10 | %5 | | | 24.51 | %7 | | | 43.59 | % | | | (16.06 | )%5,6 | | | 16.15 | %5 | | | 6.47 | %5 | | | 20.22 | %5 | | | 24.17 | %7 | | | 43.59 | % |
| | | | | | | | | | | | | | | | | | | | | | | | | | | | | | | | | | | | | | | | | | | | | | | | |
Ratios to Average Net Assets | | | | | | | | | | | | | | | | | | | | | | | | | | | | | | | | | | | | | | | | | | | | | | | | |
Total expenses, net of waivers and reimbursement | | | 1.29 | %8 | | | 1.30 | % | | | 1.30 | % | | | 1.30 | % | | | 1.30 | % | | | 1.30 | % | | | 1.56 | %8 | | | 1.57 | % | | | 1.60 | % | | | 1.60 | % | | | 1.60 | % | | | 1.60 | % |
| | | | | | | | | | | | | | | | | | | | | | | | | | | | | | | | | | | | | | | | | | | | | | | | |
Total expenses | | | 1.33 | %8 | | | 1.38 | % | | | 1.47 | % | | | 1.81 | % | | | 2.37 | % | | | 2.96 | % | | | 1.57 | %8 | | | 1.59 | % | | | 1.64 | % | | | 2.01 | % | | | 2.67 | % | | | 3.26 | % |
| | | | | | | | | | | | | | | | | | | | | | | | | | | | | | | | | | | | | | | | | | | | | | | | |
Net investment income (loss) | | | 0.12 | %8 | | | (0.62 | )% | | | (0.68 | )% | | | (0.59 | )% | | | (0.89 | )% | | | (0.62 | )% | | | (0.17 | )%8 | | | (0.88 | )% | | | (0.99 | )% | | | (0.80 | )% | | | (1.19 | )% | | | (0.92 | )% |
| | | | | | | | | | | | | | | | | | | | | | | | | | | | | | | | | | | | | | | | | | | | | | | | |
Supplemental Data | | | | | | | | | | | | | | | | | | | | | | | | | | | | | | | | | | | | | | | | | | | | | | | | |
Net assets, end of period (000) | | $ | 36,736 | | | $ | 33,707 | | | $ | 24,172 | | | $ | 12,641 | | | $ | 1,802 | | | $ | 1,238 | | | $ | 3,633 | | | $ | 4,909 | | | $ | 2,776 | | | $ | 94 | | | $ | — | 9 | | $ | — | 9 |
| | | | | | | | | | | | | | | | | | | | | | | | | | | | | | | | | | | | | | | | | | | | | | | | |
Portfolio turnover | | | 37 | % | | | 103 | % | | | 111 | % | | | 118 | % | | | 78 | % | | | 218 | % | | | 37 | % | | | 103 | % | | | 111 | % | | | 118 | % | | | 78 | % | | | 218 | % |
| | | | | | | | | | | | | | | | | | | | | | | | | | | | | | | | | | | | | | | | | | | | | | | | |
| | | | | | | | | | | | | | | | | | | | | | | | |
| | | Investor A | |
| | | Six Months
Ended
March 31, 2008
(Unaudited) | | | Year Ended September 30, | |
| | | 2007 | | | 2006 | | | 2005 | | | 2004 | | | 20031 | |
Per Share Operating Performance | | | | | | | | | | | | | | | | | | | | | | | | |
Net asset value, beginning of period | | $ | 20.86 | | | $ | 18.27 | | | $ | 17.49 | | | $ | 14.71 | | | $ | 11.99 | | | $ | 8.35 | |
| | | | | | | | | | | | | | | | | | | | | | | | |
Net investment loss | | | (0.03 | )2 | | | (0.21 | )2 | | | (0.20 | )2 | | | (0.17 | )2 | | | (0.24 | )2 | | | — | 3 |
Net realized and unrealized gain (loss) | | | (3.17 | ) | | | 3.11 | | | | 1.28 | | | | 3.06 | | | | 3.04 | | | | 3.64 | |
| | | | | | | | | | | | | | | | | | | | | | | | |
Net increase (decrease) from investment operations | | | (3.20 | ) | | | 2.90 | | | | 1.08 | | | | 2.89 | | | | 2.80 | | | | 3.64 | |
| | | | | | | | | | | | | | | | | | | | | | | | |
Dividends and distributions from: | | | | | | | | | | | | | | | | | | | | | | | | |
Net realized capital gain | | | (1.59 | ) | | | (0.31 | ) | | | (0.30 | ) | | | (0.11 | ) | | | (0.15 | ) | | | — | |
| | | | | | | | | | | | | | | | | | | | | | | | |
Redemption fees added to paid-in capital | | | — | 4 | | | — | 4 | | | — | 4 | | | — | 4 | | | 0.07 | | | | — | |
| | | | | | | | | | | | | | | | | | | | | | | | |
Net asset value, end of period | | $ | 16.07 | | | $ | 20.86 | | | $ | 18.27 | | | $ | 17.49 | | | $ | 14.71 | | | $ | 11.99 | |
| | | | | | | | | | | | | | | | | | | | | | | | |
Total Investment Return | | | | | | | | | | | | | | | | | | | | | | | | |
Based on net asset value10 | | | (16.13 | )%5,6 | | | 16.00 | %5 | | | 6.28 | %5 | | | 19.71 | %5 | | | 24.01 | %11 | | | 43.59 | % |
| | | | | | | | | | | | | | | | | | | | | | | | |
Ratios to Average Net Assets | | | | | | | | | | | | | | | | | | | | | | | | |
Total expenses, net of waivers and reimbursement | | | 1.75 | %8 | | | 1.74 | % | | | 1.73 | % | | | 1.71 | % | | | 1.74 | % | | | 1.77 | % |
| | | | | | | | | | | | | | | | | | | | | | | | |
Total expenses | | | 1.80 | %8 | | | 1.80 | % | | | 1.90 | % | | | 2.17 | % | | | 2.89 | % | | | 3.43 | % |
| | | | | | | | | | | | | | | | | | | | | | | | |
Net investment loss | | | (0.36 | )%8 | | | (1.06 | )% | | | (1.11 | )% | | | (1.01 | )% | | | (1.32 | )% | | | (1.09 | )% |
| | | | | | | | | | | | | | | | | | | | | | | | |
Supplemental Data | | | | | | | | | | | | | | | | | | | | | | | | |
Net assets, end of period (000) | | $ | 25,435 | | | $ | 29,070 | | | $ | 20,973 | | | $ | 11,997 | | | $ | 3,154 | | | $ | 7 | |
| | | | | | | | | | | | | | | | | | | | | | | | |
Portfolio turnover | | | 37 | % | | | 103 | % | | | 111 | % | | | 118 | % | | | 78 | % | | | 218 | % |
| | | | | | | | | | | | | | | | | | | | | | | | |
See Notes to Financial Statements.
| | | | | | |
| 106 | | SEMI-ANNUAL REPORT | | MARCH 31, 2008 | | |
| | |
Financial Highlights (continued) | | Small Cap Core Equity Portfolio |
| | | | | | | | | | | | | | | | | | | | | | | | |
| | | Investor B | |
| | | Six Months
Ended
March 31, 2008
(Unaudited) | | | Year Ended September 30, | |
| | | 2007 | | | 2006 | | | 2005 | | | 2004 | | | 20031 | |
Per Share Operating Performance | | | | | | | | | | | | | | | | | | | | | | | | |
Net asset value, beginning of period | | $ | 20.23 | | | $ | 17.87 | | | $ | 17.24 | | | $ | 14.61 | | | $ | 11.99 | | | $ | 8.35 | |
| | | | | | | | | | | | | | | | | | | | | | | | |
Net investment loss | | | (0.10 | )2 | | | (0.36 | )2 | | | (0.33 | )2 | | | (0.28 | )2 | | | (0.37 | )2 | | | — | 3 |
Net realized and unrealized gain (loss) | | | (3.08 | ) | | | 3.03 | | | | 1.26 | | | | 3.02 | | | | 3.07 | | | | 3.64 | |
| | | | | | | | | | | | | | | | | | | | | | | | |
Net increase (decrease) from investment operations | | | (3.18 | ) | | | 2.67 | | | | 0.93 | | | | 2.74 | | | | 2.70 | | | | 3.64 | |
| | | | | | | | | | | | | | | | | | | | | | | | |
Dividends and distributions from: | | | | | | | | | | | | | | | | | | | | | | | | |
Net realized capital gain | | | (1.42 | ) | | | (0.31 | ) | | | (0.30 | ) | | | (0.11 | ) | | | (0.15 | ) | | | — | |
| | | | | | | | | | | | | | | | | | | | | | | | |
Redemption fees added to paid-in capital | | | — | 4 | | | — | 4 | | | — | 4 | | | — | 4 | | | 0.07 | | | | — | |
| | | | | | | | | | | | | | | | | | | | | | | | |
Net asset value, end of period | | $ | 15.63 | | | $ | 20.23 | | | $ | 17.87 | | | $ | 17.24 | | | $ | 14.61 | | | $ | 11.99 | |
| | | | | | | | | | | | | | | | | | | | | | | | |
Total Investment Return | | | | | | | | | | | | | | | | | | | | | | | | |
Based on net asset value10 | | | (16.48 | )%5,6 | | | 15.06 | %5 | | | 5.49 | %5 | | | 18.81 | %5 | | | 23.17 | %11 | | | 43.59 | % |
| | | | | | | | | | | | | | | | | | | | | | | | |
Ratios to Average Net Assets | | | | | | | | | | | | | | | | | | | | | | | | |
Total expenses, net of waivers and reimbursement | | | 2.51 | %8 | | | 2.51 | % | | | 2.49 | % | | | 2.44 | % | | | 2.49 | % | | | 2.52 | % |
| | | | | | | | | | | | | | | | | | | | | | | | |
Total expenses | | | 2.56 | %8 | | | 2.57 | % | | | 2.55 | % | | | 2.81 | % | | | 3.56 | % | | | 4.18 | % |
| | | | | | | | | | | | | | | | | | | | | | | | |
Net investment loss | | | (1.12 | )%8 | | | (1.84 | )% | | | (1.87 | )% | | | (1.74 | )% | | | (2.07 | )% | | | (1.84 | )% |
| | | | | | | | | | | | | | | | | | | | | | | | |
Supplemental Data | | | | | | | | | | | | | | | | | | | | | | | | |
Net assets, end of period (000) | | $ | 6,666 | | | $ | 8,956 | | | $ | 8,326 | | | $ | 6,303 | | | $ | 1,157 | | | $ | — | 9 |
| | | | | | | | | | | | | | | | | | | | | | | | |
Portfolio turnover | | | 37 | % | | | 103 | % | | | 111 | % | | | 118 | % | | | 78 | % | | | 218 | % |
| | | | | | | | | | | | | | | | | | | | | | | | |
| | | | | | | | | | | | | | | | | | | | | | | | |
| | | Investor C | |
| | | Six Months
Ended
March 31, 2008
(Unaudited) | | | Year Ended September 30, | |
| | | 2007 | | | 2006 | | | 2005 | | | 2004 | | | 20031 | |
Per Share Operating Performance | | | | | | | | | | | | | | | | | | | | | | | | |
Net asset value, beginning of period | | $ | 20.25 | | | $ | 17.87 | | | $ | 17.23 | | | $ | 14.60 | | | $ | 11.99 | | | $ | 8.35 | |
| | | | | | | | | | | | | | | | | | | | | | | | |
Net investment loss | | | (0.10 | )2 | | | (0.35 | )2 | | | (0.32 | )2 | | | (0.28 | )2 | | | (0.28 | )2 | | | — | 3 |
Net realized and unrealized gain (loss) | | | (3.07 | ) | | | 3.04 | | | | 1.26 | | | | 3.02 | | | | 2.99 | | | | 3.64 | |
| | | | | | | | | | | | | | | | | | | | | | | | |
Net increase (decrease) from investment operations | | | (3.17 | ) | | | 2.69 | | | | 0.94 | | | | 2.74 | | | | 2.71 | | | | 3.64 | |
| | | | | | | | | | | | | | | | | | | | | | | | |
Dividends and distributions from: | | | | | | | | | | | | | | | | | | | | | | | | |
Net realized capital gain | | | (1.47 | ) | | | (0.31 | ) | | | (0.30 | ) | | | (0.11 | ) | | | (0.15 | ) | | | — | |
| | | | | | | | | | | | | | | | | | | | | | | | |
Redemption fees added to paid-in capital | | | — | 4 | | | — | 4 | | | — | 4 | | | — | 4 | | | 0.05 | | | | — | |
| | | | | | | | | | | | | | | | | | | | | | | | |
Net asset value, end of period | | $ | 15.61 | | | $ | 20.25 | | | $ | 17.87 | | | $ | 17.23 | | | $ | 14.60 | | | $ | 11.99 | |
| | | | | | | | | | | | | | | | | | | | | | | | |
Total Investment Return | | | | | | | | | | | | | | | | | | | | | | | | |
Based on net asset value10 | | | (16.45 | )%5,6 | | | 15.17 | %5 | | | 5.55 | %5 | | | 18.82 | %5 | | | 23.08 | %7 | | | 43.59 | % |
| | | | | | | | | | | | | | | | | | | | | | | | |
Ratios to Average Net Assets | | | | | | | | | | | | | | | | | | | | | | | | |
Total expenses, net of waivers and reimbursement | | | 2.48 | %8 | | | 2.48 | % | | | 2.44 | % | | | 2.44 | % | | | 2.47 | % | | | 2.52 | % |
| | | | | | | | | | | | | | | | | | | | | | | | |
Total expenses | | | 2.51 | %8 | | | 2.54 | % | | | 2.48 | % | | | 2.80 | % | | | 3.56 | % | | | 4.18 | % |
| | | | | | | | | | | | | | | | | | | | | | | | |
Net investment loss | | �� | (1.08 | )%8 | | | (1.81 | )% | | | (1.81 | )% | | | (1.74 | )% | | | (2.03 | )% | | | (1.84 | )% |
| | | | | | | | | | | | | | | | | | | | | | | | |
Supplemental Data | | | | | | | | | | | | | | | | | | | | | | | | |
Net assets, end of period (000) | | $ | 28,047 | | | $ | 32,677 | | | $ | 26,151 | | | $ | 17,266 | | | $ | 3,352 | | | $ | — | 9 |
| | | | | | | | | | | | | | | | | | | | | | | | |
Portfolio turnover | | | 37 | % | | | 103 | % | | | 111 | % | | | 118 | % | | | 78 | % | | | 218 | % |
| | | | | | | | | | | | | | | | | | | | | | | | |
1 | Audited by other auditors. |
2 | Based on average shares outstanding. |
3 | Net investment loss is less than $0.005 per share. |
4 | Redemption fees added to paid-in capital are less than $0.01 per share. |
5 | Redemption fee of 2.00% received by the Portfolio is reflected in total return calculations. There was no impact to the return. |
6 | Aggregate total investment return. |
7 | Redemption fee of 2.00% received by the Portfolio is reflected in total return calculations. The impact to the return for redemption fees received during the period was an increase of 0.42%. |
9 | Net assets end of period are less than $500. |
10 | Total investment returns exclude the effects of sales charges. |
11 | Redemption fee of 2.00% received by the Portfolio is reflected in total return calculations. The impact to the return for redemption fees received during the period was an increase of 0.59%. |
See Notes to Financial Statements.
| | | | | | |
| | SEMI-ANNUAL REPORT | | MARCH 31, 2008 | | 107 |
| | |
Financial Highlights (continued) | | Small Cap Growth Equity Portfolio |
| | | | | | | | | | | | | | | | | | | | | | | | | | | | | | | | | | | | | | | | | | | | | | | | |
| | | Institutional | | | Service | |
| | | Six Months
Ended
March 31, 2008
(Unaudited) | | | Year Ended September 30, | | | Six Months
Ended
March 31, 2008
(Unaudited) | | | Year Ended September 30, | |
| | | 2007 | | | 2006 | | | 2005 | | | 2004 | | | 20031 | | | | 2007 | | | 2006 | | | 2005 | | | 2004 | | | 20031 | |
Per Share Operating Performance | | | | | | | | | | | | | | | | | | | | | | | | | | | | | | | | | | | | | | | | | | | | | | | | |
Net asset value, beginning of period | | $ | 23.71 | | | $ | 19.26 | | | $ | 17.29 | | | $ | 14.52 | | | $ | 12.26 | | | $ | 9.00 | | | $ | 22.58 | | | $ | 18.38 | | | $ | 16.54 | | | $ | 13.92 | | | $ | 11.79 | | | $ | 8.67 | |
| | | | | | | | | | | | | | | | | | | | | | | | | | | | | | | | | | | | | | | | | | | | | | | | |
Net investment income (loss) | | | 0.03 | 2 | | | (0.07 | ) 2 | | | (0.09 | )2 | | | (0.06 | )2 | | | (0.11 | )2 | | | (0.09 | ) | | | — | 2,3 | | | (0.11 | )2 | | | (0.13 | )2 | | | (0.11 | )2 | | | (0.15 | )2 | | | (0.12 | ) |
Net realized and unrealized gain (loss) | | | (2.00 | ) | | | 4.52 | | | | 2.06 | | | | 2.82 | | | | 2.37 | | | | 3.35 | | | | (1.91 | ) | | | 4.31 | | | | 1.97 | | | | 2.72 | | | | 2.28 | | | | 3.24 | |
| | | | | | | | | | | | | | | | | | | | | | | | | | | | | | | | | | | | | | | | | | | | | | | | |
Net increase (decrease) from investment operations | | | (1.97 | ) | | | 4.45 | | | | 1.97 | | | | 2.76 | | | | 2.26 | | | | 3.26 | | | | (1.91 | ) | | | 4.20 | | | | 1.84 | | | | 2.61 | | | | 2.13 | | | | 3.12 | |
| | | | | | | | | | | | | | | | | | | | | | | | | | | | | | | | | | | | | | | | | | | | | | | | |
Redemption fees added to paid-in capital | | | — | 4 | | | — | 4 | | | — | 4 | | | 0.01 | | | | — | 4 | | | — | 4 | | | — | 4 | | | — | 4 | | | — | 4 | | | 0.01 | | | | — | 4 | | | — | 4 |
| | | | | | | | | | | | | | | | | | | | | | | | | | | | | | | | | | | | | | | | | | | | | | | | |
Net asset value, end of period | | $ | 21.74 | | | $ | 23.71 | | | $ | 19.26 | | | $ | 17.29 | | | $ | 14.52 | | | $ | 12.26 | | | $ | 20.67 | | | $ | 22.58 | | | $ | 18.38 | | | $ | 16.54 | | | $ | 13.92 | | | $ | 11.79 | |
| | | | | | | | | | | | | | | | | | | | | | | | | | | | | | | | | | | | | | | | | | | | | | | | |
Total Investment Return | | | | | | | | | | | | | | | | | | | | | | | | | | | | | | | | | | | | | | | | | | | | | | | | |
Based on net asset value | | | (8.31 | )%5,6 | | | 23.11 | % 5 | | | 11.39 | %5 | | | 19.08 | %7 | | | 18.43 | %5 | | | 36.22 | %5 | | | (8.46 | )%5,6 | | | 22.85 | %5 | | | 11.12%5 | | | | 18.82 | %7 | | | 18.07 | %5 | | | 35.99 | %5 |
| | | | | | | | | | | | | | | | | | | | | | | | | | | | | | | | | | | | | | | | | | | | | | | | |
Ratios to Average Net Assets | | | | | | | | | | | | | | | | | | | | | | | | | | | | | | | | | | | | | | | | | | | | | | | | |
Total expenses, net of waivers and reimbursement | | | 0.79 | %8 | | | 0.82 | % | | | 0.83 | % | | | 0.94 | % | | | 0.92 | % | | | 0.89 | % | | | 1.11 | %8 | | | 1.02 | % | | | 1.08 | % | | | 1.19 | % | | | 1.20 | % | | | 1.19 | % |
| | | | | | | | | | | | | | | | | | | | | | | | | | | | | | | | | | | | | | | | | | | | | | | | |
Total expenses | | | 0.79 | %8 | | | 0.82 | % | | | 0.83 | % | | | 0.95 | % | | | 0.93 | % | | | 0.92 | % | | | 1.11 | %8 | | | 1.02 | % | | | 1.08 | % | | | 1.19 | % | | | 1.20 | % | | | 1.22 | % |
| | | | | | | | | | | | | | | | | | | | | | | | | | | | | | | | | | | | | | | | | | | | | | | | |
Net investment income (loss) | | | 0.29 | %8 | | | (0.34 | )% | | | (0.48 | )% | | | (0.40 | )% | | | (0.73 | )% | | | (0.75 | )% | | | (0.02 | )%8 | | | (0.54 | )% | | | (0.73 | )% | | | (0.70 | )% | | | (1.02 | )% | | | (1.05 | )% |
| | | | | | | | | | | | | | | | | | | | | | | | | | | | | | | | | | | | | | | | | | | | | | | | |
Supplemental Data | | | | | | | | | | | | | | | | | | | | | | | | | | | | | | | | | | | | | | | | | | | | | | | | |
Net assets, end of period (000) | | $ | 635,210 | | | $ | 587,586 | | | $ | 426,000 | | | $ | 357,857 | | | $ | 272,324 | | | $ | 164,856 | | | $ | 35,905 | | | $ | 35,945 | | | $ | 26,422 | | | $ | 24,491 | | | $ | 29,569 | | | $ | 23,466 | |
| | | | | | | | | | | | | | | | | | | | | | | | | | | | | | | | | | | | | | | | | | | | | | | | |
Portfolio turnover | | | 52 | % | | | 81 | % | | | 74 | % | | | 91 | % | | | 81 | % | | | 167 | % | | | 52 | % | | | 81 | % | | | 74 | % | | | 91 | % | | | 81 | % | | | 167 | % |
| | | | | | | | | | | | | | | | | | | | | | | | | | | | | | | | | | | | | | | | | | | | | | | | |
| | |
| | | Investor A | | | Investor B | |
| | | Six Months
Ended
March 31, 2008
(Unaudited) | | | Year Ended September 30, | | | Six Months
Ended
March 31, 2008
(Unaudited) | | | Year Ended September 30, | |
| | | 2007 | | | 2006 | | | 2005 | | | 2004 | | | 20031 | | | | 2007 | | | 2006 | | | 2005 | | | 2004 | | | 20031 | |
Per Share Operating Performance | | | | | | | | | | | | | | | | | | | | | | | | | | | | | | | | | | | | | | | | | | | | | | | | |
Net asset value, beginning of period | | $ | 21.97 | | | $ | 17.90 | | | $ | 16.12 | | | $ | 13.57 | | | $ | 11.51 | | | $ | 8.48 | | | $ | 19.57 | | | $ | 16.07 | | | $ | 14.61 | | | $ | 12.39 | | | $ | 10.59 | | | $ | 7.86 | |
| | | | | | | | | | | | | | | | | | | | | | | | | | | | | | | | | | | | | | | | | | | | | | | | |
Net investment income (loss) | | | — | 2,3 | | | (0.13 | )2 | | | (0.14 | )2 | | | (0.10 | )2 | | | (0.16 | )2 | | | (0.13 | ) | | | (0.10 | )2 | | | (0.26 | ) 2 | | | (0.27 | )2 | | | (0.20 | )2 | | | (0.24 | )2 | | | (0.19 | ) |
Net realized and unrealized gain (loss) | | | (1.86 | ) | | | 4.20 | | | | 1.92 | | | | 2.64 | | | | 2.22 | | | | 3.16 | | | | (1.65 | ) | | | 3.76 | | | | 1.73 | | | | 2.41 | | | | 2.04 | | | | 2.92 | |
| | | | | | | | | | | | | | | | | | | | | | | | | | | | | | | | | | | | | | | | | | | | | | | | |
Net increase (decrease) from investment operations | | | (1.86 | ) | | | 4.07 | | | | 1.78 | | | | 2.54 | | | | 2.06 | | | | 3.03 | | | | (1.75 | ) | | | 3.50 | | | | 1.46 | | | | 2.21 | | | | 1.80 | | | | 2.73 | |
| | | | | | | | | | | | | | | | | | | | | | | | | | | | | | | | | | | | | | | | | | | | | | | | |
Redemption fees added to paid-in capital | | | — | 4 | | | — | 4 | | | — | 4 | | | 0.01 | | | | — | 4 | | | — | 4 | | | — | 4 | | | — | 4 | | | — | 4 | | | 0.01 | | | | — | 4 | | | — | 4 |
| | | | | | | | | | | | | | | | | | | | | | | | | | | | | | | | | | | | | | | | | | | | | | | | |
Net asset value, end of period | | $ | 20.11 | | | $ | 21.97 | | | $ | 17.90 | | | $ | 16.12 | | | $ | 13.57 | | | $ | 11.51 | | | $ | 17.82 | | | $ | 19.57 | | | $ | 16.07 | | | $ | 14.61 | | | $ | 12.39 | | | $ | 10.59 | |
| | | | | | | | | | | | | | | | | | | | | | | | | | | | | | | | | | | | | | | | | | | | | | | | |
Total Investment Return | | | | | | | | | | | | | | | | | | | | | | | | | | | | | | | | | | | | | | | | | | | | | | | | |
Based on net asset value9 | | | (8.47 | )%5,6 | | | 22.74 | %5 | | | 11.04 | %5 | | | 18.79 | %7 | | | 17.90 | %5 | | | 35.73 | %5 | | | (8.94 | )%5,6 | | | 21.78 | %5 | | | 9.99 | %5 | | | 17.92 | %10 | | | 17.00 | %5 | | | 34.73 | %5 |
| | | | | | | | | | | | | | | | | | | | | | | | | | | | | | | | | | | | | | | | | | | | | | | | |
Ratios to Average Net Assets | | | | | | | | | | | | | | | | | | | | | | | | | | | | | | | | | | | | | | | | | | | | | | | | |
Total expenses, net of waivers and reimbursement | | | 1.13 | %8 | | | 1.12 | % | | | 1.15 | % | | | 1.19 | % | | | 1.30 | % | | | 1.37 | % | | | 2.15 | %8 | | | 1.92 | % | | | 2.11 | % | | | 1.94 | % | | | 2.07 | % | | | 2.11 | % |
| | | | | | | | | | | | | | | | | | | | | | | | | | | | | | | | | | | | | | | | | | | | | | | | |
Total expenses | | | 1.13 | %8 | | | 1.12 | % | | | 1.25 | % | | | 1.29 | % | | | 1.40 | % | | | 1.40 | % | | | 2.15 | %8 | | | 2.02 | % | | | 2.30 | % | | | 1.94 | % | | | 2.07 | % | | | 2.14 | % |
| | | | | | | | | | | | | | | | | | | | | | | | | | | | | | | | | | | | | | | | | | | | | | | | |
Net investment loss | | | (0.03 | )%8 | | | (0.64 | )% | | | (0.80 | )% | | | (0.66 | )% | | | (1.12 | )% | | | (1.22 | )% | | | (1.06 | )%8 | | | (1.44 | )% | | | (1.77 | )% | | | (1.45 | )% | | | (1.89 | )% | | | (1.97 | )% |
| | | | | | | | | | | | | | | | | | | | | | | | | | | | | | | | | | | | | | | | | | | | | | | | |
Supplemental Data | | | | | | | | | | | | | | | | | | | | | | | | | | | | | | | | | | | | | | | | | | | | | | | | |
Net assets, end of period (000) | | $ | 194,720 | | | $ | 189,575 | | | $ | 176,250 | | | $ | 160,374 | | | $ | 131,795 | | | $ | 102,642 | | | $ | 7,392 | | | $ | 10,222 | | | $ | 10,649 | | | $ | 15,516 | | | $ | 23,983 | | | $ | 24,167 | |
| | | | | | | | | | | | | | | | | | | | | | | | | | | | | | | | | | | | | | | | | | | | | | | | |
Portfolio turnover | | | 52 | % | | | 81 | % | | | 74 | % | | | 91 | % | | | 81 | % | | | 167 | % | | | 52 | % | | | 81 | % | | | 74 | % | | | 91 | % | | | 81 | % | | | 167 | % |
| | | | | | | | | | | | | | | | | | | | | | | | | | | | | | | | | | | | | | | | | | | | | | | | |
See Notes to Financial Statements.
| | | | | | |
| 108 | | SEMI-ANNUAL REPORT | | MARCH 31, 2008 | | |
| | |
Financial Highlights (continued) | | Small Cap Growth Equity Portfolio |
| | | | | | | | | | | | | | | | | | | | | | | | |
| | | Investor C | |
| | | Six Months
Ended
March 31, 2008
(Unaudited) | | | Year Ended September 30, | |
| | | 2007 | | | 2006 | | | 2005 | | | 2004 | | | 20031 | |
Per Share Operating Performance | | | | | | | | | | | | | | | | | | | | | | | | |
Net asset value, beginning of period | | $ | 19.57 | | | $ | 16.09 | | | $ | 14.62 | | | $ | 12.40 | | | $ | 10.60 | | | $ | 7.86 | |
| | | | | | | | | | | | | | | | | | | | | | | | |
Net investment loss | | | (0.09 | )2 | | | (0.29 | )2 | | | (0.26 | )2 | | | (0.19 | )2 | | | (0.25 | )2 | | | (0.18 | ) |
Net realized and unrealized gain (loss) | | | (1.65 | ) | | | 3.77 | | | | 1.73 | | | | 2.40 | | | | 2.05 | | | | 2.92 | |
| | | | | | | | | | | | | | | | | | | | | | | | |
Net increase (decrease) from investment operations | | | (1.74 | ) | | | 3.48 | | | | 1.47 | | | | 2.21 | | | | 1.80 | | | | 2.74 | |
| | | | | | | | | | | | | | | | | | | | | | | | |
Redemption fees added to paid-in capital | | | — | 4 | | | — | 4 | | | — | 4 | | | 0.01 | | | | — | 4 | | | — | 4 |
| | | | | | | | | | | | | | | | | | | | | | | | |
Net asset value, end of period | | $ | 17.83 | | | $ | 19.57 | | | $ | 16.09 | | | $ | 14.62 | | | $ | 12.40 | | | $ | 10.60 | |
| | | | | | | | | | | | | | | | | | | | | | | | |
Total Investment Return | | | | | | | | | | | | | | | | | | | | | | | | |
Based on net asset value9 | | | (8.89 | )%5,6 | | | 21.63 | %5 | | | 10.05 | %5 | | | 17.90 | %10 | | | 16.98 | %5 | | | 34.86 | %5 |
| | | | | | | | | | | | | | | | | | | | | | | | |
Ratios to Average Net Assets | | | | | | | | | | | | | | | | | | | | | | | | |
Total expenses, net of waivers and reimbursement | | | 2.06 | %8 | | | 2.04 | % | | | 2.02 | % | | | 1.94 | % | | | 2.08 | % | | | 2.11 | % |
| | | | | | | | | | | | | | | | | | | | | | | | |
Total expenses | | | 2.06 | %8 | | | 2.09 | % | | | 2.02 | % | | | 1.94 | % | | | 2.08 | % | | | 2.14 | % |
| | | | | | | | | | | | | | | | | | | | | | | | |
Net investment loss | | | (0.98 | )%8 | | | (1.56 | )% | | | (1.68 | )% | | | (1.41 | )% | | | (1.90 | )% | | | (1.97 | )% |
| | | | | | | | | | | | | | | | | | | | | | | | |
Supplemental Data | | | | | | | | | | | | | | | | | | | | | | | | |
Net assets, end of period (000) | | $ | 21,705 | | | $ | 21,847 | | | $ | 15,667 | | | $ | 15,434 | | | $ | 13,989 | | | $ | 11,396 | |
| | | | | | | | | | | | | | | | | | | | | | | | |
Portfolio turnover | | | 52 | % | | | 81 | % | | | 74 | % | | | 91 | % | | | 81 | % | | | 167 | % |
| | | | | | | | | | | | | | | | | | | | | | | | |
1 | Audited by other auditors. |
2 | Based on average shares outstanding. |
3 | Net investment loss is less than $0.005 per share. |
4 | Redemption fees added to paid-in capital are less than $0.01 per share. |
5 | Redemption fee of 2.00% received by the Portfolio is reflected in total return calculations. There was no impact to the return. |
6 | Aggregate total investment return. |
7 | Redemption fee of 2.00% received by the Portfolio is reflected in total return calculations. The impact to the return for redemption fees received during the period was an increase of 0.07%. |
9 | Total investment returns exclude the effects of sales charges. |
10 | Redemption fee of 2.00% received by the Portfolio is reflected in total return calculations. The impact to the return for redemption fees received during the period was an increase of 0.08%. |
See Notes to Financial Statements.
| | | | | | |
| | SEMI-ANNUAL REPORT | | MARCH 31, 2008 | | 109 |
| | |
| | Global Science & Technology |
Financial Highlights (continued) | | Opportunities Portfolio |
| | | | | | | | | | | | | | | | | | | | | | | | | | | | | | | | | | | | | | | | | | | | | | | | |
| | | Institutional | | | Service | |
| | | Six Months
Ended
March 31, 2008
(Unaudited) | | | Year Ended September 30, | | | Six Months
Ended
March 31, 2008
(Unaudited) | | | Year Ended September 30, | |
| | | 2007 | | | 2006 | | | 2005 | | | 2004 | | | 20031 | | | | 2007 | | | 2006 | | | 2005 | | | 2004 | | | 20031 | |
Per Share Operating Performance | | | | | | | | | | | | | | | | | | | | | | | | | | | | | | | | | | | | | | | | | | | | | | | | |
Net asset value, beginning of period | | $ | 9.03 | | | $ | 7.20 | | | $ | 6.61 | | | $ | 5.42 | | | $ | 5.46 | | | $ | 3.59 | | | $ | 8.83 | | | $ | 7.07 | | | $ | 6.51 | | | $ | 5.35 | | | $ | 5.41 | | | $ | 3.57 | |
| | | | | | | | | | | | | | | | | | | | | | | | | | | | | | | | | | | | | | | | | | | | | | | | |
Net investment loss | | | (0.02 | )2 | | | (0.03 | )2 | | | (0.03 | )2 | | | (0.04 | )2 | | | (0.07 | )2 | | | (0.05 | ) | | | (0.04 | )2 | | | (0.07 | )2 | | | (0.05 | )2 | | | (0.06 | )2 | | | (0.08 | )2 | | | (0.06 | )2 |
Net realized and unrealized gain (loss) | | | (1.25 | ) | | | 1.86 | | | | 0.61 | | | | 1.23 | | | | 0.03 | | | | 1.92 | | | | (1.22 | ) | | | 1.83 | | | | 0.60 | | | | 1.22 | | | | 0.02 | | | | 1.90 | |
| | | | | | | | | | | | | | | | | | | | | | | | | | | | | | | | | | | | | | | | | | | | | | | | |
Net increase (decrease) from investment operations | | | (1.27 | ) | | | 1.83 | | | | 0.58 | | | | 1.19 | | | | (0.04 | ) | | | 1.87 | | | | (1.26 | ) | | | 1.76 | | | | 0.55 | | | | 1.16 | | | | (0.06 | ) | | | 1.84 | |
| | | | | | | | | | | | | | | | | | | | | | | | | | | | | | | | | | | | | | | | | | | | | | | | |
Redemption fees added to paid-in capital | | | — | 3 | | | — | 3 | | | 0.01 | | | | — | 3 | | | — | 3 | | | — | | | | — | 3 | | | — | 3 | | | 0.01 | | | | — | 3 | | | — | 3 | | | — | |
| | | | | | | | | | | | | | | | | | | | | | | | | | | | | | | | | | | | | | | | | | | | | | | | |
Net asset value, end of period | | $ | 7.76 | | | $ | 9.03 | | | $ | 7.20 | | | $ | 6.61 | | | $ | 5.42 | | | $ | 5.46 | | | $ | 7.57 | | | $ | 8.83 | | | $ | 7.07 | | | $ | 6.51 | | | $ | 5.35 | | | $ | 5.41 | |
| | | | | | | | | | | | | | | | | | | | | | | | | | | | | | | | | | | | | | | | | | | | | | | | |
Total Investment Return | | | | | | | | | | | | | | | | | | | | | | | | | | | | | | | | | | | | | | | | | | | | | | | | |
Based on net asset value | | | (14.06 | )%4,5 | | | 25.42 | %4 | | | 8.93 | %6 | | | 21.96 | %4 | | | (0.73 | )%4 | | | 52.09 | % | | | (14.27 | )%4,5 | | | 24.89 | %4 | | | 8.60 | %6 | | | 21.68 | %4 | | | (1.11 | )%4 | | | 51.54 | % |
| | | | | | | | | | | | | | | | | | | | | | | | | | | | | | | | | | | | | | | | | | | | | | | | |
Ratios to Average Net Assets | | | | | | | | | | | | | | | | | | | | | | | | | | | | | | | | | | | | | | | | | | | | | | | | |
Total expenses, net of waivers and reimbursement | | | 1.35 | %7 | | | 1.35 | % | | | 1.38 | % | | | 1.43 | % | | | 1.43 | % | | | 1.35 | % | | | 1.73 | %7 | | | 1.73 | % | | | 1.73 | % | | | 1.73 | % | | | 1.73 | % | | | 1.67 | % |
| | | | | | | | | | | | | | | | | | | | | | | | | | | | | | | | | | | | | | | | | | | | | | | | |
Total expenses | | | 1.62 | %7 | | | 1.91 | % | | | 1.79 | % | | | 1.98 | % | | | 1.63 | % | | | 1.63 | % | | | 1.95 | %7 | | | 2.30 | % | | | 2.06 | % | | | 2.27 | % | | | 1.94 | % | | | 1.88 | % |
| | | | | | | | | | | | | | | | | | | | | | | | | | | | | | | | | | | | | | | | | | | | | | | | |
Net investment loss | | | (0.52 | )%7 | | | (0.44 | )% | | | (0.45 | )% | | | (0.73 | )% | | | (1.12 | )% | | | (1.06 | )% | | | (0.90 | )%7 | | | (0.85 | )% | | | (0.79 | )% | | | (1.04 | )% | | | (1.41 | )% | | | (1.38 | )% |
| | | | | | | | | | | | | | | | | | | | | | | | | | | | | | | | | | | | | | | | | | | | | | | | |
Supplemental Data | | | | | | | | | | | | | | | | | | | | | | | | | | | | | | | | | | | | | | | | | | | | | | | | |
Net assets, end of period (000) | | $ | 1,790 | | | $ | 1,449 | | | $ | 1,262 | | | $ | 847 | | | $ | 1,592 | | | $ | 2,821 | | | $ | 133 | | | $ | 123 | | | $ | 148 | | | $ | 116 | | | $ | 86 | | | $ | 108 | |
| | | | | | | | | | | | | | | | | | | | | | | | | | | | | | | | | | | | | | | | | | | | | | | | |
Portfolio turnover | | | 54 | % | | | 92 | % | | | 132 | % | | | 113 | % | | | 115 | % | | | 226 | % | | | 54 | % | | | 92 | % | | | 132 | % | | | 113 | % | | | 115 | % | | | 226 | % |
| | | | | | | | | | | | | | | | | | | | | | | | | | | | | | | | | | | | | | | | | | | | | | | | |
| | | | | | | | | | | | | | | | | | | | | | | | | | | | | | | | | | | | | | | | | | | | | | | | |
| | | Investor A | | | Investor B | |
| | | Six Months
Ended
March 31, 2008 | | | Year Ended September 30, | | | Six Months
Ended
March 31, 2008 | | | Year Ended September 30, | |
| | | (Unaudited) | | | 2007 | | | 2006 | | | 2005 | | | 2004 | | | 20031 | | | (Unaudited) | | | 2007 | | | 2006 | | | 2005 | | | 2004 | | | 20031 | |
Per Share Operating Performance | | | | | | | | | | | | | | | | | | | | | | | | | | | | | | | | | | | | | | | | | | | | | | | | |
Net asset value, beginning of period | | $ | 8.74 | | | $ | 7.00 | | | $ | 6.45 | | | $ | 5.31 | | | $ | 5.38 | | | $ | 3.55 | | | $ | 8.26 | | | $ | 6.66 | | | $ | 6.19 | | | $ | 5.13 | | | $ | 5.24 | | | $ | 3.49 | |
| | | | | | | | | | | | | | | | | | | | | | | | | | | | | | | | | | | | | | | | | | | | | | | | |
Net investment loss | | | (0.04 | )2 | | | (0.06 | )2 | | | (0.06 | )2 | | | (0.07 | )2 | | | (0.09 | )2 | | | (0.07 | ) | | | (0.07 | )2 | | | (0.12 | )2 | | | (0.11 | )2 | | | (0.11 | )2 | | | (0.13 | )2 | | | (0.10 | ) |
Net realized and unrealized gain (loss) | | | (1.20 | ) | | | 1.80 | | | | 0.60 | | | | 1.21 | | | | 0.02 | | | | 1.90 | | | | (1.14 | ) | | | 1.72 | | | | 0.57 | | | | 1.17 | | | | 0.02 | | | | 1.85 | |
| | | | | | | | | | | | | | | | | | | | | | | | | | | | | | | | | | | | | | | | | | | | | | | | |
Net increase (decrease) from investment operations | | | (1.24 | ) | | | 1.74 | | | | 0.54 | | | | 1.14 | | | | (0.07 | ) | | | 1.83 | | | | (1.21 | ) | | | 1.60 | | | | 0.46 | | | | 1.06 | | | | (0.11 | ) | | | 1.75 | |
| | | | | | | | | | | | | | | | | | | | | | | | | | | | | | | | | | | | | | | | | | | | | | | | |
Redemption fees added to paid-in capital | | | — | 3 | | | — | 3 | | | 0.01 | | | | — | 3 | | | — | 3 | | | — | | | | — | 3 | | | — | 3 | | | 0.01 | | | | — | 3 | | | — | 3 | | | — | |
| | | | | | | | | | | | | | | | | | | | | | | | | | | | | | | | | | | | | | | | | | | | | | | | |
Net asset value, end of period | | $ | 7.50 | | | $ | 8.74 | | | $ | 7.00 | | | $ | 6.45 | | | $ | 5.31 | | | $ | 5.38 | | | $ | 7.05 | | | $ | 8.26 | | | $ | 6.66 | | | $ | 6.19 | | | $ | 5.13 | | | $ | 5.24 | |
| | | | | | | | | | | | | | | | | | | | | | | | | | | | | | | | | | | | | | | | | | | | | | | | |
Total Investment Return | | | | | | | | | | | | | | | | | | | | | | | | | | | | | | | | | | | | | | | | | | | | | | | | |
Based on net asset value8 | | | (14.19 | )%4,5 | | | 24.86 | %4 | | | 8.53 | %9 | | | 21.47 | %4 | | | (1.30 | )%4 | | | 51.55 | % | | | (14.65 | )%4,5 | | | 24.02 | %4 | | | 7.59 | %9 | | | 20.66 | %4 | | | (2.10 | )%4 | | | 50.14 | % |
| | | | | | | | | | | | | | | | | | | | | | | | | | | | | | | | | | | | | | | | | | | | | | | | |
Ratios to Average Net Assets | | | | | | | | | | | | | | | | | | | | | | | | | | | | | | | | | | | | | | | | | | | | | | | | |
Total expenses, net of waivers and reimbursement | | | 1.75 | %7 | | | 1.73 | % | | | 1.77 | % | | | 1.84 | % | | | 1.89 | % | | | 1.83 | % | | | 2.64 | %7 | | | 2.50 | % | | | 2.63 | % | | | 2.59 | % | | | 2.65 | % | | | 2.57 | % |
| | | | | | | | | | | | | | | | | | | | | | | | | | | | | | | | | | | | | | | | | | | | | | | | |
Total expenses | | | 1.94 | %7 | | | 2.16 | % | | | 2.27 | % | | | 2.35 | % | | | 2.14 | % | | | 2.10 | % | | | 2.89 | %7 | | | 3.01 | % | | | 3.06 | % | | | 3.00 | % | | | 2.82 | % | | | 2.85 | % |
| | | | | | | | | | | | | | | | | | | | | | | | | | | | | | | | | | | | | | | | | | | | | | | | |
Net investment loss | | | (0.89 | )%7 | | | (0.80 | )% | | | (0.83 | )% | | | (1.16 | )% | | | (1.56 | )% | | | (1.53 | )% | | | (1.82 | )%7 | | | (1.59 | )% | | | (1.73 | )% | | | (1.91 | )% | | | (2.33 | )% | | | (2.28 | )% |
| | | | | | | | | | | | | | | | | | | | | | | | | | | | | | | | | | | | | | | | | | | | | | | | |
Supplemental Data | | | | | | | | | | | | | | | | | | | | | | | | | | | | | | | | | | | | | | | | | | | | | | | | |
Net assets, end of period (000) | | $ | 24,916 | | | $ | 21,632 | | | $ | 13,040 | | | $ | 9,688 | | | $ | 9,929 | | | $ | 11,406 | | | $ | 6,783 | | | $ | 9,030 | | | $ | 10,439 | | | $ | 10,998 | | | $ | 12,315 | | | $ | 16,646 | |
| | | | | | | | | | | | | | | | | | | | | | | | | | | | | | | | | | | | | | | | | | | | | | | | |
Portfolio turnover | | | 54 | % | | | 92 | % | | | 132 | % | | | 113 | % | | | 115 | % | | | 226 | % | | | 54 | % | | | 92 | % | | | 132 | % | | | 113 | % | | | 115 | % | | | 226 | % |
| | | | | | | | | | | | | | | | | | | | | | | | | | | | | | | | | | | | | | | | | | | | | | | | |
See Notes to Financial Statements.
| | | | | | |
| 110 | | SEMI-ANNUAL REPORT | | MARCH 31, 2008 | | |
| | |
| | Global Science & Technology |
Financial Highlights (continued) | | Opportunities Portfolio |
| | | | | | | | | | | | | | | | | | | | | | | | |
| | | Investor C | |
| | | Six Months
Ended
March 31, 2008
(Unaudited) | | | Year Ended September 30, | |
| | | 2007 | | | 2006 | | | 2005 | | | 2004 | | | 20031 | |
Per Share Operating Performance | | | | | | | | | | | | | | | | | | | | | | | | |
Net asset value, beginning of period | | $ | 8.25 | | | $ | 6.66 | | | $ | 6.19 | | | $ | 5.14 | | | $ | 5.24 | | | $ | 3.49 | |
| | | | | | | | | | | | | | | | | | | | | | | | |
Net investment loss | | | (0.07 | )2 | | | (0.12 | )2 | | | (0.11 | )2 | | | (0.11 | )2 | | | (0.13 | )2 | | | (0.10 | ) |
Net realized and unrealized gain (loss) | | | (1.14 | ) | | | 1.71 | | | | 0.57 | | | | 1.16 | | | | 0.03 | | | | 1.85 | |
| | | | | | | | | | | | | | | | | | | | | | | | |
Net increase (decrease) from investment operations | | | (1.21 | ) | | | 1.59 | | | | 0.46 | | | | 1.05 | | | | (0.10 | ) | | | 1.75 | |
| | | | | | | | | | | | | | | | | | | | | | | | |
Redemption fees added to paid-in capital | | | — | 3 | | | — | 3 | | | 0.01 | | | | — | 3 | | | — | 3 | | | — | |
| | | | | | | | | | | | | | | | | | | | | | | | |
Net asset value, end of period | | $ | 7.04 | | | $ | 8.25 | | | $ | 6.66 | | | $ | 6.19 | | | $ | 5.14 | | | $ | 5.24 | |
| | | | | | | | | | | | | | | | | | | | | | | | |
Total Investment Return | | | | | | | | | | | | | | | | | | | | | | | | |
Based on net asset value8 | | | (14.67 | )%4,5 | | | 23.87 | %4 | | | 7.59 | %9 | | | 20.43 | %4 | | | (1.91 | )%4 | | | 50.14 | % |
| | | | | | | | | | | | | | | | | | | | | | | | |
Ratios to Average Net Assets | | | | | | | | | | | | | | | | | | | | | | | | |
Total expenses, net of waivers and reimbursement | | | 2.59 | %7 | | | 2.61 | % | | | 2.62 | % | | | 2.59 | % | | | 2.65 | % | | | 2.57 | % |
| | | | | | | | | | | | | | | | | | | | | | | | |
Total expenses | | | 2.64 | %7 | | | 2.88 | % | | | 2.84 | % | | | 3.00 | % | | | 2.80 | % | | | 2.85 | % |
| | | | | | | | | | | | | | | | | | | | | | | | |
Net investment loss | | | (1.76 | )%7 | | | (1.69 | )% | | | (1.67 | )% | | | (1.91 | )% | | | (2.33 | )% | | | (2.28 | )% |
| | | | | | | | | | | | | | | | | | | | | | | | |
Supplemental Data | | | | | | | | | | | | | | | | | | | | | | | | |
Net assets, end of period (000) | | $ | 8,112 | | | $ | 9,755 | | | $ | 6,511 | | | $ | 2,794 | | | $ | 3,244 | | | $ | 4,024 | |
| | | | | | | | | | | | | | | | | | | | | | | | |
Portfolio turnover | | | 54 | % | | | 92 | % | | | 132 | % | | | 113 | % | | | 115 | % | | | 226 | % |
| | | | | | | | | | | | | | | | | | | | | | | | |
1 | Audited by other auditors. |
2 | Based on average shares outstanding. |
3 | Redemption fees added to paid-in capital are less than $0.01 per share. |
4 | Redemption fee of 2.00% received by the Portfolio is reflected in total return calculations. There was no impact to the return. |
5 | Aggregate total investment return. |
6 | Redemption fee of 2.00% received by the Portfolio is reflected in total return calculations. The impact to the return for redemption fees received during the period was an increase of 0.15%. |
8 | Total investment returns exclude the effects of sales charges. |
9 | Redemption fee of 2.00% received by the Portfolio is reflected in total return calculations. The impact to the return for redemption fees received during the period was an increase of 0.16%. |
See Notes to Financial Statements.
| | | | | | |
| | SEMI-ANNUAL REPORT | | MARCH 31, 2008 | | 111 |
| | |
Financial Highlights (continued) | | Global Resources Portfolio |
| | | | | | | | | | | | | | | | | | | | | | | | | | | | |
| | | Institutional | |
| | | Six Months
Ended
March 31, 2008
(Unaudited) | | | Year Ended September 30, | | | 3/01/05 -
9/30/05 | | | 7/01/04 -
2/28/05 | | | Year Ended June 30, | |
| | | 2007 | | | 2006 | | | | | 2004 | | | 2003 | |
Per Share Operating Performance | | | | | | | | | | | | | | | | | | | | | | | | | | | | |
Net asset value, beginning of period | | $ | 63.42 | | | $ | 68.57 | | | $ | 79.62 | | | $ | 58.80 | | | $ | 41.25 | | | $ | 26.85 | | | $ | 23.51 | |
| | | | | | | | | | | | | | | | | | | | | | | | | | | | |
Net investment income (loss) | | | (0.08 | )1 | | | (0.02 | )1 | | | 0.57 | 1 | | | 0.15 | 1 | | | (0.08 | ) | | | 0.27 | | | | (0.04 | ) |
Net realized and unrealized gain (loss) | | | 9.49 | | | | 14.26 | | | | (2.50 | ) | | | 20.67 | | | | 19.52 | | | | 14.78 | | | | 3.38 | |
| | | | | | | | | | | | | | | | | | | | | | | | | | | | |
Net increase (decrease) from investment operations | | | 9.41 | | | | 14.24 | | | | (1.93 | ) | | | 20.82 | | | | 19.44 | | | | 15.05 | | | | 3.34 | |
| | | | | | | | | | | | | | | | | | | | | | | | | | | | |
Dividends and distributions from: | | | | | | | | | | | | | | | | | | | | | | | | | | | | |
Net investment income | | | (2.44 | ) | | | (0.81 | ) | | | (0.53 | ) | | | — | | | | (0.34 | ) | | | (0.65 | ) | | | — | |
Net realized capital gain | | | (6.80 | ) | | | (18.58 | ) | | | (8.60 | ) | | | — | | | | (1.55 | ) | | | — | | | | — | |
| | | | | | | | | | | | | | | | | | | | | | | | | | | | |
Total dividends and distributions | | | (9.24 | ) | | | (19.39 | ) | | | (9.13 | ) | | | — | | | | (1.89 | ) | | | (0.65 | ) | | | — | |
| | | | | | | | | | | | | | | | | | | | | | | | | | | | |
Redemption fees added to paid-in capital | | | — | 2 | | | — | 2 | | | 0.01 | | | | — | 2 | | | — | | | | — | | | | — | |
| | | | | | | | | | | | | | | | | | | | | | | | | | | | |
Net asset value, end of period | | $ | 63.59 | | | $ | 63.42 | | | $ | 68.57 | | | $ | 79.62 | | | $ | 58.80 | | | $ | 41.25 | | | $ | 26.85 | |
| | | | | | | | | | | | | | | | | | | | | | | | | | | | |
Total Investment Return | | | | | | | | | | | | | | | | | | | | | | | | | | | | |
Based on net asset value | | | 15.54 | %3,4 | | | 23.55 | %3 | | | (2.89 | )%5 | | | 35.41 | %3,4 | | | 47.95 | %4 | | | 56.49 | % | | | 14.21 | % |
| | | | | | | | | | | | | | | | | | | | | | | | | | | | |
Ratios to Average Net Assets | | | | | | | | | | | | | | | | | | | | | | | | | | | | |
Total expenses, net of waivers and reimbursement | | | 1.03 | %6 | | | 1.03 | % | | | 0.98 | % | | | 1.04 | %6 | | | 1.01 | %6 | | | 1.04 | % | | | 1.30 | % |
| | | | | | | | | | | | | | | | | | | | | | | | | | | | |
Total expenses | | | 1.04 | %6 | | | 1.07 | % | | | 1.02 | % | | | 1.18 | %6 | | | 1.02 | %6 | | | 1.04 | % | | | 1.31 | % |
| | | | | | | | | | | | | | | | | | | | | | | | | | | | |
Net investment income (loss) | | | (0.25 | )%6 | | | (0.03 | )% | | | 0.76 | % | | | 0.42 | %6 | | | (0.16 | )%6 | | | 0.79 | % | | | (0.20 | )% |
| | | | | | | | | | | | | | | | | | | | | | | | | | | | |
Supplemental Data | | | | | | | | | | | | | | | | | | | | | | | | | | | | |
Net assets, end of period (000) | | $ | 38,240 | | | $ | 37,498 | | | $ | 35,010 | | | $ | 40,906 | 6 | | $ | 29,188 | 6 | | $ | 20,044 | | | $ | 10,144 | |
| | | | | | | | | | | | | | | | | | | | | | | | | | | | |
Portfolio turnover | | | 19 | % | | | 15 | % | | | 27 | % | | | 9 | % | | | 22 | % | | | 27 | % | | | 33 | % |
| | | | | | | | | | | | | | | | | | | | | | | | | | | | |
See Notes to Financial Statements.
| | | | | | |
| 112 | | SEMI-ANNUAL REPORT | | MARCH 31, 2008 | | |
| | |
Financial Highlights (continued) | | Global Resources Portfolio |
| | | | | | | | | | | | | | | | | | | | | | | | | | | | |
| | | Investor A | |
| | | Six Months
Ended
March 31, 2008
(Unaudited) | | | Year Ended September 30, | | | 3/01/05 -
9/30/05 | | | 7/01/04 -
2/28/05 | | | Year Ended June 30, | |
| | | 2007 | | | 2006 | | | | | 2004 | | | 2003 | |
Per Share Operating Performance | | | | | | | | | | | | | | | | | | | | | | | | | | | | |
Net asset value, beginning of period | | $ | 59.02 | | | $ | 64.90 | | | $ | 76.01 | | | $ | 56.23 | | | $ | 39.58 | | | $ | 25.81 | | | $ | 22.74 | |
| | | | | | | | | | | | | | | | | | | | | | | | | | | | |
Net investment income (loss) | | | (0.14 | )1 | | | (0.16 | )1 | | | 0.32 | 1 | | | 0.03 | 1 | | | (0.15 | ) | | | 0.21 | | | | (0.10 | ) |
Net realized and unrealized gain (loss) | | | 8.81 | | | | 13.41 | | | | (2.36 | ) | | | 19.75 | | | | 18.69 | | | | 14.15 | | | | 3.17 | |
| | | | | | | | | | | | | | | | | | | | | | | | | | | | |
Net increase (decrease) from investment operations | | | 8.67 | | | | 13.25 | | | | (2.04 | ) | | | 19.78 | | | | 18.54 | | | | 14.36 | | | | 3.07 | |
| | | | | | | | | | | | | | | | | | | | | | | | | | | | |
Dividends and distributions from: | | | | | | | | | | | | | | | | | | | | | | | | | | | | |
Net investment income | | | (2.34 | ) | | | (0.55 | ) | | | (0.48 | ) | | | — | | | | (0.34 | ) | | | (0.59 | ) | | | — | |
Net realized capital gain | | | (6.80 | ) | | | (18.58 | ) | | | (8.60 | ) | | | — | | | | (1.55 | ) | | | — | | | | — | |
| | | | | | | | | | | | | | | | | | | | | | | | | | | | |
Total dividends and distributions | | | (9.14 | ) | | | (19.13 | ) | | | (9.08 | ) | | | — | | | | (1.89 | ) | | | (0.59 | ) | | | — | |
| | | | | | | | | | | | | | | | | | | | | | | | | | | | |
Redemption fees added to paid-in capital | | | — | 2 | | | — | 2 | | | 0.01 | | | | — | 2 | | | — | | | | — | | | | — | |
| | | | | | | | | | | | | | | | | | | | | | | | | | | | |
Net asset value, end of period | | $ | 58.55 | | | $ | 59.02 | | | $ | 64.90 | | | $ | 76.01 | | | $ | 56.23 | | | $ | 39.58 | | | $ | 25.81 | |
| | | | | | | | | | | | | | | | | | | | | | | | | | | | |
Total Investment Return | | | | | | | | | | | | | | | | | | | | | | | | | | | | |
Based on net asset value7 | | | 15.41 | %3,4 | | | 23.25 | %3 | | | (3.20 | )%5 | | | 35.18 | %3,4 | | | 47.69 | %4 | | | 56.06 | % | | | 13.50 | % |
| | | | | | | | | | | | | | | | | | | | | | | | | | | | |
Ratios to Average Net Assets | | | | | | | | | | | | | | | | | | | | | | | | | | | | |
Total expenses, net of waivers and reimbursement | | | 1.27 | %6 | | | 1.29 | % | | | 1.30 | % | | | 1.34 | %6 | | | 1.36 | %6 | | | 1.34 | % | | | 1.60 | % |
| | | | | | | | | | | | | | | | | | | | | | | | | | | | |
Total expenses | | | 1.27 | %6 | | | 1.30 | % | | | 1.41 | % | | | 1.52 | %6 | | | 1.38 | %6 | | | 1.34 | % | | | 1.61 | % |
| | | | | | | | | | | | | | | | | | | | | | | | | | | | |
Net investment income (loss) | | | (0.48 | )%6 | | | (0.28 | )% | | | 0.44 | % | | | 0.10 | %6 | | | (0.52 | )%6 | | | 0.64 | % | | | (0.47 | )% |
| | | | | | | | | | | | | | | | | | | | | | | | | | | | |
Supplemental Data | | | | | | | | | | | | | | | | | | | | | | | | | | | | |
Net assets, end of period (000) | | $ | 795,057 | | | $ | 685,590 | | | $ | 683,417 | | | $ | 877,120 | 6 | | $ | 676,234 | 6 | | $ | 406,209 | | | $ | 103,987 | |
| | | | | | | | | | | | | | | | | | | | | | | | | | | | |
Portfolio turnover | | | 19 | % | | | 15 | % | | | 27 | % | | | 9 | % | | | 22 | % | | | 27 | % | | | 33 | % |
| | | | | | | | | | | | | | | | | | | | | | | | | | | | |
1 | Based on average shares outstanding. |
2 | Redemption fees added to paid-in capital are less than $0.01 per share. |
3 | Redemption fee of 2.00% received by the Portfolio is reflected in total return calculations. There was no impact to the return. |
4 | Aggregate total investment return. |
5 | Redemption fee of 2.00% received by the Portfolio is reflected in total return calculations. The impact to the return for redemption fees received during the period was an increase of 0.02%. |
7 | Total investment returns exclude the effects of sales charges. |
See Notes to Financial Statements.
| | | | | | |
| | SEMI-ANNUAL REPORT | | MARCH 31, 2008 | | 113 |
| | |
Financial Highlights (continued) | | Global Resources Portfolio |
| | | | | | | | | | | | | | | | | | | | | | | | | | | | |
| | | Investor B | |
| | | Six Months
Ended
March 31, 2008
(Unaudited) | | | Year Ended September 30, | | | 3/01/05 -
9/30/05 | | | 7/01/04 -
2/28/05 | | | Year Ended June 30, | |
| | | 2007 | | | 2006 | | | | | 2004 | | | 2003 | |
Per Share Operating Performance | | | | | | | | | | | | | | | | | | | | | | | | | | | | |
Net asset value, beginning of period | | $ | 50.87 | | | $ | 58.19 | | | $ | 69.43 | | | $ | 51.58 | | | $ | 36.52 | | | $ | 23.89 | | | $ | 21.20 | |
| | | | | | | | | | | | | | | | | | | | | | | | | | | | |
Net investment loss | | | (0.31 | )1 | | | (0.50 | )1 | | | (0.18 | )1 | | | (0.19 | )1 | | | (0.32 | ) | | | (0.06 | ) | | | (0.23 | ) |
Net realized and unrealized gain (loss) | | | 7.55 | | | | 11.82 | | | | (2.09 | ) | | | 18.04 | | | | 17.18 | | | | 13.14 | | | | 2.92 | |
| | | | | | | | | | | | | | | | | | | | | | | | | | | | |
Net increase (decrease) from investment operations | | | 7.24 | | | | 11.32 | | | | (2.27 | ) | | | 17.85 | | | | 16.86 | | | | 13.08 | | | | 2.69 | |
| | | | | | | | | | | | | | | | | | | | | | | | | | | | |
Dividends and distributions from: | | | | | | | | | | | | | | | | | | | | | | | | | | | | |
Net investment income | | | (1.93 | ) | | | (0.06 | ) | | | (0.38 | ) | | | — | | | | (0.25 | ) | | | (0.45 | ) | | | — | |
Net realized capital gain | | | (6.80 | ) | | | (18.58 | ) | | | (8.60 | ) | | | — | | | | (1.55 | ) | | | — | | | | — | |
| | | | | | | | | | | | | | | | | | | | | | | | | | | | |
Total dividends and distributions | | | (8.73 | ) | | | (18.64 | ) | | | (8.98 | ) | | | — | | | | (1.80 | ) | | | (0.45 | ) | | | — | |
| | | | | | | | | | | | | | | | | | | | | | | | | | | | |
Redemption fees added to paid-in capital | | | — | 2 | | | — | 2 | | | 0.01 | | | | — | 2 | | | — | | | | — | | | | — | |
| | | | | | | | | | | | | | | | | | | | | | | | | | | | |
Net asset value, end of period | | $ | 49.38 | | | $ | 50.87 | | | $ | 58.19 | | | $ | 69.43 | | | $ | 51.58 | | | $ | 36.52 | | | $ | 23.89 | |
| | | | | | | | | | | | | | | | | | | | | | | | | | | | |
Total Investment Return | | | | | | | | | | | | | | | | | | | | | | | | | | | | |
Based on net asset value3 | | | 14.96 | %4,5 | | | 22.35 | %4 | | | (3.91 | )%6 | | | 34.60 | %4,5 | | | 47.09 | %5 | | | 55.07 | % | | | 12.69 | % |
| | | | | | | | | | | | | | | | | | | | | | | | | | | | |
Ratios to Average Net Assets | | | | | | | | | | | | | | | | | | | | | | | | | | | | |
Total expenses, net of waivers and reimbursement | | | 2.04 | %7 | | | 2.03 | % | | | 2.02 | % | | | 2.04 | %7 | | | 2.01 | %7 | | | 2.04 | % | | | 2.30 | % |
| | | | | | | | | | | | | | | | | | | | | | | | | | | | |
Total expenses | | | 2.06 | %7 | | | 2.08 | % | | | 2.09 | % | | | 2.18 | %7 | | | 2.02 | %7 | | | 2.04 | % | | | 2.31 | % |
| | | | | | | | | | | | | | | | | | | | | | | | | | | | |
Net investment loss | | | (1.25 | )%7 | | | (1.01 | )% | | | (0.27 | )% | | | (0.60 | )%7 | | | (1.17 | )%7 | | | (0.20 | )% | | | (1.17 | )% |
| | | | | | | | | | | | | | | | | | | | | | | | | | | | |
Net investment income (loss) | | | | | | | | | | | | | | | | | | | | | | | | | | | | |
Net assets, end of period (000) | | $ | 78,478 | | | $ | 80,178 | | | $ | 87,636 | | | $ | 117,845 | 7 | | $ | 94,506 | 7 | | $ | 66,704 | | | $ | 29,782 | |
| | | | | | | | | | | | | | | | | | | | | | | | | | | | |
Portfolio turnover | | | 19 | % | | | 15 | % | | | 27 | % | | | 9 | % | | | 22 | % | | | 27 | % | | | 33 | % |
| | | | | | | | | | | | | | | | | | | | | | | | | | | | |
See Notes to Financial Statements.
| | | | | | |
| 114 | | SEMI-ANNUAL REPORT | | MARCH 31, 2008 | | |
| | |
| Financial Highlights (continued) | | Global Resources Portfolio |
| | | | | | | | | | | | | | | | | | | | | | | | | | | | |
| | | Investor C | |
| | | Six Months Ended March 31, 2008 | | | Year Ended September 30, | | | 3/01/05 -
9/30/05 | | | 7/01/04 -
2/28/05 | | | Year Ended June 30, | |
| | (Unaudited) | | | 2007 | | | 2006 | | | | | 2004 | | | 2003 | |
Per Share Operating Performance | | | | | | | | | | | | | | | | | | | | | | | | | | | | |
Net asset value, beginning of period | | $ | 50.84 | | | $ | 58.13 | | | $ | 69.37 | | | $ | 51.53 | | | $ | 36.48 | | | $ | 23.88 | | | $ | 21.18 | |
| | | | | | | | | | | | | | | | | | | | | | | | | | | | |
Net investment loss | | | (0.30 | )1 | | | (0.50 | )1 | | | (0.17 | )1 | | | (0.19 | )1 | | | (0.30 | ) | | | (0.03 | ) | | | (0.23 | ) |
Net realized and unrealized gain (loss) | | | 7.55 | | | | 11.83 | | | | (2.10 | ) | | | 18.03 | | | | 17.14 | | | | 13.10 | | | | 2.93 | |
| | | | | | | | | | | | | | | | | | | | | | | | | | | | |
Net increase (decrease) from investment operations | | | 7.25 | | | | 11.33 | | | | (2.27 | ) | | | 17.84 | | | | 16.84 | | | | 13.07 | | | | 2.70 | |
| | | | | | | | | | | | | | | | | | | | | | | | | | | | |
Dividends and distributions from: | | | | | | | | | | | | | | | | | | | | | | | | | | | | |
Net investment income | | | (2.01 | ) | | | (0.04 | ) | | | (0.38 | ) | | | — | | | | (0.24 | ) | | | (0.47 | ) | | | — | |
Net realized capital gain | | | (6.80 | ) | | | (18.58 | ) | | | (8.60 | ) | | | — | | | | (1.55 | ) | | | — | | | | — | |
| | | | | | | | | | | | | | | | | | | | | | | | | | | | |
Total dividends and distributions | | | (8.81 | ) | | | (18.62 | ) | | | (8.98 | ) | | | — | | | | (1.79 | ) | | | (0.47 | ) | | | — | |
| | | | | | | | | | | | | | | | | | | | | | | | | | | | |
Redemption fees added to paid-in capital | | | — | 2 | | | — | 2 | | | 0.01 | | | | — | 2 | | | — | | | | — | | | | — | |
| | | | | | | | | | | | | | | | | | | | | | | | | | | | |
Net asset value, end of period | | $ | 49.28 | | | $ | 50.84 | | | $ | 58.13 | | | $ | 69.37 | | | $ | 51.53 | | | $ | 36.48 | | | $ | 23.88 | |
| | | | | | | | | | | | | | | | | | | | | | | | | | | | |
Total Investment Return | | | | | | | | | | | | | | | | | | | | | | | | | | | | |
Based on net asset value3 | | | 14.99 | %4,5 | | | 22.36 | %4 | | | (3.92 | )%8 | | | 34.62 | %4,5 | | | 47.01 | %5 | | | 55.05 | % | | | 12.75 | % |
| | | | | | | | | | | | | | | | | | | | | | | | | | | | |
Ratios to Average Net Assets | | | | | | | | | | | | | | | | | | | | | | | | | | | | |
Total expenses, net of waivers and reimbursement | | | 2.00 | %7 | | | 2.01 | % | | | 2.01 | % | | | 2.04 | %7 | | | 2.01 | %7 | | | 2.04 | % | | | 2.30 | % |
| | | | | | | | | | | | | | | | | | | | | | | | | | | | |
Total expenses | | | 2.00 | %7 | | | 2.02 | % | | | 2.05 | % | | | 2.17 | %7 | | | 2.02 | %7 | | | 2.04 | % | | | 2.31 | % |
| | | | | | | | | | | | | | | | | | | | | | | | | | | | |
Net investment loss | | | (1.21 | )%7 | | | (1.00 | )% | | | (0.26 | )% | | | (0.61 | )%7 | | | (1.17 | )%7 | | | (0.10 | )% | | | (1.18 | )% |
| | | | | | | | | | | | | | | | | | | | | | | | | | | | |
Net investment income (loss) | | | | | | | | | | | | | | | | | | | | | | | | | | | | |
Net assets, end of period (000) | | $ | 160,142 | | | $ | 144,300 | | | $ | 147,723 | | | $ | 201,265 | 7 | | $ | 169,871 | 7 | | $ | 122,088 | | | $ | 37,601 | |
| | | | | | | | | | | | | | | | | | | | | | | | | | | | |
Portfolio turnover | | | 19 | % | | | 15 | % | | | 27 | % | | | 9 | % | | | 22 | % | | | 27 | % | | | 33 | % |
| | | | | | | | | | | | | | | | | | | | | | | | | | | | |
1 | Based on average shares outstanding. |
2 | Redemption fees added to paid-in capital are less than $0.01 per share. |
3 | Total investment returns exclude the effects of sales charges. |
4 | Redemption fee of 2.00% received by the Portfolio is reflected in total return calculations. There was no impact to the return. |
5 | Aggregate total investment return. |
6 | Redemption fee of 2.00% received by the Portfolio is reflected in total return calculations. The impact to the return for redemption fees received during the period was an increase of 0.02%. |
8 | Redemption fee of 2.00% received by the Portfolio is reflected in total return calculations. The impact to the return for redemption fees received during the period was an increase of 0.01%. |
See Notes to Financial Statements.
| | | | | | |
| | SEMI-ANNUAL REPORT | | MARCH 31, 2008 | | 115 |
| | |
| Financial Highlights (continued) | | All-Cap Global Resources Portfolio |
| | | | | | | | | | | | | | | | | | | | | | | | | | | | | | | | |
| | | Institutional | | | Service | |
| | | Six Months Ended March 31, 2008 | | | Year Ended September 30, | | | Period
Ended
9/30/051 | | | Six Months
Ended
March 31, 2008
(Unaudited) | | | Year Ended September 30, | | | Period
Ended
9/30/051 | |
| | (Unaudited) | | | 2007 | | | 2006 | | | | | 2007 | | | 2006 | | |
Per Share Operating Performance | | | | | | | | | | | | | | | | | | | | | | | | | | | | | | | | |
Net asset value, beginning of period | | $ | 19.40 | | | $ | 13.85 | | | $ | 13.56 | | | $ | 10.00 | | | $ | 19.19 | | | $ | 13.75 | | | $ | 13.52 | | | $ | 10.00 | |
| | | | | | | | | | | | | | | | | | | | | | | | | | | | | | | | |
Net investment income (loss) | | | 0.22 | 2 | | | 0.05 | 2 | | | 0.02 | 2 | | | 0.02 | 2 | | | 0.18 | 2 | | | (0.02 | )2 | | | (0.02 | )2 | | | 0.03 | 2 |
Net realized and unrealized gain | | | 1.69 | | | | 5.90 | | | | 0.26 | | | | 3.54 | | | | 1.67 | | | | 5.86 | | | | 0.24 | | | | 3.49 | |
| | | | | | | | | | | | | | | | | | | | | | | | | | | | | | | | |
Net increase from investment operations | | | 1.91 | | | | 5.95 | | | | 0.28 | | | | 3.56 | | | | 1.85 | | | | 5.84 | | | | 0.22 | | | | 3.52 | |
| | | | | | | | | | | | | | | | | | | | | | | | | | | | | | | | |
Dividends and distributions from: | | | | | | | | | | | | | | | | | | | | | | | | | | | | | | | | |
Net investment income | | | (0.26 | ) | | | — | | | | — | | | | — | | | | (0.20 | ) | | | — | | | | — | | | | — | |
Net realized capital gain | | | (0.28 | ) | | | (0.40 | ) | | | — | | | | — | | | | (0.28 | ) | | | (0.40 | ) | | | — | | | | — | |
| | | | | | | | | | | | | | | | | | | | | | | | | | | | | | | | |
Total dividends and distributions | | | (0.54 | ) | | | (0.40 | ) | | | — | | | | — | | | | (0.48 | ) | | | (0.40 | ) | | | — | | | | — | |
| | | | | | | | | | | | | | | | | | | | | | | | | | | | | | | | |
Redemption fees added to paid-in capital | | | — | 3 | | | — | 3 | | | 0.01 | | | | — | 3 | | | — | 3 | | | — | 3 | | | 0.01 | | | | — | 3 |
| | | | | | | | | | | | | | | | | | | | | | | | | | | | | | | | |
Net asset value, end of period | | $ | 20.77 | | | $ | 19.40 | | | $ | 13.85 | | | $ | 13.56 | | | $ | 20.56 | | | $ | 19.19 | | | $ | 13.75 | | | $ | 13.52 | |
| | | | | | | | | | | | | | | | | | | | | | | | | | | | | | | | |
Total Investment Return | | | | | | | | | | | | | | | | | | | | | | | | | | | | | | | | |
Based on net asset value | | | 9.95 | %4,5 | | | 43.66 | %4 | | | 2.14 | %6 | | | 35.60 | %4,5 | | | 9.69 | %4,5 | | | 43.16 | %4 | | | 1.70 | %7 | | | 35.20 | %4,5 |
| | | | | | | | | | | | | | | | | | | | | | | | | | | | | | | | |
Ratios to Average Net Assets | | | | | | | | | | | | | | | | | | | | | | | | | | | | | | | | |
Total expenses, net of waivers and reimbursement | | | 0.89 | %8 | | | 0.93 | % | | | 0.99 | % | | | 1.04 | %8 | | | 1.27 | %8 | | | 1.33 | % | | | 1.34 | % | | | 1.34 | %8 |
| | | | | | | | | | | | | | | | | | | | | | | | | | | | | | | | |
Total expenses | | | 0.89 | %8 | | | 0.93 | % | | | 1.01 | % | | | 1.54 | %8 | | | 1.28 | %8 | | | 1.42 | % | | | 1.40 | % | | | 1.77 | %8 |
| | | | | | | | | | | | | | | | | | | | | | | | | | | | | | | | |
Net investment income (loss) | | | 2.17 | %8 | | | 0.31 | % | | | 0.17 | % | | | 0.25 | %8 | | | 1.81 | %8 | | | (0.11 | )% | | | (0.17 | )% | | | 0.01 | %8 |
| | | | | | | | | | | | | | | | | | | | | | | | | | | | | | | | |
Supplemental Data | | | | | | | | | | | | | | | | | | | | | | | | | | | | | | | | |
Net assets, end of period (000) | | $ | 689,422 | | | $ | 598,747 | | | $ | 337,771 | | | $ | 92,147 | | | $ | 4,480 | | | $ | 3,435 | | | $ | 2,368 | | | $ | — | 9 |
| | | | | | | | | | | | | | | | | | | | | | | | | | | | | | | | |
Portfolio turnover | | | 15 | % | | | 31 | % | | | 41 | % | | | 12 | % | | | 15 | % | | | 31 | % | | | 41 | % | | | 12 | % |
| | | | | | | | | | | | | | | | | | | | | | | | | | | | | | | | |
| | |
| | | Investor A | | | Investor B | |
| | | Six Months Ended March 31, 2008 | | | Year Ended September 30, | | | Period
Ended
9/30/051 | | | Six Months
Ended
March 31, 2008
(Unaudited) | | | Year Ended September 30, | | | Period
Ended
9/30/051 | |
| | (Unaudited) | | | 2007 | | | 2006 | | | | | 2007 | | | 2006 | | |
Per Share Operating Performance | | | | | | | | | | | | | | | | | | | | | | | | | | | | | | | | |
Net asset value, beginning of period | | $ | 19.18 | | | $ | 13.75 | | | $ | 13.50 | | | $ | 10.00 | | | $ | 18.82 | | | $ | 13.59 | | | $ | 13.44 | | | $ | 10.00 | |
| | | | | | | | | | | | | | | | | | | | | | | | | | | | | | | | |
Net investment income (loss) | | | 0.20 | 2 | | | (0.02 | )2 | | | (0.02 | )2 | | | — | 2,10 | | | 0.12 | 2 | | | (0.13 | )2 | | | (0.12 | )2 | | | (0.05 | )2 |
Net realized and unrealized gain | | | 1.65 | | | | 5.85 | | | | 0.26 | | | | 3.50 | | | | 1.63 | | | | 5.76 | | | | 0.26 | | | | 3.49 | |
| | | | | | | | | | | | | | | | | | | | | | | | | | | | | | | | |
Net increase from investment operations | | | 1.85 | | | | 5.83 | | | | 0.24 | | | | 3.50 | | | | 1.75 | | | | 5.63 | | | | 0.14 | | | | 3.44 | |
| | | | | | | | | | | | | | | | | | | | | | | | | | | | | | | | |
Dividends and distributions from: | | | | | | | | | | | | | | | | | | | | | | | | | | | | | | | | |
Net investment income | | | (0.19 | ) | | | — | | | | — | | | | — | | | | (0.07 | ) | | | — | | | | — | | | | — | |
Net realized capital gain | | | (0.28 | ) | | | (0.40 | ) | | | — | | | | — | | | | (0.28 | ) | | | (0.40 | ) | | | — | | | | — | |
| | | | | | | | | | | | | | | | | | | | | | | | | | | | | | | | |
Total dividends and distributions | | | (0.47 | ) | | | (0.40 | ) | | | — | | | | — | | | | (0.35 | ) | | | (0.40 | ) | | | — | | | | — | |
| | | | | | | | | | | | | | | | | | | | | | | | | | | | | | | | |
Redemption fees added to paid-in capital | | | — | 3 | | | — | 3 | | | 0.01 | | | | — | 3 | | | — | 3 | | | — | 3 | | | 0.01 | | | | — | 3 |
| | | | | | | | | | | | | | | | | | | | | | | | | | | | | | | | |
Net asset value, end of period | | $ | 20.56 | | | $ | 19.18 | | | $ | 13.75 | | | $ | 13.50 | | | $ | 20.22 | | | $ | 18.82 | | | $ | 13.59 | | | $ | 13.44 | |
| | | | | | | | | | | | | | | | | | | | | | | | | | | | | | | | |
Total Investment Return | | | | | | | | | | | | | | | | | | | | | | | | | | | | | | | | |
Based on net asset value11 | | | 9.73 | %4,5 | | | 43.09 | %4 | | | 1.85 | %7 | | | 35.00 | %4,5 | | | 9.32 | %4,5 | | | 42.11 | %4 | | | 1.12 | %6 | | | 34.40 | %4,5 |
| | | | | | | | | | | | | | | | | | | | | | | | | | | | | | | | |
Ratios to Average Net Assets | | | | | | | | | | | | | | | | | | | | | | | | | | | | | | | | |
Total expenses, net of waivers and reimbursement | | | 1.25 | %8 | | | 1.31 | % | | | 1.34 | % | | | 1.34 | %8 | | | 2.04 | %8 | | | 2.04 | % | | | 2.04 | % | | | 2.04 | %8 |
| | | | | | | | | | | | | | | | | | | | | | | | | | | | | | | | |
Total expenses | | | 1.25 | %8 | | | 1.34 | % | | | 1.46 | % | | | 1.87 | %8 | | | 2.11 | %8 | | | 2.23 | % | | | 2.13 | % | | | 2.49 | %8 |
| | | | | | | | | | | | | | | | | | | | | | | | | | | | | | | | |
Net investment income (loss) | | | 1.96 | %8 | | | (0.10 | )% | | | (0.16 | )% | | | 0.01 | %8 | | | 1.19 | %8 | | | (0.82 | )% | | | (0.86 | )% | | | (0.64 | )%8 |
| | | | | | | | | | | | | | | | | | | | | | | | | | | | | | | | |
Supplemental Data | | | | | | | | | | | | | | | | | | | | | | | | | | | | | | | | |
Net assets, end of period (000) | | $ | 377,982 | | | $ | 347,598 | | | $ | 248,557 | | | $ | 87,949 | | | $ | 58,697 | | | $ | 55,538 | | | $ | 43,477 | | | $ | 16,019 | |
| | | | | | | | | | | | | | | | | | | | | | | | | | | | | | | | |
Portfolio turnover | | | 15 | % | | | 31 | % | | | 41 | % | | | 12 | % | | | 15 | % | | | 31 | % | | | 41 | % | | | 12 | % |
| | | | | | | | | | | | | | | | | | | | | | | | | | | | | | | | |
See Notes to Financial Statements.
| | | | | | |
| 116 | | SEMI-ANNUAL REPORT | | MARCH 31, 2008 | | |
| | |
| Financial Highlights (continued) | | All-Cap Global Resources Portfolio |
| | | | | | | | | | | | | | | | |
| | | Investor C | |
| | | Six Months Ended March 31, 2008 | | | Year Ended September 30, | | | Period
Ended
9/30/051 | |
| | (Unaudited) | | | 2007 | | | 2006 | | |
Per Share Operating Performance | | | | | | | | | | | | | | | | |
Net asset value, beginning of period | | $ | 18.84 | | | $ | 13.60 | | | $ | 13.46 | | | $ | 10.00 | |
| | | | | | | | | | | | | | | | |
Net investment income (loss) | | | 0.12 | 2 | | | (0.13 | )2 | | | (0.12 | )2 | | | (0.05 | )2 |
Net realized and unrealized gain | | | 1.63 | | | | 5.77 | | | | 0.25 | | | | 3.51 | |
| | | | | | | | | | | | | | | | |
Net increase from investment operations | | | 1.75 | | | | 5.64 | | | | 0.13 | | | | 3.46 | |
| | | | | | | | | | | | | | | | |
Dividends and distributions from: | | | | | | | | | | | | | | | | |
Net investment income | | | (0.08 | ) | | | — | | | | — | | | | — | |
Net realized capital gain | | | (0.28 | ) | | | (0.40 | ) | | | — | | | | — | |
| | | | | | | | | | | | | | | | |
Total dividends and distributions | | | (0.36 | ) | | | (0.40 | ) | | | — | | | | — | |
| | | | | | | | | | | | | | | | |
Redemption fees added to paid-in capital | | | — | 3 | | | — | 3 | | | 0.01 | | | | — | 3 |
| | | | | | | | | | | | | | | | |
Net asset value, end of period | | $ | 20.23 | | | $ | 18.84 | | | $ | 13.60 | | | $ | 13.46 | |
| | | | | | | | | | | | | | | | |
Total Investment Return | | | | | | | | | | | | | | | | |
Based on net asset value11 | | | 9.33 | %4,5 | | | 42.15 | %4 | | | 1.04 | %7 | | | 34.60 | %4,5 |
| | | | | | | | | | | | | | | | |
Ratios to Average Net Assets | | | | | | | | | | | | | | | | |
Total expenses, net of waivers and reimbursement | | | 2.02 | %8 | | | 2.04 | % | | | 2.04 | % | | | 2.04 | %8 |
| | | | | | | | | | | | | | | | |
Total expenses | | | 2.02 | %8 | | | 2.12 | % | | | 2.09 | % | | | 2.48 | %8 |
| | | | | | | | | | | | | | | | |
Net investment income (loss) | | | 1.19 | %8 | | | (0.83 | )% | | | (0.86 | )% | | | (0.70 | )%8 |
| | | | | | | | | | | | | | | | |
Supplemental Data | | | | | | | | | | | | | | | | |
Net assets, end of period (000) | | $ | 220,768 | | | $ | 207,194 | | | $ | 136,120 | | | $ | 48,288 | |
| | | | | | | | | | | | | | | | |
Portfolio turnover | | | 15 | % | | | 31 | % | | | 41 | % | | | 12 | % |
| | | | | | | | | | | | | | | | |
1 | Commenced operations on February 16, 2005. |
2 | Based on average shares outstanding. |
3 | Redemption fees added to paid-in capital are less than $0.01 per share. |
4 | Redemption fee of 2.00% received by the Portfolio is reflected in total return calculations. There was no impact to the return. |
5 | Aggregate total investment return. |
6 | Redemption fee of 2.00% received by the Portfolio is reflected in total return calculations. The impact to the return for redemption fees received during the period was an increase of 0.08%. |
7 | Redemption fee of 2.00% received by the Portfolio is reflected in total return calculations. The impact to the return for redemption fees received during the period was an increase of 0.07%. |
9 | Net assets end of period are less than $500. |
10 | Net investment loss is less than $0.005 per share. |
11 | Total investment returns exclude the effects of sales charges. |
See Notes to Financial Statements.
| | | | | | |
| | SEMI-ANNUAL REPORT | | MARCH 31, 2008 | | 117 |
| | |
| Financial Highlights (continued) | | Health Sciences Opportunities Portfolio |
| | | | | | | | | | | | | | | | | | | | | | | | | | | | |
| | | Institutional | |
| | | Six Months Ended March 31, 2008 | | | Year Ended September 30, | | | 3/01/05 -
9/30/05 | | | Year
Ended
2/28/05 | | | Year
Ended
2/29/04 | | | Year
Ended
2/28/031 | |
| | (Unaudited) | | | 2007 | | | 2006 | | | | | |
Per Share Operating Performance | | | | | | | | | | | | | | | | | | | | | | | | | | | | |
Net asset value, beginning of period | | $ | 30.41 | | | $ | 26.18 | | | $ | 24.45 | | | $ | 20.50 | | | $ | 21.15 | | | $ | 11.64 | | | $ | 14.48 | |
| | | | | | | | | | | | | | | | | | | | | | | | | | | | |
Net investment income (loss) | | | 0.06 | 2 | | | 0.06 | 2 | | | 0.04 | 2 | | | (0.06 | )2 | | | (0.15 | ) | | | (0.06 | ) | | | (0.09 | ) |
Net realized and unrealized gain (loss) | | | (1.49 | ) | | | 4.52 | | | | 2.30 | | | | 4.02 | | | | 0.57 | | | | 10.21 | | | | (2.71 | ) |
| | | | | | | | | | | | | | | | | | | | | | | | | | | | |
Net increase (decrease) from investment operations | | | (1.43 | ) | | | 4.58 | | | | 2.34 | | | | 3.96 | | | | 0.42 | | | | 10.15 | | | | (2.80 | ) |
| | | | | | | | | | | | | | | | | | | | | | | | | | | | |
Dividends and distributions from: | | | | | | | | | | | | | | | | | | | | | | | | | | | | |
Net realized capital gain | | | (1.23 | ) | | | (0.35 | ) | | | (0.62 | ) | | | (0.01 | ) | | | (1.07 | ) | | | (0.64 | ) | | | (0.04 | ) |
| | | | | | | | | | | | | | | | | | | | | | | | | | | | |
Redemption fees added to paid-in capital | | | — | 3 | | | — | 3 | | | 0.01 | | | | — | 3 | | | — | | | | — | | | | — | |
| | | | | | | | | | | | | | | | | | | | | | | | | | | | |
Net asset value, end of period | | $ | 27.75 | | | $ | 30.41 | | | $ | 26.18 | | | $ | 24.45 | | | $ | 20.50 | | | $ | 21.15 | | | $ | 11.64 | |
| | | | | | | | | | | | | | | | | | | | | | | | | | | | |
Total Investment Return | | | | | | | | | | | | | | | | | | | | | | | | | | | | |
Based on net asset value | | | (5.13 | )%4,5 | | | 17.68 | %4 | | | 9.77 | %6 | | | 19.32 | %4,5 | | | 1.84 | % | | | 87.73 | % | | | (19.42 | )% |
| | | | | | | | | | | | | | | | | | | | | | | | | | | | |
Ratios to Average Net Assets | | | | | | | | | | | | | | | | | | | | | | | | | | | | |
Total expenses, net of waivers and reimbursement | | | 0.99 | %7 | | | 1.02 | % | | | 1.01 | % | | | 1.25 | %7 | | | 1.25 | % | | | 1.25 | % | | | 1.25 | % |
| | | | | | | | | | | | | | | | | | | | | | | | | | | | |
Total expenses | | | 0.99 | %7 | | | 1.02 | % | | | 1.01 | % | | | 1.37 | %7 | | | 1.37 | % | | | 1.84 | % | | | 2.75 | % |
| | | | | | | | | | | | | | | | | | | | | | | | | | | | |
Net investment income (loss) | | | 0.37 | %7 | | | 0.21 | % | | | 0.17 | % | | | (0.47 | )%7 | | | (0.59 | )% | | | (0.38 | )% | | | (0.69 | )% |
| | | | | | | | | | | | | | | | | | | | | | | | | | | | |
Supplemental Data | | | | | | | | | | | | | | | | | | | | | | | | | | | | |
Net assets, end of period (000) | | $ | 162,407 | | | $ | 172,902 | | | $ | 112,563 | | | $ | 31,229 | | | $ | 4,262 | | | $ | 5,067 | | | $ | 988 | |
| | | | | | | | | | | | | | | | | | | | | | | | | | | | |
Portfolio turnover | | | 41 | % | | | 98 | % | | | 157 | % | | | 77 | % | | | 173 | % | | | 106 | % | | | 157 | % |
| | | | | | | | | | | | | | | | | | | | | | | | | | | | |
| | | | | | | | | | | | | | | | | | | | |
| | | Service | |
| | | Six Months Ended March 31, 2008 | | | Year Ended September 30, | | | 3/01/05 -
9/30/05 | | | Period
Ended
2/28/058 | |
| | (Unaudited) | | | 2007 | | | 2006 | | | |
Per Share Operating Performance | | | | | | | | | | | | | | | | | | | | |
Net asset value, beginning of period | | $ | 29.85 | | | $ | 25.78 | | | $ | 24.15 | | | $ | 20.24 | | | $ | 20.30 | |
| | | | | | | | | | | | | | | | | | | | |
Net investment income (loss) | | | — | 2,9 | | | (0.02 | )2 | | | (0.03 | )2 | | | (0.12 | )2 | | | (0.01 | ) |
Net realized and unrealized gain (loss) | | | (1.45 | ) | | | 4.44 | | | | 2.27 | | | | 4.04 | | | | (0.05 | ) |
| | | | | | | | | | | | | | | | | | | | |
Net increase (decrease) from investment operations | | | (1.45 | ) | | | 4.42 | | | | 2.24 | | | | 3.92 | | | | (0.06 | ) |
| | | | | | | | | | | | | | | | | | | | |
Dividends and distributions from: | | | | | | | | | | | | | | | | | | | | |
Net realized capital gain | | | (1.14 | ) | | | (0.35 | ) | | | (0.62 | ) | | | (0.01 | ) | | | — | |
| | | | | | | | | | | | | | | | | | | | |
Redemption fees added to paid-in capital | | | — | 3 | | | — | 3 | | | 0.01 | | | | — | 3 | | | — | |
| | | | | | | | | | | | | | | | | | | | |
Net asset value, end of period | | $ | 27.26 | | | $ | 29.85 | | | $ | 25.78 | | | $ | 24.15 | | | $ | 20.24 | |
| | | | | | | | | | | | | | | | | | | | |
Total Investment Return | | | | | | | | | | | | | | | | | | | | |
Based on net asset value | | | (5.24 | )%4,5 | | | 17.33 | %4 | | | 9.47 | %6 | | | 19.37 | %4,5 | | | (0.30 | )%5 |
| | | | | | | | | | | | | | | | | | | | |
Ratios to Average Net Assets | | | | | | | | | | | | | | | | | | | | |
Total expenses, net of waivers and reimbursement | | | 1.29 | %7 | | | 1.30 | % | | | 1.34 | % | | | 1.55 | %7 | | | 0.82 | %7 |
| | | | | | | | | | | | | | | | | | | | |
Total expenses | | | 1.29 | %7 | | | 1.32 | % | | | 1.34 | % | | | 1.64 | %7 | | | 0.82 | %7 |
| | | | | | | | | | | | | | | | | | | | |
Net investment income (loss) | | | 0.03 | %7 | | | (0.08 | )% | | | (0.12 | )% | | | (0.90 | )%7 | | | (0.70 | )%7 |
| | | | | | | | | | | | | | | | | | | | |
Supplemental Data | | | | | | | | | | | | | | | | | | | | |
Net assets, end of period (000) | | $ | 6,387 | | | $ | 7,806 | | | $ | 4,347 | | | $ | 66 | | | $ | — | 10 |
| | | | | | | | | | | | | | | | | | | | |
Portfolio turnover | | | 41 | % | | | 98 | % | | | 157 | % | | | 77 | % | | | 173 | % |
| | | | | | | | | | | | | | | | | | | | |
See Notes to Financial Statements.
| | | | | | |
| 118 | | SEMI-ANNUAL REPORT | | MARCH 31, 2008 | | |
| | |
| Financial Highlights (continued) | | Health Sciences Opportunities Portfolio |
| | | | | | | | | | | | | | | | | | | | | | | | | | | | |
| | | Investor A | |
| | | Six Months Ended March 31, 2008 | | | Year Ended September 30, | | | 3/01/05 -
9/30/05 | | | Year
Ended
2/28/05 | | | Year
Ended
2/29/04 | | | Year
Ended
2/28/031 | |
| | (Unaudited) | | | 2007 | | | 2006 | | | | | |
Per Share Operating Performance | | | | | | | | | | | | | | | | | | | | | | | | | | | | |
Net asset value, beginning of period | | $ | 29.77 | | | $ | 25.72 | | | $ | 24.11 | | | $ | 20.24 | | | $ | 20.96 | | | $ | 11.57 | | | $ | 14.43 | |
| | | | | | | | | | | | | | | | | | | | | | | | | | | | |
Net investment income (loss) | | | 0.01 | 2 | | | (0.03 | )2 | | | (0.05 | )2 | | | (0.09 | )2 | | | (0.17 | ) | | | (0.12 | ) | | | (0.12 | ) |
Net realized and unrealized gain (loss) | | | (1.47 | ) | | | 4.43 | | | | 2.27 | | | | 3.97 | | | | 0.52 | | | | 10.15 | | | | (2.70 | ) |
| | | | | | | | | | | | | | | | | | | | | | | | | | | | |
Net increase (decrease) from investment operations | | | (1.46 | ) | | | 4.40 | | | | 2.22 | | | | 3.88 | | | | 0.35 | | | | 10.03 | | | | (2.82 | ) |
| | | | | | | | | | | | | | | | | | | | | | | | | | | | |
Dividends and distributions from: | | | | | | | | | | | | | | | | | | | | | | | | | | | | |
Net realized capital gain | | | (1.12 | ) | | | (0.35 | ) | | | (0.62 | ) | | | (0.01 | ) | | | (1.07 | ) | | | (0.64 | ) | | | (0.04 | ) |
| | | | | | | | | | | | | | | | | | | | | | | | | | | | |
Redemption fees added to paid-in capital | | | — | 3 | | | — | 3 | | | 0.01 | | | | — | 3 | | | — | | | | — | | | | — | |
| | | | | | | | | | | | | | | | | | | | | | | | | | | | |
Net asset value, end of period | | $ | 27.19 | | | $ | 29.77 | | | $ | 25.72 | | | $ | 24.11 | | | $ | 20.24 | | | $ | 20.96 | | | $ | 11.57 | |
| | | | | | | | | | | | | | | | | | | | | | | | | | | | |
Total Investment Return | | | | | | | | | | | | | | | | | | | | | | | | | | | | |
Based on net asset value11 | | | (5.28 | )%4,5 | | | 17.29 | %4 | | | 9.40 | %6 | | | 19.17 | %4,5 | | | 1.52 | % | | | 87.13 | % | | | (19.63 | )% |
| | | | | | | | | | | | | | | | | | | | | | | | | | | | |
Ratios to Average Net Assets | | | | | | | | | | | | | | | | | | | | | | | | | | | | |
Total expenses, net of waivers and reimbursement | | | 1.30 | %7 | | | 1.35 | % | | | 1.34 | % | | | 1.55 | %7 | | | 1.58 | % | | | 1.55 | % | | | 1.55 | % |
| | | | | | | | | | | | | | | | | | | | | | | | | | | | |
Total expenses | | | 1.30 | %7 | | | 1.35 | % | | | 1.45 | % | | | 1.69 | %7 | | | 1.73 | % | | | 2.11 | % | | | 3.04 | % |
| | | | | | | | | | | | | | | | | | | | | | | | | | | | |
Net investment income (loss) | | | 0.04 | %7 | | | (0.13 | )% | | | (0.19 | )% | | | (0.68 | )%7 | | | (0.90 | )% | | | (0.71 | )% | | | (0.99 | )% |
| | | | | | | | | | | | | | | | | | | | | | | | | | | | |
Supplemental Data | | | | | | | | | | | | | | | | | | | | | | | | | | | | |
Net assets, end of period (000) | | $ | 617,124 | | | $ | 697,451 | | | $ | 434,360 | | | $ | 186,545 | | | $ | 76,550 | | | $ | 54,638 | | | $ | 9,250 | |
| | | | | | | | | | | | | | | | | | | | | | | | | | | | |
Portfolio turnover | | | 41 | % | | | 98 | % | | | 157 | % | | | 77 | % | | | 173 | % | | | 106 | % | | | 157 | % |
| | | | | | | | | | | | | | | | | | | | | | | | | | | | |
1 | Audited by other auditors. |
2 | Based on average shares outstanding. |
3 | Redemption fees added to paid-in capital are less than $0.01 per share. |
4 | Redemption fee of 2.00% received by the Portfolio is reflected in total return calculations. There was no impact to the return. |
5 | Aggregate total investment return. |
6 | Redemption fee of 2.00% received by the Portfolio is reflected in total return calculations. The impact to the return for redemption fees received during the period was an increase of 0.04%. |
8 | Commenced operations on January 28, 2005. |
9 | Net investment loss is less than $0.005 per share. |
10 | Net assets end of period are less than $500. |
11 | Total investment returns exclude the effects of sales charges. |
See Notes to Financial Statements.
| | | | | | |
| | SEMI-ANNUAL REPORT | | MARCH 31, 2008 | | 119 |
| | |
| Financial Highlights (continued) | | Health Sciences Opportunities Portfolio |
| | | | | | | | | | | | | | | | | | | | | | | | | | | | |
| | | Investor B | |
| | | Six Months Ended March 31, 2008 | | | Year Ended September 30, | | | 3/01/05 -
9/30/05 | | | Year
Ended
2/28/05 | | | Year
Ended
2/29/04 | | | Year
Ended
2/28/031 | |
| | (Unaudited) | | | 2007 | | | 2006 | | | | | |
Per Share Operating Performance | | | | | | | | | | | | | | | | | | | | | | | | | | | | |
Net asset value, beginning of period | | $ | 28.28 | | | $ | 24.65 | | | $ | 23.31 | | | $ | 19.65 | | | $ | 20.52 | | | $ | 11.41 | | | $ | 14.34 | |
| | | | | | | | | | | | | | | | | | | | | | | | | | | | |
Net investment loss | | | (0.11 | )2 | | | (0.25 | )2 | | | (0.24 | )2 | | | (0.17 | )2 | | | (0.28 | ) | | | (0.24 | ) | | | (0.21 | ) |
Net realized and unrealized gain (loss) | | | (1.41 | ) | | | 4.23 | | | | 2.19 | | | | 3.84 | | | | 0.48 | | | | 9.99 | | | | (2.68 | ) |
| | | | | | | | | | | | | | | | | | | | | | | | | | | | |
Net increase (decrease) from investment operations | | | (1.52 | ) | | | 3.98 | | | | 1.95 | | | | 3.67 | | | | 0.20 | | | | 9.75 | | | | (2.89 | ) |
| | | | | | | | | | | | | | | | | | | | | | | | | | | | |
Dividends and distributions from: | | | | | | | | | | | | | | | | | | | | | | | | | | | | |
Net realized capital gain | | | (0.83 | ) | | | (0.35 | ) | | | (0.62 | ) | | | (0.01 | ) | | | (1.07 | ) | | | (0.64 | ) | | | (0.04 | ) |
| | | | | | | | | | | | | | | | | | | | | | | | | | | | |
Redemption fees added to paid-in capital | | | — | 3 | | | — | 3 | | | 0.01 | | | | — | 3 | | | — | | | | — | | | | — | |
| | | | | | | | | | | | | | | | | | | | | | | | | | | | |
Net asset value, end of period | | $ | 25.93 | | | $ | 28.28 | | | $ | 24.65 | | | $ | 23.31 | | | $ | 19.65 | | | $ | 20.52 | | | $ | 11.41 | |
| | | | | | | | | | | | | | | | | | | | | | | | | | | | |
Total Investment Return | | | | | | | | | | | | | | | | | | | | | | | | | | | | |
Based on net asset value4 | | | (5.69 | )%5,6 | | | 16.33 | %5 | | | 8.54 | %7 | | | 18.68 | %5,6 | | | 0.80 | % | | | 85.89 | % | | | (20.24 | )% |
| | | | | | | | | | | | | | | | | | | | | | | | | | | | |
Ratios to Average Net Assets | | | | | | | | | | | | | | | | | | | | | | | | | | | | |
Total expenses, net of waivers and reimbursement | | | 2.14 | %8 | | | 2.19 | % | | | 2.16 | % | | | 2.25 | %8 | | | 2.25 | % | | | 2.25 | % | | | 2.25 | % |
| | | | | | | | | | | | | | | | | | | | | | | | | | | | |
Total expenses | | | 2.14 | %8 | | | 2.22 | % | | | 2.16 | % | | | 2.33 | %8 | | | 2.39 | % | | | 2.91 | % | | | 3.74 | % |
| | | | | | | | | | | | | | | | | | | | | | | | | | | | |
Net investment loss | | | (0.80 | )%8 | | | (0.96 | )% | | | (1.02 | )% | | | (1.35 | )%8 | | | (1.58 | )% | | | (1.44 | )% | | | (1.69 | )% |
| | | | | | | | | | | | | | | | | | | | | | | | | | | | |
Supplemental Data | | | | | | | | | | | | | | | | | | | | | | | | | | | | |
Net assets, end of period (000) | | $ | 84,049 | | | $ | 95,231 | | | $ | 78,902 | | | $ | 45,073 | | | $ | 29,495 | | | $ | 22,825 | | | $ | 9,290 | |
| | | | | | | | | | | | | | | | | | | | | | | | | | | | |
Portfolio turnover | | | 41 | % | | | 98 | % | | | 157 | % | | | 77 | % | | | 173 | % | | | 106 | % | | | 157 | % |
| | | | | | | | | | | | | | | | | | | | | | | | | | | | |
See Notes to Financial Statements.
| | | | | | |
| 120 | | SEMI-ANNUAL REPORT | | MARCH 31, 2008 | | |
| | |
| Financial Highlights (continued) | | Health Sciences Opportunities Portfolio |
| | | | | | | | | | | | | | | | | | | | | | | | | | | | |
| | | Investor C | |
| | | Six Months Ended March 31, 2008 | | | Year Ended September 30, | | | 3/01/05 -
9/30/05 | | | Year
Ended
2/28/05 | | | Year
Ended
2/29/04 | | | Year
Ended
2/28/031 | |
| | (Unaudited) | | | 2007 | | | 2006 | | | | | |
Per Share Operating Performance | | | | | | | | | | | | | | | | | | | | | | | | | | | | |
Net asset value, beginning of period | | $ | 28.27 | | | $ | 24.62 | | | $ | 23.26 | | | $ | 19.61 | | | $ | 20.47 | | | $ | 11.39 | | | $ | 14.31 | |
| | | | | | | | | | | | | | | | | | | | | | | | | | | | |
Net investment loss | | | (0.10 | )2 | | | (0.23 | )2 | | | (0.21 | )2 | | | (0.18 | )2 | | | (0.22 | ) | | | (0.23 | ) | | | (0.21 | ) |
Net realized and unrealized gain (loss) | | | (1.40 | ) | | | 4.23 | | | | 2.18 | | | | 3.84 | | | | 0.43 | | | | 9.95 | | | | (2.67 | ) |
| | | | | | | | | | | | | | | | | | | | | | | | | | | | |
Net increase (decrease) from investment operations | | | (1.50 | ) | | | 4.00 | | | | 1.97 | | | | 3.66 | | | | 0.21 | | | | 9.72 | | | | (2.88 | ) |
| | | | | | | | | | | | | | | | | | | | | | | | | | | | |
Dividends and distributions from: | | | | | | | | | | | | | | | | | | | | | | | | | | | | |
Net realized capital gain | | | (0.89 | ) | | | (0.35 | ) | | | (0.62 | ) | | | (0.01 | ) | | | (1.07 | ) | | | (0.64 | ) | | | (0.04 | ) |
| | | | | | | | | | | | | | | | | | | | | | | | | | | | |
Redemption fees added to paid-in capital | | | — | 3 | | | — | 3 | | | 0.01 | | | | — | 3 | | | — | | | | — | | | | — | |
| | | | | | | | | | | | | | | | | | | | | | | | | | | | |
Net asset value, end of period | | $ | 25.88 | | | $ | 28.27 | | | $ | 24.62 | | | $ | 23.26 | | | $ | 19.61 | | | $ | 20.47 | | | $ | 11.39 | |
| | | | | | | | | | | | | | | | | | | | | | | | | | | | |
Total Investment Return | | | | | | | | | | | | | | | | | | | | | | | | | | | | |
Based on net asset value4 | | | (5.65 | )%5,6 | | | 16.43 | %5 | | | 8.65 | %7 | | | 18.67 | %5,6 | | | 0.86 | % | | | 85.87 | % | | | (20.21 | )% |
| | | | | | | | | | | | | | | | | | | | | | | | | | | | |
Ratios to Average Net Assets | | | | | | | | | | | | | | | | | | | | | | | | | | | | |
Total expenses, net of waivers and reimbursement | | | 2.04 | %8 | | | 2.11 | % | | | 2.04 | % | | | 2.25 | %8 | | | 2.25 | % | | | 2.25 | % | | | 2.25 | % |
| | | | | | | | | | | | | | | | | | | | | | | | | | | | |
Total expenses | | | 2.04 | %8 | | | 2.12 | % | | | 2.04 | % | | | 2.32 | %8 | | | 2.41 | % | | | 2.77 | % | | | 3.74 | % |
| | | | | | | | | | | | | | | | | | | | | | | | | | | | |
Net investment loss | | | (0.69 | )%8 | | | (0.89 | )% | | | (0.87 | )% | | | (1.41 | )%8 | | | (1.56 | )% | | | (1.38 | )% | | | (1.69 | )% |
| | | | | | | | | | | | | | | | | | | | | | | | | | | | |
Supplemental Data | | | | | | | | | | | | | | | | | | | | | | | | | | | | |
Net assets, end of period (000) | | $ | 322,793 | | | $ | 363,739 | | | $ | 254,724 | | | $ | 84,431 | | | $ | 25,248 | | | $ | 11,017 | | | $ | 1,291 | |
| | | | | | | | | | | | | | | | | | | | | | | | | | | | |
Portfolio turnover | | | 41 | % | | | 98 | % | | | 157 | % | | | 77 | % | | | 173 | % | | | 106 | % | | | 157 | % |
| | | | | | | | | | | | | | | | | | | | | | | | | | | | |
1 | Audited by other auditors. |
2 | Based on average shares outstanding. |
3 | Redemption fees added to paid-in capital are less than $0.01 per share. |
4 | Total investment returns exclude the effects of sales charges. |
5 | Redemption fee of 2.00% received by the Portfolio is reflected in total return calculations. There was no impact to the return. |
6 | Aggregate total investment return. |
7 | Redemption fee of 2.00% received by the Portfolio is reflected in total return calculations. The impact to the return for redemption fees received during the period was an increase of 0.04%. |
See Notes to Financial Statements.
| | | | | | |
| | SEMI-ANNUAL REPORT | | MARCH 31, 2008 | | 121 |
| | |
| Financial Highlights (continued) | | U.S. Opportunities Portfolio |
| | | | | | | | | | | | | | | | | | | | | | | | | | | | | | | | | | | | | | | | | | | | | | | | |
| | | Institutional | | | Service | |
| | | Six Months Ended March 31, 2008 | | | Year Ended September 30, | | | Six Months Ended March 31,
2008 | | | Year Ended September 30, | |
| | (Unaudited) | | | 2007 | | | 2006 | | | 2005 | | | 2004 | | | 20031 | | | (Unaudited) | | | 2007 | | | 2006 | | | 2005 | | | 2004 | | | 20031 | |
Per Share Operating Performance | | | | | | | | | | | | | | | | | | | | | | | | | | | | | | | | | | | | | | | | | | | | | | | | |
Net asset value, beginning of period | | $ | 37.05 | | | $ | 29.07 | | | $ | 25.56 | | | $ | 20.34 | | | $ | 16.56 | | | $ | 13.06 | | | $ | 35.89 | | | $ | 28.28 | | | $ | 24.96 | | | $ | 19.93 | | | $ | 16.27 | | | $ | 12.88 | |
| | | | | | | | | | | | | | | | | | | | | | | | | | | | | | | | | | | | | | | | | | | | | | | | |
Net investment income (loss) | | | 0.06 | 2 | | | 0.03 | 2 | | | 0.04 | 2 | | | (0.15 | )2 | | | (0.17 | )2 | | | (0.16 | ) | | | — | 2,3 | | | (0.09 | ) 2 | | | (0.07 | )2 | | | (0.21 | )2 | | | (0.22 | )2 | | | (0.19 | ) |
Net realized and unrealized gain (loss) | | | (2.75 | ) | | | 7.95 | | | | 3.46 | | | | 5.37 | | | | 3.95 | | | | 3.66 | | | | (2.66 | ) | | | 7.70 | | | | 3.38 | | | | 5.24 | | | | 3.88 | | | | 3.58 | |
| | | | | | | | | | | | | | | | | | | | | | | | | | | | | | | | | | | | | | | | | | | | | | | | |
Net increase (decrease) from investment operations | | | (2.69 | ) | | | 7.98 | | | | 3.50 | | | | 5.22 | | | | 3.78 | | | | 3.50 | | | | (2.66 | ) | | | 7.61 | | | | 3.31 | | | | 5.03 | | | | 3.66 | | | | 3.39 | |
| | | | | | | | | | | | | | | | | | | | | | | | | | | | | | | | | | | | | | | | | | | | | | | | |
Redemption fees added to paid-in capital | | | — | 4 | | | — | 4 | | | 0.01 | | | | — | 4 | | | — | 4 | | | — | | | | — | 4 | | | — | 4 | | | 0.01 | | | | — | 4 | | | — | 4 | | | — | |
| | | | | | | | | | | | | | | | | | | | | | | | | | | | | | | | | | | | | | | | | | | | | | | | |
Net asset value, end of period | | $ | 34.36 | | | $ | 37.05 | | | $ | 29.07 | | | $ | 25.56 | | | $ | 20.34 | | | $ | 16.56 | | | $ | 33.23 | | | $ | 35.89 | | | $ | 28.28 | | | $ | 24.96 | | | $ | 19.93 | | | $ | 16.27 | |
| | | | | | | | | | | | | | | | | | | | | | | | | | | | | | | | | | | | | | | | | | | | | | | | |
Total Investment Return | | | | | | | | | | | | | | | | | | | | | | | | | | | | | | | | | | | | | | | | | | | | | | | | |
Based on net asset value | | | (7.26 | )%5,6 | | | 27.45 | %5 | | | 13.73 | %7 | | | 25.66 | %5 | | | 22.83 | %5 | | | 26.80 | % | | | (7.41 | )%5,6 | | | 26.91 | %5 | | | 13.30 | %7 | | | 25.24 | %5 | | | 22.50 | %5 | | | 26.32 | % |
| | | | | | | | | | | | | | | | | | | | | | | | | | | | | | | | | | | | | | | | | | | | | | | | |
Ratios to Average Net Assets | | | | | | | | | | | | | | | | | | | | | | | | | | | | | | | | | | | | | | | | | | | | | | | | |
Total expenses, net of waivers and reimbursement | | | 1.00 | %8 | | | 1.01 | % | | | 1.19 | % | | | 1.60 | % | | | 1.60 | % | | | 1.52 | % | | | 1.37 | %8 | | | 1.40 | % | | | 1.57 | % | | | 1.90 | % | | | 1.90 | % | | | 1.83 | % |
| | | | | | | | | | | | | | | | | | | | | | | | | | | | | | | | | | | | | | | | | | | | | | | | |
Total expenses | | | 1.36 | %8 | | | 1.42 | % | | | 1.49 | % | | | 1.73 | % | | | 1.65 | % | | | 1.59 | % | | | 1.61 | %8 | | | 1.69 | % | | | 1.85 | % | | | 1.97 | % | | | 1.97 | % | | | 1.89 | % |
| | | | | | | | | | | | | | | | | | | | | | | | | | | | | | | | | | | | | | | | | | | | | | | | |
Net investment income (loss) | | | 0.35 | %8 | | | 0.09 | % | | | 0.15 | % | | | (0.65 | )% | | | (0.92 | )% | | | (0.87 | )% | | | (0.01 | )%8 | | | (0.28 | )% | | | (0.25 | )% | | | (0.96 | )% | | | (1.15 | )% | | | (1.17 | )% |
| | | | | | | | | | | | | | | | | | | | | | | | | | | | | | | | | | | | | | | | | | | | | | | | |
Supplemental Data | | | | | | | | | | | | | | | | | | | | | | | | | | | | | | | | | | | | | | | | | | | | | | | | |
Net assets, end of period (000) | | $ | 173,142 | | | $ | 158,094 | | | $ | 20,548 | | | $ | 6,390 | | | $ | 6,074 | | | $ | 7,235 | | | $ | 81,502 | | | $ | 43,763 | | | $ | 1,527 | | | $ | 472 | | | $ | 2,303 | | | $ | 421 | |
| | | | | | | | | | | | | | | | | | | | | | | | | | | | | | | | | | | | | | | | | | | | | | | | |
Portfolio turnover | | | 67 | % | | | 106 | % | | | 120 | % | | | 94 | % | | | 106 | % | | | 248 | % | | | 67 | % | | | 106 | % | | | 120 | % | | | 94 | % | | | 106 | % | | | 248 | % |
| | | | | | | | | | | | | | | | | | | | | | | | | | | | | | | | | | | | | | | | | | | | | | | | |
| | |
| | | Investor A | | | Investor B | |
| | | Six Months
Ended
March 31,
2008 | | | Year Ended September 30, | | | Six Months
Ended
March 31,
2008
(Unaudited) | | | Year Ended September 30, | |
| | (Unaudited) | | | 2007 | | | 2006 | | | 2005 | | | 2004 | | | 20031 | | | | 2007 | | | 2006 | | | 2005 | | | 2004 | | | 20031 | |
Per Share Operating Performance | | | | | | | | | | | | | | | | | | | | | | | | | | | | | | | | | | | | | | | | | | | | | | | | |
Net asset value, beginning of period | | $ | 35.57 | | | $ | 28.03 | | | $ | 24.76 | | | $ | 19.78 | | | $ | 16.17 | | | $ | 12.81 | | | $ | 33.20 | | | $ | 26.37 | | | $ | 23.45 | | | $ | 18.87 | | | $ | 15.55 | | | $ | 12.41 | |
| | | | | | | | | | | | | | | | | | | | | | | | | | | | | | | | | | | | | | | | | | | | | | | | |
Net investment loss | | | (0.02 | )2 | | | (0.10 | ) 2 | | | (0.10 | )2 | | | (0.22 | )2 | | | (0.26 | )2 | | | (0.21 | ) | | | (0.15 | )2 | | | (0.32 | ) 2 | | | (0.29 | )2 | | | (0.37 | )2 | | | (0.39 | )2 | | | (0.32 | ) |
Net realized and unrealized gain (loss) | | | (2.64 | ) | | | 7.64 | | | | 3.36 | | | | 5.20 | | | | 3.87 | | | | 3.57 | | | | (2.45 | ) | | | 7.15 | | | | 3.20 | | | | 4.95 | | | | 3.71 | | | | 3.46 | |
| | | | | | | | | | | | | | | | | | | | | | | | | | | | | | | | | | | | | | | | | | | | | | | | |
Net increase (decrease) from investment operations | | | (2.66 | ) | | | 7.54 | | | | 3.26 | | | | 4.98 | | | | 3.61 | | | | 3.36 | | | | (2.60 | ) | | | 6.83 | | | | 2.91 | | | | 4.58 | | | | 3.32 | | | | 3.14 | |
| | | | | | | | | | | | | | | | | | | | | | | | | | | | | | | | | | | | | | | | | | | | | | | | |
Redemption fees added to paid-in capital | | | — | 4 | | | — | 4 | | | 0.01 | | | | — | 4 | | | — | 4 | | | — | | | | — | 4 | | | — | 4 | | | 0.01 | | | | — | 4 | | | — | 4 | | | — | |
| | | | | | | | | | | | | | | | | | | | | | | | | | | | | | | | | | | | | | | | | | | | | | | | |
Net asset value, end of period | | $ | 32.91 | | | $ | 35.57 | | | $ | 28.03 | | | $ | 24.76 | | | $ | 19.78 | | | $ | 16.17 | | | $ | 30.60 | | | $ | 33.20 | | | $ | 26.37 | | | $ | 23.45 | | | $ | 18.87 | | | $ | 15.55 | |
| | | | | | | | | | | | | | | | | | | | | | | | | | | | | | | | | | | | | | | | | | | | | | | | |
Total Investment Return | | | | | | | | | | | | | | | | | | | | | | | | | | | | | | | | | | | | | | | | | | | | | | | | |
Based on net asset value9 | | | (7.48 | )%5,6 | | | 26.90 | %5 | | | 13.21 | %7 | | | 25.18 | %5 | | | 22.33 | %5 | | | 26.23 | % | | | (7.83 | )%5,6 | | | 25.90 | %5 | | | 12.45 | %7 | | | 24.27 | %5 | | | 21.35 | %5 | | | 25.30 | % |
| | | | | | | | | | | | | | | | | | | | | | | | | | | | | | | | | | | | | | | | | | | | | | | | |
Ratios to Average Net Assets | | | | | | | | | | | | | | | | | | | | | | | | | | | | | | | | | | | | | | | | | | | | | | | | |
Total expenses, net of waivers and reimbursement | | | 1.44 | %8 | | | 1.48 | % | | | 1.66 | % | | | 1.97 | % | | | 2.04 | % | | | 2.00 | % | | | 2.25 | %8 | | | 2.23 | % | | | 2.40 | % | | | 2.72 | % | | | 2.80 | % | | | 2.74 | % |
| | | | | | | | | | | | | | | | | | | | | | | | | | | | | | | | | | | | | | | | | | | | | | | | |
Total expenses | | | 1.68 | %8 | | | 1.77 | % | | | 1.95 | % | | | 2.08 | % | | | 2.15 | % | | | 2.06 | % | | | 2.62 | %8 | | | 2.56 | % | | | 2.68 | % | | | 2.73 | % | | | 2.81 | % | | | 2.81 | % |
| | | | | | | | | | | | | | | | | | | | | | | | | | | | | | | | | | | | | | | | | | | | | | | | |
Net investment loss | | | (0.09 | )%8 | | | (0.32 | )% | | | (0.35 | )% | | | (1.02 | )% | | | (1.36 | )% | | | (1.34 | )% | | | (0.91 | )%8 | | | (1.06 | )% | | | (1.13 | )% | | | (1.77 | )% | | | (2.12 | )% | | | (2.09 | )% |
| | | | | | | | | | | | | | | | | | | | | | | | | | | | | | | | | | | | | | | | | | | | | | | | |
Supplemental Data | | | | | | | | | | | | | | | | | | | | | | | | | | | | | | | | | | | | | | | | | | | | | | | | |
Net assets, end of period (000) | | $ | 307,395 | | | $ | 228,668 | | | $ | 96,194 | | | $ | 31,277 | | | $ | 31,282 | | | $ | 29,258 | | | $ | 21,582 | | | $ | 35,928 | | | $ | 36,093 | | | $ | 37,132 | | | $ | 40,994 | | | $ | 41,259 | |
| | | | | | | | | | | | | | | | | | | | | | | | | | | | | | | | | | | | | | | | | | | | | | | | |
Portfolio turnover | | | 67 | % | | | 106 | % | | | 120 | % | | | 94 | % | | | 106 | % | | | 248 | % | | | 67 | % | | | 106 | % | | | 120 | % | | | 94 | % | | | 106 | % | | | 248 | % |
| | | | | | | | | | | | | | | | | | | | | | | | | | | | | | | | | | | | | | | | | | | | | | | | |
See Notes to Financial Statements.
| | | | | | |
| 122 | | SEMI-ANNUAL REPORT | | MARCH 31, 2008 | | |
| | |
| Financial Highlights (continued) | | U.S. Opportunities Portfolio |
| | | | | | | | | | | | | | | | | | | | | | | | |
| | | Investor C | |
| | | Six Months Ended March 31, 2008 | | | Year Ended September 30, | |
| | (Unaudited) | | | 2007 | | | 2006 | | | 2005 | | | 2004 | | | 20031 | |
Per Share Operating Performance | | | | | | | | | | | | | | | | | | | | | | | | |
Net asset value, beginning of period | | $ | 33.18 | | | $ | 26.34 | | | $ | 23.43 | | | $ | 18.85 | | | $ | 15.53 | | | $ | 12.40 | |
| | | | | | | | | | | | | | | | | | | | | | | | |
Net investment loss | | | (0.14 | )2 | | | (0.32 | )2 | | | (0.28 | )2 | | | (0.37 | )2 | | | (0.38 | )2 | | | (0.32 | ) |
Net realized and unrealized gain (loss) | | | (2.45 | ) | | | 7.16 | | | | 3.18 | | | | 4.95 | | | | 3.70 | | | | 3.45 | |
| | | | | | | | | | | | | | | | | | | | | | | | |
Net increase (decrease) from investment operations | | | (2.59 | ) | | | 6.84 | | | | 2.90 | | | | 4.58 | | | | 3.32 | | | | 3.13 | |
| | | | | | | | | | | | | | | | | | | | | | | | |
Redemption fees added to paid-in capital | | | — | 4 | | | — | 4 | | | 0.01 | | | | — | 4 | | | — | 4 | | | — | |
| | | | | | | | | | | | | | | | | | | | | | | | |
Net asset value, end of period | | $ | 30.59 | | | $ | 33.18 | | | $ | 26.34 | | | $ | 23.43 | | | $ | 18.85 | | | $ | 15.53 | |
| | | | | | | | | | | | | | | | | | | | | | | | |
Total Investment Return | | | | | | | | | | | | | | | | | | | | | | | | |
Based on net asset value9 | | | (7.81 | )%5,6 | | | 25.97 | %5 | | | 12.42 | %7 | | | 24.30 | %5 | | | 21.38 | %5 | | | 25.24 | % |
| | | | | | | | | | | | | | | | | | | | | | | | |
Ratios to Average Net Assets | | | | | | | | | | | | | | | | | | | | | | | | |
Total expenses, net of waivers and reimbursement | | | 2.19 | %8 | | | 2.20 | % | | | 2.37 | % | | | 2.72 | % | | | 2.81 | % | | | 2.74 | % |
| | | | | | | | | | | | | | | | | | | | | | | | |
Total expenses | | | 2.43 | %8 | | | 2.51 | % | | | 2.60 | % | | | 2.73 | % | | | 2.83 | % | | | 2.81 | % |
| | | | | | | | | | | | | | | | | | | | | | | | |
Net investment loss | | | (0.84 | )%8 | | | (1.04 | )% | | | (1.07 | )% | | | (1.77 | )% | | | (2.13 | )% | | | (2.09 | )% |
| | | | | | | | | | | | | | | | | | | | | | | | |
Supplemental Data | | | | | | | | | | | | | | | | | | | | | | | | |
Net assets, end of period (000) | | $ | 106,575 | | | $ | 88,826 | | | $ | 39,427 | | | $ | 20,774 | | | $ | 20,261 | | | $ | 20,761 | |
| | | | | | | | | | | | | | | | | | | | | | | | |
Portfolio turnover | | | 67 | % | | | 106 | % | | | 120 | % | | | 94 | % | | | 106 | % | | | 248 | % |
| | | | | | | | | | | | | | | | | | | | | | | | |
1 | Audited by other auditors. |
2 | Based on average shares outstanding. |
3 | Net investment loss is less than $0.005 per share. |
4 | Redemption fees added to paid-in capital are less than $0.01 per share. |
5 | Redemption fee of 2.00% received by the Portfolio is reflected in total return calculations. There was no impact to the return. |
6 | Aggregate total investment return. |
7 | Redemption fee of 2.00% received by the Portfolio is reflected in total return calculations. The impact to the return for redemption fees received during the period was an increase of 0.04%. |
9 | Total investment returns exclude the effects of sales charges. |
See Notes to Financial Statements.
| | | | | | |
| | SEMI-ANNUAL REPORT | | MARCH 31, 2008 | | 123 |
| | |
| Financial Highlights (continued) | | Global Opportunities Portfolio |
| | | | | | | | | | | | |
| | | Institutional | |
| | | Six Months
Ended
March 31, 2008
(Unaudited) | | | Year Ended
September 30,
2007 | | | Period
Ended
9/30/061 | |
Per Share Operating Performance | | | | | | | | | | | | |
Net asset value, beginning of period | | $ | 13.31 | | | $ | 10.10 | | | $ | 10.00 | |
| | | | | | | | | | | | |
Net investment income | | | 0.02 | 2 | | | 0.09 | 2 | | | 0.08 | 2 |
Net realized and unrealized gain (loss) | | | (1.01 | ) | | | 3.21 | | | | 0.01 | |
| | | | | | | | | | | | |
Net increase (decrease) from investment operations | | | (0.99 | ) | | | 3.30 | | | | 0.09 | |
| | | | | | | | | | | | |
Dividends and distributions from: | | | | | | | | | | | | |
Net investment income | | | (0.17 | ) | | | (0.09 | ) | | | — | |
Net realized capital gain | | | (0.50 | ) | | | — | | | | — | |
| | | | | | | | | | | | |
Total dividends and distributions | | | (0.67 | ) | | | (0.09 | ) | | | — | |
| | | | | | | | | | | | |
Redemption fees added to paid-in capital | | | — | 3 | | | — | 3 | | | 0.01 | |
| | | | | | | | | | | | |
Net asset value, end of period | | $ | 11.65 | | | $ | 13.31 | | | $ | 10.10 | |
| | | | | | | | | | | | |
Total Investment Return | | | | | | | | | | | | |
Based on net asset value | | | (7.78 | )%4,5 | | | 32.81 | %4 | | | 1.00 | %5,6 |
| | | | | | | | | | | | |
Ratios to Average Net Assets | | | | | | | | | | | | |
Total expenses, net of waivers and reimbursement | | | 1.29 | %7 | | | 1.29 | % | | | 1.35 | %7 |
| | | | | | | | | | | | |
Total expenses | | | 1.29 | %7 | | | 1.32 | % | | | 2.25 | %7 |
| | | | | | | | | | | | |
Net investment income | | | 0.37 | %7 | | | 0.78 | % | | | 1.13 | %7 |
| | | | | | | | | | | | |
Supplemental Data | | | | | | | | | | | | |
Net assets, end of period (000) | | $ | 40,731 | | | $ | 35,679 | | | $ | 9,099 | |
| | | | | | | | | | | | |
Portfolio turnover | | | 76 | % | | | 107 | % | | | 110 | % |
| | | | | | | | | | | | |
| | | | | | | | | | | | | | | | | | | | | | | | |
| | | Investor A | | | Investor B | |
| | | Six Months
Ended
March 31, 2008
(Unaudited) | | | Year Ended
September 30,
2007 | | | Period Ended
9/30/061 | | | Six Months
Ended
March 31, 2008
(Unaudited) | | | Year Ended
September 30,
2007 | | | Period Ended
9/30/061 | |
Per Share Operating Performance | | | | | | | | | | | | | | | | | | | | | | | | |
Net asset value, beginning of period | | $ | 13.27 | | | $ | 10.08 | | | $ | 10.00 | | | $ | 13.16 | | | $ | 10.03 | | | $ | 10.00 | |
| | | | | | | | | | | | | | | | | | | | | | | | |
Net investment income (loss) | | | — | 2,8 | | | 0.04 | 2 | | | 0.05 | 2 | | | (0.05 | )2 | | | (0.04 | )2 | | | — | 2,8 |
Net realized and unrealized gain (loss) | | | (1.00 | ) | | | 3.22 | | | | 0.02 | | | | (1.01 | ) | | | 3.22 | | | | 0.02 | |
| | | | | | | | | | | | | | | | | | | | | | | | |
Net increase (decrease) from investment operations | | | (1.00 | ) | | | 3.26 | | | | 0.07 | | | | (1.06 | ) | | | 3.18 | | | | 0.02 | |
| | | | | | | | | | | | | | | | | | | | | | | �� | |
Dividends and distributions from: | | | | | | | | | | | | | | | | | | | | | | | | |
Net investment income | | | (0.14 | ) | | | (0.07 | ) | | | — | | | | (0.03 | ) | | | (0.05 | ) | | | — | |
Net realized capital gain | | | (0.50 | ) | | | — | | | | — | | | | (0.50 | ) | | | — | | | | — | |
| | | | | | | | | | | | | | | | | | | | | | | | |
Total dividends and distributions | | | (0.64 | ) | | | (0.07 | ) | | | — | | | | (0.53 | ) | | | (0.05 | ) | | | — | |
| | | | | | | | | | | | | | | | | | | | | | | | |
Redemption fees added to paid-in capital | | | — | 3 | | | — | 3 | | | 0.01 | | | | — | 3 | | | — | 3 | | | 0.01 | |
| | | | | | | | | | | | | | | | | | | | | | | | |
Net asset value, end of period | | $ | 11.63 | | | $ | 13.27 | | | $ | 10.08 | | | $ | 11.57 | | | $ | 13.16 | | | $ | 10.03 | |
| | | | | | | | | | | | | | | | | | | | | | | | |
Total Investment Return | | | | | | | | | | | | | | | | | | | | | | | | |
Based on net asset value9 | | | (7.90 | )%4,5 | | | 32.51 | %4 | | | 0.80 | %5,6 | | | (8.35 | )%4,5 | | | 31.79 | %4 | | | 0.30 | %5,6 |
| | | | | | | | | | | | | | | | | | | | | | | | |
Ratios to Average Net Assets | | | | | | | | | | | | | | | | | | | | | | | | |
Total expenses, net of waivers and reimbursement | | | 1.58 | %7 | | | 1.56 | % | | | 1.65 | %7 | | | 2.39 | %7 | | | 2.33 | % | | | 2.40 | %7 |
| | | | | | | | | | | | | | | | | | | | | | | | |
Total expenses | | | 1.58 | %7 | | | 1.68 | % | | | 2.84 | %7 | | | 2.41 | %7 | | | 3.06 | % | | | 4.95 | %7 |
| | | | | | | | | | | | | | | | | | | | | | | | |
Net investment income (loss) | | | 0.08 | %7 | | | 0.36 | % | | | 0.70 | %7 | | | (0.74 | )%7 | | | (0.39 | )% | | | (0.05 | )%7 |
| | | | | | | | | | | | | | | | | | | | | | | | |
Supplemental Data | | | | | | | | | | | | | | | | | | | | | | | | |
Net assets, end of period (000) | | $ | 42,332 | | | $ | 40,467 | | | $ | 23,097 | | | $ | 7,330 | | | $ | 7,673 | | | $ | 4,907 | |
| | | | | | | | | | | | | | | | | | | | | | | | |
Portfolio turnover | | | 76 | % | | | 107 | % | | | 110 | % | | | 76 | % | | | 107 | % | | | 110 | % |
| | | | | | | | | | | | | | | | | | | | | | | | |
See Notes to Financial Statements.
| | | | | | |
| 124 | | SEMI-ANNUAL REPORT | | MARCH 31, 2008 | | |
| | |
| Financial Highlights (continued) | | Global Opportunities Portfolio |
| | | | | | | | | | | | |
| | | Investor C | |
| | | Six Months
Ended
March 31, 2008
(Unaudited) | | | Year Ended
September 30,
2007 | | | Period Ended
9/30/061 | |
Per Share Operating Performance | | | | | | | | | | | | |
Net asset value, beginning of period | | $ | 13.16 | | | $ | 10.03 | | | $ | 10.00 | |
| | | | | | | | | | | | |
Net investment loss | | | (0.04 | )2 | | | (0.05 | )2 | | | — | 2,8 |
Net realized and unrealized gain (loss) | | | (1.01 | ) | | | 3.23 | | | | 0.02 | |
| | | | | | | | | | | | |
Net increase (decrease) from investment operations | | | (1.05 | ) | | | 3.18 | | | | 0.02 | |
| | | | | | | | | | | | |
Dividends and distributions from: | | | | | | | | | | | | |
Net investment income | | | (0.04 | ) | | | (0.05 | ) | | | — | |
Net realized capital gain | | | (0.50 | ) | | | — | | | | — | |
| | | | | | | | | | | | |
Total dividends and distributions | | | (0.54 | ) | | | (0.05 | ) | | | — | |
| | | | | | | | | | | | |
Redemption fees added to paid-in capital | | | — | 3 | | | — | 3 | | | 0.01 | |
| | | | | | | | | | | | |
Net asset value, end of period | | $ | 11.57 | | | $ | 13.16 | | | $ | 10.03 | |
| | | | | | | | | | | | |
Total Investment Return | | | | | | | | | | | | |
Based on net asset value9 | | | (8.27 | )%4,5 | | | 31.76 | %4 | | | 0.30 | %5,6 |
| | | | | | | | | | | | |
Ratios to Average Net Assets | | | | | | | | | �� | | | |
Total expenses, net of waivers and reimbursement | | | 2.33 | %7 | | | 2.35 | % | | | 2.40 | %7 |
| | | | | | | | | | | | |
Total expenses | | | 2.34 | %7 | | | 2.42 | % | | | 3.38 | %7 |
| | | | | | | | | | | | |
Net investment loss | | | (0.67 | )%7 | | | (0.40 | )% | | | (0.01 | )%7 |
| | | | | | | | | | | | |
Supplemental Data | | | | | | | | | | | | |
Net assets, end of period (000) | | $ | 19,806 | | | $ | 18,217 | | | $ | 10,012 | |
| | | | | | | | | | | | |
Portfolio turnover | | | 76 | % | | | 107 | % | | | 110 | % |
| | | | | | | | | | | | |
1 | Commenced operations on January 31, 2006. |
2 | Based on average shares outstanding. |
3 | Redemption fees added to paid-in capital are less than $0.01 per share. |
4 | Redemption fee of 2.00% received by the Portfolio is reflected in total return calculations. There was no impact to the return. |
5 | Aggregate total investment return. |
6 | Redemption fee of 2.00% received by the Portfolio is reflected in total return calculations. The impact to the return for redemption fees received during the period was an increase of 0.10%. |
8 | Net investment loss is less than $0.005 per share. |
9 | Total investment returns exclude the effects of sales charges. |
See Notes to Financial Statements.
| | | | | | |
| | SEMI-ANNUAL REPORT | | MARCH 31, 2008 | | 125 |
| | |
| Financial Highlights (continued) | | International Opportunities Portfolio |
| | | | | | | | | | | | | | | | | | | | | | | | | | | | | | | | | | | | | | | | | | | | | | | | |
| | | Institutional | | | Service | |
| | | Six Months Ended March 31, 2008 | | | Year Ended September 30, | | | Six Months
Ended
March 31,
2008
(Unaudited) | | | Year Ended September 30, | |
| | (Unaudited) | | | 2007 | | | 2006 | | | 2005 | | | 2004 | | | 20031 | | | | 2007 | | | 2006 | | | 2005 | | | 2004 | | | 20031 | |
Per Share Operating Performance | | | | | | | | | | | | | | | | | | | | | | | | | | | | | | | | | | | | | | | | | | | | | | | | |
Net asset value, beginning of period | | $ | 51.08 | | | $ | 42.16 | | | $ | 34.34 | | | $ | 24.44 | | | $ | 19.96 | | | $ | 15.22 | | | $ | 49.52 | | | $ | 41.06 | | | $ | 33.55 | | | $ | 23.93 | | | $ | 19.59 | | | $ | 14.98 | |
| | | | | | | | | | | | | | | | | | | | | | | | | | | | | | | | | | | | | | | | | | | | | | | | |
Net investment income (loss) | | | 0.03 | 2 | | | 0.48 | 2 | | | 0.37 | 2 | | | 0.53 | 2 | | | 0.08 | 2 | | | — | 3 | | | (0.04 | )2 | | | 0.32 | 2 | | | 0.29 | 2 | | | 0.44 | 2 | | | 0.06 | 2 | | | 0.05 | |
Net realized and unrealized gain (loss) | | | (3.36 | ) | | | 14.98 | | | | 8.57 | | | | 9.68 | | | | 4.41 | | | | 4.73 | | | | (3.24 | ) | | | 14.58 | | | | 8.32 | | | | 9.45 | | | | 4.29 | | | | 4.55 | |
| | | | | | | | | | | | | | | | | | | | | | | | | | | | | | | | | | | | | | | | | | | | | | | | |
Net increase (decrease) from investment operations | | | (3.33 | ) | | | 15.46 | | | | 8.94 | | | | 10.21 | | | | 4.49 | | | | 4.73 | | | | (3.28 | ) | | | 14.90 | | | | 8.61 | | | | 9.89 | | | | 4.35 | | | | 4.60 | |
| | | | | | | | | | | | | | | | | | | | | | | | | | | | | | | | | | | | | | | | | | | | | | | | |
Dividends and distributions from: | | | | | | | | | | | | | | | | | | | | | | | | | | | | | | | | | | | | | | | | | | | | | | | | |
Net investment income | | | (1.21 | ) | | | (0.71 | ) | | | (0.37 | ) | | | (0.32 | ) | | | (0.02 | ) | | | — | | | | (1.06 | ) | | | (0.61 | ) | | | (0.35 | ) | | | (0.28 | ) | | | (0.02 | ) | | | — | |
Net realized capital gain | | | (7.24 | ) | | | (5.83 | ) | | | (0.76 | ) | | | — | | | | — | | | | — | | | | (7.24 | ) | | | (5.83 | ) | | | (0.76 | ) | | | — | | | | — | | | | — | |
| | | | | | | | | | | | | | | | | | | | | | | | | | | | | | | | | | | | | | | | | | | | | | | | |
Total dividends and distributions | | | (8.45 | ) | | | (6.54 | ) | | | (1.13 | ) | | | (0.32 | ) | | | (0.02 | ) | | | — | | | | (8.30 | ) | | | (6.44 | ) | | | (1.11 | ) | | | (0.28 | ) | | | (0.02 | ) | | | — | |
| | | | | | | | | | | | | | | | | | | | | | | | | | | | | | | | | | | | | | | | | | | | | | | | |
Redemption fees added to paid-in capital | | | — | 4 | | | — | 4 | | | 0.01 | | | | 0.01 | | | | 0.01 | | | | 0.01 | | | | — | 4 | | | — | 4 | | | 0.01 | | | | 0.01 | | | | 0.01 | | | | 0.01 | |
| | | | | | | | | | | | | | | | | | | | | | | | | | | | | | | | | | | | | | | | | | | | | | | | |
Net asset value, end of period | | $ | 39.30 | | | $ | 51.08 | | | $ | 42.16 | | | $ | 34.34 | | | $ | 24.44 | | | $ | 19.96 | | | $ | 37.94 | | | $ | 49.52 | | | $ | 41.06 | | | $ | 33.55 | | | $ | 23.93 | | | $ | 19.59 | |
| | | | | | | | | | | | | | | | | | | | | | | | | | | | | | | | | | | | | | | | | | | | | | | | |
Total Investment Return | | | | | | | | | | | | | | | | | | | | | | | | | | | | | | | | | | | | | | | | | | | | | | | | |
Based on net asset value | | | (7.71 | )%5,6 | | | 40.42 | %5 | | | 26.64 | %7 | | | 42.13 | %8 | | | 22.54 | %9 | | | 31.14 | %10 | | | (7.85 | )%5,6 | | | 40.00 | %5 | | | 26.30 | %7 | | | 41.65 | %8 | | | 22.25 | %9 | | | 30.78 | %11 |
| | | | | | | | | | | | | | | | | | | | | | | | | | | | | | | | | | | | | | | | | | | | | | | | |
Ratios to Average Net Assets | | | | | | | | | | | | | | | | | | | | | | | | | | | | | | | | | | | | | | | | | | | | | | | | |
Total expenses, net of waivers and reimbursement | | | 1.25 | %12 | | | 1.25 | % | | | 1.33 | % | | | 1.45 | % | | | 1.45 | % | | | 1.41 | % | | | 1.56 | %12 | | | 1.58 | % | | | 1.57 | % | | | 1.74 | % | | | 1.75 | % | | | 1.72 | % |
| | | | | | | | | | | | | | | | | | | | | | | | | | | | | | | | | | | | | | | | | | | | | | | | |
Total expenses | | | 1.25 | %12 | | | 1.25 | % | | | 1.33 | % | | | 1.51 | % | | | 1.58 | % | | | 1.51 | % | | | 1.56 | %12 | | | 1.59 | % | | | 1.58 | % | | | 1.76 | % | | | 1.91 | % | | | 1.80 | % |
| | | | | | | | | | | | | | | | | | | | | | | | | | | | | | | | | | | | | | | | | | | | | | | | |
Net investment income (loss) | | | 0.12 | %12 | | | 1.06 | % | | | 0.91 | % | | | 1.81 | % | | | 0.31 | % | | | 0.42 | % | | | (0.21 | )%12 | | | 0.73 | % | | | 0.73 | % | | | 1.52 | % | | | 0.21 | % | | | 0.30 | % |
| | | | | | | | | | | | | | | | | | | | | | | | | | | | | | | | | | | | | | | | | | | | | | | | |
Supplemental Data | | | | | | | | | | | | | | | | | | | | | | | | | | | | | | | | | | | | | | | | | | | | | | | | |
Net assets, end of period (000) | | $ | 445,509 | | | $ | 492,444 | | | $ | 336,000 | | | $ | 216,070 | | | $ | 96,535 | | | $ | 57,950 | | | $ | 144,902 | | | $ | 172,135 | | | $ | 128,879 | | | $ | 44,308 | | | $ | 19,167 | | | $ | 1,573 | |
| | | | | | | | | | | | | | | | | | | | | | | | | | | | | | | | | | | | | | | | | | | | | | | | |
Portfolio turnover | | | 50 | % | | | 77 | % | | | 91 | % | | | 86 | % | | | 98 | % | | | 72 | % | | | 50 | % | | | 77 | % | | | 91 | % | | | 86 | % | | | 98 | % | | | 72 | % |
| | | | | | | | | | | | | | | | | | | | | | | | | | | | | | | | | | | | | | | | | | | | | | | | |
See Notes to Financial Statements.
| | | | | | |
| 126 | | SEMI-ANNUAL REPORT | | MARCH 31, 2008 | | |
| | |
| Financial Highlights (continued) | | International Opportunities Portfolio |
| | | | | | | | | | | | | | | | | | | | | | | | |
| | | Investor A | |
| | | Six Months Ended March 31, 2008 | | | Year Ended September 30, | |
| | (Unaudited) | | | 2007 | | | 2006 | | | 2005 | | | 2004 | | | 20031 | |
Per Share Operating Performance | | | | | | | | | | | | | | | | | | | | | | | | |
Net asset value, beginning of period | | $ | 49.19 | | | $ | 40.81 | | | $ | 33.36 | | | $ | 23.78 | | | $ | 19.49 | | | $ | 14.94 | |
| | | | | | | | | | | | | | | | | | | | | | | | |
Net investment income (loss) | | | (0.04 | )2 | | | 0.30 | 2 | | | 0.23 | 2 | | | 0.44 | 2 | | | (0.02 | )2 | | | 0.01 | |
Net realized and unrealized gain (loss) | | | (3.22 | ) | | | 14.49 | | | | 8.32 | | | | 9.38 | | | | 4.32 | | | | 4.53 | |
| | | | | | | | | | | | | | | | | | | | | | | | |
Net increase (decrease) from investment operations | | | (3.26 | ) | | | 14.79 | | | | 8.55 | | | | 9.82 | | | | 4.30 | | | | 4.54 | |
| | | | | | | | | | | | | | | | | | | | | | | | |
Dividends and distributions from: | | | | | | | | | | | | | | | | | | | | | | | | |
Net investment income | | | (1.05 | ) | | | (0.58 | ) | | | (0.35 | ) | | | (0.25 | ) | | | (0.02 | ) | | | — | |
Net realized capital gain | | | (7.24 | ) | | | (5.83 | ) | | | (0.76 | ) | | | — | | | | — | | | | — | |
| | | | | | | | | | | | | | | | | | | | | | | | |
Total dividends and distributions | | | (8.29 | ) | | | (6.41 | ) | | | (1.11 | ) | | | (0.25 | ) | | | (0.02 | ) | | | — | |
| | | | | | | | | | | | | | | | | | | | | | | | |
Redemption fees added to paid-in capital | | | — | 4 | | | — | 4 | | | 0.01 | | | | 0.01 | | | | 0.01 | | | | 0.01 | |
| | | | | | | | | | | | | | | | | | | | | | | | |
Net asset value, end of period | | $ | 37.64 | | | $ | 49.19 | | | $ | 40.81 | | | $ | 33.36 | | | $ | 23.78 | | | $ | 19.49 | |
| | | | | | | | | | | | | | | | | | | | | | | | |
Total Investment Return | | | | | | | | | | | | | | | | | | | | | | | | |
Based on net asset value13 | | | (7.86 | )%5,6 | | | 39.98 | %5 | | | 26.24 | %7 | | | 41.60 | %9 | | | 22.11 | %10 | | | 30.45 | %10 |
| | | | | | | | | | | | | | | | | | | | | | | | |
Ratios to Average Net Assets | | | | | | | | | | | | | | | | | | | | | | | | |
Total expenses, net of waivers and reimbursement | | | 1.56 | %12 | | | 1.60 | % | | | 1.63 | % | | | 1.75 | % | | | 1.89 | % | | | 1.89 | % |
| | | | | | | | | | | | | | | | | | | | | | | | |
Total expenses | | | 1.56 | %12 | | | 1.60 | % | | | 1.74 | % | | | 1.86 | % | | | 2.06 | % | | | 1.98 | % |
| | | | | | | | | | | | | | | | | | | | | | | | |
Net investment income (loss) | | | (0.19 | )%12 | | | 0.69 | % | | | 0.62 | % | | | 1.53 | % | | | (0.06 | )% | | | 0.05 | % |
| | | | | | | | | | | | | | | | | | | | | | | | |
Supplemental Data | | | | | | | | | | | | | | | | | | | | | | | | |
Net assets, end of period (000) | | $ | 511,537 | | | $ | 555,189 | | | $ | 407,282 | | | $ | 253,710 | | | $ | 99,879 | | | $ | 37,934 | |
| | | | | | | | | | | | | | | | | | | | | | | | |
Portfolio turnover | | | 50 | % | | | 77 | % | | | 91 | % | | | 86 | % | | | 98 | % | | | 72 | % |
| | | | | | | | | | | | | | | | | | | | | | | | |
1 | Audited by other auditors. |
2 | Based on average shares outstanding. |
3 | Net investment loss is less than $0.005 per share. |
4 | Redemption fees added to paid-in capital are less than $0.01 per share. |
5 | Redemption fee of 2.00% received by the Portfolio is reflected in total return calculations. There was no impact to the return. |
6 | Aggregate total investment return. |
7 | Redemption fee of 2.00% received by the Portfolio is reflected in total return calculations. The impact to the return for redemption fees received during the period was an increase of 0.03%. |
8 | Redemption fee of 2.00% received by the Portfolio is reflected in total return calculations. The impact to the return for redemption fees received during the period was an increase of 0.04%. |
9 | Redemption fee of 2.00% received by the Portfolio is reflected in total return calculations. The impact to the return for redemption fees received during the period was an increase of 0.05%. |
10 | Redemption fee of 2.00% received by the Portfolio is reflected in total return calculations. The impact to the return for redemption fees received during the period was an increase of 0.06%. |
11 | Redemption fee of 2.00% received by the Portfolio is reflected in total return calculations. The impact to the return for redemption fees received during the period was an increase of 0.07%. |
13 | Total investment returns exclude the effects of sales charges. |
See Notes to Financial Statements.
| | | | | | |
| | SEMI-ANNUAL REPORT | | MARCH 31, 2008 | | 127 |
| | |
| Financial Highlights (continued) | | International Opportunities Portfolio |
| | | | | | | | | | | | | | | | | | | | | | | | |
| | | Investor B | |
| | | Six Months Ended March 31, 2008 | | | Year Ended September 30, | |
| | (Unaudited) | | | 2007 | | | 2006 | | | 2005 | | | 2004 | | | 20031 | |
Per Share Operating Performance | | | | | | | | | | | | | | | | | | | | | | | | |
Net asset value, beginning of period | | $ | 46.43 | | | $ | 38.81 | | | $ | 31.97 | | | $ | 22.80 | | | $ | 18.83 | | | $ | 14.54 | |
| | | | | | | | | | | | | | | | | | | | | | | | |
Net investment income (loss) | | | (0.21 | )2 | | | (0.04 | )2 | | | (0.07 | )2 | | | 0.18 | 2 | | | (0.21 | )2 | | | (0.12 | ) |
Net realized and unrealized gain (loss) | | | (3.01 | ) | | | 13.74 | | | | 7.95 | | | | 9.05 | | | | 4.19 | | | | 4.40 | |
| | | | | | | | | | | | | | | | | | | | | | | | |
Net increase (decrease) from investment operations | | | (3.22 | ) | | | 13.70 | | | | 7.88 | | | | 9.23 | | | | 3.98 | | | | 4.28 | |
| | | | | | | | | | | | | | | | | | | | | | | | |
Dividends and distributions from: | | | | | | | | | | | | | | | | | | | | | | | | |
Net investment income | | | (0.68 | ) | | | (0.25 | ) | | | (0.29 | ) | | | (0.07 | ) | | | (0.02 | ) | | | — | |
Net realized capital gain | | | (7.24 | ) | | | (5.83 | ) | | | (0.76 | ) | | | — | | | | — | | | | — | |
| | | | | | | | | | | | | | | | | | | | | | | | |
Total dividends and distributions | | | (7.92 | ) | | | (6.08 | ) | | | (1.05 | ) | | | (0.07 | ) | | | (0.02 | ) | | | — | |
| | | | | | | | | | | | | | | | | | | | | | | | |
Redemption fees added to paid-in capital | | | — | 3 | | | — | 3 | | | 0.01 | | | | 0.01 | | | | 0.01 | | | | 0.01 | |
| | | | | | | | | | | | | | | | | | | | | | | | |
Net asset value, end of period | | $ | 35.29 | | | $ | 46.43 | | | $ | 38.81 | | | $ | 31.97 | | | $ | 22.80 | | | $ | 18.83 | |
| | | | | | | | | | | | | | | | | | | | | | | | |
Total Investment Return | | | | | | | | | | | | | | | | | | | | | | | | |
Based on net asset value4 | | | (8.22 | )%5,6 | | | 38.89 | %5 | | | 25.24 | %7 | | | 40.58 | %8 | | | 21.18 | %9 | | | 29.51 | %9 |
| | | | | | | | | | | | | | | | | | | | | | | | |
Ratios to Average Net Assets | | | | | | | | | | | | | | | | | | | | | | | | |
Total expenses, net of waivers and reimbursement | | | 2.36 | %10 | | | 2.37 | % | | | 2.43 | % | | | 2.50 | % | | | 2.65 | % | | | 2.63 | % |
| | | | | | | | | | | | | | | | | | | | | | | | |
Total expenses | | | 2.36 | %10 | | | 2.37 | % | | | 2.43 | % | | | 2.51 | % | | | 2.72 | % | | | 2.72 | % |
| | | | | | | | | | | | | | | | | | | | | | | | |
Net investment income (loss) | | | (1.04 | )%10 | | | (0.10 | )% | | | (0.22 | )% | | | 0.68 | % | | | (0.94 | )% | | | (0.74 | )% |
| | | | | | | | | | | | | | | | | | | | | | | | |
Supplemental Data | | | | | | | | | | | | | | | | | | | | | | | | |
Net assets, end of period (000) | | $ | 69,501 | | | $ | 102,624 | | | $ | 91,605 | | | $ | 73,946 | | | $ | 45,167 | | | $ | 31,454 | |
| | | | | | | | | | | | | | | | | | | | | | | | |
Portfolio turnover | | | 50 | % | | | 77 | % | | | 91 | % | | | 86 | % | | | 98 | % | | | 72 | % |
| | | | | | | | | | | | | | | | | | | | | | | | |
See Notes to Financial Statements.
| | | | | | |
| 128 | | SEMI-ANNUAL REPORT | | MARCH 31, 2008 | | |
| | |
| Financial Highlights (concluded) | | International Opportunities Portfolio |
| | | | | | | | | | | | | | | | | | | | | | | | |
| | | Investor C | |
| | | Six Months Ended March 31, 2008 | | | Year Ended September 30, | |
| | (Unaudited) | | | 2007 | | | 2006 | | | 2005 | | | 2004 | | | 20031 | |
Per Share Operating Performance | | | | | | | | | | | | | | | | | | | | | | | | |
Net asset value, beginning of period | | $ | 46.34 | | | $ | 38.78 | | | $ | 31.93 | | | $ | 22.80 | | | $ | 18.84 | | | $ | 14.54 | |
| | | | | | | | | | | | | | | | | | | | | | | | |
Net investment income (loss) | | | (0.19 | )2 | | | (0.03 | )2 | | | (0.04 | )2 | | | 0.21 | 2 | | | (0.21 | )2 | | | (0.11 | ) |
Net realized and unrealized gain (loss) | | | (3.01 | ) | | | 13.71 | | | | 7.93 | | | | 9.01 | | | | 4.18 | | | | 4.40 | |
| | | | | | | | | | | | | | | | | | | | | | | | |
Net increase (decrease) from investment operations | | | (3.20 | ) | | | 13.68 | | | | 7.89 | | | | 9.22 | | | | 3.97 | | | | 4.29 | |
| | | | | | | | | | | | | | | | | | | | | | | | |
Dividends and distributions from: | | | | | | | | | | | | | | | | | | | | | | | | |
Net investment income | | | (0.72 | ) | | | (0.29 | ) | | | (0.29 | ) | | | (0.10 | ) | | | (0.02 | ) | | | — | |
Net realized capital gain | | | (7.24 | ) | | | (5.83 | ) | | | (0.76 | ) | | | — | | | | — | | | | — | |
| | | | | | | | | | | | | | | | | | | | | | | | |
Total dividends and distributions | | | (7.96 | ) | | | (6.12 | ) | | | (1.05 | ) | | | (0.10 | ) | | | (0.02 | ) | | | — | |
| | | | | | | | | | | | | | | | | | | | | | | | |
Redemption fees added to paid-in capital | | | — | 3 | | | — | 3 | | | 0.01 | | | | 0.01 | | | | 0.01 | | | | 0.01 | |
| | | | | | | | | | | | | | | | | | | | | | | | |
Net asset value, end of period | | $ | 35.18 | | | $ | 46.34 | | | $ | 38.78 | | | $ | 31.93 | | | $ | 22.80 | | | $ | 18.84 | |
| | | | | | | | | | | | | | | | | | | | | | | | |
Total Investment Return | | | | | | | | | | | | | | | | | | | | | | | | |
Based on net asset value4 | | | (8.21 | )%5,6 | | | 38.91 | %5 | | | 25.33 | %7 | | | 40.60 | %9 | | | 21.12 | %9 | | | 29.57 | %9 |
| | | | | | | | | | | | | | | | | | | | | | | | |
Ratios to Average Net Assets | | | | | | | | | | | | | | | | | | | | | | | | |
Total expenses, net of waivers and reimbursement | | | 2.32 | %10 | | | 2.36 | % | | | 2.37 | % | | | 2.50 | % | | | 2.65 | % | | | 2.63 | % |
| | | | | | | | | | | | | | | | | | | | | | | | |
Total expenses | | | 2.32 | %10 | | | 2.36 | % | | | 2.37 | % | | | 2.51 | % | | | 2.72 | % | | | 2.72 | % |
| | | | | | | | | | | | | | | | | | | | | | | | |
Net investment income (loss) | | | (0.96 | )%10 | | | (0.08 | )% | | | (0.13 | )% | | | 0.75 | % | | | (0.86 | )% | | | (0.71 | )% |
| | | | | | | | | | | | | | | | | | | | | | | | |
Supplemental Data | | | | | | | | | | | | | | | | | | | | | | | | |
Net assets, end of period (000) | | $ | 222,447 | | | $ | 255,980 | | | $ | 205,958 | | | $ | 130,138 | | | $ | 54,894 | | | $ | 26,912 | |
| | | | | | | | | | | | | | | | | | | | | | | | |
Portfolio turnover | | | 50 | % | | | 77 | % | | | 91 | % | | | 86 | % | | | 98 | % | | | 72 | % |
| | | | | | | | | | | | | | | | | | | | | | | | |
1 | Audited by other auditors. |
2 | Based on average shares outstanding. |
3 | Redemption fees added to paid-in capital are less than $0.01 per share. |
4 | Total investment returns exclude the effects of sales charges. |
5 | Redemption fee of 2.00% received by the Portfolio is reflected in total return calculations. There was no impact to the return. |
6 | Aggregate total investment return. |
7 | Redemption fee of 2.00% received by the Portfolio is reflected in total return calculations. The impact to the return for redemption fees received during the period was an increase of 0.03%. |
8 | Redemption fee of 2.00% received by the Portfolio is reflected in total return calculations. The impact to the return for redemption fees received during the period was an increase of 0.04%. |
9 | Redemption fee of 2.00% received by the Portfolio is reflected in total return calculations. The impact to the return for redemption fees received during the period was an increase of 0.05%. |
See Notes to Financial Statements.
| | | | | | |
| | SEMI-ANNUAL REPORT | | MARCH 31, 2008 | | 129 |
Notes to Financial Statements (Unaudited)
1. Significant Accounting Policies:
BlackRock FundsSM (the “Fund”), a Massachusetts business trust, is registered under the Investment Company Act of 1940, as amended (the “1940 Act”), as an open-end management investment company. As of March 31, 2008, the Fund had 32 registered portfolios, 15 of which are included in these financial statements (the “Portfolios”). The Portfolios’ financial statements are prepared in conformity with accounting principles generally accepted in the United States of America, which may require the use of management accruals and estimates. Actual results may differ from these estimates. Each Portfolio is authorized to issue an unlimited number of shares with a par value of $0.001. Each Portfolio of the Fund offers multiple classes of shares. BlackRock and Institutional Shares are sold without a sales charge and only to certain eligible investors. Service Shares are sold without a sales charge. Investor A Shares are sold with a front-end sales charge. Shares of Investor B and Investor C may be subject to a contingent deferred sales charge. R Shares are sold only to certain retirement plans. All classes of shares have identical voting, dividend, liquidation and other rights and the same terms and conditions, except that the BlackRock, Service, Investor A, Investor B, Investor C and R Shares may bear certain expenses related to the service and/or distribution of such shares. Each class has exclusive voting rights with respect to matters relating to its service and distribution expenditures (except that Investor B shareholders may vote on material changes to the Investor A distribution plan).
The following is a summary of significant accounting policies followed by the Portfolios:
Valuation of Investments: Equity investments traded on a national securities exchange or on the NASDAQ Global Market System are valued at the last reported sale price that day or the NASDAQ official closing price, if applicable. Equity investments traded on a national securities exchange for which there were no sales on that day and equity investments traded on other over-the-counter markets for which market quotations are readily available are valued at the mean of the bid and asked prices. Exchange-traded options are valued at the mean between the last bid and ask prices at the close of the options market in which the options trade and previously were valued at the last sales price as of the close of options trading on applicable exchanges. Over-the-counter (“OTC”) options quotations are provided by dealers or pricing services selected under the supervision of the Board of Trustees (the “Board”). Considerations utilized by dealers or pricing services in valuing OTC options include, but are not limited to, volatility factors of the underlying security, price movement of the underlying security in relation to the strike price and the time left until expiration of the option. Short-term securities may be valued at amortized cost. Investments in open-end investment companies are valued at net asset value each business day.
In the event that application of these methods of valuation results in a price for an investment which is deemed not to be representative of the market value of such investment, the investment will be valued by a method approved by the Board of Trustees (the “Board”) as reflecting fair value (“Fair Value Assets”). When determining the price for Fair Value Assets, the investment advisor and/or the sub-advisor seeks to determine the price that the Portfolios might reasonably expect to receive from the current sale of that asset in an arm’s-length transaction. Fair value determinations shall be based upon all available factors that the investment advisor and/or sub-advisor deem relevant. The pricing of all Fair Value Assets is subsequently reported to the Board or a committee thereof.
Generally, trading in foreign securities is substantially completed each day at various times prior to the close of business on the New York Stock Exchange (“NYSE”). The values of such securities used in computing the net assets of the Portfolio are determined as of such times. Foreign currency exchange rates will be determined as of the close of business on the NYSE. Occasionally, events affecting the values of such securities and such exchange rates may occur between the times at which they are determined and the close of business on the NYSE that may not be reflected in the computation of the Portfolio’s net assets. If events (for example, a company announcement, market volatility or a natural disaster) occur during such periods that are expected to materially affect the value of such securities, those securities may be valued at their fair value as determined in good faith by the Board or by the investment advisor using a pricing service and/or procedures approved by the Board.
The Portfolios are not obligated for costs associated with the registration of restricted securities.
Derivative Financial Instruments: The Portfolios may engage in various portfolio investment strategies to increase the return of the Portfolios’ and to hedge, or protect, their exposure to interest rate movements and movements in the securities markets. Losses may arise if the value of the contract decreases due to an unfavorable change in the price of the underlying security, or if the counterparty does not perform under the contract.
| • | | Futures - The Portfolios may purchase or sell financial or index futures contracts and options on such futures contracts. Futures contracts are contracts for delayed delivery of securities at a specific future date and at a specific price or yield. Upon entering into a contract, a Portfolio deposits and maintains as collateral such initial margin as required by the exchange on which the transaction is effected. Pursuant to the contract, the Portfolio agrees to receive from, or pay to, the broker an amount of cash equal to the daily fluctuation in value of the contract. Such receipts or payments are known as variation margin and are recognized by the Portfolio as unrealized gains or losses. When the contract is closed, the Portfolio records a realized gain or loss equal to the difference between the value of the contract at the time it was opened and the value at the time it was closed. |
| • | | Forward foreign exchange contracts - The Portfolios may enter into forward foreign exchange contracts as a hedge against either specific transactions or portfolio positions. Forward currency contracts, when used by a Portfolio, help to manage the overall exposure to the foreign currency backing some of the investments held by the Portfolio. The contract is marked-to-market daily and the change in market value is recorded by the Portfolio as an unrealized gain or loss. When |
| | | | | | |
| 130 | | SEMI-ANNUAL REPORT | | MARCH 31, 2008 | | |
Notes to Financial Statements (continued)
| | the contract is closed, the Portfolio records a realized gain or loss equal to the difference between the value at the time it was opened and the value at the time it was closed. |
| • | | Options - The Portfolios may purchase and write call and put options. When a Portfolio writes an option, an amount equal to the premium received by the Portfolio is reflected as an asset and an equivalent liability. The amount of the liability is subsequently marked-to-market to reflect the current market value of the option written. When a security is purchased or sold through an exercise of an option, the related premium paid (or received) is added to (or deducted from) the basis of the security acquired or deducted from (or added to) the proceeds of the security sold. When an option expires (or the Portfolio enters into a closing transaction), the Portfolio realizes a gain or loss on the option to the extent of the premiums received or paid (or gain or loss to the extent the cost of the closing transaction exceeds the premium received or paid). If an option is exercised, the premium paid or received is added to the cost of the purchase or the proceeds from the sale in determining whether the Portfolio has realized a gain or a loss on investment transactions. |
A call option gives the purchaser of the option the right (but not the obligation) to buy, and obligates the seller to sell (when the option is exercised), the underlying position at the exercise price at any time or at a specified time during the option period. A put option gives the holder the right to sell and obligates the writer to buy the underlying position at the exercise price at any time or at a specified time during the option period.
Foreign Currency Transactions: Foreign currency amounts are translated into United States dollars on the following basis: (i) market value of investment securities, assets and liabilities at the current rate of exchange; and (ii) purchases and sales of investment securities, income and expenses at the rates of exchange prevailing on the respective dates of such transactions. The Portfolio reports foreign currency related transactions as components of realized gains for financial reporting purposes, whereas such components are treated as ordinary income for federal income tax purposes.
Preferred Stock: The Portfolios may invest in preferred stock. Preferred stock has a preference over common stock in liquidation (and generally in receiving dividends as well) but is subordinated to the liabilities of the issuer in all respects. As a general rule, the market value of preferred stock with a fixed dividend rate and no conversion element varies inversely with interest rates and perceived credit risk, while the market price of convertible preferred stock generally also reflects some element of conversion value. Because preferred stock is junior to debt securities and other obligations of the issuer, deterioration in the credit quality of the issuer will cause greater changes in the value of a preferred stock than in a more senior debt security with similar stated yield characteristics. Unlike interest payments on debt securities, preferred stock dividends are payable only if declared by the issuer’s board of directors. Preferred stock also may be subject to optional or mandatory redemption provisions.
Segregation: In cases in which the 1940 Act and the interpretive positions of the Securities and Exchange Commission (“SEC”) require that each Portfolio segregate assets in connection with certain investments (e.g., when-issued securities, reverse repurchase agreements, swaps or futures contracts), each Portfolio will, consistent with certain interpretive letters issued by the SEC, designate on its books and records cash or other liquid debt securities having a market value at least equal to the amount that would otherwise be required to be physically segregated.
Investment Transactions and Investment Income: Investment transactions are recorded on the dates the transactions are entered into (the trade dates). Realized gains and losses on security transactions are determined on the identified cost basis. Dividend income is recorded on the ex-dividend dates. Dividends from foreign securities where the ex-dividend date may have passed are subsequently recorded when the Portfolio has determined the ex-dividend date. Upon notification from issuers, some of the dividend income received from a real estate investment trust (“REIT”) may be redesignated as a reduction of cost of the related investment and/or realized gain. Interest income is recognized on the accrual basis. The Portfolios amortize all premiums and discounts on debt securities. Income, realized and unrealized gains and losses are allocated daily to each class based on its relative net assets.
Dividends and Distributions to Shareholders: Dividends and distributions paid by the Portfolios are recorded on the ex-dividend dates.
Securities Lending: The Portfolios may lend securities to financial institutions that provide cash or securities issued or guaranteed by the U.S. government as collateral, which will be maintained at all times in an amount equal to at least 100% of the current market value of the loaned securities. The market value of the loaned securities is determined at the close of business of the Portfolios and any additional required collateral is delivered to the Portfolios on the next business day. The Portfolios typically receive the income on the loaned securities but does not receive the income on the collateral. Where the Portfolios receive cash collateral, it may invest such collateral and retain the amount earned on such investment, net of any amount rebated to the borrower. The Portfolios may receive a flat fee for its loans. Loans of securities are terminable at any time and the borrower, after notice, is required to return borrowed securities within the standard time period for settlement of securities transactions. The Portfolios may pay reasonable lending agent, administrative and custodial fees in connection with its loans. In the event that the borrower defaults on its obligation to return borrowed securities because of insolvency or for any other reason, the Portfolios could experience delays and costs in gaining access to the collateral. The Portfolios also could suffer a loss where the value of the collateral falls below the market value of the borrowed securities, in the event of borrower default or in the event of losses on investments made with cash collateral.
Income Taxes: It is the Portfolios’ policy to comply with the requirements of the Internal Revenue Code applicable to regulated investment companies and to distribute substantially all of its taxable income to its shareholders. Therefore, no federal income tax provision is required. Under the applicable foreign tax laws, a withholding tax may be imposed on interest, dividends and capital gains at various rates.
| | | | | | |
| | SEMI-ANNUAL REPORT | | MARCH 31, 2008 | | 131 |
Notes to Financial Statements (continued)
Effective March 31, 2008, the Portfolios implemented Financial Accounting Standards Board (“FASB”) Interpretation No. 48, “Accounting for Uncertainty in Income Taxes — an interpretation of FASB Statement No. 109” (“FIN 48”). FIN 48 prescribes the minimum recognition threshold a tax position must meet in connection with accounting for uncertainties in income tax positions taken or expected to be taken by an entity, including investment companies, before being measured and recognized in the financial statements. The investment advisor has evaluated the application of FIN 48 to the Portfolios, and has determined that the adoption of FIN 48 did not have a material impact on the Portfolios’ financial statements. The Portfolios file U.S. and various state tax returns. No income tax returns are currently under examination. The statute of limitations on the Portfolios’ tax returns remains open for the years ended September 30, 2004 through September 30, 2006. The statute of limitations on the Portfolios’ state and local tax returns may remain open for an additional year depending upon the jurisdiction.
Recent Accounting Pronouncements: In September 2006, Statement of Financial Accounting Standards No. 157, “Fair Value Measurements” (“FAS 157”), was issued and is effective for fiscal years beginning after November 15, 2007. FAS 157 defines fair value, establishes a framework for measuring fair value and expands disclosures about fair value measurements. The impact on the Portfolios’ financial statement disclosures, if any, is currently being assessed.
In addition, in February 2007, Statement of Financial Accounting Standards No. 159, “The Fair Value Option for Financial Assets and Financial Liabilities” (“FAS 159”), was issued and is effective for fiscal years beginning after November 15, 2007. Early adoption is permitted as of the beginning of a fiscal year that begins on or before November 15, 2007, provided the entity also elects to apply the provisions of FAS 157. FAS 159 permits entities to choose to measure many financial instruments and certain other items at fair value that are not currently required to be measured at fair value. FAS 159 also establishes presentation and disclosure requirements designed to facilitate comparisons between entities that choose different measurement attributes for similar types of assets and liabilities. The impact on the Portfolios’ financial statement disclosures, if any, is currently being assessed.
In March 2008, Statement of Financial Accounting Standards No. 161, “Disclosures about Derivative Instruments and Hedging Activities—an amendment of FASB Statement No. 133” (“FAS 161”) was issued and is effective for fiscal years beginning after November 15, 2008. FAS 161 is intended to improve financial reporting for derivative instruments by requiring enhanced disclosure that enables investors to understand how and why an entity uses derivatives, how derivatives are accounted for, and how derivative instruments affect an entity’s results of operations and financial position. The investment advisor is currently evaluating the implications of FAS 161 and the impact on the Portfolios’ financial statement disclosures, if any, is currently being assessed.
Other: Expenses directly related to one of the Portfolios or classes are charged to that Portfolio or class. Other operating expenses shared by several Portfolios are pro-rated among those Portfolios on the basis of relative net assets or other appropriate methods. Other expenses of a Portfolio are allocated daily to each class based on its relative net assets.
2. Investment Advisory Agreements and Other Transactions with Affiliates:
The Fund on behalf of the Portfolios entered into an Investment Advisory Agreement with the BlackRock Advisors, LLC (the “Advisor”), an indirect, wholly owned subsidiary of BlackRock, Inc., to provide investment advisory services. Merrill Lynch & Co., Inc.(“Merrill Lynch”) and The PNC Financial Services Group, Inc. (“PNC”) are principal owners of BlackRock, Inc.
The Advisor is responsible for the management of each Portfolio and provides the necessary personnel, facilities, equipment and certain other services necessary to the operations of the Portfolios. For such services, each Portfolio pays the Advisor a monthly fee based on the average daily value of the Portfolio’s net assets, at the following annual rates:
| | | | | | | | | | | | |
Average Daily Net Assets | | first $1 billion | | | $1 billion - $2 billion | | | $2 billion - $3 billion | | | greater than $3 billion | |
Small Cap Value Equity and Small Cap Growth Equity | | 0.550 | % | | 0.500 | % | | 0.475 | % | | 0.450 | % |
Mid-Cap Value Equity and Mid-Cap Growth Equity | | 0.800 | | | 0.700 | | | 0.650 | | | 0.625 | |
U.S. Opportunities | | 1.100 | | | 1.050 | | | 1.025 | | | 1.000 | |
Global Science & Technology Opportunities and Global Opportunities | | 0.900 | | | 0.850 | | | 0.800 | | | 0.750 | |
Small/Mid-Cap Growth, Global Resources, All-Cap Global Resources and Health Sciences Opportunities | | 0.750 | | | 0.700 | | | 0.675 | | | 0.650 | |
Capital Appreciation | | 0.650 | | | 0.600 | | | 0.575 | | | 0.550 | |
Aurora | | 0.850 | | | 0.800 | | | 0.750 | | | 0.700 | |
International Opportunities | | 1.000 | | | 0.950 | | | 0.900 | | | 0.850 | |
Small Cap Core Equity Portfolio pays an advisory fee at an annual rate of 1.00% of average daily net assets.
In addition, the Advisor has entered into a sub-advisory agreement with BlackRock Financial Management, Inc. (“BFM”), an affiliate of the Advisor, pursuant to which BFM serves as sub-advisor for a portion of the
| | | | | | |
| 132 | | SEMI-ANNUAL REPORT | | MARCH 31, 2008 | | |
Notes to Financial Statements (continued)
assets of Global Opportunities Portfolio and BlackRock International, Ltd. (“BIL”), an affiliate of the Advisor, to serve as sub-advisor for International Opportunities Portfolio. The Advisor pays the sub-advisors, for services it provides, a monthly fee that is a percentage of the management fee paid by the Portfolios to the Advisor.
PFPC Trust Company (“PTC”), an indirect wholly-owned subsidiary of PNC, serves as custodian for each Portfolio. For these services, the custodian receives a fee computed daily and payable monthly, based on a percentage of the average daily gross assets of each Portfolio.
Prior to January 1, 2008, the fee was paid at the following annual rates: 0.0073% of the first $250 million, 0.006% of the next $250 million, 0.0056% of the next $250 million, 0.0048% of the next $250 million and 0.004% of average daily gross assets in excess of $1 billion; plus per transaction charges and other miscellaneous fees incurred on behalf of each Portfolio.
Effective January 1, 2008, the fee is paid at the following annual rates: 0.005% of the first $400 million, 0.004% of the next $1.6 billion, and 0.003% of average daily gross assets in excess of $2 billion; plus per transaction charges and other miscellaneous fees incurred on behalf of each Portfolio.
PFPC Inc. (“PFPC”), an indirect wholly-owned subsidiary of PNC, serves as transfer and dividend disbursing agent. Each class of each Portfolio bears the costs of transfer agent fees associated with such respective class. Transfer agency fees borne by each class of each Portfolio are comprised of those fees charged for all shareholder communications including shareholder reports, dividend and distribution notices, and proxy materials for shareholders meetings, as well as per account and per transaction fees related to servicing and maintenance of shareholder accounts, including the issuing, redeeming and transferring of shares of each class of each Portfolio, 12b-1 fee calculation, check writing, anti-money laundering services, and customer identification services.
Pursuant to written agreements, certain affiliates provide certain Portfolios with sub-accounting, recordkeeping, sub-transfer agency and other administrative services with respect to sub-accounts they service. For these services, these affiliates receive an annual fee per shareholder account which will vary depending on share class. For the six months ended March 31, 2008, the Portfolios paid the following fees in return for these services:
| | | |
Capital Appreciation | | $ | 10,327 |
Mid-Cap Value Equity | | | 192,954 |
Mid-Cap Growth Equity | | | 47,885 |
Aurora | | | 388,426 |
Small/Mid-Cap Growth | | | 120,495 |
Small Cap Value Equity | | | 15,321 |
Small Cap Core Equity | | | 27,673 |
Small Cap Growth Equity | | | 182,035 |
Global Science & Technology Opportunities | | | 21,190 |
Global Resources | | | 47,174 |
All-Cap Global Resources | | | 49,569 |
Health Sciences Opportunities | | | 181,529 |
U.S. Opportunities | | | 82,230 |
Global Opportunities | | | 19,186 |
International Opportunities | | | 166,406 |
PFPC and the Advisor act as co-administrators for the Fund. For these services, the co-administrators receive a combined administration fee computed daily and payable monthly, based on a percentage of the average daily net assets of each Portfolio. The combined administration fee is paid at the following annual rates: 0.075% of the first $500 million, 0.065% of the next $500 million and 0.055% of average of daily net assets in excess of $1 billion. In addition, each of the share classes is charged an administration fee based on the following percentages of average daily net assets of each respective class: 0.025% of the first $500 million, 0.015% of the next $500 million and 0.005% of average of daily net assets in excess of $1 billion. In addition, PFPC and the Advisor may have, at their discretion, voluntarily waived all or any portion of their administration fees for the Portfolio or a share class.
The Portfolios have received an exemptive order from the Securities and Exchange Commission permitting it to lend portfolio securities to BlackRock Investment Management, LLC (“BIM”), an affiliate of the Advisor, or its affiliates. Pursuant to that order, the Portfolios have retained BIM as the securities lending agent for a fee based on a share of the returns on investment of cash collateral. BIM may, on behalf of the Portfolios, invest cash collateral received by the Portfolios for such loans, among other things, in a private investment company managed by the Advisor or in registered money market funds advised by the Advisor or its affiliates. The value of securities lent to Merrill Lynch, Pierce, Fenner & Smith Incorporated (“MLPF&S”) or its affiliates and the securities lending agent fees received by BIM were as follows:
| | | | | | |
| | | Value of securities
loans as of
March 31, 2008 | | Securities lending
agent fees for the
period ended
March 31, 2008 |
Capital Appreciation | | $ | 993,300 | | $ | 14,413 |
Mid-Cap Value Equity | | | 35,607,200 | | | 170,615 |
Mid-Cap Growth Equity | | | 2,475,600 | | | 26,733 |
Aurora | | | 72,010,650 | | | 265,855 |
Small/Mid-Cap Growth | | | — | | | 15,191 |
Small Cap Value Equity | | | 143,500 | | | 13,822 |
Small Cap Core Equity | | | — | | | 22,249 |
Small Cap Growth Equity | | | 35,533,150 | | | 158,950 |
Global Science & Technology Opportunities | | | — | | | 892 |
Global Resources | | | 28,363,300 | | | 149,865 |
All-Cap Global Resources | | | 58,905,150 | | | 114,451 |
Health Sciences Opportunities | | | 89,582,800 | | | 90,017 |
U.S. Opportunities | | | 6,874,600 | | | 49,458 |
International Opportunities | | | — | | | 2,222 |
| | | | | | |
| | SEMI-ANNUAL REPORT | | MARCH 31, 2008 | | 133 |
|
| Notes to Financial Statements (continued) |
|
| The Fund, on behalf of the Portfolios, has entered into a Distribution Agreement with BlackRock Distributors, Inc. (“BDI”). BDI is an affiliate of BlackRock, Inc. The Fund has also adopted a Distribution Plan on behalf of each Portfolio in accordance with Rule 12b-1 under the 1940 Act. Pursuant to the Distribution Plan the Portfolios pay the BDI ongoing service and distribution fees. The fees are accrued daily and paid monthly at annual rates based upon the average daily net assets of the shares as follows: |
| | | | | | | | | | | | | | | | | | | | | | | | | | | | | | | | | | | | | | | | |
| | | Class Specific Fee Arrangement | |
Portfolio | | Share Classes | |
| | BlackRock | | | Institutional | | Service | | | Investor A | | | Investor B | | | Investor C | | | R | |
| | Contractual
Fees (1) | | | Actual
Fees (4) | | | Contractual
Fees | | Actual
Fees (4) | | Contractual
Fees (1) | | | Actual
Fees (4) | | | Contractual
Fees (1) | | | Actual
Fees (4) | | | Contractual
Fees (2) | | | Actual
Fees (4) | | | Contractual
Fees (2) | | | Actual
Fees (4) | | | Contractual
Fees (3) | | | Actual
Fees (4) | |
Capital Appreciation | | N/A | | | N/A | | | None | | None | | N/A | | | N/A | | | 0.25 | % | | 0.25 | % | | 1.00 | % | | 1.00 | % | | 1.00 | % | | 1.00 | % | | N/A | | | N/A | |
Mid-Cap Value Equity | | N/A | | | N/A | | | None | | None | | 0.25 | % | | 0.25 | % | | 0.25 | % | | 0.25 | % | | 1.00 | % | | 1.00 | % | | 1.00 | % | | 1.00 | % | | N/A | | | N/A | |
Mid-Cap Growth Equity | | N/A | | | N/A | | | None | | None | | 0.25 | % | | 0.25 | % | | 0.25 | % | | 0.25 | % | | 1.00 | % | | 1.00 | % | | 1.00 | % | | 1.00 | % | | 0.50 | % | | 0.50 | % |
Aurora | | N/A | | | N/A | | | None | | None | | N/A | | | N/A | | | 0.25 | % | | 0.25 | % | | 1.00 | % | | 1.00 | % | | 1.00 | % | | 1.00 | % | | 0.50 | % | | 0.50 | % |
Small/Mid-Cap Growth | | N/A | | | N/A | | | None | | None | | N/A | | | N/A | | | 0.25 | % | | 0.25 | % | | 1.00 | % | | 1.00 | % | | 1.00 | % | | 1.00 | % | | 0.50 | % | | 0.50 | % |
Small Cap Value Equity | | 0.25 | % | | 0.25 | % | | None | | None | | 0.25 | % | | 0.25 | % | | 0.25 | % | | 0.25 | % | | 1.00 | % | | 1.00 | % | | 1.00 | % | | 1.00 | % | | N/A | | | N/A | |
Small Cap Core Equity | | N/A | | | N/A | | | None | | None | | 0.25 | % | | 0.25 | % | | 0.25 | % | | 0.25 | % | | 1.00 | % | | 1.00 | % | | 1.00 | % | | 1.00 | % | | N/A | | | N/A | |
Small Cap Growth Equity | | N/A | | | N/A | | | None | | None | | 0.25 | % | | 0.25 | % | | 0.25 | % | | 0.25 | % | | 1.00 | % | | 1.00 | % | | 1.00 | % | | 1.00 | % | | N/A | | | N/A | |
Global Science & Technology Opportunities | | N/A | | | N/A | | | None | | None | | 0.25 | % | | 0.25 | % | | 0.25 | % | | 0.25 | % | | 1.00 | % | | 1.00 | % | | 1.00 | % | | 1.00 | % | | N/A | | | N/A | |
Global Resources | | N/A | | | N/A | | | None | | None | | N/A | | | N/A | | | 0.25 | % | | 0.25 | % | | 1.00 | % | | 1.00 | % | | 1.00 | % | | 1.00 | % | | N/A | | | N/A | |
All-Cap Global Resources | | N/A | | | N/A | | | None | | None | | 0.25 | % | | 0.25 | % | | 0.25 | % | | 0.25 | % | | 1.00 | % | | 1.00 | % | | 1.00 | % | | 1.00 | % | | N/A | | | N/A | |
Health Sciences Opportunities | | N/A | | | N/A | | | None | | None | | 0.25 | % | | 0.25 | % | | 0.25 | % | | 0.25 | % | | 1.00 | % | | 1.00 | % | | 1.00 | % | | 1.00 | % | | N/A | | | N/A | |
U.S. Opportunities | | N/A | | | N/A | | | None | | None | | 0.25 | % | | 0.25 | % | | 0.25 | % | | 0.25 | % | | 1.00 | % | | 1.00 | % | | 1.00 | % | | 1.00 | % | | N/A | | | N/A | |
Global Opportunities | | N/A | | | N/A | | | None | | None | | N/A | | | N/A | | | 0.25 | % | | 0.25 | % | | 1.00 | % | | 1.00 | % | | 1.00 | % | | 1.00 | % | | N/A | | | N/A | |
International Opportunities | | N/A | | | N/A | | | None | | None | | 0.25 | % | | 0.25 | % | | 0.25 | % | | 0.25 | % | | 1.00 | % | | 1.00 | % | | 1.00 | % | | 1.00 | % | | N/A | | | N/A | |
| (1) | the maximum annual contractual fees are comprised of a 0.25% service fee. |
| (2) | the maximum annual contractual fees are comprised of a 0.75% distribution fee and a 0.25% service fee. |
| (3) | the maximum annual contractual fees are comprised of a 0.25% distribution fee and a 0.25% service fee. |
| (4) | annualized; the actual fees are for the six months ended March 31, 2008. |
For the six months ended March 31, 2008, the Portfolios paid to affiliates the following fees in return for distribution and sales support services:
| | | |
Capital Appreciation | | $ | 52,094 |
Mid-Cap Value Equity | | | 401,066 |
Mid-Cap Growth Equity | | | 84,968 |
Aurora | | | 549,706 |
Small/Mid-Cap Growth | | | 65,577 |
Small Cap Value Equity | | | 33,135 |
Small Cap Core Equity | | | 64,643 |
Small Cap Growth Equity | | | 144,739 |
Global Science & Technology Opportunities | | | 24,757 |
Global Resources | | | 405,617 |
All-Cap Global Resources | | | 264,419 |
Health Sciences Opportunities | | | 870,353 |
U.S. Opportunities | | | 176,957 |
Global Opportunities | | | 31,296 |
International Opportunities | | | 599,698 |
| | | | | | |
| 134 | | SEMI-ANNUAL REPORT | | MARCH 31, 2008 | | |
Notes to Financial Statements (continued)
The Advisor maintains a call center, which is responsible for providing certain shareholder services to the Portfolios, such as responding to shareholder inquiries and processing transactions based upon instructions from shareholders with respect to the subscription and redemption of Portfolio shares. During the six months ended March 31, 2008, the following amounts have been accrued by each Portfolio to reimburse the Advisor for costs incurred running the call center, which are a component of the transfer agent fees in the accompanying Statements of Operations.
| | | | | | | | | | | | | | | | | | | | | | | | |
Call Center | | Share Classes |
| | BlackRock | | Institutional | | Service | | Investor A | | Investor B | | Investor C | | R | | Total |
Capital Appreciation | | $ | — | | $ | 1,104 | | $ | — | | $ | 14,954 | | $ | 8,328 | | $ | 827 | | $ | — | | $ | 25,213 |
Mid-Cap Value Equity | | | — | | | 1,158 | | | 65 | | | 54,937 | | | 17,843 | | | 13,383 | | | — | | | 87,386 |
Mid-Cap Growth Equity | | | — | | | 841 | | | 27 | | | 46,723 | | | 11,130 | | | 1,867 | | | 2 | | | 60,590 |
Aurora | | | — | | | 1,600 | | | — | | | 71,323 | | | 41,981 | | | 20,660 | | | 13 | | | 135,577 |
Small/Mid-Cap Growth | | | — | | | 374 | | | — | | | 19,485 | | | 5,017 | | | 1,629 | | | 12 | | | 26,517 |
Small Cap Value Equity | | | 30 | | | 246 | | | 60 | | | 1,188 | | | 631 | | | 250 | | | — | | | 2,405 |
Small Cap Core Equity | | | — | | | 840 | | | 227 | | | 4,833 | | | 1,059 | | | 2,591 | | | — | | | 9,550 |
Small Cap Growth Equity | | | — | | | 5,867 | | | 445 | | | 13,363 | | | 1,076 | | | 2,785 | | | — | | | 23,536 |
Global Science & Technology Opportunities | | | — | | | 172 | | | 28 | | | 4,176 | | | 1,350 | | | 766 | | | — | | | 6,492 |
Global Resources | | | — | | | 692 | | | — | | | 23,649 | | | 6,140 | | | 5,057 | | | — | | | 35,538 |
All-Cap Global Resources | | | — | | | 2,919 | | | 403 | | | 23,884 | | | 7,521 | | | 12,451 | | | — | | | 47,178 |
Health Sciences Opportunities | | | — | | | 3,096 | | | 534 | | | 48,407 | | | 10,954 | | | 16,716 | | | — | | | 79,707 |
U.S. Opportunities | | | — | | | 2,489 | | | 480 | | | 21,503 | | | 4,551 | | | 4,908 | | | — | | | 33,931 |
Global Opportunities | | | — | | | 597 | | | — | | | 3,160 | | | 918 | | | 1,010 | | | — | | | 5,685 |
International Opportunities | | | — | | | 6,741 | | | 2,122 | | | 27,034 | | | 6,061 | | | 9,647 | | | — | | | 51,605 |
|
For the six months ended March 31, 2008, the following charts show the various types of class-specific expenses borne directly by each class of each Portfolio and any associated waivers of those expenses. |
Administration Fees | | Share Classes |
| | BlackRock | | Institutional | | Service | | Investor A | | Investor B | | Investor C | | R | | Total |
Capital Appreciation | | $ | — | | $ | 8,882 | | $ | — | | $ | 16,636 | | $ | 5,004 | | $ | 1,761 | | $ | — | | $ | 32,283 |
Mid-Cap Value Equity | | | — | | | 16,422 | | | 388 | | | 69,409 | | | 12,966 | | | 19,569 | | | — | | | 118,754 |
Mid-Cap Growth Equity | | | — | | | 7,975 | | | 85 | | | 32,210 | | | 4,781 | | | 2,327 | | | 50 | | | 47,428 |
Aurora | | | — | | | 18,077 | | | — | | | 79,920 | | | 25,777 | | | 21,627 | | | 163 | | | 145,564 |
Small/Mid-Cap Growth | | | — | | | 2,858 | | | — | | | 25,245 | | | 2,289 | | | 1,972 | | | 171 | | | 32,535 |
Small Cap Value Equity | | | 433 | | | 3,096 | | | 240 | | | 2,682 | | | 445 | | | 385 | | | — | | | 7,281 |
Small Cap Core Equity | | | — | | | 4,432 | | | 519 | | | 3,414 | | | 982 | | | 3,849 | | | — | | | 13,196 |
Small Cap Growth Equity | | | — | | | 66,602 | | | 4,534 | | | 23,953 | | | 1,175 | | | 2,762 | | | — | | | 99,026 |
Global Science & Technology Opportunities | | | — | | | 243 | | | 19 | | | 2,892 | | | 1,014 | | | 1,178 | | | — | | | 5,346 |
Global Resources | | | — | | | 4,000 | | | — | | | 81,021 | | | 9,988 | | | 19,537 | | | — | | | 114,546 |
All-Cap Global Resources | | | — | | | 75,610 | | | 479 | | | 45,812 | | | 7,257 | | | 27,340 | | | — | | | 156,498 |
Health Sciences Opportunities | | | — | | | 22,061 | | | 938 | | | 77,113 | | | 11,660 | | | 45,333 | | | — | | | 157,105 |
U.S. Opportunities | | | — | | | 20,647 | | | 8,239 | | | 34,349 | | | 3,590 | | | 12,418 | | | — | | | 79,243 |
Global Opportunities | | | — | | | 4,957 | | | — | | | 5,274 | | | 984 | | | 2,438 | | | — | | | 13,653 |
International Opportunities | | | — | | | 57,547 | | | 19,878 | | | 63,616 | | | 11,021 | | | 29,273 | | | — | | | 181,335 |
| | | | | | |
| | SEMI-ANNUAL REPORT | | MARCH 31, 2008 | | 135 |
Notes to Financial Statements (continued)
| | | | | | | | | | | | | | | | | | | | | | | | |
Administration Fees Waived | | Share Classes |
| | BlackRock | | Institutional | | Service | | Investor A | | Investor B | | Investor C | | R | | Total |
Capital Appreciation | | $ | — | | $ | 8,881 | | $ | — | | $ | — | | $ | 2,010 | | $ | — | | $ | — | | $ | 10,891 |
Mid-Cap Value Equity | | | — | | | 16,422 | | | 263 | | | 69,408 | | | 12,966 | | | 19,569 | | | — | | | 118,628 |
Mid-Cap Growth Equity | | | — | | | 52 | | | 15 | | | 685 | | | 4,750 | | | 14 | | | 26 | | | 5,542 |
Aurora | | | — | | | 18,077 | | | — | | | 72,868 | | | 25,606 | | | 21,430 | | | 108 | | | 138,089 |
Small/Mid-Cap Growth | | | — | | | 2,858 | | | — | | | 25,094 | | | 2,289 | | | 1,961 | | | 120 | | | 32,322 |
Small Cap Value Equity | | | 353 | | | — | | | 186 | | | — | | | 441 | | | 77 | | | — | | | 1,057 |
Small Cap Core Equity | | | — | | | 2,981 | | | 105 | | | 1,597 | | | 619 | | | 1,333 | | | — | | | 6,635 |
Small Cap Growth Equity | | | — | | | — | | | 818 | | | — | | | 51 | | | 15 | | | — | | | 884 |
Global Science & Technology Opportunities | | | — | | | 243 | | | 18 | | | 2,879 | | | 1,007 | | | 12 | | | — | | | 4,159 |
Global Resources | | | — | | | 1,056 | | | — | | | — | | | 6,857 | | | — | | | — | | | 7,913 |
All-Cap Global Resources | | | — | | | 5 | | | 2 | | | 238 | | | 7,257 | | | 159 | | | — | | | 7,661 |
U.S. Opportunities | | | — | | | 20,647 | | | 27 | | | 155 | | | 3,565 | | | 61 | | | — | | | 24,455 |
Global Opportunities | | | — | | | 677 | | | — | | | 9 | | | 465 | | | 312 | | | — | | | 1,463 |
| |
Transfer Agent Fees | | Share Classes |
| | BlackRock | | Institutional | | Service | | Investor A | | Investor B | | Investor C | | R | | Total |
Capital Appreciation | | $ | — | | $ | 10,227 | | $ | — | | $ | 150,371 | | $ | 75,136 | | $ | 10,752 | | $ | — | | $ | 246,486 |
Mid-Cap Value Equity | | | — | | | 95,440 | | | 1,020 | | | 647,696 | | | 156,825 | | | 181,951 | | | — | | | 1,082,932 |
Mid-Cap Growth Equity | | | — | | | 30,481 | | | 745 | | | 421,855 | | | 101,585 | | | 26,479 | | | 258 | | | 581,403 |
Aurora | | | — | | | 191,784 | | | — | | | 892,816 | | | 361,907 | | | 229,270 | | | 1,168 | | | 1,676,945 |
Small/Mid-Cap Growth | | | — | | | 53,554 | | | — | | | 257,607 | | | 45,864 | | | 23,645 | | | 3,736 | | | 384,406 |
Small Cap Value Equity | | | 149 | | | 3,764 | | | 1,653 | | | 21,363 | | | 7,530 | | | 4,669 | | | — | | | 39,128 |
Small Cap Core Equity | | | — | | | 12,475 | | | 1,370 | | | 40,958 | | | 11,914 | | | 39,262 | | | — | | | 105,979 |
Small Cap Growth Equity | | | — | | | 208,257 | | | 35,429 | | | 154,361 | | | 20,221 | | | 38,625 | | | — | | | 456,893 |
Global Science & Technology Opportunities | | | — | | | 2,101 | | | 218 | | | 32,426 | | | 19,711 | | | 10,907 | | | — | | | 65,363 |
Global Resources | | | — | | | 19,681 | | | — | | | 391,161 | | | 56,083 | | | 63,654 | | | — | | | 530,579 |
All-Cap Global Resources | | | — | | | 42,629 | | | 2,740 | | | 216,084 | | | 65,022 | | | 145,518 | | | — | | | 471,993 |
Health Sciences Opportunities | | | — | | | 85,201 | | | 6,054 | | | 582,561 | | | 116,990 | | | 273,348 | | | — | | | 1,064,154 |
U.S. Opportunities | | | — | | | 79,595 | | | 32,805 | | | 237,021 | | | 51,315 | | | 88,482 | | | — | | | 489,218 |
Global Opportunities | | | — | | | 17,409 | | | — | | | 26,068 | | | 7,795 | | | 12,496 | | | — | | | 63,768 |
International Opportunities | | | — | | | 132,528 | | | 98,137 | | | 315,625 | | | 73,594 | | | 151,035 | | | — | | | 770,919 |
| |
Transfer Agent Fees Waived | | Share Classes |
| | BlackRock | | Institutional | | Service | | Investor A | | Investor B | | Investor C | | R | | Total |
Capital Appreciation | | $ | — | | $ | 1,104 | | $ | — | | $ | — | | $ | 1,372 | | $ | — | | $ | — | | $ | 2,476 |
Mid-Cap Value Equity | | | — | | | 1,158 | | | 37 | | | 54,937 | | | 17,843 | | | 13,383 | | | — | | | 87,358 |
Mid-Cap Growth Equity | | | — | | | 34 | | | 1 | | | 1,612 | | | 10,804 | | | 9 | | | 1 | | | 12,461 |
Aurora | | | — | | | 1,600 | | | — | | | 46,962 | | | 40,828 | | | 18,969 | | | 8 | | | 108,367 |
Small/Mid-Cap Growth | | | — | | | 385 | | | — | | | 18,954 | | | 4,921 | | | 1,583 | | | 8 | | | 25,851 |
Small Cap Value Equity | | | 18 | | | — | | | 25 | | | — | | | 597 | | | 12 | | | — | | | 652 |
Small Cap Core Equity | | | — | | | 397 | | | 34 | | | 1,236 | | | 406 | | | 626 | | | — | | | 2,699 |
Small Cap Growth Equity | | | — | | | — | | | 25 | | | — | | | 8 | | | 121 | | | — | | | 154 |
Global Science & Technology Opportunities | | | — | | | 169 | | | 28 | | | 4,065 | | | 1,308 | | | — | | | — | | | 5,570 |
Global Resources | | | — | | | 147 | | | — | | | — | | | 1,854 | | | — | | | — | | | 2,001 |
All-Cap Global Resources | | | — | | | — | | | 17 | | | 704 | | | 7,430 | | | 531 | | | — | | | 8,682 |
U.S. Opportunities | | | — | | | 2,489 | | | 19 | | | 1,075 | | | 4,395 | | | 241 | | | — | | | 8,219 |
Global Opportunities | | | — | | | 30 | | | — | | | — | | | 184 | | | 20 | | | — | | | 234 |
| | | | | | |
| 136 | | SEMI-ANNUAL REPORT | | MARCH 31, 2008 | | |
Notes to Financial Statements (continued)
| | | | | | | | | | | | | | | | | | | | | | | | |
Transfer Agent Fees Reimbursed | | Share Classes |
| | BlackRock | | Institutional | | Service | | Investor A | | Investor B | | Investor C | | R | | Total |
Capital Appreciation | | $ | — | | $ | 9,089 | | $ | — | | $ | — | | $ | 500 | | $ | — | | $ | — | | $ | 9,589 |
Mid-Cap Value Equity | | | — | | | 90,944 | | | 161 | | | 394,635 | | | 105,387 | | | 118,012 | | | — | | | 709,139 |
Mid-Cap Growth Equity | | | — | | | 47 | | | 1 | | | 11 | | | 18,084 | | | — | | | 96 | | | 18,239 |
Aurora | | | — | | | 135,242 | | | — | | | 60,295 | | | 102,265 | | | 29,166 | | | 640 | | | 327,608 |
Small/Mid-Cap Growth | | | — | | | 33,260 | | | — | | | 65,359 | | | 24,976 | | | 8,525 | | | 2,693 | | | 134,813 |
Small Cap Value Equity | | | 72 | | | — | | | 40 | | | — | | | 1,065 | | | 4 | | | — | | | 1,181 |
Small Cap Core Equity | | | — | | | 2,822 | | | 97 | | | 4,228 | | | 890 | | | 2,385 | | | — | | | 10,422 |
Small Cap Growth Equity | | | — | | | — | | | 180 | | | — | | | — | | | 66 | | | — | | | 246 |
Global Science & Technology Opportunities | | | — | | | 1,770 | | | 79 | | | 8,947 | | | 5,821 | | | — | | | — | | | 16,617 |
Global Resources | | | — | | | 594 | | | — | | | — | | | 331 | | | — | | | — | | | 925 |
All-Cap Global Resources | | | — | | | — | | | 3 | | | — | | | 4,984 | | | 742 | | | — | | | 5,729 |
U.S. Opportunities | | | — | | | 77,051 | | | 207 | | | 308 | | | 11,484 | | | 365 | | | — | | | 89,415 |
Global Opportunities | | | — | | | 193 | | | — | | | — | | | 50 | | | 3 | | | — | | | 246 |
| | | | | | | | | | | | | | | | | | | | | |
Service Fees | | Share Classes |
| | BlackRock | | Service | | Investor A | | Investor B | | Investor C | | R | | Total |
Capital Appreciation | | $ | — | | $ | — | | $ | 166,050 | | $ | 50,015 | | $ | 17,611 | | $ | — | | $ | 233,676 |
Mid-Cap Value Equity | | | — | | | 3,885 | | | 735,075 | | | 129,230 | | | 195,677 | | | — | | | 1,063,867 |
Mid-Cap Growth Equity | | | — | | | 849 | | | 320,595 | | | 47,034 | | | 23,242 | | | 503 | | | 392,223 |
Aurora | | | — | | | — | | | 911,596 | | | 257,259 | | | 216,018 | | | 1,634 | | | 1,386,507 |
Small/Mid-Cap Growth | | | — | | | — | | | 251,824 | | | 22,805 | | | 19,721 | | | 1,714 | | | 296,064 |
Small Cap Value Equity | | | 4,334 | | | 2,405 | | | 26,737 | | | 4,450 | | | 3,852 | | | — | | | 41,778 |
Small Cap Core Equity | | | — | | | 5,187 | | | 34,132 | | | 9,820 | | | 38,452 | | | — | | | 87,591 |
Small Cap Growth Equity | | | — | | | 35,911 | | | 239,342 | | | 11,742 | | | 27,621 | | | — | | | 314,616 |
Global Science & Technology Opportunities | | | — | | | 185 | | | 28,887 | | | 10,121 | | | 11,778 | | | — | | | 50,971 |
Global Resources | | | — | | | — | | | 931,681 | | | 99,783 | | | 195,294 | | | — | | | 1,226,758 |
All-Cap Global Resources | | | — | | | 4,786 | | | 457,804 | | | 72,352 | | | 273,384 | | | — | | | 808,326 |
Health Sciences Opportunities | | | — | | | 9,163 | | | 866,394 | | | 116,302 | | | 453,282 | | | — | | | 1,445,141 |
U.S. Opportunities | | | — | | | 82,389 | | | 342,337 | | | 35,850 | | | 124,124 | | | — | | | 584,700 |
Global Opportunities | | | — | | | — | | | 52,701 | | | 9,844 | | | 24,385 | | | — | | | 86,930 |
International Opportunities | | | — | | | 198,758 | | | 647,488 | | | 110,120 | | | 292,697 | | | — | | | 1,249,063 |
| | | | | | | | | | | | |
Distribution Fees | | Share Classes |
| | Investor B | | Investor C | | R | | Total |
Capital Appreciation | | $ | 150,111 | | $ | 52,834 | | $ | — | | $ | 202,945 |
Mid-Cap Value Equity | | | 388,975 | | | 587,032 | | | — | | | 976,007 |
Mid-Cap Growth Equity | | | 143,424 | | | 69,640 | | | 503 | | | 213,567 |
Aurora | | | 773,331 | | | 648,054 | | | 1,634 | | | 1,423,019 |
Small/Mid-Cap Growth | | | 68,680 | | | 59,164 | | | 1,714 | | | 129,558 |
Small Cap Value Equity | | | 13,349 | | | 11,555 | | | — | | | 24,904 |
Small Cap Core Equity | | | 29,462 | | | 115,358 | | | — | | | 144,820 |
Small Cap Growth Equity | | | 35,251 | | | 82,862 | | | — | | | 118,113 |
Global Science & Technology Opportunities | | | 30,406 | | | 35,335 | | | — | | | 65,741 |
Global Resources | | | 299,642 | | | 585,882 | | | — | | | 885,524 |
All-Cap Global Resources | | | 217,694 | | | 820,152 | | | — | | | 1,037,846 |
Health Sciences Opportunities | | | 349,799 | | | 1,359,846 | | | — | | | 1,709,645 |
U.S. Opportunities | | | 107,700 | | | 372,372 | | | — | | | 480,072 |
Global Opportunities | | | 29,532 | | | 73,155 | | | — | | | 102,687 |
International Opportunities | | | 330,633 | | | 878,091 | | | — | | | 1,208,724 |
| | | | | | |
| | SEMI-ANNUAL REPORT | | MARCH 31, 2008 | | 137 |
Notes to Financial Statements (continued)
The Advisor contractually agreed to waive or reimburse fees or expenses until February 1, 2009, in order to limit expenses. These expense limits apply to the aggregate expenses incurred on a share class (excluding; interest, taxes, brokerage commissions, expenses incurred as a result of investments in other funds and other expenses attributable to, and incurred as a result of, a Portfolio’s investments and other extraordinary expenses). This agreement is reviewed annually by the Board. The current expense limitations as a percentage of net assets are as follows:
| | | | | | | | | | | | | | | | | | | | | |
| | | Share Classes | |
| | | BlackRock | | | Institutional | | | Service | | | Investor A | | | Investor B | | | Investor C | | | R | |
Capital Appreciation | | N/A | | | 0.70 | % | | 1.35 | %1 | | 1.35 | % | | 2.10 | % | | 2.10 | % | | N/A | |
Mid-Cap Value Equity | | N/A | | | 0.94 | % | | 1.25 | % | | 1.25 | % | | 2.00 | % | | 2.00 | % | | N/A | |
Mid-Cap Growth Equity | | N/A | | | 1.23 | % | | 1.53 | % | | 1.58 | % | | 2.33 | % | | 2.33 | % | | 1.60 | % |
Aurora | | N/A | | | 1.05 | % | | 1.44 | %1 | | 1.44 | % | | 2.19 | % | | 2.19 | % | | 1.60 | % |
Small/Mid-Cap Growth | | N/A | | | 1.10 | % | | 1.35 | %1 | | 1.35 | % | | 2.10 | % | | 2.10 | % | | 1.63 | % |
Small Cap Value Equity | | 1.10 | % | | 0.97 | % | | 1.27 | % | | 1.44 | % | | 2.19 | % | | 2.19 | % | | N/A | |
Small Cap Core Equity | | N/A | | | 1.30 | % | | 1.60 | % | | 1.77 | % | | 2.52 | % | | 2.52 | % | | N/A | |
Small Cap Growth Equity | | N/A | | | 0.99 | % | | 1.29 | % | | 1.46 | % | | 2.21 | % | | 2.21 | % | | N/A | |
Global Science & Technology Opportunities | | N/A | | | 1.35 | % | | 1.73 | % | | 1.75 | % | | 2.65 | % | | 2.65 | % | | N/A | |
Global Resources | | N/A | | | 1.04 | % | | 1.34 | %1 | | 1.34 | % | | 2.04 | % | | 2.04 | % | | N/A | |
All-Cap Global Resources | | N/A | | | 0.93 | % | | 1.34 | % | | 1.34 | % | | 2.04 | % | | 2.04 | % | | N/A | |
Health Sciences Opportunities | | N/A | | | 1.25 | % | | 1.55 | % | | 1.55 | % | | 2.25 | % | | 2.25 | % | | N/A | |
U.S. Opportunities | | N/A | | | 1.00 | % | | 1.60 | % | | 1.60 | % | | 2.25 | % | | 2.25 | % | | N/A | |
Global Opportunities | | N/A | | | 1.35 | % | | 1.65 | %1 | | 1.65 | % | | 2.40 | % | | 2.40 | % | | N/A | |
International Opportunities | | N/A | | | 1.45 | % | | 1.75 | % | | 1.92 | % | | 2.67 | % | | 2.67 | % | | N/A | |
1 | There were no shares outstanding as of March 31, 2008. |
If operating expenses within two years following a waiver or reimbursement of the operating expenses of a share class that previously received a waiver or reimbursement from the Advisor, are less than the expense limit for that share class, the share class is required to repay the Advisor up to the amount of fees waived or expenses reimbursed under the agreement if: (1) the Portfolio has more than $50 million in assets, (2) the Advisor or an affiliate continues to be the Portfolio’s investment advisor or administrator and (3) the Board has approved the payments to the Advisor at the previous quarterly meeting.
At March 31, 2008, the amounts subject to possible future reimbursement under the expense limitation agreement are as follows:
| | | | | | | | | |
| | | Expiring January 31, |
| | | 2009 | | 2010 | | 2011 |
Capital Appreciation | | $ | — | | $ | 200,876 | | $ | 22,077 |
Mid-Cap Value Equity | | | — | | | 1,831,805 | | | 330,872 |
Mid Cap Growth Equity | | | — | | | 157,137 | | | 9,089 |
Aurora | | | — | | | 805,630 | | | 169,198 |
Small/Mid Cap Growth | | | — | | | 477,871 | | | 67,136 |
Small Cap Value Equity | | | 15,969 | | | 13,841 | | | 12,758 |
Small Cap Core Equity | | | 45,835 | | | 54,375 | | | 15,843 |
Small Cap Growth Equity | | | 28,413 | | | 16,894 | | | — |
Global Science & Technology Opportunities | | | 109,289 | | | 120,153 | | | 18,773 |
Global Resources | | | — | | | 55,847 | | | 349 |
All Cap Global Resources | | | 131,783 | | | 268,738 | | | 6,231 |
Health Sciences Opportunities | | | — | | | 18,972 | | | — |
U.S. Opportunities | | | 427,587 | | | 1,134,428 | | | 239,509 |
Global Opportunities | | | 263,545 | | | 51,967 | | | 1,083 |
International Opportunities | | | — | | | 13,266 | | | — |
The following waivers previously recorded by the Portfolios, which were subject to recoupment by the Advisor expired on January 31, 2008:
| | | |
Small Cap Value Equity | | $ | 24,977 |
Small Cap Core Equity | | | 73,554 |
Global Science & Technology Opportunities | | | 95,323 |
All-Cap Global Resources | | | 303,884 |
U.S. Opportunities | | | 8,580 |
International Opportunities | | | 81,759 |
For the six months ended March 31, 2008, Merrill Lynch, through its affiliated broker dealer, MLPF&S, earned commissions on transactions of securities as follows:
| | | |
Mid-Cap Value | | $ | 23,445 |
Mid-Cap Growth | | | 138 |
Aurora | | | 2,320 |
Small Cap Value | | | 68 |
Small Cap Core | | | 360 |
Small Cap Growth | | | 734 |
Global Science & Technology Opportunities | | | 125 |
Global Resources | | | 24,453 |
All-Cap Global Resources | | | 9,659 |
Health Sciences Opportunities | | | 29,617 |
U.S. Opportunities | | | 8,560 |
Global Opportunities | | | 1,722 |
International Opportunities | | | 19,716 |
For the six months ended March 31, 2008, affiliates earned underwriting discounts, direct commissions and dealer concessions on sales of the Portfolios’ Investor A shares as follows:
| | | |
Capital Appreciation | | $ | 1,696 |
Mid-Cap Value | | | 14,694 |
Mid-Cap Growth | | | 6,013 |
Aurora | | | 9,860 |
Small/Mid-Cap Growth | | | 2,015 |
Small Cap Value | | | 478 |
Small Cap Core | | | 6,831 |
Small Cap Growth | | | 15,879 |
Global Science & Technology Opportunities | | | 19,979 |
| | | | | | |
| 138 | | SEMI-ANNUAL REPORT | | MARCH 31, 2008 | | |
Notes to Financial Statements (continued)
| | | |
Global Resources | | $ | 51,923 |
All-Cap Global Resources | | | 84,528 |
Health Sciences Opportunities | | | 55,311 |
U.S. Opportunities | | | 79,396 |
Global Opportunities | | | 30,354 |
International Opportunities | | | 67,449 |
For the six months ended March 31, 2008, affiliates received the following contingent deferred sales charges relating to transactions in Investor A, Investor B and Investor C shares:
| | | | | | | | | |
| | | Investor A | | Investor B | | Investor C |
Capital Appreciation | | $ | 1,576 | | $ | 8,611 | | $ | 607 |
Mid-Cap Value | | | 2,267 | | | 49,359 | | | 12,872 |
Mid-Cap Growth | | | 41 | | | 25,108 | | | 678 |
Aurora | | | 3,949 | | | 103,483 | | | 4,337 |
Small/Mid-Cap Growth | | | — | | | 10,442 | | | 1,168 |
Small Cap Value | | | — | | | 2,488 | | | 28 |
Small Cap Core | | | 149 | | | 9,985 | | | 6,430 |
Small Cap Growth | | | — | | | 9,263 | | | 1,990 |
Global Science & Technology Opportunities | | | 100 | | | 7,133 | | | 2,382 |
Global Resources | | | 1,221 | | | 35,319 | | | 11,397 |
All-Cap Global Resources | | | 2,952 | | | 80,784 | | | 21,145 |
Health Sciences Opportunities | | | 2,015 | | | 91,905 | | | 30,987 |
U.S. Opportunities | | | — | | | 15,858 | | | 18,669 |
Global Opportunities | | | 259 | | | 5,946 | | | 1,875 |
International Opportunities | | | 242 | | | 50,070 | | | 6,496 |
The Portfolios may earn income on positive cash balances in demand deposit accounts that are maintained by PFPC on behalf of the Portfolios. The income earned for the six months ended March 31, 2008, was as follows:
| | | |
Capital Appreciation | | $ | 2,875 |
Mid-Cap Value Equity | | | 8,404 |
Mid-Cap Growth Equity | | | 6,783 |
Aurora | | | 13,100 |
Small/Mid-Cap Growth | | | 2,376 |
Small Cap Value Equity | | | 251 |
Small Cap Core Equity | | | 1,198 |
Small Cap Growth Equity | | | 2,877 |
Global Science & Technology Opportunities | | | 697 |
Global Resources | | | 3,892 |
All-Cap Global Resources | | | 5,468 |
Health Sciences Opportunities | | | 9,399 |
U.S. Opportunities | | | 4,356 |
Global Opportunities | | | 693 |
International Opportunities | | | 5,748 |
The Portfolios may also receive earnings credits related to cash balances with PFPC which are shown on the Statements of Operations as fees paid indirectly.
In December 2007, the Advisor determined that the Aurora Portfolio violated a fundamental investment policy. The Portfolio purchased securities representing over 5% of the value of the Portfolio’s total net assets resulting in the Portfolio’s having over 5% of its value invested in securities that derive more than 15% of its gross revenues from securities related activities. The Portfolio sold the securities and the Advisor reimbursed the Portfolio $139,965, for the realized losses incurred from the date of the violation (October 29, 2007) through the date of the disposition (December 3, 2007).
In March 2008, the Advisor determined that the International Opportunities Portfolio violated a fundamental investment policy. The Portfolio purchased shares in a registered investment company (“RIC”) representing over 3% of the total outstanding voting stock of the acquired RIC. The Portfolio sold a portion of its holdings to reduce its ownership to below the 3% level and the Advisor reimbursed the Portfolio $112,880 for the realized losses incurred from the date of the violation (March 7, 2008) through the date of the disposition (March 10, 2008).
During the six months ended March 31, 2008, the following Portfolios received reimbursements from an affiliate, which are included in capital share transactions on the Statements of Changes in Net Assets, relating to processing errors. The amounts of the reimbursements to the Portfolios were:
| | | |
Aurora | | $ | 52,054 |
Global Resources | | | 132 |
Health Sciences Opportunities | | | 245 |
Certain officers and/or trustees of the Portfolios are officers and/or trustees/directors of BlackRock, Inc. or its affiliates.
3. Investments:
For the six months ended March 31, 2008, purchases and sales of securities including paydowns, but excluding short-term investments, dollar rolls securities, were as follows:
| | | | | | |
| | | Purchases | | Sales |
Capital Appreciation | | $ | 120,488,863 | | $ | 112,934,963 |
Mid-Cap Value Equity | | | 522,919,163 | | | 513,647,203 |
Mid-Cap Growth Equity | | | 76,128,658 | | | 138,117,674 |
Aurora | | | 722,022,297 | | | 987,455,013 |
Small/Mid-Cap Growth | | | 83,091,707 | | | 113,343,667 |
Small Cap Value Equity | | | 27,597,662 | | | 36,891,900 |
Small Cap Core Equity | | | 48,557,928 | | | 38,389,531 |
Small Cap Growth Equity | | | 503,875,556 | | | 408,636,050 |
Global Science & Technology Opportunities | | | 28,325,064 | | | 22,073,453 |
Global Resources | | | 191,034,277 | | | 218,961,201 |
All-Cap Global Resources | | | 192,746,441 | | | 262,847,524 |
Health Sciences Opportunities | | | 478,849,851 | | | 545,155,612 |
U.S. Opportunities | | | 599,452,333 | | | 396,809,876 |
Global Opportunities | | | 91,428,101 | | | 77,736,957 |
International Opportunities | | | 697,614,090 | | | 814,549,229 |
Written options transactions entered into during the six months ended March 31, 2008 are summarized as follows:
| | | | | | | |
| Mid-Cap Value | | Contracts | | | Premium | |
Balance at 9/30/07 | | (900 | ) | | $ | (94,699 | ) |
Written | | (3,450 | ) | | | (567,776 | ) |
Expired | | 1,950 | | | | 143,323 | |
Closed | | 1,400 | | | | 468,192 | |
| | | | | | | |
Balance at 3/31/08 | | (1,000 | ) | | $ | (50,960 | ) |
| | | | | | | |
| | | | | | |
| | SEMI-ANNUAL REPORT | | MARCH 31, 2008 | | 139 |
Notes to Financial Statements (continued)
| | | | | | | |
| Global Resources | | Contracts | | | Premium | |
Balance at 9/30/07 | | (69,005,000 | ) | | $ | (873,123 | ) |
Written | | — | | | | — | |
Expired | | 69,005,000 | | | | 873,123 | |
Closed | | — | | | | — | |
| | | | | | | |
Balance at 3/31/08 | | — | | | $ | — | |
| | | | | | | |
| | |
| Health Sciences Opportunities | | Contracts | | | Premium | |
Balance at 9/30/07 | | — | | | $ | — | |
Written | | (45,380 | ) | | | (8,681,139 | ) |
Expired | | 21,704 | | | | 3,839,894 | |
Closed | | 18,044 | | | | 4,080,537 | |
Exercised | | 4,632 | | | | 578,710 | |
| | | | | | | |
Balance at 3/31/08 | | (1,000 | ) | | $ | (181,998 | ) |
| | | | | | | |
4. Capital Shares:
Transactions in capital shares for each period were as follows:
| | | | | | | | | | | | | | |
| | | Capital Appreciation | |
| | | Six Months Ended
March 31, 2008 | | | Year Ended
September 30, 2007 | |
| | | Shares | | | Value | | | Shares | | | Value | |
Shares sold: | | | | | | | | | | | | | | |
Institutional | | 708,985 | | | $ | 12,314,199 | | | 1,131,626 | | | $ | 18,579,733 | |
Service | | — | | | | — | | | 1,391 | | | | 20,000 | |
Investor A | | 1,321,849 | | | | 22,327,627 | | | 1,628,140 | | | | 25,861,222 | |
Investor B | | 53,226 | | | | 846,109 | | | 64,995 | | | | 949,613 | |
Investor C | | 36,128 | | | | 575,634 | | | 50,636 | | | | 745,861 | |
Shares redeemed: | | | | | | | | | | | | | | |
Institutional | | (259,595 | ) | | | (4,719,546 | ) | | (457,378 | ) | | | (7,448,295 | ) |
Service | | — | | | | — | | | (1,399 | ) | | | (24,569 | ) |
Investor A | | (633,367 | ) | | | (10,635,068 | ) | | (1,927,401 | ) | | | (30,114,884 | ) |
Investor B | | (945,553 | ) | | | (14,713,721 | ) | | (2,354,951 | ) | | | (34,680,383 | ) |
Investor C | | (94,100 | ) | | | (1,485,990 | ) | | (383,786 | ) | | | (5,565,387 | ) |
| | | | | | | | | | | | | | |
Net increase (decrease) | | 187,573 | | | $ | 4,509,244 | | | (2,248,127 | ) | | $ | (31,677,089 | ) |
| | | | | | | | | | | | | | |
| |
| | | Mid-Cap Value Equity | |
| | | Six Months Ended
March 31, 2008 | | | Year Ended
September 30, 2007 | |
| | | Shares | | | Value | | | Shares | | | Value | |
Shares sold: | | | | | | | | | | | | | | |
Institutional | | 4,368,228 | | | $ | 54,100,978 | | | 10,083,439 | | | $ | 141,522,808 | |
Service | | 18,570 | | | | 226,048 | | | 75,815 | | | | 1,035,731 | |
Investor A | | 10,103,003 | | | | 118,879,498 | | | 14,509,450 | | | | 200,736,983 | |
Investor B | | 167,109 | | | | 1,892,314 | | | 742,774 | | | | 9,476,342 | |
Investor C | | 1,346,683 | | | | 14,987,835 | | | 3,766,671 | | | | 48,195,337 | |
Shares issued in reinvestment of dividends: | | | | | | | | | | | | | | |
Institutional | | 1,138,852 | | | | 13,745,953 | | | 740,473 | | | | 9,803,964 | |
Service | | 31,430 | | | | 374,021 | | | 32,447 | | | | 424,084 | |
Investor A | | 6,308,452 | | | | 74,187,437 | | | 5,006,059 | | | | 64,778,402 | |
Investor B | | 1,233,902 | | | | 13,350,825 | | | 1,293,371 | | | | 15,546,349 | |
Investor C | | 1,839,018 | | | | 19,843,041 | | | 1,484,811 | | | | 17,817,698 | |
Shares redeemed: | | | | | | | | | | | | | | |
Institutional | | (3,153,968 | ) | | | (39,946,984 | ) | | (7,315,208 | ) | | | (104,074,320 | ) |
Service | | (63,498 | ) | | | (811,848 | ) | | (77,533 | ) | | | (1,073,163 | ) |
Investor A | | (9,446,181 | ) | | | (113,530,951 | ) | | (10,859,028 | ) | | | (149,907,994 | ) |
Investor B | | (1,827,061 | ) | | | (19,981,106 | ) | | (2,723,052 | ) | | | (34,782,138 | ) |
Investor C | | (2,473,350 | ) | | | (27,347,567 | ) | | (2,810,110 | ) | | | (35,915,929 | ) |
| | | | | | | | | | | | | | |
Net increase | | 9,591,189 | | | $ | 109,969,494 | | | 13,950,379 | | | $ | 183,584,154 | |
| | | | | | | | | | | | | | |
| | | | | | |
| 140 | | SEMI-ANNUAL REPORT | | MARCH 31, 2008 | | |
Notes to Financial Statements (continued)
| | | | | | | | | | | | | | |
| | | Mid-Cap Growth Equity | |
| | | Six Months Ended
March 31, 2008 | | | Year Ended
September 30, 2007 | |
| | | Shares | | | Value | | | Shares | | | Value | |
Shares sold: | | | | | | | | | | | | | | |
Institutional | | 787,827 | | | $ | 10,386,177 | | | 4,509,440 | | | $ | 55,588,735 | |
Service | | 2,957 | | | | 37,410 | | | 9,667 | | | | 160,097 | |
Investor A | | 773,811 | | | | 9,132,975 | | | 1,016,721 | | | | 11,492,570 | |
Investor B | | 69,460 | | | | 756,539 | | | 173,450 | | | | 1,754,126 | |
Investor C | | 82,761 | | | | 897,676 | | | 252,108 | | | | 2,678,468 | |
R | | 80,755 | | | | 988,734 | | | 2,038 | | | | 20,225 | |
Shares redeemed: | | | | | | | | | | | | | | |
Institutional | | (3,781,281 | ) | | | (46,885,391 | ) | | (5,925,671 | ) | | | (72,232,265 | ) |
Service | | (5,684 | ) | | | (70,147 | ) | | (28,136 | ) | | | (320,512 | ) |
Investor A | | (1,590,035 | ) | | | (19,209,669 | ) | | (4,915,575 | ) | | | (54,782,162 | ) |
Investor B | | (891,079 | ) | | | (9,448,175 | ) | | (1,672,378 | ) | | | (16,976,514 | ) |
Investor C | | (210,815 | ) | | | (2,302,011 | ) | | (452,352 | ) | | | (4,558,838 | ) |
R | | (19,677 | ) | | | (230,820 | ) | | (22 | ) | | | (227 | ) |
| | | | | | | | | | | | | | |
Net decrease | | (4,701,000 | ) | | $ | (55,946,702 | ) | | (7,030,710 | ) | | $ | (77,176,297 | ) |
| | | | | | | | | | | | | | |
| |
| | | Aurora | |
| | | Six Months Ended
March 31, 2008 | | | Year Ended
September 30, 2007 | |
| | | Shares | | | Value | | | Shares | | | Value | |
Shares sold: | | | | | | | | | | | | | | |
Institutional | | 1,081,542 | | | $ | 26,025,323 | | | 4,252,063 | | | $ | 131,119,757 | |
Service | | — | | | | — | | | 932 | | | | 30,052 | |
Investor A | | 1,947,316 | | | | 43,226,384 | | | 4,410,428 | | | | 129,892,533 | |
Investor B | | 103,195 | | | | 1,823,504 | | | 293,125 | | | | 7,330,857 | |
Investor C | | 179,765 | | | | 3,062,036 | | | 310,764 | | | | 7,777,720 | |
R | | 27,625 | | | | 664,083 | | | 42,492 | | | | 1,227,475 | |
Shares issued in reinvestment of dividends: | | | | | | | | | | | | | | |
Institutional | | 1,230,613 | | | | 30,780,480 | | | 1,321,669 | | | | 38,724,902 | |
Service | | — | | | | — | | | 2 | | | | 68 | |
Investor A | | 7,085,611 | | | | 162,349,475 | | | 12,269,201 | | | | 335,808,106 | |
Investor B | | 2,853,258 | | | | 52,471,586 | | | 4,483,647 | | | | 103,348,590 | |
Investor C | | 2,341,054 | | | | 43,226,520 | | | 3,691,736 | | | | 85,094,619 | |
R | | 12,134 | | | | 281,248 | | | 0 | | | | 0 | |
Shares redeemed: | | | | | | | | | | | | | | |
Institutional | | (2,264,080 | ) | | | (53,610,843 | ) | | (4,204,960 | ) | | | (136,807,815 | ) |
Service | | — | | | | — | | | (939 | ) | | | (27,016 | ) |
Investor A | | (8,270,458 | ) | | | (186,445,703 | ) | | (19,963,549 | ) | | | (591,165,011 | ) |
Investor B | | (2,814,056 | ) | | | (51,578,261 | ) | | (4,817,135 | ) | | | (121,149,485 | ) |
Investor C | | (2,325,657 | ) | | | (42,874,421 | ) | | (4,294,158 | ) | | | (110,299,769 | ) |
R | | (9,749 | ) | | | (219,431 | ) | | (2,724 | ) | | | (76,971 | ) |
| | | | | | | | | | | | | | |
Net increase (decrease) | | 1,178,113 | | | $ | 29,181,980 | | | (2,207,406 | ) | | $ | (119,171,388 | ) |
| | | | | | | | | | | | | | |
| | | | | | |
| | SEMI-ANNUAL REPORT | | MARCH 31, 2008 | | 141 |
Notes to Financial Statements (continued)
| | | | | | | | | | | | | | |
| | | Small/Mid-Cap Growth | |
| | | Six Months Ended
March 31, 2008 | | | Year Ended
September 30, 2007 | |
| | | Shares | | | Value | | | Shares | | | Value | |
Shares sold: | | | | | | | | | | | | | | |
Institutional | | 233,193 | | | $ | 3,631,817 | | | 385,438 | | | $ | 6,471,922 | |
Service | | — | | | | — | | | 1,379 | | | | 20,054 | |
Investor A | | 1,729,170 | | | | 24,886,023 | | | 3,942,077 | | | | 64,669,736 | |
Investor B | | 27,119 | | | | 338,321 | | | 82,922 | | | | 1,159,711 | |
Investor C | | 157,535 | | | | 1,851,208 | | | 160,361 | | | | 2,222,906 | |
R | | 67,440 | | | | 958,673 | | | 64,832 | | | | 1,060,326 | |
Shares issued in reinvestment of dividends: | | | | | | | | | | | | | | |
Institutional | | 242,216 | | | | 3,611,441 | | | 73,069 | | | | 1,155,953 | |
Service | | — | | | | — | | | 1 | | | | 9 | |
Investor A | | 2,499,681 | | | | 34,895,558 | | | 728,615 | | | | 10,907,333 | |
Investor B | | 281,241 | | | | 3,369,266 | | | 97,425 | | | | 1,285,043 | |
Investor C | | 231,789 | | | | 2,781,470 | | | 74,172 | | | | 980,547 | |
R | | 16,009 | | | | 221,880 | | | — | | | | — | |
Shares redeemed: | | | | | | | | | | | | | | |
Institutional | | (485,278 | ) | | | (7,883,182 | ) | | (517,620 | ) | | | (8,721,717 | ) |
Service | | — | | | | — | | | (1,388 | ) | | | (23,933 | ) |
Investor A | | (2,656,035 | ) | | | (37,609,893 | ) | | (6,200,400 | ) | | | (98,924,391 | ) |
Investor B | | (310,848 | ) | | | (3,805,937 | ) | | (543,911 | ) | | | (7,591,746 | ) |
Investor C | | (182,993 | ) | | | (2,234,116 | ) | | (405,776 | ) | | | (5,683,598 | ) |
R | | (17,973 | ) | | | (255,243 | ) | | (2,495 | ) | | | (42,446 | ) |
| | | | | | | | | | | | | | |
Net increase (decrease) | | 1,832,266 | | | $ | 24,757,286 | | | (2,061,299 | ) | | $ | (31,054,291 | ) |
| | | | | | | | | | | | | | |
| |
| | | Small Cap Value Equity | |
| | | Six Months Ended
March 31, 2008 | | | Year Ended
September 30, 2007 | |
| | | Shares | | | Value | | | Shares | | | Value | |
Shares sold: | | | | | | | | | | | | | | |
BlackRock | | 67 | | | $ | 650 | | | 2,313 | | | $ | 31,882 | |
Institutional | | 657,261 | | | | 6,462,462 | | | 2,203,931 | | | | 27,232,170 | |
Service | | 25,262 | | | | 240,014 | | | 108,832 | | | | 1,308,950 | |
Investor A | | 109,269 | | | | 970,947 | | | 265,906 | | | | 3,132,937 | |
Investor B | | 6,808 | | | | 52,984 | | | 14,373 | | | | 144,073 | |
Investor C | | 9,941 | | | | 73,381 | | | 8,943 | | | | 87,724 | |
Shares issued in reinvestment of dividends: | | | | | | | | | | | | | | |
BlackRock | | 56,693 | | | | 560,131 | | | 83,414 | | | | 980,112 | |
Institutional | | 94,196 | | | | 930,649 | | | 540,715 | | | | 6,358,811 | |
Service | | 17,735 | | | | 170,432 | | | 73,115 | | | | 840,090 | |
Investor A | | 378,470 | | | | 3,599,259 | | | 523,955 | | | | 5,962,612 | |
Investor B | | 89,449 | | | | 687,868 | | | 168,042 | | | | 1,599,759 | |
Investor C | | 75,079 | | | | 575,118 | | | 97,716 | | | | 929,291 | |
Shares redeemed: | | | | | | | | | | | | | | |
BlackRock | | (106,036 | ) | | | (1,255,000 | ) | | (12 | ) | | | (147 | ) |
Institutional | | (486,614 | ) | | | (4,864,887 | ) | | (3,086,826 | ) | | | (37,936,509 | ) |
Service | | (23,328 | ) | | | (207,534 | ) | | (288,316 | ) | | | (3,370,071 | ) |
Investor A | | (493,834 | ) | | | (4,790,952 | ) | | (673,211 | ) | | | (7,906,070 | ) |
Investor B | | (159,757 | ) | | | (1,201,504 | ) | | (364,861 | ) | | | (3,613,505 | ) |
Investor C | | (72,657 | ) | | | (549,188 | ) | | (136,195 | ) | | | (1,391,808 | ) |
| | | | | | | | | | | | | | |
Net increase (decrease) | | 178,004 | | | $ | 1,454,830 | | | (458,166 | ) | | $ | (5,609,699 | ) |
| | | | | | | | | | | | | | |
| | | | | | |
| 142 | | SEMI-ANNUAL REPORT | | MARCH 31, 2008 | | |
Notes to Financial Statements (continued)
| | | | | | | | | | | | | | |
| | | Small Cap Core Equity | |
| | | Six Months Ended
March 31, 2008 | | | Year Ended
September 30, 2007 | |
| | | Shares | | | Value | | | Shares | | | Value | |
Shares sold: | | | | | | | | | | | | | | |
Institutional | | 792,576 | | | $ | 14,512,534 | | | 964,252 | | | $ | 20,076,507 | |
Service | | 37,993 | | | | 671,980 | | | 107,584 | | | | 2,177,427 | |
Investor A | | 408,499 | | | | 7,412,769 | | | 617,262 | | | | 12,489,365 | |
Investor B | | 36,864 | | | | 631,770 | | | 78,050 | | | | 1,537,875 | |
Investor C | | 323,090 | | | | 5,740,326 | | | 481,288 | | | | 9,560,770 | |
Shares issued in reinvestment of dividends: | | | | | | | | | | | | | | |
Institutional | | 144,345 | | | | 2,634,283 | | | 18,955 | | | | 373,227 | |
Service | | 7,808 | | | | 141,645 | | | 1,116 | | | | 21,864 | |
Investor A | | 114,911 | | | | 2,066,088 | | | 16,263 | | | | 315,990 | |
Investor B | | 32,803 | | | | 575,047 | | | 7,039 | | | | 133,515 | |
Investor C | | 132,854 | | | | 2,323,753 | | | 21,846 | | | | 414,639 | |
Shares redeemed: | | | | | | | | | | | | | | |
Institutional | | (276,939 | ) | | | (5,065,613 | ) | | (700,937 | ) | | | (14,155,104 | ) |
Service | | (55,086 | ) | | | (1,010,933 | ) | | (26,289 | ) | | | (536,623 | ) |
Investor A | | (334,226 | ) | | | (6,055,498 | ) | | (387,759 | ) | | | (7,814,097 | ) |
Investor B | | (85,902 | ) | | | (1,474,342 | ) | | (108,386 | ) | | | (2,115,625 | ) |
Investor C | | (272,974 | ) | | | (4,621,764 | ) | | (352,132 | ) | | | (6,879,684 | ) |
| | | | | | | | | | | | | | |
Net increase | | 1,006,616 | | | $ | 18,482,045 | | | 738,152 | | | $ | 15,600,046 | |
| | | | | | | | | | | | | | |
| |
| | | Small Cap Growth Equity | |
| | | Six Months Ended
March 31, 2008 | | | Year Ended
September 30, 2007 | |
| | | Shares | | | Value | | | Shares | | | Value | |
Shares sold: | | | | | | | | | | | | | | |
Institutional | | 13,201,664 | | | $ | 298,561,130 | | | 14,091,075 | | | $ | 316,995,355 | |
Service | | 269,359 | | | | 5,828,625 | | | 1,037,036 | | | | 22,144,111 | |
Investor A | | 2,505,889 | | | | 53,432,989 | | | 3,319,482 | | | | 68,051,019 | |
Investor B | | 41,258 | | | | 801,891 | | | 90,371 | | | | 1,638,463 | |
Investor C | | 213,442 | | | | 4,039,055 | | | 396,856 | | | | 7,224,508 | |
Shares redeemed: | | | | | | | | | | | | | | |
Institutional | | (8,765,440 | ) | | | (206,094,290 | ) | | (11,425,758 | ) | | | (257,326,360 | ) |
Service | | (124,098 | ) | | | (2,674,526 | ) | | (882,605 | ) | | | (18,814,163 | ) |
Investor A | | (1,451,402 | ) | | | (31,324,397 | ) | | (4,535,038 | ) | | | (95,253,392 | ) |
Investor B | | (148,750 | ) | | | (2,705,746 | ) | | (230,670 | ) | | | (4,194,019 | ) |
Investor C | | (112,380 | ) | | | (2,093,931 | ) | | (253,979 | ) | | | (4,646,373 | ) |
| | | | | | | | | | | | | | |
Net increase | | 5,629,542 | | | $ | 117,770,800 | | | 1,606,770 | | | $ | 35,819,149 | |
| | | | | | | | | | | | | | |
| | | | | | |
| | SEMI-ANNUAL REPORT | | MARCH 31, 2008 | | 143 |
Notes to Financial Statements (continued)
| | | | | | | | | | | | | | |
| | | Global Science & Technology Opportunities | |
| | | Six Months Ended
March 31, 2008 | | | Year Ended
September 30, 2007 | |
| | | Shares | | | Value | | | Shares | | | Value | |
Shares sold: | | | | | | | | | | | | | | |
Institutional | | 152,770 | | | $ | 1,348,412 | | | 129,275 | | | $ | 1,015,022 | |
Service | | 6,152 | | | | 54,000 | | | 5,656 | | | | 45,500 | |
Investor A | | 1,726,278 | | | | 13,661,867 | | | 1,259,321 | | | | 9,878,275 | |
Investor B | | 82,408 | | | | 643,894 | | | 121,861 | | | | 885,132 | |
Investor C | | 158,172 | | | | 1,258,113 | | | 717,628 | | | | 5,212,904 | |
Shares redeemed: | | | | | | | | | | | | | | |
Institutional | | (82,432 | ) | | | (679,730 | ) | | (144,018 | ) | | | (1,121,471 | ) |
Service | | (2,553 | ) | | | (19,751 | ) | | (12,746 | ) | | | (94,398 | ) |
Investor A | | (876,096 | ) | | | (7,203,514 | ) | | (647,942 | ) | | | (4,889,399 | ) |
Investor B | | (213,475 | ) | | | (1,639,471 | ) | | (595,194 | ) | | | (4,274,956 | ) |
Investor C | | (188,707 | ) | | | (1,407,658 | ) | | (512,221 | ) | | | (3,661,546 | ) |
| | | | | | | | | | | | | | |
Net increase | | 762,517 | | | $ | 6,016,162 | | | 321,620 | | | $ | 2,995,063 | |
| | | | | | | | | | | | | | |
| |
| | | Global Resources | |
| | | Six Months Ended
March 31, 2008 | | | Year Ended
September 30, 2007 | |
| | | Shares | | | Value | | | Shares | | | Value | |
Shares sold: | | | | | | | | | | | | | | |
Institutional | | 250,569 | | | $ | 16,138,298 | | | 107,709 | | | $ | 6,809,549 | |
Investor A | | 2,008,961 | | | | 118,603,032 | | | 2,310,679 | | | | 132,240,360 | |
Investor B | | 68,234 | | | | 3,385,129 | | | 131,472 | | | | 6,263,188 | |
Investor C | | 293,229 | | | | 14,743,955 | | | 233,977 | | | | 11,701,273 | |
Shares issued in reinvestment of dividends: | | | | | | | | | | | | | | |
Institutional | | 44,167 | | | | 2,677,417 | | | 148,201 | | | | 8,557,075 | |
Investor A | | 1,758,021 | | | | 98,309,000 | | | 3,358,743 | | | | 180,834,342 | |
Investor B | | 237,561 | | | | 11,255,908 | | | 432,847 | | | | 20,209,647 | |
Investor C | | 476,747 | | | | 22,536,947 | | | 828,192 | | | | 38,643,668 | |
Shares redeemed: | | | | | | | | | | | | | | |
Institutional | | (284,696 | ) | | | (19,787,578 | ) | | (175,214 | ) | | | (10,623,742 | ) |
Investor A | | (1,803,551 | ) | | | (105,692,741 | ) | | (4,582,767 | ) | | | (258,498,908 | ) |
Investor B | | (292,677 | ) | | | (14,863,345 | ) | | (494,294 | ) | | | (23,875,998 | ) |
Investor C | | (358,624 | ) | | | (17,542,364 | ) | | (765,173 | ) | | | (38,702,220 | ) |
| | | | | | | | | | | | | | |
Net Increase | | 2,397,941 | | | $ | 129,763,658 | | | 1,534,372 | | | $ | 73,558,234 | |
| | | | | | | | | | | | | | |
| | | | | | |
| 144 | | SEMI-ANNUAL REPORT | | MARCH 31, 2008 | | |
Notes to Financial Statements (continued)
| | | | | | | | | | | | | | |
| | | All-Cap Global Resources | |
| | | Six Months Ended
March 31, 2008 | | | Year Ended
September 30, 2007 | |
| | | Shares | | | Value | | | Shares | | | Value | |
Shares sold: | | | | | | | | | | | | | | |
Institutional | | 4,945,049 | | | $ | 100,735,290 | | | 9,927,422 | | | $ | 155,386,527 | |
Service | | 53,968 | | | | 1,093,305 | | | 85,700 | | | | 1,364,577 | |
Investor A | | 2,335,337 | | | | 47,162,645 | | | 6,090,574 | | | | 95,782,046 | |
Investor B | | 235,585 | | | | 4,653,123 | | | 502,744 | | | | 7,975,803 | |
Investor C | | 1,203,232 | | | | 23,648,520 | | | 3,313,554 | | | | 52,091,379 | |
Shares issued in reinvestment of dividends: | | | | | | | | | | | | | | |
Institutional | | 838,728 | | | | 16,866,827 | | | 625,701 | | | | 9,760,937 | |
Service | | 3,119 | | | | 62,171 | | | 3,489 | | | | 54,010 | |
Investor A | | 358,961 | | | | 7,154,105 | | | 404,691 | | | | 6,260,400 | |
Investor B | | 46,265 | | | | 909,112 | | | 73,581 | | | | 1,123,569 | |
Investor C | | 188,487 | | | | 3,705,692 | | | 248,771 | | | | 3,801,210 | |
Shares redeemed: | | | | | | | | | | | | | | |
Institutional | | (3,449,906 | ) | | | (70,681,242 | ) | | (4,082,144 | ) | | | (64,114,699 | ) |
Service | | (18,261 | ) | | | (364,381 | ) | | (82,364 | ) | | | (1,256,285 | ) |
Investor A | | (2,434,285 | ) | | | (48,495,665 | ) | | (6,456,013 | ) | | | (99,358,821 | ) |
Investor B | | (330,053 | ) | | | (6,495,016 | ) | | (824,608 | ) | | | (12,570,778 | ) |
Investor C | | (1,475,612 | ) | | | (28,745,150 | ) | | (2,571,436 | ) | | | (39,014,751 | ) |
| | | | | | | | | | | | | | |
Net increase | | 2,500,614 | | | $ | 51,209,336 | | | 7,259,662 | | | $ | 117,285,124 | |
| | | | | | | | | | | | | | |
| |
| | | Health Sciences Opportunities | |
| | | Six Months Ended
March 31, 2008 | | | Year Ended
September 30, 2007 | |
| | | Shares | | | Value | | | Shares | | | Value | |
Shares sold: | | | | | | | | | | | | | | |
Institutional | | 1,117,391 | | | $ | 34,319,755 | | | 2,652,938 | | | $ | 73,240,733 | |
Service | | 28,491 | | | | 838,579 | | | 146,215 | | | | 4,003,506 | |
Investor A | | 2,653,396 | | | | 78,859,100 | | | 12,029,609 | | | | 326,011,610 | |
Investor B | | 185,823 | | | | 5,317,719 | | | 701,810 | | | | 18,093,155 | |
Investor C | | 1,670,409 | | | | 47,975,639 | | | 4,662,549 | | | | 120,324,076 | |
Shares issued in reinvestment of dividends: | | | | | | | | | | | | | | |
Institutional | | 208,481 | | | | 6,450,394 | | | 56,271 | | | | 1,496,805 | |
Service | | 9,591 | | | | 291,761 | | | 2,584 | | | | 67,612 | |
Investor A | | 788,663 | | | | 23,935,929 | | | 213,260 | | | | 5,568,206 | |
Investor B | | 88,138 | | | | 2,556,891 | | | 42,992 | | | | 1,073,488 | |
Investor C | | 185,106 | | | | 5,358,829 | | | 71,871 | | | | 1,792,457 | |
Shares redeemed: | | | | | | | | | | | | | | |
Institutional | | (1,158,450 | ) | | | (34,675,191 | ) | | (1,322,913 | ) | | | (36,368,909 | ) |
Service | | (65,213 | ) | | | (1,906,238 | ) | | (55,912 | ) | | | (1,511,050 | ) |
Investor A | | (4,174,182 | ) | | | (121,497,758 | ) | | (5,702,448 | ) | | | (154,261,812 | ) |
Investor B | | (400,139 | ) | | | (11,329,306 | ) | | (577,497 | ) | | | (14,976,773 | ) |
Investor C | | (2,252,741 | ) | | | (63,223,084 | ) | | (2,210,886 | ) | | | (56,979,482 | ) |
| | | | | | | | | | | | | | |
Net increase (decrease) | | (1,115,236 | ) | | $ | (26,726,981 | ) | | 10,710,443 | | | $ | 287,573,622 | |
| | | | | | | | | | | | | | |
| | | | | | |
| | SEMI-ANNUAL REPORT | | MARCH 31, 2008 | | 145 |
Notes to Financial Statements (continued)
| | | | | | | | | | | | | | |
| | | U.S. Opportunities | |
| | | Six Months Ended
March 31, 2008 | | | Year Ended
September 30, 2007 | |
| | | Shares | | | Value | | | Shares | | | Value | |
Shares sold: | | | | | | | | | | | | | | |
Institutional | | 1,315,613 | | | $ | 47,296,029 | | | 4,219,830 | | | $ | 140,879,893 | |
Service | | 1,553,058 | | | | 54,571,718 | | | 1,237,974 | | | | 42,170,871 | |
Investor A | | 3,877,800 | | | | 135,388,159 | | | 4,511,775 | | | | 145,396,928 | |
Investor B | | 154,164 | | | | 5,050,790 | | | 279,440 | | | | 8,308,268 | |
Investor C | | 1,129,137 | | | | 36,571,787 | | | 1,487,039 | | | | 44,530,359 | |
Shares redeemed: | | | | | | | | | | | | | | |
Institutional | | (543,732 | ) | | | (19,389,874 | ) | | (659,811 | ) | | | (22,390,949 | ) |
Service | | (320,054 | ) | | | (10,948,409 | ) | | (72,552 | ) | | | (2,451,174 | ) |
Investor A | | (967,593 | ) | | | (33,176,149 | ) | | (1,514,144 | ) | | | (48,692,644 | ) |
Investor B | | (531,006 | ) | | | (17,188,349 | ) | | (566,285 | ) | | | (17,226,837 | ) |
Investor C | | (322,013 | ) | | | (10,197,249 | ) | | (306,488 | ) | | | (9,229,010 | ) |
| | | | | | | | | | | | | | |
Net increase | | 5,345,374 | | | $ | 187,978,453 | | | 8,616,778 | | | $ | 281,295,705 | |
| | | | | | | | | | | | | | |
| |
| | | Global Opportunities | |
| | | Six Months Ended
March 31, 2008 | | | Year Ended
September 30, 2007 | |
| | | Shares | | | Value | | | Shares | | | Value | |
Shares sold: | | | | | | | | | | | | | | |
Institutional | | 1,091,892 | | | $ | 13,778,187 | | | 2,617,422 | | | $ | 31,249,421 | |
Service | | — | | | | — | | | 1,984 | | | | 20,013 | |
Investor A | | 843,605 | | | | 10,516,743 | | | 1,299,421 | | | | 15,413,998 | |
Investor B | | 94,015 | | | | 1,196,218 | | | 177,835 | | | | 2,051,505 | |
Investor C | | 535,527 | | | | 6,714,767 | | | 618,436 | | | | 7,153,639 | |
Shares issued in reinvestment of dividends: | | | | | | | | | | | | | | |
Institutional | | 52,175 | | | | 655,316 | | | 2,610 | | | | 28,474 | |
Service | | — | | | | — | | | — | | | | 1 | |
Investor A | | 138,764 | | | | 1,741,483 | | | 12,984 | | | | 141,531 | |
Investor B | | 17,440 | | | | 218,352 | | | 1,622 | | | | 17,601 | |
Investor C | | 41,450 | | | | 518,953 | | | 3,093 | | | | 33,589 | |
Shares redeemed: | | | | | | | | | | | | | | |
Institutional | | (329,653 | ) | | | (4,065,995 | ) | | (840,104 | ) | | | (10,526,865 | ) |
Service | | — | | | | — | | | (2,994 | ) | | | (39,583 | ) |
Investor A | | (392,535 | ) | | | (4,802,753 | ) | | (554,008 | ) | | | (6,422,507 | ) |
Investor B | | (61,335 | ) | | | (734,659 | ) | | (85,427 | ) | | | (996,859 | ) |
Investor C | | (249,568 | ) | | | (3,059,391 | ) | | (235,038 | ) | | | (2,705,934 | ) |
| | | | | | | | | | | | | | |
Net increase | | 1,781,777 | | | $ | 22,677,221 | | | 3,017,836 | | | $ | 35,418,024 | |
| | | | | | | | | | | | | | |
| | | | | | |
| 146 | | SEMI-ANNUAL REPORT | | MARCH 31, 2008 | | |
Notes to Financial Statements (concluded)
| | | | | | | | | | | | | | |
| | | International Opportunities | |
| | | Six Months Ended
March 31, 2008 | | | Year Ended
September 30, 2007 | |
| | | Shares | | | Value | | | Shares | | | Value | |
Shares sold: | | | | | | | | | | | | | | |
Institutional | | 2,121,533 | | | $ | 90,322,431 | | | 5,437,594 | | | $ | 249,562,876 | |
Service | | 256,371 | | | | 10,343,468 | | | 558,336 | | | | 24,349,747 | |
Investor A | | 2,251,078 | | | | 89,942,897 | | | 2,798,164 | | | | 121,132,644 | |
Investor B | | 72,300 | | | | 2,644,192 | | | 102,178 | | | | 4,163,593 | |
Investor C | | 513,515 | | | | 18,576,557 | | | 392,127 | | | | 16,203,950 | |
Shares issued in reinvestment of dividends: | | | | | | | | | | | | | | |
Institutional | | 1,290,442 | | | | 54,624,699 | | | 985,017 | | | | 40,563,000 | |
Service | | 664,200 | | | | 27,165,771 | | | 463,687 | | | | 18,561,373 | |
Investor A | | 2,080,883 | | | | 84,442,326 | | | 1,428,033 | | | | 56,793,130 | |
Investor B | | 403,239 | | | | 15,379,610 | | | 332,037 | | | | 12,540,780 | |
Investor C | | 1,055,533 | | | | 40,132,456 | | | 784,968 | | | | 29,585,553 | |
Shares redeemed: | | | | | | | | | | | | | | |
Institutional | | (1,717,052 | ) | | | (71,427,844 | ) | | (4,753,218 | ) | | | (217,957,963 | ) |
Service | | (577,208 | ) | | | (22,492,770 | ) | | (684,419 | ) | | | (29,971,638 | ) |
Investor A | | (2,028,755 | ) | | | (82,943,385 | ) | | (2,917,616 | ) | | | (127,250,785 | ) |
Investor B | | (716,376 | ) | | | (26,162,178 | ) | | (584,189 | ) | | | (24,143,077 | ) |
Investor C | | (770,004 | ) | | | (28,602,107 | ) | | (963,705 | ) | | | (39,597,188 | ) |
| | | | | | | | | | | | | | |
Net increase | | 4,899,699 | | | $ | 201,946,123 | | | 3,378,994 | | | $ | 134,535,995 | |
| | | | | | | | | | | | | | |
There is a 2% redemption fee on shares of certain Portfolios redeemed or exchanged which have been held for 30 days or less. The redemption fees are collected and retained by the Portfolio for the benefit of the remaining shareholders. The redemption fees are recorded as a credit to paid-in capital.
5. Short-Term Borrowings:
The Portfolios, along with certain other funds managed by the Advisor and its affiliates, is a party to a $500,000,000 credit agreement with a group of lenders. The Portfolios may borrow under the credit agreement to fund shareholder redemptions and for other lawful purposes other than for leverage. Each Portfolio may borrow up to the maximum amount allowable under the Portfolio’s current Prospectus and Statement of Additional Information, subject to various other legal, regulatory or contractual limits. On November 21, 2007, the credit agreement was renewed for one year under substantially the same terms. The Portfolios pay a commitment fee of 0.06% per annum based on the Portfolio’s pro rata share of the unused portion of the credit agreement, which is included in miscellaneous expenses in the Statements of Operations. Amounts borrowed under the credit agreement bear interest at a rate equal to, at the Portfolio’s election, the federal funds rate plus 0.35% or a base rate as defined in the credit agreement. The Portfolios did not borrow under the credit agreement during the six months ended March 31, 2008.
6. Capital Loss Carryforward:
As of September 30, 2007, the Portfolios had a capital loss carryforward available to offset future realized capital gains through the indicated expiration dates:
| | | | | | | | | | | | |
| | | Expiring September 30, |
| | | 2009 | | 2010 | | 2011 | | Total |
Capital Appreciation | | $ | — | | $ | 43,188,684 | | $ | 18,377,786 | | $ | 61,566,470 |
Mid-Cap Growth Equity | | | 49,835,110 | | | 101,417,616 | | | 16,297,623 | | | 167,550,349 |
Small Cap Growth Equity | | | — | | | 367,125,515 | | | 104,987,092 | | | 472,112,607 |
Global Science & Technology Opportunities | | | 545,731 | | | 72,072,910 | | | — | | | 72,618,641 |
U.S. Opportunities | | | — | | | 42,365,587 | | | 16,513,511 | | | 58,879,098 |
7. Market Risk:
The securities exchanges of certain foreign markets are substantially smaller, less liquid and more volatile than the major securities markets in the United States. Consequently, acquisition and disposition of securities by the Portfolios may be inhibited. In addition, a significant proportion of the aggregate market value of equity securities listed on the major securities exchanges in emerging markets are held by a smaller number of investors. This may limit the number of shares available for acquisition or disposition by the Portfolios.
8. Plan of Reorganization:
On February 26, 2008, the Board approved a plan of reorganization, subject to shareholder approval and certain other conditions, whereby Global Science & Technology Opportunities will acquire substantially all of the assets and assume certain stated liabilities of BlackRock Technology Fund, Inc. in exchange for newly issued shares of Global Science & Technology Opportunities.
| | | | | | |
| | SEMI-ANNUAL REPORT | | MARCH 31, 2008 | | 147 |
Officers and Trustees
| | |
| David O. Beim, Trustee | | Investment Advisor and Co-Administrator |
| Richard S. Davis, Trustee | | BlackRock Advisors, LLC |
| Ronald W. Forbes, Trustee | | Wilmington, DE 19809 |
| Henry Gabbay, Trustee | | |
| Dr. Matina Horner, Trustee | | Sub-Advisor — International Opportunities Portfolio |
| Rodney D. Johnson, Trustee | | BlackRock International, Ltd. |
| Herbert I. London, Trustee | | Edinburgh, Scotland EH3 8JB |
| Cynthia A. Montgomery, Trustee | | |
| Joseph P. Platt, Jr., Trustee | | Sub-Advisor — Global Opportunities Portfolio |
| Robert C. Robb, Jr., Trustee | | BlackRock Financial Management, Inc. |
| Toby Rosenblatt, Trustee | | New York, NY 10022 |
| Kenneth L. Urish, Trustee | | |
| Frederick W. Winter, Trustee | | Custodian |
| Donald C. Burke, President and Chief Executive Officer | | PFPC Trust Company |
| Anne F. Ackerley, Vice President | | Philadelphia, PA 19153 |
| Neal J. Andrews, Chief Financial Officer | | |
| Jay M. Fife, Treasurer | | Co-Administrator and Transfer Agent |
| Brian P. Kindelan, Chief Compliance Officer | | PFPC Inc. |
| Howard Surloff, Secretary | | Wilmington, DE 19809 |
| | |
| | Distributor |
| | BlackRock Distributors, Inc. |
| | King of Prussia, PA 19406 |
| | |
| | Legal Counsel |
| | Sidley Austin LLP |
| | New York, NY 10019 |
| | |
| | Independent Registered Public Accounting Firm |
| | Deloitte & Touche LLP |
| | Philadelphia, PA 19103 |
| | | | | | |
| 148 | | SEMI-ANNUAL REPORT | | MARCH 31, 2008 | | |
Additional Information (Unaudited)
BlackRock Privacy Principles
BlackRock is committed to maintaining the privacy of its current and former fund investors and individual clients (collectively, “Clients”) and to safeguarding their non-public personal information. The following information is provided to help you understand what personal information BlackRock collects, how we protect that information and why in certain cases we share such information with select parties.
If you are located in a jurisdiction where specific laws, rules or regulations require BlackRock to provide you with additional or different privacy-related rights beyond what is set forth below, then BlackRock will comply with those specific laws, rules or regulations.
BlackRock obtains or verifies personal non-public information from and about you from different sources, including the following: (i) information we receive from you or, if applicable, your financial intermediary, on applications, forms or other documents; (ii) information about your transactions with us, our affiliates, or others; (iii) information we receive from a consumer reporting agency; and (iv) from visits to our websites.
BlackRock does not sell or disclose to non-affiliated third parties any non-public personal information about its Clients, except as permitted by law or as is necessary to respond to regulatory requests or to service Client accounts. These non-affiliated third parties are required to protect the confidentiality and security of this information and to use it only for its intended purpose.
We may share information with our affiliates to service your account or to provide you with information about other BlackRock products or services that may be of interest to you. In addition, BlackRock restricts access to non-public personal information about its Clients to those BlackRock employees with a legitimate business need for the information. BlackRock maintains physical, electronic and procedural safeguards that are designed to protect the non-public personal information of its Clients, including procedures relating to the proper storage and disposal of such information.
Availability of Additional Information
Electronic copies of most financial reports and prospectuses are available on the Fund’s website or shareholders can sign up for e-mail notifications of quarterly statements, annual and semi-annual reports and prospectuses by enrolling in the Fund’s electronic delivery program.
To enroll:
Shareholders Who Hold Accounts with Investment Advisors, Banks or Brokerages:
Please contact your financial advisor. Please note that not all investment advisors, banks or brokerages may offer this service.
Shareholders Who Hold Accounts Directly With BlackRock
| 1) | Access the BlackRock website at http://www.blackrock.com/edelivery |
| 2) | Click on the applicable link and follow the steps to sign up |
The Fund will mail only one copy of shareholder documents, including prospectuses, annual and semi-annual reports and proxy statements, to shareholders with multiple accounts at the same address. This practice is commonly called “householding” and it is intended to reduce expenses and eliminate duplicate mailings of shareholder documents. Mailings of your shareholder documents may be householded indefinitely unless you instruct us otherwise. If you do not want the mailing of these documents to be combined with those for other members of your household, please contact the Fund at (800) 441-7762.
| | | | | | |
| | SEMI-ANNUAL REPORT | | MARCH 31, 2008 | | 149 |
Additional Information (concluded)
Availability of Additional Information (concluded)
Availability of Proxy Voting Policies and Procedures
A description of the policies and procedures that the Fund uses to determine how to vote proxies relating to portfolio securities is available (1) without charge, upon request by calling (800) 441-7762; (2) at www.blackrock.com; (3) on the Securities and Exchange Commission’s (the “SEC”) website at http://www.sec.gov.
Availability of Proxy Voting Record
Information (if any) on how proxies relating to the Fund’s voting securities were voted by BlackRock during the most recent 12-month period ended June 30th is available, upon request and without charge on our website at www.blackrock.com, by calling (800) 441-7762 or on the SEC’s website at http://www.sec.gov.
Availability of Quarterly Portfolio Schedule
The Fund files its complete schedule of portfolio holdings with the SEC for the first and third quarters of each fiscal year on Form N-Q. The Fund’s Forms N-Q are available on the SEC’s website at http:// www.sec.gov and may also be reviewed and copied at the SEC’s Public Reference Room in Washington, D.C. Information on the operation of the Public Reference Room may be obtained by calling (800) SEC-0330. The Fund’s Forms N-Q may also be obtained upon request and without charge by calling (800) 441-7762.
Shareholder Privileges
Account Information
Call us at (800) 441-7762 from 8:00 AM to 6:00 PM EST to get information about your account balances, recent transactions and share prices. You can also reach us on the Web at www.blackrock.com/funds.
Automatic Investment Plans
Investor Class shareholders who want to invest regularly can arrange to have $50 or more automatically deducted from their checking or savings account and invested in any of the BlackRock portfolios.
Systematic Withdrawal Plan
Investor Class shareholders can establish a systematic withdrawal plan and receive periodic payments of $50 or more from their BlackRock portfolios, as long as their account is at least $10,000.
Retirement Plans
Shareholders may make investments in conjunction with Traditional, Rollover, Roth, Coverdell, Simple IRA’s, SEP IRA’s and 403(b) Plans.
| | | | | | |
| 150 | | SEMI-ANNUAL REPORT | | MARCH 31, 2008 | | |
A World-Class Mutual Fund Family
BlackRock offers a diverse lineup of open-end mutual funds crossing all investment styles and managed by experts in equity, fixed income and tax-exempt investing.
| | | | |
Equity Funds |
| BlackRock All-Cap Global Resources Portfolio | | BlackRock Global Opportunities Portfolio | | BlackRock Mid-Cap Growth Equity Portfolio |
| BlackRock Asset Allocation Portfolio† | | BlackRock Global Resources Portfolio | | BlackRock Mid-Cap Value Equity Portfolio |
| BlackRock Aurora Portfolio | | BlackRock Global Science & Technology Opportunities Portfolio | | BlackRock Mid Cap Value Opportunities Fund |
| BlackRock Balanced Capital Fund† | | | | BlackRock Natural Resources Trust |
| BlackRock Basic Value Fund | | BlackRock Global SmallCap Fund | | BlackRock Pacific Fund |
| BlackRock Capital Appreciation Portfolio | | BlackRock Health Sciences Opportunities Portfolio* | | BlackRock Small Cap Core Equity Portfolio |
| BlackRock Equity Dividend Fund | | BlackRock Healthcare Fund | | BlackRock Small Cap Growth Equity Portfolio |
| BlackRock EuroFund | | BlackRock Index Equity Portfolio* | | BlackRock Small Cap Growth Fund II |
| BlackRock Focus Growth Fund | | BlackRock International Fund | | BlackRock Small Cap Index Fund |
| BlackRock Focus Value Fund | | BlackRock International Index Fund | | BlackRock Small Cap Value Equity Portfolio* |
| BlackRock Fundamental Growth Fund | | BlackRock International Opportunities Portfolio | | BlackRock Small/Mid-Cap Growth Portfolio |
| BlackRock Global Allocation Fund† | | BlackRock International Value Fund | | BlackRock S&P 500 Index Fund |
| BlackRock Global Dynamic Equity Fund | | BlackRock Large Cap Core Fund | | BlackRock Technology Fund |
| BlackRock Global Emerging Markets Fund | | BlackRock Large Cap Growth Fund | | BlackRock U.S. Opportunities Portfolio |
| BlackRock Global Financial Services Fund | | BlackRock Large Cap Value Fund | | BlackRock Utilities and Telecommunications Fund |
| BlackRock Global Growth Fund | | BlackRock Latin America Fund | | BlackRock Value Opportunities Fund |
Fixed Income Funds |
| BlackRock Commodity Strategies Fund | | BlackRock Income Builder Portfolio | | BlackRock Low Duration Bond Portfolio |
| BlackRock Emerging Market Debt Portfolio | | BlackRock Inflation Protected Bond Portfolio | | BlackRock Managed Income Portfolio |
| BlackRock Enhanced Income Portfolio | | BlackRock Intermediate Bond Portfolio II | | BlackRock Short-Term Bond Fund |
| BlackRock GNMA Portfolio | | BlackRock Intermediate Government Bond Portfolio | | BlackRock Strategic Income Portfolio |
| BlackRock Government Income Portfolio | | | | BlackRock Total Return Fund |
| BlackRock High Income Fund | | BlackRock International Bond Portfolio | | BlackRock Total Return Portfolio II |
| BlackRock High Yield Bond Portfolio | | BlackRock Long Duration Bond Portfolio | | BlackRock World Income Fund |
| BlackRock Income Portfolio | | | | |
Municipal Bond Funds |
| BlackRock AMT-Free Municipal Bond Portfolio | | BlackRock Intermediate Municipal Fund | | BlackRock New York Municipal Bond Fund |
| BlackRock California Insured Municipal Bond Fund | | BlackRock Kentucky Municipal Bond Portfolio | | BlackRock Ohio Municipal Bond Portfolio |
| BlackRock Delaware Municipal Bond Portfolio | | BlackRock Municipal Insured Fund | | BlackRock Pennsylvania Municipal Bond Fund |
| BlackRock Florida Municipal Bond Fund | | BlackRock National Municipal Fund | | BlackRock Short-Term Municipal Fund |
| BlackRock High Yield Municipal Fund | | BlackRock New Jersey Municipal Bond Fund | | |
Target Risk & Target Date Funds |
| BlackRock Prepared Portfolios | | BlackRock Lifecycle Prepared Portfolios | | |
| Conservative Prepared Portfolio | | Prepared Portfolio 2010 | | Prepared Portfolio 2030 |
| Moderate Prepared Portfolio | | Prepared Portfolio 2015 | | Prepared Portfolio 2035 |
| Growth Prepared Portfolio | | Prepared Portfolio 2020 | | Prepared Portfolio 2040 |
| Aggressive Growth Prepared Portfolio | | Prepared Portfolio 2025 | | Prepared Portfolio 2045 |
| | | | Prepared Portfolio 2050 |
| * | See the prospectus for information on specific limitations on investments in the fund. |
BlackRock mutual funds are distributed by BlackRock Distributors, Inc. and certain funds are also distributed by FAM Distributors, Inc. You should consider the investment objectives, risks, charges and expenses of the funds under consideration carefully before investing. Each fund’s prospectus contains this and other information and is available at www.blackrock.com or by calling (800) 882-0052 or from your financial advisor. The prospectus should be read carefully before investing.
| | | | | | |
| | SEMI-ANNUAL REPORT | | MARCH 31, 2008 | | 151 |
| | |
 | | |
| | This report is transmitted to shareholders only. It is not authorized for use as an offer of sale or a solicitation of an offer to buy shares of a Portfolio unless accompanied or preceded by the Portfolio’s current prospectus. Past performance results shown in this report should not be considered a representation of future performance. Investment returns and principal value of shares will fluctuate so that shares, when redeemed, may be worth more or less than their original cost. Statements and other information herein are as dated and are subject to change. Investment in foreign securities involves special risks including fluctuating foreign exchange rates, foreign government regulations, differing degrees of liquidity and the possibility of substantial volatility due to adverse political, economic or other developments. |
| |
| | BlackRock Funds |
| | 100 Bellevue Parkway |
| | Wilmington, DE 19809 |
| |
| |  |
| | EQUITY-3/08-SAR |
EQUITIES FIXED INCOME REAL ESTATE LIQUIDITY ALTERNATIVES BLACKROCK SOLUTIONS
| | |
| BlackRock | | 
|
Asset Allocation Portfolio | |
| |
| SEMI-ANNUAL REPORT | MARCH 31, 2008 (UNAUDITED) | | |
NOT FDIC INSURED
MAY LOSE VALUE
NO BANK GUARANTEE
Table of Contents
| | | | | | |
2 | | BLACKROCK ASSET ALLOCATION PORTFOLIO | | MARCH 31, 2008 | | |
A Letter to Shareholders
Dear Shareholder
Financial markets endured severe bouts of volatility during the reporting period, particularly as the calendar turned to 2008. It was then that fears of an economic recession swelled and credit market strains intensified, producing calamity in the financial system and, ultimately, the demise of major Wall Street firm Bear Stearns.
The Federal Reserve Board (the “Fed”), after cutting the target federal funds rate 100 basis points (1%) between September 2007 and year-end, stepped up its efforts to support the ailing financial sector in the first three months of 2008. The central bank cut interest rates 125 basis points in January alone, and followed with another 75-basis-point cut on March 18, bringing the target rate to 2.25%. In an unprecedented move, the Fed also extended its financing operations directly to broker/dealers and assisted JPMorgan in its buyout of ill-fated Bear Stearns.
Against this backdrop, investor anxiety has been acute and equity markets have struggled. The S&P 500 Index of U.S. stocks was down in March, marking the fifth consecutive month of negative returns. International markets outperformed the U.S. for much of 2007, but that trend changed in more recent months as investors grew increasingly reluctant to take on the risks of foreign investing.
In fixed income markets, an ongoing investor flight to quality continued to drive Treasury yields lower and their prices higher. The yield on 10-year Treasury issues, which touched 5.30% in June 2007 (its highest level in five years), fell to 4.04% by year-end and to 3.45% by March 31. Investors largely shunned bonds associated with the housing and credit markets, and the riskier high yield sector landed in negative territory year-to-date. Meanwhile, the municipal bond market has struggled with concerns around the creditworthiness of monoline bond insurers and the failure of auctions for auction rate securities, driving yields higher and prices lower across the curve. At period-end, municipal bonds were trading at higher yields than their Treasury counterparts, a very unusual occurrence by historical standards.
Overall, the major benchmark indexes posted mixed results for the current reporting period, generally reflecting heightened investor risk aversion:
| | | | | | |
Total Returns as of March 31, 2008 | | 6-month | | | 12-month | |
U.S. equities (S&P 500 Index) | | (12.46 | )% | | (5.08 | )% |
Small cap U.S. equities (Russell 2000 Index) | | (14.02 | )% | | (13.00 | )% |
International equities (MSCI Europe, Australasia, Far East Index) | | (10.50 | )% | | (2.70 | )% |
Fixed income (Lehman Brothers U.S. Aggregate Index) | | 5.23 | % | | 7.67 | % |
Tax-exempt fixed income (Lehman Brothers Municipal Bond Index) | | 0.75 | % | | 1.90 | % |
High yield bonds (Lehman Brothers U.S. Corporate High Yield 2% Issuer Capped Index) | | (4.01 | )% | | (3.47 | )% |
Past performance is no guarantee of future results. Index performance shown for illustrative purposes only. You cannot invest directly in an index.
As you navigate today’s volatile markets, we encourage you to review your investment goals with your financial professional and to make portfolio changes, as needed. For more up-to-date commentary on the economy and financial markets, we invite you to visit www.blackrock.com/funds. As always, we thank you for entrusting BlackRock with your investment assets, and we look forward to continuing to serve you in the months and years ahead.
Sincerely,

Rob Kapito
President, BlackRock Advisors, LLC
THIS PAGE NOT PART OF YOUR FUND REPORT
Portfolio Summary (Unaudited)
Portfolio Management Commentary
How did the Portfolio perform?
| | • | | For the six-month period, Portfolio results lagged that of the benchmark, a 60%/40% composite of the S&P 500 Index and the Lehman Brothers U.S. Aggregate Index. |
What factors influenced performance?
| | • | | The Portfolio’s overweight versus the composite benchmark in equities hindered relative results for the period, as global equity markets generally recorded negative returns, most notably in the first quarter of 2008. |
| | • | | The fixed income markets were volatile during the semi-annual period, with all spread sectors underperforming U.S. Treasuries. The return of the Portfolio’s fixed income component exceeded that of the equity segment, but it lagged its fixed income benchmark, detracting from comparative performance. |
| | • | | In contrast, overweight positions above the Portfolio’s historical strategic average in energy and commodities enhanced the relative return. Performance also benefited from our tilt toward large-cap stocks during the particularly volatile period in the market. Additional positive factors were the Portfolio’s overweight in international equities and emphasis on the consumer sectors in the emerging markets. |
Describe recent Portfolio activity.
| | • | | During the fourth quarter of 2007, we reduced the Portfolio’s overall equity allocation, particularly in the large-cap value and large-cap core categories, as these groups have significant exposure to the financials sector. |
| | • | | In the first quarter of 2008, we tilted the equity portion of the Portfolio toward sectors of the market that are traditionally less dependent on U.S. economic growth. We added to the Portfolio’s energy and commodities exposure and moderately increased exposure to emerging markets. |
| | • | | We added to the Portfolio’s U.S. equity position in the first quarter by reallocating capital from international equities to the large-cap value sleeve. This had the effect of reducing the overall underweight in value assets and expresses our anticipation that, at some point, there will be a rebound in the U.S. dollar and a strengthening in value stocks. |
| | • | | For most of the period, the fixed income portion of the Portfolio was short in duration relative to its benchmark (Lehman Brothers U.S. Aggregate Index). Near the end of the first quarter, we shifted to a more neutral duration following a sell-off in the U.S. Treasury market. |
Describe Portfolio positioning at period-end.
| | • | | At period-end, the Portfolio was allocated 64% in equities, 28% in fixed income and 8% in cash, compared with the Portfolio’s benchmark of 60% equities and 40% fixed income. |
| | • | | Within equity, the Portfolio was overweight non-U.S. stocks and underweight U.S. names. Among U.S. equities, we maintained the Portfolio’s underweight in small-cap equities and value stocks. We maintained the Portfolio’s overweight in energy and commodities and continue to emphasize the consumption theme in the emerging markets. |
| | • | | The fixed income portion of the Portfolio maintained an overweight in high-quality spread sectors. We believe these issues are cheap relative to U.S. Treasury and U.S. agency securities and will rebound when risk appetites normalize. |
Portfolio Profile as of March 31, 2008
| | | |
Ten Largest Holdings | | Percent of
Long-Term
Investments | |
Federal National Mortgage Assoc. | | 4 | % |
iShares MSCI Brazil Index Fund | | 1 | |
CONSOL Energy, Inc. | | 1 | |
The Coca-Cola Co. | | 1 | |
Wal-Mart Stores, Inc. | | 1 | |
General Electric Capital Corp., Unsecured Notes | | 1 | |
Apple Computer, Inc. | | 1 | |
Bear Stearns Mortgage Trust, Series 05-4, Class 3A1 | | 1 | |
| |
Credit Quality Allocations1 | | Percent of
Fixed Income
Portion | |
AAA | | 78 | % |
AA | | 7 | |
A | | 4 | |
BBB | | 3 | |
below BBB | | 8 | |
| 1 | Using the higher of Standard & Poor’s or Moody’s Investors Service rating. |
| | | |
Ten Largest Industries | | Percent of
Long-Term
Investments | |
Oil & Gas | | 7 | % |
Banks | | 6 | |
Finance | | 5 | |
Telecommunications | | 4 | |
Manufacturing | | 4 | |
Metal & Mining | | 3 | |
Computer Software & Services | | 3 | |
Pharmaceuticals | | 3 | |
Retail Merchandising | | 3 | |
Energy & Utilities | | 2 | |
For Portfolio compliance purposes, the Portfolio’s industry classifications refer to any one or more of the industry sub-classifications used by one or more widely recognized market indexes or ratings group indexes, and/or as defined by Portfolio management. This definition may not apply for purposes of this report, which may combine industry sub-classifications for reporting ease.
| | | | | | |
4 | | BLACKROCK ASSET ALLOCATION PORTFOLIO | | MARCH 31, 2008 | | |
Portfolio Summary (concluded)
Total Return Based on a $10,000 Investment
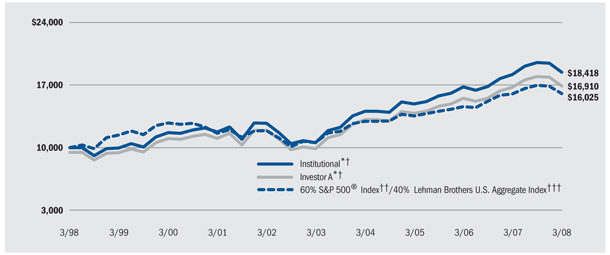
| * | Assuming maximum sales charge, if any, transaction costs and other operating expenses, including advisory fees. |
| † | The Portfolio uses an asset allocation strategy, investing varying percentages of its portfolio in three major categories: stocks, bonds and, to a lesser extent, money market instruments. |
| †† | The Standard & Poor’s Composite Stock Price Index, an unmanaged index of 500 stocks, most of which are listed on the New York Stock Exchange. The index focuses on the large-cap segment of the market, with 80% coverage of U.S. equities |
| ††† | An unmanaged index comprised of more than 5,000 taxable bonds. This is an index of investment grade bonds. All securities included must be rated investment grade by Moody’s, Standard & Poor’s or Fitch |
Performance Summary for the Period Ended March 31, 2008
| | | | | | | | | | | | | | | | | | | | | |
| | | | | | Average Annual Total Returns* | |
| | | | | | 1 Year | | | 5 Years | | | 10 Years | |
| | | 6-Month
Total Returns | | | w / o sales
charge | | | w / sales
charge | | | w / o sales
charge | | | w / sales
charge | | | w / o sales
charge | | | w / sales
charge | |
Institutional | | (5.65 | )% | | 1.30 | % | | — | | | 11.79 | % | | — | | | 6.30 | % | | — | |
Service | | (5.72 | )% | | 1.06 | % | | — | | | 11.51 | % | | — | | | 6.07 | % | | — | |
Investor A | | (5.78 | )% | | 0.88 | % | | (4.43 | )% | | 11.39 | % | | 10.20 | % | | 5.96 | % | | 5.39 | % |
Investor B | | (6.13 | )% | | 0.22 | % | | (3.90 | )% | | 10.59 | % | | 10.32 | % | | 5.29 | % | | 5.29 | % |
Investor C | | (6.18 | )% | | 0.09 | % | | (0.83 | )% | | 10.59 | % | | 10.59 | % | | 5.20 | % | | 5.20 | % |
60% S&P 500® Index/40% Lehman Brothers U.S. Aggregate Index | | (5.64 | )% | | 0.03 | % | | — | | | 8.71 | % | | — | | | 4.83 | % | | — | |
| * | Assuming maximum sales charge. See “About Portfolio’s Performance” on page 6 for a detailed description of share classes, including any related sales charges and fees. |
| | Past performance is not indicative of future results. |
Expense Example
| | | | | | | | | | | | | | | | | | |
| | | Actual | | Hypothetical** |
| | | Beginning
Account Value
October 1, 2007 | | Ending
Account Value
March 31, 2008 | | Expenses Paid
During the Period* | | Beginning
Account Value
October 1, 2007 | | Ending
Account Value
March 31, 2008 | | Expenses Paid
During the Period* |
Institutional | | $ | 1,000.00 | | $ | 943.52 | | $ | 4.53 | | $ | 1,000.00 | | $ | 1,020.28 | | $ | 4.72 |
Service | | $ | 1,000.00 | | $ | 942.83 | | $ | 5.61 | | $ | 1,000.00 | | $ | 1,019.15 | | $ | 5.85 |
Investor A | | $ | 1,000.00 | | $ | 942.19 | | $ | 6.25 | | $ | 1,000.00 | | $ | 1,018.48 | | $ | 6.52 |
Investor B | | $ | 1,000.00 | | $ | 938.72 | | $ | 10.09 | | $ | 1,000.00 | | $ | 1,014.46 | | $ | 10.54 |
Investor C | | $ | 1,000.00 | | $ | 938.25 | | $ | 9.63 | | $ | 1,000.00 | | $ | 1,014.93 | | $ | 10.07 |
| * | For each class of the Portfolio, expenses are equal to the annualized expense ratio for the class (0.93% for Institutional, 1.16% for Service, 1.29% for Investor A, 2.08% for Investor B and 1.99% for Investor C), multiplied by the average account value over the period, multiplied by 183/366 (to reflect the one-half year period shown). |
| ** | Hypothetical 5% annual return before expenses is calculated by pro-rating the number of days in the most recent fiscal half year divided by 366. |
See “Disclosure of Expenses” on page 7 for further information on how expenses were calculated.
| | | | | | |
| | | BLACKROCK ASSET ALLOCATION PORTFOLIO | | MARCH 31, 2008 | | 5 |
About Portfolio’s Performance
| | • | | Institutional Shares are not subject to any sales charge. These shares bear no ongoing distribution or service fees and are available only to eligible investors. |
| | • | | Service Shares are not subject to any sales charge. These shares are subject to a service fee of 0.25% per year (but no distribution fee). |
| | • | | Investor A Shares incur a maximum initial sales charge (front-end load) of 5.25% and a service fee of 0.25% per year (but no distribution fee). |
| | • | | Investor B Shares are subject to a maximum contingent deferred sales charge of 4.50% declining to 0% after six years. In addition, these shares are subject to a distribution fee of 0.75% per year and a service fee of 0.25% per year. These shares automatically convert to Investor A Shares after approximately eight years. (There is no initial sales charge for automatic share conversions.) All returns for periods greater than eight years reflect this conversion. |
| | • | | Investor C Shares are subject to a 1.00% contingent deferred sales charge if redeemed within one year of purchase. In addition, these shares are subject to a distribution fee of 0.75% per year and a service fee of 0.25% per year. |
Performance information reflects past performance and does not guarantee future results. Current performance may be lower or higher than the performance data quoted. Refer to www.blackrock.com/funds to obtain performance data current to the most recent month-end. Performance results do not reflect the deduction of taxes that a shareholder would pay on fund distributions or the redemption of fund shares. Figures shown in the performance tables on the previous pages assume reinvestment of all dividends and distributions, if any, at net asset value on the ex-dividend date. Investment return and principal value of shares will fluctuate so that shares, when redeemed, may be worth more or less than their original cost. Dividends paid to each class of shares will vary because of the different levels of service, distribution and transfer agency fees applicable to each class, which are deducted from the income available to be paid to shareholders.
The performance information on the previous pages includes information for each class of the Portfolio since the commencement of operations of the Portfolio, rather than the date such class was introduced. Performance information for each class introduced after the commencement of operations of the Portfolio is therefore based on the performance history of a predecessor class adjusted to reflect the class specific fees applicable to each class at the time of the launch of such share class. This information may be considered when assessing the Portfolio’s performance, but does not represent the actual performance of this share class.
Performance for the Portfolio for the periods prior to January 31, 2005 is based on performance of the former State Street Research mutual fund that reorganized with the Portfolio on that date.
Performance information is restated to reflect the current maximum front-end sales charge (in the case of Investor A Shares) or the maximum contingent deferred sales charge (in the case of Investor B and Investor C Shares), and assumes the reinvestment of dividends and distributions.
The performance information also reflects fee waivers and reimbursements that subsidize and reduce the total operating expenses of the Portfolio. The Portfolio’s returns would have been lower if there were no such waivers and reimbursements. BlackRock Advisors, LLC is under no obligation to waive or continue waiving its fees after February 1, 2009. Investment return and principal value of an investment will fluctuate so that an investor’s shares, when redeemed, may be worth more or less than their original cost.
The performance shown in the line graph is that of Institutional Shares and Investor A Shares of the Portfolio. The actual performance of Investor B, Investor C and Service Shares is lower than the performance of Institutional Shares because Investor B, Investor C and Service Shares have higher expenses than Institutional Shares. Excluding the effects of sales charges, the actual performance of Investor B and Investor C Shares is lower than the performance of Investor A Shares because Investor B and Investor C Shares have higher expenses than Investor A Shares. Purchasers of Investor A Shares generally pay a front-end sales charge, while purchasers of Investor B and Investor C Shares may pay a contingent deferred sales charge (depending on how long they hold their shares) when they sell their shares.
| | | | | | |
6 | | BLACKROCK ASSET ALLOCATION PORTFOLIO | | MARCH 31, 2008 | | |
Disclosure of Expenses
As a shareholder of the Portfolio, you incur two types of costs: (1) transaction costs, including front and back end sales charges (loads) or redemption/exchange fees, where applicable; and (2) ongoing costs, including advisory fees, distribution (12b-1) and service fees, where applicable, and other Portfolio expenses. The Expense Example on page 5 is intended to help you understand your ongoing costs (in dollars) of investing in the Portfolio and compare these costs with the ongoing costs of investing in other mutual funds.
The Expense Example on page 5 is based on an investment of $1,000 invested at the beginning of the period and held for the entire period October 1, 2007 to March 31, 2008. The information under “Actual” together with the amount you invested, allows you to estimate actual expenses incurred over the reporting period. Simply divide your account value by $1,000 (for example, an $8,600 account value divided by $1,000 = 8.60) and multiply the result by the cost shown for your share class, in the column entitled “Expenses Paid During the Period”, to estimate the expenses incurred on your account during this period.
The information under “Hypothetical” provides information about hypothetical account values and hypothetical expenses based on the Portfolio’s actual expense ratio and an assumed rate of return of 5% per year before expenses, which is not the Portfolio’s actual return. The hypothetical account values and expenses may not be used to estimate the actual ending account balance or expenses you incurred for the period. You may use this information to compare the ongoing costs of investing in the Portfolio and other funds. To do so, compare this 5% hypothetical example with the 5% hypothetical examples that appear in the shareholder reports of other funds.
Please note that the expenses shown in the table are meant to highlight your ongoing costs only and do not reflect any transactional costs, such as front and back end sales charges (loads) or redemption fees, where applicable. Therefore, the hypothetical information is useful in comparing ongoing costs only, and will not help you determine the relative total costs of owning different funds. In addition, if these transactional costs were included, your costs would have been higher.
| | | | | | |
| | | BLACKROCK ASSET ALLOCATION PORTFOLIO | | MARCH 31, 2008 | | 7 |
Schedule of Investments March 31, 2008 (Unaudited)
| | | | | |
| | | Shares | | Value |
Common Stocks — 58.1% | | | | | |
Australia — 0.5% | | | | | |
Finance — 0.1% | | | | | |
Macquarie Airports Management Ltd. | | 132,100 | | $ | 389,946 |
| | | | | |
Manufacturing — 0.1% | | | | | |
United Group Ltd. | | 95,300 | | | 1,051,234 |
| | | | | |
Metal & Mining — 0.1% | | | | | |
Lihir Gold Ltd. | | 119,800 | | | 393,052 |
Zinifex Ltd. | | 25,900 | | | 236,227 |
| | | | | |
| | | | | 629,279 |
| | | | | |
Oil & Gas — 0.1% | | | | | |
Oil Search Ltd. | | 138,400 | | | 610,917 |
| | | | | |
Retail Merchandising — 0.1% | | | | | |
Woolworths Ltd. | | 39,034 | | | 1,034,523 |
| | | | | |
Total Australia | | | | | 3,715,899 |
| | | | | |
Belgium — 0.3% | | | | | |
Beverages & Bottling — 0.2% | | | | | |
Inbev NV | | 16,450 | | | 1,447,598 |
| | | | | |
Metal & Mining — 0.1% | | | | | |
Umicore | | 10,400 | | | 541,172 |
| | | | | |
Total Belgium | | | | | 1,988,770 |
| | | | | |
Bermuda — 0.1% | | | | | |
Business Services — 0.0% | | | | | |
Genpact Ltd.(a) | | 14,000 | | | 171,500 |
| | | | | |
Electronics — 0.1% | | | | | |
Tyco Electronics Ltd. | | 9,850 | | | 338,052 |
| | | | | |
Manufacturing — 0.0% | | | | | |
Tyco International Ltd. | | 2,850 | | | 125,542 |
| | | | | |
Medical & Medical Services — 0.0% | | | | | |
Covidien Ltd. | | 6,550 | | | 289,838 |
| | | | | |
Total Bermuda | | | | | 924,932 |
| | | | | |
Brazil — 0.5% | | | | | |
Banks — 0.1% | | | | | |
Banco Industrial e Comercial SA | | 36,700 | | | 173,597 |
Unibanco SA - ADR | | 5,400 | | | 629,856 |
| | | | | |
| | | | | 803,453 |
| | | | | |
Energy & Utilities — 0.1% | | | | | |
Companhia Energetica de Minas Gerais- CEMIG - ADR | | 21,100 | | | 380,644 |
| | | | | |
Oil & Gas — 0.2% | | | | | |
Petroleo Brasileiro SA - ADR | | 10,400 | | | 1,061,944 |
| | | | | |
Paper & Forest Products — 0.1% | | | | | |
Votorantim Celulose ADR | | 13,300 | | | 379,183 |
| | | | | |
Real Estate — 0.0% | | | | | |
Mrv Engenharia(a) | | 14,800 | | | 263,156 |
| | | | | |
Telecommunications — 0.0% | | | | | |
GVT Holding SA(a) | | 12,300 | | | 231,181 |
| | | | | |
Total Brazil | | | | | 3,119,561 |
| | | | | |
Canada — 1.4% | | | | | |
Energy & Utilities — 0.0% | | | | | |
Epsilon Energy, Inc. | | 5,900 | | | 11,726 |
Tanganyika Oil Co. Ltd. | | 3,700 | | | 65,384 |
| | | | | |
| | | | | 77,110 |
| | | | | |
Metal & Mining — 0.6% | | | | | |
Agnico-Eagle Mines Ltd. | | 15,935 | | | 1,080,807 |
Alexco Resource Corp.(a) | | 12,122 | | | 50,781 |
Aurora Energy Resources, Inc.(a) | | 5,300 | | | 27,883 |
Baja Mining Corp.(a) | | 59,300 | | | 78,570 |
Crosshair Exploration & Mining Corp.(a) | | 5,600 | | | 4,910 |
Denison Mines Corp.(a) | | 4,700 | | | 29,671 |
European Goldfields Ltd.(a) | | 12,100 | | | 63,185 |
Fording Canadian Coal Trust | | 7 | | | 365 |
Frontier Pacific Mining Corp.(a) | | 79,200 | | | 50,153 |
Gold Reserve, Inc.(a) | | 26,280 | | | 121,151 |
Kinross Gold Corp. | | 43,500 | | | 970,481 |
Minefinders Corp. Ltd.(a)(b) | | 40,000 | | | 491,200 |
NovaGold Resources, Inc.(a) | | 16,792 | | | 129,466 |
Silver Wheaton Corp.(a) | | 22,800 | | | 354,084 |
Southwestern Resources Corp.(a) | | 47,300 | | | 23,501 |
Sunridge Gold Corp.(a) | | 146,757 | | | 164,422 |
Triex Minerals Corp.(a) | | 3,300 | | | 5,369 |
Triex Minerals Corp. (acquired 12/23/05, cost $14,206)(c) | | 6,600 | | | 10,738 |
Uranium One, Inc.(a) | | 11,270 | | | 37,111 |
West Timmins Mining, Inc.(a) | | 36,372 | | | 24,096 |
Yamana Gold, Inc. | | 35,600 | | | 522,321 |
| | | | | |
| | | | | 4,240,265 |
| | | | | |
Motor Vehicles — 0.0% | | | | | |
Westport Innovations, Inc.(a) | | 70,500 | | | 209,484 |
| | | | | |
Oil & Gas — 0.8% | | | | | |
Accrete Energy, Inc.(a) | | 4,960 | | | 23,243 |
Alberta Clipper Energy, Inc.(a) | | 5,026 | | | 11,752 |
Bayou Bend Petroleum Ltd.(a) | | 40,700 | | | 21,412 |
Canadian Superior Energy, Inc.(a) | | 55,890 | | | 173,818 |
Canext Energy Ltd.(a) | | 4,021 | | | 2,938 |
Cinch Energy Corp.(a) | | 40,320 | | | 49,101 |
Compton Petroleum Corp.(a) | | 68,499 | | | 762,768 |
Cork Exploration, Inc.(a) | | 1,400 | | | 4,706 |
Crescent Point Energy Trust | | 1,800 | | | 50,189 |
Portfolio Abbreviations
To simplify the listings of Portfolio holdings in the Schedule of Investments, the names of many of the securities have been abbreviated according to the list on the right.
| | | | |
| | ADR | | American Depository Receipts |
| | AUD | | Australian Dollar |
| | CAD | | Canadian Dollar |
| | CHF | | Swiss Francs |
| | DKK | | Danish Krone |
| | EUR | | Euro |
| | GBP | | British Pound |
| | HKD | | Hong Kong Dollar |
| | IO | | Interest Only |
| | JPY | | Japanese Yen |
| | LLC | | Limited Liability Corporation |
| | LP | | Limited Partnership |
| | NOK | | Norwegian Krone |
| | PLN | | Polish Zloty |
| | PO | | Principal Only |
| | REIT | | Real Estate Investment Trust |
| | SEK | | Swedish Krona |
| | SGD | | Singapore Dollar |
| | TBA | | To Be Announced |
| | ZAR | | South African Rand |
See Notes to Financial Statements.
| | | | | | |
8 | | BLACKROCK ASSET ALLOCATION PORTFOLIO | | MARCH 31, 2008 | | |
Schedule of Investments (continued)
| | | | | |
| | | Shares | | Value |
Common Stocks (Continued) | | | | | |
Canada (Continued) | | | | | |
Oil & Gas (Continued) | | | | | |
Crew Energy, Inc.(a) | | 29,400 | | $ | 383,808 |
Daylight Resources Trust | | 13,410 | | | 117,188 |
Delphi Energy Corp.(a) | | 24,700 | | | 50,774 |
Ember Resources, Inc.(a) | | 12,136 | | | 16,671 |
Endev Energy, Inc.(a) | | 231,700 | | | 187,355 |
Fairborne Energy Ltd. | | 1,482 | | | 9,962 |
First Calgary Petroleums Ltd.(a) | | 14,554 | | | 40,977 |
Galleon Energy, Inc.—Class A(a) | | 48,617 | | | 700,990 |
Gastar Exploration Ltd.(a) | | 15,900 | | | 20,670 |
Heritage Oil Corp.(a) | | 4,000 | | | 201,003 |
Highpine Oil & Gas Ltd.(a) | | 8,993 | | | 84,984 |
HSE Integrated Ltd.(a) | | 561 | | | 492 |
Iteration Energy Ltd.(a) | | 4,021 | | | 23,583 |
Leader Energy Services Ltd.(a) | | 15,957 | | | 1,244 |
Lynden Ventures Ltd.(a) | | 3,500 | | | 2,728 |
Midnight Oil Exploration Ltd.(a) | | 81,200 | | | 96,511 |
Niko Resources Ltd. (acquired 01/31/05, cost $40,606)(c) | | 2,000 | | | 162,210 |
Oilexco, Inc.(a) | | 3,525 | | | 46,121 |
Open Range Energy Corp.(a) | | 1,976 | | | 7,911 |
Pacific Rodera Energy, Inc.(a) | | 37,300 | | | 18,169 |
Pacific Rubiales Energy Corp.(a) | | 74,800 | | | 108,580 |
Pan Orient Energy Corp.(a) | | 3,600 | | | 40,579 |
Pengrowth Energy Trust | | 1,505 | | | 28,844 |
Penn West Energy Trust | | 819 | | | 22,979 |
Petro Andina Resources Inc.(a) | | 800 | | | 9,392 |
Petrolifera Petroleum Ltd.(a) | | 30,150 | | | 267,295 |
ProspEx Resources Ltd.(a) | | 43,140 | | | 146,259 |
Suncor Energy, Inc. | | 9,762 | | | 988,611 |
Tag Oil Ltd. (acquired 09/22/05, cost $4,409)(c) | | 4,000 | | | 331 |
Technicoil Corp.(a) | | 46,400 | | | 33,451 |
Trafalgar Energy Ltd.(a) | | 841 | | | 2,957 |
TransCanada Corp. | | 700 | | | 26,972 |
TriStar Oil & Gas Ltd.(a) | | 12,585 | | | 177,290 |
True Energy Trust | | 11,382 | | | 40,586 |
Tusk Energy Corp. (acquired 03/14/05 through 02/01/07, cost $211,317)(c) | | 57,966 | | | 96,003 |
Vero Energy, Inc.(a) | | 4,447 | | | 33,143 |
West Energy Ltd.(a) | | 143 | | | 474 |
WesternZagros Resources Ltd.(a) | | 1,800 | | | 4,279 |
| | | | | |
| | | | | 5,301,303 |
| | | | | |
Transportation — 0.0% | | | | | |
Railpower Technologies Corp.(a) | | 17,600 | | | 5,830 |
| | | | | |
Total Canada | | | | | 9,833,992 |
| | | | | |
Cayman Islands — 0.0% | | | | | |
Semiconductors & Related Devices — 0.0% | | | | | |
O2Micro International Ltd. - ADR(a) | | 4,000 | | | 30,920 |
| | | | | |
Chile — 0.0% | | | | | |
Banks — 0.0% | | | | | |
Banco Santander Chile SA - ADR | | 3,600 | | | 188,136 |
| | | | | |
Denmark — 0.1% | | | | | |
Retail Merchandising — 0.1% | | | | | |
FLSmidth & Co. A/S | | 5,600 | | | 554,262 |
| | | | | |
Finland — 0.6% | | | | | |
Banks — 0.0% | | | | | |
OKO Bank Plc - Series A | | 14,300 | | | 269,334 |
| | | | | |
Manufacturing — 0.1% | | | | | |
Wartsila Oyj - Series B | | 5,600 | | | 377,954 |
| | | | | |
Paper & Forest Products — 0.1% | | | | | |
UPM-Kymmene Oyj | | 52,356 | | | 929,896 |
| | | | | |
Telecommunications — 0.4% | | | | | |
Elisa Oyj | | 9,400 | | | 234,774 |
Nokia Oyj | | 82,510 | | | 2,610,474 |
| | | | | |
| | | | | 2,845,248 |
| | | | | |
Total Finland | | | | | 4,422,432 |
| | | | | |
France — 1.6% | | | | | |
Banks — 0.2% | | | | | |
Credit Agricole SA | | 52,765 | | | 1,632,740 |
| | | | | |
Computer Software & Services — 0.1% | | | | | |
Cie Generale De Geophysique | | 1,400 | | | 348,514 |
| | | | | |
Entertainment & Leisure — 0.1% | | | | | |
Ubisoft Entertainment | | 3,900 | | | 335,996 |
| | | | | |
Food & Agriculture — 0.4% | | | | | |
Carrefour SA | | 30,351 | | | 2,341,696 |
Casino Guichard-Perrachon SA | | 5,700 | | | 683,377 |
| | | | | |
| | | | | 3,025,073 |
| | | | | |
Machinery & Heavy Equipment — 0.2% | | | | | |
ALSTOM | | 7,394 | | | 1,602,981 |
| | | | | |
Manufacturing — 0.1% | | | | | |
Compagnie Generale des Etablissements Michelin - Class B | | 4,400 | | | 459,304 |
| | | | | |
Medical Instruments & Supplies — 0.3% | | | | | |
Essilor International SA | | 28,723 | | | 1,876,896 |
| | | | | |
Telecommunications — 0.2% | | | | | |
France Telecom SA | | 44,733 | | | 1,504,259 |
| | | | | |
Total France | | | | | 10,785,763 |
| | | | | |
Germany — 2.1% | | | | | |
Banks — 0.2% | | | | | |
Commerzbank AG | | 37,496 | | | 1,172,102 |
| | | | | |
Chemicals — 0.4% | | | | | |
Bayer AG | | 26,335 | | | 2,110,425 |
SGL Carbon AG | | 7,400 | | | 467,312 |
| | | | | |
| | | | | 2,577,737 |
| | | | | |
Computer Software & Services — 0.1% | | | | | |
United Internet AG | | 29,400 | | | 632,642 |
| | | | | |
Durable Goods — 0.1% | | | | | |
Gerry Weber International AG | | 11,900 | | | 425,530 |
| | | | | |
Energy & Utilities — 0.3% | | | | | |
E.ON AG | | 12,302 | | | 2,277,407 |
| | | | | |
Insurance — 0.5% | | | | | |
Allianz AG | | 13,090 | | | 2,593,159 |
Hannover Rueckversicherung AG | | 12,700 | | | 662,058 |
| | | | | |
| | | | | 3,255,217 |
| | | | | |
Manufacturing — 0.4% | | | | | |
Adidas-Salomon AG | | 5,300 | | | 352,352 |
K+S AG | | 1,000 | | | 327,292 |
Siemens AG | | 17,853 | | | 1,934,937 |
| | | | | |
| | | | | 2,614,581 |
| | | | | |
See Notes to Financial Statements.
| | | | | | |
| | | BLACKROCK ASSET ALLOCATION PORTFOLIO | | MARCH 31, 2008 | | 9 |
Schedule of Investments (continued)
| | | | | |
| | | Shares | | Value |
Common Stocks (Continued) | | | | | |
Germany (Continued) | | | | | |
Medical & Medical Services — 0.0% | | | | | |
Rhoen Klinikum AG | | 6,900 | | $ | 204,470 |
| | | | | |
Medical Instruments & Supplies — 0.1% | | | | | |
Fresenius Medical Care AG & Co. | | 8,200 | | | 412,324 |
| | | | | |
Miscellaneous Services — 0.0% | | | | | |
GEA Group AG | | 11,500 | | | 386,716 |
| | | | | |
Waste Management — 0.0% | | | | | |
Zhongde Waste Technology AG | | 3,246 | | | 130,986 |
| | | | | |
Total Germany | | | | | 14,089,712 |
| | | | | |
Greece — 0.1% | | | | | |
Banks — 0.0% | | | | | |
Piraeus Bank SA | | 5,800 | | | 178,374 |
| | | | | |
Computer & Office Equipment — 0.1% | | | | | |
Intralot SA | | 21,000 | | | 375,965 |
| | | | | |
Transportation — 0.0% | | | | | |
Navios Maritime Holdings, Inc. | | 7,700 | | | 71,456 |
| | | | | |
Total Greece | | | | | 625,795 |
| | | | | |
Hong Kong — 0.9% | | | | | |
Banks — 0.3% | | | | | |
Hang Seng Bank Ltd. | | 101,000 | | | 1,828,542 |
| | | | | |
Chemicals — 0.1% | | | | | |
Huabao International Holdings Ltd. | | 418,800 | | | 344,397 |
| | | | | |
Construction — 0.0% | | | | | |
Shenzhen Expressway Co. Ltd. | | 311,100 | | | 237,842 |
| | | | | |
Entertainment & Leisure — 0.0% | | | | | |
The Hongkong & Shanghai Hotels Ltd. | | 145,600 | | | 239,092 |
| | | | | |
Finance — 0.0% | | | | | |
Rexcapital Financial Holdings Ltd.(a) | | 1,996,500 | | | 223,183 |
| | | | | |
Metal & Mining — 0.0% | | | | | |
Yanzhou Coal Mining Co. Ltd. | | 178,700 | | | 253,034 |
| | | | | |
Real Estate — 0.3% | | | | | |
Henderson Land Development Co. Ltd. | | 142,000 | | | 1,008,988 |
New World Development Co. Ltd. | | 129,600 | | | 314,065 |
Wheelock & Co. Ltd. | | 184,600 | | | 517,083 |
| | | | | |
| | | | | 1,840,136 |
| | | | | |
Retail Merchandising — 0.2% | | | | | |
Esprit Holdings Ltd. | | 121,500 | | | 1,458,128 |
| | | | | |
Total Hong Kong | | | | | 6,424,354 |
| | | | | |
Indonesia — 0.3% | | | | | |
Banks — 0.0% | | | | | |
PT Bank Mandiri | | 1,037,100 | | | 354,901 |
| | | | | |
Metal & Mining — 0.1% | | | | | |
PT Bumi Resources Tbk | | 742,500 | | | 500,109 |
| | | | | |
Motor Vehicles — 0.2% | | | | | |
PT Astra International Tbk | | 466,500 | | | 1,228,965 |
| | | | | |
Total Indonesia | | | | | 2,083,975 |
| | | | | |
Ireland — 0.4% | | | | | |
Computer Software & Services — 0.1% | | | | | |
SkillSoft Plc - ADR(a) | | 82,190 | | | 860,529 |
| | | | | |
Pharmaceuticals — 0.3% | | | | | |
Elan Corp. Plc - ADR(a) | | 77,500 | | | 1,616,650 |
ICON Plc - ADR(a) | | 1,700 | | | 110,313 |
| | | | | |
| | | | | 1,726,963 |
| | | | | |
Total Ireland | | | | | 2,587,492 |
| | | | | |
Italy — 0.2% | | | | | |
Construction — 0.0% | | | | | |
Astaldi SpA | | 29,300 | | | 225,737 |
| | | | | |
Energy & Utilities — 0.2% | | | | | |
AEM SpA | | 152,550 | | | 560,553 |
Terna Rete Elettrica Nazionale SpA | | 113,000 | | | 482,125 |
| | | | | |
| | | | | 1,042,678 |
| | | | | |
Total Italy | | | | | 1,268,415 |
| | | | | |
Japan — 2.9% | | | | | |
Banks — 0.4% | | | | | |
Bank of Kyoto Ltd. | | 33,200 | | | 403,676 |
The Chiba Bank Ltd. | | 72,800 | | | 494,438 |
The Iyo Bank Ltd. | | 32,800 | | | 350,112 |
Mizuho Financial Group, Inc. | | 320 | | | 1,171,750 |
| | | | | |
| | | | | 2,419,976 |
| | | | | |
Chemicals — 0.1% | | | | | |
Dainippon Ink and Chemicals, Inc. | | 50,700 | | | 157,675 |
Nihon Nohyaku Co. Ltd. | | 64,400 | | | 593,736 |
Nippon Carbon Co. Ltd. | | 46,000 | | | 218,278 |
| | | | | |
| | | | | 969,689 |
| | | | | |
Conglomerates — 0.2% | | | | | |
Mitsui & Co. Ltd. | | 69,000 | | | 1,398,274 |
| | | | | |
Construction — 0.0% | | | | | |
Daito Trust Construction Co., Ltd. | | 5,500 | | | 283,607 |
| | | | | |
Durable Goods — 0.1% | | | | | |
ASICS Corp. | | 29,500 | | | 339,155 |
| | | | | |
Electronics — 0.2% | | | | | |
Denso Corp. | | 18,500 | | | 597,613 |
Hosiden Corp. | | 30,300 | | | 603,082 |
Star Micronics Co. Ltd. | | 17,500 | | | 241,046 |
| | | | | |
| | | | | 1,441,741 |
| | | | | |
Energy & Utilities — 0.2% | | | | | |
Air Water, Inc. | | 42,300 | | | 404,413 |
Kurita Water Industries Ltd. | | 23,700 | | | 872,582 |
| | | | | |
| | | | | 1,276,995 |
| | | | | |
Finance — 0.0% | | | | | |
Shinko Securities Co. Ltd.(a) | | 53,500 | | | 155,648 |
Machinery & Heavy Equipment — 0.3% | | | | | |
Komatsu Ltd. | | 43,000 | | | 1,192,767 |
Miura Co. Ltd. | | 10,000 | | | 226,224 |
Mori Seiki Co., Ltd. | | 12,700 | | | 228,060 |
Nabtesco Corp. | | 35,100 | | | 475,371 |
| | | | | |
| | | | | 2,122,422 |
| | | | | |
Manufacturing — 0.2% | | | | | |
Daihatsu Motor Co., Ltd. | | 24,600 | | | 295,407 |
Taiyo Nippon Sanso Corp. | | 45,900 | | | 367,458 |
Tokai Rika Co. Ltd. | | 13,100 | | | 342,351 |
See Notes to Financial Statements.
| | | | | | |
10 | | BLACKROCK ASSET ALLOCATION PORTFOLIO | | MARCH 31, 2008 | | |
Schedule of Investments (continued)
| | | | | |
| | | Shares | | Value |
Common Stocks (Continued) | | | | | |
Japan (Continued) | | | | | |
Manufacturing (Continued) | | | | | |
Uni-Charm Corp. | | 5,800 | | $ | 424,177 |
| | | | | |
| | | | | 1,429,393 |
| | | | | |
Medical Instruments & Supplies — 0.0% | | | | | |
Nihon Kohden Corp. | | 10,200 | | | 233,307 |
| | | | | |
Metal & Mining — 0.2% | | | | | |
Marubeni Corp. | | 176,000 | | | 1,281,862 |
Yamato Kogyo Co. Ltd. | | 5,600 | | | 225,843 |
| | | | | |
| | | | | 1,507,705 |
| | | | | |
Motor Vehicles — 0.4% | | | | | |
Futaba Industrial Co. Ltd. | | 15,000 | | | 337,831 |
Toyota Motor Corp. | | 42,000 | | | 2,094,101 |
| | | | | |
| | | | | 2,431,932 |
| | | | | |
Pharmaceuticals — 0.0% | | | | | |
Towa Pharmaceuticals Co., Ltd. | | 3,500 | | | 148,525 |
| | | | | |
Photographic Equipment — 0.0% | | | | | |
Tamron Co. Ltd. | | 8,800 | | | 215,851 |
| | | | | |
Retail Merchandising — 0.1% | | | | | |
Shimachu Co. Ltd. | | 9,900 | | | 297,457 |
Tsuruha Holdings, Inc. | | 8,600 | | | 371,850 |
| | | | | |
| | | | | 669,307 |
| | | | | |
Telecommunications — 0.2% | | | | | |
KDDI Corp. | | 201 | | | 1,228,020 |
| | | | | |
Transportation — 0.3% | | | | | |
Canon, Inc. | | 29,000 | | | 1,335,373 |
Hino Motors Ltd. | | 50,700 | | | 334,677 |
Kintetsu World Express, Inc. | | 10,000 | | | 232,745 |
| | | | | |
| | | | | 1,902,795 |
| | | | | |
Total Japan | | | | | 20,174,342 |
| | | | | |
Kazakhstan — 0.1% | | | | | |
Oil & Gas — 0.1% | | | | | |
Kamunaigaz Exploration Production, Inc. | | 15,100 | | | 378,255 |
| | | | | |
Luxembourg — 0.3% | | | | | |
Oil & Gas — 0.0% | | | | | |
Acergy SA - ADR | | 9,750 | | | 208,163 |
| | | | | |
Telecommunications — 0.3% | | | | | |
SES SA | | 84,778 | | | 1,793,684 |
| | | | | |
Total Luxembourg | | | | | 2,001,847 |
| | | | | |
Malaysia — 0.1% | | | | | |
Entertainment & Leisure — 0.1% | | | | | |
Tanjong Plc | | 86,800 | | | 455,914 |
| | | | | |
Morocco — 0.1% | | | | | |
Construction — 0.1% | | | | | |
IJM Corp. Bhd | | 234,000 | | | 446,272 |
| | | | | |
Food & Agriculture — 0.0% | | | | | |
Kuala Lumpur Kepong Bhd | | 73,100 | | | 370,242 |
| | | | | |
Total Morocco | | | | | 816,514 |
| | | | | |
Netherlands — 0.7% | | | | | |
Construction — 0.1% | | | | | |
Koninklijke Boskalis Westminster NV | | 12,800 | | | 737,191 |
| | | | | |
Food & Agriculture — 0.1% | | | | | |
Nutreco Holding NV | | 6,900 | | | 530,509 |
| | | | | |
Medical & Medical Services — 0.0% | | | | | |
Qiagen NV | | 16,134 | | | 334,203 |
| | | | | |
Telecommunications — 0.3% | | | | | |
Koninklijke KPN NV | | 119,991 | | | 2,026,971 |
| | | | | |
Transportation — 0.2% | | | | | |
TNT NV | | 27,776 | | | 1,031,827 |
| | | | | |
Total Netherlands | | | | | 4,660,701 |
| | | | | |
Norway — 0.6% | | | | | |
Banks — 0.0% | | | | | |
Sparebanken Rogaland | | 7,433 | | | 76,998 |
| | | | | |
Chemicals — 0.1% | | | | | |
Yara International ASA | | 12,600 | | | 728,681 |
| | | | | |
Oil & Gas — 0.4% | | | | | |
Fred Olsen Energy ASA | | 9,600 | | | 544,817 |
Prosafe ASA | | 33,700 | | | 529,422 |
Sevan Marine ASA | | 7,600 | | | 97,008 |
Statoil ASA | | 51,196 | | | 1,534,166 |
| | | | | |
| | | | | 2,705,413 |
| | | | | |
Transportation — 0.1% | | | | | |
Songa Offshore ASA | | 46,900 | | | 626,273 |
Stolt-Nielsen SA (acquired 01/31/05, cost $177,441)(c)(d) | | 13,000 | | | 270,602 |
| | | | | |
| | | | | 896,875 |
| | | | | |
Total Norway | | | | | 4,407,967 |
| | | | | |
Philippines — 0.1% | | | | | |
Telecommunications — 0.1% | | | | | |
Philippine Long Distance Telephone Co. - ADR | | 5,300 | | | 352,238 |
| | | | | |
Singapore — 0.5% | | | | | |
Finance — 0.3% | | | | | |
DBS Group Holdings Ltd. | | 154,107 | | | 2,015,275 |
| | | | | |
Real Estate — 0.2% | | | | | |
CapitaCommercial Trust Management Ltd. | | 209,000 | | | 337,085 |
Keppel Corp. Ltd. | | 160,000 | | | 1,150,786 |
| | | | | |
| | | | | 1,487,871 |
| | | | | |
Retail Merchandising — 0.0% | | | | | |
Hongguo International Holdings Ltd. | | 340,475 | | | 127,389 |
| | | | | |
Total Singapore | | | | | 3,630,535 |
| | | | | |
South Korea — 0.3% | | | | | |
Banks — 0.0% | | | | | |
Pusan Bank | | 22,200 | | | 277,962 |
| | | | | |
Beverages & Bottling — 0.1% | | | | | |
Woongjin Coway Co. Ltd. | | 11,700 | | | 353,239 |
| | | | | |
Electronics — 0.2% | | | | | |
Samsung Electronics Co. Ltd. | | 2,252 | | | 1,416,667 |
| | | | | |
Security Brokers & Dealers — 0.0% | | | | | |
Korea Investment Holdings Co. Ltd.(a) | | 7,400 | | | 347,453 |
| | | | | |
Total South Korea | | | | | 2,395,321 |
| | | | | |
Sweden — 0.3% | | | | | |
Banks — 0.2% | | | | | |
Nordea Bank AB | | 101,587 | | | 1,646,428 |
| | | | | |
Entertainment & Leisure — 0.0% | | | | | |
Rezidor Hotel Group AB | | 28,900 | | | 168,774 |
| | | | | |
See Notes to Financial Statements.
| | | | | | |
| | | BLACKROCK ASSET ALLOCATION PORTFOLIO | | MARCH 31, 2008 | | 11 |
Schedule of Investments (continued)
| | | | | |
| | | Shares | | Value |
Common Stocks (Continued) | | | | | |
Sweden (Continued) | | | | | |
Soaps & Cosmetics — 0.1% | | | | | |
Oriflame Cosmetics SA | | 8,510 | | $ | 565,008 |
| | | | | |
Total Sweden | | | | | 2,380,210 |
| | | | | |
Switzerland — 2.0% | | | | | |
Chemicals — 0.6% | | | | | |
Lonza Group AG | | 4,800 | | | 636,552 |
Syngenta AG | | 11,792 | | | 3,455,314 |
| | | | | |
| | | | | 4,091,866 |
| | | | | |
Food & Agriculture — 0.5% | | | | | |
Barry Callebaut AG | | 478 | | | 413,936 |
Nestle SA | | 6,686 | | | 3,340,980 |
| | | | | |
| | | | | 3,754,916 |
| | | | | |
Insurance — 0.0% | | | | | |
Swiss Life Holding | | 1,300 | | | 361,293 |
| | | | | |
Machinery & Heavy Equipment — 0.1% | | | | | |
Meyer Burger Technology AG | | 1,300 | | | 399,255 |
| | | | | |
Pharmaceuticals — 0.8% | | | | | |
Novartis AG | | 42,425 | | | 2,174,436 |
Roche Holding AG | | 15,965 | | | 3,004,590 |
| | | | | |
| | | | | 5,179,026 |
| | | | | |
Total Switzerland | | | | | 13,786,356 |
| | | | | |
Taiwan — 0.3% | | | | | |
Chemicals — 0.2% | | | | | |
Polaris Securities Co., Ltd.(a) | | 408,100 | | | 291,505 |
Taiwan Fertilizer Co. Ltd. | | 187,800 | | | 819,088 |
| | | | | |
| | | | | 1,110,593 |
| | | | | |
Computer Software & Services — 0.0% | | | | | |
Geovision, Inc. | | 19,500 | | | 137,042 |
| | | | | |
Finance — 0.1% | | | | | |
Yuanta Financial Holding Co.(a) | | 384,500 | | | 360,712 |
| | | | | |
Semiconductors & Related Devices — 0.0% | | | | | |
Av Tech Corp. | | 2,440 | | | 12,529 |
Vanguard International Semiconductor Corp. | | 149,465 | | | 107,255 |
| | | | | |
| | | | | 119,784 |
| | | | | |
Transportation — 0.0% | | | | | |
U-Ming Marine Transport Corp. | | 117,630 | | | 355,064 |
| | | | | |
Total Taiwan | | | | | 2,083,195 |
| | | | | |
Thailand — 0.2% | | | | | |
Banks — 0.1% | | | | | |
Siam Commercial Bank Public Co. Ltd. | | 227,200 | | | 653,060 |
| | | | | |
Metal & Mining — 0.1% | | | | | |
Banpu Public Co. Ltd. | | 33,200 | | | 390,134 |
| | | | | |
Total Thailand | | | | | 1,043,194 |
| | | | | |
United Kingdom — 4.1% | | | | | |
Aerospace — 0.5% | | | | | |
BAE Systems Plc | | 230,916 | | | 2,223,828 |
Cobham Plc | | 103,700 | | | 411,614 |
Meggitt Plc | | 84,800 | | | 464,080 |
| | | | | |
| | | | | 3,099,522 |
| | | | | |
Banks — 0.4% | | | | | |
Lloyd TSB Group Plc | | 196,243 | | | 1,756,517 |
Standard Chartered Plc | | 35,795 | | | 1,223,311 |
| | | | | |
| | | | | 2,979,828 |
| | | | | |
Business Services — 0.3% | | | | | |
Aegis Group Plc | | 223,600 | | | 551,378 |
Babcock International Group | | 49,400 | | | 560,305 |
De La Rue Plc | | 29,767 | | | 523,710 |
Intertek Group Plc | | 24,400 | | | 499,748 |
| | | | | |
| | | | | 2,135,141 |
| | | | | |
Energy & Utilities — 0.1% | | | | | |
International Power Plc | | 67,100 | | | 530,014 |
ITM Power Plc | | 12,000 | | | 14,825 |
| | | | | |
| | | | | 544,839 |
| | | | | |
Entertainment & Leisure — 0.1% | | | | | |
IG Group Holdings Plc | | 29,100 | | | 188,996 |
InterContinental Hotels Group Plc | | 14,419 | | | 217,482 |
| | | | | |
| | | | | 406,478 |
| | | | | |
Finance — 0.0% | | | | | |
ICAP Plc | | 17,100 | | | 193,104 |
| | | | | |
Food & Agriculture — 0.1% | | | | | |
Britvic Plc | | 64,000 | | | 404,866 |
Dairy Crest Group Plc | | 14,300 | | | 133,104 |
| | | | | |
| | | | | 537,970 |
| | | | | |
Insurance — 0.3% | | | | | |
Hiscox Ltd. | | 95,700 | | | 454,408 |
Prudential Plc | | 128,713 | | | 1,700,012 |
| | | | | |
| | | | | 2,154,420 |
| | | | | |
Machinery & Heavy Equipment — 0.1% | | | | | |
VT Group Plc | | 27,500 | | | 358,574 |
The Weir Group Plc | | 37,600 | | | 567,877 |
| | | | | |
| | | | | 926,451 |
| | | | | |
Measuring & Controlling Devices — 0.1% | | | | | |
Rotork Plc | | 21,700 | | | 464,689 |
| | | | | |
Miscellaneous Services — 0.6% | | | | | |
Aggreko Plc | | 30,700 | | | 393,293 |
Anglo American Plc | | 44,657 | | | 2,683,648 |
Mondi Plc | | 107,192 | | | 889,240 |
| | | | | |
| | | | | 3,966,181 |
| | | | | |
Oil & Gas — 0.6% | | | | | |
Archipelago Resources Plc (acquired 5/13/05, cost $51,017)(c) | | 78,900 | | | 46,976 |
BG Group Plc | | 147,079 | | | 3,406,458 |
Gulfsands Petroleum Plc | | 9,000 | | | 28,757 |
Wellstream Holdings Plc | | 17,800 | | | 464,545 |
| | | | | |
| | | | | 3,946,736 |
| | | | | |
Pharmaceuticals — 0.3% | | | | | |
GlaxoSmithKline Plc | | 85,506 | | | 1,808,987 |
Shire Plc - ADR | | 4,100 | | | 237,636 |
| | | | | |
| | | | | 2,046,623 |
| | | | | |
Publishing & Printing — 0.0% | | | | | |
United Business Media Plc | | 23,400 | | | 250,315 |
| | | | | |
See Notes to Financial Statements.
| | | | | | |
12 | | BLACKROCK ASSET ALLOCATION PORTFOLIO | | MARCH 31, 2008 | | |
Schedule of Investments (continued)
| | | | | |
| | | Shares | | Value |
Common Stocks (Continued) | | | | | |
United Kingdom (Continued) | | | | | |
Real Estate — 0.1% | | | | | |
Bellway Plc | | 20,600 | | $ | 365,090 |
| | | | | |
Telecommunications — 0.4% | | | | | |
Vodafone Group Plc | | 977,019 | | | 2,925,996 |
| | | | | |
Transportation — 0.1% | | | | | |
Arriva Plc | | 33,800 | | | 460,174 |
National Express Group Plc | | 19,500 | | | 388,940 |
| | | | | |
| | | | | 849,114 |
| | | | | |
Waste Management — 0.0% | | | | | |
Northumbrian Water Group Plc | | 46,900 | | | 325,080 |
| | | | | |
Total United Kingdom | | | | | 28,117,577 |
| | | | | |
United States — 36.4% | | | | | |
Aerospace — 0.6% | | | | | |
AAR Corp.(a) | | 5,500 | | | 149,985 |
Alliant Techsystems, Inc.(a) | | 400 | | | 41,412 |
Argon ST, Inc.(a) | | 7,700 | | | 130,977 |
BE Aerospace, Inc.(a) | | 12,450 | | | 435,127 |
The Boeing Co. | | 5,350 | | | 397,880 |
DRS Technologies, Inc. | | 800 | | | 46,624 |
Goodrich Corp. | | 3,300 | | | 189,783 |
Lockheed Martin Corp. | | 5,750 | | | 570,975 |
Northrop Grumman Corp. | | 25,550 | | | 1,988,046 |
Orbital Sciences Corp.(a) | | 5,750 | | | 138,575 |
| | | | | |
| | | | | 4,089,384 |
| | | | | |
Air Transportation — 0.0% | | | | | |
Continental Airlines, Inc. - Class B(a) | | 8,575 | | | 164,897 |
| | | | | |
Banks — 1.4% | | | | | |
Bank of America Corp. | | 23,600 | | | 894,676 |
The Bank of New York Mellon Corp. | | 29,590 | | | 1,234,791 |
Citigroup, Inc. | | 22,350 | | | 478,737 |
CoBiz, Inc. | | 7,058 | | | 91,895 |
Columbia Banking System, Inc. | | 2,294 | | | 51,340 |
Cullen/Frost Bankers, Inc. | | 5,431 | | | 288,060 |
Fidelity National Information Services, Inc. | | 7,150 | | | 272,701 |
First Midwest Bancorp, Inc. | | 8,754 | | | 243,099 |
First State Bancorporation | | 4,300 | | | 57,577 |
Hudson City Bancorp, Inc. | | 9,800 | | | 173,264 |
JPMorgan Chase & Co. | | 57,850 | | | 2,484,657 |
KBW, Inc.(a)(b) | | 4,500 | | | 99,225 |
New York Community Bancorp, Inc. | | 2,200 | | | 40,084 |
People’s United Financial, Inc. | | 21,810 | | | 377,531 |
Prosperity Bancshares, Inc. | | 3,100 | | | 88,846 |
Signature Bank(a) | | 2,950 | | | 75,225 |
Sterling Bancshares, Inc. | | 8,000 | | | 79,520 |
Susquehanna Bancshares, Inc. | | 2,100 | | | 42,777 |
SVB Financial Group(a) | | 1,450 | | | 63,278 |
U.S. Bancorp | | 27,350 | | | 885,046 |
UMB Financial Corp. | | 2,450 | | | 100,940 |
Umpqua Holdings Corp.(b) | | 6,150 | | | 95,386 |
Valley National Bancorp | | 3,100 | | | 59,551 |
Wells Fargo & Co. | | 31,450 | | | 915,195 |
Westamerica Bancorp | | 2,125 | | | 111,775 |
Wintrust Financial Corp. | | 9,810 | | | 342,860 |
Zions Bancorporation | | 4,680 | | | 213,174 |
| | | | | |
| | | | | 9,861,210 |
| | | | | |
Beverages & Bottling — 1.1% | | | | | |
The Coca-Cola Co. | | 73,600 | | | 4,480,032 |
Coca-Cola Enterprises, Inc. | | 17,650 | | | 427,130 |
Constellation Brands, Inc.(a) | | 16,160 | | | 285,547 |
Green Mountain Coffee Roasters, Inc.(a) | | 3,200 | | | 101,280 |
Molson Coors Brewing Co. - Class B | | 10,100 | | | 530,957 |
Pepsi Bottling Group, Inc. | | 12,600 | | | 427,266 |
PepsiAmericas, Inc. | | 1,200 | | | 30,636 |
PepsiCo, Inc. | | 12,900 | | | 931,380 |
| | | | | |
| | | | | 7,214,228 |
| | | | | |
Broadcasting — 0.3% | | | | | |
Belo Corp. | | 27,352 | | | 289,111 |
CBS Corp. - Class B | | 16,500 | | | 364,320 |
CKX, Inc.(a) | | 53,900 | | | 513,128 |
DIRECTV Group, Inc.(a) | | 27,300 | | | 676,767 |
Outdoor Channel Holdings, Inc.(a) | | 7,169 | | | 52,692 |
| | | | | |
| | | | | 1,896,018 |
| | | | | |
Business Services — 0.6% | | | | | |
Accenture Ltd. | | 6,050 | | | 212,778 |
The Advisory Board Co.(a) | | 3,000 | | | 164,820 |
Alliance Data Systems Corp.(a) | | 650 | | | 30,882 |
American Public Education, Inc.(a) | | 400 | | | 12,148 |
The Brink’s Co. | | 7,325 | | | 492,094 |
CommVault Systems, Inc.(a) | | 4,250 | | | 52,700 |
DeVry, Inc. | | 10,865 | | | 454,592 |
Diamond Management & Technology Consultants, Inc. | | 18,994 | | | 122,511 |
ExlService Holdings, Inc.(a) | | 14,896 | | | 342,012 |
Expedia, Inc.(a) | | 13,625 | | | 298,251 |
Fluor Corp. | | 3,500 | | | 494,060 |
Forrester Research, Inc.(a) | | 14,450 | | | 384,081 |
Gartner, Inc. - Class A(a) | | 3,600 | | | 69,624 |
Healthcare Services Group, Inc. | | 2,058 | | | 42,467 |
Hewitt Associates, Inc. - Class A(a) | | 1,925 | | | 76,557 |
Hiedrick & Struggles International, Inc. | | 1,700 | | | 55,301 |
HMS Holdings Corp.(a) | | 5,225 | | | 149,174 |
Iron Mountain, Inc.(a) | | 11,600 | | | 306,704 |
Martha Stewart Living Omnimedia, Inc.(a)(b) | | 11,500 | | | 85,445 |
Net1 UEPS Technologies, Inc.(a) | | 2,850 | | | 64,267 |
Strayer Education, Inc. | | 500 | | | 76,250 |
W.W. Grainger, Inc. | | 1,794 | | | 137,044 |
| | | | | |
| | | | | 4,123,762 |
| | | | | |
Chemicals — 0.5% | | | | | |
Agrium, Inc. | | 6,600 | | | 409,926 |
Ashland, Inc. | | 7,280 | | | 344,344 |
Celanese Corp. - Series A | | 23,460 | | | 916,113 |
CF Industries Holdings, Inc. | | 700 | | | 72,534 |
The Dow Chemical Co. | | 12,725 | | | 468,916 |
Eastman Chemical Co. | | 6,550 | | | 409,047 |
Hercules, Inc. | | 19,750 | | | 361,228 |
The Lubrizol Corp. | | 8,825 | | | 489,876 |
Minerals Technologies, Inc. | | 1,000 | | | 62,800 |
Rockwood Holdings, Inc.(a) | | 1,800 | | | 58,986 |
Terra Industries, Inc.(a) | | 1,725 | | | 61,289 |
| | | | | |
| | | | | 3,655,059 |
| | | | | |
Computer & Office Equipment — 1.4% | | | | | |
Apple Computer, Inc.(a) | | 28,819 | | | 4,135,527 |
Cisco Systems, Inc.(a) | | 92,193 | | | 2,220,929 |
Electronics for Imaging, Inc.(a) | | 9,500 | | | 141,740 |
See Notes to Financial Statements.
| | | | | | |
| | | BLACKROCK ASSET ALLOCATION PORTFOLIO | | MARCH 31, 2008 | | 13 |
Schedule of Investments (continued)
| | | | | |
| | | Shares | | Value |
Common Stocks (Continued) | | | | | |
United States (Continued) | | | | | |
Computer & Office Equipment (Continued) | | | | | |
Hewlett-Packard Co. | | 18,675 | | $ | 852,701 |
International Business Machines Corp. | | 11,800 | | | 1,358,652 |
Intuit, Inc.(a) | | 7,450 | | | 201,224 |
NCR Corp.(a) | | 1,600 | | | 36,528 |
Phase Metrics, Inc.(a)(e) | | 50,574 | | | 1,011 |
Western Digital Corp.(a) | | 22,096 | | | 597,476 |
| | | | | |
| | | | | 9,545,788 |
| | | | | |
Computer Software & Services — 2.9% | | | | | |
ACI Worldwide, Inc.(a) | | 7,850 | | | 156,372 |
Activision, Inc.(a) | | 37,075 | | | 1,012,518 |
Adobe Systems, Inc.(a) | | 92,456 | | | 3,290,509 |
Affiliated Computer Services, Inc. - Class A(a) | | 2,800 | | | 140,308 |
Aladdin Knowledge Systems Ltd.(a) | | 12,950 | | | 246,438 |
Blackboard, Inc.(a) | | 9,589 | | | 319,601 |
BMC Software, Inc.(a) | | 1,925 | | | 62,601 |
CACI International, Inc.(a) | | 1,800 | | | 81,990 |
comScore, Inc.(a) | | 4,200 | | | 84,252 |
DemandTec, Inc.(a) | | 15,500 | | | 158,100 |
eBay, Inc.(a) | | 2,700 | | | 80,568 |
Emulex Corp.(a) | | 3,275 | | | 53,186 |
Foundry Networks, Inc.(a) | | 18,950 | | | 219,441 |
Google, Inc. - Class A(a) | | 6,172 | | | 2,718,581 |
Greenfield Online, Inc.(a) | | 7,319 | | | 86,803 |
Guidance Software, Inc.(a) | | 10,969 | | | 98,173 |
i2 Technologies, Inc.(a) | | 12,250 | | | 137,935 |
IHS, Inc.(a) | | 10,050 | | | 646,316 |
International Game Technology | | 14,300 | | | 575,003 |
Jack Henry & Associates, Inc. | | 15,050 | | | 371,284 |
Juniper Networks, Inc.(a) | | 5,650 | | | 141,250 |
Lawson Software, Inc.(a) | | 12,200 | | | 91,866 |
McAfee, Inc.(a) | | 1,500 | | | 49,635 |
MICROS Systems, Inc.(a) | | 8,600 | | | 289,476 |
Microsoft Corp. | | 129,293 | | | 3,669,335 |
Move, Inc.(a) | | 20,550 | | | 63,294 |
Nuance Communications, Inc.(a) | | 17,150 | | | 298,582 |
Oracle Corp.(a) | | 23,950 | | | 468,462 |
Phase Forward, Inc.(a) | | 8,800 | | | 150,304 |
PROS Holdings, Inc.(a) | | 7,200 | | | 90,360 |
Quality Systems, Inc. | | 3,000 | | | 89,610 |
Salesforce.com, Inc.(a) | | 26,760 | | | 1,548,601 |
SonicWALL, Inc.(a) | | 29,350 | | | 239,790 |
Sun Microsystems, Inc.(a) | | 42,238 | | | 655,948 |
Sybase, Inc.(a) | | 2,150 | | | 56,545 |
Sykes Enterprises, Inc.(a) | | 17,550 | | | 308,704 |
Symantec Corp.(a) | | 16,900 | | | 280,878 |
Synopsys, Inc.(a) | | 1,700 | | | 38,607 |
Tech Data Corp.(a) | | 6,140 | | | 201,392 |
Teradata Corp.(a) | | 6,900 | | | 152,214 |
The TriZetto Group, Inc.(a) | | 10,033 | | | 167,451 |
Yahoo!, Inc.(a) | | 5,200 | | | 150,436 |
| | | | | |
| | | | | 19,742,719 |
| | | | | |
Construction — 0.0% | | | | | |
EMCor Group, Inc.(a) | | 1,900 | | | 42,199 |
NVR, Inc.(a) | | 45 | | | 26,888 |
Toll Brothers, Inc.(a) | | 4,600 | | | 108,008 |
United Rentals, Inc.(a) | | 3,200 | | | 60,288 |
| | | | | |
| | | | | 237,383 |
| | | | | |
Containers — 0.1% | | | | | |
Owens-Illinois, Inc.(a) | | 2,940 | | | 165,904 |
Pactiv Corp.(a) | | 10,250 | | | 268,652 |
Silgan Holdings, Inc. | | 3,450 | | | 171,224 |
Smurfit-Stone Container Corp.(a) | | 17,110 | | | 131,747 |
Tupperware Corp. | | 7,100 | | | 274,628 |
| | | | | |
| | | | | 1,012,155 |
| | | | | |
Electronics — 0.4% | | | | | |
Agilent Technologies, Inc.(a) | | 9,780 | | | 291,737 |
Ametek, Inc. | | 8,150 | | | 357,866 |
Amphenol Corp. | | 8,450 | | | 314,763 |
Arrow Electronics, Inc.(a) | | 2,300 | | | 77,395 |
Benchmark Electronics, Inc.(a) | | 6,300 | | | 113,085 |
Brady Corp. | | 3,800 | | | 127,034 |
Intel Corp. | | 25,500 | | | 540,090 |
Intersil Corp. - Class A | | 14,410 | | | 369,905 |
RF Micro Devices, Inc.(a) | | 8,400 | | | 22,344 |
TiVo, Inc.(a) | | 21,700 | | | 190,092 |
TTM Technologies, Inc.(a) | | 4,900 | | | 55,468 |
| | | | | |
| | | | | 2,459,779 |
| | | | | |
Energy & Utilities — 1.3% | | | | | |
Airgas, Inc. | | 2,600 | | | 118,222 |
Black Hills Corp. | | 1,825 | | | 65,298 |
Calpine Corp.(a) | | 16,100 | | | 296,562 |
CenterPoint Energy, Inc. | | 48,200 | | | 687,814 |
Constellation Energy Group, Inc. | | 3,450 | | | 304,532 |
Duke Energy Corp. | | 7,600 | | | 135,660 |
Edison International | | 20,590 | | | 1,009,322 |
El Paso Electric Co.(a) | | 5,800 | | | 123,946 |
Energy East Corp. | | 2,350 | | | 56,682 |
Entergy Corp. | | 2,580 | | | 281,426 |
Equitable Resources, Inc. | | 9,720 | | | 572,508 |
Evergreen Energy, Inc.(a)(b) | | 11,500 | | | 17,710 |
Exelon Corp. | | 14,900 | | | 1,210,923 |
FPL Group, Inc. | | 9,550 | | | 599,167 |
Integrys Energy Group, Inc. | | 6,100 | | | 284,504 |
KBR, Inc. | | 1,500 | | | 41,595 |
Longview Energy Co. (acquired 01/31/05, cost $48,000)(c)(e) | | 3,200 | | | 64,000 |
NRG Energy, Inc.(a) | | 7,770 | | | 302,952 |
Ocean Power Technologies, Inc.(a) | | 1,000 | | | 12,220 |
PPL Corp. | | 7,570 | | | 347,614 |
Quanta Services, Inc.(a) | | 8,150 | | | 188,836 |
Questar Corp. | | 9,610 | | | 543,542 |
SCANA Corp. | | 14,900 | | | 545,042 |
Sempra Energy | | 3,075 | | | 163,836 |
Sierra Pacific Resources | | 8,225 | | | 103,882 |
UIL Holdings Corp. | | 5,600 | | | 168,728 |
Vectren Corp. | | 1,875 | | | 50,306 |
Wisconsin Energy Corp. | | 9,350 | | | 411,307 |
Xcel Energy, Inc. | | 9,200 | | | 183,540 |
| | | | | |
| | | | | 8,891,676 |
| | | | | |
Entertainment & Leisure — 0.6% | | | | | |
Ameristar Casinos, Inc. | | 5,100 | | | 93,075 |
DreamWorks Animation SKG, Inc. - Class A(a) | | 10,150 | | | 261,667 |
Las Vegas Sands Corp.(a) | | 11,101 | | | 817,478 |
Morgans Hotel Group Co.(a) | | 7,265 | | | 107,667 |
Orient-Express Hotels Ltd. - Class A | | 12,437 | | | 536,781 |
See Notes to Financial Statements.
| | | | | | |
14 | | BLACKROCK ASSET ALLOCATION PORTFOLIO | | MARCH 31, 2008 | | |
Schedule of Investments (continued)
| | | | | |
| | | Shares | | Value |
Common Stocks (Continued) | | | | | |
United States (Continued) | | | | | |
Entertainment & Leisure (Continued) | | | | | |
Pinnacle Entertainment, Inc.(a) | | 29,360 | | $ | 375,808 |
Royal Caribbean Cruises Ltd.(b) | | 9,650 | | | 317,485 |
Scientific Games Corp. - Class A(a) | | 18,600 | | | 392,646 |
The Walt Disney Co. | | 26,350 | | | 826,863 |
World Wrestling Entertainment, Inc. | | 4,700 | | | 87,467 |
| | | | | |
| | | | | 3,816,937 |
| | | | | |
Finance — 1.8% | | | | | |
Affiliated Managers Group, Inc.(a) | | 4,200 | | | 381,108 |
AllianceBernstein Holding LP | | 2,450 | | | 155,281 |
American Express Co. | | 10,150 | | | 443,758 |
Astoria Financial Corp. | | 8,000 | | | 217,280 |
Capital One Financial Corp. | | 4,435 | | | 218,291 |
CME Group, Inc. | | 650 | | | 304,915 |
Deluxe Corp. | | 2,175 | | | 41,782 |
Evercore Partners, Inc. | | 7,000 | | | 124,250 |
Federated Investors, Inc. - Class B | | 8,425 | | | 329,923 |
The Goldman Sachs Group, Inc. | | 7,350 | | | 1,215,616 |
Invesco Ltd. | | 16,520 | | | 402,427 |
Knight Capital Group, Inc.(a) | | 2,700 | | | 43,848 |
Market Vectors Russia | | 45,000 | | | 2,120,400 |
NGP Capital Resources Co. | | 2,700 | | | 44,334 |
NYSE Euronext, Inc. | | 9,200 | | | 567,732 |
Regions Financial Corp. | | 5,800 | | | 114,550 |
Riskmetrics Group, Inc.(a) | | 2,300 | | | 44,505 |
State Street Corp. | | 12,500 | | | 987,500 |
Streettracks Gold Trust(a) | | 42,000 | | | 3,795,960 |
TD Ameritrade Holding Corp.(a) | | 42,930 | | | 708,774 |
Wright Express Corp.(a) | | 6,950 | | | 213,574 |
| | | | | |
| | | | | 12,475,808 |
| | | | | |
Food & Agriculture — 0.7% | | | | | |
Bunge Ltd. | | 4,950 | | | 430,056 |
Dean Foods Co.(a) | | 11,320 | | | 227,419 |
Del Monte Foods Co. | | 38,936 | | | 371,060 |
Diamond Foods, Inc. | | 5,700 | | | 103,398 |
Fresh Del Monte Produce, Inc.(a) | | 1,125 | | | 40,950 |
Monsanto Co. | | 22,436 | | | 2,501,614 |
Panera Bread Co. - Class A(a)(b) | | 7,100 | | | 297,419 |
Potash Corp. of Saskatchewan, Inc. | | 6,190 | | | 960,750 |
| | | | | |
| | | | | 4,932,666 |
| | | | | |
Furniture — 0.0% | | | | | |
Herman Miller, Inc. | | 2,100 | | | 51,597 |
| | | | | |
Insurance — 1.0% | | | | | |
ACE Ltd. | | 8,050 | | | 443,233 |
Aetna, Inc. | | 11,200 | | | 471,408 |
American Financial Group, Inc. | | 2,175 | | | 55,593 |
American International Group, Inc. | | 9,050 | | | 391,412 |
Amerigroup Corp.(a) | | 1,975 | | | 53,977 |
Arch Capital Group Ltd.(a) | | 1,900 | | | 130,473 |
Assurant, Inc. | | 5,240 | | | 318,906 |
AXIS Capital Holdings Ltd. | | 18,390 | | | 624,892 |
CHUBB Corp. | | 10,575 | | | 523,251 |
Endurance Specialty Holdings Ltd. | | 10,661 | | | 390,193 |
Everest Re Group Ltd. | | 750 | | | 67,148 |
First Mercury Financial Corp.(a) | | 10,700 | | | 186,287 |
Genworth Financial, Inc. | | 5,425 | | | 122,822 |
HCC Insurance Holdings, Inc. | | 18,830 | | | 427,253 |
Lincoln National Corp. | | 5,400 | | | 280,800 |
MetLife, Inc. | | 10,800 | | | 650,808 |
PartnerRe Ltd. | | 2,375 | | | 181,212 |
Platinum Underwriters Holdings Ltd. | | 1,741 | | | 56,513 |
RenaissanceRe Holdings Ltd. | | 2,350 | | | 121,988 |
Travelers Companies, Inc. | | 13,725 | | | 656,741 |
UnumProvident Corp. | | 20,100 | | | 442,401 |
W.R. Berkley Corp. | | 14,930 | | | 413,412 |
WellPoint, Inc.(a) | | 2,100 | | | 92,673 |
| | | | | |
| | | | | 7,103,396 |
| | | | | |
Leasing — 0.0% | | | | | |
GATX Corp. | | 1,400 | | | 54,698 |
Machinery & Heavy Equipment — 0.6% | | | | | |
AGCO Corp.(a) | | 7,625 | | | 456,585 |
Albany International Corp. - Class A | | 8,360 | | | 302,130 |
Altra Holdings, Inc.(a) | | 5,700 | | | 76,665 |
Bucyrus International, Inc. - Class A | | 1,600 | | | 162,640 |
Deere & Co. | | 9,000 | | | 723,960 |
Flowserve Corp. | | 450 | | | 46,971 |
H&E Equipment Services, Inc.(a) | | 4,800 | | | 60,336 |
Joy Global, Inc. | | 31,925 | | | 2,080,233 |
The Manitowoc Co., Inc. | | 1,025 | | | 41,820 |
| | | | | |
| | | | | 3,951,340 |
| | | | | |
Manufacturing — 2.5% | | | | | |
Actuant Corp. - Class A | | 8,925 | | | 269,624 |
Acuity Brands, Inc. | | 1,350 | | | 57,982 |
AptarGroup, Inc. | | 700 | | | 27,251 |
Chart Industries, Inc.(a) | | 5,600 | | | 189,504 |
Chattem, Inc.(a) | | 2,398 | | | 159,083 |
Corning, Inc. | | 77,900 | | | 1,872,716 |
Crane Co. | | 1,300 | | | 52,455 |
Crocs, Inc.(a)(b) | | 26,400 | | | 461,208 |
Cummins, Inc. | | 8,600 | | | 402,652 |
Danaher Corp. | | 25,500 | | | 1,938,765 |
Dover Corp. | | 8,060 | | | 336,747 |
Eaton Corp. | | 6,880 | | | 548,130 |
Elizabeth Arden, Inc.(a) | | 11,475 | | | 228,926 |
Energizer Holdings, Inc.(a) | | 1,325 | | | 119,886 |
Foster Wheeler Ltd.(a) | | 6,096 | | | 345,156 |
Fuller (H.B.) Co. | | 4,300 | | | 87,763 |
Gardner Denver, Inc.(a) | | 5,825 | | | 216,108 |
General Cable Corp.(a) | | 1,900 | | | 112,233 |
General Electric Co. | | 101,818 | | | 3,768,284 |
Harsco Corp. | | 1,350 | | | 74,763 |
Hexel Corp.(a) | | 4,250 | | | 81,217 |
Honeywell International, Inc. | | 43,160 | | | 2,435,087 |
IDEX Corp. | | 7,775 | | | 238,615 |
Jones Apparel Group, Inc. | | 12,610 | | | 169,226 |
Kaydon Corp. | | 2,400 | | | 105,384 |
Ladish Co., Inc.(a) | | 2,150 | | | 77,400 |
Lear Corp.(a) | | 1,600 | | | 41,456 |
Mettler-Toledo International, Inc.(a) | | 575 | | | 55,844 |
Newell Rubbermaid, Inc. | | 18,650 | | | 426,526 |
NIKE, Inc., Class B | | 2,450 | | | 166,600 |
Parker Hannifin Corp. | | 7,025 | | | 486,622 |
Quanex Corp. | | 10,881 | | | 562,983 |
RBC Bearings, Inc.(a) | | 2,550 | | | 94,681 |
See Notes to Financial Statements.
| | | | | | |
| | | BLACKROCK ASSET ALLOCATION PORTFOLIO | | MARCH 31, 2008 | | 15 |
Schedule of Investments (continued)
| | | | | |
| | | Shares | | Value |
Common Stocks (Continued) | | | | | |
United States (Continued) | | | | | |
Manufacturing (Continued) | | | | | |
Smith & Wesson Holding Corp.(a) | | 6,072 | | $ | 30,481 |
SPX Corp. | | 900 | | | 94,410 |
Textron, Inc. | | 3,190 | | | 176,790 |
VF Corp. | | 6,050 | | | 468,936 |
The Warnaco Group, Inc.(a) | | 3,759 | | | 148,255 |
Watson Wyatt Worldwide, Inc. | | 2,575 | | | 146,131 |
| | | | | |
| | | | | 17,275,880 |
| | | | | |
Measuring & Controlling Devices — 0.4% | | | | | |
Thermo Electron Corp.(a) | | 44,100 | | | 2,506,644 |
| | | | | |
Medical & Medical Services — 1.0% | | | | | |
Amedisys, Inc.(a) | | 4,500 | | | 177,030 |
Apria Healthcare Group, Inc.(a) | | 2,500 | | | 49,375 |
Arthrocare Corp.(a)(b) | | 2,800 | | | 93,380 |
Baxter International, Inc. | | 9,250 | | | 534,835 |
Coventry Health Care, Inc.(a) | | 3,870 | | | 156,155 |
Davita, Inc.(a) | | 3,400 | | | 162,384 |
Express Scripts, Inc.(a) | | 3,300 | | | 212,256 |
Health Net, Inc.(a) | | 750 | | | 23,100 |
Henry Schein, Inc.(a) | | 17,600 | | | 1,010,240 |
Invitrogen Corp.(a) | | 5,525 | | | 472,222 |
Kindred Healthcare, Inc.(a) | | 2,750 | | | 60,142 |
Laboratory Corp. of America Holdings(a) | | 3,630 | | | 267,458 |
Lifecell Corp.(a) | | 2,700 | | | 113,481 |
Magellan Health Services, Inc.(a) | | 9,350 | | | 371,102 |
MedCath Corp.(a) | | 5,800 | | | 105,560 |
Medco Health Solutions, Inc.(a) | | 41,270 | | | 1,807,213 |
Pediatrix Medical Group, Inc.(a) | | 12,450 | | | 839,130 |
Quest Diagnostics, Inc. | | 5,510 | | | 249,438 |
Santarus, Inc.(a) | | 23,650 | | | 60,780 |
Sun Healthcare Group, Inc.(a) | | 6,200 | | | 81,468 |
UnitedHealth Group, Inc. | | 5,400 | | | 185,544 |
WellCare Health Plans, Inc.(a) | | 325 | | | 12,659 |
| | | | | |
| | | | | 7,044,952 |
| | | | | |
Medical Instruments & Supplies — 1.4% | | | | | |
Align Technology, Inc.(a) | | 1,256 | | | 13,954 |
Bruker BioSciences Corp.(a) | | 8,050 | | | 123,890 |
C.R. Bard, Inc. | | 6,550 | | | 631,420 |
Charles River Laboratories International, Inc.(a) | | 850 | | | 50,099 |
The Cooper Cos., Inc., | | 11,290 | | | 388,715 |
DENTSPLY International, Inc. | | 2,275 | | | 87,815 |
ev3, Inc.(a) | | 9,950 | | | 80,993 |
Hillenbrand Industries, Inc. | | 3,287 | | | 157,119 |
Hologic, Inc.(a) | | 45,725 | | | 2,542,310 |
Home Diagnostics, Inc.(a) | | 2,800 | | | 19,488 |
Intuitive Surgical, Inc.(a) | | 435 | | | 141,092 |
Johnson & Johnson | | 51,950 | | | 3,369,996 |
Kinetic Concepts, Inc.(a) | | 8,725 | | | 403,357 |
Martek Biosciences Corp.(a) | | 10,850 | | | 331,684 |
MWI Veterinary Supply, Inc.(a) | | 2,747 | | | 96,859 |
Orthofix International NV(a) | | 1,800 | | | 71,586 |
SonoSite, Inc.(a) | | 6,100 | | | 173,423 |
Symmetry Medical, Inc.(a) | | 9,200 | | | 152,720 |
Wright Medical Group, Inc.(a) | | 10,405 | | | 251,177 |
Zoll Medical Corp.(a) | | 8,000 | | | 212,720 |
| | | | | |
| | | | | 9,300,417 |
| | | | | |
Metal & Mining — 2.0% | | | | | |
Arch Coal, Inc. | | 31,700 | | | 1,378,950 |
Century Aluminum Co.(a) | | 2,000 | | | 132,480 |
CONSOL Energy, Inc. | | 68,591 | | | 4,745,811 |
Foundation Coal Holdings, Inc. | | 900 | | | 45,297 |
Freeport-McMoRan Copper & Gold, Inc. - Class B | | 15,332 | | | 1,475,245 |
James River Coal Co.(a) | | 2,300 | | | 40,296 |
Kinross Gold Corp. | | 22,235 | | | 491,616 |
Massey Energy Co. | | 68,067 | | | 2,484,446 |
Pan American Silver Corp.(a) | | 8,200 | | | 314,634 |
Patriot Coal Corp.(a) | | 1,399 | | | 65,711 |
Peabody Energy Corp. | | 26,498 | | | 1,351,398 |
Reliance Steel & Aluminum Co. | | 4,915 | | | 294,212 |
Steel Dynamics, Inc. | | 4,100 | | | 135,464 |
United States Steel Corp. | | 5,550 | | | 704,128 |
| | | | | |
| | | | | 13,659,688 |
| | | | | |
Miscellaneous Services — 0.1% | | | | | |
Owens & Minor, Inc. | | 1,300 | | | 51,142 |
TeleTech Holdings, Inc.(a) | | 13,050 | | | 293,103 |
| | | | | |
| | | | | 344,245 |
| | | | | |
Motor Vehicles — 0.1% | | | | | |
American Axle & Manufacturing Holdings, Inc. | | 2,475 | | | 50,738 |
Ford Motor Co.(a) | | 37,158 | | | 212,544 |
Oshkosh Truck Corp. | | 8,850 | | | 321,078 |
Polaris Industries, Inc. | | 875 | | | 35,884 |
TRW Automotive Holdings Corp.(a) | | 5,150 | | | 120,355 |
| | | | | |
| | | | | 740,599 |
| | | | | |
Oil & Gas — 4.7% | | | | | |
Allis-Chalmers Energy, Inc.(a) | | 4,700 | | | 64,813 |
American Oil & Gas, Inc.(a) | | 5,947 | | | 19,447 |
Apache Corp. | | 6,950 | | | 839,699 |
Approach Resources, Inc.(a) | | 1,700 | | | 26,656 |
Atwood Oceanics, Inc.(a) | | 2,600 | | | 238,472 |
Aventine Renewable Energy Holdings, Inc.(a) | | 7,900 | | | 41,080 |
Baker Hughes, Inc. | | 15,300 | | | 1,048,050 |
BJ Services Co. | | 4,000 | | | 114,040 |
Bois d’Arc Energy, Inc.(a) | | 3,400 | | | 73,066 |
Brigham Exploration Co.(a) | | 811 | | | 4,923 |
Cal Dive International, Inc.(a) | | 4,800 | | | 49,824 |
Callon Petroleum Co.(a) | | 2,500 | | | 45,225 |
CanArgo Energy Corp.(a) | | 194,100 | | | 67,838 |
Chesapeake Energy Corp. | | 25,250 | | | 1,165,287 |
Chevron Corp. | | 17,200 | | | 1,468,192 |
Cimarex Energy Co. | | 7,300 | | | 399,602 |
Clayton Williams Energy, Inc.(a) | | 20,823 | | | 1,092,999 |
Complete Production Services, Inc.(a) | | 900 | | | 20,646 |
Comstock Resources, Inc.(a) | | 6,250 | | | 251,875 |
ConocoPhillips | | 17,550 | | | 1,337,485 |
Dawson Geophysical Co.(a) | | 1,500 | | | 101,250 |
Delta Petroleum Corp.(a) | | 52,155 | | | 1,175,574 |
Denbury Resources, Inc.(a) | | 3,800 | | | 108,490 |
Devon Energy Corp. | | 2 | | | 209 |
Diamond Offshore Drilling, Inc. | | 1,727 | | | 201,023 |
Encore Acquisition Co.(a) | | 1,550 | | | 62,434 |
Energen Corp. | | 5,050 | | | 314,615 |
ENSCO International, Inc. | | 10,050 | | | 629,331 |
EOG Resources, Inc. | | 19,720 | | | 2,366,400 |
EXCO Resources, Inc.(a) | | 13,100 | | | 242,350 |
Exxon Mobil Corp. | | 38,250 | | | 3,235,185 |
See Notes to Financial Statements.
| | | | | | |
16 | | BLACKROCK ASSET ALLOCATION PORTFOLIO | | MARCH 31, 2008 | | |
Schedule of Investments (continued)
| | | | | |
| | | Shares | | Value |
Common Stocks (Continued) | | | | | |
United States (Continued) | | | | | |
Oil & Gas (Continued) | | | | | |
FMC Technologies, Inc.(a) | | 2,100 | | $ | 119,469 |
Forest Oil Corp.(a) | | 1,300 | | | 63,648 |
Gasco Energy, Inc.(a) | | 19,600 | | | 47,824 |
Goodrich Petroleum Corp.(a) | | 7,850 | | | 236,128 |
Grant Prideco, Inc.(a) | | 10,580 | | | 520,748 |
Halliburton Co. | | 22,730 | | | 893,971 |
Helmerich & Payne, Inc. | | 2,600 | | | 121,862 |
Hercules Offshore, Inc.(a) | | 5,800 | | | 145,696 |
ION Geophysical Corp.(a) | | 9,200 | | | 126,960 |
Marathon Oil Corp. | | 151 | | | 6,886 |
Mariner Energy, Inc.(a) | | 2,900 | | | 78,329 |
Matador Resources Co. (acquired 01/31/05 through 04/19/06, cost $62,950)(c)(e) | | 2,895 | | | 86,850 |
McMoRan Exploration Co.(a) | | 1,900 | | | 32,851 |
National-Oilwell, Inc.(a) | | 9,450 | | | 551,691 |
Newfield Exploration Co.(a) | | 10,054 | | | 531,354 |
Noble Corp. | | 11,400 | | | 566,238 |
Occidental Petroleum Corp. | | 5,200 | | | 380,484 |
Oceaneering International, Inc.(a) | | 1,500 | | | 94,500 |
Oil States International, Inc.(a) | | 3,200 | | | 143,392 |
Oneok, Inc. | | 2,200 | | | 98,186 |
Parallel Petroleum Corp.(a) | | 4,879 | | | 95,482 |
Particle Drilling Technologies, Inc. | | 10,800 | | | 10,714 |
Penn Virginia Corp. | | 16,500 | | | 727,485 |
Plains Exploration & Production Co.(a) | | 11,450 | | | 608,453 |
Precision Drilling Trust | | 3,300 | | | 76,560 |
Schlumberger Ltd. | | 42,010 | | | 3,654,870 |
Smith International, Inc. | | 6,400 | | | 411,072 |
Southwestern Energy Co.(a) | | 10,880 | | | 366,547 |
St. Mary Land & Exploration Co. | | 2,100 | | | 80,850 |
Superior Energy Services, Inc.(a) | | 7,800 | | | 309,036 |
Tidewater, Inc. | | 3,550 | | | 195,640 |
Transocean, Inc.(a) | | 22,427 | | | 3,032,130 |
Treasure Island Royalty Trust(a) | | 217,129 | | | 75,995 |
TXCO Resources, Inc.(a) | | 8,700 | | | 107,706 |
Verasun Energy Corp.(a) | | 6,900 | | | 50,715 |
Warren Resources, Inc.(a) | | 4,034 | | | 47,884 |
Weatherford International Ltd.(a) | | 7,300 | | | 529,031 |
The Williams Cos., Inc. | | 3,400 | | | 112,132 |
| | | | | |
| | | | | 32,145,449 |
| | | | | |
Personal Services — 0.0% | | | | | |
MSCI, Inc.(a) | | 3,000 | | | 89,250 |
| | | | | |
Pharmaceuticals — 1.6% | | | | | |
Abbott Laboratories | | 35,200 | | | 1,941,280 |
Applera Corp. - Applied Biosystems Group | | 6,900 | | | 226,734 |
Celgene Corp.(a) | | 19,900 | | | 1,219,671 |
Cephalon, Inc.(a) | | 1,225 | | | 78,890 |
Dyax Corp.(a) | | 30,702 | | | 144,606 |
Eli Lilly & Co. | | 12,700 | | | 655,193 |
Endo Pharmaceuticals Holdings, Inc.(a) | | 5,800 | | | 138,852 |
Forest Laboratories, Inc.(a) | | 2,450 | | | 98,025 |
Genentech, Inc.(a) | | 12,800 | | | 1,039,104 |
Gilead Sciences, Inc.(a) | | 42,950 | | | 2,213,214 |
Medicis Pharmaceutical Corp. | | 15,450 | | | 304,210 |
Merck & Co., Inc. | | 34,870 | | | 1,323,316 |
Millennium Pharmaceuticals, Inc.(a) | | 3,100 | | | 47,926 |
Myriad Genetics, Inc.(a) | | 1,900 | | | 76,551 |
Pfizer, Inc. | | 82,600 | | | 1,728,818 |
Watson Pharmaceuticals, Inc.(a) | | 2,700 | | | 79,164 |
| | | | | |
| | | | | 11,315,554 |
| | | | | |
Plastics — 0.0% | | | | | |
Sonoco Products Co. | | 8,950 | | | 256,238 |
| | | | | |
Publishing & Printing — 0.1% | | | | | |
Dolan Media Co.(a) | | 7,212 | | | 145,033 |
R.R. Donnelley & Sons Co. | | 15,410 | | | 467,077 |
Valassis Communications, Inc.(a) | | 3,600 | | | 39,060 |
| | | | | |
| | | | | 651,170 |
| | | | | |
Railroad & Shipping — 0.2% | | | | | |
CSX Corp. | | 15,500 | | | 869,085 |
Norfolk Southern Corp. | | 3,490 | | | 189,577 |
| | | | | |
| | | | | 1,058,662 |
| | | | | |
Real Estate — 0.4% | | | | | |
AMB Property Corp. (REIT) | | 1,725 | | | 93,875 |
Annaly Capital Management, Inc. (REIT) | | 4,100 | | | 62,812 |
Arbor Realty Trust, Inc. (REIT)(b) | | 7,328 | | | 110,506 |
BioMed Realty Trust, Inc. (REIT) | | 5,100 | | | 121,839 |
Boston Properties, Inc. (REIT) | | 3,750 | | | 345,263 |
California Coastal Communities, Inc.(a) | | 2,004 | | | 9,699 |
Colonial Properties Trust (REIT) | | 5,100 | | | 122,655 |
Corporate Office Properties Trust (REIT) | | 3,500 | | | 117,635 |
FX Real Estate and Entertainment, Inc.(a) | | 7,730 | | | 45,452 |
FX Real Estate and Entertainment, Inc., Rights expire 4/11/08(a) | | 5,390 | | | 431 |
Gramercy Capital Corp. (REIT)(b) | | 8,100 | | | 169,533 |
Health Care, Inc. (REIT) | | 1,350 | | | 60,926 |
Highwoods Properties, Inc. | | 2,200 | | | 68,354 |
Hospitality Properties Trust (REIT) | | 6,925 | | | 235,588 |
Jones Lang LaSalle, Inc. (REIT) | | 800 | | | 61,872 |
Mack-Cali Realty Corp. (REIT) | | 900 | | | 32,139 |
Nationwide Health Properties, Inc. (REIT) | | 1,800 | | | 60,750 |
ProLogis (REIT) | | 8,650 | | | 509,139 |
Redwood Trust, Inc. (REIT)(b) | | 600 | | | 21,810 |
Simon Property Group, Inc. (REIT) | | 6,750 | | | 627,143 |
Ventas, Inc. (REIT) | | 1,400 | | | 62,874 |
| | | | | |
| | | | | 2,940,295 |
| | | | | |
Restaurants — 0.3% | | | | | |
Brinker International, Inc. | | 10,100 | | | 187,355 |
Carrols Restaurant Group, Inc.(a) | | 8,634 | | | 77,102 |
Chipotle Mexican Grill, Inc.(a) | | 350 | | | 39,700 |
Jack-in-the-Box, Inc.(a) | | 2,175 | | | 58,442 |
McDonald’s Corp. | | 32,150 | | | 1,793,006 |
Sonic Corp.(a) | | 2,900 | | | 63,916 |
| | | | | |
| | | | | 2,219,521 |
| | | | | |
Retail Merchandising — 2.0% | | | | | |
Advance Auto Parts, Inc. | | 9,130 | | | 310,876 |
Aeropostale, Inc.(a) | | 2,000 | | | 54,220 |
Amazon.com, Inc.(a) | | 14,791 | | | 1,054,598 |
AnnTaylor Stores Corp.(a) | | 5,700 | | | 137,826 |
AutoZone, Inc.(a) | | 3,450 | | | 392,714 |
Best Buy Co., Inc. | | 4,050 | | | 167,913 |
BJ’s Wholesale Club, Inc.(a) | | 4,325 | | | 154,359 |
The Children’s Place Retail Stores, Inc.(a) | | 3,900 | | | 95,784 |
Christopher & Banks Corp. | | 4,400 | | | 43,956 |
Coldwater Creek, Inc.(a) | | 8,900 | | | 44,945 |
Copart, Inc.(a) | | 6,200 | | | 240,312 |
Deckers Outdoor Corp.(a) | | 200 | | | 21,564 |
GameStop Corp.(a) | | 11,450 | | | 592,080 |
Golfsmith International Holdings, Inc.(a) | | 5,800 | | | 12,238 |
Hanesbrands, Inc.(a) | | 2,875 | | | 83,950 |
See Notes to Financial Statements.
| | | | | | |
| | | BLACKROCK ASSET ALLOCATION PORTFOLIO | | MARCH 31, 2008 | | 17 |
Schedule of Investments (continued)
| | | | | |
| | | Shares | | Value |
Common Stocks (Continued) | | | | | |
United States (Continued) | | | | | |
Retail Merchandising (Continued) | | | | | |
J. Crew Group, Inc.(a) | | 1,700 | | $ | 75,089 |
Jarden Corp.(a) | | 5,900 | | | 128,266 |
Jos. A. Bank Clothiers, Inc.(a)(b) | | 2,700 | | | 55,350 |
Kohl’s Corp.(a) | | 25,877 | | | 1,109,865 |
The Kroger Co. | | 15,950 | | | 405,130 |
Limited Brands, Inc. | | 18,430 | | | 315,153 |
Longs Drug Stores Corp. | | 6,380 | | | 270,895 |
Macy’s, Inc. | | 20,665 | | | 476,535 |
Nordstrom, Inc. | | 23,984 | | | 781,878 |
RadioShack Corp. | | 23,575 | | | 383,094 |
Safeway, Inc. | | 16,620 | | | 487,797 |
Sally Beauty Holdings, Inc.(a) | | 13,035 | | | 89,942 |
The Talbots, Inc.(b) | | 24,606 | | | 265,253 |
TJX Cos., Inc. | | 21,150 | | | 699,430 |
Urban Outfitters, Inc.(a) | | 4,100 | | | 128,535 |
Wal-Mart Stores, Inc. | | 84,586 | | | 4,455,990 |
| | | | | |
| | | | | 13,535,537 |
| | | | | |
Security Brokers & Dealers — 0.4% | | | | | |
GFI Group, Inc. | | 850 | | | 48,705 |
Janus Capital Group, Inc. | | 71,133 | | | 1,655,265 |
Lehman Brothers Holdings, Inc. | | 7,500 | | | 282,300 |
Piper Jaffray Cos., Inc.(a) | | 7,400 | | | 251,304 |
Waddell & Reed Financial, Inc. | | 6,500 | | | 208,845 |
| | | | | |
| | | | | 2,446,419 |
| | | | | |
Semiconductors & Related Devices — 0.5% | | | | | |
Amkor Technology, Inc.(a) | | 3,400 | | | 36,380 |
Avnet, Inc.(a) | | 6,150 | | | 201,290 |
Broadcom Corp. - Class A(a) | | 48,300 | | | 930,741 |
Lam Research Corp.(a) | | 8,400 | | | 321,048 |
MEMC Electronic Materials, Inc.(a) | | 2,850 | | | 202,065 |
Micron Technology, Inc.(a) | | 43,130 | | | 257,486 |
Microsemi Corp.(a) | | 6,400 | | | 145,920 |
NVIDIA Corp.(a) | | 7,250 | | | 143,477 |
PMC-Sierra, Inc.(a) | | 198,750 | | | 1,132,875 |
Semtech Corp.(a) | | 3,700 | | | 53,021 |
Standard Microsystems Corp.(a) | | 5,350 | | | 156,113 |
Ultra Clean Holdings, Inc.(a) | | 9,804 | | | 96,079 |
| | | | | |
| | | | | 3,676,495 |
| | | | | |
Soaps & Cosmetics — 0.7% | | | | | |
Avon Products, Inc. | | 32,200 | | | 1,273,188 |
Bare Escentuals, Inc.(a)(b) | | 16,300 | | | 381,746 |
Colgate-Palmolive Co. | | 4,200 | | | 327,222 |
Estee Lauder Cos., Inc. | | 2,300 | | | 105,455 |
The Procter & Gamble Co. | | 37,030 | | | 2,594,692 |
| | | | | |
| | | | | 4,682,303 |
| | | | | |
Telecommunications — 1.7% | | | | | |
ADC Telecommunications, Inc.(a) | | 3,775 | | | 45,602 |
Amdocs Ltd.(a) | | 19,207 | | | 544,711 |
American Tower Corp. - Class A(a) | | 38,750 | | | 1,519,388 |
Anixter International, Inc.(a) | | 3,129 | | | 200,381 |
AT&T, Inc. | | 96,828 | | | 3,708,512 |
CenturyTel, Inc. | | 1,400 | | | 46,536 |
EMS Technologies, Inc.(a) | | 11,700 | | | 317,538 |
Harris Corp. | | 8,871 | | | 430,510 |
Iowa Telecommunications Services, Inc. | | 7,000 | | | 124,110 |
iPCS, Inc. | | 3,670 | | | 85,694 |
Neutral Tandem, Inc.(a) | | 3,100 | | | 55,831 |
Occam Networks, Inc.(a) | | 6,400 | | | 34,816 |
Plantronics, Inc. | | 1,800 | | | 34,758 |
QUALCOMM, Inc. | | 71,932 | | | 2,949,212 |
Research In Motion Ltd.(a) | | 4,570 | | | 512,891 |
Verizon Communications, Inc. | | 25,994 | | | 947,481 |
| | | | | |
| | | | | 11,557,971 |
| | | | | |
Textiles — 0.0% | | | | | |
Carter’s, Inc.(a) | | 6,100 | | | 98,515 |
Kenneth Cole Productions, Inc. | | 3,800 | | | 64,372 |
| | | | | |
| | | | | 162,887 |
| | | | | |
Tobacco — 0.6% | | | | | |
Altria Group, Inc. | | 22,269 | | | 494,372 |
Loews Corp.-Carolina Group | | 5,220 | | | 378,711 |
Philip Morris International, Inc.(a) | | 63,505 | | | 3,212,083 |
UST, Inc. | | 6,080 | | | 331,481 |
| | | | | |
| | | | | 4,416,647 |
| | | | | |
Transportation — 0.3% | | | | | |
Con-Way, Inc. | | 3,300 | | | 163,284 |
Expeditors International of Washington, Inc. | | 24,265 | | | 1,096,293 |
J.B. Hunt Transport Services, Inc. | | 1,800 | | | 56,574 |
Kirby Corp.(a) | | 1,125 | | | 64,125 |
Knight Transportation, Inc. | | 3,800 | | | 62,548 |
Ryder Systems, Inc. | | 6,150 | | | 374,596 |
Vitran Corp., Inc.(a) | | 2,107 | | | 30,067 |
| | | | | |
| | | | | 1,847,487 |
| | | | | |
Waste Management — 0.1% | | | | | |
Allied Waste Industries, Inc.(a) | | 48,600 | | | 525,366 |
Clean Harbors, Inc.(a) | | 4,700 | | | 305,500 |
| | | | | |
| | | | | 830,866 |
| | | | | |
Total United States | | | | | 249,985,676 |
| | | | | |
Total Common Stocks | | | | | |
(Cost $341,171,845) | | | | | 399,314,252 |
| | | | | |
Preferred Stocks — 0.5% | | | | | |
United Kingdom — 0.3% | | | | | |
Food & Agriculture — 0.3% | | | | | |
Tesco Plc | | 261,468 | | | 1,966,705 |
| | | | | |
United States — 0.2% | | | | | |
Government — 0.2% | | | | | |
Federal Home Loan Mortgage Corp. | | 25,800 | | | 629,520 |
Federal National Mortgage Assoc. | | 34,700 | | | 834,535 |
| | | | | |
| | | | | 1,464,055 |
| | | | | |
Total Preferred Stocks | | | | | |
(Cost $3,881,522) | | | | | 3,430,760 |
| | | | | |
See Notes to Financial Statements.
| | | | | | |
18 | | BLACKROCK ASSET ALLOCATION PORTFOLIO | | MARCH 31, 2008 | | |
Schedule of Investments (continued)
| | | | | | |
| | | Par
(000) | | Value |
Trust Preferred Stocks — 0.9% | | | | | | |
Banks — 0.6% | | | | | | |
Bank of America Corp., Capital Securities | | | | | | |
8.07%, 12/31/26(d) | | $ | 225 | | $ | 231,923 |
Bank of America Corp., Depositary Shares | | | | | | |
8.00%(f) | | | 720 | | | 720,864 |
Citigroup Capital XXI, Trust Preferred Securities | | | | | | |
8.30%, 12/21/57(g) | | | 615 | | | 606,004 |
First Union Capital l, Capital Securities | | | | | | |
7.94%, 1/15/27 | | | 325 | | | 333,014 |
JPMorgan Chase Capital XXV, Captial Securities | | | | | | |
6.80%, 10/01/37 | | | 1,150 | | | 1,050,729 |
Mellon Captial IV, Capital Securities | | | | | | |
6.24%(f)(g) | | | 250 | | | 193,067 |
UBS Preferred Funding Trust, Inc., Capital Securities | | | | | | |
8.62%(f)(g) | | | 35 | | | 34,743 |
Wachovia Corp., Preferred Stock | | | | | | |
7.98%(f)(g) | | | 875 | | | 859,687 |
| | | | | | |
| | | | | | 4,030,031 |
| | | | | | |
Finance — 0.0% | | | | | | |
Goldman Sachs Capital Trust II, Unsecured Notes | | | | | | |
5.79%(f)(g) | | | 300 | | | 199,830 |
Lehman Brothers Holdings Capital Trust VII, Trust Preferred Securities | | | | | | |
5.86%(f)(g) | | | 110 | | | 69,575 |
| | | | | | |
| | | | | | 269,405 |
| | | | | | |
Insurance — 0.1% | | | | | | |
CHUBB Corp., Capital Securities | | | | | | |
6.38%, 3/29/67(g) | | | 175 | | | 163,009 |
Progressive Corp., Junior Subordinated Notes | | | | | | |
6.70%, 6/15/37(g) | | | 310 | | | 276,093 |
| | | | | | |
| | | | | | 439,102 |
| | | | | | |
Yankee — 0.2% | | | | | | |
Banks — 0.1% | | | | | | |
Barclays Bank Plc (United Kingdom), Unsecured Notes | | | | | | |
7.43%(d)(f)(g)(h) | | | 350 | | | 316,430 |
Royal Bank of Scotland Group Plc (United Kingdom), Subordinated Notes | | | | | | |
7.64%, 9/29/17(g)(h) | | | 500 | | | 430,595 |
| | | | | | |
| | | | | | 747,025 |
| | | | | | |
Finance — 0.1% | | | | | | |
Credit Suisse (Guernsey), Unsecured Notes | | | | | | |
5.86%, 5/15/17(g)(h) | | | 530 | | | 448,978 |
| | | | | | |
Total Trust Preferred Stocks | | | | | | |
(Cost $6,485,101) | | | | | | 5,934,541 |
| | | | | | |
| | |
| | | Shares | | |
Warrant — 0.0% | | | | | | |
Point North Energy Ltd. (issued/exercisable 7/24/03, 1 share for 1 warrant, expiring 7/23/08, strike price 5.00 CAD) (acquired 7/24/03, cost $0) | | | | | | |
(Cost $0)(c)(e) | | | 13,755 | | | 1 |
| | | | | | |
| | |
| | | Par
(000) | | Value |
U.S. Government & Agency Obligations — 0.6% | | | | | | |
Federal Home Loan Mortgage Corp., Unsecured Notes | | | | | | |
4.63%, 5/28/13 | | $ | 150 | | $ | 150,390 |
Resolution Funding Corp., Strip Bonds | | | | | | |
6.29%, 7/15/18(i) | | | 150 | | | 98,239 |
6.30%, 10/15/18(i) | | | 150 | | | 96,775 |
U.S. Treasury Bonds | | | | | | |
5.00%, 5/15/37 | | | 1,075 | | | 1,202,573 |
4.38%, 2/15/38 | | | 775 | | | 784,203 |
U.S. Treasury Inflation Protected Notes | | | | | | |
2.38%, 1/15/25 | | | 325 | | | 395,918 |
U.S. Treasury Notes | | | | | | |
3.50%, 2/15/18(j) | | | 1,590 | | | 1,599,192 |
| | | | | | |
Total U.S. Government & Agency Obligations | | | | | | |
(Cost $4,217,530) | | | | | | 4,327,290 |
| | | | | | |
Mortgage Pass-Throughs — 17.8% | | | | | | |
Federal Home Loan Mortgage Corp. ARM | | | | | | |
5.03%, 12/01/35(g) | | | 625 | | | 634,926 |
Federal Home Loan Mortgage Corp. Gold | | | | | | |
8.50%, 7/01/09(k) | | | — | | | 2 |
4.00%, 5/01/10-5/01/19 | | | 159 | | | 158,247 |
6.00%, 4/01/13-4/01/23 | | | 397 | | | 408,811 |
5.50%, 9/01/21-8/01/33(l)(m) | | | 3,125 | | | 3,185,972 |
9.50%, 12/01/22 | | | 193 | | | 221,140 |
8.00%, 2/01/23-8/01/27 | | | 21 | | | 22,439 |
7.50%, 9/01/27(k) | | | — | | | 296 |
6.50%, 1/01/29-8/01/32 | | | 57 | | | 59,676 |
5.00%, 5/01/34 | | | 202 | | | 200,612 |
Federal Home Loan Mortgage Corp. Gold 15 Year TBA | | | | | | |
4.50%, 4/01/23 | | | 1,000 | | | 993,750 |
Federal Home Loan Mortgage Corp. Gold 30 Year TBA | | | | | | |
5.00%, 4/01/38 | | | 2,000 | | | 1,979,380 |
5.50%, 4/01/38 | | | 5,000 | | | 5,048,450 |
Federal National Mortgage Assoc. | | | | | | |
8.00%, 4/01/08-2/01/33 | | | 134 | | | 145,977 |
7.00%, 8/01/08-10/01/32 | | | 247 | | | 259,511 |
8.50%, 2/01/09 | | | 1 | | | 616 |
6.50%, 1/01/11-9/01/36(m) | | | 3,390 | | | 3,534,659 |
6.00%, 9/01/11-8/01/36 | | | 2,731 | | | 2,813,965 |
5.50%, 4/01/17-6/01/36(l)(m) | | | 7,372 | | | 7,511,772 |
5.00%, 1/01/18-12/01/35(l)(m) | | | 15,657 | | | 15,708,677 |
4.00%, 6/01/19 | | | 801 | | | 784,112 |
7.50%, 10/01/25-1/01/31 | | | 358 | | | 387,161 |
Federal National Mortgage Assoc. 15 Year TBA | | | | | | |
4.50%, 4/01/23 | | | 1,500 | | | 1,492,035 |
6.00%, 4/01/23 | | | 2,300 | | | 2,366,838 |
Federal National Mortgage Assoc. 30 Year TBA | | | | | | |
5.50%, 4/01/38 | | | 18,200 | | | 18,370,716 |
6.00%, 4/01/38 | | | 700 | | | 716,842 |
6.50%, 4/01/38-5/01/38 | | | 12,400 | | | 12,831,673 |
Federal National Mortgage Assoc. ARM | | | | | | |
4.19%, 12/01/34(g) | | | 949 | | | 949,919 |
4.78%, 1/01/35(g) | | | 657 | | | 661,641 |
Government National Mortgage Assoc. I | | | | | | |
6.50%, 2/15/09-11/15/28 | | | 278 | | | 290,125 |
See Notes to Financial Statements.
| | | | | | |
| | | BLACKROCK ASSET ALLOCATION PORTFOLIO | | MARCH 31, 2008 | | 19 |
Schedule of Investments (continued)
| | | | | | |
| | | Par
(000) | | Value |
Mortgage Pass-Throughs (Continued) | | | | | | |
7.50%, 12/15/10 | | $ | 22 | | $ | 23,036 |
6.00%, 10/15/23-2/15/24 | | | 225 | | | 234,035 |
7.00%, 9/15/31-5/15/32 | | | 37 | | | 39,810 |
5.50%, 4/15/33-12/15/34 | | | 596 | | | 609,161 |
Government National Mortgage Assoc. I 30 Year TBA | | | | | | |
5.00%, 4/01/38 | | | 4,400 | | | 4,395,864 |
5.50%, 4/01/38 | | | 2,900 | | | 2,955,274 |
6.00%, 4/01/38 | | | 5,100 | | | 5,262,588 |
6.50%, 4/01/38 | | | 2,000 | | | 2,078,120 |
Government National Mortgage Assoc. II | | | | | | |
5.00%, 10/20/33(n) | | | 1,074 | | | 1,071,054 |
5.50%, 3/20/36(m) | | | 5,795 | | | 5,906,051 |
6.00%, 12/20/37 | | | 196 | | | 202,109 |
Government National Mortgage Assoc. II 30 Year TBA | | | | | | |
6.00%, 4/01/38 | | | 3,500 | | | 3,605,000 |
6.50%, 4/01/38 | | | 12,700 | | | 13,172,313 |
5.00%, 5/01/38 | | | 1,000 | | | 994,690 |
Government National Mortgage Assoc. II ARM | | | | | | |
4.75%, 5/20/34(g) | | | 140 | | | 140,288 |
| | | | | | |
Total Mortgage Pass-Throughs | | | | | | |
(Cost $120,874,021) | | | | | | 122,429,333 |
| | | | | | |
Collateralized Mortgage Obligations — 4.6% | | | | | | |
Banc of America Alternative Loan Trust, Series 04-6, Class 4A1, | | | | | | |
5.00%, 7/25/19 | | | 170 | | | 161,063 |
Bear Stearns Mortgage Trust, Series 06-2, Class2A1, | | | | | | |
5.65%, 7/25/36(g) | | | 1,865 | | | 1,802,014 |
CitiMortgage Alternative Loan Trust, Series 07-A8, Class A1, | | | | | | |
6.00%, 10/25/37 | | | 1,261 | | | 1,127,813 |
Countrywide Alternative Loan Trust, Series 06-OA10, Class 1A-1, | | | | | | |
5.20%, 8/25/46(g) | | | 207 | | | 157,320 |
Countrywide Home Loans, Series 03-27, Class M, | | | | | | |
3.90%, 6/25/33(g) | | | 503 | | | 463,581 |
Countrywide Home Loans, Series 03-56, Class 4A-1, | | | | | | |
4.93%, 12/25/33(g) | | | 1,294 | | | 1,180,991 |
Countrywide Home Loans, Series 03-58, Class B1, | | | | | | |
4.56%, 2/19/34(g) | | | 171 | | | 174,074 |
Countrywide Home Loans, Series 06-OA5, Class 2A-1, | | | | | | |
2.80%, 4/25/46(g) | | | 244 | | | 182,690 |
Countrywide Home Loans, Series 06-OA5, Class 3A-1, | | | | | | |
2.80%, 4/25/46(g) | | | 472 | | | 358,293 |
Countrywide Home Loans, Series 07-J3, Class A10, | | | | | | |
6.00%, 7/25/37(g) | | | 967 | | | 862,892 |
Credit Suisse Mortgage Capital Certificate, Series 06-8, Class 3-A1, | | | | | | |
6.00%, 10/25/21 | | | 325 | | | 295,589 |
Fannie Mae Grantor Trust, Series 03-T1, Class R (IO), | | | | | | |
0.67%, 11/25/12(o) | | | 6,467 | | | 140,290 |
Fannie Mae, Series 07-21, Class FC, | | | | | | |
2.96%, 3/25/37(g) | | | 665 | | | 636,511 |
Fannie Mae, Series 07-75, Class JF, | | | | | | |
3.59%, 8/25/37(g) | | | 1,171 | | | 1,117,774 |
Federal Home Loan Mortgage Corp., Series 235 (IO), | | | | | | |
5.50%, 2/01/36(o) | | | 1,230 | | | 267,448 |
Federal Home Loan Mortgage Corp., Series 2529, Class MB, | | | | | | |
5.00%, 11/15/17 | | | 100 | | | 103,556 |
Federal Home Loan Mortgage Corp., Series 2574, Class HP, | | | | | | |
5.00%, 2/15/18 | | | 1,420 | | | 1,457,895 |
Federal Home Loan Mortgage Corp., Series 2707, Class PW, | | | | | | |
4.00%, 7/15/14 | | | 99 | | | 98,685 |
Federal Home Loan Mortgage Corp., Series 2864, Class NA, | | | | | | |
5.50%, 1/15/31 | | | 123 | | | 126,613 |
Federal National Mortgage Assoc., Series 04-88, Class HA, | | | | | | |
6.50%, 7/25/34 | | | 50 | | | 52,196 |
Federal National Mortgage Assoc., Series 379, Class 5 (IO), | | | | | | |
5.00%, 7/01/36(o) | | | 2,025 | | | 441,682 |
Freddie Mac, Series 3295, Class FA, | | | | | | |
3.22%, 3/15/37(g) | | | 893 | | | 855,262 |
Freddie Mac, Series 3339, Class JF, | | | | | | |
3.23%, 7/15/37(g) | | | 1,033 | | | 984,251 |
JPMorgan Mortgage Trust, Series 06-S2, Class 2A-2, | | | | | | |
5.88%, 7/25/36 | | | 161 | | | 145,970 |
JPMorgan Mortgage Trust, Series 07-S1, Class 1A-2, | | | | | | |
5.50%, 3/25/22 | | | 174 | | | 156,747 |
Master Alternative Loans Trust, Series 04-4, Class 1A1, | | | | | | |
5.50%, 5/25/34 | | | 116 | | | 107,255 |
Residential Accredit Loans, Inc., Series 06 QO2, Class A1, | | | | | | |
2.82%, 2/25/46(g) | | | 372 | | | 282,418 |
Residential Accredit Loans, Inc., Series 07-QO3, Class A1, | | | | | | |
2.76%, 3/25/47(g) | | | 282 | | | 231,025 |
Salomon Brothers Mortgage Securities VI, Series 87-1 (IO), | | | | | | |
11.00%, 2/17/17(o) | | | 31 | | | 6,998 |
Salomon Brothers Mortgage Securities VI, Series 87-1 (PO), | | | | | | |
11.50%, 2/17/17(o) | | | 35 | | | 33,068 |
Salomon Brothers Mortgage Securities VI, Series 87-2 (IO), | | | | | | |
11.00%, 3/06/17(o) | | | 22 | | | 5,722 |
Salomon Brothers Mortgage Securities VI, Series 87-2 (PO), | | | | | | |
11.50%, 3/06/17(o) | | | 22 | | | 20,012 |
Structured Asset Securities Corp., Series 01-21A, Class B2, | | | | | | |
7.13%, 1/25/32(g) | | | 6 | | | 5,640 |
Structured Asset Securities Corp., Series 03-2A, Class B2II, | | | | | | |
6.18%, 2/25/33(g) | | | 67 | | | 66,648 |
Washington Mutual Mortgage Loan Trust, Series 03-AR3, Class B2, | | | | | | |
4.88%, 4/25/33(g) | | | 71 | | | 68,532 |
Washington Mutual Mortgage Loan Trust, Series 03-AR5, Class B2, | | | | | | |
4.50%, 6/25/33(g) | | | 252 | | | 212,581 |
See Notes to Financial Statements.
| | | | | | |
20 | | BLACKROCK ASSET ALLOCATION PORTFOLIO | | MARCH 31, 2008 | | |
Schedule of Investments (continued)
| | | | | | |
| | | Par
(000) | | Value |
Collateralized Mortgage Obligations (Continued) | | | | | | |
Washington Mutual Mortgage Loan Trust, Series 03-AR8, Class B1, | | | | | | |
4.19%, 8/25/33(g) | | $ | 289 | | $ | 255,296 |
Washington Mutual Mortgage Loan Trust, Series 04-AR1, Class B1, | | | | | | |
4.48%, 3/25/34(g) | | | 1,020 | | | 1,039,133 |
Washington Mutual Mortgage Loan Trust, Series 04-AR3, Class B1, | | | | | | |
4.17%, 6/25/34(g) | | | 223 | | | 167,839 |
Washington Mutual Mortgage Pass-Through Certificates, Series 06-AR18, Class 1A-1, | | | | | | |
5.35%, 1/25/37(g) | | | 967 | | | 909,946 |
Washington Mutual Mortgage Pass-Through Certificates, Series 07-HY3, Class 1A-1, | | | | | | |
5.67%, 3/25/37(g) | | | 3,667 | | | 3,469,497 |
Washington Mutual Mortgage Pass-Through Certificates, Series 07-HY3, Class 4A-1, | | | | | | |
5.35%, 3/25/37(g) | | | 1,727 | | | 1,629,809 |
Washington Mutual Mortgage Pass-Through Certificates, Series 07-OA4, Class 1A, | | | | | | |
5.10%, 5/25/47(g) | | | 286 | | | 243,089 |
Washington Mutual Mortgage Pass-Through Certificates, Series 07-OA5, Class 1A, | | | | | | |
5.08%, 6/25/47(g) | | | 467 | | | 373,649 |
Washington Mutual Mortgage Pass-Through Certificates, Series 07-OC1, Class A1, | | | | | | |
2.84%, 5/25/37(g) | | | 1,590 | | | 1,183,813 |
Wells Fargo Mortgage Backed Securities Trust, Series 04-K, Class 1A-2, | | | | | | |
4.47%, 7/25/34(g) | | | 380 | | | 358,817 |
Wells Fargo Mortgage Backed Securities Trust, Series 05-AR10, Class 2A-2, | | | | | | |
4.11%, 6/25/35(g) | | | 2,377 | | | 2,194,140 |
Wells Fargo Mortgage Backed Securities Trust, Series 05-AR15, Class 2A-1, | | | | | | |
5.11%, 9/25/35(g) | | | 2,045 | | | 1,915,002 |
Wells Fargo Mortgage Backed Securities Trust, Series 06-AR12, Class 2A-1, | | | | | | |
6.10%, 9/25/36(g) | | | 419 | | | 394,499 |
Wells Fargo Mortgage Backed Securities Trust, Series 06-AR17, Class A1, | | | | | | |
5.34%, 10/25/36(g) | | | 732 | | | 694,297 |
Wells Fargo Mortgage Backed Securities Trust, Series 06-AR2, Class 2A-5, | | | | | | |
5.11%, 3/25/36(g) | | | 2,191 | | | 2,099,179 |
| | | | | | |
Total Collateralized Mortgage Obligations | | | | | | |
(Cost $32,883,011) | | | | | | 31,319,104 |
| | | | | | |
Commercial Mortgage Backed Securities — 6.7% | | | | | | |
Banc of America Commercial Mortgage, Inc., Series 07-2, Class A4 | | | | | | |
5.69%, 4/10/49(g) | | | 1,000 | | | 992,825 |
Bank of America-First Union Commercial Mortgage, Series 01-3, Class A2 | | | | | | |
5.46%, 4/11/37 | | | 1,375 | | | 1,371,569 |
Bear Stearns Commercial Mortgage Securities, Inc., Series 99-WF2, Class A2 | | | | | | |
7.08%, 7/15/31 | | | 233 | | | 236,758 |
Bear Stearns Commercial Mortgage Securities, Inc., Series 00-WF2, Class A2 | | | | | | |
7.32%, 10/15/32 | | | 475 | | | 493,014 |
Bear Stearns Commercial Mortgage Securities, Inc., Series 02-TOP6, Class A1 | | | | | | |
5.92%, 10/15/36 | | | 492 | | | 496,477 |
Bear Stearns Commercial Mortgage Securities, Inc., Series 03-T12, Class A4 | | | | | | |
4.68%, 9/13/13 | | | 1,025 | | | 992,937 |
Bear Stearns Mortgage Trust, Series 05-4, Class 3A1 | | | | | | |
5.37%, 8/25/35(g) | | | 4,345 | | | 4,093,400 |
CDC Commercial Mortgage Trust, Series 02-FX1, Class A1 | | | | | | |
5.25%, 5/15/19 | | | 1,208 | | | 1,209,650 |
Citigroup Commercial Mortgage Securities, Series 07-CD5, Class A4 | | | | | | |
5.89%, 11/15/44 | | | 475 | | | 474,387 |
Citigroup Commercial Mortgage Trust, Series 07-C6, Class AM | | | | | | |
5.70%, 6/10/17(g) | | | 475 | | | 433,534 |
Citigroup-Deutsche Bank Commercial Mortgage Trust, Series 07-CD4, Class A4 | | | | | | |
5.32%, 12/11/49 | | | 1,970 | | | 1,901,380 |
Commercial Mortgage Acceptance Corp., Series 98-C2, Class C | | | | | | |
6.53%, 9/15/30(g) | | | 275 | | | 275,414 |
Commercial Mortgage Acceptance Corp., Series 98-C2, Class E | | | | | | |
7.31%, 6/15/10(g) | | | 930 | | | 956,816 |
Credit Suisse First Boston Mortgage Securities Corp., Series 01-CP4, Class D | | | | | | |
6.61%, 12/15/35 | | | 1,450 | | | 1,492,541 |
Credit Suisse First Boston Mortgage Securities Corp., Series 02-CKN2, Class A3 | | | | | | |
6.13%, 3/15/12 | | | 1,000 | | | 1,034,438 |
Credit Suisse First Boston Mortgage Securities Corp., Series 02-CKS4, Class A2 | | | | | | |
5.18%, 8/15/12 | | | 1,090 | | | 1,088,623 |
Credit Suisse First Boston Mortgage Securities Corp., Series 02-CP5, Class A2 | | | | | | |
4.94%, 12/15/35 | | | 1,010 | | | 976,229 |
Credit Suisse First Boston Mortgage Securities Corp., Series 03-C3, Class A5 | | | | | | |
3.94%, 5/15/38 | | | 1,020 | | | 936,133 |
Donaldson, Lufkin & Jenrette, Inc., Commercial Mortgage Corp., Series 99-CG1, Class A1B | | | | | | |
6.46%, 3/10/32 | | | 138 | | | 138,612 |
First Horizon Mortgage Pass-Through Trust, Series 05-AR3, Class 3A1 | | | | | | |
5.50%, 8/25/35(g) | | | 565 | | | 531,457 |
First Union National Bank Commercial Mortgage Trust, Series 01-C2, Class A2 | | | | | | |
6.66%, 1/12/43 | | | 970 | | | 998,370 |
First Union National Bank Commercial Mortgage Trust, Series 01-C4, Class A2 | | | | | | |
6.22%, 12/12/33 | | | 1,140 | | | 1,161,646 |
First Union-Lehman Brothers-Bank of America Commercial Mortgage Trust, Series 98-C2, Class A2 | | | | | | |
6.56%, 11/18/08 | | | 26 | | | 25,504 |
General Motors Acceptance Corp. Commercial Mortgage Securities, Inc., Series 99-C3, Class A2 | | | | | | |
7.18%, 8/15/36 | | | 128 | | | 130,196 |
General Motors Acceptance Corp. Commercial Mortgage Securities, Inc., Series 00-C3, Class A2 | | | | | | |
6.96%, 11/15/10 | | | 1,295 | | | 1,339,609 |
See Notes to Financial Statements.
| | | | | | |
| | | BLACKROCK ASSET ALLOCATION PORTFOLIO | | MARCH 31, 2008 | | 21 |
Schedule of Investments (continued)
| | | | | | |
| | | Par
(000) | | Value |
Commercial Mortgage Backed Securities (Continued) | | | | | | |
Goldman Sachs Mortgage Securities Corp. II, Series 07-GG10, Class A4 | | | | | | |
5.80%, 8/10/45(g) | | $ | 800 | | $ | 798,726 |
Impac Commercial Mortgage Backed Trust, Series 04-5, Class 1A1 | | | | | | |
2.96%, 10/25/34(g) | | | 96 | | | 69,257 |
Impac Commercial Mortgage Backed Trust, Series 04-7, Class 1A1 | | | | | | |
3.34%, 11/25/34(g) | | | 236 | | | 218,503 |
Impac Commercial Mortgage Backed Trust, Series 04-7, Class M4 | | | | | | |
4.94%, 11/25/34(g) | | | 78 | | | 54,927 |
JPMorgan Chase Commercial Mortgage Securities Corp., Series 06-CB17, Class A4 | | | | | | |
5.43%, 12/12/43(g) | | | 150 | | | 146,961 |
JPMorgan Commercial Mortgage Finance Corp., Series 99-C7, Class A2 | | | | | | |
6.51%, 10/15/35 | | | 197 | | | 197,300 |
JPMorgan Commercial Mortgage Finance Corp., Series 99-PLSI, Class D | | | | | | |
6.86%, 2/15/32(g) | | | 650 | | | 658,334 |
Lehman Brothers Commercial Conduit Mortgage Trust, Series 98-C4, Class A1B | | | | | | |
6.21%, 10/15/08 | | | 390 | | | 390,086 |
Lehman Brothers Commercial Conduit Mortgage Trust, Series 99-C2, Class A2 | | | | | | |
7.33%, 10/15/32 | | | 243 | | | 247,337 |
Lehman Brothers Commercial Conduit Mortgage Trust, Series 99-C2, Class E | | | | | | |
7.47%, 10/15/32 | | | 125 | | | 129,023 |
Lehman Brothers-UBS Commercial Mortgage Trust, Series 01-C7, Class A4 | | | | | | |
5.93%, 12/15/25 | | | 825 | | | 833,421 |
Lehman Brothers-UBS Commercial Mortgage Trust, Series 01-WM, Class A1 | | | | | | |
6.16%, 7/14/16(d) | | | 497 | | | 505,039 |
Lehman Brothers-UBS Commercial Mortgage Trust, Series 03-C8, Class A1 | | | | | | |
3.64%, 11/15/27 | | | 289 | | | 287,724 |
Lehman Brothers-UBS Commercial Mortgage Trust, Series 04-C2, Class A1 | | | | | | |
2.95%, 3/15/29 | | | 219 | | | 215,381 |
Lehman Brothers-UBS Commercial Mortgage Trust, Series 04-C6, Class A1 | | | | | | |
3.88%, 8/15/29 | | | 148 | | | 146,655 |
Lehman Brothers-UBS Commercial Mortgage Trust, Series 06-C6, Class A4 | | | | | | |
5.37%, 9/15/39 | | | 470 | | | 459,976 |
Lehman Brothers-UBS Commercial Mortgage Trust, Series 07-C7, Class A3 | | | | | | |
5.87%, 9/15/45 | | | 1,050 | | | 1,018,395 |
Morgan Stanley Capital I, Inc., Series 99-WF1, Class A2 | | | | | | |
6.21%, 11/15/31 | | | 276 | | | 276,184 |
Morgan Stanley Capital I, Inc., Series 02-TOP7, Class A1 | | | | | | |
5.38%, 1/15/39 | | | 214 | | | 214,277 |
Morgan Stanley Capital I, Inc., Series 03-IQ4, Class A2 | | | | | | |
4.07%, 5/15/40 | | | 1,025 | | | 949,892 |
Morgan Stanley Capital I, Inc., Series 05-HQ6, Class A4-A | | | | | | |
4.99%, 8/13/42 | | | 2,405 | | | 2,363,195 |
Morgan Stanley Capital I, Inc., Series 06-HE2, Class A2A | | | | | | |
2.67%, 3/25/36(g) | | | 52 | | | 49,233 |
Morgan Stanley Capital I, Inc., Series 07-IQ13, Class A4 | | | | | | |
5.36%, 3/15/44 | | | 1,540 | | | 1,486,615 |
Morgan Stanley Capital I, Inc., Series 07-IQ16, Class A4 | | | | | | |
5.81%, 12/12/49 | | | 640 | | | 634,500 |
Morgan Stanley Dean Witter Capital I, Inc., Series 01-TOP1, Class A4 | | | | | | |
6.66%, 2/15/33 | | | 903 | | | 932,985 |
Mortgage Capital Funding, Inc., Series 98-MC2, Class B | | | | | | |
6.55%, 6/18/30 | | | 295 | | | 294,190 |
Nationslink Funding Corp., Series 98-2, Class A2 | | | | | | |
6.48%, 8/20/30 | | | 74 | | | 73,696 |
Nationslink Funding Corp., Series 98-2, Class B | | | | | | |
6.80%, 8/20/30 | | | 525 | | | 524,861 |
Nationslink Funding Corp., Series 99-2, Class D | | | | | | |
7.13%, 6/20/31(g) | | | 175 | | | 174,890 |
Salomon Brothers Mortgage Securities VII, Series 00-C3, Class A2 | | | | | | |
6.59%, 10/18/10 | | | 1,325 | | | 1,356,169 |
Structured Asset Receivables Trust, Series 03-2 | | | | | | |
5.72%, 1/21/09(d)(g) | | | 296 | | | 292,005 |
Structured Asset Securities Corp., Series 96-CFL, Class X1 (IO) | | | | | | |
9.79%, 2/25/28(o) | | | 579 | | | 2,946 |
Structured Mortgage Loan, Series 07-3, Class 2A1 | | | | | | |
5.73%, 4/25/37(g) | | | 1,415 | | | 1,340,061 |
TIAA Retail Commercial LLC, Series 01-C1A, Class A4 | | | | | | |
6.68%, 6/19/31(d) | | | 1,305 | | | 1,324,107 |
UBS Commerical Mortgage Trust, Series 06-C1, Class A4 | | | | | | |
5.16%, 2/15/31 | | | 1,085 | | | 1,056,241 |
Wachovia Bank Commercial Mortgage Trust, Series 06-C25, Class A5 | | | | | | |
5.74%, 5/15/43(g) | | | 1,050 | | | 1,059,189 |
Wachovia Bank Commerical Mortgage Trust, Series 07-C33, Class A4 | | | | | | |
5.90%, 7/15/17(g) | | | 1,405 | | | 1,415,810 |
Washington Mutual Asset Securities Corp., Series 05-C1A, Class A1 | | | | | | |
4.24%, 5/25/36(d) | | | 36 | | | 35,454 |
Washington Mutual Asset Securities Corp., Series 05-C1A, Class X (IO) | | | | | | |
2.00%, 5/25/36(d)(o) | | | 7,921 | | | 282,161 |
| | | | | | |
Total Commercial Mortgage Backed Securities | | | | | | |
(Cost $47,600,943) | | | | | | 46,297,225 |
| | | | | | |
Asset Backed Securities — 2.2% | | | | | | |
Ace Securities Corp., Series 06-HE2, Class A2A | | | | | | |
2.66%, 5/25/36(g) | | | 37 | | | 36,466 |
Ameriquest Mortgage Securities, Inc., Series 02-3, Class M2 | | | | | | |
4.47%, 8/25/32(g) | | | 20 | | | 18,119 |
Amortizing Residential Collateral Trust, Series 02-BC5, Class M2 | | | | | | |
4.40%, 7/25/32(g) | | | 23 | | | 6,861 |
Capital Auto Receivables Asset Trust, Series 05-1, Class A4 | | | | | | |
4.05%, 7/15/09 | | | 113 | | | 113,573 |
See Notes to Financial Statements.
| | | | | | |
22 | | BLACKROCK ASSET ALLOCATION PORTFOLIO | | MARCH 31, 2008 | | |
Schedule of Investments (continued)
| | | | | | |
| | | Par
(000) | | Value |
Asset Backed Securities (Continued) | | | | | | |
Capital Auto Receivables Asset Trust, Series 06-SN1A, Class A2A | | | | | | |
5.40%, 1/20/09(d) | | $ | 53 | | $ | 52,797 |
Carrington Mortgage Loan Trust, Series 06-NC4, Class A1 | | | | | | |
2.65%, 10/25/36(g) | | | 530 | | | 507,054 |
Centex Home Equity Loan Trust, Series 02-A, Class MF2 | | | | | | |
6.54%, 1/25/32 | | | 204 | | | 157,707 |
Centex Home Equity Loan Trust, Series 03-B, Class M3 | | | | | | |
5.70%, 6/25/33(g) | | | 149 | | | 69,670 |
Chase Issuance Trust, Series 06, Class A3 | | | | | | |
2.81%, 7/15/11(g) | | | 1,075 | | | 1,064,343 |
Chase Issuance Trust, Series 07-A17, Class A | | | | | | |
5.12%, 10/15/12 | | | 1,200 | | | 1,240,645 |
Citibank Credit Card Issuance Trust, Series 03, Class A6 | | | | | | |
2.90%, 5/17/10 | | | 250 | | | 250,013 |
Citibank OMNI Master Trust, Series 07, Class A9 | | | | | | |
3.70%, 12/23/13(d)(g) | | | 1,435 | | | 1,434,641 |
Countrywide Alternative Loan Trust, Series 06-18, Class 2A1 | | | | | | |
2.65%, 7/25/36(g) | | | 875 | | | 840,964 |
Countrywide Certificates, Series 02-2, Class M2 | | | | | | |
4.32%, 12/25/31(g) | | | 4 | | | 2,683 |
Countrywide Certificates, Series 03-2, Class M2 | | | | | | |
6.04%, 3/26/33(g) | | | 162 | | | 75,953 |
Countrywide Certificates, Series 03-3, Class M6 | | | | | | |
6.04%, 7/25/32(g) | | | 61 | | | 18,446 |
Countrywide Certificates, Series 03-BCI, Class M2 | | | | | | |
6.38%, 9/25/32(g) | | | 55 | | | 25,695 |
Countrywide Certificates, Series 04-13, Class AV4 | | | | | | |
2.89%, 6/25/35(g) | | | 5 | | | 3,802 |
Credit-Based Asset Servicing and Securitization, Series 04-CB4, Class M1 | | | | | | |
5.77%, 5/25/35(g) | | | 275 | | | 253,476 |
General Electric Business Loan Trust, Series 03-1, Class A | | | | | | |
3.25%, 4/15/31(d)(g) | | | 151 | | | 146,082 |
General Electric Business Loan Trust, Series 03-1, Class B | | | | | | |
4.12%, 4/15/31(d)(g) | | | 101 | | | 87,183 |
General Electric Business Loan Trust, Series 03-2A, Class B | | | | | | |
3.82%, 11/15/31(d)(g) | | | 683 | | | 620,650 |
General Electric Business Loan Trust, Series 04-1, Class B | | | | | | |
3.52%, 5/15/32(d)(g) | | | 175 | | | 154,521 |
Green Tree Financial Corp., Series 96-6, Class A6 | | | | | | |
7.95%, 9/15/27 | | | 415 | | | 446,328 |
Green Tree Financial Corp., Series 96-7, Class A6 | | | | | | |
7.65%, 10/15/27 | | | 201 | | | 214,006 |
Harborview Mortgage Loan Trust, Series 05-10, Class 2A1A | | | | | | |
2.87%, 11/19/35(g) | | | 727 | | | 574,467 |
Harborview Mortgage Loan Trust, Series 06-9, Class 2A1A | | | | | | |
2.77%, 11/19/36(g) | | | 408 | | | 310,837 |
Harley-Davidson Motorcycle Trust, Series 05-2, Class A2 | | | | | | |
4.07%, 2/15/12 | | | 967 | | | 971,787 |
Hedged Mutual Fund Fee Trust, Series 03-1A, Class 2 | | | | | | |
5.22%, 11/30/10(d) | | | 23 | | | 23,045 |
Home Equity Asset Trust, Series 07-2, Class 2A1 | | | | | | |
2.71%, 7/25/37(g) | | | 554 | | | 523,572 |
Lehman XS Trust, Series 05-5N, Class 3A-2 | | | | | | |
2.96%, 11/25/35(g) | | | 644 | | | 417,684 |
Long Beach Mortgage Loan Trust, Series 03-4, Class M5A | | | | | | |
6.60%, 8/25/33(g) | | | 56 | | | 8,356 |
Long Beach Mortgage Loan Trust, Series 04-1, Class M5 | | | | | | |
3.70%, 2/25/34(g) | | | 475 | | | 237,500 |
Lothian Mortgages Plc, Series 3A, Class A1 | | | | | | |
5.23%, 7/24/19(d)(g) | | | 16 | | | 15,858 |
Massachusetts RRB Special Purpose Trust, Series 01-1, Class A | | | | | | |
6.53%, 6/01/15 | | | 806 | | | 862,676 |
MBNA Credit Card Master Notes Trust, Series 06-A4, Class A4 | | | | | | |
2.81%, 9/15/11(g) | | | 1,650 | | | 1,634,887 |
Nationstar Home Equity Loan Trust, Series 06-B, Class AV1 | | | | | | |
2.67%, 9/25/36(g) | | | 251 | | | 248,170 |
Option One Mortgage Loan Trust, Series 02-6, Class M1 | | | | | | |
3.72%, 11/25/32(g) | | | 26 | | | 23,214 |
Option One Mortgage Loan Trust, Series 02-6, Class M2 | | | | | | |
5.15%, 11/25/32(g) | | | 71 | | | 31,033 |
Option One Mortgage Loan Trust, Series 03-4, Class A4 | | | | | | |
2.92%, 7/25/33(g) | | | 87 | | | 72,927 |
Option One Mortgage Loan Trust, Series 03-4, Class M5A | | | | | | |
6.35%, 7/25/33(g) | | | 63 | | | 12,659 |
Option One Mortgage Loan Trust, Series 03-5, Class M4 | | | | | | |
5.50%, 8/25/33(g) | | | 37 | | | 4,800 |
Residential Asset Mortgage Products, Inc., Series 03-RZ2, Class B | | | | | | |
5.50%, 4/25/33(g) | | | 170 | | | 91,857 |
Residential Asset Securities Corp., Series 02-KS4, Class AIIB | | | | | | |
3.10%, 7/25/32(g) | | | 51 | | | 45,843 |
Structured Asset Investment Loan Trust, Series 03-BC2, Class M2 | | | | | | |
5.52%, 4/25/33(g) | | | 47 | | | 16,912 |
Structured Asset Investment Loan Trust, Series 03-BC3, Class M2 | | | | | | |
5.52%, 4/25/33(g) | | | 11 | | | 2,144 |
USAA Auto Owner Trust, Series 06-2, Class A3 | | | | | | |
5.32%, 9/15/10 | | | 1,047 | | | 1,054,746 |
| | | | | | |
Total Asset Backed Securities | | | | | | |
(Cost $16,190,787) | | | | | | 15,026,652 |
| | | | | | |
Collateralized Debt Obligations — 0.1% | | | | | | |
Knollwood Ltd., Series 04-1A, Class C, | | | | | | |
8.32%, 1/10/39(d)(e)(g) | | | 103 | | | 97 |
See Notes Financial Statements.
| | | | | | |
| | | BLACKROCK ASSET ALLOCATION PORTFOLIO | | MARCH 31, 2008 | | 23 |
Schedule of Investments (continued)
| | | | | | |
| | | Par
(000) | | Value |
Collateralized Debt Obligations (Continued) | | | | | | |
Small Business Administration Participation Certificates, Series 97-20F, Class 1, | | | | | | |
7.20%, 6/01/17 | | $ | 411 | | $ | 430,592 |
| | | | | | |
Total Collateralized Debt Obligations | | | | | | |
(Cost $514,549) | | | | | | 430,689 |
| | | | | | |
Corporate Bonds — 7.8% | | | | | | |
Banks — 1.2% | | | | | | |
Bank of America Corp., Senior Unsecured Notes | | | | | | |
6.00%, 9/01/17 | | | 550 | | | 578,254 |
5.75%, 12/01/17 | | | 1,090 | | | 1,127,979 |
Bank of America Corp., Subordinated Notes | | | | | | |
7.40%, 1/15/11 | | | 325 | | | 348,018 |
Citigroup, Inc., Depositary Shares | | | | | | |
0.01%, 12/31/49 | | | 14 | | | 324,540 |
Citigroup, Inc., Senior Unsecured Notes | | | | | | |
5.30%, 10/17/12 | | | 725 | | | 728,531 |
Citigroup, Inc., Subordinated Notes | | | | | | |
5.00%, 9/15/14 | | | 500 | | | 471,213 |
Credit Suisse New York, Subordinated Notes | | | | | | |
6.00%, 2/15/18 | | | 380 | | | 379,093 |
JPMorgan Chase Bank N.A., Subordinated Notes | | | | | | |
6.00%, 7/05/17 | | | 425 | | | 444,027 |
U.S. Bank N.A., Senior Bank Notes | | | | | | |
4.40%, 8/15/08 | | | 575 | | | 577,125 |
UBS AG, Senior Notes | | | | | | |
5.88%, 12/20/17 | | | 935 | | | 955,690 |
Wachovia Bank N.A., Subordinated Notes | | | | | | |
6.60%, 1/15/38 | | | 900 | | | 833,870 |
Wachovia Corp. | | | | | | |
8.00%, 12/17/49 | | | 15 | | | 370,500 |
Wells Fargo & Co., Senior Unsecured Notes | | | | | | |
4.20%, 1/15/10 | | | 1,200 | | | 1,220,029 |
| | | | | | |
| | | | | | 8,358,869 |
| | | | | | |
Broadcasting — 0.1% | | | | | | |
Cablevision Systems Corp., Senior Unsecured Notes | | | | | | |
9.64%, 4/01/09(g) | | | 325 | | | 322,562 |
Charter Communications Holdings II LLC, Unsecured Notes | | | | | | |
10.25%, 9/15/10 | | | 255 | | | 232,050 |
EchoStar DBS Corp., Senior Unsecured Notes | | | | | | |
7.00%, 10/01/13 | | | 4 | | | 3,770 |
7.13%, 2/01/16 | | | 25 | | | 23,313 |
News America, Inc., Senior Debentures | | | | | | |
7.75%, 1/20/24 | | | 25 | | | 27,555 |
7.28%, 6/30/28 | | | 35 | | | 36,927 |
News America, Inc., Senior Unsecured Notes | | | | | | |
6.20%, 12/15/34 | | | 100 | | | 95,238 |
| | | | | | |
| | | | | | 741,415 |
| | | | | | |
Chemicals — 0.0% | | | | | | |
Huntsman International LLC, Senior Subordinated Notes | | | | | | |
7.88%, 11/15/14 | | | 225 | | | 238,500 |
| | | | | | |
Computer & Office Equipment — 0.1% | | | | | | |
IBM Corp., Unsecured Notes | | | | | | |
5.70%, 9/14/17 | | | 360 | | | 377,122 |
| | | | | | |
Electronics — 0.0% | | | | | | |
L-3 Communications Corp., Senior Subordinated Notes | | | | | | |
6.38%, 10/15/15 | | | 35 | | | 34,212 |
| | | | | | |
Energy & Utilities — 0.3% | | | | | | |
AES Eastern Energy LP, Pass-Through Certificates, Series 99-A | | | | | | |
9.00%, 1/02/17 | | | 211 | | | 218,523 |
Florida Power & Light Co., First Mortgage Bonds | | | | | | |
5.63%, 4/01/34 | | | 150 | | | 144,107 |
5.95%, 2/01/38 | | | 225 | | | 225,824 |
Forest Oil Corp., Senior Unsecured Notes | | | | | | |
7.25%, 6/15/19 | | | 130 | | | 132,275 |
MidAmerican Energy Holdings Co. Bonds | | | | | | |
6.50%, 9/15/37 | | | 250 | | | 250,544 |
NRG Energy, Inc., Senior Unsecured Notes | | | | | | |
7.38%, 2/01/16 | | | 190 | | | 186,200 |
PacifiCorp, First Mortgage Bonds | | | | | | |
6.25%, 10/15/37 | | | 200 | | | 202,075 |
Tesoro Corp., Senior Unsecured Notes | | | | | | |
6.50%, 6/01/17 | | | 250 | | | 223,750 |
Texas Competitive Electric Holding LLC, Senior Notes | | | | | | |
10.25%, 11/01/15(d) | | | 350 | | | 348,687 |
Texas Competitive Electric Holding LLC, Toggle Notes | | | | | | |
10.50%, 11/01/16(d)(p) | | | 110 | | | 107,800 |
Transocean, Inc., Senior Unsecured Notes | | | | | | |
6.00%, 3/15/18 | | | 75 | | | 77,147 |
XTO Energy, Inc., Senior Unsecured Notes | | | | | | |
6.75%, 8/01/37 | | | 250 | | | 267,386 |
| | | | | | |
| | | | | | 2,384,318 |
| | | | | | |
Entertainment & Leisure — 0.4% | | | | | | |
Comcast Cable Holdings LLC, Senior Debentures | | | | | | |
7.88%, 8/01/13-2/15/26 | | | 7 | | | 7,461 |
Comcast Cable Holdings LLC, Senior Notes | | | | | | |
7.13%, 2/15/28 | | | 35 | | | 35,237 |
Comcast Corp., Senior Unsecured Notes | | | | | | |
7.05%, 3/15/33 | | | 115 | | | 117,268 |
Comcast Corp., Unsecured Notes | | | | | | |
6.50%, 1/15/17 | | | 850 | | | 868,122 |
6.95%, 8/15/37 | | | 360 | | | 360,722 |
CSC Holdings, Inc., Senior Unsecured Notes | | | | | | |
8.13%, 7/15/09 | | | 640 | | | 646,400 |
Harrahs Operating Co., Inc., Unsecured Notes | | | | | | |
10.75%, 2/01/18(d) | | | 360 | | | 291,600 |
Riddell Bell Holdings, Inc., Senior Subordinated Notes | | | | | | |
8.38%, 10/01/12 | | | 65 | | | 52,812 |
Seneca Gaming Corp., Senior Unsecured Notes | | | | | | |
7.25%, 5/01/12 | | | 125 | | | 117,812 |
Station Casinos, Inc., Senior Subordinated Notes | | | | | | |
6.63%, 3/15/18 | | | 20 | | | 11,100 |
Time Warner Cos., Inc., Senior Debentures | | | | | | |
7.57%, 2/01/24 | | | 30 | | | 30,797 |
Time Warner, Inc., Senior Debentures | | | | | | |
7.63%, 4/15/31(n) | | | 200 | | | 209,182 |
| | | | | | |
| | | | | | 2,748,513 |
| | | | | | |
See Notes Financial Statements.
| | | | | | |
24 | | BLACKROCK ASSET ALLOCATION PORTFOLIO | | MARCH 31, 2008 | | |
Schedule of Investments (continued)
| | | | | | |
| | | Par
(000) | | Value |
Corporate Bonds (Continued) | | | | | | |
Finance — 2.2% | | | | | | |
Arch Western Finance, Senior Notes | | | | | | |
6.75%, 7/01/13(g) | | $ | 400 | | $ | 399,000 |
The Bear Stearns Cos., Inc., Senior Unsecured Notes | | | | | | |
6.95%, 8/10/12 | | | 655 | | | 655,323 |
Berkshire Hathaway Finance Corp., Senior Unsecured Notes | | | | | | |
4.75%, 5/15/12 | | | 355 | | | 368,965 |
Ford Motor Credit Co., Senior Notes | | | | | | |
5.80%, 1/12/09 | | | 235 | | | 223,881 |
Ford Motor Credit Co., Senior Unsecured Notes | | | | | | |
8.63%, 11/01/10 | | | 250 | | | 217,824 |
Ford Motor Credit Co., Unsecured Notes | | | | | | |
9.75%, 9/15/10 | | | 135 | | | 120,255 |
7.80%, 6/01/12 | | | 285 | | | 235,089 |
General Electric Capital Corp., Senior Unsecured Notes | | | | | | |
5.00%, 12/01/10 | | | 300 | | | 313,804 |
6.75%, 3/15/32(n) | | | 50 | | | 53,405 |
General Electric Capital Corp., Subordinated Debentures | | | | | | |
6.38%, 11/15/67(g) | | | 475 | | | 464,797 |
General Electric Capital Corp., Unsecured Notes | | | | | | |
3.34%, 7/28/08(g) | | | 150 | | | 150,093 |
5.00%, 11/15/11 | | | 3,445 | | | 3,548,381 |
6.15%, 8/07/37 | | | 505 | | | 504,268 |
The Goldman Sachs Group, Inc., Senior Unsecured Notes | | | | | | |
5.25%, 10/15/13 | | | 1,050 | | | 1,043,976 |
JPMorgan Chase & Co., Unsecured Notes | | | | | | |
5.60%, 6/01/11 | | | 550 | | | 575,737 |
Lehman Brothers Holdings, Inc., Senior Notes | | | | | | |
5.63%, 1/24/13 | | | 725 | | | 701,468 |
7.00%, 9/27/27 | | | 475 | | | 439,057 |
Lehman Brothers Holdings, Inc., Subordinated Notes | | | | | | |
6.75%, 12/28/17 | | | 190 | | | 182,650 |
Lehman Brothers Holdings, Inc., Unsecured Notes | | | | | | |
5.25%, 2/06/12 | | | 440 | | | 424,572 |
6.00%, 7/19/12 | | | 350 | | | 345,452 |
Leucadia National Corp., Senior Unsecured Notes | | | | | | |
7.13%, 3/15/17 | | | 200 | | | 189,500 |
Morgan Stanley, Senior Notes | | | | | | |
4.79%, 1/09/12(g) | | | 1,655 | | | 1,524,136 |
5.55%, 4/27/17 | | | 115 | | | 108,148 |
6.25%, 8/28/17 | | | 1,025 | | | 1,019,411 |
Morgan Stanley, Unsecured Notes | | | | | | |
5.05%, 1/21/11 | | | 360 | | | 361,154 |
NSG Holdings LLC, Notes | | | | | | |
7.75%, 12/15/25(d) | | | 140 | | | 135,800 |
Russian Federation, Unsubordinated Notes | | | | | | |
7.50%, 3/31/30(g) | | | 98 | | | 113,423 |
SLM Corp., Senior Unsecured Notes | | | | | | |
3.47%, 7/27/09(g) | | | 525 | | | 441,699 |
TL Acquisitions, Inc., Senior Unsecured Notes | | | | | | |
10.50%, 1/15/15(d) | | | 290 | | | 249,400 |
| | | | | | |
| | | | | | 15,110,668 |
| | | | | | |
Food & Agriculture — 0.2% | | | | | | |
Kraft Foods, Inc., Senior Unsecured Notes | | | | | | |
6.50%, 8/11/17 | | | 535 | | | 548,883 |
6.13%, 2/01/18 | | | 475 | | | 474,699 |
| | | | | | |
| | | | | | 1,023,582 |
| | | | | | |
Insurance — 0.1% | | | | | | |
Allstate Financial Global Funding LLC, Unsecured Notes | | | | | | |
2.50%, 6/20/08(d) | | | 325 | | | 324,545 |
MetLife, Inc., Junior Subordinated Debentures | | | | | | |
6.40%, 12/15/36(g) | | | 390 | | | 309,910 |
| | | | | | |
| | | | | | 634,455 |
| | | | | | |
Leasing — 0.0% | | | | | | |
Rent-A-Center, Senior Subordinated Notes | | | | | | |
7.50%, 5/01/10 | | | 180 | | | 166,500 |
| | | | | | |
Manufacturing — 0.1% | | | | | | |
Georgia-Pacific Corp., Senior Unsecured Notes | | | | | | |
7.13%, 1/15/17(d) | | | 285 | | | 263,625 |
Jarden Corp., Senior Subordinated Notes | | | | | | |
7.50%, 5/01/17 | | | 75 | | | 65,625 |
Rexnord LLC, Senior Notes | | | | | | |
8.88%, 9/01/16 | | | 30 | | | 26,550 |
Rock-Tenn Co., Senior Unsecured Notes | | | | | | |
8.20%, 8/15/11 | | | 250 | | | 256,250 |
Terex Corp., Senior Subordinated Notes | | | | | | |
8.00%, 11/15/17 | | | 370 | | | 368,150 |
| | | | | | |
| | | | | | 980,200 |
| | | | | | |
Medical & Medical Services — 0.1% | | | | | | |
Health Management Plc, Senior Unsecured Notes | | | | | | |
6.13%, 4/15/16 | | | 230 | | | 194,350 |
Reable Therapeutics, Inc., Unsecured Notes | | | | | | |
10.88%, 11/15/14(d) | | | 280 | | | 263,200 |
| | | | | | |
| | | | | | 457,550 |
| | | | | | |
Metal & Mining — 0.1% | | | | | | |
Freeport-McMoRan Copper & Gold, Inc., Senior Unsecured Notes | | | | | | |
8.25%, 4/01/15 | | | 145 | | | 152,975 |
8.39%, 4/01/15(g) | | | 130 | | | 127,725 |
8.38%, 4/01/17 | | | 445 | | | 472,256 |
| | | | | | |
| | | | | | 752,956 |
| | | | | | |
Motor Vehicles — 0.1% | | | | | | |
ArvinMeritor, Inc., Unsecured Notes | | | | | | |
8.13%, 9/15/15 | | | 385 | | | 313,775 |
Lear Corp., Senior Unsecured Notes | | | | | | |
8.75%, 12/01/16 | | | 90 | | | 76,837 |
| | | | | | |
| | | | | | 390,612 |
| | | | | | |
Oil & Gas — 0.2% | | | | | | |
Opti, Inc. (Canada), Notes | | | | | | |
8.25%, 12/15/14(h) | | | 175 | | | 173,250 |
Colorado Interstate Gas Co., Senior Unsecured Notes | | | | | | |
6.80%, 11/15/15 | | | 35 | | | 36,085 |
Consolidated Natural Gas, Inc., Senior Debentures | | | | | | |
5.00%, 3/01/14 | | | 20 | | | 19,569 |
EXCO Resources, Inc., Senior Secured Notes | | | | | | |
7.25%, 1/15/11 | | | 65 | | | 63,213 |
Gazprom, Unsecured Notes | | | | | | |
9.63%, 3/01/13 | | | 680 | | | 764,544 |
Newfield Exploration Co., Senior Subordinated Notes | | | | | | |
6.63%, 9/01/14-4/15/16 | | | 250 | | | 245,650 |
Targa Resources, Inc., Senior Unsecured Notes | | | | | | |
8.50%, 11/01/13 | | | 10 | | | 9,225 |
See Notes Financial Statements.
| | | | | | |
| | | BLACKROCK ASSET ALLOCATION PORTFOLIO | | MARCH 31, 2008 | | 25 |
Schedule of Investments (continued)
| | | | | | |
| | | Par
(000) | | Value |
Corporate Bonds (Continued) | | | | | | |
Oil & Gas (Continued) | | | | | | |
Transocean, Inc., Senior Unsecured Notes | | | | | | |
6.80%, 3/15/38 | | $ | 105 | | $ | 107,264 |
| | | | | | |
| | | | | | 1,418,800 |
| | | | | | |
Paper & Forest Products — 0.0% | | | | | | |
NewPage Corp., Senior Secured Notes | | | | | | |
10.00%, 5/01/12(d) | | | 100 | | | 101,500 |
| | | | | | |
Pharmaceuticals — 0.1% | | | | | | |
Bristol-Myers Squibb Co., Senior Debentures | | | | | | |
6.88%, 8/01/97 | | | 25 | | | 24,979 |
Merck & Co., Inc., Senior Unsecured Notes | | | | | | |
4.38%, 2/15/13 | | | 410 | | | 420,874 |
| | | | | | |
| | | | | | 445,853 |
| | | | | | |
Real Estate — 0.1% | | | | | | |
American Real Estate Partners LP, Senior Unsecured Notes | | | | | | |
7.13%, 2/15/13 | | | 420 | | | 381,150 |
The Rouse Co., Senior Unsecured Notes (REIT) | | | | | | |
6.75%, 5/01/13(d) | | | 290 | | | 249,914 |
The Rouse Co., Unsecured Notes (REIT) | | | | | | |
3.63%, 3/15/09 | | | 195 | | | 183,622 |
| | | | | | |
| | | | | | 814,686 |
| | | | | | |
Restaurants — 0.0% | | | | | | |
Landry’s Restaurants, Inc., Senior Notes | | | | | | |
9.50%, 12/15/14 | | | 90 | | | 87,750 |
| | | | | | |
Retail Merchandising — 0.3% | | | | | | |
Michaels Stores, Inc., Senior Subordinated Notes | | | | | | |
11.38%, 11/01/16 | | | 80 | | | 62,800 |
Michaels Stores, Inc., Senior Unsecured Notes | | | | | | |
10.00%, 11/01/14 | | | 145 | | | 126,875 |
Rite Aid Corp., Notes | | | | | | |
7.50%, 3/01/17 | | | 320 | | | 288,000 |
Wal-Mart Stores, Inc., Senior Unsecured Notes | | | | | | |
5.80%, 2/15/18 | | | 1,250 | | | 1,310,033 |
| | | | | | |
| | | | | | 1,787,708 |
| | | | | | |
Telecommunications — 0.5% | | | | | | |
American Tower Corp., Senior Unsecured Notes | | | | | | |
7.50%, 5/01/12 | | | 800 | | | 818,000 |
AT&T, Inc., Unsecured Notes | | | | | | |
5.50%, 2/01/18 | | | 250 | | | 244,785 |
6.50%, 9/01/37 | | | 800 | | | 791,354 |
Cincinnati Bell, Inc., Senior Unsecured Notes | | | | | | |
7.25%, 7/15/13 | | | 520 | | | 510,900 |
Citizens Communications Co., Senior Unsecured Notes | | | | | | |
7.88%, 1/15/27 | | | 25 | | | 21,437 |
Qwest Communications International, Inc., Senior Unsecured Notes | | | | | | |
7.50%, 2/15/14 | | | 310 | | | 291,400 |
Qwest Corp., Unsecured Notes | | | | | | |
6.05%, 6/15/13(g) | | | 75 | | | 67,500 |
Superior Essex Communications & Essex Group, Senior Notes | | | | | | |
9.00%, 4/15/12 | | | 425 | | | 409,062 |
Verizon Maryland Inc., Debentures | | | | | | |
5.13%, 6/15/33 | | | 10 | | | 8,010 |
Windstream Corp., Senior Unsecured Notes | | | | | | |
8.63%, 8/01/16 | | | 150 | | | 147,375 |
| | | | | | |
| | | | | | 3,309,823 |
| | | | | | |
Tires & Rubber — 0.0% | | | | | | |
Goodyear Tire & Rubber Co., Unsecured Notes | | | | | | |
8.63%, 12/01/11 | | | 150 | | | 157,313 |
| | | | | | |
Waste Management — 0.0% | | | | | | |
Aleris International, Inc., Senior Unsecured Notes | | | | | | |
9.00%, 12/15/14(p) | | | 230 | | | 167,900 |
| | | | | | |
Yankee — 1.6% | | | | | | |
Banks — 0.4% | | | | | | |
Anz National Bank International Ltd. (New Zealand), Unsecured Notes | | | | | | |
4.49%, 4/14/10(d)(g)(h) | | | 1,645 | | | 1,630,241 |
Banco Central de la Republica Dominicana (Dominican Republic), Unsecured Notes | | | | | | |
9.04%, 1/23/18(h) | | | 33 | | | 34,593 |
Banque Centrale de Tunisie (Tunisia), Senior Unsecured Notes | | | | | | |
7.38%, 4/25/12(h) | | | 425 | | | 459,000 |
United Mexican States (Mexico), Unsecured Notes | | | | | | |
7.50%, 4/08/33(h) | | | 185 | | | 224,312 |
6.05%, 1/11/40 | | | 225 | | | 224,438 |
VTB Capital SA (Luxembourg), Unsecured Notes | | | | | | |
7.50%, 10/12/11(h) | | | 110 | | | 112,783 |
| | | | | | |
| | | | | | 2,685,367 |
| | | | | | |
Electronics — 0.0% | | | | | | |
NXP BV (Netherlands), Notes | | | | | | |
7.01%, 10/15/13(g)(h) | | | 190 | | | 156,750 |
| | | | | | |
Energy & Utilities — 0.0% | | | | | | |
Suncor Energy, Inc. (Canada), Unsecured Notes | | | | | | |
6.50%, 6/15/38(h) | | | 20 | | | 19,729 |
| | | | | | |
Finance — 0.0% | | | | | | |
Wind Acquisition Finance SA (Luxembourg), Senior Unsecured Notes | | | | | | |
10.75%, 12/01/15(d)(h) | | | 115 | | | 117,300 |
| | | | | | |
Government — 0.6% | | | | | | |
AID-Israel (Israel), Unsecured Notes | | | | | | |
5.50%, 4/26/24-9/18/33(h) | | | 185 | | | 209,376 |
Oriental Republic of Uruguay Bonds | | | | | | |
7.63%, 3/21/36(h) | | | 165 | | | 167,062 |
Republic of Argentina Bonds | | | | | | |
8.28%, 12/31/33(h) | | | 113 | | | 92,388 |
Republic of Argentina, Unsecured Notes | | | | | | |
1.33%, 12/31/38(g)(h) | | | 170 | | | 61,200 |
Republic of Brazil Bonds | | | | | | |
8.25%, 1/20/34(h) | | | 100 | | | 119,500 |
11.00%, 8/17/40(h) | | | 705 | | | 943,995 |
Republic of El Salvador, Unsecured Notes | | | | | | |
7.65%, 6/15/35(d)(h) | | | 55 | | | 58,300 |
Republic of Indonesia Bonds | | | | | | |
6.63%, 2/17/34(d)(h) | | | 100 | | | 92,000 |
Republic of Panama, Debentures | | | | | | |
8.88%, 9/30/27(h) | | | 95 | | | 121,125 |
Republic of Panama, Unsecured Notes | | | | | | |
7.13%, 1/29/26(h) | | | 170 | | | 183,600 |
Republic of Peru Bonds | | | | | | |
6.55%, 3/14/37(h) | | | 355 | | | 367,070 |
Republic of Peru, Unsecured Notes | | | | | | |
8.75%, 11/21/33(h) | | | 135 | | | 175,500 |
Republic of Philippines, Senior Unsecured Notes | | | | | | |
9.00%, 2/15/13(h) | | | 370 | | | 432,456 |
Republic of Turkey, Unsecured Notes | | | | | | |
6.75%, 4/03/18(h) | | | 730 | | | 722,700 |
See Notes Financial Statements.
| | | | | | |
26 | | BLACKROCK ASSET ALLOCATION PORTFOLIO | | MARCH 31, 2008 | | |
Schedule of Investments (continued)
| | | | | | |
| | | Par
(000) | | Value |
Corporate Bonds (Continued) | | | | | | |
Yankee (Continued) | | | | | | |
Government (Continued) | | | | | | |
Republic of Venezuela Bonds | | | | | | |
9.25%, 9/15/27(h) | | $ | 280 | | $ | 266,000 |
Republic of Venezuela, Unsecured Notes | | | | | | |
8.50%, 10/08/14(h) | | | 200 | | | 185,500 |
Ukraine Government, Unsecured Notes | | | | | | |
6.58%, 11/21/16(d)(h) | | | 100 | | | 99,250 |
| | | | | | |
| | | | | | 4,297,022 |
| | | | | | |
Manufacturing — 0.0% | | | | | | |
Ford Capital BV (Netherlands), Debentures | | | | | | |
9.50%, 6/01/10(h) | | | 390 | | | 351,000 |
| | | | | | |
Metal & Mining — 0.0% | | | | | | |
Ispat Inland ULC (Canada), Senior Secured Notes | | | | | | |
9.75%, 4/01/14(h) | | | 10 | | | 10,755 |
| | | | | | |
Oil & Gas — 0.2% | | | | | | |
ConocoPhillips Funding Co. (Australia), Unsecured Notes | | | | | | |
4.64%, 4/09/09(g)(h) | | | 1,129 | | | 1,125,927 |
Gazprom Capital (Luxembourg), Unsecured Notes | | | | | | |
9.63%, 3/01/13(d)(h) | | | 200 | | | 224,250 |
| | | | | | |
| | | | | | 1,350,177 |
| | | | | | |
Paper & Forest Products — 0.1% | | | | | | |
Ainsworth Lumber Co. Ltd. (Canada), Senior Unsecured Notes | | | | | | |
6.45%, 10/01/10(g)(h) | | | 285 | | | 188,100 |
7.25%, 10/01/12(h) | | | 25 | | | 14,375 |
Domtar Corp. (Canada), Unsecured Notes | | | | | | |
5.38%, 12/01/13(h) | | | 90 | | | 78,750 |
7.13%, 8/15/15(h) | | | 100 | | | 94,250 |
Norske Skog Canada Ltd. (Canada), Senior Unsecured Notes | | | | | | |
8.63%, 6/15/11(h) | | | 50 | | | 41,625 |
| | | | | | |
| | | | | | 417,100 |
| | | | | | |
Telecommunications — 0.3% | | | | | | |
America Movil SAB de CV (Mexico), Unsecured Notes | | | | | | |
6.38%, 3/01/35(h) | | | 75 | | | 72,581 |
Rogers Wireless, Inc. (Canada), Senior Secured Notes | | | | | | |
7.50%, 3/15/15(h) | | | 500 | | | 525,304 |
Shaw Communications, Inc. (Canada), Unsecured Notes | | | | | | |
7.20%, 12/15/11(h) | | | 175 | | | 180,250 |
Telecom Italia Capital (Italy), Senior Unsecured Notes | | | | | | |
4.95%, 9/30/14(h) | | | 475 | | | 432,279 |
Telefonica Emisiones SAU (Spain), Senior Unsecured Notes | | | | | | |
6.42%, 6/20/16(h) | | | 150 | | | 153,738 |
7.05%, 6/20/36(h) | | | 150 | | | 156,832 |
Vimpelcom (Luxembourg), Notes | | | | | | |
8.25%, 5/23/16(h) | | | 100 | | | 98,500 |
Vodafone Group Plc (United Kingdom), Senior Unsecured Notes | | | | | | |
7.75%, 2/15/10(h) | | | 125 | | | 132,471 |
| | | | | | |
| | | | | | 1,751,955 |
| | | | | | |
Total Corporate Bonds | | | | | | |
(Cost $54,827,420) | | | | | | 53,847,960 |
| | | | | | |
Foreign Bonds — 0.2% | | | | | | |
Germany — 0.2% | | | | | | |
Bundesrepublic Deutschland (EUR) | | | | | | |
4.00%, 1/04/37 | | | 425 | | | 612,698 |
4.25%, 7/04/39 | | | 250 | | | 375,258 |
| | | | | | |
Total Foreign Bonds | | | | | | |
(Cost $920,765) | | | | | | 987,956 |
| | | | | | |
Taxable Municipal Bonds — 0.1% | | | | | | |
Atlantic Marine Corp. Communities, Notes (Delaware) | | | | | | |
5.34%, 12/01/50(d) | | | 600 | | | 506,586 |
Ohana Hawaii Military Communities LLC, Military Housing Revenue Bonds (Navy Housing Privatization Project), Series 04-A, Class 1 | | | | | | |
6.19%, 4/01/49(d) | | | 25 | | | 23,964 |
| | | | | | |
Total Taxable Municipal Bonds | | | | | | |
(Cost $625,000) | | | | | | 530,550 |
| | | | | | |
| | | | |
| | | Shares | | |
Exchange-Traded Funds — 1.5% | | | | |
iShares MSCI Brazil Index Fund | | 71,000 | | 5,469,130 |
iShares MSCI South Korea Index Fund | | 40,000 | | 2,231,600 |
iShares Russell 2000 Value Index Fund | | 1,463 | | 95,929 |
iShares Silver Trust(a) | | 15,000 | | 2,562,450 |
| | | | |
Total Exchange-Traded Funds | | | | |
(Cost $10,099,591) | | | | 10,359,109 |
| | | | |
| | | | | |
| | | Par/Shares
(000) | | |
Short Term Investments — 11.6% | | | | | |
Atlantic Asset Securitization Corp., | | | | | |
2.85%, 5/12/08 | | $ | 5,000 | | 4,983,771 |
BlackRock Liquidity Series, LLC Money Market Series, 3.10%(q)(r)(s) Cafco LLC, | | | 2,936 | | 2,935,650 |
2.87%, 5/19/08 | | | 5,000 | | 4,979,416 |
Chariot Funding LLC, | | | | | |
2.80%, 5/13/08 | | | 5,000 | | 4,983,667 |
Ciesco LLC, | | | | | |
2.87%, 5/07/08 | | | 5,000 | | 4,985,650 |
Galileo Money Market Fund, 2.56%(s) Galleon Capital LLC, | | | 31,867 | | 31,867,011 |
2.98%, 5/14/08 | | | 5,000 | | 4,981,906 |
Kitty Hawk Funding Corp., | | | | | |
2.93%, 4/17/08 | | | 5,000 | | 4,993,489 |
Liberty Street Funding LLC, | | | | | |
2.95%, 5/16/08 | | | 5,000 | | 4,981,265 |
Old Line Funding LLC, | | | | | |
2.91%, 4/24/08 | | | 5,000 | | 4,990,704 |
UBS Finance Delaware LLC, | | | | | |
2.69%, 6/02/08 | | | 5,000 | | 4,976,358 |
| | | | | |
Total Short Term Investments | | | | | |
(Cost $79,661,411) | | | | | 79,658,887 |
| | | | | |
See Notes Financial Statements.
| | | | | | |
| | | BLACKROCK ASSET ALLOCATION PORTFOLIO | | MARCH 31, 2008 | | 27 |
Schedule of Investments (continued)
| | | | | | |
| | | Contracts | | | Value |
Call Options Purchased — 0.3% | | | | | | |
Interest Rate Swaps, | | | | | | |
Bank of America, Strike Rate 5.470%, Expires 5/08/12 | | 560 | (t) | | $ | 386,245 |
Credit Suisse First National Bank, Strike Rate 4.542%, Expires 3/13/09 | | 300 | (t) | | | 136,848 |
Goldman Sachs & Co., Strike Rate 5.21%, Expires 3/03/11 | | 300 | (t) | | | 193,428 |
Goldman Sachs & Co., Strike Rate 5.338%, Expires 2/22/11 | | 200 | (t) | | | 140,001 |
Lehman Brothers, Strike Rate 5.345%, Expires 11/09/09 | | 450 | (t) | | | 362,484 |
Lehman Brothers, Strike Rate 5.390%, Expires 3/19/12 | | 330 | (t) | | | 219,746 |
Lehman Brothers, Strike Rate 6.025%, Expires 6/08/12 | | 391 | (t) | | | 358,727 |
| | | | | | |
Total Call Options Purchased | | | | | | |
(Cost $1,077,359) | | | | | | 1,797,479 |
| | | | | | |
Put Options Purchased — 0.1% | | | | | | |
Interest Rate Swaps, | | | | | | |
Bank of America, Strike Rate 5.470%, Expires 5/08/12 | | 560 | (t) | | | 254,440 |
Credit Suisse First National Bank, Strike Rate 4.542%, Expires 3/13/09 | | 300 | (t) | | | 99,222 |
Goldman Sachs & Co., Strike Rate 5.21%, Expires 3/03/11 | | 300 | (t) | | | 133,602 |
JPMorgan Chase, Strike Rate 5.338%, Expires 2/22/11 | | 200 | (t) | | | 80,315 |
Lehman Brothers, Strike Rate 5.345%, Expires 11/09/09 | | 450 | (t) | | | 104,428 |
Lehman Brothers, Strike Rate 5.390%, Expires 3/19/12 | | 330 | (t) | | | 155,372 |
Lehman Brothers, Strike Rate 6.025%, Expires 6/08/12 | | 391 | (t) | | | 121,830 |
| | | | | | |
Total Put Options Purchased | | | | | | |
(Cost $1,077,359) | | | | | | 949,209 |
| | | | | | |
Total Investments Before Mortgage Pass-Through TBA Sale Commitments and Outstanding Options Written | | | | | | |
(Cost $722,108,214*) | | | | | | 776,640,997 |
| | | | | | |
| | | | | | | |
| | | Par
(000) | | | | |
Mortgage Pass-Through TBA Sale Commitments — (5.6)% | | | | | | | |
Federal Home Loan Mortgage Corp. Gold 15 Year, | | | | | | | |
5.50%, 4/01/22 | | $ | (2,300 | ) | | (2,344,574 | ) |
Federal Home Loan Mortgage Corp. Gold 30 Year, | | | | | | | |
5.50%, 4/01/38 | | | (5,700 | ) | | (5,755,233 | ) |
Federal National Mortgage Assoc. 15 Year, | | | | | | | |
5.00%, 4/01/23 | | | (8,000 | ) | | (8,075,040 | ) |
5.50%, 4/01/23 | | | (3,300 | ) | | (3,367,023 | ) |
6.00%, 4/01/23 | | | (2,300 | ) | | (2,366,838 | ) |
Federal National Mortgage Assoc. 30 Year, | | | | | | | |
5.00%, 4/01/38 | | | (2,900 | ) | | (2,870,101 | ) |
5.50%, 4/01/38 | | | (1,200 | ) | | (1,211,256 | ) |
6.00%, 4/01/38-5/01/38 | | | (3,300 | ) | | (3,374,820 | ) |
Government National Mortgage Assoc. I 30 Year, | | | | | | | |
5.50%, 4/01/38 | | | (3,400 | ) | | (3,464,804 | ) |
Government National Mortgage Assoc. II 30 Year, | | | | | | | |
5.50%, 4/01/38 | | | (3,000 | ) | | (3,051,570 | ) |
6.00%, 4/01/38 | | | (2,200 | ) | | (2,266,000 | ) |
| | | | | | | |
Total Mortgage Pass-Through TBA Sale Commitments | | | | | | | |
(Proceeds $37,886,574) | | | | | | (38,147,259 | ) |
| | | | | | | |
| | | | | | |
| | | Contracts | | | | |
Call Options Written — (0.2)% | | | | | | |
Interest Rate Swaps, | | | | | | |
Barclays Capital, Strike Rate 5.140%, Expires 4/21/08 | | (320 | )(t) | | (276,683 | ) |
Chase Securities, Strike Rate 5.460%, Expires 8/22/08 | | (170 | )(t) | | (181,123 | ) |
Chase Securities, Strike Rate 5.485%, Expires 10/26/09 | | (140 | )(t) | | (124,344 | ) |
Citibank, Strike Rate 5.670%, Expires 1/04/10 | | (50 | )(t) | | (48,432 | ) |
Deutsche Bank, Strike Rate 4.870%, Expires 2/04/10 | | (570 | )(t) | | (318,602 | ) |
UBS Securities, Strike Rate 5.400%, Expires 12/14/10 | | (260 | )(t) | | (192,143 | ) |
| | | | | | |
Total Call Options Written | | | | | | |
(Premiums received $630,007) | | | | | (1,141,327 | ) |
| | | | | | |
| | | | | | | |
Put Options Written — 0.0% | | | | | | | |
Salomon Brothers, Strike Price $97.625, Expires 6/16/08 | | (12 | ) | | | (3,225 | ) |
Citibank, Strike Price $112, Expires 5/23/08 | | (19 | ) | | | (1,484 | ) |
Interest Rate Swaps, | | | | | | | |
Barclays Capital, Strike Rate 5.140%, Expires 4/21/08 | | (320 | )(t) | | | (112 | ) |
Chase Securities, Strike Rate 5.460%, Expires 8/22/08 | | (170 | )(t) | | | (4,917 | ) |
Chase Securities, Strike Rate 5.485%, Expires 10/26/09 | | (140 | )(t) | | | (27,284 | ) |
Citibank, Strike Rate 5.670%, Expires 1/04/10 | | (50 | )(t) | | | (9,152 | ) |
Deutsche Bank, Strike Rate 4.870%, Expires 2/04/10 | | (570 | )(t) | | | (234,624 | ) |
UBS Securities, Strike Rate 5.400%, Expires 12/14/10 | | (260 | )(t) | | | (94,674 | ) |
| | | | | | | |
Total Put Options Written | | | | | | | |
(Premiums received $651,964) | | | | | | (375,472 | ) |
| | | | | | | |
Total Options Written | | | | | | | |
(Premiums received $1,281,971) | | | | | | (1,516,799 | ) |
| | | | | | | |
Total Investments Net of Mortgage Pass-Through TBA Sale Commitments and Outstanding Options Written — 107.3% | | | | | | | |
(Cost $682,939,669) | | | | | | 736,976,939 | |
Liabilities in Excess of Other Assets — (7.3)% | | | | | | (49,977,350 | ) |
| | | | | | | |
Net Assets — 100.0% | | | | | $ | 686,999,589 | |
| | | | | | | |
See Notes Financial Statements.
| | | | | | |
28 | | BLACKROCK ASSET ALLOCATION PORTFOLIO | | MARCH 31, 2008 | | |
Schedule of Investments (continued)
| * | The cost and unrealized appreciation (depreciation)of investments as of March 31, 2008, as computed for federal income tax purposes, were as follows: |
| | | | |
Aggregate cost | | $ | 726,355,217 | |
| | | | |
Gross unrealized appreciation | | $ | 76,851,978 | |
Gross unrealized depreciation | | | (26,566,198 | ) |
| | | | |
Net unrealized appreciation | | $ | 50,285,780 | |
| | | | |
| (a) | Non-income producing security. |
| (b) | Security, or a portion of security, is on loan. |
| (c) | Restricted security as to resale. As of report date the Portfolio held 0.1% of its net assets, with a current market value of $737,711 and an original cost of $609,946 in these securities. |
| (d) | Security exempt from registration under Rule 144A of the Securities Act of 1933. These securities may be resold in transactions exempt from registration to qualified institutional investors. Unless otherwise indicated, these securities are not considered to be illiquid. |
| (e) | Security is fair valued by the Board of Trustees. |
| (f) | Security is perpetual in nature and has no stated maturity date. In certain instances, a final maturity date may be extended and/or the final payment of principal may be deferred at the issuer’s option for a specified time without default. |
| (g) | Variable rate security. Rate shown is as of report date. Maturity shown is the final maturity date. |
| (h) | U.S. dollar denominated security issued by foreign domiciled entity. |
| (i) | The rate shown is the effective yield at the time of purchase. |
| (j) | Security, or a portion thereof, subject to financing transactions. |
| (k) | Par is less than $500. |
| (l) | Security, or a portion thereof, with a market value of $1,178,200, has been pledged as collateral for swap and interest rate swap contracts. |
| (m) | All or a portion of security, with a market value of $18,312,565 has been pledged as collateral for reverse repurchase agreements. |
| (n) | All or a portion of security, with a value of $1,333,642 as well as cash of $2,694,000, as seen on the Statement of Asset and Liabilities, for a combined value of $4,027,642 have been pledged as collateral in connection with open financial futures contracts. |
| (o) | The rate shown is the effective yield as of report date. |
| (p) | Represents a payment-in-kind security which may pay interest/dividends in additional face/shares. |
| (q) | Investments in companies considered to be an affiliate of the Portfolio, for purposes of Section 2(a)(3) of the Investment Company Act of 1940, were as follows: |
| | | | | | |
Affiliate | | Net
Activity | | Interest
Income |
BlackRock Liquidity Series, LLC Money Market Series | | $ | 2,935,650 | | $ | 7,306 |
| (r) | Security purchased with the cash proceeds from securities loans. |
| (s) | Represents current yield as of report date. |
| (t) | One contract represents a notional amount of $10,000. |
| • | | Reverse repurchase agreements outstanding as of March 31, 2008 were as follows: |
| | | | | | | | | | | | | |
Counterparty | | Interest
Rate | | | Settlement
Date | | Maturity
Date | | Net Closing
Amount | | Par |
Lehman Brothers | | 3.00 | % | | 03/12/08 | | 04/14/08 | | $ | 17,521,051 | | $ | 17,473,000 |
| • | Forward foreign exchange contracts purchased as of March 31, 2008 were as follows: |
| | | | | | | | | | |
Foreign Currency Purchased | | | | | | Settlement Date | | Unrealized
Appreciation
(Depreciation) | |
AUD | | 131,000 | | | | 04/02/08 | | $ | (734 | ) |
CAD | | 4,500 | | | | 04/02/08 | | | 1 | |
JPY | | 214,207,163 | | | | 04/11/08 | | | 179,587 | |
AUD | | 1,847,000 | | | | 04/23/08 | | | 55,997 | |
CAD | | 2,975,000 | | | | 04/23/08 | | | 5,569 | |
DKK | | 1,855,000 | | | | 04/23/08 | | | 27,130 | |
NOK | | 5,943,000 | | | | 04/23/08 | | | 48,165 | |
JPY | | 302,852,000 | | | | 04/23/08 | | | 186,602 | |
SEK | | 3,500,000 | | | | 04/23/08 | | | 37,921 | |
HKD | | 2,769,000 | | | | 04/23/08 | | | 395 | |
SGD | | 456,000 | | | | 04/23/08 | | | 2,460 | |
EUR | | 6,568,300 | | | | 04/23/08 | | | 724,358 | |
CHF | | 1,944,000 | | | | 04/23/08 | | | 183,152 | |
GBP | | 570,000 | | | | 04/23/08 | | | 1,884 | |
ZAR | | 2,372,000 | | | | 04/23/08 | | | (38,116 | ) |
PLN | | 1,302,000 | | | | 04/23/08 | | | 60,618 | |
| | | | | | | | | | |
Total Net Unrealized Appreciation on Forward Foreign Exchange Contracts (USD Commitment - $25,579,482) | | | | $ | 1,474,989 | |
| | | | | | | | | | |
See Notes Financial Statements.
| | | | | | |
| | | BLACKROCK ASSET ALLOCATION PORTFOLIO | | MARCH 31, 2008 | | 29 |
Schedule of Investments (continued)
| • | | Forward foreign exchange contracts sold as of March 31, 2008 were as follows: |
| | | | | | | | | | |
Foreign
Currency
Sold | | | | | | Settlement Date | | Unrealized
Appreciation
(Depreciation) | |
CAD | | 131,000 | | | | 04/01/08 | | $ | 1,145 | |
NOK | | 2,100,000 | | | | 04/01/08 | | | (586 | ) |
JPY | | 20,788,000 | | | | 04/01/08 | | | 503 | |
AUD | | 669,000 | | | | 04/23/08 | | | 3,684 | |
CAD | | 1,535,000 | | | | 04/23/08 | | | 11,955 | |
DKK | | 1,855,000 | | | | 04/23/08 | | | (5,887 | ) |
NOK | | 16,695,000 | | | | 04/23/08 | | | (218,174 | ) |
JPY | | 566,342,913 | | | | 04/23/08 | | | (313,485 | ) |
SEK | | 878,900 | | | | 04/23/08 | | | (4,629 | ) |
HKD | | 1,331,000 | | | | 04/23/08 | | | (229 | ) |
SGD | | 19,000 | | | | 04/23/08 | | | (59 | ) |
EUR | | 2,837,241 | | | | 04/23/08 | | | (187,856 | ) |
CHF | | 646,500 | | | | 04/23/08 | | | (45,914 | ) |
GBP | | 1,659,500 | | | | 04/23/08 | | | 390 | |
| | | | | | | | | | |
Total Net Unrealized Depreciation on Forward Foreign Exchange Contracts (USD Commitment - $20,196,315) | | | | $ | (759,142 | ) |
| | | | | | | | | | |
| • | | Financial futures contracts purchased as of March 31, 2008 were as follows: |
| | | | | | | | | | | |
Contracts | | Issue | | Expiration
Date | | Notional
Amount | | Unrealized
Appreciation
(Depreciation) | |
| | U.S. Treasury | | | | | | | | | |
172 | | Notes (2 Year) | | June 2008 | | $ | 36,920,875 | | $ | 46,904 | |
| | U.S. Treasury | | | | | | | | | |
176 | | Notes (10 Year) | | June 2008 | | $ | 20,935,750 | | | 299,609 | |
16 | | Euro-Bobl | | June 2008 | | $ | 2,798,054 | | | (30,816 | ) |
29 | | Euro-Bund | | June 2008 | | $ | 5,328,528 | | | (40,362 | ) |
31 | | Euro Dollar Futures | | December 2008 | | $ | 7,582,600 | | | 14,056 | |
51 | | Euro Dollar Futures | | June 2009 | | $ | 12,447,825 | | | 40,310 | |
120 | | MSCI Taiwan Index | | April 2008 | | $ | 3,944,400 | | | (113,670 | ) |
| | | | | | | | | | | |
Total Net Unrealized Appreciation | | | | | | | $ | 216,031 | |
| | | | | | | | | | | |
| | | |
• Financial futures contracts sold as of March 31, 2008 were as follows: | | | | | | | | | |
| | | | |
Contracts | | Issue | | Expiration
Date | | Notional
Amount | | Unrealized
Appreciation
(Depreciation) | |
| | U.S. Treasury | | | | | | | | | |
312 | | Notes (5 Year) | | June 2008 | | $ | 35,641,125 | | $ | 60,649 | |
54 | | U.S. Treasury Bonds | | June 2008 | | $ | 6,415,031 | | | (36,732 | ) |
51 | | Euro Dollar Futures | | June 2010 | | $ | 12,332,438 | | | (29,051 | ) |
| | | | | | | | | | | |
Total Net Unrealized Depreciation | | | | | | | $ | (5,134 | ) |
| | | | | | | | | | | |
| • | | Swaps outstanding as of March 31, 2008 were as follows: |
| | | | | | | | | |
| | | | | Notional
Amount | | Unrealized
Appreciation
(Depreciation) | |
Receive (pay) a variable return based on the change in the spread return of the Bank of America Aaa 10 Yr Index and pay a fixed rate of 1.0293% | | | | | | | | | |
Broker, Bank of America Expires, April 2008 | | USD | | $ | 2,175,000 | | $ | 54,191 | |
Receive (pay) a variable return based on the change in the spread return of the Lehman Brothers CMBS Aaa 8.5+ Yr Index and pay a fixed rate of 3.5708% | | | | | | | | | |
Broker, Goldman Sachs Expires, August 2008 | | USD | | | 2,135,000 | | | 55,759 | |
Receive (pay) a variable return based on the change in spread return of the Lehman Brothers Equity Swap Non Class 376 Index and pay a floating rate based on 1-month USD LIBOR plus .35% | | | | | | | | | |
Broker, Lehman Brothers Expires, February 2009 | | USD | | | 19,838,300 | | | 616,873 | |
Receive a fixed rate of 5.500% and pay a floating rate based on 3-month USD LIBOR | | | | | | | | | |
Broker, Bank of America Expires July 2009 | | USD | | | 7,500,000 | | | 335,032 | |
Receive a fixed rate of 4.780% and pay a floating rate based on 3-month USD LIBOR | | | | | | | | | |
Broker, Citibank Expires, August 2009 | | USD | | | 8,400,000 | | | 292,100 | |
Receive a fixed rate of 4.05% and pay a floating rate based on 3-month USD LIBOR | | | | | | | | | |
Broker, Barclays Bank Expires, December 2009 | | USD | | | 2,600,000 | | | 99,193 | |
Pay a fixed rate of 4.390% and receive a floating rate based on 3-month USD LIBOR | | | | | | | | | |
Broker, Morgan Stanley Expires, July 2010 | | USD | | | 6,300,000 | | | (257,372 | ) |
See Notes to Financial Statements.
| | | | | | |
30 | | BLACKROCK ASSET ALLOCATION PORTFOLIO | | MARCH 31, 2008 | | |
Schedule of Investments (continued)
| | | | | | | | | |
| | | | | Notional
Amount | | Unrealized
Appreciation
(Depreciation) | |
Receive a fixed rate of 5.110% and pay a floating rate based on 3-month USD LIBOR | | | | | | | | | |
Broker, UBS Expires, November 2011 | | USD | | $ | 9,100,000 | | $ | 812,176 | |
Sold credit default protection on Lehman Brothers Holdings, Inc. and receive 1.20% | | | | | | | | | |
Broker, Goldman Sachs Expires, September 2012 | | USD | | | 325,000 | | | (21,989 | ) |
Receive a fixed rate of 3.774% and pay a floating rate based on 3-month USD LIBOR | | | | | | | | | |
Broker, Bank of America Expires, January 2013 | | USD | | | 4,100,000 | | | 86,605 | |
Pay a fixed rate of 3.604% and receive a floating rate based on 3-month USD LIBOR | | | | | | | | | |
Broker, Deutsche Bank Expires, March 2013 | | USD | | | 5,700,000 | | | (80,453 | ) |
Pay a fixed rate of 3.484% and receive a floating rate based on 3-month USD LIBOR | | | | | | | | | |
Broker, Goldman Sachs Expires, March 2013 | | USD | | | 1,400,000 | | | (12,010 | ) |
Pay a fixed rate of 3.461% and receive a floating rate based on 3-month USD LIBOR | | | | | | | | | |
Broker, Goldman Sachs Expires, March 2013 | | USD | | | 1,400,000 | | | (10,551 | ) |
Receive a fixed rate of 3.461% and pay a floating rate based on 3-month USD LIBOR | | | | | | | | | |
Broker, Lehman Brothers Expires, March 2013 | | USD | | | 7,600,000 | | | (81,122 | ) |
Receive a fixed rate of 3.380% and pay a floating rate based on 3-month USD LIBOR | | | | | | | | | |
Broker, Deutsche Bank Expires, March 2013 | | USD | | | 6,400,000 | | | 24,658 | |
Bought credit default protection on DJ CDX.NA.IG.10.VI and pay 1.55% | | | | | | | | | |
Broker, Morgan Stanley Expires, June 2013 | | USD | | | 1,500,000 | | | 4,075 | |
Bought credit default protection on DJ CDX.NA.IG.10.VI and pay 1.55% | | | | | | | | | |
Broker, Lehman Brothers Expires, June 2013 | | USD | | | 1,500,000 | | | 7,049 | |
Pay a fixed rate of 4.960% and receive a floating rate based on 3-month USD LIBOR | | | | | | | | | |
Broker, UBS Expires, March 2015 | | USD | | | 5,000,000 | | | (394,300 | ) |
Pay a fixed rate of 4.500% and receive a floating rate based on 3-month USD LIBOR | | | | | | | | | |
Broker, JPMorgan Chase Expires, May 2015 | | USD | | | 1,700,000 | | | (104,452 | ) |
Receive a fixed rate of 6.650% and pay a floating rate based on 3-month NZD Bank Bill Rate | | | | | | | | | |
Broker, Citibank Expires, December 2015 | | NZD | | | 2,400,000 | | | (78,343 | ) |
Receive a fixed rate of 5.300% and pay a floating rate based on 3-month USD LIBOR | | | | | | | | | |
Broker, UBS Expires, February 2017 | | USD | | | 6,700,000 | | | 697,975 | |
Pay a fixed rate of 5.680% and receive a floating rate based on 3-month USD LIBOR | | | | | | | | | |
Broker, Lehman Brothers Expires, June 2017 | | USD | | | 2,400,000 | | | (351,370 | ) |
Pay a fixed rate of 5.640% and receive a floating rate based on 3-month USD LIBOR | | | | | | | | | |
Broker, Citibank Expires, July 2017 | | USD | | | 3,300,000 | | | (431,492 | ) |
Pay a fixed rate of 5.305% and receive a floating rate based on 3-month USD LIBOR | | | | | | | | | |
Broker, Citibank Expires, October 2017 | | USD | | | 4,800,000 | | | (562,273 | ) |
Pay a fixed rate of 5.288% and receive a floating rate based on 3-month USD LIBOR | | | | | | | | | |
Broker, Deutsche Bank Expires, October 2017 | | USD | | | 3,600,000 | | | (417,947 | ) |
Pay a fixed rate of 5.014% and receive a floating rate based on 3-month USD LIBOR | | | | | | | | | |
Broker, Deutsche Bank Expires, November 2017 | | USD | | | 3,300,000 | | | (310,045 | ) |
Pay a fixed rate of 5.115% and receive a floating rate based on 3-month USD LIBOR | | | | | | | | | |
Broker, Lehman Brothers Expires, March 2018 | | USD | | | 3,300,000 | | | (287,592 | ) |
See Notes to Financial Statements.
| | | | | | |
| | | BLACKROCK ASSET ALLOCATION PORTFOLIO | | MARCH 31, 2008 | | 31 |
Schedule of Investments (concluded)
| | | | | | | | | |
| | | | | Notional
Amount | | Unrealized
Appreciation
(Depreciation) | |
Receive a fixed rate of 5.410% and pay a floating rate based on 3-month USD LIBOR | | | | | | | | | |
Broker, JPMorgan Chase Expires, August 2022 | | USD | | $ | 4,230,000 | | $ | 126,336 | |
Receive a fixed rate of 5.410% and pay a floating rate based on 3-month USD LIBOR | | | | | | | | | |
Broker, Goldman Sachs Expires, April 2027 | | USD | | | 750,000 | | | 96,572 | |
| | | | | | | | | |
Total | | | | | | | $ | (92,717 | ) |
| | | | | | | | | |
| • | | For Portfolio compliance purposes, the Portfolio’s sector and industry classifications refer to any one or more of the Standard Industry Codes as defined by the SEC. This definition may not apply for purposes of this report, which may combine sector and industry sub-classifications for reporting ease. |
See Notes to Financial Statements.
| | | | | | |
32 | | BLACKROCK ASSET ALLOCATION PORTFOLIO | | MARCH 31, 2008 | | |
Statement of Assets and Liabilities
March 31, 2008 (Unaudited)
| | | | |
Assets | | | | |
Investments at value - unaffiliated (including securities loaned of $2,764,020) (cost $719,172,564) | | $ | 773,705,347 | |
Investments at value - affiliated (cost $2,935,650) | | | 2,935,650 | |
Cash on deposit for futures contracts | | | 2,694,000 | |
Foreign currency at value (cost $3,789,899) | | | 3,979,268 | |
Cash | | | 1,159 | |
Dividends and reclaims receivable | | | 1,157,045 | |
Interest receivable | | | 1,859,216 | |
Securities lending income receivable | | | 7,306 | |
Principal paydown receivable | | | 423,978 | |
Investments sold receivable | | | 139,895,422 | |
Receivable from advisor | | | 1,134 | |
Capital shares sold receivable | | | 926,808 | |
Prepaid expenses | | | 74,653 | |
Unrealized appreciation on forward foreign currency contracts | | | 1,531,516 | |
Unrealized appreciation on swaps | | | 3,308,594 | |
Margin variation receivable | | | 27,786 | |
| | | | |
Total assets | | | 932,528,882 | |
| | | | |
Liabilities | | | | |
Investments purchased payable | | | 176,731,719 | |
Unrealized depreciation on forward foreign currency contracts | | | 815,669 | |
Margin variation payable | | | 30,832 | |
Unrealized depreciation on swaps | | | 3,401,311 | |
Options written at value (premiums received $1,281,971) | | | 1,516,799 | |
Reverse repurchase agreements payable | | | 17,473,000 | |
Payable for financing transactions | | | 1,600,450 | |
Mortgage Pass-Throughs TBA sale commitments at value (proceeds received $37,886,574) | | | 38,147,259 | |
Collateral received at value - securities loans | | | 2,935,650 | |
Premiums received for swap contracts | | | 29,874 | |
Capital shares redeemed payable | | | 1,301,660 | |
Transfer agent fees payable | | | 405,188 | |
Investment advisory fees payable | | | 318,881 | |
Service and distribution fees payable | | | 141,021 | |
Custodian fees payable | | | 120,374 | |
Interest payable | | | 119,351 | |
Administration fees payable | | | 55,813 | |
Officer and Trustees fees payable | | | 18,174 | |
Foreign taxes payable | | | 6,334 | |
Other accrued expenses payable | | | 359,934 | |
| | | | |
Total liabilities | | | 245,529,293 | |
| | | | |
Net Assets | | | | |
Net Assets | | $ | 686,999,589 | |
| | | | |
Net Assets Consist of | | | | |
Paid-in capital | | $ | 633,938,043 | |
Undistributed net investment income | | | 2,230,539 | |
Accumulated net realized gain | | | (4,624,743 | ) |
Net unrealized appreciation | | | 55,455,750 | |
| | | | |
Net Assets | | $ | 686,999,589 | |
| | | | |
Net Asset Value | | | | |
Institutional - Based on net assets of $29,696,942, and 2,021,379 shares outstanding, unlimited number of shares authorized, $0.001 par value | | $ | 14.69 | |
| | | | |
Service - Based on net assets of $1,907,014, and 130,125 shares outstanding, unlimited number of shares authorized, $0.001 par value | | $ | 14.66 | |
| | | | |
Investor A - Based on net assets of $452,469,585, and 30,906,340 shares outstanding, unlimited number of shares authorized, $0.001 par value | | $ | 14.64 | |
| | | | |
Investor B - Based on net assets of $126,859,861, and 8,760,435 shares outstanding, unlimited number of shares authorized, $0.001 par value | | $ | 14.48 | |
| | | | |
Investor C - Based on net assets of $76,066,187, and 5,273,434 shares outstanding, unlimited number of shares authorized, $0.001 par value | | $ | 14.42 | |
| | | | |
See Notes to Financial Statements.
| | | | | | |
| | | BLACKROCK ASSET ALLOCATION PORTFOLIO | | MARCH 31, 2008 | | 33 |
Statement of Operations
Six Months Ended March 31, 2008 (Unaudited)
| | | | |
Investment Income | | | | |
Interest | | $ | 6,735,995 | |
Securities lending | | | 7,306 | |
Dividends and reclaims | | | 4,265,877 | |
Foreign taxes withheld | | | (97,173 | ) |
Interest from affiliates | | | 7,263 | |
| | | | |
Total investment income | | | 10,919,268 | |
| | | | |
Expenses | | | | |
Investment advisory | | | 2,015,137 | |
Service - class specific | | | 874,322 | |
Distribution - class specific | | | 830,470 | |
Transfer agent - class specific | | | 659,274 | |
Custodian | | | 273,907 | |
Administration | | | 263,153 | |
Administration - class specific | | | 91,543 | |
Printing | | | 73,833 | |
Professional | | | 57,696 | |
Officer and Trustees | | | 23,829 | |
Registration | | | 20,138 | |
Miscellaneous | | | 79,429 | |
| | | | |
Total expenses excluding interest expense | | | 5,262,731 | |
Interest expense | | | 256,863 | |
| | | | |
Total expenses | | | 5,519,594 | |
Less administration fees waived - class specific | | | (3,905 | ) |
Less transfer agent fees waived - class specific | | | (904 | ) |
Less transfer agent fees reimbursed - class specific | | | (7,378 | ) |
Less fees paid indirectly | | | (1,515 | ) |
| | | | |
Total expenses after waivers and reimbursement | | | 5,505,892 | |
| | | | |
Net investment income | | | 5,413,376 | |
| | | | |
Realized and Unrealized Gain (Loss) | | | | |
Net realized gain (loss) from: | | | | |
Investments | | | 21,322,939 | |
Written options | | | (448,677 | ) |
Futures and swaps | | | (4,029,526 | ) |
Foreign currency transactions | | | (50,525 | ) |
| | | | |
| | | 16,794,211 | |
| | | | |
Net change in unrealized appreciation/depreciation on: | | | | |
Investments | | | (65,851,923 | ) |
Mortgage pass-throughs TBA sale commitments | | | (402,815 | ) |
Written options | | | (689,289 | ) |
Futures and swaps | | | (5,194 | ) |
Foreign currency transactions | | | 648,072 | |
| | | | |
| | | (66,301,149 | ) |
| | | | |
Net realized and unrealized loss | | | (49,506,938 | ) |
| | | | |
Net Decrease in Net Assets Resulting from Operations | | $ | (44,093,562 | ) |
| | | | |
See Notes to Financial Statements.
| | | | | | |
34 | | BLACKROCK ASSET ALLOCATION PORTFOLIO | | MARCH 31, 2008 | | |
Statements of Changes in Net Assets
| | | | | | | | |
Increase in Net Assets: | | Six Months
Ended
March 31, 2008
(Unaudited) | | | Year Ended
September 30,
2007 | |
Operations | | | | | | | | |
Net investment income | | $ | 5,413,376 | | | $ | 11,294,292 | |
Net realized gain | | | 16,794,211 | | | | 64,921,547 | |
Net change in unrealized appreciation/depreciation | | | (66,301,149 | ) | | | 35,406,563 | |
| | | | | | | | |
Net increase (decrease) in net assets resulting from operations | | | (44,093,562 | ) | | | 111,622,402 | |
| | | | | | | | |
Dividends and Distributions to Shareholders from | | | | | | | | |
Net investment income: | | | | | | | | |
Institutional | | | (363,099 | ) | | | (518,845 | ) |
Service | | | (25,722 | ) | | | (30,612 | ) |
Investor A | | | (5,327,806 | ) | | | (6,065,281 | ) |
Investor B | | | (989,047 | ) | | | (1,015,381 | ) |
Investor C | | | (589,482 | ) | | | (610,142 | ) |
Net realized gain: | | | | | | | | |
Institutional | | | (2,001,331 | ) | | | (1,296,964 | ) |
Service | | | (175,568 | ) | | | (89,755 | ) |
Investor A | | | (38,125,134 | ) | | | (19,046,801 | ) |
Investor B | | | (11,393,688 | ) | | | (7,043,852 | ) |
Investor C | | | (6,488,172 | ) | | | (3,276,940 | ) |
| | | | | | | | |
Decrease in net assets resulting from dividends and distributions to shareholders | | | (65,479,049 | ) | | | (38,994,573 | ) |
| | | | | | | | |
Capital Share Transactions | | | | | | | | |
Net increase (decrease) in net assets resulting from capital share transactions | | | 15,574,979 | | | | (64,773,363 | ) |
Redemption Fees | | | | | | | | |
Redemption fees | | | — | | | | 472 | |
| | | | | | | | |
Net Assets | | | | | | | | |
Total increase (decrease) in net assets | | | (93,997,632 | ) | | | 7,854,938 | |
Beginning of period | | | 780,997,221 | | | | 773,142,283 | |
| | | | | | | | |
End of period | | $ | 686,999,589 | | | $ | 780,997,221 | |
| | | | | | | | |
End of period undistributed net investment income | | $ | 2,230,539 | | | $ | 4,112,319 | |
| | | | | | | | |
See Notes to Financial Statements.
| | | | | | |
| | | BLACKROCK ASSET ALLOCATION PORTFOLIO | | MARCH 31, 2008 | | 35 |
Financial Highlights
| | | | | | | | | | | | | | | | | | | | | | | | | | | | |
| | | Institutional* | |
| | | Six Months
Ended
March 31, 2008
(Unaudited) | | | Year Ended September 30, | | | 3/01/05 -
9/30/05 | | | 4/01/04 -
2/28/05 | | | Year Ended March 31, | |
| | | | | | |
| | | | 2007 | | | 2006 | | | | | 2004 | | | 20031 | |
Per Share Operating Performance | | | | | | | | | | | | | | | | | | | | | | | | | | | | |
Net asset value, beginning of period | | $ | 17.07 | | | $ | 15.53 | | | $ | 15.51 | | | $ | 14.99 | | | $ | 14.91 | | | $ | 11.38 | | | $ | 14.17 | |
| | | | | | | | | | | | | | | | | | | | | | | | | | | | |
Net investment income | | | 0.16 | 2 | | | 0.33 | 2 | | | 0.31 | 2 | | | 0.17 | 2 | | | 0.20 | | | | 0.24 | | | | 0.28 | |
Net realized and unrealized gain (loss) | | | (1.03 | ) | | | 2.08 | | | | 0.66 | | | | 0.52 | | | | 0.82 | | | | 3.54 | | | | (2.68 | ) |
| | | | | | | | | | | | | | | | | | | | | | | | | | | | |
Net increase (decrease) from investment operations | | | (0.87 | ) | | | 2.41 | | | | 0.97 | | | | 0.69 | | | | 1.02 | | | | 3.78 | | | | (2.40 | ) |
| | | | | | | | | | | | | | | | | | | | | | | | | | | | |
Dividends and distributions from: | | | | | | | | | | | | | | | | | | | | | | | | | | | | |
Net investment income | | | (0.21 | ) | | | (0.24 | ) | | | (0.30 | ) | | | (0.17 | ) | | | (0.40 | ) | | | (0.25 | ) | | | (0.33 | ) |
Net realized capital gain | | | (1.30 | ) | | | (0.63 | ) | | | (0.65 | ) | | | — | | | | (0.54 | ) | | | — | | | | (0.06 | ) |
| | | | | | | | | | | | | | | | | | | | | | | | | | | | |
Total dividends and distributions | | | (1.51 | ) | | | (0.87 | ) | | | (0.95 | ) | | | (0.17 | ) | | | (0.94 | ) | | | (0.25 | ) | | | (0.39 | ) |
| | | | | | | | | | | | | | | | | | | | | | | | | | | | |
Redemption fees added to paid-in capital | | | — | | | | — | 3 | | | — | 3 | | | — | 3 | | | — | | | | — | | | | — | |
| | | | | | | | | | | | | | | | | | | | | | | | | | | | |
Net asset value, end of period | | $ | 14.69 | | | $ | 17.07 | | | $ | 15.53 | | | $ | 15.51 | | | $ | 14.99 | | | $ | 14.91 | | | $ | 11.38 | |
| | | | | | | | | | | | | | | | | | | | | | | | | | | | |
Total Investment Return | | | | | | | | | | | | | | | | | | | | | | | | | | | | |
Based on net asset value | | | (5.65 | )%4 | | | 16.04 | %5 | | | 6.53 | %5 | | | 4.66 | %4,5 | | | 7.17 | %4 | | | 33.46 | % | | | (17.12 | )% |
| | | | | | | | | | | | | | | | | | | | | | | | | | | | |
Ratios to Average Net Assets | | | | | | | | | | | | | | | | | | | | | | | | | | | | |
Total expenses, net of waivers and reimbursement and excluding interest expense | | | 0.86 | %6 | | | 0.86 | % | | | 0.83 | % | | | 0.86 | %6 | | | 1.03 | %6 | | | 1.15 | % | | | 1.12 | % |
| | | | | | | | | | | | | | | | | | | | | | | | | | | | |
Total expenses, net of waivers and reimbursement | | | 0.93 | %6 | | | 0.86 | % | | | 0.83 | % | | | 0.86 | %6 | | | 1.03 | %6 | | | 1.15 | % | | | 1.12 | % |
| | | | | | | | | | | | | | | | | | | | | | | | | | | | |
Total expenses | | | 1.01 | %6 | | | 0.93 | % | | | 0.91 | % | | | 1.11 | %6 | | | 1.05 | %6 | | | 1.15 | % | | | 1.13 | % |
| | | | | | | | | | | | | | | | | | | | | | | | | | | | |
Net investment income | | | 2.05 | %6 | | | 2.03 | % | | | 2.04 | % | | | 1.90 | %6 | | | 1.71 | %6 | | | 1.74 | % | | | 2.21 | % |
| | | | | | | | | | | | | | | | | | | | | | | | | | | | |
Supplemental Data | | | | | | | | | | | | | | | | | | | | | | | | | | | | |
Net assets, end of period (000) | | $ | 29,697 | | | $ | 34,720 | | | $ | 32,545 | | | $ | 29,752 | | | $ | 31,328 | | | $ | 21,989 | | | $ | 17,992 | |
| | | | | | | | | | | | | | | | | | | | | | | | | | | | |
Portfolio turnover | | | 63 | % | | | 93 | % | | | 136 | % | | | 90 | % | | | 101 | % | | | 216 | % | | | 181 | % |
| | | | | | | | | | | | | | | | | | | | | | | | | | | | |
| | | | | | | | | | | | | | | | | | | | |
| | | Service | |
| | | Six Months Ended
March 31, 2008
(Unaudited) | | | Year Ended September 30, | | | 3/01/05 -
9/30/05 | | | 1/28/057 -
2/28/05 | |
| | | | | |
| | | | 2007 | | | 2006 | | | |
Per Share Operating Performance | | | | | | | | | | | | | | | | | | | | |
Net asset value, beginning of period | | $ | 17.03 | | | $ | 15.51 | | | $ | 15.49 | | | $ | 14.97 | | | $ | 14.63 | |
| | | | | | | | | | | | | | | | | | | | |
Net investment income | | | 0.14 | 2 | | | 0.29 | 2 | | | 0.27 | 2 | | | 0.14 | 2 | | | 0.01 | |
Net realized and unrealized gain (loss) | | | (1.02 | ) | | | 2.08 | | | | 0.65 | | | | 0.52 | | | | 0.33 | |
| | | | | | | | | | | | | | | | | | | | |
Net increase (decrease) from investment operations | | | (0.88 | ) | | | 2.37 | | | | 0.92 | | | | 0.66 | | | | 0.34 | |
| | | | | | | | | | | | | | | | | | | | |
Dividends and distributions from: | | | | | | | | | | | | | | | | | | | | |
Net investment income | | | (0.19 | ) | | | (0.22 | ) | | | (0.25 | ) | | | (0.14 | ) | | | — | |
Net realized capital gain | | | (1.30 | ) | | | (0.63 | ) | | | (0.65 | ) | | | — | | | | — | |
| | | | | | | | | | | | | | | | | | | | |
Total dividends and distributions | | | (1.49 | ) | | | (0.85 | ) | | | (0.90 | ) | | | (0.14 | ) | | | — | |
| | | | | | | | | | | | | | | | | | | | |
Redemption fees added to paid-in capital | | | — | | | | — | 3 | | | — | 3 | | | — | 3 | | | — | |
| | | | | | | | | | | | | | | | | | | | |
Net asset value, end of period | | $ | 14.66 | | | $ | 17.03 | | | $ | 15.51 | | | $ | 15.49 | | | $ | 14.97 | |
| | | | | | | | | | | | | | | | | | | | |
Total Investment Return | | | | | | | | | | | | | | | | | | | | |
Based on net asset value | | | (5.72 | )%4 | | | 15.74 | %5 | | | 6.24 | %5 | | | 4.44 | %4,5 | | | 2.32 | %4 |
| | | | | | | | | | | | | | | | | | | | |
Ratios to Average Net Assets | | | | | | | | | | | | | | | | | | | | |
Total expenses, net of waivers and reimbursement and excluding interest expense | | | 1.09 | %6 | | | 1.10 | % | | | 1.11 | % | | | 1.16 | %6 | | | 1.16 | %6 |
| | | | | | | | | | | | | | | | | | | | |
Total expenses, net of waivers and reimbursement | | | 1.16 | %6 | | | 1.10 | % | | | 1.11 | % | | | 1.16 | %6 | | | 1.16 | %6 |
| | | | | | | | | | | | | | | | | | | | |
Total expenses | | | 1.16 | %6 | | | 1.31 | % | | | 1.17 | % | | | 1.36 | %6 | | | 1.26 | %6 |
| | | | | | | | | | | | | | | | | | | | |
Net investment income (loss) | | | 1.81 | %6 | | | 1.80 | % | | | 1.76 | % | | | 1.60 | %6 | | | (0.17 | )%6 |
| | | | | | | | | | | | | | | | | | | | |
Supplemental Data | | | | | | | | | | | | | | | | | | | | |
Net assets, end of period (000) | | $ | 1,907 | | | $ | 2,325 | | | $ | 2,201 | | | $ | 2,171 | | | $ | 2,171 | |
| | | | | | | | | | | | | | | | | | | | |
Portfolio turnover | | | 63 | % | | | 93 | % | | | 136 | % | | | 90 | % | | | 101 | % |
| | | | | | | | | | | | | | | | | | | | |
See Notes to Financial Statements.
| | | | | | |
36 | | BLACKROCK ASSET ALLOCATION PORTFOLIO | | MARCH 31, 2008 | | |
Financial Highlights (continued)
| | | | | | | | | | | | | | | | | | | | | | | | | | | | |
| | | Investor A* | |
| | | Six Months
Ended
March 31, 2008
(Unaudited) | | | Year Ended September 30, | | | 3/01/05 -
9/30/05 | | | 4/01/04 -
2/28/05 | | | Year Ended March 31, | |
| | | | | | |
| | | | 2007 | | | 2006 | | | | | 2004 | | | 20031 | |
Per Share Operating Performance | | | | | | | | | | | | | | | | | | | | | | | | | | | | |
Net asset value, beginning of period | | $ | 17.01 | | | $ | 15.50 | | | $ | 15.48 | | | $ | 14.95 | | | $ | 14.89 | | | $ | 11.36 | | | $ | 14.15 | |
| | | | | | | | | | | | | | | | | | | | | | | | | | | | |
Net investment income | | | 0.13 | 2 | | | 0.27 | 2 | | | 0.25 | 2 | | | 0.13 | 2 | | | 0.18 | | | | 0.19 | | | | 0.24 | |
Net realized and unrealized gain (loss) | | | (1.02 | ) | | | 2.07 | | | | 0.66 | | | | 0.53 | | | | 0.80 | | | | 3.55 | | | | (2.68 | ) |
| | | | | | | | | | | | | | | | | | | | | | | | | | | | |
Net increase (decrease) from investment operations | | | (0.89 | ) | | | 2.34 | | | | 0.91 | | | | 0.66 | | | | 0.98 | | | | 3.74 | | | | (2.44 | ) |
| | | | | | | | | | | | | | | | | | | | | | | | | | | | |
Dividends and distributions from: | | | | | | | | | | | | | | | | | | | | | | | | | | | | |
Net investment income | | | (0.18 | ) | | | (0.20 | ) | | | (0.24 | ) | | | (0.13 | ) | | | (0.38 | ) | | | (0.21 | ) | | | (0.29 | ) |
Net realized capital gain | | | (1.30 | ) | | | (0.63 | ) | | | (0.65 | ) | | | — | | | | (0.54 | ) | | | — | | | | (0.06 | ) |
| | | | | | | | | | | | | | | | | | | | | | | | | | | | |
Total dividends and distributions | | | (1.48 | ) | | | (0.83 | ) | | | (0.89 | ) | | | (0.13 | ) | | | (0.92 | ) | | | (0.21 | ) | | | (0.35 | ) |
| | | | | | | | | | | | | | | | | | | | | | | | | | | | |
Redemption fees added to paid-in capital | | | — | | | | — | 3 | | | — | 3 | | | — | 3 | | | — | | | | — | | | | — | |
| | | | | | | | | | | | | | | | | | | | | | | | | | | | |
Net asset value, end of period | | $ | 14.64 | | | $ | 17.01 | | | $ | 15.50 | | | $ | 15.48 | | | $ | 14.95 | | | $ | 14.89 | | | $ | 11.36 | |
| | | | | | | | | | | | | | | | | | | | | | | | | | | | |
Total Investment Return | | | | | | | | | | | | | | | | | | | | | | | | | | | | |
Based on net asset value8 | | | (5.78 | )%4 | | | 15.58 | %5 | | | 6.12 | %5 | | | 4.44 | %4,5 | | | 6.78 | %4 | | | 32.94 | % | | | (17.37 | )% |
| | | | | | | | | | | | | | | | | | | | | | | | | | | | |
Ratios to Average Net Assets | | | | | | | | | | | | | | | | | | | | | | | | | | | | |
Total expenses, net of waivers and reimbursement and excluding interest expense | | | 1.22 | %6 | | | 1.21 | % | | | 1.23 | % | | | 1.25 | %6 | | | 1.24 | %6 | | | 1.45 | % | | | 1.42 | % |
| | | | | | | | | | | | | | | | | | | | | | | | | | | | |
Total expenses, net of waivers and reimbursement | | | 1.29 | %6 | | | 1.21 | % | | | 1.23 | % | | | 1.25 | %6 | | | 1.24 | %6 | | | 1.45 | % | | | 1.42 | % |
| | | | | | | | | | | | | | | | | | | | | | | | | | | | |
Total expenses | | | 1.29 | %6 | | | 1.21 | % | | | 1.36 | % | | | 1.46 | %6 | | | 1.32 | %6 | | | 1.45 | % | | | 1.43 | % |
| | | | | | | | | | | | | | | | | | | | | | | | | | | | |
Net investment income | | | 1.69 | %6 | | | 1.68 | % | | | 1.63 | % | | | 1.51 | %6 | | | 1.55 | %6 | | | 1.43 | % | | | 1.92 | % |
| | | | | | | | | | | | | | | | | | | | | | | | | | | | |
Supplemental Data | | | | | | | | | | | | | | | | | | | | | | | | | | | | |
Net assets, end of period (000) | | $ | 452,470 | | | $ | 506,537 | | | $ | 482,284 | | | $ | 491,557 | | | $ | 526,929 | | | $ | 357,100 | | | $ | 252,069 | |
| | | | | | | | | | | | | | | | | | | | | | | | | | | | |
Portfolio turnover | | | 63 | % | | | 93 | % | | | 136 | % | | | 90 | % | | | 101 | % | | | 216 | % | | | 181 | % |
| | | | | | | | | | | | | | | | | | | | | | | | | | | | |
| * | The performance prior to January 31, 2005 set forth in this table is the financial data of the State Street Research Asset Allocation Fund, a series of a predecessor trust, the State Street Research Income Trust. BlackRock Funds acquired all of the assets and certain stated liabilities of State Street Research Asset Allocation Fund on January 28, 2005. The net asset values and other per share information listed have been restated to reflect the conversion ratios of 0.71889936, 0.71991517, 0.72321182 and 0.72727901 for Institutional, Investor A, Investor B and Investor C shares, respectively. |
1 | Audited by other auditors. |
2 | Based on average shares outstanding. |
3 | Redemption fees added to paid-in capital are less than $0.01 per share. |
4 | Aggregate total investment return. |
5 | Redemption fee of 2.00% received by the Portfolio is reflected in total return calculations. There was no impact to the return. |
7 | Commenced operations on January 28, 2005. |
8 | Total investment returns exclude the effects of sales charges. |
See Notes to Financial Statements.
| | | | | | |
| | | BLACKROCK ASSET ALLOCATION PORTFOLIO | | MARCH 31, 2008 | | 37 |
Financial Highlights (continued)
| | | | | | | | | | | | | | | | | | | | | | | | | | | | |
| | | Investor B* | |
| | | Six Months
Ended
March 31, 2008
(Unaudited) | | | Year Ended September 30, | | | 3/01/05 -
9/30/05 | | | 4/01/04 -
2/28/05 | | | Year Ended March 31, | |
| | | | | | |
| | | | 2007 | | | 2006 | | | | | 2004 | | | 20031 | |
Per Share Operating Performance | | | | | | | | | | | | | | | | | | | | | | | | | | | | |
Net asset value, beginning of period | | $ | 16.83 | | | $ | 15.35 | | | $ | 15.34 | | | $ | 14.81 | | | $ | 14.74 | | | $ | 11.26 | | | $ | 14.01 | |
| | | | | | | | | | | | | | | | | | | | | | | | | | | | |
Net investment income | | | 0.07 | 2 | | | 0.14 | 2 | | | 0.13 | 2 | | | 0.07 | 2 | | | 0.08 | | | | 0.10 | | | | 0.15 | |
Net realized and unrealized gain (loss) | | | (1.01 | ) | | | 2.07 | | | | 0.65 | | | | 0.51 | | | | 0.81 | | | | 3.49 | | | | (2.63 | ) |
| | | | | | | | | | | | | | | | | | | | | | | | | | | | |
Net increase (decrease) from investment operations | | | (0.94 | ) | | | 2.21 | | | | 0.78 | | | | 0.58 | | | | 0.89 | | | | 3.59 | | | | (2.48 | ) |
| | | | | | | | | | | | | | | | | | | | | | | | | | | | |
Dividends and distributions from: | | | | | | | | | | | | | | | | | | | | | | | | | | | | |
Net investment income | | | (0.11 | ) | | | (0.10 | ) | | | (0.12 | ) | | | (0.05 | ) | | | (0.28 | ) | | | (0.11 | ) | | | (0.21 | ) |
Net realized capital gain | | | (1.30 | ) | | | (0.63 | ) | | | (0.65 | ) | | | — | | | | (0.54 | ) | | | — | | | | (0.06 | ) |
| | | | | | | | | | | | | | | | | | | | | | | | | | | | |
Total dividends and distributions | | | (1.41 | ) | | | (0.73 | ) | | | (0.77 | ) | | | (0.05 | ) | | | (0.82 | ) | | | (0.11 | ) | | | (0.27 | ) |
| | | | | | | | | | | | | | | | | | | | | | | | | | | | |
Redemption fees added to paid-in capital | | | — | | | | — | 3 | | | — | 3 | | | — | 3 | | | — | | | | — | | | | — | |
| | | | | | | | | | | | | | | | | | | | | | | | | | | | |
Net asset value, end of period | | $ | 14.48 | | | $ | 16.83 | | | $ | 15.35 | | | $ | 15.34 | | | $ | 14.81 | | | $ | 14.74 | | | $ | 11.26 | |
| | | | | | | | | | | | | | | | | | | | | | | | | | | | |
Total Investment Return | | | | | | | | | | | | | | | | | | | | | | | | | | | | |
Based on net asset value4 | | | (6.13 | )%5 | | | 14.81 | %6 | | | 5.30 | %6 | | | 3.94 | %5,6 | | | 6.20 | %5 | | | 32.03 | % | | | (17.91 | )% |
| | | | | | | | | | | | | | | | | | | | | | | | | | | | |
Ratios to Average Net Assets | | | | | | | | | | | | | | | | | | | | | | | | | | | | |
Total expenses, net of waivers and reimbursement and excluding interest expense | | | 2.01 | %7 | | | 2.01 | % | | | 2.00 | % | | | 2.01 | %7 | | | 2.04 | %7 | | | 2.15 | % | | | 2.12 | % |
| | | | | | | | | | | | | | | | | | | | | | | | | | | | |
Total expenses, net of waivers and reimbursement | | | 2.08 | %7 | | | 2.01 | % | | | 2.00 | % | | | 2.01 | %7 | | | 2.04 | %7 | | | 2.15 | % | | | 2.12 | % |
| | | | | | | | | | | | | | | | | | | | | | | | | | | | |
Total expenses | | | 2.08 | %7 | | | 2.01 | % | | | 2.03 | % | | | 2.11 | %7 | | | 2.04 | %7 | | | 2.15 | % | | | 2.13 | % |
| | | | | | | | | | | | | | | | | | | | | | | | | | | | |
Net investment income | | | 0.89 | %7 | | | 0.89 | % | | | 0.86 | % | | | 0.75 | %7 | | | 0.73 | %7 | | | 0.72 | % | | | 1.22 | % |
| | | | | | | | | | | | | | | | | | | | | | | | | | | | |
Supplemental Data | | | | | | | | | | | | | | | | | | | | | | | | | | | | |
Net assets, end of period (000) | | $ | 126,860 | | | $ | 152,820 | | | $ | 175,826 | | | $ | 181,583 | | | $ | 187,689 | | | $ | 133,083 | | | $ | 75,963 | |
| | | | | | | | | | | | | | | | | | | | | | | | | | | | |
Portfolio turnover | | | 63 | % | | | 93 | % | | | 136 | % | | | 90 | % | | | 101 | % | | | 216 | % | | | 181 | % |
| | | | | | | | | | | | | | | | | | | | | | | | | | | | |
See Notes to Financial Statements.
| | | | | | |
38 | | BLACKROCK ASSET ALLOCATION PORTFOLIO | | MARCH 31, 2008 | | |
Financial Highlights (continued)
| | | | | | | | | | | | | | | | | | | | | | | | | | | | |
| | | Investor C* | |
| | | Six Months
Ended
March 31, 2008
(Unaudited) | | | Year Ended September 30, | | | 3/01/05 -
9/30/05 | | | 4/01/04 -
2/28/05 | | | Year Ended March 31, | |
| | | | | | |
| | | | 2007 | | | 2006 | | | | | 2004 | | | 20031 | |
Per Share Operating Performance | | | | | | | | | | | | | | | | | | | | | | | | | | | | |
Net asset value, beginning of period | | $ | 16.78 | | | $ | 15.34 | | | $ | 15.33 | | | $ | 14.81 | | | $ | 14.74 | | | $ | 11.25 | | | $ | 14.01 | |
| | | | | | | | | | | | | | | | | | | | | | | | | | | | |
Net investment income | | | 0.08 | 2 | | | 0.15 | 2 | | | 0.15 | 2 | | | 0.06 | 2 | | | 0.08 | | | | 0.10 | | | | 0.15 | |
Net realized and unrealized gain (loss) | | | (1.02 | ) | | | 2.04 | | | | 0.65 | | | | 0.52 | | | | 0.81 | | | | 3.50 | | | | (2.65 | ) |
| | | | | | | | | | | | | | | | | | | | | | | | | | | | |
Net increase (decrease) from investment operations | | | (0.94 | ) | | | 2.19 | | | | 0.80 | | | | 0.58 | | | | 0.89 | | | | 3.60 | | | | (2.50 | ) |
| | | | | | | | | | | | | | | | | | | | | | | | | | | | |
Dividends and distributions from: | | | | | | | | | | | | | | | | | | | | | | | | | | | | |
Net investment income | | | (0.12 | ) | | | (0.12 | ) | | | (0.14 | ) | | | (0.06 | ) | | | (0.28 | ) | | | (0.11 | ) | | | (0.21 | ) |
Net realized capital gain | | | (1.30 | ) | | | (0.63 | ) | | | (0.65 | ) | | | — | | | | (0.54 | ) | | | — | | | | (0.05 | ) |
| | | | | | | | | | | | | | | | | | | | | | | | | | | | |
Total dividends and distributions | | | (1.42 | ) | | | (0.75 | ) | | | (0.79 | ) | | | (0.06 | ) | | | (0.82 | ) | | | (0.11 | ) | | | (0.26 | ) |
| | | | | | | | | | | | | | | | | | | | | | | | | | | | |
Redemption fees added to paid-in capital | | | — | | | | — | 3 | | | — | 3 | | | — | 3 | | | — | | | | — | | | | — | |
| | | | | | | | | | | | | | | | | | | | | | | | | | | | |
Net asset value, end of period | | $ | 14.42 | | | $ | 16.78 | | | $ | 15.34 | | | $ | 15.33 | | | $ | 14.81 | | | $ | 14.74 | | | $ | 11.25 | |
| | | | | | | | | | | | | | | | | | | | | | | | | | | | |
Total Investment Return | | | | | | | | | | | | | | | | | | | | | | | | | | | | |
Based on net asset value4 | | | (6.18 | )%5 | | | 14.68 | %6 | | | 5.42 | %6 | | | 3.90 | %5,6 | | | 6.20 | %5 | | | 32.14 | % | | | (17.96 | )% |
| | | | | | | | | | | | | | | | | | | | | | | | | | | | |
Ratios to Average Net Assets | | | | | | | | | | | | | | | | | | | | | | | | | | | | |
Total expenses, net of waivers and reimbursement and excluding interest expense | | | 1.92 | %7 | | | 1.94 | % | | | 1.91 | % | | | 2.00 | %7 | | | 2.04 | %7 | | | 2.15 | % | | | 2.12 | % |
| | | | | | | | | | | | | | | | | | | | | | | | | | | | |
Total expenses, net of waivers and reimbursement | | | 1.99 | %7 | | | 1.94 | % | | | 1.91 | % | | | 2.00 | %7 | | | 2.04 | %7 | | | 2.15 | % | | | 2.12 | % |
| | | | | | | | | | | | | | | | | | | | | | | | | | | | |
Total expenses | | | 1.99 | %7 | | | 1.95 | % | | | 1.94 | % | | | 2.11 | %7 | | | 2.04 | %7 | | | 2.15 | % | | | 2.13 | % |
| | | | | | | | | | | | | | | | | | | | | | | | | | | | |
Net investment income | | | 0.99 | %7 | | | 0.96 | % | | | 0.97 | % | | | 0.75 | %7 | | | 0.76 | %7 | | | 0.72 | % | | | 1.21 | % |
| | | | | | | | | | | | | | | | | | | | | | | | | | | | |
Supplemental Data | | | | | | | | | | | | | | | | | | | | | | | | | | | | |
Net assets, end of period (000) | | $ | 76,066 | | | $ | 84,596 | | | $ | 80,286 | | | $ | 67,371 | | | $ | 65,357 | | | $ | 42,262 | | | $ | 19,079 | |
| | | | | | | | | | | | | | | | | | | | | | | | | | | | |
Portfolio turnover | | | 63 | % | | | 93 | % | | | 136 | % | | | 90 | % | | | 101 | % | | | 216 | % | | | 181 | % |
| | | | | | | | | | | | | | | | | | | | | | | | | | | | |
| * | The performance prior to January 31, 2005 set forth in this table is the financial data of the State Street Research Asset Allocation Fund, a series of a predecessor trust, the State Street Research Income Trust. BlackRock Funds acquired all of the assets and certain stated liabilities of State Street Research Asset Allocation Fund on January 28, 2005. The net asset values and other per share information listed have been restated to reflect the conversion ratios of 0.71889936, 0.71991517, 0.72321182 and 0.72727901 for Institutional, Investor A, Investor B and Investor C shares, respectively. |
1 | Audited by other auditors. |
2 | Based on average shares outstanding. |
3 | Redemption fees added to paid-in capital are less than $0.01 per share. |
4 | Total investment returns exclude the effects of sales charges. |
5 | Aggregate total investment return. |
6 | Redemption fee of 2.00% received by the Portfolio is reflected in total return calculations. There was no impact to the return. |
See Notes to Financial Statements.
| | | | | | |
| | | BLACKROCK ASSET ALLOCATION PORTFOLIO | | MARCH 31, 2008 | | 39 |
Notes to Financial Statements (Unaudited)
1. Significant Accounting Policies:
BlackRock FundsSM (the “Fund”), a Massachusetts business trust, is registered under the Investment Company Act of 1940, as amended (the “1940 Act”), as an open-end management investment company. As of March 31, 2008, the Fund had 26 registered portfolios. These financial statements relate to the Fund’s Asset Allocation Portfolio (the “Portfolio”). The Portfolio is authorized to issue an unlimited number of shares with a par value of $0.001.The Portfolio’s financial statements are prepared in conformity with accounting principles generally accepted in the United States of America, which may require the use of management accruals and estimates. Actual results may differ from these estimates. The Portfolio of the Fund offers multiple classes of shares. Institutional Shares are sold without a sales charge and only to certain eligible investors. Service Shares are sold without a sales charge. Investor A Shares are sold with a front-end sales charge. Shares of Investor B and Investor C may be subject to a contingent deferred sales charge. All classes of shares have identical voting, dividend, liquidation and other rights and the same terms and conditions, except that the Service, Investor A, Investor B and Investor C Shares may bear certain expenses related to the service and/or distribution of such shares. Each class has exclusive voting rights with respect to matters relating to its service and distribution expenditures (except that Investor B shareholders may vote on material changes to the Investor A distribution plan).
The following is a summary of significant accounting policies followed by the Portfolio:
Valuation of Investments: Equity investments traded on a national securities exchange or on the NASDAQ Global Market System are valued at the last reported sale price that day or the NASDAQ official closing price, if applicable. Equity investments traded on a national securities exchange for which there were no sales on that day and equity investments traded on other over-the-counter markets for which market quotations are readily available are valued at the mean of the bid and asked prices. Exchange-traded options are valued at the mean between the last bid and ask prices at the close of the options market in which the options trade and previously were valued at the last sales price as of the close of options trading on applicable exchanges. Over-the-counter (“OTC”) options quotations are provided by dealers or pricing services selected under the supervision of the Board of Trustees (the “Board”). Considerations utilized by dealers or pricing services in valuing OTC options include, but are not limited to, volatility factors of the underlying security, price movement of the underlying security in relation to the strike price and the time left until expiration of the option. Short-term securities may be valued at amortized cost. Investments in open-end investment companies are valued at net asset value each business day.
In the event that application of these methods of valuation results in a price for an investment which is deemed not to be representative of the market value of such investment, the investment will be valued by a method approved by the Board of Trustees (the “Board”) as reflecting fair value (“Fair Value Assets”). When determining the price for Fair Value Assets, the investment advisor and/or sub-advisor seeks to determine the price that the Portfolio might reasonably expect to receive from the current sale of that asset in an arm’s-length transaction. Fair value determinations shall be based upon all available factors that the investment advisor and/or sub-advisor deem relevant. The pricing of all Fair Value Assets is subsequently reported to the Board or a committee thereof.
Generally, trading in foreign securities is substantially completed each day at various times prior to the close of business on the New York Stock Exchange (“NYSE”). The values of such securities used in computing the net assets of the Portfolio are determined as of such times. Foreign currency exchange rates will be determined as of the close of business on the NYSE. Occasionally, events affecting the values of such securities and such exchange rates may occur between the times at which they are determined and the close of business on the NYSE that may not be reflected in the computation of the Portfolio’s net assets. If events (for example, a company announcement, market volatility or a natural disaster) occur during such periods that are expected to materially affect the value of such securities, those securities may be valued at their fair value as determined in good faith by the Board or by the investment advisor using a pricing service and/or procedures approved by the Board.
The Portfolio is not obligated for costs associated with the registration of restricted securities.
Derivative Financial Instruments: The Portfolio may engage in various portfolio investment strategies to increase the return of the Portfolio and to hedge, or protect, their exposure to interest rate movements and movements in the securities markets. Losses may arise if the value of the contract decreases due to an unfavorable change in the price of the underlying security or if the counterparty does not perform under the contract.
| | • | | Swaps-The Portfolio may enter into swap agreements, which are OTC contracts in which a Portfolio and a counterparty agree to make periodic net payments on a specified notional amount. These periodic payments received or made by the Portfolio are recorded in the accompanying Statement of Operations as realized gains or losses, respectively. Gains or losses are also realized upon termination of the swap agreements. Swaps are marked-to-market daily and changes in value are recorded as unrealized appreciation (depreciation). When the swap is terminated, a Portfolio will record a realized gain or loss equal to the difference between the proceeds from (or cost of) the closing transaction and the Portfolio’s basis in the contract, if any. Risks include changes in the returns of the underlying instruments, failure of the counterparties to perform under the contracts’ terms and the possible lack of liquidity with respect to the swap agreements. |
Interest rate swaps-Interest rate swaps are agreements in which one party pays a floating rate of interest on a notional principal amount and receives a fixed rate of interest on the same notional principal amount for a specified period of time. Alternatively, a party may pay a fixed rate and receive a floating rate. Interest rate swaps are efficient as asset/liability management tools. In more complex swaps, the notional principal amount may decline (or amortize) over time.
| | | | | | |
40 | | BLACKROCK ASSET ALLOCATION PORTFOLIO | | MARCH 31, 2008 | | |
Notes to Financial Statements (continued)
Total return swaps - Total return swaps are agreements in which one party commits to pay interest in exchange for a market-linked return. To the extent the total return of the security or index underlying the transaction exceeds or falls short of the offsetting interest rate obligation, the Portfolio will receive a payment from or make a payment to the counterparty.
Credit default swaps - Credit default swaps are agreements in which one party pays fixed periodic payments to a counterparty in consideration for a guarantee from the counterparty to make a specific payment should a negative credit event take place.
| | • | | Futures - The Portfolio may purchase or sell financial or index futures contracts and options on such futures contracts. Futures contracts are contracts for delayed delivery of securities at a specific future date and at a specific price or yield. Upon entering into a contract, a Portfolio deposits and maintains as collateral such initial margin as required by the exchange on which the transaction is effected. Pursuant to the contract, the Portfolio agrees to receive from, or pay to, the broker an amount of cash equal to the daily fluctuation in value of the contract. Such receipts or payments are known as variation margin and are recognized by the Portfolio as unrealized gains or losses. When the contract is closed, the Portfolio records a realized gain or loss equal to the difference between the value of the contract at the time it was opened and the value at the time it was closed. |
| | • | | Forward foreign exchange contracts - The Portfolio may enter into forward foreign exchange contracts as a hedge against either specific transactions or portfolio positions. Forward currency contracts, when used by a Portfolio, help to manage the overall exposure to the foreign currency backing some of the investments held by the Portfolio. The contract is marked-to-market daily and the change in market value is recorded by the Portfolio as an unrealized gain or loss. When the contract is closed, the Portfolio records a realized gain or loss equal to the difference between the value at the time it was opened and the value at the time it was closed. |
| | • | | Options - The Portfolio may purchase and write call and put options. When a Portfolio writes an option, an amount equal to the premium received by a Portfolio is reflected as an asset and an equivalent liability. The amount of the liability is subsequently marked-to-market to reflect the current market value of the option written. When a security is purchased or sold through an exercise of an option, the related premium paid (or received) is added to (or deducted from) the basis of the security acquired or deducted from (or added to) the proceeds of the security sold. When an option expires (or the Portfolio enters into a closing transaction), the Portfolio realizes a gain or loss on the option to the extent of the premiums received or paid (or gain or loss to the extent the cost of the closing transaction exceeds the premium received or paid). If an option is exercised, the premium paid or received is added to the cost of the purchase or the proceeds from the sale in determining whether the Portfolio has realized a gain or a loss on investment transactions. |
A call option gives the purchaser of the option the right (but not the obligation) to buy, and obligates the seller to sell (when the option is exercised), the underlying position at the exercise price at any time or at a specified time during the option period. A put option gives the holder the right to sell and obligates the writer to buy the underlying position at the exercise price at any time or at a specified time during the option period.
Asset-Backed Securities: The Portfolio may invest in asset-backed securities. Asset-backed securities are generally issued as pass-through certificates, which represent undivided fractional ownership interests in an underlying pool of assets, or as debt instruments, which are also known as collateralized obligations, and are generally issued as the debt of a special purpose entity organized solely for the purpose of owning such assets and issuing such debt. Asset-backed securities are often backed by a pool of assets representing the obligations of a number of different parties. The yield characteristics of certain asset-backed securities may differ from traditional debt securities. One such major difference is that all or a principal part of the obligations may be prepaid at any time because the underlying assets (i.e., loans) may be prepaid at any time. As a result, a decrease in interest rates in the market may result in increases in the level of prepayments as borrowers, particularly mortgagors, refinance and repay their loans. An increased prepayment rate with respect to an asset-backed security subject to such a prepayment feature will have the effect of shortening the maturity of the security. If the Portfolio has purchased such an asset-backed security at a premium, a faster than anticipated prepayment rate could result in a loss of principal to the extent of the premium paid.
Collateralized Debt Obligations: The Portfolio may invest in collateralized debt obligations (“CDOs”), which include collateralized bond obligations (“CBOs”) and collateralized loan obligations (“CLOs”). CBOs and CLOs are types of asset-backed securities. A CDO is a bankruptcy remote entity which is backed by a diversified pool of debt securities (CBOs) or syndicated bank loans (CLOs). The cashflows of the CDO can be split into multiple segments, called “tranches”, which will vary in risk profile and yield. The riskiest segment is the subordinated or “equity” tranche. This tranche bears the greatest risk of defaults from the underlying assets in the CDO and serves to protect the other, more senior, tranches from default in all but the most severe circumstances. Since it is shielded from defaults by the more junior tranches, a “senior” tranche will typically have higher credit ratings and lower yields than their underlying securities, and often receive investment grade ratings from one or more of the nationally recognized rating agencies. Despite the protection from the more junior tranches, senior tranches can experience substantial losses due to actual defaults, increased sensitivity to future defaults and the disappearance of one or more protecting tranches as a result of changes in the credit profile of the underlying pool of assets.
| | | | | | |
| | | BLACKROCK ASSET ALLOCATION PORTFOLIO | | MARCH 31, 2008 | | 41 |
Notes to Financial Statements (continued)
Financing Transactions: The Portfolio may enter into financing transactions consisting of sales by the Portfolio of securities together with a commitment to repurchase similar securities at a future date. The difference between the selling price and the future purchase price is an adjustment to interest income. If the counterparty to whom the Portfolio sells the security becomes insolvent, the Portfolio’s right to repurchase the security may be restricted. The value of the security may change over the term of the financing transaction.
Foreign Currency Transactions: Foreign currency amounts are translated into United States dollars on the following basis: (i) market value of investment securities, assets and liabilities at the current rate of exchange; and (ii) purchases and sales of investment securities, income and expenses at the rates of exchange prevailing on the respective dates of such transactions. The Portfolio reports foreign currency related transactions as components of realized gains for financial reporting purposes, whereas such components are treated as ordinary income for federal income tax purposes.
Forward Commitments, When-Issued and Delayed Delivery Securities: The Portfolio may purchase securities on a when-issued basis and may purchase or sell securities on a forward commitment basis. Settlement of such transactions normally occurs within a month or more after the purchase or sale commitment is made. The Portfolio may purchase securities under such conditions only with the intention of actually acquiring them, but may enter into a separate agreement to sell the securities before the settlement date. Since the value of securities purchased may fluctuate prior to settlement, the Portfolio may be required to pay more at settlement than the security is worth. In addition, the purchaser is not entitled to any of the interest earned prior to settlement. Upon making a commitment to purchase a security on a when-issued basis, the Portfolio will hold liquid assets worth at least the equivalent of the amount due.
Inflation-indexed Bonds: Inflation-indexed bonds are fixed income securities whose principal value is periodically adjusted according to the rate of inflation. If the index measuring inflation falls, the principal value of inflation-indexed bonds will be adjusted downward, and consequently the interest payable on these securities (calculated with respect to a smaller principal amount) will be reduced. Repayment of the original bond principal upon maturity (as adjusted for inflation) is guaranteed in the case of U.S. Treasury inflation-indexed bonds. For bonds that do not provide a similar guarantee, the adjusted principal value of the bond repaid at maturity may be less than the original principal.
Investing in Government Sponsored Enterprises: The Portfolio may invest in securities issued by the Federal Home Loan Mortgage Corp. (“Freddie Mac”) and similar U.S. government sponsored entities such as Federal National Mortgage Assoc. (“Fannie Mae”) and the Federal Home Loan Banks (“FHLB’s”). The debt and mortgage-backed securities issued by Freddie Mac, Fannie Mae and FHLB’s are neither guaranteed nor insured by the U.S. Government.
Mortgage Dollar Rolls: The Portfolio may sell mortgage-backed securities for delivery in the current month and simultaneously contract to repurchase substantially similar (same type, coupon and maturity) securities on a specific future date at an agreed-upon price. The market value of the securities that the Portfolio is required to purchase may decline below the agreed upon repurchase price of those securities. Pools of mortgages collateralizing those securities may have different prepayment histories than those sold. During the period between the sale and repurchase, the Portfolio will not be entitled to receive interest and principal payments on the securities sold. Proceeds of the sale will be invested in additional instruments for the Portfolio, and the income from these investments will generate income for the Portfolio.
If such income does not exceed the income, capital appreciation and gain or loss that would have been realized on the securities sold as part of the dollar roll, the use of this technique will diminish the investment performance of the Portfolio compared with what the performance would have been without the use of dollar rolls.
Mortgage Pass-Through Securities: The Portfolio may purchase in the secondary market certain mortgage pass-through securities. There are a number of important differences among the agencies and instrumentalities of the U.S. Government that issue mortgage-related securities and among the securities that they issue. For example, mortgage-related securities guaranteed by the Government National Mortgage Association (“GNMA”) include Ginnie Maes, which are guaranteed as to the timely payment of principal and interest by GNMA and such guarantee is backed by the full faith and credit of the United States. However, mortgage-related securities issued by the Federal National Mortgage Association (“FNMA”) include FNMA guaranteed Mortgage Pass-Through Certificates (also known as “Fannie Maes”) which are solely the obligations of the FNMA, are not backed by or entitled to the full faith and credit of the United States and are supported by the right of the issuer to borrow from the Treasury.
Multiple Class Pass-Through Securities: The Portfolio may invest in multiple class pass-through securities, including collateralized mortgage obligations (“CMOs”) and commercial mortgage backed securities (“CMBS”). These multiple class securities may be issued by GNMA, U.S. Government agencies or instrumentalities or by trusts formed by private originators of, or investors in, mortgage loans. In general, these securities are debt obligations of a legal entity that are collateralized by, and multiple class pass-through securities represent direct ownership interests in, a pool of residential or commercial mortgage loans or mortgage pass-through securities, the payments on which are used to make payments on the multiple class pass-through securities. The markets for multiple class pass-through securities may be more illiquid than those of other securities.
Classes of multiple class pass-through securities include interest only (“IOs”), principal only (“POs”), planned amortization classes (“PACs”) and targeted amortization classes (“TACs”). IOs and POs are stripped mortgage-backed securities representing interests in a pool of mortgages the cash flow from which has been separated into interest and principal
| | | | | | |
42 | | BLACKROCK ASSET ALLOCATION PORTFOLIO | | MARCH 31, 2008 | | |
Notes to Financial Statements (continued)
components. IOs receive the interest portion of the cash flow while POs receive the principal portion. IOs and POs can be extremely volatile in response to changes in interest rates. As interest rates rise and fall, the value of IOs tends to move in the same direction as interest rates. POs perform best when prepayments on the underlying mortgages rise since this increases the rate at which the investment is returned and the yield to maturity on the PO. When payments on mortgages underlying a PO are slow, the life of the PO is lengthened and the yield to maturity is reduced.
Preferred Stock: The Portfolio may invest in preferred stock. Preferred stock has a preference over common stock in liquidation (and generally in receiving dividends as well) but is subordinated to the liabilities of the issuer in all respects. As a general rule, the market value of preferred stock with a fixed dividend rate and no conversion element varies inversely with interest rates and perceived credit risk, while the market price of convertible preferred stock generally also reflects some element of conversion value. Because preferred stock is junior to debt securities and other obligations of the issuer, deterioration in the credit quality of the issuer will cause greater changes in the value of a preferred stock than in a more senior debt security with similar stated yield characteristics. Unlike interest payments on debt securities, preferred stock dividends are payable only if declared by the issuer’s board of directors. Preferred stock also may be subject to optional or mandatory redemption provisions.
Reverse Repurchase Agreements: The Portfolio may enter into reverse repurchase agreements with qualified third party broker-dealers. Interest on the value of the reverse repurchase agreements issued and outstanding is based upon competitive market rates at the time of issuance and is included within the related liability on the Statement of Assets and Liabilities. At the time the Portfolio enters into a reverse repurchase agreement, it identifies for segregation certain liquid securities having a value not less than the repurchase price, including accrued interest, of the reverse repurchase agreement. The Portfolio may utilize reverse repurchase agreements when it is anticipated that the interest income to be earned from the investment of the proceeds of the transaction is greater than the interest expense of the transaction.
Stripped Mortgage Backed Securities: The Portfolio may invest in stripped mortgage-backed securities issued by the U.S. government, its agencies and instrumentalities. Stripped mortgage-backed securities are usually structured with two classes that receive different proportions of the interest and principal distributions on a pool of mortgage assets. In certain cases, one class will receive all of the interest (the interest-only or “IO” class), while the other class will receive all of the principal (the principal-only or “PO” class). The yield to maturity on IO’s is sensitive to the rate of principal repayments (including prepayments) on the related underlying mortgage assets, and principal pre-payments may have a material effect on yield to maturity. If the underlying mortgage assets experience greater than anticipated pre-payments of principal, the Portfolio may not fully recoup its initial investment in IO’s. Such securities will be considered liquid only if so determined in accordance with guidelines established by the Board.
TBA Purchase Commitments: The Portfolio may enter into to be announced (“TBA”) commitments to purchase or sell securities for a fixed price at a future date. TBA commitments are considered securities in themselves, and involve a risk of loss if the value of the security to be purchased or sold declines or increases prior to settlement date, which is in addition to the risk of decline in the value of the Portfolio’s other assets. Unsettled TBA commitments are valued at the current market value of the underlying securities, according to the procedures described under “Valuation of Investments”.
Trust Preferred Stock: These securities are typically issued by corporations, generally in the form of interest-bearing notes with preferred securities characteristics, or by an affiliated business trust of a corporation, generally in the form of beneficial interests in subordinated debentures or similarly structured securities. The securities can be structured as either fixed or adjustable coupon securities that can have either a perpetual or stated maturity date. Dividends can be deferred without creating an event of default or acceleration, although maturity cannot take place unless all cumulative payment obligations have been met. The deferral of payments does not affect the purchase or sale of these securities in the open market. Payments on these securities are treated as interest rather than dividends for Federal income tax purposes. These securities can have a rating that is slightly below that of the issuing company’s senior debt securities.
Zero-Coupon Bonds: The Portfolio may invest in zero-coupon bonds, which are normally issued at a significant discount from face value and do not provide for periodic interest payments. Zero-coupon bonds may experience greater volatility in market value than similar maturity debt obligations which provide for regular interest payments.
Segregation: In cases in which the 1940 Act and the interpretive positions of the Securities and Exchange Commission (“SEC”) require that each Portfolio segregate assets in connection with certain investments (e.g., when-issued securities, reverse repurchase agreements, swaps or futures contracts), each Portfolio will, consistent with certain interpretive letters issued by the SEC, designate on its books and records cash or other liquid debt securities having a market value at least equal to the amount that would otherwise be required to be physically segregated.
Investment Transactions and Investment Income: Investment transactions are recorded on the dates the transactions are entered into (the trade dates). Realized gains and losses on security transactions are determined on the identified cost basis. Dividend income is recorded on the ex-dividend dates. Dividends from foreign securities where the ex-dividend date may have passed are subsequently recorded when the Portfolio has determined the ex-dividend date. Upon notification from issuers, some of the dividend income received from a real estate investment trust (“REIT”) may be redesignated as a reduction of cost of the related investment and/or realized gain. Interest income is recognized on the accrual basis. The Portfolio amortize all premiums and discounts on debt securities. Income, realized and unrealized gains and losses are allocated daily to each class based on its relative net assets.
| | | | | | |
| | | BLACKROCK ASSET ALLOCATION PORTFOLIO | | MARCH 31, 2008 | | 43 |
Notes to Financial Statements (continued)
Dividends and Distributions to Shareholders: Dividends and distributions paid by the Portfolio are recorded on the ex-dividend dates.
Securities Lending: The Portfolio may lend securities to financial institutions that provide cash or securities issued or guaranteed by the U.S. government as collateral, which will be maintained at all times in an amount equal to at least 100% of the current market value of the loaned securities. The market value of the loaned securities is determined at the close of business of the Portfolio and any additional required collateral is delivered to the Portfolio on the next business day. The Portfolio typically receives the income on the loaned securities but does not receive the income on the collateral. Where the Portfolio receives cash collateral, it may invest such collateral and retain the amount earned on such investment, net of any amount rebated to the borrower. The Portfolio may receive a flat fee for its loans. Loans of securities are terminable at any time and the borrower, after notice, is required to return borrowed securities within the standard time period for settlement of securities transactions. The Portfolio may pay reasonable lending agent, administrative and custodial fees in connection with its loans. In the event that the borrower defaults on its obligation to return borrowed securities because of insolvency or for any other reason, the Portfolio could experience delays and costs in gaining access to the collateral. The Portfolio also could suffer a loss where the value of the collateral falls below the market value of the borrowed securities, in the event of borrower default or in the event of losses on investments made with cash collateral.
Income Taxes: It is the Portfolio’s policy to comply with the requirements of the Internal Revenue Code applicable to regulated investment companies and to distribute substantially all of its taxable income to its shareholders. Therefore, no federal income tax provision is required. Under the applicable foreign tax laws, a withholding tax may be imposed on interest, dividends and capital gains at various rates.
Effective March 31, 2008, the Portfolio implemented Financial Accounting Standards Board (“FASB”) Interpretation No. 48, “Accounting for Uncertainty in Income Taxes - an interpretation of FASB Statement No. 109” (“FIN 48”). FIN 48 prescribes the minimum recognition threshold a tax position must meet in connection with accounting for uncertainties in income tax positions taken or expected to be taken by an entity, including investment companies, before being measured and recognized in the financial statements. The investment advisor has evaluated the application of FIN 48 to the Portfolio, and has determined that the adoption of FIN 48 did not have a material impact on the Portfolio’s financial statements. The Portfolio files U.S. and various state tax returns. No income tax returns are currently under examination. The statute of limitations on the Portfolio’s tax returns remains open for the years ended September 30, 2004 through September 30, 2006. The statute of limitations on the Portfolio’s state and local tax returns may remain open for an additional year depending upon the jurisdiction.
Recent Accounting Pronouncements: In September 2006, Statement of Financial Accounting Standards No. 157, “Fair Value Measurements” (“FAS 157”), was issued and is effective for fiscal years beginning after November 15, 2007. FAS 157 defines fair value, establishes a frame- work for measuring fair value and expands disclosures about fair value measurements.The impact on the Portfolio’s financial statement disclosures, if any, is currently being assessed.
In addition, in February 2007, Statement of Financial Accounting Standards No. 159, “The Fair Value Option for Financial Assets and Financial Liabilities” (“FAS 159”), was issued and is effective for fiscal years beginning after November 15, 2007. Early adoption is permitted as of the beginning of a fiscal year that begins on or before November 15, 2007, provided the entity also elects to apply the provisions of FAS 157. FAS 159 permits entities to choose to measure many financial instruments and certain other items at fair value that are not currently required to be measured at fair value. FAS 159 also establishes presentation and disclosure requirements designed to facilitate comparisons between entities that choose different measurement attributes for similar types of assets and liabilities. The impact on the Portfolio’s financial statement disclosures, if any, is currently being assessed.
In March 2008, Statement of Financial Accounting Standards No. 161, “Disclosures about Derivative Instruments and Hedging Activities - an amendment of FASB Statement No. 133” (“FAS 161”) was issued and is effective for fiscal years beginning after November 15, 2008. FAS 161 is intended to improve financial reporting for derivative instruments by requiring enhanced disclosure that enables investors to understand how and why an entity uses derivatives, how derivatives are accounted for, and how derivative instruments affect an entity’s results of operations and financial position. The investment advisor is currently evaluating the implications of FAS 161 and the impact on the Portfolio’s financial statement disclosures, if any, is currently being assessed.
Other: Expenses directly related to the Portfolio or its classes are charged to that Portfolio or class. Other operating expenses shared by several Portfolios are pro-rated among those Portfolios on the basis of relative net assets or other appropriate methods. Other expenses of the Portfolio are allocated daily to each class based on its relative net assets.
2. Investment Advisory Agreement and Other Transactions with Affiliates:
The Fund on behalf of the Portfolio entered into an Investment Advisory Agreement with the BlackRock Advisors, LLC (the “Advisor”), an indirect, wholly owned subsidiary of BlackRock, Inc., to provide investment advisory services. Merrill Lynch & Co., Inc. (“Merrill Lynch”) and The PNC Financial Services Group, Inc. (“PNC”) are principal owners of BlackRock, Inc.
| | | | | | |
44 | | BLACKROCK ASSET ALLOCATION PORTFOLIO | | MARCH 31, 2008 | | |
Notes to Financial Statements (continued)
The Advisor is responsible for the management of the Portfolio and provides the necessary personnel, facilities, equipment and certain other services necessary to the operations of the Portfolio. For such services, the Portfolio pays the Advisor a monthly fee based on the average daily value of the Portfolio’s net assets, at the following annual rates:
| | | |
Average Daily Net Assets | | | |
first $1 billion | | 0.550 | % |
$1 billion - $2 billion | | 0.500 | |
$2 billion - $3 billion | | 0.475 | |
greater than $3 billion | | 0.450 | �� |
In addition, the Advisor has entered into a sub-advisory agreement with BlackRock Financial Management, Inc. (“BFM”), an affiliate of the Advisor, pursuant to which BFM serves as sub-advisor for the Portfolio. The Advisor pays the sub-advisor, for services it provides, a monthly fee that is a percentage of the management fee paid by the Portfolio to the Advisor.
PFPC Trust Company (“PTC”), an indirect wholly-owned subsidiary of PNC, serves as custodian for the Portfolio. For these services, the custodian receives a fee computed daily and payable monthly, based on a percentage of the average daily gross assets of the Portfolio.
Prior to January 1, 2008, the fee was paid at the following annual rates: 0.0073% of the first $250 million, 0.006% of the next $250 million, 0.0056% of the next $250 million, 0.0048% of the next $250 million and 0.004% of average daily gross assets in excess of $1 billion; plus per transaction charges and other miscellaneous fees incurred on behalf of the Portfolio.
Effective January 1, 2008, the fee is paid at the following annual rates: 0.005% of the first $400 million, 0.004% of the next $1.6 billion, and 0.003% of average daily gross assets in excess of $2 billion; plus per transaction charges and other miscellaneous fees incurred on behalf of the Portfolio.
PFPC Inc. (“PFPC”), an indirect wholly-owned subsidiary of PNC, serves as transfer and dividend disbursing agent. Each class of the Portfolio bears the costs of transfer agent fees associated with such respective class. Transfer agency fees borne by each class of the Portfolio are comprised of those fees charged for all shareholder communications including shareholder reports, dividend and distribution notices, and proxy materials for shareholders meetings, as well as per account and per transaction fees related to servicing and maintenance of shareholder accounts, including the issuing, redeeming and transferring of shares of each class of the Portfolio, 12b-1 fee calculation, check writing, anti-money laundering services, and customer identification services.
Pursuant to written agreements, certain affiliates provide the Portfolio with sub-accounting, recordkeeping, sub-transfer agency and other administrative services with respect to sub-accounts they service. For these services, affiliates receive an annual fee per shareholder account which will vary depending on share class. For the six months ended March 31, 2008, the Portfolio paid $52,360 in return for these services.
PFPC and the Advisor act as co-administrators for the Fund. For these services, the co-administrators receive a combined administration fee computed daily and payable monthly, based on a percentage of the average daily net assets of the Portfolio. The combined administration fee is paid at the following annual rates: 0.075% of the first $500 million, 0.065% of the next $500 million and 0.055% of average of daily net assets in excess of $1 billion of the Portfolio. In addition, each of the share classes is charged an administration fee based on the following percentages of average daily net assets of each respective class: 0.025% of the first $500 million, 0.015% of the next $500 million and 0.005% of average of daily net assets in excess of $1 billion. In addition, PFPC and the Advisor may have, at their discretion, voluntarily waived all or any portion of their administration fees for the Portfolio or a share class.
The Portfolio has received an exemptive order from the Securities and Exchange Commission permitting it to lend portfolio securities to BlackRock Investment Management, LLC (“BIM”), an affiliate of the Advisor, or its affiliates. As of March 31, 2008, the Portfolio had no securities loans to Merrill Lynch, Pierce, Fenner & Smith Incorporated (“MLPF&S”), a wholy owned subsidiary of Merrill Lynch, or its affiliates. Pursuant to that order, the Portfolio has retained BIM as the securities lending agent for a fee based on a share of the returns on investment of cash collateral. BIM may, on behalf of the Portfolio, invest cash collateral received by the Portfolio for such loans, among other things, in a private investment company managed by the Advisor or in registered money market funds advised by the Advisor or its affiliates. For the six months ended March 31, 2008, BIM received $2,167 in securities lending agent fees.
The Fund, on behalf of the Portfolio, has entered into a Distribution Agreement with BlackRock Distributors, Inc. (“BDI”). BDI is an affiliate of BlackRock, Inc. The Fund has also adopted a Distribution Plan on behalf of the Portfolio in accordance with Rule 12b-1 under the 1940 Act. Pursuant to the Distribution Plan the Portfolio pays BDI ongoing service and distribution fees. The fees are accrued daily and paid monthly at annual rates based upon the average daily net assets of the shares as follows:
| | | | | | |
| | | BLACKROCK ASSET ALLOCATION PORTFOLIO | | MARCH 31, 2008 | | 45 |
Notes to Financial Statements (continued)
| | | | | | | | | | | | | | | | | | | | | | | | | | |
| Class Specific Fee Arrangement | |
| Share Classes | |
| Institutional | | Service | | | Investor A | | | Investor B | | | Investor C | |
Contractual
Fees | | Actual
Fees (3) | | Contractual
Fees (1) |
| | Actual
Fees (3) |
| | Contractual
Fees (1) |
| | Actual
Fees (3) |
| | Contractual
Fees (2) |
| | Actual
Fees (3) |
| | Contractual
Fees (2) |
| | Actual
Fees (3) |
|
| | | | | | | | | | | | | | | | | | | | | | | | | | | |
| None | | None | | 0.25 | % | | 0.25 | % | | 0.25 | % | | 0.25 | % | | 1.00 | % | | 1.00 | % | | 1.00 | % | | 1.00 | % |
| (1) | the maximum annual contractual fees are comprised of a 0.25% service fee. |
| (2) | the maximum annual contractual fees are comprised of a 0.75% distribution fee and a 0.25% service fee. |
| (3) | annualized; the actual fees are for the six months ended March 31, 2008. |
For the six months ended March 31, 2008, the Portfolio paid $272,409 to affiliates in return for distribution and sales support services.
The Advisor maintains a call center, which is responsible for providing certain shareholder services to the Portfolio, such as responding to shareholder inquiries and processing transactions based upon instructions from shareholders with respect to the subscription and redemption of Portfolio shares. During the six months ended March 31, 2008, the following amounts have been accrued by the Portfolio to reimburse the Advisor for costs incurred running the call center, which are a component of the transfer agent fees in the accompanying Statement of Operations.
| | | | | | | | | | |
| Share Classes |
Institutional | | Service | | Investor A | | Investor B | | Investor C | | Total |
| $ 731 | | $ 69 | | $ 42,769 | | $ 15,547 | | $ 4,011 | | $ 63,127 |
For the six months ended March 31, 2008, the following charts show the various types of class-specific expenses borne directly by each class of the Portfolio and any associated waivers of those expenses.
| | | | | | | | | | | | | | | | | | | | | | | |
| | | Share Classes | |
| | | Institutional | | | Service | | | Investor A | | | Investor B | | Investor C | | | Total | |
Administration Fees | | $ | 3,731 | | | $ | 268 | | | $ | 59,833 | | | $ | 17,602 | | $ | 10,109 | | | $ | 91,543 | |
Administration Fees Waived | | | (3,731 | ) | | | (2 | ) | | | (115 | ) | | | — | | | (58 | ) | | | (3,905 | ) |
Transfer Agent Fees | | | 21,937 | | | | 583 | | | | 427,170 | | | | 157,020 | | | 52,564 | | | | 659,274 | |
Transfer Agent Fees Waived | | | (731 | ) | | | (3 | ) | | | — | | | | — | | | (171 | ) | | | (904 | ) |
Transfer Agent Fees Reimbursed | | | (7,177 | ) | | | (78 | ) | | | — | | | | — | | | (123 | ) | | | (7,378 | ) |
Service Fees | | | — | | | | 2,684 | | | | 595,767 | | | | 175,065 | | | 100,806 | | | | 874,322 | |
Distribution Fees | | | — | | | | — | | | | — | | | | 528,051 | | | 302,419 | | | | 830,470 | |
The Advisor contractually agreed to waive or reimburse fees or expenses until February 1, 2009, in order to limit expenses. These expense limits apply to the aggregate expenses incurred on a share class (excluding; interest, taxes, brokerage commissions, expenses incurred as a result of investments in other funds and other expenses attributable to, and incurred as a result of, a Portfolio’s investments and other extraordinary expenses). This agreement is reviewed annually by the Board. The current expense limitations as a percentage of net assets are as follows:
| | | | | | | | | | | | | |
| Share Classes | |
Institutional | | | Service | | | Investor A | | | Investor B | | | Investor C | |
| 0.86 | % | | 1.16 | % | | 1.33 | % | | 2.08 | % | | 2.08 | % |
If operating expenses, within two years following a waiver or reimbursement of the operating expenses of a share class that previously received a waiver or reimbursement from the Advisor, are less than the expense limit for that share class, the share class is required to repay the Advisor up to the amount of fees waived or expenses reimbursed under the agreement if: (1) the Portfolio has more than $50 million in assets, (2) the Advisor or an affiliate continues to be the Portfolio’s investment advisor or administrator and (3) the Board has approved the payments to the Advisor at the previous quarterly meeting.
At March 31, 2008, the amounts subject to possible future reimbursement under the expense limitation agreement are as follows:
| | |
| Expiring January 31, |
| 2010 | | 2011 |
| $47,788 | | $3,660 |
For the six months ended March 31, 2008, Merrill Lynch, through its affiliated broker dealer, MLPF&S, earned $3,875 in commissions on transactions of securities.
For the six months ended March 31, 2008, affiliates earned underwriting discounts, direct commissions and dealer concessions on sales of the Portfolio’s Investor A shares of $25,810.
| | | | | | |
46 | | BLACKROCK ASSET ALLOCATION PORTFOLIO | | MARCH 31, 2008 | | |
Notes to Financial Statements (continued)
For the six months ended March 31, 2008, affiliates received contingent deferred sales charges relating to transactions in Investor A, Investor B and Investor C shares of $71, $95,946 and $5,794 respectively.
The Portfolio may earn income on positive cash balances in demand deposit accounts that are maintained by PFPC on behalf of the Portfolio. The income earned for the six months ended March 31, 2008 was $7,263.
The Portfolio may also receive earnings credits related to cash balances with PFPC which are shown on the Statement of Operations as fees paid indirectly.
Certain officers and/or trustees of the Portfolio are officers and/or trustees/directors of BlackRock, Inc. or its affiliates.
3. Investments:
For the six months ended March 31, 2008, purchases and sales of securities including paydowns, excluding short-term investments, dollar rolls securities, were $320,608,288 and $361,402,092, respectively.
For the six months ended March 31, 2008, purchases and sales of U.S. government securities were $90,139,167 and $87,848,142, respectively.
Written options transactions entered into during the six months ended March 31, 2008 are summarized as follows:
| | | | | | | |
| | | Contracts | | | Premium | |
Balance at 9/30/07 | | (1,637,502 | ) | | $ | (1,994,023 | ) |
Written | | (7,119 | ) | | | (2,372,142 | ) |
Expired | | 1,630,758 | | | | 214,647 | |
Closed | | 10,812 | | | | 2,869,547 | |
| | | | | | | |
Balance at 3/31/08 | | (3,051 | ) | | $ | (1,281,971 | ) |
| | | | | | | |
4. Capital Shares:
Transactions in capital shares for each period were as follows:
| | | | | | | | | | | | | | |
| | | Six Months Ended
March 31, 2008 | | | Year Ended
September 30, 2007 | |
| | | Shares | | | Value | | | Shares | | | Value | |
Shares sold: | | | | | | | | | | | | | | |
Institutional | | 513,260 | | | $ | 7,818,606 | | | 774,819 | | | $ | 12,673,325 | |
Service | | 12,218 | | | | 189,692 | | | 115,714 | | | | 1,912,238 | |
Investor A | | 1,407,299 | | | | 21,697,411 | | | 2,956,580 | | | | 47,917,929 | |
Investor B | | 316,867 | | | | 4,891,534 | | | 568,659 | | | | 9,085,898 | |
Investor C | | 417,790 | | | | 6,341,821 | | | 701,045 | | | | 11,178,693 | |
Shares issued in reinvestment of dividends: | | | | | | | | | | | | | | |
Institutional | | 101,948 | | | | 1,607,941 | | | 101,243 | | | | 1,603,042 | |
Service | | 1,809 | | | | 28,406 | | | 6,121 | | | | 96,039 | |
Investor A | | 2,651,548 | | | | 41,602,823 | | | 1,521,117 | | | | 23,985,487 | |
Investor B | | 747,315 | | | | 11,605,506 | | | 488,088 | | | | 7,583,994 | |
Investor C | | 419,088 | | | | 6,483,200 | | | 229,834 | | | | 3,573,154 | |
Shares redeemed: | | | | | | | | | | | | | | |
Institutional | | (627,912 | ) | | | (10,606,328 | ) | | (937,469 | ) | | | (15,341,460 | ) |
Service | | (20,425 | ) | | | (304,999 | ) | | (127,252 | ) | | | (2,097,949 | ) |
Investor A | | (2,926,547 | ) | | | (45,500,455 | ) | | (5,822,896 | ) | | | (93,990,201 | ) |
Investor B | | (1,382,704 | ) | | | (21,158,711 | ) | | (3,432,187 | ) | | | (54,998,153 | ) |
Investor C | | (603,430 | ) | | | (9,121,468 | ) | | (1,125,583 | ) | | | (17,955,399 | ) |
| | | | | | | | | | | | | | |
Net increase (decrease) | | 1,028,124 | | | $ | 15,574,979 | | | (3,982,167 | ) | | $ | (64,773,363 | ) |
| | | | | | | | | | | | | | |
There is a 2% redemption fee on shares of the Portfolio redeemed or exchanged which have been held for 30 days or less. The redemption fees are collected and retained by the Fund for the benefit of the remaining shareholders. The redemption fees are recorded as a credit to paid-in capital.
5. Short-Term Borrowings:
The Portfolio, along with certain other funds managed by the Advisor and its affiliates, is a party to a $500,000,000 credit agreement with a group of lenders. The Portfolio may borrow under the credit agreement to fund shareholder redemptions and for other lawful purposes other than for leverage. Each Portfolio may borrow up to the maximum amount allowable under the Portfolio’s current Prospectus and Statement of Additional Information, subject to various other legal, regulatory or contractual limits. On November 21, 2007, the credit agreement was renewed for one year under substantially the same terms. The Portfolio pays a commitment fee of 0.06% per annum based on the Portfolio’s pro rata share of the unused portion of the credit agreement, which is included in miscellaneous expenses in the Statement of Operations. Amounts borrowed under the credit agreement bear interest at a rate equal to, at the Portfolio’s election, the federal funds rate plus 0.35% or a base rate as defined in the credit agreement. The Portfolio did not borrow under the credit agreement during the six months ended March 31, 2008.
| | | | | | |
| | | BLACKROCK ASSET ALLOCATION PORTFOLIO | | MARCH 31, 2008 | | 47 |
Notes to Financial Statements (concluded)
6. Capital Loss Carryforward:
As of September 30, 2007, the Portfolio had a capital loss carryforward available to offset future realized capital gains of $13,392,631 expiring September 30, 2010.
7. Market Risk:
The securities exchanges of certain foreign markets are substantially smaller, less liquid and more volatile than the major securities markets in the United States. Consequently, acquisition and disposition of securities by the Portfolio may be inhibited. In addition, a significant proportion of the aggregate market value of equity securities listed on the major securities exchanges in emerging markets are held by a smaller number of investors. This may limit the number of shares available for acquisition or disposition by the Portfolio.
| | | | | | |
48 | | BLACKROCK ASSET ALLOCATION PORTFOLIO | | MARCH 31, 2008 | | |
Officers and Trustees
David O. Beim, Trustee
Richard S. Davis, Trustee
Ronald W. Forbes, Trustee
Henry Gabbay, Trustee
Dr. Matina Horner, Trustee
Rodney D. Johnson, Trustee
Herbert I. London, Trustee
Cynthia A. Montgomery, Trustee
Joseph P. Platt, Jr., Trustee
Robert C. Robb, Jr., Trustee
Toby Rosenblatt, Trustee
Kenneth L. Urish, Trustee
Frederick W. Winter, Trustee
Donald C. Burke, President and Chief Executive Officer
Anne F. Ackerley, Vice President
Neal J. Andrews, Chief Financial Officer
Jay M. Fife, Treasurer
Brian P. Kindelan, Chief Compliance Officer
Howard Surloff, Secretary
Investment Advisor and Co-Administrator
BlackRock Advisors, LLC
Wilmington, DE 19809
Sub-Advisor
BlackRock Financial Management, Inc.
New York, NY 10022
Custodian
PFPC Trust Company
Philadelphia, PA 19153
Co-Administrator and Transfer Agent
PFPC Inc.
Wilmington, DE 19809
Distributor
BlackRock Distributors, Inc.
King of Prussia, PA 19406
Legal Counsel
Sidley Austin LLP
New York, NY 10019
Independent Registered Public Accounting Firm
Deloitte & Touche LLP
Philadelphia, PA 19103
| | | | | | |
| | | BLACKROCK ASSET ALLOCATION PORTFOLIO | | MARCH 31, 2008 | | 49 |
Additional Information (Unaudited)
BlackRock Privacy Principles
BlackRock is committed to maintaining the privacy of its current and former fund investors and individual clients (collectively, “Clients”) and to safeguarding their non-public personal information. The following information is provided to help you understand what personal information BlackRock collects, how we protect that information and why in certain cases we share such information with select parties.
If you are located in a jurisdiction where specific laws, rules or regulations require BlackRock to provide you with additional or different privacy-related rights beyond what is set forth below, then BlackRock will comply with those specific laws, rules or regulations.
BlackRock obtains or verifies personal non-public information from and about you from different sources, including the following: (i) information we receive from you or, if applicable, your financial intermediary, on applications, forms or other documents; (ii) information about your transactions with us, our affiliates, or others; (iii) information we receive from a consumer reporting agency; and (iv) from visits to our websites.
BlackRock does not sell or disclose to non-affiliated third parties any non-public personal information about its Clients, except as permitted by law or as is necessary to respond to regulatory requests or to service Client accounts. These non-affiliated third parties are required to protect the confidentiality and security of this information and to use it only for its intended purpose.
We may share information with our affiliates to service your account or to provide you with information about other BlackRock products or services that may be of interest to you. In addition, BlackRock restricts access to non-public personal information about its Clients to those BlackRock employees with a legitimate business need for the information. BlackRock maintains physical, electronic and procedural safeguards that are designed to protect the non-public personal information of its Clients, including procedures relating to the proper storage and disposal of such information.
Availability of Additional Information
Electronic copies of most financial reports and prospectuses are available on the Fund’s website or shareholders can sign up for e-mail notifications of quarterly statements, annual and semi-annual reports and prospectuses by enrolling in the Fund’s electronic delivery program.
To enroll:
Shareholders Who Hold Accounts with Investment Advisors, Banks or Brokerages:
Please contact your financial advisor. Please note that not all investment advisors, banks or brokerages may offer this service.
Shareholders Who Hold Accounts Directly With BlackRock
| 1) | Access the BlackRock website at http://www.blackrock.com/edelivery |
| 2) | Click on the applicable link and follow the steps to sign up |
The Fund will mail only one copy of shareholder documents, including prospectuses, annual and semi-annual reports and proxy statements, to shareholders with multiple accounts at the same address. This practice is commonly called “householding” and it is intended to reduce expenses and eliminate duplicate mailings of shareholder documents. Mailings of your shareholder documents may be householded indefinitely unless you instruct us otherwise. If you do not want the mailing of these documents to be combined with those for other members of your household, please contact the Fund at (800) 441-7762.
| | | | | | |
50 | | BLACKROCK ASSET ALLOCATION PORTFOLIO | | MARCH 31, 2008 | | |
Additional Information (concluded)
Availability of Additional Information (concluded)
Availability of Proxy Voting Policies and Procedures
A description of the policies and procedures that the Fund uses to determine how to vote proxies relating to portfolio securities is available (1) without charge, upon request by calling (800) 441-7762; (2) at www.blackrock.com; (3) on the Securities and Exchange Commission’s (the “SEC”) website at http://www.sec.gov.
Availability of Proxy Voting Record
Information (if any) on how proxies relating to the Fund’s voting securities were voted by BlackRock during the most recent 12-month period ended June 30th is available, upon request and without charge on our website at www.blackrock.com, by calling (800) 441-7762 or on the SEC’s website at http://www.sec.gov.
Availability of Quarterly Portfolio Schedule
The Fund files its complete schedule of portfolio holdings with the SEC for the first and third quarters of each fiscal year on Form N-Q. The Fund’s Forms N-Q are available on the SEC’s website at http:// www.sec.gov and may also be reviewed and copied at the SEC’s Public Reference Room in Washington, D.C. Information on the operation of the Public Reference Room may be obtained by calling (800) SEC-0330. The Fund’s Forms N-Q may also be obtained upon request and without charge by calling (800) 441-7762.
Shareholder Privileges
Account Information
Call us at (800) 441-7762 from 8:00 AM to 6:00 PM EST to get information about your account balances, recent transactions and share prices. You can also reach us on the Web at www.blackrock.com/funds.
Automatic Investment Plans
Investor Class shareholders who want to invest regularly can arrange to have $50 or more automatically deducted from their checking or savings account and invested in any of the BlackRock portfolios.
Systematic Withdrawal Plan
Investor Class shareholders can establish a systematic withdrawal plan and receive periodic payments of $50 or more from their BlackRock portfolios, as long as their account is at least $10,000.
Retirement Plans
Shareholders may make investments in conjunction with Traditional, Rollover, Roth, Coverdell, Simple IRA’s, SEP IRA’s and 403(b) Plans.
| | | | | | |
| | | BLACKROCK ASSET ALLOCATION PORTFOLIO | | MARCH 31, 2008 | | 51 |
A World-Class Mutual Fund Family
BlackRock offers a diverse lineup of open-end mutual funds crossing all investment styles and managed by experts in equity, fixed income and tax-exempt investing.
| | | | |
Equity Funds | | | | |
| BlackRock All-Cap Global Resources Portfolio | | BlackRock Global Opportunities Portfolio | | BlackRock Mid-Cap Growth Equity Portfolio |
| BlackRock Asset Allocation Portfolio† | | BlackRock Global Resources Portfolio | | BlackRock Mid-Cap Value Equity Portfolio |
| BlackRock Aurora Portfolio | | BlackRock Global Science & Technology | | BlackRock Mid Cap Value Opportunities Fund |
| BlackRock Balanced Capital Fund† | | Opportunities Portfolio | | BlackRock Natural Resources Trust |
| BlackRock Basic Value Fund | | BlackRock Global SmallCap Fund | | BlackRock Pacific Fund |
| BlackRock Capital Appreciation Portfolio | | BlackRock Health Sciences Opportunities Portfolio* | | BlackRock Small Cap Core Equity Portfolio |
| BlackRock Equity Dividend Fund | | BlackRock Healthcare Fund | | BlackRock Small Cap Growth Equity Portfolio |
| BlackRock EuroFund | | BlackRock Index Equity Portfolio* | | BlackRock Small Cap Growth Fund II |
| BlackRock Focus Growth Fund | | BlackRock International Fund | | BlackRock Small Cap Index Fund |
| BlackRock Focus Value Fund | | BlackRock International Index Fund | | BlackRock Small Cap Value Equity Portfolio* |
| BlackRock Fundamental Growth Fund | | BlackRock International Opportunities Portfolio | | BlackRock Small/Mid-Cap Growth Portfolio |
| BlackRock Global Allocation Fund† | | BlackRock International Value Fund | | BlackRock S&P 500 Index Fund |
| BlackRock Global Dynamic Equity Fund | | BlackRock Large Cap Core Fund | | BlackRock Technology Fund |
| BlackRock Global Emerging Markets Fund | | BlackRock Large Cap Growth Fund | | BlackRock U.S. Opportunities Portfolio |
| BlackRock Global Financial Services Fund | | BlackRock Large Cap Value Fund | | BlackRock Utilities and Telecommunications Fund |
| BlackRock Global Growth Fund | | BlackRock Latin America Fund | | BlackRock Value Opportunities Fund |
| | |
Fixed Income Funds | | | | |
| BlackRock Commodity Strategies Fund | | BlackRock Income Builder Portfolio | | BlackRock Low Duration Bond Portfolio |
| BlackRock Emerging Market Debt Portfolio | | BlackRock Inflation Protected Bond Portfolio | | BlackRock Managed Income Portfolio |
| BlackRock Enhanced Income Portfolio | | BlackRock Intermediate Bond Portfolio II | | BlackRock Short-Term Bond Fund |
| BlackRock GNMA Portfolio | | BlackRock Intermediate Government | | BlackRock Strategic Income Portfolio |
| BlackRock Government Income Portfolio | | Bond Portfolio | | BlackRock Total Return Fund |
| BlackRock High Income Fund | | BlackRock International Bond Portfolio | | BlackRock Total Return Portfolio II |
| BlackRock High Yield Bond Portfolio | | BlackRock Long Duration Bond Portfolio | | BlackRock World Income Fund |
| BlackRock Income Portfolio | | | | |
| | |
Municipal Bond Funds | | | | |
| BlackRock AMT-Free Municipal Bond Portfolio | | BlackRock Intermediate Municipal Fund | | BlackRock New York Municipal Bond Fund |
| BlackRock California Insured Municipal Bond Fund | | BlackRock Kentucky Municipal Bond Portfolio | | BlackRock Ohio Municipal Bond Portfolio |
| BlackRock Delaware Municipal Bond Portfolio | | BlackRock Municipal Insured Fund | | BlackRock Pennsylvania Municipal Bond Fund |
| BlackRock Florida Municipal Bond Fund | | BlackRock National Municipal Fund | | BlackRock Short-Term Municipal Fund |
| BlackRock High Yield Municipal Fund | | BlackRock New Jersey Municipal Bond Fund | | |
| | |
Target Risk & Target Date Funds | | | | |
| BlackRock Prepared Portfolios | | BlackRock Lifecycle Prepared Portfolios | | |
Conservative Prepared Portfolio | | Prepared Portfolio 2010 | | Prepared Portfolio 2030 |
Moderate Prepared Portfolio | | Prepared Portfolio 2015 | | Prepared Portfolio 2035 |
Growth Prepared Portfolio | | Prepared Portfolio 2020 | | Prepared Portfolio 2040 |
Aggressive Growth Prepared Portfolio | | Prepared Portfolio 2025 | | Prepared Portfolio 2045 |
| | | | Prepared Portfolio 2050 |
| * | See the prospectus for information on specific limitations on investments in the fund. |
BlackRock mutual funds are distributed by BlackRock Distributors, Inc. and certain funds are also distributed by FAM Distributors, Inc. You should consider the investment objectives, risks, charges and expenses of the funds under consideration carefully before investing. Each fund’s prospectus contains this and other information and is available at www.blackrock.com or by calling (800) 882-0052 or from your financial advisor. The prospectus should be read carefully before investing.
| | | | | | |
52 | | BLACKROCK ASSET ALLOCATION PORTFOLIO | | MARCH 31, 2008 | | |
[THIS PAGE INTENTIONALLY LEFT BLANK.]
[THIS PAGE INTENTIONALLY LEFT BLANK.]
[THIS PAGE INTENTIONALLY LEFT BLANK.]

This report is transmitted to shareholders only. It is not authorized for use as an offer of sale or a solicitation of an offer to buy shares of the Portfolio unless accompanied or preceded by the Portfolio’s current prospectus. Past performance results shown in this report should not be considered a representation of future performance. Investment returns and principal value of shares will fluctuate so that shares, when redeemed, may be worth more or less than their original cost. Statements and other information herein are as dated and are subject to change.
Investment in foreign securities involves special risks including fluctuating foreign exchange rates, foreign government regulations, differing degrees of liquidity and the possibility of substantial volatility due to adverse political, economic or other developments.
BlackRock Funds
100 Bellevue Parkway
Wilmington, DE 19809

AA-3/08-SAR
EQUITIES FIXED INCOME REAL ESTATE LIQUIDITY ALTERNATIVES BLACKROCK SOLUTIONS
| | | | |
| BlackRock | | | |  |
| Exchange Portfolio | | | |
SEMI-ANNUAL REPORT | MARCH 31, 2008 (UNAUDITED) | |
NOT FDIC INSURED
MAY LOSE VALUE
NO BANK GUARANTEE
Table of Contents
| | | | | | |
2 | | BLACKROCK EXCHANGE PORTFOLIO | | MARCH 31, 2008 | | |
A Letter to Shareholders
Dear Shareholder
Financial markets endured severe bouts of volatility during the reporting period, particularly as the calendar turned to 2008. It was then that fears of an economic recession swelled and credit market strains intensified, producing calamity in the financial system and, ultimately, the demise of major Wall Street firm Bear Stearns.
The Federal Reserve Board (the “Fed”), after cutting the target federal funds rate 100 basis points (1%) between September 2007 and year-end, stepped up its efforts to support the ailing financial sector in the first three months of 2008. The central bank cut interest rates 125 basis points in January alone, and followed with another 75-basis-point cut on March 18, bringing the target rate to 2.25%. In an unprecedented move, the Fed also extended its financing operations directly to broker/dealers and assisted JPMorgan in its buyout of ill-fated Bear Stearns.
Against this backdrop, investor anxiety has been acute and equity markets have struggled. The S&P 500 Index of U.S. stocks was down in March, marking the fifth consecutive month of negative returns. International markets outperformed the U.S. for much of 2007, but that trend changed in more recent months as investors grew increasingly reluctant to take on the risks of foreign investing.
In fixed income markets, an ongoing investor flight to quality continued to drive Treasury yields lower and their prices higher. The yield on 10-year Treasury issues, which touched 5.30% in June 2007 (its highest level in five years), fell to 4.04% by year-end and to 3.45% by March 31. Investors largely shunned bonds associated with the housing and credit markets, and the riskier high yield sector landed in negative territory year-to-date. Meanwhile, the municipal bond market has struggled with concerns around the creditworthiness of monoline bond insurers and the failure of auctions for auction rate securities, driving yields higher and prices lower across the curve. At period-end, municipal bonds were trading at higher yields than their Treasury counterparts, a very unusual occurrence by historical standards.
Overall, the major benchmark indexes posted mixed results for the current reporting period, generally reflecting heightened investor risk aversion:
| | | | | | |
Total Returns as of March 31, 2008 | | 6-month | | | 12-month | |
U.S. equities (S&P 500 Index) | | (12.46 | )% | | (5.08 | )% |
Small cap U.S. equities (Russell 2000 Index) | | (14.02 | )% | | (13.00 | )% |
International equities (MSCI Europe, Australasia, Far East Index) | | (10.50 | )% | | (2.70 | )% |
Fixed income (Lehman Brothers U.S. Aggregate Index) | | 5.23 | % | | 7.67 | % |
Tax-exempt fixed income (Lehman Brothers Municipal Bond Index) | | 0.75 | % | | 1.90 | % |
High yield bonds (Lehman Brothers U.S. Corporate High Yield 2% Issuer Capped Index) | | (4.01 | )% | | (3.47 | )% |
Past performance is no guarantee of future results. Index performance shown for illustrative purposes only. You cannot invest directly in an index.
As you navigate today’s volatile markets, we encourage you to review your investment goals with your financial professional and to make portfolio changes, as needed. For more up-to-date commentary on the economy and financial markets, we invite you to visit www.blackrock.com/funds. As always, we thank you for entrusting BlackRock with your investment assets, and we look forward to continuing to serve you in the months and years ahead.
|
| Sincerely, |
|
 |
| Rob Kapito |
| President, BlackRock Advisors, LLC |
THIS PAGE NOT PART OF YOUR FUND REPORT
Portfolio Summary (Unaudited)
Portfolio Management Commentary
How did the Portfolio perform?
| • | | Portfolio results outperformed that of the benchmark S&P 500 Index for the six-month period. |
What factors influenced performance?
| • | | Both sector positioning and stock selection contributed to the Portfolio’s relative outperformance. From a sector positioning standpoint, the Portfolio’s overweight in consumer staples and energy, along with an underweight in financials, added significant value during the period. |
| • | | Stock selection within the financials and information technology sectors produced the strongest relative results. Berkshire Hathaway drove performance among the Portfolio’s financials holdings, as shares of the company appreciated during an extremely challenging environment for the sector overall. Stock selection in the computers & peripherals sub-sector within information technology also contributed notably during the six months. In particular, Portfolio positions in International Business Machines and Hewlett-Packard Co., combined with its avoidance of Dell and EMC Corp., enhanced comparative results, as the former fared relatively well, while the latter two major technology holdings in the benchmark declined significantly over the period. |
| • | | Conversely, unfavorable stock selection in the energy and industrials sectors partially offset the successes in financials and technology. In energy, the Portfolio’s large position in Schlumberger detracted from results, as the company’s shares declined over the period following earnings disappointments. Boeing accounted for much of the relative weakness in the industrials group. |
Describe recent Portfolio activity.
| • | | During the period, we increased the Portfolio’s weighting in consumer staples, as we reduced the allocation to financials through the sale of SLM Corp. |
Describe Portfolio positioning at period-end.
| • | | Sector weights continue to be driven by our bottom-up stock selection decisions. At period-end, the Portfolio’s largest overweights versus the benchmark S&P 500 Index were in healthcare and consumer staples, while it was relatively underexposed to the consumer discretionary and materials sectors. |
Portfolio Profile as of March 31, 2008
| | | |
Ten Largest Holdings | | Percent of
Long-Term
Investments | |
The Procter & Gamble Co. | | 6 | % |
Berkshire Hathaway, Inc. - Class B | | 6 | |
Hewlett-Packard Co. | | 6 | |
Exxon Mobil Corp. | | 6 | |
Schlumberger Ltd. | | 6 | |
Target Corp. | | 5 | |
American Express Co. | | 4 | |
General Electric Co. | | 4 | |
International Business Machines Corp. | | 4 | |
Microsoft Corp. | | 4 | |
| |
Ten Largest Industries | | Percent of
Long-Term
Investments | |
Oil & Gas | | 15 | % |
Computer & Office Equipment | | 10 | |
Pharmaceuticals | | 8 | |
Retail Merchandising | | 8 | |
Finance | | 8 | |
Aerospace | | 7 | |
Soaps & Cosmetics | | 6 | |
Conglomerates | | 6 | |
Beverages & Bottling | | 5 | |
Manufacturing | | 4 | |
For Portfolio compliance purposes, the Portfolio’s industry classifications refer to any one or more of the industry sub-classifications used by one or more widely recognized market indexes or ratings group indexes, and/or as defined by Portfolio management. This definition may not apply for purposes of this report, which may combine industry sub-classifications for reporting ease.
| | | | | | |
4 | | BLACKROCK EXCHANGE PORTFOLIO | | MARCH 31, 2008 | | |
Portfolio Summary (concluded)
Total Return Based on a $10,000 Investment
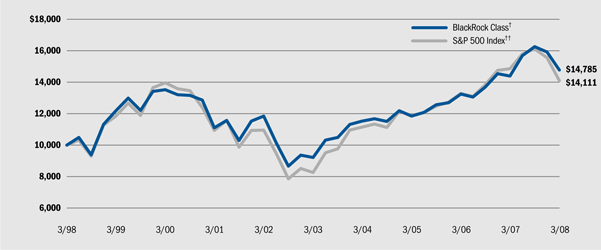
| † | The Portfolio normally invests largely in a diversified and supervised portfolio of common stocks, or securities convertible into common stocks. |
| †† | This unmanaged Index covers 500 industrial, utility, transportation and financial companies of the U.S. markets (mostly NYSE issues) representing about 75% of NYSE market capitalization and 30% of NYSE issues. S&P 500 is a registered trademark of the McGraw-Hill Companies. |
Shares of the Portfolio are not currently offered to the public.
Performance Summary for the Period Ended March 31, 2008
| | | | | | | | | | | | |
| | | 6-Month
Total Returns | | | Average Annual Total Returns* | |
| | | | 1 Year | | | 5 Years | | | 10 Years | |
BlackRock | | (9.09 | )% | | 2.59 | % | | 9.94 | % | | 3.99 | % |
S&P 500® Index | | (12.46 | )% | | (5.08 | )% | | 11.32 | % | | 3.50 | % |
| * | See “About Portfolio’s Performance” on page 6 for a detailed description of performance related information. |
Past performance is not indicative of future results.
Expense Example
| | | | | | | | | | | | | | | | | | |
| | | Actual | | Hypothetical** |
| | | Beginning
Account Value
October 1, 2007 | | Ending
Account Value
March 31, 2008 | | Expenses Paid
During the Period* | | Beginning
Account Value
October 1, 2007 | | Ending
Account Value
March 31, 2008 | | Expenses Paid
During the Period* |
BlackRock | | $ | 1,000.00 | | $ | 909.09 | | $ | 2.86 | | $ | 1,000.00 | | $ | 1,021.96 | | $ | 3.04 |
| * | For the BlackRock share class of the Portfolio, expenses are equal to the annualized expense ratio of 0.60%, multiplied by the average account value over the period, multiplied by 183/366 (to reflect the one-half year period shown). |
| ** | Hypothetical 5% annual return before expenses is calculated by pro-rating the number of days in the most recent fiscal half year divided by 366. |
See “Disclosure of Expenses” on page 6 for further information on how expenses were calculated.
| | | | | | |
| | BLACKROCK EXCHANGE PORTFOLIO | | MARCH 31, 2008 | | 5 |
About Portfolio’s Performance
| • | | BlackRock Shares are not subject to any sales charge. These shares bear no ongoing distribution or service fees and are available only to eligible investors. |
Performance information reflects past performance and does not guarantee future results. Current performance may be lower or higher than the performance data quoted. Refer to www.blackrock.com/funds to obtain performance data current to the most recent month-end. Performance results do not reflect the deduction of taxes that a shareholder would pay on Portfolio distributions or the redemption of Portfolio shares. Figures shown in the performance table on the previous page assume reinvestment of all dividends and distributions, if any, at net asset value on the ex-dividend date. Investment return and principal value of shares will fluctuate so that shares, when redeemed, may be worth more or less than their original cost.
The performance information also reflects fee waivers and reimbursements that subsidize and reduce the total operating expenses of the Portfolio. The Portfolio’s returns would have been lower if there were not such waivers and reimbursements. BlackRock Advisors, LLC is under no obligation to waive or continue waiving its fees after February 1, 2009.
Disclosure of Expenses
As a shareholder of the Portfolio, you incur ongoing costs, including advisory fees, and other Portfolio expenses. This Expense Example on page 5 is intended to help you understand your ongoing costs (in dollars) of investing in the Portfolio and compare these costs with the ongoing costs of investing in other mutual funds.
The Expense Example on page 5 is based on an investment of $1,000 invested at the beginning of the period and held for the entire period October 1, 2007 to March 31, 2008.
The information under “Actual” together with the amount you invested, allows you to estimate actual expenses incurred over the reporting period. Simply divide your account value by $1,000 (for example, an $8,600 account value divided by $1,000 = 8.60) and multiply the result by the cost shown for your share class, in the column entitled “Expenses Paid During the Period,” to estimate the expenses incurred on your account during this period.
The information under “Hypothetical” provides information about hypothetical account values and hypothetical expenses based on the Portfolio’s actual expense ratio and an assumed rate of return of 5% per year before expenses, which is not the Portfolio’s actual return. The hypothetical account values and expenses may not be used to estimate the actual ending account balance or expenses you incurred for the period. You may use this information to compare the ongoing costs of investing in the Portfolio and other funds. To do so, compare this 5% hypothetical example with the 5% hypothetical examples that appear in the shareholder reports of the other funds.
Please note that the expenses shown in the table are meant to highlight your ongoing costs only and do not reflect any transactional costs, such as front and back end sales charges (loads) or redemption fees, where applicable. Therefore, the hypothetical information is useful in comparing ongoing costs only, and will not help you determine the relative total costs of owning different funds. In addition, if these transactional costs were included, your costs would have been higher.
| | | | | | |
6 | | BLACKROCK EXCHANGE PORTFOLIO | | MARCH 31, 2008 | | |
| | |
| Schedule of Investments March 31, 2008 (Unaudited) | | (Percentages shown are based on Net Assets) |
| | | | | | |
| | | Shares | | Value | |
Common Stocks — 98.8% | | | | | | |
Aerospace — 6.5% | | | | | | |
The Boeing Co. | | 131,800 | | $ | 9,801,966 | |
General Dynamics Corp. | | 93,000 | | | 7,753,410 | |
| | | | | | |
| | | | | 17,555,376 | |
| | | | | | |
Banks — 2.0% | | | | | | |
JPMorgan Chase & Co. | | 124,728 | | | 5,357,068 | |
| | | | | | |
Beverages & Bottling — 5.3% | | | | | | |
Anheuser-Busch Cos., Inc. | | 192,315 | | | 9,125,347 | |
The Coca-Cola Co. | | 87,735 | | | 5,340,429 | |
| | | | | | |
| | | | | 14,465,776 | |
| | | | | | |
Computer & Office Equipment — 9.8% | | | | | | |
Hewlett-Packard Co. | | 349,270 | | | 15,947,668 | |
International Business Machines Corp. | | 92,371 | | | 10,635,597 | |
| | | | | | |
| | | | | 26,583,265 | |
| | | | | | |
Computer Software & Services — 3.8% | | | | | | |
Microsoft Corp. | | 367,277 | | | 10,423,321 | |
| | | | | | |
Conglomerates — 6.1% | | | | | | |
Berkshire Hathaway, Inc. - Class B(a) | | 3,687 | | | 16,491,582 | |
| | | | | | |
Electronics — 0.9% | | | | | | |
Agilent Technologies, Inc.(a) | | 29,749 | | | 887,412 | |
Intel Corp. | | 70,215 | | | 1,487,154 | |
| | | | | | |
| | | | | 2,374,566 | |
| | | | | | |
Finance — 7.6% | | | | | | |
American Express Co. | | 271,045 | | | 11,850,087 | |
Ameriprise Financial, Inc. | | 61,125 | | | 3,169,331 | |
Western Union Co. | | 266,480 | | | 5,668,030 | |
| | | | | | |
| | | | | 20,687,448 | |
| | | | | | |
Food & Agriculture — 0.8% | | | | | | |
General Mills, Inc. | | 8,497 | | | 508,800 | |
Kraft Foods, Inc. - Class A | | 53,285 | | | 1,652,368 | |
| | | | | | |
| | | | | 2,161,168 | |
| | | | | | |
Insurance — 1.5% | | | | | | |
American International Group, Inc. | | 94,900 | | | 4,104,425 | |
| | | | | | |
Machinery & Heavy Equipment — 3.6% | | | | | | |
Caterpillar, Inc.(b) | | 124,256 | | | 9,728,002 | |
| | | | | | |
Manufacturing — 4.3% | | | | | | |
General Electric Co. | | 317,848 | | | 11,763,555 | |
| | | | | | |
Medical & Medical Services — 3.1% | | | | | | |
Millipore Corp.(a) | | 123,378 | | | 8,316,911 | |
| | | | | | |
Medical Instruments & Supplies — 4.0% | | | | | | |
Johnson & Johnson | | 120,414 | | | 7,811,256 | |
Medtronic, Inc. | | 60,000 | | | 2,902,200 | |
| | | | | | |
| | | | | 10,713,456 | |
| | | | | | |
Oil & Gas — 14.8% | | | | | | |
BP Plc - ADR | | 116,846 | | | 7,086,710 | |
Exxon Mobil Corp. | | 188,062 | | | 15,906,284 | |
Schlumberger Ltd. | | 172,339 | | | 14,993,493 | |
Transocean, Inc.(a) | | 14,795 | | | 2,000,284 | |
| | | | | | |
| | | | | 39,986,771 | |
| | | | | | |
Pharmaceuticals — 7.9% | | | | | | |
AstraZeneca Plc | | 76,000 | | | 2,887,240 | |
Merck & Co., Inc. | | 83,999 | | | 3,187,762 | |
Novartis AG - ADR | | 161,364 | | | 8,266,678 | |
Pfizer, Inc. | | 89,719 | | | 1,877,819 | |
Wyeth | | 125,465 | | | 5,239,418 | |
| | | | | | |
| | | | | 21,458,917 | |
| | | | | | |
Retail Merchandising — 7.6% | | | | | | |
Target Corp. | | 248,429 | | | 12,590,382 | |
Wal-Mart Stores, Inc. | | 154,700 | | | 8,149,596 | |
| | | | | | |
| | | | | 20,739,978 | |
| | | | | | |
Soaps & Cosmetics — 6.4% | | | | | | |
The Procter & Gamble Co. | | 246,400 | | | 17,265,248 | |
| | | | | | |
Telecommunications — 0.7% | | | | | | |
Vodafone Group Plc - ADR | | 64,452 | | | 1,901,979 | |
| | | | | | |
Tobacco — 2.1% | | | | | | |
Altria Group, Inc. | | 77,000 | | | 1,709,400 | |
Philip Morris International, Inc.(a) | | 77,000 | | | 3,894,660 | |
| | | | | | |
| | | | | 5,604,060 | |
| | | | | | |
TOTAL COMMON STOCKS | | | | | | |
(Cost $58,843,669) | | | | | 267,682,872 | |
| | | | | | |
Short Term Investments — 4.0% | | | | | | |
BlackRock Liquidity Series, LLC Money Market Series, 3.10%(c)(d)(e) | | 7,900,000 | | | 7,900,000 | |
Galileo Money Market Fund, 2.56%(e) | | 3,074,861 | | | 3,074,861 | |
| | | | | | |
TOTAL SHORT TERM INVESTMENTS | | | | | | |
(Cost $10,974,861) | | | | | 10,974,861 | |
| | | | | | |
TOTAL INVESTMENTS IN SECURITIES — 102.8% | | | | | | |
(Cost $69,818,530*) | | | | | 278,657,733 | |
| | |
LIABILITIES IN EXCESS OF OTHER ASSETS — (2.8)% | | | | | (7,597,548 | ) |
| | | | | | |
NET ASSETS — 100.0% | | | | $ | 271,060,185 | |
| | | | | | |
Portfolio Abbreviations
| | | | | | |
| To simplify the listings of Portfolio holdings in the Schedule of Investments, the names of many of the securities have been abbreviated according to the list on the right. | | ADR | | American Depository Receipt | | |
See Notes to Financial Statements.
| | | | | | |
| | BLACKROCK EXCHANGE PORTFOLIO | | MARCH 31, 2008 | | 7 |
| | |
| Schedule of Investments (concluded) | | (Percentages shown are based on Net Assets) |
| * | The cost and unrealized appreciation (depreciation) of investments as of March 31, 2008, as computed for federal income tax purposes, were as follows: |
| | | | |
Aggregate cost | | $ | 65,484,475 | |
| | | | |
Gross unrealized appreciation | | $ | 216,111,615 | |
Gross unrealized depreciation | | | (2,938,357 | ) |
| | | | |
Net unrealized appreciation | | $ | 213,173,258 | |
| | | | |
| (a) | Non-income producing security. |
| (b) | Security, or a portion of security, is on loan. |
| (c) | Investments in companies considered to be an affiliate of the Portfolio, for purposes of Section 2(a)(3) of the Investment Company Act of 1940, were as follows: |
| | | | | | |
Affiliate | | Net Activity | | Interest
Income |
BlackRock Liquidity Series, LLC Money Market Series | | $ | 7,900,000 | | $ | 32,152 |
| (d) | Security purchased with the cash proceeds from securities loans. |
| (e) | Represents current yield as of report date. |
| • | | For Portfolio compliance purposes, the Portfolio’s sector and industry classifications refer to any one or more of the Standard Industry Codes as defined by the SEC. This definition may not apply for purposes of this report, which may combine sector and industry sub-classifications for reporting ease. |
See Notes to Financial Statements.
| | | | | | |
8 | | BLACKROCK EXCHANGE PORTFOLIO | | MARCH 31, 2008 | | |
Statement of Assets and Liabilities
March 31, 2008 (Unaudited)
Assets
| | | |
Investments at value - unaffiliated (including securities loaned of $7,829,000) (cost $61,918,530) | | $ | 270,757,733 |
Investments at value - affiliated (cost $7,900,000) | | | 7,900,000 |
Dividends receivable | | | 583,358 |
Securities lending income receivable | | | 5,546 |
Receivable from advisor | | | 720 |
Prepaid expenses | | | 12,963 |
| | | |
Total assets | | | 279,260,320 |
| | | |
| | | |
Liabilities |
Collateral received at value - securities loans | | | 7,900,000 |
Investment advisory fees payable | | | 107,446 |
Capital shares redeemed payable | | | 77,766 |
Foreign taxes payable | | | 36,192 |
Administration fees payable | | | 17,163 |
Custodian fees payable | | | 5,443 |
Officer and Trustees fees payable | | | 4,988 |
Transfer agent fees payable | | | 3,760 |
Other accrued expenses payable | | | 47,377 |
| | | |
Total liabilities | | | 8,200,135 |
| | | |
| | | |
Net Assets |
Net Assets | | $ | 271,060,185 |
| | | |
| | | |
Net Assets Consist of |
Paid-in capital | | $ | 52,279,455 |
Undistributed net investment income | | | 1,155,803 |
Accumulated net realized gain | | | 8,785,724 |
Net unrealized appreciation | | | 208,839,203 |
| | | |
Net Assets | | $ | 271,060,185 |
| | | |
| | | |
Net Asset Value |
Shares outstanding, unlimited number of shares authorized, $0.001 par value | | | 443,372 |
Net Asset Value | | $ | 611.36 |
See Notes to Financial Statements.
| | | | | | |
| | BLACKROCK EXCHANGE PORTFOLIO | | MARCH 31, 2008 | | 9 |
Statement of Operations
Six Months Ended March 31, 2008 (Unaudited)
| | | | |
Investment Income | |
Dividends | | $ | 2,692,060 | |
Securities lending | | | 32,152 | |
Interest from affiliates | | | 70 | |
Foreign taxes witheld | | | (36,192 | ) |
| | | | |
Total investment income | | | 2,688,090 | |
| | | | |
| | | | |
Expenses | |
Investment advisory | | | 726,413 | |
Administration | | | 145,284 | |
Professional | | | 22,868 | |
Custodian | | | 14,363 | |
Printing | | | 12,924 | |
Officer and Trustees | | | 11,411 | |
Transfer agent | | | 3,098 | |
Miscellaneous | | | 5,114 | |
| | | | |
Total expenses | | | 941,475 | |
Less investment advisory fees waived | | | (30,369 | ) |
Less administration fees waived | | | (36,322 | ) |
Less transfer agent fees waived | | | (1,673 | ) |
Less transfer agent fees reimbursed | | | (1,411 | ) |
Less fees paid indirectly | | | (15 | ) |
| | | | |
Total expenses after waivers and reimbursement | | | 871,685 | |
| | | | |
Net investment income | | | 1,816,405 | |
| | | | |
| | | | |
Realized and Unrealized Gain (Loss) | |
Net realized gain from: | | | | |
Investments | | | 193,597 | |
Redemption-in-kind transactions | | | 6,007,482 | |
| | | | |
| | | 6,201,079 | |
| | | | |
| |
Net change in unrealized appreciation/depreciation on: | | | | |
Investments | | | (35,529,086 | ) |
| | | | |
Net realized and unrealized loss | | | (29,328,007 | ) |
| | | | |
Net Decrease in Net Assets Resulting from Operations | | $ | (27,511,602 | ) |
| | | | |
See Notes to Financial Statements.
| | | | | | |
10 | | BLACKROCK EXCHANGE PORTFOLIO | | MARCH 31, 2008 | | |
Statements of Changes in Net Assets
| | | | | | | | |
| | | Six Months
Ended
March 31,
2008 | | | Year Ended
September 30,
2007 | |
| Increase (Decrease) in Net Assets: | | (Unaudited) | | | | |
Operations | |
Net investment income | | $ | 1,816,405 | | | $ | 3,003,112 | |
Net realized gain (loss) from investment transactions | | | 193,597 | | | | (1,583,883 | ) |
Net realized gain from redemption-in-kind transactions | | | 6,007,482 | | | | 19,717,131 | |
Net change in unrealized appreciation/depreciation | | | (35,529,086 | ) | | | 30,726,620 | |
| | | | | | | | |
Net increase (decrease) in net assets resulting from operations | | | (27,511,602 | ) | | | 51,862,980 | |
| | | | | | | | |
| | | | | | | | |
Dividends to Shareholders from | |
Net investment income | | | (1,814,307 | ) | | | (2,701,038 | ) |
| | | | | | | | |
| | | | | | | | |
Capital Share Transactions | |
Shares issued in reinvestment of dividends | | | 280,571 | | | | 448,506 | |
Shares redeemed | | | (12,906,357 | ) | | | (30,149,442 | ) |
| | | | | | | | |
Net decrease in net assets resulting from capital share transactions | | | (12,625,786 | ) | | | (29,700,936 | ) |
| | | | | | | | |
| | | | | | | | |
Net Assets | |
Total increase (decrease) in net assets | | | (41,951,695 | ) | | | 19,461,006 | |
Beginning of period | | | 313,011,880 | | | | 293,550,874 | |
| | | | | | | | |
End of period | | $ | 271,060,185 | | | $ | 313,011,880 | |
| | | | | | | | |
End of period undistributed net investment income | | $ | 1,155,803 | | | $ | 1,153,705 | |
| | | | | | | | |
See Notes to Financial Statements.
| | | | | | |
| | BLACKROCK EXCHANGE PORTFOLIO | | MARCH 31, 2008 | | 11 |
Financial Highlights
| | | | | | | | | | | | | | | | | | | | | | | | |
| | | Six Months
Ended
March 31,
2008 | | | Year Ended
September 30, | | | Nine
Months
Ended 9/30/05 | | | Year Ended
December 31, | |
| | | (Unaudited) | | | 2007 | | | 2006 | | | | 20041 | | | 2003 | |
Per Share Operating Performance | |
Net asset value, beginning of period | | $ | 676.66 | | | $ | 575.50 | | | $ | 533.63 | | | $ | 520.73 | | | $ | 490.99 | | | $ | 411.01 | |
| | | | | | | | | | | | | | | | | | | | | | | | |
Net investment income | | | 4.02 | 2 | | | 6.21 | 2 | | | 6.63 | 2 | | | 4.10 | 2 | | | 7.61 | | | | 5.40 | |
Net realized and unrealized gain (loss) | | | (65.33 | ) | | | 100.52 | | | | 41.58 | | | | 11.80 | | | | 29.63 | | | | 80.08 | |
Dividends from net investment income | | | (3.99 | ) | | | (5.57 | ) | | | (6.34 | ) | | | (3.00 | ) | | | (7.50 | ) | | | (5.50 | ) |
| | | | | | | | | | | | | | | | | | | | | | | | |
Net asset value, end of period | | $ | 611.36 | | | $ | 676.66 | | | $ | 575.50 | | | $ | 533.63 | | | $ | 520.73 | | | $ | 490.99 | |
| | | | | | | | | | | | | | | | | | | | | | | | |
| | | | | | | | | | | | | | | | | | | | | | | | |
Total Investment Return | |
Based on net asset value | | | (9.09 | )%3 | | | 18.62 | % | | | 9.06 | % | | | 3.10 | %3 | | | 7.63 | % | | | 20.89 | % |
| | | | | | | | | | | | | | | | | | | | | | | | |
| | | | | | | | | | | | | | | | | | | | | | | | |
Ratios to Average Net Assets | |
Total expenses, net of waivers and reimbursement | | | 0.60 | %4 | | | 0.60 | % | | | 0.60 | % | | | 0.60 | %4 | | | 0.61 | % | | | 0.59 | % |
| | | | | | | | | | | | | | | | | | | | | | | | |
Total expenses | | | 0.65 | %4 | | | 0.65 | % | | | 0.67 | % | | | 0.71 | %4 | | | 0.61 | % | | | 0.59 | % |
| | | | | | | | | | | | | | | | | | | | | | | | |
Net investment income | | | 1.25 | %4 | | | 0.99 | % | | | 1.20 | % | | | 1.06 | %4 | | | 1.47 | % | | | 1.20 | % |
| | | | | | | | | | | | | | | | | | | | | | | | |
| | | | | | | | | | | | | | | | | | | | | | | | |
Supplemental Data | |
Net assets, end of period (000) | | $ | 271,060 | | | $ | 313,012 | | | $ | 293,551 | | | $ | 292,516 | | | $ | 299,352 | | | $ | 309,699 | |
| | | | | | | | | | | | | | | | | | | | | | | | |
Portfolio turnover | | | — | | | | 1 | % | | | — | | | | — | | | | 4 | % | | | 5 | % |
| | | | | | | | | | | | | | | | | | | | | | | | |
1 | During the year ended December 31, 2004, the investment advisor reimbursed the Portfolio as part of an internal review regarding the use of fund brokerage commissions. These payments increased net realized and unrealized gain on investments per share by $0.17 and increased total return by 0.04%. |
2 | Based on average shares outstanding. |
3 | Aggregate total investment return. |
See Notes to Financial Statements.
| | | | | | |
12 | | BLACKROCK EXCHANGE PORTFOLIO | | MARCH 31, 2008 | | |
Notes to Financial Statements (Unaudited)
1. Significant Accounting Policies:
BlackRock FundsSM (the “Fund”), a Massachusetts business trust, is registered under the Investment Company Act of 1940, as amended (the “1940 Act”), as an open-end management investment company. As of March 31, 2008, the Fund had 26 registered portfolios. These financial statements relate to the Fund’s Exchange Portfolio (the “Portfolio”). The Portfolio is authorized to issue an unlimited number of shares with a par value of $0.001. The Portfolio’s financial statements are prepared in conformity with accounting principles generally accepted in the United States of America, which may require the use of management accruals and estimates. Actual results may differ from these estimates.
The following is a summary of significant accounting policies followed by the Portfolio:
Valuation of Investments: Equity investments traded on a national securities exchange or on the NASDAQ Global Market System are valued at the last reported sale price that day or the NASDAQ official closing price, if applicable. Equity investments traded on a national securities exchange for which there were no sales on that day and equity investments traded on other over-the-counter markets for which market quotations are readily available are valued at the mean of the bid and asked prices. Short-term securities may be valued at amortized cost. Investments in open-end investment companies are valued at net asset value each business day.
In the event that application of these methods of valuation results in a price for an investment which is deemed not to be representative of the market value of such investment, the investment will be valued by a method approved by the Board of Trustees (the “Board”) as reflecting fair value (“Fair Value Assets”). When determining the price for Fair Value Assets, the investment advisor and/or the sub-advisor seeks to determine the price that the Portfolio might reasonably expect to receive from the current sale of that asset in an arm’s-length transaction. Fair value determinations shall be based upon all available factors that the investment advisor and/or sub-advisor deem relevant. The pricing of all Fair Value Assets is subsequently reported to the Board or a committee thereof.
Generally, trading in foreign securities is substantially completed each day at various times prior to the close of business on the New York Stock Exchange (“NYSE”). The values of such securities used in computing the net assets of the Portfolio are determined as of such times. Foreign currency exchange rates will be determined as of the close of business on the NYSE. Occasionally, events affecting the values of such securities and such exchange rates may occur between the times at which they are determined and the close of business on the NYSE that may not be reflected in the computation of the Portfolio’s net assets. If events (for example, a company announcement, market volatility or a natural disaster) occur during such periods that are expected to materially affect the value of such securities, those securities may be valued at their fair value as determined in good faith by the Board or by the investment advisor using a pricing service and/or procedures approved by the Board.
Foreign Currency Transactions: Foreign currency amounts are translated into United States dollars on the following basis: (i) market value of investment securities, assets and liabilities at the current rate of exchange; and (ii) purchases and sales of investment securities, income and expenses at the rates of exchange prevailing on the respective dates of such transactions. The Portfolio reports foreign currency related transactions as components of realized gains for financial reporting purposes, whereas such components are treated as ordinary income for federal income tax purposes.
Redemptions-In-Kind: The Portfolio transferred securities and cash due to redemptions-in-kind. For purposes of generally accepted accounting principles, these transactions were treated as a sale of securities and the resulting gains and losses were recognized based on the market value of the securities on the date of the transfer. For tax purposes, no gains or losses were recognized. Gains and losses resulting from such redemptions in-kind are disclosed separately in the Statement of Operations.
Investment Transactions and Investment Income: Investment transactions are recorded on the dates the transactions are entered into (the trade dates). Realized gains and losses on security transactions are determined on the identified cost basis. Dividend income is recorded on the ex-dividend dates. Dividends from foreign securities where the ex-dividend date may have passed are subsequently recorded when the Portfolio has determined the ex-dividend date. Interest income is recognized on the accrual basis.
Dividends to Shareholders: Dividends and distributions paid by the Portfolio are recorded on the ex-dividend dates.
Securities Lending: The Portfolio may lend securities to financial institutions that provide cash or securities issued or guaranteed by the U.S. government as collateral, which will be maintained at all times in an amount equal to at least 100% of the current market value of the loaned securities. The market value of the loaned securities is determined at the close of business of the Portfolio and any additional required collateral is delivered to the Portfolio on the next business day. The Portfolio typically receives the income on the loaned securities but does not receive the income on the collateral. Where the Portfolio receives cash collateral, it may invest such collateral and retain the amount earned on such investment, net of any amount rebated to the borrower. The Portfolio may receive a flat fee for its loans. Loans of securities are terminable at any time and the borrower, after notice, is required to return borrowed securities within the standard time period for settlement of securities transactions. The Portfolio may pay reasonable lending agent, administrative and custodial fees in connection with its loans. In the event that the borrower defaults on its obligation to return borrowed securities because of insolvency or for any other reason, the Portfolio could experience delays and costs in gaining access to the collateral. The Portfolio also could suffer a loss where the value of the collateral falls below the market value of the borrowed securities, in the event of borrower default or in the event of losses on investments made with cash collateral.
| | | | | | |
| | BLACKROCK EXCHANGE PORTFOLIO | | MARCH 31, 2008 | | 13 |
Notes to Financial Statements (continued)
Income Taxes: It is the Portfolio’s policy to comply with the requirements of the Internal Revenue Code applicable to regulated investment companies and to distribute substantially all of its taxable income to its shareholders. Therefore, no federal income tax provision is required. Under the applicable foreign tax laws, a withholding tax may be imposed on interest, dividends and capital gains at various rates.
Effective March 31, 2008, the Portfolio implemented Financial Accounting Standards Board (“FASB”) Interpretation No. 48, “Accounting for Uncertainty in Income Taxes — an interpretation of FASB Statement No. 109” (“FIN 48”). FIN 48 prescribes the minimum recognition threshold a tax position must meet in connection with accounting for uncertainties in income tax positions taken or expected to be taken by an entity, including investment companies, before being measured and recognized in the financial statements. The investment advisor has evaluated the application of FIN 48 to the Portfolio, and has determined that the adoption of FIN 48 did not have a material impact on the Portfolio’s financial statements. The Portfolio files U.S. and various state tax returns. No income tax returns are currently under examination. The statute of limitations on the Portfolio’s tax returns remains open for the years ended September 30, 2004 through September 30, 2006. The statute of limitations on the Portfolio’s state and local tax returns may remain open for an additional year depending upon the jurisdiction.
Recent Accounting Pronouncements: In September 2006, Statement of Financial Accounting Standards No. 157, “Fair Value Measurements” (“FAS 157”), was issued and is effective for fiscal years beginning after November 15, 2007. FAS 157 defines fair value, establishes a framework for measuring fair value and expands disclosures about fair value measurements. The impact on the Portfolio’s financial statement disclosures, if any, is currently being assessed.
In addition, in February 2007, Statement of Financial Accounting Standards No. 159, “The Fair Value Option for Financial Assets and Financial Liabilities” (“FAS 159”), was issued and is effective for fiscal years beginning after November 15, 2007. Early adoption is permitted as of the beginning of a fiscal year that begins on or before November 15, 2007, provided the entity also elects to apply the provisions of FAS 157. FAS 159 permits entities to choose to measure many financial instruments and certain other items at fair value that are not currently required to be measured at fair value. FAS 159 also establishes presentation and disclosure requirements designed to facilitate comparisons between entities that choose different measurement attributes for similar types of assets and liabilities. The impact on the Portfolio’s financial statement disclosures, if any, is currently being assessed.
In March 2008, Statement of Financial Accounting Standards No. 161, “Disclosures about Derivative Instruments and Hedging Activities - an amendment of FASB Statement No. 133” (“FAS 161”) was issued and is effective for fiscal years beginning after November 15, 2008. FAS 161 is intended to improve financial reporting for derivative instruments by requiring enhanced disclosure that enables investors to understand how and why an entity uses derivatives, how derivatives are accounted for, and how derivative instruments affect an entity’s results of operations and financial position. The investment advisor is currently evaluating the implications of FAS 161 and the impact on the Portfolio’s financial statement disclosures, if any, is currently being assessed.
Other: Expenses directly related to the Portfolio are charged to the Portfolio. Other operating expenses shared by several Portfolios are pro-rated among those Portfolios on the basis of relative net assets or other appropriate methods.
2. Investment Advisory Agreement and Other Transactions with Affiliates:
The Fund on behalf of the Portfolio entered into an Investment Advisory Agreement with BlackRock Advisors, LLC (the “Advisor”), an indirect, wholly owned subsidiary of BlackRock, Inc., to provide investment advisory services. Merrill Lynch & Co., Inc. (“Merrill Lynch”) and The PNC Financial Services Group, Inc. (“PNC”) are principal owners of BlackRock, Inc. The Advisor is responsible for the management of the Portfolio and provides the necessary personnel, facilities, equipment and certain other services necessary to the operations of the Portfolio. For such services, the Portfolio pays the Advisor a monthly fee based on the average daily value of the Portfolio’s net assets, at the annual rate of 0.50%.
PFPC Trust Company (“PTC”), an indirect wholly-owned subsidiary of PNC, serves as custodian for the Portfolio. For these services, the custodian receives a fee computed daily and payable monthly, based on a percentage of the average daily gross assets of the Portfolio.
Prior to January 1, 2008, the fee was paid at the following annual rates: 0.0073% of the first $250 million, 0.006% of the next $250 million, 0.0056% of the next $250 million, 0.0048% of the next $250 million and 0.004% of average daily gross assets in excess of $1 billion; plus per transaction charges and other miscellaneous fees incurred on behalf of the Portfolio.
Effective January 1, 2008, the fee is paid at the following annual rates: 0.005% of the first $400 million, 0.004% of the next $1.6 billion, and 0.003% of average daily gross assets in excess of $2 billion; plus per transaction charges and other miscellaneous fees incurred on behalf of the Portfolio.
PFPC Inc. (“PFPC”), an indirect wholly-owned subsidiary of PNC, serves as transfer and dividend disbursing agent. Transfer agency fees are comprised of those fees charged for all shareholder communications including shareholder reports, dividend and distribution notices, and proxy materials for shareholders meetings. The Portfolio is also charged per account and per transaction fees related to servicing and maintenance of shareholder accounts, including the issuing, redeeming and transferring of shares of the Portfolio, check writing, anti-money laundering services, and customer identification services.
Pursuant to written agreements, certain affiliates provide the Portfolio with sub-accounting, recordkeeping, sub-transfer agency and other administrative services with respect to sub-accounts they service. For
| | | | | | |
14 | | BLACKROCK EXCHANGE PORTFOLIO | | MARCH 31, 2008 | | |
Notes to Financial Statements (continued)
these services, affiliates receive an annual fee per shareholder account which will vary depending on share class. For the six months ended March 31, 2008, the Portfolio paid $17 in return for these services.
PFPC and the Advisor act as co-administrators for the Portfolio. For these services, the co-administrators receive a combined administration fee computed daily and payable monthly, based on a percentage of the average daily net assets of the Portfolio. The combined administration fee is paid at the following annual rates: 0.075% of the first $500 million, 0.065% of the next $500 million and 0.055% of average of daily net assets in excess of $1 billion. In addition, the Portfolio is charged an administration fee based on the following percentages of average daily net assets of the BlackRock class: 0.025% of the first $500 million, 0.015% of the next $500 million and 0.005% of average of daily net assets in excess of $1 billion. In addition, PFPC and the Advisor may have, at their discretion, voluntarily waived all or any portion of their administration fees for the Portfolio.
The Advisor contractually agreed to waive or reimburse fees or expenses until February 1, 2009, in order to limit expenses to 0.60% of the Portfolio’s average daily net assets. These expense limits apply to the aggregate expenses incurred on a share class (excluding; interest, taxes, brokerage commissions, expenses incurred as a result of investments in other funds and other expenses attributable to, and incurred as a result of, the Portfolio’s investments and other extraordinary expenses). This agreement is reviewed annually by the Board.
If operating expenses, within two years following a waiver or reimbursement of the operating expenses of a share class that previously received a waiver or reimbursement from the Advisor, are less than the expense limit for that share class, the share class is required to repay the Advisor up to the amount of fees waived or expenses reimbursed under the agreement if: (1) the Portfolio has more than $50 million in assets, (2) the Advisor or an affiliate continues to be the Portfolio’s investment advisor or administrator and (3) the Board approved the payments to the Advisor at the previous quarterly meeting.
At March 31, 2008, the amounts subject to possible future reimbursement under the expense limitation agreement are as follows:
| | |
Expiring January 31, |
2010 | | 2011 |
$137,424 | | $24,523 |
The Portfolio may earn income on positive cash balances in demand deposit accounts that are maintained by PFPC on behalf of the Portfolio. The income earned for the six months ended March 31, 2008, was $70.
The Portfolio may also receive earnings credits related to cash balances with PFPC which are shown on the Statement of Operations as fees paid indirectly.
The Portfolio has received an exemptive order from the Securities and Exchange Commission permitting it to lend portfolio securities to BlackRock Investment Management, LLC (“BIM”), an affiliate of the Advisor, or its affiliates. As of March 31, 2008, the Portfolio had no securities loans to Merrill Lynch, Pierce, Fenner & Smith Incorporated, a wholly owned subsidiary of Merrill Lynch or its affiliates. Pursuant to that order, the Portfolio has retained BIM as the securities lending agent for a fee based on a share of the returns on investment of cash collateral. BIM may, on behalf of the Portfolio, invest cash collateral received by the Portfolio for such loans, among other things, in a private investment company managed by the Advisor or in registered money market funds advised by the Advisor or its affiliates. For the six months ended March 31, 2008, BIM received $8,372 in securities lending agent fees.
Certain officers and/or trustees of the Portfolio are officers and/or trustees/directors of BlackRock, Inc. or its affiliates.
3. Investments:
For the six months ended March 31, 2008, purchases and sales of securities, excluding short-term securities, were $642,157 and $15,154,055, including $9,746,393 of sales representing redemptions-in-kind, respectively.
4. Capital Shares:
Transactions in capital shares for each period were as follows:
| | | | | | |
| | | Six Months
Ended
March 31,
2008 | | | Year Ended
September 30,
2007 | |
Shares issued in reinvestment of dividends | | 421 | | | 714 | |
Shares redeemed | | (19,634 | )1 | | (48,206 | )2 |
| | | | | | |
Net decrease | | (19,213 | ) | | (47,492 | ) |
| | | | | | |
1 | Including (14,687) representing redemptions-in-kind. |
2 | Including (40,737) representing redemptions-in-kind. |
5. Short-Term Borrowings:
The Portfolio, along with certain other funds managed by the Advisor and its affiliates, is a party to a $500,000,000 credit agreement with a group of lenders. The Portfolio may borrow under the credit agreement to fund shareholder redemptions and for other lawful purposes other than for leverage. Each Portfolio may borrow up to the maximum amount allowable under the Portfolio’s current Prospectus and Statement of Additional Information, subject to various other legal, regulatory or contractual limits. On November 21, 2007, the credit agreement was renewed for one year under substantially the same terms. The Portfolio pays a commitment fee of 0.06% per annum based on the Portfolio’s pro rata share of the unused portion of the credit agreement, which is included in miscellaneous expenses in the Statement of Operations. Amounts borrowed under the credit agreement bear interest at a rate equal to, at the Portfolio’s election, the federal funds rate plus 0.35% or a base rate as defined in the credit agreement. The Portfolio did not borrow under the credit agreement during the six months ended March 31, 2008.
| | | | | | |
| | BLACKROCK EXCHANGE PORTFOLIO | | MARCH 31, 2008 | | 15 |
Notes to Financial Statements (concluded)
6. Capital Loss Carryforward:
As of December 31, 2007, the Portfolio had a capital loss carryforward available to offset future realized capital gains through the indicated expiration dates:
| | | | | | | | |
Expiring December 31, |
2009 | | 2010 | | 2013 | | 2014 | | Total |
| $633,046 | | $7,112,583 | | $1,281,140 | | $233,900 | | $9,260,669 |
| | | | | | |
16 | | BLACKROCK EXCHANGE PORTFOLIO | | MARCH 31, 2008 | | |
Officers and Trustees
| | |
David O. Beim, Trustee | | Investment Advisor and Co-Administrator |
Richard S. Davis, Trustee | | BlackRock Advisors, LLC |
Ronald W. Forbes, Trustee | | Wilmington, DE 19809 |
Henry Gabbay, Trustee | | |
Dr. Matina Horner, Trustee | | Custodian |
Rodney D. Johnson, Trustee | | PFPC Trust Company |
Herbert I. London, Trustee | | Philadelphia, PA 19153 |
Cynthia A. Montgomery, Trustee | | |
Joseph P. Platt, Jr., Trustee | | Co-Administrator and Transfer Agent |
Robert C. Robb, Jr., Trustee | | PFPC Inc. |
Toby Rosenblatt, Trustee | | Wilmington, DE 19809 |
Kenneth L. Urish, Trustee | | |
Frederick W. Winter, Trustee | | Distributor |
Donald C. Burke, President and Chief Executive Officer | | BlackRock Distributors, Inc. |
Anne F. Ackerley, Vice President | | King of Prussia, PA 19406 |
Neal J. Andrews, Chief Financial Officer | | |
Jay M. Fife, Treasurer | | Legal Counsel |
Brian P. Kindelan, Chief Compliance Officer | | Sidley Austin LLP |
Howard Surloff, Secretary | | New York, NY 10019 |
| | |
| | Independent Registered Public Accounting Firm |
| | Deloitte & Touche LLP |
| | Philadelphia, PA 19103 |
| | | | | | |
| | BLACKROCK EXCHANGE PORTFOLIO | | MARCH 31, 2008 | | 17 |
Additional Information (Unaudited)
BlackRock Privacy Principles
BlackRock is committed to maintaining the privacy of its current and former fund investors and individual clients (collectively, “Clients”) and to safeguarding their non-public personal information. The following information is provided to help you understand what personal information BlackRock collects, how we protect that information and why in certain cases we share such information with select parties.
If you are located in a jurisdiction where specific laws, rules or regulations require BlackRock to provide you with additional or different privacy-related rights beyond what is set forth below, then BlackRock will comply with those specific laws, rules or regulations.
BlackRock obtains or verifies personal non-public information from and about you from different sources, including the following: (i) information we receive from you or, if applicable, your financial intermediary, on applications, forms or other documents; (ii) information about your transactions with us, our affiliates, or others; (iii) information we receive from a consumer reporting agency; and (iv) from visits to our websites.
BlackRock does not sell or disclose to non-affiliated third parties any non-public personal information about its Clients, except as permitted by law or as is necessary to respond to regulatory requests or to service Client accounts. These non-affiliated third parties are required to protect the confidentiality and security of this information and to use it only for its intended purpose.
We may share information with our affiliates to service your account or to provide you with information about other BlackRock products or services that may be of interest to you. In addition, BlackRock restricts access to non-public personal information about its Clients to those BlackRock employees with a legitimate business need for the information. BlackRock maintains physical, electronic and procedural safeguards that are designed to protect the non-public personal information of its Clients, including procedures relating to the proper storage and disposal of such information.
Availability of Additional Information
Electronic copies of most financial reports and prospectuses are available on the Fund’s website or shareholders can sign up for e-mail notifications of quarterly statements, annual and semi-annual reports and prospectuses by enrolling in the Fund’s electronic delivery program.
To enroll:
Shareholders Who Hold Accounts with Investment Advisors, Banks or Brokerages:
Please contact your financial advisor. Please note that not all investment advisors, banks or brokerages may offer this service.
Shareholders Who Hold Accounts Directly With BlackRock
| 1) | Access the BlackRock website at http://www.blackrock.com/edelivery |
| 2) | Click on the applicable link and follow the steps to sign up |
The Fund will mail only one copy of shareholder documents, including prospectuses, annual and semi-annual reports and proxy statements, to shareholders with multiple accounts at the same address. This practice is commonly called “householding” and it is intended to reduce expenses and eliminate duplicate mailings of shareholder documents. Mailings of your shareholder documents may be householded indefinitely unless you instruct us otherwise. If you do not want the mailing of these documents to be combined with those for other members of your household, please contact the Fund at (800) 441-7762.
| | | | | | |
18 | | BLACKROCK EXCHANGE PORTFOLIO | | MARCH 31, 2008 | | |
Additional Information (concluded)
Availability of Additional Information (concluded)
Availability of Proxy Voting Policies and Procedures
A description of the policies and procedures that the Fund uses to determine how to vote proxies relating to portfolio securities is available (1) without charge, upon request by calling (800) 441-7762; (2) at www.blackrock.com; (3) on the Securities and Exchange Commission’s (the “SEC”) website at http://www.sec.gov.
Availability of Proxy Voting Record
Information (if any) on how proxies relating to the Fund’s voting securities were voted by BlackRock during the most recent 12-month period ended June 30th is available, upon request and without charge on our website at www.blackrock.com, by calling (800) 441-7762 or on the SEC’s website at http://www.sec.gov.
Availability of Quarterly Portfolio Schedule
The Fund files its complete schedule of portfolio holdings with the SEC for the first and third quarters of each fiscal year on Form N-Q. The Fund’s Forms N-Q are available on the SEC’s website at http://www.sec.gov and may also be reviewed and copied at the SEC’s Public Reference Room in Washington, D.C. Information on the operation of the Public Reference Room may be obtained by calling (800) SEC-0330. The Fund’s Forms N-Q may also be obtained upon request and without charge by calling (800) 441-7762.
| | | | | | |
| | BLACKROCK EXCHANGE PORTFOLIO | | MARCH 31, 2008 | | 19 |
A World-Class Mutual Fund Family
BlackRock offers a diverse lineup of open-end mutual funds crossing all investment styles and managed by experts in equity, fixed income and tax-exempt investing.
| | | | |
Equity Funds | | | | |
| BlackRock All-Cap Global Resources Portfolio | | BlackRock Global Opportunities Portfolio | | BlackRock Mid-Cap Growth Equity Portfolio |
| BlackRock Asset Allocation Portfolio† | | BlackRock Global Resources Portfolio | | BlackRock Mid-Cap Value Equity Portfolio |
| BlackRock Aurora Portfolio | | BlackRock Global Science & Technology | | BlackRock Mid Cap Value Opportunities Fund |
| BlackRock Balanced Capital Fund† | | Opportunities Portfolio | | BlackRock Natural Resources Trust |
| BlackRock Basic Value Fund | | BlackRock Global SmallCap Fund | | BlackRock Pacific Fund |
| BlackRock Capital Appreciation Portfolio | | BlackRock Health Sciences Opportunities Portfolio* | | BlackRock Small Cap Core Equity Portfolio |
| BlackRock Equity Dividend Fund | | BlackRock Healthcare Fund | | BlackRock Small Cap Growth Equity Portfolio |
| BlackRock EuroFund | | BlackRock Index Equity Portfolio* | | BlackRock Small Cap Growth Fund II |
| BlackRock Focus Growth Fund | | BlackRock International Fund | | BlackRock Small Cap Index Fund |
| BlackRock Focus Value Fund | | BlackRock International Index Fund | | BlackRock Small Cap Value Equity Portfolio* |
| BlackRock Fundamental Growth Fund | | BlackRock International Opportunities Portfolio | | BlackRock Small/Mid-Cap Growth Portfolio |
| BlackRock Global Allocation Fund† | | BlackRock International Value Fund | | BlackRock S&P 500 Index Fund |
| BlackRock Global Dynamic Equity Fund | | BlackRock Large Cap Core Fund | | BlackRock Technology Fund |
| BlackRock Global Emerging Markets Fund | | BlackRock Large Cap Growth Fund | | BlackRock U.S. Opportunities Portfolio |
| BlackRock Global Financial Services Fund | | BlackRock Large Cap Value Fund | | BlackRock Utilities and Telecommunications Fund |
| BlackRock Global Growth Fund | | BlackRock Latin America Fund | | BlackRock Value Opportunities Fund |
Fixed Income Funds | | | | |
| BlackRock Commodity Strategies Fund | | BlackRock Income Builder Portfolio | | BlackRock Low Duration Bond Portfolio |
| BlackRock Emerging Market Debt Portfolio | | BlackRock Inflation Protected Bond Portfolio | | BlackRock Managed Income Portfolio |
| BlackRock Enhanced Income Portfolio | | BlackRock Intermediate Bond Portfolio II | | BlackRock Short-Term Bond Fund |
| BlackRock GNMA Portfolio | | BlackRock Intermediate Government | | BlackRock Strategic Income Portfolio |
| BlackRock Government Income Portfolio | | Bond Portfolio | | BlackRock Total Return Fund |
| BlackRock High Income Fund | | BlackRock International Bond Portfolio | | BlackRock Total Return Portfolio II |
| BlackRock High Yield Bond Portfolio | | BlackRock Long Duration Bond Portfolio | | BlackRock World Income Fund |
| BlackRock Income Portfolio | | | | |
Municipal Bond Funds | | | | |
| BlackRock AMT-Free Municipal Bond Portfolio | | BlackRock Intermediate Municipal Fund | | BlackRock New York Municipal Bond Fund |
| BlackRock California Insured Municipal Bond Fund | | BlackRock Kentucky Municipal Bond Portfolio | | BlackRock Ohio Municipal Bond Portfolio |
| BlackRock Delaware Municipal Bond Portfolio | | BlackRock Municipal Insured Fund | | BlackRock Pennsylvania Municipal Bond Fund |
| BlackRock Florida Municipal Bond Fund | | BlackRock National Municipal Fund | | BlackRock Short-Term Municipal Fund |
| BlackRock High Yield Municipal Fund | | BlackRock New Jersey Municipal Bond Fund | | |
Target Risk & Target Date Funds | | | | |
| BlackRock Prepared Portfolios | | BlackRock Lifecycle Prepared Portfolios | | |
| Conservative Prepared Portfolio | | Prepared Portfolio 2010 | | Prepared Portfolio 2030 |
| Moderate Prepared Portfolio | | Prepared Portfolio 2015 | | Prepared Portfolio 2035 |
| Growth Prepared Portfolio | | Prepared Portfolio 2020 | | Prepared Portfolio 2040 |
| Aggressive Growth Prepared Portfolio | | Prepared Portfolio 2025 | | Prepared Portfolio 2045 |
| | | | Prepared Portfolio 2050 |
| * | See the prospectus for information on specific limitations on investments in the fund. |
BlackRock mutual funds are distributed by BlackRock Distributors, Inc. and certain funds are also distributed by FAM Distributors, Inc. You should consider the investment objectives, risks, charges and expenses of the funds under consideration carefully before investing. Each fund’s prospectus contains this and other information and is available at www.blackrock.com or by calling (800) 882-0052 or from your financial advisor. The prospectus should be read carefully before investing.
[THIS PAGE INTENTIONALLY LEFT BLANK.]
[THIS PAGE INTENTIONALLY LEFT BLANK.]
[THIS PAGE INTENTIONALLY LEFT BLANK.]

This report is transmitted to shareholders only. It is not authorized for use as an offer of sale or a solicitation of an offer to buy shares of the Portfolio unless accompanied or preceded by the Portfolio’s current prospectus. Past performance results shown in this report should not be considered a representation of future performance. Investment returns and principal value of shares will fluctuate so that shares, when redeemed, may be worth more or less than their original cost. Statements and other information herein are as dated and are subject to change.
BlackRock Funds
100 Bellevue Parkway
Wilmington, DE 19809

EXCH-3/08-SAR
EQUITIES FIXED INCOME REAL ESTATE LIQUIDITY ALTERNATIVES BLACKROCK SOLUTIONS
| | |
BlackRock Money Market Portfolios SEMI-ANNUAL REPORT | MARCH 31, 2008 (UNAUDITED) | |  |
Money Market
U.S. Treasury Money Market
Municipal Money Market
New Jersey Municipal Money Market
North Carolina Municipal Money Market
Ohio Municipal Money Market
Pennsylvania Municipal Money Market
Virginia Municipal Money Market
NOT FDIC INSURED
MAY LOSE VALUE
NO BANK GUARANTEE
Table of Contents
| | | | | | |
2 | | SEMI-ANNUAL REPORT | | MARCH 31, 2008 | | |
A Letter to Shareholders
Dear Shareholder
Financial markets endured severe bouts of volatility during the reporting period, particularly as the calendar turned to 2008. It was then that fears of an economic recession swelled and credit market strains intensified, producing calamity in the financial system and, ultimately, the demise of major Wall Street firm Bear Stearns.
The Federal Reserve Board (the “Fed”), after cutting the target federal funds rate 100 basis points (1%) between September 2007 and year-end, stepped up its efforts to support the ailing financial sector in the first three months of 2008. The central bank cut interest rates 125 basis points in January alone, and followed with another 75-basis-point cut on March 18, bringing the target rate to 2.25%. In an unprecedented move, the Fed also extended its financing operations directly to broker/dealers and assisted JPMorgan in its buyout of ill-fated Bear Stearns.
Against this backdrop, investor anxiety has been acute and equity markets have struggled. The S&P 500 Index of U.S. stocks was down in March, marking the fifth consecutive month of negative returns. International markets outperformed the U.S. for much of 2007, but that trend changed in more recent months as investors grew increasingly reluctant to take on the risks of foreign investing.
In fixed income markets, an ongoing investor flight to quality continued to drive Treasury yields lower and their prices higher. The yield on 10-year Treasury issues, which touched 5.30% in June 2007 (its highest level in five years), fell to 4.04% by year-end and to 3.45% by March 31. Investors largely shunned bonds associated with the housing and credit markets, and the riskier high yield sector landed in negative territory year-to-date. Meanwhile, the municipal bond market has struggled with concerns around the creditworthiness of monoline bond insurers and the failure of auctions for auction rate securities, driving yields higher and prices lower across the curve. At period-end, municipal bonds were trading at higher yields than their Treasury counterparts, a very unusual occurrence by historical standards.
Overall, the major benchmark indexes posted mixed results for the current reporting period, generally reflecting heightened investor risk aversion:
| | | | | | |
Total Returns as of March 31, 2008 | | 6-month | | | 12-month | |
U.S. equities (S&P 500 Index) | | (12.46 | )% | | (5.08 | )% |
Small cap U.S. equities (Russell 2000 Index) | | (14.02 | )% | | (13.00 | )% |
International equities (MSCI Europe, Australasia, Far East Index) | | (10.50 | )% | | (2.70 | )% |
Fixed income (Lehman Brothers U.S. Aggregate Index) | | 5.23 | % | | 7.67 | % |
Tax-exempt fixed income (Lehman Brothers Municipal Bond Index) | | 0.75 | % | | 1.90 | % |
High yield bonds (Lehman Brothers U.S. Corporate High Yield 2% Issuer Capped Index) | | (4.01 | )% | | (3.47 | )% |
Past performance is no guarantee of future results. Index performance shown for illustrative purposes only. You cannot invest directly in an index.
As you navigate today’s volatile markets, we encourage you to review your investment goals with your financial professional and to make portfolio changes, as needed. For more up-to-date commentary on the economy and financial markets, we invite you to visit www.blackrock.com/funds. As always, we thank you for entrusting BlackRock with your investment assets, and we look forward to continuing to serve you in the months and years ahead.
|
| Sincerely, |
|
 |
Rob Kapito President, BlackRock Advisors, LLC |
THIS PAGE NOT PART OF YOUR FUND REPORT
| | |
| Portfolio Summary (Unaudited) | | Money Market Portfolio |
| |
| Portfolio Profile as of March 31, 2008 | | |
| | | |
Portfolio Diversification | | Percentage
of Portfolio | |
Commercial Paper | | 55 | % |
Certificates of Deposit | | 20 | |
Variable Rate Obligations | | 15 | |
Agency Obligations | | 6 | |
Promissory Note | | 2 | |
Master Notes | | 2 | |
| |
7-Day Yield (Annualized) | | | |
Institutional | | 3.00 | % |
Service | | 2.64 | |
Hilliard Lyons | | 2.64 | |
Investor A | | 2.59 | |
Investor B | | 1.92 | |
Investor C | | 1.92 | |
Maturity Information
| | | | | | |
Maturity | | Par | | Percentage
of Portfolio | |
1-7 Days | | $ | 283,319,000 | | 16 | % |
8-14 Days | | | 62,305,000 | | 4 | |
15-30 Days | | | 452,768,000 | | 26 | |
31-60 Days | | | 254,489,000 | | 14 | |
61-90 Days | | | 553,431,000 | | 31 | |
91-120 Days | | | 52,445,000 | | 3 | |
121-150 Days | | | 66,455,000 | | 4 | |
over 150 Days | | | 30,645,000 | | 2 | |
| Average Weighted Maturity - 49 days | | | |
Expense Example
As a shareholder of the Portfolio, you incur ongoing costs, including advisory fees, distribution (12b-1) and service fees, where applicable, and other Portfolio expenses. This Expense Example is intended to help you understand your ongoing costs (in dollars) of investing in the Portfolio and compare these costs with the ongoing costs of investing in other mutual funds.
The Expense Example below is based on an investment of $1,000 invested at the beginning of the period and held for the entire period October 1, 2007 to March 31, 2008.
The information under “Actual Expenses,” together with the amount you invested, allows you to estimate actual expenses incurred over the reporting period. Simply divide your account value by $1,000 (for example, an $8,600 account value divided by $1,000 = 8.60) and multiply the result by the cost shown for your share class, in the column entitled “Expenses Paid During the Period,” to estimate the expenses incurred on your account during this period.
The information under “Hypothetical Expenses” provides information about hypothetical account values and hypothetical expenses based on the Portfolio’s actual expense ratio and an assumed rate of return of 5% per year before expenses, which is not the Portfolio’s actual return. The hypothetical account values and expenses may not be used to estimate the actual ending account balance or expenses you incurred for the period. You may use this information to compare the ongoing costs of investing in the Portfolio and other funds. To do so, compare this 5% hypothetical example with the 5% hypothetical examples that appear in the shareholder reports of the other funds.
Please note that the expenses shown in the table are meant to highlight your ongoing costs only and do not reflect any transactional costs, such as front and back end sales charges (loads) or redemption fees, where applicable. Therefore, the hypothetical information is useful in comparing ongoing costs only, and will not help you determine the relative total costs of owning different funds. In addition, if these transactional costs were included, your costs would have been higher.
| | | | | | | | | | | | | | | | | | |
| | | Actual | | Hypothetical** |
| | | Beginning
Account Value
October 1, 2007 | | Ending
Account Value
March 31, 2008 | | Expenses Paid
During the Period* | | Beginning
Account Value
October 1, 2007 | | Ending
Account Value
March 31, 2008 | | Expenses Paid
During the Period* |
Institutional | | $ | 1,000.00 | | $ | 1,022.03 | | $ | 2.12 | | $ | 1,000.00 | | $ | 1,022.87 | | $ | 2.13 |
Service | | $ | 1,000.00 | | $ | 1,020.62 | | $ | 3.52 | | $ | 1,000.00 | | $ | 1,021.47 | | $ | 3.53 |
Hilliard Lyons | | $ | 1,000.00 | | $ | 1,020.62 | | $ | 3.52 | | $ | 1,000.00 | | $ | 1,021.48 | | $ | 3.52 |
Investor A | | $ | 1,000.00 | | $ | 1,020.24 | | $ | 3.90 | | $ | 1,000.00 | | $ | 1,021.09 | | $ | 3.91 |
Investor B | | $ | 1,000.00 | | $ | 1,017.72 | | $ | 6.51 | | $ | 1,000.00 | | $ | 1,018.47 | | $ | 6.53 |
Investor C | | $ | 1,000.00 | | $ | 1,017.71 | | $ | 6.52 | | $ | 1,000.00 | | $ | 1,018.46 | | $ | 6.54 |
| * | For each class of the Portfolio, expenses are equal to the annualized expense ratio for the class (0.42% for Institutional, 0.70% for Service, 0.70% for Hilliard Lyons, 0.77% for Investor A, 1.29% for Investor B and 1.29% for Investor C), multiplied by the average account value over the period, multiplied by 183/366 (to reflect the one-half year period shown). |
| ** | Hypothetical 5% annual return before expenses is calculated by pro-rating the number of days in the most recent fiscal half year divided by 366. |
| | | | | | |
4 | | SEMI-ANNUAL REPORT | | MARCH 31, 2008 | | |
| | |
| Portfolio Summary (Unaudited) | | U.S. Treasury Money Market Portfolio |
| |
| Portfolio Profile as of March 31, 2008 | | |
| | | |
Portfolio Diversification | | Percentage
of Portfolio | |
Repurchase Agreements | | 100 | % |
| |
7-Day Yield (Annualized) | | | |
Institutional | | 1.33 | % |
Service | | 1.05 | |
Investor A | | 1.05 | |
Maturity Information
| | | | | | |
Maturity | | Par | | Percentage
of Portfolio | |
1-7 Days | | $ | 375,132,000 | | 65 | % |
15-30 Days | | | 150,000,000 | | 26 | |
61-90 Days | | | 25,000,000 | | 4 | |
91-120 Days | | | 25,000,000 | | 5 | |
Average Weighted Maturity - 15 days | | | |
Expense Example
As a shareholder of the Portfolio, you incur ongoing costs, including advisory fees and service fees, where applicable, and other Portfolio expenses. This Expense Example is intended to help you understand your ongoing costs (in dollars) of investing in the Portfolio and compare these costs with the ongoing costs of investing in other mutual funds.
The Expense Example below is based on an investment of $1,000 invested at the beginning of the period and held for the entire period October 1, 2007 to March 31, 2008.
The information under “Actual Expenses,” together with the amount you invested, allows you to estimate actual expenses incurred over the reporting period. Simply divide your account value by $1,000 (for example, an $8,600 account value divided by $1,000 = 8.60) and multiply the result by the cost shown for your share class, in the column entitled “Expenses Paid During the Period,” to estimate the expenses incurred on your account during this period.
The information under “Hypothetical Expenses” provides information about hypothetical account values and hypothetical expenses based on the Portfolio’s actual expense ratio and an assumed rate of return of 5% per year before expenses, which is not the Portfolio’s actual return. The hypothetical account values and expenses may not be used to estimate the actual ending account balance or expenses you incurred for the period. You may use this information to compare the ongoing costs of investing in the Portfolio and other funds. To do so, compare this 5% hypothetical example with the 5% hypothetical examples that appear in the shareholder reports of the other funds.
Please note that the expenses shown in the table are meant to highlight your ongoing costs only and do not reflect any transactional costs, such as front and back end sales charges (loads) or redemption fees, where applicable. Therefore, the hypothetical information is useful in comparing ongoing costs only, and will not help you determine the relative total costs of owning different funds. In addition, if these transactional costs were included, your costs would have been higher.
| | | | | | | | | | | | | | | | | | |
| | | Actual | | Hypothetical** |
| | | Beginning
Account Value
October 1, 2007 | | Ending
Account Value
March 31, 2008 | | Expenses Paid
During the Period* | | Beginning
Account Value
October 1, 2007 | | Ending
Account Value
March 31, 2008 | | Expenses Paid
During the Period* |
Institutional | | $ | 1,000.00 | | $ | 1,015.56 | | $ | 2.07 | | $ | 1,000.00 | | $ | 1,022.92 | | $ | 2.08 |
Service | | $ | 1,000.00 | | $ | 1,014.15 | | $ | 3.46 | | $ | 1,000.00 | | $ | 1,021.52 | | $ | 3.48 |
Investor A | | $ | 1,000.00 | | $ | 1,014.12 | | $ | 3.49 | | $ | 1,000.00 | | $ | 1,021.50 | | $ | 3.50 |
| * | For each class of the Portfolio, expenses are equal to the annualized expense ratio for the class (0.41% for Institutional, 0.69% for Service and 0.69% for Investor A), multiplied by the average account value over the period, multiplied by 183/366 (to reflect the one-half year period shown). |
| ** | Hypothetical 5% annual return before expenses is calculated by pro-rating the number of days in the most recent fiscal half year divided by 366. |
| | | | | | |
| | | SEMI-ANNUAL REPORT | | MARCH 31, 2008 | | 5 |
| | |
| Portfolio Summary (Unaudited) | | Municipal Money Market Portfolio |
| |
| Portfolio Profile as of March 31, 2008 | | |
| | | |
Top Ten States | | Percentage
of Portfolio | |
Florida | | 16 | % |
Texas | | 16 | |
New York | | 7 | |
Illinois | | 6 | |
North Carolina | | 6 | |
Michigan | | 5 | |
Colorado | | 4 | |
Arizona | | 3 | |
California | | 3 | |
New Jersey | | 3 | |
| |
7-Day Yield (Annualized) | | | |
Institutional | | 1.99 | % |
Service | | 1.72 | |
Hilliard Lyons | | 1.97 | |
Investor A | | 1.71 | |
Maturity Information
| | | | | | |
Maturity | | Par | | Percentage
of Portfolio | |
1-7 Days | | $ | 248,587,000 | | 77 | % |
8-14 Days | | | 5,000,000 | | 2 | |
31-60 Days | | | 4,000,000 | | 1 | |
61-90 Days | | | 13,515,000 | | 4 | |
91-120 Days | | | 16,100,000 | | 5 | |
121-150 Days | | | 21,065,000 | | 6 | |
over 150 Days | | | 15,820,000 | | 5 | |
| Average Weighted Maturity - 32 days | | | |
Expense Example
As a shareholder of the Portfolio, you incur ongoing costs, including advisory fees, distribution (12b-1) and service fees, where applicable, and other Portfolio expenses. This Expense Example is intended to help you understand your ongoing costs (in dollars) of investing in the Portfolio and compare these costs with the ongoing costs of investing in other mutual funds.
The Expense Example below is based on an investment of $1,000 invested at the beginning of the period and held for the entire period October 1, 2007 to March 31, 2008.
The information under “Actual Expenses,” together with the amount you invested, allows you to estimate actual expenses incurred over the reporting period. Simply divide your account value by $1,000 (for example, an $8,600 account value divided by $1,000 = 8.60) and multiply the result by the cost shown for your share class, in the column entitled “Expenses Paid During the Period,” to estimate the expenses incurred on your account during this period.
The information under “Hypothetical Expenses” provides information about hypothetical account values and hypothetical expenses based on the Portfolio’s actual expense ratio and an assumed rate of return of 5% per year before expenses, which is not the Portfolio’s actual return. The hypothetical account values and expenses may not be used to estimate the actual ending account balance or expenses you incurred for the period. You may use this information to compare the ongoing costs of investing in the Portfolio and other funds. To do so, compare this 5% hypothetical example with the 5% hypothetical examples that appear in the shareholder reports of the other funds.
Please note that the expenses shown in the table are meant to highlight your ongoing costs only and do not reflect any transactional costs, such as front and back end sales charges (loads) or redemption fees, where applicable. Therefore, the hypothetical information is useful in comparing ongoing costs only, and will not help you determine the relative total costs of owning different funds. In addition, if these transactional costs were included, your costs would have been higher.
| | | | | | | | | | | | | | | | | | |
| | | Actual | | Hypothetical** |
| | | Beginning
Account Value
October 1, 2007 | | Ending
Account Value
March 31, 2008 | | Expenses Paid
During the Period* | | Beginning
Account Value
October 1, 2007 | | Ending
Account Value
March 31, 2008 | | Expenses Paid
During the Period* |
Institutional | | $ | 1,000.00 | | $ | 1,014.10 | | $ | 2.12 | | $ | 1,000.00 | | $ | 1,022.87 | | $ | 2.13 |
Service | | $ | 1,000.00 | | $ | 1,012.69 | | $ | 3.51 | | $ | 1,000.00 | | $ | 1,021.47 | | $ | 3.53 |
Hilliard Lyons | | $ | 1,000.00 | | $ | 1,013.97 | | $ | 2.25 | | $ | 1,000.00 | | $ | 1,022.74 | | $ | 2.26 |
Investor A | | $ | 1,000.00 | | $ | 1,012.66 | | $ | 3.55 | | $ | 1,000.00 | | $ | 1,021.42 | | $ | 3.58 |
| * | For each class of the Portfolio, expenses are equal to the annualized expense ratio for the class (0.42% for Institutional, 0.70% for Service, 0.45% for Hilliard Lyons and 0.71% for Investor A), multiplied by the average account value over the period, multiplied by 183/366 (to reflect the one-half year period shown). |
| ** | Hypothetical 5% annual return before expenses is calculated by pro-rating the number of days in the most recent fiscal half year divided by 366. |
| | | | | | |
6 | | SEMI-ANNUAL REPORT | | MARCH 31, 2008 | | |
| | |
| Portfolio Summary (Unaudited) | | New Jersey Municipal Money Market Portfolio |
Portfolio Profile as of March 31, 2008
| | | |
Portfolio Diversification | | Percentage
of Portfolio | |
Variable Rate Demand Notes | | 76 | % |
Municipal Bonds | | 20 | |
Commercial Paper | | 4 | |
|
7-Day Yield (Annualized) | |
Institutional | | 1.89 | % |
Service | | 1.62 | |
Investor A | | 1.62 | |
Maturity Information
| | | | | | |
Maturity | | Par | | Percentage
of Portfolio | |
1-7 Days | | $ | 135,645,000 | | 78 | % |
31-60 Days | | | 1,592,000 | | 1 | |
61-90 Days | | | 11,471,000 | | 7 | |
91-120 Days | | | 2,305,000 | | 1 | |
121-150 Days | | | 4,305,000 | | 3 | |
over 150 Days | | | 17,749,000 | | 10 | |
Average Weighted Maturity - 42 days | | | | | | |
Expense Example
As a shareholder of the Portfolio, you incur ongoing costs, including advisory fees and service fees, where applicable, and other Portfolio expenses. This Expense Example is intended to help you understand your ongoing costs (in dollars) of investing in the Portfolio and compare these costs with the ongoing costs of investing in other mutual funds.
The Expense Example below is based on an investment of $1,000 invested at the beginning of the period and held for the entire period October 1, 2007 to March 31, 2008.
The information under “Actual Expenses,” together with the amount you invested, allows you to estimate actual expenses incurred over the reporting period. Simply divide your account value by $1,000 (for example, an $8,600 account value divided by $1,000 = 8.60) and multiply the result by the cost shown for your share class, in the column entitled “Expenses Paid During the Period,” to estimate the expenses incurred on your account during this period.
The information under “Hypothetical Expenses” provides information about hypothetical account values and hypothetical expenses based on the Portfolio’s actual expense ratio and an assumed rate of return of 5% per year before expenses, which is not the Portfolio’s actual return. The hypothetical account values and expenses may not be used to estimate the actual ending account balance or expenses you incurred for the period. You may use this information to compare the ongoing costs of investing in the Portfolio and other funds. To do so, compare this 5% hypothetical example with the 5% hypothetical examples that appear in the shareholder reports of the other funds.
Please note that the expenses shown in the table are meant to highlight your ongoing costs only and do not reflect any transactional costs, such as front and back end sales charges (loads) or redemption fees, where applicable. Therefore, the hypothetical information is useful in comparing ongoing costs only, and will not help you determine the relative total costs of owning different funds. In addition, if these transactional costs were included, your costs would have been higher.
| | | | | | | | | | | | | | | | | | |
| | | Actual | | Hypothetical** |
| | | Beginning
Account Value
October 1, 2007 | | Ending
Account Value
March 31, 2008 | | Expenses Paid
During the Period* | | Beginning
Account Value
October 1, 2007 | | Ending
Account Value
March 31, 2008 | | Expenses Paid
During the Period* |
Institutional | | $ | 1,000.00 | | $ | 1,013.83 | | $ | 1.96 | | $ | 1,000.00 | | $ | 1,023.03 | | $ | 1.97 |
Service | | $ | 1,000.00 | | $ | 1,012.43 | | $ | 3.36 | | $ | 1,000.00 | | $ | 1,021.62 | | $ | 3.38 |
Investor A | | $ | 1,000.00 | | $ | 1,012.43 | | $ | 3.35 | | $ | 1,000.00 | | $ | 1,021.62 | | $ | 3.38 |
| * | For each class of the Portfolio, expenses are equal to the annualized expense ratio for the class (0.39% for Institutional, 0.67% for Service and 0.67% for Investor A), multiplied by the average account value over the period, multiplied by 183/366 (to reflect the one-half year period shown). |
| ** | Hypothetical 5% annual return before expenses is calculated by pro-rating the number of days in the most recent fiscal half year divided by 366. |
| | | | | | |
| | | SEMI-ANNUAL REPORT | | MARCH 31, 2008 | | 7 |
| | |
| Portfolio Summary (Unaudited) | | North Carolina Municipal Money Market Portfolio |
Portfolio Profile as of March 31, 2008
| | | |
Portfolio Diversification | | Percentage
of Portfolio | |
Variable Rate Demand Notes | | 84 | % |
Municipal Bonds | | 10 | |
Commercial Paper | | 5 | |
Municipal Put Bonds | | 1 | |
|
7-Day Yield (Annualized) | |
Institutional | | 2.03 | % |
Service | | 1.75 | |
Investor A | | 1.58 | |
Maturity Information
| | | | | | |
Maturity | | Par | | Percentage
of Portfolio | |
1-7 Days | | $ | 78,696,000 | | 86 | % |
31-60 Days | | | 500,000 | | 1 | |
61-90 Days | | | 1,300,000 | | 1 | |
91-120 Days | | | 4,385,000 | | 5 | |
121-150 Days | | | 3,715,000 | | 4 | |
over 150 Days | | | 2,515,000 | | 3 | |
Average Weighted Maturity - 25 days | | | | | | |
Expense Example
As a shareholder of the Portfolio, you incur ongoing costs, including advisory fees and service fees, where applicable, and other Portfolio expenses. This Expense Example is intended to help you understand your ongoing costs (in dollars) of investing in the Portfolio and compare these costs with the ongoing costs of investing in other mutual funds.
The Expense Example below is based on an investment of $1,000 invested at the beginning of the period and held for the entire period October 1, 2007 to March 31, 2008.
The information under “Actual Expenses,” together with the amount you invested, allows you to estimate actual expenses incurred over the reporting period. Simply divide your account value by $1,000 (for example, an $8,600 account value divided by $1,000 = 8.60) and multiply the result by the cost shown for your share class, in the column entitled “Expenses Paid During the Period,” to estimate the expenses incurred on your account during this period.
The information under “Hypothetical Expenses” provides information about hypothetical account values and hypothetical expenses based on the Portfolio’s actual expense ratio and an assumed rate of return of 5% per year before expenses, which is not the Portfolio’s actual return. The hypothetical account values and expenses may not be used to estimate the actual ending account balance or expenses you incurred for the period. You may use this information to compare the ongoing costs of investing in the Portfolio and other funds. To do so, compare this 5% hypothetical example with the 5% hypothetical examples that appear in the shareholder reports of the other funds.
Please note that the expenses shown in the table are meant to highlight your ongoing costs only and do not reflect any transactional costs, such as front and back end sales charges (loads) or redemption fees, where applicable. Therefore, the hypothetical information is useful in comparing ongoing costs only, and will not help you determine the relative total costs of owning different funds. In addition, if these transactional costs were included, your costs would have been higher.
| | | | | | | | | | | | | | | | | | |
| | | Actual | | Hypothetical** |
| | | Beginning
Account Value
October 1, 2007 | | Ending
Account Value
March 31, 2008 | | Expenses Paid
During the Period* | | Beginning
Account Value
October 1, 2007 | | Ending
Account Value
March 31, 2008 | | Expenses Paid
During the Period* |
Institutional | | $ | 1,000.00 | | $ | 1,013.96 | | $ | 1.51 | | $ | 1,000.00 | | $ | 1,023.48 | | $ | 1.52 |
Service | | $ | 1,000.00 | | $ | 1,012.56 | | $ | 2.90 | | $ | 1,000.00 | | $ | 1,022.08 | | $ | 2.92 |
Investor A | | $ | 1,000.00 | | $ | 1,011.57 | | $ | 3.86 | | $ | 1,000.00 | | $ | 1,021.11 | | $ | 3.89 |
| * | For each class of the Portfolio, expenses are equal to the annualized expense ratio for the class (0.30% for Institutional, 0.58% for Service and 0.77% for Investor A), multiplied by the average account value over the period, multiplied by 183/366 (to reflect the one-half year period shown). |
| ** | Hypothetical 5% annual return before expenses is calculated by pro-rating the number of days in the most recent fiscal half year divided by 366. |
| | | | | | |
8 | | SEMI-ANNUAL REPORT | | MARCH 31, 2008 | | |
| | |
| Portfolio Summary (Unaudited) | | Ohio Municipal Money Market Portfolio |
Portfolio Profile as of March 31, 2008
| | | |
Portfolio Diversification | | Percentage
of Portfolio | |
Variable Rate Demand Notes | | 77 | % |
Municipal Bonds | | 19 | |
Commercial Paper | | 2 | |
Municipal Put Bonds | | 2 | |
|
7-Day Yield (Annualized) | |
Institutional | | 2.38 | % |
Service | | 2.10 | |
Investor A | | 2.10 | |
Maturity Information
| | | | | | |
Maturity | | Par | | Percentage
of Portfolio | |
1-7 Days | | $ | 127,586,000 | | 80 | % |
8-14 Days | | | 300,000 | | 0 | |
15-30 Days | | | 205,000 | | 0 | |
31-60 Days | | | 3,285,000 | | 2 | |
61-90 Days | | | 5,100,000 | | 3 | |
91-120 Days | | | 1,130,000 | | 1 | |
121-150 Days | | | 1,810,000 | | 1 | |
over 150 Days | | | 20,080,000 | | 13 | |
Average Weighted Maturity - 43 days | | | | | | |
Expense Example
As a shareholder of the Portfolio, you incur ongoing costs, including advisory fees and service fees, where applicable, and other Portfolio expenses. This Expense Example is intended to help you understand your ongoing costs (in dollars) of investing in the Portfolio and compare these costs with the ongoing costs of investing in other mutual funds.
The Expense Example below is based on an investment of $1,000 invested at the beginning of the period and held for the entire period October 1, 2007 to March 31, 2008.
The information under “Actual Expenses,” together with the amount you invested, allows you to estimate actual expenses incurred over the reporting period. Simply divide your account value by $1,000 (for example, an $8,600 account value divided by $1,000 = 8.60) and multiply the result by the cost shown for your share class, in the column entitled “Expenses Paid During the Period,” to estimate the expenses incurred on your account during this period.
The information under “Hypothetical Expenses” provides information about hypothetical account values and hypothetical expenses based on the Portfolio’s actual expense ratio and an assumed rate of return of 5% per year before expenses, which is not the Portfolio’s actual return. The hypothetical account values and expenses may not be used to estimate the actual ending account balance or expenses you incurred for the period. You may use this information to compare the ongoing costs of investing in the Portfolio and other funds. To do so, compare this 5% hypothetical example with the 5% hypothetical examples that appear in the shareholder reports of the other funds.
Please note that the expenses shown in the table are meant to highlight your ongoing costs only and do not reflect any transactional costs, such as front and back end sales charges (loads) or redemption fees, where applicable. Therefore, the hypothetical information is useful in comparing ongoing costs only, and will not help you determine the relative total costs of owning different funds. In addition, if these transactional costs were included, your costs would have been higher.
| | | | | | | | | | | | | | | | | | |
| | | Actual | | Hypothetical** |
| | | Beginning
Account Value
October 1, 2007 | | Ending
Account Value
March 31, 2008 | | Expenses Paid
During the Period* | | Beginning
Account Value
October 1, 2007 | | Ending
Account Value
March 31, 2008 | | Expenses Paid
During the Period* |
Institutional | | $ | 1,000.00 | | $ | 1,014.65 | | $ | 1.96 | | $ | 1,000.00 | | $ | 1,023.03 | | $ | 1.97 |
Service | | $ | 1,000.00 | | $ | 1,013.27 | | $ | 3.35 | | $ | 1,000.00 | | $ | 1,021.63 | | $ | 3.37 |
Investor A | | $ | 1,000.00 | | $ | 1,013.27 | | $ | 3.35 | | $ | 1,000.00 | | $ | 1,021.63 | | $ | 3.37 |
| * | For each class of the Portfolio, expenses are equal to the annualized expense ratio for the class (0.39% for Institutional, 0.67% for Service and 0.67% for Investor A), multiplied by the average account value over the period, multiplied by 183/366 (to reflect the one-half year period shown). |
| ** | Hypothetical 5% annual return before expenses is calculated by pro-rating the number of days in the most recent fiscal half year divided by 366. |
| | | | | | |
| | | SEMI-ANNUAL REPORT | | MARCH 31, 2008 | | 9 |
| | |
| Portfolio Summary (Unaudited) | | Pennsylvania Municipal Money Market Portfolio |
Portfolio Profile as of March 31, 2008
| | | |
Portfolio Diversification | | Percentage
of Portfolio | |
Variable Rate Demand Notes | | 87 | % |
Commercial Paper | | 7 | |
Municipal Bonds | | 5 | |
Municipal Put Bonds | | 1 | |
| |
7-Day Yield (Annualized) | | | |
Institutional | | 1.91 | % |
Service | | 1.63 | |
Investor A | | 1.63 | |
Maturity Information
| | | | | | |
Maturity | | Par | | Percentage
of Portfolio | |
1-7 Days | | $ | 544,332,000 | | 93 | % |
31-60 Days | | | 26,100,000 | | 4 | |
over 150 Days | | | 16,408,000 | | 3 | |
| Average Weighted Maturity - 16 days | | | | | | |
Expense Example
As a shareholder of the Portfolio, you incur ongoing costs, including advisory fees and service fees, where applicable, and other Portfolio expenses. This Expense Example is intended to help you understand your ongoing costs (in dollars) of investing in the Portfolio and compare these costs with the ongoing costs of investing in other mutual funds.
The Expense Example below is based on an investment of $1,000 invested at the beginning of the period and held for the entire period October 1, 2007 to March 31, 2008.
The information under “Actual Expenses,” together with the amount you invested, allows you to estimate actual expenses incurred over the reporting period. Simply divide your account value by $1,000 (for example, an $8,600 account value divided by $1,000 = 8.60) and multiply the result by the cost shown for your share class, in the column entitled “Expenses Paid During the Period,” to estimate the expenses incurred on your account during this period.
The information under “Hypothetical Expenses” provides information about hypothetical account values and hypothetical expenses based on the Portfolio’s actual expense ratio and an assumed rate of return of 5% per year before expenses, which is not the Portfolio’s actual return. The hypothetical account values and expenses may not be used to estimate the actual ending account balance or expenses you incurred for the period. You may use this information to compare the ongoing costs of investing in the Portfolio and other funds. To do so, compare this 5% hypothetical example with the 5% hypothetical examples that appear in the shareholder reports of the other funds.
Please note that the expenses shown in the table are meant to highlight your ongoing costs only and do not reflect any transactional costs, such as front and back end sales charges (loads) or redemption fees, where applicable. Therefore, the hypothetical information is useful in comparing ongoing costs only, and will not help you determine the relative total costs of owning different funds. In addition, if these transactional costs were included, your costs would have been higher.
| | | | | | | | | | | | | | | | | | |
| | | Actual | | Hypothetical** |
| | | Beginning
Account Value
October 1, 2007 | | Ending
Account Value
March 31, 2008 | | Expenses Paid
During the Period* | | Beginning
Account Value
October 1, 2007 | | Ending
Account Value
March 31, 2008 | | Expenses Paid
During the Period* |
Institutional | | $ | 1,000.00 | | $ | 1,013.37 | | $ | 2.11 | | $ | 1,000.00 | | $ | 1,022.87 | | $ | 2.13 |
Service | | $ | 1,000.00 | | $ | 1,011.97 | | $ | 3.50 | | $ | 1,000.00 | | $ | 1,021.47 | | $ | 3.53 |
Investor A | | $ | 1,000.00 | | $ | 1,011.97 | | $ | 3.51 | | $ | 1,000.00 | | $ | 1,021.47 | | $ | 3.53 |
| * | For each class of the Portfolio, expenses are equal to the annualized expense ratio for the class (0.42% for Institutional, 0.70% for Service and 0.70% for Investor A), multiplied by the average account value over the period, multiplied by 183/366 (to reflect the one-half year period shown). |
| ** | Hypothetical 5% annual return before expenses is calculated by pro-rating the number of days in the most recent fiscal half year divided by 366. |
| | | | | | |
10 | | SEMI-ANNUAL REPORT | | MARCH 31, 2008 | | |
| | |
| Portfolio Summary (Unaudited) | | Virginia Municipal Money Market Portfolio |
Portfolio Profile as of March 31, 2008
| | | |
Portfolio Diversification | | Percentage
of Portfolio | |
Variable Rate Demand Notes | | 87 | % |
Municipal Bonds | | 8 | |
Commercial Paper | | 5 | |
| |
7-Day Yield (Annualized) | | | |
Institutional | | 1.85 | % |
Service | | 1.57 | |
Maturity Information
| | | | | | |
Maturity | | Par | | Percentage
of Portfolio | |
1-7 Days | | $ | 94,965,000 | | 86 | % |
8-14 Days | | | 1,100,000 | | 1 | |
31-60 Days | | | 850,000 | | 1 | |
61-90 Days | | | 4,950,000 | | 4 | |
121-150 Days | | | 5,120,000 | | 5 | |
over 150 Days | | | 2,850,000 | | 3 | |
| Average Weighted Maturity - 23 days | | | | | | |
Expense Example
As a shareholder of the Portfolio, you incur ongoing costs, including advisory fees and service fees, where applicable, and other Portfolio expenses. This Expense Example is intended to help you understand your ongoing costs (in dollars) of investing in the Portfolio and compare these costs with the ongoing costs of investing in other mutual funds.
The Expense Example below is based on an investment of $1,000 invested at the beginning of the period and held for the entire period October 1, 2007 to March 31, 2008.
The information under “Actual Expenses,” together with the amount you invested, allows you to estimate actual expenses incurred over the reporting period. Simply divide your account value by $1,000 (for example, an $8,600 account value divided by $1,000 = 8.60) and multiply the result by the cost shown for your share class, in the column entitled “Expenses Paid During the Period,” to estimate the expenses incurred on your account during this period.
The information under “Hypothetical Expenses” provides information about hypothetical account values and hypothetical expenses based on the Portfolio’s actual expense ratio and an assumed rate of return of 5% per year before expenses, which is not the Portfolio’s actual return. The hypothetical account values and expenses may not be used to estimate the actual ending account balance or expenses you incurred for the period. You may use this information to compare the ongoing costs of investing in the Portfolio and other funds. To do so, compare this 5% hypothetical example with the 5% hypothetical examples that appear in the shareholder reports of the other funds.
Please note that the expenses shown in the table are meant to highlight your ongoing costs only and do not reflect any transactional costs, such as front and back end sales charges (loads) or redemption fees, where applicable. Therefore, the hypothetical information is useful in comparing ongoing costs only, and will not help you determine the relative total costs of owning different funds. In addition, if these transactional costs were included, your costs would have been higher.
| | | | | | | | | | | | | | | | | | |
| | | Actual | | Hypothetical** |
| | | Beginning
Account Value
October 1, 2007 | | Ending
Account Value
March 31, 2008 | | Expenses Paid
During the Period* | | Beginning
Account Value
October 1, 2007 | | Ending
Account Value
March 31, 2008 | | Expenses Paid
During the Period* |
Institutional Class | | $ | 1,000.00 | | $ | 1,013.64 | | $ | 1.51 | | $ | 1,000.00 | | $ | 1,023.48 | | $ | 1.52 |
Service Class | | $ | 1,000.00 | | $ | 1,012.17 | | $ | 2.95 | | $ | 1,000.00 | | $ | 1,022.03 | | $ | 2.97 |
| * | For each class of the Portfolio, expenses are equal to the annualized expense ratio for the class (0.30% for Institutional and 0.59% for Service), multiplied by the average account value over the period, multiplied by 183/366 (to reflect the one-half year period shown). |
| ** | Hypothetical 5% annual return before expenses is calculated by pro-rating the number of days in the most recent fiscal half year divided by 366. |
| | | | | | |
| | | SEMI-ANNUAL REPORT | | MARCH 31, 2008 | | 11 |
| | |
| Schedule of Investments March 31, 2008 (Unaudited) | | Money Market Portfolio (Percentages shown are based on Net Assets) |
| | | | | | |
| | | Par
(000) | | Value |
Agency Obligations — 6.0% | | | | | | |
Federal Home Loan Bank Variable Rate Notes — 1.7% | | | | | | |
2.36%, 3/20/09(a) | | $ | 8,535 | | $ | 8,542,700 |
2.82%, 8/13/09(a) | | | 9,050 | | | 9,050,000 |
2.77%, 8/14/09(a) | | | 13,255 | | | 13,253,183 |
| | | | | | |
| | | | | | 30,845,883 |
| | | | | | |
Federal Home Loan Mortgage Corp. Discount Note — 0.2% | | | | | | |
2.50%, 8/18/08(b) | | | 3,755 | | | 3,718,754 |
| | | | | | |
Federal Home Loan Mortgage Corp. Variable Rate Notes — 2.2% | | | | | | |
2.46%, 9/25/09(a) | | | 24,015 | | | 24,004,514 |
2.61%, 9/28/09(a) | | | 14,820 | | | 14,814,515 |
| | | | | | |
| | | | | | 38,819,029 |
| | | | | | |
Federal National Mortgage Assoc. Discount Notes — 1.9% | | | | | | |
2.50%, 8/06/08(b) | | | 4,140 | | | 4,103,487 |
2.50%, 8/20/08(b) | | | 3,465 | | | 3,431,140 |
2.51%, 8/20/08(b) | | | 15,000 | | | 14,852,537 |
2.49%, 9/08/08(b) | | | 7,415 | | | 7,332,941 |
2.49%, 9/10/08(b) | | | 4,555 | | | 4,503,961 |
| | | | | | |
| | | | | | 34,224,066 |
| | | | | | |
Total Agency Obligations | | | | | | |
(Cost $107,607,732) | | | | | | 107,607,732 |
| | | | | | |
Certificates of Deposit — 19.9% | | | | | | |
Domestic — 2.2% | | | | | | |
Chase Bank USA N.A., | | | | | | |
5.13%, 4/15/08 | | | 9,600 | | | 9,600,000 |
5.13%, 4/16/08 | | | 10,250 | | | 10,250,000 |
4.70%, 5/07/08 | | | 18,580 | | | 18,580,000 |
| | | | | | |
| | | | | | 38,430,000 |
| | | | | | |
Yankee — 17.7% | | | | | | |
Banco Bilbao Vizcaya Argentaria S.A., New York, | | | | | | |
5.06%, 4/02/08(c)(d) | | | 6,305 | | | 6,305,001 |
2.45%, 4/21/08(c)(d) | | | 15,000 | | | 15,000,000 |
3.80%, 4/22/08(c)(d) | | | 10,000 | | | 10,000,000 |
2.80%, 6/16/08(c)(d) | | | 10,000 | | | 10,000,000 |
2.56%, 6/25/08(c)(d) | | | 24,500 | | | 24,500,000 |
Bank of Montreal, Chicago, | | | | | | |
5.10%, 4/01/08(d) | | | 6,140 | | | 6,140,000 |
4.87%, 6/02/08(d) | | | 6,030 | | | 6,030,000 |
Bank of Scotland Plc, New York, | | | | | | |
4.39%, 7/07/08(d) | | | 5,000 | | | 5,000,000 |
3.07%, 7/31/08(d) | | | 11,000 | | | 11,000,000 |
Banque Nationale de Paris, New York, | | | | | | |
4.80%, 6/05/08(d) | | | 19,125 | | | 19,125,000 |
2.91%, 8/19/08(d) | | | 20,000 | | | 20,000,000 |
Barclays Bank Plc, New York, | | | | | | |
4.60%, 4/03/08(d) | | | 10,000 | | | 10,000,000 |
2.60%, 6/19/08(d) | | | 10,000 | | | 10,000,000 |
Canadian Imperial Bank of Commerce, New York, | | | | | | |
5.09%, 4/01/08(d) | | | 17,435 | | | 17,435,000 |
4.87%, 6/10/08(d) | | | 13,910 | | | 13,910,000 |
DEPFA Bank Plc, New York, | | | | | | |
4.30%, 4/14/08(d) | | | 20,000 | | | 20,000,000 |
Natixis, New York, | | | | | | |
5.42%, 7/10/08(d) | | | 5,170 | | | 5,175,327 |
Nordea Bank Finland Plc, New York, | | | | | | |
4.91%, 6/23/08(d) | | | 5,565 | | | 5,565,124 |
4.82%, 10/17/08(d) | | | 18,675 | | | 18,675,985 |
Rabobank Nederland N.V., New York, | | | | | | |
2.95%, 4/15/08(d) | | | 8,000 | | | 8,000,000 |
Societe Generale, New York, | | | | | | |
3.62%, 4/22/08(c)(d) | | | 14,000 | | | 14,000,000 |
Svenska Handelsbanken AB, New York, | | | | | | |
3.86%, 4/16/08(d) | | | 10,000 | | | 10,000,041 |
Toronto Dominion Bank, New York, | | | | | | |
4.86%, 5/30/08(d) | | | 1,850 | | | 1,850,000 |
4.85%, 6/06/08(d) | | | 14,240 | | | 14,240,000 |
2.57%, 6/20/08(d) | | | 20,000 | | | 20,000,000 |
UBS AG, Stamford, | | | | | | |
4.90%, 6/04/08(d) | | | 4,745 | | | 4,745,000 |
Unicredito Italiano Bank, New York, | | | | | | |
2.65%, 6/26/08(d) | | | 9,000 | | | 9,000,000 |
| | | | | | |
| | | | | | 315,696,478 |
| | | | | | |
Total Certificates of Deposit | | | | | | |
(Cost $354,126,478) | | | | | | 354,126,478 |
| | | | | | |
Portfolios Abbreviations
To simplify the listings of Portfolios holdings in the Schedules of Investments, the names of many of the securities have been abbreviated according to the list on the right.
| | |
| AAC | | Aid Anticipation Certificate |
| AMBAC | | American Municipal Bond Assurance Corp. |
| AMT | | Alternative Minimum Tax (subject to) |
| BAN | | Bond Anticipation Note |
| COP | | Certificate of Participation |
| DN | | Demand Note |
| FGIC | | Financial Guaranty Insurance Co. |
| FSA | | Financial Security Assurance |
| GAN | | Grant Anticipation Note |
| GO | | General Obligation |
| HFA | | Housing Finance Authority |
| IDA | | Industrial Development Authority |
| IDRB | | Industrial Development Revenue Bond |
| ISD | | Independent School District |
| LOC | | Letter of Credit |
| MB | | Municipal Bond |
| MBIA | | Municipal Bond Insurance Association |
| MERLOTS | | Municipal Exempt Receipt-Liquidity |
| | Optional Tender |
| PCRB | | Pollution Control Revenue Bond |
| PUTTERS | | Putable Tax-Exempt Receipt |
| RAN | | Revenue Anticipation Note |
| RB | | Revenue Bond |
| ROC | | Reset Option Certificate |
| SBPA | | Stand-by Bond Purchase Agreement |
| TAN | | Tax Anticipation Note |
| TECP | | Tax-Exampt Commercial Paper |
| TRAN | | Tax & Revenue Anticipation Note |
See Notes to Financial Statements.
| | | | | | |
12 | | SEMI-ANNUAL REPORT | | MARCH 31, 2008 | | |
| | |
| Schedule of Investments (continued) | | Money Market Portfolio (Percentages shown are based on Net Assets) |
| | | | | | |
| | | Par
(000) | | Value |
Commercial Paper — 54.0% | | | | | | |
Asset Backed Securities — 32.8% | | | | | | |
Amstel Funding Corp., | | | | | | |
3.07%, 5/09/08 | | $ | 25,000 | | $ | 24,918,986 |
Apreco LLC, | | | | | | |
2.87%, 6/05/08 | | | 13,000 | | | 12,932,635 |
Atlantic Asset Securitization Corp., | | | | | | |
4.30%, 4/07/08 | | | 10,000 | | | 9,992,833 |
Atlantis One Funding Corp., | | | | | | |
3.13%, 4/21/08 | | | 5,000 | | | 4,991,305 |
3.22%, 4/29/08 | | | 25,000 | | | 24,937,389 |
3.10%, 5/05/08 | | | 53,386 | | | 53,229,698 |
3.11%, 6/04/08 | | | 4,860 | | | 4,833,130 |
Cafco LLC, | | | | | | |
2.72%, 5/07/08 | | | 10,000 | | | 9,972,800 |
Cancara Asset Securitisation LLC, | | | | | | |
3.10%, 4/14/08 | | | 10,000 | | | 9,988,806 |
Ciesco LLC, | | | | | | |
3.16%, 5/28/08 | | | 28,000 | | | 27,859,907 |
2.80%, 6/05/08 | | | 27,000 | | | 26,863,500 |
CRC Funding LLC, | | | | | | |
3.26%, 4/02/08 | | | 14,000 | | | 13,998,732 |
Galleon Capital LLC, | | | | | | |
3.36%, 4/04/08 | | | 12,523 | | | 12,519,494 |
2.93%, 4/23/08 | | | 20,000 | | | 19,964,189 |
Liberty Street Funding LLC, | | | | | | |
3.23%, 4/28/08 | | | 40,000 | | | 39,903,100 |
Long Lane Master Trust IV, | | | | | | |
3.00%, 5/08/08 | | | 5,000 | | | 4,984,583 |
3.05%, 5/09/08 | | | 17,000 | | | 16,945,269 |
Nieuw Amsterdam Receivables Corp., | | | | | | |
3.25%, 4/01/08 | | | 60,000 | | | 60,000,000 |
4.45%, 4/03/08 | | | 9,589 | | | 9,586,629 |
Palisades CP Program, | | | | | | |
3.60%, 4/03/08 | | | 5,700 | | | 5,698,860 |
Picaros Funding LLC, | | | | | | |
2.87%, 6/12/08 | | | 30,877 | | | 30,699,766 |
Ranger Funding Co. LLC, | | | | | | |
2.86%, 6/06/08 | | | 15,000 | | | 14,921,350 |
Regency Markets No. 1 LLC, | | | | | | |
2.85%, 4/18/08 | | | 5,000 | | | 4,993,271 |
Thames Asset Global Securitization No. 1, Inc., | | | | | | |
3.90%, 4/04/08 | | | 9,042 | | | 9,039,061 |
3.85%, 4/18/08 | | | 28,635 | | | 28,582,940 |
3.25%, 4/28/08 | | | 28,788 | | | 28,717,829 |
3.14%, 5/07/08 | | | 10,000 | | | 9,968,600 |
3.10%, 5/15/08 | | | 7,000 | | | 6,973,478 |
Ticonderoga Funding LLC, | | | | | | |
3.00%, 5/05/08 | | | 10,000 | | | 9,971,667 |
Versailles Commercial Paper LLC, | | | | | | |
3.15%, 5/07/08 | | | 1,000 | | | 996,850 |
Victory Receivables Corp., | | | | | | |
3.00%, 4/24/08 | | | 22,000 | | | 21,957,833 |
Windmill Funding Corp., | | | | | | |
3.05%, 4/25/08 | | | 19,000 | | | 18,961,367 |
Yorktown Capital LLC, | | | | | | |
3.15%, 5/09/08 | | | 5,000 | | | 4,983,375 |
| | | | | | |
| | | | | | 584,889,232 |
| | | | | | |
Banks — 19.2% | | | | | | |
Banco Bilbao Vizcaya Argentaria S.A., | | | | | | |
2.80%, 6/27/08(c) | | | 8,000 | | | 7,945,867 |
Banco Santander Puerto Rico, | | | | | | |
2.57%, 5/19/08 | | | 27,958 | | | 27,862,197 |
Bank of America Corp., | | | | | | |
3.67%, 6/12/08 | | | 11,000 | | | 10,919,194 |
3.80%, 7/11/08 | | | 11,275 | | | 11,154,796 |
2.83%, 8/19/08 | | | 9,095 | | | 8,994,940 |
Citigroup Funding, Inc., | | | | | | |
4.73%, 5/02/08 | | | 7,830 | | | 7,798,108 |
Danske Corp., | | | | | | |
4.46%, 4/03/08 | | | 5,000 | | | 4,998,761 |
2.52%, 6/20/08 | | | 25,000 | | | 24,860,000 |
2.62%, 6/25/08 | | | 5,000 | | | 4,969,069 |
JPMorgan Chase & Co., | | | | | | |
4.97%, 4/01/08 | | | 10,000 | | | 10,000,000 |
2.86%, 7/07/08 | | | 21,500 | | | 21,334,319 |
Lloyds TSB Bank Plc, | | | | | | |
2.90%, 6/03/08 | | | 6,539 | | | 6,505,814 |
Raiffeisen Zentralbank Osterreich AG, | | | | | | |
4.06%, 4/02/08 | | | 13,100 | | | 13,098,523 |
3.20%, 4/23/08 | | | 65,000 | | | 64,872,889 |
3.14%, 5/01/08 | | | 5,000 | | | 4,986,917 |
Royal Bank of Scotland Plc, | | | | | | |
4.79%, 5/21/08 | | | 6,000 | | | 5,960,083 |
San Paolo IMI U.S. Financial Co., | | | | | | |
2.64%, 6/27/08 | | | 29,127 | | | 28,941,170 |
Svenska Handelsbanken AB, | | | | | | |
3.76%, 4/17/08 | | | 6,500 | | | 6,489,138 |
UBS Finance Delaware LLC, | | | | | | |
3.94%, 4/11/08 | | | 10,000 | | | 9,989,055 |
2.56%, 6/09/08 | | | 10,148 | | | 10,098,207 |
Unicredito Italiano Bank, Ireland, | | | | | | |
4.68%, 4/03/08 | | | 10,000 | | | 9,997,400 |
4.00%, 4/17/08 | | | 30,000 | | | 29,946,667 |
2.83%, 6/11/08 | | | 10,000 | | | 9,944,186 |
| | | | | | |
| | | | | | 341,667,300 |
| | | | | | |
Finance Services — 2.0% | | | | | | |
General Electric Capital Corp., | | | | | | |
3.50%, 4/29/08 | | | 16,325 | | | 16,280,560 |
3.83%, 7/10/08 | | | 9,500 | | | 9,398,930 |
KBC Financial Products International Ltd., | | | | | | |
3.00%, 6/06/08 | | | 10,000 | | | 9,945,000 |
| | | | | | |
| | | | | | 35,624,490 |
| | | | | | |
Total Commercial Paper | | | | | | |
(Cost $962,181,022) | | | | | | 962,181,022 |
| | | | | | |
Master Notes — 1.7% | | | | | | |
Security Brokers & Dealers — 1.7% | | | | | | |
Bank of America Securities LLC, | | | | | | |
3.08%, 4/01/08 | | | | | | |
(Cost $30,250,000) | | | 30,250 | | | 30,250,000 |
| | | | | | |
Variable Rate Obligations — 14.8% | | | | | | |
Asset Backed Securities — 0.6% | | | | | | |
Cullinan Finance Corp., | | | | | | |
2.58%, 6/25/08(a)(e) | | | 10,235 | | | 10,234,762 |
| | | | | | |
Banks — 8.4% | | | | | | |
Bank of Montreal, Chicago, | | | | | | |
3.20%, 11/10/08(a) | | | 15,885 | | | 15,885,000 |
See Notes to Financial Statements.
| | | | | | |
| | | SEMI-ANNUAL REPORT | | MARCH 31, 2008 | | 13 |
| | |
| Schedule of Investments (concluded) | | Money Market Portfolio (Percentages shown are based on Net Assets) |
| | | | | | |
| | | Par
(000) | | Value |
Variable Rate Obligations (Continued) | | | | | | |
Banks (Continued) | | | | | | |
Deutsche Bank AG, New York, | | | | | | |
2.81%, 1/21/09(a) | | $ | 12,265 | | $ | 12,265,000 |
HBOS Treasury Services Plc, | | | | | | |
2.67%, 6/24/08(a) | | | 65,000 | | | 65,000,000 |
Park Street Properties I LLC Series 2004 DN (U.S. Bank N.A. LOC), | | | | | | |
3.30%, 4/07/08(f) | | | 445 | | | 445,000 |
Park Village (Bank One N.A. LOC), | | | | | | |
2.26%, 4/07/08(c)(f) | | | 6,655 | | | 6,655,000 |
Royal Bank of Scotland Plc, | | | | | | |
2.76%, 9/26/08(a) | | | 15,000 | | | 15,000,000 |
Wachovia Bank, N.A., | | | | | | |
4.75%, 2/04/09(a) | | | 9,300 | | | 9,300,000 |
Westpac Banking Corp., New York, | | | | | | |
3.00%, 10/10/08(a) | | | 24,250 | | | 24,250,000 |
| | | | | | |
| | | | | | 148,800,000 |
| | | | | | |
Life Insurance — 4.2% | | | | | | |
MetLife Global Funding I, | | | | | | |
2.79%, 4/28/08(a) | | | 15,000 | | | 15,000,000 |
Transamerica Occidental Life Insurance Co., | | | | | | |
3.29%, 5/01/09(a)(e) | | | 60,000 | | | 60,000,000 |
| | | | | | |
| | | | | | 75,000,000 |
| | | | | | |
Municipal Bonds — 1.6% | | | | | | |
Savannah College Georgia RB (Art & Design Project) Series 2004 DN (Bank of America N.A. LOC), | | | | | | |
2.70%, 4/07/08(f)(g) | | | 6,600 | | | 6,600,000 |
South Central Texas IDRB (Rohr Industries Project) Series 1990 DN (Bank One N.A. LOC), | | | | | | |
2.85%, 4/07/08(f)(g) | | | 14,800 | | | 14,800,000 |
Utah Telecommunication Open Infrastructure Agency Taxable Adjustable Rate Telecommunications RB Series 2004 DN (Bank of America N.A. LOC), | | | | | | |
2.70%, 4/07/08(f)(g) | | | 7,900 | | | 7,900,000 |
| | | | | | |
| | | | | | 29,300,000 |
| | | | | | |
Total Variable Rate Obligations | | | | | | |
(Cost $263,334,762) | | | | | | 263,334,762 |
| | | | | | |
Promissory Note — 2.0% | | | | | | |
Security Brokers & Dealers — 2.0% | | | | | | |
The Goldman Sachs Group, Inc., | | | | | | |
2.65%, 8/22/08(a)(e) | | | | | | |
(Cost $34,850,000) | | | 34,850 | | | 34,850,000 |
| | | | | | |
Total Investments in Securities — 98.4% | | | | | | |
(Cost $1,752,349,994*) | | | | | | 1,752,349,994 |
Other Assets in Excess of Liabilities — 1.6% | | | | | | 28,028,483 |
| | | | | | |
Net Assets — 100.0% | | | | | $ | 1,780,378,477 |
| | | | | | |
| * | Aggregate cost for federal income tax purposes. |
| (a) | Rate shown is as of report date and the date shown is the final maturity date. |
| (b) | Rate shown is the effective yield at the time of purchase. |
| (c) | Ratings reflect those of main branch. |
| (d) | Issuer is a U.S. branch of a foreign domiciled bank. |
| (f) | Rate shown is as of report date and maturities shown are the next interest readjustment date or the date the principal owed can be recovered through demand. |
| (g) | Ratings reflect those of guarantor. |
| • | | For Portfolio compliance purposes, the Portfolio’s sector and industry classifications refer to any one or more of the Standard Industry Codes as defined by the SEC. This definition may not apply for purposes of this report, which may combine sector and industry sub-classifications for reporting ease. |
See Notes to Financial Statements.
| | | | | | |
14 | | SEMI-ANNUAL REPORT | | MARCH 31, 2008 | | |
| | |
| Schedule of Investments March 31, 2008 (Unaudited) | | U.S. Treasury Money Market Portfolio (Percentages shown are based on Net Assets) |
| | | | | | |
| | | Par
(000) | | Value |
Repurchase Agreements — 99.9% | | | | | | |
Credit Suisse Securities (USA) LLC, | | | | | | |
0.40%, 4/01/08 | | $ | 25,000 | | $ | 25,000,000 |
(Agreement dated 3/24/08 to be repurchased at $25,002,222, collateralized by $21,625,000 U.S. Treasury Inflation Indexed Securities 2.38% to 3.88% due from 1/15/09 to 1/15/17. The value of the collateral is $25,504,088.) | | | | | | |
Credit Suisse Securities (USA) LLC, | | | | | | |
1.85%, 4/03/08 | | | 25,000 | | | 25,000,000 |
(Agreement dated 3/14/08 to be repurchased at $25,025,694, collateralized by $21,690,000 U.S. Treasury Inflation Indexed Securities 2.38% due 1/15/17. The value of the collateral is $25,503,471.) | | | | | | |
Deutsche Bank Securities Inc., | | | | | | |
2.50%, 4/22/08 | | | 50,000 | | | 50,000,000 |
(Agreement dated 1/23/08 to be repurchased at $50,312,500, collateralized by $100,174,714 U.S. Treasury Strips due from 2/15/21 to 5/15/26. The value of the collateral is $51,000,000.) | | | | | | |
Deutsche Bank Securities Inc., | | | | | | |
1.79%, 6/10/08 | | | 25,000 | | | 25,000,000 |
(Agreement dated 3/11/08 to be repurchased at $25,113,118, collateralized by $50,087,357 U.S. Treasury Strips due from 2/15/21 to 5/15/26. The value of the collateral is $25,500,000.) | | | | | | |
Greenwich Capital Markets, Inc., | | | | | | |
1.35%, 4/01/08 | | | 75,000 | | | 75,000,000 |
(Agreement dated 3/31/08 to be repurchased at $75,002,813, collateralized by $76,620,000 U.S. Treasury Notes 2.50% due 3/31/13. The value of the collateral is $76,500,475.) | | | | | | |
Greenwich Capital Markets, Inc., | | | | | | |
2.26%, 4/01/08 | | | 35,000 | | | 35,000,000 |
(Agreement dated 1/24/08 to be repurchased at $35,149,411, collateralized by $35,760,000 U.S. Treasury Notes 2.50% due 3/31/13. The value of the collateral is $35,704,215.) | | | | | | |
Greenwich Capital Markets, Inc., | | | | | | |
1.40%, 7/25/08 | | | 25,000 | | | 25,000,000 |
(Agreement dated 3/18/08 to be repurchased at $25,125,417, collateralized by $25,540,000 U.S. Treasury Notes 2.50% due 3/31/13. The value of the collateral is $25,500,158.) | | | | | | |
HSBC Securities (USA) Inc., | | | | | | |
1.45%, 4/01/08 | | | 50,000 | | | 50,000,000 |
(Agreement dated 3/31/08 to be repurchased at $50,002,014, collateralized by $35,380,000 U.S. Treasury Bonds 8.00% due 11/15/21. The value of the collateral is $51,000,832.) | | | | | | |
JPMorgan Securities Inc., | | | | | | |
1.45%, 4/01/08 | | $ | 100,000 | | $ | 100,000,000 |
(Agreement dated 3/31/08 to be repurchased at $100,004,028, collateralized by $174,653,000 U.S. Treasury Strips due from 8/15/16 to 5/15/24. The value of the collateral is $102,002,617.) | | | | | | |
Lehman Brothers Inc., | | | | | | |
1.40%, 4/01/08 | | | 15,000 | | | 15,000,000 |
(Agreement dated 3/31/08 to be repurchased at $15,000,583, collateralized by $12,395,000 U.S. Treasury Bonds 6.25% due 8/15/23. The value of the collateral is $15,301,958.) | | | | | | |
Morgan Stanley & Co., Inc., | | | | | | |
1.35%, 4/01/08 | | | 50,132 | | | 50,132,000 |
(Agreement dated 3/31/08 to be repurchased at $50,133,880, collateralized by $101,868,000 U.S. Treasury Strips due 5/15/23. The value of the collateral is $51,134,680.) | | | | | | |
UBS Securities LLC, | | | | | | |
2.45%, 4/21/08 | | | 50,000 | | | 50,000,000 |
(Agreement dated 1/22/08 to be repurchased at $50,360,250, collateralized by $41,614,000 U.S. Treasury Bonds 7.13% to 11.75% due from 11/15/14 to 2/15/23. The value of the collateral is $51,001,600.) | | | | | | |
UBS Securities LLC, | | | | | | |
2.45%, 4/25/08 | | | 50,000 | | | 50,000,000 |
(Agreement dated 1/22/08 to be repurchased at $50,319,861, collateralized by $38,365,000 U.S. Treasury Bonds 7.13% due 2/15/23. The value of the collateral is $51,003,906.) | | | | | | |
Total Repurchase Agreements — 99.9% | | | | | | |
| | | | | | |
(Cost $575,132,000*) | | | | | | 575,132,000 |
Other Assets in Excess of Liabilities — 0.1% | | | | | | 511,921 |
| | | | | | |
Net Assets — 100.0% | | | | | $ | 575,643,921 |
| | | | | | |
| * | Aggregate cost for federal income tax purposes. |
| • | | For Portfolio compliance purposes, the Portfolio’s sector and industry classifications refer to any one or more of the Standard Industry Codes as defined by the SEC. This definition may not apply for purposes of this report, which may combine sector and industry sub-classifications for reporting ease. |
See Notes to Financial Statements.
| | | | | | |
| | | SEMI-ANNUAL REPORT | | MARCH 31, 2008 | | 15 |
| | |
| Schedule of Investments March 31, 2008 (Unaudited) | | Municipal Money Market Portfolio (Percentages shown are based on Net Assets) |
| | | | | | |
| | | Par
(000) | | Value |
Municipal Bonds — 99.2% | | | | | | |
Alabama — 1.2% | | | | | | |
Alabama HFA Single Family Mortgage RB Series 2006H AMT DN (Bayerische Landesbank Girozentrale Guaranty), | | | | | | |
2.47%, 4/07/08(a) | | $ | 345 | | $ | 345,000 |
Alexander Industrial Board IDRB (Precision Millwork Project) Series 2000 AMT DN (Wachovia Bank N.A. LOC), | | | | | | |
2.20%, 4/07/08(a) | | | 865 | | | 865,000 |
Geneva County Health Care Authority RB Series 2001 DN (Wachovia Bank N.A. LOC), | | | | | | |
2.20%, 4/07/08(a) | | | 2,833 | | | 2,833,000 |
| | | | | | |
| | | | | | 4,043,000 |
| | | | | | |
Arizona — 3.3% | | | | | | |
Revenue Bond Certificates (Tierra Antigua Project) Series 2006-1 AMT DN (AIG Retirement Services, Inc. Liquidity Facilities), | | | | | | |
2.61%, 4/07/08(a)(b) | | | 7,688 | | | 7,688,000 |
Scottsdale IDA RB (Scottsdale Health Care Project) Series 2006C DN (FSA Insurance, Citibank N.A. Liquidity Facility), | | | | | | |
2.05%, 4/07/08(a) | | | 3,200 | | | 3,200,000 |
| | | | | | |
| | | | | | 10,888,000 |
| | | | | | |
Arkansas — 0.6% | | | | | | |
Little Rock Residential Housing & Public Facilities Board Capital Improvement RB (Park Systems Project) Series 2001 DN (Bank of America N.A. LOC), | | | | | | |
2.31%, 4/07/08(a) | | | 2,075 | | | 2,075,000 |
California — 3.1% | | | | | | |
California GO Series 2007 RAN, | | | | | | |
4.00%, 6/30/08 | | | 7,000 | | | 7,010,648 |
California PCRB Solid Waste Disposal RB (Republic Services, Inc. Project) Series 2003 AMT DN (Republic Services, Inc. Guaranty), | | | | | | |
3.10%, 4/07/08(a) | | | 3,000 | | | 3,000,000 |
| | | | | | |
| | | | | | 10,010,648 |
| | | | | | |
Colorado — 3.7% | | | | | | |
Colorado Housing & Finance Authority RB Series 2001 DN (Landesbank Hessen-Thueringen Girozentrale SBPA), | | | | | | |
2.10%, 4/07/08(a) | | | 8,740 | | | 8,740,000 |
Revenue Bond Certificates (Sterling Park Apartments Project) Series 2006-6 AMT DN (AIG Retirement Services, Inc. Liquidity Facilities), | | | | | | |
2.61%, 4/07/08(a) | | | 1,808 | | | 1,808,000 |
Southglenn Metropolitan District RB Series 2007 DN (Banque Nationale de Paribas LOC), | | | | | | |
2.26%, 4/07/08(a) | | | 1,500 | | | 1,500,000 |
| | | | | | |
| | | | | | 12,048,000 |
| | | | | | |
Connecticut — 1.8% | | | | | | |
Connecticut Health & Educational Facilities Authority RB (Yale University Project) Series 1997T-2 DN, | | | | | | |
1.50%, 4/07/08(a) | | | 6,000 | | | 6,000,000 |
| | | | | | |
Delaware — 0.6% | | | | | | |
Delaware Economic Development Authority RB (St. Anne’s Episcopal School Project) Series 2001 DN (Wilmington Trust Co. LOC), | | | | | | |
2.19%, 4/07/08(a) | | | 1,935 | | | 1,935,000 |
| | | | | | |
Florida — 16.1% | | | | | | |
Brevard County Health Facilities Authority RB (Health First, Inc. Project) Series 2003 DN (SunTrust Bank LOC), | | | | | | |
1.25%, 4/01/08(a) | | | 2,000 | | | 2,000,000 |
Dade County IDA PCRB (Florida Power & Light Co. Project) Series 1995 DN, | | | | | | |
1.18%, 4/01/08(a) | | | 2,500 | | | 2,500,000 |
Florida Housing Finance Corp. Multi-Family Mortgage RB Series 2006 ROC-RR-II-R-600CE AMT DN (Citigroup Financial Products Guaranty, Citigroup Financial Products Liquidity Facility), | | | | | | |
2.35%, 4/07/08(a)(b) | | | 1,000 | | | 1,000,000 |
Florida Housing Finance Corp. RB Series 2007 ROC-RR-II-R-11209 AMT DN (Government National Mortgage Assoc. Insurance, Federal National Mortgage Assoc. Insurance, Federal Home Loan Mortgage Corp. Insurance), | | | | | | |
2.32%, 4/07/08(a)(b) | | | 3,200 | | | 3,200,000 |
Gainesville Utilities System RB Series 2006A DN (SunTrust Bank SBPA), | | | | | | |
1.25%, 4/07/08(a) | | | 10,700 | | | 10,700,000 |
Greater Orlando Aviation Authority RB (Special Purpose Cessna Aircraft Project) Series 2001 AMT DN (Textron, Inc. Guaranty), | | | | | | |
3.29%, 4/07/08(a) | | | 3,000 | | | 3,000,000 |
Gulfstream Park Community Development District Special Assessment RB Municipal Trust Receipts Floaters Series 2008-2G DN (The Goldman Sachs Group, Inc. Guaranty, The Goldman Sachs Group, Inc. Liquidity Facility), | | | | | | |
1.79%, 4/07/08(a)(b) | | | 5,055 | | | 5,055,000 |
Highlands County Health Facilities Authority RB (Adventist Health System Project) Series 2007A-2 DN, | | | | | | |
2.15%, 4/07/08(a) | | | 2,300 | | | 2,300,000 |
Jacksonville Electric Authority RB (Electric Systems Project) Series 2001B DN (Bank of America N.A. SBPA), | | | | | | |
1.30%, 4/01/08(a) | | | 7,900 | | | 7,900,000 |
Jacksonville Health Facilities Authority Hospital RB (Baptist Medical Center Project) Series 2001 DN (Wachovia Bank N.A. LOC), | | | | | | |
1.20%, 4/01/08(a) | | | 4,950 | | | 4,950,000 |
Lee County IDRB (Raymond Building Supply Corp. Project) Series 1997 AMT DN (SunTrust Bank LOC), | | | | | | |
2.36%, 4/07/08(a) | | | 1,145 | | | 1,145,000 |
Miami-Dade County School District GO PUTTERS Series 2007-1783 DN (MBIA Insurance, JPMorgan Chase & Co. Liquidity Facility), | | | | | | |
3.50%, 4/07/08(a)(b) | | | 4,000 | | | 4,000,000 |
Sunrise Utility System RB Series 2008-518 DN (AMBAC Insurance, Deutsche Bank Guaranty, Deutsche Bank Liquidity Facility), | | | | | | |
2.27%, 4/07/08(a)(b) | | | 2,715 | | | 2,715,000 |
See Notes to Financial Statements.
| | | | | | |
16 | | SEMI-ANNUAL REPORT | | MARCH 31, 2008 | | |
| | |
| Schedule of Investments (continued) | | Municipal Money Market Portfolio (Percentages shown are based on Net Assets) |
| | | | | | |
| | | Par
(000) | | Value |
Municipal Bonds (Continued) | | | | | | |
Florida (Continued) | | | | | | |
Wauchula IDRB (Hardee County Center Project) Series 1993 DN (JPMorgan Chase Bank LOC), | | | | | | |
2.22%, 4/07/08(a) | | $ | 2,275 | | $ | 2,275,000 |
| | | | | | |
| | | | | | 52,740,000 |
| | | | | | |
Idaho — 0.3% | | | | | | |
Idaho GO Series 2007 TAN, | | | | | | |
4.50%, 6/30/08 | | | 1,100 | | | 1,102,007 |
| | | | | | |
Illinois — 6.3% | | | | | | |
Harvard Multi-Family Housing RB (Northfield Court Project) Series 1999 AMT DN (Fifth Third Bank N.A. LOC), | | | | | | |
2.32%, 4/07/08(a) | | | 7,350 | | | 7,350,000 |
Illinois Development Finance Authority PCRB (Amoco Oil Co. Project) Series 1994 DN, | | | | | | |
1.25%, 4/01/08(a) | | | 700 | | | 700,000 |
Illinois Educational Facilities Authority RB Series 2007 1B-3 TECP (Dexia Bank LOC), | | | | | | |
3.66%, 5/06/08 | | | 3,000 | | | 3,000,000 |
Illinois Housing Development Authority RB Series 2007H-2 AMT DN, | | | | | | |
3.48%, 10/01/08(a) | | | 520 | | | 520,000 |
Quad Cities Regional Economic Development Authority RB (Whitey’s Ice Cream Manufacturing Project) Series 1995 AMT DN (Bank One N.A. LOC), | | | | | | |
3.60%, 4/07/08(a) | | | 410 | | | 410,000 |
Rockford County RB (Fairhaven Christian Center Project) Series 2000 DN (JPMorgan Chase Bank LOC), | | | | | | |
3.50%, 4/07/08(a) | | | 1,100 | | | 1,100,000 |
Rockford County RB (Wesley Willows Obligation Project) Series 2007 DN (M & I Marshall & Ilsley LOC), | | | | | | |
1.23%, 4/01/08(a)(b) | | | 6,800 | | | 6,800,000 |
Roselle Village IDRB (Abrasive-Form, Inc. Project) Series 1995 AMT DN (Lasalle Bank N.A. LOC), | | | | | | |
2.25%, 4/07/08(a)(c) | | | 600 | | | 600,000 |
| | | | | | |
| | | | | | 20,480,000 |
| | | | | | |
Indiana — 2.3% | | | | | | |
Elkhart County Industrial Hospital Authority RB (Oaklawn Center Project) Series 2006 DN (Charter One Bank, N.A. LOC), | | | | | | |
2.26%, 4/07/08(a) | | | 3,305 | | | 3,305,000 |
Hendricks County Industrial Redevelopment Commission Tax Increment RB (Heartland Crossing Project) Series 2000A DN (Huntington National Bank LOC), | | | | | | |
2.60%, 4/07/08(a) | | | 2,600 | | | 2,600,000 |
Indiana Bond Bank RB (Mid-Year Funding Program) Series 2007A RAN (Bank of New York LOC), | | | | | | |
4.50%, 5/20/08 | | | 1,000 | | | 1,000,971 |
South Bend Economic Development Authority RB (SGW Realty LLC Project) Series 1998 DN (Fifth Third Bank N.A. LOC), | | | | | | |
2.40%, 4/07/08(a) | | | 600 | | | 600,000 |
| | | | | | |
| | | | | | 7,505,971 |
| �� | | | | | |
Iowa — 0.6% | | | | | | |
Iowa GO Series 2007 TRAN, | | | | | | |
4.00%, 6/30/08 | | | 1,000 | | | 1,001,813 |
Urbandale IDRB (Meredith Drive Assoc. Project) Series 1985 DN (Wells Fargo Bank N.A. LOC), | | | | | | |
2.27%, 4/07/08(a) | | | 1,000 | | | 1,000,000 |
| | | | | | |
| | | | | | 2,001,813 |
| | | | | | |
Kentucky — 0.5% | | | | | | |
Newport Industrial Building RB (Newport Holdings Project) Series 2001A AMT DN (Huntington National Bank LOC), | | | | | | |
2.53%, 4/07/08(a) | | | 1,525 | | | 1,525,000 |
| | | | | | |
Louisiana — 1.5% | | | | | | |
Lake Charles Harbor & Terminal District RB (Lake Charles Cogeneration Project) Series 2008 MB (Rabobank N.A. GIC), | | | | | | |
2.25%, 3/15/09 | | | 2,000 | | | 2,000,000 |
Plaquemines Parish Environmental RB (BP Exploration & Oil, Inc. Project) Series 1995 AMT DN, | | | | | | |
1.35%, 4/01/08(a) | | | 2,800 | | | 2,800,000 |
| | | | | | |
| | | | | | 4,800,000 |
| | | | | | |
Maine — 0.3% | | | | | | |
Maine School Administrative District No. 051 GO Series 2007 BAN, | | | | | | |
3.75%, 12/30/08 | | | 1,000 | | | 1,004,694 |
| | | | | | |
Maryland — 2.6% | | | | | | |
Baltimore County RB (Odyssey School Facility Project) Series 2001 DN (M&T Bank Corp. LOC), | | | | | | |
2.21%, 4/07/08(a) | | | 2,175 | | | 2,175,000 |
Baltimore County RB (St. Paul’s School for Girls Facility Project) Series 2000 DN (M&T Bank Corp. LOC), | | | | | | |
2.21%, 4/07/08(a) | | | 1,240 | | | 1,240,000 |
Maryland Economic Development Corp. RB (Assoc. of Catholic Charities Project) Series 1999B DN (M&T Bank Corp. LOC), | | | | | | |
2.21%, 4/07/08(a) | | | 1,275 | | | 1,275,000 |
Maryland Economic Development Corp. RB (Assoc. of Catholic Charities Project) Series 2001 DN (M&T Bank Corp. LOC), | | | | | | |
2.26%, 4/07/08(a) | | | 2,035 | | | 2,035,000 |
Maryland Economic Development Corp. RB (Assoc. of Catholic Charities Project) Series 2002 DN (M&T Bank Corp. LOC), | | | | | | |
2.21%, 4/07/08(a) | | | 1,800 | | | 1,800,000 |
| | | | | | |
| | | | | | 8,525,000 |
| | | | | | |
Massachusetts — 0.4% | | | | | | |
Massachusetts GO MERLOTS Trust Receipts Series 2002A-9 DN (FSA Insurance, Wachovia Bank N.A. SBPA), | | | | | | |
2.30%, 4/07/08(a)(b) | | | 1,480 | | | 1,480,000 |
| | | | | | |
Michigan — 4.9% | | | | | | |
Detroit Economic Development Corp. RB (E.H. Assoc. Ltd. Project) Series 2002 DN (First Federal Bank of Northern Michigan LOC), | | | | | | |
2.29%, 4/07/08(a) | | | 2,765 | | | 2,765,000 |
Michigan Hospital Finance Authority RB (Ascension Health Credit Group Project) Series 1999B-2 DN, | | | | | | |
1.95%, 4/07/08(a) | | | 1,300 | | | 1,300,000 |
See Notes to Financial Statements.
| | | | | | |
| | | SEMI-ANNUAL REPORT | | MARCH 31, 2008 | | 17 |
| | |
| Schedule of Investments (continued) | | Municipal Money Market Portfolio (Percentages shown are based on Net Assets) |
| | | | | | |
| | | Par
(000) | | Value |
Municipal Bonds (Continued) | | | | | | |
Michigan (Continued) | | | | | | |
Michigan Housing Development Authority Multi-Family Housing RB (Berrien Woods III Project) Series 2000A AMT DN (Citibank N.A. LOC), | | | | | | |
2.15%, 4/07/08(a) | | $ | 300 | | $ | 300,000 |
Michigan Municipal Bond Authority GO Series 2007B-2 RAN (Scotiabank LOC), | | | | | | |
4.50%, 8/20/08 | | | 2,400 | | | 2,407,304 |
Michigan Strategic Fund Ltd. Obligation RB (Apollo Plating, Inc. Project) Series 2007 AMT DN (Fifth Third Bank N.A. LOC), | | | | | | |
2.34%, 4/07/08(a) | | | 1,680 | | | 1,680,000 |
Michigan Strategic Fund Ltd. Obligation RB (Horizons of Michigan Project) Series 2001 DN (Huntington National Bank LOC), | | | | | | |
2.46%, 4/07/08(a) | | | 1,255 | | | 1,255,000 |
Michigan Strategic Fund Ltd. Obligation RB (Surefil Properties LLC Project) Series 2006 AMT DN (Huntington National Bank LOC), | | | | | | |
2.70%, 4/07/08(a) | | | 4,300 | | | 4,300,000 |
Wayne State University RB Munitops Trust Certificates Series 2006-61 DN (AMBAC Insurance, Bank of America N.A. SBPA), | | | | | | |
2.31%, 4/07/08(a)(b) | | | 2,000 | | | 2,000,000 |
| | | | | | |
| | | | | | 16,007,304 |
| | | | | | |
Minnesota — 0.9% | | | | | | |
Minnesota School District Tax & Aid Anticipation Borrowing Program COP Series 2007 AAC, | | | | | | |
4.50%, 8/28/08 | | | 3,000 | | | 3,010,125 |
| | | | | | |
Missouri — 1.4% | | | | | | |
Taney County IDRB (Keeter Heights Project) Series 2006 AMT DN (U.S. Bank N.A. LOC), | | | | | | |
2.33%, 4/07/08(a) | | | 4,500 | | | 4,500,000 |
| | | | | | |
New Jersey — 3.1% | | | | | | |
New Jersey GO Series 2007 TRAN, | | | | | | |
4.50%, 6/24/08 | | | 10,000 | | | 10,019,895 |
| | | | | | |
New Mexico — 2.1% | | | | | | |
New Mexico GO Series 2007 TRAN, | | | | | | |
3.75%, 6/30/08 | | | 7,000 | | | 7,012,036 |
| | | | | | |
New York — 6.6% | | | | | | |
New York City GO Series 2005E-3 DN (Bank of America N.A. LOC), | | | | | | |
2.07%, 4/07/08(a) | | | 1,400 | | | 1,400,000 |
New York City GO Series 2006I-6 DN (CALSTRS LOC), | | | | | | |
1.05%, 4/01/08(a) | | | 2,900 | | | 2,900,000 |
New York City Municipal Water Finance Authority Water & Sewer System RB (Second General Resolution Project) Series 2005AA-1 DN (State Street Bank & Trust Co. & CALSTERS SBPA), | | | | | | |
1.05%, 4/01/08(a) | | | 6,000 | | | 6,000,000 |
New York City Municipal Water Finance Authority Water & Sewer System RB (Second General Resolution Project) Series 2007-2008BB-1 DN (Fortis Bank SBPA), | | | | | | |
1.25%, 4/01/08(a) | | | 100 | | | 100,000 |
New York City Transitional Finance Authority RB (Future Tax Secured Project) Series 1998A-1 DN (WestLB AG SBPA), | | | | | | |
2.05%, 4/07/08(a) | | | 200 | | | 200,000 |
New York City Transitional Finance Authority RB (New York City Recovery Project) Series 2002-3B DN (Citigroup Global Markets Holdings, Inc. SBPA), | | | | | | |
1.36%, 4/01/08(a) | | | 7,100 | | | 7,100,000 |
New York City Transitional Finance Authority RB Series 2002-2A DN (Dexia Credit Local Liquidity Facility), | | | | | | |
1.15%, 4/01/08(a) | | | 900 | | | 900,000 |
New York Mortgage Agency RB (Homeowner Mortgage Project) Series 2006-135 AMT DN (Dexia Credit Local SBPA), | | | | | | |
1.25%, 4/01/08(a) | | | 2,000 | | | 2,000,000 |
Rockland County IDRB (Northern River Assisted Living Project) Series 1999 DN (M&T Bank Corp. LOC), | | | | | | |
2.26%, 4/07/08(a) | | | 1,065 | | | 1,065,000 |
| | | | | | |
| | | | | | 21,665,000 |
| | | | | | |
North Carolina — 5.7% | | | | | | |
Charlotte Water & Sewer System RB Munitops Trust Certificates Series 2007-10 DN (Bank of America N.A. SBPA), | | | | | | |
2.24%, 4/07/08(a)(b) | | | 4,000 | | | 4,000,000 |
Charlotte-Mecklenburg Hospital Authority RB (Carolina’s Healthcare System Project) Series 2006-1388 DN (Morgan Stanley Group Liquidity Facility), | | | | | | |
2.21%, 4/07/08(a)(b) | | | 300 | | | 300,000 |
Guilford County Industrial Facilities PCRB (Recreational Facilities-YMCA Project) Series 2002 DN (Branch Banking & Trust Co. LOC), | | | | | | |
2.28%, 4/07/08(a) | | | 1,550 | | | 1,550,000 |
North Carolina Capital Facilities Finance Agency Educational Facilities RB (High Point University Project) Series 2006 DN (Branch Banking & Trust Co. LOC), | | | | | | |
2.28%, 4/07/08(a) | | | 3,160 | | | 3,160,000 |
North Carolina Capital Facilities Finance Agency RB Municipal Trust Receipts Floaters Series 2007-1895 DN (Morgan Stanley Group Liquidity Facility), | | | | | | |
2.16%, 4/07/08(a)(b) | | | 546 | | | 546,500 |
North Carolina Educational Facilities Finance Agency RB (Duke University Project) Series 1991B DN, | | | | | | |
1.60%, 4/07/08(a) | | | 3,000 | | | 3,000,000 |
North Carolina GO Series 2003A-23 MB (Wachovia Bank N.A. SBPA), | | | | | | |
2.00%, 2/09/09(b) | | | 300 | | | 300,000 |
North Carolina Medical Care Commission Health Care Facilities RB Series 2007 ROC-RR-II- R-10313 DN (Citigroup Financial Products Liquidity Facility), | | | | | | |
2.31%, 4/07/08(a)(b) | | | 4,300 | | | 4,300,000 |
University of North Carolina at Chapel Hill RB Munitops Trust Certificates Series 2005-52 DN (Bank of America N.A. SBPA), | | | | | | |
2.24%, 4/07/08(a)(b) | | | 1,400 | | | 1,400,000 |
| | | | | | |
| | | | | | 18,556,500 |
| | | | | | |
See Notes to Financial Statements.
| | | | | | |
18 | | SEMI-ANNUAL REPORT | | MARCH 31, 2008 | | |
| | |
| Schedule of Investments (continued) | | Municipal Money Market Portfolio (Percentages shown are based on Net Assets) |
| | | | | | |
| | | Par
(000) | | Value |
Municipal Bonds (Continued) | | | | | | |
Ohio — 1.5% | | | | | | |
American Municipal Power, Inc. GO (Cleveland Public Power Project) Series 2007 BAN, | | | | | | |
3.78%, 8/14/08 | | $ | 265 | | $ | 265,000 |
Butler Hospital Facilities RB (Ucpha, Inc. Project) Series 2004 DN (Huntington Capital LOC), | | | | | | |
2.55%, 4/07/08(a) | | | 1,400 | | | 1,400,000 |
Dover GO (Municipal Electric Systems Improvements Project) Series 2007 BAN, | | | | | | |
4.25%, 6/05/08 | | | 100 | | | 100,090 |
Franklin County Health Care Facilities RB (Worthington Christian Project) Series 2007 DN (Huntington National Bank LOC), | | | | | | |
2.60%, 4/07/08(a) | | | 1,620 | | | 1,620,000 |
Mason GO (Downtown Improvements Project) Series 2007 BAN, | | | | | | |
4.50%, 6/04/08 | | | 315 | | | 315,425 |
Summit County Civic Facility RB (Akron Area Electric Junction Project) Series 2001 DN (KeyBank N.A. LOC), | | | | | | |
2.29%, 4/07/08(a) | | | 1,205 | | | 1,205,000 |
| | | | | | |
| | | | | | 4,905,515 |
| | | | | | |
Oklahoma — 0.3% | | | | | | |
Oklahoma Development Finance Authority GO (ConocoPhillips Co. Project) Series 2003 AMT DN, | | | | | | |
2.35%, 4/07/08(a) | | | 1,000 | | | 1,000,000 |
| | | | | | |
Pennsylvania — 2.9% | | | | | | |
Butler County IDRB (Concordia Lutheran Project) Series 2000C DN (Bank of America N.A. LOC), | | | | | | |
2.10%, 4/07/08(a) | | | 2,000 | | | 2,000,000 |
Delaware County IDRB (Scott Paper Co. Project) Series 1984A DN, | | | | | | |
2.60%, 4/07/08(a) | | | 2,500 | | | 2,500,000 |
Pennsylvania Economic Development Financing Authority RB UBS Municipal Certificates Floaters Series 2007-07-15 DN (Landebank Hessen-Thruingen Girozentrale Liquidity Facility), | | | | | | |
2.26%, 4/07/08(a)(b) | | | 2,975 | | | 2,975,000 |
Pennsylvania Housing Finance Agency Single Family Mortgage RB Series 2006-92B AMT DN (Landesbank Hessen-Thueringen Girozentrale SBPA), | | | | | | |
2.25%, 4/07/08(a) | | | 400 | | | 400,000 |
Philadelphia Authority IDRB (Gift of Life Donor Program Project) Series 2003 DN (Commerce Bank N.A. LOC), | | | | | | |
2.24%, 4/07/08(a) | | | 965 | | | 965,000 |
Upper Merion General Authority Lease RB Series 2003 DN (Commerce Bank N.A. LOC), | | | | | | |
2.24%, 4/07/08(a) | | | 500 | | | 500,000 |
| | | | | | |
| | | | | | 9,340,000 |
| | | | | | |
South Carolina — 0.5% | | | | | | |
Greenwood County Exempt Facility IDRB (FUJIFILM Photo Project) Series 2004 AMT DN (FUJIFILM Corp. Guaranty), | | | | | | |
2.38%, 4/07/08(a) | | | 1,500 | | | 1,500,000 |
Tennessee — 2.9% | | | | | | |
Municipal Energy Acquistion Corp. of Tennessee Gas RB PUTTERS Series 2006-1578 DN (JPMorgan Chase Liquidity Facility), | | | | | | |
2.29%, 4/07/08(a)(b) | | | 5,425 | | | 5,425,000 |
Tennergy Corp. Gas RB BNP Paribas STARS Certificates Trust Series 2006-001 DN (BNP Paribas Liquidity Facility), | | | | | | |
2.29%, 4/07/08(a)(b) | | | 2,000 | | | 2,000,000 |
Tennergy Corp. Gas RB PUTTERS Series 2006-1258Q DN (JPMorgan Chase & Co. Liquidity Facility), | | | | | | |
2.29%, 4/07/08(a)(b) | | | 2,000 | | | 2,000,000 |
| | | | | | |
| | | | | | 9,425,000 |
| | | | | | |
Texas — 15.6% | | | | | | |
Dallas ISD Building GO Munitops Trust Certificates Series 2006-8 DN (PSF Guaranty, Bank of America N.A. SBPA), | | | | | | |
2.23%, 4/07/08(a)(b) | | | 3,000 | | | 3,000,000 |
Harris County RB (Toll Road Unlimited Tax & Subordinate Lien Revenue Refunding Bonds Project) Series 2003 MB, | | | | | | |
5.00%, 8/01/08 | | | 400 | | | 404,821 |
Houston Higher Education Finance Corp. RB Municipal Trust Receipts Floaters Series 2007-1914 DN (Morgan Stanley Group LOC), | | | | | | |
2.16%, 4/07/08(a)(b) | | | 707 | | | 707,000 |
Houston ISD GO (Schoolhouse Project) Series 2004 MB (PSF Guaranty, Bank of America N.A. SBPA), | | | | | | |
3.75%, 6/16/08 | | | 2,000 | | | 2,000,000 |
Houston Water & Sewer System RB Municipal Trust Receipts Floaters Series 2007-2043 DN (Branch Banking & Trust Co. Liquidity Facility), | | | | | | |
2.29%, 4/07/08(a)(b) | | | 1,380 | | | 1,380,000 |
Hutto ISD GO Series 2007-1001 DN (PSF Guaranty, Bank of New York SBPA), | | | | | | |
2.27%, 4/07/08(a)(b) | | | 1,000 | | | 1,000,000 |
Lower Colorado River Authority RB MERLOTS Trust Receipts Series 2000 DN (FSA Insurance, Wachovia Bank N.A. SBPA), | | | | | | |
2.30%, 4/07/08(a)(b) | | | 3,385 | | | 3,385,000 |
North Texas Tollway Authority GO Series 2007 BAN, | | | | | | |
4.12%, 11/19/08 | | | 10,000 | | | 10,001,752 |
Nueces River IDA Series 1984 TECP (National Rural Utilities Co-op Guaranty), | | | | | | |
2.75%, 4/09/08 | | | 5,000 | | | 5,000,000 |
Red River Education Finance RB (Texas Christian University Project) Series 2000 DN, | | | | | | |
2.18%, 4/07/08(a) | | | 1,300 | | | 1,300,000 |
Texas GO Series 2007 TRAN, | | | | | | |
4.50%, 8/28/08 | | | 15,000 | | | 15,048,131 |
Texas Municipal Gas Acquisition & Supply Corp. II RB Series 2007 ROC-RR-II-R-10014 DN (Dexia Credit Local Liquidity Facility), | | | | | | |
2.31%, 4/07/08(a)(b) | | | 2,100 | | | 2,100,000 |
Texas Municipal Gas Acquisition & Supply Corp. II RB Series 2007 ROC-RR-II-R-10015 DN (Landesbank Hessen-Thueringen Girozentrale Liquidity Facility), | | | | | | |
2.31%, 4/07/08(a)(b) | | | 1,100 | | | 1,100,000 |
Texas Public Finance Authority RB Series 2003A MB (FSA Insurance), | | | | | | |
5.00%, 4/07/08 | | | 2,500 | | | 2,506,025 |
See Notes to Financial Statements.
| | | | | | |
| | | SEMI-ANNUAL REPORT | | MARCH 31, 2008 | | 19 |
| | |
| Schedule of Investments (concluded) | | Municipal Money Market Portfolio (Percentages shown are based on Net Assets) |
| | | | | | |
| | | Par
(000) | | Value |
Municipal Bonds (Continued) | | | | | | |
Texas (Continued) | | | | | | |
University of Texas Financing System RB Series 2007B DN (University of Texas System Board Liquidity Facility), | | | | | | |
1.95%, 4/07/08(a) | | $ | 2,000 | | $ | 2,000,000 |
| | | | | | |
| | | | | | 50,932,729 |
| | | | | | |
Virginia — 1.2% | | | | | | |
Norfolk Redevelopment & Housing Authority Multi-Family Housing RB (Residential Rental Project) Series 2003 AMT DN (SunTrust Bank LOC), | | | | | | |
2.29%, 4/07/08(a) | | | 1,920 | | | 1,920,000 |
Virginia College Building Authority Educational Facilities RB Series 2003-379 DN (JPMorgan Chase & Co. LOC), | | | | | | |
2.29%, 4/07/08(a)(b) | | | 1,865 | | | 1,865,000 |
| | | | | | |
| | | | | | 3,785,000 |
| | | | | | |
Washington — 1.2% | | | | | | |
Washington Economic Development Finance Authority RB Series 2006-1531 DN (Morgan Stanley Group LOC), | | | | | | |
2.21%, 4/07/08(a)(b) | | | 1,334 | | | 1,334,500 |
Washington Housing Finance Commission Non-Profit RB (Eastside Catholic School Project) Series 2007A DN (KeyBank N.A. LOC), | | | | | | |
2.25%, 4/07/08(a) | | | 1,000 | | | 1,000,000 |
Washington Housing Finance Commission Non-Profit RB (Eastside Catholic School Project) Series 2007B DN (KeyBank N.A. LOC), | | | | | | |
2.11%, 4/07/08(a) | | | 1,200 | | | 1,200,000 |
Yakima County Public Corp. RB (Michelsen Packaging Co. Project) Series 2000 AMT DN (Bank of America N.A. LOC), | | | | | | |
2.25%, 4/07/08(a) | | | 315 | | | 315,000 |
| | | | | | |
| | | | | | 3,849,500 |
| | | | | | |
West Virginia — 1.0% | | | | | | |
Kanawha County RB (Bible Center Church Project) Series 2006 DN (Huntington National Bank LOC), | | | | | | |
2.60%, 4/07/08(a) | | | 3,200 | | | 3,200,000 |
| | | | | | |
Wisconsin — 1.6% | | | | | | |
Amery IDRB (Plastech Corp. Project) Series 1997 AMT DN (U.S. Bank N.A. LOC), | | | | | | |
2.49%, 4/07/08(a) | | | 2,000 | | | 2,000,000 |
Mequon IDRB (Johnson Level GRW Investment Project) Series 1995 AMT DN (Bank One N.A. LOC), | | | | | | |
3.60%, 4/07/08(a) | | | 355 | | | 355,000 |
Sheboygan Falls IDRB (HTT, Inc. Project) Series 2007A AMT DN (U.S. Bank N.A. LOC), | | | | | | |
2.32%, 4/07/08(a) | | | 1,890 | | | 1,890,000 |
Wisconsin GO Series 2007 MB, | | | | | | |
4.50%, 6/16/08 | | | 1,100 | | | 1,101,674 |
| | | | | | |
| | | | | | 5,346,674 |
| | | | | | |
Wyoming — 0.6% | | | | | | |
Campbell County IDRB (Two Elk Partners Project) Series 2007 MB (Royal Bank of Canada GIC), | | | | | | |
3.65%, 11/28/08 | | | 2,000 | | | 2,000,000 |
| | | | | | |
Total Investments in Securities — 99.2% | | | | | | |
(Cost $324,219,411*) | | | | | | 324,219,411 |
Other Assets in Excess of Liabilities — 0.8% | | | | | | 2,695,088 |
| | | | | | |
Net Assets — 100.0% | | | | | $ | 326,914,499 |
| | | | | | |
| * | Aggregate cost for federal income tax purposes. |
| (a) | Rate shown is as of report date and maturities shown are the next interest readjustment date or the date the principal owed can be recovered through demand. |
| (b) | Security exempt from registration under Rule 144A of the Securities Act of 1933. These securities may be resold in transactions exempt from registration to qualified institutional investors. Unless otherwise indicated, these securities are not considered to be illiquid. |
| (c) | Restricted security as to resale. As of report date the Portfolio held 0.2% of its net assets, with a current market value of $600,000 and an original cost of $600,000 in these securities. |
| • | Investments in companies considered to be an affiliate of the Portfolio were as follows: |
| | | | | | | | | | |
Affiliate | | Purchase
Cost | | Sales
Cost | | Realized
Gain | | Interest
Income |
Golden State Tobacco Settlement Securitization Corp. RB P-Float Trust Receipts Series 2004 PA-1236 DN (Merrill Lynch & Co. Guaranty, Merrill Lynch Capital Services SBPA) | | — | | $ | 1,330,000 | | — | | $ | 4,934 |
| | | | |
Affiliate | | Purchase
Cost | | Sales
Cost | | Realized
Gain | | Interest
Income |
Municipal Securities Pool Trust Receipts RB Series 2004-18 DN (Multiple Insurers, Societe Generale Group SBPA) | | — | | $ | 975,000 | | — | | $ | 11,982 |
| • | For Portfolio compliance purposes, the Portfolio’s sector and industry classifications refer to any one or more of the Standard Industry Codes as defined by the SEC. This definition may not apply for purposes of this report, which may combine sector and industry sub-classifications for reporting ease. |
See Notes to Financial Statements.
| | | | | | |
20 | | SEMI-ANNUAL REPORT | | MARCH 31, 2008 | | |
| | |
| Schedule of Investments March 31, 2008 (Unaudited) | | New Jersey Municipal Money Market Portfolio (Percentages shown are based on Net Assets) |
| | | | | | |
| | | Par
(000) | | Value |
Municipal Bonds — 88.1% | | | | | | |
New Jersey — 88.1% | | | | | | |
Alexandria Township GO Series 2007 BAN, | | | | | | |
4.00%, 12/17/08 | | $ | 200 | | $ | 201,198 |
Camden County Improvement Authority RB (Harvest Village Project) Series 1999A DN (JPMorgan Chase Bank LOC), | | | | | | |
2.99%, 4/01/08(a) | | | 9,600 | | | 9,600,000 |
Chester Township Board of Education GO Series 2007 GAN, | | | | | | |
4.12%, 8/15/08 | | | 515 | | | 515,654 |
Cinton GO Series 2008 BAN, | | | | | | |
3.25%, 1/23/09 | | | 300 | | | 301,089 |
Cranford Township GO Series 2008 BAN, | | | | | | |
2.25%, 2/04/09 | | | 500 | | | 500,865 |
Demarest School District GO Series 2007 TAN, | | | | | | |
4.00%, 7/11/08 | | | 295 | | | 295,157 |
Dennis Township GO Series 2008 BAN, | | | | | | |
2.25%, 3/20/09 | | | 100 | | | 100,246 |
East Brunswick Township GO Series 2008 BAN, | | | | | | |
3.50%, 1/09/09 | | | 1,805 | | | 1,811,900 |
East Windsor Township GO Series 2007 BAN, | | | | | | |
3.75%, 11/28/08 | | | 1,300 | | | 1,303,305 |
Edgewater GO Series 2007 BAN, | | | | | | |
4.00%, 6/13/08 | | | 395 | | | 395,189 |
Elmwood Park GO Series 2007 TAN, | | | | | | |
3.75%, 11/14/08 | | | 950 | | | 952,565 |
Essex County Utilities Authority GO Series 2007 MB, | | | | | | |
3.75%, 11/14/08 | | | 750 | | | 751,796 |
Evesham Township GO Series 2007 BAN, | | | | | | |
4.12%, 8/08/08 | | | 605 | | | 605,729 |
Haddon Heights GO Series 2008A BAN, | | | | | | |
2.10%, 8/08/08 | | | 150 | | | 150,089 |
Hamilton Township GO Series 2008 BAN, | | | | | | |
2.00%, 2/06/09 | | | 300 | | | 300,399 |
Hammonton GO Series 2008 BAN, | | | | | | |
3.50%, 1/09/09 | | | 1,100 | | | 1,105,041 |
Highlands GO Series 2008 BAN, | | | | | | |
3.12%, 1/29/09 | | | 400 | | | 401,660 |
Hillsborough Township GO Series 2007 BAN, | | | | | | |
3.75%, 12/12/08 | | | 140 | | | 140,615 |
Howell Township GO Series 2007B BAN, | | | | | | |
4.00%, 9/16/08 | | | 705 | | | 705,840 |
Hudson County Improvement Authority RB (Essential Purpose Pooled Government Project) Series 1986 DN (Bank of New York LOC), | | | | | | |
2.05%, 4/07/08(a) | | | 6,320 | | | 6,320,000 |
Keyport GO Series 2007 BAN, | | | | | | |
4.12%, 8/08/08 | | | 980 | | | 981,146 |
Lakewood Township GO Series 2007 BAN, | | | | | | |
4.25%, 7/11/08 | | | 250 | | | 250,299 |
Leonia GO Series 2008 BAN, | | | | | | |
2.50%, 2/27/09 | | | 400 | | | 401,764 |
Long Beach Township GO Series 2007A BAN, | | | | | | |
3.50%, 12/18/08 | | | 160 | | | 160,453 |
Lower Township GO Series 2007 BAN, | | | | | | |
4.00%, 5/30/08 | | | 430 | | | 430,187 |
Lower Township GO Series 2008 BAN, | | | | | | |
2.00%, 4/03/09 | | | 400 | | | 400,980 |
Lyndhurst Township GO Series 2008 BAN, | | | | | | |
2.00%, 5/09/08 | | | 200 | | | 200,033 |
Manasquan Township GO Series 2008 BAN, | | | | | | |
2.50%, 1/30/09 | | | 200 | | | 200,505 |
Maple Shade Township GO Series 2007 BAN, | | | | | | |
4.00%, 8/01/08 | | | 560 | | | 560,413 |
Maywood GO Series 2008 BAN, | | | | | | |
2.50%, 3/20/09 | | | 200 | | | 200,967 |
Mercer County GO Series 2007B BAN, | | | | | | |
3.50%, 6/13/08 | | | 750 | | | 750,809 |
Mercer County Improvement Authority RB (Atlantic Foundation Project) Series 1998 DN (MBIA Insurance, Bank of America N.A. LOC), | | | | | | |
2.43%, 4/07/08(a) | | | 12,460 | | | 12,460,000 |
Middlesex County GO Series 2007 BAN, | | | | | | |
4.00%, 5/23/08 | | | 475 | | | 475,195 |
Montville Township GO Series 2007 BAN, | | | | | | |
4.00%, 5/23/08 | | | 487 | | | 487,264 |
New Jersey Economic Development Authority Multi-Mode IDRB (V&S Amboy Galvanizing LLC Project) Series 1999 AMT DN (KeyBank N.A. LOC), | | | | | | |
2.36%, 4/07/08(a) | | | 1,510 | | | 1,510,000 |
New Jersey Economic Development Authority RB (Applewood Estates Project) Series 2005 DN (Commerce Bank N.A. LOC), | | | | | | |
2.05%, 4/07/08(a) | | | 3,650 | | | 3,650,000 |
New Jersey Economic Development Authority RB (Cedar Crest Village, Inc. Project) Series 2006B DN (Sovereign Bank LOC, Bank of New York LOC), | | | | | | |
1.97%, 4/07/08(a) | | | 8,200 | | | 8,200,000 |
New Jersey Economic Development Authority RB (Frisch School Project) Series 2006 DN (Princeton University Guaranty, Kredietbank N.V. LOC, Sovereign Bank LOC), | | | | | | |
1.95%, 4/07/08(a) | | | 1,550 | | | 1,550,000 |
New Jersey Economic Development Authority RB (Hamilton Industrial Development Project) Series 1998 DN (Wachovia Bank N.A. LOC), | | | | | | |
2.18%, 4/07/08(a) | | | 1,340 | | | 1,340,000 |
New Jersey Economic Development Authority RB (J. James Realty Co. Project) Series 1998 AMT DN (Wachovia Bank N.A. LOC), | | | | | | |
2.18%, 4/07/08(a) | | | 390 | | | 390,000 |
New Jersey Economic Development Authority RB (Jacea LLC Project) Series 2004 DN (Wachovia Bank N.A. LOC), | | | | | | |
2.18%, 4/07/08(a) | | | 3,190 | | | 3,190,000 |
New Jersey Economic Development Authority RB (Jewish Family Service Project) Series 2002 DN (Wachovia Bank N.A. LOC), | | | | | | |
2.13%, 4/07/08(a) | | | 660 | | | 660,000 |
New Jersey Economic Development Authority RB (Lawrenceville School Project) Series 1996B DN (JPMorgan Chase Bank SBPA), | | | | | | |
0.80%, 4/01/08(a) | | | 1,000 | | | 1,000,000 |
New Jersey Economic Development Authority RB (Morris Museum Project) Series 2006 DN (JPMorgan Chase Bank LOC), | | | | | | |
1.97%, 4/07/08(a) | | | 3,300 | | | 3,300,000 |
New Jersey Economic Development Authority RB (Nandan Co. Project) Series 2000 AMT DN (M&T Bank Corp. LOC), | | | | | | |
2.26%, 4/07/08(a) | | | 2,650 | | | 2,650,000 |
See Notes to Financial Statements.
| | | | | | |
| | | SEMI-ANNUAL REPORT | | MARCH 31, 2008 | | 21 |
| | |
| Schedule of Investments (continued) | | New Jersey Municipal Money Market Portfolio (Percentages shown are based on Net Assets) |
| | | | | | |
| | | Par
(000) | | Value |
Municipal Bonds (Continued) | | | | | | |
New Jersey (Continued) | | | | | | |
New Jersey Economic Development Authority RB (Nandan Co. Project) Series 2001 AMT DN (M&T Bank Corp. LOC), | | | | | | |
2.26%, 4/07/08(a) | | $ | 1,025 | | $ | 1,025,000 |
New Jersey Economic Development Authority RB (Paddock Realty LLC Project) Series 2006 AMT DN (Wells Fargo Bank N.A. LOC), | | | | | | |
2.41%, 4/07/08(a) | | | 1,300 | | | 1,300,000 |
New Jersey Economic Development Authority RB (Pennington Montessori School Project) Series 1998 DN (Wachovia Bank N.A. LOC), | | | | | | |
2.18%, 4/07/08(a) | | | 1,045 | | | 1,045,000 |
New Jersey Economic Development Authority RB (Presbyterian Homes Project) Series 2006 DN (Commerce Bank LOC), | | | | | | |
2.21%, 4/07/08(a) | | | 1,400 | | | 1,400,000 |
New Jersey Economic Development Authority RB (Princeton Montessori Society Project) Series 2008 DN (Sovereign Bank LOC), | | | | | | |
2.30%, 4/07/08(a) | | | 2,000 | | | 2,000,000 |
New Jersey Economic Development Authority RB (School Facilities Project) Municipal Trust Receipts Floaters Series 2007-2420 DN (Morgan Stanley Municipal Funding Liquidity Facility, Morgan Stanley Municpal Funding Guaranty), | | | | | | |
2.31%, 4/07/08(a)(b) | | | 780 | | | 780,500 |
New Jersey Economic Development Authority RB (School Facilities Project) Municipal Trust Receipts Floaters Series 2008-2421 DN (Morgan Stanley Municipal Funding Liquidity Facility, Morgan Stanley Municpal Funding Guaranty), | | | | | | |
2.31%, 4/07/08(a)(b) | | | 1,080 | | | 1,079,500 |
New Jersey Economic Development Authority RB (Stuart Country Day School Project) Series 2002 DN (Allied Irish Bank Plc LOC), | | | | | | |
2.10%, 4/07/08(a) | | | 1,640 | | | 1,640,000 |
New Jersey Economic Development Authority RB MERLOTS Trust Receipts Series 2007D-41 DN (FSA Insurance, Wachovia Bank N.A. SBPA), | | | | | | |
2.30%, 4/07/08(a)(b) | | | 5,990 | | | 5,990,000 |
New Jersey Economic Development Authority RB P-Float Trust Receipts Series 2004 MT-035 DN (Assured Guaranty Ltd. Insurance, Landesbank Hessen-Thueringen Girozentrale SBPA), | | | | | | |
2.21%, 4/07/08(a)(b)(c) | | | 6,795 | | | 6,795,000 |
New Jersey Economic Development Authority RB Series 2004 ROC-RR-II-R-309 DN (Assured Guaranty Ltd. Insurance, Citibank N.A. Liquidity Facility), | | | | | | |
2.27%, 4/07/08(a)(b) | | | 5,565 | | | 5,565,000 |
New Jersey Economic Development Authority Thermal Energy Facilities RB (Marina Energy LLC Project) Series 2001A AMT DN (Wachovia Bank N.A. LOC), | | | | | | |
2.20%, 4/07/08(a) | | | 1,100 | | | 1,100,000 |
New Jersey Economic Development Authority Thermal Energy Facilities RB (Thermal Energy LP Project) Series 1995 AMT DN (Bank One N.A. LOC), | | | | | | |
2.20%, 4/07/08(a) | | | 500 | | | 500,000 |
New Jersey Environmental Infrastructure Trust RB Series 2004-585 AMT DN (JPMorgan Chase Bank Liquidity Facility), | | | | | | |
2.39%, 4/07/08(a)(b) | | | 3,965 | | | 3,965,000 |
New Jersey GO Series 2007 TRAN, | | | | | | |
4.50%, 6/24/08 | | | 6,000 | | | 6,011,937 |
New Jersey Health Care Facilities Financing Authority RB (Hospital Capital Asset Financing Project) Series 1985A DN (Wachovia Bank N.A. LOC), | | | | | | |
2.05%, 4/07/08(a) | | | 1,175 | | | 1,175,000 |
New Jersey Health Care Facilities Financing Authority RB (Meridian Health System Project) Series 2003B DN (Fleet National Bank LOC), | | | | | | |
2.15%, 4/07/08(a) | | | 4,700 | | | 4,700,000 |
New Jersey Health Care Facilities Financing Authority RB (South Jersey Hospital Systems Project) Series 2004A-4 DN (Wachovia Bank N.A. LOC), | | | | | | |
2.18%, 4/07/08(a) | | | 700 | | | 700,000 |
New Jersey Health Care Facilities Financing Authority RB (Virtua Health Project) Series 2004 DN (Wachovia Bank N.A. LOC), | | | | | | |
2.03%, 4/07/08(a) | | | 1,880 | | | 1,880,000 |
New Jersey Health Care Facilities Financing Authority RB P-Float Trust Receipts (Bayonnne Hospital Project) Series 2005L-26UD DN (FSA Insurance, Lehman Liquidity Co. Liquidity Facility), | | | | | | |
1.85%, 4/07/08(a)(b) | | | 4,000 | | | 4,000,000 |
New Jersey Health Care Facilities Financing Authority RB P-Float Trust Receipts (JFK Health System Obligation Group Project) Series 2008-2397 DN (Morgan Stanley Municipal Funding Liquidity Facility), | | | | | | |
2.31%, 4/07/08(a)(b) | | | 870 | | | 870,000 |
New Jersey Housing & Mortgage Finance Agency RB (Multi-Family Housing Project) Series 2002D DN (FSA Insurance, Lehman SBPA), | | | | | | |
1.98%, 4/07/08(a)(b) | | | 200 | | | 200,000 |
New Jersey Housing & Mortgage Finance Agency RB (Single Family Housing Project) Series 2005O AMT DN (Dexia Credit Local LOC), | | | | | | |
1.88%, 4/07/08(a) | | | 500 | | | 500,000 |
New Jersey Sports & Exposition Authority State Contract RB Series 1992C DN (MBIA Insurance, Credit Suisse SBPA), | | | | | | |
3.25%, 4/07/08(a) | | | 1,085 | | | 1,085,000 |
New Jersey Transportation Trust Fund Authority Capital Appreciation RB Series 2006 ROC-RR-II-R-684Z DN (AMBAC Insurance, Citibank N.A. Liquidity Facility), | | | | | | |
2.79%, 4/07/08(a)(b) | | | 590 | | | 590,000 |
New Jersey Transportation Trust Fund Authority Capital Appreciation RB Series 2007DB-447 DN (FSA Insurance, AMBAC Insurance, Deutsche Bank Liquidity Facility), | | | | | | |
2.28%, 4/07/08(a)(b) | | | 3,750 | | | 3,750,000 |
New Jersey Transportation Trust Fund Authority RB Municipal Trust Receipts Floaters Series 2004-963D DN (FGIC Insurance, Transamerica Life Insurance Co. Guaranty, Morgan Stanley Municipal Funding Liquidity Facility), | | | | | | |
2.31%, 4/07/08(a)(b) | | | 5,100 | | | 5,100,000 |
New Jersey Transportation Trust Fund Authority RB PUTTERS Series 2001-241 DN (FSA Insurance, JPMorgan Chase & Co. Liquidity Facility), | | | | | | |
2.29%, 4/07/08(a)(b) | | | 1,545 | | | 1,545,000 |
See Notes to Financial Statements.
| | | | | | |
22 | | SEMI-ANNUAL REPORT | | MARCH 31, 2008 | | |
| | |
| Schedule of Investments (continued) | | New Jersey Municipal Money Market Portfolio (Percentages shown are based on Net Assets) |
| | | | | | |
| | | Par
(000) | | Value |
Municipal Bonds (Continued) | | | | | | |
New Jersey (Continued) | | | | | | |
New Jersey Turnpike Authority RB Municipal Trust Receipts Floaters Series 2005-K9D DN (FSA Insurance, Lehman Liquidity Co. Liquidity Facility), | | | | | | |
1.93%, 4/07/08(a)(b) | | $ | 1,300 | | $ | 1,300,000 |
New Jersey Turnpike Authority RB Series 2003C-1 DN (FSA Insurance, WestLB AG SBPA), | | | | | | |
1.75%, 4/07/08(a) | | | 3,100 | | | 3,100,000 |
New Jersey Turnpike Authority RB Series 2006 DN (FSA Insurance, Dexia Credit Local SBPA), | | | | | | |
1.75%, 4/07/08(a) | | | 1,600 | | | 1,600,000 |
New Milford GO Series 2008 BAN, | | | | | | |
2.25%, 1/30/09 | | | 200 | | | 200,342 |
New Providence GO Series 2008 BAN, | | | | | | |
2.50%, 2/20/09 | | | 100 | | | 100,605 |
Newark Housing Authority Port Newark Marine Terminal Additional Rent-Backed RB Municipal Trust Receipts Floaters (Newark Redevelopment Project) Series 2007-2044 DN (MBIA Insurance), | | | | | | |
2.27%, 4/07/08(a)(b) | | | 555 | | | 555,000 |
North Wildwood GO Series 2007 BAN, | | | | | | |
3.75%, 12/12/08 | | | 1,100 | | | 1,104,531 |
Northvale GO Series 2008 BAN, | | | | | | |
2.50%, 2/20/09 | | | 100 | | | 100,605 |
Oakland GO Series 2008 BAN, | | | | | | |
2.25%, 2/11/09 | | | 100 | | | 100,270 |
2.50%, 2/11/09 | | | 500 | | | 502,998 |
Park Ridge GO Series 2008 BAN, | | | | | | |
2.00%, 2/06/09 | | | 200 | | | 200,149 |
Pascack Valley Regional High School District GO | | | | | | |
Series 2008 TAN, | | | | | | |
2.00%, 2/06/09 | | | 200 | | | 200,150 |
Pennsauken Township GO Series 2007A BAN, | | | | | | |
4.00%, 9/10/08 | | | 1,220 | | | 1,221,559 |
Pilesgrove Township GO Series 2007 BAN, | | | | | | |
4.00%, 8/28/08 | | | 1,100 | | | 1,100,647 |
Port Authority of New York & New Jersey RB Eagle Trust Receipts Series 2006A-107 AMT DN (Landesbank Hessen-Thuringen Girozentrale Liquidity Facility), | | | | | | |
2.31%, 4/07/08(a)(b) | | | 2,000 | | | 2,000,000 |
Port Authority of New York & New Jersey RB Series 2006-1546 DN (JPMorgan Chase Bank Liquidity Facility), | | | | | | |
2.29%, 4/07/08(a)(b) | | | 1,300 | | | 1,300,000 |
Port Authority of New York & New Jersey Special Obligation RB (Versatile Structure Obligation Project) Series 1994-2 DN (JPMorgan Chase & Co. SBPA), | | | | | | |
0.98%, 4/01/08(a) | | | 700 | | | 700,000 |
Port Authority of New York & New Jersey Special Obligation RB (Versatile Structure Obligation Project) Series 1996-4 AMT DN (Landesbank Hessen-Thuringen Girozentrale SBPA), | | | | | | |
1.09%, 4/01/08(a) | | | 600 | | | 600,000 |
Port Authority of New York & New Jersey Special Obligation RB (Versatile Structure Obligation Project) Series 1997-1R AMT DN (Bayerische Landesbank Gironzentrale SBPA), | | | | | | |
1.25%, 4/01/08(a) | | | 3,000 | | | 3,000,000 |
Port Authority of New York & New Jersey TECP, | | | | | | |
1.50%, 4/03/08 | | | 2,000 | | | 2,000,000 |
1.60%, 4/03/08 | | | 2,000 | | | 2,000,000 |
1.65%, 6/05/08 | | | 3,000 | | | 3,000,000 |
Rahway GO Series 2007 BAN, | | | | | | |
4.25%, 6/24/08 | | | 310 | | | 310,294 |
Ringwood Borough GO Series 2007 BAN, | | | | | | |
3.75%, 11/07/08 | | | 800 | | | 801,813 |
Rutherford Borough GO Series 2007 BAN, | | | | | | |
3.50%, 7/01/08 | | | 300 | | | 300,301 |
4.00%, 7/17/08 | | | 685 | | | 685,423 |
Salem County Pollution Control Financing Authority RB (Atlantic City Electric Co. Project) Series 1997B AMT DN (MBIA Insurance, Bank of New York LOC), | | | | | | |
2.25%, 4/07/08(a) | | | 1,390 | | | 1,390,000 |
South Bound Brook GO Series 2007 BAN, | | | | | | |
4.00%, 8/22/08 | | | 395 | | | 395,401 |
Summit GO Series 2007 BAN, | | | | | | |
3.75%, 12/12/08 | | | 530 | | | 532,038 |
Tinton Falls GO Series 2008 BAN, | | | | | | |
3.12%, 1/23/09 | | | 150 | | | 150,635 |
Tuckerton GO Series 2007 BAN, | | | | | | |
4.00%, 6/20/08 | | | 546 | | | 546,252 |
Union Township GO Series 2008 BAN, | | | | | | |
3.50%, 1/09/09 | | | 650 | | | 652,978 |
Waldwick GO Series 2007 BAN, | | | | | | |
4.00%, 6/20/08 | | | 470 | | | 470,208 |
Washington Township GO Series 2007 BAN, | | | | | | |
4.00%, 10/24/08 | | | 1,039 | | | 1,041,879 |
3.25%, 12/26/08 | | | 350 | | | 350,547 |
Westfield GO Series 2007 BAN, | | | | | | |
4.00%, 7/18/08 | | | 775 | | | 776,091 |
Woodbury School District GO Series 2007 GAN, | | | | | | |
4.00%, 12/04/08 | | | 600 | | | 602,385 |
| | | | | | |
Total Investments in Securities — 88.1% | | | | | | |
(Cost $173,143,390*) | | | | | | 173,143,390 |
Other Assets in Excess of Liabilities — 11.9% | | | | | | 23,345,694 |
| | | | | | |
Net Assets — 100.0% | | | | | $ | 196,489,084 |
| | | | | | |
| * | Aggregate cost for federal income tax purposes. |
| (a) | Rate shown is as of report date and maturities shown are the next interest readjustment date or the date the principal owed can be recovered through demand. |
See Notes to Financial Statements.
| | | | | | |
| | | SEMI-ANNUAL REPORT | | MARCH 31, 2008 | | 23 |
| | |
| Schedule of Investments (concluded) | | New Jersey Municipal Money Market Portfolio (Percentages shown are based on Net Assets) |
| (b) | Security exempt from registration under Rule 144A of the Securities Act of 1933. These securities may be resold in transactions exempt from registration to qualified institutional investors. Unless otherwise indicated, these securities are not considered to be illiquid. |
| (c) | Investments in companies considered to be an affiliate of the Portfolio were as follows: |
| | | | | | | | | | |
Affiliate | | Purchase
Cost | | Sales
Cost | | Realized
Gain | | Interest
Income |
New Jersey Economic Development Authority RB P-Float Trust Receipts Series
2004 MT-035 DN (Assured Guaranty Ltd. Insurance, Landesbank
Hessen-Thuringen Girozentrale SBPA) | | — | | | — | | — | | $ | 102,491 |
New Jersey Health Care Facilities Financing Authority RB P-Float Trust Receipts Series 2001 PT-1319 DN (AMBAC Insurance, Merrill Lynch Capital Services SBPA) | | — | | $ | 7,415,000 | | — | | $ | 27,616 |
Port Authority of New York & New Jersey RB P-Float Trust Receipts Series
2004-056 DN (FGIC Insurance, Banque Nationale de Paribas SBPA) | | — | | $ | 7,855,000 | | — | | $ | 88,829 |
| • | For Portfolio compliance purposes, the Portfolio’s sector and industry classifications refer to any one or more of the Standard Industry Codes as defined by the SEC. This definition may not apply for purposes of this report, which may combine sector and industry sub-classifications for reporting ease. |
See Notes to Financial Statements.
| | | | | | |
24 | | SEMI-ANNUAL REPORT | | MARCH 31, 2008 | | |
| | |
| Schedule of Investments March 31, 2008 (Unaudited) | | North Carolina Municipal Money Market Portfolio (Percentages shown are based on Net Assets) |
| | | | | | |
| | | Par
(000) | | Value |
Municipal Bonds — 99.7% | | | | | | |
North Carolina — 96.4% | | | | | | |
Cabarrus County Installment Financing Contract COP Series 2003 ROC-RR-II-4520 DN (AMBAC Insurance, Citigroup Financial Products Liquidity Facility), | | | | | | |
2.39%, 4/07/08(a)(b) | | $ | 900 | | $ | 900,000 |
Carrboro GO Series 2007 BAN, | | | | | | |
3.75%, 8/27/08 | | | 715 | | | 715,789 |
Charlotte Airport RB Series 1999D DN (MBIA Insurance, Bank of America N.A. SBPA), | | | | | | |
2.65%, 4/01/08(b) | | | 2,000 | | | 2,000,000 |
Charlotte COP (Transit Projects Phase II Project) Series 2005F DN (Depfa Bank Plc SBPA), | | | | | | |
2.05%, 4/07/08(b) | | | 2,665 | | | 2,665,000 |
Charlotte GO Series 2007 DN (KBC Bank N.V. SBPA), | | | | | | |
2.10%, 4/07/08(b) | | | 400 | | | 400,000 |
Charlotte Water & Sewer System GO Series 2007 TECP, | | | | | | |
3.05%, 7/22/08 | | | 3,500 | | | 3,500,000 |
Charlotte Water & Sewer System RB Munitops Trust Certificates Series 2007-10 DN (Bank of America N.A. SBPA), | | | | | | |
2.24%, 4/07/08(a)(b) | | | 2,000 | | | 2,000,000 |
Charlotte-Mecklenburg Hospital Authority RB (Carolina’s Healthcare System Project) Series 2006-1388 DN (Morgan Stanley Group Liquidity Facility), | | | | | | |
2.21%, 4/07/08(a)(b) | | | 2,900 | | | 2,900,000 |
Charlotte-Mecklenburg Hospital Authority RB (Carolina’s Healthcare System Project) Series 2007F DN (FSA Insurance, Dexia Credit Local SBPA), | | | | | | |
2.10%, 4/01/08(b) | | | 920 | | | 920,000 |
East Moore Water District GO Series 2007 BAN, | | | | | | |
4.25%, 4/02/08 | | | 2,100 | | | 2,100,023 |
Fayetteville Public Works Commission RB Series 2003A DN (FSA Insurance, Dexia Credit Local SBPA), | | | | | | |
2.05%, 4/07/08(b) | | | 1,400 | | | 1,400,000 |
Fayetteville Public Works Commission RB Series 2003 DN (FSA Insurance, Dexia Credit Local SBPA), | | | | | | |
2.05%, 4/07/08(b) | | | 2,440 | | | 2,440,000 |
Guilford County GO Series 2005B DN (Wachovia Bank N.A. SBPA), | | | | | | |
2.10%, 4/07/08(b) | | | 600 | | | 600,000 |
Mecklenburg County COP Series 2006 DN (DEPFA Bank Plc SBPA), | | | | | | |
2.08%, 4/07/08(b) | | | 500 | | | 500,000 |
Mecklenburg County COP Series 2008A DN (SunTrust Bank SBPA), | | | | | | |
2.25%, 4/07/08(b) | | | 5,000 | | | 5,000,000 |
Mecklenburg County GO Series 1996C DN (Bank of America N.A. LOC), | | | | | | |
2.08%, 4/07/08(b) | | | 2,200 | | | 2,200,000 |
Mecklenburg County GO Series 2005B DN (Wachovia Bank N.A. SBPA), | | | | | | |
2.08%, 4/07/08(b) | | | 515 | | | 515,000 |
Mecklenburg County GO Series 2006A DN (DEPFA Bank Plc SBPA), | | | | | | |
2.08%, 4/07/08(b) | | | 590 | | | 590,000 |
New Hanover County COP Series 2007 DN (DEFPA Bank Plc SBPA), | | | | | | |
2.08%, 4/07/08(b) | | | 1,300 | | | 1,300,000 |
North Carolina Capital Facilities Finance Agency Educational Facilities RB (High Point University Project) Series 2006 DN (Branch Banking & Trust Co. LOC), | | | | | | |
2.28%, 4/07/08(b) | | | 790 | | | 790,000 |
North Carolina Capital Facilities Finance Agency Educational Facilities RB (Megellan Charter School Project) Series 2007 DN (Wachovia Bank N.A. LOC), | | | | | | |
2.15%, 4/07/08(b) | | | 1,300 | | | 1,300,000 |
North Carolina Capital Facilities Finance Agency Educational Facilities RB (The Downtown Middle School Project) Series 2006 DN (Branch Banking & Trust Co. LOC), | | | | | | |
2.28%, 4/07/08(b) | | | 1,150 | | | 1,150,000 |
North Carolina Capital Facilities Finance Agency RB (Aquarium Society Project) Series 2004 DN (Bank of America N.A. LOC), | | | | | | |
2.10%, 4/07/08(b) | | | 3,515 | | | 3,515,000 |
North Carolina Capital Facilities Finance Agency RB Eagle Trust Receipts Series 2006A DN (Citibank N.A. Liquidity Facility), | | | | | | |
2.25%, 4/07/08(a)(b) | | | 1,000 | | | 1,000,000 |
North Carolina Capital Facilities Finance Agency RB Municipal Trust Receipts Floaters Series 2007-1894 DN (Morgan Stanley Group Liquidity Facility), | | | | | | |
2.16%, 4/07/08(a)(b) | | | 106 | | | 106,000 |
North Carolina Capital Facilities TECP, | | | | | | |
2.25%, 5/01/08 | | | 1,000 | | | 1,000,000 |
North Carolina Educational Facilities Finance Agency RB (Duke University Project) Series 1991B DN, | | | | | | |
1.60%, 4/07/08(b) | | | 9,900 | | | 9,900,000 |
North Carolina Educational Facilities Finance Agency RB (Duke University Project) Series 1992A DN, | | | | | | |
1.60%, 4/07/08(b) | | | 1,200 | | | 1,200,000 |
North Carolina GO MERLOTS Trust Receipts Series 2008C-04 DN (Wachovia Bank N.A. LOC), | | | | | | |
2.05%, 4/07/08(a)(b) | | | 1,400 | | | 1,400,000 |
North Carolina GO Series 2003A-23 MB (Wachovia Bank N.A. SBPA), | | | | | | |
2.00%, 2/09/09(a)(b) | | | 800 | | | 800,000 |
North Carolina HFA RB (Home Ownership Project) Series 2003-17-C AMT DN (Bank of America N.A. Liquidity Facility), | | | | | | |
2.30%, 4/07/08(b) | | | 350 | | | 350,000 |
North Carolina Medical Care Commission Health Care Facilities RB (Duke University Health System Project) Series 2005A DN, | | | | | | |
2.07%, 4/07/08(b) | | | 1,650 | | | 1,650,000 |
North Carolina Medical Care Commission Health Care Facilities RB (Duke University Health System Project) Series 2005B DN, | | | | | | |
2.07%, 4/07/08(b) | | | 700 | | | 700,000 |
North Carolina Medical Care Commission Health Care Facilities RB (Novant Health Group Project) Series 2004A DN (JPMorgan Chase Bank SBPA), | | | | | | |
2.08%, 4/07/08(b) | | | 1,600 | | | 1,600,000 |
See Notes to Financial Statements.
| | | | | | |
| | | SEMI-ANNUAL REPORT | | MARCH 31, 2008 | | 25 |
| | |
| Schedule of Investments (concluded) | | North Carolina Municipal Money Market Portfolio (Percentages shown are based on Net Assets) |
| | | | | | |
| | | Par
(000) | | Value |
Municipal Bonds (Continued) | | | | | | |
North Carolina (Continued) | | | | | | |
North Carolina Medical Care Commission Health Care Facilities RB (Novant Health Group Project) Series 2004B DN (Morgan Stanley Guaranty Trust LOC), | | | | | | |
1.80%, 4/07/08(b) | | $ | 2,900 | | $ | 2,900,000 |
North Carolina Medical Care Commission Health Care Facilities RB (Watauga Medical Center Project) Series 2005 DN (Wachovia Bank N.A. LOC), | | | | | | |
2.10%, 4/07/08(b) | | | 1,000 | | | 1,000,000 |
North Carolina Medical Care Commission Health Care Facilities RB Series 2007 ROC-RR-II- R-10313 DN (Citigroup Financial Products Liquidity Facility), | | | | | | |
2.31%, 4/07/08(a)(b) | | | 3,700 | | | 3,700,000 |
North Carolina Medical Care Commission Hospital RB (Aces-Pooled Equipment Financing Project) Series 1985 DN (MBIA Insurance, KBC Bank N.V. SBPA), | | | | | | |
3.50%, 4/07/08(b) | | | 500 | | | 500,000 |
North Carolina Medical Care Commission Hospital RB (Moses Cone Health Systems Project) Series 2001B DN (Chase Manhattan Bank LOC), | | | | | | |
2.00%, 4/07/08(b) | | | 200 | | | 200,000 |
North Carolina Medical Care Commission Retirement Facilities RB (Aldersgate Project) Series 2001 DN (Branch Banking & Trust Co. LOC), | | | | | | |
2.25%, 4/07/08(b) | | | 4,400 | | | 4,400,000 |
North Carolina Medical Care Commission Retirement Facilities RB (United Church Homes & Services Project) Series 2007 DN (Branch Banking & Trust Co. LOC), | | | | | | |
2.28%, 4/07/08(b) | | | 500 | | | 500,000 |
North Carolina Municipal Power Agency RB Series 2003 ROCS-RR-11 R211 DN (MBIA Insurance, Citibank N.A. Liquidity Facility), | | | | | | |
2.59%, 4/07/08(a)(b) | | | 1,100 | | | 1,100,000 |
Oneals Water District GO Series 2007 BAN, | | | | | | |
3.75%, 7/23/08 | | | 885 | | | 885,667 |
Raleigh Comb Enterprise System RB Eagle Trust Receipts Series 2007A-0010 DN (Landesbank Hessen-Thueringen Girozentrale Liquidity Facility), | | | | | | |
2.23%, 4/07/08(a)(b) | | | 1,275 | | | 1,275,000 |
Sampson County COP Eclipse Funding Trust Series 2006-0160 DN (FSA Insurance, U.S. Bank N.A. Liquidity Facility), | | | | | | |
3.60%, 4/07/08(a)(b) | | | 700 | | | 700,000 |
South Central Water & Sewer District GO Series 2008 BAN, | | | | | | |
2.75%, 12/17/08 | | | 1,715 | | | 1,717,972 |
Spring Lake GO Series 2007 BAN, | | | | | | |
3.90%, 5/21/08 | | | 300 | | | 300,144 |
Trinity GO Series 2007 BAN, | | | | | | |
4.25%, 4/23/08 | | | 500 | | | 500,113 |
University of North Carolina at Chapel Hill RB Munitops Trust Certificates Series 2005-52 DN (Bank of America N.A. SBPA), | | | | | | |
2.24%, 4/07/08(a)(b) | | | 2,600 | | | 2,600,000 |
University of North Carolina at Chapel Hill RB Series 2001B DN, | | | | | | |
2.08%, 4/07/08(b) | | | 790 | | | 790,000 |
Wake County GO Series 2006B DN (Lloyds TSB Bank Plc SBPA), | | | | | | |
2.15%, 4/07/08(b) | | | 1,900 | | | 1,899,930 |
Wake County HFA RB (Casa Melvid Multi-Family Housing Project) Series 2001A AMT DN (SunTrust Bank LOC), | | | | | | |
2.24%, 4/07/08(b) | | | 400 | | | 400,000 |
Washington County Industrial Facilities PCRB (Mackey’s Ferry Sawmill, Inc. Project) Series 1997 AMT DN (Wachovia Bank N.A. LOC), | | | | | | |
2.20%, 4/07/08(b) | | | 330 | | | 330,000 |
Wilmington GO Series 2002 DN (Wachovia Bank N.A. SBPA), | | | | | | |
2.10%, 4/07/08(b) | | | 300 | | | 300,000 |
Winston-Salem COP (Risk Acceptance Management Corp. Project) Series 1988 DN (Dexia Credit Local LOC), | | | | | | |
2.15%, 4/07/08(b) | | | 400 | | | 400,000 |
Winston-Salem Water & Sewer Systems RB Series 2002C DN (Dexia Credit Local LOC), | | | | | | |
2.10%, 4/07/08(b) | | | 2,610 | | | 2,610,000 |
| | | | | | |
| | | | | | 88,115,638 |
| | | | | | |
Puerto Rico — 3.3% | | | | | | |
Commonwealth of Puerto Rico GO Series 2007 TRAN (Bank of Nova Scotia, Banque Nationale de Paribas, Dexia Credit Local, Fortis Bank, Banco Bilbao Vizcaya Argentaria S.A., KBC Bank N.V. and Banco Santander Central Hisapano LOC), | | | | | | |
4.25%, 7/30/08 | | | 3,000 | | | 3,008,193 |
| | | | | | |
Total Investments in Securities — 99.7% | | | | | | |
(Cost $91,123,831*) | | | | | | 91,123,831 |
Other Assets in Excess of Liabilities — 0.3% | | | | | | 301,747 |
| | | | | | |
Net Assets — 100.0% | | | | | $ | 91,425,578 |
| | | | | | |
| * | Aggregate cost for federal income tax purposes. |
| (a) | Security exempt from registration under Rule 144A of the Securities Act of 1933. These securities may be resold in transactions exempt from registration to qualified institutional investors. Unless otherwise indicated, these securities are not considered to be illiquid. |
| (b) | Rate shown is as of report date and maturities shown are the next interest readjustment date or the date the principal owed can be recovered through demand. |
| • | For Portfolio compliance purposes, the Portfolio’s sector and industry classifications refer to any one or more of the Standard Industry Codes as defined by the SEC. This definition may not apply for purposes of this report, which may combine sector and industry sub-classifications for reporting ease. |
See Notes to Financial Statements.
| | | | | | |
26 | | SEMI-ANNUAL REPORT | | MARCH 31, 2008 | | |
| | |
| Schedule of Investments March 31, 2008 (Unaudited) | | Ohio Municipal Money Market Portfolio (Percentages shown are based on Net Assets) |
| | | | | | |
| | | Par
(000) | | Value |
Municipal Bonds — 99.6% | | | | | | |
Ohio — 99.6% | | | | | | |
American Municipal Power, Inc. GO (Amherst City Project) Series 2007 BAN, | | | | | | |
3.50%, 11/25/08 | | $ | 150 | | $ | 150,000 |
American Municipal Power, Inc. GO (Bowling Green Project) Series 2007 BAN, | | | | | | |
3.50%, 11/25/08 | | | 550 | | | 550,000 |
American Municipal Power, Inc. GO (Brewster Village Project) Series 2008 RAN, | | | | | | |
3.50%, 1/09/09 | | | 150 | | | 150,457 |
American Municipal Power, Inc. GO (Electric System-Lodi Village Project) Series 2008 BAN, | | | | | | |
3.00%, 3/12/09 | | | 300 | | | 301,402 |
American Municipal Power, Inc. GO (Hubbard Project) Series 2007 BAN, | | | | | | |
3.70%, 9/25/08 | | | 175 | | | 175,000 |
American Municipal Power, Inc. GO (Oberlin Project) Series 2007 BAN, | | | | | | |
3.50%, 12/04/08 | | | 115 | | | 115,000 |
American Municipal Power, Inc. GO (Shelby Project) Series 2007 BAN, | | | | | | |
3.45%, 11/13/08 | | | 1,500 | | | 1,500,000 |
American Municipal Power, Inc. GO (St. Mary’s Electric System Project) Series 2007 BAN, | | | | | | |
3.70%, 10/02/08 | | | 145 | | | 145,000 |
American Municipal Power, Inc. GO Series 2007 BAN, | | | | | | |
3.50%, 10/30/08 | | | 600 | | | 600,000 |
American Municipal Power, Inc. GO Series 2008A TECP (JPMorgan Chase Bank LOC), | | | | | | |
2.55%, 4/04/08 | | | 3,000 | | | 3,000,000 |
American Municipal Power, Inc. RB (Combustion Turbine Project) Series 2006 DN (KeyBank N.A. LOC), | | | | | | |
2.24%, 4/07/08(a) | | | 620 | | | 620,000 |
American Municipal Power, Inc. RB (Electric Systems Project) Series 2007 BAN, | | | | | | |
3.85%, 8/15/08 | | | 1,200 | | | 1,200,000 |
Avon Local School District GO Series 2008 BAN, | | | | | | |
3.50%, 1/08/09 | | | 550 | | | 552,139 |
Barberton GO Series 2007 BAN, | | | | | | |
3.75%, 11/13/08 | | | 200 | | | 200,322 |
Barberton GO Series 2008 BAN, | | | | | | |
2.25%, 4/08/09 | | | 350 | | | 351,368 |
Brooklyn IDRB (Dylon Industries, Inc. Project) Series 1999 AMT DN (KeyBank N.A. LOC), | | | | | | |
2.36%, 4/07/08(a) | | | 630 | | | 630,000 |
Brunswick GO Series 2007 BAN, | | | | | | |
3.70%, 12/04/08 | | | 100 | | | 100,163 |
Buckeye Tobacco Settlement Financing Authority RB Series 2007 ROC-RR-II-R-10308 DN (Citigroup Financial Products Liquidity Facility, Citigroup Financial Products Guaranty), | | | | | | |
2.27%, 4/07/08(a)(b) | | | 1,000 | | | 1,000,000 |
Buckeye Tobacco Settlement Financing Authority RB Series 2008-619 DN (Deutsche Bank A.G. Guaranty, Deutsche Bank A.G. Liquidity Facility), | | | | | | |
2.27%, 4/07/08(a)(b) | | | 11,500 | | | 11,500,000 |
Butler County GO Series 2007 BAN, | | | | | | |
4.10%, 8/07/08 | | | 260 | | | 260,585 |
Celina GO Series 2007 BAN, | | | | | | |
3.75%, 11/12/08 | | | 400 | | | 400,688 |
Cincinnati School District COP Series 2007 ROC-RR-II-R-12049 DN (FSA Insurance, Citigroup Financial Products Liquidity Facility), | | | | | | |
2.28%, 4/07/08(a)(b) | | | 1,000 | | | 1,000,000 |
Cincinnati Student Loan Funding Corp. RB Series 1998A-2 AMT DN (Citibank N.A. Liquidity Facility), | | | | | | |
2.17%, 4/01/08(a) | | | 1,000 | | | 1,000,000 |
Clark County GO Series 2007 BAN, | | | | | | |
4.00%, 5/08/08 | | | 300 | | | 300,082 |
Clark County GO Series 2008 BAN, | | | | | | |
2.50%, 2/11/09 | | | 100 | | | 100,338 |
Cleveland Waterworks RB Series 2006 DN (FSA Insurance, Dexia Credit Local SBPA), | | | | | | |
1.95%, 4/07/08(a) | | | 420 | | | 420,000 |
Cleveland-Cuyahoga County Port Authority Educational Facility RB (Laurel School Project) Series 2004 DN (KeyBank N.A. LOC), | | | | | | |
2.29%, 4/07/08(a) | | | 1,070 | | | 1,070,000 |
Clinton County GO (Human Services Project) Series 2008 BAN, | | | | | | |
3.88%, 4/10/08 | | | 300 | | | 300,073 |
Clinton Massie Local School Distriict GO Series 2007 BAN, | | | | | | |
4.00%, 11/18/08 | | | 600 | | | 602,050 |
Columbus GO (Police-Firemen Disability Project) Series 1998 MB, | | | | | | |
5.00%, 4/07/08 | | | 250 | | | 255,096 |
Columbus Regional Airport Authority RB PUTTERS Series 2007-2353 DN (FSA Insurance, JPMorgan Chase Bank Liquidity Facility), | | | | | | |
2.29%, 4/07/08(a)(b) | | | 3,690 | | | 3,690,000 |
Columbus Sewerage System RB Series 2008B DN, | | | | | | |
1.78%, 4/07/08(a) | | | 1,000 | | | 1,000,000 |
Cuyahoga County Civic Facility RB (Orion Services, Inc. Project) Series 2001 DN (Bank One N.A. LOC), | | | | | | |
3.50%, 4/07/08(a) | | | 2,550 | | | 2,550,000 |
Cuyahoga County Economic Development RB (Berea Children’s Home Project) Series 2000 DN (Huntington National Bank LOC), | | | | | | |
2.46%, 4/07/08(a) | | | 2,800 | | | 2,800,000 |
Cuyahoga County Economic Development RB (Cleveland Botanical Garden Project) Series 2001 DN (M&T Bank Corp. LOC), | | | | | | |
2.27%, 4/07/08(a) | | | 635 | | | 635,000 |
Cuyahoga County IDRB (AFI Generations LLC Project) Series 2007B AMT DN (Charter One Bank N.A. LOC), | | | | | | |
2.31%, 4/07/08(a) | | | 2,015 | | | 2,015,000 |
Cuyahoga County IDRB (All Foils, Inc. Project) Series 2007A AMT DN (Charter One Bank N.A. LOC), | | | | | | |
2.31%, 4/07/08(a) | | | 1,000 | | | 1,000,000 |
Cuyahoga County IDRB (Trio Diversified Co. Project) Series 2000 AMT DN (KeyBank N.A. LOC), | | | | | | |
2.36%, 4/07/08(a) | | | 1,125 | | | 1,125,000 |
Delaware County Economic Development RB (The Columbus Zoological Park Assoc., Inc. Project) Series 2003 DN (Huntington National Bank LOC), | | | | | | |
2.60%, 4/07/08(a) | | | 3,705 | | | 3,705,000 |
Delaware County IDRB (Air Waves, Inc. Project) Series 1995 DN (KeyBank N.A. LOC), | | | | | | |
2.36%, 4/07/08(a) | | | 60 | | | 60,000 |
Dover GO Series 2007 BAN, | | | | | | |
4.25%, 4/03/08 | | | 775 | | | 775,022 |
Elyria GO Series 2007-2 BAN, | | | | | | |
4.00%, 10/02/08 | | | 1,100 | | | 1,102,024 |
See Notes to Financial Statements.
| | | | | | |
| | | SEMI-ANNUAL REPORT | | MARCH 31, 2008 | | 27 |
| | |
| Schedule of Investments (continued) | | Ohio Municipal Money Market Portfolio (Percentages shown are based on Net Assets) |
| | | | | | |
| | | Par
(000) | | Value |
Municipal Bonds (Continued) | | | | | | |
Ohio (Continued) | | | | | | |
Elyria GO Series 2007 BAN, | | | | | | |
4.25%, 7/03/08 | | $ | 260 | | $ | 260,254 |
Euclid GO Series 2007 BAN, | | | | | | |
4.00%, 5/29/08 | | | 780 | | | 780,297 |
Fairborn GO Series 2007 BAN, | | | | | | |
4.25%, 6/26/08 | | | 295 | | | 295,293 |
4.50%, 6/26/08-8/15/08 | | | 200 | | | 200,410 |
Fairborn GO Series 2008 BAN, | | | | | | |
3.25%, 10/30/08 | | | 80 | | | 80,274 |
Franklin County Economic Development RB (Columbus Montessori Educational Center Project) Series 2000 DN (Huntington National Bank LOC), | | | | | | |
2.31%, 4/07/08(a) | | | 1,460 | | | 1,460,000 |
Franklin County Economic Development RB (Dominican Sisters Project) Series 1994 DN (Fifth Third Bank N.A. LOC), | | | | | | |
2.29%, 4/07/08(a) | | | 850 | | | 850,000 |
Franklin County Health Care Facilities RB (Heritage Day Health Centers Project) Series 2002 DN (Huntington National Bank LOC), | | | | | | |
2.60%, 4/07/08(a) | | | 366 | | | 366,000 |
Franklin County Health Care Facilities RB (Ohio Presbyterian Retirement Services Project) Series 2006C DN (National City Bank N.A. LOC), | | | | | | |
2.40%, 4/07/08(a) | | | 6,665 | | | 6,665,000 |
Franklin County Health Care Facilities RB (Willow Brook Christian Project) Series 2004 DN (Fifth Third Bank N.A. LOC), | | | | | | |
2.47%, 4/07/08(a) | | | 500 | | | 500,000 |
Franklin County Hospital RB Series 2006 DN (AMBAC Insurance, Landesbank Hessen-Thueringen Girozentrale SBPA), | | | | | | |
4.50%, 4/07/08(a) | | | 10,050 | | | 10,050,000 |
Franklin County Senior Housing RB (St. George on the Commons Apartments Project) Series 2007 AMT DN (Federal National Mortgage Assoc. Insurance, Federal National Mortgage Assoc. Liquidity Facility), | | | | | | |
2.35%, 4/07/08(a) | | | 915 | | | 915,000 |
Fulton County RB (Fulton Couth Health Center Project) Series 2005 DN (JPMorgan Chase Bank LOC), | | | | | | |
4.00%, 4/07/08(a) | | | 2,475 | | | 2,475,000 |
Geauga County GO (Human Services Building Project) Series 2007 BAN, | | | | | | |
4.00%, 12/04/08 | | | 150 | | | 150,391 |
Geauga County GO (Safety Center Project) Series 2007 BAN, | | | | | | |
4.00%, 8/27/08 | | | 250 | | | 250,243 |
Geauga County RB (Thistle Lane Project) Series 2000 AMT DN (Huntington National Bank LOC), | | | | | | |
2.40%, 4/07/08(a) | | | 2,210 | | | 2,210,000 |
Greene County IDRB (AFC Stamping & Production, Inc., Barsplice Products Project) Series 1995 AMT DN (KeyBank N.A. LOC), | | | | | | |
2.36%, 4/07/08(a) | | | 95 | | | 95,000 |
Hamilton County GO Series 2007 BAN, | | | | | | |
4.00%, 9/11/08 | | | 1,240 | | | 1,241,331 |
Hamilton County Hospital Facilities RB (Health Alliance Project) Series 1997B DN (MBIA Insurance, Credit Suisse SBPA) ), | | | | | | |
5.00%, 4/07/08(a) | | | 2,280 | | | 2,280,000 |
Hamilton County Hospital Facilities RB P-Float Trust Receipts Series 2001 PT-507 DN (FSA Insurance, Svenska Handelsbanken AB SBPA), | | | | | | |
2.23%, 4/07/08(a)(b)(c) | | | 4,855 | | | 4,855,000 |
Indian Lake Local School District GO (School Construction Project) Series 2007 BAN, | | | | | | |
4.00%, 12/11/08 | | | 290 | | | 291,168 |
Kent GO Series 2007 BAN, | | | | | | |
4.00%, 10/16/08 | | | 300 | | | 300,627 |
Kent State University RB Municipal Trust Receipts Floaters Series 2001 DN (MBIA Insurance, Dexia Credit Local SBPA), | | | | | | |
2.80%, 4/07/08(a) | | | 4,125 | | | 4,125,000 |
Lake County GO Series 2007 BAN, | | | | | | |
4.25%, 5/15/08-7/18/08 | | | 495 | | | 495,484 |
Lancaster GO Series 2007 BAN, | | | | | | |
4.00%, 10/16/08 | | | 300 | | | 300,752 |
Lima GO (Water System Capacity Facility) Series 2007 BAN, | | | | | | |
4.25%, 5/29/08 | | | 1,510 | | | 1,510,806 |
Lorain County GO Series 2007B Highway Improvement BAN, | | | | | | |
4.25%, 6/04/08 | | | 720 | | | 720,606 |
Lorain County IDRB (Ohio Metallurgical Services Project) Series 2001 AMT DN (First Merit Bank N.A. LOC), | | | | | | |
2.62%, 4/07/08(a) | | �� | 1,270 | | | 1,270,000 |
Lucas County Economic Development RB (Hammill Manufacturing Co. Project) Series 1996 AMT DN (Fifth Third Bank N.A. LOC), | | | | | | |
2.30%, 4/07/08(a)(b) | | | 655 | | | 655,000 |
Mahoning County Housing RB (Youngstown State University Project) Series 2002 DN (National City Bank N.A. LOC), | | | | | | |
2.25%, 4/07/08(a) | | | 5,000 | | | 5,000,000 |
Marion County GO (Legacy Crossing Project) Series 2007 BAN, | | | | | | |
4.10%, 5/01/08 | | | 435 | | | 435,130 |
Marion GO Series 2007 BAN, | | | | | | |
4.00%, 6/26/08 | | | 285 | | | 285,129 |
Miami County GO Series 2007 BAN, | | | | | | |
4.00%, 11/27/08 | | | 550 | | | 552,056 |
Montgomery County RB (Miami Valley Hospital Project) Series 1998A DN (National City Bank N.A. SBPA), | | | | | | |
1.30%, 4/01/08(a) | | | 2,150 | | | 2,150,000 |
Muskingum County GO Series 2007 BAN, | | | | | | |
4.00%, 9/25/08 | | | 200 | | | 200,944 |
4.15%, 9/25/08 | | | 205 | | | 205,526 |
Muskingum County GO Series 2008 BAN, | | | | | | |
3.50%, 1/15/09 | | | 710 | | | 713,100 |
North Olmsted GO (Capital Improvement Project) Series 2008 BAN, | | | | | | |
2.35%, 4/02/09 | | | 550 | | | 551,073 |
North Ridgeville GO Series 2007-2 BAN, | | | | | | |
4.00%, 6/05/08 | | | 285 | | | 285,131 |
North Ridgeville GO Series 2007-3 BAN, | | | | | | |
3.95%, 6/05/08(d) | | | 195 | | | 195,074 |
Ohio Building Authority Facilities RB (Administrative Building Fund Projects) Series 1998A MB, | | | | | | |
5.25%, 4/07/08 | | | 55 | | | 56,396 |
See Notes to Financial Statements.
| | | | | | |
28 | | SEMI-ANNUAL REPORT | | MARCH 31, 2008 | | |
| | |
| Schedule of Investments (continued) | | Ohio Municipal Money Market Portfolio (Percentages shown are based on Net Assets) |
| | | | | | |
| | | Par
(000) | | Value |
Municipal Bonds (Continued) | | | | | | |
Ohio (Continued) | | | | | | |
Ohio GO (Common Schools Project) Series 2005A DN, | | | | | | |
1.95%, 4/07/08(a) | | $ | 280 | | $ | 280,000 |
Ohio Higher Educational Facility RB (Kenyon College Project) Series 1999 DN (JPMorgan Chase Bank Liquidity Facility), | | | | | | |
3.50%, 4/07/08(a) | | | 200 | | | 200,000 |
Ohio Housing Finance Agency Mortgage RB (Residential Mortgage-Backed Securities Program) Series 2006F AMT DN (Citibank N.A. LOC), | | | | | | |
2.00%, 4/07/08(a)(c) | | | 1,400 | | | 1,400,000 |
Ohio Housing Finance Agency Mortgage RB (Residential Mortgage-Backed Securities Program) Series 2007B AMT DN (Government National Mortgage Assoc. Insurance, Federal National Mortgage Assoc. Insurance, KBC Bank N.V. SBPA), | | | | | | |
1.95%, 4/07/08(a)(c) | | | 11,250 | | | 11,250,000 |
Ohio Housing Finance Agency Mortgage RB MERLOTS Trust Receipts Series 2001A-78 DN (Wachovia Bank N.A. LOC), | | | | | | |
2.30%, 4/07/08(a)(b) | | | 1,165 | | | 1,165,000 |
Ohio Housing Finance Agency Mortgage RB MERLOTS Trust Receipts Series 2005A-10 AMT DN (Wachovia Bank N.A. SBPA), | | | | | | |
2.30%, 4/07/08(a)(b) | | | 535 | | | 535,000 |
Ohio Housing Finance Agency Mortgage RB Various Certificates Series 2001 DN (Bank of America N.A. LOC), | | | | | | |
2.27%, 4/07/08(a)(b) | | | 1,105 | | | 1,105,000 |
Ohio Solid Waste RB (Republic Services, Inc. Project) Series 2005 AMT DN, | | | | | | |
2.65%, 4/07/08(a) | | | 1,000 | | | 1,000,000 |
Ohio Water Development Authority Pollution Control Facilities RB (First Energy Nuclear Project) Series 2006 AMT DN (Barclays Bank Plc LOC), | | | | | | |
2.00%, 4/07/08(a) | | | 125 | | | 125,000 |
Ohio Water Development Authority RB (Water Development Pure Water Project) Series 2002B DN (MBIA Insurance, State Street Bank & Trust Co. SBPA), | | | | | | |
5.00%, 4/07/08(a) | | | 2,050 | | | 2,050,000 |
Olmsted Falls School District GO Series 2008 BAN, | | | | | | |
3.75%, 12/18/08 | | | 150 | | | 150,603 |
3.50%, 1/15/09 | | | 300 | | | 301,379 |
Painesville GO Series 2007 BAN, | | | | | | |
4.00%, 11/07/08 | | | 200 | | | 200,580 |
Parma IDRB (FDC Realty Project) Series 2006 AMT DN (Huntington National Bank LOC), | | | | | | |
2.70%, 4/07/08(a) | | | 1,890 | | | 1,890,000 |
Pickerington GO Series 2008 BAN, | | | | | | |
2.25%, 2/27/09 | | | 750 | | | 753,513 |
Port of Greater Cincinnati RB (Springdale Public Infrastructure Project) Series 2006 MB (U.S. Bank N.A. LOC), | | | | | | |
2.25%, 2/01/09 | | | 2,800 | | | 2,800,000 |
Portage County IDRB (Action Super Abrasive Project) Series 1996 AMT DN (Huntington National Bank LOC), | | | | | | |
2.63%, 4/07/08(a) | | | 630 | | | 630,000 |
Portage County IDRB (Singer Steel Co. Project) Series 2007 AMT DN (Huntington National Bank LOC), | | | | | | |
2.70%, 4/07/08(a) | | | 2,090 | | | 2,090,000 |
Putnam County Health Care Facilities RB (Hilty Memorial Home Project) Series 2004 DN (LaSalle Bank N.A. LOC), | | | | | | |
2.30%, 4/07/08(a) | | | 3,330 | | | 3,330,000 |
Richland County GO (Correctional Facilities Project) Series 2008 BAN, | | | | | | |
3.50%, 1/15/09 | | | 1,000 | | | 1,004,597 |
Sandusky GO Series 2007 BAN, | | | | | | |
4.25%, 10/22/08 | | | 700 | | | 702,825 |
Seneca County GO Series 2007 BAN, | | | | | | |
3.80%, 11/13/08 | | | 200 | | | 200,381 |
Seven Hills GO (Street Improvement Project) Series 2007 BAN, | | | | | | |
3.45%, 12/04/08 | | | 500 | | | 500,000 |
Sharonville GO Series 2007 BAN, | | | | | | |
4.25%, 7/25/08 | | | 380 | | | 380,540 |
Sharonville GO Series 2008 BAN, | | | | | | |
3.50%, 1/21/09 | | | 170 | | | 170,798 |
Solon GO Series 2007 BAN, | | | | | | |
3.75%, 11/20/08 | | | 850 | | | 851,829 |
St. Marys GO (Sanitation Improvement Project) Series 2007 BAN, | | | | | | |
4.00%, 6/04/08 | | | 220 | | | 220,074 |
St. Marys School District GO Series 2007 BAN, | | | | | | |
3.75%, 6/10/08 | | | 1,000 | | | 1,001,261 |
St. Marys School District GO Series 2008 BAN, | | | | | | |
3.62%, 6/10/08 | | | 700 | | | 701,027 |
Stark County IDRB (Thakar Properties LLC Project) Series 2002 AMT DN (National City Bank N.A. LOC), | | | | | | |
2.55%, 4/07/08(a) | | | 115 | | | 115,000 |
Stark County Port Authority Economic Development RB (Slesnick Iron & Metal Project) Series 2007 AMT DN (Huntington National Bank LOC), | | | | | | |
2.70%, 4/07/08(a) | | | 700 | | | 700,000 |
Summit County Civic Facility RB (Akron Area Electric Junction Project) Series 2001 DN (KeyBank N.A. LOC), | | | | | | |
2.29%, 4/07/08(a) | | | 170 | | | 170,000 |
Summit County IDRB (Flutes LLC Project) Series 2002 AMT DN (M & I Marshall & Ilsley Bank LOC), | | | | | | |
2.57%, 4/07/08(a) | | | 1,670 | | | 1,670,000 |
Summit County IDRB (Jendrisak Properties Project) Series 2001 AMT DN (First Merit Bank N.A. LOC), | | | | | | |
2.62%, 4/07/08(a) | | | 1,540 | | | 1,540,000 |
Summit County IDRB (KB Compost Services, Inc. Project) Series 2001 AMT DN (KeyBank N.A. LOC), | | | | | | |
2.36%, 4/07/08(a) | | | 1,000 | | | 1,000,000 |
Summit County Port Authority RB (Meadow Lane Building LLC Project) Series 2003A AMT DN (KeyBank N.A. LOC), | | | | | | |
2.36%, 4/07/08(a) | | | 340 | | | 340,000 |
Tipp GO Series 2007 BAN, | | | | | | |
4.00%, 4/24/08 | | | 205 | | | 205,037 |
Toledo Multi-Family Housing RB (Cherrywood Apartments Project) Series 2001 AMT DN (KeyBank N.A. LOC), | | | | | | |
2.36%, 4/07/08(a) | | | 2,420 | | | 2,420,000 |
Trumbull County IDRB (Ellwood Engineered Project) Series 2004 AMT DN (KeyBank N.A. LOC), | | | | | | |
2.36%, 4/07/08(a) | | | 3,100 | | | 3,100,000 |
See Notes to Financial Statements.
| | | | | | |
| | | SEMI-ANNUAL REPORT | | MARCH 31, 2008 | | 29 |
| | |
| Schedule of Investments (concluded) | | Ohio Municipal Money Market Portfolio (Percentages shown are based on Net Assets) |
| | | | | | |
| | | Par
(000) | | Value |
Municipal Bonds (Continued) | | | | | | |
Ohio (Continued) | | | | | | |
Trumbull County IDRB (United Steel Service, Inc. Project) Series 2000B AMT DN (Bank One N.A. LOC), | | | | | | |
3.60%, 4/07/08(a) | | $ | 165 | | $ | 165,000 |
Union County GO Series 2007 BAN, | | | | | | |
3.50%, 12/10/08 | | | 345 | | | 346,158 |
University of Cincinnati General Receipts RB Series 2007B DN (MBIA Insurance, Bayerische Landesbank Girozentrale SBPA), | | | | | | |
6.00%, 4/07/08(a) | | | 100 | | | 100,000 |
Wapakoneta GO Series 2007 BAN, | | | | | | |
3.85%, 12/04/08 | | | 255 | | | 255,415 |
Wapakoneta School District GO (School Improvement Project) Series 2007 BAN, | | | | | | |
3.50%, 6/26/08 | | | 1,300 | | | 1,301,443 |
Warren County GO Series 2007 BAN, | | | | | | |
4.15%, 9/05/08 | | | 200 | | | 200,330 |
Western Reserve Housing Development Corp. Economic RB (Trumbull Metropolitan Housing Project) Series 2003 DN (KeyBank N.A. LOC), | | | | | | |
2.55%, 4/07/08(a) | | | 3,295 | | | 3,295,000 |
Westerville GO Munitops Trust Certificates Series 2001 DN (ABN-AMRO Bank N.V. LOC), | | | | | | |
2.26%, 4/07/08(a)(b) | | | 100 | | | 100,000 |
Wilmington GO (Lowes Drive Construction Project) Series 2007 BAN, | | | | | | |
4.50%, 7/25/08 | | | 255 | | | 255,555 |
| | | | | | |
Total Investments in Securities — 99.6% | | | | | | |
(Cost $159,553,649*) | | | | | | 159,553,649 |
Other Assets in Excess of Liabilities — 0.4% | | | | | | 602,440 |
| | | | | | |
Net Assets — 100.0% | | | | | $ | 160,156,089 |
| | | | | | |
| * | Aggregate cost for federal income tax purposes. |
| (a) | Rate shown is as of report date and maturities shown are the next interest readjustment date or the date the principal owed can be recovered through demand. |
| (b) | Security exempt from registration under Rule 144A of the Securities Act of 1933. These securities may be resold in transactions exempt from registration to qualified institutional investors. Unless otherwise indicated, these securities are not considered to be illiquid. |
| (c) | Investments in companies considered to be an affiliate of the Portfolio were as follows: |
| | | | | | | | | | |
Affiliate | | Purchase
Cost | | Sales
Cost | | Realized
Gain | | Interest
Income |
Hamilton County Hospital Facilities RB P-Float Trust Receipts Series 2001 PT-507 DN (FSA Insurance, Svenska Handelsbanken AB SBPA) | | | — | | — | | — | | $ | 94,843 |
Ohio Housing Finance Agency Mortgage RB (Residential Mortgage-Backed Securities Program) Series 2006F AMT DN (Citibank N.A. LOC) | | | — | | — | | — | | $ | 21,380 |
Ohio Housing Finance Agency Mortgage RB (Residential Mortgage-Backed Securities Program) Series 2007B AMT DN (Government National Mortgage Assoc. Insurance, Federal National Mortgage Assoc. Insurance, KBC Bank N.V. SBPA) | | $ | 11,250,000 | | — | | — | | | — |
| (d) | Restricted security as to resale. As of report date the Portfolio held 0.1% of its net assets, with a current market value of $195,074 and an original cost of $195,349 in these securities. |
| • | For Portfolio compliance purposes, the Portfolio’s sector and industry classifications refer to any one or more of the Standard Industry Codes as defined by the SEC. This definition may not apply for purposes of this report, which may combine sector and industry sub-classifications for reporting ease. |
See Notes to Financial Statements.
| | | | | | |
30 | | SEMI-ANNUAL REPORT | | MARCH 31, 2008 | | |
| | | |
| Schedule of Investments March 31, 2008 (Unaudited) | | Pennsylvania Municipal Money Market Portfolio
(Percentages shown are based on Net Assets |
) |
| | | | | | |
| | | Par
(000) | | Value |
Municipal Bonds — 97.8% | | | | | | |
Pennsylvania — 96.6% | | | | | | |
Allegheny County Hospital Development Authority RB (Dialysis Clinic, Inc. Project) Series 2000 DN (Bank of America N.A. LOC), | | | | | | |
2.10%, 4/07/08(a) | | $ | 3,400 | | $ | 3,400,000 |
Allegheny County Hospital Development Authority RB (Presbyterian University Hospital Project) Series 1988B-3 DN (Bank One N.A. LOC), | | | | | | |
2.07%, 4/07/08(a) | | | 3,275 | | | 3,275,000 |
Allegheny County Hospital Development Authority RB (University of Pittsburgh Medical Center Project) PUTTERS Series 2007-2327 DN (JPMorgan Chase Bank LOC, JPMorgan Chase & Co. Liquidity Facility), | | | | | | |
2.29%, 4/07/08(a)(b) | | | 4,000 | | | 4,000,000 |
Allegheny County Hospital Development Authority RB (University of Pittsburgh Medical Center Project) Series 2003B MB, | | | | | | |
5.00%, 6/15/08 | | | 1,400 | | | 1,403,585 |
Allegheny County IDRB (Carnegie Museums Pittsburgh Project) Series 2005 DN (Citizens Bank of Pennsylvania LOC), | | | | | | |
2.24%, 4/07/08(a) | | | 3,600 | | | 3,600,000 |
Allegheny County IDRB (Commonwealth Development Parkway Project) Series 1994A DN (National City Bank N.A. LOC), | | | | | | |
2.48%, 4/07/08(a) | | | 1,300 | | | 1,300,000 |
Allegheny County IDRB (UPMC Health System Project) Series 2002C DN (Comerica Bank N.A. LOC), | | | | | | |
2.23%, 4/07/08(a) | | | 1,270 | | | 1,270,000 |
Berks County GO Series 2002 DN (MBIA Insurance, Wachovia Bank N.A. SBPA), | | | | | | |
6.60%, 4/07/08(a) | | | 5,140 | | | 5,140,000 |
Berks County IDRB (Tray Pak Co. Project) Series 2001A AMT DN (Wachovia Bank N.A. LOC), | | | | | | |
2.25%, 4/07/08(a) | | | 1,620 | | | 1,620,000 |
Berks County Municpal Authority RB (Phoebe-Devitt Homes Project) Series 2008A DN (Sovereign Bank & Banco Santander LOC), | | | | | | |
2.05%, 4/07/08(a) | | | 3,100 | | | 3,100,000 |
Bermudian Springs School District GO Series 2006 DN (FSA Insurance, Royal Bank of Canada SBPA), | | | | | | |
2.24%, 4/07/08(a) | | | 10,495 | | | 10,495,000 |
Bethlehem Area School District GO Series 2007 DN (FSA Insurance, Dexia Credit Local SBPA), | | | | | | |
2.25%, 4/07/08(a) | | | 2,800 | | | 2,800,000 |
Blair County IDRB (CCK, Inc. Project) Series 2003 AMT DN (Fulton Bank LOC), | | | | | | |
2.41%, 4/07/08(a) | | | 1,885 | | | 1,885,000 |
Bucks County IDRB (Pennswood Village Project) Series 2002B DN (Fleet National Bank LOC), | | | | | | |
1.95%, 4/07/08(a) | | | 6,890 | | | 6,890,000 |
Butler County General Authority RB Municipal Securities Trust Receipts Series 2002A DN (FSA Insurance, Societe Generale Liquidity Facililty), | | | | | | |
2.30%, 4/07/08(a)(b) | | | 4,350 | | | 4,350,000 |
Butler County General Authority RB Municipal Securities Trust Receipts Series 2007 DN (FSA Insurance, Societe Generale Liquidity Facility), | | | | | | |
3.05%, 4/07/08(a)(b) | | | 3,000 | | | 3,000,000 |
Cambria County IDA Resource Recovery RB (Cambria Cogen Co. Project) Series 1998A-2 AMT DN (Bayerische Landesbank Girozentrale LOC), | | | | | | |
2.20%, 4/07/08(a) | | | 16,000 | | | 16,000,000 |
Chester County IDA Student Housing RB (University Student Housing LLC Project) Series 2003 DN (Royal Bank of Scotland LOC), | | | | | | |
2.31%, 4/07/08(a) | | | 790 | | | 790,000 |
Chester County IDA Student Housing RB (University Student Housing LLC Project) Series 2008A DN (Citizens Bank of Pennsylvania LOC), | | | | | | |
2.25%, 4/07/08(a) | | | 4,000 | | | 4,000,000 |
Chester County IDRB (RV Industrial, Inc. Project) Series 2001 AMT DN (M&T Bank Corp. LOC), | | | | | | |
2.36%, 4/07/08(a) | | | 2,200 | | | 2,200,000 |
City of Philadelphia TECP, | | | | | | |
1.00%, 5/12/08 | | | 10,000 | | | 10,000,000 |
Crawford County IDRB (Uniplast International, Inc. Project) Series 2000 AMT DN (National City Bank N.A. LOC), | | | | | | |
2.70%, 4/07/08(a) | | | 755 | | | 755,000 |
Cumberland County Municipal Authority RB (Dickinson College Project) Series 1996B DN (Citizens Bank N.A. LOC), | | | | | | |
3.45%, 4/07/08(a) | | | 2,295 | | | 2,295,000 |
Dauphin County General Auhtority Health Systems RB (Pinnacle Health Systems Project) Series 2005 DN (FSA Insurance, Wachovia Bank N.A. SBPA), | | | | | | |
2.05%, 4/07/08(a) | | | 1,400 | | | 1,400,000 |
Delaware County Authority RB (Dunwoody Village Project) Series 2006 DN (Citizens Bank of Pennsylvania LOC), | | | | | | |
2.13%, 4/07/08(a) | | | 2,100 | | | 2,100,000 |
Delaware County IDRB (Scott Paper Co. Project) Series 1984A DN, | | | | | | |
2.60%, 4/07/08(a) | | | 100 | | | 100,000 |
Delaware County IDRB (Sunoco, Inc., Project) Series 1998 DN (Bank of America N.A. LOC), | | | | | | |
2.10%, 4/07/08(a) | | | 1,260 | | | 1,260,000 |
Delaware Valley Regional Finance Authority Local Government RB Municipal Securities Trust Receipts Series 2007A DN (Societe Generale Liquidity Facility), | | | | | | |
2.29%, 4/07/08(a)(b) | | | 5,500 | | | 5,500,000 |
East Hempfield Township IDRB (Herley Industrial, Inc. Project) Series 2001 AMT DN (M&T Bank Corp. LOC), | | | | | | |
2.36%, 4/07/08(a) | | | 2,355 | | | 2,355,000 |
East Hempfield Township IDRB (Herley Industrial, Inc. Project) Series 2005 AMT DN (M&T Bank Corp. LOC), | | | | | | |
2.45%, 4/07/08(a) | | | 2,700 | | | 2,700,000 |
Emmaus General Authority RB Series 1989A-11 DN (DEPFA Bank Plc LOC), | | | | | | |
2.17%, 4/07/08(a) | | | 1,100 | | | 1,100,000 |
Emmaus General Authority RB Series 1989B-29 DN (DEPFA Bank Plc LOC), | | | | | | |
2.17%, 4/07/08(a) | | | 8,500 | | | 8,500,000 |
Emmaus General Authority RB Series 1989F-19 DN (State Aid Withholding Insurance, DEPFA Bank Plc LOC), | | | | | | |
2.17%, 4/07/08(a) | | | 1,300 | | | 1,300,000 |
Emmaus General Authority RB Series 1989F-24 DN (DEPFA Bank Plc LOC), | | | | | | |
2.17%, 4/07/08(a) | | | 1,500 | | | 1,500,000 |
Emmaus General Authority RB Series 1989G-18 DN (DEPFA Bank Plc LOC), | | | | | | |
2.17%, 4/07/08(a) | | | 3,000 | | | 3,000,000 |
See Notes to Financial Statements.
| | | | | | |
| | | SEMI-ANNUAL REPORT | | MARCH 31, 2008 | | 31 |
| | | |
| Schedule of Investments (continued) | | Pennsylvania Municipal Money Market Portfolio
(Percentages shown are based on Net Assets |
) |
| | | | | | |
| | | Par
(000) | | Value |
Municipal Bonds (Continued) | | | | | | |
Pennsylvania (Continued) | | | | | | |
Emmaus General Authority RB Series 1996 DN (FSA Insurance, Wachovia Bank N.A. SBPA), | | | | | | |
2.10%, 4/07/08(a) | | $ | 8,345 | | $ | 8,345,000 |
Erie Water Authority RB Series 2006A DN (FSA Insurance), | | | | | | |
2.20%, 4/07/08(a) | | | 1,200 | | | 1,200,000 |
Franklin County IDRB (Precast System Project) Series 2001A AMT DN (M&T Bank Corp. LOC), | | | | | | |
2.36%, 4/07/08(a) | | | 1,760 | | | 1,760,000 |
Geisinger Authority Health System RB Series 2007 ROC-RR-II-R-11013 DN (Citibank N.A. Liquidity Facility), | | | | | | |
2.24%, 4/07/08(a)(b) | | | 2,020 | | | 2,020,000 |
Horizon Hospital System Authority Health & Housing Facility RB (St. Paul Homes Project) Series 2002 DN (M&T Bank Corp. LOC), | | | | | | |
2.26%, 4/07/08(a) | | | 7,160 | | | 7,160,000 |
Horizon Hospital System Authority Health & Housing Facility RB (St. Paul Homes Project) Series 2005 DN (M&T Bank Corp. LOC), | | | | | | |
2.26%, 4/07/08(a) | | | 7,900 | | | 7,900,000 |
Indiana County IDRB (Conemaugh Project) Series 1997A AMT DN (Bank One N.A. LOC), | | | | | | |
3.50%, 4/07/08(a) | | | 3,160 | | | 3,160,000 |
Lackawanna County GO Municipal Trust Receipts Floaters Series 2007-2183 DN (FSA Insurance, Morgan Stanley Municipal Funding Liquidity Facility), | | | | | | |
2.80%, 4/07/08(a)(b) | | | 1,065 | | | 1,065,000 |
Lackawanna County IDRB (Herff Jones, Inc. Project) Series 2001 AMT DN (National City Bank N.A. LOC), | | | | | | |
2.55%, 4/07/08(a) | | | 2,800 | | | 2,800,000 |
Lancaster County Hospital Authority RB (Health Center Luthercare Project) Series 1999 DN (M&T Bank Corp. LOC), | | | | | | |
2.21%, 4/07/08(a) | | | 4,760 | | | 4,760,000 |
Lancaster County Hospital Authority RB (Landis Homes Retirement Community Project) Series 2002 DN (M&T Bank Corp. LOC), | | | | | | |
2.21%, 4/07/08(a) | | | 8,190 | | | 8,190,000 |
Lancaster County IDRB (Clean Creek Partners Project) Series 2000 AMT DN (M&T Bank Corp. LOC), | | | | | | |
2.36%, 4/07/08(a) | | | 4,365 | | | 4,365,000 |
Lancaster County IDRB (D&P Skibo LLC Project) Series 2001 AMT DN (Wachovia Bank N.A. LOC), | | | | | | |
2.25%, 4/07/08(a) | | | 1,250 | | | 1,250,000 |
Lancaster County IDRB (John F. Martin & Sons Project) Series 2001 AMT DN (Fulton Bank LOC), | | | | | | |
2.46%, 4/07/08(a) | | | 600 | | | 600,000 |
Lancaster County IDRB (Oakfront LP Project) Series 2001 AMT DN (M&T Bank Corp. LOC), | | | | | | |
2.36%, 4/07/08(a) | | | 1,875 | | | 1,875,000 |
Lawrence County IDRB (L&N Metallurgical Products Project) Series 1996 AMT DN (Banque Nationale de Paribas LOC), | | | | | | |
2.45%, 4/07/08(a) | | | 3,645 | | | 3,645,000 |
Lebanon County Health Facility RB (Evangelican Long Church Retirement Village Project) Series 2000 DN (Northern Trust LOC), | | | | | | |
2.26%, 4/07/08(a) | | | 2,730 | | | 2,730,000 |
Montgomery County Higher Education & Health Authority RB (Pennsylvania Higher Education & Health Loan Project) Series 1996A DN (M&T Bank Corp. LOC), | | | | | | |
2.26%, 4/07/08(a) | | | 1,600 | | | 1,600,000 |
Montgomery County IDRB (Apple Fresh Foods Ltd. Project) Series 1996 AMT DN (Wachovia Bank N.A. LOC), | | | | | | |
2.22%, 4/07/08(a) | | | 550 | | | 550,000 |
Montgomery County TECP, | | | | | | |
2.20%, 4/01/08 | | | 6,500 | | | 6,500,000 |
Moon IDRB (Providence Point Project) Series 2007 DN (Bank of Scotland Plc LOC), | | | | | | |
2.00%, 4/07/08(a) | | | 13,180 | | | 13,180,000 |
New Garden General Purpose Authority RB (Municipal Pooled Financing Project) Series 2003 II DN (FSA Insurance, Bank of Nova Scotia SPBA), | | | | | | |
1.95%, 4/07/08(a) | | | 1,095 | | | 1,095,000 |
Northampton County General Purpose Authority RB (Lafayette College Project) Series 2006 DN (JPMorgan Chase & Co. SBPA), | | | | | | |
2.10%, 4/07/08(a) | | | 1,150 | | | 1,150,000 |
Northampton County General Purpose Authority RB (Lafayette College Project) Series 2007 MB, | | | | | | |
3.35%, 12/01/08 | | | 3,000 | | | 3,000,000 |
Northampton County IDRB (Bethlehem Contracting Project) Series 2001A AMT DN (M&T Bank Corp. LOC), | | | | | | |
2.36%, 4/07/08(a) | | | 2,695 | | | 2,695,000 |
Northampton County IDRB (Trent Family Partnership Project) Series 2002 AMT DN (Wachovia Bank N.A. LOC), | | | | | | |
2.25%, 4/07/08(a) | | | 1,795 | | | 1,795,000 |
Pennsylvania Economic Development Financing Authority RB (AMC Delancey Traditions Project) Series 2006 AMT DN (Citizens Bank of Pennsylvania LOC), | | | | | | |
2.30%, 4/07/08(a) | | | 3,200 | | | 3,200,000 |
Pennsylvania Economic Development Financing Authority RB (Evergreen Community Power Facility Project) Series 2007 AMT DN (Manufacturers & Traders Trust Co. LOC), | | | | | | |
2.31%, 4/07/08(a) | | | 3,000 | | | 3,000,000 |
Pennsylvania Economic Development Financing Authority RB (Homewood Retirement Project) Series 1992E DN (M&T Bank Corp. LOC), | | | | | | |
2.33%, 4/07/08(a) | | | 3,925 | | | 3,925,000 |
Pennsylvania Economic Development Financing Authority RB (Material Technology Project) Series 2000D AMT DN (Wachovia Bank N.A. LOC), | | | | | | |
2.25%, 4/07/08(a) | | | 600 | | | 600,000 |
Pennsylvania Economic Development Financing Authority RB (Penn Waste, Inc. Project) Series 2007 AMT DN (Manufacturers & Traders Trust Co. LOC), | | | | | | |
2.31%, 4/07/08(a) | | | 2,000 | | | 2,000,000 |
Pennsylvania Economic Development Financing Authority RB UBS Municipal Certificates Floaters Series 2007-07-15 DN (Landebank Hessen-Thruingen Girozentrale Liquidity Facility), | | | | | | |
2.26%, 4/07/08(a)(b) | | | 8,600 | | | 8,600,000 |
See Notes to Financial Statements.
| | | | | | |
32 | | SEMI-ANNUAL REPORT | | MARCH 31, 2008 | | |
| | | |
| Schedule of Investments (Continued) | | Pennsylvania Municipal Money Market Portfolio
(Percentages shown are based on Net Assets |
) |
| | | | | | |
| | | Par
(000) | | Value |
Municipal Bonds (Continued) | | | | | | |
Pennsylvania (Continued) | | | | | | |
Pennsylvania Economic Development Financing Authority Solid Waste Disposal RB (IESI, Corp. Project) Series 2006V AMT DN (Bank of America N.A. Liquidity Facility), | | | | | | |
2.29%, 4/07/08(a)(b) | | $ | 8,700 | | $ | 8,700,000 |
Pennsylvania Economic Development Financing Authority Wastewater Treatment RB (Sunoco, Inc. Project) Series 2004A AMT DN (Sunoco, Inc. Guaranty), | | | | | | |
2.56%, 4/07/08(a) | | | 4,700 | | | 4,700,000 |
Pennsylvania Energy Development Authority RB (B&W Ebensburg Project) Series 1986 AMT DN (Landesbank Hessen-Thueringen Girozentrale LOC), | | | | | | |
2.14%, 4/07/08(a) | | | 1,125 | | | 1,125,000 |
Pennsylvania Energy Development Authority RB (B&W Ebensburg Project) Series 1988 AMT DN (Landesbank Hessen-Thuringen Girozentrale LOC), | | | | | | |
2.14%, 4/07/08(a) | | | 2,000 | | | 2,000,000 |
Pennsylvania GO PUTTERS Series 2006-1382 DN (JPMorgan Chase Bank Liquidity Facility), | | | | | | |
2.29%, 4/07/08(a)(b) | | | 2,115 | | | 2,115,000 |
Pennsylvania GO Series 1999 MB, | | | | | | |
5.25%, 10/01/08 | | | 675 | | | 680,413 |
Pennsylvania GO Series 2004 MB, | | | | | | |
5.00%, 7/01/08 | | | 2,450 | | | 2,458,691 |
Pennsylvania GO Series 2006 MB, | | | | | | |
4.75%, 9/01/08 | | | 1,170 | | | 1,179,348 |
Pennsylvania GO Series 2007 ROC-RR-II-R-11056 DN (Citibank N.A. Liquidity Facility), | | | | | | |
2.24%, 4/07/08(a)(b) | | | 2,000 | | | 2,000,000 |
Pennsylvania Higher Educational Facilities Authority RB (Assoc. of Independent Colleges & Universities Project) Series 1998 DN (Banque Nationale de Paribas LOC), | | | | | | |
2.42%, 4/07/08(a) | | | 2,600 | | | 2,600,000 |
Pennsylvania Higher Educational Facilities Authority RB (Honeysuckle Student Holding Project) Series 2004A DN (Allied Irish Bank Plc LOC), | | | | | | |
2.21%, 4/07/08(a) | | | 4,200 | | | 4,200,000 |
Pennsylvania Higher Educational Facilities Authority RB (Rosemont College Project) Series 2004O DN (Wachovia Bank N.A. LOC), | | | | | | |
3.42%, 11/01/08(a) | | | 900 | | | 900,000 |
Pennsylvania Higher Educational Facilities Authority RB (St. Joesph’s University Project) Series 1998C-4 DN (Allied Irish Bank Plc LOC), | | | | | | |
2.08%, 4/07/08(a) | | | 6,900 | | | 6,900,000 |
Pennsylvania Higher Educational Facilities Authority RB (Student Assoc. Housing, Inc. Project) Series 2006A DN (Citizens Bank of Pennsylvania LOC), | | | | | | |
2.21%, 4/07/08(a) | | | 7,895 | | | 7,895,000 |
Pennsylvania Higher Educational Facilities Authority RB (University of Pennsylvania Financing Project) Series 2004-N2 DN (National City Bank LOC), | | | | | | |
2.50%, 4/07/08(a) | | | 1,600 | | | 1,600,000 |
Pennsylvania Higher Educational Facilities Authority RB PUTTERS Series 2006-1271 DN (JPMorgan Chase Bank Liquidity Facility), | | | | | | |
2.29%, 4/07/08(a)(b) | | | 4,870 | | | 4,870,000 |
Pennsylvania Housing Finance Agency Single Family Mortgage RB Municipal Trust Receipts Floaters Series 2006K-57 AMT DN (Lehman Liquidity Co. Liquidity Facility), | | | | | | |
2.48%, 4/07/08(a)(b) | | | 2,500 | | | 2,500,000 |
Pennsylvania Housing Finance Agency Single Family Mortgage RB Municipal Trust Receipts Floaters Series 2007-2158 AMT DN (Morgan Stanley Municipal Funding Liquidity Facility), | | | | | | |
2.33%, 4/07/08(a)(b) | | | 750 | | | 750,000 |
Pennsylvania Housing Finance Agency Single Family Mortgage RB Municipal Trust Receipts Floaters Series 2008-2380 AMT DN (Morgan Stanley Municipal Funding Liquidity Facility), | | | | | | |
2.33%, 4/07/08(a)(b) | | | 2,600 | | | 2,600,000 |
Pennsylvania Housing Finance Agency Single Family Mortgage RB Municipal Trust Receipts Floaters Series 2008-2494 AMT DN (Morgan Stanley Municipal Funding Liquidity Facility), | | | | | | |
2.33%, 4/07/08(a)(b) | | | 1,600 | | | 1,600,000 |
Pennsylvania Housing Finance Agency Single Family Mortgage RB PUTTERS Series 2006-1592 AMT DN (JPMorgan Chase Bank Liquidity Facility), | | | | | | |
2.39%, 4/07/08(a)(b) | | | 4,945 | | | 4,945,000 |
Pennsylvania Housing Finance Agency Single Family Mortgage RB PUTTERS Series 2007-1213B AMT DN (JPMorgan Chase & Co. Liquidity Facility), | | | | | | |
2.39%, 4/07/08(a)(b) | | | 1,600 | | | 1,600,000 |
Pennsylvania Housing Finance Agency Single Family Mortgage RB Series 2004-83B AMT DN (Landesbank Hessen-Thuringen Girozentrale SBPA), | | | | | | |
2.25%, 4/07/08(a) | | | 2,020 | | | 2,020,000 |
Pennsylvania Housing Finance Agency Single Family Mortgage RB Series 2004-83C AMT DN (Landesbank Hessen-Thuringen Girozentrale SBPA), | | | | | | |
2.25%, 4/07/08(a) | | | 1,400 | | | 1,400,000 |
Pennsylvania Housing Finance Agency Single Family Mortgage RB Series 2004-85B AMT DN (Landesbank Hessen-Thuringen Girozentrale SBPA), | | | | | | |
2.25%, 4/07/08(a) | | | 3,300 | | | 3,300,000 |
Pennsylvania Housing Finance Agency Single Family Mortgage RB Series 2004-85C AMT DN (Landesbank Hessen-Thuringen Girozentrale SBPA), | | | | | | |
2.25%, 4/07/08(a) | | | 7,145 | | | 7,145,000 |
Pennsylvania Housing Finance Agency Single Family Mortgage RB Series 2004-86B AMT DN (DEPFA Bank Plc SBPA), | | | | | | |
2.15%, 4/07/08(a) | | | 6,000 | | | 6,000,000 |
Pennsylvania Housing Finance Agency Single Family Mortgage RB Series 2004-86C AMT DN (GO of Agency Insurance, DEPFA Bank Plc SBPA), | | | | | | |
2.15%, 4/07/08(a) | | | 2,400 | | | 2,400,000 |
Pennsylvania Housing Finance Agency Single Family Mortgage RB Series 2005-87C AMT DN (Depfa Bank Plc SBPA), | | | | | | |
2.25%, 4/07/08(a) | | | 23,500 | | | 23,500,000 |
See Notes to Financial Statements.
| | | | | | |
| | | SEMI-ANNUAL REPORT | | MARCH 31, 2008 | | 33 |
| | |
| Schedule of Investments (continued) | | Pennsylvania Municipal Money Market Portfolio (Percentages shown are based on Net Assets) |
| | | | | | |
| | | Par
(000) | | Value |
Municipal Bonds (Continued) | | | | | | |
Pennsylvania (Continued) | | | | | | |
Pennsylvania Housing Finance Agency Single Family Mortgage RB Series 2005-89 AMT DN (GO of Agency Insurance, DEPFA Bank Plc SBPA), | | | | | | |
2.15%, 4/07/08(a) | | $ | 7,500 | | $ | 7,500,000 |
Pennsylvania Housing Finance Agency Single Family Mortgage RB Series 2005-91B AMT DN (GO of Agency Insurance, DEPFA Bank Plc SBPA), | | | | | | |
2.15%, 4/07/08(a) | | | 2,000 | | | 2,000,000 |
Pennsylvania Housing Finance Agency Single Family Mortgage RB Series 2006-92B AMT DN (Landesbank Hessen-Thueringen Girozentrale SBPA), | | | | | | |
2.25%, 4/07/08(a) | | | 17,270 | | | 17,270,000 |
Pennsylvania Housing Finance Agency Single Family Mortgage RB Series 2006-95C AMT DN (Dexia Bank SBPA), | | | | | | |
2.25%, 4/07/08(a) | | | 8,000 | | | 8,000,000 |
Pennsylvania Housing Finance Agency Single Family Mortgage RB Series 2007-99C AMT DN (Dexia Credit Local SBPA), | | | | | | |
2.15%, 4/07/08(a) | | | 2,400 | | | 2,400,000 |
Pennsylvania Housing Finance Agency Single Family Mortgage RB Series 2008-101A AMT MB, | | | | | | |
2.35%, 3/01/09 | | | 1,300 | | | 1,300,000 |
Pennsylvania Housing Finance Agency Single Family Mortgage RB Series 2008-101B MB, | | | | | | |
2.15%, 3/01/09 | | | 1,600 | | | 1,600,000 |
Pennsylvania Public School Building Authority RB (Philadelphia School District Project) PUTTERS Series 2007-1970 DN (FSA Insurance, State Aid Withholding Insurance, JPMorgan Chase Bank Liquidity Facility), | | | | | | |
2.29%, 4/07/08(a)(b) | | | 3,330 | | | 3,330,000 |
Pennsylvania Turnpike Commission RB Munitops Trust Certificates Series 2004-9 DN (AMBAC Insurance, ABN-AMRO Bank N.V. SBPA), | | | | | | |
2.31%, 4/07/08(a)(b) | | | 10,335 | | | 10,335,000 |
Pennsylvania Turnpike Commission RB Series 2001U DN (Dexia Credit Local SBPA), | | | | | | |
1.90%, 4/07/08(a) | | | 6,800 | | | 6,800,000 |
Pennsylvania Turnpike Commission RB Series 2002A-1 DN (WestLB SBPA), | | | | | | |
2.05%, 4/07/08(a) | | | 7,225 | | | 7,225,000 |
Pennsylvania Turnpike Commission RB Series 2002B DN (Dexia Credit Local SBPA), | | | | | | |
2.21%, 4/07/08(a) | | | 440 | | | 440,000 |
Pennsylvania Turnpike Commission RB Series 2005B DN (FSA Insurance, JPMorgan Chase Bank SBPA), | | | | | | |
1.95%, 4/07/08(a) | | | 675 | | | 675,000 |
Philadelphia Airport RB Floaters Series 2007-2157 AMT DN (FSA Insurance, Morgan Stanley Municipal Funding Liquidity Facility), | | | | | | |
2.24%, 4/07/08(a)(b) | | | 1,700 | | | 1,700,000 |
Philadelphia Airport RB Series 2008DB-495 DN (FSA Insurance, Deutsche Bank A.G. Liquidity Facility), | | | | | | |
2.30%, 4/07/08(a)(b) | | | 2,885 | | | 2,885,000 |
Philadelphia Airport RB Series 2008DB-558 AMT DN (FSA Insurance, Deutsche Bank A.G. Liquidity Facility), | | | | | | |
2.30%, 4/07/08(a)(b) | | | 655 | | | 655,000 |
Philadelphia Authority IDRB (Evangelical Manor Project) Series 2008 DN (Citizens Bank N.A. LOC), | | | | | | |
2.28%, 4/07/08(a) | | | 2,600 | | | 2,600,000 |
Philadelphia Authority IDRB (Gift of Life Donor Program Project) Series 2003 DN (Commerce Bank N.A. LOC), | | | | | | |
2.24%, 4/07/08(a) | | | 995 | | | 995,000 |
Philadelphia Authority IDRB (Greater Philadelphia Health System Project) Series 2003 DN (Commerce Bank N.A. Liquidity Facility), | | | | | | |
2.24%, 4/07/08(a) | | | 2,600 | | | 2,600,000 |
Philadelphia Authority IDRB (Settlement Music School Project) Series 2004 DN (Allied Irish Bank Plc), | | | | | | |
2.15%, 4/07/08(a) | | | 1,000 | | | 1,000,000 |
Philadelphia Authority IDRB (Universal Community Homes Project) Series 2003 DN (Wachovia Bank N.A. LOC), | | | | | | |
2.20%, 4/07/08(a) | | | 1,930 | | | 1,930,000 |
Philadelphia Hospitals & Higher Education Facilities Authority RB (Philadelphia Protestant Home Project) Series 2002 DN (Bank of America N.A. LOC), | | | | | | |
2.10%, 4/07/08(a) | | | 7,070 | | | 7,070,000 |
Philadelphia Redevelopment Authority Multi-Family Housing RB Municipal Trust Receipts Floaters Series 2006G-1 AMT DN (The Goldman Sachs Group, Inc. Guaranty, The Goldman Sachs Group, Inc. SBPA), | | | | | | |
2.30%, 4/07/08(a)(b) | | | 20,395 | | | 20,395,000 |
Philadelphia School District GO Series 2007A TRAN (Bank of America N.A. LOC), | | | | | | |
4.50%, 6/27/08 | | | 13,675 | | | 13,699,528 |
Philadelphia Water & Wastewater RB Series 2003 DN (FSA Insurance, Dexia Credit Local SBPA), | | | | | | |
2.05%, 4/07/08(a) | | | 990 | | | 990,000 |
Philadelphia Water & Wastewater RB Series 2005B DN (FSA Insurance, DEFPA Bank Plc SBPA), | | | | | | |
2.05%, 4/07/08(a) | | | 1,000 | | | 1,000,000 |
Philadelphia Water RB Munitops Trust Certificates Series 2005-15 DN (FSA Insurance, ABN-AMRO Bank N.V. SBPA), | | | | | | |
2.24%, 4/07/08(a)(b) | | | 5,395 | | | 5,395,000 |
Pittsburgh Water & Sewer System RB Series 2007B-1 DN (FSA Insurance, JPMorgan Chase Bank SBPA), | | | | | | |
1.78%, 4/07/08(a) | | | 1,000 | | | 1,000,000 |
Schuylkill County IDRB (KP-Tamaqua LP Project) Series 2007 AMT DN (Citizens Bank of Pennsylvania LOC), | | | | | | |
2.38%, 4/07/08(a) | | | 1,535 | | | 1,535,000 |
Shippensburg Borough Authority RB (Bethlehem School District Project) Series 2007 DN (FSA Insurance, Dexia Credit Local SBPA), | | | | | | |
2.25%, 4/07/08(a) | | | 5,600 | | | 5,600,000 |
Southcentral General Authority RB (Homewood Hanover Project) Series 2003 DN (M&T Bank Corp. LOC), | | | | | | |
2.21%, 4/07/08(a) | | | 18,500 | | | 18,500,000 |
Southcentral General Authority RB (York Cerebral Palsy Home Project) Series 2000 DN (Fulton Bank LOC), | | | | | | |
2.31%, 4/07/08(a) | | | 3,300 | | | 3,300,000 |
See Notes to Financial Statements.
| | | | | | |
34 | | SEMI-ANNUAL REPORT | | MARCH 31, 2008 | | |
| | |
| Schedule of Investments (continued) | | Pennsylvania Municipal Money Market Portfolio (Percentages shown are based on Net Assets) |
| | | | | | |
| | | Par
(000) | | Value |
Municipal Bonds (Continued) | | | | | | |
Pennsylvania (Continued) | | | | | | |
St. Mary Hospital Authority Bucks County RB (Catholic Health Initiatives Project) Series 2004B DN (Landesbank Hessen-Thuringen Girozentrale SBPA), | | | | | | |
2.15%, 4/07/08(a) | | $ | 1,100 | | $ | 1,100,000 |
St. Mary Hospital Authority Bucks County RB (Catholic Health Initiatives Project) Series 2004C DN, | | | | | | |
2.05%, 4/07/08(a) | | | 10,050 | | | 10,050,000 |
State Public School Building Authority RB (Philadelphia School District Project) ROC-RR-II- R-11268 DN (FSA State Aid Withholding Insurance, Citibank N.A. Liquidity Facility), | | | | | | |
2.29%, 4/07/08(a)(b) | | | 2,415 | | | 2,415,000 |
Stroudsburg Area School District GO Series 2007 TRAN, | | | | | | |
4.50%, 6/30/08 | | | 1,333 | | | 1,334,955 |
Union County IDRB (Stabler Cos., Inc. Project) Series 2001 AMT DN (M&T Bank Corp. LOC), | | | | | | |
2.36%, 4/07/08(a) | | | 6,365 | | | 6,365,000 |
University of Pittsburgh of the Commonwealth System of Higher Education RB (University Capital Project) Series 2000B DN (GO of University Insurance, Lloyds TSB Bank Plc SBPA), | | | | | | |
2.08%, 4/07/08(a) | | | 2,500 | | | 2,500,000 |
University of Pittsburgh of the Commonwealth System of Higher Education RB (University Capital Project) Series 2006C DN (Lloyds TSB Bank Plc SBPA), | | | | | | |
2.08%, 4/07/08(a) | | | 800 | | | 800,000 |
University of Pittsburgh of the Commonwealth System of Higher Education RB (University Capital Project) Series 2007A DN (Fortis Bank SBPA, Banco Bilbao Vizcaya Argentaria S.A. SBPA), | | | | | | |
2.08%, 4/07/08(a) | | | 24,750 | | | 24,750,000 |
Upper Merion General Authority Lease RB Series 2003 DN (Commerce Bank N.A. LOC), | | | | | | |
2.24%, 4/07/08(a) | | | 2,205 | | | 2,205,000 |
Upper Merion Municipal Utility Authority RB (Sewer Project) Series 2003 DN (Commerce Bank N.A. LOC), | | | | | | |
2.24%, 4/07/08(a) | | | 2,095 | | | 2,095,000 |
Upper St. Clair Township GO Munitops Trust Certificates Series 2002 DN (FSA Insurance, ABN-AMRO Bank N.V. SBPA), | | | | | | |
2.23%, 4/07/08(a)(b) | | | 2,640 | | | 2,640,000 |
Venango AMT TECP (Dexia Credit Local LOC), | | | | | | |
2.00%, 5/07/08-5/08/08 | | | 30,028 | | | 30,028,000 |
Washington County Authority RB (Girard Estate Refunding Project) Series 1999 DN (Chase Manhattan LOC), | | | | | | |
2.20%, 4/07/08(a) | | | 1,000 | | | 1,000,000 |
West Cornwall Township Municipal Authority RB (General Government Loan Program) Series 2003A DN (FSA Insurance, Dexia Credit Local SBPA), | | | | | | |
2.25%, 4/07/08(a) | | | 1,670 | | | 1,670,000 |
Westmoreland County IDRB (Industrial Development McCutcheon Enterprise Project) Series 1999 AMT DN (National City Bank N.A. LOC), | | | | | | |
2.70%, 4/07/08(a) | | | 1,490 | | | 1,490,000 |
York County GO Series 2008 TRAN, | | | | | | |
3.50%, 6/30/08 | | | 1,980 | | | 1,983,523 |
York County Hospital Authority RB (Homewood Retirement Centers of The United Church of Christ, Inc. Project) Series 1990 DN (M&T Bank Corp. LOC), | | | | | | |
2.33%, 4/07/08(a) | | | 3,600 | | | 3,600,000 |
York County IDRB (Allied-Signal, Inc. Project) Series 1993 DN, | | | | | | |
3.50%, 4/07/08(a) | | | 1,000 | | | 1,000,000 |
York County IDRB (Interstate Holdings Co. Project) Series 2003 AMT DN (Wachovia Bank N.A. Liquidity Facility), | | | | | | |
2.25%, 4/07/08(a) | | | 1,195 | | | 1,195,000 |
York County IDRB (Raich Family Ltd. Partner Project) Series 2000 AMT DN (M&T Bank Corp. LOC), | | | | | | |
2.36%, 4/07/08(a) | | | 1,880 | | | 1,880,000 |
York County IDRB (York Sheet Metal, Inc. Project) Series 1998 DN (Wachovia Bank N.A. LOC), | | | | | | |
2.48%, 4/07/08(a) | | | 2,165 | | | 2,165,000 |
York General Authority RB (Strand Capital Performing Arts Center Project) Series 2002 DN (M&T Bank Corp. LOC), | | | | | | |
2.26%, 4/07/08(a) | | | 5,410 | | | 5,410,000 |
| | | | | | |
| | | | | | 623,183,043 |
| | | | | | |
Puerto Rico — 1.2% | | | | | | |
Commonwealth of Puerto Rico GO Series 2007 TRAN (Bank of Nova Scotia, Banque Nationale de Paribas, Dexia Credit Local, Fortis Bank, Banco Bilbao Vizcaya Argentaria S.A., KBC Bank N.V. and Banco Santander Central Hisapano LOC), | | | | | | |
4.25%, 7/30/08 | | | 7,500 | | | 7,520,481 |
| | | | | | |
Total Investments in Securities — 97.8% | | | | | | |
(Cost $630,703,524*) | | | | | | 630,703,524 |
Other Assets in Excess of Liabilities — 2.2% | | | | | | 14,435,903 |
| | | | | | |
Net Assets — 100.0% | | | | | $ | 645,139,427 |
| | | | | | |
| * | Aggregate cost for federal income tax purposes. |
| (a) | Rate shown is as of report date and maturities shown are the next interest readjustment date or the date the principal owed can be recovered through demand. |
See Notes to Financial Statements.
| | | | | | |
| | | SEMI-ANNUAL REPORT | | MARCH 31, 2008 | | 35 |
| | |
| Schedule of Investments (concluded) | | Pennsylvania Municipal Money Market Portfolio (Percentages shown are based on Net Assets) |
| (b) | Security exempt from registration under Rule 144A of the Securities Act of 1933. These securities may be resold in transactions exempt from registration to qualified institutional investors. Unless otherwise indicated, these securities are not considered to be illiquid. |
| • | Investments in companies considered to be an affiliate of the Portfolio were as follows: |
| | | | | | | | | | |
Affiliate | | Purchase
Cost | | Sales
Cost | | Realized
Gain | | Interest
Income |
Pennsylvania Economic Development Financing Authority RB P-Float Trust Receipts Series 2004-1282 AMT DN (Merrill Lynch & Co. Guaranty, Merrill Lynch Capital Services SBPA) | | — | | $ | 5,000,000 | | — | | $ | 18,945 |
Pennsylvania Higher Educational Facilities Authority RB P-Float Trust Receipts Series 2004 MT-042 DN (Lloyds TSB Bank Plc LOC, Merrill Lynch Capital Services SBPA) | | — | | $ | 19,225,000 | | — | | $ | 72,017 |
Pennsylvania Housing Finance Agency Single Family Mortgage RB Series 2004-82B AMT DN (Landesbank Hessen-Thuringen Girozentrale SBPA) | | — | | $ | 10,835,000 | | — | | $ | 41,025 |
Philadelphia Redevelopment Authority RB Spear DB-134 Series 2005 AMT DN (FGIC Insurance, Deutsche Bank Liquidity Facility) | | — | | $ | 10,295,000 | | — | | $ | 70,548 |
| • | For Portfolio compliance purposes, the Portfolio’s sector and industry classifications refer to any one or more of the Standard Industry Codes as defined by the SEC. This definition may not apply for purposes of this report, which may combine sector and industry sub-classifications for reporting ease. |
See Notes to Financial Statements.
| | | | | | |
36 | | SEMI-ANNUAL REPORT | | MARCH 31, 2008 | | |
| | |
| Schedule of Investments March 31, 2008 (Unaudited) | | Virginia Municipal Money Market Portfolio (Percentages shown are based on Net Assets) |
| | | | | | |
| | | Par
(000) | | Value |
Municipal Bonds — 99.7% | | | | | | |
Puerto Rico — 11.0% | | | | | | |
Commonwealth of Puerto Rico Aqueduct & Sewer Authority RB Series 2007R-1001CE DN (Citigroup Financial Products Liquidity Facility, Citigroup Global Markets Holdings, Inc. Guaranty), | | | | | | |
2.27%, 4/07/08(a)(b) | | $ | 1,500 | | $ | 1,500,000 |
Commonwealth of Puerto Rico GO Series 2007 TRAN (Bank of Nova Scotia, Banque Nationale de Paribas, Dexia Credit Local, Fortis Bank, Banco Bilbao Vizcaya Argentaria S.A., KBC Bank N.V. and Banco Santander Central Hisapano LOC), | | | | | | |
4.25%, 7/30/08 | | | 4,000 | | | 4,010,923 |
Puerto Rico Electric Power Authority RB Series 2007 SGB-69 DN (FSA Insurance, Societe General Group LOC), | | | | | | |
3.00%, 4/01/08(a)(b) | | | 1,000 | | | 1,000,000 |
Puerto Rico Electric Power Authority RB Series 2007 SGC-19 DN (FSA Insurance, Societe General Group Liquidity Facility), | | | | | | |
2.24%, 4/07/08(a)(b) | | | 1,780 | | | 1,780,000 |
Puerto Rico Sales Tax Financing Corp. RB Municipal Trust Receipts Floaters Series 2007-2006-1991 DN (Morgan Stanley Municipal Funding Guaranty, Morgan Stanley Municipal Funding Liquidity Facility), | | | | | | |
2.27%, 4/07/08(a)(b) | | | 3,900 | | | 3,900,000 |
| | | | | | |
| | | | | | 12,190,923 |
| | | | | | |
Virginia — 88.7% | | | | | | |
Albemarle County IDRB (Jefferson Scholars Foundation Project) Series 2007 DN (SunTrust Bank LOC), | | | | | | |
2.09%, 4/07/08(b) | | | 2,400 | | | 2,400,000 |
Alexandria IDRB (Goodwin House Project) Series 2005 DN (Wachovia Bank N.A. LOC), | | | | | | |
1.10%, 4/01/08(b) | | | 100 | | | 100,000 |
Alexandria IDRB (YMCA of Billings Project) Series 1998 DN (M&T Bank Corp. LOC), | | | | | | |
2.38%, 4/07/08(b) | | | 3,350 | | | 3,350,000 |
Arlington County IDRB (Woodbury Park Project) Series 2005A DN (Federal Home Loan Mortgage Liquidity Facility), | | | | | | |
2.21%, 4/07/08(b) | | | 1,420 | | | 1,420,000 |
Charlottesville IDA Educational Facilities RB (University of Virginia Foundation Project) Series 2006B DN (Wachovia Bank N.A. LOC), | | | | | | |
2.05%, 4/07/08(b) | | | 2,400 | | | 2,400,000 |
Chesapeake Bay Bridge & Tunnel District RB (General Resolution Project) Series 2008A DN (Branch Banking & Trust Co. LOC), | | | | | | |
2.28%, 4/07/08(b) | | | 2,250 | | | 2,250,000 |
Clarke County IDA Hospital Facilities RB (Winchester Medical Center, Inc. Project) Series 2000 DN (FSA Insurance, Morgan Guaranty Trust SBPA), | | | | | | |
2.05%, 4/07/08(b) | | | 925 | | | 925,000 |
Fairfax County Economic Development Authority RB (National Industries for Severe Handicap Project) Series 2002 DN (SunTrust Bank LOC), | | | | | | |
2.09%, 4/07/08(b) | | | 450 | | | 450,000 |
Fairfax County Economic Development Authority RB (Smithsonian Institute Project) Series 2006A DN (Bank of America N.A. LOC), | | | | | | |
1.80%, 4/07/08(b) | | | 1,350 | | | 1,350,000 |
Fairfax County Economic Development Authority RB Munitops Trust Certificates (Route 28 Project) Series 2003 DN (MBIA Insurance, ABN-AMRO Bank SBPA), | | | | | | |
2.26%, 4/07/08(a)(b) | | | 2,500 | | | 2,500,000 |
Fairfax County GO Series 2000A MB, | | | | | | |
5.00%, 6/01/08 | | | 350 | | | 357,878 |
Fairfax County IDRB (Inova Health Systems Project) Series 2005A-1 DN, | | | | | | |
2.10%, 4/07/08(b) | | | 3,205 | | | 3,205,000 |
Fairfax County IDRB (Inova Health Systems Project) Series 2005A-2 DN, | | | | | | |
2.05%, 4/07/08(b) | | | 1,800 | | | 1,800,000 |
Fairfax County IDRB (Inova Health Systems Project) Series 2005C-1 DN, | | | | | | |
2.05%, 4/07/08(b) | | | 5,945 | | | 5,945,000 |
Farmville IDA Educational Facilities RB (Longwood Student Housing Projects) Series 2007 DN (Assured Guaranty Ltd., Bank of America N.A. SBPA), | | | | | | |
2.10%, 4/07/08(b) | | | 3,000 | | | 3,000,000 |
Hampton Redevelopment & Housing Authority RB (Multi-Family Housing Project) Series 1998 DN (Federal National Mortgage Assoc. Credit Support & LOC), | | | | | | |
2.25%, 4/07/08(b) | | | 400 | | | 400,000 |
Hampton Roads Regional Jail Authority Facilities RB Series 2004 ROC-RR-II-R-2156 DN (MBIA Insurance, Citibank N.A. Liquidity Facility), | | | | | | |
2.60%, 4/07/08(a)(b) | | | 1,370 | | | 1,370,000 |
Hanover County IDA Residential Care Facility RB (Covenent Woods Project) Series 1999 DN (Branch Banking & Trust Co. LOC), | | | | | | |
2.28%, 4/07/08(b) | | | 350 | | | 350,000 |
Henrico County Economic Development Authority RB (Bon Secours Health Systems Project) Series 2008B-1 DN (Assured Guaranty Ltd., Dexia Credit Local SBPA), | | | | | | |
2.07%, 4/07/08(b) | | | 5,000 | | | 5,000,000 |
Henrico County Public Improvement GO Series 2008 MB, | | | | | | |
5.00%, 12/01/08 | | | 1,190 | | | 1,212,732 |
Loudoun County GO (Public Improvement Project) Series 2002A MB, | | | | | | |
5.00%, 5/01/08 | | | 850 | | | 850,908 |
Loudoun County IDRB (Hill School Project) Series 2002 DN (SunTrust Bank LOC), | | | | | | |
2.09%, 4/07/08(b) | | | 2,490 | | | 2,490,000 |
Loudoun County IDRB (Howard Hughes Medical Institute Project) Series 2003A DN, | | | | | | |
2.00%, 4/07/08(b) | | | 1,300 | | | 1,300,000 |
Loudoun County IDRB (Howard Hughes Medical Institute Project) Series 2003D DN, | | | | | | |
1.50%, 4/07/08(b) | | | 900 | | | 900,000 |
Loudoun County IDRB (Howard Hughes Medical Institute Project) Series 2003E DN, | | | | | | |
1.95%, 4/01/08(b) | | | 1,000 | | | 1,000,000 |
Loudoun County IDRB (Howard Hughes Medical Institute Project) Series 2003F DN, | | | | | | |
1.95%, 4/07/08(b) | | | 2,295 | | | 2,295,000 |
Louisa County IDRB (Pooled Financing Project) Series 1995 DN (Bank of America N.A. LOC), | | | | | | |
2.10%, 4/07/08(b) | | | 165 | | | 165,000 |
See Notes to Financial Statements.
| | | | | | |
| | | SEMI-ANNUAL REPORT | | MARCH 31, 2008 | | 37 |
| | |
| Schedule of Investments (continued) | | Virginia Municipal Money Market Portfolio (Percentages shown are based on Net Assets) |
| | | | | | |
| | | Par
(000) | | Value |
Municipal Bonds (Continued) | | | | | | |
Virginia (Continued) | | | | | | |
Louisa IDA PCRB (Virginia Electric & Power Co. Project) Series 2008 TECP, | | | | | | |
2.60%, 4/08/08 | | $ | 1,100 | | $ | 1,100,000 |
Madison County IDRB (Woodberry Forest School Project) Series 2007 DN (SunTrust Bank LOC), | | | | | | |
1.25%, 4/01/08(b) | | | 2,700 | | | 2,700,000 |
Montgomery County IDRB (Virginia Technical Foundation Project) Series 2005 DN (Bank of America N.A. LOC), | | | | | | |
1.35%, 4/01/08(b) | | | 100 | | | 100,000 |
Newport News IDRB (CNU Warwick LLC Student Apartments Project) Series 2004 DN (Bank of America N.A. LOC), | | | | | | |
2.10%, 4/07/08(b) | | | 200 | | | 200,000 |
Norfolk Redevelopment & Housing Authority RB (Harbor’s Edge Project) Series 2004B DN (HSH Nordbank AG LOC), | | | | | | |
2.12%, 4/07/08(b) | | | 3,700 | | | 3,700,000 |
Richmond IDRB (Diocese of Virginia Church School Project) Series 2001 DN (SunTrust Bank LOC), | | | | | | |
1.40%, 4/01/08(b) | | | 210 | | | 210,000 |
Richmond IDRB (Diocese of Virginia Church School Project) Series 2005 DN (SunTrust Bank LOC), | | | | | | |
1.40%, 4/01/08(b) | | | 1,500 | | | 1,500,000 |
Roanoke Public Improvement GO Series 2008 MB (State Aid Withholding Insurance), | | | | | | |
3.25%, 2/01/09 | | | 1,660 | | | 1,674,327 |
University of Virginia GO Series 2008 TECP, | | | | | | |
1.00%, 6/25/08 | | | 4,600 | | | 4,600,000 |
University of Virginia RB Munitops Trust Certificates Series 2005-48 DN (ABN-AMRO Bank N.V. SBPA), | | | | | | |
2.23%, 4/07/08(a)(b) | | | 3,500 | | | 3,500,000 |
Upper Occoquan Sewer Authority RB Munitops Trust Certificates Series 2007-30 DN (ABN-AMRO Bank N.V. SBPA), | | | | | | |
2.24%, 4/07/08(a)(b) | | | 1,600 | | | 1,600,000 |
Virginia Beach Development Authority IDRB (Ocean Ranch Motel Corp. Project) Series 1998 DN (Branch Banking & Trust Co. LOC), | | | | | | |
2.28%, 4/07/08(b) | | | 700 | | | 700,000 |
Virginia Beach GO MERLOTS Trust Receipts Series 2007D-11 DN (Wachovia Bank N.A. LOC), | | | | | | |
2.25%, 4/07/08(a)(b) | | | 1,470 | | | 1,470,000 |
Virginia Biotechnology Research Partnership Authority RB (Virginia Blood Services Project) Series 2006 DN (SunTrust Bank LOC), | | | | | | |
2.09%, 4/07/08(b) | | | 600 | | | 600,000 |
Virginia College Building Authority Educational Facilities RB (Shenandoah University Project) Series 2006 DN (Branch Banking & Trust Co. LOC), | | | | | | |
1.42%, 4/01/08(b) | | | 400 | | | 400,000 |
Virginia College Building Authority Educational Facilities RB (University of Richmond Project) Series 2006 DN (SunTrust Bank SBPA), | | | | | | |
1.35%, 4/01/08(b) | | | 500 | | | 500,000 |
Virginia College Building Authority Educational Facilities RB PUTTERS Series 2007-1958 DN (JPMorgan Chase Bank Liquidity Facility), | | | | | | |
2.29%, 4/07/08(a)(b) | | | 1,100 | | | 1,100,000 |
Virginia College Building Authority Educational Facilities RB Series 2003-379 DN (JPMorgan Chase & Co. LOC), | | | | | | |
2.29%, 4/07/08(a)(b) | | | 4,605 | | | 4,605,000 |
Virginia Commonwealth Transportation Board RB Series 2007-1807B DN (JPMorgan Chase & Co. LOC), | | | | | | |
2.29%, 4/07/08(a)(b) | | | 1,115 | | | 1,115,000 |
Virginia Commonwealth Transportation Board RB Series 2007 ROC-RR-II-R-10076 DN (Citibank N.A. Liquidity Facility), | | | | | | |
2.24%, 4/07/08(a)(b) | | | 1,200 | | | 1,200,000 |
Virginia Commonwealth University Health Systems Authority RB Series 2008B DN (Branch Banking & Trust Co. LOC), | | | | | | |
1.20%, 4/01/08(b) | | | 1,200 | | | 1,200,000 |
Virginia Public Building Authority RB Series 2003A MB, | | | | | | |
4.00%, 8/01/08 | | | 500 | | | 501,986 |
Virginia Public Building Authority RB Series 2005D DN (Dexia Bank SBPA), | | | | | | |
2.00%, 4/07/08(b) | | | 2,200 | | | 2,200,000 |
Virginia Public School Authority RB (School Financing Project) Series 2004A MB (State Aid Withholding Insurance), | | | | | | |
5.00%, 8/01/08 | | | 620 | | | 623,488 |
Virginia Public School Authority RB Series 2003 ROC-RR-II-R-4050 DN (Citigroup, Inc. Liquidity Facility), | | | | | | |
2.24%, 4/07/08(a)(b) | | | 1,840 | | | 1,840,000 |
Virginia Resources Authority Clean Water RB Municipal Trust Receipts Floaters Series 2007-1860 DN (Wells Fargo Bank N.A. LOC), | | | | | | |
2.16%, 4/07/08(a)(b) | | | 3,600 | | | 3,600,000 |
Virginia Resources Authority Clean Water RB UBS Municipal Certificates Floaters (Clean Water State Revolving Project) Series 2007 DN (Bank of New York LOC), | | | | | | |
2.27%, 4/07/08(a)(b) | | | 2,700 | | | 2,700,000 |
Virginia Small Business Financing Authority RB (Children’s Hospital-Kings Project) Series 2006 DN (Wachovia Bank N.A. LOC), | | | | | | |
2.08%, 4/07/08(b) | | | 2,180 | | | 2,180,000 |
Winchester Authority Residential Care Facility IDRB (Westminster-Canterbury Project) Series 2005B DN (Branch Banking & Trust Co. LOC), | | | | | | |
2.28%, 4/07/08(b) | | | 1,500 | | | 1,500,000 |
| | | | | | |
| | | | | | 97,706,319 |
| | | | | | |
Total Investments in Securities — 99.7% | | | | | | |
(Cost $109,897,242*) | | | | | | 109,897,242 |
Other Assets in Excess of Liabilities — 0.3% | | | | | | 301,050 |
| | | | | | |
Net Assets — 100.0% | | | | | $ | 110,198,292 |
| | | | | | |
See Notes to Financial Statements.
| | | | | | |
38 | | SEMI-ANNUAL REPORT | | MARCH 31, 2008 | | |
| | |
| Schedule of Investments (concluded) | | Virginia Municipal Money Market Portfolio (Percentages shown are based on Net Assets) |
| * | Aggregate cost for federal income tax purposes. |
| (a) | Security exempt from registration under Rule 144A of the Securities Act of 1933. These securities may be resold in transactions exempt from registration to qualified institutional investors. Unless otherwise indicated, these securities are not considered to be illiquid. |
| (b) | Rate shown is as of report date and maturities shown are the next interest readjustment date or the date the principal owed can be recovered through demand. |
| • | | Investments in companies considered to be an affiliate of the Portfolio were as follows: |
| | | | | | | | | | |
Affiliate | | Purchase
Cost | | Sales
Cost | | Realized
Gain | | Interest
Income |
Virginia Commonwealth University RB Series 2006A DN (AMBAC Insurance, Wachovia Bank N.A. Liquidity Facility) | | — | | $ | 2,400,000 | | — | | $ | 21,709 |
Virginia Resources Authority Clean Water RB P-Float Trust Receipts Series 2000 PA-790 DN (Merrill Lynch & Co. Guaranty, Merrill Lynch Captial Services SBPA) | | — | | $ | 505,000 | | — | | $ | 1,916 |
| • | | For Portfolio compliance purposes, the Portfolio’s sector and industry classifications refer to any one or more of the Standard Industry Codes as defined by the SEC. This definition may not apply for purposes of this report, which may combine sector and industry sub-classifications for reporting ease. |
See Notes to Financial Statements.
| | | | | | |
| | | SEMI-ANNUAL REPORT | | MARCH 31, 2008 | | 39 |
|
| Statements of Assets and Liabilities |
| | | | | | | | | | | | | |
March 31, 2008 (Unaudited) | | Money Market
Portfolio | | U.S. Treasury
Money Market
Portfolio | | | Municipal
Money Market
Portfolio | | New Jersey
Municipal
Money Market
Portfolio |
Assets | | | | | | | | | | | | | |
Investments at value - unaffiliated1 | | $ | 1,752,349,994 | | $ | — | | | $ | 324,219,411 | | $ | 166,348,390 |
Investments at value - affiliated2 | | | — | | | — | | | | — | | | 6,795,000 |
Repurchase agreements3 | | | — | | | 575,132,000 | | | | — | | | — |
Cash | | | 166 | | | 984 | | | | 91,177 | | | 22,719,682 |
Interest receivable | | | 4,815,413 | | | 941,763 | | | | 2,449,628 | | | 1,080,168 |
Interest receivable - affiliated | | | — | | | — | | | | — | | | 53,429 |
Investments sold receivable | | | 3,160,220 | | | — | | | | — | | | — |
Receivable from advisor | | | 2,224 | | | 218 | | | | 45 | | | 195 |
Capital shares sold receivable | | | 26,685,874 | | | 526,850 | | | | 2,547,842 | | | 305,840 |
Prepaid expenses | | | 141,475 | | | 58,680 | | | | 55,661 | | | 22,954 |
| | | | | | | | | | | | | |
Total assets | | | 1,787,155,366 | | | 576,660,495 | | | | 329,363,764 | | | 197,325,658 |
| | | | | | | | | | | | | |
Liabilities | | | | | | | | | | | | | |
Investments purchased payable | | | — | | | — | | | | 2,000,000 | | | 400,980 |
Income dividends payable | | | 2,893,774 | | | 684,954 | | | | 234,983 | | | 312,855 |
Capital shares redeemed payable | | | 2,532,247 | | | — | | | | 1,200 | | | — |
Investment advisory fees payable | | | 472,816 | | | 147,478 | | | | 79,915 | | | 37,489 |
Transfer agent fees payable | | | 166,781 | | | 14,011 | | | | 11,551 | | | 2,286 |
Administration fees payable | | | 117,580 | | | 42,562 | | | | 26,898 | | | 14,072 |
Officer and Trustees fees payable | | | 43,842 | | | 9,775 | | | | 5,369 | | | 3,226 |
Custodian fees payable | | | 23,497 | | | 6,947 | | | | 2,916 | | | 3,415 |
Service and distribution fees payable | | | 14,334 | | | — | | | | — | | | — |
Other accrued expenses payable | | | 512,018 | | | 110,847 | | | | 86,433 | | | 62,251 |
| | | | | | | | | | | | | |
Total liabilities | | | 6,776,889 | | | 1,016,574 | | | | 2,449,265 | | | 836,574 |
| | | | | | | | | | | | | |
Net Assets | | | | | | | | | | | | | |
| | | | | | | | | | | | | |
Net Assets | | $ | 1,780,378,477 | | $ | 575,643,921 | | | $ | 326,914,499 | | $ | 196,489,084 |
| | | | | | | | | | | | | |
Net Assets Consist of | | | | | | | | | | | | | |
Paid-in capital | | $ | 1,780,298,769 | | $ | 575,647,909 | | | $ | 326,902,396 | | $ | 196,484,359 |
Undistributed net investment income | | | 64,239 | | | 46,591 | | | | 8,019 | | | 13 |
Accumulated net realized gain (loss) | | | 15,469 | | | (50,579 | ) | | | 4,084 | | | 4,712 |
| | | | | | | | | | | | | |
Net Assets | | $ | 1,780,378,477 | | $ | 575,643,921 | | | $ | 326,914,499 | | $ | 196,489,084 |
| | | | | | | | | | | | | |
1 Investments at cost - unaffiliated | | $ | 1,752,349,994 | | $ | — | | | $ | 324,219,411 | | $ | 166,348,390 |
2 Investments at cost - affiliated | | | — | | | — | | | | — | | | 6,795,000 |
3 Cost of repurchase agreements | | | — | | | 575,132,000 | | | | — | | | — |
See Notes to Financial Statements.
| | | | | | |
40 | | SEMI-ANNUAL REPORT | | MARCH 31, 2008 | | |
|
| Statements of Assets and Liabilities (continued) |
| | | | | | | | | | | | |
March 31, 2008 (Unaudited) | | Money Market
Portfolio | | U.S. Treasury
Money Market
Portfolio | | Municipal
Money Market
Portfolio | | New Jersey
Municipal
Money Market
Portfolio |
Institutional | | | | | | | | | | | | |
Net Assets | | $ | 633,734,619 | | $ | 306,433,524 | | $ | 58,695,085 | | $ | 127,521,627 |
Shares outstanding, unlimited number of shares authorized, $0.001 par value | | | 633,758,298 | | | 306,460,658 | | | 58,629,823 | | | 127,509,508 |
Net Asset Value | | $ | 1.00 | | $ | 1.00 | | $ | 1.00 | | $ | 1.00 |
Service | | | | | | | | | | | | |
Net Assets | | $ | 512,792,383 | | $ | 224,513,965 | | $ | 72,329,856 | | $ | 33,643,014 |
Shares outstanding, unlimited number of shares authorized, $0.001 par value | | | 512,772,709 | | | 224,568,280 | | | 72,354,582 | | | 33,659,317 |
Net Asset Value | | $ | 1.00 | | $ | 1.00 | | $ | 1.00 | | $ | 1.00 |
Hilliard Lyons | | | | | | | | | | | | |
Net Assets | | $ | 150,076,810 | | $ | — | | $ | 189,793,258 | | $ | — |
Shares outstanding, unlimited number of shares authorized, $0.001 par value | | | 150,063,539 | | | — | | | 189,786,384 | | | — |
Net Asset Value | | $ | 1.00 | | $ | — | | $ | 1.00 | | $ | — |
Investor A | | | | | | | | | | | | |
Net Assets | | $ | 461,734,469 | | $ | 44,696,432 | | $ | 6,096,300 | | $ | 35,324,443 |
Shares outstanding, unlimited number of shares authorized, $0.001 par value | | | 461,719,710 | | | 44,684,635 | | | 6,095,794 | | | 35,316,653 |
Net Asset Value | | $ | 1.00 | | $ | 1.00 | | $ | 1.00 | | $ | 1.00 |
Investor B | | | | | | | | | | | | |
Net Assets | | $ | 14,098,302 | | $ | — | | $ | — | | $ | — |
Shares outstanding, unlimited number of shares authorized, $0.001 par value | | | 14,096,111 | | | — | | | — | | | — |
Net Asset Value | | $ | 1.00 | | $ | — | | $ | — | | $ | — |
Investor C | | | | | | | | | | | | |
Net Assets | | $ | 7,941,894 | | $ | — | | $ | — | | $ | — |
Shares outstanding, unlimited number of shares authorized, $0.001 par value | | | 7,941,641 | | | — | | | — | | | — |
Net Asset Value | | $ | 1.00 | | $ | — | | $ | — | | $ | — |
See Notes to Financial Statements.
| | | | | | |
| | | SEMI-ANNUAL REPORT | | MARCH 31, 2008 | | 41 |
|
| Statements of Assets and Liabilities (continued) |
| | | | | | | | | | | | | | |
March 31, 2008 (Unaudited) | | North Carolina
Municipal
Money Market
Portfolio | | | Ohio
Municipal
Money Market
Portfolio | | | Pennsylvania
Municipal
Money Market
Portfolio | | Virginia
Municipal
Money Market
Portfolio |
Assets | | | | | | | | | | | | | | |
Investments at value - unaffiliated1 | | $ | 91,123,831 | | | $ | 142,048,649 | | | $ | 630,703,524 | | $ | 109,897,242 |
Investments at value - affiliated2 | | | — | | | | 17,505,000 | | | | — | | | — |
Cash | | | 12,475 | | | | 17,450 | | | | 80,525 | | | 33,023 |
Interest receivable | | | 427,196 | | | | 971,206 | | | | 3,575,330 | | | 524,614 |
Interest receivable - affiliated | | | — | | | | 69,462 | | | | — | | | — |
Investments sold receivable | | | — | | | | — | | | | 10,975,000 | | | — |
Receivable from advisor | | | 269 | | | | 88 | | | | 723 | | | 674 |
Capital shares sold receivable | | | — | | | | 808,939 | | | | 1,211,041 | | | — |
Prepaid expenses | | | 15,179 | | | | 16,011 | | | | 38,627 | | | 17,472 |
| | | | | | | | | | | | | | |
Total assets | | | 91,578,950 | | | | 161,436,805 | | | | 646,584,770 | | | 110,473,025 |
| | | | | | | | | | | | | | |
Liabilities | | | | | | | | | | | | | | |
Investments purchased payable | | | — | | | | 902,441 | | | | — | | | — |
Income dividends payable | | | 100,087 | | | | 290,365 | | | | 1,098,676 | | | 218,776 |
Administration fees payable | | | 5,660 | | | | 10,463 | | | | 42,559 | | | 7,497 |
Investment advisory fees payable | | | 5,043 | | | | 29,262 | | | | 176,094 | | | 11,117 |
Custodian fees payable | | | 2,785 | | | | 4,090 | | | | 4,653 | | | 2,504 |
Transfer agent fees payable | | | 1,476 | | | | 1,813 | | | | 7,838 | | | 2,304 |
Officer and Trustees fees payable | | | 1,387 | | | | 2,519 | | | | 13,510 | | | 1,619 |
Other accrued expenses payable | | | 36,934 | | | | 39,763 | | | | 102,013 | | | 30,916 |
| | | | | | | | | | | | | | |
Total liabilities | | | 153,372 | | | | 1,280,716 | | | | 1,445,343 | | | 274,733 |
| | | | | | | | | | | | | | |
Net Assets | | | | | | | | | | | | | | |
| | | | | | | | | | | | | | |
Net Assets | | $ | 91,425,578 | | | $ | 160,156,089 | | | $ | 645,139,427 | | $ | 110,198,292 |
| | | | | | | | | | | | | | |
Net Assets Consist of | | | | | | | | | | | | | | |
Paid-in capital | | $ | 91,433,029 | | | $ | 160,159,630 | | | $ | 645,123,386 | | $ | 110,197,605 |
Undistributed net investment income | | | 4 | | | | — | | | | — | | | 52 |
Accumulated net realized gain (loss) | | | (7,455 | ) | | | (3,541 | ) | | | 16,041 | | | 635 |
| | | | | | | | | | | | | | |
Net Assets | | $ | 91,425,578 | | | $ | 160,156,089 | | | $ | 645,139,427 | | $ | 110,198,292 |
| | | | | | | | | | | | | | |
1 Investments at cost - unaffiliated | | $ | 91,123,831 | | | $ | 142,048,649 | | | $ | 630,703,524 | | $ | 109,897,242 |
2 Investments at cost - affiliated | | | — | | | | 17,505,000 | | | | — | | | — |
See Notes to Financial Statements.
| | | | | | |
42 | | SEMI-ANNUAL REPORT | | MARCH 31, 2008 | | |
Statements of Assets and Liabilities (concluded)
| | | | | | | | | | | | |
March 31, 2008 (Unaudited) | | North Carolina
Municipal
Money Market
Portfolio | | Ohio
Municipal
Money Market
Portfolio | | Pennsylvania
Municipal
Money Market
Portfolio | | Virginia
Municipal
Money Market
Portfolio |
Institutional | | | | | | | | | | | | |
Net Assets | | $ | 86,319,218 | | $ | 125,868,290 | | $ | 547,912,802 | | $ | 109,856,499 |
Shares outstanding, unlimited number of shares authorized, $0.001 par value | | | 86,322,260 | | | 125,862,328 | | | 547,885,252 | | | 109,855,492 |
Net Asset Value | | $ | 1.00 | | $ | 1.00 | | $ | 1.00 | | $ | 1.00 |
Service | | | | | | | | | | | | |
Net Assets | | $ | 4,978,671 | | $ | 7,681,540 | | $ | 53,881,220 | | $ | 341,793 |
Shares outstanding, unlimited number of shares authorized, $0.001 par value | | | 4,978,453 | | | 7,683,266 | | | 53,888,352 | | | 341,772 |
Net Asset Value | | $ | 1.00 | | $ | 1.00 | | $ | 1.00 | | $ | 1.00 |
Investor A | | | | | | | | | | | | |
Net Assets | | $ | 127,689 | | $ | 26,606,259 | | $ | 43,345,405 | | $ | — |
Shares outstanding, unlimited number of shares authorized, $0.001 par value | | | 127,705 | | | 26,612,989 | | | 43,345,213 | | | — |
Net Asset Value | | $ | 1.00 | | $ | 1.00 | | $ | 1.00 | | $ | — |
See Notes to Financial Statements.
| | | | | | |
| | | SEMI-ANNUAL REPORT | | MARCH 31, 2008 | | 43 |
Statements of Operations
| | | | | | | | | | | | |
Six Months Ended March 31, 2008 (Unaudited) | | Money Market
Portfolio | | | U.S. Treasury
Money Market
Portfolio | | | Municipal
Money Market
Portfolio | |
Investment Income | | | | | | | | | | | | |
Interest | | $ | 40,847,698 | | | $ | 9,705,807 | | | $ | 5,421,449 | |
Interest from affiliates | | | 1,482 | | | | 27 | | | | 16,923 | |
| | | | | | | | | | | | |
Total investment income | | | 40,849,180 | | | | 9,705,834 | | | | 5,438,372 | |
| | | | | | | | | | | | |
Expenses | | | | | | | | | | | | |
Investment advisory | | | 3,668,694 | | | | 1,270,541 | | | | 766,406 | |
Service - class specific | | | 1,323,062 | | | | 333,099 | | | | 337,417 | |
Administration | | | 545,071 | | | | 208,349 | | | | 127,734 | |
Administration - class specific | | | 205,652 | | | | 70,586 | | | | 42,578 | |
Transfer agent - class specific | | | 194,694 | | | | 5,814 | | | | 2,442 | |
Printing | | | 150,694 | | | | 26,547 | | | | 18,319 | |
Distribution - class specific | | | 67,213 | | | | — | | | | — | |
Professional | | | 66,903 | | | | 29,196 | | | | 29,206 | |
Officer and Trustees | | | 48,361 | | | | 16,862 | | | | 11,692 | |
Custodian | | | 47,857 | | | | 20,221 | | | | 15,182 | |
Registration | | | 30,988 | | | | 17,875 | | | | 21,023 | |
Miscellaneous | | | 20,021 | | | | 11,327 | | | | 5,414 | |
| | | | | | | | | | | | |
Total expenses | | | 6,369,210 | | | | 2,010,417 | | | | 1,377,413 | |
Less investment advisory fees waived | | | (989,176 | ) | | | (443,263 | ) | | | (278,834 | ) |
Less administration fees waived - class specific | | | (76,171 | ) | | | (37,276 | ) | | | (8,847 | ) |
Less transfer agent fees waived - class specific | | | (4,627 | ) | | | (985 | ) | | | (127 | ) |
Less transfer agent fees reimbursed - class specific | | | (18,903 | ) | | | (1,762 | ) | | | (370 | ) |
Less service fees waived - class specific | | | (18,078 | ) | | | — | | | | (230,374 | ) |
Less fees paid indirectly | | | (509 | ) | | | (6 | ) | | | (1 | ) |
| | | | | | | | | | | | |
Total expenses after waivers and reimbursement | | | 5,261,746 | | | | 1,527,125 | | | | 858,860 | |
| | | | | | | | | | | | |
Net investment income | | | 35,587,434 | | | | 8,178,709 | | | | 4,579,512 | |
| | | | | | | | | | | | |
Realized Gain (Loss) | | | | | | | | | | | | |
Net realized gain (loss) from investments | | | 88,849 | | | | — | | | | 18,418 | |
| | | | | | | | | | | | |
Net Increase in Net Assets Resulting from Operations | | $ | 35,676,283 | | | $ | 8,178,709 | | | $ | 4,597,930 | |
| | | | | | | | | | | | |
See Notes to Financial Statements.
| | | | | | |
44 | | SEMI-ANNUAL REPORT | | MARCH 31, 2008 | | |
Statements of Operations (concluded)
| | | | | | | | | | | | | | | | | | |
New Jersey
Municipal
Money Market
Portfolio | | | North Carolina
Municipal
Money Market
Portfolio | | | Ohio
Municipal
Money Market
Portfolio | | | Pennsylvania
Municipal
Money Market
Portfolio | | | Virginia
Municipal
Money Market
Portfolio | |
| $ | 2,916,114 | | | $ | 1,230,308 | | | $ | 2,213,274 | | | $ | 9,411,516 | | | $ | 1,741,956 | |
| | 218,945 | | | | 4 | | | | 217,196 | | | | 202,546 | | | | 23,628 | |
| | | | | | | | | | | | | | | | | | | |
| | 3,135,059 | | | | 1,230,312 | | | | 2,430,470 | | | | 9,614,062 | | | | 1,765,584 | |
| | | | | | | | | | | | | | | | | | | |
| | 446,212 | | | | 180,584 | | | | 331,502 | | | | 1,416,264 | | | | 266,782 | |
| | 87,053 | | | | 6,037 | | | | 41,382 | | | | 115,415 | | | | 845 | |
| | 74,369 | | | | 30,097 | | | | 55,250 | | | | 229,572 | | | | 44,464 | |
| | 24,789 | | | | 10,032 | | | | 18,418 | | | | 76,832 | | | | 14,821 | |
| | 2,397 | | | | 2,047 | | | | 1,365 | | | | 8,776 | | | | 4,226 | |
| | 9,352 | | | | 3,406 | | | | 6,642 | | | | 26,453 | | | | 4,476 | |
| | — | | | | — | | | | — | | | | — | | | | — | |
| | 24,212 | | | | 20,846 | | | | 18,564 | | | | 33,680 | | | | 16,539 | |
| | 9,996 | | | | 8,072 | | | | 9,037 | | | | 19,455 | | | | 8,467 | |
| | 10,194 | | | | 5,819 | | | | 9,768 | | | | 21,028 | | | | 6,376 | |
| | 6,111 | | | | 5,130 | | | | 4,281 | | | | 6,576 | | | | 6,214 | |
| | 4,189 | | | | 2,994 | | | | 3,702 | | | | 7,783 | | | | 2,772 | |
| | | | | | | | | | | | | | | | | | | |
| | 698,874 | | | | 275,064 | | | | 499,911 | | | | 1,961,834 | | | | 375,982 | |
| | (197,999 | ) | | | (136,558 | ) | | | (152,173 | ) | | | (439,599 | ) | | | (178,233 | ) |
| | (16,084 | ) | | | (9,429 | ) | | | (14,280 | ) | | | (65,290 | ) | | | (14,746 | ) |
| | (482 | ) | | | (197 | ) | | | (275 | ) | | | (1,723 | ) | | | (301 | ) |
| | (1,180 | ) | | | (1,674 | ) | | | (842 | ) | | | (6,150 | ) | | | (3,876 | ) |
| | — | | | | — | | | | — | | | | — | | | | — | |
| | (2 | ) | | | — | | | | (10 | ) | | | (2 | ) | | | — | |
| | | | | | | | | | | | | | | | | | | |
| | 483,127 | | | | 127,206 | | | | 332,331 | | | | 1,449,070 | | | | 178,826 | |
| | | | | | | | | | | | | | | | | | | |
| | 2,651,932 | | | | 1,103,106 | | | | 2,098,139 | | | | 8,164,992 | | | | 1,586,758 | |
| | | | | | | | | | | | | | | | | | | |
| | 587 | | | | 132 | | | | (4,000 | ) | | | 68,155 | | | | 1,119 | |
| | | | | | | | | | | | | | | | | | | |
| $ | 2,652,519 | | | $ | 1,103,238 | | | $ | 2,094,139 | | | $ | 8,233,147 | | | $ | 1,587,877 | |
| | | | | | | | | | | | | | | | | | | |
See Notes to Financial Statements.
| | | | | | |
| | | SEMI-ANNUAL REPORT | | MARCH 31, 2008 | | 45 |
|
| Statements of Changes in Net Assets |
| | | | | | | | | | | | | | | | | | | | | | | | |
| | | Money Market Portfolio | | | U.S.Treasury
Money Market Portfolio | | | Municipal
Money Market Portfolio | |
Increase (Decrease) in Net Assets: | | Six Months
Ended
March 31, 2008
(Unaudited) | | | Year Ended
September 30,
2007 | | | Six Months
Ended
March 31, 2008
(Unaudited) | | | Year Ended
September 30,
2007 | | | Six Months
Ended
March 31, 2008
(Unaudited) | | | Year Ended
September 30,
2007 | |
Operations | | | | | | | | | | | | | | | | | | | | | | | | |
Net investment income | | $ | 35,587,434 | | | $ | 76,741,208 | | | $ | 8,178,709 | | | $ | 20,415,039 | | | $ | 4,579,512 | | | $ | 10,444,956 | |
Net realized gain (loss) | | | 88,849 | | | | (2,848 | ) | | | — | | | | — | | | | 18,418 | | | | (14,334 | ) |
| | | | | | | | | | | | | | | | | | | | | | | | |
Net increase in net assets resulting from operations | | | 35,676,283 | | | | 76,738,360 | | | | 8,178,709 | | | | 20,415,039 | | | | 4,597,930 | | | | 10,430,622 | |
| | | | | | | | | | | | | | | | | | | | | | | | |
Dividends to Shareholders from | | | | | | | | | | | | | | | | | | | | | | | | |
Net investment income: | | | | | | | | | | | | | | | | | | | | | | | | |
Institutional | | | (14,287,433 | ) | | | (30,926,483 | ) | | | (4,421,764 | ) | | | (8,825,939 | ) | | | (952,210 | ) | | | (2,027,791 | ) |
Service | | | (9,863,985 | ) | | | (20,365,498 | ) | | | (3,255,590 | ) | | | (10,219,151 | ) | | | (1,021,509 | ) | | | (3,260,720 | ) |
Hilliard Lyons | | | (2,930,276 | ) | | | (6,327,437 | ) | | | — | | | | — | | | | (2,541,333 | ) | | | (5,026,924 | ) |
Investor A | | | (8,198,805 | ) | | | (18,353,476 | ) | | | (501,355 | ) | | | (1,369,949 | ) | | | (64,460 | ) | | | (129,599 | ) |
Investor B | | | (201,412 | ) | | | (570,502 | ) | | | — | | | | — | | | | — | | | | — | |
Investor C | | | (105,523 | ) | | | (197,812 | ) | | | — | | | | — | | | | — | | | | — | |
| | | | | | | | | | | | | | | | | | | | | | | | |
Decrease in net assets resulting from dividends to shareholders | | | (35,587,434 | ) | | | (76,741,208 | ) | | | (8,178,709 | ) | | | (20,415,039 | ) | | | (4,579,512 | ) | | | (10,445,034 | ) |
| | | | | | | | | | | | | | | | | | | | | | | | |
Capital Share Transactions | | | | | | | | | | | | | | | | | | | | | | | | |
Net increase (decrease) in net assets resulting from capital share transactions | | | 87,101,788 | | | | 127,891,591 | | | | (14,914,816 | ) | | | 103,487,944 | | | | 13,582,653 | | | | (23,588,224 | ) |
| | | | | | | | | | | | | | | | | | | | | | | | |
Net Assets | | | | | | | | | | | | | | | | | | | | | | | | |
Total increase (decrease) in net assets | | | 87,190,637 | | | | 127,888,743 | | | | (14,914,816 | ) | | | 103,487,944 | | | | 13,601,071 | | | | (23,602,636 | ) |
Beginning of period | | | 1,693,187,840 | | | | 1,565,299,097 | | | | 590,558,737 | | | | 487,070,793 | | | | 313,313,428 | | | | 336,916,064 | |
| | | | | | | | | | | | | | | | | | | | | | | | |
End of period | | $ | 1,780,378,477 | | | $ | 1,693,187,840 | | | $ | 575,643,921 | | | $ | 590,558,737 | | | $ | 326,914,499 | | | $ | 313,313,428 | |
| | | | | | | | | | | | | | | | | | | | | | | | |
End of period undistributed net investment income | | $ | 64,239 | | | $ | 64,239 | | | $ | 46,591 | | | $ | 46,591 | | | $ | 8,019 | | | $ | 8,019 | |
| | | | | | | | | | | | | | | | | | | | | | | | |
See Notes to Financial Statements.
| | | | | | |
46 | | SEMI-ANNUAL REPORT | | MARCH 31, 2008 | | |
|
| Statements of Changes in Net Assets (concluded) |
| | | | | | | | | | | | | | | | | | | | | | | | | | | | | | | | | | | | | | |
New Jersey Municipal
Money Market Portfolio | | | North Carolina Municipal Money
Market Portfolio | | | Ohio Municipal
Money Market Portfolio | | | Pennsylvania Municipal
Money Market Portfolio | | | Virginia Municipal
Money Market Portfolio | |
Six Months
Ended
March 31, 2008
(Unaudited) | | | Year Ended
September 30,
2007 | | | Six Months
Ended
March 31, 2008
(Unaudited) | | | Year Ended
September 30,
2007 | | | Six Months
Ended
March 31, 2008
(Unaudited) | | | Year Ended
September 30,
2007 | | | Six Months
Ended
March 31, 2008
(Unaudited) | | | Year Ended
September 30,
2007 | | | Six Months
Ended
March 31, 2008
(Unaudited) | | | Year Ended
September 30,
2007 | |
| $ | 2,651,932 | | | $ | 5,664,183 | | | $ | 1,103,106 | | | $ | 2,545,427 | | | $ | 2,098,139 | | | $ | 5,097,354 | | | $ | 8,164,992 | | | $ | 19,110,199 | | | $ | 1,586,758 | | | $ | 2,602,675 | |
| | 587 | | | | 7,366 | | | | 132 | | | | 38 | | | | (4,000 | ) | | | 28,703 | | | | 68,155 | | | | (28,946 | ) | | | 1,119 | | | | (484 | ) |
| | | | | | | | | | | | | | | | | | | | | | | | | | | | | | | | | | | | | | | |
| | 2,652,519 | | | | 5,671,549 | | | | 1,103,238 | | | | 2,545,465 | | | | 2,094,139 | | | | 5,126,057 | | | | 8,233,147 | | | | 19,081,253 | | | | 1,587,877 | | | | 2,602,191 | |
| | | | | | | | | | | | | | | | | | | | | | | | | | | | | | | | | | | | | | | |
| | (1,788,066 | ) | | | (3,456,093 | ) | | | (1,043,698 | ) | | | (2,506,251 | ) | | | (1,659,530 | ) | | | (4,205,016 | ) | | | (7,073,515 | ) | | | (16,495,727 | ) | | | (1,577,653 | ) | | | (2,583,685 | ) |
| | (459,938 | ) | | | (1,493,271 | ) | | | (57,804 | ) | | | (30,289 | ) | | | (106,846 | ) | | | (190,290 | ) | | | (668,471 | ) | | | (1,573,883 | ) | | | (9,105 | ) | | | (18,990 | ) |
| | — | | | | — | | | | — | | | | — | | | | — | | | | — | | | | — | | | | — | | | | — | | | | — | |
| | (403,928 | ) | | | (714,819 | ) | | | (1,600 | ) | | | (8,895 | ) | | | (331,763 | ) | | | (702,048 | ) | | | (423,006 | ) | | | (1,040,589 | ) | | | — | | | | — | |
| | — | | | | — | | | | — | | | | — | | | | — | | | | — | | | | — | | | | — | | | | — | | | | — | |
| | — | | | | — | | | | — | | | | — | | | | — | | | | — | | | | — | | | | — | | | | — | | | | — | |
| | | | | | | | | | | | | | | | | | | | | | | | | | | | | | | | | | | | | | | |
| | (2,651,932 | ) | | | (5,664,183 | ) | | | (1,103,102 | ) | | | (2,545,435 | ) | | | (2,098,139 | ) | | | (5,097,354 | ) | | | (8,164,992 | ) | | | (19,110,199 | ) | | | (1,586,758 | ) | | | (2,602,675 | ) |
| | | | | | | | | | | | | | | | | | | | | | | | | | | | | | | | | | | | | | | |
| | (32,779,296 | ) | | | 55,470,254 | | | | 23,695,575 | | | | 5,671,615 | | | | 28,434,666 | | | | (25,233,037 | ) | | | 55,245,554 | | | | 52,198,539 | | | | 27,519,726 | | | | 11,160,010 | |
| | | | | | | | | | | | | | | | | | | | | | | | | | | | | | | | | | | | | | | |
| | (32,778,709 | ) | | | 55,477,620 | | | | 23,695,711 | | | | 5,671,645 | | | | 28,430,666 | | | | (25,204,334 | ) | | | 55,313,709 | | | | 52,169,593 | | | | 27,520,845 | | | | 11,159,526 | |
| | | | | | | | | | | | | | | | | | | | | | | | | | | | | | | | | | | | | | | |
| | 229,267,793 | | | | 173,790,173 | | | | 67,729,867 | | | | 62,058,222 | | | | 131,725,423 | | | | 156,929,757 | | | | 589,825,718 | | | | 537,656,125 | | | | 82,677,447 | | | | 71,517,921 | |
| | | | | | | | | | | | | | | | | | | | | | | | | | | | | | | | | | | | | | | |
| $ | 196,489,084 | | | $ | 229,267,793 | | | $ | 91,425,578 | | | $ | 67,729,867 | | | $ | 160,156,089 | | | $ | 131,725,423 | | | $ | 645,139,427 | | | $ | 589,825,718 | | | $ | 110,198,292 | | | $ | 82,677,447 | |
| | | | | | | | | | | | | | | | | | | | | | | | | | | | | | | | | | | | | | | |
| $ | 13 | | | $ | 13 | | | $ | 4 | | | $ | — | | | $ | — | | | $ | — | | | $ | — | | | $ | — | | | $ | 52 | | | $ | 52 | |
| | | | | | | | | | | | | | | | | | | | | | | | | | | | | | | | | | | | | | | |
See Notes to Financial Statements.
| | | | | | |
| | | SEMI-ANNUAL REPORT | | MARCH 31, 2008 | | 47 |
| | |
| Financial Highlights | | Money Market Portfolio |
| | | | | | | | | | | | | | | | | | | | | | | | | | | | | | | | | | | | | | | | | | | | | | | | |
| | | Institutional | | | Service | |
| | | Six Months
Ended
March 31, 2008
(Unaudited) | | | | | | | | | | | | | | | | | | Six Months
Ended
March 31, 2008
(Unaudited) | | | | | | | | | | | | | | | | |
| | | | Year Ended September 30, | | | | Year Ended September 30, | |
| | | | 2007 | | | 2006 | | | 2005 | | | 2004 | | | 20031 | | | | 2007 | | | 2006 | | | 2005 | | | 2004 | | | 20031 | |
Per Share Operating Performance | | | | | | | | | | | | | | | | | | | | | | | | | | | | | | | | | | | | | | | | | | | | | | | | |
Net asset value, beginning of period | | $ | 1.00 | | | $ | 1.00 | | | $ | 1.00 | | | $ | 1.00 | | | $ | 1.00 | | | $ | 1.00 | | | $ | 1.00 | | | $ | 1.00 | | | $ | 1.00 | | | $ | 1.00 | | | $ | 1.00 | | | $ | 1.00 | |
| | | | | | | | | | | | | | | | | | | | | | | | | | | | | | | | | | | | | | | | | | | | | | | | |
Net investment income | | | 0.0217 | | | | 0.0498 | | | | 0.0436 | | | | 0.0233 | | | | 0.0083 | | | | 0.0103 | | | | 0.0204 | | | | 0.0469 | | | | 0.0407 | | | | 0.0203 | | | | 0.0054 | | | | 0.0073 | |
Dividends from net investment income | | | (0.0217 | ) | | | (0.0498 | ) | | | (0.0436 | ) | | | (0.0233 | ) | | | (0.0083 | ) | | | (0.0103 | ) | | | (0.0204 | ) | | | (0.0469 | ) | | | (0.0407 | ) | | | (0.0203 | ) | | | (0.0054 | ) | | | (0.0073 | ) |
| | | | | | | | | | | | | | | | | | | | | | | | | | | | | | | | | | | | | | | | | | | | | | | | |
Net asset value, end of period | | $ | 1.00 | | | $ | 1.00 | | | $ | 1.00 | | | $ | 1.00 | | | $ | 1.00 | | | $ | 1.00 | | | $ | 1.00 | | | $ | 1.00 | | | $ | 1.00 | | | $ | 1.00 | | | $ | 1.00 | | | $ | 1.00 | |
| | | | | | | | | | | | | | | | | | | | | | | | | | | | | | | | | | | | | | | | | | | | | | | | |
Total Investment Return | | | | | | | | | | | | | | | | | | | | | | | | | | | | | | | | | | | | | | | | | | | | | | | | |
Based on net asset value | | | 2.20 | %2 | | | 5.10 | % | | | 4.44 | % | | | 2.36 | % | | | 0.84 | % | | | 1.04 | % | | | 2.06 | %2 | | | 4.80 | % | | | 4.14 | % | | | 2.05 | % | | | 0.54 | % | | | 0.74 | % |
| | | | | | | | | | | | | | | | | | | | | | | | | | | | | | | | | | | | | | | | | | | | | | | | |
Ratios to Average Net Assets | | | | | | | | | | | | | | | | | | | | | | | | | | | | | | | | | | | | | | | | | | | | | | | | |
Total expenses, net of waivers and reimbursement | | | 0.42 | %3 | | | 0.42 | % | | | 0.42 | % | | | 0.42 | % | | | 0.42 | % | | | 0.42 | % | | | 0.70 | %3 | | | 0.71 | % | | | 0.71 | % | | | 0.72 | % | | | 0.71 | % | | | 0.72 | % |
| | | | | | | | | | | | | | | | | | | | | | | | | | | | | | | | | | | | | | | | | | | | | | | | |
Total expenses | | | 0.56 | %3 | | | 0.58 | % | | | 0.63 | % | | | 0.71 | % | | | 0.63 | % | | | 0.62 | % | | | 0.81 | %3 | | | 0.84 | % | | | 0.89 | % | | | 0.96 | % | | | 0.93 | % | | | 0.94 | % |
| | | | | | | | | | | | | | | | | | | | | | | | | | | | | | | | | | | | | | | | | | | | | | | | |
Net investment income | | | 4.40 | %3 | | | 4.99 | % | | | 4.36 | % | | | 2.30 | % | | | 0.78 | % | | | 1.04 | % | | | 4.06 | %3 | | | 4.69 | % | | | 4.09 | % | | | 2.02 | % | | | 0.54 | % | | | 0.74 | % |
| | | | | | | | | | | | | | | | | | | | | | | | | | | | | | | | | | | | | | | | | | | | | | | | |
Supplemental Data | | | | | | | | | | | | | | | | | | | | | | | | | | | | | | | | | | | | | | | | | | | | | | | | |
Net assets, end of period (000) | | $ | 633,735 | | | $ | 745,726 | | | $ | 568,058 | | | $ | 574,473 | | | $ | 593,380 | | | $ | 2,006,202 | | | $ | 512,792 | | | $ | 405,701 | | | $ | 448,015 | | | $ | 411,831 | | | $ | 374,441 | | | $ | 431,854 | |
| | | | | | | | | | | | | | | | | | | | | | | | | | | | | | | | | | | | | | | | | | | | | | | | |
| | |
| | | Hilliard Lyons | | | Investor A | |
| | | Six Months
Ended
March 31, 2008
(Unaudited) | | | | | | | | | | | | | | | | | | Six Months
Ended
March 31, 2008
(Unaudited) | | | | | | | | | | | | | | | | |
| | | | Year Ended September 30, | | | | Year Ended September 30, | |
| | | | 2007 | | | 2006 | | | 2005 | | | 2004 | | | 20031 | | | | 2007 | | | 2006 | | | 2005 | | | 2004 | | | 20031 | |
Per Share Operating Performance | | | | | | | | | | | | | | | | | | | | | | | | | | | | | | | | | | | | | | | | | | | | | | | | |
Net asset value, beginning of period | | $ | 1.00 | | | $ | 1.00 | | | $ | 1.00 | | | $ | 1.00 | | | $ | 1.00 | | | $ | 1.00 | | | $ | 1.00 | | | $ | 1.00 | | | $ | 1.00 | | | $ | 1.00 | | | $ | 1.00 | | | $ | 1.00 | |
| | | | | | | | | | | | | | | | | | | | | | | | | | | | | | | | | | | | | | | | | | | | | | | | |
Net investment income | | | 0.0204 | | | | 0.0471 | | | | 0.0406 | | | | 0.0198 | | | | 0.0043 | | | | 0.0056 | | | | 0.0200 | | | | 0.0461 | | | | 0.0399 | | | | 0.0199 | | | | 0.0044 | | | | 0.0056 | |
Dividends from net investment income | | | (0.0204 | ) | | | (0.0471 | ) | | | (0.0406 | ) | | | (0.0198 | ) | | | (0.0043 | ) | | | (0.0056 | ) | | | (0.0200 | ) | | | (0.0461 | ) | | | (0.0399 | ) | | | (0.0199 | ) | | | (0.0044 | ) | | | (0.0056 | ) |
| | | | | | | | | | | | | | | | | | | | | | | | | | | | | | | | | | | | | | | | | | | | | | | | |
Net asset value, end of period | | $ | 1.00 | | | $ | 1.00 | | | $ | 1.00 | | | $ | 1.00 | | | $ | 1.00 | | | $ | 1.00 | | | $ | 1.00 | | | $ | 1.00 | | | $ | 1.00 | | | $ | 1.00 | | | $ | 1.00 | | | $ | 1.00 | |
| | | | | | | | | | | | | | | | | | | | | | | | | | | | | | | | | | | | | | | | | | | | | | | | |
Total Investment Return | | | | | | | | | | | | | | | | | | | | | | | | | | | | | | | | | | | | | | | | | | | | | | | | |
Based on net asset value | | | 2.06 | %2 | | | 4.81 | % | | | 4.13 | % | | | 2.00 | % | | | 0.43 | % | | | 0.57 | % | | | 2.02 | %2 | | | 4.71 | % | | | 4.07 | % | | | 2.01 | % | | | 0.44 | % | | | 0.57 | % |
| | | | | | | | | | | | | | | | | | | | | | | | | | | | | | | | | | | | | | | | | | | | | | | | |
Ratios to Average Net Assets | | | | | | | | | | | | | | | | | | | | | | | | | | | | | | | | | | | | | | | | | | | | | | | | |
Total expenses, net of waivers and reimbursement | | | 0.70 | %3 | | | 0.70 | % | | | 0.72 | % | | | 0.77 | % | | | 0.82 | % | | | 0.89 | % | | | 0.77 | %3 | | | 0.79 | % | | | 0.79 | % | | | 0.76 | % | | | 0.82 | % | | | 0.89 | % |
| | | | | | | | | | | | | | | | | | | | | | | | | | | | | | | | | | | | | | | | | | | | | | | | |
Total expenses | | | 0.81 | %3 | | | 0.82 | % | | | 0.98 | % | | | 1.07 | % | | | 1.13 | % | | | 1.10 | % | | | 0.89 | %3 | | | 0.92 | % | | | 1.05 | % | | | 1.06 | % | | | 1.13 | % | | | 1.11 | % |
| | | | | | | | | | | | | | | | | | | | | | | | | | | | | | | | | | | | | | | | | | | | | | | | |
Net investment income | | | 4.08 | %3 | | | 4.70 | % | | | 4.06 | % | | | 1.98 | % | | | 0.42 | % | | | 0.56 | % | | | 3.98 | %3 | | | 4.61 | % | | | 3.98 | % | | | 2.04 | % | | | 0.43 | % | | | 0.57 | % |
| | | | | | | | | | | | | | | | | | | | | | | | | | | | | | | | | | | | | | | | | | | | | | | | |
Supplemental Data | | | | | | | | | | | | | | | | | | | | | | | | | | | | | | | | | | | | | | | | | | | | | | | | |
Net assets, end of period (000) | | $ | 150,077 | | | $ | 131,720 | | | $ | 121,243 | | | $ | 116,066 | | | $ | 116,254 | | | $ | 148,277 | | | $ | 461,734 | | | $ | 393,399 | | | $ | 399,656 | | | $ | 433,609 | | | $ | 362,495 | | | $ | 451,676 | |
| | | | | | | | | | | | | | | | | | | | | | | | | | | | | | | | | | | | | | | | | | | | | | | | |
See Notes to Financial Statements.
| | | | | | |
48 | | SEMI-ANNUAL REPORT | | MARCH 31, 2008 | | |
| | |
| Financial Highlights (continued) | | Money Market Portfolio |
| | | | | | | | | | | | | | | | | | | | | | | | | | | | | | | | | | | | | | | | | | | | | | | | |
| | | Investor B | | | Investor C | |
| | | Six Months
Ended
March 31, 2008
(Unaudited) | | | Year Ended September 30, | | | Six Months
Ended
March 31, 2008
(Unaudited) | | | Year Ended September 30, | |
| | | | 2007 | | | 2006 | | | 2005 | | | 2004 | | | 20031 | | | | 2007 | | | 2006 | | | 2005 | | | 2004 | | | 20031 | |
Per Share Operating Performance | | | | | | | | | | | | | | | | | | | | | | | | | | | | | | | | | | | | | | | | | | | | | | | | |
Net asset value, beginning of period | | $ | 1.00 | | | $ | 1.00 | | | $ | 1.00 | | | $ | 1.00 | | | $ | 1.00 | | | $ | 1.00 | | | $ | 1.00 | | | $ | 1.00 | | | $ | 1.00 | | | $ | 1.00 | | | $ | 1.00 | | | $ | 1.00 | |
| | | | | | | | | | | | | | | | | | | | | | | | | | | | | | | | | | | | | | | | | | | | | | | | |
Net investment income | | | 0.0175 | | | | 0.0418 | | | | 0.0354 | | | | 0.0151 | | | | 0.0015 | | | | 0.0014 | | | | 0.0175 | | | | 0.0417 | | | | 0.0354 | | | | 0.0151 | | | | 0.0014 | | | | 0.0014 | |
Dividends from net investment income | | | (0.0175 | ) | | | (0.0418 | ) | | | (0.0354 | ) | | | (0.0151 | ) | | | (0.0015 | ) | | | (0.0014 | ) | | | (0.0175 | ) | | | (0.0417 | ) | | | (0.0354 | ) | | | (0.0151 | ) | | | (0.0014 | ) | | | (0.0014 | ) |
| | | | | | | | | | | | | | | | | | | | | | | | | | | | | | | | | | | | | | | | | | | | | | | | |
Net asset value, end of period | | $ | 1.00 | | | $ | 1.00 | | | $ | 1.00 | | | $ | 1.00 | | | $ | 1.00 | | | $ | 1.00 | | | $ | 1.00 | | | $ | 1.00 | | | $ | 1.00 | | | $ | 1.00 | | | $ | 1.00 | | | $ | 1.00 | |
| | | | | | | | | | | | | | | | | | | | | | | | | | | | | | | | | | | | | | | | | | | | | | | | |
Total Investment Return | | | | | | | | | | | | | | | | | | | | | | | | | | | | | | | | | | | | | | | | | | | | | | | | |
Based on net asset value | | | 1.77 | %2 | | | 4.27 | % | | | 3.60 | % | | | 1.52 | % | | | 0.15 | % | | | 0.14 | % | | | 1.77 | %2 | | | 4.25 | % | | | 3.60 | % | | | 1.52 | % | | | 0.15 | % | | | 0.14 | % |
| | | | | | | | | | | | | | | | | | | | | | | | | | | | | | | | | | | | | | | | | | | | | | | | |
Ratios to Average Net Assets | | | | | | | | | | | | | | | | | | | | | | | | | | | | | | | | | | | | | | | | | | | | | | | | |
Total expenses, net of waivers and reimbursement | | | 1.29 | %3 | | | 1.22 | % | | | 1.24 | % | | | 1.24 | % | | | 1.10 | % | | | 1.34 | % | | | 1.29 | %3 | | | 1.24 | % | | | 1.24 | % | | | 1.24 | % | | | 1.10 | % | | | 1.35 | % |
| | | | | | | | | | | | | | | | | | | | | | | | | | | | | | | | | | | | | | | | | | | | | | | | |
Total expenses | | | 1.82 | %3 | | | 1.83 | % | | | 1.83 | % | | | 1.74 | % | | | 1.79 | % | | | 1.86 | % | | | 1.71 | %3 | | | 1.79 | % | | | 1.78 | % | | | 1.73 | % | | | 1.79 | % | | | 1.86 | % |
| | | | | | | | | | | | | | | | | | | | | | | | | | | | | | | | | | | | | | | | | | | | | | | | |
Net investment income | | | 3.41 | %3 | | | 4.18 | % | | | 3.54 | % | | | 1.66 | % | | | 0.14 | % | | | 0.15 | % | | | 3.38 | %3 | | | 4.16 | % | | | 3.59 | % | | | 1.79 | % | | | 0.14 | % | | | 0.15 | % |
| | | | | | | | | | | | | | | | | | | | | | | | | | | | | | | | | | | | | | | | | | | | | | | | |
Supplemental Data | | | | | | | | | | | | | | | | | | | | | | | | | | | | | | | | | | | | | | | | | | | | | | | | |
Net assets, end of period (000) | | $ | 14,098 | | | $ | 11,532 | | | $ | 19,462 | | | $ | 18,716 | | | $ | 8,924 | | | $ | 13,490 | | | $ | 7,942 | | | $ | 5,109 | | | $ | 8,866 | | | $ | 5,043 | | | $ | 884 | | | $ | 2,197 | |
| | | | | | | | | | | | | | | | | | | | | | | | | | | | | | | | | | | | | | | | | | | | | | | | |
1 | Audited by other auditors. |
2 | Aggregate total investment return. |
See Notes to Financial Statements.
| | | | | | |
| | | SEMI-ANNUAL REPORT | | MARCH 31, 2008 | | 49 |
| | |
| Financial Highlights (continued) | | U.S. Treasury Money Market Portfolio |
| | | | | | | | | | | | | | | | | | | | | | | | | | | | | | | | | | | | | | | | | | | | | | | | |
| | | Institutional | | | Service | |
| | | Six Months
Ended
March 31, 2008
(Unaudited) | | | Year Ended September 30, | | | Six Months
Ended
March 31, 2008
(Unaudited) | | | Year Ended September 30, | |
| | | | 2007 | | | 2006 | | | 2005 | | | 2004 | | | 20031 | | | | 2007 | | | 2006 | | | 2005 | | | 2004 | | | 20031 | |
Per Share Operating Performance | | | | | | | | | | | | | | | | | | | | | | | | | | | | | | | | | | | | | | | | | | | | | | | | |
Net asset value, beginning of period | | $ | 1.00 | | | $ | 1.00 | | | $ | 1.00 | | | $ | 1.00 | | | $ | 1.00 | | | $ | 1.00 | | | $ | 1.00 | | | $ | 1.00 | | | $ | 1.00 | | | $ | 1.00 | | | $ | 1.00 | | | $ | 1.00 | |
| | | | | | | | | | | | | | | | | | | | | | | | | | | | | | | | | | | | | | | | | | | | | | | | |
Net investment income | | | 0.0155 | | | | 0.0478 | | | | 0.0422 | | | | 0.0221 | | | | 0.0072 | | | | 0.0091 | | | | 0.0141 | | | | 0.0450 | | | | 0.0393 | | | | 0.0190 | | | | 0.0042 | | | | 0.0061 | |
Dividends from net investment income | | | (0.0155 | ) | | | (0.0478 | ) | | | (0.0422 | ) | | | (0.0221 | ) | | | (0.0072 | ) | | | (0.0091 | ) | | | (0.0141 | ) | | | (0.0450 | ) | | | (0.0393 | ) | | | (0.0190 | ) | | | (0.0042 | ) | | | (0.0061 | ) |
| | | | | | | | | | | | | | | | | | | | | | | | | | | | | | | | | | | | | | | | | | | | | | | | |
Net asset value, end of period | | $ | 1.00 | | | $ | 1.00 | | | $ | 1.00 | | | $ | 1.00 | | | $ | 1.00 | | | $ | 1.00 | | | $ | 1.00 | | | $ | 1.00 | | | $ | 1.00 | | | $ | 1.00 | | | $ | 1.00 | | | $ | 1.00 | |
| | | | | | | | | | | | | | | | | | | | | | | | | | | | | | | | | | | | | | | | | | | | | | | | |
Total Investment Return | | | | | | | | | | | | | | | | | | | | | | | | | | | | | | | | | | | | | | | | | | | | | | | | |
Based on net asset value | | | 1.56 | %2 | | | 4.89 | % | | | 4.30 | % | | | 2.23 | % | | | 0.72 | % | | | 0.92 | % | | | 1.42 | %2 | | | 4.60 | % | | | 4.00 | % | | | 1.93 | % | | | 0.42 | % | | | 0.62 | % |
| | | | | | | | | | | | | | | | | | | | | | | | | | | | | | | | | | | | | | | | | | | | | | | | |
Ratios to Average Net Assets | | | | | | | | | | | | | | | | | | | | | | | | | | | | | | | | | | | | | | | | | | | | | | | | |
Total expenses, net of waivers and reimbursement | | | 0.41 | %3 | | | 0.41 | % | | | 0.41 | % | | | 0.41 | % | | | 0.41 | % | | | 0.41 | % | | | 0.69 | %3 | | | 0.69 | % | | | 0.70 | % | | | 0.71 | % | | | 0.71 | % | | | 0.71 | % |
| | | | | | | | | | | | | | | | | | | | | | | | | | | | | | | | | | | | | | | | | | | | | | | | |
Total expenses | | | 0.59 | %3 | | | 0.61 | % | | | 0.65 | % | | | 0.73 | % | | | 0.70 | % | | | 0.70 | % | | | 0.84 | %3 | | | 0.86 | % | | | 0.90 | % | | | 0.98 | % | | | 0.99 | % | | | 1.00 | % |
| | | | | | | | | | | | | | | | | | | | | | | | | | | | | | | | | | | | | | | | | | | | | | | | |
Net investment income | | | 2.97 | %3 | | | 4.75 | % | | | 4.26 | % | | | 2.18 | % | | | 0.68 | % | | | 0.93 | % | | | 2.84 | %3 | | | 4.50 | % | | | 3.94 | % | | | 1.99 | % | | | 0.41 | % | | | 0.61 | % |
| | | | | | | | | | | | | | | | | | | | | | | | | | | | | | | | | | | | | | | | | | | | | | | | |
Supplemental Data | | | | | | | | | | | | | | | | | | | | | | | | | | | | | | | | | | | | | | | | | | | | | | | | |
Net assets, end of period (000) | | $ | 306,434 | | | $ | 312,979 | | | $ | 211,960 | | | $ | 164,905 | | | $ | 176,136 | | | $ | 379,240 | | | $ | 224,514 | | | $ | 245,609 | | | $ | 246,517 | | | $ | 257,187 | | | $ | 219,788 | | | $ | 250,314 | |
| | | | | | | | | | | | | | | | | | | | | | | | | | | | | | | | | | | | | | | | | | | | | | | | |
| | | | | | | | | | | | | | | | | | | | | | | | |
| | | Investor A | |
| | | Six Months
Ended
March 31, 2008
(Unaudited) | | | Year Ended September 30, | |
| | | | 2007 | | | 2006 | | | 2005 | | | 2004 | | | 20031 | |
Per Share Operating Performance | | | | | | | | | | | | | | | | | | | | | | | | |
Net asset value, beginning of period | | $ | 1.00 | | | $ | 1.00 | | | $ | 1.00 | | | $ | 1.00 | | | $ | 1.00 | | | $ | 1.00 | |
| | | | | | | | | | | | | | | | | | | | | | | | |
Net investment income | | | 0.0140 | | | | 0.0450 | | | | 0.0388 | | | | 0.0186 | | | | 0.0031 | | | | 0.0044 | |
Dividends from net investment income | | | (0.0140 | ) | | | (0.0450 | ) | | | (0.0388 | ) | | | (0.0186 | ) | | | (0.0031 | ) | | | (0.0044 | ) |
| | | | | | | | | | | | | | | | | | | | | | | | |
Net asset value, end of period | | $ | 1.00 | | | $ | 1.00 | | | $ | 1.00 | | | $ | 1.00 | | | $ | 1.00 | | | $ | 1.00 | |
| | | | | | | | | | | | | | | | | | | | | | | | |
Total Investment Return | | | | | | | | | | | | | | | | | | | | | | | | |
Based on net asset value | | | 1.41 | %2 | | | 4.59 | % | | | 3.95 | % | | | 1.88 | % | | | 0.31 | % | | | 0.44 | % |
| | | | | | | | | | | | | | | | | | | | | | | | |
Ratios to Average Net Assets | | | | | | | | | | | | | | | | | | | | | | | | |
Total expenses, net of waivers and reimbursement | | | 0.69 | %3 | | | 0.70 | % | | | 0.75 | % | | | 0.75 | % | | | 0.82 | % | | | 0.88 | % |
| | | | | | | | | | | | | | | | | | | | | | | | |
Total expenses | | | 0.85 | %3 | | | 0.86 | % | | | 1.04 | % | | | 1.07 | % | | | 1.19 | % | | | 1.17 | % |
| | | | | | | | | | | | | | | | | | | | | | | | |
Net investment income | | | 2.70 | %3 | | | 4.49 | % | | | 3.86 | % | | | 1.83 | % | | | 0.31 | % | | | 0.47 | % |
| | | | | | | | | | | | | | | | | | | | | | | | |
Supplemental Data | | | | | | | | | | | | | | | | | | | | | | | | |
Net assets, end of period (000) | | $ | 44,696 | | | $ | 31,970 | | | $ | 28,593 | | | $ | 31,990 | | | $ | 41,283 | | | $ | 49,906 | |
| | | | | | | | | | | | | | | | | | | | | | | | |
See Notes to Financial Statements.
| | | | | | |
50 | | SEMI-ANNUAL REPORT | | MARCH 31, 2008 | | |
| | |
| Financial Highlights (continued) | | Municipal Money Market Portfolio |
| | | | | | | | | | | | | | | | | | | | | | | | | | | | | | | | | | | | | | | | | | | | | | | | |
| | | Institutional | | | Service | |
| | | Six Months
Ended
March 31, 2008
(Unaudited) | | | Year Ended September 30, | | | Six Months
Ended
March 31, 2008
(Unaudited) | | | Year Ended September 30, | |
| | | | 2007 | | | 2006 | | | 2005 | | | 2004 | | | 20031 | | | | 2007 | | | 2006 | | | 2005 | | | 2004 | | | 20031 | |
Per Share Operating Performance | | | | | | | | | | | | | | | | | | | | | | | | | | | | | | | | | | | | | | | | | | | | | | | | |
Net asset value, beginning of period | | $ | 1.00 | | | $ | 1.00 | | | $ | 1.00 | | | $ | 1.00 | | | $ | 1.00 | | | $ | 1.00 | | | $ | 1.00 | | | $ | 1.00 | | | $ | 1.00 | | | $ | 1.00 | | | $ | 1.00 | | | $ | 1.00 | |
| | | | | | | | | | | | | | | | | | | | | | | | | | | | | | | | | | | | | | | | | | | | | | | | |
Net investment income | | | 0.0139 | | | | 0.0331 | | | | 0.0289 | | | | 0.0172 | | | | 0.0073 | | | | 0.0092 | | | | 0.0126 | | | | 0.0301 | | | | 0.0260 | | | | 0.0143 | | | | 0.0043 | | | | 0.0062 | |
Dividends from net investment income | | | (0.0139 | ) | | | (0.0331 | ) | | | (0.0289 | ) | | | (0.0172 | ) | | | (0.0073 | ) | | | (0.0092 | ) | | | (0.0126 | ) | | | (0.0301 | ) | | | (0.0260 | ) | | | (0.0143 | ) | | | (0.0043 | ) | | | (0.0062 | ) |
| | | | | | | | | | | | | | | | | | | | | | | | | | | | | | | | | | | | | | | | | | | | | | | | |
Net asset value, end of period | | $ | 1.00 | | | $ | 1.00 | | | $ | 1.00 | | | $ | 1.00 | | | $ | 1.00 | | | $ | 1.00 | | | $ | 1.00 | | | $ | 1.00 | | | $ | 1.00 | | | $ | 1.00 | | | $ | 1.00 | | | $ | 1.00 | |
| | | | | | | | | | | | | | | | | | | | | | | | | | | | | | | | | | | | | | | | | | | | | | | | |
Total Investment Return | | | | | | | | | | | | | | | | | | | | | | | | | | | | | | | | | | | | | | | | | | | | | | | | |
Based on net asset value | | | 1.41 | %2 | | | 3.36 | % | | | 2.93 | % | | | 1.74 | % | | | 0.73 | % | | | 0.92 | % | | | 1.27 | %2 | | | 3.05 | % | | | 2.63 | % | | | 1.44 | % | | | 0.43 | % | | | 0.62 | % |
| | | | | | | | | | | | | | | | | | | | | | | | | | | | | | | | | | | | | | | | | | | | | | | | |
Ratios to Average Net Assets | | | | | | | | | | | | | | | | | | | | | | | | | | | | | | | | | | | | | | | | | | | | | | | | |
Total expenses, net of waivers and reimbursement | | | 0.42 | %3 | | | 0.42 | % | | | 0.42 | % | | | 0.42 | % | | | 0.42 | % | | | 0.42 | % | | | 0.70 | %3 | | | 0.72 | % | | | 0.71 | % | | | 0.72 | % | | | 0.72 | % | | | 0.72 | % |
| | | | | | | | | | | | | | | | | | | | | | | | | | | | | | | | | | | | | | | | | | | | | | | | |
Total expenses | | | 0.61 | %3 | | | 0.63 | % | | | 0.67 | % | | | 0.74 | % | | | 0.71 | % | | | 0.71 | % | | | 0.86 | %3 | | | 0.91 | % | | | 0.91 | % | | | 0.99 | % | | | 1.00 | % | | | 1.01 | % |
| | | | | | | | | | | | | | | | | | | | | | | | | | | | | | | | | | | | | | | | | | | | | | | | |
Net investment income | | | 2.69 | %3 | | | 3.29 | % | | | 2.88 | % | | | 1.69 | % | | | 0.69 | % | | | 0.92 | % | | | 2.54 | %3 | | | 3.00 | % | | | 2.64 | % | | | 1.45 | % | | | 0.42 | % | | | 0.63 | % |
| | | | | | | | | | | | | | | | | | | | | | | | | | | | | | | | | | | | | | | | | | | | | | | | |
Supplemental Data | | | | | | | | | | | | | | | | | | | | | | | | | | | | | | | | | | | | | | | | | | | | | | | | |
Net assets, end of period (000) | | $ | 58,695 | | | $ | 42,083 | | | $ | 61,154 | | | $ | 75,789 | | | $ | 126,534 | | | $ | 437,613 | | | $ | 72,330 | | | $ | 100,454 | | | $ | 132,523 | | | $ | 93,844 | | | $ | 70,344 | | | $ | 88,769 | |
| | | | | | | | | | | | | | | | | | | | | | | | | | | | | | | | | | | | | | | | | | | | | | | | |
| | |
| | | Hilliard Lyons | | | Investor A | |
| | | Six Months
Ended
March 31, 2008
(Unaudited) | | | Year Ended September 30, | | | Six Months
Ended
March 31, 2008
(Unaudited) | | | Year Ended September 30, | |
| | | | 2007 | | | 2006 | | | 2005 | | | 2004 | | | 20031 | | | | 2007 | | | 2006 | | | 2005 | | | 2004 | | | 20031 | |
Per Share Operating Performance | | | | | | | | | | | | | | | | | | | | | | | | | | | | | | | | | | | | | | | | | | | | | | | | |
Net asset value, beginning of period | | $ | 1.00 | | | $ | 1.00 | | | $ | 1.00 | | | $ | 1.00 | | | $ | 1.00 | | | $ | 1.00 | | | $ | 1.00 | | | $ | 1.00 | | | $ | 1.00 | | | $ | 1.00 | | | $ | 1.00 | | | $ | 1.00 | |
| | | | | | | | | | | | | | | | | | | | | | | | | | | | | | | | | | | | | | | | | | | | | | | | |
Net investment income | | | 0.0139 | | | | 0.0328 | | | | 0.0284 | | | | 0.0163 | | | | 0.0056 | | | | 0.0070 | | | | 0.0125 | | | | 0.0302 | | | | 0.0258 | | | | 0.0136 | | | | 0.0042 | | | | 0.0048 | |
Dividends from net investment income | | | (0.0139 | ) | | | (0.0328 | ) | | | (0.0284 | ) | | | (0.0163 | ) | | | (0.0056 | ) | | | (0.0070 | ) | | | (0.0125 | ) | | | (0.0302 | ) | | | (0.0258 | ) | | | (0.0136 | ) | | | (0.0042 | ) | | | (0.0048 | ) |
| | | | | | | | | | | | | | | | | | | | | | | | | | | | | | | | | | | | | | | | | | | | | | | | |
Net asset value, end of period | | $ | 1.00 | | | $ | 1.00 | | | $ | 1.00 | | | $ | 1.00 | | | $ | 1.00 | | | $ | 1.00 | | | $ | 1.00 | | | $ | 1.00 | | | $ | 1.00 $ | | | $ | 1.00 | | | | 1.00 | | | $ | 1.00 | |
| | | | | | | | | | | | | | | | | | | | | | | | | | | | | | | | | | | | | | | | | | | | | | | | |
Total Investment Return | | | | | | | | | | | | | | | | | | | | | | | | | | | | | | | | | | | | | | | | | | | | | | | | |
Based on net asset value | | | 1.40 | %2 | | | 3.33 | % | | | 2.87 | % | | | 1.64 | % | | | 0.57 | % | | | 0.70 | % | | | 1.27 | %2 | | | 3.06 | % | | | 2.61 | % | | | 1.37 | % | | | 0.43 | % | | | 0.49 | % |
| | | | | | | | | | | | | | | | | | | | | | | | | | | | | | | | | | | | | | | | | | | | | | | | |
Ratios to Average Net Assets | | | | | | | | | | | | | | | | | | | | | | | | | | | | | | | | | | | | | | | | | | | | | | | | |
Total expenses, net of waivers and reimbursement | | | 0.45 | %3 | | | 0.45 | % | | | 0.47 | % | | | 0.52 | % | | | 0.59 | % | | | 0.64 | % | | | 0.71 | %3 | | | 0.71 | % | | | 0.73 | % | | | 0.79 | % | | | 0.72 | % | | | 0.85 | % |
| | | | | | | | | | | | | | | | | | | | | | | | | | | | | | | | | | | | | | | | | | | | | | | | |
Total expenses | | | 0.86 | %3 | | | 0.88 | % | | | 1.02 | % | | | 1.09 | % | | | 1.13 | % | | | 0.93 | % | | | 0.87 | %3 | | | 0.89 | % | | | 1.03 | % | | | 1.11 | % | | | 1.19 | % | | | 1.18 | % |
| | | | | | | | | | | | | | | | | | | | | | | | | | | | | | | | | | | | | | | | | | | | | | | | |
Net investment income | | | 2.76 | %3 | | | 3.28 | % | | | 2.84 | % | | | 1.62 | % | | | 0.56 | % | | | 0.70 | % | | | 2.48 | %3 | | | 3.01 | % | | | 2.53 | % | | | 1.29 | % | | | 0.42 | % | | | 0.47 | % |
| | | | | | | | | | | | | | | | | | | | | | | | | | | | | | | | | | | | | | | | | | | | | | | | |
Supplemental Data | | | | | | | | | | | | | | | | | | | | | | | | | | | | | | | | | | | | | | | | | | | | | | | | |
Net assets, end of period (000) | | $ | 189,793 | | | $ | 166,999 | | | $ | 140,409 | | | $ | 126,397 | | | $ | 127,151 | | | $ | 143,305 | | | $ | 6,096 | | | $ | 3,776 | | | $ | 2,830 | | | $ | 4,262 | | | $ | 7,322 | | | $ | 9,019 | |
| | | | | | | | | | | | | | | | | | | | | | | | | | | | | | | | | | | | | | | | | | | | | | | | |
| 1 | Audited by other auditors. |
| 2 | Aggregate total investment return. |
See Notes to Financial Statements.
| | | | | | |
| | | SEMI-ANNUAL REPORT | | MARCH 31, 2008 | | 51 |
| | |
| Financial Highlights (continued) | | New Jersey Municipal
Money Market Portfolio |
| | | | | | | | | | | | | | | | | | | | | | | | | | | | | | | | | | | | | | | | | | | | | | | | |
| | | Institutional | | | Service | |
| | | Six Months
Ended
March 31, 2008
(Unaudited) | | | Year Ended September 30, | | | Six Months
Ended
March 31, 2008
(Unaudited) | | | Year Ended September 30, | |
| | | | 2007 | | | 2006 | | | 2005 | | | 2004 | | | 20031 | | | | 2007 | | | 2006 | | | 2005 | | | 2004 | | | 20031 | |
Per Share Operating Performance | | | | | | | | | | | | | | | | | | | | | | | | | | | | | | | | | | | | | | | | | | | | | | | | |
Net asset value, beginning of period | | $ | 1.00 | | | $ | 1.00 | | | $ | 1.00 | | | $ | 1.00 | | | $ | 1.00 | | | $ | 1.00 | | | $ | 1.00 | | | $ | 1.00 | | | $ | 1.00 | | | $ | 1.00 | | | $ | 1.00 | | | $ | 1.00 | |
| | | | | | | | | | | | | | | | | | | | | | | | | | | | | | | | | | | | | | | | | | | | | | | | |
Net investment income | | | 0.0137 | | | | 0.0326 | | | | 0.0285 | | | | 0.0175 | | | | 0.0074 | | | | 0.0089 | | | | 0.0124 | | | | 0.0298 | | | | 0.0256 | | | | 0.0145 | | | | 0.0044 | | | | 0.0059 | |
Dividends from net investment income | | | (0.0137 | ) | | | (0.0326 | ) | | | (0.0285 | ) | | | (0.0175 | ) | | | (0.0074 | ) | | | (0.0089 | ) | | | (0.0124 | ) | | | (0.0298 | ) | | | (0.0256 | ) | | | (0.0145 | ) | | | (0.0044 | ) | | | (0.0059 | ) |
| | | | | | | | | | | | | | | | | | | | | | | | | | | | | | | | | | | | | | | | | | | | | | | | |
Net asset value, end of period | | $ | 1.00 | | | $ | 1.00 | | | $ | 1.00 | | | $ | 1.00 | | | $ | 1.00 | | | $ | 1.00 | | | $ | 1.00 | | | $ | 1.00 | | | $ | 1.00 | | | $ | 1.00 | | | $ | 1.00 | | | $ | 1.00 | |
| | | | | | | | | | | | | | | | | | | | | | | | | | | | | | | | | | | | | | | | | | | | | | | | |
Total Investment Return | | | | | | | | | | | | | | | | | | | | | | | | | | | | | | | | | | | | | | | | | | | | | | | | |
Based on net asset value | | | 1.38 | %2 | | | 3.31 | % | | | 2.89 | % | | | 1.76 | % | | | 0.74 | % | | | 0.89 | % | | | 1.24 | %2 | | | 3.03 | % | | | 2.60 | % | | | 1.46 | % | | | 0.44 | % | | | 0.59 | % |
| | | | | | | | | | | | | | | | | | | | | | | | | | | | | | | | | | | | | | | | | | | | | | | | |
Ratios to Average Net Assets | | | | | | | | | | | | | | | | | | | | | | | | | | | | | | | | | | | | | | | | | | | | | | | | |
Total expenses, net of waivers and reimbursement | | | 0.39 | %3 | | | 0.39 | % | | | 0.39 | % | | | 0.39 | % | | | 0.39 | % | | | 0.39 | % | | | 0.67 | %3 | | | 0.67 | % | | | 0.68 | % | | | 0.69 | % | | | 0.69 | % | | | 0.69 | % |
| | | | | | | | | | | | | | | | | | | | | | | | | | | | | | | | | | | | | | | | | | | | | | | | |
Total expenses | | | 0.62 | %3 | | | 0.62 | % | | | 0.66 | % | | | 0.74 | % | | | 0.72 | % | | | 0.72 | % | | | 0.87 | %3 | | | 0.88 | % | | | 0.92 | % | | | 0.99 | % | | | 1.01 | % | | | 1.02 | % |
| | | | | | | | | | | | | | | | | | | | | | | | | | | | | | | | | | | | | | | | | | | | | | | | |
Net investment income | | | 2.78 | %3 | | | 3.26 | % | | | 2.88 | % | | | 1.73 | % | | | 0.74 | % | | | 0.89 | % | | | 2.50 | %3 | | | 2.98 | % | | | 2.57 | % | | | 1.45 | % | | | 0.44 | % | | | 0.59 | % |
| | | | | | | | | | | | | | | | | | | | | | | | | | | | | | | | | | | | | | | | | | | | | | | | |
Supplemental Data | | | | | | | | | | | | | | | | | | | | | | | | | | | | | | | | | | | | | | | | | | | | | | | | |
Net assets, end of period (000) | | $ | 127,522 | | | $ | 156,005 | | | $ | 99,173 | | | $ | 74,329 | | | $ | 80,530 | | | $ | 77,267 | | | $ | 33,643 | | | $ | 43,013 | | | $ | 56,955 | | | $ | 59,794 | | | $ | 59,899 | | | $ | 64,313 | |
| | | | | | | | | | | | | | | | | | | | | | | | | | | | | | | | | | | | | | | | | | | | | | | | |
| | | | | | | | | | | | | | | | | | | | | | | | |
| | | Investor A | |
| | | Six Months
Ended
March 31, 2008
(Unaudited) | | | Year Ended September 30, | |
| | | | 2007 | | | 2006 | | | 2005 | | | 2004 | | | 20031 | |
Per Share Operating Performance | | | | | | | | | | | | | | | | | | | | | | | | |
Net asset value, beginning of period | | $ | 1.00 | | | $ | 1.00 | | | $ | 1.00 | | | $ | 1.00 | | | $ | 1.00 | | | $ | 1.00 | |
| | | | | | | | | | | | | | | | | | | | | | | | |
Net investment income | | | 0.0123 | | | | 0.0298 | | | | 0.0255 | | | | 0.0138 | | | | 0.0044 | | | | 0.0045 | |
Dividends from net investment income | | | (0.0123 | ) | | | (0.0298 | ) | | | (0.0255 | ) | | | (0.0138 | ) | | | (0.0044 | ) | | | (0.0045 | ) |
| | | | | | | | | | | | | | | | | | | | | | | | |
Net asset value, end of period | | $ | 1.00 | | | $ | 1.00 | | | $ | 1.00 | | | $ | 1.00 | | | $ | 1.00 | | | $ | 1.00 | |
| | | | | | | | | | | | | | | | | | | | | | | | |
Total Investment Return | | | | | | | | | | | | | | | | | | | | | | | | |
Based on net asset value | | | 1.24 | %2 | | | 3.03 | % | | | 2.58 | % | | | 1.39 | % | | | 0.44 | % | | | 0.45 | % |
| | | | | | | | | | | | | | | | | | | | | | | | |
Ratios to Average Net Assets | | | | | | | | | | | | | | | | | | | | | | | | |
Total expenses, net of waivers and reimbursement | | | 0.67 | %3 | | | 0.67 | % | | | 0.69 | % | | | 0.75 | % | | | 0.69 | % | | | 0.82 | % |
| | | | | | | | | | | | | | | | | | | | | | | | |
Total expenses | | | 0.87 | %3 | | | 0.87 | % | | | 1.02 | % | | | 1.11 | % | | | 1.21 | % | | | 1.19 | % |
| | | | | | | | | | | | | | | | | | | | | | | | |
Net investment income | | | 2.46 | %3 | | | 2.99 | % | | | 2.56 | % | | | 1.40 | % | | | 0.43 | % | | | 0.44 | % |
| | | | | | | | | | | | | | | | | | | | | | | | |
Supplemental Data | | | | | | | | | | | | | | | | | | | | | | | | |
Net assets, end of period (000) | | $ | 35,324 | | | $ | 30,250 | | | $ | 17,662 | | | $ | 15,027 | | | $ | 12,821 | | | $ | 17,783 | |
| | | | | | | | | | | | | | | | | | | | | | | | |
See Notes to Financial Statements.
| | | | | | |
52 | | SEMI-ANNUAL REPORT | | MARCH 31, 2008 | | |
| | |
| Financial Highlights (continued) | | North Carolina Municipal
Money Market Portfolio |
| | | | | | | | | | | | | | | | | | | | | | | | | | | | | | | | | | | | | | | | | | | | | | | | |
| | | Institutional | | | Service | |
| | | Six Months
Ended
March 31, 2008
(Unaudited) | | | Year Ended September 30, | | | Six Months
Ended
March 31, 2008
(Unaudited) | | | Year Ended September 30, | |
| | | | 2007 | | | 2006 | | | 2005 | | | 2004 | | | 20031 | | | | 2007 | | | 2006 | | | 2005 | | | 2004 | | | 20031 | |
Per Share Operating Performance | | | | | | | | | | | | | | | | | | | | | | | | | | | | | | | | | | | | | | | | | | | | | | | | |
Net asset value, beginning of period | | $ | 1.00 | | | $ | 1.00 | | | $ | 1.00 | | | $ | 1.00 | | | $ | 1.00 | | | $ | 1.00 | | | $ | 1.00 | | | $ | 1.00 | | | $ | 1.00 | | | $ | 1.00 | | | $ | 1.00 | | | $ | 1.00 | |
| | | | | | | | | | | | | | | | | | | | | | | | | | | | | | | | | | | | | | | | | | | | | | | | |
Net investment income | | | 0.0139 | | | | 0.0336 | | | | 0.0299 | | | | 0.0185 | | | | 0.0084 | | | | 0.0097 | | | | 0.0125 | | | | 0.0307 | | | | 0.0270 | | | | 0.0155 | | | | 0.0054 | | | | 0.0067 | |
Dividends from net investment income | | | (0.0139 | ) | | | (0.0336 | ) | | | (0.0299 | ) | | | (0.0185 | ) | | | (0.0084 | ) | | | (0.0097 | ) | | | (0.0125 | ) | | | (0.0307 | ) | | | (0.0270 | ) | | | (0.0155 | ) | | | (0.0054 | ) | | | (0.0067 | ) |
| | | | | | | | | | | | | | | | | | | | | | | | | | | | | | | | | | | | | | | | | | | | | | | | |
Net asset value, end of period | | $ | 1.00 | | | $ | 1.00 | | | $ | 1.00 | | | $ | 1.00 | | | $ | 1.00 | | | $ | 1.00 | | | $ | 1.00 | | | $ | 1.00 | | | $ | 1.00 | | | $ | 1.00 | | | $ | 1.00 | | | $ | 1.00 | |
| | | | | | | | | | | | | | | | | | | | | | | | | | | | | | | | | | | | | | | | | | | | | | | | |
Total Investment Return | | | | | | | | | | | | | | | | | | | | | | | | | | | | | | | | | | | | | | | | | | | | | | | | |
Based on net asset value | | | 1.40 | %2 | | | 3.42 | % | | | 3.04 | % | | | 1.87 | % | | | 0.85 | % | | | 0.97 | % | | | 1.26 | %2 | | | 3.12 | % | | | 2.73 | % | | | 1.56 | % | | | 0.54 | % | | | 0.67 | % |
| | | | | | | | | | | | | | | | | | | | | | | | | | | | | | | | | | | | | | | | | | | | | | | | |
Ratios to Average Net Assets | | | | | | | | | | | | | | | | | | | | | | | | | | | | | | | | | | | | | | | | | | | | | | | | |
Total expenses, net of waivers and reimbursement | | | 0.30 | %3 | | | 0.30 | % | | | 0.30 | % | | | 0.30 | % | | | 0.30 | % | | | 0.30 | % | | | 0.58 | %3 | | | 0.58 | % | | | 0.60 | % | | | 0.60 | % | | | 0.60 | % | | | 0.60 | % |
| | | | | | | | | | | | | | | | | | | | | | | | | | | | | | | | | | | | | | | | | | | | | | | | |
Total expenses | | | 0.67 | %3 | | | 0.68 | % | | | 0.70 | % | | | 0.80 | % | | | 0.74 | % | | | 0.74 | % | | | 0.92 | %3 | | | 0.94 | % | | | 0.98 | % | | | 1.07 | % | | | 1.03 | % | | | 1.04 | % |
| | | | | | | | | | | | | | | | | | | | | | | | | | | | | | | | | | | | | | | | | | | | | | | | |
Net investment income | | | 2.77 | %3 | | | 3.36 | % | | | 3.00 | % | | | 1.84 | % | | | 0.84 | % | | | 0.96 | % | | | 2.46 | %3 | | | 3.10 | % | | | 2.61 | % | | | 1.69 | % | | | 0.55 | % | | | 0.63 | % |
| | | | | | | | | | | | | | | | | | | | | | | | | | | | | | | | | | | | | | | | | | | | | | | | |
Supplemental Data | | | | | | | | | | | | | | | | | | | | | | | | | | | | | | | | | | | | | | | | | | | | | | | | |
Net assets, end of period (000) | | $ | 86,319 | | | $ | 66,246 | | | $ | 61,086 | | | $ | 56,017 | | | $ | 58,168 | | | $ | 162,465 | | | $ | 4,979 | | | $ | 1,295 | | | $ | 656 | | | $ | 6,923 | | | $ | 160 | | | $ | 227 | |
| | | | | | | | | | | | | | | | | | | | | | | | | | | | | | | | | | | | | | | | | | | | | | | | |
| | | | | | | | | | | | | | | | | | | | | | | | |
| | | Investor A | |
| | | Six Months
Ended
March 31, 2008
(Unaudited) | | | Year Ended September 30, | |
| | | | 2007 | | | 2006 | | | 2005 | | | 2004 | | | 20031 | |
Per Share Operating Performance | | | | | | | | | | | | | | | | | | | | | | | | |
Net asset value, beginning of period | | $ | 1.00 | | | $ | 1.00 | | | $ | 1.00 | | | $ | 1.00 | | | $ | 1.00 | | | $ | 1.00 | |
| | | | | | | | | | | | | | | | | | | | | | | | |
Net investment income | | | 0.0115 | | | | 0.0298 | | | | 0.0264 | | | | 0.0151 | | | | 0.0054 | | | | 0.0053 | |
Dividends from net investment income | | | (0.0115 | ) | | | (0.0298 | ) | | | (0.0264 | ) | | | (0.0151 | ) | | | (0.0054 | ) | | | (0.0053 | ) |
| | | | | | | | | | | | | | | | | | | | | | | | |
Net asset value, end of period | | $ | 1.00 | | | $ | 1.00 | | | $ | 1.00 | | | $ | 1.00 | | | $ | 1.00 | | | $ | 1.00 | |
| | | | | | | | | | | | | | | | | | | | | | | | |
Total Investment Return | | | | | | | | | | | | | | | | | | | | | | | | |
Based on net asset value | | | 1.16 | %2 | | | 3.03 | % | | | 2.67 | % | | | 1.52 | % | | | 0.55 | % | | | 0.53 | % |
| | | | | | | | | | | | | | | | | | | | | | | | |
Ratios to Average Net Assets | | | | | | | | | | | | | | | | | | | | | | | | |
Total expenses, net of waivers and reimbursement | | | 0.77 | %3 | | | 0.67 | % | | | 0.66 | % | | | 0.64 | % | | | 0.60 | % | | | 0.74 | % |
| | | | | | | | | | | | | | | | | | | | | | | | |
Total expenses | | | 1.11 | %3 | | | 1.02 | % | | | 1.10 | % | | | 1.15 | % | | | 1.23 | % | | | 1.21 | % |
| | | | | | | | | | | | | | | | | | | | | | | | |
Net investment income | | | 2.30 | %3 | | | 2.98 | % | | | 2.64 | % | | | 1.51 | % | | | 0.54 | % | | | 0.53 | % |
| | | | | | | | | | | | | | | | | | | | | | | | |
Supplemental Data | | | | | | | | | | | | | | | | | | | | | | | | |
Net assets, end of period (000) | | $ | 128 | | | $ | 189 | | | $ | 316 | | | $ | 321 | | | $ | 319 | | | $ | 338 | |
| | | | | | | | | | | | | | | | | | | | | | | | |
1 | Audited by other auditors. |
2 | Aggregate total investment return. |
See Notes to Financial Statements.
| | | | | | |
| | | SEMI-ANNUAL REPORT | | MARCH 31, 2008 | | 53 |
| | |
| Financial Highlights (continued) | | Ohio Municipal
Money Market Portfolio |
| | | | | | | | | | | | | | | | | | | | | | | | | | | | | | | | | | | | | | | | | | | | | | | | |
| | | Institutional | | | Service | |
| | | Six Months
Ended
March 31, 2008
(Unaudited) | | | Year Ended September 30, | | | Six Months
Ended
March 31, 2008
(Unaudited) | | | Year Ended September 30, | |
| | | | 2007 | | | 2006 | | | 2005 | | | 2004 | | | 20031 | | | | 2007 | | | 2006 | | | 2005 | | | 2004 | | | 20031 | |
Per Share Operating Performance | | | | | | | | | | | | | | | | | | | | | | | | | | | | | | | | | | | | | | | | | | | | | | | | |
Net asset value, beginning of period | | $ | 1.00 | | | $ | 1.00 | | | $ | 1.00 | | | $ | 1.00 | | | $ | 1.00 | | | $ | 1.00 | | | $ | 1.00 | | | $ | 1.00 | | | $ | 1.00 | | | $ | 1.00 | | | $ | 1.00 | | | $ | 1.00 | |
| | | | | | | | | | | | | | | | | | | | | | | | | | | | | | | | | | | | | | | | | | | | | | | | |
Net investment income | | | 0.0145 | | | | 0.0336 | | | | 0.0297 | | | | 0.0182 | | | | 0.0087 | | | | 0.0105 | | | | 0.0131 | | | | 0.0308 | | | | 0.0268 | | | | 0.0152 | | | | 0.0057 | | | | 0.0075 | |
Dividends from net investment income | | | (0.0145 | ) | | | (0.0336 | ) | | | (0.0297 | ) | | | (0.0182 | ) | | | (0.0087 | ) | | | (0.0105 | ) | | | (0.0131 | ) | | | (0.0308 | ) | | | (0.0268 | ) | | | (0.0152 | ) | | | (0.0057 | ) | | | (0.0075 | ) |
| | | | | | | | | | | | | | | | | | | | | | | | | | | | | | | | | | | | | | | | | | | | | | | | |
Net asset value, end of period | | $ | 1.00 | | | $ | 1.00 | | | $ | 1.00 | | | $ | 1.00 | | | $ | 1.00 | | | $ | 1.00 | | | $ | 1.00 | | | $ | 1.00 | | | $ | 1.00 | | | $ | 1.00 | | | $ | 1.00 | | | $ | 1.00 | |
| | | | | | | | | | | | | | | | | | | | | | | | | | | | | | | | | | | | | | | | | | | | | | | | |
Total Investment Return | | | | | | | | | | | | | | | | | | | | | | | | | | | | | | | | | | | | | | | | | | | | | | | | |
Based on net asset value | | | 1.47 | %2 | | | 3.41 | % | | | 3.01 | % | | | 1.83 | % | | | 0.87 | % | | | 1.06 | % | | | 1.33 | %2 | | | 3.13 | % | | | 2.72 | % | | | 1.53 | % | | | 0.57 | % | | | 0.75 | % |
| | | | | | | | | | | | | | | | | | | | | | | | | | | | | | | | | | | | | | | | | | | | | | | | |
Ratios to Average Net Assets | | | | | | | | | | | | | | | | | | | | | | | | | | | | | | | | | | | | | | | | | | | | | | | | |
Total expenses, net of waivers and reimbursement | | | 0.39 | %3 | | | 0.39 | % | | | 0.39 | % | | | 0.39 | % | | | 0.39 | % | | | 0.39 | % | | | 0.67 | %3 | | | 0.67 | % | | | 0.68 | % | | | 0.69 | % | | | 0.69 | % | | | 0.69 | % |
| | | | | | | | | | | | | | | | | | | | | | | | | | | | | | | | | | | | | | | | | | | | | | | | |
Total expenses | | | 0.62 | %3 | | | 0.62 | % | | | 0.67 | % | | | 0.73 | % | | | 0.72 | % | | | 0.72 | % | | | 0.87 | %3 | | | 0.87 | % | | | 0.92 | % | | | 0.98 | % | | | 1.01 | % | | | 1.03 | % |
| | | | | | | | | | | | | | | | | | | | | | | | | | | | | | | | | | | | | | | | | | | | | | | | |
Net investment income | | | 2.91 | %3 | | | 3.35 | % | | | 2.99 | % | | | 1.79 | % | | | 0.87 | % | | | 1.05 | % | | | 2.64 | %3 | | | 3.09 | % | | | 2.65 | % | | | 1.50 | % | | | 0.56 | % | | | 0.75 | % |
| | | | | | | | | | | | | | | | | | | | | | | | | | | | | | | | | | | | | | | | | | | | | | | | |
Supplemental Data | | | | | | | | | | | | | | | | | | | | | | | | | | | | | | | | | | | | | | | | | | | | | �� | | | |
Net assets, end of period (000) | | $ | 125,868 | | | $ | 101,325 | | | $ | 131,016 | | | $ | 88,697 | | | $ | 122,030 | | | $ | 94,936 | | | $ | 7,682 | | | $ | 8,199 | | | $ | 5,647 | | | $ | 10,224 | | | $ | 15,311 | | | $ | 13,061 | |
| | | | | | | | | | | | | | | | | | | | | | | | | | | | | | | | | | | | | | | | | | | | | | | | |
| | | | | | | | | | | | | | | | | | | | | | | | |
| | | Investor A | |
| | | Six Months
Ended
March 31, 2008
(Unaudited) | | | Year Ended September 30, | |
| | | | 2007 | | | 2006 | | | 2005 | | | 2004 | | | 20031 | |
Per Share Operating Performance | | | | | | | | | | | | | | | | | | | | | | | | |
Net asset value, beginning of period | | $ | 1.00 | | | $ | 1.00 | | | $ | 1.00 | | | $ | 1.00 | | | $ | 1.00 | | | $ | 1.00 | |
| | | | | | | | | | | | | | | | | | | | | | | | |
Net investment income | | | 0.0131 | | | | 0.0308 | | | | 0.0267 | | | | 0.0150 | | | | 0.0046 | | | | 0.0058 | |
Dividends from net investment income | | | (0.0131 | ) | | | (0.0308 | ) | | | (0.0267 | ) | | | (0.0150 | ) | | | (0.0046 | ) | | | (0.0058 | ) |
| | | | | | | | | | | | | | | | | | | | | | | | |
Net asset value, end of period | | $ | 1.00 | | | $ | 1.00 | | | $ | 1.00 | | | $ | 1.00 | | | $ | 1.00 | | | $ | 1.00 | |
| | | | | | | | | | | | | | | | | | | | | | | | |
Total Investment Return | | | | | | | | | | | | | | | | | | | | | | | | |
Based on net asset value | | | 1.33 | %2 | | | 3.13 | % | | | 2.70 | % | | | 1.51 | % | | | 0.46 | % | | | 0.58 | % |
| | | | | | | | | | | | | | | | | | | | | | | | |
Ratios to Average Net Assets | | | | | | | | | | | | | | | | | | | | | | | | |
Total expenses, net of waivers and reimbursement | | | 0.67 | %3 | | | 0.67 | % | | | 0.69 | % | | | 0.71 | % | | | 0.80 | % | | | 0.86 | % |
| | | | | | | | | | | | | | | | | | | | | | | | |
Total expenses | | | 0.87 | %3 | | | 0.87 | % | | | 1.01 | % | | | 1.06 | % | | | 1.20 | % | | | 1.19 | % |
| | | | | | | | | | | | | | | | | | | | | | | | |
Net investment income | | | 2.65 | %3 | | | 3.08 | % | | | 2.67 | % | | | 1.47 | % | | | 0.46 | % | | | 0.59 | % |
| | | | | | | | | | | | | | | | | | | | | | | | |
Supplemental Data | | | | | | | | | | | | | | | | | | | | | | | | |
Net assets, end of period (000) | | $ | 26,606 | | | $ | 22,201 | | | $ | 20,267 | | | $ | 20,893 | | | $ | 32,171 | | | $ | 26,154 | |
| | | | | | | | | | | | | | | | | | | | | | | | |
See Notes to Financial Statements.
| | | | | | |
54 | | SEMI-ANNUAL REPORT | | MARCH 31, 2008 | | |
| | |
| Financial Highlights (continued) | | Pennsylvania Municipal Money Market Portfolio |
| | | | | | | | | | | | | | | | | | | | | | | | | | | | | | | | | | | | | | | | | | | | | | | | |
| | | Institutional | | | Service | |
| | | Six Months
Ended
March 31, 2008
(Unaudited) | | | Year Ended September 30, | | | Six Months
Ended
March 31, 2008
(Unaudited) | | | Year Ended September 30, | |
| | | | 2007 | | | 2006 | | | 2005 | | | 2004 | | | 20031 | | | | 2007 | | | 2006 | | | 2005 | | | 2004 | | | 20031 | |
Per Share Operating Performance | | | | | | | | | | | | | | | | | | | | | | | | | | | | | | | | | | | | | | | | | | | | | | | | |
Net asset value, beginning of period | | $ | 1.00 | | | $ | 1.00 | | | $ | 1.00 | | | $ | 1.00 | | | $ | 1.00 | | | $ | 1.00 | | | $ | 1.00 | | | $ | 1.00 | | | $ | 1.00 | | | $ | 1.00 | | | $ | 1.00 | | | $ | 1.00 | |
| | | | | | | | | | | | | | | | | | | | | | | | | | | | | | | | | | | | | | | | | | | | | | | | |
Net investment income | | | 0.0132 | | | | 0.0329 | | | | 0.0290 | | | | 0.0178 | | | | 0.0073 | | | | 0.0093 | | | | 0.0119 | | | | 0.0301 | | | | 0.0261 | | | | 0.0148 | | | | 0.0043 | | | | 0.0063 | |
Dividends from net investment income | | | (0.0132 | ) | | | (0.0329 | ) | | | (0.0290 | ) | | | (0.0178 | ) | | | (0.0073 | ) | | | (0.0093 | ) | | | (0.0119 | ) | | | (0.0301 | ) | | | (0.0261 | ) | | | (0.0148 | ) | | | (0.0043 | ) | | | (0.0063 | ) |
| | | | | | | | | | | | | | | | | | | | | | | | | | | | | | | | | | | | | | | | | | | | | | | | |
Net asset value, end of period | | $ | 1.00 | | | $ | 1.00 | | | $ | 1.00 | | | $ | 1.00 | | | $ | 1.00 | | | $ | 1.00 | | | $ | 1.00 | | | $ | 1.00 | | | $ | 1.00 | | | $ | 1.00 | | | $ | 1.00 | | | $ | 1.00 | |
| | | | | | | | | | | | | | | | | | | | | | | | | | | | | | | | | | | | | | | | | | | | | | | | |
Total Investment Return | | | | | | | | | | | | | | | | | | | | | | | | | | | | | | | | | | | | | | | | | | | | | | | | |
Based on net asset value | | | 1.34 | %2 | | | 3.34 | % | | | 2.94 | % | | | 1.79 | % | | | 0.73 | % | | | 0.93 | % | | | 1.20 | %2 | | | 3.06 | % | | | 2.65 | % | | | 1.49 | % | | | 0.43 | % | | | 0.63 | % |
| | | | | | | | | | | | | | | | | | | | | | | | | | | | | | | | | | | | | | | | | | | | | | | | |
Ratios to Average Net Assets | | | | | | | | | | | | | | | | | | | | | | | | | | | | | | | | | | | | | | | | | | | | | | | | |
Total expenses, net of waivers and reimbursement | | | 0.42 | %3 | | | 0.42 | % | | | 0.42 | % | | | 0.42 | % | | | 0.42 | % | | | 0.42 | % | | | 0.70 | %3 | | | 0.70 | % | | | 0.71 | % | | | 0.72 | % | | | 0.72 | % | | | 0.72 | % |
| | | | | | | | | | | | | | | | | | | | | | | | | | | | | | | | | | | | | | | | | | | | | | | | |
Total expenses | | | 0.59 | %3 | | | 0.59 | % | | | 0.64 | % | | | 0.72 | % | | | 0.71 | % | | | 0.71 | % | | | 0.84 | %3 | | | 0.84 | % | | | 0.89 | % | | | 0.97 | % | | | 0.99 | % | | | 1.01 | % |
| | | | | | | | | | | | | | | | | | | | | | | | | | | | | | | | | | | | | | | | | | | | | | | | |
Net investment income | | | 2.63 | %3 | | | 3.29 | % | | | 2.92 | % | | | 1.78 | % | | | 0.73 | % | | | 0.93 | % | | | 2.39 | %3 | | | 3.01 | % | | | 2.63 | % | | | 1.47 | % | | | 0.43 | % | | | 0.64 | % |
| | | | | | | | | | | | | | | | | | | | | | | | | | | | | | | | | | | | | | | | | | | | | | | | |
Supplemental Data | | | | | | | | | | | | | | | | | | | | | | | | | | | | | | | | | | | | | | | | | | | | | | | | |
Net assets, end of period (000) | | $ | 547,913 | | | $ | 500,402 | | | $ | 464,708 | | | $ | 430,376 | | | $ | 426,130 | | | $ | 416,412 | | | $ | 53,881 | | | $ | 55,934 | | | $ | 44,406 | | | $ | 34,219 | | | $ | 32,866 | | | $ | 44,164 | |
| | | | | | | | | | | | | | | | | | | | | | | | | | | | | | | | | | | | | | | | | | | | | | | | |
| | | | | | | | | | | | | | | | | | | | | | | | |
| | | Investor A | |
| | | Six Months
Ended
March 31, 2008
(Unaudited) | | | Year Ended September 30, | |
| | | | 2007 | | | 2006 | | | 2005 | | | 2004 | | | 20031 | |
Per Share Operating Performance | | | | | | | | | | | | | | | | | | | | | | | | |
Net asset value, beginning of period | | $ | 1.00 | | | $ | 1.00 | | | $ | 1.00 | | | $ | 1.00 | | | $ | 1.00 | | | $ | 1.00 | |
| | | | | | | | | | | | | | | | | | | | | | | | |
Net investment income | | | 0.0118 | | | | 0.0300 | | | | 0.0259 | | | | 0.0155 | | | | 0.0045 | | | | 0.0049 | |
Dividends from net investment income | | | (0.0118 | ) | | | (0.0300 | ) | | | (0.0259 | ) | | | (0.0155 | ) | | | (0.0045 | ) | | | (0.0049 | ) |
| | | | | | | | | | | | | | | | | | | | | | | | |
Net asset value, end of period | | $ | 1.00 | | | $ | 1.00 | | | $ | 1.00 | | | $ | 1.00 | | | $ | 1.00 | | | $ | 1.00 | |
| | | | | | | | | | | | | | | | | | | | | | | | |
Total Investment Return | | | | | | | | | | | | | | | | | | | | | | | | |
Based on net asset value | | | 1.20 | %2 | | | 3.05 | % | | | 2.62 | % | | | 1.56 | % | | | 0.45 | % | | | 0.49 | % |
| | | | | | | | | | | | | | | | | | | | | | | | |
Ratios to Average Net Assets | | | | | | | | | | | | | | | | | | | | | | | | |
Total expenses, net of waivers and reimbursement | | | 0.70 | %3 | | | 0.71 | % | | | 0.73 | % | | | 0.65 | % | | | 0.70 | % | | | 0.87 | % |
| | | | | | | | | | | | | | | | | | | | | | | | |
Total expenses | | | 0.84 | %3 | | | 0.85 | % | | | 1.01 | % | | | 0.96 | % | | | 1.17 | % | | | 1.18 | % |
| | | | | | | | | | | | | | | | | | | | | | | | |
Net investment income | | | 2.32 | %3 | | | 3.00 | % | | | 2.49 | % | | | 1.64 | % | | | 0.44 | % | | | 0.51 | % |
| | | | | | | | | | | | | | | | | | | | | | | | |
Supplemental Data | | | | | | | | | | | | | | | | | | | | | | | | |
Net assets, end of period (000) | | $ | 43,345 | | | $ | 33,490 | | | $ | 28,542 | | | $ | 72,079 | | | $ | 29,647 | | | $ | 33,726 | |
| | | | | | | | | | | | | | | | | | | | | | | | |
1 | Audited by other auditors. |
2 | Aggregate total investment return. |
See Notes to Financial Statements.
| | | | | | |
| | | SEMI-ANNUAL REPORT | | MARCH 31, 2008 | | 55 |
| | |
| Financial Highlights (concluded) | | Virginia Municipal Money Market Portfolio |
| | | | | | | | | | | | | | | | | | | | | | | | |
| | | Institutional | |
| | | Six Months
Ended
March 31, 2008
(Unaudited) | | | Year Ended September 30, | |
| | | | 2007 | | | 2006 | | | 2005 | | | 2004 | | | 20031 | |
Per Share Operating Performance | | | | | | | | | | | | | | | | | | | | | | | | |
Net asset value, beginning of period | | $ | 1.00 | | | $ | 1.00 | | | $ | 1.00 | | | $ | 1.00 | | | $ | 1.00 | | | $ | 1.00 | |
| | | | | | | | | | | | | | | | | | | | | | | | |
Net investment income | | | 0.0136 | | | | 0.0336 | | | | 0.0295 | | | | 0.0181 | | | | 0.0082 | | | | 0.0094 | |
Dividends from net investment income | | | (0.0136 | ) | | | (0.0336 | ) | | | (0.0295 | ) | | | (0.0181 | ) | | | (0.0082 | ) | | | (0.0094 | ) |
| | | | | | | | | | | | | | | | | | | | | | | | |
Net asset value, end of period | | $ | 1.00 | | | $ | 1.00 | | | $ | 1.00 | | | $ | 1.00 | | | $ | 1.00 | | | $ | 1.00 | |
| | | | | | | | | | | | | | | | | | | | | | | | |
Total Investment Return | | | | | | | | | | | | | | | | | | | | | | | | |
Based on net asset value | | | 1.36 | %2 | | | 3.42 | % | | | 2.99 | % | | | 1.83 | % | | | 0.82 | % | | | 0.95 | % |
| | | | | | | | | | | | | | | | | | | | | | | | |
Ratios to Average Net Assets | | | | | | | | | | | | | | | | | | | | | | | | |
Total expenses, net of waivers and reimbursement | | | 0.30 | %3 | | | 0.30 | % | | | 0.29 | % | | | 0.30 | % | | | 0.30 | % | | | 0.30 | % |
| | | | | | | | | | | | | | | | | | | | | | | | |
Total expenses | | | 0.63 | %3 | | | 0.67 | % | | | 0.75 | % | | | 0.92 | % | | | 0.89 | % | | | 0.75 | % |
| | | | | | | | | | | | | | | | | | | | | | | | |
Net investment income | | | 2.68 | %3 | | | 3.37 | % | | | 3.03 | % | | | 1.84 | % | | | 0.83 | % | | | 0.93 | % |
| | | | | | | | | | | | | | | | | | | | | | | | |
Supplemental Data | | | | | | | | | | | | | | | | | | | | | | | | |
Net assets, end of period (000) | | $ | 109,856 | | | $ | 81,190 | | | $ | 71,518 | | | $ | 24,169 | | | $ | 17,857 | | | $ | 21,963 | |
| | | | | | | | | | | | | | | | | | | | | | | | |
| |
| | | Service | |
| | | Six Months
Ended
March 31, 2008
(Unaudited) | | | Year Ended
September 30,
2007 | | | 4/24/064-
9/30/065 | | | 05/13/054 -
06/27/056 | | | 10/01/03 -
10/07/031,7 | | | Year Ended
September 30,
20031 | |
Per Share Operating Performance | | | | | | | | | | | | | | | | | | | | | | | | |
Net asset value, beginning of period | | $ | 1.00 | | | $ | 1.00 | | | $ | 1.00 | | | $ | 1.00 | | | $ | 1.00 | | | $ | 1.00 | |
| | | | | | | | | | | | | | | | | | | | | | | | |
Net investment income | | | 0.0121 | | | | 0.0307 | | | | 0.0104 | | | | 0.0023 | | | | 0.0001 | | | | 0.0084 | |
Dividends from net investment income | | | (0.0121 | ) | | | (0.0307 | ) | | | (0.0104 | ) | | | (0.0023 | ) | | | (0.0001 | ) | | | (0.0084 | ) |
| | | | | | | | | | | | | | | | | | | | | | | | |
Net asset value, end of period | | $ | 1.00 | | | $ | 1.00 | | | $ | 1.00 | | | $ | 1.00 | | | $ | 1.00 | | | $ | 1.00 | |
| | | | | | | | | | | | | | | | | | | | | | | | |
Total Investment Return | | | | | | | | | | | | | | | | | | | | | | | | |
Based on net asset value | | | 1.22 | %2 | | | 3.11 | % | | | 1.05 | %2 | | | 0.23 | %2 | | | 0.01 | %2 | | | 0.85 | % |
| | | | | | | | | | | | | | | | | | | | | | | | |
Ratios to Average Net Assets | | | | | | | | | | | | | | | | | | | | | | | | |
Total expenses, net of waivers and reimbursement | | | 0.59 | %3 | | | 0.58 | % | | | 0.58 | %3 | | | 0.60 | %3 | | | 0.40 | %3 | | | 0.40 | % |
| | | | | | | | | | | | | | | | | | | | | | | | |
Total expenses | | | 0.89 | %3 | | | 0.91 | % | | | 1.09 | %3 | | | 1.18 | %3 | | | 1.06 | %3 | | | 1.05 | % |
| | | | | | | | | | | | | | | | | | | | | | | | |
Net investment income | | | 2.69 | %3 | | | 3.14 | % | | | 3.11 | %3 | | | 1.96 | %3 | | | 0.71 | %3 | | | 0.85 | % |
| | | | | | | | | | | | | | | | | | | | | | | | |
Supplemental Data | | | | | | | | | | | | | | | | | | | | | | | | |
Net assets, end of period (000) | | $ | 342 | | | $ | 1,488 | | | $ | — | 8 | | $ | — | 6 | | $ | — | 7 | | $ | 41,011 | |
| | | | | | | | | | | | | | | | | | | | | | | | |
1 | Audited by other auditors. |
2 | Aggregate total investment return. |
5 | There were no Service shares outstanding during the period May 3, 2006 to June 1, 2006. |
6 | There were no Service shares outstanding as of September 30, 2005. |
7 | There were no Service shares outstanding as of September 30, 2004. |
8 | Net assets end of period are less than $500. |
See Notes to Financial Statements.
| | | | | | |
56 | | SEMI-ANNUAL REPORT | | MARCH 31, 2008 | | |
Notes to Financial Statements (Unaudited)
1. Significant Accounting Policies:
BlackRock FundsSM (the “Fund”), a Massachusetts business trust, is registered under the Investment Company Act of 1940, as amended (the “1940 Act”), as an open-end management investment company. As of March 31, 2008, the Fund had 26 registered portfolios and 8 of which, BlackRock Money Market Portfolio (“Money Market”), BlackRock U.S. Treasury Money Market Portfolio (“U.S. Treasury”), BlackRock Municipal Money Market Portfolio (“Municipal”), BlackRock New Jersey Municipal Money Market Portfolio (“New Jersey Municipal”), BlackRock North Carolina Municipal Money Market Portfolio (“North Carolina Municipal”), BlackRock Ohio Municipal Money Market Portfolio (“Ohio Municipal”), BlackRock Pennsylvania Municipal Money Market Portfolio (“Pennsylvania Municipal”) and BlackRock Virginia Municipal Money Market Portfolio (“Virginia Municipal”), are included in these financial statements (the “Portfolios”). Each Portfolio is authorized to issue an unlimited number of shares with a par value of $0.001. The Portfolios’ financial statements are prepared in conformity with accounting principles generally accepted in the United States of America, which may require the use of management accruals and estimates. Actual results may differ from these estimates. Each Portfolio of the Fund offers multiple classes of shares. Each Portfolio may offer Shares of Institutional, Service, Investor A, Investor B and Investor C classes. In addition, the Money Market and Municipal Portfolios may offer Hilliard Lyons Shares. All classes of shares have identical voting, dividend, liquidation and other rights and the same terms and conditions, except that Service, Hilliard Lyons, Investor A, Investor B and Investor C Shares bear certain expenses related to the shareholder service and/or distribution of such shares. Each class has exclusive voting rights with respect to matters relating to its shareholder servicing and distribution expenditures (except that Investor B shareholders may vote on material changes to the Investor A distribution plan).
The following is a summary of significant accounting policies followed by the Portfolios:
Valuation of Investments: Portfolio securities are valued under the amortized cost method which approximates current market value in accordance with Rule 2a-7 of the 1940 Act. Under this method, securities are valued at cost when purchased and thereafter, a constant proportionate amortization of any discount or premium is recorded until the maturity of the security. Regular review and monitoring of the valuation is performed in an attempt to avoid dilution or other unfair results to shareholders. Each Portfolio seeks to maintain the net asset value per share at $1.00, although there is no assurance that it will be able to do so on a continuing basis.
Repurchase Agreements: The Portfolios may invest in U.S. government and agency securities pursuant to repurchase agreements. Under such agreements, the counterparty agrees to repurchase the security at a mutually agreed upon time and price. The counterparty will be required on a daily basis to maintain the value of the securities subject to the agreement at no less than the repurchase price. The agreements are conditioned upon the collateral being deposited under the Federal Reserve book entry system or held in a segregated account by the Portfolio’s custodian. If the counterparty defaults and the fair value of the collateral declines, liquidation of the collateral by the Fund may be delayed or limited.
Investment Transactions and Investment Income: Investment transactions are recorded on the dates the transactions are entered into (the trade dates). Realized gains and losses on security transactions are determined on the identified cost basis. Interest income is recognized on the accrual basis. The Portfolios amortize all premiums and discounts on debt securities. Income, realized and unrealized gains and losses are allocated daily to each class based on its relative net assets.
Dividends and Distributions to Shareholders: Dividends from net investment income are declared daily and paid monthly. Distributions of capital gains are recorded on the ex-dividend dates.
Income Taxes: It is the Portfolios’ policy to comply with the requirements of the Internal Revenue Code applicable to regulated investment companies and to distribute substantially all of its taxable income to its shareholders. Therefore, no federal income tax provision is required. Under the applicable foreign tax laws, a withholding tax may be imposed on interest, dividends and capital gains at various rates.
Effective March 31, 2008, the Portfolios implemented Financial Accounting Standards Board (“FASB”) Interpretation No. 48, “Accounting for Uncertainty in Income Taxes – an interpretation of FASB Statement No. 109” (“FIN 48”). FIN 48 prescribes the minimum recognition threshold a tax position must meet in connection with accounting for uncertainties in income tax positions taken or expected to be taken by an entity, including investment companies, before being measured and recognized in the financial statements. The investment advisor has evaluated the application of FIN 48 to the Portfolios, and has determined that the adoption of FIN 48 did not have a material impact on the Portfolios’ financial statements. The Portfolios file U.S. and various state tax returns. No income tax returns are currently under examination. The statute of limitations on the Portfolios’ tax returns remains open for the years ended September 30, 2004 through September 30, 2006. The statute of limitations on the Portfolios’ state and local tax returns may remain open for an additional year depending upon the jurisdiction.
Recent Accounting Pronouncements: In September 2006, Statement of Financial Accounting Standards No. 157, “Fair Value Measurements” (“FAS 157”), was issued and is effective for fiscal years beginning after November 15, 2007. FAS 157 defines fair value, establishes a framework for measuring fair value and expands disclosures about fair value measurements. The impact on the Portfolios’ financial statement disclosures, if any, is currently being assessed.
In addition, in February 2007, Statement of Financial Accounting Standards No. 159, “The Fair Value Option for Financial Assets and Financial Liabilities” (“FAS 159”), was issued and is effective for fiscal years beginning after November 15, 2007. Early adoption is permitted as of the beginning of a fiscal year that begins on or before November 15, 2007, provided the entity also elects to apply the provisions of FAS 157. FAS
| | | | | | |
| | | SEMI-ANNUAL REPORT | | MARCH 31, 2008 | | 57 |
|
| Notes to Financial Statements (continued) |
159 permits entities to choose to measure many financial instruments and certain other items at fair value that are not currently required to be measured at fair value. FAS 159 also establishes presentation and disclosure requirements designed to facilitate comparisons between entities that choose different measurement attributes for similar types of assets and liabilities. The impact on the Portfolios’ financial statement disclosures, if any, is currently being assessed.
In March 2008, Statement of Financial Accounting Standards No. 161, “Disclosures about Derivative Instruments and Hedging Activities - an amendment of FASB Statement No. 133” (“FAS 161”) was issued and is effective for fiscal years beginning after November 15, 2008. FAS 161 is intended to improve financial reporting for derivative instruments by requiring enhanced disclosure that enables investors to understand how and why an entity uses derivatives, how derivatives are accounted for, and how derivative instruments affect an entity’s results of operations and financial position. The investment advisor is currently evaluating the implications of FAS 161 and the impact on the Portfolios’ financial statement disclosures, if any, is currently being assessed.
Other: Expenses directly related to one of the Portfolios or classes are charged to that Portfolio or class. Other operating expenses shared by several Portfolios are pro-rated among those Portfolios on the basis of relative net assets or other appropriate methods. Other expenses of a Portfolio are allocated daily to each class based on its relative net assets.
2. Investment Advisory Agreement and Other Transactions with Affiliates:
The Fund on behalf of the Portfolios have entered into an Investment Advisory Agreement with BlackRock Advisors, LLC (the “Advisor”), an indirect wholly-owned subsidiary of BlackRock, Inc., to provide investment advisory services. BlackRock Institutional Management Corporation (“BIMC”), an indirect wholly-owned subsidiary of BlackRock, Inc., serves as sub-advisor for all of the Portfolios. Merrill Lynch & Co., Inc.(“Merrill Lynch”) and The PNC Financial Services Group, Inc. (“PNC”) are principal owners of BlackRock, Inc. The Advisor is responsible for the management of each Portfolio and provides the necessary personnel, facilities, equipment and certain other services necessary to the operations of the Portfolios. For such services, each Portfolio pays the Advisor a monthly fee based on the average daily value of the Portfolio’s net assets, at the following annual rates: 0.45% of the first $1 billion, 0.40% of the next $1 billion, 0.375% of the next $1 billion and 0.35% of net assets in excess of $3 billion.
In addition, the Advisor has entered into a sub-advisory agreement with BIMC, an affiliate of the Advisor, pursuant to when BIMC serves as subadvisor for all of the Portfolios. The Advisor pays the sub-advisor, for services it provides, a monthly fee that is a percentage of the investment advisory fee paid by the Portfolios to the Advisor.
PFPC Trust Company (“PTC”), an indirect wholly-owned subsidiary of PNC, serves as custodian for each Portfolio. For these services, the cus- todian receives a fee computed daily and payable monthly, based on a percentage of the average daily gross assets of each Portfolio.
Prior to January 1, 2008, the fee was paid at the following annual rates: 0.0073% of the first $250 million, 0.006% of the next $250 million, 0.0056% of the next $250 million, 0.0048% of the next $250 million and 0.004% of average daily gross assets in excess of $1 billion; plus per transaction charges and other miscellaneous fees incurred on behalf of each Portfolio.
Effective January 1, 2008, the fee is paid at the following annual rates: 0.0025% of the first $2 billion and 0.002% of average daily gross assets in excess of $2 billion; plus per transaction charges and other miscellaneous fees incurred on behalf of each Portfolio.
PFPC Inc. (“PFPC”), an indirect wholly-owned subsidiary of PNC, serves as transfer and dividend disbursing agent. Each class of each Portfolio bears the costs of transfer agent fees associated with such respective class. Transfer agency fees borne by each class of each Portfolio are comprised of those fees charged for all shareholder communications including shareholder reports, dividend and distribution notices, and proxy materials for shareholders meetings, as well as per account and per transaction fees related to servicing and maintenance of shareholder accounts, including the issuing, redeeming and transferring of shares of each class of each Portfolio, 12b-1 fee calculation, check writing, antimoney laundering services, and customer identification services.
Pursuant to written agreements, certain affiliates provide certain Portfolios with sub-accounting, recordkeeping, sub-transfer agency and other administrative services with respect to sub-accounts they service. For these services, affiliates receive an annual fee per shareholder account which will vary depending on share class. For the six months ended March 31, 2008, the Portfolios paid the following fees in return for these services:
| | | |
Money Market | | $ | 4,855 |
U.S. Treasury | | | 7 |
Municipal | | | 1,192 |
New Jersey Municipal | | | 7 |
Pennsylvania Municipal | | | 63 |
PFPC and the Advisor act as co-administrators for the Portfolios. For these services, the co-administrators receive a combined administration fee computed daily and payable monthly, based on a percentage of the average daily net assets of each Portfolio. The combined administration fee is paid at the following annual rates: 0.075% of the first $500 million, 0.065% of the next $500 million and 0.055% of average of daily net assets in excess of $1 billion. In addition, each of the share classes is charged an administration fee based on the following percentages of average daily net assets of each respective class: 0.025% of the first $500 million, 0.015% of the next $500 million and 0.005% of average of daily net assets in excess of $1 billion. In addition, PFPC and the Advisor may have, at their discretion, voluntarily waived all or any portion of their administration fees for the Portfolio or a share class.
| | | | | | |
58 | | SEMI-ANNUAL REPORT | | MARCH 31, 2008 | | |
|
| Notes to Financial Statements (continued) |
The Fund, on behalf of the Portfolios, has entered into a Distribution Agreement with BlackRock Distributors, Inc. (“BDI”). BDI is an affiliate of BlackRock, Inc. The Fund has also adopted a Distribution Plan on behalf of each Portfolio in accordance with Rule 12b-1 under the 1940 Act. Pursuant to the Distribution Plan the Portfolios pay the BDI ongoing service and distribution fees. The fees are accrued daily and paid monthly at annual rates based upon the average daily net assets of the shares as follows:
| | | | | | | | | | | | | | | | | | | | | | | | | | | | | | | | | | |
Class Specific Fee Arrangement | |
Portfolio | | Share Classes | |
| | | Institutional | | Service | | | Hilliard Lyons | | | Investor A | | | Investor B | | | Investor C | |
| | | Contractual
Fees | | Actual
Fees (3) | | Contractual
Fees (1) | | | Actual
Fees (3) | | | Contractual
Fees (1) | | | Actual
Fees (3) | | | Contractual
Fees (1) | | | Actual
Fees (3) | | | Contractual
Fees (2) | | | Actual
Fees (3) | | | Contractual
Fees (2) | | | Actual
Fees (3) | |
Money Market | | None | | None | | 0.25 | % | | 0.25 | % | | 0.25 | % | | 0.25 | % | | 0.25 | % | | 0.25 | % | | 1.00 | % | | 0.80 | % | | 1.00 | % | | 0.80 | % |
U.S. Treasury | | None | | None | | 0.25 | % | | 0.25 | % | | N/A | | | N/A | | | 0.25 | % | | 0.25 | % | | 1.00 | % | | N/A | | | 1.00 | % | | N/A | |
Municipal | | None | | None | | 0.25 | % | | 0.25 | % | | 0.25 | % | | None | | | 0.25 | % | | 0.25 | % | | 1.00 | % | | N/A | | | 1.00 | % | | N/A | |
New Jersey Municipal | | None | | None | | 0.25 | % | | 0.25 | % | | N/A | | | N/A | | | 0.25 | % | | 0.25 | % | | 1.00 | % | | N/A | | | 1.00 | % | | N/A | |
North Carolina Municipal | | None | | None | | 0.25 | % | | 0.25 | % | | N/A | | | N/A | | | 0.25 | % | | 0.25 | % | | 1.00 | % | | N/A | | | 1.00 | % | | N/A | |
Ohio Municipal | | None | | None | | 0.25 | % | | 0.25 | % | | N/A | | | N/A | | | 0.25 | % | | 0.25 | % | | 1.00 | % | | N/A | | | 1.00 | % | | N/A | |
Pennsylvania Municipal | | None | | None | | 0.25 | % | | 0.25 | % | | N/A | | | N/A | | | 0.25 | % | | 0.25 | % | | 1.00 | % | | N/A | | | 1.00 | % | | N/A | |
Virginia Municipal | | None | | None | | 0.25 | % | | 0.25 | % | | N/A | | | N/A | | | 0.25 | % | | N/A | | | 1.00 | % | | N/A | | | 1.00 | % | | N/A | |
| (1) | the maximum annual contractual fees are comprised of a 0.25% service fee. |
| (2) | the maximum annual contractual fees are comprised of a 0.75% distribution fee and a 0.25% service fee. |
| (3) | annualized; the actual fees are for the six months ended March 31, 2008. |
For the six months ended March 31, 2008, the Portfolios paid to affiliates the following fees in return for distribution and sales support services:
| | | |
Money Market | | $ | 1,141,153 |
U.S. Treasury | | | 255,012 |
Municipal | | | 106,874 |
New Jersey Municipal | | | 86,853 |
North Carolina Municipal | | | 609 |
Ohio Municipal | | | 41,340 |
Pennsylvania Municipal | | | 115,081 |
The Advisor maintains a call center, which is responsible for providing certain shareholder services to the Portfolios, such as responding to shareholder inquiries and processing transactions based upon instructions from shareholders with respect to the subscription and redemption of Portfolio shares. During the six months ended March 31, 2008, the following amounts have been accrued by the Portfolios to reimburse the Advisor for costs incurred running the call center, which are a component of the transfer agent fees in the accompanying Statements of Operations.
Call Center
| | | | | | | | | | | | | | | | | | | | | |
| | | Share Classes |
| | | Institutional | | Service | | Hilliard
Lyons | | Investor A | | Investor B | | Investor C | | Total |
Money Market | | $ | 1,826 | | $ | 1,993 | | $ | 570 | | $ | 16,236 | | $ | 1,360 | | $ | 387 | | $ | 22,372 |
U.S. Treasury | | | 698 | | | 1,143 | | | — | | | 241 | | | — | | | — | | | 2,082 |
Municipal | | | 106 | | | 477 | | | 689 | | | 41 | | | — | | | — | | | 1,313 |
New Jersey Municipal | | | 344 | | | 228 | | | — | | | 138 | | | — | | | — | | | 710 |
North Carolina Municipal | | | 162 | | | 7 | | | — | | | 14 | | | — | | | — | | | 183 |
Ohio Municipal | | | 227 | | | 36 | | | — | | | 111 | | | — | | | — | | | 374 |
Pennsylvania Municipal | | | 1,237 | | | 250 | | | — | | | 194 | | | — | | | — | | | 1,681 |
Virginia Municipal | | | 214 | | | 8 | | | — | | | — | | | — | | | — | | | 222 |
| | | | | | |
| | | SEMI-ANNUAL REPORT | | MARCH 31, 2008 | | 59 |
|
| Notes to Financial Statements (continued) |
For the six months ended March 31, 2008, the following charts show the various types of class-specific expenses borne directly by each class of each Portfolio and any associated waivers of those expenses.
Administration Fees
| | | | | | | | | | | | | | | | | | | | | |
| | | Share Classes |
| | | Institutional | | Service | | Hilliard
Lyons | | Investor A | | Investor B | | Investor C | | Total |
Money Market | | $ | 73,728 | | $ | 60,302 | | $ | 17,973 | | $ | 51,408 | | $ | 1,465 | | $ | 776 | | $ | 205,652 |
U.S. Treasury | | | 37,277 | | | 28,669 | | | — | | | 4,640 | | | — | | | — | | | 70,586 |
Municipal | | | 8,835 | | | 10,055 | | | 23,037 | | | 651 | | | — | | | — | | | 42,578 |
New Jersey Municipal | | | 16,084 | | | 4,598 | | | — | | | 4,107 | | | — | | | — | | | 24,789 |
North Carolina Municipal | | | 9,429 | | | 586 | | | — | | | 17 | | | — | | | — | | | 10,032 |
Ohio Municipal | | | 14,280 | | | 1,011 | | | — | | | 3,127 | | | — | | | — | | | 18,418 |
Pennsylvania Municipal | | | 65,290 | | | 6,987 | | | — | | | 4,555 | | | — | | | — | | | 76,832 |
Virginia Municipal | | | 14,736 | | | 85 | | | — | | | — | | | — | | | — | | | 14,821 |
Administration Fees Waived
| | | | | | | | | | | | | | | |
| | | Share Classes |
| | | Institutional | | Service | | Investor B | | Investor C | | Total |
Money Market | | $ | 73,729 | | $ | 210 | | $ | 1,457 | | $ | 775 | | $ | 76,171 |
U.S. Treasury | | | 37,276 | | | — | | | — | | | — | | | 37,276 |
Municipal | | | 8,836 | | | 11 | | | — | | | — | | | 8,847 |
New Jersey Municipal | | | 16,084 | | | — | | | — | | | — | | | 16,084 |
North Carolina Municipal | | | 9,429 | | | — | | | — | | | — | | | 9,429 |
Ohio Municipal | | | 14,280 | | | — | | | — | | | — | | | 14,280 |
Pennsylvania Municipal | | | 65,290 | | | — | | | — | | | — | | | 65,290 |
Virginia Municipal | | | 14,736 | | | 10 | | | — | | | — | | | 14,746 |
Transfer Agent Fees
| | | | | | | | | | | | | | | | | | | | | |
| | | Share Classes |
| | | Institutional | | Service | | Hilliard
Lyons | | Investor A | | Investor B | | Investor C | | Total |
Money Market | | $ | 10,440 | | $ | 4,263 | | $ | 723 | | $ | 159,761 | | $ | 15,106 | | $ | 4,401 | | $ | 194,694 |
U.S. Treasury | | | 2,748 | | | 1,698 | | | — | | | 1,368 | | | — | | | — | | | 5,814 |
Municipal | | | 497 | | | 754 | | | 914 | | | 277 | | | — | | | — | | | 2,442 |
New Jersey Municipal | | | 1,662 | | | 428 | | | — | | | 307 | | | — | | | — | | | 2,397 |
North Carolina Municipal | | | 1,871 | | | 42 | | | — | | | 134 | | | — | | | — | | | 2,047 |
Ohio Municipal | | | 1,119 | | | 64 | | | — | | | 179 | | | 2 | | | 1 | | | 1,365 |
Pennsylvania Municipal | | | 7,874 | | | 394 | | | — | | | 508 | | | — | | | — | | | 8,776 |
Virginia Municipal | | | 4,178 | | | 48 | | | — | | | — | | | — | | | — | | | 4,226 |
Transfer Agent Fees Waived
| | | | | | | | | | | | |
| | | Share Classes |
| | | Institutional | | Investor B | | Investor C | | Total |
Money Market | | $ | 2,444 | | $ | 1,687 | | $ | 496 | | $ | 4,627 |
U.S. Treasury | | | 985 | | | — | | | — | | | 985 |
Municipal | | | 127 | | | — | | | — | | | 127 |
New Jersey Municipal | | | 482 | | | — | | | — | | | 482 |
North Carolina Municipal | | | 197 | | | — | | | — | | | 197 |
Ohio Municipal | | | 275 | | | — | | | — | | | 275 |
Pennsylvania Municipal | | | 1,723 | | | — | | | — | | | 1,723 |
Virginia Municipal | | | 301 | | | — | | | — | | | 301 |
Transfer Agent Fees Reimbursed
| | | | | | | | | | | | |
| | | Share Classes |
| | | Institutional | | Investor B | | Investor C | | Total |
Money Market | | $ | 7,968 | | $ | 9,218 | | $ | 1,717 | | $ | 18,903 |
U.S. Treasury | | | 1,762 | | | — | | | — | | | 1,762 |
Municipal | | | 370 | | | — | | | — | | | 370 |
New Jersey Municipal | | | 1,180 | | | — | | | — | | | 1,180 |
North Carolina Municipal | | | 1,674 | | | — | | | — | | | 1,674 |
Ohio Municipal | | | 842 | | | — | | | — | | | 842 |
Pennsylvania Municipal | | | 6,150 | | | — | | | — | | | 6,150 |
Virginia Municipal | | | 3,876 | | | — | | | — | | | 3,876 |
| | | | | | |
60 | | SEMI-ANNUAL REPORT | | MARCH 31, 2008 | | |
Notes to Financial Statements (continued)
| | | | | | | | | | | | | | | | | | |
Service Fees | | Share Classes | | |
| | | Service | | Hilliard
Lyons | | Investor A | | Investor B | | Investor C | | Total |
Money Market | | $ | 607,700 | | $ | 179,741 | | $ | 513,271 | | $ | 14,624 | | $ | 7,726 | | $ | 1,323,062 |
U.S. Treasury | | | 286,694 | | | — | | | 46,405 | | | — | | | — | | | 333,099 |
Municipal | | | 100,536 | | | 230,375 | | | 6,506 | | | — | | | — | | | 337,417 |
New Jersey Municipal | | | 45,985 | | | — | | | 41,068 | | | — | | | — | | | 87,053 |
North Carolina Municipal | | | 5,863 | | | — | | | 174 | | | — | | | — | | | 6,037 |
Ohio Municipal | | | 10,110 | | | — | | | 31,272 | | | — | | | — | | | 41,382 |
Pennsylvania Municipal | | | 69,866 | | | — | | | 45,549 | | | — | | | — | | | 115,415 |
Virginia Municipal | | | 845 | | | — | | | — | | | — | | | — | | | 845 |
| | | | | | | | | | | | |
Service Fees Waived | | Share Classes | | |
| | | Hilliard
Lyons | | Investor B | | Investor C | | Total |
Money Market | | $ | — | | $ | 11,856 | | $ | 6,222 | | $ | 18,078 |
Municipal | | | 230,374 | | | — | | | — | | | 230,374 |
| | | | | | | | | |
Distribution Fees | | Share Classes | | |
| | | Investor B | | Investor C | | Total |
Money Market | | $ | 43,949 | | $ | 23,264 | | $ | 67,213 |
The Advisor contractually agreed to waive or reimburse fees or expenses until February 1, 2009, in order to limit expenses. These expense limits apply to the aggregate expenses incurred on a share class (excluding; interest, taxes, brokerage commissions, expenses incurred as a result of investments in other funds and other expenses attributable to, and incurred as a result of, a Portfolio’s investments and other extraordinary expenses). This agreement is reviewed annually by the Board. The current expense limitations as a percentage of net assets are as follows:
| | | | | | | | | | | | | | | | | | |
| | | Share Classes | |
| | | Institutional | | | Service | | | Hilliard Lyons | | | Investor A | | | Investor B | | | Investor C | |
Money Market | | 0.42 | % | | 0.72 | % | | 0.91 | % | | 0.89 | % | | 1.49 | % | | 1.49 | % |
U.S. Treasury | | 0.41 | % | | 0.71 | % | | N/A | | | 0.88 | % | | 1.48 | %1 | | 1.48 | %1 |
Municipal | | 0.42 | % | | 0.72 | % | | 0.66 | % | | 0.89 | % | | 1.49 | %1 | | 1.49 | %1 |
New Jersey Municipal | | 0.39 | % | | 0.69 | % | | N/A | | | 0.96 | % | | 1.46 | %1 | | 1.46 | %1 |
North Carolina Municipal | | 0.30 | % | | 0.60 | % | | N/A | | | 0.87 | % | | 1.37 | %1 | | 1.37 | %1 |
Ohio Municipal | | 0.39 | % | | 0.69 | % | | N/A | | | 0.96 | % | | 1.46 | %1 | | 1.46 | %1 |
Pennsylvania Municipal | | 0.42 | % | | 0.72 | % | | N/A | | | 0.99 | % | | 1.49 | %1 | | 1.49 | %1 |
Virginia Municipal | | 0.30 | % | | 0.60 | % | | N/A | | | 0.87 | %1 | | 1.37 | %1 | | 1.37 | %1 |
1 | There were no shares outstanding as of March 31, 2008. |
If operating expenses within two years following a waiver or reimbursement of the operating expenses of a share class that previously received a waiver or reimbursement from the Advisor, are less than the expense limit for that share class, the share class is required to repay the Advisor up to the amount of fees waived or expenses reimbursed under the agreement if: (1) the Portfolio has more than $50 million in assets, (2) the Advisor or an affiliate continues to be the Portfolio’s investment advisor or administrator and (3) the Board has approved the payments to the Advisor at the previous quarterly meeting.
At March 31, 2008, the amounts subject to possible future reimbursement under the expense limitation agreement are as follows:
| | | | | | | | | |
| | | Expiring January 31, |
| | | 2009 | | 2010 | | 2011 |
Money Market | | $ | 1,638,585 | | $ | 1,599,658 | | $ | 220,573 |
U.S. Treasury | | | 772,301 | | | 707,285 | | | 150,558 |
Municipal | | | 334,488 | | | 294,144 | | | 43,547 |
New Jersey Municipal | | | 356,460 | | | 344,675 | | | 53,913 |
North Carolina Municipal | | | 246,782 | | | 293,900 | | | 52,876 |
Ohio Municipal | | | 311,945 | | | 279,571 | | | 48,705 |
Pennsylvania Municipal | | | 968,214 | | | 913,386 | | | 159,862 |
Virginia Municipal | | | 224,221 | | | 317,929 | | | 70,894 |
The following waivers previously recorded by the Portfolios, which were subject to recoupment by the Advisor expired on January 31, 2008:
| | | |
U.S. Treasury | | $ | 1,194,807 |
Municipal | | | 630,099 |
New Jersey Municipal | | | 456,571 |
North Carolina Municipal | | | 304,943 |
Ohio Municipal | | | 413,974 |
Pennsylvania Municipal | | | 1,359,479 |
Virginia Municipal | | | 142,461 |
| | | | | | |
| | | SEMI-ANNUAL REPORT | | MARCH 31, 2008 | | 61 |
Notes to Financial Statements (continued)
For the six months ended March 31, 2008, affiliates received the following contingent deferred sales charges relating to transactions in Investor B shares and Investor C shares:
| | | | | | |
| | | Investor B | | Investor C |
Money Market | | $ | 33,784 | | $ | 8,979 |
The Portfolios may earn income on positive cash balances in demand deposit accounts that are maintained by PFPC on behalf of the Portfolios. The income earned for the six months ended March 31, 2008, was as follows:
| | | |
Money Market | | $ | 1,027 |
U.S. Treasury | | | 17 |
Municipal | | | 5 |
New Jersey Municipal | | | 6 |
North Carolina Municipal | | | 3 |
Ohio Municipal | | | 2 |
Pennsylvania Municipal | | | 7 |
Virginia Municipal | | | 2 |
The Portfolios may also receive earnings credits related to cash balances with PFPC which are shown on the Statements of Operations as fees paid indirectly.
Certain officers and/or trustees of the Portfolios are officers and/or trustees/directors of BlackRock, Inc. or its affiliates.
3. Capital Shares:
Because the Portfolios have each sold and redeemed shares only at a constant net asset value of $1.00 per share, the number of shares represented by such sales, reinvestments and redemptions is the same as the dollar amounts shown on the following pages for such transactions.
Transactions in capital shares for each period were as follows:
| | | | | | | | |
| | | Money Market | |
| | | Six Months
Ended
March 31,
2008 | | | Year Ended
September 30,
2007 | |
Shares sold: | | | | | | | | |
Institutional | | $ | 713,310,132 | | | $ | 1,537,243,468 | |
Service | | | 969,544,911 | | | | 1,813,995,747 | |
Hilliard Lyons | | | 57,572,065 | | | | 109,753,956 | |
Investor A | | | 206,894,856 | | | | 331,708,848 | |
Investor B | | | 9,460,330 | | | | 11,373,692 | |
Investor C | | | 7,824,425 | | | | 6,280,041 | |
Shares issued in reinvestment of dividends: | | | | | | | | |
Institutional | | | 350,199 | | | | 1,155,114 | |
Service | | | 993,159 | | | | 2,713,337 | |
Hilliard Lyons | | | 2,930,338 | | | | 6,327,179 | |
Investor A | | | 7,986,201 | | | | 17,601,711 | |
Investor B | | | 175,305 | | | | 470,652 | |
Investor C | | | 87,793 | | | | 161,325 | |
Shares redeemed: | | | | | | | | |
Institutional | | | (825,682,709 | ) | | | (1,360,729,536 | ) |
Service | | | (863,473,596 | ) | | | (1,859,021,649 | ) |
Hilliard Lyons | | | (42,153,133 | ) | | | (105,603,555 | ) |
Investor A | | | (146,568,750 | ) | | | (355,566,796 | ) |
Investor B | | | (7,069,722 | ) | | | (19,774,296 | ) |
Investor C | | | (5,080,016 | ) | | | (10,197,647 | ) |
| | | | | | | | |
Net increase | | $ | 87,101,788 | | | $ | 127,891,591 | |
| | | | | | | | |
| |
| | | U.S. Treasury | |
| | | Six Months
Ended
March 31,
2008 | | | Year Ended
September 30,
2007 | |
Shares sold: | | | | | | | | |
Institutional | | $ | 386,369,214 | | | $ | 559,564,732 | |
Service | | | 434,993,692 | | | | 984,280,361 | |
Investor A | | | 31,154,908 | | | | 33,270,755 | |
Shares issued in reinvestment of dividends: | | | | | | | | |
Institutional | | | 3,382 | | | | 9,207 | |
Service | | | 725,398 | | | | 826,713 | |
Investor A | | | 499,619 | | | | 1,368,800 | |
Shares redeemed: | | | | | | | | |
Institutional | | | (392,918,421 | ) | | | (458,556,613 | ) |
Service | | | (456,814,231 | ) | | | (986,012,985 | ) |
Investor A | | | (18,928,377 | ) | | | (31,263,026 | ) |
| | | | | | | | |
Net increase (decrease) | | $ | (14,914,816 | ) | | $ | 103,487,944 | |
| | | | | | | | |
| |
| | | Municipal | |
| | | Six Months
Ended
March 31,
2008 | | | Year Ended
September 30,
2007 | |
Shares sold: | | | | | | | | |
Institutional | | $ | 161,743,286 | | | $ | 172,961,952 | |
Service | | | 143,638,597 | | | | 229,353,268 | |
Hilliard Lyons | | | 104,609,823 | | | | 192,779,882 | |
Investor A | | | 17,122,834 | | | | 23,757,807 | |
Shares issued in reinvestment of dividends: | | | | | | | | |
Institutional | | | 2,127 | | | | 880 | |
Service | | | 225,928 | | | | 650,526 | |
Hilliard Lyons | | | 2,541,182 | | | | 5,026,924 | |
Investor A | | | 64,152 | | | | 129,475 | |
Shares redeemed: | | | | | | | | |
Institutional | | | (145,138,359 | ) | | | (192,031,540 | ) |
Service | | | (171,992,995 | ) | | | (262,065,852 | ) |
Hilliard Lyons | | | (84,366,657 | ) | | | (171,211,126 | ) |
Investor A | | | (14,867,265 | ) | | | (22,940,420 | ) |
| | | | | | | | |
Net increase (decrease) | | $ | 13,582,653 | | | $ | (23,588,224 | ) |
| | | | | | | | |
| |
| | | New Jersey Municipal | |
| | | Six Months
Ended
March 31,
2008 | | | Year Ended
September 30,
2007 | |
Shares sold: | | | | | | | | |
Institutional | | $ | 168,473,244 | | | $ | 350,149,665 | |
Service | | | 3,267,759 | | | | 37,401,353 | |
Investor A | | | 29,101,001 | | | | 68,757,860 | |
Shares issued in reinvestment of dividends: | | | | | | | | |
Institutional | | | 43,237 | | | | 69,990 | |
| | | | | | |
62 | | SEMI-ANNUAL REPORT | | MARCH 31, 2008 | | |
Notes to Financial Statements (continued)
| | | | | | | | |
| | | New Jersey Municipal | |
| | | Six Months
Ended
March 31,
2008 | | | Year Ended
September 30,
2007 | |
Service | | $ | 51,874 | | | $ | 122,086 | |
Investor A | | | 404,043 | | | | 714,819 | |
Shares redeemed: | | | | | | | | |
Institutional | | | (196,999,954 | ) | | | (293,392,912 | ) |
Service | | | (12,689,895 | ) | | | (51,467,194 | ) |
Investor A | | | (24,430,605 | ) | | | (56,885,413 | ) |
| | | | | | | | |
Net increase (decrease) | | $ | (32,779,296 | ) | | $ | 55,470,254 | |
| | | | | | | | |
| |
| | | North Carolina Municipal | |
| | | Six Months
Ended
March 31,
2008 | | | Year Ended
September 30,
2007 | |
Shares sold: | | | | | | | | |
Institutional | | $ | 150,712,032 | | | $ | 291,128,975 | |
Service | | | 8,033,829 | | | | 3,789,948 | |
Investor A | | | 42,400 | | | | 177,265 | |
Shares issued in reinvestment of dividends: | | | | | | | | |
Institutional | | | 491,564 | | | | 1,422,320 | |
Service | | | 42,339 | | | | 5,113 | |
Investor A | | | 1,593 | | | | 8,697 | |
Shares redeemed: | | | | | | | | |
Institutional | | | (131,130,570 | ) | | | (287,390,964 | ) |
Service | | | (4,392,155 | ) | | | (3,156,724 | ) |
Investor A | | | (105,457 | ) | | | (313,015 | ) |
| | | | | | | | |
Net increase | | $ | 23,695,575 | | | $ | 5,671,615 | |
| | | | | | | | |
| |
| | | Ohio Municipal | |
| | | Six Months
Ended
March 31,
2008 | | | Year Ended
September 30,
2007 | |
Shares sold: | | | | | | | | |
Institutional | | $ | 221,877,792 | | | $ | 396,071,177 | |
Service | | | 7,092,481 | | | | 16,516,784 | |
Investor A | | | 68,883,779 | | | | 67,412,683 | |
Shares issued in reinvestment of dividends: | | | | | | | | |
Institutional | | | 28,667 | | | | 106,237 | |
Service | | | 42,330 | | | | 65,484 | |
Investor A | | | 332,162 | | | | 702,048 | |
Shares redeemed: | | | | | | | | |
Institutional | | | (197,359,650 | ) | | | (425,892,956 | ) |
Service | | | (7,652,423 | ) | | | (14,031,016 | ) |
Investor A | | | (64,810,472 | ) | | | (66,183,478 | ) |
| | | | | | | | |
Net increase (decrease) | | $ | 28,434,666 | | | $ | (25,233,037 | ) |
| | | | | | | | |
| |
| | | Pennsylvania Municipal | |
| | | Six Months
Ended
March 31,
2008 | | | Year Ended
September 30,
2007 | |
Shares sold: | | | | | | | | |
Institutional | | $ | 384,634,484 | | | $ | 731,049,582 | |
Service | | | 50,862,065 | | | | 142,840,710 | |
Investor A | | | 50,589,444 | | | | 79,731,765 | |
Shares issued in reinvestment of dividends: | | | | | | | | |
Institutional | | | 167,871 | | | | 313,748 | |
Service | | | 315,874 | | | | 660,793 | |
Investor A | | | 422,602 | | | | 1,040,155 | |
Shares redeemed: | | | | | | | | |
Institutional | | | (337,349,755 | ) | | | (695,644,721 | ) |
Service | | | (53,236,017 | ) | | | (131,971,718 | ) |
Investor A | | | (41,161,014 | ) | | | (75,821,775 | ) |
| | | | | | | | |
Net increase | | $ | 55,245,554 | | | $ | 52,198,539 | |
| | | | | | | | |
| |
| | | Virginia Municipal | |
| | | Six Months
Ended
March 31,
2008 | | | Year Ended
September 30,
2007 | |
Shares sold: | | | | | | | | |
Institutional | | $ | 159,870,017 | | | $ | 175,563,494 | |
Service | | | 1,068,838 | | | | 15,761,266 | |
Shares issued in reinvestment of dividends: | | | | | | | | |
Institutional | | | 69,712 | | | | 115,113 | |
Service | | | 9,105 | | | | 18,429 | |
Shares redeemed: | | | | | | | | |
Institutional | | | (131,274,151 | ) | | | (166,005,984 | ) |
Service | | | (2,223,795 | ) | | | (14,292,308 | ) |
| | | | | | | | |
Net increase | | $ | 27,519,726 | | | $ | 11,160,010 | |
| | | | | | | | |
4. Capital Loss Carryforward:
As of September 30, 2007, the Portfolios had a capital loss carryforward available to offset future realized capital gains through the indicated expiration dates:
| | | | | | | | | | | | | | | | | | |
| | | Expiring September 30, |
| | | 2009 | | 2010 | | 2011 | | 2014 | | 2015 | | Total |
Money Market | | $ | — | | $ | — | | $ | 66,446 | | $ | — | | $ | — | | $ | 66,446 |
U.S. Treasury | | | 13,150 | | | 11,911 | | | 12,380 | | | 13,138 | | | — | | | 50,579 |
Municipal | | | — | | | — | | | — | | | — | | | 14,334 | | | 14,334 |
North Carolina Municipal | | | — | | | — | | | — | | | — | | | 7,587 | | | 7,587 |
Pennsylvania Municipal | | | — | | | — | | | — | | | 23,168 | | | — | | | 23,168 |
| | | | | | |
| | | SEMI-ANNUAL REPORT | | MARCH 31, 2008 | | 63 |
David O. Beim, Trustee
Richard S. Davis, Trustee
Ronald W. Forbes, Trustee
Henry Gabbay, Trustee
Dr. Matina Horner, Trustee
Rodney D. Johnson, Trustee
Herbert I. London, Trustee
Cynthia A. Montgomery, Trustee
Joseph P. Platt, Jr., Trustee
Robert C. Robb, Jr., Trustee
Toby Rosenblatt, Trustee
Kenneth L. Urish, Trustee
Frederick W. Winter, Trustee
Donald C. Burke, President and Chief Executive Officer
Anne F. Ackerley, Vice President
Neal J. Andrews, Chief Financial Officer
Jay M. Fife, Treasurer
Brian P. Kindelan, Chief Compliance Officer
Howard Surloff, Secretary
Investment Advisor and Co-Administrator
BlackRock Advisors, LLC
Wilmington, DE 19809
Sub-Advisor
BlackRock Institutional Management Corporation
Wilmington, DE 19809
Custodian
PFPC Trust Company
Philadelphia, PA 19153
Co-Administrator and Transfer Agent
PFPC Inc.
Wilmington, DE 19809
Distributor
BlackRock Distributors, Inc.
King of Prussia, PA 19406
Legal Counsel
Sidley Austin LLP
New York, NY 10019
Independent Registered Public Accounting Firm
Deloitte & Touche LLP
Philadelphia, PA 19103
Electronic copies of most financial reports and prospectuses are available on the Funds’ website.
The Trust has delegated proxy voting responsibilities to BlackRock, subject to the general oversight of the Trust’s Board of Trustees. A description of the policies and procedures that BlackRock uses to determine how to vote proxies relating to Fund securities is available without charge, upon request, by calling 1-800-821-7432, or on the website of the Securities and Exchange Commission (the “Commission”) at http://www.sec.gov.
Information on how proxies relating to the Trust’s voting securities (if any) were voted by BlackRock during the most recent 12-month period ended June 30th is available, upon request and without charge, by calling 1-800-821-7432 or on the website of the Commission at http://www.sec.gov.
The Trust files its complete schedule of Fund holdings for the first and third quarters of its fiscal year with the Commission on Form N-Q. The Trust’s Forms N-Q are available on the Commission’s website at http://www.sec.gov. The Trust’s Forms N-Q may be reviewed and copied at the Commission’s Public Reference Room in Washington, D.C. Information regarding the operation of the Public Reference Room may be obtained by calling 1-800-SEC-0330. The Trust’s Forms N-Q may also be obtained, upon request, by calling 1-800-821-7432.
This report is submitted for the general information of the shareholders of the Trust. It is not authorized for distribution to prospective investors unless accompanied or preceded by effective prospectuses for each Fund of the Trust, which contain information concerning the investment policies of the Funds as well as other pertinent information. Statements and other information contained in this report are as dated and subject to change.
| | | | | | |
64 | | SEMI-ANNUAL REPORT | | MARCH 31, 2008 | | |
|
| Additional Information (Unaudited) |
BlackRock Privacy Principles
BlackRock is committed to maintaining the privacy of its current and former fund investors and individual clients (collectively, “Clients”) and to safeguarding their non-public personal information. The following information is provided to help you understand what personal information BlackRock collects, how we protect that information and why in certain cases we share such information with select parties.
If you are located in a jurisdiction where specific laws, rules or regulations require BlackRock to provide you with additional or different privacy-related rights beyond what is set forth below, then BlackRock will comply with those specific laws, rules or regulations.
BlackRock obtains or verifies personal non-public information from and about you from different sources, including the following: (i) information we receive from you or, if applicable, your financial intermediary, on applications, forms or other documents; (ii) information about your transactions with us, our affiliates, or others; (iii) information we receive from a consumer reporting agency; and (iv) from visits to our websites.
BlackRock does not sell or disclose to non-affiliated third parties any non-public personal information about its Clients, except as permitted by law or as is necessary to respond to regulatory requests or to service Client accounts. These non-affiliated third parties are required to protect the confidentiality and security of this information and to use it only for its intended purpose.
We may share information with our affiliates to service your account or to provide you with information about other BlackRock products or services that may be of interest to you. In addition, BlackRock restricts access to non-public personal information about its Clients to those BlackRock employees with a legitimate business need for the information. BlackRock maintains physical, electronic and procedural safeguards that are designed to protect the non-public personal information of its Clients, including procedures relating to the proper storage and disposal of such information.
Availability of Additional Information
Electronic copies of most financial reports and prospectuses are available on the Fund’s website or shareholders can sign up for e-mail notifications of quarterly statements, annual and semi-annual reports and prospectuses by enrolling in the Fund’s electronic delivery program.
To enroll:
Shareholders Who Hold Accounts with Investment Advisors, Banks or Brokerages:
Please contact your financial advisor. Please note that not all investment advisors, banks or brokerages may offer this service.
Shareholders Who Hold Accounts Directly With BlackRock
| 1) | Access the BlackRock website at http://www.blackrock.com/edelivery |
| 2) | Click on the applicable link and follow the steps to sign up |
The Fund will mail only one copy of shareholder documents, including prospectuses, annual and semi-annual reports and proxy statements, to shareholders with multiple accounts at the same address. This practice is commonly called “householding” and it is intended to reduce expenses and eliminate duplicate mailings of shareholder documents. Mailings of your shareholder documents may be householded indefinitely unless you instruct us otherwise. If you do not want the mailing of these documents to be combined with those for other members of your household, please contact the Fund at (800) 441-7762.
| | | | | | |
| | | SEMI-ANNUAL REPORT | | MARCH 31, 2008 | | 65 |
|
| Additional Information (concluded) |
Availability of Additional Information (concluded)
Availability of Proxy Voting Policies and Procedures
A description of the policies and procedures that the Fund uses to determine how to vote proxies relating to portfolio securities is available (1) without charge, upon request by calling (800) 441-7762; (2) at www.blackrock.com; (3) on the Securities and Exchange Commission’s (the “SEC”) website at http://www.sec.gov.
Availability of Proxy Voting Record
Information (if any) on how proxies relating to the Fund’s voting securities were voted by BlackRock during the most recent 12-month period ended June 30th is available, upon request and without charge on our website at www.blackrock.com, by calling (800) 441-7762 or on the SEC’s website at http://www.sec.gov.
Availability of Quarterly Portfolio Schedule
The Fund files its complete schedule of portfolio holdings with the SEC for the first and third quarters of each fiscal year on Form N-Q. The Fund’s Forms N-Q are available on the SEC’s website at http://www.sec.gov and may also be reviewed and copied at the SEC’s Public Reference Room in Washington, D.C. Information on the operation of the Public Reference Room may be obtained by calling (800) SEC-0330. The Fund’s Forms N-Q may also be obtained upon request and without charge by calling (800) 441-7762.
Shareholder Privileges
Account Information
Call us at (800) 441-7762 from 8:00 AM to 6:00 PM EST to get information about your account balances, recent transactions and share prices. You can also reach us on the Web at www.blackrock.com/funds.
Automatic Investment Plans
Investor Class shareholders who want to invest regularly can arrange to have $50 or more automatically deducted from their checking or savings account and invested in any of the BlackRock portfolios.
Systematic Withdrawal Plan
Investor Class shareholders can establish a systematic withdrawal plan and receive periodic payments of $50 or more from their BlackRock portfolios, as long as their account is at least $10,000.
Retirement Plans
Shareholders may make investments in conjunction with Traditional, Rollover, Roth, Coverdell, Simple IRA’s, SEP IRA’s and 403(b) Plans.
| | | | | | |
66 | | SEMI-ANNUAL REPORT | | MARCH 31, 2008 | | |
A World-Class Mutual Fund Family
BlackRock offers a diverse lineup of open-end mutual funds crossing all investment styles and managed by experts in equity, fixed income and tax-exempt investing.
| | | | |
Equity Funds | | | | |
| | |
BlackRock All-Cap Global Resources Portfolio | | BlackRock Global Opportunities Portfolio | | BlackRock Mid-Cap Growth Equity Portfolio |
BlackRock Asset Allocation Portfolio† | | BlackRock Global Resources Portfolio | | BlackRock Mid-Cap Value Equity Portfolio |
BlackRock Aurora Portfolio | | BlackRock Global Science & Technology Opportunities Portfolio | | BlackRock Mid Cap Value Opportunities Fund |
BlackRock Balanced Capital Fund† | | | | BlackRock Natural Resources Trust |
BlackRock Basic Value Fund | | BlackRock Global SmallCap Fund | | BlackRock Pacific Fund |
BlackRock Capital Appreciation Portfolio | | BlackRock Health Sciences Opportunities Portfolio* | | BlackRock Small Cap Core Equity Portfolio |
BlackRock Equity Dividend Fund | | BlackRock Healthcare Fund | | BlackRock Small Cap Growth Equity Portfolio |
BlackRock EuroFund | | BlackRock Index Equity Portfolio* | | BlackRock Small Cap Growth Fund II |
BlackRock Focus Growth Fund | | BlackRock International Fund | | BlackRock Small Cap Index Fund |
BlackRock Focus Value Fund | | BlackRock International Index Fund | | BlackRock Small Cap Value Equity Portfolio* |
BlackRock Fundamental Growth Fund | | BlackRock International Opportunities Portfolio | | BlackRock Small/Mid-Cap Growth Portfolio |
BlackRock Global Allocation Fund† | | BlackRock International Value Fund | | BlackRock S&P 500 Index Fund |
BlackRock Global Dynamic Equity Fund | | BlackRock Large Cap Core Fund | | BlackRock Technology Fund |
BlackRock Global Emerging Markets Fund | | BlackRock Large Cap Growth Fund | | BlackRock U.S. Opportunities Portfolio |
BlackRock Global Financial Services Fund | | BlackRock Large Cap Value Fund | | BlackRock Utilities and Telecommunications Fund |
BlackRock Global Growth Fund | | BlackRock Latin America Fund | | BlackRock Value Opportunities Fund |
| | |
Fixed Income Funds | | | | |
BlackRock Commodity Strategies Fund | | BlackRock Income Builder Portfolio | | BlackRock Low Duration Bond Portfolio |
BlackRock Emerging Market Debt Portfolio | | BlackRock Inflation Protected Bond Portfolio | | BlackRock Managed Income Portfolio |
BlackRock Enhanced Income Portfolio | | BlackRock Intermediate Bond Portfolio II | | BlackRock Short-Term Bond Fund |
BlackRock GNMA Portfolio | | BlackRock Intermediate Government | | BlackRock Strategic Income Portfolio |
BlackRock Government Income Portfolio | | Bond Portfolio | | BlackRock Total Return Fund |
BlackRock High Income Fund | | BlackRock International Bond Portfolio | | BlackRock Total Return Portfolio II |
BlackRock High Yield Bond Portfolio | | BlackRock Long Duration Bond Portfolio | | BlackRock World Income Fund |
BlackRock Income Portfolio | | | | |
| | |
Municipal Bond Funds | | | | |
BlackRock AMT-Free Municipal Bond Portfolio | | BlackRock Intermediate Municipal Fund | | BlackRock New York Municipal Bond Fund |
BlackRock California Insured Municipal Bond Fund | | BlackRock Kentucky Municipal Bond Portfolio | | BlackRock Ohio Municipal Bond Portfolio |
BlackRock Delaware Municipal Bond Portfolio | | BlackRock Municipal Insured Fund | | BlackRock Pennsylvania Municipal Bond Fund |
BlackRock Florida Municipal Bond Fund | | BlackRock National Municipal Fund | | BlackRock Short-Term Municipal Fund |
BlackRock High Yield Municipal Fund | | BlackRock New Jersey Municipal Bond Fund | | |
| | |
Target Risk & Target Date Funds | | | | |
| | |
BlackRock Prepared Portfolios | | BlackRock Lifecycle Prepared Portfolios | | |
Conservative Prepared Portfolio | | Prepared Portfolio 2010 | | Prepared Portfolio 2030 |
Moderate Prepared Portfolio | | Prepared Portfolio 2015 | | Prepared Portfolio 2035 |
Growth Prepared Portfolio | | Prepared Portfolio 2020 | | Prepared Portfolio 2040 |
Aggressive Growth Prepared Portfolio | | Prepared Portfolio 2025 | | Prepared Portfolio 2045 |
| | | | Prepared Portfolio 2050 |
| * | See the prospectus for information on specific limitations on investments in the fund. |
BlackRock mutual funds are distributed by BlackRock Distributors, Inc. and certain funds are also distributed by FAM Distributors, Inc. You should consider the investment objectives, risks, charges and expenses of the funds under consideration carefully before investing. Each fund’s prospectus contains this and other information and is available at www.blackrock.com or by calling (800) 882-0052 or from your financial advisor. The prospectus should be read carefully before investing.
| | | | | | |
| | | SEMI-ANNUAL REPORT | | MARCH 31, 2008 | | 67 |

This report is transmitted to shareholders only. It is not authorized for use as an offer of sale or a solicitation of an offer to buy shares of a Portfolio unless accompanied or preceded by a Portfolio’s current prospectus. An investment in a Portfolio is not insured or guaranteed by the Federal Deposit Insurance Corporation or any other government agency. Although the Portfolios seek to preserve the value of your investment at $1.00 per share, it is possible to lose money by investing in a Portfolio. Performance data quoted represents past performance and does not guarantee future results. Total return information assumes reinvestment of all distributions. Current performance may be higher or lower than the performance data quoted. For current month-end performance information, call (800) 441-7762. The Portfolios’ current 7-day yield more closely reflects the current earnings of a Portfolio than the total returns quoted. Statements and other information herein are as dated and are subject to change.
BlackRock Funds
100 Bellevue Parkway
Wilmington, DE 19809
MM-3/08-SAR
| | | | |
| | |
Item 2 | | – | | Code of Ethics – Not Applicable to this semi-annual report |
| | |
Item 3 | | – | | Audit Committee Financial Expert – Not Applicable to this semi-annual report |
| | |
Item 4 | | – | | Principal Accountant Fees and Services – Not Applicable to this semi-annual report |
| | |
Item 5 | | – | | Audit Committee of Listed Registrants – Not Applicable |
| | |
Item 6 | | – | | Investments (a) The registrant’s Schedule of Investments is included as part of the Report to Stockholders filed under Item 1 of this form. (b) Not Applicable due to no such divestments during the semi-annual period covered since the previous Form N-CSR filing. |
| | |
Item 7 | | – | | Disclosure of Proxy Voting Policies and Procedures for Closed-End Management Investment Companies – Not Applicable |
| | |
Item 8 | | – | | Portfolio Managers of Closed-End Management Investment Companies – Not Applicable |
| | |
Item 9 | | – | | Purchases of Equity Securities by Closed-End Management Investment Company and Affiliated Purchasers – Not Applicable |
| | |
Item 10 | | – | | Submission of Matters to a Vote of Security Holders – The registrant’s Nominating and Governance Committee will consider nominees to the Board recommended by shareholders when a vacancy becomes available. Shareholders who wish to recommend a nominee should send nominations which include biographical information and set forth the qualifications of the proposed nominee to the registrant’s Secretary. There have been no material changes to these procedures. |
| | |
Item 11 | | – | | Controls and Procedures |
| | |
11(a) | | – | | The registrant’s principal executive and principal financial officers or persons performing similar functions have concluded that the registrant’s disclosure controls and procedures (as defined in Rule 30a-3(c) under the Investment Company Act of 1940, as amended (the “1940 Act”)) are effective as of a date within 90 days of the filing of this report based on the evaluation of these controls and procedures required by Rule 30a-3(b) under the 1940 Act and Rule 15d-15(b) under the Securities Exchange Act of 1934, as amended. |
| | |
11(b) | | – | | There were no changes in the registrant’s internal control over financial reporting (as defined in Rule 30a-3(d) under the 1940 Act) that occurred during the second fiscal quarter of the period covered by this report that have materially affected, or are reasonably likely to materially affect, the registrant’s internal control over financial reporting. |
| | |
Item 12 | | – | | Exhibits attached hereto |
| | |
12(a)(1) | | – | | Code of Ethics – Not Applicable to this semi-annual report |
| | |
12(a)(2) | | – | | Certifications – Attached hereto |
| | |
12(a)(3) | | – | | Not Applicable |
| | | | |
12(b) | | – | | Certifications – Attached hereto |
Pursuant to the requirements of the Securities Exchange Act of 1934 and the Investment Company Act of 1940, the registrant has duly caused this report to be signed on its behalf by the undersigned, thereunto duly authorized.
| | |
| BlackRock Funds |
| |
| By: | | /s/ Donald C. Burke |
| | Donald C. Burke |
| | Chief Executive Officer of |
| | BlackRock Funds |
Date: July 2, 2008
Pursuant to the requirements of the Securities Exchange Act of 1934 and the Investment Company Act of 1940, this report has been signed below by the following persons on behalf of the registrant and in the capacities and on the dates indicated.
| | |
| By: | | /s/ Donald C. Burke |
| | Donald C. Burke |
| | Chief Executive Officer (principal executive officer) of |
| | BlackRock Funds |
Date: July 2, 2008
| | |
| By: | | /s/ Neal J. Andrews |
| | Neal J. Andrews |
| | Chief Financial Officer (principal financial officer) of |
| | BlackRock Funds |
Date: July 2, 2008