UNITEDSTATES
SECURITIESANDEXCHANGECOMMISSION
Washington,D.C.20549
FORM N-CSRS
CERTIFIED SHAREHOLDER REPORT OF REGISTERED MANAGEMENT
INVESTMENT COMPANIES
Investment Company Act file number 811-05742
Name of Fund: BlackRock International Diversification Fund of BlackRock Funds
Fund Address: 100 Bellevue Parkway, Wilmington, DE 19809
Name and address of agent for service: Anne F. Ackerley, Chief Executive Officer, BlackRock
International Diversification Fund of BlackRock Funds, 40 East 52nd Street, New York, NY
10022.
Registrant’s telephone number, including area code: (800) 441-7762
Date of fiscal year end: 12/31/2009
Date of reporting period: 06/30/2009
Item 1 – Report to Stockholders

BlackRock International Diversification Fund
OF BLACKROCK FUNDS
BlackRock Pacific Fund, Inc.
NOT FDIC INSURED
MAY LOSE VALUE
NO BANK GUARANTEE
Table of Contents
Page
| |
| Dear Shareholder | 3 |
| Semi-Annual Report: | |
| Fund Summaries | 4 |
| About Fund Performance | 8 |
| Disclosure of Expenses | 8 |
| Portfolio Information | 9 |
| Financial Statements: | |
| Schedules of Investment | 10 |
| Statements of Assets and Liabilities | 13 |
| Statements of Operations | 15 |
| Statements of Changes in Net Assets | 16 |
| Financial Highlights | 17 |
| Notes to Financial Statements | 24 |
| Disclosure of Investment Advisory Agreement and Sub-Advisory Agreement | 31 |
| Officers and Directors | 35 |
| Additional Information | 36 |
| Mutual Fund Family | 38 |
2 SEMI-ANNUAL REPORT JUNE 30, 2009
Dear Shareholder
The past 12 months reveal two distinct market backdrops — one of investor pessimism and decided weakness, and another of optimism and nascent
signs of recovery. The first half of the year was characterized by the former, as the global financial crisis erupted into the worst recession in decades.
Daily headlines recounted universal macroeconomic deterioration, financial sector casualties, volatile swings in global equity markets, and unprece-
dented government intervention that included widespread (and globally coordinated) monetary and quantitative easing by central banks and large-
scale fiscal stimuli. Sentiment improved noticeably in March, however, on the back of new program announcements by the Treasury and Federal
Reserve, as well as generally stronger-than-expected economic data in a few key areas, including retail sales, business and consumer confidence,
manufacturing and housing.
In this environment, US equities contended with extraordinary volatility, posting steep declines early, and then recouping those losses — and more —
between March and May. Investor enthusiasm eased off in the final month of the period, mostly as a result of profit taking and portfolio rebalancing,
as opposed to a change in the economic outlook. Through June 30, stocks did quite well on a year-to-date basis, with nearly all major indices crossing
into positive territory. The experience in international markets was similar to that in the United States, though performance was generally more extreme
both on the decline and on the upturn. Notably, emerging markets, which lagged most developed regions through the downturn, reassumed leadership
in 2009 as these areas of the globe have generally seen a stronger acceleration in economic recovery.
In fixed income markets, while a flight to quality remained a prevalent theme, relatively attractive yields and distressed valuations, alongside a more
favorable macro environment, eventually captured investor attention, leading to a sharp recovery in non-Treasury assets. A notable example from the
opposite end of the credit spectrum was the high yield sector, which has firmly outpaced all other taxable asset classes since the start of 2009. At the
same time, the municipal bond market enjoyed a strong return after the exceptional market volatility of 2008, buoyed by a combination of attractive
valuations, robust retail investor demand and a slowdown in forced selling. Direct aid to state and local governments via the American Recovery and
Reinvestment Act of 2009 has also lent support.
All told, results for the major benchmark indexes reflected a bifurcated market.
| | |
| Total Returns as of June 30, 2009 | 6-month | 12-month |
| US equities (S&P 500 Index) | 3.16% | (26.21)% |
| Small cap US equities (Russell 2000 Index) | 2.64 | (25.01) |
| International equities (MSCI Europe, Australasia, Far East Index) | 7.95 | (31.35) |
| US Treasury securities (Merrill Lynch 10-Year US Treasury Index) | (8.74) | 7.41 |
| Taxable fixed income (Barclays Capital US Aggregate Bond Index) | 1.90 | 6.05 |
| Tax-exempt fixed income (Barclays Capital Municipal Bond Index) | 6.43 | 3.77 |
| High yield bonds (Barclays Capital US Corporate High Yield 2% Issuer Capped Index) | 30.92 | (1.91) |
| Past performance is no guarantee of future results. Index performance shown for illustrative purposes only. You cannot invest directly in an index. | |
The market environment has clearly improved since the beginning of the year, but a great deal of uncertainty and risk remain. Through periods of market
turbulence, as ever, BlackRock’s full resources are dedicated to the management of our clients’ assets. For additional insight and timely “food for thought,”
we invite you to visit our award-winning Shareholder® magazine, now available exclusively online at www.blackrock.com/shareholdermagazine. We thank
you for entrusting BlackRock with your investments, and we look forward to continuing to serve you in the months and years ahead.

Announcement to Shareholders
On June 16, 2009, BlackRock, Inc. announced that it received written notice from Barclays PLC (“Barclays”) in which Barclays’ Board of Directors had
accepted BlackRock’s offer to acquire Barclays Global Investors (“BGI”). At a special meeting held on August 6, 2009, BlackRock’s proposed purchase
of BGI was approved by an overwhelming majority of Barclays’ voting shareholders, an important step toward closing the transaction. The combination
of BlackRock and BGI will bring together market leaders in active and index strategies to create the preeminent asset management firm. The transac-
tion is scheduled to be completed in the fourth quarter of 2009, subject to important fund shareholder and regulatory approvals.
THIS PAGE NOT PART OF YOUR FUND REPORT 3
Fund Summary as of June 30, 2009 BlackRock International Diversification Fund
Portfolio Management Commentary
How did the Fund perform?
•The Fund’s Institutional, Investor A and Class R Shares outperformed the
benchmark MSCI EAFE Index for the six-month period, while Investor C
Shares lagged the index.
What factors influenced performance?
•After posting steep declines early in the year, global equities rebounded
sharply in the second quarter of 2009, on increasing evidence of a
recovery in global growth and a notable shift by investors into riskier
assets. From their low point on March 6, most markets around the world
were up around 40% or more by the close of the period. International
markets, as represented by the MSCI EAFE Index, advanced 25.43% in
the second quarter alone, leaving the index up 7.95% for the year. In
developed markets, the majority of regions gained better than 20%
in the second quarter, while some posted returns in excess of 30%, on
a net dividend basis, helping push most countries into positive territory
for the year to date. Standouts included Norway 28.70%, Sweden
26.33%, Australia 26.32% and Austria 23.07%. More notable were the
gains made by Asian markets, such as Hong Kong 35.14% and
Singapore 32.80%, and the overall emerging market universe, which
rose by an impressive 36.01% for the period. Brazil 58.48% was the
best performer in the emerging market space, followed by India 57.45%,
Indonesia 56.25% and Chile 52.39%.
•Against this backdrop, selection decisions by the Fund’s underlying
managers were positive, as were allocation decisions. The strongest con-
tributions to performance came from allocations to the Pacific Fund,
Global Emerging Markets Fund and International Opportunities Portfolio.
Both asset allocation and stock selection were strong positive contribu-
tors for Global Emerging Markets Fund. Outperformance came from all
three geographic regions covered by the fund: EMEA (Europe, the Middle
East and Africa), Asia and Latin America. Meanwhile, good stock selec-
tion results benefited International Opportunities Portfolio. An overweight
in emerging Asia was a source of relative strength, in addition to selec-
tion and allocation effects within developed Europe.
By contrast, the Fund’s allocation to a Japanese index fund had a
negative effect on relative performance. This allocation had a positive
effect on the portfolio during the March rally, but this contribution was
overshadowed by negative relative effects during the rest of the period.
Describe recent portfolio activity.
There were no allocation changes to the Fund during the first half
of 2009.
Describe Fund positioning at period end.
At the end of the period, the Fund held just over half of its assets in
developed European markets. Regional investments in the Pacific region
and Japan comprised approximately 20% of the portfolio, and the
remainder was allocated to broad international strategies and emerging
markets. The aggregate portfolio was overweight relative to the MSCI
EAFE Index in emerging markets and underweight in developed markets.
The views expressed reflect the opinions of BlackRock as of the date of this report and are subject to change based on changes in market, economic or other conditions.
These views are not intended to be a forecast of future events and are no guarantee of future results.
Expense Example
| | | | | | |
| | | Actual | | | Hypothetical2 | |
| | Beginning | Ending | | Beginning | Ending | |
| | Account Value | Account Value | Expenses Paid | Account Value | Account Value | Expenses Paid |
| | January 1, 2009 | June 30, 2009 | During the Period1 | January 1, 2009 | June 30, 2009 | During the Period1 |
| Institutional | $1,000 | $1,082.20 | $1.03 | $1,000 | $1,023.81 | $1.00 |
| Investor A | $1,000 | $1,082.30 | $2.32 | $1,000 | $1,022.57 | $2.26 |
| Investor C | $1,000 | $1,077.00 | $6.18 | $1,000 | $1,018.85 | $6.01 |
| Class R | $1,000 | $1,079.60 | $3.61 | $1,000 | $1,021.33 | $3.51 |
| |
| 1 For each class of the Fund, expenses are equal to the annualized expense ratio for the class (0.20% for Institutional, 0.45% for Investor A, 1.20% for Investor C and 0.70% |
| for Class R), multiplied by the average account value over the period, multiplied by 181/365 (to reflect the one-half year period shown). | |
| 2 Hypothetical 5% annual return before expenses is calculated by pro-rating the number of days in the most recent fiscal half year divided by 365. | |
| See “Disclosure of Expenses” on page 8 for further information on how expenses were calculated. | | | |
4 SEMI-ANNUAL REPORT JUNE 30, 2009
BlackRock International Diversification Fund
Total Return Based on a $10,000 Investment
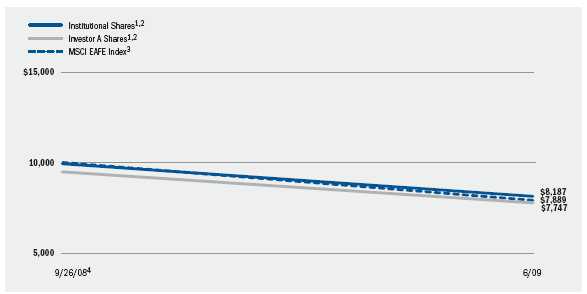
1 Assuming maximum sales charge, if any, transaction costs and other operating expenses, including administration fees. Institutional Shares do
not have a sales charge.
2 The Fund will invest substantially all of its assets in BlackRock international equity mutual funds, called the “underlying funds” and may,
on an opportunistic basis, invest up to 15% of its assets in exchange traded funds (“ETFs”).
3 This unmanaged broad-based index measures the total returns of developed foreign stock markets in Europe, Australasia and the Far East.
4 Commencement of operations.
| | | |
| Performance Summary for the Period Ended June 30, 2009 | | | |
| |
| | | Aggregate Total Returns5 |
| | | Since Inception6 |
| | 6 Month | w/o sales | w/sales |
| | Total Returns | charge | charge |
| Institutional | 8.22% | (18.13)% | N/A |
| Investor A | 8.23 | (18.23) | (22.53)% |
| Investor C | 7.70 | (18.74) | (19.54) |
| Class R | 7.96 | (18.43) | N/A |
| MSCI EAFE Index | 7.95 | (21.11) | N/A |
| 5 Assuming maximum sales charges. Aggregate total returns with and without sales charges reflect reductions for distribution and service fees. See “About Fund Performance” |
| on page 8 for a detailed description of share classes, including any related sales charges and fees. | | | |
| 6 The Fund commenced operations on September 26, 2008 | | | |
| N/A — Not applicable as share class and index do not have a sales charge. | | | |
| Past performance is not indicative of future results. | | | |
SEMI-ANNUAL REPORT JUNE 30, 2009 5
Fund Summary as of June 30, 2009 BlackRock Pacific Fund, Inc.
Portfolio Management Commentary
How did the Fund perform?
•The Fund underperformed the benchmark MSCI All Country Asia Pacific
Index for the six-month period.
What factors influenced performance?
•The Fund’s asset allocation, particularly its underweight in India, de-
tracted from performance during the six months. Although the election
results were encouraging for India’s political panorama, the government’s
fiscal plans are still constrained in the short-term by an increasing bud-
get deficit. Thus, we maintain our underweight in the region.
•On the positive side, stock selection, particularly within Japan and in
China, aided Fund performance over the period. In Japan, we took
advantage of the Nikkei 225 Index’s new post-bubble low in March, as
we added some companies with weaker balance sheets, but attractive
valuations, on the expectation of a medium-term recovery. Stocks
added near the bottom of the market, such as ROHM Co., Ltd. and
Konica Minolta Holdings, Inc., made particularly significant positive
contributions. In China, the Fund’s exposure to property names was
additive. A surge in bank lending, coupled with local government efforts
to stimulate the real estate market, saw transactions strengthen, and
the sector has recovered from the lethargy of late 2008. Additionally,
security selection was strong within financials, as regional banks benefit-
ed from near-term visibility in earnings and lessening fears around
balance sheets and the severity of the non-performing loan cycle.
Describe recent portfolio activity.
•We slowly increased the Fund’s exposure to carefully-selected, cyclical
stocks in the first quarter of 2009, in anticipation of a bear market rally.
This was best illustrated through a significant reduction in allocation to
the healthcare sector, while we increased several oversold cyclicals. As
the rally took hold in the second quarter of 2009, we took some profit
in outperforming sectors, such as technology. The Fund’s holdings in
Japan were increased in recent months as the market underperformed
the rest of the region due to its high exposure to the global economy,
particularly the United States.
Describe Fund positioning at period end.
•While Western demand remains muted, we remain cautious over the out-
look for Asia’s exporters. We are instead focusing on pockets of strength,
such as regional banks and domestic consumption in Japan. At period-
end, the Fund is overweight in consumer staples and financials, and
underweight in technology and materials.
•Second-quarter earnings remain crucial to the rally’s extension; however,
resilience in Chinese demand, political stabilization in India and improv-
ing cross-Strait relations continue to support investor sentiment. In addi-
tion, the realization that Asia must become less dependent on exports
bodes well for the longer-term.
The views expressed reflect the opinions of BlackRock as of the date of this report and are subject to change based on changes in market, economic or other conditions.
These views are not intended to be a forecast of future events and are no guarantee of future results.
| | | | | | |
| Expense Example | | | | | | |
| |
| | | Actual | | | Hypothetical2 | |
| | Beginning | Ending | | Beginning | Ending | |
| | Account Value | Account Value | Expenses Paid | Account Value | Account Value | Expenses Paid |
| | January 1, 2009 | June 30, 2009 | During the Period1 | January 1, 2009 | June 30, 2009 | During the Period1 |
| Institutional | $1,000 | $1,152.30 | $ 5.39 | $1,000 | $1,019.79 | $ 5.06 |
| Investor A | $1,000 | $1,150.60 | $ 6.83 | $1,000 | $1,018.45 | $ 6.41 |
| Investor B | $1,000 | $1,145.80 | $11.23 | $1,000 | $1,014.34 | $10.54 |
| Investor C | $1,000 | $1,147.00 | $10.75 | $1,000 | $1,014.78 | $10.09 |
| Class R | $1,000 | $1,146.00 | $10.43 | $1,000 | $1,015.08 | $ 9.79 |
| |
| 1 For each class of the Fund, expenses are equal to the annualized expense ratio for the class (1.01% for Institutional, 1.28% for Investor A, 2.11% for Investor B, 2.02% for |
| Investor C and 1.96% for Class R), multiplied by the average account value over the period, multiplied by 181/365 (to reflect the one-half year period shown). |
| 2 Hypothetical 5% annual return before expenses is calculated by pro-rating the number of days in the most recent fiscal half year divided by 365. | |
| See “Disclosure of Expenses” on page 8 for further information on how expenses were calculated. | | | |
6 SEMI-ANNUAL REPORT JUNE 30, 2009
BlackRock Pacific Fund, Inc.
Total Return Based on a $10,000 Investment

1 Assuming maximum sales charge, if any, transaction costs and other operating expenses, including advisory fees. Institutional Shares do not
have a sales charge.
2 The Fund invests primarily in equities of corporations domiciled in Far Eastern or Western Pacific countries, including Japan, Australia, Hong
Kong and Singapore.
3 The MSCI All Country Asia Pacific Index is a free float-adjusted market capitalization-weighted index of the stock markets of Australia, China,
Hong Kong, India, Indonesia, Japan, Malaysia, New Zealand, Pakistan, Philippines, Singapore, South Korea, Taiwan and Thailand.
| | | | | | | |
| Performance Summary for the Period Ended June 30, 2009 | | | | | | |
| |
| | | | | Average Annual Total Returns4 | | |
| | | 1 Year | 5 Years | | 10 Years |
| | 6-Month | w/o sales | w/sales | w/o sales | w/sales | w/o sales | w/sales |
| | Total Returns | charge | charge | charge | charge | charge | charge |
| Institutional | 15.23% | (17.79)% | N/A) | 5.61% | N/A | 4.35% | N/A |
| Investor A | 15.06 | (18.08) | (22.39)% | 5.34 | 4.21% | 4.09 | 3.53% |
| Investor B | 14.58 | (18.68) | (21.62) | 4.53 | 4.25 | 3.44 | 3.44 |
| Investor C | 14.70 | (18.64) | (19.28) | 4.56 | 4.56 | 3.30 | 3.30 |
| Class R | 14.60 | (18.65) | N/A) | 4.95 | N/A | 3.90 | N/A |
| MSCI All Country Asia Pacific Index | 16.71 | (22.58) | N/A | 4.45 | N/A | 1.90 | N/A |
| Composite Index5 | 12.10 | (22.35) | N/A | 3.15 | N/A | 1.63 | N/A |
| MSCI Australia | 26.46 | (31.52) | N/A | 10.90 | N/A | 9.41 | N/A |
| MSCI Hong Kong | 35.14 | (15.38) | N/A | 10.08 | N/A | 4.63 | N/A |
| MSCI India | 57.45 | (5.02) | N/A | 23.79 | N/A | 14.81 | N/A |
| MSCI Japan | 2.67 | (23.01) | N/A | (0.50) | N/A | (1.04) | N/A |
| MSCI Singapore | 32.82 | (23.78) | N/A | 12.24 | N/A | 4.12 | N/A |
| MSCI South Korea | 25.04 | (30.33) | N/A | 10.00 | N/A | 6.95 | N/A |
| MSCI Taiwan | 35.39 | (22.99) | N/A | 2.39 | N/A | (2.76) | N/A |
| |
| 4 Assuming maximum sales charges. Average annual total returns with and without sales charges reflect reduction for distribution and service fees. See “About Fund Performance” |
| on page 8 for a detailed description of share classes, including any related sales charges and fees. | | | | |
| 5 The unmanaged Composite Index is a customized index used to measure the Fund’s relative performance, comprised as follows: 68% Morgan Stanley Capital International |
| (MSCI) Japan, 10% MSCI Australia, 10% MSCI Hong Kong, 6% MSCI Taiwan, 2% MSCI India, 2% MSCI South Korea and 2% MSCI Singapore. | | |
| N/A — Not applicable as share class and index do not have a sales charge. | | | | | |
| Past performance is not indicative of future results. | | | | | | |
SEMI-ANNUAL REPORT JUNE 30, 2009 7
About Fund Performance
•Institutional Shares are not subject to any sales charge. Institutional
Shares bear no ongoing distribution or service fees and are available
only to eligible investors.
•Investor A Shares incur a maximum initial sales charge (front-end load)
of 5.25% and a service fee of 0.25% per year (but no distribution fee).
•Investor B Shares (for BlackRock Pacific Fund, Inc.) are subject to a
maximum contingent deferred sales charge of 4.50% declining to 0%
after six years. In addition, Investor B Shares are subject to a distribution
fee of 0.75% per year and a service fee of 0.25% per year. These shares
automatically convert to Investor A Shares after approximately eight
years. (There is no initial sales charge for automatic share conversions.)
All returns for periods greater than eight years reflect this conversion.
Investor B Shares of the Fund are no longer available for purchase
except through exchanges, dividend reinvestments, and for purchase by
certain qualified employee benefit plans.
•Investor C Shares are subject to a distribution fee of 0.75% and a service
fee of 0.25% per year. In addition, Investor C Shares are subject to a 1%
contingent deferred sales charge if redeemed within one year of purchase.
•Class R Shares do not incur a maximum initial sales charge (front-end
load) or deferred sales charge. These shares are subject to a distribution
fee of 0.25% per year and a service fee of 0.25% per year. Class R
Shares are available only to certain retirement plans. For the
BlackRock Pacific Fund, Inc., prior to inception, Class R Share per-
formance results are those of Institutional Shares (which have no
distribution or service fees) restated to reflect Class R Share fees.
Performance information reflects past performance and does not guar-
antee future results. Current performance may be lower or higher than the
performance data quoted. Refer to www.blackrock.com/funds to obtain
performance data current to the most recent month-end. Performance
results do not reflect the deduction of taxes that a shareholder would
pay on fund distributions or the redemption of fund shares. The Funds
may charge a 2% redemption fee for sales or exchanges of shares within
30 days of purchase or exchange. Performance data does not reflect
this potential fee. Figures shown in the performance tables on pages 5
and 7 assume reinvestment of all dividends and capital gain distributions,
if any, at net asset value on the ex-dividend date. Investment return and
principal value of shares will fluctuate so that shares, when redeemed,
may be worth more or less than their original cost. Dividends paid to each
class of shares will vary because of the different levels of service, distri-
bution and transfer agency fees applicable to each class, which are
deducted from the income available to be paid to shareholders.
Disclosure of Expenses
Shareholders of each Fund may incur the following charges: (a) expenses
related to transactions, including sales charges, redemption fees and
exchange fees; and (b) operating expenses including advisory fees,
distribution fees including 12b-1 fees, and other Fund expenses. The
expense examples on pages 4 and 6, which are based on a hypothetical
investment of $1,000 invested on January 1, 2009 and held through
June 30, 2009, are intended to assist shareholders both in calculating
expenses based on an investment in the Fund and in comparing
these expenses with similar costs of investing in other mutual funds.
The tables provide information about actual account values and actual
expenses. In order to estimate the expenses a shareholder paid during the
period covered by this report, shareholders can divide their account value
by $1,000 and then multiply the result by the number corresponding
to their share class under the headings entitled “Expenses Paid During
the Period.”
The tables also provide information about hypothetical account values
and hypothetical expenses based on each Fund’s actual expense ratio
and an assumed rate of return of 5% per year before expenses. In
order to assist shareholders in comparing the ongoing expenses of
investing in these Funds and other funds, compare the 5% hypothetical
example with the 5% hypothetical examples that appear in other funds’
shareholder reports.
The expenses shown in the tables are intended to highlight shareholders’
ongoing costs only and do not reflect any transactional expenses, such as
sales charges, redemption fees or exchange fees. Therefore, the hypotheti-
cal examples are useful in comparing ongoing expenses only, and will
not help shareholders determine the relative total expenses of owning
different funds. If these transactional expenses were included, shareholder
expenses would have been higher.
8 SEMI-ANNUAL REPORT JUNE 30, 2009
Portfolio Information as of June 30, 2009
BlackRock International Diversification Fund
| | | |
| | Percent of | | Percent of |
| | Total | | Total |
| Portfolio Holdings | Investments | Portfolio Composition | Investments |
| BlackRock EuroFund, Institutional Shares | 54% | Investment Companies | 100% |
| BlackRock Pacific Fund, Inc., Institutional Shares | 16 | | |
| BlackRock International Value Fund, Institutional Shares | 15 | | |
| BlackRock International Opportunities Portfolio | | | |
| of BlackRock Funds, Institutional Shares | 7 | | |
| iShares MSCI Japan Index Fund, Institutional Shares | 5 | | |
| BlackRock Global Emerging Markets Fund, Inc., | | | |
| Institutional Shares | 3 | | |
| |
| |
| |
| |
| BlackRock Pacific Fund, Inc. | | | |
| |
| | Percent of | | Percent of |
| | Long-Term | | Long-Term |
| Ten Largest Holdings | Investments | Geographic Allocation | Investments |
| Samsung Electronics Co., Ltd. | 2% | Japan | 50% |
| BHP Billion Ltd. | 2 | Australia | 14 |
| Mitsubishi UFJ Financial Group, Inc. | 2 | China | 10 |
| Henderson Land Development Co., Ltd. | 2 | South Korea | 6 |
| Mitsubishi Corp. | 2 | Hong Kong | 6 |
| Honda Motor Co., Ltd. | 2 | Taiwan | 4 |
| Kasikornbank PCL | 2 | Singapore | 4 |
| Sony Corp. | 2 | Thailand | 2 |
| JFE Holdings, Inc. | 2 | India | 2 |
| Japan Tobacco, Inc. | 2 | United States | 1 |
| | | Indonesia | 1 |
Derivative Instruments
BlackRock Pacific Fund, Inc. may invest in various derivative instruments,
including foreign currency exchange contracts and other instruments
specified in the Notes to Financial Statements, which constitute forms of
economic leverage. Such instruments are used to obtain exposure to a
market without owning or taking physical custody of securities or to hedge
market and/or interest rate risks. Such derivative instruments involve risks,
including the imperfect correlation between the value of a derivative
instrument and the underlying asset, possible default of the counterparty
to the transaction and illiquidity of the derivative instrument. The Fund’s
ability to successfully use a derivative instrument depends on the invest-
ment advisor’s ability to accurately predict pertinent market movements,
which cannot be assured. The use of derivative instruments may result in
losses greater than if they had not been used, may require the Fund to
sell or purchase portfolio securities at inopportune times or for distressed
values, may limit the amount of appreciation the Fund can realize on an
investment or may cause the Fund to hold a security that it might other-
wise sell. The Fund’s investments in these instruments are discussed in
detail in the Notes to Financial Statements.
SEMI-ANNUAL REPORT JUNE 30, 2009 9
Schedule of Investment June 30, 2009 (Unaudited) BlackRock International Diversification Fund
(Percentages shown are based on Net Assets)
| | | | | | | |
| Investment Companies | | | | Shares | | Value |
| |
| BlackRock EuroFund, Institutional Shares (a) | | 27,068 | $ | 288,271 |
| BlackRock Global Emerging Markets Fund, Inc., | | | | | |
| Institutional Shares (a) | | | | | 960 | | 13,434 |
| BlackRock International Opportunities Portfolio | | | | | |
| of BlackRock Funds, Institutional Shares (a) | | | 1,381 | | 36,894 |
| BlackRock International Value Fund, Institutional | | | | | |
| Shares (a) | | | | | 4,561 | | 79,687 |
| BlackRock Pacific Fund, Inc., Institutional Shares (a) | 4,992 | | 84,615 |
| iShares MSCI Japan Index Fund | | | | | 3,000 | | 28,290 |
| Total Investment Companies | | | | | | | |
| (Cost — $583,919) — 107.4% | | | | | | | 531,191 |
| |
| |
| |
| Short Term Securities | | | | | | | |
| BlackRock Liquidity Funds, TempFund, | | | | | |
| Institutional Shares, 0.45% (a)(b) | | | 93 | | 93 |
| Total Short-Term Securities (Cost — $93) — 0.0% | | | 93 |
| Total Investments (Cost — $584,012*) — 107.4% | | | 531,284 |
| Liabilities in Excess of Other Assets — (7.4)% | | | | | (36,496) |
| Net Assets — 100.0% | | | | | | $ | 494,788 |
| |
| * The cost and unrealized appreciation (depreciation) of investments as of June |
| 30, 2009, as computed for federal income tax purposes, were as follows: |
| Aggregate cost | | | | | | $ | 591,474 |
| Gross unrealized appreciation | | | | | | $10,775 |
| Gross unrealized depreciation | | | | | | (70,965) |
| Net unrealized depreciation | | | | | | $ | (60,190) |
| |
| (a) Investments in companies considered to be an affiliate of the Fund, for purposes |
| of Section 2(a)(3) of the Investment Company Act of 1940, were as follows: |
| |
| | Purchase | | Sales | Realized | |
| Affiliate | | Cost | | Cost | Loss | Income |
| BlackRock EuroFund, | | | | | | | |
| Institutional Shares | $72,742 | $36,853 | $(16,272) | — |
| BlackRock Global | | | | | | | |
| Emerging Markets | | | | | | | |
| Fund, Inc., | | | | | | | |
| Institutional Shares | $ 2,651 | $ | 938 | $ (348) | — |
| BlackRock International | | | | | | | |
| Opportunities Portfolio | | | | | | | |
| of BlackRock Funds, | | | | | | | |
| Institutional Shares | $ 8,768 | $ | 2,964 | $ (1,013) | — |
| BlackRock International | | | | | | | |
| Value Fund, | | | | | | | |
| Institutional Shares | $18,739 | $ | 4,937 | $ (769) | — |
| BlackRock Liquidity | | | | | | | |
| Funds, TempFund, | | | | | | | |
| Institutional Shares | $ | 931 | | — | | — | $ 11 |
| BlackRock Pacific | | | | | | | |
| Fund, Inc., | | | | | | | |
| Institutional Shares | $18,702 | $ | 6,812 | $ (2,652) | — |
| |
| 1 Represents net purchase cost. | | | | | |
| (b) Represents the current yield as of report date. | | | |
| | |
| •FinancialAccounting Standards Board Statement of Financial Accounting |
| Standards No. 157, “Fair Value Measurements” (“FAS 157”), clarifies the defini- |
| tion of fair value, establishes a framework for measuring fair values and requires |
| additional disclosures about the use of fair value measurements. Various inputs |
| are used in determining the fair value of investments, which are as follows: |
| |
| •Level1 — price quotations in active markets/exchanges for identical securities |
| •Level2 — other observable inputs (including, but not limited to: quoted prices |
| for similar assets or liabilities in markets that are active, quoted prices for |
| identical or similar assets or liabilities in markets that are not active, inputs |
| other than quoted prices that are observable for the assets or liabilities (such |
| as interest rates, yield curves, volatilities, prepayment speeds, loss severities, |
| credit risks and default rates) or other market-corroborated inputs |
| |
| •Level3 — unobservable inputs based on the best information available in the |
| circumstances, to the extent observable inputs are not available (including the |
| Fund’s own assumptions used in determining the fair value of investments) |
| The inputs or methodology used for valuing securities are not necessarily an indi- |
| cation of the risk associated with investing in those securities. For information |
| about the Fund’s policy regarding valuation of investments and other significant |
| accounting policies, please refer to Note 1 of the Notes to Financial Statements. |
| The following table summarizes the inputs used as of June 30, 2009 in deter- |
| mining the fair valuation of the Fund’s investments: | | |
| |
| | Investments in |
| Valuation Inputs | | Securities |
| | | Assets |
| Level 11 | $ | 531,284 |
| Level 2 | | — |
| Level 3 | | — |
| Total | $ | 531,284 |
| 1 See above Schedule of Investments for values in each security type. |
See Notes to Financial Statements.
10 SEMI-ANNUAL REPORT JUNE 30, 2009
Schedule of Investment June 30, 2009 (Unaudited) BlackRock Pacific Fund, Inc.
(Percentages shown are based on Net Assets)
| | | | | |
| Common Stocks | Shares | Value | Common Stocks | Shares | Value |
| |
| Australia — 14.1% | | | Japan (concluded) | | |
| AXA Asia Pacific Holdings Ltd. | 1,247,343 | $ 3,896,263 | Nintendo Co., Ltd. | 16,500 | $ 4,566,456 |
| Ansell Ltd. | 421,329 | 2,971,883 | Nippon Telegraph & Telephone Corp. | 156,900 | 6,389,818 |
| Australia & New Zealand Banking Group Ltd. | 471,756 | 6,251,939 | Nomura Holdings, Inc. | 878,200 | 7,412,751 |
| BHP Billiton Ltd. | 382,155 | 10,469,480 | OJI Paper Co., Ltd. | 503,000 | 2,161,128 |
| CSL Ltd. | 142,009 | 3,671,813 | Orix JREIT, Inc. | 819 | 3,749,964 |
| Fairfax Media Ltd. | 4,116,830 | 4,034,210 | ROHM Co., Ltd. | 79,900 | 5,827,743 |
| Metcash Ltd. | 1,291,600 | 4,483,203 | Sekisui House Ltd. | 366,600 | 3,712,911 |
| National Australia Bank Ltd. | 279,398 | 5,033,694 | Shin-Etsu Chemical Co., Ltd. | 104,600 | 4,851,234 |
| Newcrest Mining Ltd. | 109,541 | 2,677,323 | Sojitz Corp. | 2,603,400 | 5,709,260 |
| Origin Energy Ltd. | 226,262 | 2,664,101 | Sony Corp. | 306,500 | 7,996,283 |
| QBE Insurance Group Ltd. | 334,109 | 5,346,437 | Sumitomo Chemical Co., Ltd. | 747,800 | 3,362,967 |
| Qantas Airways Ltd. | 1,859,020 | 3,010,308 | Sumitomo Mitsui Financial Group, Inc. | 159,400 | 6,450,170 |
| Woodside Petroleum Ltd. | 84,300 | 2,912,234 | Takeda Pharmaceutical Co., Ltd. | 191,500 | 7,445,507 |
| Woolworths Ltd. | 251,241 | 5,330,320 | Tokio Marine Holdings, Inc. | 272,600 | 7,484,668 |
| | | 62,753,208 | Tokyo Gas Co., Ltd. | 1,516,000 | 5,415,811 |
| | | | Toppan Printing Co., Ltd. | 649,000 | 6,538,702 |
| China — 9.5% | | | Toyota Motor Corp. | 175,400 | 6,633,167 |
| CNOOC Ltd. | 5,116,000 | 6,302,155 | West Japan Railway Co. | 1,455 | 4,811,727 |
| China Construction Bank Class H | 8,008,000 | 6,170,508 | | | |
| China Mobile Ltd. | 664,000 | 6,648,236 | | | 218,820,212 |
| China Shenhua Energy Co. Ltd. Class H | 1,690,000 | 6,174,214 | Singapore — 4.1% | | |
| China Vanke Co. Ltd. | 1,347,977 | 1,942,824 | CapitaLand Ltd. | 1,676,500 | 4,262,578 |
| Focus Media Holding Ltd. (a)(b)(c) | 497,800 | 4,012,268 | DBS Group Holdings Ltd. | 726,500 | 5,889,844 |
| Industrial and Commercial Bank of China Ltd. | 9,716,000 | 6,730,147 | Olam International Ltd. | 1,473,000 | 2,456,353 |
| Zijin Mining Group Co. Ltd. | 4,922,000 | 4,429,519 | United Overseas Bank Ltd. | 565,000 | 5,701,295 |
| | | 42,409,871 | | | 18,310,070 |
| Hong Kong — 5.7% | | | South Korea — 5.9% | | |
| Hang Seng Bank Ltd. | 354,200 | 4,957,440 | Dongbu Insurance Co., Ltd. | 94,400 | 1,925,069 |
| Henderson Land Development Co., Ltd. | 1,732,000 | 9,883,179 | Hite Brewery Co., Ltd. | 37,210 | 4,574,040 |
| Hutchison Whampoa Ltd. | 1,009,400 | 6,566,291 | Hyundai Development Co. | 143,540 | 4,518,357 |
| Shenzhen Investment Ltd. | 9,078,000 | 3,757,382 | Samsung Electronics Co., Ltd. | 23,026 | 10,646,407 |
| | | 25,164,292 | Shinsegae Co. Ltd. | 12,140 | 4,797,423 |
| India — 1.6% | | | | | 26,461,296 |
| ICICI Bank Ltd. | 466,571 | 6,995,620 | Taiwan — 4.5% | | |
| Indonesia — 0.9% | | | Asustek Computer, Inc. | 2,865,000 | 3,703,679 |
| Telekomunikasi Indonesia Tbk PT | 5,175,000 | 3,831,044 | Chunghwa Telecom Co., Ltd. | 2,546,407 | 5,079,196 |
| | | | HON HAI Precision Industry Co., Ltd. | 1,827,803 | 5,605,372 |
| Japan — 49.1% | | | Taiwan Semiconductor Manufacturing Co., Ltd. | 3,476,000 | 5,704,814 |
| Asahi Breweries Ltd. | 382,200 | 5,476,826 | | | |
| COMSYS Holdings Corp. | 438,000 | 4,832,446 | | | 20,093,061 |
| Chubu Electric Power Co., Inc. | 268,700 | 6,205,298 | Thailand — 1.8% | | |
| Daiichi Sankyo Co., Ltd. | 307,900 | 5,495,847 | Kasikornbank PCL | 3,859,600 | 8,167,884 |
| Daikin Industries Ltd. | 164,100 | 5,281,310 | Total Common Stocks — 97.2% | | 433,006,558 |
| Fuji Media Holdings, Inc. | 3,575 | 5,380,022 | | | |
| Honda Motor Co., Ltd. | 297,500 | 8,184,478 | | | |
| J Front Retailing Co. Ltd. | 1,179,000 | 5,625,666 | | | |
| JFE Holdings, Inc. | 228,800 | 7,687,068 | | | |
| Japan Tobacco, Inc. | 2,439 | 7,623,905 | Warrants (d) | | |
| KDDI Corp. | 1,185 | 6,287,663 | United States — 0.9% | | |
| Konica Minolta Holdings, Inc. | 683,500 | 7,141,513 | Deutsche Bank AG (Bharti Airtel Ltd.) | | |
| Marubeni Corp. | 1,317,000 | 5,824,810 | (expires 1/24/17) | 238,289 | 3,970,228 |
| Mazda Motor Corp. | 2,718,000 | 6,951,254 | Total Warrants — 0.9% | | 3,970,228 |
| Mitsubishi Corp. | 474,800 | 8,761,587 | | | |
| Mitsubishi UFJ Financial Group, Inc. | 1,677,400 | 10,357,604 | Total Long-Term Investments | | |
| Mitsui OSK Lines Ltd. | 854,000 | 5,518,840 | (Cost — $376,347,128) — 98.1% | | 436,976,786 |
| Mitsui Sumitomo Insurance Group Holdings, Inc. | 216,500 | 5,663,808 | | | |
See Notes to Financial Statements.
SEMI-ANNUAL REPORT JUNE 30, 2009 11
Schedule of Investment (concluded) BlackRock Pacific Fund, Inc.
(Percentages shown are based on Net Assets)
| | | | |
| Short-Term Securities | Shares | | | Value |
| United States — 2.4% | | | | |
| Money Market Funds — 2.4% | | | | |
| BlackRock Liquidity Funds, TempFund, 0.45% (e)(f) 6,432,537 | $ | 6,432,537 |
| | Beneficial | | | |
| | Interest | | | |
| | (000) | | | |
| BlackRock Liquidity Series, LLC Money | | | | |
| Market Series, 0.55% (e)(f)(g) | USD 4,189 | | 4,188,800 |
| Total Money Market Funds — 2.4% | | | 10,621,337 |
| |
| |
| | Par | | | |
| Time Deposits — 0.3% | (000) | | | |
| Hong Kong — 0.1% | | | | |
| Brown Brothers Harriman & Co., 0.01%, | | | | |
| 7/01/09 | HKD 2,622 | | | 338,272 |
| Japan — 0.2% | | | | |
| Brown Brothers Harriman & Co., 0.01%, | | | | |
| 7/01/09 | JPY 113,364 | | 1,174,935 |
| Total Time Deposits — 0.3% | | | 1,513,207 |
| Total Short-Term Securities (Cost — $12,134,544) — 2.7% | | 12,134,544 |
| Total Investments (Cost — $388,481,672*) — 100.8% | 449,111,330 |
| Liabilities in Excess of Other Assets — (0.8)% | | | (3,513,435) |
| Net Assets — 100.0% | | $445,597,895 |
| * The cost and unrealized appreciation (depreciation) of investments as of June 30, |
| 2009, as computed for federal income tax purposes, were as follows: | |
| Aggregate cost | | $391,650,864 |
| Gross unrealized appreciation | | $ | 78,250,749 |
| Gross unrealized depreciation | | | (20,790,283) |
| Net unrealized appreciation | | $ | 57,460,466 |
| (a) Depositary receipts. | | | | |
| (b) Non-income producing security. | | | | |
| (c) Security, or a portion of security, is on loan. | | | | |
| (d) Warrants entitle the Fund to purchase a predetermined number of shares of |
| common stock and are non-income producing. The purchase price and number |
| of shares are subject to adjustment under certain conditions until the expiration |
| date. | | | | |
| (e) Investments in companies considered to be an affiliate of the Fund, for purposes |
| of Section 2(a)(3) of the Investment Company Act of 1940, were as follows: |
| | Net | | | |
| Affiliate | Activity | | Income |
| BlackRock Liquidity Funds, TempFund | 6,432,537 | | $ | 2,902 |
| BlackRock Liquidity Series, LLC | | | | |
| Cash Sweep Series | USD (1,618,189) | | $ | 1,529 |
| BlackRock Liquidity Series, LLC | | | | |
| Money Market Series | USD 2,838,800 | | $ 22,954 |
| (f) Represents the current yield as of report date. | | | |
| (g) Security was purchased with the cash proceeds from securities loans. | |
| | | | | |
| •Foreigncurrency exchange contracts as of June 30, 2009 were as follows: |
| |
| Currency | Currency | | Settlement Unrealized |
| Purchased | Sold | Counterparty | Date | Depreciation |
| |
| USD 1,150,687 | SGD 1,672,709 JPMorgan Chase | 7/02/09 | $ (4,157) |
| | | | Bank NA | | |
| |
| •CurrencyAbbreviations: | | | |
| HKD | Hong Kong Dollar | | | |
| JPY | Japanese Yen | | | |
| SGD | Singapore Dollar | | | |
| USD | U.S. Dollar | | | | |
| |
| •FinancialAccounting Standards Board Statement of Financial Accounting |
| Standards No. 157, “Fair Value Measurements” (“FAS 157”), clarifies the defini- |
| tion of fair value, establishes a framework for measuring fair values and requires |
| additional disclosures about the use of fair value measurements. Various inputs |
| are used in determining the fair value of investments, which are as follows: |
| |
| •Level1 — price quotations in active markets/exchanges for identical securities |
| •Level2 — other observable inputs (including, but not limited to: quoted prices |
| for similar assets or liabilities in markets that are active, quoted prices for |
| identical or similar assets or liabilities in markets that are not active, inputs |
| other than quoted prices that are observable for the assets or liabilities (such |
| as interest rates, yield curves, volatilities, prepayment speeds, loss severities, |
| credit risks and default rates) or other market-corroborated inputs |
| |
| •Level3 — unobservable inputs based on the best information available in the |
| circumstances, to the extent observable inputs are not available (including the |
| Fund’s own assumptions used in determining the fair value of investments) |
| The inputs or methodology used for valuing securities are not necessarily an indi- |
| cation of the risk associated with investing in those securities. For information |
| about the Fund’s policy regarding valuation of investments and other significant |
| accounting policies, please refer to Note 1 of the Notes to Financial Statements. |
| The following table summarizes the inputs used as of June 30, 2009 in deter- |
| mining the fair valuation of the Fund’s investments: | | |
| |
| | | | | Investments in |
| Valuation Inputs | | | | Securities |
| | | | | | Assets |
| Level 1 | | | | | |
| Long-Term Investments — China | $ | 4,012,268 |
| Short-Term Securites | | | 6,432,537 |
| Total Level 1 | | | | 10,444,805 |
| Level 2 | | | | | |
| Long-Term Investments1 | | | 432,964,518 |
| Short-Term Investments | | | 5,702,007 |
| Total Level 2 | | | | 438,666,525 |
| Level 3 | | | | | — |
| Total | | | | $ 449,111,330 |
| |
| 1 See above Schedule of Investments for values in each country excluding the |
| country in Level 1 within the table. | | |
| |
| | | | | Other Financial |
| Valuation Inputs | | | | Instruments2 |
| | | | | | Liabilities |
| Level 1 | | | | | — |
| Level 2 | | | | $ | (4,157) |
| Level 3 | | | | | — |
| Total | | | | $ | (4,157) |
| |
| 2 Other financial instruments are foreign currency exchange contracts which |
| are shown at the unrealized appreciation/depreciation on the instrument. |
See Notes to Financial Statements.
12 SEMI-ANNUAL REPORT JUNE 30, 2009
Statements of Assets and Liabilities
| | | |
| | BlackRock | | |
| | International | | BlackRock |
| | Diversification | | Pacific |
| June 30, 2009 (Unaudited) | Fund | | Fund, Inc. |
| |
| Assets | | | |
| |
| Investments at value — unaffiliated1,2 | $ 28,290 | $ | 438,489,993 |
| Investments at value — affiliated3 | 502,994 | | 10,621,337 |
| Foreign currency at value4 | — | | 703,831 |
| Investments sold receivable | — | | 1,154,866 |
| Dividends receivable | — | | 731,309 |
| Capital shares sold receivable | — | | 121,460 |
| Receivable from investment advisor | 25,246 | | — |
| Securities lending income receivable — affiliated | — | | 8,174 |
| Prepaid expenses | 152,238 | | 39,739 |
| Other assets | — | | 137,347 |
| Total assets | 708,768 | | 452,008,056 |
| |
| |
| Liabilities | | | |
| |
| Collateral at value — securities loaned | — | | 4,188,800 |
| Unrealized depreciation on foreign currency exchange contracts | — | | 4,157 |
| Capital shares redeemed payable | — | | 1,603,498 |
| Investment advisory fees payable | — | | 221,376 |
| Service and distribution fees payable | 72 | | 107,580 |
| Other affiliates payable | 26 | | 24,335 |
| Administration fees payable | 40 | | — |
| Officer’s and Directors’ fees payable | — | | 39 |
| Other accrued expenses payable | 213,842 | | 260,376 |
| Total liabilities | 213,980 | | 6,410,161 |
| Net Assets | $ 494,788 | $ | 445,597,895 |
| |
| |
| Net Assets Consist of | | | |
| |
| Paid-in capital | $ 588,093 | $ | 413,284,264 |
| Undistributed (accumulated) net investment income (loss) | (482) | | 1,314,623 |
| Accumulated net realized loss | (40,095) | | (29,630,250) |
| Net unrealized appreciation/depreciation | (52,728) | | 60,629,258 |
| Net Assets | $ 494,788 | $ | 445,597,895 |
See Notes to Financial Statements.
SEMI-ANNUAL REPORT JUNE 30, 2009 13
Statements of Assets and Liabilities (concluded)
| | | |
| | BlackRock | | |
| | International | BlackRock |
| | Diversification | Pacific |
| June 30, 2009 (Unaudited) | Fund | Fund, Inc. |
| Net Asset Value | | | |
| Institutional: | | | |
| Net assets | $ 379,186 | $ 179,286,909 |
| Shares outstanding5 | 47,192 | 10,578,323 |
| Net asset value | $ 8.03 | $ | 16.95 |
| Par value | $ 0.001 | $ | 0.10 |
| Investor A: | | | |
| Net assets | $ 26,353 | $ 185,624,803 |
| Shares outstanding6 | 3,286 | 11,042,540 |
| Net asset value | $ 8.02 | $ | 16.81 |
| Par value | $ 0.001 | $ | 0.10 |
| Investor B: | | | |
| Net assets | — | $ 12,216,218 |
| Shares outstanding7 | — | 809,780 |
| Net asset value | — | $ | 15.09 |
| Par value | — | $ | 0.10 |
| Investor C: | | | |
| Net assets | $ 73,241 | $ 64,033,037 |
| Shares outstanding8 | 9,185 | 4,535,589 |
| Net asset value | $ 7.97 | $ | 14.12 |
| Par value | $ 0.001 | $ | 0.10 |
| Class R: | | | |
| Net assets | $ 16,008 | $ 4,436,928 |
| Shares outstanding9 | 2,000 | 297,517 |
| Net asset value | $ 8.00 | $ | 14.91 |
| Par value | $ 0.001 | $ | 0.10 |
| 1 Securities loaned — at value | — | $ 3,971,968 |
| 2 Investments at cost — unaffiliated | $ 23,321 | $ 377,860,335 |
| 3 Investments at cost — affiliated | $ 560,691 | $ 10,621,337 |
| 4 Foreign currency at cost | — | $ 711,408 |
| 5 Authorized Shares — Institutional | unlimited | 100 million |
| 6 Authorized Shares — Investor A | unlimited | 100 million |
| 7 Authorized Shares — Investor B | — | 200 million |
| 8 Authorized Shares — Investor C | unlimited | 100 million |
| 9 Authorized Shares — Class R | unlimited | 200 million |
See Notes to Financial Statements.
14 SEMI-ANNUAL REPORT JUNE 30, 2009
Statements of Operations
| | |
| | BlackRock | |
| | International | BlackRock |
| | Diversification | Pacific |
| Six Months Ended June 30, 2009 (Unaudited) | Fund | Fund, Inc. |
| |
| Investment Income | | |
| |
| Dividends | $ 150 | $ 6,289,261 |
| Foreign tax withheld | — | (347,586) |
| Securities lending — affiliated | — | 22,954 |
| Income — affiliated | 11 | 4,431 |
| Interest | — | 880 |
| Total income | 161 | 5,969,940 |
| |
| |
| Expenses | | |
| |
| Investment advisory | — | 1,171,343 |
| Offering costs | 77,403 | — |
| Accounting services | 13,696 | 99,589 |
| Professional | 13,586 | 47,320 |
| Registration | 11,149 | 39,206 |
| Officer and Directors | 8,003 | 10,932 |
| Printing | 1,516 | 58,392 |
| Custodian | 673 | 116,987 |
| Service — Investor A | 23 | 199,575 |
| Service and distribution — Investor B | — | 60,648 |
| Service and distribution — Investor C | 318 | 288,093 |
| Service and distribution — Class R | 35 | 9,306 |
| Administration | 202 | — |
| Transfer agent — Institutional | 28 | 161,022 |
| Transfer agent — Investor A | 18 | 178,353 |
| Transfer agent — Investor B | — | 18,769 |
| Transfer agent — Investor C | 27 | 62,761 |
| Transfer agent — Class R | 13 | 12,229 |
| Miscellaneous | 4,451 | 24,701 |
| Total expenses | 131,141 | 2,559,226 |
| Less fees reimbursed by advisor | (130,273) | — |
| Less transfer agent fees reimbursed — class specific | (86) | — |
| Less fees waived by advisor | — | (348) |
| Total expenses after fees waived | 782 | 2,558,878 |
| Net investment income (loss) | (621) | 3,411,062 |
| |
| |
| Realized and Unrealized Gain (Loss) | | |
| |
| Net realized loss from: | | |
| Investments — unaffiliated | — | (19,323,578) |
| Investments — affiliated | (21,054) | — |
| Foreign currency | — | (290,169) |
| | (21,054) | (19,613,747) |
| Net change in unrealized appreciation/depreciation on: | | |
| Investments — unaffiliated | (510) | 72,327,797 |
| Investments — affiliated | 59,082 | — |
| Foreign currency | — | (6,871) |
| | 58,572 | 72,320,926 |
| Total realized and unrealized gain | 37,518 | 52,707,179 |
| Net Increase in Net Assets Resulting from Operations | $ 36,897 | $ 56,118,241 |
See Notes to Financial Statements.
SEMI-ANNUAL REPORT JUNE 30, 2009 15
Statements of Changes in Net Assets
| | | | | | | |
| | | BlackRock | | | | |
| | | International | BlackRock |
| | | Diversification Fund | Pacific Fund, Inc. |
| | | | | Period | | | |
| | Six Months | September 26, | Six Months | | |
| | Ended | | 20081 to | Ended | | Year Ended |
| | June 30, 2009 | December 31, | June 30, 2009 | December 31, |
| Increase (Decrease) in Net Assets: | (Unaudited) | | 2008 | (Unaudited) | | 2008 |
| |
| Operations | | | | | | | |
| |
| Net investment income (loss) | $ | (621) | $ | 8,025 | $ 3,411,062 | $ | 11,295,656 |
| Net realized gain (loss) | | (21,054) | | (19,041) | (19,613,747) | | 82,400,947 |
| Net change in unrealized appreciation/depreciation | | 58,572 | | (111,300) | 72,320,926 | (388,431,740) |
| Net increase (decrease) in net assets resulting from operations | | 36,897 | | (122,316) | 56,118,241 | (294,735,137) |
| |
| |
| Dividends and Distributions to Shareholders From | | | | | | | |
| |
| Net investment income: | | | | | | | |
| Institutional | | — | | (6,198) | — | | (2,324,111) |
| Investor A | | — | | (282) | — | | (1,659,458) |
| Investor C | | — | | (1,264) | — | | — |
| Class R | | — | | (282) | — | | (16,451) |
| Net realized gain: | | | | | | | |
| Institutional | | — | | — | — | | (33,771,566) |
| Investor A | | — | | — | — | | (34,047,270) |
| Investor B | | — | | — | — | | (3,291,245) |
| Investor C | | — | | — | — | | (15,445,762) |
| Class R | | — | | — | — | | (838,443) |
| Decrease in net assets resulting from dividends and distributions to shareholders | | — | | (8,026) | — | | (91,394,306) |
| |
| |
| Capital Share Transactions | | | | | | | |
| |
| Net increase (decrease) in net assets derived from capital share transactions | | 34,602 | | 553,631 | (25,817,268) | (103,078,415) |
| |
| |
| Redemption Fee | | | | | | | |
| |
| Redemption fee | | — | | — | 1,967 | | 21,038 |
| |
| |
| Net Assets | | | | | | | |
| |
| Total increase (decrease) in net assets | | 71,499 | | 423,289 | 30,302,940 | (489,186,820) |
| Beginning of period | | 423,289 | | — | 415,294,955 | | 904,481,775 |
| End of period | | 494,788 | $ | 423,289 | $ 445,597,895 | $ | 415,294,955 |
| End of period undistributed (accumulated) net investment income (loss) | $ | (482) | $ | 139 | $ 1,314,623 | $ | (2,096,439) |
| |
| 1 Commencement of operations. | | | | | | | |
See Notes to Financial Statements.
16 SEMI-ANNUAL REPORT JUNE 30, 2009
| | | | | | | |
| Financial Highlights | | BlackRock International Diversification Fund |
| |
| | | Institutional | | Investor A |
| | | | Period | | | | Period |
| | Six Months September 26, | | Six Months | September 26, |
| | Ended | 20081 to | | Ended | | 20081 to |
| | June 30, 2009 December 31, | June 30, 2009 December 31, |
| | (Unaudited) | 2008 | (Unaudited) | | 2008 |
| Per Share Operating Performance | | | | | | | |
| Net asset value, beginning of period | $ | 7.42 $ | 10.00 | $ | 7.41 | $ | 10.00 |
| Net investment income (loss)2 | | (0.00)3 | 0.16 | | (0.01) | | 0.16 |
| Net realized and unrealized gain (loss) | | 0.61 | (2.60) | | 0.62 | | (2.61) |
| Net increase (decrease) from investment operations | | 0.61 | (2.44) | | 0.61 | | (2.45) |
| Dividends from net investment income | | — | (0.14) | | — | | (0.14) |
| Net asset value, end of period | $ | 8.03 $ | 7.42 | $ | 8.02 | $ | 7.41 |
| |
| Total Investment Return4 | | | | | | | |
| Based on net asset value | | 8.22%5 | (24.35)%5 | | 8.23%5 | | (24.45)%5 |
| |
| Ratios to Average Net Assets | | | | | | | |
| Total expenses | | 63.43%6,7 | 127.20%7,8 | | 63.88%6,7 | 127.69%7,8 |
| Total expenses after fees reimbursed | | 0.20%6,7 | 0.20%7,8 | | 0.45%6,7 | 0.45%7,8 |
| Net investment income (loss) | | (0.12)%6,7 | 8.24%7,8 | | (0.36)%6,7 | 7.99%7,8 |
| |
| Supplemental Data | | | | | | | |
| Net assets, end of period (000) | $ | 379 $ | 326 | $ | 26 | $ | 15 |
| Portfolio turnover | | 8% | 27% | | 8% | | 27% |
| 1 Commencement of operations. | | | | | | | |
| 2 Based on average shares outstanding. | | | | | | | |
| 3 Amount is less than $(0.01). | | | | | | | |
| 4 Total investment returns exclude the effect of any sales charges. | | | | | | | |
| 5 Aggregate total investment return. | | | | | | | |
| 6 Ratios do not include expenses incurred indirectly as a result of investments in underlying funds of approximately 1.10%. | | | | | |
| 7 Annualized. | | | | | | | |
| 8 Ratios do not include expenses incurred indirectly as a result of investments in underlying funds of approximately 1.08%. | | | | | |
See Notes to Financial Statements.
SEMI-ANNUAL REPORT JUNE 30, 2009 17
| | | | | | | | |
| Financial Highlights (concluded) | | | BlackRock International Diversification Fund |
| |
| | | Investor C | | Class R |
| | | | | Period | | | | Period |
| | Six Months | September 26, | | Six Months | September 26, |
| | Ended | | 20081 to | | Ended | | 20081 to |
| | June 30, 2009 December 31, | June 30, 2009 December 31, |
| | (Unaudited) | | 2008 | (Unaudited) | | 2008 |
| Per Share Operating Performance | | | | | | | | |
| Net asset value, beginning of period | $ | 7.40 | $ | 10.00 | $ | 7.41 | $ | 10.00 |
| Net investment income (loss)2 | | (0.04) | | 0.08 | | (0.01) | | 0.15 |
| Net realized and unrealized gain (loss) | | 0.61 | | (2.54) | | 0.60 | | (2.60) |
| Net increase (decrease) from investment operations | | 0.57 | | (2.46) | | 0.59 | | (2.45) |
| Dividends from net investment income | | — | | (0.14) | | — | | (0.14) |
| Net asset value, end of period | $ | 7.97 | $ | 7.40 | $ | 8.00 | $ | 7.41 |
| |
| Total Investment Return3 | | | | | | | | |
| Based on net asset value | | 7.70%4 | (24.55)%4 | | 7.96%4 | | (24.45)%4 |
| |
| Ratios to Average Net Assets | | | | | | | | |
| Total expenses | | 71.75%5,6 | 144.41%6,7 | | 64.07%5,6 | 127.96%6,7 |
| Total expenses after fees reimbursed | | 1.20%5,6 | 1.20%6,7 | | 0.70%5,6 | 0.70%6,7 |
| Net investment income (loss) | | (1.13)%5,6 | 4.90%6,7 | | (0.62)%5,6 | 7.73%6,7 |
| |
| Supplemental Data | | | | | | | | |
| Net assets, end of period (000) | $ | 73 | $ | 67 | $ | 16 | $ | 15 |
| Portfolio turnover | | 8% | | 27% | | 8% | | 27% |
| 1 Commencement of operations. | | | | | | | | |
| 2 Based on average shares outstanding. | | | | | | | | |
| 3 Total investment returns exclude the effect of any sales charges. | | | | | | | | |
| 4 Aggregate total investment return. | | | | | | | | |
| 5 Ratios do not include expenses incurred indirectly as a result of investments in underlying funds of approximately 1.10%. | | | | | |
| 6 Annualized. | | | | | | | | |
| 7 Ratios do not include expenses incurred indirectly as a result of investments in underlying funds of approximately 1.08%. | | | | | |
See Notes to Financial Statements.
18 SEMI-ANNUAL REPORT JUNE 30, 2009
| | | | | | | | | | | | |
| Financial Highlights | | | | | | | | | BlackRock Pacific Fund, Inc. |
| |
| | | | | | | Institutional | | | | |
| | Six Months | | | | | | | | | | |
| | Ended | | | | | | | | | | |
| | June 30, 2009 | | | | Year Ended December 31, | | | |
| | (Unaudited) | | 2008 | | 2007 | | 2006 | | 2005 | | 2004 |
| Per Share Operating Performance | | | | | | | | | | | | |
| Net asset value, beginning of period | $ | 14.71 | $ | 28.43 | $ | 29.01 | $ | 24.65 | $ | 20.74 | $ | 18.87 |
| Net investment income1 | | 0.15 | | 0.47 | | 0.44 | | 0.15 | | 0.16 | | 0.13 |
| Net realized and unrealized gain (loss)2 | | 2.09 | | (10.67) | | 2.94 | | 4.54 | | 4.31 | | 2.88 |
| Net increase (decrease) from investment operations | | 2.24 | | (10.20) | | 3.38 | | 4.69 | | 4.47 | | 3.01 |
| Dividends and distributions from: | | | | | | | | | | | | |
| Net investment income | | — | | (0.23) | | (0.46) | | (0.33) | | (0.56) | | (1.14) |
| Net realized gain | | — | | (3.29) | | (3.50) | | — | | — | | — |
| Total dividends and distributions | | — | | (3.52) | | (3.96) | | (0.33) | | (0.56) | | (1.14) |
| Net asset value, end of period | $ | 16.95 | $ | 14.71 | $ | 28.43 | $ | 29.01 | $ | 24.65 | $ | 20.74 |
| |
| Total Investment Return3 | | | | | | | | | | | | |
| Based on net asset value | | 15.23%4 | | (36.13)% | | 11.94% | | 19.06% | | 21.75% | | 16.48% |
| |
| Ratios to Average Net Assets | | | | | | | | | | | | |
| Total expenses | | 1.01%5 | | 0.88% | | 0.88% | | 0.84% | | 0.88% | | 0.89% |
| Total expenses after fees waived | | 1.01%5 | | 0.88% | | 0.88% | | 0.84% | | 0.88% | | 0.89% |
| Net investment income | | 2.05%5 | | 2.03% | | 1.44% | | 0.55% | | 0.74% | | 0.66% |
| |
| Supplemental Data | | | | | | | | | | | | |
| Net assets, end of period (000) | $ | 179,287 | $ | 168,030 | $ | 344,722 | $ | 555,849 | $ | 397,782 | $ | 343,639 |
| Portfolio turnover | | 62% | | 86% | | 22% | | 17% | | 22% | | 20% |
| 1 Based on average shares outstanding. | | | | | | | | | | | | |
| 2 Includes a redemption fee, which is less than $0.01 per share. | | | | | | | | | | | | |
| 3 Total investment returns exclude the effect of any sales charges. | | | | | | | | | | | | |
| 4 Aggregate total investment return. Total return calculation includes redemption fees received by the Fund. The impact to the return is less than 0.01%. | | |
| 5 Annualized. | | | | | | | | | | | | |
See Notes to Financial Statements.
SEMI-ANNUAL REPORT JUNE 30, 2009 19
| | | | | | | | | | | | |
| Financial Highlights (continued) | | | | | | | | | BlackRock Pacific Fund, Inc. |
| |
| | | | | | | Investor A | | | | |
| | Six Months | | | | | | | | | | |
| | Ended | | | | | | | | | | |
| | June 30, 2009 | | | | Year Ended December 31, | | | |
| | (Unaudited) | | 2008 | | 2007 | | 2006 | | 2005 | | 2004 |
| Per Share Operating Performance | | | | | | | | | | | | |
| Net asset value, beginning of period | $ | 14.61 | $ | 28.24 | $ | 28.84 | $ | 24.52 | $ | 20.64 | $ | 18.75 |
| Net investment income1 | | 0.13 | | 0.40 | | 0.36 | | 0.08 | | 0.10 | | 0.08 |
| Net realized and unrealized gain (loss)2 | | 2.07 | | (10.58) | | 2.95 | | 4.50 | | 4.29 | | 2.87 |
| Net increase (decrease) from investment operations | | 2.20 | | (10.18) | | 3.31 | | 4.58 | | 4.39 | | 2.95 |
| Dividends and distributions from: | | | | | | | | | | | | |
| Net investment income | | — | | (0.16) | | (0.41) | | (0.26) | | (0.51) | | (1.06) |
| Net realized gain | | — | | (3.29) | | (3.50) | | — | | — | | — |
| Total dividends and distributions | | — | | (3.45) | | (3.91) | | (0.26) | | (0.51) | | (1.06) |
| Net asset value, end of period | $ | 16.81 | $ | 14.61 | $ | 28.24 | $ | 28.84 | $ | 24.52 | $ | 20.64 |
| |
| Total Investment Return3 | | | | | | | | | | | | |
| Based on net asset value | | 15.06%4 | | (36.32)% | | 11.76% | | 18.73% | | 21.46% | | 16.22% |
| |
| Ratios to Average Net Assets | | | | | | | | | | | | |
| Total expenses | | 1.28%5 | | 1.16% | | 1.09% | | 1.09% | | 1.13% | | 1.14% |
| Total expenses after fees waived | | 1.28%5 | | 1.16% | | 1.09% | | 1.09% | | 1.13% | | 1.14% |
| Net investment income | | 1.79%5 | | 1.73% | | 1.15% | | 0.31% | | 0.48% | | 0.43% |
| |
| Supplemental Data | | | | | | | | | | | | |
| Net assets, end of period (000) | $ | 185,625 | $ | 166,829 | $ | 358,163 | $ | 329,203 | $ | 248,078 | $ | 188,572 |
| Portfolio turnover | | 62% | | 86% | | 22% | | 17% | | 22% | | 20% |
| 1 Based on average shares outstanding. | | | | | | | | | | | | |
| 2 Includes a redemption fee, which is less than $0.01 per share. | | | | | | | | | | | | |
| 3 Total investment returns exclude the effect of sales charges. | | | | | | | | | | | | |
| 4 Aggregate total investment return. Total return calculation includes redemption fees received by the Fund. The impact to the return is less than 0.01%. | | |
| 5 Annualized. | | | | | | | | | | | | |
See Notes to Financial Statements.
20 SEMI-ANNUAL REPORT JUNE 30, 2009
| | | | | | | | | | | | |
| Financial Highlights (continued) | | | | | | | | | BlackRock Pacific Fund, Inc. |
| |
| | | | | | | Investor B | | | | |
| | Six Months | | | | | | | | | | |
| | Ended | | | | | | | | | | |
| | June 30, 2009 | | | | Year Ended December 31, | | | |
| | (Unaudited) | | 2008 | | 2007 | | 2006 | | 2005 | | 2004 |
| Per Share Operating Performance | | | | | | | | | | | | |
| Net asset value, beginning of period | $ | 13.17 | $ | 25.89 | $ | 26.64 | $ | 22.65 | $ | 19.10 | $ | 17.24 |
| Net investment income (loss)1 | | 0.06 | | 0.20 | | 0.15 | | (0.11) | | (0.05) | | (0.07) |
| Net realized and unrealized gain (loss)2 | | 1.86 | | (9.63) | | 2.67 | | 4.15 | | 3.92 | | 2.65 |
| Net increase (decrease) from investment operations | | 1.92 | | (9.43) | | 2.82 | | 4.04 | | 3.87 | | 2.58 |
| Dividends and distributions from: | | | | | | | | | | | | |
| Net investment income | | — | | — | | (0.07) | | (0.05) | | (0.32) | | (0.72) |
| Net realized gain | | — | | (3.29) | | (3.50) | | — | | — | | — |
| Total dividends and distributions | | — | | (3.29) | | (3.57) | | (0.05) | | (0.32) | | (0.72) |
| Net asset value, end of period | $ | 15.09 | $ | 13.17 | $ | 25.89 | $ | 26.64 | $ | 22.65 | $ | 19.10 |
| |
| Total Investment Return3 | | | | | | | | | | | | |
| Based on net asset value | | 14.58%4 | | (36.78)% | | 10.86% | | 17.85% | | 20.48% | | 15.34% |
| |
| Ratios to Average Net Assets | | | | | | | | | | | | |
| Total expenses | | 2.11%5 | | 1.93% | | 1.89% | | 1.86% | | 1.90% | | 1.92% |
| Total expenses after fee waived | | 2.11%5 | | 1.93% | | 1.89% | | 1.86% | | 1.90% | | 1.92% |
| Net investment income (loss) | | 0.94%5 | | 0.96% | | 0.52% | | (0.44)% | | (0.25)% | | (0.37)% |
| |
| Supplemental Data | | | | | | | | | | | | |
| Net assets, end of period (000) | $ | 12,216 | $ | 14,317 | $ | 41,552 | $ | 65,458 | $ | 79,128 | $ | 94,667 |
| Portfolio turnover | | 62% | | 86% | | 22% | | 17% | | 22% | | 20% |
| 1 Based on average shares outstanding. | | | | | | | | | | | | |
| 2 Includes a redemption fee, which is less than $0.01 per share. | | | | | | | | | | | | |
| 3 Total investment returns exclude the effect of sales charges. | | | | | | | | | | | | |
| 4 Aggregate total investment return. Total return calculation includes redemption fees received by the Fund. The impact to the return is less than 0.01%. | | |
| 5 Annualized. | | | | | | | | | | | | |
See Notes to Financial Statements.
SEMI-ANNUAL REPORT JUNE 30, 2009 21
| | | | | | | | | | | | |
| Financial Highlights (continued) | | | | | | | | | BlackRock Pacific Fund, Inc. |
| |
| | | | | | | Investor C | | | | |
| | Six Months | | | | | | | | | | |
| | Ended | | | | | | | | | | |
| | June 30, 2009 | | | | Year Ended December 31, | | | |
| | (Unaudited) | | 2008 | | 2007 | | 2006 | | 2005 | | 2004 |
| Per Share Operating Performance | | | | | | | | | | | | |
| Net asset value, beginning of period | $ | 12.31 | $ | 24.53 | $ | 25.53 | $ | 21.75 | $ | 18.41 | $ | 16.78 |
| Net investment income (loss)1 | | 0.06 | | 0.21 | | 0.11 | | (0.11) | | (0.06) | | (0.06) |
| Net realized and unrealized gain (loss)2 | | 1.75 | | (9.14) | | 2.59 | | 3.98 | | 3.80 | | 2.56 |
| Net increase (decrease) from investment operations | | 1.81 | | (8.93) | | 2.70 | | 3.87 | | 3.74 | | 2.50 |
| Dividends and distributions from: | | | | | | | | | | | | |
| Net investment income | | — | | — | | (0.20) | | (0.09) | | (0.40) | | (0.87) |
| Net realized gain | | — | | (3.29) | | (3.50) | | — | | — | | — |
| Total dividends and distributions | | — | | (3.29) | | (3.70) | | (0.09) | | (0.40) | | (0.87) |
| Net asset value, end of period | $ | 14.12 | $ | 12.31 | $ | 24.53 | $ | 25.53 | $ | 21.75 | $ | 18.41 |
| |
| Total Investment Return3 | | | | | | | | | | | | |
| Based on net asset value | | 14.70%4 | | (36.79)% | | 10.87% | | 17.82% | | 20.54% | | 15.34% |
| |
| Ratios to Average Net Assets | | | | | | | | | | | | |
| Total expenses | | 2.02%5 | | 1.89% | | 1.85% | | 1.86% | | 1.90% | | 1.92% |
| Total expenses after fees waived | | 2.02%5 | | 1.89% | | 1.85% | | 1.86% | | 1.90% | | 1.92% |
| Net investment income (loss) | | 1.04%5 | | 1.03% | | 0.42% | | (0.45)% | | (0.33)% | | (0.36)% |
| |
| Supplemental Data | | | | | | | | | | | | |
| Net assets, end of period (000) | $ | 64,033 | $ | 62,527 | $ | 153,969 | $ | 149,933 | $ | 107,893 | $ | 63,988 |
| Portfolio turnover | | 62% | | 86% | | 22% | | 17% | | 22% | | 20% |
| 1 Based on average shares outstanding. | | | | | | | | | | | | |
| 2 Includes a redemption fee, which is less than $0.01 per share. | | | | | | | | | | | | |
| 3 Total investment returns exclude the effect of sales charges. | | | | | | | | | | | | |
| 4 Aggregate total investment return. Total return calculation includes redemption fees received by the Fund. The impact to the return is less than 0.01%. | | |
| 5 Annualized. | | | | | | | | | | | | |
See Notes to Financial Statements.
22 SEMI-ANNUAL REPORT JUNE 30, 2009
| | | | | | | | | | | | |
| Financial Highlights (concluded) | | | | | | | | | BlackRock Pacific Fund, Inc. |
| |
| | | | | | | | Class R | | | | |
| | Six Months | | | | | | | | | | |
| | Ended | | | | | | | | | | |
| | June 30, 2009 | | | | Year Ended December 31, | | | |
| | (Unaudited) | | 2008 | | 2007 | | 2006 | | 2005 | | 2004 |
| Per Share Operating Performance | | | | | | | | | | | | |
| Net asset value, beginning of period | $ | 13.01 | $ | 25.70 | $ | 26.63 | $ | 22.67 | $ | 19.14 | $ | 17.53 |
| Net investment income1 | | 0.07 | | 0.24 | | 0.14 | | 0.01 | | 0.03 | | 0.06 |
| Net realized and unrealized gain (loss)2 | | 1.83 | | (9.58) | | 2.77 | | 4.16 | | 3.99 | | 2.67 |
| Net increase (decrease) from investment operations | | 1.90 | | (9.34) | | 2.91 | | 4.17 | | 4.02 | | 2.73 |
| Dividends and distributions from: | | | | | | | | | | | | |
| Net investment income | | — | | (0.06) | | (0.34) | | (0.21) | | (0.49) | | (1.12) |
| Net realized gain | | — | | (3.29) | | (3.50) | | — | | — | | — |
| Total dividends and distributions | | — | | (3.35) | | (3.84) | | (0.21) | | (0.49) | | (1.12) |
| Net asset value, end of period | $ | 14.91 | $ | 13.01 | $ | 25.70 | $ | 26.63 | $ | 22.67 | $ | 19.14 |
| |
| Total Investment Return | | | | | | | | | | | | |
| Based on net asset value | | 14.60%3 | | (36.67)% | | 11.23% | | 18.44% | | 21.25% | | 16.14% |
| |
| Ratios to Average Net Assets | | | | | | | | | | | | |
| Total expenses | | 1.96%4 | | 1.73% | | 1.55% | | 1.34% | | 1.35% | | 1.18% |
| Total expenses after fees waived | | 1.96%4 | | 1.73% | | 1.55% | | 1.34% | | 1.35% | | 1.18% |
| Net investment income | | 1.10%4 | | 1.17% | | 0.50% | | 0.05% | | 0.14% | | 0.40% |
| |
| Supplemental Data | | | | | | | | | | | | |
| Net assets, end of period (000) | $ | 4,437 | $ | 3,592 | $ | 6,076 | $ | 3,153 | $ | 1,468 | $ | 443 |
| Portfolio turnover | | 62% | | 86% | | 22% | | 17% | | 22% | | 20% |
| 1 Based on average shares outstanding. | | | | | | | | | | | | |
| 2 Includes a redemption fee, which is less than $0.01 per share. | | | | | | | | | | | | |
| 3 Aggregate total investment return. Total return calculation includes redemption fees received by the Fund. The impact to the return is less than 0.01%. | | |
| 4 Annualized. | | | | | | | | | | | | |
See Notes to Financial Statements.
SEMI-ANNUAL REPORT JUNE 30, 2009 23
Notes to Financial Statements (Unaudited)
1. Organization and Significant Accounting Policies:
BlackRock International Diversification Fund (“International
Diversification Fund”), and BlackRock Pacific Fund, Inc. (“Pacific Fund”)
(each individually, the “Fund” or collectively the “Funds”) are registered
under the Investment Company Act of 1940, as amended (the “1940
Act”), as non-diversified, open-end management investment companies.
International Diversification Fund is a series of BlackRock FundsSM which
is organized as a Massachusetts business trust. Pacific Fund is organ-
ized as a Maryland corporation. The Funds’ financial statements are pre-
pared in conformity with accounting principles generally accepted in the
United States of America, which may require the use of management
accruals and estimates. Actual results may differ from these estimates.
The Boards of Trustees and the Boards of Directors of the Funds are
referred to throughout this report as the “Board of Directors” or the
“Board.” The Funds offer multiple classes of shares. Institutional Shares
are sold without a sales charge and only to certain eligible investors.
Investor A Shares are generally sold with a front-end sales charge.
Investor B and Investor C Shares may be subject to a contingent
deferred sales charge. Class R Shares are sold only to certain retirement
or similar plans. All classes of shares have identical voting, dividend, liq-
uidation and other rights and the same terms and conditions, except
that Investor A, Investor B, Investor C and Class R Shares bear certain
expenses related to the shareholder servicing of such shares, and
Investor B, Investor C and Class R Shares also bear certain expenses
related to the distribution of such shares. Each class has exclusive vot-
ing rights with respect to matters relating to its shareholder servicing
and distribution expenditures (except that Investor B shareholders may
vote on material changes to the Investor A distribution plan).
International Diversification Fund generally will invest in other open-end
investment companies (mutual funds) that are managed by subsidiaries
of BlackRock, Inc. (collectively, the “Underlying Funds”). By owning
shares of an Underlying Fund, the Fund indirectly invests, to varying
degrees, in securities of US and non-US companies, including small and
medium sized companies, and in fixed-income securities. Equity funds
may also include funds that invest in real estate-related and other simi-
lar securities, as well as commodities. Fixed income funds may include
funds that invest in domestic and non-US bonds, US Government securi-
ties, high yield (or junk) bonds, and cash or money market instruments.
In addition, the Underlying Funds may invest in derivatives.
The following is a summary of significant accounting policies followed by
the Funds:
Valuation of Investments: Equity investments traded on a recognized
securities exchange or the NASDAQ Global Market System are valued at
the last reported sale price that day or the NASDAQ official closing price,
if applicable. For equity investments traded on more than one exchange,
the last reported sale price on the exchange where the stock is primarily
traded is used. Equity investments traded on a recognized exchange for
which there were no sales on that day are valued at the last available
bid price. If no bid price is available, the prior day’s price will be used,
unless it is determined that such prior day’s price no longer reflects the
fair value of the security. Investments in open-end investment companies
are valued at net asset value each business day. Short-term securities
with maturities less than 60 days may be valued at amortized cost,
which approximates fair value. The Funds value their investments in Cash
Sweep Series and Money Market Series, each of BlackRock Liquidity
Series, LLC at fair value, which is ordinarily based upon their pro rata
ownership in the net assets of the underlying fund.
In the event that application of these methods of valuation results in a
price for an investment which is deemed not to be representative of the
market value of such investment, the investment will be valued by a
method approved by the Board as reflecting fair value (“Fair Value
Assets”). When determining the price for Fair Value Assets, the invest-
ment advisor and/or sub-advisor seeks to determine the price that the
Funds might reasonably expect to receive from the current sale of that
asset in an arm’s-length transaction. Fair value determinations shall be
based upon all available factors that the investment advisor and/or sub-
advisor deems relevant. The pricing of all Fair Value Assets is subse-
quently reported to the Board or a committee thereof.
Generally, trading in foreign securities is substantially completed each
day at various times prior to the close of business on the New York Stock
Exchange (“NYSE”). The values of such securities used in computing the
net assets of the Fund are determined as of such times. Foreign curren-
cy exchange rates will be determined as of the close of business on the
NYSE. Occasionally, events affecting the values of such securities and
such exchange rates may occur between the times at which they are
determined and the close of business on the NYSE that may not be
reflected in the computation of the Fund’s net assets. If events (for
example, a company announcement, market volatility or a natural disas-
ter) occur during such periods that are expected to materially affect the
value of such securities, those securities will be valued at their fair value
as determined in good faith by the Board or by the investment advisor
using a pricing service and/or procedures approved by the Board.
Foreign currency exchange contracts are valued at the mean between
the bid and ask prices. Interpolated values are derived when the settle-
ment date of the contract is an interim date for which quotations are
not available.
Foreign Currency Transactions: Foreign currency amounts are trans-
lated into United States dollars on the following basis: (i) market value
of investment securities, assets and liabilities at the current rate of
exchange; and (ii) purchases and sales of investment securities, income-
and expenses at the rates of exchange prevailing on the respective dates
of such transactions.
The Funds report foreign currency related transactions as components
of realized gains for financial reporting purposes, whereas such compo-
nents are treated as ordinary income for federal income tax purposes.
24 SEMI-ANNUAL REPORT JUNE 30, 2009
Notes to Financial Statements (continued)
Segregation and Collateralization: In cases in which the 1940 Act and
the interpretive positions of the Securities and Exchange Commission
(“SEC”) require that the Pacific Fund segregate assets in connection with
certain investments (e.g., foreign currency exchange contracts), the Fund
will, consistent with certain interpretive letters issued by the SEC, desig-
nate on its books and records cash or other liquid securities having a
market value at least equal to the amount that would otherwise be
required to be physically segregated.
Investment Transactions and Investment Income: Investment trans-
actions are recorded on the dates the transactions are entered into
(the trade dates). Realized gains and losses on investment transactions
are determined on the identified cost basis. Dividend income is recorded
on the ex-dividend dates. Dividends from foreign securities where the
ex-dividend date may have passed are subsequently recorded when
the Fund has determined the ex-dividend date. Upon notification from
issuers, some of the dividend income received from a real estate invest-
ment trust (“REIT”) may be redesignated as a reduction of cost of the
related investment and/or realized gain. Interest income is recognized on
the accrual basis. Income and realized and unrealized gains and losses
are allocated daily to each class based on its relative net assets.
Dividends and Distributions: Dividends and distributions paid by the
Funds are recorded on the ex-dividend dates.
Securities Lending: Pacific Fund may lend securities to financial institu-
tions that provide cash as collateral, which will be maintained at all
times in an amount equal to at least 100% of the current market value
of the loaned securities. The market value of the loaned securities is
determined at the close of business of the Fund and any additional
required collateral is delivered to the Fund on the next business day.
The Fund typically receives the income on the loaned securities but does
not receive the income on the collateral. The Fund may invest the cash
collateral and retain the amount earned on such investment, net of any
amount rebated to the borrower. Loans of securities are terminable at
any time and the borrower, after notice, is required to return borrowed
securities within the standard time period for settlement of securities
transactions. The Fund may pay reasonable lending agent, administrative
and custodial fees in connection with its loans. In the event that the
borrower defaults on its obligation to return borrowed securities because
of insolvency or for any other reason, the Fund could experience delays
and costs in gaining access to the collateral. The Fund also could suffer
a loss if the value of an investment purchased with cash collateral falls
below the market value of loaned securities.
Income Taxes: It is each Fund’s policy to comply with the requirements of
the Internal Revenue Code applicable to regulated investment companies
and to distribute substantially all of its taxable income to its shareholders.
Therefore, no federal income tax provision is required. Under the applica-
ble foreign tax laws, a withholding tax may be imposed on interest, divi-
dends and capital gains at various rates.
Each Fund files US federal and various state and local tax returns.
No income tax returns are currently under examination. The statutes of
limitations on the Funds’ US federal tax returns remain open for the peri-
od ended December 31, 2008 for the International Diversification Fund
and for each of the four years ended December 31, 2008 for the Pacific
Fund. The statutes of limitations on the Pacific Fund’s state and local tax
returns may remain open for an additional year depending upon the
jurisdiction.
Recent Accounting Pronouncement: In June 2009, Statement of
Financial Accounting Standards No. 166, “Accounting for Transfers of
Financial Assets — an amendment of FASB Statement No. 140” (“FAS
166”), was issued. FAS 166 is intended to improve the relevance, repre-
sentational faithfulness and comparability of the information that a
reporting entity provides in its financial statements about a transfer of
financial assets; the effects of a transfer on its financial position, finan-
cial performance, and cash flows; and a transferor’s continuing involve-
ment, if any, in transferred financial assets. FAS 166 is effective for
financial statements issued for fiscal years and interim periods begin-
ning after November 15, 2009. Earlier application is prohibited. The
recognition and measurement provisions of FAS 166 must be applied to
transfers occurring on or after the effective date. Additionally, the disclo-
sure provisions of FAS 166 should be applied to transfers that occurred
both before and after the effective date of FAS 166. The impact of FAS
166 on the Fund’s financial statement disclosures, if any, is currently
being assessed.
Offering Costs: Offering costs are amortized over a 12-month period
beginning with the commencement of operations of the Fund.
Other: Expenses directly related to each Fund or its classes are charged
to that Fund or class. Other operating expenses shared by several funds
are prorated among those funds on the basis of relative net assets or
other appropriate methods. Other expenses of the Funds are allocated
daily to each class based on their relative net assets.
2. Derivative Financial Instruments:
The Pacific Fund may engage in various portfolio investment strategies
both to increase the return of the Pacific Fund and to economically
hedge, or protect, its exposure to interest rate movements and move-
ments in the securities markets. Losses may arise if the value of the
contract decreases due to an unfavorable change in the price of the
underlying security or if the counter-party does not perform under the
contract. The Pacific Fund may mitigate these losses through an ISDA
Master Agreement between the Pacific Fund and its counterparties. The
ISDA allows the Pacific Fund to offset its derivative financial instrument’s
payables and/or receivables with collateral held with each counterparty.
See Note 1 “Segregation and Collateralization” for additional information
with respect to collateral practices.
SEMI-ANNUAL REPORT JUNE 30, 2009 25
Notes to Financial Statements (continued)
The Fund is subject to foreign currency exchange rate risk in the normal
course of pursuing its investment objectives by investing in various deriv-
ative instruments, as described below.
Foreign Currency Exchange Contracts: The Pacific Fund may enter into
foreign currency exchange contracts as an economic hedge against
either specific transactions or portfolio positions (foreign currency ex-
change rate risk). A foreign currency exchange contract is an agreement
between two parties to buy and sell a currency at a set exchange rate
on a future date. Foreign currency exchange contracts, when used
by the Pacific Fund, help to manage the overall exposure to the foreign
currency backing some of the investments held by the Pacific Fund. The
contract is marked-to-market daily and the change in market value is
recorded by the Pacific Fund as an unrealized gain or loss. When the
contract is closed, the Pacific Fund records a realized gain or loss equal
to the difference between the value at the time it was opened and the
value at the time it was closed. The use of foreign currency exchange
contracts involves the risk that counterparties may not meet the terms
of the agreement and market risk of unanticipated movements in the
value of a foreign currency relative to the US dollar. In the event of
default by the counterparty to the transaction, the Pacific Fund’s maxi-
mum amount of loss, as either the buyer or seller, is the unrealized
loss of the contract.
Derivatives Not Accounted for as Hedging Instruments Under Financial
Accounting Standards Board Statement of Financial Accounting
Standards No. 133, “Accounting for Derivative Instruments and
Hedging Activities”:
| | | |
| Value of Derivative Instruments as of June 30, 2009* |
|
| | Liability Derivatives |
| | Balance | | |
| | Sheet | | |
| | Location | | Value |
| | Unrealized | | |
| | depreciation | | |
| | on foreign | | |
| | currency | | |
| | exchange | | |
| Foreign currency exchange contracts | contracts | $ | 4,157 |
| * For open derivative instruments as of June 30, 2009, see the Schedule |
| of Investments, which is also indicative of activity for the six months ended |
| June 30, 2009. | | | |
| |
| The Effect of Derivative Instruments on the Statement of Operations |
| Six Months Ended June 30, 2009 |
|
| Net Realized Loss From Derivatives Recognized in Income |
|
| | Foreign Currency |
| | Exchange Contracts |
| Foreign currency exchange contracts | $ | (1,140,599) |
| Net Change in Unrealized Depreciation on Derivatives Recognized in Income |
| | Foreign Currency |
| | Exchange Contracts |
| Foreign currency exchange contracts | $ | | (5,138) |
3. Investment Advisory Agreement and Other Transactions
with Affiliates:
The PNC Financial Services Group, Inc. (“PNC”) and Bank of America
Corporation (“BAC”) are the largest stockholders of BlackRock, Inc.
(“BlackRock”). Due to the ownership structure, PNC is an affiliate
for 1940 Act purposes, but BAC is not.
Pacific Fund and BlackRock Funds on behalf of International
Diversification Fund entered into an Investment Advisory Agreement
with BlackRock Advisors, LLC (the “Manager”), the Funds’ investment
advisor, an indirect, wholly owned subsidiary of BlackRock, to provide
investment advisory and administration services.
The Manager is responsible for the management of the Funds’ portfolio
and provides the necessary personnel, facilities, equipment and cer-
tain other services necessary to the operations of the Funds. For such
services, Pacific Fund pays the Manager a monthly fee at an annual
rate of 0.60% of the average daily value of the Fund’s net assets. The
Manager will not receive an investment advisory fee for International
Diversification Fund.
The Manager has agreed to waive its advisory fee by the amount of
investment advisory fees Pacific Fund pays to the Manager indirectly
through its investment in affiliated money market funds. For the six
months ended June 30, 2009, the Manager waived $348 with respect
to the Pacific Fund which is shown as fees waived by advisor in the
Statement of Operations.
On behalf of Pacific Fund, the Manager has entered into a sub-advisory
agreement with BlackRock Investment Management, LLC (“BIM”), an
affiliate of the Manager, under which the Manager pays BIM for services
it provides, a monthly fee that is a percentage of the investment advisory
fee paid by the Fund to the Manager.
On behalf of International Diversification Fund, the Manager has entered
into a sub-advisory agreement with BlackRock Financial Management,
Inc. (“BFM”), an affiliate of the Manager. BFM will not receive any sub-
advisory fees from the Fund for its sub-advisory services.
With respect to the International Diversification Fund, State Street Bank
and Trust Company (“State Street”) and the Manager act as co-adminis-
trators. For these services, the co-administrators receive a combined
administration fee computed daily and payable monthly, at an aggregate
annual rate of 0.10% of the Fund’s average daily net assets. In addition,
State Street and the Manager may, at their discretion, voluntarily waive
all or any portion of their administration fees for the Fund.
With respect to the International Diversification Fund, the Manager has
contractually agreed to waive or reimburse fees or expenses (excluding
interest expense, acquired fund (underlying fund) fees and expenses
and certain other Fund expenses) in order to limit Fund expenses until
26 SEMI-ANNUAL REPORT JUNE 30, 2009
| | | | | |
| Notes to Financial Statements (continued) |
| |
| May 1, 2010. The current expense limitations as a percentage of net |
| assets are as follows: 0.20% for Institutional Shares, 0.45% for Investor |
| A Shares, 1.20% for Investor C Shares and 0.70% for Class R Shares. |
| The expense waiver or reimbursement applies to direct Fund expenses |
| only, not expenses attributable to investments in underlying funds. This |
| amount is shown as transfer agent fees reimbursed in the Statements of |
| Operations. The amounts were as follows: | | | |
| Institutional | | | | $ | 28 |
| Investor A | | | | $ | 18 |
| Investor C | | | | $ | 27 |
| Class R | | | | $ | 13 |
| |
| If within two years following a waiver or reimbursement, the operating |
| expenses of a share class that previously received a waiver or reim- |
| bursement from the Manager are less than the expense limit for that |
| share class, the Manager is entitled to be reimbursed by such share |
| class up to the amount of fees waived or expenses reimbursed under |
| the agreement if: (1) the Fund has more than $50 million in assets, |
| (2) the Manager or an affiliate continues to be the Fund’s investment |
| advisor or administrator and (3) the Board has approved in advance |
| the payments to the Manager at the previous quarterly meeting. | |
| |
| For the six months ended June 30, 2009, the Funds reimbursed the |
| Manager for certain accounting services, which is included in accounting |
| services in the Statements of Operations as follows: | | |
| |
| International Diversification Fund | | | $ | 5 |
| Pacific Fund | | | | $ | 3,591 |
| |
| Each Fund has entered into Distribution Agreements and Distribution |
| Plans with BlackRock Investments, LLC (“BIL”), which is an affiliate of |
| BlackRock. | | | | | |
| |
| Pursuant to the Distribution Plans adopted by the Funds in accordance |
| with Rule 12b-1 under the 1940 Act, each Fund pays BIL ongoing | |
| service and distribution fees. The fees are accrued daily and paid | |
| monthly at annual rates based upon the average daily net assets of the |
| shares as follows: | | | | | |
| |
| | International | | Pacific | |
| | Diversification Fund | | Fund | |
| | Service | Distribution | Service | Distribution |
| | Fee | Fee | Fee | | Fee |
| Investor A | 0.25% | — | 0.25% | | — |
| Investor B | — | — | 0.25% | | 0.75% |
| Investor C | 0.25% | 0.75% | 0.25% | | 0.75% |
| Class R | 0.25% | 0.25% | 0.25% | | 0.25% |
| |
| Pursuant to sub-agreements with BIL, broker-dealers and BIL provide |
| shareholder servicing and distribution services to each Fund. The ongoing |
| service fee and/or distribution fee compensates BIL and each broker- |
| dealer for providing shareholder servicing and/or distribution-related |
| services to Investor A, Investor B, Investor C and Class R shareholders. |
For the six months ended June 30, 2009 for International Diversification
Fund, no underwriting discounts, direct commissions, dealer conces-
sions or contingent deferred sales charges were paid to BIL or affiliates.
For the six months ended June 30, 2009, for Pacific Fund, BIL earned
underwriting discounts, direct commissions and dealer concessions on
sales of the Fund’s Investor A Shares, totaling $318. For the six months
ended June 30, 2009, affiliates received contingent deferred sales
charges of $15,243 and $5,841 relating to transactions in Investor B
and Investor C Shares, respectively. Furthermore, affiliates received con-
tingent deferred sales charges of $102 relating to transactions subject
to front-end sales charge waivers in Investor A Shares.
Pacific Fund has received an exemptive order from the Securities and
Exchange Commission permitting it, among other things, to pay an affili-
ated securities lending agent a fee based on a share of the income
derived from the securities lending activities. The Fund has retained BIM
as the securities lending agent for a fee based on a share of the income
from investment of cash collateral. BIM may, on behalf of the Fund,
invest cash collateral received by the Fund for such loans, among other
things, in a private investment company managed by the Manager or in
registered money market funds advised by the Manager or its affiliates.
The share of income earned by the Fund on such investments is shown
as securities lending — affiliated in the Statements of Operations. For
the six months ended June 30, 2009, BIM received $5,953 in securities
lending agent fees.
PNC Global Investment Servicing (U.S.) Inc., an indirect, wholly owned
subsidiary of PNC and an affiliate of the Manager, is the transfer agent
and dividend disbursing agent. Each class of the Funds bear the costs
of transfer agent fees associated with such respective classes. Transfer
agency fees borne by each class of the Funds are comprised of those
fees charged for all shareholder communications including mailing of
shareholder reports, dividend and distribution notices, and proxy materi-
als for shareholder meetings, as well as per account and per transaction
fees related to servicing and maintenance of shareholder accounts,
including the issuing, redeeming and transferring of shares of each class
of the Fund, 12b-1 fee calculation, check writing, anti-money laundering
services, and customer identification services.
Pursuant to written agreements, certain affiliates provide the Funds with
sub-accounting, recordkeeping, sub-transfer agency and other adminis-
trative services with respect to sub-accounts they service. For these
services, these affiliates receive an annual fee per shareholder account
which will vary depending on share class. For the six months ended June
30, 2009, no fees were paid by the International Diversification Fund
and the Pacific Fund paid $338 in return for these services.
The Manager maintains a call center, which is responsible for providing
certain shareholder services to the Funds, such as responding to share-
holder inquiries and processing transactions based upon instructions
SEMI-ANNUAL REPORT JUNE 30, 2009 27
| | | | |
| Notes to Financial Statements (continued) |
| |
| from shareholders with respect to the subscription and redemption of |
| Fund shares. During the six months ended June 30, 2009, Pacific Fund |
| reimbursed the Manager the following amounts for costs incurred run- |
| ning the call center, which are included in transfer agent fees in the |
| Statements of Operations. | | | | |
| |
| Pacific Fund | | | Call Center Fees |
| Institutional | | | | $3,774 |
| Investor A | | | | $3,474 |
| Investor B | | | | $ 399 |
| Investor C | | | | $1,054 |
| Class R | | | | $ 62 |
| |
| International Diversification Fund incurred no costs relating to the call |
| center for the six months ended June 30, 2009. | | |
| |
| Certain officers and/or directors/trustees of the Funds are officers |
| and/or directors of BlackRock or its affiliates. Each Fund reimburses the |
| Manager for compensation paid to the Funds’ Chief Compliance Officer. |
| |
| 4. Investments: | | | | |
| Purchases and sales of investments, excluding short-term securities, for |
| the six months ended June 30, 2009 were as follows: | | |
| |
| | | Purchases | | Sales |
| International Diversification Fund | $ | 121,602 | $ | 31,449 |
| Pacific Fund | $241,981,135 | $273,060,293 |
| |
| 5. Short-Term Borrowings: | | | | |
| The Funds, along with certain other funds managed by the Manager and |
| its affiliates, are party to a $500 million credit agreement with a group |
| of lenders, which expires in November 2009. The Funds may borrow |
| under the credit agreement to fund shareholder redemptions and for |
| other lawful purposes other than for leverage. The Funds may borrow up |
| to the maximum amount allowable under each Fund’s current Prospec- |
| tus and Statement of Additional Information, subject to various other |
| legal, regulatory or contractual limits. Each Fund paid its pro rata share |
| of a 0.02% upfront fee on the aggregate commitment amount based on |
| its net assets. The Funds pay a commitment fee of 0.08% per annum |
| based on the Fund’s pro rata share of the unused portion of the credit |
| agreement, which is included in miscellaneous in the Statements of |
| Operations. Amounts borrowed under the credit agreement bear interest |
| at a rate equal to the higher of the (a) federal funds effective rate and |
| |
| (b) reserve adjusted one month LIBOR, plus, in each case, the higher of |
| (i) 1.50% and (ii) 50% of the CDX Index (as defined in the credit agree- |
| ment) in effect from time to time. The Funds did not borrow under the |
| credit agreement during the six months ended June 30, 2009. |
| |
| 6. Capital Loss Carryforwards: | |
| As of December 31, 2008, International Diversification Fund had a capi- |
| tal loss carryforward in the amount of $11,579 available to offset future |
| realized capital gains through December 31, 2016. | |
| |
| 7. Concentration, Market and Credit Risk: | |
| In the normal course of business, the Funds invest in securities and |
| enter into transactions where risks exist due to fluctuations in the market |
| (market risk) or failure of the issuer of a security to meet all of its obliga- |
| tions (credit risk). The value of securities held by the Funds may decline |
| in response to certain events, including those directly involving the |
| issuers whose securities are owned by the Funds; conditions affecting |
| the general economy; overall market changes; local, regional or global |
| political, social or economic instability; and currency and interest rate |
| and price fluctuations. Similar to credit risk, the Funds may be exposed |
| to counterparty risk, or the risk that an entity with which the Funds have |
| unsettled or open transactions may default. Financial assets, which |
| potentially expose the Funds to credit and counterparty risks, consist |
| principally of investments and cash due from counterparties. The extent |
| of the Funds’ exposure to credit and counterparty risks with respect to |
| these financial assets is approximated by their value recorded in the |
| Funds’ Statements of Assets and Liabilities. | |
| |
| Pacific Fund invests from time to time a substantial amount of its assets in |
| issuers located in a single country or a limited number of countries. Please |
| see the Schedule of Investments for concentrations in specific countries. |
| |
| As of June 30, 2009, Pacific Fund had the following industry classifications: |
| | Percent of |
| | Long-Term |
| Industry | Investments |
| Commercial Banks | 17% |
| Metals & Mining | 6 |
| Insurance | 6 |
| Semiconductors & Semiconductor Equipment | 5 |
| Automobiles | 5 |
| Trading Companies & Distributors | 5 |
| Other* | 56 |
| * All other industries held were each less than 5% of long-term investments. |
28 SEMI-ANNUAL REPORT JUNE 30, 2009
Notes to Financial Statements (continued)
8. Capital Share Transactions:
Transactions in capital shares for each class were as follows:
| | | | | | | |
| | Six Months Ended | | Period September 26, 20081 |
| | June 30, 2009 | | to December 31, 2008 | |
| International Diversification Fund | Shares | Amount | | Shares | | Amount |
| Institutional | | | | | | | |
| Shares sold | 3,192 | $25,602 | 44,000 | | $440,000 |
| Net increase | 3,192 | $25,602 | 44,000 | | $440,000 |
| |
| Investor A | | | | | | | |
| Shares sold | 1,286 | $ 8,500 | 2,000 | | $ | 20,000 |
| Net increase | 1,286 | $ 8,500 | 2,000 | | $ | 20,000 |
| |
| Investor C | | | | | | | |
| Shares sold | 75 | $ | 500 | 8,974 | | $ | 72,649 |
| Shares issued to shareholders in reinvestment of dividends | — | | — | 136 | | | 982 |
| Net increase | 75 | $ | 500 | 9,110 | | $ | 73,631 |
| |
| Class R | | | | | | | |
| Shares sold | — | | — | 2,000 | | $ | 20,000 |
| Net increase | — | | — | 2,000 | | $ | 20,000 |
| 1 Commencement of operations. | | | | | | | |
| |
| | Six Months Ended | | Year Ended | | |
| | June 30, 2009 | | December 31, 2008 | |
| Pacific Fund | Shares | Amount | | Shares | | Amount |
| Institutional | | | | | | | |
| Shares sold | 1,971,368 | $ 28,584,417 | 3,813,640 | $ | 87,002,727 |
| Shares issued to shareholders in reinvestment | | | | | | | |
| of dividends and distributions | — | | — | 2,009,963 | | 31,572,267 |
| Total issued | 1,971,368 | 28,584,417 | 5,823,603 | | 118,574,994 |
| Shares redeemed | (2,816,410) | (40,336,246) | (6,526,278) | | (144,019,096) |
| Net decrease | (845,042) | $(11,751,829) | (702,675) | $ | (25,444,102) |
| |
| Investor A | | | | | | | |
| Shares sold and automatic conversion of shares | 798,471 | $ 12,015,194 | 1,196,013 | $ | 27,207,900 |
| Shares issued to shareholders in reinvestment | | | | | | | |
| of dividends and distributions | — | | — | 1,923,285 | | 29,953,856 |
| Total issued | 798,471 | 12,015,194 | 3,119,298 | | 57,161,756 |
| Shares redeemed | (1,175,678) | (16,540,892) | (4,383,860) | | (97,349,670) |
| Net decrease | (377,207) | $ (4,525,698) | (1,264,562) | $ | (40,187,914) |
SEMI-ANNUAL REPORT JUNE 30, 2009 29
Notes to Financial Statements (concluded)
| | | | | | |
| | Six Months Ended | Year Ended | |
| | June 30, 2009 | | December 31, 2008 |
| Pacific Fund (concluded) | Shares | | Amount | Shares | | Amount |
| Investor B | | | | | | |
| Shares sold | 24,199 | $ | 337,841 | 48,162 | $ | 999,973 |
| Shares issued to shareholders in reinvestment | | | | | | |
| of dividends and distributions | — | | — | 200,402 | | 2,866,660 |
| Total issued | 24,199 | | 337,841 | 248,564 | | 3,866,633 |
| Shares redeemed and automatic conversion of shares | (301,945) | | (3,880,297) | (766,213) | | (16,132,313) |
| Net decrease | (277,746) | $ | (3,542,456) | (517,649) | $ | (12,265,680) |
| |
| Investor C | | | | | | |
| Shares sold | 214,852 | $ | 2,635,279 | 365,965 | $ | 7,120,423 |
| Shares issued to shareholders in reinvestment | | | | | | |
| of dividends and distributions | — | | — | 1,044,260 | | 13,986,660 |
| Total issued | 214,852 | | 2,635,279 | 1,410,225 | | 21,107,083 |
| Shares redeemed | (756,758) | | (8,891,649) | (2,608,344) | | (47,033,319) |
| Net decrease | (541,906) | | $(6,256,370) | (1,198,119) | $ | (25,926,236) |
| |
| Class R | | | | | | |
| Shares sold | 97,830 | $ | 1,236,431 | 148,591 | $ | 2,964,731 |
| Shares issued to shareholders in reinvestment | | | | | | |
| of dividends and distributions | — | | — | 61,737 | | 853,105 |
| Total issued | 97,830 | | 1,236,431 | 210,328 | | 3,817,836 |
| Shares redeemed | (76,505) | | (977,346) | (170,558) | | (3,072,319) |
| Net increase | 21,325 | $ | 259,085 | 39,770 | $ | 745,517 |
| |
| There is a 2% redemption fee on shares redeemed or exchanged that have been held 30 days or less. The redemption fees are collected and retained |
| by the Funds for the benefit of the remaining shareholders. The redemption fees are recorded as a credit to paid-in capital. | | |
| 9. Subsequent Events: | | | | | | |
| The Pacific Fund paid an ordinary income dividend on July 24, 2009 | | | | | |
| to shareholders of record on July 22, 2009 in the following amounts: | | | | | |
| | Amount | | | | | |
| Institutional | $0.032278 | | | | | |
| Investor A | $0.032197 | | | | | |
| Investor B | $0.032278 | | | | | |
| Investor C | $0.031767 | | | | | |
| Class R | $0.031860 | | | | | |
| |
| Management’s evaluation of the impact of all subsequent events on the | | | | | |
| Funds’ financial statements was completed through August 25, 2009, | | | | | |
| the date the financial statements were issued. | | | | | | |
30 SEMI-ANNUAL REPORT JUNE 30, 2009
Disclosure of Investment Advisory Agreement BlackRock Pacific Fund, Inc.
and Sub-Advisory Agreement
The Board of Directors (the “Board,” and the members of which are
referred to as “Board Members”) of BlackRock Pacific Fund, Inc. (the
“Fund”) met on April 16, 2009 and May 21-22, 2009 to consider the
approval of the Fund’s investment advisory agreement (the “Advisory
Agreement”) with BlackRock Advisors, LLC (the “Manager”), the Fund’s
investment advisor. The Board also considered the approval of the
sub-advisory agreement (the “Sub-Advisory Agreement”) between
the Manager and BlackRock Investment Management, LLC (the “Sub-
Advisor”) with respect to the Fund. The Manager and the Sub-Advisor are
referred to herein as “BlackRock.” The Advisory Agreement and the Sub-
Advisory Agreement are referred to herein as the “Agreements.”
Activities and Composition of the Board
The Board of the Fund consists of thirteen individuals, eleven of whom
are not “interested persons” of the Fund as defined in the Investment
Company Act of 1940, as amended (the “1940 Act”) (the “Independent
Board Members”). The Board Members are responsible for the oversight
of the operations of the Fund and perform the various duties imposed
on the directors of investment companies by the 1940 Act. The Inde-
pendent Board Members have retained independent legal counsel to
assist them in connection with their duties. The Co-Chairs of the Board
are each Independent Board Members. The Board has established five
standing committees: an Audit Committee, a Governance and Nomin-
ating Committee, a Compliance Committee, a Performance Oversight
and Contract Committee and an Executive Committee, each of which is
composed of Independent Board Members (except for the Performance
Oversight and Contract Committee and the Executive Committee, which
each have one interested Board Member) and is chaired by Independent
Board Members.
The Agreements
Pursuant to the 1940 Act, the Board is required to consider the continu-
ation of the Agreements on an annual basis. In connection with this
process, the Board assessed, among other things, the nature, scope
and quality of the services provided to the Fund by the personnel of
BlackRock and its affiliates, including investment management, adminis-
trative services, shareholder services, oversight of fund accounting and
custody, marketing services and assistance in meeting legal and regula-
tory requirements.
Throughout the year, the Board, acting directly and through its commit-
tees, considers at each of its meetings factors that are relevant to its
annual consideration of the renewal of the Agreements, including the
services and support provided by BlackRock to the Fund and its share-
holders. Among the matters the Board considered were: (a) investment
performance for one-, three- and five-year periods, as applicable, against
peer funds, and applicable benchmarks, if any, as well as senior man-
agement and portfolio managers’ analysis of the reasons for any under-
performance against its peers; (b) fees, including advisory, administra-
tion, if applicable, and other amounts paid to BlackRock and its affili-
ates by the Fund for services, such as transfer agency, marketing and
distribution, call center and fund accounting; (c) Fund operating expens-
es; (d) the resources devoted to and compliance reports
relating to the Fund’s investment objective, policies and restrictions,
(e) the Fund’s compliance with its Code of Ethics and compliance
policies and procedures; (f) the nature, cost and character of non-
investment management services provided by BlackRock and its affili-
ates; (g) BlackRock’s and other service providers’ internal controls;
(h) BlackRock’s implementation of the proxy voting policies approved
by the Board; (i) the use of brokerage commissions and execution quali-
ty; (j) BlackRock’s implementation of the Fund’s valuation and liquidity
procedures; and (k) periodic updates on BlackRock’s business.
Board Considerations in Approving the Agreements
The Approval Process: Prior to the April 16, 2009 meeting, the Board
requested and received materials specifically relating to the Agreements.
The Board is engaged in an ongoing process with BlackRock to continu-
ously review the nature and scope of the information provided to better
assist its deliberations. The materials provided in connection with the
April meeting included (a) information independently compiled and
prepared by Lipper, Inc. (“Lipper”) on Fund fees and expenses, and the
investment performance of the Fund as compared with a peer group of
funds as determined by Lipper (collectively, “Peers”); (b) information on
the profitability of the Agreements to BlackRock and a discussion of fall-
out benefits to BlackRock and its affiliates and significant shareholders;
(c) a general analysis provided by BlackRock concerning investment
advisory fees charged to other clients, such as institutional and closed-
end funds, under similar investment mandates, as well as the perform-
ance of such other clients; (d) the impact of economies of scale;
(e) a summary of aggregate amounts paid by the Fund to BlackRock;
(f) sales and redemption data regarding the Fund’s shares; and
(g) an internal comparison of management fees classified by Lipper,
if applicable.
At an in-person meeting held on April 16, 2009, the Board reviewed
materials relating to its consideration of the Agreements. As a result
of the discussions that occurred during the April 16, 2009 meeting, the
Board presented BlackRock with questions and requests for additional
information and BlackRock responded to these requests with additional
written information in advance of the May 21-22, 2009 Board meeting.
At an in-person meeting held on May 21-22, 2009, the Board Members
present at the meeting, including the Independent Board Members
present at the meeting, unanimously approved the continuation of the
Advisory Agreement between the Manager and the Fund and the Sub-
Advisory Agreement between the Manager and the Sub-Advisor with
SEMI-ANNUAL REPORT JUNE 30, 2009 31
Disclosure of Investment Advisory Agreement BlackRock Pacific Fund, Inc.
and Sub-Advisory Agreement (continued)
respect to the Fund, each for a one-year term ending June 30, 2010.
The Board considered all factors it believed relevant with respect to the
Fund, including, among other factors: (a) the nature, extent and quality
of the services provided by BlackRock; (b) the investment performance
of the Fund and BlackRock portfolio management; (c) the advisory fee
and the cost of the services and profits to be realized by BlackRock and
certain affiliates from the relationship with the Fund; (d) economies of
scale; and (e) other factors.
The Board also considered other matters it deemed important to the
approval process, such as payments made to BlackRock or its affiliates
relating to the distribution of Fund shares, services related to the valua-
tion and pricing of Fund portfolio holdings, direct and indirect benefits
to BlackRock and its affiliates from their relationship with the Fund and
advice from independent legal counsel with respect to the review proc-
ess and materials submitted for the Board’s review. The Board noted
the willingness of BlackRock personnel to engage in open, candid dis-
cussions with the Board. The Board did not identify any particular infor-
mation as controlling, and each Board Member may have attributed dif-
ferent weights to the various items considered.
A. Nature, Extent and Quality of the Services: The Board, including the
Independent Board Members, reviewed the nature, extent and quality
of services provided by BlackRock, including the investment advisory
services and the resulting performance of the Fund. Throughout the year,
the Board compared Fund performance to the performance of
a comparable group of mutual funds, and the performance of at least
one relevant benchmark, if any. The Board met with BlackRock’s senior
management personnel responsible for investment operations, including
the senior investment officers. The Board also reviewed the materials
provided by the Fund’s portfolio management team discussing Fund
performance and the Fund’s investment objective, strategies
and outlook.
The Board considered, among other factors, the number, education
and experience of BlackRock’s investment personnel generally and the
Fund’s portfolio management team, investments by portfolio managers
in the funds they manage, BlackRock’s portfolio trading capabilities,
BlackRock’s use of technology, BlackRock’s commitment to compliance
and BlackRock’s approach to training and retaining portfolio managers
and other research, advisory and management personnel. The Board
also reviewed a general description of BlackRock’s compensation
structure with respect to the Fund’s portfolio management team
and BlackRock’s ability to attract and retain high-quality talent.
In addition to advisory services, the Board considered the quality of
the administrative and non-investment advisory services provided to the
Fund. BlackRock and its affiliates provide the Fund with certain adminis-
trative, transfer agency, shareholder and other services (in addition to
any such services provided to the Fund by third parties) and officers
and other personnel as are necessary for the operations of the Fund.
In addition to investment advisory services, BlackRock and its affiliates
provide the Fund with other services, including (i) preparing disclosure
documents, such as the prospectus, the statement of additional infor-
mation and periodic shareholder reports; (ii) assisting with daily accoun-
ting and pricing; (iii) overseeing and coordinating the activities of other
service providers; (iv) organizing Board meetings and preparing the
materials for such Board meetings; (v) providing legal and compliance
support; and (vi) performing other administrative functions necessary for
the operation of the Fund, such as tax reporting, fulfilling regulatory filing
requirements, and call center services. The Board reviewed the structure
and duties of BlackRock’s fund administration, accounting, legal and
compliance departments and considered BlackRock’s policies and pro-
cedures for assuring compliance with applicable laws and regulations.
B. The Investment Performance of the Fund and BlackRock: The
Board, including the Independent Board Members, also reviewed and
considered the performance history of the Fund. In preparation for the
April 16, 2009 meeting, the Board was provided with reports, independ-
ently prepared by Lipper, which included a comprehensive analysis of
the Fund’s performance. The Board also reviewed a narrative and statisti-
cal analysis of the Lipper data that was prepared by BlackRock, which
analyzed various factors that affect Lipper’s rankings. In connection with
its review, the Board received and reviewed information regarding the
investment performance of the Fund as compared to a representative
group of similar funds as determined by Lipper and to all funds in
the Fund’s applicable Lipper category. The Board was provided with
a description of the methodology used by Lipper to select peer funds.
The Board regularly reviews the performance of the Fund throughout
the year. The Board attaches more importance to performance over
relatively long periods of time, typically three to five years.
The Board noted that the Fund’s performance was below the median
of its Lipper Performance Universe for the three- and five-year periods
reported, but that during each of these periods the Fund outperformed
its benchmark. The Board and BlackRock reviewed the reasons for the
Fund’s underperformance during these periods compared with its Peers.
The Board was informed that, among other things, this performance dif-
ferential was primarily attributable to differences in the Fund’s Japan
weighting, since the Fund was underweight in Japan compared to its
benchmark but more heavily weighted than its Peers and Japan’s per-
formance was relatively weak in 2006 and 2007. The Board also noted
that, for the one-year period, the Fund’s performance was above the
median of its Lipper Performance Universe and the Fund outperformed
its benchmark.
32 SEMI-ANNUAL REPORT JUNE 30, 2009
Disclosure of Investment Advisory Agreement BlackRock Pacific Fund, Inc.
and Sub-Advisory Agreement (continued)
The Board and BlackRock discussed BlackRock’s commitment to
providing the resources necessary to assist the portfolio managers
and to improve the Fund’s performance.
C. Consideration of the Advisory Fees and the Cost of the Services and
Profits to be Realized by BlackRock and its Affiliates from their
Relationship with the Fund: The Board, including the Independent Board
Members, reviewed the Fund’s contractual advisory fee rates compared
with the other funds in its Lipper category. It also compared the Fund’s
total expenses, as well as actual management fees, to those of other
comparable funds. The Board considered the services provided and the
fees charged by BlackRock to other types of clients with similar invest-
ment mandates, including separately managed institutional accounts.
The Board received and reviewed statements relating to BlackRock’s
financial condition and profitability with respect to the services it
provided the Fund. The Board was also provided with a profitability
analysis that detailed the revenues earned and the expenses incurred
by BlackRock for services provided to the Fund. The Board reviewed
BlackRock’s profitability with respect to the Fund and each fund the
Board currently oversees for the year ended December 31, 2008
compared to aggregate profitability data provided for the year ended
December 31, 2007. The Board reviewed BlackRock’s profitability with
respect to other fund complexes managed by the Manager and/or its
affiliates. The Board reviewed BlackRock’s assumptions and methodolo-
gy of allocating expenses in the profitability analysis, noting the inherent
limitations in allocating costs among various advisory products. The
Board recognized that profitability may be affected by numerous factors
including, among other things, fee waivers and expense reimbursements
by the Manager, the types of funds managed, expense allocations and
business mix, and therefore comparability of profitability is somewhat
limited.
The Board noted that, in general, individual fund or product line prof-
itability of other advisors is not publicly available. Nevertheless, to the
extent such information is available, the Board considered BlackRock’s
operating margin in general compared to the operating margin for lead-
ing investment management firms whose operations include advising
open-end funds, among other product types. The comparison indicated
that operating margins for BlackRock with respect to its registered funds
are consistent with margins earned by similarly situated publicly traded
competitors. In addition, the Board considered, among other things, cer-
tain third party data comparing BlackRock’s operating margin with that
of other publicly-traded asset management firms, which concluded
that larger asset bases do not, in themselves, translate to higher
profit margins.
In addition, the Board considered the cost of the services provided to
the Fund by BlackRock, and BlackRock’s and its affiliates’ profits relating
to the management and distribution of the Fund and the other funds
advised by BlackRock and its affiliates. As part of its analysis, the Board
reviewed BlackRock’s methodology in allocating its costs to the manage-
ment of the Fund. The Board also considered whether BlackRock has
the financial resources necessary to attract and retain high quality
investment management personnel to perform its obligations under
the Agreements and to continue to provide the high quality of services
that is expected by the Board.
The Board noted that the Fund’s contractual advisory fees, which do not
take into account any expense reimbursement or fee waivers, were lower
than or equal to the median contractual advisory fees paid by the
Fund’s Peers.
D. Economies of Scale: The Board, including the Independent Board
Members, considered the extent to which economies of scale might be
realized as the assets of the Fund increase and whether there should be
changes in the advisory fee rate or structure in order to enable the Fund
to participate in these economies of scale, for example through the use
of breakpoints in the advisory fee based upon the assets of the Fund.
The Board considered that the funds in the BlackRock fund complex
share some common resources and, as a result, an increase in the over-
all size of the complex could permit each fund to incur lower expenses
than it would otherwise as a stand-alone entity. The Board also consid-
ered BlackRock’s overall operations and its efforts to expand the scale
of, and improve the quality of, its operations.
E. Other Factors: The Board also took into account other ancillary or
“fall-out” benefits that BlackRock or its affiliates and significant share-
holders may derive from its relationship with the Fund, both tangible
and intangible, such as BlackRock’s ability to leverage its investment
professionals who manage other portfolios, an increase in BlackRock’s
profile in the investment advisory community, and the engagement of
BlackRock’s affiliates as service providers to the Fund, including for
administrative, transfer agency and distribution services. The Board
also noted that BlackRock may use third party research obtained by
soft dollars generated by certain mutual fund transactions to assist
itself in managing all or a number of its other client accounts.
In connection with its consideration of the Agreements, the Board also
received information regarding BlackRock’s brokerage and soft dollar
practices. The Board received reports from BlackRock which included
information on brokerage commissions and trade execution practices
throughout the year.
SEMI-ANNUAL REPORT JUNE 30, 2009 33
Disclosure of Investment Advisory Agreement BlackRock Pacific Fund, Inc.
and Sub-Advisory Agreement (concluded)
Conclusion
The Board Members present at the meeting, including the Independent
Board Members present at the meeting, unanimously approved the
continuation of the Advisory Agreement between the Manager and the
Fund for a one-year term ending June 30, 2010 and the Sub-Advisory
Agreement between the Manager and Sub-Advisor with respect to the
Fund for a one-year term ending June 30, 2010. Based upon their eval-
uation of all these factors in their totality, the Board Members present
at the meeting, including the Independent Board Members present at
the meeting, were satisfied that the terms of the Agreements were fair
and reasonable and in the best interest of the Fund and its sharehold-
ers. In arriving at a decision to approve the Agreements, the Board did
not identify any single factor or group of factors as all-important or con-
trolling, but considered all factors together, and different Board Members
may have attributed different weights to the various factors considered.
The Independent Board Members were also assisted by the advice of
independent legal counsel in making this determination. The contractual
fee arrangements for the Fund reflect the results of several years of
review by the Board Members and predecessor Board Members, and
discussions between such Board Members (and predecessor Board
Members) and BlackRock. Certain aspects of the arrangements may
be the subject of more attention in some years than in others, and the
Board Members’ conclusions may be based in part on their considera-
tion of these arrangements in prior years.
34 SEMI-ANNUAL REPORT JUNE 30, 2009
Officers and Directors
Ronald W. Forbes, Co-Chairman of the Board and Director
Rodney D. Johnson, Co-Chairman of the Board and Director
David O. Beim, Director
Richard S. Davis, Director
Henry Gabbay, Director
Dr. Matina Horner, Director
Herbert I. London, Director
Cynthia A. Montgomery, Director
Joseph P. Platt, Jr., Director
Robert C. Robb, Jr., Director
Toby Rosenblatt, Director
Kenneth L. Urish, Chairman of the Audit Committee and Director
Frederick W. Winter, Director
Donald C. Burke, President and Chief Executive Officer
Anne F. Ackerley, Vice President
Neal J. Andrews, Chief Financial Officer
Jay M. Fife, Treasurer
Brian P. Kindelan, Chief Compliance Officer of the Fund
Howard B. Surloff, Secretary
Investment Advisor
BlackRock Advisors, LLC
Wilmington, DE 19809
Custodian
State Street Bank and Trust Company1
Boston, MA 02101
Brown Brothers Harriman & Co.2
Boston, MA 02109
Transfer Agent
PNC Global Investment Servicing (U.S.) Inc.
Wilmington, DE 19809
Accounting Agent
State Street Bank and Trust Company
Princeton, NJ 08540
Distributor
BlackRock Investments, LLC
New York, NY 10022
Legal Counsel
Sidley Austin LLP
New York, NY 10019
Independent Registered Public
Accounting Firm
Deloitte & Touche LLP
Princeton, NJ 08540
Address of the Funds
100 Bellevue Parkway
Wilmington, DE 19809
1 For BlackRock International Diversification Fund
2 For BlackRock Pacific Fund, Inc.
Effective July 31, 2009, Donald C. Burke, President and Chief Executive Officer of the Funds retired. The Funds’
Board of Directors wishes Mr. Burke well in his retirement.
Effective August 1, 2009, Anne F. Ackerley became President and Chief Executive Officer of the Funds, and Jeffrey
Holland and Brian Schmidt became Vice Presidents of the Funds.
SEMI-ANNUAL REPORT JUNE 30, 2009
Additional Information
BlackRock Privacy Principles
BlackRock is committed to maintaining the privacy of its current and
former fund investors and individual clients (collectively, “Clients”) and
to safeguarding their non-public personal information. The following infor-
mation is provided to help you understand what personal information
BlackRock collects, how we protect that information and why in certain
cases we share such information with select parties.
If you are located in a jurisdiction where specific laws, rules or regulations
require BlackRock to provide you with additional or different privacy-related
rights beyond what is set forth below, then BlackRock will comply with
those specific laws, rules or regulations.
BlackRock obtains or verifies personal non-public information from and
about you from different sources, including the following: (i) information
we receive from you or, if applicable, your financial intermediary, on appli-
cations, forms or other documents; (ii) information about your trans-
actions with us, our affiliates, or others; (iii) information we receive from
a consumer reporting agency; and (iv) from visits to our websites.
BlackRock does not sell or disclose to non-affiliated third parties any non-
public personal information about its Clients, except as permitted by law
or as is necessary to respond to regulatory requests or to service Client
accounts. These non-affiliated third parties are required to protect the
confidentiality and security of this information and to use it only for its
intended purpose.
We may share information with our affiliates to service your account
or to provide you with information about other BlackRock products or
services that may be of interest to you. In addition, BlackRock restricts
access to non-public personal information about its Clients to those
BlackRock employees with a legitimate business need for the informa-
tion. BlackRock maintains physical, electronic and procedural safeguards
that are designed to protect the non-public personal information of its
Clients, including procedures relating to the proper storage and disposal
of such information.
36 SEMI-ANNUAL REPORT JUNE 30, 2009
Additional Information (concluded)
General Information
Electronic Delivery
Electronic copies of most financial reports and prospectuses are available
on the Funds’ website or shareholders can sign up for e-mail notifications
of quarterly statements, annual and semi-annual reports and prospectus-
es by enrolling in the Funds’ electronic delivery program.
To enroll:
Shareholders Who Hold Accounts with Investment Advisors, Banks or
Brokerages:
Please contact your financial advisor. Please note that not all investment
advisors, banks or brokerages may offer this service.
Shareholders Who Hold Accounts Directly with BlackRock:
1) Access the BlackRock website at
http://www.blackrock.com/edelivery
2) Click on the applicable link and follow the steps to sign up
3) Log into your account
Householding
The Funds will mail only one copy of shareholder documents, including
prospectuses, annual and semi-annual reports and proxy statements, to
shareholders with multiple accounts at the same address. This practice is
commonly called “householding” and it is intended to reduce expenses
and eliminate duplicate mailings of shareholder documents. Mailings of
your shareholder documents may be householded indefinitely unless you
instruct us otherwise. If you do not want the mailing of these documents
to be combined with those for other members of your household, please
contact the Fund at (800) 441-7762.
Availability of Proxy Voting Policies and Procedures
A description of the policies and procedures that the Funds use to
determine how to vote proxies relating to portfolio securities is available
(1) without charge, upon request, by calling toll-free (800) 441-7762;
(2) at www.blackrock.com; and (3) on the Securities and Exchange
Commission’s (the “SEC”) website at http://www.sec.gov.
Availability of Proxy Voting Record
Information about how the Funds vote proxies relating to securities held
in the Fund’s portfolio during the most recent 12-month period ended
June 30 is available upon request and without charge (1) at www.black-
rock.com or by calling (800) 441-7762 and (2) on the SEC’s website at
http://www.sec.gov.
Availability of Quarterly Portfolio Schedule
The Funds file their complete schedules of portfolio holdings with the SEC
for the first and third quarters of each fiscal year on Form N-Q. The Funds’
Forms N-Q are available on the SEC’s website at http://www.sec.gov
and may also be reviewed and copied at the SEC’s Public Reference
Room in Washington, D.C. Information on the operation of the Public
Reference Room may be obtained by calling (202) 551-8090. The
Funds’ Forms N-Q may also be obtained upon request and without
charge by calling (800) 441-7762.
Shareholder Privileges
Account Information
Call us at (800) 441-7762 from 8:00 AM to 6:00 PM EST to get infor-
mation about your account balances, recent transactions and share
prices. You can also reach us on the Web at www.blackrock.com/funds.
Automatic Investment Plans
Investor Class shareholders who want to invest regularly can arrange to
have $50 or more automatically deducted from their checking or savings
account and invested in any of the BlackRock funds.
Systematic Withdrawal Plans
Investor Class shareholders can establish a systematic withdrawal plan
and receive periodic payments of $50 or more from their BlackRock
funds, as long as their account is at least $10,000.
Retirement Plans
Shareholders may make investments in conjunction with Traditional,
Rollover, Roth, Coverdell, Simple IRAs, SEP IRAs and 403(b) Plans.
SEMI-ANNUAL REPORT JUNE 30, 2009 37
A World-Class Mutual Fund Family
BlackRock offers a diverse lineup of open-end mutual funds crossing all investment styles and managed by experts in equity, fixed income and
tax-exempt investing.
| | |
| Equity Funds | | |
| |
| BlackRock All-Cap Energy & Resources Portfolio | BlackRock Global Opportunities Portfolio | BlackRock Mid-Cap Value Equity Portfolio |
| BlackRock Asset Allocation Portfolio† | BlackRock Global SmallCap Fund | BlackRock Mid Cap Value Opportunities Fund |
| BlackRock Aurora Portfolio | BlackRock Health Sciences Opportunities Portfolio | BlackRock Natural Resources Trust |
| BlackRock Balanced Capital Fund† | BlackRock Healthcare Fund | BlackRock Pacific Fund |
| BlackRock Basic Value Fund | BlackRock Index Equity Portfolio* | BlackRock Science & Technology |
| BlackRock Capital Appreciation Portfolio | BlackRock International Fund | Opportunities Portfolio |
| BlackRock Energy & Resources Portfolio | BlackRock International Diversification Fund | BlackRock Small Cap Core Equity Portfolio |
| BlackRock Equity Dividend Fund | BlackRock International Index Fund | BlackRock Small Cap Growth Equity Portfolio |
| BlackRock EuroFund | BlackRock International Opportunities Portfolio | BlackRock Small Cap Growth Fund II |
| BlackRock Focus Growth Fund | BlackRock International Value Fund | BlackRock Small Cap Index Fund |
| BlackRock Focus Value Fund | BlackRock Large Cap Core Fund | BlackRock Small Cap Value Equity Portfolio |
| BlackRock Fundamental Growth Fund | BlackRock Large Cap Core Plus Fund | BlackRock Small/Mid-Cap Growth Portfolio |
| BlackRock Global Allocation Fund† | BlackRock Large Cap Growth Fund | BlackRock S&P 500 Index Fund |
| BlackRock Global Dynamic Equity Fund | BlackRock Large Cap Value Fund | BlackRock U.S. Opportunities Portfolio |
| BlackRock Global Emerging Markets Fund | BlackRock Latin America Fund | BlackRock Utilities and Telecommunications Fund |
| BlackRock Global Financial Services Fund | BlackRock Mid-Cap Growth Equity Portfolio | BlackRock Value Opportunities Fund |
| BlackRock Global Growth Fund | | |
| |
| Fixed Income Funds | | |
| |
| BlackRock Bond Portfolio | BlackRock Income Builder Portfolio† | BlackRock Short-Term Bond Fund |
| BlackRock Emerging Market Debt Portfolio | BlackRock Inflation Protected Bond Portfolio | BlackRock Strategic Income Portfolio |
| BlackRock Enhanced Income Portfolio | BlackRock Intermediate Government | BlackRock Total Return Fund |
| BlackRock GNMA Portfolio | Bond Portfolio | BlackRock Total Return Portfolio II |
| BlackRock Government Income Portfolio | BlackRock International Bond Portfolio | BlackRock World Income Fund |
| BlackRock High Income Fund | BlackRock Long Duration Bond Portfolio | |
| BlackRock High Yield Bond Portfolio | BlackRock Low Duration Bond Portfolio | |
| BlackRock Income Portfolio† | BlackRock Managed Income Portfolio | |
| |
| Municipal Bond Funds | | |
| BlackRock AMT-Free Municipal Bond Portfolio | BlackRock Kentucky Municipal Bond Portfolio | BlackRock New York Municipal Bond Fund |
| BlackRock California Municipal Bond Fund | BlackRock Municipal Insured Fund | BlackRock Ohio Municipal Bond Portfolio |
| BlackRock Delaware Municipal Bond Portfolio | BlackRock National Municipal Fund | BlackRock Pennsylvania Municipal Bond Fund |
| BlackRock High Yield Municipal Fund | BlackRock New Jersey Municipal Bond Fund | BlackRock Short-Term Municipal Fund |
| BlackRock Intermediate Municipal Fund | | |
| |
| Target Risk & Target Date Funds | | |
| |
| BlackRock Prepared Portfolios | BlackRock Lifecycle Prepared Portfolios | |
| Conservative Prepared Portfolio | Prepared Portfolio 2010 | Prepared Portfolio 2030 |
| Moderate Prepared Portfolio | Prepared Portfolio 2015 | Prepared Portfolio 2035 |
| Growth Prepared Portfolio | Prepared Portfolio 2020 | Prepared Portfolio 2040 |
| Aggressive Growth Prepared Portfolio | Prepared Portfolio 2025 | Prepared Portfolio 2045 |
| | | Prepared Portfolio 2050 |
| * See the prospectus for information on specific limitations on investments in the fund. | |
| † Mixed asset fund. | | |
| BlackRock mutual funds are currently distributed by BlackRock Investments, LLC. You should consider the investment objectives, risks, charges and |
| expenses of the funds under consideration carefully before investing. Each fund’s prospectus contains this and other information and is available at |
| www.blackrock.com or by calling (800) 882-0052 or from your financial advisor. The prospectus should be read carefully before investing. |
38 SEMI-ANNUAL REPORT JUNE 30, 2009

This report is not authorized for use as an offer of sale or a solicita-
tion of an offer to buy shares of the Funds unless accompanied
or preceded by the Funds’ current prospectus. Past performance
results shown in this report should not be considered a representa-
tion of future performance. Investment return and principal value
of shares will fluctuate so that shares, when redeemed, may be
worth more or less than their original cost. Statements and other
information herein are as dated and are subject to change.
Investment in foreign securities involves special risks including
fluctuating foreign exchange rates, foreign government regulations,
differing degrees of liquidity and the possibility of substantial
volatility due to adverse political, economic or other developments.

Item 2 – Code of Ethics – Not Applicable to this semi-annual report
Item 3 – Audit Committee Financial Expert – Not Applicable to this semi-annual report
Item 4 – Principal Accountant Fees and Services – Not Applicable to this semi-annual report
Item 5 – Audit Committee of Listed Registrants – Not Applicable
Item 6 – Investments
(a) The registrant’s Schedule of Investments is included as part of the Report to
Stockholders filed under Item 1 of this form.
(b) Not Applicable due to no such divestments during the semi-annual period covered since
the previous Form N-CSR filing.
Item 7 – Disclosure of Proxy Voting Policies and Procedures for Closed-End Management
Investment Companies – Not Applicable
Item 8 – Portfolio Managers of Closed-End Management Investment Companies – Not Applicable
Item 9 – Purchases of Equity Securities by Closed-End Management Investment Company and
Affiliated Purchasers – Not Applicable
Item 10 – Submission of Matters to a Vote of Security Holders – The registrant’s Nominating and
Governance Committee will consider nominees to the board of directors recommended by
shareholders when a vacancy becomes available. Shareholders who wish to recommend a
nominee should send nominations that include biographical information and set forth the
qualifications of the proposed nominee to the registrant’s Secretary. There have been no
material changes to these procedures.
Item 11 – Controls and Procedures
11(a) – The registrant’s principal executive and principal financial officers or persons performing
similar functions have concluded that the registrant’s disclosure controls and procedures (as
defined in Rule 30a-3(c) under the Investment Company Act of 1940, as amended (the
“1940 Act”)) are effective as of a date within 90 days of the filing of this report based on the
evaluation of these controls and procedures required by Rule 30a-3(b) under the 1940 Act
and Rule 15(d)-15(b) under the Securities Exchange Act of 1934, as amended.
11(b) – There were no changes in the registrant’s internal control over financial reporting (as
defined in Rule 30a-3(d) under the 1940 Act) that occurred during the second fiscal quarter
of the period covered by this report that have materially affected, or are reasonably likely to
materially affect, the registrant’s internal control over financial reporting.
Item 12 – Exhibits attached hereto
12(a)(1) – Code of Ethics – Not Applicable to this semi-annual report
12(a)(2) – Certifications – Attached hereto
12(a)(3) – Not Applicable
12(b) – Certifications – Attached hereto
Pursuant to the requirements of the Securities Exchange Act of 1934 and the Investment
Company Act of 1940, the registrant has duly caused this report to be signed on its behalf by
the undersigned, thereunto duly authorized.
BlackRock International Diversification Fund of BlackRock Funds
By: /s/Anne F. Ackerley
Anne F. Ackerley
Chief Executive Officer of
BlackRock International Diversification Fund of BlackRock Funds
Date: August 21, 2009
Pursuant to the requirements of the Securities Exchange Act of 1934 and the Investment
Company Act of 1940, this report has been signed below by the following persons on behalf
of the registrant and in the capacities and on the dates indicated.
By: /s/Anne F. Ackerley
Anne F. Ackerley
Chief Executive Officer (principal executive officer) of
BlackRock International Diversification Fund of BlackRock Funds
Date: August 21, 2009
By: /s/ Neal J. Andrews
Neal J. Andrews
Chief Financial Officer (principal financial officer) of
BlackRock International Diversification Fund of BlackRock Funds
Date: August 21, 2009