UNITED STATES
SECURITIES AND EXCHANGE COMMISSION
Washington, D.C. 20549
FORM N-CSRS
CERTIFIED SHAREHOLDER REPORT OF REGISTERED
MANAGEMENT INVESTMENT COMPANIES
Investment Company Act file number 811-05742
Name of Fund: BlackRock Funds
| | |
All-Cap Energy & Resources Portfolio Asset Allocation Portfolio Aurora Portfolio Capital Appreciation Portfolio Energy & Resources Portfolio Global Opportunities Portfolio Health Sciences Opportunities Portfolio International Opportunities Portfolio Mid-Cap Growth Equity Portfolio Mid-Cap Value Equity Portfolio Science & Technology Opportunities Portfolio Small Cap Core Equity Portfolio Small Cap Growth Equity Portfolio Small Cap Value Equity Portfolio Small/Mid-Cap Growth Portfolio U.S. Opportunities Portfolio | | |
Fund Address: 100 Bellevue Parkway, Wilmington, DE 19809
Name and address of agent for service: Donald C. Burke, Chief Executive Officer, BlackRock Funds, 800 Scudders Mill Road, Plainsboro, NJ, 08536. Mailing address: P.O. Box 9011, Princeton, NJ, 08543-9011
Registrant’s telephone number, including area code: (800) 441-7762
Date of fiscal year end: 09/30/2009
Date of reporting period: 03/31/2009
| | | | |
| Item 1 | | – | | Report to Stockholders |
EQUITIES FIXED INCOME REAL ESTATE LIQUIDITY ALTERNATIVES BLACKROCK SOLUTIONS
| | |
| BlackRock FundsSM | |  |
| SEMI-ANNUAL REPORT | MARCH 31, 2009 (UNAUDITED) | | |
BlackRock All-Cap Energy & Resources Portfolio
BlackRock Aurora Portfolio
BlackRock Capital Appreciation Portfolio
BlackRock Energy & Resources Portfolio
NOT FDIC INSURED
MAY LOSE VALUE
NO BANK GUARANTEE
Table of Contents
| | | | | | |
2 | | SEMI-ANNUAL REPORT | | MARCH 31, 2009 | | |
A Letter to Shareholders
The past 12 months have been a period investors would like to forget, but instead will vividly remember, as the global financial crisis erupted into the worst recession in decades. Daily headlines recounted the downfalls of storied financial firms, volatile swings in the world’s financial markets and monumental government actions, including the recent passage of the nearly $800 billion American Recovery and Reinvestment Act of 2009.
The economic data generally deteriorated throughout the reporting period. US gross domestic product (“GDP”) contracted at an annual rate of 6.3% in the fourth quarter of 2008, and economic activity appears on pace to be negative in the first quarter of 2009 as well. The Federal Reserve Board (the “Fed”) took forceful action to revive the global economy and ailing financial system. In addition to slashing the federal funds target rate from 3.0% to a record low range of 0% to 0.25%, the central bank provided enormous cash infusions and radically expanded its balance sheet through a range of lending and acquisition programs.
Against this backdrop, US equities contended with high levels of volatility and posted steep losses, notwithstanding a powerful rally in the final month of the reporting period. International markets also experienced sharp downturns, with some regions declining as much or more than the United States. Risk aversion remained the dominant theme in fixed income markets, as investors sought out the haven of Treasury issues at the expense of virtually all other asset classes. High yield issues, in particular, faced unprecedented challenges and posted severe underperformance; that said, the sector pared its losses in the first quarter of 2009, as both liquidity and investor sentiment toward lower-quality debt improved. At the same time, the start of the new year brought somewhat of a return to normalcy for the tax-exempt market, which registered one of its worst years on record in 2008.
In all, investors continued to gravitate toward relative safety, as evidenced in the six- and 12-month returns of the major benchmark indexes:
| | | | | | |
Total Returns as of March 31, 2009 | | 6-month | | | 12-month | |
US equities (S&P 500 Index) | | (30.54 | )% | | (38.09 | )% |
Small cap US equities (Russell 2000 Index) | | (37.17 | ) | | (37.50 | ) |
International equities (MSCI Europe, Australasia, Far East Index) | | (31.11 | ) | | (46.50 | ) |
US Treasury securities (Merrill Lynch 10-Year US Treasury Index) | | 11.88 | | | 10.46 | |
Taxable fixed income (Barclays Capital US Aggregate Bond Index) | | 4.70 | | | 3.13 | |
Tax-exempt fixed income (Barclays Capital Municipal Bond Index) | | 5.00 | | | 2.27 | |
High yield bonds (Barclays Capital US Corporate High Yield 2% Issuer Capped Index) | | (12.65 | ) | | (18.56) | |
Past performance is no guarantee of future results. Index performance shown for illustrative purposes only. You cannot invest directly in an index.
Through periods of market turbulence, as ever, BlackRock’s full resources are dedicated to the management of our clients’ assets. We thank you for entrusting BlackRock with your investments and look forward to continuing to serve you in the months and years ahead.
|
| Sincerely, |
|
 |
| Rob Kapito |
| President, BlackRock Advisors, LLC |
Seeking additional investment insights?
Visit BlackRock’s award-winning Shareholder® magazine, now available exclusively online at www.blackrock.com/shareholdermagazine. In this issue:
| • | | Discover why portfolio diversification still matters – even as nearly every financial asset class lost value over the past year. |
| • | | Learn how adding commodities to a more traditional mix of assets can help you to balance risks and access new potential rewards. |
| • | | Assuage your fears about higher taxes and discover how municipal bonds may offer some relief. |
| • | | Find out if there’s still value to be found in dividend-paying stocks. |
THIS PAGE NOT PART OF YOUR FUND REPORT
| | |
| Portfolio Summary as of March 31, 2009 | | All-Cap Energy & Resources Portfolio (formerly All-Cap Global Resources Portfolio) |
| |
Portfolio Management Commentary | | |
How did the Portfolio perform?
| | • | | The Portfolio underperformed the broad-market S&P 500 Index and the Lipper Natural Resources Funds Index, its sector benchmark, for the six-month period. |
What factors influenced performance?
| | • | | Detracting from performance was the Portfolio’s aggressive positioning (i.e., being fully invested); this hurt performance as we entered a period of financial turmoil and extreme global economic weakness. We remained almost fully invested as the market collapsed during the fourth quarter of 2008. Oil prices fell from more than $100/barrel to about $30/barrel, before rebounding recently. As a result, energy stocks were particularly weak toward the end of 2008, causing the Portfolio to underperform. Coal producers and natural-gas-related stocks were among the hardest hit, as pricing weakened significantly within these segments. As such, the Portfolio’s overweight in exploration & production and coal & consumable fuels detracted considerably from results. |
| | • | | Relative to the broad market, the lack of exposure to financials contributed to the Portfolio’s relative performance over the six months. However, given the broad nature of the market decline in the fourth quarter of 2008, none of the subsectors in the Portfolio contributed significantly to returns. Notably, we did witness a rebound in the stocks in the first quarter of 2009. The Portfolio posted positive absolute and relative returns during that period, led by a mid-cap focus and a rebound in oil-related names and metals & mining companies, as oil and industrial metals prices strengthened. |
Describe recent Portfolio activity.
| | • | | No significant changes were made to the Portfolio during the period. We modestly increased exposure to the metals complex on concerns over future inflation due to the current amount of monetary and fiscal stimulus. |
Describe Portfolio positioning at period-end.
| | • | | Overall, we continue to believe oil, natural gas and coal stocks offer compelling value, even with relatively muted growth expectations. As cuts to exploration and production projects take hold in the coming months, we expect supply-demand dynamics to come back into balance sooner than many may anticipate. Similar to 1998/1999, dramatic downward price moves will likely take too much supply off the market at a time when economies are beginning to stabilize, resulting in significantly higher prices. As this unfolds, we expect the stocks to participate in a meaningful upward revaluation. In anticipation, we have positioned the Portfolio in those stocks and industries that should have the most leverage toward upward-moving prices, while ensuring that the Portfolio’s holdings should be somewhat stable in a flat commodity price environment. We continue to emphasize oil and gas exploration & production, oil service and coal producers. |
The views expressed reflect the opinions of BlackRock as of the date of this report and are subject to change based on changes in market, economic or other conditions. These views are not intended to be a forecast of future events and are no guarantee of future results.
Portfolio Profile as of March 31, 2009
| | | |
Ten Largest Holdings | | Percent of
Long-Term
Investments | |
Range Resources Corp. | | 3 | % |
CONSOL Energy, Inc. | | 3 | |
Potash Corp. of Saskatchewan, Inc. | | 3 | |
Occidental Petroleum Corp. | | 3 | |
FMC Technologies, Inc. | | 3 | |
Bill Barrett Corp. | | 3 | |
Southwestern Energy Co. | | 3 | |
BG Group Plc - ADR | | 3 | |
Silver Wheaton Corp. | | 3 | |
Hess Corp. | | 3 | |
| | | |
Industry Representation | | Percent of
Long-Term
Investments | |
Oil, Gas & Consumable Fuels | | 61 | % |
Energy Equipment & Services | | 21 | |
Metals & Mining | | 11 | |
Gas Utilities | | 4 | |
Chemicals | | 3 | |
For Portfolio compliance purposes, the Portfolio’s industry classifications refer to any one or more of the industry sub-classifications used by one or more widely recognized market indexes or ratings group indexes, and/or as defined by Portfolio management. This definition may not apply for purposes of this report, which may combine industry sub-classifications for reporting ease.
| | | | | | |
4 | | SEMI-ANNUAL REPORT | | MARCH 31, 2009 | | |
| | |
| Portfolio Summary as of March 31, 2009 | | All-Cap Energy & Resources Portfolio |
| |
Total Return Based on a $10,000 Investment | | |
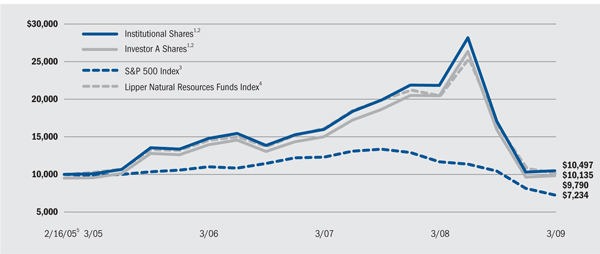
| 1 | Assuming maximum sales charge, if any, transaction costs and other operating expenses, including advisory fees. Institutional Shares do not have a sales charge. |
| 2 | Under normal market conditions, the Portfolio invests at least 80% of its total assets in securities of global energy and natural resources companies and companies in associated businesses, as well as utilities (such as gas, water, cable, electrical and telecommunications utilities). |
| 3 | This unmanaged index covers 500 industrial, utility, transportation and financial companies of the US markets (mostly NYSE issues) representing about 75% of NYSE market capitalization and 30% of NYSE issues. S&P 500 is a trademark of the McGraw-Hill Companies. |
| 4 | An equally weighted index of typically the 30 largest mutual funds within its respective investment objective. |
| 5 | Commencement of operations. |
Past performance is not indicative of future results.
Performance Summary for the Period Ended March 31, 2009
| | | | | | | | | | | | | | | |
| | | | | | Average Annual Total Returns6 | |
| | | | | | 1 Year | | | From Inception7 | |
| | | 6-Month
Total Returns | | | w/o sales
charge | | | w/ sales
charge | | | w/o sales
charge | | | w/ sales
charge | |
Institutional | | (38.48 | )% | | (52.01 | )% | | N/A | | | 1.19 | % | | N/A | |
Service | | (38.56 | ) | | (52.16 | ) | | N/A | | | 0.79 | | | N/A | |
Investor A | | (38.56 | ) | | (52.16 | ) | | (54.67 | )% | | 0.79 | | | (0.51 | )% |
Investor B | | (38.76 | ) | | (52.51 | ) | | (54.27 | ) | | 0.06 | | | (0.32 | ) |
Investor C | | (38.80 | ) | | (52.53 | ) | | (52.92 | ) | | 0.08 | | | 0.08 | |
S&P 500 Index | | (30.54 | ) | | (38.09 | ) | | N/A | | | (7.73 | ) | | N/A | |
Lipper Natural Resources Funds Index | | (19.76 | ) | | (17.57 | ) | | N/A | | | 0.33 | | | N/A | |
| 6 | Assuming maximum sales charges. Average annual total returns with and without sales charges reflect reductions for distribution and service fees. See “About Portfolio Performance” on page 12 for a detailed description of share classes, including any related sales charges and fees. |
| 7 | The Portfolio commenced operations on February 16, 2005. |
N/A - Not applicable as share class and index do not have a sales charge.
Past performance is not indicative of future results.
Expense Example
| | | | | | | | | | | | | | | | | | |
| | | Actual | | Hypothetical9 |
| | | Beginning
Account Value
October 1, 2008 | | Ending
Account Value
March 31, 2009 | | Expenses Paid
During the Period8 | | Beginning
Account Value
October 1, 2008 | | Ending
Account Value
March 31, 2009 | | Expenses Paid
During the Period8 |
Institutional | | $ | 1,000.00 | | $ | 615.20 | | $ | 3.75 | | $ | 1,000.00 | | $ | 1,020.30 | | $ | 4.70 |
Service | | $ | 1,000.00 | | $ | 614.40 | | $ | 5.39 | | $ | 1,000.00 | | $ | 1,018.23 | | $ | 6.77 |
Investor A | | $ | 1,000.00 | | $ | 614.40 | | $ | 5.39 | | $ | 1,000.00 | | $ | 1,018.23 | | $ | 6.77 |
Investor B | | $ | 1,000.00 | | $ | 612.40 | | $ | 8.20 | | $ | 1,000.00 | | $ | 1,014.70 | | $ | 10.30 |
Investor C | | $ | 1,000.00 | | $ | 612.00 | | $ | 8.20 | | $ | 1,000.00 | | $ | 1,014.70 | | $ | 10.30 |
| 8 | For each class of the Portfolio, expenses are equal to the annualized expense ratio for the class (0.93% for Institutional, 1.34% for Service, 1.34% for Investor A, 2.04% for Investor B and 2.04% for Investor C), multiplied by the average account value over the period, multiplied by 182/365 (to reflect the one-half year period shown). |
| 9 | Hypothetical 5% annual return before expenses is calculated by pro-rating the number of days in the most recent fiscal half year divided by 365. |
See “Disclosure of Expenses” on page 13 for further information on how expenses were calculated.
| | | | | | |
| | | SEMI-ANNUAL REPORT | | MARCH 31, 2009 | | 5 |
| | |
| Portfolio Summary as of March 31, 2009 | | Aurora Portfolio |
| |
Portfolio Management Commentary | | |
How did the Portfolio perform?
| | • | | The Portfolio outperformed the benchmark Russell 2500 Value Index for the six-month period. |
What factors influenced performance?
| | • | | In an extremely volatile period for financial stocks, the Portfolio’s relative performance benefited most directly from strong stock selection in the financials sector. PHH Corp., Annaly Capital Management, Inc. and Fidelity National Financial were among the standout individual contributors. A significant underweight in real estate investment trusts (REITs), which sold off sharply during the period, also added value to Portfolio returns. |
| | • | | In industrials, positive stock selection among commercial services and supplies names, including The Brink’s Co. and pest control services provider Rollins, Inc., benefited relative returns. The Portfolio’s machinery holdings also outperformed their benchmark counterparts, contributing to favorable performance comparisons. |
| | • | | While overweight positions in the information technology and consumer discretionary sectors created value, these relative gains were overshadowed by the negative impact of weak stock selection. Customer management services provider Convergys and specialty retailer Collective Brands, Inc. were among the key individual detractors from Portfolio performance, and both of these positions were eliminated during the period. |
| | • | | The utilities sector outperformed the broader market during the period as investors preferred the more defensive areas of the market. Accordingly, an underweight among utilities stocks detracted from the Portfolio’s relative performance. |
Describe recent Portfolio activity.
| | • | | Given the difficult credit environment and ongoing deterioration in the housing market, the Portfolio was significantly underweight in the financials sector at the beginning of the period. However, we added to the Portfolio’s exposure in this area, particularly during the fourth quarter of 2008, in response to unprecedented fiscal and monetary stimulus and historically-attractive valuations within the sector. |
| | • | | More broadly, we reduced the Portfolio’s defensive positioning later in the period, trimming overweight positions in the consumer staples and healthcare sectors, while adding to the Portfolio’s weighting in consumer discretionary. |
Describe Portfolio positioning at period-end.
| | • | | At period-end, the Portfolio was overweight relative to the benchmark in consumer discretionary, primarily within the hotels, restaurant and leisure and apparel and luxury goods sub-sectors. Other Portfolio overweights included consumer staples and healthcare, particularly among healthcare providers and services names. Key underweights included financials, specifically REITs, insurance companies and commercial banks, and utilities. |
The views expressed reflect the opinions of BlackRock as of the date of this report and are subject to change based on changes in market, economic or other conditions. These views are not intended to be a forecast of future events and are no guarantee of future results.
Portfolio Profile as of March 31, 2009
| | | |
Ten Largest Holdings | | Percent of
Long-Term
Investments | |
Cullen/Frost Bankers, Inc. | | 4 | % |
PHH Corp. | | 4 | |
Ralcorp Holdings, Inc. | | 2 | |
First Niagara Financial Group, Inc. | | 2 | |
SkillSoft Plc - ADR | | 2 | |
Magellan Health Services, Inc. | | 2 | |
Darden Restaurants, Inc. | | 2 | |
DaVita, Inc. | | 2 | |
The Brink’s Co. | | 2 | |
Sybase, Inc. | | 2 | |
| | | |
Sector Allocation | | Percent of
Long-Term
Investments | |
Financials | | 24 | % |
Consumer Discretionary | | 18 | |
Information Technology | | 13 | |
Industrials | | 11 | |
Health Care | | 10 | |
Consumer Staples | | 9 | |
Materials | | 6 | |
Energy | | 5 | |
Utilities | | 4 | |
For Portfolio compliance purposes, the Portfolio’s sector classifications refer to any one or more of the sector sub-classifications used by one or more widely recognized market indexes or ratings group indexes, and/or as defined by Portfolio management. This definition may not apply for purposes of this report, which may combine sector sub-classifications for reporting ease.
| | | | | | |
6 | | SEMI-ANNUAL REPORT | | MARCH 31, 2009 | | |
Aurora Portfolio
Total Return Based on a $10,000 Investment
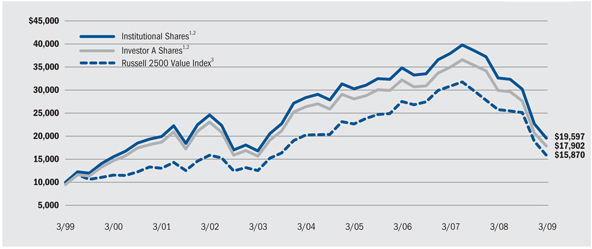
| 1 | Assuming maximum sales charge, if any, transaction costs and other operating expenses, including advisory fees. Institutional Shares do not have a sales charge. |
| 2 | Under normal market conditions, the Portfolio invests at least 80% of its total assets in small- and mid-capitalization common and preferred stocks and securities convertible into common and preferred stocks. |
| 3 | An index composed of the Russell 2500 companies with lower price-to-book ratios and lower forecasted growth values. |
Past performance is not indicative of future results.
Performance Summary for the Period Ended March 31, 2009
| | | | | | | | | | | | | | | | | | | | | |
| | | | | | Average Annual Total Returns4 | |
| | | | | | 1 Year | | | 5 Years | | | 10 Years | |
| | | 6-Month
Total Returns | | | w/o sales
charge | | | w/sales
charge | | | w/o sales
charge | | | w/sales
charge | | | w/o sales
charge | | | w/sales
charge | |
Institutional | | (35.30 | )% | | (40.10 | )% | | N/A | | | (7.17 | )% | | N/A | | | 6.96 | % | | N/A | |
Investor A | | (35.39 | ) | | (40.30 | ) | | (43.43 | )% | | (7.49 | ) | | (8.48 | )% | | 6.57 | | | 6.00 | % |
Investor B | | (35.69 | ) | | (40.80 | ) | | (43.46 | ) | | (8.19 | ) | | (8.33 | ) | | 5.95 | | | 5.95 | |
Investor C | | (35.65 | ) | | (40.72 | ) | | (41.32 | ) | | (8.18 | ) | | (8.18 | ) | | 5.79 | | | 5.79 | |
R | | (35.44 | ) | | (40.26 | ) | | N/A | | | (7.64 | ) | | N/A | | | 6.38 | | | N/A | |
Russell 2500 Value Index | | (37.13 | ) | | (38.66 | ) | | N/A | | | (4.79 | ) | | N/A | | | 4.73 | | | N/A | |
| 4 | Assuming maximum sales charges. Average annual total returns with and without sales charges reflect reductions for distribution and service fees. See “About Portfolio Performance” on page 12 for a detailed description of share classes, including any related sales charges and fees. |
N/A - Not applicable as share class and index do not have a sales charge.
Past performance is not indicative of future results.
Expense Example
| | | | | | | | | | | | | | | | | | |
| | | Actual | | Hypothetical6 |
| | | Beginning
Account Value
October 1, 2008 | | Ending
Account Value
March 31, 2009 | | Expenses Paid
During the Period5 | | Beginning
Account Value
October 1, 2008 | | Ending
Account Value
March 31, 2009 | | Expenses Paid
During the Period5 |
Institutional | | $ | 1,000.00 | | $ | 647.00 | | $ | 4.31 | | $ | 1,000.00 | | $ | 1,019.70 | | $ | 5.30 |
Investor A | | $ | 1,000.00 | | $ | 646.10 | | $ | 5.91 | | $ | 1,000.00 | | $ | 1,017.73 | | $ | 7.27 |
Investor B | | $ | 1,000.00 | | $ | 643.10 | | $ | 8.97 | | $ | 1,000.00 | | $ | 1,013.94 | | $ | 11.06 |
Investor C | | $ | 1,000.00 | | $ | 643.50 | | $ | 8.97 | | $ | 1,000.00 | | $ | 1,013.94 | | $ | 11.06 |
R | | $ | 1,000.00 | | $ | 645.60 | | $ | 6.56 | | $ | 1,000.00 | | $ | 1,016.92 | | $ | 8.08 |
| 5 | For each class of the Portfolio, expenses are equal to the annualized expense ratio for the class (1.05% for Institutional, 1.44% for Investor A, 2.19% for Investor B, 2.19% for Investor C and 1.60% for R), multiplied by the average account value over the period, multiplied by 182/365 (to reflect the one-half year period shown). |
| 6 | Hypothetical 5% annual return before expenses is calculated by pro-rating the number of days in the most recent fiscal half year divided by 365. |
See “Disclosure of Expenses” on page 13 for further information on how expenses were calculated.
| | | | | | |
| | | SEMI-ANNUAL REPORT | | MARCH 31, 2009 | | 7 |
| | |
| Portfolio Summary as of March 31, 2009 | | Capital Appreciation Portfolio |
| |
Portfolio Management Commentary | | |
How did the Portfolio perform?
| | • | | The Portfolio outperformed the benchmark Russell 1000 Growth Index for the six-month period. |
What factors influenced performance?
| | • | | The US stock market was under heavy pressure during the last six months. Poor economic and housing data, combined with a shuttered credit market and continued doubts about financial institutions, produced extreme levels of fear and volatility. However, toward the end of the six months, we saw significant rallies, and the period ended up closing on a relatively high note. Stocks of every size and style were negatively affected, and the benchmark Russell 1000 Growth Index lost 26% over the period. Against this backdrop, the Portfolio also registered a large decline, but managed to outperform the index thanks to sector strategy and excellent stock selection in the consumer discretionary sector. These positive factors overshadowed negative results in the healthcare and energy sectors. |
| | • | | Stock selection in the consumer discretionary sector provided the greatest source of absolute and relative strength, with the Portfolio’s holdings collectively delivering a positive return for the period, despite the strongly-negative market. Top contributors included education services provider Apollo Group, Inc. and several value-oriented retailers, including Ross Stores, Inc., Kohl’s Corp. and Amazon.com. The Portfolio’s sector positioning also added value, with significant overweights in consumer staples and healthcare held earlier in the period boosting relative returns. |
| | • | | Conversely, stock selection in the energy sector detracted from relative returns during the period. While the Portfolio’s energy services stocks slightly outperformed, its investments in exploration and production companies underperformed significantly. Investments in coal producer Massey Energy Co. and natural gas producer EOG Resources, Inc. significantly underperformed the benchmark allocation, which was dominated by oil producers. In healthcare, we missed out on significant upside by not holding Genentech Inc. and Schering-Plough Corp., which were both acquired at significant premiums during the period. |
Describe recent Portfolio activity.
| | • | | During the six months, we began to neutralize the defensive positioning that characterized the Portfolio for the majority of 2008. We accomplished this by significantly reducing the Portfolio’s investments in the defensive healthcare and consumer staples sectors, while increasing its exposure to opportunistic investments in the more cyclical consumer discretionary and information technology sectors. |
Describe Portfolio positioning at period-end.
| | • | | At period-end, the Portfolio’s largest overweights relative to the benchmark were in the consumer discretionary and telecommunication services sectors, while its most substantial underweights were in the consumer staples and utilities sectors. |
The views expressed reflect the opinions of BlackRock as of the date of this report and are subject to change based on changes in market, economic or other conditions. These views are not intended to be a forecast of future events and are no guarantee of future results.
Portfolio Profile as of March 31, 2009
| | | |
Ten Largest Holdings | | Percent of
Long-Term
Investments | |
QUALCOMM, Inc. | | 4 | % |
Cisco Systems, Inc. | | 3 | |
Wal-Mart Stores, Inc. | | 3 | |
Google, Inc. - Class A | | 3 | |
The Coca-Cola Co. | | 3 | |
Abbott Laboratories | | 3 | |
Apple, Inc. | | 3 | |
Danaher Corp. | | 3 | |
Kohl’s Corp. | | 2 | |
American Tower Corp. - Class A | | 2 | |
| | | |
Sector Allocation | | Percent of
Long-Term
Investments | |
Information Technology | | 31 | % |
Health Care | | 16 | |
Consumer Discretionary | | 13 | |
Industrials | | 11 | |
Consumer Staples | | 11 | |
Energy | | 8 | |
Financials | | 4 | |
Telecommunication Services | | 3 | |
Materials | | 3 | |
For Portfolio compliance purposes, the Portfolio’s sector classifications refer to any one or more of the sector sub-classifications used by one or more widely recognized market indexes or ratings group indexes, and/or as defined by Portfolio management. This definition may not apply for purposes of this report, which may combine sector sub-classifications for reporting ease.
| | | | | | |
8 | | SEMI-ANNUAL REPORT | | MARCH 31, 2009 | | |
Capital Appreciation Portfolio
Total Return Based on a $10,000 Investment
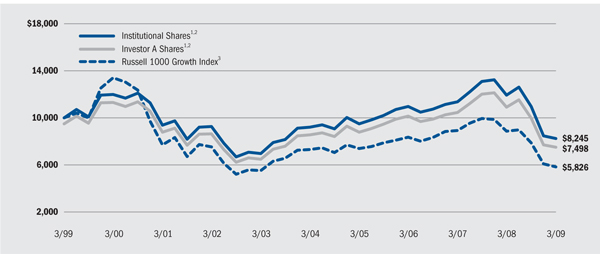
| 1 | Assuming maximum sales charge, if any, transaction costs and other operating expenses, including advisory fees. Institutional Shares do not have a sales charge. |
| 2 | Under normal market conditions, the Portfolio invests at least 80% of total assets in common and preferred stock and securities convertible into common and preferred stock of mid- and large-size companies. |
| 3 | An index composed of those Russell 1000 securities with greater-than-average growth orientation, generally having higher price-to-book and price-to-earnings ratios, lower dividend yields and higher forecasted growth values. |
Past performance is not indicative of future results.
Performance Summary for the Period Ended March 31, 2009
| | | | | | | | | | | | | | | | | | | | | |
| | | | | | Average Annual Total Returns4 | |
| | | | | | 1 Year | | | 5 Years | | | 10 Years | |
| | | 6-Month
Total Returns | | | w/o sales
charge | | | w/sales
charge | | | w/o sales
charge | | | w/sales
charge | | | w/o sales
charge | | | w/sales
charge | |
Institutional | | (24.85 | )% | | (30.96 | )% | | N/A | | | (2.16 | )% | | N/A | | | (1.91 | )% | | N/A | |
Investor A | | (24.81 | ) | | (31.35 | ) | | (34.97 | )% | | (2.56 | ) | | (3.60 | )% | | (2.31 | ) | | (2.84 | )% |
Investor B | | (25.32 | ) | | (31.82 | ) | | (34.89 | ) | | (3.29 | ) | | (3.68 | ) | | (2.89 | ) | | (2.89 | ) |
Investor C | | (25.30 | ) | | (31.79 | ) | | (32.47 | ) | | (3.22 | ) | | (3.22 | ) | | (3.00 | ) | | (3.00 | ) |
Russell 1000 Growth Index | | (25.97 | ) | | (34.28 | ) | | N/A | | | (4.38 | ) | | N/A | | | (5.26 | ) | | N/A | |
| 4 | Assuming maximum sales charges. Average annual total returns with and without sales charges reflect reductions for distribution and service fees. See “About Portfolio Performance” on page 12 for a detailed description of share classes, including any related sales charges and fees. |
N/A - Not applicable as share class and index do not have a sales charge.
Past performance is not indicative of future results.
Expense Example
| | | | | | | | | | | | | | | | | | |
| | | Actual | | Hypothetical6 |
| | | Beginning
Account Value
October 1, 2008 | | Ending
Account Value
March 31, 2009 | | Expenses Paid
During the Period5 | | Beginning
Account Value
October 1, 2008 | | Ending
Account Value
March 31, 2009 | | Expenses Paid
During the Period5 |
Institutional | | $ | 1,000.00 | | $ | 751.50 | | $ | 3.06 | | $ | 1,000.00 | | $ | 1,021.47 | | $ | 3.53 |
Investor A | | $ | 1,000.00 | | $ | 751.90 | | $ | 5.68 | | $ | 1,000.00 | | $ | 1,018.44 | | $ | 6.56 |
Investor B | | $ | 1,000.00 | | $ | 746.80 | | $ | 9.15 | | $ | 1,000.00 | | $ | 1,014.40 | | $ | 10.60 |
Investor C | | $ | 1,000.00 | | $ | 747.00 | | $ | 8.19 | | $ | 1,000.00 | | $ | 1,015.51 | | $ | 9.49 |
| 5 | For each class of the Portfolio, expenses are equal to the annualized expense ratio for the class (0.70% for Institutional, 1.30% for Investor A, 2.10% for Investor B and 1.88% for Investor C), multiplied by the average account value over the period, multiplied by 182/365 (to reflect the one-half year period shown). |
| 6 | Hypothetical 5% annual return before expenses is calculated by pro-rating the number of days in the most recent fiscal half year divided by 365. |
See “Disclosure of Expenses” on page 13 for further information on how expenses were calculated.
| | | | | | |
| | | SEMI-ANNUAL REPORT | | MARCH 31, 2009 | | 9 |
| | |
| Portfolio Summary as of March 31, 2009 | | Energy & Resources Portfolio (formerly Global Resources Portfolio) |
| |
Portfolio Management Commentary | | |
How did the Portfolio perform?
| | • | | The Portfolio underperformed the broad-market S&P 500 Index and the Lipper Natural Resources Funds Index, its sector benchmark, for the six-month period. |
What factors influenced performance?
| | • | | Overall, the Portfolio’s aggressive positioning (i.e., being fully invested) and small-cap orientation hurt returns in an environment in which investors became extraordinarily risk averse. The Portfolio’s emphasis on coal producers and oil and gas exploration and production companies sharply detracted from performance as commodity prices plunged and the global economy slipped into a severe recession. While oil prices have recently rebounded, natural gas and coal pricing remains subdued as electricity demand has declined. These factors continue to pressure many of the Portfolio’s coal and exploration and production holdings. |
| | • | | Energy stocks were among the market leaders on both the upside and the downside during the six months. The Portfolio underperformed the broad market significantly during the fourth quarter of 2008, as did all subsectors, but it outperformed during the first quarter of 2009. While relative leadership was fairly broad-based, energy service names and other oil-related stocks outperformed as the price of oil rebounded due to significant Organization of the Petroleum Exporting Countries (OPEC) and non-OPEC production cuts. Additionally, metals and mining holdings performed relatively well, as base metal prices rebounded and investors flocked to precious metals as a hedge against potential future inflation. |
Describe recent Portfolio activity.
| | • | | Few significant changes were made to the Portfolio during the six-month period. We deployed cash and added to names, such as Penn Virginia Corp., on significant price weakness and attractive valuation. |
Describe Portfolio positioning at period-end.
| | • | | Overall, we continue to believe oil, natural gas and coal stocks offer compelling value, even with relatively muted growth expectations. As cuts to exploration and production projects take hold in the coming months, we expect supply-demand dynamics to come back into balance sooner than many may anticipate. Similar to 1998/1999, dramatic downward price moves will likely take too much supply off the market at a time when economies are beginning to stabilize, resulting in significantly higher prices. As this unfolds, we expect the stocks to participate in a meaningful upward revaluation. In anticipation, we have positioned the Portfolio in those stocks and industries that should have the most leverage toward upward-moving prices, while ensuring that the Portfolio’s holdings should be somewhat stable in a flat commodity price environment. We continue to emphasize oil and gas exploration & production, oil service and coal producers. |
| | • | | Additionally, while investors’ risk aversion is negatively affecting our small cap portfolios in the near term, we believe that fundamentals will dictate a reversal of this trend on a longer-term. Thus, we remain aggressively positioned and believe that we will benefit when the market capitalization performance gap narrows, as it has in past cycles. |
The views expressed reflect the opinions of BlackRock as of the date of this report and are subject to change based on changes in market, economic or other conditions. These views are not intended to be a forecast of future events and are no guarantee of future results.
Portfolio Profile as of March 31, 2009
| | | |
Ten Largest Holdings | | Percent of
Long-Term
Investments | |
Southwestern Energy Co. | | 7 | % |
PetroHawk Energy Corp. | | 7 | |
CONSOL Energy, Inc. | | 5 | |
Peabody Energy Corp. | | 4 | |
Newfield Exploration Co. | | 4 | |
Plains Exploration & Production Co. | | 4 | |
Arch Coal, Inc. | | 3 | |
Massey Energy Co. | | 3 | |
Goodrich Petroleum Corp. | | 3 | |
Penn Virginia Corp. | | 3 | |
| | | |
Industry Representation | | Percent of
Long-Term
Investments | |
Oil, Gas & Consumable Fuels | | 74 | % |
Metals & Mining | | 12 | |
Energy Equipment & Services | | 11 | |
Gas Utilities | | 2 | |
Electrical Equipment | | 1 | |
For Portfolio compliance purposes, the Portfolio’s industry classifications refer to any one or more of the industry sub-classifications used by one or more widely recognized market indexes or ratings group indexes, and/or as defined by Portfolio management. This definition may not apply for purposes of this report, which may combine industry sub-classifications for reporting ease.
| | | | | | |
10 | | SEMI-ANNUAL REPORT | | MARCH 31, 2009 | | |
| | |
| Portfolio Summary as of March 31, 2009 | | Energy & Resources Portfolio |
| |
| Total Return Based on a $10,000 Investment | | |
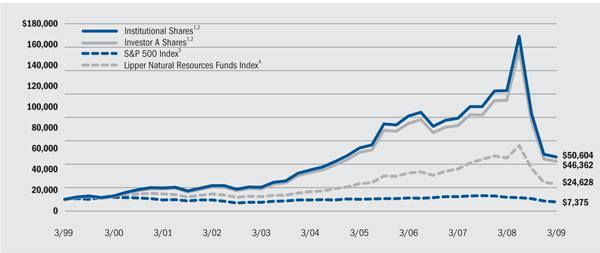
| 1 | Assuming maximum sales charge, if any, transaction costs and other operating expenses, including advisory fees. Institutional Shares do not have a sales charge. |
| 2 | Under normal market conditions, the Portfolio invests at least 80% of its total assets in securities of global energy and natural resources companies and companies in associated businesses, as well as utilities (such as gas, water, cable, electrical and telecommunications utilities). |
| 3 | This unmanaged Index covers 500 industrial, utility, transportation and financial companies of the US markets (mostly NYSE issues) representing about 75% of NYSE market capitalization and 30% of NYSE issues. S&P 500 is a trademark of the McGraw-Hill Companies. |
| 4 | An equally weighted index of typically the 30 largest mutual funds within its respective investment objective. Past performance is not indicative of future results. |
Performance Summary for the Period Ended March 31, 2009
| | | | | | | | | | | | | | | | | | | | | |
| | | | | | Average Annual Total Returns5 | |
| | | | | | 1 Year | | | 5 Years | | | 10 Years | |
| | | 6-Month
Total Returns | | | w/o sales
charge | | | w/sales
charge | | | w/o sales
charge | | | w/sales
charge | | | w/o sales
charge | | | w/sales
charge | |
Institutional | | (45.14 | )% | | (55.73 | )% | | N/A | | | 5.74 | % | | N/A | | | 17.60 | % | | N/A | |
Investor A | | (45.38 | ) | | (55.88 | ) | | (58.19 | )% | | 5.44 | | | 4.31 | % | | 17.20 | | | 16.58 | % |
Investor B | | (45.48 | ) | | (56.19 | ) | | (57.36 | ) | | 4.69 | | | 4.56 | | | 16.55 | | | 16.55 | |
Investor C | | (45.49 | ) | | (56.18 | ) | | (56.44 | ) | | 4.69 | | | 4.69 | | | 16.41 | | | 16.41 | |
S&P 500 Index | | (30.54 | ) | | (38.09 | ) | | N/A | | | (4.77 | ) | | N/A | | | (3.00 | ) | | N/A | |
Lipper Natural Resources Funds Index | | (19.76 | ) | | (17.57 | ) | | N/A | | | 7.35 | | | N/A | | | 9.43 | | | N/A | |
| 5 | Assuming maximum sales charges. Average annual total returns with and without sales charges reflect reductions for distribution and service fees. See “About Portfolio Performance” on page 12 for a detailed description of share classes, including any related sales charges and fees. |
N/A - Not applicable as share class and index do not have a sales charge.
Past performance is not indicative of future results.
Expense Example
| | | | | | | | | | | | | | | | | | |
| | | Actual | | Hypothetical7 |
| | | Beginning
Account Value
October 1, 2008 | | Ending
Account Value
March 31, 2009 | | Expenses Paid
During the Period6 | | Beginning
Account Value
October 1, 2008 | | Ending
Account Value
March 31, 2009 | | Expenses Paid
During the Period6 |
Institutional | | $ | 1,000.00 | | $ | 548.60 | | $ | 3.98 | | $ | 1,000.00 | | $ | 1,019.80 | | $ | 5.20 |
Investor A | | $ | 1,000.00 | | $ | 546.20 | | $ | 5.09 | | $ | 1,000.00 | | $ | 1,018.34 | | $ | 6.66 |
Investor B | | $ | 1,000.00 | | $ | 545.20 | | $ | 7.86 | | $ | 1,000.00 | | $ | 1,014.70 | | $ | 10.30 |
Investor C | | $ | 1,000.00 | | $ | 545.10 | | $ | 7.86 | | $ | 1,000.00 | | $ | 1,014.70 | | $ | 10.30 |
| 6 | For each class of the Portfolio, expenses are equal to the annualized expense ratio for the class (1.03% for Institutional, 1.32% for Investor A, 2.04% Investor B and 2.04% for Investor C), multiplied by the average account value over the period, multiplied by 182/365 (to reflect the one-half year period shown). |
| 7 | Hypothetical 5% annual return before expenses is calculated by pro-rating the number of days in the most recent fiscal half year divided by 365. |
See “Disclosure of Expenses” on page 13 for further information on how expenses were calculated.
| | | | | | |
| | | SEMI-ANNUAL REPORT | | MARCH 31, 2009 | | 11 |
About Portfolio Performance
| | • | | Institutional Shares are not subject to any sales charge (front-end load) or deferred sales charge and are available only to eligible investors. These shares bear no ongoing distribution or service fees. |
| | • | | Service Shares are not subject to any sales charge (front-end load) or deferred sales charge. These shares are subject to a service fee of 0.25% per year (but no distribution fee). |
| | • | | Investor A Shares incur a maximum initial sales charge (front-end load) of 5.25% and a service fee of 0.25% per year (but no distribution fee). |
| | • | | Investor B Shares are subject to a maximum contingent deferred sales charge of 4.50% declining to 0% after six years. In addition, these shares are subject to a distribution fee of 0.75% per year and a service fee of 0.25% per year. These shares automatically convert to Investor A Shares after approximately eight years. (There is no initial sales charge for automatic share conversions.) All returns for periods greater than eight years reflect this conversion. |
| | • | | Investor C Shares are subject to a 1.00% contingent deferred sales charge if redeemed within one year of purchase. In addition, these shares are subject to a distribution fee of 0.75% per year and a service fee of 0.25% per year. |
| | • | | R Shares are not subject to any initial sales charge (front-end load) or deferred sales charge. These shares are subject to a distribution fee of 0.25% per year and a service fee of 0.25% per year. R Shares are available only to certain retirement and other similar plans. |
Performance information reflects past performance and does not guarantee future results. Current performance may be lower or higher than the performance data quoted. Refer to www.blackrock.com/funds to obtain performance data current to the most recent month-end. Performance results do not reflect the deduction of taxes that a shareholder would pay on fund distributions or the redemption of fund shares. Each Portfolio other than the BlackRock Capital Appreciation Portfolio may charge a 2% redemption fee for sales or exchanges of shares within 30 days of purchase or exchange. Performance data does not reflect this potential fee. Figures shown in the performance tables on the previous pages assume reinvestment of all dividends and distributions, if any, at net asset value on the ex-dividend date. Investment return and principal value of shares will fluctuate so that shares, when redeemed, may be worth more or less than their original cost. Dividends paid to each class of shares will vary because of the different levels of service, distribution and transfer agency fees applicable to each class, which are deducted from the income available to be paid to shareholders.
The performance information on the previous pages includes information for each class of each Portfolio since the commencement of operations of such Portfolio, rather than the date such class was introduced. Performance information for each class introduced after the commencement of operations of a Portfolio is therefore based on the performance history of a predecessor class adjusted to reflect the class specific fees applicable to each class at the time of the launch of such share class. This information may be considered when assessing a Portfolio’s performance, but does not represent the actual performance of this share class.
Performance for the Aurora, Capital Appreciation and Energy & Resources Portfolios for the periods prior to January 31, 2005 is based on performance of certain former State Street Research mutual funds that reorganized with the Portfolios on that date.
The performance information also reflects fee waivers and reimbursements that subsidize and reduce the total operating expenses of each Portfolio. The Portfolios’ returns would have been lower if there were no such waivers and reimbursements. BlackRock Advisors, LLC is under no obligation to waive or continue waiving its fees after February 1, 2010.
| | | | | | |
12 | | SEMI-ANNUAL REPORT | | MARCH 31, 2009 | | |
Disclosure of Expenses
Shareholders of these Portfolios may incur the following charges: (a) expenses related to transactions, including sales charges and redemption fees; and (b) operating expenses, including advisory fees, service and distribution fees including 12b-1 fees, and other Portfolio expenses. The expense examples on the previous pages (which are based on a hypothetical investment of $1,000 invested on October 1, 2008 and held through March 31, 2009) are intended to assist shareholders both in calculating expenses based on an investment in each Portfolio and in comparing these expenses with similar costs of investing in other mutual funds.
The Expense Example tables provide information about actual account values and actual expenses. In order to estimate the expenses a shareholder paid during the period covered by this report, shareholders can divide their account value by $1,000 and then multiply the result by the number corresponding to their share class under the headings entitled “Expenses Paid During the Period.”
The tables also provide information about hypothetical account values and hypothetical expenses based on the Portfolios’ actual expense ratios and an assumed rate of return of 5% per year before expenses. In order to assist shareholders in comparing the ongoing expenses of investing in these Portfolios and other funds, compare the 5% hypothetical example with the 5% hypothetical examples that appear in other funds’ shareholder reports.
The expenses shown in the table are intended to highlight shareholders’ ongoing costs only and do not reflect any transactional expenses, such as sales charges, redemption fees or exchange fees. Therefore, the hypothetical table is useful in comparing ongoing expenses only, and will not help shareholders determine the relative total expenses of owning different funds. If these transactional expenses were included, shareholder expenses would have been higher.
Derivative Instruments
The Portfolios may invest in various derivative instruments, including forward currency contracts, and other instruments specified in the Notes to Financials Statements, which constitute forms of economic leverage. Such instruments are used to obtain exposure to a market without owning or taking physical custody of securities or to hedge market and/or interest rate risks. Such derivative instruments involve risks, including the imperfect correlation between the value of a derivative instrument and the underlying asset, possible default of the other party to the transaction and illiquidity of the derivative instrument. A Portfolio’s ability to successfully use a derivative instrument depends on the Advisor’s ability to accurately predict pertinent market movements, which cannot be assured. The use of derivative instruments may result in losses greater than if they had not been used, may require a Portfolio to sell or purchase portfolio securities at inopportune times or for prices other than current market values, may limit the amount of appreciation a Portfolio can realize on an investment or may cause a Portfolio to hold a security that it might otherwise sell. The Portfolios’ investments in these instruments are discussed in detail in the Notes to Financial Statements.
| | | | | | |
| | | SEMI-ANNUAL REPORT | | MARCH 31, 2009 | | 13 |
| | |
| Schedule of Investments March 31, 2009 (Unaudited) | | All-Cap Energy & Resources Portfolio |
| | (Percentages shown are based on Net Assets) |
| | | | | |
| | | Shares | | Value |
Common Stocks | | | | | |
Chemicals — 2.8% | | | | | |
Potash Corp. of Saskatchewan, Inc. | | 154,900 | | $ | 12,517,469 |
| | | | | |
Energy Equipment & Services — 20.8% | | | | | |
Cameron International Corp. (a) | | 212,930 | | | 4,669,555 |
Core Laboratories NV | | 148,850 | | | 10,889,866 |
ENSCO International, Inc. | | 124,838 | | | 3,295,723 |
FMC Technologies, Inc. (a) | | 391,390 | | | 12,277,904 |
Halliburton Co. | | 259,000 | | | 4,006,730 |
Helmerich & Payne, Inc. | | 334,330 | | | 7,612,694 |
Noble Corp. | | 212,310 | | | 5,114,548 |
Oceaneering International, Inc. (a) | | 137,310 | | | 5,062,620 |
Pride International, Inc. (a) | | 230,580 | | | 4,145,828 |
Schlumberger Ltd. | | 198,480 | | | 8,062,258 |
Smith International, Inc. | | 164,340 | | | 3,530,023 |
Transocean Ltd. (a) | | 187,240 | | | 11,017,202 |
Unit Corp. (a) | | 279,340 | | | 5,843,793 |
Weatherford International Ltd. (a) | | 694,870 | | | 7,692,211 |
| | | | | |
| | | | | 93,220,955 |
| | | | | |
Gas Utilities — 4.2% | | | | | |
EQT Corp. | | 351,410 | | | 11,009,675 |
Questar Corp. | | 272,030 | | | 8,005,843 |
| | | | | |
| | | | | 19,015,518 |
| | | | | |
Metals & Mining — 10.3% | | | | | |
Agnico-Eagle Mines Ltd. | | 147,590 | | | 8,400,823 |
BHP Billiton Ltd. - ADR | | 239,510 | | | 10,682,146 |
Eldorado Gold Corp. (a) | | 570,620 | | | 5,159,476 |
Goldcorp, Inc. | | 242,852 | | | 8,091,829 |
Silver Wheaton Corp. (a) | | 1,370,824 | | | 11,281,881 |
Teck Cominco Ltd. - Class B | | 438,290 | | | 2,450,781 |
| | | | | |
| | | | | 46,066,936 |
| | | | | |
Oil, Gas & Consumable Fuels — 60.4% | | | | | |
Apache Corp. | | 173,630 | | | 11,127,947 |
Arch Coal, Inc. | | 333,500 | | | 4,458,895 |
BG Group Plc - ADR | | 155,110 | | | 11,678,232 |
Bill Barrett Corp. (a) | | 543,621 | | | 12,090,131 |
Cameco Corp. | | 76,770 | | | 1,318,141 |
Canadian Natural Resources Ltd. | | 173,340 | | | 6,683,990 |
CONSOL Energy, Inc. | | 543,530 | | | 13,718,697 |
Crescent Point Energy Trust | | 275,870 | | | 5,767,714 |
Denbury Resources, Inc. (a) | | 671,190 | | | 9,973,883 |
Devon Energy Corp. | | 190,120 | | | 8,496,463 |
EnCana Corp. | | 234,260 | | | 9,513,299 |
EOG Resources, Inc. | | 167,970 | | | 9,198,037 |
Forest Oil Corp. (a) | | 319,590 | | | 4,202,608 |
Galleon Energy, Inc. - Class A (a) | | 720,094 | | | 2,061,817 |
Gasco Energy, Inc. (a)(b) | | 1,525,000 | | | 594,750 |
Heritage Oil Ltd. (a) | | 491,250 | | | 2,340,159 |
Hess Corp. | | 207,470 | | | 11,244,874 |
Hugoton Royalty Trust | | 1 | | | 10 |
Massey Energy Co. | | 624,639 | | | 6,321,347 |
Murphy Oil Corp. | | 137,890 | | | 6,173,335 |
Newfield Exploration Co. (a) | | 358,000 | | | 8,126,600 |
Nexen, Inc. | | 605,754 | | | 10,272,066 |
Noble Energy, Inc. | | 173,800 | | | 9,364,344 |
Occidental Petroleum Corp. | | 222,350 | | | 12,373,778 |
OGX Petroleo e Gas Participacoes SA (a) | | 11,200 | | | 3,481,113 |
Patriot Coal Corp. (a)(b) | | 64,116 | | | 237,870 |
Peabody Energy Corp. | | 409,390 | | | 10,251,126 |
PetroChina Co. Ltd. - ADR | | 33,390 | | | 2,661,183 |
Petroleo Brasileiro SA - ADR | | 365,240 | | | 11,128,863 |
Plains Exploration & Production Co. (a) | | 283,710 | | | 4,888,323 |
Range Resources Corp. | | 374,800 | | | 15,426,768 |
Rex Energy Corp. (a) | | 310,500 | | | 891,135 |
Southwestern Energy Co. (a) | | 404,400 | | | 12,006,636 |
StatoilHydro ASA | | 373,222 | | | 6,603,389 |
StatoilHydro ASA - ADR | | 157,440 | | | 2,745,754 |
Suncor Energy, Inc. | | 245,980 | | | 5,463,216 |
TriStar Oil & Gas Ltd. (a) | | 259,114 | | | 1,896,908 |
Whiting Petroleum Corp. (a) | | 277,130 | | | 7,163,810 |
XTO Energy, Inc. | | 310,671 | | | 9,512,746 |
| | | | | |
| | | | | 271,459,957 |
| | | | | |
Total Long-Term Investments
(Cost — $598,523,002) — 98.5% | | | | | 442,280,835 |
| | | | | |
| | | | | | |
| | | Shares/
Beneficial
Interest | | | |
Short-Term Securities | | | | | | |
BlackRock Liquidity Funds, TempFund, | | | | | | |
0.60% (c)(d) | | 6,493,941 | | | 6,493,941 | |
BlackRock Liquidity Series, LLC Money Market Series, 1.17% (c)(d)(e) | | 440,000 | | | 440,000 | |
| | | | | | |
Total Short-Term Securities
(Cost — $6,933,941) — 1.5% | | | | | 6,933,941 | |
| | | | | | |
Total Investments
(Cost — $605,456,943*) — 100.0% | | | | | 449,214,776 | |
Liabilities in Excess of Other Assets — (0.0)% | | | | | (88,174 | ) |
| | | | | | |
Net Assets — 100.0% | | | | $ | 449,126,602 | |
| | | | | | |
| * | The cost and unrealized appreciation (depreciation) of investments as of March 31, 2009, as computed for federal income tax purposes, were as follows: |
| | | | |
Aggregate cost | | $ | 599,976,130 | |
| | | | |
Gross unrealized appreciation | | $ | 48,757,328 | |
Gross unrealized depreciation | | | (199,518,682 | ) |
| | | | |
Net unrealized depreciation | | $ | (150,761,354 | ) |
| | | | |
| (a) | Non-income producing security. |
| (b) | Security, or a portion of security, is on loan. |
Portfolios Abbreviations
| | | | |
| To simplify the listings of portfolio holdings in the Schedules of Investments, the names of certain securities have been abbreviated according to the list on the right. | | ADR CAD | | American Depository Receipts Canadian Dollar |
| | | | | | |
14 | | SEMI-ANNUAL REPORT | | MARCH 31, 2009 | | |
| | |
| Schedule of Investments (concluded) | | All-Cap Energy & Resources Portfolio |
| (c) | Investments in companies considered to be an affiliate of the Portfolio, for purposes of Section 2(a)(3) of the Investment Company Act of 1940, as amended, were as follows: |
| | | | | | | |
Affiliate | | Net
Activity | | | Income |
BlackRock Liquidity Funds, TempFund | | $ | 6,493,941 | ** | | $ | 14,983 |
BlackRock Liquidity Series, LLC Money Market Series | | $ | (41,358,000 | )*** | | $ | 66,934 |
| ** | Represents net purchase cost. |
| *** | Represents net sales cost. |
| (d) | Represents current yield as of report date. |
| (e) | Security purchased with the cash proceeds from securities loans. |
| • | | For Portfolio compliance purposes, the Portfolio’s industry classifications refer to any one or more of the industry sub-classifications used by one or more widely recognized market indexes or ratings group indexes, and/or as defined by Portfolio management. This definition may not apply for purposes of this report, which may combine industry sub-classifications for reporting ease. |
| • | | Effective October 1, 2008, the Portfolio adopted Financial Accounting Standards Board Statement of Financial Accounting Standards No. 157, “Fair Value Measurements” (“FAS 157”). FAS 157 clarifies the definition of fair value, establishes a framework for measuring fair values and requires additional disclosures about the use of fair value measurements. Various inputs are used in determining the fair value of investments, which are as follows: |
| | • | | Level 1 – price quotations in active markets/exchanges for identical securities |
| | • | | Level 2 – other observable inputs (including, but not limited to: quoted prices for similar assets or liabilities in markets that are active, quoted prices for identical or similar assets in markets that are not active, inputs other than quoted prices that are observable for the assets or liabilities (such as interest rates, yield curves, volatilities, prepayment speeds, loss severities, credit risks and default rates) or other market – corroborated inputs) |
| | • | | Level 3 – unobservable inputs based on the best information available in the circumstance, to the extent observable inputs are not available (including the Portfolio’s own assumptions used in determining the fair value of investments. |
The inputs or methodology used for valuing securities are not necessarily an indication of the risk associated with investing in those securities. For information about the Portfolio’s policy regarding valuation of investments and other significant accounting policies, please refer to Note 1 of the Notes to Financial Statements.
The following table summarizes the inputs used as of March 31, 2009 in determining the fair valuation of the Portfolio’s investments:
| | | |
Valuation Inputs | | Investments
in Securities |
| | | Assets |
Level 1 | | $ | 440,342,970 |
Level 2 | | | 8,871,806 |
Level 3 | | | — |
| | | |
Total | | $ | 449,214,776 |
| | | |
See Notes to Financial Statements.
| | | | | | |
| | | SEMI-ANNUAL REPORT | | MARCH 31, 2009 | | 15 |
| | |
| Schedule of Investments March 31, 2009 (Unaudited) | | Aurora Portfolio |
| | (Percentages shown are based on Net Assets) |
| | | | | |
| | | Shares | | Value |
Common Stocks | | | | | |
Aerospace & Defense — 0.4% | | | | | |
Orbital Sciences Corp.(a) | | 140,277 | | $ | 1,667,894 |
| | | | | |
Biotechnology — 0.5% | | | | | |
Dyax Corp.(a) | | 805,326 | | | 2,021,368 |
| | | | | |
Building Products — 0.3% | | | | | |
Lennox International, Inc.(b) | | 54,325 | | | 1,437,439 |
| | | | | |
Capital Markets — 1.0% | | | | | |
Jefferies Group, Inc.(b) | | 296,900 | | | 4,097,220 |
| | | | | |
Chemicals — 3.0% | | | | | |
Airgas, Inc. | | 122,700 | | | 4,148,487 |
FMC Corp. | | 95,300 | | | 4,111,242 |
The Scotts Miracle-Gro Co. - Class A | | 127,000 | | | 4,406,900 |
| | | | | |
| | | | | 12,666,629 |
| | | | | |
Commercial Banks — 5.8% | | | | | |
Associated Banc-Corp. | | 220,200 | | | 3,399,888 |
City National Corp. | | 133,600 | | | 4,511,672 |
Cullen/Frost Bankers, Inc. | | 320,200 | | | 15,030,188 |
TCF Financial Corp.(b) | | 176,800 | | | 2,079,168 |
| | | | | |
| | | | | 25,020,916 |
| | | | | |
Commercial Services & Supplies — 4.3% | | | | | |
The Brink’s Co. | | 301,251 | | | 7,971,101 |
The GEO Group, Inc.(a) | | 270,400 | | | 3,582,800 |
Rollins, Inc. | | 196,253 | | | 3,365,739 |
Waste Connections, Inc.(a) | | 142,100 | | | 3,651,970 |
| | | | | |
| | | | | 18,571,610 |
| | | | | |
Communications Equipment — 0.7% | | | | | |
Polycom, Inc.(a) | | 188,600 | | | 2,902,554 |
| | | | | |
Computers & Peripherals — 0.6% | | | | | |
Teradata Corp.(a) | | 166,800 | | | 2,705,496 |
| | | | | |
Construction & Engineering — 0.5% | | | | | |
URS Corp.(a) | | 51,700 | | | 2,089,197 |
| | | | | |
Containers & Packaging — 3.1% | | | | | |
Crown Holdings, Inc.(a) | | 281,100 | | | 6,389,403 |
Silgan Holdings, Inc. | | 130,300 | | | 6,845,962 |
| | | | | |
| | | | | 13,235,365 |
| | | | | |
Diversified Consumer Services — 1.1% | | | | | |
Brink’s Home Security Holdings, Inc.(a) | | 201,951 | | | 4,564,093 |
| | | | | |
Diversified Financial Services — 3.4% | | | | | |
PHH Corp.(a) | | 1,043,841 | | | 14,665,966 |
| | | | | |
Electric Utilities — 1.3% | | | | | |
ITC Holdings Corp. | | 126,158 | | | 5,503,012 |
| | | | | |
Electrical Equipment — 1.8% | | | | | |
AMETEK, Inc. | | 174,800 | | | 5,465,996 |
Roper Industries, Inc. | | 51,400 | | | 2,181,930 |
| | | | | |
| | | | | 7,647,926 |
| | | | | |
Electronic Equipment, Instruments & Components — 1.9% | | | | | |
Amphenol Corp. - Class A | | 154,500 | | | 4,401,705 |
Anixter International, Inc.(a) | | 115,600 | | | 3,662,208 |
| | | | | |
| | | | | 8,063,913 |
| | | | | |
Energy Equipment & Services — 2.2% | | | | | |
Core Laboratories NV | | 81,200 | | | 5,940,592 |
Lufkin Industries, Inc. | | 90,774 | | | 3,438,519 |
| | | | | |
| | | | | 9,379,111 |
| | | | | |
Food & Staples Retailing — 2.0% | | | | | |
BJ’s Wholesale Club, Inc.(a) | | 200,300 | | | 6,407,597 |
Spartan Stores, Inc. | | 135,300 | | | 2,084,973 |
| | | | | |
| | | | | 8,492,570 |
| | | | | |
Food Products — 5.0% | | | | | |
Fresh Del Monte Produce, Inc.(a) | | 228,800 | | | 3,756,896 |
Hain Celestial Group, Inc.(a) | | 382,308 | | | 5,444,066 |
Ralcorp Holdings, Inc.(a) | | 188,870 | | | 10,176,316 |
Sanderson Farms, Inc. | | 60,200 | | | 2,260,510 |
| | | | | |
| | | | | 21,637,788 |
| | | | | |
Gas Utilities — 0.9% | | | | | |
EQT Corp. | | 119,500 | | | 3,743,935 |
| | | | | |
Health Care Equipment & Supplies — 2.2% | | | | | |
The Cooper Cos., Inc. | | 137,900 | | | 3,646,076 |
Hologic, Inc.(a) | | 265,900 | | | 3,480,631 |
Teleflex, Inc. | | 58,100 | | | 2,271,129 |
| | | | | |
| | | | | 9,397,836 |
| | | | | |
Health Care Providers & Services — 6.4% | | | | | |
DaVita, Inc.(a) | | 204,800 | | | 9,000,960 |
HMS Holdings Corp.(a) | | 139,900 | | | 4,602,710 |
Magellan Health Services, Inc.(a) | | 253,618 | | | 9,241,840 |
MEDNAX, Inc.(a) | | 76,200 | | | 2,245,614 |
Omnicare, Inc. | | 92,600 | | | 2,267,774 |
| | | | | |
| | | | | 27,358,898 |
| | | | | |
Hotels, Restaurants & Leisure — 7.0% | | | | | |
Darden Restaurants, Inc. | | 265,265 | | | 9,087,979 |
Penn National Gaming, Inc.(a) | | 178,200 | | | 4,303,530 |
Scientific Games Corp. - Class A(a) | | 528,574 | | | 6,401,031 |
Starwood Hotels & Resorts Worldwide, Inc. | | 333,000 | | | 4,229,100 |
Wendy’s/Arby’s Group, Inc. - Class A | | 1,174,300 | | | 5,906,729 |
| | | | | |
| | | | | 29,928,369 |
| | | | | |
Household Durables — 1.7% | | | | | |
Jarden Corp.(a) | | 574,100 | | | 7,273,847 |
| | | | | |
Insurance — 6.0% | | | | | |
Aspen Insurance Holdings Ltd. | | 76,900 | | | 1,727,174 |
Fidelity National Financial, Inc. - Class A | | 369,713 | | | 7,213,101 |
First American Corp. | | 119,600 | | | 3,170,596 |
The Hanover Insurance Group, Inc. | | 223,030 | | | 6,427,724 |
HCC Insurance Holdings, Inc. | | 112,800 | | | 2,841,432 |
Platinum Underwriters Holdings Ltd. | | 157,977 | | | 4,480,228 |
| | | | | |
| | | | | 25,860,255 |
| | | | | |
Internet & Catalog Retail — 0.8% | | | | | |
priceline.com, Inc.(a)(b) | | 44,300 | | | 3,489,954 |
| | | | | |
Internet Software & Services — 2.2% | | | | | |
SkillSoft Plc - ADR(a) | | 1,411,281 | | | 9,441,470 |
| | | | | |
IT Services — 1.6% | | | | | |
Hewitt Associates, Inc. - Class A(a) | | 149,400 | | | 4,446,144 |
Lender Processing Services, Inc. | | 76,900 | | | 2,353,909 |
| | | | | |
| | | | | 6,800,053 |
| | | | | |
| | | | | | |
16 | | SEMI-ANNUAL REPORT | | MARCH 31, 2009 | | |
| | |
| Schedule of Investments (continued) | | Aurora Portfolio |
| | (Percentages shown are based on Net Assets) |
| | | | | | |
| | | Shares | | Value | |
Common Stocks | | | | | | |
Leisure Equipment & Products — 1.2% | | | | | | |
Hasbro, Inc. | | 202,800 | | $ | 5,084,196 | |
| | | | | | |
Life Sciences Tools & Services — 0.9% | | | | | | |
Life Technologies Corp. (a) | | 114,100 | | | 3,705,968 | |
| | | | | | |
Machinery — 2.3% | | | | | | |
Dover Corp. | | 78,300 | | | 2,065,554 | |
IDEX Corp. | | 189,300 | | | 4,139,991 | |
Pentair, Inc. | | 177,800 | | | 3,852,926 | |
| | | | | | |
| | | | | 10,058,471 | |
| | | | | | |
Multi-Utilities — 1.6% | | | | | | |
Wisconsin Energy Corp. | | 169,500 | | | 6,978,315 | |
| | | | | | |
Oil, Gas & Consumable Fuels — 2.4% | | | | | | |
Foundation Coal Holdings, Inc. | | 220,800 | | | 3,168,480 | |
Peabody Energy Corp. | | 124,100 | | | 3,107,464 | |
PetroHawk Energy Corp. (a) | | 94,200 | | | 1,811,466 | |
Range Resources Corp. | | 50,700 | | | 2,086,812 | |
| | | | | | |
| | | | | 10,174,222 | |
| | | | | | |
Personal Products — 1.7% | | | | | | |
Alberto-Culver Co. | | 154,900 | | | 3,502,289 | |
Chattem, Inc. (a)(b) | | 65,700 | | | 3,682,485 | |
| | | | | | |
| | | | | 7,184,774 | |
| | | | | | |
Real Estate Investment Trusts — 4.0% | | | | | | |
Annaly Capital Management, Inc. | | 498,600 | | | 6,915,582 | |
Essex Property Trust, Inc. (b) | | 59,500 | | | 3,411,730 | |
Mack-Cali Realty Corp. | | 128,800 | | | 2,551,528 | |
Redwood Trust, Inc. (b) | | 282,000 | | | 4,328,700 | |
| | | | | | |
| | | | | 17,207,540 | |
| | | | | | |
Road & Rail — 1.3% | | | | | | |
Genesee & Wyoming, Inc. - Class A (a) | | 147,000 | | | 3,123,750 | |
Landstar System, Inc. | | 75,800 | | | 2,537,026 | |
| | | | | | |
| | | | | 5,660,776 | |
| | | | | | |
Semiconductors & Semiconductor Equipment — 2.1% | | | | | | |
Intersil Corp. - Class A | | 289,500 | | | 3,329,250 | |
ON Semiconductor Corp. (a) | | 634,700 | | | 2,475,330 | |
Varian Semiconductor Equipment Associates, Inc. (a) | | 152,100 | | | 3,294,486 | |
| | | | | | |
| | | | | 9,099,066 | |
| | | | | | |
Software — 2.8% | | | | | | |
Lawson Software, Inc. (a) | | 1,004,100 | | | 4,267,425 | |
Sybase, Inc. (a) | | 262,700 | | | 7,957,183 | |
| | | | | | |
| | | | | 12,224,608 | |
| | | | | | |
Specialty Retail — 3.2% | | | | | | |
PetSmart, Inc. | | 223,100 | | | 4,676,176 | |
Tractor Supply Co. (a) | | 97,400 | | | 3,512,244 | |
Urban Outfitters, Inc. (a) | | 329,900 | | | 5,400,463 | |
| | | | | | |
| | | | | 13,588,883 | |
| | | | | | |
Textiles, Apparel & Luxury Goods — 2.1% | | | | | | |
Carter’s, Inc. (a) | | 208,200 | | | 3,916,242 | |
VF Corp. (b) | | 86,300 | | | 4,928,593 | |
| | | | | | |
| | | | | 8,844,835 | |
| | | | | | |
Thrifts & Mortgage Finance — 2.3% | | | | | | |
First Niagara Financial Group, Inc. | | 919,400 | | | 10,021,460 | |
| | | | | | |
Total Long-Term Investments
(Cost — $428,144,763) — 95.6% | | | | | 409,497,798 | |
| | | | | | |
| | |
| | | Shares/
Beneficial
Interest | | | |
Short-Term Securities | | | | | | |
BlackRock Liquidity Funds, TempFund, | | | | | | |
0.60% (c)(d) | | 21,883,965 | | | 21,883,965 | |
BlackRock Liquidity Series, LLC Money Market Series, | | | | | | |
1.17% (c)(d)(e) | | 22,332,800 | | | 22,332,800 | |
| | | | | | |
Total Short-Term Securities
(Cost — $44,216,765) — 10.3% | | | | | 44,216,765 | |
| | | | | | |
Total Investments
(Cost — $472,361,528*) — 105.9% | | | | | 453,714,563 | |
Liabilities in Excess of Other Assets — (5.9)% | | | | | (25,232,887 | ) |
| | | | | | |
Net Assets — 100.0% | | | | $ | 428,481,676 | |
| | | | | | |
| * | The cost and unrealized appreciation (depreciation) of investments as of March 31, 2009, as computed for federal income tax purposes, were as follows: |
| | | | |
Aggregate cost | | $ | 489,919,946 | |
| | | | |
Gross unrealized appreciation | | $ | 25,880,760 | |
Gross unrealized depreciation | | | (62,086,143 | ) |
| | | | |
Net unrealized depreciation | | $ | (36,205,383 | ) |
| | | | |
| (a) | Non-income producing security. |
| (b) | Security, or a portion of security, is on loan. |
| (c) | Investments in companies considered to be an affiliate of the Portfolio, for purposes of Section 2(a)(3) of the Investment Company Act of 1940, as amended, were as follows: |
| | | | | | | |
Affiliate | | Net
Activity | | | Income |
BlackRock Liquidity Funds, TempFund | | $ | 21,883,965 | ** | | $ | 23,432 |
BlackRock Liquidity Series, LLC Money Market Series | | $ | (34,022,600 | )*** | | $ | 149,576 |
| ** | Represents net purchase cost. |
| *** | Represents net sales cost. |
| (d) | Represents current yield as of report date. |
| (e) | Security purchased with the cash proceeds from securities loans. |
| | | | | | |
| | | SEMI-ANNUAL REPORT | | MARCH 31, 2009 | | 17 |
| | |
| Schedule of Investments (concluded) | | Aurora Portfolio |
| • | | For Portfolio compliance purposes, the Portfolio’s industry classifications refer to any one or more of the industry sub-classifications used by one or more widely recognized market indexes or ratings group indexes, and/or as defined by Portfolio management. This definition may not apply for purposes of this report, which may combine industry sub-classifications for reporting ease. |
| • | | Effective October 1, 2008, the Portfolio adopted Financial Accounting Standards Board Statement of Financial Accounting Standards No. 157, “Fair Value Measurements”. FAS 157 clarifies the definition of fair value, establishes a framework for measuring fair values and requires additional disclosures about the use of fair value measurements. Various inputs are used in determining the fair value of investments, which are as follows: |
| | • | | Level 1 – price quotations in active markets/exchanges for identical securities |
| | • | | Level 2 – other observable inputs (including, but not limited to: quoted prices for similar assets or liabilities in markets that are active, quoted prices for identical or similar assets in markets that are not active, inputs other than quoted prices that are observable for the assets or liabilities (such as interest rates, yield curves, volatilities, prepayment speeds, loss severities, credit risks and default rates) or other market – corroborated inputs) |
| | • | | Level 3 – unobservable inputs based on the best information available in the circumstance, to the extent observable inputs are not available (including the Portfolio’s own assumptions used in determining the fair value of investments. |
The inputs or methodology used for valuing securities are not necessarily an indication of the risk associated with investing in those securities. For information about the Portfolio’s policy regarding valuation of investments and other significant accounting policies, please refer to Note 1 of the Notes to Financial Statements.
The following table summarizes the inputs used as of March 31, 2009 in determining the fair valuation of the Portfolio’s investments:
| | | |
Valuation Inputs | | Investments
in Securities |
| | | Assets |
Level 1 | | $ | 453,714,563 |
Level 2 | | | — |
Level 3 | | | — |
| | | |
Total | | $ | 453,714,563 |
| | | |
See Notes to Financial Statements.
| | | | | | |
18 | | SEMI-ANNUAL REPORT | | MARCH 31, 2009 | | |
| | |
| Schedule of Investments March 31, 2009 (Unaudited) | | Capital Appreciation Portfolio |
| | (Percentages shown are based on Net Assets) |
| | | | | |
| | | Shares | | Value |
Common Stocks | | | | | |
Aerospace & Defense — 2.1% | | | | | |
General Dynamics Corp. | | 38,300 | | $ | 1,592,897 |
Honeywell International, Inc. | | 109,618 | | | 3,053,957 |
| | | | | |
| | | | | 4,646,854 |
| | | | | |
Air Freight & Logistics — 0.7% | | | | | |
United Parcel Service, Inc. - Class B | | 32,000 | | | 1,575,040 |
| | | | | |
Airlines — 0.9% | | | | | |
Delta Air Lines, Inc.(a) | | 344,900 | | | 1,941,787 |
| | | | | |
Beverages — 3.7% | | | | | |
The Coca-Cola Co. | | 132,954 | | | 5,843,328 |
PepsiCo, Inc. | | 44,324 | | | 2,281,800 |
| | | | | |
| | | | | 8,125,128 |
| | | | | |
Biotechnology — 3.8% | | | | | |
Celgene Corp.(a) | | 52,600 | | | 2,335,440 |
Genzyme Corp.(a) | | 36,477 | | | 2,166,369 |
Gilead Sciences, Inc.(a) | | 84,300 | | | 3,904,776 |
| | | | | |
| | | | | 8,406,585 |
| | | | | |
Capital Markets — 0.8% | | | | | |
The Goldman Sachs Group, Inc. | | 17,400 | | | 1,844,748 |
| | | | | |
Chemicals — 0.8% | | | | | |
Ecolab, Inc. | | 51,900 | | | 1,802,487 |
| | | | | |
Commercial Services & Supplies — 0.9% | | | | | |
Waste Management, Inc. | | 72,600 | | | 1,858,560 |
| | | | | |
Communications Equipment — 7.0% | | | | | |
Cisco Systems, Inc.(a) | | 393,321 | | | 6,595,993 |
QUALCOMM, Inc. | | 225,423 | | | 8,771,209 |
| | | | | |
| | | | | 15,367,202 |
| | | | | |
Computers & Peripherals — 6.2% | | | | | |
Apple, Inc.(a) | | 53,118 | | | 5,583,764 |
Hewlett-Packard Co. | | 112,600 | | | 3,609,956 |
International Business Machines Corp. | | 45,400 | | | 4,398,806 |
| | | | | |
| | | | | 13,592,526 |
| | | | | |
Construction & Engineering — 0.7% | | | | | |
Fluor Corp. | | 44,900 | | | 1,551,295 |
| | | | | |
Diversified Consumer Services — 1.5% | | | | | |
Apollo Group, Inc. - Class A(a) | | 40,600 | | | 3,180,198 |
| | | | | |
Diversified Financial Services — 1.9% | | | | | |
CME Group, Inc. | | 9,220 | | | 2,271,716 |
JPMorgan Chase & Co. | | 67,300 | | | 1,788,834 |
| | | | | |
| | | | | 4,060,550 |
| | | | | |
Diversified Telecommunication Services — 0.5% | | | | | |
AT&T, Inc. | | 46,848 | | | 1,180,570 |
| | | | | |
Energy Equipment & Services — 2.1% | | | | | |
Schlumberger Ltd. | | 49,017 | | | 1,991,071 |
Transocean Ltd.(a) | | 42,705 | | | 2,512,762 |
| | | | | |
| | | | | 4,503,833 |
| | | | | |
Food & Staples Retailing — 4.1% | | | | | |
The Kroger Co. | | 58,300 | | | 1,237,126 |
Safeway, Inc. | | 74,300 | | | 1,500,117 |
Wal-Mart Stores, Inc. | | 120,886 | | | 6,298,161 |
| | | | | |
| | | | | 9,035,404 |
| | | | | |
Health Care Equipment & Supplies — 0.7% | | | | | |
C.R. Bard, Inc. | | 18,600 | | | 1,482,792 |
| | | | | |
Health Care Providers & Services — 3.1% | | | | | |
Henry Schein, Inc.(a) | | 47,300 | | | 1,892,473 |
Medco Health Solutions, Inc.(a) | | 80,522 | | | 3,328,779 |
UnitedHealth Group, Inc. | | 72,700 | | | 1,521,611 |
| | | | | |
| | | | | 6,742,863 |
| | | | | |
Hotels, Restaurants & Leisure — 2.9% | | | | | |
Burger King Holdings, Inc. | | 139,100 | | | 3,192,345 |
McDonald’s Corp. | | 56,400 | | | 3,077,748 |
| | | | | |
| | | | | 6,270,093 |
| | | | | |
Household Durables — 0.8% | | | | | |
D.R. Horton, Inc. | | 175,900 | | | 1,706,230 |
| | | | | |
Household Products — 1.1% | | | | | |
Clorox Co. | | 29,000 | | | 1,492,920 |
The Procter & Gamble Co. | | 17,986 | | | 846,961 |
| | | | | |
| | | | | 2,339,881 |
| | | | | |
Industrial Conglomerates — 1.1% | | | | | |
3M Co. | | 48,100 | | | 2,391,532 |
| | | | | |
Insurance — 1.1% | | | | | |
The Travelers Cos., Inc. | | 57,400 | | | 2,332,736 |
| | | | | |
Internet & Catalog Retail — 1.7% | | | | | |
Amazon.com, Inc.(a) | | 49,840 | | | 3,660,250 |
| | | | | |
Internet Software & Services — 2.7% | | | | | |
Google, Inc. - Class A(a) | | 17,254 | | | 6,005,427 |
| | | | | |
IT Services — 0.4% | | | | | |
Accenture Ltd. - Class A | | 32,800 | | | 901,672 |
| | | | | |
Life Sciences Tools & Services — 0.9% | | | | | |
Thermo Fisher Scientific, Inc.(a) | | 56,300 | | | 2,008,221 |
| | | | | |
Machinery — 4.4% | | | | | |
Cummins, Inc. | | 84,200 | | | 2,142,890 |
Danaher Corp. | | 102,022 | | | 5,531,633 |
Deere & Co. | | 60,100 | | | 1,975,487 |
| | | | | |
| | | | | 9,650,010 |
| | | | | |
Metals & Mining — 2.2% | | | | | |
Agnico-Eagle Mines Ltd. | | 42,900 | | | 2,441,868 |
Freeport-McMoRan Copper & Gold, Inc. - Class B | | 62,737 | | | 2,390,907 |
| | | | | |
| | | | | 4,832,775 |
| | | | | |
Multiline Retail — 2.3% | | | | | |
Kohl’s Corp.(a) | | 121,068 | | | 5,123,598 |
| | | | | |
Oil, Gas & Consumable Fuels — 6.0% | | | | | |
Apache Corp. | | 13,700 | | | 878,033 |
EOG Resources, Inc. | | 22,620 | | | 1,238,671 |
Exxon Mobil Corp. | | 50,600 | | | 3,445,860 |
Massey Energy Co. | | 91,986 | | | 930,898 |
PetroHawk Energy Corp.(a) | | 69,500 | | | 1,336,485 |
Petroleo Brasileiro SA - ADR | | 74,300 | | | 2,263,921 |
Range Resources Corp. | | 41,800 | | | 1,720,488 |
Valero Energy Corp. | | 74,500 | | | 1,333,550 |
| | | | | |
| | | | | 13,147,906 |
| | | | | |
Pharmaceuticals — 6.9% | | | | | |
Abbott Laboratories | | 120,300 | | | 5,738,310 |
Johnson & Johnson | | 56,100 | | | 2,950,860 |
Schering-Plough Corp. | | 133,200 | | | 3,136,860 |
Teva Pharmaceutical Industries Ltd. - ADR | | 73,100 | | | 3,293,155 |
| | | | | |
| | | | | 15,119,185 |
| | | | | |
| | | | | | |
| | | SEMI-ANNUAL REPORT | | MARCH 31, 2009 | | 19 |
| | |
| Schedule of Investments (concluded) | | Capital Appreciation Portfolio |
| | (Percentages shown are based on Net Assets) |
| | | | | | |
| | | Shares | | Value | |
Common Stocks | | | | | | |
Semiconductors & Semiconductor Equipment — 5.2% | | | | | | |
Broadcom Corp. - Class A(a) | | 170,927 | | $ | 3,415,121 | |
Lam Research Corp.(a) | | 107,617 | | | 2,450,439 | |
NVIDIA Corp.(a) | | 213,400 | | | 2,104,124 | |
PMC-Sierra, Inc.(a) | | 531,457 | | | 3,390,696 | |
| | | | | | |
| | | | | 11,360,380 | |
| | | | | | |
Software — 9.4% | | | | | | |
Activision Blizzard, Inc.(a) | | 355,400 | | | 3,717,484 | |
Adobe Systems, Inc.(a) | | 55,120 | | | 1,179,017 | |
Check Point Software Technologies(a) | | 134,300 | | | 2,982,803 | |
Microsoft Corp. | | 263,342 | | | 4,837,592 | |
Oracle Corp. | | 270,910 | | | 4,895,344 | |
Salesforce.com, Inc.(a) | | 87,879 | | | 2,876,280 | |
| | | | | | |
| | | | | 20,488,520 | |
| | | | | | |
Specialty Retail — 3.6% | | | | | | |
CarMax, Inc.(a)(b) | | 175,400 | | | 2,181,976 | |
The Home Depot, Inc. | | 101,900 | | | 2,400,764 | |
Ross Stores, Inc. | | 89,770 | | | 3,220,948 | |
| | | | | | |
| | | | | 7,803,688 | |
| | | | | | |
Tobacco — 1.7% | | | | | | |
Philip Morris International, Inc. | | 104,640 | | | 3,723,091 | |
| | | | | | |
Wireless Telecommunication Services — 2.8% | | | | | | |
American Tower Corp. - Class A(a) | | 165,038 | | | 5,022,106 | |
MetroPCS Communications, Inc.(a) | | 63,200 | | | 1,079,456 | |
| | | | | | |
| | | | | 6,101,562 | |
| | | | | | |
Total Long-Term Investments
(Cost — $235,359,259) — 98.7% | | | | | 215,865,179 | |
| | | | | | |
| | |
| | | Shares/
Beneficial
Interest | | | |
Short-Term Securities | | | | | | |
BlackRock Liquidity Funds, TempFund, 0.60%(c)(d) | | 3,220,741 | | | 3,220,741 | |
BlackRock Liquidity Series, LLC Money Market Series, 1.17%(c)(d)(e) | | 2,145,000 | | | 2,145,000 | |
| | | | | | |
Total Short-Term Securities
(Cost — $5,365,741) — 2.5% | | | | | 5,365,741 | |
| | | | | | |
Total Investments
(Cost — $240,725,000*) — 101.2% | | | | | 221,230,920 | |
Liabilities in Excess of Other Assets — (1.2)% | | | | | (2,522,569 | ) |
| | | | | | |
Net Assets — 100.0% | | | | $ | 218,708,351 | |
| | | | | | |
| * | The cost and unrealized appreciation (depreciation) of investments as of March 31, 2009, as computed for federal income tax purposes, were as follows: |
| | | | |
Aggregate cost | | $ | 242,267,087 | |
| | | | |
Gross unrealized appreciation | | $ | 12,740,083 | |
Gross unrealized depreciation | | | (33,776,250 | ) |
| | | | |
Net unrealized depreciation | | $ | (21,036,167 | ) |
| | | | |
| (a) | Non-income producing security. |
| (b) | Security, or a portion of security, is on loan. |
| (c) | Investments in companies considered to be an affiliate of the Portfolio, for purposes of Section 2(a)(3) of the Investment Company Act of 1940, as amended, were as follows: |
| | | | | | | |
Affiliate | | Net
Activity | | | Income |
BlackRock Liquidity Funds, TempFund | | $ | 3,220,741 | ** | | $ | 3,746 |
BlackRock Liquidity Series, LLC | | | | | | | |
Money Market Series | | $ | (7,615,350 | )*** | | $ | 2,535 |
| ** | Represents net purchase cost. |
| *** | Represents net sales cost. |
| (d) | Represents current yield as of report date. |
| (e) | Security purchased with the cash proceeds from securities loans. |
| • | | For Portfolio compliance purposes, the Portfolio’s industry classifications refer to any one or more of the industry sub-classifications used by one or more widely recognized market indexes or ratings group indexes, and/or as defined by Portfolio management. This definition may not apply for purposes of this report, which may combine industry sub-classifications for reporting ease. |
| • | | Effective October 1, 2008, the Portfolio adopted Financial Accounting Standards Board Statement of Financial Accounting Standards No. 157, “Fair Value Measurements”. FAS 157 clarifies the definition of fair value, establishes a framework for measuring fair values and requires additional disclosures about the use of fair value measurements. Various inputs are used in determining the fair value of investments, which are as follows: |
| | • | | Level 1 – price quotations in active markets/exchanges for identical securities |
| | • | | Level 2 – other observable inputs (including, but not limited to: quoted prices for similar assets or liabilities in markets that are active, quoted prices for identical or similar assets in markets that are not active, inputs other than quoted prices that are observable for the assets or liabilities (such as interest rates, yield curves, volatilities, prepayment speeds, loss severities, credit risks and default rates) or other market – corroborated inputs) |
| | • | | Level 3 – unobservable inputs based on the best information available in the circumstance, to the extent observable inputs are not available (including the Portfolio’s own assumptions used in determining the fair value of investments. |
The inputs or methodology used for valuing securities are not necessarily an indication of the risk associated with investing in those securities. For information about the Portfolio’s policy regarding valuation of investments and other significant accounting policies, please refer to Note 1 of the Notes to Financial Statements.
The following table summarizes the inputs used as of March 31, 2009 in determining the fair valuation of the Portfolio’s investments:
| | | |
Valuation Inputs | | Investments
in Securities |
| | | Assets |
Level 1 | | $ | 221,230,920 |
Level 2 | | | — |
Level 3 | | | — |
| | | |
Total | | $ | 221,230,920 |
| | | |
See Notes to Financial Statements.
| | | | | | |
20 | | SEMI-ANNUAL REPORT | | MARCH 31, 2009 | | |
| | |
| Schedule of Investments March 31, 2009 (Unaudited) | | Energy & Resources Portfolio |
| | (Percentages shown are based on Net Assets) |
| | | | | |
| | | Shares | | Value |
Common Stocks | | | | | |
Auto Components — 0.2% | | | | | |
Westport Innovations, Inc. (a) | | 274,143 | | $ | 1,089,353 |
| | | | | |
Capital Markets — 0.0% | | | | | |
Treasure Island Royalty Trust (a) | | 366,922 | | | 117,415 |
| | | | | |
Commercial Services & Supplies — 0.2% | | | | | |
Alexco Resource Corp. (a) | | 813,583 | | | 1,078,833 |
Republic Resources, Inc. (a) | | 28,750 | | | 460 |
| | | | | |
| | | | | 1,079,293 |
| | | | | |
Diversified Financial Services — 0.0% | | | | | |
Quest Capital Corp. | | 61,000 | | | 34,351 |
| | | | | |
Electrical Equipment — 1.3% | | | | | |
First Solar, Inc. (a)(b) | | 50,000 | | | 6,635,000 |
ITM Power Plc (a) | | 525,200 | | | 73,333 |
Ocean Power Technologies, Inc. (a) | | 63,900 | | | 421,740 |
| | | | | |
| | | | | 7,130,073 |
| | | | | |
Energy Equipment & Services — 10.2% | | | | | |
Baker Hughes, Inc. | | 300,000 | | | 8,565,000 |
BJ Services Co. | | 1,012,400 | | | 10,073,380 |
Complete Production Services, Inc. (a) | | 34,400 | | | 105,952 |
ENSCO International, Inc. | | 94,100 | | | 2,484,240 |
Halliburton Co. | | 490,726 | | | 7,591,531 |
Hercules Offshore, Inc. (a) | | 68,900 | | | 108,862 |
HSE Integrated Ltd. (a) | | 28,238 | | | 7,839 |
Key Energy Services, Inc. (a) | | 676,000 | | | 1,946,880 |
Leader Energy Services Ltd. (a) | | 454,104 | | | 14,407 |
National Oilwell Varco, Inc. (a) | | 43,270 | | | 1,242,282 |
Smith International, Inc. | | 200,000 | | | 4,296,000 |
Technicoil Corp. (a) | | 1,300,900 | | | 309,541 |
Transocean Ltd. (a) | | 166,500 | | | 9,796,860 |
Weatherford International Ltd. (a) | | 754,396 | | | 8,351,164 |
| | | | | |
| | | | | 54,893,938 |
| | | | | |
Gas Utilities — 1.5% | | | | | |
EQT Corp. | | 256,500 | | | 8,036,145 |
| | | | | |
Independent Power Producers & Energy Traders — 0.0% | | | | | |
Dynegy, Inc. - Class A (a) | | 1,560 | | | 2,200 |
| | | | | |
Machinery — 0.0% | | | | | |
Railpower Technologies Corp. (a) | | 360,600 | | | 24,311 |
| | | | | |
Metals & Mining — 11.0% | | | | | |
Archipelago Resources Plc (a) | | 2,247,400 | | | 362,775 |
Baja Mining Corp. (a) | | 3,654,800 | | | 1,029,072 |
BHP Billiton Ltd. - ADR | | 300,000 | | | 13,380,000 |
Companhia Vale do Rio Doce - ADR | | 300,000 | | | 3,990,000 |
Corriente Resources, Inc. - Class A (a) | | 982,800 | | | 4,606,875 |
Crosshair Exploration & Mining Corp. (a) | | 559,600 | | | 68,796 |
Eldorado Gold Corp. (a) | | 368,965 | | | 3,336,137 |
Eldorado Gold Corp., Exchange Receipts (acquired 7/14/08, cost $0, unrestricted issue on 7/14/08 was valued at $8.72 per share) (a)(c) | | 3,024,300 | | | — |
Epsilon Energy, Inc. (d) | | 332,500 | | | 150,321 |
Erdene Gold, Inc. | | 1,100,000 | | | 218,115 |
European Goldfields Ltd. (a) | | 561,400 | | | 1,491,664 |
Freeport-McMoRan Copper & Gold, Inc. - Class B | | 300,000 | | | 11,433,000 |
Fronteer Development Group, Inc. (a) | | 500,000 | | | 1,209,550 |
Gold Reserve, Inc. (a) | | 123,948 | | | 83,045 |
Goldcorp, Inc. | | 4,600 | | | 154,841 |
Golden Star Resources Ltd. (a)(b) | | 789,408 | | | 1,208,405 |
Helio Resource Corp. (a) | | 500,000 | | | 152,681 |
Kinross Gold Corp. | | 111,175 | | | 1,986,697 |
Linear Gold Corp. (a) | | 1,000,000 | | | 920,051 |
MAG Silver Corp. (a) | | 964,000 | | | 4,304,664 |
Minefinders Corp. Ltd. (a)(b) | | 250,000 | | | 1,925,000 |
Nevsun Resources Ltd. (a) | | 1,554,800 | | | 1,677,132 |
Northern Star Mining Corp. (a) | | 1,133,500 | | | 521,439 |
Polymet Mining Corp. (a) | | 2,250,000 | | | 1,713,198 |
Q2 Gold Resources, Inc. | | 327,600 | | | — |
Romarco Minerals, Inc. (a) | | 223,000 | | | 99,048 |
Rusoro Mining Ltd. (a) | | 11,764 | | | 5,132 |
Selkirk Metals Corp. (a) | | 2,000,000 | | | 214,150 |
Sunridge Gold Corp. (a) | | 3,325,559 | | | 553,908 |
Virginia Mines, Inc. (a) | | 216,350 | | | 652,070 |
West Timmins Mining, Inc. (a) | | 2,660,128 | | | 1,308,121 |
X-Cal Resources Ltd. (a) | | 1,755,500 | | | 111,390 |
| | | | | |
| | | | | 58,867,277 |
| | | | | |
Oil, Gas & Consumable Fuels — 70.4% | | | | | |
Alberta Clipper Energy, Inc. (a) | | 95,415 | | | 37,839 |
American Oil & Gas, Inc. (a) | | 224,088 | | | 172,548 |
Approach Resources, Inc. (a) | | 93,700 | | | 580,940 |
Arch Coal, Inc. | | 1,324,400 | | | 17,707,228 |
Argosy Energy, Inc. (a) | | 3,422 | | | 3,664 |
ATP Oil & Gas Corp. (a)(b) | | 168,800 | | | 865,944 |
Bayou Bend Petroleum Ltd. (a) | | 2,237,500 | | | 319,440 |
Baytex Energy Trust | | 421,948 | | | 5,053,470 |
Canadian Superior Energy, Inc. (a) | | 6,230,300 | | | 2,912,354 |
Canext Energy Ltd. (a) | | 207,829 | | | 52,748 |
Cinch Energy Corp. (a) | | 901,980 | | | 393,472 |
Clayton Williams Energy, Inc. (a) | | 319,421 | | | 9,339,870 |
Compton Petroleum Corp. (a) | | 104,300 | | | 67,835 |
Comstock Resources, Inc. (a) | | 163,300 | | | 4,866,340 |
CONSOL Energy, Inc. | | 997,600 | | | 25,179,424 |
Continental Resources, Inc. (a)(b) | | 135,000 | | | 2,863,350 |
Corridor Resources, Inc. (a) | | 646,600 | | | 974,413 |
Crescent Point Energy Trust | | 102,000 | | | 2,132,551 |
Crew Energy, Inc. (a) | | 1,121,837 | | | 3,479,047 |
Daylight Resources Trust | | 346,361 | | | 1,870,811 |
Delphi Energy Corp. (a) | | 831,300 | | | 540,661 |
Delta Petroleum Corp. (a) | | 3,139,346 | | | 3,767,215 |
Denbury Resources, Inc. (a) | | 595,200 | | | 8,844,672 |
Ember Resources, Inc. (a) | | 109,690 | | | 43,500 |
Energy XXI Bermuda Ltd. | | 553,900 | | | 207,712 |
Evergreen Energy, Inc. (a) | | 393,400 | | | 547,613 |
EXCO Resources, Inc. (a) | | 1,268,800 | | | 12,688,000 |
Fairborne Energy Ltd. (a) | | 259,558 | | | 619,662 |
Forest Oil Corp. (a) | | 100,000 | | | 1,315,000 |
Foundation Coal Holdings, Inc. | | 230,300 | | | 3,304,805 |
Galleon Energy, Inc. - Class A (a) | | 2,333,982 | | | 6,682,801 |
Gasco Energy, Inc. (a)(b) | | 927,600 | | | 361,764 |
Gastar Exploration Ltd. (a) | | 1,055,300 | | | 569,862 |
GMX Resources, Inc. (a)(b) | | 206,189 | | | 1,340,228 |
Goodrich Petroleum Corp. (a)(b) | | 809,700 | | | 15,675,792 |
Gulfsands Petroleum Plc (a) | | 422,500 | | | 964,171 |
Heritage Oil Ltd. (a) | | 2,523,000 | | | 11,970,231 |
Highpine Oil & Gas Ltd. (a) | | 323,650 | | | 1,201,366 |
Iteration Energy Ltd. (a) | | 226,744 | | | 176,244 |
James River Coal Co. (a) | | 131,100 | | | 1,617,774 |
Longview Energy Co. (acquired 1/20/05, cost $1,281,000) (a)(c) | | 85,400 | | | 1,567,090 |
Lynden Energy Corp. (a) | | 200,400 | | | 47,684 |
Marathon Oil Corp. | | 6,447 | | | 169,492 |
Massey Energy Co. | | 1,694,840 | | | 17,151,781 |
| | | | | | |
| | | SEMI-ANNUAL REPORT | | MARCH 31, 2009 | | 21 |
| | |
| Schedule of Investments | | Energy & Resources Portfolio |
| | (Percentages shown are based on Net Assets) |
| | | | | |
| | | Shares | | Value |
Common Stocks | | | | | |
Oil, Gas & Consumable Fuels (concluded) | | | | | |
Matador Resources Co. (acquired 1/20/05 through 4/19/06, cost $2,957,155) (a)(c) | | 513,393 | | $ | 6,925,671 |
MGM Energy Corp. (a) | | 15,084 | | | 1,256 |
Midnight Oil Exploration Ltd. (a) | | 1,127,700 | | | 715,546 |
Newfield Exploration Co. (a) | | 959,310 | | | 21,776,337 |
Niko Resources Ltd. | | 39,000 | | | 1,815,133 |
Open Range Energy Corp. (a) | | 48,061 | | | 46,506 |
Pacific Rodera Energy, Inc. (a) | | 990,200 | | | 161,002 |
Pacific Rubiales Energy Corp. (a) | | 678,950 | | | 2,633,301 |
Pan Orient Energy Corp. (a) | | 198,600 | | | 637,952 |
Parallel Petroleum Corp. (a) | | 107,032 | | | 137,001 |
Paramount Resources Ltd. - Class A (a) | | 377,100 | | | 1,803,548 |
Patriot Coal Corp. (a)(b) | | 377,346 | | | 1,399,954 |
Peabody Energy Corp. | | 895,436 | | | 22,421,717 |
Pengrowth Energy Trust | | 25,486 | | | 143,520 |
Penn Virginia Corp. | | 1,408,300 | | | 15,463,134 |
Penn West Energy Trust | | 153,333 | | | 1,444,794 |
Petro Andina Resources, Inc. (a) | | 49,500 | | | 228,105 |
PetroHawk Energy Corp. (a) | | 1,756,500 | | | 33,777,495 |
Petrolifera Petroleum Ltd. (a) | | 892,415 | | | 1,132,506 |
Pioneer Natural Resources Co. | | 209,200 | | | 3,445,524 |
Plains Exploration & Production Co. (a) | | 1,255,525 | | | 21,632,696 |
ProspEx Resources Ltd. (a) | | 1,504,120 | | | 524,915 |
Quest Resource Corp. (a) | | 112,000 | | | 35,056 |
Quicksilver Resources, Inc. (a)(b) | | 364,400 | | | 2,018,776 |
Range Resources Corp. | | 200,000 | | | 8,232,000 |
Rex Energy Corp. (a) | | 772,871 | | | 2,218,140 |
Ship Finance International Ltd. | | 27 | | | 177 |
Southwestern Energy Co. (a) | | 1,248,600 | | | 37,070,934 |
Stone Energy Corp. (a) | | 27,274 | | | 90,822 |
Tag Oil Ltd. | | 39,600 | | | 5,025 |
Trafalgar Energy Ltd. (a) | | 21,717 | | | 9,990 |
TransCanada Corp. | | 40,700 | | | 962,945 |
Triex Minerals Corp. (a) | | 468,150 | | | 61,266 |
Trilogy Energy Trust | | 152,791 | | | 811,945 |
TriStar Oil & Gas Ltd. (a) | | 806,837 | | | 5,906,651 |
True Energy Trust | | 188,332 | | | 101,575 |
Tullow Oil Plc | | 544,198 | | | 6,256,934 |
TUSK Energy Corp. | | 681,846 | | | 1,157,321 |
Uranium One, Inc. (a) | | 1,005,765 | | | 2,034,185 |
Vero Energy, Inc. (a) | | 91,642 | | | 238,409 |
Warren Resources, Inc. (a) | | 222,282 | | | 213,391 |
West Energy Ltd. (a) | | 1,199,235 | | | 2,092,574 |
WesternZagros Resources Ltd. (a) | | 76,800 | | | 35,330 |
| | | | | |
| | | | | 378,069,467 |
| | | | | |
Total Common Stocks — 94.8% | | | | | 509,343,823 |
| | | | | |
Warrants Metals & Mining — 0.0% | | | | | |
Crosshair Exploration & Mining Corp. (issued 4/04/08, 1 share for 1 warrant, expiring 10/04/09, strike price 1.80 CAD) (acquired 4/04/08, cost $2,004) (a)(c) | | 206,800 | | | 607 |
| | | | | |
Total Long-Term Investments
(Cost — $738,332,904) — 94.8% | | | | | 509,344,430 |
| | | | | |
| | | | | | |
| | | Shares/
Beneficial
Interest | | Value | |
Short-Term Securities | | | | | | |
BlackRock Liquidity Funds, TempFund, 0.60% (e)(f) | | 21,307,492 | | $ | 21,307,492 | |
BlackRock Liquidity Series, LLC Money Market Series, 1.17% (e)(f)(g) | | 21,459,900 | | | 21,459,900 | |
| | | | | | |
Total Short-Term Securities
(Cost — $42,767,392) — 7.9% | | | | | 42,767,392 | |
| | | | | | |
Total Investments
(Cost — $781,100,296*) — 102.7% | | | | | 552,111,822 | |
Liabilities in Excess of Other Assets — (2.7)% | | | | | (14,679,110 | ) |
| | | | | | |
Net Assets — 100.0% | | | | $ | 537,432,712 | |
| | | | | | |
| * | The cost and unrealized appreciation (depreciation) of investments as of March 31, 2009, as computed for federal income tax purposes, were as follows: |
| | | | |
Aggregate cost | | $ | 791,434,439 | |
| | | | |
Gross unrealized appreciation | | $ | 78,169,944 | |
Gross unrealized depreciation | | | (317,492,561 | ) |
| | | | |
Net unrealized depreciation | | $ | (239,322,617 | ) |
| | | | |
| (a) | Non-income producing security. |
| (b) | Security, or a portion of security, is on loan. |
| (c) | Restricted security as to resale. As of report date the Portfolio held 1.6% of its net assets, with a current market value of $8,493,368 and an original cost of $4,240,159 in these securities. |
| (d) | Security exempt from registration under Rule 144A of the Securities Act of 1933. These securities may be resold in transactions exempt from registration to qualified institutional investors. |
| (e) | Investments in companies considered to be an affiliate of the Portfolio, for purposes of Section 2(a)(3) of the Investment Company Act of 1940, as amended, were as follows: |
| | | | | | | |
Affiliate | | Net
Activity | | | Income |
BlackRock Liquidity Funds, TempFund | | $ | 21,307,492 | ** | | $ | 68,264 |
BlackRock Liquidity Series, LLC | | | | | | | |
Money Market Series | | $ | (43,006,300 | )*** | | $ | 175,202 |
| ** | Represents net purchase cost. |
| *** | Represents net sales cost. |
| (f) | Represents current yield as of report date. |
| (g) | Security purchased with the cash proceeds from securities loans. |
| • | | For Portfolio compliance purposes, the Portfolio’s industry classifications refer to any one or more of the industry sub-classifications used by one or more widely recognized market indexes or ratings group indexes, and/or as defined by Portfolio management. This definition may not apply for purposes of this report, which may combine industry sub-classifications for reporting ease. |
| | | | | | |
22 | | SEMI-ANNUAL REPORT | | MARCH 31, 2009 | | |
| | |
| Schedule of Investments (concluded) | | Energy & Resources Portfolio |
| • | | Effective October 1, 2008, the Portfolio adopted Financial Accounting Standards Board Statement of Financial Accounting Standards No. 157, “Fair Value Measurements”. FAS 157 clarifies the definition of fair value, establishes a framework for measuring fair values and requires additional disclosures about the use of fair value measurements. Various inputs are used in determining the fair value of investments, which are as follows: |
| | • | | Level 1 – price quotations in active markets/exchanges for identical securities |
| | • | | Level 2 – other observable inputs (including, but not limited to: quoted prices for similar assets or liabilities in markets that are active, quoted prices for identical or similar assets in markets that are not active, inputs other than quoted prices that are observable for the assets or liabilities (such as interest rates, yield curves, volatilities, prepayment speeds, loss severities, credit risks and default rates) or other market – corroborated inputs) |
| | • | | Level 3 – unobservable inputs based on the best information available in the circumstance, to the extent observable inputs are not available (including the Portfolio’s own assumptions used in determining the fair value of investments. |
The inputs or methodology used for valuing securities are not necessarily an indication of the risk associated with investing in those securities. For information about the Portfolio’s policy regarding valuation of investments and other significant accounting policies, please refer to Note 1 of the Notes to Financial Statements.
The following table summarizes the inputs used as of March 31, 2009 in determining the fair valuation of the Portfolio’s investments:
| | | |
Valuation Inputs | | Investments
in Securities |
| | | Assets |
Level 1 | | $ | 521,441,430 |
Level 2 | | | 19,264,669 |
Level 3 | | | 11,405,723 |
| | | |
Total | | $ | 552,111,822 |
| | | |
The following table is a reconciliation of Level 3 investments for the period ended March 31, 2009:
| | | | |
| | | Investments
in Securities | |
| | | Assets | |
Balance, as of September 30, 2008 | | $ | 9,733,032 | |
Accrued discounts/premiums | | | — | |
Realized gain (loss) | | | — | |
Change in unrealized appreciation/ depreciation**** | | | (1,239,663 | ) |
Net purchases (sales) | | | — | |
Net transfers in of Level 3 | | | 2,912,354 | |
| | | | |
Balance, as of March 31, 2009 | | $ | 11,405,723 | |
| | | | |
| |
| | **** | Included in the related net change in appreciation/depreciation on the Statement of Operations. |
See Notes to Financial Statements.
| | | | | | |
| | | SEMI-ANNUAL REPORT | | MARCH 31, 2009 | | 23 |
Statements of Assets and Liabilities
| | | | | | | | | | | | | | | | |
March 31, 2009 (Unaudited) | | All-Cap Energy &
Resources
Portfolio | | | Aurora
Portfolio | | | Capital
Appreciation
Portfolio | | | Energy &
Resources
Portfolio | |
Assets | | | | | | | | | | | | | | | | |
Investments at value - unaffiliated1,2 | | $ | 442,280,835 | | | $ | 409,497,798 | | | $ | 215,865,179 | | | $ | 509,344,430 | |
Investments at value - affiliated3 | | | 6,933,941 | | | | 44,216,765 | | | | 5,365,741 | | | | 42,767,392 | |
Cash | | | 37,326 | | | | 20,836 | | | | — | | | | 22,140 | |
Foreign currency at value4 | | | 1,927 | | | | 83 | | | | — | | | | 8,911 | |
Investments sold receivable | | | — | | | | 26,065,567 | | | | 350,204 | | | | 82,247 | |
Securities lending income receivable - affiliated | | | 1,523 | | | | 7,575 | | | | 876 | | | | 7,458 | |
Capital shares sold receivable | | | 1,187,828 | | | | 358,256 | | | | 374,503 | | | | 9,289,196 | |
Dividends and reclaims receivable | | | 444,682 | | | | 446,829 | | | | 202,692 | | | | 194,476 | |
Receivable from advisor | | | 41,182 | | | | 76,654 | | | | 8,652 | | | | 64,046 | |
Dividends receivable - affiliated | | | 5,053 | | | | 5,094 | | | | 1,301 | | | | 23,202 | |
Prepaid expenses | | | 164,694 | | | | 97,801 | | | | 41,881 | | | | 131,648 | |
Other assets | | | — | | | | 17,413 | | | | 162 | | | | 51,636 | |
| | | | | | | | | | | | | | | | |
Total assets | | | 451,098,991 | | | | 480,810,671 | | | | 222,211,191 | | | | 561,986,782 | |
| | | | | | | | | | | | | | | | |
Liabilities | | | | | | | | | | | | | | | | |
Collateral at value - securities loaned | | | 440,000 | | | | 22,332,800 | | | | 2,145,000 | | | | 21,459,900 | |
Bank overdraft - affiliated | | | — | | | | — | | | | 89,913 | | | | — | |
Investments purchased payable | | | — | | | | 27,063,700 | | | | 786,205 | | | | — | |
Investment advisory fees payable | | | 277,873 | | | | 296,864 | | | | 94,108 | | | | 321,700 | |
Capital shares redeemed payable | | | 629,362 | | | | 1,503,920 | | | | 165,486 | | | | 1,903,443 | |
Other affiliates payable | | | 270,343 | | | | 731,327 | | | | 111,658 | | | | 482,202 | |
Printing payable | | | 181,372 | | | | 135,147 | | | | 28,333 | | | | 162,513 | |
Service and distribution fees payable | | | 120,112 | | | | 214,652 | | | | 46,161 | | | | 175,656 | |
Officer’s and Trustees’ fees payable | | | 9,454 | | | | 11,772 | | | | 6,768 | | | | 7,897 | |
Other accrued expenses payable | | | 43,873 | | | | 38,813 | | | | 29,208 | | | | 40,759 | |
| | | | | | | | | | | | | | | | |
Total liabilities | | | 1,972,389 | | | | 52,328,995 | | | | 3,502,840 | | | | 24,554,070 | |
| | | | | | | | | | | | | | | | |
Net Assets | | $ | 449,126,602 | | | $ | 428,481,676 | | | $ | 218,708,351 | | | $ | 537,432,712 | |
| | | | | | | | | | | | | | | | |
Net Assets Consist of | | | | | | | | | | | | | | | | |
Paid-in capital | | $ | 754,681,969 | | | $ | 824,345,961 | | | $ | 332,685,782 | | | $ | 953,967,744 | |
Undistributed (accumulated) net investment income (loss) | | | 4,352,722 | | | | 5,909,242 | | | | 829,036 | | | | (30,847,376 | ) |
Accumulated net realized loss | | | (153,665,384 | ) | | | (383,126,547 | ) | | | (95,312,387 | ) | | | (156,699,124 | ) |
Net unrealized appreciation/depreciation | | | (156,242,705 | ) | | | (18,646,980 | ) | | | (19,494,080 | ) | | | (228,988,532 | ) |
| | | | | | | | | | | | | | | | |
Net Assets | | $ | 449,126,602 | | | $ | 428,481,676 | | | $ | 218,708,351 | | | $ | 537,432,712 | |
| | | | | | | | | | | | | | | | |
1 Investments at cost - unaffiliated | | $ | 598,523,002 | | | $ | 428,144,763 | | | $ | 235,359,259 | | | $ | 738,332,904 | |
2 Securities loaned at value | | $ | 300,600 | | | $ | 22,020,586 | | | $ | 2,052,600 | | | $ | 20,261,506 | |
3 Investments at cost - affiliated | | $ | 6,933,941 | | | $ | 44,216,765 | | | $ | 5,365,741 | | | $ | 42,767,392 | |
4 Foreign currency at cost | | $ | 2,031 | | | $ | 98 | | | | — | | | $ | 6,848 | |
See Notes to Financial Statements.
| | | | | | |
24 | | SEMI-ANNUAL REPORT | | MARCH 31, 2009 | | |
Statements of Assets and Liabilities (concluded)
| | | | | | | | | | | | |
March 31, 2009 (Unaudited) | | All-Cap Energy &
Resources
Portfolio | | Aurora
Portfolio | | Capital
Appreciation
Portfolio | | Energy &
Resources
Portfolio |
Net Asset Value | | | | | | | | | | | | |
Institutional: | | | | | | | | | | | | |
Net Assets | | $ | 229,162,633 | | $ | 44,606,821 | | $ | 99,147,051 | | $ | 45,693,208 |
| | | | | | | | | | | | |
Shares outstanding, unlimited number of shares authorized, $0.001 par value | | | 27,632,639 | | | 3,537,365 | | | 8,650,606 | | | 2,359,221 |
| | | | | | | | | | | | |
Net Asset Value | | $ | 8.29 | | $ | 12.61 | | $ | 11.46 | | $ | 19.37 |
| | | | | | | | | | | | |
Service: | | | | | | | | | | | | |
Net Assets | | $ | 1,935,639 | | | — | | | — | | | — |
| | | | | | | | | | | | |
Shares outstanding, unlimited number of shares authorized, $0.001 par value | | | 237,217 | | | — | | | — | | | — |
| | | | | | | | | | | | |
Net Asset Value | | $ | 8.16 | | | — | | | — | | | — |
| | | | | | | | | | | | |
Investor A: | | | | | | | | | | | | |
Net Assets | | $ | 122,035,353 | | $ | 272,082,872 | | $ | 94,503,752 | | $ | 395,587,780 |
| | | | | | | | | | | | |
Shares outstanding, unlimited number of shares authorized, $0.001 par value | | | 14,956,650 | | | 23,582,295 | | | 8,617,929 | | | 23,190,095 |
| | | | | | | | | | | | |
Net Asset Value | | $ | 8.16 | | $ | 11.54 | | $ | 10.97 | | $ | 17.06 |
| | | | | | | | | | | | |
Investor B: | | | | | | | | | | | | |
Net Assets | | $ | 21,803,314 | | $ | 53,160,981 | | $ | 10,207,014 | | $ | 23,142,240 |
| | | | | | | | | | | | |
Shares outstanding, unlimited number of shares authorized, $0.001 par value | | | 2,750,956 | | | 5,796,846 | | | 1,012,011 | | | 1,797,383 |
| | | | | | | | | | | | |
Net Asset Value | | $ | 7.93 | | $ | 9.17 | | $ | 10.09 | | $ | 12.88 |
| | | | | | | | | | | | |
Investor C: | | | | | | | | | | | | |
Net Assets | | $ | 74,189,663 | | $ | 57,782,269 | | $ | 14,850,534 | | $ | 73,009,484 |
| | | | | | | | | | | | |
Shares outstanding, unlimited number of shares authorized, $0.001 par value | | | 9,353,625 | | | 6,302,523 | | | 1,465,377 | | | 5,685,997 |
| | | | | | | | | | | | |
Net Asset Value | | $ | 7.93 | | $ | 9.17 | | $ | 10.13 | | $ | 12.84 |
| | | | | | | | | | | | |
R: | | | | | | | | | | | | |
Net Assets | | | — | | $ | 848,733 | | | — | | | — |
| | | | | | | | | | | | |
Shares outstanding, unlimited number of shares authorized, $0.001 par value | | | — | | | 74,219 | | | — | | | — |
| | | | | | | | | | | | |
Net Asset Value | | | — | | $ | 11.44 | | | — | | | — |
| | | | | | | | | | | | |
See Notes to Financial Statements.
| | | | | | |
| | | SEMI-ANNUAL REPORT | | MARCH 31, 2009 | | 25 |
Statements of Operations
| | | | | | | | | | | | | | | | |
Six Months Ended March 31, 2009 (Unaudited) | | All-Cap Energy &
Resources
Portfolio | | | Aurora
Portfolio | | | Capital
Appreciation
Portfolio | | | Energy &
Resources
Portfolio | |
Investment Income | | | | | | | | | | | | | | | | |
Dividends and reclaims | | $ | 2,943,440 | | | $ | 4,346,885 | | | $ | 1,511,479 | | | $ | 2,381,857 | |
Securities lending - affiliated | | | 66,934 | | | | 149,576 | | | | 2,535 | | | | 175,202 | |
Interest and dividends - affiliated | | | 15,965 | | | | 25,118 | | | | 4,178 | | | | 69,335 | |
Interest | | | 471 | | | | 878 | | | | — | | | | 4,215 | |
Foreign taxes withheld | | | (183,315 | ) | | | (2,143 | ) | | | (3,417 | ) | | | (148,482 | ) |
| | | | | | | | | | | | | | | | |
Total investment income | | | 2,843,495 | | | | 4,520,314 | | | | 1,514,775 | | | | 2,482,127 | |
| | | | | | | | | | | | | | | | |
Expenses | | | | | | | | | | | | | | | | |
Investment advisory | | | 1,909,177 | | | | 2,154,041 | | | | 661,477 | | | | 2,040,784 | |
Service and distribution - class specific | | | 700,445 | | | | 1,064,336 | | | | 242,864 | | | | 1,010,402 | |
Transfer agent - class specific | | | 540,750 | | | | 1,082,472 | | | | 217,933 | | | | 877,202 | |
Administration | | | 188,962 | | | | 188,431 | | | | 76,324 | | | | 201,313 | |
Printing | | | 129,086 | | | | 136,080 | | | | 27,624 | | | | 114,748 | |
Administration - class specific | | | 63,775 | | | | 63,477 | | | | 25,431 | | | | 67,800 | |
Registration | | | 56,816 | | | | 23,500 | | | | 18,340 | | | | 41,776 | |
Custodian | | | 38,417 | | | | 29,079 | | | | 12,188 | | | | 39,871 | |
Professional | | | 32,404 | | | | 29,538 | | | | 16,628 | | | | 31,514 | |
Officer and Trustees | | | 11,824 | | | | 11,016 | | | | 8,707 | | | | 12,035 | |
Miscellaneous | | | 23,117 | | | | 16,284 | | | | 7,360 | | | | 27,752 | |
| | | | | | | | | | | | | | | | |
Total expenses | | | 3,694,773 | | | | 4,798,254 | | | | 1,314,876 | | | | 4,465,197 | |
Less fees waived by advisor | | | (39,220 | ) | | | (1,549 | ) | | | (116,288 | ) | | | (5,294 | ) |
Less administration fees waived - class specific | | | (62,944 | ) | | | (63,295 | ) | | | (12,796 | ) | | | (65,351 | ) |
Less transfer agent fees waived - class specific | | | (46,257 | ) | | | (40,991 | ) | | | (4,140 | ) | | | (42,735 | ) |
Less transfer agent fees reimbursed - class specific | | | (315,691 | ) | | | (617,031 | ) | | | (22,302 | ) | | | (403,209 | ) |
Less fees paid indirectly | | | (1,407 | ) | | | (2,618 | ) | | | (682 | ) | | | (1,643 | ) |
| | | | | | | | | | | | | | | | |
Total expenses after waivers, reimbursement and fees paid indirectly | | | 3,229,254 | | | | 4,072,770 | | | | 1,158,668 | | | | 3,946,965 | |
| | | | | | | | | | | | | | | | |
Net investment income (loss) | | | (385,759 | ) | | | 447,544 | | | | 356,107 | | | | (1,464,838 | ) |
| | | | | | | | | | | | | | | | |
Realized and Unrealized Gain (Loss) | | | | | | | | | | | | | | | | |
Net realized gain (loss) from: | | | | | | | | | | | | | | | | |
Investments | | | (154,385,078 | ) | | | (253,686,274 | ) | | | (42,494,078 | ) | | | (153,281,451 | ) |
Foreign currency transactions | | | (16,530 | ) | | | (67 | ) | | | — | | | | 517,430 | |
| | | | | | | | | | | | | | | | |
| | | (154,401,608 | ) | | | (253,686,341 | ) | | | (42,494,078 | ) | | | (152,764,021 | ) |
| | | | | | | | | | | | | | | | |
Net change in unrealized appreciation/depreciation on: | | | | | | | | | | | | | | | | |
Investments | | | (218,784,025 | ) | | | (20,130,238 | ) | | | (18,233,206 | ) | | | (290,542,964 | ) |
Foreign currency transactions | | | 12,279 | | | | (16 | ) | | | — | | | | (493,585 | ) |
| | | | | | | | | | | | | | | | |
| | | (218,771,746 | ) | | | (20,130,254 | ) | | | (18,233,206 | ) | | | (291,036,549 | ) |
| | | | | | | | | | | | | | | | |
Total realized and unrealized loss | | | (373,173,354 | ) | | | (273,816,595 | ) | | | (60,727,284 | ) | | | (443,800,570 | ) |
| | | | | | | | | | | | | | | | |
Net Decrease in Net Assets Resulting from Operations | | $ | (373,559,113 | ) | | $ | (273,369,051 | ) | | $ | (60,371,177 | ) | | $ | (445,265,408 | ) |
| | | | | | | | | | | | | | | | |
See Notes to Financial Statements.
| | | | | | |
26 | | SEMI-ANNUAL REPORT | | MARCH 31, 2009 | | |
[THIS PAGE INTENTIONALLY LEFT BLANK.]
Statements of Changes in Net Assets
| | | | | | | | |
| | | All-Cap
Energy &
Resources
Portfolio | |
Increase (Decrease) in Net Assets: | | Six Months
Ended
March 31, 2009
(Unaudited) | | | Year Ended
September 30,
2008 | |
Operations | | | | | | | | |
Net investment income (loss) | | $ | (385,759 | ) | | $ | 11,336,746 | |
Net realized gain (loss) | | | (154,401,608 | ) | | | 102,084,945 | |
Net change in unrealized appreciation/depreciation | | | (218,771,746 | ) | | | (269,024,429 | ) |
| | | | | | | | |
Net decrease in net assets resulting from operations | | | (373,559,113 | ) | | | (155,602,738 | ) |
| | | | | | | | |
Dividends and Distributions to Shareholders From | | | | | | | | |
Net investment income: | | | | | | | | |
Institutional | | | — | | | | (4,105,246 | ) |
Service | | | — | | | | (16,970 | ) |
Investor A | | | — | | | | (1,618,979 | ) |
Investor B | | | — | | | | (88,534 | ) |
Investor C | | | — | | | | (404,429 | ) |
Tax return of capital: | | | | | | | | |
Institutional | | | — | | | | — | |
Investor A | | | — | | | | — | |
Investor B | | | — | | | | — | |
Investor C | | | — | | | | — | |
R | | | — | | | | — | |
Net realized gain: | | | | | | | | |
Institutional | | | (46,056,784 | ) | | | (14,094,817 | ) |
Service | | | (320,003 | ) | | | (71,355 | ) |
Investor A | | | (21,057,087 | ) | | | (6,879,249 | ) |
Investor B | | | (3,991,134 | ) | | | (912,837 | ) |
Investor C | | | (13,578,948 | ) | | | (3,537,720 | ) |
R | | | — | | | | — | |
| | | | | | | | |
Decrease in net assets resulting from dividends and distributions to shareholders | | | (85,003,956 | ) | | | (31,730,136 | ) |
| | | | | | | | |
Capital Share Transactions | | | | | | | | |
Net increase (decrease) in net assets derived from capital share transactions | | | (71,319,136 | ) | | | (46,293,225 | ) |
| | | | | | | | |
Redemption Fees | | | | | | | | |
Redemption fees | | | 36,415 | | | | 86,648 | |
| | | | | | | | |
Net Assets | | | | | | | | |
Total increase (decrease) in net assets | | | (529,845,790 | ) | | | (233,539,451 | ) |
Beginning of period | | | 978,972,392 | | | | 1,212,511,843 | |
| | | | | | | | |
End of period | | $ | 449,126,602 | | | $ | 978,972,392 | |
| | | | | | | | |
End of period undistributed (accumulated) net investment income (loss) | | $ | 4,352,722 | | | $ | 4,738,481 | |
| | | | | | | | |
See Notes to Financial Statements.
| | | | | | |
28 | | SEMI-ANNUAL REPORT | | MARCH 31, 2009 | | |
Statements of Changes in Net Assets (concluded)
| | | | | | | | | | | | | | | | | | | | | | |
| Aurora Portfolio | | | Capital Appreciation Portfolio | | | Energy & Resources Portfolio | |
Six Months Ended
March 31, 2009
(Unaudited) | | | Year Ended
September 30,
2008 | | | Six Months Ended
March 31, 2009
(Unaudited) | | | Year Ended
September 30,
2008 | | | Six Months Ended
March 31, 2009
(Unaudited) | | | Year Ended
September 30,
2008 | |
| $ | 447,544 | | | $ | (7,096,388 | ) | | $ | 356,107 | | | $ | (217,917 | ) | | $ | (1,464,838 | ) | | $ | (7,675,740 | ) |
| | (253,686,341 | ) | | | (100,132,909 | ) | | | (42,494,078 | ) | | | 9,419,750 | | | | (152,764,021 | ) | | | 213,150,989 | |
| | (20,130,254 | ) | | | (166,084,129 | ) | | | (18,233,206 | ) | | | (56,576,048 | ) | | | (291,036,549 | ) | | | (357,347,796 | ) |
| | | | | | | | | | | | | | | | | | | | | | | |
| | (273,369,051 | ) | | | (273,313,426 | ) | | | (60,371,177 | ) | | | (47,374,215 | ) | | | (445,265,408 | ) | | | (151,872,547 | ) |
| | | | | | | | | | | | | | | | | | | | | | | |
| | — | | | | — | | | | — | | | | — | | | | — | | | | (777,499 | ) |
| | — | | | | — | | | | — | | | | — | | | | — | | | | — | |
| | — | | | | — | | | | — | | | | — | | | | — | | | | (21,815,192 | ) |
| | — | | | | — | | | | — | | | | — | | | | — | | | | (2,184,581 | ) |
| | — | | | | — | | | | — | | | | — | | | | — | | | | (4,465,841 | ) |
| | — | | | | (1,127,041 | ) | | | — | | | | — | | | | — | | | | — | |
| | — | | | | (6,120,894 | ) | | | — | | | | — | | | | — | | | | — | |
| | — | | | | (2,063,828 | ) | | | — | | | | — | | | | — | | | | — | |
| | — | | | | (1,733,899 | ) | | | — | | | | — | | | | — | | | | — | |
| | — | | | | (10,832 | ) | | | — | | | | — | | | | — | | | | — | |
| | | | | | | | | | | | | | | | | | | | | — | |
| | — | | | | (30,668,524 | ) | | | — | | | | — | | | | (8,049,448 | ) | | | (2,796,071 | ) |
| | — | | | | — | | | | — | | | | — | | | | — | | | | — | |
| | — | | | | (162,487,528 | ) | | | — | | | | — | | | | (118,212,233 | ) | | | (82,411,812 | ) |
| | — | | | | (52,727,334 | ) | | | — | | | | — | | | | (11,269,678 | ) | | | (10,490,630 | ) |
| | — | | | | (44,412,046 | ) | | | — | | | | — | | | | (30,833,705 | ) | | | (20,432,459 | ) |
| | — | | | | (294,567 | ) | | | — | | | | — | | | | — | | | | — | |
| | | | | | | | | | | | | | | | | | | | | | | |
| | — | | | | (301,646,493 | ) | | | — | | | | — | | | | (168,365,064 | ) | | | (145,374,085 | ) |
| | | | | | | | | | | | | | | | | | | | | | | |
| | (88,874,299 | ) | | | (137,141,667 | ) | | | 44,211,017 | | | | 16,036,638 | | | | 170,535,976 | | | | 329,664,238 | |
| | | | | | | | | | | | | | | | | | | | | | | |
| | 7,727 | | | | 7,015 | | | | — | | | | 1,487 | | | | 150,670 | | | | 393,391 | |
| | | | | | | | | | | | | | | | | | | | | | | |
| | (362,235,623 | ) | | | (712,094,571 | ) | | | (16,160,160 | ) | | | (31,336,090 | ) | | | (442,943,826 | ) | | | 32,810,997 | |
| | 790,717,299 | | | | 1,502,811,870 | | | | 234,868,511 | | | | 266,204,601 | | | | 980,376,538 | | | | 947,565,541 | |
| | | | | | | | | | | | | | | | | | | | | | | |
| $ | 428,481,676 | | | $ | 790,717,299 | | | $ | 218,708,351 | | | $ | 234,868,511 | | | $ | 537,432,712 | | | $ | 980,376,538 | |
| | | | | | | | | | | | | | | | | | | | | | | |
| $ | 5,909,242 | | | $ | 5,461,698 | | | $ | 829,036 | | | $ | 472,929 | | | $ | (30,847,376 | ) | | $ | (29,382,538 | ) |
| | | | | | | | | | | | | | | | | | | | | | | |
See Notes to Financial Statements.
| | | | | | |
| | | SEMI-ANNUAL REPORT | | MARCH 31, 2009 | | 29 |
| | |
| Financial Highlights | | All-Cap Energy & Resources Portfolio |
| | | | | | | | | | | | | | | | | | | | | | | | | | | | | | | | | | | | | | | | |
| | | Institutional | | | Service | |
| | | Six Months
Ended
March 31, 2009
(Unaudited) | | | Year Ended September 30, | | | Period
February 16, 20051 to | | | Six Months
Ended
March 31, 2009
(Unaudited) | | | Year Ended September 30, | | | Period
February 16, 20051 to | |
| | | 2008 | | | 2007 | | | 2006 | | | September 30, 2005 | | | | 2008 | | | 2007 | | | 2006 | | | September 30, 2005 | |
Per Share Operating Performance | |
Net asset value, beginning of period | | $ | 16.20 | | | $ | 19.40 | | | $ | 13.85 | | | $ | 13.56 | | | $ | 10.00 | | | $ | 16.01 | | | $ | 19.19 | | | $ | 13.75 | | | $ | 13.52 | | | $ | 10.00 | |
| | | | | | | | | | | | | | | | | | | | | | | | | | | | | | | | | | | | | | | | |
Net investment income (loss)2 | | | 0.01 | | | | 0.24 | | | | 0.05 | | | | 0.02 | | | | 0.02 | | | | (0.01 | ) | | | 0.12 | | | | (0.02 | ) | | | (0.02 | ) | | | 0.03 | |
Net realized and unrealized gain (loss) | | | (6.30 | ) | | | (2.90 | ) | | | 5.90 | | | | 0.26 | | | | 3.54 | | | | (6.22 | ) | | | (2.83 | ) | | | 5.86 | | | | 0.24 | | | | 3.49 | |
| | | | | | | | | | | | | | | | | | | | | | | | | | | | | | | | | | | | | | | | |
Net increase (decrease) from investment operations | | | (6.29 | ) | | | (2.66 | ) | | | 5.95 | | | | 0.28 | | | | 3.56 | | | | (6.23 | ) | | | (2.71 | ) | | | 5.84 | | | | 0.22 | | | | 3.52 | |
| | | | | | | | | | | | | | | | | | | | | | | | | | | | | | | | | | | | | | | | |
Dividends and distributions from: | | | | | | | | | | | | | | | | | | | | | | | | | | | | | | | | | | | | | | | | |
Net investment income | | | — | | | | (0.23 | ) | | | — | | | | — | | | | — | | | | — | | | | (0.16 | ) | | | — | | | | — | | | | — | |
Net realized gain | | | (1.62 | ) | | | (0.31 | ) | | | (0.40 | ) | | | — | | | | — | | | | (1.62 | ) | | | (0.31 | ) | | | (0.40 | ) | | | — | | | | — | |
| | | | | | | | | | | | | | | | | | | | | | | | | | | | | | | | | | | | | | | | |
Total dividends and distributions | | | (1.62 | ) | | | (0.54 | ) | | | (0.40 | ) | | | — | | | | — | | | | (1.62 | ) | | | (0.47 | ) | | | (0.40 | ) | | | — | | | | — | |
| | | | | | | | | | | | | | | | | | | | | | | | | | | | | | | | | | | | | | | | |
Redemption fees added to paid-in capital | | | 0.00 | 3 | | | 0.00 | 3 | | | 0.00 | 3 | | | 0.01 | | | | 0.00 | 3 | | | 0.00 | 3 | | | 0.00 | 3 | | | 0.00 | 3 | | | 0.01 | | | | 0.00 | 3 |
| | | | | | | | | | | | | | | | | | | | | | | | | | | | | | | | | | | | | | | | |
Net asset value, end of period | | $ | 8.29 | | | $ | 16.20 | | | $ | 19.40 | | | $ | 13.85 | | | $ | 13.56 | | | $ | 8.16 | | | $ | 16.01 | | | $ | 19.19 | | | $ | 13.75 | | | $ | 13.52 | |
| | | | | | | | | | | | | | | | | | | | | | | | | | | | | | | | | | | | | | | | |
Total Investment Return | |
Based on net asset value | | | (38.48 | )%4,5 | | | (14.25 | )%4 | | | 43.66 | %4 | | | 2.14 | %6 | | | 35.60 | %4,5 | | | (38.56 | )%4,5 | | | (14.59 | )%4 | | | 43.16 | %4 | | | 1.70 | %7 | | | 35.20 | %4,5 |
| | | | | | | | | | | | | | | | | | | | | | | | | | | | | | | | | | | | | | | | |
Ratios to Average Net Assets | |
Total expenses after waivers, reimbursement and fees paid indirectly | | | 0.93 | %8 | | | 0.89 | % | | | 0.93 | % | | | 0.99 | % | | | 1.04 | %8 | | | 1.34 | %8 | | | 1.25 | % | | | 1.33 | % | | | 1.34 | % | | | 1.34 | %8 |
| | | | | | | | | | | | | | | | | | | | | | | | | | | | | | | | | | | | | | | | |
Total expenses | | | 1.01 | %8 | | | 0.89 | % | | | 0.93 | % | | | 1.01 | % | | | 1.54 | %8 | | | 1.71 | %8 | | | 1.25 | % | | | 1.42 | % | | | 1.40 | % | | | 1.77 | %8 |
| | | | | | | | | | | | | | | | | | | | | | | | | | | | | | | | | | | | | | | | |
Net investment income (loss) | | | 0.19 | %8 | | | 1.14 | % | | | 0.31 | % | | | 0.17 | % | | | 0.25 | %8 | | | (0.25 | )%8 | | | 0.56 | % | | | (0.11 | )% | | | (0.17 | )% | | | 0.01 | %8 |
| | | | | | | | | | | | | | | | | | | | | | | | | | | | | | | | | | | | | | | | |
Supplemental Data | |
Net assets, end of period (000) | | $ | 229,163 | | | $ | 510,804 | | | $ | 598,747 | | | $ | 337,771 | | | $ | 92,147 | | | $ | 1,936 | | | $ | 4,836 | | | $ | 3,435 | | | $ | 2,368 | | | $ | — | 9 |
| | | | | | | | | | | | | | | | | | | | | | | | | | | | | | | | | | | | | | | | |
Portfolio turnover | | | 11 | % | | | 38 | % | | | 31 | % | | | 41 | % | | | 12 | % | | | 11 | % | | | 38 | % | | | 31 | % | | | 41 | % | | | 12 | % |
| | | | | | | | | | | | | | | | | | | | | | | | | | | | | | | | | | | | | | | | |
See Notes to Financial Statements.
| | | | | | |
30 | | SEMI-ANNUAL REPORT | | MARCH 31, 2009 | | |
| | |
| Financial Highlights (continued) | | All-Cap Energy & Resources Portfolio |
| | | | | | | | | | | | | | | | | | | | | | | | | | | | | | | | | | | | | | | | |
| | | Investor A | | | Investor B | |
| | | Six Months
Ended
March 31, 2009
(Unaudited) | | | Year Ended September 30, | | | Period
February 16, 20051 to | | | Six Months
Ended
March 31, 2009
(Unaudited) | | | Year Ended September 30, | | | Period
February 16, 20051 to | |
| | | 2008 | | | 2007 | | | 2006 | | | September 30, 2005 | | | | 2008 | | | 2007 | | | 2006 | | | September 30, 2005 | |
Per Share Operating Performance | |
Net asset value, beginning of period | | $ | 16.01 | | | $ | 19.18 | | | $ | 13.75 | | | $ | 13.50 | | | $ | 10.00 | | | $ | 15.68 | | | $ | 18.82 | | | $ | 13.59 | | | $ | 13.44 | | | $ | 10.00 | |
| | | | | | | | | | | | | | | | | | | | | | | | | | | | | | | | | | | | | | | | |
Net investment income (loss)2 | | | (0.01 | ) | | | 0.17 | | | | (0.02 | ) | | | (0.02 | ) | | | 0.00 | 3 | | | (0.04 | ) | | | 0.01 | | | | (0.13 | ) | | | (0.12 | ) | | | (0.05 | ) |
Net realized and unrealized gain (loss) | | | (6.22 | ) | | | (2.87 | ) | | | 5.85 | | | | 0.26 | | | | 3.50 | | | | (6.09 | ) | | | (2.81 | ) | | | 5.76 | | | | 0.26 | | | | 3.49 | |
| | | | | | | | | | | | | | | | | | | | | | | | | | | | | | | | | | | | | | | | |
Net increase (decrease) from investment operations | | | (6.23 | ) | | | (2.70 | ) | | | 5.83 | | | | 0.24 | | | | 3.50 | | | | (6.13 | ) | | | (2.80 | ) | | | 5.63 | | | | 0.14 | | | | 3.44 | |
| | | | | | | | | | | | | | | | | | | | | | | | | | | | | | | | | | | | | | | | |
Dividends and distributions from: | | | | | | | | | | | | | | | | | | | | | | | | | | | | | | | | | | | | | | | | |
Net investment income | | | — | | | | (0.16 | ) | | | — | | | | — | | | | — | | | | — | | | | (0.03 | ) | | | — | | | | — | | | | — | |
Net realized gain | | | (1.62 | ) | | | (0.31 | ) | | | (0.40 | ) | | | — | | | | — | | | | (1.62 | ) | | | (0.31 | ) | | | (0.40 | ) | | | — | | | | — | |
| | | | | | | | | | | | | | | | | | | | | | | | | | | | | | | | | | | | | | | | |
Total dividends and distributions | | | (1.62 | ) | | | (0.47 | ) | | | (0.40 | ) | | | — | | | | — | | | | (1.62 | ) | | | (0.34 | ) | | | (0.40 | ) | | | — | | | | — | |
| | | | | | | | | | | | | | | | | | | | | | | | | | | | | | | | | | | | | | | | |
Redemption fees added to paid-in capital | | | 0.00 | 3 | | | 0.00 | 3 | | | 0.00 | 3 | | | 0.01 | | | | 0.00 | 3 | | | 0.00 | 3 | | | 0.00 | 3 | | | 0.00 | 3 | | | 0.01 | | | | 0.00 | 3 |
| | | | | | | | | | | | | | | | | | | | | | | | | | | | | | | | | | | | | | | | |
Net asset value, end of period | | $ | 8.16 | | | $ | 16.01 | | | $ | 19.18 | | | $ | 13.75 | | | $ | 13.50 | | | $ | 7.93 | | | $ | 15.68 | | | $ | 18.82 | | | $ | 13.59 | | | $ | 13.44 | |
| | | | | | | | | | | | | | | | | | | | | | | | | | | | | | | | | | | | | | | | |
Total Investment Return | |
Based on net asset value10 | | | (38.56 | )%4,5 | | | (14.55 | )%4 | | | 43.09 | %4 | | | 1.85 | %7 | | | 35.00 | %4,5 | | | (38.76 | )%4,5 | | | (15.23 | )%4 | | | 42.11 | %4 | | | 1.12 | %6 | | | 34.40 | %4,5 |
| | | | | | | | | | | | | | | | | | | | | | | | | | | | | | | | | | | | | | | | |
Ratios to Average Net Assets | |
Total expenses after waivers, reimbursement and fees paid indirectly | | | 1.34 | %8 | | | 1.26 | % | | | 1.31 | % | | | 1.34 | % | | | 1.34 | %8 | | | 2.04 | %8 | | | 2.04 | % | | | 2.04 | % | | | 2.04 | % | | | 2.04 | %8 |
| | | | | | | | | | | | | | | | | | | | | | | | | | | | | | | | | | | | | | | | |
Total expenses | | | 1.61 | %8 | | | 1.27 | % | | | 1.34 | % | | | 1.46 | % | | | 1.87 | %8 | | | 2.48 | %8 | | | 2.09 | % | | | 2.23 | % | | | 2.13 | % | | | 2.49 | %8 |
| | | | | | | | | | | | | | | | | | | | | | | | | | | | | | | | | | | | | | | | |
Net investment income (loss) | | | (0.23 | )%8 | | | 0.81 | % | | | (0.10 | )% | | | (0.16 | )% | | | 0.01 | %8 | | | (0.91 | )%8 | | | 0.06 | % | | | (0.82 | )% | | | (0.86 | )% | | | (0.64 | )%8 |
| | | | | | | | | | | | | | | | | | | | | | | | | | | | | | | | | | | | | | | | |
Supplemental Data | | | | | | | | | | | | | | | | | | | | | | | | | | | | | | | | | | | | | | | | |
Net assets, end of period (000) | | $ | 122,035 | | | $ | 267,422 | | | $ | 347,598 | | | $ | 248,557 | | | $ | 87,949 | | | $ | 21,803 | | | $ | 42,399 | | | $ | 55,538 | | | $ | 43,477 | | | $ | 16,019 | |
| | | | | | | | | | | | | | | | | | | | | | | | | | | | | | | | | | | | | | | | |
Portfolio turnover | | | 11 | % | | | 38 | % | | | 31 | % | | | 41 | % | | | 12 | % | | | 11 | % | | | 38 | % | | | 31 | % | | | 41 | % | | | 12 | % |
| | | | | | | | | | | | | | | | | | | | | | | | | | | | | | | | | | | | | | | | |
| 1 | Commencement of operations. |
| 2 | Based on average shares outstanding. |
| 3 | Less than $0.01 per share. |
| 4 | Redemption fee of 2.00% received by the Portfolio is reflected in total return calculations. There was no impact to the return. |
| 5 | Aggregate total investment return. |
| 6 | Redemption fee of 2.00% received by the Portfolio is reflected in total return calculations. The impact to the return from redemption fees received during the period was an increase of 0.08%. |
| 7 | Redemption fee of 2.00% received by the Portfolio is reflected in total return calculations. The impact to the return from redemption fees received during the period was an increase of 0.07%. |
| 9 | Net assets end of period are less than $500. |
| 10 | Total investment returns exclude the effects of sales charges. |
See Notes to Financial Statements.
| | | | | | |
| | | SEMI-ANNUAL REPORT | | MARCH 31, 2009 | | 31 |
| | |
| Financial Highlights (continued) | | All-Cap Energy & Resources Portfolio |
| | | | | | | | | | | | | | | | | | | | |
| | | Investor C | |
| | | Six Months
Ended
March 31, 2009
(Unaudited) | | | Year Ended September 30, | | | Period
February 16, 20051 to | |
| | | | 2008 | | | 2007 | | | 2006 | | | September 30, 2005 | |
Per Share Operating Performance | |
Net asset value, beginning of period | | $ | 15.69 | | | $ | 18.84 | | | $ | 13.60 | | | $ | 13.46 | | | $ | 10.00 | |
| | | | | | | | | | | | | | | | | | | | |
Net investment income (loss)2 | | | (0.04 | ) | | | 0.02 | | | | (0.13 | ) | | | (0.12 | ) | | | (0.05 | ) |
Net realized and unrealized gain (loss) | | | (6.10 | ) | | | (2.82 | ) | | | 5.77 | | | | 0.25 | | | | 3.51 | |
| | | | | | | | | | | | | | | | | | | | |
Net increase (decrease) from investment operations | | | (6.14 | ) | | | (2.80 | ) | | | 5.64 | | | | 0.13 | | | | 3.46 | |
| | | | | | | | | | | | | | | | | | | | |
Dividends and distributions from: | | | | | | | | | | | | | | | | | | | | |
Net investment income | | | — | | | | (0.04 | ) | | | — | | | | — | | | | — | |
Net realized gain | | | (1.62 | ) | | | (0.31 | ) | | | (0.40 | ) | | | — | | | | — | |
| | | | | | | | | | | | | | | | | | | | |
Total dividends and distributions | | | (1.62 | ) | | | (0.35 | ) | | | (0.40 | ) | | | — | | | | — | |
| | | | | | | | | | | | | | | | | | | | |
Redemption fees added to paid-in capital | | | 0.00 | 3 | | | 0.00 | 3 | | | 0.00 | 3 | | | 0.01 | | | | 0.00 | 3 |
| | | | | | | | | | | | | | | | | | | | |
Net asset value, end of period | | $ | 7.93 | | | $ | 15.69 | | | $ | 18.84 | | | $ | 13.60 | | | $ | 13.46 | |
| | | | | | | | | | | | | | | | | | | | |
Total Investment Return | |
Based on net asset value4 | | | (38.80 | )%5,6 | | | (15.21 | )%5 | | | 42.15 | %5 | | | 1.04 | %7 | | | 34.60 | %5,6 |
| | | | | | | | | | | | | | | | | | | | |
Ratios to Average Net Assets | |
Total expenses after waivers, reimbursement and fees paid indirectly | | | 2.04 | %8 | | | 2.01 | % | | | 2.04 | % | | | 2.04 | % | | | 2.04 | %8 |
| | | | | | | | | | | | | | | | | | | | |
Total expenses | | | 2.35 | %8 | | | 2.02 | % | | | 2.12 | % | | | 2.09 | % | | | 2.48 | %8 |
| | | | | | | | | | | | | | | | | | | | |
Net investment income (loss) | | | (0.92 | )%8 | | | 0.08 | % | | | (0.83 | )% | | | (0.86 | )% | | | (0.70 | )%8 |
| | | | | | | | | | | | | | | | | | | | |
Supplemental Data | |
Net assets, end of period (000) | | $ | 74,190 | | | $ | 153,512 | | | $ | 207,194 | | | $ | 136,120 | | | $ | 48,288 | |
| | | | | | | | | | | | | | | | | | | | |
Portfolio turnover | | | 11 | % | | | 38 | % | | | 31 | % | | | 41 | % | | | 12 | % |
| | | | | | | | | | | | | | | | | | | | |
| 1 | Commencement of operations. |
| 2 | Based on average shares outstanding. |
| 3 | Less than $0.01 per share. |
| 4 | Total investment returns exclude the effects of sales charges. |
| 5 | Redemption fee of 2.00% received by the Portfolio is reflected in total return calculations. There was no impact to the return. |
| 6 | Aggregate total investment return. |
| 7 | Redemption fee of 2.00% received by the Portfolio is reflected in total return calculations. The impact to the return from redemption fees received during the period was an increase of 0.07%. |
See Notes to Financial Statements.
| | | | | | |
32 | | SEMI-ANNUAL REPORT | | MARCH 31, 2009 | | |
| | |
| Financial Highlights (continued) | | Aurora Portfolio |
| | | | | | | | | | | | | | | | | | | | | | | | |
| | | Institutional | |
| | | Six Months
Ended
March 31, 2009 | | | Year Ended September 30, | |
| | (Unaudited) | | | 2008 | | | 2007 | | | 2006 | | | 2005 | | | 2004 | |
Per Share Operating Performance | |
Net asset value, beginning of period | | $ | 19.49 | | | $ | 30.87 | | | $ | 37.15 | | | $ | 43.43 | | | $ | 40.71 | | | $ | 33.18 | |
| | | | | | | | | | | | | | | | | | | | | | | | |
Net investment income (loss) | | | 0.05 | 1 | | | (0.02 | )1 | | | 0.10 | 1 | | | 0.08 | 1 | | | (0.04 | )1 | | | (0.11 | ) |
Net realized and unrealized gain (loss) | | | (6.93 | ) | | | (5.34 | ) | | | 4.82 | | | | 1.13 | | | | 6.60 | | | | 7.66 | |
| | | | | | | | | | | | | | | | | | | | | | | | |
Net increase (decrease) from investment operations | | | (6.88 | ) | | | (5.36 | ) | | | 4.92 | | | | 1.21 | | | | 6.56 | | | | 7.55 | |
| | | | | | | | | | | | | | | | | | | | | | | | |
Dividends and distributions from: | | | | | | | | | | | | | | | | | | | | | | | | |
Tax return of capital | | | — | | | | (0.21 | ) | | | — | | | | — | | | | — | | | | — | |
Net realized gain | | | — | | | | (5.81 | ) | | | (11.20 | ) | | | (7.49 | ) | | | (3.84 | ) | | | (0.02 | ) |
| | | | | | | | | | | | | | | | | | | | | | | | |
Total dividends and distributions | | | — | | | | (6.02 | ) | | | (11.20 | ) | | | (7.49 | ) | | | (3.84 | ) | | | (0.02 | ) |
| | | | | | | | | | | | | | | | | | | | | | | | |
Redemption fees added to paid-in capital | | | 0.00 | 2 | | | 0.00 | 2 | | | 0.00 | 2 | | | 0.00 | 2 | | | 0.00 | 2 | | | — | |
| | | | | | | | | | | | | | | | | | | | | | | | |
Net asset value, end of period | | $ | 12.61 | | | $ | 19.49 | | | $ | 30.87 | | | $ | 37.15 | | | $ | 43.43 | | | $ | 40.71 | |
| | | | | | | | | | | | | | | | | | | | | | | | |
Total Investment Return | |
Based on net asset value | | | (35.30 | )%3,4 | | | (21.60 | )%3,5 | | | 14.86 | %3 | | | 3.40 | %3 | | | 16.62 | %3 | | | 22.75 | % |
| | | | | | | | | | | | | | | | | | | | | | | | |
Ratios to Average Net Assets | |
Total expenses after waivers, reimbursement and fees paid indirectly | | | 1.05 | %6 | | | 1.05 | % | | | 1.01 | % | | | 1.06 | % | | | 1.14 | % | | | 1.10 | % |
| | | | | | | | | | | | | | | | | | | | | | | | |
Total expenses | | | 1.41 | %6 | | | 1.28 | % | | | 1.11 | % | | | 1.07 | % | | | 1.14 | % | | | 1.10 | % |
| | | | | | | | | | | | | | | | | | | | | | | | |
Net investment income (loss) | | | 0.74 | %6 | | | (0.08 | )% | | | 0.32 | % | | | 0.22 | % | | | (0.09 | )% | | | (0.27 | )% |
| | | | | | | | | | | | | | | | | | | | | | | | |
Supplemental Data | |
Net assets, end of period (000) | | $ | 44,606 | | | $ | 81,400 | | | $ | 169,479 | | | $ | 153,103 | | | $ | 165,837 | | | $ | 197,475 | |
| | | | | | | | | | | | | | | | | | | | | | | | |
Portfolio turnover | | | 148 | % | | | 147 | % | | | 134 | % | | | 142 | % | | | 73 | % | | | 33 | % |
| | | | | | | | | | | | | | | | | | | | | | | | |
| 1 | Based on average shares outstanding. |
| 2 | Less than $0.01 per share. |
| 3 | Redemption fee of 2.00% received by the Portfolio is reflected in total return calculations. There was no impact to the return. |
| 4 | Aggregate total investment return. |
| 5 | Payment from affiliate of $139,965 received by the Portfolio is reflected in total return calculations. There was no impact to the return. |
See Notes to Financial Statements.
| | | | | | |
| | | SEMI-ANNUAL REPORT | | MARCH 31, 2009 | | 33 |
| | |
| Financial Highlights (continued) | | Aurora Portfolio |
| | | | | | | | | | | | | | | | | | | | | | | | | | | | | | | | | | | | | | | | | | | | | | | | |
| | | Investor A | | | Investor B | |
| | | Six Months
Ended
March 31, 2009 | | | Year Ended September 30, | | | Six Months
Ended
March 31, 2009 | | | Year Ended September 30, | |
| | (Unaudited) | | | 2008 | | | 2007 | | | 2006 | | | 2005 | | | 2004 | | | (Unaudited) | | | 2008 | | | 2007 | | | 2006 | | | 2005 | | | 2004 | |
Per Share Operating Performance | |
Net asset value, beginning of period | | $ | 17.86 | | | $ | 28.75 | | | $ | 35.39 | | | $ | 41.88 | | | $ | 39.49 | | | $ | 32.28 | | | $ | 14.26 | | | $ | 24.06 | | | $ | 31.48 | | | $ | 38.32 | | | $ | 36.67 | | | $ | 30.19 | |
| | | | | | | | | | | | | | | | | | | | | | | | | | | | | | | | | | | | | | | | | | | | | | | | |
Net investment income (loss) | | | 0.02 | 1 | | | (0.10 | )1 | | | 0.01 | 1 | | | (0.05 | )1 | | | (0.16 | )1 | | | (0.22 | ) | | | (0.02 | )1 | | | (0.21 | )1 | | | (0.19 | )1 | | | (0.29 | )1 | | | (0.40 | )1 | | | (0.45 | ) |
Net realized and unrealized gain (loss) | | | (6.34 | ) | | | (4.91 | ) | | | 4.55 | | | | 1.05 | | | | 6.39 | | | | 7.45 | | | | (5.07 | ) | | | (3.92 | ) | | | 3.97 | | | | 0.94 | | | | 5.89 | | | | 6.95 | |
| | | | | | | | | | | | | | | | | | | | | | | | | | | | | | | | | | | | | | | | | | | | | | | | |
Net increase (decrease) from investment operations | | | (6.32 | ) | | | (5.01 | ) | | | 4.56 | | | | 1.00 | | | | 6.23 | | | | 7.23 | | | | (5.09 | ) | | | (4.13 | ) | | | 3.78 | | | | 0.65 | | | | 5.49 | | | | 6.50 | |
| | | | | | | | | | | | | | | | | | | | | | | | | | | | | | | | | | | | | | | | | | | | | | | | |
Dividends and distributions from: | | | | | | | | | | | | | | | | | | | | | | | | | | | | | | | | | | | | | | | | | | | | | | | | |
Tax return of capital | | | — | | | | (0.21 | ) | | | — | | | | — | | | | — | | | | — | | | | — | | | | (0.21 | ) | | | — | | | | — | | | | — | | | | — | |
Net realized gain | | | — | | | | (5.67 | ) | | | (11.20 | ) | | | (7.49 | ) | | | (3.84 | ) | | | (0.02 | ) | | | — | | | | (5.46 | ) | | | (11.20 | ) | | | (7.49 | ) | | | (3.84 | ) | | | (0.02 | ) |
| | | | | | | | | | | | | | | | | | | | | | | | | | | | | | | | | | | | | | | | | | | | | | | | |
Total dividends and distributions | | | — | | | | (5.88 | ) | | | (11.20 | ) | | | (7.49 | ) | | | (3.84 | ) | | | (0.02 | ) | | | — | | | | (5.67 | ) | | | (11.20 | ) | | | (7.49 | ) | | | (3.84 | ) | | | (0.02 | ) |
| | | | | | | | | | | | | | | | | | | | | | | | | | | | | | | | | | | | | | | �� | | | | | | | | | |
Redemption fees added to paid-in capital | | | 0.00 | 2 | | | 0.00 | 2 | | | 0.00 | 2 | | | 0.00 | 2 | | | 0.00 | 2 | | | — | | | | 0.00 | 2 | | | 0.00 | 2 | | | 0.00 | 2 | | | 0.00 | 2 | | | 0.00 | 2 | | | — | |
| | | | | | | | | | | | | | | | | | | | | | | | | | | | | | | | | | | | | | | | | | | | | | | | |
Net asset value, end of period | | $ | 11.54 | | | $ | 17.86 | | | $ | 28.75 | | | $ | 35.39 | | | $ | 41.88 | | | $ | 39.49 | | | $ | 9.17 | | | $ | 14.26 | | | $ | 24.06 | | | $ | 31.48 | | | $ | 38.32 | | | $ | 36.67 | |
| | | | | | | | | | | | | | | | | | | | | | | | | | | | | | | | | | | | | | | | | | | | | | | | |
Total Investment Return | |
Based on net asset value3 | | | (35.39 | )%4,5 | | | (21.92 | )%4,6 | | | 14.48 | %4 | | | 2.95 | %4 | | | 16.28 | %4 | | | 22.39 | % | | | (35.69 | )%4,5 | | | (22.47 | )%4,6 | | | 13.56 | %4 | | | 2.18 | %4 | | | 15.44 | %4 | | | 21.53 | % |
| | | | | | | | | | | | | | | | | | | | | | | | | | | | | | | | | | | | | | | | | | | | | | | | |
Ratios to Average Net Assets | |
Total expenses after waivers, reimbursement and fees paid indirectly | | | 1.44 | %7 | | | 1.42 | % | | | 1.39 | % | | | 1.44 | % | | | 1.40 | % | | | 1.40 | % | | | 2.19 | %7 | | | 2.18 | % | | | 2.16 | % | | | 2.19 | % | | | 2.14 | % | | | 2.10 | % |
| | | | | | | | | | | | | | | | | | | | | | | | | | | | | | | | | | | | | | | | | | | | | | | | |
Total expenses | | | 1.70 | %7 | | | 1.45 | % | | | 1.40 | % | | | 1.56 | % | | | 1.47 | % | | | 1.40 | % | | | 2.57 | %7 | | | 2.32 | % | | | 2.24 | % | | | 2.23 | % | | | 2.15 | % | | | 2.10 | % |
| | | | | | | | | | | | | | | | | | | | | | | | | | | | | | | | | | | | | | | | | | | | | | | | |
Net investment income (loss) | | | 0.35 | %7 | | | (0.44 | )% | | | 0.03 | % | | | (0.15 | )% | | | (0.36 | )% | | | (0.57 | )% | | | (0.42 | )%7 | | | (1.21 | )% | | | (0.75 | )% | | | (0.90 | )% | | | (1.10 | )% | | | (1.27 | )% |
| | | | | | | | | | | | | | | | | | | | | | | | | | | | | | | | | | | | | | | | | | | | | | | | |
Supplemental Data | |
Net assets, end of period (000) | | $ | 272,083 | | | $ | 481,193 | | | $ | 871,699 | | | $ | 1,189,440 | | | $ | 1,690,497 | | | $ | 2,169,836 | | | $ | 53,161 | | | $ | 119,213 | | | $ | 250,672 | | | $ | 329,207 | | | $ | 436,642 | | | $ | 470,430 | |
| | | | | | | | | | | | | | | | | | | | | | | | | | | | | | | | | | | | | | | | | | | | | | | | |
Portfolio turnover | | | 148 | % | | | 147 | % | | | 134 | % | | | 142 | % | | | 73 | % | | | 33 | % | | | 148 | % | | | 147 | % | | | 134 | % | | | 142 | % | | | 73 | % | | | 33 | % |
| | | | | | | | | | | | | | | | | | | | | | | | | | | | | | | | | | | | | | | | | | | | | | | | |
See Notes to Financial Statements.
| | | | | | |
34 | | SEMI-ANNUAL REPORT | | MARCH 31, 2009 | | |
| | |
| Financial Highlights (continued) | | Aurora Portfolio |
| | | | | | | | | | | | | | | | | | | | | | | | | | | | | | | | | | | | |
| | | Investor C | | | R | |
| | | Six Months
Ended
March 31, 2009 | | | Year Ended September 30, | | | Six Months
Ended
March 31, 2009 | | | Year Ended
September 30, | | | Period
October 2, 20068 to | |
| | (Unaudited) | | | 2008 | | | 2007 | | | 2006 | | | 2005 | | | 2004 | | | (Unaudited) | | | 2008 | | | September 30, 2007 | |
Per Share Operating Performance | |
Net asset value, beginning of period | | $ | 14.25 | | | $ | 24.07 | | | $ | 31.47 | | | $ | 38.32 | | | $ | 36.67 | | | $ | 30.18 | | | $ | 17.72 | | | $ | 28.70 | | | $ | 35.21 | |
| | | | | | | | | | | | | | | | | | | | | | | | | | | | | | | | | | | | |
Net investment income (loss) | | | (0.02 | )1 | | | (0.21 | )1 | | | (0.18 | )1 | | | (0.29 | )1 | | | (0.42 | )1 | | | (0.45 | ) | | | 0.01 | 1 | | | (0.13 | )1 | | | (0.16 | )1 |
Net realized and unrealized gain (loss) | | | (5.06 | ) | | | (3.93 | ) | | | 3.98 | | | | 0.93 | | | | 5.91 | | | | 6.96 | | | | (6.29 | ) | | | (4.83 | ) | | | 4.85 | |
| | | | | | | | | | | | | | | | | | | | | | | | | | | | | | | | | | | | |
Net increase (decrease) from investment operations | | | (5.08 | ) | | | (4.14 | ) | | | 3.80 | | | | 0.64 | | | | 5.49 | | | | 6.51 | | | | (6.28 | ) | | | (4.96 | ) | | | 4.69 | |
| | | | | | | | | | | | | | | | | | | | | | | | | | | | | | | | | | | | |
Dividends and distributions from: | | | | | | | | | | | | | | | | | | | | | | | | | | | | | | | | | | | | |
Tax return of capital | | | — | | | | (0.21 | ) | | | — | | | | — | | | | — | | | | — | | | | — | | | | (0.21 | ) | | | — | |
Net realized gain | | | — | | | | (5.47 | ) | | | (11.20 | ) | | | (7.49 | ) | | | (3.84 | ) | | | (0.02 | ) | | | — | | | | (5.81 | ) | | | (11.20 | ) |
| | | | | | | | | | | | | | | | | | | | | | | | | | | | | | | | | | | | |
Total dividends and distributions | | | — | | | | (5.68 | ) | | | (11.20 | ) | | | (7.49 | ) | | | (3.84 | ) | | | (0.02 | ) | | | — | | | | (6.02 | ) | | | (11.20 | ) |
| | | | | | | | | | | | | | | | | | | | | | | | | | | | | | | | | | | | |
Redemption fees added to paid-in capital | | | 0.00 | 2 | | | 0.00 | 2 | | | 0.00 | 2 | | | 0.00 | 2 | | | 0.00 | 2 | | | — | | | | 0.00 | 2 | | | 0.00 | 2 | | | 0.00 | 2 |
| | | | | | | | | | | | | | | | | | | | | | | | | | | | | | | | | | | | |
Net asset value, end of period | | $ | 9.17 | | | $ | 14.25 | | | $ | 24.07 | | | $ | 31.47 | | | $ | 38.32 | | | $ | 36.67 | | | $ | 11.44 | | | $ | 17.72 | | | $ | 28.70 | |
| | | | | | | | | | | | | | | | | | | | | | | | | | | | | | | | | | | | |
Total Investment Return | |
Based on net asset value | | | (35.65 | )%4,5 | | | (22.50 | )%3,4,6 | | | 13.64 | %3,4 | | | 2.16 | %3,4 | | | 15.45 | %3,4 | | | 21.57 | %3 | | | (35.44 | )%4,5 | | | (21.90 | )%4,6 | | | 14.87 | %4,5 |
| | | | | | | | | | | | | | | | | | | | | | | | | | | | | | | | | | | | |
Ratios to Average Net Assets | |
Total expenses after waivers, reimbursement and fees paid indirectly | | | 2.19 | %7 | | | 2.17 | % | | | 2.13 | % | | | 2.19 | % | | | 2.14 | % | | | 2.10 | % | | | 1.60 | %7 | | | 1.58 | % | | | 1.50 | %7 |
| | | | | | | | | | | | | | | | | | | | | | | | | | | | | | | | | | | | |
Total expenses | | | 2.44 | %7 | | | 2.23 | % | | | 2.17 | % | | | 2.22 | % | | | 2.15 | % | | | 2.10 | % | | | 1.88 | %7 | | | 1.71 | % | | | 1.50 | %7 |
| | | | | | | | | | | | | | | | | | | | | | | | | | | | | | | | | | | | |
Net investment income (loss) | | | (0.41 | )%7 | | | (1.20 | )% | | | (0.72 | )% | | | (0.90 | )% | | | (1.10 | )% | | | (1.27 | )% | | | 0.19 | %7 | | | (0.60 | )% | | | (0.57 | )%7 |
| | | | | | | | | | | | | | | | | | | | | | | | | | | | | | | | | | | | |
Supplemental Data | |
Net assets, end of period (000) | | $ | 57,782 | | | $ | 107,555 | | | $ | 209,820 | | | $ | 283,562 | | | $ | 405,952 | | | $ | 493,980 | | | $ | 849 | | | $ | 1,356 | | | $ | 1,141 | |
| | | | | | | | | | | | | | | | | | | | | | | | | | | | | | | | | | | | |
Portfolio turnover | | | 148 | % | | | 147 | % | | | 134 | % | | | 142 | % | | | 73 | % | | | 33 | % | | | 148 | % | | | 147 | % | | | 134 | % |
| | | | | | | | | | | | | | | | | | | | | | | | | | | | | | | | | | | | |
| 1 | Based on average shares outstanding. |
| 2 | Less than $0.01 per share. |
| 3 | Total investment returns exclude the effects of sales charges. |
| 4 | Redemption fee of 2.00% received by the Portfolio is reflected in total return calculations. There was no impact to the return. |
| 5 | Aggregate total investment return. |
| 6 | Payment from affiliate of $139,965 received by the Portfolio is reflected in total return calculations. There was no impact to the return. |
| 8 | Commencement of operations. |
See Notes to Financial Statements.
| | | | | | |
| | | SEMI-ANNUAL REPORT | | MARCH 31, 2009 | | 35 |
| | |
| Financial Highlights (continued) | | Capital Appreciation Portfolio |
| | | | | | | | | | | | | | | | | | | | | | | | | | | | |
| | | Institutional | |
| | | Six Months
Ended
March 31, 2009 | | | Year Ended September 30, | | | Period
November 1, 2004 to | | | Year Ended
October 31, | |
| | (Unaudited) | | | 2008 | | | 2007 | | | 2006 | | | September 30, 2005 | | | 2004 | | | 2003 | |
Per Share Operating Performance | |
Net asset value, beginning of period | | $ | 15.25 | | | $ | 18.21 | | | $ | 14.91 | | | $ | 14.19 | | | $ | 12.78 | | | $ | 12.17 | | | $ | 10.14 | |
| | | | | | | | | | | | | | | | | | | | | | | | | | | | |
Net investment income (loss) | | | 0.05 | 1 | | | 0.07 | 1 | | | 0.06 | 1 | | | 0.00 | 1,2 | | | 0.05 | 1 | | | (0.04 | ) | | | (0.02 | ) |
Net realized and unrealized gain (loss) | | | (3.84 | ) | | | (3.03 | ) | | | 3.24 | | | | 0.72 | | | | 1.36 | | | | 0.65 | | | | 2.05 | |
| | | | | | | | | | | | | | | | | | | | | | | | | | | | |
Net increase (decrease) from investment operations | | | (3.79 | ) | | | (2.96 | ) | | | 3.30 | | | | 0.72 | | | | 1.41 | | | | 0.61 | | | | 2.03 | |
| | | | | | | | | | | | | | | | | | | | | | | | | | | | |
Redemption fees added to paid-in capital | | | — | | | | 0.00 | 2 | | | — | | | | 0.00 | 2 | | | 0.00 | 2 | | | — | | | | — | |
| | | | | | | | | | | | | | | | | | | | | | | | | | | | |
Net asset value, end of period | | $ | 11.46 | | | $ | 15.25 | | | $ | 18.21 | | | $ | 14.91 | | | $ | 14.19 | | | $ | 12.78 | | | $ | 12.17 | |
| | | | | | | | | | | | | | | | | | | | | | | | | | | | |
Total Investment Return | |
Based on net asset value | | | (24.85 | )%3 | | | (16.26 | )%4 | | | 22.13 | %4 | | | 5.07 | %4 | | | 11.03 | %3,4,5 | | | 5.01 | % | | | 20.02 | % |
| | | | | | | | | | | | | | | | | | | | | | | | | | | | |
Ratios to Average Net Assets | |
Total expenses after waivers, reimbursement and fees paid indirectly | | | 0.70 | %6 | | | 0.70 | % | | | 0.75 | % | | | 0.95 | % | | | 1.05 | %6 | | | 1.14 | % | | | 1.08 | % |
| | | | | | | | | | | | | | | | | | | | | | | | | | | | |
Total expenses | | | 0.88 | %6 | | | 0.85 | % | | | 0.88 | % | | | 1.00 | % | | | 1.15 | %6 | | | 1.14 | % | | | 1.08 | % |
| | | | | | | | | | | | | | | | | | | | | | | | | | | | |
Net investment income (loss) | | | 0.81 | %6 | | | 0.42 | % | | | 0.38 | % | | | 0.00 | %7 | | | 0.43 | %6 | | | (0.31 | )% | | | (0.19 | )% |
| | | | | | | | | | | | | | | | | | | | | | | | | | | | |
Supplemental Data | |
Net assets, end of period (000) | | $ | 99,147 | | | $ | 77,323 | | | $ | 71,072 | | | $ | 48,146 | | | $ | 52,154 | | | $ | 52,399 | | | $ | 60,878 | |
| | | | | | | | | | | | | | | | | | | | | | | | | | | | |
Portfolio turnover | | | 43 | % | | | 80 | % | | | 97 | % | | | 87 | % | | | 70 | % | | | 91 | % | | | 113 | % |
| | | | | | | | | | | | | | | | | | | | | | | | | | | | |
| |
| | | Investor A | |
| | | Six Months
Ended
March 31, 2009 | | | Year Ended September 30, | | | Period
November 1, 2004 to | | | Year Ended
October 31, | |
| | (Unaudited) | | | 2008 | | | 2007 | | | 2006 | | | September 30, 2005 | | | 2004 | | | 2003 | |
Per Share Operating Performance | |
Net asset value, beginning of period | | $ | 14.59 | | | $ | 17.56 | | | $ | 14.46 | | | $ | 13.82 | | | $ | 12.47 | | | $ | 11.91 | | | $ | 9.96 | |
| | | | | | | | | | | | | | | | | | | | | | | | | | | | |
Net investment income (loss) | | | 0.01 | 1 | | | (0.02 | )1 | | | (0.02 | )1 | | | (0.06 | )1 | | | 0.02 | 1 | | | (0.08 | ) | | | (0.05 | ) |
Net realized and unrealized gain (loss) | | | (3.63 | ) | | | (2.95 | ) | | | 3.12 | | | | 0.70 | | | | 1.33 | | | | 0.64 | | | | 2.00 | |
| | | | | | | | | | | | | | | | | | | | | | | | | | | | |
Net increase (decrease) from investment operations | | | (3.62 | ) | | | (2.97 | ) | | | 3.10 | | | | 0.64 | | | | 1.35 | | | | 0.56 | | | | 1.95 | |
| | | | | | | | | | | | | | | | | | | | | | | | | | | | |
Redemption fees added to paid-in capital | | | — | | | | 0.00 | 2 | | | — | | | | 0.00 | 2 | | | 0.00 | 2 | | | — | | | | — | |
| | | | | | | | | | | | | | | | | | | | | | | | | | | | |
Net asset value, end of period | | $ | 10.97 | | | $ | 14.59 | | | $ | 17.56 | | | $ | 14.46 | | | $ | 13.82 | | | $ | 12.47 | | | $ | 11.91 | |
| | | | | | | | | | | | | | | | | | | | | | | | | | | | |
Total Investment Return | |
Based on net asset value8 | | | (24.81 | )%3 | | | (16.91 | )%4 | | | 21.44 | %4 | | | 4.63 | %4 | | | 10.83 | %3,4,5 | | | 4.70 | % | | | 19.58 | % |
| | | | | | | | | | | | | | | | | | | | | | | | | | | | |
Ratios to Average Net Assets | |
Total expenses after waivers, reimbursement and fees paid indirectly | | | 1.30 | %6 | | | 1.23 | % | | | 1.28 | % | | | 1.35 | % | | | 1.31 | %6 | | | 1.44 | % | | | 1.38 | % |
| | | | | | | | | | | | | | | | | | | | | | | | | | | | |
Total expenses | | | 1.42 | %6 | | | 1.33 | % | | | 1.35 | % | | | 1.53 | % | | | 1.48 | %6 | | | 1.44 | % | | | 1.38 | % |
| | | | | | | | | | | | | | | | | | | | | | | | | | | | |
Net investment income (loss) | | | 0.17 | %6 | | | (0.10 | )% | | | (0.16 | )% | | | (0.40 | )% | | | 0.21 | %6 | | | (0.62 | )% | | | (0.47 | )% |
| | | | | | | | | | | | | | | | | | | | | | | | | | | | |
Supplemental Data | |
Net assets, end of period (000) | | $ | 94,504 | | | $ | 125,521 | | | $ | 131,712 | | | $ | 112,737 | | | $ | 120,371 | | | $ | 99,435 | | | $ | 103,247 | |
| | | | | | | | | | | | | | | | | | | | | | | | | | | | |
Portfolio turnover | | | 43 | % | | | 80 | % | | | 97 | % | | | 87 | % | | | 70 | % | | | 91 | % | | | 113 | % |
| | | | | | | | | | | | | | | | | | | | | | | | | | | | |
See Notes to Financial Statements.
| | | | | | |
36 | | SEMI-ANNUAL REPORT | | MARCH 31, 2009 | | |
| | |
| Financial Highlights (continued) | | Capital Appreciation Portfolio |
| | | | | | | | | | | | | | | | | | | | | | | | | | | | |
| | | Investor B | |
| | | Six Months
Ended
March 31, 2009 | | | Year Ended September 30, | | | Period
November 1, 2004 to | | | Year Ended
October 31, | |
| | (Unaudited) | | | 2008 | | | 2007 | | | 2006 | | | September 30, 2005 | | | 2004 | | | 2003 | |
Per Share Operating Performance | |
Net asset value, beginning of period | | $ | 13.51 | | | $ | 16.34 | | | $ | 13.56 | | | $ | 13.06 | | | $ | 11.86 | | | $ | 11.41 | | | $ | 9.61 | |
| | | | | | | | | | | | | | | | | | | | | | | | | | | | |
Net investment loss | | | (0.03 | )1 | | | (0.14 | )1 | | | (0.14 | )1 | | | (0.16 | )1 | | | (0.06 | )1 | | | (0.15 | ) | | | (0.12 | ) |
Net realized and unrealized gain (loss) | | | (3.39 | ) | | | (2.69 | ) | | | 2.92 | | | | 0.66 | | | | 1.26 | | | | 0.60 | | | | 1.92 | |
| | | | | | | | | | | | | | | | | | | | | | | | | | | | |
Net increase (decrease) from investment operations | | | (3.42 | ) | | | (2.83 | ) | | | 2.78 | | | | 0.50 | | | | 1.20 | | | | 0.45 | | | | 1.80 | |
| | | | | | | | | | | | | | | | | | | | | | | | | | | | |
Redemption fees added to paid-in capital | | | — | | | | 0.00 | 2 | | | — | | | | 0.00 | 2 | | | 0.00 | 2 | | | — | | | | — | |
| | | | | | | | | | | | | | | | | | | | | | | | | | | | |
Net asset value, end of period | | $ | 10.09 | | | $ | 13.51 | | | $ | 16.34 | | | $ | 13.56 | | | $ | 13.06 | | | $ | 11.86 | | | $ | 11.41 | |
| | | | | | | | | | | | | | | | | | | | | | | | | | | | |
Total Investment Return | |
Based on net asset value8 | | | (25.32 | )%3 | | | (17.32 | )%4 | | | 20.50 | %4 | | | 3.83 | %4 | | | 10.12 | %3,4,9 | | | 3.94 | % | | | 18.73 | % |
| | | | | | | | | | | | | | | | | | | | | | | | | | | | |
Ratios to Average Net Assets | |
Total expenses after waivers, reimbursement and fees paid indirectly | | | 2.10 | %6 | | | 2.00 | % | | | 2.07 | % | | | 2.10 | % | | | 2.05 | %6 | | | 2.14 | % | | | 2.08 | % |
| | | | | | | | | | | | | | | | | | | | | | | | | | | | |
Total expenses | | | 2.35 | %6 | | | 2.11 | % | | | 2.20 | % | | | 2.20 | % | | | 2.15 | %6 | | | 2.14 | % | | | 2.08 | % |
| | | | | | | | | | | | | | | | | | | | | | | | | | | | |
Net investment loss | | | (0.63 | )%6 | | | (0.87 | )% | | | (0.95 | )% | | | (1.16 | )% | | | (0.53 | )%6 | | | (1.31 | )% | | | (1.17 | )% |
| | | | | | | | | | | | | | | | | | | | | | | | | | | | |
Supplemental Data | |
Net assets, end of period (000) | | $ | 10,207 | | | $ | 19,663 | | | $ | 48,260 | | | $ | 71,078 | | | $ | 85,465 | | | $ | 97,938 | | | $ | 108,125 | |
| | | | | | | | | | | | | | | | | | | | | | | | | | | | |
Portfolio turnover | | | 43 | % | | | 80 | % | | | 97 | % | | | 87 | % | | | 70 | % | | | 91 | % | | | 113 | % |
| | | | | | | | | | | | | | | | | | | | | | | | | | | | |
| 1 | Based on average shares outstanding. |
| 2 | Less than $0.01 per share. |
| 3 | Aggregate total investment return. |
| 4 | Redemption fee of 2.00% received by the Portfolio is reflected in total return calculations. There was no impact to the return. |
| 5 | The total return includes an increase of 0.08% related to payments made by the previous investment advisor prior to January 31, 2005. |
| 8 | Total investment returns exclude the effects of sales charges. |
| 9 | The total return includes an increase of 0.09% related to payments made by the previous investment advisor prior to January 31, 2005. |
See Notes to Financial Statements.
| | | | | | |
| | | SEMI-ANNUAL REPORT | | MARCH 31, 2009 | | 37 |
| | |
| Financial Highlights (continued) | | Capital Appreciation Portfolio |
| | | | | | | | | | | | | | | | | | | | | | | | | | | | |
| | | Investor C | |
| | | Six Months
Ended
March 31, 2009 | | | Year Ended September 30, | | | Period
November 1, 2004 to | | | Year Ended
October 31, | |
| | (Unaudited) | | | 2008 | | | 2007 | | | 2006 | | | September 30, 2005 | | | 2004 | | | 2003 | |
Per Share Operating Performance | |
Net asset value, beginning of period | | $ | 13.56 | | | $ | 16.38 | | | $ | 13.57 | | | $ | 13.06 | | | $ | 11.86 | | | $ | 11.41 | | | $ | 9.61 | |
| | | | | | | | | | | | | | | | | | | | | | | | | | | | |
Net investment loss | | | (0.02 | )1 | | | (0.11 | )1 | | | (0.12 | )1 | | | (0.15 | )1 | | | (0.06 | )1 | | | (0.15 | ) | | | (0.11 | ) |
Net realized and unrealized gain (loss) | | | (3.41 | ) | | | (2.71 | ) | | | 2.93 | | | | 0.66 | | | | 1.26 | | | | 0.60 | | | | 1.91 | |
| | | | | | | | | | | | | | | | | | | | | | | | | | | | |
Net increase (decrease) from investment operations | | | (3.43 | ) | | | (2.82 | ) | | | 2.81 | | | | 0.51 | | | | 1.20 | | | | 0.45 | | | | 1.80 | |
| | | | | | | | | | | | | | | | | | | | | | | | | | | | |
Redemption fees added to paid-in capital | | | — | | | | 0.00 | 2 | | | — | | | | 0.00 | 2 | | | 0.00 | 2 | | | — | | | | — | |
| | | | | | | | | | | | | | | | | | | | | | | | | | | | |
Net asset value, end of period | | $ | 10.13 | | | $ | 13.56 | | | $ | 16.38 | | | $ | 13.57 | | | $ | 13.06 | | | $ | 11.86 | | | $ | 11.41 | |
| | | | | | | | | | | | | | | | | | | | | | | | | | | | |
Total Investment Return | |
Based on net asset value3 | | | (25.30 | )%4 | | | (17.22 | )%5 | | | 20.71 | %5 | | | 3.91 | %5 | | | 10.12 | %4,5,6 | | | 3.94 | % | | | 18.73 | % |
| | | | | | | | | | | | | | | | | | | | | | | | | | | | |
Ratios to Average Net Assets | |
Total expenses after waivers, reimbursement and fees paid indirectly | | | 1.88 | %7 | | | 1.85 | % | | | 1.92 | % | | | 2.04 | % | | | 2.05 | %7 | | | 2.14 | % | | | 2.08 | % |
| | | | | | | | | | | | | | | | | | | | | | | | | | | | |
Total expenses | | | 1.99 | %7 | | | 1.96 | % | | | 1.99 | % | | | 2.10 | % | | | 2.15 | %7 | | | 2.14 | % | | | 2.08 | % |
| | | | | | | | | | | | | | | | | | | | | | | | | | | | |
Net investment loss | | | (0.39 | )%7 | | | (0.73 | )% | | | (0.80 | )% | | | (1.10 | )% | | | (0.51 | )%7 | | | (1.30 | )% | | | (1.15 | )% |
| | | | | | | | | | | | | | | | | | | | | | | | | | | | |
Supplemental Data | |
Net assets, end of period (000) | | $ | 14,851 | | | $ | 12,361 | | | $ | 15,160 | | | $ | 17,079 | | | $ | 20,570 | | | $ | 23,854 | | | $ | 30,516 | |
| | | | | | | | | | | | | | | | | | | | | | | | | | | | |
Portfolio turnover | | | 43 | % | | | 80 | % | | | 97 | % | | | 87 | % | | | 70 | % | | | 91 | % | | | 113 | % |
| | | | | | | | | | | | | | | | | | | | | | | | | | | | |
| 1 | Based on average shares outstanding. |
| 2 | Less than $0.01 per share. |
| 3 | Total investment returns exclude the effects of sales charges. |
| 4 | Aggregate total investment return. |
| 5 | Redemption fee of 2.00% received by the Portfolio is reflected in total return calculations. There was no impact to the return. |
| 6 | The total return includes an increase of 0.09% related to payments made by the previous investment advisor prior to January 31, 2005. |
See Notes to Financial Statements.
| | | | | | |
38 | | SEMI-ANNUAL REPORT | | MARCH 31, 2009 | | |
| | |
| Financial Highlights (continued) | | Energy & Resources Portfolio |
| | | | | | | | | | | | | | | | | | | | | | | | | | | | |
| | | Institutional | |
| | | Six Months
Ended
March 31, 2009 | | | Year Ended September 30, | | | Period
March 1, 2005 to | | | Period
July 1, 2004 to
February 28, 2005 | | | Year Ended
June 30,
2004 | |
| | (Unaudited) | | | 2008 | | | 2007 | | | 2006 | | | September 30, 2005 | | | |
Per Share Operating Performance | |
Net asset value, beginning of period | | $ | 51.31 | | | $ | 63.42 | | | $ | 68.57 | | | $ | 79.62 | | | $ | 58.80 | | | $ | 41.25 | | | $ | 26.85 | |
| | | | | | | | | | | | | | | | | | | | | | | | | | | | |
Net investment income (loss) | | | (0.01 | )1 | | | (0.13 | )1 | | | (0.02 | )1 | | | 0.57 | 1 | | | 0.15 | 1 | | | (0.08 | ) | | | 0.27 | |
Net realized and unrealized gain (loss) | | | (22.90 | ) | | | (2.78 | ) | | | 14.26 | | | | (2.50 | ) | | | 20.67 | | | | 19.52 | | | | 14.78 | |
| | | | | | | | | | | | | | | | | | | | | | | | | | | | |
Net increase (decrease) from investment operations | | | (22.91 | ) | | | (2.91 | ) | | | 14.24 | | | | (1.93 | ) | | | 20.82 | | | | 19.44 | | | | 15.05 | |
| | | | | | | | | | | | | | | | | | | | | | | | | | | | |
Dividends and distributions from: | | | | | | | | | | | | | | | | | | | | | | | | | | | | |
Net investment income | | | — | | | | (2.01 | ) | | | (0.81 | ) | | | (0.53 | ) | | | — | | | | (0.34 | ) | | | (0.65 | ) |
Net realized gain | | | (9.04 | ) | | | (7.22 | ) | | | (18.58 | ) | | | (8.60 | ) | | | — | | | | (1.55 | ) | | | — | |
| | | | | | | | | | | | | | | | | | | | | | | | | | | | |
Total dividends and distributions | | | (9.04 | ) | | | (9.23 | ) | | | (19.39 | ) | | | (9.13 | ) | | | — | | | | (1.89 | ) | | | (0.65 | ) |
| | | | | | | | | | | | | | | | | | | | | | | | | | | | |
Redemption fees added to paid-in capital | | | 0.01 | | | | 0.03 | | | | 0.00 | 2 | | | 0.01 | | | | 0.00 | 2 | | | — | | | | — | |
| | | | | | | | | | | | | | | | | | | | | | | | | | | | |
Net asset value, end of period | | $ | 19.37 | | | $ | 51.31 | | | $ | 63.42 | | | $ | 68.57 | | | $ | 79.62 | | | $ | 58.80 | | | $ | 41.25 | |
| | | | | | | | | | | | | | | | | | | | | | | | | | | | |
Total Investment Return | |
Based on net asset value | | | (45.14 | )%3,4 | | | (6.77 | )%3 | | | 23.55 | %5 | | | (2.89 | )%6 | | | 35.41 | %4,5 | | | 47.95 | %4 | | | 56.49 | % |
| | | | | | | | | | | | | | | | | | | | | | | | | | | | |
Ratios to Average Net Assets | |
Total expenses after waivers, reimbursement and fees paid indirectly | | | 1.03 | %7 | | | 0.92 | % | | | 1.03 | % | | | 0.98 | % | | | 1.04 | %7 | | | 1.01 | %7 | | | 1.04 | % |
| | | | | | | | | | | | | | | | | | | | | | | | | | | | |
Total expenses | | | 1.08 | %7 | | | 0.92 | % | | | 1.07 | % | | | 1.02 | % | | | 1.18 | %7 | | | 1.02 | %7 | | | 1.04 | % |
| | | | | | | | | | | | | | | | | | | | | | | | | | | | |
Net investment income (loss) | | | (0.12 | )%7 | | | (0.18 | )% | | | (0.03 | )% | | | 0.76 | % | | | 0.42 | %7 | | | (0.16 | )%7 | | | 0.79 | % |
| | | | | | | | | | | | | | | | | | | | | | | | | | | | |
Supplemental Data | |
Net assets, end of period (000) | | $ | 45,693 | | | $ | 82,147 | | | $ | 37,498 | | | $ | 35,010 | | | $ | 40,906 | 7 | | $ | 29,188 | 7 | | $ | 20,044 | |
| | | | | | | | | | | | | | | | | | | | | | | | | | | | |
Portfolio turnover | | | 17 | % | | | 32 | % | | | 15 | % | | | 27 | % | | | 9 | % | | | 22 | % | | | 27 | % |
| | | | | | | | | | | | | | | | | | | | | | | | | | | | |
| 1 | Based on average shares outstanding. |
| 2 | Less than $0.01 per share. |
| 3 | Redemption fee of 2.00% received by the Portfolio is reflected in total return calculations. The impact to the return from redemption fees received during the period was an increase of 0.03%. |
| 4 | Aggregate total investment return. |
| 5 | Redemption fee of 2.00% received by the Portfolio is reflected in total return calculations. There was no impact to the return. |
| 6 | Redemption fee of 2.00% received by the Portfolio is reflected in total return calculations. The impact to the return from redemption fees received during the period was an increase of 0.02%. |
See Notes to Financial Statements.
| | | | | | |
| | | SEMI-ANNUAL REPORT | | MARCH 31, 2009 | | 39 |
| | |
| Financial Highlights (continued) | | Energy & Resources Portfolio |
| | | | | | | | | | | | | | | | | | | | | | | | | | | | |
| | | Investor A | |
| | | Six Months
Ended
March 31, 2009 | | | Year Ended September 30, | | | Period
March 1, 2005 to | | | Period July 1, 2004 to | | | Year Ended
June 30,
2004 | |
| | (Unaudited) | | | 2008 | | | 2007 | | | 2006 | | | September 30, 2005 | | | February 28, 2005 | | |
Per Share Operating Performance | |
Net asset value, beginning of period | | $ | 47.29 | | | $ | 59.02 | | | $ | 64.90 | | | $ | 76.01 | | | $ | 56.23 | | | $ | 39.58 | | | $ | 25.81 | |
| | | | | | | | | | | | | | | | | | | | | | | | | | | | |
Net investment income (loss) | | | (0.04 | )1 | | | (0.32 | )1 | | | (0.16 | )1 | | | 0.32 | 1 | | | 0.03 | 1 | | | (0.15 | ) | | | 0.21 | |
Net realized and unrealized gain (loss) | | | (21.16 | ) | | | (2.29 | ) | | | 13.41 | | | | (2.36 | ) | | | 19.75 | | | | 18.69 | | | | 14.15 | |
| | | | | | | | | | | | | | | | | | | | | | | | | | | | |
Net increase (decrease) from investment operations | | | (21.20 | ) | | | (2.61 | ) | | | 13.25 | | | | (2.04 | ) | | | 19.78 | | | | 18.54 | | | | 14.36 | |
| | | | | | | | | | | | | | | | | | | | | | | | | | | | |
Dividends and distributions from: | | | | | | | | | | | | | | | | | | | | | | | | | | | | |
Net investment income | | | — | | | | (1.92 | ) | | | (0.55 | ) | | | (0.48 | ) | | | — | | | | (0.34 | ) | | | (0.59 | ) |
Net realized gain | | | (9.04 | ) | | | (7.22 | ) | | | (18.58 | ) | | | (8.60 | ) | | | — | | | | (1.55 | ) | | | — | |
| | | | | | | | | | | | | | | | | | | | | | | | | | | | |
Total dividends and distributions | | | (9.04 | ) | | | (9.14 | ) | | | (19.13 | ) | | | (9.08 | ) | | | — | | | | (1.89 | ) | | | (0.59 | ) |
| | | | | | | | | | | | | | | | | | | | | | | | | | | | |
Redemption fees added to paid-in capital | | | 0.01 | | | | 0.02 | | | | 0.00 | 2 | | | 0.01 | | | | 0.00 | 2 | | | — | | | | — | |
| | | | | | | | | | | | | | | | | | | | | | | | | | | | |
Net asset value, end of period | | $ | 17.06 | | | $ | 47.29 | | | $ | 59.02 | | | $ | 64.90 | | | $ | 76.01 | | | $ | 56.23 | | | $ | 39.58 | |
| | | | | | | | | | | | | | | | | | | | | | | | | | | | |
Total Investment Return | |
Based on net asset value3 | | | (45.38 | )%4,5 | | | (6.78 | )%6 | | | 23.25 | %7 | | | (3.20 | )%6 | | | 35.18 | %5,7 | | | 47.69 | %5 | | | 56.06 | % |
| | | | | | | | | | | | | | | | | | | | | | | | | | | | |
Ratios to Average Net Assets | |
Total expenses after waivers, reimbursement and fees paid indirectly | | | 1.32 | %8 | | | 1.25 | % | | | 1.29 | % | | | 1.30 | % | | | 1.34 | %8 | | | 1.36 | %8 | | | 1.34 | % |
| | | | | | | | | | | | | | | | | | | | | | | | | | | | |
Total expenses | | | 1.52 | %8 | | | 1.25 | % | | | 1.30 | % | | | 1.41 | % | | | 1.52 | %8 | | | 1.38 | %8 | | | 1.34 | % |
| | | | | | | | | | | | | | | | | | | | | | | | | | | | |
Net investment income (loss) | | | (0.41 | )%8 | | | (0.49 | )% | | | (0.28 | )% | | | 0.44 | % | | | 0.10 | %8 | | | (0.52 | )%8 | | | 0.64 | % |
| | | | | | | | | | | | | | | | | | | | | | | | | | | | |
Supplemental Data | |
Net assets, end of period (000) | | $ | 395,588 | | | $ | 689,646 | | | $ | 685,590 | | | $ | 683,417 | | | $ | 877,120 | 8 | | $ | 676,234 | 8 | | $ | 406,209 | |
| | | | | | | | | | | | | | | | | | | | | | | | | | | | |
Portfolio turnover | | | 17 | % | | | 32 | % | | | 15 | % | | | 27 | % | | | 9 | % | | | 22 | % | | | 27 | % |
| | | | | | | | | | | | | | | | | | | | | | | | | | | | |
See Notes to Financial Statements.
| | | | | | |
40 | | SEMI-ANNUAL REPORT | | MARCH 31, 2009 | | |
| | |
| Financial Highlights (continued) | | Energy & Resources Portfolio |
| | | | | | | | | | | | | | | | | | | | | | | | | | | | |
| | | Investor B | |
| | | Six Months
Ended
March 31, 2009
(Unaudited) | | | Year Ended September 30, | | | Period
March 1, 2005 to
September 30, 2005 | | | Period
July 1, 2004 to
February 28, 2005 | | | Year Ended
June 30, 2004 | |
| | | | 2008 | | | 2007 | | | 2006 | | | | |
Per Share Operating Performance | | | | | | | | | | | | | | | | | | | | | | | | | | | | |
Net asset value, beginning of period | | $ | 39.68 | | | $ | 50.87 | | | $ | 58.19 | | | $ | 69.43 | | | $ | 51.58 | | | $ | 36.52 | | | $ | 23.89 | |
| | | | | | | | | | | | | | | | | | | | | | | | | | | | |
Net investment loss | | | (0.10 | )1 | | | (0.67 | )1 | | | (0.50 | )1 | | | (0.18 | )1 | | | (0.19 | )1 | | | (0.32 | ) | | | (0.06 | ) |
Net realized and unrealized gain (loss) | | | (17.67 | ) | | | (1.81 | ) | | | 11.82 | | | | (2.09 | ) | | | 18.04 | | | | 17.18 | | | | 13.14 | |
| | | | | | | | | | | | | | | | | | | | | | | | | | | | |
Net increase (decrease) from investment operations | | | (17.77 | ) | | | (2.48 | ) | | | 11.32 | | | | (2.27 | ) | | | 17.85 | | | | 16.86 | | | | 13.08 | |
| | | | | | | | | | | | | | | | | | | | | | | | | | | | |
Dividends and distributions from: | | | | | | | | | | | | | | | | | | | | | | | | | | | | |
Net investment income | | | — | | | | (1.51 | ) | | | (0.06 | ) | | | (0.38 | ) | | | — | | | | (0.25 | ) | | | (0.45 | ) |
Net realized gain | | | (9.04 | ) | | | (7.22 | ) | | | (18.58 | ) | | | (8.60 | ) | | | — | | | | (1.55 | ) | | | — | |
| | | | | | | | | | | | | | | | | | | | | | | | | | | | |
Total dividends and distributions | | | (9.04 | ) | | | (8.73 | ) | | | (18.64 | ) | | | (8.98 | ) | | | — | | | | (1.80 | ) | | | (0.45 | ) |
| | | | | | | | | | | | | | | | | | | | | | | | | | | | |
Redemption fees added to paid-in capital | | | 0.01 | | | | 0.02 | | | | 0.00 | 2 | | | 0.01 | | | | 0.00 | 2 | | | — | | | | — | |
| | | | | | | | | | | | | | | | | | | | | | | | | | | | |
Net asset value, end of period | | $ | 12.88 | | | $ | 39.68 | | | $ | 50.87 | | | $ | 58.19 | | | $ | 69.43 | | | $ | 51.58 | | | $ | 36.52 | |
| | | | | | | | | | | | | | | | | | | | | | | | | | | | |
Total Investment Return | | | | | | | | | | | | | | | | | | | | | | | | | | | | |
Based on net asset value3 | | | (45.48 | )%5,9 | | | (7.63 | )%6 | | | 22.35 | %7 | | | (3.91 | )%6 | | | 34.60 | %5,7 | | | 47.09 | %5 | | | 55.07 | % |
| | | | | | | | | | | | | | | | | | | | | | | | | | | | |
Ratios to Average Net Assets | | | | | | | | | | | | | | | | | | | | | | | | | | | | |
Total expenses after waivers, reimbursement and fees paid indirectly | | | 2.04 | %8 | | | 2.00 | % | | | 2.03 | % | | | 2.02 | % | | | 2.04 | %8 | | | 2.01 | %8 | | | 2.04 | % |
| | | | | | | | | | | | | | | | | | | | | | | | | | | | |
Total expenses | | | 2.32 | %8 | | | 2.01 | % | | | 2.08 | % | | | 2.09 | % | | | 2.18 | %8 | | | 2.02 | %8 | | | 2.04 | % |
| | | | | | | | | | | | | | | | | | | | | | | | | | | | |
Net investment loss | | | (1.12 | )%8 | | | (1.24 | )% | | | (1.01 | )% | | | (0.27 | )% | | | (0.60 | )%8 | | | (1.17 | )%8 | | | (0.20 | )% |
| | | | | | | | | | | | | | | | | | | | | | | | | | | | |
Net investment income (loss) | | | | | | | | | | | | | | | | | | | | | | | | | | | | |
Net assets, end of period (000) | | $ | 23,142 | | | $ | 57,174 | | | $ | 80,178 | | | $ | 87,636 | | | $ | 117,845 | 8 | | $ | 94,506 | 8 | | $ | 66,704 | |
| | | | | | | | | | | | | | | | | | | | | | | | | | | | |
Portfolio turnover | | | 17 | % | | | 32 | % | | | 15 | % | | | 27 | % | | | 9 | % | | | 22 | % | | | 27 | % |
| | | | | | | | | | | | | | | | | | | | | | | | | | | | |
| 1 | Based on average shares outstanding. |
| 2 | Less than $0.01 per share. |
| 3 | Total investment returns exclude the effects of sales charges. |
| 4 | Redemption fee of 2.00% received by the Portfolio is reflected in total return calculations. The impact to the return from redemption fees received during the period was an increase of 0.03%. |
| 5 | Aggregate total investment return. |
| 6 | Redemption fee of 2.00% received by the Portfolio is reflected in total return calculations. The impact to the return from redemption fees received during the period was an increase of 0.02%. |
| 7 | Redemption fee of 2.00% received by the Portfolio is reflected in total return calculations. There was no impact to the return. |
| 9 | Redemption fee of 2.00% received by the Portfolio is reflected in total return calculations. The impact to the return from redemption fees received during the period was an increase of 0.04%. |
See Notes to Financial Statements.
| | | | | | |
| | | SEMI-ANNUAL REPORT | | MARCH 31, 2009 | | 41 |
| | |
| Financial Highlights (concluded) | | Energy & Resources Portfolio |
| | | | | | | | | | | | | | | | | | | | | | | | | | | | |
| | | Investor C | |
| | | Six Months
Ended
March 31, 2009
(Unaudited) | | | Year Ended September 30, | | | Period
March 1, 2005 to
September 30, 2005 | | | Period
July 1, 2004 to
February 28, 2005 | | | Year Ended
June 30, 2004 | |
| | | | 2008 | | | 2007 | | | 2006 | | | | |
Per Share Operating Performance | | | | | | | | | | | | | | | | | | | | | | | | | | | | |
Net asset value, beginning of period | | $ | 39.61 | | | $ | 50.84 | | | $ | 58.13 | | | $ | 69.37 | | | $ | 51.53 | | | $ | 36.48 | | | $ | 23.88 | |
| | | | | | | | | | | | | | | | | | | | | | | | | | | | |
Net investment loss | | | (0.10 | )1 | | | (0.66 | )1 | | | (0.50 | )1 | | | (0.17 | )1 | | | (0.19 | )1 | | | (0.30 | ) | | | (0.03 | ) |
Net realized and unrealized gain (loss) | | | (17.63 | ) | | | (1.79 | ) | | | 11.83 | | | | (2.10 | ) | | | 18.03 | | | | 17.14 | | | | 13.10 | |
| | | | | | | | | | | | | | | | | | | | | | | | | | | | |
Net increase (decrease) from investment operations | | | (17.73 | ) | | | (2.45 | ) | | | 11.33 | | | | (2.27 | ) | | | 17.84 | | | | 16.84 | | | | 13.07 | |
| | | | | | | | | | | | | | | | | | | | | | | | | | | | |
Dividends and distributions from: | | | | | | | | | | | | | | | | | | | | | | | | | | | | |
Net investment income | | | — | | | | (1.58 | ) | | | (0.04 | ) | | | (0.38 | ) | | | — | | | | (0.24 | ) | | | (0.47 | ) |
Net realized gain | | | (9.04 | ) | | | (7.22 | ) | | | (18.58 | ) | | | (8.60 | ) | | | — | | | | (1.55 | ) | | | — | |
| | | | | | | | | | | | | | | | | | | | | | | | | | | | |
Total dividends and distributions | | | (9.04 | ) | | | (8.80 | ) | | | (18.62 | ) | | | (8.98 | ) | | | — | | | | (1.79 | ) | | | (0.47 | ) |
| | | | | | | | | | | | | | | | | | | | | | | | | | | | |
Redemption fees added to paid-in capital | | | 0.00 | 2 | | | 0.02 | | | | 0.00 | 2 | | | 0.01 | | | | 0.00 | 2 | | | — | | | | — | |
| | | | | | | | | | | | | | | | | | | | | | | | | | | | |
Net asset value, end of period | | $ | 12.84 | | | $ | 39.61 | | | $ | 50.84 | | | $ | 58.13 | | | $ | 69.37 | | | $ | 51.53 | | | $ | 36.48 | |
| | | | | | | | | | | | | | | | | | | | | | | | | | | | |
Total Investment Return | | | | | | | | | | | | | | | | | | | | | | | | | | | | |
Based on net asset value3 | | | (45.49 | )%4,5 | | | (7.57 | )%6 | | | 22.36 | %4 | | | (3.92 | )%7 | | | 34.62 | %4,5 | | | 47.01 | %5 | | | 55.05 | % |
| | | | | | | | | | | | | | | | | | | | | | | | | | | | |
Ratios to Average Net Assets | | | | | | | | | | | | | | | | | | | | | | | | | | | | |
Total expenses after waivers, reimbursement and fees paid indirectly | | | 2.04 | %8 | | | 1.96 | % | | | 2.01 | % | | | 2.01 | % | | | 2.04 | %8 | | | 2.01 | %8 | | | 2.04 | % |
| | | | | | | | | | | | | | | | | | | | | | | | | | | | |
Total expenses | | | 2.22 | %8 | | | 1.96 | % | | | 2.02 | % | | | 2.05 | % | | | 2.17 | %8 | | | 2.02 | %8 | | | 2.04 | % |
| | | | | | | | | | | | | | | | | | | | | | | | | | | | |
Net investment loss | | | (1.13 | )%8 | | | (1.21 | )% | | | (1.00 | )% | | | (0.26 | )% | | | (0.61 | )%8 | | | (1.17 | )%8 | | | (0.10 | )% |
| | | | | | | | | | | | | | | | | | | | | | | | | | | | |
Net investment income (loss) | | | | | | | | | | | | | | | | | | | | | | | | | | | | |
Net assets, end of period (000) | | $ | 73,009 | | | $ | 151,409 | | | $ | 144,300 | | | $ | 147,723 | | | $ | 201,265 | 8 | | $ | 169,871 | 8 | | $ | 122,088 | |
| | | | | | | | | | | | | | | | | | | | | | | | | | | | |
Portfolio turnover | | | 17 | % | | | 32 | % | | | 15 | % | | | 27 | % | | | 9 | % | | | 22 | % | | | 27 | % |
| | | | | | | | | | | | | | | | | | | | | | | | | | | | |
| 1 | Based on average shares outstanding. |
| 2 | Less than $0.01 per share. |
| 3 | Total investment returns exclude the effects of sales charges. |
| 4 | Redemption fee of 2.00% received by the Portfolio is reflected in total return calculations. There was no impact to the return. |
| 5 | Aggregate total investment return. |
| 6 | Redemption fee of 2.00% received by the Portfolio is reflected in total return calculations. The impact to the return from redemption fees received during the period was an increase of 0.02%. |
| 7 | Redemption fee of 2.00% received by the Portfolio is reflected in total return calculations. The impact to the return from redemption fees received during the period was an increase of 0.01%. |
See Notes to Financial Statements.
| | | | | | |
42 | | SEMI-ANNUAL REPORT | | MARCH 31, 2009 | | |
Notes to Financial Statements (Unaudited)
1. Organization and Significant Accounting Policies:
BlackRock FundsSM (the “Fund”), a Massachusetts business trust, is registered under the Investment Company Act of 1940, as amended (the “1940 Act”), as an open-end management investment company. As of March 31, 2009, the Fund had 27 registered portfolios, of which the BlackRock All-Cap Energy & Resources Portfolio (“All-Cap Energy & Resources”), BlackRock Aurora Portfolio (“Aurora”), BlackRock Capital Appreciation Portfolio (“Capital Appreciation”) and BlackRock Energy & Resources Portfolio (“Energy & Resources Portfolio”) (collectively the “Portfolios”) are included in these financial statements. The Portfolios’ financial statements are prepared in conformity with accounting principles generally accepted in the United States of America, which may require the use of management accruals and estimates. Actual results may differ from these estimates. Each Portfolio offers multiple classes of shares. Institutional Shares are sold without a sales charge and only to certain eligible investors. Service Shares are sold without a sales charge. Investor A Shares are sold with a front-end sales charge. Shares of Investor B and Investor C may be subject to a contingent deferred sales charge. R Shares are sold without a sales charge and only to certain retirement and other similar plans. All classes of shares have identical voting, dividend, liquidation and other rights and the same terms and conditions, except that the Service, Investor A, Investor B, Investor C and R Shares may bear certain expenses related to the service and/or distribution of such shares. Each class has exclusive voting rights with respect to matters relating to its service and distribution expenditures (except that Investor B shareholders may vote on material changes to the Investor A distribution plan).
Fund Reorganization:
The Board of Trustees (the “Board”) of the Fund on behalf of Capital Appreciation and the shareholders of the PNC Equity Growth Fund, a series of the PNC Funds, Inc., approved a reorganization (the “Reorganization”), which was a tax-free event that took place on November 17, 2008.
| | |
Target Fund | | Acquiring Portfolio |
PNC Equity Growth Fund | | Capital Appreciation |
Under the agreement and plan of reorganization with respect to the Reorganization, PNC Equity Growth Fund Investor A Shares, Investor C Shares and Institutional Shares were exchanged for Capital Appreciation Investor A Shares and Institutional Shares. The conversion ratio for each Share class was as follows:
| | |
PNC Equity Growth Fund/ Capital Appreciation | | |
Investor A/ Investor A | | 0.43269926 |
Investor C/ Investor A | | 0.41215351 |
Institutional/ Institutional | | 0.42252433 |
The net assets before and after the Reorganization and shares issued and redeemed in the Reorganization were as follows:
| | | | | | | | | | |
BlackRock Portfolio | | Net Assets Combined
After Reorganization as of
November 17, 2008 | | Net Assets Prior to
Reorganization as of
November 17, 2008 | | Shares Issued | | PNC Equity Growth Fund
Shares Redeemed |
Capital Appreciation | | $ | 192,543,523 | | $ | 182,664,682 | | 868,487 | | 2,054,276 |
Included in the net assets acquired were the following components:
| | | | | | | | | | |
PNC Fund | | Paid In Capital | | Net
Unrealized
Depreciation | | | Net
Assets |
PNC Equity Growth Fund | | $ | 15,211,923 | | $ | (5,333,082 | ) | | $ | 9,878,841 |
The following Portfolios of the Fund changed their names on February 2, 2009:
| | |
Former Name | | New Name |
| BlackRock All-Cap Global Resources Portfolio | | BlackRock All-Cap Energy & Resources Portfolio |
| BlackRock Global Resources Portfolio | | BlackRock Energy & Resources Portfolio |
The following is a summary of significant accounting policies followed by the Portfolios:
Valuation of Investments: Equity investments traded on a recognized securities exchange or the NASDAQ Global Market System are valued at the last reported sale price that day or the NASDAQ official closing price, if applicable. For equity investments traded on more than one exchange, the last reported sale price on the exchange where the stock is primarily traded is used. Equity investments traded on a recognized exchange for which there were no sales on that day are valued at the last available bid price. If no bid price is available, the prior day’s price will be used, unless it is determined that such prior day’s price no longer reflects the fair value of the security. Short-term securities with maturities less than 60 days are valued at amortized cost, which approximates fair value. Investments in investment companies are valued at the net asset value each business day. The Portfolios value their investments in the BlackRock Liquidity Series, LLC Money Market Series at fair value, which is ordinarily based upon their pro rata ownership in the net assets of the underlying fund.
In the event that application of these methods of valuation results in a price for an investment which is deemed not to be representative of the market value of such investment, the investment will be valued by a method approved by the Board as reflecting fair value (“Fair Value Assets”). When determining the price for Fair Value Assets, the investment advisor seeks to determine the price that the Portfolios might reasonably expect to receive from the current sale of that asset in an
| | | | | | |
| | | SEMI-ANNUAL REPORT | | MARCH 31, 2009 | | 43 |
Notes to Financial Statements (continued)
arm’s-length transaction. Fair value determinations shall be based upon all available factors that the investment advisor deems relevant. The pricing of all Fair Value Assets is subsequently reported to the Board or a committee thereof.
Generally, trading in foreign securities is substantially completed each day at various times prior to the close of business on the New York Stock Exchange (“NYSE”). The values of such securities used in computing the net assets of a Portfolio are determined as of such times. Foreign currency exchange rates will be determined as of the close of business on the NYSE. Occasionally, events affecting the values of such securities and such exchange rates may occur between the times at which they are determined and the close of business on the NYSE that may not be reflected in the computation of the Portfolios’ net assets. If events (for example, a company announcement, market volatility or a natural disaster) occur during such periods that are expected to materially affect the value of such securities, those securities may be valued at their fair value as determined in good faith by the Board or by the investment advisor using a pricing service and/or procedures approved by the Board. Foreign currency exchange contracts and forward foreign currency exchange contracts are valued at the mean between the bid and ask prices. Interpolated values are derived when the settlement date of the contract is an interim date for which quotations are not available.
Derivative Financial Instruments: The Portfolios may engage in various portfolio investment strategies to both increase the return of the Portfolios and to hedge, or protect, their exposure to interest rate movements and movements in the securities markets. Losses may arise if the value of the contract decreases due to an unfavorable change in the price of the underlying security, or if the counterparty does not perform under the contract.
| • | | Forward Currency Contracts – A forward currency contract is an agreement between two parties to buy and sell a currency at a set exchange rate on a future date. The Portfolios may enter into forward currency contracts as a hedge against either specific transactions or portfolio positions. Forward currency contracts, when used by a Portfolio, help to manage the overall exposure to the foreign currency backing some of the investments held by the Portfolio. The contract is marked-to-market daily and the change in market value is recorded by a Portfolio as an unrealized gain or loss. When the contract is closed, a Portfolio records a realized gain or loss equal to the difference between the value at the time it was opened and the value at the time it was closed. The use of forward currency contracts involves the risk that counterparties may not meet the terms of the agreement and market risk of unanticipated movements in the value of a foreign currency relative to the US dollar. |
Foreign Currency Transactions: Foreign currency amounts are translated into United States dollars on the following basis: (i) market value of investment securities, assets and liabilities at the current rate of exchange; and (ii) purchases and sales of investment securities, income and expenses at the rates of exchange prevailing on the respective dates of such transactions.
The Portfolios report foreign currency related transactions as components of realized gains for financial reporting purposes, whereas such components are treated as ordinary income for federal income tax purposes.
Segregation and Collateralization: In cases in which the 1940 Act and the interpretive positions of the Securities and Exchange Commission (“SEC”) require that each Portfolio segregate assets in connection with certain investments (e.g., forward currency contracts), each Portfolio will, consistent with certain interpretive letters issued by the SEC, designate on its books and records cash or other liquid debt securities having a market value at least equal to the amount that would otherwise be required to be physically segregated. Furthermore, based on requirements and agreements with certain exchanges and third party broker-dealers, each Portfolio may also be required to deliver or deposit securities as collateral for certain investments (e.g., forward currency contracts).
Investment Transactions and Investment Income: Investment transactions are recorded on the dates the transactions are entered into (the trade dates). Realized gains and losses on investment transactions are determined on the identified cost basis. Dividend income is recorded on the ex-dividend dates. Dividends from foreign securities where the ex-dividend date may have passed are subsequently recorded when the Portfolio has determined the ex-dividend date. Upon notification from issuers, some of the dividend income received from a real estate investment trust may be redesignated as a reduction of cost of the related investment and/or realized gain. Income, realized and unrealized gains and losses of the Portfolios are allocated daily to each class based on its relative net assets.
Dividends and Distributions: Dividends and distributions paid by the Portfolios are recorded on the ex-dividend dates.
Securities Lending: The Portfolios may lend securities to financial institutions that provide cash which will be maintained at all times in an amount equal to at least 100% of the current market value of the loaned securities. The market value of the loaned securities is determined at the close of business of the Portfolios and any additional required collateral is delivered to the Portfolios on the next business day. The Portfolios typically receive income on the loaned securities but do not receive the income on the collateral. The Portfolios may invest the cash collateral and retain the amount earned on such investment, net of any amount rebated to the borrower. Loans of securities are terminable at any time and the borrower, after notice, is required to return borrowed securities within the standard time period for settlement of securities transactions. The Portfolios may pay reasonable lending agent, administrative and custodial fees in connection with their loans. In the event that the borrower defaults on its obligation to return borrowed securities because of insolvency or for any other reason, the Portfolios could experience delays and costs in gaining access to the collateral. The
| | | | | | |
44 | | SEMI-ANNUAL REPORT | | MARCH 31, 2009 | | |
Notes to Financial Statements (continued)
Portfolios also could suffer a loss if the value of an investment purchased with cash collateral falls below the market value of loaned securities.
Income Taxes: It is each Portfolio’s policy to comply with the requirements of the Internal Revenue Code applicable to regulated investment companies and to distribute substantially all of their taxable income to their shareholders. Therefore, no federal income tax provision is required. Under the applicable foreign tax laws, a withholding tax may be imposed on interest, dividends and capital gains at various rates.
The Portfolios file US federal and various state and local tax returns. No income tax returns are currently under examination. The statutes of limitations on each Portfolio’s US federal income tax returns remain open for each of the four years ended September 30, 2008. The statutes of limitations on each Portfolio’s state and local tax returns may remain open for an additional year depending upon the jurisdiction.
Recent Accounting Pronouncement: In March 2008, Statement of Financial Accounting Standards No. 161, “Disclosures about Derivative Instruments and Hedging Activities – an amendment of FASB Statement No. 133” (“FAS 161”), was issued. FAS 161 is intended to improve financial reporting for derivative instruments by requiring enhanced disclosure that enables investors to understand how and why an entity uses derivatives, how derivatives are accounted for, and how derivative instruments affect an entity’s results of operations and financial position. FAS 161 is effective for financial statements issued for fiscal years and interim periods beginning after November 15, 2008. The impact on each Portfolio’s financial statement disclosures is currently being assessed.
Other: Expenses directly related to a Portfolio or class are charged to that Portfolio or class. Other operating expenses shared by several funds are pro-rated among those funds on the basis of relative net assets or other appropriate methods. Other expenses of a Portfolio are allocated daily to each class based on its relative net assets.
2. Investment Advisory Agreement and Other Transactions with Affiliates:
The Fund, on behalf of the Portfolios, entered into an Investment Advisory Agreement with BlackRock Advisors, LLC (the “Advisor”), an indirect, wholly owned subsidiary of BlackRock, Inc., to provide investment advisory services. The PNC Financial Services Group, Inc. (“PNC”) and Bank of America Corporation (“BAC”) are the largest stockholders of BlackRock, Inc. (“BlackRock”). BAC became a stockholder of BlackRock following its acquisition of Merrill Lynch & Co., Inc. (“Merrill Lynch”) on January 1, 2009. Prior to that date, both PNC and Merrill Lynch were considered affiliates of the Fund under the 1940 Act. Subsequent to the acquisition, PNC remains an affiliate, but due to the restructuring of Merrill Lynch’s ownership interest of BlackRock, BAC is not deemed to be an affiliate under the 1940 Act.
The Advisor is responsible for the management of each Portfolio and provides the necessary personnel, facilities, equipment and certain other services necessary to the operations of the Portfolios. For such services, each Portfolio pays the Advisor a monthly fee based on the average daily value of the Portfolio’s net assets, at the following annual rates:
| | | | | | | | | | | | |
Average Daily Net Assets | | All-Cap
Energy &
Resources | | | Aurora | | | Capital
Appreciation | | | Energy &
Resources | |
First $1 Billion | | 0.750 | % | | 0.850 | % | | 0.650 | % | | 0.750 | % |
$1 Billion - $2 Billion | | 0.700 | | | 0.800 | | | 0.600 | | | 0.700 | |
$2 Billion - $3 Billion | | 0.675 | | | 0.750 | | | 0.575 | | | 0.675 | |
Greater Than $3 Billion | | 0.650 | | | 0.700 | | | 0.550 | | | 0.650 | |
The Advisor contractually agreed to waive or reimburse fees or expenses until February 1, 2010, in order to limit expenses. These expense limits apply to the aggregate expenses incurred on a share class (excluding: interest, taxes, brokerage commissions, expenses incurred as a result of investments in other funds and other expenses attributable to, and incurred as a result of, a Portfolio’s investments and other extraordinary expenses). This agreement is reviewed annually by the Board. The current expense limitations as a percentage of net assets are as follows:
| | | | | | | | | | | | |
Share Classes | | All-Cap
Energy &
Resources | | | Aurora | | | Capital
Appreciation | | | Energy &
Resources | |
Institutional | | 0.93 | % | | 1.05 | % | | 0.70 | % | | 1.04 | % |
Service | | 1.34 | % | | 1.44 | %1 | | 1.35 | %1 | | 1.34 | %1 |
Investor A | | 1.34 | % | | 1.44 | % | | 1.35 | % | | 1.34 | % |
Investor B | | 2.04 | % | | 2.19 | % | | 2.10 | % | | 2.04 | % |
Investor C | | 2.04 | % | | 2.19 | % | | 2.10 | % | | 2.04 | % |
R | | 1.78 | %1 | | 1.60 | % | | 1.94 | %1 | | 1.88 | %1 |
| 1 | There were no shares outstanding as of March 31, 2009. |
PFPC Trust Company, an indirect wholly-owned subsidiary of PNC, serves as custodian for each Portfolio. For these services, the custodian receives a fee computed daily and payable monthly, based on a percentage of the average daily gross assets of each Portfolio. The fee is paid at the following annual rates: 0.005% of the first $400 million, 0.004% of the next $1.6 billion, and 0.003% of average daily gross assets in excess of $2 billion; plus per transaction charges and other miscellaneous fees incurred on behalf of each Portfolio.
PNC Global Investment Servicing (U.S.) Inc. (“PNCGIS”), an indirect, wholly owned subsidiary of PNC, serves as transfer and dividend disbursing agent. Each class of each Portfolio bears the costs of transfer agent fees associated with such respective class. Transfer agent fees borne by each class of each Portfolio are comprised of those fees charged for all shareholder communications including mailing of shareholder reports, dividend and distribution notices, and proxy materials for shareholders meetings, as well as per account and per transaction fees related to servicing and maintenance of shareholder accounts, including the issuing, redeeming and transferring of shares of each class of each Portfolio, 12b-1 fee calculations, check writing, anti-money laundering services, and customer identification services.
Pursuant to written agreements, Merrill Lynch and certain other affiliates provide the Portfolios with sub-accounting, recordkeeping, sub-transfer agency and other administrative services with respect to sub-accounts they service. For these services, affiliates receive an annual fee per
| | | | | | |
| | | SEMI-ANNUAL REPORT | | MARCH 31, 2009 | | 45 |
Notes to Financial Statements (continued)
shareholder account which will vary depending on share class. The Portfolios incurred the following fees in return for these services, which are a component of the transfer agent fees in the accompanying Statements of Operations:
| | | | | | |
| | | Merrill Lynch | | Other Affiliates |
| | | Period
October 1, 2008
to
December 31, 2008 | | Six Months
Ended
March 31, 2009 |
All-Cap Energy & Resources | | $ | 25,974 | | $ | 212 |
Aurora | | | 116,744 | | | 14,689 |
Capital Appreciation | | | 5,674 | | | 15,010 |
Energy & Resources | | | 37,618 | | | 272 |
PNCGIS and the Advisor act as co-administrators for the Portfolios. For these services, the co-administrators receive a combined administration fee computed daily and payable monthly, based on a percentage of the average daily net assets of each Portfolio. The combined administration fee is based on a percentage of the average daily net assets at the following annual rates: 0.075% of the first $500 million, 0.065% of the next $500 million and 0.055% of average of daily net assets in excess of $1 billion. In addition, each of the share classes is charged an administration fee based on the following percentages of average daily net assets of each respective class: 0.025% of the first $500 million of each Portfolio, 0.015% of the next $500 million and 0.005% of average of daily net assets in excess of $1 billion. In addition, PNCGIS and the Advisor may have, at their discretion, voluntarily waived all or any portion of their administration fees for a Portfolio or a share class.
The Portfolios have received an exemptive order from the SEC permitting them to lend portfolio securities to Merrill Lynch, Pierce, Fenner & Smith (“MLPF&S”) or its affiliates. Pursuant to that order, the Portfolios have retained BlackRock Investment Management, LLC (“BIM”), an affiliate of the Advisor, as the securities lending agent for a fee based on a share of the returns on investment of cash collateral. BIM may, on behalf of the Portfolios, invest cash collateral received by the Portfolios for such loans, among other things, in a private investment company managed by the Advisor or in registered money market funds advised by the Advisor or its affiliates. The share of income earned by the Portfolios on such investments is shown as securities lending—affiliated on the Statements of Operations.
The securities lending agent fees received by BIM were as follows:
| | | |
| | | Securities lending
agent fees for the
six months ended
March 31, 2009 |
All-Cap Energy & Resources | | $ | 13,768 |
Aurora | | | 33,287 |
Capital Appreciation | | | 261 |
Energy & Resources | | | 40,208 |
The Fund, on behalf of the Portfolios, has entered into a separate Distribution Agreement and Distribution Plan with BlackRock Investments, LLC (“BIL”), an affiliate of BlackRock. Pursuant to the Distribution Plan, in accordance with Rule 12b-1 under the 1940 Act, the Portfolios pay BIL ongoing service and distribution fees. The fees are accrued daily and paid monthly at annual rates based upon the average daily net assets of the shares of each Portfolio as follows:
| | | | | | |
| | | Service
Fee | | | Distribution
Fee | |
Service | | 0.25 | % | | — | |
Investor A | | 0.25 | % | | — | |
Investor B | | 0.25 | % | | 0.75 | % |
Investor C | | 0.25 | % | | 0.75 | % |
R | | 0.25 | % | | 0.25 | % |
For the six months ended March 31, 2009, the Portfolios paid to affiliates the following fees in return for distribution and sales support services:
| | | |
All-Cap Energy & Resources | | $ | 56,868 |
Aurora | | | 122,520 |
Capital Appreciation | | | 20,324 |
Energy & Resources | | | 85,089 |
The Advisor maintains a call center, which is responsible for providing certain shareholder services to the Portfolios, such as responding to shareholder inquiries and processing transactions based upon instructions from shareholders with respect to the subscription and redemption of Portfolio shares. During the six months ended March 31, 2009, each Portfolio reimbursed the Advisor the following amounts for costs incurred in running the call center, which are a component of the transfer agent fees in the accompanying Statements of Operations.
| | | | | | | | | | | | | | | | | | | | | |
| | | Share Classes | | |
Call Center | | Institutional | | Service | | Investor A | | Investor B | | Investor C | | R | | Total |
All-Cap Energy & Resources | | $ | 3,871 | | $ | 619 | | $ | 24,193 | | $ | 5,444 | | $ | 12,358 | | | — | | $ | 46,485 |
Aurora | | | — | | | — | | | 41,196 | | | — | | | — | | $ | 22 | | | 41,218 |
Capital Appreciation | | | — | | | — | | | 13,548 | | | 4,195 | | | 613 | | | — | | | 18,356 |
Energy & Resources | | | 1,207 | | | — | | | 30,334 | | | 5,123 | | | 7,191 | | | — | | | 43,855 |
| | | | | | |
46 | | SEMI-ANNUAL REPORT | | MARCH 31, 2009 | | |
Notes to Financial Statements (continued)
For the six months ended March 31, 2009, the following charts show the various types of class specific expenses borne directly by each class of each Portfolio and any associated waivers or reimbursements of those expenses.
| | | | | | | | | | | | | | | | | | | | | | |
| | | Share Classes | | | |
Administration Fees | | Institutional | | Service | | Investor A | | Investor B | | Investor C | | R | | | Total |
All-Cap Energy & Resources | | $ | 33,556 | | $ | 283 | | $ | 16,731 | | $ | 2,971 | | $ | 10,234 | | | — | ) | | $ | 63,775 |
Aurora | | | 6,637 | | | — | | | 39,029 | | | 9,084 | | | 8,611 | | $ | 116 | | | | 63,477 |
Capital Appreciation | | | 10,506 | | | — | | | 11,733 | | | 1,570 | | | 1,622 | | | — | | | | 25,431 |
Energy & Resources | | | 4,432 | | | — | | | 49,570 | | | 3,606 | | | 10,192 | | | — | | | | 67,800 |
| | |
| | | Share Classes | | | |
Administration Fees Waived | | Institutional | | Service | | Investor A | | Investor B | | Investor C | | R | | | Total |
All-Cap Energy & Resources | | $ | 32,725 | | $ | 283 | | $ | 16,731 | | $ | 2,971 | | $ | 10,234 | | | — | | | $ | 62,944 |
Aurora | | | 6,637 | | | — | | | 38,847 | | | 9,084 | | | 8,611 | | $ | 116 | | | | 63,295 |
Capital Appreciation | | | 10,506 | | | — | | | 801 | | | 1,489 | | | — | | | — | | | | 12,796 |
Energy & Resources | | | 2,729 | | | — | | | 49,019 | | | 3,606 | | | 9,997 | | | — | | | | 65,351 |
| | | | | | | | | | | | | | | | | | |
| | | Share Classes | | |
Service and Distribution Fees | | Service | | Investor A | | Investor B | | Investor C | | R | | Total |
All-Cap Energy & Resources | | $ | 2,833 | | $ | 166,939 | | $ | 119,702 | | $ | 410,971 | | | — | | $ | 700,445 |
Aurora | | | — | | | 369,207 | | | 355,392 | | | 337,409 | | $ | 2,328 | | | 1,064,336 |
Capital Appreciation | | | — | | | 117,153 | | | 61,312 | | | 64,399 | | | — | | | 242,864 |
Energy & Resources | | | — | | | 462,044 | | | 142,895 | | | 405,463 | | | — | | | 1,010,402 |
| | | | | | | | | | | | | | | | | | | | | |
| | | Share Classes | | |
Transfer Agent Fees | | Institutional | | Service | | Investor A | | Investor B | | Investor C | | R | | Total |
All-Cap Energy & Resources | | $ | 56,935 | | $ | 5,571 | | $ | 263,267 | | $ | 60,464 | | $ | 154,513 | | | — | | $ | 540,750 |
Aurora | | | 97,686 | | | — | | | 644,154 | | | 196,649 | | | 142,446 | | $ | 1,537 | | | 1,082,472 |
Capital Appreciation | | | 18,993 | | | — | | | 154,739 | | | 33,704 | | | 10,497 | | | — | | | 217,933 |
Energy & Resources | | | 23,492 | | | — | | | 686,538 | | | 54,079 | | | 113,093 | | | — | | | 877,202 |
| | |
| | | Share Classes | | |
Transfer Agent Fees Waived | | Institutional | | Service | | Investor A | | Investor B | | Investor C | | R | | Total |
All-Cap Energy & Resources | | $ | 3,743 | | $ | 619 | | $ | 24,093 | | $ | 5,444 | | $ | 12,358 | | | — | | $ | 46,257 |
Aurora | | | — | | | — | | | 40,969 | | | — | | | — | | $ | 22 | | | 40,991 |
Capital Appreciation | | | — | | | — | | | 215 | | | 3,925 | | | — | | | — | | | 4,140 |
Energy & Resources | | | 682 | | | — | | | 29,834 | | | 5,123 | | | 7,096 | | | — | | | 42,735 |
| | |
| | | Share Classes | | |
Transfer Agent Fees Reimbursed | | Institutional | | Service | | Investor A | | Investor B | | Investor C | | R | | Total |
All-Cap Energy & Resources | | $ | 45,233 | | $ | 3,066 | | $ | 127,904 | | $ | 42,172 | | $ | 97,316 | | | — | | $ | 315,691 |
Aurora | | | 89,840 | | | — | | | 320,634 | | | 127,468 | | | 77,946 | | $ | 1,143 | | | 617,031 |
Capital Appreciation | | | 18,946 | | | — | | | — | | | 3,356 | | | — | | | — | | | 22,302 |
Energy & Resources | | | 4,527 | | | — | | | 312,279 | | | 30,717 | | | 55,686 | | | — | | | 403,209 |
If within two years following a waiver or reimbursement, the operating expenses of a share class that previously received a waiver or reimbursement from the Advisor are less than the expense limit for that share class, the Advisor is entitled to be reimbursed by such share class up to the amount of fees waived or expenses reimbursed under the agreement if: (1) the Portfolio has more than $50 million in assets, (2) the Advisor or an affiliate continues to serve as the Portfolio’s investment advisor or administrator and (3) the Board has approved in advance the payments to the Advisor at the previous quarterly meeting.
At March 31, 2009, the amounts subject to possible future reimbursement under the expense limitation agreement are as follows:
| | | | | | | | | |
| | | Expiring January 31, |
| | | 2010 | | 2011 | | 2012 |
All-Cap Energy & Resources | | $ | 268,738 | | $ | 381,735 | | $ | 130,792 |
Aurora | | | 805,630 | | | 955,200 | | | 197,839 |
| |
| | | Expiring January 31, |
| | | 2010 | | 2011 | | 2012 |
Capital Appreciation | | | 200,876 | | | 165,487 | | | 51,484 |
Energy & Resources | | | 55,847 | | | 404,402 | | | 135,019 |
| | | | | | |
| | | SEMI-ANNUAL REPORT | | MARCH 31, 2009 | | 47 |
Notes to Financial Statements (continued)
The following waivers previously recorded by the portfolios, which were subject to recoupment by the Advisor, expired on January 31, 2009:
| | | |
All-Cap Energy & Resources | | $ | 131,783 |
For the three months ended December 31, 2008, Merrill Lynch, through its affiliated broker dealer, MLPF&S, earned commissions on transactions of securities as follows:
| | | |
All-Cap Energy & Resources | | $ | 6,195 |
Aurora | | | 97,391 |
Capital Appreciation | | | 3,240 |
Energy & Resources | | | 75,122 |
For the six months ended March 31, 2009, affiliates earned underwriting discounts, direct commissions and dealer concessions on sales of each Portfolio’s Investor A Shares as follows:
| | | |
All-Cap Energy & Resources | | $ | 9,181 |
Aurora | | | 1,588 |
Capital Appreciation | | | 14,370 |
Energy & Resources | | | 33,346 |
For the six months ended March 31, 2009, affiliates received the following contingent deferred sales charges relating to transactions in Investor A, B and C Shares:
| | | | | | | | | |
| | | Investor A | | Investor B | | Investor C |
All-Cap Energy & Resources | | $ | 15,827 | | $ | 88,181 | | $ | 32,800 |
Aurora | | | 80 | | | 24,753 | | | 1,251 |
Capital Appreciation | | | — | | | 10,192 | | | 2,632 |
Energy & Resources | | | 12,411 | | | 40,083 | | | 39,455 |
The Portfolios may earn income on positive cash balances in demand deposit accounts that are maintained by PNCGIS on behalf of the Portfolios. The income earned for the six months ended March 31, 2009 was as follows which is included in interest and dividends – affiliated on the Statements of Operations:
| | | |
All-Cap Energy & Resources | | $ | 982 |
Aurora | | | 1,686 |
Capital Appreciation | | | 432 |
Energy & Resources | | | 1,071 |
The Portfolios may also receive earnings credits related to cash balances with PNCGIS which are shown on the Statements of Operations as fees paid indirectly.
Certain officers and/or trustees of the Fund are officers and/or directors of BlackRock, Inc. or its affiliates. The Portfolios reimburse the Advisor for compensation paid to the Fund’s Chief Compliance Officer.
3. Investments:
For the six months ended March 31, 2009, purchases and sales of investments, excluding short-term securities, were as follows:
| | | | | | |
| | | Purchases | | Sales |
All-Cap Energy & Resources | | $ | 58,951,764 | | $ | 216,061,780 |
| | |
| | | Purchases | | Sales |
Aurora | | | 781,125,939 | | | 867,915,304 |
Capital Appreciation | | | 123,200,917 | | | 90,282,570 |
Energy & Resources | | | 114,232,816 | | | 95,616,095 |
4. Short-Term Borrowings:
The Portfolios, along with certain other funds managed by the Advisor and its affiliates, are a party to a $500 million credit agreement with a group of lenders, which expired November 2008 and was renewed until November 2009. The Portfolios may borrow under the credit agreement to fund shareholder redemptions and for other lawful purposes other than for leverage. Each Portfolio may borrow up to the maximum amount allowable under the Portfolio’s current Prospectus and Statement of Additional Information, subject to various other legal, regulatory or contractual limits. The Portfolios paid their pro rata share of a 0.02% upfront fee on the aggregate commitment amount based on their net assets as of October 31, 2008. The Portfolios pay a commitment fee of 0.08% per annum based on each Portfolio’s pro rata share of the unused portion of the credit agreement, which is included in miscellaneous on the Statements of Operations. Amounts borrowed under the credit agreement bear interest at a rate equal to, the higher of the (a) federal funds effective rate and (b) reserve adjusted one month LIBOR, plus, in each case, the higher of (i) 1.50% and (ii) 50% of the CDX index (as defined in the credit agreement) in effect from time to time. The Portfolios did not borrow under the credit agreement during the six months ended March 31, 2009.
5. Capital Loss Carryforward:
As of September 30, 2008, capital loss carryforwards available to offset future realized capital gains through the indicated expiration dates:
| | | | | | | | | |
| | | Expiring September 30, | | |
| | | 2010 | | 2011 | | Total |
Capital Appreciation | | $ | 32,425,507 | | $ | 18,377,786 | | $ | 50,803,293 |
6. Market and Credit Risk:
In the normal course of business, the Portfolios invest in securities and enter into transactions where risks exist due to fluctuations in the market (market risk) or failure of the issuer of a security to meet all its obligations (credit risk). The value of securities held by the Portfolios may decline in response to certain events, including those directly involving the issuers whose securities are owned by the Portfolios; conditions affecting the general economy; overall market changes; local, regional or global political, social or economic instability; and currency and interest rate and price fluctuations. Similar to credit risk, the Portfolios may be exposed to counterparty risk, or the risk that an entity with which the Portfolios have unsettled or open transactions may default. Financial assets, which potentially expose the Portfolios to credit and counterparty risks, consist principally of investments and cash due from counterparties. The extent of the Portfolios’ exposure to credit and counterparty risks with respect to these financial assets is approximated by their value recorded in the Portfolios’ Statements of Assets and Liabilities.
| | | | | | |
48 | | SEMI-ANNUAL REPORT | | MARCH 31, 2009 | | |
Notes to Financial Statements (continued)
7. Capital Shares Transactions:
Transactions in shares for each period were as follows:
| | | | | | | | | | | | | | |
| | | Six Months Ended
March 31, 2009 | | | Year Ended
September 30, 2008 | |
All-Cap Energy & Resources | | Shares | | | Amount | | | Shares | | | Amount | |
Institutional | | | | | | | | | | | | | | |
Shares sold | | 3,964,038 | | | $ | 35,623,597 | | | 9,052,749 | | | $ | 188,696,516 | |
Shares issued in reinvestment of dividends and distributions | | 5,705,652 | | | | 45,759,161 | | | 838,728 | | | | 16,866,827 | |
| | | | | | | | | | | | | | |
Total issued | | 9,669,690 | | | | 81,382,758 | | | 9,891,477 | | | | 205,563,343 | |
Shares redeemed | | (13,568,149 | ) | | | (124,181,634 | ) | | (9,226,778 | ) | | | (206,600,458 | ) |
| | | | | | | | | | | | | | |
Net increase (decrease) | | (3,898,459 | ) | | $ | (42,798,876 | ) | | 664,699 | | | $ | (1,037,115 | ) |
| | | | | | | | | | | | | | |
Service | | | | | | | | | | | | | | |
Shares sold | | 47,365 | | | $ | 463,008 | | | 249,773 | | | $ | 5,748,476 | |
Shares issued in reinvestment of dividends and distributions | | 36,296 | | | | 286,741 | | | 3,119 | | | | 62,170 | |
| | | | | | | | | | | | | | |
Total issued | | 83,661 | | | | 749,749 | | | 252,892 | | | | 5,810,646 | |
Shares redeemed | | (148,448 | ) | | | (1,355,481 | ) | | (129,909 | ) | | | (2,707,905 | ) |
| | | | | | | | | | | | | | |
Net increase (decrease) | | (64,787 | ) | | $ | (605,732 | ) | | 122,983 | | | $ | 3,102,741 | |
| | | | | | | | | | | | | | |
Investor A | | | | | | | | | | | | | | |
Shares sold | | 2,776,744 | | | $ | 24,496,357 | | | 6,199,085 | | | $ | 136,305,042 | |
Shares issued in reinvestment of dividends and distributions | | 2,485,168 | | | | 19,632,659 | | | 358,961 | | | | 7,154,106 | |
| | | | | | | | | | | | | | |
Total issued | | 5,261,912 | | | | 44,129,016 | | | 6,558,046 | | | | 143,459,148 | |
Shares redeemed | | (7,012,875 | ) | | | (65,241,206 | ) | | (7,972,335 | ) | | | (165,962,206 | ) |
| | | | | | | | | | | | | | |
Net decrease | | (1,750,963 | ) | | $ | (21,112,190 | ) | | (1,414,289 | ) | | $ | (22,503,058 | ) |
| | | | | | | | | | | | | | |
Investor B | | | | | | | | | | | | | | |
Shares sold | | 211,458 | | | $ | 1,812,746 | | | 507,174 | | | $ | 10,924,000 | |
Shares issued in reinvestment of dividends and distributions | | 474,990 | | | | 3,652,624 | | | 46,276 | | | | 909,329 | |
| | | | | | | | | | | | | | |
Total issued | | 686,448 | | | | 5,465,370 | | | 553,450 | | | | 11,833,329 | |
Shares redeemed | | (639,293 | ) | | | (5,659,008 | ) | | (801,196 | ) | | | (16,092,877 | ) |
| | | | | | | | | | | | | | |
Net increase (decrease) | | 47,155 | | | $ | (193,638 | ) | | (247,746 | ) | | $ | (4,259,548 | ) |
| | | | | | | | | | | | | | |
Investor C | | | | | | | | | | | | | | |
Shares sold | | 979,945 | | | $ | 8,473,128 | | | 2,689,785 | | | $ | 57,811,060 | |
Shares issued in reinvestment of dividends and distributions | | 1,666,587 | | | | 12,815,816 | | | 188,487 | | | | 3,705,692 | |
| | | | | | | | | | | | | | |
Total issued | | 2,646,532 | | | | 21,288,944 | | | 2,878,272 | | | | 61,516,752 | |
Shares redeemed | | (3,078,107 | ) | | | (27,897,644 | ) | | (4,091,437 | ) | | | (83,112,997 | ) |
| | | | | | | | | | | | | | |
Net decrease | | (431,575 | ) | | $ | (6,608,700 | ) | | (1,213,165 | ) | | $ | (21,596,245 | ) |
| | | | | | | | | | | | | | |
| | | | | | |
| | | SEMI-ANNUAL REPORT | | MARCH 31, 2009 | | 49 |
Notes to Financial Statements (continued)
| | | | | | | | | | | | | | |
| | | Six Months Ended
March 31, 2009 | | | Year Ended
September 30, 2008 | |
Aurora | | Shares | | | Amount | | | Shares | | | Amount | |
Institutional | | | | | | | | | | | | | | |
Shares sold | | 1,013,835 | | | $ | 13,820,111 | | | 2,074,486 | | | $ | 47,704,495 | |
Shares issued in reinvestment of distributions | | — | | | | — | | | 1,230,662 | | | | 30,781,548 | |
| | | | | | | | | | | | | | |
Total issued | | 1,013,835 | | | | 13,820,111 | | | 3,305,148 | | | | 78,486,043 | |
Shares redeemed | | (1,653,194 | ) | | | (22,694,363 | ) | | (4,618,681 | ) | | | (104,430,818 | ) |
| | | | | | | | | | | | | | |
Net decrease | | (639,359 | ) | | $ | (8,874,252 | ) | | (1,313,533 | ) | | $ | (25,944,775 | ) |
| | | | | | | | | | | | | | |
Investor A | | | | | | | | | | | | | | |
Shares sold | | 2,433,096 | | | $ | 29,323,906 | | | 3,833,437 | | | $ | 80,386,960 | |
Shares issued in reinvestment of distributions | | — | | | | — | | | 7,085,729 | | | | 162,351,816 | |
| | | | | | | | | | | | | | |
Total issued | | 2,433,096 | | | | 29,323,906 | | | 10,919,166 | | | | 242,738,776 | |
Shares redeemed | | (5,787,264 | ) | | | (72,135,362 | ) | | (14,304,737 | ) | | | (304,632,209 | ) |
| | | | | | | | | | | | | | |
Net decrease | | (3,354,168 | ) | | $ | (42,811,456 | ) | | (3,385,571 | ) | | $ | (61,893,433 | ) |
| | | | | | | | | | | | | | |
Investor B | | | | | | | | | | | | | | |
Shares sold | | 134,625 | | | $ | 1,406,607 | | | 183,023 | | | $ | 3,085,634 | |
Shares issued in reinvestment of distributions | | — | | | | — | | | 2,853,257 | | | | 52,471,586 | |
| | | | | | | | | | | | | | |
Total issued | | 134,625 | | | | 1,406,607 | | | 3,036,280 | | | | 55,557,220 | |
Shares redeemed | | (2,699,598 | ) | | | (26,162,610 | ) | | (5,092,762 | ) | | | (87,545,343 | ) |
| | | | | | | | | | | | | | |
Net decrease | | (2,564,973 | ) | | $ | (24,756,003 | ) | | (2,056,482 | ) | | $ | (31,988,123 | ) |
| | | | | | | | | | | | | | |
Investor C | | | | | | | | | | | | | | |
Shares sold | | 89,088 | | | $ | 886,231 | | | 260,720 | | | $ | 4,350,936 | |
Shares issued in reinvestment of distributions | | — | | | | — | | | 2,341,321 | | | | 43,230,706 | |
| | | | | | | | | | | | | | |
Total issued | | 89,088 | | | | 886,231 | | | 2,602,041 | | | | 47,581,642 | |
Shares redeemed | | (1,333,795 | ) | | | (13,288,923 | ) | | (3,773,111 | ) | | | (65,758,800 | ) |
| | | | | | | | | | | | | | |
Net decrease | | (1,244,707 | ) | | $ | (12,402,692 | ) | | (1,171,070 | ) | | $ | (18,177,158 | ) |
| | | | | | | | | | | | | | |
R | | | | | | | | | | | | | | |
Shares sold | | 8,473 | | | $ | 102,360 | | | 48,891 | | | $ | 1,086,944 | |
Shares issued in reinvestment of distributions | | — | | | | — | | | 12,133 | | | | 281,248 | |
| | | | | | | | | | | | | | |
Total issued | | 8,473 | | | | 102,360 | | | 61,024 | | | | 1,368,192 | |
Shares redeemed | | (10,757 | ) | | | (132,256 | ) | | (24,289 | ) | | | (506,370 | ) |
| | | | | | | | | | | | | | |
Net increase (decrease) | | (2,284 | ) | | $ | (29,896 | ) | | 36,735 | | | $ | 861,822 | |
| | | | | | | | | | | | | | |
| | | | |
Capital Appreciation | | | | | | | | | | | | |
Institutional | | | | | | | | | | | | | | |
Shares issued from the reorganization | | 846,171 | | | $ | 9,635,176 | | | — | | | $ | — | |
Shares sold | | 3,692,247 | | | | 44,157,900 | | | 1,638,547 | | | | 28,297,038 | |
| | | | | | | | | | | | | | |
Total issued | | 4,538,418 | | | | 53,793,076 | | | 1,638,547 | | | | 28,297,038 | |
Shares redeemed | | (959,180 | ) | | | (10,950,950 | ) | | (470,687 | ) | | | (8,322,488 | ) |
| | | | | | | | | | | | | | |
Net increase | | 3,579,238 | | | $ | 42,842,126 | | | 1,167,860 | | | $ | 19,974,550 | |
| | | | | | | | | | | | | | |
| | | | | | |
50 | | SEMI-ANNUAL REPORT | | MARCH 31, 2009 | | |
Notes to Financial Statements (continued)
| | | | | | | | | | | | | | |
| | | Six Months Ended
March 31, 2009 | | | Year Ended
September 30, 2008 | |
Capital Appreciation (concluded) | | Shares | | | Amount | | | Shares | | | Amount | |
Investor A | | | | | | | | | | | | | | |
Shares issued from the reorganization | | 22,316 | | | $ | 243,665 | | | — | | | $ | — | |
Shares sold | | 1,870,199 | | | | 20,660,435 | | | 3,197,945 | | | | 53,739,514 | |
| | | | | | | | | | | | | | |
Total issued | | 1,892,515 | | | | 20,904,100 | | | 3,197,945 | | | | 53,739,514 | |
Shares redeemed | | (1,876,784 | ) | | | (20,845,338 | ) | | (2,095,586 | ) | | | (34,173,398 | ) |
| | | | | | | | | | | | | | |
Net increase | | 15,731 | | | $ | 58,762 | | | 1,102,359 | | | $ | 19,566,116 | |
| | | | | | | | | | | | | | |
Investor B | | | | | | | | | | | | | | |
Shares sold | | 78,081 | | | $ | 793,400 | | | 96,209 | | | $ | 1,508,158 | |
Shares redeemed | | (521,565 | ) | | | (5,237,901 | ) | | (1,594,178 | ) | | | (24,746,487 | ) |
| | | | | | | | | | | | | | |
Net decrease | | (443,484 | ) | | $ | (4,444,501 | ) | | (1,497,969 | ) | | $ | (23,238,329 | ) |
| | | | | | | | | | | | | | |
Investor C | | | | | | | | | | | | | | |
Shares sold | | 861,757 | | | $ | 8,823,785 | | | 195,339 | | | $ | 2,936,249 | |
Shares redeemed | | (307,778 | ) | | | (3,069,155 | ) | | (209,587 | ) | | | (3,201,948 | ) |
| | | | | | | | | | | | | | |
Net increase (decrease) | | 553,979 | | | $ | 5,754,630 | | | (14,248 | ) | | $ | (265,699 | ) |
| | | | | | | | | | | | | | |
| | | | |
Energy & Resources | | | | | | | | | | | | |
Institutional | | | | | | | | | | | | | | |
Shares sold | | 1,973,622 | | | $ | 44,293,942 | | | 1,839,333 | | | $ | 136,929,369 | |
Shares issued in reinvestment of dividends and distributions | | 380,846 | | | | 7,594,158 | | | 44,166 | | | | 2,677,415 | |
| | | | | | | | | | | | | | |
Total issued | | 2,354,468 | | | | 51,888,100 | | | 1,883,499 | | | | 139,606,784 | |
Shares redeemed | | (1,596,089 | ) | | | (45,243,643 | ) | | (873,950 | ) | | | (60,686,858 | ) |
| | | | | | | | | | | | | | |
Net increase | | 758,379 | | | $ | 6,644,457 | | | 1,009,549 | | | $ | 78,919,926 | |
| | | | | | | | | | | | | | |
Investor A | | | | | | | | | | | | | | |
Shares sold | | 7,703,418 | | | $ | 161,338,891 | | | 7,408,833 | | | $ | 495,863,823 | |
Shares issued in reinvestment of dividends and distributions | | 6,478,750 | | | | 113,896,770 | | | 1,758,021 | | | | 98,308,999 | |
| | | | | | | | | | | | | | |
Total issued | | 14,182,168 | | | | 275,235,661 | | | 9,166,854 | | | | 594,172,822 | |
Shares redeemed | | (5,575,152 | ) | | | (134,459,327 | ) | | (6,200,250 | ) | | | (394,977,968 | ) |
| | | | | | | | | | | | | | |
Net increase | | 8,607,016 | | | $ | 140,776,334 | | | 2,966,604 | | | $ | 199,194,854 | |
| | | | | | | | | | | | | | |
Investor B | | | | | | | | | | | | | | |
Shares sold | | 155,548 | | | $ | 2,520,568 | | | 256,247 | | | $ | 14,709,333 | |
Shares issued in reinvestment of dividends and distributions | | 785,430 | | | | 10,446,300 | | | 237,561 | | | | 11,255,907 | |
| | | | | | | | | | | | | | |
Total issued | | 940,978 | | | | 12,966,868 | | | 493,808 | | | | 25,965,240 | |
Shares redeemed | | (584,584 | ) | | | (10,287,902 | ) | | (628,938 | ) | | | (33,196,754 | ) |
| | | | | | | | | | | | | | |
Net increase (decrease) | | 356,394 | | | $ | 2,678,966 | | | (135,130 | ) | | $ | (7,231,514 | ) |
| | | | | | | | | | | | | | |
| | | | | | |
| | | SEMI-ANNUAL REPORT | | MARCH 31, 2009 | | 51 |
Notes to Financial Statements (concluded)
| | | | | | | | | | | | | | |
| | | Six Months Ended
March 31, 2009 | | | Year Ended
September 30, 2008 | |
Energy & Resources (concluded) | | Shares | | | Amount | | | Shares | | | Amount | |
Investor C | | | | | | | | | | | | | | |
Shares sold | | 954,997 | | | $ | 16,020,682 | | | 1,659,207 | | | $ | 97,391,961 | |
Shares issued in reinvestment of dividends and distributions | | 2,181,238 | | | | 28,923,438 | | | 476,747 | | | | 22,536,947 | |
| | | | | | | | | | | | | | |
Total issued | | 3,136,235 | | | | 44,944,120 | | | 2,135,954 | | | | 119,928,908 | |
Shares redeemed | | (1,272,839 | ) | | | (24,507,901 | ) | | (1,151,408 | ) | | | (61,147,936 | ) |
| | | | | | | | | | | | | | |
Net increase | | 1,863,396 | | | $ | 20,436,219 | | | 984,546 | | | $ | 58,780,972 | |
| | | | | | | | | | | | | | |
There is a 2% redemption fee on shares of certain Portfolios redeemed or exchanged which have been held for 30 days or less. The redemption fees are collected and retained by the Portfolio for the benefit of the remaining shareholders. The redemption fees are recorded as a credit to paid-in capital.
| | | | | | |
52 | | SEMI-ANNUAL REPORT | | MARCH 31, 2009 | | |
Officers and Trustees
Ronald W. Forbes, Co-Chairman of the Board and Trustee
Rodney D. Johnson, Co-Chairman of the Board and Trustee
David O. Beim, Trustee
Dr. Matina Horner, Trustee
Herbert I. London, Member of the Audit Committee and Trustee
Cynthia A. Montgomery, Trustee
Joseph P. Platt, Jr., Trustee
Robert C. Robb, Jr., Trustee
Toby Rosenblatt, Trustee
Kenneth L. Urish, Chairman of the Audit Committee and Trustee
Frederick W. Winter, Member of the Audit Committee and Trustee
Richard S. Davis, Trustee
Henry Gabbay, Trustee
Donald C. Burke, Fund President and Chief Executive Officer
Anne F. Ackerley, Vice President
Neal J. Andrews, Chief Financial Officer
Jay M. Fife, Treasurer
Brian P. Kindelan, Chief Compliance Officer of the Fund
Howard Surloff, Secretary
Investment Advisor and Co-Administrator
BlackRock Advisors, LLC
Wilmington, DE 19809
Custodian
PFPC Trust Company
Philadelphia, PA 19153
Co-Administrator and Transfer Agent
PNC Global Investment Servicing (U.S.) Inc.
Wilmington, DE 19809
Distributor
BlackRock Investments, LLC
New York, NY 10022
Legal Counsel
Sidley Austin LLP
New York, NY 10019
Independent Registered Public Accounting Firm
Deloitte & Touche LLP
Philadelphia, PA 19103
Address of the Portfolios
100 Bellevue Parkway
Wilmington, DE 19809
| | | | | | |
| | | SEMI-ANNUAL REPORT | | MARCH 31, 2009 | | 53 |
Additional Information
BlackRock Privacy Principles
BlackRock is committed to maintaining the privacy of its current and former fund investors and individual clients (collectively, “Clients”) and to safeguarding their non-public personal information. The following information is provided to help you understand what personal information BlackRock collects, how we protect that information and why in certain cases we share such information with select parties.
If you are located in a jurisdiction where specific laws, rules or regulations require BlackRock to provide you with additional or different privacy-related rights beyond what is set forth below, then BlackRock will comply with those specific laws, rules or regulations.
BlackRock obtains or verifies personal non-public information from and about you from different sources, including the following: (i) information we receive from you or, if applicable, your financial intermediary, on applications, forms or other documents; (ii) information about your transactions with us, our affiliates, or others; (iii) information we receive from a consumer reporting agency; and (iv) from visits to our websites.
BlackRock does not sell or disclose to non-affiliated third parties any non-public personal information about its Clients, except as permitted by law or as is necessary to respond to regulatory requests or to service Client accounts. These non-affiliated third parties are required to protect the confidentiality and security of this information and to use it only for its intended purpose.
We may share information with our affiliates to service your account or to provide you with information about other BlackRock products or services that may be of interest to you. In addition, BlackRock restricts access to non-public personal information about its Clients to those BlackRock employees with a legitimate business need for the information. BlackRock maintains physical, electronic and procedural safeguards that are designed to protect the non-public personal information of its Clients, including procedures relating to the proper storage and disposal of such information.
Availability of Additional Information
Electronic copies of most financial reports and prospectuses are available on the Fund’s website or shareholders can sign up for e-mail notifications of quarterly statements, annual and semi-annual reports and prospectuses by enrolling in the Fund’s electronic delivery program.
To enroll:
Shareholders Who Hold Accounts with Investment Advisors, Banks or Brokerages:
Please contact your financial advisor. Please note that not all investment advisors, banks or brokerages may offer this service.
Shareholders Who Hold Accounts Directly With BlackRock
| 1) | Access the BlackRock website at |
http://www.blackrock.com/edelivery
| 2) | Click on the applicable link and follow the steps to sign up |
Householding
The Fund will mail only one copy of shareholder documents, including prospectuses, annual and semi-annual reports and proxy statements, to shareholders with multiple accounts at the same address. This practice is commonly called “householding” and it is intended to reduce expenses and eliminate duplicate mailings of shareholder documents. Mailings of your shareholder documents may be householded indefinitely unless you instruct us otherwise. If you do not want the mailing of these documents to be combined with those for other members of your household, please contact the Fund at (800) 441-7762.
| | | | | | |
54 | | SEMI-ANNUAL REPORT | | MARCH 31, 2009 | | |
Additional Information (concluded)
Availability of Additional Information (concluded)
Availability of Proxy Voting Policies and Procedures
A description of the policies and procedures that the Fund uses to determine how to vote proxies relating to portfolio securities is available (1) without charge, upon request by calling (800) 441-7762; (2) at www.blackrock.com; and (3) on the Securities and Exchange Commission’s (the “SEC”) website at http://www.sec.gov.
Availability of Proxy Voting Record
Information about how the Fund votes proxies relating to securities held in the Fund’s portfolios during the most recent 12-month period ended June 30th is available upon request and without charge (1) at www.blackrock.com or by calling (800) 441-7762 (2) on the SEC’s website at http://www.sec.gov.
Availability of Quarterly Portfolio Schedule
The Fund files its complete schedule of portfolio holdings with the SEC for the first and third quarters of each fiscal year on Form N-Q. The Fund’s Forms N-Q are available on the SEC’s website at http:// www.sec.gov and may also be reviewed and copied at the SEC’s Public Reference Room in Washington, D.C. Information on the operation of the Public Reference Room may be obtained by calling (800) SEC-0330. The Fund’s Forms N-Q may also be obtained upon request and without charge by calling (800) 441-7762.
Shareholder Privileges
Account Information
Call us at (800) 441-7762 from 8:00 AM to 6:00 PM EST Monday through Friday to get information about your account balances, recent transactions and share prices. You can also reach us on the Web at www.blackrock.com/funds.
Automatic Investment Plans
Investor Class shareholders who want to invest regularly can arrange to have $50 or more automatically deducted from their checking or savings account and invested in any of the BlackRock portfolios.
Systematic Withdrawal Plan
Investor Class shareholders can establish a systematic withdrawal plan and receive periodic payments of $50 or more from their BlackRock portfolios, as long as their account is at least $10,000.
Retirement Plans
Shareholders may make investments in conjunction with Traditional, Rollover, Roth, Coverdell, Simple IRA’s, SEP IRA’s and 403(b) Plans.
| | | | | | |
| | | SEMI-ANNUAL REPORT | | MARCH 31, 2009 | | 55 |
A World-Class Mutual Fund Family
BlackRock offers a diverse lineup of open-end mutual funds crossing all investment styles and managed by experts in equity, fixed income and tax-exempt investing.
| | | | |
Equity Funds | | | | |
| | |
BlackRock All-Cap Energy & Resources Portfolio | | BlackRock Global Opportunities Portfolio | | BlackRock Mid-Cap Value Equity Portfolio |
BlackRock Asset Allocation Portfolio† | | BlackRock Global SmallCap Fund | | BlackRock Mid Cap Value Opportunities Fund |
BlackRock Aurora Portfolio | | BlackRock Health Sciences Opportunities Portfolio | | BlackRock Natural Resources Trust |
BlackRock Balanced Capital Fund† | | BlackRock Healthcare Fund | | BlackRock Pacific Fund |
BlackRock Basic Value Fund | | BlackRock Index Equity Portfolio* | | BlackRock Science & Technology Opportunities Portfolio |
BlackRock Capital Appreciation Portfolio | | BlackRock International Fund | | BlackRock Small Cap Core Equity Portfolio |
BlackRock Energy & Resources Portfolio | | BlackRock International Diversification Fund | | BlackRock Small Cap Growth Equity Portfolio |
BlackRock Equity Dividend Fund | | BlackRock International Index Fund | | BlackRock Small Cap Growth Fund II |
BlackRock EuroFund | | BlackRock International Opportunities Portfolio | | BlackRock Small Cap Index Fund |
BlackRock Focus Growth Fund | | BlackRock International Value Fund | | BlackRock Small Cap Value Equity Portfolio* |
BlackRock Focus Value Fund | | BlackRock Large Cap Core Fund | | BlackRock Small/Mid-Cap Growth Portfolio |
BlackRock Fundamental Growth Fund | | BlackRock Large Cap Core Plus Fund | | BlackRock S&P 500 Index Fund |
BlackRock Global Allocation Fund† | | BlackRock Large Cap Growth Fund | | BlackRock U.S. Opportunities Portfolio |
BlackRock Global Dynamic Equity Fund | | BlackRock Large Cap Value Fund | | BlackRock Utilities and Telecommunications Fund |
BlackRock Global Emerging Markets Fund | | BlackRock Latin America Fund | | BlackRock Value Opportunities Fund |
BlackRock Global Financial Services Fund | | BlackRock Mid-Cap Growth Equity Portfolio | | |
BlackRock Global Growth Fund | | | | |
| | |
Fixed Income Funds | | | | |
| | |
BlackRock Bond Portfolio | | BlackRock Income Builder Portfolio | | BlackRock Short-Term Bond Fund |
BlackRock Emerging Market Debt Portfolio | | BlackRock Inflation Protected Bond Portfolio | | BlackRock Strategic Income Portfolio |
BlackRock Enhanced Income Portfolio | | BlackRock Intermediate Government Bond Portfolio | | BlackRock Total Return Fund |
BlackRock GNMA Portfolio | | BlackRock International Bond Portfolio | | BlackRock Total Return Portfolio II |
BlackRock Government Income Portfolio | | BlackRock Long Duration Bond Portfolio | | BlackRock World Income Fund |
BlackRock High Income Fund | | BlackRock Low Duration Bond Portfolio | | |
BlackRock High Yield Bond Portfolio | | BlackRock Managed Income Portfolio | | |
BlackRock Income Portfolio | | | | |
| | |
Municipal Bond Funds | | | | |
| | |
BlackRock AMT-Free Municipal Bond Portfolio | | BlackRock Kentucky Municipal Bond Portfolio | | BlackRock New York Municipal Bond Fund |
BlackRock California Municipal Bond Fund | | BlackRock Municipal Insured Fund | | BlackRock Ohio Municipal Bond Portfolio |
BlackRock Delaware Municipal Bond Portfolio | | BlackRock National Municipal Fund | | BlackRock Pennsylvania Municipal Bond Fund |
BlackRock High Yield Municipal Fund | | BlackRock New Jersey Municipal Bond Fund | | BlackRock Short-Term Municipal Fund |
BlackRock Intermediate Municipal Fund | | | | |
| | |
Target Risk & Target Date Funds | | | | |
| | |
BlackRock Prepared Portfolios | | BlackRock Lifecycle Prepared Portfolios | | |
Conservative Prepared Portfolio | | Prepared Portfolio 2010 | | Prepared Portfolio 2030 |
Moderate Prepared Portfolio | | Prepared Portfolio 2015 | | Prepared Portfolio 2035 |
Growth Prepared Portfolio | | Prepared Portfolio 2020 | | Prepared Portfolio 2040 |
Aggressive Growth Prepared Portfolio | | Prepared Portfolio 2025 | | Prepared Portfolio 2045 |
| | | | Prepared Portfolio 2050 |
| * | See the prospectus for information on specific limitations on investments in the fund. |
BlackRock mutual funds are distributed by BlackRock Investments, LLC. You should consider the investment objectives, risks, charges and expenses of the funds under consideration carefully before investing. Each fund’s prospectus contains this and other information and is available at www.blackrock.com or by calling (800) 882-0052 or from your financial advisor. The prospectus should be read carefully before investing.
| | | | | | |
56 | | SEMI-ANNUAL REPORT | | MARCH 31, 2009 | | |
[THIS PAGE INTENTIONALLY LEFT BLANK.]
[THIS PAGE INTENTIONALLY LEFT BLANK.]

This report is transmitted to shareholders only. It is not authorized for use as an offer of sale or a solicitation of an offer to buy shares of the Portfolios unless accompanied or preceded by the Portfolios’ current prospectus. Past performance results shown in this report should not be considered a representation of future performance. Investment returns and principal value of shares will fluctuate so that shares, when redeemed, may be worth more or less than their original cost. Statements and other information herein are as dated and are subject to change.
Investment in foreign securities involves special risks including fluctuating foreign exchange rates, foreign government regulations, differing degrees of liquidity and the possibility of substantial volatility due to adverse political, economic or other developments.

EQUITY12-3/09-SAR
EQUITIES FIXED INCOME REAL ESTATE LIQUIDITY ALTERNATIVES BLACKROCK SOLUTIONS
| | |
BlackRock FundsSM | |  |
SEMI-ANNUAL REPORT | MARCH 31, 2009 (UNAUDITED) |
BlackRock Small Cap Core Equity Portfolio
BlackRock Small Cap Growth Equity Portfolio
BlackRock Small Cap Value Equity Portfolio
NOT FDIC INSURED
MAY LOSE VALUE
NO BANK GUARANTEE
Table of Contents
| | | | | | |
2 | | SEMI-ANNUAL REPORT | | MARCH 31, 2009 | | |
A Letter to Shareholders
The past 12 months have been a period investors would like to forget, but instead will vividly remember, as the global financial crisis erupted into the worst recession in decades. Daily headlines recounted the downfalls of storied financial firms, volatile swings in the world’s financial markets and monumental government actions, including the recent passage of the nearly $800 billion American Recovery and Reinvestment Act of 2009.
The economic data generally deteriorated throughout the reporting period. US gross domestic product (“GDP”) contracted at an annual rate of 6.3% in the fourth quarter of 2008, and economic activity appears on pace to be negative in the first quarter of 2009 as well. The Federal Reserve Board (the “Fed”) took forceful action to revive the global economy and ailing financial system. In addition to slashing the federal funds target rate from 3.0% to a record low range of 0% to 0.25%, the central bank provided enormous cash infusions and radically expanded its balance sheet through a range of lending and acquisition programs.
Against this backdrop, US equities contended with high levels of volatility and posted steep losses, notwithstanding a powerful rally in the final month of the reporting period. International markets also experienced sharp downturns, with some regions declining as much or more than the United States. Risk aversion remained the dominant theme in fixed income markets, as investors sought out the haven of Treasury issues at the expense of virtually all other asset classes. High yield issues, in particular, faced unprecedented challenges and posted severe underperformance; that said, the sector pared its losses in the first quarter of 2009, as both liquidity and investor sentiment toward lower-quality debt improved. At the same time, the start of the new year brought somewhat of a return to normalcy for the tax-exempt market, which registered one of its worst years on record in 2008.
In all, investors continued to gravitate toward relative safety, as evidenced in the six- and 12-month returns of the major benchmark indexes:
| | | | | | |
Total Returns as of March 31, 2009 | | 6-month | | | 12-month | |
US equities (S&P 500 Index) | | (30.54 | )% | | (38.09 | )% |
Small cap US equities (Russell 2000 Index) | | (37.17 | ) | | (37.50 | ) |
International equities (MSCI Europe, Australasia, Far East Index) | | (31.11 | ) | | (46.50 | ) |
US Treasury securities (Merrill Lynch 10-Year US Treasury Index) | | 11.88 | | | 10.46 | |
Taxable fixed income (Barclays Capital US Aggregate Bond Index) | | 4.70 | | | 3.13 | |
Tax-exempt fixed income (Barclays Capital Municipal Bond Index) | | 5.00 | | | 2.27 | |
High yield bonds (Barclays Capital US Corporate High Yield 2% Issuer Capped Index) | | (12.65 | ) | | (18.56 | ) |
Past performance is no guarantee of future results. Index performance shown for illustrative purposes only. You cannot invest directly in an index.
Through periods of market turbulence, as ever, BlackRock’s full resources are dedicated to the management of our clients’ assets. We thank you for entrusting BlackRock with your investments and look forward to continuing to serve you in the months and years ahead.
|
Sincerely, |
|
 |
Rob Kapito |
President, BlackRock Advisors, LLC |
Seeking additional investment insights?
Visit BlackRock’s award-winning Shareholder® magazine, now available exclusively online at www.blackrock.com/shareholdermagazine. In this issue:
| | • | | Discover why portfolio diversification still matters — even as nearly every financial asset class lost value over the past year. |
| | • | | Learn how adding commodities to a more traditional mix of assets can help you to balance risks and access new potential rewards. |
| | • | | Assuage your fears about higher taxes and discover how municipal bonds may offer some relief. |
| | • | | Find out if there’s still value to be found in dividend-paying stocks. |
THIS PAGE NOT PART OF YOUR FUND REPORT
| | |
| Portfolio Summary as of March 31, 2009 | | Small Cap Core Equity Portfolio |
| |
Portfolio Management Commentary | | |
How did the Portfolio perform?
| | • | | The Portfolio underperformed the benchmark Russell 2000 Index for the six-month period. |
What factors influenced performance?
| | • | | Underperformance for the period was largely driven by weak stock selection in industrials and information technology (IT). In industrials, selection among machinery and aerospace & defense names hampered relative performance. Altra Holdings Inc. and Orbital Sciences Inc. were among the key individual detractors in these areas. Disappointing relative performance from the Portfolio’s semiconductors & semiconductor equipment and internet software & services companies led to the performance shortfall in the IT sector. |
| | • | | Portfolio performance benefited from allocation and favorable stock selection in the materials sector. Key areas of strength included the containers & packaging and chemicals sub-sectors. Consumer goods packaging producer Silgan Holdings Inc. and specialty chemicals maker Hercules Inc., which was acquired during the period, added the greatest value. |
| | • | | In consumer discretionary, an overweight and stock selection in the specialty retail area and positive stock selection among textiles, apparel & luxury goods makers contributed to favorable performance comparisons. Notable contributors included Rent-A-Center Inc., Carter’s Inc. and J. Crew Group Inc. |
| | • | | HMS Holdings Corp. was a standout individual contributor in the healthcare sector. The company, which provides cost management services to state Medicaid agencies and other government-sponsored health programs, reported earnings that consistently beat expectations during the period. |
Describe recent Portfolio activity.
| | • | | Allocations to the financials and consumer discretionary sectors increased during the period, while healthcare, materials and consumer staples weightings declined. Within financials, we increased the Portfolio’s exposure within the insurance and real estate investment trust (REIT) sub-sectors. In consumer discretionary, we added to a weighting in specialty retailers as valuations reached historically attractive levels. |
| | • | | Conversely, we trimmed exposure to healthcare equipment & supplies companies and healthcare providers in the healthcare sector. Within the materials sector, we eliminated several positions in highly cyclical chemicals manufacturers as global economic conditions deteriorated. |
Describe Portfolio positioning at period-end.
| | • | | At period-end, the Portfolio’s most notable overweight relative to the benchmark was in the healthcare sector, particularly within the healthcare providers & services sub-sector. The Portfolio was also modestly overweight in the materials sector, primarily among containers & packaging producers. Key underweights included industrials, notably electrical equipment and machinery, and utilities, primarily gas utilities. |
The views expressed reflect the opinions of BlackRock as of the date of this report and are subject to change based on changes in market, economic or other conditions. These views are not intended to be a forecast of future events and are no guarantee of future results.
Portfolio Profile as of March 31, 2009
| | | |
Ten Largest Holdings | | Percent of
Long-Term
Investments | |
Silgan Holdings, Inc. | | 3 | % |
Aspen Insurance Holdings Ltd. | | 3 | |
HMS Holdings Corp. | | 2 | |
SkillSoft Plc - ADR | | 2 | |
The GEO Group, Inc. | | 2 | |
EMS Technologies, Inc. | | 2 | |
Chattem, Inc. | | 2 | |
First American Corp. | | 2 | |
Platinum Underwriters Holdings Ltd. | | 2 | |
MEDNAX, Inc. | | 2 | |
| | | |
Sector Allocation | | Percent of
Long-Term
Investments | |
Financials | | 21 | % |
Information Technology | | 19 | |
Health Care | | 19 | |
Industrials | | 12 | |
Consumer Discretionary | | 12 | |
Materials | | 5 | |
Consumer Staples | | 4 | |
Energy | | 4 | |
Utilities | | 3 | |
Telecommunication Services | | 1 | |
For Portfolio compliance purposes, the Portfolio’s sector classifications refer to any one or more of the sector sub-classifications used by one or more widely recognized market indexes or ratings group indexes, and/or as defined by Portfolio management. This definition may not apply for purposes of this report, which may combine sector sub-classifications for reporting ease.
| | | | | | |
4 | | SEMI-ANNUAL REPORT | | MARCH 31, 2009 | | |
Small Cap Core Equity Portfolio
Total Return Based on a $10,000 Investment
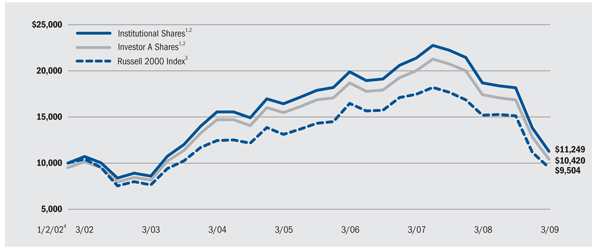
| 1 | Assuming maximum sales charge, if any, transaction costs and other operating expenses, including advisory fees. Institutional Shares do not have a sales charge. |
| 2 | The Portfolio normally invests at least 80% of its net assets in the equity securities of US small capitalization companies (market capitalizations between approximately $7.6 million and $3.2 billion as of December 31, 2008). |
| 3 | An index that measures the performance of the 2000 smallest companies in the Russell 3000. |
| 4 | Commencement of operations. |
Past performance is not indicative of future results.
Performance Summary for the Period Ended March 31, 2009
| | | | | | | | | | | | | | | | | | | | | |
| | | 6-Month
Total Returns | | | Average Annual Total Returns5 | |
| | | 1 Year | | | 5 Years | | | From Inception6 | |
| | | w/o sales
charge | | | w/sales
charge | | | w/o sales
charge | | | w/sales
charge | | | w/o sales
charge | | | w/sales
charge | |
Institutional | | (38.21 | )% | | (39.99 | )% | | N/A | | | (6.29 | )% | | N/A | | | 1.64 | % | | N/A | |
Service | | (38.33 | ) | | (40.20 | ) | | N/A | | | (6.53 | ) | | N/A | | | 1.47 | | | N/A | |
Investor A | | (38.34 | ) | | (40.26 | ) | | (43.40 | )% | | (6.67 | ) | | (7.67 | )% | | 1.32 | | | 0.57 | % |
Investor B | | (38.57 | ) | | (40.73 | ) | | (43.40 | ) | | (7.38 | ) | | (7.71 | ) | | 0.74 | | | 0.74 | |
Investor C | | (38.62 | ) | | (40.74 | ) | | (41.34 | ) | | (7.37 | ) | | (7.37 | ) | | 0.75 | | | 0.75 | |
Russell 2000 Index | | (37.17 | ) | | (37.50 | ) | | N/A | | | (5.24 | ) | | N/A | | | (0.70 | ) | | N/A | |
| 5 | Assuming maximum sales charges. Average annual total returns with and without sales charges reflect reductions for distribution and service fees. See “About Portfolio Performance” on page 10 for a detailed description of share classes, including any related sales charges and fees. |
| 6 | The Portfolio commenced operations on January 2, 2002. |
N/A - Not applicable as share class and index do not have a sales charge.
Past performance is not indicative of future results.
Expense Example
| | | | | | | | | | | | | | | | | | |
| | | Actual | | Hypothetical8 |
| | | Beginning | | Ending | | | | Beginning | | Ending | | |
| | | Account Value | | Account Value | | Expenses Paid | | Account Value | | Account Value | | Expenses Paid |
| | | October 1, 2008 | | March 31, 2009 | | During the Period7 | | October 1, 2008 | | March 31, 2009 | | During the Period7 |
Institutional | | $ | 1,000.00 | | $ | 617.90 | | $ | 5.24 | | $ | 1,000.00 | | $ | 1,018.44 | | $ | 6.56 |
Service | | $ | 1,000.00 | | $ | 616.70 | | $ | 6.45 | | $ | 1,000.00 | | $ | 1,016.92 | | $ | 8.08 |
Investor A | | $ | 1,000.00 | | $ | 616.60 | | $ | 7.13 | | $ | 1,000.00 | | $ | 1,016.06 | | $ | 8.94 |
Investor B | | $ | 1,000.00 | | $ | 614.30 | | $ | 10.14 | | $ | 1,000.00 | | $ | 1,012.28 | | $ | 12.72 |
Investor C | | $ | 1,000.00 | | $ | 613.80 | | $ | 10.14 | | $ | 1,000.00 | | $ | 1,012.28 | | $ | 12.72 |
| 7 | For each class of the Portfolio, expenses are equal to the annualized expense ratio for the class (1.30% for Institutional, 1.60% for Service, 1.77% for Investor A, 2.52% for Investor B and 2.52% for Investor C), multiplied by the average account value over the period, multiplied by 182/365 (to reflect the one-half year period shown). |
| 8 | Hypothetical 5% annual return before expenses is calculated by pro-rating the number of days in the most recent fiscal half year divided by 365. See “Disclosure of Expenses” on page 10 for further information on how expenses were calculated. |
| | | | | | |
| | | SEMI-ANNUAL REPORT | | MARCH 31, 2009 | | 5 |
| | |
| Portfolio Summary as of March 31, 2009 | | Small Cap Growth Equity Portfolio |
| |
Portfolio Management Commentary | | |
How did the Portfolio perform?
| | • | | The Portfolio underperformed the benchmark Russell 2000 Growth Index for the six-month period. |
What factors influenced performance?
| | • | | Poor stock selection within the healthcare and consumer discretionary sectors was the most significant detractor from relative returns during the period. Within the healthcare sector, the healthcare equipment and supplies industry accounted for the majority of the Portfolio’s underperformance. Wright Medical Group, Inc., a manufacturer of hip and joint replacements, plummeted more than 50% on worries of decreased demand for its products. Additionally, ZOLL Medical Corp. dropped more than 50% on declining revenues for its defibrillator products. Within consumer discretionary, a position in Ticketmaster Entertainment, Inc. was the most significant detractor in the group. The company’s stock sunk more than 65% after a potential acquisition with a competitor was met with resistance from federal regulators. Portfolio holding Orient-Express Hotels also severely declined after repeatedly refusing to participate in discussions with potential acquirers. |
| | • | | On the positive side, strong stock selection within information technology (IT) and industrials was the biggest contributor to performance. Within IT, telecommunications equipment provider Neutral Tandem, Inc. was up more than 30% on strong market share gains and its high earnings visibility business model. Call center company ExlService Holdings, Inc. was flat for the period after posting a rally in the first quarter of 2009. Within industrials, outsourcing company Sykes Enterprises, Inc. was a relative outperformer in a sector that was down more than 40% for the period. The outsourcing company continues to benefit from its broad, global economic footprint. Elsewhere in the Portfolio, holding Green Mountain Coffee Roasters, Inc. climbed more than 20% on continued success in its coffee distribution business. |
Describe recent Portfolio activity.
| | • | | During the period, we increased the Portfolio’s overweight in the IT sector, adding names ON Semiconductor Corp., Monolithic Power Systems, Inc. and Silicon Laboratories, Inc. among others. We decreased its weighting in energy, eliminating holdings Delta Petroleum Corp., James River Coal Co. and Atwood Oceanics, Inc. |
Describe Portfolio positioning at period-end.
| | • | | At period-end, the Portfolio’s most significant overweight relative to the benchmark was in the IT sector, and its largest underweight was in healthcare. |
The views expressed reflect the opinions of BlackRock as of the date of this report and are subject to change based on changes in market, economic or other conditions. These views are not intended to be a forecast of future events and are no guarantee of future results.
Portfolio Profile as of March 31, 2009
| | | |
Ten Largest Holdings | | Percent of
Long-Term
Investments | |
SkillSoft Plc - ADR | | 3 | % |
TiVo, Inc. | | 3 | |
Sykes Enterprises, Inc | | 2 | |
ExlService Holdings, Inc. | | 2 | |
Forrester Research, Inc. | | 2 | |
Scientific Games Corp. - Class A | | 2 | |
Magellan Health Services, Inc. | | 2 | |
SonicWALL, Inc. | | 2 | |
Neutral Tandem, Inc. | | 2 | |
SRA International, Inc. - Class A | | 2 | |
| | | |
Sector Allocation | | Percent of
Long-Term
Investments | |
Information Technology | | 33 | % |
Health Care | | 21 | |
Industrials | | 16 | |
Consumer Discretionary | | 12 | |
Financials | | 5 | |
Energy | | 4 | |
Consumer Staples | | 4 | |
Materials | | 3 | |
Exchange-Traded Funds | | 2 | |
For Portfolio compliance purposes, the Portfolio’s sector classifications refer to any one or more of the sector sub-classifications used by one or more widely recognized market indexes or ratings group indexes, and/or as defined by Portfolio management. This definition may not apply for purposes of this report, which may combine sector sub-classifications for reporting ease.
| | | | | | |
6 | | SEMI-ANNUAL REPORT | | MARCH 31, 2009 | | |
Small Cap Growth Equity Portfolio
Total Return Based on a $10,000 Investment
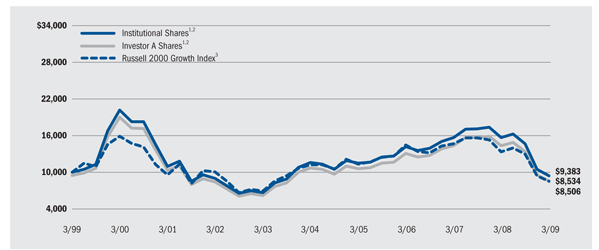
| 1 | Assuming maximum sales charge, if any, transaction costs and other operating expenses, including advisory fees. Institutional Shares do not have a sales charge. |
| 2 | The Portfolio normally invests at least 80% of its net assets in equity securities issued by US small capitalization growth companies (market capitalizations between approximately $7.6 million and $3.2 billion as of December 31, 2008) which the portfolio management team believes offer superior prospects for growth. |
| 3 | An index that contains those securities with greater-than-average growth orientations, generally having higher price-to-book and price-to- earnings ratios. |
Past performance is not indicative of future results.
Performance Summary for the Period Ended March 31, 2009
| | | | | | | | | | | | | | | | | | | | | |
| | | 6-Month
Total Returns | | | Average Annual Total Returns4 | |
| | | 1 Year | | | 5 Years | | | 10 Years | |
| | | w/o sales
charge | | | w/sales
charge | | | w/o sales
charge | | | w/sales
charge | | | w/o sales
charge | | | w/sales
charge | |
Institutional | | (36.11 | )% | | (40.25 | )% | | N/A | | | (4.09 | )% | | N/A | | | (0.64 | )% | | N/A | |
Service | | (36.17 | ) | | (40.40 | ) | | N/A | | | (4.33 | ) | | N/A | | | (0.89 | ) | | N/A | |
Investor A | | (36.25 | ) | | (40.53 | ) | | (43.64 | )% | | (4.40 | ) | | (5.43 | )% | | (1.04 | ) | | (1.57 | )% |
Investor B | | (36.53 | ) | | (41.02 | ) | | (43.68 | ) | | (5.22 | ) | | (5.60 | ) | | (1.65 | ) | | (1.65 | ) |
Investor C | | (36.53 | ) | | (41.06 | ) | | (41.64 | ) | | (5.23 | ) | | (5.23 | ) | | (1.80 | ) | | (1.80 | ) |
Russell 2000 Growth Index | | (34.51 | ) | | (36.36 | ) | | N/A | | | (5.37 | ) | | N/A | | | (1.61 | ) | | N/A | |
| 4 | Assuming maximum sales charges. Average annual total returns with and without sales charges reflect reductions for distribution and service fees. See “About Portfolio Performance” on page 10 for a detailed description of share classes, including any related sales charges and fees. |
N/A - Not applicable as share class and index do not have a sales charge.
Past performance is not indicative of future results.
Expense Example
| | | | | | | | | | | | | | | | | | |
| | | Actual | | Hypothetical6 |
| | | Beginning | | Ending | | | | Beginning | | Ending | | |
| | | Account Value | | Account Value | | Expenses Paid | | Account Value | | Account Value | | Expenses Paid |
| | | October 1, 2008 | | March 31, 2009 | | During the Period5 | | October 1, 2008 | | March 31, 2009 | | During the Period5 |
Institutional | | $ | 1,000.00 | | $ | 638.90 | | $ | 3.60 | | $ | 1,000.00 | | $ | 1,020.56 | | $ | 4.44 |
Service | | $ | 1,000.00 | | $ | 638.30 | | $ | 4.70 | | $ | 1,000.00 | | $ | 1,019.19 | | $ | 5.81 |
Investor A | | $ | 1,000.00 | | $ | 637.50 | | $ | 5.47 | | $ | 1,000.00 | | $ | 1,018.23 | | $ | 6.77 |
Investor B | | $ | 1,000.00 | | $ | 634.70 | | $ | 9.01 | | $ | 1,000.00 | | $ | 1,013.84 | | $ | 11.16 |
Investor C | | $ | 1,000.00 | | $ | 634.70 | | $ | 9.01 | | $ | 1,000.00 | | $ | 1,013.84 | | $ | 11.16 |
| 5 | For each class of the Portfolio, expenses are equal to the annualized expense ratio for the class (0.88% for Institutional, 1.15% for Service, 1.34% for Investor A, 2.21% for Investor B and 2.21% for Investor C), multiplied by the average account value over the period, multiplied by 182/365 (to reflect the one-half year period shown). |
| 6 | Hypothetical 5% annual return before expenses is calculated by pro-rating the number of days in the most recent fiscal half year divided by 365. See “Disclosure of Expenses” on page 10 for further information on how expenses were calculated. |
| | | | | | |
| | | SEMI-ANNUAL REPORT | | MARCH 31, 2009 | | 7 |
| | |
| Portfolio Summary as of March 31, 2009 | | Small Cap Value Equity Portfolio |
| |
Portfolio Management Commentary | | |
How did the Portfolio perform?
| | • | | The Portfolio outperformed the benchmark Russell 2000 Value Index for the six-month period. |
What factors influenced performance?
| | • | | In an extremely volatile period for financial stocks, relative performance benefited from strong stock selection in the financials sector. Mortgage and vehicle fleet management services provider PHH Corp. was among the standout individual contributors. An underweight among commercial banks and real estate investment trusts (REITs) also drove relative outperformance in the sector as these areas experienced significant selling pressure. |
| | • | | Stock selection among chemicals and metals & mining names added value in the materials sector. Key contributors included Reliance Steel & Aluminum Co. and Sensient Technologies Corp., a maker of food coloring and artificial flavors. In industrials, pest control services provider Rollins Inc. boosted relative returns. |
| | • | | By contrast, allocation and stock selection in both the utilities and information technology (IT) sectors weighed on relative performance. Notable individual detractors included customer management services provider Convergys Corp. and semiconductor manufacturer Microsemi Corp. Both stocks were sold during the period. |
| | • | | Although an overweight in the consumer staples sector added value, these gains were overshadowed by poor performance from select food producers, including Hain Celestial Group Inc. and Fresh Del Monte Produce Inc. |
Describe recent Portfolio activity.
| | • | | During the six months, we increased the Portfolio’s exposure to utilities, energy and financials. In utilities, we established several positions in electric utilities. In energy, we initiated positions in exploration & production names as commodity prices bottomed. In financials, we added to capital markets with new positions in KBW Inc. and Jefferies Group Inc. |
| | • | | We reduced exposure to consumer staples, consumer discretionary and IT. In consumer staples, we trimmed positions in food products and food & staples retailers. In consumer discretionary, we reduced exposure to specialty retailers, hotels, restaurants & leisure names, and apparel & luxury goods companies. In IT, we eliminated positions in IT services providers Forrester Research Inc. and Acxiom Corp. |
Describe Portfolio positioning at period-end.
| | • | | At period-end, the Portfolio was overweight relative to the benchmark in healthcare, particularly among healthcare providers & services and healthcare equipment & supplies, consumer staples and energy. Key underweights included financials, primarily REITs and commercial banks, utilities and IT. |
The views expressed reflect the opinions of BlackRock as of the date of this report and are subject to change based on changes in market, economic or other conditions. These views are not intended to be a forecast of future events and are no guarantee of future results.
Portfolio Profile as of March 31, 2009
| | | |
Ten Largest Holdings | | Percent of
Long-Term
Investments | |
PHH Corp. | | 3 | % |
Sensient Technologies Corp. | | 3 | |
First Niagara Financial Group, Inc. | | 2 | |
Silgan Holdings, Inc. | | 2 | |
Magellan Health Services, Inc. | | 2 | |
Aspen Insurance Holdings Ltd. | | 2 | |
Endurance Specialty Holdings Ltd. | | 2 | |
SkillSoft Plc - ADR | | 2 | |
KBW, Inc. | | 2 | |
Platinum Underwriters Holdings Ltd. | | 2 | |
| | | |
| | | Percent of | |
| | | Long-Term | |
Sector Allocation | | Investments | |
Financials | | 32 | % |
Consumer Discretionary | | 12 | |
Industrials | | 11 | |
Information Technology | | 10 | |
Health Care | | 10 | |
Consumer Staples | | 8 | |
Utilities | | 6 | |
Materials | | 5 | |
Energy | | 5 | |
Transportation | | 1 | |
For Portfolio compliance purposes, the Portfolio’s sector classifications refer to any one or more of the sector sub-classifications used by one or more widely recognized market indexes or ratings group indexes, and/or as defined by Portfolio management. This definition may not apply for purposes of this report, which may combine sector sub-classifications for reporting ease.
| | | | | | |
8 | | SEMI-ANNUAL REPORT | | MARCH 31, 2009 | | |
Small Cap Value Equity Portfolio
Total Return Based on a $10,000 Investment
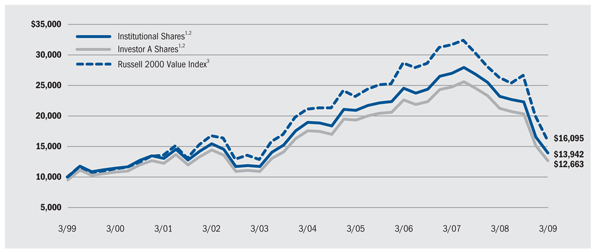
| 1 | Assuming maximum sales charge, if any, transaction costs and other operating expenses, including advisory fees. Institutional Shares do not have a sales charge. |
| 2 | The Portfolio normally invests at least 80% of its net assets in equity securities issued by US small capitalization value companies (market capitalizations between approximately $7.8 million and $3.2 billion as of December 31, 2008). |
| 3 | An index that contains those securities with less-than-average growth orientations, generally having lower price-to-book and price-to- earnings ratios. |
Past performance is not indicative of future results.
Performance Summary for the Period Ended March 31, 2009
| | | | | | | | | | | | | | | | | | | | | |
| | | 6-Month
Total Returns | | | Average Annual Total Returns4 | |
| | | 1 Year | | | 5 Years | | | 10 Years | |
| | | w/o sales
charge | | | w/sales
charge | | | w/o sales
charge | | | w/sales
charge | | | w/o sales
charge | | | w/sales
charge | |
BlackRock | | (37.55 | )% | | (40.08 | )% | | N/A | | | (6.08 | )% | | N/A | | | 3.23 | % | | N/A | |
Institutional | | (37.48 | ) | | (39.93 | ) | | N/A | | | (5.93 | ) | | N/A | | | 3.38 | | | N/A | |
Service | | (37.58 | ) | | (40.18 | ) | | N/A | | | (6.23 | ) | | N/A | | | 3.07 | | | N/A | |
Investor A | | (37.66 | ) | | (40.28 | ) | | (43.40 | )% | | (6.30 | ) | | (7.31 | )% | | 2.95 | | | 2.39 | % |
Investor B | | (37.95 | ) | | (40.73 | ) | | (43.38 | ) | | (6.99 | ) | | (7.14 | ) | | 2.30 | | | 2.30 | |
Investor C | | (37.81 | ) | | (40.69 | ) | | (41.28 | ) | | (7.01 | ) | | (7.01 | ) | | 2.16 | | | 2.16 | |
Russell 2000 Value Index | | (39.64 | ) | | (38.90 | ) | | N/A | | | (5.30 | ) | | N/A | | | 4.88 | | | N/A | |
| 4 | Assuming maximum sales charges. Average annual total returns with and without sales charges reflect reductions for distribution and service fees. See “About Portfolio Performance” on page 10 for a detailed description of share classes, including any related sales charges and fees. |
N/A - Not applicable as share class and index do not have a sales charge.
Past performance is not indicative of future results.
Expense Example
| | | | | | | | | | | | | | | | | | |
| | | Actual | | Hypothetical6 |
| | | Beginning | | Ending | | | | Beginning | | Ending | | |
| | | Account Value | | Account Value | | Expenses Paid | | Account Value | | Account Value | | Expenses Paid |
| | | October 1, 2008 | | March 31, 2009 | | During Period5 | | October 1, 2008 | | March 31, 2009 | | During Period5 |
BlackRock | | $ | 1,000.00 | | $ | 624.50 | | $ | 4.46 | | $ | 1,000.00 | | $ | 1,019.45 | | $ | 5.55 |
Institutional | | $ | 1,000.00 | | $ | 625.20 | | $ | 3.85 | | $ | 1,000.00 | | $ | 1,020.20 | | $ | 4.80 |
Service | | $ | 1,000.00 | | $ | 624.20 | | $ | 5.14 | | $ | 1,000.00 | | $ | 1,018.59 | | $ | 6.41 |
Investor A | | $ | 1,000.00 | | $ | 623.40 | | $ | 5.79 | | $ | 1,000.00 | | $ | 1,017.78 | | $ | 7.22 |
Investor B | | $ | 1,000.00 | | $ | 620.50 | | $ | 8.85 | | $ | 1,000.00 | | $ | 1,013.94 | | $ | 11.06 |
Investor C | | $ | 1,000.00 | | $ | 621.90 | | $ | 8.86 | | $ | 1,000.00 | | $ | 1,013.94 | | $ | 11.06 |
| 5 | For each class of the Portfolio, expenses are equal to the annualized expense ratio for the class (1.10% for BlackRock, 0.95% for Institutional, 1.27% for Service, 1.43% for Investor A, 2.19% for Investor B and 2.19% for Investor C), multiplied by the average account value over the period, multiplied by 182/365 (to reflect the one-half year period shown). |
| 6 | Hypothetical 5% annual return before expenses is calculated by pro-rating the number of days in the most recent fiscal half year divided by 365. See “Disclosure of Expenses” on page 10 for further information on how expenses were calculated. |
| | | | | | |
| | | SEMI-ANNUAL REPORT | | MARCH 31, 2009 | | 9 |
About Portfolio Performance
| | • | | BlackRock and Institutional Shares are not subject to any sales charge (front-end load) or deferred sales charge and are available only to eligible investors. These shares bear no ongoing distribution or service fees, except that the BlackRock class of Small Cap Value Equity is subject to a service fee of 0.25% per year (but no distribution fee). |
| | • | | Service Shares are not subject to any sales charge (front-end load) or deferred sales charge. These shares are subject to a service fee of 0.25% per year (but no distribution fee). |
| | • | | Investor A Shares incur a maximum initial sales charge (front-end load) of 5.25% and a service fee of 0.25% per year (but no distribution fee). |
| | • | | Investor B Shares are subject to a maximum contingent deferred sales charge of 4.50% declining to 0% after six years. In addition, these shares are subject to a distribution fee of 0.75% per year and a service fee of 0.25% per year. These shares automatically convert to Investor A Shares after approximately eight years. (There is no initial sales charge for automatic share conversions.) All returns for periods greater than eight years reflect this conversion. |
| | • | | Investor C Shares are subject to a 1.00% contingent deferred sales charge if redeemed within one year of purchase. In addition, these shares are subject to a distribution fee of 0.75% per year and a service fee of 0.25% per year. |
Performance information reflects past performance and does not guarantee future results. Current performance may be lower or higher than the performance data quoted. Refer to www.blackrock.com/funds to obtain performance data current to the most recent month-end. Performance results do not reflect the deduction of taxes that a shareholder would pay on fund distributions or the redemption of fund shares. Each Portfolio may charge a 2% redemption fee for sales or exchanges of shares within 30 days of purchase or exchange. Performance data does not reflect this potential fee. Figures shown in the performance tables on the previous pages assume reinvestment of all dividends and distributions, if any, at net asset value on the ex-dividend date. Investment return and principal value of shares will fluctuate so that shares, when redeemed, may be worth more or less than their original cost. Dividends paid to each class of shares will vary because of the different levels of service, distribution and transfer agency fees applicable to each class, which are deducted from the income available to be paid to shareholders.
The performance information on the previous pages includes information for each class of each Portfolio since the commencement of operations of such Portfolio, rather than the date such class was introduced. Performance information for each class introduced after the commencement of operations of a Portfolio is therefore based on the performance history of a predecessor class adjusted to reflect the class specific fees applicable to each class at the time of the launch of such share class. This information may be considered when assessing a Portfolio’s performance, but does not represent the actual performance of this share class.
The performance information also reflects fee waivers and reimbursements that subsidize and reduce the total operating expenses of each Portfolio. The Portfolios’ returns would have been lower if there were no such waivers and reimbursements. BlackRock Advisors, LLC is under no obligation to waive or continue waiving its fees after February 1, 2010.
Disclosure of Expenses
Shareholders of these Portfolios may incur the following charges: (a) expenses related to transactions, including sales charges and redemption fees; and (b) operating expenses, including advisory fees, service and distribution fees including 12b-1 fees, and other Portfolio expenses. The expense examples on the previous pages (which are based on a hypothetical investment of $1,000 invested on October 1, 2008 and held through March 31, 2009) are intended to assist shareholders both in calculating expenses based on an investment in each Portfolio and in comparing these expenses with similar costs of investing in other mutual funds.
The Expense Example tables provide information about actual account values and actual expenses. In order to estimate the expenses a shareholder paid during the period covered by this report, shareholders can divide their account value by $1,000 and then multiply the result by the number corresponding to their share class under the headings entitled “Expenses Paid During the Period.”
The tables also provide information about hypothetical account values and hypothetical expenses based on the Portfolios’ actual expense ratios and an assumed rate of return of 5% per year before expenses. In order to assist shareholders in comparing the ongoing expenses of investing in these Portfolios and other funds, compare the 5% hypothetical example with the 5% hypothetical examples that appear in other funds’ shareholder reports.
The expenses shown in the table are intended to highlight shareholders’ ongoing costs only and do not reflect any transactional expenses, such as sales charges, redemption fees or exchange fees. Therefore, the hypothetical table is useful in comparing ongoing expenses only, and will not help shareholders determine the relative total expenses of owning different funds. If these transactional expenses were included, shareholder expenses would have been higher.
| | | | | | |
10 | | SEMI-ANNUAL REPORT | | MARCH 31, 2009 | | |
| | |
| Schedule of Investments March 31, 2009 (Unaudited) | | Small Cap Core Equity Portfolio |
| | (Percentages shown are based on Net Assets) |
| | | | | |
| | | Shares | | Value |
Common Stocks | | | | | |
Aerospace & Defense — 1.5% | | | | | |
Orbital Sciences Corp. (a) | | 70,450 | | $ | 837,651 |
| | | | | |
Air Freight & Logistics — 1.6% | | | | | |
Forward Air Corp. | | 35,400 | | | 574,542 |
UTi Worldwide, Inc. | | 26,200 | | | 313,090 |
| | | | | |
| | | | | 887,632 |
| | | | | |
Biotechnology — 1.9% | | | | | |
Dyax Corp. (a) | | 192,421 | | | 482,977 |
Martek Biosciences Corp. | | 31,600 | | | 576,700 |
| | | | | |
| | | | | 1,059,677 |
| | | | | |
Capital Markets — 1.4% | | | | | |
KBW, Inc. (a)(b) | | 39,300 | | | 799,755 |
| | | | | |
Chemicals — 0.8% | | | | | |
Albemarle Corp. | | 20,300 | | | 441,931 |
| | | | | |
Commercial Banks — 6.5% | | | | | |
CoBiz Financial, Inc. (b) | | 92,612 | | | 486,213 |
Columbia Banking System, Inc. | | 58,547 | | | 374,701 |
CVB Financial Corp. (b) | | 62,400 | | | 413,712 |
Glacier Bancorp, Inc. | | 20,900 | | | 328,339 |
PacWest Bancorp | | 32,100 | | | 459,993 |
Prosperity Bancshares, Inc. | | 23,700 | | | 648,195 |
Westamerica Bancorp (b) | | 14,300 | | | 651,508 |
Wintrust Financial Corp. | | 21,300 | | | 261,990 |
| | | | | |
| | | | | 3,624,651 |
| | | | | |
Commercial Services & Supplies — 5.4% | | | | | |
Clean Harbors, Inc. (a) | | 9,700 | | | 465,600 |
Copart, Inc. (a) | | 12,400 | | | 367,784 |
The GEO Group, Inc. (a) | | 86,380 | | | 1,144,535 |
Team, Inc. (a) | | 22,197 | | | 260,149 |
Tetra Tech, Inc. (a) | | 36,600 | | | 745,908 |
| | | | | |
| | | | | 2,983,976 |
| | | | | |
Communications Equipment — 5.0% | | | | | |
Arris Group, Inc. (a) | | 108,500 | | | 799,645 |
EMS Technologies, Inc. (a) | | 61,061 | | | 1,066,125 |
Polycom, Inc. (a) | | 58,800 | | | 904,932 |
| | | | | |
| | | | | 2,770,702 |
| | | | | |
Containers & Packaging — 3.8% | | | | | |
AptarGroup, Inc. | | 10,300 | | | 320,742 |
Silgan Holdings, Inc. | | 33,950 | | | 1,783,733 |
| | | | | |
| | | | | 2,104,475 |
| | | | | |
Diversified Telecommunication Services — 1.0% | | | | | |
Iowa Telecommunications Services, Inc. (b) | | 48,300 | | | 553,518 |
| | | | | |
Electric Utilities — 3.6% | | | | | |
El Paso Electric Co. (a) | | 54,190 | | | 763,537 |
UIL Holdings Corp. | | 24,132 | | | 538,626 |
Westar Energy, Inc. | | 39,100 | | | 685,423 |
| | | | | |
| | | | | 1,987,586 |
| | | | | |
Electronic Equipment, Instruments & Components — 1.3% | | | | | |
TTM Technologies, Inc. (a) | | 123,800 | | | 718,040 |
Food & Staples Retailing — 1.0% | | | | | |
Ruddick Corp. | | 25,200 | | | 565,740 |
| | | | | |
Food Products — 1.2% | | | | | |
Fresh Del Monte Produce, Inc. (a) | | 39,500 | | | 648,590 |
| | | | | |
Health Care Equipment & Supplies — 1.4% | | | | | |
Immucor, Inc. (a) | | 24,300 | | | 611,145 |
Symmetry Medical, Inc. (a) | | 30,600 | | | 193,086 |
| | | | | |
| | | | | 804,231 |
| | | | | |
Health Care Providers & Services — 13.6% | | | | | |
Centene Corp. (a) | | 33,700 | | | 607,274 |
HealthSouth Corp. (a) | | 62,800 | | | 557,664 |
HMS Holdings Corp. (a) | | 37,845 | | | 1,245,101 |
IPC The Hospitalist Co., Inc. (a) | | 32,980 | | | 627,609 |
Magellan Health Services, Inc. (a) | | 22,500 | | | 819,900 |
MEDNAX, Inc. (a) | | 31,550 | | | 929,778 |
MWI Veterinary Supply, Inc. (a) | | 32,581 | | | 927,907 |
PharMerica Corp. (a) | | 44,600 | | | 742,144 |
Sun Healthcare Group, Inc. (a) | | 89,300 | | | 753,692 |
VCA Antech, Inc. (a) | | 15,400 | | | 347,270 |
| | | | | |
| | | | | 7,558,339 |
| | | | | |
Health Care Technology — 1.2% | | | | | |
Phase Forward, Inc. (a) | | 51,800 | | | 662,522 |
Hotels, Restaurants & Leisure — 1.8% | | | | | |
Sonic Corp. (a) | | 34,700 | | | 347,694 |
Starwood Hotels & Resorts Worldwide, Inc. | | 50,100 | | | 636,270 |
| | | | | |
| | | | | 983,964 |
| | | | | |
Insurance — 6.7% | | | | | |
Aspen Insurance Holdings Ltd. | | 62,100 | | | 1,394,766 |
First American Corp. | | 36,600 | | | 970,266 |
First Mercury Financial Corp. (a) | | 27,900 | | | 402,876 |
Platinum Underwriters Holdings Ltd. | | 33,979 | | | 963,644 |
| | | | | |
| | | | | 3,731,552 |
| | | | | |
Internet Software & Services — 2.1% | | | | | |
SkillSoft Plc - ADR (a) | | 172,108 | | | 1,151,403 |
| | | | | |
IT Services — 2.0% | | | | | |
Forrester Research, Inc. (a) | | 17,050 | | | 350,548 |
NCI, Inc. - Class A (a) | | 29,786 | | | 774,436 |
| | | | | |
| | | | | 1,124,984 |
| | | | | |
Life Sciences Tools & Services — 0.7% | | | | | |
ICON Plc - ADR (a) | | 23,100 | | | 373,065 |
| | | | | |
Machinery — 1.3% | | | | | |
Actuant Corp. - Class A | | 46,500 | | | 480,345 |
Altra Holdings, Inc. (a) | | 58,395 | | | 226,573 |
| | | | | |
| | | | | 706,918 |
| | | | | |
Oil, Gas & Consumable Fuels — 3.6% | | | | | |
James River Coal Co. (a) | | 52,700 | | | 650,318 |
Penn Virginia Corp. | | 42,700 | | | 468,846 |
Petroleum Development Corp. (a) | | 26,400 | | | 311,784 |
Whiting Petroleum Corp. (a) | | 23,300 | | | 602,305 |
| | | | | |
| | | | | 2,033,253 |
| | | | | |
Portfolios Abbreviations
| | | | | | |
| To simplify the listings of portfolio holdings in the Schedules of Investments, the names of certain securities have been abbreviated according to the list on the right. | | ADR American Depository Receipts | | | | |
| | | | | | |
| | | SEMI-ANNUAL REPORT | | MARCH 31, 2009 | | 11 |
| | |
| Schedule of Investments (continued) | | Small Cap Core Equity Portfolio |
| | (Percentages shown are based on Net Assets) |
| | | | | | |
| | | Shares | | Value | |
Common Stocks | | | | | | |
Personal Products — 1.8% | | | | | | |
Chattem, Inc. (a)(b) | | 17,682 | | $ | 991,076 | |
| | | | | | |
Professional Services — 1.0% | | | | | | |
Huron Consulting Group, Inc. (a) | | 13,800 | | | 585,534 | |
| | | | | | |
Real Estate Investment Trusts — 4.7% | | | | | | |
Digital Realty Trust, Inc. | | 14,900 | | | 494,382 | |
Home Properties, Inc. | | 12,900 | | | 395,385 | |
MFA Mortgage Investments, Inc. | | 53,600 | | | 315,168 | |
Mid-America Apartment Communities, Inc. | | 18,600 | | | 573,438 | |
Redwood Trust, Inc. | | 53,400 | | | 819,690 | |
| | | | | | |
| | | | | 2,598,063 | |
| | | | | | |
Road & Rail — 0.7% | | | | | | |
Landstar System, Inc. | | 10,800 | | | 361,476 | |
Vitran Corp., Inc. (a) | | 9,397 | | | 49,428 | |
| | | | | | |
| | | | | 410,904 | |
| | | | | | |
Semiconductors & Semiconductor Equipment — 4.9% | | | | | | |
Advanced Energy Industries, Inc. (a) | | 55,000 | | | 414,150 | |
Cymer, Inc. (a) | | 35,000 | | | 779,100 | |
Hittite Microwave Corp. (a) | | 16,800 | | | 524,160 | |
ON Semiconductor Corp. (a) | | 173,400 | | | 676,260 | |
Varian Semiconductor Equipment Associates, Inc. (a) | | 16,700 | | | 361,722 | |
| | | | | | |
| | | | | 2,755,392 | |
| | | | | | |
Software — 3.5% | | | | | | |
Blackboard, Inc. (a) | | 26,970 | | | 856,028 | |
DemandTec, Inc. (a) | | 72,700 | | | 636,125 | |
Lawson Software, Inc. (a) | | 106,550 | | | 452,837 | |
| | | | | | |
| | | | | 1,944,990 | |
| | | | | | |
Specialty Retail — 6.4% | | | | | | |
Bebe Stores, Inc. | | 41,200 | | | 274,804 | |
CarMax, Inc. (a)(b) | | 45,400 | | | 564,776 | |
Chico’s FAS, Inc. (a) | | 71,300 | | | 382,881 | |
J. Crew Group, Inc. (a)(b) | | 70,000 | | | 922,600 | |
Rent-A-Center, Inc. (a) | | 29,500 | | | 571,415 | |
Sally Beauty Holdings, Inc. (a)(b) | | 144,050 | | | 818,204 | |
| | | | | | |
| | | | | 3,534,680 | |
| | | | | | |
Textiles, Apparel & Luxury Goods — 3.6% | | | | | | |
Carter’s, Inc. (a) | | 44,000 | | | 827,640 | |
Iconix Brand Group, Inc. (a) | | 67,800 | | | 600,030 | |
Movado Group, Inc. | | 76,600 | | | 577,564 | |
| | | | | | |
| | | | | 2,005,234 | |
| | | | | | |
Thrifts & Mortgage Finance — 1.0% | | | | | | |
First Niagara Financial Group, Inc. | | 49,800 | | | 542,820 | |
Trading Companies & Distributors — 0.5% | | | | | | |
Applied Industrial Technologies, Inc. | | 15,400 | | | 259,798 | |
| | | | | | |
Total Long-Term Investments
(Cost — $63,839,953) — 98.5% | | | | | 54,742,646 | |
| | | | | | |
| | |
| | | Shares/ | | | |
| | | Beneficial | | | |
| | | Interest | | | |
Short-Term Securities | | | | | | |
BlackRock Liquidity Funds, TempFund, | | | | | | |
0.60% (c)(d) | | 776,348 | | $ | 776,348 | |
BlackRock Liquidity Series, LLC Money Market | | | | | | |
Series, 1.17% (c)(d)(e) | | 4,732,500 | | | 4,732,500 | |
| | | | | | |
Total Short-Term Securities
(Cost — $5,508,848) — 9.9% | | | | | 5,508,848 | |
| | | | | | |
Total Investments
(Cost — $69,348,801*) — 108.4% | | | | | 60,251,494 | |
Liabilities in Excess of Other Assets — (8.4)% | | | | | (4,652,557 | ) |
| | | | | | |
Net Assets — 100.0% | | | | $ | 55,598,937 | |
| | | | | | |
| * | The cost and unrealized appreciation (depreciation) of investments as of March 31, 2009, as computed for federal income tax purposes, were as follows: |
| | | | |
Aggregate cost | | $ | 69,587,016 | |
| | | | |
Gross unrealized appreciation. | | $ | 3,163,536 | |
Gross unrealized depreciation. | | | (12,499,058 | ) |
| | | | |
Net unrealized depreciation | | $ | (9,335,522 | ) |
| | | | |
| (a) | Non-income producing security. |
| (b) | Security, or a portion of security, is on loan. |
| (c) | Investments in companies considered to be an affiliate of the Portfolio, for purposes of Section 2(a)(3) of the Investment Company Act of 1940, as amended, were as follows: |
| | | | | | | |
| | | Net | | | |
Affiliate | | Activity | | | Income |
BlackRock Liquidity Funds, TempFund | | $ | 776,348 | ** | | $ | 1,752 |
BlackRock Liquidity Series, LLC Money Market Series | | $ | (3,794,300 | )*** | | $ | 31,075 |
| ** | Represents net purchase cost. |
| *** | Represents net sales cost. |
| (d) | Represents current yield as of report date. |
| (e) | Security purchased with the cash proceeds from securities loans. |
| • | For Portfolio compliance purposes, the Portfolio’s industry classifications refer to any one or more of the industry sub-classifications used by one or more widely recognized market indexes or ratings group indexes, and/or as defined by Portfolio management. This definition may not apply for purposes of this report, which may combine industry sub-classifications for reporting ease. |
| | | | | | |
12 | | SEMI-ANNUAL REPORT | | MARCH 31, 2009 | | |
| | |
| Schedule of Investments (concluded) | | Small Cap Core Equity Portfolio |
| • | | Effective October 1, 2008, the Portfolio adopted Financial Accounting Standards Board Statement of Financial Accounting Standards No. 157, “Fair Value Measurements” (“FAS 157”). FAS 157 clarifies the definition of fair value, establishes a framework for measuring fair values and requires additional disclosures about the use of fair value measurements. Various inputs are used in determining the fair value of investments, which are as follows: |
| | • | | Level 1 – price quotations in active markets/exchanges for identical securities |
| | • | | Level 2 – other observable inputs (including, but not limited to: quoted prices for similar assets or liabilities in markets that are active, quoted prices for identical or similar assets in markets that are not active, inputs other than quoted prices that are observable for the assets or liabilities (such as interest rates, yield curves, volatilities, prepayment speeds, loss severities, credit risks and default rates) or other market – corroborated inputs) |
| | • | | Level 3 – unobservable inputs based on the best information available in the circumstance, to the extent observable inputs are not available (including the Portfolio’s own assumptions used in determining the fair value of investments). |
The inputs or methodology used for valuing securities are not necessarily an indication of the risk associated with investing in those securities. For information about the Portfolio’s policy regarding valuation of investments and other significant accounting policies, please refer to Note 1 of the Notes to Financial Statements.
The following table summarizes the inputs used as of March 31, 2009 in determining the fair valuation of the Portfolio’s investments:
| | | |
| | | Investments |
Valuation Inputs | | in Securities |
| |
| | | Assets |
Level 1 | | $ | 60,251,494 |
Level 2 | | | — |
Level 3 | | | — |
| | | |
Total | | $ | 60,251,494 |
| | | |
See Notes to Financial Statements.
| | | | | | |
| | | SEMI-ANNUAL REPORT | | MARCH 31, 2009 | | 13 |
| | |
| Schedule of Investments March 31, 2009 (Unaudited) | | Small Cap Growth Equity Portfolio |
| | (Percentages shown are based on Net Assets) |
| | | | | |
| | | Shares | | Value |
Common Stocks | | | | | |
Aerospace & Defense — 2.3% | | | | | |
Argon ST, Inc. (a) | | 509,414 | | $ | 9,663,584 |
BE Aerospace, Inc. (a) | | 843,060 | | | 7,309,330 |
| | | | | |
| | | | | 16,972,914 |
| | | | | |
Beverages — 1.3% | | | | | |
Heckmann Corp. (a)(b) | | 2,040,100 | | | 9,833,282 |
| | | | | |
Biotechnology — 3.0% | | | | | |
Acorda Therapeutics, Inc. (a) | | 221,600 | | | 4,389,896 |
Alkermes, Inc. (a) | | 475,900 | | | 5,772,667 |
BioMarin Pharmaceutical, Inc. (a)(b) | | 129,700 | | | 1,601,795 |
Celera Corp. (a) | | 502,600 | | | 3,834,838 |
Martek Biosciences Corp. | | 373,000 | | | 6,807,250 |
| | | | | |
| | | | | 22,406,446 |
| | | | | |
Building Products — 0.9% | | | | | |
Griffon Corp. (a) | | 881,671 | | | 6,612,532 |
| | | | | |
Capital Markets — 1.7% | | | | | |
Knight Capital Group, Inc. - Class A (a) | | 318,600 | | | 4,696,164 |
RiskMetrics Group, Inc. (a) | | 571,165 | | | 8,161,948 |
| | | | | |
| | | | | 12,858,112 |
| | | | | |
Chemicals — 1.6% | | | | | |
Celanese Corp. - Series A | | 196,400 | | | 2,625,868 |
Intrepid Potash, Inc. (a)(b) | | 485,000 | | | 8,948,250 |
| | | | | |
| | | | | 11,574,118 |
| | | | | |
Commercial Banks — 1.3% | | | | | |
Signature Bank (a) | | 341,600 | | | 9,643,368 |
| | | | | |
Commercial Services & Supplies — 3.6% | | | | | |
Clean Harbors, Inc. (a) | | 238,900 | | | 11,467,200 |
Sykes Enterprises, Inc. (a) | | 924,597 | | | 15,376,048 |
| | | | | |
| | | | | 26,843,248 |
| | | | | |
Communications Equipment — 2.9% | | | | | |
EMS Technologies, Inc. (a) | | 489,578 | | | 8,548,032 |
Neutral Tandem, Inc. (a) | | 541,108 | | | 13,316,668 |
| | | | | |
| | | | | 21,864,700 |
| | | | | |
Construction & Engineering — 0.7% | | | | | |
Chicago Bridge & Iron Co. NV - ADR | | 838,500 | | | 5,257,395 |
| | | | | |
Containers & Packaging — 1.2% | | | | | |
Rock-Tenn Co. - Class A | | 341,032 | | | 9,224,916 |
| | | | | |
Diversified Consumer Services — 1.3% | | | | | |
DeVry, Inc. | | 193,881 | | | 9,341,187 |
| | | | | |
Diversified Financial Services — 1.5% | | | | | |
MSCI, Inc. - Class A (a) | | 656,500 | | | 11,101,415 |
| | | | | |
Electrical Equipment — 0.7% | | | | | |
Energy Conversion Devices, Inc. (a)(b) | | 422,300 | | | 5,603,921 |
| | | | | |
Electronic Equipment, Instruments & Components — 1.4% | | | | | |
Cogent, Inc. (a) | | 884,000 | | | 10,519,600 |
| | | | | |
Energy Equipment & Services — 0.7% | | | | | |
Superior Energy Services, Inc. (a) | | 412,477 | | | 5,316,828 |
| | | | | |
Food Products — 1.7% | | | | | |
American Italian Pasta Co. - Class A (a) | | 110,200 | | | 3,836,062 |
Green Mountain Coffee Roasters, Inc. (a) | | 104,000 | | | 4,992,000 |
Smart Balance, Inc. (a) | | 636,948 | | | 3,847,166 |
| | | | | |
| | | | | 12,675,228 |
| | | | | |
Health Care Equipment & Supplies — 8.1% | | | | | |
Hologic, Inc. (a) | | 929,900 | | | 12,172,391 |
| | | | | |
Merit Medical Systems, Inc. (a) | | 728,230 | | | 8,891,688 |
NuVasive, Inc. (a) | | 72,200 | | | 2,265,636 |
SonoSite, Inc. (a)(b) | | 556,900 | | | 9,957,372 |
Symmetry Medical, Inc. (a) | | 527,065 | | | 3,325,780 |
Thoratec Corp. (a) | | 127,200 | | | 3,267,768 |
Wright Medical Group, Inc. (a) | | 717,981 | | | 9,355,293 |
ZOLL Medical Corp. (a) | | 773,577 | | | 11,108,566 |
| | | | | |
| | | | | 60,344,494 |
| | | | | |
Health Care Providers & Services — 5.8% | | | | | |
Amedisys, Inc. (a)(b) | | 290,400 | | | 7,983,096 |
Lincare Holdings, Inc. (a) | | 392,983 | | | 8,567,029 |
Magellan Health Services, Inc. (a) | | 388,200 | | | 14,146,008 |
MEDNAX, Inc. (a) | | 413,200 | | | 12,177,004 |
| | | | | |
| | | | | 42,873,137 |
| | | | | |
Health Care Technology — 2.2% | | | | | |
MedAssets, Inc. (a) | | 661,600 | | | 9,427,800 |
Omnicell, Inc. (a) | | 891,918 | | | 6,974,799 |
| | | | | |
| | | | | 16,402,599 |
| | | | | |
Hotels, Restaurants & Leisure — 3.8% | | | | | |
P.F. Chang’s China Bistro, Inc. (a)(b) | | 307,700 | | | 7,040,176 |
Scientific Games Corp. - Class A (a) | | 1,178,500 | | | 14,271,635 |
Texas Roadhouse, Inc. - Class A (a) | | 539,900 | | | 5,145,247 |
WMS Industries, Inc. (a) | | 85,700 | | | 1,791,987 |
| | | | | |
| | | | | 28,249,045 |
| | | | | |
Household Durables — 0.9% | | | | | |
iRobot Corp. (a)(b) | | 860,998 | | | 6,543,585 |
| | | | | |
Insurance — 0.7% | | | | | |
Aspen Insurance Holdings Ltd. | | 246,000 | | | 5,525,160 |
| | | | | |
Internet & Catalog Retail — 0.5% | | | | | |
Ticketmaster Entertainment, Inc. (a) | | 951,237 | | | 3,510,064 |
| | | | | |
Internet Software & Services — 8.1% | | | | | |
comScore, Inc. (a) | | 965,211 | | | 11,669,401 |
Omniture, Inc. (a) | | 749,012 | | | 9,879,469 |
SkillSoft Plc - ADR (a) | | 3,727,483 | | | 24,936,861 |
SonicWALL, Inc. (a) | | 3,116,933 | | | 13,901,521 |
| | | | | |
| | | | | 60,387,252 |
| | | | | |
IT Services — 7.4% | | | | | |
ExlService Holdings, Inc. (a) | | 1,754,812 | | | 15,126,479 |
Forrester Research, Inc. (a) | | 727,100 | | | 14,949,176 |
SRA International, Inc. - Class A (a) | | 902,100 | | | 13,260,870 |
Wright Express Corp. (a) | | 637,100 | | | 11,607,962 |
| | | | | |
| | | | | 54,944,487 |
| | | | | |
Life Sciences Tools & Services — 0.4% | | | | | |
ICON Plc - ADR (a) | | 164,905 | | | 2,663,216 |
| | | | | |
Machinery — 2.7% | | | | | |
Bucyrus International, Inc. | | 277,274 | | | 4,209,019 |
IDEX Corp. | | 322,955 | | | 7,063,026 |
Kaydon Corp. | | 337,200 | | | 9,215,676 |
| | | | | |
| | | | | 20,487,721 |
| | | | | |
Media — 4.2% | | | | | |
CKX, Inc. (a) | | 3,211,499 | | | 13,167,146 |
Dolan Media Co. (a) | | 777,662 | | | 6,120,200 |
| | | | | | |
14 | | SEMI-ANNUAL REPORT | | MARCH 31, 2009 | | |
| | |
| Schedule of Investments (continued) | | Small Cap Growth Equity Portfolio |
| | (Percentages shown are based on Net Assets) |
| | | | | | |
| | | Shares | | Value | |
Common Stocks | | | | | | |
Media (concluded) | | | | | | |
DreamWorks Animation SKG, Inc. - Class A (a) | | 381,100 | | $ | 8,247,004 | |
Outdoor Channel Holdings, Inc. (a) | | 208,342 | | | 1,420,892 | |
RHI Entertainment, Inc. (a) | | 1,360,657 | | | 2,068,199 | |
| | | | | | |
| | | | | 31,023,441 | |
| | | | | | |
Oil, Gas & Consumable Fuels — 3.8% | | | | | | |
Comstock Resources, Inc. (a) | | 262,610 | | | 7,825,778 | |
EXCO Resources, Inc. (a) | | 795,000 | | | 7,950,000 | |
Massey Energy Co. | | 480,052 | | | 4,858,126 | |
Plains Exploration & Production Co. (a) | | 429,600 | | | 7,402,008 | |
| | | | | | |
| | | | | 28,035,912 | |
| | | | | | |
Personal Products — 0.9% | | | | | | |
Chattem, Inc. (a)(b) | | 125,491 | | | 7,033,770 | |
| | | | | | |
Pharmaceuticals — 1.4% | | | | | | |
Medicis Pharmaceutical Corp. - Class A | | 630,300 | | | 7,796,811 | |
Santarus, Inc. (a) | | 1,608,400 | | | 2,589,524 | |
| | | | | | |
| | | | | 10,386,335 | |
| | | | | | |
Professional Services — 4.3% | | | | | | |
The Advisory Board Co. (a) | | 405,345 | | | 6,720,620 | |
Diamond Management & Technology Consultants, Inc. | | 1,765,996 | | | 4,503,290 | |
IHS, Inc. - Class A (a) | | 265,171 | | | 10,919,742 | |
TrueBlue, Inc. (a) | | 244,200 | | | 2,014,650 | |
Watson Wyatt Worldwide, Inc. - Class A | | 159,000 | | | 7,849,830 | |
| | | | | | |
| | | | | 32,008,132 | |
| | | | | | |
Semiconductors & Semiconductor Equipment — 4.8% | | | | | | |
FEI Co. (a) | | 305,499 | | | 4,713,850 | |
Microsemi Corp. (a) | | 635,300 | | | 7,369,480 | |
Monolithic Power Systems, Inc. (a) | | 438,807 | | | 6,801,508 | |
ON Semiconductor Corp. (a) | | 2,096,200 | | | 8,175,180 | |
Silicon Laboratories, Inc. (a) | | 161,100 | | | 4,253,040 | |
Standard Microsystems Corp. (a) | | 255,153 | | | 4,745,846 | |
| | | | | | |
| | | | | 36,058,904 | |
| | | | | | |
Software — 7.4% | | | | | | |
Blackboard, Inc. (a)(b) | | 394,152 | | | 12,510,384 | |
DemandTec, Inc. (a) | | 1,453,545 | | | 12,718,519 | |
i2 Technologies, Inc. (a)(b) | | 1,426,905 | | | 11,272,550 | |
TiVo, Inc. (a) | | 2,676,380 | | | 18,841,715 | |
| | | | | | |
| | | | | 55,343,168 | |
| | | | | | |
Textiles, Apparel & Luxury Goods — 0.8% | | | | | | |
Lululemon Athletica, Inc. (a)(b) | | 710,600 | | | 6,153,796 | |
| | | | | | |
Total Common Stocks — 96.0% | | | | | 715,623,428 | |
| | | | | | |
Exchange-Traded Funds — 1.7% | | | | | | |
iShares Russell 2000 Growth Index Fund | | 272,000 | | | 12,506,560 | |
| | | | | | |
Total Long-Term Investments
(Cost — $920,884,610) — 97.7% | | | | | 728,129,988 | |
| | | | | | |
| | |
| | | Shares/ | | | |
| | | Beneficial | | | |
| | | Interest | | | |
Short-Term Securities | | | | | | |
BlackRock Liquidity Funds, TempFund, | | | | | | |
0.60% (c)(d) | | 35,260,342 | | | 35,260,342 | |
BlackRock Liquidity Series, LLC Money Market | | | | | | |
Series, 1.17% (d)(e) | | 52,551,800 | | | 52,551,800 | |
| | | | | | |
Total Short-Term Securities
(Cost — $87,812,142) — 11.8% | | | | | 87,812,142 | |
| | | | | | |
Total Investments
(Cost — $1,008,696,752*) — 109.5% | | | | | 815,942,130 | |
Liabilities in Excess of Other Assets — (9.5)% | | | | | (71,017,863 | ) |
| | | | | | |
Net Assets — 100.0% | | | | $ | 744,924,267 | |
| | | | | | |
| * | The cost and unrealized appreciation (depreciation) of investments as of March 31, 2009, as computed for federal income tax purposes, were as follows: |
| | | | |
Aggregate cost | | $ | 1,015,230,164 | |
| | | | |
Gross unrealized appreciation | | $ | 33,074,961 | |
Gross unrealized depreciation | | | (232,362,995 | ) |
| | | | |
Net unrealized depreciation | | $ | (199,288,034 | ) |
| | | | |
| (a) | Non-income producing security. |
| (b) | Security, or a portion of security, is on loan. |
| (c) | Investments in companies considered to be an affiliate of the Portfolio, for purposes of Section 2(a)(3) of the Investment Company Act of 1940, as amended, were as follows: |
| | | | | | | |
| | | Net | | | |
Affiliate | | Activity | | | Income |
BlackRock Liquidity Funds, TempFund | | $ | 35,260,342 | ** | | $ | 20,841 |
BlackRock Liquidity Series, LLC Money Market Series | | $ | (86,865,550 | )*** | | $ | 1,007,684 |
| ** | Represents net purchase cost. |
| *** | Represents net sales cost. |
| (d) | Represents current yield as of report date. |
| (e) | Security purchased with the cash proceeds from securities loans. |
| • | For Portfolio compliance purposes, the Portfolio’s industry classifications refer to any one or more of the industry sub-classifications used by one or more widely recognized market indexes or ratings group indexes, and/or as defined by Portfolio management. This definition may not apply for purposes of this report, which may combine industry sub-classifications for reporting ease. |
| | | | | | |
| | | SEMI-ANNUAL REPORT | | MARCH 31, 2009 | | 15 |
| | |
| Schedule of Investments (concluded) | | Small Cap Growth Equity Portfolio |
| • | | Effective October 1, 2008, the Portfolio adopted Financial Accounting Standards Board Statement of Financial Accounting Standards No. 157, “Fair Value Measurements”. FAS 157 clarifies the definition of fair value, establishes a framework for measuring fair values and requires additional disclosures about the use of fair value measurements. Various inputs are used in determining the fair value of investments, which are as follows: |
| | • | | Level 1 – price quotations in active markets/exchanges for identical securities |
| | • | | Level 2 – other observable inputs (including, but not limited to: quoted prices for similar assets or liabilities in markets that are active, quoted prices for identical or similar assets in markets that are not active, inputs other than quoted prices that are observable for the assets or liabilities (such as interest rates, yield curves, volatilities, prepayment speeds, loss severities, credit risks and default rates) or other market – corroborated inputs) |
| | • | | Level 3 – unobservable inputs based on the best information available in the circumstance, to the extent observable inputs are not available (including the Portfolio’s own assumptions used in determining the fair value of investments). |
The inputs or methodology used for valuing securities are not necessarily an indication of the risk associated with investing in those securities. For information about the Portfolio’s policy regarding valuation of investments and other significant accounting policies, please refer to Note 1 of the Notes to Financial Statements.
The following table summarizes the inputs used as of March 31, 2009 in determining the fair valuation of the Portfolio’s investments:
| | | |
| | | Investments |
Valuation Inputs | | in Securities |
| |
| | | Assets |
Level 1 | | $ | 815,942,130 |
Level 2 | | | — |
Level 3 | | | — |
| | | |
Total | | $ | 815,942,130 |
| | | |
See Notes to Financial Statements.
| | | | | | |
16 | | SEMI-ANNUAL REPORT | | MARCH 31, 2009 | | |
| | |
| Schedule of Investments March 31, 2009 (Unaudited) | | Small Cap Value Equity Portfolio |
| | (Percentages shown are based on Net Assets) |
| | | | | |
| | | Shares | | Value |
Common Stocks | | | | | |
Aerospace & Defense — 0.7% | | | | | |
Orbital Sciences Corp. (a) | | 15,100 | | $ | 179,539 |
| | | | | |
Air Freight & Logistics — 0.4% | | | | | |
Hub Group, Inc. - Class A (a) | | 5,900 | | | 100,300 |
| | | | | |
Airlines — 0.8% | | | | | |
JetBlue Airways Corp. (a) | | 52,900 | | | 193,085 |
| | | | | |
Building Products — 0.3% | | | | | |
Lennox International, Inc. | | 2,600 | | | 68,796 |
| | | | | |
Capital Markets — 5.0% | | | | | |
Jefferies Group, Inc. | | 16,900 | | | 233,220 |
KBW, Inc. (a)(b) | | 23,500 | | | 478,225 |
Piper Jaffray Cos., Inc. (a) | | 10,000 | | | 257,900 |
TradeStation Group, Inc. (a) | | 34,380 | | | 226,908 |
| | | | | |
| | | | | 1,196,253 |
| | | | | |
Chemicals — 2.7% | | | | | |
Sensient Technologies Corp. | | 27,519 | | | 646,696 |
| | | | | |
Commercial Banks — 9.0% | | | | | |
Associated Banc-Corp. | | 12,300 | | | 189,912 |
Cullen/Frost Bankers, Inc. | | 5,200 | | | 244,088 |
Fulton Financial Corp. | | 28,800 | | | 190,944 |
Glacier Bancorp, Inc. | | 15,900 | | | 249,789 |
PacWest Bancorp | | 13,400 | | | 192,022 |
Prosperity Bancshares, Inc. | | 13,300 | | | 363,755 |
TCF Financial Corp. (b) | | 22,500 | | | 264,600 |
United Bankshares, Inc. (b) | | 11,719 | | | 202,036 |
Westamerica Bancorp (b) | | 6,100 | | | 277,916 |
| | | | | |
| | | | | 2,175,062 |
| | | | | |
Commercial Services & Supplies — 4.0% | | | | | |
The Brink’s Co. | | 17,100 | | | 452,466 |
The GEO Group, Inc. (a) | | 22,700 | | | 300,775 |
Waste Connections, Inc. (a) | | 8,300 | | | 213,310 |
| | | | | |
| | | | | 966,551 |
| | | | | |
Communications Equipment — 2.9% | | | | | |
ADTRAN, Inc. | | 21,400 | | | 346,894 |
Arris Group, Inc. (a) | | 16,500 | | | 121,605 |
Polycom, Inc. (a) | | 14,700 | | | 226,233 |
| | | | | |
| | | | | 694,732 |
| | | | | |
Construction & Engineering — 0.7% | | | | | |
Pike Electric Corp. (a) | | 17,200 | | | 159,100 |
| | | | | |
Containers & Packaging — 2.3% | | | | | |
Silgan Holdings, Inc. | | 10,400 | | | 546,416 |
| | | | | |
Diversified Consumer Services — 1.8% | | | | | |
Brink’s Home Security Holdings, Inc. (a) | | 14,600 | | | 329,960 |
K12, Inc. (a) | | 8,200 | | | 113,980 |
| | | | | |
| | | | | 443,940 |
| | | | | |
Diversified Financial Services — 3.4% | | | | | |
PHH Corp. (a) | | 58,682 | | | 824,482 |
| | | | | |
Electric Utilities — 5.5% | | | | | |
Cleco Corp. | | 16,000 | | | 347,040 |
El Paso Electric Co. (a) | | 11,400 | | | 160,626 |
UIL Holdings Corp. | | 14,400 | | | 321,408 |
Unisource Energy Corp. | | 6,300 | | | 177,597 |
Westar Energy, Inc. | | 18,800 | | | 329,564 |
| | | | | |
| | | | | 1,336,235 |
| | | | | |
Electrical Equipment — 1.1% | | | | | |
Regal-Beloit Corp. | | 8,700 | | | 266,568 |
| | | | | |
Electronic Equipment, Instruments & Components — 1.5% | | | | | |
Anixter International, Inc. (a) | | 5,400 | | | 171,072 |
Tech Data Corp. (a) | | 9,100 | | | 198,198 |
| | | | | |
| | | | | 369,270 |
| | | | | |
Energy Equipment & Services — 1.2% | | | | | |
Lufkin Industries, Inc. | | 7,676 | | | 290,767 |
| | | | | |
Food & Staples Retailing — 1.5% | | | | | |
BJ’s Wholesale Club, Inc. (a) | | 7,400 | | | 236,726 |
Spartan Stores, Inc. | | 8,900 | | | 137,149 |
| | | | | |
| | | | | 373,875 |
| | | | | |
Food Products — 4.1% | | | | | |
Fresh Del Monte Produce, Inc. (a) | | 19,900 | | | 326,758 |
Hain Celestial Group, Inc. (a) | | 16,900 | | | 240,656 |
Ralcorp Holdings, Inc. (a) | | 5,400 | | | 290,952 |
Sanderson Farms, Inc. | | 3,800 | | | 142,690 |
| | | | | |
| | | | | 1,001,056 |
| | | | | |
Health Care Equipment & Supplies — 2.0% | | | | | |
The Cooper Cos., Inc. | | 10,900 | | | 288,196 |
Symmetry Medical, Inc. (a) | | 9,400 | | | 59,314 |
Teleflex, Inc. | | 3,300 | | | 128,997 |
| | | | | |
| | | | | 476,507 |
| | | | | |
Health Care Providers & Services — 7.9% | | | | | |
HealthSouth Corp. (a) | | 10,700 | | | 95,016 |
Kindred Healthcare, Inc. (a) | | 27,300 | | | 408,135 |
Magellan Health Services, Inc. (a) | | 14,405 | | | 524,918 |
MEDNAX, Inc. (a) | | 4,200 | | | 123,774 |
MWI Veterinary Supply, Inc. (a) | | 12,400 | | | 353,152 |
Skilled Healthcare Group, Inc. - Class A (a) | | 9,300 | | | 76,353 |
Sun Healthcare Group, Inc. (a) | | 37,866 | | | 319,589 |
| | | | | |
| | | | | 1,900,937 |
| | | | | |
Hotels, Restaurants & Leisure — 2.9% | | | | | |
Scientific Games Corp. - Class A (a) | | 19,301 | | | 233,735 |
Starwood Hotels & Resorts Worldwide, Inc. | | 17,200 | | | 218,440 |
Wendy’s/Arby’s Group, Inc. - Class A | | 48,400 | | | 243,452 |
| | | | | |
| | | | | 695,627 |
| | | | | |
Household Durables — 2.1% | | | | | |
Centex Corp. | | 15,300 | | | 114,750 |
Jarden Corp. (a) | | 31,900 | | | 404,173 |
| | | | | |
| | | | | 518,923 |
| | | | | |
Insurance — 8.5% | | | | | |
Aspen Insurance Holdings Ltd. | | 23,000 | | | 516,580 |
Endurance Specialty Holdings Ltd. | | 20,100 | | | 501,294 |
The Hanover Insurance Group, Inc. | | 12,209 | | | 351,864 |
Navigators Group, Inc. (a) | | 4,562 | | | 215,235 |
Platinum Underwriters Holdings Ltd. | | 16,189 | | | 459,120 |
| | | | | |
| | | | | 2,044,093 |
| | | | | |
Internet Software & Services — 2.1% | | | | | |
SkillSoft Plc - ADR (a) | | 74,789 | | | 500,338 |
| | | | | |
IT Services — 1.3% | | | | | |
Hewitt Associates, Inc. - Class A (a) | | 10,200 | | | 303,552 |
| | | | | |
| | | | | | |
| | | SEMI-ANNUAL REPORT | | MARCH 31, 2009 | | 17 |
| | |
| Schedule of Investments (continued) | | Small Cap Value Equity Portfolio |
| | (Percentages shown are based on Net Assets) |
| | | | | | |
| | | Shares | | Value | |
Common Stocks | | | | | | |
Machinery — 1.5% | | | | | | |
Actuant Corp. - Class A | | 13,200 | | $ | 136,356 | |
IDEX Corp. | | 10,500 | | | 229,635 | |
| | | | | | |
| | | | | 365,991 | |
| | | | | | |
Metals & Mining — 0.5% | | | | | | |
Reliance Steel & Aluminum Co. | | 4,200 | | | 110,586 | |
| | | | | | |
Oil, Gas & Consumable Fuels — 3.5% | | | | | | |
James River Coal Co. (a) | | 23,500 | | | 289,990 | |
Southern Union Co. | | 13,000 | | | 197,860 | |
Walter Industries, Inc. | | 5,000 | | | 114,350 | |
Whiting Petroleum Corp. (a) | | 9,000 | | | 232,650 | |
| | | | | | |
| | | | | 834,850 | |
| | | | | | |
Personal Products — 2.2% | | | | | | |
Alberto-Culver Co. | | 14,000 | | | 316,540 | |
Chattem, Inc. (a)(b) | | 3,900 | | | 218,595 | |
| | | | | | |
| | | | | 535,135 | |
| | | | | | |
Professional Services — 0.6% | | | | | | |
Huron Consulting Group, Inc. (a) | | 3,500 | | | 148,505 | |
| | | | | | |
Real Estate Investment Trusts — 3.2% | | | | | | |
Chimera Investment Corp. | | 48,000 | | | 161,280 | |
Mack-Cali Realty Corp. | | 6,600 | | | 130,746 | |
MFA Mortgage Investments, Inc. | | 42,200 | | | 248,136 | |
Redwood Trust, Inc. | | 15,800 | | | 242,530 | |
| | | | | | |
| | | | | 782,692 | |
| | | | | | |
Road & Rail — 1.9% | | | | | | |
Genesee & Wyoming, Inc. - Class A (a) | | 16,500 | | | 350,625 | |
Landstar System, Inc. | | 2,900 | | | 97,063 | |
| | | | | | |
| | | | | 447,688 | |
| | | | | | |
Semiconductors & Semiconductor Equipment — 2.2% | | | | | | |
Hittite Microwave Corp. (a) | | 5,100 | | | 159,120 | |
Intersil Corp. - Class A | | 19,200 | | | 220,800 | |
ON Semiconductor Corp. (a) | | 36,000 | | | 140,400 | |
| | | | | | |
| | | | | 520,320 | |
| | | | | | |
Software — 0.5% | | | | | | |
Progress Software Corp. (a) | | 6,800 | | | 118,048 | |
| | | | | | |
Specialty Retail — 2.7% | | | | | | |
Abercrombie & Fitch Co. - Class A | | 4,100 | | | 97,580 | |
J. Crew Group, Inc. (a)(b) | | 9,400 | | | 123,892 | |
Rent-A-Center, Inc. (a) | | 10,600 | | | 205,322 | |
Tractor Supply Co. (a) | | 6,300 | | | 227,178 | |
| | | | | | |
| | | | | 653,972 | |
| | | | | | |
Textiles, Apparel & Luxury Goods — 1.9% | | | | | | |
Carter’s, Inc. (a) | | 8,400 | | | 158,004 | |
Phillips-Van Heusen Corp. | | 12,800 | | | 290,304 | |
| | | | | | |
| | | | | 448,308 | |
| | | | | | |
Thrifts & Mortgage Finance — 2.4% | | | | | | |
First Niagara Financial Group, Inc. | | 54,300 | | | 591,870 | |
| | | | | | |
Total Long-Term Investments
(Cost — $24,851,677) — 98.8% | | | | | 23,830,665 | |
| | | | | | |
| | | Shares/ | | | |
| | | Beneficial | | | |
| | | Interest | | | |
Short-Term Securities | | | | | | |
BlackRock Liquidity Funds, TempFund, | | | | | | |
0.60% (c)(d) | | 433,276 | | $ | 433,276 | |
BlackRock Liquidity Series, LLC Money Market | | | | | | |
Series, 1.17% (c)(d)(e) | | 1,538,500 | | | 1,538,500 | |
| | | | | | |
Total Short-Term Securities
(Cost — $1,971,776) — 8.2% | | | | | 1,971,776 | |
| | | | | | |
Total Investments
(Cost — $26,823,453*) — 107.0% | | | | | 25,802,441 | |
Liabilities in Excess of Other Assets — (7.0)% | | | | | (1,682,565 | ) |
| | | | | | |
Net Assets — 100.0% | | | | $ | 24,119,876 | |
| | | | | | |
| * | The cost and unrealized appreciation (depreciation) of investments as of March 31, 2009, as computed for federal income tax purposes, were as follows: |
| | | | |
Aggregate cost | | $ | 27,434,068 | |
| | | | |
Gross unrealized appreciation. | | $ | 5,153,023 | |
Gross unrealized depreciation. | | | (6,784,650 | ) |
| | | | |
Net unrealized depreciation | | $ | (1,631,627 | ) |
| | | | |
| (a) | Non-income producing security. |
| (b) | Security, or a portion of security, is on loan. |
| (c) | Investments in companies considered to be an affiliate of the Portfolio, for purposes of Section 2(a)(3) of the Investment Company Act of 1940, as amended, were as follows: |
| | | | | | | |
| | | Net | | | |
Affiliate | | Activity | | | Income |
BlackRock Liquidity Funds, TempFund | | $ | 433,276 | ** | | $ | 1,067 |
BlackRock Liquidity Series, LLC Money Market Series | | $ | (339,000 | )*** | | $ | 10,500 |
| ** | Represents net purchase cost. |
| *** | Represents net sales cost. |
| (d) | Represents current yield as of report date. |
| (e) | Security purchased with the cash proceeds from securities loans. |
| • | For Portfolio compliance purposes, the Portfolio’s industry classifications refer to any one or more of the industry sub-classifications used by one or more widely recognized market indexes or ratings group indexes, and/or as defined by Portfolio management. This definition may not apply for purposes of this report, which may combine industry sub-classifications for reporting ease. |
| • | Effective October 1, 2008, the Portfolio adopted Financial Accounting Standards Board Statement of Financial Accounting Standards No. 157, “Fair Value Measurements”. FAS 157 clarifies the definition of fair value, establishes a framework for measuring fair values and requires additional disclosures about the use of fair value measurements. Various inputs are used in determining the fair value of investments, which are as follows: |
| | • | | Level 1 – price quotations in active markets/exchanges for identical securities |
| | • | | Level 2 – other observable inputs (including, but not limited to: quoted prices for similar assets or liabilities in markets that are active, quoted prices for identical or similar assets in markets that are not active, inputs other than quoted prices that are observable for the assets or liabilities (such as interest rates, yield curves, volatilities, prepayment speeds, loss severities, credit risks and default rates) or other market – corroborated inputs) |
| | • | | Level 3 – unobservable inputs based on the best information available in the circumstance, to the extent observable inputs are not available (including the Portfolio’s own assumptions used in determining the fair value of investments). |
| | | | | | |
18 | | SEMI-ANNUAL REPORT | | MARCH 31, 2009 | | |
| | |
| Schedule of Investments (concluded) | | Small Cap Value Equity Portfolio |
The inputs or methodology used for valuing securities are not necessarily an indication of the risk associated with investing in those securities. For information about the Portfolio’s policy regarding valuation of investments and other significant accounting policies, please refer to Note 1 of the Notes to Financial Statements.
The following table summarizes the inputs used as of March 31, 2009 in determining the fair valuation of the Portfolio’s investments:
| | | |
| | | Investments |
Valuation Inputs | | in Securities |
| |
| | | Assets |
Level 1 | | $ | 25,802,441 |
| | | |
Level 2 | | | — |
Level 3 | | | — |
| | | |
Total | | $ | 25,802,441 |
| | | |
See Notes to Financial Statements.
| | | | | | |
| | | SEMI-ANNUAL REPORT | | MARCH 31, 2009 | | 19 |
Statements of Assets and Liabilities
| | | | | | | | | | | | |
| | | Small Cap | | | Small Cap | | | Small Cap | |
| | | Core Equity | | | Growth Equity | | | Value Equity | |
March 31, 2009 (Unaudited) | | Portfolio | | | Portfolio | | | Portfolio | |
Assets | | | | | | | | | | | | |
Investments at value - unaffiliated1,2 | | $ | 54,742,646 | | | $ | 728,129,988 | | | $ | 23,830,665 | |
Investments at value - affiliated3 | | | 5,508,848 | | | | 87,812,142 | | | | 1,971,776 | |
Cash | | | 4,169 | | | | — | | | | 268 | |
Investments sold receivable | | | 813,421 | | | | 3,380,085 | | | | 2,027,882 | |
Capital shares sold receivable | | | 143,347 | | | | 1,709,641 | | | | 1,000 | |
Dividends receivable | | | 80,083 | | | | 94,461 | | | | 22,537 | |
Receivable from advisor | | | 13,673 | | | | 3,482 | | | | 2,786 | |
Securities lending income receivable - affiliated | | | 1,982 | | | | 59,623 | | | | 644 | |
Dividends receivable - affiliated | | | 311 | | | | 7,709 | | | | 297 | |
Prepaid expenses | | | 42,467 | | | | 88,627 | | | | 43,975 | |
Other assets | | | — | | | | 230,421 | | | | — | |
| | | | | | | | | | | | |
Total assets | | | 61,350,947 | | | | 821,516,179 | | | | 27,901,830 | |
| | | | | | | | | | | | |
Liabilities | | | | | | | | | | | | |
Collateral at value - securities loaned | | | 4,732,500 | | | | 52,551,800 | | | | 1,538,500 | |
Bank overdraft - affiliated | | | — | | | | 531 | | | | — | |
Investments purchased payable | | | 706,334 | | | | 20,249,464 | | | | 1,968,198 | |
Capital shares redeemed payable | | | 144,904 | | | | 2,971,014 | | | | 212,844 | |
Other affiliates payable | | | 61,681 | | | | 299,479 | | | | 21,359 | |
Investment advisory fees payable | | | 42,028 | | | | 324,797 | | | | 840 | |
Service and distribution fees payable | | | 18,406 | | | | 54,626 | | | | 5,509 | |
Officer’s and Trustees’ fees payable | | | 6,415 | | | | 8,243 | | | | 6,444 | |
Other accrued expenses payable | | | 39,742 | | | | 131,958 | | | | 28,260 | |
| | | | | | | | | | | | |
Total liabilities | | | 5,752,010 | | | | 76,591,912 | | | | 3,781,954 | |
| | | | | | | | | | | | |
Net Assets | | $ | 55,598,937 | | | $ | 744,924,267 | | | $ | 24,119,876 | |
| | | | | | | | | | | | |
Net Assets Consist of | | | | | | | | | | | | |
Paid-in capital | | $ | 103,929,597 | | | $ | 1,563,436,997 | | | $ | 46,238,554 | |
Undistributed net investment income | | | 165,645 | | | | 2,953,622 | | | | 34,607 | |
Accumulated net realized loss | | | (39,398,998 | ) | | | (628,711,730 | ) | | | (21,132,273 | ) |
Net unrealized appreciation/depreciation | | | (9,097,307 | ) | | | (192,754,622 | ) | | | (1,021,012 | ) |
| | | | | | | | | | | | |
Net Assets | | $ | 55,598,937 | | | $ | 744,924,267 | | | $ | 24,119,876 | |
| | | | | | | | | | | | |
1 Investments at cost - unaffiliated | | $ | 63,839,953 | | | $ | 920,884,610 | | | $ | 24,851,677 | |
2 Securities loaned at value | | $ | 4,533,980 | | | $ | 50,881,254 | | | $ | 1,506,910 | |
3 Investments at cost - affiliated | | $ | 5,508,848 | | | $ | 87,812,142 | | | $ | 1,971,776 | |
See Notes to Financial Statements.
| | | | | | |
20 | | SEMI-ANNUAL REPORT | | MARCH 31, 2009 | | |
Statements of Assets and Liabilities (concluded)
| | | | | | | | | |
| | | Small Cap | | Small Cap | | Small Cap |
| | | Core Equity | | Growth Equity | | Value Equity |
March 31, 2009 (Unaudited) | | Portfolio | | Portfolio | | Portfolio |
Net Asset Value | | | | | | | | | |
BlackRock: | | | | | | | | | |
Net Assets | | | — | | | — | | $ | 35,928 |
| | | | | | | | | |
Shares outstanding, unlimited number of shares authorized, $0.001 par value | | | — | | | — | | | 6,960 |
| | | | | | | | | |
Net Asset Value | | | — | | | — | | $ | 5.16 |
| | | | | | | | | |
Institutional: | | | | | | | | | |
Net Assets | | $ | 23,899,351 | | $ | 545,492,954 | | $ | 11,263,567 |
| | | | | | | | | |
Shares outstanding, unlimited number of shares authorized, $0.001 par value | | | 2,438,699 | | | 41,989,156 | | | 2,179,215 |
| | | | | | | | | |
Net Asset Value | | $ | 9.80 | | $ | 12.99 | | $ | 5.17 |
| | | | | | | | | |
Service: | | | | | | | | | |
Net Assets | | $ | 309,582 | | $ | 27,628,828 | | $ | 848,591 |
| | | | | | | | | |
Shares outstanding, unlimited number of shares authorized, $0.001 par value | | | 31,924 | | | 2,243,179 | | | 169,454 |
| | | | | | | | | |
Net Asset Value | | $ | 9.70 | | $ | 12.32 | | $ | 5.01 |
| | | | | | | | | |
Investor A: | | | | | | | | | |
Net Assets | | $ | 14,013,889 | | $ | 152,061,359 | | $ | 9,822,162 |
| | | | | | | | | |
Shares outstanding, unlimited number of shares authorized, $0.001 par value | | | 1,460,449 | | | 12,714,439 | | | 1,983,033 |
| | | | | | | | | |
Net Asset Value | | $ | 9.60 | | $ | 11.96 | | $ | 4.95 |
| | | | | | | | | |
Investor B: | | | | | | | | | |
Net Assets | | $ | 3,001,092 | | $ | 2,808,196 | | $ | 834,286 |
Shares outstanding, unlimited number of shares authorized, $0.001 par value | | | 323,828 | | | 267,148 | | | 210,500 |
| | | | | | | | | |
Net Asset Value | | $ | 9.27 | | $ | 10.51 | | $ | 3.96 |
| | | | | | | | | |
Investor C: | | | | | | | | | |
Net Assets | | $ | 14,375,023 | | $ | 16,932,930 | | $ | 1,315,342 |
| | | | | | | | | |
Shares outstanding, unlimited number of shares authorized, $0.001 par value | | | 1,554,230 | | | 1,611,038 | | | 333,291 |
| | | | | | | | | |
Net Asset Value | | $ | 9.25 | | $ | 10.51 | | $ | 3.95 |
| | | | | | | | | |
See Notes to Financial Statements.
| | | | | | |
| | | SEMI-ANNUAL REPORT | | MARCH 31, 2009 | | 21 |
Statements of Operations
| | | | | | | | | | | | |
| | | Small Cap | | | Small Cap | | | Small Cap | |
| | | Core Equity | | | Growth Equity | | | Value Equity | |
Six Months Ended March 31, 2009 (Unaudited) | | Portfolio | | | Portfolio | | | Portfolio | |
Investment Income | | | | | | | | | | | | |
Dividends | | $ | 395,977 | | | $ | 990,473 | | | $ | 275,892 | |
Securities lending - affiliated | | | 31,075 | | | | 1,007,684 | | | | 10,500 | |
Interest and dividends - affiliated | | | 1,968 | | | | 21,441 | | | | 1,102 | |
Interest | | | 902 | | | | 5,108 | | | | 80 | |
| | | | | | | | | | | | |
Total investment income | | | 429,922 | | | | 2,024,706 | | | | 287,574 | |
| | | | | | | | | | | | |
Expenses | | | | | | | | | | | | |
Investment advisory | | | 328,024 | | | | 2,036,161 | | | | 78,520 | |
Transfer agent - class specific | | | 128,963 | | | | 866,301 | | | | 41,894 | |
Service and distribution - class specific | | | 127,790 | | | | 335,133 | | | | 29,513 | |
Administration | | | 24,602 | | | | 265,569 | | | | 10,707 | |
Registration | | | 21,628 | | | | 32,016 | | | | 21,388 | |
Printing | | | 17,736 | | | | 116,040 | | | | 10,782 | |
Professional | | | 15,274 | | | | 25,264 | | | | 14,774 | |
Custodian | | | 10,891 | | | | 32,008 | | | | 12,737 | |
Administration - class specific | | | 8,212 | | | | 90,505 | | | | 3,574 | |
Officer and Trustees | | | 7,894 | | | | 12,386 | | | | 7,656 | |
Miscellaneous | | | 6,684 | | | | 14,442 | | | | 6,982 | |
| | | | | | | | | | | | |
Total expenses | | | 697,698 | | | | 3,825,825 | | | | 238,527 | |
Less fees waived by advisor | | | (11,709 | ) | | | (1,068 | ) | | | (40,725 | ) |
Less administration fees waived - class specific | | | (8,209 | ) | | | (5,947 | ) | | | (2,695 | ) |
Less transfer agent fees waived - class specific | | | (8,252 | ) | | | (3,704 | ) | | | (1,016 | ) |
Less transfer agent fees reimbursed - class specific | | | (73,511 | ) | | | (17,052 | ) | | | (12,765 | ) |
Less fees paid indirectly | | | (314 | ) | | | (991 | ) | | | (55 | ) |
| | | | | | | | | | | | |
Total expenses after waivers, reimbursement and fees paid indirectly | | | 595,703 | | | | 3,797,063 | | | | 181,271 | |
| | | | | | | | | | | | |
Net investment income (loss) | | | (165,781 | ) | | | (1,772,357 | ) | | | 106,303 | |
| | | | | | | | | | | | |
Realized and Unrealized Loss | | | | | | | | | | | | |
Net realized loss from investments | | | (27,662,265 | ) | | | (175,046,971 | ) | | | (14,898,111 | ) |
Net change in unrealized appreciation/depreciation on investments | | | (9,452,965 | ) | | | (193,027,137 | ) | | | (1,405,557 | ) |
| | | | | | | | | | | | |
Total realized and unrealized loss | | | (37,115,230 | ) | | | (368,074,108 | ) | | | (16,303,668 | ) |
| | | | | | | | | | | | |
Net Decrease in Net Assets Resulting from Operations | | $ | (37,281,011 | ) | | $ | (369,846,465 | ) | | $ | (16,197,365 | ) |
| | | | | | | | | | | | |
See Notes to Financial Statements.
| | | | | | |
22 | | SEMI-ANNUAL REPORT | | MARCH 31, 2009 | | |
Statements of Changes in Net Assets
| | | | | | | | | | | | | | | | | | | | | | | | |
| | | Small Cap Core
Equity Portfolio | | | Small Cap
Growth Equity
Portfolio | | | Small Cap Value
Equity Portfolio | |
Increase (Decrease) in Net Assets: | | Six Months
Ended
March 31, 2009
(Unaudited) | | | Year Ended
September 30,
2008 | | | Six Months
Ended
March 31, 2009
(Unaudited) | | | Year Ended
September 30,
2008 | | | Six Months
Ended
March 31, 2009
(Unaudited) | | | Year Ended
September 30,
2008 | |
Operations | | | | | | | | | | | | | | | | | | | | | | | | |
Net investment income (loss) | | $ | (165,781 | ) | | $ | (824,702 | ) | | $ | (1,772,357 | ) | | $ | 73,105 | | | $ | 106,303 | | | $ | 128,517 | |
Net realized gain (loss) | | | (27,662,265 | ) | | | (11,478,306 | ) | | | (175,046,971 | ) | | | 23,710,054 | | | | (14,898,111 | ) | | | (5,732,363 | ) |
Net change in unrealized appreciation/depreciation | | | (9,452,965 | ) | | | (9,749,568 | ) | | | (193,027,137 | ) | | | (161,736,801 | ) | | | (1,405,557 | ) | | | (4,920,623 | ) |
| | | | | | | | | | | | | | | | | | | | | | | | |
Net decrease in net assets resulting from operations | | | (37,281,011 | ) | | | (22,052,576 | ) | | | (369,846,465 | ) | | | (137,953,642 | ) | | | (16,197,365 | ) | | | (10,524,469 | ) |
| | | | | | | | | | | | | | | | | | | | | | | | |
Dividends and Distributions to Shareholders From | | | | | | | | | | | | | | | | | | | | | | | | |
Net investment income: | | | | | | | | | | | | | | | | | | | | | | | | |
BlackRock | | | — | | | | — | | | | — | | | | — | | | | (11,359 | ) | | | — | |
Institutional | | | — | | | | — | | | | — | | | | — | | | | (74,533 | ) | | | (45,006 | ) |
Service | | | — | | | | — | | | | — | | | | — | | | | (5,298 | ) | | | — | |
Investor A | | | — | | | | — | | | | — | | | | — | | | | (52,689 | ) | | | — | |
Investor B | | | — | | | | — | | | | — | | | | — | | | | (4,979 | ) | | | — | |
Investor C | | | — | | | | — | | | | — | | | | — | | | | (6,349 | ) | | | — | |
Tax return of capital: | | | | | | | | | | | | | | | | | | | | | | | | |
BlackRock | | | — | | | | — | | | | — | | | | — | | | | — | | | | (87,513 | ) |
Institutional | | | — | | | | — | | | | — | | | | — | | | | — | | | | (628,719 | ) |
Service | | | — | | | | — | | | | — | | | | — | | | | — | | | | (51,758 | ) |
Investor A | | | — | | | | — | | | | — | | | | — | | | | — | | | | (574,809 | ) |
Investor B | | | — | | | | — | | | | — | | | | — | | | | — | | | | (119,712 | ) |
Investor C | | | — | | | | — | | | | — | | | | — | | | | — | | | | (102,421 | ) |
Net realized gain: | | | | | | | | | | | | | | | | | | | | | | | | |
BlackRock | | | — | | | | — | | | | — | | | | — | | | | — | | | | (472,617 | ) |
Institutional | | | — | | | | (2,956,776 | ) | | | — | | | | — | | | | — | | | | (3,425,943 | ) |
Service | | | — | | | | (358,504 | ) | | | — | | | | — | | | | — | | | | (280,468 | ) |
Investor A | | | — | | | | (2,250,029 | ) | | | — | | | | — | | | | — | | | | (3,071,371 | ) |
Investor B | | | — | | | | (603,710 | ) | | | — | | | | — | | | | — | | | | (607,482 | ) |
Investor C | | | — | | | | (2,458,205 | ) | | | — | | | | — | | | | — | | | | (519,399 | ) |
| | | | | | | | | | | | | | | | | | | | | | | | |
Decrease in net assets resulting from dividends and distributions to shareholders | | | — | | | | (8,627,224 | ) | | | — | | | | — | | | | (155,207 | ) | | | (9,987,218 | ) |
| | | | | | | | | | | | | | | | | | | | | | | | |
Capital Share Transactions | | | | | | | | | | | | | | | | | | | | | | | | |
Net increase (decrease) in net assets derived from capital share transactions | | | (4,843,866 | ) | | | 19,065,677 | | | | 133,249,982 | | | | 274,159,643 | | | | (3,878,444 | ) | | | (4,047,188 | ) |
| | | | | | | | | | | | | | | | | | | | | | | | |
Redemption Fees | | | | | | | | | | | | | | | | | | | | | | | | |
Redemption fees | | | 11,271 | | | | 7,309 | | | | 53,704 | | | | 85,371 | | | | 268 | | | | 394 | |
| | | | | | | | | | | | | | | | | | | | | | | | |
Net Assets | | | | | | | | | | | | | | | | | | | | | | | | |
Total increase (decrease) in net assets | | | (42,113,606 | ) | | | (11,606,814 | ) | | | (236,542,779 | ) | | | 136,291,372 | | | | (20,230,748 | ) | | | (24,558,481 | ) |
Beginning of period | | | 97,712,543 | | | | 109,319,357 | | | | 981,467,046 | | | | 845,175,674 | | | | 44,350,624 | | | | 68,909,105 | |
| | | | | | | | | | | | | | | | | | | | | | | | |
End of period | | $ | 55,598,937 | | | $ | 97,712,543 | | | $ | 744,924,267 | | | $ | 981,467,046 | | | $ | 24,119,876 | | | $ | 44,350,624 | |
| | | | | | | | | | | | | | | | | | | | | | | | |
End of period undistributed net investment income | | $ | 165,645 | | | $ | 331,426 | | | $ | 2,953,622 | | | $ | 4,725,979 | | | $ | 34,607 | | | $ | 83,511 | |
| | | | | | | | | | | | | | | | | | | | | | | | |
See Notes to Financial Statements.
| | | | | | |
| | | SEMI-ANNUAL REPORT | | MARCH 31, 2009 | | 23 |
| | | | |
| Financial Highlights | | | | Small Cap Core Equity Portfolio |
| | | | | | | | | | | | | | | | | | | | | | | | | | | | | | | | | | | | | | | | | | | | | | | | |
| | | Institutional | | | Service | |
| | | Six Months
Ended
March 31, 2009
(Unaudited) | | | Year Ended September 30, | | | Six Months
Ended
March 31, 2009
(Unaudited) | | | Year Ended September 30, | |
| | | | 2008 | | | 2007 | | | 2006 | | | 2005 | | | 2004 | | | | 2008 | | | 2007 | | | 2006 | | | 2005 | | | 2004 | |
Per Share Operating Performance | |
Net asset value, beginning of period | | $ | 15.86 | | | $ | 21.21 | | | $ | 18.50 | | | $ | 17.62 | | | $ | 14.77 | | | $ | 11.99 | | | $ | 15.73 | | | $ | 21.05 | | | $ | 18.41 | | | $ | 17.59 | | | $ | 14.73 | | | $ | 11.99 | |
| | | | | | | | | | | | | | | | | | | | | | | | | | | | | | | | | | | | | | | | | | | | | | | | |
Net investment income (loss)1 | | | 0.00 | 2 | | | (0.05 | ) | | | (0.13 | ) | | | (0.12 | ) | | | (0.10 | ) | | | (0.13 | ) | | | (0.04 | ) | | | (0.09 | ) | | | (0.18 | ) | | | (0.18 | ) | | | (0.13 | ) | | | (0.20 | ) |
Net realized and unrealized gain (loss) | | | (6.06 | ) | | | (3.63 | ) | | | 3.15 | | | | 1.30 | | | | 3.06 | | | | 3.01 | | | | (5.99 | ) | | | (3.61 | ) | | | 3.13 | | | | 1.30 | | | | 3.10 | | | | 3.04 | |
| | | | | | | | | | | | | | | | | | | | | | | | | | | | | | | | | | | | | | | | | | | | | | | | |
Net increase (decrease) from investment operations | | | (6.06 | ) | | | (3.68 | ) | | | 3.02 | | | | 1.18 | | | | 2.96 | | | | 2.88 | | | | (6.03 | ) | | | (3.70 | ) | | | 2.95 | | | | 1.12 | | | | 2.97 | | | | 2.84 | |
| | | | | | | | | | | | | | | | | | | | | | | | | | | | | | | | | | | | | | | | | | | | | | | | |
Distributions from net realized gain | | | — | | | | (1.67 | ) | | | (0.31 | ) | | | (0.30 | ) | | | (0.11 | ) | | | (0.15 | ) | | | — | | | | (1.62 | ) | | | (0.31 | ) | | | (0.30 | ) | | | (0.11 | ) | | | (0.15 | ) |
| | | | | | | | | | | | | | | | | | | | | | | | | | | | | | | | | | | | | | | | | | | | | | | | |
Redemption fees added to paid-in capital | | | 0.00 | 2 | | | 0.00 | 2 | | | 0.00 | 2 | | | 0.00 | 2 | | | 0.00 | 2 | | | 0.05 | | | | 0.00 | 2 | | | 0.00 | 2 | | | 0.00 | 2 | | | 0.00 | 2 | | | 0.00 | 2 | | | 0.05 | |
| | | | | | | | | | | | | | | | | | | | | | | | | | | | | | | | | | | | | | | | | | | | | | | | |
Net asset value, end of period | | $ | 9.80 | | | $ | 15.86 | | | $ | 21.21 | | | $ | 18.50 | | | $ | 17.62 | | | $ | 14.77 | | | $ | 9.70 | | | $ | 15.73 | | | $ | 21.05 | | | $ | 18.41 | | | $ | 17.59 | | | $ | 14.73 | |
| | | | | | | | | | | | | | | | | | | | | | | | | | | | | | | | | | | | | | | | | | | | | | | | |
Total Investment Return | |
Based on net asset value | | | (38.21 | )%3,4 | | | (18.37 | )%3 | | | 16.46 | %3 | | | 6.81 | %3 | | | 20.10 | %3 | | | 24.51 | %5 | | | (38.33 | )%3,4 | | | (18.59 | )%3 | | | 16.15 | %3 | | | 6.47 | %3 | | | 20.22 | %3 | | | 24.17 | %5 |
| | | | | | | | | | | | | | | | | | | | | | | | | | | | | | | | | | | | | | | | | | | | | | | | |
Ratios to Average Net Assets | |
Total expenses after waivers, reimbursement and fees paid indirectly | | | 1.30 | %6 | | | 1.30 | % | | | 1.30 | % | | | 1.30 | % | | | 1.30 | % | | | 1.30 | % | | | 1.60 | %6 | | | 1.58 | % | | | 1.57 | % | | | 1.60 | % | | | 1.60 | % | | | 1.60 | % |
| | | | | | | | | | | | | | | | | | | | | | | | | | | | | | | | | | | | | | | | | | | | | | | | |
Total expenses | | | 1.50 | %6 | | | 1.40 | % | | | 1.38 | % | | | 1.47 | % | | | 1.81 | % | | | 2.37 | % | | | 1.87 | %6 | | | 1.64 | % | | | 1.59 | % | | | 1.64 | % | | | 2.01 | % | | | 2.67 | % |
| | | | | | | | | | | | | | | | | | | | | | | | | | | | | | | | | | | | | | | | | | | | | | | | |
Net investment income (loss) | | | 0.02 | %6 | | | (0.26 | )% | | | (0.62 | )% | | | (0.68 | )% | | | (0.59 | )% | | | (0.89 | )% | | | (0.65 | )%6 | | | (0.51 | )% | | | (0.88 | )% | | | (0.99 | )% | | | (0.80 | )% | | | (1.19 | )% |
| | | | | | | | | | | | | | | | | | | | | | | | | | | | | | | | | | | | | | | | | | | | | | | | |
Supplemental Data | |
Net assets, end of period (000) | | $ | 23,899 | | | $ | 38,685 | | | $ | 33,707 | | | $ | 24,172 | | | $ | 12,641 | | | $ | 1,802 | | | $ | 310 | | | $ | 3,430 | | | $ | 4,909 | | | $ | 2,776 | | | $ | 94 | | | $ | — | 7 |
| | | | | | | | | | | | | | | | | | | | | | | | | | | | | | | | | | | | | | | | | | | | | | | | |
Portfolio turnover | | | 74 | % | | | 103 | % | | | 103 | % | | | 111 | % | | | 118 | % | | | 78 | % | | | 74 | % | | | 103 | % | | | 103 | % | | | 111 | % | | | 118 | % | | | 78 | % |
| | | | | | | | | | | | | | | | | | | | | | | | | | | | | | | | | | | | | | | | | | | | | | | | |
| | | | | | | | | | | | | | | | | | | | | | | | |
| | | Investor A | |
| | | Six Months
Ended
March 31, 2009
(Unaudited) | | | Year Ended September 30, | |
| | | | 2008 | | | 2007 | | | 2006 | | | 2005 | | | 2004 | |
Per Share Operating Performance | | | | | | | | | | | | | | | | | | | | | | | | |
Net asset value, beginning of period | | $ | 15.57 | | | $ | 20.86 | | | $ | 18.27 | | | $ | 17.49 | | | $ | 14.71 | | | $ | 11.99 | |
| | | | | | | | | | | | | | | | | | | | | | | | |
Net investment loss1 | | | (0.02 | ) | | | (0.12 | ) | | | (0.21 | ) | | | (0.20 | ) | | | (0.17 | ) | | | (0.24 | ) |
Net realized and unrealized gain (loss) | | | (5.95 | ) | | | (3.58 | ) | | | 3.11 | | | | 1.28 | | | | 3.06 | | | | 3.04 | |
| | | | | | | | | | | | | | | | | | | | | | | | |
Net increase (decrease) from investment operations | | | (5.97 | ) | | | (3.70 | ) | | | 2.90 | | | | 1.08 | | | | 2.89 | | | | 2.80 | |
| | | | | | | | | | | | | | | | | | | | | | | | |
Distributions from net realized gain | | | — | | | | (1.59 | ) | | | (0.31 | ) | | | (0.30 | ) | | | (0.11 | ) | | | (0.15 | ) |
| | | | | | | | | | | | | | | | | | | | | | | | |
Redemption fees added to paid-in capital | | | 0.00 | 2 | | | 0.00 | 2 | | | 0.00 | 2 | | | 0.00 | 2 | | | 0.00 | 2 | | | 0.07 | |
| | | | | | | | | | | | | | | | | | | | | | | | |
Net asset value, end of period | | $ | 9.60 | | | $ | 15.57 | | | $ | 20.86 | | | $ | 18.27 | | | $ | 17.49 | | | $ | 14.71 | |
| | | | | | | | | | | | | | | | | | | | | | | | |
Total Investment Return | | | | | | | | | | | | | | | | | | | | | | | | |
Based on net asset value8 | | | (38.34 | )%3,4 | | | (18.74 | )%3 | | | 16.00 | %3 | | | 6.28 | %3 | | | 19.71 | %3 | | | 24.01 | %9 |
| | | | | | | | | | | | | | | | | | | | | | | | |
Ratios to Average Net Assets | | | | | | | | | | | | | | | | | | | | | | | | |
Total expenses after waivers, reimbursement and fees paid indirectly | | | 1.77 | %6 | | | 1.76 | % | | | 1.74 | % | | | 1.73 | % | | | 1.71 | % | | | 1.74 | % |
| | | | | | | | | | | | | | | | | | | | | | | | |
Total expenses | | | 2.19 | %6 | | | 1.90 | % | | | 1.80 | % | | | 1.90 | % | | | 2.17 | % | | | 2.89 | % |
| | | | | | | | | | | | | | | | | | | | | | | | |
Net investment loss | | | (0.45 | )%6 | | | (0.69 | )% | | | (1.06 | )% | | | (1.11 | )% | | | (1.01 | )% | | | (1.32 | )% |
| | | | | | | | | | | | | | | | | | | | | | | | |
Supplemental Data | | | | | | | | | | | | | | | | | | | | | | | | |
Net assets, end of period (000) | | $ | 14,014 | | | $ | 23,687 | | | $ | 29,070 | | | $ | 20,973 | | | $ | 11,997 | | | $ | 3,154 | |
| | | | | | | | | | | | | | | | | | | | | | | | |
Portfolio turnover | | | 74 | % | | | 103 | % | | | 103 | % | | | 111 | % | | | 118 | % | | | 78 | % |
| | | | | | | | | | | | | | | | | | | | | | | | |
See Notes to Financial Statements.
| | | | | | |
24 | | SEMI-ANNUAL REPORT | | MARCH 31, 2009 | | |
| | | | |
| Financial Highlights (continued) | | | | Small Cap Core Equity Portfolio |
| | | | | | | | | | | | | | | | | | | | | | | | |
| | | Investor B | |
| | | Six Months
Ended
March 31, 2009
(Unaudited) | | | Year Ended September 30, | |
| | | | 2008 | | | 2007 | | | 2006 | | | 2005 | | | 2004 | |
Per Share Operating Performance | | | | | | | | | | | | | | | | | | | | | | | | |
Net asset value, beginning of period | | $ | 15.09 | | | $ | 20.23 | | | $ | 17.87 | | | $ | 17.24 | | | $ | 14.61 | | | $ | 11.99 | |
| | | | | | | | | | | | | | | | | | | | | | | | |
Net investment loss1 | | | (0.06 | ) | | | (0.24 | ) | | | (0.36 | ) | | | (0.33 | ) | | | (0.28 | ) | | | (0.37 | ) |
Net realized and unrealized gain (loss) | | | (5.76 | ) | | | (3.48 | ) | | | 3.03 | | | | 1.26 | | | | 3.02 | | | | 3.07 | |
| | | | | | | | | | | | | | | | | | | | | | | | |
Net increase (decrease) from investment operations | | | (5.82 | ) | | | (3.72 | ) | | | 2.67 | | | | 0.93 | | | | 2.74 | | | | 2.70 | |
| | | | | | | | | | | | | | | | | | | | | | | | |
Distributions from net realized gain | | | — | | | | (1.42 | ) | | | (0.31 | ) | | | (0.30 | ) | | | (0.11 | ) | | | (0.15 | ) |
| | | | | | | | | | | | | | | | | | | | | | | | |
Redemption fees added to paid-in capital | | | 0.00 | 2 | | | 0.00 | 2 | | | 0.00 | 2 | | | 0.00 | 2 | | | 0.00 | 2 | | | 0.07 | |
| | | | | | | | | | | | | | | | | | | | | | | | |
Net asset value, end of period | | $ | 9.27 | | | $ | 15.09 | | | $ | 20.23 | | | $ | 17.87 | | | $ | 17.24 | | | $ | 14.61 | |
| | | | | | | | | | | | | | | | | | | | | | | | |
Total Investment Return | | | | | | | | | | | | | | | | | | | | | | | | |
Based on net asset value8 | | | (38.57 | )%3,4 | | | (19.36 | )%3 | | | 15.06 | %3 | | | 5.49 | %3 | | | 18.81 | %3 | | | 23.17 | %9 |
| | | | | | | | | | | | | | | | | | | | | | | | |
Ratios to Average Net Assets | | | | | | | | | | | | | | | | | | | | | | | | |
Total expenses after waivers, reimbursement and fees paid indirectly | | | 2.52 | %6 | | | 2.51 | % | | | 2.51 | % | | | 2.49 | % | | | 2.44 | % | | | 2.49 | % |
| | | | | | | | | | | | | | | | | | | | | | | | |
Total expenses | | | 2.87 | %6 | | | 2.60 | % | | | 2.57 | % | | | 2.55 | % | | | 2.81 | % | | | 3.56 | % |
| | | | | | | | | | | | | | | | | | | | | | | | |
Net investment loss | | | (1.22 | )%6 | | | (1.42 | )% | | | (1.84 | )% | | | (1.87 | )% | | | (1.74 | )% | | | (2.07 | )% |
| | | | | | | | | | | | | | | | | | | | | | | | |
Supplemental Data | | | | | | | | | | | | | | | | | | | | | | | | |
Net assets, end of period (000) | | $ | 3,001 | | | $ | 5,724 | | | $ | 8,956 | | | $ | 8,326 | | | $ | 6,303 | | | $ | 1,157 | |
| | | | | | | | | | | | | | | | | | | | | | | | |
Portfolio turnover | | | 74 | % | | | 103 | % | | | 103 | % | | | 111 | % | | | 118 | % | | | 78 | % |
| | | | | | | | | | | | | | | | | | | | | | | | |
| |
| | | Investor C | |
| | | Six Months
Ended
March 31, 2009
(Unaudited) | | | Year Ended September 30, | |
| | | | 2008 | | | 2007 | | | 2006 | | | 2005 | | | 2004 | |
Per Share Operating Performance | | | | | | | | | | | | | | | | | | | | | | | | |
Net asset value, beginning of period | | $ | 15.07 | | | $ | 20.25 | | | $ | 17.87 | | | $ | 17.23 | | | $ | 14.60 | | | $ | 11.99 | |
| | | | | | | | | | | | | | | | | | | | | | | | |
Net investment loss1 | | | (0.06 | ) | | | (0.24 | ) | | | (0.35 | ) | | | (0.32 | ) | | | (0.28 | ) | | | (0.28 | ) |
Net realized and unrealized gain (loss) | | | (5.76 | ) | | | (3.47 | ) | | | 3.04 | | | | 1.26 | | | | 3.02 | | | | 2.99 | |
| | | | | | | | | | | | | | | | | | | | | | | | |
Net increase (decrease) from investment operations | | | (5.82 | ) | | | (3.71 | ) | | | 2.69 | | | | 0.94 | | | | 2.74 | | | | 2.71 | |
| | | | | | | | | | | | | | | | | | | | | | | | |
Distributions from net realized gain | | | — | | | | (1.47 | ) | | | (0.31 | ) | | | (0.30 | ) | | | (0.11 | ) | | | (0.15 | ) |
| | | | | | | | | | | | | | | | | | | | | | | | |
Redemption fees added to paid-in capital | | | 0.00 | 2 | | | 0.00 | 2 | | | 0.00 | 2 | | | 0.00 | 2 | | | 0.00 | 2 | | | 0.05 | |
| | | | | | | | | | | | | | | | | | | | | | | | |
Net asset value, end of period | | $ | 9.25 | | | $ | 15.07 | | | $ | 20.25 | | | $ | 17.87 | | | $ | 17.23 | | | $ | 14.60 | |
| | | | | | | | | | | | | | | | | | | | | | | | |
Total Investment Return | | | | | | | | | | | | | | | | | | | | | | | | |
Based on net asset value8 | | | (38.62 | )%3,4 | | | (19.34 | )%3 | | | 15.17 | %3 | | | 5.55 | %3 | | | 18.82 | %3 | | | 23.08 | %5 |
| | | | | | | | | | | | | | | | | | | | | | | | |
Ratios to Average Net Assets | | | | | | | | | | | | | | | | | | | | | | | | |
Total expenses after waivers, reimbursement and fees paid indirectly | | | 2.52 | %6 | | | 2.50 | % | | | 2.48 | % | | | 2.44 | % | | | 2.44 | % | | | 2.47 | % |
| | | | | | | | | | | | | | | | | | | | | | | | |
Total expenses | | | 2.89 | %6 | | | 2.60 | % | | | 2.54 | % | | | 2.48 | % | | | 2.80 | % | | | 3.56 | % |
| | | | | | | | | | | | | | | | | | | | | | | | |
Net investment loss | | | (1.21 | )%6 | | | (1.43 | )% | | | (1.81 | )% | | | (1.81 | )% | | | (1.74 | )% | | | (2.03 | )% |
| | | | | | | | | | | | | | | | | | | | | | | | |
Supplemental Data | | | | | | | | | | | | | | | | | | | | | | | | |
Net assets, end of period (000) | | $ | 14,375 | | | $ | 26,187 | | | $ | 32,677 | | | $ | 26,151 | | | $ | 17,266 | | | $ | 3,352 | |
| | | | | | | | | | | | | | | | | | | | | | | | |
Portfolio turnover | | | 74 | % | | | 103 | % | | | 103 | % | | | 111 | % | | | 118 | % | | | 78 | % |
| | | | | | | | | | | | | | | | | | | | | | | | |
| 1 | Based on average shares outstanding. |
| 2 | Less than $0.01 per share. |
| 3 | Redemption fee of 2.00% received by the Portfolio is reflected in total return calculations. There was no impact to the return. |
| 4 | Aggregate total investment return. |
| 5 | Redemption fee of 2.00% received by the Portfolio is reflected in total return calculations. The impact to the return from redemption fees received during the period was an increase of 0.42%. |
| 7 | Net assets end of period are less than $500. |
| 8 | Total investment returns exclude the effects of sales charges. |
| 9 | Redemption fee of 2.00% received by the Portfolio is reflected in total return calculations. The impact to the return from redemption fees received during the period was an increase of 0.59%. |
See Notes to Financial Statements.
| | | | | | |
| | | SEMI-ANNUAL REPORT | | MARCH 31, 2009 | | 25 |
| | | | |
| Financial Highlights (continued) | | | | Small Cap Growth Equity Portfolio |
| | | | | | | | | | | | | | | | | | | | | | | | | | | | | | | | | | | | | | | | | | | | | | | | |
| | | Institutional | | | Service | |
| | | Six Months
Ended
March 31, 2009
(Unaudited) | | | Year Ended September 30, | | | Six Months
Ended
March 31, 2009
(Unaudited) | | | Year Ended September 30, | |
| | | | 2008 | | | 2007 | | | 2006 | | | 2005 | | | 2004 | | | | 2008 | | | 2007 | | | 2006 | | | 2005 | | | 2004 | |
Per Share Operating Performance | |
Net asset value, beginning of period | | $ | 20.33 | | | $ | 23.71 | | | $ | 19.26 | | | $ | 17.29 | | | $ | 14.52 | | | $ | 12.26 | | | $ | 19.30 | | | $ | 22.58 | | | $ | 18.38 | | | $ | 16.54 | | | $ | 13.92 | | | $ | 11.79 | |
| | | | | | | | | | | | | | | | | | | | | | | | | | | | | | | | | | | | | | | | | | | | | | | | |
Net investment income (loss)1 | | | (0.02 | ) | | | 0.03 | | | | (0.07 | ) | | | (0.09 | ) | | | (0.06 | ) | | | (0.11 | ) | | | (0.04 | ) | | | (0.03 | ) | | | (0.11 | ) | | | (0.13 | ) | | | (0.11 | ) | | | (0.15 | ) |
Net realized and unrealized gain (loss) | | | (7.32 | ) | | | (3.41 | ) | | | 4.52 | | | | 2.06 | | | | 2.82 | | | | 2.37 | | | | (6.94 | ) | | | (3.25 | ) | | | 4.31 | | | | 1.97 | | | | 2.72 | | | | 2.28 | |
| | | | | | | | | | | | | | | | | | | | | | | | | | | | | | | | | | | | | | | | | | | | | | | | |
Net increase (decrease) from investment operations | | | (7.34 | ) | | | (3.38 | ) | | | 4.45 | | | | 1.97 | | | | 2.76 | | | | 2.26 | | | | (6.98 | ) | | | (3.28 | ) | | | 4.20 | | | | 1.84 | | | | 2.61 | | | | 2.13 | |
| | | | | | | | | | | | | | | | | | | | | | | | | | | | | | | | | | | | | | | | | | | | | | | | |
Redemption fees added to paid-in capital | | | 0.00 | 2 | | | 0.00 | 2 | | | 0.00 | 2 | | | 0.00 | 2 | | | 0.01 | | | | 0.00 | 2 | | | 0.00 | 2 | | | 0.00 | 2 | | | 0.00 | 2 | | | 0.00 | 2 | | | 0.01 | | | | 0.00 | 2 |
| | | | | | | | | | | | | | | | | | | | | | | | | | | | | | | | | | | | | | | | | | | | | | | | |
Net asset value, end of period | | $ | 12.99 | | | $ | 20.33 | | | $ | 23.71 | | | $ | 19.26 | | | $ | 17.29 | | | $ | 14.52 | | | $ | 12.32 | | | $ | 19.30 | | | $ | 22.58 | | | $ | 18.38 | | | $ | 16.54 | | | $ | 13.92 | |
| | | | | | | | | | | | | | | | | | | | | | | | | | | | | | | | | | | | | | | | | | | | | | | | |
Total Investment Return | |
Based on net asset value | | | (36.11 | )%3,4 | | | (14.26 | )%3 | | | 23.11 | %3 | | | 11.39 | %3 | | | 19.08 | %5 | | | 18.43 | %3 | | | (36.17 | )%3,4 | | | (14.53 | )%3 | | | 22.85 | %3 | | | 11.12 | %3 | | | 18.82 | %5 | | | 18.07 | %3 |
| | | | | | | | | | | | | | | | | | | | | | | | | | | | | | | | | | | | | | | | | | | | | | | | |
Ratios to Average Net Assets | |
Total expenses after waivers, reimbursement and fees paid indirectly | | | 0.88 | %6 | | | 0.77 | % | | | 0.82 | % | | | 0.83 | % | | | 0.94 | % | | | 0.92 | % | | | 1.15 | %6 | | | 1.07 | % | | | 1.02 | % | | | 1.08 | % | | | 1.19 | % | | | 1.20 | % |
| | | | | | | | | | | | | | | | | | | | | | | | | | | | | | | | | | | | | | | | | | | | | | | | |
Total expenses | | | 0.88 | %6 | | | 0.77 | % | | | 0.82 | % | | | 0.83 | % | | | 0.95 | % | | | 0.93 | % | | | 1.22 | %6 | | | 1.07 | % | | | 1.02 | % | | | 1.08 | % | | | 1.19 | % | | | 1.20 | % |
| | | | | | | | | | | | | | | | | | | | | | | | | | | | | | | | | | | | | | | | | | | | | | | | |
Net investment income (loss) | | | (0.34 | )%6 | | | 0.15 | % | | | (0.34 | )% | | | (0.48 | )% | | | (0.40 | )% | | | (0.73 | )% | | | (0.58 | )%6 | | | (0.14 | )% | | | (0.54 | )% | | | (0.73 | )% | | | (0.70 | )% | | | (1.02 | )% |
| | | | | | | | | | | | | | | | | | | | | | | | | | | | | | | | | | | | | | | | | | | | | | | | |
Supplemental Data | |
Net assets, end of period (000) | | $ | 545,493 | | | $ | 699,761 | | | $ | 587,586 | | | $ | 426,000 | | | $ | 357,857 | | | $ | 272,324 | | | $ | 27,629 | | | $ | 40,514 | | | $ | 35,945 | | | $ | 26,422 | | | $ | 24,491 | | | $ | 29,569 | |
| | | | | | | | | | | | | | | | | | | | | | | | | | | | | | | | | | | | | | | | | | | | | | | | |
Portfolio turnover | | | 41 | % | | | 81 | % | | | 81 | % | | | 74 | % | | | 91 | % | | | 81 | % | | | 41 | % | | | 81 | % | | | 81 | % | | | 74 | % | | | 91 | % | | | 81 | % |
| | | | | | | | | | | | | | | | | | | | | | | | | | | | | | | | | | | | | | | | | | | | | | | | |
| | |
| | | Investor A | | | Investor B | |
| | | Six Months
Ended
March 31, 2009
(Unaudited) | | | Year Ended September 30, | | | Six Months
Ended
March 31, 2009
(Unaudited) | | | Year Ended September 30, | |
| | | | 2008 | | | 2007 | | | 2006 | | | 2005 | | | 2004 | | | | 2008 | | | 2007 | | | 2006 | | | 2005 | | | 2004 | |
Per Share Operating Performance | |
Net asset value, beginning of period | | $ | 18.76 | | | $ | 21.97 | | | $ | 17.90 | | | $ | 16.12 | | | $ | 13.57 | | | $ | 11.51 | | | $ | 16.56 | | | $ | 19.57 | | | $ | 16.07 | | | $ | 14.61 | | | $ | 12.39 | | | $ | 10.59 | |
| | | | | | | | | | | | | | | | | | | | | | | | | | | | | | | | | | | | | | | | | | | | | | | | |
Net investment loss1 | | | (0.05 | ) | | | (0.05 | ) | | | (0.13 | ) | | | (0.14 | ) | | | (0.10 | ) | | | (0.16 | ) | | | (0.09 | ) | | | (0.21 | ) | | | (0.26 | ) | | | (0.27 | ) | | | (0.20 | ) | | | (0.24 | ) |
Net realized and unrealized gain (loss) | | | (6.75 | ) | | | (3.16 | ) | | | 4.20 | | | | 1.92 | | | | 2.64 | | | | 2.22 | | | | (5.96 | ) | | | (2.80 | ) | | | 3.76 | | | | 1.73 | | | | 2.41 | | | | 2.04 | |
| | | | | | | | | | | | | | | | | | | | | | | | | | | | | | | | | | | | | | | | | | | | | | | | |
Net increase (decrease) from investment operations | | | (6.80 | ) | | | (3.21 | ) | | | 4.07 | | | | 1.78 | | | | 2.54 | | | | 2.06 | | | | (6.05 | ) | | | (3.01 | ) | | | 3.50 | | | | 1.46 | | | | 2.21 | | | | 1.80 | |
| | | | | | | | | | | | | | | | | | | | | | | | | | | | | | | | | | | | | | | | | | | | | | | | |
Redemption fees added to paid-in capital | | | 0.00 | 2 | | | 0.00 | 2 | | | 0.00 | 2 | | | 0.00 | 2 | | | 0.01 | | | | 0.00 | 2 | | | 0.00 | 2 | | | 0.00 | 2 | | | 0.00 | 2 | | | 0.00 | 2 | | | 0.01 | | | | 0.00 | 2 |
| | | | | | | | | | | | | | | | | | | | | | | | | | | | | | | | | | | | | | | | | | | | | | | | |
Net asset value, end of period | | $ | 11.96 | | | $ | 18.76 | | | $ | 21.97 | | | $ | 17.90 | | | $ | 16.12 | | | $ | 13.57 | | | $ | 10.51 | | | $ | 16.56 | | | $ | 19.57 | | | $ | 16.07 | | | $ | 14.61 | | | $ | 12.39 | |
| | | | | | | | | | | | | | | | | | | | | | | | | | | | | | | | | | | | | | | | | | | | | | | | |
Total Investment Return | |
Based on net asset value7 | | | (36.25 | )%3,4 | | | (14.61 | )%3 | | | 22.74 | %3 | | | 11.04 | %3 | | | 18.79 | %5 | | | 17.90 | %3 | | | (36.53 | )%3,4 | | | (15.38 | )%3 | | | 21.78 | %3 | | | 9.99 | %3 | | | 17.92 | %8 | | | 17.00 | %3 |
| | | | | | | | | | | | | | | | | | | | | | | | | | | | | | | | | | | | | | | | | | | | | | | | |
Ratios to Average Net Assets | |
Total expenses after waivers, reimbursement and fees paid indirectly | | | 1.34 | %6 | | | 1.16 | % | | | 1.12 | % | | | 1.15 | % | | | 1.19 | % | | | 1.30 | % | | | 2.21 | %6 | | | 2.08 | % | | | 1.92 | % | | | 2.11 | % | | | 1.94 | % | | | 2.07 | % |
| | | | | | | | | | | | | | | | | | | | | | | | | | | | | | | | | | | | | | | | | | | | | | | | |
Total expenses | | | 1.34 | %6 | | | 1.16 | % | | | 1.12 | % | | | 1.25 | % | | | 1.29 | % | | | 1.40 | % | | | 2.38 | %6 | | | 2.08 | % | | | 2.02 | % | | | 2.30 | % | | | 1.94 | % | | | 2.07 | % |
| | | | | | | | | | | | | | | | | | | | | | | | | | | | | | | | | | | | | | | | | | | | | | | | |
Net investment loss | | | (0.79 | )%6 | | | (0.22 | )% | | | (0.64 | )% | | | (0.80 | )% | | | (0.66 | )% | | | (1.12 | )% | | | (1.56 | )%6 | | | (1.11 | )% | | | (1.44 | )% | | | (1.77 | )% | | | (1.45 | )% | | | (1.89 | )% |
| | | | | | | | | | | | | | | | | | | | | | | | | | | | | | | | | | | | | | | | | | | | | | | | |
Supplemental Data | |
Net assets, end of period (000) | | $ | 152,061 | | | $ | 211,065 | | | $ | 189,575 | | | $ | 176,250 | | | $ | 160,374 | | | $ | 131,795 | | | $ | 2,808 | | | $ | 5,721 | | | $ | 10,222 | | | $ | 10,649 | | | $ | 15,516 | | | $ | 23,983 | |
| | | | | | | | | | | | | | | | | | | | | | | | | | | | | | | | | | | | | | | | | | | | | | | | |
Portfolio turnover | | | 41 | % | | | 81 | % | | | 81 | % | | | 74 | % | | | 91 | % | | | 81 | % | | | 41 | % | | | 81 | % | | | 81 | % | | | 74 | % | | | 91 | % | | | 81 | % |
| | | | | | | | | | | | | | | | | | | | | | | | | | | | | | | | | | | | | | | | | | | | | | | | |
See Notes to Financial Statements.
| | | | | | |
26 | | SEMI-ANNUAL REPORT | | MARCH 31, 2009 | | |
| | | | |
| Financial Highlights (continued) | | | | Small Cap Growth Equity Portfolio |
| | | | | | | | | | | | | | | | | | | | | | | | |
| | | Investor C | |
| | | Six Months
Ended
March 31, 2009
(Unaudited) | | | Year Ended September 30, | |
| | | | 2008 | | | 2007 | | | 2006 | | | 2005 | | | 2004 | |
Per Share Operating Performance | | | | | | | | | | | | | | | | | | | | | | | | |
Net asset value, beginning of period | | $ | 16.56 | | | $ | 19.57 | | | $ | 16.09 | | | $ | 14.62 | | | $ | 12.40 | | | $ | 10.60 | |
| | | | | | | | | | | | | | | | | | | | | | | | |
Net investment loss1 | | | (0.09 | ) | | | (0.21 | ) | | | (0.29 | ) | | | (0.26 | ) | | | (0.19 | ) | | | (0.25 | ) |
Net realized and unrealized gain (loss) | | | (5.96 | ) | | | (2.80 | ) | | | 3.77 | | | | 1.73 | | | | 2.40 | | | | 2.05 | |
| | | | | | | | | | | | | | | | | | | | | | | | |
Net increase (decrease) from investment operations | | | (6.05 | ) | | | (3.01 | ) | | | 3.48 | | | | 1.47 | | | | 2.21 | | | | 1.80 | |
| | | | | | | | | | | | | | | | | | | | | | | | |
Redemption fees added to paid-in capital | | | 0.00 | 2 | | | 0.00 | 2 | | | 0.00 | 2 | | | 0.00 | 2 | | | 0.01 | | | | 0.00 | 2 |
| | | | | | | | | | | | | | | | | | | | | | | | |
Net asset value, end of period | | $ | 10.51 | | | $ | 16.56 | | | $ | 19.57 | | | $ | 16.09 | | | $ | 14.62 | | | $ | 12.40 | |
| | | | | | | | | | | | | | | | | | | | | | | | |
Total Investment Return | | | | | | | | | | | | | | | | | | | | | | | | |
Based on net asset value7 | | | (36.53 | )%3,4 | | | (15.38 | )%3 | | | 21.63 | %3 | | | 10.05 | %3 | | | 17.90 | %8 | | | 16.98 | %3 |
| | | | | | | | | | | | | | | | | | | | | | | | |
Ratios to Average Net Assets | | | | | | | | | | | | | | | | | | | | | | | | |
Total expenses after waivers, reimbursement and fees paid indirectly | | | 2.21 | %6 | | | 2.08 | % | | | 2.04 | % | | | 2.02 | % | | | 1.94 | % | | | 2.08 | % |
| | | | | | | | | | | | | | | | | | | | | | | | |
Total expenses | | | 2.34 | %6 | | | 2.08 | % | | | 2.09 | % | | | 2.02 | % | | | 1.94 | % | | | 2.08 | % |
| | | | | | | | | | | | | | | | | | | | | | | | |
Net investment loss | | | (1.65 | )%6 | | | (1.14 | )% | | | (1.56 | )% | | | (1.68 | )% | | | (1.41 | )% | | | (1.90 | )% |
| | | | | | | | | | | | | | | | | | | | | | | | |
Supplemental Data | | | | | | | | | | | | | | | | | | | | | | | | |
Net assets, end of period (000) | | $ | 16,933 | | | $ | 24,405 | | | $ | 21,847 | | | $ | 15,667 | | | $ | 15,434 | | | $ | 13,989 | |
| | | | | | | | | | | | | | | | | | | | | | | | |
Portfolio turnover | | | 41 | % | | | 81 | % | | | 81 | % | | | 74 | % | | | 91 | % | | | 81 | % |
| | | | | | | | | | | | | | | | | | | | | | | | |
| 1 | Based on average shares outstanding. |
| 2 | Less than $0.01 per share. |
| 3 | Redemption fee of 2.00% received by the Portfolio is reflected in total return calculations. There was no impact to the return. |
| 4 | Aggregate total investment return. |
| 5 | Redemption fee of 2.00% received by the Portfolio is reflected in total return calculations. The impact to the return from redemption fees received during the period was an increase of 0.07%. |
| 7 | Total investment returns exclude the effects of sales charges. |
| 8 | Redemption fee of 2.00% received by the Portfolio is reflected in total return calculations. The impact to the return from redemption fees received during the period was an increase of 0.08%. |
See Notes to Financial Statements.
| | | | | | |
| | | SEMI-ANNUAL REPORT | | MARCH 31, 2009 | | 27 |
| | | | |
| Financial Highlights (continued) | | | | Small Cap Value Equity Portfolio |
| | | | | | | | | | | | | | | | | | | | | | | | | | | | | | | | | | | | | | | | | | | | | | | | |
| | | BlackRock | | | Institutional | |
| | | Six Months
Ended
March 31, 2009
(Unaudited) | | | Year Ended September 30, | | | Period
April 12, 20041 to
September 30, 2004 | | | Six Months
Ended
March 31, 2009
(Unaudited) | | | Year Ended September 30, | |
| | | | 2008 | | | 2007 | | | 2006 | | | 2005 | | | | | 2008 | | | 2007 | | | 2006 | | | 2005 | | | 2004 | |
Per Share Operating Performance | |
Net asset value, beginning of period | | $ | 8.31 | | | $ | 11.83 | | | $ | 13.46 | | | $ | 15.16 | | | $ | 15.23 | | | $ | 16.02 | | | $ | 8.32 | | | $ | 11.86 | | | $ | 13.49 | | | $ | 15.17 | | | $ | 15.22 | | | $ | 14.17 | |
| | | | | | | | | | | | | | | | | | | | | | | | | | | | | | | | | | | | | | | | | | | | | | | | |
Net investment income (loss)2 | | | 0.03 | | | | 0.03 | | | | 0.04 | | | | (0.00 | )3 | | | 0.02 | | | | (0.00 | )3 | | | 0.03 | | | | 0.05 | | | | 0.07 | | | | 0.03 | | | | 0.04 | | | | (0.02 | ) |
Net realized and unrealized gain (loss) | | | (3.15 | ) | | | (1.75 | ) | | | 1.27 | | | | 1.21 | | | | 2.90 | | | | (0.79 | ) | | | (3.15 | ) | | | (1.75 | ) | | | 1.28 | | | | 1.21 | | | | 2.90 | | | | 2.86 | |
| | | | | | | | | | | | | | | | | | | | | | | | | | | | | | | | | | | | | | | | | | | | | | | | |
Net increase (decrease) from investment operations | | | (3.12 | ) | | | (1.72 | ) | | | 1.31 | | | | 1.21 | | | | 2.92 | | | | (0.79 | ) | | | (3.12 | ) | | | (1.70 | ) | | | 1.35 | | | | 1.24 | | | | 2.94 | | | | 2.84 | |
| | | | | | | | | | | | | | | | | | | | | | | | | | | | | | | | | | | | | | | | | | | | | | | | |
Dividends and distributions from: | | | | | | | | | | | | | | | | | | | | | | | | | | | | | | | | | | | | | | | | | | | | | | | | |
Net investment income | | | (0.03 | ) | | | — | | | | (0.29 | ) | | | (0.17 | ) | | | — | | | | — | | | | (0.03 | ) | | | (0.02 | ) | | | (0.33 | ) | | | (0.18 | ) | | | — | | | | — | |
Tax return of capital | | | — | | | | (0.29 | ) | | | — | | | | — | | | | — | | | | — | | | | — | | | | (0.31 | ) | | | — | | | | — | | | | — | | | | — | |
Net realized gain | | | — | | | | (1.51 | ) | | | (2.65 | ) | | | (2.74 | ) | | | (2.99 | ) | | | — | | | | — | | | | (1.51 | ) | | | (2.65 | ) | | | (2.74 | ) | | | (2.99 | ) | | | (1.79 | ) |
| | | | | | | | | | | | | | | | | | | | | | | | | | | | | | | | | | | | | | | | | | | | | | | | |
Total dividends and distributions | | | (0.03 | ) | | | (1.80 | ) | | | (2.94 | ) | | | (2.91 | ) | | | (2.99 | ) | | | — | | | | (0.03 | ) | | | (1.84 | ) | | | (2.98 | ) | | | (2.92 | ) | | | (2.99 | ) | | | (1.79 | ) |
| | | | | | | | | | | | | | | | | | | | | | | | | | | | | | | | | | | | | | | | | | | | | | | | |
Redemption fees added to paid-in capital3 | | | 0.00 | | | | 0.00 | | | | 0.00 | | | | 0.00 | | | | 0.00 | | | | 0.00 | | | | 0.00 | | | | 0.00 | | | | 0.00 | | | | 0.00 | | | | 0.00 | | | | 0.00 | |
| | | | | | | | | | | | | | | | | | | | | | | | | | | | | | | | | | | | | | | | | | | | | | | | |
Net asset value, end of period | | $ | 5.16 | | | $ | 8.31 | | | $ | 11.83 | | | $ | 13.46 | | | $ | 15.16 | | | $ | 15.23 | | | $ | 5.17 | | | $ | 8.32 | | | $ | 11.86 | | | $ | 13.49 | | | $ | 15.17 | | | $ | 15.22 | |
| | | | | | | | | | | | | | | | | | | | | | | | | | | | | | | | | | | | | | | | | | | | | | | | |
Total Investment Return | |
Based on net asset value4 | | | (37.55 | )%5 | | | (16.96 | )% | | | 9.90 | % | | | 9.61 | % | | | 20.60 | % | | | (4.93 | )%5 | | | (37.48 | )%5 | | | (16.83 | )% | | | 10.20 | % | | | 9.81 | % | | | 20.77 | % | | | 20.87 | % |
| | | | | | | | | | | | | | | | | | | | | | | | | | | | | | | | | | | | | | | | | | | | | | | | |
Ratios to Average Net Assets | |
Total expenses after waivers, reimbursement and fees paid indirectly | | | 1.10 | %6 | | | 1.10 | % | | | 1.08 | % | | | 1.10 | % | | | 1.07 | % | | | 1.10 | %6 | | | 0.95 | %6 | | | 0.90 | % | | | 0.86 | % | | | 0.89 | % | | | 0.97 | % | | | 0.95 | % |
| | | | | | | | | | | | | | | | | | | | | | | | | | | | | | | | | | | | | | | | | | | | | | | | |
Total expenses | | | 1.35 | %6 | | | 1.25 | % | | | 1.10 | % | | | 1.12 | % | | | 1.08 | % | | | 1.33 | %6 | | | 1.36 | %6 | | | 1.01 | % | | | 0.87 | % | | | 0.91 | % | | | 1.00 | % | | | 0.98 | % |
| | | | | | | | | | | | | | | | | | | | | | | | | | | | | | | | | | | | | | | | | | | | | | | | |
Net investment income (loss) | | | 1.01 | %6 | | | 0.33 | % | | | 0.32 | % | | | (0.01 | )% | | | 0.16 | % | | | (0.17 | )%6 | | | 1.06 | %6 | | | 0.55 | % | | | 0.57 | % | | | 0.23 | % | | | 0.26 | % | | | (0.15 | )% |
| | | | | | | | | | | | | | | | | | | | | | | | | | | | | | | | | | | | | | | | | | | | | | | | |
Supplemental Data | |
Net assets, end of period (000) | | $ | 36 | | | $ | 3,046 | | | $ | 4,929 | | | $ | 4,454 | | | $ | 5,162 | | | $ | 4,787 | | | $ | 11,264 | | | $ | 19,077 | | | $ | 27,999 | | | $ | 36,480 | | | $ | 68,880 | | | $ | 66,083 | |
| | | | | | | | | | | | | | | | | | | | | | | | | | | | | | | | | | | | | | | | | | | | | | | | |
Portfolio turnover | | | 125 | % | | | 159 | % | | | 108 | % | | | 123 | % | | | 133 | % | | | 154 | % | | | 125 | % | | | 159 | % | | | 108 | % | | | 123 | % | | | 133 | % | | | 154 | % |
| | | | | | | | | | | | | | | | | | | | | | | | | | | | | | | | | | | | | | | | | | | | | | | | |
| | | | | | | | | | | | | | | | | | | | | | | | | | | | | | | | | | | | | | | | | | | | | | | | |
| | | Service | | | Investor A | |
| | | Six Months
Ended
March 31, 2009
(Unaudited) | | | Year Ended September 30, | | | Six Months
Ended
March 31, 2009
(Unaudited) | | | Year Ended September 30, | |
| | | | 2008 | | | 2007 | | | 2006 | | | 2005 | | | 2004 | | | | 2008 | | | 2007 | | | 2006 | | | 2005 | | | 2004 | |
Per Share Operating Performance | |
Net asset value, beginning of period | | $ | 8.07 | | | $ | 11.57 | | | $ | 13.21 | | | $ | 14.95 | | | $ | 15.07 | | | $ | 14.09 | | | $ | 7.98 | | | $ | 11.45 | | | $ | 13.11 | | | $ | 14.86 | | | $ | 15.00 | | | $ | 14.04 | |
| | | | | | | | | | | | | | | | | | | | | | | | | | | | | | | | | | | | | | | | | | | | | | | | |
Net investment income (loss)2 | | | 0.02 | | | | 0.02 | | | | 0.04 | | | | (0.02 | ) | | | (0.00 | )3 | | | (0.07 | ) | | | 0.02 | | | | 0.01 | | | | 0.02 | | | | (0.03 | ) | | | (0.00 | )3 | | | (0.09 | ) |
Net realized and unrealized gain (loss) | | | (3.05 | ) | | | (1.71 | ) | | | 1.25 | | | | 1.19 | | | | 2.87 | | | | 2.84 | | | | (3.02 | ) | | | (1.69 | ) | | | 1.24 | | | | 1.19 | | | | 2.85 | | | | 2.84 | |
| | | | | | | | | | | | | | | | | | | | | | | | | | | | | | | | | | | | | | | | | | | | | | | | |
Net increase (decrease) from investment operations | | | (3.03 | ) | | | (1.69 | ) | | | 1.29 | | | | 1.17 | | | | 2.87 | | | | 2.77 | | | | (3.00 | ) | | | (1.68 | ) | | | 1.26 | | | | 1.16 | | | | 2.85 | | | | 2.75 | |
| | | | | | | | | | | | | | | | | | | | | | | | | | | | | | | | | | | | | | | | | | | | | | | | |
Dividends and distributions from: | | | | | | | | | | | | | | | | | | | | | | | | | | | | | | | | | | | | | | | | | | | | | | | | |
Net investment income | | | (0.03 | ) | | | — | | | | (0.28 | ) | | | (0.17 | ) | | | — | | | | — | | | | (0.03 | ) | | | — | | | | (0.27 | ) | | | (0.17 | ) | | | — | | | | — | |
Tax return of capital | | | — | | | | (0.30 | ) | | | — | | | | — | | | | — | | | | — | | | | — | | | | (0.28 | ) | | | — | | | | — | | | | — | | | | — | |
Net realized gain | | | — | | | | (1.51 | ) | | | (2.65 | ) | | | (2.74 | ) | | | (2.99 | ) | | | (1.79 | ) | | | — | | | | (1.51 | ) | | | (2.65 | ) | | | (2.74 | ) | | | (2.99 | ) | | | (1.79 | ) |
| | | | | | | | | | | | | | | | | | | | | | | | | | | | | | | | | | | | | | | | | | | | | | | | |
Total dividends and distributions | | | (0.03 | ) | | | (1.81 | ) | | | (2.93 | ) | | | (2.91 | ) | | | (2.99 | ) | | | (1.79 | ) | | | (0.03 | ) | | | (1.79 | ) | | | (2.92 | ) | | | (2.91 | ) | | | (2.99 | ) | | | (1.79 | ) |
| | | | | | | | | | | | | | | | | | | | | | | | | | | | | | | | | | | | | | | | | | | | | | | | |
Redemption fees added to paid-in capital3 | | | 0.00 | | | | 0.00 | | | | 0.00 | | | | 0.00 | | | | 0.00 | | | | 0.00 | | | | 0.00 | | | | 0.00 | | | | 0.00 | | | | 0.00 | | | | 0.00 | | | | 0.00 | |
| | | | | | | | | | | | | | | | | | | | | | | | | | | | | | | | | | | | | | | | | | | | | | | | |
Net asset value, end of period | | $ | 5.01 | | | $ | 8.07 | | | $ | 11.57 | | | $ | 13.21 | | | $ | 14.95 | | | $ | 15.07 | | | $ | 4.95 | | | $ | 7.98 | | | $ | 11.45 | | | $ | 13.11 | | | $ | 14.86 | | | $ | 15.00 | |
| | | | | | | | | | | | | | | | | | | | | | | | | | | | | | | | | | | | | | | | | | | | | | | | |
Total Investment Return | |
Based on net asset value4 | | | (37.58 | )%5 | | | (17.15 | )% | | | 9.92 | % | | | 9.45 | % | | | 20.46 | % | | | 20.45 | % | | | (37.66 | )%5,7 | | | (17.23 | )%7 | | | 9.79 | %7 | | | 9.40 | %7 | | | 20.43 | %7 | | | 20.38 | %7 |
| | | | | | | | | | | | | | | | | | | | | | | | | | | | | | | | | | | | | | | | | | | | | | | | |
Ratios to Average Net Assets | |
Total expenses after waivers, reimbursement and fees paid indirectly | | | 1.27 | %6 | | | 1.26 | % | | | 1.10 | % | | | 1.27 | % | | | 1.24 | % | | | 1.25 | % | | | 1.43 | %6 | | | 1.32 | % | | | 1.23 | % | | | 1.29 | % | | | 1.24 | % | | | 1.35 | % |
| | | | | | | | | | | | | | | | | | | | | | | | | | | | | | | | | | | | | | | | | | | | | | | | |
Total expenses | | | 1.81 | %6 | | | 1.40 | % | | | 1.12 | % | | | 1.32 | % | | | 1.25 | % | | | 1.29 | % | | | 1.79 | %6 | | | 1.44 | % | | | 1.24 | % | | | 1.40 | % | | | 1.35 | % | | | 1.47 | % |
| | | | | | | | | | | | | | | | | | | | | | | | | | | | | | | | | | | | | | | | | | | | | | | | |
Net investment income (loss) | | | 0.74 | %6 | | | 0.19 | % | | | 0.34 | % | | | (0.18 | )% | | | (0.03 | )% | | | (0.45 | )% | | | 0.58 | %6 | | | 0.12 | % | | | 0.17 | % | | | (0.19 | )% | | | (0.01 | )% | | | (0.55 | )% |
| | | | | | | | | | | | | | | | | | | | | | | | | | | | | | | | | | | | | | | | | | | | | | | | |
Supplemental Data | |
Net assets, end of period (000) | | $ | 849 | | | $ | 1,546 | | | $ | 2,143 | | | $ | 3,852 | | | $ | 3,405 | | | $ | 3,288 | | | $ | 9,822 | | | $ | 16,490 | | | $ | 25,737 | | | $ | 27,943 | | | $ | 31,889 | | | $ | 35,240 | |
| | | | | | | | | | | | | | | | | | | | | | | | | | | | | | | | | | | | | | | | | | | | | | | | |
Portfolio turnover | | | 125 | % | | | 159 | % | | | 108 | % | | | 123 | % | | | 133 | % | | | 154 | % | | | 125 | % | | | 159 | % | | | 108 | % | | | 123 | % | | | 133 | % | | | 154 | % |
| | | | | | | | | | | | | | | | | | | | | | | | | | | | | | | | | | | | | | | | | | | | | | | | |
See Notes to Financial Statements.
| | | | | | |
28 | | SEMI-ANNUAL REPORT | | MARCH 31, 2009 | | |
| | | | |
| Financial Highlights (concluded) | | | | Small Cap Value Equity Portfolio |
| | | | | | | | | | | | | | | | | | | | | | | | | | | | | | | | | | | | | | | | | | | | | | | | |
| | | Investor B | | | Investor C | |
| | | Six Months
Ended
March 31, 2009
(Unaudited) | | | Year Ended September 30, | | | Six Months
Ended
March 31, 2009
(Unaudited) | | | Year Ended September 30, | |
| | | | 2008 | | | 2007 | | | 2006 | | | 2005 | | | 2004 | | | | 2008 | | | 2007 | | | 2006 | | | 2005 | | | 2004 | |
Per Share Operating Performance | |
Net asset value, beginning of period | | $ | 6.41 | | | $ | 9.53 | | | $ | 11.30 | | | $ | 13.28 | | | $ | 13.77 | | | $ | 13.11 | | | $ | 6.38 | | | $ | 9.50 | | | $ | 11.31 | | | $ | 13.28 | | | $ | 13.78 | | | $ | 13.11 | |
| | | | | | | | | | | | | | | | | | | | | | | | | | | | | | | | | | | | | | | | | | | | | | | | |
Net investment loss2 | | | (0.00 | )3 | | | (0.05 | ) | | | (0.05 | ) | | | (0.12 | ) | | | (0.10 | ) | | | (0.19 | ) | | | (0.00 | )3 | | | (0.05 | ) | | | (0.06 | ) | | | (0.11 | ) | | | (0.10 | ) | | | (0.19 | ) |
Net realized and unrealized gain (loss) | | | (2.43 | ) | | | (1.36 | ) | | | 1.07 | | | | 1.03 | | | | 2.60 | | | | 2.64 | | | | (2.41 | ) | | | (1.36 | ) | | | 1.05 | | | | 1.03 | | | | 2.59 | | | | 2.65 | |
| | | | | | | | | | | | | | | | | | | | | | | | | | | | | | | | | | | | | | | | | | | | | | | | |
Net increase (decrease) from investment operations | | | (2.43 | ) | | | (1.41 | ) | | | 1.02 | | | | 0.91 | | | | 2.50 | | | | 2.45 | | | | (2.41 | ) | | | (1.41 | ) | | | 0.99 | | | | 0.92 | | | | 2.49 | | | | 2.46 | |
| | | | | | | | | | | | | | | | | | | | | | | | | | | | | | | | | | | | | | | | | | | | | | | | |
Dividends and distributions from: | | | | | | | | | | | | | | | | | | | | | | | | | | | | | | | | | | | | | | | | | | | | | | | | |
Net investment income | | | (0.02 | ) | | | — | | | | (0.14 | ) | | | (0.15 | ) | | | — | | | | — | | | | (0.02 | ) | | | — | | | | (0.15 | ) | | | (0.15 | ) | | | — | | | | — | |
Tax return of capital | | | — | | | | (0.20 | ) | | | — | | | | — | | | | — | | | | — | | | | — | | | | (0.20 | ) | | | — | | | | — | | | | — | | | | — | |
Net realized gain | | | — | | | | (1.51 | ) | | | (2.65 | ) | | | (2.74 | ) | | | (2.99 | ) | | | (1.79 | ) | | | — | | | | (1.51 | ) | | | (2.65 | ) | | | (2.74 | ) | | | (2.99 | ) | | | (1.79 | ) |
| | | | | | | | | | | | | | | | | | | | | | | | | | | | | | | | | | | | | | | | | | | | | | | | |
Total dividends and distributions | | | (0.02 | ) | | | (1.71 | ) | | | (2.79 | ) | | | (2.89 | ) | | | (2.99 | ) | | | (1.79 | ) | | | (0.02 | ) | | | (1.71 | ) | | | (2.80 | ) | | | (2.89 | ) | | | (2.99 | ) | | | (1.79 | ) |
| | | | | | | | | | | | | | | | | | | | | | | | | | | | | | | | | | | | | | | | | | | | | | | | |
Redemption fees added to paid-in capital3 | | | 0.00 | | | | 0.00 | | | | 0.00 | | | | 0.00 | | | | 0.00 | | | | 0.00 | | | | 0.00 | | | | 0.00 | | | | 0.00 | | | | 0.00 | | | | 0.00 | | | | 0.00 | |
| | | | | | | | | | | | | | | | | | | | | | | | | | | | | | | | | | | | | | | | | | | | | | | | |
Net asset value, end of period | | $ | 3.96 | | | $ | 6.41 | | | $ | 9.53 | | | $ | 11.30 | | | $ | 13.28 | | | $ | 13.77 | | | $ | 3.95 | | | $ | 6.38 | | | $ | 9.50 | | | $ | 11.31 | | | $ | 13.28 | | | $ | 13.78 | |
| | | | | | | | | | | | | | | | | | | | | | | | | | | | | | | | | | | | | | | | | | | | | | | | |
Total Investment Return | | | | | | | | | | | | | | | | | | | | | | | | | | | | | | | | | | | | | | | | | | | | | | | | |
Based on net asset value4,7 | | | (37.95 | )%5 | | | (17.79 | )% | | | 9.08 | % | | | 8.46 | % | | | 19.58 | % | | | 19.45 | % | | | (37.81 | )%5 | | | (17.87 | )% | | | 8.80 | % | | | 8.56 | % | | | 19.49 | % | | | 19.53 | % |
| | | | | | | | | | | | | | | | | | | | | | | | | | | | | | | | | | | | | | | | | | | | | | | | |
Ratios to Average Net Assets | | | | | | | | | | | | | | | | | | | | | | | | | | | | | | | | | | | | | | | | | | | | | | | | |
Total expenses after waivers, reimbursement and fees paid indirectly | | | 2.19 | %6 | | | 2.12 | % | | | 1.92 | % | | | 2.12 | % | | | 2.00 | % | | | 2.07 | % | | | 2.19 | %6 | | | 2.16 | % | | | 2.04 | % | | | 2.10 | % | | | 2.00 | % | | | 2.09 | % |
| | | | | | | | | | | | | | | | | | | | | | | | | | | | | | | | | | | | | | | | | | | | | | | | |
Total expenses | | | 2.84 | %6 | | | 2.31 | % | | | 2.08 | % | | | 2.23 | % | | | 2.00 | % | | | 2.09 | % | | | 2.66 | %6 | | | 2.28 | % | | | 2.05 | % | | | 2.11 | % | | | 2.00 | % | | | 2.11 | % |
| | | | | | | | | | | | | | | | | | | | | | | | | | | | | | | | | | | | | | | | | | | | | | | | |
Net investment loss | | | (0.18 | )%6 | | | (0.63 | )% | | | (0.48 | )% | | | (1.01 | )% | | | (0.76 | )% | | | (1.28 | )% | | | (0.17 | )%6 | | | (0.70 | )% | | | (0.64 | )% | | | (1.00 | )% | | | (0.76 | )% | | | (1.30 | )% |
| | | | | | | | | | | | | | | | | | | | | | | | | | | | | | | | | | | | | | | | | | | | | | | | |
Supplemental Data | | | | | | | | | | | | | | | | | | | | | | | | | | | | | | | | | | | | | | | | | | | | | | | | |
Net assets, end of period (000) | | $ | 834 | | | $ | 1,947 | | | $ | 4,479 | | | $ | 7,373 | | | $ | 12,848 | | | $ | 15,952 | | | $ | 1,315 | | | $ | 2,244 | | | $ | 3,622 | | | $ | 4,643 | | | $ | 6,414 | | | $ | 6,715 | |
| | | | | | | | | | | | | | | | | | | | | | | | | | | | | | | | | | | | | | | | | | | | | | | | |
Portfolio turnover | | | 125 | % | | | 159 | % | | | 108 | % | | | 123 | % | | | 133 | % | | | 154 | % | | | 125 | % | | | 159 | % | | | 108 | % | | | 123 | % | | | 133 | % | | | 154 | % |
| | | | | | | | | | | | | | | | | | | | | | | | | | | | | | | | | | | | | | | | | | | | | | | | |
| 1 | Commencement of operations. |
| 2 | Based on average shares outstanding. |
| 3 | Less than $0.01 per share. |
| 4 | Redemption fee of 2.00% received by the Portfolio is reflected in total return calculations. There was no impact to the return. |
| 5 | Aggregate total investment return. |
| 7 | Total investment returns exclude the effects of sales charges. |
See Notes to Financial Statements.
| | | | | | |
| | | SEMI-ANNUAL REPORT | | MARCH 31, 2009 | | 29 |
Notes to Financial Statements (Unaudited)
1. Organization and Significant Accounting Policies:
BlackRock FundsSM (the “Fund”), a Massachusetts business trust, is registered under the Investment Company Act of 1940, as amended (the “1940 Act”), as an open-end management investment company. As of March 31, 2009, the Fund had 27 registered portfolios, of which the BlackRock Small Cap Core Equity Portfolio (“Small Cap Core Equity”), BlackRock Small Cap Growth Equity Portfolio (“Small Cap Growth Equity”) and BlackRock Small Cap Value Equity Portfolio (“Small Cap Value Equity”)(collectively the “Portfolios”) are included in these financial statements. The Portfolios’ financial statements are prepared in conformity with accounting principles generally accepted in the United States of America, which may require the use of management accruals and estimates. Actual results may differ from these estimates. Each Portfolio offers multiple classes of shares. BlackRock and Institutional Shares are sold without a sales charge and only to certain eligible investors. Service Shares are sold without a sales charge. Investor A Shares are sold with a front-end sales charge. Shares of Investor B and Investor C may be subject to a contingent deferred sales charge. All classes of shares have identical voting, dividend, liquidation and other rights and the same terms and conditions, except that the BlackRock, Service, Investor A, Investor B and Investor C Shares may bear certain expenses related to the service and/or distribution of such shares. Each class has exclusive voting rights with respect to matters relating to its service and distribution expenditures (except that Investor B shareholders may vote on material changes to the Investor A distribution plan).
The following is a summary of significant accounting policies followed by the Portfolios:
Valuation of Investments: Equity investments traded on a recognized securities exchange or the NASDAQ Global Market System are valued at the last reported sale price that day or the NASDAQ official closing price, if applicable. For equity investments traded on more than one exchange, the last reported sale price on the exchange where the stock is primarily traded is used. Equity investments traded on a recognized exchange for which there were no sales on that day are valued at the last available bid price. If no bid price is available, the prior day’s price will be used, unless it is determined that such prior day’s price no longer reflects the fair value of the security. Short-term securities with maturities less than 60 days are valued at amortized cost, which approximates fair value. Investments in investment companies are valued at the net asset value each business day. The Portfolios value their investments in the BlackRock Liquidity Series, LLC Money Market Series at fair value, which is ordinarily based upon their pro rata ownership in the net assets of the underlying fund.
In the event that application of these methods of valuation results in a price for an investment which is deemed not to be representative of the market value of such investment, the investment will be valued by a method approved by the Board of Trustees (the “Board”) as reflecting fair value (“Fair Value Assets”). When determining the price for Fair Value Assets, the investment advisor seeks to determine the price that the Portfolios might reasonably expect to receive from the current sale of that asset in an arm’s-length transaction. Fair value determinations shall be based upon all available factors that the investment advisor deems relevant. The pricing of all Fair Value Assets is subsequently reported to the Board or a committee thereof.
Investment Transactions and Investment Income: Investment transactions are recorded on the dates the transactions are entered into (the trade dates). Realized gains and losses on investment transactions are determined on the identified cost basis. Dividend income is recorded on the ex-dividend dates. Dividends from foreign securities where the ex-dividend date may have passed are subsequently recorded when the Portfolios have determined the ex-dividend date. Upon notification from issuers, some of the dividend income received from a real estate investment trust may be redesignated as a reduction of cost of the related investment and/or realized gain. Income, realized and unrealized gains and losses of the Portfolios are allocated daily to each class based on its relative net assets.
Dividends and Distributions: Dividends and distributions paid by the Portfolios are recorded on the ex-dividend dates.
Securities Lending: The Portfolios may lend securities to financial institutions that provide cash which will be maintained at all times in an amount equal to at least 100% of the current market value of the loaned securities. The market value of the loaned securities is determined at the close of business of the Portfolios and any additional required collateral is delivered to the Portfolios on the next business day. The Portfolios typically receive income on the loaned securities but do not receive the income on the collateral. The Portfolios may invest the cash collateral and retain the amount earned on such investment, net of any amount rebated to the borrower. Loans of securities are terminable at any time and the borrower, after notice, is required to return borrowed securities within the standard time period for settlement of securities transactions. The Portfolios may pay reasonable lending agent, administrative and custodial fees in connection with their loans. In the event that the borrower defaults on its obligation to return borrowed securities because of insolvency or for any other reason, the Portfolios could experience delays and costs in gaining access to the collateral. The Portfolios also could suffer a loss if the value of an investment purchased with cash collateral falls below the market value of loaned securities.
Income Taxes: It is each Portfolio’s policy to comply with the requirements of the Internal Revenue Code applicable to regulated investment companies and to distribute substantially all of their taxable income to their shareholders. Therefore, no federal income tax provision is required. Under the applicable foreign tax laws, a withholding tax may be imposed on interest, dividends and capital gains at various rates.
The Portfolios file US federal and various state and local tax returns. No income tax returns are currently under examination. The statutes of limitations on each Portfolio’s US federal income tax returns remain open for each of the four years ended September 30, 2008. The statutes of limitations on each Portfolio’s state and local tax returns may remain open for an additional year depending upon the jurisdiction.
| | | | | | |
30 | | SEMI-ANNUAL REPORT | | MARCH 31, 2009 | | |
| | |
| Notes to Financial Statements (continued) | | |
Recent Accounting Pronouncement: In March 2008, Statement of Financial Accounting Standards No. 161, “Disclosures about Derivative Instruments and Hedging Activities - an amendment of FASB Statement No. 133” (“FAS 161”), was issued. FAS 161 is intended to improve financial reporting for derivative instruments by requiring enhanced disclosure that enables investors to understand how and why an entity uses derivatives, how derivatives are accounted for, and how derivative instruments affect an entity’s results of operations and financial position. FAS 161 is effective for financial statements issued for fiscal years and interim periods beginning after November 15, 2008. The impact on each Portfolio’s financial statement disclosures is currently being assessed.
Bank Overdraft: As of March 31, 2009, Small Cap Growth Equity recorded a bank overdraft resulting from the estimation of available cash. The overdraft balance incurs fees charged by the custodian which are included in custodian on the Statements of Operations.
Other: Expenses directly related to a Portfolio or class are charged to that Portfolio or class. Other operating expenses shared by several funds are pro-rated among those funds on the basis of relative net assets or other appropriate methods. Other expenses of a Portfolio are allocated daily to each class based on its relative net assets.
2. Investment Advisory Agreement and Other Transactions with Affiliates:
The Fund, on behalf of the Portfolios, entered into an Investment Advisory Agreement with BlackRock Advisors, LLC (the “Advisor”), an indirect, wholly owned subsidiary of BlackRock, Inc., to provide investment advisory services. The PNC Financial Services Group, Inc. (“PNC”) and Bank of America Corporation (“BAC”) are the largest stockholders of BlackRock, Inc. (“BlackRock”). BAC became a stockholder of BlackRock following its acquisition of Merrill Lynch & Co., Inc. (“Merrill Lynch”) on January 1, 2009. Prior to that date, both PNC and Merrill Lynch were considered affiliates of the Fund under the 1940 Act. Subsequent to the acquisition, PNC remains an affiliate, but due to the restructuring of Merrill Lynch’s ownership interest of BlackRock, BAC is not deemed to be an affiliate under the 1940 Act.
The Advisor is responsible for the management of each Portfolio and provides the necessary personnel, facilities, equipment and certain other services necessary to the operations of the Portfolios. For such services, each Portfolio pays the Advisor a monthly fee based on the average daily value of the Portfolio’s net assets, at the following annual rates:
| | | |
Average Daily Net Assets | | Small Cap
Growth Equity
and Small Cap
Value Equity | |
First $1 Billion | | 0.550 | % |
$1 Billion - $2 Billion | | 0.500 | |
$2 Billion - $3 Billion | | 0.475 | |
Greater Than $3 Billion | | 0.450 | |
Small Cap Core Equity Portfolio pays an advisory fee at an annual rate of 1.00% of average daily net assets.
The Advisor contractually agreed to waive or reimburse fees or expenses until February 1, 2010, in order to limit expenses. These expense limits apply to the aggregate expenses incurred on a share class (excluding: interest, taxes, brokerage commissions, expenses incurred as a result of investments in other funds and other expenses attributable to, and incurred as a result of, a Portfolio’s investments and other extraordinary expenses). This agreement is reviewed annually by the Board. The current expense limitations as a percentage of net assets are as follows:
| | | | | | | | | |
Share Classes | | Small Cap
Core Equity | | | Small Cap
Growth Equity | | | Small Cap
Value Equity | |
BlackRock | | N/A | | | N/A | | | 1.10 | % |
Institutional | | 1.30 | % | | 0.99 | % | | 0.97 | % |
Service | | 1.60 | % | | 1.29 | % | | 1.27 | % |
Investor A | | 1.77 | % | | 1.46 | % | | 1.44 | % |
Investor B | | 2.52 | % | | 2.21 | % | | 2.19 | % |
Investor C | | 2.52 | % | | 2.21 | % | | 2.19 | % |
PFPC Trust Company, an indirect wholly owned subsidiary of PNC, serves as custodian for each Portfolio. For these services, the custodian receives a fee computed daily and payable monthly, based on a percentage of the average daily gross assets of each Portfolio. The fee is paid at the following annual rates: 0.005% of the first $400 million, 0.004% of the next $1.6 billion, and 0.003% of average daily gross assets in excess of $2 billion; plus per transaction charges and other miscellaneous fees incurred on behalf of each Portfolio.
PNC Global Investment Servicing (U.S.) Inc. (“PNCGIS”), an indirect, wholly owned subsidiary of PNC, serves as transfer and dividend disbursing agent. Each class of each Portfolio bears the costs of transfer agent fees associated with such respective class. Transfer agent fees borne by each class of each Portfolio are comprised of those fees charged for all shareholder communications including mailing of shareholder reports, dividend and distribution notices, and proxy materials for shareholders meetings, as well as per account and per transaction fees related to servicing and maintenance of shareholder accounts, including the issuing, redeeming and transferring of shares of each class of each Portfolio, 12b-1 fee calculations, check writing, anti-money laundering services, and customer identification services.
| | | | | | |
| | | SEMI-ANNUAL REPORT | | MARCH 31, 2009 | | 31 |
| | |
| Notes to Financial Statements (continued) | | |
Pursuant to written agreements, Merrill Lynch and certain other affiliates provide the Portfolios with sub-accounting, recordkeeping, sub-transfer agency and other administrative services with respect to sub-accounts they service. For these services, affiliates receive an annual fee per shareholder account which will vary depending on share class. The Portfolios incurred the following fees in return for these services, which are a component of the transfer agent fees in the accompanying Statements of Operations:
| | | | | | |
| | | Merrill Lynch | | Other Affiliates |
| | | Period
October 1, 2008
to
December 31, 2008 | | Six Months
Ended
March 31, 2009 |
Small Cap Core Equity | | $ | 17,011 | | $ | 4,489 |
Small Cap Growth Equity | | | 133,911 | | | 87,107 |
Small Cap Value Equity | | | 1,932 | | | 11,157 |
PNCGIS and the Advisor act as co-administrators for the Portfolios. For these services, the co-administrators receive a combined administration fee computed daily and payable monthly, based on a percentage of the average daily net assets of each Portfolio. The combined administration fee is based on a percentage of the average daily net assets at the following annual rates: 0.075% of the first $500 million, 0.065% of the next $500 million and 0.055% of average of daily net assets in excess of $1 billion. In addition, each of the share classes is charged an administration fee based on the following percentages of average daily net assets of each respective class: 0.025% of the first $500 million of each Portfolio, 0.015% of the next $500 million and 0.005% of average of daily net assets in excess of $1 billion. In addition, PNCGIS and the Advisor may have, at their discretion, voluntarily waived all or any portion of their administration fees for a Portfolio or a share class.
The Portfolios have received an exemptive order from the Securities and Exchange Commission permitting them to lend portfolio securities to Merrill Lynch, Pierce, Fenner & Smith or its affiliates. Pursuant to that order, the Portfolios have retained BlackRock Investment Management, LLC (“BIM”), an affiliate of the Advisor, as the securities lending agent for a fee based on a share of the returns on investment of cash collateral. BIM may, on behalf of the Portfolios, invest cash collateral received by the Portfolios for such loans, among other things, in a private investment company managed by the Advisor or in registered money market funds advised by the Advisor or its affiliates. The share of income earned by the Portfolios on such investments is shown as securities lending – affiliated on the Statements of Operations. The securities lending agent fees received by BIM were as follows:
| | | |
| | | Securities lending
agent fees for the
six months ended
March 31, 2009 |
Small Cap Core Equity | | $ | 6,946 |
Small Cap Growth Equity | | | 240,728 |
Small Cap Value Equity | | | 2,491 |
The Fund, on behalf of the Portfolios, has entered into a separate Distribution Agreement and Distribution Plan with BlackRock Investments, LLC (“BIL”), an affiliate of BlackRock. Pursuant to the Distribution Plan, in accordance with Rule 12b-1 under the 1940 Act, the Portfolios pay BIL ongoing service and distribution fees. The fees are accrued daily and paid monthly at annual rates based upon the average daily net assets of the shares of each Portfolio as follows:
| | | | | | |
| | | Service
Fee | | | Distribution
Fee | |
BlackRock | | 0.25 | % | | — | |
Service | | 0.25 | % | | — | |
Investor A | | 0.25 | % | | — | |
Investor B | | 0.25 | % | | 0.75 | % |
Investor C | | 0.25 | % | | 0.75 | % |
For the six months ended March 31, 2009, the Portfolios paid to affiliates the following fees in return for distribution and sales support services:
| | | |
Small Cap Core Equity | | $ | 25,324 |
Small Cap Growth Equity | | | 80,886 |
Small Cap Value Equity | | | 13,718 |
The Advisor maintains a call center, which is responsible for providing certain shareholder services to the Portfolios, such as responding to shareholder inquiries and processing transactions based upon instructions from shareholders with respect to the subscription and redemption of Portfolio shares. During the six months ended March 31, 2009, each Portfolio reimbursed the Advisor the following amounts for costs incurred in running the call center, which are a component of the transfer agent fees in the accompanying Statements of Operations.
| | | | | | | | | |
| | | Share Classes |
Call Center | | Small Cap
Core Equity | | Small Cap
Growth Equity | | Small Cap
Value Equity |
BlackRock | | | — | | | — | | $ | 10 |
Institutional | | $ | 681 | | $ | 12,727 | | | 162 |
Service | | | 187 | | | 490 | | | 38 |
Investor A | | | 4,654 | | | 14,176 | | | 917 |
Investor B | | | 699 | | | 606 | | | — |
Investor C | | | 2,037 | | | 2,588 | | | 167 |
| | | | | | | | | |
Total | | $ | 8,258 | | $ | 30,587 | | $ | 1,294 |
| | | | | | | | | |
For the six months ended March 31, 2009, the following charts show the various types of class specific expenses borne directly by each class of each Portfolio and any associated waivers or reimbursements of those expenses.
| | | | | | | | | |
| | | Share Classes |
Administration Fees | | Small Cap
Core Equity | | Small Cap
Growth Equity | | Small Cap
Value Equity |
BlackRock | | | — | | | — | | $ | 136 |
Institutional | | $ | 3,391 | | $ | 64,789 | | | 1,584 |
Service | | | 132 | | | 3,663 | | | 125 |
Investor A | | | 2,024 | | | 19,379 | | | 1,399 |
Investor B | | | 470 | | | 438 | | | 143 |
Investor C | | | 2,195 | | | 2,236 | | | 187 |
| | | | | | | | | |
Total | | $ | 8,212 | | $ | 90,505 | | $ | 3,574 |
| | | | | | | | | |
| | | | | | |
32 | | SEMI-ANNUAL REPORT | | MARCH 31, 2009 | | |
| | |
| Notes to Financial Statements (continued) | | |
| | | | | | | | | |
| | | Share Classes |
Administration Fees Waived | | Small Cap
Core Equity | | Small Cap
Growth Equity | | Small Cap
Value Equity |
BlackRock | | | — | | | — | | $ | 136 |
Institutional | | $ | 3,391 | | | — | | | 1,038 |
Service | | | 132 | | $ | 2,427 | | | 125 |
Investor A | | | 2,021 | | | 1,046 | | | 1,068 |
Investor B | | | 470 | | | 413 | | | 143 |
Investor C | | | 2,195 | | | 2,061 | | | 185 |
| | | | | | | | | |
Total | | $ | 8,209 | | $ | 5,947 | | $ | 2,695 |
| | | | | | | | | |
| |
| | | Share Classes |
Service and Distribution Fees | | Small Cap
Core Equity | | Small Cap
Growth Equity | | Small Cap
Value Equity |
BlackRock | | | — | | | — | | $ | 1,316 |
Service | | $ | 1,312 | | $ | 36,630 | | | 1,247 |
Investor A | | | 20,237 | | | 191,596 | | | 13,908 |
Investor B | | | 18,859 | | | 17,501 | | | 5,593 |
Investor C | | | 87,382 | | | 89,406 | | | 7,449 |
| | | | | | | | | |
Total | | $ | 127,790 | | $ | 335,133 | | $ | 29,513 |
| | | | | | | | | |
| |
| | | Share Classes |
Transfer Agent Fees | | Small Cap
Core Equity | | Small Cap
Growth Equity | | Small Cap
Value Equity |
BlackRock | | | — | | | — | | $ | 91 |
Institutional | | $ | 21,356 | | $ | 463,255 | | | 12,035 |
Service | | | 1,621 | | | 37,648 | | | 1,928 |
Investor A | | | 47,844 | | | 296,920 | | | 20,299 |
Investor B | | | 9,698 | | | 11,719 | | | 3,912 |
Investor C | | | 48,444 | | | 56,759 | | | 3,629 |
| | | | | | | | | |
Total | | $ | 128,963 | | $ | 866,301 | | $ | 41,894 |
| | | | | | | | | |
| |
| | | Share Classes |
Transfer Agent Fees Waived | | Small Cap
Core Equity | | Small Cap
Growth Equity | | Small Cap
Value Equity |
BlackRock | | | — | | | — | | $ | 10 |
Institutional | | $ | 680 | | | — | | | 113 |
Service | | | 182 | | $ | 288 | | | 38 |
Investor A | | | 4,654 | | | 571 | | | 691 |
Investor B | | | 699 | | | 580 | | | — |
Investor C | | | 2,037 | | | 2,265 | | | 164 |
| | | | | | | | | |
Total | | $ | 8,252 | | $ | 3,704 | | $ | 1,016 |
| | | | | | | | | |
| |
| | | Share Classes |
Transfer Agent Fees Reimbursed | | Small Cap
Core Equity | | Small Cap
Growth Equity | | Small Cap
Value Equity |
BlackRock | | | — | | | — | | $ | 81 |
Institutional | | $ | 18,482 | | | — | | | 6,842 |
Service | | | 1,002 | | $ | 7,286 | | | 1,095 |
Investor A | | | 23,969 | | | 76 | | | 1,798 |
Investor B | | | 4,639 | | | 2,008 | | | 1,938 |
Investor C | | | 25,419 | | | 7,682 | | | 1,011 |
| | | | | | | | | |
Total | | $ | 73,511 | | $ | 17,052 | | $ | 12,765 |
| | | | | | | | | |
If within two years following a waiver or reimbursement, the operating expenses of a share class that previously received a waiver or reimbursement from the Advisor are less than the expense limit for that share class, the Advisor is entitled to be reimbursed by such share class up to the amount of fees waived or expenses reimbursed under the agreement if: (1) the Portfolio has more than $50 million in assets, (2) the Advisor or an affiliate continues to serve as the Portfolio’s investment advisor or administrator and (3) the Board has approved in advance the payments to the Advisor at the previous quarterly meeting.
At March 31, 2009, the amounts subject to possible future reimbursement under the expense limitation agreement are as follows:
| | | | | | | | | |
| | | Expiring January 31, |
| | | 2010 | | 2011 | | 2012 |
Small Cap Core Equity | | $ | 54,375 | | $ | 176,353 | | $ | 36,806 |
Small Cap Growth Equity | | | 16,894 | | | 10,923 | | | 8,868 |
Small Cap Value Equity | | | 13,841 | | | 61,262 | | | 23,957 |
The following waivers previously recorded by the Portfolios, which were subject to recoupment by the Advisor, expired on January 31, 2009:
| | | |
Small Cap Core Equity | | $ | 45,835 |
Small Cap Growth Equity | | | 28,413 |
Small Cap Value Equity | | | 15,969 |
For the six months ended March 31, 2009, affiliates earned underwriting discounts, direct commissions and dealer concessions on sales of each Portfolio’s Investor A Shares as follows:
| | | |
Small Cap Core Equity | | $ | 3,303 |
Small Cap Growth Equity | | | 7,955 |
Small Cap Value Equity | | | 1,834 |
For the six months ended March 31, 2009, affiliates received the following contingent deferred sales charges relating to transactions in Investor A, B and C Shares:
| | | | | | | | | |
| | | Investor A | | Investor B | | Investor C |
Small Cap Core Equity | | $ | 454 | | $ | 6,259 | | $ | 4,003 |
Small Cap Growth Equity | | | 4,108 | | | 3,278 | | | 4,903 |
Small Cap Value Equity | | | — | | | 1,561 | | | 118 |
The Portfolios may earn income on positive cash balances in demand deposit accounts that are maintained by PNCGIS on behalf of the Portfolios. The income earned for the six months ended March 31, 2009 was as follows which is included in interest and dividends - affiliated on the Statements of Operations:
| | | |
Small Cap Core Equity | | $ | 216 |
Small Cap Growth Equity | | | 600 |
Small Cap Value Equity | | | 35 |
The Portfolios may also receive earnings credits related to cash balances with PNCGIS which are shown on the Statements of Operations as fees paid indirectly.
Certain officers and/or trustees of the Fund are officers and/or directors of BlackRock, Inc. or its affiliates. The Portfolios reimburse the Advisor for compensation paid to the Fund’s Chief Compliance Officer.
| | | | | | |
| | | SEMI-ANNUAL REPORT | | MARCH 31, 2009 | | 33 |
Notes to Financial Statements (continued)
3. Investments:
For the six months ended March 31, 2009, purchases and sales of investments, excluding short-term securities, were as follows:
| | | | | | |
| | | Purchases | | Sales |
Small Cap Core Equity | | $ | 50,219,266 | | $ | 52,601,473 |
Small Cap Growth Equity | | | 480,346,236 | | | 305,294,012 |
Small Cap Value Equity | | | 37,214,159 | | | 40,865,016 |
4. Short-Term Borrowings:
The Portfolios, along with certain other funds managed by the Advisor and its affiliates, are a party to a $500 million credit agreement with a group of lenders, which expired November 2008 and was renewed until November 2009. The Portfolios may borrow under the credit agreement to fund shareholder redemptions and for other lawful purposes other than for leverage. Each Portfolio may borrow up to the maximum amount allowable under the Portfolio’s current Prospectus and Statement of Additional Information, subject to various other legal, regulatory or contractual limits. The Portfolios paid their pro rata share of a 0.02% upfront fee on the aggregate commitment amount based on their net assets as of October 31, 2008. The Portfolios pay a commitment fee of 0.08% per annum based on each Portfolio’s pro rata share of the unused portion of the credit agreement, which is included in miscellaneous on the Statements of Operations. Amounts borrowed under the credit agreement bear interest at a rate equal to, the higher of the (a) federal funds effective rate and (b) reserve adjusted one month LIBOR, plus, in each case, the higher of (i) 1.50% and (ii) 50% of the CDX index (as defined in the credit agreement) in effect from time to time. The Portfolios did not borrow under the credit agreement during the six months ended March 31, 2009.
5. Capital Loss Carryforward:
As of September 30, 2008, capital loss carryforwards available to offset future realized capital gains through the indicated expiration dates:
| | | | | | | | | |
| | | Expiring September 30, |
| | | 2010 | | 2011 | | 2016 |
Small Cap Core Equity | | $ | — | | $ | — | | $ | 461,113 |
Small Cap Growth Equity | | | 337,418,276 | | | 104,987,092 | | | — |
6. Market and Credit Risk:
In the normal course of business, the Portfolios invest in securities and enter into transactions where risks exist due to fluctuations in the market (market risk) or failure of the issuer of a security to meet all its obligations (credit risk). The value of securities held by the Portfolios may decline in response to certain events, including those directly involving the issuers whose securities are owned by the Portfolios; conditions affecting the general economy; overall market changes; local, regional or global political, social or economic instability; and currency and interest rate and price fluctuations. Similar to credit risk, the Portfolios may be exposed to counterparty risk, or the risk that an entity with which the Portfolios have unsettled or open transactions may default. Financial assets, which potentially expose the Portfolios to credit and counterparty risks, consist principally of investments and cash due from counterparties. The extent of the Portfolios’ exposure to credit and counterparty risks with respect to these financial assets is approximated by their value recorded in the Portfolios’ Statements of Assets and Liabilities.
7. Capital Shares Transactions:
Transactions in shares for each period were as follows:
| | | | | | | | | | | | | | |
| | | Six Months Ended
March 31, 2009 | | | Year Ended
September 30, 2008 | |
Small Cap Core Equity | | Shares | | | Amount | | | Shares | | | Amount | |
Institutional | | | | | | | | | | | | | | |
Shares sold | | 790,298 | | | $ | 8,986,181 | | | 1,364,139 | | | $ | 24,046,536 | |
Shares issued in reinvestment of dividends | | — | | | | — | | | 144,344 | | | | 2,634,282 | |
| | | | | | | | | | | | | | |
Total issued | | 790,298 | | | | 8,986,181 | | | 1,508,483 | | | | 26,680,818 | |
Shares redeemed | | (790,282 | ) | | | (8,842,301 | ) | | (658,819 | ) | | | (11,358,761 | ) |
| | | | | | | | | | | | | | |
Net increase | | 16 | | | $ | 143,880 | | | 849,664 | | | $ | 15,322,057 | |
| | | | | | | | | | | | | | |
Service | | | | | | | | | | | | | | |
Shares sold | | 1,850 | | | $ | 24,490 | | | 53,494 | | | $ | 929,891 | |
Shares issued in reinvestment of dividends | | — | | | | — | | | 7,809 | | | | 141,645 | |
| | | | | | | | | | | | | | |
Total issued | | 1,850 | | | | 24,490 | | | 61,303 | | | | 1,071,536 | |
Shares redeemed | | (188,017 | ) | | | (1,945,142 | ) | | (76,420 | ) | | | (1,366,692 | ) |
| | | | | | | | | | | | | | |
Net decrease | | (186,167 | ) | | $ | (1,920,652 | ) | | (15,117 | ) | | $ | (295,156 | ) |
| | | | | | | | | | | | | | |
| | | | | | |
34 | | SEMI-ANNUAL REPORT | | MARCH 31, 2009 | | |
Notes to Financial Statements (continued)
| | | | | | | | | | | | | | |
| | | Six Months Ended
March 31, 2009 | | | Year Ended
September 30, 2008 | |
Small Cap Core Equity (concluded) | | Shares | | | Amount | | | Shares | | | Amount | |
Investor A | | | | | | | | | | | | | | |
Shares sold | | 362,208 | | | $ | 4,043,971 | | | 741,357 | | | $ | 12,871,654 | |
Shares issued in reinvestment of dividends | | — | | | | — | | | 114,910 | | | | 2,066,087 | |
| | | | | | | | | | | | | | |
Total issued | | 362,208 | | | | 4,043,971 | | | 856,267 | | | | 14,937,741 | |
Shares redeemed | | (422,889 | ) | | | (4,689,694 | ) | | (728,662 | ) | | | (12,426,165 | ) |
| | | | | | | | | | | | | | |
Net increase (decrease) | | (60,681 | ) | | $ | (645,723 | ) | | 127,605 | | | $ | 2,511,576 | |
| | | | | | | | | | | | | | |
Investor B | | | | | | | | | | | | | | |
Shares sold | | 12,094 | | | $ | 133,171 | | | 52,890 | | | $ | 887,951 | |
Shares issued in reinvestment of dividends | | — | | | | — | | | 32,803 | | | | 575,046 | |
| | | | | | | | | | | | | | |
Total issued | | 12,094 | | | | 133,171 | | | 85,693 | | | | 1,462,997 | |
Shares redeemed | | (67,536 | ) | | | (711,563 | ) | | (149,045 | ) | | | (2,471,884 | ) |
| | | | | | | | | | | | | | |
Net decrease | | (55,442 | ) | | $ | (578,392 | ) | | (63,352 | ) | | $ | (1,008,887 | ) |
| | | | | | | | | | | | | | |
Investor C | | | | | | | | | | | | | | |
Shares sold | | 220,535 | | | $ | 2,355,718 | | | 531,601 | | | $ | 9,067,924 | |
Shares issued in reinvestment of dividends | | — | | | | — | | | 132,853 | | | | 2,323,753 | |
| | | | | | | | | | | | | | |
Total issued | | 220,535 | | | | 2,355,718 | | | 664,454 | | | | 11,391,677 | |
Shares redeemed | | (404,389 | ) | | | (4,198,697 | ) | | (540,356 | ) | | | (8,855,590 | ) |
| | | | | | | | | | | | | | |
Net increase (decrease) | | (183,854 | ) | | $ | (1,842,979 | ) | | 124,098 | | | $ | 2,536,087 | |
| | | | | | | | | | | | | | |
| | | | |
Small Cap Growth Equity | | | | | | | | | | | | |
Institutional | | | | | | | | | | | | | | |
Shares sold | | 13,702,131 | | | $ | 193,681,788 | | | 26,210,280 | | | $ | 592,523,628 | |
Shares redeemed | | (6,138,264 | ) | | | (82,800,678 | ) | | (16,563,602 | ) | | | (387,167,186 | ) |
| | | | | | | | | | | | | | |
Net increase | | 7,563,867 | | | $ | 110,881,110 | | | 9,646,678 | | | $ | 205,356,442 | |
| | | | | | | | | | | | | | |
Service | | | | | | | | | | | | | | |
Shares sold | | 382,064 | | | $ | 5,223,588 | | | 759,940 | | | $ | 16,295,030 | |
Shares redeemed | | (237,906 | ) | | | (3,085,819 | ) | | (252,607 | ) | | | (5,415,418 | ) |
| | | | | | | | | | | | | | |
Net increase | | 144,158 | | | $ | 2,137,769 | | | 507,333 | | | $ | 10,879,612 | |
| | | | | | | | | | | | | | |
Investor A | | | | | | | | | | | | | | |
Shares sold | | 4,730,025 | | | $ | 60,836,195 | | | 6,747,731 | | | $ | 141,983,947 | |
Shares redeemed | | (3,266,830 | ) | | | (41,512,678 | ) | | (4,126,237 | ) | | | (87,664,687 | ) |
| | | | | | | | | | | | | | |
Net increase | | 1,463,195 | | | $ | 19,323,517 | | | 2,621,494 | | | $ | 54,319,260 | |
| | | | | | | | | | | | | | |
| | | | | | |
| | | SEMI-ANNUAL REPORT | | MARCH 31, 2009 | | 35 |
Notes to Financial Statements (continued)
| | | | | | | | | | | | | | |
| | | Six Months Ended
March 31, 2009 | | | Year Ended
September 30, 2008 | |
Small Cap Growth Equity (concluded) | | Shares | | | Amount | | | Shares | | | Amount | |
Investor B | | | | | | | | | | | | | | |
Shares sold | | 27,624 | | | $ | 324,335 | | | 94,630 | | | $ | 1,807,045 | |
Shares redeemed | | (106,008 | ) | | | (1,179,052 | ) | | (271,481 | ) | | | (4,962,057 | ) |
| | | | | | | | | | | | | | |
Net decrease | | (78,384 | ) | | $ | (854,717 | ) | | (176,851 | ) | | $ | (3,155,012 | ) |
| | | | | | | | | | | | | | |
Investor C | | | | | | | | | | | | | | |
Shares sold | | 413,143 | | | $ | 4,863,186 | | | 628,994 | | | $ | 11,776,014 | |
Shares redeemed | | (276,023 | ) | | | (3,100,883 | ) | | (271,495 | ) | | | (5,016,673 | ) |
| | | | | | | | | | | | | | |
Net increase | | 137,120 | | | $ | 1,762,303 | | | 357,499 | | | $ | 6,759,341 | |
| | | | | | | | | | | | | | |
| | | | |
Small Cap Value Equity | | | | | | | | | | | | |
BlackRock | | | | | | | | | | | | | | |
Shares sold | | 228 | | | $ | 2,175 | | | 170 | | | $ | 1,553 | |
Shares issued in reinvestment of dividends and distributions | | 2,088 | | | | 11,359 | | | 56,693 | | | | 560,132 | |
| | | | | | | | | | | | | | |
Total issued | | 2,316 | | | | 13,534 | | | 56,863 | | | | 561,685 | |
Shares redeemed | | (361,911 | ) | | | (2,089,429 | ) | | (106,923 | ) | | | (1,262,762 | ) |
| | | | | | | | | | | | | | |
Net decrease | | (359,595 | ) | | $ | (2,075,895 | ) | | (50,060 | ) | | $ | (701,077 | ) |
| | | | | | | | | | | | | | |
Institutional | | | | | | | | | | | | | | |
Shares sold | | 149,385 | | | $ | 856,236 | | | 700,118 | | | $ | 6,837,512 | |
Shares issued in reinvestment of dividends and distributions | | 1,998 | | | | 10,869 | | | 94,195 | | | | 930,649 | |
| | | | | | | | | | | | | | |
Total issued | | 151,383 | | | | 867,105 | | | 794,313 | | | | 7,768,161 | |
Shares redeemed | | (265,164 | ) | | | (1,582,434 | ) | | (862,808 | ) | | | (8,137,224 | ) |
| | | | | | | | | | | | | | |
Net decrease | | (113,781 | ) | | $ | (715,329 | ) | | (68,495 | ) | | $ | (369,063 | ) |
| | | | | | | | | | | | | | |
Service | | | | | | | | | | | | | | |
Shares sold | | 5,048 | | | $ | 26,024 | | | 28,830 | | | $ | 270,508 | |
Shares issued in reinvestment of dividends and distributions | | 486 | | | | 2,567 | | | 17,734 | | | | 170,431 | |
| | | | | | | | | | | | | | |
Total issued | | 5,534 | | | | 28,591 | | | 46,564 | | | | 440,939 | |
Shares redeemed | | (27,675 | ) | | | (154,403 | ) | | (40,279 | ) | | | (353,709 | ) |
| | | | | | | | | | | | | | |
Net increase (decrease) | | (22,141 | ) | | $ | (125,812 | ) | | 6,285 | | | $ | 87,230 | |
| | | | | | | | | | | | | | |
Investor A | | | | | | | | | | | | | | |
Shares sold | | 159,128 | | | $ | 874,202 | | | 201,643 | | | $ | 1,757,564 | |
Shares issued in reinvestment of dividends and distributions | | 9,940 | | | | 51,887 | | | 378,470 | | | | 3,599,258 | |
| | | | | | | | | | | | | | |
Total issued | | 169,068 | | | | 926,089 | | | 580,113 | | | | 5,356,822 | |
Shares redeemed | | (251,747 | ) | | | (1,376,297 | ) | | (762,411 | ) | | | (7,077,882 | ) |
| | | | | | | | | | | | | | |
Net decrease | | (82,679 | ) | | $ | (450,208 | ) | | (182,298 | ) | | $ | (1,721,060 | ) |
| | | | | | | | | | | | | | |
| | | | | | |
36 | | SEMI-ANNUAL REPORT | | MARCH 31, 2009 | | |
Notes to Financial Statements (concluded)
| | | | | | | | | | | | | | |
| | | Six Months Ended
March 31, 2009 | | | Year Ended
September 30, 2008 | |
Small Cap Value Equity (concluded) | | Shares | | | Amount | | | Shares | | | Amount | |
Investor B | | | | | | | | | | | | | | |
Shares sold | | 8,346 | | | $ | 38,086 | | | 9,284 | | | $ | 69,936 | |
Shares issued in reinvestment of dividends and distributions | | 1,112 | | | | 4,659 | | | 89,449 | | | | 687,867 | |
| | | | | | | | | | | | | | |
Total issued | | 9,458 | | | | 42,745 | | | 98,733 | | | | 757,803 | |
Shares redeemed | | (102,747 | ) | | | (458,453 | ) | | (264,918 | ) | | | (1,915,386 | ) |
| | | | | | | | | | | | | | |
Net decrease | | (93,289 | ) | | $ | (415,708 | ) | | (166,185 | ) | | $ | (1,157,583 | ) |
| | | | | | | | | | | | | | |
Investor C | | | | | | | | | | | | | | |
Shares sold | | 81,718 | | | $ | 349,149 | | | 10,417 | | | $ | 76,592 | |
Shares issued in reinvestment of dividends and distributions | | 1,425 | | | | 5,940 | | | 75,079 | | | | 575,118 | |
| | | | | | | | | | | | | | |
Total issued | | 83,143 | | | | 355,089 | | | 85,496 | | | | 651,710 | |
Shares redeemed | | (101,400 | ) | | | (450,581 | ) | | (115,083 | ) | | | (837,345 | ) |
| | | | | | | | | | | | | | |
Net decrease | | (18,257 | ) | | $ | (95,492 | ) | | (29,587 | ) | | $ | (185,635 | ) |
| | | | | | | | | | | | | | |
There is a 2% redemption fee on shares of certain Portfolios redeemed or exchanged which have been held for 30 days or less. The redemption fees are collected and retained by the Portfolio for the benefit of the remaining shareholders. The redemption fees are recorded as a credit to paid-in capital.
| | | | | | |
| | | SEMI-ANNUAL REPORT | | MARCH 31, 2009 | | 37 |
Officers and Trustees
Ronald W. Forbes, Co-Chairman of the Board and Trustee
Rodney D. Johnson, Co-Chairman of the Board and Trustee
David O. Beim, Trustee
Dr. Matina Horner, Trustee
Herbert I. London, Member of the Audit Committee and Trustee
Cynthia A. Montgomery, Trustee
Joseph P. Platt, Jr., Trustee
Robert C. Robb, Jr., Trustee
Toby Rosenblatt, Trustee
Kenneth L. Urish, Chairman of the Audit Committee and Trustee
Frederick W. Winter, Member of the Audit Committee and Trustee
Richard S. Davis, Trustee
Henry Gabbay, Trustee
Donald C. Burke, Fund President and Chief Executive Officer
Anne F. Ackerley, Vice President
Neal J. Andrews, Chief Financial Officer
Jay M. Fife, Treasurer
Brian P. Kindelan, Chief Compliance Officer of the Fund
Howard Surloff, Secretary
Investment Advisor and Co-Administrator
BlackRock Advisors, LLC
Wilmington, DE 19809
Custodian
PFPC Trust Company
Philadelphia, PA 19153
Co-Administrator and Transfer Agent
PNC Global Investment Servicing (U.S.) Inc.
Wilmington, DE 19809
Distributor
BlackRock Investments, LLC
New York, NY 10022
Legal Counsel
Sidley Austin LLP
New York, NY 10019
Independent Registered Public Accounting Firm
Deloitte & Touche LLP
Philadelphia, PA 19103
Address of the Portfolios
100 Bellevue Parkway
Wilmington, DE 19809
| | | | | | |
38 | | SEMI-ANNUAL REPORT | | MARCH 31, 2009 | | |
Additional Information
BlackRock Privacy Principles
BlackRock is committed to maintaining the privacy of its current and former fund investors and individual clients (collectively, “Clients”) and to safeguarding their non-public personal information. The following information is provided to help you understand what personal information BlackRock collects, how we protect that information and why in certain cases we share such information with select parties.
If you are located in a jurisdiction where specific laws, rules or regulations require BlackRock to provide you with additional or different privacy-related rights beyond what is set forth below, then BlackRock will comply with those specific laws, rules or regulations.
BlackRock obtains or verifies personal non-public information from and about you from different sources, including the following: (i) information we receive from you or, if applicable, your financial intermediary, on applications, forms or other documents; (ii) information about your transactions with us, our affiliates, or others; (iii) information we receive from a consumer reporting agency; and (iv) from visits to our websites.
BlackRock does not sell or disclose to non-affiliated third parties any non-public personal information about its Clients, except as permitted by law or as is necessary to respond to regulatory requests or to service Client accounts. These non-affiliated third parties are required to protect the confidentiality and security of this information and to use it only for its intended purpose.
We may share information with our affiliates to service your account or to provide you with information about other BlackRock products or services that may be of interest to you. In addition, BlackRock restricts access to non-public personal information about its Clients to those BlackRock employees with a legitimate business need for the information. BlackRock maintains physical, electronic and procedural safeguards that are designed to protect the non-public personal information of its Clients, including procedures relating to the proper storage and disposal of such information.
Availability of Additional Information
Electronic copies of most financial reports and prospectuses are available on the Fund’s website or shareholders can sign up for e-mail notifications of quarterly statements, annual and semi-annual reports and prospectuses by enrolling in the Fund’s electronic delivery program.
To enroll:
Shareholders Who Hold Accounts with Investment Advisors, Banks or Brokerages:
Please contact your financial advisor. Please note that not all investment advisors, banks or brokerages may offer this service.
Shareholders Who Hold Accounts Directly With BlackRock
| 1) | Access the BlackRock website at |
http://www.blackrock.com/edelivery
��
| 2) | Click on the applicable link and follow the steps to sign up |
Householding
The Fund will mail only one copy of shareholder documents, including prospectuses, annual and semi-annual reports and proxy statements, to shareholders with multiple accounts at the same address. This practice is commonly called “householding” and it is intended to reduce expenses and eliminate duplicate mailings of shareholder documents. Mailings of your shareholder documents may be householded indefinitely unless you instruct us otherwise. If you do not want the mailing of these documents to be combined with those for other members of your household, please contact the Fund at (800) 441-7762.
| | | | | | |
| | | SEMI-ANNUAL REPORT | | MARCH 31, 2009 | | 39 |
Additional Information (concluded)
Availability of Additional Information (concluded)
Availability of Proxy Voting Policies and Procedures
A description of the policies and procedures that the Fund uses to determine how to vote proxies relating to portfolio securities is available (1) without charge, upon request by calling (800) 441-7762; (2) at www.blackrock.com; and (3) on the Securities and Exchange Commission’s (the “SEC”) website at http://www.sec.gov.
Availability of Proxy Voting Record
Information about how the Fund votes proxies relating to securities held in the Fund’s portfolios during the most recent 12-month period ended June 30th is available upon request and without charge (1) at www.blackrock.com or by calling (800) 441-7762 (2) on the SEC’s website at http://www.sec.gov.
Availability of Quarterly Portfolio Schedule
The Fund files its complete schedule of portfolio holdings with the SEC for the first and third quarters of each fiscal year on Form N-Q. The Fund’s Forms N-Q are available on the SEC’s website at http:// www.sec.gov and may also be reviewed and copied at the SEC’s Public Reference Room in Washington, D.C. Information on the operation of the Public Reference Room may be obtained by calling (800) SEC-0330. The Fund’s Forms N-Q may also be obtained upon request and without charge by calling (800) 441-7762.
Shareholder Privileges
Account Information
Call us at (800) 441-7762 from 8:00 AM to 6:00 PM EST Monday through Friday to get information about your account balances, recent transactions and share prices. You can also reach us on the Web at www.blackrock.com/funds.
Automatic Investment Plans
Investor Class shareholders who want to invest regularly can arrange to have $50 or more automatically deducted from their checking or savings account and invested in any of the BlackRock portfolios.
Systematic Withdrawal Plan
Investor Class shareholders can establish a systematic withdrawal plan and receive periodic payments of $50 or more from their BlackRock portfolios, as long as their account is at least $10,000.
Retirement Plans
Shareholders may make investments in conjunction with Traditional, Rollover, Roth, Coverdell, Simple IRA’s, SEP IRA’s and 403(b) Plans.
| | | | | | |
40 | | SEMI-ANNUAL REPORT | | MARCH 31, 2009 | | |
A World-Class Mutual Fund Family
BlackRock offers a diverse lineup of open-end mutual funds crossing all investment styles and managed by experts in equity, fixed income and tax-exempt investing.
| | | | |
Equity Funds | | | | |
| | |
BlackRock All-Cap Energy & Resources Portfolio | | BlackRock Global Opportunities Portfolio | | BlackRock Mid-Cap Value Equity Portfolio |
BlackRock Asset Allocation Portfolio† | | BlackRock Global SmallCap Fund | | BlackRock Mid Cap Value Opportunities Fund |
BlackRock Aurora Portfolio | | BlackRock Health Sciences Opportunities Portfolio | | BlackRock Natural Resources Trust |
BlackRock Balanced Capital Fund† | | BlackRock Healthcare Fund | | BlackRock Pacific Fund |
BlackRock Basic Value Fund | | BlackRock Index Equity Portfolio* | | BlackRock Science & Technology Opportunities Portfolio |
BlackRock Capital Appreciation Portfolio | | BlackRock International Fund | | BlackRock Small Cap Core Equity Portfolio |
BlackRock Energy & Resources Portfolio | | BlackRock International Diversification Fund | | BlackRock Small Cap Growth Equity Portfolio |
BlackRock Equity Dividend Fund | | BlackRock International Index Fund | | BlackRock Small Cap Growth Fund II |
BlackRock EuroFund | | BlackRock International Opportunities Portfolio | | BlackRock Small Cap Index Fund |
BlackRock Focus Growth Fund | | BlackRock International Value Fund | | BlackRock Small Cap Value Equity Portfolio* |
BlackRock Focus Value Fund | | BlackRock Large Cap Core Fund | | BlackRock Small/Mid-Cap Growth Portfolio |
BlackRock Fundamental Growth Fund | | BlackRock Large Cap Core Plus Fund | | BlackRock S&P 500 Index Fund |
BlackRock Global Allocation Fund† | | BlackRock Large Cap Growth Fund | | BlackRock U.S. Opportunities Portfolio |
BlackRock Global Dynamic Equity Fund | | BlackRock Large Cap Value Fund | | BlackRock Utilities and Telecommunications Fund |
BlackRock Global Emerging Markets Fund | | BlackRock Latin America Fund | | BlackRock Value Opportunities Fund |
BlackRock Global Financial Services Fund | | BlackRock Mid-Cap Growth Equity Portfolio | | |
BlackRock Global Growth Fund | | | | |
| | |
Fixed Income Funds | | | | |
| | |
BlackRock Bond Portfolio | | BlackRock Income Builder Portfolio | | BlackRock Short-Term Bond Fund |
BlackRock Emerging Market Debt Portfolio | | BlackRock Inflation Protected Bond Portfolio | | BlackRock Strategic Income Portfolio |
BlackRock Enhanced Income Portfolio | | BlackRock Intermediate Government Bond Portfolio | | BlackRock Total Return Fund |
BlackRock GNMA Portfolio | | BlackRock International Bond Portfolio | | BlackRock Total Return Portfolio II |
BlackRock Government Income Portfolio | | BlackRock Long Duration Bond Portfolio | | BlackRock World Income Fund |
BlackRock High Income Fund | | BlackRock Low Duration Bond Portfolio | | |
BlackRock High Yield Bond Portfolio | | BlackRock Managed Income Portfolio | | |
BlackRock Income Portfolio | | | | |
| | |
Municipal Bond Funds | | | | |
| | |
BlackRock AMT-Free Municipal Bond Portfolio | | BlackRock Kentucky Municipal Bond Portfolio | | BlackRock New York Municipal Bond Fund |
BlackRock California Municipal Bond Fund | | BlackRock Municipal Insured Fund | | BlackRock Ohio Municipal Bond Portfolio |
BlackRock Delaware Municipal Bond Portfolio | | BlackRock National Municipal Fund | | BlackRock Pennsylvania Municipal Bond Fund |
BlackRock High Yield Municipal Fund | | BlackRock New Jersey Municipal Bond Fund | | BlackRock Short-Term Municipal Fund |
BlackRock Intermediate Municipal Fund | | | | |
| | |
Target Risk & Target Date Funds | | | | |
| | |
BlackRock Prepared Portfolios | | BlackRock Lifecycle Prepared Portfolios | | |
Conservative Prepared Portfolio | | Prepared Portfolio 2010 | | Prepared Portfolio 2030 |
Moderate Prepared Portfolio | | Prepared Portfolio 2015 | | Prepared Portfolio 2035 |
Growth Prepared Portfolio | | Prepared Portfolio 2020 | | Prepared Portfolio 2040 |
Aggressive Growth Prepared Portfolio | | Prepared Portfolio 2025 | | Prepared Portfolio 2045 |
| | | | Prepared Portfolio 2050 |
| * | See the prospectus for information on specific limitations on investments in the fund. |
BlackRock mutual funds are distributed by BlackRock Investments, LLC. You should consider the investment objectives, risks, charges and expenses of the funds under consideration carefully before investing. Each fund’s prospectus contains this and other information and is available at www.blackrock.com or by calling (800) 882-0052 or from your financial advisor. The prospectus should be read carefully before investing.
| | | | | | |
| | | SEMI-ANNUAL REPORT | | MARCH 31, 2009 | | 41 |
[THIS PAGE INTENTIONALLY LEFT BLANK.]
[THIS PAGE INTENTIONALLY LEFT BLANK.]

This report is transmitted to shareholders only. It is not authorized for use as an offer of sale or a solicitation of an offer to buy shares of the Portfolios unless accompanied or preceded by the Portfolios’ current prospectus. Past performance results shown in this report should not be considered a representation of future performance. Investment returns and principal value of shares will fluctuate so that shares, when redeemed, may be worth more or less than their original cost. Statements and other information herein are as dated and are subject to change.

EQUITY3-3/09-SAR
EQUITIES FIXED INCOME REAL ESTATE LIQUIDITY ALTERNATIVES BLACKROCK SOLUTIONS
| | |
| BlackRock FundsSM | |  |
| SEMI-ANNUAL REPORT | MARCH 31, 2009 (UNAUDITED) | |
BlackRock Mid-Cap Growth Equity Portfolio
BlackRock Mid-Cap Value Equity Portfolio
BlackRock Small/Mid-Cap Growth Portfolio
NOT FDIC INSURED
MAY LOSE VALUE
NO BANK GUARANTEE
Table of Contents
| | | | | | |
2 | | SEMI-ANNUAL REPORT | | MARCH 31, 2009 | | |
A Letter to Shareholders
The past 12 months have been a period investors would like to forget, but instead will vividly remember, as the global financial crisis erupted into the worst recession in decades. Daily headlines recounted the downfalls of storied financial firms, volatile swings in the world’s financial markets and monumental government actions, including the recent passage of the nearly $800 billion American Recovery and Reinvestment Act of 2009.
The economic data generally deteriorated throughout the reporting period. US gross domestic product (“GDP”) contracted at an annual rate of 6.3% in the fourth quarter of 2008, and economic activity appears on pace to be negative in the first quarter of 2009 as well. The Federal Reserve Board (the “Fed”) took forceful action to revive the global economy and ailing financial system. In addition to slashing the federal funds target rate from 3.0% to a record low range of 0% to 0.25%, the central bank provided enormous cash infusions and radically expanded its balance sheet through a range of lending and acquisition programs.
Against this backdrop, US equities contended with high levels of volatility and posted steep losses, notwithstanding a powerful rally in the final month of the reporting period. International markets also experienced sharp downturns, with some regions declining as much or more than the United States. Risk aversion remained the dominant theme in fixed income markets, as investors sought out the haven of Treasury issues at the expense of virtually all other asset classes. High yield issues, in particular, faced unprecedented challenges and posted severe underperformance; that said, the sector pared its losses in the first quarter of 2009, as both liquidity and investor sentiment toward lower-quality debt improved. At the same time, the start of the new year brought somewhat of a return to normalcy for the tax-exempt market, which registered one of its worst years on record in 2008.
In all, investors continued to gravitate toward relative safety, as evidenced in the six- and 12-month returns of the major benchmark indexes:
| | | | | | |
Total Returns as of March 31, 2009 | | 6-month | | | 12-month | |
US equities (S&P 500 Index) | | (30.54 | )% | | (38.09 | )% |
Small cap US equities (Russell 2000 Index) | | (37.17 | ) | | (37.50 | ) |
International equities (MSCI Europe, Australasia, Far East Index) | | (31.11 | ) | | (46.50 | ) |
US Treasury securities (Merrill Lynch 10-Year US Treasury Index) | | 11.88 | | | 10.46 | |
Taxable fixed income (Barclays Capital US Aggregate Bond Index) | | 4.70 | | | 3.13 | |
Tax-exempt fixed income (Barclays Capital Municipal Bond Index) | | 5.00 | | | 2.27 | |
High yield bonds (Barclays Capital US Corporate High Yield 2% Issuer Capped Index) | | (12.65 | ) | | (18.56 | ) |
Past performance is no guarantee of future results. Index performance shown for illustrative purposes only. You cannot invest directly in an index.
Through periods of market turbulence, as ever, BlackRock’s full resources are dedicated to the management of our clients’ assets. We thank you for entrusting BlackRock with your investments and look forward to continuing to serve you in the months and years ahead.
|
| Sincerely, |
|
 |
Rob Kapito |
President, BlackRock Advisors, LLC |
Seeking additional investment insights?
Visit BlackRock’s award-winning Shareholder® magazine, now available exclusively online at www.blackrock.com/shareholdermagazine. In this issue:
| | • | | Discover why portfolio diversification still matters — even as nearly every financial asset class lost value over the past year. |
| | • | | Learn how adding commodities to a more traditional mix of assets can help you to balance risks and access new potential rewards. |
| | • | | Assuage your fears about higher taxes and discover how municipal bonds may offer some relief. |
| | • | | Find out if there’s still value to be found in dividend-paying stocks. |
THIS PAGE NOT PART OF YOUR FUND REPORT
| | |
| Portfolio Summary as of March 31, 2009 | | Mid-Cap Growth Equity Portfolio |
| |
Portfolio Management Commentary | | |
How did the Portfolio perform?
| | • | | The Portfolio underperformed the benchmark Russell Midcap Growth Index for the six-month period. |
What factors influenced performance?
| | • | | Weak stock selection in the energy and materials sectors was the primary detractor from overall returns during the period. Within energy, many exploration and production companies experienced significant declines as oil fell from more than $100/barrel at the beginning of the period to $50/barrel at period-end. Among these were holdings Massey Energy, Chesapeake Energy and Plains Exploration and Production. Services companies were also hit hard, as Superior Energy Services and National Oilwell Varco both sank more than 50%. Within the materials sector, chemical company Celanese plummeted 50% on weaker demand. Additionally, metals provider Century Aluminum fell more than 90% on concerns of possible bankruptcy after a collapse in aluminum prices on weaker global demand. |
| | • | | On the positive side, stock selection in the industrials and information technology (IT) sectors aided relative returns during the six months. Within industrials, electronic motor manufacturer AMETEK continued to execute with its diverse business in a difficult environment. Oil & gas database provider IHS also relatively outperformed within the industrials sector. In IT, semiconductor company Broadcom was up 7% on increased demand for its products surrounding 3G technology. Mortgage processing company Lender Processing Services also continued to experience growing volumes, as the company’s stock was flat for the period. Elsewhere in the Portfolio, education provider Apollo Group jumped 16% on increasing applications for secondary education. |
Describe recent Portfolio activity.
| | • | | There were no major changes made to the Portfolio during the period. Within the consumer discretionary sector, we incrementally added Burger King Holdings and Bed Bath & Beyond, while eliminating holdings in Apollo Group, Urban Outfitters and Orient-Express Hotels. |
Describe Portfolio positioning at period-end.
| | • | | At period-end, the Portfolio’s largest overweight relative to the benchmark was in the healthcare sector, and its most prominent underweight was in consumer staples. |
The views expressed reflect the opinions of BlackRock as of the date of this report and are subject to change based on changes in market, economic or other conditions. These views are not intended to be a forecast of future events and are no guarantee of future results.
Portfolio Profile as of March 31, 2009
| | | |
Ten Largest Holdings | | Percent of
Long-Term
Investments | |
AMETEK, Inc. | | 3 | % |
MEDNAX, Inc. | | 3 | |
GameStop Corp. - Class A | | 3 | |
Amdocs Ltd. | | 2 | |
Broadcom Corp. - Class A | | 2 | |
Lender Processing Services, Inc. | | 2 | |
PMC-Sierra, Inc. | | 2 | |
Quanta Services, Inc. | | 2 | |
MSCI, Inc. - Class A | | 2 | |
Scientific Games Corp. - Class A | | 2 | |
| | | |
Sector Allocation | | Percent of
Long-Term
Investments | |
Information Technology | | 25 | % |
Health Care | | 18 | |
Consumer Discretionary | | 17 | |
Industrials | | 16 | |
Energy | | 9 | |
Financials | | 5 | |
Materials | | 5 | |
Consumer Staples | | 2 | |
Telecommunication Services | | 2 | |
Exchange-Traded Funds | | 1 | |
For Portfolio compliance purposes, the Portfolio’s sector classifications refer to any one or more of the sector sub-classifications used by one or more widely recognized market indexes or ratings group indexes, and/or as defined by Portfolio management. This definition may not apply for purposes of this report, which may combine sector sub-classifications for reporting ease.
| | | | | | |
4 | | SEMI-ANNUAL REPORT | | MARCH 31, 2009 | | |
| | |
| | Mid-Cap Growth Equity Portfolio |
| |
Total Return Based on a $10,000 Investment | | |
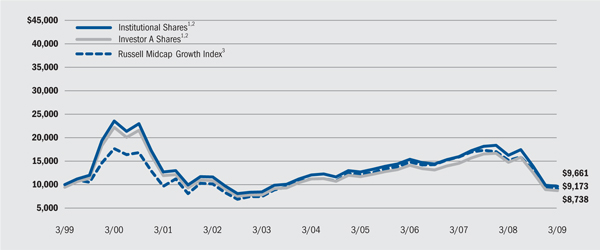
| 1 | Assuming maximum sales charge, if any, transaction costs and other operating expenses, including advisory fees. Institutional Shares do not have a sales charge. |
| 2 | The Portfolio normally invests at least 80% of its net assets in equity securities issued by US mid-capitalization growth companies which the portfolio management team believes have above-average earnings growth potential. |
| 3 | An index that consists of the bottom 800 securities of the Russell 1000 Index with greater-than-average growth orientation as ranked by total market capitalization. Securities in this index generally have higher price-to-book and price-to-earnings ratios, lower dividend yields and higher forecasted growth values. |
Past performance is not indicative of future results.
Performance Summary for the Period Ended March 31, 2009
| | | | | | | | | | | | | | | | | | | | | |
| | | 6-Month
Total Returns | | | Average Annual Total Returns4 | |
| | | 1 Year | | | 5 Years | | | 10 Years | |
| | | w/o sales
charge | | | w/ sales
charge | | | w/o sales
charge | | | w/ sales
charge | | | w/o sales
charge | | | w/ sales
charge | |
Institutional | | (30.59 | )% | | (40.65 | )% | | N/A | | | (4.42 | )% | | N/A | | | (0.34 | )% | | N/A | |
Service | | (30.60 | ) | | (40.64 | ) | | N/A | | | (4.67 | ) | | N/A | | | (0.61 | ) | | N/A | |
Investor A | | (30.65 | ) | | (40.80 | ) | | (43.91 | )% | | (4.85 | ) | | (5.87 | )% | | (0.81 | ) | | (1.34 | )% |
Investor B | | (30.96 | ) | | (41.31 | ) | | (43.95 | ) | | (5.56 | ) | | (5.94 | ) | | (1.39 | ) | | (1.39 | ) |
Investor C | | (30.96 | ) | | (41.31 | ) | | (41.90 | ) | | (5.56 | ) | | (5.56 | ) | | (1.54 | ) | | (1.54 | ) |
R | | (30.65 | ) | | (40.86 | ) | | N/A | | | (4.89 | ) | | N/A | | | (0.85 | ) | | N/A | |
Russell Midcap Growth Index | | (29.81 | ) | | (39.58 | ) | | N/A | | | (3.91 | ) | | N/A | | | (0.86 | ) | | N/A | |
| 4 | Assuming maximum sales charges. Average annual total returns with and without sales charges reflect reductions for distribution and service fees. See “About Portfolio Performance” on page 10 for a detailed description of share classes, including any related sales charges and fees. |
N/A - Not applicable as share class and index do not have a sales charge.
Past performance is not indicative of future results.
Expense Example
| | | | | | | | | | | | | | | | | | |
| | | Actual | | Hypothetical6 |
| | | Beginning
Account Value
October 1, 2008 | | Ending
Account Value
March 31, 2009 | | Expenses Paid
During the Period5 | | Beginning
Account Value
October 1, 2008 | | Ending
Account Value
March 31, 2009 | | Expenses Paid
During the Period5 |
Institutional | | $ | 1,000.00 | | $ | 694.10 | | $ | 5.11 | | $ | 1,000.00 | | $ | 1,018.89 | | $ | 6.11 |
Service | | $ | 1,000.00 | | $ | 694.00 | | $ | 6.21 | | $ | 1,000.00 | | $ | 1,017.58 | | $ | 7.42 |
Investor A | | $ | 1,000.00 | | $ | 693.50 | | $ | 6.67 | | $ | 1,000.00 | | $ | 1,017.02 | | $ | 7.98 |
Investor B | | $ | 1,000.00 | | $ | 690.40 | | $ | 9.82 | | $ | 1,000.00 | | $ | 1,013.24 | | $ | 11.76 |
Investor C | | $ | 1,000.00 | | $ | 690.40 | | $ | 9.82 | | $ | 1,000.00 | | $ | 1,013.24 | | $ | 11.76 |
R | | $ | 1,000.00 | | $ | 693.50 | | $ | 6.76 | | $ | 1,000.00 | | $ | 1,016.92 | | $ | 8.08 |
| 5 | For each class of the Portfolio, expenses are equal to the annualized expense ratio for the class (1.21% for Institutional, 1.47% for Service, 1.58% for Investor A, 2.33% for Investor B, 2.33% for Investor C and 1.60% for R), multiplied by the average account value over the period, multiplied by 182/365 (to reflect the one-half year period shown). |
| 6 | Hypothetical 5% annual return before expenses is calculated by pro-rating the number of days in the most recent fiscal half year divided by 365. |
See “Disclosure of Expenses” on page 11 for further information on how expenses were calculated.
| | | | | | |
| | | SEMI-ANNUAL REPORT | | MARCH 31, 2009 | | 5 |
| | |
| Portfolio Summary as of March 31, 2009 | | Mid-Cap Value Equity Portfolio |
| |
Portfolio Management Commentary | | |
How did the Portfolio perform?
| | • | | The Portfolio significantly outperformed the benchmark Russell Midcap Value Index for the six-month period. |
What factors influenced performance?
| | • | | Portfolio performance benefited from strong stock selection in financials, primarily among capital markets, insurance and diversified financial services names. Notable contributors included insurance companies W.R. Berkley and HCC Insurance Holdings, as well as CME Group, operator of the Chicago Mercantile Exchange. Additionally, an underweight in real estate investment trusts (REITs), which sold off sharply during the period, helped to minimize losses in the sector and boosted relative returns. |
| | • | | Allocation and positive stock selection, particularly among restaurants and specialty retailers, contributed to favorable performance comparisons in the consumer discretionary sector. Stock selection also benefited relative performance in the energy sector, where the Portfolio’s exploration & production holdings outperformed their benchmark counterparts during the six months. |
| | • | | Although an overweight in information technology (IT) added value to Portfolio performance, the negative impact of stock selection overshadowed these gains. Key areas of weakness included the computers & peripherals, IT services and communications equipment sub-sectors. |
| | • | | The Portfolio modestly underperformed in the materials and healthcare sectors, due primarily to poor stock selection within the containers & packaging and healthcare equipment & supplies sub-industries, respectively. |
Describe recent Portfolio activity.
| | • | | Although market volatility reached unprecedented levels during the six-month period, the Portfolio’s sector exposure remained fairly stable. Allocations to the consumer staples and utilities sectors increased modestly during the period, while consumer discretionary and industrials weightings declined. Within technology, we added to IT services and internet-related holdings. We also reduced exposure to machinery-related names in the industrials sector and chemicals producers in materials. |
Describe Portfolio positioning at period-end.
| | • | | At period-end, the Portfolio was overweight relative to the benchmark in IT, particularly within the electronic equipment & services and internet software & services sub-sectors, and industrials, most notably among commercial services names. Key underweights included financials, primarily REITs, thrifts & mortgage finance and commercial banks; utilities, particularly multi-utilities; and consumer discretionary, notably household durables and multiline retailers. |
The views expressed reflect the opinions of BlackRock as of the date of this report and are subject to change based on changes in market, economic or other conditions. These views are not intended to be a forecast of future events and are no guarantee of future results.
Portfolio Profile as of March 31, 2009
| | | |
Ten Largest Holdings | | Percent of
Long-Term
Investments | |
W.R. Berkley Corp. | | 2 | % |
The Travelers Cos., Inc | | 2 | |
HCC Insurance Holdings, Inc. | | 2 | |
PG&E Corp. | | 2 | |
AON Corp. | | 2 | |
AXIS Capital Holdings Ltd. | | 2 | |
The J.M. Smucker Co. | | 2 | |
Safeway, Inc. | | 2 | |
Wisconsin Energy Corp. | | 2 | |
The Hanover Insurance Group, Inc. | | 1 | |
| | | |
Sector Allocation | | Percent of
Long-Term
Investments | |
Financials | | 25 | % |
Utilities | | 13 | |
Information Technology | | 12 | |
Consumer Discretionary | | 12 | |
Consumer Staples | | 9 | |
Industrials | | 9 | |
Materials | | 7 | |
Health Care | | 7 | |
Energy | | 6 | |
For Portfolio compliance purposes, the Portfolio’s sector classifications refer to any one or more of the sector sub-classifications used by one or more widely recognized market indexes or ratings group indexes, and/or as defined by Portfolio management. This definition may not apply for purposes of this report, which may combine sector sub-classifications for reporting ease.
| | | | | | |
6 | | SEMI-ANNUAL REPORT | | MARCH 31, 2009 | | |
Mid-Cap Value Equity Portfolio
Total Return Based on a $10,000 Investment
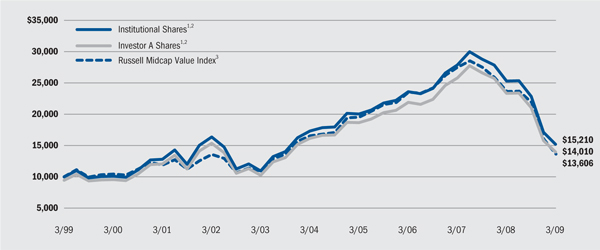
| 1 | Assuming maximum sales charge, if any, transaction costs and other operating expenses, including advisory fees. Institutional Shares do not have a sales charge. |
| 2 | The Portfolio normally invests at least 80% of its net assets in equity securities issued by US mid-capitalization value companies. |
| 3 | An index that consists of the bottom 800 securities of the Russell 1000 Index with less-than-average growth orientation as ranked by total market capitalization. Securities in this index generally have low price-to-book and price-to-earnings ratios, higher dividend yields and lower forecasted growth values. |
Past performance is not indicative of future results.
Performance Summary for the Period Ended March 31, 2009
| | | | | | | | | | | | | | | | | | | | | |
| | | | | | Average Annual Total Returns4 | |
| | | | | | 1 Year | | | 5 Years | | | 10 Years | |
| | | 6-Month Total
Returns | | | w / o sales
charge | | | w / sales
charge | | | w / o sales
charge | | | w / sales
charge | | | w / o sales
charge | | | w / sales
charge | |
Institutional | | (33.54 | )% | | (40.00 | )% | | N/A | | | (2.61 | )% | | N/A | | | 4.28 | % | | N/A | |
Service | | (33.64 | ) | | (40.13 | ) | | N/A | | | (2.87 | ) | | N/A | | | 3.99 | | | N/A | |
Investor A | | (33.54 | ) | | (40.11 | ) | | (43.23 | )% | | (2.86 | ) | | (3.90 | )% | | 3.99 | | | 3.43 | % |
Investor B | | (33.84 | ) | | (40.56 | ) | | (43.22 | ) | | (3.58 | ) | | (3.82 | ) | | 3.38 | | | 3.38 | |
Investor C | | (33.84 | ) | | (40.58 | ) | | (41.17 | ) | | (3.59 | ) | | (3.59 | ) | | 3.25 | | | 3.25 | |
Russell Midcap Value Index | | (37.87 | ) | | (42.51 | ) | | N/A | | | (3.81 | ) | | N/A | | | 3.13 | | | N/A | |
| 4 | Assuming maximum sales charges. Average annual total returns with and without sales charges reflect reductions for distribution and service fees. See “About Portfolio Performance” on page 10 for a detailed description of share classes, including any related sales charges and fees. |
N/A - Not applicable as share class and index do not have a sales charge.
Past performance is not indicative of future results.
Expense Example
| | | | | | | | | | | | | | | | | | |
| | | Actual | | Hypothetical6 |
| | | Beginning
Account Value
October 1, 2008 | | Ending
Account Value
March 31, 2009 | | Expenses Paid
During the Period5 | | Beginning
Account Value
October 1, 2008 | | Ending
Account Value
March 31, 2009 | | Expenses Paid
During the Period5 |
Institutional | | $ | 1,000.00 | | $ | 664.60 | | $ | 3.90 | | $ | 1,000.00 | | $ | 1,020.25 | | $ | 4.75 |
Service | | $ | 1,000.00 | | $ | 663.60 | | $ | 5.18 | | $ | 1,000.00 | | $ | 1,018.69 | | $ | 6.31 |
Investor A | | $ | 1,000.00 | | $ | 664.60 | | $ | 5.19 | | $ | 1,000.00 | | $ | 1,018.69 | | $ | 6.31 |
Investor B | | $ | 1,000.00 | | $ | 661.60 | | $ | 8.29 | | $ | 1,000.00 | | $ | 1,014.90 | | $ | 10.10 |
Investor C | | $ | 1,000.00 | | $ | 661.60 | | $ | 8.29 | | $ | 1,000.00 | | $ | 1,014.90 | | $ | 10.10 |
| 5 | For each class of the Portfolio, expenses are equal to the annualized expense ratio for the class (0.94% for Institutional, 1.25% for Service, 1.25% for Investor A, 2.00% for Investor B and 2.00% for Investor C), multiplied by the average account value over the period, multiplied by 182/365 (to reflect the one-half year period shown). |
| 6 | Hypothetical 5% annual return before expenses is calculated by pro-rating the number of days in the most recent fiscal half year divided by 365. |
See “Disclosure of Expenses” on page 11 for further information on how expenses were calculated.
| | | | | | |
| | | SEMI-ANNUAL REPORT | | MARCH 31, 2009 | | 7 |
| | |
| Portfolio Summary as of March 31, 2009 | | Small/Mid-Cap Growth Portfolio |
| |
Portfolio Management Commentary | | |
How did the Portfolio perform?
| | • | | The Portfolio underperformed the benchmark Russell 2500 Growth Index for the six-month period. |
What factors influenced performance?
| | • | | Poor stock selection within the healthcare and consumer discretionary sectors was the most significant detractor from relative returns during the six months. Within the healthcare sector, the healthcare equipment and supplies industry accounted for the majority of the Portfolio’s underperformance. Wright Medical Group, a manufacturer of hip and joint replacements, plummeted more than 50% on worries of decreased demand for its products. Additionally, ZOLL Medical dropped more than 50% on declining revenues for its defibrillator products. Within consumer discretionary, a position in Ticketmaster Entertainment was the most significant detractor in the group. The company’s stock sunk more than 65% after a potential acquisition with a competitor was met with resistance from federal regulators. Portfolio holding Orient-Express Hotels also severely declined after repeatedly refusing to participate in discussions with potential acquirers. |
| | • | | Positive relative contributors to performance included an overweight in information technology (IT) and good stock selection in industrials. Within IT, telecommunications equipment provider Neutral Tandem was up more than 30% on strong market share gains and its high earnings visibility business model, and call center company ExlService Holdings was flat for the period after posting a rally in the first quarter of 2009. Within industrials, outsourcing company Sykes Enterprises was a relative outperformer in a sector that was down more than 40% for the period. The outsourcing company continued to benefit from its broad, global economic footprint. Elsewhere in the Portfolio, newer holding Cogent Communications Group was up 5% on strength in demand for its fingerprint identification processors. |
Describe recent Portfolio activity.
| | • | | During the period, we slightly increased the Portfolio’s weighting in the IT and healthcare sectors, initiating positions in SRA International, Cogent Communications Group and MedAssets, among others. We reduced its weighting in the consumer discretionary and energy sectors, eliminating names Smith & Wesson Holding, Dolan Media and Massey Energy. |
Describe Portfolio positioning at period-end.
| | • | | At period-end, the Portfolio’s most significant overweight relative to the benchmark was in the IT sector, and its largest underweight was in consumer discretionary. |
The views expressed reflect the opinions of BlackRock as of the date of this report and are subject to change based on changes in market, economic or other conditions. These views are not intended to be a forecast of future events and are no guarantee of future results.
Portfolio Profile as of March 31, 2009
| | | |
Ten Largest Holdings | | Percent of
Long-Term
Investments | |
SkillSoft Plc - ADR | | 4 | % |
Sykes Enterprises, Inc. | | 3 | |
TiVo, Inc. | | 3 | |
Magellan Health Services, Inc. | | 2 | |
AMETEK, Inc. | | 2 | |
Neutral Tandem, Inc. | | 2 | |
IHS, Inc. - Class A | | 2 | |
SonicWALL, Inc. | | 2 | |
Blackboard, Inc. | | 2 | |
Scientific Games Corp. - Class A | | 2 | |
| | | |
Sector Allocation | | Percent of
Long-Term
Investments | |
Information Technology | | 33 | % |
Health Care | | 24 | |
Industrials | | 17 | |
Consumer Discretionary | | 10 | |
Financials | | 5 | |
Energy | | 4 | |
Materials | | 4 | |
Consumer Staples | | 3 | |
For Portfolio compliance purposes, the Portfolio’s sector classifications refer to any one or more of the sector sub-classifications used by one or more widely recognized market indexes or ratings group indexes, and/or as defined by Portfolio management. This definition may not apply for purposes of this report, which may combine sector sub-classifications for reporting ease.
| | | | | | |
8 | | SEMI-ANNUAL REPORT | | MARCH 31, 2009 | | |
Small/Mid-Cap Growth Portfolio
Total Return Based on a $10,000 Investment
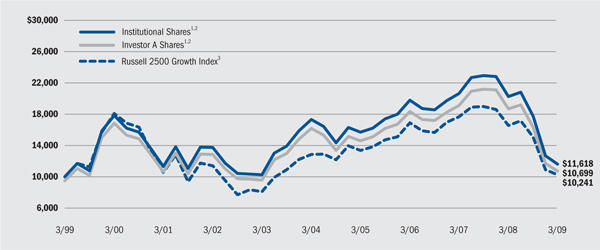
| 1 | Assuming maximum sales charge, if any, transaction costs and other operating expenses, including advisory fees. Institutional Shares do not have a sales charge. |
| 2 | Under normal market conditions, the Portfolio invests at least 80% of total assets in small-capitalization and mid-capitalization companies. |
| 3 | An index composed of the Russell 2500 companies with higher price-to-book ratios and higher forecasted growth values. Past performance is not indicative of future results. |
Performance Summary for the Period Ended March 31, 2009
| | | | | | | | | | | | | | | | | | | | | |
| | | | | | Average Annual Total Returns4 | |
| | | | | | 1 Year | | | 5 Years | | | 10 Years | |
| | | 6-Month
Total Returns | | | w / o sales
charge | | | w / sales
charge | | | w / o sales
charge | | | w / sales
charge | | | w / o sales
charge | | | w / sales
charge | |
Institutional | | (34.52 | )% | | (42.64 | )% | | N/A | | | (7.67 | )% | | N/A | | | 1.51 | % | | N/A | |
Investor A | | (34.62 | ) | | (42.77 | ) | | (45.78 | )% | | (7.92 | ) | | (8.91 | )% | | 1.22 | | | 0.68 | % |
Investor B | | (34.86 | ) | | (43.19 | ) | | (45.75 | ) | | (8.62 | ) | | (8.89 | ) | | 0.65 | | | 0.65 | |
Investor C | | (34.82 | ) | | (43.15 | ) | | (43.72 | ) | | (8.62 | ) | | (8.62 | ) | | 0.51 | | | 0.51 | |
R | | (34.71 | ) | | (42.91 | ) | | N/A | | | (8.17 | ) | | N/A | | | 0.92 | | | N/A | |
Russell 2500 Growth Index | | (32.09 | ) | | (38.14 | ) | | N/A | | | (4.46 | ) | | N/A | | | 0.24 | | | N/A | |
| 4 | Assuming maximum sales charges. Average annual total returns with and without sales charges reflect reductions for distribution and service fees. See “About Portfolio Performance” on page 10 for a detailed description of share classes, including any related sales charges and fees. |
N/A—Not applicable as share class and index do not have a sales charge. Past performance is not indicative of future results.
Expense Example
| | | | | | | | | | | | | | | | | | |
| | | Actual | | Hypothetical6 |
| | | Beginning
Account Value
October 1, 2008 | | Ending
Account Value
March 31, 2009 | | Expenses Paid
During the Period5 | | Beginning
Account Value
October 1, 2008 | | Ending
Account Value
March 31, 2009 | | Expenses Paid
During the Period5 |
Institutional | | $ | 1,000.00 | | $ | 654.80 | | $ | 4.54 | | $ | 1,000.00 | | $ | 1,019.45 | | $ | 5.55 |
Investor A | | $ | 1,000.00 | | $ | 653.80 | | $ | 5.57 | | $ | 1,000.00 | | $ | 1,018.18 | | $ | 6.82 |
Investor B | | $ | 1,000.00 | | $ | 651.40 | | $ | 8.65 | | $ | 1,000.00 | | $ | 1,014.40 | | $ | 10.60 |
Investor C | | $ | 1,000.00 | | $ | 651.80 | | $ | 8.65 | | $ | 1,000.00 | | $ | 1,014.40 | | $ | 10.60 |
R | | $ | 1,000.00 | | $ | 652.90 | | $ | 6.72 | | $ | 1,000.00 | | $ | 1,016.77 | | $ | 8.23 |
| 5 | For each class of the Portfolio, expenses are equal to the annualized expense ratio for the class (1.10% for Institutional, 1.35% for Investor A, 2.10% Investor B, 2.10% for Investor C and 1.63% for R), multiplied by the average account value over the period, multiplied by 182/365 (to reflect the one-half year period shown). |
| 6 | Hypothetical 5% annual return before expenses is calculated by pro-rating the number of days in the most recent fiscal half year divided by 365. See “Disclosure of Expenses” on page 11 for further information on how expenses were calculated. |
| | | | | | |
| | | SEMI-ANNUAL REPORT | | MARCH 31, 2009 | | 9 |
About Portfolio Performance
| | • | | Institutional Shares are not subject to any sales charge (front-end load) or deferred sales charge and are available only to eligible investors. These shares bear no ongoing distribution or service fees. |
| | • | | Service Shares are not subject to any sales charge (front-end load) or deferred sales charge. These shares are subject to a service fee of 0.25% per year (but no distribution fee). |
| | • | | Investor A Shares incur a maximum initial sales charge (front-end load) of 5.25% and a service fee of 0.25% per year (but no distribution fee). |
| | • | | Investor B Shares are subject to a maximum contingent deferred sales charge of 4.50% declining to 0% after six years. In addition, these shares are subject to a distribution fee of 0.75% per year and a service fee of 0.25% per year. These shares automatically convert to Investor A Shares after approximately eight years. (There is no initial sales charge for automatic share conversions.) All returns for periods greater than eight years reflect this conversion. |
| | • | | Investor C Shares are subject to a 1.00% contingent deferred sales charge if redeemed within one year of purchase. In addition, these shares are subject to a distribution fee of 0.75% per year and a service fee of 0.25% per year. |
| | • | | R Shares are not subject to any initial sales charge (front-end load) or deferred sales charge. These shares are subject to a distribution fee of 0.25% per year and a service fee of 0.25% per year. R Shares are available only to certain retirement and other similar plans. |
Performance information reflects past performance and does not guarantee future results. Current performance may be lower or higher than the performance data quoted. Refer to www.blackrock.com/funds to obtain performance data current to the most recent month-end. Performance results do not reflect the deduction of taxes that a shareholder would pay on fund distributions or the redemption of fund shares. Each
Portfolio may charge a 2% redemption fee for sales or exchanges of shares within 30 days of purchase or exchange. Performance data does not reflect this potential fee. Figures shown in the performance tables on the previous pages assume reinvestment of all dividends and distributions, if any, at net asset value on the ex-dividend date. Investment return and principal value of shares will fluctuate so that shares, when redeemed, may be worth more or less than their original cost. Dividends paid to each class of shares will vary because of the different levels of service, distribution and transfer agency fees applicable to each class, which are deducted from the income available to be paid to shareholders.
The performance information on the previous pages include information for each class of each Portfolio since the commencement of operations of such Portfolio, rather than the date such class was introduced. Performance information for each class introduced after the commencement of operations of a Portfolio is therefore based on the performance history of a predecessor class adjusted to reflect the class specific fees applicable to each class at the time of the launch of such share class. This information may be considered when assessing a Portfolio’s performance, but does not represent the actual performance of this share class.
Performance for the Mid-Cap Value Equity and Small/Mid-Cap Growth Portfolios for the periods prior to January 31, 2005 is based on performance of certain former State Street Research mutual funds that reorganized with the Portfolios on that date.
The performance information also reflects fee waivers and reimbursements that subsidize and reduce the total operating expenses of each Portfolio. The Portfolios’ returns would have been lower if there were no such waivers and reimbursements. BlackRock Advisors, LLC is under no obligation to waive or continue waiving its fees after February 1, 2010.
| | | | | | |
10 | | SEMI-ANNUAL REPORT | | MARCH 31, 2009 | | |
Disclosure of Expenses
Shareholders of these Portfolios may incur the following charges: (a) expenses related to transactions, including sales charges and redemption fees; and (b) operating expenses, including advisory fees, service and distribution fees including 12b-1 fees, and other Portfolio expenses. The expense examples on the previous pages (which are based on a hypothetical investment of $1,000 invested on October 1, 2008 and held through March 31, 2009) are intended to assist shareholders both in calculating expenses based on an investment in each Portfolio and in comparing these expenses with similar costs of investing in other mutual funds.
The Expense Example tables provide information about actual account values and actual expenses. In order to estimate the expenses a shareholder paid during the period covered by this report, shareholders can divide their account value by $1,000 and then multiply the result by the number corresponding to their share class under the headings entitled “Expenses Paid During the Period.”
The tables also provide information about hypothetical account values and hypothetical expenses based on the Portfolios’ actual expense ratios and an assumed rate of return of 5% per year before expenses. In order to assist shareholders in comparing the ongoing expenses of investing in these Portfolios and other funds, compare the 5% hypothetical example with the 5% hypothetical examples that appear in other funds’ shareholder reports.
The expenses shown in the table are intended to highlight shareholders’ ongoing costs only and do not reflect any transactional expenses, such as sales charges, redemption fees or exchange fees. Therefore, the hypothetical table is useful in comparing ongoing expenses only, and will not help shareholders determine the relative total expenses of owning different funds. If these transactional expenses were included, shareholder expenses would have been higher.
| | | | | | |
| | | SEMI-ANNUAL REPORT | | MARCH 31, 2009 | | 11 |
| | |
| Schedule of Investments March 31, 2009 (Unaudited) | | Mid-Cap Growth Equity Portfolio |
| | (Percentages shown are based on Net Assets) |
| | | | | |
| | | Shares | | Value |
Common Stocks | | | | | |
Aerospace & Defense — 4.1% | | | | | |
BE Aerospace, Inc.(a) | | 301,400 | | $ | 2,613,138 |
Goodrich Corp. | | 74,900 | | | 2,837,961 |
Precision Castparts Corp. | | 22,100 | | | 1,323,790 |
| | | | | |
| | | | | 6,774,889 |
| | | | | |
Biotechnology — 0.9% | | | | | |
Martek Biosciences Corp.(b) | | 82,000 | | | 1,496,500 |
| | | | | |
Capital Markets — 1.3% | | | | | |
Invesco Ltd. | | 153,907 | | | 2,133,151 |
| | | | | |
Chemicals — 3.7% | | | | | |
Agrium, Inc.(b) | | 58,400 | | | 2,090,136 |
Airgas, Inc. | | 39,600 | | | 1,338,876 |
Celanese Corp. - Series A | | 203,700 | | | 2,723,469 |
| | | | | |
| | | | | 6,152,481 |
| | | | | |
Commercial Banks — 0.7% | | | | | |
KeyCorp | | 148,200 | | | 1,166,334 |
| | | | | |
Commercial Services & Supplies — 1.5% | | | | | |
Iron Mountain, Inc.(a) | | 113,200 | | | 2,509,644 |
| | | | | |
Communications Equipment — 0.9% | | | | | |
Harris Corp. | | 49,781 | | | 1,440,662 |
| | | | | |
Construction & Engineering — 2.2% | | | | | |
Quanta Services, Inc.(a) | | 167,900 | | | 3,601,455 |
| | | | | |
Containers & Packaging — 0.9% | | | | | |
Rock-Tenn Co. - Class A | | 53,100 | | | 1,436,355 |
| | | | | |
Diversified Financial Services — 3.1% | | | | | |
CME Group, Inc. | | 6,400 | | | 1,576,896 |
MSCI, Inc. - Class A(a) | | 211,100 | | | 3,569,701 |
| | | | | |
| | | | | 5,146,597 |
| | | | | |
Electrical Equipment — 2.8% | | | | | |
AMETEK, Inc. | | 149,900 | | | 4,687,373 |
| | | | | |
Electronic Equipment, Instruments & Components — 1.4% | | | | | |
Amphenol Corp. - Class A | | 84,100 | | | 2,396,009 |
| | | | | |
Energy Equipment & Services — 3.5% | | | | | |
Noble Corp. | | 101,000 | | | 2,433,090 |
Superior Energy Services, Inc.(a) | | 108,800 | | | 1,402,432 |
Weatherford International Ltd.(a) | | 173,900 | | | 1,925,073 |
| | | | | |
| | | | | 5,760,595 |
| | | | | |
Health Care Equipment & Supplies — 3.2% | | | | | |
Hologic, Inc.(a) | | 187,900 | | | 2,459,611 |
ResMed, Inc.(a) | | 79,500 | | | 2,809,530 |
| | | | | |
| | | | | 5,269,141 |
| | | | | |
Health Care Providers & Services — 9.5% | | | | | |
AmerisourceBergen Corp. | | 64,500 | | | 2,106,570 |
Laboratory Corp. of America Holdings(a) | | 35,000 | | | 2,047,150 |
Lincare Holdings, Inc.(a) | | 87,700 | | | 1,911,860 |
Magellan Health Services, Inc.(a) | | 74,000 | | | 2,696,560 |
Medco Health Solutions, Inc.(a) | | 70,900 | | | 2,931,006 |
MEDNAX, Inc.(a) | | 142,800 | | | 4,208,316 |
| | | | | |
| | | | | 15,901,462 |
| | | | | |
Hotels, Restaurants & Leisure — 7.3% | | | | | |
Burger King Holdings, Inc. | | 125,400 | | | 2,877,930 |
Darden Restaurants, Inc. | | 99,600 | | | 3,412,296 |
Panera Bread Co. - Class A(a)(b) | | 41,200 | | | 2,303,080 |
Scientific Games Corp. - Class A(a) | | 293,000 | | | 3,548,230 |
| | | | | |
| | | | | 12,141,536 |
| | | | | |
Household Durables — 1.0% | | | | | |
NVR, Inc.(a) | | 3,900 | | | 1,668,225 |
| | | | | |
Household Products — 1.4% | | | | | |
Church & Dwight Co., Inc. | | 46,100 | | | 2,407,803 |
| | | | | |
IT Services — 6.3% | | | | | |
Genpact Ltd.(a) | | 346,000 | | | 3,065,560 |
Lender Processing Services, Inc. | | 125,900 | | | 3,853,799 |
SAIC, Inc.(a) | | 95,600 | | | 1,784,852 |
TeleTech Holdings, Inc.(a) | | 157,600 | | | 1,716,264 |
| | | | | |
| | | | | 10,420,475 |
| | | | | |
Life Sciences Tools & Services — 1.3% | | | | | |
Thermo Fisher Scientific, Inc.(a) | | 61,900 | | | 2,207,973 |
| | | | | |
Machinery — 3.5% | | | | | |
IDEX Corp. | | 126,700 | | | 2,770,929 |
Joy Global, Inc. | | 91,700 | | | 1,953,210 |
Oshkosh Corp. | | 173,100 | | | 1,166,694 |
| | | | | |
| | | | | 5,890,833 |
| | | | | |
Media — 2.8% | | | | | |
CKX, Inc.(a) | | 353,000 | | | 1,447,300 |
DreamWorks Animation SKG, Inc. - Class A(a) | | 146,400 | | | 3,168,096 |
| | | | | |
| | | | | 4,615,396 |
| | | | | |
Metals & Mining — 0.2% | | | | | |
Century Aluminum Co.(a) | | 147,757 | | | 311,767 |
| | | | | |
Oil, Gas & Consumable Fuels — 5.7% | | | | | |
Chesapeake Energy Corp. | | 109,000 | | | 1,859,540 |
CONSOL Energy, Inc. | | 93,700 | | | 2,364,988 |
Massey Energy Co. | | 89,100 | | | 901,692 |
Plains Exploration & Production Co.(a) | | 90,700 | | | 1,562,761 |
Ultra Petroleum Corp.(a) | | 37,900 | | | 1,360,231 |
The Williams Cos., Inc. | | 122,000 | | | 1,388,360 |
| | | | | |
| | | | | 9,437,572 |
Personal Products — 0.7% | | | | | |
Avon Products, Inc. | | 62,100 | | | 1,194,183 |
| | | | | |
Portfolios Abbreviations
| | | | |
| To simplify the listings of portfolio holdings in the Schedules of Investments, the names of certain securities have been abbreviated according to the list on the right. | | ADR | | American Depository Receipts |
| | | | | | |
12 | | SEMI-ANNUAL REPORT | | MARCH 31, 2009 | | |
| | |
| Schedule of Investments (concluded) | | Mid-Cap Growth Equity Portfolio |
| | (Percentages shown are based on Net Assets) |
| | | | | | |
| | | Shares | | Value | |
Common Stocks | | | | | | |
Pharmaceuticals — 3.0% | | | | | | |
Medicis Pharmaceutical Corp. - Class A | | 126,400 | | $ | 1,563,568 | |
Shire Plc - ADR | | 95,356 | | | 3,427,095 | |
| | | | | | |
| | | | | 4,990,663 | |
| | | | | | |
Professional Services — 1.7% | | | | | | |
IHS, Inc. - Class A(a) | | 70,100 | | | 2,886,718 | |
| | | | | | |
Semiconductors & Semiconductor Equipment — 6.4% | | | | | | |
Broadcom Corp. - Class A(a) | | 199,500 | | | 3,986,010 | |
Lam Research Corp.(a) | | 127,000 | | | 2,891,790 | |
PMC-Sierra, Inc.(a) | | 598,600 | | | 3,819,068 | |
| | | | | | |
| | | | | 10,696,868 | |
| | | | | | |
Software — 9.0% | | | | | | |
Adobe Systems, Inc.(a) | | 141,300 | | | 3,022,407 | |
Amdocs Ltd.(a) | | 219,300 | | | 4,061,436 | |
Ansys, Inc.(a) | | 38,400 | | | 963,840 | |
CA, Inc. | | 98,200 | | | 1,729,302 | |
Intuit, Inc.(a) | | 120,500 | | | 3,253,500 | |
Salesforce.com, Inc.(a) | | 61,200 | | | 2,003,076 | |
| | | | | | |
| | | | | 15,033,561 | |
| | | | | | |
Specialty Retail — 5.4% | | | | | | |
Bed Bath & Beyond, Inc.(a) | | 92,200 | | | 2,281,950 | |
GameStop Corp. - Class A(a) | | 149,300 | | | 4,183,386 | |
TJX Cos., Inc. | | 101,600 | | | 2,605,024 | |
| | | | | | |
| | | | | 9,070,360 | |
| | | | | | |
Textiles, Apparel & Luxury Goods — 0.6% | | | | | | |
Lululemon Athletica, Inc.(a)(b) | | 107,200 | | | 928,352 | |
| | | | | | |
Wireless Telecommunication Services — 1.3% | | | | | | |
American Tower Corp. - Class A(a) | | 73,900 | | | 2,248,777 | |
| | | | | | |
Total Common Stocks — 97.3% | | | | | 162,023,710 | |
| | | | | | |
Exchange-Traded Funds — 1.0% | | | | | | |
iShares Russell Midcap Growth Index Fund | | 58,600 | | | 1,763,860 | |
| | | | | | |
Total Long-Term Investments
(Cost — $218,767,121) — 98.3% | | | | | 163,787,570 | |
| | | | | | |
| | |
| | | Shares/
Beneficial
Interest | | | |
Short-Term Securities | | | | | | |
BlackRock Liquidity Funds, TempFund, | | | | | | |
0.60%(c)(d) | | 3,181,647 | | | 3,181,647 | |
| | | | | | |
BlackRock Liquidity Series, LLC Money Market | | | | | | |
Series, 1.17%(d)(e) | | 5,261,000 | | | 5,261,000 | |
| | | | | | |
Total Short-Term Securities
(Cost — $8,442,647) — 5.1% | | | | | 8,442,647 | |
| | | | | | |
Total Investments
(Cost — $227,209,768*) — 103.4% | | | | | 172,230,217 | |
Liabilities in Excess of Other Assets — (3.4)% | | | | | (5,667,575 | ) |
| | | | | | |
Net Assets — 100.0% | | | | $ | 166,562,642 | |
| | | | | | |
| * | The cost and unrealized appreciation (depreciation) of investments as of March 31, 2009, as computed for federal income tax purposes, were as follows: |
| | | | |
Aggregate cost | | $ | 234,493,492 | |
| | | | |
Gross unrealized appreciation | | $ | 11,145,351 | |
Gross unrealized depreciation | | | (73,408,626 | ) |
| | | | |
Net unrealized depreciation | | $ | (62,263,275 | ) |
| | | | |
| (a) | Non-income producing security. |
| (b) | Security, or a portion of security, is on loan. |
| (c) | Investments in companies considered to be an affiliate of the Portfolio, for purposes of Section 2(a)(3) of the Investment Company Act of 1940, as amended, were as follows: |
| | | | | | | |
Affiliate | | Net Activity | | | Income |
BlackRock Liquidity Funds, TempFund | | $ | 3,181,647 | ** | | $ | 4,933 |
BlackRock Liquidity Series, LLC Money Market Series | | $ | (15,210,900 | )*** | | $ | 80,758 |
| ** | Represents net purchase cost. |
| *** | Represents net sales cost. |
| (d) | Represents current yield as of report date. |
| (e) | Security purchased with the cash proceeds from securities loans. |
| • | | For Portfolio compliance purposes, the Portfolio’s industry classifications refer to any one or more of the industry sub-classifications used by one or more widely recognized market indexes or ratings group indexes, and/or as defined by Portfolio management. This definition may not apply for purposes of this report, which may combine industry sub-classifications for reporting ease. |
| • | | Effective October 1, 2008, the Portfolio adopted Financial Accounting Standards Board Statement of Financial Accounting Standards No. 157, “Fair Value Measurements” (“FAS 157”). FAS 157 clarifies the definition of fair value, establishes a framework for measuring fair values and requires additional disclosures about the use of fair value measurements. Various inputs are used in determining the fair value of investments, which are as follows: |
| | • | | Level 1 – price quotations in active markets/exchanges for identical securities |
| | • | | Level 2 – other observable inputs (including, but not limited to: quoted prices for similar assets or liabilities in markets that are active, quoted prices for identical or similar assets in markets that are not active, inputs other than quoted prices that are observable for the assets or liabilities (such as interest rates, yield curves, volatilities, prepayment speeds, loss severities, credit risks and default rates) or other market – corroborated inputs) |
| | • | | Level 3 – unobservable inputs based on the best information available in the circumstance, to the extent observable inputs are not available (including the Portfolio’s own assumptions used in determining the fair value of investments). |
The inputs or methodology used for valuing securities are not necessarily an indication of the risk associated with investing in those securities. For information about the Portfolio’s policy regarding valuation of investments and other significant accounting policies, please refer to Note 1 of the Notes to Financial Statements.
The following table summarizes the inputs used as of March 31, 2009 in determining the fair valuation of the Portfolio’s investments:
| | | |
Valuation Inputs | | Investments
in Securities |
| | | Assets |
Level 1 | | $ | 172,230,217 |
Level 2 | | | — |
Level 3 | | | — |
| | | |
Total | | $ | 172,230,217 |
| | | |
See Notes to Financial Statements.
| | | | | | |
| | | SEMI-ANNUAL REPORT | | MARCH 31, 2009 | | 13 |
| | |
| Schedule of Investments March 31, 2009 (Unaudited) | | Mid-Cap Value Equity Portfolio |
| | (Percentages shown are based on Net Assets) |
| | | | | |
| | | Shares | | Value |
Common Stocks | | | | | |
Aerospace & Defense — 0.9% | | | | | |
Honeywell International, Inc. | | 173,120 | | $ | 4,823,123 |
| | | | | |
Air Freight & Logistics — 0.4% | | | | | |
FedEx Corp. | | 49,500 | | | 2,202,255 |
| | | | | |
Airlines — 0.6% | | | | | |
Delta Air Lines, Inc.(a)(b) | | 554,900 | | | 3,124,087 |
| | | | | |
Auto Components — 0.9% | | | | | |
Autoliv, Inc. | | 242,000 | | | 4,493,940 |
| | | | | |
Beverages — 1.4% | | | | | |
Constellation Brands, Inc. - Class A(a) | | 332,200 | | | 3,953,180 |
Molson Coors Brewing Co. - Class B | | 99,400 | | | 3,407,432 |
| | | | | |
| | | | | 7,360,612 |
| | | | | |
Capital Markets — 2.8% | | | | | |
The Bank of New York Mellon Corp. | | 96,100 | | | 2,714,825 |
Freedom Pay, Inc. | | 43,051 | | | 430 |
Invesco Ltd. | | 423,480 | | | 5,869,433 |
TD Ameritrade Holding Corp.(a) | | 422,800 | | | 5,838,868 |
| | | | | |
| | | | | 14,423,556 |
| | | | | |
Chemicals — 2.0% | | | | | |
Albemarle Corp. | | 307,800 | | | 6,700,806 |
FMC Corp. | | 86,650 | | | 3,738,081 |
| | | | | |
| | | | | 10,438,887 |
| | | | | |
Commercial Banks — 3.1% | | | | | |
City National Corp.(b) | | 110,800 | | | 3,741,716 |
Cullen/Frost Bankers, Inc. | | 97,700 | | | 4,586,038 |
KeyCorp | | 547,450 | | | 4,308,432 |
Zions Bancorp(b) | | 324,540 | | | 3,190,228 |
| | | | | |
| | | | | 15,826,414 |
| | | | | |
Commercial Services & Supplies — 2.5% | | | | | |
Corrections Corp. of America(a) | | 480,200 | | | 6,151,362 |
Republic Services, Inc. | | 400,600 | | | 6,870,290 |
| | | | | |
| | | | | 13,021,652 |
| | | | | |
Communications Equipment — 1.0% | | | | | |
Polycom, Inc.(a) | | 328,400 | | | 5,054,076 |
| | | | | |
Computers & Peripherals — 1.0% | | | | | |
Sun Microsystems, Inc.(a) | | 221,200 | | | 1,619,184 |
Teradata Corp.(a) | | 215,800 | | | 3,500,276 |
| | | | | |
| | | | | 5,119,460 |
| | | | | |
Consumer Finance — 0.4% | | | | | |
Capital One Financial Corp. | | 176,300 | | | 2,157,912 |
| | | | | |
Containers & Packaging — 2.7% | | | | | |
Ball Corp. | | 90,300 | | | 3,919,020 |
Owens-Illinois, Inc.(a) | | 316,840 | | | 4,575,170 |
Pactiv Corp.(a) | | 383,900 | | | 5,601,101 |
| | | | | |
| | | | | 14,095,291 |
| | | | | |
Diversified Financial Services — 2.3% | | | | | |
CME Group, Inc. | | 18,850 | | | 4,644,452 |
NYSE Euronext, Inc. | | 195,300 | | | 3,495,870 |
PHH Corp.(a) | | 273,700 | | | 3,845,485 |
| | | | | |
| | | | | 11,985,807 |
| | | | | |
Electric Utilities — 4.4% | | | | | |
American Electric Power Co., Inc. | | 200,600 | | | 5,067,156 |
Edison International | | 186,800 | | | 5,381,708 |
Entergy Corp. | | 98,800 | | | 6,727,292 |
Northeast Utilities | | 244,100 | | | 5,270,119 |
| | | | | |
| | | | | 22,446,275 |
| | | | | |
Electronic Equipment, Instruments & Components — 2.6% | | | | | |
Agilent Technologies, Inc.(a) | | 236,700 | | | 3,638,079 |
Anixter International, Inc.(a) | | 122,075 | | | 3,867,336 |
Tech Data Corp.(a) | | 257,740 | | | 5,613,577 |
| | | | | |
| | | | | 13,118,992 |
| | | | | |
Energy Equipment & Services — 0.6% | | | | | |
Noble Corp. | | 133,300 | | | 3,211,197 |
| | | | | |
Food & Staples Retailing — 2.3% | | | | | |
The Kroger Co. | | 206,600 | | | 4,384,052 |
Safeway, Inc. | | 359,480 | | | 7,257,901 |
| | | | | |
| | | | | 11,641,953 |
| | | | | |
Food Products — 4.1% | | | | | |
Campbell Soup Co. | | 186,300 | | | 5,097,168 |
Dean Foods Co.(a) | | 212,800 | | | 3,847,424 |
Del Monte Foods Co. | | 650,217 | | | 4,740,082 |
The J.M. Smucker Co. | | 197,300 | | | 7,353,371 |
| | | | | |
| | | | | 21,038,045 |
| | | | | |
Gas Utilities — 3.7% | | | | | |
CMS Energy Corp. | | 579,300 | | | 6,858,912 |
EQT Corp. | | 186,100 | | | 5,830,513 |
Questar Corp. | | 216,700 | | | 6,377,481 |
| | | | | |
| | | | | 19,066,906 |
| | | | | |
Health Care Equipment & Supplies — 2.2% | | | | | |
The Cooper Cos., Inc. | | 174,476 | | | 4,613,146 |
Hologic, Inc.(a) | | 335,590 | | | 4,392,873 |
Teleflex, Inc. | | 64,900 | | | 2,536,941 |
| | | | | |
| | | | | 11,542,960 |
| | | | | |
Health Care Providers & Services — 3.0% | | | | | |
DaVita, Inc.(a) | | 59,500 | | | 2,615,025 |
Laboratory Corp. of America Holdings(a) | | 97,400 | | | 5,696,926 |
MEDNAX, Inc.(a) | | 128,050 | | | 3,773,634 |
WellPoint, Inc.(a) | | 87,300 | | | 3,314,781 |
| | | | | |
| | | | | 15,400,366 |
| | | | | |
Hotels, Restaurants & Leisure — 2.5% | | | | | |
Darden Restaurants, Inc. | | 89,100 | | | 3,052,566 |
Pinnacle Entertainment, Inc.(a) | | 376,800 | | | 2,652,672 |
Starwood Hotels & Resorts Worldwide, Inc.(b) | | 361,600 | | | 4,592,320 |
Wendy’s/Arby’s Group, Inc. - Class A | | 493,100 | | | 2,480,293 |
| | | | | |
| | | | | 12,777,851 |
| | | | | |
Household Durables — 0.8% | | | | | |
Centex Corp. | | 533,900 | | | 4,004,250 |
| | | | | |
Independent Power Producers & Energy Traders — 1.3% | | | | | |
NRG Energy, Inc.(a) | | 364,190 | | | 6,409,744 |
| | | | | |
Insurance — 10.4% | | | | | |
AON Corp. | | 188,200 | | | 7,682,324 |
AXIS Capital Holdings Ltd. | | 332,230 | | | 7,488,464 |
The Hanover Insurance Group, Inc. | | 243,399 | | | 7,014,759 |
HCC Insurance Holdings, Inc. | | 331,400 | | | 8,347,966 |
RenaissanceRe Holdings Ltd. | | 118,500 | | | 5,858,640 |
The Travelers Cos., Inc. | | 206,350 | | | 8,386,064 |
| | | | | | |
14 | | SEMI-ANNUAL REPORT | | MARCH 31, 2009 | | |
| | |
| Schedule of Investments (continued) | | Mid-Cap Value Equity Portfolio |
| | (Percentages shown are based on Net Assets) |
| | | | | | |
| | | Shares | | Value | |
Common Stocks | | | | | | |
Insurance (concluded) | | | | | | |
W.R. Berkley Corp. | | 392,200 | | $ | 8,844,110 | |
| | | | | | |
| | | | | 53,622,327 | |
| | | | | | |
Internet Software & Services — 1.3% | | | | | | |
eBay, Inc.(a) | | 522,420 | | | 6,561,595 | |
| | | | | | |
IT Services — 1.9% | | | | | | |
Convergys Corp.(a) | | 363,300 | | | 2,935,464 | |
Fidelity National Information Services, Inc. | | 381,750 | | | 6,947,850 | |
| | | | | | |
| | | | | 9,883,314 | |
| | | | | | |
Life Sciences Tools & Services — 0.9% | | | | | | |
Thermo Fisher Scientific, Inc.(a) | | 131,500 | | | 4,690,605 | |
| | | | | | |
Machinery — 2.4% | | | | | | |
Danaher Corp. | | 86,600 | | | 4,695,452 | |
Eaton Corp. | | 81,800 | | | 3,015,148 | |
SPX Corp. | | 60,050 | | | 2,822,950 | |
Terex Corp.(a) | | 185,750 | | | 1,718,188 | |
| | | | | | |
| | | | | 12,251,738 | |
| | | | | | |
Media — 2.3% | | | | | | |
Cablevision Systems Corp. - Class A | | 456,000 | | | 5,900,640 | |
Viacom, Inc. - Class B(a) | | 351,550 | | | 6,109,939 | |
| | | | | | |
| | | | | 12,010,579 | |
| | | | | | |
Metals & Mining — 0.7% | | | | | | |
Reliance Steel & Aluminum Co. | | 138,050 | | | 3,634,856 | |
| | | | | | |
Multiline Retail — 0.9% | | | | | | |
Macy’s, Inc. | | 512,550 | | | 4,561,695 | |
| | | | | | |
Multi-Utilities — 3.0% | | | | | | |
PG&E Corp. | | 215,900 | | | 8,251,698 | |
Wisconsin Energy Corp. | | 174,400 | | | 7,180,048 | |
| | | | | | |
| | | | | 15,431,746 | |
| | | | | | |
Office Electronics — 0.4% | | | | | | |
Xerox Corp. | | 389,000 | | | 1,769,950 | |
| | | | | | |
Oil, Gas & Consumable Fuels — 4.8% | | | | | | |
CONSOL Energy, Inc. | | 187,681 | | | 4,737,068 | |
EOG Resources, Inc. | | 48,200 | | | 2,639,432 | |
Hess Corp. | | 69,200 | | | 3,750,640 | |
Newfield Exploration Co.(a) | | 289,600 | | | 6,573,920 | |
Plains Exploration & Production Co.(a) | | 252,300 | | | 4,347,129 | |
Southwestern Energy Co.(a) | | 95,300 | | | 2,829,457 | |
| | | | | | |
| | | | | 24,877,646 | |
| | | | | | |
Paper & Forest Products — 1.1% | | | | | | |
Weyerhaeuser Co. | | 206,200 | | | 5,684,934 | |
| | | | | | |
Real Estate Investment Trusts — 3.4% | | | | | | |
Boston Properties, Inc.(b) | | 130,430 | | | 4,568,963 | |
Mack-Cali Realty Corp. | | 296,400 | | | 5,871,684 | |
Redwood Trust, Inc.(b) | | 221,270 | | | 3,396,495 | |
Simon Property Group, Inc. | | 99,583 | | | 3,449,555 | |
| | | | | | |
| | | | | 17,286,697 | |
| | | | | | |
Road & Rail — 0.8% | | | | | | |
Union Pacific Corp. | | 103,000 | | | 4,234,330 | |
| | | | | | |
Semiconductors & Semiconductor Equipment — 2.2% | | | | | | |
Intersil Corp. - Class A | | 319,340 | | | 3,672,410 | |
Micron Technology, Inc.(a) | | 1,026,700 | | | 4,168,402 | |
Varian Semiconductor Equipment Associates, Inc.(a) | | 162,650 | | | 3,522,999 | |
| | | | | | |
| | | | | 11,363,811 | |
| | | | | | |
Software — 1.0% | | | | | | |
Amdocs Ltd. (a) | | 285,714 | | | 5,291,423 | |
Phase Metrics, Inc.(a) | | 108,409 | | | 2,168 | |
| | | | | | |
| | | | | 5,293,591 | |
| | | | | | |
Specialty Retail — 3.6% | | | | | | |
Abercrombie & Fitch Co. - Class A | | 143,850 | | | 3,423,630 | |
The Gap, Inc. | | 534,700 | | | 6,945,753 | |
Limited Brands, Inc. | | 670,766 | | | 5,835,664 | |
The Sherwin-Williams Co. | | 45,600 | | | 2,369,832 | |
| | | | | | |
| | | | | 18,574,879 | |
| | | | | | |
Thrifts & Mortgage Finance — 0.6% | | | | | | |
Astoria Financial Corp. | | 350,820 | | | 3,224,036 | |
| | | | | | |
Tobacco — 1.0% | | | | | | |
Lorillard, Inc. | | 83,200 | | | 5,136,768 | |
| | | | | | |
Trading Companies & Distributors — 0.7% | | | | | | |
W.W. Grainger, Inc.(b) | | 48,722 | | | 3,419,310 | |
| | | | | | |
Total Long-Term Investments
(Cost — $498,504,574) — 92.9% | | | | | 478,300,018 | |
| | | | | | |
| | |
| | | Shares/
Beneficial
Interest | | | |
Short-Term Securities | | | | | | |
BlackRock Liquidity Funds, TempFund, | | | | | | |
0.60%(c)(d) | | 38,826,385 | | | 38,826,385 | |
BlackRock Liquidity Series, LLC Money Market | | | | | | |
Series, 1.17%(d)(e) | | 16,352,000 | | | 16,352,000 | |
| | | | | | |
Total Short-Term Securities
(Cost — $55,178,385) — 10.7% | | | | | 55,178,385 | |
| | | | | | |
Total Investments
(Cost — $553,682,959*) — 103.6% | | | | | 533,478,403 | |
Liabilities in Excess of Other Assets — (3.6)% | | | | | (18,612,952 | ) |
| | | | | | |
Net Assets — 100.0% | | | | $ | 514,865,451 | |
| | | | | | |
| * | The cost and unrealized appreciation (depreciation) of investments as of March 31, 2009, as computed for federal income tax purposes, were as follows: |
| | | | |
Aggregate cost | | $ | 596,676,919 | |
| | | | |
Gross unrealized appreciation | | $ | 23,365,830 | |
Gross unrealized depreciation | | | (86,564,346 | ) |
| | | | |
Net unrealized depreciation | | $ | (63,198,516 | ) |
| | | | |
| (a) | Non-income producing security. |
| (b) | Security, or a portion of security, is on loan. |
| | | | | | |
| | | SEMI-ANNUAL REPORT | | MARCH 31, 2009 | | 15 |
| | |
| Schedule of Investments (concluded) | | Mid-Cap Value Equity Portfolio |
| | |
| (c) | Investments in companies considered to be an affiliate of the Portfolio, for purposes of Section 2(a)(3) of the Investment Company Act of 1940, as amended, were as follows: |
| | | | | | | |
Affiliate | | Net Activity | | | Income |
BlackRock Liquidity Funds, TempFund | | $ | 38,826,385 | ** | | $ | 41,668 |
BlackRock Liquidity Series, LLC Money Market Series | | $ | (24,036,550 | )*** | | $ | 105,788 |
| ** | Represents net purchase cost. |
| *** | Represents net sales cost. |
| (d) | Represents current yield as of report date. |
| (e) | Security purchased with the cash proceeds from securities loans. |
| • | | For Portfolio compliance purposes, the Portfolio’s industry classifications refer to any one or more of the industry sub-classifications used by one or more widely recognized market indexes or ratings group indexes, and/or as defined by Portfolio management. This definition may not apply for purposes of this report, which may combine industry sub-classifications for reporting ease. |
| • | | Effective October 1, 2008, the Portfolio adopted Financial Accounting Standards Board Statement of Financial Accounting Standards No. 157, “Fair Value Measurements”. FAS 157 clarifies the definition of fair value, establishes a framework for measuring fair values and requires additional disclosures about the use of fair value measurements. Various inputs are used in determining the fair value of investments, which are as follows: |
| | • | | Level 1 – price quotations in active markets/exchanges for identical securities |
| | • | | Level 2 – other observable inputs (including, but not limited to: quoted prices for similar assets or liabilities in markets that are active, quoted prices for identical or similar assets in markets that are not active, inputs other than quoted prices that are observable for the assets or liabilities (such as interest rates, yield curves, volatilities, prepayment speeds, loss severities, credit risks and default rates) or other market – corroborated inputs) |
| | • | | Level 3 – unobservable inputs based on the best information available in the circumstance, to the extent observable inputs are not available (including the Portfolio’s own assumptions used in determining the fair value of investments). |
The inputs or methodology used for valuing securities are not necessarily an indication of the risk associated with investing in those securities. For information about the Portfolio’s policy regarding valuation of investments and other significant accounting policies, please refer to Note 1 of the Notes to Financial Statements.
The following table summarizes the inputs used as of March 31, 2009 in determining the fair valuation of the Portfolio’s investments:
| | | |
Valuation Inputs | | Investments
in Securities |
| | | Assets |
Level 1 | | $ | 533,475,805 |
Level 2 | | | — |
Level 3 | | | 2,598 |
| | | |
Total | | $ | 533,478,403 |
| | | |
The following table is reconciliation of Level 3 investments for the period ended March 31, 2009:
| | | |
| | | Investments
in Securities |
| | | Assets |
Balance as of September 30, 2008 | | $ | 2,598 |
Accrued discounts/premiums | | | — |
Realized gain (loss) | | | — |
Change in unrealized appreciation (depreciation) | | | — |
Net purchases (sales) | | | — |
Net transfers in/out of Level 3 | | | — |
| | | |
Balance as of March 31, 2009 | | $ | 2,598 |
| | | |
See Notes to Financial Statements.
| | | | | | |
16 | | SEMI-ANNUAL REPORT | | MARCH 31, 2009 | | |
| | |
Schedule of Investments March 31, 2009 (Unaudited) | | Small/Mid-Cap Growth Portfolio |
| | (Percentages shown are based on Net Assets) |
| | | | | |
| | | Shares | | Value |
Common Stocks | | | | | |
Aerospace & Defense — 2.2% | | | | | |
Argon ST, Inc.(a) | | 81,911 | | $ | 1,553,852 |
BE Aerospace, Inc.(a) | | 101,700 | | | 881,739 |
| | | | | |
| | | | | 2,435,591 |
| | | | | |
Beverages — 1.2% | | | | | |
Heckmann Corp.(a)(b) | | 261,000 | | | 1,258,020 |
| | | | | |
Biotechnology — 0.9% | | | | | |
Martek Biosciences Corp. | | 54,600 | | | 996,450 |
| | | | | |
Building Products — 0.9% | | | | | |
Griffon Corp.(a) | | 130,100 | | | 975,750 |
| | | | | |
Capital Markets — 1.0% | | | | | |
Invesco Ltd. | | 77,000 | | | 1,067,220 |
| | | | | |
Chemicals — 2.4% | | | | | |
Celanese Corp. - Series A | | 109,400 | | | 1,462,678 |
Intrepid Potash, Inc.(a) | | 62,200 | | | 1,147,590 |
| | | | | |
| | | | | 2,610,268 |
| | | | | |
Commercial Banks — 1.3% | | | | | |
Signature Bank(a) | | 51,300 | | | 1,448,199 |
| | | | | |
Commercial Services & Supplies — 4.3% | | | | | |
Clean Harbors, Inc.(a) | | 36,800 | | | 1,766,400 |
Sykes Enterprises, Inc.(a) | | 179,384 | | | 2,983,156 |
| | | | | |
| | | | | 4,749,556 |
| | | | | |
Communications Equipment — 3.3% | | | | | |
Harris Corp. | | 48,400 | | | 1,400,696 |
Neutral Tandem, Inc.(a) | | 88,900 | | | 2,187,829 |
| | | | | |
| | | | | 3,588,525 |
| | | | | |
Construction & Engineering — 0.6% | | | | | |
Chicago Bridge & Iron Co. NV - ADR | | 104,400 | | | 654,588 |
| | | | | |
Containers & Packaging — 1.3% | | | | | |
Rock-Tenn Co. - Class A | | 53,502 | | | 1,447,229 |
| | | | | |
Diversified Consumer Services — 0.8% | | | | | |
Apollo Group, Inc. - Class A(a) | | 11,100 | | | 869,463 |
| | | | | |
Diversified Financial Services — 1.5% | | | | | |
MSCI, Inc. - Class A(a) | | 100,200 | | | 1,694,382 |
| | | | | |
Electrical Equipment — 2.5% | | | | | |
AMETEK, Inc. | | 70,600 | | | 2,207,662 |
Energy Conversion Devices, Inc.(a)(b) | | 36,800 | | | 488,336 |
| | | | | |
| | | | | 2,695,998 |
| | | | | |
Electronic Equipment, Instruments & Components — 1.5% | | | | | |
Cogent, Inc.(a) | | 135,700 | | | 1,614,830 |
| | | | | |
Energy Equipment & Services — 1.5% | | | | | |
Superior Energy Services, Inc.(a) | | 56,600 | | | 729,574 |
Weatherford International Ltd.(a) | | 78,200 | | | 865,674 |
| | | | | |
| | | | | 1,595,248 |
| | | | | |
Food Products — 1.3% | | | | | |
Green Mountain Coffee Roasters, Inc.(a) | | 17,700 | | | 849,600 |
Smart Balance, Inc.(a) | | 90,200 | | | 544,808 |
| | | | | |
| | | | | 1,394,408 |
| | | | | |
Health Care Equipment & Supplies — 9.5% | | | | | |
Hologic, Inc.(a) | | 114,800 | | | 1,502,732 |
Merit Medical Systems, Inc.(a) | | 64,800 | | | 791,208 |
NuVasive, Inc.(a) | | 10,600 | | | 332,628 |
ResMed, Inc.(a) | | 49,100 | | | 1,735,194 |
SonoSite, Inc.(a) | | 113,278 | | | 2,025,411 |
Symmetry Medical, Inc.(a) | | 116,200 | | | 733,222 |
Wright Medical Group, Inc.(a) | | 116,848 | | | 1,522,529 |
Zoll Medical Corp.(a) | | 120,442 | | | 1,729,547 |
| | | | | |
| | | | | 10,372,471 |
| | | | | |
Health Care Providers & Services — 7.4% | | | | | |
Amedisys, Inc.(a)(b) | | 42,600 | | | 1,171,074 |
Lincare Holdings, Inc.(a) | | 61,600 | | | 1,342,880 |
Magellan Health Services, Inc.(a) | | 69,800 | | | 2,543,512 |
Medco Health Solutions, Inc.(a) | | 27,400 | | | 1,132,716 |
MEDNAX, Inc.(a) | | 63,100 | | | 1,859,557 |
| | | | | |
| | | | | 8,049,739 |
| | | | | |
Health Care Technology — 1.2% | | | | | |
MedAssets, Inc.(a) | | 95,000 | | | 1,353,750 |
| | | | | |
Hotels, Restaurants & Leisure — 4.0% | | | | | |
P.F. Chang’s China Bistro, Inc.(a)(b) | | 53,400 | | | 1,221,792 |
Scientific Games Corp. - Class A(a) | | 168,500 | | | 2,040,535 |
Texas Roadhouse, Inc. - Class A(a) | | 84,900 | | | 809,097 |
WMS Industries, Inc.(a) | | 12,600 | | | 263,466 |
| | | | | |
| | | | | 4,334,890 |
| | | | | |
Insurance — 0.5% | | | | | |
Aspen Insurance Holdings Ltd. | | 26,300 | | | 590,698 |
| | | | | |
Internet & Catalog Retail — 0.5% | | | | | |
Ticketmaster Entertainment, Inc.(a) | | 155,783 | | | 574,839 |
| | | | | |
Internet Software & Services — 7.0% | | | | | |
comScore, Inc.(a) | | 136,900 | | | 1,655,121 |
SkillSoft Plc - ADR(a) | | 579,498 | | | 3,876,842 |
SonicWALL, Inc.(a) | | 474,700 | | | 2,117,162 |
| | | | | |
| | | | | 7,649,125 |
| | | | | |
IT Services — 8.7% | | | | | |
ExlService Holdings, Inc.(a) | | 234,501 | | | 2,021,399 |
Forrester Research, Inc.(a) | | 91,251 | | | 1,876,120 |
Genpact Ltd.(a) | | 200,200 | | | 1,773,772 |
SRA International, Inc. - Class A(a) | | 133,300 | | | 1,959,510 |
Wright Express Corp.(a) | | 101,318 | | | 1,846,014 |
| | | | | |
| | | | | 9,476,815 |
| | | | | |
Life Sciences Tools & Services — 2.0% | | | | | |
ICON Plc - ADR(a) | | 61,200 | | | 988,380 |
Thermo Fisher Scientific, Inc.(a) | | 34,400 | | | 1,227,048 |
| | | | | |
| | | | | 2,215,428 |
| | | | | |
Machinery — 3.1% | | | | | |
IDEX Corp. | | 72,392 | | | 1,583,213 |
Joy Global, Inc. | | 36,500 | | | 777,450 |
Kaydon Corp. | | 38,131 | | | 1,042,120 |
| | | | | |
| | | | | 3,402,783 |
| | | | | |
Media — 3.6% | | | | | |
CKX, Inc.(a) | | 485,700 | | | 1,991,370 |
DreamWorks Animation SKG, Inc. - Class A(a) | | 71,732 | | | 1,552,280 |
RHI Entertainment, Inc.(a) | | 232,015 | | | 352,663 |
| | | | | |
| | | | | 3,896,313 |
| | | | | |
Oil, Gas & Consumable Fuels — 2.7% | | | | | |
CONSOL Energy, Inc. | | 28,400 | | | 716,816 |
Delta Petroleum Corp.(a) | | 22,718 | | | 27,262 |
EXCO Resources, Inc.(a) | | 117,700 | | | 1,177,000 |
| | | | | | |
| | | SEMI-ANNUAL REPORT | | MARCH 31, 2009 | | 17 |
| | |
| Schedule of Investments (concluded) | | Small/Mid-Cap Growth Portfolio |
| | (Percentages shown are based on Net Assets) |
| | | | | | |
| | | Shares | | Value | |
Common Stocks | | | | | | |
Oil, Gas & Consumable Fuels (concluded) | | | | | | |
Plains Exploration & Production Co.(a) | | 62,700 | | $ | 1,080,321 | |
| | | | | | |
| | | | | 3,001,399 | |
| | | | | | |
Personal Products — 0.9% | | | | | | |
Chattem, Inc.(a)(b) | | 18,400 | | | 1,031,320 | |
Pharmaceuticals — 2.4% | | | | | | |
Medicis Pharmaceutical Corp. - Class A | | 99,600 | | | 1,232,052 | |
Shire Plc - ADR | | 39,476 | | | 1,418,768 | |
| | | | | | |
| | | | | 2,650,820 | |
| | | | | | |
Professional Services — 3.0% | | | | | | |
The Advisory Board Co.(a) | | 65,786 | | | 1,090,732 | |
IHS, Inc. - Class A(a) | | 52,108 | | | 2,145,807 | |
| | | | | | |
| | | | | 3,236,539 | |
| | | | | | |
Semiconductors & Semiconductor Equipment — 4.2% | | | | | | |
FEI Co.(a) | | 23,600 | | | 364,148 | |
Microsemi Corp.(a) | | 100,900 | | | 1,170,440 | |
ON Semiconductor Corp.(a) | | 364,600 | | | 1,421,940 | |
Standard Microsystems Corp.(a) | | 87,300 | | | 1,623,780 | |
| | | | | | |
| | | | | 4,580,308 | |
| | | | | | |
Software — 7.6% | | | | | | |
Amdocs Ltd.(a) | | 77,775 | | | 1,440,393 | |
Blackboard, Inc.(a) | | 66,300 | | | 2,104,362 | |
DemandTec, Inc.(a) | | 208,700 | | | 1,826,125 | |
TiVo, Inc.(a) | | 409,800 | | | 2,884,992 | |
| | | | | | |
| | | | | 8,255,872 | |
| | | | | | |
Specialty Retail — 1.3% | | | | | | |
GameStop Corp. - Class A(a) | | 51,766 | | | 1,450,483 | |
| | | | | | |
Total Long-Term Investments
(Cost — $138,249,111) — 98.1% | | | | | 107,219,317 | |
| | | | | | |
| | |
| | | Shares/
Beneficial
Interest | | | |
Short-Term Securities | | | | | | |
BlackRock Liquidity Funds, TempFund, 0.60%(c)(d) | | 3,257,568 | | | 3,257,568 | |
BlackRock Liquidity Series, LLC Money Market Series, 1.17%(c)(d)(e) | | 4,327,700 | | | 4,327,700 | |
Total Short-Term Securities
(Cost — $7,585,268) — 7.0% | | | | | 7,585,268 | |
| | | | | | |
Total Investments
(Cost — $145,834,379*) — 105.1% | | | | | 114,804,585 | |
Liabilities in Excess of Other Assets — (5.1)% | | | | | (5,539,901 | ) |
| | | | | | |
Net Assets — 100.0% | | | | $ | 109,264,684 | |
| | | | | | |
| * | The cost and unrealized appreciation (depreciation) of investments as of March 31, 2009, as computed for federal income tax purposes, were as follows: |
| | | | |
Aggregate cost | | $ | 148,506,651 | |
| | | | |
Gross unrealized appreciation | | $ | 5,153,023 | |
Gross unrealized depreciation | | | (38,855,089 | ) |
| | | | |
Net unrealized depreciation | | $ | (33,702,066) | |
| | | | |
| (a) | Non-income producing security. |
| (b) | Security, or a portion of security, is on loan. |
| (c) | Investments in companies considered to be an affiliate of the Portfolio, for purposes of Section 2(a)(3) of the Investment Company Act of 1940, as amended, were as follows: |
| | | | | | | |
Affiliate | | Net Activity | | | Income |
BlackRock Liquidity Funds, TempFund | | $ | 3,257,568 | ** | | $ | 1,650 |
BlackRock Liquidity Series, LLC Money Market Series | | $ | (7,251,350 | )*** | | $ | 101,268 |
| ** | Represents net purchase cost. |
| *** | Represents net sales cost. |
| (d) | Represents current yield as of report date. |
| (e) | Security purchased with the cash proceeds from securities loans. |
| • | | For Portfolio compliance purposes, the Portfolio’s industry classifications refer to any one or more of the industry sub-classifications used by one or more widely recognized market indexes or ratings group indexes, and/or as defined by Portfolio management. This definition may not apply for purposes of this report, which may combine industry sub-classifications for reporting ease. |
| • | | Effective October 1, 2008, the Portfolio adopted Financial Accounting Standards Board Statement of Financial Accounting Standards No. 157, “Fair Value Measurements”. FAS 157 clarifies the definition of fair value, establishes a framework for measuring fair values and requires additional disclosures about the use of fair value measurements. Various inputs are used in determining the fair value of investments, which are as follows: |
| | • | | Level 1 – price quotations in active markets/exchanges for identical securities |
| | • | | Level 2 – other observable inputs (including, but not limited to: quoted prices for similar assets or liabilities in markets that are active, quoted prices for identical or similar assets in markets that are not active, inputs other than quoted prices that are observable for the assets or liabilities (such as interest rates, yield curves, volatilities, prepayment speeds, loss severities, credit risks and default rates) or other market – corroborated inputs) |
| | • | | Level 3 – unobservable inputs based on the best information available in the circumstance, to the extent observable inputs are not available (including the Portfolio’s own assumptions used in determining the fair value of investments). |
The inputs or methodology used for valuing securities are not necessarily an indication of the risk associated with investing in those securities. For information about the Portfolio’s policy regarding valuation of investments and other significant accounting policies, please refer to Note 1 of the Notes to Financial Statements.
The following table summarizes the inputs used as of March 31, 2009 in determining the fair valuation of the Portfolio’s investments:
| | | |
Valuation Inputs | | Investments
in Securities |
| | | Assets |
Level 1 | | $ | 114,804,585 |
Level 2 | | | — |
Level 3 | | | — |
| | | |
Total | | $ | 114,804,585 |
| | | |
See Notes to Financial Statements.
| | | | | | |
18 | | SEMI-ANNUAL REPORT | | MARCH 31, 2009 | | |
Statements of Assets and Liabilities
| | | | | | | | | | | | |
March 31, 2009 (Unaudited) | | Mid-Cap
Growth Equity
Portfolio | | | Mid-Cap
Value Equity
Portfolio | | | Small/Mid-Cap
Growth
Portfolio | |
Assets | | | | | | | | | | | | |
Investments at value - unaffiliated1,2 | | $ | 163,787,570 | | | $ | 478,300,018 | | | $ | 107,219,317 | |
Investments at value - affiliated3 | | | 8,442,647 | | | | 55,178,385 | | | | 7,585,268 | |
Cash | | | 17,444 | | | | 31 | | | | 8 | |
Investments sold receivable | | | 21,491 | | | | 20,394,294 | | | | 141,471 | |
Capital shares sold receivable | | | 102,925 | | | | 829,252 | | | | 285,224 | |
Dividends receivable | | | 51,467 | | | | 844,452 | | | | 19,658 | |
Receivable from advisor | | | 37,655 | | | | 125,901 | | | | 43,397 | |
Dividends receivable - affiliated | | | 1,870 | | | | 16,331 | | | | 700 | |
Securities lending income receivable - affiliated | | | 1,681 | | | | 4,463 | | | | 5,034 | |
Prepaid expenses | | | 54,751 | | | | 82,928 | | | | 48,154 | |
Other assets | | | 102,779 | | | | — | | | | 1,171 | |
| | | | | | | | | | | | |
Total assets | | | 172,622,280 | | | | 555,776,055 | | | | 115,349,402 | |
| | | | | | | | | | | | |
Liabilities | | | | | | | | | | | | |
Collateral at value - securities loaned | | | 5,261,000 | | | | 16,352,000 | | | | 4,327,700 | |
Investments purchased payable | | | 183,755 | | | | 21,868,676 | | | | 948,430 | |
Capital shares redeemed payable | | | 242,924 | | | | 1,534,916 | | | | 463,048 | |
Other affiliates payable | | | 143,109 | | | | 509,037 | | | | 192,161 | |
Investment advisory fees payable | | | 106,224 | | | | 325,427 | | | | 65,737 | |
Service and distribution fees payable | | | 45,451 | | | | 158,758 | | | | 30,995 | |
Officer’s and Trustees’ fees payable | | | 7,032 | | | | 8,628 | | | | 6,860 | |
Other accrued expenses payable | | | 70,143 | | | | 153,162 | | | | 49,787 | |
| | | | | | | | | | | | |
Total liabilities | | | 6,059,638 | | | | 40,910,604 | | | | 6,084,718 | |
| | | | | | | | | | | | |
Net Assets | | $ | 166,562,642 | | | $ | 514,865,451 | | | $ | 109,264,684 | |
| | | | | | | | | | | | |
Net Assets Consist of | | | | | | | | | | | | |
Paid-in capital | | $ | 396,514,514 | | | $ | 910,040,589 | | | $ | 177,599,536 | |
Undistributed (distributions in excess of) net investment income | | | 347,151 | | | | 1,404,714 | | | | (306,768 | ) |
Accumulated net realized loss | | | (175,319,472 | ) | | | (376,375,296 | ) | | | (36,998,290 | ) |
Net unrealized appreciation/depreciation | | | (54,979,551 | ) | | | (20,204,556 | ) | | | (31,029,794 | ) |
| | | | | | | | | | | | |
Net Assets | | $ | 166,562,642 | | | $ | 514,865,451 | | | $ | 109,264,684 | |
| | | | | | | | | | | | |
| 1 Investments at cost- unaffiliated | | $ | 218,767,121 | | | $ | 498,504,574 | | | $ | 138,249,111 | |
| 2 Securities loaned at value | | $ | 5,176,400 | | | $ | 16,463,630 | | | $ | 4,152,226 | |
| 3 Investments at cost - affiliated | | $ | 8,442,647 | | | $ | 55,178,385 | | | $ | 7,585,268 | |
See Notes to Financial Statements.
| | | | | | |
| | | SEMI-ANNUAL REPORT | | MARCH 31, 2009 | | 19 |
Statements of Assets and Liabilities (concluded)
| | | | | | | | | |
March 31, 2009 (Unaudited) | | Mid-Cap
Growth Equity
Portfolio | | Mid-Cap
Value Equity
Portfolio | | Small/Mid-Cap
Growth
Portfolio |
Net Asset Value | | | | | | | | | |
Institutional: | | | | | | | | | |
Net Assets | | $ | 18,209,340 | | $ | 112,928,966 | | $ | 11,540,656 |
| | | | | | | | | |
Shares outstanding, unlimited number of shares authorized, $0.001 par value | | | 2,538,221 | | | 17,256,305 | | | 1,496,388 |
| | | | | | | | | |
Net Asset Value | | $ | 7.17 | | $ | 6.54 | | $ | 7.71 |
| | | | | | | | | |
Service: | | | | | | | | | |
Net Assets | | $ | 290,385 | | $ | 1,623,543 | | | — |
| | | | | | | | | |
Shares outstanding, unlimited number of shares authorized, $0.001 par value | | | 42,410 | | | 252,429 | | | — |
| | | | | | | | | |
Net Asset Value | | $ | 6.85 | | $ | 6.43 | | | — |
| | | | | | | | | |
Investor A: | | | | | | | | | |
| | | | | | | | | |
Net Assets | | $ | 128,549,176 | | $ | 294,688,369 | | $ | 84,236,650 |
| | | | | | | | | |
Shares outstanding, unlimited number of shares authorized, $0.001 par value | | | 19,386,127 | | | 46,354,585 | | | 11,704,099 |
| | | | | | | | | |
Net Asset Value | | $ | 6.63 | | $ | 6.36 | | $ | 7.20 |
| | | | | | | | | |
Investor B: | | | | | | | | | |
| | | | | | | | | |
Net Assets | | $ | 10,189,159 | | $ | 35,968,041 | | $ | 5,489,226 |
| | | | | | | | | |
Shares outstanding, unlimited number of shares authorized, $0.001 par value | | | 1,722,793 | | | 6,206,494 | | | 895,606 |
| | | | | | | | | |
Net Asset Value | | $ | 5.91 | | $ | 5.80 | | $ | 6.13 |
| | | | | | | | | |
Investor C: | | | | | | | | | |
| | | | | | | | | |
Net Assets | | $ | 8,752,981 | | $ | 69,656,532 | | $ | 6,362,096 |
| | | | | | | | | |
Shares outstanding, unlimited number of shares authorized, $0.001 par value | | | 1,480,121 | | | 12,055,721 | | | 1,036,725 |
| | | | | | | | | |
Net Asset Value | | $ | 5.91 | | $ | 5.78 | | $ | 6.14 |
| | | | | | | | | |
R: | | | | | | | | | |
| | | | | | | | | |
Net Assets | | $ | 571,601 | | | — | | $ | 1,636,056 |
| | | | | | | | | |
Shares outstanding, unlimited number of shares authorized, $0.001 par value | | | 86,273 | | | — | | | 229,534 |
| | | | | | | | | |
Net Asset Value | | $ | 6.63 | | | — | | $ | 7.13 |
| | | | | | | | | |
See Notes to Financial Statements.
| | | | | | |
20 | | SEMI-ANNUAL REPORT | | MARCH 31, 2009 | | |
Statements of Operations
| | | | | | | | | | | | |
Six Months Ended March 31, 2009 (Unaudited) | | Mid-Cap
Growth Equity
Portfolio | | | Mid-Cap
Value Equity
Portfolio | | | Small/Mid-Cap
Growth
Portfolio | |
Investment Income | | | | | | | | | | | | |
Dividends | | $ | 591,904 | | | $ | 6,290,618 | | | $ | 156,611 | |
Securities lending - affiliated | | | 80,758 | | | | 105,788 | | | | 101,268 | |
Interest and dividends - affiliated | | | 5,941 | | | | 42,938 | | | | 1,987 | |
Interest | | | 1,080 | | | | 3,753 | | | | 615 | |
Foreign taxes withheld | | | (430 | ) | | | — | | | | — | |
| | | | | | | | | | | | |
Total investment income | | | 679,253 | | | | 6,443,097 | | | | 260,481 | |
| | | | | | | | | | | | |
Expenses | | | | | | | | | | | | |
Investment advisory | | | 692,898 | | | | 2,252,849 | | | | 444,581 | |
Transfer agent - class specific | | | 411,196 | | | | 944,519 | | | | 338,442 | |
Service and distribution - class specific | | | 271,940 | | | | 1,011,683 | | | | 184,910 | |
Administration | | | 64,959 | | | | 207,820 | | | | 44,458 | |
Printing | | | 45,218 | | | | 133,902 | | | | 26,644 | |
Registration | | | 25,044 | | | | 27,680 | | | | 22,140 | |
Administration - class specific | | | 21,668 | | | | 70,487 | | | | 14,837 | |
Professional | | | 18,374 | | | | 25,852 | | | | 17,470 | |
Custodian | | | 11,762 | | | | 25,313 | | | | 12,560 | |
Officer and Trustees | | | 8,601 | | | | 11,184 | | | | 8,324 | |
Miscellaneous | | | 9,089 | | | | 14,927 | | | | 7,698 | |
| | | | | | | | | | | | |
Total expenses | | | 1,580,749 | | | | 4,726,216 | | | | 1,122,064 | |
Less fees waived by advisor | | | (414 | ) | | | (53,172 | ) | | | (144 | ) |
Less administration fees waived - class specific | | | (19,739 | ) | | | (70,487 | ) | | | (14,837 | ) |
Less transfer agent fees waived - class specific | | | (36,567 | ) | | | (62 | ) | | | (16 | ) |
Less transfer agent fees reimbursed - class specific | | | (109,232 | ) | | | (803,469 | ) | | | (267,913 | ) |
Less fees paid indirectly | | | (1,577 | ) | | | (2,005 | ) | | | (510 | ) |
| | | | | | | | | | | | |
Total expenses after waivers, reimbursement and fees paid indirectly | | | 1,413,220 | | | | 3,797,021 | | | | 838,644 | |
| | | | | | | | | | | | |
Net investment income (loss) | | | (733,967 | ) | | | 2,646,076 | | | | (578,163 | ) |
| | | | | | | | | | | | |
Realized and Unrealized Gain (Loss) | | | | | | | | | | | | |
Net realized loss from investments | | | (30,205,093 | ) | | | (303,423,805 | ) | | | (31,470,052 | ) |
Net change in unrealized appreciation/depreciation on investments | | | (47,776,249 | ) | | | 29,866,805 | | | | (29,533,599 | ) |
| | | | | | | | | | | | |
Total realized and unrealized loss | | | (77,981,342 | ) | | | (273,557,000 | ) | | | (61,003,651 | ) |
| | | | | | | | | | | | |
Net Decrease in Net Assets Resulting from Operations | | $ | (78,715,309 | ) | | $ | (270,910,924 | ) | | $ | (61,581,814 | ) |
| | | | | | | | | | | | |
See Notes to Financial Statements.
| | | | | | |
| | | SEMI-ANNUAL REPORT | | MARCH 31, 2009 | | 21 |
Statements of Changes in Net Assets
| | | | | | | | | | | | | | | | | | | | | | | | |
| | | Mid-Cap
Growth Equity
Portfolio | | | Mid-Cap
Value Equity
Portfolio | | | Small/Mid-Cap
Growth
Portfolio | |
Increase (Decrease) in Net Assets: | | Six Months
Ended
March 31, 2009
(Unaudited) | | | Year Ended
September 30,
2008 | | | Six Months
Ended
March 31, 2009
(Unaudited) | | | Year Ended
September 30,
2008 | | | Six Months
Ended
March 31, 2009
(Unaudited) | | | Year Ended
September 30,
2008 | |
Operations | | | | | | | | | | | | | | | | | | | | | | | | |
Net investment income (loss) | | $ | (733,967 | ) | | $ | (2,988,481 | ) | | $ | 2,646,076 | | | $ | 3,717,731 | | | $ | (578,163 | ) | | $ | (1,794,557 | ) |
Net realized gain (loss) | | | (30,205,093 | ) | | | 22,460,515 | | | | (303,423,805 | ) | | | (49,098,035 | ) | | | (31,470,052 | ) | | | 724,275 | |
Net change in unrealized appreciation/depreciation | | | (47,776,249 | ) | | | (106,025,639 | ) | | | 29,866,805 | | | | (174,716,820 | ) | | | (29,533,599 | ) | | | (57,802,393 | ) |
| | | | | | | | | | | | | | | | | | | | | | | | |
Net decrease in net assets resulting from operations | | | (78,715,309 | ) | | | (86,553,605 | ) | | | (270,910,924 | ) | | | (220,097,124 | ) | | | (61,581,814 | ) | | | (58,872,675 | ) |
| | | | | | | | | | | | | | | | | | | | | | | | |
Dividends and Distributions to Shareholders From | | | | | | | | | | | | | | | | | | | | | | | | |
Net investment income: | | | | | | | | | | | | | | | | | | | | | | | | |
Institutional | | | — | | | | — | | | | (1,133,643 | ) | | | (484,718 | ) | | | (24,231 | ) | | | — | |
Service | | | — | | | | — | | | | (15,870 | ) | | | (2,856 | ) | | | — | | | | — | |
Investor A | | | — | | | | — | | | | (3,029,032 | ) | | | (431,750 | ) | | | (140,153 | ) | | | — | |
Investor B | | | — | | | | — | | | | (358,215 | ) | | | — | | | | — | | | | — | |
Investor C | | | — | | | | — | | | | (649,056 | ) | | | — | | | | — | | | | — | |
R | | | — | | | | — | | | | — | | | | — | | | | (1,194 | ) | | | — | |
Tax return of capital: | | | | | | | | | | | | | | | | | | | | | | | | |
Institutional | | | — | | | | — | | | | — | | | | (118,755 | ) | | | — | | | | — | |
Service | | | — | | | | — | | | | — | | | | (2,975 | ) | | | — | | | | — | |
Investor A | | | — | | | | — | | | | — | | | | (574,416 | ) | | | — | | | | — | |
Investor B | | | — | | | | — | | | | — | | | | (111,910 | ) | | | — | | | | — | |
Investor C | | | — | | | | — | | | | — | | | | (166,401 | ) | | | — | | | | — | |
Net realized gain: | | | | | | | | | | | | | | | | | | | | | | | | |
Institutional | | | — | | | | — | | | | — | | | | (15,654,461 | ) | | | — | | | | (3,835,548 | ) |
Service | | | — | | | | — | | | | — | | | | (392,228 | ) | | | — | | | | — | |
Investor A | | | — | | | | — | | | | — | | | | (75,720,395 | ) | | | — | | | | (36,072,316 | ) |
Investor B | | | — | | | | — | | | | — | | | | (13,884,159 | ) | | | — | | | | (3,584,103 | ) |
Investor C | | | — | | | | — | | | | — | | | | (20,826,117 | ) | | | — | | | | (3,000,370 | ) |
R | | | — | | | | — | | | | — | | | | — | | | | — | | | | (221,880 | ) |
| | | | | | | | | | | | | | | | | | | | | | | | |
Decrease in net assets resulting from dividends and distributions to shareholders | | | — | | | | — | | | | (5,185,816 | ) | | | (128,371,141 | ) | | | (165,578 | ) | | | (46,714,217 | ) |
| | | | | | | | | | | | | | | | | | | | | | | | |
Capital Share Transactions | | | | | | | | | | | | | | | | | | | | | | | | |
Net increase (decrease) in net assets derived from capital share transactions | | | (11,881,182 | ) | | | (70,749,257 | ) | | | (9,476,573 | ) | | | 74,762,087 | | | | (7,883,903 | ) | | | (591,809 | ) |
| | | | | | | | | | | | | | | | | | | | | | | | |
Redemption Fees | | | | | | | | | | | | | | | | | | | | | | | | |
Redemption fees | | | — | | | | — | | | | — | | | | — | | | | 5,162 | | | | 14,117 | |
| | | | | | | | | | | | | | | | | | | | | | | | |
Net Assets | | | | | | | | | | | | | | | | | | | | | | | | |
Total decrease in net assets | | | (90,596,491 | ) | | | (157,302,862 | ) | | | (285,573,313 | ) | | | (273,706,178 | ) | | | (69,626,133 | ) | | | (106,164,584 | ) |
Beginning of period | | | 257,159,133 | | | | 414,461,995 | | | | 800,438,764 | | | | 1,074,144,942 | | | | 178,890,817 | | | | 285,055,401 | |
| | | | | | | | | | | | | | | | | | | | | | | | |
End of period | | $ | 166,562,642 | | | $ | 257,159,133 | | | $ | 514,865,451 | | | $ | 800,438,764 | | | $ | 109,264,684 | | | $ | 178,890,817 | |
| | | | | | | | | | | | | | | | | | | | | | | | |
End of period undistributed (distributions in excess of) net investment income | | $ | 347,151 | | | $ | 1,081,118 | | | $ | 1,404,714 | | | $ | 3,944,454 | | | $ | (306,768 | ) | | $ | 436,973 | |
| | | | | | | | | | | | | | | | | | | | | | | | |
See Notes to Financial Statements.
| | | | | | |
22 | | SEMI-ANNUAL REPORT | | MARCH 31, 2009 | | |
| | |
| Financial Highlights | | Mid-Cap Growth Equity Portfolio |
| | | | | | | | | | | | | | | | | | | | | | | | | | | | | | | | | | | | | | | | | | | | | | | | |
| | | Institutional | | | Service | |
| | Six Months
Ended
March 31, 2009
(Unaudited) | | | Year Ended September 30, | | | Six Months
Ended
March 31, 2009
(Unaudited) | | | Year Ended September 30, | |
| | | 2008 | | | 2007 | | | 2006 | | | 2005 | | | 2004 | | | | 2008 | | | 2007 | | | 2006 | | | 2005 | | | 2004 | |
Per Share Operating Performance | | | | | | | | | | | | | | | | | | | | | | | | | | | | | | | | | | | | | | | | | | | | | | | | |
Net asset value, beginning of period | | $ | 10.33 | | | $ | 13.49 | | | $ | 10.70 | | | $ | 10.44 | | | $ | 8.76 | | | $ | 7.57 | | | $ | 9.87 | | | $ | 12.92 | | | $ | 10.27 | | | $ | 10.07 | | | $ | 8.46 | | | $ | 7.33 | |
| | | | | | | | | | | | | | | | | | | | | | | | | | | | | | | | | | | | | | | | | | | | | | | | |
Net investment loss1 | | | (0.02 | ) | | | (0.04 | ) | | | (0.07 | ) | | | (0.06 | ) | | | (0.07 | ) | | | (0.06 | ) | | | (0.02 | ) | | | (0.07 | ) | | | (0.09 | ) | | | (0.11 | ) | | | (0.07 | ) | | | (0.08 | ) |
Net realized and unrealized gain (loss) | | | (3.14 | ) | | | (3.12 | ) | | | 2.86 | | | | 0.45 | | | | 1.75 | | | | 1.25 | | | | (3.00 | ) | | | (2.98 | ) | | | 2.74 | | | | 0.44 | | | | 1.68 | | | | 1.21 | |
| | | | | | | | | | | | | | | | | | | | | | | | | | | | | | | | | | | | | | | | | | | | | | | | |
Net increase (decrease) from investment operations | | | (3.16 | ) | | | (3.16 | ) | | | 2.79 | | | | 0.39 | | | | 1.68 | | | | 1.19 | | | | (3.02 | ) | | | (3.05 | ) | | | 2.65 | | | | 0.33 | | | | 1.61 | | | | 1.13 | |
| | | | | | | | | | | | | | | | | | | | | | | | | | | | | | | | | | | | | | | | | | | | | | | | |
Distributions from net realized gain | | | — | | | | — | | | | — | | | | (0.13 | ) | | | — | | | | — | | | | — | | | | — | | | | — | | | | (0.13 | ) | | | — | | | | — | |
| | | | | | | | | | | | | | | | | | | | | | | | | | | | | | | | | | | | | | | | | | | | | | | | |
Redemption fees added to paid-in capital | | | — | | | | — | | | | 0.00 | 2 | | | 0.00 | 2 | | | 0.00 | 2 | | | 0.00 | 2 | | | — | | | | — | | | | 0.00 | 2 | | | 0.00 | 2 | | | 0.00 | 2 | | | 0.00 | 2 |
| | | | | | | | | | | | | | | | | | | | | | | | | | | | | | | | | | | | | | | | | | | | | | | | |
Net asset value, end of period | | $ | 7.17 | | | $ | 10.33 | | | $ | 13.49 | | | $ | 10.70 | | | $ | 10.44 | | | $ | 8.76 | | | $ | 6.85 | | | $ | 9.87 | | | $ | 12.92 | | | $ | 10.27 | | | $ | 10.07 | | | $ | 8.46 | |
| | | | | | | | | | | | | | | | | | | | | | | | | | | | | | | | | | | | | | | | | | | | | | | | |
Total Investment Return | | | | | | | | | | | | | | | | | | | | | | | | | | | | | | | | | | | | | | | | | | | | | | | | |
Based on net asset value | | | (30.59 | )%3 | | | (23.43 | )% | | | 26.08 | %4 | | | 3.75 | %4 | | | 19.18 | %4 | | | 15.72 | %4 | | | (30.60 | )%3 | | | (23.61 | )% | | | 25.80 | %4 | | | 3.29 | %4 | | | 19.03 | %4 | | | 15.42 | %4 |
| | | | | | | | | | | | | | | | | | | | | | | | | | | | | | | | | | | | | | | | | | | | | | | | |
Ratios to Average Net Assets | | | | | | | | | | | | | | | | | | | | | | | | | | | | | | | | | | | | | | | | | | | | | | | | |
Total expenses after waivers, reimbursement and fees paid indirectly | | | 1.21 | %5 | | | 1.06 | % | | | 1.05 | % | | | 1.08 | % | | | 1.23 | % | | | 1.23 | % | | | 1.47 | %5 | | | 1.28 | % | | | 1.22 | % | | | 1.53 | % | | | 1.53 | % | | | 1.53 | % |
| | | | | | | | | | | | | | | | | | | | | | | | | | | | | | | | | | | | | | | | | | | | | | | | |
Total expenses | | | 1.26 | %5 | | | 1.07 | % | | | 1.06 | % | | | 1.15 | % | | | 1.41 | % | | | 1.28 | % | | | 1.70 | %5 | | | 1.29 | % | | | 1.32 | % | | | 2.02 | % | | | 1.60 | % | | | 1.56 | % |
| | | | | | | | | | | | | | | | | | | | | | | | | | | | | | | | | | | | | | | | | | | | | | | | |
Net investment loss | | | (0.43 | )%5 | | | (0.33 | )% | | | (0.59 | )% | | | (0.60 | )% | | | (0.72 | )% | | | (0.65 | )% | | | (0.68 | )%5 | | | (0.56 | )% | | | (0.76 | )% | | | (1.06 | )% | | | (0.77 | )% | | | (0.97 | )% |
| | | | | | | | | | | | | | | | | | | | | | | | | | | | | | | | | | | | | | | | | | | | | | | | |
Supplemental Data | | | | | | | | | | | | | | | | | | | | | | | | | | | | | | | | | | | | | | | | | | | | | | | | |
Net assets, end of period (000) | | $ | 18,209 | | | $ | 26,468 | | | $ | 75,577 | | | $ | 75,111 | | | $ | 75,407 | | | $ | 40,337 | | | $ | 290 | | | $ | 459 | | | $ | 714 | | | $ | 757 | | | $ | 1,136 | | | $ | 10,871 | |
| | | | | | | | | | | | | | | | | | | | | | | | | | | | | | | | | | | | | | | | | | | | | | | | |
Portfolio turnover | | | 22 | % | | | 45 | % | | | 53 | % | | | 64 | % | | | 85 | % | | | 29 | % | | | 22 | % | | | 45 | % | | | 53 | % | | | 64 | % | | | 85 | % | | | 29 | % |
| | | | | | | | | | | | | | | | | | | | | | | | | | | | | | | | | | | | | | | | | | | | | | | | |
| 1 | Based on average shares outstanding. |
| 2 | Less than $0.01 per share. |
| 3 | Aggregate total investment return. |
| 4 | Redemption fee of 2.00% received by the Portfolio is reflected in total return calculations. There was no impact to the return. |
See Notes to Financial Statements.
| | | | | | |
| | | SEMI-ANNUAL REPORT | | MARCH 31, 2009 | | 23 |
| | |
| Financial Highlights (continued) | | Mid-Cap Growth Equity Portfolio |
| | | | | | | | | | | | | | | | | | | | | | | | | | | | | | | | | | | | | | | | | | | | | | | | |
| | | Investor A | | | Investor B | |
| | | Six Months
Ended
March 31, 2009 | | | Year Ended September 30, | | | Six Months
Ended
March 31, 2009 | | | Year Ended September 30, | |
| | (Unaudited) | | | 2008 | | | 2007 | | | 2006 | | | 2005 | | | 2004 | | | (Unaudited) | | | 2008 | | | 2007 | | | 2006 | | | 2005 | | | 2004 | |
Per Share Operating Performance | |
Net asset value, beginning of period | | $ | 9.56 | | | $ | 12.55 | | | $ | 10.00 | | | $ | 9.82 | | | $ | 8.26 | | | $ | 7.17 | | | $ | 8.56 | | | $ | 11.32 | | | $ | 9.09 | | | $ | 9.00 | | | $ | 7.63 | | | $ | 6.67 | |
| | | | | | | | | | | | | | | | | | | | | | | | | | | | | | | | | | | | | | | | | | | | | | | | |
Net investment loss1 | | | (0.03 | ) | | | (0.10 | ) | | | (0.12 | ) | | | (0.11 | ) | | | (0.11 | ) | | | (0.09 | ) | | | (0.04 | ) | | | (0.17 | ) | | | (0.18 | ) | | | (0.17 | ) | | | (0.15 | ) | | | (0.14 | ) |
Net realized and unrealized gain (loss) | | | (2.90 | ) | | | (2.89 | ) | | | 2.67 | | | | 0.42 | | | | 1.67 | | | | 1.18 | | | | (2.61 | ) | | | (2.59 | ) | | | 2.41 | | | | 0.39 | | | | 1.52 | | | | 1.10 | |
| | | | | | | | | | | | | | | | | | | | | | | | | | | | | | | | | | | | | | | | | | | | | | | | |
Net increase (decrease) from investment operations | | | (2.93 | ) | | | (2.99 | ) | | | 2.55 | | | | 0.31 | | | | 1.56 | | | | 1.09 | | | | (2.65 | ) | | | (2.76 | ) | | | 2.23 | | | | 0.22 | | | | 1.37 | | | | 0.96 | |
| | | | | | | | | | | | | | | | | | | | | | | | | | | | | | | | | | | | | | | | | | | | | | | | |
Distributions from net realized gain | | | — | | | | — | | | | — | | | | (0.13 | ) | | | — | | | | — | | | | — | | | | — | | | | — | | | | (0.13 | ) | | | — | | | | — | |
| | | | | | | | | | | | | | | | | | | | | | | | | | | | | | | | | | | | | | | | | | | | | | | | |
Redemption fees added to paid-in capital | | | — | | | | — | | | | 0.00 | 2 | | | 0.00 | 2 | | | 0.00 | 2 | | | 0.00 | 2 | | | — | | | | — | | | | 0.00 | 2 | | | 0.00 | 2 | | | 0.00 | 2 | | | 0.00 | 2 |
| | | | | | | | | | | | | | | | | | | | | | | | | | | | | | | | | | | | | | | | | | | | | | | | |
Net asset value, end of period | | $ | 6.63 | | | $ | 9.56 | | | $ | 12.55 | | | $ | 10.00 | | | $ | 9.82 | | | $ | 8.26 | | | $ | 5.91 | | | $ | 8.56 | | | $ | 11.32 | | | $ | 9.09 | | | $ | 9.00 | | | $ | 7.63 | |
| | | | | | | | | | | | | | | | | | | | | | | | | | | | | | | | | | | | | | | | | | | | | | | | |
Total Investment Return | |
Based on net asset value3 | | | (30.65 | )%4 | | | (23.83 | )% | | | 25.50 | %5 | | | 3.16 | %5 | | | 18.89 | %5 | | | 15.20 | %5 | | | (30.96 | )%4 | | | (24.38 | )% | | | 24.53 | %5 | | | 2.44 | %5 | | | 17.96 | %5 | | | 14.39 | %5 |
| | | | | | | | | | | | | | | | | | | | | | | | | | | | | | | | | | | | | | | | | | | | | | | | |
Ratios to Average Net Assets | |
Total expenses after waivers, reimbursement and fees paid indirectly | | | 1.58 | %6 | | | 1.53 | % | | | 1.57 | % | | | 1.58 | % | | | 1.58 | % | | | 1.67 | % | | | 2.33 | %6 | | | 2.31 | % | | | 2.25 | % | | | 2.33 | % | | | 2.33 | % | | | 2.44 | % |
| | | | | | | | | | | | | | | | | | | | | | | | | | | | | | | | | | | | | | | | | | | | | | | | |
Total expenses | | | 1.77 | %6 | | | 1.53 | % | | | 1.60 | % | | | 1.74 | % | | | 1.78 | % | | | 1.77 | % | | | 2.78 | %6 | | | 2.45 | % | | | 2.46 | % | | | 2.54 | % | | | 2.41 | % | | | 2.45 | % |
| | | | | | | | | | | | | | | | | | | | | | | | | | | | | | | | | | | | | | | | | | | | | | | | |
Net investment loss | | | (0.80 | )%6 | | | (0.81 | )% | | | (1.11 | )% | | | (1.11 | )% | | | (1.14 | )% | | | (1.09 | )% | | | (1.51 | )%6 | | | (1.58 | )% | | | (1.79 | )% | | | (1.86 | )% | | | (1.82 | )% | | | (1.86 | )% |
| | | | | | | | | | | | | | | | | | | | | | | | | | | | | | | | | | | | | | | | | | | | | | | | |
Supplemental Data | |
Net assets, end of period (000) | | $ | 128,549 | | | $ | 195,980 | | | $ | 274,333 | | | $ | 257,729 | | | $ | 290,285 | | | $ | 27,777 | | | $ | 10,189 | | | $ | 19,565 | | | $ | 43,610 | | | $ | 48,635 | | | $ | 59,100 | | | $ | 31,900 | |
| | | | | | | | | | | | | | | | | | | | | | | | | | | | | | | | | | | | | | | | | | | | | | | | |
Portfolio turnover | | | 22 | % | | | 45 | % | | | 53 | % | | | 64 | % | | | 85 | % | | | 29 | % | | | 22 | % | | | 45 | % | | | 53 | % | | | 64 | % | | | 85 | % | | | 29 | % |
| | | | | | | | | | | | | | | | | | | | | | | | | | | | | | | | | | | | | | | | | | | | | | | | |
See Notes to Financial Statements.
| | | | | | |
24 | | SEMI-ANNUAL REPORT | | MARCH 31, 2009 | | |
| | |
| Financial Highlights (continued) | | Mid-Cap Growth Equity Portfolio |
| | | | | | | | | | | | | | | | | | | | | | | | | | | | | | | | | | | | |
| | | Investor C | | | R | |
| | | Six Months
Ended
March 31, 2009 | | | Year Ended September 30, | | | Six Months
Ended
March 31, 2009 | | | Year Ended
September 30, 2008 | | | Period
October 2, 20067 to
September 30, 2007 | |
| | (Unaudited) | | | 2008 | | | 2007 | | | 2006 | | | 2005 | | | 2004 | | | (Unaudited) | | | |
Per Share Operating Performance | |
Net asset value, beginning of period | | $ | 8.56 | | | $ | 11.32 | | | $ | 9.09 | | | $ | 9.00 | | | $ | 7.63 | | | $ | 6.67 | | | $ | 9.56 | | | $ | 12.55 | | | $ | 9.92 | |
| | | | | | | | | | | | | | | | | | | | | | | | | | | | | | | | | | | | |
Net investment loss1 | | | (0.05 | ) | | | (0.16 | ) | | | (0.19 | ) | | | (0.17 | ) | | | (0.15 | ) | | | (0.14 | ) | | | (0.03 | ) | | | (0.10 | ) | | | (0.13 | ) |
Net realized and unrealized gain (loss) | | | (2.60 | ) | | | (2.60 | ) | | | 2.42 | | | | 0.39 | | | | 1.52 | | | | 1.10 | | | | (2.90 | ) | | | (2.89 | ) | | | 2.76 | |
| | | | | | | | | | | | | | | | | | | | | | | | | | | | | | | | | | | | |
Net increase (decrease) from investment operations | | | (2.65 | ) | | | (2.76 | ) | | | 2.23 | | | | 0.22 | | | | 1.37 | | | | 0.96 | | | | (2.93 | ) | | | (2.99 | ) | | | 2.63 | |
| | | | | | | | | | | | | | | | | | | | | | | | | | | | | | | | | | | | |
Distributions from net realized gain | | | — | | | | — | | | | — | | | | (0.13 | ) | | | — | | | | — | | | | — | | | | — | | | | — | |
| | | | | | | | | | | | | | | | | | | | | | | | | | | | | | | | | | | | |
Redemption fees added to paid-in capital | | | — | | | | — | | | | 0.00 | 2 | | | 0.00 | 2 | | | 0.00 | 2 | | | 0.00 | 2 | | | — | | | | — | | | | 0.00 | 2 |
| | | | | | | | | | | | | | | | | | | | | | | | | | | | | | | | | | | | |
Net asset value, end of period | | $ | 5.91 | | | $ | 8.56 | | | $ | 11.32 | | | $ | 9.09 | | | $ | 9.00 | | | $ | 7.63 | | | $ | 6.63 | | | $ | 9.56 | | | $ | 12.55 | |
| | | | | | | | | | | | | | | | | | | | | | | | | | | | | | | | | | | | |
Total Investment Return | |
Based on net asset value | | | (30.96 | )%3,4 | | | (24.38 | )%3 | | | 24.53 | %3,5 | | | 2.44 | %3,5 | | | 17.96 | %3,5 | | | 14.39 | %3,5 | | | (30.65 | )%4 | | | (23.83 | )% | | | 26.51 | %4,5 |
| | | | | | | | | | | | | | | | | | | | | | | | | | | | | | | | | | | | |
Ratios to Average Net Assets | |
Total expenses after waivers, reimbursement and fees paid indirectly | | | 2.33 | %6 | | | 2.25 | % | | | 2.30 | % | | | 2.33 | % | | | 2.33 | % | | | 2.44 | % | | | 1.60 | %6 | | | 1.58 | % | | | 1.59 | %6 |
| | | | | | | | | | | | | | | | | | | | | | | | | | | | | | | | | | | | |
Total expenses | | | 2.53 | %6 | | | 2.25 | % | | | 2.31 | % | | | 2.37 | % | | | 2.41 | % | | | 2.45 | % | | | 2.07 | %6 | | | 1.73 | % | | | 1.63 | %6 |
| | | | | | | | | | | | | | | | | | | | | | | | | | | | | | | | | | | | |
Net investment loss | | | (1.55 | )%6 | | | (1.53 | )% | | | (1.84 | )% | | | (1.86 | )% | | | (1.83 | )% | | | (1.86 | )% | | | (0.84 | )%6 | | | (0.82 | )% | | | (1.12 | )%6 |
| | | | | | | | | | | | | | | | | | | | | | | | | | | | | | | | | | | | |
Supplemental Data | |
Net assets, end of period (000) | | $ | 8,753 | | | $ | 13,964 | | | $ | 20,203 | | | $ | 18,047 | | | $ | 20,748 | | | $ | 11,269 | | | $ | 572 | | | $ | 723 | | | $ | 25 | |
| | | | | | | | | | | | | | | | | | | | | | | | | | | | | | | | | | | | |
Portfolio turnover | | | 22 | % | | | 45 | % | | | 53 | % | | | 64 | % | | | 85 | % | | | 29 | % | | | 22 | % | | | 45 | % | | | 53 | % |
| | | | | | | | | | | | | | | | | | | | | | | | | | | | | | | | | | | | |
| 1 | Based on average shares outstanding. |
| 2 | Less than $0.01 per share. |
| 3 | Total investment returns exclude the effects of sales charges. |
| 4 | Aggregate total investment return. |
| 5 | Redemption fee of 2.00% received by the Portfolio is reflected in total return calculations. There was no impact to the return. |
| 7 | Commencement of operations. |
See Notes to Financial Statements.
| | | | | | |
| | | SEMI-ANNUAL REPORT | | MARCH 31, 2009 | | 25 |
| | |
| Financial Highlights (continued) | | Mid-Cap Value Equity Portfolio* |
| | | | | | | | | | | | | | | | | | | | | | | | |
| | | Institutional | |
| | | Six Months
Ended
March 31, 2009 | | | Year Ended September 30, | | | Period
March 1, 2005 to | | | Period
July 1, 2004 to
February 28, 2005 | |
| | (Unaudited) | | | 2008 | | | 2007 | | | 2006 | | | September 30, 2005 | | |
Per Share Operating Performance | |
Net asset value, beginning of period | | $ | 9.94 | | | $ | 14.35 | | | $ | 13.67 | | | $ | 13.74 | | | $ | 12.73 | | | $ | 12.14 | |
| | | | | | | | | | | | | | | | | | | | | | | | |
Net investment income | | | 0.05 | 1 | | | 0.10 | 1 | | | 0.11 | 1 | | | 0.12 | 1 | | | 0.04 | 1 | | | 0.11 | |
Net realized and unrealized gain (loss) | | | (3.38 | ) | | | (2.77 | ) | | | 2.38 | | | | 1.23 | | | | 0.97 | | | | 1.44 | |
| | | | | | | | | | | | | | | | | | | | | | | | |
Net increase (decrease) from investment operations | | | (3.33 | ) | | | (2.67 | ) | | | 2.49 | | | | 1.35 | | | | 1.01 | | | | 1.55 | |
| | | | | | | | | | | | | | | | | | | | | | | | |
Dividends and distributions from: | |
Net investment income | | | (0.07 | ) | | | — | | | | (0.15 | ) | | | (0.04 | ) | | | — | | | | (0.15 | ) |
Tax return of capital | | | — | | | | (0.02 | ) | | | — | | | | — | | | | — | | | | — | |
Net realized gain | | | — | | | | (1.72 | ) | | | (1.66 | ) | | | (1.38 | ) | | | — | | | | (0.81 | ) |
| | | | | | | | | | | | | | | | | | | | | | | | |
Total dividends and distributions | | | (0.07 | ) | | | (1.74 | ) | | | (1.81 | ) | | | (1.42 | ) | | | — | | | | (0.96 | ) |
| | | | | | | | | | | | | | | | | | | | | | | | |
Redemption fees added to paid-in capital | | | — | | | | — | | | | 0.00 | 2 | | | 0.00 | 2 | | | 0.00 | 2 | | | — | |
| | | | | | | | | | | | | | | | | | | | | | | | |
Net asset value, end of period | | $ | 6.54 | | | $ | 9.94 | | | $ | 14.35 | | | $ | 13.67 | | | $ | 13.74 | | | $ | 12.73 | |
| | | | | | | | | | | | | | | | | | | | | | | | |
Total Investment Return | | | | | | | | | | | | | | | | | | | | | | | | |
Based on net asset value | | | (33.54 | )%3 | | | (20.74 | )% | | | 19.35 | %4 | | | 10.77 | %4 | | | 7.94 | %3,4 | | | 13.07 | %3 |
| | | | | | | | | | | | | | | | | | | | | | | | |
Ratios to Average Net Assets | |
Total expenses after waivers, reimbursement and fees paid indirectly | | | 0.94 | %5 | | | 0.94 | % | | | 0.95 | % | | | 0.99 | % | | | 1.00 | %5 | | | 0.99 | %5 |
| | | | | | | | | | | | | | | | | | | | | | | | |
Total expenses | | | 1.16 | %5 | | | 1.10 | % | | | 1.07 | % | | | 1.07 | % | | | 1.30 | %5 | | | 1.09 | %5 |
| | | | | | | | | | | | | | | | | | | | | | | | |
Net investment income | | | 1.37 | %5 | | | 0.82 | % | | | 0.79 | % | | | 0.88 | % | | | 0.49 | %5 | | | 1.18 | %5 |
| | | | | | | | | | | | | | | | | | | | | | | | |
Supplemental Data | |
Net assets, end of period (000) | | $ | 112,929 | | | $ | 141,900 | | | $ | 134,665 | | | $ | 80,292 | | | $ | 53,111 | | | $ | 50,383 | |
| | | | | | | | | | | | | | | | | | | | | | | | |
Portfolio turnover | | | 110 | % | | | 117 | % | | | 202 | % | | | 153 | % | | | 60 | % | | | 53 | % |
| | | | | | | | | | | | | | | | | | | | | | | | |
| |
| | | Service | |
| | | Six Months
Ended
March 31, 2009 | | | Year Ended September 30, | | | Period
March 1, 2005 to | | | Period
January 28, 20056 to
February 28, 2005 | |
| | (Unaudited) | | | 2008 | | | 2007 | | | 2006 | | | September 30, 2005 | | |
Per Share Operating Performance | |
Net asset value, beginning of period | | $ | 9.78 | | | $ | 14.14 | | | $ | 13.49 | | | $ | 13.61 | | | $ | 12.63 | | | $ | 12.04 | |
| | | | | | | | | | | | | | | | | | | | | | | | |
Net investment income (loss) | | | 0.04 | 1 | | | 0.06 | 1 | | | 0.10 | 1 | | | 0.08 | 1 | | | 0.02 | 1 | | | (0.01 | ) |
Net realized and unrealized gain (loss) | | | (3.33 | ) | | | (2.72 | ) | | | 2.33 | | | | 1.21 | | | | 0.96 | | | | 0.60 | |
| | | | | | | | | | | | | | | | | | | | | | | | |
Net increase (decrease) from investment operations | | | (3.29 | ) | | | (2.66 | ) | | | 2.43 | | | | 1.29 | | | | 0.98 | | | | 0.59 | |
| | | | | | | | | | | | | | | | | | | | | | | | |
Dividends and distributions from: | |
Net investment income | | | (0.06 | ) | | | — | | | | (0.12 | ) | | | (0.03 | ) | | | — | | | | — | |
Tax return of capital | | | — | | | | (0.02 | ) | | | — | | | | — | | | | — | | | | — | |
Net realized gain | | | — | | | | (1.68 | ) | | | (1.66 | ) | | | (1.38 | ) | | | — | | | | — | |
Total dividends and distributions | | | (0.06 | ) | | | (1.70 | ) | | | (1.78 | ) | | | (1.41 | ) | | | — | | | | — | |
| | | | | | | | | | | | | | | | | | | | | | | | |
Redemption fees added to paid-in capital | | | — | | | | — | | | | 0.00 | 2 | | | 0.00 | 2 | | | 0.00 | 2 | | | — | |
| | | | | | | | | | | | | | | | | | | | | | | | |
Net asset value, end of period | | $ | 6.43 | | | $ | 9.78 | | | $ | 14.14 | | | $ | 13.49 | | | $ | 13.61 | | | $ | 12.63 | |
| | | | | | | | | | | | | | | | | | | | | | | | |
Total Investment Return | |
Based on net asset value | | | (33.64 | )%3 | | | (20.95 | )% | | | 19.10 | %4 | | | 10.45 | %4 | | | 7.76 | %3,4 | | | 4.89 | %3 |
| | | | | | | | | | | | | | | | | | | | | | | | |
Ratios to Average Net Assets | |
Total expenses after waivers, reimbursement and fees paid indirectly | | | 1.25 | %5 | | | 1.23 | % | | | 1.20 | % | | | 1.25 | % | | | 1.25 | %5 | | | 1.25 | %5 |
| | | | | | | | | | | | | | | | | | | | | | | | |
Total expenses | | | 1.37 | %5 | | | 1.25 | % | | | 1.24 | % | | | 1.50 | % | | | 1.54 | %5 | | | 1.49 | %5 |
| | | | | | | | | | | | | | | | | | | | | | | | |
Net investment income | | | 1.04 | %5 | | | 0.54 | % | | | 0.68 | % | | | 0.61 | % | | | 0.20 | %5 | | | 0.39 | %5 |
| | | | | | | | | | | | | | | | | | | | | | | | |
Supplemental Data | |
Net assets, end of period (000) | | $ | 1,624 | | | $ | 2,431 | | | $ | 3,716 | | | $ | 3,130 | | | $ | 889 | | | $ | 1,374 | |
| | | | | | | | | | | | | | | | | | | | | | | | |
Portfolio turnover | | | 110 | % | | | 117 | % | | | 202 | % | | | 153 | % | | | 60 | % | | | 53 | % |
| | | | | | | | | | | | | | | | | | | | | | | | |
See Notes to Financial Statements.
| | | | | | |
26 | | SEMI-ANNUAL REPORT | | MARCH 31, 2009 | | |
| | |
| Financial Highlights (continued) | | Mid-Cap Value Equity Portfolio* |
| | | | | | | | | | | | | | | | | | | | | | | | |
| | | Investor A | |
| | | Six Months
Ended
March 31, 2009 | | | Year Ended September 30, | | | Period
March 1, 2005 to | | | Period
July 1, 2004 to | |
| | (Unaudited) | | | 2008 | | | 2007 | | | 2006 | | | September 30, 2005 | | | February 28, 2005 | |
Per Share Operating Performance | |
Net asset value, beginning of period | | $ | 9.66 | | | $ | 14.00 | | | $ | 13.38 | | | $ | 13.49 | | | $ | 12.53 | | | $ | 11.92 | |
| | | | | | | | | | | | | | | | | | | | | | | | |
Net investment income | | | 0.04 | 1 | | | 0.06 | 1 | | | 0.08 | 1 | | | 0.08 | 1 | | | 0.02 | 1 | | | 0.07 | |
Net realized and unrealized gain (loss) | | | (3.28 | ) | | | (2.70 | ) | | | 2.32 | | | | 1.21 | | | | 0.94 | | | | 1.45 | |
| | | | | | | | | | | | | | | | | | | | | | | | |
Net increase from investment operations | | | (3.24 | ) | | | (2.64 | ) | | | 2.40 | | | | 1.29 | | | | 0.96 | | | | 1.52 | |
| | | | | | | | | | | | | | | | | | | | | | | | |
Dividends and distributions from: | | | | | | | | | | | | | | | | | | | | | | | | |
Net investment income | | | (0.06 | ) | | | — | | | | (0.12 | ) | | | (0.02 | ) | | | — | | | | (0.11 | ) |
Tax return of capital | | | — | | | | (0.02 | ) | | | — | | | | — | | | | — | | | | — | |
Net realized gain | | | — | | | | (1.68 | ) | | | (1.66 | ) | | | (1.38 | ) | | | — | | | | (0.80 | ) |
| | | | | | | | | | | | | | | | | | | | | | | | |
Total dividends and distributions | | | (0.06 | ) | | | (1.70 | ) | | | (1.78 | ) | | | (1.40 | ) | | | — | | | | (0.91 | ) |
| | | | | | | | | | | | | | | | | | | | | | | | |
Redemption fees added to paid-in capital | | | — | | | | — | | | | 0.00 | 2 | | | 0.00 | 2 | | | 0.00 | 2 | | | — | |
| | | | | | | | | | | | | | | | | | | | | | | | |
Net asset value, end of period | | $ | 6.36 | | | $ | 9.66 | | | $ | 14.00 | | | $ | 13.38 | | | $ | 13.49 | | | $ | 12.53 | |
| | | | | | | | | | | | | | | | | | | | | | | | |
Total Investment Return | |
Based on net asset value7 | | | (33.54 | )%3 | | | (21.04 | )% | | | 19.02 | %4 | | | 10.56 | %4 | | | 7.66 | %3,4 | | | 12.98 | %3 |
| | | | | | | | | | | | | | | | | | | | | | | | |
Ratios to Average Net Assets | |
Total expenses after waivers, reimbursement and fees paid indirectly | | | 1.25 | %5 | | | 1.25 | % | | | 1.25 | % | | | 1.25 | % | | | 1.25 | %5 | | | 1.24 | %5 |
| | | | | | | | | | | | | | | | | | | | | | | | |
Total expenses | | | 1.59 | %5 | | | 1.43 | % | | | 1.40 | % | | | 1.56 | % | | | 1.64 | %5 | | | 1.38 | %5 |
| | | | | | | | | | | | | | | | | | | | | | | | |
Net investment income | | | 1.03 | %5 | | | 0.53 | % | | | 0.61 | % | | | 0.62 | % | | | 0.24 | %5 | | | 0.92 | %5 |
| | | | | | | | | | | | | | | | | | | | | | | | |
Supplemental Data | |
Net assets, end of period (000) | | $ | 294,688 | | | $ | 470,265 | | | $ | 642,264 | | | $ | 497,964 | | | $ | 500,479 | | | $ | 448,237 | |
| | | | | | | | | | | | | | | | | | | | | | | | |
Portfolio turnover | | | 110 | % | | | 117 | % | | | 202 | % | | | 153 | % | | | 60 | % | | | 53 | % |
| | | | | | | | | | | | | | | | | | | | | | | | |
| * | The performance prior to January 31, 2005 set forth in this table is the financial data of State Street Research Mid-Cap Value Fund, a series of a predecessor trust, State Street Research Equity Trust. BlackRock Funds acquired all of the assets and certain stated liabilities of State Street Research Mid-Cap Value Fund on January 28, 2005. The net asset values and other per share information listed have been restated to reflect the conversion ratios of 1.56483770, 1.57950264, 1.62345461 and 1.63087248 for Institutional, Investor A, Investor B and Investor C shares, respectively. |
| 1 | Based on average shares outstanding. |
| 2 | Less than $0.01 per share. |
| 3 | Aggregate total investment return. |
| 4 | Redemption fee of 2.00% received by the Portfolio is reflected in total return calculations. There was no impact to the return. |
| 6 | Commencement of operations. |
| 7 | Total investment returns exclude the effects of sales charges. |
See Notes to Financial Statements.
| | | | | | |
| | | SEMI-ANNUAL REPORT | | MARCH 31, 2009 | | 27 |
| | |
| Financial Highlights (continued) | | Mid-Cap Value Equity Portfolio* |
| | | | | | | | | | | | | | | | | | | | | | | | |
| | | Investor B | |
| | | Six Months
Ended
March 31, 2009 | | | Year Ended September 30, | | | Period
March 1, 2005 to | | | Period
July 1, 2004 to | |
| | (Unaudited) | | | 2008 | | | 2007 | | | 2006 | | | September 30, 2005 | | | February 28, 2005 | |
Per Share Operating Performance | | | | | | | | | | | | | | | | | | | | | | | | |
Net asset value, beginning of period | | $ | 8.84 | | | $ | 12.92 | | | $ | 12.46 | | | $ | 12.73 | | | $ | 11.87 | | | $ | 11.28 | |
| | | | | | | | | | | | | | | | | | | | | | | | |
Net investment income (loss) | | | 0.01 | 1 | | | (0.02 | )1 | | | (0.01 | )1 | | | (0.02 | )1 | | | (0.04 | )1 | | | (0.03 | ) |
Net realized and unrealized gain (loss) | | | (3.00 | ) | | | (2.47 | ) | | | 2.15 | | | | 1.13 | | | | 0.90 | | | | 1.41 | |
| | | | | | | | | | | | | | | | | | | | | | | | |
Net increase (decrease) from investment operations | | | (2.99 | ) | | | (2.49 | ) | | | 2.14 | | | | 1.11 | | | | 0.86 | | | | 1.38 | |
| | | | | | | | | | | | | | | | | | | | | | | | |
Dividends and distributions from: | | | | | | | | | | | | | | | | | | | | | | | | |
Net investment income | | | (0.05 | ) | | | — | | | | (0.02 | ) | | | — | | | | — | | | | (0.01 | ) |
Net realized gain | | | — | | | | (1.59 | ) | | | (1.66 | ) | | | (1.38 | ) | | | — | | | | (0.78 | ) |
| | | | | | | | | | | | | | | | | | | | | | | | |
Total dividends and distributions | | | (0.05 | ) | | | (1.59 | ) | | | (1.68 | ) | | | (1.38 | ) | | | — | | | | (0.79 | ) |
| | | | | | | | | | | | | | | | | | | | | | | | |
Redemption fees added to paid-in capital | | | — | | | | — | | | | 0.00 | 2 | | | 0.00 | 2 | | | 0.00 | 2 | | | — | |
| | | | | | | | | | | | | | | | | | | | | | | | |
Net asset value, end of period | | $ | 5.80 | | | $ | 8.84 | | | $ | 12.92 | | | $ | 12.46 | | | $ | 12.73 | | | $ | 11.87 | |
| | | | | | | | | | | | | | | | | | | | | | | | |
Total Investment Return | | | | | | | | | | | | | | | | | | | | | | | | |
Based on net asset value3 | | | (33.84 | )%4 | | | (21.53 | )% | | | 18.18 | %5 | | | 9.63 | %5 | | | 7.25 | %4,5 | | | 12.39 | %4 |
| | | | | | | | | | | | | | | | | | | | | | | | |
Ratios to Average Net Assets | | | | | | | | | | | | | | | | | | | | | | | | |
Total expenses after waivers, reimbursement and fees paid indirectly | | | 2.00 | %6 | | | 2.00 | % | | | 2.00 | % | | | 2.00 | % | | | 2.00 | %6 | | | 1.99 | %6 |
| | | | | | | | | | | | | | | | | | | | | | | | |
Total expenses | | | 2.42 | %6 | | | 2.24 | % | | | 2.23 | % | | | 2.25 | % | | | 2.29 | %6 | | | 2.09 | %6 |
| | | | | | | | | | | | | | | | | | | | | | | | |
Net investment income (loss) | | | 0.27 | %6 | | | (0.21 | )% | | | (0.09 | )% | | | (0.13 | )% | | | (0.52 | )%6 | | | 0.20 | %6 |
| | | | | | | | | | | | | | | | | | | | | | | | |
Supplemental Data | | | | | | | | | | | | | | | | | | | | | | | | |
Net assets, end of period (000) | | $ | 35,968 | | | $ | 67,656 | | | $ | 119,768 | | | $ | 124,089 | | | $ | 131,651 | | | $ | 128,568 | |
| | | | | | | | | | | | | | | | | | | | | | | | |
Portfolio turnover | | | 110 | % | | | 117 | % | | | 202 | % | | | 153 | % | | | 60 | % | | | 53 | % |
| | | | | | | | | | | | | | | | | | | | | | | | |
See Notes to Financial Statements.
| | | | | | |
28 | | SEMI-ANNUAL REPORT | | MARCH 31, 2009 | | |
| | |
| Financial Highlights (continued) | | Mid-Cap Value Equity Portfolio* |
| | | | | | | | | | | | | | | | | | | | | | | | |
| | | Investor C | |
| | | Six Months Ended
March 31, 2009 | | | Year Ended September 30, | | | Period March 1, 2005 to | | | Period July 1, 2004 to | |
| | (Unaudited) | | | 2008 | | | 2007 | | | 2006 | | | September 30, 2005 | | | February 28, 2005 | |
Per Share Operating Performance | | | | | | | | | | | | | | | | | | | | | | | | |
Net asset value, beginning of period | | $ | 8.81 | | | $ | 12.90 | | | $ | 12.46 | | | $ | 12.73 | | | $ | 11.87 | | | $ | 11.28 | |
| | | | | | | | | | | | | | | | | | | | | | | | |
Net investment income (loss) | | | 0.01 | 1 | | | (0.02 | )1 | | | (0.02 | )1 | | | (0.02 | )1 | | | (0.04 | )1 | | | (0.03 | ) |
Net realized and unrealized gain (loss) | | | (2.99 | ) | | | (2.47 | ) | | | 2.15 | | | | 1.13 | | | | 0.90 | | | | 1.40 | |
| | | | | | | | | | | | | | | | | | | | | | | | |
Net increase (decrease) from investment operations | | | (2.98 | ) | | | (2.49 | ) | | | 2.13 | | | | 1.11 | | | | 0.86 | | | | 1.37 | |
| | | | | | | | | | | | | | | | | | | | | | | | |
Dividends and distributions from: | | | | | | | | | | | | | | | | | | | | | | | | |
Net investment income | | | (0.05 | ) | | | — | | | | (0.03 | ) | | | — | | | | — | | | | (0.01 | ) |
Net realized gain | | | — | | | | (1.60 | ) | | | (1.66 | ) | | | (1.38 | ) | | | — | | | | (0.77 | ) |
| | | | | | | | | | | | | | | | | | | | | | | | |
Total dividends and distributions | | | (0.05 | ) | | | (1.60 | ) | | | (1.69 | ) | | | (1.38 | ) | | | — | | | | (0.78 | ) |
| | | | | | | | | | | | | | | | | | | | | | | | |
Redemption fees added to paid-in capital | | | — | | | | — | | | | 0.00 | 2 | | | 0.00 | 2 | | | 0.00 | 2 | | | — | |
| | | | | | | | | | | | | | | | | | | | | | | | |
Net asset value, end of period | | $ | 5.78 | | | $ | 8.81 | | | $ | 12.90 | | | $ | 12.46 | | | $ | 12.73 | | | $ | 11.87 | |
| | | | | | | | | | | | | | | | | | | | | | | | |
Total Investment Return | | | | | | | | | | | | | | | | | | | | | | | | |
Based on net asset value3 | | | (33.84 | )%4 | | | (21.56 | )% | | | 18.16 | %5 | | | 9.63 | %5 | | | 7.25 | %4,5 | | | 12.40 | %4 |
| | | | | | | | | | | | | | | | | | | | | | | | |
Ratios to Average Net Assets | | | | | | | | | | | | | | | | | | | | | | | | |
Total expenses after waivers, reimbursement and fees paid indirectly | | | 2.00 | %6 | | | 2.00 | % | | | 2.00 | % | | | 2.00 | % | | | 2.00 | %6 | | | 1.99 | %6 |
| | | | | | | | | | | | | | | | | | | | | | | | |
Total expenses | | | 2.42 | %6 | | | 2.20 | % | | | 2.21 | % | | | 2.15 | % | | | 2.29 | %6 | | | 2.09 | %6 |
| | | | | | | | | | | | | | | | | | | | | | | | |
Net investment income (loss) | | | 0.28 | %6 | | | (0.22 | )% | | | (0.14 | )% | | | (0.13 | )% | | | (0.50 | )%6 | | | 0.19 | %6 |
| | | | | | | | | | | | | | | | | | | | | | | | |
Supplemental Data | | | | | | | | | | | | | | | | | | | | | | | | |
Net assets, end of period (000) | | $ | 69,657 | | | $ | 118,186 | | | $ | 173,731 | | | $ | 137,382 | | | $ | 103,344 | | | $ | 91,657 | |
| | | | | | | | | | | | | | | | | | | | | | | | |
Portfolio turnover | | | 110 | % | | | 117 | % | | | 202 | % | | | 153 | % | | | 60 | % | | | 53 | % |
| | | | | | | | | | | | | | | | | | | | | | | | |
| * | The performance prior to January 31, 2005 set forth in this table is the financial data of State Street Research Mid-Cap Value Fund, a series of a predecessor trust, State Street Research Equity Trust. BlackRock Funds acquired all of the assets and certain stated liabilities of State Street Research Mid-Cap Value Fund on January 28, 2005. The net asset values and other per share information listed have been restated to reflect the conversion ratios of 1.56483770, 1.57950264, 1.62345461 and 1.63087248 for Institutional, Investor A, Investor B and Investor C shares, respectively. |
| 1 | Based on average shares outstanding. |
| 2 | Less than $0.01 per share. |
| 3 | Total investment returns exclude the effects of sales charges. |
| 4 | Aggregate total investment return. |
| 5 | Redemption fee of 2.00% received by the Portfolio is reflected in total return calculations. There was no impact to the return. |
See Notes to Financial Statements.
| | | | | | |
| | | SEMI-ANNUAL REPORT | | MARCH 31, 2009 | | 29 |
| | |
| Financial Highlights (continued) | | Small/Mid-Cap Growth Portfolio |
| | | | | | | | | | | | | | | | | | | | | | | | |
| | | Institutional | |
| | | Six Months
Ended
March 31, 2009 | | | Year Ended September 30, | |
| | (Unaudited) | | | 2008 | | | 2007 | | | 2006 | | | 2005 | | | 2004 | |
Per Share Operating Performance | | | | | | | | | | | | | | | | | | | | | | | | |
Net asset value, beginning of period | | $ | 11.80 | | | $ | 18.24 | | | $ | 15.51 | | | $ | 15.16 | | | $ | 12.49 | | | $ | 12.11 | |
| | | | | | | | | | | | | | | | | | | | | | | | |
Net investment loss | | | (0.03 | )1 | | | (0.06 | )1 | | | (0.12 | )1 | | | (0.10 | )1 | | | (0.17 | )1 | | | (0.10 | ) |
Net realized and unrealized gain (loss) | | | (4.04 | ) | | | (3.49 | ) | | | 3.68 | | | | 1.09 | | | | 2.84 | | | | 0.48 | |
| | | | | | | | | | | | | | | | | | | | | | | | |
Net increase (decrease) from investment operations | | | (4.07 | ) | | | (3.55 | ) | | | 3.56 | | | | 0.99 | | | | 2.67 | | | | 0.38 | |
| | | | | | | | | | | | | | | | | | | | | | | | |
Dividends and distributions from: | | | | | | | | | | | | | | | | | | | | | | | | |
Net investment income | | | (0.02 | ) | | | — | | | | — | | | | — | | | | — | | | | — | |
Net realized gain | | | — | | | | (2.89 | ) | | | (0.83 | ) | | | (0.64 | ) | | | — | | | | — | |
| | | | | | | | | | | | | | | | | | | | | | | | |
Total dividends and distributions | | | (0.02 | ) | | | (2.89 | ) | | | (0.83 | ) | | | (0.64 | ) | | | — | | | | — | |
| | | | | | | | | | | | | | | | | | | | | | | | |
Redemption fees added to paid-in capital | | | 0.00 | 2 | | | 0.00 | 2 | | | 0.00 | 2 | | | 0.00 | 2 | | | 0.00 | 2 | | | — | |
| | | | | | | | | | | | | | | | | | | | | | | | |
Net asset value, end of period | | $ | 7.71 | | | $ | 11.80 | | | $ | 18.24 | | | $ | 15.51 | | | $ | 15.16 | | | $ | 12.49 | |
| | | | | | | | | | | | | | | | | | | | | | | | |
Total Investment Return | | | | | | | | | | | | | | | | | | | | | | | | |
Based on net asset value | | | (34.52 | )%3,4 | | | (22.78 | )%3 | | | 23.74 | %3 | | | 6.63 | %3 | | | 21.38 | %3 | | | 3.14 | % |
| | | | | | | | | | | | | | | | | | | | | | | | |
Ratios to Average Net Assets | | | | | | | | | | | | | | | | | | | | | | | | |
Total expenses after waivers, reimbursement and fees paid indirectly | | | 1.10 | %5 | | | 1.10 | % | | | 1.05 | % | | | 0.99 | % | | | 1.10 | % | | | 1.09 | % |
| | | | | | | | | | | | | | | | | | | | | | | | |
Total expenses | | | 1.98 | %5 | | | 1.44 | % | | | 1.38 | % | | | 1.06 | % | | | 1.28 | % | | | 1.28 | % |
| | | | | | | | | | | | | | | | | | | | | | | | |
Net investment loss | | | (0.66 | )%5 | | | (0.41 | )% | | | (0.71 | )% | | | (0.64 | )% | | | (0.72 | )% | | | (0.80 | )% |
| | | | | | | | | | | | | | | | | | | | | | | | |
Supplemental Data | | | | | | | | | | | | | | | | | | | | | | | | |
Net assets, end of period (000) | | $ | 11,541 | | | $ | 17,019 | | | $ | 26,976 | | | $ | 23,866 | | | $ | 20,133 | | | $ | 87,520 | |
| | | | | | | | | | | | | | | | | | | | | | | | |
Portfolio turnover | | | 33 | % | | | 63 | % | | | 76 | % | | | 49 | % | | | 122 | % | | | 208 | % |
| | | | | | | | | | | | | | | | | | | | | | | | |
| | | | | | | | | | | | | | | | | | | | | | | | | | | | | | | | | | | | | | | | | | | | | | | | |
| | | Investor A | | | Investor B | |
| | Six Months
Ended
March 31, 2009 | | | Year Ended September 30, | | | Six Months
Ended
March 31, 2009 | | | Year Ended September 30, | |
| | (Unaudited) | | | 2008 | | | 2007 | | | 2006 | | | 2005 | | | 2004 | | | (Unaudited) | | | 2008 | | | 2007 | | | 2006 | | | 2005 | | | 2004 | |
Per Share Operating Performance | |
Net asset value, beginning of period | | $ | 11.03 | | | $ | 17.24 | | | $ | 14.74 | | | $ | 14.48 | | | $ | 11.96 | | | $ | 11.63 | | | $ | 9.41 | | | $ | 15.09 | | | $ | 13.10 | | | $ | 13.03 | | | $ | 10.84 | | | $ | 10.62 | |
| | | | | | | | | | | | | | | | | | | | | | | | | | | | | | | | | | | | | | | | | | | | | | | | |
Net investment loss | | | (0.03 | )1 | | | (0.09 | )1 | | | (0.15 | )1 | | | (0.15 | )1 | | | (0.13 | )1 | | | (0.14 | ) | | | (0.05 | )1 | | | (0.17 | )1 | | | (0.24 | )1 | | | (0.23 | )1 | | | (0.19 | )1 | | | (0.21 | ) |
Net realized and unrealized gain (loss) | | | (3.79 | ) | | | (3.26 | ) | | | 3.48 | | | | 1.05 | | | | 2.65 | | | | 0.47 | | | | (3.23 | ) | | | (2.80 | ) | | | 3.06 | | | | 0.94 | | | | 2.38 | | | | 0.43 | |
| | | | | | | | | | | | | | | | | | | | | | | | | | | | | | | | | | | | | | | | | | | | | | | | |
Net increase (decrease) from investment operations | | | (3.82 | ) | | | (3.35 | ) | | | 3.33 | | | | 0.90 | | | | 2.52 | | | | 0.33 | | | | (3.28 | ) | | | (2.97 | ) | | | 2.82 | | | | 0.71 | | | | 2.19 | | | | 0.22 | |
| | | | | | | | | | | | | | | | | | | | | | | | | | | | | | | | | | | | | | | | | | | | | | | | |
Dividends and distributions from: | | | | | | | | | | | | | | | | | | | | | | | | | | | | | | | | | | | | | | | | | | | | | | | | |
Net investment income | | | (0.01 | ) | | | — | | | | — | | | | — | | | | — | | | | — | | | | — | | | | — | | | | — | | | | — | | | | — | | | | — | |
Net realized gain | | | — | | | | (2.86 | ) | | | (0.83 | ) | | | (0.64 | ) | | | — | | | | — | | | | — | | | | (2.71 | ) | | | (0.83 | ) | | | (0.64 | ) | | | — | | | | — | |
| | | | | | | | | | | | | | | | | | | | | | | | | | | | | | | | | | | | | | | | | | | | | | | | |
Total dividends and distributions | | | (0.01 | ) | | | (2.86 | ) | | | (0.83 | ) | | | (0.64 | ) | | | — | | | | — | | | | — | | | | (2.71 | ) | | | (0.83 | ) | | | (0.64 | ) | | | — | | | | — | |
| | | | | | | | | | | | | | | | | | | | | | | | | | | | | | | | | | | | | | | | | | | | | | | | |
Redemption fees added to paid-in capital | | | 0.00 | 2 | | | 0.00 | 2 | | | 0.00 | 2 | | | 0.00 | 2 | | | 0.00 | 2 | | | — | | | | 0.00 | 2 | | | 0.00 | 2 | | | 0.00 | 2 | | | 0.00 | 2 | | | 0.00 | 2 | | | — | |
| | | | | | | | | | | | | | | | | | | | | | | | | | | | | | | | | | | | | | | | | | | | | | | | |
Net asset value, end of period | | $ | 7.20 | | | $ | 11.03 | | | $ | 17.24 | | | $ | 14.74 | | | $ | 14.48 | | | $ | 11.96 | | | $ | 6.13 | | | $ | 9.41 | | | $ | 15.09 | | | $ | 13.10 | | | $ | 13.03 | | | $ | 10.84 | |
| | | | | | | | | | | | | | | | | | | | | | | | | | | | | | | | | | | | | | | | | | | | | | | | |
Total Investment Return | |
Based on net asset value6 | | | (34.62 | )%3,4 | | | (22.93 | )%3 | | | 23.41 | %3 | | | 6.31 | %3 | | | 21.07 | %3 | | | 2.84 | % | | | (34.86 | )%3,4 | | | (23.51 | )%3 | | | 22.40 | %3 | | | 5.52 | %3 | | | 20.20 | %3 | | | 2.17 | % |
| | | | | | | | | | | | | | | | | | | | | | | | | | | | | | | | | | | | | | | | | | | | | | | | |
Ratios to Average Net Assets | |
Total expenses after waivers, reimbursement and fees paid indirectly | | | 1.35 | %5 | | | 1.35 | % | | | 1.26 | % | | | 1.35 | % | | | 1.37 | %* | | | 1.39 | % | | | 2.10 | %5 | | | 2.10 | % | | | 2.09 | % | | | 2.10 | % | | | 2.10 | % | | | 2.09 | % |
| | | | | | | | | | | | | | | | | | | | | | | | | | | | | | | | | | | | | | | | | | | | | | | | |
Total expenses | | | 1.76 | %5 | | | 1.45 | % | | | 1.42 | % | | | 1.66 | % | | | 1.64 | % | | | 1.56 | % | | | 2.68 | %5 | | | 2.40 | % | | | 2.40 | % | | | 2.40 | % | | | 2.30 | % | | | 2.25 | % |
| | | | | | | | | | | | | | | | | | | | | | | | | | | | | | | | | | | | | | | | | | | | | | | | |
Net investment loss | | | (0.91 | )%5 | | | (0.66 | )% | | | (0.92 | )% | | | (1.00 | )% | | | (0.87 | )% | | | (1.09 | )% | | | (1.66 | )%5 | | | (1.40 | )% | | | (1.75 | )% | | | (1.75 | )% | | | (1.58 | )% | | | (1.79 | )% |
| | | | | | | | | | | | | | | | | | | | | | | | | | | | | | | | | | | | | | | | | | | | | | | | |
Supplemental Data | |
Net assets, end of period (000) | | $ | 84,237 | | | $ | 138,073 | | | $ | 218,851 | | | $ | 209,646 | | | $ | 215,622 | | | $ | 268,065 | | | $ | 5,489 | | | $ | 10,468 | | | $ | 21,110 | | | $ | 23,085 | | | $ | 24,925 | | | $ | 24,880 | |
| | | | | | | | | | | | | | | | | | | | | | | | | | | | | | | | | | | | | | | | | | | | | | | | |
Portfolio turnover | | | 33 | % | | | 63 | % | | | 76 | % | | | 49 | % | | | 122 | % | | | 208 | % | | | 33 | % | | | 63 | % | | | 76 | % | | | 49 | % | | | 122 | % | | | 208 | % |
| | | | | | | | | | | | | | | | | | | | | | | | | | | | | | | | | | | | | | | | | | | | | | | | |
See Notes to Financial Statements.
| | | | | | |
30 | | SEMI-ANNUAL REPORT | | MARCH 31, 2009 | | |
| | |
| Financial Highlights (concluded) | | Small/Mid-Cap Growth Portfolio |
| | | | | | | | | | | | | | | | | | | | | | | | | | | | | | | | | | | | |
| | | Investor C | | | R | |
| | | Six Months
Ended
March 31, 2009 | | | Year Ended September 30, | | | Six Months
Ended
March 31, 2009 | | | Year Ended | | | Period
October 2, 20067 to | |
| | (Unaudited) | | | 2008 | | | 2007 | | | 2006 | | | 2005 | | | 2004 | | | (Unaudited) | | | September 30, 2008 | | | September 30, 2007 | |
Per Share Operating Performance | | | | | | | | | | | | | | | | | | | | | | | | | | | | | | | | | | | | |
Net asset value, beginning of period | | $ | 9.42 | | | $ | 15.12 | | | $ | 13.12 | | | $ | 13.06 | | | $ | 10.87 | | | $ | 10.64 | | | $ | 10.93 | | | $ | 17.18 | | | $ | 14.54 | |
| | | | | | | | | | | | | | | | | | | | | | | | | | | | | | | | | | | | |
Net investment loss | | | (0.05 | )1 | | | (0.17 | )1 | | | (0.24 | )1 | | | (0.23 | )1 | | | (0.20 | )1 | | | (0.21 | ) | | | (0.05 | )1 | | | (0.12 | )1 | | | (0.20 | )1 |
Net realized and unrealized gain (loss) | | | (3.23 | ) | | | (2.80 | ) | | | 3.07 | | | | 0.93 | | | | 2.39 | | | | 0.44 | | | | (3.74 | ) | | | (3.23 | ) | | | 3.67 | |
| | | | | | | | | | | | | | | | | | | | | | | | | | | | | | | | | | | | |
Net increase (decrease) from investment operations | | | (3.28 | ) | | | (2.97 | ) | | | 2.83 | | | | 0.70 | | | | 2.19 | | | | 0.23 | | | | (3.79 | ) | | | (3.35 | ) | | | 3.47 | |
| | | | | | | | | | | | | | | | | | | | | | | | | | | | | | | | | | | | |
Dividends and distributions from: | | | | | | | | | | | | | | | | | | | | | | | | | | | | | | | | | | | | |
Net investment income | | | — | | | | — | | | | — | | | | — | | | | — | | | | — | | | | (0.01 | ) | | | — | | | | — | |
Net realized gain | | | — | | | | (2.73 | ) | | | (0.83 | ) | | | (0.64 | ) | | | — | | | | — | | | | — | | | | (2.90 | ) | | | (0.83 | ) |
| | | | | | | | | | | | | | | | | | | | | | | | | | | | | | | | | | | | |
Total dividends and distributions | | | — | | | | (2.73 | ) | | | (0.83 | ) | | | (0.64 | ) | | | — | | | | — | | | | (0.01 | ) | | | (2.90 | ) | | | (0.83 | ) |
| | | | | | | | | | | | | | | | | | | | | | | | | | | | | | | | | | | | |
Redemption fees added to paid-in capital | | | 0.00 | 2 | | | 0.00 | 2 | | | 0.00 | 2 | | | 0.00 | 2 | | | 0.00 | 2 | | | — | | | | 0.00 | 2 | | | 0.00 | 2 | | | 0.00 | 2 |
| | | | | | | | | | | | | | | | | | | | | | | | | | | | | | | | | | | | |
Net asset value, end of period | | $ | 6.14 | | | $ | 9.42 | | | $ | 15.12 | | | $ | 13.12 | | | $ | 13.06 | | | $ | 10.87 | | | $ | 7.13 | | | $ | 10.93 | | | $ | 17.18 | |
| | | | | | | | | | | | | | | | | | | | | | | | | | | | | | | | | | | | |
Total Investment Return | | | | | | | | | | | | | | | | | | | | | | | | | | | | | | | | | | | | |
Based on net asset value | | | (34.82 | )%3,4,6 | | | (23.52 | )%3,6 | | | 22.44 | %3,6 | | | 5.43 | %3,6 | | | 20.15 | %3,6 | | | 2.16 | %6 | | | (34.71 | )%3,4 | | | (23.08 | )%3 | | | 24.68 | %3,4 |
| | | | | | | | | | | | | | | | | | | | | | | | | | | | | | | | | | | | |
Ratios to Average Net Assets | | | | | | | | | | | | | | | | | | | | | | | | | | | | | | | | | | | | |
Total expenses after waivers, reimbursement and fees paid indirectly | | | 2.10 | %5 | | | 2.10 | % | | | 2.07 | % | | | 2.10 | % | | | 2.10 | % | | | 2.09 | % | | | 1.63 | %5 | | | 1.61 | % | | | 1.56 | %5 |
| | | | | | | | | | | | | | | | | | | | | | | | | | | | | | | | | | | | |
Total expenses | | | 2.58 | %5 | | | 2.25 | % | | | 2.23 | % | | | 2.30 | % | | | 2.32 | % | | | 2.26 | % | | | 2.35 | %5 | | | 2.07 | % | | | 1.81 | %5 |
| | | | | | | | | | | | | | | | | | | | | | | | | | | | | | | | | | | | |
Net investment loss | | | (1.66 | )%5 | | | (1.41 | )% | | | (1.73 | )% | | | (1.75 | )% | | | (1.60 | )% | | | (1.79 | )% | | | (1.20 | )%5 | | | (0.93 | )% | | | (1.22 | )%5 |
| | | | | | | | | | | | | | | | | | | | | | | | | | | | | | | | | | | | |
Supplemental Data | | | | | | | | | | | | | | | | | | | | | | | | | | | | | | | | | | | | |
Net assets, end of period (000) | | $ | 6,362 | | | $ | 11,427 | | | $ | 17,047 | | | $ | 17,041 | | | $ | 20,963 | | | $ | 29,627 | | | $ | 1,636 | | | $ | 1,903 | | | $ | 1,071 | |
| | | | | | | | | | | | | | | | | | | | | | | | | | | | | | | | | | | | |
Portfolio turnover | | | 33 | % | | | 63 | % | | | 76 | % | | | 49 | % | | | 122 | % | | | 208 | % | | | 33 | % | | | 63 | % | | | 76 | % |
| | | | | | | | | | | | | | | | | | | | | | | | | | | | | | | | | | | | |
| * | For the period October 1, 2004, through January 28, 2005, the expense ratio reflects the expenses of State Street Research Emerging Growth Fund prior to its reorganization with the Small/Mid-Cap Growth Portfolio on January 28, 2005. The expense ratio for the period October 1, 2004 through January 28, 2005 was 1.41%. The expense ratio of the Portfolio for the period January 29, 2005 through September 30, 2005 was 1.31%. |
| 1 | Based on average shares outstanding. |
| 2 | Less than $0.01 per share. |
| 3 | Redemption fee of 2.00% received by the Portfolio is reflected in total return calculations. There was no impact to the return. |
| 4 | Aggregate total investment return. |
| 6 | Total investment returns exclude the effects of sales charges. |
| 7 | Commencement of operations. |
See Notes to Financial Statements.
| | | | | | |
| | | SEMI-ANNUAL REPORT | | MARCH 31, 2009 | | 31 |
Notes to Financial Statements (Unaudited)
1. Organization and Significant Accounting Policies:
BlackRock FundsSM (the “Fund”), a Massachusetts business trust, is registered under the Investment Company Act of 1940, as amended (the “1940 Act”), as an open-end management investment company. As of March 31, 2009, the Fund had 27 registered portfolios, of which the BlackRock Mid-Cap Growth Equity Portfolio (“Mid-Cap Growth Equity”), BlackRock Mid-Cap Value Equity Portfolio (“Mid-Cap Value Equity”), and BlackRock Small/Mid-Cap Growth Portfolio (“Small/Mid-Cap Growth”) (collectively the “Portfolios”) are included in these financial statements. The Portfolios’ financial statements are prepared in conformity with accounting principles generally accepted in the United States of America, which may require the use of management accruals and estimates. Actual results may differ from these estimates. Each Portfolio offers multiple classes of shares. Institutional Shares are sold without a sales charge and only to certain eligible investors. Service Shares are sold without a sales charge. Investor A Shares are sold with a front-end sales charge. Shares of Investor B and Investor C may be subject to a contingent deferred sales charge. R Shares are sold without a sales charge and only to certain retirement and other similar plans. All classes of shares have identical voting, dividend, liquidation and other rights and the same terms and conditions, except that the Service, Investor A, Investor B, Investor C and R Shares may bear certain expenses related to the service and/or distribution of such shares. Each class has exclusive voting rights with respect to matters relating to its service and distribution expenditures (except that Investor B shareholders may vote on material changes to the Investor A distribution plan).
The following is a summary of significant accounting policies followed by the Portfolios:
Valuation of Investments: Equity investments traded on a recognized securities exchange or the NASDAQ Global Market System are valued at the last reported sale price that day or the NASDAQ official closing price, if applicable. For equity investments traded on more than one exchange, the last reported sale price on the exchange where the stock is primarily traded is used. Equity investments traded on a recognized exchange for which there were no sales on that day are valued at the last available bid price. If no bid price is available, the prior day’s price will be used, unless it is determined that such prior day’s price no longer reflects the fair value of the security. Short-term securities with maturities less than 60 days are valued at amortized cost, which approximates fair value. Investments in investment companies are valued at the net asset value each business day. The Portfolios value their investments in the BlackRock Liquidity Series, LLC Money Market Series at fair value, which is ordinarily based upon their pro rata ownership in the net assets of the underlying fund.
In the event that application of these methods of valuation results in a price for an investment which is deemed not to be representative of the market value of such investment, the investment will be valued by a method approved by the Board of Trustees (the “Board”) as reflecting fair value (“Fair Value Assets”). When determining the price for Fair Value Assets, the investment advisor seeks to determine the price that the Portfolios might reasonably expect to receive from the current sale of that asset in an arm’s-length transaction. Fair value determinations shall be based upon all available factors that the investment advisor deems relevant. The pricing of all Fair Value Assets is subsequently reported to the Board or a committee thereof.
Investment Transactions and Investment Income: Investment transactions are recorded on the dates the transactions are entered into (the trade dates). Realized gains and losses on investment transactions are determined on the identified cost basis. Dividend income is recorded on the ex-dividend dates. Dividends from foreign securities where the ex-dividend date may have passed are subsequently recorded when the Portfolios have determined the ex-dividend date. Upon notification from issuers, some of the dividend income received from a real estate investment trust may be redesignated as a reduction of cost of the related investment and/or realized gain. Income, realized and unrealized gains and losses of the Portfolios are allocated daily to each class based on its relative net assets.
Dividends and Distributions: Dividends and distributions paid by the Portfolios are recorded on the ex-dividend dates.
Securities Lending: The Portfolios may lend securities to financial institutions that provide cash which will be maintained at all times in an amount equal to at least 100% of the current market value of the loaned securities. The market value of the loaned securities is determined at the close of business of the Portfolios and any additional required collateral is delivered to the Portfolios on the next business day. The Portfolios typically receive income on the loaned securities but do not receive the income on the collateral. The Portfolios may invest the cash collateral and retain the amount earned on such investment, net of any amount rebated to the borrower. Loans of securities are terminable at any time and the borrower, after notice, is required to return borrowed securities within the standard time period for settlement of securities transactions. The Portfolios may pay reasonable lending agent, administrative and custodial fees in connection with their loans. In the event that the borrower defaults on its obligation to return borrowed securities because of insolvency or for any other reason, the Portfolios could experience delays and costs in gaining access to the collateral. The Portfolios also could suffer a loss if the value of an investment purchased with cash collateral falls below the market value of loaned securities.
Income Taxes: It is each Portfolio’s policy to comply with the requirements of the Internal Revenue Code applicable to regulated investment companies and to distribute substantially all of their taxable income to their shareholders. Therefore, no federal income tax provision is required. Under the applicable foreign tax laws, a withholding tax may be imposed on interest, dividends and capital gains at various rates.
The Portfolios file US federal and various state and local tax returns. No income tax returns are currently under examination. The statutes of limitations on each Portfolio’s US federal income tax returns remain open for each of the four years ended September 30, 2008. The statutes of limitations on each Portfolio’s state and local tax returns may remain open for an additional year depending upon the jurisdiction.
| | | | | | |
32 | | SEMI-ANNUAL REPORT | | MARCH 31, 2009 | | |
Notes to Financial Statements (continued)
Recent Accounting Pronouncement: In March 2008, Statement of Financial Accounting Standards No. 161, “Disclosures about Derivative Instruments and Hedging Activities—an amendment of FASB Statement No. 133” (“FAS 161”), was issued. FAS 161 is intended to improve financial reporting for derivative instruments by requiring enhanced disclosure that enables investors to understand how and why an entity uses derivatives, how derivatives are accounted for, and how derivative instruments affect an entity’s results of operations and financial position. FAS 161 is effective for financial statements issued for fiscal years and interim periods beginning after November 15, 2008. The impact on each Portfolio’s financial statement disclosures is currently being assessed.
Other: Expenses directly related to a Portfolio or class are charged to that Portfolio or class. Other operating expenses shared by several funds are pro-rated among those funds on the basis of relative net assets or other appropriate methods. Other expenses of a Portfolio are allocated daily to each class based on its relative net assets.
2. Investment Advisory Agreement and Other Transactions with Affiliates:
The Fund, on behalf of the Portfolios, entered into an Investment Advisory Agreement with BlackRock Advisors, LLC (the “Advisor”), an indirect, wholly owned subsidiary of BlackRock, Inc., to provide investment advisory services. The PNC Financial Services Group, Inc. (“PNC”) and Bank of America Corporation (“BAC”) are the largest stockholders of BlackRock, Inc. (“BlackRock”). BAC became a stockholders of BlackRock following its acquisition of Merrill Lynch & Co., Inc. (“Merrill Lynch”) on January 1, 2009. Prior to that date, both PNC and Merrill Lynch were considered affiliates of the Fund under the 1940 Act. Subsequent to the acquisition, PNC remains an affiliate, but due to the restructuring of Merrill Lynch’s ownership interest of BlackRock, BAC is not deemed to be an affiliate under the 1940 Act.
The Advisor is responsible for the management of each Portfolio and provides the necessary personnel, facilities, equipment and certain other services necessary to the operations of the Portfolios. For such services, each Portfolio pays the Advisor a monthly fee based on the average daily value of the Portfolio’s net assets, at the following annual rates:
| | | | | | |
Average Daily Net Assets | | Mid-Cap Growth Equity
and
Mid-Cap Value Equity | | | Small/Mid-Cap
Growth | |
First $1 Billion | | 0.800 | % | | 0.750 | % |
$1 Billion - $2 Billion | | 0.700 | | | 0.700 | |
$2 Billion - $3 Billion | | 0.650 | | | 0.675 | |
Greater Than $3 Billion | | 0.625 | | | 0.650 | |
The Advisor contractually agreed to waive or reimburse fees or expenses until February 1, 2010, in order to limit expenses. These expense limits apply to the aggregate expenses incurred on a share class (excluding: interest, taxes, brokerage commissions, expenses incurred as a result of investments in other funds and other expenses attributable to, and incurred as a result of, a Portfolio’s investments and other extraordinary expenses). This agreement is reviewed annually by the Board. The current expense limitations as a percentage of net assets are as follows:
| | | | | | | | | |
Share Classes | | Mid-Cap
Growth
Equity | | | Mid-Cap
Value
Equity | | | Small/
Mid-Cap
Growth | |
Institutional | | 1.23 | % | | 0.94 | % | | 1.10 | % |
Service | | 1.53 | % | | 1.25 | % | | 1.35 | %1 |
Investor A | | 1.58 | % | | 1.25 | % | | 1.35 | % |
Investor B | | 2.33 | % | | 2.00 | % | | 2.10 | % |
Investor C | | 2.33 | % | | 2.00 | % | | 2.10 | % |
R | | 1.60 | % | | 1.98 | %1 | | 1.63 | % |
| 1 | There were no shares outstanding as of March 31, 2009. |
PFPC Trust Company, an indirect, wholly owned subsidiary of PNC, serves as custodian for each Portfolio. For these services, the custodian receives a fee computed daily and payable monthly, based on a percentage of the average daily gross assets of each Portfolio. The fee is based on a percentage of the average daily net assets at the following annual rates: 0.005% of the first $400 million, 0.004% of the next $1.6 billion, and 0.003% of average daily gross assets in excess of $2 billion; plus per transaction charges and other miscellaneous fees incurred on behalf of each Portfolio.
PNC Global Investment Servicing (U.S.) Inc. (“PNCGIS”), an indirect, wholly owned subsidiary of PNC, serves as transfer and dividend disbursing agent. Each class of each Portfolio bears the costs of transfer agent fees associated with such respective class. Transfer agent fees borne by each class of each Portfolio are comprised of those fees charged for all shareholder communications including mailing of shareholder reports, dividend and distribution notices, and proxy materials for shareholders meetings, as well as per account and per transaction fees related to servicing and maintenance of shareholder accounts, including the issuing, redeeming and transferring of shares of each class of each Portfolio, 12b-1 fee calculations, check writing, anti-money laundering services, and customer identification services.
Pursuant to written agreements, Merrill Lynch and certain other affiliates provide the Portfolios with sub-accounting, recordkeeping, sub-transfer agency and other administrative services with respect to sub-accounts they service. For these services, affiliates receive an annual fee per shareholder account which will vary depending on share class. The Portfolios incurred the following fees in return for these services, which are a component of the transfer agent fees in the accompanying Statements of Operations:
| | | | | | |
| | | Merrill Lynch | | Other Affiliates |
| | | Period
October 1, 2008
to
December 31, 2008 | | Six Months
Ended
March 31, 2009 |
Mid-Cap Growth Equity | | $ | 11,932 | | $ | 6,566 |
Mid-Cap Value Equity | | | 106,399 | | | 8,047 |
Small/Mid-Cap Growth | | | 63,623 | | | 601 |
| | | | | | |
| | | SEMI-ANNUAL REPORT | | MARCH 31, 2009 | | 33 |
Notes to Financial Statements (continued)
PNCGIS and the Advisor act as co-administrators for the Portfolios. For these services, the co-administrators receive a combined administration fee computed daily and payable monthly, based on a percentage of the average daily net assets of each Portfolio. The combined administration fee is paid at the following annual rates: 0.075% of the first $500 million, 0.065% of the next $500 million and 0.055% of average of daily net assets in excess of $1 billion. In addition, each of the share classes is charged an administration fee based on the following percentages of average daily net assets of each respective class: 0.025% of the first $500 million of each Portfolio, 0.015% of the next $500 million and 0.005% of average of daily net assets in excess of $1 billion. In addition, PNCGIS and the Advisor may have, at their discretion, voluntarily waived all or any portion of their administration fees for a Portfolio or a share class.
The Portfolios have received an exemptive order from the Securities and Exchange Commission permitting them to lend portfolio securities to Merrill Lynch, Pierce, Fenner & Smith (“MLPF&S”) or its affiliates. Pursuant to that order, the Portfolios have retained BlackRock Investment Management, LLC (“BIM”), an affiliate of the Advisor, as the securities lending agent for a fee based on a share of the returns on investment of cash collateral. BIM may, on behalf of the Portfolios, invest cash collateral received by the Portfolios for such loans, among other things, in a private investment company managed by the Advisor or in registered money market funds advised by the Advisor or its affiliates. The share of income earned by the Portfolios on such investments is shown as securities lending — affiliated on the Statements of Operations. The securities lending agent fees received by BIM were as follows:
| | | |
| | | Securities lending
agent fees for the
six months ended
March 31, 2009 |
Mid-Cap Growth Equity | | $ | 18,594 |
Mid-Cap Value Equity | | | 22,398 |
Small/Mid-Cap Growth | | | 23,476 |
The Fund, on behalf of the Portfolios, has entered into a separate Distribution Agreement and Distribution Plan with BlackRock Investments, LLC (“BIL”), an affiliate of BlackRock. Pursuant to the Distribution Plan, in accordance with Rule 12b-1 under the 1940 Act, the Portfolios pay BIL ongoing service and distribution fees. The fees are accrued daily and paid monthly at annual rates based upon the average daily net assets of the shares of each Portfolio as follows:
| | | | | | |
| | | Service
Fee | | | Distribution
Fee | |
Service | | 0.25 | % | | — | |
Investor A | | 0.25 | % | | — | |
Investor B | | 0.25 | % | | 0.75 | % |
Investor C | | 0.25 | % | | 0.75 | % |
R | | 0.25 | % | | 0.25 | % |
For the six months ended March 31, 2009, the Portfolios paid to affiliates the following fees in return for distribution and sales support services:
| | | |
Mid-Cap Growth Equity | | $ | 28,146 |
Mid-Cap Value Equity | | | 119,832 |
Small/Mid-Cap Growth | | | 17,379 |
The Advisor maintains a call center, which is responsible for providing certain shareholder services to the Portfolios, such as responding to shareholder inquiries and processing transactions based upon instructions from shareholders with respect to the subscription and redemption of Portfolio shares. During the six months ended March 31, 2009, each Portfolio reimbursed the Advisor the following amounts for costs incurred in running the call center, which are a component of the transfer agent fees in the accompanying Statements of Operations.
| | | | | | | | | |
| Call Center | | | | | | | | | |
Share Classes | | Mid-Cap
Growth
Equity | | Mid-Cap
Value
Equity | | Small/
Mid-Cap
Growth |
Institutional | | $ | 575 | | | — | | | — |
Service | | | 25 | | $ | 62 | | | — |
Investor A | | | 36,824 | | | — | | | — |
Investor B | | | — | | | — | | | — |
Investor C | | | 1,471 | | | — | | | — |
R | | | 5 | | | — | | $ | 16 |
| | | | | | | | | |
Total | | $ | 38,900 | | $ | 62 | | $ | 16 |
| | | | | | | | | |
For the six months ended March 31, 2009, the following charts show the various types of class specific expenses borne directly by each class of each Portfolio and any associated waivers or reimbursements of those expenses.
| | | | | | | | | |
| Administration Fees | | | | | | | | | |
Share Classes | | Mid-Cap
Growth
Equity | | Mid-Cap
Value
Equity | | Small/
Mid-Cap
Growth |
Institutional | | $ | 2,304 | | $ | 14,466 | | $ | 1,496 |
Service | | | 39 | | | 216 | | | — |
Investor A | | | 16,607 | | | 40,554 | | | 11,440 |
Investor B | | | 1,485 | | | 5,415 | | | 808 |
Investor C | | | 1,162 | | | 9,836 | | | 906 |
R | | | 71 | | | — | | | 187 |
| | | | | | | | | |
Total | | $ | 21,668 | | $ | 70,487 | | $ | 14,837 |
| | | | | | | | | |
| | | |
| Administration Fees Waived | | | | | | | | | |
Share Classes | | Mid-Cap
Growth
Equity | | Mid-Cap
Value
Equity | | Small/
Mid-Cap
Growth |
Institutional | | $ | 1,232 | | $ | 14,466 | | $ | 1,496 |
Service | | | 26 | | | 216 | | | — |
Investor A | | | 15,779 | | | 40,554 | | | 11,440 |
Investor B | | | 1,485 | | | 5,415 | | | 808 |
Investor C | | | 1,146 | | | 9,836 | | | 906 |
R | | | 71 | | | — | | | 187 |
| | | | | | | | | |
Total | | $ | 19,739 | | $ | 70,487 | | $ | 14,837 |
| | | | | | | | | |
| | | | | | |
34 | | SEMI-ANNUAL REPORT | | MARCH 31, 2009 | | |
Notes to Financial Statements (continued)
| | | | | | | | | | |
| Service and Distribution Fees | | | |
Share Classes | | Mid-Cap
Growth
Equity | | Mid-Cap
Value
Equity | | | Small/
Mid-Cap
Growth |
Service | | $ | 378 | | $ | 2,162 | | | | — |
Investor A | | | 164,839 | | | 400,619 | | | $ | 113,897 |
Investor B | | | 58,991 | | | 215,936 | | | | 31,763 |
Investor C | | | 46,306 | | | 392,966 | | | | 35,518 |
R | | | 1,426 | | | — | | | | 3,732 |
| | | | | | | | | | |
Total | | $ | 271,940 | | $ | 1,011,683 | | | $ | 184,910 |
| | | | | | | | | | |
| | | |
| Transfer Agent Fees | | | | | | | | | | |
Share Classes | | Mid-Cap
Growth
Equity | | Mid-Cap
Value
Equity | | | Small/
Mid-Cap
Growth |
Institutional | | $ | 20,638 | | $ | 100,867 | | | $ | 58,309 |
Service | | | 664 | | | 1,214 | | | | — |
Investor A | | | 320,551 | | | 578,828 | | | | 230,282 |
Investor B | | | 44,639 | | | 94,224 | | | | 22,222 |
Investor C | | | 23,195 | | | 169,386 | | | | 21,365 |
R | | | 1,509 | | | — | | | | 6,264 |
| | | | | | | | | | |
Total | | $ | 411,196 | | $ | 944,519 | | | $ | 338,442 |
| | | | | | | | | | |
| | | |
| Transfer Agent Fees Waived | | | | | | | | | | |
Share Classes | | Mid-Cap
Growth
Equity | | Mid-Cap
Value
Equity | | | Small/
Mid-Cap
Growth |
Institutional | | $ | 290 | | | — | | | | — |
Service | | | 18 | | $ | 62 | ) | | | — |
Investor A | | | 34,804 | | | — | | | | — |
Investor B | | | — | | | — | | | | — |
Investor C | | | 1,450 | | | — | | | | — |
R | | | 5 | | | — | | | $ | 16 |
| | | | | | | | | | |
Total | | $ | 36,567 | | $ | 62 | | | $ | 16 |
| | | | | | | | | | |
| | | |
| Transfer Agent Fees Reimbursed | | | | | | | | | | |
Share Classes | | Mid-Cap
Growth
Equity | | Mid-Cap
Value
Equity | | | Small/
Mid-Cap
Growth |
Institutional | | $ | 2,909 | | $ | 100,678 | | | $ | 51,437 |
Service | | | 309 | | | 626 | | | | — |
Investor A | | | 72,731 | | | 475,412 | | | | 176,821 |
Investor B | | | 25,216 | | | 80,810 | | | | 17,952 |
Investor C | | | 6,816 | | | 145,943 | | | | 16,529 |
R | | | 1,251 | | | — | | | | 5,174 |
| | | | | | | | | | |
Total | | $ | 109,232 | | $ | 803,469 | | | $ | 267,913 |
| | | | | | | | | | |
If within two years following a waiver or reimbursement, the operating expenses of a share class that previously received a waiver or reimbursement from the Advisor are less than the expense limit for that share class, the Advisor is entitled to be reimbursed by such share class up to the amount of fees waived or expenses reimbursed under the agreement if: (1) the Portfolio has more than $50 million in assets, (2) the Advisor or an affiliate continues to serve as the Portfolio’s investment advisor or administrator and (3) the Board has approved in advance the payments to the Advisor at the previous quarterly meeting.
At March 31, 2009, the amounts subject to possible future reimbursement under the expense limitation agreement are as follows:
| | | | | | | | | |
| | | Expiring January 31, |
| | | 2010 | | 2011 | | 2012 |
Mid-Cap Growth Equity | | $ | 157,137 | | $ | 113,595 | | $ | 76,309 |
Mid-Cap Value Equity | | | 1,831,805 | | | 1,878,537 | | | 284,048 |
Small/Mid-Cap Growth | | | 477,871 | | | 413,315 | | | 88,919 |
For the three months ended December 31, 2008, Merrill Lynch, through its affiliated broker dealer, MLPF&S, earned commissions on transactions of securities as follows:
| | | |
Mid-Cap Value Equity | | $ | 127,813 |
For the six months ended March 31, 2009, affiliates earned underwriting discounts, direct commissions and dealer concessions on sales of each Portfolio’s Investor A Shares as follows:
| | | |
Mid-Cap Growth Equity | | $ | 1,908 |
Mid-Cap Value Equity | | | 3,498 |
Small/Mid-Cap Growth | | | 964 |
For the six months ended March 31, 2009, affiliates received the following contingent deferred sales charges relating to transactions in Investor A, B and C Shares:
| | | | | | | | | |
| | | Investor A | | Investor B | | Investor C |
Mid-Cap Growth Equity | | $ | — | | $ | 7,592 | | $ | 1,106 |
Mid-Cap Value Equity | | | 26,638 | | | 31,775 | | | 6,656 |
Small/Mid-Cap Growth | | | — | | | 7,270 | | | 518 |
The Portfolios may earn income on positive cash balances in demand deposit accounts that are maintained by PNCGIS on behalf of the Portfolios. The income earned for the six months ended March 31, 2009 was as follows which is included in interest and dividends — affiliated on the Statements of Operations:
| | | |
Mid-Cap Growth Equity | | $ | 1,008 |
Mid-Cap Value Equity | | | 1,270 |
Small/Mid-Cap Growth | | | 337 |
The Portfolios may also receive earnings credits related to cash balances with PNCGIS which are shown on the Statements of Operations as fees paid indirectly.
Certain officers and/or trustees of the Fund are officers and/or directors of BlackRock, Inc. or its affiliates. The Portfolios reimburse the Advisor for compensation paid to the Fund’s Chief Compliance Officer.
3. Investments:
For the six months ended March 31, 2009, purchases and sales of investments, excluding short-term securities, were as follows:
| | | | | | |
| | | Purchases | | Sales |
Mid-Cap Growth Equity | | $ | 40,034,529 | | $ | 47,938,759 |
Mid-Cap Value Equity | | | 618,576,156 | | | 639,242,555 |
Small/Mid-Cap Growth | | | 40,184,990 | | | 46,534,118 |
| | | | | | |
| | | SEMI-ANNUAL REPORT | | MARCH 31, 2009 | | 35 |
Notes to Financial Statements (continued)
4. Short-Term Borrowings:
The Portfolios, along with certain other funds managed by the Advisor and its affiliates, are a party to a $500 million credit agreement with a group of lenders, which expired November 2008 and was renewed until November 2009. The Portfolios may borrow under the credit agreement to fund shareholder redemptions and for other lawful purposes other than for leverage. Each Portfolio may borrow up to the maximum amount allowable under the Portfolio’s current Prospectus and Statement of Additional Information, subject to various other legal, regulatory or contractual limits. The Portfolios paid their pro rata share of a 0.02% upfront fee on the aggregate commitment amount based on their net assets as of October 31, 2008. The Portfolios pay a commitment fee of 0.08% per annum based on each Portfolio’s pro rata share of the unused portion of the credit agreement, which is included in miscellaneous on the Statements of Operations. Amounts borrowed under the credit agreement bear interest at a rate equal to, the higher of the (a) federal funds effective rate and (b) reserve adjusted one month LIBOR, plus, in each case, the higher of (i) 1.50% and (ii) 50% of the CDX index (as defined in the credit agreement) in effect from time to time. The Portfolios did not borrow under the credit agreement during the six months ended March 31, 2009.
5. Capital Loss Carryforward:
As of September 30, 2008, capital loss carryforwards available to offset future realized capital gains through the indicated expiration dates:
| | | | | | | | | |
| | | Expiring September 30, |
| | | 2009 | | 2010 | | 2011 |
Mid-Cap Growth Equity | | $ | 20,673,416 | | $ | 99,778,499 | | $ | 16,297,623 |
6. Market and Credit Risk:
In the normal course of business, the Portfolios invest in securities and enter into transactions where risks exist due to fluctuations in the market (market risk) or failure of the issuer of a security to meet all its obligations (credit risk). The value of securities held by the Portfolios may decline in response to certain events, including those directly involving the issuers whose securities are owned by the Portfolios; conditions affecting the general economy; overall market changes; local, regional or global political, social or economic instability; and currency and interest rate and price fluctuations. Similar to credit risk, the Portfolios may be exposed to counterparty risk, or the risk that an entity with which the Portfolios have unsettled or open transactions may default. Financial assets, which potentially expose the Portfolios to credit and counterparty risks, consist principally of investments and cash due from counterparties. The extent of the Portfolios’ exposure to credit and counterparty risks with respect to these financial assets is approximated by their value recorded in the Portfolios’ Statements of Assets and Liabilities.
7. Capital Shares Transactions:
Transactions in shares for each period were as follows:
| | | | | | | | | | | | | | |
| | | Six Months Ended
March 31, 2009 | | | Year Ended
September 30, 2008 | |
Mid-Cap Growth Equity | | Shares | | | Amount | | | Shares | | | Amount | |
Institutional | | | | | | | | | | | | | | |
Shares sold | | 540,726 | | | $ | 3,869,655 | | | 1,151,861 | | | $ | 14,981,239 | |
Shares redeemed | | (564,583 | ) | | | (3,990,773 | ) | | (4,190,156 | ) | | | (52,159,710 | ) |
| | | | | | | | | | | | | | |
Net decrease | | (23,857 | ) | | $ | (121,118 | ) | | (3,038,295 | ) | | $ | (37,178,471 | ) |
| | | | | | | | | | | | | | |
| | | | |
Service | | | | | | | | | | | | | | |
Shares sold | | 3,442 | | | $ | 24,105 | | | 4,386 | | | $ | 54,430 | |
Shares redeemed | | (7,563 | ) | | | (50,983 | ) | | (13,091 | ) | | | (158,878 | ) |
| | | | | | | | | | | | | | |
Net decrease | | (4,121 | ) | | $ | (26,878 | ) | | (8,705 | ) | | $ | (104,448 | ) |
| | | | | | | | | | | | | | |
| | | | | | |
36 | | SEMI-ANNUAL REPORT | | MARCH 31, 2009 | | |
Notes to Financial Statements (continued)
| | | | | | | | | | | | | | |
| | | Six Months Ended
March 31, 2009 | | | Year Ended
September 30, 2008 | |
Mid-Cap Growth Equity (concluded) | | Shares | | | Amount | | | Shares | | | Amount | |
Investor A | | | | | | | | | | | | | | |
Shares sold | | 751,998 | | | $ | 4,917,341 | | | 1,732,544 | | | $ | 20,409,145 | |
Shares redeemed | | (1,872,582 | ) | | | (12,510,257 | ) | | (3,091,741 | ) | | | (36,638,821 | ) |
| | | | | | | | | | | | | | |
Net decrease | | (1,120,584 | ) | | $ | (7,592,916 | ) | | (1,359,197 | ) | | $ | (16,229,676 | ) |
| | | | | | | | | | | | | | |
| | | | |
Investor B | | | | | | | | | | | | | | |
Shares sold | | 74,020 | | | $ | 443,148 | | | 133,076 | | | $ | 1,435,938 | |
Shares redeemed | | (637,011 | ) | | | (3,739,106 | ) | | (1,698,317 | ) | | | (17,945,602 | ) |
| | | | | | | | | | | | | | |
Net decrease | | (562,991 | ) | | $ | (3,295,958 | ) | | (1,565,241 | ) | | $ | (16,509,664 | ) |
| | | | | | | | | | | | | | |
| | | | |
Investor C | | | | | | | | | | | | | | |
Shares sold | | 103,442 | | | $ | 614,498 | | | 193,942 | | | $ | 2,062,581 | |
Shares redeemed | | (254,696 | ) | | | (1,529,058 | ) | | (347,584 | ) | | | (3,707,473 | ) |
| | | | | | | | | | | | | | |
Net decrease | | (151,254 | ) | | $ | (914,560 | ) | | (153,642 | ) | | $ | (1,644,892 | ) |
| | | | | | | | | | | | | | |
| | | | |
R | | | | | | | | | | | | | | |
Shares sold | | 31,246 | | | $ | 209,621 | | | 116,909 | | | $ | 1,398,648 | |
Shares redeemed | | (20,594 | ) | | | (139,373 | ) | | (43,304 | ) | | | (480,754 | ) |
| | | | | | | | | | | | | | |
Net increase | | 10,652 | | | $ | 70,248 | | | 73,605 | | | $ | 917,894 | |
| | | | | | | | | | | | | | |
| | | | |
Mid-Cap Value Equity | | | | | | | | | | | | |
Institutional | | | | | | | | | | | | | | |
Shares sold | | 6,643,816 | | | $ | 48,052,986 | | | 8,752,224 | | | $ | 103,036,657 | |
Shares issued in reinvestment of dividends and distributions | | 145,437 | | | | 994,775 | | | 1,138,852 | | | | 13,745,952 | |
| | | | | | | | | | | | | | |
Total issued | | 6,789,253 | | | | 49,047,761 | | | 9,891,076 | | | | 116,782,609 | |
Shares redeemed | | (3,805,589 | ) | | | (25,953,451 | ) | | (5,001,036 | ) | | | (60,377,528 | ) |
| | | | | | | | | | | | | | |
Net increase | | 2,983,664 | | | $ | 23,094,310 | | | 4,890,040 | | | $ | 56,405,081 | |
| | | | | | | | | | | | | | |
| | | | |
Service | | | | | | | | | | | | | | |
Shares sold | | 12,162 | | | $ | 85,096 | | | 40,136 | | | $ | 472,967 | |
Shares issued in reinvestment of dividends and distributions | | 2,305 | | | | 15,491 | | | 31,430 | | | | 374,020 | |
| | | | | | | | | | | | | | |
Total issued | | 14,467 | | | | 100,587 | | | 71,566 | | | | 846,987 | |
Shares redeemed | | (10,642 | ) | | | (71,023 | ) | | (85,690 | ) | | | (1,062,724 | ) |
| | | | | | | | | | | | | | |
Net increase (decrease) | | 3,825 | | | $ | 29,564 | | | (14,124 | ) | | $ | (215,737 | ) |
| | | | | | | | | | | | | | |
| | | | | | |
| | | SEMI-ANNUAL REPORT | | MARCH 31, 2009 | | 37 |
Notes to Financial Statements (continued)
| | | | | | | | | | | | | | |
| | | Six Months Ended
March 31, 2009 | | | Year Ended
September 30, 2008 | |
Mid-Cap Value Equity (concluded) | | Shares | | | Amount | | | Shares | | | Amount | |
Investor A | | | | | | | | | | | | | | |
Shares sold | | 7,929,773 | | | $ | 54,007,110 | | | 16,797,599 | | | $ | 192,499,463 | |
Shares issued in reinvestment of dividends and distributions | | 430,418 | | | | 2,857,964 | | | 6,308,452 | | | | 74,187,436 | |
| | | | | | | | | | | | | | |
Total issued | | 8,360,191 | | | | 56,865,074 | | | 23,106,051 | | | | 266,686,899 | |
Shares redeemed | | (10,668,622 | ) | | | (72,317,686 | ) | | (20,326,790 | ) | | | (231,569,629 | ) |
| | | | | | | | | | | | | | |
Net increase (decrease) | | (2,308,431 | ) | | $ | (15,452,612 | ) | | 2,779,261 | | | $ | 35,117,270 | |
| | | | | | | | | | | | | | |
| | | | |
Investor B | | | | | | | | | | | | | | |
Shares sold | | 101,529 | | | $ | 628,760 | | | 289,786 | | | $ | 3,122,722 | |
Shares issued in reinvestment of dividends and distributions | | 56,009 | | | | 339,972 | | | 1,233,901 | | | | 13,350,825 | |
| | | | | | | | | | | | | | |
Total issued | | 157,538 | | | | 968,732 | | | 1,523,687 | | | | 16,473,547 | |
Shares redeemed | | (1,608,412 | ) | | | (9,829,671 | ) | | (3,135,066 | ) | | | (33,019,875 | ) |
| | | | | | | | | | | | | | |
Net decrease | | (1,450,874 | ) | | $ | (8,860,939 | ) | | (1,611,379 | ) | | $ | (16,546,328 | ) |
| | | | | | | | | | | | | | |
| | | | |
Investor C | | | | | | | | | | | | | | |
Shares sold | | 1,135,522 | | | $ | 7,124,939 | | | 2,382,590 | | | $ | 25,347,779 | |
Shares issued in reinvestment of dividends and distributions | | 101,409 | | | | 613,484 | | | 1,839,018 | | | | 19,843,040 | |
| | | | | | | | | | | | | | |
Total issued | | 1,236,931 | | | | 7,738,423 | | | 4,221,608 | | | | 45,190,819 | |
Shares redeemed | | (2,595,703 | ) | | | (16,025,319 | ) | | (4,270,696 | ) | | | (45,189,018 | ) |
| | | | | | | | | | | | | | |
Net increase (decrease) | | (1,358,772 | ) | | $ | (8,286,896 | ) | | (49,088 | ) | | $ | 1,801 | |
| | | | | | | | | | | | | | |
| | | | |
Small/Mid-Cap Growth | | | | | | | | | | | | |
Institutional | | | | | | | | | | | | | | |
Shares sold | | 386,432 | | | $ | 3,093,188 | | | 381,949 | | | $ | 5,685,288 | |
Shares issued in reinvestment of dividends and distributions | | 3,062 | | | | 23,788 | | | 242,216 | | | | 3,611,440 | |
| | | | | | | | | | | | | | |
Total issued | | 389,494 | | | | 3,116,976 | | | 624,165 | | | | 9,296,728 | |
Shares redeemed | | (334,839 | ) | | | (2,651,806 | ) | | (661,695 | ) | | | (10,305,119 | ) |
| | | | | | | | | | | | | | |
Net increase (decrease) | | 54,655 | | | $ | 465,170 | | | (37,530 | ) | | $ | (1,008,391 | ) |
| | | | | | | | | | | | | | |
| | | | |
Investor A | | | | | | | | | | | | | | |
Shares sold | | 1,682,381 | | | $ | 12,825,098 | | | 3,211,416 | | | $ | 44,154,763 | |
Shares issued in reinvestment of dividends and distributions | | 18,736 | | | | 136,024 | | | 2,499,681 | | | | 34,895,558 | |
| | | | | | | | | | | | | | |
Total issued | | 1,701,117 | | | | 12,961,122 | | | 5,711,097 | | | | 79,050,321 | |
Shares redeemed | | (2,517,967 | ) | | | (19,128,556 | ) | | (5,887,993 | ) | | | (77,983,235 | ) |
| | | | | | | | | | | | | | |
Net increase (decrease) | | (816,850 | ) | | $ | (6,167,434 | ) | | (176,896 | ) | | $ | 1,067,086 | |
| | | | | | | | | | | | | | |
| | | | | | |
38 | | SEMI-ANNUAL REPORT | | MARCH 31, 2009 | | |
Notes to Financial Statements (continued)
| | | | | | | | | | | | | | |
| | | Six Months Ended
March 31, 2009 | | | Year Ended
September 30, 2008 | |
Small/Mid-Cap Growth (concluded) | | Shares | | | Amount | | | Shares | | | Amount | |
Investor B | | | | | | | | | | | | | | |
Shares sold | | 35,271 | | | $ | 225,964 | | | 54,581 | | | $ | 640,182 | |
Shares issued in reinvestment of dividends and distributions | | — | | | | — | | | 281,240 | | | | 3,369,265 | |
| | | | | | | | | | | | | | |
Total issued | | 35,271 | | | | 225,964 | | | 335,821 | | | | 4,009,447 | |
Shares redeemed | | (252,261 | ) | | | (1,637,660 | ) | | (622,199 | ) | | | (7,246,568 | ) |
| | | | | | | | | | | | | | |
Net decrease | | (216,990 | ) | | $ | (1,411,696 | ) | | (286,378 | ) | | $ | (3,237,121 | ) |
| | | | | | | | | | | | | | |
| | | | |
Investor C | | | | | | | | | | | | | | |
Shares sold | | 107,014 | | | $ | 690,838 | | | 246,547 | | | $ | 2,833,038 | |
Shares issued in reinvestment of dividends and distributions | | — | | | | — | | | 231,789 | | | | 2,781,470 | |
| | | | | | | | | | | | | | |
Total issued | | 107,014 | | | | 690,838 | | | 478,336 | | | | 5,614,508 | |
Shares redeemed | | (282,942 | ) | | | (1,885,202 | ) | | (392,905 | ) | | | (4,547,481 | ) |
| | | | | | | | | | | | | | |
Net increase (decrease) | | (175,928 | ) | | $ | (1,194,364 | ) | | 85,431 | | | $ | 1,067,027 | |
| | | | | | | | | | | | | | |
| | | | |
R | | | | | | | | | | | | | | |
Shares sold | | 79,213 | | | $ | 599,451 | | | 132,367 | | | $ | 1,779,872 | |
Shares issued in reinvestment of dividends and distributions | | 166 | | | | 1,194 | | | 16,009 | | | | 221,879 | |
| | | | | | | | | | | | | | |
Total issued | | 79,379 | | | | 600,645 | | | 148,376 | | | | 2,001,751 | |
Shares redeemed | | (24,044 | ) | | | (176,224 | ) | | (36,514 | ) | | | (482,161 | ) |
| | | | | | | | | | | | | | |
Net increase | | 55,335 | | | $ | 424,421 | | | 111,862 | | | $ | 1,519,590 | |
| | | | | | | | | | | | | | |
There is a 2% redemption fee on shares of certain Portfolios redeemed or exchanged which have been held for 30 days or less. The redemption fees are collected and retained by the Portfolio for the benefit of the remaining shareholders. The redemption fees are recorded as a credit to paid-in capital.
| | | | | | |
| | | SEMI-ANNUAL REPORT | | MARCH 31, 2009 | | 39 |
Officers and Trustees
Ronald W. Forbes, Co-Chairman of the Board and Trustee
Rodney D. Johnson, Co-Chairman of the Board and Trustee
David O. Beim, Trustee
Dr. Matina Horner, Trustee
Herbert I. London, Member of the Audit Committee and Trustee
Cynthia A. Montgomery, Trustee
Joseph P. Platt, Jr., Trustee
Robert C. Robb, Jr., Trustee
Toby Rosenblatt, Trustee
Kenneth L. Urish, Chairman of the Audit Committee and Trustee
Frederick W. Winter, Member of the Audit Committee and Trustee
Richard S. Davis, Trustee
Henry Gabbay, Trustee
Donald C. Burke, Fund President and Chief Executive Officer
Anne F. Ackerley, Vice President
Neal J. Andrews, Chief Financial Officer
Jay M. Fife, Treasurer
Brian P. Kindelan, Chief Compliance Officer of the Fund
Howard Surloff, Secretary
Investment Advisor and Co-Administrator
BlackRock Advisors, LLC
Wilmington, DE 19809
Custodian
PFPC Trust Company
Philadelphia, PA 19153
Co-Administrator and Transfer Agent
PNC Global Investment Servicing (U.S.) Inc.
Wilmington, DE 19809
Distributor
BlackRock Investments, LLC
New York, NY 10022
Legal Counsel
Sidley Austin LLP
New York, NY 10019
Independent Registered Public Accounting Firm
Deloitte & Touche LLP
Philadelphia, PA 19103
Address of the Portfolios
100 Bellevue Parkway
Wilmington, DE 19809
| | | | | | |
40 | | SEMI-ANNUAL REPORT | | MARCH 31, 2009 | | |
Additional Information
BlackRock Privacy Principles
BlackRock is committed to maintaining the privacy of its current and former fund investors and individual clients (collectively, “Clients”) and to safeguarding their non-public personal information. The following information is provided to help you understand what personal information BlackRock collects, how we protect that information and why in certain cases we share such information with select parties.
If you are located in a jurisdiction where specific laws, rules or regulations require BlackRock to provide you with additional or different privacy-related rights beyond what is set forth below, then BlackRock will comply with those specific laws, rules or regulations.
BlackRock obtains or verifies personal non-public information from and about you from different sources, including the following: (i) information we receive from you or, if applicable, your financial intermediary, on applications, forms or other documents; (ii) information about your transactions with us, our affiliates, or others; (iii) information we receive from a consumer reporting agency; and (iv) from visits to our websites.
BlackRock does not sell or disclose to non-affiliated third parties any non-public personal information about its Clients, except as permitted by law or as is necessary to respond to regulatory requests or to service Client accounts. These non-affiliated third parties are required to protect the confidentiality and security of this information and to use it only for its intended purpose.
We may share information with our affiliates to service your account or to provide you with information about other BlackRock products or services that may be of interest to you. In addition, BlackRock restricts access to non-public personal information about its Clients to those BlackRock employees with a legitimate business need for the information. BlackRock maintains physical, electronic and procedural safeguards that are designed to protect the non-public personal information of its Clients, including procedures relating to the proper storage and disposal of such information.
Availability of Additional Information
Electronic copies of most financial reports and prospectuses are available on the Fund’s website or shareholders can sign up for e-mail notifications of quarterly statements, annual and semi-annual reports and prospectuses by enrolling in the Fund’s electronic delivery program.
To enroll:
Shareholders Who Hold Accounts with Investment Advisors, Banks or Brokerages:
Please contact your financial advisor. Please note that not all investment advisors, banks or brokerages may offer this service.
Shareholders Who Hold Accounts Directly With BlackRock
| 1) | Access the BlackRock website at |
http://www.blackrock.com/edelivery
| 2) | Click on the applicable link and follow the steps to sign up |
Householding
The Fund will mail only one copy of shareholder documents, including prospectuses, annual and semi-annual reports and proxy statements, to shareholders with multiple accounts at the same address. This practice is commonly called “householding” and it is intended to reduce expenses and eliminate duplicate mailings of shareholder documents. Mailings of your shareholder documents may be householded indefinitely unless you instruct us otherwise. If you do not want the mailing of these documents to be combined with those for other members of your household, please contact the Fund at (800) 441-7762.
| | | | | | |
| | | SEMI-ANNUAL REPORT | | MARCH 31, 2009 | | 41 |
Additional Information (concluded)
Availability of Additional Information (concluded)
Availability of Proxy Voting Policies and Procedures
A description of the policies and procedures that the Fund uses to determine how to vote proxies relating to portfolio securities is available (1) without charge, upon request by calling (800) 441-7762; (2) at www.blackrock.com; and (3) on the Securities and Exchange Commission’s (the “SEC”) website at http://www.sec.gov.
Availability of Proxy Voting Record
Information about how the Fund votes proxies relating to securities held in the Fund’s portfolios during the most recent 12-month period ended June 30th is available upon request and without charge (1) at www.blackrock.com or by calling (800) 441-7762 (2) on the SEC’s website at http://www.sec.gov.
Availability of Quarterly Portfolio Schedule
The Fund files its complete schedule of portfolio holdings with the SEC for the first and third quarters of each fiscal year on Form N-Q. The Fund’s Forms N-Q are available on the SEC’s website at http:// www.sec.gov and may also be reviewed and copied at the SEC’s Public Reference Room in Washington, D.C. Information on the operation of the Public Reference Room may be obtained by calling (800) SEC-0330. The Fund’s Forms N-Q may also be obtained upon request and without charge by calling (800) 441-7762.
Shareholder Privileges
Account Information
Call us at (800) 441-7762 from 8:00 AM to 6:00 PM EST Monday through Friday to get information about your account balances, recent transactions and share prices. You can also reach us on the Web at www.blackrock.com/funds.
Automatic Investment Plans
Investor Class shareholders who want to invest regularly can arrange to have $50 or more automatically deducted from their checking or savings account and invested in any of the BlackRock portfolios.
Systematic Withdrawal Plan
Investor Class shareholders can establish a systematic withdrawal plan and receive periodic payments of $50 or more from their BlackRock portfolios, as long as their account is at least $10,000.
Retirement Plans
Shareholders may make investments in conjunction with Traditional, Rollover, Roth, Coverdell, Simple IRA’s, SEP IRA’s and 403(b) Plans.
| | | | | | |
42 | | SEMI-ANNUAL REPORT | | MARCH 31, 2009 | | |
A World-Class Mutual Fund Family
BlackRock offers a diverse lineup of open-end mutual funds crossing all investment styles and managed by experts in equity, fixed income and tax-exempt investing.
| | | | |
Equity Funds |
| | |
BlackRock All-Cap Energy & Resources Portfolio | | BlackRock Global Opportunities Portfolio | | BlackRock Mid-Cap Value Equity Portfolio |
BlackRock Asset Allocation Portfolio† | | BlackRock Global SmallCap Fund | | BlackRock Mid Cap Value Opportunities Fund |
BlackRock Aurora Portfolio | | BlackRock Health Sciences Opportunities Portfolio | | BlackRock Natural Resources Trust |
BlackRock Balanced Capital Fund† | | BlackRock Healthcare Fund | | BlackRock Pacific Fund |
BlackRock Basic Value Fund | | BlackRock Index Equity Portfolio* | | BlackRock Science & Technology Opportunities Portfolio |
BlackRock Capital Appreciation Portfolio | | BlackRock International Fund | |
BlackRock Energy & Resources Portfolio | | BlackRock International Diversification Fund | | BlackRock Small Cap Core Equity Portfolio |
BlackRock Equity Dividend Fund | | BlackRock International Index Fund | | BlackRock Small Cap Growth Equity Portfolio |
BlackRock EuroFund | | BlackRock International Opportunities Portfolio | | BlackRock Small Cap Growth Fund II |
BlackRock Focus Growth Fund | | BlackRock International Value Fund | | BlackRock Small Cap Index Fund |
BlackRock Focus Value Fund | | BlackRock Large Cap Core Fund | | BlackRock Small Cap Value Equity Portfolio |
BlackRock Fundamental Growth Fund | | BlackRock Large Cap Core Plus Fund | | BlackRock Small/Mid-Cap Growth Portfolio |
BlackRock Global Allocation Fund† | | BlackRock Large Cap Growth Fund | | BlackRock S&P 500 Index Fund |
BlackRock Global Dynamic Equity Fund | | BlackRock Large Cap Value Fund | | BlackRock U.S. Opportunities Portfolio |
BlackRock Global Emerging Markets Fund | | BlackRock Latin America Fund | | BlackRock Utilities and Telecommunications Fund |
BlackRock Global Financial Services Fund | | BlackRock Mid-Cap Growth Equity Portfolio | | BlackRock Value Opportunities Fund |
BlackRock Global Growth Fund | | | | |
|
Fixed Income Funds |
| | |
BlackRock Bond Portfolio | | BlackRock Income Builder Portfolio | | BlackRock Short-Term Bond Fund |
BlackRock Emerging Market Debt Portfolio | | BlackRock Inflation Protected Bond Portfolio | | BlackRock Strategic Income Portfolio |
BlackRock Enhanced Income Portfolio | | BlackRock Intermediate Government Bond Portfolio | | BlackRock Total Return Fund |
BlackRock GNMA Portfolio | | | BlackRock Total Return Portfolio II |
BlackRock Government Income Portfolio | | BlackRock International Bond Portfolio | | BlackRock World Income Fund |
BlackRock High Income Fund | | BlackRock Long Duration Bond Portfolio | | |
BlackRock High Yield Bond Portfolio | | BlackRock Low Duration Bond Portfolio | | |
BlackRock Income Portfolio | | BlackRock Managed Income Portfolio | | |
|
Municipal Bond Funds |
| | |
BlackRock AMT-Free Municipal Bond Portfolio | | BlackRock Kentucky Municipal Bond Portfolio | | BlackRock New York Municipal Bond Fund |
BlackRock California Municipal Bond Fund | | BlackRock Municipal Insured Fund | | BlackRock Ohio Municipal Bond Portfolio |
BlackRock Delaware Municipal Bond Portfolio | | BlackRock National Municipal Fund | | BlackRock Pennsylvania Municipal Bond Fund |
BlackRock High Yield Municipal Fund | | BlackRock New Jersey Municipal Bond Fund | | BlackRock Short-Term Municipal Fund |
BlackRock Intermediate Municipal Fund | | | | |
|
Target Risk & Target Date Funds |
| | |
BlackRock Prepared Portfolios | | BlackRock Lifecycle Prepared Portfolios | | |
Conservative Prepared Portfolio | | Prepared Portfolio 2010 | | Prepared Portfolio 2030 |
Moderate Prepared Portfolio | | Prepared Portfolio 2015 | | Prepared Portfolio 2035 |
Growth Prepared Portfolio | | Prepared Portfolio 2020 | | Prepared Portfolio 2040 |
Aggressive Growth Prepared Portfolio | | Prepared Portfolio 2025 | | Prepared Portfolio 2045 |
| | | | Prepared Portfolio 2050 |
| * | See the prospectus for information on specific limitations on investments in the fund. |
BlackRock mutual funds are distributed by BlackRock Investments, LLC. You should consider the investment objectives, risks, charges and expenses of the funds under consideration carefully before investing. Each fund’s prospectus contains this and other information and is available at www.blackrock.com or by calling (800) 882-0052 or from your financial advisor. The prospectus should be read carefully before investing.
| | | | | | |
| | | SEMI-ANNUAL REPORT | | MARCH 31, 2009 | | 43 |

This report is transmitted to shareholders only. It is not authorized for use as an offer of sale or a solicitation of an offer to buy shares of the Portfolios unless accompanied or preceded by the Portfolios’ current prospectus. Past performance results shown in this report should not be considered a representation of future performance. Investment returns and principal value of shares will fluctuate so that shares, when redeemed, may be worth more or less than their original cost. Statements and other information herein are as dated and are subject to change.
Investment in foreign securities involves special risks including fluctuating foreign exchange rates, foreign government regulations, differing degrees of liquidity and the possibility of substantial volatility due to adverse political, economic or other developments.

EQUITY4-3/09-SAR
| | |
EQUITIES FIXED INCOME REAL ESTATE LIQUIDITY ALTERNATIVES BLACKROCK SOLUTIONS |
| |
| BlackRock FundsSM | |  |
| SEMI-ANNUAL REPORT | MARCH 31, 2009 (UNAUDITED) |
BlackRock Global Opportunities Portfolio
BlackRock Health Sciences Opportunities Portfolio
BlackRock International Opportunities Portfolio
BlackRock Science & Technology Opportunities Portfolio
BlackRock U.S. Opportunities Portfolio
NOT FDIC INSURED
MAY LOSE VALUE
NO BANK GUARANTEE
Table of Contents
| | | | | | |
2 | | SEMI-ANNUAL REPORT | | MARCH 31, 2009 | | |
A Letter to Shareholders
The past 12 months have been a period investors would like to forget, but instead will vividly remember, as the global financial crisis erupted into the worst recession in decades. Daily headlines recounted the downfalls of storied financial firms, volatile swings in the world’s financial markets and monumental government actions, including the recent passage of the nearly $800 billion American Recovery and Reinvestment Act of 2009.
The economic data generally deteriorated throughout the reporting period. US gross domestic product (“GDP”) contracted at an annual rate of 6.3% in the fourth quarter of 2008, and economic activity appears on pace to be negative in the first quarter of 2009 as well. The Federal Reserve Board (the “Fed”) took forceful action to revive the global economy and ailing financial system. In addition to slashing the federal funds target rate from 3.0% to a record low range of 0% to 0.25%, the central bank provided enormous cash infusions and radically expanded its balance sheet through a range of lending and acquisition programs.
Against this backdrop, US equities contended with high levels of volatility and posted steep losses, notwithstanding a powerful rally in the final month of the reporting period. International markets also experienced sharp downturns, with some regions declining as much or more than the United States. Risk aversion remained the dominant theme in fixed income markets, as investors sought out the haven of Treasury issues at the expense of virtually all other asset classes. High yield issues, in particular, faced unprecedented challenges and posted severe underperformance; that said, the sector pared its losses in the first quarter of 2009, as both liquidity and investor sentiment toward lower-quality debt improved. At the same time, the start of the new year brought somewhat of a return to normalcy for the tax-exempt market, which registered one of its worst years on record in 2008.
In all, investors continued to gravitate toward relative safety, as evidenced in the six- and 12-month returns of the major benchmark indexes:
| | | | | | |
Total Returns as of March 31, 2009 | | 6-month | | | 12-month | |
US equities (S&P 500 Index) | | (30.54 | )% | | (38.09 | )% |
Small cap US equities (Russell 2000 Index) | | (37.17 | ) | | (37.50 | ) |
International equities (MSCI Europe, Australasia, Far East Index) | | (31.11 | ) | | (46.50 | ) |
US Treasury securities (Merrill Lynch 10-Year US Treasury Index) | | 11.88 | | | 10.46 | |
Taxable fixed income (Barclays Capital US Aggregate Bond Index) | | 4.70 | | | 3.13 | |
Tax-exempt fixed income (Barclays Capital Municipal Bond Index) | | 5.00 | | | 2.27 | |
High yield bonds (Barclays Capital US Corporate High Yield 2% Issuer Capped Index) | | (12.65 | ) | | (18.56 | ) |
Past performance is no guarantee of future results. Index performance shown for illustrative purposes only. You cannot invest directly in an index.
Through periods of market turbulence, as ever, BlackRock’s full resources are dedicated to the management of our clients’ assets. We thank you for entrusting BlackRock with your investments and look forward to continuing to serve you in the months and years ahead.
| | | | |
 | | | | |
| Rob Kapito | | | | |
| President, BlackRock Advisors, LLC | | | | |
Seeking additional investment insights?
Visit BlackRock’s award-winning Shareholder® magazine, now available exclusively online at www.blackrock.com/shareholdermagazine. In this issue:
| | • | | Discover why portfolio diversification still matters – even as nearly every financial asset class lost value over the past year. |
| | • | | Learn how adding commodities to a more traditional mix of assets can help you to balance risks and access new potential rewards. |
| | • | | Assuage your fears about higher taxes and discover how municipal bonds may offer some relief. |
| | • | | Find out if there’s still value to be found in dividend-paying stocks. |
THIS PAGE NOT PART OF YOUR FUND REPORT
| | | | |
| Portfolio Summary as of March 31, 2009 | | Global Opportunities Portfolio |
| |
| Portfolio Management Commentary | | |
How did the Portfolio perform?
| | • | | The Portfolio outperformed the benchmark S&P Global Broad Market Index (BMI) for the six-month period. |
What factors influenced performance?
| | • | | The Portfolio benefited from both stock selection and sector allocation decisions. Stock selection proved most favorable in the financials, healthcare and materials sectors. Despite financials being the worst-performing sector on an absolute return basis, it was a strong contributor to the Portfolio’s relative strength versus the benchmark over the past six months. This was due in part to the Portfolio’s underweight in real estate stocks and strong stock selection within the diversified banks and property casualty & insurance sub-industries. Other meaningful contributors included an overweight in healthcare, favorable positioning among biotechnology and pharmaceutical companies, and an overweight exposure to gold mining stocks within the materials sector. |
| | • | | Notable weakness came from the energy sector due to an underweight in integrated oil companies, which were more defensive in a declining commodity price environment, and worse-than-benchmark performance amongst the Portfolio’s oil & gas drilling holdings. Other sources of relative weakness could be attributable to an underweight and stock selection within the telecommunication services and utilities sectors and underperformance of the Portfolio’s food, beverage and tobacco positions. |
Describe recent Portfolio activity.
| | • | | During the first half of the reporting period, Portfolio activity focused primarily on maintaining a quality bias, with overweights to defensive sectors such as healthcare and consumer staples. While we believe it is still too early to call a definitive turn in the markets, we have been adding back cyclical risks over the past several months, while taking profits in defensive names. As a result, allocations have shifted more recently back into the information technology (IT), energy, financials and materials sectors. Within the developed markets, we added exposure to Japan while trimming allocations to Europe. We also slightly increased exposure to emerging markets, primarily within the Asia Pacific region. |
Describe Portfolio positioning at period-end.
| | • | | At period-end, the Portfolio was overweight relative to the benchmark in energy, financials, consumer discretionary and IT, and underweight in healthcare, consumer staples, materials, industrials, telecommunication services and utilities. |
| | • | | As earnings visibility remains poor, it is our intention at this time to generate alpha primarily through individual stock picking and sound risk management practices. We believe it is risk appropriate to have a relatively balanced portfolio that is neither too aggressively nor too defensively positioned. This is reflected in our active sector bets, as most of them are within approximately 200 basis points (2.00%) of the benchmark. |
The views expressed reflect the opinions of BlackRock as of the date of this report and are subject to change based on changes in market, economic or other conditions. These views are not intended to be a forecast of future events and are no guarantee of future results.
Portfolio Profile as of March 31, 2009
| | | |
Ten Largest Holdings | | Percent of
Long-Term
Investments | |
Samsung Electronics Co. Ltd. | | 2 | % |
Wyeth | | 2 | |
Roche Holding AG - ADR | | 1 | |
Pfizer, Inc. | | 1 | |
Taiwan Semiconductor Manufacturing Co. Ltd. - ADR | | 1 | |
QUALCOMM, Inc. | | 1 | |
Medco Health Solutions, Inc. | | 1 | |
Toyota Motor Corp. | | 1 | |
Amgen, Inc. | | 1 | |
Bharti Tele-Ventures Ltd. | | 1 | |
| | | |
Geographic Allocation | | Percent of
Long-Term
Investments | |
United States | | 46 | % |
Japan | | 8 | |
United Kingdom | | 7 | |
Canada | | 5 | |
France | | 4 | |
Taiwan | | 3 | |
Switzerland | | 2 | |
Germany | | 2 | |
China | | 2 | |
Norway | | 2 | |
Australia | | 2 | |
Singapore | | 2 | |
Spain | | 2 | |
South Korea | | 2 | |
India | | 1 | |
South Africa | | 1 | |
Hong Kong | | 1 | |
Italy | | 1 | |
Sweden | | 1 | |
Austria | | 1 | |
Belgium | | 1 | |
Brazil | | 1 | |
Mexico | | 1 | |
Luxembourg | | 1 | |
Netherlands | | 1 | |
| | | | | | |
4 | | SEMI-ANNUAL REPORT | | MARCH 31, 2009 | | |
| | |
| | Global Opportunities Portfolio |
| |
Total Return Based on a $10,000 Investment | | |
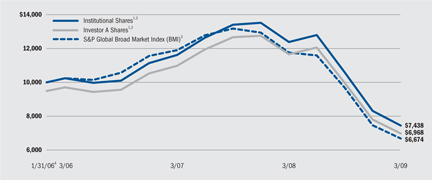
| 1 | Assuming maximum sales charge, if any, transaction costs and other operating expenses, including advisory fees. Institutional Shares do not have a sales charge. |
| 2 | The Portfolio will invest, under normal market conditions, at least 40% of its total assets in issuers located outside of the US. The Portfolio may invest up to 25% of its total assets in stocks of issuers in emerging market countries. The Portfolio may also invest up to 25% of its total assets in global fixed income securities, including emerging market debt. |
| 3 | The all-encompassing S&P Global index is known as the S&P Global Broad Market Index (BMI). The BMI measures the performance of the entire universe of investable securities greater than USD 100 million. The BMI is segmented into two size components: the Primary Market Index (PMI), and the Extended Market Index (EMI). The PMI defines the large-cap universe, representing the top 80% of BMI market capitalization for each listed country. The EMI defines the small-cap universe for each country, representing the remaining 20%. |
| 4 | Commencement of operations. |
Past performance is not indicative of future results.
Performance Summary for the Period Ended March 31, 2009
| | | | | | | | | | | | | | | |
| | | | | | Average Annual Total Returns5 | |
| | | | | | 1 Year | | | From Inception6 | |
| | | 6-Month
Total Returns | | | w / o sales
charge | | | w / sales
charge | | | w / o sales
charge | | | w / sales
charge | |
Institutional | | (29.67 | )% | | (39.92 | )% | | N/A | | | (8.94 | )% | | N/A | |
Investor A | | (29.94 | ) | | (40.24 | ) | | (43.36 | )% | | (9.27 | ) | | (10.80 | )% |
Investor B | | (30.52 | ) | | (41.02 | ) | | (43.67 | ) | | (10.06 | ) | | (10.88 | ) |
Investor C | | (30.55 | ) | | (41.06 | ) | | (41.64 | ) | | (10.08 | ) | | (10.08 | ) |
S&P Global Broad Market Index (BMI) | | (30.96 | ) | | (43.24 | ) | | N/A | | | (11.99 | ) | | N/A | |
| 5 | Assuming maximum sales charges. Average annual total returns with and without sales charges reflect reductions for distribution and service fees. See “About Portfolio Performance” on page 14 for a detailed description of share classes, including any related sales charges and fees. |
| 6 | The Portfolio commenced operations on January 31, 2006. |
N/A - Not applicable as share class and index do not have a sales charge.
Past performance is not indicative of future results.
Expense Example
| | | | | | | | | | | | | | | | | | |
| | | Actual | | Hypothetical8 |
| | | Beginning
Account Value
October 1, 2008 | | Ending
Account Value
March 31, 2009 | | Expenses Paid
During the Period7 | | Beginning
Account Value
October 1, 2008 | | Ending
Account Value
March 31, 2009 | | Expenses Paid
During the Period7 |
Institutional | | $ | 1,000.00 | | $ | 703.30 | | $ | 5.73 | | $ | 1,000.00 | | $ | 1,018.18 | | $ | 6.82 |
Investor A | | $ | 1,000.00 | | $ | 700.60 | | $ | 7.00 | | $ | 1,000.00 | | $ | 1,016.67 | | $ | 8.33 |
Investor B | | $ | 1,000.00 | | $ | 694.80 | | $ | 10.14 | | $ | 1,000.00 | | $ | 1,012.88 | | $ | 12.12 |
Investor C | | $ | 1,000.00 | | $ | 694.50 | | $ | 10.14 | | $ | 1,000.00 | | $ | 1,012.88 | | $ | 12.12 |
| 7 | For each class of the Portfolio, expenses are equal to the annualized expense ratio for the class (1.35% for Institutional, 1.65% for Investor A, 2.40% for Investor B and 2.40% for Investor C), multiplied by the average account value over the period, multiplied by 182/365 (to reflect the one-half year period shown). |
| 8 | Hypothetical 5% annual return before expenses is calculated by pro-rating the number of days in the most recent fiscal half year divided by 365. |
See “Disclosure of Expenses” on page 15 for further information on how expenses were calculated.
| | | | | | |
| | | SEMI-ANNUAL REPORT | | MARCH 31, 2009 | | 5 |
| | | | |
| Portfolio Summary as of March 31, 2009 | | Health Sciences Opportunities Portfolio |
| |
Portfolio Management Commentary | | |
How did the Portfolio perform?
| | • | | The Portfolio outperformed the broad-market S&P 500 Index and its sector benchmarks, the Lipper Health/Biotechnology Funds Index and the Russell 3000 Health Care Index, for the six-month period. |
What factors influenced performance?
| | • | | Both stock selection and sub-sector allocation decisions contributed positively to relative return comparisons over the past six months. Selection was strongest within the medical equipment & supplies sub-sector as stocks like DiaSorin S.p.A., Boston Scientific Corp., and Sonova Holding AG posted double-digit returns. We also had good selection in the healthcare distributors and life sciences tools & services sub-industries. While an overweight in biotechnology was mainly the result of finding attractive opportunities at the individual company level, the group outperformed the benchmark and was a source of relative strength from the sub-sector allocation perspective. |
| | • | | The greatest source of weakness on a relative basis, but strongest absolute performer, was the pharmaceutical sub-sector. An underweight compared with the large benchmark exposure hindered results in an environment when investors tended to favor its defensive qualities; selection within the group also detracted somewhat. While we owned shares in Bristol-Myers Squibb Co., Merck & Co. and Abbott Laboratories, underweights to their benchmark weights hurt relative returns. Outside of pharmaceuticals, relative weakness came from stock selection within biotechnology, an overweight exposure to medical devices & supplies, and selection with the healthcare supplies sub-industry, most notably a position in Alcon. |
Describe recent Portfolio activity.
| | • | | From an industry standpoint, exposure to biotechnology declined as we trimmed some of the Portfolio’s larger holdings. We also reduced the Portfolio’s allocation to medical devices & supplies after cutting the size of several healthcare equipment positions. The proceeds from these sales have since been redeployed into life sciences tools & services companies, as well as small additions among managed care and healthcare services names. Similarly, pharmaceuticals exposure has increased as a result of additions to large caps such as Abbott Laboratories, Merck, Pfizer and Wyeth. |
Describe Portfolio positioning at period-end.
| | • | | At period-end, the Portfolio was slightly overweight relative to the Russell 3000 Health Care Index in biotechnology, medical devices & supplies and healthcare services. Conversely, despite recent additions, the Portfolio remains underweight in pharmaceuticals, which make up nearly half the weight of the benchmark. |
The views expressed reflect the opinions of BlackRock as of the date of this report and are subject to change based on changes in market, economic or other conditions. These views are not intended to be a forecast of future events and are no guarantee of future results.
Portfolio Profile as of March 31, 2009
| | | |
Ten Largest Holdings | | Percent of
Long-Term
Investments | |
Wyeth | | 7 | % |
Amgen, Inc. | | 6 | |
Medco Health Solutions, Inc. | | 4 | |
Gilead Sciences, Inc. | | 4 | |
Becton, Dickinson & Co. | | 4 | |
Abbott Laboratories | | 4 | |
CVS Caremark Corp. | | 4 | |
Johnson & Johnson | | 4 | |
Pfizer, Inc. | | 3 | |
Alcon, Inc. | | 3 | |
| | | |
Industry Representation | | Percent of
Long-Term
Investments | |
Pharmaceuticals | | 31 | % |
Health Care Equipment & Supplies | | 24 | |
Health Care Providers & Services | | 19 | |
Biotechnology | | 18 | |
Life Sciences Tools & Services | | 4 | |
Food & Staples Retailing | | 4 | |
For Portfolio compliance purposes, the Portfolio’s industry classifications refer to any one or more of the industry sub-classifications used by one or more widely recognized market indexes or ratings group indexes, and/or as defined by Portfolio management. This definition may not apply for purposes of this report, which may combine industry sub-classifications for reporting ease.
| | | | | | |
6 | | SEMI-ANNUAL REPORT | | MARCH 31, 2009 | | |
| | |
| | Health Sciences Opportunities Portfolio |
| |
Total Return Based on a $10,000 Investment | | |
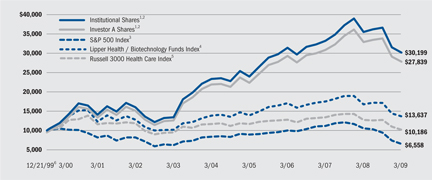
| 1 | Assuming maximum sales charge, if any, transaction costs and other operating expenses, including advisory fees. Institutional Shares do not have a sales charge. |
| 2 | Under normal market conditions, the Portfolio invests at least 80% of total assets in securities of companies in health sciences and related industries. |
| 3 | This unmanaged index covers 500 industrial, utility, transportation and financial companies of the US markets (mostly NYSE issues) representing about 75% of NYSE market capitalization and 30% of NYSE issues. S&P 500 is a trademark of the McGraw-Hill Companies. |
| 4 | An equally weighted index of typically the 30 largest mutual funds within its respective investment objective. |
| 5 | An unmanaged index representative of companies involved in medical services or health care in the Russell 3000 Index, which is comprised of the 3,000 largest US companies as determined by total market capitalization. |
| 6 | Commencement of operations. |
Past performance is not indicative of future results.
Performance Summary for the Period Ended March 31, 2009
| | | | | | | | | | | | | | | | | | | | | |
| | | | | | Average Annual Total Returns7 | |
| | | | | | 1 Year | | | 5 Years | | | From Inception8 | |
| | | 6-Month
Total Returns | | | w / o sales
charge | | | w / sales
charge | | | w / o sales
charge | | | w / sales
charge | | | w / o sales
charge | | | w / sales
charge | |
Institutional | | (17.63 | )% | | (14.97 | )% | | N/A | | | 5.26 | % | | N/A | | | 12.65 | % | | N/A | |
Service | | (17.79 | ) | | (15.32 | ) | | N/A | | | 4.97 | | | N/A | | | 12.35 | | | N/A | |
Investor A | | (17.80 | ) | | (15.34 | ) | | (19.77 | )% | | 4.91 | | | 3.79 | % | | 12.32 | | | 11.67 | % |
Investor B | | (18.13 | ) | | (15.99 | ) | | (19.40 | ) | | 4.10 | | | 3.77 | | | 11.56 | | | 11.56 | |
Investor C | | (18.09 | ) | | (15.88 | ) | | (16.64 | ) | | 4.18 | | | 4.18 | | | 11.54 | | | 11.54 | |
S&P 500 Index | | (30.54 | ) | | (38.09 | ) | | N/A | | | (4.77 | ) | | N/A | | | (4.45 | ) | | N/A | |
Lipper Health/Biotechnology Funds Index | | (20.53 | ) | | (18.69 | ) | | N/A | | | (0.35 | ) | | N/A | | | 3.40 | | | N/A | |
Russell 3000 Health Care Index | | (19.97 | ) | | (20.13 | ) | | N/A | | | (2.67 | ) | | N/A | | | 0.20 | | | N/A | |
| 7 | Assuming maximum sales charges. Average annual total returns with and without sales charges reflect reductions for distribution and service fees. See “About Portfolio Performance” on page 14 for a detailed description of share classes, including any related sales charges and fees. |
| 8 | The Portfolio commenced operations on December 21, 1999. |
N/A - Not applicable as share class and index do not have a sales charge.
Past performance is not indicative of future results.
Expense Example
| | | | | | | | | | | | | | | | | | |
| | | Actual | | Hypothetical10 |
| | | Beginning
Account Value
October 1, 2008 | | Ending
Account Value
March 31, 2009 | | Expenses Paid
During the Period9 | | Beginning
Account Value
October 1, 2008 | | Ending
Account Value
March 31, 2009 | | Expenses Paid
During the Period9 |
Institutional | | $ | 1,000.00 | | $ | 823.70 | | $ | 4.68 | | $ | 1,000.00 | | $ | 1,019.80 | | $ | 5.20 |
Service | | $ | 1,000.00 | | $ | 822.10 | | $ | 6.31 | | $ | 1,000.00 | | $ | 1,017.98 | | $ | 7.02 |
Investor A | | $ | 1,000.00 | | $ | 822.00 | | $ | 6.45 | | $ | 1,000.00 | | $ | 1,017.83 | | $ | 7.17 |
Investor B | | $ | 1,000.00 | | $ | 818.70 | | $ | 10.02 | | $ | 1,000.00 | | $ | 1,013.84 | | $ | 11.16 |
Investor C | | $ | 1,000.00 | | $ | 819.10 | | $ | 9.57 | | $ | 1,000.00 | | $ | 1,014.35 | | $ | 10.65 |
| 9 | For each class of the Portfolio, expenses are equal to the annualized expense ratio for the class (1.03% for Institutional, 1.39% for Service, 1.42% for Investor A, 2.21% for Investor B and 2.11% for Investor C), multiplied by the average account value over the period, multiplied by 182/365 (to reflect the one-half year period shown). |
| 10 | Hypothetical 5% annual return before expenses is calculated by pro-rating the number of days in the most recent fiscal half year divided by 365. |
See “Disclosure of Expenses” on page 15 for further information on how expenses were calculated.
| | | | | | |
| | | SEMI-ANNUAL REPORT | | MARCH 31, 2009 | | 7 |
| | |
| Portfolio Summary as of March 31, 2009 | | International Opportunities Portfolio |
| |
Portfolio Management Commentary | | |
How did the Portfolio perform?
| | • | | The Portfolio outperformed the benchmark S&P Global Ex-U.S. Broad Market Index (BMI) for the six-month period. |
What factors influenced performance?
| | • | | Strong stock selection benefited the Portfolio, led by results within the financials, materials and industrials sectors. Despite financials being the worst-performing sector on an absolute return basis, it was the strongest contributor to the Portfolio’s relative strength versus the benchmark over the past six months. This was due mainly to an underweight in and good selection among banks, in combination with strong stock selection within the investment-banking & brokerage and property casualty & insurance sub-industries. Positive allocation effects and performance within the materials sector that far outpaced benchmark comparisons was also a large source of alpha. This was due in part to an overweight in gold and good results within the diversified metals & mining sub-industry. |
| | • | | By contrast, allocation decisions detracted overall. Notable weakness came from the energy sector, due to an underweight in integrated oil companies, which were more defensive in a declining commodity price environment, and overall steeper declines in the Portfolio’s holdings than those represented by the benchmark. Further weakness was attributed to underweights in the information technology (IT) and telecommunication services sectors. |
Describe recent Portfolio activity.
| | • | | While we believe it is still too early to call a definitive turn in the markets, we have been adding back cyclical areas of the market over the past several months, while taking profits in higher quality, defensive names. As a result, sector weighting has shifted away from areas like utilities and consumer staples, and into the likes of IT, energy and materials. Geographically, we added Asian exposure, including within Japan and the developing markets. Sources of these funds came from Eastern Europe and the Portfolio’s cash position. |
Describe Portfolio positioning at period-end.
| | • | | At the end of the period, the Portfolio was overweight relative to the benchmark in energy, financials, consumer discretionary and materials, and underweight in utilities, healthcare, IT, consumer staples and industrials. |
| | • | | As earnings visibility remains poor, it is our intention at this time to generate alpha primarily through individual stock picking and sound risk management practices. We believe it is risk appropriate to have a relatively balanced portfolio that is neither too aggressively nor too defensively positioned. This is reflected in our active sector bets, as most of them are within approximately 200 basis points (2.00%) of the benchmark. |
The views expressed reflect the opinions of BlackRock as of the date of this report and are subject to change based on changes in market, economic or other conditions. These views are not intended to be a forecast of future events and are no guarantee of future results.
Portfolio Profile as of March 31, 2009
| | | |
Ten Largest Holdings | | Percent of
Long-Term
Investments | |
Samsung Electronics Co. Ltd. | | 2 | % |
Taiwan Semiconductor Manufacturing Co. Ltd. - ADR | | 1 | |
Eldorado Gold Corp. | | 1 | |
Rhoen Klinikum AG | | 1 | |
Total SA | | 1 | |
Vodafone Group Plc | | 1 | |
Nestle SA | | 1 | |
Toyota Motor Corp. | | 1 | |
Industrial & Commercial Bank of China - Class H - ADR | | 1 | |
China Construction Bank Corp. - Class H | | 1 | |
| | | |
Geographic Allocation | | Percent of
Long-Term
Investments | |
United Kingdom | | 18 | % |
Japan | | 14 | |
Germany | | 8 | |
Canada | | 8 | |
France | | 6 | |
Taiwan | | 5 | |
Switzerland | | 4 | |
Hong Kong | | 4 | |
China | | 3 | |
Brazil | | 3 | |
Australia | | 3 | |
Spain | | 2 | |
Netherlands | | 2 | |
Italy | | 2 | |
South Korea | | 2 | |
Norway | | 2 | |
India | | 2 | |
Luxembourg | | 2 | |
Thailand | | 1 | |
Singapore | | 1 | |
South Africa | | 1 | |
Austria | | 1 | |
Sweden | | 1 | |
Papua New Guinea | | 1 | |
Philippines | | 1 | |
Belgium | | 1 | |
Mexico | | 1 | |
Israel | | 1 | |
| | | | | | |
8 | | SEMI-ANNUAL REPORT | | MARCH 31, 2009 | | |
| | |
| | International Opportunities Portfolio |
| |
Total Return Based on a $10,000 Investment | | |
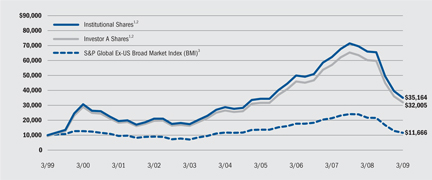
| 1 | Assuming maximum sales charge, if any, transaction costs and other operating expenses, including advisory fees. Institutional Shares do not have a sales charge. |
| 2 | The Portfolio under normal market conditions, invests at least 80% of its net assets in equity securities issued by international companies of any market capitalization. |
| 3 | S&P Global Ex-U.S. Broad Market Index (BMI) is an available market capitalization weighted equity index made up of 52 global developed and emerging markets, not including the US. The BMI is segmented into two size components: the S&P LargeMidCap Index and the S&P SmallCap Index. |
Past performance is not indicative of future results.
Performance Summary for the Period Ended March 31, 2009
| | | | | | | | | | | | | | | | | | | | | |
| | | | | | Average Annual Total Returns5 | |
| | | | | | 1 Year | | | 5 Years | | | 10 Years | |
| | | 6-Month
Total Returns | | | w / o sales
charge | | | w / sales
charge | | | w / o sales
charge | | | w / sales
charge | | | w / o sales
charge | | | w / sales
charge | |
Institutional | | (28.86 | )% | | (46.71 | )% | | N/A | | | 4.09 | % | | N/A | | | 13.40 | % | | N/A | |
Service | | (28.97 | ) | | (46.88 | ) | | N/A | | | 3.78 | | | N/A | | | 13.03 | | | N/A | |
Investor A | | (28.99 | ) | | (46.90 | ) | | (49.69 | )% | | 3.74 | | | 2.63 | % | | 12.95 | | | 12.34 | % |
Investor B | | (29.29 | ) | | (47.32 | ) | | (49.69 | ) | | 2.93 | | | 2.64 | | | 12.28 | | | 12.28 | |
Investor C | | (29.26 | ) | | (47.30 | ) | | (47.83 | ) | | 2.96 | | | 2.96 | | | 12.12 | | | 12.12 | |
S&P Global Ex-US Broad Market Index (BMI) | | (30.42 | ) | | (46.59 | ) | | N/A | | | (0.17 | ) | | N/A | | | 1.55 | | | N/A | |
| 5 | Assuming maximum sales charges. Average annual total returns with and without sales charges reflect reductions for distribution and service fees. See “About Portfolio Performance” on page 14 for a detailed description of share classes, including any related sales charges and fees. |
N/A - Not applicable as share class and index do not have a sales charge.
Past performance is not indicative of future results.
Expense Example
| | | | | | | | | | | | | | | | | | |
| | | Actual | | Hypothetical7 |
| | | Beginning
Account Value
October 1, 2008 | | Ending
Account Value
March 31, 2009 | | Expenses Paid
During the Period6 | | Beginning
Account Value
October 1, 2008 | | Ending
Account Value
March 31, 2009 | | Expenses Paid
During the Period6 |
Institutional | | $ | 1,000.00 | | $ | 711.40 | | $ | 6.02 | | $ | 1,000.00 | | $ | 1,017.88 | | $ | 7.12 |
Service | | $ | 1,000.00 | | $ | 710.30 | | $ | 7.46 | | $ | 1,000.00 | | $ | 1,016.16 | | $ | 8.84 |
Investor A | | $ | 1,000.00 | | $ | 710.10 | | $ | 7.67 | | $ | 1,000.00 | | $ | 1,015.91 | | $ | 9.09 |
Investor B | | $ | 1,000.00 | | $ | 707.10 | | $ | 11.19 | | $ | 1,000.00 | | $ | 1,011.72 | | $ | 13.28 |
Investor C | | $ | 1,000.00 | | $ | 707.40 | | $ | 10.98 | | $ | 1,000.00 | | $ | 1,011.97 | | $ | 13.03 |
| 6 | For each class of the Portfolio, expenses are equal to the annualized expense ratio for the class (1.41% for Institutional, 1.75% for Service, 1.80% for Investor A, 2.63% for Investor B and 2.58% for Investor C), multiplied by the average account value over the period, multiplied by 182/365 (to reflect the one-half year period shown). |
| 7 | Hypothetical 5% annual return before expenses is calculated by pro-rating the number of days in the most recent fiscal half year divided by 365. |
See “Disclosure of Expenses” on page 15 for further information on how expenses were calculated.
| | | | | | |
| | | SEMI-ANNUAL REPORT | | MARCH 31, 2009 | | 9 |
| | |
| Portfolio Summary as of March 31, 2009 | | Science & Technology Opportunities Portfolio |
| |
Portfolio Management Commentary | | |
How did the Portfolio perform?
| | • | | The Portfolio’s Institutional, Service and Investor A shares outperformed the benchmark NYSE Arca Tech 100 Index for the six-month period. The Portfolio’s Class R shares performed in line with the index, while Investor B and Investor C shares lagged the index. |
What factors influenced performance?
| | • | | Allocation decisions benefited return comparisons over the reporting period. Within the information technology (IT) segment of the portfolio, overweights in semiconductors and systems software and underweights in application software were sources of relative strength. Outside of IT, allocation effects were also positive for the healthcare, telecommunication services and industrials sectors. Security selection within the IT sector was also positive. In particular, positioning within semiconductors, application software and office electronics boosted comparisons relative to the benchmark. Names like Taiwan Semiconductor Manufacturing, NetLogic Microsystems Inc. and National Semiconductor Corp. all fell substantially less than their peers. |
| | • | | Sources of relative weakness were most prominently the result of weaker selection effects within the healthcare and industrials sectors. Within healthcare, the Portfolio’s positioning in biotechnology was the largest detractor from comparative results, most notably due to exposure to Celera Corp. (-50.61%). Additionally, weaker results were found within the internet software & services (specifically Baidu, Digital River and SINA) and computer hardware (namely an underweight in Apple and overweight in Hewlett-Packard) sub-industries. |
Describe recent Portfolio activity.
| | • | | During the six months, we added to the Portfolio’s IT exposure, primarily within the semiconductors sub-industry. Conversely, within healthcare, the Portfolio’s weight in biotechnology decreased as names like Genentech and Genzyme Corp. were eliminated. Outside of IT and healthcare, we reduced exposure to industrials holdings, finishing the period with a minimal weight in the sector. |
Describe Portfolio positioning at period-end.
| | • | | At period-end, the Portfolio maintained an active overweight in the IT sector given our intentions to add back more cyclical risks over the past several months, at the expense of underweighting healthcare. The semiconductors sub-industry represents the largest overweight within IT, with nearly twice the weighting of the benchmark. Conversely, smaller underweights relative to the benchmark are held across the computer hardware, data processing & outsourced services and application software sub-industries. |
The views expressed reflect the opinions of BlackRock as of the date of this report and are subject to change based on changes in market, economic or other conditions. These views are not intended to be a forecast of future events and are no guarantee of future results.
Portfolio Profile as of March 31, 2009
| | | |
Ten Largest Holdings | | Percent of
Long-Term
Investments | |
Apple, Inc. | | 4 | % |
International Business Machines Corp. | | 4 | |
QUALCOMM, Inc. | | 4 | |
Amgen, Inc. | | 3 | |
Applied Materials, Inc. | | 3 | |
Intel Corp. | | 2 | |
Cisco Systems, Inc. | | 2 | |
Oracle Corp. | | 2 | |
Medtronic, Inc. | | 2 | |
McAfee, Inc. | | 2 | |
| | | |
Industry Representation | | Percent of
Long-Term
Investments | |
Semiconductors & Semiconductor Equipment | | 24 | % |
Software | | 19 | |
Computers & Peripherals | | 12 | |
Communications Equipment | | 11 | |
Internet Software & Services | | 9 | |
Biotechnology | | 6 | |
Health Care Equipment & Supplies | | 6 | |
Diversified Telecommunication Services | | 3 | |
Electronic Equipment, Instruments & Components | | 2 | |
Pharmaceuticals | | 2 | |
Aerospace & Defense | | 1 | |
Wireless Telecommunication Services | | 1 | |
Office Electronics | | 1 | |
IT Services | | 1 | |
Food & Staples Retailing | | 1 | |
Internet & Catalog Retail | | 1 | |
For Portfolio compliance purposes, the Portfolio’s industry classifications refer to any one or more of the industry sub-classifications used by one or more widely recognized market indexes or ratings group indexes, and/or as defined by Portfolio management. This definition may not apply for purposes of this report, which may combine industry sub-classifications for reporting ease.
| | | | | | |
10 | | SEMI-ANNUAL REPORT | | MARCH 31, 2009 | | |
Science & Technology Opportunities Portfolio
Total Return Based on a $10,000 Investment
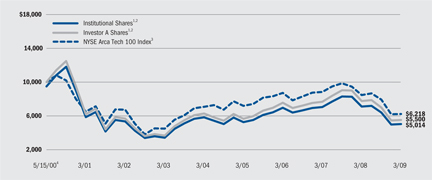
| 1 | Assuming maximum sales charge, if any, transaction costs and other operating expenses, including advisory fees. Institutional Shares do not have a sales charge. |
| 2 | The Portfolio will invest primarily in equity securities of US and non-US companies in all capitalization ranges selected for their rapid and sustainable growth potential from the development, advancement and use of science and/or technology. |
| 3 | A price-weighted index comprised of not more than 100 individual stocks listed on the NYSE, AMEX or NASDAQ. The index is modeled to represent a broad spectrum of companies engaged principally in manufacturing products and/or providing services within technology fields. |
| 4 | Commencement of operations. |
Past performance is not indicative of future results.
Performance Summary for the Period Ended March 31, 2009
| | | | | | | | | | | | | | | | | | | | | |
| | | 6-Month
Total Returns | | | Average Annual Total Returns5 | |
| | | 1 Year | | | 5 Years | | | From Inception6 | |
| | | w / o sales
charge | | | w / sales
charge | | | w / o sales
charge | | | w / sales
charge | | | w / o sales
charge | | | w / sales
charge | |
Institutional | | (21.20 | )% | | (29.12 | )% | | N/A | | | (2.59 | )% | | N/A | | | (6.51 | )% | | N/A | |
Service | | (21.32 | ) | | (29.33 | ) | | N/A | | | (2.91 | ) | | N/A | | | (6.80 | ) | | N/A | |
Investor A | | (21.40 | ) | | (29.47 | ) | | (33.21 | )% | | (2.97 | ) | | (4.01 | )% | | (6.92 | ) | | (7.48 | )% |
Investor B | | (21.75 | ) | | (30.07 | ) | | (33.22 | ) | | (3.79 | ) | | (4.18 | ) | | (7.58 | ) | | (7.58 | ) |
Investor C | | (21.62 | ) | | (29.97 | ) | | (30.67 | ) | | (3.79 | ) | | (3.79 | ) | | (7.66 | ) | | (7.66 | ) |
R | | (21.52 | ) | | (29.76 | ) | | N/A | | | (3.36 | ) | | N/A | | | (7.25 | ) | | N/A | |
NYSE Arca Tech 100 Index | | (21.54 | ) | | (26.43 | ) | | N/A | | | (2.51 | ) | | N/A | | | (5.21 | ) | | N/A | |
| 5 | Assuming maximum sales charges. Average annual total returns with and without sales charges reflect reductions for distribution and service fees. See “About Portfolio Performance” on page 14 for a detailed description of share classes, including any related sales charges and fees. |
| 6 | The Portfolio commenced operations on May 15, 2000. |
N/A - Not applicable as share class and index do not have a sales charge.
Past performance is not indicative of future results.
Expense Example
| | | | | | | | | | | | | | | | | | |
| | | Actual | | Hypothetical8 |
| | | Beginning
Account Value
October 1, 2008 | | Ending
Account Value
March 31, 2009 | | Expenses Paid
During the Period7 | | Beginning
Account Value
October 1, 2008 | | Ending
Account Value
March 31, 2009 | | Expenses Paid
During the Period7 |
Institutional | | $ | 1,000.00 | | $ | 788.00 | | $ | 6.02 | | $ | 1,000.00 | | $ | 1,018.18 | | $ | 6.82 |
Service | | $ | 1,000.00 | | $ | 786.80 | | $ | 7.71 | | $ | 1,000.00 | | $ | 1,016.27 | | $ | 8.73 |
Investor A | | $ | 1,000.00 | | $ | 786.00 | | $ | 7.79 | | $ | 1,000.00 | | $ | 1,016.16 | | $ | 8.84 |
Investor B | | $ | 1,000.00 | | $ | 782.50 | | $ | 11.78 | | $ | 1,000.00 | | $ | 1,011.62 | | $ | 13.38 |
Investor C | | $ | 1,000.00 | | $ | 783.80 | | $ | 11.79 | | $ | 1,000.00 | | $ | 1,011.62 | | $ | 13.38 |
R | | $ | 1,000.00 | | $ | 784.80 | | $ | 9.48 | | $ | 1,000.00 | | $ | 1,014.25 | | $ | 10.75 |
| 7 | For each class of the Portfolio, expenses are equal to the annualized expense ratio for the class (1.35% for Institutional, 1.73% for Service, 1.75% for Investor A, 2.65% for Investor B, 2.65% for Investor C and 2.13% for R), multiplied by the average account value over the period, multiplied by 182/365 (to reflect the one-half year period shown). |
| 8 | Hypothetical 5% annual return before expenses is calculated by pro-rating the number of days in the most recent fiscal half year divided by 365. |
See “Disclosure of Expenses” on page 15 for further information on how expenses were calculated.
| | | | | | |
| | | SEMI-ANNUAL REPORT | | MARCH 31, 2009 | | 11 |
| | |
| Portfolio Summary as of March 31, 2009 | | U.S. Opportunities Portfolio |
Portfolio Management Commentary
How did the Portfolio perform?
| | • | | As part of a broader rebranding of its indices, Standard & Poor’s changed the name of the S&P Citigroup Extended Market Index (EMI) US to the S&P US MidSmall Cap Index, effective October 1, 2008. |
| | • | | The Portfolio outperformed the benchmark S&P US MidSmall Cap Index for the six-month period. |
What factors influenced performance?
| | • | | The Portfolio benefited from strong stock selection, led by results within the information technology (IT), consumer discretionary and financials sectors. Our positioning within and decision to overweight the semiconductors sub-industry within IT was a meaningful source of alpha. As well, despite financials being the second worst-performing sector on an absolute return basis, it was a strong contributor to the Portfolio’s relative strength over the past six months. This was due to our favorable allocations to banks during the period, underweight in real estate and strong stock selection within the asset management and investment-banking sub-industries. |
| | • | | While allocation effects were mixed overall, weaker results could be found within the energy, IT and utilities sector. Within energy, our decision to overweight the coal & consumable fuels as well as the oil & gas exploration & production sub-industries, were a drag on results as the commodities complex remained under pressure for most of the time period. Names like Arch Coal Inc., Chesapeake Energy Corp. and Forest Oil Corp. all fell substantially due to deteriorating supply/demand fundamentals and investor risk-aversion. Relative return comparisons were also hurt by underweights in consumer staples, utilities and IT, which held up better than the overall market. |
Describe recent Portfolio activity.
| | • | | While we believe it is still too early to call a definitive turn in the markets, we have been adding back cyclical risks over the past several months while taking profits in high quality, defensive names. As a result, allocations have shifted away from areas like utilities and consumer staples, while into the likes of IT, financials, consumer discretionary and materials. |
Describe Portfolio positioning at period-end.
| | • | | At period-end, the Portfolio was overweight relative to the benchmark in energy and financials, and underweight in utilities, consumer staples, healthcare, consumer discretionary and industrials. |
| | • | | As earnings visibility remains poor, it is our intention at this time to generate alpha primarily through individual stock picking and sound risk management practices. We believe it is risk appropriate to have a relatively balanced portfolio that is neither too aggressively nor too defensively positioned. This is reflected in our active sector bets, as most of them are within approximately 200 basis points (2.00%) of the benchmark. |
The views expressed reflect the opinions of BlackRock as of the date of this report and are subject to change based on changes in market, economic or other conditions. These views are not intended to be a forecast of future events and are no guarantee of future results.
Portfolio Profile as of March 31, 2009
| | | |
Ten Largest Holdings | | Percent of
Long-Term
Investments | |
DaVita, Inc. | | 2 | % |
AmerisourceBergen Corp. | | 1 | |
Liberty Media Corp. - Entertainment - Series A | | 1 | |
Beckman Coulter, Inc. | | 1 | |
Crown Holdings, Inc. | | 1 | |
Sybase, Inc. | | 1 | |
Xcel Energy, Inc. | | 1 | |
Airgas, Inc. | | 1 | |
Vertex Pharmaceuticals, Inc. | | 1 | |
PMC-Sierra, Inc. | | 1 | |
| |
Sectors | | Percent of
Long-Term
Investments | |
Financials | | 19 | % |
Information Technology | | 18 | |
Consumer Discretionary | | 15 | |
Industrials | | 13 | |
Health Care | | 11 | |
Energy | | 8 | |
Materials | | 6 | |
Consumer Staples | | 5 | |
Utilities | | 3 | |
Telecommunication Services | | 2 | |
For Portfolio compliance purposes, the Portfolio’s sector classifications refer to any one or more of the sector sub-classifications used by one or more widely recognized market indexes or ratings group indexes, and/or as defined by Portfolio management. This definition may not apply for purposes of this report, which may combine sector sub-classifications for reporting ease.
| | | | | | |
12 | | SEMI-ANNUAL REPORT | | MARCH 31, 2009 | | |
U.S. Opportunities Portfolio
Total Return Based on a $10,000 Investment
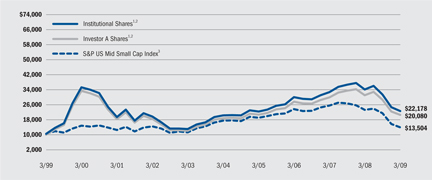
| 1 | Assuming maximum sales charge, if any, transaction costs and other operating expenses, including advisory fees. Institutional Shares do not have a sales charge. |
| 2 | The Portfolio normally invests at least 80% of its net assets in equity securities issued by US emerging capitalization companies with relatively attractive earnings growth potential and valuation. |
| 3 | An unmanaged index comprised of smaller-capitalization US stocks representing the bottom 30% of available market capital, with a minimum market capitalization of at least $100 million. |
Past performance is not indicative of future results.
Performance Summary for the Period Ended March 31, 2009
| | | | | | | | | | | | | | | | | | | | | |
| | | 6-Month
Total Returns | | | Average Annual Total Returns4 | |
| | | 1 Year | | | 5 Years | | | 10 Years | |
| | | w / o sales
charge | | | w / sales
charge | | | w / o sales
charge | | | w / sales
charge | | | w / o sales
charge | | | w / sales
charge | |
Institutional | | (28.35 | )% | | (33.92 | )% | | N/A | | | 2.25 | % | | N/A | | | 8.29 | % | | N/A | |
Service | | (28.52 | ) | | (34.22 | ) | | N/A | | | 1.88 | | | N/A | | | 7.90 | | | N/A | |
Investor A | | (28.56 | ) | | (34.25 | ) | | (37.69 | )% | | 1.81 | | | 0.72 | % | | 7.80 | | | 7.22 | % |
Investor B | | (28.75 | ) | | (34.71 | ) | | (37.64 | ) | | 1.06 | | | 0.68 | | | 7.17 | | | 7.17 | |
Investor C | | (28.78 | ) | | (34.70 | ) | | (35.35 | ) | | 1.06 | | | 1.06 | | | 7.01 | | | 7.01 | |
S&P US Mid Small Cap Index | | (35.50 | ) | | (40.81 | ) | | N/A | | | (4.49 | ) | | N/A | | | 3.05 | | | N/A | |
| 4 | Assuming maximum sales charges. Average annual total returns with and without sales charges reflect reductions for distribution and service fees. See “About Portfolio Performance” on page 14 for a detailed description of share classes, including any related sales charges and fees. |
N/A - Not applicable as share class and index do not have a sales charge.
Past performance is not indicative of future results.
Expense Example
| | | | | | | | | | | | | | | | | | |
| | | Actual | | Hypothetical6 |
| | | Beginning
Account Value
October 1, 2008 | | Ending
Account Value
March 31, 2009 | | Expenses Paid
During the Period5 | | Beginning
Account Value
October 1, 2008 | | Ending
Account Value
March 31, 2009 | | Expenses Paid
During the Period5 |
Institutional | | $ | 1,000.00 | | $ | 716.50 | | $ | 4.28 | | $ | 1,000.00 | | $ | 1,019.95 | | $ | 5.05 |
Service | | $ | 1,000.00 | | $ | 714.80 | | $ | 6.20 | | $ | 1,000.00 | | $ | 1,017.68 | | $ | 7.32 |
Investor A | | $ | 1,000.00 | | $ | 714.40 | | $ | 6.50 | | $ | 1,000.00 | | $ | 1,017.33 | | $ | 7.67 |
Investor B | | $ | 1,000.00 | | $ | 712.50 | | $ | 9.61 | | $ | 1,000.00 | | $ | 1,013.64 | | $ | 11.36 |
Investor C | | $ | 1,000.00 | | $ | 712.20 | | $ | 9.60 | | $ | 1,000.00 | | $ | 1,013.64 | | $ | 11.36 |
| 5 | For each class of the Portfolio, expenses are equal to the annualized expense ratio for the class (1.00% for Institutional, 1.45% for Service, 1.52% for Investor A, 2.25% for Investor B and 2.25% for Investor C), multiplied by the average account value over the period, multiplied by 182/365 (to reflect the one-half year period shown). |
| 6 | Hypothetical 5% annual return before expenses is calculated by pro-rating the number of days in the most recent fiscal half year divided by 365. |
See “Disclosure of Expenses” on page 15 for further information on how expenses were calculated.
| | | | | | |
| | | SEMI-ANNUAL REPORT | | MARCH 31, 2009 | | 13 |
About Portfolios’ Performance
| | • | | Institutional Shares are not subject to any sales charge (front-end load) or deferred sales charge and are available only to eligible investors. These shares bear no ongoing distribution or service fees. |
| | • | | Service Shares are not subject to any sales charge (front-end load) or deferred sales charge. These shares are subject to a service fee of 0.25% per year (but no distribution fee). |
| | • | | Investor A Shares incur a maximum initial sales charge (front-end load) of 5.25% and a service fee of 0.25% per year (but no distribution fee). |
| | • | | Investor B Shares are subject to a maximum contingent deferred sales charge of 4.50% declining to 0% after six years. In addition, these shares are subject to a distribution fee of 0.75% per year and a service fee of 0.25% per year. These shares automatically convert to Investor A Shares after approximately eight years. (There is no initial sales charge for automatic share conversions.) All returns for periods greater than eight years reflect this conversion. |
| | • | | Investor C Shares are subject to a 1.00% contingent deferred sales charge if redeemed within one year of purchase. In addition, these shares are subject to a distribution fee of 0.75% per year and a service fee of 0.25% per year. |
| | • | | R Shares are not subject to any initial sales charge (front-end load) or deferred sales charge. These shares are subject to a distribution fee of 0.25% per year and a service fee of 0.25% per year. R Shares are available only to certain retirement and other similar plans. |
Performance information reflects past performance and does not guarantee future results. Current performance may be lower or higher than the performance data quoted. Refer to www.blackrock.com/funds to obtain performance data current to the most recent month-end. Performance results do not reflect the deduction of taxes that a shareholder would pay on fund distributions or the redemption of fund shares. Each Portfolio may charge a 2% redemption fee for sales or exchanges of shares within 30 days of purchase or exchange. Performance data does not reflect this potential fee. Figures shown in the performance tables on the previous pages assume reinvestment of all dividends and distributions, if any, at net asset value on the ex-dividend date. Investment return and principal value of shares will fluctuate so that shares, when redeemed, may be worth more or less than their original cost. Dividends paid to each class of shares will vary because of the different levels of service, distribution and transfer agency fees applicable to each class, which are deducted from the income available to be paid to shareholders.
The performance information on the previous pages includes information for each class of each Portfolio since the commencement of operations of such Portfolio, rather than the date such class was introduced. Performance information for each class introduced after the commencement of operations of a Portfolio is therefore based on the performance history of a predecessor class adjusted to reflect the class specific fees applicable to each class at the time of the launch of such share class. This information may be considered when assessing a Portfolio’s performance, but does not represent the actual performance of this share class.
Performance for the Health Sciences Opportunities Portfolio for the periods prior to January 31, 2005 is based on performance of certain former State Street Research mutual funds that reorganized with the Portfolio on that date.
The performance information also reflects fee waivers and reimbursements that subsidize and reduce the total operating expenses of each Portfolio. The Portfolios’ returns would have been lower if there were no such waivers and reimbursements. BlackRock Advisors, LLC is under no obligation to waive or continue waiving its fees after February 1, 2010.
| | | | | | |
14 | | SEMI-ANNUAL REPORT | | MARCH 31, 2009 | | |
Disclosure of Expenses
Shareholders of these Portfolios may incur the following charges: (a) expenses related to transactions, including sales charges and redemption fees; and (b) operating expenses, including advisory fees, service and distribution fees including 12b-1 fees, and other Portfolio expenses. The expense examples on the previous pages (which are based on a hypothetical investment of $1,000 invested on October 1, 2008 and held through March 31, 2009) are intended to assist shareholders both in calculating expenses based on an investment in each Portfolio and in comparing these expenses with similar costs of investing in other mutual funds.
The Expense Example tables provide information about actual account values and actual expenses. In order to estimate the expenses a shareholder paid during the period covered by this report, shareholders can divide their account value by $1,000 and then multiply the result by the number corresponding to their share class under the headings entitled “Expenses Paid During the Period.”
The tables also provide information about hypothetical account values and hypothetical expenses based on the Portfolios’ actual expense ratios and an assumed rate of return of 5% per year before expenses. In order to assist shareholders in comparing the ongoing expenses of investing in these Portfolios and other funds, compare the 5% hypothetical example with the 5% hypothetical examples that appear in other funds’ shareholder reports.
The expenses shown in the table are intended to highlight shareholders’ ongoing costs only and do not reflect any transactional expenses, such as sales charges, redemption fees or exchange fees. Therefore, the hypothetical table is useful in comparing ongoing expenses only, and will not help shareholders determine the relative total expenses of owning different funds. If these transactional expenses were included, shareholder expenses would have been higher.
Derivative Instruments
The Portfolios may invest in various derivative instruments, including options, futures and forward currency contracts, and other instruments specified in the Notes to Financials Statements, which constitute forms of economic leverage. Such instruments are used to obtain exposure to a market without owning or taking physical custody of securities or to hedge market and/or interest rate risks. Such derivative instruments involve risks, including the imperfect correlation between the value of a derivative instrument and the underlying asset, possible default of the other party to the transaction and illiquidity of the derivative instrument. A Portfolio’s ability to successfully use a derivative instrument depends on the Advisor’s ability to accurately predict pertinent market movements, which cannot be assured. The use of derivative instruments may result in losses greater than if they had not been used, may require a Portfolio to sell or purchase portfolio securities at inopportune times or for prices other than current market values, may limit the amount of appreciation a Portfolio can realize on an investment or may cause a Portfolio to hold a security that it might otherwise sell. The Portfolios’ investments in these instruments are discussed in detail in the Notes to Financial Statements.
| | | | | | |
| | | SEMI-ANNUAL REPORT | | MARCH 31, 2009 | | 15 |
| | |
| Schedule of Investments March 31, 2009 (Unaudited) | | Global Opportunities Portfolio |
| | (Percentages shown are based on Net Assets) |
| | | | | |
| | | Shares | | Value |
Common Stocks | | | | | |
Australia — 1.7% | | | | | |
BHP Billiton Ltd. | | 14,000 | | $ | 309,417 |
Commonwealth Bank of Australia | | 4,500 | | | 108,030 |
Santos Ltd. | | 26,900 | | | 316,612 |
Westpac Banking Corp. Ltd. | | 8,500 | | | 112,243 |
| | | | | |
| | | | | 846,302 |
| | | | | |
Austria — 0.7% | | | | | |
OMV AG | | 10,100 | | | 337,886 |
| | | | | |
Belgium — 0.6% | | | | | |
Anheuser-Busch InBev NV | | 11,600 | | | 319,409 |
| | | | | |
Bermuda — 0.3% | | | | | |
IPC Holdings Ltd. | | 5,800 | | | 156,832 |
| | | | | |
Brazil — 0.6% | | | | | |
Banco Bradesco SA - ADR | | 5,300 | | | 52,470 |
BM&FBOVESPA SA | | 22,042 | | | 66,988 |
Companhia Energetica de Minas Gerais - CEMIG - ADR | | 49 | | | 724 |
Itau UniBanco Banco Multiplo SA - ADR | | 17,950 | | | 195,299 |
| | | | | |
| | | | | 315,481 |
| | | | | |
Canada — 4.7% | | | | | |
Canadian Natural Resources Ltd. | | 6,700 | | | 259,912 |
EnCana Corp. | | 7,900 | | | 323,318 |
Imperial Oil Ltd. | | 8,500 | | | 308,772 |
Kinross Gold Corp. | | 10,900 | | | 198,064 |
Potash Corp. of Saskatchewan, Inc. | | 2,400 | | | 193,944 |
Research In Motion Ltd.(a) | | 3,700 | | | 159,359 |
Royal Bank of Canada | | 5,000 | | | 145,860 |
Shoppers Drug Mart Corp. | | 8,600 | | | 295,625 |
Suncor Energy, Inc. | | 12,500 | | | 278,990 |
Toronto-Dominion Bank - ADR | | 4,800 | | | 165,457 |
| | | | | |
| | | | | 2,329,301 |
| | | | | |
China — 2.0% | | | | | |
China Construction Bank Corp. - Class H | | 407,700 | | | 231,443 |
China Railway Construction Corp. Ltd. - Class H(a) | | 185,500 | | | 241,559 |
Industrial & Commercial Bank of China - Class H - ADR | | 511,300 | | | 265,734 |
Sina Corp.(a) | | 10,800 | | | 251,100 |
| | | | | |
| | | | | 989,836 |
| | | | | |
France — 3.8% | | | | | |
AXA SA | | 6,400 | | | 76,816 |
BNP Paribas SA | | 4,700 | | | 193,906 |
France Telecom SA | | 17,500 | | | 398,951 |
Mercialys SA | | 1,200 | | | 34,731 |
PPR | | 3,500 | | | 224,386 |
Sanofi-Aventis - ADR | | 3,200 | | | 179,588 |
Societe Generale | | 3,400 | | | 132,998 |
Societe Immobiliere de Location pour l’Industrie et le Commerce | | 700 | | | 52,459 |
Total SA | | 6,200 | | | 306,587 |
Unibail-Rodamco | | 500 | | | 70,754 |
Vivendi Universal SA | | 8,900 | | | 235,396 |
| | | | | |
| | | | | 1,906,572 |
| | | | | |
Germany — 2.4% | | | | | |
Adidas AG | | 11,800 | | | 391,634 |
Allianz SE | | 1,400 | | | 117,184 |
Deutsche Boerse AG | | 3,300 | | | 197,987 |
Fresenius Medical Care AG & Co. KGaA | | 3,200 | | | 124,175 |
Muenchener Rueckversicherungs-Gesellschaft AG | | 1,400 | | | 170,473 |
Salzgitter AG | | 3,400 | | | 189,233 |
| | | | | |
| | | | | 1,190,686 |
| | | | | |
Hong Kong — 1.2% | | | | | |
China Mobile Ltd. | | 22,000 | | | 191,640 |
China Unicom Hong Kong Ltd. | | 162,800 | | | 169,887 |
Industrial and Commercial Bank of China (Asia) Ltd. | | 74,200 | | | 78,908 |
New World Development Co. Ltd. | | 147,300 | | | 147,039 |
| | | | | |
| | | | | 587,474 |
| | | | | |
India — 1.4% | | | | | |
Bharti Tele-Ventures Ltd.(a) | | 37,100 | | | 459,140 |
Punjab National Bank Ltd. | | 31,400 | | | 255,411 |
| | | | | |
| | | | | 714,551 |
| | | | | |
Israel — 0.5% | | | | | |
Teva Pharmaceutical Industries Ltd. - ADR | | 5,900 | | | 265,795 |
| | | | | |
Italy — 0.8% | | | | | |
A2A SpA | | 130,100 | | | 197,529 |
Assicurazioni Generali SpA | | 3,800 | | | 65,119 |
Credito Emiliano SpA | | 16,300 | | | 67,032 |
Intesa Sanpaolo SpA | | 30,900 | | | 84,990 |
| | | | | |
| | | | | 414,670 |
| | | | | |
Japan — 8.4% | | | | | |
Amada Co. Ltd. | | 54,900 | | | 293,320 |
Benesse Corp. | | 4,500 | | | 165,762 |
The Gunma Bank Ltd. | | 40,300 | | | 219,286 |
Hino Motors Ltd. | | 134,900 | | | 297,512 |
Honda Motor Co. Ltd | | 9,800 | | | 233,297 |
ITOCHU Corp. | | 73,400 | | | 362,157 |
Millea Holdings, Inc. | | 4,100 | | | 100,979 |
Mitsubishi Electric Corp. | | 91,300 | | | 414,919 |
Mitsubishi Estate Co. Ltd. | | 6,000 | | | 68,066 |
Mitsubishi Tokyo Financial Group, Inc. | | 28,900 | | | 142,382 |
Mitsui Fudosan Co. Ltd. | | 6,000 | | | 65,819 |
Mizuho Financial Group, Inc. | | 36,107 | | | 70,508 |
Nintendo Co. Ltd. | | 800 | | | 234,026 |
Sumitomo Metal Mining Co. Ltd. | | 39,000 | | | 374,967 |
Portfolio Abbreviations
| | | | | | | | |
| To simplify the listings of portfolio holdings in the Schedules of Investments, the names of certain securities have been abbreviated according to the list on the right. | | ADR | | American Depository Receipts | | JPY | | Japanese Yen |
| | AUD | | Australian Dollar | | LLC | | Limited Liability Company |
| | CAD | | Canadian Dollar | | NOK | | Norwegian Krone |
| | CHF | | Swiss Francs | | SEK | | Swedish Krona |
| | CZK | | Czechoslovakian Krone | | SGD | | Singapore Dollar |
| | DKK | | Danish Krone | | USD | | United States Dollar |
| | EUR | | Euro | | ZAR | | South African Rand |
| | GBP | | British Pound | | | | |
| | HKD | | Hong Kong Dollar | | | | |
| | | | | | |
16 | | SEMI-ANNUAL REPORT | | MARCH 31, 2009 | | |
| | |
| Schedule of Investments (continued) | | Global Opportunities Portfolio |
| | (Percentages shown are based on Net Assets) |
| | | | | |
| | | Shares | | Value |
Common Stocks | | | | | |
Japan (concluded) | | | | | |
Sumitomo Mitsui Financial Group, Inc. | | 2,100 | | $ | 73,944 |
Toyo Suisan Kaisha Ltd. | | 13,800 | | | 284,744 |
Toyota Motor Corp. | | 14,900 | | | 473,282 |
Yamato Holdings Co. Ltd. | | 30,700 | | | 291,159 |
| | | | | |
| | | | | 4,166,129 |
| | | | | |
Luxembourg — 0.6% | | | | | |
ArcelorMittal | | 14,500 | | | 295,854 |
| | | | | |
Mexico — 0.6% | | | | | |
Fomento Economico Mexicano SAB de CV - ADR | | 12,400 | | | 312,604 |
| | | | | |
Netherlands — 0.6% | | | | | |
Corio NV | | 2,000 | | | 82,716 |
Royal Dutch Shell Plc - B Shares | | 9,300 | | | 202,319 |
| | | | | |
| | | | | 285,035 |
| | | | | |
Norway — 1.9% | | | | | |
Norsk Hydro ASA | | 99,000 | | | 372,525 |
StatoilHydro ASA | | 14,700 | | | 257,260 |
Yara International ASA | | 13,900 | | | 303,673 |
| | | | | |
| | | | | 933,458 |
| | | | | |
Russia — 0.2% | | | | | |
Vimpel-Communications - ADR | | 16,700 | | | 109,218 |
| | | | | |
Singapore — 1.7% | | | | | |
Singapore Airlines Ltd. | | 37,700 | | | 248,627 |
United Overseas Bank Ltd. | | 43,600 | | | 279,663 |
Wilmar International Ltd. | | 145,300 | | | 304,029 |
| | | | | |
| | | | | 832,319 |
| | | | | |
South Africa — 1.2% | | | | | |
Naspers Ltd. - N Shares | | 23,800 | | | 402,710 |
Telkom SA Ltd. | | 18,100 | | | 201,661 |
| | | | | |
| | | | | 604,371 |
| | | | | |
South Korea — 1.6% | | | | | |
Samsung Electronics Co. Ltd. | | 1,900 | | | 784,999 |
| | | | | |
Spain — 1.7% | | | | | |
Banco Bilbao Vizcaya Argentaria SA | | 14,500 | | | 117,693 |
Banco Santander SA | | 24,800 | | | 170,991 |
Iberdrola Renovables SA(a) | | 49,400 | | | 204,602 |
Inditex SA | | 8,500 | | | 331,237 |
| | | | | |
| | | | | 824,523 |
| | | | | |
Sweden — 0.7% | | | | | |
Nordea Bank AB | | 27,900 | | | 138,823 |
Volvo AB - B Shares | | 43,500 | | | 230,823 |
| | | | | |
| | | | | 369,646 |
| | | | | |
Switzerland — 2.5% | | | | | |
Credit Suisse Group AG - ADR | | 3,600 | | | 109,613 |
Nestle SA | | 13,000 | | | 439,197 |
Roche Holding AG - ADR | | 3,900 | | | 535,275 |
UBS AG(a) | | 9,900 | | | 92,815 |
Zurich Financial Services AG | | 500 | | | 79,022 |
| | | | | |
| | | | | 1,255,922 |
| | | | | |
Taiwan — 2.9% | | | | | |
ASUSTeK Computer, Inc. | | 292,965 | | | 308,906 |
HTC Corp. | | 32,810 | | | 403,989 |
Siliconware Precision Industries Co. - ADR | | 35,900 | | | 208,220 |
Taiwan Semiconductor Manufacturing Co. Ltd. - ADR | | 57,100 | | | 511,045 |
| | | | | |
| | | | | 1,432,160 |
| | | | | |
Thailand — 0.3% | | | | | |
Bangkok Bank Public Co. Ltd. - ADR | | 57,700 | | | 122,082 |
| | | | | |
United Kingdom — 6.8% | | | | | |
AstraZeneca Plc | | 5,400 | | | 191,240 |
Barclays Plc | | 47,800 | | | 101,485 |
Bellway Plc | | 12,800 | | | 124,116 |
BG Group Plc | | 20,700 | | | 312,247 |
Charter International Plc | | 57,000 | | | 372,569 |
GlaxoSmithKline Plc | | 8,600 | | | 133,942 |
HSBC Holdings Plc | | 34,800 | | | 193,751 |
Imperial Tobacco Group Plc | | 18,200 | | | 408,741 |
Legal & General Group Plc | | 95,100 | | | 58,552 |
Man Group Plc | | 39,700 | | | 124,411 |
Persimmon Plc | | 25,700 | | | 127,032 |
Standard Chartered Plc | | 9,900 | | | 122,931 |
Unilever Plc | | 14,700 | | | 277,972 |
Vodafone Group Plc - ADR | | 15,900 | | | 276,978 |
WPP Plc | | 47,400 | | | 266,567 |
Xstrata Plc | | 47,000 | | | 315,274 |
| | | | | |
| | | | | 3,407,808 |
| | | | | |
United States — 45.4% | | | | | |
Alcoa, Inc. | | 45,500 | | | 333,970 |
Allergan, Inc. | | 4,700 | | | 224,472 |
The Allstate Corp. | | 4,500 | | | 86,175 |
Ameriprise Financial, Inc. | | 8,600 | | | 176,214 |
Amgen, Inc.(a) | | 9,300 | | | 460,536 |
Analog Devices, Inc. | | 21,100 | | | 406,597 |
AON Corp. | | 5,900 | | | 240,838 |
Applied Materials, Inc. | | 13,200 | | | 141,900 |
Arch Capital Group Ltd.(a) | | 1,500 | | | 80,790 |
Arch Coal, Inc. | | 17,800 | | | 237,986 |
AvalonBay Communities, Inc. | | 5,973 | | | 281,089 |
Bally Technologies, Inc.(a) | | 2,800 | | | 51,576 |
Bank of America Corp. | | 17,200 | | | 117,304 |
Becton, Dickinson & Co. | | 5,900 | | | 396,716 |
BJ Services Co. | | 25,600 | | | 254,720 |
Boston Properties, Inc. | | 2,400 | | | 84,072 |
Bucyrus International, Inc. | | 13,000 | | | 197,340 |
Campbell Soup Co. | | 10,400 | | | 284,544 |
Carnival Corp. | | 5,800 | | | 125,280 |
CBS Corp. - Class B | | 27,200 | | | 104,448 |
The Charles Schwab Corp. | | 14,000 | | | 217,000 |
Chesapeake Energy Corp. | | 9,200 | | | 156,952 |
Chevron Corp. | | 4,700 | | | 316,028 |
Chipotle Mexican Grill, Inc. - Class A(a) | | 1,900 | | | 126,122 |
Cisco Systems, Inc.(a) | | 23,300 | | | 390,741 |
Commerce Bancshares, Inc. | | 3,170 | | | 115,071 |
Commercial Metals Co. | | 14,300 | | | 165,165 |
ConocoPhillips | | 7,800 | | | 305,448 |
CONSOL Energy, Inc. | | 9,200 | | | 232,208 |
Cummins, Inc. | | 13,000 | | | 330,850 |
eBay, Inc.(a) | | 33,100 | | | 415,736 |
Everest Re Group Ltd. | | 1,800 | | | 127,440 |
FPL Group, Inc. | | 6,700 | | | 339,891 |
Freeport-McMoRan Copper & Gold, Inc. - Class B | | 5,100 | | | 194,361 |
The Goldman Sachs Group, Inc. | | 1,800 | | | 190,836 |
| | | | | | |
| | | SEMI-ANNUAL REPORT | | MARCH 31, 2009 | | 17 |
| | |
| Schedule of Investments (continued) | | Global Opportunities Portfolio |
| | (Percentages shown are based on Net Assets) |
| | | | | |
| | | Shares | | Value |
Common Stocks | | | | | |
United States (concluded) | | | | | |
Google, Inc. - Class A(a) | | 700 | | $ | 243,642 |
GrafTech International Ltd.(a) | | 29,900 | | | 184,184 |
Halliburton Co. | | 11,900 | | | 184,093 |
Hess Corp. | | 3,300 | | | 178,860 |
Hewlett-Packard Co. | | 6,000 | | | 192,360 |
Hudson City Bancorp, Inc. | | 15,700 | | | 183,533 |
Intel Corp. | | 26,000 | | | 391,300 |
IntercontinentalExchange, Inc.(a) | | 2,100 | | | 156,387 |
International Business Machines Corp. | | 2,600 | | | 251,914 |
J. Crew Group, Inc.(a) | | 7,800 | | | 102,804 |
The J.M. Smucker Co. | | 7,528 | | | 280,569 |
Jacobs Engineering Group, Inc.(a) | | 4,800 | | | 185,568 |
JetBlue Airways Corp.(a) | | 57,600 | | | 210,240 |
JPMorgan Chase & Co. | | 9,000 | | | 239,220 |
KLA-Tencor Corp. | | 9,600 | | | 192,000 |
Kohl’s Corp.(a) | | 10,700 | | | 452,824 |
Macy’s, Inc. | | 16,900 | | | 150,410 |
McDonald’s Corp. | | 5,100 | | | 278,307 |
Medco Health Solutions, Inc.(a) | | 11,800 | | | 487,812 |
Medtronic, Inc.(b) | | 7,400 | | | 218,078 |
MetLife, Inc. | | 4,200 | | | 95,634 |
Microsoft Corp. | | 14,100 | | | 259,017 |
Morgan Stanley | | 6,200 | | | 141,174 |
Murphy Oil Corp. | | 3,000 | | | 134,310 |
The NASDAQ OMX Group, Inc.(a) | | 6,000 | | | 117,480 |
Nike, Inc. - Class B | | 3,700 | | | 173,493 |
Noble Energy, Inc. | | 3,900 | | | 210,132 |
Northern Trust Corp. | | 3,000 | | | 179,460 |
Occidental Petroleum Corp. | | 5,300 | | | 294,945 |
Oracle Corp. | | 16,400 | | | 296,348 |
Peabody Energy Corp. | | 10,100 | | | 252,904 |
People’s United Financial, Inc. | | 11,800 | | | 212,046 |
PetroHawk Energy Corp.(a) | | 12,500 | | | 240,375 |
Pfizer, Inc. | | 37,600 | | | 512,112 |
Pride International, Inc.(a) | | 11,400 | | | 204,972 |
The Procter & Gamble Co. | | 5,354 | | | 252,120 |
QUALCOMM, Inc.(b) | | 12,900 | | | 501,939 |
Ralcorp Holdings, Inc.(a) | | 5,700 | | | 307,116 |
Range Resources Corp. | | 5,000 | | | 205,800 |
Robert Half International, Inc. | | 13,800 | | | 246,054 |
Steel Dynamics, Inc. | | 35,400 | | | 311,874 |
T. Rowe Price Group, Inc. | | 5,800 | | | 167,388 |
Terex Corp.(a) | | 19,400 | | | 179,450 |
Texas Instruments, Inc. | | 7,900 | | | 130,429 |
Timken Co. | | 14,100 | | | 196,836 |
The Travelers Cos., Inc. | | 8,700 | | | 353,568 |
TreeHouse Foods, Inc.(a) | | 10,800 | | | 310,932 |
Trinity Industries, Inc. | | 18,800 | | | 171,832 |
U.S. Bancorp | | 9,200 | | | 134,412 |
UMB Financial Corp. | | 2,800 | | | 118,972 |
Unum Group | | 4,000 | | | 50,000 |
Urban Outfitters, Inc.(a) | | 20,000 | | | 327,400 |
Wabtec Corp. | | 10,000 | | | 263,800 |
Wal-Mart Stores, Inc. | | 7,200 | | | 375,120 |
The Walt Disney Co. | | 19,100 | | | 346,856 |
Weatherford International Ltd.(a) | | 20,700 | | | 229,149 |
WellPoint, Inc.(a) | | 2,200 | | | 83,534 |
Wells Fargo & Co. | | 9,000 | | | 128,160 |
Werner Enterprises, Inc. | | 13,400 | | | 202,608 |
Wyeth | | 16,600 | | | 714,464 |
Yum! Brands, Inc. | | 12,500 | | | 343,500 |
| | | | | |
| | | | | 22,652,236 |
| | | | | |
Total Common Stocks — 97.8% | | | | | 48,763,159 |
| | | | | |
Rights | | | | | |
HSBC Holdings Plc, Expiring 4/03/09(a) | | 6,500 | | | 36,189 |
Nordea Bank AB, Expiring 4/03/09(a) | | 291,500 | | | 33,337 |
| | | | | |
Total Rights — 0.1% | | | | | 69,526 |
| | | | | |
Total Long-Term Investments
(Cost — $60,330,213) — 97.9% | | | | | 48,832,685 |
| | | | | |
Short-Term Securities | | | | | |
BlackRock Liquidity Funds, TempFund, 0.60%(c)(d)
(Cost — $190,812) — 0.4% | | 190,812 | | | 190,812 |
| | | | | |
Total Investments (Cost — $60,521,025*) — 98.3% | | | | | 49,023,497 |
Other Assets in Excess of Liabilities — 1.7% | | | | | 834,514 |
| | | | | |
Net Assets — 100.0% | | | | $ | 49,858,011 |
| | | | | |
| * | The cost and unrealized appreciation (depreciation) of investments as of March 31, 2009, as computed for federal income tax purposes, were as follows: |
| | | | |
Aggregate cost | | $ | 61,293,546 | |
| | | | |
Gross unrealized appreciation | | $ | 677,671 | |
Gross unrealized depreciation | | | (12,947,720 | ) |
| | | | |
Net unrealized depreciation | | $ | (12,270,049 | ) |
| | | | |
| (a) | Non-income producing security. |
| (b) | All or a portion of security pledged as collateral in connection with open financial futures contracts. |
| (c) | Investments in companies considered to be an affiliate of the Portfolio, for purposes of Section 2(a)(3) of the Investment Company Act of 1940, as amended, were as follows: |
| | | | | | | |
Affiliate | | Net
Activity | | | Income |
BlackRock Liquidity Funds, TempFund | | $ | 190,812 | ** | | $ | 1,988 |
| ** | Represents net purchase cost. |
| (d) | Represents current yield as of report date. |
| • | | Foreign currency exchange contracts as of March 31, 2009 were as follows: |
| | | | | | | | | | | | | | |
Currency
Purchased | | Currency
Sold | | Counterparty | | Settlement
Date | | Unrealized
Appreciation
(Depreciation) | |
| AUD | | 1,116,000 | | USD | | 731,491 | | Citibank, N.A. | | 4/15/09 | | $ | 43,595 | |
| CAD | | 321,000 | | USD | | 252,688 | | Citibank, N.A. | | 4/15/09 | | | 1,918 | |
| CHF | | 350,000 | | USD | | 311,343 | | Citibank, N.A. | | 4/15/09 | | | (3,770 | ) |
| CHF | | 266,000 | | USD | | 236,057 | | Deutsche Bank AG | | 4/15/09 | | | (2,302 | ) |
| CHF | | 99,000 | | USD | | 85,939 | | Citibank, N.A. | | 4/15/09 | | | 1,060 | |
| | | | | | |
18 | | SEMI-ANNUAL REPORT | | MARCH 31, 2009 | | |
| | |
| Schedule of Investments (continued) | | Global Opportunities Portfolio |
| | (Percentages shown are based on Net Assets) |
| | | | | | | | | | | | | | |
Currency
Purchased | | Currency
Sold | | Counterparty | | Settlement
Date | | Unrealized
Appreciation
(Depreciation) | |
| DKK | | 1,618,000 | | USD | | 284,474 | | Deutsche Bank AG | | 4/15/09 | | $ | 4,004 | |
| EUR | | 372,000 | | USD | | 487,751 | | Citibank, N.A. | | 4/15/09 | | | 6,472 | |
| EUR | | 1,140,000 | | USD | | 1,490,934 | | Deutsche Bank AG | | 4/15/09 | | | 23,619 | |
| GBP | | 1,250,000 | | USD | | 1,825,469 | | Deutsche Bank AG | | 4/15/09 | | | (31,845 | ) |
| JPY | | 60,000,000 | | USD | | 678,043 | | UBS Securities, Inc. | | 4/15/09 | | | (71,761 | ) |
| JPY | | 6,431,000 | | USD | | 72,594 | | Deutsche Bank AG | | 4/15/09 | | | (7,610 | ) |
| JPY | | 17,467,000 | | USD | | 182,839 | | Citibank, N.A. | | 4/15/09 | | | (6,340 | ) |
| JPY | | 5,374,000 | | USD | | 60,397 | | UBS Securities, Inc. | | 4/15/09 | | | (6,094 | ) |
| JPY | | 15,855,000 | | USD | | 161,634 | | Citibank, N.A. | | 4/15/09 | | | (1,424 | ) |
| NOK | | 1,268,000 | | USD | | 186,828 | | Citibank, N.A. | | 4/15/09 | | | 1,721 | |
| NOK | | 571,000 | | USD | | 79,403 | | Citibank, N.A. | | 4/15/09 | | | 5,503 | |
| SEK | | 1,500,000 | | USD | | 180,026 | | Royal Bank of Scotland | | 4/15/09 | | | 2,450 | |
| USD | | 157,017 | | CAD | | 200,000 | | UBS Securities, Inc. | | 4/15/09 | | | (1,617 | ) |
| USD | | 163,572 | | CAD | | 200,000 | | UBS Securities, Inc. | | 4/15/09 | | | 4,939 | |
| USD | | 92,366 | | EUR | | 68,000 | | Citibank, N.A. | | 4/15/09 | | | 2,024 | |
| USD | | 61,359 | | GBP | | 44,000 | | Deutsche Bank AG | | 4/15/09 | | | (1,776 | ) |
| USD | | 144,711 | | GBP | | 102,000 | | Deutsche Bank AG | | 4/15/09 | | | (1,649 | ) |
| USD | | 73,809 | | GBP | | 51,000 | | Barclays Bank, PLC | | 4/15/09 | | | 629 | |
| USD | | 146,069 | | GBP | | 101,000 | | Citibank, N.A. | | 4/15/09 | | | 1,144 | |
| USD | | 347,978 | | HKD | | 2,700,000 | | Goldman Sachs Bank USA | | 4/15/09 | | | (413 | ) |
| USD | | 926,238 | | NOK | | 6,695,000 | | Citibank, N.A. | | 4/15/09 | | | (69,293 | ) |
| USD | | 64,810 | | SEK | | 544,000 | | UBS Securities, Inc. | | 4/15/09 | | | (1,367 | ) |
| USD | | 601,958 | | SGD | | 900,000 | | UBS Securities, Inc. | | 4/15/09 | | | 10,466 | |
| CAD | | 232,000 | | USD | | 189,293 | | Deutsche Bank AG | | 6/10/09 | | | (5,145 | ) |
| GBP | | 70,000 | | USD | | 101,082 | | Deutsche Bank AG | | 6/10/09 | | | (618 | ) |
| HKD | | 4,360,000 | | USD | | 562,862 | | Deutsche Bank AG | | 6/10/09 | | | (73 | ) |
| SEK | | 1,742,000 | | USD | | 206,199 | | Citibank, N.A. | | 6/10/09 | | | 5,819 | |
| USD | | 95,555 | | AUD | | 139,000 | | Citibank, N.A. | | 6/10/09 | | | (641 | ) |
| USD | | 43,107 | | AUD | | 62,000 | | Citibank, N.A. | | 6/10/09 | | | 200 | |
| USD | | 102,409 | | AUD | | 147,000 | | Citibank, N.A. | | 6/10/09 | | | 678 | |
| USD | | 305,492 | | CAD | | 387,000 | | Citibank, N.A. | | 6/10/09 | | | (1,686 | ) |
| USD | | 58,515 | | CHF | | 66,000 | | Citibank, N.A. | | 6/10/09 | | | 442 | |
| USD | | 356,846 | | EUR | | 274,000 | | Citibank, N.A. | | 6/10/09 | | | (7,221 | ) |
| USD | | 137,005 | | EUR | | 103,000 | | Citibank, N.A. | | 6/10/09 | | | 148 | |
| USD | | 80,264 | | EUR | | 59,000 | | Deutsche Bank AG | | 6/10/09 | | | 1,870 | |
| USD | | 266,996 | | EUR | | 197,000 | | Deutsche Bank AG | | 6/10/09 | | | 5,241 | |
| USD | | 324,723 | | GBP | | 230,000 | | Deutsche Bank AG | | 6/10/09 | | | (5,372 | ) |
| USD | | 96,837 | | GBP | | 66,000 | | Citibank, N.A. | | 6/10/09 | | | 2,114 | |
| USD | | 459,791 | | GBP | | 317,000 | | Citibank, N.A. | | 6/10/09 | | | 4,835 | |
| USD | | 290,246 | | JPY | | 28,460,000 | | Citibank, N.A. | | 6/10/09 | | | 2,405 | |
| USD | | 34,407 | | ZAR | | 337,000 | | Deutsche Bank AG | | 6/10/09 | | | (630 | ) |
| USD | | 96,772 | | ZAR | | 931,000 | | Citibank, N.A. | | 6/10/09 | | | (22 | ) |
| USD | | 85,428 | | ZAR | | 817,000 | | Citibank, N.A. | | 6/10/09 | | $ | 486 | |
| | | | | | | | | | | | | | |
| Total | | | | | | | | | | | | $ | (94,887 | ) |
| | | | | | | | | | | | | | |
| • | | Effective October 1, 2008, the Portfolio adopted Financial Accounting Standards Board Statement of Financial Accounting Standards No. 157, “Fair Value Measurements” (“FAS 157”). FAS 157 clarifies the definition of fair value, establishes a framework for measuring fair values and requires additional disclosures about the use of fair value measurements. Various inputs are used in determining the fair value of investments, which are as follows: |
| | • | | Level 1 – price quotations in active markets/exchanges for identical securities |
| | • | | Level 2 – other observable inputs (including, but not limited to: quoted prices for similar assets or liabilities in markets that are active, quoted prices for identical or similar assets in markets that are not active, inputs other than quoted prices that are observable for the assets or liabilities (such as interest rates, yield curves, volatilities, prepayment speeds, loss severities, credit risks and default rates) or other market – corroborated inputs) |
| | • | | Level 3 – unobservable inputs based on the best information available in the circumstance, to the extent observable inputs are not available (including the Portfolio’s own assumptions used in determining the fair value of investments). |
The inputs or methodology used for valuing securities are not necessarily an indication of the risk associated with investing in those securities. For information about the Portfolio’s policy regarding valuation of investments and other significant accounting policies, please refer to Note 1 of the Notes to Financial Statements.
The following table summarizes the inputs used as of March 31, 2009 in determining the fair valuation of the Portfolio’s investments:
| | | | | | | | | | |
Valuation Inputs | | Investments
in Securities | | Other Financial
Instruments*** | |
| | | Assets | | Assets | | Liabilities | |
Level 1 | | $ | 27,353,046 | | $ | — | | $ | — | |
Level 2 | | | 21,410,539 | | | 133,782 | | | (228,669 | ) |
Level 3 | | | 259,912 | | | — | | | — | |
| | | | | | | | | | |
Total | | $ | 49,023,497 | | $ | 133,782 | | $ | (228,669 | ) |
| | | | | | | | | | |
| *** | Other financial instruments are foreign currency exchange contracts. Foreign currency exchange contracts are valued at the unrealized appreciation/ depreciation on the instrument. |
| | | | | | |
| | | SEMI-ANNUAL REPORT | | MARCH 31, 2009 | | 19 |
| | |
| Schedule of Investments (concluded) | | Global Opportunities Portfolio |
The following table is a reconciliation of Level 3 investments for which significant unobservable inputs were used to determine fair value:
| | | | |
| | | Investments
in Securities | |
| | | Assets | |
Balance, as of September 30, 2008 | | $ | — | |
Accrued discounts/premiums | | | — | |
Realized loss | | | — | |
Change in unrealized appreciation/depreciation**** | | | (394,042 | ) |
Net purchases | | | 653,954 | |
Transfers in/out of Level 3 | | | — | |
| | | | |
Balance, as of March 31, 2009 | | $ | 259,912 | |
| | | | |
| **** | Included in the related net change in appreciation/depreciation on the Statement of Operations. |
See Notes to Financial Statements.
| | | | | | |
20 | | SEMI-ANNUAL REPORT | | MARCH 31, 2009 | | |
| | |
| Schedule of Investments March 31, 2009 (Unaudited) | | Health Sciences Opportunities Portfolio |
| | (Percentages shown are based on Net Assets) |
| | | | | | | |
| | | Shares | | | Value | |
Common Stocks | | | | | | | |
Biotechnology — 17.0% | | | | | | | |
3Sbio, Inc. - ADR(a) | | 85,100 | | | $ | 576,127 | |
Alexion Pharmaceuticals, Inc.(a) | | 455,600 | | | | 17,157,896 | |
Amgen, Inc.(a) | | 920,510 | | | | 45,583,655 | |
Biogen Idec, Inc.(a) | | 27,100 | | | | 1,420,582 | |
BioMarin Pharmaceutical, Inc.(a)(b) | | 472,009 | | | | 5,829,311 | |
Celera Corp.(a) | | 974,280 | | | | 7,433,757 | |
Genzyme Corp.(a) | | 111,860 | | | | 6,643,365 | |
Gilead Sciences, Inc.(a) | | 713,190 | | | | 33,034,961 | |
Immunogen, Inc.(a) | | 79,300 | | | | 563,030 | |
Incyte Corp.(a) | | 190,400 | | | | 445,536 | |
Nanosphere, Inc.(a) | | 84,400 | | | | 419,468 | |
Pharmasset, Inc.(a) | | 78,300 | | | | 768,123 | |
Poniard Pharmaceuticals, Inc.(a)(b) | | 192,800 | | | | 412,592 | |
Rigel Pharmaceuticals, Inc.(a) | | 351,800 | | | | 2,160,052 | |
Vertex Pharmaceuticals, Inc.(a) | | 475,520 | | | | 13,661,690 | |
| | | | | | | |
| | | | | | 136,110,145 | |
| | | | | | | |
| | | | | | | |
Food & Staples Retailing — 3.8% | | | | | | | |
CVS Caremark Corp. | | 1,091,280 | | | | 29,999,287 | |
| | | | | | | |
Health Care Equipment & Supplies — 23.3% | | | | | | | |
Alcon, Inc. | | 252,950 | | | | 22,995,684 | |
Baxter International, Inc. | | 197,810 | | | | 10,131,828 | |
Beckman Coulter, Inc. | | 354,130 | | | | 18,064,171 | |
Becton, Dickinson & Co. | | 475,090 | | | | 31,945,052 | |
Boston Scientific Corp.(a) | | 2,039,500 | | | | 16,214,025 | |
Cie Generale d’Optique Essilor International SA | | 82,708 | | | | 3,195,635 | |
Covidien Ltd. | | 298,670 | | | | 9,927,791 | |
Dexcom, Inc.(a) | | 179,200 | | | | 741,888 | |
DiaSorin SpA | | 229,700 | | | | 5,137,462 | |
Gen-Probe, Inc.(a) | | 355,200 | | | | 16,190,016 | |
Hologic, Inc.(a) | | 116,700 | | | | 1,527,603 | |
Immucor, Inc.(a) | | 404,200 | | | | 10,165,630 | |
Medtronic, Inc. | | 617,260 | | | | 18,190,652 | |
ResMed, Inc.(a) | | 57,800 | | | | 2,042,652 | |
ResMed, Inc. - ADR(a) | | 658,800 | | | | 2,427,919 | |
Smith & Nephew Plc | | 308,500 | | | | 1,920,229 | |
Sonova Holding AG | | 115,100 | | | | 6,946,866 | |
St. Jude Medical, Inc.(a) | | 199,600 | | | | 7,251,468 | |
West Pharmaceutical Services, Inc. | | 40,500 | | | | 1,328,805 | |
| | | | | | | |
| | | | | | 186,345,376 | |
| | | | | | | |
Health Care Providers & Services — 18.6% | | | | | | | |
AMERIGROUP Corp.(a) | | 190,300 | | | | 5,240,862 | |
AmerisourceBergen Corp. | | 421,880 | | | | 13,778,601 | |
Centene Corp.(a) | | 132,000 | | | | 2,378,640 | |
Coventry Health Care, Inc.(a) | | 275,500 | | | | 3,564,970 | |
DaVita, Inc.(a) | | 522,280 | | | | 22,954,206 | |
Express Scripts, Inc.(a) | | 184,110 | | | | 8,500,359 | |
Fresenius Medical Care AG & Co. KGaA | | 121,900 | | | | 4,730,280 | |
Laboratory Corp. of America Holdings(a) | | 200,000 | | | | 11,698,000 | |
McKesson Corp. | | 247,430 | | | | 8,669,947 | |
Medco Health Solutions, Inc.(a) | | 835,750 | | | | 34,549,905 | |
MEDNAX, Inc.(a) | | 252,300 | | | | 7,435,281 | |
UnitedHealth Group, Inc. | | 251,200 | | | | 5,257,616 | |
VCA Antech, Inc.(a) | | 170,300 | | | | 3,840,265 | |
WellPoint, Inc.(a) | | 426,300 | | | | 16,186,611 | |
| | | | | | | |
| | | | | | 148,785,543 | |
| | | | | | | |
Life Sciences Tools & Services — 3.9% | | | | | | | |
Medivation, Inc.(a)(b) | | 161,400 | | | | 2,948,778 | |
Millipore Corp.(a)(b) | | 171,900 | | | | 9,868,779 | |
Qiagen NV(a)(b) | | 736,510 | | | | 11,754,700 | |
Tecan Group AG | | 63,800 | | | | 1,704,674 | |
Thermo Fisher Scientific, Inc.(a) | | 143,200 | | | | 5,107,944 | |
| | | | | | | |
| | | | | | 31,384,875 | |
| | | | | | | |
Pharmaceuticals — 30.6% | | | | | | | |
Abbott Laboratories | | 653,090 | | | | 31,152,393 | |
Allergan, Inc. | | 297,300 | | | | 14,199,048 | |
ARYx Therapeutics, Inc.(a) | | 122,000 | | | | 414,800 | |
Auxilium Pharmaceuticals, Inc.(a)(b) | | 297,600 | | | | 8,249,472 | |
BioForm Medical, Inc.(a) | | 79,600 | | | | 97,112 | |
Bristol-Myers Squibb Co. | | 387,600 | | | | 8,496,192 | |
Johnson & Johnson | | 518,840 | | | | 27,290,984 | |
Merck & Co., Inc. | | 853,700 | | | | 22,836,475 | |
Novartis AG - ADR | | 142,240 | | | | 5,380,939 | |
Optimer Pharmaceuticals, Inc.(a)(b) | | 48,800 | | | | 643,672 | |
Pfizer, Inc. | | 1,840,940 | | | | 25,073,603 | |
Roche Holding AG - ADR | | 153,500 | | | | 21,067,898 | |
Sanofi-Aventis - ADR | | 164,900 | | | | 9,254,400 | |
Teva Pharmaceutical Industries Ltd. - ADR | | 389,060 | | | | 17,527,153 | |
Wyeth | | 1,215,132 | | | | 52,299,281 | |
| | | | | | | |
| | | | | | 243,983,422 | |
| | | | | | | |
Total Long-Term Investments
(Cost — $819,170,354) — 97.2% | | | | | | 776,608,648 | |
| | | | | | | |
| | |
| | | Shares/
Beneficial
Interest | | | | |
Short-Term Securities | | | | | | | |
BlackRock Liquidity Funds, TempFund, 0.60%(c)(d) | | 11,044,114 | | | | 11,044,114 | |
BlackRock Liquidity Series, LLC Money Market Series, 1.17%(c)(d)(e) | | 17,354,250 | | | | 17,354,250 | |
| | | | | | | |
Total Short-Term Securities
(Cost — $28,398,364) — 3.6% | | | | | | 28,398,364 | |
| | | | | | | |
Total Investments Before Outstanding Options Written
(Cost — $847,568,718*) — 100.8% | | | | | | 805,007,012 | |
| | | | | | | |
| | |
| | | Contracts | | | | |
Options Written | | | | | | | |
Exchange-Traded Call Options Written | | | | | | | |
Amgen, Inc., Strike Price $55, Expires 4/18/09 | | (920 | ) | | | (23,460 | ) |
| | | | | | | |
Exchange-Traded Put Options Written | | | | | | | |
Merck & Co., Inc., Strike Price $25, Expires 4/18/09 | | (770 | ) | | | (38,500 | ) |
| | | | | | | |
Total Options Written
(Premiums Received — $153,339) — (0.0)% | | | | | | (61,960 | ) |
| | | | | | | |
Total Investments Net of Outstanding Options Written — 100.8% | | | | | | 804,945,052 | |
Liabilities in Excess of Other Assets — (0.8)% | | | | | | (6,167,553 | ) |
| | | | | | | |
Net Assets — 100.0% | | | | | $ | 798,777,499 | |
| | | | | | | |
| * | The cost and unrealized appreciation (depreciation) of investments as of March 31, 2009, as computed for federal income tax purposes, were as follows: |
| | | | |
Aggregate cost | | $ | 845,790,530 | |
| | | | |
Gross unrealized appreciation | | $ | 38,805,078 | |
Gross unrealized depreciation | | | (79,588,596 | ) |
| | | | |
Net unrealized depreciation | | $ | (40,783,518 | ) |
| | | | |
| (a) | Non-income producing security. |
| (b) | Security, or a portion of security, is on loan. |
| (c) | Represents current yield as of report date. |
| | | | | | |
| | | SEMI-ANNUAL REPORT | | MARCH 31, 2009 | | 21 |
| | |
| Schedule of Investments (concluded) | | Health Sciences Opportunities Portfolio |
| | |
| (d) | Investments in companies considered to be an affiliate of the Portfolio, for purposes of Section 2(a)(3) of the Investment Company Act of 1940, as amended, were as follows: |
| | | | | | | |
Affiliate | | Net
Activity | | | Income |
BlackRock Liquidity Funds, TempFund | | $ | (18,955,886 | )** | | $ | 304,363 |
BlackRock Liquidity Series, LLC Money Market Series | | $ | (60,807,850 | )** | | $ | 104,546 |
| ** | Represents net sales cost. |
| (e) | Security purchased with the cash proceeds from securities loans. |
| • | | Foreign currency exchange contracts as of March 31, 2009 were as follows: |
| | | | | | | | | | | | | | |
Currency
Purchased | | Currency
Sold | | Counterparty | | Settlement
Date | | Unrealized
Appreciation
(Depreciation) | |
| CHF | | 4,307,000 | | USD | | 3,822,176 | | Deutsche Bank AG | | 4/15/09 | | $ | (37,276 | ) |
| CHF | | 1,696,000 | | USD | | 1,471,107 | | Deutsche Bank AG | | 4/15/09 | | | 19,301 | |
| CHF | | 2,649,000 | | USD | | 2,277,765 | | Citibank, N.A. | | 4/15/09 | | | 50,119 | |
| CHF | | 11,037,000 | | USD | | 9,399,911 | | UBS Securities, Inc. | | 4/15/09 | | | 299,169 | |
| EUR | | 3,833,000 | | USD | | 4,985,575 | | Citibank, N.A. | | 4/15/09 | | | 106,779 | |
| GBP | | 1,578,000 | | USD | | 2,221,966 | | Deutsche Bank AG | | 4/15/09 | | | 42,306 | |
| USD | | 79,010 | | AUD | | 120,000 | | Citibank, N.A. | | 4/15/09 | | | (4,333 | ) |
| USD | | 2,050,371 | | CHF | | 2,396,000 | | Citibank, N.A. | | 4/15/09 | | | (55,183 | ) |
| USD | | 44,189,773 | | CHF | | 49,645,000 | | UBS Securities, Inc. | | 4/15/09 | | | 562,807 | |
| USD | | 23,065,475 | | EUR | | 17,664,000 | | UBS Securities, Inc. | | 4/15/09 | | | (402,135 | ) |
| USD | | 1,624,869 | | EUR | | 1,253,000 | | Citibank, N.A. | | 4/15/09 | | | (39,811 | ) |
| USD | | 2,198,833 | | EUR | | 1,660,000 | | Deutsche Bank AG | | 4/15/09 | | | (6,570 | ) |
| USD | | 161,776 | | GBP | | 116,000 | | Citibank, N.A. | | 4/15/09 | | | (4,673 | ) |
| USD | | 475,098 | | GBP | | 330,000 | | UBS Securities, Inc. | | 4/15/09 | | | 1,581 | |
| USD | | 5,000,863 | | GBP | | 3,426,000 | | UBS Securities, Inc. | | 4/15/09 | | | 84,898 | |
| GBP | | 1,817,000 | | USD | | 2,601,882 | | Citibank, N.A. | | 6/10/09 | | | 5,331 | |
| USD | | 1,626,474 | | AUD | | 2,492,000 | | Citibank, N.A. | | 6/10/09 | | | (98,121 | ) |
| USD | | 964,876 | | EUR | | 725,000 | | Citibank, N.A. | | 6/10/09 | | | 1,562 | |
| | | | | | | | | | | | | | |
| Total | | | | | | | | | | | | $ | 525,751 | |
| | | | | | | | | | | | | | |
| • | | For Portfolio compliance purposes, the Portfolio’s industry classifications refer to any one or more of the industry sub-classifications used by one or more widely recognized market indexes or ratings group indexes, and/or as defined by Portfolio management. This definition may not apply for purposes of this report, which may combine industry sub-classifications for reporting ease. |
| • | | Effective October 1, 2008, the Portfolio adopted Financial Accounting Standards Board Statement of Financial Accounting Standards No. 157, “Fair Value Measurements”. FAS 157 clarifies the definition of fair value, establishes a framework for measuring fair values and requires additional disclosures about the use of fair value measurements. Various inputs are used in determining the fair value of investments, which are as follows: |
| | • | | Level 1 – price quotations in active markets/exchanges for identical securities |
| | • | | Level 2 – other observable inputs (including, but not limited to: quoted prices for similar assets or liabilities in markets that are active, quoted prices for identical or similar assets in markets that are not active, inputs other than quoted prices that are observable for the assets or liabilities (such as interest rates, yield curves, volatilities, prepayment speeds, loss severities, credit risks and default rates) or other market – corroborated inputs) |
| | • | | Level 3 – unobservable inputs based on the best information available in the circumstance, to the extent observable inputs are not available (including the Portfolio’s own assumptions used in determining the fair value of investments). |
The inputs or methodology used for valuing securities are not necessarily an indication of the risk associated with investing in those securities. For information about the Portfolio’s policy regarding valuation of investments and other significant accounting policies, please refer to Note 1 of the Notes to Financial Statements.
The following table summarizes the inputs used as of March 31, 2009 in determining the fair valuation of the Portfolio’s investments:
| | | | | | | | | | |
Valuation Inputs | | Investments
in Securities | | Other Financial
Instruments *** | |
| | | Assets | | Assets | | Liabilities | |
Level 1 | | $ | 751,049,568 | | $ | — | | $ | (61,960 | ) |
Level 2 | | | 53,957,444 | | | 1,173,853 | | | (648,102 | ) |
Level 3 | | | — | | | — | | | — | |
| | | | | | | | | | |
Total | | $ | 805,007,012 | | $ | 1,173,853 | | $ | (710,062 | ) |
| | | | | | | | | | |
| *** | Other financial instruments are foreign currency exchange contracts and options written. Foreign currency exchange contracts are valued at the unrealized appreciation/depreciation on the instrument and options written are shown at market value. |
See Notes to Financial Statements.
| | | | | | |
22 | | SEMI-ANNUAL REPORT | | MARCH 31, 2009 | | |
| | |
| Schedule of Investments March 31, 2009 (Unaudited) | | International Opportunities Portfolio |
| | (Percentages shown are based on Net Assets) |
| | | | | |
| | | Shares | | Value |
Common Stocks | | | | | |
Australia — 2.9% | | | | | |
BHP Billiton Ltd. | | 214,900 | | $ | 4,749,559 |
Commonwealth Bank of Australia | | 111,500 | | | 2,676,739 |
National Australia Bank Ltd. | | 129,600 | | | 1,809,135 |
Santos Ltd. | | 448,700 | | | 5,281,174 |
Westpac Banking Corp. Ltd. | | 208,300 | | | 2,750,611 |
Woodside Petroleum Ltd. | | 134,700 | | | 3,587,893 |
WorleyParsons Ltd. | | 288,200 | | | 3,631,990 |
| | | | | |
| | | | | 24,487,101 |
| | | | | |
Austria — 0.7% | | | | | |
OMV AG | | 178,900 | | | 5,984,930 |
| | | | | |
Belgium — 0.5% | | | | | |
Anheuser-Busch InBev NV | | 167,100 | | | 4,601,144 |
| | | | | |
Brazil — 3.0% | | | | | |
Banco Bradesco SA - ADR | | 230,400 | | | 2,296,303 |
Banco Itau Holding Financeira SA - ADR | | 156,100 | | | 1,722,668 |
BM&FBOVESPA SA | | 422,700 | | | 1,284,636 |
Companhia Energetica de Minas Gerais - CEMIG - ADR(a) | | 248,564 | | | 3,673,776 |
Gerdau SA - ADR | | 751,900 | | | 4,112,893 |
Petroleo Brasileiro SA - ADR | | 194,700 | | | 5,932,509 |
Tele Norte Leste Participacoes SA - ADR | | 285,000 | | | 3,944,400 |
Usinas Siderurgicas de Minas Gerais SA, Class A - Preference Shares | | 163,900 | | | 2,079,352 |
| | | | | |
| | | | | 25,046,537 |
| | | | | |
Canada — 7.2% | | | | | |
Addax Petroleum Corp. | | 117,100 | | | 2,535,557 |
Bank of Nova Scotia | | 84,700 | | | 2,087,269 |
Canadian Natural Resources Ltd. | | 109,400 | | | 4,243,936 |
Eldorado Gold Corp.(b) | | 941,800 | | | 8,515,641 |
EnCana Corp. | | 117,100 | | | 4,792,481 |
Imperial Oil Ltd. | | 119,000 | | | 4,322,811 |
Kinross Gold Corp. | | 176,000 | | | 3,198,096 |
Potash Corp. of Saskatchewan, Inc. | | 38,900 | | | 3,143,509 |
Research In Motion Ltd.(b) | | 72,500 | | | 3,122,575 |
Royal Bank of Canada | | 111,900 | | | 3,264,342 |
Shoppers Drug Mart Corp. | | 116,200 | | | 3,994,375 |
Suncor Energy, Inc. | | 188,500 | | | 4,207,162 |
Talisman Energy, Inc. | | 539,600 | | | 5,713,563 |
Teck Cominco Ltd. - Class B | | 831,600 | | | 4,650,047 |
Toronto-Dominion Bank - ADR | | 96,400 | | | 3,322,925 |
| | | | | |
| | | | | 61,114,289 |
| | | | | |
China — 3.1% | | | | | |
China Construction Bank Corp. - Class H | | 12,313,700 | | | 6,990,231 |
China Life Insurance Co. Ltd. - Class H | | 751,100 | | | 2,470,377 |
China Railway Construction Corp. Ltd. - Class H(b) | | 2,523,800 | | | 3,286,508 |
Industrial & Commercial Bank of China - Class H - ADR | | 14,376,900 | | | 7,471,990 |
PetroChina Co. Ltd. - ADR | | 71,500 | | | 5,698,550 |
| | | | | |
| | | | | 25,917,656 |
| | | | | |
Denmark — 0.4% | | | | | |
TrygVesta AS | | 70,500 | | | 3,567,304 |
| | | | | |
Finland — 0.4% | | | | | |
Outokumpu Oyj - Series B | | 334,100 | | | 3,614,796 |
| | | | | |
France — 5.8% | | | | | |
AXA SA | | 104,600 | | | 1,255,459 |
BNP Paribas SA | | 77,200 | | | 3,185,012 |
Compagnie Generale des Etablissements Michelin - Class B | | 81,300 | | | 3,013,343 |
Credit Agricole SA | | 111,800 | | | 1,233,558 |
France Telecom SA | | 162,900 | | | 3,713,665 |
Gaz de France | | 139,500 | | | 4,784,106 |
Mercialys SA | | 57,000 | | | 1,649,724 |
PPR | | 47,100 | | | 3,019,600 |
Sanofi-Aventis - ADR | | 105,300 | | | 5,909,571 |
Societe Generale | | 68,000 | | | 2,659,953 |
Societe Immobiliere de Location pour l’Industrie et le Commerce | | 10,300 | | | 771,901 |
Sodexo | | 83,400 | | | 3,798,877 |
Technip SA | | 90,600 | | | 3,193,796 |
Total SA | | 162,000 | | | 8,010,823 |
Unibail-Rodamco | | 16,600 | | | 2,349,022 |
| | | | | |
| | | | | 48,548,410 |
| | | | | |
Germany — 7.3% | | | | | |
Adidas AG | | 154,200 | | | 5,117,799 |
Allianz SE | | 33,100 | | | 2,770,561 |
Deutsche Bank AG | | 52,600 | | | 2,106,959 |
Deutsche Boerse AG | | 37,700 | | | 2,261,852 |
Deutsche Post AG | | 339,500 | | | 3,658,176 |
Deutsche Telekom AG | | 543,300 | | | 6,729,322 |
Fresenius Medical Care AG & Co. KGaA | | 78,000 | | | 3,026,758 |
Gerry Weber International AG | | 182,282 | | | 3,725,559 |
MAN AG | | 114,900 | | | 4,987,474 |
Muenchener Rueckversicherungs-Gesellschaft AG | | 18,000 | | | 2,191,794 |
Rhoen Klinikum AG | | 435,900 | | | 8,084,379 |
RWE AG | | 69,200 | | | 4,846,124 |
Salzgitter AG | | 50,100 | | | 2,788,413 |
SGL Carbon AG(b) | | 215,800 | | | 5,136,315 |
Siemens AG | | 77,200 | | | 4,407,328 |
| | | | | |
| | | | | 61,838,813 |
| | | | | |
Hong Kong — 3.5% | | | | | |
China Mobile Ltd. | | 288,600 | | | 2,513,970 |
China Unicom Hong Kong Ltd. | | 2,147,500 | | | 2,240,983 |
CNOOC Ltd. - ADR | | 56,000 | | | 5,633,600 |
Hong Kong Exchanges & Clearing Ltd. | | 328,700 | | | 3,102,093 |
Huabao International Holdings Ltd. | | 7,371,700 | | | 6,062,696 |
New World Development Co. Ltd. | | 3,298,700 | | | 3,292,859 |
REXLot Holdings Ltd.(b) | | 34,140,900 | �� | | 1,079,223 |
Sun Hung Kai Properties Ltd. | | 194,300 | | | 1,743,451 |
Wheelock & Co. Ltd. | | 2,051,600 | | | 3,450,450 |
| | | | | |
| | | | | 29,119,325 |
| | | | | |
India — 1.6% | | | | | |
Bharti Tele-Ventures Ltd.(b) | | 492,457 | | | 6,094,517 |
HDFC Bank Ltd. | | 154,100 | | | 2,964,668 |
State Bank of India Ltd. | | 211,000 | | | 4,447,049 |
| | | | | |
| | | | | 13,506,234 |
| | | | | |
Israel — 0.5% | | | | | |
Teva Pharmaceutical Industries Ltd. - ADR | | 89,500 | | | 4,031,975 |
| | | | | |
Italy — 2.1% | | | | | |
Assicurazioni Generali SpA | | 98,400 | | | 1,686,237 |
Benetton Group SpA | | 705,600 | | | 4,594,278 |
Intesa Sanpaolo SpA | | 1,204,100 | | | 3,311,861 |
Parmalat SpA | | 1,312,600 | | | 2,702,350 |
UniCredito Italiano SpA | | 1,327,700 | | | 2,185,220 |
| | | | | | |
| | | SEMI-ANNUAL REPORT | | MARCH 31, 2009 | | 23 |
| | |
| Schedule of Investments (continued) | | International Opportunities Portfolio |
| | (Percentages shown are based on Net Assets) |
| | | | | |
| | | Shares | | Value |
Common Stocks | | | | | |
Italy (concluded) | | | | | |
Unione di Banche Italiane ScpA | | 261,800 | | $ | 2,882,725 |
| | | | | |
| | | | | 17,362,671 |
| | | | | |
Japan — 13.3% | | | | | |
Air Water, Inc. | | 455,400 | | | 4,037,484 |
Amada Co. Ltd. | | 959,600 | | | 5,126,962 |
The Bank of Kyoto Ltd. | | 274,300 | | | 2,329,720 |
Benesse Corp. | | 75,100 | | | 2,766,377 |
Geo Corp. | | 4,000 | | | 2,319,575 |
Honda Motor Co. Ltd | | 161,000 | | | 3,832,729 |
Hosiden Corp. | | 333,900 | | | 3,331,489 |
Japan Prime Realty Investment Corp. | | 700 | | | 1,300,793 |
Kamigumi Co. Ltd. | | 612,400 | | | 4,076,959 |
Kintetsu World Express, Inc. | | 339,200 | | | 6,310,865 |
Matsui Securities Co. Ltd. | | 370,700 | | | 2,433,940 |
Mitsubishi Estate Co. Ltd. | | 82,200 | | | 932,503 |
Mitsubishi Materials Corp. | | 1,325,600 | | | 3,610,934 |
Mitsubishi Tokyo Financial Group, Inc. | | 918,800 | | | 4,526,674 |
Mitsui Fudosan Co. Ltd. | | 82,300 | | | 902,819 |
Mizuho Financial Group, Inc. | | 779,847 | | | 1,522,856 |
Nihon Nohyaku Co. Ltd. | | 628,500 | | | 4,347,431 |
Nintendo Co. Ltd. | | 12,300 | | | 3,598,141 |
Nippon Express Co. Ltd. | | 941,500 | | | 2,967,066 |
Seino Holdings Corp. | | 1,010,200 | | | 4,886,064 |
Shimano, Inc. | | 135,800 | | | 4,134,372 |
Shinko Securities Co. Ltd. | | 1,358,600 | | | 2,681,843 |
The Sumitomo Industries Ltd. | | 320,700 | | | 1,241,683 |
Sumitomo Metal Mining Co. Ltd. | | 510,000 | | | 4,903,415 |
Sumitomo Mitsui Financial Group, Inc. | | 60,000 | | | 2,112,683 |
Tokyo Steel Manufacturing Co. Ltd. | | 328,600 | | | 3,311,977 |
Toyo Seikan Kaisha Ltd. | | 253,300 | | | 3,738,935 |
Toyo Suisan Kaisha Ltd. | | 165,000 | | | 3,404,552 |
Toyota Motor Corp. | | 243,000 | | | 7,718,619 |
Yamato Holdings Co. Ltd. | | 428,800 | | | 4,066,748 |
Yamato Kogyo Co. Ltd. | | 241,800 | | | 5,220,848 |
Zeon Corp. | | 1,790,100 | | | 4,863,024 |
| | | | | |
| | | | | 112,560,080 |
| | | | | |
Luxembourg — 1.5% | | | | | |
ArcelorMittal | | 309,300 | | | 6,310,865 |
SES SA | | 317,000 | | | 6,050,876 |
| | | | | |
| | | | | 12,361,741 |
| | | | | |
Malaysia — 0.2% | | | | | |
Bumiputra-Commerce Holdings Berhad | | 901,100 | | | 1,694,989 |
| | | | | |
Mexico — 0.5% | | | | | |
Fomento Economico Mexicano SAB de CV - ADR | | 164,800 | | | 4,154,608 |
| | | | | |
Netherlands — 2.1% | | | | | |
ASML Holding NV | | 144,100 | | | 2,523,191 |
Corio NV | | 28,100 | | | 1,162,154 |
Heineken NV | | 161,000 | | | 4,573,572 |
Qiagen NV(b) | | 267,600 | | | 4,261,962 |
Royal Dutch Shell Plc - B Shares | | 214,500 | | | 4,666,401 |
Wereldhave NV | | 12,200 | | | 853,035 |
| | | | | |
| | | | | 18,040,315 |
| | | | | |
Norway — 1.8% | | | | | |
Norsk Hydro ASA | | 1,374,700 | | | 5,172,827 |
StatoilHydro ASA | | 227,100 | | | 3,974,410 |
Yara International ASA | | 292,400 | | | 6,388,046 |
| | | | | |
| | | | | 15,535,283 |
| | | | | |
Papua New Guinea — 0.6% | | | | | |
Oil Search Ltd. | | 1,421,300 | | | 5,222,028 |
| | | | | |
Philippines — 0.6% | | | | | |
Philippine Long Distance Telephone Co. - ADR | | 106,600 | | | 4,704,258 |
| | | | | |
Russia — 0.2% | | | | | |
Vimpel-Communications - ADR | | 268,300 | | | 1,754,682 |
| | | | | |
Singapore — 1.1% | | | | | |
Singapore Airlines Ltd. | | 513,300 | | | 3,385,156 |
United Overseas Bank Ltd. | | 273,300 | | | 1,753,025 |
Wilmar International Ltd. | | 1,922,100 | | | 4,021,847 |
| | | | | |
| | | | | 9,160,028 |
| | | | | |
South Africa — 1.0% | | | | | |
Naspers Ltd. - N Shares | | 306,300 | | | 5,182,772 |
Telkom SA Ltd. | | 291,800 | | | 3,251,092 |
| | | | | |
| | | | | 8,433,864 |
| | | | | |
South Korea — 2.0% | | | | | |
LG Chem Ltd. | | 75,300 | | | 4,766,397 |
Samsung Electronics Co. Ltd. | | 29,600 | | | 12,229,459 |
| | | | | |
| | | | | 16,995,856 |
| | | | | |
Spain — 2.3% | | | | | |
Banco Bilbao Vizcaya Argentaria SA | | 372,300 | | | 3,021,878 |
Banco Santander SA | | 558,400 | | | 3,850,058 |
Iberdrola Renovables SA(b) | | 818,700 | | | 3,390,847 |
Inditex SA | | 113,900 | | | 4,438,575 |
Telefonica SA | | 227,900 | | | 4,544,637 |
| | | | | |
| | | | | 19,245,995 |
| | | | | |
Sweden — 0.6% | | | | | |
Nordea Bank AB | | 297,900 | | | 1,482,276 |
Volvo AB - B Shares | | 655,600 | | | 3,478,791 |
| | | | | |
| | | | | 4,961,067 |
| | | | | |
Switzerland — 3.9% | | | | | |
Credit Suisse Group AG - ADR | | 113,200 | | | 3,446,711 |
Nestle SA | | 228,500 | | | 7,719,727 |
Novartis AG | | 132,400 | | | 5,009,164 |
Roche Holding AG - ADR | | 50,400 | | | 6,917,408 |
Sonova Holding AG | | 65,700 | | | 3,965,326 |
UBS AG(b) | | 302,700 | | | 2,837,887 |
Zurich Financial Services AG | | 18,800 | | | 2,971,214 |
| | | | | |
| | | | | 32,867,437 |
| | | | | |
Taiwan — 5.0% | | | | | |
ASUSTeK Computer, Inc. | | 3,559,691 | | | 3,753,386 |
AU Optronics Corp. - ADR | | 342,900 | | | 2,876,931 |
Chang Hwa Commercial Bank | | 6,816,400 | | | 2,296,758 |
China Airlines Ltd.(b) | | 13,579,600 | | | 3,386,775 |
GeoVision, Inc. | | 491,000 | | | 1,914,381 |
HTC Corp. | | 321,960 | | | 3,964,290 |
Polaris Securities Co. Ltd. | | 11,367,304 | | | 3,960,122 |
Siliconware Precision Industries Co. - ADR | | 1,087,800 | | | 6,309,240 |
Taishin Financial Holdings Co. Ltd. | | 8 | | | 1 |
Taiwan Semiconductor Manufacturing Co. Ltd. - ADR | | 1,000,934 | | | 8,958,359 |
Yuanta Financial Holding Co. Ltd. | | 10,301,000 | | | 4,716,933 |
| | | | | |
| | | | | 42,137,176 |
| | | | | |
Thailand — 1.1% | | | | | |
Bangkok Bank Public Co. Ltd. | | 1,638,900 | | | 3,442,012 |
| | | | | | |
24 | | SEMI-ANNUAL REPORT | | MARCH 31, 2009 | | |
| | |
| Schedule of Investments (continued) | | International Opportunities Portfolio |
| | (Percentages shown are based on Net Assets) |
| | | | | |
| | | Shares | | Value |
Common Stocks | | | | | |
Thailand (concluded) | | | | | |
Banpu Public Co. Ltd. | | 499,700 | | $ | 3,018,044 |
Siam Commercial Bank Public Co. Ltd. | | 2,133,000 | | | 3,244,409 |
| | | | | |
| | | | | 9,704,465 |
| | | | | |
United Kingdom — 16.6% | | | | | |
Aberdeen Asset Management Plc | | 619,400 | | | 1,131,838 |
AstraZeneca Plc | | 131,700 | | | 4,664,138 |
Aviva Plc | | 403,600 | | | 1,251,560 |
Barclays Plc | | 1,601,100 | | | 3,399,323 |
Beazley Group Plc | | 2,000,000 | | | 2,459,785 |
Bellway Plc | | 213,400 | | | 2,069,239 |
BG Group Plc | | 273,800 | | | 4,130,107 |
British American Tobacco Plc | | 104,600 | | | 2,416,342 |
Britvic Plc | | 984,800 | | | 3,188,512 |
Cable & Wireless Plc | | 2,289,800 | | | 4,579,131 |
Catlin Group Ltd. | | 882,000 | | | 3,955,844 |
Charter International Plc | | 821,600 | | | 5,370,223 |
Cookson Group Plc | | 21,000,000 | | | 4,899,237 |
Dana Petroleum Plc(b) | | 215,500 | | | 3,440,655 |
De La Rue Plc | | 409,399 | | | 5,701,096 |
Domino’s Pizza UK & IRL Plc | | 1,393,400 | | | 4,486,605 |
GlaxoSmithKline Plc | | 383,900 | | | 5,979,105 |
Greene King Plc | | 323,500 | | | 2,268,681 |
Hiscox Ltd. | | 1,362,200 | | | 6,027,188 |
HSBC Holdings Plc | | 948,000 | | | 5,278,041 |
ICAP Plc | | 359,100 | | | 1,563,791 |
Imperial Tobacco Group Plc | | 306,550 | | | 6,884,596 |
Inchcape Plc | | 2,292,700 | | | 2,485,699 |
InterContinental Hotels Group Plc | | 327,504 | | | 2,484,858 |
John Wood Group Plc | | 1,322,500 | | | 4,249,214 |
Legal & General Group Plc | | 2,316,100 | | | 1,426,010 |
Man Group Plc | | 614,800 | | | 1,926,641 |
Next Plc | | 313,000 | | | 5,939,564 |
Persimmon Plc | | 426,500 | | | 2,108,133 |
Premier Oil Plc(b) | | 231,900 | | | 3,532,771 |
Prudential Plc | | 313,700 | | | 1,520,784 |
Standard Chartered Plc | | 202,200 | | | 2,510,771 |
Unilever Plc | | 306,000 | | | 5,786,360 |
Vodafone Group Plc | | 4,503,700 | | | 7,851,970 |
Vodafone Group Plc - ADR | | 226,000 | | | 3,936,920 |
VT Group Plc | | 611,000 | | | 4,139,640 |
Xstrata Plc | | 799,700 | | | 5,364,347 |
| | | | | |
| | | | | 140,408,719 |
| | | | | |
United States — 0.3% | | | | | |
Alcon, Inc. | | 25,000 | | | 2,272,750 |
| | | | | |
Total Common Stocks — 93.7% | | | | | 790,956,526 |
| | | | | |
Rights | | | | | |
Beazley Group Plc, Expiring 4/03/09(b) | | 947,368 | | | 680 |
HSBC Holdings Plc, Expiring 4/03/09(b) | | 395,000 | | | 2,199,183 |
Nordea Bank AB, Expiring 4/03/09(b) | | 3,276,900 | | | 374,758 |
| | | | | |
Total Rights — 0.3% | | | | | 2,574,621 |
| | | | | |
Total Long-Term Investments
(Cost — $963,252,762) — 94.0% | | | | | 793,531,147 |
| | | | | |
| | | Shares/
Beneficial
Interest | | Value |
Short-Term Securities | | | | | |
BlackRock Liquidity Series, LLC Money Market Series, 1.17% (c)(d)(e) | | 1,740,000 | | $ | 1,740,000 |
TCW Money Market Fund, 0.31% (e) | | 40,384,206 | | | 40,384,206 |
| | | | | |
Total Short-Term Securities
(Cost — $42,124,206) — 5.0% | | | | | 42,124,206 |
| | | | | |
Total Investments (Cost — $1,005,376,968*) — 99.0% | | | | | 835,655,353 |
Other Assets in Excess of Liabilities — 1.0% | | | | | 8,181,733 |
| | | | | |
Net Assets — 100.0% | | | | $ | 843,837,086 |
| | | | | |
| * | The cost and unrealized appreciation (depreciation) of investments as of March 31, 2009, as computed for federal income tax purposes, were as follows: |
| | | | |
Aggregate cost | | $ | 1,012,464,555 | |
| | | | |
Gross unrealized appreciation | | $ | 34,828,384 | |
Gross unrealized depreciation | | | (211,637,586 | ) |
| | | | |
Net unrealized depreciation | | $ | (176,809,202 | ) |
| | | | |
| (a) | Security, or a portion of security, is on loan. |
| (b) | Non-income producing security. |
| (c) | Security purchased with the cash proceeds from securities loans. |
| (d) | Investments in companies considered to be an affiliate of the Portfolio, for purposes of Section 2(a)(3) of the Investment Company Act of 1940, as amended, were as follows: |
| | | | | | | |
Affiliate | | Net
Activity | | | Income |
BlackRock Liquidity Series, LLC Money Market Series | | $ | (10,071,100 | )** | | $ | 13,865 |
BlackRock Liquidity Funds, TempFund | | $ | (30,000,000 | )** | | $ | 445,850 |
| ** | Represents net sales cost. |
| (e) | Represents current yield as of report date. |
| • | | Foreign currency exchange contracts as of March 31, 2009 were as follows: |
| | | | | | | | | | | | | | |
Currency
Purchased | | Currency
Sold | | Counterparty | | Settlement
Date | | Unrealized
Appreciation
(Depreciation) | |
| AUD | | 3,776,000 | | USD | | 2,455,880 | | Deutsche Bank AG | | 4/15/09 | | $ | 166,630 | |
| AUD | | 8,000,000 | | USD | | 5,201,200 | | BNP Paribas | | 4/15/09 | | | 354,965 | |
| AUD | | 14,668,000 | | USD | | 9,614,258 | | Citibank, N.A. | | 4/15/09 | | | 572,989 | |
| CAD | | 12,450,040 | | USD | | 9,999,791 | | Citibank, N.A. | | 4/15/09 | | | (124,842 | ) |
| CHF | | 21,545,000 | | USD | | 19,165,370 | | Citibank, N.A. | | 4/15/09 | | | (232,084 | ) |
| CHF | | 2,382,000 | | USD | | 2,113,867 | | Deutsche Bank AG | | 4/15/09 | | | (20,616 | ) |
| CHF | | 172,000 | | USD | | 147,896 | | Citibank, N.A. | | 4/15/09 | | | 3,254 | |
| CHF | | 697,000 | | USD | | 605,047 | | Citibank, N.A. | | 4/15/09 | | | 7,461 | |
| DKK | | 1,700,000 | | USD | | 298,891 | | Deutsche Bank AG | | 4/15/09 | | | 4,207 | |
| EUR | | 1,129,000 | | USD | | 1,480,297 | | Citibank, N.A. | | 4/15/09 | | | 19,642 | |
| EUR | | 30,000,000 | | USD | | 39,235,109 | | Deutsche Bank AG | | 4/15/09 | | | 621,566 | |
| GBP | | 8,100,000 | | USD | | 11,829,038 | | Deutsche Bank AG | | 4/15/09 | | | (206,353 | ) |
| | | | | | |
| | | SEMI-ANNUAL REPORT | | MARCH 31, 2009 | | 25 |
| | |
| Schedule of Investments (continued) | | International Opportunities Portfolio |
| | |
| | | | | | | | | | | | | | |
Currency Purchased | | Currency
Sold | | Counterparty | | Settlement
Date | | Unrealized
Appreciation
(Depreciation) | |
GBP | | 656,000 | | USD | | 935,162 | | Citibank, N.A. | | 4/15/09 | | $ | 6,132 | |
HKD | | 12,000,000 | | USD | | 1,548,328 | | Citibank, N.A. | | 4/15/09 | | | 77 | |
JPY | | 2,173,000,000 | | USD | | 24,556,447 | | UBS Securities, Inc. | | 4/15/09 | | | (2,598,945 | ) |
JPY | | 700,602,000 | | USD | | 7,333,674 | | Citibank, N.A. | | 4/15/09 | | | (254,305 | ) |
JPY | | 123,725,000 | | USD | | 1,396,618 | | Deutsche Bank AG | | 4/15/09 | | | (146,415 | ) |
JPY | | 100,027,000 | | USD | | 1,124,177 | | UBS Securities, Inc. | | 4/15/09 | | | (113,434 | ) |
JPY | | 87,647,000 | | USD | | 979,614 | | Deutsche Bank AG | | 4/15/09 | | | (93,967 | ) |
JPY | | 796,898,000 | | USD | | 8,123,969 | | Citibank, N.A. | | 4/15/09 | | | (71,558 | ) |
NOK | | 13,666,000 | | USD | | 2,013,554 | | Citibank, N.A. | | 4/15/09 | | | 18,548 | |
NOK | | 8,862,000 | | USD | | 1,232,351 | | Citibank, N.A. | | 4/15/09 | | | 85,408 | |
NOK | | 20,894,000 | | USD | | 3,003,710 | | Deutsche Bank AG | | 4/15/09 | | | 103,179 | |
SEK | | 115,553,000 | | USD | | 13,868,324 | | Royal Bank of Scotland | | 4/15/09 | | | 188,714 | |
USD | | 4,712,935 | | AUD | | 7,158,000 | | Citibank, N.A. | | 4/15/09 | | | (258,453 | ) |
USD | | 2,739,941 | | CAD | | 3,490,000 | | UBS Securities, Inc. | | 4/15/09 | | | (28,208 | ) |
USD | | 1,197,577 | | CAD | | 1,525,000 | | Citibank, N.A. | | 4/15/09 | | | (12,002 | ) |
USD | | 1,226,793 | | CAD | | 1,500,000 | | UBS Securities, Inc. | | 4/15/09 | | | 37,044 | |
USD | | 1,566,367 | | CAD | | 1,928,000 | | Citibank, N.A. | | 4/15/09 | | | 37,142 | |
USD | | 3,273,880 | | CAD | | 4,007,000 | | UBS Securities, Inc. | | 4/15/09 | | | 95,664 | |
USD | | 981,372 | | CHF | | 1,110,000 | | Citibank, N.A. | | 4/15/09 | | | 5,928 | |
USD | | 1,122,761 | | CZK | | 23,173,000 | | UBS Securities, Inc. | | 4/15/09 | | | (1,878 | ) |
USD | | 1,666,755 | | EUR | | 1,225,000 | | Deutsche Bank AG | | 4/15/09 | | | 39,274 | |
USD | | 7,891,833 | | EUR | | 5,810,000 | | Citibank, N.A. | | 4/15/09 | | | 172,924 | |
USD | | 1,946,760 | | GBP | | 1,396,000 | | Deutsche Bank AG | | 4/15/09 | | | (56,361 | ) |
USD | | 1,909,612 | | GBP | | 1,346,000 | | Deutsche Bank AG | | 4/15/09 | | | (21,763 | ) |
USD | | 1,376,805 | | GBP | | 952,000 | | Citibank, N.A. | | 4/15/09 | | | 10,780 | |
USD | | 1,382,112 | | GBP | | 955,000 | | Barclays Bank, PLC | | 4/15/09 | | | 11,783 | |
USD | | 1,855,911 | | HKD | | 14,382,000 | | Deutsche Bank AG | | 4/15/09 | | | 148 | |
USD | | 1,773,312 | | JPY | | 173,969,000 | | Citibank, N.A. | | 4/15/09 | | | 15,408 | |
USD | | 20,892,313 | | NOK | | 151,013,000 | | Citibank, N.A. | | 4/15/09 | | | (1,562,969 | ) |
USD | | 1,038,157 | | SEK | | 8,714,000 | | UBS Securities, Inc. | | 4/15/09 | | | (21,902 | ) |
USD | | 1,619,595 | | SGD | | 2,455,000 | | Citibank, N.A. | | 4/15/09 | | | 6,135 | |
USD | | 758,468 | | SGD | | 1,134,000 | | UBS Securities, Inc. | | 4/15/09 | | | 13,187 | |
CAD | | 5,265,000 | | USD | | 4,295,803 | | Deutsche Bank AG | | 6/10/09 | | | (116,763 | ) |
DKK | | 2,449,000 | | USD | | 426,870 | | Citibank, N.A. | | 6/10/09 | | | 9,269 | |
GBP | | 125,000 | | USD | | 180,503 | | Deutsche Bank AG | | 6/10/09 | | | (1,104 | ) |
SEK | | 21,935,000 | | USD | | 2,596,429 | | Citibank, N.A. | | 6/10/09 | | | 73,275 | |
USD | | 2,959,451 | | AUD | | 4,305,000 | | Citibank, N.A. | | 6/10/09 | | | (19,835 | ) |
USD | | 1,145,312 | | AUD | | 1,644,000 | | Citibank, N.A. | | 6/10/09 | | | 7,578 | |
USD | | 2,023,982 | | CAD | | 2,564,000 | | Citibank, N.A. | | 6/10/09 | | | (11,167 | ) |
USD | | 1,512,754 | | CHF | | 1,786,000 | | Citibank, N.A. | | 6/10/09 | | | (58,736 | ) |
USD | | 17,910,014 | | EUR | | 13,752,000 | | Citibank, N.A. | | 6/10/09 | | | (362,405 | ) |
USD | | 8,520,442 | | GBP | | 6,035,000 | | Deutsche Bank AG | | 6/10/09 | | | (140,949 | ) |
USD | | 4,552,947 | | GBP | | 3,139,000 | | Citibank, N.A. | | 6/10/09 | | | 47,875 | |
USD | | 74,693 | | JPY | | 7,324,000 | | Citibank, N.A. | | 6/10/09 | | | 619 | |
USD | | 585,123 | | ZAR | | 5,731,000 | | Deutsche Bank AG | | 6/10/09 | | | (10,716 | ) |
USD | | 1,651,154 | | ZAR | | 15,885,000 | | Citibank, N.A. | | 6/10/09 | | | (371 | ) |
USD | | 923,915 | | ZAR | | 8,836,000 | | Citibank, N.A. | | 6/10/09 | | | 5,258 | |
| | | | | | | | | | | | | | |
Total | | | | | | | | | | | | $ | (3,806,038 | ) |
| | | | | | | | | | | | | | |
| • | | Financial futures contracts purchased as of March 31, 2009 were as follows: |
| | | | | | | | | | | | |
Contracts | | Issue | | Exchange | | Expiration
Date | | Face
Value | | Unrealized
Appreciation |
303 | | FTSE 100 Index | | London | | June 2009 | | $ | 16,890,338 | | $ | 1,162,763 |
215 | | TOPIX Index | | Tokyo | | June 2009 | | $ | 16,876,800 | | | 1,358,011 |
| | | | | | | | | | | | |
Total | | | | | | | | | | | $ | 2,520,774 |
| | | | | | | | | | | | |
| • | | Effective October 1, 2008, the Portfolio adopted Financial Accounting Standards Board Statement of Financial Accounting Standards No. 157, “Fair Value Measurements”. FAS 157 clarifies the definition of fair value, establishes a framework for measuring fair values and requires additional disclosures about the use of fair value measurements. Various inputs are used in determining the fair value of investments, which are as follows: |
| | • | | Level 1 – price quotations in active markets/exchanges for identical securities |
| | • | | Level 2 – other observable inputs (including, but not limited to: quoted prices for similar assets or liabilities in markets that are active, quoted prices for identical or similar assets in markets that are not active, inputs other than quoted prices that are observable for the assets or liabilities (such as interest rates, yield curves, volatilities, prepayment speeds, loss severities, credit risks and default rates) or other market – corroborated inputs) |
| | • | | Level 3 – unobservable inputs based on the best information available in the circumstance, to the extent observable inputs are not available (including the Portfolio’s own assumptions used in determining the fair value of investments). |
The inputs or methodology used for valuing securities are not necessarily an indication of the risk associated with investing in those securities. For information about the Portfolio’s policy regarding valuation of investments and other significant accounting policies, please refer to Note 1 of the Notes to Financial Statements.
The following table summarizes the inputs used as of March 31, 2009 in determining the fair valuation of the Portfolio’s investments:
| | | | | | | | | | |
Valuation Inputs | | Investments
in Securities | | Other Financial
Instruments *** | |
| | | Assets | | Assets | | Liabilities | |
Level 1 | | $ | 177,271,599 | | $ | 2,520,774 | | $ | — | |
Level 2 | | | 650,861,981 | | | 2,742,063 | | | (6,548,101 | ) |
Level 3 | | | 7,521,773 | | | — | | | — | |
| | | | | | | | | | |
Total | | $ | 835,655,353 | | $ | 5,262,837 | | $ | (6,548,101 | ) |
| | | | | | | | | | |
| *** | Other financial instruments are futures and foreign currency exchange contracts. Futures and foreign currency exchange contracts are valued at the unrealized appreciation/depreciation on the instrument. |
| | | | | | |
26 | | SEMI-ANNUAL REPORT | | MARCH 31, 2009 | | |
| | |
| Schedule of Investments (concluded) | | International Opportunities Portfolio |
The following table is a reconciliation of Level 3 investments for which significant unobservable inputs were used to determine fair value:
| | | |
| | | Investments
in Securities |
| | | Assets |
Balance, as of September 30, 2008 | | $ | — |
Accrued discounts/premiums | | | — |
Realized gain (loss) | | | — |
Change in unrealized appreciation/depreciation | | | — |
Net purchases (sales) | | | — |
Transfers in of Level 3 | | | 7,521,773 |
| | | |
Balance, as of March 31, 2009 | | $ | 7,521,773 |
| | | |
See Notes to Financial Statements.
| | | | | | |
| | | SEMI-ANNUAL REPORT | | MARCH 31, 2009 | | 27 |
| | |
| Schedule of Investments March 31, 2009 (Unaudited) | | Science & Technology Opportunities Portfolio |
| | (Percentages shown are based on Net Assets) |
| | | | | |
| | | Shares | | Value |
Common Stocks | | | | | |
Aerospace & Defense — 1.4% | | | | | |
Lockheed Martin Corp. | | 14,300 | | $ | 987,129 |
Raytheon Co. | | 9,900 | | | 385,506 |
| | | | | |
| | | | | 1,372,635 |
| | | | | |
Biotechnology — 6.2% | | | | | |
Amgen, Inc.(a) | | 61,200 | | | 3,030,624 |
Biogen Idec, Inc.(a) | | 14,400 | | | 754,848 |
Celera Corp.(a) | | 58,300 | | | 444,829 |
Gilead Sciences, Inc.(a) | | 26,000 | | | 1,204,320 |
Vertex Pharmaceuticals, Inc.(a) | | 18,700 | | | 537,251 |
| | | | | |
| | | | | 5,971,872 |
| | | | | |
Communications Equipment — 10.5% | | | | | |
Cisco Systems, Inc.(a) | | 130,000 | | | 2,180,100 |
Corning, Inc. | | 43,600 | | | 578,572 |
F5 Networks, Inc.(a) | | 32,600 | | | 682,970 |
Harris Corp. | | 30,000 | | | 868,200 |
Juniper Networks, Inc.(a) | | 54,600 | | | 822,276 |
Motorola, Inc. | | 70,800 | | | 299,484 |
Nokia Oyj - ADR | | 33,400 | | | 389,778 |
Polycom, Inc.(a) | | 25,500 | | | 392,445 |
QUALCOMM, Inc. | | 82,700 | | | 3,217,857 |
Research In Motion Ltd.(a) | | 14,700 | | | 633,129 |
Tellabs, Inc.(a) | | 34,200 | | | 156,636 |
| | | | | |
| | | | | 10,221,447 |
| | | | | |
Computers & Peripherals — 11.6% | | | | | |
Apple, Inc.(a) | | 34,700 | | | 3,647,664 |
ASUSTeK Computer, Inc. | | 142,351 | | | 150,097 |
Dell, Inc.(a) | | 47,600 | | | 451,248 |
EMC Corp.(a) | | 88,000 | | | 1,003,200 |
Hewlett-Packard Co. | | 41,400 | | | 1,327,284 |
HTC Corp. | | 16,510 | | | 203,287 |
International Business Machines Corp. | | 35,100 | | | 3,400,839 |
NetApp, Inc.(a) | | 42,100 | | | 624,764 |
Sandisk Corp.(a) | | 34,200 | | | 432,630 |
| | | | | |
| | | | | 11,241,013 |
| | | | | |
Diversified Telecommunication Services — 2.4% | | | | | |
AT&T, Inc. | | 35,500 | | | 894,600 |
Verizon Communications, Inc. | | 36,200 | | | 1,093,240 |
Vimpel-Communications - ADR | | 58,700 | | | 383,898 |
| | | | | |
| | | | | 2,371,738 |
| | | | | |
Electronic Equipment, Instruments & Components — 2.1% | | | | | |
Agilent Technologies, Inc.(a) | | 33,400 | | | 513,358 |
Amphenol Corp. - Class A | | 24,900 | | | 709,401 |
AU Optronics Corp. - ADR | | 38,900 | | | 326,371 |
Nidec Corp. | | 9,700 | | | 436,643 |
| | | | | |
| | | | | 1,985,773 |
| | | | | |
Food & Staples Retailing — 0.8% | | | | | |
CVS Caremark Corp. | | 29,000 | | | 797,210 |
| | | | | |
Health Care Equipment & Supplies — 5.8% | | | | | |
Alcon, Inc. | | 7,400 | | | 672,734 |
Baxter International, Inc. | | 9,400 | | | 481,468 |
Beckman Coulter, Inc. | | 17,800 | | | 907,978 |
Becton, Dickinson & Co. | | 12,700 | | | 853,948 |
Boston Scientific Corp.(a) | | 37,700 | | | 299,715 |
Covidien Ltd. | | 6,500 | | | 216,060 |
Medtronic, Inc. | | 58,100 | | | 1,712,207 |
St. Jude Medical, Inc.(a) | | 12,400 | | | 450,492 |
| | | | | |
| | | | | 5,594,602 |
| | | | | |
Internet & Catalog Retail — 0.7% | | | | | |
priceline.com, Inc.(a)(b) | | 8,100 | | | 638,118 |
| | | | | |
Internet Software & Services — 8.2% | | | | | |
Ariba, Inc.(a) | | 66,800 | | | 583,164 |
AsiaInfo Holdings, Inc.(a) | | 22,700 | | | 382,495 |
Baidu.Com - ADR(a) | | 2,700 | | | 476,820 |
Digital River, Inc.(a) | | 17,900 | | | 533,778 |
eBay, Inc.(a) | | 70,200 | | | 881,712 |
Google, Inc. - Class A(a) | | 4,300 | | | 1,496,658 |
Open Text Corp.(a) | | 32,700 | | | 1,126,188 |
Sina Corp.(a) | | 16,300 | | | 378,975 |
VeriSign, Inc.(a) | | 61,700 | | | 1,164,279 |
Yahoo!, Inc.(a) | | 75,700 | | | 969,717 |
| | | | | |
| | | | | 7,993,786 |
| | | | | |
IT Services — 0.9% | | | | | |
Automatic Data Processing, Inc. | | 25,200 | | | 886,032 |
| | | | | |
Office Electronics — 0.9% | | | | | |
Canon, Inc. | | 17,100 | | | 498,496 |
Konica Corp. | | 47,800 | | | 416,653 |
| | | | | |
| | | | | 915,149 |
| | | | | |
Pharmaceuticals — 1.9% | | | | | |
Pfizer, Inc. | | 28,800 | | | 392,256 |
Roche Holding AG | | 8,800 | | | 302,720 |
Roche Holding AG - ADR | | 1,900 | | | 260,775 |
Wyeth | | 19,400 | | | 834,976 |
| | | | | |
| | | | | 1,790,727 |
| | | | | |
Semiconductors & Semiconductor Equipment — 22.5% | | | | | |
Advanced Semiconductor Engineering, Inc. | | 608,300 | | | 296,819 |
Altera Corp. | | 46,600 | | | 817,830 |
Analog Devices, Inc. | | 36,300 | | | 699,501 |
Applied Materials, Inc. | | 252,100 | | | 2,710,075 |
ASM Pacific Technology Ltd. | | 169,300 | | | 593,082 |
Atheros Communications, Inc.(a) | | 25,100 | | | 367,966 |
ATMI, Inc.(a) | | 22,900 | | | 353,347 |
Broadcom Corp. - Class A(a) | | 57,800 | | | 1,154,844 |
Cavium Networks, Inc.(a) | | 26,000 | | | 300,040 |
Disco Corp. | | 10,300 | | | 257,122 |
Intel Corp. | | 144,900 | | | 2,180,745 |
Intersil Corp. - Class A | | 49,400 | | | 568,100 |
KLA-Tencor Corp. | | 42,800 | | | 856,000 |
Lam Research Corp.(a) | | 38,700 | | | 881,199 |
Linear Technology Corp. | | 36,700 | | | 843,366 |
Marvell Technology Group Ltd.(a) | | 85,100 | | | 779,516 |
Micron Technology, Inc.(a) | | 61,900 | | | 251,314 |
National Semiconductor Corp. | | 42,500 | | | 436,475 |
Netlogic Microsystems, Inc.(a) | | 30,400 | | | 835,392 |
Novellus Systems, Inc.(a) | | 37,900 | | | 630,277 |
PMC-Sierra, Inc.(a) | | 72,600 | | | 463,188 |
Samsung Electronics Co. Ltd. | | 2,300 | | | 950,262 |
Siliconware Precision Industries Co. - ADR | | 69,000 | | | 400,200 |
Taiwan Semiconductor Manufacturing Co. Ltd. - ADR | | 93,535 | | | 837,138 |
Teradyne, Inc.(a) | | 78,500 | | | 343,830 |
Texas Instruments, Inc. | | 88,100 | | | 1,454,531 |
| | | | | | |
28 | | SEMI-ANNUAL REPORT | | MARCH 31, 2009 | | |
| | |
| Schedule of Investments (continued) | | Science & Technology Opportunities Portfolio |
| | (Percentages shown are based on Net Assets) |
| | | | | | |
| | | Shares | | Value | |
Common Stocks | | | | | | |
Semiconductors & Semiconductor Equipment (concluded) | | | | | | |
Varian Semiconductor Equipment Associates, Inc.(a) | | 23,200 | | $ | 502,512 | |
Xilinx, Inc. | | 55,300 | | | 1,059,548 | |
| | | | | | |
| | | | | 21,824,219 | |
| | | | | | |
Software — 17.7% | | | | | | |
Adobe Systems, Inc.(a) | | 48,000 | | | 1,026,720 | |
BMC Software, Inc.(a) | | 43,500 | | | 1,435,500 | |
CA, Inc. | | 41,300 | | | 727,293 | |
Check Point Software Technologies(a) | | 25,400 | | | 564,134 | |
Citrix Systems, Inc.(a) | | 59,800 | | | 1,353,872 | |
Electronic Arts, Inc.(a) | | 24,600 | | | 447,474 | |
Intuit, Inc.(a) | | 18,800 | | | 507,600 | |
Longtop Financial Technologies Ltd.(a) | | 19,100 | | | 405,493 | |
McAfee, Inc.(a) | | 49,900 | | | 1,671,650 | |
Microsoft Corp. | | 69,600 | | | 1,278,552 | |
Nintendo Co. Ltd. | | 1,400 | | | 409,545 | |
Oracle Corp. | | 120,200 | | | 2,172,014 | |
Progress Software Corp.(a) | | 31,600 | | | 548,576 | |
Red Hat, Inc.(a) | | 39,400 | | | 702,896 | |
Salesforce.com, Inc.(a) | | 13,000 | | | 425,490 | |
SAP AG – ADR | | 12,600 | | | 444,654 | |
Sybase, Inc.(a) | | 40,000 | | | 1,211,600 | |
Symantec Corp.(a) | | 88,600 | | | 1,323,684 | |
Synopsys, Inc.(a) | | 24,100 | | | 499,593 | |
| | | | | | |
| | | | | 17,156,340 | |
| | | | | | |
Wireless Telecommunication Services — 1.0% | | | | | | |
American Tower Corp. - Class A(a) | | 29,000 | | | 882,470 | |
Bharti Tele-Ventures Ltd.(a) | | 7,900 | | | 97,768 | |
| | | | | | |
| | | | | 980,238 | |
| | | | | | |
Total Long-Term Investments
(Cost — $115,837,837) — 94.6% | | | | | 91,740,899 | |
| | | | | | |
| | |
| | | Shares/
Beneficial
Interest | | | |
Short-Term Securities | | | | | | |
BlackRock Liquidity Funds, TempFund, 0.60%(c)(d) | | 4,994,153 | | | 4,994,153 | |
BlackRock Liquidity Series, LLC Money Market Series, 1.17%(c)(d)(e) | | 1,261,500 | | | 1,261,500 | |
| | | | | | |
Total Short-Term Securities
(Cost — $6,255,653) — 6.4% | | | | | 6,255,653 | |
| | | | | | |
Total Investments (Cost — $122,093,490*) — 101.0% | | | | | 97,996,552 | |
Liabilities in Excess of Other Assets — (1.0)% | | | | | (972,917 | ) |
| | | | | | |
Net Assets — 100.0% | | | | $ | 97,023,635 | |
| | | | | | |
| * | The cost and unrealized appreciation (depreciation) of investments as of March 31, 2009, as computed for federal income tax purposes, were as follows: |
| | | | |
Aggregate cost | | $ | 123,699,512 | |
| | | | |
Gross unrealized appreciation | | $ | 136,589 | |
Gross unrealized depreciation | | | (25,839,549 | ) |
| | | | |
Net unrealized depreciation | | $ | (25,702,960 | ) |
| | | | |
| (a) | Non-income producing security. |
| (b) | Security, or a portion of security, is on loan. |
| (c) | Investments in companies considered to be an affiliate of the Portfolio, for purposes of Section 2(a)(3) of the Investment Company Act of 1940, as amended, were as follows: |
| | | | | | | |
Affiliate | | Net
Activity | | | Income |
BlackRock Liquidity Funds, TempFund | | $ | 4,994,153 | ** | | $ | 5,562 |
BlackRock Liquidity Series, LLC Money Market Series | | $ | 857,000 | ** | | $ | 3,851 |
| ** | Represents net purchase cost. |
| (d) | Represents current yield as of report date. |
| (e) | Security purchased with the cash proceeds from securities loans. |
| • | | Foreign currency exchange contracts as of March 31, 2009 were as follows: |
| | | | | | | | | | | | | | |
Currency Purchased | | Currency Sold | | Counterparty | | Settlement
Date | | Unrealized
Appreciation
(Depreciation) | |
CHF | | 384,000 | | USD | | 340,774 | | Deutsche Bank AG | | 4/15/09 | | $ | (3,323 | ) |
JPY | | 17,886,000 | | USD | | 201,899 | | Deutsche Bank AG | | 4/15/09 | | | (21,166 | ) |
JPY | | 14,883,000 | | USD | | 167,266 | | UBS Securities, Inc. | | 4/15/09 | | | (16,878 | ) |
USD | | 692,510 | | CHF | | 778,000 | | UBS Securities, Inc. | | 4/15/09 | | | 8,820 | |
USD | | 515,524 | | HKD | | 4,000,000 | | Goldman Sachs Bank USA | | 4/15/09 | | | (611 | ) |
USD | | 286,672 | | JPY | | 28,309,000 | | Citibank, N.A. | | 4/15/09 | | | 618 | |
USD | | 1,999,629 | | JPY | | 196,029,000 | | Citibank, N.A. | | 6/10/09 | | | 17,015 | |
| | | | | | | | | | | | | | |
Total | | | | | | $ | (15,525 | ) |
| | | | | | | | | | | | | | |
| • | | For Portfolio compliance purposes, the Portfolio’s industry classifications refer to any one or more of the industry sub-classifications used by one or more widely recognized market indexes or ratings group indexes, and/or as defined by Portfolio management. This definition may not apply for purposes of this report, which may combine industry sub-classifications for reporting ease. |
| • | | Effective October 1, 2008, the Portfolio adopted Financial Accounting Standards Board Statement of Financial Accounting Standards No. 157, “Fair Value Measurements”. FAS 157 clarifies the definition of fair value, establishes a framework for measuring fair values and requires additional disclosures about the use of fair value measurements. Various inputs are used in determining the fair value of investments, which are as follows: |
| | • | | Level 1 – price quotations in active markets/exchanges for identical securities |
| | • | | Level 2 – other observable inputs (including, but not limited to: quoted prices for similar assets or liabilities in markets that are active, quoted prices for identical or similar assets in markets that are not active, inputs other than quoted prices that are observable for the assets or liabilities (such as interest rates, yield curves, volatilities, prepayment speeds, loss severities, credit risks and default rates) or other market – corroborated inputs) |
| | • | | Level 3 – unobservable inputs based on the best information available in the circumstance, to the extent observable inputs are not available (including the Portfolio’s own assumptions used in determining the fair value of investments). |
| | | | | | |
| | | SEMI-ANNUAL REPORT | | MARCH 31, 2009 | | 29 |
| | |
| Schedule of Investments (concluded) | | Science & Technology Opportunities Portfolio |
| | |
The inputs or methodology used for valuing securities are not necessarily an indication of the risk associated with investing in those securities. For information about the Portfolio’s policy regarding valuation of investments and other significant accounting policies, please refer to Note 1 of the Notes to Financial Statements.
The following table summarizes the inputs used as of March 31, 2009 in determining the fair valuation of the Portfolio’s investments:
| | | | | | | | | | |
Valuation Inputs | | Investments
in Securities | | Other Financial
Instruments *** | |
| | | Assets | | Assets | | Liabilities | |
Level 1 | | $ | 93,426,003 | | $ | — | | $ | — | |
Level 2 | | | 4,570,549 | | | 26,453 | | | (41,978 | ) |
Level 3 | | | — | | | — | | | — | |
| | | | | | | | | | |
Total | | $ | 97,996,552 | | $ | 26,453 | | $ | (41,978 | ) |
| | | | | | | | | | |
| *** | Other financial instruments are foreign currency exchange contracts. Foreign currency exchange contracts are valued at the unrealized appreciation/depreciation on the instrument. |
See Notes to Financial Statements.
| | | | | | |
30 | | SEMI-ANNUAL REPORT | | MARCH 31, 2009 | | |
| | |
| Schedule of Investments March 31, 2009 (Unaudited) | | U.S. Opportunities Portfolio |
| | (Percentages shown are based on Net Assets) |
| | | | | |
| | | Shares | | Value |
Common Stocks | | | | | |
Aerospace & Defense — 1.4% | | | | | |
Alliant Techsystems, Inc.(a) | | 127,100 | | $ | 8,513,158 |
BE Aerospace, Inc.(a) | | 225,500 | | | 1,955,085 |
Curtiss-Wright Corp. | | 210,400 | | | 5,901,720 |
| | | | | |
| | | | | 16,369,963 |
| | | | | |
Air Freight & Logistics — 0.2% | | | | | |
Atlas Air Worldwide Holdings, Inc.(a) | | 161,100 | | | 2,795,085 |
| | | | | |
Airlines — 0.6% | | | | | |
Airtran Holdings, Inc.(a)(b) | | 875,300 | | | 3,982,615 |
USAirways Group, Inc.(a) | | 1,204,300 | | | 3,046,879 |
| | | | | |
| | | | | 7,029,494 |
| | | | | |
Auto Components — 0.6% | | | | | |
The Goodyear Tire & Rubber Co.(a) | | 1,026,400 | | | 6,425,264 |
| | | | | |
Biotechnology — 1.2% | | | | | |
Alexion Pharmaceuticals, Inc.(a) | | 110,300 | | | 4,153,898 |
Celera Corp.(a) | | 75,900 | | | 579,117 |
Vertex Pharmaceuticals, Inc.(a)(b) | | 339,300 | | | 9,748,089 |
| | | | | |
| | | | | 14,481,104 |
| | | | | |
Capital Markets — 3.3% | | | | | |
Ameriprise Financial, Inc. | | 170,900 | | | 3,501,741 |
Greenhill & Co., Inc.(b) | | 94,000 | | | 6,941,900 |
Invesco Ltd. | | 501,000 | | | 6,943,860 |
Knight Capital Group, Inc. - Class A(a) | | 255,500 | | | 3,766,070 |
Northern Trust Corp. | | 77,300 | | | 4,624,086 |
Stifel Financial Corp. | | 66,300 | | | 2,871,453 |
TD Ameritrade Holding Corp.(a) | | 256,200 | | | 3,538,122 |
Waddell & Reed Financial, Inc. - Class A | | 334,100 | | | 6,037,187 |
| | | | | |
| | | | | 38,224,419 |
| | | | | |
Chemicals — 1.5% | | | | | |
Airgas, Inc. | | 305,700 | | | 10,335,717 |
The Mosaic Co. | | 166,100 | | | 6,972,878 |
| | | | | |
| | | | | 17,308,595 |
| | | | | |
Commercial Banks — 3.3% | | | | | |
BB&T Corp.(b) | | 125,500 | | | 2,123,460 |
City National Corp. | | 73,600 | | | 2,485,472 |
Commerce Bancshares, Inc. | | 108,620 | | | 3,942,906 |
First Horizon National Corp.(b) | | 547,867 | | | 5,884,091 |
Fulton Financial Corp.(b) | | 152,300 | | | 1,009,749 |
Iberiabank Corp. | | 35,900 | | | 1,649,246 |
Investors Bancorp, Inc. | | 206,500 | | | 1,749,055 |
KeyCorp | | 380,300 | | | 2,992,961 |
M&T Bank Corp.(b) | | 36,500 | | | 1,651,260 |
Marshall & IIsley Corp.(b) | | 487,000 | | | 2,741,810 |
PacWest Bancorp | | 134,100 | | | 1,921,653 |
Regions Financial Corp. | | 690,700 | | | 2,942,382 |
TCF Financial Corp.(b) | | 190,800 | | | 2,243,808 |
UMB Financial Corp. | | 54,900 | | | 2,332,701 |
Zions Bancorp(b) | | 291,500 | | | 2,865,445 |
| | | | | |
| | | | | 38,535,999 |
| | | | | |
Commercial Services & Supplies — 1.4% | | | | | |
Avery Dennison Corp. | | 212,300 | | | 4,742,782 |
The GEO Group, Inc.(a) | | 291,100 | | | 3,857,075 |
Iron Mountain, Inc.(a) | | 371,500 | | | 8,236,155 |
| | | | | |
| | | | | 16,836,012 |
| | | | | |
Communications Equipment — 1.7% | | | | | |
Harris Corp. | | 242,600 | | | 7,020,844 |
Juniper Networks, Inc.(a) | | 254,800 | | | 3,837,288 |
Tekelec(a) | | 537,200 | | | 7,107,156 |
Tellabs, Inc.(a) | | 405,700 | | | 1,858,106 |
| | | | | |
| | | | | 19,823,394 |
| | | | | |
Computers & Peripherals — 0.5% | | | | | |
Western Digital Corp.(a) | | 285,400 | | | 5,519,636 |
| | | | | |
Construction & Engineering — 0.5% | | | | | |
Jacobs Engineering Group, Inc.(a) | | 141,300 | | | 5,462,658 |
| | | | | |
Containers & Packaging — 1.0% | | | | | |
Crown Holdings, Inc.(a) | | 487,900 | | | 11,089,967 |
| | | | | |
Diversified Consumer Services — 0.8% | | | | | |
Apollo Group, Inc. - Class A(a) | | 61,800 | | | 4,840,794 |
ITT Educational Services, Inc.(a) | | 40,600 | | | 4,929,652 |
| | | | | |
| | | | | 9,770,446 |
| | | | | |
Diversified Financial Services — 1.0% | | | | | |
IntercontinentalExchange, Inc.(a) | | 75,300 | | | 5,607,591 |
The NASDAQ OMX Group, Inc.(a) | | 303,000 | | | 5,932,740 |
| | | | | |
| | | | | 11,540,331 |
| | | | | |
Electric Utilities — 1.1% | | | | | |
DPL, Inc. | | 416,000 | | | 9,376,640 |
NV Energy, Inc. | | 404,200 | | | 3,795,438 |
| | | | | |
| | | | | 13,172,078 |
| | | | | |
Electrical Equipment — 0.8% | | | | | |
GrafTech International Ltd.(a) | | 810,700 | | | 4,993,912 |
Thomas & Betts Corp.(a) | | 165,100 | | | 4,130,802 |
| | | | | |
| | | | | 9,124,714 |
| | | | | |
Electronic Equipment, Instruments & Components — 1.2% | | | | | |
Amphenol Corp. - Class A | | 263,900 | | | 7,518,511 |
Plexus Corp.(a) | | 241,600 | | | 3,338,912 |
SYNNEX Corp.(a)(b) | | 140,900 | | | 2,771,503 |
| | | | | |
| | | | | 13,628,926 |
| | | | | |
Energy Equipment & Services — 2.4% | | | | | |
BJ Services Co. | | 584,900 | | | 5,819,755 |
Cameron International Corp.(a) | | 206,300 | | | 4,524,159 |
Helmerich & Payne, Inc. | | 165,000 | | | 3,757,050 |
Pride International, Inc.(a) | | 254,100 | | | 4,568,718 |
Smith International, Inc. | | 181,100 | | | 3,890,028 |
Weatherford International Ltd.(a) | | 505,000 | | | 5,590,350 |
| | | | | |
| | | | | 28,150,060 |
| | | | | |
Food & Staples Retailing — 0.5% | | | | | |
Safeway, Inc. | | 211,900 | | | 4,278,261 |
SUPERVALU, Inc. | | 129,300 | | | 1,846,404 |
| | | | | |
| | | | | 6,124,665 |
| | | | | |
Food Products — 3.6% | | | | | |
Bunge Ltd.(b) | | 100,800 | | | 5,710,320 |
Flowers Foods, Inc. | | 290,300 | | | 6,816,244 |
Fresh Del Monte Produce, Inc.(a) | | 168,800 | | | 2,771,696 |
The J.M. Smucker Co. | | 151,100 | | | 5,631,497 |
McCormick & Co., Inc. | | 109,500 | | | 3,237,915 |
Ralcorp Holdings, Inc.(a) | | 114,800 | | | 6,185,424 |
Smithfield Foods, Inc.(a)(b) | | 272,600 | | | 2,578,796 |
TreeHouse Foods, Inc.(a) | | 304,300 | | | 8,760,797 |
| | | | | |
| | | | | 41,692,689 |
| | | | | |
| | | | | | |
| | | SEMI-ANNUAL REPORT | | MARCH 31, 2009 | | 31 |
| | |
| Schedule of Investments (continued) | | U.S. Opportunities Portfolio |
| | (Percentages shown are based on Net Assets) |
| | | | | |
| | | Shares | | Value |
Common Stocks | | | | | |
Gas Utilities — 1.8% | | | | | |
AGL Resources, Inc. | | 214,900 | | $ | 5,701,297 |
CMS Energy Corp. | | 435,000 | | | 5,150,400 |
Xcel Energy, Inc. | | 556,400 | | | 10,365,732 |
| | | | | |
| | | | | 21,217,429 |
| | | | | |
Health Care Equipment & Supplies — 3.1% | | | | | |
Beckman Coulter, Inc. | | 233,100 | | | 11,890,431 |
Becton, Dickinson & Co. | | 134,300 | | | 9,030,332 |
Gen-Probe, Inc.(a) | | 140,500 | | | 6,403,990 |
Hologic, Inc.(a) | | 46,200 | | | 604,758 |
Immucor, Inc.(a) | | 277,100 | | | 6,969,065 |
West Pharmaceutical Services, Inc. | | 19,800 | | | 649,638 |
| | | | | |
| | | | | 35,548,214 |
| | | | | |
Health Care Providers & Services — 4.8% | | | | | |
AMERIGROUP Corp.(a) | | 68,200 | | | 1,878,228 |
AmerisourceBergen Corp. | | 459,500 | | | 15,007,270 |
Coventry Health Care, Inc.(a) | | 82,400 | | | 1,066,256 |
DaVita, Inc.(a) | | 393,600 | | | 17,298,720 |
Express Scripts, Inc.(a) | | 172,600 | | | 7,968,942 |
Laboratory Corp. of America Holdings(a) | | 35,500 | | | 2,076,395 |
McKesson Corp. | | 178,000 | | | 6,237,120 |
MEDNAX, Inc.(a) | | 36,100 | | | 1,063,867 |
VCA Antech, Inc.(a)(b) | | 161,400 | | | 3,639,570 |
| | | | | |
| | | | | 56,236,368 |
| | | | | |
Hotels, Restaurants & Leisure — 1.5% | | | | | |
Bally Technologies, Inc.(a) | | 147,600 | | | 2,718,792 |
Burger King Holdings, Inc. | | 299,800 | | | 6,880,410 |
Chipotle Mexican Grill, Inc. - Class A(a) | | 36,500 | | | 2,422,870 |
Life Time Fitness, Inc.(b) | | 238,800 | | | 2,999,328 |
Royal Caribbean Cruises Ltd.(b) | | 353,300 | | | 2,829,933 |
| | | | | |
| | | | | 17,851,333 |
| | | | | |
Household Durables — 1.5% | | | | | |
Fortune Brands, Inc. | | 127,200 | | | 3,122,760 |
Jarden Corp.(a)(b) | | 408,000 | | | 5,169,360 |
Toll Brothers, Inc.(a)(b) | | 395,700 | | | 7,185,912 |
Whirlpool Corp.(b) | | 62,500 | | | 1,849,375 |
| | | | | |
| | | | | 17,327,407 |
| | | | | |
Insurance — 4.4% | | | | | |
Allied World Assurance Co. Holdings Ltd. | | 76,100 | | | 2,894,083 |
AON Corp. | | 115,200 | | | 4,702,464 |
Assurant, Inc. | | 155,900 | | | 3,395,502 |
AXIS Capital Holdings Ltd. | | 148,700 | | | 3,351,698 |
Cincinnati Financial Corp. | | 128,200 | | | 2,931,934 |
Everest Re Group Ltd. | | 33,400 | | | 2,364,720 |
The Hanover Insurance Group, Inc. | | 127,800 | | | 3,683,196 |
IPC Holdings Ltd. | | 108,700 | | | 2,939,248 |
Platinum Underwriters Holdings Ltd. | | 96,000 | | | 2,722,560 |
Principal Financial Group, Inc. | | 216,600 | | | 1,771,788 |
ProAssurance Corp. | | 77,500 | | | 3,613,050 |
RenaissanceRe Holdings Ltd. | | 69,800 | | | 3,450,912 |
Torchmark Corp. | | 68,000 | | | 1,783,640 |
Unum Group | | 147,600 | | | 1,845,000 |
Validus Holdings Ltd. | | 117,400 | | | 2,780,032 |
W.R. Berkley Corp. | | 149,400 | | | 3,368,970 |
XL Capital Ltd. | | 691,100 | | | 3,773,406 |
| | | | | |
| | | | | 51,372,203 |
| | | | | |
Internet & Catalog Retail — 0.7% | | | | | |
priceline.com, Inc.(a)(b) | | 97,100 | | | 7,649,538 |
| | | | | |
Internet Software & Services — 1.8% | | | | | |
Ariba, Inc.(a) | | 650,300 | | | 5,677,119 |
Digital River, Inc.(a) | | 198,200 | | | 5,910,324 |
VeriSign, Inc.(a) | | 466,700 | | | 8,806,629 |
| | | | | |
| | | | | 20,394,072 |
| | | | | |
IT Services — 0.6% | | | | | |
SAIC, Inc.(a) | | 397,800 | | | 7,426,926 |
| | | | | |
Leisure Equipment & Products — 0.2% | | | | | |
Jakks Pacific, Inc.(a) | | 230,900 | | | 2,851,615 |
| | | | | |
Life Sciences Tools & Services — 1.0% | | | | | |
Millipore Corp.(a)(b) | | 66,500 | | | 3,817,765 |
Qiagen NV(a) | | 487,300 | | | 7,777,308 |
| | | | | |
| | | | | 11,595,073 |
| | | | | |
Machinery — 3.4% | | | | | |
Bucyrus International, Inc. | | 288,400 | | | 4,377,912 |
Cummins, Inc. | | 170,400 | | | 4,336,680 |
Flowserve Corp. | | 82,400 | | | 4,624,288 |
Lincoln Electric Holdings, Inc. | | 123,200 | | | 3,904,208 |
SPX Corp. | | 118,700 | | | 5,580,087 |
Terex Corp.(a) | | 429,600 | | | 3,973,800 |
Timken Co. | | 312,300 | | | 4,359,708 |
Trinity Industries, Inc.(b) | | 415,000 | | | 3,793,100 |
Wabtec Corp. | | 175,000 | | | 4,616,500 |
| | | | | |
| | | | | 39,566,283 |
| | | | | |
Marine — 0.3% | | | | | |
Eagle Bulk Shipping, Inc.(b) | | 841,400 | | | 3,575,950 |
| | | | | |
Media — 1.8% | | | | | |
CBS Corp. - Class B | | 626,200 | | | 2,404,608 |
Liberty Media Corp. - Entertainment - Series A(a) | | 602,200 | | | 12,013,890 |
Lions Gate Entertainment Corp.(a) | | 548,500 | | | 2,769,925 |
Marvel Entertainment, Inc.(a) | | 146,500 | | | 3,889,575 |
| | | | | |
| | | | | 21,077,998 |
| | | | | |
Metals & Mining — 3.2% | | | | | |
Commercial Metals Co. | | 555,600 | | | 6,417,180 |
Kinross Gold Corp. | | 226,100 | | | 4,040,407 |
Nucor Corp. | | 167,400 | | | 6,389,658 |
Reliance Steel & Aluminum Co. | | 242,300 | | | 6,379,759 |
Royal Gold, Inc.(b) | | 179,300 | | | 8,384,068 |
Steel Dynamics, Inc. | | 628,200 | | | 5,534,442 |
| | | | | |
| | | | | 37,145,514 |
| | | | | |
Multiline Retail — 1.1% | | | | | |
Family Dollar Stores, Inc. | | 154,900 | | | 5,169,013 |
Macy’s, Inc. | | 383,500 | | | 3,413,150 |
Nordstrom, Inc.(b) | | 259,700 | | | 4,349,975 |
| | | | | |
| | | | | 12,932,138 |
| | | | | |
Oil, Gas & Consumable Fuels — 4.8% | | | | | |
Arch Coal, Inc. | | 393,400 | | | 5,259,758 |
Arena Resources, Inc.(a) | | 111,600 | | | 2,843,568 |
Chesapeake Energy Corp. | | 317,200 | | | 5,411,432 |
CONSOL Energy, Inc. | | 133,900 | | | 3,379,636 |
Continental Resources, Inc.(a)(b) | | 268,300 | | | 5,690,643 |
Denbury Resources, Inc.(a) | | 298,200 | | | 4,431,252 |
Murphy Oil Corp. | | 65,600 | | | 2,936,912 |
Noble Energy, Inc. | | 75,900 | | | 4,089,492 |
Peabody Energy Corp. | | 189,500 | | | 4,745,080 |
PetroHawk Energy Corp.(a) | | 256,600 | | | 4,934,418 |
Range Resources Corp. | | 103,600 | | | 4,264,176 |
| | | | | | |
32 | | SEMI-ANNUAL REPORT | | MARCH 31, 2009 | | |
| | |
| Schedule of Investments (continued) | | U.S. Opportunities Portfolio |
| | (Percentages shown are based on Net Assets) |
| | | | | |
| | | Shares | | Value |
Common Stocks | | | | | |
Oil, Gas & Consumable Fuels (concluded) | | | | | |
Southwestern Energy Co.(a) | | 134,700 | | $ | 3,999,243 |
Ultra Petroleum Corp.(a)(b) | | 99,200 | | | 3,560,288 |
| | | | | |
| | | | | 55,545,898 |
| | | | | |
Professional Services — 1.9% | | | | | |
The Dun & Bradstreet Corp. | | 121,200 | | | 9,332,400 |
Robert Half International, Inc. | | 318,500 | | | 5,678,855 |
Watson Wyatt Worldwide, Inc. - Class A | | 132,200 | | | 6,526,714 |
| | | | | |
| | | | | 21,537,969 |
| | | | | |
Real Estate Investment Trusts — 3.5% | | | | | |
AMB Property Corp. | | 245,500 | | | 3,535,200 |
AvalonBay Communities, Inc.(b) | | 96,660 | | | 4,548,819 |
Boston Properties, Inc.(b) | | 70,000 | | | 2,452,100 |
Equity Residential | | 86,800 | | | 1,592,780 |
Essex Property Trust, Inc. | | 33,400 | | | 1,915,156 |
Health Care REIT, Inc. | | 76,700 | | | 2,346,253 |
Hospitality Properties Trust | | 143,700 | | | 1,724,400 |
Host Hotels & Resorts, Inc. | | 353,500 | | | 1,385,720 |
Kimco Realty Corp. | | 197,900 | | | 1,507,998 |
The Macerich Co.(b) | | 192,800 | | | 1,206,928 |
Plum Creek Timber Co., Inc.(b) | | 143,100 | | | 4,159,917 |
Rayonier, Inc. | | 165,200 | | | 4,992,344 |
Taubman Centers, Inc.(b) | | 206,900 | | | 3,525,576 |
Ventas, Inc. | | 90,300 | | | 2,041,683 |
Vornado Realty Trust | | 1,129 | | | 37,528 |
Washington Real Estate Investment Trust | | 226,900 | | | 3,925,370 |
| | | | | |
| | | | | 40,897,772 |
| | | | | |
Road & Rail — 1.5% | | | | | |
Heartland Express, Inc.(b) | | 386,700 | | | 5,727,027 |
Knight Transportation, Inc.(b) | | 306,200 | | | 4,641,992 |
Werner Enterprises, Inc. | | 475,400 | | | 7,188,048 |
| | | | | |
| | | | | 17,557,067 |
| | | | | |
Semiconductors & Semiconductor Equipment — 5.5% | | | | | |
Altera Corp. | | 332,500 | | | 5,835,375 |
Analog Devices, Inc. | | 309,300 | | | 5,960,211 |
Cavium Networks, Inc.(a)(b) | | 83,000 | | | 957,820 |
Hittite Microwave Corp.(a) | | 201,300 | | | 6,280,560 |
Intersil Corp. - Class A | | 361,800 | | | 4,160,700 |
National Semiconductor Corp. | | 448,900 | | | 4,610,203 |
Netlogic Microsystems, Inc.(a)(b) | | 322,900 | | | 8,873,292 |
Novellus Systems, Inc.(a) | | 363,200 | | | 6,040,016 |
PMC-Sierra, Inc.(a) | | 1,522,800 | | | 9,715,464 |
Teradyne, Inc.(a) | | 922,200 | | | 4,039,236 |
Varian Semiconductor Equipment Associates, Inc.(a) | | 320,900 | | | 6,950,694 |
| | | | | |
| | | | | 63,423,571 |
| | | | | |
Software — 4.8% | | | | | |
Advent Software, Inc.(a) | | 122,500 | | | 4,080,475 |
BMC Software, Inc.(a) | | 276,600 | | | 9,127,800 |
Citrix Systems, Inc.(a) | | 229,300 | | | 5,191,352 |
McAfee, Inc.(a) | | 227,800 | | | 7,631,300 |
Quest Software, Inc.(a) | | 125,347 | | | 1,589,400 |
Salesforce.com, Inc.(a) | | 169,200 | | | 5,537,916 |
Solera Holdings, Inc.(a) | | 270,900 | | | 6,712,902 |
Sybase, Inc.(a) | | 348,400 | | | 10,553,036 |
TIBCO Software, Inc.(a) | | 1,023,500 | | | 6,007,945 |
| | | | | |
| | | | | 56,432,126 |
| | | | | |
Specialty Retail — 4.2% | | | | | |
American Eagle Outfitters, Inc. | | 462,400 | | | 5,659,776 |
Chico’s FAS, Inc.(a) | | 1,047,300 | | | 5,624,001 |
Dick’s Sporting Goods, Inc.(a) | | 385,800 | | | 5,505,366 |
Group 1 Automotive, Inc. | | 208,100 | | | 2,907,157 |
Guess?, Inc. | | 266,400 | | | 5,615,712 |
J. Crew Group, Inc.(a)(b) | | 173,600 | | | 2,288,048 |
O’Reilly Automotive, Inc.(a) | | 162,800 | | | 5,699,628 |
Penske Auto Group, Inc. | | 302,400 | | | 2,821,392 |
Ross Stores, Inc. | | 167,100 | | | 5,995,548 |
Urban Outfitters, Inc.(a) | | 408,800 | | | 6,692,056 |
| | | | | |
| | | | | 48,808,684 |
| | | | | |
Textiles, Apparel & Luxury Goods — 1.1% | | | | | |
Iconix Brand Group, Inc.(a) | | 561,100 | | | 4,965,735 |
VF Corp. | | 140,000 | | | 7,995,400 |
| | | | | |
| | | | | 12,961,135 |
| | | | | |
Thrifts & Mortgage Finance — 1.9% | | | | | |
Brookline Bancorp, Inc. | | 181,200 | | | 1,721,400 |
Capitol Federal Financial | | 85,000 | | | 3,213,850 |
First Niagara Financial Group, Inc. | | 208,300 | | | 2,270,470 |
Hudson City Bancorp, Inc. | | 380,200 | | | 4,444,538 |
New York Community Bancorp, Inc.(b) | | 130,600 | | | 1,458,802 |
People’s United Financial, Inc. | | 368,800 | | | 6,627,336 |
Washington Federal, Inc. | | 172,100 | | | 2,287,209 |
| | | | | |
| | | | | 22,023,605 |
| | | | | |
Tobacco — 0.5% | | | | | |
Lorillard, Inc. | | 99,000 | | | 6,112,260 |
| | | | | |
Water Utilities — 0.3% | | | | | |
American States Water Co. | | 80,600 | | | 2,927,392 |
| | | | | |
Wireless Telecommunication Services — 1.5% | | | | | |
American Tower Corp. - Class A(a) | | 268,700 | | | 8,176,541 |
SBA Communications Corp. - Class A(a) | | 395,800 | | | 9,222,140 |
| | | | | |
| | | | | 17,398,681 |
| | | | | |
Total Long-Term Investments
(Cost — $1,157,637,681) — 91.3% | | | | | 1,062,499,720 |
| | | | | |
| | |
| | | Shares/
Beneficial
Interest | | |
Short-Term Securities | | | | | |
BlackRock Liquidity Funds, TempFund, 0.60%(c)(d) | | 50,000,000 | | | 50,000,000 |
BlackRock Liquidity Series, LLC Money Market Series, 1.17%(c)(d)(e) | | 112,805,750 | | | 112,805,750 |
TCW Money Market Fund, 0.31%(d) | | 44,741,933 | | | 44,741,933 |
| | | | | |
Total Short-Term Securities
(Cost — $207,547,683) — 17.8% | | | | | 207,547,683 |
| | | | | |
Total Investments Before Options Written
(Cost — $1,365,185,364*) — 109.1% | | | | | 1,270,047,403 |
| | | | | |
| | | | | | |
| | | SEMI-ANNUAL REPORT | | MARCH 31, 2009 | | 33 |
| | |
| Schedule of Investments (concluded) | | U.S. Opportunities Portfolio |
| | (Percentages shown are based on Net Assets) |
| | | | | | | |
| | | Contracts | | | Value | |
Options Written | | | | | | | |
Exchange-Traded Call Options Written | | | | | | | |
Torchmark Corp., Strike Price $30, Expires 4/21/09
(Premiums Received — $44,116) — (0.0)% | | (328 | ) | | $ | (20,500 | ) |
| | | | | | | |
Total Investments Net of Outstanding Options Written — 109.1% | | | | | | 1,270,026,903 | |
Liabilities in Excess of Other Assets — (9.1)% | | | | | | (105,602,684 | ) |
| | | | | | | |
Net Assets — 100.0% | | | | | $ | 1,164,424,219 | |
| | | | | | | |
| * | The cost and unrealized appreciation (depreciation) of investments as of March 31, 2009, as computed for federal income tax purposes, were as follows: |
| | | | |
Aggregate cost | | $ | 1,366,521,716 | |
| | | | |
Gross unrealized appreciation | | $ | 42,853,568 | |
Gross unrealized depreciation | | | (139,327,881 | ) |
| | | | |
Net unrealized depreciation | | $ | (96,474,313 | ) |
| | | | |
| (a) | Non-income producing security. |
| (b) | Security, or a portion of security, is on loan. |
| (c) | Investments in companies considered to be an affiliate of the Portfolio, for purposes of Section 2(a)(3) of the Investment Company Act of 1940, as amended, were as follows: |
| | | | | | | |
Affiliate | | Net
Activity | | | Income |
BlackRock Liquidity Funds, TempFund | | $ | 20,000,000 | ** | | $ | 607,335 |
BlackRock Liquidity Series, LLC Money Market Series | | $ | 33,444,250 | ** | | $ | 563,392 |
| ** | Represents net purchase cost. |
| (d) | Represents current yield as of report date. |
| (e) | Security purchased with the cash proceeds from securities loans. |
| • | | Financial futures contracts purchased as of March 31, 2009 were as follows: |
| | | | | | | | | | |
Contracts | | Issue | | Expiration
Date | | Face
Value | | Unrealized
Appreciation |
1,001 | | Russell ICE MINI | | June 2009 | | $ | 42,172,130 | | $ | 3,520,668 |
| | | | | | | | | | |
| • | | For Portfolio compliance purposes, the Portfolio’s industry classifications refer to any one or more of the industry sub-classifications used by one or more widely recognized market indexes or ratings group indexes, and/or as defined by Portfolio management. This definition may not apply for purposes of this report, which may combine industry sub-classifications for reporting ease. |
| • | | Effective October 1, 2008, the Portfolio adopted Financial Accounting Standards Board Statement of Financial Accounting Standards No. 157, “Fair Value Measurements”. FAS 157 clarifies the definition of fair value, establishes a framework for measuring fair values and requires additional disclosures about the use of fair value measurements. Various inputs are used in determining the fair value of investments, which are as follows: |
| | • | | Level 1 – price quotations in active markets/exchanges for identical securities |
| | • | | Level 2 – other observable inputs (including, but not limited to: quoted prices for similar assets or liabilities in markets that are active, quoted prices for identical or similar assets in markets that are not active, inputs other than quoted prices that are observable for the assets or liabilities (such as interest rates, yield curves, volatilities, prepayment speeds, loss severities, credit risks and default rates) or other market – corroborated inputs) |
| | • | | Level 3 – unobservable inputs based on the best information available in the circumstance, to the extent observable inputs are not available (including the Portfolio’s own assumptions used in determining the fair value of investments). |
The inputs or methodology used for valuing securities are not necessarily an indication of the risk associated with investing in those securities. For information about the Portfolio’s policy regarding valuation of investments and other significant accounting policies, please refer to Note 1 of the Notes to Financial Statements.
The following table summarizes the inputs used as of March 31, 2009 in determining the fair valuation of the Portfolio’s investments:
| | | | | | | | | | |
Valuation Inputs | | Investments
in Securities | | Other Financial
Instruments *** | |
| | | Assets | | Assets | | Liabilities | |
Level 1 | | $ | 1,270,047,403 | | $ | 3,520,668 | | $ | — | |
Level 2 | | | — | | | — | | | (20,500 | ) |
Level 3 | | | — | | | — | | | — | |
| | | | | | | | | | |
Total | | $ | 1,270,047,403 | | $ | 3,520,668 | | $ | (20,500 | ) |
| | | | | | | | | | |
| *** | Other financial instruments are futures contracts and options written. Futures contracts are valued at the unrealized appreciation/depreciation on the instrument and options written are shown at market value. |
See Notes to Financial Statements.
| | | | | | |
34 | | SEMI-ANNUAL REPORT | | MARCH 31, 2009 | | |
Statements of Assets and Liabilities
| | | | | | | | | | | | | | | | | | | | |
March 31, 2009 (Unaudited) | | Global
Opportunities
Portfolio | | | Health
Sciences
Opportunities
Portfolio | | | International
Opportunities
Portfolio | | | Science
& Technology
Opportunities
Portfolio | | | U.S.
Opportunities
Portfolio | |
Assets | | | | | | | | | | | | | | | | | | | | |
Investments at value - unaffiliated1,2 | | $ | 48,832,685 | | | $ | 776,608,648 | | | $ | 833,915,353 | | | $ | 91,740,899 | | | $ | 1,107,241,653 | |
Investments at value - affiliated3 | | | 190,812 | | | | 28,398,364 | | | | 1,740,000 | | | | 6,255,653 | | | | 162,805,750 | |
Cash | | | 288,828 | | | | 212 | | | | 9,233 | | | | — | | | | 4,731 | |
Cash collateral pledged for futures contracts | | | 117,270 | | | | — | | | | 8,956,053 | | | | — | | | | 6,443,000 | |
Cash collateral pledged for options written contracts | | | — | | | | 2,020,850 | | | | — | | | | — | | | | — | |
Foreign currency at value4 | | | 808,473 | | | | 4,176,833 | | | | 6,598,046 | | | | 576,704 | | | | — | |
Unrealized appreciation on foreign currency exchange contracts | | | 133,782 | | | | 1,173,853 | | | | 2,742,063 | | | | 26,453 | | | | — | |
Investments sold receivable | | | 185,011 | | | | 18,497,034 | | | | 3,359,375 | | | | 825,409 | | | | 12,559,256 | |
Capital shares sold receivable | | | 163,545 | | | | 2,190,380 | | | | 2,713,529 | | | | 177,963 | | | | 11,206,966 | |
Dividends and reclaims receivable | | | 119,506 | | | | 1,075,016 | | | | 3,376,835 | | | | 68,835 | | | | 887,342 | |
Receivable from advisor | | | 7,869 | | | | — | | | | 7,248 | | | | 47,010 | | | | 57,120 | |
Securities lending income receivable - affiliated | | | — | | | | 12,274 | | | | 682 | | | | 4,345 | | | | 52,063 | |
Dividends receivable - affiliated | | | 439 | | | | 10,973 | | | | 2,552 | | | | 2,829 | | | | 33,971 | |
Margin variation receivable | | | — | | | | — | | | | 1,276,515 | | | | — | | | | 653,796 | |
Prepaid expenses | | | 40,968 | | | | 100,175 | | | | 130,805 | | | | 58,777 | | | | 145,456 | |
Other assets | | | — | | | | 245 | | | | 90,130 | | | | — | | | | 67,441 | |
| | | | | | | | | | | | | | | | | | | | |
Total assets | | | 50,889,188 | | | | 834,264,857 | | | | 864,918,419 | | | | 99,784,877 | | | | 1,302,158,545 | |
| | | | | | | | | | | | | | | | | | | | |
Liabilities | | | | | | | | | | | | | | | | | | | | |
Collateral at value - securities loaned | | | — | | | | 17,354,250 | | | | 1,740,000 | | | | 1,261,500 | | | | 112,805,750 | |
Options written at value5 | | | — | | | | 61,960 | | | | — | | | | — | | | | 20,500 | |
Bank overdraft - affiliated | | | — | | | | — | | | | — | | | | 3,659 | | | | — | |
Unrealized depreciation on foreign currency exchange contracts | | | 228,669 | | | | 648,102 | | | | 6,548,101 | | | | 41,978 | | | | — | |
Investments purchased payable | | | 381,021 | | | | 12,644,546 | | | | 6,952,874 | | | | 776,945 | | | | 20,046,295 | |
Capital share redeemed payable | | | 234,510 | | | | 3,138,829 | | | | 3,545,382 | | | | 334,524 | | | | 3,397,408 | |
Other affiliates payable | | | 93,327 | | | | 595,645 | | | | 531,603 | | | | 224,459 | | | | 336,190 | |
Investment advisory fees payable | | | 30,670 | | | | 499,586 | | | | 684,844 | | | | 70,247 | | | | 780,121 | |
Service and distribution fees payable | | | 17,483 | | | | 326,330 | | | | 203,715 | | | | 30,728 | | | | 232,890 | |
Officer’s and Trustees’ fees payable | | | 6,448 | | | | 9,628 | | | | 9,631 | | | | 6,596 | | | | 7,052 | |
Margin variation payable | | | — | | | | — | | | | 655,010 | | | | — | | | | — | |
Other accrued expenses payable | | | 39,049 | | | | 208,482 | | | | 210,173 | | | | 10,606 | | | | 108,120 | |
| | | | | | | | | | | | | | | | | | | | |
Total liabilities | | | 1,031,177 | | | | 35,487,358 | | | | 21,081,333 | | | | 2,761,242 | | | | 137,734,326 | |
| | | | | | | | | | | | | | | | | | | | |
Net Assets | | $ | 49,858,011 | | | $ | 798,777,499 | | | $ | 843,837,086 | | | $ | 97,023,635 | | | $ | 1,164,424,219 | |
| | | | | | | | | | | | | | | | | | | | |
Net Assets Consist of | | | | | | | | | | | | | | | | | | | | |
Paid-in capital | | $ | 91,671,745 | | | $ | 915,898,117 | | | $ | 1,371,200,866 | | | $ | 439,122,267 | | | $ | 1,625,819,721 | |
Undistributed (distributions in excess of) net investment income (loss) | | | 1,208,218 | | | | (2,632,767 | ) | | | 23,041,388 | | | | (495,708 | ) | | | 5,574,961 | |
Accumulated net realized loss | | | (31,415,888 | ) | | | (72,505,788 | ) | | | (379,909,783 | ) | | | (317,483,358 | ) | | | (375,376,786 | ) |
Net unrealized appreciation/depreciation | | | (11,606,064 | ) | | | (41,982,063 | ) | | | (170,495,385 | ) | | | (24,119,566 | ) | | | (91,593,677 | ) |
| | | | | | | | | | | | | | | | | | | | |
Net Assets | | $ | 49,858,011 | | | $ | 798,777,499 | | | $ | 843,837,086 | | | $ | 97,023,635 | | | $ | 1,164,424,219 | |
| | | | | | | | | | | | | | | | | | | | |
1 Investments at cost - unaffiliated | | $ | 60,330,213 | | | $ | 819,170,354 | | | $ | 1,003,636,968 | | | $ | 115,837,837 | | | $ | 1,202,379,614 | |
2 Securities loaned at value | | | — | | | $ | 16,847,047 | | | $ | 1,714,480 | | | $ | 1,238,460 | | | $ | 111,467,290 | |
3 Investments at cost - affiliated | | $ | 190,812 | | | $ | 28,398,364 | | | $ | 1,740,000 | | | $ | 6,255,653 | | | $ | 162,805,750 | |
4 Foreign currency at cost | | $ | 820,658 | | | $ | 4,198,872 | | | $ | 6,093,578 | | | $ | 583,274 | | | | — | |
5 Premiums received - options written | | | — | | | $ | 153,339 | | | | — | | | | — | | | $ | 44,116 | |
See Notes to Financial Statements.
| | | | | | |
| | | SEMI-ANNUAL REPORT | | MARCH 31, 2009 | | 35 |
Statements of Assets and Liabilities (concluded)
| | | | | | | | | | | | | | | |
March 31, 2009 (Unaudited) | | Global
Opportunities
Portfolio | | Health
Sciences
Opportunities
Portfolio | | International
Opportunities
Portfolio | | Science
& Technology
Opportunities
Portfolio | | U.S.
Opportunities
Portfolio |
Net Asset Value | | | | | | | | | | | | | | | |
Institutional: | | | | | | | | | | | | | | | |
Net Assets | | $ | 11,263,451 | | $ | 136,110,656 | | $ | 325,250,863 | | $ | 18,637,998 | | $ | 436,844,348 |
| | | | | | | | | | | | | | | |
Shares outstanding, unlimited number of shares authorized, $0.001 par value | | | 1,609,658 | | | 6,406,090 | | | 15,595,942 | | | 3,387,902 | | | 19,242,003 |
| | | | | | | | | | | | | | | |
Net Asset Value | | $ | 7.00 | | $ | 21.25 | | $ | 20.85 | | $ | 5.50 | | $ | 22.70 |
| | | | | | | | | | | | | | | |
Service: | | | | | | | | | | | | | | | |
Net Assets | | | — | | $ | 5,406,046 | | $ | 47,325,003 | | $ | 58,643 | | $ | 115,438,046 |
| | | | | | | | | | | | | | | |
Shares outstanding, unlimited number of shares authorized, $0.001 par value | | | — | | | 259,511 | | | 2,348,820 | | | 10,962 | | | 5,280,836 |
| | | | | | | | | | | | | | | |
Net Asset Value | | | — | | $ | 20.83 | | $ | 20.15 | | $ | 5.35 | | $ | 21.86 |
| | | | | | | | | | | | | | | |
Investor A: | | | | | | | | | | | | | | | |
Net Assets | | $ | 24,979,819 | | $ | 382,337,311 | | $ | 332,711,863 | | $ | 56,037,991 | | $ | 465,955,123 |
| | | | | | | | | | | | | | | |
Shares outstanding, unlimited number of shares authorized, $0.001 par value | | | 3,593,125 | | | 18,386,748 | | | 16,653,197 | | | 10,588,615 | | | 21,531,507 |
| | | | | | | | | | | | | | | |
Net Asset Value | | $ | 6.95 | | $ | 20.79 | | $ | 19.98 | | $ | 5.29 | | $ | 21.64 |
| | | | | | | | | | | | | | | |
Investor B: | | | | | | | | | | | | | | | |
Net Assets | | $ | 3,213,901 | | $ | 54,627,520 | | $ | 24,238,152 | | $ | 6,076,140 | | $ | 15,267,399 |
| | | | | | | | | | | | | | | |
Shares outstanding, unlimited number of shares authorized, $0.001 par value | | | 470,567 | | | 2,771,111 | | | 1,303,601 | | | 1,231,950 | | | 764,280 |
| | | | | | | | | | | | | | | |
Net Asset Value | | $ | 6.83 | | $ | 19.71 | | $ | 18.59 | | $ | 4.93 | | $ | 19.98 |
| | | | | | | | | | | | | | | |
Investor C: | | | | | | | | | | | | | | | |
Net Assets | | $ | 10,400,840 | | $ | 220,295,966 | | $ | 114,311,205 | | $ | 14,959,078 | | $ | 130,919,303 |
| | | | | | | | | | | | | | | |
Shares outstanding, unlimited number of shares authorized, $0.001 par value | | | 1,524,680 | | | 11,194,604 | | | 6,166,254 | | | 3,033,846 | | | 6,557,364 |
| | | | | | | | | | | | | | | |
Net Asset Value | | $ | 6.82 | | $ | 19.68 | | $ | 18.54 | | $ | 4.93 | | $ | 19.97 |
| | | | | | | | | | | | | | | |
R: | | | | | | | | | | | | | | | |
Net Assets | | | — | | | — | | | — | | $ | 1,253,785 | | | — |
| | | | | | | | | | | | | | | |
Shares outstanding, unlimited number of shares authorized, $0.001 par value | | | — | | | — | | | — | | | 229,101 | | | — |
| | | | | | | | | | | | | | | |
Net Asset Value | | | — | | | — | | | — | | $ | 5.47 | | | — |
| | | | | | | | | | | | | | | |
See Notes to Financial Statements.
| | | | | | |
36 | | SEMI-ANNUAL REPORT | | MARCH 31, 2009 | | |
Statements of Operations
| | | | | | | | | | | | | | | | | | | | |
Six Months Ended March 31, 2009 (Unaudited) | | Global
Opportunities
Portfolio | | | Health Sciences
Opportunities
Portfolio | | | International
Opportunities
Portfolio | | | Science &
Technology
Opportunities
Portfolio | | | U.S.
Opportunities
Portfolio | |
Investment Income | | | | | | | | | | | | | | | | | | | | |
Dividends and reclaims | | $ | 591,103 | | | $ | 5,662,453 | | | $ | 12,408,468 | | | $ | 622,420 | | | $ | 8,554,407 | |
Interest | | | 9,895 | | | | 20,329 | | | | 51,537 | | | | 3,967 | | | | 55,808 | |
Interest and dividends - affiliated | | | 2,110 | | | | 305,712 | | | | 447,116 | | | | 5,965 | | | | 608,712 | |
Securities lending - affiliated | | | — | | | | 104,546 | | | | 13,865 | | | | 3,851 | | | | 563,392 | |
Foreign taxes withheld | | | (21,843 | ) | | | (172,850 | ) | | | (666,291 | ) | | | (8,052 | ) | | | — | |
| | | | | | | | | | | | | | | | | | | | |
Total investment income | | | 581,265 | | | | 5,920,190 | | | | 12,254,695 | | | | 628,151 | | | | 9,782,319 | |
| | | | | | | | | | | | | | | | | | | | |
Expenses | | | | | | | | | | | | | | | | | | | | |
Investment advisory | | | 276,334 | | | | 3,284,046 | | | | 4,369,844 | | | | 474,274 | | | | 5,330,522 | |
Service and distribution - class specific | | | 112,053 | | | | 2,036,007 | | | | 1,263,173 | | | | 187,461 | | | | 1,308,311 | |
Transfer agent - class specific | | | 70,265 | | | | 961,445 | | | | 1,155,007 | | | | 526,643 | | | | 1,020,774 | |
Custodian | | | 36,058 | | | | 39,762 | | | | 343,972 | | | | 15,264 | | | | 42,581 | |
Administration | | | 23,028 | | | | 309,406 | | | | 308,737 | | | | 39,523 | | | | 338,582 | |
Professional | | | 17,914 | | | | 30,642 | | | | 39,206 | | | | 19,816 | | | | 24,340 | |
Printing | | | 15,734 | | | | 178,294 | | | | 209,002 | | | | 20,730 | | | | 157,294 | |
Registration | | | 14,740 | | | | 35,790 | | | | 53,130 | | | | 24,458 | | | | 64,158 | |
Officer and Trustees | | | 7,900 | | | | 13,005 | | | | 13,611 | | | | 8,056 | | | | 13,232 | |
Administration - class specific | | | 7,697 | | | | 109,683 | | | | 109,445 | | | | 13,191 | | | | 120,928 | |
Miscellaneous | | | 12,667 | | | | 23,742 | | | | 37,462 | | | | 8,855 | | | | 15,124 | |
| | | | | | | | | | | | | | | | | | | | |
Total expenses | | | 594,390 | | | | 7,021,822 | | | | 7,902,589 | | | | 1,338,271 | | | | 8,435,846 | |
Less fees waived by advisor | | | (7,035 | ) | | | (17,750 | ) | | | (24,712 | ) | | | (528 | ) | | | (1,131,298 | ) |
Less administration fees waived - class specific | | | (7,251 | ) | | | — | | | | (15,638 | ) | | | (13,191 | ) | | | (50,279 | ) |
Less transfer agent fees waived - class specific | | | (5,006 | ) | | | — | | | | (3,135 | ) | | | (9,475 | ) | | | (7,602 | ) |
Less transfer agent fees reimbursed - class specific | | | (38,873 | ) | | | — | | | | (32,476 | ) | | | (338,459 | ) | | | (250,227 | ) |
Less fees paid indirectly | | | (180 | ) | | | (2,125 | ) | | | (1,964 | ) | | | (460 | ) | | | (2,551 | ) |
| | | | | | | | | | | | | | | | | | | | |
Total expenses after waivers, reimbursement and fees paid indirectly | | | 536,045 | | | | 7,001,947 | | | | 7,824,664 | | | | 976,158 | | | | 6,993,889 | |
| | | | | | | | | | | | | | | | | | | | |
Net investment income (loss) | | | 45,220 | | | | (1,081,757 | ) | | | 4,430,031 | | | | (348,007 | ) | | | 2,788,430 | |
| | | | | | | | | | | | | | | | | | | | |
Realized and Unrealized Gain (Loss) | | | | | | | | | | | | | | | | | | | | |
Net realized gain (loss) from: | | | | | | | | | | | | | | | | | | | | |
Investments | | | (25,847,298 | ) | | | (82,379,773 | ) | | | (304,880,181 | ) | | | (26,369,862 | ) | | | (255,312,230 | ) |
Options written | | | 4,200 | | | | 4,145,119 | | | | — | | | | — | | | | 335,945 | |
Futures | | | (1,441,339 | ) | | | — | | | | (41,817,587 | ) | | | — | | | | (49,564,243 | ) |
Foreign currency transactions | | | (1,321,218 | ) | | | 7,631,699 | | | | (22,696,746 | ) | | | (301,826 | ) | | | — | |
| | | | | | | | | | | | | | | | | | | | |
| | | (28,605,655 | ) | | | (70,602,955 | ) | | | (369,394,514 | ) | | | (26,671,688 | ) | | | (304,540,528 | ) |
| | | | | | | | | | | | | | | | | | | | |
Net change in unrealized appreciation/depreciation on: | | | | | | | | | | | | | | | | | | | | |
Investments | | | (1,715,608 | ) | | | (128,211,160 | ) | | | (14,160,222 | ) | | | (5,709,633 | ) | | | (23,952,579 | ) |
Options written | | | — | | | | 91,379 | | | | — | | | | — | | | | 23,616 | |
Futures | | | 318,710 | | | | — | | | | 5,649,505 | | | | — | | | | 6,073,400 | |
Foreign currency transactions | | | 1,314,078 | | | | (4,596,463 | ) | | | 17,427,886 | | | | (98,081 | ) | | | — | |
| | | | | | | | | | | | | | | | | | | | |
| | | (82,820 | ) | | | (132,716,244 | ) | | | 8,917,169 | | | | (5,807,714 | ) | | | (17,855,563 | ) |
| | | | | | | | | | | | | | | | | | | | |
Total realized and unrealized loss | | | (28,688,475 | ) | | | (203,319,199 | ) | | | (360,477,345 | ) | | | (32,479,402 | ) | | | (322,396,091 | ) |
| | | | | | | | | | | | | | | | | | | | |
Net Decrease in Net Assets Resulting from Operations | | $ | (28,643,255 | ) | | $ | (204,400,956 | ) | | $ | (356,047,314 | ) | | $ | (32,827,409 | ) | | $ | (319,607,661 | ) |
| | | | | | | | | | | | | | | | | | | | |
See Notes to Financial Statements.
| | | | | | |
| | | SEMI-ANNUAL REPORT | | MARCH 31, 2009 | | 37 |
Statements of Changes in Net Assets
| | | | | | | | | | | | | | | | |
| | | Global
Opportunities
Portfolio | | | Health Sciences
Opportunities
Portfolio | |
Increase (Decrease) in Net Assets: | | Six Months
Ended
March 31, 2009
(Unaudited) | | | Year Ended
September 30,
2008 | | | Six Months
Ended
March 31, 2009
(Unaudited) | | | Year Ended
September 30,
2008 | |
Operations | | | | | | | | | | | | | | | | |
Net investment income (loss) | | $ | 45,220 | | | $ | 462,173 | | | $ | (1,081,757 | ) | | $ | (3,279,561 | ) |
Net realized gain (loss) | | | (28,605,655 | ) | | | (361,669 | ) | | | (70,602,955 | ) | | | 94,473,824 | |
Net change in unrealized appreciation/depreciation | | | (82,820 | ) | | | (27,365,968 | ) | | | (132,716,244 | ) | | | (122,613,081 | ) |
| | | | | | | | | | | | | | | | |
Net decrease in net assets resulting from operations | | | (28,643,255 | ) | | | (27,265,464 | ) | | | (204,400,956 | ) | | | (31,418,818 | ) |
| | | | | | | | | | | | | | | | |
Dividends and Distributions to Shareholders From | | | | | | | | | | | | | | | | |
Net investment income: | | | | | | | | | | | | | | | | |
Institutional | | | (13,294 | ) | | | (516,368 | ) | | | — | | | | — | |
Service | | | — | | | | — | | | | — | | | | — | |
Investor A | | | — | | | | (438,794 | ) | | | — | | | | — | |
Investor B | | | — | | | | (18,976 | ) | | | — | | | | — | |
Investor C | | | — | | | | (63,696 | ) | | | — | | | | — | |
Net realized gain: | | | | | | | | | | | | | | | | |
Institutional | | | — | | | | (1,500,686 | ) | | | (14,779,840 | ) | | | (6,907,979 | ) |
Service | | | — | | | | — | | | | (476,833 | ) | | | (294,520 | ) |
Investor A | | | — | | | | (1,612,774 | ) | | | (41,129,678 | ) | | | (26,251,005 | ) |
Investor B | | | — | | | | (310,579 | ) | | | (5,993,765 | ) | | | (2,732,260 | ) |
Investor C | | | — | | | | (756,979 | ) | | | (22,988,455 | ) | | | (11,313,900 | ) |
| | | | | | | | | | | | | | | | |
Decrease in net assets resulting from dividends and distributions to shareholders | | | (13,294 | ) | | | (5,218,852 | ) | | | (85,368,571 | ) | | | (47,499,664 | ) |
| | | | | | | | | | | | | | | | |
Capital Share Transactions | | | | | | | | | | | | | | | | |
Net increase (decrease) in net assets derived from capital share transactions | | | (19,381,206 | ) | | | 28,333,404 | | | | (53,426,419 | ) | | | (116,325,620 | ) |
| | | | | | | | | | | | | | | | |
Redemption Fees | | | | | | | | | | | | | | | | |
Redemption fees | | | 2,676 | | | | 8,217 | | | | 49,591 | | | | 38,516 | |
| | | | | | | | | | | | | | | | |
Net Assets | | | | | | | | | | | | | | | | |
Total increase (decrease) in net assets | | | (48,035,079 | ) | | | (4,142,695 | ) | | | (343,146,355 | ) | | | (195,205,586 | ) |
Beginning of period | | | 97,893,090 | | | | 102,035,785 | | | | 1,141,923,854 | | | | 1,337,129,440 | |
| | | | | | | | | | | | | | | | |
End of period | | $ | 49,858,011 | | | $ | 97,893,090 | | | $ | 798,777,499 | | | $ | 1,141,923,854 | |
| | | | | | | | | | | | | | | | |
End of period undistributed (distributions in excess of) net investment income (loss) | | $ | 1,208,218 | | | $ | 1,176,292 | | | $ | (2,632,767 | ) | | $ | (1,551,010 | ) |
| | | | | | | | | | | | | | | | |
See Notes to Financial Statements.
| | | | | | |
38 | | SEMI-ANNUAL REPORT | | MARCH 31, 2009 | | |
| | | | | | | | | | | | | | | | | | | | | | |
| International Opportunities Portfolio | | | Science & Technology Opportunities
Portfolio | | | U.S. Opportunities Portfolio | |
Six Months Ended
March 31, 2009
(Unaudited) | | | Year Ended
September 30,
2008 | | | Six Months
Ended
March 31, 2009
(Unaudited) | | | Year Ended
September 30,
2008 | | | Six Months
Ended
March��31, 2009
(Unaudited) | | | Year Ended
September 30,
2008 | |
| | | | | | | | | | | | | | | | | | | | | | |
| $ | 4,430,031 | | | $ | 11,548,174 | | | $ | (348,007 | ) | | $ | (524,742 | ) | | $ | 2,788,430 | | | $ | (1,731,225 | ) |
| | (369,394,514 | ) | | | 38,698,096 | | | | (26,671,688 | ) | | | (677,640 | ) | | | (304,540,528 | ) | | | (11,717,699 | ) |
| | 8,917,169 | | | | (598,796,282 | ) | | | (5,807,714 | ) | | | (18,195,547 | ) | | | (17,855,563 | ) | | | (147,024,317 | ) |
| | | | | | | | | | | | | | | | | | | | | | | |
| | (356,047,314 | ) | | | (548,550,012 | ) | | | (32,827,409 | ) | | | (19,397,929 | ) | | | (319,607,661 | ) | | | (160,473,241 | ) |
| | | | | | | | | | | | | | | | | | | | | | | |
| | | | | | | | | | | | | | | | | | | | | | |
| | | | | | | | | | | | | | | | | | | | | | |
| | (1,523,480 | ) | | | (11,844,156 | ) | | | — | | | | — | | | | (60,616 | ) | | | — | |
| | — | | | | (3,649,556 | ) | | | — | | | | — | | | | — | | | | — | |
| | (153,036 | ) | | | (11,746,350 | ) | | | — | | | | — | | | | — | | | | — | |
| | — | | | | (1,437,329 | ) | | | — | | | | — | | | | — | | | | — | |
| | — | | | | (3,891,839 | ) | | | — | | | | — | | | | — | | | | — | |
| | | | | | | | | | | | | | | | | | | | | | |
| | — | | | | (70,893,490 | ) | | | — | | | | — | | | | — | | | | — | |
| | — | | | | (25,020,162 | ) | | | — | | | | — | | | | — | | | | — | |
| | — | | | | (81,040,060 | ) | | | — | | | | — | | | | — | | | | — | |
| | — | | | | (15,320,494 | ) | | | — | | | | — | | | | — | | | | — | |
| | — | | | | (39,325,420 | ) | | | — | | | | — | | | | — | | | | — | |
| | | | | | | | | | | | | | | | | | | | | | | |
| | (1,676,516 | ) | | | (264,168,856 | ) | | | — | | | | — | | | | (60,616 | ) | | | — | |
| | | | | | | | | | | | | | | | | | | | | | | |
| | | | | | | | | | | | | | | | | | | | | | |
| | (33,015,788 | ) | | | 468,735,342 | | | | (20,643,641 | ) | | | 127,894,166 | | | | 413,759,593 | | | | 675,253,305 | |
| | | | | | | | | | | | | | | | | | | | | | | |
| | | | | | | | | | | | | | | | | | | | | | |
| | 83,062 | | | | 105,456 | | | | 4,847 | | | | 4,608 | | | | 208,633 | | | | 64,821 | |
| | | | | | | | | | | | | | | | | | | | | | | |
| | | | | | | | | | | | | | | | | | | | | | |
| | (390,656,556 | ) | | | (343,878,070 | ) | | | (53,466,203 | ) | | | 108,500,845 | | | | 94,299,949 | | | | 514,844,885 | |
| | 1,234,493,642 | | | | 1,578,371,712 | | | | 150,489,838 | | | | 41,988,993 | | | | 1,070,124,270 | | | | 555,279,385 | |
| | | | | | | | | | | | | | | | | | | | | | | |
| $ | 843,837,086 | | | $ | 1,234,493,642 | | | $ | 97,023,635 | | | $ | 150,489,838 | | | $ | 1,164,424,219 | | | $ | 1,070,124,270 | |
| | | | | | | | | | | | | | | | | | | | | | | |
| $ | 23,041,388 | | | $ | 20,287,873 | | | $ | (495,708 | ) | | $ | (147,701 | ) | | $ | 5,574,961 | | | $ | 2,847,147 | |
| | | | | | | | | | | | | | | | | | | | | | | |
See Notes to Financial Statements.
| | | | | | |
| | | SEMI-ANNUAL REPORT | | MARCH 31, 2009 | | 39 |
| | |
| Financial Highlights | | Global Opportunities Portfolio |
| | | | | | | | | | | | | | | | |
| | | Institutional | |
| | Six Months
Ended
March 31, 2009
(Unaudited) | | | Year Ended
September 30, | | | Period
January 31, 20061 to
September 30, 2006 | |
| | | 2008 | | | 2007 | | |
Per Share Operating Performance | |
Net asset value, beginning of period | | $ | 9.96 | | | $ | 13.31 | | | $ | 10.10 | | | $ | 10.00 | |
| | | | | | | | | | | | | | | | |
Net investment income2 | | | 0.02 | | | | 0.09 | | | | 0.09 | | | | 0.08 | |
Net realized and unrealized gain (loss) | | | (2.97 | ) | | | (2.77 | ) | | | 3.21 | | | | 0.01 | |
| | | | | | | | | | | | | | | | |
Net increase (decrease) from investment operations | | | (2.95 | ) | | | (2.68 | ) | | | 3.30 | | | | 0.09 | |
| | | | | | | | | | | | | | | | |
Dividends and distributions from: | | | | | | | | | | | | | | | | |
Net investment income | | | (0.01 | ) | | | (0.17 | ) | | | (0.09 | ) | | | — | |
Net realized gain | | | — | | | | (0.50 | ) | | | — | | | | — | |
| | | | | | | | | | | | | | | | |
Total dividends and distributions | | | (0.01 | ) | | | (0.67 | ) | | | (0.09 | ) | | | — | |
| | | | | | | | | | | | | | | | |
Redemption fees added to paid-in capital | | | 0.00 | 3 | | | 0.00 | 3 | | | 0.00 | 3 | | | 0.01 | |
| | | | | | | | | | | | | | | | |
Net asset value, end of period | | $ | 7.00 | | | $ | 9.96 | | | $ | 13.31 | | | $ | 10.10 | |
| | | | | | | | | | | | | | | | |
Total Investment Return | |
Based on net asset value | | | (29.67 | )%4,5 | | | (21.16 | )%4 | | | 32.81 | %4 | | | 1.00 | %5,6 |
| | | | | | | | | | | | | | | | |
Ratios to Average Net Assets | |
Total expenses after waivers, reimbursement and fees paid indirectly | | | 1.35 | %7 | | | 1.32 | % | | | 1.29 | % | | | 1.35 | %7 |
| | | | | | | | | | | | | | | | |
Total expenses | | | 1.51 | %7 | | | 1.33 | % | | | 1.32 | % | | | 2.25 | %7 |
| | | | | | | | | | | | | | | | |
Net investment income | | | 0.51 | %7 | | | 0.77 | % | | | 0.78 | % | | | 1.13 | %7 |
| | | | | | | | | | | | | | | | |
Supplemental Data | |
Net assets, end of period (000) | | $ | 11,263 | | | $ | 36,625 | | | $ | 35,679 | | | $ | 9,099 | |
| | | | | | | | | | | | | | | | |
Portfolio turnover | | | 96 | % | | | 181 | % | | | 107 | % | | | 110 | % |
| | | | | | | | | | | | | | | | |
| | | | | | | | | | | | | | | | | | | | | | | | | | | | | | | | |
| | | Investor A | | | Investor B | |
| | | Six Months
Ended
March 31, 2009
(Unaudited) | | | Year Ended
September 30, | | | Period
January 31, 20061 to
September 30, 2006 | | | Six Months
Ended
March 31, 2009
(Unaudited) | | | Year Ended
September 30, | | | Period
January 31, 20061 to
September 30, 2006 | |
| | | 2008 | | | 2007 | | | | | 2008 | | | 2007 | | |
Per Share Operating Performance | |
Net asset value, beginning of period | | $ | 9.92 | | | $ | 13.27 | | | $ | 10.08 | | | $ | 10.00 | | | $ | 9.83 | | | $ | 13.16 | | | $ | 10.03 | | | $ | 10.00 | |
| | | | | | | | | | | | | | | | | | | | | | | | | | | | | | | | |
Net investment income (loss)2 | | | 0.01 | | | | 0.06 | | | | 0.04 | | | | 0.05 | | | | (0.02 | ) | | | (0.04 | ) | | | (0.04 | ) | | | 0.00 | 8 |
Net realized and unrealized gain (loss) | | | (2.98 | ) | | | (2.77 | ) | | | 3.22 | | | | 0.02 | | | | (2.98 | ) | | | (2.76 | ) | | | 3.22 | | | | 0.02 | |
| | | | | | | | | | | | | | | | | | | | | | | | | | | | | | | | |
Net increase (decrease) from investment operations | | | (2.97 | ) | | | (2.71 | ) | | | 3.26 | | | | 0.07 | | | | (3.00 | ) | | | (2.80 | ) | | | 3.18 | | | | 0.02 | |
| | | | | | | | | | | | | | | | | | | | | | | | | | | | | | | | |
Dividends and distributions from: | | | | | | | | | | | | | | | | | | | | | | | | | | | | | | | | |
Net investment income | | | — | | | | (0.14 | ) | | | (0.07 | ) | | | — | | | | — | | | | (0.03 | ) | | | (0.05 | ) | | | — | |
Net realized gain | | | — | | | | (0.50 | ) | | | — | | | | — | | | | — | | | | (0.50 | ) | | | — | | | | — | |
| | | | | | | | | | | | | | | | | | | | | | | | | | | | | | | | |
Total dividends and distributions | | | — | | | | (0.64 | ) | | | (0.07 | ) | | | — | | | | — | | | | (0.53 | ) | | | (0.05 | ) | | | — | |
| | | | | | | | | | | | | | | | | | | | | | | | | | | | | | | | |
Redemption fees added to paid-in capital | | | 0.00 | 3 | | | 0.00 | 3 | | | 0.00 | 3 | | | 0.01 | | | | 0.00 | 3 | | | 0.00 | 3 | | | 0.00 | 3 | | | 0.01 | |
| | | | | | | | | | | | | | | | | | | | | | | | | | | | | | | | |
Net asset value, end of period | | $ | 6.95 | | | $ | 9.92 | | | $ | 13.27 | | | $ | 10.08 | | | $ | 6.83 | | | $ | 9.83 | | | $ | 13.16 | | | $ | 10.03 | |
| | | | | | | | | | | | | | | | | | | | | | | | | | | | | | | | |
Total Investment Return | |
Based on net asset value9 | | | (29.94 | )%4,5 | | | (21.44 | )%4 | | | 32.51 | %4 | | | 0.80 | %5,6 | | | (30.52 | )%4,5 | | | (22.13 | )%4 | | | 31.79 | %4 | | | 0.30 | %5,6 |
| | | | | | | | | | | | | | | | | | | | | | | | | | | | | | | | |
Ratios to Average Net Assets | |
Total expenses after waivers, reimbursement and fees paid indirectly | | | 1.65 | %7 | | | 1.60 | % | | | 1.56 | % | | | 1.65 | %7 | | | 2.40 | %7 | | | 2.36 | % | | | 2.33 | % | | | 2.40 | %7 |
| | | | | | | | | | | | | | | | | | | | | | | | | | | | | | | | |
Total expenses | | | 1.83 | %7 | | | 1.60 | % | | | 1.68 | % | | | 2.84 | %7 | | | 2.70 | %7 | | | 2.37 | % | | | 3.06 | % | | | 4.95 | %7 |
| | | | | | | | | | | | | | | | | | | | | | | | | | | | | | | | |
Net investment income (loss) | | | 0.26 | %7 | | | 0.49 | % | | | 0.36 | % | | | 0.70 | %7 | | | (0.48 | )%7 | | | (0.30 | )% | | | (0.39 | )% | | | (0.05 | )%7 |
| | | | | | | | | | | | | | | | | | | | | | | | | | | | | | | | |
Supplemental Data | |
Net assets, end of period (000) | | $ | 24,980 | | | $ | 37,529 | | | $ | 40,467 | | | $ | 23,097 | | | $ | 3,214 | | | $ | 5,665 | | | $ | 7,673 | | | $ | 4,907 | |
| | | | | | | | | | | | | | | | | | | | | | | | | | | | | | | | |
Portfolio turnover | | | 96 | % | | | 181 | % | | | 107 | % | | | 110 | % | | | 96 | % | | | 181 | % | | | 107 | % | | | 110 | % |
| | | | | | | | | | | | | | | | | | | | | | | | | | | | | | | | |
See Notes to Financial Statements.
| | | | | | |
40 | | SEMI-ANNUAL REPORT | | MARCH 31, 2009 | | |
| | |
| Financial Highlights (continued) | | Global Opportunities Portfolio |
| | | | | | | | | | | | | | | | |
| | | Investor C | |
| | | Six Months
Ended
March 31, 2009
(Unaudited) | | | Year Ended
September 30, | | | Period
January 31, 20061 to
September 30, 2006 | |
| | | 2008 | | | 2007 | | |
Per Share Operating Performance | |
Net asset value, beginning of period | | $ | 9.82 | | | $ | 13.16 | | | $ | 10.03 | | | $ | 10.00 | |
| | | | | | | | | | | | | | | | |
Net investment income (loss)2 | | | (0.02 | ) | | | (0.03 | ) | | | (0.05 | ) | | | 0.00 | 3 |
Net realized and unrealized gain (loss) | | | (2.98 | ) | | | (2.77 | ) | | | 3.23 | | | | 0.02 | |
| | | | | | | | | | | | | | | | |
Net increase (decrease) from investment operations | | | (3.00 | ) | | | (2.80 | ) | | | 3.18 | | | | 0.02 | |
| | | | | | | | | | | | | | | | |
Dividends and distributions from: | | | | | | | | | | | | | | | | |
Net investment income | | | — | | | | (0.04 | ) | | | (0.05 | ) | | | — | |
Net realized gain | | | — | | | | (0.50 | ) | | | — | | | | — | |
| | | | | | | | | | | | | | | | |
Total dividends and distributions | | | — | | | | (0.54 | ) | | | (0.05 | ) | | | — | |
| | | | | | | | | | | | | | | | |
Redemption fees added to paid-in capital | | | 0.00 | 3 | | | 0.00 | 3 | | | 0.00 | 3 | | | 0.01 | |
| | | | | | | | | | | | | | | | |
Net asset value, end of period | | $ | 6.82 | | | $ | 9.82 | | | $ | 13.16 | | | $ | 10.03 | |
| | | | | | | | | | | | | | | | |
Total Investment Return | |
Based on net asset value9 | | | (30.55 | )%4,5 | | | (22.14 | )%4 | | | 31.76 | %4 | | | 0.30 | %5,6 |
| | | | | | | | | | | | | | | | |
Ratios to Average Net Assets | |
Total expenses after waivers, reimbursement and fees paid indirectly | | | 2.40 | %7 | | | 2.37 | % | | | 2.35 | % | | | 2.40 | %7 |
| | | | | | | | | | | | | | | | |
Total expenses | | | 2.63 | %7 | | | 2.38 | % | | | 2.42 | % | | | 3.38 | %7 |
| | | | | | | | | | | | | | | | |
Net investment loss | | | (0.48 | )%7 | | | (0.26 | )% | | | (0.40 | )% | | | (0.01 | )%7 |
| | | | | | | | | | | | | | | | |
Supplemental Data | |
Net assets, end of period (000) | | $ | 10,401 | | | $ | 18,074 | | | $ | 18,217 | | | $ | 10,012 | |
| | | | | | | | | | | | | | | | |
Portfolio turnover | | | 96 | % | | | 181 | % | | | 107 | % | | | 110 | % |
| | | | | | | | | | | | | | | | |
| 1 | Commencement of operations. |
| 2 | Based on average shares outstanding. |
| 3 | Less than $0.01 per share. |
| 4 | Redemption fee of 2.00% received by the Portfolio is reflected in total return calculations. There was no impact to the return. |
| 5 | Aggregate total investment return. |
| 6 | Redemption fee of 2.00% received by the Portfolio is reflected in total return calculations. The impact to the return from redemption fees received during the period was an increase of 0.10%. |
| 8 | Net investment income (loss) is less than $0.005 per share. |
| 9 | Total investment returns exclude the effects of sales charges. |
See Notes to Financial Statements.
| | | | | | |
| | | SEMI-ANNUAL REPORT | | MARCH 31, 2009 | | 41 |
| | |
| Financial Highlights (continued) | | Health Sciences Opportunities Portfolio |
| | | | | | | | | | | | | | | | | | | | | | | | | | | | |
| | | Institutional | |
| | | Six Months
Ended
March 31, 2009
(Unaudited) | | | Year Ended September 30, | | | Period
March 1, 2005 to
September 30, 2005 | | | Year
Ended
February 28, 2005 | | | Year
Ended
February 29, 2004 | |
| | | 2008 | | | 2007 | | | 2006 | | | | |
Per Share Operating Performance | |
Net asset value, beginning of period | | $ | 28.77 | | | $ | 30.41 | | | $ | 26.18 | | | $ | 24.45 | | | $ | 20.50 | | | $ | 21.15 | | | $ | 11.64 | |
| | | | | | | | | | | | | | | | | | | | | | | | | | | | |
Net investment income (loss) | | | 0.04 | 1 | | | 0.08 | 1 | | | 0.06 | 1 | | | 0.04 | 1 | | | (0.06 | )1 | | | (0.15 | ) | | | (0.06 | ) |
Net realized and unrealized gain (loss) | | | (5.14 | ) | | | (0.49 | ) | | | 4.52 | | | | 2.30 | | | | 4.02 | | | | 0.57 | | | | 10.21 | |
| | | | | | | | | | | | | | | | | | | | | | | | | | | | |
Net increase (decrease) from investment operations | | | (5.10 | ) | | | (0.41 | ) | | | 4.58 | | | | 2.34 | | | | 3.96 | | | | 0.42 | | | | 10.15 | |
| | | | | | | | | | | | | | | | | | | | | | | | | | | | |
Distributions from net realized gain | | | (2.42 | ) | | | (1.23 | ) | | | (0.35 | ) | | | (0.62 | ) | | | (0.01 | ) | | | (1.07 | ) | | | (0.64 | ) |
| | | | | | | | | | | | | | | | | | | | | | | | | | | | |
Redemption fees added to paid-in capital | | | 0.00 | 2 | | | 0.00 | 2 | | | 0.00 | 2 | | | 0.01 | | | | 0.00 | 2 | | | — | | | | — | |
| | | | | | | | | | | | | | | | | | | | | | | | | | | | |
Net asset value, end of period | | $ | 21.25 | | | $ | 28.77 | | | $ | 30.41 | | | $ | 26.18 | | | $ | 24.45 | | | $ | 20.50 | | | $ | 21.15 | |
| | | | | | | | | | | | | | | | | | | | | | | | | | | | |
Total Investment Return | |
Based on net asset value | | | (17.63 | )%3,4 | | | (1.64 | )%3 | | | 17.68 | %3 | | | 9.77 | %5 | | | 19.32 | %3,4 | | | 1.84 | % | | | 87.73 | % |
| | | | | | | | | | | | | | | | | | | | | | | | | | | | |
Ratios to Average Net Assets | |
Total expenses after waivers, reimbursement and fees paid indirectly | | | 1.03 | %6 | | | 1.00 | % | | | 1.02 | % | | | 1.01 | % | | | 1.25 | %6 | | | 1.25 | % | | | 1.25 | % |
| | | | | | | | | | | | | | | | | | | | | | | | | | | | |
Total expenses | | | 1.03 | %6 | | | 1.00 | % | | | 1.02 | % | | | 1.01 | % | | | 1.37 | %6 | | | 1.37 | % | | | 1.84 | % |
| | | | | | | | | | | | | | | | | | | | | | | | | | | | |
Net investment income (loss) | | | 0.32 | %6 | | | 0.28 | % | | | 0.21 | % | | | 0.17 | % | | | (0.47 | )%6 | | | (0.59 | )% | | | (0.38 | )% |
| | | | | | | | | | | | | | | | | | | | | | | | | | | | |
Supplemental Data | |
Net assets, end of period (000) | | $ | 136,111 | | | $ | 185,933 | | | $ | 172,902 | | | $ | 112,563 | | | $ | 31,229 | | | $ | 4,262 | | | $ | 5,067 | |
| | | | | | | | | | | | | | | | | | | | | | | | | | | | |
Portfolio turnover | | | 72 | % | | | 91 | % | | | 98 | % | | | 157 | % | | | 77 | % | | | 173 | % | | | 106 | % |
| | | | | | | | | | | | | | | | | | | | | | | | | | | | |
| | | | | | | | | | | | | | | | | | | | | | | | |
| | | Service | |
| | | Six Months
Ended
March 31, 2009
(Unaudited) | | | Year Ended September 30, | | | Period
March 1, 2005 to
September 30, 2005 | | | Period
January 28, 20057 to
February 28, 2005 | |
| | | 2008 | | | 2007 | | | 2006 | | | |
Per Share Operating Performance | |
Net asset value, beginning of period | | $ | 28.20 | | | $ | 29.85 | | | $ | 25.78 | | | $ | 24.15 | | | $ | 20.24 | | | $ | 20.30 | |
| | | | | | | | | | | | | | | | | | | | | | | | |
Net investment loss | | | (0.00 | )1,2 | | | (0.02 | )1 | | | (0.02 | )1 | | | (0.03 | )1 | | | (0.12 | )1 | | | (0.01 | ) |
Net realized and unrealized gain (loss) | | | (5.04 | ) | | | (0.49 | ) | | | 4.44 | | | | 2.27 | | | | 4.04 | | | | (0.05 | ) |
| | | | | | | | | | | | | | | | | | | | | | | | |
Net increase (decrease) from investment operations | | | (5.04 | ) | | | (0.51 | ) | | | 4.42 | | | | 2.24 | | | | 3.92 | | | | (0.06 | ) |
| | | | | | | | | | | | | | | | | | | | | | | | |
Distributions from net realized gain | | | (2.33 | ) | | | (1.14 | ) | | | (0.35 | ) | | | (0.62 | ) | | | (0.01 | ) | | | — | |
| | | | | | | | | | | | | | | | | | | | | | | | |
Redemption fees added to paid-in capital | | | 0.00 | 2 | | | 0.00 | 2 | | | 0.00 | 2 | | | 0.01 | | | | 0.00 | 2 | | | — | |
| | | | | | | | | | | | | | | | | | | | | | | | |
Net asset value, end of period | | $ | 20.83 | | | $ | 28.20 | | | $ | 29.85 | | | $ | 25.78 | | | $ | 24.15 | | | $ | 20.24 | |
| | | | | | | | | | | | | | | | | | | | | | | | |
Total Investment Return | |
Based on net asset value | | | (17.79 | )%3,4 | | | (1.98 | )%3 | | | 17.33 | %3 | | | 9.47 | %5 | | | 19.37 | %3,4 | | | (0.30 | )%4 |
| | | | | | | | | | | | | | | | | | | | | | | | |
Ratios to Average Net Assets | |
Total expenses after waivers, reimbursement and fees paid indirectly | | | 1.39 | %6 | | | 1.35 | % | | | 1.30 | % | | | 1.34 | % | | | 1.55 | %6 | | | 0.82 | %6 |
| | | | | | | | | | | | | | | | | | | | | | | | |
Total expenses | | | 1.39 | %6 | | | 1.35 | % | | | 1.32 | % | | | 1.34 | % | | | 1.64 | %6 | | | 0.82 | %6 |
| | | | | | | | | | | | | | | | | | | | | | | | |
Net investment loss | | | (0.02 | )%6 | | | (0.06 | )% | | | (0.08 | )% | | | (0.12 | )% | | | (0.90 | )%6 | | | (0.70 | )%6 |
| | | | | | | | | | | | | | | | | | | | | | | | |
Supplemental Data | |
Net assets, end of period (000) | | $ | 5,406 | | | $ | 5,764 | | | $ | 7,806 | | | $ | 4,347 | | | $ | 66 | | | $ | — | 8 |
| | | | | | | | | | | | | | | | | | | | | | | | |
Portfolio turnover | | | 72 | % | | | 91 | % | | | 98 | % | | | 157 | % | | | 77 | % | | | 173 | % |
| | | | | | | | | | | | | | | | | | | | | | | | |
See Notes to Financial Statements.
| | | | | | |
42 | | SEMI-ANNUAL REPORT | | MARCH 31, 2009 | | |
| | |
| Financial Highlights (continued) | | Health Sciences Opportunities Portfolio |
| | | | | | | | | | | | | | | | | | | | | | | | | | | | |
| | | Investor A | |
| | | Six Months
Ended
March 31, 2009
(Unaudited) | | | Year Ended September 30, | | | Period
March 1, 2005 to
September 30, 2005 | | | Year
Ended
February 28, 2005 | | | Year
Ended
February 29, 2004 | |
| | | 2008 | | | 2007 | | | 2006 | | | | |
Per Share Operating Performance | |
Net asset value, beginning of period | | $ | 28.14 | | | $ | 29.77 | | | $ | 25.72 | | | $ | 24.11 | | | $ | 20.24 | | | $ | 20.96 | | | $ | 11.57 | |
| | | | | | | | | | | | | | | | | | | | | | | | | | | | |
Net investment loss | | | (0.01 | )1 | | | (0.02 | )1 | | | (0.03 | )1 | | | (0.05 | )1 | | | (0.09 | )1 | | | (0.17 | ) | | | (0.12 | ) |
Net realized and unrealized gain (loss) | | | (5.03 | ) | | | (0.49 | ) | | | 4.43 | | | | 2.27 | | | | 3.97 | | | | 0.52 | | | | 10.15 | |
| | | | | | | | | | | | | | | | | | | | | | | | | | | | |
Net increase (decrease) from investment operations | | | (5.04 | ) | | | (0.51 | ) | | | 4.40 | | | | 2.22 | | | | 3.88 | | | | 0.35 | | | | 10.03 | |
| | | | | | | | | | | | | | | | | | | | | | | | | | | | |
Distributions from net realized gain | | | (2.31 | ) | | | (1.12 | ) | | | (0.35 | ) | | | (0.62 | ) | | | (0.01 | ) | | | (1.07 | ) | | | (0.64 | ) |
| | | | | | | | | | | | | | | | | | | | | | | | | | | | |
Redemption fees added to paid-in capital | | | 0.00 | 2 | | | 0.00 | 2 | | | 0.00 | 2 | | | 0.01 | | | | 0.00 | 2 | | | — | | | | — | |
| | | | | | | | | | | | | | | | | | | | | | | | | | | | |
Net asset value, end of period | | $ | 20.79 | | | $ | 28.14 | | | $ | 29.77 | | | $ | 25.72 | | | $ | 24.11 | | | $ | 20.24 | | | $ | 20.96 | |
| | | | | | | | | | | | | | | | | | | | | | | | | | | | |
Total Investment Return | |
Based on net asset value9 | | | (17.80 | )%3,4 | | | (1.97 | )%3 | | | 17.29 | %3 | | | 9.40 | %5 | | | 19.17 | %3,4 | | | 1.52 | % | | | 87.13 | % |
| | | | | | | | | | | | | | | | | | | | | | | | | | | | |
Ratios to Average Net Assets | |
Total expenses after waivers, reimbursement and fees paid indirectly | | | 1.42 | %6 | | | 1.35 | % | | | 1.35 | % | | | 1.34 | % | | | 1.55 | %6 | | | 1.58 | % | | | 1.55 | % |
| | | | | | | | | | | | | | | | | | | | | | | | | | | | |
Total expenses | | | 1.43 | %6 | | | 1.35 | % | | | 1.35 | % | | | 1.45 | % | | | 1.69 | %6 | | | 1.73 | % | | | 2.11 | % |
| | | | | | | | | | | | | | | | | | | | | | | | | | | | |
Net investment loss | | | (0.07 | )%6 | | | (0.06 | )% | | | (0.13 | )% | | | (0.19 | )% | | | (0.68 | )%6 | | | (0.90 | )% | | | (0.71 | )% |
| | | | | | | | | | | | | | | | | | | | | | | | | | | | |
Supplemental Data | |
Net assets, end of period (000) | | $ | 382,337 | | | $ | 564,943 | | | $ | 697,451 | | | $ | 434,360 | | | $ | 186,545 | | | $ | 76,550 | | | $ | 54,638 | |
| | | | | | | | | | | | | | | | | | | | | | | | | | | | |
Portfolio turnover | | | 72 | % | | | 91 | % | | | 98 | % | | | 157 | % | | | 77 | % | | | 173 | % | | | 106 | % |
| | | | | | | | | | | | | | | | | | | | | | | | | | | | |
| 1 | Based on average shares outstanding. |
| 2 | Less than $0.01 per share. |
| 3 | Redemption fee of 2.00% received by the Portfolio is reflected in total return calculations. There was no impact to the return. |
| 4 | Aggregate total investment return. |
| 5 | Redemption fee of 2.00% received by the Portfolio is reflected in total return calculations. The impact to the return from redemption fees received during the period was an increase of 0.04%. |
| 7 | Commencement of operations. |
| 8 | Net assets end of period are less than $500. |
| 9 | Total investment returns exclude the effects of sales charges. |
See Notes to Financial Statements.
| | | | | | |
| | | SEMI-ANNUAL REPORT | | MARCH 31, 2009 | | 43 |
| | |
| Financial Highlights (continued) | | Health Sciences Opportunities Portfolio |
| | | | | | | | | | | | | | | | | | | | | | | | | | | | |
| | | Investor B | |
| | | Six Months
Ended
March 31, 2009
(Unaudited) | | | Year Ended September 30, | | | Period
March 1, 2005 to
September 30, 2005 | | | Year
Ended
February 28, 2005 | | | Year
Ended
February 29, 2004 | |
| | | 2008 | | | 2007 | | | 2006 | | | | |
Per Share Operating Performance | |
Net asset value, beginning of period | | $ | 26.73 | | | $ | 28.28 | | | $ | 24.65 | | | $ | 23.31 | | | $ | 19.65 | | | $ | 20.52 | | | $ | 11.41 | |
| | | | | | | | | | | | | | | | | | | | | | | | | | | | |
Net investment loss | | | (0.09 | )1 | | | (0.23 | )1 | | | (0.25 | )1 | | | (0.24 | )1 | | | (0.17 | )1 | | | (0.28 | ) | | | (0.24 | ) |
Net realized and unrealized gain (loss) | | | (4.78 | ) | | | (0.49 | ) | | | 4.23 | | | | 2.19 | | | | 3.84 | | | | 0.48 | | | | 9.99 | |
| | | | | | | | | | | | | | | | | | | | | | | | | | | | |
Net increase (decrease) from investment operations | | | (4.87 | ) | | | (0.72 | ) | | | 3.98 | | | | 1.95 | | | | 3.67 | | | | 0.20 | | | | 9.75 | |
| | | | | | | | | | | | | | | | | | | | | | | | | | | | |
Distributions from net realized gain | | | (2.15 | ) | | | (0.83 | ) | | | (0.35 | ) | | | (0.62 | ) | | | (0.01 | ) | | | (1.07 | ) | | | (0.64 | ) |
| | | | | | | | | | | | | | | | | | | | | | | | | | | | |
Redemption fees added to paid-in capital | | | 0.00 | 2 | | | 0.00 | 2 | | | 0.00 | 2 | | | 0.01 | | | | 0.00 | 2 | | | — | | | | — | |
| | | | | | | | | | | | | | | | | | | | | | | | | | | | |
Net asset value, end of period | | $ | 19.71 | | | $ | 26.73 | | | $ | 28.28 | | | $ | 24.65 | | | $ | 23.31 | | | $ | 19.65 | | | $ | 20.52 | |
| | | | | | | | | | | | | | | | | | | | | | | | | | | | |
Total Investment Return | |
Based on net asset value3 | | | (18.13 | )%4,5 | | | (2.78 | )%4 | | | 16.33 | %4 | | | 8.54 | %6 | | | 18.68 | %4,5 | | | 0.80 | % | | | 85.89 | % |
| | | | | | | | | | | | | | | | | | | | | | | | | | | | |
Ratios to Average Net Assets | |
Total expenses after waivers, reimbursement and fees paid indirectly | | | 2.21 | %7 | | | 2.14 | % | | | 2.19 | % | | | 2.16 | % | | | 2.25 | %7 | | | 2.25 | % | | | 2.25 | % |
| | | | | | | | | | | | | | | | | | | | | | | | | | | | |
Total expenses | | | 2.21 | %7 | | | 2.14 | % | | | 2.22 | % | | | 2.16 | % | | | 2.33 | %7 | | | 2.39 | % | | | 2.91 | % |
| | | | | | | | | | | | | | | | | | | | | | | | | | | | |
Net investment loss | | | (0.86 | )%7 | | | (0.85 | )% | | | (0.96 | )% | | | (1.02 | )% | | | (1.35 | )%7 | | | (1.58 | )% | | | (1.44 | )% |
| | | | | | | | | | | | | | | | | | | | | | | | | | | | |
Supplemental Data | |
Net assets, end of period (000) . | | $ | 54,628 | | | $ | 80,269 | | | $ | 95,231 | | | $ | 78,902 | | | $ | 45,073 | | | $ | 29,495 | | | $ | 22,825 | |
| | | | | | | | | | | | | | | | | | | | | | | | | | | | |
Portfolio turnover | | | 72 | % | | | 91 | % | | | 98 | % | | | 157 | % | | | 77 | % | | | 173 | % | | | 106 | % |
| | | | | | | | | | | | | | | | | | | | | | | | | | | | |
See Notes to Financial Statements.
| | | | | | |
44 | | SEMI-ANNUAL REPORT | | MARCH 31, 2009 | | |
| | |
| Financial Highlights (continued) | | Health Sciences Opportunities Portfolio |
| | | | | | | | | | | | | | | | | | | | | | | | | | | | |
| | | Investor C | |
| | | Six Months
Ended
March 31, 2009
(Unaudited) | | | Year Ended September 30, | | | Period
March 1, 2005 to
September 30, 2005 | | | Year
Ended
February 28, 2005 | | | Year
Ended
February 29, 2004 | |
| | | 2008 | | | 2007 | | | 2006 | | | | |
Per Share Operating Performance | |
Net asset value, beginning of period | | $ | 26.70 | | | $ | 28.27 | | | $ | 24.62 | | | $ | 23.26 | | | $ | 19.61 | | | $ | 20.47 | | | $ | 11.39 | |
| | | | | | | | | | | | | | | | | | | | | | | | | | | | |
Net investment loss | | | (0.08 | )1 | | | (0.21 | )1 | | | (0.23 | )1 | | | (0.21 | )1 | | | (0.18 | )1 | | | (0.22 | ) | | | (0.23 | ) |
Net realized and unrealized gain (loss) | | | (4.77 | ) | | | (0.47 | ) | | | 4.23 | | | | 2.18 | | | | 3.84 | | | | 0.43 | | | | 9.95 | |
| | | | | | | | | | | | | | | | | | | | | | | | | | | | |
Net increase (decrease) from investment operations | | | (4.85 | ) | | | (0.68 | ) | | | 4.00 | | | | 1.97 | | | | 3.66 | | | | 0.21 | | | | 9.72 | |
| | | | | | | | | | | | | | | | | | | | | | | | | | | | |
Distributions from net realized gain | | | (2.17 | ) | | | (0.89 | ) | | | (0.35 | ) | | | (0.62 | ) | | | (0.01 | ) | | | (1.07 | ) | | | (0.64 | ) |
| | | | | | | | | | | | | | | | | | | | | | | | | | | | |
Redemption fees added to paid-in capital | | | 0.00 | 2 | | | 0.00 | 2 | | | 0.00 | 2 | | | 0.01 | | | | 0.00 | 2 | | | — | | | | — | |
| | | | | | | | | | | | | | | | | | | | | | | | | | | | |
Net asset value, end of period | | $ | 19.68 | | | $ | 26.70 | | | $ | 28.27 | | | $ | 24.62 | | | $ | 23.26 | | | $ | 19.61 | | | $ | 20.47 | |
| | | | | | | | | | | | | | | | | | | | | | | | | | | | |
Total Investment Return | |
Based on net asset value3 | | | (18.09 | )%4,5 | | | (2.66 | )%4 | | | 16.43 | %4 | | | 8.65 | %6 | | | 18.67 | %4,5 | | | 0.86 | % | | | 85.87 | % |
| | | | | | | | | | | | | | | | | | | | | | | | | | | | |
Ratios to Average Net Assets | |
Total expenses after waivers, reimbursement and fees paid indirectly | | | 2.11 | %7 | | | 2.05 | % | | | 2.11 | % | | | 2.04 | % | | | 2.25 | %7 | | | 2.25 | % | | | 2.25 | % |
| | | | | | | | | | | | | | | | | | | | | | | | | | | | |
Total expenses | | | 2.12 | %7 | | | 2.05 | % | | | 2.12 | % | | | 2.04 | % | | | 2.32 | %7 | | | 2.41 | % | | | 2.77 | % |
| | | | | | | | | | | | | | | | | | | | | | | | | | | | |
Net investment loss | | | (0.76 | )%7 | | | (0.76 | )% | | | (0.89 | )% | | | (0.87 | )% | | | (1.41 | )%7 | | | (1.56 | )% | | | (1.38 | )% |
| | | | | | | | | | | | | | | | | | | | | | | | | | | | |
Supplemental Data | |
Net assets, end of period (000) | | $ | 220,296 | | | $ | 305,015 | | | $ | 363,739 | | | $ | 254,724 | | | $ | 84,431 | | | $ | 25,248 | | | $ | 11,017 | |
| | | | | | | | | | | | | | | | | | | | | | | | | | | | |
Portfolio turnover | | | 72 | % | | | 91 | % | | | 98 | % | | | 157 | % | | | 77 | % | | | 173 | % | | | 106 | % |
| | | | | | | | | | | | | | | | | | | | | | | | | | | | |
| 1 | Based on average shares outstanding. |
| 2 | Less than $0.01 per share. |
| 3 | Total investment returns exclude the effects of sales charges. |
| 4 | Redemption fee of 2.00% received by the Portfolio is reflected in total return calculations. There was no impact to the return. |
| 5 | Aggregate total investment return. |
| 6 | Redemption fee of 2.00% received by the Portfolio is reflected in total return calculations. The impact to the return from redemption fees received during the period was an increase of 0.04%. |
See Notes to Financial Statements.
| | | | | | |
| | | SEMI-ANNUAL REPORT | | MARCH 31, 2009 | | 45 |
| | |
| Financial Highlights (continued) | | International Opportunities Portfolio |
| | | | | | | | | | | | | | | | | | | | | | | | | | | | | | | | | | | | | | | | | | | | | | | | |
| | | Institutional | | | Service | |
| | | Six Months
Ended
March 31, 2009
(Unaudited) | | | Year Ended September 30, | | | Six Months
Ended
March 31, 2009
(Unaudited) | | | Year Ended September 30, | |
| | | 2008 | | | 2007 | | | 2006 | | | 2005 | | | 2004 | | | | 2008 | | | 2007 | | | 2006 | | | 2005 | | | 2004 | |
Per Share Operating Performance | |
Net asset value, beginning of period | | $ | 29.44 | | | $ | 51.08 | | | $ | 42.16 | | | $ | 34.34 | | | $ | 24.44 | | | $ | 19.96 | | | $ | 28.36 | | | $ | 49.52 | | | $ | 41.06 | | | $ | 33.55 | | | $ | 23.93 | | | $ | 19.59 | |
| | | | | | | | | | | | | | | | | | | | | | | | | | | | | | | | | | | | | | | | | | | | | | | | |
Net investment income1 | | | 0.15 | | | | 0.47 | | | | 0.48 | | | | 0.37 | | | | 0.53 | | | | 0.08 | | | | 0.12 | | | | 0.28 | | | | 0.32 | | | | 0.29 | | | | 0.44 | | | | 0.06 | |
Net realized and unrealized gain (loss) | | | (8.64 | ) | | | (13.66 | ) | | | 14.98 | | | | 8.57 | | | | 9.68 | | | | 4.41 | | | | (8.33 | ) | | | (13.14 | ) | | | 14.58 | | | | 8.32 | | | | 9.45 | | | | 4.29 | |
| | | | | | | | | | | | | | | | | | | | | | | | | | | | | | | | | | | | | | | | | | | | | | | | |
Net increase (decrease) from investment operations | | | (8.49 | ) | | | (13.19 | ) | | | 15.46 | | | | 8.94 | | | | 10.21 | | | | 4.49 | | | | (8.21 | ) | | | (12.86 | ) | | | 14.90 | | | | 8.61 | | | | 9.89 | | | | 4.35 | |
| | | | | | | | | | | | | | | | | | | | | | | | | | | | | | | | | | | | | | | | | | | | | | | | |
Dividends and distributions from: | | | | | | | | | | | | | | | | | | | | | | | | | | | | | | | | | | | | | | | | | | | | | | | | |
Net investment income | | | (0.10 | ) | | | (1.21 | ) | | | (0.71 | ) | | | (0.37 | ) | | | (0.32 | ) | | | (0.02 | ) | | | — | | | | (1.06 | ) | | | (0.61 | ) | | | (0.35 | ) | | | (0.28 | ) | | | (0.02 | ) |
Net realized gain | | | — | | | | (7.24 | ) | | | (5.83 | ) | | | (0.76 | ) | | | — | | | | — | | | | — | | | | (7.24 | ) | | | (5.83 | ) | | | (0.76 | ) | | | — | | | | — | |
| | | | | | | | | | | | | | | | | | | | | | | | | | | | | | | | | | | | | | | | | | | | | | | | |
Total dividends and distributions | | | (0.10 | ) | | | (8.45 | ) | | | (6.54 | ) | | | (1.13 | ) | | | (0.32 | ) | | | (0.02 | ) | | | — | | | | (8.30 | ) | | | (6.44 | ) | | | (1.11 | ) | | | (0.28 | ) | | | (0.02 | ) |
| | | | | | | | | | | | | | | | | | | | | | | | | | | | | | | | | | | | | | | | | | | | | | | | |
Redemption fees added to paid-in capital | | | 0.00 | 2 | | | 0.00 | 2 | | | 0.00 | 2 | | | 0.01 | | | | 0.01 | | | | 0.01 | | | | 0.00 | 2 | | | 0.00 | 2 | | | 0.00 | 2 | | | 0.01 | | | | 0.01 | | | | 0.01 | |
| | | | | | | | | | | | | | | | | | | | | | | | | | | | | | | | | | | | | | | | | | | | | | | | |
Net asset value, end of period | | $ | 20.85 | | | $ | 29.44 | | | $ | 51.08 | | | $ | 42.16 | | | $ | 34.34 | | | $ | 24.44 | | | $ | 20.15 | | | $ | 28.36 | | | $ | 49.52 | | | $ | 41.06 | | | $ | 33.55 | | | $ | 23.93 | |
| | | | | | | | | | | | | | | | | | | | | | | | | | | | | | | | | | | | | | | | | | | | | | | | |
Total Investment Return | |
Based on net asset value | | | (28.86 | )%3,4 | | | (30.87 | )%3,5 | | | 40.42 | %3 | | | 26.64 | %6 | | | 42.13 | %7 | | | 22.54 | %8 | | | (28.97 | )%3,4 | | | (31.10 | )%3,5 | | | 40.00 | %3 | | | 26.30 | %6 | | | 41.65 | %7 | | | 22.25 | %8 |
| | | | | | | | | | | | | | | | | | | | | | | | | | | | | | | | | | | | | | | | | | | | | | | | |
Ratios to Average Net Assets | |
Total expenses after waivers, reimbursement and fees paid indirectly | | | 1.41 | %9 | | | 1.25 | % | | | 1.25 | % | | | 1.33 | % | | | 1.45 | % | | | 1.45 | % | | | 1.75 | %9 | | | 1.58 | % | | | 1.58 | % | | | 1.57 | % | | | 1.74 | % | | | 1.75 | % |
| | | | | | | | | | | | | | | | | | | | | | | | | | | | | | | | | | | | | | | | | | | | | | | | |
Total expenses | | | 1.43 | %9 | | | 1.25 | % | | | 1.25 | % | | | 1.33 | % | | | 1.51 | % | | | 1.58 | % | | | 1.88 | %9 | | | 1.58 | % | | | 1.59 | % | | | 1.58 | % | | | 1.76 | % | | | 1.91 | % |
| | | | | | | | | | | | | | | | | | | | | | | | | | | | | | | | | | | | | | | | | | | | | | | | |
Net investment income | | | 1.39 | %9 | | | 1.18 | % | | | 1.06 | % | | | 0.91 | % | | | 1.81 | % | | | 0.31 | % | | | 1.10 | %9 | | | 0.72 | % | | | 0.73 | % | | | 0.73 | % | | | 1.52 | % | | | 0.21 | % |
| | | | | | | | | | | | | | | | | | | | | | | | | | | | | | | | | | | | | | | | | | | | | | | | |
Supplemental Data | |
Net assets, end of period (000) | | $ | 325,251 | | | $ | 450,605 | | | $ | 492,444 | | | $ | 336,000 | | | $ | 216,070 | | | $ | 96,535 | | | $ | 47,325 | | | $ | 64,368 | | | $ | 172,135 | | | $ | 128,879 | | | $ | 44,308 | | | $ | 19,167 | |
| | | | | | | | | | | | | | | | | | | | | | | | | | | | | | | | | | | | | | | | | | | | | | | | |
Portfolio turnover | | | 78 | % | | | 138 | % | | | 77 | % | | | 91 | % | | | 86 | % | | | 98 | % | | | 78 | % | | | 138 | % | | | 77 | % | | | 91 | % | | | 86 | % | | | 98 | % |
| | | | | | | | | | | | | | | | | | | | | | | | | | | | | | | | | | | | | | | | | | | | | | | | |
See Notes to Financial Statements.
| | | | | | |
46 | | SEMI-ANNUAL REPORT | | MARCH 31, 2009 | | |
| | |
| Financial Highlights (continued) | | International Opportunities Portfolio |
| | | | | | | | | | | | | | | | | | | | | | | | |
| | | Investor A | |
| | | Six Months
Ended
March 31, 2009
(Unaudited) | | | Year Ended September 30, | |
| | | 2008 | | | 2007 | | | 2006 | | | 2005 | | | 2004 | |
Per Share Operating Performance | |
Net asset value, beginning of period | | $ | 28.14 | | | $ | 49.19 | | | $ | 40.81 | | | $ | 33.36 | | | $ | 23.78 | | | $ | 19.49 | |
| | | | | | | | | | | | | | | | | | | | | | | | |
Net investment income (loss)1 | | | 0.10 | | | | 0.33 | | | | 0.30 | | | | 0.23 | | | | 0.44 | | | | (0.02 | ) |
Net realized and unrealized gain (loss) | | | (8.25 | ) | | | (13.09 | ) | | | 14.49 | | | | 8.32 | | | | 9.38 | | | | 4.32 | |
| | | | | | | | | | | | | | | | | | | | | | | | |
Net increase (decrease) from investment operations | | | (8.15 | ) | | | (12.76 | ) | | | 14.79 | | | | 8.55 | | | | 9.82 | | | | 4.30 | |
| | | | | | | | | | | | | | | | | | | | | | | | |
Dividends and distributions from: | | | | | | | | | | | | | | | | | | | | | | | | |
Net investment income | | | (0.01 | ) | | | (1.05 | ) | | | (0.58 | ) | | | (0.35 | ) | | | (0.25 | ) | | | (0.02 | ) |
Net realized gain | | | — | | | | (7.24 | ) | | | (5.83 | ) | | | (0.76 | ) | | | — | | | | — | |
| | | | | | | | | | | | | | | | | | | | | | | | |
Total dividends and distributions | | | (0.01 | ) | | | (8.29 | ) | | | (6.41 | ) | | | (1.11 | ) | | | (0.25 | ) | | | (0.02 | ) |
| | | | | | | | | | | | | | | | | | | | | | | | |
Redemption fees added to paid-in capital | | | 0.00 | 2 | | | 0.00 | 2 | | | 0.00 | 2 | | | 0.01 | | | | 0.01 | | | | 0.01 | |
| | | | | | | | | | | | | | | | | | | | | | | | |
Net asset value, end of period | | $ | 19.98 | | | $ | 28.14 | | | $ | 49.19 | | | $ | 40.81 | | | $ | 33.36 | | | $ | 23.78 | |
| | | | | | | | | | | | | | | | | | | | | | | | |
Total Investment Return | |
Based on net asset value10 | | | (28.99 | )%3,4 | | | (31.09 | )%3,5 | | | 39.98 | %3 | | | 26.24 | %6 | | | 41.60 | %8 | | | 22.11 | %11 |
| | | | | | | | | | | | | | | | | | | | | | | | |
Ratios to Average Net Assets | |
Total expenses after waivers, reimbursement and fees paid indirectly | | | 1.80 | %9 | | | 1.58 | % | | | 1.60 | % | | | 1.63 | % | | | 1.75 | % | | | 1.89 | % |
| | | | | | | | | | | | | | | | | | | | | | | | |
Total expenses | | | 1.81 | %9 | | | 1.58 | % | | | 1.60 | % | | | 1.74 | % | | | 1.86 | % | | | 2.06 | % |
| | | | | | | | | | | | | | | | | | | | | | | | |
Net investment income (loss) | | | 1.00 | %9 | | | 0.87 | % | | | 0.69 | % | | | 0.62 | % | | | 1.53 | % | | | (0.06 | )% |
| | | | | | | | | | | | | | | | | | | | | | | | |
Supplemental Data | |
Net assets, end of period (000) | | $ | 332,712 | | | $ | 482,526 | | | $ | 555,189 | | | $ | 407,282 | | | $ | 253,710 | | | $ | 99,879 | |
| | | | | | | | | | | | | | | | | | | | | | | | |
Portfolio turnover | | | 78 | % | | | 138 | % | | | 77 | % | | | 91 | % | | | 86 | % | | | 98 | % |
| | | | | | | | | | | | | | | | | | | | | | | | |
| 1 | Based on average shares outstanding. |
| 2 | Less than $0.01 per share. |
| 3 | Redemption fee of 2.00% received by the Portfolio is reflected in total return calculations. There was no impact to the return. |
| 4 | Aggregate total investment return. |
| 5 | Payment from affiliate of $112,880 received by the Portfolio is reflected in total return calculations. There was no impact to the return. |
| 6 | Redemption fee of 2.00% received by the Portfolio is reflected in total return calculations. The impact to the return from redemption fees received during the period was an increase of 0.03%. |
| 7 | Redemption fee of 2.00% received by the Portfolio is reflected in total return calculations. The impact to the return from redemption fees received during the period was an increase of 0.04%. |
| 8 | Redemption fee of 2.00% received by the Portfolio is reflected in total return calculations. The impact to the return from redemption fees received during the period was an increase of 0.05%. |
| 10 | Total investment returns exclude the effects of sales charges. |
| 11 | Redemption fee of 2.00% received by the Portfolio is reflected in total return calculations. The impact to the return from redemption fees received during the period was an increase of 0.06%. |
See Notes to Financial Statements.
| | | | | | |
| | | SEMI-ANNUAL REPORT | | MARCH 31, 2009 | | 47 |
| | |
| Financial Highlights (continued) | | International Opportunities Portfolio |
| | | | | | | | | | | | | | | | | | | | | | | | |
| | | Investor B | |
| | | Six Months
Ended
March 31, 2009
(Unaudited) | | | Year Ended September 30, | |
| | | 2008 | | | 2007 | | | 2006 | | | 2005 | | | 2004 | |
Per Share Operating Performance | |
Net asset value, beginning of period | | $ | 26.29 | | | $ | 46.43 | | | $ | 38.81 | | | $ | 31.97 | | | $ | 22.80 | | | $ | 18.83 | |
| | | | | | | | | | | | | | | | | | | | | | | | |
Net investment income (loss)1 | | | 0.02 | | | | (0.06 | ) | | | (0.04 | ) | | | (0.07 | ) | | | 0.18 | | | | (0.21 | ) |
Net realized and unrealized gain (loss) | | | (7.72 | ) | | | (12.16 | ) | | | 13.74 | | | | 7.95 | | | | 9.05 | | | | 4.19 | |
| | | | | | | | | | | | | | | | | | | | | | | | |
Net increase (decrease) from investment operations | | | (7.70 | ) | | | (12.22 | ) | | | 13.70 | | | | 7.88 | | | | 9.23 | | | | 3.98 | |
| | | | | | | | | | | | | | | | | | | | | | | | |
Dividends and distributions from: | | | | | | | | | | | | | | | | | | | | | | | | |
Net investment income | | | — | | | | (0.68 | ) | | | (0.25 | ) | | | (0.29 | ) | | | (0.07 | ) | | | (0.02 | ) |
Net realized gain | | | — | | | | (7.24 | ) | | | (5.83 | ) | | | (0.76 | ) | | | — | | | | —�� | |
| | | | | | | | | | | | | | | | | | | | | | | | |
Total dividends and distributions | | | — | | | | (7.92 | ) | | | (6.08 | ) | | | (1.05 | ) | | | (0.07 | ) | | | (0.02 | ) |
| | | | | | | | | | | | | | | | | | | | | | | | |
Redemption fees added to paid-in capital | | | 0.00 | 2 | | | 0.00 | 2 | | | 0.00 | 2 | | | 0.01 | | | | 0.01 | | | | 0.01 | |
| | | | | | | | | | | | | | | | | | | | | | | | |
Net asset value, end of period | | $ | 18.59 | | | $ | 26.29 | | | $ | 46.43 | | | $ | 38.81 | | | $ | 31.97 | | | $ | 22.80 | |
| | | | | | | | | | | | | | | | | | | | | | | | |
Total Investment Return | |
Based on net asset value3 | | | (29.29 | )%4,5 | | | (31.63 | )%4,6 | | | 38.89 | %4 | | | 25.24 | %7 | | | 40.58 | %8 | | | 21.18 | %9 |
| | | | | | | | | | | | | | | | | | | | | | | | |
Ratios to Average Net Assets | |
Total expenses after waivers, reimbursement and fees paid indirectly | | | 2.63 | %10 | | | 2.35 | % | | | 2.37 | % | | | 2.43 | % | | | 2.50 | % | | | 2.65 | % |
| | | | | | | | | | | | | | | | | | | | | | | | |
Total expenses | | | 2.64 | %10 | | | 2.35 | % | | | 2.37 | % | | | 2.43 | % | | | 2.51 | % | | | 2.72 | % |
| | | | | | | | | | | | | | | | | | | | | | | | |
Net investment income (loss) | | | 0.20 | %10 | | | (0.15 | )% | | | (0.10 | )% | | | (0.22 | )% | | | 0.68 | % | | | (0.94 | )% |
| | | | | | | | | | | | | | | | | | | | | | | | |
Supplemental Data | |
Net assets, end of period (000) | | $ | 24,238 | | | $ | 42,927 | | | $ | 102,624 | | | $ | 91,605 | | | $ | 73,946 | | | $ | 45,167 | |
| | | | | | | | | | | | | | | | | | | | | | | | |
Portfolio turnover | | | 78 | % | | | 138 | % | | | 77 | % | | | 91 | % | | | 86 | % | | | 98 | % |
| | | | | | | | | | | | | | | | | | | | | | | | |
See Notes to Financial Statements.
| | | | | | |
48 | | SEMI-ANNUAL REPORT | | MARCH 31, 2009 | | |
| | |
| Financial Highlights (continued) | | International Opportunities Portfolio |
| | | | | | | | | | | | | | | | | | | | | | | | |
| | | Investor C | |
| | | Six Months
Ended
March 31, 2009
(Unaudited) | | | Year Ended September 30, | |
| | | 2008 | | | 2007 | | | 2006 | | | 2005 | | | 2004 | |
Per Share Operating Performance | |
Net asset value, beginning of period | | $ | 26.21 | | | $ | 46.34 | | | $ | 38.78 | | | $ | 31.93 | | | $ | 22.80 | | | $ | 18.84 | |
| | | | | | | | | | | | | | | | | | | | | | | | |
Net investment income (loss)1 | | | 0.02 | | | | 0.03 | | | | (0.03 | ) | | | (0.04 | ) | | | 0.21 | | | | (0.21 | ) |
Net realized and unrealized gain (loss) | | | (7.69 | ) | | | (12.20 | ) | | | 13.71 | | | | 7.93 | | | | 9.01 | | | | 4.18 | |
| | | | | | | | | | | | | | | | | | | | | | | | |
Net increase (decrease) from investment operations | | | (7.67 | ) | | | (12.17 | ) | | | 13.68 | | | | 7.89 | | | | 9.22 | | | | 3.97 | |
| | | | | | | | | | | | | | | | | | | | | | | | |
Dividends and distributions from: | | | | | | | | | | | | | | | | | | | | | | | | |
Net investment income | | | — | | | | (0.72 | ) | | | (0.29 | ) | | | (0.29 | ) | | | (0.10 | ) | | | (0.02 | ) |
Net realized gain | | | — | | | | (7.24 | ) | | | (5.83 | ) | | | (0.76 | ) | | | — | | | | — | |
| | | | | | | | | | | | | | | | | | | | | | | | |
Total dividends and distributions | | | — | | | | (7.96 | ) | | | (6.12 | ) | | | (1.05 | ) | | | (0.10 | ) | | | (0.02 | ) |
| | | | | | | | | | | | | | | | | | | | | | | | |
Redemption fees added to paid-in capital | | | 0.00 | 2 | | | 0.00 | 2 | | | 0.00 | 2 | | | 0.01 | | | | 0.01 | | | | 0.01 | |
| | | | | | | | | | | | | | | | | | | | | | | | |
Net asset value, end of period | | $ | 18.54 | | | $ | 26.21 | | | $ | 46.34 | | | $ | 38.78 | | | $ | 31.93 | | | $ | 22.80 | |
| | | | | | | | | | | | | | | | | | | | | | | | |
Total Investment Return | |
Based on net asset value3 | | | (29.26 | )%4,5 | | | (31.61 | )%4,6 | | | 38.91 | %4 | | | 25.33 | %7 | | | 40.60 | %9 | | | 21.12 | %9 |
| | | | | | | | | | | | | | | | | | | | | | | | |
Ratios to Average Net Assets | |
Total expenses after waivers, reimbursement and fees paid indirectly | | | 2.58 | %10 | | | 2.32 | % | | | 2.36 | % | | | 2.37 | % | | | 2.50 | % | | | 2.65 | % |
| | | | | | | | | | | | | | | | | | | | | | | | |
Total expenses | | | 2.59 | %10 | | | 2.32 | % | | | 2.36 | % | | | 2.37 | % | | | 2.51 | % | | | 2.72 | % |
| | | | | | | | | | | | | | | | | | | | | | | | |
Net investment income (loss) | | | 0.23 | %10 | | | 0.08 | % | | | (0.08 | )% | | | (0.13 | )% | | | 0.75 | % | | | (0.86 | )% |
| | | | | | | | | | | | | | | | | | | | | | | | |
Supplemental Data | |
Net assets, end of period (000) | | $ | 114,311 | | | $ | 194,068 | | | $ | 255,980 | | | $ | 205,958 | | | $ | 130,138 | | | $ | 54,894 | |
| | | | | | | | | | | | | | | | | | | | | | | | |
Portfolio turnover | | | 78 | % | | | 138 | % | | | 77 | % | | | 91 | % | | | 86 | % | | | 98 | % |
| | | | | | | | | | | | | | | | | | | | | | | | |
| 1 | Based on average shares outstanding. |
| 2 | Less than $0.01 per share. |
| 3 | Total investment returns exclude the effects of sales charges. |
| 4 | Redemption fee of 2.00% received by the Portfolio is reflected in total return calculations. There was no impact to the return. |
| 5 | Aggregate total investment return. |
| 6 | Payment from affiliate of $112,880 received by the Portfolio is reflected in total return calculations. There was no impact to the return. |
| 7 | Redemption fee of 2.00% received by the Portfolio is reflected in total return calculations. The impact to the return from redemption fees received during the period was an increase of 0.03%. |
| 8 | Redemption fee of 2.00% received by the Portfolio is reflected in total return calculations. The impact to the return from redemption fees received during the period was an increase of 0.04%. |
| 9 | Redemption fee of 2.00% received by the Portfolio is reflected in total return calculations. The impact to the return from redemption fees received during the period was an increase of 0.05%. |
See Notes to Financial Statements.
| | | | | | |
| | | SEMI-ANNUAL REPORT | | MARCH 31, 2009 | | 49 |
| | |
| Financial Highlights (continued) | | Science & Technology Opportunities Portfolio |
| | | | | | | | | | | | | | | | | | | | | | | | | | | | | | | | | | | | | | | | | | | | | | | | |
| | | Institutional | | | Service | |
| | | Six Months
Ended
March 31, 2009
(Unaudited) | | | Year Ended September 30, | | | Six Months
Ended
March 31, 2009
(Unaudited) | | | Year Ended September 30, | |
| | | 2008 | | | 2007 | | | 2006 | | | 2005 | | | 2004 | | | | 2008 | | | 2007 | | | 2006 | | | 2005 | | | 2004 | |
Per Share Operating Performance | |
Net asset value, beginning of period | | $ | 6.98 | | | $ | 9.03 | | | $ | 7.20 | | | $ | 6.61 | | | $ | 5.42 | | | $ | 5.46 | | | $ | 6.80 | | | $ | 8.83 | | | $ | 7.07 | | | $ | 6.51 | | | $ | 5.35 | | | $ | 5.41 | |
| | | | | | | | | | | | | | | | | | | | | | | | | | | | | | | | | | | | | | | | | | | | | | | | |
Net investment loss1 | | | (0.00 | )2 | | | (0.05 | ) | | | (0.03 | ) | | | (0.03 | ) | | | (0.04 | ) | | | (0.07 | ) | | | (0.01 | ) | | | (0.06 | ) | | | (0.07 | ) | | | (0.05 | ) | | | (0.06 | ) | | | (0.08 | ) |
Net realized and unrealized gain (loss) | | | (1.48 | ) | | | (2.00 | ) | | | 1.86 | | | | 0.61 | | | | 1.23 | | | | 0.03 | | | | (1.44 | ) | | | (1.97 | ) | | | 1.83 | | | | 0.60 | | | | 1.22 | | | | 0.02 | |
| | | | | | | | | | | | | | | | | | | | | | | | | | | | | | | | | | | | | | | | | | | | | | | | |
Net increase (decrease) from investment operations | | | (1.48 | ) | | | (2.05 | ) | | | 1.83 | | | | 0.58 | | | | 1.19 | | | | (0.04 | ) | | | (1.45 | ) | | | (2.03 | ) | | | 1.76 | | | | 0.55 | | | | 1.16 | | | | (0.06 | ) |
| | | | | | | | | | | | | | | | | | | | | | | | | | | | | | | | | | | | | | | | | | | | | | | | |
Redemption fees added to paid-in capital | | | 0.00 | 2 | | | 0.00 | 2 | | | 0.00 | 2 | | | 0.01 | | | | 0.00 | 2 | | | 0.00 | 2 | | | 0.00 | 2 | | | 0.00 | 2 | | | 0.00 | 2 | | | 0.01 | | | | 0.00 | 2 | | | 0.00 | 2 |
| | | | | | | | | | | | | | | | | | | | | | | | | | | | | | | | | | | | | | | | | | | | | | | | |
Net asset value, end of period | | $ | 5.50 | | | $ | 6.98 | | | $ | 9.03 | | | $ | 7.20 | | | $ | 6.61 | | | $ | 5.42 | | | $ | 5.35 | | | $ | 6.80 | | | $ | 8.83 | | | $ | 7.07 | | | $ | 6.51 | | | $ | 5.35 | |
| | | | | | | | | | | | | | | | | | | | | | | | | | | | | | | | | | | | | | | | | | | | | | | | |
Total Investment Return | |
Based on net asset value | | | (21.20 | )%3,4 | | | (22.70 | )%3 | | | 25.42 | %3 | | | 8.93 | %5 | | | 21.96 | %3 | | | (0.73 | )%3 | | | (21.32 | )%3,4 | | | (22.99 | )%3 | | | 24.89 | %3 | | | 8.60 | %5 | | | 21.68 | %3 | | | (1.11 | )%3 |
| | | | | | | | | | | | | | | | | | | | | | | | | | | | | | | | | | | | | | | | | | | | | | | | |
Ratios to Average Net Assets | |
Total expenses after waivers, reimbursement and fees paid indirectly | | | 1.35 | %6 | | | 1.35 | % | | | 1.35 | % | | | 1.38 | % | | | 1.43 | % | | | 1.43 | % | | | 1.73 | %6 | | | 1.73 | % | | | 1.73 | % | | | 1.73 | % | | | 1.73 | % | | | 1.73 | % |
| | | | | | | | | | | | | | | | | | | | | | | | | | | | | | | | | | | | | | | | | | | | | | | | |
Total expenses | | | 2.00 | %6 | | | 1.70 | % | | | 1.91 | % | | | 1.79 | % | | | 1.98 | % | | | 1.63 | % | | | 1.99 | %6 | | | 2.01 | % | | | 2.30 | % | | | 2.06 | % | | | 2.27 | % | | | 1.94 | % |
| | | | | | | | | | | | | | | | | | | | | | | | | | | | | | | | | | | | | | | | | | | | | | | | |
Net investment loss | | | (0.17 | )%6 | | | (0.55 | )% | | | (0.44 | )% | | | (0.45 | )% | | | (0.73 | )% | | | (1.12 | )% | | | (0.53 | )%6 | | | (0.75 | )% | | | (0.85 | )% | | | (0.79 | )% | | | (1.04 | )% | | | (1.41 | )% |
| | | | | | | | | | | | | | | | | | | | | | | | | | | | | | | | | | | | | | | | | | | | | | | | |
Supplemental Data | |
Net assets, end of period (000) | | $ | 18,638 | | | $ | 42,886 | | | $ | 1,449 | | | $ | 1,262 | | | $ | 847 | | | $ | 1,592 | | | $ | 59 | | | $ | 106 | | | $ | 123 | | | $ | 148 | | | $ | 116 | | | $ | 86 | |
| | | | | | | | | | | | | | | | | | | | | | | | | | | | | | | | | | | | | | | | | | | | | | | | |
Portfolio turnover | | | 35 | % | | | 89 | % | | | 92 | % | | | 132 | % | | | 113 | % | | | 115 | % | | | 35 | % | | | 89 | % | | | 92 | % | | | 132 | % | | | 113 | % | | | 115 | % |
| | | | | | | | | | | | | | | | | | | | | | | | | | | | | | | | | | | | | | | | | | | | | | | | |
| | |
| | | Investor A | | | Investor B | |
| | | Six Months
Ended
March 31, 2009
(Unaudited) | | | Year Ended September 30, | | | Six Months
Ended
March 31, 2009
(Unaudited) | | | Year Ended September 30, | |
| | | 2008 | | | 2007 | | | 2006 | | | 2005 | | | 2004 | | | | 2008 | | | 2007 | | | 2006 | | | 2005 | | | 2004 | |
Per Share Operating Performance | |
Net asset value, beginning of period | | $ | 6.73 | | | $ | 8.74 | | | $ | 7.00 | | | $ | 6.45 | | | $ | 5.31 | | | $ | 5.38 | | | $ | 6.30 | | | $ | 8.26 | | | $ | 6.66 | | | $ | 6.19 | | | $ | 5.13 | | | $ | 5.24 | |
| | | | | | | | | | | | | | | | | | | | | | | | | | | | | | | | | | | | | | | | | | | | | | | | |
Net investment loss1 | | | (0.01 | ) | | | (0.06 | ) | | | (0.06 | ) | | | (0.06 | ) | | | (0.07 | ) | | | (0.09 | ) | | | (0.04 | ) | | | (0.13 | ) | | | (0.12 | ) | | | (0.11 | ) | | | (0.11 | ) | | | (0.13 | ) |
Net realized and unrealized gain (loss) | | | (1.43 | ) | | | (1.95 | ) | | | 1.80 | | | | 0.60 | | | | 1.21 | | | | 0.02 | | | | (1.33 | ) | | | (1.83 | ) | | | 1.72 | | | | 0.57 | | | | 1.17 | | | | 0.02 | |
| | | | | | | | | | | | | | | | | | | | | | | | | | | | | | | | | | | | | | | | | | | | | | | | |
Net increase (decrease) from investment operations | | | (1.44 | ) | | | (2.01 | ) | | | 1.74 | | | | 0.54 | | | | 1.14 | | | | (0.07 | ) | | | (1.37 | ) | | | (1.96 | ) | | | 1.60 | | | | 0.46 | | | | 1.06 | | | | (0.11 | ) |
| | | | | | | | | | | | | | | | | | | | | | | | | | | | | | | | | | | | | | | | | | | | | | | | |
Redemption fees added to paid-in capital | | | 0.00 | 2 | | | 0.00 | 2 | | | 0.00 | 2 | | | 0.01 | | | | 0.00 | 2 | | | 0.00 | 2 | | | 0.00 | 2 | | | 0.00 | 2 | | | 0.00 | 2 | | | 0.01 | | | | 0.00 | 2 | | | 0.00 | 2 |
| | | | | | | | | | | | | | | | | | | | | | | | | | | | | | | | | | | | | | | | | | | | | | | | |
Net asset value, end of period | | $ | 5.29 | | | $ | 6.73 | | | $ | 8.74 | | | $ | 7.00 | | | $ | 6.45 | | | $ | 5.31 | | | $ | 4.93 | | | $ | 6.30 | | | $ | 8.26 | | | $ | 6.66 | | | $ | 6.19 | | | $ | 5.13 | |
| | | | | | | | | | | | | | | | | | | | | | | | | | | | | | | | | | | | | | | | | | | | | | | | |
Total Investment Return | |
Based on net asset value7 | | | (21.40 | )%3,4 | | | (23.00 | )%3 | | | 24.86 | %3 | | | 8.53 | %8 | | | 21.47 | %3 | | | (1.30 | )%3 | | | (21.75 | )%3,4 | | | (23.73 | )%3 | | | 24.02 | %3 | | | 7.59 | %8 | | | 20.66 | %3 | | | (2.10 | )%3 |
| | | | | | | | | | | | | | | | | | | | | | | | | | | | | | | | | | | | | | | | | | | | | | | | |
Ratios to Average Net Assets | |
Total expenses after waivers, reimbursement and fees paid indirectly | | | 1.75 | %6 | | | 1.75 | % | | | 1.73 | % | | | 1.77 | % | | | 1.84 | % | | | 1.89 | % | | | 2.65 | %6 | | | 2.65 | % | | | 2.50 | % | | | 2.63 | % | | | 2.59 | % | | | 2.65 | % |
| | | | | | | | | | | | | | | | | | | | | | | | | | | | | | | | | | | | | | | | | | | | | | | | |
Total expenses | | | 2.40 | %6 | | | 2.04 | % | | | 2.16 | % | | | 2.27 | % | | | 2.35 | % | | | 2.14 | % | | | 3.51 | %6 | | | 2.96 | % | | | 3.01 | % | | | 3.06 | % | | | 3.00 | % | | | 2.82 | % |
| | | | | | | | | | | | | | | | | | | | | | | | | | | | | | | | | | | | | | | | | | | | | | | | |
Net investment loss | | | (0.55 | )%6 | | | (0.77 | )% | | | (0.80 | )% | | | (0.83 | )% | | | (1.16 | )% | | | (1.56 | )% | | | (1.45 | )%6 | | | (1.70 | )% | | | (1.59 | )% | | | (1.73 | )% | | | (1.91 | )% | | | (2.33 | )% |
| | | | | | | | | | | | | | | | | | | | | | | | | | | | | | | | | | | | | | | | | | | | | | | | |
Supplemental Data | |
Net assets, end of period (000) | | $ | 56,038 | | | $ | 72,659 | | | $ | 21,632 | | | $ | 13,040 | | | $ | 9,688 | | | $ | 9,929 | | | $ | 6,076 | | | $ | 11,473 | | | $ | 9,030 | | | $ | 10,439 | | | $ | 10,998 | | | $ | 12,315 | |
| | | | | | | | | | | | | | | | | | | | | | | | | | | | | | | | | | | | | | | | | | | | | | | | |
Portfolio turnover | | | 35 | % | | | 89 | % | | | 92 | % | | | 132 | % | | | 113 | % | | | 115 | % | | | 35 | % | | | 89 | % | | | 92 | % | | | 132 | % | | | 113 | % | | | 115 | % |
| | | | | | | | | | | | | | | | | | | | | | | | | | | | | | | | | | | | | | | | | | | | | | | | |
See Notes to Financial Statements.
| | | | | | |
50 | | SEMI-ANNUAL REPORT | | MARCH 31, 2009 | | |
| | |
| Financial Highlights (continued) | | Science & Technology Opportunities Portfolio |
| | | | | | | | | | | | | | | | | | | | | | | | | | | | | | | | |
| | | Investor C | | | R | |
| | | Six Months
Ended
March 31, 2009
(Unaudited) | | | Year Ended September 30, | | | Six Months
Ended
March 31, 2009
(Unaudited) | | | Period
September 8, 20089 to
September 30, 2008 | |
| | | 2008 | | | 2007 | | | 2006 | | | 2005 | | | 2004 | | | |
Per Share Operating Performance | |
Net asset value, beginning of period | | $ | 6.29 | | | $ | 8.25 | | | $ | 6.66 | | | $ | 6.19 | | | $ | 5.14 | | | $ | 5.24 | | | $ | 6.97 | | | $ | 7.38 | |
| | | | | | | | | | | | | | | | | | | | | | | | | | | | | | | | |
Net investment loss1 | | | (0.04 | ) | | | (0.13 | ) | | | (0.12 | ) | | | (0.11 | ) | | | (0.11 | ) | | | (0.13 | ) | | | (0.03 | ) | | | (0.01 | ) |
Net realized and unrealized gain (loss) | | | (1.32 | ) | | | (1.83 | ) | | | 1.71 | | | | 0.57 | | | | 1.16 | | | | 0.03 | | | | (1.47 | ) | | | (0.40 | ) |
| | | | | | | | | | | | | | | | | | | | | | | | | | | | | | | | |
Net increase (decrease) from investment operations | | | (1.36 | ) | | | (1.96 | ) | | | 1.59 | | | | 0.46 | | | | 1.05 | | | | (0.10 | ) | | | (1.50 | ) | | | (0.41 | ) |
| | | | | | | | | | | | | | | | | | | | | | | | | | | | | | | | |
Redemption fees added to paid-in capital | | | 0.00 | 2 | | | 0.00 | 2 | | | 0.00 | 2 | | | 0.01 | | | | 0.00 | 2 | | | 0.00 | 2 | | | 0.00 | 2 | | | 0.00 | 2 |
| | | | | | | | | | | | | | | | | | | | | | | | | | | | | | | | |
Net asset value, end of period | | $ | 4.93 | | | $ | 6.29 | | | $ | 8.25 | | | $ | 6.66 | | | $ | 6.19 | | | $ | 5.14 | | | $ | 5.47 | | | $ | 6.97 | |
| | | | | | | | | | | | | | | | | | | | | | | | | | | | | | | | |
Total Investment Return | |
Based on net asset value7 | | | (21.62 | )%3,4 | | | (23.76 | )%3 | | | 23.87 | %3 | | | 7.59 | %8 | | | 20.43 | %3 | | | (1.91 | )%3 | | | (21.52 | )%3,4 | | | (5.56 | )%3,4 |
| | | | | | | | | | | | | | | | | | | | | | | | | | | | | | | | |
Ratios to Average Net Assets | |
Total expenses after waivers, reimbursement and fees paid indirectly | | | 2.65 | %6 | | | 2.62 | % | | | 2.61 | % | | | 2.62 | % | | | 2.59 | % | | | 2.65 | % | | | 2.13 | %6 | | | 2.13 | %6 |
| | | | | | | | | | | | | | | | | | | | | | | | | | | | | | | | |
Total expenses | | | 3.47 | %6 | | | 2.73 | % | | | 2.88 | % | | | 2.84 | % | | | 3.00 | % | | | 2.80 | % | | | 2.46 | %6 | | | 2.36 | %6 |
| | | | | | | | | | | | | | | | | | | | | | | | | | | | | | | | |
Net investment loss | | | (1.46 | )%6 | | | (1.67 | )% | | | (1.69 | )% | | | (1.67 | )% | | | (1.91 | )% | | | (2.33 | )% | | | (0.93 | )%6 | | | (1.49 | )%6 |
| | | | | | | | | | | | | | | | | | | | | | | | | | | | | | | | |
Supplemental Data | |
Net assets, end of period (000) | | $ | 14,959 | | | $ | 22,003 | | | $ | 9,755 | | | $ | 6,511 | | | $ | 2,794 | | | $ | 3,244 | | | $ | 1,254 | | | $ | 1,362 | |
| | | | | | | | | | | | | | | | | | | | | | | | | | | | | | | | |
Portfolio turnover | | | 35 | % | | | 89 | % | | | 92 | % | | | 132 | % | | | 113 | % | | | 115 | % | | | 35 | % | | | 89 | % |
| | | | | | | | | | | | | | | | | | | | | | | | | | | | | | | | |
| 1 | Based on average shares outstanding. |
| 2 | Less than $0.01 per share. |
| 3 | Redemption fee of 2.00% received by the Portfolio is reflected in total return calculations. There was no impact to the return. |
| 4 | Aggregate total investment return. |
| 5 | Redemption fee of 2.00% received by the Portfolio is reflected in total return calculations. The impact to the return from redemption fees received during the period was an increase of 0.15%. |
| 7 | Total investment returns exclude the effects of sales charges. |
| 8 | Redemption fee of 2.00% received by the Portfolio is reflected in total return calculations. The impact to the return from redemption fees received during the period was an increase of 0.16%. |
| 9 | Commencement of operations. |
See Notes to Financial Statements.
| | | | | | |
| | | SEMI-ANNUAL REPORT | | MARCH 31, 2009 | | 51 |
| | |
| Financial Highlights (continued) | | U.S. Opportunities Portfolio |
| | | | | | | | | | | | | | | | | | | | | | | | | | | | | | | | | | | | | | | | | | | | | | | | |
| | | Institutional | | | Service | |
| | | Six Months
Ended
March 31, 2009
(Unaudited) | | | Year Ended September 30, | | | Six Months
Ended
March 31, 2009
(Unaudited) | | | Year Ended September 30, | |
| | | 2008 | | | 2007 | | | 2006 | | | 2005 | | | 2004 | | | | 2008 | | | 2007 | | | 2006 | | | 2005 | | | 2004 | |
Per Share Operating Performance | |
Net asset value, beginning of period | | $ | 31.69 | | | $ | 37.05 | | | $ | 29.07 | | | $ | 25.56 | | | $ | 20.34 | | | $ | 16.56 | | | $ | 30.58 | | | $ | 35.89 | | | $ | 28.28 | | | $ | 24.96 | | | $ | 19.93 | | | $ | 16.27 | |
| | | | | | | | | | | | | | | | | | | | | | | | | | | | | | | | | | | | | | | | | | | | | | | | |
Net investment income (loss)1 | | | 0.12 | | | | 0.09 | | | | 0.03 | | | | 0.04 | | | | (0.15 | ) | | | (0.17 | ) | | | 0.06 | | | | (0.06 | ) | | | (0.09 | ) | | | (0.07 | ) | | | (0.21 | ) | | | (0.22 | ) |
Net realized and unrealized gain (loss) | | | (9.10 | ) | | | (5.45 | ) | | | 7.95 | | | | 3.46 | | | | 5.37 | | | | 3.95 | | | | (8.78 | ) | | | (5.25 | ) | | | 7.70 | | | | 3.38 | | | | 5.24 | | | | 3.88 | |
| | | | | | | | | | | | | | | | | | | | | | | | | | | | | | | | | | | | | | | | | | | | | | | | |
Net increase (decrease) from investment operations | | | (8.98 | ) | | | (5.36 | ) | | | 7.98 | | | | 3.50 | | | | 5.22 | | | | 3.78 | | | | (8.72 | ) | | | (5.31 | ) | | | 7.61 | | | | 3.31 | | | | 5.03 | | | | 3.66 | |
| | | | | | | | | | | | | | | | | | | | | | | | | | | | | | | | | | | | | | | | | | | | | | | | |
Dividends from net investment income | | | (0.01 | ) | | | — | | | | — | | | | — | | | | — | | | | — | | | | — | | | | — | | | | — | | | | — | | | | — | | | | — | |
| | | | | | | | | | | | | | | | | | | | | | | | | | | | | | | | | | | | | | | | | | | | | | | | |
Redemption fees added to paid-in capital | | | 0.00 | 2 | | | 0.00 | 2 | | | 0.00 | 2 | | | 0.01 | | | | 0.00 | 2 | | | 0.00 | 2 | | | 0.00 | 2 | | | 0.00 | 2 | | | 0.00 | 2 | | | 0.01 | | | | 0.00 | 2 | | | 0.00 | 2 |
| | | | | | | | | | | | | | | | | | | | | | | | | | | | | | | | | | | | | | | | | | | | | | | | |
Net asset value, end of period | | $ | 22.70 | | | $ | 31.69 | | | $ | 37.05 | | | $ | 29.07 | | | $ | 25.56 | | | $ | 20.34 | | | $ | 21.86 | | | $ | 30.58 | | | $ | 35.89 | | | $ | 28.28 | | | $ | 24.96 | | | $ | 19.93 | |
| | | | | | | | | | | | | | | | | | | | | | | | | | | | | | | | | | | | | | | | | | | | | | | | |
Total Investment Return | |
Based on net asset value | | | (28.35 | )%3,4 | | | (14.47 | )%3 | | | 27.45 | %3 | | | 13.73 | %5 | | | 25.66 | %3 | | | 22.83 | %3 | | | (28.52 | )%3,4 | | | (14.80 | )%3 | | | 26.91 | %3 | | | 13.30 | %5 | | | 25.24 | %3 | | | 22.50 | %3 |
| | | | | | | | | | | | | | | | | | | | | | | | | | | | | | | | | | | | | | | | | | | | | | | | |
Ratios to Average Net Assets | |
Total expenses after waivers, reimbursement and fees paid indirectly | | | 1.00 | %6 | | | 1.00 | % | | | 1.01 | % | | | 1.19 | % | | | 1.60 | % | | | 1.60 | % | | | 1.45 | %6 | | | 1.43 | % | | | 1.40 | % | | | 1.57 | % | | | 1.90 | % | | | 1.90 | % |
| | | | | | | | | | | | | | | | | | | | | | | | | | | | | | | | | | | | | | | | | | | | | | | | |
Total expenses | | | 1.40 | %6 | | | 1.42 | % | | | 1.42 | % | | | 1.49 | % | | | 1.73 | % | | | 1.65 | % | | | 1.69 | %6 | | | 1.68 | % | | | 1.69 | % | | | 1.85 | % | | | 1.97 | % | | | 1.97 | % |
| | | | | | | | | | | | | | | | | | | | | | | | | | | | | | | | | | | | | | | | | | | | | | | | |
Net investment income (loss) | | | 1.01 | %6 | | | 0.26 | % | | | 0.09 | % | | | 0.15 | % | | | (0.65 | )% | | | (0.92 | )% | | | 0.57 | %6 | | | (0.17 | )% | | | (0.28 | )% | | | (0.25 | )% | | | (0.96 | )% | | | (1.15 | )% |
| | | | | | | | | | | | | | | | | | | | | | | | | | | | | | | | | | | | | | | | | | | | | | | | |
Supplemental Data | |
Net assets, end of period (000) . | | $ | 436,844 | | | $ | 298,166 | | | $ | 158,094 | | | $ | 20,548 | | | $ | 6,390 | | | $ | 6,074 | | | $ | 115,438 | | | $ | 109,679 | | | $ | 43,763 | | | $ | 1,527 | | | $ | 472 | | | $ | 2,303 | |
| | | | | | | | | | | | | | | | | | | | | | | | | | | | | | | | | | | | | | | | | | | | | | | | |
Portfolio turnover | | | 71 | % | | | 164 | % | | | 106 | % | | | 120 | % | | | 94 | % | | | 106 | % | | | 71 | % | | | 164 | % | | | 106 | % | | | 120 | % | | | 94 | % | | | 106 | % |
| | | | | | | | | | | | | | | | | | | | | | | | | | | | | | | | | | | | | | | | | | | | | | | | |
| | |
| | | Investor A | | | Investor B | |
| | | Six Months
Ended
March 31, 2009
(Unaudited) | | | Year Ended September 30, | | | Six Months
Ended
March 31, 2009
(Unaudited) | | | Year Ended September 30, | |
| | | 2008 | | | 2007 | | | 2006 | | | 2005 | | | 2004 | | | | 2008 | | | 2007 | | | 2006 | | | 2005 | | | 2004 | |
Per Share Operating Performance | |
Net asset value, beginning of period | | $ | 30.29 | | | $ | 35.57 | | | $ | 28.03 | | | $ | 24.76 | | | $ | 19.78 | | | $ | 16.17 | | | $ | 28.06 | | | $ | 33.20 | | | $ | 26.37 | | | $ | 23.45 | | | $ | 18.87 | | | $ | 15.55 | |
| | | | | | | | | | | | | | | | | | | | | | | | | | | | | | | | | | | | | | | | | | | | | | | | |
Net investment income (loss)1 | | | 0.05 | | | | (0.08 | ) | | | (0.10 | ) | | | (0.10 | ) | | | (0.22 | ) | | | (0.26 | ) | | | (0.02 | ) | | | (0.31 | ) | | | (0.32 | ) | | | (0.29 | ) | | | (0.37 | ) | | | (0.39 | ) |
Net realized and unrealized gain (loss) | | | (8.70 | ) | | | (5.20 | ) | | | 7.64 | | | | 3.36 | | | | 5.20 | | | | 3.87 | | | | (8.06 | ) | | | (4.83 | ) | | | 7.15 | | | | 3.20 | | | | 4.95 | | | | 3.71 | |
| | | | | | | | | | | | | | | | | | | | | | | | | | | | | | | | | | | | | | | | | | | | | | | | |
Net increase (decrease) from investment operations | | | (8.65 | ) | | | (5.28 | ) | | | 7.54 | | | | 3.26 | | | | 4.98 | | | | 3.61 | | | | (8.08 | ) | | | (5.14 | ) | | | 6.83 | | | | 2.91 | | | | 4.58 | | | | 3.32 | |
| | | | | | | | | | | | | | | | | | | | | | | | | | | | | | | | | | | | | | | | | | | | | | | | |
Redemption fees added to paid-in capital | | | 0.00 | 2 | | | 0.00 | 2 | | | 0.00 | 2 | | | 0.01 | | | | 0.00 | 2 | | | 0.00 | 2 | | | 0.00 | 2 | | | 0.00 | 2 | | | 0.00 | 2 | | | 0.01 | | | | 0.00 | 2 | | | 0.00 | 2 |
| | | | | | | | | | | | | | | | | | | | | | | | | | | | | | | | | | | | | | | | | | | | | | | | |
Net asset value, end of period | | $ | 21.64 | | | $ | 30.29 | | | $ | 35.57 | | | $ | 28.03 | | | $ | 24.76 | | | $ | 19.78 | | | $ | 19.98 | | | $ | 28.06 | | | $ | 33.20 | | | $ | 26.37 | | | $ | 23.45 | | | $ | 18.87 | |
| | | | | | | | | | | | | | | | | | | | | | | | | | | | | | | | | | | | | | | | | | | | | | | | |
Total Investment Return | |
Based on net asset value7 | | | (28.56 | )%3,4 | | | (14.84 | )%3 | | | 26.90 | %3 | | | 13.21 | %5 | | | 25.18 | %3 | | | 22.33 | %3 | | | (28.75 | )%3,4 | | | (15.48 | )%3 | | | 25.90 | %3 | | | 12.45 | %5 | | | 24.27 | %3 | | | 21.35 | %3 |
| | | | | | | | | | | | | | | | | | | | | | | | | | | | | | | | | | | | | | | | | | | | | | | | |
Ratios to Average Net Assets | |
Total expenses after waivers, reimbursement and fees paid indirectly | | | 1.52 | %6 | | | 1.48 | % | | | 1.48 | % | | | 1.66 | % | | | 1.97 | % | | | 2.04 | % | | | 2.25 | %6 | | | 2.22 | % | | | 2.23 | % | | | 2.40 | % | | | 2.72 | % | | | 2.80 | % |
| | | | | | | | | | | | | | | | | | | | | | | | | | | | | | | | | | | | | | | | | | | | | | | | |
Total expenses | | | 1.76 | %6 | | | 1.73 | % | | | 1.77 | % | | | 1.95 | % | | | 2.08 | % | | | 2.15 | % | | | 2.65 | %6 | | | 2.56 | % | | | 2.56 | % | | | 2.68 | % | | | 2.73 | % | | | 2.81 | % |
| | | | | | | | | | | | | | | | | | | | | | | | | | | | | | | | | | | | | | | | | | | | | | | | |
Net investment income (loss) | | | 0.49 | %6 | | | (0.22 | )% | | | (0.32 | )% | | | (0.35 | )% | | | (1.02 | )% | | | (1.36 | )% | | | (0.19 | )%6 | | | (0.95 | )% | | | (1.06 | )% | | | (1.13 | )% | | | (1.77 | )% | | | (2.12 | )% |
| | | | | | | | | | | | | | | | | | | | | | | | | | | | | | | | | | | | | | | | | | | | | | | | |
Supplemental Data | |
Net assets, end of period (000) | | $ | 465,955 | | | $ | 495,656 | | | $ | 228,668 | | | $ | 96,194 | | | $ | 31,277 | | | $ | 31,282 | | | $ | 15,267 | | | $ | 20,998 | | | $ | 35,928 | | | $ | 36,093 | | | $ | 37,132 | | | $ | 40,994 | |
| | | | | | | | | | | | | | | | | | | | | | | | | | | | | | | | | | | | | | | | | | | | | | | | |
Portfolio turnover | | | 71 | % | | | 164 | % | | | 106 | % | | | 120 | % | | | 94 | % | | | 106 | % | | | 71 | % | | | 164 | % | | | 106 | % | | | 120 | % | | | 94 | % | | | 106 | % |
| | | | | | | | | | | | | | | | | | | | | | | | | | | | | | | | | | | | | | | | | | | | | | | | |
See Notes to Financial Statements.
| | | | | | |
52 | | SEMI-ANNUAL REPORT | | MARCH 31, 2009 | | |
| | |
| Financial Highlights (concluded) | | U.S. Opportunities Portfolio |
| | | | | | | | | | | | | | | | | | | | | | | | |
| | | Investor C | |
| | | Six Months
Ended
March 31, 2009
(Unaudited) | | | Year Ended September 30, | |
| | | 2008 | | | 2007 | | | 2006 | | | 2005 | | | 2004 | |
Per Share Operating Performance | |
Net asset value, beginning of period | | $ | 28.04 | | | $ | 33.18 | | | $ | 26.34 | | | $ | 23.43 | | | $ | 18.85 | | | $ | 15.53 | |
| | | | | | | | | | | | | | | | | | | | | | | | |
Net investment loss1 | | | (0.02 | ) | | | (0.30 | ) | | | (0.32 | ) | | | (0.28 | ) | | | (0.37 | ) | | | (0.38 | ) |
Net realized and unrealized gain (loss) | | | (8.05 | ) | | | (4.84 | ) | | | 7.16 | | | | 3.18 | | | | 4.95 | | | | 3.70 | |
| | | | | | | | | | | | | | | | | | | | | | | | |
Net increase (decrease) from investment operations | | | (8.07 | ) | | | (5.14 | ) | | | 6.84 | | | | 2.90 | | | | 4.58 | | | | 3.32 | |
| | | | | | | | | | | | | | | | | | | | | | | | |
Redemption fees added to paid-in capital | | | 0.00 | 2 | | | 0.00 | 2 | | | 0.00 | 2 | | | 0.01 | | | | 0.00 | 2 | | | 0.00 | 2 |
| | | | | | | | | | | | | | | | | | | | | | | | |
Net asset value, end of period | | $ | 19.97 | | | $ | 28.04 | | | $ | 33.18 | | | $ | 26.34 | | | $ | 23.43 | | | $ | 18.85 | |
| | | | | | | | | | | | | | | | | | | | | | | | |
Total Investment Return | |
Based on net asset value7 | | | (28.78 | )%3,4 | | | (15.49 | )%3 | | | 25.97 | %3 | | | 12.42 | %5 | | | 24.30 | %3 | | | 21.38 | %3 |
| | | | | | | | | | | | | | | | | | | | | | | | |
Ratios to Average Net Assets | |
Total expenses after waivers, reimbursement and fees paid indirectly | | | 2.25 | %6 | | | 2.21 | % | | | 2.20 | % | | | 2.37 | % | | | 2.72 | % | | | 2.81 | % |
| | | | | | | | | | | | | | | | | | | | | | | | |
Total expenses | | | 2.51 | %6 | | | 2.46 | % | | | 2.51 | % | | | 2.60 | % | | | 2.73 | % | | | 2.83 | % |
| | | | | | | | | | | | | | | | | | | | | | | | |
Net investment loss | | | (0.21 | )%6 | | | (0.95 | )% | | | (1.04 | )% | | | (1.07 | )% | | | (1.77 | )% | | | (2.13 | )% |
| | | | | | | | | | | | | | | | | | | | | | | | |
Supplemental Data | |
Net assets, end of period (000) | | $ | 130,919 | | | $ | 145,626 | | | $ | 88,826 | | | $ | 39,427 | | | $ | 20,774 | | | $ | 20,261 | |
| | | | | | | | | | | | | | | | | | | | | | | | |
Portfolio turnover | | | 71 | % | | | 164 | % | | | 106 | % | | | 120 | % | | | 94 | % | | | 106 | % |
| | | | | | | | | | | | | | | | | | | | | | | | |
| 1 | Based on average shares outstanding. |
| 2 | Less than $0.01 per share. |
| 3 | Redemption fee of 2.00% received by the Portfolio is reflected in total return calculations. There was no impact to the return. |
| 4 | Aggregate total investment return. |
| 5 | Redemption fee of 2.00% received by the Portfolio is reflected in total return calculations. The impact to the return from redemption fees received during the period was an increase of 0.04%. |
| 7 | Total investment returns exclude the effects of sales charges. |
See Notes to Financial Statements.
| | | | | | |
| | | SEMI-ANNUAL REPORT | | MARCH 31, 2009 | | 53 |
Notes to Financial Statements (Unaudited)
1. Organization and Significant Accounting Policies:
BlackRock FundsSM (the “Fund”), a Massachusetts business trust, is registered under the Investment Company Act of 1940, as amended (the “1940 Act”), as an open-end management investment company. As of March 31, 2009, the Fund had 27 registered portfolios, of which the BlackRock Global Opportunities Portfolio (“Global Opportunities”), BlackRock Health Sciences Opportunities Portfolio (“Health Sciences Opportunities”), BlackRock International Opportunities Portfolio (“International Opportunities”), BlackRock Science & Technology Opportunities Portfolio (“Science & Technology Opportunities”) and BlackRock U.S. Opportunities Portfolio (“U.S. Opportunities”) (collectively the “Portfolios”) are included in these financial statements. The Portfolios’ financial statements are prepared in conformity with accounting principles generally accepted in the United States of America, which may require the use of management accruals and estimates. Actual results may differ from these estimates. Each Portfolio offers multiple classes of shares. Institutional Shares are sold without a sales charge and only to certain eligible investors. Service Shares are sold without a sales charge. Investor A Shares are sold with a front-end sales charge. Shares of Investor B and Investor C may be subject to a contingent deferred sales charge. R Shares are sold without a sales charge and only to certain retirement and other similar plans. All classes of shares have identical voting, dividend, liquidation and other rights and the same terms and conditions, except that the Service, Investor A, Investor B, Investor C and R Shares may bear certain expenses related to the service and/or distribution of such shares. Each class has exclusive voting rights with respect to matters relating to its service and distribution expenditures (except that Investor B shareholders may vote on material changes to the Investor A distribution plan).
Fund Reorganization:
The Board of Trustees (the “Board”) of Science & Technology Opportunities and shareholders of the below BlackRock Fund approved a reorganization with BlackRock Technology Fund, Inc. (the “Reorganization”), as indicated below. The Reorganization was a tax-free event and took place on September 15, 2008.
| | |
Target Fund | | Acquiring Portfolio |
| BlackRock Technology Fund, Inc. | | Science & Technology Opportunities |
Under the agreement and plan of reorganization with respect to the Reorganization, BlackRock Technology Fund, Inc. Investor A Shares, Investor B Shares, Investor C Shares, Institutional Shares and R Shares were exchanged for Science & Technology Opportunities Investor A Shares, Investor B Shares, Investor C Shares, Institutional Shares and R Shares, respectively. The conversion ratio for each Share class was as follows:
| | |
Science & Technology Opportunities | | |
Investor A | | 0.89302835 |
Investor B | | 0.87637176 |
Investor C | | 0.87439671 |
Institutional | | 0.88413428 |
R | | 0.83033708 |
The net assets before and after the Reorganization and shares issued and redeemed in the Reorganization were as follows:
| | | | | | | | | | |
BlackRock Portfolio | | Net Assets Combined
After Reorganization
as of September 15, 2008 | | Net Assets Prior to
Reorganization as of
September 15, 2008 | | Shares Issued | | BlackRock
Technology
Fund, Inc.
Shares
Redeemed |
Science & Technology Opportunities | | $ | 172,438,131 | | $ | 41,095,813 | | 18,216,414 | | 20,570,019 |
Included in the net assets acquired were the following components:
| | | | | | | | | | | | | | |
BlackRock Fund | | Paid In Capital | | Accumulated
Net Realized Loss | | | Net
Unrealized
Depreciation | | | Net Assets |
BlackRock Technology Fund, Inc. | | $ | 1,344,537,764 | | $ | (1,204,274,389 | ) | | $ | (8,921,057 | ) | | $ | 131,342,318 |
The following is a summary of significant accounting policies followed by the Portfolios:
Valuation of Investments: Equity investments traded on a recognized securities exchange or the NASDAQ Global Market System are valued at the last reported sale price that day or the NASDAQ official closing price, if applicable. For equity investments traded on more than one exchange, the last reported sale price on the exchange where the stock is primarily traded is used. Equity investments traded on a recognized exchange for which there were no sales on that day are valued at the last available bid price. If no bid price is available, the prior day’s price will be used, unless it is determined that such prior day’s price no longer reflects the fair value of the security. Financial futures contracts are traded on exchanges and are valued at their last sale price. Short-term securities with maturities less than 60 days are valued at amortized cost, which approximates fair value. Investments in investment companies are valued at the net asset value each business day. The Portfolios value their investments in the BlackRock Liquidity Series, LLC Money Market Series at fair value, which is ordinarily based upon their pro rata ownership in the net assets of the underlying fund.
Exchange-traded options are valued at the mean between the last bid and ask prices at the close of the options market in which the options trade. An exchange-traded option for which there is no mean price is valued at the last bid (long position) or ask (short position) price. If no bid or ask price is available, the prior day’s price will be used, unless it is determined that such prior day’s price no longer reflects the fair value of
| | | | | | |
54 | | SEMI-ANNUAL REPORT | | MARCH 31, 2009 | | |
Notes to Financial Statements (continued)
the option. Over-the-counter options are valued by an independent pricing service using a mathematical model which incorporates a number of market data factors, such as the trades and prices of the underlying securities.
In the event that application of these methods of valuation results in a price for an investment which is deemed not to be representative of the market value of such investment, the investment will be valued by a method approved by the Board as reflecting fair value (“Fair Value Assets”). When determining the price for Fair Value Assets, the investment advisor and/or the sub-advisor seeks to determine the price that the Portfolios might reasonably expect to receive from the current sale of that asset in an arm’s-length transaction. Fair value determinations shall be based upon all available factors that the investment advisor and/or sub-advisor deems relevant. The pricing of all Fair Value Assets is subsequently reported to the Board or a committee thereof.
Generally, trading in foreign securities is substantially completed each day at various times prior to the close of business on the New York Stock Exchange (“NYSE”). The values of such securities used in computing the net assets of a Portfolio are determined as of such times. Foreign currency exchange rates will be determined as of the close of business on the NYSE. Occasionally, events affecting the values of such securities and such exchange rates may occur between the times at which they are determined and the close of business on the NYSE that may not be reflected in the computation of the Portfolio’s net assets. If events (for example, a company announcement, market volatility or a natural disaster) occur during such periods that are expected to materially affect the value of such securities, those securities may be valued at their fair value as determined in good faith by the Board or by the investment advisor using a pricing service and/or procedures approved by the Board. Foreign currency exchange contracts and forward foreign currency exchange contracts are valued at the mean between the bid and ask prices. Interpolated values are derived when the settlement date of the contract is an interim date for which quotations are not available.
Derivative Financial Instruments: The Portfolios may engage in various portfolio investment strategies to both increase the return of the Portfolios and to hedge, or protect, their exposure to interest rate movements and movements in the securities markets. Losses may arise if the value of the contract decreases due to an unfavorable change in the price of the underlying security, or if the counterparty does not perform under the contract.
| • | | Financial Futures Contracts – The Portfolios may purchase or sell financial or index futures contracts and options on financial futures contracts for investment purposes or to manage their interest rate risk. Futures are contracts for delayed delivery of securities at a specific future date and at a specific price or yield. Pursuant to the contract, a Portfolio agrees to receive from or pay to the broker an amount of cash equal to the daily fluctuation in value of the contract. Such receipts or payments are known as margin variation and are recognized by a Portfolio as unrealized gains or losses. When the contract is closed, a Portfolio records a realized gain or loss equal to the difference between the value of the contract at the time it was opened and the value at the time it was closed. The use of futures transactions involves the risk of an imperfect correlation in the movements in the price of futures contracts, interest rates and the underlying assets, and the possible inability of counterparties to meet the terms of their contracts. |
| • | | Forward Currency Contracts – A forward currency contract is an agreement between two parties to buy and sell a currency at a set exchange rate on a future date. The Portfolios may enter into forward currency contracts as a hedge against either specific transactions or portfolio positions. Forward currency contracts, when used by a Portfolio, help to manage the overall exposure to the foreign currency backing some of the investments held by the Portfolio. The contract is marked-to-market daily and the change in market value is recorded by a Portfolio as an unrealized gain or loss. When the contract is closed, a Portfolio records a realized gain or loss equal to the difference between the value at the time it was opened and the value at the time it was closed. The use of forward currency contracts involves the risk that counterparties may not meet the terms of the agreement and market risk of unanticipated movements in the value of a foreign currency relative to the US dollar. |
| • | | Options – The Portfolios may purchase and write call and put options. A call option gives the purchaser of the option the right (but not the obligation) to buy, and obligates the seller to sell (when the option is exercised), the underlying position at the exercise price at any time or at a specified time during the option period. A put option gives the holder the right to sell and obligates the writer to buy the underlying position at the exercise price at any time or at a specified time during the option period. |
When a Portfolio purchases (writes) an option, an amount equal to the premium paid (received) by a Portfolio is reflected as an asset and an equivalent liability. The amount of the asset (liability) is subsequently marked-to-market to reflect the current market value of the option written. When a security is purchased or sold through an exercise of an option, the related premium paid (or received) is added to (or deducted from) the basis of the security acquired or deducted from (or added to) the proceeds of the security sold. When an option expires (or the Portfolio enters into a closing transaction), a Portfolio realizes a gain or loss on the option to the extent of the premiums received or paid (or gain or loss to the extent the cost of the closing transaction exceeds the premium received or paid). When the Portfolio writes a call option, such option is “covered”, meaning that the Portfolio holds the underlying security subject to being called by the option counterparty, or cash in an amount sufficient to cover the obligation. When the Portfolio writes a put option, such option is covered by cash in an amount sufficient to cover the obligation.
In purchasing and writing options, the Portfolios bear the market risk of an unfavorable change in the price of the underlying security or index. Exercise of a written option could result in a Portfolio purchasing a security at a price different from the current market value. The
| | | | | | |
| | | SEMI-ANNUAL REPORT | | MARCH 31, 2009 | | 55 |
Notes to Financial Statements (continued)
Portfolio may execute transactions in both listed and over-the-counter options. Transactions in certain over-the-counter options may expose the Portfolio to the risk of default by the counterparty to the transaction.
Foreign Currency Transactions: Foreign currency amounts are translated into United States dollars on the following basis: (i) market value of investment securities, assets and liabilities at the current rate of exchange; and (ii) purchases and sales of investment securities, income and expenses at the rates of exchange prevailing on the respective dates of such transactions.
The Portfolios report foreign currency related transactions as components of realized gains for financial reporting purposes, whereas such components are treated as ordinary income for federal income tax purposes.
Preferred Stock: The Portfolios may invest in preferred stock. Preferred stock has a preference over common stock in liquidation (and generally in receiving dividends as well) but is subordinated to the liabilities of the issuer in all respects. As a general rule, the market value of preferred stock with a fixed dividend rate and no conversion element varies inversely with interest rates and perceived credit risk, while the market price of convertible preferred stock generally also reflects some element of conversion value. Because preferred stock is junior to debt securities and other obligations of the issuer, deterioration in the credit quality of the issuer will cause greater changes in the value of a preferred stock than in a more senior debt security with similar stated yield characteristics. Unlike interest payments on debt securities, preferred stock dividends are payable only if declared by the issuer’s board of directors. Preferred stock also may be subject to optional or mandatory redemption provisions.
Segregation and Collateralization: In cases in which the 1940 Act and the interpretive positions of the Securities and Exchange Commission (“SEC”) require that each Portfolio segregate assets in connection with certain investments (e.g., options written and financial futures contracts), each Portfolio will, consistent with certain interpretive letters issued by the SEC, designate on its books and records cash or other liquid debt securities having a market value at least equal to the amount that would otherwise be required to be physically segregated. Furthermore, based on requirements and agreements with certain exchanges and third party broker-dealers, each Portfolio may also be required to deliver or deposit securities as collateral for certain investments (e.g., options written and financial futures contracts).
Investment Transactions and Investment Income: Investment transactions are recorded on the dates the transactions are entered into (the trade dates). Realized gains and losses on investment transactions are determined on the identified cost basis. Dividend income is recorded on the ex-dividend dates. Dividends from foreign securities where the ex-dividend date may have passed are subsequently recorded when the Portfolio has determined the ex-dividend date. Upon notification from issuers, some of the dividend income received from a real estate investment trust may be redesignated as a reduction of cost of the related investment and/or realized gain. Income, realized and unrealized gains and losses of the Portfolios are allocated daily to each class based on its relative net assets.
Dividends and Distributions: Dividends and distributions paid by the Portfolios are recorded on the ex-dividend dates.
Securities Lending: The Portfolios may lend securities to financial institutions that provide cash which will be maintained at all times in an amount equal to at least 100% of the current market value of the loaned securities. The market value of the loaned securities is determined at the close of business of the Portfolios and any additional required collateral is delivered to the Portfolios on the next business day. The Portfolios typically receive income on the loaned securities but do not receive the income on the collateral. The Portfolios may invest the cash collateral and retain the amount earned on such investment, net of any amount rebated to the borrower. Loans of securities are terminable at any time and the borrower, after notice, is required to return borrowed securities within the standard time period for settlement of securities transactions. The Portfolios may pay reasonable lending agent, administrative and custodial fees in connection with their loans. In the event that the borrower defaults on its obligation to return borrowed securities because of insolvency or for any other reason, the Portfolios could experience delays and costs in gaining access to the collateral. The Portfolios also could suffer a loss if the value of an investment purchased with cash collateral falls below the market value of loaned securities.
Income Taxes: It is each Portfolio’s policy to comply with the requirements of the Internal Revenue Code applicable to regulated investment companies and to distribute substantially all of their taxable income to their shareholders. Therefore, no federal income tax provision is required. Under the applicable foreign tax laws, a withholding tax may be imposed on interest, dividends and capital gains at various rates.
The Portfolios file US federal and various state and local tax returns. No income tax returns are currently under examination. The statutes of limitations on Health Sciences Opportunities, International Opportunities, Science & Technology Opportunities and U.S. Opportunities Portfolios’ US federal income tax returns remain open for each of the four years ended September 30, 2008. The statutes of limitations on Global Opportunities’ US federal income tax returns remain open for each of the three years ended September 30, 2008. The statutes of limitations on each Portfolio’s state and local tax returns may remain open for an additional year depending upon the jurisdiction.
Recent Accounting Pronouncement: In March 2008, Statement of Financial Accounting Standards No. 161, “Disclosures about Derivative Instruments and Hedging Activities – an amendment of FASB Statement No. 133” (“FAS 161”), was issued. FAS 161 is intended to improve financial reporting for derivative instruments by requiring enhanced disclosure that enables investors to understand how and why an entity uses derivatives, how derivatives are accounted for, and how derivative instruments affect an entity’s results of operations and financial position. FAS 161 is
| | | | | | |
56 | | SEMI-ANNUAL REPORT | | MARCH 31, 2009 | | |
Notes to Financial Statements (continued)
effective for financial statements issued for fiscal years and interim periods beginning after November 15, 2008. The impact on each Portfolio’s financial statement disclosures is currently being assessed.
Bank Overdraft: As of March 31, 2009, Science & Technology Opportunities recorded a bank overdraft resulting from the estimation of available cash. The overdraft balance incurs fees charged by the custodian which are included in custodian on the Statements of Operations.
Other: Expenses directly related to a Portfolio or class are charged to that Portfolio or class. Other operating expenses shared by several funds are pro-rated among those funds on the basis of relative net assets or other appropriate methods. Other expenses of a Portfolio are allocated daily to each class based on its relative net assets.
2. Investment Advisory Agreements and Other Transactions with Affiliates:
The Fund, on behalf of the Portfolios, entered into an Investment Advisory Agreement with BlackRock Advisors, LLC (the “Advisor”), an indirect, wholly owned subsidiary of BlackRock, Inc., to provide investment advisory services. The PNC Financial Services Group, Inc. (“PNC”) and Bank of America Corporation (“BAC”) are the largest stockholders of BlackRock, Inc. (“BlackRock”). BAC became a stockholder of BlackRock following its acquisition of Merrill Lynch & Co., Inc. (“Merrill Lynch”) on January 1, 2009. Prior to that date, both PNC and Merrill Lynch were considered affiliates of the Fund under the 1940 Act. Subsequent to the acquisition, PNC remains an affiliate, but due to the restructuring of Merrill Lynch’s ownership interest of BlackRock, BAC is not deemed to be an affiliate under the 1940 Act.
The Advisor is responsible for the management of each Portfolio and provides the necessary personnel, facilities, equipment and certain other services necessary to the operations of the Portfolios. For such services, each Portfolio pays the Advisor a monthly fee based on the average daily value of the Portfolio’s net assets, at the following annual rates:
| | | | | | | | | | | | |
| | | First $1 Billion | | | $1 Billion - $2 Billion | | | $2 Billion - $3 Billion | | | Greater Than $3 Billion | |
Global Opportunities and Science & Technology Opportunities | | 0.900 | % | | 0.850 | % | | 0.800 | % | | 0.750 | % |
Health Sciences Opportunities | | 0.750 | | | 0.700 | | | 0.675 | | | 0.650 | |
International Opportunities | | 1.000 | | | 0.950 | | | 0.900 | | | 0.850 | |
U.S. Opportunities | | 1.100 | | | 1.050 | | | 1.025 | | | 1.000 | |
In addition, the Advisor has entered into a sub-advisory agreement with BlackRock Financial Management, Inc., an affiliate of the Advisor, to serve as sub-advisor for a portion of the assets of Global Opportunities and BlackRock International, Ltd., an affiliate of the Advisor, to serve as sub-advisor for International Opportunities. The Advisor pays the sub-advisors, for services they provide, a monthly fee that is a percentage of the investment advisory fees paid by the applicable Portfolio to the Advisor.
The Advisor contractually agreed to waive or reimburse fees or expenses until February 1, 2010, in order to limit expenses. These expense limits apply to the aggregate expenses incurred on a share class (excluding: interest, taxes, brokerage commissions, expenses incurred as a result of investments in other funds and other expenses attributable to, and incurred as a result of, a Portfolio’s investments and other extraordinary expenses). This agreement is reviewed annually by the Board. The current expense limitations as a percentage of net assets are as follows:
| | | | | | | | | | | | | | | | | | |
| | | Share Classes | |
| | | Institutional | | | Service | | | Investor A | | | Investor B | | | Investor C | | | R | |
Global Opportunities | | 1.35 | % | | 1.65 | %1 | | 1.65 | % | | 2.40 | % | | 2.40 | % | | 3.59 | %1 |
Health Sciences Opportunities | | 1.25 | % | | 1.55 | % | | 1.55 | % | | 2.25 | % | | 2.25 | % | | 1.81 | %1 |
International Opportunities | | 1.45 | % | | 1.75 | % | | 1.92 | % | | 2.67 | % | | 2.67 | % | | 2.12 | %1 |
Science & Technology Opportunities | | 1.35 | % | | 1.73 | % | | 1.75 | % | | 2.65 | % | | 2.65 | % | | 2.57 | % |
U.S. Opportunities | | 1.00 | % | | 1.60 | % | | 1.60 | % | | 2.25 | % | | 2.25 | % | | 2.32 | %1 |
| 1 | There were no shares outstanding as of March 31, 2009. |
PFPC Trust Company, an indirect wholly-owned subsidiary of PNC, serves as custodian for each Portfolio. For these services, the custodian receives a fee computed daily and payable monthly, based on a percentage of the average daily gross assets of each Portfolio. The fee is based on a percentage of the average daily net assets at the following annual rates: 0.005% of the first $400 million, 0.004% of the next $1.6 billion, and 0.003% of average daily gross assets in excess of $2 billion; plus per transaction charges and other miscellaneous fees incurred on behalf of each Portfolio.
PNC Global Investment Servicing (U.S.) Inc. (“PNCGIS”), an indirect, wholly owned subsidiary of PNC, serves as transfer and dividend disbursing agent. Each class of each Portfolio bears the costs of transfer agent fees associated with such respective class. Transfer agent fees borne by each class of each Portfolio are comprised of those fees
| | | | | | |
| | | SEMI-ANNUAL REPORT | | MARCH 31, 2009 | | 57 |
Notes to Financial Statements (continued)
charged for all shareholder communications including mailing of shareholder reports, dividend and distribution notices, and proxy materials for shareholders meetings, as well as per account and per transaction fees related to servicing and maintenance of shareholder accounts, including the issuing, redeeming and transferring of shares of each class of each Portfolio, 12b-1 fee calculations, check writing, anti-money laundering services, and customer identification services.
Pursuant to written agreements, Merrill Lynch and certain other affiliates provide the Portfolios with sub-accounting, recordkeeping, sub-transfer agency and other administrative services with respect to sub-accounts they service. For these services, affiliates receive an annual fee per shareholder account which will vary depending on share class. The Portfolios incurred the following fees in return for these services, which are a component of the transfer agent fees in the accompanying Statements of Operations:
| | | | | | |
| | | Merrill Lynch | | Other Affiliates |
| | | Period
October 1, 2008
to
December 31, 2008 | | Six Months
Ended
March 31, 2009 |
Global Opportunities | | $ | 10,651 | | $ | — |
Health Sciences Opportunities | | | 86,516 | | | 57 |
International Opportunities | | | 110,582 | | | 47,655 |
Science & Technology Opportunities | | | 196,427 | | | 536 |
U.S. Opportunities | | | 68,088 | | | 43,507 |
PNCGIS and the Advisor act as co-administrators for the Portfolios. For these services, the co-administrators receive a combined administration fee computed daily and payable monthly, based on a percentage of the average daily net assets of each Portfolio. The combined administration fee is paid at the following annual rates: 0.075% of the first $500 million, 0.065% of the next $500 million and 0.055% of average of daily net assets in excess of $1 billion. In addition, each of the share classes is charged an administration fee based on the following percentages of average daily net assets of each respective class: 0.025% of the first $500 million of each Portfolio, 0.015% of the next $500 million and 0.005% of average of daily net assets in excess of $1 billion. In addition, PNCGIS and the Advisor may have, at their discretion, voluntarily waived all or any portion of their administration fees for a Portfolio or a share class.
The Portfolios have received an exemptive order from the SEC permitting them to lend portfolio securities to Merrill Lynch, Pierce, Fenner & Smith (“MLPF&S”) or its affiliates. Pursuant to that order, the Portfolios have retained BlackRock Investment Management, LLC (“BIM”), an affiliate of the Advisor, as the securities lending agent for a fee based on a share of the returns on investment of cash collateral. BIM may, on behalf of the Portfolios, invest cash collateral received by the Portfolios for such loans, among other things, in a private investment company managed by the Advisor or in registered money market funds advised by the Advisor or its affiliates. The share of income earned by the Portfolios on such investments is shown as securities lending - affiliated on the Statements of Operations. The securities lending agent fees received by BIM were as follows:
| | | |
| | | Securities lending
agent fees for the
six months ended
March 31, 2009 |
Health Sciences Opportunities | | $ | 21,671 |
International Opportunities | | | 1,281 |
Science & Technology Opportunities | | | 897 |
U.S. Opportunities | | | 136,597 |
The Fund, on behalf of the Portfolios, has entered into a separate Distribution Agreement and Distribution Plan with BlackRock Investments, LLC (“BIL”), an affiliate of BlackRock. Pursuant to the Distribution Plan, in accordance with Rule 12b-1 under the 1940 Act, the Portfolios pay BIL ongoing service and distribution fees. The fees are accrued daily and paid monthly at annual rates based upon the average daily net assets of the shares of each Portfolio as follows:
| | | | | | |
| | | Service
Fee | | | Distribution
Fee | |
Service | | 0.25 | % | | — | |
Investor A | | 0.25 | % | | — | |
Investor B | | 0.25 | % | | 0.75 | % |
Investor C | | 0.25 | % | | 0.75 | % |
R | | 0.25 | % | | 0.25 | % |
For the six months ended March 31, 2009, the Portfolios paid to affiliates the following fees in return for distribution and sales support services:
| | | |
Global Opportunities | | $ | 11,823 |
Health Sciences Opportunities | | | 354,652 |
International Opportunities | | | 163,454 |
Science & Technology Opportunities | | | 66,159 |
U.S. Opportunities | | | 99,401 |
The Advisor maintains a call center, which is responsible for providing certain shareholder services to the Portfolios, such as responding to shareholder inquiries and processing transactions based upon instructions from shareholders with respect to the subscription and redemption of Portfolio shares. During the six months ended March 31, 2009, each Portfolio reimbursed the Advisor the following amounts for costs incurred in running the call center, which are a component of the transfer agent fees in the accompanying Statements of Operations.
| | | | | | | | | | | | | | | | | | |
| | | Share Classes |
Call Center | | Institutional | | Service | | Investor A | | Investor B | | Investor C | | Total |
Global Opportunities | | $ | 599 | | | — | | $ | 2,925 | | $ | 743 | | $ | 970 | | $ | 5,237 |
Health Sciences Opportunities | | | 2,603 | | $ | 371 | | | 36,180 | | | 8,006 | | | 12,929 | | | 60,089 |
International Opportunities | | | 6,874 | | | 2,009 | | | 30,356 | | | 3,833 | | | 9,069 | | | 52,141 |
Science & Technology Opportunities | | | 3,192 | | | — | | | 6,283 | | | — | | | — | | | 9,475 |
U.S. Opportunities | | | 3,609 | | | 1,221 | | | 32,589 | | | 2,118 | | | 6,130 | | | 45,667 |
| | | | | | |
58 | | SEMI-ANNUAL REPORT | | MARCH 31, 2009 | | |
Notes to Financial Statements (continued)
For the six months ended March 31, 2009, the following charts show the various types of class specific expenses borne directly by each class of each Portfolio and any associated waivers or reimbursements of those expenses.
| | | | | | | | | | | | | | | | | | | | | |
| | | Share Classes | | |
Administration Fees | | Institutional | | Service | | Investor A | | Investor B | | Investor C | | R | | Total |
Global Opportunities | | $ | 2,487 | | | — | | $ | 3,219 | | $ | 474 | | $ | 1,517 | | | — | | $ | 7,697 |
Health Sciences Opportunities | | | 18,463 | | $ | 632 | | | 53,081 | | | 7,731 | | | 29,776 | | | — | | | 109,683 |
International Opportunities | | | 42,020 | | | 5,652 | | | 42,127 | | | 3,485 | | | 16,161 | | | — | | | 109,445 |
Science & Technology Opportunities | | | 3,169 | | | 9 | | | 7,009 | | | 906 | | | 1,943 | | $ | 155 | | | 13,191 |
U.S. Opportunities | | | 40,959 | | | 12,750 | | | 50,198 | | | 1,975 | | | 15,046 | | | — | | | 120,928 |
| | | | | | | | | | | | | | | | | | | | | |
| | | Share Classes | | |
Administration Fees Waived | | Institutional | | Service | | Investor A | | Investor B | | Investor C | | R | | Total |
Global Opportunities | | $ | 2,283 | | | — | | $ | 3,058 | | $ | 454 | | $ | 1,456 | | | — | | $ | 7,251 |
International Opportunities | | | 9,585 | | $ | 4,931 | | | — | | | 589 | | | 533 | | | — | | | 15,638 |
Science & Technology Opportunities | | | 3,169 | | | 9 | | | 7,009 | | | 906 | | | 1,943 | | $ | 155 | | | 13,191 |
U.S. Opportunities | | | 40,959 | | | — | | | 582 | | | 1,975 | | | 6,763 | | | — | | | 50,279 |
| | | | | | | | | | | | | | | | | | |
| | | Share Classes | | |
Service and Distribution Fees | | Service | | Investor A | | Investor B | | Investor C | | R | | Total |
Global Opportunities | | | — | | $ | 32,186 | | $ | 18,957 | | $ | 60,910 | | | — | | $ | 112,053 |
Health Sciences Opportunities | | $ | 6,327 | | | 530,944 | | | 309,107 | | | 1,189,629 | | | — | | | 2,036,007 |
International Opportunities | | | 56,503 | | | 419,847 | | | 139,414 | | | 647,409 | | | — | | | 1,263,173 |
Science & Technology Opportunities | | | 85 | | | 70,169 | | | 36,293 | | | 77,789 | | $ | 3,125 | | | 187,461 |
U.S. Opportunities | | | 127,498 | | | 500,058 | | | 78,973 | | | 601,782 | | | — | | | 1,308,311 |
| | | | | | | | | | | | | | | | | | | | | |
| | | Share Classes | | |
Transfer Agent Fees | | Institutional | | Service | | Investor A | | Investor B | | Investor C | | R | | Total |
Global Opportunities | | $ | 18,548 | | | — | | $ | 29,960 | | $ | 6,436 | | $ | 15,321 | | | — | | $ | 70,265 |
Health Sciences Opportunities | | | 84,148 | | $ | 5,635 | | | 547,150 | | | 90,588 | | | 233,924 | | | — | | | 961,445 |
International Opportunities | | | 294,135 | | | 84,962 | | | 509,821 | | | 53,274 | | | 212,815 | | | — | | | 1,155,007 |
Science & Technology Opportunities | | | 105,007 | | | 191 | | | 269,515 | | | 47,919 | | | 99,241 | | $ | 4,770 | | | 526,643 |
U.S. Opportunities | | | 232,765 | | | 92,557 | | | 505,364 | | | 31,092 | | | 158,996 | | | — | | | 1,020,774 |
| | | | | | | | | | | | | | | | | | |
| | | Share Classes | | |
Transfer Agent Fees Waived | | Institutional | | Service | | Investor A | | Investor B | | Investor C | | Total |
Global Opportunities | | $ | 562 | | | — | | $ | 2,791 | | $ | 715 | | $ | 938 | | $ | 5,006 |
International Opportunities | | | 1,450 | | $ | 1,633 | | | — | | | 52 | | | — | | | 3,135 |
Science & Technology Opportunities | | | 3,192 | | | — | | | 6,283 | | | — | | | — | | | 9,475 |
U.S. Opportunities | | | 3,609 | | | — | | | — | | | 2,118 | | | 1,875 | | | 7,602 |
| | | | | | | | | | | | | | | | | | | | | |
| | | Share Classes | | |
Transfer Agent Fees Reimbursed | | Institutional | | Service | | Investor A | | Investor B | | Investor C | | R | | Total |
Global Opportunities | | $ | 11,111 | | | — | | $ | 13,894 | | $ | 4,119 | | $ | 9,749 | | | — | | $ | 38,873 |
International Opportunities | | | 9,813 | | $ | 22,663 | | | — | | | — | | | — | | | — | | | 32,476 |
Science & Technology Opportunities | | | 76,202 | | | 80 | | | 168,608 | | | 30,189 | | | 61,499 | | $ | 1,881 | | | 338,459 |
U.S. Opportunities | | | 228,906 | | | — | | | — | | | 8,938 | | | 12,383 | | | — | | | 250,227 |
| | | | | | |
| | | SEMI-ANNUAL REPORT | | MARCH 31, 2009 | | 59 |
Notes to Financial Statements (continued)
If within two years following a waiver or reimbursement, the operating expenses of a share class that previously received a waiver or reimbursement from the Advisor are less than the expense limit for that share class, the Advisor is entitled to be reimbursed by such share class up to the amount of fees waived or expenses reimbursed under the agreement if: (1) the Portfolio has more than $50 million in assets, (2) the Advisor or an affiliate continues to serve as the Portfolio’s investment advisor or administrator and (3) the Board has approved in advance the payments to the Advisor at the previous quarterly meeting.
At March 31, 2009, the amounts subject to possible future reimbursement under the expense limitation agreement are as follows:
| | | | | | | | | |
| | | Expiring January 31, |
| | | 2010 | | 2011 | | 2012 |
Global Opportunities | | $ | 51,967 | | $ | 42,056 | | $ | 26,563 |
Health Sciences Opportunities | | | 18,972 | | | — | | | — |
International Opportunities | | | 13,266 | | | 25,689 | | | 17,408 |
Science & Technology Opportunities | | | 120,153 | | | 386,166 | | | 84,039 |
U.S. Opportunities | | | 1,134,428 | | | 2,152,468 | | | 420,670 |
The following waivers previously recorded by the Portfolios, which were subject to recoupment by the Advisor, expired on January 31, 2009:
| | | |
Global Opportunities | | $ | 263,545 |
Science & Technology Opportunities | | | 109,289 |
U.S. Opportunities | | | 427,587 |
For the three months ended December 31, 2008, Merrill Lynch, through its affiliated broker dealer, MLPF&S, earned commissions on transactions of securities as follows:
| | | |
Global Opportunities | | $ | 4,473 |
Health Sciences Opportunities | | | 14,892 |
Science & Technology Opportunities | | | 8,460 |
U.S. Opportunities | | | 38,457 |
For the six months ended March 31, 2009, affiliates earned underwriting discounts, direct commissions and dealer concessions on sales of each Portfolio’s Investor A Shares as follows:
| | | |
Global Opportunities | | $ | 1,145 |
Health Sciences Opportunities | | | 13,692 |
International Opportunities | | | 33,523 |
Science & Technology Opportunities | | | 3,866 |
U.S. Opportunities | | | 45,662 |
For the six months ended March 31, 2009, affiliates received the following contingent deferred sales charges relating to transactions in Investor A, B and C Shares:
| | | | | | | | | |
| | | Investor A | | Investor B | | Investor C |
Global Opportunities | | $ | — | | $ | 14,067 | | $ | 5,452 |
Health Sciences Opportunities | | | 5,044 | | | 106,757 | | | 16,302 |
International Opportunities | | | 19,777 | | | 63,114 | | | 55,197 |
Science & Technology | | | | | | | | | |
Opportunities | | | 232 | | | 6,056 | | | 2,124 |
U.S. Opportunities | | | 3,371 | | | 28,323 | | | 59,545 |
The Portfolios may earn income on positive cash balances in demand deposit accounts that are maintained by PNCGIS on behalf of the Portfolios. The income earned for the six months ended March 31, 2009, was as follows which is included in interest and dividends – affiliated on the Statements of Operations:
| | | |
Global Opportunities | | $ | 122 |
Health Sciences Opportunities | | | 1,349 |
International Opportunities | | | 1,266 |
Science & Technology Opportunities | | | 403 |
U.S. Opportunities | | | 1,377 |
The Portfolios may also receive earnings credits related to cash balances with PNCGIS which are shown on the Statements of Operations as fees paid indirectly.
Certain officers and/or trustees of the Fund are officers and/or directors of BlackRock, Inc. or its affiliates. The Portfolios reimburse the Advisor for compensation paid to the Fund’s Chief Compliance Officer.
3. Investments:
For the six months ended March 31, 2009, purchases and sales of investments, excluding short-term securities, were as follows:
| | | | | | |
| | | Purchases | | Sales |
Global Opportunities | | $ | 59,418,712 | | $ | 71,402,221 |
Health Sciences Opportunities | | | 599,222,913 | | | 628,011,910 |
International Opportunities | | | 665,317,775 | | | 632,456,324 |
Science & Technology Opportunities | | | 36,247,968 | | | 56,461,434 |
U.S. Opportunities | | | 1,045,750,092 | | | 637,523,737 |
Written options transactions entered into during the six months ended March 31, 2009 are summarized as follows:
| | | | | | | |
Global Opportunities | | Contracts | | | Premium | |
Balance at 9/30/08 | | — | | | $ | — | |
Written | | (100 | ) | | | (8,750 | ) |
Expired | | 50 | | | | 4,200 | |
Closed | | — | | | | — | |
Exercised | | 50 | | | | 4,550 | |
| | | | | | | |
Balance at 3/31/09 | | — | | | $ | — | |
| | | | | | | |
| | | | | | | |
Health Sciences Opportunities | | Contracts | | | Premium | |
Balance at 9/30/08 | | — | | | $ | — | |
Written | | (226,985 | ) | | | (8,926,641 | ) |
Expired | | 23,005 | | | | 3,923,794 | |
Closed | | 191,181 | | | | 2,902,250 | |
Exercised | | 11,109 | | | | 1,947,258 | |
| | | | | | | |
Balance at 3/31/09 | | (1,690 | ) | | $ | (153,339 | ) |
| | | | | | | |
| | | | | | |
60 | | SEMI-ANNUAL REPORT | | MARCH 31, 2009 | | |
Notes to Financial Statements (continued)
| | | | | | | |
U.S. Opportunities | | Contracts | | | Premium | |
Balance at 9/30/08 | | — | | | $ | — | |
Written | | (1,789 | ) | | | (380,061 | ) |
Expired | | 1,461 | | | | 335,945 | |
Closed | | — | | | | — | |
Exercised | | — | | | | — | |
| | | | | | | |
Balance at 3/31/09 | | (328 | ) | | $ | (44,116 | ) |
| | | | | | | |
4. Short-Term Borrowings:
The Portfolios, along with certain other funds managed by the Advisor and its affiliates, are a party to a $500 million credit agreement with a group of lenders, which expired November 2008 and was renewed until November 2009. The Portfolios may borrow under the credit agreement to fund shareholder redemptions and for other lawful purposes other than for leverage. Each Portfolio may borrow up to the maximum amount allowable under the Portfolio’s current Prospectus and Statement of Additional Information, subject to various other legal, regulatory or contractual limits. The Portfolios paid their pro rata share of a 0.02% upfront fee on the aggregate commitment amount based on their net assets as of October 31, 2008. The Portfolios pay a commitment fee of 0.08% per annum based on each Portfolio’s pro rata share of the unused portion of the credit agreement, which is included in miscellaneous on the Statement of Operations. Amounts borrowed under the credit agreement bear interest at a rate equal to, the higher of the (a) federal funds effective rate and (b) reserve adjusted one month LIBOR, plus, in each case, the higher of (i) 1.50% and (ii) 50% of the CDX index (as defined in the credit agreement) in effect from time to time. The Portfolios did not borrow under the credit agreement during the six months ended March 31, 2009.
5. Capital Loss Carryforward:
As of September 30, 2008, capital loss carryforwards available to offset future realized capital gains through the indicated expiration dates:
| | | | | | | | | | | | |
| | | Expiring September 30, |
| | | 2009 | | 2010 | | 2011 | | 2015 |
Science & Technology Opportunities | | $ | 226,710,557 | | $ | 7,544,799 | | $ | — | | $ | 54,937,681 |
U.S. Opportunities | | | — | | | 36,277,437 | | | 16,513,511 | | | — |
6. Market and Credit Risk:
In the normal course of business, the Portfolios invest in securities and enter into transactions where risks exist due to fluctuations in the market (market risk) or failure of the issuer of a security to meet all its obligations (credit risk). The value of securities held by the Portfolios may decline in response to certain events, including those directly involving the issuers whose securities are owned by the Portfolios; conditions affecting the general economy; overall market changes; local, regional or global political, social or economic instability; and currency and interest rate and price fluctuations. Similar to credit risk, the Portfolios may be exposed to counterparty risk, or the risk that an entity with which the Portfolios have unsettled or open transactions may default. Financial assets, which potentially expose the Portfolios to credit and counterparty risks, consist principally of investments and cash due from counterparties. The extent of the Portfolios’ exposure to credit and counterparty risks with respect to these financial assets is approximated by their value recorded in the Portfolios’ Statements of Assets and Liabilities.
7. Capital Shares Transactions:
Transactions in shares for each period were as follows:
| | | | | | | | | | | | | | |
| | | Six Months Ended
March 31, 2009 | | | Year Ended
September 30, 2008 | |
Global Opportunities | | Shares | | | Amount | | | Shares | | | Amount | |
Institutional | | | | | | | | | | | | | | |
Shares sold | | 366,391 | | | $ | 2,823,464 | | | 1,871,396 | | | $ | 22,994,920 | |
Shares issued in reinvestment of dividends and distributions | | 1,598 | | | | 12,017 | | | 52,175 | | | | 655,316 | |
| | | | | | | | | | | | | | |
Total issued | | 367,989 | | | | 2,835,481 | | | 1,923,571 | | | | 23,650,236 | |
Shares redeemed | | (2,434,790 | ) | | | (17,456,833 | ) | | (927,987 | ) | | | (10,862,583 | ) |
| | | | | | | | | | | | | | |
Net increase (decrease) | | (2,066,801 | ) | | $ | (14,621,352 | ) | | 995,584 | | | $ | 12,787,653 | |
| | | | | | | | | | | | | | |
Investor A | | | | | | | | | | | | | | |
Shares sold | | 1,073,356 | | | $ | 7,538,821 | | | 2,077,064 | | | $ | 24,760,185 | |
Shares issued in reinvestment of dividends and distributions | | — | | | | — | | | 138,763 | | | | 1,741,483 | |
| | | | | | | | | | | | | | |
Total issued | | 1,073,356 | | | | 7,538,821 | | | 2,215,827 | | | | 26,501,668 | |
Shares redeemed | | (1,262,369 | ) | | | (9,241,887 | ) | | (1,483,646 | ) | | | (16,792,204 | ) |
| | | | | | | | | | | | | | |
Net increase (decrease) | | (189,013 | ) | | | (1,703,066 | ) | | 732,181 | | | $ | 9,709,464 | |
| | | | | | | | | | | | | | |
| | | | | | |
| | | SEMI-ANNUAL REPORT | | MARCH 31, 2009 | | 61 |
Notes to Financial Statements (continued)
| | | | | | | | | | | | | | |
| | | Six Months Ended
March 31, 2009 | | | Year Ended
September 30, 2008 | |
Global Opportunities (concluded) | | Shares | | | Amount | | | Shares | | | Amount | |
Investor B | | | | | | | | | | | | | | |
Shares sold | | 20,754 | | | $ | 151,242 | | | 129,011 | | | $ | 1,612,083 | |
Shares issued in reinvestment of dividends and distributions | | — | | | | — | | | 17,440 | | | | 218,352 | |
| | | | | | | | | | | | | | |
Total issued | | 20,754 | | | | 151,242 | | | 146,451 | | | | 1,830,435 | |
Shares redeemed | | (126,688 | ) | | | (913,700 | ) | | (153,153 | ) | | | (1,781,665 | ) |
| | | | | | | | | | | | | | |
Net increase (decrease) | | (105,934 | ) | | $ | (762,458 | ) | | (6,702 | ) | | $ | 48,770 | |
| | | | | | | | | | | | | | |
Investor C | | | | | | | | | | | | | | |
Shares sold | | 379,140 | | | $ | 2,822,226 | | | 902,717 | | | $ | 11,026,553 | |
Shares issued in reinvestment of dividends and distributions | | — | | | | — | | | 41,450 | | | | 518,953 | |
| | | | | | | | | | | | | | |
Total issued | | 379,140 | | | | 2,822,226 | | | 944,167 | | | | 11,545,506 | |
Shares redeemed | | (695,163 | ) | | | (5,116,556 | ) | | (487,805 | ) | | | (5,757,989 | ) |
| | | | | | | | | | | | | | |
Net increase (decrease) | | (316,023 | ) | | $ | (2,294,330 | ) | | 456,362 | | | $ | 5,787,517 | |
| | | | | | | | | | | | | | |
| | | | |
Health Sciences Opportunities | | | | | | | | | | | | |
Institutional | | | | | | | | | | | | | | |
Shares sold | | 1,889,357 | | | $ | 43,831,012 | | | 2,360,582 | | | $ | 71,114,202 | |
Shares issued in reinvestment of dividends and distributions | | 654,857 | | | | 13,743,792 | | | 206,270 | | | | 6,381,988 | |
| | | | | | | | | | | | �� | | |
Total issued | | 2,544,214 | | | | 57,574,804 | | | 2,566,852 | | | | 77,496,190 | |
Shares redeemed | | (2,600,620 | ) | | | (58,801,768 | ) | | (1,789,484 | ) | | | (52,047,635 | ) |
| | | | | | | | | | | | | | |
Net increase (decrease) | | (56,406 | ) | | $ | (1,226,964 | ) | | 777,368 | | | $ | 25,448,555 | |
| | | | | | | | | | | | | | |
Service | | | | | | | | | | | | | | |
Shares sold | | 89,172 | | | $ | 1,999,134 | | | 68,625 | | | $ | 1,990,269 | |
Shares issued in reinvestment of dividends and distributions | | 22,209 | | | | 457,497 | | | 9,591 | | | | 291,761 | |
| | | | | | | | | | | | | | |
Total issued | | 111,381 | | | | 2,456,631 | | | 78,216 | | | | 2,282,030 | |
Shares redeemed | | (56,236 | ) | | | (1,279,773 | ) | | (135,331 | ) | | | (3,869,823 | ) |
| | | | | | | | | | | | | | |
Net increase (decrease) | | 55,145 | | | $ | 1,176,858 | | | (57,115 | ) | | $ | (1,587,793 | ) |
| | | | | | | | | | | | | | |
Investor A | | | | | | | | | | | | | | |
Shares sold | | 3,071,148 | | | $ | 67,107,970 | | | 3,866,195 | | | $ | 112,836,542 | |
Shares issued in reinvestment of dividends and distributions | | 1,779,579 | | | | 36,587,917 | | | 774,671 | | | | 23,511,250 | |
| | | | | | | | | | | | | | |
Total issued | | 4,850,727 | | | | 103,695,887 | | | 4,640,866 | | | | 136,347,792 | |
Shares redeemed | | (6,539,117 | ) | | | (144,883,010 | ) | | (7,991,237 | ) | | | (229,010,671 | ) |
| | | | | | | | | | | | | | |
Net decrease | | (1,688,390 | ) | | $ | (41,187,123 | ) | | (3,350,371 | ) | | $ | (92,662,879 | ) |
| | | | | | | | | | | | | | |
| | | | | | |
62 | | SEMI-ANNUAL REPORT | | MARCH 31, 2009 | | |
Notes to Financial Statements (continued)
| | | | | | | | | | | | | | |
| | | Six Months Ended
March 31, 2009 | | | Year Ended
September 30, 2008 | |
Health Sciences Opportunities (concluded) | | Shares | | | Amount | | | Shares | | | Amount | |
Investor B | | | | | | | | | | | | | | |
Shares sold | | 118,088 | | | $ | 2,418,642 | | | 134,108 | | | $ | 3,724,930 | |
Shares issued in reinvestment of dividends and distributions | | 288,269 | | | | 5,632,774 | | | 88,135 | | | | 2,556,802 | |
| | | | | | | | | | | | | | |
Total issued | | 406,357 | | | | 8,051,416 | | | 222,243 | | | | 6,281,732 | |
Shares redeemed | | (637,827 | ) | | | (13,313,527 | ) | | (587,431 | ) | | | (16,148,103 | ) |
| | | | | | | | | | | | | | |
Net decrease | | (231,470 | ) | | $ | (5,262,111 | ) | | (365,188 | ) | | $ | (9,866,371 | ) |
| | | | | | | | | | | | | | |
Investor C | | | | | | | | | | | | | | |
Shares sold | | 806,964 | | | $ | 16,591,103 | | | 837,443 | | | $ | 23,392,641 | |
Shares issued in reinvestment of dividends and distributions | | 1,084,301 | | | | 21,143,009 | | | 362,228 | | | | 10,486,508 | |
| | | | | | | | | | | | | | |
Total issued | | 1,891,265 | | | | 37,734,112 | | | 1,199,671 | | | | 33,879,149 | |
Shares redeemed | | (2,122,136 | ) | | | (44,661,191 | ) | | (2,642,187 | ) | | | (71,536,281 | ) |
| | | | | | | | | | | | | | |
Net decrease | | (230,871 | ) | | $ | (6,927,079 | ) | | (1,442,516 | ) | | $ | (37,657,132 | ) |
| | | | | | | | | | | | | | |
| | | | |
International Opportunities | | | | | | | | | | | | |
Institutional | | | | | | | | | | | | | | |
Shares sold | | 5,638,074 | | | $ | 124,928,216 | | | 8,315,655 | | | $ | 319,379,089 | |
Shares issued in reinvestment of dividends and distributions | | 44,657 | | | | 1,008,792 | | | 1,290,442 | | | | 54,624,699 | |
| | | | | | | | | | | | | | |
Total issued | | 5,682,731 | | | | 125,937,008 | | | 9,606,097 | | | | 374,003,788 | |
Shares redeemed | | (5,392,224 | ) | | | (116,240,856 | ) | | (3,940,492 | ) | | | (148,720,827 | ) |
| | | | | | | | | | | | | | |
Net increase | | 290,507 | | | $ | 9,696,152 | | | 5,665,605 | | | $ | 225,282,961 | |
| | | | | | | | | | | | | | |
Service | | | | | | | | | | | | | | |
Shares sold | | 880,191 | | | $ | 18,429,534 | | | 924,653 | | | $ | 34,809,315 | |
Shares issued in reinvestment of dividends and distributions | | — | | | | — | | | 664,200 | | | | 27,165,771 | |
| | | | | | | | | | | | | | |
Total issued | | 880,191 | | | | 18,429,534 | | | 1,588,853 | | | | 61,975,086 | |
Shares redeemed | | (800,684 | ) | | | (17,096,454 | ) | | (2,795,756 | ) | | | (98,602,667 | ) |
| | | | | | | | | | | | | | |
Net increase (decrease) | | 79,507 | | | $ | 1,333,080 | | | (1,206,903 | ) | | $ | (36,627,581 | ) |
| | | | | | | | | | | | | | |
Investor A | | | | | | | | | | | | | | |
Shares sold | | 5,677,874 | | | $ | 118,534,318 | | | 8,805,941 | | | $ | 329,503,186 | |
Shares issued in reinvestment of dividends and distributions | | 6,522 | | | | 141,330 | | | 2,080,883 | | | | 84,442,326 | |
| | | | | | | | | | | | | | |
Total issued | | 5,684,396 | | | | 118,675,648 | | | 10,886,824 | | | | 413,945,512 | |
Shares redeemed | | (6,175,548 | ) | | | (132,108,781 | ) | | (5,029,800 | ) | | | (185,085,966 | ) |
| | | | | | | | | | | | | | |
Net increase (decrease) | | (491,152 | ) | | $ | (13,433,133 | ) | | 5,857,024 | | | $ | 228,859,546 | |
| | | | | | | | | | | | | | |
| | | | | | |
| | | SEMI-ANNUAL REPORT | | MARCH 31, 2009 | | 63 |
Notes to Financial Statements (continued)
| | | | | | | | | | | | | | |
| | | Six Months Ended
March 31, 2009 | | | Year Ended
September 30, 2008 | |
International Opportunities (concluded) | | Shares | | | Amount | | | Shares | | | Amount | |
Investor B | | | | | | | | | | | | | | |
Shares sold | | 63,147 | | | $ | 1,221,842 | | | 211,829 | | | $ | 7,530,494 | |
Shares issued in reinvestment of dividends and distributions | | — | | | | — | | | 403,239 | | | | 15,379,610 | |
| | | | | | | | | | | | | | |
Total issued | | 63,147 | | | | 1,221,842 | | | 615,068 | | | | 22,910,104 | |
Shares redeemed | | (392,405 | ) | | | (7,665,552 | ) | | (1,192,608 | ) | | | (42,182,227 | ) |
| | | | | | | | | | | | | | |
Net decrease | | (329,258 | ) | | $ | (6,443,710 | ) | | (577,540 | ) | | $ | (19,272,123 | ) |
| | | | | | | | | | | | | | |
Investor C | | | | | | | | | | | | | | |
Shares sold | | 732,177 | | | $ | 14,377,182 | | | 2,674,323 | | | $ | 93,386,640 | |
Shares issued in reinvestment of dividends and distributions | | — | | | | — | | | 1,055,533 | | | | 40,132,456 | |
| | | | | | | | | | | | | | |
Total issued | | 732,177 | | | | 14,377,182 | | | 3,729,856 | | | | 133,519,096 | |
Shares redeemed | | (1,970,663 | ) | | | (38,545,359 | ) | | (1,849,406 | ) | | | (63,026,557 | ) |
| | | | | | | | | | | | | | |
Net increase (decrease) | | (1,238,486 | ) | | $ | (24,168,177 | ) | | 1,880,450 | | | $ | 70,492,539 | |
| | | | | | | | | | | | | | |
| | | | |
Science & Technology Opportunities | | | | | | | | | | | | |
Institutional | | | | | | | | | | | | | | |
Shares issued from the reorganization | | — | | | $ | — | | | 5,985,171 | | | $ | 44,785,989 | |
Shares sold | | 211,480 | | | | 1,097,021 | | | 200,203 | | | | 1,729,191 | |
| | | | | | | | | | | | | | |
Total issued | | 211,480 | | | | 1,097,021 | | | 6,185,374 | | | | 46,515,180 | |
Shares redeemed | | (2,970,913 | ) | | | (15,717,566 | ) | | (198,473 | ) | | | (1,555,290 | ) |
| | | | | | | | | | | | | | |
Net increase (decrease) | | (2,759,433 | ) | | $ | (14,620,545 | ) | | 5,986,901 | | | $ | 44,959,890 | |
| | | | | | | | | | | | | | |
Service | | | | | | | | | | | | | | |
Shares sold | | 849 | | | $ | 4,874 | | | 7,103 | | | $ | 61,566 | |
Shares redeemed | | (5,505 | ) | | | (28,353 | ) | | (5,386 | ) | | | (41,218 | ) |
| | | | | | | | | | | | | | |
Net increase (decrease) | | (4,656 | ) | | $ | (23,479 | ) | | 1,717 | | | $ | 20,348 | |
| | | | | | | | | | | | | | |
Investor A | | | | | | | | | | | | | | |
Shares issued from the reorganization | | — | | | $ | — | | | 8,192,933 | | | $ | 59,135,218 | |
Shares sold | | 1,360,578 | | | | 7,235,368 | | | 2,789,422 | | | | 21,786,402 | |
| | | | | | | | | | | | | | |
Total issued | | 1,360,578 | | | | 7,235,368 | | | 10,982,355 | | | | 80,921,620 | |
Shares redeemed | | (1,576,311 | ) | | | (8,263,833 | ) | | (2,652,055 | ) | | | (19,857,422 | ) |
| | | | | | | | | | | | | | |
Net increase (decrease) | | (215,733 | ) | | $ | (1,028,465 | ) | | 8,330,300 | | | $ | 61,064,198 | |
| | | | | | | | | | | | | | |
| | | | | | |
64 | | SEMI-ANNUAL REPORT | | MARCH 31, 2009 | | |
Notes to Financial Statements (continued)
| | | | | | | | | | | | | | |
| | | Six Months Ended
March 31, 2009 | | | Year Ended
September 30, 2008 | |
Science & Technology Opportunities (concluded) | | Shares | | | Amount | | | Shares | | | Amount | |
Investor B | | | | | | | | | | | | | | |
Shares issued from the reorganization | | — | | | $ | — | | | 1,380,801 | | | $ | 9,336,277 | |
Shares sold | | 79,113 | | | | 388,098 | | | 153,054 | | | | 1,159,204 | |
| | | | | | | | | | | | | | |
Total issued | | 79,113 | | | | 388,098 | | | 1,533,855 | | | | 10,495,481 | |
Shares redeemed | | (668,157 | ) | | | (3,240,147 | ) | | (806,074 | ) | | | (5,864,330 | ) |
| | | | | | | | | | | | | | |
Net increase (decrease) | | (589,044 | ) | | $ | (2,852,049 | ) | | 727,781 | | | $ | 4,631,151 | |
| | | | | | | | | | | | | | |
Investor C | | | | | | | | | | | | | | |
Shares issued from the reorganization | | — | | | $ | — | | | 2,471,268 | | | $ | 16,692,503 | |
Shares sold | | 191,409 | | | | 928,758 | | | 288,948 | | | | 2,212,142 | |
| | | | | | | | | | | | | | |
Total issued | | 191,409 | | | | 928,758 | | | 2,760,216 | | | | 18,904,645 | |
Shares redeemed | | (656,876 | ) | | | (3,248,864 | ) | | (443,267 | ) | | | (3,147,730 | ) |
| | | | | | | | | | | | | | |
Net increase (decrease) | | (465,467 | ) | | $ | (2,320,106 | ) | | 2,316,949 | | | $ | 15,756,915 | |
| | | | | | | | | | | | | | |
R | | | | | | | | | | | | | | |
Shares issued from the reorganization | | — | | | $ | — | | | 186,241 | | | $ | 1,392,331 | |
Shares sold | | 67,392 | | | | 380,565 | | | 12,787 | | | | 94,885 | |
| | | | | | | | | | | | | | |
Total issued | | 67,392 | | | | 380,565 | | | 199,028 | | | | 1,487,216 | |
Shares redeemed | | (33,782 | ) | | | (179,562 | ) | | (3,537 | ) | | | (25,552 | ) |
| | | | | | | | | | | | | | |
Net increase | | 33,610 | | | $ | 201,003 | | | 195,491 | | | $ | 1,461,664 | |
| | | | | | | | | | | | | | |
| | | | |
U.S. Opportunities | | | | | | | | | | | | |
Institutional | | | | | | | | | | | | | | |
Shares sold | | 12,585,327 | | | $ | 295,846,450 | | | 6,527,636 | | | $ | 232,856,375 | |
Shares issued in reinvestment of dividends | | 1,747 | | | | 37,968 | | | — | | | | — | |
| | | | | | | | | | | | | | |
Total issued | | 12,587,074 | | | | 295,884,418 | | | 6,527,636 | | | | 232,856,375 | |
Shares redeemed | | (2,753,211 | ) | | | (63,029,753 | ) | | (1,386,445 | ) | | | (48,859,106 | ) |
| | | | | | | | | | | | | | |
Net increase | | 9,833,863 | | | $ | 232,854,665 | | | 5,141,191 | | | $ | 183,997,269 | |
| | | | | | | | | | | | | | |
Service | | | | | | | | | | | | | | |
Shares sold | | 2,882,495 | | | $ | 64,344,882 | | | 3,094,115 | | | $ | 107,890,871 | |
Shares redeemed | | (1,187,870 | ) | | | (26,025,892 | ) | | (727,325 | ) | | | (24,788,342 | ) |
| | | | | | | | | | | | | | |
Net increase | | 1,694,625 | | | $ | 38,318,990 | | | 2,366,790 | | | $ | 83,102,529 | |
| | | | | | | | | | | | | | |
Investor A | | | | | | | | | | | | | | |
Shares sold | | 11,133,074 | | | $ | 247,716,338 | | | 12,405,934 | | | $ | 421,435,122 | |
Shares redeemed | | (5,967,703 | ) | | | (134,261,506 | ) | | (2,468,662 | ) | | | (83,100,583 | ) |
| | | | | | | | | | | | | | |
Net increase | | 5,165,371 | | | $ | 113,454,832 | | | 9,937,272 | | | $ | 338,334,539 | |
| | | | | | | | | | | | | | |
| | | | | | |
| | | SEMI-ANNUAL REPORT | | MARCH 31, 2009 | | 65 |
Notes to Financial Statements (concluded)
| | | | | | | | | | | | | | |
| | | Six Months Ended
March 31, 2009 | | | Year Ended
September 30, 2008 | |
U.S. Opportunities (concluded) | | Shares | | | Amount | | | Shares | | | Amount | |
Investor B | | | | | | | | | | | | | | |
Shares sold | | 174,206 | | | $ | 3,621,484 | | | 309,367 | | | $ | 9,956,416 | |
Shares redeemed | | (158,239 | ) | | | (3,191,173 | ) | | (643,101 | ) | | | (20,686,509 | ) |
| | | | | | | | | | | | | | |
Net increase (decrease) | | 15,967 | | | $ | 430,311 | | | (333,734 | ) | | $ | (10,730,093 | ) |
| | | | | | | | | | | | | | |
Investor C | | | | | | | | | | | | | | |
Shares sold | | 2,496,768 | | | $ | 51,801,720 | | | 3,202,904 | | | $ | 102,028,096 | |
Shares redeemed | | (1,132,338 | ) | | | (23,100,925 | ) | | (687,264 | ) | | | (21,479,035 | ) |
| | | | | | | | | | | | | | |
Net increase | | 1,364,430 | | | $ | 28,700,795 | | | 2,515,640 | | | $ | 80,549,061 | |
| | | | | | | | | | | | | | |
There is a 2% redemption fee on shares of certain Portfolios redeemed or exchanged which have been held for 30 days or less. The redemption fees are collected and retained by the Portfolio for the benefit of the remaining shareholders. The redemption fees are recorded as a credit to paid-in capital.
| | | | | | |
66 | | SEMI-ANNUAL REPORT | | MARCH 31, 2009 | | |
Officers and Trustees
Ronald W. Forbes, Co-Chairman of the Board and Trustee
Rodney D. Johnson, Co-Chairman of the Board and Trustee
David O. Beim, Trustee
Dr. Matina Horner, Trustee
Herbert I. London, Member of the Audit Committee and Trustee
Cynthia A. Montgomery, Trustee
Joseph P. Platt, Jr., Trustee
Robert C. Robb, Jr., Trustee
Toby Rosenblatt, Trustee
Kenneth L. Urish, Chairman of the Audit Committee and Trustee
Frederick W. Winter, Member of the Audit Committee and Trustee
Richard S. Davis, Trustee
Henry Gabbay, Trustee
Donald C. Burke, Fund President and Chief Executive Officer
Anne F. Ackerley, Vice President
Neal J. Andrews, Chief Financial Officer
Jay M. Fife, Treasurer
Brian P. Kindelan, Chief Compliance Officer of the Fund
Howard Surloff, Secretary
Investment Advisor and Co-Administrator
BlackRock Advisors, LLC
Wilmington, DE 19809
Sub-Advisor - International Opportunities Portfolio
BlackRock International, Ltd.
Edinburgh, Scotland EH3 8JB
Sub-Advisor - Global Opportunities Portfolio
BlackRock Financial Management, Inc.
New York, NY 10022
Custodian
PFPC Trust Company
Philadelphia, PA 19153
Co-Administrator and Transfer Agent
PNC Global Investment Servicing (U.S.) Inc.
Wilmington, DE 19809
Distributor
BlackRock Investments, LLC
New York, NY 10022
Legal Counsel
Sidley Austin LLP
New York, NY 10019
Independent Registered Public Accounting Firm
Deloitte & Touche LLP
Philadelphia, PA 19103
Address of the Portfolios
100 Bellevue Parkway
Wilmington, DE 19809
| | | | | | |
| | | SEMI-ANNUAL REPORT | | MARCH 31, 2009 | | 67 |
Additional Information
BlackRock Privacy Principles
BlackRock is committed to maintaining the privacy of its current and former fund investors and individual clients (collectively, “Clients”) and to safeguarding their non-public personal information. The following information is provided to help you understand what personal information BlackRock collects, how we protect that information and why in certain cases we share such information with select parties.
If you are located in a jurisdiction where specific laws, rules or regulations require BlackRock to provide you with additional or different privacy-related rights beyond what is set forth below, then BlackRock will comply with those specific laws, rules or regulations.
BlackRock obtains or verifies personal non-public information from and about you from different sources, including the following: (i) information we receive from you or, if applicable, your financial intermediary, on applications, forms or other documents; (ii) information about your transactions with us, our affiliates, or others; (iii) information we receive from a consumer reporting agency; and (iv) from visits to our websites.
BlackRock does not sell or disclose to non-affiliated third parties any non-public personal information about its Clients, except as permitted by law or as is necessary to respond to regulatory requests or to service Client accounts. These non-affiliated third parties are required to protect the confidentiality and security of this information and to use it only for its intended purpose.
We may share information with our affiliates to service your account or to provide you with information about other BlackRock products or services that may be of interest to you. In addition, BlackRock restricts access to non-public personal information about its Clients to those BlackRock employees with a legitimate business need for the information. BlackRock maintains physical, electronic and procedural safeguards that are designed to protect the non-public personal information of its Clients, including procedures relating to the proper storage and disposal of such information.
Availability of Additional Information
Electronic copies of most financial reports and prospectuses are available on the Fund’s website or shareholders can sign up for e-mail notifications of quarterly statements, annual and semi-annual reports and prospectuses by enrolling in the Fund’s electronic delivery program.
To enroll:
Shareholders Who Hold Accounts with Investment Advisors, Banks or Brokerages:
Please contact your financial advisor. Please note that not all investment advisors, banks or brokerages may offer this service.
Shareholders Who Hold Accounts Directly With BlackRock
| 1) | Access the BlackRock website at |
http://www.blackrock.com/edelivery
| 2) | Click on the applicable link and follow the steps to sign up 3) Log into your account |
Householding
The Fund will mail only one copy of shareholder documents, including prospectuses, annual and semi-annual reports and proxy statements, to shareholders with multiple accounts at the same address. This practice is commonly called “householding” and it is intended to reduce expenses and eliminate duplicate mailings of shareholder documents. Mailings of your shareholder documents may be householded indefinitely unless you instruct us otherwise. If you do not want the mailing of these documents to be combined with those for other members of your household, please contact the Fund at (800) 441-7762.
| | | | | | |
68 | | SEMI-ANNUAL REPORT | | MARCH 31, 2009 | | |
Additional Information (concluded)
Availability of Additional Information (concluded)
Availability of Proxy Voting Policies and Procedures
A description of the policies and procedures that the Fund uses to determine how to vote proxies relating to portfolio securities is available (1) without charge, upon request by calling (800) 441-7762; (2) at www.blackrock.com; and (3) on the Securities and Exchange Commission’s (the “SEC”) website at http://www.sec.gov.
Availability of Proxy Voting Record
Information about how the Fund votes proxies relating to securities held in the Fund’s portfolios during the most recent 12-month period ended June 30th is available upon request and without charge (1) at www.blackrock.com or by calling (800) 441-7762 (2) on the SEC’s website at http://www.sec.gov.
Availability of Quarterly Portfolio Schedule
The Fund files its complete schedule of portfolio holdings with the SEC for the first and third quarters of each fiscal year on Form N-Q. The Fund’s Forms N-Q are available on the SEC’s website at http:// www.sec.gov and may also be reviewed and copied at the SEC’s Public Reference Room in Washington, D.C. Information on the operation of the Public Reference Room may be obtained by calling (800) SEC-0330. The Fund’s Forms N-Q may also be obtained upon request and without charge by calling (800) 441-7762.
Shareholder Privileges
Account Information
Call us at (800) 441-7762 from 8:00 AM to 6:00 PM EST Monday through Friday to get information about your account balances, recent transactions and share prices. You can also reach us on the Web at www.blackrock.com/funds.
Automatic Investment Plans
Investor Class shareholders who want to invest regularly can arrange to have $50 or more automatically deducted from their checking or savings account and invested in any of the BlackRock portfolios.
Systematic Withdrawal Plan
Investor Class shareholders can establish a systematic withdrawal plan and receive periodic payments of $50 or more from their BlackRock portfolios, as long as their account is at least $10,000.
Retirement Plans
Shareholders may make investments in conjunction with Traditional, Rollover, Roth, Coverdell, Simple IRA’s, SEP IRA’s and 403(b) Plans.
| | | | | | |
| | | SEMI-ANNUAL REPORT | | MARCH 31, 2009 | | 69 |
A World-Class Mutual Fund Family
BlackRock offers a diverse lineup of open-end mutual funds crossing all investment styles and managed by experts in equity, fixed income and tax-exempt investing.
| | | | |
Equity Funds | | | | |
| | |
BlackRock All-Cap Energy & Resources Portfolio | | BlackRock Global Opportunities Portfolio | | BlackRock Mid-Cap Value Equity Portfolio |
BlackRock Asset Allocation Portfolio† | | BlackRock Global SmallCap Fund | | BlackRock Mid Cap Value Opportunities Fund |
BlackRock Aurora Portfolio | | BlackRock Health Sciences Opportunities Portfolio | | BlackRock Natural Resources Trust |
BlackRock Balanced Capital Fund† | | BlackRock Healthcare Fund | | BlackRock Pacific Fund |
BlackRock Basic Value Fund | | BlackRock Index Equity Portfolio* | | BlackRock Science & Technology Opportunities Portfolio |
BlackRock Capital Appreciation Portfolio | | BlackRock International Fund | | BlackRock Small Cap Core Equity Portfolio |
BlackRock Energy & Resources Portfolio | | BlackRock International Diversification Fund | | BlackRock Small Cap Growth Equity Portfolio |
BlackRock Equity Dividend Fund | | BlackRock International Index Fund | | BlackRock Small Cap Growth Fund II |
BlackRock EuroFund | | BlackRock International Opportunities Portfolio | | BlackRock Small Cap Index Fund |
BlackRock Focus Growth Fund | | BlackRock International Value Fund | | BlackRock Small Cap Value Equity Portfolio* |
BlackRock Focus Value Fund | | BlackRock Large Cap Core Fund | | BlackRock Small/Mid-Cap Growth Portfolio |
BlackRock Fundamental Growth Fund | | BlackRock Large Cap Core Plus Fund | | BlackRock S&P 500 Index Fund |
BlackRock Global Allocation Fund† | | BlackRock Large Cap Growth Fund | | BlackRock U.S. Opportunities Portfolio |
BlackRock Global Dynamic Equity Fund | | BlackRock Large Cap Value Fund | | BlackRock Utilities and Telecommunications Fund |
BlackRock Global Emerging Markets Fund | | BlackRock Latin America Fund | | BlackRock Value Opportunities Fund |
BlackRock Global Financial Services Fund | | BlackRock Mid-Cap Growth Equity Portfolio | | |
BlackRock Global Growth Fund | | | | |
| | | | |
Fixed Income Funds | | | | |
| | |
BlackRock Bond Portfolio | | BlackRock Income Builder Portfolio | | BlackRock Short-Term Bond Fund |
BlackRock Emerging Market Debt Portfolio | | BlackRock Inflation Protected Bond Portfolio | | BlackRock Strategic Income Portfolio |
BlackRock Enhanced Income Portfolio | | BlackRock Intermediate Government Bond Portfolio | | BlackRock Total Return Fund |
BlackRock GNMA Portfolio | | BlackRock International Bond Portfolio | | BlackRock Total Return Portfolio II |
BlackRock Government Income Portfolio | | BlackRock Long Duration Bond Portfolio | | BlackRock World Income Fund |
BlackRock High Income Fund | | BlackRock Low Duration Bond Portfolio | | |
BlackRock High Yield Bond Portfolio | | BlackRock Managed Income Portfolio | | |
BlackRock Income Portfolio | | | | |
| | | | |
Municipal Bond Funds | | | | |
| | |
BlackRock AMT-Free Municipal Bond Portfolio | | BlackRock Kentucky Municipal Bond Portfolio | | BlackRock New York Municipal Bond Fund |
BlackRock California Municipal Bond Fund | | BlackRock Municipal Insured Fund | | BlackRock Ohio Municipal Bond Portfolio |
BlackRock Delaware Municipal Bond Portfolio | | BlackRock National Municipal Fund | | BlackRock Pennsylvania Municipal Bond Fund |
BlackRock High Yield Municipal Fund | | BlackRock New Jersey Municipal Bond Fund | | BlackRock Short-Term Municipal Fund |
BlackRock Intermediate Municipal Fund | | | | |
| | | | |
Target Risk & Target Date Funds | | | | |
| | |
BlackRock Prepared Portfolios | | BlackRock Lifecycle Prepared Portfolios | | |
Conservative Prepared Portfolio | | Prepared Portfolio 2010 | | Prepared Portfolio 2030 |
Moderate Prepared Portfolio | | Prepared Portfolio 2015 | | Prepared Portfolio 2035 |
Growth Prepared Portfolio | | Prepared Portfolio 2020 | | Prepared Portfolio 2040 |
Aggressive Growth Prepared Portfolio | | Prepared Portfolio 2025 | | Prepared Portfolio 2045 |
| | | | Prepared Portfolio 2050 |
| * | See the prospectus for information on specific limitations on investments in the fund. |
BlackRock mutual funds are distributed by BlackRock Investments, LLC. You should consider the investment objectives, risks, charges and expenses of the funds under consideration carefully before investing. Each fund’s prospectus contains this and other information and is available at www.blackrock.com or by calling (800) 882-0052 or from your financial advisor. The prospectus should be read carefully before investing.
| | | | | | |
| 70 | | SEMI-ANNUAL REPORT | | MARCH 31, 2009 | | |

This report is transmitted to shareholders only. It is not authorized for use as an offer of sale or a solicitation of an offer to buy shares of the Portfolios unless accompanied or preceded by the Portfolios’ current prospectus. Past performance results shown in this report should not be considered a representation of future performance. Investment returns and principal value of shares will fluctuate so that shares, when redeemed, may be worth more or less than their original cost. Statements and other information herein are as dated and are subject to change.
Investment in foreign securities involves special risks including fluctuating foreign exchange rates, foreign government regulations, differing degrees of liquidity and the possibility of substantial volatility due to adverse political, economic or other developments.
EQUITY5-3/09-SAR
EQUITIES FIXED INCOME REAL ESTATE LIQUIDITY ALTERNATIVES BLACKROCK SOLUTIONS
| | |
BlackRock Asset Allocation Portfolio of BlackRock FundsSM | |  |
| |
| SEMI-ANNUAL REPORT | MARCH 31, 2009 (UNAUDITED) | |
NOT FDIC INSURED
MAY LOSE VALUE
NO BANK GUARANTEE
| | | | | | |
2 | | BLACKROCK ASSET ALLOCATION PORTFOLIO | | MARCH 31, 2009 | | |
A Letter to Shareholders
The past 12 months have been a period investors would like to forget, but instead will vividly remember, as the global financial crisis erupted into the worst recession in decades. Daily headlines recounted the downfalls of storied financial firms, volatile swings in the world’s financial markets and monumental government actions, including the recent passage of the nearly $800 billion American Recovery and Reinvestment Act of 2009.
The economic data generally deteriorated throughout the reporting period. US gross domestic product (“GDP”) contracted at an annual rate of 6.3% in the fourth quarter of 2008, and economic activity appears on pace to be negative in the first quarter of 2009 as well. The Federal Reserve Board (the “Fed”) took forceful action to revive the global economy and ailing financial system. In addition to slashing the federal funds target rate from 3.0% to a record low range of 0% to 0.25%, the central bank provided enormous cash infusions and radically expanded its balance sheet through a range of lending and acquisition programs.
Against this backdrop, US equities contended with high levels of volatility and posted steep losses, notwithstanding a powerful rally in the final month of the reporting period. International markets also experienced sharp downturns, with some regions declining as much or more than the United States. Risk aversion remained the dominant theme in fixed income markets, as investors sought out the haven of Treasury issues at the expense of virtually all other asset classes. High yield issues, in particular, faced unprecedented challenges and posted severe underperformance; that said, the sector pared its losses in the first quarter of 2009, as both liquidity and investor sentiment toward lower-quality debt improved. At the same time, the start of the new year brought somewhat of a return to normalcy for the tax-exempt market, which registered one of its worst years on record in 2008.
In all, investors continued to gravitate toward relative safety, as evidenced in the six- and 12-month returns of the major benchmark indexes:
| | | | | | |
Total Returns as of March 31, 2009 | | 6-month | | | 12-month | |
US equities (S&P 500 Index) | | (30.54 | )% | | (38.09 | )% |
Small cap US equities (Russell 2000 Index) | | (37.17 | ) | | (37.50 | ) |
International equities (MSCI Europe, Australasia, Far East Index) | | (31.11 | ) | | (46.50 | ) |
US Treasury securities (Merrill Lynch 10-Year US Treasury Index) | | 11.88 | | | 10.46 | |
Taxable fixed income (Barclays Capital US Aggregate Bond Index) | | 4.70 | | | 3.13 | |
Tax-exempt fixed income (Barclays Capital Municipal Bond Index) | | 5.00 | | | 2.27 | |
High yield bonds (Barclays Capital US Corporate High Yield 2% Issuer Capped Index) | | (12.65 | ) | | (18.56 | ) |
Past performance is no guarantee of future results. Index performance shown for illustrative purposes only. You cannot invest directly in an index.
Through periods of market turbulence, as ever, BlackRock’s full resources are dedicated to the management of our clients’ assets. We thank you for entrusting BlackRock with your investments and look forward to continuing to serve you in the months and years ahead.
|
| Sincerely, |
|
 |
| Rob Kapito |
| President, BlackRock Advisors, LLC |
Seeking additional investment insights?
Visit BlackRock’s award-winning Shareholder® magazine, now available exclusively online at www.blackrock.com/shareholdermagazine. In this issue:
| | • | | Discover why portfolio diversification still matters — even as nearly every financial asset class lost value over the past year. |
| | • | | Learn how adding commodities to a more traditional mix of assets can help you to balance risks and access new potential rewards. |
| | • | | Assuage your fears about higher taxes and discover how municipal bonds may offer some relief. |
| | • | | Find out if there’s still value to be found in dividend-paying stocks. |
THIS PAGE NOT PART OF YOUR FUND REPORT
| | |
| Portfolio Summary as of March 31, 2009 | | |
Portfolio Management Commentary
How did the Portfolio perform?
| | • | | For the six-month period, the Portfolio underperformed its benchmark, a 60%/40% composite of the S&P 500 Index and the Barclays Capital US Aggregate Bond Index. |
What factors influenced performance?
| | • | | Stock selection by the Portfolio’s underlying managers detracted from performance over the reporting period. Our fixed income allocation was a large detractor, followed by our global energy, large value and small core equity strategies. |
| | • | | By contrast, allocation decisions among the Portfolio’s underlying managers were positive. This effect was equally split between broad allocation decisions (stocks, bonds and cash) and sub-allocation to the Portfolio’s underlying managers. Among the Portfolio’s underlying managers, the domestic large growth and non-US equity segment, both smaller cap and large cap, made the most significant contribution. |
Describe recent Portfolio activity.
| | • | | We added US large cap and European large cap equity exposure in mid- December to reduce the equity underweight and bring the Portfolio closer to a neutral equity stance. |
| | • | | At the end of the period, we moved the Portfolio from slightly overweight equities to flat by reducing European large cap exposure. |
Describe Portfolio positioning at period-end.
| | • | | At the end of the period, the Portfolio was neutral relative to the benchmark in its equity and fixed income weightings. We favor US stocks to developed international ones, remain neutral on value versus growth and prefer large cap to small cap. Our fixed income allocations are tilted toward the inflation and credit sectors. |
| | • | | Looking ahead, we believe that 2009 will present a strong opportunity for security selection as the market begins to differentiate winning names from losing ones in both the equity and fixed income universes. Accordingly, a large part of the Portfolio’s active risk is allocated to our set of underlying managers, through which we have strong prospects of creating alpha. |
Portfolio Profile as of March 31, 2009
| | | |
Ten Largest Holdings | | Percent of
Long-Term
Investments | |
Federal National Mortgage Assoc. | | 14 | % |
Federal Home Loan Mortgage Corp. | | 4 | |
Government National Mortgage Assoc. | | 3 | |
JPMorgan Chase & Co. | | 2 | |
The Bear Stearns Cos., Inc. | | 1 | |
Credit Suisse Group. | | 1 | |
Wells Fargo & Co. | | 1 | |
Morgan Stanley | | 1 | |
General Electric Co. | | 1 | |
Student Loan Marketing Corp. | | 1 | |
| | | |
Portfolio Composition | | Percent of
Long-Term
Investments | |
Common Stocks | | 49 | % |
U.S. Government Sponsored Agency Mortgage-Backed Securities | | 18 | |
Corporate Bonds | | 12 | |
Non-U.S. Government Sponsored Agency Mortgage-Backed Securities | | 10 | |
U.S. Government Sponsored Agency Obligations | | 4 | |
Asset Backed Securities | | 4 | |
Foreign Government Obligations | | 1 | |
U.S. Treasury Obligations | | 1 | |
Capital Trusts | | 1 | |
| | | | | | |
4 | | BLACKROCK ASSET ALLOCATION PORTFOLIO | | MARCH 31, 2009 | | |
| | |
| Total Return Based on a $10,000 Investment | | |
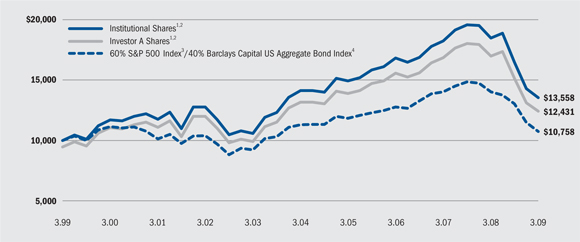
1 | Assuming maximum sales charge, if any, transaction costs and other operating expenses, including advisory fees. Institutional shares do not have a sales charge. |
2 | The Portfolio uses an asset allocation strategy, investing varying percentages of its portfolio in three major categories: stocks, bonds and, to a lesser extent, money market instruments. |
3 | This unmanaged index covers 500 industrial, utility, transportation and financial companies of the US markets (mostly NYSE issues) representing about 75% of the NYSE market capitalization and 30% of NYSE issues. S&P 500 is a trademark of the McGraw-Hill Companies. |
4 | An unmanaged index comprised of more than 5,000 taxable bonds. This is an index of investment grade bonds. All securities included must be rated investment grade by Moody’s Investors Service, Inc., Standard & Poor’s or Fitch Ratings. |
Past performance is not indicative of future results.
Performance Summary for the Period Ended March 31, 2009
| | | | | | | | | | | | | | | | | | | | | |
| | | | | | Average Annual Total Returns5 | |
| | | | | | 1 Year | | | 5 Years | | | 10 Years | |
| | | 6-Month
Total Returns | | | w/o sales
charge | | | w/sales
charge | | | w/o sales
charge | | | w/sales
charge | | | w/o sales
charge | | | w/sales
charge | |
Institutional | | (17.84 | )% | | (26.69 | )% | | N/A | | | (0.83 | )% | | N/A | | | 3.09 | % | | N/A | |
Service | | (17.94 | ) | | (26.83 | ) | | N/A | | | (1.07 | ) | | N/A | | | 2.86 | | | N/A | |
Investor A | | (17.99 | ) | | (26.93 | ) | | (30.76 | )% | | (1.18 | ) | | (2.23 | )% | | 2.76 | | | 2.20 | % |
Investor B | | (18.29 | ) | | (27.66 | ) | | (30.82 | ) | | (1.95 | ) | | (2.25 | ) | | 2.16 | | | 2.16 | |
Investor C | | (18.28 | ) | | (27.46 | ) | | (28.16 | ) | | (1.90 | ) | | (1.90 | ) | | 2.02 | | | 2.02 | |
60% S&P 500 Index/40% Barclays Capital US Aggregate Bond Index | | (17.55 | ) | | (23.35 | ) | | N/A | | | (1.03 | ) | | N/A | | | 0.73 | | | N/A | |
5 | Assuming maximum sales charge. Average annual total returns with and without sales charges reflect reductions for distribution and service fees. See “About Portfolio Performance” on page 6 for a detailed description of share classes, including any related sales charges and fees. |
N/A - Not applicable as share class and index do not have a sales charge.
Past performance is not indicative of future results.
Expense Example
| | | | | | | | | | | | | | | | | | |
| | | Actual | | Hypothetical7 |
| | | Beginning
Account Value
October 1, 2008 | | Ending
Account Value
March 31, 2009 | | Expenses Paid
During the Period6 | | Beginning
Account Value
October 1, 2008 | | Ending
Account Value
March 31, 2009 | | Expenses Paid
During the Period6 |
Institutional | | $ | 1,000.00 | | $ | 821.60 | | $ | 3.91 | | $ | 1,000.00 | | $ | 1,020.66 | | $ | 4.34 |
Service | | $ | 1,000.00 | | $ | 820.60 | | $ | 5.13 | | $ | 1,000.00 | | $ | 1,019.30 | | $ | 5.70 |
Investor A | | $ | 1,000.00 | | $ | 820.10 | | $ | 5.76 | | $ | 1,000.00 | | $ | 1,018.59 | | $ | 6.41 |
Investor B | | $ | 1,000.00 | | $ | 817.10 | | $ | 9.38 | | $ | 1,000.00 | | $ | 1,014.55 | | $ | 10.45 |
Investor C | | $ | 1,000.00 | | $ | 817.20 | | $ | 8.93 | | $ | 1,000.00 | | $ | 1,015.05 | | $ | 9.95 |
6 | For each class of the Portfolio, expenses are equal to the annualized expense ratio for the class (0.86% for Institutional, 1.13% for Service, 1.27% for Investor A, 2.07% for Investor B and 1.97% for Investor C), multiplied by the average account value over the period, multiplied by 182/365 (to reflect the one-half year period shown). |
7 | Hypothetical 5% annual return before expenses is calculated by pro-rating the number of days in the most recent fiscal half year divided by 365. |
See “Disclosure of Expenses” on page 6 for further information on how expenses were calculated.
| | | | | | |
| | | BLACKROCK ASSET ALLOCATION PORTFOLIO | | MARCH 31, 2009 | | 5 |
| | |
| About Portfolio Performance | | |
| | • | | Institutional Shares are not subject to any sales charge (front-end load) or deferred sales charge and are available only to eligible investors. These shares bear no ongoing distribution or service fees. |
| | • | | Service Shares are not subject to any sales charge (front-end load) or deferred sales charge. These shares are subject to a service fee of 0.25% per year (but no distribution fee). |
| | • | | Investor A Shares incur a maximum initial sales charge (front-end load) of 5.25% and a service fee of 0.25% per year (but no distribution fee). |
| | • | | Investor B Shares are subject to a maximum contingent deferred sales charge of 4.50% declining to 0% after six years. In addition, these shares are subject to a distribution fee of 0.75% per year and a service fee of 0.25% per year. These shares automatically convert to Investor A Shares after approximately eight years. (There is no initial sales charge for automatic share conversions.) All returns for periods greater than eight years reflect this conversion. |
| | • | | Investor C Shares are subject to a 1.00% contingent deferred sales charge if redeemed within one year of purchase. In addition, these shares are subject to a distribution fee of 0.75% per year and a service fee of 0.25% per year. |
Performance information reflects past performance and does not guarantee future results. Current performance may be lower or higher than the performance data quoted. Refer to www.blackrock.com/funds to obtain performance data current to the most recent month-end. Performance results do not reflect the deduction of taxes that a shareholder would pay on fund distributions or the redemption of fund shares. The Portfolio may charge a 2% redemption fee for sales or exchanges of shares within 30 days of purchase or exchange. Performance data does not reflect this potential fee. Figures shown in the performance tables on the previous pages assume reinvestment of all dividends and distributions, if any, at net asset value on the ex-dividend date. Investment return and principal value of shares will fluctuate so that shares, when redeemed, may be worth more or less than their original cost. Dividends paid to each class of shares will vary because of the different levels of service, distribution and transfer agency fees applicable to each class, which are deducted from the income available to be paid to shareholders.
The performance information on the previous pages includes information for each class of the Portfolio since the commencement of operations of the Portfolio, rather than the date such class was introduced. Performance information for each class introduced after the commencement of operations of the Portfolio is therefore based on the performance history of a predecessor class adjusted to reflect the class specific fees applicable to each class at the time of the launch of such share class. This information may be considered when assessing the Portfolio’s performance, but does not represent the actual performance of this share class.
Performance for the Portfolio for the periods prior to January 31, 2005 is based on performance of the former State Street Research mutual fund that reorganized with the Portfolio on that date.
The performance information also reflects fee waivers and reimbursements that subsidize and reduce the total operating expenses of the Portfolio. The Portfolio’s returns would have been lower if there were no such waivers and reimbursements. BlackRock Advisors, LLC is under no obligation to waive or continue waiving its fees after February 1, 2010.
Disclosure of Expenses
Shareholders of the Portfolio may incur the following charges: (a) expenses related to transactions, including sales charges and redemption fees; and (b) operating expenses, including advisory fees, service and distribution fees including 12b-1 fees, and other Portfolio expenses. The expense example on the previous page (which is based on a hypothetical investment of $1,000 invested on October 1, 2008 and held through March 31, 2009) are intended to assist shareholders both in calculating expenses based on an investment in the Portfolio and in comparing these expenses with similar costs of investing in other mutual funds.
The Expense Example table provides information about actual account values and actual expenses. In order to estimate the expenses a shareholder paid during the period covered by this report, shareholders can divide their account value by $1,000 and then multiply the result by the number corresponding to their share class under the headings entitled “Expenses Paid During the Period.”
The table also provides information about hypothetical account values and hypothetical expenses based on the Portfolio’s actual expense ratios and an assumed rate of return of 5% per year before expenses. In order to assist shareholders in comparing the ongoing expenses of investing in the Portfolio and other funds, compare the 5% hypothetical example with the 5% hypothetical examples that appear in other funds’ shareholder reports.
The expenses shown in the table are intended to highlight shareholders’ ongoing costs only and do not reflect any transactional expenses, such as sales charges, redemption fees or exchange fees. Therefore, the hypothetical table is useful in comparing ongoing expenses only, and will not help shareholders determine the relative total expenses of owning different funds. If these transactional expenses were included, shareholder expenses would have been higher.
| | | | | | |
6 | | BLACKROCK ASSET ALLOCATION PORTFOLIO | | MARCH 31, 2009 | | |
| | |
| The Benefits and Risks of Leveraging | | |
The Portfolio may utilize leverage to seek to enhance the yield and NAV. However, these objectives cannot be achieved in all interest rate environments.
The Portfolio may utilize leverage through borrowings or issuance of short-term debt securities including reverse repurchase agreements, or through other techniques, such as dollar rolls. In general, the concept of leveraging is based on the premise that the cost of assets to be obtained from leverage will be based on short-term interest rates, which normally will be lower than the income earned by the Portfolio on its longer-term portfolio investments. To the extent that the total assets of the Portfolio (including the assets obtained from leverage) are invested in higher-yielding portfolio investments, the Portfolio’s shareholders will benefit from the incremental yield.
The use of leverage may enhance opportunities for increased returns to the Portfolio, but as described above, they also create risks as short- or long-term interest rates fluctuate. Leverage also will generally cause greater changes in the Portfolio’s NAV, market price and dividend rate than a comparable portfolio without leverage. If the income derived from securities purchased with assets received from leverage exceeds the cost of leverage, the Portfolio’s net income will be greater than if leverage had not been used. Conversely, if the income from the securities purchased is not sufficient to cover the cost of leverage, the Portfolio’s net income will be less than if leverage had not been used, and therefore the amount available for distribution to shareholders will be reduced. The Portfolio may be required to sell portfolio securities at inopportune times or below fair market values in order to comply with regulatory requirements applicable to the use of leverage or as required by the terms of leverage instruments which may cause the Portfolio to incur losses. The use of leverage may limit the Portfolio’s ability to invest in certain types of securities or use certain types of hedging strategies. The Portfolio will incur expenses in connection with the use of leverage, all of which are borne by Portfolio shareholders and may reduce investment returns.
Derivative Instruments
The Portfolio may invest in various derivative instruments, including swap agreements, swaptions, futures and forward currency contracts, and other instruments specified in the Notes to Financial Statements, which constitute additional forms of economic leverage. Such instruments are used to obtain exposure to a market without owning or taking physical custody of securities or to hedge market and/or interest rate risks. Such derivative instruments involve risks, including the imperfect correlation between the value of a derivative instrument and the underlying asset, possible default of the other party to the transaction and illiquidity of the derivative instrument. The Portfolio’s ability to successfully use a derivative instrument depends on the Advisor’s ability to accurately predict pertinent market movements, which cannot be assured. The use of derivative instruments may result in losses greater than if they had not been used, may require the Portfolio to sell or purchase portfolio securities at inopportune times or for prices other than current market values, may limit the amount of appreciation the Portfolio can realize on an investment or may cause the Portfolio to hold a security that it might otherwise sell. The Portfolio’s investments in these instruments are discussed in detail in the Notes to Financial Statements.
| | | | | | |
| | | BLACKROCK ASSET ALLOCATION PORTFOLIO | | MARCH 31, 2009 | | 7 |
| | |
| Summary Schedule of Investments March 31, 2009 (Unaudited) | | |
This summary schedule of investments is presented to help investors focus on the Portfolio’s principal holdings. It includes the Portfolio’s 50 largest holdings, each investment of any issuer that exceeds 1% of the Portfolio’s net assets and affiliated issues. “Other Securities” represent all issues not required to be disclosed under the rules adopted by the Securities and Exchange Commission. A complete schedule of investments is available without charge, upon request, by calling 800-441-7762 or on the Securities and Exchange Commission’s website at http://www.sec.gov.
| | | | | | | | | |
Asset Backed Securities | | Par
(000) | | Value | | Percentages
of Net Assets | |
MBNA Credit Card Master Note Trust, Series 06-A4, Class A4, | | | | | | | | | |
0.55%, 9/15/11(a) | | $ | 1,650 | | $ | 1,648,303 | | 0.4 | % |
Student Loan Marketing Assoc. Student Loan Trust, Series 05-4, Class A2, | | | | | | | | | |
1.24%, 4/26/21(a) | | | 475 | | | 459,091 | | 0.1 | % |
Student Loan Marketing Assoc. Student Loan Trust, Series 08-5, Class A2, | | | | | | | | | |
2.26%, 10/25/16(a) | | | 1,720 | | | 1,682,043 | | 0.4 | % |
Student Loan Marketing Assoc. Student Loan Trust, Series 08-5, Class A3, | | | | | | | | | |
2.46%, 1/25/18(a) | | | 440 | | | 429,744 | | 0.1 | % |
Student Loan Marketing Assoc. Student Loan Trust, Series 08-5, Class A4, | | | | | | | | | |
2.86%, 7/25/23(a) | | | 1,170 | | | 1,105,865 | | 0.2 | % |
Other Securities(b) | | | | | | 10,555,932 | | 2.4 | % |
| | | | | | | | | |
Total Asset Backed Securities — 3.6% | | | | | | 15,880,978 | | 3.6 | % |
| | | | | | | | | |
Capital Trusts | | | | | | | | | |
Commercial Banks — 0.1% | | | | | | | | | |
Other Securities | | | | | | 589,197 | | 0.1 | % |
| | | | | | | | | |
Diversified Financial Services — 0.5% | | | | | | | | | |
Credit Suisse Guernsey Ltd. (Switzerland), Unsecured Notes, | | | | | | | | | |
5.86%(a)(c)(d) | | | 530 | | | 196,416 | | 0.0 | % |
General Electric Capital Corp., Subordinated Debentures, | | | | | | | | | |
6.38%, 11/15/67(a) | | | 475 | | | 230,652 | | 0.1 | % |
JPMorgan Chase & Co., Subordinated Depositary Shares, | | | | | | | | | |
7.90%(a)(d) | | | 775 | | | 498,046 | | 0.1 | % |
JPMorgan Chase Capital XXV, Subordinated Capital Securities, | | | | | | | | | |
6.80%, 10/01/37 | | | 1,150 | | | 761,612 | | 0.2 | % |
Other Securities | | | | | | 496,201 | | 0.1 | % |
| | | | | | | | | |
| | | | | | 2,182,927 | | 0.5 | % |
| | | | | | | | | |
Insurance — 0.1% | | | | | | | | | |
Other Securities | | | | | | 416,007 | | 0.1 | % |
| | | | | | | | | |
Total Capital Trusts — 0.7% | | | | | | 3,188,131 | | 0.7 | % |
| | | | | | | | | |
Collateralized Debt | | | | | | | | | |
Obligations — 0.0% | | | | | | | | | |
Other Securities | | | | | | — | | 0.0 | % |
| | | | | | | | | |
| | | |
Common Stocks | | Shares | | | | | |
Aerospace & Defense — 0.9% | | | | | | | | | |
Other Securities | | | | | | 3,931,076 | | 0.9 | % |
| | | | | | | | | |
Air Freight & Logistics — 0.3% | | | | | | | | | |
Other Securities | | | | | | 1,339,213 | | 0.3 | % |
| | | | | | | | | |
Airlines — 0.3% | | | | | | | | | |
Other Securities | | | | | | 1,209,686 | | 0.3 | % |
| | | | | | | | | |
Auto Components — 0.2% | | | | | | | | | |
Other Securities | | | | | | 753,146 | | 0.2 | % |
| | | | | | | | | |
Automobiles — 0.3% | | | | | | | | | |
Other Securities | | | | | | 1,424,230 | | 0.3 | % |
| | | | | | | | | |
Beverages — 0.9% | | | | | | | | | |
The Coca-Cola Co. | | | 42,873 | | | 1,884,268 | | 0.4 | % |
Other Securities | | | | | | 2,003,900 | | 0.5 | % |
| | | | | | | | | |
| | | | | | 3,888,168 | | 0.9 | % |
| | | | | | | | | |
Biotechnology — 0.9% | | | | | | | | | |
Other Securities | | | | | | 3,727,902 | | 0.9 | % |
| | | | | | | | | |
Building Products — 0.0% | | | | | | | | | |
Other Securities | | | | | | 61,500 | | 0.0 | % |
| | | | | | | | | |
Capital Markets — 0.9% | | | | | | | | | |
Morgan Stanley | | | 12,100 | | | 275,517 | | 0.0 | % |
Other Securities | | | | | | 3,849,271 | | 0.9 | % |
| | | | | | | | | |
| | | | | | 4,124,788 | | 0.9 | % |
| | | | | | | | | |
Chemicals — 1.0% | | | | | | | | | |
Other Securities | | | | | | 4,351,514 | | 1.0 | % |
| | | | | | | | | |
Commercial Banks — 1.7% | | | | | | | | | |
Wells Fargo & Co. | | | 42,500 | | | 605,200 | | 0.2 | % |
Other Securities | | | | | | 6,727,199 | | 1.5 | % |
| | | | | | | | | |
| | | | | | 7,332,399 | | 1.7 | % |
| | | | | | | | | |
Portfolio Abbreviations
| | | | | | | | |
| To simplify the listings of Portfolio holdings in the Schedule of Investments, we have abbreviated certain descriptions according to the list on the right. | | AUD | | Australian Dollar | | HKD | | Hong Kong Dollar |
| | CAD | | Canadian Dollar | | JPY | | Japanese Yen |
| | CHF | | Swiss Francs | | LIBOR | | London InterBank Offered Rate |
| | CZK | | Czech Koruna | | NOK | | Norwegian Krone |
| | DJIA | | Dow Jones Industrial Average | | SEK | | Swedish Krona |
| | DKK | | Danish Krone | | SGD | | Singapore Dollar |
| | EUR | | Euro | | TBA | | To-Be-Announced |
| | GBP | | British Pound | | USD | | United States Dollar |
| | | | | | ZAR | | South African Rand |
| | | | | | |
8 | | BLACKROCK ASSET ALLOCATION PORTFOLIO | | MARCH 31, 2009 | | |
| | |
| Summary Schedule of Investments (continued) | | |
| | | | | | | | |
Common Stocks | | Shares | | Value | | Percentage
of Net Assets | |
Commercial Services & Supplies — 0.9% | | | | | | | | |
Other Securities | | | | $ | 3,739,748 | | 0.9 | % |
| | | | | | | | |
Communications Equipment — 1.4% | | | | | | | | |
Cisco Systems, Inc.(e) | | 103,816 | | | 1,740,994 | | 0.4 | % |
QUALCOMM, Inc. | | 63,922 | | | 2,487,205 | | 0.6 | % |
Other Securities | | | | | 1,814,497 | | 0.4 | % |
| | | | | | | | |
| | | | | 6,042,696 | | 1.4 | % |
| | | | | | | | |
Computers & Peripherals — 1.4% | | | | | | | | |
Apple, Inc.(e) | | 16,234 | | | 1,706,518 | | 0.4 | % |
International Business Machines Corp. | | 20,625 | | | 1,998,356 | | 0.5 | % |
Other Securities | | | | | 2,323,735 | | 0.5 | % |
| | | | | | | | |
| | | | | 6,028,609 | | 1.4 | % |
| | | | | | | | |
Construction & Engineering — 0.3% | | | | | | | | |
Other Securities | | | | | 1,294,569 | | 0.3 | % |
| | | | | | | | |
Construction Materials — 0.0% | | | | | | | | |
Other Securities | | | | | 13,877 | | 0.0 | % |
| | | | | | | | |
Consumer Finance — 0.0% | | | | | | | | |
Other Securities | | | | | 83,232 | | 0.0 | % |
| | | | | | | | |
Containers & Packaging — 0.3% | | | | | | | | |
Other Securities | | | | | 1,523,842 | | 0.3 | % |
| | | | | | | | |
Distributors — 0.0% | | | | | | | | |
Other Securities | | | | | 89,336 | | 0.0 | % |
| | | | | | | | |
Diversified Consumer Services — 0.3% | | | | | | | | |
Other Securities | | | | | 1,295,030 | | 0.3 | % |
| | | | | | | | |
Diversified Financial Services — 1.1% | | | | | | | | |
JPMorgan Chase & Co. | | 62,025 | | | 1,648,625 | | 0.4 | % |
Other Securities | | | | | 3,209,774 | | 0.7 | % |
| | | | | | | | |
| | | | | 4,858,399 | | 1.1 | % |
| | | | | | | | |
Diversified Telecommunication Services — 1.1% | | | | | | | | |
AT&T, Inc. | | 62,099 | | | 1,564,895 | | 0.3 | % |
Other Securities | | | | | 3,390,943 | | 0.8 | % |
| | | | | | | | |
| | | | | 4,955,838 | | 1.1 | % |
| | | | | | | | |
Electric Utilities — 0.8% | | | | | | | | |
Other Securities | | | | | 3,415,609 | | 0.8 | % |
| | | | | | | | |
Electrical Equipment — 0.3% | | | | | | | | |
Other Securities | | | | | 1,088,968 | | 0.3 | % |
| | | | | | | | |
Electronic Equipment, Instruments & Components — 0.5% | | | | | | | | |
Other Securities | | | | | 2,251,685 | | 0.5 | % |
| | | | | | | | |
Energy Equipment & Services — 1.3% | | | | | | | | |
Other Securities | | | | | 5,649,038 | | 1.3 | % |
| | | | | | | | |
Food & Staples Retailing — 1.3% | | | | | | | | |
Wal-Mart Stores, Inc. | | 45,586 | | | 2,375,030 | | 0.5 | % |
Other Securities | | | | | 3,515,154 | | 0.8 | % |
| | | | | | | | |
| | | | | 5,890,184 | | 1.3 | % |
| | | | | | | | |
Food Products — 1.0% | | | | | | | | |
Other Securities | | | | | 4,580,004 | | 1.0 | % |
| | | | | | | | |
Gas Utilities — 0.3% | | | | | | | | |
Other Securities | | | | | 1,311,982 | | 0.3 | % |
| | | | | | | | |
Health Care Equipment & Supplies — 0.9% | | | | | | | | |
Other Securities | | | | | 4,109,943 | | 0.9 | % |
| | | | | | | | |
Health Care Providers & Services — 1.5% | | | | | | | | |
Other Securities | | | | | 6,641,863 | | 1.5 | % |
| | | | | | | | |
Health Care Technology — 0.1% | | | | | | | | |
Other Securities | | | | | 288,048 | | 0.1 | % |
| | | | | | | | |
Hotels, Restaurants & Leisure — 1.1% | | | | | | | | |
Other Securities | | | | | 4,897,376 | | 1.1 | % |
| | | | | | | | |
Household Durables — 0.3% | | | | | | | | |
Other Securities | | | | | 1,477,250 | | 0.3 | % |
| | | | | | | | |
Household Products — 0.5% | | | | | | | | |
Other Securities | | | | | 2,184,180 | | 0.5 | % |
| | | | | | | | |
Independent Power Producers & Energy Traders — 0.1% | | | | | | | | |
Other Securities | | | | | 387,739 | | 0.1 | % |
| | | | | | | | |
Industrial Conglomerates — 0.6% | | | | | | | | |
Other Securities | | | | | 2,764,722 | | 0.6 | % |
| | | | | | | | |
Insurance — 1.8% | | | | | | | | |
Other Securities | | | | | 7,718,027 | | 1.8 | % |
| | | | | | | | |
Internet & Catalog Retail — 0.3% | | | | | | | | |
Other Securities | | | | | 1,314,408 | | 0.3 | % |
| | | | | | | | |
Internet Software & Services — 0.7% | | | | | | | | |
Google, Inc. - Class A(e) | | 4,722 | | | 1,643,539 | | 0.4 | % |
Other Securities | | | | | 1,583,765 | | 0.3 | % |
| | | | | | | | |
| | | | | 3,227,304 | | 0.7 | % |
| | | | | | | | |
IT Services — 0.6% | | | | | | | | |
Other Securities | | | | | 2,720,753 | | 0.6 | % |
| | | | | | | | |
Leisure Equipment & Products — 0.1% | | | | | | | | |
Other Securities | | | | | 331,369 | | 0.1 | % |
| | | | | | | | |
Life Sciences Tools & Services — 0.3% | | | | | | | | |
Other Securities | | | | | 1,370,169 | | 0.3 | % |
| | | | | | | | |
Machinery — 1.4% | | | | | | | | |
Danaher Corp. | | 28,500 | | | 1,545,270 | | 0.4 | % |
Other Securities | | | | | 4,496,779 | | 1.0 | % |
| | | | | | | | |
| | | | | 6,042,049 | | 1.4 | % |
| | | | | | | | |
Media — 1.1% | | | | | | | | |
Other Securities | | | | | 4,682,414 | | 1.1 | % |
| | | | | | | | |
Metals & Mining — 1.6% | | | | | | | | |
Eldorado Gold Corp., Exchange Receipts (acquired 7/14/08, cost $0, unrestricted issue on 7/14/08 was valued at $8.72 per share)(e)(f) | | 79,200 | | | 0 | | 0.0 | % |
Other Securities | | | | | 6,822,552 | | 1.6 | % |
| | | | | | | | |
| | | | | 6,822,552 | | 1.6 | % |
| | | | | | | | |
Multiline Retail — 0.6% | | | | | | | | |
Other Securities | | | | | 2,499,287 | | 0.6 | % |
| | | | | | | | |
Multi-Utilities — 0.5% | | | | | | | | |
Other Securities | | | | | 2,186,719 | | 0.5 | % |
| | | | | | | | |
Office Electronics — 0.2% | | | | | | | | |
Other Securities | | | | | 843,916 | | 0.2 | % |
| | | | | | | | |
Oil, Gas & Consumable Fuels — 5.4% | | | | | | | | |
Chevron Corp. | | 23,675 | | | 1,591,907 | | 0.4 | % |
Exxon Mobil Corp. | | 59,800 | | | 4,072,380 | | 0.9 | % |
| | | | | | |
| | | BLACKROCK ASSET ALLOCATION PORTFOLIO | | MARCH 31, 2009 | | 9 |
| | |
| Summary Schedule of Investments (continued) | | |
| | | | | | | | | |
| | | Shares | | Value | | Percentage
of Net Assets | |
Common Stocks | | | | | | | | | |
Oil, Gas & Consumable Fuels (concluded) | | | | | | | | | |
Longview Energy Co. (acquired 8/13/04, cost $48,000)(e)(f) | | | 3,200 | | $ | 58,720 | | 0.0 | % |
Matador Resources Co. (acquired 10/14/03 through 4/13/06, cost
$62,950)(e)(f) | | | 8,685 | | | 117,161 | | 0.0 | % |
Other Securities | | | | | | 17,827,767 | | 4.1 | % |
| | | | | | | | | |
| | | | | | 23,667,935 | | 5.4 | % |
| | | | | | | | | |
Paper & Forest Products — 0.1% | | | | | | | | | |
Other Securities | | | | | | 299,176 | | 0.1 | % |
| | | | | | | | | |
Personal Products — 0.1% | | | | | | | | | |
Other Securities | | | | | | 377,883 | | 0.1 | % |
| | | | | | | | | |
Pharmaceuticals — 2.7% | | | | | | | | | |
Abbott Laboratories | | | 37,425 | | | 1,785,173 | | 0.4 | % |
Johnson & Johnson | | | 31,200 | | | 1,641,120 | | 0.4 | % |
Other Securities | | | | | | 8,441,721 | | 1.9 | % |
| | | | | | | | | |
| | | | | | 11,868,014 | | 2.7 | % |
| | | | | | | | | |
Professional Services — 0.1% | | | | | | | | | |
Other Securities | | | | | | 608,512 | | 0.1 | % |
| | | | | | | | | |
Real Estate Investment Trusts — 0.6% | | | | | | | | | |
Other Securities | | | | | | 2,630,409 | | 0.6 | % |
| | | | | | | | | |
Real Estate Management & Development — 0.3% | | | | | | | | | |
Other Securities | | | | | | 1,223,895 | | 0.3 | % |
| | | | | | | | | |
Road & Rail — 0.5% | | | | | | | | | |
Other Securities | | | | | | 2,093,807 | | 0.5 | % |
| | | | | | | | | |
Semiconductors & Semiconductor Equipment — 1.4% | | | | | | | | | |
Other Securities | | | | | | 6,208,400 | | 1.4 | % |
| | | | | | | | | |
Software — 2.2% | | | | | | | | | |
Microsoft Corp. | | | 88,625 | | | 1,628,041 | | 0.4 | % |
Oracle Corp. | | | 91,950 | | | 1,661,536 | | 0.4 | % |
Other Securities | | | | | | 6,130,892 | | 1.4 | % |
| | | | | | | | | |
| | | | | | 9,420,469 | | 2.2 | % |
| | | | | | | | | |
Specialty Retail — 1.3% | | | | | | | | | |
Other Securities | | | | | | 5,756,134 | | 1.3 | % |
| | | | | | | | | |
Textiles, Apparel & Luxury Goods — 0.4% | | | | | | | | | |
Other Securities | | | | | | 1,536,259 | | 0.4 | % |
| | | | | | | | | |
Thrifts & Mortgage Finance — 0.1% | | | | | | | | | |
Other Securities | | | | | | 596,462 | | 0.1 | % |
| | | | | | | | | |
Tobacco — 0.4% | | | | | | | | | |
Other Securities | | | | | | 1,746,766 | | 0.4 | % |
| | | | | | | | | |
Trading Companies & Distributors — 0.2% | | | | | | | | | |
Other Securities | | | | | | 1,070,579 | | 0.2 | % |
| | | | | | | | | |
Transportation Infrastructure — 0.1% | | | | | | | | | |
Other Securities | | | | | | 467,704 | | 0.1 | % |
| | | | | | | | | |
Water Utilities — 0.0% | | | | | | | | | |
Other Securities | | | | | | 205,165 | | 0.0 | % |
| | | | | | | | | |
Wireless Telecommunication Services — 0.9% | | | | | | | | | |
Other Securities | | | | | | 3,892,671 | | 0.9 | % |
| | | | | | | | | |
Total Common Stocks — 50.8% | | | | | | 222,436,596 | | 50.8 | % |
| | | | | | | | | |
| | | |
| | | Par
(000) | | | | | |
Corporate Bonds | | | | | | | | | |
Aerospace & Defense — 0.0% | | | | | | | | | |
Other Securities | | | | | | 32,987 | | 0.0 | % |
| | | | | | | | | |
Air Freight & Logistics — 0.3% | | | | | | | | | |
Other Securities | | | | | | 1,227,998 | | 0.3 | % |
| | | | | | | | | |
Auto Components — 0.0% | | | | | | | | | |
Other Securities | | | | | | 122,200 | | 0.0 | % |
| | | | | | | | | |
Capital Markets — 0.7% | | | | | | | | | |
Morgan Stanley, Senior Notes, | | | | | | | | | |
1.65%, 1/09/12(a) | | $ | 925 | | | 742,388 | | 0.2 | % |
5.55%, 4/27/17 | | | 115 | | | 102,332 | | 0.0 | % |
Other Securities | | | | | | 2,281,830 | | 0.5 | % |
| | | | | | | | | |
| | | | | | 3,126,550 | | 0.7 | % |
| | | | | | | | | |
Chemicals — 0.0% | | | | | | | | | |
Other Securities | | | | | | 167,500 | | 0.0 | % |
| | | | | | | | | |
Commercial Banks — 0.9% | | | | | | | | | |
Kreditanstalt fuer Wiederaufbau (Germany), Unsecured Notes, | | | | | | | | | |
3.50%, 3/10/14(c) | | | 1,700 | | | 1,718,583 | | 0.4 | % |
Other Securities | | | | | | 2,194,403 | | 0.5 | % |
| | | | | | | | | |
| | | | | | 3,912,986 | | 0.9 | % |
| | | | | | | | | |
Commercial Services & Supplies — 0.0% | | | | | | | | | |
Other Securities | | | | | | 22,638 | | 0.0 | % |
| | | | | | | | | |
Computers & Peripherals — 0.2% | | | | | | | | | |
Other Securities | | | | | | 717,072 | | 0.2 | % |
| | | | | | | | | |
Consumer Finance — 0.1% | | | | | | | | | |
Other Securities | | | | | | 505,822 | | 0.1 | % |
| | | | | | | | | |
Containers & Packaging — 0.1% | | | | | | | | | |
Other Securities | | | | | | 250,625 | | 0.1 | % |
| | | | | | | | | |
Diversified Financial Services — 2.3% | | | | | | | | | |
The Bear Stearns Cos., Inc., Senior Unsecured Notes, | | | | | | | | | |
6.95%, 8/10/12 | | | 655 | | | 667,030 | | 0.2 | % |
General Electric Capital Corp., Senior Notes, | | | | | | | | | |
1.80%, 3/11/11 | | | 2,800 | | | 2,807,451 | | 0.6 | % |
General Electric Capital Corp., Senior Unsecured Notes, | | | | | | | | | |
5.00%, 12/01/10 | | | 300 | | | 297,697 | | 0.1 | % |
6.75%, 3/15/32 | | | 50 | | | 40,545 | | 0.0 | % |
General Electric Capital Corp., Unsecured Notes, | | | | | | | | | |
6.15%, 8/07/37 | | | 505 | | | 373,457 | | 0.1 | % |
JPMorgan Chase & Co., Unsecured Notes, | | | | | | | | | |
1.65%, 2/23/11 | | | 1,800 | | | 1,807,546 | | 0.4 | % |
5.60%, 6/01/11 | | | 550 | | | 555,329 | | 0.1 | % |
JPMorgan Chase Bank N.A., Subordinated Notes, | | | | | | | | | |
6.00%, 7/05/17 | | | 425 | | | 406,575 | | 0.1 | % |
Other Securities | | | | | | 3,168,065 | | 0.7 | % |
| | | | | | | | | |
| | | | | | 10,123,695 | | 2.3 | % |
| | | | | | | | | |
Diversified Telecommunication Services — 0.9% | | | | | | | | | |
Other Securities | | | | | | 4,119,949 | | 0.9 | % |
| | | | | | | | | |
| | | | | | |
10 | | BLACKROCK ASSET ALLOCATION PORTFOLIO | | MARCH 31, 2009 | | |
| | |
| Summary Schedule of Investments (continued) | | |
| | | | | | | | | |
Corporate Bonds | | Par
(000) | | Value | | Percentage
of Net Assets | |
Electric Utilities — 0.3% | | | | | | | | | |
Other Securities | | | | | $ | 1,484,453 | | 0.3 | % |
| | | | | | | | | |
Energy Equipment & Services — 0.1% | | | | | | | | | |
Other Securities | | | | | | 201,425 | | 0.1 | % |
| | | | | | | | �� | |
Food & Staples Retailing — 0.3% | | | | | | | | | |
Other Securities | | | | | | 1,428,355 | | 0.3 | % |
| | | | | | | | | |
Food Products — 0.3% | | | | | | | | | |
Other Securities | | | | | | 1,480,883 | | 0.3 | % |
| | | | | | | | | |
Gas Utilities — 0.2% | | | | | | | | | |
Other Securities | | | | | | 857,426 | | 0.2 | % |
| | | | | | | | | |
Health Care Equipment & Supplies — 0.1% | | | | | | | | | |
Other Securities | | | | | | 256,163 | | 0.1 | % |
| | | | | | | | | |
Health Care Providers & Services — 0.0% | | | | | | | | | |
Other Securities | | | | | | 188,025 | | 0.0 | % |
| | | | | | | | | |
Hotels, Restaurants & Leisure — 0.1% | | | | | | | | | |
Other Securities | | | | | | 425,744 | | 0.1 | % |
| | | | | | | | | |
Household Durables — 0.5% | | | | | | | | | |
Other Securities | | | | | | 2,138,524 | | 0.5 | % |
| | | | | | | | | |
Independent Power Producers & Energy Traders — 0.0% | | | | | | | | | |
Other Securities | | | | | | 176,700 | | 0.0 | % |
| | | | | | | | | |
Insurance — 0.4% | | | | | | | | | |
Other Securities | | | | | | 1,741,253 | | 0.4 | % |
| | | | | | | | | |
Internet & Catalog Retail — 0.2% | | | | | | | | | |
Other Securities | | | | | | 728,400 | | 0.2 | % |
| | | | | | | | | |
Media — 1.1% | | | | | | | | | |
Other Securities | | | | | | 4,578,834 | | 1.1 | % |
| | | | | | | | | |
Metals & Mining — 0.0% | | | | | | | | | |
Other Securities | | | | | | 9,100 | | 0.0 | % |
| | | | | | | | | |
Multiline Retail — 0.0% | | | | | | | | | |
Other Securities | | | | | | 196,239 | | 0.0 | % |
| | | | | | | | | |
Oil, Gas & Consumable Fuels — 1.0% | | | | | | | | | |
Other Securities | | | | | | 4,238,456 | | 1.0 | % |
| | | | | | | | | |
Paper & Forest Products — 0.0% | | | | | | | | | |
Other Securities | | | | | | 90,916 | | 0.0 | % |
| | | | | | | | | |
Other Securities | | | | | | 22,875 | | 0.0 | % |
| | | | | | | | | |
Pharmaceuticals — 1.0% | | | | | | | | | |
Other Securities | | | | | | 4,408,561 | | 1.0 | % |
| | | | | | | | | |
Software — 0.2% | | | | | | | | | |
Other Securities | | | | | | 1,011,870 | | 0.2 | % |
| | | | | | | | | |
Specialty Retail — 0.2% | | | | | | | | | |
Other Securities | | | | | | 675,981 | | 0.2 | % |
| | | | | | | | | |
Tobacco — 0.1% | | | | | | | | | |
Other Securities | | | | | | 297,628 | | 0.1 | % |
| | | | | | | | | |
Wireless Telecommunication Services — 0.4% | | | | | | | | | |
Other Securities | | | | | | 1,743,294 | | 0.4 | % |
| | | | | | | | | |
Total Corporate Bonds — 12.0% | | | | | | 52,711,127 | | 12.0 | % |
| | | |
Exchange-Traded Funds — 0.1% | | Shares | | | | | |
Other Securities | | | 7,863 | | | 290,070 | | 0.1 | % |
| | | | | | | | | |
| | | |
Foreign Government Obligations | | Par
(000) | | | | | |
Argentina — 0.0% | | | | | | | | | |
Other Securities(b) | | | | | | 25,775 | | 0.0 | % |
| | | | | | | | | |
Brazil — 0.2% | | | | | | | | | |
Other Securities | | | | | | 1,084,050 | | 0.2 | % |
| | | | | | | | | |
Colombia — 0.1% | | | | | | | | | |
Other Securities | | | | | | 313,688 | | 0.1 | % |
| | | | | | | | | |
El Salvador — 0.0% | | | | | | | | | |
Other Securities | | | | | | 40,150 | | 0.0 | % |
| | | | | | | | | |
Germany — 0.1% | | | | | | | | | |
Other Securities | | | | | | 448,780 | | 0.1 | % |
| | | | | | | | | |
Indonesia — 0.0% | | | | | | | | | |
Other Securities | | | | | | 152,378 | | 0.0 | % |
| | | | | | | | | |
Israel — 0.1% | | | | | | | | | |
Other Securities | | | | | | 216,131 | | 0.1 | % |
| | | | | | | | | |
Mexico — 0.1% | | | | | | | | | |
Other Securities | | | | | | 321,924 | | 0.1 | % |
| | | | | | | | | |
Panama — 0.1% | | | | | | | | | |
Other Securities | | | | | | 262,300 | | 0.1 | % |
| | | | | | | | | |
Peru — 0.0% | | | | | | | | | |
Other Securities | | | | | | 102,925 | | 0.0 | % |
| | | | | | | | | |
Philippines — 0.1% | | | | | | | | | |
Other Securities | | | | | | 423,650 | | 0.1 | % |
| | | | | | | | | |
Russia — 0.0% | | | | | | | | | |
Other Securities(b) | | | | | | 184,814 | | 0.0 | % |
| | | | | | | | | |
Turkey — 0.1% | | | | | | | | | |
Other Securities | | | | | | 487,600 | | 0.1 | % |
| | | | | | | | | |
Ukraine — 0.0% | | | | | | | | | |
Other Securities | | | | | | 43,000 | | 0.0 | % |
| | | | | | | | | |
United Kingdom — 0.1% | | | | | | | | | |
Other Securities | | | | | | 384,224 | | 0.1 | % |
| | | | | | | | | |
Uruguay — 0.0% | | | | | | | | | |
Other Securities | | | | | | 132,000 | | 0.0 | % |
| | | | | | | | | |
Venezuela — 0.1% | | | | | | | | | |
Other Securities | | | | | | 290,250 | | 0.1 | % |
| | | | | | | | | |
Total Foreign Government Obligations — 1.1% | | | | | | 4,913,639 | | 1.1 | % |
| | | | | | | | | |
Non-U.S. Government Sponsored Agency Mortgage-Backed Securities Collateralized Mortgage Obligations — 4.5% | | | | | | | | | |
Bear Stearns Adjustable Rate Mortgage Trust, Series 05-4, Class 3A1, 5.37%, 8/25/35(a) | | $ | 3,978 | | | 2,571,394 | | 0.6 | % |
| | | | | | |
| | | BLACKROCK ASSET ALLOCATION PORTFOLIO | | MARCH 31, 2009 | | 11 |
| | |
| Summary Schedule of Investments (continued) | | |
| | | | | | | | | |
| | | Par
(000) | | Value | | Percentage
of Net Assets | |
Non-U.S. Government Sponsored Agency Mortgage-Backed Securities | | | | | | | | | |
Collateralized Mortgage Obligations (concluded) | | | | | | | | | |
Bear Stearns Adjustable Rate Mortgage Trust, Series 06-2, Class 2A1, | | | | | | | | | |
5.65%, 7/25/36(a) | | $ | 1,643 | | $ | 838,263 | | 0.2 | % |
JPMorgan Mortgage Trust, Series 06-S2, Class 2A2, | | | | | | | | | |
5.88%, 7/25/36 | | | 136 | | | 98,618 | | 0.0 | % |
JPMorgan Mortgage Trust, Series 07-S1, Class 1A2, | | | | | | | | | |
5.50%, 3/25/22 | | | 139 | | | 103,085 | | 0.0 | % |
Washington Mutual Mortgage Pass-Through Certificates, Series 07-HY3, Class 1A1, | | | | | | | | | |
5.62%, 3/25/37(a) | | | 3,301 | | | 1,612,104 | | 0.4 | % |
Wells Fargo Mortgage Backed Securities Trust, Series 05-AR15, Class 2A1, | | | | | | | | | |
5.11%, 9/25/35(a) | | | 1,794 | | | 1,377,635 | | 0.3 | % |
Wells Fargo Mortgage Backed Securities Trust, Series 06-AR10, Class IIA2, | | | | | | | | | |
4.19%, 6/25/35(a) | | | 1,921 | | | 1,422,740 | | 0.3 | % |
Wells Fargo Mortgage Backed Securities Trust, Series 06-AR12, Class 2A1, | | | | | | | | | |
6.10%, 9/25/36(a) | | | 360 | | | 226,280 | | 0.0 | % |
Wells Fargo Mortgage Backed Securities Trust, Series 06-AR17, Class A1, | | | | | | | | | |
5.33%, 10/25/36(a) | | | 625 | | | 345,757 | | 0.1 | % |
Wells Fargo Mortgage Backed Securities Trust, Series 06-AR2, Class 2A5, | | | | | | | | | |
5.08%, 3/25/36(a) | | | 1,933 | | | 1,106,321 | | 0.3 | % |
Other Securities | | | | | | 10,076,405 | | 2.3 | % |
| | | | | | | | | |
| | | | | | 19,778,602 | | 4.5 | % |
| | | | | | | | | |
Commercial Mortgage-Backed Securities — 5.9% | | | | | | | | | |
Bear Stearns Commercial Mortgage Securities, Inc., Series 00-WF2, Class A2, | | | | | | | | | |
7.32%, 10/15/32(a) | | | 462 | | | 466,378 | | 0.1 | % |
Bear Stearns Commercial Mortgage Securities, Inc., Series 02-TOP6, Class A1, | | | | | | | | | |
5.92%, 10/15/36 | | | 223 | | | 223,646 | | 0.1 | % |
Bear Stearns Commercial Mortgage Securities, Inc., Series 03-T12, Class A4, | | | | | | | | | |
4.68%, 9/13/13(a) | | | 1,025 | | | 898,356 | | 0.2 | % |
Bear Stearns Commercial Mortgage Securities, Inc., Series 99-WF2, Class A2, | | | | | | | | | |
7.08%, 7/15/31 | | | 94 | | | 93,986 | | 0.0 | % |
Credit Suisse First Boston Mortgage Securities Corp., Series 01-CP4, Class D, | | | | | | | | | |
6.61%, 12/15/35 | | | 1,450 | | | 1,328,099 | | 0.3 | % |
Credit Suisse First Boston Mortgage Securities Corp., Series 02-CKN2, Class A3, | | | | | | | | | |
6.13%, 3/15/12 | | | 1,000 | | | 981,652 | | 0.2 | % |
Credit Suisse First Boston Mortgage Securities Corp., Series 02-CKS4, Class A2, | | | | | | | | | |
5.18%, 8/15/12 | | | 1,090 | | | 1,031,918 | | 0.2 | % |
Credit Suisse First Boston Mortgage Securities Corp., Series 02-CP5, Class A2, | | | | | | | | | |
4.94%, 12/15/35 | | | 1,010 | | | 952,972 | | 0.2 | % |
Credit Suisse First Boston Mortgage Securities Corp., Series 03-C3, Class A5, | | | | | | | | | |
3.94%, 5/15/38 | | | 1,020 | | | 879,407 | | 0.2 | % |
JPMorgan Chase Commercial Mortgage Securities Corp., Series 07-LD11, Class A2, | | | | | | | | | |
5.80%, 6/15/49(a) | | | 1,220 | | | 973,766 | | 0.2 | % |
Morgan Stanley Capital I, Inc., Series 01-TOP1, Class A4, | | | | | | | | | |
6.66%, 2/15/33 | | | 845 | | | 838,898 | | 0.2 | % |
Morgan Stanley Capital I, Inc., Series 02-TOP7, Class A1, | | | | | | | | | |
5.38%, 1/15/39 | | | 154 | | | 153,840 | | 0.0 | % |
Morgan Stanley Capital I, Inc., Series 05-HQ6, Class A4A, | | | | | | | | | |
4.99%, 8/13/42 | | | 2,405 | | | 1,934,760 | | 0.5 | % |
Morgan Stanley Capital I, Series 03-IQ4, Class A2, | | | | | | | | | |
4.07%, 5/15/40 | | | 1,025 | | | 889,917 | | 0.2 | % |
Other Securities | | | | | | 14,201,424 | | 3.3 | % |
| | | | | | | | | |
| | | | | | 25,849,019 | | 5.9 | % |
| | | | | | | | | |
Total Non-U.S. Government Sponsored Agency Mortgage-Backed Securities — 10.4% | | | | | | 45,627,621 | | 10.4 | % |
| | | | | | | | | |
Rights — 0.1% | | | | | | | | | |
Other Securities | | | | | | 262,759 | | 0.1 | % |
| | | | | | | | | |
| | | |
Taxable Municipal Bonds — 0.1% | | | | | | | | | |
Other Securities | | | | | | 399,744 | | 0.1 | % |
| | | | | | | | | |
U.S. Government Sponsored Agency | | | | | | | | | |
Mortgage-Backed Securities Collateralized Mortgage Obligations — 18.8% | | | | | | | | | |
Federal Home Loan Mortgage Corp. 30 Year TBA, | | | | | | | | | |
5.00%, 4/01/39(g) | | | 1,600 | | | 1,649,000 | | 0.4 | % |
5.50%, 4/01/39(g) | | | 6,300 | | | 6,534,281 | | 1.5 | % |
Federal Home Loan Mortgage Corp. Gold, | | | | | | | | | |
4.50%, 3/01/39 | | | 1,465 | | | 1,497,075 | | 0.4 | % |
Federal National Mortgage Assoc., | | | | | | | | | |
5.50%, 1/01/35(h) | | | 6,357 | | | 6,618,135 | | 1.5 | % |
5.50%, 2/01/35 | | | 5,408 | | | 5,636,184 | | 1.3 | % |
6.00%, 4/01/35 | | | 1,365 | | | 1,434,305 | | 0.3 | % |
5.00%, 2/01/38 | | | 5,636 | | | 5,828,533 | | 1.4 | % |
| | | | | | |
12 | | BLACKROCK ASSET ALLOCATION PORTFOLIO | | MARCH 31, 2009 | | |
| | |
| Summary Schedule of Investments (continued) | | |
| | | | | | | | | |
| | | Par
(000) | | Value | | Percentage
of Net Assets | |
U.S. Government Sponsored Agency Mortgage-Backed Securities | | | | | | | | | |
Collateralized Mortgage Obligations (concluded) | | | | | | | | | |
Federal National Mortgage Assoc. 15 Year TBA, | | | | | | | | | |
4.00%, 4/01/24(g) | | $ | 2,000 | | $ | 2,032,500 | | 0.5 | % |
4.50%, 4/01/24(g) | | | 2,200 | | | 2,264,625 | | 0.5 | % |
5.50%, 4/01/24(g) | | | 4,100 | | | 4,271,688 | | 1.0 | % |
6.00%, 4/01/24(g) | | | 100 | | | 104,656 | | 0.0 | % |
5.00%, 5/01/24(g) | | | 3,600 | | | 3,722,623 | | 0.8 | % |
Federal National Mortgage Assoc. 30 Year TBA, | | | | | | | | | |
4.50%, 3/01/39-4/01/39(g) | | | 5,730 | | | 5,854,194 | | 1.3 | % |
5.00%, 4/01/39(g) | | | 5,900 | | | 6,086,219 | | 1.4 | % |
5.50%, 4/01/39(g) | | | 1,200 | | | 1,245,375 | | 0.3 | % |
6.00%, 4/01/39(g) | | | 100 | | | 104,406 | | 0.0 | % |
Federal National Mortgage Assoc. Grantor Trust, Series 03-T1, Class R (IO), | | | | | | | | | |
0.49%, 11/25/12(a) | | | 6,352 | | | 111,136 | | 0.0 | % |
Federal National Mortgage Assoc., Series 08-2, Class SA (IO), | | | | | | | | | |
5.75%, 2/25/38(a) | | | 1,606 | | | 134,964 | | 0.0 | % |
Federal National Mortgage Assoc., Series 378, Class 5 (IO), | | | | | | | | | |
5.00%, 7/01/36 | | | 1,790 | | | 208,762 | | 0.1 | % |
Government National Mortgage Assoc. I, | | | | | | | | | |
6.00%, 12/15/23-1/15/24 | | | 187 | | | 196,150 | | 0.1 | % |
6.50%, 6/15/24-11/15/28 | | | 206 | | | 219,161 | | 0.0 | % |
7.00%, 4/15/29-9/15/31 | | | 773 | | | 830,796 | | 0.2 | % |
6.50%, 1/15/35 | | | 893 | | | 939,928 | | 0.2 | % |
Government National Mortgage Assoc. I 30 Year TBA, | | | | | | | | | |
4.50%, 4/01/39-5/01/39(g) | | | 5,300 | | | 5,404,875 | | 1.2 | % |
Government National Mortgage Assoc. II 30 Year TBA, | | | | | | | | | |
6.00%, 5/01/39(g) | | | 1,800 | | | 1,872,000 | | 0.4 | % |
Government National Mortgage Assoc., Series 07-72, Class US (IO), | | | | | | | | | |
6.01%, 11/20/37(a) | | | 3,511 | | | 203,451 | | 0.1 | % |
Other Securities(g) | | | | | | 17,238,586 | | 3.9 | % |
| | | | | | | | | |
Total U.S. Government Sponsored Agency Mortgage-Backed Securities — 18.8% | | | | | | 82,243,608 | | 18.8 | % |
| | | | | | | | | |
U.S. Government Sponsored Agency Obligations | | | | | | | | | |
Federal Home Loan Bank, Bonds, | | | | | | | | | |
5.38%, 5/15/19 | | | 2,005 | | | 2,200,927 | | 0.5 | % |
Federal Home Loan Mortgage Corp., Unsecured Notes, | | | | | | | | | |
2.13%, 3/23/12 | | | 1,450 | | | 1,460,988 | | 0.3 | % |
Federal National Mortgage Assoc., Unsecured Notes, | | | | | | | | | |
2.88%, 10/12/10 | | | 1,900 | | | 1,952,626 | | 0.4 | % |
2.00%, 1/09/12(h) | | | 1,915 | | | 1,934,303 | | 0.4 | % |
2.88%, 12/11/13(i) | | | 1,675 | | | 1,712,237 | | 0.4 | % |
2.75%, 2/05/14 | | | 1,650 | | | 1,674,227 | | 0.4 | % |
2.75%, 3/13/14 | | | 3,400 | | | 3,440,586 | | 0.8 | % |
Other Securities | | | | | | 2,898,755 | | 0.7 | % |
| | | | | | | | | |
Total U.S. Government Sponsored Agency Obligations — 3.9% | | | | | | 17,274,649 | | 3.9 | % |
| | | | | | | | | |
U.S. Treasury Obligations | | | | | | | | | |
U.S. Treasury Bonds, | | | | | | | | | |
8.13%, 8/15/19(j) | | | 1,025 | | | 1,486,250 | | 0.3 | % |
U.S. Treasury Notes, | | | | | | | | | |
2.75%, 2/15/19(j) | | | 2,490 | | | 2,503,620 | | 0.6 | % |
Other Securities | | | | | | 296,930 | | 0.1 | % |
| | | | | | | | | |
Total U.S. Treasury Obligations — 1.0% | | | | | | 4,286,800 | | 1.0 | % |
| | | | | | | | | |
| | | |
Warrant — 0.0% | | Shares | | | | | |
Crosshair Exploration & Mining Corp. (issued/exercisable 4/04/08, 1 share for 1 warrant, expiring 10/04/09, strike price 1.80 CAD)(acquired 4/04/08, cost $51)(e)(f) | | | 5,300 | | | 16 | | 0.0 | % |
| | | | | | | | | |
Total Long-Term Investments
(Cost — $513,575,743) | | | | | | 449,515,738 | | 102.6 | % |
| | | | | | | | | |
| | | |
Short-Term Securities | | Beneficial
Interest
Par/Shares
(000) | | | | | |
BlackRock Liquidity Funds, TempFund, 0.60%(k)(l) | | | 22,244 | | | 22,244,139 | | 5.1 | % |
BlackRock Liquidity Series, LLC Money Market Series, 1.17%(k)(l)(m) | | | 1,590 | | | 1,590,400 | | 0.3 | % |
BNP Paribas Finance, Inc., 0.55%, 4/09/09(l) | | | 5,000 | | | 4,999,015 | | 1.1 | % |
Danske Corp., 1.50%, 6/04/09(l) | | | 6,000 | | | 5,990,272 | | 1.4 | % |
| | | | | | | | | |
Total Short-Term Securities
(Cost — $34,817,928) | | | | | | 34,823,826 | | 7.9 | % |
| | | | | | | | | |
| | | | | | |
| | | BLACKROCK ASSET ALLOCATION PORTFOLIO | | MARCH 31, 2009 | | 13 |
| | |
| Summary Schedule of Investments (continued) | | |
| | | | | | | | | | | |
| | | Contracts | | | Value | | | Percentage
of Net Assets | |
Options Purchased | | | | | | | | | | | |
Over-the-Counter Call Swaptions Purchased | | | | | | | | | | | |
Other Securities | | | | | | $ | 51,364 | | | 0.0 | % |
| | | | | | | | | | | |
Over-the-Counter Put Swaptions Purchased | | | | | | | | | | | |
Other Securities | | | | | | | 4,110 | | | 0.0 | % |
| | | | | | | | | | | |
Total Options Purchased
(Cost — $87,790) — 0.0% | | | | | | | 55,474 | | | 0.0 | % |
| | | | | | | | | | | |
Total Investments Before TBA Sale Commitments and Outstanding Options Written
(Cost — $548,481,461*) | | | | | | | 484,395,038 | | | 110.5 | % |
| | | | | | | | | | | |
| | | |
| | | Par
(000) | | | | | | | |
TBA Sale Commitments | | | | | | | | | | | |
Federal Home Loan Mortgage Corp. 30 Year TBA, | | | | | | | | | | | |
4.50%, 4/01/39(g) | | $ | (2,900 | ) | | | (2,958,000 | ) | | (0.7 | )% |
5.50%, 4/01/39(g) | | | (4,600 | ) | | | (4,771,062 | ) | | (1.1 | )% |
Federal National Mortgage Assoc. 15 Year TBA, | | | | | | | | | | | |
5.50%, 4/01/24(g) | | | (4,500 | ) | | | (4,688,438 | ) | | (1.1 | )% |
Federal National Mortgage Assoc. 30 Year TBA, | | | | | | | | | | | |
4.50%, 4/01/39(g) | | | (3,700 | ) | | | (3,777,469 | ) | | (0.9 | )% |
5.00%, 4/01/39- 5/01/39(g) | | | (10,800 | ) | | | (11,116,832 | ) | | (2.5 | )% |
5.50%, 4/01/39- 5/01/39(g) | | | (10,100 | ) | | | (10,456,875 | ) | | (2.4 | )% |
6.00%, 4/01/39(g) | | | (2,300 | ) | | | (2,401,344 | ) | | (0.5 | )% |
6.50%, 4/01/39(g) | | | (200 | ) | | | (210,625 | ) | | (0.0 | )% |
7.00%, 4/01/39(g) | | | (47 | ) | | | (50,056 | ) | | (0.0 | )% |
Government National Mortgage Assoc. I 30 Year TBA, | | | | | | | | | | | |
4.50%, 4/01/39(g) | | | (1,600 | ) | | | (1,635,500 | ) | | (0.4 | )% |
5.50%, 4/01/39(g) | | | (100 | ) | | | (104,062 | ) | | (0.0 | )% |
6.50%, 4/01/39(g) | | | (300 | ) | | | (314,531 | ) | | (0.1 | )% |
| | | | | | | | | | | |
Total TBA Sale Commitments (Proceeds — $42,210,978) — (9.7)% | | | | | | | (42,484,794 | ) | | (9.7 | )% |
| | | | | | | | | | | |
| | | |
| | | Contracts(n) | | | | | | | |
Options Written | | | | | | | | | | | |
Over-the-Counter Call Swaptions Written | | | | | | | | | | | |
Pay a fixed rate of 3.310% and receive a floating rate based on 3-month LIBOR, expiring March 2010, Broker, JPMorgan Chase Bank, National Association | | | (190 | ) | | | (86,134 | ) | | (0.0 | )% |
Pay a fixed rate of 3.330% and receive a floating rate based on 3-month LIBOR, expiring March 2010, Broker, Citibank, N.A. | | | (210 | ) | | | (97,483 | ) | | (0.0 | )% |
Over-the-Counter Call Swaptions Written (concluded) | | | | | | | | | | | |
Pay a fixed rate of 3.470% and receive a floating rate based on 3-month LIBOR, expiring March 2010, Broker, Deutsche Bank AG | | | (190 | ) | | | (102,385 | ) | | (0.0 | )% |
Pay a fixed rate of 4.870% and receive a floating rate based on 3-month LIBOR, expiring February 2010, Broker, Deutsche Bank AG | | | (570 | ) | | | (876,858 | ) | | (0.2 | )% |
Pay a fixed rate of 5.400% and receive a floating rate based on 3-month LIBOR, expiring December 2010, Broker, UBS AG | | | (260 | ) | | | (463,301 | ) | | (0.1 | )% |
Pay a fixed rate of 5.485% and receive a floating rate based on 3-month LIBOR, expiring October 2009, Broker, JPMorgan Chase Bank, National Association | | | (140 | ) | | | (297,260 | ) | | (0.1 | )% |
Pay a fixed rate of 5.670% and receive a floating rate based on 3-month LIBOR, expiring January 2010, Broker, Citibank, N.A. | | | (50 | ) | | | (111,300 | ) | | (0.1 | )% |
| | | | | | | | | | | |
| | | | | | | (2,034,721 | ) | | (0.5 | )% |
| | | | | | | | | | | |
Over-the-Counter Put Swaptions Written | | | | | | | | | | | |
Receive a fixed rate of 3.310% and pay a floating rate based on 3-month LIBOR, expiring March 2010, Broker, JPMorgan Chase Bank, National Association | | | (190 | ) | | | (60,387 | ) | | (0.0 | )% |
Receive a fixed rate of 3.330% and pay a floating rate based on 3-month LIBOR, expiring March 2010, Broker, Citibank, N.A. | | | (210 | ) | | | (64,550 | ) | | (0.0 | )% |
Receive a fixed rate of 3.470% and pay a floating rate based on 3-month LIBOR, expiring March 2010, Broker, Deutsche Bank AG 2010, Broker, Barclays Bank, Plc | | | (190 | ) | | | (44,323 | ) | | (0.0 | )% |
Receive a fixed rate of 4.870% and pay a floating rate based on 3-month LIBOR, expiring February 2010, Broker, Deutsche Bank AG | | | (570 | ) | | | (20,522 | ) | | (0.0 | )% |
Receive a fixed rate of 5.400% and pay a floating rate based on 3-month LIBOR, expiring December 2010, Broker, UBS AG | | | (260 | ) | | | (18,639 | ) | | (0.0 | )% |
| | | | | | |
14 | | BLACKROCK ASSET ALLOCATION PORTFOLIO | | MARCH 31, 2009 | | |
| | |
| Summary Schedule of Investments (continued) | | |
| | | | | | | | | | |
| | | Contracts(n) | | | Value | | | Percentage
of Net Assets | |
Options Written | | | | | | | | | | |
Over-the-Counter Put Swaptions Written (concluded) | | | | | | | | | | |
Receive a fixed rate of 5.485% and pay a floating rate based on 3-month LIBOR, expiring October 2009, Broker, JPMorgan Chase Bank, National Association | | (140 | ) | | $ | (652 | ) | | (0.0 | )% |
Receive a fixed rate of 5.670% and pay a floating rate based on 3-month LIBOR, expiring January 2010, Broker, Citibank, N.A. | | (50 | ) | | | (390 | ) | | (0.0 | )% |
| | | | | | | | | | |
| | | | | | (259,532 | ) | | (0.0 | )% |
| | | | | | | | | | |
Total Options Written (Premiums Received — $1,551,320) — (0.5)% | | | | | | (2,294,253 | ) | | (0.5 | )% |
| | | | | | | | | | |
Total Investments Net of TBA Sale Commitments and Outstanding Options Written — 100.3% | | | | | | 439,615,991 | | | 100.3 | % |
Liabilities in Excess of Other Assets — (0.3)% | | | | | | (1,384,232 | ) | | (0.3 | )% |
| | | | | | | | | | |
Net Assets — 100.0% | | | | | $ | 438,231,759 | | | 100.0 | % |
| | | | | | | | | | |
| * | The cost and unrealized appreciation (depreciation) of investments as of March 31, 2009, as computed for federal income tax purposes, were as follows: |
| | | | |
Aggregate cost | | $ | 555,067,249 | |
| | | | |
Gross unrealized appreciation | | $ | 19,004,287 | |
Gross unrealized depreciation | | | (89,676,498 | ) |
| | | | |
Net unrealized depreciation | | $ | (70,672,211 | ) |
| | | | |
| (a) | Variable rate security. Rate shown is as of report date. |
| (b) | Represents a step-up bond that pays an initial coupon rate for the first period and then a higher coupon rate for the following periods. Rate shown reflects the effective yield at the time of purchase. |
| (c) | U.S. dollar denominated security issued by foreign domiciled entity. |
| (d) | Security is perpetual in nature and has no stated maturity date. In certain instances, a final maturity date may be extended and/or the final payment of principal may be deferred at the issuer’s option for a specified time without default. |
| (e) | Non-income producing security. |
| (f) | Restricted security as to resale. As of report date the Portfolio held 0.04% of its net assets, with a current market value of $175,897 and an original cost of $111,001 in these securities. |
| (g) | Represents or includes a to-be-announced transaction. The Portfolio has committed to purchasing (selling) securities for which all specific information is not available at this time. |
| | | | | | | | |
Counterparty | | Market Value | | | Unrealized
Appreciation
(Depreciation) | |
AK Capital Services Ltd. | | $ | (50,056 | ) | | $ | 251 | |
Bank of America, N.A. | | $ | (10,094 | ) | | $ | (18,703 | ) |
Barclays Bank, Plc | | $ | (2,040,000 | ) | | $ | 9,375 | |
Citibank, N.A. | | $ | (16,166,938 | ) | | $ | (92,828 | ) |
Credit Suisse International | | $ | (7,318,988 | ) | | $ | (93,160 | ) |
Deutsche Bank AG | | $ | 15,580,311 | | | $ | 161,167 | |
JPMorgan Chase Bank, National Association | | $ | 9,915,125 | | | $ | 69,094 | |
| (h) | Security, or a portion thereof, has been pledged as collateral for swap contracts. |
| (i) | All or a portion of security pledged as collateral in connection with open financial futures contracts. |
| (j) | Security, or a portion thereof, subject to mortgage dollar roll transactions. |
| (k) | Investments in companies considered to be an affiliate of the Portfolio, for purposes of Section 2(a)(3) of the Investment Company Act of 1940, as amended, were as follows: |
| | | | | | | |
Affiliate | | Net Activity | | | Income |
BlackRock Liquidity Funds, TempFund | | $ | 22,244,139 | ** | | $ | 49,398 |
BlackRock Liquidity Series, LLC Money Market Series | | $ | 120,500 | ** | | $ | 15,713 |
| ** | Represents net purchase cost. |
| (l) | Represents current yield as of report date. |
| (m) | Security purchased with the cash proceeds from securities loans. |
| (n) | One contract represents a notional amount of $10,000. |
| • | | Foreign currency exchange contracts as of March 31, 2009 were as follows: |
| | | | | | | | | | | | |
Currency
Purchased | | Currency Sold | | Counterparty | | Settlement
Date | | Unrealized
Appreciation
(Depreciation) | |
| AUD | 745,000 | | USD | 488,316 | | Citibank, N.A. | | 4/15/09 | | $ | 29,103 | |
| CAD | 569,000 | | USD | 448,247 | | Deutsche Bank AG | | 4/15/09 | | | 3,065 | |
| CHF | 1,355,000 | | USD | 1,205,341 | | Citibank, N.A. | | 4/15/09 | | | (14,596 | ) |
| CHF | 1,000 | | USD | 860 | | Citibank, N.A. | | 4/15/09 | | | 19 | |
| CHF | 52,000 | | USD | 45,140 | | Citibank, N.A. | | 4/15/09 | | | 557 | |
| CHF | 23,000 | | USD | 19,406 | | Deutsche Bank AG | | 4/15/09 | | | 806 | |
| DKK | 1,300,000 | | USD | 228,563 | | Deutsche Bank AG | | 4/15/09 | | | 3,217 | |
| EUR | 930,000 | | USD | 1,216,288 | | Deutsche Bank AG | | 4/15/09 | | | 19,268 | |
| GBP | 40,000 | | USD | 57,084 | | UBS AG | | 4/15/09 | | | 312 | |
| JPY | 9,278,000 | | USD | 97,119 | | Citibank, N.A. | | 4/15/09 | | | (3,368 | ) |
| JPY | 23,297,000 | | USD | 260,386 | | Deutsche Bank AG | | 4/15/09 | | | (24,977 | ) |
| JPY | 11,987,000 | | USD | 135,310 | | Deutsche Bank AG | | 4/15/09 | | | (14,185 | ) |
| JPY | 60,000,000 | | USD | 678,043 | | UBS AG | | 4/15/09 | | | (71,761 | ) |
| JPY | 6,891,000 | | USD | 77,446 | | UBS AG | | 4/15/09 | | | (7,815 | ) |
| NOK | 313,000 | | USD | 43,526 | | Citibank, N.A. | | 4/15/09 | | | 3,017 | |
| NOK | 370,000 | | USD | 53,191 | | Deutsche Bank AG | | 4/15/09 | | | 1,827 | |
| SEK | 5,577,000 | | USD | 669,335 | | Royal Bank of Scotland | | 4/15/09 | | | 9,108 | |
| SGD | 360,000 | | USD | 241,061 | | Deutsche Bank AG | | 4/15/09 | | | (4,464 | ) |
| USD | 52,673 | | AUD | 80,000 | | Citibank, N.A. | | 4/15/09 | | | (2,889 | ) |
| USD | 35,425 | | AUD | 54,000 | | UBS AG | | 4/15/09 | | | (2,080 | ) |
| USD | 39,265 | | CAD | 50,000 | | Citibank, N.A. | | 4/15/09 | | | (394 | ) |
| USD | 37,000 | | CAD | 45,000 | | Citibank, N.A. | | 4/15/09 | | | 1,308 | |
| USD | 58,495 | | CAD | 72,000 | | Citibank, N.A. | | 4/15/09 | | | 1,387 | |
| USD | 220,823 | | CAD | 270,000 | | UBS AG | | 4/15/09 | | | 6,668 | |
| USD | 44,042 | | CZK | 909,000 | | UBS AG | | 4/15/09 | | | (74 | ) |
| USD | 187,765 | | EUR | 138,000 | | Deutsche Bank AG | | 4/15/09 | | | 4,424 | |
| USD | 32,772 | | EUR | 25,000 | | UBS AG | | 4/15/09 | | | (442 | ) |
| | | | | | |
| | | BLACKROCK ASSET ALLOCATION PORTFOLIO | | MARCH 31, 2009 | | 15 |
| | |
| Summary Schedule of Investments (continued) | | |
| | | | | | | | | | | | |
| | | | | | | | | Unrealized | |
Currency
Purchased | | Currency Sold | | Counterparty | | Settlement
Date | | Appreciation
(Depreciation) | |
| USD | 50,653 | | GBP | 35,000 | | Barclays Bank, Plc | | 4/15/09 | | $ | 432 | |
| USD | 64,148 | | GBP | 46,000 | | Deutsche Bank AG | | 4/15/09 | | | (1,857 | ) |
| USD | 205,681 | | GBP | 144,000 | | Deutsche Bank AG | | 4/15/09 | | | (944 | ) |
| USD | 715,243 | | GBP | 490,000 | | UBS AG | | 4/15/09 | | | 12,142 | |
| | | | | | Goldman Sachs Bank | | | | | | |
| USD | 347,978 | | HKD | 2,700,000 | | USA | | 4/15/09 | | | (413 | ) |
| USD | 39,448 | | JPY | 3,870,000 | | Citibank, N.A. | | 4/15/09 | | | 343 | |
| USD | 613,711 | | NOK | 4,436,000 | | Citibank, N.A. | | 4/15/09 | | | (45,912 | ) |
| USD | 47,601 | | SEK | 380,000 | | Citibank, N.A. | | 4/15/09 | | | 1,374 | |
| USD | 53,016 | | SEK | 445,000 | | UBS AG | | 4/15/09 | | | (1,119 | ) |
| USD | 613,255 | | EUR | 476,500 | | Citibank, N.A. | | 5/20/09 | | | (19,828 | ) |
| GBP | 34,000 | | USD | 49,097 | | Deutsche Bank AG | | 6/10/09 | | | (300 | ) |
| HKD | 492,000 | | USD | 63,516 | | Deutsche Bank AG | | 6/10/09 | | | (8 | ) |
| SEK | 230,000 | | USD | 27,225 | | Citibank, N.A. | | 6/10/09 | | | 768 | |
| USD | 74,075 | | AUD | 108,000 | | Citibank, N.A. | | 6/10/09 | | | (666 | ) |
| USD | 56,001 | | EUR | 43,000 | | Citibank, N.A. | | 6/10/09 | | | (1,133 | ) |
| USD | 828,520 | | GBP | 592,500 | | Deutsche Bank AG | | 6/10/09 | | | (21,832 | ) |
| USD | 612,738 | | GBP | 434,000 | | Deutsche Bank AG | | 6/10/09 | | | (10,136 | ) |
| USD | 335,286 | | JPY | 32,869,000 | | Citibank, N.A. | | 6/10/09 | | | 2,853 | |
| USD | 59,872 | | ZAR | 576,000 | | Citibank, N.A. | | 6/10/09 | | | (13 | ) |
| USD | 33,042 | | ZAR | 316,000 | | Citibank, N.A. | | 6/10/09 | | | 188 | |
| USD | 20,828 | | ZAR | 204,000 | | Deutsche Bank AG | | 6/10/09 | | | (381 | ) |
| | | | | | | | | | | | |
| | Total | | | | | | | | | $ | (149,401 | ) |
| | | | | | | | | | | | |
| • | Financial futures contracts purchased as of March 31, 2009 were as follows: |
| | | | | | | | | | | | | |
Contracts | | Issue | | Exchange | | Expiration
Date | | Face
Value | | Unrealized
Appreciation
(Depreciation) | |
200 | | DJIA Index | | Chicago | | June 2009 | | $ | 14,960,000 | | $ | 892,000 | |
8 | | Euro-Bund | | Chicago | | June 2009 | | $ | 1,322,545 | | | (1,275 | ) |
17 | | United Kingdom Gilt | | London | | June 2009 | | $ | 3,005,381 | | | 49,402 | |
130 | | S&P 500 Index | | Chicago | | June 2009 | | $ | 25,831,000 | | | 1,508,000 | |
65 | | U.S. Treasury Bonds | | Chicago | | June 2009 | | $ | 8,430,703 | | | 220,433 | |
12 | | U.S. Treasury Notes
(2 Year) | | Chicago | | June 2009 | | $ | 2,614,688 | | | 6,382 | |
194 | | U.S. Treasury Notes
(5 Year) | | Chicago | | June 2009 | | $ | 23,040,531 | | | 244,561 | |
| | | | | | | | | | | | | |
Total | | | | | | | | | | | $ | 2,919,503 | |
| | | | | | | | | | | | | |
| • | Financial futures contracts sold as of March 31, 2009 were as follows: |
| | | | | | | | | | | | | |
Contracts | | Issue | | Exchange | | Expiration
Date | | Face
Value | | Unrealized
Depreciation | |
57 | | U.S. Treasury Notes
(10 Year) | | Chicago | | June 2009 | | $ | 6,541,875 | | $ | (7,130 | ) |
41 | | Euro Dollar Futures
(90 Day) | | Chicago | | June 2009 | | $ | 10,137,250 | | | (99,162 | ) |
9 | | Euro Dollar Futures
(90 Day) | | Chicago | | September 2009 | | $ | 2,225,363 | | | (5,950 | ) |
9 | | Euro Dollar Futures
(90 Day) | | Chicago | | December 2009 | | $ | 2,221,988 | | | (6,175 | ) |
6 | | Euro Dollar Futures
(90 Day) | | Chicago | | March 2010 | | $ | 1,480,500 | | | (5,540 | ) |
7 | | Euro Dollar Futures
(90 Day) | | Chicago | | June 2010 | | $ | 1,724,538 | | | (7,945 | ) |
7 | | Euro Dollar Futures
(90 Day) | | Chicago | | September 2010 | | $ | 1,721,738 | | | (9,207 | ) |
7 | | Euro Dollar Futures
(90 Day) | | Chicago | | December 2010 | | $ | 1,718,150 | | | (9,669 | ) |
3 | | Euro Dollar Futures
(90 Day) | | Chicago | | March 2011 | | $ | 735,225 | | | (4,648 | ) |
3 | | Euro Dollar Futures
(90 Day) | | Chicago | | June 2011 | | $ | 733,763 | | | (4,685 | ) |
3 | | Euro Dollar Futures
(90 Day) | | Chicago | | September 2011 | | $ | 732,300 | | | (4,493 | ) |
3 | | Euro Dollar Futures
(90 Day) | | Chicago | | December 2011 | | $ | 730,688 | | | (4,043 | ) |
| | | | | | | | | | | | | |
Total | | | | | | | | | | | $ | (168,647 | ) |
| | | | | | | | | | | | | |
| • | Interest rate swaps outstanding as of March 31, 2009 were as follows: |
| | | | | | | | | | | | | |
Fixed
Rate | | Floating Rate | | Counterparty | | Expiration | | Notional
Amount
(000) | | Unrealized
Appreciation
(Depreciation) | |
5.50% | | 3-month LIBOR | | Bank of America, N.A. | | July 2009 | | USD | 7,500 | | $ | 161,750 | |
4.05% | | 3-month LIBOR | | Barclays Bank, Plc | | December 2009 | | USD | 2,600 | | | 79,162 | |
1.76% | | 3-month LIBOR | | Deutsche Bank AG | | March 2011 | | USD | 3,600 | | | (26,675 | ) |
5.11% | | 3-month LIBOR | | UBS AG | | November 2011 | | USD | 9,100 | | | 964,213 | |
1.81% | | 3-month LIBOR | | Citibank, N.A. | | March 2012 | | USD | 10,000 | | | (36,725 | ) |
3.77% | | 3-month LIBOR | | Bank of America, N.A. | | January 2013 | | USD | 4,100 | | | 268,525 | |
4.27% | | 3-month LIBOR | | Deutsche Bank AG | | July 2013 | | USD | 1,600 | | | 146,238 | |
2.53% | | 3-month LIBOR | | Citibank, N.A. | | March 2014 | | USD | 3,500 | | | (54,160 | ) |
2.56% | | 3-month LIBOR | | Morgan Stanley Capital Services, Inc. | | March 2014 | | USD | 3,500 | | | (58,212 | ) |
4.96% | | 3-month LIBOR | | UBS AG | | March 2015 | | USD | 5,000 | | | (719,220 | ) |
4.50% | | 3-month LIBOR | | JPMorgan Chase Bank, National Association | | May 2015 | | USD | 1,700 | | | (226,511 | ) |
4.39% | | 3-month LIBOR | | Morgan Stanley Capital Services, Inc. | | July 2015 | | USD | 6,300 | | | (760,870 | ) |
| | | | | | |
16 | | BLACKROCK ASSET ALLOCATION PORTFOLIO | | MARCH 31, 2009 | | |
| | |
| Summary Schedule of Investments (continued) | | |
| | | | | | | | | | | | | |
Fixed
Rate | | Floating Rate | | Counterparty | | Expiration | | Notional
Amount
(000) | | Unrealized
Appreciation
(Depreciation) | |
5.30% | | 3-month LIBOR | | UBS AG | | February 2017 | | USD | 6,700 | | $ | 1,285,186 | |
2.21% | | 3-month LIBOR | | Goldman Sachs Bank USA | | December 2018 | | USD | 2,500 | | | (124,734 | ) |
2.30% | | 3-month LIBOR | | Citibank, N.A. | | December 2018 | | USD | 2,200 | | | (93,235 | ) |
2.86% | | 3-month LIBOR | | Goldman Sachs Bank USA | | January 2019 | | USD | 1,300 | | | 2,895 | |
2.71% | | 3-month LIBOR | | Bank of America, N.A. | | January 2019 | | USD | 2,400 | | | (26,633 | ) |
2.90% | | 3-month LIBOR | | Deutsche Bank AG | | February 2019 | | USD | 2,600 | | | 15,096 | |
3.22% | | 3-month LIBOR | | Morgan Stanley Capital Services, Inc. | | March 2019 | | USD | 1,500 | | | 48,442 | |
3.06% | | 3-month LIBOR | | Credit Suisse International | | March 2019 | | USD | 2,100 | | | 37,054 | |
2.82% | | 3-month LIBOR | | Barclays Bank, Plc | | March 2019 | | USD | 1,000 | | | (4,261 | ) |
5.41% | | 3-month LIBOR | | JPMorgan Chase Bank, National Association | | August 2022 | | USD | 1,130 | | | 295,097 | |
3.50% | | 3-month LIBOR | | Barclays Bank, Plc | | March 2040 | | USD | 500 | | | (13,193 | ) |
| | | | | | | | | | | | | |
Total | | | | | | | | | | | $ | 1,159,229 | |
| | | | | | | | | | | | | |
| • | Credit default swaps on single-name issues - buy protection outstanding as of March 31, 2009 were as follows: |
| | | | | | | | | | | | | |
Issuer | | Pay
Fixed
Rate | | | Counterparty | | Expiration | | Notional
Amount
(000)1 | | Unrealized
Appreciation
(Depreciation) | |
Centex Corp. | | 6.92 | % | | JPMorgan Chase Bank, National Association | | December 2010 | | 265 | | $ | (10,497 | ) |
Knight, Inc. | | 1.80 | % | | Credit Suisse International | | January 2011 | | 365 | | | (1,925 | ) |
Viacom, Inc. | | 2.40 | % | | Deutsche Bank AG | | June 2011 | | 525 | | | 4,581 | |
KB Home | | 4.90 | % | | JPMorgan Chase Bank, National Association | | September 2011 | | 460 | | | 456 | |
Wendy’s/Arby’s Group, Inc. | | 2.90 | % | | JPMorgan Chase Bank, National Association | | December 2011 | | 360 | | | (7,306 | ) |
United Rentals N.A., Inc. | | 5.00 | % | | JPMorgan Chase Bank, National Association | | March 2012 | | 500 | | | 953 | |
PolyOne Corp. | | 5.00 | % | | JPMorgan Chase Bank, National Association | | June 2012 | | 140 | | | (1,105 | ) |
Ryland Group, Inc. | | 4.51 | % | | JPMorgan Chase Bank, National Association | | June 2012 | | 165 | | | (6,533 | ) |
Macy’s, Inc. | | 7.50 | % | | Morgan Stanley Capital Services, Inc. | | June 2012 | | 250 | | | (1,624 | ) |
D.R. Horton, Inc. | | 5.04 | % | | JPMorgan Chase Bank, National Association | | June 2013 | | 525 | | | (19,009 | ) |
Expedia, Inc. | | 5.00 | % | | Citibank, N.A. | | September 2013 | | 380 | | | (3,345 | ) |
Expedia, Inc. | | 5.18 | % | | Goldman Sachs Bank USA | | September 2013 | | 175 | | | (2,707 | ) |
Centex Corp. | | 4.40 | % | | JPMorgan Chase Bank, National Association | | December 2013 | | 330 | | | (3,195 | ) |
Tyson Foods, Inc. | | 4.10 | % | | Barclays Bank, Plc | | March 2014 | | 445 | | | (23,211 | ) |
Hertz Global Holdings, Inc. | | 5.00 | % | | Goldman Sachs Bank USA | | March 2014 | | 165 | | | (16,305 | ) |
Toll Brothers, Inc. | | 2.00 | % | | JPMorgan Chase Bank, National Association | | March 2014 | | 155 | | | (1,769 | ) |
Idearc, Inc. | | 5.00 | % | | Barclays Bank, Plc | | June 2014 | | 305 | | | 9,913 | |
D.R. Horton, Inc. | | 5.07 | % | | JPMorgan Chase Bank, National Association | | September 2014 | | 155 | | | (8,839 | ) |
| | | | | | |
| | | BLACKROCK ASSET ALLOCATION PORTFOLIO | | MARCH 31, 2009 | | 17 |
| | |
| Summary Schedule of Investments (continued) | | |
| | | | | | | | | | | | | |
Issuer | | Pay
Fixed
Rate | | | Counterparty | | Expiration | | Notional
Amount
(000)1 | | Unrealized
Appreciation
(Depreciation) | |
Huntsman Corp. | | 5.00 | % | | Goldman Sachs Bank USA | | December 2014 | | 175 | | $ | (3,551 | ) |
Energy Future Holdings Corp. | | 5.00 | % | | Morgan Stanley Capital Services, Inc. | | December 2014 | | 680 | | | (30,119 | ) |
Huntsman Corp. | | 5.00 | % | | Goldman Sachs Bank USA | | March 2015 | | 85 | | | 5,953 | |
Pulte Homes, Inc. | | 3.00 | % | | JPMorgan Chase Bank, National Association | | March 2015 | | 185 | | | (5,588 | ) |
Lennar Corp. | | 5.86 | % | | JPMorgan Chase Bank, National Association | | June 2015 | | 250 | | | (11,740 | ) |
First Data Corp. | | 5.00 | % | | Barclays Bank, Plc | | December 2015 | | 320 | | | (11,244 | ) |
First Data Corp. | | 5.00 | % | | Credit Suisse International | | December 2015 | | 130 | | | (4,568 | ) |
First Data Corp. | | 5.00 | % | | Goldman Sachs Bank USA | | December 2015 | | 85 | | | (2,562 | ) |
First Data Corp. | | 5.00 | % | | JPMorgan Chase Bank, National Association | | December 2015 | | 165 | | | (5,797 | ) |
Sabre Holdings Corp. | | 5.00 | % | | JPMorgan Chase Bank, National Association | | March 2016 | | 690 | | | (40,827 | ) |
| | | | | | | | | | | | | |
Total | | | | | | | | | | | $ | (201,510 | ) |
| | | | | | | | | | | | | |
| • | | Credit default swaps on traded indexes - sold protection outstanding as of March 31, 2009 were as follows: |
| | | | | | | | | | | | | | | | |
Index | | Receive
Fixed
Rate | | | Counterparty | | Credit
Rating2 | | Expiration | | Notional
Amount
(000)1 | | Unrealized
Depreciation | |
Commercial Mortgage-Backed North America Index Series 3 | | 0.08 | % | | Credit Suisse International | | AAA | | December 2049 | | USD | 1,200 | | $ | (279,947 | ) |
| 1 | The maximum potential amount the Fund may pay should a negative credit event take place under the terms of the agreement. |
| 2 | Using Standard & Poor’s weighted average ratings of the underlying securities in the index. |
| • | | For Portfolio compliance purposes, the Portfolio’s industry classifications refer to any one or more of the industry sub-classifications used by one or more widely recognized market indexes or ratings group indexes and/or as defined by Portfolio management. This definition may not apply for purposes of this report, which may combine industry sub-classifications for reporting ease. |
| • | | Effective October 1, 2008, the Portfolio adopted Financial Accounting Standards Board Statement of Financial Accounting Standards No. 157, “Fair Value Measurements” (“FAS 157”). FAS 157 clarifies the definition of fair value, establishes a framework for measuring fair values and requires additional disclosures about the use of fair value measurements. Various inputs are used in determining the fair value of investments, which are as follows: |
| | • | | Level 1 – price quotations in active markets/exchanges for identical securities |
| | • | | Level 2 – other observable inputs (including, but not limited to: quoted prices for similar assets or liabilities in markets that are active, quoted prices for identical or similar assets in markets that are not active, inputs other than quoted prices that are observable for the assets or liabilities (such as interest rates, yield curves, volatilities, prepayment speeds, loss severities, credit risks and default rates) or other market – corroborated inputs) |
| | • | | Level 3 – unobservable inputs based on the best information available in the circumstance, to the extent observable inputs are not available (including the Portfolio’s own assumptions used in determining the fair value of investments). |
The inputs or methodology used for valuing securities are not necessarily an indication of the risk associated with investing in those securities. For information about the Portfolio’s policy regarding valuation of investments and other significant accounting policies, please refer to Note 1 of the Notes to Financial Statements.
The following table summarizes the inputs used as of March 31, 2009 in determining the fair valuation of the Portfolio’s investments:
| | | | | | | | | | | | | | |
Valuation Inputs | | Investments
in Securities | | | Other Financial
Instruments ** | |
| | | Assets | | Liabilities | | | Assets | | Liabilities | |
Level 1 | | $ | 190,406,812 | | $ | — | | | $ | 2,920,778 | | $ | (169,922 | ) |
Level 2 | | | 293,664,055 | | | (42,484,794 | ) | | | 3,427,700 | | | (4,913,635 | ) |
Level 3 | | | 324,171 | | | — | | | | — | | | (279,947 | ) |
| | | | | | | | | | | | | | |
Total | | $ | 484,395,038 | | $ | (42,484,794 | ) | | $ | 6,348,478 | | $ | (5,363,504 | ) |
| | | | | | | | | | | | | | |
| | | | | | |
18 | | BLACKROCK ASSET ALLOCATION PORTFOLIO | | MARCH 31, 2009 | | |
| | |
| Summary Schedule of Investments (concluded) | | |
The following table is a reconciliation of Level 3 investments for the period ended March 31, 2009:
| | | | | | | | |
| | | Investments
in Securities | | | Other Financial
Instruments ** | |
| | | Assets | | | Liabilities | |
Balance, as of September 30, 2008 | | $ | 310,093 | | | $ | (818 | ) |
Accrued discounts/premiums | | | 2,433 | | | | — | |
Realized loss | | | (221 | ) | | | — | |
Change in unrealized appreciation/depreciation*** | | | 11,606 | | | | (279,129 | ) |
Net sales | | | (18,297 | ) | | | — | |
Net transfers in of Level 3 | | | 18,557 | | | | — | |
| | | | | | | | |
Balance, as of March 31, 2009 | | $ | 324,171 | | | $ | (279,947 | ) |
| | | | | | | | |
| ** | Other financial instruments are futures, swaps, foreign currency exchange contracts and options. Futures, swaps and foreign currency exchange contracts are valued at the unrealized appreciation/depreciation on the instrument and options written are shown at market value. |
| *** | Included in the related net change in appreciation/depreciation on the Statement of Operations. |
| | | | | | |
See Notes to Financial Statements. | | | | | | |
| | | BLACKROCK ASSET ALLOCATION PORTFOLIO | | MARCH 31, 2009 | | 19 |
| | |
| Statement of Assets and Liabilities | | |
March 31, 2009 (Unaudited)
| | | | |
Assets | | | | |
Investments at value - unaffiliated (including securities loaned of $1,554,796) (cost - $524,646,922) | | $ | 460,560,499 | |
Investments at value - affiliated (cost - $23,834,539) | | | 23,834,539 | |
Investment in swap contracts | | | 1,287,999 | |
Cash collateral pledged for futures contracts | | | 6,107,000 | |
Cash | | | 207,149 | |
Foreign currency at value (cost - $245,472) | | | 244,686 | |
Unrealized appreciation on foreign currency exchange contracts | | | 102,186 | |
Unrealized appreciation on swaps | | | 3,325,514 | |
Investments sold receivable | | | 83,866,151 | |
Interest receivable | | | 4,132,934 | |
Dividends and reclaims receivable | | | 588,009 | |
Dividends receivable - affiliated | | | 11,628 | |
Receivable from advisor | | | 4,475 | |
Capital shares sold receivable | | | 469,202 | |
Securities lending income receivable - affiliated | | | 4,652 | |
Principal paydown receivable | | | 66,567 | |
Margin variation receivable | | | 606,376 | |
Prepaid expenses | | | 69,378 | |
| | | | |
Total assets | | | 585,488,944 | |
| | | | |
Liabilities | | | | |
Investments purchased payable | | | 89,941,164 | |
TBA sale commitments at value (proceeds received $42,210,978) | | | 42,484,794 | |
Payable for dollar rolls | | | 6,167,557 | |
Unrealized depreciation on swaps | | | 2,647,742 | |
Options written at value (premiums received $1,551,320) | | | 2,294,253 | |
Collateral at value - securities loaned | | | 1,590,400 | |
Capital shares redeemed payable | | | 964,731 | |
Other affiliates payable | | | 346,050 | |
Unrealized depreciation on foreign currency exchange contracts | | | 251,587 | |
Investment advisory fees payable | | | 197,813 | |
Service and distribution fees payable | | | 172,734 | |
Interest payable | | | 72,959 | |
Officer’s and Trustees’ fees payable | | | 8,018 | |
Other accrued expenses payable | | | 117,383 | |
| | | | |
Total liabilities | | | 147,257,185 | |
| | | | |
Net Assets | | $ | 438,231,759 | |
| | | | |
Net Assets Consist of
Paid-in capital | | $ | 580,154,536 | |
Undistributed net investment income | | | 394,904 | |
Accumulated net realized loss | | | (79,811,776 | ) |
Net unrealized appreciation/depreciation | | | (62,505,905 | ) |
| | | | |
Net Assets | | $ | 438,231,759 | |
| | | | |
Net Asset Value | | | | |
Institutional - Based on net assets of $23,270,889 and 2,240,878 shares outstanding, unlimited number of shares authorized, $0.001 par value | | $ | 10.38 | |
| | | | |
Service - Based on net assets of $1,198,784 and 115,799 shares outstanding, unlimited number of shares authorized, $0.001 par value | | $ | 10.35 | |
| | | | |
Investor A - Based on net assets of $290,229,109 and 28,074,630 shares outstanding, unlimited number of shares authorized, $0.001 par value. | | $ | 10.34 | |
| | | | |
Investor B - Based on net assets of $63,421,088 and 6,222,666 shares outstanding, unlimited number of shares authorized, $0.001 par value | | $ | 10.19 | |
| | | | |
Investor C - Based on net assets of $60,111,889 and 5,909,627 shares outstanding, unlimited number of shares authorized, $0.001 par value | | $ | 10.17 | |
| | | | |
See Notes to Financial Statements.
| | | | | | |
20 | | BLACKROCK ASSET ALLOCATION PORTFOLIO | | MARCH 31, 2009 | | |
| | | | |
Six Months Ended March 31, 2009 (Unaudited) | | | |
Investment Income | | | | |
Interest | | $ | 5,579,291 | |
Dividends and reclaims | | | 2,440,070 | |
Foreign taxes withheld | | | (50,579 | ) |
Securities lending - affiliated | | | 15,713 | |
Interest and dividends - affiliated | | | 50,487 | |
| | | | |
Total investment income | | | 8,034,982 | |
| | | | |
Expenses | | | | |
Investment advisory | | | 1,310,320 | |
Service and distribution - class specific | | | 1,080,152 | |
Transfer agent - class specific | | | 512,778 | |
Custodian | | | 198,517 | |
Administration | | | 178,418 | |
Administration - class specific | | | 59,643 | |
Printing | | | 49,642 | |
Professional | | | 47,386 | |
Officer and Trustees | | | 10,462 | |
Registration | | | 23,150 | |
Miscellaneous | | | 66,477 | |
| | | | |
Total expenses excluding interest expense | | | 3,536,945 | |
Interest expense | | | 7,004 | |
| | | | |
Total expenses | | | 3,543,949 | |
Less investment advisory waived | | | (4,102 | ) |
Less administration fees waived - class specific | | | (12,856 | ) |
Less transfer agent fees waived - class specific | | | (8,433 | ) |
Less transfer agent fees reimbursed - class specific | | | (12,638 | ) |
Less fees paid indirectly | | | (1,698 | ) |
| | | | |
Total expenses after waivers, reimbursement and fees paid indirectly | | | 3,504,222 | |
| | | | |
Net investment income | | | 4,530,760 | |
| | | | |
Realized and Unrealized Gain (Loss) | | | | |
Net realized gain (loss) from: | | | | |
Investments | | | (64,712,680 | ) |
Options written | | | 54,794 | |
Futures and swaps | | | (5,527,988 | ) |
Foreign currency transactions | | | (720,235 | ) |
| | | | |
| | | (70,906,109 | ) |
| | | | |
Net change in unrealized appreciation/depreciation on: | | | | |
Investments | | | (41,689,466 | ) |
TBA sale commitments | | | (356,123 | ) |
Options written | | | (661,334 | ) |
Futures and swaps | | | 3,502,930 | |
Foreign currency transactions and other | | | 31,979 | |
| | | | |
| | | (39,172,014 | ) |
| | | | |
Total realized and unrealized loss | | | (110,078,123 | ) |
| | | | |
Net Decrease in Net Assets Resulting from Operations | | $ | (105,547,363 | ) |
| | | | |
See Notes to Financial Statements.
| | | | | | |
| | | BLACKROCK ASSET ALLOCATION PORTFOLIO | | MARCH 31, 2009 | | 21 |
| | |
| Statements of Changes in Net Assets | | |
| | | | | | | | |
Increase (Decrease) in Net Assets: | | Six Months Ended
March 31, 2009
(Unaudited) | | | Year Ended
September 30,
2008 | |
Operations | | | | | | | | |
Net investment income | | $ | 4,530,760 | | | $ | 11,490,444 | |
Net realized gain (loss) | | | (70,906,109 | ) | | | 17,204,510 | |
Net change in unrealized appreciation/depreciation | | | (39,172,014 | ) | | | (145,090,790 | ) |
| | | | | | | | |
Net decrease in net assets resulting from operations | | | (105,547,363 | ) | | | (116,395,836 | ) |
| | | | | | | | |
Dividends and Distributions to Shareholders From | | | | | | | | |
Net investment income: | | | | | | | | |
Institutional | | | (176,037 | ) | | | (671,005 | ) |
Service | | | (9,652 | ) | | | (43,165 | ) |
Investor A | | | (2,229,464 | ) | | | (9,616,809 | ) |
Investor B | | | (340,963 | ) | | | (1,647,905 | ) |
Investor C | | | (299,920 | ) | | | (1,059,761 | ) |
Net realized gain: | | | | | | | | |
Institutional | | | (406,332 | ) | | | (2,001,331 | ) |
Service | | | (21,686 | ) | | | (175,568 | ) |
Investor A | | | (5,466,565 | ) | | | (38,125,135 | ) |
Investor B | | | (1,298,809 | ) | | | (11,393,688 | ) |
Investor C | | | (1,188,380 | ) | | | (6,488,172 | ) |
| | | | | | | | |
Decrease in net assets resulting from dividends and distributions to shareholders | | | (11,437,808 | ) | | | (71,222,539 | ) |
| | | | | | | | |
Capital Share Transactions | | | | | | | | |
Net decrease in net assets derived from capital share transactions | | | (26,763,686 | ) | | | (11,398,230 | ) |
| | | | | | | | |
Net Assets | | | | | | | | |
Total decrease in net assets | | | (143,748,857 | ) | | | (199,016,605 | ) |
Beginning of period | | | 581,980,616 | | | | 780,997,221 | |
| | | | | | | | |
End of period | | $ | 438,231,759 | | | $ | 581,980,616 | |
| | | | | | | | |
End of period undistributed (distributions in excess of) net investment income | | $ | 394,904 | | | $ | (1,079,820 | ) |
| | | | | | | | |
See Notes to Financial Statements.
| | | | | | |
22 | | BLACKROCK ASSET ALLOCATION PORTFOLIO | | MARCH 31, 2009 | | |
| | | | | | | | | | | | | | | | | | | | | | | | | | | | | | | | |
| | | Institutional* | |
| | | Six Months
Ended
March 31, 2009
(Unaudited) | | | Year Ended September 30, | | | Period
March 1, 2005 to
September 30, 2005 | | | Period
April 1, 2004 to
February 28, 2005 | | | Year Ended March 31, | |
| | | | 2008 | | | 2007 | | | 2006 | | | | | 2004 | | | 20031 | |
Per Share Operating Performance | |
Net asset value, beginning of period | | $ | 12.96 | | | $ | 17.07 | | | $ | 15.53 | | | $ | 15.51 | | | $ | 14.99 | | | $ | 14.91 | | | $ | 11.38 | | | $ | 14.17 | |
| | | | | | | | | | | | | | | | | | | | | | | | | | | | | | | | |
Net investment income | | | 0.14 | 2 | | | 0.33 | 2 | | | 0.33 | 2 | | | 0.31 | 2 | | | 0.17 | 2 | | | 0.20 | | | | 0.24 | | | | 0.28 | |
Net realized and unrealized gain (loss) | | | (2.44 | ) | | | (2.76 | ) | | | 2.08 | | | | 0.66 | | | | 0.52 | | | | 0.82 | | | | 3.54 | | | | (2.68 | ) |
| | | | | | | | | | | | | | | | | | | | | | | | | | | | | | | | |
Net increase (decrease) from investment operations | | | (2.30 | ) | | | (2.43 | ) | | | 2.41 | | | | 0.97 | | | | 0.69 | | | | 1.02 | | | | 3.78 | | | | (2.40 | ) |
| | | | | | | | | | | | | | | | | | | | | | | | | | | | | | | | |
Dividends and distributions from: | | | | | | | | | | | | | | | | | | | | | | | | | | | | | | | | |
Net investment income | | | (0.09 | ) | | | (0.38 | ) | | | (0.24 | ) | | | (0.30 | ) | | | (0.17 | ) | | | (0.40 | ) | | | (0.25 | ) | | | (0.33 | ) |
Net realized gain | | | (0.19 | ) | | | (1.30 | ) | | | (0.63 | ) | | | (0.65 | ) | | | — | | | | (0.54 | ) | | | — | | | | (0.06 | ) |
| | | | | | | | | | | | | | | | | | | | | | | | | | | | | | | | |
Total dividends and distributions | | | (0.28 | ) | | | (1.68 | ) | | | (0.87 | ) | | | (0.95 | ) | | | (0.17 | ) | | | (0.94 | ) | | | (0.25 | ) | | | (0.39 | ) |
| | | | | | | | | | | | | | | | | | | | | | | | | | | | | | | | |
Redemption fees added to paid-in capital | | | — | | | | — | | | | 0.00 | 3 | | | 0.00 | 3 | | | 0.00 | 3 | | | — | | | | — | | | | — | |
| | | | | | | | | | | | | | | | | | | | | | | | | | | | | | | | |
Net asset value, end of period | | $ | 10.38 | | | $ | 12.96 | | | $ | 17.07 | | | $ | 15.53 | | | $ | 15.51 | | | $ | 14.99 | | | $ | 14.91 | | | $ | 11.38 | |
| | | | | | | | | | | | | | | | | | | | | | | | | | | | | | | | |
Total Investment Return | |
Based on net asset value | | | (17.84 | )%4 | | | (15.81 | )% | | | 16.04 | %5 | | | 6.53 | %5 | | | 4.66 | %4,5 | | | 7.17 | %4 | | | 33.46 | % | | | (17.12 | )% |
| | | | | | | | | | | | | | | | | | | | | | | | | | | | | | | | |
Ratios to Average Net Assets | | | | | | | | | | | | | | | | | | | | | | | | | | | | | | | | |
Total expenses after waivers, reimbursement and fees paid indirectly | | | 0.86 | %6 | | | 0.89 | %7 | | | 0.86 | % | | | 0.83 | % | | | 0.86 | %6 | | | 1.03 | %6 | | | 1.15 | % | | | 1.12 | % |
| | | | | | | | | | | | | | | | | | | | | | | | | | | | | | | | |
Total expenses | | | 0.97 | %6 | | | 0.94 | % | | | 0.93 | % | | | 0.91 | % | | | 1.11 | %6 | | | 1.05 | %6 | | | 1.15 | % | | | 1.13 | % |
| | | | | | | | | | | | | | | | | | | | | | | | | | | | | | | | |
Net investment income | | | 2.51 | %6 | | | 2.20 | % | | | 2.03 | % | | | 2.04 | % | | | 1.90 | %6 | | | 1.71 | %6 | | | 1.74 | % | | | 2.21 | % |
| | | | | | | | | | | | | | | | | | | | | | | | | | | | | | | | |
Supplemental Data | |
Net assets, end of period (000) | | $ | 23,271 | | | $ | 23,083 | | | $ | 34,720 | | | $ | 32,545 | | | $ | 29,752 | | | $ | 31,328 | | | $ | 21,989 | | | $ | 17,992 | |
| | | | | | | | | | | | | | | | | | | | | | | | | | | | | | | | |
Portfolio turnover | | | 159 | %8 | | | 391 | %9 | | | 93 | % | | | 136 | % | | | 90 | % | | | 101 | % | | | 216 | % | | | 181 | % |
| | | | | | | | | | | | | | | | | | | | | | | | | | | | | | | | |
| * | The performance prior to January 31, 2005 set forth in this table is the financial data of the State Street Research Asset Allocation Fund, a series of a predecessor trust, the State Street Research Income Trust. BlackRock Funds acquired all of the assets and certain stated liabilities of State Street Research Asset Allocation Fund on January 28, 2005. The net asset values and other per share information listed have been restated to reflect the conversion ratios of 0.71889936, 0.71991517, 0.72321182 and 0.72727901 for Institutional, Investor A, Investor B and Investor C shares, respectively. |
| 1 | Audited by other auditors. |
| 2 | Based on average shares outstanding. |
| 3 | Less than $0.01 per share. |
| 4 | Aggregate total investment return. |
| 5 | Redemption fee of 2.00% received by the Portfolio is reflected in total return calculations. There was no impact to the return. |
| 7 | The Portfolio incurred interest expense during the year. If interest expense had not been incurred, the ratio would have been 0.85%, 1.07% and 1.20% for Institutional, Service and Investor A shares, respectively. |
| 8 | Includes mortgage dollar roll transactions; excluding these transactions the portfolio turnover would have been 86%. |
| 9 | Includes TBA transactions, excluding these transactions, the portfolio turnover would have been 121%. |
See Notes to Financial Statements.
| | | | | | |
| | | BLACKROCK ASSET ALLOCATION PORTFOLIO | | MARCH 31, 2009 | | 23 |
| | |
| Financial Highlights (continued) | | |
| | | | | | | | | | | | | | | | | | | | | | | | |
| | | Service | |
| | | Six Months
Ended
March 31, 2009
(Unaudited) | | | Year Ended September 30, | | | Period
March 1, 2005 to
September 30, 2005 | | | Period
January 28, 20051 to
February 28, 2005 | |
| | | | 2008 | | | 2007 | | | 2006 | | | |
Per Share Operating Performance | |
Net asset value, beginning of period | | $ | 12.93 | | | $ | 17.03 | | | $ | 15.51 | | | $ | 15.49 | | | $ | 14.97 | | | $ | 14.63 | |
| | | | | | | | | | | | | | | | | | | | | | | | |
Net investment income | | | 0.12 | 2 | | | 0.30 | 2 | | | 0.29 | 2 | | | 0.27 | 2 | | | 0.14 | 2 | | | 0.01 | |
Net realized and unrealized gain (loss) | | | (2.43 | ) | | | (2.76 | ) | | | 2.08 | | | | 0.65 | | | | 0.52 | | | | 0.33 | |
| | | | | | | | | | | | | | | | | | | | | | | | |
Net increase (decrease) from investment operations | | | (2.31 | ) | | | (2.46 | ) | | | 2.37 | | | | 0.92 | | | | 0.66 | | | | 0.34 | |
| | | | | | | | | | | | | | | | | | | | | | | | |
Dividends and distributions from: | | | | | | | | | | | | | | | | | | | | | | | | |
Net investment income | | | (0.08 | ) | | | (0.34 | ) | | | (0.22 | ) | | | (0.25 | ) | | | (0.14 | ) | | | — | |
Net realized gain | | | (0.19 | ) | | | (1.30 | ) | | | (0.63 | ) | | | (0.65 | ) | | | — | | | | — | |
| | | | | | | | | | | | | | | | | | | | | | | | |
Total dividends and distributions | | | (0.27 | ) | | | (1.64 | ) | | | (0.85 | ) | | | (0.90 | ) | | | (0.14 | ) | | | — | |
| | | | | | | | | | | | | | | | | | | | | | | | |
Redemption fees added to paid-in capital | | | — | | | | — | | | | 0.00 | 3 | | | 0.00 | 3 | | | 0.00 | 3 | | | — | |
| | | | | | | | | | | | | | | | | | | | | | | | |
Net asset value, end of period | | $ | 10.35 | | | $ | 12.93 | | | $ | 17.03 | | | $ | 15.51 | | | $ | 15.49 | | | $ | 14.97 | |
| | | | | | | | | | | | | | | | | | | | | | | | |
Total Investment Return | | | | | | | | | | | | | | | | | | | | | | | | |
Based on net asset value | | | (17.94 | )%4 | | | (16.00 | )% | | | 15.74 | %5 | | | 6.24 | %5 | | | 4.44 | %4,5 | | | 2.32 | %4 |
| | | | | | | | | | | | | | | | | | | | | | | | |
Ratios to Average Net Assets | |
Total expenses after waivers, reimbursement and fees paid indirectly | | | 1.13 | %6 | | | 1.11 | %7 | | | 1.10 | % | | | 1.11 | % | | | 1.16 | %6 | | | 1.16 | %6 |
| | | | | | | | | | | | | | | | | | | | | | | | |
Total expenses | | | 1.22 | %6 | | | 1.11 | % | | | 1.31 | % | | | 1.17 | % | | | 1.36 | %6 | | | 1.26 | %6 |
| | | | | | | | | | | | | | | | | | | | | | | | |
Net investment income (loss) | | | 2.25 | %6 | | | 1.96 | % | | | 1.80 | % | | | 1.76 | % | | | 1.60 | %6 | | | (0.17 | )%6 |
| | | | | | | | | | | | | | | | | | | | | | | | |
Supplemental Data | |
Net assets, end of period (000) | | $ | 1,199 | | | $ | 1,552 | | | $ | 2,325 | | | $ | 2,201 | | | $ | 2,171 | | | $ | 2,171 | |
| | | | | | | | | | | | | | | | | | | | | | | | |
Portfolio turnover | | | 159 | %8 | | | 391 | %9 | | | 93 | % | | | 136 | % | | | 90 | % | | | 101 | % |
| | | | | | | | | | | | | | | | | | | | | | | | |
| | | | | | | | | | | | | | | | | | | | | | | | | | | | | | | | |
| | | Investor A* | |
| | | Six Months
Ended
March 31, 2009
(Unaudited) | | | Year Ended September 30, | | | Period
March 1, 2005 to
September 30, 2005 | | | Period
April 1, 2004 to
February 28, 2005 | | | Year Ended March 31, | |
| | | | 2008 | | | 2007 | | | 2006 | | | | | 2004 | | | 200310 | |
Per Share Operating Performance | |
Net asset value, beginning of period | | $ | 12.92 | | | $ | 17.01 | | | $ | 15.50 | | | $ | 15.48 | | | $ | 14.95 | | | $ | 14.89 | | | $ | 11.36 | | | $ | 14.15 | |
| | | | | | | | | | | | | | | | | | | | | | | | | | | | | | | | |
Net investment income | | | 0.11 | 2 | | | 0.28 | 2 | | | 0.27 | 2 | | | 0.25 | 2 | | | 0.13 | 2 | | | 0.18 | | | | 0.19 | | | | 0.24 | |
Net realized and unrealized gain (loss) | | | (2.42 | ) | | | (2.75 | ) | | | 2.07 | | | | 0.66 | | | | 0.53 | | | | 0.80 | | | | 3.55 | | | | (2.68 | ) |
| | | | | | | | | | | | | | | | | | | | | | | | | | | | | | | | |
Net increase (decrease) from investment operations | | | (2.31 | ) | | | (2.47 | ) | | | 2.34 | | | | 0.91 | | | | 0.66 | | | | 0.98 | | | | 3.74 | | | | (2.44 | ) |
| | | | | | | | | | | | | | | | | | | | | | | | | | | | | | | | |
Dividends and distributions from: | | | | | | | | | | | | | | | | | | | | | | | | | | | | | | | | |
Net investment income | | | (0.08 | ) | | | (0.32 | ) | | | (0.20 | ) | | | (0.24 | ) | | | (0.13 | ) | | | (0.38 | ) | | | (0.21 | ) | | | (0.29 | ) |
Net realized gain | | | (0.19 | ) | | | (1.30 | ) | | | (0.63 | ) | | | (0.65 | ) | | | — | | | | (0.54 | ) | | | — | | | | (0.06 | ) |
| | | | | | | | | | | | | | | | | | | | | | | | | | | | | | | | |
Total dividends and distributions | | | (0.27 | ) | | | (1.62 | ) | | | (0.83 | ) | | | (0.89 | ) | | | (0.13 | ) | | | (0.92 | ) | | | (0.21 | ) | | | (0.35 | ) |
| | | | | | | | | | | | | | | | | | | | | | | | | | | | | | | | |
Redemption fees added to paid-in capital | | | — | | | | — | | | | 0.00 | 3 | | | 0.00 | 3 | | | 0.00 | 3 | | | — | | | | — | | | | — | |
| | | | | | | | | | | | | | | | | | | | | | | | | | | | | | | | |
Net asset value, end of period | | $ | 10.34 | | | $ | 12.92 | | | $ | 17.01 | | | $ | 15.50 | | | $ | 15.48 | | | $ | 14.95 | | | $ | 14.89 | | | $ | 11.36 | |
| | | | | | | | | | | | | | | | | | | | | | | | | | | | | | | | |
Total Investment Return | |
Based on net asset value11 | | | (17.99 | )%4 | | | (16.05 | )% | | | 15.58 | %5 | | | 6.12 | %5 | | | 4.44 | %4,5 | | | 6.78 | %4 | | | 32.94 | % | | | (17.37 | )% |
| | | | | | | | | | | | | | | | | | | | | | | | | | | | | | | | |
Ratios to Average Net Assets | |
Total expenses after waivers, reimbursement and fees paid indirectly | | | 1.27 | %6 | | | 1.24 | %7 | | | 1.21 | % | | | 1.23 | % | | | 1.25 | %6 | | | 1.24 | %6 | | | 1.45 | % | | | 1.42 | % |
| | | | | | | | | | | | | | | | | | | | | | | | | | | | | | | | |
Total expenses | | | 1.28 | %6 | | | 1.24 | % | | | 1.21 | % | | | 1.36 | % | | | 1.46 | %6 | | | 1.32 | %6 | | | 1.45 | % | | | 1.43 | % |
| | | | | | | | | | | | | | | | | | | | | | | | | | | | | | | | |
Net investment income | | | 2.10 | %6 | | | 1.84 | % | | | 1.68 | % | | | 1.63 | % | | | 1.51 | %6 | | | 1.55 | %6 | | | 1.43 | % | | | 1.92 | % |
| | | | | | | | | | | | | | | | | | | | | | | | | | | | | | | | |
Supplemental Data | |
Net assets, end of period (000) | | $ | 290,229 | | | $ | 390,051 | | | $ | 506,537 | | | $ | 482,284 | | | $ | 491,557 | | | $ | 526,929 | | | $ | 357,100 | | | $ | 252,069 | |
| | | | | | | | | | | | | | | | | | | | | | | | | | | | | | | | |
Portfolio turnover | | | 159 | %8 | | | 391 | %9 | | | 93 | % | | | 136 | % | | | 90 | % | | | 101 | % | | | 216 | % | | | 181 | % |
| | | | | | | | | | | | | | | | | | | | | | | | | | | | | | | | |
See Notes to Financial Statements.
| | | | | | |
24 | | BLACKROCK ASSET ALLOCATION PORTFOLIO | | MARCH 31, 2009 | | |
| | |
| Financial Highlights (continued) | | |
| | | | | | | | | | | | | | | | | | | | | | | | | | | | | | | | |
| | | Investor B* | |
| | | Six Months
Ended
March 31, 2009
(Unaudited) | | | Year Ended September 30, | | | Period
March 1, 2005 to
September 30, 2005 | | | Period
April 1, 2004 to
February 28, 2005 | | | Year Ended March 31, | |
| | | | 2008 | | | 2007 | | | 2006 | | | | | 2004 | | | 200310 | |
Per Share Operating Performance | |
Net asset value, beginning of period | | $ | 12.75 | | | $ | 16.83 | | | $ | 15.35 | | | $ | 15.34 | | | $ | 14.81 | | | $ | 14.74 | | | $ | 11.26 | | | $ | 14.01 | |
| | | | | | | | | | | | | | | | | | | | | | | | | | | | | | | | |
Net investment income | | | 0.07 | 2 | | | 0.16 | 2 | | | 0.14 | 2 | | | 0.13 | 2 | | | 0.07 | 2 | | | 0.08 | | | | 0.10 | | | | 0.15 | |
Net realized and unrealized gain (loss) | | | (2.39 | ) | | | (2.75 | ) | | | 2.07 | | | | 0.65 | | | | 0.51 | | | | 0.81 | | | | 3.49 | | | | (2.63 | ) |
| | | | | | | | | | | | | | | | | | | | | | | | | | | | | | | | |
Net increase (decrease) from investment operations | | | (2.32 | ) | | | (2.59 | ) | | | 2.21 | | | | 0.78 | | | | 0.58 | | | | 0.89 | | | | 3.59 | | | | (2.48 | ) |
| | | | | | | | | | | | | | | | | | | | | | | | | | | | | | | | |
Dividends and distributions from: | | | | | | | | | | | | | | | | | | | | | | | | | | | | | | | | |
Net investment income | | | (0.05 | ) | | | (0.19 | ) | | | (0.10 | ) | | | (0.12 | ) | | | (0.05 | ) | | | (0.28 | ) | | | (0.11 | ) | | | (0.21 | ) |
Net realized gain | | | (0.19 | ) | | | (1.30 | ) | | | (0.63 | ) | | | (0.65 | ) | | | — | | | | (0.54 | ) | | | — | | | | (0.06 | ) |
| | | | | | | | | | | | | | | | | | | | | | | | | | | | | | | | |
Total dividends and distributions | | | (0.24 | ) | | | (1.49 | ) | | | (0.73 | ) | | | (0.77 | ) | | | (0.05 | ) | | | (0.82 | ) | | | (0.11 | ) | | | (0.27 | ) |
| | | | | | | | | | | | | | | | | | | | | | | | | | | | | | | | |
Redemption fees added to paid-in capital | | | — | | | | — | | | | 0.00 | 3 | | | 0.00 | 3 | | | 0.00 | 3 | | | — | | | | — | | | | — | |
| | | | | | | | | | | | | | | | | | | | | | | | | | | | | | | | |
Net asset value, end of period | | $ | 10.19 | | | $ | 12.75 | | | $ | 16.83 | | | $ | 15.35 | | | $ | 15.34 | | | $ | 14.81 | | | $ | 14.74 | | | $ | 11.26 | |
| | | | | | | | | | | | | | | | | | | | | | | | | | | | | | | | |
Total Investment Return | |
Based on net asset value11 | | | (18.29 | )%4 | | | (16.89 | )% | | | 14.81 | %5 | | | 5.30 | %5 | | | 3.94 | %4,5 | | | 6.20 | %4 | | | 32.03 | % | | | (17.91 | )% |
| | | | | | | | | | | | | | | | | | | | | | | | | | | | | | | | |
Ratios to Average Net Assets | |
Total expenses after waivers, reimbursement and fees paid indirectly | | | 2.07 | %6 | | | 2.02 | %12 | | | 2.01 | % | | | 2.00 | % | | | 2.01 | %6 | | | 2.04 | %6 | | | 2.15 | % | | | 2.12 | % |
| | | | | | | | | | | | | | | | | | | | | | | | | | | | | | | | |
Total expenses | | | 2.10 | %6 | | | 2.02 | % | | | 2.01 | % | | | 2.03 | % | | | 2.11 | %6 | | | 2.04 | %6 | | | 2.15 | % | | | 2.13 | % |
| | | | | | | | | | | | | | | | | | | | | | | | | | | | | | | | |
Net investment income | | | 1.30 | %6 | | | 1.06 | % | | | 0.89 | % | | | 0.86 | % | | | 0.75 | %6 | | | 0.73 | %6 | | | 0.72 | % | | | 1.22 | % |
| | | | | | | | | | | | | | | | | | | | | | | | | | | | | | | | |
Supplemental Data | |
Net assets, end of period (000) | | $ | 63,421 | | | $ | 97,710 | | | $ | 152,820 | | | $ | 175,826 | | | $ | 181,583 | | | $ | 187,689 | | | $ | 133,083 | | | $ | 75,963 | |
| | | | | | | | | | | | | | | | | | | | | | | | | | | | | | | | |
Portfolio turnover | | | 159 | %8 | | | 391 | %9 | | | 93 | % | | | 136 | % | | | 90 | % | | | 101 | % | | | 216 | % | | | 181 | % |
| | | | | | | | | | | | | | | | | | | | | | | | | | | | | | | | |
| * | The performance prior to January 31, 2005 set forth in this table is the financial data of the State Street Research Asset Allocation Fund, a series of a predecessor trust, the State Street Research Income Trust. BlackRock Funds acquired all of the assets and certain stated liabilities of State Street Research Asset Allocation Fund on January 28, 2005. The net asset values and other per share information listed have been restated to reflect the conversion ratios of 0.71889936, 0.71991517, 0.72321182 and 0.72727901 for Institutional, Investor A, Investor B and Investor C shares, respectively. |
| 1 | Commencement of operations. |
| 2 | Based on average shares outstanding. |
| 3 | Less than $0.01 per share. |
| 4 | Aggregate total investment return. |
| 5 | Redemption fee of 2.00% received by the Portfolio is reflected in total return calculations. There was no impact to the return. |
| 7 | The Portfolio incurred interest expense during the year. If interest expense had not been incurred, the ratio would have been 0.85%, 1.07% and 1.20% for Institutional, Service and Investor A shares, respectively. |
| 8 | Includes mortgage dollar roll transactions; excluding these transactions the portfolio turnover would have been 86%. |
| 9 | Includes TBA transactions, excluding these transactions, the portfolio turnover would have been 121%. |
| 10 | Audited by other auditors. |
| 11 | Total investment returns exclude the effects of sales charges. |
| 12 | The Portfolio incurred interest expense during the year. If interest expense had not been incurred, the ratio would have been 1.97% and 1.90% for Investor B and Investor C shares, respectively. |
See Notes to Financial Statements.
| | | | | | |
| | | BLACKROCK ASSET ALLOCATION PORTFOLIO | | MARCH 31, 2009 | | 25 |
| | |
| Financial Highlights (concluded) | | |
| | | | | | | | | | | | | | | | | | | | | | | | | | | | | | | | |
| | | Investor C* | |
| | | Six Months Ended March 31, 2009 | | | Year Ended September 30, | | | Period March 1, 2005 to | | | Period April 1, 2004 to | | | Year Ended March 31, | |
| | | (Unaudited) | | | 2008 | | | 2007 | | | 2006 | | | September 30, 2005 | | | February 28, 2005 | | | 2004 | | | 20031 | |
Per Share Operating Performance | |
Net asset value, beginning of period | | $ | 12.73 | | | $ | 16.78 | | | $ | 15.34 | | | $ | 15.33 | | | $ | 14.81 | | | $ | 14.74 | | | $ | 11.25 | | | $ | 14.01 | |
| | | | | | | | | | | | | | | | | | | | | | | | | | | | | | | | |
Net investment income | | | 0.08 | 2 | | | 0.17 | 2 | | | 0.15 | 2 | | | 0.15 | 2 | | | 0.06 | 2 | | | 0.08 | | | | 0.10 | | | | 0.15 | |
Net realized and unrealized gain (loss) | | | (2.40 | ) | | | (2.71 | ) | | | 2.04 | | | | 0.65 | | | | 0.52 | | | | 0.81 | | | | 3.50 | | | | (2.65 | ) |
| | | | | | | | | | | | | | | | | | | | | | | | | | | | | | | | |
Net increase (decrease) from investment operations | | | (2.32 | ) | | | (2.54 | ) | | | 2.19 | | | | 0.80 | | | | 0.58 | | | | 0.89 | | | | 3.60 | | | | (2.50 | ) |
| | | | | | | | | | | | | | | | | | | | | | | | | | | | | | | | |
Dividends and distributions from: | | | | | | | | | | | | | | | | | | | | | | | | | | | | | | | | |
Net investment income | | | (0.05 | ) | | | (0.21 | ) | | | (0.12 | ) | | | (0.14 | ) | | | (0.06 | ) | | | (0.28 | ) | | | (0.11 | ) | | | (0.21 | ) |
Net realized gain | | | (0.19 | ) | | | (1.30 | ) | | | (0.63 | ) | | | (0.65 | ) | | | — | | | | (0.54 | ) | | | — | | | | (0.05 | ) |
| | | | | | | | | | | | | | | | | | | | | | | | | | | | | | | | |
Total dividends and distributions | | | (0.24 | ) | | | (1.51 | ) | | | (0.75 | ) | | | (0.79 | ) | | | (0.06 | ) | | | (0.82 | ) | | | (0.11 | ) | | | (0.26 | ) |
| | | | | | | | | | | | | | | | | | | | | | | | | | | | | | | | |
Redemption fees added to paid-in capital | | | — | | | | — | | | | 0.00 | 3 | | | 0.00 | 3 | | | 0.00 | 3 | | | — | | | | — | | | | — | |
| | | | | | | | | | | | | | | | | | | | | | | | | | | | | | | | |
Net asset value, end of period | | $ | 10.17 | | | $ | 12.73 | | | $ | 16.78 | | | $ | 15.34 | | | $ | 15.33 | | | $ | 14.81 | | | $ | 14.74 | | | $ | 11.25 | |
| | | | | | | | | | | | | | | | | | | | | | | | | | | | | | | | |
Total Investment Return | | | | | | | | | | | | | | | | | | | | | | | | | | | | | | | | |
Based on net asset value4 | | | (18.28 | )%5 | | | (16.66 | )% | | | 14.68 | %6 | | | 5.42 | %6 | | | 3.90 | %5,6 | | | 6.20 | %5 | | | 32.14 | % | | | (17.96 | )% |
| | | | | | | | | | | | | | | | | | | | | | | | | | | | | | | | |
Ratios to Average Net Assets | | | | | | | | | | | | | | | | | | | | | | | | | | | | | | | | |
Total expenses after waivers, reimbursement and fees paid indirectly | | | 1.97 | %7 | | | 1.94 | %8 | | | 1.94 | % | | | 1.91 | % | | | 2.00 | %7 | | | 2.04 | %7 | | | 2.15 | % | | | 2.12 | % |
| | | | | | | | | | | | | | | | | | | | | | | | | | | | | | | | |
Total expenses | | | 1.97 | %7 | | | 1.94 | % | | | 1.95 | % | | | 1.94 | % | | | 2.11 | %7 | | | 2.04 | %7 | | | 2.15 | % | | | 2.13 | % |
| | | | | | | | | | | | | | | | | | | | | | | | | | | | | | | | |
Net investment income | | | 1.39 | %7 | | | 1.14 | % | | | 0.96 | % | | | 0.97 | % | | | 0.75 | %7 | | | 0.76 | %7 | | | 0.72 | % | | | 1.21 | % |
| | | | | | | | | | | | | | | | | | | | | | | | | | | | | | | | |
Supplemental Data | | | | | | | | | | | | | | | | | | | | | | | | | | | | | | | | |
Net assets, end of period (000) | | $ | 60,112 | | | $ | 69,584 | | | $ | 84,596 | | | $ | 80,286 | | | $ | 67,371 | | | $ | 65,357 | | | $ | 42,262 | | | $ | 19,079 | |
| | | | | | | | | | | | | | | | | | | | | | | | | | | | | | | | |
Portfolio turnover | | | 159 | %9 | | | 391 | %10 | | | 93 | % | | | 136 | % | | | 90 | % | | | 101 | % | | | 216 | % | | | 181 | % |
| | | | | | | | | | | | | | | | | | | | | | | | | | | | | | | | |
| * | The performance prior to January 31, 2005 set forth in this table is the financial data of the State Street Research Asset Allocation Fund, a series of a predecessor trust, the State Street Research Income Trust. BlackRock Funds acquired all of the assets and certain stated liabilities of State Street Research Asset Allocation Fund on January 28, 2005. The net asset values and other per share information listed have been restated to reflect the conversion ratios of 0.71889936, 0.71991517, 0.72321182 and 0.72727901 for Institutional, Investor A, Investor B and Investor C shares, respectively. |
| 1 | Audited by other auditors. |
| 2 | Based on average shares outstanding. |
| 3 | Less than $0.01 per share. |
| 4 | Total investment returns exclude the effects of sales charges. |
| 5 | Aggregate total investment return. |
| 6 | Redemption fee of 2.00% received by the Portfolio is reflected in total return calculations. There was no impact to the return. |
| 8 | The Portfolio incurred interest expense during the year. If interest expense had not been incurred, the ratio would have been 1.97% and 1.90% for Investor B and Investor C shares, respectively. |
| 9 | Includes mortgage dollar roll transactions; excluding these transactions the portfolio turnover would have been 86%. |
| 10 | Includes TBA transactions, excluding these transactions, the portfolio turnover would have been 121%. |
See Notes to Financial Statements.
| | | | | | |
26 | | BLACKROCK ASSET ALLOCATION PORTFOLIO | | MARCH 31, 2009 | | |
| | |
| Notes to Financial Statements (Unaudited) | | |
1. Organization and Significant Accounting Policies:
BlackRock FundsSM (the “Fund”), a Massachusetts business trust, is registered under the Investment Company Act of 1940, as amended (the “1940 Act”), as an open-end management investment company. As of March 31, 2009, the Fund had 27 registered portfolios. These financial statements relate to the Fund’s Asset Allocation Portfolio (the “Portfolio”). The Portfolio’s financial statements are prepared in conformity with accounting principles generally accepted in the United States of America, which may require the use of management accruals and estimates. Actual results may differ from these estimates. The Portfolio offers multiple classes of shares. Institutional Shares are sold without a sales charge and only to certain eligible investors. Service Shares are sold without a sales charge. Investor A Shares are sold with a front-end sales charge. Shares of Investor B and Investor C may be subject to a contingent deferred sales charge. All classes of shares have identical voting, dividend, liquidation and other rights and the same terms and conditions, except that the Service, Investor A, Investor B and Investor C Shares may bear certain expenses related to the service and/ or distribution of such shares. Each class has exclusive voting rights with respect to matters relating to its service and distribution expenditures (except that Investor B shareholders may vote on material changes to the Investor A distribution plan).
The following is a summary of significant accounting policies followed by the Portfolio:
Valuation of Investments: Equity investments traded on a recognized securities exchange or the NASDAQ Global Market System are valued at the last reported sale price that day or the NASDAQ official closing price, if applicable. For equity investments traded on more than one exchange, the last reported sale price on the exchange where the stock is primarily traded is used. Equity investments traded on a recognized exchange for which there were no sales on that day are valued at the last available bid price. If no bid price is available, the prior day’s price will be used, unless it is determined that such prior day’s price no longer reflects the fair value of the security. The Portfolio values its bond investments on the basis of last available bid price or current market quotations provided by dealers or pricing services selected under the supervision of the Fund’s Board of Trustees (the “Board”). In determining the value of a particular investment, pricing services may use certain information with respect to transactions in such investments, quotations from dealers, pricing matrixes, market transactions in comparable investments and information with respect to various relationships observed in the market between investments and calculated yield measures based on valuation technology commonly employed in the market for such investments. The fair value of asset-backed and mortgage-backed securities are estimated based on models that consider the estimated cash flows of each tranche of the entity, establish a benchmark yield and develop an estimated tranche specific spread to the benchmark yield based on the unique attributes of the tranche. Financial futures contracts traded on exchanges are valued at their last sale price. Swap agreements are valued by utilizing quotes received daily by the Portfolio’s pricing service or through brokers which are derived using daily swap curves and trades of underlying securities.
To-be-announced (“TBA”) commitments are valued at the current market value of the underlying securities. Short-term securities with maturities less than 60 days are valued at amortized cost, which approximates fair value. Investments in investment companies are valued at net asset value each business day. The Portfolio values its investment in the BlackRock Liquidity Series, LLC Money Market Series at fair value, which is ordinarily based on its pro rata ownership in the net assets of the underlying fund.
Exchange-traded options are valued at the mean between the last bid and ask prices at the close of the options market in which the options trade. An exchange-traded option for which there is no mean price is valued at the last bid (long positions) or ask (short positions) price. If no bid or ask price is available, the prior day’s price will be used, unless it is determined that such prior day’s price no longer reflects the fair value of the option. Over-the-counter options and swaptions are valued by an independent pricing service using a mathematical model which incorporates a number of market data factors, such as the trades and prices of the underlying securities.
In the event that application of these methods of valuation results in a price for an investment which is deemed not to be representative of the market value of such investment, the investment will be valued by a method approved by the Board as reflecting fair value (“Fair Value Assets”). When determining the price for Fair Value Assets, the investment advisor and/or sub-advisor seeks to determine the price that the Portfolio might reasonably expect to receive from the current sale of that asset in an arm’s-length transaction. Fair value determinations shall be based upon all available factors that the investment advisor and/or sub-advisor deems relevant. The pricing of all Fair Value Assets is subsequently reported to the Board or a committee thereof.
Generally, trading in foreign securities is substantially completed each day at various times prior to the close of business on the New York Stock Exchange (“NYSE”). The values of such securities used in computing the net assets of the Portfolio are determined as of such times. Foreign currency exchange rates will be determined as of the close of business on the NYSE. Occasionally, events affecting the values of such securities and such exchange rates may occur between the times at which they are determined and the close of business on the NYSE that may not be reflected in the computation of the Portfolio’s net assets. If events (for example, a company announcement, market volatility or a natural disaster) occur during such periods that are expected to materially affect the value of such securities, those securities may be valued at their fair value as determined in good faith by the Board or by the investment advisor using a pricing service and/or procedures approved by the Board. Foreign currency exchange contracts and forward foreign currency exchange contracts are valued at the mean between the bid and ask prices. Interpolated values are derived when the settlement date of the contract is an interim date for which quotations are not available.
Derivative Financial Instruments: The Portfolio may engage in various portfolio investment strategies to both increase the return of the Portfolio and to hedge, or protect, its exposure to interest rate movements and
| | | | | | |
| | | BLACKROCK ASSET ALLOCATION PORTFOLIO | | MARCH 31, 2009 | | 27 |
| | |
| Notes to Financial Statements (continued) | | |
movements in the securities markets. Losses may arise if the value of the contract decreases due to an unfavorable change in the price of the underlying security, or if the counterparty does not perform under the contract.
| • | | Financial Futures Contracts – The Portfolio may purchase or sell financial or index futures contracts and options on financial futures contracts for investment purposes or to manage its interest rate risk. Futures are contracts for delayed delivery of securities at a specific future date and at a specific price or yield. Pursuant to the contract, the Portfolio agrees to receive from or pay to the broker an amount of cash equal to the daily fluctuation in the value of the contract. Such receipts or payments are known as margin variation and are recognized by the Portfolio as unrealized gains or losses. When the contract is closed, the Portfolio records a realized gain or loss equal to the difference between the value of the contract at the time it was opened and the value at the time it was closed. The use of futures transactions involves the risk of an imperfect correlation in the movements in the price of futures contracts, interest rates and the underlying assets, and the possible inability of counterparties to meet the terms of their contracts. |
| • | | Forward Currency Contracts – A forward currency contract is an agreement between two parties to buy and sell a currency at a set exchange rate on a future date. The Portfolio may enter into forward currency contracts as a hedge against either specific transactions or portfolio positions. Forward currency contracts, when used by the Portfolio, help to manage the overall exposure to the foreign currency backing some of the investments held by the Portfolio. The contract is marked-to-market daily and the change in market value is recorded by the Portfolio as an unrealized gain or loss. When the contract is closed, the Portfolio records a realized gain or loss equal to the difference between the value at the time it was opened and the value at the time it was closed. The use of forward currency contracts involves the risk that counterparties may not meet the terms of the agreement and market risk of unanticipated movements in the value of a foreign currency relative to the US dollar. |
| • | | Options – The Portfolio may purchase and write call and put options. A call option gives the purchaser of the option the right (but not the obligation) to buy, and obligates the seller to sell (when the option is exercised), the underlying position at the exercise price at any time or at a specified time during the option period. A put option gives the holder the right to sell and obligates the writer to buy the underlying position at the exercise price at any time or at a specified time during the option period. |
When the Portfolio purchase (writes) an option, an amount equal to the premium paid (received) by the Portfolio is reflected as an asset and an equivalent liability. The amount of the asset (liability) is subsequently marked-to-market to reflect the current market value of the option written. When a security is purchased or sold through an exercise of an option, the related premium paid (or received) is added to (or deducted from) the basis of the security acquired or deducted from (or added to) the proceeds of the security sold. When an option expires (or the Portfolio enters into a closing transaction), the Portfolio realizes a gain or loss on the option to the extent of the premiums received or paid (or gain or loss to the extent the cost of the closing transaction exceeds the premium received or paid). When the Portfolio writes a call option, such option is “covered”, meaning that the Portfolio holds the underlying security subject to being called by the option counterparty, or cash in an amount sufficient to cover the obligation. When the Portfolio writes a put option, such option is covered by cash in an amount sufficient to cover the obligation.
In purchasing and writing options, the Portfolio bears the market risk of an unfavorable change in the price of the underlying security or index. Exercise of a written option could result in the Portfolio purchasing a security at a price different from the current market value. The Portfolio may executed transactions in both listed and over-the-counter options. Transactions in certain over-the-counter options may expose the Portfolio to the risk of default by the counterparty to the transaction.
| • | | Swaps – The Portfolio may enter into swap agreements, in which the Portfolio and a counterparty agree to make periodic net payments on a specified notional amount. These periodic payments received or made by the Portfolio are recorded in the accompanying Statement of Operations as realized gains or losses, respectively. Swaps are marked-to-market daily and changes in value are recorded as unrealized appreciation (depreciation). When the swap is terminated, the Portfolio will record a realized gain or loss equal to the difference between the proceeds from (or cost of) the closing transaction and the Portfolio’s basis in the contract, if any. |
Swap transactions involve, to varying degrees, elements of credit and market risk in excess of the amounts recognized on the Statement of Assets and Liabilities. Such risks involve the possibility that there will be no liquid market for these agreements, that the counterparty to the agreements may default on its obligation to perform or disagree as to the meaning of the contractual terms in the agreements, and that there may be unfavorable changes in interest rates and/or market values associated with these transactions.
Interest Rate Swaps – The Portfolio may enter into interest rate swaps for investment purposes or to manage its interest rate risk. Interest rate swaps are agreements in which one party pays a floating rate of interest on a notional principal amount and receives a fixed rate of interest on the same notional principal amount for a specified period of time. Alternatively, a party may pay a fixed rate and receive a floating rate. In more complex swaps, the notional principal amount may decline (or amortize) over time.
Credit Default Swaps – The Portfolio may enter into credit default swaps for investment purposes or to manage its credit risk. The Portfolio enters into credit default agreements to provide a measure of protection against the default of an issuer (as buyer protection) and/or gain credit exposure to an issuer to which it is not otherwise
| | | | | | |
28 | | BLACKROCK ASSET ALLOCATION PORTFOLIO | | MARCH 31, 2009 | | |
| | |
| Notes to Financial Statements (continued) | | |
exposed (as seller of protection). Credit default swaps are agreements in which one party pays fixed periodic payments to a counterparty in consideration for a guarantee from the counterparty to make a specific payment should a negative credit event take place (e.g., bankruptcy, failure to pay, obligation accelerators, repudiation, moratorium, or restructuring). The Portfolio may either buy or sell (write) credit default swaps. As a buyer, the Portfolio will either receive from the seller an amount equal to the notional amount of the swap and deliver the referenced security or underlying securities comprising of an index or receive a net settlement of cash equal to the notional amount of the swap less the recovery value of the security or underlying securities comprising of an index. As a seller (writer), the Portfolio will either pay the buyer an amount equal to the notional amount of the swap and take delivery of the referenced security or underlying securities comprising of an index or pay a net settlement of cash equal to the notional amount of the sweep less the recovery value of the security or underlying securities comprising of an index. In the event of default by the counterparty, the Portfolio may recover amounts paid under the agreement either partially or in total by offsetting any payables and/or receivables with collateral held or pledged.
Swaptions – Swap options (swaptions) are similar to options on securities except that instead of selling or purchasing the right to buy or sell a security, the writer or purchaser of the swap option is granting or buying the right to enter into a previously agreed upon interest rate swap agreement at any time before the expiration of the option.
Foreign Currency Transactions: Foreign currency amounts are translated into United States dollars on the following basis: (i) market value of investment securities, assets and liabilities at the current rate of exchange; and (ii) purchases and sales of investment securities, income and expenses at the rates of exchange prevailing on the respective dates of such transactions.
The Portfolio reports foreign currency related transactions as components of realized gains for financial reporting purposes, whereas such components are treated as ordinary income for federal income tax purposes.
Asset-Backed and Mortgage-Backed Securities: The Portfolio may invest in asset-backed securities. Asset-backed securities are generally issued as pass-through certificates, which represent undivided fractional ownership interests in an underlying pool of assets, or as debt instruments, which are also known as collateralized obligations, and are generally issued as the debt of a special purpose entity organized solely for the purpose of owning such assets and issuing such debt. Asset-backed securities are often backed by a pool of assets representing the obligations of a number of different parties. The yield characteristics of certain asset-backed securities may differ from traditional debt securities. One such major difference is that all or a principal part of the obligations may be prepaid at any time because the underlying assets (i.e., loans) may be prepaid at any time. As a result, a decrease in interest rates in the market may result in increases in the level of prepayments as borrowers, particularly mortgagors, refinance and repay their loans. An increased prepayment rate with respect to an asset-backed security subject to such a prepayment feature will have the effect of shortening the maturity of the security. If the Portfolio has purchased such an asset-backed security at a premium, a faster than anticipated prepayment rate could result in a loss of principal to the extent of the premium paid.
The Portfolio may purchase in the secondary market certain mortgage pass-through securities. There are a number of important differences among the agencies and instrumentalities of the US Government that issue mortgage-related securities and among the securities that they issue. For example, mortgage-related securities guaranteed by the Government National Mortgage Association (“GNMA”) are guaranteed as to the timely payment of principal and interest by GNMA and such guarantee is backed by the full faith and credit of the United States. However, mortgage-related securities issued by the Federal National Mortgage Association (“FNMA”) include FNMA guaranteed Mortgage Pass-Through Certificates which are solely the obligations of the FNMA, are not backed by or entitled to the full faith and credit of the United States and are supported by the right of the issuer to borrow from the Treasury. The Portfolio invests a significant portion of its assets in securities backed by commercial or residential mortgage loans or in issuers that hold mortgage and other asset-backed securities. Please see the Schedule of Investments for these securities. Changes in economic conditions, including delinquencies and/or defaults on assets underlying these securities, can affect the value, income and/or liquidity of such positions.
Collateralized Debt Obligations: The Portfolio may invest in collateralized debt obligations (“CDOs”), which include collateralized bond obligations (“CBOs”) and collateralized loan obligations (“CLOs”). CBOs and CLOs are types of asset-backed securities. A CDO is a bankruptcy remote entity which is backed by a diversified pool of debt securities (CBOs) or syndicated bank loans (CLOs). The cashflows of the CDO can be split into multiple segments, called “tranches”, which will vary in risk profile and yield. The riskiest segment is the subordinated or “equity” tranche. This tranche bears the greatest risk of defaults from the underlying assets in the CDO and serves to protect the other, more senior, tranches from default in all but the most severe circumstances. Since it is shielded from defaults by the more junior tranches, a “senior” tranche will typically have higher credit ratings and lower yields than their underlying securities, and often receive investment grade ratings from one or more of the nationally recognized rating agencies. Despite the protection from the more junior tranches, senior tranches can experience substantial losses due to actual defaults, increased sensitivity to future defaults and the disappearance of one or more protecting tranches as a result of changes in the credit profile of the underlying pool of assets.
Multiple Class Pass-Through Securities: The Portfolio may invest in multiple class pass-through securities, including collateralized mortgage obligations and commercial mortgage backed securities. These multiple class securities may be issued by GNMA, US Government agencies or instrumentalities or by trusts formed by private originators of, or investors in, mortgage loans. In general, these securities are debt obligations of a
| | | | | | |
| | | BLACKROCK ASSET ALLOCATION PORTFOLIO | | MARCH 31, 2009 | | 29 |
| | |
| Notes to Financial Statements (continued) | | |
legal entity that are collateralized by, and multiple class pass-through securities represent direct ownership interests in, a pool of residential or commercial mortgage loans or mortgage pass-through securities, the payments on which are used to make payments on the multiple class pass-through securities. The markets for multiple class pass-through securities may be more illiquid than those of other securities. Classes of multiple class pass-through securities include interest only (“IOs”), principal only (“POs”), planned amortization classes and targeted amortization classes. IOs and POs are stripped mortgage-backed securities representing interests in a pool of mortgages the cash flow from which has been separated into interest and principal components. IOs receive the interest portion of the cash flow while POs receive the principal portion. IOs and POs can be extremely volatile in response to changes in interest rates. As interest rates rise and fall, the value of IOs tends to move in the same direction as interest rates. POs perform best when prepayments on the underlying mortgages rise since this increases the rate at which the investment is returned and the yield to maturity on the PO. When payments on mortgages underlying a PO are slower than anticipated, the life of the PO is lengthened and the yield to maturity is reduced. If the underlying mortgage assets experience greater than anticipated prepayments of principal, the Portfolios may not fully recoup their initial investments in IOs.
Stripped Mortgage Backed Securities: The Portfolio may invest in stripped mortgage-backed securities issued by the US government, its agencies and instrumentalities. Stripped mortgage-backed securities are usually structured with two classes that receive different proportions of the interest and principal distributions on a pool of mortgage assets. The Portfolio also may invest in stripped mortgage-backed securities that are privately issued.
TBA Commitments: The Portfolio may enter into TBA commitments to purchase or sell securities for a fixed price at a future date. TBA commitments are considered securities in themselves, and involve a risk of loss if the value of the security to be purchased or sold declines or increases prior to settlement date, which is in addition to the risk of decline in the value of the Portfolio’s other assets.
Capital Trusts: These securities are typically issued by corporations, generally in the form of interest-bearing notes with preferred securities characteristics, or by an affiliated business trust of a corporation, generally in the form of beneficial interests in subordinated debentures or similarly structured securities. The securities can be structured as either fixed or adjustable coupon securities that can have either a perpetual or stated maturity date. Dividends can be deferred without creating an event of default or acceleration, although maturity cannot take place unless all cumulative payment obligations have been met. The deferral of payments does not affect the purchase or sale of these securities in the open market. Payments on these securities are treated as interest rather than dividends for Federal income tax purposes. These securities can have a rating that is slightly below that of the issuing company’s senior debt securities.
Preferred Stock: The Portfolio may invest in preferred stocks. Preferred stock has a preference over common stock in liquidation (and generally in receiving dividends as well) but is subordinated to the liabilities of the issuer in all respects. As a general rule, the market value of preferred stock with a fixed dividend rate and no conversion element varies inversely with interest rates and perceived credit risk, while the market price of convertible preferred stock generally also reflects some element of conversion value. Because preferred stock is junior to debt securities and other obligations of the issuer, deterioration in the credit quality of the issuer will cause greater changes in the value of a preferred stock than in a more senior debt security with similar stated yield characteristics. Unlike interest payments on debt securities, preferred stock dividends are payable only if declared by the issuer’s board of directors. Preferred stock also may be subject to optional or mandatory redemption provisions.
Forward Commitments and When-Issued Delayed Delivery Securities: The Portfolio may purchase securities on a when-issued basis and may purchase or sell securities on a forward commitment basis. Settlement of such transactions normally occurs within a month or more after the purchase or sale commitment is made. The Portfolio may purchase securities under such conditions only with the intention of actually acquiring them, but may enter into a separate agreement to sell the securities before the settlement date. Since the value of securities purchased may fluctuate prior to settlement, the Portfolio may be required to pay more at settlement than the security is worth. In addition, the purchaser is not entitled to any of the interest earned prior to settlement. When purchasing a security on a delayed-delivery basis, the Portfolio assumes the rights and risks of ownership of the security, including the risk of price and yield fluctuations.
Inflation-Indexed Bonds: Inflation-indexed bonds are fixed income securities whose principal value is periodically adjusted according to the rate of inflation. If the index measuring inflation falls, the principal value of inflation-indexed bonds will be adjusted downward, and consequently the interest payable on these securities (calculated with respect to a smaller principal amount) will be reduced. Repayment of the original bond principal upon maturity (as adjusted for inflation) is guaranteed in the case of US Treasury inflation-indexed bonds. For bonds that do not provide a similar guarantee, the adjusted principal value of the bond repaid at maturity may be less than the original principal.
Mortgage Dollar Roll Transactions: The Portfolio may sell mortgage-backed securities and simultaneously contract to repurchase substantially similar (same type, coupon and maturity) securities on a specific future date at an agreed upon price. Pools of mortgage securities are used to collateralize mortgage dollar roll transactions and may have different prepayment histories than those sold. During the period between the sale and the repurchase, the Portfolio will not be entitled to receive interest and principal payments on the securities sold. Proceeds of the sale will be invested in additional instruments for the Portfolio, and the income from these investments will generate income for the Portfolio. The Portfolio will account for dollar roll transactions as purchases and sales and realize gains and losses on these transactions.
| | | | | | |
30 | | BLACKROCK ASSET ALLOCATION PORTFOLIO | | MARCH 31, 2009 | | |
| | |
| Notes to Financial Statements (continued) | | |
Mortgage dollar rolls involve the risk that the market value of the securities that the Portfolio is required to purchase may decline below the agreed upon repurchase price of those securities. If investment performance of securities purchased with proceeds from these transactions does not exceed the income, capital appreciation and gain or loss that would have been realized on the securities sold as part of the dollar roll, the use of this technique will adversely impact the investment performance of the Portfolio.
Treasury Roll Transactions: A treasury roll transaction involves the sale of a Treasury security, with an agreement to repurchase the same security at an agreed upon price and date. Treasury rolls constitutes a borrowing (not treated as purchase and sales) and the difference between the sale and repurchase prices represents interest expense at an agreed upon rate. Whether such a transaction produces a positive impact on performance depends upon whether the income and gains on the securities purchased with the proceeds received from the sale of the security exceeds the interest expense incurred by the Portfolio. Treasury rolls are not considered purchases and sales and any gains or losses incurred on the treasury rolls will be deferred until the treasury securities are disposed.
Treasury roll transactions involve the risk that the market value of the securities that the Portfolio is required to purchase may decline below the agreed upon repurchase price of those securities. If investment performance of securities purchased with proceeds from these transactions does not exceed the income, capital appreciation and gain or loss that would have been realized on the securities sold as part of the dollar roll, the use of this technique will adversely impact the investment performance of the Portfolio.
Zero-Coupon Bonds: The Portfolio may invest in zero-coupon bonds, which are normally issued at a significant discount from face value and do not provide for periodic interest payments. Zero-coupon bonds may experience greater volatility in market value than similar maturity debt obligations which provide for regular interest payments.
Segregation and Collateralization: In cases in which the 1940 Act and the interpretive positions of the Securities and Exchange Commission (“SEC”) require that the Portfolio segregate assets in connection with certain investments (e.g., TBA’s beyond normal settlement, extended settlements, swaps, written swaptions, written options, forward foreign currency contracts and financial futures contracts), the Portfolio will, consistent with certain interpretive letters issued by the SEC, designate on its books and records cash or other liquid debt securities having a market value at least equal to the amount that would otherwise be required to be physically segregated. Furthermore, based on requirements and agreements with certain exchanges and third party broker-dealers, the Portfolio may also be required to deliver or deposit securities as collateral for certain investments (e.g., swaps, written options and financial futures contracts).
Investment Transactions and Investment Income: Investment transactions are recorded on the dates the transactions are entered into (the trade dates). Realized gains and losses on investment transactions are determined on the identified cost method. Dividend income is recorded on the ex-dividend dates. Dividends from foreign securities where the ex-dividend date may have passed are subsequently recorded when the Portfolio has determined the ex-dividend date. Upon notification from issuers, some of the dividend income received from a real estate investment trust may be redesignated as a reduction of cost of the related investment and/or realized gain. Interest income is recognized on the accrual method. The Portfolio amortizes all premiums and discounts on debt securities. Income, realized and unrealized gains and losses of the Portfolio is allocated daily to each class based on its relative net assets.
Dividends and Distributions: Dividends and distributions paid by the Portfolio are recorded on the ex-dividend dates.
Securities Lending: The Portfolio may lend securities to financial institutions that provide cash which will be maintained at all times in an amount equal to at least 100% of the current market value of the loaned securities. The market value of the loaned securities is determined at the close of business of the Portfolio and any additional required collateral is delivered to the Portfolio on the next business day. The Portfolio typically receives income on the loaned securities but does not receive income on the collateral. The Portfolio may invest the cash collateral and retain the amount earned on such investment, net of any amount rebated to the borrower. Loans of securities are terminable at any time and the borrower, after notice, is required to return borrowed securities within the standard time period for settlement of securities transactions. The Portfolio may pay reasonable lending agent, administrative and custodial fees in connection with its loans. In the event that the borrower defaults on its obligation to return borrowed securities because of insolvency or for any other reason, the Portfolio could experience delays and costs in gaining access to the collateral. The Portfolio also could suffer a loss if the value of an investment purchased with cash collateral falls below the market value of loaned securities.
Income Taxes: It is the Portfolio’s policy to comply with the requirements of the Internal Revenue Code applicable to regulated investment companies and to distribute substantially all of its taxable income to its shareholders. Therefore, no federal income tax provision is required. Under the applicable foreign tax law, a withholding tax may be imposed on interest, dividends and capital gains at various rates.
The Portfolio files US federal and various state and local tax returns. No income tax returns are currently under examination. The statutes of limitations on the Portfolio’s US federal income tax returns remain open for each of the four years ended September 30, 2008. The statutes of limitations on the Portfolio’s state and local tax returns may remain open for an additional year depending upon the jurisdiction.
Recent Accounting Pronouncement: In March 2008, Statement of Financial Accounting Standards No. 161, “Disclosures about Derivative Instruments and Hedging Activities - an amendment of FASB Statement No. 133” (“FAS 161”), was issued. FAS 161 is intended to improve financial reporting for derivative instruments by requiring enhanced disclosure
| | | | | | |
| | | BLACKROCK ASSET ALLOCATION PORTFOLIO | | MARCH 31, 2009 | | 31 |
| | |
| Notes to Financial Statements (continued) | | |
that enables investors to understand how and why an entity uses derivatives, how derivatives are accounted for, and how derivative instruments affect an entity’s results of operations and financial position. FAS 161 is effective for financial statements issued for fiscal years and interim periods beginning after November 15, 2008. The impact on the Portfolio’s financial statement disclosures is currently being assessed.
Other: Expenses directly related to the Portfolio or class are charged to that Portfolio or class. Other operating expenses shared by several funds are pro-rated among those funds on the basis of relative net assets or other appropriate methods. Other expenses of the Portfolio are allocated daily to each class based on its relative net assets.
2. Investment Advisory Agreements and Other Transactions with Affiliates:
The Fund, on behalf of the Portfolio, entered into an Investment Advisory Agreement with BlackRock Advisors, LLC (the “Advisor”), an indirect, wholly owned subsidiary of BlackRock, Inc., to provide investment advisory services. The PNC Financial Services Group, Inc. (“PNC”) and Bank of America Corporation (“BAC”) are the largest stockholders of BlackRock, Inc. (“BlackRock”). BAC became a stockholder of BlackRock following its acquisition of Merrill Lynch & Co., Inc. (“Merrill Lynch”) on January 1, 2009. Prior to that date, both PNC and Merrill Lynch were considered affiliates of the Fund under the 1940 Act. Subsequent to the acquisition, PNC remains an affiliate, but due to the restructuring of Merrill Lynch’s ownership interest of BlackRock, BAC is not deemed to be an affiliate under the 1940 Act.
The Advisor is responsible for the management of the Portfolio and provides the necessary personnel, facilities, equipment and certain other services necessary to the operations of the Portfolio. For such services, the Portfolio pays the Advisor a monthly fee based on the average daily value of the Portfolio’s net assets, at the following annual rates:
| | | |
Average Daily Net Assets | | | |
First $1 Billion | | 0.550 | % |
$1 Billion - $2 Billion | | 0.500 | |
$2 Billion - $3 Billion | | 0.475 | |
Greater Than $3 Billion | | 0.450 | |
In addition, the Advisor has entered into a sub-advisory agreement with BlackRock Financial Management, Inc. (“BFM”), an affiliate of the Advisor, pursuant to which BFM serves as sub-advisor for the Portfolio. The Advisor pays the sub-advisor, for services it provides, a monthly fee that is a percentage of the investment advisory fees paid by the Portfolio to the Advisor
The Advisor contractually agreed to waive or reimburse fees or expenses until February 1, 2010, in order to limit expenses. These expense limits apply to the aggregate expenses incurred on a share class (excluding: interest, taxes, brokerage commissions, expenses incurred as a result of investments in other funds and other expenses attributable to, and incurred as a result of, the Portfolio’s investments and other extraordinary expenses). This agreement is reviewed annually by the Board. The current expense limitations as a percentage of net assets are as follows:
| | | | | | | | | | | | | |
| Share Classes | |
Institutional | | | Service | | | Investor A | | | Investor B | | | Investor C | |
| 0.86 | % | | 1.16 | % | | 1.33 | % | | 2.08 | % | | 2.08 | % |
PFPC Trust Company, an indirect, wholly owned subsidiary of PNC, serves as custodian for the Portfolio. For these services, the custodian receives a fee computed daily and payable monthly, based on a percentage of the average daily gross assets of the Portfolio. The fee is paid at the following annual rates: 0.005% of the first $400 million, 0.004% of the next $1.6 billion, and 0.003% of average daily gross assets in excess of $2 billion; plus per transaction charges and other miscellaneous fees incurred on behalf of the Portfolio.
PNC Global Investment Servicing (U.S.) Inc. (“PNCGIS”), an indirect, wholly owned subsidiary of PNC, serves as transfer and dividend disbursing agent. Each class of the Portfolio bears the costs of transfer agent fees associated with such respective class. Transfer agent fees borne by each class of the Portfolio are comprised of those fees charged for all shareholder communications including mailing of shareholder reports, dividend and distribution notices, and proxy materials for shareholders meetings, as well as per account and per transaction fees related to servicing and maintenance of shareholder accounts, including the issuing, redeeming and transferring of shares of each class of the Portfolio, 12b-1 fee calculations, check writing, anti-money laundering services, and customer identification services.
Pursuant to written agreements, Merrill Lynch and certain other affiliates provide the Portfolio with sub-accounting, recordkeeping, sub-transfer agency and other administrative services with respect to sub-accounts they service. For these services, affiliates receive an annual fee per shareholder account which will vary depending on share class. The Portfolio incurred $23,057 in return for these services, with $13,112 to Merrill Lynch during period from October 1, 2008 to December 31, 2008, and $9,945 to other affiliates for the six months ended March 31, 2009, which are a component of the transfer agent fees in the accompanying Statement of Operations.
PNCGIS and the Advisor act as co-administrators for the Portfolio. For these services, the co-administrators receive a combined administration fee computed daily and payable monthly, based on a percentage of the average daily net assets of the Portfolio. The combined administration fee is based on a percentage of the average daily net assets at the following annual rates: 0.075% of the first $500 million, 0.065% of the next $500 million and 0.055% of average of daily net assets in excess of $1 billion. In addition, each of the share classes is charged an administration fee based on the following percentages of average daily net assets of each respective class: 0.025% of the first $500 million of the Portfolio, 0.015% of the next $500 million and 0.005% of average of daily net assets in excess of $1 billion. In addition, PNCGIS and the Advisor may have, at their discretion, voluntarily waived all or any portion of their administration fees for the Portfolio or a share class.
| | | | | | |
32 | | BLACKROCK ASSET ALLOCATION PORTFOLIO | | MARCH 31, 2009 | | |
| | |
| Notes to Financial Statements (continued) | | |
The Portfolio has received an exemptive order from the SEC permitting it to lend portfolio securities to Merrill Lynch, Pierce, Fenner & Smith (“MLPF&S”) or its affiliates. Pursuant to that order, the Portfolio has retained BlackRock Investment Management, LLC (“BIM”), an affiliate of the Advisor, as the securities lending agent for a fee based on a share of the returns on investment of cash collateral. BIM may, on behalf of the Portfolio, invest cash collateral received by the Portfolio for such loans, among other things, in a private investment company managed by the Advisor or in registered money market funds advised by the Advisor or its affiliates. The share of income earned by the Portfolio on such investments is shown as securities lending - affiliated on the Statement of Operations. For the six months ended March 31, 2009, BIM received $3,669 in securities lending agent fees.
The Fund, on behalf of the Portfolio, has entered into a separate Distribution Agreement and Distribution Plan with BlackRock Investment, LLC (“BIL”), an affiliates of BlackRock, Inc. Pursuant to the Distribution Plan, in accordance with Rule 12b-1 under the 1940 Act, the Portfolio pays BIL ongoing service and distribution fees. The fees are accrued daily and paid monthly at annual rates based upon the average daily net assets of the shares of the Portfolio as follows:
| | | | | | |
| | | Service
Fee | | | Distribution
Fee | |
Service | | 0.25 | % | | — | |
Investor A | | 0.25 | % | | — | |
Investor B | | 0.25 | % | | 0.75 | % |
Investor C | | 0.25 | % | | 0.75 | % |
For the six months ended March 31, 2009, the Portfolio paid $123,028 to affiliates in return for distribution and sales support services.
The Advisor maintains a call center, which is responsible for providing certain shareholder services to the Portfolio, such as responding to shareholder inquiries and processing transactions based upon instructions from shareholders with respect to the subscription and redemption of Portfolio shares. During the six months ended March 31, 2009, the Portfolio reimbursed the Advisor the following amounts for costs incurred in running the call center, which are a component of the transfer agent fees in the accompanying Statement of Operations.
| | | | | | | | | | | | | | | | |
| Share Classes |
Institutional | | Service | | Investor A | | Investor B | | Investor C | | Total |
| $ | 493 | | $ | 53 | | $ | 33,854 | | $ | 11,317 | | $ | 3,352 | | $ | 49,069 |
For the six months ended March 31, 2009, the following chart shows the various types of class specific expenses borne directly by each class of the Portfolio and any associated waivers or reimbursements of those expenses.
| | | | | | | | | | | | | | | | | | | | | | | |
| | | Share Classes | |
| | | Institutional | | | Service | | | Investor A | | | Investor B | | | Investor C | | Total | |
Administration Fees | | $ | 2,897 | | | $ | 158 | | | $ | 39,228 | | | $ | 9,150 | | | $ | 8,210 | | $ | 59,643 | |
Administration Fees Waived | | | (2,880 | ) | | | (81 | ) | | | (6,581 | ) | | | (3,314 | ) | | | — | | | (12,856 | ) |
Service and Distribution Fees | | | — | | | | 1,575 | | | | 389,048 | | | | 362,419 | | | | 327,110 | | | 1,080,152 | |
Transfer Agent Fees | | | 17,327 | | | | 929 | | | | 337,806 | | | | 105,400 | | | | 51,316 | | | 512,778 | |
Transfer Agent Fees Waived | | | (553 | ) | | | (25 | ) | | | (5,443 | ) | | | (2,412 | ) | | | — | | | (8,433 | ) |
Transfer Agent Fees Reimbursed | | | (8,679 | ) | | | (406 | ) | | | (1,124 | ) | | | (2,429 | ) | | | — | | | (12,638 | ) |
If within two years following a waiver or reimbursement, the operating expenses of a share class that previously received a waiver or reimbursement from the Advisor are less than the expense limit for that share class, the Advisor is entitled to be reimbursed by such share class up to the amount of fees waived or expenses reimbursed under the agreement if: (1) the Portfolio has more than $50 million in assets, (2) the Advisor or an affiliate continues to serve as the Portfolio’s investment advisor or administrator and (3) the Board has approved in advance the payments to the Advisor at the previous quarterly meeting.
At March 31, 2009, the amounts subject to possible future reimbursement under the expense limitation agreement are as follows:
| | | | | | | |
| Expiring January 31, |
| 2010 | | 2011 | | 2012 |
| $ | 47,788 | | $ | 15,016 | | $ | 20,706 |
For the three months ended December 31, 2008, Merrill Lynch, through its affiliated broker dealer, MLPF&S, earned $7,204 in commissions on transactions of securities.
For the six months ended March 31, 2009, affiliates earned underwriting discounts, direct commissions and dealer concessions on sales of the Portfolio’s Investor A Shares of $8,600.
For the six months ended March 31, 2009, affiliates received contingent deferred sales charges relating to transactions in Investor A, B and C Shares of $4,546, $88,191 and $10,460 respectively.
The Portfolio may earn income on positive cash balances in demand deposit accounts that are maintained by PNCGIS on behalf of the Portfolio. The income earned for the six months ended March 31, 2009 was $1,089 which is included in interest and dividends—affiliated on the Statement of Operations.
The Portfolio may also receive earnings credits related to cash balances with PNCGIS which are shown on the Statement of Operations as fees paid indirectly.
| | | | | | |
| | | BLACKROCK ASSET ALLOCATION PORTFOLIO | | MARCH 31, 2009 | | 33 |
| | |
| Notes to Financial Statements (continued) | | |
Certain officers and/or trustees of the Fund are officers and/or directors of BlackRock, Inc. or its affiliates. The Portfolio reimburses the Advisor for compensation paid to the Fund’s Chief Compliance Officer.
3. Investments:
For the six months ended March 31, 2009, purchases and sales of investments (including paydowns, TBA and mortgage dollar roll transactions), excluding short-term securities and US government securities, were $675,840,729 and $711,073,595, respectively.
For the six months ended March 31, 2009, purchases and sales of US government securities were $29,662,686 and $25,356,535, respectively.
For the six months ended March 31, 2009, purchases and sales of mortgage dollar rolls were $324,973,820 and $325,271,387, respectively.
Written options transactions entered into during the six months ended March 31, 2009 are summarized as follows:
| | | | | | | |
| | | Contracts | | | Premium | |
Balance at 9/30/08 | | (7,520 | ) | | $ | (2,096,700 | ) |
Written | | (2,970 | ) | | | (1,498,490 | ) |
Expired | | 3,080 | | | | 241,620 | |
Closed | | 4,000 | | | | 1,802,250 | |
| | | | | | | |
Balance at 3/31/09 | | (3,410 | ) | | $ | (1,551,320 | ) |
4. Average Borrowings:
For the six months ended March 31, 2009, the average amount outstanding of investments considered as borrowings was approximately $902,652 and daily weighted average interest rate was 0.15%.
5. Short-Term Borrowings:
The Portfolio, along with certain other funds managed by the Advisor and its affiliates, is a party to a $500 million credit agreement with a group of lenders, which expired November 2008 and was renewed until November 2009. The Portfolio may borrow under the credit agreement to fund shareholder redemptions and for other lawful purposes other than for leverage. The Portfolio may borrow up to the maximum amount allowable under the Portfolio’s current Prospectus and Statement of Additional Information, subject to various other legal, regulatory or contractual limits. The Portfolio paid its pro rata share of a 0.02% upfront fee on the aggregate commitment amount based on its net assets as of October 31, 2008. The Portfolio pays a commitment fee of 0.08% per annum based on the Portfolio’s pro rata share of the unused portion of the credit agreement, which is included in miscellaneous on the Statement of Operations. Amounts borrowed under the credit agreement bear interest at a rate equal to, the higher of the (a) federal funds effective rate and (b) reserve adjusted one month LIBOR, plus, in each case, the higher of (i) 1.50% and (ii) 50% of the CDX index (as defined in the credit agreement) in effect from time to time. The Portfolio did not borrow under the credit agreement during the six months ended March 31, 2009.
6. Capital Loss Carryforward:
As of September 30, 2008, the Portfolio had a capital loss carryforward available to offset future realized capital gains of $2,685,812 expiring September 30, 2010.
7. Market and Credit Risk:
In the normal course of business, the Portfolio invests in securities and enters into transactions where risks exist due to fluctuations in the market (market risk) or failure of the issuer of a security to meet all its obligations (credit risk). The value of securities held by the Portfolio may decline in response to certain events, including those directly involving the issuers whose securities are owned by the Portfolio; conditions affecting the general economy; overall market changes; local, regional or global political, social or economic instability; and currency and interest rate and price fluctuations. Similar to credit risk, the Portfolio may be exposed to counterparty risk, or the risk that an entity with which the Portfolio has unsettled or open transactions may default. Financial assets, which potentially expose the Portfolio to credit and counterparty risks, consist principally of investments and cash due from counterparties. The extent of the Portfolio’s exposure to credit and counterparty risks with respect to these financial assets is approximated by their value recorded in the Portfolio’s Statement of Assets and Liabilities.
| | | | | | |
34 | | BLACKROCK ASSET ALLOCATION PORTFOLIO | | MARCH 31, 2009 | | |
| | |
| Notes to Financial Statements (concluded) | | |
8. Capital Shares Transactions:
Transactions in shares for each period were as follows:
| | | | | | | | | | | | | | |
| | | Six Months Ended
March 31, 2009 | | | Year Ended
September 30, 2008 | |
| | | Shares | | | Amount | | | Shares | | | Amount | |
Institutional | | | | | | | | | | | | | | |
Shares sold | | 1,133,297 | | | $ | 12,317,395 | | | 719,701 | | | $ | 10,781,671 | |
Shares issued in reinvestment of dividends and distributions | | 41,108 | | | | 437,311 | | | 116,442 | | | | 1,821,085 | |
| | | | | | | | | | | | | | |
Total issued | | 1,174,405 | | | | 12,754,706 | | | 836,143 | | | | 12,602,756 | |
Shares redeemed | | (714,403 | ) | | | (7,513,365 | ) | | (1,089,350 | ) | | | (17,388,674 | ) |
| | | | | | | | | | | | | | |
Net increase (decrease) | | 460,002 | | | $ | 5,241,341 | | | (253,207 | ) | | $ | (4,785,918 | ) |
| | | | | | | | | | | | | | |
| | | | |
Service | | | | | | | | | | | | | | |
Shares sold | | 4,774 | | | $ | 50,898 | | | 15,761 | | | $ | 240,679 | |
Shares issued in reinvestment of dividends and distributions | | 588 | | | | 6,246 | | | 2,025 | | | | 31,561 | |
| | | | | | | | | | | | | | |
Total issued | | 5,362 | | | | 57,144 | | | 17,786 | | | | 272,240 | |
Shares redeemed | | (9,606 | ) | | | (101,202 | ) | | (34,266 | ) | | | (509,908 | ) |
| | | | | | | | | | | | | | |
Net decrease | | (4,244 | ) | | $ | (44,058 | ) | | (16,480 | ) | | $ | (237,668 | ) |
| | | | | | | | | | | | | | |
| | | | |
Investor A | | | | | | | | | | | | | | |
Shares sold | | 3,845,626 | | | $ | 41,167,405 | | | 3,270,332 | | | $ | 48,680,010 | |
Shares issued in reinvestment of dividends and distributions | | 695,942 | | | | 7,376,271 | | | 2,930,518 | | | | 45,682,395 | |
| | | | | | | | | | | | | | |
Total issued | | 4,541,568 | | | | 48,543,676 | | | 6,200,850 | | | | 94,362,405 | |
Shares redeemed | | (6,666,042 | ) | | | (70,867,281 | ) | | (5,775,786 | ) | | | (86,718,679 | ) |
| | | | | | | | | | | | | | |
Net increase (decrease) | | (2,124,474 | ) | | $ | (22,323,605 | ) | | 425,064 | | | $ | 7,643,726 | |
| | | | | | | | | | | | | | |
| | | | |
Investor B | | | | | | | | | | | | | | |
Shares sold | | 264,834 | | | $ | 2,800,477 | | | 529,002 | | | $ | 7,998,032 | |
Shares issued in reinvestment of dividends and distributions | | 145,877 | | | | 1,522,916 | | | 789,550 | | | | 12,215,796 | |
| | | | | | | | | | | | | | |
Total issued | | 410,711 | | | | 4,323,393 | | | 1,318,552 | | | | 20,213,828 | |
Shares redeemed | | (1,848,816 | ) | | | (19,308,153 | ) | | (2,736,738 | ) | | | (40,629,040 | ) |
| | | | | | | | | | | | | | |
Net decrease | | (1,438,105 | ) | | $ | (14,984,760 | ) | | (1,418,186 | ) | | $ | (20,415,212 | ) |
| | | | | | | | | | | | | | |
| | | | |
Investor C | | | | | | | | | | | | | | |
Shares sold | | 3,299,779 | | | $ | 35,061,542 | | | 1,208,908 | | | $ | 17,588,746 | |
Shares issued in reinvestment of dividends and distributions | | 133,233 | | | | 1,387,519 | | | 448,828 | | | | 6,911,581 | |
| | | | | | | | | | | | | | |
Total issued | | 3,433,012 | | | | 36,449,061 | | | 1,657,736 | | | | 24,500,327 | |
Shares redeemed | | (2,989,092 | ) | | | (31,101,665 | ) | | (1,232,015 | ) | | | (18,103,485 | ) |
| | | | | | | | | | | | | | |
Net increase | | 443,920 | | | $ | 5,347,396 | | | 425,721 | | | $ | 6,396,842 | |
| | | | | | | | | | | | | | |
| | | | | | |
| | | BLACKROCK ASSET ALLOCATION PORTFOLIO | | MARCH 31, 2009 | | 35 |
Officers and Trustees
Ronald W. Forbes, Co-Chairman of the Board and Trustee
Rodney D. Johnson, Co-Chairman of the Board and Trustee
David O. Beim, Trustee
Dr. Matina Horner, Trustee
Herbert I. London, Member of the Audit Committee and Trustee
Cynthia A. Montgomery, Trustee
Joseph P. Platt, Jr., Trustee
Robert C. Robb, Jr., Trustee
Toby Rosenblatt, Trustee
Kenneth L. Urish, Chairman of the Audit Committee and Trustee
Frederick W. Winter, Member of the Audit Committee and Trustee
Richard S. Davis, Trustee
Henry Gabbay, Trustee
Donald C. Burke, Fund President and Chief Executive Officer
Anne F. Ackerley, Vice President
Neal J. Andrews, Chief Financial Officer
Jay M. Fife, Treasurer
Brian P. Kindelan, Chief Compliance Officer of the Fund
Howard Surloff, Secretary
Investment Advisor and Co-Administrator
BlackRock Advisors, LLC
Wilmington, DE 19809
Sub-Advisor
BlackRock Financial Management, Inc.
New York, NY 10022
Custodian
PFPC Trust Company
Philadelphia, PA 19153
Co-Administrator and Transfer Agent
PNC Global Investment Servicing (U.S.) Inc.
Wilmington, DE 19809
Distributor
BlackRock Investments, LLC
New York, NY 10022
Legal Counsel
Sidley AustinLLP
New York, NY 10019
Independent Registered Public Accounting Firm
Deloitte & ToucheLLP
Philadelphia, PA 19103
Address of the Portfolio
100 Bellevue Parkway.
Wilmington, DE 19809
| | | | | | |
36 | | SEMI-ANNUAL REPORT | | MARCH 31, 2009 | | |
BlackRock Privacy Principles
BlackRock is committed to maintaining the privacy of its current and former fund investors and individual clients (collectively, “Clients”) and to safeguarding their non-public personal information. The following information is provided to help you understand what personal information BlackRock collects, how we protect that information and why in certain cases we share such information with select parties.
If you are located in a jurisdiction where specific laws, rules or regulations require BlackRock to provide you with additional or different privacy-related rights beyond what is set forth below, then BlackRock will comply with those specific laws, rules or regulations.
BlackRock obtains or verifies personal non-public information from and about you from different sources, including the following: (i) information we receive from you or, if applicable, your financial intermediary, on applications, forms or other documents; (ii) information about your transactions with us, our affiliates, or others; (iii) information we receive from a consumer reporting agency; and (iv) from visits to our websites.
BlackRock does not sell or disclose to non-affiliated third parties any non-public personal information about its Clients, except as permitted by law or as is necessary to respond to regulatory requests or to service Client accounts. These non-affiliated third parties are required to protect the confidentiality and security of this information and to use it only for its intended purpose.
We may share information with our affiliates to service your account or to provide you with information about other BlackRock products or services that may be of interest to you. In addition, BlackRock restricts access to non-public personal information about its Clients to those BlackRock employees with a legitimate business need for the information. BlackRock maintains physical, electronic and procedural safeguards that are designed to protect the non-public personal information of its Clients, including procedures relating to the proper storage and disposal of such information.
Availability of Additional Information
Electronic copies of most financial reports and prospectuses are available on the Fund’s website or shareholders can sign up for e-mail notifications of quarterly statements, annual and semi-annual reports and prospectuses by enrolling in the Fund’s electronic delivery program.
To enroll:
Shareholders Who Hold Accounts with Investment Advisors, Banks or Brokerages:
Please contact your financial advisor. Please note that not all investment advisors, banks or brokerages may offer this service.
Shareholders Who Hold Accounts Directly With BlackRock
| 1) | Access the BlackRock website at |
http://www.blackrock.com/edelivery
| 2) | Click on the applicable link and follow the steps to sign up |
Householding
The Fund will mail only one copy of shareholder documents, including prospectuses, annual and semi-annual reports and proxy statements, to shareholders with multiple accounts at the same address. This practice is commonly called “householding” and it is intended to reduce expenses and eliminate duplicate mailings of shareholder documents. Mailings of your shareholder documents may be householded indefinitely unless you instruct us otherwise. If you do not want the mailing of these documents to be combined with those for other members of your household, please contact the Fund at (800) 441-7762.
| | | | | | |
| | | BLACKROCK ASSET ALLOCATION PORTFOLIO | | MARCH 31, 2009 | | 37 |
| | |
| Additional Information (concluded) | | |
Availability of Additional Information (concluded)
Availability of Proxy Voting Policies and Procedures
A description of the policies and procedures that the Fund uses to determine how to vote proxies relating to portfolio securities is available (1) without charge, upon request by calling (800) 441-7762; (2) at www.blackrock.com; and (3) on the Securities and Exchange Commission’s (the “SEC”) website at http://www.sec.gov.
Availability of Proxy Voting Record
Information about how the Fund votes proxies relating to securities held in the Fund’s portfolios during the most recent 12-month period ended June 30th is available upon request and without charge (1) at www.blackrock.com or by calling (800) 441-7762 (2) on the SEC’s website at http://www.sec.gov.
Availability of Quarterly Portfolio Schedule
The Fund files its complete schedule of portfolio holdings with the SEC for the first and third quarters of each fiscal year on Form N-Q. The Fund’s Forms N-Q are available on the SEC’s website at http:// www.sec.gov and may also be reviewed and copied at the SEC’s Public Reference Room in Washington, D.C. Information on the operation of the Public Reference Room may be obtained by calling (800) SEC-0330. The Fund’s Forms N-Q may also be obtained upon request and without charge by calling (800) 441-7762.
Shareholder Privileges
Account Information
Call us at (800) 441-7762 from 8:00 AM to 6:00 PM EST Monday through Friday to get information about your account balances, recent transactions and share prices. You can also reach us on the Web at www.blackrock.com/funds.
Automatic Investment Plans
Investor Class shareholders who want to invest regularly can arrange to have $50 or more automatically deducted from their checking or savings account and invested in any of the BlackRock portfolios.
Systematic Withdrawal Plan
Investor Class shareholders can establish a systematic withdrawal plan and receive periodic payments of $50 or more from their BlackRock portfolios, as long as their account is at least $10,000.
Retirement Plans
Shareholders may make investments in conjunction with Traditional, Rollover, Roth, Coverdell, Simple IRA’s, SEP IRA’s and 403(b) Plans.
| | | | | | |
38 | | BLACKROCK ASSET ALLOCATION PORTFOLIO | | MARCH 31, 2009 | | |
| | |
| A World-Class Mutual Fund Family | | |
BlackRock offers a diverse lineup of open-end mutual funds crossing all investment styles and managed by experts in equity, fixed income and tax-exempt investing.
| | | | |
Equity Funds | | | | |
| | |
BlackRock All-Cap Energy & Resources Portfolio | | BlackRock Global Opportunities Portfolio | | BlackRock Mid-Cap Value Equity Portfolio |
BlackRock Asset Allocation Portfolio† | | BlackRock Global SmallCap Fund | | BlackRock Mid Cap Value Opportunities Fund |
BlackRock Aurora Portfolio | | BlackRock Health Sciences Opportunities Portfolio | | BlackRock Natural Resources Trust |
BlackRock Balanced Capital Fund† | | BlackRock Healthcare Fund | | BlackRock Pacific Fund |
BlackRock Basic Value Fund | | BlackRock Index Equity Portfolio* | | BlackRock Science & Technology Opportunities Portfolio |
BlackRock Capital Appreciation Portfolio | | BlackRock International Fund | |
BlackRock Energy & Resources Portfolio | | BlackRock International Diversification Fund | | BlackRock Small Cap Core Equity Portfolio |
BlackRock Equity Dividend Fund | | BlackRock International Index Fund | | BlackRock Small Cap Growth Equity Portfolio |
BlackRock EuroFund | | BlackRock International Opportunities Portfolio | | BlackRock Small Cap Growth Fund II |
BlackRock Focus Growth Fund | | BlackRock International Value Fund | | BlackRock Small Cap Index Fund |
BlackRock Focus Value Fund | | BlackRock Large Cap Core Fund | | BlackRock Small Cap Value Equity Portfolio* |
BlackRock Fundamental Growth Fund | | BlackRock Large Cap Core Plus Fund | | BlackRock Small/Mid-Cap Growth Portfolio |
BlackRock Global Allocation Fund† | | BlackRock Large Cap Growth Fund | | BlackRock S&P 500 Index Fund |
BlackRock Global Dynamic Equity Fund | | BlackRock Large Cap Value Fund | | BlackRock U.S. Opportunities Portfolio |
BlackRock Global Emerging Markets Fund | | BlackRock Latin America Fund | | BlackRock Utilities and Telecommunications Fund |
BlackRock Global Financial Services Fund | | BlackRock Mid-Cap Growth Equity Portfolio | | BlackRock Value Opportunities Fund |
BlackRock Global Growth Fund | | | | |
| | |
Fixed Income Funds | | | | |
| | |
BlackRock Bond Portfolio | | BlackRock Income Builder Portfolio | | BlackRock Short-Term Bond Fund |
BlackRock Emerging Market Debt Portfolio | | BlackRock Inflation Protected Bond Portfolio | | BlackRock Strategic Income Portfolio |
BlackRock Enhanced Income Portfolio | | BlackRock Intermediate Government Bond Portfolio | | BlackRock Total Return Fund |
BlackRock GNMA Portfolio | | | BlackRock Total Return Portfolio II |
BlackRock Government Income Portfolio | | BlackRock International Bond Portfolio | | BlackRock World Income Fund |
BlackRock High Income Fund | | BlackRock Long Duration Bond Portfolio | | |
BlackRock High Yield Bond Portfolio | | BlackRock Low Duration Bond Portfolio | | |
BlackRock Income Portfolio | | BlackRock Managed Income Portfolio | | |
| | |
Municipal Bond Funds | | | | |
| | |
BlackRock AMT-Free Municipal Bond Portfolio | | BlackRock Kentucky Municipal Bond Portfolio | | BlackRock New York Municipal Bond Fund |
BlackRock California Municipal Bond Fund | | BlackRock Municipal Insured Fund | | BlackRock Ohio Municipal Bond Portfolio |
BlackRock Delaware Municipal Bond Portfolio | | BlackRock National Municipal Fund | | BlackRock Pennsylvania Municipal Bond Fund |
BlackRock High Yield Municipal Fund | | BlackRock New Jersey Municipal Bond Fund | | BlackRock Short-Term Municipal Fund |
BlackRock Intermediate Municipal Fund | | | | |
| | |
Target Risk & Target Date Funds | | | | |
| | |
BlackRock Prepared Portfolios | | BlackRock Lifecycle Prepared Portfolios | | |
Conservative Prepared Portfolio | | Prepared Portfolio 2010 | | Prepared Portfolio 2030 |
Moderate Prepared Portfolio | | Prepared Portfolio 2015 | | Prepared Portfolio 2035 |
Growth Prepared Portfolio | | Prepared Portfolio 2020 | | Prepared Portfolio 2040 |
Aggressive Growth Prepared Portfolio | | Prepared Portfolio 2025 | | Prepared Portfolio 2045 |
| | | | Prepared Portfolio 2050 |
| * | See the prospectus for information on specific limitations on investments in the fund. |
BlackRock mutual funds are distributed by BlackRock Investments, LLC. You should consider the investment objectives, risks, charges and expenses of the funds under consideration carefully before investing. Each fund’s prospectus contains this and other information and is available at www.blackrock.com or by calling (800) 882-0052 or from your financial advisor. The prospectus should be read carefully before investing.
| | | | | | |
| | | BLACKROCK ASSET ALLOCATION PORTFOLIO | | MARCH 31, 2009 | | 39 |

This report is transmitted to shareholders only. It is not authorized for use as an offer of sale or a solicitation of an offer to buy shares of the Portfolio unless accompanied or preceded by that Portfolio’s current prospectus. Past performance results shown in this report should not be considered a representation of future performance. Investment returns and principal value of shares will fluctuate so that shares, when redeemed, may be worth more or less than their original cost. Statements and other information herein are as dated and are subject to change.
Investment in foreign securities involves special risks including fluctuating foreign exchange rates, foreign government regulations, differing degrees of liquidity and the possibility of substantial volatility due to adverse political, economic or other developments.

AA-3/09-SAR
| | | | |
| Item 2 | | – | | Code of Ethics – Not Applicable to this semi-annual report |
| | |
| Item 3 | | – | | Audit Committee Financial Expert – Not Applicable to this semi-annual report |
| | |
| Item 4 | | – | | Principal Accountant Fees and Services – Not Applicable to this semi-annual report |
| | |
| Item 5 | | – | | Audit Committee of Listed Registrants – Not Applicable |
| | |
| Item 6 | | – | | Investments (a) Asset Allocation Portfolio – Schedule of Investments. |
| | |
| Schedule of Investments March 31, 2009 (Unaudited) | | |
| | (Percentages shown are based on Net Assets) |
| | | | | | |
| | | Par
(000) | | Value |
Asset Backed Securities | | | | | | |
American Express Issuance Trust, Series 08-2, Class A, | | | | | | |
4.02%, 2/15/10 | | $ | 1,420 | | $ | 1,411,313 |
Amortizing Residential Collateral Trust, Series 02-BC5, Class M2, | | | | | | |
2.32%, 7/25/32(a) | | | 22 | | | 6,113 |
Carrington Mortgage Loan Trust, Series 06-NC4, Class A1, | | | | | | |
0.57%, 10/25/36(a) | | | 257 | | | 241,011 |
Centex Home Equity Loan Trust, Series 02-A, Class MF2, | | | | | | |
6.54%, 1/25/32(a) | | | 185 | | | 10,755 |
Centex Home Equity Loan Trust, Series 03-B, Class M3, | | | | | | |
3.62%, 6/25/33(a) | | | 137 | | | 49,144 |
Chase Issuance Trust, Series 06-A3, Class A3, | | | | | | |
0.55%, 7/15/11(a) | | | 1,075 | | | 1,072,288 |
Chase Issuance Trust, Series 07-A17, Class A, | | | | | | |
5.12%, 10/15/12 | | | 1,200 | | | 1,207,463 |
Chase Issuance Trust, Series 08-A9, Class A9, | | | | | | |
4.26%, 5/15/13 | | | 660 | | | 657,614 |
Citibank OMNI Master Trust, Series 07-A9A, Class A9, | | | | | | |
1.62%, 12/23/13(a)(b) | | | 1,435 | | | 1,299,491 |
Conseco Financial Corp., Series 96-7, Class A6, | | | | | | |
7.65%, 10/15/27(a) | | | 146 | | | 129,930 |
Countrywide Asset-Backed Certificates, Series 02-2, Class M2, | | | | | | |
2.25%, 12/25/31(a) | | | 2 | | | 657 |
Countrywide Asset-Backed Certificates, Series 03-2, Class M2, | | | | | | |
3.00%, 3/26/33(a) | | | 123 | | | 32,624 |
Countrywide Asset-Backed Certificates, Series 03-3, Class M6, | | | | | | |
3.42%, 7/25/32(a) | | | 3 | | | 379 |
Countrywide Asset-Backed Certificates, Series 03-BCI, Class M2, | | | | | | |
3.52%, 9/25/32(a) | | | 35 | | | 3,575 |
Countrywide Asset-Backed Certificates, Series 06-18, Class 2A1, | | | | | | |
0.57%, 7/25/36(a) | | | 309 | | | 291,055 |
Credit-Based Asset Servicing and Securitization, Series 04-CB4, Class M1, | | | | | | |
5.77%, 5/25/35(c) | | | 198 | | | 141,503 |
General Electric Business Loan Trust, Series 03-1, Class A, | | | | | | |
0.99%, 4/15/31(a)(b) | | | 134 | | | 96,719 |
General Electric Business Loan Trust, Series 03-1, Class B, | | | | | | |
1.86%, 4/15/31(a)(b) | | | 90 | | | 8,960 |
General Electric Business Loan Trust, Series 03-2A, Class B, | | | | | | |
1.56%, 11/15/31(a)(b) | | | 589 | | | 395,143 |
General Electric Business Loan Trust, Series 04-1, Class B, | | | | | | |
1.26%, 5/15/32(a)(b) | | | 146 | | | 60,864 |
Green Tree Manufactured Housing Contract, Series 96-6, Class A6, | | | | | | |
7.95%, 9/15/27 | | | 316 | | | 290,953 |
Harley-Davidson Motorcycle Trust, Series 05-2, Class A2, | | | | | | |
4.07%, 2/15/12 | | | 512 | | | 501,793 |
Home Equity Asset Trust, Series 07-2, Class 2A1, | | | | | | |
0.63%, 7/25/37(a) | | | 293 | | | 241,735 |
Lehman XS Trust, Series 05-5N, Class 3A2, | | | | | | |
0.88%, 11/25/35(a) | | | 563 | | | 147,274 |
Long Beach Mortgage Loan Trust, Series 03-4, Class M5A, | | | | | | |
6.52%, 8/25/33(a) | | | 45 | | | 5,889 |
Long Beach Mortgage Loan Trust, Series 04-1, Class M5, | | | | | | |
1.62%, 2/25/34(a) | | | 106 | | | 41,257 |
Massachusetts RRB Special Purpose Trust, Series 01-1, Class A, | | | | | | |
6.53%, 6/01/15 | | | 673 | | | 727,058 |
MBNA Credit Card Master Note Trust, Series 06-A4, Class A4, | | | | | | |
0.55%, 9/15/11(a) | | | 1,650 | | | 1,648,303 |
Nissan Auto Receivables Owner Trust, Series 09-A, Class 2A, | | | | | | |
2.94%, 7/15/11 | | | 1,060 | | | 1,052,731 |
Option One Mortgage Loan Trust, Series 02-6, Class M1, | | | | | | |
1.65%, 11/25/32(a) | | | 17 | | | 7,254 |
Option One Mortgage Loan Trust, Series 02-6, Class M2, | | | | | | |
3.07%, 11/25/32(a) | | | 51 | | | 5,800 |
Option One Mortgage Loan Trust, Series 03-4, Class A2, | | | | | | |
0.84%, 7/25/33(a) | | | 84 | | | 37,862 |
Option One Mortgage Loan Trust, Series 03-4, Class M5A, | | | | | | |
4.27%, 7/25/33(a) | | | 38 | | | 4,845 |
Option One Mortgage Loan Trust, Series 03-5, Class M4, | | | | | | |
3.42%, 8/25/33(a) | | | 34 | | | 3,242 |
Residential Asset Mortgage Products, Inc., Series 03-RZ2, Class M3, | | | | | | |
5.50%, 4/25/33(c) | | | 81 | | | 25,583 |
Residential Asset Securities Corp., Series 02-KS4, Class AIIB, | | | | | | |
1.02%, 7/25/32(a) | | | 38 | | | 17,247 |
Portfolio Abbreviations
| | | | | | | | |
| To simplify the listings of Portfolio holdings in the Schedule of Investments, we have abbreviated certain descriptions according to the list on the right. | | ADR | | American Depositary Receipts | | HKD | | Hong Kong Dollar |
| | ARM | | Adjustable Rate Mortgage | | IO | | Interest Only |
| | AUD | | Australian Dollar | | JPY | | Japanese Yen |
| | CAD | | Canadian Dollar | | LIBOR | | London InterBank Offered Rate |
| | CHF | | Swiss Francs | | MXN | | Mexican Peso |
| | CMT | | Constant Maturity Treasury Rate | | NOK | | Norwegian Krone |
| | CZK | | Czech Koruna | | PO | | Principal Only |
| | DJIA | | Dow Jones Industrial Average | | SEK | | Swedish Krona |
| | DKK | | Danish Krone | | SGD | | Singapore Dollar |
| | EUR | | Euro | | TBA | | To-Be-Announced |
| | GBP | | British Pound | | USD | | United States Dollar |
| | | | | | ZAR | | South African Rand |
| | | | | | |
| | | BLACKROCK ASSET ALLOCATION PORTFOLIO | | MARCH 31, 2009 | | 1 |
| | |
| Schedule of Investments (continued) | | |
| | (Percentages shown are based on Net Assets) |
| | | | | | |
| | | Par
(000) | | Value |
Asset Backed Securities | | | | | | |
Small Business Administration Participation Certificates, Series 97-20F, Class 1, | | | | | | |
7.20%, 6/01/17 | | $ | 302 | | $ | 326,970 |
Structured Asset Investment Loan Trust, Series 03-BC3, Class M2, | | | | | | |
3.45%, 4/25/33(a) | | | 11 | | | 1,838 |
Student Loan Marketing Assoc. Student Loan Trust, Series 05-4, Class A2, | | | | | | |
1.24%, 4/26/21(a) | | | 475 | | | 459,091 |
Student Loan Marketing Assoc. Student Loan Trust, Series 08-5, Class A2, | | | | | | |
2.26%, 10/25/16(a) | | | 1,720 | | | 1,682,043 |
Student Loan Marketing Assoc. Student Loan Trust, Series 08-5, Class A3, | | | | | | |
2.46%, 1/25/18(a) | | | 440 | | | 429,744 |
Student Loan Marketing Assoc. Student Loan Trust, Series 08-5, Class A4, | | | | | | |
2.86%, 7/25/23(a) | | | 1,170 | | | 1,105,865 |
| | | | | | |
Total Asset Backed Securities — 3.6% | | | | | | 15,880,978 |
| | | | | | |
Capital Trusts | | | | | | |
Commercial Banks — 0.1% | | | | | | |
Barclays Bank Plc (United Kingdom), Unsecured Notes, | | | | | | |
7.43%(a)(b)(d)(e) | | | 350 | | | 145,400 |
Royal Bank of Scotland Group Plc (United Kingdom), Subordinated Capital Securities, | | | | | | |
7.64%(a)(d)(e) | | | 500 | | | 112,500 |
UBS Preferred Funding Trust I, Capital Securities, | | | | | | |
8.62%(a)(e) | | | 35 | | | 14,047 |
Wells Fargo & Co., Series K, Subordinated Notes, | | | | | | |
7.98%(a)(e) | | | 675 | | | 317,250 |
| | | | | | |
| | | | | | 589,197 |
| | | | | | |
Diversified Financial Services — 0.5% | | | | | | |
Bank of America Institutional Capital A, Subordinated Capital Securities, | | | | | | |
8.07%, 12/31/26(b) | | | 225 | | | 95,010 |
Credit Suisse Guernsey Ltd. (Switzerland), Unsecured Notes, | | | | | | |
5.86%(a)(d)(e) | | | 530 | | | 196,416 |
First Union Capital l, Subordinated Capital Securities, | | | | | | |
7.94%, 1/15/27 | | | 325 | | | 276,278 |
General Electric Capital Corp., Subordinated Debentures, | | | | | | |
6.38%, 11/15/67(a) | | | 475 | | | 230,652 |
Goldman Sachs Capital Trust II, Unsecured Notes, | | | | | | |
5.79%(a)(e) | | | 300 | | | 124,902 |
JPMorgan Chase & Co., Subordinated Depositary Shares, | | | | | | |
7.90%(a)(e) | | | 775 | | | 498,046 |
JPMorgan Chase Capital XXV, Subordinated Capital Securities, | | | | | | |
6.80%, 10/01/37 | | | 1,150 | | | 761,612 |
Lehman Brothers Holdings Capital Trust VII, Subordinated Trust Preferred Securities, | | | | | | |
5.86%(a)(e)(f) | | | 110 | | | 11 |
| | | | | | |
| | | | | | 2,182,927 |
| | | | | | |
Insurance — 0.1% | | | | | | |
American International Group, Inc., Junior Subordinated Debentures, | | | | | | |
8.18%, 5/15/58(a)(b) | | | 151 | | | 12,865 |
CHUBB Corp., Subordinated Capital Securities, | | | | | | |
6.38%, 3/29/67(a) | | | 175 | | | 99,892 |
MetLife, Inc., Junior Subordinated Debentures, | | | | | | |
6.40%, 12/15/36 | | | 390 | | | 163,800 |
The Progressive Corp., Junior Subordinated Notes, | | | | | | |
6.70%, 6/15/37(a) | | | 310 | | | 139,450 |
| | | | | | |
| | | | | | 416,007 |
| | | | | | |
Total Capital Trusts — 0.7% | | | | | | 3,188,131 |
| | | | | | |
Collateralized Debt Obligations — 0.0% | | | | | | |
Knollwood Ltd., Series 04-1A, Class C, | | | | | | |
4.61%, 1/10/39(a)(b) | | | 111 | | | 0 |
| | | | | | |
| | |
| | | Shares | | |
Common Stocks | | | | | | |
Aerospace & Defense — 0.9% | | | | | | |
Alliant Techsystems, Inc.(g) | | | 475 | | | 31,816 |
Argon ST, Inc.(g) | | | 4,642 | | | 88,059 |
BAE Systems Plc | | | 92,308 | | | 442,718 |
BE Aerospace, Inc.(g) | | | 27,900 | | | 241,893 |
General Dynamics Corp. | | | 9,400 | | | 390,946 |
Goodrich Corp. | | | 8,475 | | | 321,118 |
Honeywell International, Inc. | | | 33,426 | | | 931,248 |
L-3 Communications Holdings, Inc. | | | 3,350 | | | 227,130 |
Lockheed Martin Corp. | | | 3,125 | | | 215,719 |
Northrop Grumman Corp. | | | 10,850 | | | 473,494 |
Orbital Sciences Corp.(g) | | | 10,950 | | | 130,195 |
Precision Castparts Corp. | | | 1,500 | | | 89,850 |
VT Group Plc | | | 51,200 | | | 346,890 |
| | | | | | |
| | | | | | 3,931,076 |
| | | | | | |
Air Freight & Logistics — 0.3% | | | | | | |
Deutsche Post AG | | | 31,453 | | | 338,912 |
FedEx Corp. | | | 1,880 | | | 83,641 |
Forward Air Corp. | | | 6,700 | | | 108,741 |
Kintetsu World Express, Inc. | | | 12,700 | | | 236,285 |
United Parcel Service, Inc. - Class B | | | 7,900 | | | 388,838 |
UTi Worldwide, Inc. | | | 4,900 | | | 58,555 |
Yamato Holdings Co. Ltd. | | | 13,100 | | | 124,241 |
| | | | | | |
| | | | | | 1,339,213 |
| | | | | | |
Airlines — 0.3% | | | | | | |
Alaska Air Group, Inc.(g) | | | 1,450 | | | 25,476 |
China Airlines Ltd.(g) | | | 505,100 | | | 125,973 |
Copa Holdings SA - Class A | | | 1,800 | | | 51,606 |
Delta Air Lines, Inc.(g) | | | 106,650 | | | 600,440 |
easyJet Plc(g) | | | 86,172 | | | 344,790 |
Southwest Airlines Co. | | | 9,700 | | | 61,401 |
| | | | | | |
| | | | | | 1,209,686 |
| | | | | | |
Auto Components — 0.2% | | | | | | |
Aisin Seiki Co. Ltd. | | | 6,300 | | | 101,093 |
Autoliv, Inc. | | | 9,400 | | | 174,558 |
Compagnie Generale des Etablissements Michelin - Class B | | | 3,900 | | | 144,552 |
Hyundai Mobis | | | 4,000 | | | 232,293 |
Westport Innovations, Inc.(g) | | | 20,143 | | | 100,650 |
| | | | | | |
| | | | | | 753,146 |
| | | | | | |
| | | | | | |
2 | | BLACKROCK ASSET ALLOCATION PORTFOLIO | | MARCH 31, 2009 | | |
| | |
| Schedule of Investments (continued) | | |
| | (Percentages shown are based on Net Assets) |
| | | | | |
| | | Shares | | Value |
Common Stocks | | | | | |
Automobiles — 0.3% | | | | | |
Nissan Motor Co. Ltd. | | 50,400 | | $ | 182,162 |
PT Astra International Tbk | | 346,500 | | | 428,913 |
Toyota Motor Corp. | | 25,600 | | | 813,155 |
| | | | | |
| | | | | 1,424,230 |
| | | | | |
Beverages — 0.9% | | | | | |
Britvic Plc | | 30,000 | | | 97,132 |
The Coca-Cola Co. | | 42,873 | | | 1,884,268 |
Constellation Brands, Inc. - Class A(g) | | 34,985 | | | 416,322 |
Foster’s Group Ltd. | | 67,700 | | | 238,091 |
Heckmann Corp.(g)(h) | | 18,600 | | | 89,652 |
Molson Coors Brewing Co. - Class B | | 3,800 | | | 130,264 |
Pepsi Bottling Group, Inc. | | 12,975 | | | 287,266 |
PepsiCo, Inc. | | 14,475 | | | 745,173 |
| | | | | |
| | | | | 3,888,168 |
| | | | | |
Biotechnology — 0.9% | | | | | |
Acorda Therapeutics, Inc.(g) | | 2,000 | | | 39,620 |
Alkermes, Inc.(g) | | 4,400 | | | 53,372 |
Amgen, Inc.(g) | | 16,275 | | | 805,938 |
Biogen Idec, Inc.(g) | | 3,800 | | | 199,196 |
BioMarin Pharmaceutical, Inc.(g) | | 1,200 | | | 14,820 |
Celera Corp.(g) | | 4,600 | | | 35,098 |
Celgene Corp.(g) | | 13,000 | | | 577,200 |
Cephalon, Inc.(g) | | 650 | | | 44,265 |
Dyax Corp.(g) | | 36,702 | | | 92,122 |
Genzyme Corp.(g) | | 9,000 | | | 534,510 |
Gilead Sciences, Inc.(g) | | 20,800 | | | 963,456 |
Martek Biosciences Corp. | | 15,525 | | | 283,331 |
Myriad Genetics, Inc.(g) | | 1,000 | | | 45,470 |
Vertex Pharmaceuticals, Inc.(g) | | 1,375 | | | 39,504 |
| | | | | |
| | | | | 3,727,902 |
| | | | | |
Building Products — 0.0% | | | | | |
Griffon Corp.(g) | | 8,200 | | | 61,500 |
| | | | | |
Capital Markets — 0.9% | | | | | |
The Bank of New York Mellon Corp. | | 3,700 | | | 104,525 |
The Charles Schwab Corp. | | 9,350 | | | 144,925 |
Daishin Securities Co. Ltd.(g) | | 8,900 | | | 110,667 |
Eaton Vance Corp. | | 1,175 | | | 26,849 |
The Goldman Sachs Group, Inc. | | 7,450 | | | 789,849 |
Greenhill & Co., Inc. | | 300 | | | 22,155 |
ICAP Plc | | 17,900 | | | 77,950 |
Invesco Ltd. | | 26,938 | | | 373,361 |
KBW, Inc.(g) | | 8,900 | | | 181,115 |
Knight Capital Group, Inc.—Class A(g) | | 4,550 | | | 67,067 |
Matsui Securities Co. Ltd. | | 10,500 | | | 68,941 |
Morgan Stanley | | 12,100 | | | 275,517 |
NGP Capital Resources Co. | | 2,700 | | | 13,419 |
Northern Trust Corp. | | 2,724 | | | 162,950 |
Polaris Securities Co. Ltd. | | 634,112 | | | 220,911 |
Raymond James Financial, Inc.(h) | | 8,950 | | | 176,315 |
RiskMetrics Group, Inc.(g) | | 5,225 | | | 74,665 |
Samsung Securities Co. Ltd.(g) | | 1,700 | | | 71,517 |
Schroders Plc | | 9,800 | | | 111,093 |
Shinko Securities Co. Ltd. | | 74,400 | | | 146,864 |
State Street Corp. | | 5,625 | | | 173,137 |
TD Ameritrade Holding Corp.(g) | | 16,360 | | | 225,932 |
Treasure Island Royalty Trust(g) | | 217,129 | | | 69,481 |
UBS AG(g) | | 46,461 | | | 435,583 |
| | | | | |
| | | | | 4,124,788 |
| | | | | |
Chemicals — 1.0% | | | | | |
Agrium, Inc. | | 3,950 | | | 141,371 |
Air Water, Inc. | | 16,600 | | | 147,172 |
Airgas, Inc. | | 2,450 | | | 82,835 |
Albemarle Corp. | | 15,800 | | | 343,966 |
Celanese Corp. - Series A | | 15,400 | | | 205,898 |
E.I. du Pont de Nemours & Co. | | 5,500 | | | 122,815 |
Ecolab, Inc. | | 12,600 | | | 437,598 |
FMC Corp. | | 11,400 | | | 491,796 |
Huabao International Holdings Ltd. | | 367,700 | | | 302,407 |
Intrepid Potash, Inc.(g) | | 4,525 | | | 83,486 |
LG Chem Ltd. | | 3,700 | | | 234,205 |
Monsanto Co. | | 2,325 | | | 193,208 |
Nihon Nohyaku Co. Ltd. | | 21,500 | | | 148,719 |
Praxair, Inc. | | 1,575 | | | 105,982 |
Rockwood Holdings, Inc.(g) | | 1,800 | | | 14,292 |
The Scotts Miracle-Gro Co.—Class A | | 4,275 | | | 148,342 |
Syngenta AG | | 3,294 | | | 662,136 |
Terra Industries, Inc. | | 1,725 | | | 48,455 |
Valspar Corp. | | 1,925 | | | 38,442 |
Yara International ASA | | 10,700 | | | 233,762 |
Zeon Corp. | | 60,600 | | | 164,627 |
| | | | | |
| | | | | 4,351,514 |
| | | | | |
Commercial Banks — 1.7% | | | | | |
Banco de Sabadell SA | | 19,000 | | | 95,361 |
Banco Santander SA | | 22,534 | | | 155,367 |
Bangkok Bank Public Co. Ltd. | | 57,100 | | | 119,921 |
Bank of Hawaii Corp. | | 7,650 | | | 252,297 |
The Bank of Kyoto Ltd. | | 10,000 | | | 84,933 |
Chang Hwa Commercial Bank | | 266,000 | | | 89,628 |
The Chiba Bank Ltd. | | 21,900 | | | 109,161 |
China Construction Bank Corp. - Class H | | 791,000 | | | 449,034 |
City National Corp. | | 4,200 | | | 141,834 |
CoBiz Financial, Inc. | | 17,235 | | | 90,484 |
Columbia Banking System, Inc. | | 11,194 | | | 71,642 |
Commerce Bancshares, Inc. | | 4,025 | | | 146,108 |
Credit Agricole SA | | 50,255 | | | 554,494 |
Credito Emiliano SpA | | 8,600 | | | 35,367 |
Cullen/Frost Bankers, Inc. | | 4,225 | | | 198,322 |
CVB Financial Corp.(h) | | 11,700 | | | 77,571 |
DBS Group Holdings Ltd. | | 126,660 | | | 706,122 |
Glacier Bancorp, Inc. | | 4,000 | | | 62,840 |
The Gunma Bank Ltd. | | 25,000 | | | 136,033 |
HSBC Holdings Plc | | 101,909 | | | 567,384 |
Itau UniBanco Banco Multiplo SA - ADR | | 9,200 | | | 100,098 |
KeyCorp | | 31,300 | | | 246,331 |
Mizuho Financial Group, Inc. | | 95,100 | | | 185,708 |
National Bank of Canada | | 3,600 | | | 114,956 |
PacWest Bancorp | | 6,200 | | | 88,846 |
Prosperity Bancshares, Inc. | | 4,500 | | | 123,075 |
Siam Commercial Bank Public Co. Ltd. | | 78,400 | | | 120,442 |
Signature Bank(g) | | 3,175 | | | 89,630 |
Standard Chartered Plc | | 42,333 | | | 525,660 |
Trustmark Corp. | | 1,200 | | | 22,056 |
U.S. Bancorp | | 11,700 | | | 170,937 |
Union Bank of India | | 55,900 | | | 162,046 |
Unione di Banche Italiane ScpA | | 8,600 | | | 94,696 |
Valley National Bancorp | | 10,525 | | | 130,194 |
Wells Fargo & Co. | | 42,500 | | | 605,200 |
Westamerica Bancorp | | 3,800 | | | 173,128 |
Wing Hang Bank Ltd. | | 13,000 | | | 62,311 |
Wintrust Financial Corp. | | 4,050 | | | 49,815 |
| | | | | | |
| | | BLACKROCK ASSET ALLOCATION PORTFOLIO | | MARCH 31, 2009 | | 3 |
| | |
| Schedule of Investments (continued) | | |
| | (Percentages shown are based on Net Assets) |
| | | | | |
| | | Shares | | Value |
Common Stocks | | | | | |
Commercial Banks (concluded) | | | | | |
Zions Bancorp | | 12,550 | | $ | 123,367 |
| | | | | |
| | | | | 7,332,399 |
| | | | | |
Commercial Services & Supplies — 0.9% | | | | | |
Alexco Resource Corp.(g) | | 12,122 | | | 16,056 |
Babcock International Group Plc | | 76,500 | | | 470,604 |
The Brink’s Co. | | 5,975 | | | 158,098 |
Clean Harbors, Inc.(g) | | 4,100 | | | 196,800 |
Copart, Inc.(g) | | 2,400 | | | 71,184 |
Corrections Corp. of America(g) | | 18,600 | | | 238,266 |
De La Rue Plc | | 7,800 | | | 108,619 |
De La Rue Plc—Preference Shares | | 4,594 | | | 64,065 |
Deluxe Corp. | | 2,675 | | | 25,760 |
G4S Plc | | 59,400 | | | 165,051 |
The GEO Group, Inc.(g) | | 17,000 | | | 225,250 |
Iron Mountain, Inc.(g) | | 7,550 | | | 167,384 |
Loomis AB - Class B(g) | | 24,300 | | | 187,733 |
Republic Services, Inc. | | 26,362 | | | 452,108 |
RPS Group Plc | | 76,100 | | | 170,080 |
Sykes Enterprises, Inc.(g) | | 8,448 | | | 140,490 |
Team, Inc.(g) | | 4,300 | | | 50,396 |
Tetra Tech, Inc.(g) | | 6,800 | | | 138,584 |
Waste Connections, Inc.(g) | | 1,000 | | | 25,700 |
Waste Management, Inc. | | 26,075 | | | 667,520 |
| | | | | |
| | | | | 3,739,748 |
| | | | | |
Communications Equipment — 1.4% | | | | | |
Arris Group, Inc.(g) | | 23,500 | | | 173,195 |
Cisco Systems, Inc.(g) | | 103,816 | | | 1,740,994 |
CommScope, Inc.(g) | | 2,304 | | | 26,173 |
EMS Technologies, Inc.(g) | | 19,525 | | | 340,907 |
GeoVision, Inc. | | 22,500 | | | 87,726 |
Harris Corp. | | 3,946 | | | 114,197 |
Neutral Tandem, Inc.(g) | | 5,025 | | | 123,665 |
Nokia Oyj | | 49,793 | | | 582,352 |
Polycom, Inc.(g) | | 23,800 | | | 366,282 |
QUALCOMM, Inc. | | 63,922 | | | 2,487,205 |
| | | | | |
| | | | | 6,042,696 |
| | | | | |
Computers & Peripherals — 1.4% | | | | | |
Apple, Inc.(g) | | 16,234 | | | 1,706,518 |
EMC Corp.(g) | | 24,775 | | | 282,435 |
Hewlett-Packard Co. | | 36,025 | | | 1,154,961 |
HTC Corp. | | 7,670 | | | 94,441 |
International Business Machines Corp. | | 20,625 | | | 1,998,356 |
Lexmark International, Inc. - Class A(g) | | 1,450 | | | 24,462 |
NCR Corp.(g) | | 1,400 | | | 11,130 |
QLogic Corp.(g) | | 15,975 | | | 177,642 |
Sun Microsystems, Inc.(g) | | 8,600 | | | 62,952 |
Teradata Corp.(g) | | 8,340 | | | 135,275 |
Western Digital Corp.(g) | | 19,671 | | | 380,437 |
| | | | | |
| | | | | 6,028,609 |
| | | | | |
Construction & Engineering — 0.3% | | | | | |
Chicago Bridge & Iron Co. NV - ADR | | 7,800 | | | 48,906 |
EMCOR Group, Inc.(g) | | 1,900 | | | 32,623 |
Fluor Corp. | | 16,000 | | | 552,800 |
Granite Construction, Inc. | | 800 | | | 29,984 |
Quanta Services, Inc.(g) | | 11,600 | | | 248,820 |
The Shaw Group, Inc.(g) | | 700 | | | 19,187 |
United Group Ltd. | | 53,741 | | | 344,064 |
URS Corp.(g) | | 450 | | | 18,185 |
| | | | | |
| | | | | 1,294,569 |
| | | | | |
Construction Materials — 0.0% | | | | | |
Martin Marietta Materials, Inc. | | 175 | | | 13,877 |
| | | | | |
Consumer Finance — 0.0% | | | | | |
Capital One Financial Corp. | | 6,800 | | | 83,232 |
| | | | | |
Containers & Packaging — 0.3% | | | | | |
AptarGroup, Inc. | | 2,000 | | | 62,280 |
Ball Corp. | | 3,500 | | | 151,900 |
Owens-Illinois, Inc.(g) | | 11,920 | | | 172,125 |
Pactiv Corp.(g) | | 17,475 | | | 254,960 |
Rock-Tenn Co. - Class A | | 6,618 | | | 179,017 |
Silgan Holdings, Inc. | | 6,450 | | | 338,883 |
Sonoco Products Co. | | 11,050 | | | 231,829 |
Toyo Seikan Kaisha Ltd. | | 9,000 | | | 132,848 |
| | | | | |
| | | | | 1,523,842 |
| | | | | |
Distributors — 0.0% | | | | | |
Inchcape Plc | | 82,400 | | | 89,336 |
| | | | | |
Diversified Consumer Services — 0.3% | | | | | |
Apollo Group, Inc. - Class A(g) | | 11,525 | | | 902,753 |
Benesse Corp. | | 2,700 | | | 99,457 |
Career Education Corp.(g) | | 1,875 | | | 44,925 |
DeVry, Inc. | | 1,777 | | | 85,616 |
H&R Block, Inc. | | 5,250 | | | 95,498 |
ITT Educational Services, Inc.(g) | | 550 | | | 66,781 |
| | | | | |
| | | | | 1,295,030 |
| | | | | |
Diversified Financial Services — 1.1% | | | | | |
Bank of America Corp. | | 61,750 | | | 421,135 |
Citigroup, Inc.(h) | | 46,850 | | | 118,531 |
CME Group, Inc. | | 3,450 | | | 850,046 |
Deutsche Boerse AG | | 2,100 | | | 125,992 |
Hong Kong Exchanges & Clearing Ltd. | | 13,600 | | | 128,349 |
Investor AB - B Shares | | 29,815 | | | 377,018 |
JPMorgan Chase & Co. | | 62,025 | | | 1,648,625 |
London Stock Exchange Group Plc | | 6,200 | | | 50,130 |
MSCI, Inc. - Class A(g) | | 19,375 | | | 327,631 |
The NASDAQ OMX Group, Inc.(g) | | 9,350 | | | 183,073 |
NYSE Euronext, Inc. | | 7,600 | | | 136,040 |
PHH Corp.(g) | | 10,600 | | | 148,930 |
Pohjola Bank Plc | | 12,800 | | | 75,251 |
Yuanta Financial Holding Co. Ltd. | | 584,500 | | | 267,648 |
| | | | | |
| | | | | 4,858,399 |
| | | | | |
Diversified Telecommunication Services — 1.1% | | | | | |
AT&T, Inc. | | 62,099 | | | 1,564,895 |
Cable & Wireless Plc | | 82,500 | | | 164,983 |
CenturyTel, Inc. | | 6,575 | | | 184,889 |
Embarq Corp. | | 3,600 | | | 136,260 |
France Telecom SA | | 31,962 | | | 728,644 |
Iowa Telecommunications Services, Inc. | | 9,200 | | | 105,432 |
Koninklijke KPN NV | | 52,996 | | | 707,554 |
Tele Norte Leste Participacoes SA—ADR | | 12,700 | | | 175,768 |
Telkom SA Ltd. | | 10,500 | | | 116,986 |
Verizon Communications, Inc. | | 33,344 | | | 1,006,989 |
Vimpel-Communications - ADR | | 9,700 | | | 63,438 |
| | | | | |
| | | | | 4,955,838 |
| | | | | |
Electric Utilities — 0.8% | | | | | |
American Electric Power Co., Inc. | | 20,300 | | | 512,778 |
Companhia Energetica de Minas Gerais - CEMIG - ADR | | 15,353 | | | 226,917 |
DPL, Inc. | | 2,050 | | | 46,207 |
E.ON AG | | 19,551 | | | 542,231 |
| | | | | | |
4 | | BLACKROCK ASSET ALLOCATION PORTFOLIO | | MARCH 31, 2009 | | |
| | |
| Schedule of Investments (continued) | | |
| | (Percentages shown are based on Net Assets) |
| | | | | |
| | | Shares | | Value |
Common Stocks | | | | | |
Electric Utilities (concluded) | | | | | |
Edison International | | 7,010 | | $ | 201,958 |
El Paso Electric Co.(g) | | 10,300 | | | 145,127 |
Entergy Corp. | | 6,410 | | | 436,457 |
IDACORP, Inc. | | 1,600 | | | 37,376 |
Northeast Utilities | | 9,500 | | | 205,105 |
NV Energy, Inc. | | 25,075 | | | 235,454 |
Pinnacle West Capital Corp. | | 13,775 | | | 365,864 |
Terna Rete Elettrica Nazionale SpA | | 67,500 | | | 210,122 |
UIL Holdings Corp. | | 4,600 | | | 102,672 |
Unisource Energy Corp. | | 625 | | | 17,619 |
Westar Energy, Inc. | | 7,400 | | | 129,722 |
| | | | | |
| | | | | 3,415,609 |
| | | | | |
Electrical Equipment — 0.3% | | | | | |
A.O. Smith Corp. | | 1,375 | | | 34,622 |
Alstom SA | | 6,643 | | | 344,482 |
AMETEK, Inc. | | 10,000 | | | 312,700 |
Energy Conversion Devices, Inc.(g)(h) | | 3,925 | | | 52,085 |
ITM Power Plc(g) | | 12,000 | | | 1,676 |
Ocean Power Technologies, Inc.(g) | | 1,000 | | | 6,600 |
Panasonic Electric Works Co. Ltd. | | 18,000 | | | 131,763 |
SGL Carbon AG(g) | | 7,800 | | | 185,650 |
Thomas & Betts Corp.(g) | | 775 | | | 19,390 |
| | | | | |
| | | | | 1,088,968 |
| | | | | |
Electronic Equipment, Instruments & Components — 0.5% | | | | | |
Agilent Technologies, Inc.(g) | | 9,190 | | | 141,250 |
Amphenol Corp. - Class A | | 8,900 | | | 253,561 |
Anixter International, Inc.(g) | | 4,529 | | | 143,479 |
Arrow Electronics, Inc.(g) | | 13,850 | | | 263,981 |
AU Optronics Corp. - ADR | | 12,500 | | | 104,875 |
Avnet, Inc.(g) | | 2,250 | | | 39,397 |
Cogent, Inc.(g) | | 8,125 | | | 96,687 |
Hosiden Corp. | | 12,200 | | | 121,726 |
Ingram Micro, Inc. - Class A(g) | | 1,900 | | | 24,016 |
Jabil Circuit, Inc. | | 25,125 | | | 139,695 |
Nidec Corp. | | 5,400 | | | 243,080 |
Rotork Plc | | 26,700 | | | 326,056 |
Tech Data Corp.(g) | | 9,990 | | | 217,582 |
TTM Technologies, Inc.(g) | | 23,500 | | | 136,300 |
| | | | | |
| | | | | 2,251,685 |
| | | | | |
Energy Equipment & Services — 1.3% | | | | | |
Allis-Chalmers Energy, Inc.(g) | | 15,900 | | | 30,687 |
Baker Hughes, Inc. | | 15,300 | | | 436,815 |
BJ Services Co. | | 8,700 | | | 86,565 |
Complete Production Services, Inc.(g) | | 900 | | | 2,772 |
ENSCO International, Inc. | | 4,475 | | | 118,140 |
FMC Technologies, Inc.(g) | | 925 | | | 29,017 |
Halliburton Co. | | 22,730 | | | 351,633 |
Helix Energy Solutions Group, Inc.(g) | | 5,075 | | | 26,086 |
Helmerich & Payne, Inc. | | 1,925 | | | 43,832 |
Hercules Offshore, Inc.(g) | | 1,400 | | | 2,212 |
HSE Integrated Ltd.(g) | | 561 | | | 156 |
John Wood Group Plc | | 49,400 | | | 158,723 |
Key Energy Services, Inc.(g) | | 10,800 | | | 31,104 |
Leader Energy Services Ltd.(g) | | 15,957 | | | 506 |
Nabors Industries Ltd.(g) | | 14,975 | | | 149,600 |
National Oilwell Varco, Inc.(g) | | 899 | | | 25,810 |
Noble Corp. | | 11,510 | | | 277,276 |
Precision Drilling Trust | | 3,300 | | | 8,844 |
Saipem SpA | | 7,600 | | | 135,227 |
Schlumberger Ltd. | | 33,447 | | | 1,358,617 |
Smith International, Inc. | | 13,400 | | | 287,832 |
Superior Energy Services, Inc.(g) | | 9,905 | | | 127,675 |
Technicoil Corp.(g) | | 46,400 | | | 11,041 |
Technip SA | | 3,400 | | | 119,856 |
Tidewater, Inc. | | 1,275 | | | 47,341 |
Transocean Ltd.(g) | | 22,556 | | | 1,327,195 |
Unit Corp.(g) | | 1,475 | | | 30,857 |
Weatherford International Ltd.(g) | | 26,200 | | | 290,034 |
WorleyParsons Ltd. | | 10,600 | | | 133,585 |
| | | | | |
| | | | | 5,649,038 |
| | | | | |
Food & Staples Retailing — 1.3% | | | | | |
BJ’s Wholesale Club, Inc.(g) | | 5,575 | | | 178,344 |
Carrefour SA | | 13,233 | | | 516,220 |
CVS Caremark Corp. | | 14,325 | | | 393,794 |
The Kroger Co. | | 22,400 | | | 475,328 |
Ruddick Corp. | | 5,710 | | | 128,190 |
Safeway, Inc. | | 31,980 | | | 645,676 |
Shoppers Drug Mart Corp. | | 4,800 | | | 165,000 |
SUPERVALU, Inc. | | 16,375 | | | 233,835 |
Tesco Plc | | 162,999 | | | 778,766 |
Wal-Mart Stores, Inc. | | 45,586 | | | 2,375,031 |
| | | | | |
| | | | | 5,890,184 |
| | | | | |
Food Products — 1.0% | | | | | |
American Italian Pasta Co. - Class A(g) | | 1,000 | | | 34,810 |
Archer-Daniels-Midland Co. | | 12,250 | | | 340,305 |
Barry Callebaut AG(g) | | 200 | | | 91,353 |
Cadbury Plc | | 21,200 | | | 159,911 |
Campbell Soup Co. | | 7,000 | | | 191,520 |
ConAgra Foods, Inc. | | 18,000 | | | 303,660 |
Dean Foods Co.(g) | | 17,760 | | | 321,101 |
Del Monte Foods Co. | | 24,396 | | | 177,847 |
Fresh Del Monte Produce, Inc.(g) | | 7,800 | | | 128,076 |
Green Mountain Coffee Roasters, Inc.(g) | | 1,000 | | | 48,000 |
The Hershey Co. | | 3,550 | | | 123,362 |
The J.M. Smucker Co. | | 7,600 | | | 283,252 |
Kraft Foods, Inc. - Class A | | 2,726 | | | 60,763 |
Nestle SA | | 37,015 | | | 1,250,528 |
Nong Shim Co. Ltd. | | 1,800 | | | 280,479 |
Nutreco Holding NV | | 5,200 | | | 186,189 |
Parmalat SpA | | 73,200 | | | 150,702 |
Ralcorp Holdings, Inc.(g) | | 950 | | | 51,186 |
Smart Balance, Inc.(g) | | 5,600 | | | 33,824 |
Toyo Suisan Kaisha Ltd. | | 7,900 | | | 163,006 |
Viscofan SA | | 10,300 | | | 200,130 |
| | | | | |
| | | | | 4,580,004 |
| | | | | |
Gas Utilities — 0.3% | | | | | |
Atmos Energy Corp. | | 5,725 | | | 132,362 |
CMS Energy Corp. | | 22,400 | | | 265,216 |
EQT Corp. | | 11,170 | | | 349,956 |
Questar Corp. | | 8,280 | | | 243,680 |
Snam Rete Gas SpA | | 24,800 | | | 133,068 |
UGI Corp. | | 7,950 | | | 187,700 |
| | | | | |
| | | | | 1,311,982 |
| | | | | |
Health Care Equipment & Supplies — 0.9% | | | | | |
Baxter International, Inc. | | 3,725 | | | 190,795 |
Beckman Coulter, Inc. | | 675 | | | 34,432 |
Becton, Dickinson & Co. | | 2,375 | | | 159,695 |
C.R. Bard, Inc. | | 4,550 | | | 362,726 |
Cie Generale d’Optique Essilor International SA | | 13,095 | | | 505,959 |
| | | | | | |
| | | BLACKROCK ASSET ALLOCATION PORTFOLIO | | MARCH 31, 2009 | | 5 |
| | |
| Schedule of Investments (continued) | | |
| | (Percentages shown are based on Net Assets) |
| | | | | |
| | | Shares | | Value |
Common Stocks | | | | | |
Health Care Equipment & Supplies (concluded) | | | | | |
The Cooper Cos., Inc. | | 12,373 | | $ | 327,142 |
Covidien Ltd. | | 4,850 | | | 161,214 |
DiaSorin SpA | | 6,900 | | | 154,325 |
Edwards Lifesciences Corp.(g) | | 750 | | | 45,473 |
Hologic, Inc.(g) | | 37,050 | | | 484,984 |
Immucor, Inc.(g) | | 4,630 | | | 116,444 |
Kinetic Concepts, Inc.(g) | | 7,725 | | | 163,152 |
Masimo Corp.(g) | | 1,300 | | | 37,674 |
Merit Medical Systems, Inc.(g) | | 6,725 | | | 82,112 |
NuVasive, Inc.(g) | | 700 | | | 21,966 |
ResMed, Inc.(g) | | 5,400 | | | 190,836 |
ResMed, Inc. - ADR(g) | | 21,500 | | | 79,235 |
Smith & Nephew Plc | | 12,100 | | | 75,315 |
SonoSite, Inc.(g) | | 5,225 | | | 93,423 |
Sonova Holding AG | | 3,400 | | | 205,207 |
St. Jude Medical, Inc.(g) | | 3,900 | | | 141,687 |
STERIS Corp. | | 2,050 | | | 47,724 |
Symmetry Medical, Inc.(g) | | 10,725 | | | 67,675 |
Teleflex, Inc. | | 3,575 | | | 139,747 |
Thoratec Corp.(g) | | 1,200 | | | 30,828 |
Wright Medical Group, Inc.(g) | | 6,605 | | | 86,063 |
Zoll Medical Corp.(g) | | 7,250 | | | 104,110 |
| | | | | |
| | | | | 4,109,943 |
| | | | | |
Health Care Providers & Services — 1.5% | | | | | |
Aetna, Inc. | | 12,200 | | | 296,826 |
Amedisys, Inc.(g) | | 2,700 | | | 74,223 |
AmerisourceBergen Corp. | | 4,600 | | | 150,236 |
Centene Corp.(g) | | 6,400 | | | 115,328 |
CIGNA Corp. | | 13,825 | | | 243,182 |
DaVita, Inc.(g) | | 2,300 | | | 101,085 |
Express Scripts, Inc.(g) | | 3,550 | | | 163,904 |
Fresenius Medical Care AG & Co. KGaA | | 5,400 | | | 209,545 |
HealthSouth Corp.(g) | | 11,900 | | | 105,672 |
Henry Schein, Inc.(g) | | 11,700 | | | 468,117 |
HMS Holdings Corp.(g) | | 7,425 | | | 244,282 |
IPC The Hospitalist Co., Inc.(g) | | 6,300 | | | 119,889 |
Kindred Healthcare, Inc.(g) | | 1,375 | | | 20,556 |
Laboratory Corp. of America Holdings(g) | | 6,080 | | | 355,619 |
LifePoint Hospitals, Inc.(g) | | 2,175 | | | 45,371 |
Lincare Holdings, Inc.(g) | | 9,500 | | | 207,100 |
Magellan Health Services, Inc.(g) | | 13,000 | | | 473,720 |
Medco Health Solutions, Inc.(g) | | 24,670 | | | 1,019,858 |
MEDNAX, Inc.(g) | | 25,530 | | | 752,369 |
MWI Veterinary Supply, Inc.(g) | | 6,247 | | | 177,915 |
Omnicare, Inc. | | 1,450 | | | 35,510 |
PharMerica Corp.(g) | | 8,800 | | | 146,432 |
Rhoen Klinikum AG | | 15,000 | | | 278,196 |
Sun Healthcare Group, Inc.(g) | | 16,800 | | | 141,792 |
UnitedHealth Group, Inc. | | 22,775 | | | 476,681 |
Universal Health Services, Inc. - Class B | | 625 | | | 23,962 |
VCA Antech, Inc.(g) | | 2,900 | | | 65,395 |
WellPoint, Inc.(g) | | 3,400 | | | 129,098 |
| | | | | |
| | | | | 6,641,863 |
| | | | | |
Health Care Technology — 0.1% | | | | | |
MedAssets, Inc.(g) | | 6,200 | | | 88,350 |
Omnicell, Inc.(g) | | 8,200 | | | 64,124 |
Phase Forward, Inc.(g) | | 10,600 | | | 135,574 |
| | | | | |
| | | | | 288,048 |
| | | | | |
Hotels, Restaurants & Leisure — 1.1% | | | | | |
Brinker International, Inc. | | 4,200 | | | 63,420 |
Burger King Holdings, Inc. | | 42,700 | | | 979,965 |
Darden Restaurants, Inc. | | 11,800 | | | 404,268 |
Domino’s Pizza UK & IRL Plc | | 50,200 | | | 161,639 |
Greene King Plc | | 12,000 | | | 84,155 |
InterContinental Hotels Group Plc | | 19,718 | | | 149,606 |
Intralot SA | | 13,000 | | | 64,095 |
McDonald’s Corp. | | 25,600 | | | 1,396,992 |
P.F. Chang’s China Bistro, Inc.(g) | | 2,825 | | | 64,636 |
Panera Bread Co. - Class A(g)(h) | | 2,700 | | | 150,930 |
Pinnacle Entertainment, Inc.(g) | | 14,110 | | | 99,334 |
REXLot Holdings Ltd.(g) | | 1,361,400 | | | 43,035 |
Scientific Games Corp. - Class A(g) | | 29,950 | | | 362,694 |
Sodexo | | 4,800 | | | 218,640 |
Sonic Corp.(g) | | 5,900 | | | 59,118 |
Starwood Hotels & Resorts Worldwide, Inc. | | 23,550 | | | 299,085 |
Texas Roadhouse, Inc. - Class A(g) | | 4,950 | | | 47,174 |
Wendy’s/Arby’s Group, Inc. - Class A | | 19,000 | | | 95,570 |
William Hill Plc | | 55,900 | | | 136,292 |
WMS Industries, Inc.(g) | | 800 | | | 16,728 |
| | | | | |
| | | | | 4,897,376 |
| | | | | |
Household Durables — 0.3% | | | | | |
Bellway Plc | | 7,800 | | | 75,633 |
Centex Corp. | | 20,500 | | | 153,750 |
D.R. Horton, Inc. | | 43,500 | | | 421,950 |
iRobot Corp.(g) | | 8,074 | | | 61,362 |
KB Home | | 12,525 | | | 165,080 |
Newell Rubbermaid, Inc. | | 30,150 | | | 192,357 |
NVR, Inc.(g) | | 475 | | | 203,181 |
Persimmon Plc | | 15,600 | | | 77,109 |
The Stanley Works | | 3,950 | | | 115,024 |
Toll Brothers, Inc.(g) | | 650 | | | 11,804 |
| | | | | |
| | | | | 1,477,250 |
| | | | | |
Household Products — 0.5% | | | | | |
Church & Dwight Co., Inc. | | 9,650 | | | 504,020 |
Clorox Co. | | 7,100 | | | 365,508 |
Colgate-Palmolive Co. | | 1,900 | | | 112,062 |
Energizer Holdings, Inc.(g) | | 600 | | | 29,814 |
The Procter & Gamble Co. | | 24,905 | | | 1,172,776 |
| | | | | |
| | | | | 2,184,180 |
| | | | | |
Independent Power Producers & Energy Traders — 0.1% | | | | | |
International Power Plc | | 48,200 | | | 145,563 |
NRG Energy, Inc.(g) | | 13,760 | | | 242,176 |
| | | | | |
| | | | | 387,739 |
| | | | | |
Industrial Conglomerates — 0.6% | | | | | |
3M Co. | | 11,900 | | | 591,668 |
Cookson Group Plc | | 766,000 | | | 178,706 |
General Electric Co. | | 106,375 | | | 1,075,451 |
Hutchison Whampoa Ltd. | | 97,000 | | | 476,180 |
Keppel Corp. Ltd. | | 134,000 | | | 442,717 |
| | | | | |
| | | | | 2,764,722 |
| | | | | |
Insurance — 1.8% | | | | | |
ACE Ltd. | | 8,025 | | | 324,210 |
AFLAC, Inc. | | 6,000 | | | 116,160 |
Allianz SE | | 7,310 | | | 611,867 |
American Financial Group, Inc. | | 2,550 | | | 40,928 |
Amlin Plc | | 11,600 | | | 57,172 |
AON Corp. | | 7,000 | | | 285,740 |
Arch Capital Group Ltd.(g) | | 2,525 | | | 135,996 |
| | | | | | |
6 | | BLACKROCK ASSET ALLOCATION PORTFOLIO | | MARCH 31, 2009 | | |
| | |
| Schedule of Investments (continued) | | |
| | (Percentages shown are based on Net Assets) |
| | | | | |
| | | Shares | | Value |
Common Stocks | | | | | |
Insurance (concluded) | | | | | |
Aspen Insurance Holdings Ltd. | | 13,900 | | $ | 312,194 |
AXIS Capital Holdings Ltd. | | 12,460 | | | 280,848 |
Baloise Holding AG | | 1,000 | | | 63,912 |
Brit Insurance Holdings Plc | | 46,300 | | | 119,713 |
Catlin Group Ltd. | | 21,420 | | | 96,070 |
CHUBB Corp. | | 7,325 | | | 309,994 |
Everest Re Group Ltd. | | 675 | | | 47,790 |
Fidelity National Financial, Inc. - Class A | | 2,925 | | | 57,067 |
First American Corp. | | 6,900 | | | 182,919 |
First Mercury Financial Corp.(g) | | 5,300 | | | 76,532 |
The Hanover Insurance Group, Inc. | | 9,387 | | | 270,533 |
HCC Insurance Holdings, Inc. | | 12,710 | | | 320,165 |
Hiscox Ltd. | | 39,900 | | | 176,541 |
Jardine Lloyd Thompson Group Plc | | 9,300 | | | 58,414 |
Lancashire Holdings Ltd.(g) | | 25,800 | | | 177,246 |
MBIA, Inc.(g) | | 15,825 | | | 72,478 |
PartnerRe Ltd. | | 3,400 | | | 211,038 |
Platinum Underwriters Holdings Ltd. | | 6,441 | | | 182,667 |
Prudential Plc | | 109,614 | | | 531,397 |
Reinsurance Group of America, Inc. | | 1,050 | | | 34,010 |
RenaissanceRe Holdings Ltd. | | 4,600 | | | 227,424 |
Standard Life Plc | | 20,000 | | | 47,631 |
T&D Holdings, Inc. | | 12,350 | | | 300,780 |
The Travelers Cos., Inc. | | 33,775 | | | 1,372,616 |
Unum Group | | 17,275 | | | 215,938 |
W.R. Berkley Corp. | | 17,740 | | | 400,037 |
| | | | | |
| | | | | 7,718,027 |
| | | | | |
Internet & Catalog Retail — 0.3% | | | | | |
Amazon.com, Inc.(g) | | 14,150 | | | 1,039,176 |
NetFlix, Inc.(g)(h) | | 1,100 | | | 47,212 |
priceline.com, Inc.(g) | | 2,500 | | | 196,950 |
Ticketmaster Entertainment, Inc.(g) | | 8,420 | | | 31,070 |
| | | | | |
| | | | | 1,314,408 |
| | | | | |
Internet Software & Services — 0.7% | | | | | |
comScore, Inc.(g) | | 8,831 | | | 106,767 |
eBay, Inc.(g) | | 20,100 | | | 252,456 |
Google, Inc. - Class A(g) | | 4,722 | | | 1,643,539 |
Omniture, Inc.(g) | | 6,960 | | | 91,803 |
Sina Corp.(g) | | 5,500 | | | 127,875 |
SkillSoft Plc - ADR(g) | | 70,290 | | | 470,240 |
SonicWALL, Inc.(g) | | 29,300 | | | 130,678 |
Tencent Holdings Ltd. | | 46,800 | | | 346,301 |
Yahoo!, Inc.(g) | | 4,500 | | | 57,645 |
| | | | | |
| | | | | 3,227,304 |
| | | | | |
IT Services — 0.6% | | | | | |
Accenture Ltd. - Class A | | 13,300 | | | 365,617 |
Affiliated Computer Services, Inc. - Class A(g) | | 3,925 | | | 187,968 |
Alliance Data Systems Corp.(g) | | 1,125 | | | 41,569 |
Broadridge Financial Solutions, Inc. | | 3,025 | | | 56,295 |
Convergys Corp.(g) | | 14,100 | | | 113,928 |
CSG Systems International, Inc.(g) | | 1,500 | | | 21,420 |
ExlService Holdings, Inc.(g) | | 16,098 | | | 138,765 |
Fidelity National Information Services, Inc. | | 14,300 | | | 260,260 |
Forrester Research, Inc.(g) | | 9,950 | | | 204,572 |
Genpact Ltd.(g) | | 23,300 | | | 206,438 |
Hewitt Associates, Inc. - Class A(g) | | 1,500 | | | 44,640 |
Lender Processing Services, Inc. | | 10,275 | | | 314,518 |
Mantech International Corp. - Class A(g) | | 850 | | | 35,615 |
Mastercard, Inc. - Class A | | 675 | | | 113,049 |
NCI, Inc. - Class A(g) | | 5,700 | | | 148,200 |
SAIC, Inc.(g) | | 6,600 | | | 123,222 |
SRA International, Inc. - Class A(g) | | 8,350 | | | 122,745 |
TeleTech Holdings, Inc.(g) | | 10,550 | | | 114,890 |
Wright Express Corp.(g) | | 5,875 | | | 107,042 |
| | | | | |
| | | | | 2,720,753 |
| | | | | |
Leisure Equipment & Products — 0.1% | | | | | |
Hasbro, Inc. | | 725 | | | 18,176 |
JUMBO SA | | 18,400 | | | 139,359 |
Polaris Industries, Inc. | | 1,150 | | | 24,656 |
Shimano, Inc. | | 4,900 | | | 149,178 |
| | | | | |
| | | | | 331,369 |
| | | | | |
Life Sciences Tools & Services — 0.3% | | | | | |
ICON Plc - ADR(g) | | 6,000 | | | 96,900 |
Lonza Group AG(g) | | 1,700 | | | 167,963 |
Qiagen NV(g) | | 18,000 | | | 286,679 |
Thermo Fisher Scientific, Inc.(g) | | 22,950 | | | 818,627 |
| | | | | |
| | | | | 1,370,169 |
| | | | | |
Machinery — 1.4% | | | | | |
Actuant Corp. - Class A | | 2,700 | | | 27,891 |
AGCO Corp.(g) | | 3,700 | | | 72,520 |
Altra Holdings, Inc.(g) | | 10,700 | | | 41,516 |
Amada Co. Ltd. | | 35,100 | | | 187,533 |
Briggs & Stratton Corp. | | 2,375 | | | 39,187 |
Bucyrus International, Inc. | | 2,540 | | | 38,557 |
Charter International Plc | | 25,300 | | | 165,368 |
Cummins, Inc. | | 20,600 | | | 524,270 |
Danaher Corp. | | 28,500 | | | 1,545,270 |
Deere & Co. | | 14,900 | | | 489,763 |
Eaton Corp. | | 3,000 | | | 110,580 |
Federal Signal Corp. | | 3,375 | | | 17,786 |
Flowserve Corp. | | 3,625 | | | 203,435 |
Gardner Denver, Inc.(g) | | 2,025 | | | 44,024 |
GEA Group AG | | 23,600 | | | 251,212 |
Harsco Corp. | | 1,875 | | | 41,569 |
Hino Motors Ltd. | | 60,900 | | | 134,311 |
IDEX Corp. | | 11,475 | | | 250,958 |
Joy Global, Inc. | | 12,050 | | | 256,665 |
Kaydon Corp. | | 3,025 | | | 82,673 |
MAN AG | | 5,500 | | | 238,739 |
Mori Seiki Co. Ltd. | | 15,400 | | | 141,106 |
Nabtesco Corp. | | 18,900 | | | 132,274 |
Navistar International Corp.(g) | | 4,050 | | | 135,513 |
Oshkosh Corp. | | 9,900 | | | 66,726 |
Parker Hannifin Corp. | | 7,925 | | | 269,292 |
Railpower Technologies Corp.(g) | | 17,600 | | | 1,187 |
SPX Corp. | | 2,350 | | | 110,473 |
Terex Corp.(g) | | 6,990 | | | 64,658 |
Trinity Industries, Inc. | | 1,950 | | | 17,823 |
Volvo AB - B Shares | | 23,000 | | | 122,044 |
The Weir Group Plc | | 36,600 | | | 217,126 |
| | | | | |
| | | | | 6,042,049 |
| | | | | |
Media — 1.1% | | | | | |
Cablevision Systems Corp. - Class A | | 17,600 | | | 227,744 |
CKX, Inc.(g) | | 60,550 | | | 248,255 |
Comcast Corp. - Class A | | 23,825 | | | 324,973 |
The DIRECTV Group, Inc.(g) | | 16,550 | | | 377,174 |
Dolan Media Co.(g) | | 7,162 | | | 56,365 |
DreamWorks Animation SKG, Inc. - Class A(g) | | 13,250 | | | 286,730 |
Naspers Ltd. - N Shares | | 12,100 | | | 204,739 |
| | | | | | |
| | | BLACKROCK ASSET ALLOCATION PORTFOLIO | | MARCH 31, 2009 | | 7 |
| | |
| Schedule of Investments (continued) | | |
| | (Percentages shown are based on Net Assets) |
| | | | | |
| | | Shares | | Value |
Common Stocks | | | | | |
Media (concluded) | | | | | |
Outdoor Channel Holdings, Inc.(g) | | 2,666 | | $ | 18,182 |
Reed Elsevier NV | | 59,976 | | | 641,795 |
RHI Entertainment, Inc.(g) | | 14,626 | | | 22,231 |
SES SA | | 49,210 | | | 936,858 |
Time Warner Cable, Inc. | | 4,214 | | | 104,507 |
Time Warner, Inc. | | 16,782 | | | 323,893 |
Viacom, Inc. - Class B(g) | | 13,450 | | | 233,761 |
The Walt Disney Co. | | 6,200 | | | 112,592 |
Wolters Kluwer NV | | 9,600 | | | 155,613 |
Woongjin Thinkbig Co. Ltd. | | 17,370 | | | 230,093 |
WPP Plc | | 19,200 | | | 107,977 |
Zee Entertainment Enterprises Ltd. | | 32,800 | | | 68,932 |
| | | | | |
| | | | | 4,682,414 |
| | | | | |
Metals & Mining — 1.6% | | | | | |
Agnico-Eagle Mines Ltd. | | 15,600 | | | 890,749 |
Anglo American Plc | | 22,594 | | | 384,744 |
Archipelago Resources Plc(g) | | 78,900 | | | 12,736 |
Baja Mining Corp.(g) | | 59,300 | | | 16,697 |
BHP Billiton Ltd. | | 30,636 | | | 677,094 |
Century Aluminum Co.(g) | | 9,734 | | | 20,539 |
Cliffs Natural Resources, Inc. | | 2,600 | | | 47,216 |
Crosshair Exploration & Mining Corp.(g) | | 10,900 | | | 1,340 |
Eldorado Gold Corp.(g) | | 43,162 | | | 390,265 |
Eldorado Gold Corp., Exchange Receipts (acquired 7/14/08, cost $0, unrestricted issue on 7/14/08 was valued at $8.72 per share)(g)(i) | | 79,200 | | | 0 |
Epsilon Energy, Inc.(b) | | 5,900 | | | 2,667 |
European Goldfields Ltd.(g) | | 12,100 | | | 32,150 |
Freeport-McMoRan Copper & Gold, Inc. - Class B | | 20,457 | | | 779,616 |
Gerdau SA - ADR | | 27,800 | | | 152,066 |
Gold Reserve, Inc.(g) | | 26,280 | | | 17,608 |
Kinross Gold Corp. | | 28,735 | | | 515,451 |
Minefinders Corp. Ltd.(g)(h) | | 40,000 | | | 308,000 |
Mitsubishi Materials Corp. | | 49,300 | | | 134,293 |
Newmont Mining Corp. | | 1,675 | | | 74,973 |
Norsk Hydro ASA | | 49,700 | | | 187,015 |
Nucor Corp. | | 1,800 | | | 68,706 |
Outokumpu Oyj - Series B | | 12,200 | | | 131,998 |
Pacific Metals Co. Ltd. | | 31,000 | | | 137,579 |
Reliance Steel & Aluminum Co. | | 5,290 | | | 139,286 |
Salzgitter AG | | 1,800 | | | 100,182 |
Sunridge Gold Corp.(g) | | 146,757 | | | 24,444 |
Teck Cominco Ltd. - Class B | | 30,601 | | | 171,111 |
ThyssenKrupp AG | | 16,400 | | | 286,120 |
Tokyo Steel Manufacturing Co. Ltd. | | 12,100 | | | 121,956 |
United States Steel Corp. | | 2,825 | | | 59,692 |
Usinas Siderurgicas de Minas Gerais SA, Class A - Preference Shares | | 5,900 | | | 74,852 |
Vedanta Resources Plc | | 13,700 | | | 132,820 |
West Timmins Mining, Inc.(g) | | 36,372 | | | 17,886 |
Yamana Gold, Inc. | | 45,600 | | | 425,692 |
Yamato Kogyo Co. Ltd. | | 13,200 | | | 285,009 |
| | | | | |
| | | | | 6,822,552 |
| | | | | |
Multiline Retail — 0.6% | | | | | |
Dollar Tree, Inc.(g) | | 1,500 | | | 66,825 |
Family Dollar Stores, Inc. | | 9,925 | | | 331,197 |
Kohl’s Corp.(g) | | 34,302 | | | 1,451,661 |
Macy’s, Inc. | | 36,650 | | | 326,185 |
Next Plc | | 11,300 | | | 214,431 |
PPR | | 1,700 | | | 108,988 |
| | | | | |
| | | | | 2,499,287 |
| | | | | |
Multi-Utilities — 0.5% | | | | | |
Ameren Corp. | | 17,225 | | | 399,448 |
CenterPoint Energy, Inc. | | 4,050 | | | 42,241 |
DTE Energy Co. | | 4,475 | | | 123,957 |
NSTAR | | 1,925 | | | 61,369 |
OGE Energy Corp. | | 1,600 | | | 38,112 |
PG&E Corp. | | 20,500 | | | 783,510 |
Sempra Energy | | 9,150 | | | 423,096 |
Vectren Corp. | | 1,700 | | | 35,853 |
Wisconsin Energy Corp. | | 6,780 | | | 279,133 |
| | | | | |
| | | | | 2,186,719 |
| | | | | |
Office Electronics — 0.2% | | | | | |
Canon, Inc. | | 26,600 | | | 775,439 |
Xerox Corp. | | 15,050 | | | 68,477 |
| | | | | |
| | | | | 843,916 |
| | | | | |
Oil, Gas & Consumable Fuels — 5.4% | | | | | |
Addax Petroleum Corp. | | 4,300 | | | 93,108 |
Alberta Clipper Energy, Inc.(g) | | 5,027 | | | 1,994 |
American Oil & Gas, Inc.(g) | | 5,947 | | | 4,579 |
Apache Corp. | | 3,400 | | | 217,906 |
Approach Resources, Inc.(g) | | 1,700 | | | 10,540 |
Arch Coal, Inc. | | 31,700 | | | 423,829 |
Argosy Energy, Inc.(g) | | 1,240 | | | 1,328 |
ATP Oil & Gas Corp.(g) | | 4,300 | | | 22,059 |
Banpu Public Co. Ltd. | | 20,500 | | | 123,814 |
Bayou Bend Petroleum Ltd.(g) | | 40,700 | | | 5,811 |
Berry Petroleum Co. - Class A | | 2,700 | | | 29,592 |
BG Group Plc | | 54,597 | | | 823,563 |
Canadian Superior Energy, Inc.(g) | | 57,300 | | | 26,785 |
Canext Energy Ltd.(g) | | 4,020 | | | 1,020 |
Chesapeake Energy Corp. | | 25,325 | | | 432,044 |
Chevron Corp. | | 23,675 | | | 1,591,907 |
Cimarex Energy Co. | | 1,325 | | | 24,353 |
Cinch Energy Corp.(g) | | 40,320 | | | 17,589 |
Clayton Williams Energy, Inc.(g) | | 19,123 | | | 559,157 |
Compton Petroleum Corp.(g) | | 3,800 | | | 2,471 |
Comstock Resources, Inc.(g) | | 3,783 | | | 112,733 |
ConocoPhillips | | 14,975 | | | 586,421 |
CONSOL Energy, Inc. | | 37,564 | | | 948,115 |
Crescent Point Energy Trust | | 1,800 | | | 37,633 |
Crew Energy, Inc.(g) | | 39,700 | | | 123,118 |
Dana Petroleum Plc(g) | | 7,700 | | | 122,938 |
Daylight Resources Trust | | 13,410 | | | 72,432 |
Delphi Energy Corp.(g) | | 24,700 | | | 16,064 |
Delta Petroleum Corp.(g) | | 45,255 | | | 54,306 |
Denbury Resources, Inc.(g) | | 1,150 | | | 17,089 |
Ember Resources, Inc.(g) | | 4,855 | | | 1,925 |
Energy XXI Bermuda Ltd. | | 13,100 | | | 4,912 |
EOG Resources, Inc. | | 7,400 | | | 405,224 |
Evergreen Energy, Inc.(g) | | 11,500 | | | 16,008 |
EXCO Resources, Inc.(g) | | 27,600 | | | 276,000 |
Exxon Mobil Corp. | | 59,800 | | | 4,072,380 |
Fairborne Energy Ltd.(g) | | 1,482 | | | 3,538 |
Felix Resources Ltd. | | 24,300 | | | 148,844 |
Foundation Coal Holdings, Inc. | | 3,300 | | | 47,355 |
Galleon Energy, Inc. - Class A(g) | | 78,617 | | | 225,101 |
Gasco Energy, Inc.(g) | | 19,600 | | | 7,644 |
Gastar Exploration Ltd.(g) | | 15,900 | | | 8,586 |
GMX Resources, Inc.(g) | | 4,612 | | | 29,978 |
Goodrich Petroleum Corp.(g) | | 18,400 | | | 356,224 |
Gulfsands Petroleum Plc(g) | | 6,700 | | | 15,290 |
Heritage Oil Ltd.(g) | | 40,000 | | | 189,778 |
| | | | | | |
8 | | BLACKROCK ASSET ALLOCATION PORTFOLIO | | MARCH 31, 2009 | | |
| | |
| Schedule of Investments (continued) | | |
| | (Percentages shown are based on Net Assets) |
| | | | | |
| | | Shares | | Value |
Common Stocks | | | | | |
Oil, Gas & Consumable Fuels (concluded) | | | | | |
Hess Corp. | | 2,630 | | $ | 142,546 |
Highpine Oil & Gas Ltd.(g) | | 8,993 | | | 33,381 |
Iteration Energy Ltd.(g) | | 4,021 | | | 3,125 |
James River Coal Co.(g) | | 12,400 | | | 153,016 |
Longview Energy Co. (acquired 8/13/04, cost $48,000)(g)(i) | | 3,200 | | | 58,720 |
Lynden Energy Corp.(g) | | 3,500 | | | 833 |
Marathon Oil Corp. | | 21,351 | | | 561,318 |
Massey Energy Co. | | 70,941 | | | 717,923 |
Matador Resources Co. (acquired 10/14/03 through 4/13/06, cost $62,950)(g)(i) | | 8,685 | | | 117,161 |
Midnight Oil Exploration Ltd.(g) | | 81,200 | | | 51,523 |
Newfield Exploration Co.(g) | | 10,985 | | | 249,359 |
Niko Resources Ltd. | | 2,000 | | | 93,084 |
Occidental Petroleum Corp. | | 2,850 | | | 158,602 |
Oil Search Ltd. | | 34,800 | | | 127,859 |
OMV AG | | 6,600 | | | 220,797 |
Open Range Energy Corp.(g) | | 1,975 | | | 1,911 |
Pacific Rodera Energy, Inc.(g) | | 37,300 | | | 6,065 |
Pacific Rubiales Energy Corp.(g) | | 12,466 | | | 48,349 |
Pan Orient Energy Corp.(g) | | 3,600 | | | 11,564 |
Parallel Petroleum Corp.(g) | | 4,879 | | | 6,245 |
Patriot Coal Corp.(g) | | 2,798 | | | 10,381 |
Peabody Energy Corp. | | 26,498 | | | 663,510 |
Pengrowth Energy Trust | | 2,877 | | | 16,201 |
Penn Virginia Corp. | | 38,200 | | | 419,436 |
Penn West Energy Trust | | 10,319 | | | 97,232 |
Petro Andina Resources, Inc. - Class A(g) | | 800 | | | 3,687 |
Petro-Canada | | 5,300 | | | 142,379 |
PetroHawk Energy Corp.(g) | | 47,400 | | | 911,502 |
Petroleo Brasileiro SA - ADR | | 37,376 | | | 1,138,847 |
Petroleum Development Corp.(g) | | 5,100 | | | 60,231 |
Petrolifera Petroleum Ltd.(g) | | 30,150 | | | 38,261 |
Plains Exploration & Production Co.(g) | | 50,825 | | | 875,715 |
Premier Oil Plc(g) | | 8,600 | | | 131,013 |
ProspEx Resources Ltd.(g) | | 43,140 | | | 15,055 |
Quest Resource Corp.(g) | | 2,500 | | | 782 |
Quicksilver Resources, Inc.(g) | | 10,200 | | | 56,508 |
Range Resources Corp. | | 10,300 | | | 423,948 |
Rex Energy Corp.(g) | | 9,100 | | | 26,117 |
Santos Ltd. | | 13,900 | | | 163,602 |
Southern Union Co. | | 11,050 | | | 168,181 |
Southwestern Energy Co.(g) | | 10,945 | | | 324,957 |
StatoilHydro ASA | | 31,034 | | | 543,117 |
Stone Energy Corp.(g) | | 561 | | | 1,868 |
Tag Oil Ltd. | | 800 | | | 101 |
Talisman Energy, Inc. | | 19,200 | | | 203,299 |
Tesoro Corp. | | 1,150 | | | 15,490 |
Total SA | | 16,079 | | | 795,099 |
Trafalgar Energy Ltd.(g) | | 841 | | | 387 |
TransCanada Corp. | | 700 | | | 16,562 |
Triex Minerals Corp.(g) | | 9,900 | | | 1,296 |
TriStar Oil & Gas Ltd.(g) | | 12,585 | | | 92,132 |
True Energy Trust | | 11,382 | | | 6,139 |
Tullow Oil Plc | | 32,343 | | | 371,865 |
Ultra Petroleum Corp.(g) | | 2,400 | | | 86,136 |
Uranium One, Inc.(g) | | 25,970 | | | 52,525 |
Valero Energy Corp. | | 26,700 | | | 477,930 |
Vero Energy, Inc.(g) | | 4,447 | | | 11,569 |
Warren Resources, Inc.(g) | | 4,034 | | | 3,873 |
West Energy Ltd.(g) | | 9,543 | | | 16,652 |
WesternZagros Resources Ltd.(g) | | 1,800 | | | 828 |
Whiting Petroleum Corp.(g) | | 4,400 | | | 113,740 |
| | | | |
The Williams Cos., Inc. | | 8,200 | | 93,316 |
| | | | |
| | | | 23,667,935 |
| | | | |
Paper & Forest Products — 0.1% | | | | |
Ainsworth Lumber Co. Ltd. (Canada)(b)(g) | | 36,747 | | 22,442 |
Clearwater Paper Corp.(g) | | 0 | | 0 |
International Paper Co. | | 8,175 | | 57,552 |
Weyerhaeuser Co. | | 7,950 | | 219,182 |
| | | | |
| | | | 299,176 |
| | | | |
Personal Products — 0.1% | | | | |
Avon Products, Inc. | | 4,500 | | 86,535 |
Chattem, Inc.(g) | | 5,198 | | 291,348 |
| | | | |
| | | | 377,883 |
| | | | |
Pharmaceuticals — 2.7% | | | | |
Abbott Laboratories | | 37,425 | | 1,785,173 |
Bayer AG | | 12,051 | | 575,756 |
Bristol-Myers Squibb Co. | | 15,525 | | 340,308 |
Eli Lilly & Co. | | 21,625 | | 722,491 |
GlaxoSmithKline Plc | | 42,907 | | 668,261 |
Johnson & Johnson | | 31,200 | | 1,641,120 |
King Pharmaceuticals, Inc.(g) | | 4,875 | | 34,466 |
Medicis Pharmaceutical Corp. - Class A | | 14,500 | | 179,365 |
Merck & Co., Inc. | | 3,900 | | 104,325 |
Mylan, Inc.(g) | | 10,700 | | 143,487 |
Novartis AG | | 26,232 | | 992,450 |
Pfizer, Inc. | | 66,750 | | 909,135 |
Roche Holding AG - ADR | | 7,893 | | 1,083,315 |
Santarus, Inc.(g) | | 23,450 | | 37,755 |
Schering-Plough Corp. | | 41,325 | | 973,204 |
Seperacor, Inc.(g) | | 1,000 | | 14,660 |
Shire Plc - ADR | | 6,350 | | 228,219 |
Teva Pharmaceutical Industries Ltd. - ADR | | 18,000 | | 810,900 |
Watson Pharmaceuticals, Inc.(g) | | 850 | | 26,444 |
Wyeth | | 13,875 | | 597,180 |
| | | | |
| | | | 11,868,014 |
| | | | |
Professional Services — 0.1% | | | | |
The Advisory Board Co.(g) | | 3,525 | | 58,444 |
Diamond Management & Technology Consultants, Inc. | | 19,294 | | 49,200 |
Huron Consulting Group, Inc.(g) | | 2,600 | | 110,318 |
IHS, Inc. - Class A(g) | | 7,125 | | 293,408 |
TrueBlue, Inc.(g) | | 2,200 | | 18,150 |
Watson Wyatt Worldwide, Inc. - Class A | | 1,600 | | 78,992 |
| | | | |
| | | | 608,512 |
| | | | |
Real Estate Investment Trusts — 0.6% | | | | |
Annaly Capital Management, Inc. | | 15,175 | | 210,477 |
Boston Properties, Inc. | | 5,010 | | 175,500 |
CFS Retail Property Trust | | 33,000 | | 37,495 |
Corio NV | | 1,300 | | 53,765 |
Digital Realty Trust, Inc. | | 2,900 | | 96,222 |
Eurocommercial Properties NV | | 2,000 | | 54,309 |
Fonciere Des Regions | | 500 | | 23,476 |
Hammerson Plc | | 5,600 | | 20,432 |
Highwoods Properties, Inc. | | 1,150 | | 24,633 |
Home Properties, Inc. | | 2,500 | | 76,625 |
Hospitality Properties Trust | | 10,875 | | 130,500 |
HRPT Properties Trust | | 36,100 | | 115,159 |
Liberty Property Trust | | 7,100 | | 134,474 |
The Macerich Co.(h) | | 1,975 | | 12,364 |
| | | | | | |
| | | BLACKROCK ASSET ALLOCATION PORTFOLIO | | MARCH 31, 2009 | | 9 |
| | |
| Schedule of Investments (continued) | | |
| | (Percentages shown are based on Net Assets) |
| | | | | |
| | | Shares | | Value |
Common Stocks | | | | | |
Real Estate Investment Trusts (concluded) | | | | | |
Mack-Cali Realty Corp. | | 12,675 | | $ | 251,092 |
Mercialys SA | | 2,200 | | | 63,674 |
MFA Mortgage Investments, Inc. | | 10,200 | | | 59,976 |
Mid-America Apartment Communities, Inc. | | 3,600 | | | 110,988 |
Nationwide Health Properties, Inc. | | 1,775 | | | 39,387 |
Omega Healthcare Investors, Inc. | | 2,625 | | | 36,960 |
Realty Income Corp. | | 1,175 | | | 22,114 |
Redwood Trust, Inc. | | 21,100 | | | 323,885 |
Segro Plc | | 7,500 | | | 2,445 |
Simon Property Group, Inc. | | 5,980 | | | 207,147 |
SL Green Realty Corp. | | 1,000 | | | 10,800 |
Societe Immobiliere de Location pour l’Industrie et le Commerce | | 300 | | | 22,483 |
Suntec Real Estate Investment Trust | | 92,900 | | | 38,505 |
Unibail-Rodamco | | 1,700 | | | 240,562 |
Wereldhave NV | | 500 | | | 34,960 |
| | | | | |
| | | | | 2,630,409 |
| | | | | |
Real Estate Management & Development — 0.3% | | | | | |
Agile Property Holdings Ltd. | | 109,900 | | | 62,318 |
Castellum AB | | 5,700 | | | 32,037 |
Guangzhou R&F Properties Co. Ltd. - H Shares(g) | | 67,300 | | | 78,131 |
Henderson Land Development Co. Ltd. | | 145,000 | | | 552,911 |
New World Development Co. Ltd. | | 159,500 | | | 159,218 |
PSP Swiss Property AG(g) | | 1,500 | | | 63,237 |
Sino-Ocean Land Holdings Ltd. | | 126,000 | | | 82,906 |
Tokyo Tatemono Co. Ltd. | | 17,000 | | | 44,127 |
Wheelock & Co. Ltd. | | 88,600 | | | 149,010 |
| | | | | |
| | | | | 1,223,895 |
| | | | | |
Road & Rail — 0.5% | | | | | |
East Japan Railway Co. | | 8,800 | | | 458,781 |
Firstgroup Plc | | 60,100 | | | 230,559 |
Heartland Express, Inc. | | 2,350 | | | 34,804 |
J.B. Hunt Transport Services, Inc. | | 9,025 | | | 217,593 |
Landstar System, Inc. | | 3,400 | | | 113,798 |
Nippon Express Co. Ltd. | | 34,900 | | | 109,985 |
Norfolk Southern Corp. | | 11,875 | | | 400,781 |
Ryder System, Inc. | | 3,750 | | | 106,162 |
Seino Holdings Corp. | | 52,000 | | | 251,510 |
Union Pacific Corp. | | 3,900 | | | 160,329 |
Vitran Corp., Inc.(g) | | 1,807 | | | 9,505 |
| | | | | |
| | | | | 2,093,807 |
| | | | | |
Semiconductors & Semiconductor Equipment — 1.4% | | | | | |
Advanced Energy Industries, Inc.(g) | | 10,400 | | | 78,312 |
Advanced Semiconductor Engineering, Inc. | | 189,100 | | | 92,271 |
ASML Holding NV | | 5,400 | | | 94,554 |
Broadcom Corp. - Class A(g) | | 55,400 | | | 1,106,892 |
Cymer, Inc.(g) | | 6,700 | | | 149,142 |
Disco Corp. | | 3,200 | | | 79,882 |
FEI Co.(g) | | 2,700 | | | 41,661 |
Hittite Microwave Corp.(g) | | 3,230 | | | 100,776 |
Integrated Device Technology, Inc.(g) | | 4,050 | | | 18,428 |
Intel Corp. | | 21,650 | | | 325,832 |
Intersil Corp. - Class A | | 12,260 | | | 140,990 |
Lam Research Corp.(g) | | 35,282 | | | 803,371 |
Micron Technology, Inc.(g) | | 38,430 | | | 156,026 |
Microsemi Corp.(g) | | 5,925 | | | 68,730 |
Monolithic Power Systems, Inc.(g) | | 4,000 | | | 62,000 |
NVIDIA Corp.(g) | | 52,700 | | | 519,622 |
ON Semiconductor Corp.(g) | | 53,700 | | | 209,430 |
PMC-Sierra, Inc.(g) | | 170,320 | | | 1,086,642 |
Samsung Electronics Co. Ltd. | | 1,007 | | | 416,049 |
Silicon Laboratories, Inc.(g) | | 1,500 | | | 39,600 |
Siliconware Precision Industries Co. - ADR | | 29,000 | | | 168,200 |
Skyworks Solutions, Inc.(g) | | 2,625 | | | 21,158 |
Standard Microsystems Corp.(g) | | 2,350 | | | 43,710 |
STMicroelectronics NV | | 18,300 | | | 90,768 |
Ultra Clean Holdings, Inc.(g) | | 6,704 | | | 7,173 |
United Microelectronics Corp. | | 249,400 | | | 81,411 |
Varian Semiconductor Equipment Associates, Inc.(g) | | 9,500 | | | 205,770 |
| | | | | |
| | | | | 6,208,400 |
| | | | | |
| Software — 2.2% | | | | | |
Activision Blizzard, Inc.(g) | | 87,700 | | | 917,342 |
Adobe Systems, Inc.(g) | | 22,908 | | | 490,002 |
Amdocs Ltd.(g) | | 25,067 | | | 464,241 |
Ansys, Inc.(g) | | 2,600 | | | 65,260 |
Blackboard, Inc.(g) | | 8,752 | | | 277,788 |
BMC Software, Inc.(g) | | 1,450 | | | 47,850 |
CA, Inc. | | 6,500 | | | 114,465 |
Check Point Software Technologies(g) | | 33,200 | | | 737,372 |
DemandTec, Inc.(g) | | 26,700 | | | 233,625 |
i2 Technologies, Inc.(g) | | 12,625 | | | 99,738 |
Intuit, Inc.(g) | | 8,250 | | | 222,750 |
Lawson Software, Inc.(g) | | 19,700 | | | 83,725 |
Micro Focus International Plc | | 46,700 | | | 202,086 |
Microsoft Corp. | | 88,625 | | | 1,628,041 |
Nintendo Co. Ltd. | | 2,500 | | | 731,330 |
Oracle Corp. | | 91,950 | | | 1,661,536 |
Parametric Technology Corp.(g) | | 1,875 | | | 18,713 |
Phase Metrics, Inc.(g) | | 50,574 | | | 1,011 |
Salesforce.com, Inc.(g) | | 25,469 | | | 833,600 |
Sybase, Inc.(g) | | 2,400 | | | 72,696 |
Symantec Corp.(g) | | 20,650 | | | 308,511 |
Synopsys, Inc.(g) | | 1,675 | | | 34,723 |
TiVo, Inc.(g) | | 24,725 | | | 174,064 |
| | | | | |
| | | | | 9,420,469 |
| | | | | |
| Specialty Retail — 1.3% | | | | | |
Abercrombie & Fitch Co. - Class A | | 5,600 | | | 133,280 |
Advance Auto Parts, Inc. | | 1,450 | | | 59,566 |
Aeropostale, Inc.(g) | | 2,125 | | | 56,440 |
AutoZone, Inc.(g) | | 1,250 | | | 203,275 |
Bebe Stores, Inc. | | 11,700 | | | 78,039 |
Bed Bath & Beyond, Inc.(g) | | 6,300 | | | 155,925 |
CarMax, Inc.(g)(h) | | 52,400 | | | 651,856 |
Chico’s FAS, Inc.(g) | | 13,500 | | | 72,495 |
Esprit Holdings Ltd. | | 88,900 | | | 453,599 |
Foot Locker, Inc. | | 3,050 | | | 31,964 |
GameStop Corp. - Class A(g) | | 9,650 | | | 270,393 |
The Gap, Inc. | | 20,700 | | | 268,893 |
Geo Corp. | | 100 | | | 57,990 |
Guess?, Inc. | | 2,125 | | | 44,795 |
The Home Depot, Inc. | | 37,250 | | | 877,610 |
J. Crew Group, Inc.(g)(h) | | 13,300 | | | 175,294 |
Limited Brands, Inc. | | 26,000 | | | 226,200 |
Lowe’s Cos., Inc. | | 9,825 | | | 179,306 |
PetSmart, Inc. | | 950 | | | 19,912 |
Rent-A-Center, Inc.(g) | | 7,625 | | | 147,696 |
Ross Stores, Inc. | | 24,529 | | | 880,101 |
Sally Beauty Holdings, Inc.(g) | | 27,435 | | | 155,831 |
The Sherwin-Williams Co. | | 4,090 | | | 212,557 |
| | | | | | |
10 | | BLACKROCK ASSET ALLOCATION PORTFOLIO | | MARCH 31, 2009 | | |
| | |
| Schedule of Investments (continued) | | |
| | (Percentages shown are based on Net Assets) |
| | | | | | |
| | | Shares | | Value |
Common Stocks | | | | | | |
Specialty Retail (concluded) | | | | | | |
Shimachu Co. Ltd. | | | 9,800 | | $ | 166,201 |
TJX Cos., Inc. | | | 6,900 | | | 176,916 |
| | | | | | |
| | | | | | 5,756,134 |
| | | | | | |
| Textiles, Apparel & Luxury Goods — 0.4% | | | | | | |
Adidas AG | | | 6,000 | | | 199,136 |
Anta Sports Products Ltd. | | | 509,100 | | | 335,755 |
ASICS Corp. | | | 25,800 | | | 180,036 |
Benetton Group SpA | | | 25,400 | | | 165,384 |
Carter’s, Inc.(g) | | | 8,300 | | | 156,123 |
Gerry Weber International AG | | | 8,310 | | | 169,843 |
Hanesbrands, Inc.(g) | | | 2 | | | 19 |
Iconix Brand Group, Inc.(g) | | | 12,600 | | | 111,510 |
Lululemon Athletica, Inc.(g) | | | 12,775 | | | 110,631 |
Movado Group, Inc. | | | 14,300 | | | 107,822 |
| | | | | | |
| | | | | | 1,536,259 |
| | | | | | |
| Thrifts & Mortgage Finance — 0.1% | | | | | | |
Astoria Financial Corp. | | | 13,540 | | | 124,433 |
First Niagara Financial Group, Inc. | | | 9,700 | | | 105,730 |
Hudson City Bancorp, Inc. | | | 18,475 | | | 215,973 |
New York Community Bancorp, Inc. | | | 3,725 | | | 41,608 |
People’s United Financial, Inc. | | | 6,050 | | | 108,718 |
| | | | | | |
| | | | | | 596,462 |
| | | | | | |
| Tobacco — 0.4% | | | | | | |
Altria Group, Inc. | | | 24,850 | | | 398,097 |
Lorillard, Inc. | | | 3,100 | | | 191,394 |
Philip Morris International, Inc. | | | 32,526 | | | 1,157,275 |
| | | | | | |
| | | | | | 1,746,766 |
| | | | | | |
| Trading Companies & Distributors — 0.2% | | | | | | |
Applied Industrial Technologies, Inc. | | | 3,000 | | | 50,610 |
Marubeni Corp. | | | 68,000 | | | 214,168 |
Mitsui & Co. Ltd. | | | 62,000 | | | 631,612 |
W.W. Grainger, Inc. | | | 1,914 | | | 134,325 |
WESCO International, Inc.(g) | | | 2,200 | | | 39,864 |
| | | | | | |
| | | | | | 1,070,579 |
| | | | | | |
| Transportation Infrastructure — 0.1% | | | | | | |
COSCO Pacific Ltd. | | | 239,000 | | | 235,362 |
Kamigumi Co. Ltd. | | | 34,900 | | | 232,342 |
| | | | | | |
| | | | | | 467,704 |
| | | | | | |
| Water Utilities — 0.0% | | | | | | |
Guangdong Investment Ltd. | | | 508,900 | | | 205,165 |
| | | | | | |
| Wireless Telecommunication Services — 0.9% | | | | | | |
American Tower Corp. - Class A(g) | | | 45,350 | | | 1,380,000 |
KDDI Corp. | | | 135 | | | 635,734 |
MetroPCS Communications, Inc.(g) | | | 15,600 | | | 266,448 |
MTN Group Ltd. | | | 28,657 | | | 317,964 |
Philippine Long Distance Telephone Co. - ADR | | | 4,500 | | | 198,585 |
Sprint Nextel Corp.(g) | | | 29,550 | | | 105,493 |
Vodafone Group Plc | | | 566,949 | | | 988,447 |
| | | | | | |
| | | | | | 3,892,671 |
| | | | | | |
| Total Common Stocks — 50.8% | | | | | | 222,436,596 |
| | | | | | |
| | |
| | | Par
(000) | | |
Corporate Bonds | | | | | | |
Aerospace & Defense — 0.0% | | | | | | |
L-3 Communications Corp., Senior Subordinated Notes, | | | | | | |
6.38%, 10/15/15 | | $ | 35 | | | 32,987 |
| | | | | | |
| Air Freight & Logistics — 0.3% | | | | | | |
United Parcel Service, Inc., Senior Unsecured Notes, | | | | | | |
3.88%, 4/01/14 | | | 1,225 | | | 1,227,998 |
| | | | | | |
| Auto Components — 0.0% | | | | | | |
The Goodyear Tire & Rubber Co., Unsecured Notes, | | | | | | |
8.63%, 12/01/11 | | | 125 | | | 103,750 |
Lear Corp., Senior Unsecured Notes, | | | | | | |
8.75%, 12/01/16 | | | 90 | | | 18,450 |
| | | | | | |
| | | | | | 122,200 |
| | | | | | |
| Capital Markets — 0.7% | | | | | | |
BP Capital Markets Plc (United Kingdom), Unsecured Notes, | | | | | | |
3.13%, 3/10/12(d) | | | 775 | | | 778,191 |
Eksportfinans A/S (Norway), Unsecured Notes, | | | | | | |
5.50%, 5/25/16(d) | | | 575 | | | 615,529 |
The Goldman Sachs Group, Inc., Unsecured Notes, | | | | | | |
5.25%, 10/15/13 | | | 785 | | | 733,029 |
Lehman Brothers Holdings, Inc., Senior Notes, | | | | | | |
5.63%, 1/24/13(f) | | | 320 | | | 38,400 |
Lehman Brothers Holdings, Inc., Senior Unsecured Notes, | | | | | | |
7.00%, 9/27/27(f) | | | 475 | | | 60,562 |
Lehman Brothers Holdings, Inc., Subordinated Notes, | | | | | | |
6.75%, 12/28/17(f) | | | 190 | | | 19 |
Lehman Brothers Holdings, Inc., Unsecured Notes, | | | | | | |
5.25%, 2/06/12(f) | | | 440 | | | 56,100 |
Morgan Stanley, Senior Notes, | | | | | | |
1.65%, 1/09/12(a) | | | 925 | | | 742,388 |
5.55%, 4/27/17 | | | 115 | | | 102,332 |
| | | | | | |
| | | | | | 3,126,550 |
| | | | | | |
| Chemicals — 0.0% | | | | | | |
Huntsman International LLC, Senior Subordinated Notes, | | | | | | |
7.88%, 11/15/14 | | | 175 | | | 71,750 |
7.38%, 1/01/15 | | | 85 | | | 34,850 |
PolyOne Corp., Senior Unsecured Notes, | | | | | | |
8.88%, 5/01/12 | | | 140 | | | 60,900 |
| | | | | | |
| | | | | | 167,500 |
| | | | | | |
| Commercial Banks — 0.9% | | | | | | |
Banco Central de la Republica Dominicana (Dominican Republic), Unsecured Notes, | | | | | | |
9.04%, 1/23/18(d) | | | 33 | | | 25,412 |
Banque Centrale de Tunisie (Tunisia), Unsecured Notes, | | | | | | |
7.38%, 4/25/12(d) | | | 425 | | | 429,250 |
Kreditanstalt fuer Wiederaufbau (Germany), Unsecured Notes, | | | | | | |
3.50%, 3/10/14(d) | | | 1,700 | | | 1,718,583 |
UBS AG (Switzerland), Senior Notes, | | | | | | |
5.88%, 12/20/17(d) | | | 935 | | | 804,185 |
| | | | | | |
| | | BLACKROCK ASSET ALLOCATION PORTFOLIO | | MARCH 31, 2009 | | 11 |
| | |
| Schedule of Investments (continued) | | |
| | (Percentages shown are based on Net Assets) |
| | | | | | |
| | | Par
(000) | | Value |
Corporate Bonds | | | | | | |
Commercial Banks (concluded) | | | | | | |
UBS AG (Switzerland), Senior Unsecured Notes, | | | | | | |
5.75%, 4/25/18(d) | | $ | 600 | | $ | 501,872 |
VTB Capital SA (Luxembourg), Unsecured Notes, | | | | | | |
7.50%, 10/12/11(d) | | | 110 | | | 101,525 |
Wachovia Bank N.A., Subordinated Notes, | | | | | | |
6.60%, 1/15/38 | | | 420 | | | 332,159 |
| | | | | | |
| | | | | | 3,912,986 |
| | | | | | |
| Commercial Services & Supplies — 0.0% | | | | | | |
Aleris International, Inc., Toggle Notes, | | | | | | |
9.75%, 12/15/14(f) | | | 230 | | | 138 |
RBS Global, Inc./Rexnord LLC, Senior Notes, | | | | | | |
8.88%, 9/01/16 | | | 30 | | | 22,500 |
| | | | | | |
| | | | | | 22,638 |
| | | | | | |
| Computers & Peripherals — 0.2% | | | | | | |
International Business Machines Corp., Unsecured Notes, | | | | | | |
5.70%, 9/14/17 | | | 360 | | | 372,914 |
7.63%, 10/15/18 | | | 300 | | | 344,158 |
| | | | | | |
| | | | | | 717,072 |
| | | | | | |
| Consumer Finance — 0.1% | | | | | | |
Student Loan Marketing Corp., Senior Unsecured Notes, | | | | | | |
1.30%, 7/27/09(a) | | | 525 | | | 505,822 |
| | | | | | |
| Containers & Packaging — 0.1% | | | | | | |
Rock-Tenn Co., Senior Unsecured Notes, | | | | | | |
8.20%, 8/15/11 | | | 250 | | | 250,625 |
| | | | | | |
| Diversified Financial Services — 2.3% | | | | | | |
Bank of America Corp., Senior Unsecured Notes, | | | | | | |
6.00%, 9/01/17 | | | 315 | | | 268,119 |
5.75%, 12/01/17 | | | 835 | | | 701,221 |
Bank of America Corp., Subordinated Notes, | | | | | | |
7.40%, 1/15/11 | | | 325 | | | 302,984 |
The Bear Stearns Cos., Inc., Senior Unsecured Notes, | | | | | | |
6.95%, 8/10/12 | | | 655 | | | 667,030 |
Citigroup, Inc., Senior Unsecured Notes, | | | | | | |
5.30%, 10/17/12 | | | 725 | | | 639,020 |
Ford Capital BV (Netherlands), Debentures, | | | | | | |
9.50%, 6/01/10(d) | | | 390 | | | 212,550 |
Ford Motor Credit Co. LLC, Senior Unsecured Notes, | | | | | | |
8.63%, 11/01/10 | | | 250 | | | 199,125 |
Ford Motor Credit Co. LLC, Unsecured Notes, | | | | | | |
9.75%, 9/15/10 | | | 135 | | | 111,057 |
7.80%, 6/01/12 | | | 225 | | | 152,488 |
General Electric Capital Corp., Senior Notes, | | | | | | |
1.80%, 3/11/11 | | | 2,800 | | | 2,807,451 |
General Electric Capital Corp., Senior Unsecured Notes, | | | | | | |
5.00%, 12/01/10 | | | 300 | | | 297,697 |
6.75%, 3/15/32 | | | 50 | | | 40,545 |
General Electric Capital Corp., Unsecured Notes, | | | | | | |
6.15%, 8/07/37 | | | 505 | | | 373,457 |
Icahn Enterprises LP/Icahn Enterprises Finance Corp., Senior Unsecured Notes, | | | | | | |
7.13%, 2/15/13 | | | 420 | | | 333,900 |
JPMorgan Chase & Co., Unsecured Notes, | | | | | | |
1.65%, 2/23/11 | | | 1,800 | | | 1,807,546 |
5.60%, 6/01/11 | | | 550 | | | 555,330 |
JPMorgan Chase Bank N.A., Subordinated Notes, | | | | | | |
6.00%, 7/05/17 | | | 425 | | | 406,575 |
Leucadia National Corp., Senior Unsecured Notes, | | | | | | |
7.13%, 3/15/17 | | | 200 | | | 137,000 |
NSG Holdings LLC/NSG Holdings, Inc., Notes, | | | | | | |
7.75%, 12/15/25(b) | | | 140 | | | 110,600 |
| | | | | | |
| | | | | | 10,123,695 |
| | | | | | |
| Diversified Telecommunication Services — 0.9% | | | | | | |
AT&T, Inc., Unsecured Notes, | | | | | | |
5.50%, 2/01/18 | | | 250 | | | 241,739 |
6.50%, 9/01/37 | | | 800 | | | 721,938 |
Cincinnati Bell, Inc., Senior Unsecured Notes, | | | | | | |
7.25%, 7/15/13 | | | 520 | | | 496,600 |
Qwest Communications International, Inc., Senior Unsecured Notes, | | | | | | |
7.50%, 2/15/14 | | | 280 | | | 242,200 |
7.50%, 2/15/14 | | | 30 | | | 25,950 |
Qwest Corp., Unsecured Notes, | | | | | | |
4.57%, 6/15/13(a) | | | 75 | | | 64,313 |
Telecom Italia Capital SA (Italy), Senior Unsecured Notes, | | | | | | |
4.95%, 9/30/14(d) | | | 475 | | | 410,130 |
Telefonica Emisiones SAU (Spain), Senior Unsecured Notes, | | | | | | |
6.42%, 6/20/16(d) | | | 150 | | | 155,090 |
7.05%, 6/20/36(d) | | | 150 | | | 154,129 |
Verizon Communications, Inc., Senior Unsecured Notes, | | | | | | |
8.75%, 11/01/18 | | | 1,050 | | | 1,201,389 |
6.35%, 4/01/19 | | | 300 | | | 296,382 |
Verizon Maryland, Inc., Debentures, | | | | | | |
5.13%, 6/15/33 | | | 10 | | | 6,927 |
Windstream Corp., Senior Unsecured Notes, | | | | | | |
8.63%, 8/01/16 | | | 105 | | | 103,162 |
| | | | | | |
| | | | | | 4,119,949 |
| | | | | | |
| Electric Utilities — 0.3% | | | | | | |
AES Eastern Energy LP, Pass-Through Certificates, Series 99-A, | | | | | | |
9.00%, 1/02/17 | | | 201 | | | 182,468 |
Florida Power & Light Co., First Mortgage Bonds, | | | | | | |
5.63%, 4/01/34 | | | 150 | | | 145,213 |
5.95%, 2/01/38 | | | 225 | | | 227,466 |
Florida Power Corp., First Mortgage Bonds, | | | | | | |
6.40%, 6/15/38 | | | 150 | | | 156,715 |
MidAmerican Energy Holdings Co., Bonds, | | | | | | |
6.50%, 9/15/37 | | | 250 | | | 231,192 |
PacifiCorp, First Mortgage Bonds, | | | | | | |
6.25%, 10/15/37 | | | 200 | | | 202,130 |
Texas Competitive Electric Holdings Co. LLC, | | | | | | |
10.25%, 11/01/15(b) | | | 90 | | | 45,000 |
Texas Competitive Electric Holdings Co. LLC, Toggle Notes, | | | | | | |
11.25%, 11/01/16(b)(j) | | | 110 | | | 41,250 |
TXU Corp., Senior Unsecured Notes, Series P, | | | | | | |
5.55%, 11/15/14 | | | 680 | | | 253,019 |
| | | | | | |
| | | | | | 1,484,453 |
| | | | | | |
| | | | | | |
12 | | BLACKROCK ASSET ALLOCATION PORTFOLIO | | MARCH 31, 2009 | | |
| | |
| Schedule of Investments (continued) | | |
| | (Percentages shown are based on Net Assets) |
| | | | | | |
| | | Par
(000) | | Value |
Corporate Bonds | | | | | | |
Energy Equipment & Services — 0.1% | | | | | | |
Halliburton Co., Senior Unsecured Notes, | | | | | | |
6.15%, 9/15/19 | | $ | 80 | | $ | 81,290 |
7.45%, 9/15/39 | | | 120 | | | 120,135 |
| | | | | | |
| | | | | | 201,425 |
| | | | | | |
Food & Staples Retailing — 0.3% | | | | | | |
Rite Aid Corp., Senior Secured Notes, | | | | | | |
7.50%, 3/01/17 | | | 120 | | | 61,800 |
Wal-Mart Stores, Inc., Senior Unsecured Notes, | | | | | | |
5.80%, 2/15/18 | | | 1,250 | | | 1,366,555 |
| | | | | | |
| | | | | | 1,428,355 |
| | | | | | |
Food Products — 0.3% | | | | | | |
Kraft Foods, Inc., Senior Unsecured Notes, | | | | | | |
6.50%, 8/11/17 | | | 535 | | | 550,910 |
6.13%, 2/01/18 | | | 475 | | | 476,073 |
Tyson Foods, Inc., Senior Unsecured Notes, | | | | | | |
10.50%, 3/01/14(b) | | | 445 | | | 453,900 |
| | | | | | |
| | | | | | 1,480,883 |
| | | | | | |
Gas Utilities — 0.2% | | | | | | |
Dominion Resources, Inc., Senior Debentures, | | | | | | |
5.00%, 3/01/14 | | | 20 | | | 19,592 |
Gazprom Capital (Luxembourg), Unsecured Notes, | | | | | | |
9.63%, 3/01/13(b)(d) | | | 200 | | | 189,250 |
Gazprom, Unsecured Notes, | | | | | | |
9.63%, 3/01/13 | | | 680 | | | 648,584 |
| | | | | | |
| | | | | | 857,426 |
| | | | | | |
Health Care Equipment & Supplies — 0.1% | | | | | | |
DJO Finance LLC/DJO Finance Corp., Senior Unsecured Notes, | | | | | | |
10.88%, 11/15/14 | | | 345 | | | 256,163 |
| | | | | | |
| Health Care Providers & Services — 0.0% | | | | | | |
Health Management Associates, Inc., Senior Unsecured Notes, | | | | | | |
6.13%, 4/15/16 | | | 230 | | | 188,025 |
| | | | | | |
| Hotels, Restaurants & Leisure — 0.1% | | | | | | |
Harrah’s Operating Co., Inc., Notes, | | | | | | |
10.00%, 12/15/18(b) | | | 61 | | | 18,300 |
Seneca Gaming Corp., Senior Unsecured Notes, | | | | | | |
7.25%, 5/01/12 | | | 125 | | | 79,844 |
Wendy’s International, Inc., Senior Unsecured Notes, | | | | | | |
6.25%, 11/15/11 | | | 360 | | | 327,600 |
| | | | | | |
| | | | | | 425,744 |
| | | | | | |
Household Durables — 0.5% | | | | | | |
Centex Corp., Senior Unsecured Notes, | | | | | | |
5.13%, 10/01/13 | | | 330 | | | 260,700 |
Centex Corp., Unsecured Notes, | | | | | | |
4.55%, 11/01/10 | | | 265 | | | 241,150 |
D.R. Horton, Inc., Senior Unsecured Notes, | | | | | | |
6.88%, 5/01/13 | | | 525 | | | 441,000 |
5.63%, 9/15/14 | | | 155 | | | 121,675 |
Jarden Corp., Senior Subordinated Notes, | | | | | | |
7.50%, 5/01/17 | | | 75 | | | 60,375 |
KB Home, Senior Unsecured Notes, | | | | | | |
6.38%, 8/15/11 | | | 460 | | | 414,000 |
Lennar Corp., Senior Unsecured Notes, Series B, | | | | | | |
5.60%, 5/31/15 | | | 250 | | | 178,125 |
Pulte Homes, Inc., Senior Unsecured Notes, | | | | | | |
5.20%, 2/15/15 | | | 185 | | | 146,381 |
Ryland Group, Inc., Senior Unsecured Notes, | | | | | | |
5.38%, 5/15/12 | | | 165 | | | 143,550 |
Toll Brothers Finance Corp., Senior Unsecured Notes, | | | | | | |
4.95%, 3/15/14 | | | 155 | | | 131,568 |
| | | | | | |
| | | | | | 2,138,524 |
| | | | | | |
| Independent Power Producers & Energy Traders — 0.0% | | | | | | |
NRG Energy, Inc., Senior Unsecured Notes, | | | | | | |
7.38%, 2/01/16 | | | 190 | | | 176,700 |
| | | | | | |
| Insurance — 0.4% | | | | | | |
Berkshire Hathaway Finance Corp., Senior Unsecured Notes, | | | | | | |
4.75%, 5/15/12 | | | 355 | | | 364,472 |
Hartford Life Global Funding Trusts, Secured Notes, | | | | | | |
1.50%, 6/16/14(a)(b) | | | 950 | | | 600,484 |
Metropolitan Life Global Funding I, Senior Unsecured Notes, | | | | | | |
5.13%, 4/10/13(b) | | | 850 | | | 776,297 |
| | | | | | |
| | | | | | 1,741,253 |
| | | | | | |
| Internet & Catalog Retail — 0.2% | | | | | | |
Expedia, Inc., Senior Unsecured Notes, | | | | | | |
7.46%, 8/15/18 | | | 555 | | | 466,200 |
Sabre Holdings Corp., Senior Unsecured Notes, | | | | | | |
8.35%, 3/15/16 | | | 690 | | | 262,200 |
| | | | | | |
| | | | | | 728,400 |
| | | | | | |
| Media — 1.1% | | | | | | |
Cablevision Systems Corp., Senior Unsecured Notes, | | | | | | |
8.33%, 4/01/09(a) | | | 325 | | | 325,000 |
Cengage Learning Acquisitions, Inc., Senior Unsecured Notes, | | | | | | |
10.50%, 1/15/15(b) | | | 310 | | | 158,875 |
Comcast Cable Holdings LLC, Senior Debentures, | | | | | | |
7.88%, 8/01/13 | | | 2 | | | 2,025 |
Comcast Corp., Senior Unsecured Notes, | | | | | | |
7.05%, 3/15/33 | | | 115 | | | 106,875 |
Comcast Corp., Unsecured Notes, | | | | | | |
6.50%, 1/15/17 | | | 850 | | | 841,428 |
6.95%, 8/15/37 | | | 360 | | | 335,236 |
Cox Communications, Inc., Unsecured Notes, | | | | | | |
8.38%, 3/01/39(b) | | | 375 | | | 351,844 |
DirecTV Holdings LLC/DirecTV Financing Co., Senior Unsecured Notes, | | | | | | |
7.63%, 5/15/16 | | | 180 | | | 176,400 |
DISH DBS Corp., Senior Unsecured Notes, | | | | | | |
7.00%, 10/01/13 | | | 219 | | | 203,123 |
EchoStar DBS Corp., Senior Unsecured Notes, | | | | | | |
7.13%, 2/01/16 | | | 25 | | | 22,375 |
Idearc, Inc., Senior Unsecured Notes, | | | | | | |
8.00%, 11/15/16(f) | | | 305 | | | 8,006 |
News America Holdings, Inc., Senior Debentures, | | | | | | |
7.75%, 1/20/24 | | | 25 | | | 21,951 |
News America, Inc., Senior Debentures, | | | | | | |
7.28%, 6/30/28 | | | 35 | | | 29,071 |
News America, Inc., Senior Unsecured Notes, | | | | | | |
6.20%, 12/15/34 | | | 100 | | | 71,936 |
| | | | | | |
| | | BLACKROCK ASSET ALLOCATION PORTFOLIO | | MARCH 31, 2009 | | 13 |
| | |
| Schedule of Investments (continued) | | |
| | (Percentages shown are based on Net Assets) |
| | | | | | |
| | | Par
(000) | | Value |
Corporate Bonds | | | | | | |
Media (concluded) | | | | | | |
Shaw Communications, Inc. (Canada), Unsecured Notes, | | | | | | |
7.20%, 12/15/11(d) | | $ | 175 | | $ | 173,688 |
TCI Communications, Inc., Senior Debentures, | | | | | | |
7.88%, 2/15/26 | | | 5 | | | 4,593 |
TCI Communications, Inc., Senior Notes, | | | | | | |
7.13%, 2/15/28 | | | 35 | | | 30,777 |
Time Warner Cable, Inc., Senior Unsecured Notes, | | | | | | |
6.20%, 7/01/13 | | | 1,025 | | | 997,825 |
Time Warner Cos., Inc., Senior Debentures, | | | | | | |
7.57%, 2/01/24 | | | 30 | | | 27,668 |
Time Warner, Inc., Senior Debentures, | | | | | | |
7.63%, 4/15/31 | | | 200 | | | 178,705 |
Viacom, Inc., Senior Unsecured Notes, | | | | | | |
5.75%, 4/30/11 | | | 525 | | | 511,433 |
| | | | | | |
| | | | | | 4,578,834 |
| | | | | | |
Metals & Mining — 0.0% | | | | | | |
Ispat Inland ULC (Canada), Notes, | | | | | | |
9.75%, 4/01/14(d) | | | 10 | | | 9,100 |
| | | | | | |
Multiline Retail — 0.0% | | | | | | |
Federated Retail Holdings, Inc., Notes, | | | | | | |
5.35%, 3/15/12 | | | 250 | | | 196,239 |
| | | | | | |
Oil, Gas & Consumable Fuels — 1.0% | | | | | | |
Anadarko Petroleum Corp., Senior Unsecured Notes, | | | | | | |
5.95%, 9/15/16 | | | 405 | | | 348,818 |
Arch Western Finance LLC, Senior Notes, | | | | | | |
6.75%, 7/01/13 | | | 400 | | | 366,000 |
Chesapeake Energy Corp., Senior Unsecured Notes, | | | | | | |
7.25%, 12/15/18 | | | 400 | | | 328,500 |
ConocoPhillips Australia Funding Co., Unsecured Notes, | | | | | | |
1.50%, 4/09/09(a) | | | 1,129 | | | 1,128,998 |
ConocoPhillips, Senior Unsecured Notes, | | | | | | |
6.50%, 2/01/39 | | | 150 | | | 146,321 |
EXCO Resources, Inc., Notes, | | | | | | |
7.25%, 1/15/11 | | | 65 | | | 50,375 |
Forest Oil Corp., Senior Unsecured Notes, | | | | | | |
7.25%, 6/15/19 | | | 130 | | | 102,700 |
Kinder Morgan Finance Co. ULC (Canada), Senior Unsecured Notes, | | | | | | |
5.35%, 1/05/11(d) | | | 365 | | | 348,575 |
Newfield Exploration Co., Senior Subordinated Notes, | | | | | | |
6.63%, 9/01/14 | | | 130 | | | 117,650 |
6.63%, 4/15/16 | | | 120 | | | 107,400 |
OPTi, Inc. (Canada), Notes, | | | | | | |
8.25%, 12/15/14(d) | | | 175 | | | 78,313 |
Shell International Finance BV (Netherlands), Unsecured Notes, | | | | | | |
4.00%, 3/21/14(d) | | | 875 | | | 887,277 |
XTO Energy, Inc., Senior Unsecured Notes, | | | | | | |
6.75%, 8/01/37 | | | 250 | | | 227,529 |
| | | | | | |
| | | | | | 4,238,456 |
| | | | | | |
Paper & Forest Products — 0.0% | | | | | | |
Ainsworth Lumber Co. Ltd. (Canada), Toggle Notes, | | | | | | |
11.00%, 7/29/15(b)(d) | | | 146 | | | 42,266 |
NewPage Corp., Senior Secured Notes, | | | | | | |
10.00%, 5/01/12 | | | 140 | | | 48,650 |
Catalyst Paper Corp. (Canada), Senior Unsecured Notes, | | | | | | |
8.63%, 6/15/11(d) | | | 50 | | | 22,875 |
| | | | | | |
| | | | | | 113,791 |
| | | | | | |
Pharmaceuticals — 1.0% | | | | | | |
Abbott Laboratories, Senior Unsecured Notes, | | | | | | |
5.13%, 4/01/19 | | | 420 | | | 422,406 |
Bristol-Myers Squibb Co., Senior Debentures, | | | | | | |
6.88%, 8/01/97 | | | 25 | | | 24,481 |
Eli Lilly & Co., Senior Unsecured Notes, | | | | | | |
3.55%, 3/06/12 | | | 370 | | | 378,019 |
GlaxoSmithKline Capital, Inc., Senior Unsecured Notes, | | | | | | |
4.85%, 5/15/13 | | | 400 | | | 416,160 |
Merck & Co., Inc., Senior Unsecured Notes, | | | | | | |
4.38%, 2/15/13 | | | 410 | | | 429,031 |
Novartis Securities Investment Ltd. (Bermuda), Senior Unsecured Notes, | | | | | | |
5.13%, 2/10/19(d) | | | 440 | | | 446,742 |
Pfizer, Inc., Senior Unsecured Notes, | | | | | | |
5.35%, 3/15/15 | | | 1,250 | | | 1,318,808 |
Roche Holdings, Inc., Unsecured Notes, | | | | | | |
3.25%, 2/25/11(a)(b) | | | 180 | | | 179,681 |
5.00%, 3/01/14(b) | | | 775 | | | 793,233 |
| | | | | | |
| | | | | | 4,408,561 |
| | | | | | |
Software — 0.2% | | | | | | |
First Data Corp., Senior Unsecured Notes, | | | | | | |
9.88%, 9/24/15 | | | 700 | | | 409,500 |
Oracle Corp., Senior Unsecured Notes, | | | | | | |
4.95%, 4/15/13 | | | 570 | | | 602,370 |
| | | | | | |
| | | | | | 1,011,870 |
| | | | | | |
Specialty Retail — 0.2% | | | | | | |
The Hertz Corp., Senior Unsecured Notes, | | | | | | |
8.88%, 1/01/14 | | | 165 | | | 100,031 |
Rent-A-Center, Inc., Senior Subordinated Notes, | | | | | | |
7.50%, 5/01/10 | | | 180 | | | 175,950 |
United Rentals N.A., Inc., Senior Unsecured Notes, | | | | | | |
6.50%, 2/15/12 | | | 500 | | | 400,000 |
| | | | | | |
| | | | | | 675,981 |
| | | | | | |
Tobacco — 0.1% | | | | | | |
Philip Morris International, Inc., Senior Unsecured Notes, | | | | | | |
6.88%, 3/17/14 | | | 275 | | | 297,628 |
| | | | | | |
Wireless Telecommunication Services — 0.4% | | | | | | |
America Movil SAB de CV (Mexico), | | | | | | |
6.38%, 3/01/35(d) | | | 75 | | | 60,247 |
American Tower Corp., Senior Unsecured Notes, | | | | | | |
7.50%, 5/01/12 | | | 800 | | | 804,000 |
7.13%, 10/15/12 | | | 230 | | | 231,150 |
Rogers Communications, Inc. (Canada), Notes, | | | | | | |
7.50%, 3/15/15(d) | | | 500 | | | 518,199 |
Vodafone Group Plc (United Kingdom), Senior Unsecured Notes, | | | | | | |
7.75%, 2/15/10(d) | | | 125 | | | 129,698 |
| | | | | | |
| | | | | | 1,743,294 |
| | | | | | |
Total Corporate Bonds — 12.0% | | | | | | 52,711,127 |
| | | | | | |
| | | | | | |
14 | | BLACKROCK ASSET ALLOCATION PORTFOLIO | | MARCH 31, 2009 | | |
| | |
| Schedule of Investments (continued) | | |
| | (Percentages shown are based on Net Assets) |
| | | | | |
| | | Shares | | Value |
Exchange-Traded Funds | | | | | |
iShares Russell 2000 Growth Index Fund | | 2,500 | | $ | 114,950 |
iShares Russell 2000 Value Index Fund | | 1,463 | | | 57,730 |
iShares Russell Midcap Growth Index Fund | | 3,900 | | | 117,390 |
| | | | | |
Total Exchange-Traded Funds — 0.1% | | | | | 290,070 |
| | | | | |
| | |
| | | Par
(000) | | |
Foreign Government Obligations | | | | | |
Argentina — 0.0% | | | | | |
Republic of Argentina, | | | | | |
8.28%, 12/31/33(d) | | USD 37 | | | 10,025 |
2.50%, 12/31/38(c)(d) | | 90 | | | 15,750 |
| | | | | |
| | | | | 25,775 |
| | | | | |
Brazil — 0.2% | | | | | |
Republic of Brazil, | | | | | |
8.25%, 1/20/34(d) | | 170 | | | 188,700 |
11.00%, 8/17/40(d) | | 705 | | | 895,350 |
| | | | | |
| | | | | 1,084,050 |
| | | | | |
Colombia — 0.1% | | | | | |
Republic of Colombia, | | | | | |
7.38%, 3/18/19(d) | | 225 | | | 224,438 |
7.38%, 9/18/37(d) | | 100 | | | 89,250 |
| | | | | |
| | | | | 313,688 |
| | | | | |
El Salvador — 0.0% | | | | | |
Republic of El Salvador, | | | | | |
7.65%, 6/15/35(b)(d) | | 55 | | | 40,150 |
| | | | | |
Germany — 0.1% | | | | | |
Bundesrepublic Deutschland, | | | | | |
4.00%, 1/04/37 | | EUR 70 | | | 94,076 |
4.25%, 7/04/39 | | 250 | | | 354,704 |
| | | | | |
| | | | | 448,780 |
| | | | | |
Indonesia — 0.0% | | | | | |
Republic of Indonesia, | | | | | |
6.63%, 2/17/37(b)(d) | | USD 100 | | | 67,500 |
7.75%, 1/17/38(d) | | 110 | | | 84,878 |
| | | | | |
| | | | | 152,378 |
| | | | | |
Israel — 0.1% | | | | | |
Israel Government AID Bond, | | | | | |
5.50%, 4/26/24(d) | | 100 | | | 112,655 |
5.50%, 9/18/33(d) | | 85 | | | 103,476 |
| | | | | |
| | | | | 216,131 |
| | | | | |
Mexico — 0.1% | | | | | |
United Mexican States, | | | | | |
8.30%, 8/15/31(d) | | 194 | | | 215,049 |
6.05%, 1/11/40(d) | | 125 | | | 106,875 |
| | | | | |
| | | | | 321,924 |
| | | | | |
Panama — 0.1% | | | | | |
Republic of Panama, | | | | | |
7.13%, 1/29/26(d) | | 170 | | | 160,650 |
8.88%, 9/30/27(d) | | 95 | | | 101,650 |
| | | | | |
| | | | | 262,300 |
| | | | | |
Peru — 0.0% | | | | | |
Republic of Peru, | | | | | |
6.55%, 3/14/37(d) | | 115 | | | 102,925 |
| | | | | |
Philippines — 0.1% | | | | | |
Republic of Philippines, | | | | | |
9.00%, 2/15/13(d) | | 370 | | | 423,650 |
| | | | | |
Russia — 0.0% | | | | | |
Russian Federation, | | | | | |
7.50%, 3/31/30(c)(d) | | 196 | | | 184,814 |
| | | | | |
Turkey — 0.1% | | | | | |
Republic of Turkey, | | | | | |
6.75%, 4/03/18(d) | | 530 | | | 487,600 |
| | | | | |
Ukraine — 0.0% | | | | | |
Ukraine Government, | | | | | |
6.58%, 11/21/16(b)(d) | | 100 | | | 43,000 |
| | | | | |
United Kingdom — 0.1% | | | | | |
United Kingdom Treasury Bonds, | | | | | |
4.25%, 12/07/49 | | GBP 275 | | | 384,224 |
| | | | | |
Uruguay — 0.0% | | | | | |
Republic of Uruguay, | | | | | |
7.63%, 3/21/36(d) | | USD 165 | | | 132,000 |
| | | | | |
Venezuela — 0.1% | | | | | |
Republic of Venezuela, | | | | | |
8.50%, 10/08/14(d) | | 200 | | | 123,000 |
9.25%, 9/15/27(d) | | 200 | | | 116,000 |
9.38%, 1/13/34(d) | | 100 | | | 51,250 |
| | | | | |
| | | | | 290,250 |
| | | | | |
Total Foreign Government Obligations — 1.1% | | | | | 4,913,639 |
| | | | | |
Non-U.S. Government Sponsored Agency Mortgage-Backed Securities | | | | | |
Collateralized Mortgage Obligations — 4.5% | | | | | |
Banc of America Alternative Loan Trust, Series 04-6, Class 4A1, | | | | | |
5.00%, 7/25/19 | | 149 | | | 132,030 |
Bear Stearns Adjustable Rate Mortgage Trust, Series 05-4, Class 3A1, | | | | | |
5.37%, 8/25/35(a) | | 3,978 | | | 2,571,394 |
Bear Stearns Adjustable Rate Mortgage Trust, Series 06-2, Class 2A1, | | | | | |
5.65%, 7/25/36(a) | | 1,643 | | | 838,263 |
| | | | | | |
| | | BLACKROCK ASSET ALLOCATION PORTFOLIO | | MARCH 31, 2009 | | 15 |
| | |
| Schedule of Investments (continued) | | |
| | (Percentages shown are based on Net Assets) |
| | | | | | |
| | | Par
(000) | | Value |
Non-U.S. Government Sponsored Agency Mortgage-Backed Securities | | | | | | |
Collateralized Mortgage Obligations (continued) | | | | | | |
CitiMortgage Alternative Loan Trust, Series 07-A8, Class A1, | | | | | | |
6.00%, 10/25/37 | | $ | 1,183 | | $ | 549,578 |
Countrywide Alternative Loan Trust, Series 05-21CB, Class A17, | | | | | | |
6.00%, 6/25/35 | | | 1,205 | | | 622,461 |
Countrywide Home Loan Mortgage Pass Through Trust, Series 03-27, Class M, | | | | | | |
4.66%, 6/25/33(a) | | | 493 | | | 296,737 |
Countrywide Home Loan Mortgage Pass Through Trust, Series 03-56, Class 4A1, | | | | | | |
4.92%, 12/25/33(a) | | | 1,164 | | | 962,817 |
Countrywide Home Loan Mortgage Pass Through Trust, Series 03-58, Class B1, | | | | | | |
4.90%, 2/19/34(a) | | | 120 | | | 28,861 |
Countrywide Home Loan Mortgage Pass Through Trust, Series 06-OA5, Class 2A1, | | | | | | |
0.72%, 4/25/46(a) | | | 239 | | | 85,182 |
Countrywide Home Loan Mortgage Pass Through Trust, Series 06-OA5, Class 3A1, | | | | | | |
0.72%, 4/25/46(a) | | | 435 | | | 173,859 |
Countrywide Home Loan Mortgage Pass Through Trust, Series 07-J3, Class A10, | | | | | | |
6.00%, 7/25/37 | | | 921 | | | 422,008 |
Credit Suisse Mortgage Capital Certificates, Series 06-8, Class 3A1, | | | | | | |
6.00%, 10/25/21 | | | 269 | | | 152,641 |
First Horizon Asset Securities, Inc., Series 05-AR3, Class 3A1, | | | | | | |
5.50%, 8/25/35(a) | | | 183 | | | 131,649 |
Harborview Mortgage Loan Trust, Series 05-10, Class 2A1A, | | | | | | |
0.87%, 11/19/35(a) | | | 651 | | | 247,458 |
Homebanc Mortgage Trust, Series 06-2, Class A1, | | | | | | |
0.70%, 12/25/36(a) | | | 547 | | | 228,541 |
JPMorgan Mortgage Trust, Series 06-S2, Class 2A2, | | | | | | |
5.88%, 7/25/36 | | | 136 | | | 98,618 |
JPMorgan Mortgage Trust, Series 07-S1, Class 1A2, | | | | | | |
5.50%, 3/25/22 | | | 139 | | | 103,085 |
Master Alternative Loans Trust, Series 04-4, Class 1A1, | | | | | | |
5.50%, 5/25/34 | | | 106 | | | 88,712 |
Residential Accredit Loans, Inc., Series 06-QO2, Class A1, | | | | | | |
0.74%, 2/25/46(a) | | | 325 | | | 135,791 |
Residential Funding Mortgage Securities I, Series 04-S9, Class2A1, | | | | | | |
4.75%, 12/25/19 | | | 1,488 | | | 1,371,342 |
Salomon Brothers Mortgage Securities VI, Inc., Series 87-1 (IO), | | | | | | |
11.00%, 2/17/17(a) | | | 23 | | | 4,223 |
Salomon Brothers Mortgage Securities VI, Inc., Series 87-1 (PO), | | | | | | |
1.60%, 2/17/17(k) | | | 25 | | | 22,300 |
Salomon Brothers Mortgage Securities VI, Inc., Series 87-2 (IO), | | | | | | |
11.00%, 3/16/17(a) | | | 18 | | | 4,028 |
Salomon Brothers Mortgage Securities VI, Inc., Series 87-2 (PO), | | | | | | |
0.54%, 3/06/17(k) | | | 18 | | | 17,571 |
Salomon Brothers Mortgage Securities VII, Inc., Series 00-C3, Class A2, | | | | | | |
6.59%, 12/18/33 | | | 1,278 | | | 1,280,530 |
Structured Adjustable Rate Mortgage Loan Trust, Series 07-3, Class 2A1, | | | | | | |
5.73%, 4/25/37(a) | | | 1,293 | | | 659,852 |
Structured Asset Securities Corp., Series 01-21A, Class B2, | | | | | | |
5.14%, 1/25/32(a) | | | 5 | | | 1,928 |
Structured Asset Securities Corp., Series 03-2A, Class B2II, | | | | | | |
5.21%, 2/25/33(a) | | | 56 | | | 20,968 |
Washington Mutual Mortgage Pass-Through Certificates, Series 03-AR3, Class B2, | | | | | | |
3.62%, 4/25/33(a) | | | 43 | | | 25,321 |
Washington Mutual Mortgage Pass-Through Certificates, Series 03-AR5, Class B2, | | | | | | |
4.50%, 6/25/33(a) | | | 157 | | | 67,283 |
Washington Mutual Mortgage Pass-Through Certificates, Series 03-AR8, Class B1, | | | | | | |
4.26%, 8/25/33(a) | | | 187 | | | 122,594 |
Washington Mutual Mortgage Pass-Through Certificates, Series 04-AR1, Class B1, | | | | | | |
3.74%, 3/25/34(a) | | | 747 | | | 184,171 |
Washington Mutual Mortgage Pass-Through Certificates, Series 04-AR3, Class B1, | | | | | | |
4.07%, 6/25/34(a) | | | 210 | | | 107,852 |
Washington Mutual Mortgage Pass-Through Certificates, Series 06-AR18, Class 1A1, | | | | | | |
5.31%, 1/25/37(a) | | | 857 | | | 414,200 |
Washington Mutual Mortgage Pass-Through Certificates, Series 07-HY3, Class 1A1, | | | | | | |
5.62%, 3/25/37(a) | | | 3,301 | | | 1,612,104 |
Washington Mutual Mortgage Pass-Through Certificates, Series 07-HY3, Class 4A1, | | | | | | |
5.33%, 3/25/37(a) | | | 1,512 | | | 833,245 |
Washington Mutual Mortgage Pass-Through Certificates, Series 07-OA4, Class 1A, | | | | | | |
2.40%, 5/25/47(a) | | | 265 | | | 100,326 |
Washington Mutual Mortgage Pass-Through Certificates, Series 07-OA5, Class 1A, | | | | | | |
2.38%, 6/25/47(a) | | | 222 | | | 78,195 |
Washington Mutual Mortgage Pass-Through Certificates, Series 07-OC1, Class A1, | | | | | | |
0.76%, 1/25/47(a) | | | 1,362 | | | 502,152 |
Wells Fargo Mortgage Backed Securities Trust, Series 05-AR15, Class 2A1, | | | | | | |
5.11%, 9/25/35(a) | | | 1,794 | | | 1,377,635 |
Wells Fargo Mortgage Backed Securities Trust, Series 06-AR10, Class IIA2, | | | | | | |
4.19%, 6/25/35(a) | | | 1,921 | | | 1,422,739 |
Wells Fargo Mortgage Backed Securities Trust, Series 06-AR12, Class 2A1, | | | | | | |
6.10%, 9/25/36(a) | | | 360 | | | 226,280 |
Wells Fargo Mortgage Backed Securities Trust, Series 06-AR17, Class A1, | | | | | | |
5.33%, 10/25/36(a) | | | 625 | | | 345,757 |
Wells Fargo Mortgage Backed Securities Trust, Series 06-AR2, Class 2A5, | | | | | | |
5.08%, 3/25/36(a) | | | 1,933 | | | 1,106,321 |
| | | | | | |
| | | | | | 19,778,602 |
| | | | | | |
Commercial Mortgage-Backed Securities — 5.9% | | | | | | |
Banc of America Commercial Mortgage, Inc., Series 07-2, Class A4, | | | | | | |
5.69%, 4/10/49(a) | | | 1,000 | | | 725,055 |
| | | | | | |
16 | | BLACKROCK ASSET ALLOCATION PORTFOLIO | | MARCH 31, 2009 | | |
| | |
| Schedule of Investments (continued) | | |
| | (Percentages shown are based on Net Assets) |
| | | | | | |
| | | Par
(000) | | Value |
Non-U.S. Government Sponsored Agency Mortgage-Backed Securities | | | | | | |
Commercial Mortgage-Backed Securities (continued) | | | | | | |
Bank of America-First Union Commercial Mortgage, Series 01-3, Class A2, | | | | | | |
5.46%, 4/11/37 | | $ | 1,375 | | $ | 1,327,354 |
Bear Stearns Commercial Mortgage Securities, Inc., Series 00-WF2, Class A2, | | | | | | |
7.32%, 10/15/32(a) | | | 462 | | | 466,378 |
Bear Stearns Commercial Mortgage Securities, Inc., Series 02-TOP6, Class A1, | | | | | | |
5.92%, 10/15/36 | | | 223 | | | 223,646 |
Bear Stearns Commercial Mortgage Securities, Inc., Series 03-T12, Class A4, | | | | | | |
4.68%, 9/13/13(a) | | | 1,025 | | | 898,357 |
Bear Stearns Commercial Mortgage Securities, Inc., Series 99-WF2, Class A2, | | | | | | |
7.08%, 7/15/31 | | | 94 | | | 93,986 |
CDC Commercial Mortgage Trust, Series 02-FX1, Class A1, | | | | | | |
5.25%, 5/15/19 | | | 573 | | | 571,523 |
Citigroup/Deutsche Bank Commercial Mortgage Trust, Series 07-CD4, Class A4, | | | | | | |
5.32%, 12/11/49 | | | 68 | | | 44,911 |
Citigroup/Deutsche Bank Commercial Mortgage Trust, Series 07-CD5, Class A4, | | | | | | |
5.89%, 11/15/44(a) | | | 475 | | | 340,010 |
Citigroup-Deutsche Bank Commercial Mortgage Trust, Series 07-C6, Class AM, | | | | | | |
5.70%, 6/10/17(a) | | | 475 | | | 194,346 |
Commercial Mortgage Acceptance Corp., Series 98-C2, Class E, | | | | | | |
6.87%, 6/15/10(a) | | | 930 | | | 931,405 |
Commercial Mortgage Pass-Through Certificates, Series 04-LB3A, Class A3, | | | | | | |
5.09%, 7/10/37(a) | | | 515 | | | 467,058 |
Commercial Mortgage Pass-Through Certificates, Series 07-C9, Class A4, | | | | | | |
5.82%, 12/10/49(a) | | | 300 | | | 218,159 |
Credit Suisse First Boston Mortgage Securities Corp., Series 01-CP4, Class D, | | | | | | |
6.61%, 12/15/35 | | | 1,450 | | | 1,328,099 |
Credit Suisse First Boston Mortgage Securities Corp., Series 02-CKN2, Class A3, | | | | | | |
6.13%, 3/15/12 | | | 1,000 | | | 981,652 |
Credit Suisse First Boston Mortgage Securities Corp., Series 02-CKS4, Class A2, | | | | | | |
5.18%, 8/15/12 | | | 1,090 | | | 1,031,918 |
Credit Suisse First Boston Mortgage Securities Corp., Series 02-CP5, Class A2, | | | | | | |
4.94%, 12/15/35 | | | 1,010 | | | 952,972 |
Credit Suisse First Boston Mortgage Securities Corp., Series 03-C3, Class A5, | | | | | | |
3.94%, 5/15/38 | | | 1,020 | | | 879,407 |
First Union National Bank Commercial Mortgage Trust, Series 01-C2, Class A2, | | | | | | |
6.66%, 1/12/43 | | | 942 | | | 961,750 |
First Union National Bank Commercial Mortgage Trust, Series 01-C4, Class A2, | | | | | | |
6.22%, 12/12/33 | | | 1,140 | | | 1,124,539 |
General Motors Acceptance Corp. Commercial Mortgage Securities, Inc., Series 00-C3, Class A2, | | | | | | |
6.96%, 11/15/10 | | | 1,270 | | | 1,288,329 |
General Motors Acceptance Corp. Commercial Mortgage Securities, Inc., Series 99-C3, Class A2, | | | | | | |
7.18%, 8/15/36(a) | | | 86 | | | 86,065 |
Impac Commercial Mortgage Backed Trust, Series 04-5, Class 1A1, | | | | | | |
0.88%, 10/25/34(a) | | | 82 | | | 47,339 |
Impac Commercial Mortgage Backed Trust, Series 04-7, Class 1A1, | | | | | | |
1.26%, 11/25/34(a) | | | 201 | | | 102,835 |
Impac Commercial Mortgage Backed Trust, Series 04-7, Class M4, | | | | | | |
2.32%, 11/25/34(a) | | | 66 | | | 14,179 |
JPMorgan Chase Commercial Mortgage Securities Corp., Series 07-LD11, Class A2, | | | | | | |
5.80%, 6/15/49(a) | | | 1,220 | | | 973,766 |
Lehman Brothers Commercial Conduit Mortgage Trust, Series 99-C2, Class A2, | | | | | | |
7.33%, 10/15/32 | | | 168 | | | 169,063 |
Lehman Brothers Commercial Conduit Mortgage Trust, Series 99-C2, Class E, | | | | | | |
7.47%, 10/15/32 | | | 125 | | | 125,318 |
Lehman Brothers-UBS Commercial Mortgage Trust, Series 01-C7, Class A4, | | | | | | |
5.93%, 12/15/25 | | | 377 | | | 373,527 |
Lehman Brothers-UBS Commercial Mortgage Trust, Series 01-WM, Class A1, | | | | | | |
6.16%, 7/14/16(b) | | | 373 | | | 371,299 |
Lehman Brothers-UBS Commercial Mortgage Trust, Series 04-C6, Class A1, | | | | | | |
3.88%, 8/15/29 | | | 83 | | | 82,803 |
Lehman Brothers-UBS Commercial Mortgage Trust, Series 06-C1, Class A4, | | | | | | |
5.16%, 2/15/31 | | | 1,085 | | | 827,580 |
Lehman Brothers-UBS Commercial Mortgage Trust, Series 06-C6, Class A4, | | | | | | |
5.37%, 9/15/39 | | | 470 | | | 338,244 |
Lehman Brothers-UBS Commercial Mortgage Trust, Series 07-C7, Class A3, | | | | | | |
5.87%, 9/15/45(a) | | | 1,050 | | | 735,514 |
Morgan Stanley Capital I, Inc., Series 01-TOP1, Class A4, | | | | | | |
6.66%, 2/15/33 | | | 845 | | | 838,898 |
Morgan Stanley Capital I, Inc., Series 02-TOP7, Class A1, | | | | | | |
5.38%, 1/15/39 | | | 154 | | | 153,840 |
Morgan Stanley Capital I, Inc., Series 05-HQ6, Class A4A, | | | | | | |
4.99%, 8/13/42 | | | 2,405 | | | 1,934,760 |
Morgan Stanley Capital I, Series 03-IQ4, Class A2, | | | | | | |
4.07%, 5/15/40 | | | 1,025 | | | 889,917 |
Structured Asset Securities Corp. Commercial Trust, Series 96-CFL, Class X1 (IO), | | | | | | |
2.17%, 2/25/28(a) | | | 476 | | | 22 |
TIAA Retail Commercial Trust, Series 01-C1A, Class A4, | | | | | | |
6.68%, 6/19/31(a)(b) | | | 499 | | | 499,584 |
Wachovia Bank Commercial Mortgage Trust, Series 05-C21, Class A3, | | | | | | |
5.21%, 10/15/44(a) | | | 490 | | | 452,883 |
Wachovia Bank Commercial Mortgage Trust, Series 06-C25, Class A5, | | | | | | |
5.74%, 5/15/43(a) | | | 1,050 | | | 765,796 |
Wachovia Bank Commercial Mortgage Trust, Series 07-C33, Class A4, | | | | | | |
5.90%, 7/15/17(a) | | | 1,405 | | | 862,073 |
| | | | | | |
| | | BLACKROCK ASSET ALLOCATION PORTFOLIO | | MARCH 31, 2009 | | 17 |
| | |
| Schedule of Investments (continued) | | |
| | (Percentages shown are based on Net Assets) |
| | | | | | |
| | | Par
(000) | | Value |
Non-U.S. Government Sponsored Agency Mortgage-Backed Securities | | | | | | |
Commercial Mortgage-Backed Securities (concluded) | | | | | | |
Washington Mutual Commercial Mortgage Securities Trust, Series 05-C1A, Class X (IO), | | | | | | |
1.97%, 5/25/36(a)(b) | | $ | 5,308 | | $ | 152,860 |
| | | | | | |
| | | | | | 25,849,019 |
| | | | | | |
Total Non-U.S. Government Sponsored Agency Mortgage-Backed Securities — 10.4% | | | | | | 45,627,621 |
| | | | | | |
| | |
| | | Shares | | |
Rights | | | | | | |
HSBC Holdings Plc, Expiring 4/03/09(g) | | | 34,850 | | | 194,031 |
Pohjola Bank Plc, Expiring 4/24/09(g) | | | 12,800 | | | 17,395 |
William Hill Plc, Expiring 4/07/09(g) | | | 55,900 | | | 51,333 |
| | | | | | |
Total Rights — 0.1% | | | | | | 262,759 |
| | | | | | |
| | |
| | | Par
(000) | | |
Taxable Municipal Bonds | | | | | | |
Atlantic Marine Corp. Communities LLC, Notes (Delaware), | | | | | | |
5.34%, 12/01/49(b) | | $ | 600 | | | 380,250 |
Ohana Hawaii Military Communities LLC, Military Housing Revenue Bonds (Navy Housing Privatization Project), Series 04-A, Class 1, | | | | | | |
6.19%, 4/01/49(b) | | | 25 | | | 19,494 |
| | | | | | |
Total Taxable Municipal Bonds — 0.1% | | | | | | 399,744 |
| | | | | | |
U.S. Government Sponsored Agency Mortgage-Backed Securities | | | | | | |
Collateralized Mortgage Obligations — 18.8% | | | | | | |
Federal Home Loan Mortgage Corp. 1 Year CMT, | | | | | | |
4.77%, 1/01/35(a) | | | 544 | | | 557,576 |
5.05%, 12/01/35(a) | | | 514 | | | 525,994 |
5.97%, 6/01/36(a) | | | 783 | | | 813,312 |
Federal Home Loan Mortgage Corp. 15 Year TBA, | | | | | | |
6.00%, 4/01/24(l) | | | 300 | | | 313,969 |
Federal Home Loan Mortgage Corp. 30 Year TBA, | | | | | | |
4.50%, 4/01/39(l) | | | 200 | | | 204,000 |
5.00%, 4/01/39(l) | | | 1,600 | | | 1,649,000 |
5.50%, 4/01/39(l) | | | 6,300 | | | 6,534,281 |
Federal Home Loan Mortgage Corp. Gold, | | | | | | |
4.00%, 5/01/10 | | | 70 | | | 70,245 |
6.00%, 4/01/13-6/01/16 | | | 71 | | | 74,789 |
9.50%, 12/01/22 | | | 147 | | | 168,421 |
8.00%, 2/01/23-8/01/27 | | | 17 | | | 18,498 |
7.50%, 9/01/27(m) | | | 0 | | | 257 |
6.50%, 1/01/29-8/01/32 | | | 54 | | | 57,459 |
5.50%, 8/01/33-9/01/38 | | | 623 | | | 647,552 |
4.50%, 9/01/35-3/01/39 | | | 2,701 | | | 2,761,981 |
Federal Home Loan Mortgage Corp. Non Gold Pool, | | | | | | |
5.05%, 9/01/35-4/01/38(a) | | | 1,866 | | | 1,918,582 |
Federal Home Loan Mortgage Corp., Series 2864, Class NA, | | | | | | |
5.50%, 1/15/31 | | | 98 | | | 102,005 |
Federal Home Loan Mortgage Corp., Series 3171, Class ST (IO), | | | | | | |
5.93%, 6/15/36(a) | | | 2,657 | | | 221,197 |
Federal Home Loan Mortgage Corp., Series 3218, Class SA (IO), | | | | | | |
6.01%, 9/15/36(a) | | | 1,259 | | | 98,458 |
Federal Home Loan Mortgage Corp., Series 3501, Class SC (IO), | | | | | | |
5.29%, 1/15/39(a) | | | 900 | | | 61,549 |
Federal Home Loan Mortgage Corp., Series 3501, Class SJ (IO), | | | | | | |
5.89%, 1/15/39(a) | | | 900 | | | 68,502 |
Federal National Mortgage Assoc., | | | | | | |
6.00%, 9/01/11-8/01/36 | | | 2,291 | | | 2,406,594 |
7.00%, 8/01/14-10/01/32 | | | 186 | | | 195,702 |
5.50%, 4/01/17-2/01/35(n) | | | 12,169 | | | 12,678,134 |
7.50%, 10/01/25-2/01/30 | | | 2 | | | 2,332 |
6.50%, 5/01/29-7/01/32 | | | 85 | | | 91,078 |
5.00%, 2/01/38 | | | 5,636 | | | 5,828,533 |
Federal National Mortgage Assoc. 15 Year TBA, | | | | | | |
4.00%, 4/01/24(l) | | | 2,000 | | | 2,032,500 |
4.50%, 4/01/24(l) | | | 2,200 | | | 2,264,625 |
5.50%, 4/01/24(l) | | | 4,100 | | | 4,271,688 |
6.00%, 4/01/24(l) | | | 100 | | | 104,656 |
5.00%, 5/01/24(l) | | | 3,600 | | | 3,722,623 |
Federal National Mortgage Assoc. 30 Year TBA, | | | | | | |
4.50%, 3/01/39-4/01/39(l) | | | 6,270 | | | 6,406,624 |
5.00%, 4/01/39(l) | | | 5,900 | | | 6,086,219 |
5.50%, 4/01/39(l) | | | 1,200 | | | 1,245,375 |
6.00%, 4/01/39(l) | | | 100 | | | 104,406 |
6.50%, 4/01/39(l) | | | 200 | | | 210,625 |
Federal National Mortgage Assoc. ARM, | | | | | | |
4.19%, 12/01/34(a) | | | 817 | | | 822,093 |
Federal National Mortgage Assoc. Grantor Trust, Series 03-T1, Class R (IO), | | | | | | |
0.49%, 11/25/12(a) | | | 6,352 | | | 111,136 |
Federal National Mortgage Assoc., Series 04-88, Class HA, | | | | | | |
6.50%, 7/25/34 | | | 37 | | | 38,907 |
Federal National Mortgage Assoc., Series 07-108, Class AN, | | | | | | |
8.87%, 11/25/37(a) | | | 760 | | | 838,233 |
Federal National Mortgage Assoc., Series 07-30, Class WI (IO), | | | | | | |
6.24%, 4/25/37(a) | | | 3,143 | | | 249,962 |
Federal National Mortgage Assoc., Series 08-2, Class SA (IO), | | | | | | |
5.75%, 2/25/38(a) | | | 1,606 | | | 134,964 |
Federal National Mortgage Assoc., Series 378, Class 5 (IO), | | | | | | |
5.00%, 7/01/36 | | | 1,790 | | | 208,762 |
Government National Mortgage Assoc. I, | | | | | | |
6.50%, 6/15/09-1/15/35 | | | 1,119 | | | 1,181,217 |
7.50%, 12/15/10 | | | 11 | | | 11,742 |
6.00%, 10/15/23-2/15/24 | | | 195 | | | 205,145 |
7.00%, 4/15/29-6/15/35 | | | 1,874 | | | 2,001,796 |
5.50%, 4/15/33-8/15/33 | | | 478 | | | 499,218 |
Government National Mortgage Assoc. I 30 Year TBA, | | | | | | |
4.50%, 4/01/39-5/01/39(l) | | | 5,300 | | | 5,404,875 |
5.50%, 4/01/39-5/01/39(l) | | | 400 | | | 415,406 |
6.00%, 5/01/39(l) | | | 1,100 | | | 1,146,063 |
Government National Mortgage Assoc. II, | | | | | | |
5.00%, 10/20/33 | | | 963 | | | 1,000,801 |
Government National Mortgage Assoc. II 30 Year TBA, | | | | | | |
5.00%, 4/01/39(l) | | | 1,000 | | | 1,034,375 |
6.00%, 5/01/39(l) | | | 1,800 | | | 1,872,000 |
| | | | | | |
18 | | BLACKROCK ASSET ALLOCATION PORTFOLIO | | MARCH 31, 2009 | | |
| | |
| Schedule of Investments (continued) | | |
| | (Percentages shown are based on Net Assets) |
| | | | | | | | |
| | | Par
(000) | | | Value | |
U.S. Government Sponsored Agency Mortgage-Backed Securities | | | | | | | | |
Collateralized Mortgage Obligations (concluded) | | | | | | | | |
Government National Mortgage Assoc. II ARM, | | | | | | | | |
3.75%, 5/20/34(a) | | $ | 117 | | | $ | 116,539 | |
Government National Mortgage Assoc., Series 07-59, Class SC (IO), | | | | | | | | |
5.96%, 7/20/37(a) | | | 2,228 | | | | 144,497 | |
Government National Mortgage Assoc., Series 07-67, Class SI (IO), | | | | | | | | |
5.97%, 11/20/37(a) | | | 1,331 | | | | 83,086 | |
Government National Mortgage Assoc., Series 07-72, Class US (IO), | | | | | | | | |
6.01%, 11/20/37(a) | | | 3,511 | | | | 203,450 | |
| | | | | | | | |
Total U.S. Government Sponsored Agency Mortgage-Backed Securities — 18.8% | | | | | | | 82,243,608 | |
| | | | | | | | |
U.S. Government Sponsored Agency Obligations | | | | | | | | |
Federal Home Loan Bank, Bonds, | | | | | | | | |
5.38%, 5/15/19 | | | 2,005 | | | | 2,200,927 | |
Federal Home Loan Bank, Subordinated Notes, | | | | | | | | |
5.63%, 6/13/16 | | | 890 | | | | 868,852 | |
Federal Home Loan Mortgage Corp., Subordinated Notes, | | | | | | | | |
5.75%, 6/27/16 | | | 920 | | | | 958,969 | |
Federal Home Loan Mortgage Corp., Unsecured Notes, | | | | | | | | |
2.13%, 3/23/12 | | | 1,450 | | | | 1,460,988 | |
5.25%, 4/18/16 | | | 760 | | | | 859,995 | |
Federal National Mortgage Assoc., Unsecured Notes, | | | | | | | | |
2.88%, 10/12/10 | | | 1,900 | | | | 1,952,626 | |
2.00%, 1/09/12(n) | | | 1,915 | | | | 1,934,303 | |
2.88%, 12/11/13(o) | | | 1,675 | | | | 1,712,237 | |
2.75%, 2/05/14 | | | 1,650 | | | | 1,674,227 | |
2.75%, 3/13/14 | | | 3,400 | | | | 3,440,586 | |
Resolution Funding Corp., Strip Bonds, | | | | | | | | |
3.77%, 7/15/18(k) | | | 150 | | | | 105,987 | |
3.78%, 10/15/18(k) | | | 150 | | | | 104,952 | |
| | | | | | | | |
Total U.S. Government Sponsored Agency Obligations — 3.9% | | | | | | | 17,274,649 | |
| | | | | | | | |
U.S. Treasury Obligations | | | | | | | | |
U.S. Treasury Bonds, | | | | | | | | |
8.13%, 8/15/19(p) | | | 1,025 | | | | 1,486,250 | |
4.50%, 5/15/38 | | | 250 | | | | 291,875 | |
U.S. Treasury Notes, | | | | | | | | |
1.88%, 2/28/14 | | | 5 | | | | 5,055 | |
2.75%, 2/15/19(p) | | | 2,490 | | | | 2,503,620 | |
| | | | | | | | |
Total U.S. Treasury Obligations — 1.0% | | | | | | | 4,286,800 | |
| | | | | | | | |
| | |
| | | Shares | | | | |
Warrant — 0.0% | | | | | | | | |
Crosshair Exploration & Mining Corp. (issued/exercisable 4/04/08, 1 share for 1 warrant, expiring 10/04/09, strike price 1.80 CAD) (acquired 4/04/08, cost $51)(g)(i) | | | 5,300 | | | | 16 | |
| | | | | | | | |
Total Long-Term Investments
(Cost — $513,575,743) — 102.6% | | | | | | $ | 449,515,738 | |
| | | | | | | | |
| | |
| | | Par/Shares/
Beneficial
Interest
(000) | | | | |
Short-Term Securities | | | | | | | | |
BlackRock Liquidity Funds, TempFund, | | | | | | | | |
0.60%(q)(r) | | | 22,244 | | | | 22,244,139 | |
BlackRock Liquidity Series, LLC Money Market Series, | | | | | | | | |
1.17%(q)(r)(s) | | | 1,590 | | | | 1,590,400 | |
BNP Paribas Finance, Inc., | | | | | | | | |
0.55%, 4/09/09(r) | | | 5,000 | | | | 4,999,015 | |
Danske Corp., | | | | | | | | |
1.50%, 6/04/09(r) | | | 6,000 | | | | 5,990,272 | |
| | | | | | | | |
Total Short-Term Securities
(Cost — $34,817,928) — 7.9% | | | | | | | 34,823,826 | |
| | | | | | | | |
| | |
| | | Contracts(t) | | | | |
Options Purchased | | | | | | | | |
Over-the-Counter Call Swaptions Purchased | | | | | | | | |
Receive a fixed rate of 2.500% and pay a floating rate based on 3-month LIBOR, expiring March 2010, Broker, Barclays Bank, Plc | | | 190 | | | | 51,364 | |
| | | | | | | | |
Over-the-Counter Put Swaptions Purchased | | | | | | | | |
Pay a fixed rate of 5.500% and receive a floating rate based on 3-month LIBOR, expiring December 2009, Broker, Bank of America, N.A. | | | 110 | | | | 4,110 | |
| | | | | | | | |
Total Options Purchased
(Cost — $87,790) — 0.0% | | | | | | | 55,474 | |
| | | | | | | | |
Total Investments Before TBA Sale Commitments and Outstanding Options Written
(Cost — $548,481,461*) — 110.5% | | | | | | | 484,395,038 | |
| | | | | | | | |
| | |
| | | Par
(000) | | | | |
TBA Sale Commitments | | | | | | | | |
Federal Home Loan Mortgage Corp. 30 Year TBA, | | | | | | | | |
4.50%, 4/01/39(l) | | $ | (2,900 | ) | | | (2,958,000 | ) |
5.50%, 4/01/39(l) | | | (4,600 | ) | | | (4,771,062 | ) |
Federal National Mortgage Assoc. 15 Year TBA, | | | | | | | | |
5.50%, 4/01/24(l) | | | (4,500 | ) | | | (4,688,438 | ) |
Federal National Mortgage Assoc. 30 Year TBA, | | | | | | | | |
4.50%, 4/01/39(l) | | | (3,700 | ) | | | (3,777,469 | ) |
5.00%, 4/01/39-5/01/39(l) | | | (10,800 | ) | | | (11,116,832 | ) |
5.50%, 4/01/39-5/01/39(l) | | | (10,100 | ) | | | (10,456,875 | ) |
6.00%, 4/01/39(l) | | | (2,300 | ) | | | (2,401,344 | ) |
6.50%, 4/01/39(l) | | | (200 | ) | | | (210,625 | ) |
7.00%, 4/01/39(l) | | | (47 | ) | | | (50,056 | ) |
Government National Mortgage Assoc. I 30 Year TBA, | | | | | | | | |
4.50%, 4/01/39(l) | | | (1,600 | ) | | | (1,635,500 | ) |
5.50%, 4/01/39(l) | | | (100 | ) | | | (104,062 | ) |
6.50%, 4/01/39(l) | | | (300 | ) | | | (314,531 | ) |
| | | | | | | | |
Total TBA Sale Commitments
(Proceeds — $42,210,978) — (9.7)% | | | | | | | (42,484,794 | ) |
| | | | | | | | |
| | | | | | |
| | | BLACKROCK ASSET ALLOCATION PORTFOLIO | | MARCH 31, 2009 | | 19 |
| | |
| Schedule of Investments (continued) | | |
| | (Percentages shown are based on Net Assets) |
| | | | | | | |
| | | Contracts(t) | | | Value | |
Options Written | | | | | | | |
Over-the-Counter Call Swaptions Written | | | | | | | |
Pay a fixed rate of 3.310% and receive a floating rate based on 3-month LIBOR, expiring March 2010, Broker, JPMorgan Chase Bank, National Association | | (190 | ) | | $ | (86,134 | ) |
Pay a fixed rate of 3.330% and receive a floating rate based on 3-month LIBOR, expiring March 2010, Broker, Citibank, N.A. | | (210 | ) | | | (97,483 | ) |
Pay a fixed rate of 3.470% and receive a floating rate based on 3-month LIBOR, expiring March 2010, Broker, Deutsche Bank AG | | (190 | ) | | | (102,385 | ) |
Pay a fixed rate of 4.870% and receive a floating rate based on 3-month LIBOR, expiring February 2010, Broker, Deutsche Bank AG | | (570 | ) | | | (876,858 | ) |
Pay a fixed rate of 5.400% and receive a floating rate based on 3-month LIBOR, expiring December 2010, Broker, UBS AG | | (260 | ) | | | (463,301 | ) |
Pay a fixed rate of 5.485% and receive a floating rate based on 3-month LIBOR, expiring October 2009, Broker, JPMorgan Chase Bank, National Association | | (140 | ) | | | (297,260 | ) |
Pay a fixed rate of 5.670% and receive a floating rate based on 3-month LIBOR, expiring January 2010, Broker, Citibank, N.A. | | (50 | ) | | | (111,300 | ) |
| | | | | | | |
| | | | | | (2,034,721 | ) |
| | | | | | | |
Over-the-Counter Put Swaptions Written | | | | | | | |
Receive a fixed rate of 3.310% and pay a floating rate based on 3-month LIBOR, expiring March 2010, Broker, JPMorgan Chase Bank, National Association | | (190 | ) | | | (60,387 | ) |
Receive a fixed rate of 3.330% and pay a floating rate based on 3-month LIBOR, expiring March 2010, Broker, Citibank, N.A. | | (210 | ) | | | (64,550 | ) |
Receive a fixed rate of 3.470% and pay a floating rate based on 3-month LIBOR, expiring March 2010, Broker, Deutsche Bank AG | | (190 | ) | | | (50,069 | ) |
Receive a fixed rate of 4.500% and pay a floating rate based on 3-month LIBOR, expiring March 2010, Broker, Barclays Bank, Plc | | (190 | ) | | | (44,323 | ) |
Receive a fixed rate of 4.870% and pay a floating rate based on 3-month LIBOR, expiring February 2010, Broker, Deutsche Bank AG | | (570 | ) | | | (20,522 | ) |
Receive a fixed rate of 5.400% and pay a floating rate based on 3-month LIBOR, expiring December 2010, Broker, UBS AG | | (260 | ) | | | (18,639 | ) |
Receive a fixed rate of 5.485% and pay a floating rate based on 3-month LIBOR, expiring October 2009, Broker, JPMorgan Chase Bank, National Association | | (140 | ) | | | (652 | ) |
Receive a fixed rate of 5.670% and pay a floating rate based on 3-month LIBOR, expiring January 2010, Broker, Citibank, N.A. | | (50 | ) | | | (390 | ) |
| | | | | | | |
| | | | | | (259,532 | ) |
| | | | | | | |
Total Options Written
(Premiums Received — $1,551,320) — (0.5)% | | | | | | (2,294,253 | ) |
| | | | | | | |
Total Investments Net of TBA Sale Commitments and Outstanding Options Written — 100.3% | | | | | | 439,615,991 | |
Liabilities in Excess of Other Assets — (0.3)% | | | | | | (1,384,232 | ) |
| | | | | | | |
Net Assets — 100.0% | | | | | $ | 438,231,759 | |
| | | | | | | |
| * | The cost and unrealized appreciation (depreciation) of investments as of March 31, 2009, as computed for federal income tax purposes, were as follows: |
| | | | |
Aggregate cost | | $ | 555,067,249 | |
| | | | |
Gross unrealized appreciation | | $ | 19,004,287 | |
Gross unrealized depreciation | | | (89,676,498 | ) |
| | | | |
Net unrealized depreciation | | $ | (70,672,211 | ) |
| | | | |
| (a) | Variable rate security. Rate shown is as of report date. |
| (b) | Security exempt from registration under Rule 144A of the Securities Act of 1933. These securities may be resold in transactions exempt from registration to qualified institutional investors. |
| (c) | Represents a step-up bond that pays an initial coupon rate for the first period and then a higher coupon rate for the following periods. Rate shown reflects the effective yield at the time of purchase. |
| (d) | U.S. dollar denominated security issued by foreign domiciled entity. |
| (e) | Security is perpetual in nature and has no stated maturity date. In certain instances, a final maturity date may be extended and/or the final payment of principal may be deferred at the issuer’s option for a specified time without default. |
| (f) | Issuer filed for bankruptcy and/or is in default of interest payments. |
| (g) | Non-income producing security. |
| (h) | Security, or a portion of security, is on loan. |
| (i) | Restricted security as to resale. As of report date the Portfolio held 0.04% of its net assets, with a current market value of $175,897 and an original cost of $111,001 in these securities. |
| (j) | Represents a payment-in-kind security which may pay interest/dividends in additional face/shares. |
| (k) | Represents a zero coupon bond. Rate shown reflects the current yield as of report date. |
| (l) | Represents or includes a to-be-announced transaction. The Portfolio has committed to purchasing (selling) securities for which all specific information is not available at this time. |
| | | | | | | | |
Counterparty | | Market Value | | | Unrealized
Appreciation
(Depreciation) | |
AK Capital Services Ltd. | | $ | (50,056 | ) | | $ | 251 | |
Bank of America, N.A. | | $ | (10,094 | ) | | $ | (18,703 | ) |
Barclays Bank, Plc | | $ | (2,040,000 | ) | | $ | 9,375 | |
Citibank, N.A. | | $ | (16,166,938 | ) | | $ | (92,828 | ) |
Credit Suisse International | | $ | (7,318,988 | ) | | $ | (93,160 | ) |
Deutsche Bank AG | | $ | 15,580,311 | | | $ | 161,167 | |
JPMorgan Chase Bank, National Association | | $ | 9,915,125 | | | $ | 69,094 | |
| (m) | Par is less than $500. |
| (n) | Security, or a portion thereof, has been pledged as collateral for swap contracts. (o) All or a portion of security pledged as collateral in connection with open financial futures contracts. |
| (p) | Security, or a portion thereof, subject to mortgage dollar roll transactions. |
| | | | | | |
20 | | BLACKROCK ASSET ALLOCATION PORTFOLIO | | MARCH 31, 2009 | | |
| | |
| Schedule of Investments (continued) | | |
| (q) | Investments in companies considered to be an affiliate of the Portfolio, for purposes of Section 2(a)(3) of the Investment Company Act of 1940, as amended, were as follows: |
| | | | | | | |
Affiliate | | Net
Activity | | | Income |
BlackRock Liquidity Funds, TempFund | | $ | 22,244,139 | ** | | $ | 49,398 |
BlackRock Liquidity Series, LLC Money Market Series | | $ | 120,500 | ** | | $ | 15,713 |
| ** | Represents net purchase cost. |
| (r) | Represents current yield as of report date. |
| (s) | Security purchased with the cash proceeds from securities loans. (t) One contract represents a notional amount of $10,000. |
| • | | Foreign currency exchange contracts as of March 31, 2009 were as follows: |
| | | | | | | | | | | | | | |
Currency
Purchased | | Currency Sold | | Counterparty | | Settlement
Date | | Unrealized
Appreciation
(Depreciation) | |
AUD | | 745,000 | | USD | | 488,316 | | Citibank, N.A. | | 4/15/09 | | $ | 29,103 | |
CAD | | 569,000 | | USD | | 448,247 | | Deutsche Bank AG | | 4/15/09 | | | 3,065 | |
CHF | | 1,355,000 | | USD | | 1,205,341 | | Citibank, N.A. | | 4/15/09 | | | (14,596 | ) |
CHF | | 1,000 | | USD | | 860 | | Citibank, N.A. | | 4/15/09 | | | 19 | |
CHF | | 52,000 | | USD | | 45,140 | | Citibank, N.A. | | 4/15/09 | | | 557 | |
CHF | | 23,000 | | USD | | 19,406 | | Deutsche Bank AG | | 4/15/09 | | | 806 | |
DKK | | 1,300,000 | | USD | | 228,563 | | Deutsche Bank AG | | 4/15/09 | | | 3,217 | |
EUR | | 930,000 | �� | USD | | 1,216,288 | | Deutsche Bank AG | | 4/15/09 | | | 19,268 | |
GBP | | 40,000 | | USD | | 57,084 | | UBS AG | | 4/15/09 | | | 312 | |
JPY | | 9,278,000 | | USD | | 97,119 | | Citibank, N.A. | | 4/15/09 | | | (3,368 | ) |
JPY | | 23,297,000 | | USD | | 260,386 | | Deutsche Bank AG | | 4/15/09 | | | (24,977 | ) |
JPY | | 11,987,000 | | USD | | 135,310 | | Deutsche Bank AG | | 4/15/09 | | | (14,185 | ) |
JPY | | 60,000,000 | | USD | | 678,043 | | UBS AG | | 4/15/09 | | | (71,761 | ) |
JPY | | 6,891,000 | | USD | | 77,446 | | UBS AG | | 4/15/09 | | | (7,815 | ) |
NOK | | 313,000 | | USD | | 43,526 | | Citibank, N.A. | | 4/15/09 | | | 3,017 | |
NOK | | 370,000 | | USD | | 53,191 | | Deutsche Bank AG | | 4/15/09 | | | 1,827 | |
SEK | | 5,577,000 | | USD | | 669,335 | | Royal Bank of Scotland | | 4/15/09 | | | 9,108 | |
SGD | | 360,000 | | USD | | 241,061 | | Deutsche Bank AG | | 4/15/09 | | | (4,464 | ) |
USD | | 52,673 | | AUD | | 80,000 | | Citibank, N.A. | | 4/15/09 | | | (2,889 | ) |
USD | | 35,425 | | AUD | | 54,000 | | UBS AG | | 4/15/09 | | | (2,080 | ) |
USD | | 39,265 | | CAD | | 50,000 | | Citibank, N.A. | | 4/15/09 | | | (394 | ) |
USD | | 37,000 | | CAD | | 45,000 | | Citibank, N.A. | | 4/15/09 | | | 1,308 | |
USD | | 58,495 | | CAD | | 72,000 | | Citibank, N.A. | | 4/15/09 | | | 1,387 | |
USD | | 220,823 | | CAD | | 270,000 | | UBS AG | | 4/15/09 | | | 6,668 | |
USD | | 44,042 | | CZK | | 909,000 | | UBS AG | | 4/15/09 | | | (74 | ) |
USD | | 187,765 | | EUR | | 138,000 | | Deutsche Bank AG | | 4/15/09 | | | 4,424 | |
USD | | 32,772 | | EUR | | 25,000 | | UBS AG | | 4/15/09 | | | (442 | ) |
USD | | 50,653 | | GBP | | 35,000 | | Barclays Bank, Plc | | 4/15/09 | | | 432 | |
USD | | 64,148 | | GBP | | 46,000 | | Deutsche Bank AG | | 4/15/09 | | | (1,857 | ) |
USD | | 205,681 | | GBP | | 144,000 | | Deutsche Bank AG | | 4/15/09 | | | (944 | ) |
USD | | 715,243 | | GBP | | 490,000 | | UBS AG Goldman Sachs Bank | | 4/15/09 | | | 12,142 | |
USD | | 347,978 | | HKD | | 2,700,000 | | USA | | 4/15/09 | | | (413 | ) |
USD | | 39,448 | | JPY | | 3,870,000 | | Citibank, N.A. | | 4/15/09 | | | 343 | |
USD | | 613,711 | | NOK | | 4,436,000 | | Citibank, N.A. | | 4/15/09 | | | (45,912 | ) |
USD | | 47,601 | | SEK | | 380,000 | | Citibank, N.A. | | 4/15/09 | | | 1,374 | |
USD | | 53,016 | | SEK | | 445,000 | | UBS AG | | 4/15/09 | | | (1,119 | ) |
USD | | 613,255 | | EUR | | 476,500 | | Citibank, N.A. | | 5/20/09 | | | (19,828 | ) |
GBP | | 34,000 | | USD | | 49,097 | | Deutsche Bank AG | | 6/10/09 | | | (300 | ) |
HKD | | 492,000 | | USD | | 63,516 | | Deutsche Bank AG | | 6/10/09 | | | (8 | ) |
SEK | | 230,000 | | USD | | 27,225 | | Citibank, N.A. | | 6/10/09 | | | 768 | |
USD | | 74,075 | | AUD | | 108,000 | | Citibank, N.A. | | 6/10/09 | | | (666 | ) |
USD | | 56,001 | | EUR | | 43,000 | | Citibank, N.A. | | 6/10/09 | | | (1,133 | ) |
USD | | 828,520 | | GBP | | 592,500 | | Deutsche Bank AG | | 6/10/09 | | | (21,832 | ) |
USD | | 612,738 | | GBP | | 434,000 | | Deutsche Bank AG | | 6/10/09 | | | (10,136 | ) |
USD | | 335,286 | | JPY | | 32,869,000 | | Citibank, N.A. | | 6/10/09 | | | 2,853 | |
USD | | 59,872 | | ZAR | | 576,000 | | Citibank, N.A. | | 6/10/09 | | | (13 | ) |
USD | | 33,042 | | ZAR | | 316,000 | | Citibank, N.A. | | 6/10/09 | | | 188 | |
USD | | 20,828 | | ZAR | | 204,000 | | Deutsche Bank AG | | 6/10/09 | | | (381 | ) |
| | | | | | | | | | | | | | |
| Total | | | | | | | | | | $ | (149,401 | ) |
| | | | | | | | | | | | | | |
| • | | Financial futures contracts purchased as of March 31, 2009 were as follows: |
| | | | | | | | | | | | | |
Contracts | | Issue | | Exchange | | Expiration
Date | | Face
Value | | Unrealized
Appreciation
(Depreciation) | |
200 | | DJIA Index | | Chicago | | June 2009 | | $ | 14,960,000 | | $ | 892,000 | |
8 | | Euro-Bund | | Chicago | | June 2009 | | $ | 1,322,545 | | | (1,275 | ) |
17 | | United Kingdom Gilt | | London | | June 2009 | | $ | 3,005,381 | | | 49,402 | |
130 | | S&P 500 Index | | Chicago | | June 2009 | | $ | 25,831,000 | | | 1,508,000 | |
65 | | U.S. Treasury Bonds | | Chicago | | June 2009 | | $ | 8,430,703 | | | 220,433 | |
12 | | U.S. Treasury Notes (2 Year) | | Chicago | | June 2009 | | $ | 2,614,688 | | | 6,382 | |
194 | | U.S. Treasury Notes (5 Year) | | Chicago | | June 2009 | | $ | 23,040,531 | | | 244,561 | |
| | | | | | | | | | | | | |
Total | | | | | | | | | | | $ | 2,919,503 | |
| | | | | | | | | | | | | |
| • | | Financial futures contracts sold as of March 31, 2009 were as follows: |
| | | | | | | | | | | | | |
Contracts | | Issue | | Exchange | | Expiration Date | | Face
Value | | Unrealized
Depreciation | |
57 | | U.S. Treasury Notes (10 Year) | | Chicago | | June 2009 | | $ | 6,541,875 | | $ | (7,130 | ) |
41 | | Euro Dollar Futures (90 Day) | | Chicago | | June 2009 | | $ | 10,137,250 | | | (99,162 | ) |
9 | | Euro Dollar Futures (90 Day) | | Chicago | | September 2009 | | $ | 2,225,363 | | | (5,950 | ) |
9 | | Euro Dollar Futures (90 Day) | | Chicago | | December 2009 | | $ | 2,221,988 | | | (6,175 | ) |
6 | | Euro Dollar Futures (90 Day) | | Chicago | | March 2010 | | $ | 1,480,500 | | | (5,540 | ) |
| | | | | | |
| | | BLACKROCK ASSET ALLOCATION PORTFOLIO | | MARCH 31, 2009 | | 21 |
| | |
| Schedule of Investments (continued) | | |
| | | | | | | | | | | | | |
Contracts | | Issue | | Exchange | | Expiration
Date | | Face
Value | | Unrealized
Depreciation | |
7 | | Euro Dollar Futures
(90 Day) | | Chicago | | June 2010 | | $ | 1,724,538 | | | (7,945 | ) |
7 | | Euro Dollar Futures
(90 Day) | | Chicago | | September 2010 | | $ | 1,721,738 | | | (9,207 | ) |
7 | | Euro Dollar Futures
(90 Day) | | Chicago | | December 2010 | | $ | 1,718,150 | | | (9,669 | ) |
3 | | Euro Dollar Futures
(90 Day) | | Chicago | | March 2011 | | $ | 735,225 | | | (4,648 | ) |
3 | | Euro Dollar Futures
(90 Day) | | Chicago | | June 2011 | | $ | 733,763 | | | (4,685 | ) |
3 | | Euro Dollar Futures
(90 Day) | | Chicago | | September 2011 | | $ | 732,300 | | | (4,493 | ) |
3 | | Euro Dollar Futures
(90 Day) | | Chicago | | December 2011 | | $ | 730,688 | | | (4,043 | ) |
| | | | | | | | | | | | | |
Total | | | | | | | | | | | $ | (168,647 | ) |
| | | | | | | | | | | | | |
| • | | Interest rate swaps outstanding as of March 31, 2009 were as follows: |
| | | | | | | | | | | | | |
Fixed Rate | | Floating Rate | | Counterparty | | Expiration | | Notional
Amount
(000) | | Unrealized
Appreciation
(Depreciation) | |
| 5.50% | | 3-month LIBOR | | Bank of America, N.A. | | July 2009 | | USD | 7,500 | | $ | 161,750 | |
| 4.05% | | 3-month LIBOR | | Barclays Bank, Plc | | December 2009 | | USD | 2,600 | | | 79,162 | |
| 1.76% | | 3-month LIBOR | | Deutsche Bank AG | | March 2011 | | USD | 3,600 | | | (26,675 | ) |
| 5.11% | | 3-month LIBOR | | UBS AG | | November 2011 | | USD | 9,100 | | | 964,213 | |
| 1.81% | | 3-month LIBOR | | Citibank, N.A. | | March 2012 | | USD | 10,000 | | | (36,725 | ) |
| 3.77% | | 3-month LIBOR | | Bank of America, N.A. | | January 2013 | | USD | 4,100 | | | 268,525 | |
| 4.27% | | 3-month LIBOR | | Deutsche Bank AG | | July 2013 | | USD | 1,600 | | | 146,238 | |
| 2.53% | | 3-month LIBOR | | Citibank, N.A. | | March 2014 | | USD | 3,500 | | | (54,160 | ) |
| 2.56% | | 3-month LIBOR | | Morgan Stanley Capital Services, Inc. | | March 2014 | | USD | 3,500 | | | (58,212 | ) |
| 4.96% | | 3-month LIBOR | | UBS AG | | March 2015 | | USD | 5,000 | | | (719,220 | ) |
| 4.50% | | 3-month LIBOR | | JPMorgan Chase Bank, National Association | | May 2015 | | USD | 1,700 | | | (226,511 | ) |
| 4.39% | | 3-month LIBOR | | Morgan Stanley Capital Services, Inc. | | July 2015 | | USD | 6,300 | | | (760,870 | ) |
| 5.30% | | 3-month LIBOR | | UBS AG | | February 2017 | | USD | 6,700 | | | 1,285,186 | |
| 2.21% | | 3-month LIBOR | | Goldman Sachs Bank USA | | December 2018 | | USD | 2,500 | | | (124,734 | ) |
| 2.30% | | 3-month LIBOR | | Citibank, N.A. | | December 2018 | | USD | 2,200 | | | (93,235 | ) |
| 2.86% | | 3-month LIBOR | | Goldman Sachs Bank USA | | January 2019 | | USD | 1,300 | | | 2,895 | |
| 2.71% | | 3-month LIBOR | | Bank of America, N.A. | | January 2019 | | USD | 2,400 | | | (26,633 | ) |
| 2.90% | | 3-month LIBOR | | Deutsche Bank AG | | February 2019 | | USD | 2,600 | | | 15,096 | |
| 3.22% | | 3-month LIBOR | | Morgan Stanley Capital Services, Inc. | | March 2019 | | USD | 1,500 | | | 48,442 | |
| 3.06% | | 3-month LIBOR | | Credit Suisse International | | March 2019 | | USD | 2,100 | | | 37,054 | |
| 2.82% | | 3-month LIBOR | | Barclays Bank, Plc | | March 2019 | | USD | 1,000 | | | (4,261 | ) |
| 5.41% | | 3-month LIBOR | | JPMorgan Chase Bank, National Association | | August 2022 | | USD | 1,130 | | | 295,097 | |
| 3.50% | | 3-month LIBOR | | Barclays Bank, Plc | | March 2040 | | USD | 500 | | | (13,193 | ) |
| | | | | | | | | | | | | |
| Total | | | | | | | | | | | $ | 1,159,229 | |
| | | | | | | | | | | | | |
| • | | Credit default swaps on single-name issues - buy protection outstanding as of March 31, 2009 were as follows: |
| | | | | | | | | | | | | |
Issuer | | Pay Fixed Rate | | | Counterparty | | Expiration | | Notional
Amount
(000)1 | | Unrealized
Appreciation
(Depreciation) | |
Centex Corp. | | 6.92 | % | | JPMorgan Chase Bank, National Association | | December 2010 | | 265 | | $ | (10,497 | ) |
| | | | | | |
22 | | BLACKROCK ASSET ALLOCATION PORTFOLIO | | MARCH 31, 2009 | | |
| | |
| Schedule of Investments (continued) | | |
| | | | | | | | | | | | | |
Issuer | | Pay Fixed Rate | | | Counterparty | | Expiration | | Notional
Amount
(000)1 | | Unrealized
Appreciation
(Depreciation) | |
Knight, Inc. | | 1.80 | % | | Credit Suisse International | | January 2011 | | 365 | | $ | (1,925 | ) |
Viacom, Inc. | | 2.40 | % | | Deutsche Bank AG | | June 2011 | | 525 | | | 4,581 | |
KB Home | | 4.90 | % | | JPMorgan Chase Bank, National Association | | September 2011 | | 460 | | | 456 | |
Wendy’s/Arby’s Group, Inc. | | 2.90 | % | | JPMorgan Chase Bank, National Association | | December 2011 | | 360 | | | (7,306 | ) |
United Rentals N.A., Inc. | | 5.00 | % | | JPMorgan Chase Bank, National Association | | March 2012 | | 500 | | | 953 | |
PolyOne Corp. | | 5.00 | % | | JPMorgan Chase Bank, National Association | | June 2012 | | 140 | | | (1,105 | ) |
Ryland Group, Inc. | | 4.51 | % | | JPMorgan Chase Bank, National Association | | June 2012 | | 165 | | | (6,533 | ) |
Macy’s, Inc. | | 7.50 | % | | Morgan Stanley Capital Services, Inc. | | June 2012 | | 250 | | | (1,624 | ) |
D.R. Horton, Inc. | | 5.04 | % | | JPMorgan Chase Bank, National Association | | June 2013 | | 525 | | | (19,009 | ) |
Expedia, Inc. | | 5.00 | % | | Citibank, N.A. | | September 2013 | | 380 | | | (3,345 | ) |
Expedia, Inc. | | 5.18 | % | | Goldman Sachs Bank USA | | September 2013 | | 175 | | | (2,707 | ) |
Centex Corp. | | 4.40 | % | | JPMorgan Chase Bank, National Association | | December 2013 | | 330 | | | (3,195 | ) |
Tyson Foods, Inc. | | 4.10 | % | | Barclays Bank, Plc | | March 2014 | | 445 | | | (23,211 | ) |
Hertz Global Holdings, Inc. | | 5.00 | % | | Goldman Sachs Bank USA | | March 2014 | | 165 | | | (16,305 | ) |
Toll Brothers, Inc. | | 2.00 | % | | JPMorgan Chase Bank, National Association | | March 2014 | | 155 | | | (1,769 | ) |
Idearc, Inc. | | 5.00 | % | | Barclays Bank, Plc | | June 2014 | | 305 | | | 9,913 | |
D.R. Horton, Inc. | | 5.07 | % | | JPMorgan Chase Bank, National Association | | September 2014 | | 155 | | | (8,839 | ) |
Huntsman Corp. | | 5.00 | % | | Goldman Sachs Bank USA | | December 2014 | | 175 | | | (3,551 | ) |
Energy Future Holdings Corp. | | 5.00 | % | | Morgan Stanley Capital Services, Inc. | | December 2014 | | 680 | | | (30,119 | ) |
Huntsman Corp. | | 5.00 | % | | Goldman Sachs Bank USA | | March 2015 | | 85 | | | 5,953 | |
Pulte Homes, Inc. | | 3.00 | % | | JPMorgan Chase Bank, National Association | | March 2015 | | 185 | | | (5,588 | ) |
Lennar Corp. | | 5.86 | % | | JPMorgan Chase Bank, National Association | | June 2015 | | 250 | | | (11,740 | ) |
First Data Corp. | | 5.00 | % | | Barclays Bank, Plc | | December 2015 | | 320 | | | (11,244 | ) |
First Data Corp. | | 5.00 | % | | Credit Suisse International | | December 2015 | | 130 | | | (4,568 | ) |
First Data Corp. | | 5.00 | % | | Goldman Sachs Bank USA | | December 2015 | | 85 | | | (2,562 | ) |
First Data Corp. | | 5.00 | % | | JPMorgan Chase Bank, National Association | | December 2015 | | 165 | | | (5,797 | ) |
Sabre Holdings Corp. | | 5.00 | % | | JPMorgan Chase Bank, National Association | | March 2016 | | 690 | | | (40,827 | ) |
| | | | | | | | | | | | | |
Total | | | | | | | | | | | $ | (201,510 | ) |
| | | | | | | | | | | | | |
| | | | | | |
| | | BLACKROCK ASSET ALLOCATION PORTFOLIO | | MARCH 31, 2009 | | 23 |
| | |
| Schedule of Investments (concluded) | | |
| • | | Credit default swaps on traded indexes - sold protection outstanding as of March 31, 2009 were as follows: |
| | | | | | | | | | | | | | | | |
Index | | Receive Fixed Rate | | | Counterparty | | Credit
Rating2 | | Expiration | | Notional
Amount
(000)1 | | Unrealized
Depreciation | |
Commercial Mortgage-Backed North America Index Series 3 | | 0.08 | % | | Credit Suisse International | | AAA | | December 2049 | | USD | 1,200 | | $ | (279,947 | ) |
| | | | | | | | | | | | | | | | |
1 | The maximum potential amount the Fund may pay should a negative credit event take place under the terms of the agreement. |
2 | Using Standard & Poor’s weighted average ratings of the underlying securities in the index. |
| • | | For Portfolio compliance purposes, the Portfolio’s industry classifications refer to any one or more of the industry sub-classifications used by one or more widely recognized market indexes or ratings group indexes and/or as defined by Portfolio management. This definition may not apply for purposes of this report, which may combine industry sub-classifications for reporting ease. |
| • | | Effective October 1, 2008, the Portfolio adopted Financial Accounting Standards Board Statement of Financial Accounting Standards No. 157, “Fair Value Measurements” (“FAS 157”). FAS 157 clarifies the definition of fair value, establishes a framework for measuring fair values and requires additional disclosures about the use of fair value measurements. Various inputs are used in determining the fair value of investments, which are as follows: |
| | • | | Level 1 – price quotations in active markets/exchanges for identical securities |
| | • | | Level 2 – other observable inputs (including, but not limited to: quoted prices for similar assets or liabilities in markets that are active, quoted prices for identical or similar assets in markets that are not active, inputs other than quoted prices that are observable for the assets or liabilities (such as interest rates, yield curves, volatilities, prepayment speeds, loss severities, credit risks and default rates) or other market – corroborated inputs) |
| | • | | Level 3 – unobservable inputs based on the best information available in the circumstance, to the extent observable inputs are not available (including the Portfolio’s own assumptions used in determining the fair value of investments). |
The inputs or methodology used for valuing securities are not necessarily an indication of the risk associated with investing in those securities. For information about the Portfolio’s policy regarding valuation of investments and other significant accounting policies, please refer to Note 1 of the Notes to Financial Statements.
The following table summarizes the inputs used as of March 31, 2009 in determining the fair valuation of the Portfolio’s investments:
| | | | | | | | | | | | | | |
Valuation Inputs | | Investments
in Securities | | | Other Financial
Instruments ** | |
| | Assets | | Liabilities | | | Assets | | Liabilities | |
Level 1 | | $ | 190,406,812 | | $ | — | | | $ | 2,920,778 | | $ | (169,922 | ) |
Level 2 | | | 293,664,055 | | | (42,484,794 | ) | | | 3,427,700 | | | (4,913,635 | ) |
Level 3 | | | 324,171 | | | — | | | | — | | | (279,947 | ) |
| | | | | | | | | | | | | | |
Total | | $ | 484,395,038 | | $ | (42,484,794 | ) | | $ | 6,348,478 | | $ | (5,363,504 | ) |
| | | | | | | | | | | | | | |
The following table is a reconciliation of Level 3 investments for the period ended March 31, 2009:
| | | | | | | | |
| | | Investments
in Securities | | | Other Financial
Instruments ** | |
| | | Assets | | | Liabilities | |
Balance, as of September 30, 2008 | | $ | 310,093 | | | $ | (818 | ) |
Accrued discounts/premiums | | | 2,433 | | | | — | |
Realized loss | | | (221 | ) | | | — | |
Change in unrealized appreciation/depreciation*** | | | 11,606 | | | | (279,129 | ) |
Net sales | | | (18,297 | ) | | | — | |
Net transfers in of Level 3 | | | 18,557 | | | | — | |
| | | | | | | | |
Balance, as of March 31, 2009 | | $ | 324,171 | | | $ | (279,947 | ) |
| | | | | | | | |
| ** | Other financial instruments are futures, swaps, foreign currency exchange contracts and options. Futures, swaps and foreign currency exchange contracts are valued at the unrealized appreciation/depreciation on the instrument and options written are shown at market value. |
| *** | Included in the related net change in appreciation/depreciation on the Statement of Operations. |
See Notes to Financial Statements.
| | | | | | |
24 | | BLACKROCK ASSET ALLOCATION PORTFOLIO | | MARCH 31, 2009 | | |
| | | | |
| | | | (b) Not Applicable due to no such divestments during the semi-annual period covered since the previous Form N-CSR filing. |
| | |
| Item 7 | | – | | Disclosure of Proxy Voting Policies and Procedures for Closed-End Management Investment Companies – Not Applicable |
| | |
| Item 8 | | – | | Portfolio Managers of Closed-End Management Investment Companies – Not Applicable |
| | |
| Item 9 | | – | | Purchases of Equity Securities by Closed-End Management Investment Company and Affiliated Purchasers – Not Applicable |
| | |
| Item 10 | | – | | Submission of Matters to a Vote of Security Holders – The registrant’s Nominating and Governance Committee will consider nominees to the board of directors recommended by shareholders when a vacancy becomes available. Shareholders who wish to recommend a nominee should send nominations that include biographical information and set forth the qualifications of the proposed nominee to the registrant’s Secretary. There have been no material changes to these procedures. |
| | |
| Item 11 | | – | | Controls and Procedures |
| | |
| 11(a) | | – | | The registrant’s principal executive and principal financial officers or persons performing similar functions have concluded that the registrant’s disclosure controls and procedures (as defined in Rule 30a-3(c) under the Investment Company Act of 1940, as amended (the “1940 Act”)) are effective as of a date within 90 days of the filing of this report based on the evaluation of these controls and procedures required by Rule 30a-3(b) under the 1940 Act and Rule 15(d)-15(b) under the Securities Exchange Act of 1934, as amended. |
| | |
| 11(b) | | – | | There were no changes in the registrant’s internal control over financial reporting (as defined in Rule 30a-3(d) under the 1940 Act) that occurred during the second fiscal quarter of the period covered by this report that have materially affected, or are reasonably likely to materially affect, the registrant’s internal control over financial reporting. |
| | |
| Item 12 | | – | | Exhibits attached hereto |
| | |
| 12(a)(1) | | – | | Code of Ethics – Not Applicable to this semi-annual report |
| | |
| 12(a)(2) | | – | | Certifications – Attached hereto |
| | |
| 12(a)(3) | | – | | Not Applicable |
| | |
| 12(b) | | – | | Certifications – Attached hereto |
Pursuant to the requirements of the Securities Exchange Act of 1934 and the Investment Company Act of 1940, the registrant has duly caused this report to be signed on its behalf by the undersigned, thereunto duly authorized.
| | | | |
BlackRock Funds |
| | |
| By: | | /s/ Donald C. Burke | | |
| | Donald C. Burke |
| | Chief Executive Officer of BlackRock Funds |
| |
Date: | | May 20, 2009 |
Pursuant to the requirements of the Securities Exchange Act of 1934 and the Investment Company Act of 1940, this report has been signed below by the following persons on behalf of the registrant and in the capacities and on the dates indicated.
| | | | |
| By: | | /s/ Donald C. Burke | | |
| | Donald C. Burke | | |
| | Chief Executive Officer (principal executive officer) of BlackRock Funds |
| |
Date: | | May 20, 2009 |
| | | | |
| By: | | /s/ Neal J. Andrews | | |
| | Neal J. Andrews | | |
| | Chief Financial Officer (principal financial officer) of BlackRock Funds |
| |
Date: | | May 20, 2009 |