UNITED STATES
SECURITIES AND EXCHANGE COMMISSION
Washington, D.C. 20549
FORM N-CSR
CERTIFIED SHAREHOLDER REPORT OF REGISTERED MANAGEMENT INVESTMENT COMPANIES
Investment Company Act file number: 811-05742
Name of Fund: BlackRock Funds
BlackRock Commodity Strategies Fund
BlackRock Global Long/Short Credit Fund
BlackRock Macro Themes Fund
BlackRock Multi-Asset Real Return Fund
BlackRock Short Obligations Fund
BlackRock Strategic Risk Allocation Fund
Fund Address: 100 Bellevue Parkway, Wilmington, DE 19809
Name and address of agent for service: John M. Perlowski, Chief Executive Officer, BlackRock Funds, 55 East 52nd Street, New York, NY 10055
Registrant’s telephone number, including area code: (800) 441-7762
Date of fiscal year end: 07/31/2016
Date of reporting period: 01/31/2016
Item 1 – Report to Stockholders
JANUARY 31, 2016
| | | | |
SEMI-ANNUAL REPORT (UNAUDITED) | | | | BLACKROCK® |
BlackRock FundsSM
▶ BlackRock Commodity Strategies Fund
▶ BlackRock Global Long/Short Credit Fund
▶ BlackRock Macro Themes Fund
| | |
| Not FDIC Insured ¡ May Lose Value ¡ No Bank Guarantee | | |
| | |

| | Shareholders can sign up for e-mail notifications of quarterly statements, annual and semi-annual shareholder reports and prospectuses by enrolling in the electronic delivery program. Electronic copies of shareholder reports and prospectuses are also available on BlackRock’s website. TO ENROLL IN ELECTRONIC DELIVERY: Shareholders Who Hold Accounts with Investment Advisors, Banks or Brokerages: Please contact your financial advisor. Please note that not all investment advisors, banks or brokerages may offer this service. Shareholders Who Hold Accounts Directly with BlackRock: 1. Access the BlackRock website at blackrock.com 2. Select "Access Your Account" 3. Next, select "eDelivery" in the "Related Resources" box and follow the sign-up instructions |
| | | | | | |
| 2 | | BLACKROCK FUNDS | | JANUARY 31, 2016 | | |
Dear Shareholder,
Diverging monetary policies and shifting economic outlooks across regions have been the overarching themes driving financial markets over the past couple of years. With U.S. growth outpacing the global economic recovery while inflationary pressures remained low, investors spent most of 2015 anticipating a short-term rate hike from the Federal Reserve, which ultimately came to fruition in December. In contrast, the European Central Bank and the Bank of Japan moved to a more accommodative stance over the year. In this environment, the U.S. dollar strengthened considerably, causing profit challenges for U.S. exporters and high levels of volatility in emerging market currencies and commodities.
Market volatility broadly increased in the latter part of 2015 and continued into 2016 given a collapse in oil prices and decelerating growth in China, while global growth and inflation failed to pick up. Oil prices were driven lower due to excess supply while the world’s largest oil producers had yet to negotiate a deal that would stabilize oil prices. In China, slower economic growth combined with a depreciating yuan and declining confidence in the country’s policymakers stoked worries about the potential impact to the broader global economy. After a long period in which global central bank policies had significant influence on investor sentiment and hence the direction of financial markets, in recent months, the underperformance of markets in Europe and Japan — where central banks had taken aggressive measures to stimulate growth and stabilize their currencies — highlighted the possibility that central banks could be losing their effectiveness.
In this environment, higher quality assets such as municipal bonds, U.S. Treasuries and investment grade corporate bonds outperformed risk assets including equities and high yield bonds. Large cap U.S. equities fared better than international developed and emerging markets.
At BlackRock, we believe investors need to think globally, extend their scope across a broad array of asset classes and be prepared to move freely as market conditions change over time. We encourage you to talk with your financial advisor and visit blackrock.com for further insight about investing in today’s markets.
Sincerely,

Rob Kapito
President, BlackRock Advisors, LLC

Rob Kapito
President, BlackRock Advisors, LLC
| | | | | | | | |
| Total Returns as of January 31, 2016 | |
| | | 6-month | | | 12-month | |
U.S large cap equities
(S&P 500® Index) | | | (6.77 | )% | | | (0.67 | )% |
U.S. small cap equities
(Russell 2000® Index) | | | (15.80 | ) | | | (9.92 | ) |
International equities
(MSCI Europe, Australasia,
Far East Index) | | | (14.58 | ) | | | (8.43 | ) |
Emerging market
equities (MSCI Emerging
Markets Index) | | | (16.96 | ) | | | (20.91 | ) |
3-month Treasury bills
(BofA Merrill Lynch
3-Month U.S. Treasury
Bill Index) | | | 0.05 | | | | 0.05 | |
U.S. Treasury securities
(BofA Merrill Lynch
10-Year U.S. Treasury
Index) | | | 3.36 | | | | (0.41 | ) |
U.S. investment grade
bonds (Barclays U.S.
Aggregate Bond Index) | | | 1.33 | | | | (0.16 | ) |
Tax-exempt municipal
bonds (S&P Municipal
Bond Index) | | | 3.67 | | | | 2.66 | |
U.S. high yield bonds
(Barclays U.S. Corporate
High Yield 2% Issuer
Capped Index) | | | (7.75 | ) | | | (6.58 | ) |
|
| Past performance is no guarantee of future results. Index performance is shown for illustrative purposes only. You cannot invest directly in an index. | |
| | | | | | |
| | | THIS PAGE NOT PART OF YOUR FUND REPORT | | | | 3 |
| | | | |
| Fund Summary as of January 31, 2016 | | | BlackRock Commodity Strategies Fund | |
BlackRock Commodity Strategies Fund’s (the “Fund”) investment objective is to seek total return.
|
| Portfolio Management Commentary |
How did the Fund perform?
| • | | For the six-month period ended January 31, 2016, the Fund outperformed its benchmark, the Bloomberg Commodity Index Total ReturnSM. |
What factors influenced performance?
| • | | The Fund’s allocation to equities had a mixed effect on performance relative to the commodity-only benchmark. However, the Fund’s investments in precious metals equities had the largest positive impact on relative performance, as the industry was buoyed by a modest increase in the gold price. The majority of gold’s positive performance was generated during January, when the metal benefited from “safe-haven” buying at a time of global equity market weakness, currency market volatility and rising geopolitical uncertainty. Gold stocks outperformed gold, which in part reflected the proximity of the gold price to the average cost of production for companies in the industry. At the individual stock level, the Fund’s position in Barrick Gold Corp. was a notable contributor to performance. The stock benefited from its high sensitivity to the price of gold, as well as the market’s positive response to the company’s larger-than-expected reduction of debt. |
| • | | The portion of the Fund invested in commodity futures based investments also made a positive contribution to six-month performance, with curve strategies in the energy sector aiding relative performance. Oil prices continued to trend downward due to resilient global supply and a weaker demand outlook. Natural gas prices also declined, reflecting both robust supply and above-average winter temperatures in the United States. At a time in which shorter-dated contracts declined more than longer-dated contracts for both commodities, the Fund added value by emphasizing the latter. |
| • | | The Fund’s allocation to agricultural stocks also made a modest contribution relative to performance. While the industry was pressured by the broader weakness in the global equity markets, it outperformed due in part to its lower sensitivity to moves in the underlying commodity prices. |
| • | | The Fund’s position in mining stocks represented the largest drag on relative performance. The mining sector was negatively impacted by deteriorating sentiment regarding China’s economic outlook, as the country consumes roughly half the world’s mined commodities. |
| • | | The Fund’s investments in energy stocks, which were hit hard by the decline in oil prices, also weighed on relative performance. While energy |
| | | stocks generally held up better than oil prices, they underperformed the Bloomberg Commodity Index total return. The Fund’s exposure to this sector therefore detracted from relative performance. |
| • | | Approximately 50% of the Fund’s portfolio was held in fully collateralized, commodity-linked notes tied to commodity indices, using an enhanced index approach. This aspect of the Fund’s strategy contributed positively to relative performance, with the majority of outperformance occurring during the second half of the period. |
Describe recent portfolio activity.
| • | | The Fund sought to maintain generally equal weightings in the equity and commodity futures based investments strategies, as well as balanced and broad equity exposure across commodity sectors. The Fund rebalanced its weightings in equities and commodity-linked notes at the end of January 2016 by increasing its position in equities and reducing its allocation to commodity-based investments. |
| • | | The Fund reduced its position in energy stocks during the period. While the investment advisor held a positive longer-term view on the sector, it also believed the near-term risks were significant. The Fund added to its exposure in mining stocks following their significant underperformance, and it moderately increased its allocation to precious-metals stocks. The Fund also increased its exposure to the agriculture stocks. The investment advisor continued to identify potentially attractive opportunities in the downstream agricultural companies, such as those in the livestock and grain-handling industries. |
| • | | The Fund maintained a position in cash and cash equivalents, predominantly comprised of U.S. Treasury bills, as collateral against its exposure to commodity-linked notes. The Fund’s cash balance did not have a material impact on performance. |
Describe portfolio positioning at period end.
| • | | The Fund ended the period with approximately 50% of net assets exposed to the commodity-related equity strategy and 50% exposed to the commodity-linked derivatives strategy (including collateral held against the commodity-linked note exposure). In the aggregate, the Fund was overweight relative to the benchmark in the agriculture & livestock and precious metals sub-sectors and underweight in the energy and industrial metals sub-sectors. |
The views expressed reflect the opinions of BlackRock as of the date of this report and are subject to change based on changes in market, economic or other conditions. These views are not intended to be a forecast of future events and are no guarantee of future results.
| | | | | | |
| 4 | | BLACKROCK FUNDS | | JANUARY 31, 2016 | | |
| | | | |
| Fund Summary as of January 31, 2016 | | | BlackRock Commodity Strategies Fund | |
| | | | | |
| Ten Largest Holdings | | Percent of
Total Investments1 |
UBS AG, 3-month LIBOR, 2/13/172 | | | | 8 | % |
JPMorgan Chase Bank, N.A., 3-month LIBOR, 12/19/162 | | | | 6 | |
Morgan Stanley B.V. 3-month LIBOR, 2/10/172 | | | | 6 | |
Bank of America Corp. 3-month LIBOR, 12/27/162 | | | | 6 | |
Monsanto Co. | | | | 3 | |
Exxon Mobil Corp. | | | | 3 | |
Syngenta AG, Registered Shares | | | | 2 | |
Tyson Foods, Inc., Class A | | | | 2 | |
Royal Dutch Shell PLC, A Shares | | | | 2 | |
Chevron Corp. | | | | 2 | |
| | 1 | | Total investments exclude short-term securities. |
| | 2 | | Represents a commodity-linked note. |
| | | | | |
| Portfolio Composition | | Percent of
Total Investments3 |
Common Stocks | | | | 73 | % |
Commodity-Linked Notes | | | | 26 | |
Preferred Stocks | | | | 1 | |
| | 3 | | Total investments exclude short-term securities. |
| | | | | | |
| | | BLACKROCK FUNDS | | JANUARY 31, 2016 | | 5 |
| | | | |
| | | | BlackRock Commodity Strategies Fund | |
|
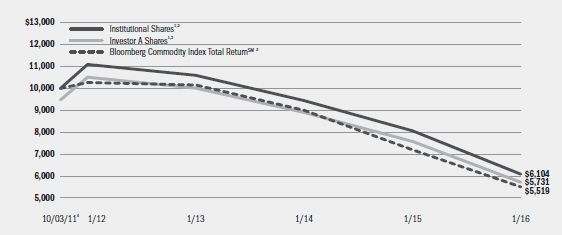
| Total Return Based on a $10,000 Investment |
| | 1 | Assuming maximum sales charges, if any, transaction costs and other operating expenses, including investment advisory fees and administration fees, if any. Institutional Shares do not have a sales charge. |
| | 2 | The Fund utilizes two strategies and under normal circumstances expects to invest approximately 50% of its total assets in each strategy; provided, however, that from time to time, Fund management may alter the weightings if it deems it prudent to do so based on market conditions, trends or movements or other similar factors. |
| | 3 | An unmanaged commodity index currently composed of futures contracts on 20 physical commodities, and assumes that the futures positions are fully collateralized. Prior to July 1, 2014, the Bloomberg Commodity Index Total ReturnSM was known as the Dow Jones-UBS Commodity Index Total ReturnSM. |
| | 4 | Commencement of operations. |
| | | | | | | | | | |
| Performance Summary for the Period Ended January 31, 2016 |
| | | | | | | | | | | | | | | | | | | | | | | | | |
| | | | | Average Annual Total Returns5 |
| | | | | 1 Year | | Since Inception6 |
| | | 6-Month
Total Returns | | w/o sales
charge | | w/ sales
charge | | w/o sales
charge | | w/ sales
charge |
Institutional | | | | (14.90 | )% | | | | (24.33 | )% | | | | N/A | | | | | (10.78 | )% | | | | N/A | |
Investor A | | | | (15.13 | ) | | | | (24.49 | ) | | | | (28.45 | )% | | | | (10.97 | ) | | | | (12.07 | )% |
Investor C | | | | (15.28 | ) | | | | (24.97 | ) | | | | (25.72 | ) | | | | (11.62 | ) | | | | (11.62 | ) |
Bloomberg Commodity Index Total ReturnSM | | | | (15.81 | ) | | | | (23.36 | ) | | | | N/A | | | | | (12.84 | ) | | | | N/A | |
| | 5 | | Assuming maximum sales charges, if any. Average annual total returns with and without sales charges reflect reductions for distribution and service fees. See “About Fund Performance” on page 13 for a detailed description of share classes, including any related sales charges and fees. |
| | 6 | | The Fund commenced operations on October 3, 2011. |
| | | | N/A—Not applicable as share class and index do not have a sales charge. |
| | | | Past performance is not indicative of future results. |
| | | | | | | | | | | | | | |
| Expense Example |
| | | Actual | | Hypothetical8 | | |
| | | Beginning Account Value
August 1, 2015 | | Ending Account Value
January 31, 2016 | | Expenses Paid
During the Period7 | | Beginning Account Value
August 1, 2015 | | Ending Account Value
January 31, 2016 | | Expenses Paid
During the Period7 | | Annualized Expense Ratio |
Institutional | | $1,000.00 | | $851.00 | | $ 5.96 | | $1,000.00 | | $1,018.70 | | $ 6.50 | | 1.28% |
Investor A | | $1,000.00 | | $848.70 | | $ 6.97 | | $1,000.00 | | $1,017.60 | | $ 7.61 | | 1.50% |
Investor C | | $1,000.00 | | $847.20 | | $10.45 | | $1,000.00 | | $1,013.83 | | $11.39 | | 2.25% |
| | 7 | | For each class of the Fund, expenses are equal to the annualized expense ratio for the class, multiplied by the average account value over the period, multiplied by 184/366 (to reflect the one-half year period shown). The fees and expenses of the underlying funds in which the Fund invests are not included in the Fund’s annualized expense ratio. |
| | 8 | | Hypothetical 5% annual return before expenses is calculated by prorating the number of days in the most recent fiscal half year divided by 366. |
| | | | See “Disclosure of Expenses” on page 14 for further information on how expenses were calculated. |
| | | | Performance results do not include adjustments made for financial reporting purposes in accordance with U.S. generally accepted accounting principles and may differ from amounts reported in the financial highlights on pages 78-80. |
| | | | | | |
| 6 | | BLACKROCK FUNDS | | JANUARY 31, 2016 | | |
| | | | |
| Fund Summary as of January 31, 2016 | | | BlackRock Global Long/Short Credit Fund | |
BlackRock Global Long/Short Credit Fund’s (the “Fund”) investment objective is to seek absolute total returns over a complete market cycle.
|
| Portfolio Management Commentary |
How did the Fund perform?
| • | | For the six-month period ended January 31, 2016, the Fund underperformed the benchmark, the BofA Merrill Lynch 3-Month U.S. Treasury Bill Index. |
What factors influenced performance?
| • | | The largest detractors from Fund returns were from event-based strategies, namely long positions in a Portuguese bank and in a Spanish infrastructure credit. In the case of the former, the bond’s value was negatively impacted by an unexpected recapitalization put forward by Portugal’s central bank that may have breached a number of banking regulation principles, and the managers are assessing possible next steps from a legal perspective. |
| • | | Long positions in U.S. and European high yield bonds detracted throughout the period as credit spreads widened due to commodity weakness, poor sentiment and liquidity concerns for the sector. Likewise, long positions in European hybrid securities from telecommunications, utility and transportation issuers detracted as asset prices reflected the broader deterioration in risk sentiment. |
| • | | Positioning in European financials hindered results, as the sector broadly moved with risk assets and responded to investor concerns around the Bank of Portugal’s bondholder-unfriendly actions and recent earnings woes. |
| • | | U.S. bank loans and collateralized loan obligations (“CLOs”) came under pressure with the selloff in U.S. high yield bonds. Additionally, tactical long positions in technology credits and capital structure trades in technology and energy credits detracted modestly. |
| • | | On the positive side, given poor credit market sentiment for much of the period, the most significant contributors to performance were short positions and derivative strategies, as well as exposure to assets with lower volatility. The leading positive contributors to performance were short positions in several energy-related credits given the collapse in commodity prices during the period. Additionally, short positions in financial and cyclical credits in anticipation of spread widening was beneficial. In Europe, long positions in convertible bonds versus short positions in the corresponding equities performed well. Long positions in European bank loans and CLOs contributed positively, as did security selection in U.S. financial and industrial credits. |
| • | | As part of its investment strategy, the Fund uses derivatives to manage duration (sensitivity to interest rate movements) and currency risk. The Fund also has the flexibility to utilize derivatives in order to express a positive or negative view on a particular issuer or sector, or to manage overall credit risk. Derivatives may also serve as a more liquid way to express exposures and depending on the market environment the Fund |
| | | may utilize various instruments, including not but limited to: bonds, equities and derivatives. During the period, the Fund’s derivative holdings had a net positive impact on performance. This included the use of options to manage exposure to downside moves in the equity market and potential downside moves on single issuers, credit default swaps to express long and short views on credit issuers and credit indices, and forward foreign currency contracts, which help manage non-dollar currency exposure back to U.S. dollars. |
Describe recent portfolio activity.
| • | | During the six-month period, while fundamentals for corporate issuers remained strong, the broader market backdrop experienced substantial volatility. In the midst of this volatility, the Fund sought to reduce risk, using market strength in October as an opportunity to reduce exposures in Europe. In particular, positions were lowered with respect to chemicals and telecommunications/cable credits, senior and subordinated securities of core and peripheral banks, and investment grade hybrid securities. In addition, certain convertible bond positions, which have performed well to date, were closed out. |
| • | | In the United States, the Fund essentially maintained its overall exposures, rotating out of core high yield and investment grade credit bond positions while building positions through the new issue market. Exposure was reduced with respect to CLOs, while positions were initiated in commercial mortgage-backed securities. Toward the end of the period, exposure to financials was reduced and short positions were built in certain investment grade credit issuers vulnerable to potential spread widening, namely energy and other cyclical credits. In derivative strategies, a mix of equity options and credit indices was utilized. |
| • | | The Fund’s cash exposure had no material impact on performance as the Fund may express long and short positions via the credit default swap market, which does not require a cash outlay like that of traditional cash bonds. |
Describe portfolio positioning at period end.
| • | | As of period end, the Fund’s positioning reflected a view that macro factors have become less supportive, with slowing global growth dynamics, heightened volatility and credit-based investment vehicles vulnerable to outflows given recent underperformance. The Fund was also positioned in the expectation that traditional credit sectors such as high yield and investment grade corporates will play a reduced role in return generation for 2016. The focus within the Fund was on security selection and on the utilization of market-neutral, idiosyncratic approach to capitalize on dislocations across credits and sectors. |
| • | | The Fund ended the period with a net long credit position in Europe at 19% of net assets, 21% in the United States, 3% in Asia and emerging markets, and 42% overall. |
The views expressed reflect the opinions of BlackRock as of the date of this report and are subject to change based on changes in market, economic or other conditions. These views are not intended to be a forecast of future events and are no guarantee of future results.
| | | | | | |
| | �� | BLACKROCK FUNDS | | JANUARY 31, 2016 | | 7 |
| | | | |
| | | | BlackRock Global Long/Short Credit Fund | |
|
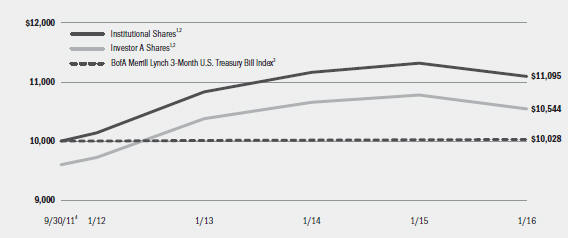
| Total Return Based on a $10,000 Investment |
| | 1 | Assuming maximum sales charges, if any, transaction costs and other operating expenses, including investment advisory fees and administration fees, if any. Institutional Shares do not have a sales charge. |
| | 2 | The Fund seeks to provide absolute total returns over a complete market cycle through diversified long and short exposure to the global fixed income markets. Under normal circumstances, the Fund invests at least 80% of its total assets in credit-related instruments. |
| | 3 | An unmanaged index that tracks 3-month U.S. Treasury securities. |
| | 4 | Commencement of operations. |
| | | | | | | | | | | | | | | | | | | | | | | | | | | | | | | | | | | |
| Performance Summary for the Period Ended January 31, 2016 | | | | | | |
| | | | | | | | | Average Annual Total Returns5 |
| | | | | | | | | 1 Year | | Since Inception6 |
| | | Standardized 30-Day Yield | | Unsubsidized 30-Day Yield | | 6-Month Total Returns | | w/o sales charge | | w/ sales charge | | w/o sales charge | | w/ sales charge |
Institutional | | | | 2.59 | % | | | | 2.59 | % | | | | (2.73 | )% | | | | (1.98 | )% | | | | N/A | | | | | 2.42 | % | | | | N/A | |
Investor A | | | | 2.24 | | | | | 2.23 | | | | | (2.85 | ) | | | | (2.20 | ) | | | | (6.11 | )% | | | | 2.19 | | | | | 1.23 | % |
Investor C | | | | 1.60 | | | | | 1.59 | | | | | (3.25 | ) | | | | (2.97 | ) | | | | (3.90 | ) | | | | 1.43 | | | | | 1.43 | |
BofA Merrill Lynch 3-Month U.S. Treasury Bill Index | | | | — | | | | | — | | | | | 0.05 | | | | | 0.05 | | | | | N/A | | | | | 0.06 | | | | | N/A | |
| | 5 | | Assuming maximum sales charges, if any. Average annual total returns with and without sales charges reflect reductions for distribution and service fees. See “About Fund Performance” on page 13 for a detailed description of share classes, including any related sales charges and fees. |
| | 6 | | The Fund commenced operations on September 30, 2011. |
| | | | N/A—Not applicable as share class and index do not have a sales charge. |
| | | | Past performance is not indicative of future results. |
| | | | | | | | | | | | | | | | | | |
| Expense Example |
| | | Actual | | Hypothetical9 |
| | | | | | | Including
Interest Expense | | Excluding
Interest Expense | | | | Including Interest Expense | | Excluding Interest Expense |
| | | Beginning
Account Value
August 1, 2015 | | Ending Account Value
January 31, 2016 | | Expenses Paid During the Period7 | | Expenses Paid During the Period8 | | Beginning
Account Value
August 1, 2015 | | Ending Account Value
January 31, 2016 | | Expenses Paid During the Period7 | | Ending Account Value
January 31, 2016 | | Expenses Paid During the Period8 |
Institutional | | $1,000.00 | | $972.70 | | $ 9.37 | | $ 5.31 | | $1,000.00 | | $1,015.63 | | $ 9.58 | | $1,019.76 | | $ 5.43 |
Investor A | | $1,000.00 | | $971.50 | | $10.70 | | $ 6.69 | | $1,000.00 | | $1,014.28 | | $10.94 | | $1,018.35 | | $ 6.85 |
Investor C | | $1,000.00 | | $967.50 | | $14.24 | | $10.24 | | $1,000.00 | | $1,010.66 | | $14.56 | | $1,014.73 | | $10.48 |
| | 7 | | For each class of the Fund, expenses are equal to the annualized expense ratio for the class (1.89% for Institutional, 2.16% for Investor A and 2.88% for Investor C), multiplied by the average account value over the period, multiplied by 184/366 (to reflect the one-half year period shown). The fees and expenses of the underlying funds in which the Fund invests are not included in the Fund’s annualized expense ratio. |
| | 8 | | For each class of the Fund, expenses are equal to the annualized expense ratio for the class (1.07% for Institutional, 1.35% for Investor A and 2.07% for Investor C), multiplied by the average account value over the period, multiplied by 184/366 (to reflect the one-half year period shown). The fees and expenses of the underlying funds in which the Fund invests are not included in the Fund’s annualized expense ratio. |
| | 9 | | Hypothetical 5% annual return before expenses is calculated by prorating the number of days in the most recent fiscal half year divided by 366. |
| | | | See “Disclosure of Expenses” on page 14 for further information on how expenses were calculated. |
| | | | | | |
| 8 | | BLACKROCK FUNDS | | JANUARY 31, 2016 | | |
|
| BlackRock Global Long/Short Credit Fund’s Portfolio Information |
| | | | | | | | | | | | | | | |
| | | Percent of Total Investments1 |
| Geographic Allocation | | Long | | Short | | Total |
United States | | | | 43 | % | | | | 19 | % | | | | 62 | % |
United Kingdom | | | | 4 | | | | | 1 | | | | | 5 | |
Italy | | | | 4 | | | | | — | | | | | 4 | |
France | | | | 3 | | | | | 1 | | | | | 4 | |
Spain | | | | 3 | | | | | — | | | | | 3 | |
Netherlands | | | | 3 | | | | | — | | | | | 3 | |
Germany | | | | 2 | | | | | — | | | | | 2 | |
Luxembourg | | | | 2 | | | | | — | | | | | 2 | |
Ireland | | | | 2 | | | | | — | | | | | 2 | |
Cayman Islands | | | | 2 | | | | | — | | | | | 2 | |
Canada | | | | 1 | | | | | 1 | | | | | 2 | |
Belgium | | | | 1 | | | | | 1 | | | | | 2 | |
Other2 | | | | 6 | | | | | 1 | | | | | 7 | |
Total | | | | 76 | % | | | | 24 | % | | | | 100 | % |
| | 1 | | Total investments include the gross market values of long and short positions and exclude short-term securities. |
| | 2 | | Includes holdings within countries that are 1% or less of long-term investments. Please refer to the Schedule of Investments for such countries. |
| | | | | |
| Credit Quality Allocation3 | | Percent of
Total Investments4 |
AAA/Aaa5 | | | | 7 | % |
AA/Aa | | | | 2 | |
A | | | | 13 | |
BBB/Baa | | | | 24 | |
BB/Ba | | | | 26 | |
B | | | | 18 | |
CCC/Caa | | | | 2 | |
N/R | | | | 8 | |
| | 3 | | For financial reporting purposes, credit quality ratings shown above reflect the highest rating assigned by either Standard & Poor’s (“S&P”) or Moody’s Investors Service if ratings differ. These rating agencies are independent, nationally recognized statistical rating organizations and are widely used. Investment grade ratings are credit ratings of BBB/Baa or higher. Below investment grade ratings are credit ratings of BB/Ba or lower. Investments designated N/R are not rated by either rating agency. Unrated investments do not necessarily indicate low credit quality. Credit quality ratings are subject to change. |
| | 4 | | Total investments exclude Short-Term Securities, Options Purchased, Options Written, Borrowed Bonds and Investments Sold Short. |
| | 5 | | The investment advisor evaluates the credit quality of not-rated investments based upon certain factors including, but not limited to, credit ratings for similar investments and financial analysis of sectors, individual investments and/or issuers. Using this approach, the investment advisor has deemed not-rated U.S. Government Sponsored Agency Securities and U.S. Treasury Obligations as AAA/ Aaa. |
| | | | | | |
| | | BLACKROCK FUNDS | | JANUARY 31, 2016 | | 9 |
| | | | |
| Fund Summary as of January 31, 2016 | | | BlackRock Macro Themes Fund | |
BlackRock Macro Themes Fund’s (the “Fund”) investment objective is to seek total return.
|
| Portfolio Management Commentary |
How did the Fund perform?
| • | | For the six-month period ended January 31, 2016, the Fund underperformed its BofA Merrill Lynch 3-Month U.S. Treasury Bill Index benchmark and outperformed its MSCI All Country World Index (ACWI) benchmark. |
Underlying Fund Strategies
| • | | The Fund utilizes underlying investment strategies, which are diversified across various asset classes, including equity, fixed income, commodities, foreign exchange, and assets associated with market volatility. However, notwithstanding their categorization for financial reporting purposes, many of the positions held by the Fund provided exposure to multiple types of underlying strategies. These include: |
| | • | | Tactical strategies use short-term positions to manage risk and boost returns through temporary asset price dislocations. |
| | • | | Thematic strategies use global multi-asset strategies that seek to exploit medium-term macro-economic trends. |
| | • | | Cyclical strategies use high conviction positions held for long-term growth. |
| | • | | Discretionary volatility strategies are based on fundamental research that benefits from current and expected volatility levels of different asset classes. |
| | • | | Systematic volatility strategies utilize algorithms to benefit from current and expected volatility levels of different asset classes. |
What factors influenced performance?
| • | | The Fund employs a top down, dynamic approach to asset allocation and seeks to achieve total return by investing in a global portfolio that uses multiple strategies across a variety of asset classes, including equity securities, fixed and floating rate debt securities, and currency, commodity and cash instruments. Asset allocation is expected to be highly dynamic over time so that the Fund can adapt to a range of different market environments. The portfolio will be comprised of strategies that seek to generate growth over multiple time horizons in order to diversify sources of returns. |
| • | | For the six-month period, the largest detractors from performance were related to the Fund’s long equity positions. A customized basket of stocks designed to provide exposure to domestically focused European peripheral companies was the largest detractor, followed by a customized equity basket of global consumer brand stocks. U.S. equity exposure also weighed on returns, principally via homebuilders and a basket of companies that exhibit above average lobbying intensity. Finally, as interest rates fell during the period, short exposure to U.S. Treasury bonds detracted from results. |
| • | | Elsewhere, short exposures were the primary contributors to performance, as many global equity markets experienced double-digit declines. Concerns surrounding China, commodities, global growth, and policy all weighed on investors during the time period. Short exposure to European auto stocks was the largest contributor, followed by a short position in a customized equity basket of global industrial companies. Within currencies, a short position in the pound versus the U.S. dollar was additive, as risks of a U.K. exit from the European Union increased. The Fund’s bearish stance on commodities via short crude oil exposure benefited performance as well. |
| • | | The Fund utilizes derivatives to a material degree on a regular basis. These include, but are not limited to, total return, variance, interest rate and credit default swaps, options, futures, options on futures and swaps, indexed and inverse securities and foreign exchange transactions, to manage exposure to certain risks, as well as to enhance returns. During the period, the use of financial futures contracts and swaps detracted from performance. |
| • | | The Fund had a significant cash allocation in order to cover derivatives positions and foreign exchange positions across different currencies, for both managing exposure to certain risks and to enhance returns. The cash balance did not have a material impact on performance. |
Describe recent portfolio activity.
| • | | As market volatility increased in the third quarter of 2015, the Fund tactically reduced sensitivity to equities and increased sensitivity to fixed income. This defensive positioning was somewhat reversed during the fourth quarter, as markets rebounded and concerns around policy and the macro-economic backdrop abated. However, as macro-economic risks increased, resulting in equity markets dropping sharply at the outset of 2016, the Fund reduced risk exposure once again to close the period with an overall defensive positioning. |
| • | | Within equities, the Fund reduced exposure to both developed and emerging markets over the period. In developed markets, the Fund reduced exposure to North America, Japan, and the United Kingdom, while increasing exposure to both core and peripheral European equities. In emerging markets, the Fund moved from an overall long stance to a more bearish positioning, with outright short positions in Chinese equities. From a sector perspective, the Fund reduced exposure to technology, consumer staples, and materials, increased short exposure to energy, and increased exposure to health care and transportation stocks. |
| • | | The Fund actively managed sensitivity to fixed income as markets experienced heightened volatility. After initially increasing fixed income exposure, the Fund gradually reduced this position and finished the period with significantly less exposure to fixed income assets, primarily through a decreased weighting in international bonds. Within currencies, the Fund significantly increased long exposure to the U.S. dollar and correspondingly shorted Asian and commodity-sensitive currencies. |
| • | | In terms of alternative asset classes, the Fund reduced exposure to commodities during the period and tactically traded both volatility products and crude oil to take advantage of extreme market movements. In addition, toward the end of the period, the Fund initiated long positions in gold and silver as diversifiers for the broader portfolio. |
Describe portfolio positioning at period end.
| • | | At the end of the period, the Fund’s risk (including derivatives) was diversified across equity 32%, fixed income 7%, cash and foreign exchange 56%, commodities 3%, and volatility strategies 3%. Geographically, the portfolio was allocated in Europe 45%, North America 15%, Emerging Markets 27%, Global Diversified 9%, and Japan 4%. Overall, the portfolio was positioned defensively with lower risk relative to historical averages, lower sensitivity to equity markets due to targeted short exposures versus longs, and generally low sensitivity to interest rate risk. |
The views expressed reflect the opinions of BlackRock as of the date of this report and are subject to change based on changes in market, economic or other conditions. These views are not intended to be a forecast of future events and are no guarantee of future results
| | | | | | |
| 10 | | BLACKROCK FUNDS | | JANUARY 31, 2016 | | |
| | | | |
| | | | BlackRock Macro Themes Fund | |
|
| Total Return Based on a $10,000 Investment |

| | 1 | | Assuming maximum sales charges, if any, transaction costs and other operating expenses, including investment advisory fees and administration fees, if any. Institutional Shares do not have a sales charge. |
| | 2 | | The Fund invests in a broad range of global asset classes, such as equity securities, fixed and floating rate debt securities, and currency, commodity and cash instruments. |
| | 3 | | An unmanaged index that tracks 3-month U.S. Treasury securities. |
| | 4 | | A free float-adjusted market capitalization weighted index that is designed to measure the equity market performance of developed and emerging markets. The MSCI All Country World Index consists of 46 country indexes comprising 23 developed and 23 emerging market country indexes. |
| | 5 | | Commencement of operations. |
| | | | | | | | | | | | | | |
| Performance Summary for the Period Ended January 31, 2016 |
| | | | | | | | | | | | | | | | | | | | | | | | | |
| | | | | Average Annual Total Returns6 |
| | | | | 1 Year | | Since Inception7 |
| | | 6-Month
Total Returns | | w/o sales
charge | | w/ sales
charge | | w/o sales
charge | | w/ sales
charge |
Institutional | | | | (6.47 | )% | | | | (6.00 | )% | | | | N/A | | | | | (5.42 | )% | | | | N/A | |
Investor A | | | | (6.55 | ) | | | | (6.27 | ) | | | | (11.19 | )% | | | | (5.68 | ) | | | | (9.97 | )% |
Investor C | | | | (6.88 | ) | | | | (6.97 | ) | | | | (7.88 | ) | | | | (6.360 | ) | | | | (6.36 | ) |
BofA Merrill Lynch 3-Month U.S. Treasury Bill Index | | | | 0.05 | | | | | 0.05 | | | | | N/A | | | | | 0.05 | | | | | N/A | |
MSCI All Country World Index (ACWI) | | | | (11.40 | ) | | | | (6.80 | ) | | | | N/A | | | | | (8.48 | ) | | | | N/A | |
| | 6 | | Assuming maximum sales charges, if any. Average annual total returns with and without sales charges reflect reductions for distribution and service fees. See “About Fund Performance” on page 13 for a detailed description of share classes, including any related sales charges and fees. |
| | 7 | | The Fund commenced operations on December 4, 2014. |
| | | | N/A—Not applicable as share class and index do not have a sales charge. |
| | | | Past performance is not indicative of future results. |
| | | | Performance results include adjustments made for financial reporting purposes in accordance with U.S. generally accepted accounting principles. |
| | | | | | | | | | | | | | |
| Expense Example |
| | | Actual | | Hypothetical9 | | |
| | | Beginning Account Value August 1, 2015 | | Ending
Account Value
January 31, 2016 | | Expenses Paid
During the Period8 | | Beginning Account Value August 1, 2015 | | Ending
Account Value
January 31, 2016 | | Expenses Paid
During the Period8 | | Annualized Expense
Ratio |
Institutional | | $1,000.00 | | $935.30 | | $ 5.84 | | $1,000.00 | | $1,019.10 | | $ 6.09 | | 1.20% |
Investor A | | $1,000.00 | | $934.50 | | $ 7.05 | | $1,000.00 | | $1,017.85 | | $ 7.35 | | 1.45% |
Investor C | | $1,000.00 | | $931.20 | | $10.68 | | $1,000.00 | | $1,014.08 | | $11.14 | | 2.20% |
| | 8 | | For each class of the Fund, expenses are equal to the annualized expense ratio for the class, multiplied by the average account value over the period, multiplied by 184/366. The fees and expenses of the underlying funds in which the Fund invests are not included in the Fund’s annualized expense ratio. |
| | 9 | | Hypothetical 5% annual return before expenses is calculated by prorating the number of days in the most recent fiscal period divided by 366. |
| | | | See “Disclosure of Expenses” on page 14 for further information on how expenses were calculated. |
| | | | | | |
| | | BLACKROCK FUNDS | | JANUARY 31, 2016 | | 11 |
|
| BlackRock Macro Themes Fund’s Portfolio Information |
| | | | | |
| Ten Largest Holdings | | Percent of Total Investments1 |
U.S. Treasury Inflation Indexed Notes | | | | 16 | % |
Portugal Obrigacoes do Tesouro OT | | | | 6 | |
U.S. Treasury Note | | | | 4 | |
Financial Select Sector SPDR Fund | | | | 3 | |
Canada Housing Trust No 1 | | | | 2 | |
South Africa Government Bonds | | | | 2 | |
Republic of Turkey | | | | 2 | |
Republic of Indonesia | | | | 2 | |
Nordea Bank AB | | | | 2 | |
Source Physical Gold P-ETC | | | | 1 | |
| | 1 | | Total investments exclude short-term securities, options purchased and options written. |
| | | | | |
| Portfolio Composition | | Percent of
Total Investments2 |
Corporate Bonds | | | | 44 | % |
Foreign Government Obligations | | | | 21 | |
U.S. Treasury Obligations | | | | 21 | |
Common Stocks | | | | 7 | |
Investment Companies | | | | 6 | |
Foreign Agency Obligations | | | | 1 | |
| | 2 | | Total investments exclude short-term securities, options purchased and options written. |
| | | | | | |
| 12 | | BLACKROCK FUNDS | | JANUARY 31, 2016 | | |
| | |
| The Benefits and Risks of Leveraging | | |
BlackRock Global Long/Short Credit Fund may utilize leverage to seek to enhance yield and net asset value (“NAV”). However, these objectives cannot be achieved in all interest rate environments.
BlackRock Global Long/Short Credit Fund may utilize leverage by entering into reverse repurchase agreements. In general, the concept of leveraging is based on the premise that the financing cost of leverage, which is based on short-term interest rates, is normally lower than the income earned by BlackRock Global Long/Short Credit Fund on its longer-term portfolio investments purchased with the proceeds from leverage. To the extent that the total assets of BlackRock Global Long/Short Credit Fund (including the assets obtained from leverage) are invested in higher-yielding portfolio investments, BlackRock Global Long/Short Credit Fund’s shareholders benefit from the incremental net income.
The interest earned on securities purchased with the proceeds from leverage is distributed to BlackRock Global Long/Short Credit Fund shareholders, and the value of these portfolio holdings is reflected in BlackRock Global Long/Short Credit Fund’s per share NAV. However, in order to benefit shareholders, the return on assets purchased with leverage proceeds must exceed the ongoing costs associated with the leverage. If interest and other ongoing costs of leverage exceed BlackRock Global Long/Short Credit Fund’s return on assets purchased with leverage proceeds, income to shareholders is lower than if BlackRock Global Long/Short Credit Fund had not used leverage.
Furthermore, the value of BlackRock Global Long/Short Credit Fund’s portfolio investments generally varies inversely with the direction of long-term interest rates, although other factors can also influence the value of portfolio investments. As a result, changes in interest rates can influence BlackRock Global Long/Short Credit Fund’s NAV positively or negatively in addition to the impact on BlackRock Global Long/Short Credit Fund performance from leverage. Changes in the direction of interest rates are difficult to predict accurately, and there is no assurance that a Fund’s leveraging strategy will be successful.
The use of leverage also generally causes greater changes in BlackRock Global Long/Short Credit Fund’s NAV and distribution rates than a comparable fund that does not use leverage. In a declining market, leverage is likely to cause a greater decline in the NAV of BlackRock Global Long/Short Credit Fund’s shares than if BlackRock Global Long/Short Credit Fund were not leveraged. In addition, BlackRock Global Long/Short Credit Fund may be required to sell portfolio securities at inopportune times or at distressed values in order to comply with regulatory requirements applicable to the use of leverage or as required by the terms of leverage instruments, which may cause BlackRock Global Long/Short Credit Fund to incur losses. The use of leverage may limit BlackRock Global Long/Short Credit Fund’s ability to invest in certain types of securities or use certain types of hedging strategies. BlackRock Global Long/Short Credit Fund incurs expenses in connection with the use of leverage, all of which are borne by BlackRock Global Long/Short Credit Fund shareholders and may reduce income.
| • | | Institutional Shares are not subject to any sales charge. These shares bear no ongoing distribution or service fees and are available only to certain eligible investors. |
| • | | Investor A Shares are subject to a maximum initial sales charge (front-end load) of 5.25% for BlackRock Commodity Strategies Fund and BlackRock Macro Themes Fund and 4.00% for BlackRock Global Long/Short Credit Fund. These shares are subject to a service fee of 0.25% per year (but no distribution fee). Certain redemptions of these shares may be subject to a contingent deferred sales charge (“CDSC”) where no initial sales charge was paid at the time of purchase. These shares are generally available through financial intermediaries. |
| • | | Investor C Shares are subject to a 1.00% CDSC if redeemed within one year of purchase. In addition, these shares are subject to a distribution fee of 0.75% per year and a service fee of 0.25% per year. These shares are generally available through financial intermediaries. |
Performance information reflects past performance and does not guarantee future results. Current performance may be lower or higher than the performance data quoted. Refer to www.blackrock.com/funds to obtain performance data current to the most recent month end.
Performance results do not reflect the deduction of taxes that a shareholder would pay on fund distributions or the redemption of fund shares. Figures shown in the performance tables on the previous pages assume reinvestment of all distributions, if any, at net asset value (“NAV”) on the ex-dividend/payable dates. Investment return and principal value of shares will fluctuate so that shares, when redeemed, may be worth more or less than their original cost. Distributions paid to each class of shares will vary because of the different levels of service, distribution and transfer agency fees applicable to each class, which are deducted from the income available to be paid to shareholders.
BlackRock Advisors, LLC (the “Manager”), the Funds’ investment advisor, has contractually agreed to waive and/or reimburse a portion of each Fund’s expenses. Without such waiver and/or reimbursement, each Fund’s performance would have been lower. The Manager is under no obligation to continue waiving and/or reimbursing its fees after the applicable termination date of such agreement. See Note 6 of the Notes to Financial Statements for additional information on waivers and/or reimbursements. The standardized 30-day yield includes the effects of any waivers and/or reimbursements. The unsubsidized 30-day yield excludes the effects of any waiver and/or reimbursements.
| | | | | | |
| | | BLACKROCK FUNDS | | JANUARY 31, 2016 | | 13 |
Shareholders of the Funds may incur the following charges: (a) transactional expenses, such as sales charges; and (b) operating expenses, including investment advisory fees, administration fees, service and distribution fees, including 12b-1 fees, acquired fund fees and expenses, and other Fund expenses. The expense examples shown on the previous pages (which are based on a hypothetical investment of $1,000 invested on August 1, 2015 and held through January 31, 2016) are intended to assist shareholders both in calculating expenses based on an investment in each Fund and in comparing these expenses with similar costs of investing in other mutual funds.
The expense examples provide information about actual account values and actual expenses. In order to estimate the expenses a shareholder paid during the period covered by this report, shareholders can divide their account value by $1,000 and then multiply the result by the number corresponding to their Fund and share class under the headings entitled “Expenses Paid During the Period.”
The expense examples also provide information about hypothetical account values and hypothetical expenses based on a Fund’s actual expense ratio and an assumed rate of return of 5% per year before expenses. In order to assist shareholders in comparing the ongoing expenses of investing in these Funds and other funds, compare the 5% hypothetical examples with the 5% hypothetical examples that appear in shareholder reports of other funds.
The expenses shown in the expense examples are intended to highlight shareholders’ ongoing costs only and do not reflect any transactional expenses, such as sales charges, if any. Therefore, the hypothetical examples are useful in comparing ongoing expenses only, and will not help shareholders determine the relative total expenses of owning different funds. If these transactional expenses were included, shareholder expenses would have been higher.
|
| Derivative Financial Instruments |
The Funds may invest in various derivative financial instruments. Derivative financial instruments are used to obtain exposure to a security, index and/or market without owning or taking physical custody of securities or to manage market, equity, credit, interest rate, foreign currency exchange rate, commodity and/or other risks. Derivative financial instruments may give rise to a form of economic leverage. Derivative financial instruments also involve risks, including the imperfect correlation between the value of a derivative financial instrument and the underlying asset, possible default of the counterparty to the transaction or illiquidity of the
derivative financial instrument. The Funds’ ability to use a derivative financial instrument successfully depends on the investment advisor’s ability to predict pertinent market movements accurately, which cannot be assured. The use of derivative financial instruments may result in losses greater than if they had not been used, may limit the amount of appreciation the Funds can realize on an investment and/or may result in lower distributions paid to shareholders. The Funds’ investments in these instruments, if any, are discussed in detail in the Notes to Financial Statements.
| | | | | | |
| 14 | | BLACKROCK FUNDS | | JANUARY 31, 2016 | | |
| | | | |
| Schedule of Investments January 31, 2016 (Unaudited) | | | BlackRock Commodity Strategies Fund | |
| | | (Percentages shown are based on Net Assets) | |
| | | | | | | | |
| Commodity-Linked Notes | | Par (000) | | | Value | |
Bank of America Corp. 3-month LIBOR (Indexed to the Bloomberg Commodity Index Roll Select Total Return, multiplied by 3), 12/27/16 | | $ | 5,000 | | | $ | 4,294,767 | |
JPMorgan Chase Bank, N.A., 3-month LIBOR (Indexed to the Performance of the J.P. Morgan Enhanced Beta Select Alternative Benchmark Total Return Index, multiplied by 3), 12/19/16 (a) | | | 5,000 | | | | 4,581,385 | |
Morgan Stanley B.V. 3-month LIBOR (Indexed to the Morgan Stanley HDX RADAR MS Dynamic Roll Total Return IndexSM, multiplied by 3), 2/10/17 (a) | | | 4,000 | | | | 4,330,266 | |
UBS AG, 3-month LIBOR (Indexed to the Bloomberg Commodity Total Return IndexSM, multiplied by 3), 2/13/17 (a) | | | 5,000 | | | | 5,561,451 | |
Total Commodity-Linked Notes — 16.9% | | | | | | | 18,767,869 | |
| | | | | | | | |
| Common Stocks | | Shares | | | | |
Chemicals — 6.3% | | | | | | | | |
Albemarle Corp. | | | 8,722 | | | | 459,126 | |
CF Industries Holdings, Inc. | | | 28,556 | | | | 856,680 | |
Highfield Resources Ltd. (b)(c) | | | 175,917 | | | | 239,962 | |
Monsanto Co. | | | 23,122 | | | | 2,094,853 | |
Mosaic Co. | | | 14,952 | | | | 360,343 | |
Potash Corp. of Saskatchewan, Inc. | | | 46,296 | | | | 754,625 | |
Syngenta AG, Registered Shares | | | 4,662 | | | | 1,716,620 | |
Umicore SA | | | 7,051 | | | | 259,232 | |
Yara International ASA | | | 6,354 | | | | 240,879 | |
| | | | | | | | |
| | | | | | | | 6,982,320 | |
Energy Equipment & Services — 0.9% | | | | | | | | |
Halliburton Co. | | | 4,500 | | | | 143,055 | |
Schlumberger Ltd. | | | 11,357 | | | | 820,770 | |
| | | | | | | | |
| | | | | | | | 963,825 | |
Food & Staples Retailing — 0.6% | | | | | | | | |
Fyffes PLC | | | 319,951 | | | | 499,106 | |
Total Produce PLC (b) | | | 74,359 | | | | 110,760 | |
| | | | | | | | |
| | | | | | | | 609,866 | |
| | | | | | | | |
Common Stocks | | Shares | | | Value | |
Food Products — 9.9% | | | | | | | | |
Adecoagro SA (b) | | | 18,468 | | | $ | 220,139 | |
Agt Food & Ingredients, Inc. | | | 11,031 | | | | 276,543 | |
Archer-Daniels-Midland Co. | | | 19,878 | | | | 702,687 | |
Astra Agro Lestari Tbk PT | | | 508,700 | | | | 636,291 | |
BRF SA — ADR | | | 25,067 | | | | 304,063 | |
Bumitama Agri Ltd. | | | 53,300 | | | | 25,442 | |
Bunge Ltd. | | | 18,350 | | | | 1,137,884 | |
Calavo Growers, Inc. | | | 3,244 | | | | 167,877 | |
First Resources Ltd. | | | 409,300 | | | | 504,169 | |
Glanbia PLC | | | 48,741 | | | | 925,362 | |
Hormel Foods Corp. | | | 3,938 | | | | 316,655 | |
Ingredion, Inc. | | | 2,340 | | | | 235,685 | |
Input Capital Corp. (b) | | | 63,587 | | | | 78,071 | |
Kerry Group PLC (b) | | | 5,290 | | | | 431,359 | |
Leroy Seafood Group ASA | | | 9,518 | | | | 365,033 | |
Marine Harvest ASA | | | 25,936 | | | | 353,489 | |
Mead Johnson Nutrition Co. | | | 5,569 | | | | 403,697 | |
MG Unit Trust (b) | | | 183,745 | | | | 311,691 | |
Pilgrim’s Pride Corp. | | | 41,146 | | | | 912,618 | |
Purecircle Ltd. (b) | | | 26,185 | | | | 152,043 | |
Sao Martinho SA | | | 17,554 | | | | 209,781 | |
Select Harvests Ltd. (c) | | | 47,375 | | | | 180,545 | |
SunOpta, Inc. (b) | | | 40,095 | | | | 237,362 | |
Synlait Milk Ltd. (b) | | | 71,890 | | | | 134,322 | |
Tyson Foods, Inc., Class A | | | 25,855 | | | | 1,379,623 | |
Wilmar International Ltd. | | | 201,300 | | | | 406,998 | |
| | | | | | | | |
| | | | | | | | 11,009,429 | |
Machinery — 0.4% | | | | | | | | |
Kubota Corp. | | | 33,000 | | | | 487,740 | |
Metals & Mining — 14.4% | | | | | | | | |
Acacia Mining PLC | | | 35,758 | | | | 105,649 | |
African Rainbow Minerals Ltd. | | | 5,425 | | | | 19,663 | |
Agnico Eagle Mines Ltd. | | | 33,235 | | | | 985,022 | |
Alamos Gold, Inc. | | | 55,807 | | | | 182,053 | |
AngloGold Ashanti Ltd. (b) | | | 38,345 | | | | 331,069 | |
AuRico Metals, Inc. (b) | | | 9,962 | | | | 4,124 | |
Aurubis AG | | | 284 | | | | 11,579 | |
Barrick Gold Corp. | | | 85,309 | | | | 845,747 | |
| | | | | | | | | | | | | | |
| Portfolio Abbreviations | | | | |
| ADR | | American Depositary Receipts | | DKK | | Danish Krone | | LIBOR | | London Interbank Offered Rate | | S&P | | Standard & Poor’s |
| AKA | | Also Known As | | ETF | | Exchange Traded Fund | | LP | | Limited Partnership | | SEK | | Swedish Krona |
| AUD | | Australian Dollar | | EUR | | Euro | | MXN | | Mexican Peso | | SGD | | Singapore Dollar |
| BBSW | | Bank-Bill Reference Rate | | EURIBOR | | Euro Interbank Offered Rate | | MYR | | Malaysian Ringgit | | SOR | | Swap Offer Rate |
| BRL | | Brazilian Real | | FKA | | Formerly Known As | | NIBOR | | Norwegian Interbank Offered Rate | | SPDR | | Standard & Poor’s |
| BUBOR | | Budapest Interbank Offer Rate | | GBP | | British Pound | | NOK | | Norwegian Krone | | | | Depositary Receipts |
| CAD | | Canadian Dollar | | HIBOR | | Hong Kong Interbank Offered Rate | | NZD | | New Zealand Dollar | | TELBOR | | Tel Aviv Interbank |
| CDI | | Brazil Interbank Deposit Rate | | HKD | | Hong Kong Dollar | | OTC | | Over-the-counter | | | | Offered Rate |
| | Annualized | | HUF | | Hungarian Forint | | PIK | | Payment-in-kind | | TRY | | Turkish Lira |
| CDO | | Collateralized Debt Obligation | | IDR | | Indonesian Rupiah | | PHP | | Philippine Peso | | TWD | | Taiwan Dollar |
| CHF | | Swiss Franc | | ILS | | Israeli Shekel | | PLN | | Polish Zloty | | USD | | U.S. Dollar |
| CLO | | Collateralized Loan Obligation | | INR | | Indian Rupee | | PRIBOR | | Prague Interbank Offered Rate | | WIBOR | | Warsaw Interbank |
| CNH | | Chinese Yuan | | JIBAR | | Johannesburg Interbank Agreed Rate | | REIT | | Real Estate Investment Trust | | | | Offered Rate |
| CNY | | Chinese Yuan Renmimbi | | JPY | | Japanese Yen | | RON | | Romanian New Leu | | WOP | | Worst of Put |
| CZK | | Czech Republic Koruna | | KRW | | Korean Won | | RUB | | Russian Ruble | | ZAR | | South African Rand |
See Notes to Financial Statements.
| | | | | | |
| | | BLACKROCK FUNDS | | JANUARY 31, 2016 | | 15 |
| | | | |
| Schedule of Investments (continued) | | | BlackRock Commodity Strategies Fund | |
| | | | |
| | | | | | | | |
| Common Stocks | | Shares | | | Value | |
Metals & Mining (continued) | | | | | | | | |
Belo Sun Mining Corp. (b) | | | 466,642 | | | $ | 86,606 | |
BHP Billiton PLC | | | 80,568 | | | | 782,330 | |
Boliden AB | | | 15,171 | | | | 211,068 | |
Centamin PLC | | | 255,029 | | | | 247,358 | |
Detour Gold Corp. (b) | | | 40,620 | | | | 494,086 | |
Dominion Diamond Corp. | | | 29,835 | | | | 318,390 | |
Eldorado Gold Corp. | | | 237,160 | | | | 538,346 | |
First Quantum Minerals Ltd. | | | 60,912 | | | | 131,746 | |
Franco-Nevada Corp. | | | 10,465 | | | | 463,376 | |
Fresnillo PLC | | | 67,384 | | | | 697,489 | |
Glencore PLC | | | 582,900 | | | | 751,534 | |
Gold Fields Ltd. — ADR | | | 97,809 | | | | 332,551 | |
Goldcorp, Inc. | | | 57,749 | | | | 657,916 | |
HudBay Minerals, Inc. | | | 19,909 | | | | 39,224 | |
Iluka Resources Ltd. | | | 51,011 | | | | 200,139 | |
Industrias Penoles SAB de CV | | | 6,967 | | | | 66,444 | |
Kinross Gold Corp. (b) | | | 42,317 | | | | 69,778 | |
Lundin Mining Corp. (b) | | | 147,698 | | | | 365,845 | |
MAG Silver Corp. (b) | | | 47,889 | | | | 313,813 | |
Metals X Ltd. | | | 364,858 | | | | 258,069 | |
MMC Norilsk Nickel PJSC — ADR | | | 26,167 | | | | 301,706 | |
Mountain Province Diamonds, Inc. (b) | | | 320 | | | | 982 | |
Nevsun Resources Ltd. | | | 54,854 | | | | 149,185 | |
New Gold, Inc. (b) | | | 49,615 | | | | 122,187 | |
Newcrest Mining Ltd. (b) | | | 80,025 | | | | 752,290 | |
Newmont Mining Corp. | | | 21,336 | | | | 425,867 | |
Northern Star Resources Ltd. | | | 60,641 | | | | 127,858 | |
Oceanagold Corp. | | | 219,298 | | | | 452,403 | |
Osisko Gold Royalties Ltd. | | | 12,761 | | | | 129,714 | |
OZ Minerals Ltd. | | | 37,000 | | | | 101,209 | |
Petra Diamonds Ltd. | | | 41,097 | | | | 51,825 | |
Polymetal International PLC | | | 8,763 | | | | 72,268 | |
Randgold Resources Ltd. | | | 4,150 | | | | 294,528 | |
Randgold Resources Ltd. — ADR | | | 17,049 | | | | 1,205,705 | |
Rio Tinto PLC | | | 24,146 | | | | 592,106 | |
Sandfire Resources NL | | | 339 | | | | 1,200 | |
Sierra Metals, Inc. (b) | | | 176,284 | | | | 128,353 | |
Silver Wheaton Corp. | | | 52,270 | | | | 616,017 | |
Sociedad Minera Cerro Verde SAA (b) | | | 5,514 | | | | 77,196 | |
Tahoe Resources, Inc. | | | 28,050 | | | | 217,849 | |
TMAC Resources, Inc. (b) | | | 70,129 | | | | 312,875 | |
Trevali Mining Corp. (b) | | | 139,147 | | | | 34,764 | |
Volcan Cia Minera SAA, Class B | | | 588,947 | | | | 40,554 | |
Western Areas Ltd. | | | 70,607 | | | | 96,076 | |
Yamana Gold, Inc. | | | 53,680 | | | | 92,347 | |
| | | | | | | | |
| | | | | | | | 15,908,078 | |
Oil, Gas & Consumable Fuels — 14.0% | | | | | | | | |
Altagas Ltd. | | | 21,450 | | | | 501,914 | |
Anadarko Petroleum Corp. | | | 4,711 | | | | 184,153 | |
BG Group PLC | | | 56,830 | | | | 860,002 | |
BP PLC | | | 146,300 | | | | 790,056 | |
Cabot Oil & Gas Corp. | | | 12,500 | | | | 259,375 | |
Cairn Energy PLC (b) | | | 76,928 | | | | 157,252 | |
Cameco Corp. | | | 19,609 | | | | 238,096 | |
Carrizo Oil & Gas, Inc. (b) | | | 4,200 | | | | 113,946 | |
Chevron Corp. | | | 14,285 | | | | 1,235,224 | |
China Shenhua Energy Co. Ltd., H Shares | | | 19,500 | | | | 29,443 | |
Cimarex Energy Co. | | | 4,099 | | | | 381,207 | |
Concho Resources, Inc. (b) | | | 1,800 | | | | 171,234 | |
ConocoPhillips | | | 20,154 | | | | 787,618 | |
Devon Energy Corp. | | | 7,899 | | | | 220,382 | |
Enbridge, Inc. | | | 23,893 | | | | 829,919 | |
EnCana Corp. | | | 33,900 | | | | 148,822 | |
Energen Corp. | | | 2,900 | | | | 102,283 | |
EOG Resources, Inc. | | | 10,675 | | | | 758,140 | |
| | | | | | | | |
| Common Stocks | | Shares | | | Value | |
Oil, Gas & Consumable Fuels (continued) | | | | | | | | |
EQT Corp. | | | 6,500 | | | $ | 401,310 | |
Exxon Mobil Corp. | | | 25,091 | | | | 1,953,334 | |
Green Plains, Inc. | | | 9,183 | | | | 174,018 | |
Hess Corp. | | | 9,480 | | | | 402,900 | |
Kosmos Energy Ltd. (b) | | | 22,921 | | | | 104,749 | |
Marathon Oil Corp. | | | 18,291 | | | | 177,971 | |
Noble Energy, Inc. | | | 9,455 | | | | 306,058 | |
Occidental Petroleum Corp. | | | 11,238 | | | | 773,512 | |
Oil Search Ltd. | | | 67,050 | | | | 315,087 | |
Phillips 66 | | | 4,601 | | | | 368,770 | |
Pioneer Natural Resources Co. | | | 4,124 | | | | 511,170 | |
Royal Dutch Shell PLC, A Shares | | | 62,300 | | | | 1,360,982 | |
Tesoro Corp. | | | 1,000 | | | | 87,250 | |
TOTAL SA | | | 12,716 | | | | 564,854 | |
Valero Energy Corp. | | | 4,200 | | | | 285,054 | |
| | | | | | | | |
| | | | | | | | 15,556,085 | |
Paper & Forest Products — 0.7% | | | | | | | | |
Interfor Corp. (b) | | | 30,469 | | | | 235,983 | |
Louisiana-Pacific Corp. (b) | | | 21,960 | | | | 345,211 | |
West Fraser Timber Co. Ltd. | | | 4,453 | | | | 153,053 | |
| | | | | | | | |
| | | | | | | | 734,247 | |
Total Common Stocks — 47.2% | | | | | | | 52,251,590 | |
| | | | | | | | |
| Preferred Stocks | | | | | | |
Food Products — 0.5% | | | | | | | | |
Tyson Foods, Inc., 4.75% | | | 10,085 | | | | 605,503 | |
Total Long-Term Investments (Cost — $73,801,328) — 64.6% | | | | 71,624,962 | |
| | | | | | | | |
| Short-Term Securities | | | | | | |
Money Market Funds | | | | | | | | |
BlackRock Liquidity Funds, TempFund, Institutional Class, 0.32% (d)(e) | | | 1,191,073 | | | | 1,191,073 | |
| | | Beneficial
Interest
(000) | | | | |
BlackRock Liquidity Series, LLC, Money Market Series, 0.51% (d)(e)(f) | | $ | 459 | | | | 459,321 | |
Total Money Market Funds — 1.5% | | | | 1,650,394 | |
| U.S. Treasury Obligations | | Par (000) | | | | |
U.S. Treasury Bills (g): | | | | | | | | |
0.09%, 2/11/16 | | | 6,000 | | | | 5,999,652 | |
0.14%, 3/10/16 | | | 7,000 | | | | 6,998,208 | |
0.22%, 4/07/16 | | | 8,000 | | | | 7,996,008 | |
0.27%, 4/28/16 | | | 8,000 | | | | 7,993,920 | |
0.42%, 7/28/16 | | | 6,000 | | | | 5,987,436 | |
Total U.S. Treasury Obligations — 31.6% | | | | | | | 34,975,224 | |
Total Short-Term Securities (Cost — $36,628,388) — 33.1% | | | | 36,625,618 | |
Total Investments (Cost — $110,429,716) — 97.7% | | | $ | 108,250,580 | |
Other Assets Less Liabilities — 2.3% | | | | 2,550,291 | |
| | | | | | | | |
Net Assets — 100.0% | | | $ | 110,800,871 | |
| | | | | | | | |
See Notes to Financial Statements.
| | | | | | |
| 16 | | BLACKROCK FUNDS | | JANUARY 31, 2016 | | |
| | | | |
| Schedule of Investments (continued) | | | BlackRock Commodity Strategies Fund | |
|
| Notes to Schedule of Investments |
| (a) | Security exempt from registration pursuant to Rule 144A under the Securities Act of 1933, as amended. These securities may be resold in transactions exempt from registration to qualified institutional investors. |
| (b) | Non-income producing security. |
| (c) | Security, or a portion of security, is on loan. |
| (d) | During the six months ended January 31, 2016, investments in issuers considered to be affiliates of the Fund for purposes of Section 2(a)(3) of the Investment Company Act of 1940, as amended, were as follows: |
| | | | | | | | | | | | | | | | |
| Affiliate | | Shares/Beneficial
Interest Held at July 31, 2015 | | | Net Activity | | | Shares/Beneficial
Interest Held at
January 31, 2016 | | | Income | |
BlackRock Liquidity Funds, TempFund, Institutional Class | | | 3,481,404 | | | | (2,290,331 | ) | | | 1,191,073 | | | $ | 2,820 | |
BlackRock Liquidity Series, LLC Money Market Series | | | $2,239,796 | | | $ | (1,780,475 | ) | | | $ 459,321 | | | $ | 44,294 | 1 |
| | 1 | | Represents securities lending income earned from the reinvestment of cash collateral from loaned securities, net of fees and collateral investment expenses, and other payments to and from borrowers of securities. |
| (e) | Current yield as of period end. |
| (f) | Security was purchased with the cash collateral from loaned securities. The Fund may withdraw up to 25% of its investment daily, although the manager of the BlackRock Liquidity Series, LLC, Money Market Series, in its sole discretion, may permit an investor to withdraw more than 25% on any one day. |
| (g) | Rates are discount rates or a range of discount rates at the time of purchase. |
| • | | For Fund compliance purposes, the Fund’s industry classifications refer to any one or more of the industry sub-classifications used by one or more widely recognized market indexes or ratings group indexes, and/or as defined by the investment advisor. These definitions may not apply for purposes of this report, which may combine such industry sub-classifications for reporting ease. |
|
| Fair Value Hierarchy as of Period End |
Various inputs are used in determining the fair value of investments. For information about the Fund’s policy regarding valuation of investments, refer to the Notes to Financial Statements.
The following table summarizes the Fund’s investments and derivative financial instruments categorized in the disclosure hierarchy:
| | | | | | | | | | | | | | | | |
| | | Level 1 | | | Level 2 | | | Level 3 | | | Total | |
Assets: | | | | | | | | | | | | | | | | |
Investments: | | | | | | | | | | | | | | | | |
Long-Term Investments: | | | | | | | | | | | | | | | | |
Commodity-Linked Notes | | | — | | | $ | 18,767,869 | | | | — | | | $ | 18,767,869 | |
Common Stocks: | | | | | | | | | | | | | | | | |
Chemicals | | $ | 4,525,627 | | | | 2,456,693 | | | | — | | | | 6,982,320 | |
Energy Equipment & Services | | | 963,825 | | | | — | | | | — | | | | 963,825 | |
Food & Staples Retailing | | | 609,866 | | | | — | | | | — | | | | 609,866 | |
Food Products | | | 6,760,170 | | | | 4,249,259 | | | | — | | | | 11,009,429 | |
Machinery | | | — | | | | 487,740 | | | | — | | | | 487,740 | |
Metals & Mining | | | 10,254,596 | | | | 5,653,482 | | | | — | | | | 15,908,078 | |
Oil, Gas & Consumable Fuels | | | 11,478,409 | | | | 4,077,676 | | | | — | | | | 15,556,085 | |
Paper & Forest Products | | | 734,247 | | | | — | | | | — | | | | 734,247 | |
Preferred Stocks | | | 605,503 | | | | — | | | | — | | | | 605,503 | |
Short-Term Securities: | | | | | | | | | | | | | | | | |
Money Market Funds | | | 1,191,073 | | | | 459,321 | | | | — | | | | 1,650,394 | |
U.S. Treasury Obligations | | | — | | | | 34,975,224 | | | | — | | | | 34,975,224 | |
| | | | |
Total | | $ | 37,123,316 | | | $ | 71,127,264 | | | | — | | | $ | 108,250,580 | |
| | | | |
|
The Fund may hold assets and/or liabilities in which the fair value approximates the carrying amount for financial statement purposes. As of period end, such assets and/or liabilities are categorized within the disclosure hierarchy as follows: | |
| | | Level 1 | | | Level 2 | | | Level 3 | | | Total | |
Assets: | | | | | | | | | | | | | | | | |
Cash | | $ | 3,594,375 | | | | — | | | | — | | | $ | 3,594,375 | |
Liabilities: | | | | | | | | | | | | | | | | |
Collateral on securities loaned at value | | | — | | | $ | (459,321 | ) | | | — | | | | (459,321 | ) |
| | | | |
Total | | $ | 3,594,375 | | | $ | (459,321 | ) | | | — | | | $ | 3,135,054 | |
| | | | |
See Notes to Financial Statements.
| | | | | | |
| | | BLACKROCK FUNDS | | JANUARY 31, 2016 | | 17 |
| | | | |
| Schedule of Investments (concluded) | | | BlackRock Commodity Strategies Fund | |
During the six months ended January 31, 2016, there were no transfers between Level 1 and Level 2.
A reconciliation of Level 3 investments is presented when the Fund had a significant amount of Level 3 investments at the beginning and/or end of the period in relation to net assets. The following table is a reconciliation of Level 3 investments for which significant unobservable inputs were used in determining fair value:
| | | | |
| | | Commodity-Linked
Notes | |
Assets: | |
Opening Balance, as of July 31, 2015 | | | $ 18,806,085 | |
Transfers into Level 3 | | | | |
Transfers out of Level 3 | | | — | |
Accrued discounts/premiums | | | — | |
Net realized gain (loss) | | | (8,990,423 | ) |
Net change in unrealized appreciation (depreciation)1,2 | | | 5,193,915 | |
Purchases | | | — | |
Sales | | | (15,009,577 | ) |
| | | | |
Closing Balance, as of January 31, 2016 | | | — | |
| | | | |
Net change in unrealized appreciation (depreciation) on investments still held at January 31, 20162 | | | — | |
| | | | |
| | 1 | | Included in the related net change in unrealized appreciation (depreciation) in the Statements of Operations. |
| | 2 | | Any difference between net change in unrealized appreciation (depreciation) and net change in unrealized appreciation (depreciation) on investments still held at January 31, 2016, is generally due to investments no longer held or categorized as Level 3 at period end. |
See Notes to Financial Statements.
| | | | | | |
| 18 | | BLACKROCK FUNDS | | JANUARY 31, 2016 | | |
| | | | |
| Schedule of Investments January 31, 2016 (Unaudited) | | | BlackRock Global Long/Short Credit Fund | |
| | | (Percentages shown are based on Net Assets) | |
| | | | | | | | | | | | |
| Asset-Backed Securities | | | | | Par
(000) | | | Value | |
Cayman Islands — 1.7% | | | | | | | | | | | | |
ACAS CLO Ltd., Series 2014-1A, Class C,
3.22%, 7/18/26 (a)(b) | | | USD | | | | 1,795 | | | $ | 1,685,011 | |
Adirondack Park CLO Ltd., Series 2013-1A, Class D,
3.97%, 4/15/24 (a)(b) | | | | | | | 1,000 | | | | 920,220 | |
ALM VIII Ltd.: | | | | | | | | | | | | |
Series 2013-8A, Class B, 3.07%, 1/20/26 (a)(b) | | | | | | | 1,520 | | | | 1,438,521 | |
Series 2013-8A, Class D, 4.82%, 1/20/26 (a)(b) | | | | | | | 1,450 | | | | 972,732 | |
ALM XIV Ltd.: | | | | | | | | | | | | |
Series 2014-14A, Class B, 3.27%, 7/28/26 (a)(b) | | | | | | | 2,290 | | | | 2,194,275 | |
Series 2014-14A, Class C, 3.77%, 7/28/26 (a)(b) | | | | | | | 2,375 | | | | 2,092,634 | |
Apidos CLO XII, Series 2013-12A, Class D,
3.37%, 4/15/25 (a)(b) | | | | | | | 1,500 | | | | 1,332,929 | |
Apidos CLO XVII, Series 2014-17A, Class B,
3.17%, 4/17/26 (a)(b) | | | | | | | 1,080 | | | | 1,032,277 | |
Apidos CLO XVIII, Series 2014-18A, Class C,
3.97%, 7/22/26 (a)(b) | | | | | | | 880 | | | | 774,119 | |
Ares XXV CLO Ltd., Series 2012-3X, Class C,
3.47%, 1/17/24 (b) | | | | | | | 1,300 | | | | 1,257,238 | |
Atlas Senior Loan Fund IV Ltd., Series 2013-2A, Class A3L, 3.06%, 2/17/26 (a)(b) | | | | | | | 1,800 | | | | 1,700,151 | |
Atlas Senior Loan Fund V Ltd.: | | | | | | | | | | | | |
Series 2014-1A, Class C, 3.62%, 7/16/26 (a)(b) | | | | | | | 500 | | | | 478,153 | |
Series 2014-1A, Class D, 4.07%, 7/16/26 (a)(b) | | | | | | | 980 | | | | 835,885 | |
Avalon IV Capital Ltd., Series 2012-1AR, Class CR,
3.17%, 4/17/23 (a)(b) | | | | | | | 1,185 | | | | 1,178,925 | |
Benefit Street Partners CLO III Ltd., Series 2013-IIIA, Class C, 3.57%, 1/20/26 (a)(b) | | | | | | | 1,070 | | | | 880,699 | |
Benefit Street Partners CLO IV Ltd., Series 2014-IVA,
Class C, 3.82%, 7/20/26 (a)(b) | | | | | | | 1,000 | | | | 877,670 | |
BlueMountain CLO Ltd., Series 2011-1A, Class D,
4.36%, 8/16/22 (a)(b) | | | | | | | 2,000 | | | | 1,971,464 | |
Carlyle Global Market Strategies CLO Ltd.: | | | | | | | | | | | | |
Series 2012-3A, Class C, 4.82%, 10/04/24 (a)(b) | | | | | | | 3,495 | | | | 3,389,300 | |
Series 2012-4A, Class D, 5.12%, 1/20/25 (a)(b) | | | | | | | 726 | | | | 706,186 | |
Cedar Funding III CLO Ltd., Series 2014-3A, Class D,
3.92%, 5/20/26 (a)(b) | | | | | | | 1,105 | | | | 954,634 | |
CIFC Funding Ltd.: | | | | | | | | | | | | |
Series 2012-1AR, Class B1R, 4.46%, 8/14/24 (a)(b) | | | | | | | 1,500 | | | | 1,414,584 | |
Series 2014-2A, Class B1L, 3.88%, 5/24/26 (a)(b) | | | | | | | 1,355 | | | | 1,191,912 | |
Series 2014-4A, Class D, 4.02%, 10/17/26 (a)(b) | | | | | | | 3,250 | | | | 2,824,305 | |
Dryden 34 Senior Loan Fund, Series 2014-34A, Class C, 3.12%, 10/15/26 (a)(b) | | | | | | | 1,000 | | | | 947,906 | |
Eaton Vance CLO Ltd., Series 2014-1A, Class INC,
0.00%, 7/15/26 (a)(b) | | | | | | | 4,000 | | | | 951,799 | |
Flatiron CLO Ltd., Series 2013-1A, Class A1,
1.72%, 1/17/26 (a)(b) | | | | | | | 3,205 | | | | 3,157,440 | |
Fraser Sullivan CLO VII Ltd.: | | | | | | | | | | | | |
Series 2012-7A, Class ER, 8.54%, 4/20/23 (a)(b) | | | | | | | 1,045 | | | | 805,726 | |
Series 2012-7A, Class SUBR, 0.00%, 4/20/23 (a)(c) | | | | | | | 1,455 | | | | 322,659 | |
Galaxy XV CLO Ltd., Series 2013-15A, Class C,
2.92%, 4/15/25 (a)(b) | | | | | | | 1,000 | | | | 945,546 | |
Gramercy Park CLO Ltd., Series 2012-1AR, Class DR,
6.12%, 7/17/23 (a)(b) | | | | | | | 1,000 | | | | 922,196 | |
| | | | | | | | | | | | |
| Asset-Backed Securities | | | | | Par
(000) | | | Value | |
Cayman Islands (continued) | | | | | | | | | | | | |
KKR Financial CLO Ltd., Series 2013-1A, Class A1,
1.47%, 7/15/25 (a)(b) | | | USD | | | | 1,640 | | | $ | 1,605,560 | |
LCM X LP: | | | | | | | | | | | | |
Series 10AR, Class CR, 3.17%, 4/15/22 (a)(b) | | | | | | | 645 | | | | 637,943 | |
Series 10AR, Class DR, 4.07%, 4/15/22 (a)(b) | | | | | | | 2,000 | | | | 1,940,486 | |
Madison Park Funding IX Ltd., Series 2012-9AR, Class DR, 4.17%, 8/15/22 (a)(b) | | | | | | | 1,500 | | | | 1,419,689 | |
Madison Park Funding Ltd.: | | | | | | | | | | | | |
Series 2012-8AR, Class CR, 3.12%, 4/22/22 (a)(b) | | | | | | | 1,252 | | | | 1,251,180 | |
Series 2012-8AR, Class DR, 4.17%, 4/22/22 (a)(b) | | | | | | | 864 | | | | 827,732 | |
Madison Park Funding X Ltd., Series 2012-10A, Class D, 4.57%, 1/20/25 (a)(b) | | | | | | | 2,630 | | | | 2,528,513 | |
Madison Park Funding XI Ltd., Series 2013-11A, Class C, 3.07%, 10/23/25 (a)(b) | | | | | | | 2,680 | | | | 2,482,137 | |
Mountain Hawk II CLO Ltd., Series 2013-2A, Class A1,
1.78%, 7/22/24 (a)(b) | | | | | | | 2,320 | | | | 2,291,000 | |
Neuberger Berman CLO XII Ltd., Series 2012-12AR,
Class DR, 4.32%, 7/25/23 (a)(b) | | | | | | | 2,000 | | | | 1,881,876 | |
Neuberger Berman CLO XVII Ltd., Series 2014-17A,
Class D, 3.88%, 8/04/25 (a)(b) | | | | | | | 568 | | | | 492,457 | |
Octagon Investment Partners XVII Ltd., Series 2013-1A,
Class D, 3.82%, 10/25/25 (a)(b) | | | | | | | 1,000 | | | | 879,226 | |
Octagon Investment Partners XVIII Ltd., Series 2013-1A,
Class C, 4.06%, 12/16/24 (a)(b) | | | | | | | 1,000 | | | | 913,206 | |
OHA Credit Partners VII Ltd., Series 2012-7A, Class A,
1.79%, 11/20/23 (a)(b) | | | | | | | 3,350 | | | | 3,338,481 | |
OZLM Funding IV Ltd., Series 2013-4A, Class C,
3.82%, 7/22/25 (a)(b) | | | | | | | 1,000 | | | | 895,545 | |
OZLM VII Ltd., Series 2014-7A, Class C,
4.22%, 7/17/26 (a)(b) | | | | | | | 1,062 | | | | 934,692 | |
OZLM VIII Ltd.: | | | | | | | | | | | | |
Series 2014-8A, Class B, 3.62%, 10/17/26 (a)(b) | | | | | | | 3,000 | | | | 2,848,493 | |
Series 2014-8A, Class C, 4.12%, 10/17/26 (a)(b) | | | | | | | 1,700 | | | | 1,487,506 | |
Palmer Square CLO Ltd., Series 2014-1A, Class C,
4.47%, 10/17/22 (a)(b) | | | | | | | 1,215 | | | | 1,171,195 | |
Pinnacle Park CLO Ltd., Series 2014-1A, Class D,
3.82%, 4/15/26 (a)(b) | | | | | | | 1,050 | | | | 928,768 | |
Race Point V CLO Ltd., Series 2011-5AR, Class DR,
4.09%, 12/15/22 (a)(b) | | | | | | | 1,645 | | | | 1,641,631 | |
RAIT Preferred Funding II Ltd., Series 2007-2A, Class A1T, 0.72%, 6/25/45 (a)(b) | | | | | | | 2,163 | | | | 2,022,088 | |
Regatta IV Funding Ltd.: | | | | | | | | | | | | |
Series 2014-1A, Class C, 3.27%, 7/25/26 (a)(b) | | | | | | | 550 | | | | 519,991 | |
Series 2014-1A, Class D, 3.82%, 7/25/26 (a)(b) | | | | | | | 660 | | | | 563,714 | |
Seneca Park CLO Ltd., Series 2014-1A, Class D,
3.82%, 7/17/26 (a)(b) | | | | | | | 1,435 | | | | 1,267,995 | |
Steele Creek CLO Ltd., Series 2014-1A, Class C,
3.58%, 8/21/26 (a)(b) | | | | | | | 1,110 | | | | 1,094,338 | |
TICP CLO II Ltd., Series 2014-2A, Class B,
3.62%, 7/26/26 (a)(b) | | | | | | | 870 | | | | 836,827 | |
Tyron Park CLO Ltd., Series 2013-1A, Class C,
3.82%, 7/15/25 (a)(b) | | | | | | | 1,000 | | | | 911,093 | |
Venture XIII CLO Ltd., Series 2013-13A, Class D,
4.04%, 6/10/25 (a)(b) | | | | | | | 500 | | | | 448,565 | |
Venture XVI CLO Ltd., Series 2014-16A, Class A3L,
3.07%, 4/15/26 (a)(b) | | | | | | | 1,750 | | | | 1,632,971 | |
See Notes to Financial Statements.
| | | | | | |
| | | BLACKROCK FUNDS | | JANUARY 31, 2016 | | 19 |
| | | | |
| Schedule of Investments (continued) | | | BlackRock Global Long/Short Credit Fund | |
| | | | |
| | | | | | | | | | | | |
| Asset-Backed Securities | | | | | Par
(000) | | | Value | |
Cayman Islands (continued) | | | | | | | | | | | | |
Voya CLO Ltd.: | | | | | | | | | | | | |
Series 2012-1RA, Class CR, 4.20%, 3/14/22 (a)(b) | | | USD | | | | 2,350 | | | $ | 2,235,797 | |
Series 2013-3A, Class B, 3.02%, 1/18/26 (a)(b) | | | | | | | 2,120 | | | | 1,999,838 | |
Series 2014-3A, Class C, 3.92%, 7/25/26 (a)(b) | | | | | | | 765 | | | | 673,616 | |
| | | | | | | | | | | | |
| | | | | | | | | | | | 86,761,245 | |
Iceland — 0.0% | | | | | | | | | | | | |
Avoca CLO XV Ltd., Series 15X, Class F,
6.79%, 11/28/28 (b) | | | EUR | | | | 2,650 | | | | 2,571,560 | |
Ireland — 2.0% | | | | | | | | | | | | |
ALME Loan Funding II Ltd.: | | | | | | | | | | | | |
Series 2014-2X, Class A, 1.40%, 8/15/27 (b) | | | | | | | 6,285 | | | | 6,741,263 | |
Series 2X, Class E, 5.10%, 8/15/27 (b) | | | | | | | 5,710 | | | | 5,560,446 | |
Series 2X, Class F, 5.85%, 8/15/27 (b) | | | | | | | 3,825 | | | | 3,587,074 | |
Arbour CLO Ltd.: | | | | | | | | | | | | |
Series 2014-1X, Class E, 5.00%, 7/15/27 (b) | | | | | | | 5,313 | | | | 5,226,652 | |
Series 2014-1X, Class F, 5.75%, 7/15/27 (b) | | | | | | | 2,883 | | | | 2,656,363 | |
Avoca CLO XIII Ltd, Series 13X, Class E,
5.37%, 12/29/27 (b) | | | | | | | 3,530 | | | | 3,521,336 | |
Avoca CLO XIV Ltd.: | | | | | | | | | | | | |
Series 14X, Class E, 4.75%, 7/12/28 (b) | | | | | | | 1,070 | | | | 1,066,395 | |
Series 14X, Class SUB, 0.00%, 7/12/28 | | | | | | | 1,500 | | | | 1,397,450 | |
Avoca CLO XV Ltd.: | | | | | | | | | | | | |
Series 15X, Class E, 5.04%, 11/28/28 (b) | | | | | | | 7,040 | | | | 6,857,842 | |
Series 15X, Class M1, 0.00%, 11/28/28 (b) | | | | | | | 6,300 | | | | 5,577,662 | |
CVC Cordatus Loan Fund III Ltd., Series 3X, Class A1, 1.35%, 7/08/27 (b) | | | | | | | 21,280 | | | | 22,819,516 | |
CVC Cordatus Loan Fund IV Ltd.: | | | | | | | | | | | | |
Series 4X, Class E, 5.95%, 1/22/28 (b) | | | | | | | 1,300 | | | | 1,352,841 | |
Series 4X, Class F, 6.55%, 1/22/28 (b) | | | | | | | 4,400 | | | | 4,279,369 | |
Series 4X, Class SUB, 0.21%, 1/22/28 (b) | | | | | | | 21,100 | | | | 17,512,584 | |
Harvest CLO: | | | | | | | | | | | | |
Series 11X, Class E, 5.21%, 3/26/29 (b) | | | | | | | 3,120 | | | | 3,075,340 | |
Series 11X, Class SUB, 0.00%, 3/26/29 (b) | | | | | | | 8,080 | | | | 7,002,416 | |
Sorrento Park CLO Ltd., Series 1X, Class E,
6.24%, 11/16/27 (b) | | | | | | | 4,200 | | | | 4,039,424 | |
| | | | | | | | | | | | |
| | | | | | | | | | | | 102,273,973 | |
Italy — 0.4% | | | | | | | | | | | | |
Arianna SPV Srl: | | | | | | | | | | | | |
Series 2014-1, Class A, 3.60%, 10/20/30 | | | | | | | 12,985 | | | | 14,339,298 | |
Series 2014-1, Class B, 5.50%, 10/20/30 | | | | | | | 5,200 | | | | 5,903,848 | |
Colombo Srl, Series 2014-1, Class B, 0.65%, 8/28/26 (b) | | | | | | | 2,749 | | | | 2,948,551 | |
| | | | | | | | | | | | |
| | | | | | | | | | | | 23,191,697 | |
Netherlands — 1.2% | | | | | | | | | | | | |
Euro-Galaxy IV CLO BV: | | | | | | | | | | | | |
Series 2015-4X, Class D, 3.42%, 7/30/28 (b) | | | | | | | 1,480 | | | | 1,515,096 | |
Series 2015-4X, Class E, 4.50%, 7/30/28 (b) | | | | | | | 1,965 | | | | 1,890,262 | |
Series 2015-4X, Class F, 6.32%, 7/30/28 (b) | | | | | | | 750 | | | | 701,975 | |
| | | | | | | | | | | | |
| Asset-Backed Securities | | | | | Par
(000) | | | Value | |
Netherlands (continued) | | | | | | | | | | | | |
Jubilee CDO BV, Series 2014-VIII-X, Class SUB,
5.05%, 1/15/24 (b) | | | EUR | | | | 11,440 | | | $ | 6,734,979 | |
North Westerly CLO IV BV: | | | | | | | | | | | | |
Series 2014-IV-X, Class A-1, 0.00%, 1/15/26 (c) | | | | | | | 6,166 | | | | 5,218,297 | |
Series 2014-IV-X, Class A-1, 1.40%, 1/15/26 (b) | | | | | | | 21,350 | | | | 23,122,609 | |
St. Pauls CLO, Series 4X, Class A1, 1.35%, 4/25/28 (b) | | | | | | | 19,500 | | | | 21,117,219 | |
| | | | | | | | | | | | |
| | | | | | | | | | | | 60,300,437 | |
Portugal — 0.1% | | | | | | | | | | | | |
TAGUS-Sociedade de Titularizacao de Creditos
SA/Volta II Electricity Receivables, Series 2,
Class SNR, 2.98%, 2/16/18 | | | | | | | 3,847 | | | | 4,186,701 | |
United Kingdom — 0.1% | | | | | | | | | | | | |
Ludgate Funding PLC, Series 2007-1, Class R,
0.00%, 1/01/61 (b) | | | GBP | | | | 119,000 | | | | 4,900,398 | |
United States — 2.6% | | | | | | | | | | | | |
Aircraft Loan Trust, Series 2015-1, Class X,
0.00%, 3/20/22 (c) | | | USD | | | | — | (d) | | | 2,551,005 | |
Countrywide Asset-Backed Certificates, Series 2006-BC5, Class 2A3, 0.60%, 3/25/37 (b) | | | | | | | 7,134 | | | | 7,399,745 | |
Credit Acceptance Auto Loan Trust: | | | | | | | | | | | | |
Series 2014-2A, Class B, 2.67%, 9/15/22 (a) | | | | | | | 2,000 | | | | 2,010,192 | |
Series 2015-1A, Class B, 2.61%, 1/17/23 (a) | | | | | | | 4,240 | | | | 4,254,226 | |
Series 2015-1A, Class C, 3.30%, 7/17/23 (a) | | | | | | | 1,500 | | | | 1,494,103 | |
Series 2015-2A, Class B, 3.04%, 8/15/23 (a) | | | | | | | 3,695 | | | | 3,717,739 | |
Series 2015-2A, Class C, 3.76%, 2/15/24 (a) | | | | | | | 2,000 | | | | 2,004,215 | |
DCP Rights LLC, Series 2014-1A, Class A,
5.46%, 10/25/44 (a) | | | | | | | 4,641 | | | | 4,636,599 | |
Navient Private Education Loan Trust: | | | | | | | | | | | | |
Series 2015-AA, Class A3, 2.03%, 11/15/30 (a)(b) | | | | | | | 4,705 | | | | 4,428,071 | |
Series 2015-AA, Class B, 3.50%, 12/15/44 (a) | | | | | | | 1,400 | | | | 1,196,724 | |
Series 2014-CTA, Class A, 1.13%, 9/16/24 (a)(b) | | | | | | | 782 | | | | 772,592 | |
Series 2014-CTA, Class B, 2.18%, 10/17/44 (a)(b) | | | | | | | 1,500 | | | | 1,424,148 | |
OneMain Financial Issuance Trust: | | | | | | | | | | | | |
Series 2015-1A, Class B, 3.85%, 3/18/26 (a) | | | | | | | 4,710 | | | | 4,736,093 | |
Series 2014-1A, Class A, 2.43%, 6/18/24 (a) | | | | | | | 6,590 | | | | 6,582,918 | |
Series 2014-2A, Class A, 2.47%, 9/18/24 (a) | | | | | | | 4,000 | | | | 3,977,500 | |
Series 2014-2A, Class B, 3.02%, 9/18/24 (a) | | | | | | | 1,000 | | | | 992,040 | |
Series 2015-1A, Class A, 3.19%, 3/18/26 (a) | | | | | | | 4,710 | | | | 4,698,225 | |
Series 2015-2A, Class A, 2.57%, 7/18/25 (a) | | | | | | | 9,235 | | | | 9,113,070 | |
Series 2015-2A, Class B, 3.10%, 7/18/25 (a) | | | | | | | 1,845 | | | | 1,820,369 | |
Santander Drive Auto Receivables Trust: | | | | | | | | | | | | |
Series 2012-AA, 0.00%, 12/16/19 (a)(c) | | | | | | | — | (d) | | | 2,316,990 | |
See Notes to Financial Statements.
| | | | | | |
| 20 | | BLACKROCK FUNDS | | JANUARY 31, 2016 | | |
| | | | |
| Schedule of Investments (continued) | | | BlackRock Global Long/Short Credit Fund | |
| | | | |
| | | | | | | | | | | | |
| Asset-Backed Securities | | | | | Par
(000) | | | Value | |
United States (continued) | | | | | | | | | | | | |
Series 2014-3, Class C, 2.13%, 8/17/20 | | | USD | | | | 1,500 | | | $ | 1,502,439 | |
Series 2014-3, Class D, 2.65%, 8/17/20 | | | | | | | 5,000 | | | | 5,005,607 | |
Series 2014-4, Class D, 3.10%, 11/16/20 | | | | | | | 1,250 | | | | 1,260,523 | |
Series 2014-S2, 0.00% 11/16/18 (a)(c) | | | | | | | — | (d) | | | 4,214,925 | |
Series 2014-S3, 0.00% 2/19/19 (a)(c) | | | | | | | — | (d) | | | 6,045,650 | |
Series 2014-S4, 0.00%, 4/16/19 (a)(c) | | | | | | | — | (d) | | | 6,700,650 | |
Series 2014-S5, 0.00%, 6/18/19 (a)(c) | | | | | | | — | (d) | | | 2,687,100 | |
Series 2014-S6, 0.00%, 12/16/19 (a)(c) | | | | | | | — | (d) | | | 3,549,000 | |
SLM Private Education Loan Trust: | | | | | | | | | | | | |
Series 2011-B, Class A3, 2.68%, 6/16/42 (a)(b) | | | | | | | 9,870 | | | | 10,031,091 | |
Series 2013-B, Class B, 3.00%, 5/16/44 (a) | | | | | | | 5,640 | | | | 5,497,642 | |
SMB Private Education Loan Trust, Series 2015-C,
Class B, 3.50%, 9/15/43 (a) | | | | | | | 9,225 | | | | 8,445,773 | |
Springleaf Funding Trust, Series 2015-AA, Class A, 3.16%, 11/15/24 (a) | | | | | | | 7,525 | | | | 7,464,570 | |
| | | | | | | | | | | | |
| | | | | | | | | | | | 132,531,534 | |
Total Asset-Backed Securities — 8.1% | | | | | | | | | | | 416,717,545 | |
| | | | | | | | | | | | |
| Common Stocks | | | | | Shares | | | | |
Luxembourg — 0.0% | | | | | | | | | | | | |
Concrete Investment II SCA (e)(f) | | | | | | | 11,824 | | | | — | |
United States — 1.0% | | | | | | | | | | | | |
Apple, Inc. | | | | | | | 71,450 | | | | 6,954,943 | |
EMC Corp. | | | | | | | 602,228 | | | | 14,917,188 | |
HCA Holdings, Inc. | | | | | | | 9,000 | | | | 626,220 | |
Infrareit, Inc. | | | | | | | 75,000 | | | | 1,449,750 | |
Oracle Corp. | | | | | | | 99,000 | | | | 3,594,690 | |
Ovation Acquisition I, LLC (Acquired 12/28/15,
cost $10,049) (e)(g) | | | | | | | 10,049 | | | | 10,049 | |
Paypal Holdings, Inc. | | | | | | | 349,675 | | | | 12,637,255 | |
Project Ivy | | | | | | | 55,550,000 | | | | 55,550 | |
Sabre Corp. | | | | | | | 194,925 | | | | 4,992,029 | |
Wal-Mart Stores, Inc. | | | | | | | 62,750 | | | | 4,164,090 | |
| | | | | | | | | | | | |
| | | | | | | | | | | | 49,401,764 | |
Total Common Stocks — 1.0% | | | | | | | | | | | 49,401,764 | |
| | | | | | | | | | | | |
| Corporate Bonds | | | | | Par (000) | | | | |
Australia — 0.4% | | | | | | | | | | | | |
APT Pipelines Ltd.: | | | | | | | | | | | | |
3.88%, 10/11/22 | | | USD | | | | 379 | | | | 379,284 | |
4.20%, 3/23/25 | | | | | | | 1,300 | | | | 1,280,565 | |
Goodman Funding Pty Ltd., 6.00%, 3/22/22 | | | | | | | 900 | | | | 1,013,144 | |
National Australia Bank Ltd., 3.38%, 1/14/26 | | | | | | | 1,000 | | | | 1,016,630 | |
SGSP Australia Assets Pty Ltd., 3.30%, 4/09/23 | | | | | | | 400 | | | | 387,124 | |
Virgin Australia Trust: | | | | | | | | | | | | |
Series 2013-1, Class B, 6.00%, 4/23/22 (a) | | | | | | | 3,216 | | | | 3,248,188 | |
Series 2013-1, Class C, 7.13%, 10/23/18 (a) | | | | | | | 6,914 | | | | 6,948,179 | |
Series 2013-1, Class D, 8.50%, 10/23/16 (a) | | | | | | | 4,704 | | | | 4,774,893 | |
| | | | | | | | | | | | |
| | | | | | | | | | | | 19,048,007 | |
| | | | | | | | | | | | |
| Corporate Bonds | | | | | Par
(000) | | | Value | |
Belgium — 0.8% | | | | | | | | | | | | |
Anheuser-Busch InBev Finance, Inc.: | | | | | | | | | | | | |
2.65%, 2/01/21 | | | USD | | | | 12,905 | | | $ | 12,983,875 | |
4.90%, 2/01/46 | | | | | | | 13,225 | | | | 13,695,466 | |
Solvay Finance America LLC, 4.45%, 12/03/25 (a) | | | | | | | 15,435 | | | | 15,404,238 | |
| | | | | | | | | | | | |
| | | | | | | | | | | | 42,083,579 | |
Canada — 0.8% | | | | | | | | | | | | |
Air Canada, 6.75%, 10/01/19 (a) | | | | | | | 8,000 | | | | 8,200,000 | |
Air Canada Pass-Through Trust: | | | | | | | | | | | | |
Series 2013-1, Class B, 5.38%, 11/15/22 (a) | | | | | | | 1,693 | | | | 1,663,076 | |
Series 2013-1, Class C, 6.63%, 5/15/18 (a) | | | | | | | 3,045 | | | | 3,041,194 | |
Series 2015-2, Class B, 5.00%, 12/15/23 (a) | | | | | | | 20,000 | | | | 19,984,000 | |
BC ULC/New Red Finance, Inc., 6.00%, 4/01/22 (a) | | | | | | | 8,490 | | | | 8,861,437 | |
| | | | | | | | | | | | |
| | | | | | | | | | | | 41,749,707 | |
Cayman Islands — 0.1% | | | | | | | | | | | | |
Goodman HK Finance, 4.38%, 6/19/24 | | | | | | | 400 | | | | 408,676 | |
Hutchison Whampoa International 11 Ltd., 4.63%, 1/13/22 | | | | | | | 1,076 | | | | 1,169,488 | |
Hutchison Whampoa International 14 Ltd., 3.63%, 10/31/24 | | | | | | | 1,500 | | | | 1,514,004 | |
| | | | | | | | | | | | |
| | | | | | | | | | | | 3,092,168 | |
China — 0.2% | | | | | | | | | | | | |
China Aoyuan Property Group Ltd., 10.88%, 5/26/18 | | | | | | | 450 | | | | 470,255 | |
China New Town Finance I Ltd., 5.50%, 5/06/18 | | | CNH | | | | 3,750 | | | | 542,409 | |
China Overseas Finance Cayman III Ltd., 6.38%, 10/29/43 | | | USD | | | | 680 | | | | 717,779 | |
CIFI Holdings Group Co. Ltd., 7.75%, 6/05/20 | | | | | | | 1,350 | | | | 1,323,502 | |
Far East Horizon Ltd., 5.55% (b)(h) | | | | | | | 400 | | | | 404,392 | |
Fuqing Investment Management Ltd., 4.85%, 7/21/18 | | | CNH | | | | 3,500 | | | | 506,601 | |
Jingneng Clean Energy Investment Holdings Ltd.,
4.30%, 12/23/17 | | | | | | | 6,000 | | | | 875,811 | |
Proven Honour Capital Ltd., 4.13%, 5/19/25 | | | USD | | | | 1,500 | | | | 1,490,016 | |
Wanda Properties International Co. Ltd., 7.25%, 1/29/24 | | | | | | | 950 | | | | 973,969 | |
Wanda Properties Overseas Ltd., 4.88%, 11/21/18 | | | | | | | 700 | | | | 702,379 | |
Zhaohai Investment BVI Ltd, 4.00%, 7/23/20 | | | | | | | 1,350 | | | | 1,352,767 | |
| | | | | | | | | | | | |
| | | | | | | | | | | | 9,359,880 | |
Cyprus — 0.5% | | | | | | | | | | | | |
Aroundtown Property Holdings PLC: | | | | | | | | | | | | |
3.00%, 5/05/20 (i) | | | EUR | | | | 13,000 | | | | 16,899,394 | |
3.00%, 12/09/21 | | | | | | | 7,800 | | | | 8,284,928 | |
| | | | | | | | | | | | |
| | | | | | | | | | | | 25,184,322 | |
Czech Republic — 0.1% | | | | | | | | | | | | |
CE Energy A/S, 7.00%, 2/01/21 | | | | | | | 3,387 | | | | 3,577,391 | |
France — 1.3% | | | | | | | | | | | | |
Alcatel-Lucent USA, Inc.: | | | | | | | | | | | | |
4.63%, 7/01/17 (a) | | | USD | | | | 2,790 | | | | 2,908,575 | |
6.75%, 11/15/20 (a) | | | | | | | 3,521 | | | | 3,785,075 | |
6.45%, 3/15/29 | | | | | | | 300 | | | | 310,500 | |
BNP Paribas Cardif SA, 4.03% (b)(h) | | | EUR | | | | 14,000 | | | | 14,142,000 | |
Dakar Finance SA, 9.00% (9.00% Cash or 9.00% PIK), 11/15/20 (j) | | | | | | | 2,500 | | | | 2,589,074 | |
Dry Mix Solutions Investissements SAS, 4.12%, 6/15/21 (b) | | | | | | | 2,903 | | | | 3,046,875 | |
See Notes to Financial Statements.
| | | | | | |
| | | BLACKROCK FUNDS | | JANUARY 31, 2016 | | 21 |
| | | | |
| Schedule of Investments (continued) | | | BlackRock Global Long/Short Credit Fund | |
| | | | |
| | | | | | | | | | | | |
| Corporate Bonds | | | | | Par
(000) | | | Value | |
France (continued) | | | | | | | | | | | | |
Lion/Seneca France 2, 7.88%, 4/15/19 | | | EUR | | | | 9,210 | | | $ | 7,832,057 | |
Numericable-SFR SAS: | | | | | | | | | | | | |
5.38%, 5/15/22 | | | | | | | 3,828 | | | | 4,250,523 | |
5.63%, 5/15/24 | | | | | | | 5,459 | | | | 5,993,776 | |
6.25%, 5/15/24 (a) | | | USD | | | | 4,305 | | | | 4,197,375 | |
SGD Group SAS, 5.63%, 5/15/19 | | | EUR | | | | 5,574 | | | | 5,935,633 | |
Société Générale SA, 4.75%, 11/24/25 (a) | | | USD | | | | 12,258 | | | | 11,624,335 | |
| | | | | | | | | | | | |
| | | | | | | | | | | | 66,615,798 | |
Germany — 0.8% | | | | | | | | | | | | |
Commerzbank AG, 7.75%, 3/16/21 | | | EUR | | | | 6,800 | | | | 8,689,887 | |
Deutsche Bank AG, 2.75%, 2/17/25 | | | | | | | 3,082 | | | | 2,971,442 | |
Fresenius Medical Care U.S. Finance II, Inc.,
4.75%, 10/15/24 (a) | | | USD | | | | 710 | | | | 713,550 | |
Pfleiderer GmbH, 7.88%, 8/01/19 | | | EUR | | | | 3,318 | | | | 3,707,594 | |
Schaeffler Holding Finance BV: | | | | | | | | | | | | |
6.25% (6.25% Cash or 6.50% PIK), 11/15/19 (a)(j) | | | USD | | | | 3,202 | | | | 3,338,085 | |
6.75% (6.75% Cash or 7.00% PIK), 11/15/22 (a)(j) | | | | | | | 4,069 | | | | 4,252,105 | |
Unitymedia Hessen GmbH & Co. KG/Unitymedia NRW GmbH: | | | | | | | | | | | | |
5.63%, 4/15/23 | | | EUR | | | | 1,237 | | | | 1,415,036 | |
4.00%, 1/15/25 | | | | | | | 5,330 | | | | 5,637,001 | |
3.50%, 1/15/27 | | | | | | | 120 | | | | 122,521 | |
6.25%, 1/15/29 | | | | | | | 4,949 | | | | 5,804,062 | |
ZF North America Capital, Inc., 2.75%, 4/27/23 | | | | | | | 4,800 | | | | 4,788,768 | |
| | | | | | | | | | | | |
| | | | | | | | | | | | 41,440,051 | |
Greece — 0.1% | | | | | | | | | | | | |
Intralot Capital Luxembourg SA, 6.00%, 5/15/21 | | | | | | | 697 | | | | 665,220 | |
Intralot Finance Luxembourg SA, 9.75%, 8/15/18 | | | | | | | 2,585 | | | | 2,850,722 | |
| | | | | | | | | | | | |
| | | | | | | | | | | | 3,515,942 | |
Guernsey — 0.1% | | | | | | | | | | | | |
Doric Nimrod Air Alpha Pass-Through Trust,
Series 2013-1, 5.25%, 5/30/23 (a) | | | USD | | | | 3,577 | | | | 3,639,210 | |
Hong Kong — 0.1% | | | | | | | | | | | | |
Aia Group Ltd., 3.20%, 3/11/25 | | | | | | | 1,350 | | | | 1,331,994 | |
Noble Group Ltd., 6.75%, 1/29/20 | | | | | | | 250 | | | | 129,688 | |
Sun Hung Kai Properties Capital Market Ltd.,
4.50%, 2/14/22 | | | | | | | 260 | | | | 281,128 | |
Swire Properties MTN Financing Ltd., 3.63%, 1/13/26 | | | | | | | 1,500 | | | | 1,514,100 | |
| | | | | | | | | | | | |
| | | | | | | | | | | | 3,256,910 | |
India — 0.0% | | | | | | | | | | | | |
Greenko Dutch BV, 8.00%, 8/01/19 | | | | | | | 200 | | | | 209,445 | |
Lodha Developers International Ltd., 12.00%, 3/13/20 | | | | | | | 900 | | | | 783,000 | |
Reliance Holding USA, Inc., 5.40%, 2/14/22 | | | | | | | 1,000 | | | | 1,099,248 | |
Vedanta Resources PLC, 8.25%, 6/07/21 | | | | | | | 811 | | | | 463,527 | |
| | | | | | | | | | | | |
| | | | | | | | | | | | 2,555,220 | |
Indonesia — 0.0% | | | | | | | | | | | | |
Pacific Emerald Pte Ltd., 9.75%, 7/25/18 | | | | | | | 200 | | | | 190,000 | |
Pratama Agung Pte Ltd., 6.25%, 2/24/20 | | | | | | | 1,700 | | | | 1,668,045 | |
| | | | | | | | | | | | |
| | | | | | | | | | | | 1,858,045 | |
Ireland — 0.1% | | | | | | | | | | | | |
Allied Irish Banks PLC, 4.13%, 11/26/25 (b) | | | EUR | | | | 2,975 | | | | 3,105,169 | |
| | | | | | | | | | | | |
| Corporate Bonds | | | | | Par
(000) | | | Value | |
Italy — 3.4% | | | | | | | | | | | | |
Banca Monte dei Paschi di Siena SpA, 3.63%, 4/01/19 | | | EUR | | | | 1,804 | | | $ | 1,846,779 | |
Banca Popolare di Milano Scarl, 7.13%, 3/01/21 | | | | | | | 1,780 | | | | 2,013,416 | |
Banco Popolare SC, 3.50%, 3/14/19 | | | | | | | 28,038 | | | | 29,992,620 | |
Buzzi Unicem SpA, 1.38%, 7/17/19 (i) | | | | | | | 2,500 | | | | 3,093,618 | |
Intesa Sanpaolo SpA, 6.63%, 9/13/23 | | | | | | | 11,995 | | | | 15,330,798 | |
Meccanica Holdings USA, Inc.: | | | | | | | | | | | | |
7.38%, 7/15/39 (a) | | | USD | | | | 6,850 | | | | 7,175,375 | |
6.25%, 1/15/40 (a) | | | | | | | 9,890 | | | | 8,950,450 | |
Mercury Bondco PLC, 8.25% (8.25% Cash or
9.00% PIK), 5/30/21 (j) | | | EUR | | | | 13,216 | | | | 13,672,211 | |
Snai SpA, 7.63%, 6/15/18 | | | | | | | 1,899 | | | | 2,036,769 | |
Telecom Italia Capital SA: | | | | | | | | | | | | |
6.38%, 11/15/33 | | | USD | | | | 6,733 | | | | 6,345,853 | |
6.00%, 9/30/34 | | | | | | | 6,047 | | | | 5,412,065 | |
7.72%, 6/04/38 | | | | | | | 3,875 | | | | 3,990,475 | |
Telecom Italia Finance SA, 7.75%, 1/24/33 | | | EUR | | | | 13,060 | | | | 18,225,796 | |
UniCredit SpA: | | | | | | | | | | | | |
6.95%, 10/31/22 | | | | | | | 4,520 | | | | 5,480,124 | |
5.75%, 10/28/25 (b) | | | | | | | 38,390 | | | | 43,460,785 | |
Wind Acquisition Finance SA, 4.00%, 7/15/20 | | | | | | | 4,701 | | | | 4,977,985 | |
| | | | | | | | | | | | |
| | | | | | | | | | | | 172,005,119 | |
Japan — 0.1% | | | | | | | | | | | | |
Fukoku Mutual Life Insurance Co., 5.00% (b)(h) | | | USD | | | | 379 | | | | 378,773 | |
Mizuho Financial Group, Inc., 4.35%, 10/20/25 | | | | | | | 900 | | | | 912,240 | |
SoftBank Group Corp., 4.75%, 7/30/25 | | | EUR | | | | 2,500 | | | | 2,525,430 | |
| | | | | | | | | | | | |
| | | | | | | | | | | | 3,816,443 | |
Luxembourg — 1.6% | | | | | | | | | | | | |
Actavis Funding SCS, 4.75%, 3/15/45 | | | USD | | | | 33,814 | | | | 33,812,039 | |
Altice Financing SA: | | | | | | | | | | | | |
6.50%, 1/15/22 (a) | | | | | | | 3,975 | | | | 3,955,125 | |
5.25%, 2/15/23 | | | EUR | | | | 6,508 | | | | 6,850,916 | |
6.63%, 2/15/23 (a) | | | USD | | | | 2,329 | | | | 2,288,243 | |
Altice Luxembourg SA, 7.25%, 5/15/22 | | | EUR | | | | 4,656 | | | | 4,772,714 | |
Altice SA: | | | | | | | | | | | | |
7.75%, 5/15/22 (a) | | | USD | | | | 3,520 | | | | 3,282,400 | |
6.25%, 2/15/25 | | | EUR | | | | 5,502 | | | | 5,037,634 | |
7.63%, 2/15/25 (a) | | | USD | | | | 1,982 | | | | 1,763,980 | |
APERAM SA, 0.63%, 7/08/21 (i) | | | | | | | 11,600 | | | | 12,008,320 | |
Bilbao Luxembourg SA, 10.50% (10.50% Cash or
11.25% PIK), 12/01/18 (j) | | | EUR | | | | 5,672 | | | | 4,726,461 | |
Swissport Investments SA, 6.75%, 12/15/21 | | | | | | | 3,915 | | | | 4,378,934 | |
Trinseo Materials Operating SCA/Trinseo | | | | | | | | | | | | |
Materials Finance, Inc., 6.38%, 5/01/22 | | | | | | | 1,000 | | | | 1,035,261 | |
Wind Acquisition Finance SA, 7.00%, 4/23/21 | | | | | | | 600 | | | | 628,852 | |
| | | | | | | | | | | | |
| | | | | | | | | | | | 84,540,879 | |
Netherlands — 1.0% | | | | | | | | | | | | |
Achmea BV, 6.00%, 4/04/43 (b) | | | | | | | 3,612 | | | | 4,070,489 | |
AerCap Ireland Capital Ltd./AerCap Global Aviation Trust: | | | | | | | | | | | | |
4.25%, 7/01/20 | | | USD | | | | 9,981 | | | | 9,706,523 | |
4.63%, 7/01/22 | | | | | | | 6,469 | | | | 6,291,103 | |
Atrium European Real Estate Ltd., 4.00%, 4/20/20 | | | EUR | | | | 1,440 | | | | 1,659,512 | |
Constellium NV, 8.00%, 1/15/23 (a) | | | USD | | | | 2,020 | | | | 1,732,150 | |
Hema Bondco I BV: | | | | | | | | | | | | |
5.12%, 6/15/19 (b) | | | EUR | | | | 1,457 | | | | 1,097,118 | |
6.25%, 6/15/19 | | | | | | | 1,918 | | | | 1,516,889 | |
Hema Bondco II BV, 8.50%, 12/15/19 | | | | | | | 476 | | | | 213,994 | |
See Notes to Financial Statements.
| | | | | | |
| 22 | | BLACKROCK FUNDS | | JANUARY 31, 2016 | | |
| | | | |
| Schedule of Investments (continued) | | | BlackRock Global Long/Short Credit Fund | |
| | | | |
| | | | | | | | | | | | |
| Corporate Bonds | | | | | Par
(000) | | | Value | |
Netherlands (continued) | | | | | | | | | | | | |
NXP BV/NXP Funding LLC: | | | | | | | | | | | | |
3.75%, 6/01/18 (a) | | | USD | | | | 9,385 | | | $ | 9,446,003 | |
5.75%, 2/15/21 (a) | | | | | | | 3,300 | | | | 3,415,500 | |
4.63%, 6/15/22 (a) | | | | | | | 5,600 | | | | 5,446,000 | |
Sensata Technologies BV, 5.00%, 10/01/25 (a) | | | | | | | 3,155 | | | | 3,036,687 | |
Ziggo Bond Finance BV, 4.63%, 1/15/25 | | | EUR | | | | 4,591 | | | | 4,615,071 | |
| | | | | | | | | | | | |
| | | | | | | | | | | | 52,247,039 | |
New Zealand — 0.1% | | | | | | | | | | | | |
ANZ New Zealand International Ltd., 2.75%, 2/03/21 | | | USD | | | | 1,300 | | | | 1,306,591 | |
Beverage Packaging Holdings Luxembourg II SA/Beverage Packaging Holdings II Is, 6.00%, 6/15/17 (a) | | | | | | | 2,995 | | | | 2,890,175 | |
| | | | | | | | | | | | |
| | | | | | | | | | | | 4,196,766 | |
Philippines — 0.1% | | | | | | | | | | | | |
Rizal Commercial Banking Corp., 4.25%, 1/22/20 | | | | | | | 400 | | | | 417,655 | |
Royal Capital BV, 6.25% (b)(h) | | | | | | | 2,150 | | | | 2,140,647 | |
Security Bank Corp., 3.95%, 2/03/20 | | | | | | | 421 | | | | 433,267 | |
| | | | | | | | | | | | |
| | | | | | | | | | | | 2,991,569 | |
Poland — 0.1% | | | | | | | | | | | | |
Play Finance 1 SA, 6.50%, 8/01/19 | | | EUR | | | | 3,665 | | | | 4,090,971 | |
Portugal — 0.4% | | | | | | | | | | | | |
Banco Espirito Santo SA: | | | | | | | | | | | | |
2.63%, 5/08/17 (e)(k) | | | | | | | 6,100 | | | | 2,279,793 | |
4.75%, 1/15/18 (e)(k) | | | | | | | 19,300 | | | | 7,213,117 | |
4.00%, 1/21/19 (e)(k) | | | | | | | 22,800 | | | | 8,521,195 | |
| | | | | | | | | | | | |
| | | | | | | | | | | | 18,014,105 | |
Puerto Rico — 0.1% | | | | | | | | | | | | |
Popular, Inc., 7.00%, 7/01/19 | | | USD | | | | 7,405 | | | | 6,895,906 | |
Singapore — 0.0% | | | | | | | | | | | | |
Global A&T Electronics Ltd., 10.00%, 2/01/19 | | | | | | | 2,850 | | | | 2,080,500 | |
South Korea — 0.0% | | | | | | | | | | | | |
Woori Bank Co. Ltd., 4.75%, 4/30/24 | | | | | | | 2,130 | | | | 2,210,450 | |
Spain — 2.5% | | | | | | | | | | | | |
Abengoa Finance SAU, 6.00%, 3/31/21 | | | EUR | | | | 3,229 | | | | 516,369 | |
Bankia SA: | | | | | | | | | | | | |
3.50%, 1/17/19 | | | | | | | 18,700 | | | | 21,092,221 | |
4.00%, 5/22/24 (b) | | | | | | | 55,700 | | | | 57,632,312 | |
BPE Financiaciones SA, 2.00%, 2/03/20 | | | | | | | 19,300 | | | | 20,046,944 | |
CaixaBank SA: | | | | | | | | | | | | |
4.50%, 11/22/16 (i) | | | | | | | 10,000 | | | | 5,818,375 | |
5.00%, 11/14/23 (b) | | | | | | | 4,600 | | | | 5,092,261 | |
Cirsa Funding Luxembourg SA, 5.88%, 5/15/23 | | | | | | | 2,893 | | | | 2,914,593 | |
Obrascon Huarte Lain SA, 5.50%, 3/15/23 | | | | | | | 5,466 | | | | 4,544,588 | |
PortAventura Entertainment Barcelona BV,
7.25%, 12/01/20 | | | | | | | 8,186 | | | | 8,954,310 | |
Santander Issuances SAU, 2.50%, 3/18/25 | | | | | | | 4,000 | | | | 4,066,714 | |
| | | | | | | | | | | | |
| | | | | | | | | | | | 130,678,687 | |
Sri Lanka — 0.0% | | | | | | | | | | | | |
Republic of Sri Lanka, 6.85%, 11/03/25 | | | USD | | | | 600 | | | | 545,939 | |
Sweden — 0.1% | | | | | | | | | | | | |
Verisure Holding AB, 6.00%, 11/01/22 | | | EUR | | | | 3,725 | | | | 4,161,374 | |
| | | | | | | | | | | | |
| Corporate Bonds | | | | | Par
(000) | | | Value | |
Switzerland — 0.4% | | | | | | | | | | | | |
Credit Suisse Group Funding Guernsey Ltd.,
3.13%, 12/10/20 (a) | | | USD | | | | 20,000 | | | $ | 20,060,480 | |
UBS AG, 4.75%, 5/22/23 (b) | | | | | | | 1,560 | | | | 1,573,347 | |
| | | | | | | | | | | | |
| | | | | | | | | | | | 21,633,827 | |
Turkey — 0.3% | | | | | | | | | | | | |
Turkish Airlines Pass-Through Trust, Series 2015-1, Class A, 4.20%, 3/15/27 (a) | | | | | | | 15,136 | | | | 14,455,224 | |
United Kingdom — 2.6% | | | | | | | | | | | | |
Annington Finance No. 4 PLC, 1.56%, 1/10/23 (b) | | | GBP | | | | — | (d) | | | 654 | |
Annington Finance No. 5 PLC, 13.00% (13.00% Cash or 13.50% PIK), 1/15/23 (j) | | | | | | | 5,486 | | | | 8,989,870 | |
AstraZeneca PLC: | | | | | | | | | | | | |
2.38%, 11/16/20 | | | USD | | | | 5,675 | | | | 5,691,826 | |
3.38%, 11/16/25 | | | | | | | 25,410 | | | | 25,528,893 | |
Care UK Health & Social Care PLC, 5.58%, 7/15/19 (b) | | | GBP | | | | 335 | | | | 421,256 | |
CNH Industrial Finance Europe SA, 2.75%, 3/18/19 | | | EUR | | | | 9,925 | | | | 10,542,040 | |
Cognita Financing PLC, 7.75%, 8/15/21 | | | GBP | | | | 1,325 | | | | 1,916,322 | |
Enterprise Funding Ltd., 3.50%, 9/10/20 (i) | | | | | | | 4,600 | | | | 5,230,549 | |
New Look Senior Issuer PLC, 8.00%, 7/01/23 | | | | | | | 264 | | | | 355,486 | |
Pension Insurance Corp. PLC, 6.50%, 7/03/24 | | | | | | | 2,925 | | | | 3,885,856 | |
Punch Taverns Finance B Ltd.: | | | | | | | | | | | | |
Series A3, 7.37%, 9/30/21 | | | | | | | 829 | | | | 1,179,117 | |
Series A6, 5.94%, 9/30/22 | | | | | | | 3,963 | | | | 5,429,009 | |
Series A7, 5.27%, 3/30/24 | | | | | | | 2,420 | | | | 3,078,417 | |
Punch Taverns Finance PLC, 0.58%, 7/15/21 (b) | | | | | | | 3,522 | | | | 4,616,307 | |
Punch Taverns Finance PLC, Series 2014,
6.08%, 10/15/27 (a)(b) | | | | | | | 10,514 | | | | 13,183,696 | |
Silk Bidco A/S, 7.50%, 2/01/22 | | | EUR | | | | 3,350 | | | | 3,665,327 | |
Unique Pub Finance Co. PLC: | | | | | | | | | | | | |
7.40%, 3/28/24 | | | GBP | | | | 3,366 | | | | 4,724,293 | |
5.66%, 6/30/27 | | | | | | | 10,099 | | | | 14,217,672 | |
6.46%, 3/30/32 | | | | | | | 5,595 | | | | 6,725,957 | |
Virgin Media Secured Finance PLC: | | | | | | | | | | | | |
5.50%, 1/15/25 | | | | | | | 1,035 | | | | 1,445,283 | |
6.25%, 3/28/29 | | | | | | | 1,111 | | | | 1,574,206 | |
Vougeot Bidco PLC, 7.88%, 7/15/20 | | | | | | | 2,359 | | | | 3,512,886 | |
Voyage Care Bondco PLC, 11.00%, 2/01/19 | | | | | | | 5,000 | | | | 7,160,870 | |
| | | | | | | | | | | | |
| | | | | | | | | | | | 133,075,792 | |
United States — 33.5% | | | | | | | | | | | | |
Acadia Healthcare Co., Inc., 5.63%, 2/15/23 | | | USD | | | | 740 | | | | 697,450 | |
Actavis Funding SCS: | | | | | | | | | | | | |
3.45%, 3/15/22 | | | | | | | 11,340 | | | | 11,507,276 | |
3.80%, 3/15/25 | | | | | | | 14,023 | | | | 14,228,016 | |
Actavis, Inc., 3.25%, 10/01/22 | | | | | | | 8,850 | | | | 8,822,769 | |
Aircastle Ltd., 5.13%, 3/15/21 | | | | | | | 580 | | | | 572,750 | |
Alcoa, Inc., 5.13%, 10/01/24 | | | | | | | 1,660 | | | | 1,361,200 | |
Alere, Inc., 6.38%, 7/01/23 (a) | | | | | | | 430 | | | | 406,350 | |
Ally Financial, Inc.: | | | | | | | | | | | | |
3.75%, 11/18/19 | | | | | | | 5,000 | | | | 4,881,250 | |
4.13%, 3/30/20 | | | | | | | 7,500 | | | | 7,387,500 | |
5.13%, 9/30/24 | | | | | | | 5,925 | | | | 6,006,469 | |
8.00%, 11/01/31 | | | | | | | 2,441 | | | | 2,746,125 | |
Altice U.S. Finance I Corp., 5.38%, 7/15/23 (a) | | | | | | | 4,491 | | | | 4,513,455 | |
AMC Networks, Inc., 4.75%, 12/15/22 | | | | | | | 250 | | | | 248,750 | |
See Notes to Financial Statements.
| | | | | | |
| | | BLACKROCK FUNDS | | JANUARY 31, 2016 | | 23 |
| | | | |
| Schedule of Investments (continued) | | | BlackRock Global Long/Short Credit Fund | |
| | | | |
| | | | | | | | | | | | |
| Corporate Bonds | | | | | Par
(000) | | | Value | |
United States (continued) | | | | | | | | | | | | |
American Airlines Group, Inc., 4.63%, 3/01/20 (a) | | | USD | | | | 8,135 | | | $ | 7,758,756 | |
American Airlines Pass-Through Trust: | | | | | | | | | | | | |
Series 2001-1, Class A-1, 6.98%, 5/23/21 | | | | | | | 11,498 | | | | 11,843,261 | |
Series 2011-1, Class B, 7.00%, 1/31/18 (a) | | | | | | | 3,356 | | | | 3,490,659 | |
Series 2013-1, Class C, 6.13%, 7/15/18 (a) | | | | | | | 12,304 | | | | 12,550,080 | |
Series 2013-2, Class C, 6.00%, 1/15/17 (a) | | | | | | | 32,632 | | | | 32,713,837 | |
American Capital Ltd., 6.50%, 9/15/18 (a) | | | | | | | 10,775 | | | | 11,071,313 | |
American Tire Distributors, Inc., 10.25%, 3/01/22 (a) | | | | | | | 410 | | | | 340,300 | |
American Tower Corp.: | | | | | | | | | | | | |
3.30%, 2/15/21 | | | | | | | 1,610 | | | | 1,616,509 | |
4.40%, 2/15/26 | | | | | | | 525 | | | | 531,391 | |
Amsurg Corp., 5.63%, 7/15/22 | | | | | | | 8,473 | | | | 8,504,774 | |
AT&T Inc.: | | | | | | | | | | | | |
0.00%, 11/27/22 (a)(c) | | | | | | | 50,000 | | | | 38,628,050 | |
4.12%, 2/17/26 | | | | | | | 7,500 | | | | 7,495,050 | |
Aviation Capital Group Corp., 4.88%, 10/01/25 (a) | | | | | | | 13,488 | | | | 13,420,560 | |
Avis Budget Car Rental LLC/Avis Budget Finance, Inc., 5.25%, 3/15/25 (a) | | | | | | | 180 | | | | 162,900 | |
Bank of America Corp.: | | | | | | | | | | | | |
2.63%, 10/19/20 | | | | | | | 40,000 | | | | 39,573,520 | |
3.30%, 1/11/23 (l) | | | | | | | 65,977 | | | | 64,987,477 | |
4.20%, 8/26/24 | | | | | | | 30,000 | | | | 29,780,550 | |
Belden, Inc., 5.50%, 4/15/23 | | | EUR | | | | 580 | | | | 610,404 | |
Blackstone CQP Holdco LP, 9.30%, 3/31/19 | | | USD | | | | 10,310 | | | | 9,485,161 | |
Blue Coat Holdings, Inc., 8.38%, 6/01/23 (a) | | | | | | | 8,092 | | | | 8,172,920 | |
Boyd Gaming Corp., 6.88%, 5/15/23 | | | | | | | 1,080 | | | | 1,096,200 | |
Building Materials Corp. of America, 6.00%, 10/15/25 (a) | | | | | | | 3,425 | | | | 3,493,500 | |
Caesars Entertainment Resort Properties LLC,
8.00%, 10/01/20 | | | | | | | 1,220 | | | | 1,134,600 | |
Calpine Corp.: | | | | | | | | | | | | |
5.38%, 1/15/23 | | | | | | | 8,581 | | | | 7,808,710 | |
5.50%, 2/01/24 | | | | | | | 970 | | | | 848,750 | |
5.75%, 1/15/25 | | | | | | | 4,448 | | | | 3,997,640 | |
Capital One Financial Corp.: | | | | | | | | | | | | |
4.75%, 7/15/21 | | | | | | | 4,035 | | | | 4,382,280 | |
4.20%, 10/29/25 | | | | | | | 45,965 | | | | 46,042,819 | |
CCO Holdings LLC/CCO Holdings Capital Corp.,
5.88%, 5/01/27 (a) | | | | | | | 7,500 | | | | 7,387,500 | |
CCO Safari II LLC: | | | | | | | | | | | | |
6.48%, 10/23/45 (a) | | | | | | | 4,365 | | | | 4,394,411 | |
6.83%, 10/23/55 (a) | | | | | | | 20,281 | | | | 20,191,906 | |
CCOH Safari LLC, 5.75%, 2/15/26 (a) | | | | | | | 4,259 | | | | 4,235,022 | |
Centene Corp., 4.75%, 5/15/22 | | | | | | | 630 | | | | 604,800 | |
Centene Escrow Corp.: | | | | | | | | | | | | |
5.63%, 2/15/21 (a) | | | | | | | 2,220 | | | | 2,258,850 | |
6.13%, 2/15/24 (a) | | | | | | | 656 | | | | 674,040 | |
Citigroup, Inc.: | | | | | | | | | | | | |
3.75%, 6/16/24 | | | | | | | 20,000 | | | | 20,216,100 | |
4.40%, 6/10/25 | | | | | | | 30,000 | | | | 29,960,370 | |
Clear Channel Worldwide Holdings, Inc., 6.50%, 11/15/22 | | | | | | | 4,595 | | | | 4,256,119 | |
CommScope Technologies Finance LLC, 6.00%, 6/15/25 (a) | | | | | | | 1,233 | | | | 1,199,093 | |
CommScope, Inc., 5.50%, 6/15/24 (a) | | | | | | | 1,723 | | | | 1,658,387 | |
Concho Resources, Inc., 5.50%, 4/01/23 | | | | | | | 490 | | | | 444,425 | |
Constellation Brands, Inc., 3.88%, 11/15/19 | | | | | | | 290 | | | | 298,700 | |
Continental Airlines Pass-Through Certificates: | | | | | | | | | | | | |
Series 2012-2, Class A, 4.00%, 4/29/26 | | | | | | | 2,512 | | | | 2,570,842 | |
Series 2012-3, Class C, 6.13%, 4/29/18 | | | | | | | 4,500 | | | | 4,702,500 | |
| | | | | | | | | | | | |
| Corporate Bonds | | | | | Par
(000) | | | Value | |
United States (continued) | | | | | | | | | | | | |
Continental Resources, Inc.: | | | | | | | | | | | | |
4.50%, 4/15/23 | | | | | | | 8,910 | | | $ | 6,114,764 | |
3.80%, 6/01/24 | | | | | | | 9,212 | | | | 5,952,076 | |
Corrections Corp. of America, 4.63%, 5/01/23 | | | | | | | 270 | | | | 265,950 | |
Crown Castle International Corp.: | | | | | | | | | | | | |
3.40%, 2/15/21 | | | | | | | 1,396 | | | | 1,405,913 | |
4.45%, 2/15/26 | | | | | | | 9,231 | | | | 9,296,496 | |
CSC Holdings LLC, 5.25%, 6/01/24 | | | | | | | 1,785 | | | | 1,575,263 | |
DaVita HealthCare Partners, Inc., 5.00%, 5/01/25 | | | | | | | 3,862 | | | | 3,799,243 | |
Delta Air Lines Pass Through Trust, Series 2015-1, Class B, 4.25%, 7/30/23 | | | | | | | 19,001 | | | | 18,905,995 | |
DISH DBS Corp., 5.88%, 11/15/24 | | | | | | | 5,996 | | | | 5,343,935 | |
DJO Finco, Inc./DJO Finance LLC/DJO Finance Corp., 8.13%, 6/15/21 (a) | | | | | | | 2,555 | | | | 2,146,200 | |
Dollar Tree, Inc.: | | | | | | | | | | | | |
5.25%, 3/01/20 (a) | | | | | | | 471 | | | | 494,550 | |
5.75%, 3/01/23 (a) | | | | | | | 4,921 | | | | 5,185,504 | |
Dynegy, Inc., 6.75%, 11/01/19 | | | | | | | 640 | | | | 617,600 | |
E*TRADE Financial Corp., 4.63%, 9/15/23 | | | | | | | 690 | | | | 679,650 | |
Eastman Chemical Co., 4.65%, 10/15/44 | | | | | | | 20,000 | | | | 16,529,640 | |
EMC Corp., 1.88%, 6/01/18 | | | | | | | 6,559 | | | | 6,272,247 | |
Endo International PLC: | | | | | | | | | | | | |
6.00%, 7/15/23 (a) | | | | | | | 18,653 | | | | 18,746,265 | |
6.00%, 2/01/25 (a) | | | | | | | 2,698 | | | | 2,664,599 | |
Energy Transfer Partners LP: | | | | | | | | | | | | |
4.05%, 3/15/25 | | | | | | | 4,352 | | | | 3,565,842 | |
4.75%, 1/15/26 | | | | | | | 18,480 | | | | 15,614,288 | |
Equinix, Inc.: | | | | | | | | | | | | |
5.38%, 1/01/22 | | | | | | | 6,456 | | | | 6,714,240 | |
5.75%, 1/01/25 | | | | | | | 4,554 | | | | 4,679,235 | |
5.88%, 1/15/26 | | | | | | | 2,296 | | | | 2,376,360 | |
Expedia, Inc., 5.00%, 2/15/26 (a) | | | | | | | 10,000 | | | | 9,819,430 | |
Fidelity National Information Services, Inc.,
3.63%, 10/15/20 | | | | | | | 3,100 | | | | 3,157,350 | |
FireEye, Inc., 1.00%, 6/01/35 (a)(i) | | | | | | | 7,150 | | | | 5,863,000 | |
First Data Corp.: | | | | | | | | | | | | |
5.38%, 8/15/23 (a) | | | | | | | 2,652 | | | | 2,705,040 | |
7.00%, 12/01/23 (a) | | | | | | | 10,179 | | | | 10,255,343 | |
5.00%, 1/15/24 (a) | | | | | | | 3,076 | | | | 3,076,000 | |
5.75%, 1/15/24 (a) | | | | | | | 3,564 | | | | 3,537,270 | |
Flextronics International Ltd., 4.75%, 6/15/25 | | | | | | | 8,995 | | | | 8,635,200 | |
Florida East Coast Holdings Corp., 6.75%, 5/01/19 (a) | | | | | | | 5,985 | | | | 5,476,275 | |
Freescale Semiconductor, Inc., 5.00%, 5/15/21 (a) | | | | | | | 2,600 | | | | 2,652,000 | |
Frontier Communications Corp.: | | | | | | | | | | | | |
7.13%, 1/15/23 | | | | | | | 85 | | | | 70,763 | |
7.63%, 4/15/24 | | | | | | | 340 | | | | 283,900 | |
6.88%, 1/15/25 | | | | | | | 856 | | | | 680,520 | |
Gates Global LLC/Gates Global Co., 5.75%, 7/15/22 | | | EUR | | | | 1,200 | | | | 935,758 | |
Genworth Holdings, Inc.: | | | | | | | | | | | | |
6.52%, 5/22/18 | | | USD | | | | 13,765 | | | | 11,252,887 | |
7.70%, 6/15/20 | | | | | | | 1,201 | | | | 921,767 | |
4.80%, 2/15/24 | | | | | | | 5,000 | | | | 2,900,000 | |
Gilead Sciences, Inc.: | | | | | | | | | | | | |
2.55%, 9/01/20 | | | | | | | 11,464 | | | | 11,608,022 | |
3.65%, 3/01/26 | | | | | | | 29,071 | | | | 29,696,288 | |
4.75%, 3/01/46 | | | | | | | 4,000 | | | | 4,080,520 | |
Goldman Sachs Group, Inc.: | | | | | | | | | | | | |
4.00%, 3/03/24 | | | | | | | 40,000 | | | | 41,003,080 | |
3.75%, 5/22/25 | | | | | | | 25,000 | | | | 25,110,325 | |
Halliburton Co., 3.38%, 11/15/22 | | | | | | | 2,645 | | | | 2,597,848 | |
See Notes to Financial Statements.
| | | | | | |
| 24 | | BLACKROCK FUNDS | | JANUARY 31, 2016 | | |
| | | | |
| Schedule of Investments (continued) | | | BlackRock Global Long/Short Credit Fund | |
| | | | |
| | | | | | | | | | | | |
| Corporate Bonds | | | | | Par
(000) | | | Value | |
United States (continued) | | | | | | | | | | | | |
HCA, Inc.: | | | | | | | | | | | | |
4.25%, 10/15/19 | | | USD | | | | 9,075 | | | $ | 9,301,875 | |
7.50%, 2/15/22 | | | | | | | 610 | | | | 677,100 | |
5.38%, 2/01/25 | | | | | | | 2,318 | | | | 2,344,077 | |
5.25%, 4/15/25 | | | | | | | 10,598 | | | | 10,862,950 | |
5.88%, 2/15/26 | | | | | | | 1,924 | | | | 1,962,480 | |
HD Supply, Inc.: | | | | | | | | | | | | |
7.50%, 7/15/20 | | | | | | | 1,999 | | | | 2,078,960 | |
5.25%, 12/15/21 (a) | | | | | | | 10,696 | | | | 11,003,510 | |
HealthSouth Corp., 5.75%, 11/01/24 | | | | | | | 170 | | | | 167,805 | |
Hertz Corp., 7.38%, 1/15/21 | | | | | | | 560 | | | | 567,000 | |
Hilton Worldwide Finance LLC/Hilton Worldwide Finance Corp., 5.63%, 10/15/21 | | | | | | | 5,575 | | | | 5,742,250 | |
Hologic, Inc., 5.25%, 7/15/22 (a) | | | | | | | 1,881 | | | | 1,946,835 | |
HSBC USA, Inc., 1.70%, 3/05/18 | | | | | | | 44,255 | | | | 44,075,546 | |
Huntington Ingalls Industries, Inc., 5.00%, 12/15/21 (a) | | | | | | | 7,183 | | | | 7,416,447 | |
Icahn Enterprises LP/Icahn Enterprises Finance Corp., 5.88%, 2/01/22 | | | | | | | 5,186 | | | | 4,634,987 | |
Iron Mountain, Inc., 6.00%, 10/01/20 (a) | | | | | | | 660 | | | | 702,900 | |
Italics Merger Sub, Inc., 7.13%, 7/15/23 (a) | | | | | | | 11,592 | | | | 10,374,840 | |
Jaguar Holding Co. II/Pharmaceutical Product Development LLC, 6.38%, 8/01/23 (a) | | | | | | | 2,992 | | | | 2,947,120 | |
John Deere Capital Corp., 3.35%, 6/12/24 | | | | | | | 15,000 | | | | 15,429,225 | |
JPMorgan Chase & Co.: | | | | | | | | | | | | |
3.20%, 1/25/23 | | | | | | | 20,000 | | | | 19,871,520 | |
3.90%, 7/15/25 | | | | | | | 40,000 | | | | 41,006,920 | |
KLA-Tencor Corp., 4.65%, 11/01/24 | | | | | | | 17,755 | | | | 17,984,714 | |
L Brands, Inc., 6.88%, 11/01/35 (a) | | | | | | | 680 | | | | 702,950 | |
Lennar Corp., 4.50%, 11/15/19 | | | | | | | 6,751 | | | | 6,936,653 | |
Level 3 Financing, Inc.: | | | | | | | | | | | | |
6.13%, 1/15/21 | | | | | | | 9,808 | | | | 10,273,880 | |
5.13%, 5/01/23 | | | | | | | 2,754 | | | | 2,767,770 | |
5.38%, 1/15/24 (a) | | | | | | | 1,120 | | | | 1,131,200 | |
5.38%, 5/01/25 | | | | | | | 3,224 | | | | 3,244,150 | |
Live Nation Entertainment, Inc., 7.00%, 9/01/20 (a) | | | | | | | 270 | | | | 283,500 | |
Mallinckrodt International Finance | | | | | | | | | | | | |
SA/Mallinckrodt CB LLC: | | | | | | | | | | | | |
4.88%, 4/15/20 (a) | | | | | | | 709 | | | | 678,868 | |
5.75%, 8/01/22 (a) | | | | | | | 14,935 | | | | 14,262,925 | |
5.50%, 4/15/25 (a) | | | | | | | 614 | | | | 546,460 | |
McDonald’s Corp.: | | | | | | | | | | | | |
2.75%, 12/09/20 | | | | | | | 1,850 | | | | 1,876,266 | |
3.70%, 1/30/26 | | | | | | | 2,665 | | | | 2,694,494 | |
4.70%, 12/09/35 | | | | | | | 3,060 | | | | 3,086,527 | |
4.88%, 12/09/45 | | | | | | | 7,220 | | | | 7,293,868 | |
MGM Resorts International, 6.00%, 3/15/23 | | | | | | | 4,650 | | | | 4,635,469 | |
Micron Technology, Inc.: | | | | | | | | | | | | |
5.25%, 8/01/23 (a) | | | | | | | 22,146 | | | | 17,938,260 | |
5.25%, 1/15/24 (a) | | | | | | | 4,240 | | | | 3,445,000 | |
5.50%, 2/01/25 | | | | | | | 11,530 | | | | 9,108,700 | |
5.63%, 1/15/26 (a) | | | | | | | 11,600 | | | | 8,990,000 | |
Mobile Mini, Inc., 7.88%, 12/01/20 | | | | | | | 940 | | | | 958,800 | |
Morgan Stanley: | | | | | | | | | | | | |
3.88%, 4/29/24 | | | | | | | 20,000 | | | | 20,301,800 | |
4.00%, 7/23/25 | | | | | | | 9,990 | | | | 10,188,401 | |
3.88%, 1/27/26 | | | | | | | 19,340 | | | | 19,557,730 | |
Motorola Solutions, Inc.: | | | | | | | | | | | | |
3.50%, 9/01/21 | | | | | | | 6,481 | | | | 6,147,274 | |
3.75%, 5/15/22 | | | | | | | 10,719 | | | | 9,889,499 | |
MSCI, Inc., 5.75%, 8/15/25 (a) | | | | | | | 430 | | | | 454,725 | |
Mylan NV, 3.75%, 12/15/20 (a) | | | | | | | 10,000 | | | | 10,113,190 | |
Neptune Finco Corp.: | | | | | | | | | | | | |
10.13%, 1/15/23 (a) | | | | | | | 1,984 | | | | 2,098,080 | |
6.63%, 10/15/25 (a) | | | | | | | 4,671 | | | | 4,846,163 | |
| | | | | | | | | | | | |
| Corporate Bonds | | | | | Par
(000) | | | Value | |
United States (continued) | | | | | | | | | | | | |
Nexteer Automotive Group Ltd., 5.88%, 11/15/21 (a) | | | USD | | | | 600 | | | $ | 603,000 | |
Nielsen Finance LLC/Nielsen Finance Co., 5.00%, 4/15/22 (a) | | | | | | | 470 | | | | 474,113 | |
Northwest Florida Timber Finance LLC, 4.75%, 3/04/29 (a) | | | | | | | 8,970 | | | | 8,015,762 | |
Novelis, Inc., 8.75%, 12/15/20 | | | | | | | 780 | | | | 708,942 | |
Nuance Communications, Inc., 5.38%, 8/15/20 (a) | | | | | | | 4,654 | | | | 4,654,000 | |
Outfront Media Capital LLC/Outfront Media Capital Corp., 5.63%, 2/15/24 | | | | | | | 630 | | | | 644,175 | |
Owens-Brockway Glass Container, Inc., 5.88%, 8/15/23 | | | | | | | 2,725 | | | | 2,673,906 | |
Penske Automotive Group, Inc., 5.75%, 10/01/22 | | | | | | | 190 | | | | 188,575 | |
Perrigo Finance PLC, 3.90%, 12/15/24 | | | | | | | 17,576 | | | | 17,249,702 | |
Pioneer Natural Resources Co.: | | | | | | | | | | | | |
3.45%, 1/15/21 | | | | | | | 4,220 | | | | 3,955,165 | |
4.45%, 1/15/26 | | | | | | | 10,715 | | | | 9,768,223 | |
Plains All American Pipeline LP/PAA Finance Corp.,
4.65%, 10/15/25 | | | | | | | 18,849 | | | | 16,129,033 | |
Post Holdings, Inc.: | | | | | | | | | | | | |
7.75%, 3/15/24 (a) | | | | | | | 2,561 | | | | 2,727,465 | |
8.00%, 7/15/25 (a) | | | | | | | 1,083 | | | | 1,164,225 | |
Project Homestake Merger Corp., 8.88%, 3/01/23 (a) | | | | | | | 6,430 | | | | 5,875,413 | |
Qorvo, Inc.: | | | | | | | | | | | | |
6.75%, 12/01/23 (a) | | | | | | | 8,875 | | | | 8,764,063 | |
7.00%, 12/01/25 (a) | | | | | | | 11,125 | | | | 11,041,563 | |
Radian Group, Inc.: | | | | | | | | | | | | |
5.50%, 6/01/19 | | | | | | | 7,000 | | | | 6,755,000 | |
5.25%, 6/15/20 | | | | | | | 7,500 | | | | 6,862,500 | |
Rite Aid Corp., 6.13%, 4/01/23 (a) | | | | | | | 11,855 | | | | 12,507,025 | |
Rolta Americas LLC, 8.88%, 7/24/19 | | | | | | | 650 | | | | 305,500 | |
RSP Permian, Inc., 6.63%, 10/01/22 | | | | | | | 3,130 | | | | 2,785,700 | |
Sabine Pass Liquefaction LLC: | | | | | | | | | | | | |
5.63%, 2/01/21 | | | | | | | 10,085 | | | | 9,227,775 | |
6.25%, 3/15/22 | | | | | | | 2,628 | | | | 2,421,045 | |
5.75%, 5/15/24 | | | | | | | 1,050 | | | | 921,375 | |
Sabine Pass LNG LP, 7.50%, 11/30/16 | | | | | | | 2,755 | | | | 2,844,537 | |
Sabre GLBL, Inc.: | | | | | | | | | | | | |
5.38%, 4/15/23 (a) | | | | | | | 9,957 | | | | 10,006,785 | |
5.25%, 11/15/23 (a) | | | | | | | 1,456 | | | | 1,441,440 | |
Sally Holdings LLC/Sally Capital, Inc., 5.75%, 6/01/22 | | | | | | | 390 | | | | 407,063 | |
SBA Communications Corp., 4.88%, 7/15/22 | | | | | | | 5,765 | | | | 5,765,000 | |
Schlumberger Holdings Corp., 3.00%, 12/21/20 (a) | | | | | | | 29,004 | | | | 28,369,421 | |
Seagate HDD Cayman, 4.88%, 6/01/27 (a) | | | | | | | 3,100 | | | | 2,335,069 | |
Sealed Air Corp., 5.13%, 12/01/24 (a) | | | | | | | 3,486 | | | | 3,486,000 | |
Service Corp. International, 4.50%, 11/15/20 | | | | | | | 700 | | | | 714,875 | |
Shea Homes LP/Shea Homes Funding Corp.,
5.88%, 4/01/23 (a) | | | | | | | 680 | | | | 680,000 | |
Sirius XM Radio, Inc., 5.38%, 4/15/25 (a) | | | | | | | 470 | | | | 472,350 | |
Spectrum Brands, Inc., 5.75%, 7/15/25 (a) | | | | | | | 4,679 | | | | 4,795,975 | |
Sprint Communications, Inc., 9.00%, 11/15/18 (a) | | | | | | | 3,009 | | | | 3,069,180 | |
Sprint Corp., 7.13%, 6/15/24 | | | | | | | 2,305 | | | | 1,555,875 | |
Station Casinos LLC, 7.50%, 3/01/21 | | | | | | | 680 | | | | 700,400 | |
Steel Dynamics, Inc., 5.13%, 10/01/21 | | | | | | | 2,795 | | | | 2,606,337 | |
Synchrony Financial, 4.50%, 7/23/25 | | | | | | | 4,744 | | | | 4,774,437 | |
See Notes to Financial Statements.
| | | | | | |
| | | BLACKROCK FUNDS | | JANUARY 31, 2016 | | 25 |
| | |
| Schedule of Investments (continued) | | BlackRock Global Long/Short Credit Fund |
| | |
| | | | | | | | | | | | |
| Corporate Bonds | | | | | Par
(000) | | | Value | |
United States (continued) | | | | | | | | | | | | |
Tenet Healthcare Corp.: | | | | | | | | | | | | |
5.00%, 3/01/19 | | | USD | | | | 6,812 | | | $ | 6,420,310 | |
4.01%, 6/15/20 (a)(b) | | | | | | | 6,100 | | | | 5,993,250 | |
6.00%, 10/01/20 | | | | | | | 3,227 | | | | 3,412,553 | |
8.13%, 4/01/22 | | | | | | | 5,845 | | | | 5,859,613 | |
6.75%, 6/15/23 | | | | | | | 2,623 | | | | 2,426,275 | |
Tesoro Logistics LP/Tesoro Logistics Finance Corp., 6.25%, 10/15/22 (a) | | | | | | | 2,003 | | | | 1,822,730 | |
Texas Competitive Electric Holdings Co. LLC/TCEH Finance, Inc.: | | | | | | | | | | | | |
10.25%, 11/01/15 (e)(k) | | | | | | | 469 | | | | 25,209 | |
10.50%, 11/01/16 (e)(k) | | | | | | | 312 | | | | 15,600 | |
Time Warner Cable, Inc., 5.00%, 2/01/20 | | | | | | | 14,897 | | | | 15,845,611 | |
T-Mobile USA, Inc.: | | | | | | | | | | | | |
6.63%, 4/28/21 | | | | | | | 2,895 | | | | 2,992,706 | |
6.73%, 4/28/22 | | | | | | | 1,490 | | | | 1,529,113 | |
6.00%, 3/01/23 | | | | | | | 1,642 | | | | 1,651,031 | |
6.50%, 1/15/24 | | | | | | | 2,810 | | | | 2,838,100 | |
6.38%, 3/01/25 | | | | | | | 6,975 | | | | 6,992,437 | |
6.50%, 1/15/26 | | | | | | | 4,054 | | | | 4,054,000 | |
TransDigm, Inc.: | | | | | | | | | | | | |
6.00%, 7/15/22 | | | | | | | 3,770 | | | | 3,694,600 | |
6.50%, 7/15/24 | | | | | | | 5,335 | | | | 5,214,963 | |
TRI Pointe Holdings, Inc., 4.38%, 6/15/19 | | | | | | | 3,785 | | | | 3,671,450 | |
U.S. Airways Pass-Through Trust: | | | | | | | | | | | | |
Series 2012-1, Class B, 8.00%, 4/01/21 | | | | | | | 835 | | | | 897,329 | |
Series 2012-2, Class B, 6.75%, 12/03/22 | | | | | | | 2,618 | | | | 2,722,687 | |
Series 2012-2, Class C, 5.45%, 6/03/18 | | | | | | | 12,800 | | | | 12,768,000 | |
Series 2013-1, Class B, 5.38%, 11/15/21 | | | | | | | 6,550 | | | | 6,598,926 | |
United Airlines Pass-Through Trust: | | | | | | | | | | | | |
Series 2013-1, Class A, 4.30%, 2/15/27 | | | | | | | 5,664 | | | | 5,905,055 | |
Series 2014-2, Class B, 4.63%, 9/03/22 | | | | | | | 8,940 | | | | 8,984,700 | |
United Rentals North America, Inc., 6.13%, 6/15/23 | | | | | | | 5,825 | | | | 5,606,563 | |
Univision Communications, Inc.: | | | | | | | | | | | | |
8.50%, 5/15/21 (a) | | | | | | | 5,275 | | | | 5,235,437 | |
5.13%, 5/15/23 (a) | | | | | | | 13,525 | | | | 13,119,250 | |
5.13%, 2/15/25 (a) | | | | | | | 1,369 | | | | 1,297,127 | |
USG Corp., 9.75%, 1/15/18 | | | | | | | 1,160 | | | | 1,276,000 | |
Valeant Pharmaceuticals International, Inc.: | | | | | | | | | | | | |
6.75%, 8/15/18 (a) | | | | | | | 5,664 | | | | 5,639,220 | |
5.38%, 3/15/20 (a) | | | | | | | 3,217 | | | | 3,034,033 | |
6.38%, 10/15/20 (a) | | | | | | | 11,519 | | | | 11,058,240 | |
7.50%, 7/15/21 (a) | | | | | | | 7,800 | | | | 7,736,625 | |
5.63%, 12/01/21 (a) | | | | | | | 14,500 | | | | 13,195,000 | |
5.50%, 3/01/23 (a) | | | | | | | 1,702 | | | | 1,502,015 | |
4.50%, 5/15/23 | | | EUR | | | | 13,224 | | | | 12,288,402 | |
5.88%, 5/15/23 (a) | | | USD | | | | 8,587 | | | | 7,685,365 | |
6.13%, 4/15/25 (a) | | | | | | | 2,878 | | | | 2,586,603 | |
Weatherford International Ltd., 5.50%, 2/15/16 | | | | | | | 9,299 | | | | 9,302,720 | |
Wells Fargo & Co., 4.30%, 7/22/27 | | | | | | | 30,000 | | | | 30,853,020 | |
XPO Logistics, Inc.: | | | | | | | | | | | | |
7.88%, 9/01/19 (a) | | | | | | | 460 | | | | 458,850 | |
6.50%, 6/15/22 (a) | | | | | | | 2,834 | | | | 2,536,430 | |
Zayo Group LLC/Zayo Capital, Inc., 6.00%, 4/01/23 | | | | | | | 760 | | | | 742,900 | |
| | | | | | | | | | | | |
| | | | | | | | | | | | 1,718,728,537 | |
| | | | | | | | | | | | |
| Corporate Bonds | | | | | Par
(000) | | | Value | |
Vietnam — 0.0% | | | | | | | | | | | | |
Vingroup JSC, 11.63%, 5/07/18 | | | USD | | | | 810 | | | $ | 850,690 | |
Total Corporate Bonds — 51.7% | | | | | | | | | | | 2,647,301,216 | |
| | | | | | | | | | | | |
| Floating Rate Loan Interests (b) | | | | | | | | | |
British Virgin Islands — 0.0% | | | | | | | | | | | | |
Baring Private Equity Asia VI Holding Ltd.: | | | | | | | | | | | | |
Initial Euro Term Loan (First Lien),
4.75%, 10/26/22 | | | EUR | | | | 1,314 | | | | 1,425,808 | |
Initial Euro Term Loan (Second Lien),
9.00%, 10/26/23 | | | | | | | 525 | | | | 567,308 | |
| | | | | | | | | | | | |
| | | | | | | | | | | | 1,993,116 | |
Canada — 0.4% | | | | | | | | | | | | |
B.C. Unlimited Liability Co. (New Red Finance, Inc.) (AKA Burger King/Tim Hortons), Term B-2 Loan, 3.75%, 12/10/21 | | | USD | | | | 8,416 | | | | 8,358,847 | |
Ceva Logistics Canada ULC (FKA TNT Canada ULC), Canadian Term Loan, 6.50%, 3/19/21 | | | | | | | 128 | | | | 105,131 | |
Valeant Pharmaceuticals International, Inc., Series F-1 Tranche B Term Loan, 4.00%, 4/01/22 | | | | | | | 10,467 | | | | 10,060,703 | |
| | | | | | | | | | | | |
| | | | | | | | | | | | 18,524,681 | |
Cayman Islands — 0.2% | | | | | | | | | | | | |
Avago Technologies Cayman Ltd. (Avago Technologies Holdings Luxembourg S.à r.l.), Term Loan, 3.75%, 5/06/21 | | | | | | | 11,749 | | | | 11,730,503 | |
Denmark — 0.2% | | | | | | | | | | | | |
Nassa Midco AS, Facility B (EUR),
3.75%, 7/09/21 | | | EUR | | | | 8,500 | | | | 9,073,014 | |
France — 0.4% | | | | | | | | | | | | |
Horizon Holdings III, Facility B, 5.00%, 10/31/22 | | | | | | | 2,202 | | | | 2,380,524 | |
Lully Finance S.à r.l. (Lully Finance LLC), Initial Term B-2 Loan (First Lien), 4.25%, 10/14/22 | | | | | | | 1,640 | | | | 1,773,423 | |
Numericable Group SA, Euro Denominated Tranche B-1 Loan, 4.50%, 5/21/20 | | | | | | | 9,165 | | | | 9,712,988 | |
Vivarte, Term Loan, 4.00% - 7.00%, 10/29/19 | | | | | | | 8,150 | | | | 8,737,497 | |
| | | | | | | | | | | | |
| | | | | | | | | | | | 22,604,432 | |
Germany — 0.6% | | | | | | | | | | | | |
IVG Immobilien AG: | | | | | | | | | | | | |
Facility A1 Loan, 9.50%, 6/02/17 | | | | | | | 2,313 | | | | 2,493,026 | |
Facility A2 Loan, 9.50%, 6/02/17 | | | | | | | 3,382 | | | | 3,645,788 | |
Kleopatra Holdings 2 SCA: | | | | | | | | | | | | |
Initial Erste Euro Term Loan, 5.00%, 4/28/20 | | | | | | | 2,803 | | | | 3,040,193 | |
Initial GmbH Euro Term Loan, 5.00%, 4/28/20 | | | | | | | 2,480 | | | | 2,690,436 | |
PAW Luxco II S.à r.l. (Jack Wolfskin), Facility B,
5.05%, 7/29/18 | | | | | | | 5,548 | | | | 4,672,892 | |
Springer SBM Two GmbH: | | | | | | | | | | | | |
Initial Term B8 Loan, 4.75%, 8/14/20 | | | | | | | 4,089 | | | | 4,350,886 | |
Term Loan, 8.00%, 8/14/21 (a) | | | | | | | 3,000 | | | | 3,314,881 | |
Wittur GmbH, Term Loan B, 6.13%, 3/31/22 | | | | | | | 4,352 | | | | 4,588,762 | |
| | | | | | | | | | | | |
| | | | | | | | | | | | 28,796,864 | |
See Notes to Financial Statements.
| | | | | | |
| 26 | | BLACKROCK FUNDS | | JANUARY 31, 2016 | | |
| | | | |
| Schedule of Investments (continued) | | | BlackRock Global Long/Short Credit Fund | |
| | | | |
| | | | | | | | | | | | |
| Floating Rate Loan Interests (b) | | | | | Par (000) | | | Value | |
Italy — 0.2% | | | | | | | | | | | | |
Sit SpA, Medium Term Facility B, 5.53%, 4/30/20 | | | EUR | | | | 12,000 | | | $ | 12,739,543 | |
Luxembourg — 0.9% | | | | | | | | | | | | |
Azelis Finance SA (Azelis U.S. Holding, Inc.): | | | | | | | | | | | | |
Euro Term Loan (First Lien), 6.50%, 12/16/22 | | | | | | | 2,250 | | | | 2,415,062 | |
Euro Term Loan (Second Lien), 9.12%, 12/18/23 | | | | | | | 5,040 | | | | 5,364,258 | |
BSN Medical Luxembourg Finance Holding S.à r.l. (FKA Boston Luxembourg III S.à r.l.), Facility C, 4.00%, 8/28/19 | | | | | | | 4,828 | | | | 5,212,190 | |
Constantinople Luxembourg I S.à r.l.: | | | | | | | | | | | | |
Facility B1 (EUR), 4.75%, 4/30/22 | | | | | | | 3,464 | | | | 3,763,812 | |
Facility B2 (EUR), 4.75%, 4/30/22 | | | | | | | 517 | | | | 561,864 | |
ConvaTec, Inc., Euro Term Loan, 4.25%, 6/15/20 | | | | | | | 4,318 | | | | 4,664,846 | |
Endo Luxembourg Finance Co. I S.à r.l., 2015 Incremental Term B Loan, 3.75%, 9/26/22 | | | USD | | | | 3,355 | | | | 3,310,446 | |
Intelsat Jackson Holdings SA, Tranche B-2 Term Loan, 3.75%, 6/30/19 | | | | | | | 1,196 | | | | 1,144,085 | |
IVG Immobilien AG: | | | | | | | | | | | | |
Facility A3, 1.93%, 6/02/17 | | | EUR | | | | 38 | | | | 2,074 | |
Facility A3 (EUR), 1.89%, 6/02/17 | | | | | | | 10 | | | | 518 | |
Tranche B, 1.94%, 6/02/17 | | | | | | | 69 | | | | 3,735 | |
Tranche C, 1.94%, 6/02/17 | | | | | | | 100 | | | | 5,428 | |
Lully Finance S.à r.l. (Lully Finance LLC), Initial Term B-2 Loan (Second Lien), 9.25%, 10/16/23 | | | | | | | 1,090 | | | | 1,177,839 | |
Mallinckrodt International Finance SA, Initial Term B Loan, 3.25%, 3/19/21 | | | USD | | | | 764 | | | | 735,440 | |
Oxea Finance & Cy SCA (Oxea Finance LLC), Tranche B-2 Term Loan (First Lien), 4.25%, 1/15/20 | | | | | | | 2,590 | | | | 2,491,941 | |
SS&C European Holdings S.à r.l., Term B-2 Loan, 4.00% - 4.08%, 7/08/22 | | | | | | | 411 | | | | 408,529 | |
Swissport International Ltd., Term Loan B, 5.25%, 12/02/21 | | | EUR | | | | 6,860 | | | | 7,427,908 | |
Xella International SA, Facility G, 3.75%, 3/31/19 | | | | | | | 6,020 | | | | 6,472,522 | |
| | | | | | | | | | | | |
| | | | | | | | | | | | 45,162,497 | |
Netherlands — 0.8% | | | | | | | | | | | | |
Action Holding BV (FKA Peer Holdings BV), Term B (A2), 4.25%, 1/13/21 | | | | | | | 2,497 | | | | 2,698,401 | |
Amaya Holdings BV, Initial Term B Loan (First Lien), 5.00%, 8/01/21 | | | USD | | | | 4,666 | | | | 4,289,933 | |
Ceva Intercompany BV, Dutch BV Term Loan, 6.50%, 3/19/21 | | | | | | | 745 | | | | 609,762 | |
Charger OpCo BV, Term B-1 EUR Loan, 4.25%, 7/02/22 | | | EUR | | | | 4,712 | | | | 5,091,785 | |
MacDermid European Holdings BV (MacDermid Funding LLC), Euro Tranche C-2 Term Loan, 5.50%, 6/07/20 | | | | | | | 5,586 | | | | 5,811,773 | |
Maxeda DIY BV (FKA Maxeda DIY Group BV): | | | | | | | | | | | | |
Facility E1, 7.00%, 6/28/19 | | | | | | | 265 | | | | 229,673 | |
Facility E2, 7.00%, 6/28/19 | | | | | | | 2,566 | | | | 2,225,440 | |
Pelican Rouge (Akorn) (FKA Autobar), Super Senior Term Loan B, 3.75%, 10/31/19 | | | | | | | 3,200 | | | | 3,466,542 | |
Yellow Maple Holding BV: | | | | | | | | | | | | |
Facility B1, 4.00%, 9/17/21 | | | | | | | 3,089 | | | | 3,326,420 | |
Facility B3, 5.09%, 9/23/21 | | | GBP | | | | 3,875 | | | | 5,442,170 | |
Ziggo BV: | | | | | | | | | | | | |
EUR B1 Facility, 3.75%, 1/15/22 | | | EUR | | | | 1,862 | | | | 1,961,321 | |
EUR B2 Facility, 3.75%, 1/15/22 | | | | | | | 1,200 | | | | 1,263,645 | |
EUR B3 Facility, 3.75%, 1/15/22 | | | | | | | 3,370 | | | | 3,549,700 | |
| | | | | | | | | | | | |
| | | | | | | | | | | | 39,966,565 | |
| | | | | | | | | | | | |
| Floating Rate Loan Interests (b) | | | | | Par (000) | | | Value | |
Serbia — 0.1% | | | | | | | | | | | | |
Charter Communications Operating LLC (AKA CCO Safari LLC), Term I Loan, 3.50%, 1/24/23 | | | USD | | | | 4,960 | | | $ | 4,951,965 | |
South Korea — 0.0% | | | | | | | | | | | | |
CCC Information Services, Inc. (FKA CCC Holdings, Inc.), Term Loan, 4.00%, 12/20/19 | | | | | | | 456 | | | | 441,083 | |
Spain — 0.1% | | | | | | | | | | | | |
Car Rentals Subsidiary, S.L.U. (AKA Goldcar), Facility B, 6.50%, 6/18/20 | | | EUR | | | | 5,620 | | | | 5,901,697 | |
Sweden — 0.2% | | | | | | | | | | | | |
Verisure Holding AB (Verisure Cayman 2), Facility B1, 5.25%, 10/21/22 | | | | | | | 8,170 | | | | 8,842,197 | |
United Kingdom — 0.9% | | | | | | | | | | | | |
CD&R Firefly Bidco Ltd., Facility B, 6.00%, 7/18/22 | | | GBP | | | | 5,510 | | | | 7,654,957 | |
Ceva Group PLC (FKA Louis No.1 PLC/TNT Logistics), Pre-Funded L/C Loan, 6.50%, 3/19/21 | | | USD | | | | 719 | | | | 588,522 | |
Euro Garages (Project Ultimo): | | | | | | | | | | | | |
Term Loan-B1, 0.00%, 1/21/23 | | | GBP | | | | 1,800 | | | | 2,528,489 | |
Term Loan-B2, 0.00%, 1/21/23 | | | EUR | | | | 3,888 | | | | 4,214,503 | |
INEOS Finance PLC, 2020 Euro Term Loan, 4.00%, 12/15/20 | | | | | | | 8,976 | | | | 9,343,106 | |
LGC Science (Figaro Bidco Ltd.), Term Loan-B2, 0.00%, 1/25/23 | | | | | | | 1,319 | | | | 1,429,824 | |
RAC Bidco Ltd. (formerly Nelson Bidco Ltd.): | | | | | | | | | | | | |
Initial Term Loan (First Lien), 5.25% - 5.34%, 12/10/21 | | | GBP | | | | 2,484 | | | | 3,533,579 | |
Initial Term Loan (Second Lien), 8.25%, 12/09/22 | | | | | | | 6,800 | | | | 9,716,595 | |
Virgin Media Investment Holdings Ltd.: | | | | | | | | | | | | |
E Facility, 4.25%, 6/30/23 | | | | | | | 4,270 | | | | 5,961,145 | |
F Facility, 3.50%, 6/30/23 | | | USD | | | | 347 | | | | 339,472 | |
| | | | | | | | | | | | |
| | | | | | | | | | | | 45,310,192 | |
United States — 5.5% | | | | | | | | | | | | |
Accudyne Industries Borrower SCA/Accudyne Industries LLC (AKA Hamilton Sundstrand), Refinancing Term Loan, 4.00%, 12/13/19 | | | | | | | 894 | | | | 742,980 | |
Advantage Sales & Marketing, Inc., Initial Term Loan (First Lien), 4.25%, 7/23/21 | | | | | | | 4,597 | | | | 4,380,395 | |
Alere, Inc. (FKA IM U.S. Holdings LLC), B Term Loan, 4.25%, 6/20/22 | | | | | | | 593 | | | | 586,328 | |
Allied Security Holdings LLC, Closing Date Term Loan (First Lien), 4.25%, 2/12/21 | | | | | | | 3,593 | | | | 3,516,382 | |
American Capital Ltd. (FKA American Capital Strategies Ltd.), Term Loan B, 3.50%, 8/22/17 | | | | | | | 213 | | | | 210,776 | |
American Energy — Marcellus LLC, Initial Loan (Second Lien), 8.50%, 8/04/21 | | | | | | | 9,433 | | | | 212,231 | |
Ascend Performance Materials Operations LLC, Term B Loan, 6.75%, 4/10/18 | | | | | | | 193 | | | | 177,485 | |
Avago Technologies, Term Loan B, 3.50%, 11/11/22 | | | | | | | 34,420 | | | | 33,844,498 | |
Axalta Coating Systems Dutch Holding B BV (Axalta Coating Systems U.S. Holdings, Inc.), Refinanced Term B Loan, 3.75%, 2/01/20 | | | | | | | 1,079 | | | | 1,069,359 | |
B/E Aerospace, Inc., Term Loan, 4.00%, 12/16/21 | | | | | | | 1,937 | | | | 1,934,924 | |
Bass Pro Group LLC, New Term Loan (2015), 4.00%, 6/05/20 | | | | | | | 1,231 | | | | 1,175,539 | |
Berry Plastics Corp., Term F Loan, 4.00%, 10/03/22 | | | | | | | 1,753 | | | | 1,743,249 | |
See Notes to Financial Statements.
| | | | | | |
| | | BLACKROCK FUNDS | | JANUARY 31, 2016 | | 27 |
| | | | |
| Schedule of Investments (continued) | | | BlackRock Global Long/Short Credit Fund | |
| | | | |
| | | | | | | | | | | | |
| Floating Rate Loan Interests (b) | | | | | Par (000) | | | Value | |
United States (continued) | | | | | | | | | | | | |
BJ’s Wholesale Club, Inc., New 2013 (November) Replacement Loan (First Lien), 4.50%, 9/26/19 | | | USD | | | | 1,389 | | | $ | 1,316,362 | |
Blue Coat Holdings, Inc., Initial Term Loan, 4.50%, 5/20/22 | | | | | | | 3,097 | | | | 2,985,737 | |
Boyd Gaming Corp., Term B Loan, 4.00%, 8/14/20 | | | | | | | 2,403 | | | | 2,379,755 | |
Bright Horizons Family Solutions LLC (FKA Bright Horizons Family Solutions, Inc.), Term B Loan, 4.00%, 1/30/20 | | | | | | | 2,566 | | | | 2,556,077 | |
Caesars Entertainment Resort Properties LLC, Term B Loan, 7.00%, 10/11/20 | | | | | | | 9,970 | | | | 8,669,022 | |
Capsugel Holdings U.S., Inc., Initial Term Loan, 3.50%, 8/01/18 | | | | | | | 1,726 | | | | 1,701,523 | |
Catalent Pharma Solutions, Inc. (FKA Cardinal Health 409, Inc.), Dollar Term Loan, 4.25%, 5/20/21 | | | | | | | 3,448 | | | | 3,427,891 | |
Cengage Learning Acquisitions, Inc. (FKA TL Acquisitions, Inc.), Term Loan, 7.00%, 3/31/20 | | | | | | | 2,666 | | | | 2,594,249 | |
Ceva Logistics U.S. Holdings, Inc. (FKA Louis U.S. Holdco, Inc.), U.S. Term Loan, 6.50%, 3/19/21 | | | | | | | 1,028 | | | | 841,051 | |
CHS/Community Health Systems, Inc., Incremental 2019 Term G Loan, 3.75%, 12/31/19 | | | | | | | 8,706 | | | | 8,353,647 | |
Continental Building Products LLC, First Lien Term Loan, 4.00%, 8/28/20 | | | | | | | 1,789 | | | | 1,745,481 | |
Cotiviti Corp. (FKA Connolly Intermediate, Inc.), Initial Term Loan (First Lien), 4.50%, 5/14/21 | | | | | | | 3,891 | | | | 3,803,208 | |
CPG International, Inc., Term Loan, 4.75%, 9/30/20 | | | | | | | 2,693 | | | | 2,517,967 | |
CSC Holdings LLC (FKA CSC Holdings, Inc. (Cablevision)), Initial Term Loan, 5.00%, 10/09/22 | | | | | | | 3,170 | | | | 3,161,092 | |
DaVita HealthCare Partners, Inc. (FKA DaVita, Inc.), Tranche B Term Loan, 3.50%, 6/24/21 | | | | | | | 1,384 | | | | 1,381,343 | |
Dell International LLC, Term C Loan, 3.75%, 10/29/18 | | | | | | | 10,872 | | | | 10,845,021 | |
Dollar Tree, Inc., Term B-1 Loan, 2.75%, 7/06/22 | | | | | | | 1,801 | | | | 1,794,075 | |
DTZ U.S. Borrower LLC (DTZ AUS Holdco PTY Ltd.), 2015-1 Additional Term Loan (First Lien), 3.25%, 11/04/21 | | | | | | | 2,368 | | | | 2,295,091 | |
Dynegy, Inc., Tranche B-2 Term Loan, 4.00%, 4/23/20 | | | | | | | 1,155 | | | | 1,112,372 | |
Energy Future Intermediate Holding Co. LLC (EFIH Finance, Inc.), Term Loan, 4.25%, 12/19/16 | | | | | | | 3,665 | | | | 3,648,984 | |
Epicor Software Corporation (FKA Eagle Parent, Inc.), Term B Loan, 4.75%, 6/01/22 | | | | | | | 2,960 | | | | 2,821,384 | |
First Data Corp.: | | | | | | | | | | | | |
2018 New Dollar Term Loan, 3.93%, 3/23/18 | | | | | | | 11,745 | | | | 11,581,040 | |
2018B Second New Term Loan, 3.93%, 9/24/18 | | | | | | | 1,005 | | | | 990,106 | |
Gates Global LLC, Initial Dollar Term Loan, 4.25%, 7/06/21 | | | | | | | 8,853 | | | | 7,960,296 | |
Gol Luxco SA, Term Loan, 6.50%, 8/31/20 | | | | | | | 19,925 | | | | 18,829,125 | |
Grifols Worldwide Operations Ltd., U.S. Tranche B Term Loan, 3.43%, 2/27/21 | | | | | | | 8,911 | | | | 8,875,630 | |
IMS Health, Inc., Term B Dollar Loan, 3.50%, 3/17/21 | | | | | | | 8,302 | | | | 8,127,836 | |
Informatica Corp., Dollar Term Loan, 4.50%, 8/05/22 | | | | | | | 11,185 | | | | 10,658,996 | |
Jaguar Holding Co. I (AKA Pharmaceutical Product Development, Inc.), Initial Term Loan, 4.25%, 8/18/22 | | | | | | | 1,627 | | | | 1,593,715 | |
| | | | | | | | | | | | |
| Floating Rate Loan Interests (b) | | | | | Par
(000) | | | Value | |
United States (continued) | | | | | | | | | | | | |
Kronos, Inc., Incremental Term Loan (First Lien), 4.50%, 10/30/19 | | | USD | | | | 1,739 | | | $ | 1,705,313 | |
Las Vegas Sands LLC, Term B Loan, 3.25%, 12/19/20 | | | | | | | 5,292 | | | | 5,261,412 | |
Level 3 Financing, Inc., Tranche B 2020 Term Loan, 4.00%, 1/15/20 | | | | | | | 405 | | | | 403,988 | |
MacDermid, Inc. (Platform Specialty Products Corp.): | | | | | | | | | | | | |
Term Loan B3 USD, 5.50%, 6/07/20 | | | | | | | 1,746 | | | | 1,620,935 | |
Tranche B Term Loan (First Lien), 5.50%, 6/07/20 | | | | | | | 1,121 | | | | 1,037,717 | |
MGM Resorts International (MGM Grand Detroit LLC), Term B Loan, 3.50%, 12/20/19 | | | | | | | 825 | | | | 816,255 | |
Michaels Stores, Inc., Term B Loan, 3.75%, 1/28/20 | | | | | | | 1,293 | | | | 1,274,994 | |
Microsemi Corp., Closing Date Term B Loan, 5.25%, 1/15/23 | | | | | | | 800 | | | | 794,600 | |
Northwest Airlines, Inc.: | | | | | | | | | | | | |
B757-300, 1.77%, 3/10/17 | | | | | | | 273 | | | | 264,810 | |
B757-300, 2.39%, 3/10/17 | | | | | | | 225 | | | | 223,080 | |
Loan B757-200, 1.77%, 9/10/18 | | | | | | | 277 | | | | 268,690 | |
Loan B757-200, 1.77%, 9/10/18 | | | | | | | 275 | | | | 266,750 | |
Loan B757-300, 2.39%, 3/10/17 | | | | | | | 225 | | | | 222,420 | |
Novelis, Inc., Initial Term Loan, 4.00%, 6/02/22 | | | | | | | 7,835 | | | | 7,237,708 | |
NXP BV (NXP Funding LLC), Tranche B Loan, 3.75%, 12/07/20 | | | | | | | 23,378 | | | | 23,319,486 | |
Ortho-Clinical Diagnostics Holdings Luxembourg S.à r.l., Initial Term Loan, 4.75%, 6/30/21 | | | | | | | 3,694 | | | | 3,237,572 | |
PetCo Animal Supplies, Inc., Tranche B-1 Term Loan, 4.75%, 1/15/23 | | | | | | | 2,484 | | | | 2,431,270 | |
PetSmart, Inc., Tranche B-1 Loan, 4.25%, 3/11/22 | | | | | | | 811 | | | | 785,085 | |
Pinnacle Entertainment, Inc., Tranche B-2 Term Loan, 3.75%, 8/13/20 | | | | | | | 390 | | | | 389,657 | |
Pinnacle Foods Finance LLC, Tranche H Term Loan, 3.00%, 4/29/20 | | | | | | | 1,339 | | | | 1,322,435 | |
Realogy Group LLC (FKA Realogy Corp.), | | | | | | | | | | | | |
Extended Synthetic Commitment, 0.28% - 4.40%, 10/10/16 | | | | | | | 6 | | | | 5,975 | |
Rexnord LLC/RBS Global, Inc., Term B Loan, 4.00%, 8/21/20 | | | | | | | 2,348 | | | | 2,235,263 | |
Rite Aid Corp., Tranche 1 Term Loan (Second Lien), 5.75%, 8/21/20 | | | | | | | 360 | | | | 360,000 | |
ROC Finance LLC, Funded Term B Loan, 5.00%, 6/20/19 | | | | | | | 401 | | | | 355,187 | |
Sequa Corp., Initial Term Loan, 5.25%, 6/19/17 | | | | | | | 172 | | | | 111,951 | |
Servicemaster Co. LLC, Initial Term Loan, 4.25%, 7/01/21 | | | | | | | 8,547 | | | | 8,459,208 | |
Spectrum Brands, Inc.: | | | | | | | | | | | | |
Euro Term Loan, 3.50%, 6/23/22 | | | EUR | | | | 3,168 | | | | 3,418,803 | |
USD Term Loan, 3.50%, 6/23/22 | | | USD | | | | 2,013 | | | | 2,006,842 | |
Spin Holdco, Inc., Initial Term Loan (First Lien), 4.25%, 11/14/19 | | | | | | | 2,974 | | | | 2,821,793 | |
SS&C Technologies, Inc., Term B-1 Loan, 4.00% - 4.08%, 7/08/22 | | | | | | | 2,858 | | | | 2,843,380 | |
Staples Escrow LLC, Term Loan B, 0.00%, 1/28/22 | | | | | | | 4,600 | | | | 4,563,568 | |
Surgery Center Holdings, Inc., Initial Term Loan (First Lien), 5.25%, 11/03/20 | | | | | | | 2,197 | | | | 2,152,909 | |
Surgical Care Affiliates, Inc., Initial Term Loan, 4.25%, 3/17/22 | | | | | | | 794 | | | | 789,371 | |
Telesat Canada, U.S. Term B-2 Loan, 2.75%, 3/28/19 | | | | | | | 1,065 | | | | 1,043,700 | |
T-Mobile USA, Inc., Senior Lien Term Loan, 3.50%, 11/09/22 | | | | | | | 2,470 | | | | 2,470,469 | |
See Notes to Financial Statements.
| | | | | | |
| 28 | | BLACKROCK FUNDS | | JANUARY 31, 2016 | | |
| | | | |
| Schedule of Investments (continued) | | | BlackRock Global Long/Short Credit Fund | |
| | | | |
| | | | | | | | | | | | |
| Floating Rate Loan Interests (b) | | | | | Par (000) | | | Value | |
United States (continued) | | | | | | | | | | | | |
Tribune Media Co. (FKA Tribune Co.), Term B Loan, 3.75%, 12/27/20 | | | USD | | | | 321 | | | $ | 315,240 | |
Univision Communications, Inc., Replacement First-Lien Term Loan, 4.00%, 3/01/20 | | | | | | | 6,494 | | | | 6,327,803 | |
WESCO Distribution, Inc., Tranche B-1 Loan, 3.75%, 12/12/19 | | | | | | | 142 | | | | 142,030 | |
Wilsonart LLC, Initial Term Loan, 4.00%, 10/31/19 | | | | | | | 2,565 | | | | 2,499,074 | |
| | | | | | | | | | | | |
| | | | | | | | | | | | 283,968,965 | |
Total Floating Rate Loan Interests — 10.5% | | | | | | | | | | | 540,007,314 | |
| | | | | | | | | | | | |
| Foreign Agency Obligations | | | | | | | | | |
Brazil — 0.3% | | | | | | | | | | | | |
Petrobras Global Finance BV: | | | | | | | | | | | | |
5.38%, 10/01/29 | | | GBP | | | | 2,405 | | | | 1,956,576 | |
6.63%, 1/16/34 | | | | | | | 6,460 | | | | 5,632,579 | |
7.25%, 3/17/44 | | | USD | | | | 14,735 | | | | 9,651,425 | |
| | | | | | | | | | | | |
| | | | | | | | | | | | 17,240,580 | |
British Virgin Islands — 0.0% | | | | | | | | | | | | |
China Cinda Finance 2014 Ltd., 5.63%, 5/14/24 | | | | | | | 820 | | | | 859,378 | |
Canada — 0.1% | | | | | | | | | | | | |
NOVA Chemicals Corp., 5.00%, 5/01/25 (a) | | | | | | | 2,160 | | | | 2,025,000 | |
China — 0.4% | | | | | | | | | | | | |
BAIC Inalfa HK Investment Co. Ltd., 1.90%, 11/02/20 | | | EUR | | | | 1,600 | | | | 1,715,899 | |
Baosteel Financing 2015 Pty. Ltd., 3.88%, 1/28/20 | | | | | | | 410 | | | | 414,708 | |
CCBL Cayman Corp. Ltd., 3.25%, 7/28/20 | | | | | | | 1,050 | | | | 1,061,288 | |
CCCI Treasure Ltd., 3.50% (b)(h) | | | | | | | 2,700 | | | | 2,664,052 | |
China Cinda Finance 2015 I Ltd., 4.25%, 4/23/25 | | | | | | | 1,940 | | | | 1,843,452 | |
CITIC Pacific Ltd., 6.80%, 1/17/23 | | | | | | | 2,000 | | | | 2,326,072 | |
CNPC HK Overseas Capital Ltd., 4.50%, 4/28/21 | | | | | | | 2,000 | | | | 2,136,912 | |
COSCO Finance 2011 Ltd., 4.00%, 12/03/22 | | | | | | | 1,950 | | | | 1,988,741 | |
Eastern Creation II Investment Holdings Ltd., 1.50%, 7/29/19 | | | | | | | 220 | | | | 236,163 | |
Export-Import Bank of China/The Via Avi Funding Co. Ltd., 2.85%, 9/16/20 | | | | | | | 1,100 | | | | 1,113,862 | |
Huarong Finance II Co. Ltd., 5.00%, 11/19/25 | | | | | | | 1,593 | | | | 1,612,036 | |
ICBCIL Finance Co. Ltd., 3.20%, 11/10/20 | | | | | | | 1,900 | | | | 1,914,345 | |
Industrial & Commercial Bank of China Ltd., 2.91%, 11/13/20 | | | | | | | 1,100 | | | | 1,113,073 | �� |
Minmetals Bounteous Finance BVI Ltd., 4.75%, 7/30/25 | | | | | | | 1,900 | | | | 1,934,390 | |
| | | | | | | | | | | | |
| | | | | | | | | | | | 22,074,993 | |
Germany — 0.6% | | | | | | | | | | | | |
Bayerische Landesbank, 0.74%, 2/07/19 (b) | | | | | | | 3,950 | | | | 4,113,022 | |
HSH Nordbank AG: | | | | | | | | | | | | |
0.72%, 2/14/17 (b) | | | | | | | 18,000 | | | | 17,412,876 | |
0.76%, 2/14/17 (b) | | | | | | | 9,359 | | | | 9,048,659 | |
| | | | | | | | | | | | |
| | | | | | | | | | | | 30,574,557 | |
India — 0.1% | | | | | | | | | | | | |
Bank of India, 6.25%, 2/16/21 | | | USD | | | | 430 | | | | 484,799 | |
Bharat Petroleum Corp. Ltd., 4.63%, 10/25/22 | | | | | | | 200 | | | | 207,435 | |
Export-Import Bank of India, 3.13%, 7/20/21 | | | | | | | 941 | | | | 937,659 | |
| | | | | | | | | | | | |
| Foreign Agency Obligations | | | | | Par (000) | | | Value | |
India (continued) | | | | | | | | | | | | |
NTPC Ltd., 5.63%, 7/14/21 | | | USD | | | | 1,100 | | | $ | 1,224,104 | |
| | | | | | | | | | | | |
| | | | | | | | | | | | 2,853,997 | |
Indonesia — 0.1% | | | | | | | | | | | | |
Pelabuhan Indonesia II PT: | | | | | | | | | | | | |
4.25%, 5/05/25 | | | | | | | 1,938 | | | | 1,715,130 | |
5.38%, 5/05/45 | | | | | | | 400 | | | | 310,000 | |
Pertamina Persero PT: | | | | | | | | | | | | |
5.63%, 5/20/43 | | | | | | | 2,680 | | | | 2,088,221 | |
6.45%, 5/30/44 | | | | | | | 1,000 | | | | 860,366 | |
| | | | | | | | | | | | |
| | | | | | | | | | | | 4,973,717 | |
Malaysia — 0.0% | | | | | | | | | | | | |
Axiata SPV2 BHD, 3.47%, 11/19/20 | | | | | | | 1,305 | | | | 1,320,309 | |
Mongolia — 0.1% | | | | | | | | | | | | |
Development Bank of Mongolia LLC, 5.75%, 3/21/17 | | | | | | | 1,000 | | | | 930,769 | |
Trade & Development Bank of Mongolia LLC, 9.38%, 5/19/20 | | | | | | | 2,050 | | | | 1,819,601 | |
| | | | | | | | | | | | |
| | | | | | | | | | | | 2,750,370 | |
South Korea — 0.0% | | | | | | | | | | | | |
Korea Midland Power Co. Ltd., 2.50%, 7/21/21 | | | | | | | 1,490 | | | | 1,492,745 | |
Venezuela — 0.1% | | | | | | | | | | | | |
Petroleos de Venezuela SA: | | | | | | | | | | | | |
5.25%, 4/12/17 | | | | | | | 4,700 | | | | 1,833,000 | |
6.00%, 11/15/26 | | | | | | | 4,200 | | | | 1,244,880 | |
| | | | | | | | | | | | |
| | | | | | | | | | | | 3,077,880 | |
Total Foreign Agency Obligations — 1.8% | | | | | | | | | | | 89,243,526 | |
| | | | | | | | | | | | |
| Foreign Government Obligations | | | | | | | | | |
Angola — 0.0% | | | | | | | | | | | | |
Republic of Angola, 9.50%, 11/12/25 | | | | | | | 2,800 | | | | 2,338,560 | |
Croatia — 0.0% | | | | | | | | | | | | |
Republic of Croatia, 3.88%, 5/30/22 | | | EUR | | | | 1,800 | | | | 1,985,029 | |
Dominican Republic — 0.1% | | | | | | | | | | | | |
Dominican Republic International Bond, 7.45%, 4/30/44 | | | USD | | | | 2,800 | | | | 2,702,000 | |
Hungary — 0.1% | | | | | | | | | | | | |
Hungary Government International Bond, 5.38%, 3/25/24 | | | | | | | 4,500 | | | | 4,957,470 | |
Indonesia — 0.2% | | | | | | | | | | | | |
Republic of Indonesia: | | | | | | | | | | | | |
2.88%, 7/08/21 | | | EUR | | | | 3,700 | | | | 3,975,162 | |
5.88%, 1/15/24 | | | USD | | | | 950 | | | | 1,040,962 | |
3.38%, 7/30/25 | | | EUR | | | | 1,300 | | | | 1,333,571 | |
4.75%, 1/08/26 | | | USD | | | | 1,096 | | | | 1,113,920 | |
6.75%, 1/15/44 | | | | | | | 4,100 | | | | 4,469,951 | |
5.95%, 1/08/46 | | | | | | | 900 | | | | 931,440 | |
| | | | | | | | | | | | |
| | | | | | | | | | | | 12,865,006 | |
Mongolia — 0.0% | | | | | | | | | | | | |
Mongolian People’s Republic, 7.50%, 6/30/18 | | | CNH | | | | 4,000 | | | | 539,695 | |
Portugal — 0.3% | | | | | | | | | | | | |
Republic of Portugal, 5.13%, 10/15/24 | | | USD | | | | 12,875 | | | | 13,222,625 | |
Russia — 0.1% | | | | | | | | | | | | |
Russian Federation, 3.25%, 4/04/17 | | | | | | | 4,600 | | | | 4,610,065 | |
See Notes to Financial Statements.
| | | | | | |
| | | BLACKROCK FUNDS | | JANUARY 31, 2016 | | 29 |
| | | | |
| Schedule of Investments (continued) | | | BlackRock Global Long/Short Credit Fund | |
| | | | |
| | | | | | | | | | | | |
| Foreign Government Obligations | | | | | Par
(000) | | | Value | |
Serbia — 0.2% | | | | | | | | | | | | |
Republic of Serbia, 5.88%, 12/03/18 | | | USD | | | | 7,400 | | | $ | 7,751,500 | |
Slovenia — 0.1% | | | | | | | | | | | | |
Republic of Slovenia, 4.63%, 9/09/24 | | | EUR | | | | 3,400 | | | | 4,644,627 | |
Sri Lanka — 0.0% | | | | | | | | | | | | |
Republic of Sri Lanka: | | | | | | | | | | | | |
6.00%, 1/14/19 | | | USD | | | | 429 | | | | 418,719 | |
6.25%, 10/04/20 | | | | | | | 997 | | | | 955,581 | |
| | | | | | | | | | | | |
| | | | | | | | | | | | 1,374,300 | |
Venezuela — 0.0% | | | | | | | | | | | | |
Bolivarian Republic of Venezuela, 11.75%, 10/21/26 | | | | | | | 1,500 | | | | 551,250 | |
Total Foreign Government Obligations — 1.1% | | | | | | | | | | | 57,542,127 | |
| | | | | | | | | | | | |
| Non-Agency Mortgage-Backed Securities | | | | | | | | | |
Collateralized Mortgage Obligations — 0.1% | | | | | | | | | | | | |
United Kingdom — 0.1% | | | | | | | | | | | | |
Paragon Mortgages No. 13 PLC, Series 2006-13X, Class A2C, 0.50%, 1/15/39 (b) | | | | | | | 5,843 | | | | 5,168,246 | |
Commercial Mortgage-Backed Securities — 2.3% | | | | | | | | | | | | |
Ireland — 0.1% | | | | | | | | | | | | |
German Residential Funding Ltd., Series 2013-1, Class E, 4.05%, 8/27/24 (b) | | | EUR | | | | 3,512 | | | | 3,880,123 | |
United States — 2.2% | | | | | | | | | | | | |
Banc of America Commercial Mortgage Trust,
Series 2007-3, Class AJ, 5.74%, 6/10/49 (b) | | | USD | | | | 4,000 | | | | 3,991,810 | |
BXHTL Mortgage Trust: | | | | | | | | | | | | |
Series 2015-JWRZ, Class DR3,
4.22%, 5/15/29 (a)(b) | | | | | | | 7,500 | | | | 6,995,513 | |
Series 2015-JWRZ, Class GL3,
4.00%, 5/15/29 (a)(b) | | | | | | | 9,280 | | | | 8,606,853 | |
CDGJ Commercial Mortgage Trust,
Series 2014-BXCH, Class EPA,
4.58%, 12/15/27 (a)(b) | | | | | | | 4,700 | | | | 4,450,902 | |
Commercial Mortgage Pass Through Certificates, Series 2014-KYO, Class F, 3.80%, 6/11/27 (a)(b) | | | | | | | 18,510 | | | | 18,302,333 | |
Commercial Mortgage Trust: | | | | | | | | | | | | |
Series 2014-PAT, Class E,
3.47%, 8/13/27 (a)(b) | | | | | | | 1,000 | | | | 965,532 | |
Series 2014-PAT, Class F,
2.76%, 8/13/27 (a)(b) | | | | | | | 2,000 | | | | 1,887,819 | |
Series 2014-PAT, Class G,
1.91%, 8/13/27 (a)(b) | | | | | | | 2,000 | | | | 1,846,520 | |
Core Industrial Trust: | | | | | | | | | | | | |
Series 2015-CALW, Class F,
3.98%, 2/10/34 (a)(b) | | | | | | | 4,620 | | | | 4,170,377 | |
Series 2015-CALW, Class G,
3.98%, 2/10/34 (a)(b) | | | | | | | 5,640 | | | | 5,214,744 | |
Credit Suisse Commercial Mortgage Trust,
Series 2007-C4, Class AJ, 6.15%, 9/15/39 (b) | | | | | | | 3,300 | | | | 3,325,092 | |
Credit Suisse First Boston Mortgage Securities Corp., Series 2005-C2, Class AMFX, 4.88%, 4/15/37 | | | | | | | 278 | | | | 252,059 | |
GAHR Commercial Mortgage Trust: | | | | | | | | | | | | |
Series 2015-NRF, Class EFX,
3.49%, 12/15/19 (a)(b) | | | | | | | 8,740 | | | | 8,129,632 | |
Series 2015-NRF, Class FFX,
3.38%, 12/15/19 (a)(b) | | | | | | | 4,620 | | | | 4,213,297 | |
| | | | | | | | | | | | |
| Non-Agency Mortgage-Backed Securities | | | | | Par
(000) | | | Value | |
Commercial Mortgage-Backed Securities (continued) | | | | | |
United States (continued) | | | | | | | | | | | | |
Series 2015-NRF, Class GFX,
3.38%, 12/15/19 (a)(b) | | | USD | | | | 14,125 | | | $ | 12,827,041 | |
GRACE Mortgage Trust, Series 2014-GRCE,
Class F, 3.71%, 6/10/28 (a)(b) | | | | | | | 2,545 | | | | 2,404,620 | |
Hilton USA Trust, Series 2013-HLT, Class EFX, 5.61%, 11/05/30 (a)(b) | | | | | | | 4,673 | | | | 4,680,889 | |
LB-UBS Commercial Mortgage Trust: | | | | | | | | | | | | |
Series 2006-C4, Class B,
6.05%, 6/15/38 (b) | | | | | | | 4,710 | | | | 4,771,928 | |
Series 2007-C1, Class AJ, 5.48%, 2/15/40 | | | | | | | 3,040 | | | | 3,031,908 | |
Lone Star Portfolio Trust, Series 2015-LSP,
Class E, 6.03%, 9/15/20 (a)(b) | | | | | | | 6,246 | | | | 6,132,831 | |
Wachovia Bank Commercial Mortgage Trust, Series 2007-C33, Class AJ, 6.15%, 2/15/51 (b) | | | | | | | 2,286 | | | | 2,302,589 | |
Wells Fargo Commercial Mortgage Trust,
Series 2015-C31, Class D, 3.85%, 11/15/25 | | | | | | | 4,630 | | | | 3,303,028 | |
| | | | | | | | | | | | |
| | | | | | | | | | | | 111,807,317 | |
Total Non-Agency Mortgage-Backed Securities — 2.4% | | | | 120,855,686 | |
| | | | | | | | | | | | |
| Preferred Securities | | | | | | | | | |
Capital Trusts | | | | | | | | | | | | |
Australia — 0.0% | | | | | | | | | | | | |
Commonwealth Bank of Australia, 4.50%, 12/09/25 | | | | | | | 1,400 | | | | 1,407,347 | |
China — 0.1% | | | | | | | | | | | | |
Central Plaza Development Ltd., 7.13% (b)(h) | | | | | | | 900 | | | | 924,165 | |
China Life Insurance Co. Ltd., 4.00%, 7/03/75 (b) | | | | | | | 2,800 | | | | 2,753,800 | |
CITIC Ltd., 8.63% (b)(h) | | | | | | | 2,000 | | | | 2,242,134 | |
| | | | | | | | | | | | |
| | | | | | | | | | | | 5,920,099 | |
France — 1.4% | | | | | | | | | | | | |
Casino Guichard Perrachon SA, 4.87% (b)(h) | | | EUR | | | | 2,300 | | | | 1,968,720 | |
Credit Agricole Assurances SA, 4.25% (b)(h) | | | | | | | 24,000 | | | | 24,084,029 | |
Credit Agricole SA, 8.13% (a)(b)(h) | | | USD | | | | 15,000 | | | | 14,991,000 | |
Electricite de France SA: | | | | | | | | | | | | |
5.00% (b)(h) | | | EUR | | | | 6,400 | | | | 6,253,643 | |
5.88% (b)(h) | | | GBP | | | | 5,900 | | | | 7,330,021 | |
Orange SA: | | | | | | | | | | | | |
4.00% (b)(h) | | | EUR | | | | 3,450 | | | | 3,634,588 | |
4.25% (b)(h) | | | | | | | 4,269 | | | | 4,659,269 | |
5.00% (b)(h) | | | | | | | 5,825 | | | | 6,133,707 | |
| | | | | | | | | | | | |
| | | | | | | | | | | | 69,054,977 | |
Germany — 0.6% | | | | | | | | | | | | |
Bertelsmann SE & Co. KGaA, 3.50%, 4/23/75 (b) | | | | | | | 3,400 | | | | 3,099,598 | |
HSH Nordbank AG, 7.25% (b)(h) | | | USD | | | | 25,165 | | | | 6,271,118 | |
Volkswagen International Finance NV, 3.50% (b)(h) | | | EUR | | | | 12,855 | | | | 11,140,601 | |
Vonovia Finance BV, 4.00% (b)(h) | | | | | | | 11,600 | | | | 11,812,243 | |
| | | | | | | | | | | | |
| | | | | | | | | | | | 32,323,560 | |
Hong Kong — 0.0% | | | | | | | | | | | | |
Bank of East Asia Ltd., 5.50% (b)(h) | | | USD | | | | 1,800 | | | | 1,710,090 | |
Noble Group Ltd., 6.00% (b)(h) | | | | | | | 1,400 | | | | 427,000 | |
| | | | | | | | | | | | |
| | | | | | | | | | | | 2,137,090 | |
See Notes to Financial Statements.
| | | | | | |
| 30 | | BLACKROCK FUNDS | | JANUARY 31, 2016 | | |
| | | | |
| Schedule of Investments (continued) | | | BlackRock Global Long/Short Credit Fund | |
| | | | |
| | | | | | | | | | | | |
| Preferred Securities | | | | | Par
(000) | | | Value | |
India — 0.0% | | | | | | | | | | | | |
ICICI Bank Ltd., 6.38%, 4/30/22 (b) | | | USD | | | | 1,400 | | | $ | 1,410,706 | |
Italy — 0.5% | | | | | | | | | | | | |
Enel SpA: | | | | | | | | | | | | |
6.50%, 1/10/74 (b) | | | EUR | | | | 7,900 | | | | 9,093,066 | |
5.00%, 1/15/75 (b) | | | | | | | 2,720 | | | | 3,016,542 | |
Intesa Sanpaolo SpA: | | | | | | | | | | | | |
7.00% (b)(h) | | | | | | | 7,420 | | | | 7,937,779 | |
7.70% (a)(b)(h) | | | USD | | | | 2,775 | | | | 2,677,875 | |
| | | | | | | | | | | | |
| | | | | | | | | | | | 22,725,262 | |
Japan — 0.4% | | | | | | | | | | | | |
Meiji Yasuda Life Insurance Co.,
5.20%, 10/20/45 (b) | | | | | | | 1,150 | | | | 1,204,683 | |
Nippon Life Insurance Co., 5.00%, 1/20/46 (a)(b) | | | | | | | 18,255 | | | | 18,346,275 | |
| | | | | | | | | | | | |
| | | | | | | | | | | | 19,550,958 | |
Netherlands — 0.2% | | | | | | | | | | | | |
ABN AMRO Bank NV, 5.75% (b)(h) | | | EUR | | | | 7,900 | | | | 8,316,699 | |
South Korea — 0.0% | | | | | | | | | | | | |
Shinsegae Co. Ltd., 2.63%, 5/08/45 (b) | | | USD | | | | 900 | | | | 892,620 | |
Spain — 1.5% | | | | | | | | | | | | |
Banco Bilbao Vizcaya Argentaria SA: | | | | | | | | | | | | |
7.00% (b)(h) | | | EUR | | | | 13,400 | | | | 13,656,762 | |
9.00% (b)(h) | | | USD | | | | 4,000 | | | | 4,180,000 | |
Banco Popular Espanol SA: | | | | | | | | | | | | |
8.25% (b)(h) | | | EUR | | | | 6,400 | | | | 5,873,460 | |
11.50% (b)(h) | | | | | | | 8,300 | | | | 8,890,192 | |
Banco Santander SA, 6.25% (b)(h) | | | | | | | 10,900 | | | | 10,863,277 | |
Gas Natural Fenosa Finance BV, 4.13% (b)(h) | | | | | | | 6,700 | | | | 6,523,556 | |
Telefonica Europe BV: | | | | | | | | | | | | |
4.20% (b)(h) | | | | | | | 13,200 | | | | 13,575,161 | |
5.00% (b)(h) | | | | | | | 9,900 | | | | 10,354,402 | |
5.88% (b)(h) | | | | | | | 1,800 | | | | 1,841,222 | |
| | | | | | | | | | | | |
| | | | | | | | | | | | 75,758,032 | |
Switzerland — 0.0% | | | | | | | | | | | | |
UBS Group AG, 5.75% (b)(h) | | | | | | | 1,500 | | | | 1,677,752 | |
United Kingdom — 0.9% | | | | | | | | | | | | |
Barclays PLC, 7.88% (b)(h) | | | GBP | | | | 9,425 | | | | 12,841,405 | |
Centrica PLC, 3.00%, 4/10/76 (b) | | | EUR | | | | 5,290 | | | | 4,905,738 | |
Coventry Building Society, 6.38% (b)(h) | | | GBP | | | | 3,600 | | | | 4,817,782 | |
HBOS Capital Funding LP, 6.85% (b)(h) | | | USD | | | | 4,341 | | | | 4,372,516 | |
Lloyds Banking Group PLC, 6.38% (b)(h) | | | EUR | | | | 12,714 | | | | 14,151,764 | |
Santander UK Group Holdings PLC, 7.38% (b)(h) | | | GBP | | | | 3,810 | | | | 5,313,532 | |
| | | | | | | | | | | | |
| | | | | | | | | | | | 46,402,737 | |
United States — 1.4% | | | | | | | | | | | | |
Citigroup, Inc., 6.13% (b)(h) | | | USD | | | | 20,385 | | | | 20,505,883 | |
General Electric Co., 5.00% (b)(h) | | | | | | | 8,773 | | | | 9,014,257 | |
JPMorgan Chase Capital XXI, 1.28%, 2/02/37 (b) | | | | | | | 15,000 | | | | 11,362,500 | |
NBCUniversal Enterprise, Inc., 5.25% (a)(h) | | | | | | | 4,000 | | | | 4,240,000 | |
State Street Capital Trust IV, 1.51%, 6/15/37 (b) | | | | | | | 34,140 | | | | 26,816,970 | |
| | | | | | | | | | | | |
| | | | | | | | | | | | 71,939,610 | |
Total Capital Trusts — 7.0% | | | | | | | | | | | 359,517,449 | |
| | | | | | | | | | | | |
| | | | | | | | | | |
| | | | | | | | | | | | |
| Preferred Stocks | | | | |
Shares | | | Value | |
Israel — 0.2% | | | | | | | | | | | | |
Teva Pharmaceutical Industries Ltd., 7.00% (h) | | | | | | | 10,509 | | | $ | 10,265,613 | |
Luxembourg — 0.0% | | | | | | | | | | | | |
Concrete Investment I SCA: | | | | | | | | | | | | |
0.00% (e)(h) | | | | | | | 10,000 | | | | 1,245,789 | |
0.00% (e)(f)(h) | | | | | | | 10,000 | | | | — | |
Concrete Investment II SCA,
0.00%, 8/27/44 (e) | | | | | | | 11,824 | | | | 1,447,403 | |
Novartex Holding Luxembourg SCA Equity,
0.00% (e)(h) | | | | | | | 3,800 | | | | — | |
| | | | | | | | | | | | |
| | | | | | | | | | | | 2,693,192 | |
Netherlands — 0.5% | | | | | | | | | | | | |
RBS Capital Funding Trust V, Series E,
5.90% (h) | | | | | | | 185,913 | | | | 4,577,178 | |
RBS Capital Funding Trust VI, 6.25% (h) | | | | | | | 151,363 | | | | 3,781,048 | |
RBS Capital Funding Trust VII, 6.08% (h) | | | | | | | 728,691 | | | | 18,144,406 | |
| | | | | | | | | | | | |
| | | | | | | | | | | | 26,502,632 | |
Spain — 0.1% | | | | | | | | | | | | |
Santander Finance Preferred SAU, 4.00% (h) | | | | | | | 164,000 | | | | 3,514,520 | |
United Kingdom — 0.1% | | | | | | | | | | | | |
Royal Bank of Scotland Group PLC: | | | | | | | | | | | | |
6.13% (h) | | | | | | | 19,117 | | | | 478,116 | |
6.60% (h) | | | | | | | 95,580 | | | | 2,416,262 | |
| | | | | | | | | | | | |
| | | | | | | | | | | | 2,894,378 | |
United States — 0.2% | | | | | | | | | | | | |
Allergan PLC, Series A, 1.38% (h) | | | | | | | 9,950 | | | | 9,435,486 | |
Total Preferred Stocks — 1.1% | | | | | | | | | | | 55,305,821 | |
Total Preferred Securities — 8.1% | | | | | | | | | | | 414,823,270 | |
| | | | | | | | | | | | |
| U.S. Treasury Obligations | | | | | Par
(000) | | | | |
U.S. Treasury Bonds: | | | | | | | | | | | | |
2.88%, 8/15/45 | | | USD | | | | 73,053 | | | | 74,662,328 | |
3.00%, 11/15/45 | | | | | | | 120,730 | | | | 126,705,163 | |
U.S. Treasury Notes: | | | | | | | | | | | | |
1.13%, 1/15/19 | | | | | | | 972 | | | | 976,366 | |
2.25%, 11/15/25 | | | | | | | 17,368 | | | | 17,863,635 | |
Total U.S. Treasury Obligations — 4.3% | | | | | | | | | | | 220,207,492 | |
Total Long-Term Investments (Cost — $4,905,937,548) — 89.0% | | | | | | | | | | | 4,556,099,940 | |
| | | | | | | | | | | | |
| Short-Term Securities | | | | | | | | | |
Borrowed Bond Agreements — 23.9% | | | | | | | | | | | | |
Barclays Bank PLC, (2.75)%, Open (o) | | | | | | | 883 | | | | 882,810 | |
(Purchased on 1/15/16 to be repurchased at $882,001, collateralized by Standard Chartered PLC, 6.50% (h), par and fair value of USD 900,000 and $849,033, respectively) | | | | | | | | | | | | |
Barclays Bank PLC, (2.00)%, Open (o) | | | | | | | 2,504 | | | | 2,503,807 | |
(Purchased on 8/27/15 to be repurchased at $2,481,968, collateralized by Federal Republic of Nigeria, 6.38% due at 7/12/23, par and fair value of USD 2,700,000 and $2,387,880, respectively) | | | | | | | | | | | | |
See Notes to Financial Statements.
| | | | | | |
| | | BLACKROCK FUNDS | | JANUARY 31, 2016 | | 31 |
| | | | |
| Schedule of Investments (continued) | | | BlackRock Global Long/Short Credit Fund | |
| | | | |
| | | | | | | | | | | | |
| Short-Term Securities | | | | | Par
(000) | | | Value | |
Borrowed Bond Agreements (continued) | | | | | | | | | | | | |
Barclays Bank PLC, (1.50)%, Open (o) | | | EUR | | | | 565 | | | $ | 612,270 | |
(Purchased on 1/14/16 to be repurchased at EUR 564,863, collateralized by Grupo Antolin Dutch BV, 5.13% due at 6/30/22, par and fair value of EUR 560,000 and $621,811, respectively) | | | | | | | | | | | | |
Barclays Bank PLC, (1.50)%, Open (o) | | | | | | | 316 | | | | 342,833 | |
(Purchased on 1/15/16 to be repurchased at EUR 316,301, collateralized by Grupo Antolin Dutch BV, 5.13% due at 6/30/22, par and fair value of EUR 313,000 and $347,548, respectively) | | | | | | | | | | | | |
Barclays Bank PLC, (1.35)%, Open (o) | | | | | | | 2,435 | | | | 2,637,486 | |
(Purchased on 1/21/16 to be repurchased at EUR 2,434,051, collateralized by Wendel SA, 1.88% due at 4/10/20, par and fair value of EUR 2,600,000 and $2,748,687, respectively) | | | | | | | | | | | | |
Barclays Bank PLC, (1.25)%, Open (o) | | | USD | | | | 1,073 | | | | 1,073,156 | |
(Purchased on 1/07/16 to be repurchased at $1,072,411, collateralized by HSBC Holdings PLC, 5.63% (h), par and fair value of USD 1,050,000 and $1,023,159, respectively) | | | | | | | | | | | | |
Barclays Bank PLC, (1.00)%, Open (o) | | | | | | | 1,584 | | | | 1,584,271 | |
(Purchased on 1/08/16 to be repurchased at $1,583,434, collateralized by HSBC Holdings PLC, 5.63% (h), par and fair value of USD 1,550,000 and $1,510,377, respectively) | | | | | | | | | | | | |
Barclays Bank PLC, (0.85)%, Open (o) | | | EUR | | | | 1,235 | | | | 1,338,303 | |
(Purchased on 1/19/16 to be repurchased at EUR 1,235,080, collateralized by Rexel SA, 3.25% due at 6/15/22, par and fair value of EUR 1,318,000 and $1,370,671, respectively) | | | | | | | | | | | | |
Barclays Bank PLC, (0.85)%, Open (o) | | | | | | | 1,543 | | | | 1,671,881 | |
(Purchased on 1/19/16 to be repurchased at EUR 1,542,929, collateralized by Total Capital International SA, 1.38% due at 3/19/25, par and fair value of EUR 1,600,000 and $1,728,546, respectively) | | | | | | | | | | | | |
Barclays Bank PLC, (0.85)%, Open (o) | | | | | | | 984 | | | | 1,066,046 | |
(Purchased on 1/19/16 to be repurchased at EUR 983,822, collateralized by Rexel SA, 3.25% due at 6/15/22, par and fair value of EUR 1,049,000 and $1,090,921, respectively) | | | | | | | | | | | | |
Barclays Bank PLC, (0.65)%, Open (o) | | | | | | | 1,130 | | | | 1,223,837 | |
(Purchased on 10/13/15 to be repurchased at EUR 1,127,513, collateralized by SABMiller Holdings, Inc., 1.88% due at 1/20/20, par and fair value of EUR 1,075,000 and $1,221,398, respectively) | | | | | | | | | | | | |
Barclays Bank PLC, (0.65)%, Open (o) | | | | | | | 2,133 | | | | 2,310,641 | |
(Purchased on 10/13/15 to be repurchased at EUR 2,128,778, collateralized by SABMiller Holdings, Inc., 1.88% due at 1/20/20, par and fair value of EUR 2,030,000 and $2,306,454, respectively) | | | | | | | | | | | | |
Barclays Bank PLC, 0.00%, Open (o) | | | USD | | | | 3,126 | | | | 3,126,222 | |
(Purchased on 1/15/16 to be repurchased at $3,126,222, collateralized by Barclays PLC, 4.38% due at 9/11/24, par and fair value of USD 3,135,000 and $3,055,559, respectively) | | | | | | | | | | | | |
| | | | | | | | | | | | |
| Short-Term Securities | | | | | Par
(000) | | | Value | |
Borrowed Bond Agreements (continued) | | | | | | | | | | | | |
Barclays Capital, Inc., 0.00%, Open (o) | | | USD | | | | 5,279 | | | $ | 5,279,165 | |
(Purchased on 1/27/16 to be repurchased at $5,279,165, collateralized by Bank of Nova Scotia, 4.50% due at 12/16/25, par and fair value of USD 5,266,000 and $5,205,178, respectively) | | | | | | | | | | | | |
Barclays Capital, Inc., 0.05%, Open (o) | | | | | | | 31,023 | | | | 31,022,557 | |
(Purchased on 1/29/16 to be repurchased at $31,022,687, collateralized by Royal Bank of Canada, 2.15% due at 3/15/19, par and fair value of USD 30,489,000 and $30,740,016, respectively) | | | | | | | | | | | | |
Barclays Capital, Inc., 0.05%, Open (o) | | | | | | | 21,199 | | | | 21,198,940 | |
(Purchased on 12/17/15 to be repurchased at $21,200,265, collateralized by Potash Corp. of Saskatchewan, Inc., 5.63% due at 12/01/40, par and fair value of USD 19,999,000 and $21,421,429, respectively) | | | | | | | | | | | | |
Barclays Capital, Inc., 0.05%, Open (o) | | | | | | | 24,600 | | | | 24,600,000 | |
(Purchased on 12/17/15 to be repurchased at $24,601,538, collateralized by Total Capital International SA, 3.75% due at 4/10/24, par and fair value of USD 24,000,000 and $24,301,272, respectively) | | | | | | | | | | | | |
Barclays Capital, Inc., 0.05%, Open (o) | | | | | | | 34,743 | | | | 34,743,461 | |
(Purchased on 12/17/15 to be repurchased at $34,745,633, collateralized by International Business Machines Corp., 4.00% due at 6/20/42, par and fair value of USD 36,717,000 and $33,224,479, respectively) | | | | | | | | | | | | |
Barclays Capital, Inc., 0.10%, Open (o) | | | | | | | 239 | | | | 238,500 | |
(Purchased on 12/17/15 to be repurchased at $238,530, collateralized by Standard Chartered PLC, 5.70% due at 3/26/44, par and fair value of USD 240,000 and $234,159, respectively) | | | | | | | | | | | | |
Barclays Capital, Inc., 0.10%, Open (o) | | | | | | | 9,965 | | | | 9,965,250 | |
(Purchased on 12/17/15 to be repurchased at $9,966,496, collateralized by Citigroup, Inc., 5.88% due at 1/30/42, par and fair value of USD 8,600,000 and $9,815,154, respectively) | | | | | | | | | | | | |
BNP Paribas Securities Corp., 0.38%, 2/01/16 | | | | | | | 4,105 | | | | 4,105,000 | |
(Purchased on 1/28/16 to be repurchased at $4,105,173, collateralized by U.S. Treasury Notes, 2.13% due at 12/31/22, par and fair value of USD 4,000,000 and $4,121,408, respectively) | | | | | | | | | | | | |
BNP Paribas Securities Corp., 0.40%, Open (o) | | | | | | | 12,026 | | | | 12,026,000 | |
(Purchased on 12/31/15 to be repurchased at $12,030,276, collateralized by U.S. Treasury Notes, 2.25% due at 11/15/25, par and fair value of USD 12,026,000 and $12,369,403, respectively) | | | | | | | | | | | | |
Citigroup Global Markets Ltd., (1.75)%, Open (o) | | | | | | | 2,806 | | | | 2,806,180 | |
(Purchased on 1/12/16 to be repurchased at $2,803,725, collateralized by Bank of Communications Co. Ltd., 5.00% (h), par and fair value of USD 2,600,000 and $2,619,370, respectively) | | | | | | | | | | | | |
See Notes to Financial Statements.
| | | | | | |
| 32 | | BLACKROCK FUNDS | | JANUARY 31, 2016 | | |
| | | | |
| Schedule of Investments (continued) | | | BlackRock Global Long/Short Credit Fund | |
| | | | |
| | | | | | | | | | | | |
| Short-Term Securities | | | | | Par
(000) | | | Value | |
Borrowed Bond Agreements (continued) | | | | | | | | | | | | |
Citigroup Global Markets Ltd., (0.75)%, Open (o) | | | EUR | | | | 2,288 | | | $ | 2,479,049 | |
(Purchased on 10/29/15 to be repurchased at EUR 2,284,096, collateralized by EDP — Energias de Portugal SA, 5.38% due at 9/16/75, par and fair value of EUR 2,200,000 and $2,276,002, respectively) | | | | | | | | | | | | |
Citigroup Global Markets, Inc., (0.25)%, Open (o) | | | USD | | | | 2,163 | | | | 2,163,000 | |
(Purchased on 12/17/15 to be repurchased at $2,162,309, collateralized by Tribune Media Co., 5.88% due at 7/15/22, par and fair value of USD 2,100,000 and $2,094,750, respectively) | | | | | | | | | | | | |
Citigroup Global Markets, Inc., (0.20)%, Open (o) | | | | | | | 17,214 | | | | 17,214,413 | |
(Purchased on 11/27/15 to be repurchased at $17,208,387, collateralized by Enterprise Products Operating LLC, 3. 75% due at 2/15/25, par and fair value of USD 18,002,000 and $16,408,733, respectively) | | | | | | | | | | | | |
Citigroup Global Markets, Inc., 0.00%, Open (o) | | | | | | | 438 | | | | 437,546 | |
(Purchased on 1/12/16 to be repurchased at $437,546, collateralized by Kennametal, Inc., 3.88% due at 2/15/22, par and fair value of USD 437,000 and $435,935, respectively) | | | | | | | | | | | | |
Citigroup Global Markets, Inc., 0.05%, Open (o) | | | | | | | 19,725 | | | | 19,725,000 | |
(Purchased on 1/22/16 to be repurchased at $19,725,192, collateralized by Target Corp., 4.00% due at 7/01/42, par and fair value of USD 20,000,000 and $19,797,520, respectively) | | | | | | | | | | | | |
Citigroup Global Markets, Inc., 0.10%, Open (o) | | | | | | | 14,732 | | | | 14,731,781 | |
(Purchased on 1/22/16 to be repurchased at $14,732,068, collateralized by Merck & Co., Inc., 3.70% due at 2/10/45, par and fair value of USD 15,207,000 and $14,194,776, respectively) | | | | | | | | | | | | |
Citigroup Global Markets, Inc., 0.10%, Open (o) | | | | | | | 2,191 | | | | 2,190,500 | |
(Purchased on 1/22/16 to be repurchased at $2,190,543, collateralized by Infor U.S., Inc., 6.50% due at 5/15/22, par and fair value of USD 2,600,000 and $2,268,500, respectively) | | | | | | | | | | | | |
Citigroup Global Markets, Inc., 0.10%, Open (o) | | | | | | | 20,125 | | | | 20,125,000 | |
(Purchased on 1/22/16 to be repurchased at $20,125,391, collateralized by Novartis Capital Corp., 4.00% due at 11/20/45, par and fair value of USD 20,000,000 and $20,200,140, respectively) | | | | | | | | | | | | |
Citigroup Global Markets, Inc., 0.10%, Open (o) | | | | | | | 36,006 | | | | 36,006,250 | |
(Purchased on 10/06/15 to be repurchased at $36,018,052, collateralized by Anheuser-Busch InBev Finance, Inc., 3.70% due at 2/01/24, par and fair value of USD 35,000,000 and $36,187,620, respectively) | | | | | | | | | | | | |
Citigroup Global Markets, Inc., 0.10%, Open (o) | | | | | | | 14,396 | | | | 14,395,625 | |
(Purchased on 12/10/15 to be repurchased at $14,397,704, collateralized by Enterprise Products Operating LLC, 3.70% due at 2/15/26, par and fair value of USD 15,500,000 and $13,941,165, respectively) | | | | | | | | | | | | |
| | | | | | | | | | | | |
| Short-Term Securities | | | | | Par
(000) | | | Value | |
Borrowed Bond Agreements (continued) | | | | | | | | | | | | |
Citigroup Global Markets, Inc., 0.10%, Open (o) | | | USD | | | | 4,808 | | | $ | 4,808,377 | |
(Purchased on 12/21/15 to be repurchased at $4,808,925, collateralized by BHP Billiton Finance USA Ltd., 6.75% due at 10/19/75, par and fair value of USD 4,938,000 and $4,641,720, respectively) | | | | | | | | | | | | |
Citigroup Global Markets, Inc., 0.10%, Open (o) | | | | | | | 8,681 | | | | 8,681,250 | |
(Purchased on 6/08/15 to be repurchased at $8,686,989, collateralized by PepsiCo, Inc., 5.50% due at 1/15/40, par and fair value of USD 7,500,000 and $8,906,093, respectively) | | | | | | | | | | | | |
Citigroup Global Markets, Inc., 0.10%, Open (o) | | | | | | | 11,460 | | | | 11,460,000 | |
(Purchased on 6/09/15 to be repurchased at $11,467,545, collateralized by PepsiCo, Inc., 2.75% due at 4/30/25, par and fair value of USD 12,000,000 and $11,915,376, respectively) | | | | | | | | | | | | |
Citigroup Global Markets, Inc., 0.10%, Open (o) | | | | | | | 1,439 | | | | 1,439,000 | |
(Purchased on 6/10/15 to be repurchased at $1,439,939, collateralized by Eastman Chemical Co., 3.60% due at 8/15/22, par and fair value of USD 1,425,000 and $1,382,241, respectively) | | | | | | | | | | | | |
Citigroup Global Markets, Inc., 0.10%, Open (o) | | | | | | | 10,750 | | | | 10,750,000 | |
(Purchased on 8/05/15 to be repurchased at $10,755,375, collateralized by Bank of America Corp., 4.88% due at 4/01/44, par and fair value of USD 10,000,000 and $10,210,660, respectively) | | | | | | | | | | | | |
Citigroup Global Markets, Inc., 0.10%, Open (o) | | | | | | | 33,418 | | | | 33,418,000 | |
(Purchased on 8/13/15 to be repurchased at $33,433,966, collateralized by Verizon Communications, Inc., 3.50% due at 11/01/24, par and fair value of USD 34,100,000 and $33,813,731, respectively) | | | | | | | | | | | | |
Citigroup Global Markets, Inc., 0.10%, Open (o) | | | | | | | 31,425 | | | | 31,425,000 | |
(Purchased on 8/18/15 to be repurchased at $31,439,578, collateralized by Wal-Mart Stores, Inc., 4.30% due at 4/22/44, par and fair value of USD 30,000,000 and $31,076,970, respectively) | | | | | | | | | | | | |
Citigroup Global Markets, Inc., 0.10%, Open (o) | | | | | | | 3,557 | | | | 3,556,875 | |
(Purchased on 9/03/15 to be repurchased at $3,558,367, collateralized by Medtronic, Inc., 3.50% due at 3/15/25, par and fair value of USD 3,500,000 and $3,593,660, respectively) | | | | | | | | | | | | |
Citigroup Global Markets, Inc., 0.15%, Open (o) | | | | | | | 19,750 | | | | 19,750,000 | |
(Purchased on 1/14/16 to be repurchased at $19,751,481, collateralized by Hewlett Packard Enterprise Co., 4.90% due at 10/15/25, par and fair value of USD 20,000,000 and $19,036,200, respectively) | | | | | | | | | | | | |
Citigroup Global Markets, Inc., 0.15%, Open (o) | | | | | | | 11,547 | | | | 11,546,987 | |
(Purchased on 12/22/15 to be repurchased at $11,548,960, collateralized by Goldman Sachs Group, Inc., 4.80% due at 7/08/44, par and fair value of USD 11,170,000 and $11,056,457, respectively) | | | | | | | | | | | | |
Citigroup Global Markets, Inc., 0.15%, Open (o) | | | | | | | 3,228 | | | | 3,227,875 | |
(Purchased on 12/22/15 to be repurchased at $3,228,426, collateralized by Amazon.com, Inc., 3.80% due at 12/05/24, par and fair value of USD 3,100,000 and $3,250,530, respectively) | | | | | | | | | | | | |
See Notes to Financial Statements.
| | | | | | |
| | | BLACKROCK FUNDS | | JANUARY 31, 2016 | | 33 |
| | | | |
| Schedule of Investments (continued) | | | BlackRock Global Long/Short Credit Fund | |
| | | | |
| | | | | | | | | | | | |
| Short-Term Securities | | | | | Par
(000) | | | Value | |
Borrowed Bond Agreements (continued) | | | | | | | | | | | | |
Credit Suisse Securities (USA) LLC,
0.00%, Open (o) | | | USD | | | | 11,128 | | | $ | 11,128,145 | |
(Purchased on 12/17/15 to be repurchased at $11,128,145, collateralized by Enterprise Products Operating LLC, 3.75% due at 2/15/25, par and fair value of USD 11,998,000 and $10,936,117, respectively) | | | | | | | | | | | | |
Credit Suisse Securities (USA) LLC,
0.10%, Open (o) | | | | | | | 11,058 | | | | 11,058,320 | |
(Purchased on 12/17/15 to be repurchased at $11,059,702, collateralized by Royal Bank of Canada, 2.15% due at 3/15/19, par and fair value of USD 10,976,000 and $11,066,365, respectively) | | | | | | | | | | | | |
Credit Suisse Securities (USA) LLC,
0.10%, Open (o) | | | | | | | 23,063 | | | | 23,062,500 | |
(Purchased on 12/17/15 to be repurchased at $23,065,383, collateralized by Wells Fargo & Co., 3.90% due at 5/01/45, par and fair value of USD 25,000,000 and $22,816,400, respectively) | | | | | | | | | | | | |
Deutsche Bank Securities, Inc., (0.38)%, Open (o) | | | | | | | 24,540 | | | | 24,540,000 | |
(Purchased on 9/18/15 to be repurchased at $24,504,771, collateralized by Statoil ASA, 3.70% due at 3/01/24, par and fair value of USD 24,000,000 and $24,116,880, respectively) | | | | | | | | | | | | |
Deutsche Bank Securities, Inc., (0.25)%, Open (o) | | | | | | | 20,225 | | | | 20,225,000 | |
(Purchased on 1/22/16 to be repurchased at $20,224,017, collateralized by Roche Holdings, Inc., 3.00% due at 11/10/25, par and fair value of USD 20,000,000 and $20,184,840, respectively) | | | | | | | | | | | | |
Deutsche Bank Securities, Inc., 0.05%, Open (o) | | | | | | | 4,661 | | | | 4,660,500 | |
(Purchased on 12/22/15 to be repurchased at $4,660,765, collateralized by Amazon.com, Inc., 2.50% due at 11/29/22, par and fair value of USD 4,780,000 and $4,710,217, respectively) | | | | | | | | | | | | |
Deutsche Bank Securities, Inc., 0.38%, 2/01/16 | | | | | | | 41,258 | | | | 41,257,686 | |
(Purchased on 1/29/16 to be repurchased at $41,258,993, collateralized by U.S. Treasury Notes, 2.25% due at 11/15/25, par and fair value of USD 39,910,700 and $41,050,350, respectively) | | | | | | | | | | | | |
J.P. Morgan Securities LLC, (0.12)%, Open (o) | | | | | | | 22,830 | | | | 22,830,000 | |
(Purchased on 12/15/15 to be repurchased at $22,826,347, collateralized by ConocoPhillips Co., 3.35% due at 11/15/24, par and fair value of USD 24,000,000 and $20,611,272, respectively) | | | | | | | | | | | | |
J.P. Morgan Securities LLC, (0.06)%, Open (o) | | | | | | | 140,667 | | | | 140,666,581 | |
(Purchased on 1/26/16 to be repurchased at $140,665,409, collateralized by U.S. Treasury Notes, 1.75% due at 12/31/20, par and fair value of USD 138,417,300 and $141,147,853, respectively) | | | | | | | | | | | | |
J.P. Morgan Securities LLC, 0.05%, Open (o) | | | | | | | 8,234 | | | | 8,234,375 | |
(Purchased on 12/30/15 to be repurchased at $8,234,752, collateralized by Bank of America Corp., 5.00% due at 1/21/44, par and fair value of USD 7,750,000 and $7,992,033, respectively) | | | | | | | | | | | | |
| | | | | | | | | | | | |
| Short-Term Securities | | | | | Par
(000) | | | Value | |
Borrowed Bond Agreements (continued) | | | | | | | | | | | | |
J.P. Morgan Securities LLC, 0.41%, Open (o) | | | USD | | | | 105,984 | | | $ | 105,983,975 | |
(Purchased on 1/26/16 to be repurchased at $105,990,010, collateralized by U.S. Treasury Notes, 2.13% due at 12/31/22, par and fair value of USD 103,399,000 and $106,537,366, respectively) | | | | | | | | | | | | |
J.P. Morgan Securities PLC, (3.00)%, Open (o) | | | EUR | | | | 1,434 | | | | 1,553,426 | |
(Purchased on 1/19/16 to be repurchased at EUR 1,432,669, collateralized by Repsol International Finance BV, 3.63% due at 10/07/21, par and fair value of EUR 1,400,000 and $1,526,543, respectively) | | | | | | | | | | | | |
J.P. Morgan Securities PLC, (2.50)%, Open (o) | | | | | | | 794 | | | | 859,863 | |
(Purchased on 1/18/16 to be repurchased at EUR 793,087, collateralized by Faurecia, 3.13% due at 6/15/22, par and fair value of EUR 800,000 and $834,137, respectively) | | | | | | | | | | | | |
J.P. Morgan Securities PLC, (1.60)%, Open (o) | | | | | | | 310 | | | | 336,222 | |
(Purchased on 1/15/16 to be repurchased at EUR 310,190, collateralized by Repsol International Finance BV, 3.63% due at 10/07/21, par and fair value of EUR 300,000 and $327,116, respectively) | | | | | | | | | | | | |
J.P. Morgan Securities PLC, (1.60)%, Open (o) | | | | | | | 414 | | | | 448,296 | |
(Purchased on 1/15/16 to be repurchased at EUR 413,587, collateralized by Repsol International Finance BV, 3.63% due at 10/07/21, par and fair value of EUR 400,000 and $436,156, respectively) | | | | | | | | | | | | |
J.P. Morgan Securities PLC, (1.50)%, Open (o) | | | | | | | 1,189 | | | | 1,288,440 | |
(Purchased on 1/18/16 to be repurchased at EUR 1,188,777, collateralized by Eni SpA, 1.50% due at 2/02/26, par and fair value of EUR 1,200,000 and $1,250,263, respectively) | | | | | | | | | | | | |
J.P. Morgan Securities PLC, (1.50)%, Open (o) | | | | | | | 1,373 | | | | 1,487,459 | |
(Purchased on 1/18/16 to be repurchased at EUR 1,372,402, collateralized by Solvay SA, 1.63% due at 12/02/22, par and fair value of EUR 1,300,000 and $1,421,839, respectively) | | | | | | | | | | | | |
J.P. Morgan Securities PLC, (1.50)%, Open (o) | | | | | | | 396 | | | | 429,480 | |
(Purchased on 1/18/16 to be repurchased at EUR 396,259, collateralized by Eni SpA, 1.50% due at 2/02/26, par and fair value of EUR 400,000 and $416,754, respectively) | | | | | | | | | | | | |
J.P. Morgan Securities PLC, (1.30)%, Open (o) | | | | | | | 1,044 | | | | 1,130,547 | |
(Purchased on 1/25/16 to be repurchased at EUR 1,043,430, collateralized by Vodafone Group PLC, 1.88% due at 9/11/25, par and fair value of EUR 1,000,000 and $1,087,017, respectively) | | | | | | | | | | | | |
J.P. Morgan Securities PLC, (1.30)%, Open (o) | | | | | | | 1,879 | | | | 2,034,984 | |
(Purchased on 1/25/16 to be repurchased at EUR 1,878,175, collateralized by Vodafone Group PLC, 1.88% due at 9/11/25, par and fair value of EUR 1,800,000 and $1,956,630, respectively) | | | | | | | | | | | | |
See Notes to Financial Statements.
| | | | | | |
| 34 | | BLACKROCK FUNDS | | JANUARY 31, 2016 | | |
| | | | |
| Schedule of Investments (continued) | | | BlackRock Global Long/Short Credit Fund | |
| | | | |
| | | | | | | | | | | | |
| Short-Term Securities | | | | | Par
(000) | | | Value | |
Borrowed Bond Agreements (continued) | | | | | | | | | | | | |
J.P. Morgan Securities PLC, (1.30)%, Open (o) | | | EUR | | | | 1,045 | | | $ | 1,131,528 | |
(Purchased on 1/26/16 to be repurchased at EUR 1,044,374, collateralized by Vodafone Group PLC, 1.88% due at 9/11/25, par and fair value of EUR 1,000,000 and $1,087,017, respectively) | | | | | | | | | | | | |
J.P. Morgan Securities PLC, (1.30)%, Open (o) | | | | | | | 1,462 | | | | 1,584,139 | |
(Purchased on 1/26/16 to be repurchased at EUR 1,462,124, collateralized by Vodafone Group PLC, 1.88% due at 9/11/25, par and fair value of EUR 1,400,000 and $1,521,823, respectively) | | | | | | | | | | | | |
J.P. Morgan Securities PLC, (1.25)%, Open (o) | | | | | | | 612 | | | | 663,465 | |
(Purchased on 1/14/16 to be repurchased at EUR 612,153, collateralized by Gestamp Funding Luxembourg SA, 5.88% due at 5/31/20, par and fair value of EUR 560,000 and $622,569, respectively) | | | | | | | | | | | | |
J.P. Morgan Securities PLC, (1.25)%, Open (o) | | | | | | | 907 | | | | 982,060 | |
(Purchased on 1/14/16 to be repurchased at EUR 906,108, collateralized by Gestamp Funding Luxembourg SA, 5.88% due at 5/31/20, par and fair value of EUR 840,000 and $933,854, respectively) | | | | | | | | | | | | |
J.P. Morgan Securities PLC, (1.25)%, Open (o) | | | | | | | 343 | | | | 372,088 | |
(Purchased on 1/18/16 to be repurchased at EUR 343,335, collateralized by Lock AS, 7.00% due at 8/15/21, par and fair value of EUR 313,000 and $347,928, respectively) | | | | | | | | | | | | |
J.P. Morgan Securities PLC, (1.20)%, Open (o) | | | | | | | 1,362 | | | | 1,474,982 | |
(Purchased on 1/21/16 to be repurchased at EUR 1,361,253, collateralized by Solvay SA, 1.63% due at 12/02/22, par and fair value of EUR 1,300,000 and $1,421,839, respectively) | | | | | | | | | | | | |
J.P. Morgan Securities PLC, (1.10)%, Open (o) | | | | | | | 228 | | | | 246,677 | |
(Purchased on 1/18/16 to be repurchased at EUR 227,627, collateralized by Rexel SA, 3.25% due at 6/15/22, par and fair value of EUR 233,000 and $242,311, respectively) | | | | | | | | | | | | |
J.P. Morgan Securities PLC, (1.10)%, Open (o) | | | | | | | 1,293 | | | | 1,400,581 | |
(Purchased on 9/25/15 to be repurchased at EUR 1,287,952, collateralized by Glencore Finance Europe SA, 5.25% due at 3/22/17, par and fair value of EUR 1,200,000 and $1,286,954, respectively) | | | | | | | | | | | | |
J.P. Morgan Securities PLC, (1.10)%, Open (o) | | | | | | | 862 | | | | 933,720 | |
(Purchased on 9/25/15 to be repurchased at EUR 858,635, collateralized by Glencore Finance Europe SA, 5.25% due at 3/22/17, par and fair value of EUR 800,000 and $857,969, respectively) | | | | | | | | | | | | |
J.P. Morgan Securities PLC, (1.05)%, Open (o) | | | | | | | 574 | | | | 622,081 | |
(Purchased on 1/14/16 to be repurchased at EUR 574,015, collateralized by Faurecia, 3.13% due at 6/15/22, par and fair value of EUR 560,000 and $583,896, respectively) | | | | | | | | | | | | |
J.P. Morgan Securities PLC, (1.00)%, Open (o) | | | | | | | 952 | | | | 1,031,750 | |
(Purchased on 1/08/16 to be repurchased at EUR 951,916, collateralized by EDP Finance BV, 2.63% due at 1/18/22, par and fair value of EUR 900,000 and $961,776, respectively) | | | | | | | | | | | | |
| | | | | | | | | | | | |
| Short-Term Securities | | | | | Par
(000) | | | Value | |
Borrowed Bond Agreements (continued) | | | | | | | | | | | | |
J.P. Morgan Securities PLC, (0.75)%, Open (o) | | | USD | | | | 774 | | | $ | 774,199 | |
(Purchased on 1/14/16 to be repurchased at $774,006, collateralized by Societe Generale SA, 6.00% (h), par and fair value of USD 765,000 and $700,908, respectively) | | | | | | | | | | | | |
J.P. Morgan Securities PLC, (0.40)%, Open (o) | | | | | | | 1,857 | | | | 1,857,387 | |
(Purchased on 1/15/16 to be repurchased at $1,857,160, collateralized by Societe Generale SA, 6.00% (h), par and fair value of USD 1,835,000 and $1,681,264, respectively) | | | | | | | | | | | | |
J.P. Morgan Securities PLC, (0.25)%, Open (o) | | | | | | | 2,220 | | | | 2,219,737 | |
(Purchased on 1/08/16 to be repurchased at $2,219,428, collateralized by Republic of Ecuador, 7.95% due at 6/20/24, par and fair value of USD 3,000,000 and $2,077,500, respectively) | | | | | | | | | | | | |
Merrill Lynch, Pierce, Fenner & Smith, Inc., 0.00%, Open (o) | | | | | | | 6,256 | | | | 6,256,125 | |
(Purchased on 12/16/15 to be repurchased at $6,256,125, collateralized by Standard Chartered PLC, 5.70% due at 3/26/44, par and fair value of USD 6,225,000 and $6,073,496, respectively) | | | | | | | | | | | | |
Merrill Lynch, Pierce, Fenner & Smith, Inc., 0.00%, Open (o) | | | | | | | 15,518 | | | | 15,518,475 | |
(Purchased on 8/05/15 to be repurchased at $15,518,475, collateralized by Morgan Stanley, 6.38% due at 7/24/42, par and fair value of USD 12,390,000 and $15,040,679, respectively) | | | | | | | | | | | | |
RBC Capital Markets, LLC, (3.50)%, Open (o) | | | | | | | 9,163 | | | | 9,163,125 | |
(Purchased on 12/17/15 to be repurchased at $9,123,036, collateralized by Molson Coors Brewing Co., 3.50% due at 5/01/22, par and fair value of USD 9,050,000 and $9,219,326, respectively) | | | | | | | | | | | | |
RBC Capital Markets, LLC, 0.15%, Open (o) | | | | | | | 17,535 | | | | 17,535,000 | |
(Purchased on 1/11/16 to be repurchased at $17,536,534, collateralized by Citigroup, Inc., 6.68% due at 9/13/43, par and fair value of USD 14,000,000 and $16,733,136, respectively) | | | | | | | | | | | | |
RBC Capital Markets, LLC, 0.15%, Open (o) | | | | | | | 18,519 | | | | 18,518,500 | |
(Purchased on 1/11/16 to be repurchased at $18,520,120, collateralized by Wells Fargo & Co., 4.90% due at 11/17/45, par and fair value of USD 18,200,000 and $18,281,117, respectively) | | | | | | | | | | | | |
RBC Capital Markets, LLC, 0.15%, Open (o) | | | | | | | 18,529 | | | | 18,528,750 | |
(Purchased on 1/11/16 to be repurchased at $18,530,371, collateralized by Merrill Lynch & Co., 7.75% due at 5/14/38, par and fair value of USD 13,500,000 and $18,190,913, respectively) | | | | | | | | | | | | |
RBC Capital Markets, LLC, 0.15%, Open (o) | | | | | | | 5,341 | | | | 5,340,600 | |
(Purchased on 1/15/16 to be repurchased at $5,340,889, collateralized by Netflix Inc., 5.50% due at 2/15/22, par and fair value of USD 5,160,000 and $5,314,800, respectively) | | | | | | | | | | | | |
See Notes to Financial Statements.
| | | | | | |
| | | BLACKROCK FUNDS | | JANUARY 31, 2016 | | 35 |
| | | | |
| Schedule of Investments (continued) | | | BlackRock Global Long/Short Credit Fund | |
| | | | |
| | | | | | | | | | | | |
| Short-Term Securities | | | | | Par
(000) | | | Value | |
Borrowed Bond Agreements (continued) | | | | | | | | | | | | |
RBC Capital Markets, LLC, 0.15%, Open (o) | | | USD | | | | 779 | | | $ | 778,844 | |
(Purchased on 1/15/16 to be repurchased at $778,899, collateralized by Sabine Pass Liquefaction LLC, 5.63% due at 3/01/25, par and fair value of USD 875,000 and $752,500, respectively) | | | | | | | | | | | | |
RBC Capital Markets, LLC, 0.15%, Open (o) | | | | | | | 5,385 | | | | 5,384,500 | |
(Purchased on 1/20/16 to be repurchased at $5,384,747, collateralized by Cimarex Energy Co., 4.38% due at 6/01/24, par and fair value of USD 6,050,000 and $5,296,231, respectively) | | | | | | | | | | | | |
RBC Capital Markets, LLC, 0.15%, Open (o) | | | | | | | 1,812 | | | | 1,811,563 | |
(Purchased on 1/21/16 to be repurchased at $1,811,638, collateralized by Steel Dynamics, Inc., 5.50% due at 10/01/24, par and fair value of USD 2,125,000 and $1,917,813, respectively) | | | | | | | | | | | | |
RBC Capital Markets, LLC, 0.15%, Open (o) | | | | | | | 46,224 | | | | 46,224,000 | |
(Purchased on 1/21/16 to be repurchased at $46,225,926, collateralized by JPMorgan Chase & Co., 4.85% due at 2/01/44, par and fair value of USD 42,800,000 and $45,413,197, respectively) | | | | | | | | | | | | |
RBC Capital Markets, LLC, 0.15%, Open (o) | | | | | | | 11,730 | | | | 11,730,000 | |
(Purchased on 1/26/16 to be repurchased at $11,730,293, collateralized by ConocoPhillips Co., 6.50% due at 2/01/39, par and fair value of USD 11,500,000 and $11,045,808, respectively) | | | | | | | | | | | | |
RBC Capital Markets, LLC, 0.15%, Open (o) | | | | | | | 2,766 | | | | 2,765,820 | |
(Purchased on 1/27/16 to be repurchased at $2,765,866, collateralized by Rackspace Hosting, Inc., 6.50% due at 1/15/24, par and fair value of USD 2,974,000 and $2,713,775, respectively) | | | | | | | | | | | | |
RBC Capital Markets, LLC, 0.15%, Open (o) | | | | | | | 11,634 | | | | 11,634,375 | |
(Purchased on 12/17/15 to be repurchased at $11,636,556, collateralized by Rio Tinto Finance USA Ltd., 3.75% due at 6/15/25, par and fair value of USD 12,750,000 and $11,437,949, respectively) | | | | | | | | | | | | |
RBC Capital Markets, LLC, 0.15%, Open (o) | | | | | | | 13,331 | | | | 13,331,250 | |
(Purchased on 12/17/15 to be repurchased at $13,333,750, collateralized by Goldman Sachs Group, Inc., 5.15% due at 5/22/45, par and fair value of USD 13,500,000 and $13,158,477, respectively) | | | | | | | | | | | | |
RBC Capital Markets, LLC, 0.15%, Open (o) | | | | | | | 15,188 | | | | 15,187,500 | |
(Purchased on 12/17/15 to be repurchased at $15,190,348, collateralized by Caterpillar, Inc., 3.40% due at 5/15/24, par and fair value of USD 15,000,000 and $15,234,885, respectively) | | | | | | | | | | | | |
RBC Capital Markets, LLC, 0.15%, Open (o) | | | | | | | 18,225 | | | | 18,225,000 | |
(Purchased on 12/17/15 to be repurchased at $18,228,417, collateralized by Verizon Communications, Inc., 6.55% due at 9/15/43, par and fair value of USD 15,000,000 and $17,511,840, respectively) | | | | | | | | | | | | |
| | | | | | | | | | | | |
| Short-Term Securities | | | | | Par
(000) | | | Value | |
Borrowed Bond Agreements (continued) | | | | | | | | | | | | |
RBC Capital Markets, LLC, 0.15%, Open (o) | | | USD | | | | 2,827 | | | $ | 2,827,187 | |
(Purchased on 12/17/15 to be repurchased at $2,827,718, collateralized by Owens-Brockway Glass Container, Inc., 5.88% due at 8/15/23, par and fair value of USD 2,725,000 and $2,673,906, respectively) | | | | | | | | | | | | |
RBC Capital Markets, LLC, 0.15%, Open (o) | | | | | | | 20,000 | | | | 20,000,000 | |
(Purchased on 12/17/15 to be repurchased at $20,003,750, collateralized by Time Warner, Inc., 3.60% due at 7/15/25, par and fair value of USD 20,000,000 and $19,415,040, respectively) | | | | | | | | | | | | |
RBC Capital Markets, LLC, 0.15%, Open (o) | | | | | | | 20,050 | | | | 20,050,000 | |
(Purchased on 12/17/15 to be repurchased at $20,053,759, collateralized by Abbott Laboratories, 2.95% due at 3/15/25, par and fair value of USD 20,000,000 and $19,985,080, respectively) | | | | | | | | | | | | |
RBC Capital Markets, LLC, 0.15%, Open (o) | | | | | | | 24,540 | | | | 24,540,000 | |
(Purchased on 12/17/15 to be repurchased at $24,544,601, collateralized by BP Capital Markets PLC, 3.81% due at 2/10/24, par and fair value of USD 24,000,000 and $23,774,400, respectively) | | | | | | | | | | | | |
RBC Capital Markets, LLC, 0.15%, Open (o) | | | | | | | 25,476 | | | | 25,475,587 | |
(Purchased on 12/17/15 to be repurchased at $25,480,364, collateralized by CCO Safari II LLC, 4.91% due at 7/23/25, par and fair value of USD 24,915,000 and $24,939,691, respectively) | | | | | | | | | | | | |
RBC Capital Markets, LLC, 0.15%, Open (o) | | | | | | | 3,360 | | | | 3,360,000 | |
(Purchased on 12/17/15 to be repurchased at $3,360,630, collateralized by LyondellBasell Industries NV, 5.75% due at 4/15/24, par and fair value of USD 3,000,000 and $3,252,933, respectively) | | | | | | | | | | | | |
RBC Capital Markets, LLC, 0.15%, Open (o) | | | | | | | 3,930 | | | | 3,930,000 | |
(Purchased on 12/17/15 to be repurchased at $3,930,737, collateralized by Merck & Co., Inc., 2.75% due at 2/10/25, par and fair value of USD 4,000,000 and $3,959,664, respectively) | | | | | | | | | | | | |
RBC Capital Markets, LLC, 0.15%, Open (o) | | | | | | | 6,987 | | | | 6,987,000 | |
(Purchased on 12/17/15 to be repurchased at $6,988,310, collateralized by Time Warner Cable, Inc., 6.55% due at 5/01/37, par and fair value of USD 6,850,000 and $6,837,903, respectively) | | | | | | | | | | | | |
RBC Capital Markets, LLC, 0.15%, Open (o) | | | | | | | 11,190 | | | | 11,190,375 | |
(Purchased on 12/18/15 to be repurchased at $11,192,473, collateralized by Seagate HDD, 4.75% due at 6/01/23, par and fair value of USD 13,050,000 and $11,212,312, respectively) | | | | | | | | | | | | |
RBC Capital Markets, LLC, 0.15%, Open (o) | | | | | | | 14,406 | | | | 14,406,000 | |
(Purchased on 12/21/15 to be repurchased at $14,408,521, collateralized by Occidental Petroleum Corp., 2.70% due at 2/15/23, par and fair value of USD 14,700,000 and $13,614,626, respectively) | | | | | | | | | | | | |
See Notes to Financial Statements.
| | | | | | |
| 36 | | BLACKROCK FUNDS | | JANUARY 31, 2016 | | |
| | | | |
| Schedule of Investments (continued) | | | BlackRock Global Long/Short Credit Fund | |
| | | | |
| | | | | | | | | | | | |
| Short-Term Securities | | | | | Par (000) | | | Value | |
Borrowed Bond Agreements (continued) | |
RBC Capital Markets, LLC, 0.15%, Open (o) | | | USD | | | | 1,339 | | | $ | 1,339,000 | |
(Purchased on 12/28/15 to be repurchased at $1,339,195, collateralized by LifePoint Health, Inc., 5.50% due at 12/01/21, par and fair value of USD 1,300,000 and $1,319,500, respectively) | | | | | | | | | | | | |
| | | | | | | | | | | | 1,226,438,913 | |
| | | |
| Short-Term Securities | | | | | Shares | | | | |
Money Market Funds — 8.7% | | | | | | | | | | | | |
BlackRock Liquidity Funds, TempFund, Institutional Class, 0.32% (m)(n) | | | | | | | 444,946,963 | | | | 444,946,963 | |
Total Short-Term Securities (Cost — $1,671,820,245) — 32.6% | | | | 1,671,385,876 | |
| | | | | | | | | | | | |
| Options Purchased | | | | | | | | | |
(Cost — $10,068,539) — 0.1% | | | | | | | | | | | 6,627,378 | |
Total Investments Before Options Written, Borrowed Bonds and Investments Sold Short | | | | | |
(Cost — $6,587,826,332) — 121.7% | | | | | | | | | | | 6,234,113,194 | |
| | | | | | | | | | | | |
| Options Written | | | | | | | | | |
(Premiums Received — $1,591,991) — (0.0)% | | | | (689,777 | ) |
| | | | | | | | | | | | |
| Borrowed Bonds | | | | | Par (000) | | | | |
Corporate Bonds — (17.1)% | | | | | | | | | | | | |
Abbott Laboratories, 2.95%, 3/15/25 | | | USD | | | | 20,000 | | | | (19,985,080 | ) |
Amazon.com, Inc.: | | | | | | | | | | | | |
2.50%, 11/29/22 | | | | | | | 4,780 | | | | (4,710,217 | ) |
3.80%, 12/05/24 | | | | | | | 3,100 | | | | (3,250,530 | ) |
Anheuser-Busch InBev Finance, Inc., 3.70%, 2/01/24 | | | | | | | 35,000 | | | | (36,187,620 | ) |
Bank of America Corp.: | | | | | | | | | | | | |
5.00%, 1/21/44 | | | | | | | 7,750 | | | | (7,992,033 | ) |
4.88%, 4/01/44 | | | | | | | 10,000 | | | | (10,210,660 | ) |
Bank of Communications Co. Ltd., 5.00% (b)(h) | | | | | | | 2,600 | | | | (2,619,370 | ) |
Bank of Nova Scotia, 4.50%, 12/16/25 | | | | | | | 5,266 | | | | (5,205,178 | ) |
Barclays PLC, 4.38%, 9/11/24 | | | | | | | 3,135 | | | | (3,055,559 | ) |
BHP Billiton Finance USA Ltd., 6.75%, 10/19/75 (a)(b) | | | | | | | 4,938 | | | | (4,641,720 | ) |
BP Capital Markets PLC, 3.81%, 2/10/24 | | | | | | | 24,000 | | | | (23,774,400 | ) |
Caterpillar, Inc., 3.40%, 5/15/24 | | | | | | | 15,000 | | | | (15,234,885 | ) |
CCO Safari II LLC, 4.91%, 7/23/25 (a) | | | | | | | 24,915 | | | | (24,939,691 | ) |
Cimarex Energy Co., 4.38%, 6/01/24 | | | | | | | 6,050 | | | | (5,296,231 | ) |
Citigroup, Inc.: | | | | | | | | | | | | |
5.88%, 1/30/42 | | | | | | | 8,600 | | | | (9,815,154 | ) |
6.68%, 9/13/43 | | | | | | | 14,000 | | | | (16,733,136 | ) |
ConocoPhillips Co.: | | | | | | | | | | | | |
3.35%, 11/15/24 | | | | | | | 24,000 | | | | (20,611,272 | ) |
6.50%, 2/01/39 | | | | | | | 11,500 | | | | (11,045,808 | ) |
Eastman Chemical Co., 3.60%, 8/15/22 | | | | | | | 1,425 | | | | (1,382,241 | ) |
EDP — Energias de Portugal SA, 5.38%, 9/16/75 (b) | | | EUR | | | | 2,200 | | | | (2,276,002 | ) |
EDP Finance BV, 2.63%, 1/18/22 | | | | | | | 900 | | | | (961,776 | ) |
| | | | | | | | | | | | |
| Borrowed Bonds | | | | | Par
(000) | | | Value | |
Corporate Bonds (continued) | | | | | | | | | | | | |
Eni SpA, 1.50%, 2/02/26 | | | EUR | | | | 1,600 | | | $ | (1,667,017 | ) |
Enterprise Products Operating LLC: | | | | | | | | | | | | |
3.75%, 2/15/25 | | | USD | | | | 30,000 | | | | (27,344,850 | ) |
3.70%, 2/15/26 | | | | | | | 15,500 | | | | (13,941,165 | ) |
Faurecia, 3.13%, 6/15/22 | | | EUR | | | | 1,360 | | | | (1,418,033 | ) |
Gestamp Funding Luxembourg SA, 5.88%, 5/31/20 | | | | | | | 1,400 | | | | (1,556,423 | ) |
Glencore Finance Europe SA, 5.25%, 3/22/17 | | | | | | | 2,000 | | | | (2,144,923 | ) |
Goldman Sachs Group, Inc.: | | | | | | | | | | | | |
4.80%, 7/08/44 | | | USD | | | | 11,170 | | | | (11,056,457 | ) |
5.15%, 5/22/45 | | | | | | | 13,500 | | | | (13,158,477 | ) |
Grupo Antolin Dutch BV, 5.13%, 6/30/22 | | | EUR | | | | 873 | | | | (969,359 | ) |
Hewlett Packard Enterprise Co., 4.90%, 10/15/25 (a) | | | USD | | | | 20,000 | | | | (19,036,200 | ) |
HSBC Holdings PLC, 5.63% (b)(h) | | | | | | | 2,600 | | | | (2,533,536 | ) |
Infor U.S., Inc., 6.50%, 5/15/22 (a) | | | | | | | 2,600 | | | | (2,268,500 | ) |
International Business Machines Corp., 4.00%, 6/20/42 | | | | | | | 36,717 | | | | (33,224,479 | ) |
JPMorgan Chase & Co., 4.85%, 2/01/44 | | | | | | | 42,800 | | | | (45,413,197 | ) |
Kennametal, Inc., 3.88%, 2/15/22 | | | | | | | 437 | | | | (435,935 | ) |
LifePoint Health, Inc., 5.50%, 12/01/21 | | | | | | | 1,300 | | | | (1,319,500 | ) |
Lock A/S, 7.00%, 8/15/21 | | | EUR | | | | 313 | | | | (347,928 | ) |
LyondellBasell Industries NV, 5.75%, 4/15/24 | | | USD | | | | 3,000 | | | | (3,252,933 | ) |
Medtronic, Inc., 3.50%, 3/15/25 | | | | | | | 3,500 | | | | (3,593,660 | ) |
Merck & Co., Inc.: | | | | | | | | | | | | |
2.75%, 2/10/25 | | | | | | | 4,000 | | | | (3,959,664 | ) |
3.70%, 2/10/45 | | | | | | | 15,207 | | | | (14,194,776 | ) |
Merrill Lynch & Co., 7.75%, 5/14/38 | | | | | | | 13,500 | | | | (18,190,913 | ) |
Molson Coors Brewing Co., 3.50%, 5/01/22 | | | | | | | 9,050 | | | | (9,219,326 | ) |
Morgan Stanley, 6.38%, 7/24/42 | | | | | | | 12,390 | | | | (15,040,679 | ) |
Netflix, Inc., 5.50%, 2/15/22 (a) | | | | | | | 5,160 | | | | (5,314,800 | ) |
Novartis Capital Corp., 4.00%, 11/20/45 | | | | | | | 20,000 | | | | (20,200,140 | ) |
Occidental Petroleum Corp., 2.70%, 2/15/23 | | | | | | | 14,700 | | | | (13,614,626 | ) |
Owens-Brockway Glass Container, Inc., 5.88%, 8/15/33 | | | | | | | 2,725 | | | | (2,673,906 | ) |
PepsiCo, Inc.: | | | | | | | | | | | | |
2.75%, 4/30/25 | | | | | | | 12,000 | | | | (11,915,376 | ) |
5.50%, 1/15/40 | | | | | | | 7,500 | | | | (8,906,093 | ) |
Potash Corp. of Saskatchewan, Inc., 5.63%, 12/01/40 | | | | | | | 19,999 | | | | (21,421,429 | ) |
Rackspace Hosting, Inc., 6.50%, 1/15/24 (a) | | | | | | | 2,974 | | | | (2,713,775 | ) |
Repsol International Finance BV, 3.63%, 10/07/21 | | | EUR | | | | 2,100 | | | | (2,289,815 | ) |
Rexel SA, 3.25%, 6/15/22 | | | | | | | 2,600 | | | | (2,703,903 | ) |
Rio Tinto Finance USA Ltd., 3.75%, 6/15/25 | | | USD | | | | 12,750 | | | | (11,437,949 | ) |
Roche Holdings, Inc., 3.00%, 11/10/25 (a) | | | | | | | 20,000 | | | | (20,184,840 | ) |
Royal Bank of Canada, 2.15%, 3/15/19 | | | | | | | 41,465 | | | | (41,806,381 | ) |
Sabine Pass Liquefaction LLC, 5.63%, 3/01/25 | | | | | | | 875 | | | | (752,500 | ) |
SABMiller Holdings, Inc., 1.88%, 1/20/20 | | | EUR | | | | 3,105 | | | | (3,527,852 | ) |
Seagate HDD, 4.75%, 6/01/23 | | | USD | | | | 13,050 | | | | (11,212,312 | ) |
Société Générale SA, 6.00% (b)(h) | | | | | | | 2,600 | | | | (2,382,172 | ) |
Solvay SA, 1.63%, 12/02/22 | | | EUR | | | | 2,600 | | | | (2,843,678 | ) |
Standard Chartered PLC: | | | | | | | | | | | | |
6.50% (b)(h) | | | USD | | | | 900 | | | | (849,033 | ) |
5.70%, 3/26/44 (a) | | | | | | | 6,465 | | | | (6,307,655 | ) |
Steel Dynamics, Inc., 5.50%, 10/01/24 | | | | | | | 2,125 | | | | (1,917,813 | ) |
Target Corp., 4.00%, 7/01/42 | | | | | | | 20,000 | | | | (19,797,520 | ) |
Time Warner Cable, Inc., 6.55%, 5/01/37 | | | | | | | 6,850 | | | | (6,837,903 | ) |
Time Warner, Inc., 3.60%, 7/15/25 | | | | | | | 20,000 | | | | (19,415,040 | ) |
Total Capital International SA: | | | | | | | | | | | | |
3.75%, 4/10/24 | | | | | | | 24,000 | | | | (24,301,272 | ) |
1.38%, 3/19/25 | | | EUR | | | | 1,600 | | | | (1,728,546 | ) |
See Notes to Financial Statements.
| | | | | | |
| | | BLACKROCK FUNDS | | JANUARY 31, 2016 | | 37 |
| | | | |
| Schedule of Investments (continued) | | | BlackRock Global Long/Short Credit Fund | |
| | | | |
| | | | | | | | | | | | |
| Borrowed Bonds | | | | | Par
(000) | | | Value | |
Corporate Bonds (continued) | | | | | | | | | | | | |
Tribune Media Co., 5.88%, 7/15/22 (a) | | | USD | | | | 2,100 | | | $ | (2,094,750 | ) |
Verizon Communications, Inc.: | | | | | | | | | | | | |
3.50%, 11/01/24 | | | | | | | 34,100 | | | | (33,813,731 | ) |
6.55%, 9/15/43 | | | | | | | 15,000 | | | | (17,511,840 | ) |
Vodafone Group PLC, 1.88%, 9/11/25 | | | EUR | | | | 5,200 | | | | (5,652,487 | ) |
Wal-Mart Stores, Inc., 4.30%, 4/22/44 | | | USD | | | | 30,000 | | | | (31,076,970 | ) |
Wells Fargo & Co.: | | | | | | | | | | | | |
3.90%, 5/01/45 | | | | | | | 25,000 | | | | (22,816,400 | ) |
4.90%, 11/17/45 | | | | | | | 18,200 | | | | (18,281,117 | ) |
Wendel SA, 1.88%, 4/10/20 | | | EUR | | | | 2,600 | | | | (2,748,687 | ) |
| | | | | | | | | | | | |
| | | | | | | | | | | | (876,268,804 | ) |
Foreign Agency Obligations — (0.5)% | | | | | | | | | | | | |
Statoil ASA, 3.70%, 3/01/24 | | | USD | | | | 24,000 | | | | (24,116,880 | ) |
Foreign Government Obligations — (0.1)% | | | | | | | | | | | | |
Federal Republic of Nigeria, 6.38%, 7/12/23 | | | | | | | 2,700 | | | | (2,387,880 | ) |
Republic of Ecuador, 7.95%, 6/20/24 | | | | | | | 3,000 | | | | (2,077,500 | ) |
| | | | | | | | | | | | |
| | | | | | | | | | | | (4,465,380 | ) |
U.S. Treasury Obligations — (5.9)% | | | | | | | | | | | | |
U.S. Treasury Notes: | | | | | | | | | | | | |
1.75%, 12/31/20 | | | | | | | 138,417 | | | | (141,147,853 | ) |
2.13%, 12/31/22 | | | | | | | 107,399 | | | | (110,658,774 | ) |
2.25%, 11/15/25 | | | | | | | 51,937 | | | | (53,419,753 | ) |
| | | | | | | | | | | | |
| | | | | | | | | | | | (305,226,380 | ) |
Total Borrowed Bonds (Proceeds — $1,234,534,715) — (23.6)% | | | | | | | | | | | (1,210,077,444 | ) |
| | | | | | | | | | | | |
| | | | | | | | | | |
| | | | | | | | | | | | |
| Investments Sold Short | | | | | Shares | | | Value | |
Common Stocks — (0.9)% | | | | | | | | | | | | |
Allergan PLC | | | | | | | 8,335 | | | $ | (2,370,724 | ) |
Amazon.com, Inc. (e) | | | | | | | 900 | | | | (528,300 | ) |
Calpine Corp. | | | | | | | 81,000 | | | | (1,240,110 | ) |
Caterpillar, Inc. | | | | | | | 121,250 | | | | (7,546,600 | ) |
Cheniere Energy, Inc. | | | | | | | 28,025 | | | | (842,151 | ) |
Community Health Systems, Inc. | | | | | | | 30,750 | | | | (660,510 | ) |
Continental Resources, Inc. | | | | | | | 35,000 | | | | (738,850 | ) |
Endo International PLC | | | | | | | 14,750 | | | | (818,183 | ) |
General Electric Co. | | | | | | | 185,000 | | | | (5,383,500 | ) |
HCA Holdings, Inc. | | | | | | | 9,000 | | | | (626,220 | ) |
Hewlett Packard Enterprise Co. | | | | | | | 203,210 | | | | (2,796,170 | ) |
Hewlett-Packard Co. | | | | | | | 133,210 | | | | (1,293,469 | ) |
Mallinckrodt PLC | | | | | | | 21,500 | | | | (1,248,935 | ) |
Micron Technology, Inc. | | | | | | | 342,750 | | | | (3,780,532 | ) |
Powershares Senior Loan Portfolio | | | | | | | 500,000 | | | | (11,090,000 | ) |
Qorvo, Inc. | | | | | | | 24,150 | | | | (956,340 | ) |
Tenet Healthcare Corp. | | | | | | | 45,500 | | | | (1,233,960 | ) |
Valeant Pharmaceuticals International, Inc. | | | | | | | 50,050 | | | | (4,515,511 | ) |
| | | | | | | | | | | | |
| | | | | | | | | | | | (47,670,065 | ) |
| Corporate Bonds — (1.6)% | | | | | Par (000) | | | | |
AbbVie, Inc., 3.60%, 05/14/25 | | | USD | | | | 25,000 | | | | (24,979,828 | ) |
AT&T Inc., 3.90%, 03/11/24 | | | | | | | 15,000 | | | | (15,414,900 | ) |
Bank of Nova Scotia, 4.50%, 12/16/25 | | | | | | | 12,111 | | | | (11,971,118 | ) |
Health Care REIT, Inc., 4.00%, 06/01/25 | | | | | | | 6,527 | | | | (6,500,422 | ) |
Pfizer, Inc., 3.40%, 05/15/24 | | | | | | | 15,000 | | | | (15,624,960 | ) |
Ventas Realty LP, 3.50%, 02/01/25 | | | | | | | 7,398 | | | | (7,160,746 | ) |
| | | | | | | | | | | | |
| | | | | | | | | | | | (81,651,974 | ) |
| Investment Companies — (2.5)% | | | | | Shares | | | | |
Industrial Select Sector SPDR Fund | | | | | | | 20,000 | | | | (999,800 | ) |
iShares iBoxx $ High Yield Corporate Bond ETF (m) | | | | | | | 1,300,000 | | | | (103,064,000 | ) |
iShares U.S. Preferred Stock ETF (m) | | | | | | | 163,600 | | | | (6,293,692 | ) |
Market Vectors Semiconductor ETF | | | | | | | 100,000 | | | | (4,972,000 | ) |
Powershares QQQ Trust Series 1 | | | | | | | 92,600 | | | | (9,642,438 | ) |
SPDR S&P Oil & Gas Exploration & Production ETF | | | | | | | 75,000 | | | | (2,136,750 | ) |
| | | | | | | | | | | | |
| | | | | | | | | | | | (127,108,680 | ) |
| U.S. Treasury Obligations — (0.4)% | | | | | Par (000) | | | | |
U.S. Treasury Notes, 1.75%, 12/31/20 | | | USD | | | | 17,063 | | | | (17,399,193 | ) |
Total Investments Sold Short (Proceeds — $283,289,829) — (5.4)% | | | | | | | | | | | (273,829,912 | ) |
Total Investments Net of Options Written, Borrowed Bonds and Investments Sold Short — 92.7% | | | | 4,749,516,061 | |
Other Assets Less Liabilities — 7.3% | | | | 373,754,752 | |
| | | | | | | | | | | | |
Net Assets — 100.0% | | | | | | | | | | $ | 5,123,270,813 | |
| | | | | | | | | | | | |
|
| Notes to Schedule of Investments |
| (a) | Security exempt from registration pursuant to Rule 144A under the Securities Act of 1933, as amended. These securities may be resold in transactions exempt from registration to qualified institutional investors. |
| (b) | Variable rate security. Rate as of period end. |
| (d) | Amount is less than $500. |
| (e) | Non-income producing security. |
| (f) | Stapled Security — A security contractually bound to one or more other securities to form a single saleable unit which cannot be sold separately. |
| (g) | Restricted security as to resale, excluding 144a securities. As of period end, the Fund held restricted securities with a current value of $10,049 and an original cost of $10,049 which was 0.0% of its net assets. |
See Notes to Financial Statements.
| | | | | | |
| 38 | | BLACKROCK FUNDS | | JANUARY 31, 2016 | | |
| | | | |
| Schedule of Investments (continued) | | | BlackRock Global Long/Short Credit Fund | |
| (h) | Perpetual security with no stated maturity date. |
| (j) | Payment-in-kind security which may pay interest/dividends in additional par/shares and/or in cash. Rates shown are the current rate and possible payment rates. |
| (k) | Issuer filed for bankruptcy and/or is in default of interest payments. |
| (l) | All or a portion of security has been pledged as collateral in connection with outstanding borrowed bonds. |
| (m) | During the period ended January 31, 2016, investments in issuers considered to be affiliates of the Fund for purposes of Section 2(a)(3) of the Investment Company Act of 1940, as amended, were as follows: |
| | | | | | | | | | | | | | | | | | | | | | | | | | | | |
| Affiliate | | Shares Held at
July 31, 2015 | | | Shares Purchased | | | Shares Sold | | | Shares Held at
January 31, 2016 | | | Value at
January 31, 2016 | | | Income | | | Realized
Gain (Loss) | |
BlackRock Liquidity Funds, TempFund,
Institutional Class | | | — | | | | 444,946,963 | 1 | | | — | | | | 444,946,963 | | | | $444,946,963 | | | | $451,761 | | | | $ 25,723 | |
iShares iBoxx $ High Yield Corporate Bond ETF | | | — | | | | 440,000 | | | | (440,000 | ) | | | — | | | | — | | | | $ 92,543 | | | | $(296,056 | ) |
| | 1 | | Represents net shares purchased. |
| | | | | | | | | | | | | | | | | | | | | | | | | | | | |
| Affiliate | | Shares Held at
July 31, 2015 | | | Shares Purchased | | | Shares Sold | | | Shares Held at
January 31, 2016 | | | Value at January 31, 2016 | | | Expense | | | Realized
Gain
(Loss) | |
iShares iBoxx $ High Yield Corporate Bond ETF | | | (134,125 | ) | | | 441,625 | | | | (1,607,500 | ) | | | (1,300,000 | ) | | | $(103,064,000 | ) | | | $(884,997 | ) | | | $ 901,452 | |
iShares U.S. Preferred Stock ETF | | | — | | | | 623,000 | | | | (786,600 | ) | | | (163,600 | ) | | | $ (6,293,692 | ) | | | $(146,456 | ) | | | $(360,188 | ) |
| (n) | Current yield as of period end. |
| (o) | The amount to be repurchased assumes the maturity will be the day after the period end. |
| • | | For Fund compliance purposes, the Fund’s industry classifications refer to any one or more of the industry sub-classifications used by one or more widely recognized market indexes or ratings group indexes, and/or as defined by the investment advisor. These definitions may not apply for purposes of this report, which may combine such industry sub-classifications for reporting ease. |
|
| Derivative Financial Instruments Outstanding as of Period End |
| | | | | | | | | | | | | | | | |
Financial Futures Contracts |
| | | | | | | | | | | | | | | | |
Contracts Long (Short) | | Issue | | Expiration | | Notional Value | | | Unrealized
Appreciation
(Depreciation) | |
| (15) | | E-Mini S&P 500 Index | | March 2016 | | | USD | | | | 1,447,575 | | | $ | 53,098 | |
| 242 | | Euro STOXX 50 Index | | March 2016 | | | USD | | | | 7,938,122 | | | | (761,467 | ) |
| (1,093) | | Euro-Bobl | | March 2016 | | | USD | | | | 156,802,537 | | | | (707,844 | ) |
| (1,226) | | Euro-Bund | | March 2016 | | | USD | | | | 216,948,251 | | | | (4,169,331 | ) |
| (1,078) | | Euro-Schatz | | March 2016 | | | USD | | | | 130,588,283 | | | | (76,759 | ) |
| (455) | | Long Gilt British | | March 2016 | | | USD | | | | 78,007,389 | | | | (1,951,974 | ) |
| (106) | | NASDAQ 100 E-Mini Index | | March 2016 | | | USD | | | | 9,037,560 | | | | (94,153 | ) |
| (192) | | U.S. Treasury Bonds (30 Year) | | March 2016 | | | USD | | | | 30,918,000 | | | | (1,638,022 | ) |
| 2 | | U.S. Treasury Notes (2 Year) | | March 2016 | | | USD | | | | 437,250 | | | | 2,063 | |
| (329) | | U.S. Treasury Notes (5 Year) | | March 2016 | | | USD | | | | 39,701,047 | | | | (661,170 | ) |
| (460) | | U.S. Treasury Notes (10 Year) | | March 2016 | | | USD | | | | 59,605,937 | | | | (1,570,069 | ) |
| (274) | | U.S. Ultra Treasury Bonds | | March 2016 | | | USD | | | | 45,535,375 | | | | (2,532,060 | ) |
| (1) | | U.S. Ultra Treasury Bonds (10 Year) | | March 2016 | | | USD | | | | 139,594 | | | | (2,157 | ) |
| 250 | | Euro-Bund 8.5 to 10.5-Year Bond Futures Put Options, Strike Price
EUR 156 | | March 2016 | | | EUR | | | | 170,619 | | | | (89,610 | ) |
| 234 | | Euro-Bund 8.5 to 10.5-Year Bond Futures Put Options, Strike Price
EUR 159.5 | | March 2016 | | | EUR | | | | 233,212 | | | | (15,433 | ) |
| (242) | | Euro Dollar Futures | | December 2016 | | | USD | | | | 60,006,925 | | | | (535,754 | ) |
| Total | | | | | | | | | | | | | | $ | (14,750,642 | ) |
| | | | | | | | | | | | | | | | |
|
| Forward Foreign Currency Exchange Contracts |
| | | | | | | | | | | | | | | | | | | | |
Currency
Purchased | | | Currency
Sold | | | | | Counterparty | | Settlement Date | | | Unrealized Appreciation (Depreciation) | |
| EUR | | | 1,800,000,000 | | | USD | | | 1,968,566,585 | | | Citibank N.A. | | | 2/03/16 | | | $ | (18,413,579 | ) |
| EUR | | | 10,000,000 | | | USD | | | 10,892,374 | | | Citibank N.A. | | | 2/03/16 | | | | (58,191 | ) |
| EUR | | | 697,971,000 | | | USD | | | 758,153,613 | | | Morgan Stanley & Co. International PLC | | | 2/03/16 | | | | (1,959,033 | ) |
See Notes to Financial Statements.
| | | | | | |
| | | BLACKROCK FUNDS | | JANUARY 31, 2016 | | 39 |
| | | | |
| Schedule of Investments (continued) | | | BlackRock Global Long/Short Credit Fund | |
| | | | | | | | | | | | | | | | | | | | | | |
Currency Purchased | | | Currency
Sold | | | Counterparty | | Settlement
Date | | | Unrealized
Appreciation
(Depreciation) | |
| EUR | | | 3,600,000 | | | | USD | | | | 3,923,515 | | | Morgan Stanley & Co. International PLC | | | 2/03/16 | | | $ | (23,209 | ) |
| EUR | | | 1,500,000 | | | | USD | | | | 1,631,395 | | | Morgan Stanley & Co. International PLC | | | 2/03/16 | | | | (6,268 | ) |
| EUR | | | 14,000,000 | | | | USD | | | | 15,298,286 | | | Royal Bank of Scotland PLC | | | 2/03/16 | | | | (130,429 | ) |
| EUR | | | 31,500,000 | | | | USD | | | | 34,231,138 | | | Royal Bank of Scotland PLC | | | 2/03/16 | | | | (103,461 | ) |
| EUR | | | 10,200,000 | | | | USD | | | | 10,985,844 | | | Royal Bank of Scotland PLC | | | 2/03/16 | | | | 65,023 | |
| GBP | | | 100,000,000 | | | | USD | | | | 143,320,400 | | | Citibank N.A. | | | 2/03/16 | | | | (829,020 | ) |
| USD | | | 1,551,187 | | | | CNH | | | | 10,331,000 | | | Goldman Sachs International | | | 2/03/16 | | | | (14,329 | ) |
| USD | | | 14,045,827 | | | | EUR | | | | 12,885,000 | | | Citibank N.A. | | | 2/03/16 | | | | 85,982 | |
| USD | | | 1,968,773,502 | | | | EUR | | | | 1,800,000,000 | | | Citibank N.A. | | | 2/03/16 | | | | 18,620,497 | |
| USD | | | 3,847,181 | | | | EUR | | | | 3,563,000 | | | State Street Bank and Trust Co. | | | 2/03/16 | | | | (13,038 | ) |
| USD | | | 2,016,418 | | | | EUR | | | | 1,857,000 | | | State Street Bank and Trust Co. | | | 2/03/16 | | | | 4,510 | |
| USD | | | 2,176,070 | | | | EUR | | | | 2,000,000 | | | State Street Bank and Trust Co. | | | 2/03/16 | | | | 9,233 | |
| USD | | | 3,668,924 | | | | EUR | | | | 3,352,000 | | | State Street Bank and Trust Co. | | | 2/03/16 | | | | 37,306 | |
| USD | | | 148,085,900 | | | | GBP | | | | 100,000,000 | | | Citibank N.A. | | | 2/03/16 | | | | 5,594,520 | |
| USD | | | 27,304,372 | | | | GBP | | | | 18,547,000 | | | UBS AG | | | 2/03/16 | | | | 876,496 | |
| EUR | | | 97,209,048 | | | | USD | | | | 105,769,963 | | | JPMorgan Chase Bank N.A. | | | 2/16/16 | | | | (420,464 | ) |
| EUR | | | 10,100,000 | | | | USD | | | | 10,926,292 | | | Citibank N.A. | | | 2/22/16 | | | | 21,008 | |
| EUR | | | 20,200,000 | | | | USD | | | | 21,899,326 | | | Deutsche Bank AG | | | 2/22/16 | | | | (4,726 | ) |
| EUR | | | 10,100,000 | | | | USD | | | | 10,908,404 | | | Morgan Stanley & Co. International PLC | | | 2/22/16 | | | | 38,896 | |
| EUR | | | 10,100,000 | | | | USD | | | | 10,899,770 | | | Morgan Stanley & Co. International PLC | | | 2/22/16 | | | | 47,531 | |
| USD | | | 1,518,356 | | | | EUR | | | | 1,400,000 | | | Citibank N.A. | | | 2/22/16 | | | | 908 | |
| USD | | | 1,518,356 | | | | EUR | | | | 1,400,000 | | | Citibank N.A. | | | 2/22/16 | | | | 908 | |
| USD | | | 1,518,356 | | | | EUR | | | | 1,400,000 | | | Citibank N.A. | | | 2/22/16 | | | | 908 | |
| USD | | | 3,042,135 | | | | EUR | | | | 2,805,000 | | | Citibank N.A. | | | 2/22/16 | | | | 1,820 | |
| USD | | | 6,350,509 | | | | EUR | | | | 5,855,000 | | | Citibank N.A. | | | 2/22/16 | | | | 4,327 | |
| USD | | | 6,350,509 | | | | EUR | | | | 5,855,000 | | | Citibank N.A. | | | 2/22/16 | | | | 4,327 | |
| USD | | | 6,350,509 | | | | EUR | | | | 5,855,000 | | | Citibank N.A. | | | 2/22/16 | | | | 4,327 | |
| USD | | | 12,701,019 | | | | EUR | | | | 11,710,000 | | | Citibank N.A. | | | 2/22/16 | | | | 8,654 | |
| USD | | | 3,085,787 | | | | EUR | | | | 2,845,000 | | | Goldman Sachs International | | | 2/22/16 | | | | 2,117 | |
| USD | | | 3,085,787 | | | | EUR | | | | 2,845,000 | | | Goldman Sachs International | | | 2/22/16 | | | | 2,117 | |
| USD | | | 3,085,787 | | | | EUR | | | | 2,845,000 | | | Goldman Sachs International | | | 2/22/16 | | | | 2,117 | |
| USD | | | 6,166,150 | | | | EUR | | | | 5,685,000 | | | Goldman Sachs International | | | 2/22/16 | | | | 4,229 | |
| USD | | | 25,019,447 | | | | EUR | | | | 23,000,000 | | | JPMorgan Chase Bank N.A. | | | 2/29/16 | | | | 85,719 | |
| EUR | | | 4,400,000 | | | | USD | | | | 4,771,518 | | | Royal Bank of Scotland PLC | | | 3/03/16 | | | | (1,127 | ) |
| EUR | | | 748,462,000 | | | | USD | | | | 817,867,638 | | | UBS AG | | | 3/03/16 | | | | (6,400,225 | ) |
| USD | | | 1,969,862,418 | | | | EUR | | | | 1,800,000,000 | | | Citibank N.A. | | | 3/03/16 | | | | 18,338,701 | |
| USD | | | 143,321,700 | | | | GBP | | | | 100,000,000 | | | Citibank N.A. | | | 3/03/16 | | | | 825,150 | |
| USD | | | 4,249,892 | | | | GBP | | | | 2,975,000 | | | UBS AG | | | 3/03/16 | | | | 10,619 | |
| Total | | | | | | | | | | | | | | | | | | | | $ | 16,320,851 | |
| | | | | | | | | | | | | | | | | | | | | | |
| | | | | | | | | | | | | | |
| Exchange-Traded Options Purchased |
| | | | | | | | | | | | | | | | | | | | | | | | |
| Description | | Put/
Call | | | Expiration Date | | | Strike Price | | | Contracts | | | Value | |
JPMorgan Chase & Co. | | | Call | | | | 2/19/16 | | | | USD | | | | 62.50 | | | | 1,000 | | | $ | 27,000 | |
Oracle Corp. | | | Call | | | | 3/18/16 | | | | USD | | | | 38.00 | | | | 1,000 | | | | 51,500 | |
VMware, Inc. | | | Call | | | | 3/18/16 | | | | USD | | | | 50.00 | | | | 500 | | | | 41,250 | |
See Notes to Financial Statements.
| | | | | | |
| 40 | | BLACKROCK FUNDS | | JANUARY 31, 2016 | | |
| | | | |
| Schedule of Investments (continued) | | | BlackRock Global Long/Short Credit Fund | |
| | | | | | | | | | | | | | | | | | | | |
| Description | | Put/
Call | | Expiration
Date | | Strike Price | | | Contracts | | | Value | |
Amazon.com, Inc. | | Put | | 2/19/16 | | | USD | | | | 560.00 | | | | 100 | | | $ | 95,000 | |
Avago Technologies Ltd. | | Put | | 2/19/16 | | | USD | | | | 120.00 | | | | 500 | | | | 48,750 | |
Continental Resources, Inc. | | Put | | 2/19/16 | | | USD | | | | 22.00 | | | | 500 | | | | 117,500 | |
EURO STOXX 50 Index | | Put | | 2/19/16 | | | EUR | | | | 2,850.00 | | | | 729 | | | | 179,267 | |
EURO STOXX 50 Index | | Put | | 2/19/16 | | | EUR | | | | 2,900.00 | | | | 582 | | | | 200,492 | |
General Electric Co. | | Put | | 2/19/16 | | | USD | | | | 28.00 | | | | 1,500 | | | | 40,500 | |
iShares iBoxx $ High Yield Corporate Bond ETF | | Put | | 2/19/16 | | | USD | | | | 78.00 | | | | 1,500 | | | | 100,500 | |
iShares Russell 2000 Index ETF | | Put | | 2/19/16 | | | USD | | | | 98.00 | | | | 1,000 | | | | 82,000 | |
iShares US Preferred Stock ETF | | Put | | 2/19/16 | | | USD | | | | 38.00 | | | | 1,500 | | | | 37,500 | |
PowerShares QQQ Trust, Series 1 ETF | | Put | | 2/19/16 | | | USD | | | | 100.00 | | | | 1,000 | | | | 93,500 | |
PowerShares QQQ Trust, Series 1 ETF | | Put | | 2/19/16 | | | USD | | | | 94.00 | | | | 1,000 | | | | 21,000 | |
S&P 500 Index | | Put | | 2/19/16 | | | USD | | | | 1,850.00 | | | | 205 | | | | 219,350 | |
SPDR S&P 500 ETF Trust | | Put | | 2/19/16 | | | USD | | | | 181.00 | | | | 1,000 | | | | 60,000 | |
Valeant Pharmaceuticals International, Inc. | | Put | | 2/19/16 | | | USD | | | | 90.00 | | | | 500 | | | | 290,000 | |
PowerShares QQQ Trust, Series 1 ETF | | Put | | 2/26/16 | | | USD | | | | 102.00 | | | | 1,250 | | | | 218,125 | |
Citigroup, Inc. | | Put | | 3/18/16 | | | USD | | | | 40.00 | | | | 1,000 | | | | 96,500 | |
EURO STOXX 50 Index | | Put | | 3/18/16 | | | EUR | | | | 2,900.00 | | | | 325 | | | | 238,352 | |
Financial Select Sector SPDR Fund | | Put | | 3/18/16 | | | USD | | | | 20.00 | | | | 2,000 | | | | 48,000 | |
General Electric Co. | | Put | | 3/18/16 | | | USD | | | | 27.00 | | | | 1,000 | | | | 34,500 | |
Health Care Select Sector SPDR Fund | | Put | | 3/18/16 | | | USD | | | | 67.00 | | | | 1,000 | | | | 246,000 | |
iShares iBoxx $ High Yield Corporate Bond ETF | | Put | | 3/18/16 | | | USD | | | | 79.00 | | | | 4,000 | | | | 700,000 | |
iShares iBoxx $ High Yield Corporate Bond ETF | | Put | | 3/18/16 | | | USD | | | | 75.00 | | | | 1,250 | | | | 68,125 | |
iShares Russell 2000 Index ETF | | Put | | 3/18/16 | | | USD | | | | 92.00 | | | | 1,000 | | | | 81,000 | |
Micron Technology, Inc. | | Put | | 3/18/16 | | | USD | | | | 12.00 | | | | 1,250 | | | | 195,000 | |
PowerShares QQQ Trust, Series 1 ETF | | Put | | 3/18/16 | | | USD | | | | 100.00 | | | | 1,000 | | | | 204,000 | |
Teva Pharmaceutical Industries Ltd. ADR | | Put | | 3/18/16 | | | USD | | | | 60.00 | | | | 1,000 | | | | 193,000 | |
Valeant Pharmaceuticals International, Inc. | | Put | | 3/18/16 | | | USD | | | | 85.00 | | | | 100 | | | | 72,750 | |
Endo International PLC | | Put | | 4/15/16 | | | USD | | | | 45.00 | | | | 500 | | | | 72,500 | |
Mallinckrodt PLC | | Put | | 4/15/16 | | | USD | | | | 55.00 | | | | 200 | | | | 90,000 | |
Micron Technology, Inc. | | Put | | 4/15/16 | | | USD | | | | 11.00 | | | | 1,000 | | | | 125,500 | |
Qorvo, Inc. | | Put | | 5/20/16 | | | USD | | | | 35.00 | | | | 150 | | | | 44,250 | |
Total | | | | | | | | | | | | | | | | | | $ | 4,432,711 | |
| | | | | | | | | | | | | | | | | | | | |
OTC Options Purchased
| | | | | | | | | | | | | | | | | | | | | | | | | | |
| Description | | Put/ Call | | Counterparty | | Expiration Date | | Strike Price | | | Notional Amount (000) | | | Value | |
EUR Currency | | Call | | BNP Paribas S.A. | | 2/18/16 | | | USD | | | | 1.09 | | | | EUR | | | | 29,270 | | | $ | 178,253 | |
EUR Currency | | Call | | BNP Paribas S.A. | | 2/25/16 | | | USD | | | | 1.09 | | | | EUR | | | | 50,100 | | | | 368,232 | |
Total | | | | | | | | | | | | | | | | | | | | | | | | $ | 546,485 | |
| | | | | | | | | | | | | | | | | | | | | | | | | | |
OTC Credit Default Swaptions Purchased
| | | | | | | | | | | | | | | | | | | | | | | | | | | | | | | | |
| Description | | Counterparty | | Put/
Call | | | Strike Price | | | Pay/Receive
Floating
Rate Index | | Floating Rate Index | | Expiration
Date | | Notional
Amount (000) | | | Value | |
Bought protection on 5-Year Credit Default Swaps | | JPMorgan Chase Bank N.A. | | | Put | | | | EUR | | | | 350.00 | | | Receive | | iTraxx Crossover Series 24 Version 1 | | 2/17/16 | | | EUR | | | | 41,600 | | | $ | 626,669 | |
Bought protection on 5-Year Credit Default Swaps | | JPMorgan Chase Bank N.A. | | | Put | | | | EUR | | | | 350.00 | | | Receive | | iTraxx Crossover Series 24 Version 1 | | 2/17/16 | | | EUR | | | | 41,600 | | | | 626,669 | |
Bought protection on 5-Year Credit Default Swaps | | Credit Suisse International | | | Put | | | | EUR | | | | 375.00 | | | Receive | | iTraxx Crossover Series 24 Version 1 | | 2/17/16 | | | EUR | | | | 41,600 | | | | 370,969 | |
Total | | | | | | | | | | | | | | | | | | | | | | | | | | | | | | $ | 1,624,307 | |
| | | | | | | | | | | | | | | | | | | | | | | | | | | | | | | | |
See Notes to Financial Statements.
| | | | | | |
| | | BLACKROCK FUNDS | | JANUARY 31, 2016 | | 41 |
| | | | |
| Schedule of Investments (continued) | | | BlackRock Global Long/Short Credit Fund | |
OTC Interest Rate Swaptions Purchased
| | | | | | | | | | | | | | | | | | | | | | | | |
| Description | | Counterparty | | Put/
Call | | Exercise Rate | | Pay/Receive
Exercise Rate | | Floating Rate
Index | | Expiration
Date | | Notional
Amount (000) | | | Value | |
10-Year Interest Rate Swap | | Goldman Sachs
Bank USA | | Put | | 2.50% | | Pay | | 3-month LIBOR | | 3/18/16 | | | USD | | | | 61,000 | | | $ | 12,601 | |
5-Year Interest Rate Swap | | Goldman Sachs
Bank USA | | Put | | 2.05% | | Pay | | 3-month LIBOR | | 3/18/16 | | | USD | | | | 133,000 | | | | 11,274 | |
Total | | | | | | | | | | | | | | | | | | | | | | $ | 23,875 | |
| | | | | | | | | | | | | | | | | | | | | | | | |
Exchange-Traded Options Written
| | | | | | | | | | | | | | | | | | | | | | | | | | | | | | |
| Description | | Put/
Call | | Expiration
Date | | Strike Price | | Contracts | | Value |
Avago Technologies Ltd. | | | | Put | | | | | 2/19/16 | | | | | USD | | | | | 110.00 | | | | | 500 | | | | $ | (18,750 | ) |
Continental Resources, Inc. | | | | Put | | | | | 2/19/16 | | | | | USD | | | | | 18.00 | | | | | 500 | | | | | (33,750 | ) |
General Electric Co. | | | | Put | | | | | 2/19/16 | | | | | USD | | | | | 25.00 | | | | | 1,500 | | | | | (8,250 | ) |
iShares iBoxx $ High Yield Corporate Bond ETF | | | | Put | | | | | 2/19/16 | | | | | USD | | | | | 75.00 | | | | | 1,500 | | | | | (24,750 | ) |
iShares Russell 2000 Index ETF | | | | Put | | | | | 2/19/16 | | | | | USD | | | | | 93.00 | | | | | 1,000 | | | | | (24,500 | ) |
PowerShares QQQ Trust, Series 1 ETF | | | | Put | | | | | 2/19/16 | | | | | USD | | | | | 95.00 | | | | | 1,000 | | | | | (28,500 | ) |
SPDR S&P 500 ETF Trust | | | | Put | | | | | 2/19/16 | | | | | USD | | | | | 174.00 | | | | | 1,000 | | | | | (22,500 | ) |
PowerShares QQQ Trust, Series 1 ETF | | | | Put | | | | | 2/26/16 | | | | | USD | | | | | 96.00 | | | | | 1,250 | | | | | (68,750 | ) |
Health Care Select Sector SPDR Fund | | | | Put | | | | | 3/18/16 | | | | | USD | | | | | 61.00 | | | | | 1,000 | | | | | (69,500 | ) |
iShares iBoxx $ High Yield Corporate Bond ETF | | | | Put | | | | | 3/18/16 | | | | | USD | | | | | 73.00 | | | | | 4,000 | | | | | (138,000 | ) |
PowerShares QQQ Trust, Series 1 ETF | | | | Put | | | | | 3/18/16 | | | | | USD | | | | | 92.00 | | | | | 1,000 | | | | | (66,000 | ) |
Total | | | | | | | | | | | | | | | | | | | | | | | | | | | | $ | (503,250 | ) |
| | | | | | | | | | | | | | | | | | | | | | | | | | | | | | |
OTC Credit Default Swaptions Written
| | | | | | | | | | | | | | | | | | | | | | | | | | | | | | | | | | |
| Description | | Counterparty | | Put/
Call | | | Strike Price | | | Pay/Receive
Floating
Rate Index | | Floating Rate Index | | Credit
Rating1 | | Expiration
Date | | Notional
Amount
(000)2 | | | Value | |
Sold protection on 5-Year Credit Default Swaps | | JPMorgan Chase Bank N.A. | | | Put | | | | EUR | | | | 450.00 | | | Pay | | iTraxx Crossover Series 24 Version 1 | | A+ | | 2/17/16 | | | EUR | | | | 41,600 | | | $ | (72,463 | ) |
Sold protection on 5-Year Credit Default Swaps | | JPMorgan Chase Bank N.A. | | | Put | | | | EUR | | | | 450.00 | | | Pay | | iTraxx Crossover Series 24 Version 1 | | A+ | | 2/17/16 | | | EUR | | | | 41,600 | | | | (72,463 | ) |
Sold protection on 5-Year Credit Default Swaps | | Credit Suisse International | | | Put | | | | EUR | | | | 475.00 | | | Pay | | iTraxx Crossover Series 24 Version 1 | | A | | 2/17/16 | | | EUR | | | | 41,600 | | | | (41,601 | ) |
Total | | | | | | | | | | | | | | | | | | | | | | | | | | | | | | | | $ | (186,527 | ) |
| | | | | | | | | | | | | | | | | | | | | | | | | | | | | | | | | | |
| | 1 | Using S&P’s rating of the issuer or the underlying securities of the index, as applicable. |
| | 2 | The maximum potential amount the Fund may pay should a negative credit event take place as defined under the terms of the agreement. |
Centrally Cleared Credit Default Swaps — Buy Protection
| | | | | | | | | | | | | | | | |
| Index | | Pay
Fixed
Rate | | Expiration
Date | | Notional
Amount (000) | | | Unrealized
Appreciation
(Depreciation) | |
iTraxx Crossover Series 22 Version 2 | | 5.00% | | 12/20/19 | | | EUR | | | | 121,252 | | | $ | 14,948,825 | |
iTraxx Sub Financials Series 22 Version 1 | | 1.00% | | 12/20/19 | | | EUR | | | | 6,100 | | | | 7,788 | |
iTraxx Crossover Series 24 Version 1 | | 5.00% | | 12/20/20 | | | EUR | | | | 54,430 | | | | (40,620 | ) |
Total | | | | | | | | | | | | | | $ | 14,915,993 | |
| | | | | | | | | | | | | | | | |
See Notes to Financial Statements.
| | | | | | |
| 42 | | BLACKROCK FUNDS | | JANUARY 31, 2016 | | |
| | | | |
| Schedule of Investments (continued) | | | BlackRock Global Long/Short Credit Fund | |
Centrally Cleared Credit Default Swaps — Sell Protection
| | | | | | | | | | | | | | | | | | |
| Index | | Receive
Fixed
Rate | | Expiration
Date | | Credit
Rating1 | | Notional Amount (000)2 | | | Unrealized
Appreciation
(Depreciation) | |
iTraxx Crossover Series 21 Version 2 | | 5.00% | | 6/20/19 | | BB- | | | EUR | | | | 25,944 | | | | $(553,287 | ) |
iTraxx Europe Series 21 Version 1 | | 1.00% | | 6/20/19 | | BBB+ | | | EUR | | | | 22,298 | | | | (154,963 | ) |
CDX.NA.IG Series 24 Version 1 | | 1.00% | | 6/20/20 | | BBB+ | | | USD | | | | 7,889 | | | | (33,272 | ) |
iTraxx Crossover Series 23 Version 2 | | 5.00% | | 6/20/20 | | B+ | | | EUR | | | | 86,511 | | | | (534,684 | ) |
iTraxx Europe Series 23 Version 1 | | 1.00% | | 6/20/20 | | BBB+ | | | EUR | | | | 15,348 | | | | (180,897 | ) |
CDX.NA.HY Series 25 Version 1 | | 5.00% | | 12/20/20 | | B+ | | | USD | | | | 25,000 | | | | 317,679 | |
CDX.NA.IG Series 25 Version 1 | | 1.00% | | 12/20/20 | | BBB+ | | | USD | | | | 601,820 | | | | 744,687 | |
Total | | | | | | | | | | | | | | | | | $(394,737 | ) |
| | | | | | | | | | | | | | | | | | |
| | 1 | Using S&P’s rating of the issuer or the underlying securities of the index, as applicable. |
| | 2 | The maximum potential amount the Fund may pay should a negative credit event take place as defined under the terms of the agreement. |
Centrally Cleared Interest Rate Swaps
| | | | | | | | | | | | | | | | | | | | | | |
Fixed Rate | | Floating Rate | | | | Expiration Date | | | | Notional
Amount (000) | | | | | Unrealized
Appreciation
(Depreciation) | |
0.81%1 | | 3-month LIBOR | | | | 9/23/16 | | | | | USD | | | | 5,000 | | | | | $ | (14,656 | ) |
1.03%1 | | 3-month LIBOR | | | | 4/07/17 | | | | | USD | | | | 8,000 | | | | | | (50,850 | ) |
1.01%1 | | 3-month LIBOR | | | | 4/28/17 | | | | | USD | | | | 9,000 | | | | | | (54,655 | ) |
0.92%1 | | 3-month LIBOR | | | | 5/16/17 | | | | | USD | | | | 5,000 | | | | | | (18,169 | ) |
1.03%1 | | 3-month LIBOR | | | | 6/16/17 | | | | | USD | | | | 3,000 | | | | | | (13,144 | ) |
1.30%1 | | 3-month LIBOR | | | | 9/23/17 | | | | | USD | | | | 3,250 | | | | | | (39,810 | ) |
1.10%1 | | 3-month LIBOR | | | | 1/26/18 | | | | | USD | | | | 5,700 | | | | | | (29,066 | ) |
1.02%1 | | 3-month LIBOR | | | | 1/30/18 | | | | | USD | | | | 12,000 | | | | | | (92,858 | ) |
1.25%1 | | 3-month LIBOR | | | | 2/13/18 | | | | | USD | | | | 10,500 | | | | | | (138,749 | ) |
1.25%2 | | 3-month LIBOR | | | | 2/13/18 | | | | | USD | | | | 3,660 | | | | | | 48,196 | |
1.24%1 | | 3-month LIBOR | | | | 5/14/18 | | | | | USD | | | | 4,000 | | | | | | (39,474 | ) |
1.22%1 | | 3-month LIBOR | | | | 8/14/18 | | | | | USD | | | | 6,300 | | | | | | (76,380 | ) |
1.89%1 | | 3-month LIBOR | | | | 9/11/19 | | | | | USD | | | | 5,000 | | | | | | (174,845 | ) |
1.99%1 | | 3-month LIBOR | | | | 9/23/19 | | | | | USD | | | | 7,500 | | | | | | (288,161 | ) |
1.78%1 | | 3-month LIBOR | | | | 12/23/19 | | | | | USD | | | | 6,000 | | | | | | (154,719 | ) |
1.44%2 | | 3-month LIBOR | | | | 1/22/20 | | | | | USD | | | | 2,790 | | | | | | 32,289 | |
1.44%1 | | 3-month LIBOR | | | | 1/22/20 | | | | | USD | | | | 2,480 | | | | | | (28,889 | ) |
1.67%1 | | 3-month LIBOR | | | | 2/13/20 | | | | | USD | | | | 1,930 | | | | | | (52,607 | ) |
1.69%1 | | 3-month LIBOR | | | | 2/20/20 | | | | | USD | | | | 4,000 | | | | | | (110,826 | ) |
1.69%1 | | 3-month LIBOR | | | | 5/29/20 | | | | | USD | | | | 6,000 | | | | | | (138,087 | ) |
1.92%1 | | 3-month LIBOR | | | | 6/12/20 | | | | | USD | | | | 4,000 | | | | | | (129,910 | ) |
1.54%1 | | 3-month LIBOR | | | | 11/04/20 | | | | | USD | | | | 9,000 | | | | | | (147,037 | ) |
2.38%1 | | 3-month LIBOR | | | | 9/23/21 | | | | | USD | | | | 1,000 | | | | | | (63,153 | ) |
1.91%1 | | 3-month LIBOR | | | | 2/13/22 | | | | | USD | | | | 2,080 | | | | | | (75,460 | ) |
1.80%1 | | 3-month LIBOR | | | | 4/02/22 | | | | | USD | | | | 3,000 | | | | | | (80,237 | ) |
1.92%1 | | 3-month LIBOR | | | | 1/22/25 | | | | | USD | | | | 4,230 | | | | | | (70,475 | ) |
1.92%1 | | 3-month LIBOR | | | | 1/22/25 | | | | | USD | | | | 920 | | | | | | (15,367 | ) |
2.01%1 | | 3-month LIBOR | | | | 10/23/25 | | | | | USD | | | | 8,200 | | | | | | (210,392 | ) |
2.10%1 | | 3-month LIBOR | | | | 11/02/25 | | | | | USD | | | | 1,500 | | | | | | (50,294 | ) |
Total | | | | | | | | | | | | | | | | | | | | $ | (2,277,785 | ) |
| | | | | | | | | | | | | | | | | | | | | | |
| | 1 | Fund pays the fixed rate and receives the floating rate. |
| | 2 | Fund pays the floating rate and receives the fixed rate. |
See Notes to Financial Statements.
| | | | | | |
| | | BLACKROCK FUNDS | | JANUARY 31, 2016 | | 43 |
| | | | |
| Schedule of Investments (continued) | | | BlackRock Global Long/Short Credit Fund | |
OTC Credit Default Swaps — Buy Protection
| | | | | | | | | | | | | | | | | | | | | | | | | | | | |
| Issuer/Index | | Pay
Fixed
Rate | | | Counterparty | | Expiration
Date | | | Notional Amount (000) | | | Value | | | Premiums
Paid
(Received) | | | Unrealized
Appreciation
(Depreciation) | |
Weatherford International Ltd. | | | 1.00 | % | | Morgan Stanley Capital Services LLC | | | 3/20/16 | | | USD | | | 9,407 | | | $ | 45,118 | | | $ | 12,240 | | | $ | 32,878 | |
Altice Finco SA | | | 5.00 | % | | Citibank N.A. | | | 12/20/16 | | | EUR | | | 4,160 | | | | (172,213 | ) | | | (135,852 | ) | | | (36,361 | ) |
CDX.NA.IG Series 17 Version 1 | | | 1.00 | % | | Credit Suisse International | | | 12/20/16 | | | USD | | | 4,000 | | | | (26,122 | ) | | | 16,630 | | | | (42,752 | ) |
CDX.NA.IG Series 17 Version 1 | | | 1.00 | % | | Morgan Stanley Capital Services LLC | | | 12/20/16 | | | USD | | | 1,000 | | | | (10,482 | ) | | | 189 | | | | (10,671 | ) |
Glencore International AG | | | 5.00 | % | | Goldman Sachs International | | | 12/20/16 | | | EUR | | | 3,700 | | | | 43,049 | | | | 95,276 | | | | (52,227 | ) |
Numericable-SFR SAS | | | 5.00 | % | | Citibank N.A. | | | 12/20/16 | | | EUR | | | 4,160 | | | | (199,712 | ) | | | (173,691 | ) | | | (26,021 | ) |
Stena AB | | | 5.00 | % | | Credit Suisse International | | | 12/20/16 | | | EUR | | | 4,100 | | | | (115,571 | ) | | | (81,663 | ) | | | (33,908 | ) |
Republic of Ireland | | | 1.00 | % | | Citibank N.A. | | | 3/20/17 | | | USD | | | 500 | | | | (5,597 | ) | | | 21,326 | | | | (26,923 | ) |
ArcelorMittal | | | 5.00 | % | | Goldman Sachs International | | | 12/20/17 | | | EUR | | | 1,250 | | | | 70,602 | | | | 100,942 | | | | (30,340 | ) |
Volkswagen AG | | | 1.00 | % | | JPMorgan Chase Bank N.A. | | | 12/20/17 | | | EUR | | | 2,156 | | | | 24,743 | | | | 25,074 | | | | (331 | ) |
Volkswagen AG | | | 1.00 | % | | JPMorgan Chase Bank N.A. | | | 12/20/17 | | | EUR | | | 2,154 | | | | 24,720 | | | | 24,184 | | | | 536 | |
Republic of Italy | | | 1.00 | % | | Barclays Bank PLC | | | 3/20/18 | | | USD | | | 6,750 | | | | (61,915 | ) | | | 176,694 | | | | (238,609 | ) |
Dell, Inc. | | | 1.00 | % | | Barclays Bank PLC | | | 6/20/18 | | | USD | | | 1,750 | | | | 58,818 | | | | 42,322 | | | | 16,496 | |
Dell, Inc. | | | 1.00 | % | | Barclays Bank PLC | | | 6/20/18 | | | USD | | | 1,750 | | | | 58,818 | | | | 42,322 | | | | 16,496 | |
Genworth Holdings, Inc. | | | 1.00 | % | | Citibank N.A. | | | 6/20/18 | | | USD | | | 9,000 | | | | 1,615,391 | | | | 377,926 | | | | 1,237,465 | |
Genworth Holdings, Inc. | | | 1.00 | % | | Credit Suisse International | | | 6/20/18 | | | USD | | | 1,612 | | | | 289,335 | | | | 65,999 | | | | 223,336 | |
Genworth Holdings, Inc. | | | 1.00 | % | | Credit Suisse International | | | 6/20/18 | | | USD | | | 1,611 | | | | 289,156 | | | | 65,292 | | | | 223,864 | |
Genworth Holdings, Inc. | | | 1.00 | % | | Credit Suisse International | | | 6/20/18 | | | USD | | | 1,540 | | | | 276,412 | | | | 76,491 | | | | 199,921 | |
iTraxx Europe Series 9 3-6% | | | 5.00 | % | | Citibank N.A. | | | 6/20/18 | | | EUR | | | 10,350 | | | | (541,024 | ) | | | 720,343 | | | | (1,261,367 | ) |
Republic of France | | | 0.25 | % | | Barclays Bank PLC | | | 6/20/18 | | | USD | | | 6,590 | | | | (24,310 | ) | | | 56,477 | | | | (80,787 | ) |
Republic of France | | | 0.25 | % | | Citibank N.A. | | | 6/20/18 | | | USD | | | 7,125 | | | | (26,283 | ) | | | 69,157 | | | | (95,440 | ) |
Republic of France | | | 0.25 | % | | JPMorgan Chase Bank N.A. | | | 6/20/18 | | | USD | | | 7,135 | | | | (26,320 | ) | | | 53,172 | | | | (79,492 | ) |
Dow Chemical Co. | | | 1.00 | % | | JPMorgan Chase Bank N.A. | | | 9/20/18 | | | USD | | | 5,000 | | | | (81,736 | ) | | | (12,251 | ) | | | (69,485 | ) |
Abbott Laboratories | | | 1.00 | % | | JPMorgan Chase Bank N.A. | | | 12/20/18 | | | USD | | | 15,000 | | | | (372,273 | ) | | | (295,468 | ) | | | (76,805 | ) |
Bayerische Motoren Werke AG | | | 1.00 | % | | Citibank N.A. | | | 12/20/18 | | | EUR | | | 5,200 | | | | (37,182 | ) | | | (2,886 | ) | | | (34,296 | ) |
Cardinal Health, Inc. | | | 1.00 | % | | Barclays Bank PLC | | | 12/20/18 | | | USD | | | 15,000 | | | | (414,826 | ) | | | (256,432 | ) | | | (158,394 | ) |
Dell, Inc. | | | 1.00 | % | | Goldman Sachs Bank USA | | | 12/20/18 | | | USD | | | 4,000 | | | | 204,826 | | | | 60,217 | | | | 144,609 | |
Dell, Inc. | | | 1.00 | % | | Goldman Sachs International | | | 12/20/18 | | | USD | | | 2,000 | | | | 102,413 | | | | 30,111 | | | | 72,302 | |
International Business Machines Corp. | | | 1.00 | % | | Goldman Sachs International | | | 12/20/18 | | | USD | | | 15,000 | | | | (305,055 | ) | | | (256,432 | ) | | | (48,623 | ) |
iTraxx Financials Series 20 Version 1 | | | 1.00 | % | | Barclays Bank PLC | | | 12/20/18 | | | EUR | | | 17,690 | | | | (245,431 | ) | | | (70,106 | ) | | | (175,325 | ) |
iTraxx Financials Series 20 Version 1 | | | 1.00 | % | | Citibank N.A. | | | 12/20/18 | | | EUR | | | 37,890 | | | | (525,684 | ) | | | (147,221 | ) | | | (378,463 | ) |
Microsoft Corp. | | | 1.00 | % | | Credit Suisse International | | | 12/20/18 | | | USD | | | 11,841 | | | | (294,662 | ) | | | (195,492 | ) | | | (99,170 | ) |
Microsoft Corp. | | | 1.00 | % | | Goldman Sachs International | | | 12/20/18 | | | USD | | | 3,159 | | | | (78,606 | ) | | | (53,092 | ) | | | (25,514 | ) |
Sony Corp. | | | 1.00 | % | | JPMorgan Chase Bank N.A. | | | 3/20/19 | | | JPY | | | 2,000,000 | | | | (302,737 | ) | | | 834,638 | | | | (1,137,375 | ) |
Federal Republic of Brazil | | | 1.00 | % | | Bank of America N.A. | | | 6/20/19 | | | USD | | | 14,735 | | | | 1,361,589 | | | | 391,100 | | | | 970,489 | |
Federal Republic of Brazil | | | 1.00 | % | | Citibank N.A. | | | 6/20/19 | | | USD | | | 13,910 | | | | 1,285,354 | | | | 429,332 | | | | 856,022 | |
GDF Suez | | | 1.00 | % | | Bank of America N.A. | | | 6/20/19 | | | EUR | | | 11,095 | | | | (121,804 | ) | | | (257,420 | ) | | | 135,616 | |
GDF Suez | | | 1.00 | % | | Citibank N.A. | | | 6/20/19 | | | EUR | | | 6,355 | | | | (69,766 | ) | | | (134,963 | ) | | | 65,197 | |
GDF Suez | | | 1.00 | % | | Deutsche Bank AG | | | 6/20/19 | | | EUR | | | 6,350 | | | | (69,712 | ) | | | (147,330 | ) | | | 77,618 | |
iTraxx Financials Series 21 Version 1 | | | 1.00 | % | | Citibank N.A. | | | 6/20/19 | | | EUR | | | 26,460 | | | | (334,239 | ) | | | (215,331 | ) | | | (118,908 | ) |
iTraxx Financials Series 21 Version 1 | | | 1.00 | % | | Citibank N.A. | | | 6/20/19 | | | EUR | | | 25,363 | | | | (320,735 | ) | | | (218,274 | ) | | | (102,461 | ) |
Radian Group, Inc. | | | 5.00 | % | | JPMorgan Chase Bank N.A. | | | 6/20/19 | | | USD | | | 8,750 | | | | (324,799 | ) | | | (703,155 | ) | | | 378,356 | |
Radian Group, Inc. | | | 5.00 | % | | JPMorgan Chase Bank N.A. | | | 6/20/19 | | | USD | | | 6,600 | | | | (244,991 | ) | | | (543,178 | ) | | | 298,187 | |
See Notes to Financial Statements.
| | | | | | |
| 44 | | BLACKROCK FUNDS | | JANUARY 31, 2016 | | |
| | | | |
| Schedule of Investments (continued) | | | BlackRock Global Long/Short Credit Fund | |
| | | | | | | | | | | | | | | | | | | | | | | | | | | | |
| Issuer/Index | | Pay
Fixed
Rate | | | Counterparty | | Expiration
Date | | | Notional Amount (000) | | | Value | | | Premiums
Paid
(Received) | | | Unrealized
Appreciation
(Depreciation) | |
Republic of Portugal | | | 1.00 | % | | BNP Paribas S.A. | | | 9/20/19 | | | USD | | | 12,875 | | | $ | 312,107 | | | $ | 275,578 | | | $ | 36,529 | |
Ally Financial, Inc. | | | 5.00 | % | | Credit Suisse International | | | 12/20/19 | | | USD | | | 2,500 | | | | (223,679 | ) | | | (294,308 | ) | | | 70,629 | |
Lennar Corp. | | | 5.00 | % | | Goldman Sachs International | | | 12/20/19 | | | USD | | | 4,000 | | | | (449,492 | ) | | | (411,930 | ) | | | (37,562 | ) |
Navient Corp. | | | 1.00 | % | | JPMorgan Chase Bank N.A. | | | 12/20/19 | | | USD | | | 2,000 | | | | 351,560 | | | | 105,531 | | | | 246,029 | |
Southwest Airlines Co. | | | 1.00 | % | | Credit Suisse International | | | 12/20/19 | | | USD | | | 10,000 | | | | (222,652 | ) | | | (128,863 | ) | | | (93,789 | ) |
AT&T Inc. | | | 1.00 | % | | Goldman Sachs Bank USA | | | 3/20/20 | | | USD | | | 30,000 | | | | (272,169 | ) | | | (399,580 | ) | | | 127,411 | |
Genworth Holdings, Inc. | | | 1.00 | % | | Citibank N.A. | | | 3/20/20 | | | USD | | | 5,647 | | | | 1,710,926 | | | | 694,362 | | | | 1,016,564 | |
Genworth Holdings, Inc. | | | 1.00 | % | | Citibank N.A. | | | 3/20/20 | | | USD | | | 1,129 | | | | 342,065 | | | | 140,473 | | | | 201,592 | |
Genworth Holdings, Inc. | | | 1.00 | % | | Goldman Sachs International | | | 3/20/20 | | | USD | | | 1,435 | | | | 434,776 | | | | 180,858 | | | | 253,918 | |
Genworth Holdings, Inc. | | | 1.00 | % | | JPMorgan Chase Bank N.A. | | | 3/20/20 | | | USD | | | 5,083 | | | | 1,540,046 | | | | 639,186 | | | | 900,860 | |
Raytheon Co. | | | 1.00 | % | | Goldman Sachs Bank USA | | | 3/20/20 | | | USD | | | 15,555 | | | | (569,392 | ) | | | (518,640 | ) | | | (50,752 | ) |
Raytheon Co. | | | 1.00 | % | | Goldman Sachs Bank USA | | | 3/20/20 | | | USD | | | 15,485 | | | | (566,829 | ) | | | (516,151 | ) | | | (50,678 | ) |
Time Warner Cable, Inc. | | | 1.00 | % | | Goldman Sachs Bank USA | | | 3/20/20 | | | USD | �� | | 7,554 | | | | (102,375 | ) | | | (103,709 | ) | | | 1,334 | |
Time Warner Cable, Inc. | | | 1.00 | % | | Goldman Sachs Bank USA | | | 3/20/20 | | | USD | | | 3,451 | | | | (46,772 | ) | | | (50,120 | ) | | | 3,348 | |
Time Warner Cable, Inc. | | | 1.00 | % | | Goldman Sachs Bank USA | | | 3/20/20 | | | USD | | | 3,313 | | | | (44,892 | ) | | | (41,467 | ) | | | (3,425 | ) |
Time Warner Cable, Inc. | | | 1.00 | % | | JPMorgan Chase Bank N.A. | | | 3/20/20 | | | USD | | | 3,028 | | | | (41,030 | ) | | | (41,531 | ) | | | 501 | |
Ally Financial, Inc. | | | 5.00 | % | | Citibank N.A. | | | 6/20/20 | | | USD | | | 3,900 | | | | (353,237 | ) | | | (482,209 | ) | | | 128,972 | |
Boston Scientific Corp. | | | 1.00 | % | | JPMorgan Chase Bank N.A. | | | 6/20/20 | | | USD | | | 15,000 | | | | (423,293 | ) | | | (314,440 | ) | | | (108,853 | ) |
Genworth Holdings, Inc. | | | 1.00 | % | | Citibank N.A. | | | 6/20/20 | | | USD | | | 808 | | | | 254,751 | | | | 82,417 | | | | 172,334 | |
Genworth Holdings, Inc. | | | 1.00 | % | | Goldman Sachs International | | | 6/20/20 | | | USD | | | 1,112 | | | | 350,598 | | | | 107,138 | | | | 243,460 | |
Genworth Holdings, Inc. | | | 1.00 | % | | JPMorgan Chase Bank N.A. | | | 6/20/20 | | | USD | | | 706 | | | | 222,592 | | | | 73,475 | | | | 149,117 | |
Time Warner Cable, Inc. | | | 1.00 | % | | Citibank N.A. | | | 6/20/20 | | | USD | | | 8,250 | | | | (98,979 | ) | | | 277,346 | | | | (376,325 | ) |
Time Warner Cable, Inc. | | | 1.00 | % | | JPMorgan Chase Bank N.A. | | | 6/20/20 | | | USD | | | 766 | | | | (9,195 | ) | | | 22,480 | | | | (31,675 | ) |
Time Warner Cable, Inc. | | | 1.00 | % | | JPMorgan Chase Bank N.A. | | | 6/20/20 | | | USD | | | 449 | | | | (5,386 | ) | | | 15,251 | | | | (20,637 | ) |
Anthem, Inc. | | | 1.00 | % | | JPMorgan Chase Bank N.A. | | | 9/20/20 | | | USD | | | 20,000 | | | | (388,089 | ) | | | (306,610 | ) | | | (81,479 | ) |
Bank of America Corp. | | | 1.00 | % | | Barclays Bank PLC | | | 9/20/20 | | | USD | | | 15,000 | | | | (80,740 | ) | | | (145,680 | ) | | | 64,940 | |
Bank of America Corp. | | | 1.00 | % | | JPMorgan Chase Bank N.A. | | | 9/20/20 | | | USD | | | 15,000 | | | | (80,932 | ) | | | (104,847 | ) | | | 23,915 | |
Caterpillar, Inc. | | | 1.00 | % | | JPMorgan Chase Bank N.A. | | | 9/20/20 | | | USD | | | 14,900 | | | | (23,452 | ) | | | (329,427 | ) | | | 305,975 | |
Citigroup, Inc. | | | 1.00 | % | | Barclays Bank PLC | | | 9/20/20 | | | USD | | | 5,231 | | | | (14,235 | ) | | | (10,816 | ) | | | (3,419 | ) |
Citigroup, Inc. | | | 1.00 | % | | Goldman Sachs International | | | 9/20/20 | | | USD | | | 15,000 | | | | (40,820 | ) | | | (38,677 | ) | | | (2,143 | ) |
Citigroup, Inc. | | | 1.00 | % | | Goldman Sachs International | | | 9/20/20 | | | USD | | | 9,769 | | | | (26,584 | ) | | | (54,909 | ) | | | 28,325 | |
Genworth Holdings, Inc. | | | 1.00 | % | | Goldman Sachs International | | | 9/20/20 | | | USD | | | 8,425 | | | | 2,753,670 | | | | 764,860 | | | | 1,988,810 | |
Goldman Sachs Group, Inc. | | | 1.00 | % | | Bank of America N.A. | | | 9/20/20 | | | USD | | | 15,000 | | | | (49,371 | ) | | | 21,601 | | | | (70,972 | ) |
Goldman Sachs Group, Inc. | | | 1.00 | % | | Bank of America N.A. | | | 9/20/20 | | | USD | | | 15,000 | | | | (49,371 | ) | | | 26,946 | | | | (76,317 | ) |
JPMorgan Chase and Co. | | | 1.00 | % | | Bank of America N.A. | | | 9/20/20 | | | USD | | | 5,263 | | | | (59,506 | ) | | | (39,175 | ) | | | (20,331 | ) |
JPMorgan Chase and Co. | | | 1.00 | % | | Citibank N.A. | | | 9/20/20 | | | USD | | | 7,131 | | | | (80,629 | ) | | | (59,124 | ) | | | (21,505 | ) |
JPMorgan Chase and Co. | | | 1.00 | % | | Citibank N.A. | | | 9/20/20 | | | USD | | | 7,130 | | | | (80,615 | ) | | | (52,573 | ) | | | (28,042 | ) |
JPMorgan Chase and Co. | | | 1.00 | % | | Goldman Sachs International | | | 9/20/20 | | | USD | | | 5,722 | | | | (64,696 | ) | | | (57,844 | ) | | | (6,852 | ) |
JPMorgan Chase and Co. | | | 1.00 | % | | Goldman Sachs International | | | 9/20/20 | | | USD | | | 4,754 | | | | (53,687 | ) | | | (46,168 | ) | | | (7,519 | ) |
Louis Dreyfus Commodities BV | | | 5.00 | % | | Goldman Sachs International | | | 9/20/20 | | | EUR | | | 590 | | | | 4,036 | | | | (56,770 | ) | | | 60,806 | |
Morgan Stanley | | | 1.00 | % | | Bank of America N.A. | | | 9/20/20 | | | USD | | | 9,444 | | | | (30,223 | ) | | | (66,540 | ) | | | 36,317 | |
Morgan Stanley | | | 1.00 | % | | Goldman Sachs International | | | 9/20/20 | | | USD | | | 15,000 | | | | (48,004 | ) | | | (45,269 | ) | | | (2,735 | ) |
Morgan Stanley | | | 1.00 | % | | JPMorgan Chase Bank N.A. | | | 9/20/20 | | | USD | | | 5,556 | | | | (17,781 | ) | | | (41,370 | ) | | | 23,589 | |
Motorola Solutions, Inc. | | | 1.00 | % | | Bank of America N.A. | | | 9/20/20 | | | USD | | | 4,625 | | | | 85,031 | | | | 128,097 | | | | (43,066 | ) |
See Notes to Financial Statements.
| | | | | | |
| | | BLACKROCK FUNDS | | JANUARY 31, 2016 | | 45 |
| | | | |
| Schedule of Investments (continued) | | | BlackRock Global Long/Short Credit Fund | |
| | | | | | | | | | | | | | | | | | | | | | | | | | | | |
| Issuer/Index | | Pay
Fixed
Rate | | | Counterparty | | Expiration
Date | | | Notional Amount (000) | | | Value | | | Premiums
Paid
(Received) | | | Unrealized
Appreciation
(Depreciation) | |
Motorola Solutions, Inc. | | | 1.00 | % | | Barclays Bank PLC | | | 9/20/20 | | | USD | | | 650 | | | $ | 11,950 | | | $ | 18,003 | | | $ | (6,053 | ) |
Navient Corp. | | | 5.00 | % | | Citibank N.A. | | | 9/20/20 | | | USD | | | 2,000 | | | | 133,908 | | | | 13,995 | | | | 119,913 | |
Textron, Inc. | | | 1.00 | % | | JPMorgan Chase Bank N.A. | | | 9/20/20 | | | USD | | | 8,000 | | | | (79,064 | ) | | | (44,836 | ) | | | (34,228 | ) |
Wells Fargo & Co. | | | 1.00 | % | | Bank of America N.A. | | | 9/20/20 | | | USD | | | 9,743 | | | | (211,656 | ) | | | (182,144 | ) | | | (29,512 | ) |
Wells Fargo & Co. | | | 1.00 | % | | Goldman Sachs International | | | 9/20/20 | | | USD | | | 5,257 | | | | (114,270 | ) | | | (85,872 | ) | | | (28,398 | ) |
Wells Fargo & Co. | | | 1.00 | % | | JPMorgan Chase Bank N.A. | | | 9/20/20 | | | USD | | | 15,000 | | | | (326,052 | ) | | | (225,352 | ) | | | (100,700 | ) |
21st Century Fox America, Inc. | | | 1.00 | % | | Credit Suisse International | | | 12/20/20 | | | USD | | | 11,110 | | | | (292,591 | ) | | | (171,147 | ) | | | (121,444 | ) |
21st Century Fox America, Inc. | | | 1.00 | % | | Credit Suisse International | | | 12/20/20 | | | USD | | | 8,890 | | | | (234,126 | ) | | | (140,997 | ) | | | (93,129 | ) |
American Express Co. | | | 1.00 | % | | Citibank N.A. | | | 12/20/20 | | | USD | | | 20,000 | | | | (428,740 | ) | | | (583,364 | ) | | | 154,624 | |
Ardagh Packaging Finance PLC | | | 5.00 | % | | Goldman Sachs International | | | 12/20/20 | | | EUR | | | 1,245 | | | | (49,740 | ) | | | (44,620 | ) | | | (5,120 | ) |
Arrow Electronics, Inc. | | | 1.00 | % | | Credit Suisse International | | | 12/20/20 | | | USD | | | 10,000 | | | | (104,103 | ) | | | (82,408 | ) | | | (21,695 | ) |
Arrow Electronics, Inc. | | | 1.00 | % | | JPMorgan Chase Bank N.A. | | | 12/20/20 | | | USD | | | 15,000 | | | | (156,153 | ) | | | (153,832 | ) | | | (2,321 | ) |
Avnet, Inc. | | | 1.00 | % | | Credit Suisse International | | | 12/20/20 | | | USD | | | 24,500 | | | | (289,744 | ) | | | (137,347 | ) | | | (152,397 | ) |
Banco Comercial Portugues SA | | | 5.00 | % | | BNP Paribas S.A. | | | 12/20/20 | | | EUR | | | 1,284 | | | | 17,664 | | | | (22,166 | ) | | | 39,830 | |
Bank of America N.A. | | | 1.00 | % | | Goldman Sachs International | | | 12/20/20 | | | USD | | | 40,000 | | | | (159,372 | ) | | | (106,958 | ) | | | (52,414 | ) |
Bank of America N.A. | | | 1.00 | % | | Goldman Sachs International | | | 12/20/20 | | | USD | | | 24,500 | | | | (97,615 | ) | | | (180,560 | ) | | | 82,945 | |
Bank of America N.A. | | | 1.00 | % | | Goldman Sachs International | | | 12/20/20 | | | USD | | | 20,000 | | | | (79,685 | ) | | | (235,014 | ) | | | 155,329 | |
Bayerische Motoren Werke AG | | | 1.00 | % | | Goldman Sachs International | | | 12/20/20 | | | EUR | | | 5,100 | | | | (508 | ) | | | (39,213 | ) | | | 38,705 | |
BNP Paribas S.A. | | | 1.00 | % | | Citibank N.A. | | | 12/20/20 | | | EUR | | | 4,133 | | | | (46,319 | ) | | | (41,123 | ) | | | (5,196 | ) |
Brisa Concessao Rodoviaria SA | | | 5.00 | % | | Goldman Sachs International | | | 12/20/20 | | | EUR | | | 1,288 | | | | (240,864 | ) | | | (281,538 | ) | | | 40,674 | |
Brisa Concessao Rodoviaria SA | | | 5.00 | % | | Goldman Sachs International | | | 12/20/20 | | | EUR | | | 1,287 | | | | (240,677 | ) | | | (284,723 | ) | | | 44,046 | |
Brisa Concessao Rodoviaria SA | | | 5.00 | % | | Goldman Sachs International | | | 12/20/20 | | | EUR | | | 1,284 | | | | (240,117 | ) | | | (263,635 | ) | | | 23,518 | |
Cable & Wireless Ltd. | | | 5.00 | % | | Bank of America N.A. | | | 12/20/20 | | | EUR | | | 314 | | | | (33,512 | ) | | | (40,887 | ) | | | 7,375 | |
Cable & Wireless Ltd. | | | 5.00 | % | | Barclays Bank PLC | | | 12/20/20 | | | EUR | | | 2,306 | | | | (245,752 | ) | | | (293,648 | ) | | | 47,896 | |
Capital One Financial Corp. | | | 1.00 | % | | JPMorgan Chase Bank N.A. | | | 12/20/20 | | | USD | | | 5,000 | | | | (68,309 | ) | | | (104,950 | ) | | | 36,641 | |
Caterpillar, Inc. | | | 1.00 | % | | Citibank N.A. | | | 12/20/20 | | | USD | | | 5,000 | | | | 5,308 | | | | (92,978 | ) | | | 98,286 | |
Caterpillar, Inc. | | | 1.00 | % | | Credit Suisse International | | | 12/20/20 | | | USD | | | 17,145 | | | | 18,200 | | | | (262,773 | ) | | | 280,973 | |
Caterpillar, Inc. | | | 1.00 | % | | JPMorgan Chase Bank N.A. | | | 12/20/20 | | | USD | | | 17,500 | | | | 18,577 | | | | (293,294 | ) | | | 311,871 | |
Caterpillar, Inc. | | | 1.00 | % | | JPMorgan Chase Bank N.A. | | | 12/20/20 | | | USD | | | 10,000 | | | | 10,615 | | | | 79,467 | | | | (68,852 | ) |
Centurylink, Inc. | | | 1.00 | % | | Goldman Sachs International | | | 12/20/20 | | | USD | | | 5,000 | | | | 752,572 | | | | 647,800 | | | | 104,772 | |
Citigroup, Inc. | | | 1.00 | % | | Goldman Sachs International | | | 12/20/20 | | | USD | | | 20,000 | | | | (15,973 | ) | | | (155,402 | ) | | | 139,429 | |
Clariant AG | | | 1.00 | % | | Barclays Bank PLC | | | 12/20/20 | | | EUR | | | 205 | | | | 2,633 | | | | 2,967 | | | | (334 | ) |
Clariant AG | | | 1.00 | % | | Barclays Bank PLC | | | 12/20/20 | | | EUR | | | 204 | | | | 2,620 | | | | 2,952 | | | | (332 | ) |
Clariant AG | | | 1.00 | % | | Barclays Bank PLC | | | 12/20/20 | | | EUR | | | 204 | | | | 2,620 | | | | 2,952 | | | | (332 | ) |
Clariant AG | | | 1.00 | % | | Barclays Bank PLC | | | 12/20/20 | | | EUR | | | 204 | | | | 2,620 | | | | 3,155 | | | | (535 | ) |
Clariant AG | | | 1.00 | % | | BNP Paribas S.A. | | | 12/20/20 | | | EUR | | | 1,225 | | | | 15,735 | | | | 22,029 | | | | (6,294 | ) |
Clariant AG | | | 1.00 | % | | BNP Paribas S.A. | | | 12/20/20 | | | EUR | | | 408 | | | | 5,241 | | | | 2,153 | | | | 3,088 | |
Clariant AG | | | 1.00 | % | | Goldman Sachs International | | | 12/20/20 | | | EUR | | | 2,450 | | | | 31,494 | | | | (10,132 | ) | | | 41,626 | |
Comcast Corp. | | | 1.00 | % | | Credit Suisse International | | | 12/20/20 | | | USD | | | 7,615 | | | | (251,224 | ) | | | (230,978 | ) | | | (20,246 | ) |
Comcast Corp. | | | 1.00 | % | | Credit Suisse International | | | 12/20/20 | | | USD | | | 7,385 | | | | (243,636 | ) | | | (227,012 | ) | | | (16,624 | ) |
See Notes to Financial Statements.
| | | | | | |
| 46 | | BLACKROCK FUNDS | | JANUARY 31, 2016 | | |
| | | | |
| Schedule of Investments (continued) | | | BlackRock Global Long/Short Credit Fund | |
| | | | | | | | | | | | | | | | | | | | | | | | | | | | |
| Issuer/Index | | Pay
Fixed
Rate | | | Counterparty | | Expiration
Date | | | Notional Amount (000) | | | Value | | | Premiums
Paid
(Received) | | | Unrealized
Appreciation
(Depreciation) | |
Compagnie de Saint-Gobain SA | | | 1.00 | % | | Credit Suisse International | | | 12/20/20 | | | EUR | | | 1,666 | | | $ | (6,260 | ) | | $ | (8,551 | ) | | $ | 2,291 | |
Compagnie de Saint-Gobain SA | | | 1.00 | % | | Goldman Sachs International | | | 12/20/20 | | | EUR | | | 2,500 | | | | (9,393 | ) | | | (11,513 | ) | | | 2,120 | |
Compagnie de Saint-Gobain SA | | | 1.00 | % | | JPMorgan Chase Bank N.A. | | | 12/20/20 | | | EUR | | | 942 | | | | (3,548 | ) | | | 2,064 | | | | (5,612 | ) |
Compagnie de Saint-Gobain SA | | | 1.00 | % | | JPMorgan Chase Bank N.A. | | | 12/20/20 | | | EUR | | | 940 | | | | (3,541 | ) | | | 2,542 | | | | (6,083 | ) |
Compagnie de Saint-Gobain SA | | | 1.00 | % | | JPMorgan Chase Bank N.A. | | | 12/20/20 | | | EUR | | | 830 | | | | (3,118 | ) | | | (818 | ) | | | (2,300 | ) |
ConvaTec Healthcare E SA | | | 5.00 | % | | Morgan Stanley Capital Services LLC | | | 12/20/20 | | | EUR | | | 2,110 | | | | (306,290 | ) | | | (377,656 | ) | | | 71,366 | |
Cox Communications, Inc. | | | 1.00 | % | | Credit Suisse International | | | 12/20/20 | | | USD | | | 7,615 | | | | (165,044 | ) | | | (124,546 | ) | | | (40,498 | ) |
Cox Communications, Inc. | | | 1.00 | % | | Credit Suisse International | | | 12/20/20 | | | USD | | | 7,385 | | | | (160,059 | ) | | | (130,830 | ) | | | (29,229 | ) |
Daimler AG | | | 1.00 | % | | Citibank N.A. | | | 12/20/20 | | | EUR | | | 5,100 | | | | (30,654 | ) | | | (57,966 | ) | | | 27,312 | |
DIRECTV | | | 1.00 | % | | Credit Suisse International | | | 12/20/20 | | | USD | | | 11,110 | | | | (132,295 | ) | | | (134,314 | ) | | | 2,019 | |
DIRECTV | | | 1.00 | % | | Credit Suisse International | | | 12/20/20 | | | USD | | | 4,630 | | | | (55,132 | ) | | | (55,974 | ) | | | 842 | |
DIRECTV | | | 1.00 | % | | Credit Suisse International | | | 12/20/20 | | | USD | | | 4,260 | | | | (50,726 | ) | | | (53,212 | ) | | | 2,486 | |
Galapagos Holding SA | | | 5.00 | % | | Bank of America N.A. | | | 12/20/20 | | | EUR | | | 1,738 | | | | 134,014 | | | | 83,587 | | | | 50,427 | |
Galapagos Holding SA | | | 5.00 | % | | Goldman Sachs International | | | 12/20/20 | | | EUR | | | 1,600 | | | | 123,451 | | | | 159,829 | | | | (36,378 | ) |
Galapagos Holding SA | | | 5.00 | % | | Goldman Sachs International | | | 12/20/20 | | | EUR | | | 1,200 | | | | 92,588 | | | | 113,349 | | | | (20,761 | ) |
GKN Holdings PLC | | | 1.00 | % | | BNP Paribas S.A. | | | 12/20/20 | | | EUR | | | 2,500 | | | | 65,078 | | | | 56,634 | | | | 8,444 | |
GKN Holdings PLC | | | 1.00 | % | | Goldman Sachs International | | | 12/20/20 | | | EUR | | | 1,250 | | | | 32,527 | | | | 36,202 | | | | (3,675 | ) |
GKN Holdings PLC | | | 1.00 | % | | JPMorgan Chase Bank N.A. | | | 12/20/20 | | | EUR | | | 1,250 | | | | 32,527 | | | | 33,106 | | | | (579 | ) |
Goldman Sachs Group, Inc. | | | 1.00 | % | | Bank of America N.A. | | | 12/20/20 | | | USD | | | 20,000 | | | | (31,286 | ) | | | (136,752 | ) | | | 105,466 | |
HCA, Inc. | | | 5.00 | % | | Barclays Bank PLC | | | 12/20/20 | | | USD | | | 6,000 | | | | (823,954 | ) | | | (679,550 | ) | | | (144,404 | ) |
HCA, Inc. | | | 5.00 | % | | Citibank N.A. | | | 12/20/20 | | | USD | | | 2,500 | | | | (343,314 | ) | | | (233,847 | ) | | | (109,467 | ) |
Hewlett-Packard Co. | | | 1.00 | % | | Credit Suisse International | | | 12/20/20 | | | USD | | | 7,500 | | | | 269,611 | | | | 202,867 | | | | 66,744 | |
Home Depot, Inc. | | | 1.00 | % | | JPMorgan Chase Bank N.A. | | | 12/20/20 | | | USD | | | 15,000 | | | | (578,143 | ) | | | (592,946 | ) | | | 14,803 | |
JPMorgan Chase & Co. | | | 1.00 | % | | Credit Suisse International | | | 12/20/20 | | | USD | | | 20,000 | | | | (207,653 | ) | | | (230,316 | ) | | | 22,663 | |
Kohl’s Corp. | | | 1.00 | % | | JPMorgan Chase Bank N.A. | | | 12/20/20 | | | USD | | | 20,000 | | | | 685,233 | | | | 1,138,810 | | | | (453,577 | ) |
Ladbrokes PLC | | | 1.00 | % | | Citibank N.A. | | | 12/20/20 | | | EUR | | | 457 | | | | 26,048 | | | | 32,024 | | | | (5,976 | ) |
Lanxess AG | | | 1.00 | % | | Bank of America N.A. | | | 12/20/20 | | | EUR | | | 2,050 | | | | 9,983 | | | | 26,557 | | | | (16,574 | ) |
Lanxess AG | | | 1.00 | % | | Barclays Bank PLC | | | 12/20/20 | | | EUR | | | 661 | | | | 3,225 | | | | (1,344 | ) | | | 4,569 | |
Lanxess AG | | | 1.00 | % | | Citibank N.A. | | | 12/20/20 | | | EUR | | | 2,358 | | | | 10,350 | | | | (7,135 | ) | | | 17,485 | |
Lanxess AG | | | 1.00 | % | | Citibank N.A. | | | 12/20/20 | | | EUR | | | 2,050 | | | | 9,982 | | | | 22,229 | | | | (12,247 | ) |
Lanxess AG | | | 1.00 | % | | JPMorgan Chase Bank N.A. | | | 12/20/20 | | | EUR | | | 2,707 | | | | 13,182 | | | | 40,502 | | | | (27,320 | ) |
Lanxess AG | | | 1.00 | % | | JPMorgan Chase Bank N.A. | | | 12/20/20 | | | EUR | | | 1,682 | | | | 8,190 | | | | 30,257 | | | | (22,067 | ) |
Lanxess AG | | | 1.00 | % | | JPMorgan Chase Bank N.A. | | | 12/20/20 | | | EUR | | | 1,682 | | | | 8,190 | | | | 30,257 | | | | (22,067 | ) |
Louis Dreyfus Commodities BV | | | 5.00 | % | | Citibank N.A. | | | 12/20/20 | | | EUR | | | 861 | | | | 10,975 | | | | 9,826 | | | | 1,149 | |
Louis Dreyfus Commodities BV | | | 5.00 | % | | Citibank N.A. | | | 12/20/20 | | | EUR | | | 223 | | | | 2,842 | | | | 2,545 | | | | 297 | |
Louis Dreyfus Commodities BV | | | 5.00 | % | | Credit Suisse International | | | 12/20/20 | | | EUR | | | 800 | | | | 10,193 | | | | (6,628 | ) | | | 16,821 | |
Louis Dreyfus Commodities BV | | | 5.00 | % | | Goldman Sachs International | | | 12/20/20 | | | EUR | | | 780 | | | | 9,942 | | | | (43,940 | ) | | | 53,882 | |
Lowes Corp. | | | 1.00 | % | | Citibank N.A. | | | 12/20/20 | | | USD | | | 20,000 | | | | (646,771 | ) | | | (651,391 | ) | | | 4,620 | |
Lowes Corp. | | | 1.00 | % | | JPMorgan Chase Bank N.A. | | | 12/20/20 | | | USD | | | 15,000 | | | | (628,303 | ) | | | (592,946 | ) | | | (35,357 | ) |
Marriott International, Inc. | | | 1.00 | % | | Credit Suisse International | | | 12/20/20 | | | USD | | | 7,615 | | | | (163,212 | ) | | | (146,326 | ) | | | (16,886 | ) |
Marriott International, Inc. | | | 1.00 | % | | Goldman Sachs International | | | 12/20/20 | | | USD | | | 7,385 | | | | (158,282 | ) | | | (144,946 | ) | | | (13,336 | ) |
Matterhorn Telecom Holding SA | | | 5.00 | % | | Citibank N.A. | | | 12/20/20 | | | EUR | | | 1,245 | | | | (40,386 | ) | | | (22,172 | ) | | | (18,214 | ) |
See Notes to Financial Statements.
| | | | | | |
| | | BLACKROCK FUNDS | | JANUARY 31, 2016 | | 47 |
| | | | |
| Schedule of Investments (continued) | | | BlackRock Global Long/Short Credit Fund | |
| | | | | | | | | | | | | | | | | | | | | | | | | | | | |
| Issuer/Index | | Pay
Fixed
Rate | | | Counterparty | | Expiration
Date | | | Notional Amount (000) | | | Value | | | Premiums
Paid
(Received) | | | Unrealized
Appreciation
(Depreciation) | |
Matterhorn Telecom Holding SA | | | 5.00 | % | | Goldman Sachs International | | | 12/20/20 | | | EUR | | | 830 | | | $ | (26,966 | ) | | $ | (5,273 | ) | | $ | (21,693 | ) |
Melia Hotels International SA | | | 5.00 | % | | Citibank N.A. | | | 12/20/20 | | | EUR | | | 2,890 | | | | (538,359 | ) | | | (578,029 | ) | | | 39,670 | |
Melia Hotels International SA | | | 5.00 | % | | Citibank N.A. | | | 12/20/20 | | | EUR | | | 2,145 | | | | (399,578 | ) | | | (416,710 | ) | | | 17,132 | |
Melia Hotels International SA | | | 5.00 | % | | Citibank N.A. | | | 12/20/20 | | | EUR | | | 1,250 | | | | (232,804 | ) | | | (234,574 | ) | | | 1,770 | |
Melia Hotels International SA | | | 5.00 | % | | Goldman Sachs International | | | 12/20/20 | | | EUR | | | 2,145 | | | | (399,578 | ) | | | (419,624 | ) | | | 20,046 | |
Melia Hotels International SA | | | 5.00 | % | | Goldman Sachs International | | | 12/20/20 | | | EUR | | | 1,250 | | | | (232,865 | ) | | | (237,673 | ) | | | 4,808 | |
MetLife, Inc. | | | 1.00 | % | | Citibank N.A. | | | 12/20/20 | | | USD | | | 5,365 | | | | 10,009 | | | | (4,396 | ) | | | 14,405 | |
Metro AG | | | 1.00 | % | | BNP Paribas S.A. | | | 12/20/20 | | | EUR | | | 2,050 | | | | 42,179 | | | | 40,434 | | | | 1,745 | |
Monitchem HoldCo 3 SA | | | 5.00 | % | | Credit Suisse International | | | 12/20/20 | | | EUR | | | 1,743 | | | | (111,408 | ) | | | (151,696 | ) | | | 40,288 | |
Monitchem HoldCo 3 SA | | | 5.00 | % | | Credit Suisse International | | | 12/20/20 | | | EUR | | | 1,307 | | | | (83,556 | ) | | | (111,777 | ) | | | 28,221 | |
Monitchem HoldCo 3 SA | | | 5.00 | % | | Goldman Sachs International | | | 12/20/20 | | | EUR | | | 1,320 | | | | (84,387 | ) | | | (53,533 | ) | | | (30,854 | ) |
Morgan Stanley | | | 1.00 | % | | Citibank N.A. | | | 12/20/20 | | | USD | | | 20,000 | | | | (29,444 | ) | | | (136,752 | ) | | | 107,308 | |
Motorola Solutions, Inc. | | | 1.00 | % | | Goldman Sachs International | | | 12/20/20 | | | USD | | | 6,870 | | | | 161,471 | | | | 161,712 | | | | (241 | ) |
Motorola Solutions, Inc. | | | 1.00 | % | | Goldman Sachs International | | | 12/20/20 | | | USD | | | 3,155 | | | | 74,154 | | | | 57,688 | | | | 16,466 | |
Motorola Solutions, Inc. | | | 1.00 | % | | JPMorgan Chase Bank N.A. | | | 12/20/20 | | | USD | | | 6,000 | | | | 141,022 | | | | 201,799 | | | | (60,777 | ) |
New Look | | | 5.00 | % | | Credit Suisse International | | | 12/20/20 | | | EUR | | | 1,400 | | | | (4,517 | ) | | | (23,950 | ) | | | 19,433 | |
New Look | | | 5.00 | % | | Credit Suisse International | | | 12/20/20 | | | EUR | | | 600 | | | | (1,932 | ) | | | (13,126 | ) | | | 11,194 | |
Omnicom Group, Inc. | | | 1.00 | % | | Credit Suisse International | | | 12/20/20 | | | USD | | | 6,481 | | | | (203,795 | ) | | | (168,224 | ) | | | (35,571 | ) |
Omnicom Group, Inc. | | | 1.00 | % | | Credit Suisse International | | | 12/20/20 | | | USD | | | 4,630 | | | | (145,580 | ) | | | (120,170 | ) | | | (25,410 | ) |
People’s Republic of China | | | 1.00 | % | | Goldman Sachs International | | | 12/20/20 | | | USD | | | 10,000 | | | | 104,226 | | | | 139,918 | | | | (35,692 | ) |
Pernod Ricard SA | | | 1.00 | % | | JPMorgan Chase Bank N.A. | | | 12/20/20 | | | EUR | | | 3,900 | | | | (53,644 | ) | | | (35,092 | ) | | | (18,552 | ) |
Prudential Financial, Inc. | | | 1.00 | % | | Citibank N.A. | | | 12/20/20 | | | USD | | | 5,712 | | | | (3,870 | ) | | | (15,258 | ) | | | 11,388 | |
Prudential Financial, Inc. | | | 1.00 | % | | Goldman Sachs International | | | 12/20/20 | | | USD | | | 5,413 | | | | (3,668 | ) | | | (37,218 | ) | | | 33,550 | |
Rallye SA | | | 5.00 | % | | Goldman Sachs International | | | 12/20/20 | | | EUR | | | 2,010 | | | | 675,195 | | | | 307,675 | | | | 367,520 | |
Repsol SA | | | 1.00 | % | | Goldman Sachs International | | | 12/20/20 | | | EUR | | | 2,400 | | | | 297,955 | | | | 369,098 | | | | (71,143 | ) |
Repsol SA | | | 1.00 | % | | JPMorgan Chase Bank N.A. | | | 12/20/20 | | | EUR | | | 2,400 | | | | 297,955 | | | | 301,749 | | | | (3,794 | ) |
Rexel SA | | | 5.00 | % | | Barclays Bank PLC | | | 12/20/20 | | | EUR | | | 820 | | | | (108,604 | ) | | | (91,528 | ) | | | (17,076 | ) |
Rexel SA | | | 5.00 | % | | Barclays Bank PLC | | | 12/20/20 | | | EUR | | | 647 | | | | (85,692 | ) | | | (84,285 | ) | | | (1,407 | ) |
Rexel SA | | | 5.00 | % | | Credit Suisse International | | | 12/20/20 | | | EUR | | | 832 | | | | (110,195 | ) | | | (118,867 | ) | | | 8,672 | |
Rexel SA | | | 5.00 | % | | Goldman Sachs International | | | 12/20/20 | | | EUR | | | 2,080 | | | | (275,486 | ) | | | (289,141 | ) | | | 13,655 | |
Royal Dutch Shell PLC | | | 1.00 | % | | JPMorgan Chase Bank N.A. | | | 12/20/20 | | | EUR | | | 2,500 | | | | 33,958 | | | | 34,642 | | | | (684 | ) |
Smurfit Kappa Acquisitions | | | 5.00 | % | | JPMorgan Chase Bank N.A. | | | 12/20/20 | | | EUR | | | 2,075 | | | | (372,826 | ) | | | (408,340 | ) | | | 35,514 | |
Société Générale SA | | | 1.00 | % | | Citibank N.A. | | | 12/20/20 | | | EUR | | | 5,200 | | | | (50,372 | ) | | | (58,775 | ) | | | 8,403 | |
Solvay SA | | | 1.00 | % | | Bank of America N.A. | | | 12/20/20 | | | EUR | | | 1,950 | | | | 44,163 | | | | (13,185 | ) | | | 57,348 | |
Solvay SA | | | 1.00 | % | | Barclays Bank PLC | | | 12/20/20 | | | EUR | | | 580 | | | | 13,136 | | | | (4,003 | ) | | | 17,139 | |
Solvay SA | | | 1.00 | % | | Citibank N.A. | | | 12/20/20 | | | EUR | | | 1,160 | | | | 26,271 | | | | (7,938 | ) | | | 34,209 | |
Solvay SA | | | 1.00 | % | | Credit Suisse International | | | 12/20/20 | | | EUR | | | 429 | | | | 9,715 | | | | 10,932 | | | | (1,217 | ) |
Solvay SA | | | 1.00 | % | | JPMorgan Chase Bank N.A. | | | 12/20/20 | | | EUR | | | 1,170 | | | | 26,498 | | | | (6,179 | ) | | | 32,677 | |
Sprint Nextel Corp. | | | 5.00 | % | | Goldman Sachs International | | | 12/20/20 | | | USD | | | 4,600 | | | | 1,109,277 | | | | 1,562,177 | | | | (452,900 | ) |
Staples, Inc. | | | 1.00 | % | | JPMorgan Chase Bank N.A. | | | 12/20/20 | | | USD | | | 13,278 | | | | 890,006 | | | | 755,989 | | | | 134,017 | |
Staples, Inc. | | | 1.00 | % | | JPMorgan Chase Bank N.A. | | | 12/20/20 | | | USD | | | 2,300 | | | | 154,038 | | | | 160,116 | | | | (6,078 | ) |
STMicroelectronics NV | | | 1.00 | % | | Bank of America N.A. | | | 12/20/20 | | | EUR | | | 2,070 | | | | 14,555 | | | | 16,249 | | | | (1,694 | ) |
See Notes to Financial Statements.
| | | | | | |
| 48 | | BLACKROCK FUNDS | | JANUARY 31, 2016 | | |
| | | | |
| Schedule of Investments (continued) | | | BlackRock Global Long/Short Credit Fund | |
| | | | | | | | | | | | | | | | | | | | | | | | | | | | |
| Issuer/Index | | Pay
Fixed
Rate | | | Counterparty | | Expiration
Date | | | Notional Amount (000) | | | Value | | | Premiums
Paid
(Received) | | | Unrealized
Appreciation
(Depreciation) | |
STMicroelectronics NV | | | 1.00 | % | | Barclays Bank PLC | | | 12/20/20 | | | EUR | | | 2,070 | | | $ | 14,554 | | | $ | 22,562 | | | $ | (8,008 | ) |
STMicroelectronics NV | | | 1.00 | % | | Citibank N.A. | | | 12/20/20 | | | EUR | | | 2,080 | | | | 14,624 | | | | 21,618 | | | | (6,994 | ) |
Target Corp. | | | 1.00 | % | | JPMorgan Chase Bank N.A. | | | 12/20/20 | | | USD | | | 15,000 | | | | (565,188 | ) | | | (519,270 | ) | | | (45,918 | ) |
TDC A/S | | | 1.00 | % | | BNP Paribas S.A. | | | 12/20/20 | | | EUR | | | 1,500 | | | | 33,151 | | | | 27,023 | | | | 6,128 | |
TDC A/S | | | 1.00 | % | | Goldman Sachs International | | | 12/20/20 | | | EUR | | | 1,500 | | | | 33,151 | | | | 28,534 | | | | 4,617 | |
Time Warner Cable, Inc. | | | 1.00 | % | | Credit Suisse International | | | 12/20/20 | | | USD | | | 7,615 | | | | (68,232 | ) | | | (17,229 | ) | | | (51,003 | ) |
Time Warner Cable, Inc. | | | 1.00 | % | | Credit Suisse International | | | 12/20/20 | | | USD | | | 7,385 | | | | (66,171 | ) | | | (16,098 | ) | | | (50,073 | ) |
Time Warner, Inc. | | | 1.00 | % | | Credit Suisse International | | | 12/20/20 | | | USD | | | 11,110 | | | | (225,461 | ) | | | (144,815 | ) | | | (80,646 | ) |
Time Warner, Inc. | | | 1.00 | % | | Credit Suisse International | | | 12/20/20 | | | USD | | | 8,890 | | | | (180,409 | ) | | | (144,943 | ) | | | (35,466 | ) |
Time Warner, Inc. | | | 1.00 | % | | Credit Suisse International | | | 12/20/20 | | | USD | | | 7,615 | | | | (154,534 | ) | | | (74,189 | ) | | | (80,345 | ) |
Time Warner, Inc. | | | 1.00 | % | | Credit Suisse International | | | 12/20/20 | | | USD | | | 7,385 | | | | (149,867 | ) | | | (78,298 | ) | | | (71,569 | ) |
Total SA | | | 1.00 | % | | Barclays Bank PLC | | | 12/20/20 | | | EUR | | | 5,000 | | | | (4,286 | ) | | | 299 | | | | (4,585 | ) |
Unilabs Subholding AB | | | 5.00 | % | | Citibank N.A. | | | 12/20/20 | | | EUR | | | 390 | | | | (76,161 | ) | | | (83,579 | ) | | | 7,418 | |
Unilabs Subholding AB | | | 5.00 | % | | Goldman Sachs International | | | 12/20/20 | | | EUR | | | 1,170 | | | | (228,486 | ) | | | (247,735 | ) | | | 19,249 | |
Unitymedia Hessen GmbH & Co. KG | | | 5.00 | % | | JPMorgan Chase Bank N.A. | | | 12/20/20 | | | EUR | | | 4,070 | | | | (704,494 | ) | | | (624,429 | ) | | | (80,065 | ) |
Unitymedia Hessen GmbH & Co. KG | | | 5.00 | % | | JPMorgan Chase Bank N.A. | | | 12/20/20 | | | EUR | | | 3,970 | | | | (687,185 | ) | | | (396,775 | ) | | | (290,410 | ) |
Valeo SA | | | 1.00 | % | | Barclays Bank PLC | | | 12/20/20 | | | EUR | | | 372 | | | | 488 | | | | (1,321 | ) | | | 1,809 | |
Valeo SA | | | 1.00 | % | | BNP Paribas S.A. | | | 12/20/20 | | | EUR | | | 4,200 | | | | 5,461 | | | | (23,508 | ) | | | 28,969 | |
Valeo SA | | | 1.00 | % | | Goldman Sachs International | | | 12/20/20 | | | EUR | | | 672 | | | | 881 | | | | 743 | | | | 138 | |
Valero Energy Corp. | | | 1.00 | % | | Goldman Sachs International | | | 12/20/20 | | | USD | | | 7,977 | | | | 131,924 | | | | 66,374 | | | | 65,550 | |
Valero Energy Corp. | | | 1.00 | % | | Goldman Sachs International | | | 12/20/20 | | | USD | | | 4,363 | | | | 72,156 | | | | 41,956 | | | | 30,200 | |
Valero Energy Corp. | | | 1.00 | % | | Goldman Sachs International | | | 12/20/20 | | | USD | | | 2,660 | | | | 43,991 | | | | 25,740 | | | | 18,251 | |
Valero Energy Corp. | | | 1.00 | % | | Morgan Stanley Capital Services LLC | | | 12/20/20 | | | USD | | | 15,000 | | | | 248,072 | | | | 361,979 | | | | (113,907 | ) |
Valero Energy Corp. | | | 1.00 | % | | Morgan Stanley Capital Services LLC | | | 12/20/20 | | | USD | | | 7,814 | | | | 128,795 | | | | 143,269 | | | | (14,474 | ) |
Valero Energy Corp. | | | 1.00 | % | | Morgan Stanley Capital Services LLC | | | 12/20/20 | | | USD | | | 6,927 | | | | 114,560 | | | | 197,864 | | | | (83,304 | ) |
Valero Energy Corp. | | | 1.00 | % | | Morgan Stanley Capital Services LLC | | | 12/20/20 | | | USD | | | 5,259 | | | | 86,974 | | | | 143,264 | | | | (56,290 | ) |
Verizon Communications, Inc. | | | 1.00 | % | | Credit Suisse International | | | 12/20/20 | | | USD | | | 11,110 | | | | (204,515 | ) | | | (134,314 | ) | | | (70,201 | ) |
Verizon Communications, Inc. | | | 1.00 | % | | Credit Suisse International | | | 12/20/20 | | | USD | | | 8,890 | | | | (163,649 | ) | | | (111,536 | ) | | | (52,113 | ) |
Volkswagen AG | | | 1.00 | % | | Citibank N.A. | | | 12/20/20 | | | EUR | | | 2,600 | | | | 107,329 | | | | 157,974 | | | | (50,645 | ) |
Volkswagen AG | | | 1.00 | % | | Citibank N.A. | | | 12/20/20 | | | EUR | | | 1,960 | | | | 80,909 | | | | 137,476 | | | | (56,567 | ) |
Volkswagen AG | | | 1.00 | % | | Goldman Sachs International | | | 12/20/20 | | | EUR | | | 2,120 | | | | 87,514 | | | | 114,018 | | | | (26,504 | ) |
Volkswagen AG | | | 1.00 | % | | Goldman Sachs International | | | 12/20/20 | | | EUR | | | 2,120 | | | | 87,514 | | | | 115,014 | | | | (27,500 | ) |
Volvo AB | | | 1.00 | % | | Goldman Sachs International | | | 12/20/20 | | | EUR | | | 1,980 | | | | 43,938 | | | | 24,121 | | | | 19,817 | |
Volvo AB | | | 1.00 | % | | JPMorgan Chase Bank N.A. | | | 12/20/20 | | | EUR | | | 3,960 | | | | 87,875 | | | | 54,689 | | | | 33,186 | |
Walt Disney Co. | | | 1.00 | % | | Credit Suisse International | | | 12/20/20 | | | USD | | | 11,110 | | | | (449,515 | ) | | | (402,314 | ) | | | (47,201 | )�� |
Walt Disney Co. | | | 1.00 | % | | Credit Suisse International | | | 12/20/20 | | | USD | | | 8,890 | | | | (359,692 | ) | | | (321,923 | ) | | | (37,769 | ) |
Western Union Co. | | | 1.00 | % | | Credit Suisse International | | | 12/20/20 | | | USD | | | 7,640 | | | | 158,063 | | | | 112,469 | | | | 45,594 | |
XLIT Ltd. | | | 1.00 | % | | Citibank N.A. | | | 12/20/20 | | | USD | | | 7,385 | | | | (246,056 | ) | | | (237,628 | ) | | | (8,428 | ) |
XLIT Ltd. | | | 1.00 | % | | Citibank N.A. | | | 12/20/20 | | | USD | | | 3,690 | | | | (122,944 | ) | | | (104,600 | ) | | | (18,344 | ) |
XLIT Ltd. | | | 1.00 | % | | Citibank N.A. | | | 12/20/20 | | | USD | | | 2,080 | | | | (69,302 | ) | | | (57,006 | ) | | | (12,296 | ) |
See Notes to Financial Statements.
| | | | | | |
| | | BLACKROCK FUNDS | | JANUARY 31, 2016 | | 49 |
| | | | |
| Schedule of Investments (continued) | | | BlackRock Global Long/Short Credit Fund | |
| | | | | | | | | | | | | | | | | | | | | | | | | | | | |
| Issuer/Index | | Pay
Fixed
Rate | | | Counterparty | | Expiration
Date | | | Notional Amount (000) | | | Value | | | Premiums
Paid
(Received) | | | Unrealized
Appreciation
(Depreciation) | |
XLIT Ltd. | | | 1.00 | % | | Citibank N.A. | | | 12/20/20 | | | USD | | | 1,845 | | | $ | (61,473 | ) | | $ | (50,509 | ) | | $ | (10,964 | ) |
Republic of Korea | | | 1.00 | % | | Goldman Sachs International | | | 3/20/21 | | | USD | | | 4,006 | | | | (71,515 | ) | | | (79,043 | ) | | | 7,528 | |
Total | | | | | | | | | | | | | | | | | | $ | (4,777,224 | ) | | $ | (9,761,007 | ) | | $ | 4,983,783 | |
| | | | | | | | | | | | | | | | | | | | |
OTC Credit Default Swaps — Sell Protection
| | | | | | | | | | | | | | | | | | | | | | | | | | | | |
| Issuer/Index | | Receive
Fixed
Rate | | | Counterparty | | Expiration
Date | | Credit
Rating1 | | Notional
Amount
(000)2 | | | Value | | | Premiums
Paid
(Received) | | | Unrealized
Appreciation
(Depreciation) | |
CDX.NA.IG Series 17 Version 1 | | | 1.00 | % | | Credit Suisse International | | 12/20/16 | | BBB+ | | USD | | | 5,000 | | | $ | 32,653 | | | $ | (16,921 | ) | | $ | 49,574 | |
Glencore International AG | | | 5.00 | % | | JPMorgan Chase Bank N.A. | | 12/20/17 | | BBB | | EUR | | | 1,980 | | | | (248,502 | ) | | | (109,214 | ) | | | (139,288 | ) |
Republic of Italy | | | 1.00 | % | | Barclays Bank PLC | | 3/20/18 | | BBB- | | EUR | | | 5,050 | | | | 61,996 | | | | (145,563 | ) | | | 207,559 | |
Republic of Italy | | | 1.00 | % | | Barclays Bank PLC | | 3/20/18 | | BBB- | | USD | | | 59 | | | | 541 | | | | (2,024 | ) | | | 2,565 | |
Bayerische Landesbank | | | 1.00 | % | | Barclays Bank PLC | | 12/20/18 | | Not Rated | | EUR | | | 8,870 | | | | 107,209 | | | | 17,705 | | | | 89,504 | |
iTraxx Sub Financials Series 20 Version 1 | | | 5.00 | % | | Barclays Bank PLC | | 12/20/18 | | BBB | | EUR | | | 14,150 | | | | 1,764,212 | | | | 2,138,315 | | | | (374,103 | ) |
iTraxx Sub Financials Series 20 Version 1 | | | 5.00 | % | | Citibank N.A. | | 12/20/18 | | BBB | | EUR | | | 20,210 | | | | 2,519,770 | | | | 3,026,501 | | | | (506,731 | ) |
iTraxx Sub Financials Series 20 Version 1 | | | 5.00 | % | | Deutsche Bank AG | | 12/20/18 | | BBB | | EUR | | | 10,120 | | | | 1,261,755 | | | | 1,522,402 | | | | (260,647 | ) |
CNH Industrial NV | | | 5.00 | % | | Citibank N.A. | | 3/20/19 | | BB+ | | EUR | | | 2,950 | | | | 178,460 | | | | 404,913 | | | | (226,453 | ) |
CNH Industrial NV | | | 5.00 | % | | Citibank N.A. | | 3/20/19 | | BB+ | | EUR | | | 2,950 | | | | 178,461 | | | | 412,779 | | | | (234,318 | ) |
ArcelorMittal | | | 1.00 | % | | Barclays Bank PLC | | 9/20/19 | | BB | | EUR | | | 2,133 | | | | (579,178 | ) | | | (144,536 | ) | | | (434,642 | ) |
ArcelorMittal | | | 1.00 | % | | Barclays Bank PLC | | 9/20/19 | | BB | | EUR | | | 2,130 | | | | (578,499 | ) | | | (138,544 | ) | | | (439,955 | ) |
ArcelorMittal | | | 1.00 | % | | Citibank N.A. | | 9/20/19 | | BB | | EUR | | | 4,265 | | | | (1,158,356 | ) | | | (285,352 | ) | | | (873,004 | ) |
ArcelorMittal | | | 1.00 | % | | Credit Suisse International | | 9/20/19 | | BB | | EUR | | | 4,260 | | | | (1,156,998 | ) | | | (277,086 | ) | | | (879,912 | ) |
ArcelorMittal | | | 1.00 | % | | Citibank N.A. | | 12/20/19 | | BB | | EUR | | | 3,255 | | | | (932,989 | ) | | | (209,254 | ) | | | (723,735 | ) |
Hertz Corp. | | | 5.00 | % | | Barclays Bank PLC | | 6/20/20 | | B | | USD | | | 2,000 | | | | 21,265 | | | | 95,079 | | | | (73,814 | ) |
Hertz Corp. | | | 5.00 | % | | Goldman Sachs International | | 6/20/20 | | B | | USD | | | 2,000 | | | | 21,265 | | | | 108,482 | | | | (87,217 | ) |
Teva Pharmaceutical Industries Ltd. | | | 1.00 | % | | JPMorgan Chase Bank N.A. | | 6/20/20 | | BBB+ | | USD | | | 15,000 | | | | 70,384 | | | | 91,945 | | | | (21,561 | ) |
Vougeot Bidco PLC | | | 5.00 | % | | Credit Suisse International | | 6/20/20 | | B | | EUR | | | 2,710 | | | | 235,396 | | | | 278,890 | | | | (43,494 | ) |
Community Health Systems, Inc. | | | 5.00 | % | | Goldman Sachs International | | 9/20/20 | | B- | | USD | | | 3,500 | | | | (58,590 | ) | | | 271,850 | | | | (330,440 | ) |
Glencore International AG | | | 1.00 | % | | Citibank N.A. | | 9/20/20 | | BBB | | EUR | | | 2,590 | | | | (750,987 | ) | | | (232,766 | ) | | | (518,221 | ) |
Glencore International AG | | | 1.00 | % | | Citibank N.A. | | 9/20/20 | | BBB | | EUR | | | 350 | | | | (101,484 | ) | | | (31,455 | ) | | | (70,029 | ) |
Glencore International AG | | | 1.00 | % | | Credit Suisse International | | 9/20/20 | | BBB | | EUR | | | 920 | | | | (266,759 | ) | | | (86,417 | ) | | | (180,342 | ) |
Calpine Corp. | | | 5.00 | % | | JPMorgan Chase Bank N.A. | | 12/20/20 | | B | | USD | | | 1,850 | | | | 40,284 | | | | 64,746 | | | | (24,462 | ) |
Casino Guichard Perrachon SA | | | 1.00 | % | | Barclays Bank PLC | | 12/20/20 | | BBB- | | EUR | | | 5,265 | | | | (819,677 | ) | | | (410,303 | ) | | | (409,374 | ) |
Casino Guichard Perrachon SA | | | 1.00 | % | | Barclays Bank PLC | | 12/20/20 | | BBB- | | EUR | | | 4,106 | | | | (639,240 | ) | | | (318,175 | ) | | | (321,065 | ) |
Casino Guichard Perrachon SA | | | 1.00 | % | | Barclays Bank PLC | | 12/20/20 | | BBB- | | EUR | | | 1,980 | | | | (308,254 | ) | | | (137,278 | ) | | | (170,976 | ) |
Casino Guichard Perrachon SA | | | 1.00 | % | | Barclays Bank PLC | | 12/20/20 | | BBB- | | EUR | | | 880 | | | | (137,009 | ) | | | (165,192 | ) | | | 28,183 | |
Casino Guichard Perrachon SA | | | 1.00 | % | | Goldman Sachs International | | 12/20/20 | | BBB- | | EUR | | | 1,960 | | | | (305,141 | ) | | | (128,363 | ) | | | (176,778 | ) |
Casino Guichard Perrachon SA | | | 1.00 | % | | JPMorgan Chase Bank N.A. | | 12/20/20 | | BBB- | | EUR | | | 1,159 | | | | (180,438 | ) | | | (90,322 | ) | | | (90,116 | ) |
Community Health Systems, Inc. | | | 5.00 | % | | Barclays Bank PLC | | 12/20/20 | | B- | | USD | | | 3,000 | | | | (81,322 | ) | | | 191,564 | | | | (272,886 | ) |
Community Health Systems, Inc. | | | 5.00 | % | | Citibank N.A. | | 12/20/20 | | B- | | USD | | | 2,500 | | | | (67,769 | ) | | | (8,549 | ) | | | (59,220 | ) |
See Notes to Financial Statements.
| | | | | | |
| 50 | | BLACKROCK FUNDS | | JANUARY 31, 2016 | | |
| | | | |
| Schedule of Investments (continued) | | | BlackRock Global Long/Short Credit Fund | |
| | | | | | | | | | | | | | | | | | | | | | | | | | | | |
| Issuer/Index | | Receive
Fixed
Rate | | | Counterparty | | Expiration
Date | | Credit
Rating1 | | Notional
Amount
(000)2 | | | Value | | | Premiums
Paid
(Received) | | | Unrealized
Appreciation
(Depreciation) | |
Community Health Systems, Inc. | | | 5.00 | % | | Citibank N.A. | | 12/20/20 | | B- | | USD | | | 2,000 | | | $ | (54,215 | ) | | $ | (8,875 | ) | | $ | (45,340 | ) |
Community Health Systems, Inc. | | | 5.00 | % | | JPMorgan Chase Bank N.A. | | 12/20/20 | | B- | | USD | | | 2,300 | | | | (62,348 | ) | | | 98,191 | | | | (160,539 | ) |
Hellenic Telecommunications Organization SA | | | 5.00 | % | | Goldman Sachs International | | 12/20/20 | | B+ | | EUR | | | 1,320 | | | | 71,685 | | | | 72,801 | | | | (1,116 | ) |
Hertz Corp. | | | 5.00 | % | | Barclays Bank PLC | | 12/20/20 | | B | | USD | | | 2,500 | | | | (30,680 | ) | | | 187,837 | | | | (218,517 | ) |
Hertz Corp. | | | 5.00 | % | | Goldman Sachs International | | 12/20/20 | | B | | USD | | | 1,850 | | | | (22,703 | ) | | | 98,498 | | | | (121,201 | ) |
Hertz Corp. | | | 5.00 | % | | JPMorgan Chase Bank N.A. | | 12/20/20 | | B | | USD | | | 1,700 | | | | (20,862 | ) | | | 107,274 | | | | (128,136 | ) |
iTraxx Asia ex-Japan IG Series 24 Version 1 | | | 1.00 | % | | Goldman Sachs International | | 12/20/20 | | A- | | USD | | | 3,750 | | | | (86,249 | ) | | | (102,409 | ) | | | 16,160 | |
Macy’s, Inc. | | | 1.00 | % | | JPMorgan Chase Bank N.A. | | 12/20/20 | | BBB+ | | USD | | | 20,000 | | | | (822,697 | ) | | | (1,138,811 | ) | | | 316,114 | |
Macy’s, Inc. | | | 1.00 | % | | JPMorgan Chase Bank N.A. | | 12/20/20 | | BBB+ | | USD | | | 7,722 | | | | (317,643 | ) | | | (428,945 | ) | | | 111,302 | |
Macy’s, Inc. | | | 1.00 | % | | JPMorgan Chase Bank N.A. | | 12/20/20 | | BBB+ | | USD | | | 5,556 | | | | (228,545 | ) | | | (308,896 | ) | | | 80,351 | |
MGIC Investment Corp. | | | 5.00 | % | | Morgan Stanley Capital Services LLC | | 12/20/20 | | B+ | | USD | | | 1,835 | | | | 71,517 | | | | 6,275 | | | | 65,242 | |
Radian Group, Inc. | | | 5.00 | % | | Morgan Stanley Capital Services LLC | | 12/20/20 | | B+ | | USD | | | 5,000 | | | | 15,606 | | | | (193,457 | ) | | | 209,063 | |
Republic of Indonesia | | | 1.00 | % | | Barclays Bank PLC | | 12/20/20 | | BB+ | | USD | | | 1,750 | | | | (100,099 | ) | | | (120,125 | ) | | | 20,026 | |
Republic of Indonesia | | | 1.00 | % | | HSBC Bank PLC | | 12/20/20 | | BB+ | | USD | | | 3,750 | | | | (214,498 | ) | | | (249,774 | ) | | | 35,276 | |
Volkswagen AG | | | 1.00 | % | | Barclays Bank PLC | | 12/20/20 | | BBB+ | | EUR | | | 1,740 | | | | (71,828 | ) | | | (115,284 | ) | | | 43,456 | |
Volkswagen AG | | | 1.00 | % | | Barclays Bank PLC | | 12/20/20 | | BBB+ | | EUR | | | 60 | | | | (2,477 | ) | | | (3,975 | ) | | | 1,498 | |
Glencore International AG | | | 1.00 | % | | BNP Paribas S.A. | | 6/20/21 | | BBB | | EUR | | | 2,057 | | | | (658,837 | ) | | | (206,892 | ) | | | (451,945 | ) |
Glencore International AG | | | 1.00 | % | | Citibank N.A. | | 6/20/21 | | BBB | | EUR | | | 4,113 | | | | (1,317,674 | ) | | | (425,910 | ) | | | (891,764 | ) |
Republic of France | | | 0.25 | % | | Barclays Bank PLC | | 6/20/23 | | AA | | USD | | | 4,035 | | | | (55,372 | ) | | | (230,662 | ) | | | 175,290 | |
Republic of France | | | 0.25 | % | | Citibank N.A. | | 6/20/23 | | AA | | USD | | | 4,350 | | | | (59,695 | ) | | | (262,610 | ) | | | 202,915 | |
Republic of France | | | 0.25 | % | | JPMorgan Chase Bank N.A. | | 6/20/23 | | AA | | USD | | | 4,350 | | | | (59,695 | ) | | | (244,014 | ) | | | 184,319 | |
Total | | | | | | | | | | | | | | | | | | $ | (5,904,850 | ) | | $ | 2,218,094 | | | $ | (8,122,944 | ) |
| | | | | | | | | | | | | | | | | | | | |
| | 1 | | Using S&P’s rating of the issuer or the underlying securities of the index, as applicable. |
| | 2 | | The maximum potential amount the Fund may pay should a negative credit event take place as defined under the terms of the agreement. |
OTC Total Return Swaps
| | | | | | | | | | | | | | | | | | | | | | | | |
| Reference Entity | | Floating Rate | | Counterparty | | Expiration
Date | | | Contract
Amount | | | Value | | | Premiums
Paid
(Received) | | | Unrealized
Appreciation
(Depreciation) | |
PowerShares QQQ Trust Series 1 | | 3-month LIBOR1 | | Bank of America N.A. | | | 2/26/16 | | | | 55,500 | | | $ | 550,427 | | | | — | | | $ | 550,427 | |
Cheniere Energy, Inc. | | 3-month LIBOR minus 0.30%1 | | Bank of America N.A. | | | 7/17/16 | | | | 7,500 | | | | (286 | ) | | | — | | | | (286 | ) |
Industrial Select Sector SPDR ETF | | 3-month LIBOR minus 0.20%1 | | BNP Paribas S.A. | | | 7/23/16 | | | | 9,400 | | | | (18,325 | ) | | | — | | | | (18,325 | ) |
Abengoa SA, Class B | | 3-month LIBOR minus 50.00%2 | | Credit Suisse International | | | 11/12/16 | | | | 641,418 | | | | 455,653 | | | | — | | | | 455,653 | |
iShares iBoxx $ High Yield Corporate Bond ETF | | 3-month LIBOR minus 0.90%1 | | BNP Paribas S.A. | | | 12/05/16 | | | | 120,000 | | | | 367,845 | | | | — | | | | 367,845 | |
Total | | | | | | | | | | | | | | $ | 1,355,314 | | | | — | | | $ | 1,355,314 | |
| | | | | | | | | | | | | | | | |
| | 1 | | Fund pays the total return of the reference entity and receives the floating rate. |
| | 2 | | Fund pays the total return of the reference entity and receives the floating rate. Net payment made at termination. |
See Notes to Financial Statements.
| | | | | | |
| | | BLACKROCK FUNDS | | JANUARY 31, 2016 | | 51 |
| | | | |
| Schedule of Investments (continued) | | | BlackRock Global Long/Short Credit Fund | |
OTC Total Return Swaps1
| | | | | | | | | | | | | | | | | | |
| Reference Entity | | Counterparty | | Expiration
Date | | | | Notional
Amount | | | | Unrealized
Depreciation | | | | Net Value of
Reference
Entity |
Equity Securities Long/Short: | | Bank of America N.A. | | 2/26/16 | | | | USD | | 3,538,012 | | | | $(1,715,754)2 | | | | $1,331,487 |
| | 1 | | The Fund receives or pays the total return on a portfolio of long and short positions underlying the total return swap. In addition, the Fund pays or receives a variable rate of interest, based on a specified benchmark, plus or minus a spread in a range of 0.15%-40.0% basis points. The benchmark and spread are determined based upon the country and/or currency of the individual underlying positions. The following are the specified benchmarks used in determining the variable rate of interest: |
| | | | | | |
Canada Bankers Acceptances 1 Month | | | | 1 Week AUD BBSW |
Copenhagen Interbank Offered Rates 1 Week | | | | 1 Week BRL CDI |
Garban Intercapital Federal Funds Rate Open | | | | 1 Week CZK PRIBOR |
Intercontinental Exchange LIBOR: | | | | 1 Week EURIBOR |
| | CHF 1 Week | | | | 1 Week HKD HIBOR |
| | GBP 1 Week | | | | 1 Week HUF BUBOR |
| | JPY 1 Week | | | | 1 Week ILS TELBOR |
| | MXN 1 Week | | | | 1 Week NIBOR |
| | RUB 1 Week | | | | 1 Week NZD Bank |
| | SEK 1 Week | | | | 1 Week PLN WIBOR |
| | TRY 1 Week | | | | 1 Week SGD SOR |
| | USD 1 Month | | | | 1 Week ZAR JIBAR |
| | USD 1 Week | | | | |
| | 2 | | Amount includes $490,771 of net dividends and financing fees. |
The following table represents the individual long and short positions and related values of equity securities underlying the total return swap with Bank of America Merrill Lynch, as of period end, expiration date 2/26/16:
| | | | | | | | |
| | | Shares | | | Value | |
Reference Entity — Long | | | | | | | | |
AA PLC | | | 303,241 | | | $ | $1,278,255 | |
Altice NV, Class A | | | 102,421 | | | | 1,477,108 | |
Barclays PLC | | | 1,797,243 | | | | 4,809,219 | |
Eurobank Ergasias SA | | | 2,850,347 | | | | 2,369,702 | |
Hellenic Telecommunications Organization SA | | | 1,211,648 | | | | 10,549,651 | |
Lloyds Banking Group PLC | | | 6,209,454 | | | | 5,817,411 | |
Numericable-SFR SAS | | | 108,399 | | | | 4,303,886 | |
Smurfit Kappa Group Plc | | | 102,026 | | | | 2,213,612 | |
Total Reference Entity — Long | | | | 32,818,844 | |
| | | | | | | | |
| | | | | | | |
| | | | | | | | |
| | | Shares | | | Value | |
Reference Entity — Short | | | | | | | | |
Abengoa SA | | | (121,977 | ) | | $ | (24,578 | ) |
Anglo American PLC | | | (1,493,752 | ) | | | (5,958,189 | ) |
APERAM SA | | | (79,771 | ) | | | (2,492,027 | ) |
ArcelorMittal | | | (757,075 | ) | | | (2,872,146 | ) |
Banco Bilbao Vizcaya Argentaria SA | | | (296,240 | ) | | | (1,906,762 | ) |
Banco Popular Espanol SA | | | (1,508,199 | ) | | | (4,075,050 | ) |
Banco Popular Espanol SA Rights | | | (1,633,326 | ) | | | (24,771 | ) |
Buzzi Unicem SpA | | | (103,285 | ) | | | (1,565,179 | ) |
Casino Guichard Perrachon SA | | | (60,540 | ) | | | (2,744,200 | ) |
Repsol YPF SA | | | (489,160 | ) | | | (5,071,824 | ) |
Royal Bank of Scotland Group PLC | | | (1,312,780 | ) | | | (4,752,631 | ) |
Total Reference Entity — Short | | | | | | | (31,487,357 | ) |
Net Value of Reference Entity — Bank of
America N.A. | | | | | | $ | 1,331,487 | |
|
| Transactions in Options Written for the Six Months Ended January 31, 2016 |
| | | | | | | | | | | | | | | | | | | | | | |
| | | Calls | | | | | Puts | |
| | | | | | | | | | |
| | | | | | | | | | | | | | Notional (000) | | | | |
| | | Contracts | | | Premiums
Received | | | | | Contracts | | | EUR | | | Premiums
Received | |
| | | | | | | | | | |
Outstanding options, beginning of period | | | 2,000 | | | $ | 77,527 | | | | | | 13,600 | | | | 222,900 | | | $ | 1,863,813 | |
Options written | | | 4,000 | | | | 78,975 | | | | | | 86,250 | | | | 247,200 | | | | 7,524,538 | |
Options expired | | | (6,000 | ) | | | (156,502 | ) | | | | | (33,400 | ) | | | (345,300 | ) | | | (4,971,805 | ) |
Options closed | | | — | | | | — | | | | | | (52,200 | ) | | | — | | | | (2,824,555 | ) |
| | | | | | | | | | |
Outstanding options, end of period | | | — | | | | — | | | | | | 14,250 | | | | 124,800 | | | $ | 1,591,991 | |
| | | | | | | | | | |
See Notes to Financial Statements.
| | | | | | |
| 52 | | BLACKROCK FUNDS | | JANUARY 31, 2016 | | |
| | | | |
| Schedule of Investments (continued) | | | BlackRock Global Long/Short Credit Fund | |
|
| Derivative Financial Instruments Categorized by Risk Exposure |
As of period end, the fair values of derivative financial instruments located in the Statements of Assets and Liabilities were as follows:
| | | | | | | | | | | | | | | | | | | | | | | | | | |
| Assets — Derivative Financial Instruments | | Commodity
Contracts | | Credit
Contracts | | | Equity
Contracts | | | Foreign
Currency
Exchange
Contracts | | | Interest Rate
Contracts | | | Other
Contracts | | Total | |
Financial futures contracts | | Net unrealized appreciation1 | | — | | | — | | | $ | 53,098 | | | | — | | | $ | 2,063 | | | — | | $ | 55,161 | |
Forward foreign currency exchange contracts | | Unrealized appreciation on forward foreign currency exchange contracts | | — | | | — | | | | — | | | $ | 44,697,950 | | | | — | | | — | | | 44,697,950 | |
Options purchased | | Investments at value — unaffiliated2 | | — | | $ | 1,624,307 | | | | 4,432,711 | | | | 546,485 | | | | 23,875 | | | — | | | 6,627,378 | |
Swaps — OTC | | Unrealized appreciation on OTC swaps; Swap premiums paid | | — | | | 41,760,363 | | | | 1,373,925 | | | | — | | | | — | | | — | | | 43,134,288 | |
Swaps — centrally cleared | | Net unrealized appreciation1 | | — | | | 16,018,979 | | | | — | | | | — | | | | 80,485 | | | — | | | 16,099,464 | |
| | | |
Total | | | | — | | $ | 59,403,649 | | | $ | 5,859,734 | | | $ | 45,244,435 | | | $ | 106,423 | | | — | | $ | 110,614,241 | |
| | | |
| | | | | | | | | | | | | | | | | | | | | | | | | | |
| Liabilities — Derivative Financial Instruments | | Commodity
Contracts | | Credit
Contracts | | | Equity
Contracts | | | Foreign
Currency
Exchange
Contracts | | | Interest
Rate
Contracts | | | Other
Contracts | | Total | |
Financial futures contracts | | Net unrealized depreciation1 | | — | | | — | | | $ | 855,620 | | | | — | | | $ | 13,950,183 | | | — | | $ | 14,805,803 | |
Forward foreign currency exchange contracts | | Unrealized depreciation on forward foreign currency exchange contracts | | — | | | — | | | | — | | | $ | 28,377,099 | | | | — | | | — | | | 28,377,099 | |
Options written | | Options written, at value | | — | | $ | 186,527 | | | | 503,250 | | | | — | | | | — | | | — | | | 689,777 | |
Swaps — OTC | | Unrealized depreciation on OTC swaps; Swap premiums received | | — | | | 52,442,437 | | | | 1,734,365 | | | | — | | | | — | | | — | | | 54,176,802 | |
Swaps — centrally cleared | | Net unrealized depreciation1 | | — | | | 1,497,723 | | | | — | | | | — | | | | 2,358,270 | | | — | | | 3,855,993 | |
| | | |
Total | | | | — | | $ | 54,126,687 | | | $ | 3,093,235 | | | $ | 28,377,099 | | | $ | 16,308,453 | | | — | | $ | 101,905,474 | |
| | | |
| | 1 | | Includes cumulative appreciation (depreciation) on financial futures contracts and centrally cleared swaps, if any, as reported in the Schedule of Investments. Only current day’s variation margin is reported within the Statements of Assets and Liabilities. |
| | 2 | | Includes options purchased at value as reported in the Schedule of Investments. |
For the six months ended January 31, 2016, the effect of derivative financial instruments in the Statements of Operations was as follows:
| | | | | | | | | | | | | | | | | | | | | | | | | | | | | | | | | | |
| Net Realized Gain (Loss) from: | | Commodity Contracts | | | | Credit
Contracts | | | | | Equity
Contracts | | | | | Foreign
Currency
Exchange
Contracts | | | | | Interest Rate Contracts | | | | | Other
Contracts | | Total | |
Financial futures contracts | | — | | | | | — | | | | | $ | 2,798,654 | | | | | | — | | | | | $ | (15,412,209 | ) | | | | — | | $ | (12,613,555 | ) |
Forward foreign currency transactions | | — | | | | | — | | | | | | — | | | | | $ | 9,684,124 | | | | | | — | | | | | — | | | 9,684,124 | |
Options purchased1 | | — | | | | $ | (3,692,427 | ) | | | | | 38,664,401 | | | | | | (438,475 | ) | | | | | (3,169,331 | ) | | | | — | | | 31,364,168 | |
Options written | | — | | | | | 1,978,013 | | | | | | (3,005,666 | ) | | | | | — | | | | | | 70,843 | | | | | — | | | (956,810 | ) |
Swaps | | — | | | | | (40,845,877 | ) | | | | | 60,003,958 | | | | | | — | | | | | | (4,798,409 | ) | | | | — | | | 14,359,672 | |
| | | |
Total | | — | | | | $ | (42,560,291 | ) | | | | $ | 98,461,347 | | | | | $ | 9,245,649 | | | | | $ | (23,309,106 | ) | | | | — | | $ | 41,837,599 | |
| | | |
1 Options purchased are included in the net realized gain (loss) from investments. | | | | |
Net Change in Unrealized Appreciation (Depreciation) on: | | Commodity
Contracts | | | | Credit
Contracts | | | | | Equity
Contracts | | | | | Foreign
Currency
Exchange
Contracts | | | | | Interest Rate Contracts | | | | | Other
Contracts | | Total | |
Financial futures contracts | | — | | | | | | | | | | $ | (988,016 | ) | | | | | — | | | | | $ | (10,617,222 | ) | | | | — | | $ | (11,605,238 | ) |
Forward foreign currency translations | | — | | | | | | | | | | | | | | | | $ | 11,162,908 | | | | | | — | | | | | — | | | 11,162,908 | |
Options purchased1 | | — | | | | $ | 1,571,090 | | | | | | (235,082 | ) | | | | | (395,620 | ) | | | | | (121,155 | ) | | | | — | | | 819,233 | |
Options written | | — | | | | | (1,237,113 | ) | | | | | 500,950 | | | | | | | | | | | | — | | | | | — | | | (736,163 | ) |
Swaps | | — | | | | | 19,278,483 | | | | | | (14,181,832 | ) | | | | | | | | | | | 1,216,419 | | | | | — | | | 6,313,070 | |
| | | |
Total | | — | | | | $ | 19,612,460 | | | | | $ | (14,903,980 | ) | | | | $ | 10,767,288 | | | | | $ | (9,521,958 | ) | | | | — | | $ | 5,953,810 | |
| | | |
| | 1 | | Options purchased are included in net change in unrealized appreciation (depreciation) on investments. |
See Notes to Financial Statements.
| | | | | | |
| | | BLACKROCK FUNDS | | JANUARY 31, 2016 | | 53 |
| | | | |
| Schedule of Investments (continued) | | | BlackRock Global Long/Short Credit Fund | |
|
| Average Quarterly Balances of Outstanding Derivative Financial Instruments |
| | | | |
Financial futures contracts: | | | | |
Average notional value of contracts — long | | $ | 4,675,018 | |
Average notional value of contracts — short | | $ | 925,500,068 | |
Forward foreign currency exchange contracts: | | | | |
Average amounts purchased — in USD | | $ | 4,408,536,532 | |
Average amounts sold — in USD | | $ | 3,644,722,103 | |
Options: | | | | |
Average value of option contracts purchased | | $ | 14,982,929 | |
Average value of option contracts written | | $ | 366,588 | |
Average notional value of swaption contracts purchased | | $ | 487,396,177 | |
Average notional value of swaption contracts written | | $ | 134,896,177 | |
Credit default swaps: | | | | |
Average notional value — buy protection | | $ | 1,837,345,923 | |
Average notional value — sell protection | | $ | 706,583,626 | |
Interest rate swaps: | | | | |
Average notional value — pays fixed rate | | $ | 164,690,000 | |
Average notional value — receives fixed rate | | $ | 12,150,000 | |
Total return swaps: | | | | |
Average notional value | | $ | 30,445,138 | |
For information about the Fund’s investment risks regarding derivative financial instruments, refer to the Notes to Financial Statements.
|
| Derivative Financial Instruments — Offsetting as of Period End |
The Fund’s derivative assets and liabilities (by type) were as follows:
| | | | | | | | | | | | | | |
| | | | | Assets | | | | | Liabilities | | | |
Derivative Financial Instruments: | | | | | | | | | | | | | | |
Financial futures contracts | | | | $ | 141,971 | | | | | $ | 3,473,169 | | | |
Forward foreign currency exchange contracts | | | | | 44,697,950 | | | | | | 28,377,099 | | | |
Options | | | | | 6,627,378 | 1 | | | | | 689,777 | | | |
Swaps — Centrally cleared | | | | | 900,609 | | | | | | — | | | |
Swaps — OTC2 | | | | | 43,134,288 | | | | | | 54,176,802 | | | |
| | |
Total derivative assets and liabilities in the Statements of Assets and Liabilities | | | | $ | 95,502,196 | | | | | $ | 86,716,847 | | | |
| | |
Derivatives not subject to a Master Netting Agreement or similar agreement (“MNA”) | | | | | (5,475,291 | ) | | | | | (3,976,419 | ) | | |
| | |
Total derivative assets and liabilities subject to an MNA | | | | $ | 90,026,905 | | | | | $ | 82,740,428 | | | |
| | |
| | 1 | | Includes options purchased at value which is included in Investments at value — unaffiliated in the Statements of Assets and Liabilities and reported in the Schedule of Investments. |
| | 2 | | Includes unrealized appreciation (depreciation) on OTC swaps and swap premiums paid/received in the Statements of Assets and Liabilities. |
See Notes to Financial Statements.
| | | | | | |
| 54 | | BLACKROCK FUNDS | | JANUARY 31, 2016 | | |
| | | | |
| Schedule of Investments (continued) | | | BlackRock Global Long/Short Credit Fund | |
The following tables present the Fund’s derivative assets and liabilities by counterparty net of amounts for offset under an MNA and net of the related collateral received and pledged by the Fund:
| | | | | | | | | | | | | | | | | | | | | | | | | | | | |
| | | Gross Amounts Not Offset in the Statements of Assets and Liabilities
and Subject to an MNA | |
| Counterparty | | | | Derivative Assets
Subject to an MNA by
Counterparty | | | | | Derivatives Available
for Offset1 | | | | | Non-cash
Collateral
Received | | | | Cash
Collateral
Received2 | | | | | Net Amount of
Derivative Assets3 | |
Bank of America N.A. | | | | | $ 2,607,602 | | | | | | $ (2,607,602 | ) | | | | — | | | | | — | | | | | | — | |
Barclays Bank PLC | | | | | 3,738,631 | | | | | | (3,738,631 | ) | | | | — | | | | | — | | | | | | — | |
BNP Paribas S.A. | | | | | 1,462,914 | | | | | | (729,130 | ) | | | | — | | | | | — | | | | | | $ 733,784 | |
Citibank N.A. | | | | | 55,113,049 | | | | | | (33,033,680 | ) | | | | — | | | | | — | | | | | | 22,079,369 | |
Credit Suisse International | | | | | 2,971,757 | | | | | | (2,971,757 | ) | | | | — | | | | | — | | | | | | — | |
Deutsche Bank AG | | | | | 1,600,020 | | | | | | (412,703 | ) | | | | — | | | | | $(1,187,317 | ) | | | | | — | |
Goldman Sachs Bank USA | | | | | 360,794 | | | | | | (360,794 | ) | | | | — | | | | | — | | | | | | — | |
Goldman Sachs International | | | | | 9,825,566 | | | | | | (6,280,374 | ) | | | | — | | | | | (3,545,192 | ) | | | | | — | |
HSBC Bank PLC | | | | | 35,276 | | | | | | (35,276 | ) | | | | — | | | | | — | | | | | | — | |
JPMorgan Chase Bank N.A. | | | | | 9,978,053 | | | | | | (9,978,053 | ) | | | | — | | | | | — | | | | | | — | |
Morgan Stanley & Co. International PLC | | | | | 86,427 | | | | | | (86,427 | ) | | | | — | | | | | — | | | | | | — | |
Morgan Stanley Capital Services LLC | | | | | 1,243,629 | | | | | | (849,759 | ) | | | | — | | | | | — | | | | | | 393,870 | |
Royal Bank of Scotland PLC | | | | | 65,023 | | | | | | (65,023 | ) | | | | — | | | | | — | | | | | | — | |
State Street Bank and Trust Co. | | | | | 51,049 | | | | | | (13,038 | ) | | | | — | | | | | — | | | | | | 38,011 | |
UBS AG | | | | | 887,115 | | | | | | (887,115 | ) | | | | — | | | | | — | | | | | | — | |
| | | |
Total | | | | | $90,026,905 | | | | | | $(62,049,362 | ) | | | | — | | | | | $(4,732,509 | ) | | | | | $23,245,034 | |
| | | |
| | | | | | | | | | | | | | | | | | | | | | | | | | | | |
| Counterparty | | | | Derivative Liabilities
Subject to an MNA by
Counterparty | | | | | Derivatives Available
for Offset1 | | | | | Non-cash
Collateral
Pledged | | | | Cash
Collateral
Pledged4 | | | | | Net Amount of
Derivative Liabilities5 | |
Bank of America N.A. | | | | | $ 2,710,609 | | | | | | $ (2,607,602 | ) | | | | — | | | | | — | | | | | | $ 103,007 | |
Barclays Bank PLC | | | | | 7,125,306 | | | | | | (3,738,631 | ) | | | | — | | | | | $ (3,386,675 | ) | | | | | — | |
BNP Paribas S.A. | | | | | 729,130 | | | | | | (729,130 | ) | | | | — | | | | | — | | | | | | — | |
Citibank N.A. | | | | | 33,033,680 | | | | | | (33,033,680 | ) | | | | — | | | | | — | | | | | | — | |
Credit Suisse International | | | | | 7,943,278 | | | | | | (2,971,757 | ) | | | | — | | | | | (4,150,000 | ) | | | | | 821,521 | |
Deutsche Bank AG | | | | | 412,703 | | | | | | (412,703 | ) | | | | — | | | | | — | | | | | | — | |
Goldman Sachs Bank USA | | | | | 1,734,522 | | | | | | (360,794 | ) | | | | — | | | | | (1,373,728 | ) | | | | | — | |
Goldman Sachs International | | | | | 6,280,374 | | | | | | (6,280,374 | ) | | | | — | | | | | — | | | | | | — | |
HSBC Bank PLC | | | | | 249,774 | | | | | | (35,276 | ) | | | | — | | | | | — | | | | | | 214,498 | |
JPMorgan Chase Bank N.A. | | | | | 13,034,503 | | | | | | (9,978,053 | ) | | | | — | | | | | (2,200,000 | ) | | | | | 856,450 | |
Morgan Stanley & Co. International PLC | | | | | 1,988,510 | | | | | | (86,427 | ) | | | | — | | | | | — | | | | | | 1,902,083 | |
Morgan Stanley Capital Services LLC | | | | | 849,759 | | | | | | (849,759 | ) | | | | — | | | | | — | | | | | | — | |
Royal Bank of Scotland PLC | | | | | 235,017 | | | | | | (65,023 | ) | | | | — | | | | | — | | | | | | 169,994 | |
State Street Bank and Trust Co. | | | | | 13,038 | | | | | | (13,038 | ) | | | | — | | | | | — | | | | | | — | |
UBS AG | | | | | 6,400,225 | | | | | | (887,115 | ) | | | | — | | | | | — | | | | | | 5,513,110 | |
| | | |
Total | | | | | $82,740,428 | | | | | | $(62,049,362 | ) | | | | — | | | | | $(11,110,403 | ) | | | | | $9,580,663 | |
| | | |
| | 1 | | The amount of derivatives available for offset is limited to the amount of derivative assets and/or liabilities that are subject to an MNA. |
| | 2 | | Excess of collateral received from the individual counterparty is not shown for financial reporting purposes. |
| | 3 | | Net amount represents the net amount receivable from the counterparty in the event of default. |
| | 4 | | Excess of collateral pledged to the individual counterparty is not shown for financial reporting purposes. |
| | 5 | | Net amount represents the net amount payable due to the counterparty in the event of default. Net amount may be offset further by the options written receivable/payable on the Statements of Assets and Liabilities. |
|
| Fair Value Hierarchy as of Period End |
Various inputs are used in determining the fair value of investments and derivative financial instruments. For information about the Fund’s policy regarding valuation of investments and derivative financial instruments, refer to the Notes to Financial Statements.
The following tables summarize the Fund’s investments and derivative financial instruments categorized in the disclosure hierarchy:
| | | | | | | | | | | | | | | | | | | | |
| | | Level 1 | | Level 2 | | Level 3 | | Total |
Assets: | | | | | | | | | | | | | | | | | | | | |
Investments: | | | | | | | | | | | | | | | | | | | | |
Long-Term Investments: | | | | | | | | | | | | | | | | | | | | |
Asset-Backed Securities | | | | — | | | | $ | 347,006,867 | | | | $ | 69,710,678 | | | | $ | 416,717,545 | |
Common Stocks | | | $ | 49,336,165 | | | | | — | | | | | 65,599 | | | | | 49,401,764 | |
Corporate Bonds | | | | — | | | | | 2,633,199,748 | | | | | 14,101,468 | | | | | 2,647,301,216 | |
Floating Rate Loan Interests | | | | — | | | | | 484,009,019 | | | | | 55,998,295 | | | | | 540,007,314 | |
See Notes to Financial Statements.
| | | | | | |
| | | BLACKROCK FUNDS | | JANUARY 31, 2016 | | 55 |
| | | | |
| Schedule of Investments (continued) | | | BlackRock Global Long/Short Credit Fund | |
| | | | | | | | | | | | | | | | | | | | |
| | | Level 1 | | Level 2 | | Level 3 | | Total |
Foreign Agency Obligations | | | | — | | | | $ | 89,243,526 | | | | | — | | | | $ | 89,243,526 | |
Foreign Government Obligations | | | | — | | | | | 57,542,127 | | | | | — | | | | | 57,542,127 | |
Non-Agency Mortgage-Backed Securities | | | | — | | | | | 105,253,320 | | | | $ | 15,602,366 | | | | | 120,855,686 | |
Preferred Securities | | | $ | 52,612,629 | | | | | 359,517,449 | | | | | 2,693,192 | | | | | 414,823,270 | |
U.S. Treasury Obligations | | | | — | | | | | 220,207,492 | | | | | — | | | | | 220,207,492 | |
Short-Term Securities: | | | | | | | | | | | | | | | | | | | | |
Borrowed Bond Agreements | | | | — | | | | | 1,226,438,913 | | | | | — | | | | | 1,226,438,913 | |
Money Market Funds | | | | 444,946,963 | | | | | — | | | | | — | | | | | 444,946,963 | |
Options Purchased: | | | | | | | | | | | | | | | | | | | | |
Credit Contracts | | | | — | | | | | 1,624,307 | | | | | — | | | | | 1,624,307 | |
Equity Contracts | | | | 4,432,711 | | | | | — | | | | | — | | | | | 4,432,711 | |
Interest Rate Contracts | | | | — | | | | | 23,875 | | | | | — | | | | | 23,875 | |
Foreign Currency Exchange Contracts | | | | — | | | | | 546,485 | | | | | — | | | | | 546,485 | |
Liabilities: | | | | | | | | | | | | | | | | | | | | |
Investments: | | | | | | | | | | | | | | | | | | | | |
Borrowed Bonds | | | | — | | | | | (1,210,077,444 | ) | | | | — | | | | | (1,210,077,444 | ) |
Investments Sold Short | | | | (174,778,745 | ) | | | | (99,051,167 | ) | | | | — | | | | | (273,829,912 | ) |
Unfunded floating rate loan interests1 | | | | — | | | | | (634,623 | ) | | | | — | | | | | (634,623 | ) |
| | | | | |
Total | | | $ | 376,549,723 | | | | $ | 4,214,849,894 | | | | $ | 158,171,598 | | | | $ | 4,749,571,215 | |
| | | | | |
1 Unfunded floating rate loan interests are valued at the unrealized appreciation (depreciation) on the commitment. | |
| | | Level 1 | | Level 2 | | Level 3 | | Total |
Derivative Financial Instruments1 | | | | | | | | | | | | | | | | | | | | |
Assets: | | | | | | | | | | | | | | | | | | | | |
Credit contracts | | | | — | | | | $ | 32,504,418 | | | | | — | | | | $ | 32,504,418 | |
Equity contracts | | | $ | 53,098 | | | | | 1,373,925 | | | | | — | | | | | 1,427,023 | |
Foreign currency exchange contracts | | | | — | | | | | 44,697,950 | | | | | — | | | | | 44,697,950 | |
Interest rate contracts | | | | 2,063 | | | | | 80,485 | | | | | — | | | | | 82,548 | |
Liabilities: | | | | | | | | | | | | | | | | | | | | |
Credit contracts | | | | — | | | | | (21,308,850 | ) | | | | — | | | | | (21,308,850 | ) |
Equity contracts | | | | (1,358,870 | ) | | | | (1,734,365 | ) | | | | — | | | | | (3,093,235 | ) |
Foreign currency exchange contracts | | | | — | | | | | (28,377,099 | ) | | | | — | | | | | (28,377,099 | ) |
Interest rate contracts | | | | (13,950,183 | ) | | | | (2,358,270 | ) | | | | — | | | | | (16,308,453 | ) |
| | | | | |
Total | | | $ | (15,253,892 | ) | | | $ | 24,878,194 | | | | | — | | | | $ | 9,624,302 | |
| | | | | |
1 Derivative financial instruments are swaps, financial futures contracts, forward foreign currency exchange contracts and options written. Swaps, financial futures contracts and forward foreign currency exchange contracts are valued at the unrealized appreciation (depreciation) on the instrument and options written are shown at value. | |
|
The Fund may hold assets and/or liabilities in which the fair value approximates the carrying amount for financial statement purposes. As of period end, such assets and/or liabilities are categorized within the disclosure hierarchy as follows: | |
| | | Level 1 | | Level 2 | | Level 3 | | Total |
Assets: | | | | | | | | | | | | | | | | | | | | |
Cash | | | $ | 271,975,405 | | | | | — | | | | | — | | | | $ | 271,975,405 | |
Foreign currency at value | | | | 25,854,357 | | | | | — | | | | | — | | | | | 25,854,357 | |
Cash pledged as collateral for OTC derivatives | | | | 29,070,000 | | | | | — | | | | | — | | | | | 29,070,000 | |
Cash pledged for centrally cleared swaps | | | | 20,770,760 | | | | | — | | | | | — | | | | | 20,770,760 | |
Cash pledged for financial futures contracts | | | | 11,672,880 | | | | | — | | | | | — | | | | | 11,672,880 | |
Liabilities: | | | | | | | | | | | | | | | | | | | | |
Cash received as collateral for borrowed bonds | | | | — | | | | $ | (2,804,000 | ) | | | | — | | | | | (2,804,000 | ) |
Cash received as collateral for OTC derivatives | | | | — | | | | | (5,410,000 | ) | | | | — | | | | | (5,410,000 | ) |
| | | | | |
Total | | | $ | 359,343,402 | | | | $ | (8,214,000 | ) | | | | — | | | | $ | 351,129,402 | |
| | | | | |
During the six months ended January 31, 2016, there were no transfers between levels.
See Notes to Financial Statements.
| | | | | | |
| 56 | | BLACKROCK FUNDS | | JANUARY 31, 2016 | | |
| | | | |
| Schedule of Investments (concluded) | | | BlackRock Global Long/Short Credit Fund | |
A reconciliation of Level 3 investments is presented when the Fund had a significant amount of Level 3 investments at the beginning and/or end of the period in relation to net assets. The following table is a reconciliation of Level 3 investments for which significant unobservable inputs were used in determining fair value:
| | | | | | | | | | | | | | | | | | | | | | | | | | | | |
| | | Asset-Backed
Securities | | | Common Stocks | | | Corporate Bonds | | | Floating Rate
Loan Interests | | | Non-Agency
Mortgage-Backed
Securities | | | Preferred
Securities | | | Total | |
Assets: | | | | | | | | | | | | | | | | | | | | | | | | | | | | |
Opening Balance, as of July 31, 2015 | | $ | 84,924,584 | | | $ | 11,926,249 | | | $ | 22,294,306 | | | $ | 26,338,997 | | | $ | 23,085,617 | | | | — | | | $ | 168,569,753 | |
Transfers into Level 3 | | | 4,455,413 | | | | — | | | | 14,046,438 | | | | 2,427,867 | | | | — | | | | — | | | | 20,929,718 | |
Transfers out of Level 3 | | | (28,694,736 | ) | | | — | | | | (11,930,366 | ) | | | (578,023 | ) | | | (5,249,148 | ) | | | — | | | | (46,452,273 | ) |
Other1 | | | — | | | | (1,447,403 | ) | | | — | | | | — | | | | — | | | $ | 1,447,403 | | | | — | |
Accrued discounts/premiums | | | 30,758 | | | | — | | | | 119,476 | | | | 55,897 | | | | 31,701 | | | | — | | | | 237,832 | |
Net realized gain (loss) | | | 448,619 | | | | (461,874 | ) | | | 411,001 | | | | 19,451 | | | | 13,531 | | | | — | | | | 430,728 | |
Net change in unrealized appreciation
(depreciation)2,3 | | | (2,394,192 | ) | | | 2,945,614 | | | | (1,637,506 | ) | | | (1,431,524 | ) | | | (532,135 | ) | | | 4,913 | | | | (3,044,830 | ) |
Purchases | | | 18,176,470 | | | | 10,055 | | | | 475,018 | | | | 31,989,498 | | | | — | | | | 1,240,876 | | | | 51,891,917 | |
Sales | | | (7,236,238 | ) | | | (12,907,042 | ) | | | (9,676,899 | ) | | | (2,823,868 | ) | | | (1,747,200 | ) | | | — | | | | (34,391,247 | ) |
| | | | |
Closing Balance, as of January 31, 2016 | | $ | 69,710,678 | | | $ | 65,599 | | | $ | 14,101,468 | | | $ | 55,998,295 | | | $ | 15,602,366 | | | $ | 2,693,192 | | | $ | 158,171,598 | |
| | | | |
Net change in unrealized appreciation (depreciation) on investments still held at January 31, 20163 | | $ | (2,394,192 | ) | | $ | 319,169 | | | $ | (1,637,506 | ) | | $ | (1,419,532 | ) | | $ | (532,136 | ) | | $ | 4,913 | | | $ | (5,659,284 | ) |
| | | | |
| | 1 | | Certain Level 3 investments were re-classified between Common Stocks and Preferred Securities. |
| | 2 | | Included in the related net change in unrealized appreciation (depreciation) in the Statements of Operations. |
| | 3 | | Any difference between net change in unrealized appreciation (depreciation) and net change in unrealized appreciation (depreciation) on investments still held at January 31, 2016, is generally due to investments no longer held or categorized as Level 3 at period end. |
The Fund’s investments that are categorized as Level 3 were valued utilizing third party pricing information without adjustment. Such valuations are based on unobservable inputs. A significant change in third party information could result in a significantly lower or higher value of such Level 3 investments.
See Notes to Financial Statements.
| | | | | | |
| | | BLACKROCK FUNDS | | JANUARY 31, 2016 | | 57 |
| | | | |
| Consolidated Schedule of Investments January 31, 2016 (Unaudited) | | | BlackRock Macro Themes Fund | |
| | | (Percentages shown are based on Net Assets) | |
| | | | | | | | |
| Common Stocks | | Shares | | | Value | |
Aerospace & Defense — 0.7% | | | | | | | | |
Boeing Co. | | | 201 | | | $ | 24,146 | |
General Dynamics Corp. | | | 203 | | | | 27,155 | |
L-3 Communications Holdings, Inc. | | | 234 | | | | 27,341 | |
Lockheed Martin Corp. | | | 131 | | | | 27,641 | |
Northrop Grumman Corp. | | | 154 | | | | 28,499 | |
Raytheon Co. | | | 237 | | | | 30,393 | |
Textron, Inc. | | | 683 | | | | 23,372 | |
| | | | | | | | |
| | | | | | | | 188,547 | |
Air Freight & Logistics — 0.2% | | | | | | | | |
FedEx Corp. | | | 179 | | | | 23,786 | |
United Parcel Service, Inc., Class B | | | 281 | | | | 26,189 | |
| | | | | | | | |
| | | | | | | | 49,975 | |
Airlines — 0.1% | | | | | | | | |
American Airlines Group, Inc. | | | 676 | | | | 26,357 | |
Auto Components — 0.1% | | | | | | | | |
Goodyear Tire & Rubber Co. | | | 895 | | | | 25,427 | |
Beverages — 0.1% | | | | | | | | |
Brown-Forman Corp., Class B | | | 277 | | | | 27,102 | |
Biotechnology — 0.2% | | | | | | | | |
Amgen, Inc. | | | 188 | | | | 28,713 | |
Vertex Pharmaceuticals, Inc. (a) | | | 231 | | | | 20,963 | |
| | | | | | | | |
| | | | | | | | 49,676 | |
Chemicals — 0.4% | | | | | | | | |
Dow Chemical Co. | | | 560 | | | | 23,520 | |
E.I. Du Pont de Nemours & Co. | | | 430 | | | | 22,687 | |
FMC Corp. | | | 697 | | | | 24,897 | |
Monsanto Co. | | | 304 | | | | 27,542 | |
| | | | | | | | |
| | | | | | | | 98,646 | |
Commercial Services & Supplies — 0.1% | | | | | | | | |
Pitney Bowes, Inc. | | | 1,390 | | | | 27,216 | |
Communications Equipment — 0.3% | | | | | | | | |
Harris Corp. | | | 359 | | | | 31,222 | |
Motorola Solutions, Inc. | | | 414 | | | | 27,643 | |
QUALCOMM, Inc. | | | 548 | | | | 24,846 | |
| | | | | | | | |
| | | | | | | | 83,711 | |
Construction & Engineering — 0.1% | | | | | | | | |
Fluor Corp. | | | 604 | | | | 27,114 | |
Diversified Consumer Services — 0.1% | | | | | | | | |
H&R Block, Inc. | | | 794 | | | | 27,036 | |
Diversified Financial Services — 0.1% | | | | | | | | |
McGraw Hill Financial, Inc. | | | 304 | | | | 25,846 | |
Electric Utilities — 0.1% | | | | | | | | |
Southern Co. | | | 646 | | | | 31,602 | |
Electronic Equipment, Instruments & Components — 0.1% | | | | | | | | |
FLIR Systems, Inc. | | | 1,008 | | | | 29,474 | |
Food & Staples Retailing — 0.1% | | | | | | | | |
CVS Health Corp. | | | 309 | | | | 29,846 | |
Food Products — 0.1% | | | | | | | | |
Kellogg Co. | | | 432 | | | | 31,726 | |
Health Care Equipment & Supplies — 0.2% | | | | | | | | |
Edwards Lifesciences Corp. (a) | | | 376 | | | | 29,407 | |
Varian Medical Systems, Inc. (a) | | | 365 | | | | 28,152 | |
| | | | | | | | |
| | | | | | | | 57,559 | |
| | | | | | | | | | | | |
| Common Stocks | | | | | Shares | | | Value | |
Health Care Providers & Services — 0.1% | | | | | | | | | | | | |
DaVita HealthCare Partners, Inc. (a) | | | | | | | 394 | | | $ | 26,445 | |
Hotels, Restaurants & Leisure — 0.1% | | | | | | | | | | | | |
Yum! Brands, Inc. | | | | | | | 420 | | | | 30,395 | |
Internet & Catalog Retail — 0.1% | | | | | | | | | | | | |
Amazon.com, Inc. (a) | | | | | | | 46 | | | | 27,002 | |
Internet Software & Services — 0.2% | | | | | | | | | | | | |
Facebook, Inc., Class A (a) | | | | | | | 277 | | | | 31,082 | |
VeriSign, Inc. (a) | | | | | | | 347 | | | | 26,233 | |
| | | | | | | | | | | | |
| | | | | | | | | | | | 57,315 | |
IT Services — 0.3% | | | | | | | | | | | | |
Accenture Plc, Class A | | | | | | | 272 | | | | 28,707 | |
MasterCard, Inc., Class A | | | | | | | 294 | | | | 26,175 | |
Teradata Corp. (a) | | | | | | | 1,098 | | | | 26,725 | |
| | | | | | | | | | | | |
| | | | | | | | | | | | 81,607 | |
Media — 0.3% | | | | | | | | | | | | |
CBS Corp., Class B | | | | | | | 568 | | | | 26,980 | |
Time Warner Cable, Inc. | | | | | | | 156 | | | | 28,394 | |
Viacom, Inc., Class B | | | | | | | 556 | | | | 25,376 | |
| | | | | | | | | | | | |
| | | | | | | | | | | | 80,750 | |
Metals & Mining — 0.1% | | | | | | | | | | | | |
Nucor Corp. | | | | | | | 704 | | | | 27,505 | |
Oil, Gas & Consumable Fuels — 0.1% | | | | | | | | | | | | |
Occidental Petroleum Corp. | | | | | | | 385 | | | | 26,500 | |
Pharmaceuticals — 0.1% | | | | | | | | | | | | |
Eli Lilly & Co. | | | | | | | 355 | | | | 28,081 | |
Professional Services — 0.2% | | | | | | | | | | | | |
Dun & Bradstreet Corp. | | | | | | | 271 | | | | 26,672 | |
Equifax, Inc. | | | | | | | 271 | | | | 28,672 | |
| | | | | | | | | | | | |
| | | | | | | | | | | | 55,344 | |
Real Estate Investment Trusts (REITs) — 0.1% | | | | | | | | | | | | |
Plum Creek Timber Co., Inc. | | | | | | | 614 | | | | 24,873 | |
Software — 0.1% | | | | | | | | | | | | |
Intuit, Inc. | | | | | | | 299 | | | | 28,557 | |
Tobacco — 0.1% | | | | | | | | | | | | |
Altria Group, Inc. | | | | | | | 510 | | | | 31,166 | |
Total Common Stocks — 5.0% | | | | | | | | | | | 1,362,400 | |
| | | | | | | | | | | | |
| Corporate Bonds | | | | | Par
(000) | | | | |
Aerospace & Defense — 0.3% | | | | | | | | | | | | |
L-3 Communications Corp., 1.50%, 5/28/17 | | | USD | | | | 80 | | | | 79,354 | |
Lockheed Martin Corp., 3.55%, 1/15/26 | | | | | | | 10 | | | | 10,259 | |
| | | | | | | | | | | | |
| | | | | | | | | | | | 89,613 | |
Auto Components — 0.1% | | | | | | | | | | | | |
Hella KGaA Hueck & Co., 1.25%, 9/07/17 | | | EUR | | | | 35 | | | | 38,405 | |
Automobiles — 0.5% | | | | | | | | | | | | |
BMW Finance NV, 0.50%, 9/05/18 | | | | | | | 10 | | | | 10,900 | |
Renault SA, 3.13%, 3/05/21 | | | | | | | 25 | | | | 29,015 | |
Volkswagen International Finance NV,
0.55%, 4/15/19 (b) | | | | | | | 100 | | | | 104,879 | |
| | | | | | | | | | | | |
| | | | | | | | | | | | 144,794 | |
See Notes to Financial Statements.
| | | | | | |
| 58 | | BLACKROCK FUNDS | | JANUARY 31, 2016 | | |
| | | | |
| Consolidated Schedule of Investments (continued) | | | BlackRock Macro Themes Fund | |
| | | | |
| | | | | | | | | | | | |
| Corporate Bonds | | | | | Par
(000) | | | Value | |
Banks — 11.8% | | | | | | | | | | | | |
Abbey National Treasury Services PLC, 2.00%, 1/14/19 | | | EUR | | | | 100 | | | $ | 112,982 | |
Bank of America Corp., 5.75%, 12/01/17 | | | USD | | | | 110 | | | | 116,993 | |
Bank of America NA, 2.05%, 12/07/18 | | | | | | | 250 | | | | 250,191 | |
Bank of Ireland, 2.00%, 5/08/17 | | | EUR | | | | 100 | | | | 110,436 | |
Bankia SA, 3.50%, 1/17/19 | | | | | | | 100 | | | | 112,793 | |
BNP Paribas SA, 5.43%, 9/07/17 | | | | | | | 90 | | | | 104,990 | |
BPCE SA: | | | | | | | | | | | | |
2.13%, 3/17/21 | | | | | | | 100 | | | | 116,111 | |
2.75%, 7/08/26 (b) | | | | | | | 100 | | | | 109,232 | |
Citigroup, Inc., 5.50%, 9/13/25 | | | USD | | | | 40 | | | | 42,917 | |
Commerzbank AG, 6.38%, 3/22/19 | | | EUR | | | | 30 | | | | 35,749 | |
Cooperatieve Rabobank UA, 3.75%, 11/09/20 | | | | | | | 50 | | | | 59,609 | |
Credit Agricole SA, 1.88%, 10/18/17 | | | | | | | 100 | | | | 111,792 | |
ICICI Bank Ltd., 4.75%, 11/25/16 | | | USD | | | | 200 | | | | 204,949 | |
ING Bank NV, 6.13%, 5/29/23 (b) | | | EUR | | | | 80 | | | | 95,727 | |
Intesa Sanpaolo SpA: | | | | | | | | | | | | |
2.38%, 1/13/17 | | | USD | | | | 200 | | | | 200,765 | |
5.00%, 9/23/19 | | | EUR | | | | 50 | | | | 58,462 | |
KFW: | | | | | | | | | | | | |
2.75%, 4/16/20 | | | AUD | | | | 200 | | | | 142,270 | |
0.13%, 6/01/20 | | | EUR | | | | 90 | | | | 98,788 | |
Lloyds Bank PLC, 10.75%, 12/16/21 (b) | | | GBP | | | | 60 | | | | 91,434 | |
Nordea Bank AB: | | | | | | | | | | | | |
4.50%, 3/26/20 | | | EUR | | | | 80 | | | | 97,791 | |
2.50%, 9/17/20 (c) | | | USD | | | | 200 | | | | 201,164 | |
Royal Bank of Scotland PLC, 4.35%, 1/23/17 | | | EUR | | | | 100 | | | | 111,282 | |
Santander Holdings USA, Inc., 3.45%, 8/27/18 | | | USD | | | | 110 | | | | 112,405 | |
Santander UK Group Holdings PLC: | | | | | | | | | | | | |
2.88%, 10/16/20 | | | | | | | 25 | | | | 24,953 | |
3.13%, 1/08/21 | | | | | | | 40 | | | | 40,494 | |
Société Générale SA, 4.75%, 3/02/21 | | | EUR | | | | 100 | | | | 130,959 | |
Svenska Handelsbanken AB, 2.66%, 1/15/24 (b) | | | | | | | 100 | | | | 112,042 | |
UniCredit SpA, 5.75%, 9/26/17 | | | | | | | 90 | | | | 103,938 | |
Wells Fargo & Co.: | | | | | | | | | | | | |
2.55%, 12/07/20 | | | USD | | | | 45 | | | | 45,180 | |
3.00%, 2/19/25 | | | | | | | 30 | | | | 29,281 | |
3.90%, 5/01/45 | | | | | | | 25 | | | | 22,816 | |
| | | | | | | | | | | | |
| | | | | | | | | | | | 3,208,495 | |
Beverages — 0.6% | | | | | | | | | | | | |
Anheuser-Busch InBev Finance, Inc., 2.65%, 2/01/21 | | | | | | | 65 | | | | 65,397 | |
Coca-Cola Co., 0.75%, 3/09/23 | | | EUR | | | | 100 | | | | 107,279 | |
| | | | | | | | | | | | |
| | | | | | | | | | | | 172,676 | |
Biotechnology — 0.5% | | | | | | | | | | | | |
AbbVie, Inc.: | | | | | | | | | | | | |
1.80%, 5/14/18 | | | | | | | 90 | | | | 89,738 | |
2.50%, 5/14/20 | | | | | | | 35 | | | | 34,740 | |
| | | | | | | | | | | | |
| | | | | | | | | | | | 124,478 | |
Capital Markets — 1.6% | | | | | | | | | | | | |
Goldman Sachs Group, Inc.: | | | | | | | | | | | | |
6.13%, 5/14/17 | | | GBP | | | | 20 | | | | 29,956 | |
6.25%, 9/01/17 | | | USD | | | | 110 | | | | 117,007 | |
4.25%, 10/21/25 | | | | | | | 20 | | | | 19,934 | |
Morgan Stanley: | | | | | | | | | | | | |
4.75%, 3/22/17 | | | | | | | 110 | | | | 113,929 | |
2.20%, 12/07/18 | | | | | | | 15 | | | | 15,111 | |
4.88%, 11/01/22 | | | | | | | 60 | | | | 63,814 | |
3.88%, 1/27/26 | | | | | | | 65 | | | | 65,732 | |
| | | | | | | | | | | | |
| | | | | | | | | | | | 425,483 | |
| | | | | | | | | | | | |
| Corporate Bonds | | | | | Par
(000) | | | Value | |
Communications Equipment — 0.1% | | | | | | | | | | | | |
QUALCOMM, Inc., 2.25%, 5/20/20 | | | USD | | | | 25 | | | $ | 25,070 | |
Construction Materials — 0.3% | | | | | | | | | | | | |
HeidelbergCement Finance Luxembourg SA,
8.00%, 1/31/17 | | | EUR | | | | 80 | | | | 92,513 | |
Consumer Finance — 0.4% | | | | | | | | | | | | |
John Deere Capital Corp., 2.38%, 7/14/20 | | | USD | | | | 75 | | | | 75,491 | |
Synchrony Financial, 2.60%, 1/15/19 | | | | | | | 45 | | | | 44,932 | |
| | | | | | | | | | | | |
| | | | | | | | | | | | 120,423 | |
Diversified Financial Services — 1.4% | | | | | | | | | | | | |
European Investment Bank, 4.00%, 4/15/30 | | | EUR | | | | 65 | | | | 98,992 | |
General Motors Financial Co., Inc., 3.00%, 9/25/17 | | | USD | | | | 180 | | | | 180,667 | |
Shell International Finance B.V., 1.25%, 11/10/17 | | | | | | | 100 | | | | 99,764 | |
| | | | | | | | | | | | |
| | | | | | | | | | | | 379,423 | |
Diversified Telecommunication Services — 1.0% | | | | | | | | | | | | |
Telecom Italia SpA, 7.38%, 12/15/17 | | | GBP | | | | 100 | | | | 154,272 | |
Verizon Communications, Inc., 2.63%, 2/21/20 | | | USD | | | | 120 | | | | 120,691 | |
| | | | | | | | | | | | |
| | | | | | | | | | | | 274,963 | |
Electric Utilities — 0.2% | | | | | | | | | | | | |
Duke Energy Progress LLC, 3.25%, 8/15/25 | | | | | | | 25 | | | | 25,553 | |
Virginia Electric & Power Co., Series B, 4.20%, 5/15/45 | | | | | | | 20 | | | | 20,301 | |
| | | | | | | | | | | | |
| | | | | | | | | | | | 45,854 | |
Health Care Equipment & Supplies — 0.1% | | | | | | | | | | | | |
Medtronic, Inc., 3.50%, 3/15/25 | | | | | | | 30 | | | | 30,803 | |
Household Products — 0.1% | | | | | | | | | | | | |
Procter & Gamble Co., 2.70%, 2/02/26 | | | | | | | 30 | | | | 30,087 | |
Industrial Conglomerates — 0.2% | | | | | | | | | | | | |
General Electric Co., 4.38%, 9/16/20 | | | | | | | 50 | | | | 54,991 | |
IT Services — 0.4% | | | | | | | | | | | | |
Fidelity National Information Services, Inc.,
3.50%, 4/15/23 | | | | | | | 50 | | | | 48,298 | |
Visa, Inc., 2.20%, 12/14/20 | | | | | | | 65 | | | | 65,526 | |
| | | | | | | | | | | | |
| | | | | | | | | | | | 113,824 | |
Media — 1.4% | | | | | | | | | | | | |
DIRECTV Holdings LLC/DIRECTV Financing Co., Inc., 4.60%, 2/15/21 | | | | | | | 60 | | | | 63,617 | |
Interpublic Group of Cos., Inc., 3.75%, 2/15/23 | | | | | | | 14 | | | | 13,554 | |
NBCUniversal Enterprise, Inc., 1.66%, 4/15/18 (c) | | | | | | | 100 | | | | 100,316 | |
Sky PLC, 2.50%, 9/15/26 | | | EUR | | | | 100 | | | | 111,753 | |
WPP Finance SA, 6.38%, 11/06/20 | | | GBP | | | | 50 | | | | 84,177 | |
| | | | | | | | | | | | |
| | | | | | | | | | | | 373,417 | |
Metals & Mining — 0.4% | | | | | | | | | | | | |
Alcoa, Inc., 6.75%, 7/15/18 | | | USD | | | | 50 | | | | 51,900 | |
Barrick Gold Corp., 4.10%, 5/01/23 | | | | | | | 10 | | | | 8,596 | |
BHP Billiton Finance USA Ltd., 3.85%, 9/30/23 | | | | | | | 60 | | | | 56,868 | |
| | | | | | | | | | | | |
| | | | | | | | | | | | 117,364 | |
Oil, Gas & Consumable Fuels — 2.4% | | | | | | | | | | | | |
Chevron Corp., 1.34%, 11/09/17 | | | | | | | 115 | | | | 114,718 | |
Devon Energy Corp., 3.25%, 5/15/22 | | | | | | | 11 | | | | 8,746 | |
Kinder Morgan Energy Partners LP, 4.25%, 9/01/24 | | | | | | | 20 | | | | 17,040 | |
Kinder Morgan, Inc.: | | | | | | | | | | | | |
2.00%, 12/01/17 | | | | | | | 60 | | | | 57,872 | |
See Notes to Financial Statements.
| | | | | | |
| | | BLACKROCK FUNDS | | JANUARY 31, 2016 | | 59 |
| | | | |
| Consolidated Schedule of Investments (continued) | | | BlackRock Macro Themes Fund | |
| | | | |
| | | | | | | | | | | | |
| Corporate Bonds | | | | | Par
(000) | | | Value | |
Oil, Gas & Consumable Fuels (continued) | | | | | | | | | | | | |
3.05%, 12/01/19 | | | USD | | | | 60 | | | $ | 55,538 | |
Petroleos Mexicanos: | | | | | | | | | | | | |
5.50%, 2/04/19 | | | | | | | 73 | | | | 73,730 | |
6.88%, 8/04/26 | | | | | | | 83 | | | | 83,896 | |
Phillips 66, 2.95%, 5/01/17 | | | | | | | 125 | | | | 126,778 | |
TransCanada PipeLines Ltd., 1.63%, 11/09/17 | | | | | | | 100 | | | | 98,321 | |
| | | | | | | | | | | | |
| | | | | | | | | | | | 636,639 | |
Pharmaceuticals — 1.6% | | | | | | | | | | | | |
Actavis Funding SCS, 1.30%, 6/15/17 | | | | | | | 90 | | | | 89,598 | |
Forest Laboratories LLC, 5.00%, 12/15/21 (c) | | | | | | | 30 | | | | 32,885 | |
Novartis Finance SA, 0.75%, 11/09/21 | | | EUR | | | | 100 | | | | 110,657 | |
Roche Holdings, Inc., 2.88%, 9/29/21 (c) | | | USD | | | | 200 | | | | 206,783 | |
| | | | | | | | | | | | |
| | | | | | | | | | | | 439,923 | |
Real Estate Investment Trusts (REITs) — 0.7% | | | | | | | | | | | | |
American Tower Corp., 3.45%, 9/15/21 | | | | | | | 40 | | | | 40,091 | |
AvalonBay Communities, Inc.: | | | | | | | | | | | | |
4.20%, 12/15/23 | | | | | | | 20 | | | | 21,401 | |
3.45%, 6/01/25 | | | | | | | 20 | | | | 20,161 | |
HCP, Inc., 3.88%, 8/15/24 | | | | | | | 18 | | | | 17,594 | |
Host Hotels & Resorts LP, Series E, 4.00%, 6/15/25 | | | | | | | 25 | | | | 24,280 | |
Ventas Realty LP, 3.75%, 5/01/24 | | | | | | | 60 | | | | 59,676 | |
| | | | | | | | | | | | |
| | | | | | | | | | | | 183,203 | |
Road & Rail — 0.3% | | | | | | | | | | | | |
Burlington Northern Santa Fe LLC, 4.15%, 4/01/45 | | | | | | | 10 | | | | 9,257 | |
Penske Truck Leasing Co. LP/PTL Finance Corp., 3.75%, 5/11/17 (c) | | | | | | | 60 | | | | 61,158 | |
| | | | | | | | | | | | |
| | | | | | | | | | | | 70,415 | |
Semiconductors & Semiconductor Equipment — 0.5% | | | | | | | | | |
ASML Holding NV, 3.38%, 9/19/23 | | | EUR | | | | 100 | | | | 121,961 | |
Software — 0.8% | | | | | | | | | | | | |
Amadeus Finance BV, 0.63%, 12/02/17 | | | | | | | 100 | | | | 108,772 | |
SAP SE, 0.21%, 11/20/18 (b) | | | | | | | 100 | | | | 108,495 | |
| | | | | | | | | | | | |
| | | | | | | | | | | | 217,267 | |
Specialty Retail — 0.4% | | | | | | | | | | | | |
Lowe’s Cos., Inc., 3.88%, 9/15/23 | | | USD | | | | 60 | | | | 64,448 | |
QVC, Inc., 4.45%, 2/15/25 | | | | | | | 49 | | | | 45,383 | |
| | | | | | | | | | | | |
| | | | | | | | | | | | 109,831 | |
Technology Hardware, Storage & Peripherals — 0.5% | | | | | | | | | | | | |
Apple, Inc., 0.90%, 5/12/17 | | | | | | | 125 | | | | 125,101 | |
Thrifts & Mortgage Finance — 1.3% | | | | | | | | | | | | |
Nordea Kredit Realkreditaktieselskab: | | | | | | | | | | | | |
2.00%, 1/01/17 | | | DKK | | | | 1,410 | | | | 208,180 | |
2.00%, 10/01/47 | | | | | | | 110 | | | | 14,685 | |
Nykredit Realkredit A/S: | | | | | | | | | | | | |
1.00%, 7/01/18 | | | | | | | 240 | | | | 35,502 | |
2.00%, 10/01/47 | | | | | | | 565 | | | | 75,496 | |
Realkredit Danmark A/S, Series 27S, 2.00%, 10/01/47 | | | | | | | 180 | | | | 23,962 | |
| | | | | | | | | | | | |
| | | | | | | | | | | | 357,825 | |
| | | | | | | | | | | | |
| Corporate Bonds | | | | | Par (000) | | | Value | |
Tobacco — 0.4% | | | | | | | | | | | | |
Reynolds American, Inc.: | | | | | | | | | | | | |
2.30%, 6/12/18 | | | USD | | | | 30 | | | $ | 30,288 | |
4.85%, 9/15/23 | | | | | | | 60 | | | | 65,490 | |
| | | | | | | | | | | | |
| | | | | | | | | | | | 95,778 | |
Wireless Telecommunication Services — 0.4% | | | | | | | | | | | | |
Eutelsat SA, 4.13%, 3/27/17 | | | EUR | | | | 50 | | | | 56,563 | |
Vodafone Group PLC, 1.63%, 3/20/17 | | | USD | | | | 60 | | | | 60,049 | |
| | | | | | | | | | | | |
| | | | | | | | | | | | 116,612 | |
Total Corporate Bonds — 30.7% | | | | | | | | | | | 8,337,231 | |
| | | | | | | | | | | | |
| Foreign Agency Obligations | | | | | | | | | |
Brazil — 0.3% | | | | | | | | | | | | |
Petrobras Global Finance BV: | | | | | | | | | | | | |
3.25%, 3/17/17 | | | | | | | 60 | | | | 56,400 | |
6.85%, 6/05/2115 | | | | | | | 20 | | | | 12,650 | |
| | | | | | | | | | | | |
| | | | | | | | | | | | 69,050 | |
Luxembourg — 0.4% | | | | | | | | | | | | |
Gazprom OAO Via Gaz Capital SA, 5.14%, 3/22/17 | | | EUR | | | | 105 | | | | 115,736 | |
Total Foreign Agency Obligations — 0.7% | | | | | | | | | | | 184,786 | |
| | | | | | | | | | | | |
| Foreign Government Obligations | | | | | | | | | |
Brazil — 0.4% | | | | | | | | | | | | |
Federal Republic of Brazil, 2.88%, 4/01/21 | | | | | | | 100 | | | | 96,906 | |
Canada — 1.9% | | | | | | | | | | | | |
Canada Housing Trust No 1, 2.35%, 12/15/18 | | | CAD | | | | 605 | | | | 451,213 | |
Canadian Government Bonds, 2.25%, 6/01/25 | | | | | | | 100 | | | | 78,082 | |
| | | | | | | | | | | | |
| | | | | | | | | | | | 529,295 | |
Cyprus — 0.3% | | | | | | | | | | | | |
Cyprus Government International Bond: | | | | | | | | | | | | |
4.75%, 6/25/19 | | | EUR | | | | 25 | | | | 28,952 | |
3.88%, 5/06/22 | | | | | | | 40 | | | | 44,701 | |
| | | | | | | | | | | | |
| | | | | | | | | | | | 73,653 | |
Germany — 0.4% | | | | | | | | | | | | |
Bundesrepublik Deutschland, 2.50%, 8/15/46 | | | | | | | 20 | | | | 29,647 | |
Bundesschatzanweisungen, 0.00%, 6/16/17 (d) | | | | | | | 75 | | | | 81,766 | |
| | | | | | | | | | | | |
| | | | | | | | | | | | 111,413 | |
Greece — 0.9% | | | | | | | | | | | | |
Hellenic Republic: | | | | | | | | | | | | |
4.75%, 4/17/19 | | | | | | | 8 | | | | 7,123 | |
2.00%, 2/24/23 (e) | | | | | | | 17 | | | | 12,071 | |
2.00%, 2/24/24 (e) | | | | | | | 17 | | | | 12,001 | |
2.00%, 2/24/25 (e) | | | | | | | 18 | | | | 12,289 | |
2.00%, 2/24/26 (e) | | | | | | | 19 | | | | 12,598 | |
2.00%, 2/24/27 (e) | | | | | | | 19 | | | | 12,422 | |
2.00%, 2/24/28 (e) | | | | | | | 20 | | | | 12,461 | |
2.00%, 2/24/29 (e) | | | | | | | 20 | | | | 12,438 | |
2.00%, 2/24/30 (e) | | | | | | | 20 | | | | 12,531 | |
See Notes to Financial Statements.
| | | | | | |
| 60 | | BLACKROCK FUNDS | | JANUARY 31, 2016 | | |
| | | | |
| Consolidated Schedule of Investments (continued) | | | BlackRock Macro Themes Fund | |
| | | | |
| | | | | | | | | | | | |
| Foreign Government Obligations | | | | | Par
(000) | | | Value | |
Hellenic Republic (continued): | | | | | | | | | | | | |
2.00%, 2/24/31 (e) | | | EUR | | | | 21 | | | $ | 12,335 | |
2.00%, 2/24/32 (e) | | | | | | | 21 | | | | 12,381 | |
2.00%, 2/24/33 (e) | | | | | | | 21 | | | | 12,151 | |
2.00%, 2/24/34 (e) | | | | | | | 21 | | | | 12,309 | |
2.00%, 2/24/35 (e) | | | | | | | 22 | | | | 12,075 | |
2.00%, 2/24/36 (e) | | | | | | | 22 | | | | 12,009 | |
2.00%, 2/24/37 (e) | | | | | | | 22 | | | | 12,143 | |
2.00%, 2/24/38 (e) | | | | | | | 22 | | | | 11,916 | |
2.00%, 2/24/39 (e) | | | | | | | 22 | | | | 12,135 | |
2.00%, 2/24/40 (e) | | | | | | | 22 | | | | 12,154 | |
2.00%, 2/24/41 (e) | | | | | | | 22 | | | | 12,170 | |
2.00%, 2/24/42 (e) | | | | | | | 22 | | | | 12,201 | |
| | | | | | | | | | | | |
| | | | | | | | | | | | 251,913 | |
Indonesia — 1.2% | | | | | | | | | | | | |
Republic of Indonesia: | | | | | | | | | | | | |
2.88%, 7/08/21 | | | | | | | 200 | | | | 214,874 | |
3.38%, 7/30/25 | | | | | | | 100 | | | | 102,582 | |
| | | | | | | | | | | | |
| | | | | | | | | | | | 317,456 | |
Italy — 1.2% | | | | | | | | | | | | |
Italy Buoni Poliennali Del Tesoro: | | | | | | | | | | | | |
1.15%, 5/15/17 | | | | | | | 120 | | | | 132,001 | |
1.05%, 12/01/19 | | | | | | | 85 | | | | 94,988 | |
Italy Buoni Poliennali Del Tesoro Inflation Linked Bond, 2.15%, 11/12/17 | | | | | | | 90 | | | | 100,862 | |
| | | | | | | | | | | | |
| | | | | | | | | | | | 327,851 | |
Portugal — 4.4% | | | | | | | | | | | | |
Portugal Obrigacoes do Tesouro OT: | | | | | | | | | | | | |
3.85%, 4/15/21 | | | | | | | 33 | | | | 40,134 | |
5.65%, 2/15/24 | | | | | | | 8 | | | | 9,962 | |
2.88%, 10/15/25 | | | | | | | 4 | | | | 4,403 | |
2.88%, 7/21/26 | | | | | | | 75 | | | | 81,219 | |
3.88%, 2/15/30 | | | | | | | 314 | | | | 360,727 | |
4.10%, 2/15/45 | | | | | | | 620 | | | | 699,078 | |
| | | | | | | | | | | | |
| | | | | | | | | | | | 1,195,523 | |
Slovenia — 0.9% | | | | | | | | | | | | |
Republic of Slovenia, 5.85%, 5/10/23 | | | USD | | | | 200 | | | | 229,420 | |
Slovenia Government Bonds, 2.13%, 7/28/25 | | | EUR | | | | 21 | | | | 23,997 | |
| | | | | | | | | | | | |
| | | | | | | | | | | | 253,417 | |
South Africa — 1.4% | | | | | | | | | | | | |
South Africa Government Bonds: | | | | | | | | | | | | |
8.25%, 3/31/32 | | | ZAR | | | | 4,000 | | | | 222,985 | |
6.25%, 3/31/36 | | | | | | | 520 | | | | 22,789 | |
8.50%, 1/31/37 | | | | | | | 2,200 | | | | 122,165 | |
| | | | | | | | | | | | |
| | | | | | | | | | | | 367,939 | |
Spain — 0.5% | | | | | | | | | | | | |
Kingdom of Spain, 5.50%, 7/30/17 | | | EUR | | | | 105 | | | | 123,085 | |
Kingdom of Spain Inflation Linked Bond,
1.80%, 11/30/24 | | | | | | | 20 | | | | 23,694 | |
| | | | | | | | | | | | |
| | | | | | | | | | | | 146,779 | |
Turkey — 1.3% | | | | | | | | | | | | |
Republic of Turkey, 7.50%, 7/14/17 | | | USD | | | | 320 | | | | 342,429 | |
| | | | | | | | | | | | |
| Foreign Government Obligations | | | | | Par (000) | | | Value | |
United Kingdom — 0.3% | | | | | | | | | | | | |
United Kingdom Gilt Inflation Linked Bond, 2.50%, 7/26/16 | | | GBP | | | | 20 | | | $ | 91,501 | |
Total Foreign Government Obligations — 15.1% | | | | 4,106,075 | |
| | | | | | | | | | | | |
| Investment Companies | | | | | Shares | | | | |
ETFS 1X Daily Short WTI Crude Oil (a)(f) | | | | | | | 1,200 | | | | 144,288 | |
Financial Select Sector SPDR Fund (g) | | | | | | | 23,978 | | | | 520,562 | |
Lyxor ETF FTSE Athex 20 | | | | | | | 270,000 | | | | 215,572 | |
Source Physical Gold P-ETC (a)(f) | | | | | | | 2,500 | | | | 273,700 | |
Total Investment Companies — 4.3% | | | | | | | | | | | 1,154,122 | |
| | | | | | | | | | | | |
| U.S. Treasury Obligations | | | | | Par (000) | | | | |
U.S. Treasury Inflation Indexed Notes: | | | | | | | | | | | | |
0.25%, 1/15/25 | | | USD | | | | 1,603 | | | | 1,561,626 | |
0.38%, 7/15/25 | | | | | | | 1,601 | | | | 1,581,826 | |
U.S. Treasury Note, 0.63%, 12/31/16 | | | | | | | 790 | | | | 789,908 | |
Total U.S. Treasury Obligations — 14.5% | | | | | | | | | | | 3,933,360 | |
Total Long-Term Investments (Cost — $20,150,251) — 70.3% | | | | | | | | | | | 19,077,974 | |
| | | | | | | | | | | | |
| Short-Term Securities | | | | | Shares | | | | |
BlackRock Liquidity Funds, TempFund, Institutional Class, 0.32% (f)(h)(i) | | | 4,394,584 | | | | 4,394,584 | |
| | | | | | Beneficial
Interest (000) | | | | |
BlackRock Liquidity Series, LLC, Money Market Series, 0.51%, (h)(i)(j) | | | USD | | | | 508 | | | | 508,486 | |
Total Short-Term Securities (Cost — $4,903,070) — 18.1% | | | | 4,903,070 | |
| | | | | | | | | | | | |
| Options Purchased | | | | | | | | | |
(Cost — $485,054) — 1.5% | | | | | | | | | | | 415,862 | |
Total Investments Before Options Written (Cost — $25,538,375) — 89.9% | | | | | | | | | | | 24,396,906 | |
| | | | | | | | | | | | |
| Options Written | | | | | | | | | |
(Premiums Received — $446,614) — (1.9)% | | | | | | | | | | | (502,554 | ) |
Total Investments Net of Options Written
(Cost — $25,091,761) — 88.0% | | | | | | | | | | | 23,894,352 | |
Other Assets Less Liabilities — 12.0% | | | | | | | | | | | 3,255,072 | |
| | | | | | | | | | | | |
Net Assets — 100.0% | | | | | | | | | | $ | 27,149,424 | |
| | | | | | | | | | | | |
|
| Notes to Consolidated Schedule of Investments |
| (a) | Non-income producing security. |
| (b) | Variable rate security. Rate as of period end. |
| (c) | Security exempt from registration pursuant to Rule 144A under the Securities Act of 1933, as amended. These securities may be resold in transactions exempt from registration to qualified institutional investors. |
| (e) | Step-up bond that pays an initial coupon rate for the first period and then a higher coupon rate for the following periods. Rate as of period end. |
See Notes to Financial Statements.
| | | | | | |
| | | BLACKROCK FUNDS | | JANUARY 31, 2016 | | 61 |
| | | | |
| Consolidated Schedule of Investments (continued) | | | BlackRock Macro Themes Fund | |
| (f) | All or a portion of security is held by a wholly owned subsidiary. See Note 1 of the Notes to Financial Statements for details on the wholly owned subsidiary. |
| (g) | Security, or a portion of security, is on loan. |
| (h) | During the six months ended January 31, 2016, investments in issuers considered to be affiliates of the Fund for purposes of Section 2(a)(3) of the Investment Company Act of 1940, as amended, were as follows: |
| | | | | | | | | | | | | | | | | | | | | | | | | | | | |
| Affiliate | | Shares/Beneficial
Interest Held at July 31, 2015 | | | Shares/
Beneficial Interest
Purchased | | | Shares
Sold | | | Shares/Beneficial
Interest Held at January 31, 2016 | | | Value at
December 31,
2015 | | | Income | | | Realized
Gain | |
BlackRock Liquidity Funds, TempFund, Institutional Class | | | 8,688,635 | | | | — | | | | (4,294,051 | )1 | | | 4,394,584 | | | | $4,394,584 | | | | $5,193 | | | | $198 | |
BlackRock Liquidity Series, LLC, Money Market Series | | | — | | | | $508,4862 | | | | — | | | | $ 508,486 | | | | $ 508,486 | | | | $ 1073 | | | | — | |
iShares STOXX Europe 600 Real Estate UCITS ETF | | | — | | | | 21,000 | | | | (21,000 | ) | | | — | | | | — | | | | $3,156 | | | | — | |
| | 1 | | Represents net shares sold. |
| | 2 | | Represents net beneficial interest purchased. |
| | 3 | | Represents securities lending income earned from the reinvestment of cash collateral from loaned securities, net of fees, and other payments to and from borrowers of securities, and less the collateral investment expenses. |
| (i) | Current yield as of period end. |
| (j) | Security was purchased with the cash collateral from loaned securities. The Fund may withdraw up to 25% of its investment daily, although the manager of the BlackRock Liquidity Series, LLC, Money Market Series, in its sole discretion, may permit an investor to withdraw more than 25% on any one day. |
| • | | For Fund compliance purposes, the Fund’s industry classifications refer to any one or more of the industry sub-classifications used by one or more widely recognized market indexes or ratings group indexes, and/or as defined by the investment advisor. These definitions may not apply for purposes of this report, which may combine such industry sub-classifications for reporting ease. |
|
| Derivative Financial Instruments Outstanding as of Period End |
Financial Futures Contracts
| | | | | | | | | | | | | | | | |
Contracts
Long (Short) | | Issue | | Expiration | | Notional Value | | | Unrealized
Appreciation
(Depreciation) | |
| (217) | | BIST National-30 Index1 | | February 2016 | | | USD | | | | 666,102 | | | | $(20,894) | |
| (11) | | Hang Seng China Enterprises Index1 | | February 2016 | | | USD | | | | 585,919 | | | | (20,567 | ) |
| 12 | | Australian Government Bonds (10 Year)1 | | March 2016 | | | USD | | | | 8,204,698 | | | | 13,961 | |
| (1) | | Canadian Government Bonds (10 Year) | | March 2016 | | | USD | | | | 101,963 | | | | 434 | |
| (2) | | DAX Index1 | | March 2016 | | | USD | | | | 528,431 | | | | (7,816 | ) |
| (14) | | E-Mini S&P 500 Index1 | | March 2016 | | | USD | | | | 1,351,070 | | | | (31,079 | ) |
| (24) | | Euro STOXX 600 Automobiles & Parts Index1 | | March 2016 | | | USD | | | | 612,018 | | | | 68,675 | |
| (8) | | Euro STOXX 600 Food & Beverages Index1 | | March 2016 | | | USD | | | | 275,850 | | | | (3,199 | ) |
| 21 | | Euro STOXX 600 Large 200 Index1 | | March 2016 | | | USD | | | | 393,788 | | | | (14,143 | ) |
| (51) | | Euro STOXX 600 Oil & Gas Index1 | | March 2016 | | | USD | | | | 703,584 | | | | (44,540 | ) |
| (11) | | Euro STOXX 600 Personal & Household Goods Index1 | | March 2016 | | | USD | | | | 442,033 | | | | (935 | ) |
| 106 | | Euro STOXX 600 Real Estate Index1 | | March 2016 | | | USD | | | | 996,718 | | | | (32,959 | ) |
| (31) | | Euro STOXX 600 Small 200 Index1 | | March 2016 | | | USD | | | | 402,146 | | | | 21,989 | |
| 87 | | Euro STOXX Banks Index1 | | March 2016 | | | USD | | | | 497,622 | | | | (91,670 | ) |
| 30 | | Euro STOXX Healthcare Index1 | | March 2016 | | | USD | | | | 1,187,507 | | | | (42,150 | ) |
| (12) | | Euro-Bund1 | | March 2016 | | | USD | | | | 2,123,474 | | | | (53,503 | ) |
| (4) | | Euro-Schatz | | March 2016 | | | USD | | | | 484,558 | | | | (285 | ) |
| 5 | | FTSE 100 Index1 | | March 2016 | | | USD | | | | 427,971 | | | | 5,063 | |
| (15) | | FTSE 250 Index Futures1 | | March 2016 | | | USD | | | | 703,747 | | | | 1,637 | |
| 7 | | German Midcap Stock Index1 | | March 2016 | | | USD | | | | 735,443 | | | | (44,763 | ) |
| 1 | | Long Gilt British | | March 2016 | | | USD | | | | 171,445 | | | | 4,872 | |
| (12) | | Mini MSCI Emerging Markets Index1 | | March 2016 | | | USD | | | | 448,680 | | | | (16,657 | ) |
| (5) | | Mini-DAX Index1 | | March 2016 | | | USD | | | | 264,216 | | | | (513 | ) |
| (4) | | S&P/Toronto Stock Exchange 60 Index1 | | March 2016 | | | USD | | | | 429,895 | | | | 1,105 | |
| 2 | | TOPIX Index1 | | March 2016 | | | USD | | | | 237,724 | | | | (20,360 | ) |
| (12) | | U.S. Treasury Notes (10 Year) | | March 2016 | | | USD | | | | 1,554,937 | | | | (37,767 | ) |
| 5 | | U.S. Treasury Notes (2 Year) | | March 2016 | | | USD | | | | 1,093,125 | | | | 5,463 | |
| 5 | | U.S. Treasury Notes (5 Year) | | March 2016 | | | USD | | | | 603,359 | | | | 10,384 | |
| 1 | | U.S. Ultra Treasury Bonds | | March 2016 | | | USD | | | | 166,188 | | | | 8,358 | |
| 4 | | Canadian Bankers Acceptance | | December 2016 | | | USD | | | | 709,258 | | | | 993 | |
See Notes to Financial Statements.
| | | | | | |
| 62 | | BLACKROCK FUNDS | | JANUARY 31, 2016 | | |
| | | | |
| Consolidated Schedule of Investments (continued) | | | BlackRock Macro Themes Fund | |
| | | | | | | | | | | | | | | | |
Contracts
Long (Short) | | Issue | | Expiration | | Notional Value | | | Unrealized
Appreciation
(Depreciation) | |
| (12) | | Three Month Sterling | | December 2016 | | | USD | | | | 2,124,964 | | | | $ (12,712 | ) |
Total | | | | | | | | | | | | | | | $(353,578 | ) |
| | | | | | | | | | | | | | | | |
| | 1 | | All or a portion of security is held by a wholly owned subsidiary. See Note 1 of the Notes to Financial Statements for details on the wholly owned subsidiary. |
|
| |
| Forward Foreign Currency Exchange Contracts |
| | | | | | | | | | | | | | | | | | | | |
Currency
Purchased | | | Currency
Sold | | | Counterparty | | Settlement
Date | | | Unrealized
Appreciation
(Depreciation) | |
| AUD | | | 195,000 | | | USD | | | 137,929 | | | Westpac Banking Corp. | | | 2/03/16 | | | | $ 605 | |
| CAD | | | 747,000 | | | USD | | | 530,823 | | | JPMorgan Chase Bank N.A. | | | 2/03/16 | | | | 5,391 | |
| DKK | | | 750,054 | | | USD | | | 108,756 | | | JPMorgan Chase Bank N.A. | | | 2/03/16 | | | | 722 | |
| DKK | | | 60,000 | | | USD | | | 8,764 | | | UBS AG | | | 2/03/16 | | | | (53 | ) |
| EUR | | | 4,055,000 | | | USD | | | 4,387,831 | | | Deutsche Bank AG | | | 2/03/16 | | | | 29,294 | |
| EUR | | | 260,000 | | | USD | | | 283,688 | | | Goldman Sachs International | | | 2/03/16 | | | | (1,999 | ) |
| EUR | | | 20,000 | | | USD | | | 21,810 | | | Goldman Sachs International | | | 2/03/16 | | | | (142 | ) |
| GBP | | | 332,000 | | | USD | | | 471,008 | | | Barclays Bank PLC | | | 2/03/16 | | | | 8,366 | |
| USD | | | 141,669 | | | AUD | | | 195,000 | | | Westpac Banking Corp. | | | 2/03/16 | | | | 3,690 | |
| USD | | | 439,226 | | | CAD | | | 640,000 | | | Goldman Sachs International | | | 2/03/16 | | | | (17,623 | ) |
| USD | | | 77,030 | | | CAD | | | 107,000 | | | UBS AG | | | 2/03/16 | | | | 650 | |
| USD | | | 117,997 | | | DKK | | | 810,054 | | | Deutsche Bank AG | | | 2/03/16 | | | | 396 | |
| USD | | | 2,353,420 | | | EUR | | | 2,165,000 | | | Goldman Sachs International | | | 2/03/16 | | | | 7,819 | |
| USD | | | 2,358,857 | | | EUR | | | 2,170,000 | | | UBS AG | | | 2/03/16 | | | | 7,840 | |
| USD | | | 243,218 | | | GBP | | | 165,000 | | | Barclays Bank PLC | | | 2/03/16 | | | | 8,107 | |
| USD | | | 246,165 | | | GBP | | | 167,000 | | | HSBC Bank PLC | | | 2/03/16 | | | | 8,204 | |
| USD | | | 23,753 | | | ZAR | | | 370,000 | | | HSBC Bank PLC | | | 2/03/16 | | | | 482 | |
| ZAR | | | 370,000 | | | USD | | | 23,266 | | | JPMorgan Chase Bank N.A. | | | 2/03/16 | | | | (57 | ) |
| EUR | | | 20,000 | | | USD | | | 21,928 | | | Bank of America N.A. | | | 2/16/16 | | | | (253 | ) |
| EUR | | | 7,225 | | | USD | | | 7,919 | | | Bank of America N.A. | | | 2/16/16 | | | | (89 | ) |
| EUR | | | 10,000 | | | USD | | | 10,792 | | | Barclays Bank PLC | | | 2/16/16 | | | | 46 | |
| EUR | | | 30,000 | | | USD | | | 31,853 | | | Barclays Bank PLC | | | 2/16/16 | | | | 659 | |
| EUR | | | 55,000 | | | USD | | | 60,184 | | | JPMorgan Chase Bank N.A. | | | 2/16/16 | | | | (578 | ) |
| EUR | | | 20,000 | | | USD | | | 21,930 | | | JPMorgan Chase Bank N.A. | | | 2/16/16 | | | | (255 | ) |
| EUR | | | 20,000 | | | USD | | | 21,728 | | | JPMorgan Chase Bank N.A. | | | 2/16/16 | | | | (53 | ) |
| EUR | | | 27,500 | | | USD | | | 30,057 | | | UBS AG | | | 2/16/16 | | | | (254 | ) |
| GBP | | | 20,000 | | | USD | | | 28,731 | | | Deutsche Bank AG | | | 2/16/16 | | | | (232 | ) |
| GBP | | | 20,000 | | | USD | | | 28,542 | | | HSBC Bank PLC | | | 2/16/16 | | | | (43 | ) |
| GBP | | | 25,000 | | | USD | | | 35,485 | | | HSBC Bank PLC | | | 2/16/16 | | | | 138 | |
| GBP | | | 20,000 | | | USD | | | 28,410 | | | JPMorgan Chase Bank N.A. | | | 2/16/16 | | | | 88 | |
| GBP | | | 20,000 | | | USD | | | 28,223 | | | JPMorgan Chase Bank N.A. | | | 2/16/16 | | | | 276 | |
| GBP | | | 40,000 | | | USD | | | 57,846 | | | UBS AG | | | 2/16/16 | | | | (849 | ) |
| INR | | | 1,795,000 | | | USD | | | 26,771 | | | HSBC Bank PLC | | | 2/16/16 | | | | (404 | ) |
| INR | | | 1,700,000 | | | USD | | | 25,298 | | | HSBC Bank PLC | | | 2/16/16 | | | | (326 | ) |
| INR | | | 1,790,000 | | | USD | | | 26,707 | | | UBS AG | | | 2/16/16 | | | | (414 | ) |
| MXN | | | 1,300,000 | | | USD | | | 76,957 | | | Deutsche Bank AG | | | 2/16/16 | | | | (5,369 | ) |
| NOK | | | 328,500 | | | USD | | | 38,118 | | | UBS AG | | | 2/16/16 | | | | (286 | ) |
| PHP | | | 1,150,000 | | | USD | | | 24,344 | | | HSBC Bank PLC | | | 2/16/16 | | | | (233 | ) |
| PHP | | | 690,000 | | | USD | | | 14,600 | | | JPMorgan Chase Bank N.A. | | | 2/16/16 | | | | (134 | ) |
| PHP | | | 460,000 | | | USD | | | 9,742 | | | JPMorgan Chase Bank N.A. | | | 2/16/16 | | | | (97 | ) |
| SEK | | | 500,000 | | | USD | | | 57,847 | | | Deutsche Bank AG | | | 2/16/16 | | | | 432 | |
See Notes to Financial Statements.
| | | | | | |
| | | BLACKROCK FUNDS | | JANUARY 31, 2016 | | 63 |
| | | | |
| Consolidated Schedule of Investments (continued) | | | BlackRock Macro Themes Fund | |
| | | | | | | | | | | | | | | | | | | | |
Currency
Purchased | | | Currency
Sold | | | Counterparty | | Settlement
Date | | | Unrealized
Appreciation
(Depreciation) | |
| SEK | | | 500,000 | | | USD | | | 58,847 | | | JPMorgan Chase Bank N.A. | | | 2/16/16 | | | | $ (569 | ) |
| USD | | | 104,528 | | | EUR | | | 97,500 | | | Deutsche Bank AG | | | 2/16/16 | | | | (1,137 | ) |
| USD | | | 32,674 | | | EUR | | | 30,000 | | | Deutsche Bank AG | | | 2/16/16 | | | | 162 | |
| USD | | | 27,305 | | | EUR | | | 25,000 | | | Deutsche Bank AG | | | 2/16/16 | | | | 211 | |
| USD | | | 32,576 | | | EUR | | | 30,000 | | | HSBC Bank PLC | | | 2/16/16 | | | | 64 | |
| USD | | | 27,185 | | | EUR | | | 25,000 | | | HSBC Bank PLC | | | 2/16/16 | | | | 91 | |
| USD | | | 32,432 | | | EUR | | | 30,000 | | | JPMorgan Chase Bank N.A. | | | 2/16/16 | | | | (81 | ) |
| USD | | | 65,019 | | | EUR | | | 60,000 | | | JPMorgan Chase Bank N.A. | | | 2/16/16 | | | | (5 | ) |
| USD | | | 32,704 | | | EUR | | | 30,000 | | | JPMorgan Chase Bank N.A. | | | 2/16/16 | | | | 192 | |
| USD | | | 65,126 | | | EUR | | | 60,000 | | | UBS AG | | | 2/16/16 | | | | 102 | |
| USD | | | 21,227 | | | GBP | | | 15,000 | | | Bank of America N.A. | | | 2/16/16 | | | | (147 | ) |
| USD | | | 6,794 | | | GBP | | | 4,800 | | | Bank of America N.A. | | | 2/16/16 | | | | (45 | ) |
| USD | | | 28,353 | | | GBP | | | 20,000 | | | UBS AG | | | 2/16/16 | | | | (146 | ) |
| USD | | | 40,667 | | | JPY | | | 5,000,000 | | | Barclays Bank PLC | | | 2/16/16 | | | | (646 | ) |
| USD | | | 10,184 | | | MXN | | | 190,000 | | | JPMorgan Chase Bank N.A. | | | 2/16/16 | | | | (279 | ) |
| USD | | | 16,923 | | | MXN | | | 300,000 | | | JPMorgan Chase Bank N.A. | | | 2/16/16 | | | | 403 | |
| USD | | | 13,667 | | | MXN | | | 250,000 | | | Morgan Stanley & Co. International PLC | | | 2/16/16 | | | | (100 | ) |
| USD | | | 22,956 | | | NOK | | | 200,000 | | | JPMorgan Chase Bank N.A. | | | 2/16/16 | | | | (77 | ) |
| USD | | | 14,732 | | | NOK | | | 128,500 | | | JPMorgan Chase Bank N.A. | | | 2/16/16 | | | | (66 | ) |
| USD | | | 59,446 | | | SEK | | | 500,000 | | | JPMorgan Chase Bank N.A. | | | 2/16/16 | | | | 1,168 | |
| USD | | | 48,753 | | | SGD | | | 70,000 | | | HSBC Bank PLC | | | 2/16/16 | | | | (367 | ) |
| USD | | | 9,505 | | | ZAR | | | 160,000 | | | Deutsche Bank AG | | | 2/16/16 | | | | (534 | ) |
| USD | | | 21,345 | | | ZAR | | | 325,000 | | | JPMorgan Chase Bank N.A. | | | 2/16/16 | | | | 953 | |
| ZAR | | | 100,000 | | | USD | | | 6,874 | | | Deutsche Bank AG | | | 2/16/16 | | | | (600 | ) |
| ZAR | | | 1,205,000 | | | USD | | | 83,430 | | | JPMorgan Chase Bank N.A. | | | 2/16/16 | | | | (7,824 | ) |
| USD | | | 137,734 | | | AUD | | | 195,000 | | | Westpac Banking Corp. | | | 3/03/16 | | | | (616 | ) |
| USD | | | 530,810 | | | CAD | | | 747,000 | | | JPMorgan Chase Bank N.A. | | | 3/03/16 | | | | (5,395 | ) |
| USD | | | 35,829 | | | DKK | | | 250,000 | | | Goldman Sachs International | | | 3/03/16 | | | | (494 | ) |
| USD | | | 108,838 | | | DKK | | | 750,054 | | | JPMorgan Chase Bank N.A. | | | 3/03/16 | | | | (726 | ) |
| USD | | | 4,390,762 | | | EUR | | | 4,055,000 | | | Deutsche Bank AG | | | 3/03/16 | | | | (29,332 | ) |
| USD | | | 471,030 | | | GBP | | | 332,000 | | | Barclays Bank PLC | | | 3/03/16 | | | | (8,355 | ) |
| USD | | | 23,137 | | | ZAR | | | 370,000 | | | JPMorgan Chase Bank N.A. | | | 3/03/16 | | | | 50 | |
| EUR | | | 155,000 | | | CHF | | | 170,846 | | | Barclays Bank PLC | | | 4/07/16 | | | | 943 | |
| EUR | | | 155,000 | | | JPY | | | 19,925,808 | | | JPMorgan Chase Bank N.A. | | | 4/07/16 | | | | 3,337 | |
| EUR | | | 250,000 | | | PLN | | | 1,117,268 | | | JPMorgan Chase Bank N.A. | | | 4/07/16 | | | | (2,185 | ) |
| EUR | | | 1,250,000 | | | USD | | | 1,356,776 | | | JPMorgan Chase Bank N.A. | | | 4/07/16 | | | | (73 | ) |
| GBP | | | 400,000 | | | EUR | | | 525,043 | | | JPMorgan Chase Bank N.A. | | | 4/07/16 | | | | 187 | |
| JPY | | | 64,890,650 | | | USD | | | 550,000 | | | Barclays Bank PLC | | | 4/07/16 | | | | (13,003 | ) |
| MXN | | | 5,379,363 | | | USD | | | 290,000 | | | JPMorgan Chase Bank N.A. | | | 4/07/16 | | | | 5,144 | |
| PHP | | | 42,116,700 | | | USD | | | 870,000 | | | HSBC Bank PLC | | | 4/07/16 | | | | 10,536 | |
| PLN | | | 1,127,285 | | | EUR | | | 250,000 | | | JPMorgan Chase Bank N.A. | | | 4/07/16 | | | | 4,637 | |
| USD | | | 720,000 | | | BRL | | | 3,024,360 | | | Citibank N.A. | | | 4/07/16 | | | | (20,090 | ) |
| USD | | | 355,000 | | | CHF | | | 359,171 | | | Barclays Bank PLC | | | 4/07/16 | | | | 3,309 | |
| USD | | | 870,000 | | | CHF | | | 880,223 | | | Barclays Bank PLC | | | 4/07/16 | | | | 8,108 | |
| USD | | | 275,000 | | | CNH | | | 1,835,075 | | | JPMorgan Chase Bank N.A. | | | 4/07/16 | | | | (120 | ) |
| USD | | | 820,296 | | | EUR | | | 750,000 | | | JPMorgan Chase Bank N.A. | | | 4/07/16 | | | | 6,274 | |
| USD | | | 1,852,269 | | | EUR | | | 1,700,000 | | | JPMorgan Chase Bank N.A. | | | 4/07/16 | | | | 7,153 | |
| USD | | | 2,000,000 | | | GBP | | | 1,399,747 | | | Barclays Bank PLC | | | 4/07/16 | | | | 5,190 | |
See Notes to Financial Statements.
| | | | | | |
| 64 | | BLACKROCK FUNDS | | JANUARY 31, 2016 | | |
| | | | |
| Consolidated Schedule of Investments (continued) | | | BlackRock Macro Themes Fund | |
| | | | | | | | | | | | | | | | | | | | |
Currency
Purchased | | | Currency
Sold | | | Counterparty | | Settlement
Date | | | Unrealized
Appreciation
(Depreciation) | |
| USD | | | 813,000 | | | KRW | | | 975,071,550 | | | Morgan Stanley & Co. International PLC | | | 4/07/16 | | | $ | 1,066 | |
| USD | | | 815,000 | | | SGD | | | 1,164,391 | | | JPMorgan Chase Bank N.A. | | | 4/07/16 | | | | (1,086 | ) |
| USD | | | 290,000 | | | TRY | | | 886,721 | | | JPMorgan Chase Bank N.A. | | | 4/07/16 | | | | (4,243 | ) |
| USD | | | 135,000 | | | TRY | | | 414,632 | | | JPMorgan Chase Bank N.A. | | | 4/07/16 | | | | (2,588 | ) |
| USD | | | 590,000 | | | TWD | | | 19,815,150 | | | HSBC Bank PLC | | | 4/07/16 | | | | (4,632 | ) |
| USD | | | 90,000 | | | TWD | | | 3,015,000 | | | HSBC Bank PLC | | | 4/07/16 | | | | (477 | ) |
| USD | | | 289,403 | | | ZAR | | | 4,809,100 | | | Barclays Bank PLC | | | 4/07/16 | | | | (9,268 | ) |
| USD | | | 214,077 | | | DKK | | | 1,500,000 | | | Commonwealth Bank of Australia | | | 5/13/16 | | | | (4,377 | ) |
| CNH | | | 4,588,920 | | | USD | | | 720,000 | | | Goldman Sachs International | | | 7/08/16 | | | | (39,351 | ) |
| USD | | | 720,000 | | | CNH | | | 4,598,280 | | | JPMorgan Chase Bank N.A. | | | 7/08/16 | | | | 37,963 | |
| Total | | | | | | | | | | | | | | | | | | $ | (8,329 | ) |
| | | | | | | | | | | | | | | | | | | | |
|
| |
| Exchange-Traded Options Purchased |
| | | | | | | | | | | | | | | | | | | | | | | | | | | | | | |
| Description1 | | Put/ Call | | Expiration Date | | Strike Price | | Contracts | | Value |
S&P 500 Index | | | | Call | | | | | 2/19/16 | | | | | USD | | | | | 2,150.00 | | | | | 14 | | | | $ | 140 | |
Nikkei 225 Index | | | | Call | | | | | 3/11/16 | | | | | JPY | | | | | 18,000.00 | | | | | 5 | | | | | 21,476 | |
FTSE MIB Index | | | | Call | | | | | 3/18/16 | | | | | EUR | | | | | 23,000.00 | | | | | 15 | | | | | 487 | |
NASDAQ 100 Index | | | | Call | | | | | 3/18/16 | | | | | USD | | | | | 4,400.00 | | | | | 6 | | | | | 41,730 | |
EURO STOXX 50 Index | | | | Call | | | | | 6/17/16 | | | | | EUR | | | | | 2,925.00 | | | | | 84 | | | | | 180,174 | |
S&P 500 Index | | | | Call | | | | | 6/17/16 | | | | | USD | | | | | 2,075.00 | | | | | 15 | | | | | 31,050 | |
EURO STOXX 50 Index | | | | Call | | | | | 12/15/17 | | | | | EUR | | | | | 4,000.00 | | | | | 11 | | | | | 4,469 | |
FTSE 100 Index | | | | Put | | | | | 3/18/16 | | | | | GBP | | | | | 6,000.00 | | | | | 10 | | | | | 25,292 | |
S&P 500 Index | | | | Put | | | | | 3/18/16 | | | | | USD | | | | | 1,950.00 | | | | | 6 | | | | | 36,750 | |
Euro Dollar 3-Month Future | | | | Put | | | | | 4/15/16 | | | | | USD | | | | | 98.75 | | | | | 136 | | | | | 13,600 | |
Total | | | | | | | | | | | | | | | | | | | | | | | | | | | | $ | 355,168 | |
| | | | | | | | | | | | | | | | | | | | | | | | | | | | | | |
1 All or a portion of security is held by a wholly owned subsidiary. See Note 1 of the Notes to Financial Statements for details on the wholly owned subsidiary. | |
| | | | | | | | | | | | | | | | | | | | | | | | | | | | |
| OTC Options Purchased | | | | | | | | | | | | | | | | | | | | | | | | | |
| Description1 | | Put/
Call | | | Counterparty | | | | Expiration Date | | | | Strike Price(s) | | | Notional Amount (000) | | | Contracts | | Value |
USD Currency | | | Call | | | Bank of America N.A. | | | | 3/09/16 | | | | CNH | | | 6.60 | | | USD | | | 315 | | | — | | $ 4,086 |
USD Currency | | | Call | | | Citibank N.A. | | | | 3/09/16 | | | | CNH | | | 6.60 | | | USD | | | 580 | | | — | | 7,524 |
USD Currency | | | Call | | | HSBC Bank PLC | | | | 3/09/16 | | | | CNH | | | 6.60 | | | USD | | | 265 | | | — | | 3,438 |
SPDR Gold Shares (U.S.) | | | Call | | | Citibank N.A. | | | | 3/18/16 | | | | USD | | | 108.00 | | | | | | — | | | 11,000 | | 21,175 |
USD Currency | | | Call | | | Bank of America N.A. | | | | 4/19/16 | | | | JPY | | | 121.00 | | | USD | | | 1,375 | | | — | | 24,308 |
WOP:SPX/CMS2 | | | Put | | | Bank of America N.A. | | | | 3/18/16 | | | | USD | | | 2,050/2.34 | | | USD | | | 1,200 | | | — | | 163 |
Total | | | | | | | | | | | | | | | | | | | | | | | | | | | | $ 60,694 |
| | | | | | | | | | | | | | | | | | | | | | | | | | | | |
1 All or a portion of security is held by a wholly owned subsidiary. See Note 1 of the Notes to Financial Statements for details on the wholly owned subsidiary. |
2 Composed of two or more options. Only the worst performing (least performing) option can be exercised at expiration. |
|
| |
| Exchange-Traded Options Written |
| | | | | | | | | | | | | | | | | | | | |
| Description1 | | Put/ Call | | | Expiration Date | | Strike Price | | | Contracts | | | Value | |
Nikkei 225 Index | | | Call | | | 3/11/16 | | JPY | | | 18,750.00 | | | | 10 | | | | $(18,998 | ) |
EURO STOXX 50 Index | | | Call | | | 3/18/16 | | EUR | | | 3,400.00 | | | | 25 | | | | (1,787 | ) |
NASDAQ 100 Index | | | Call | | | 3/18/16 | | USD | | | 4,600.00 | | | | 6 | | | | (9,120 | ) |
EURO STOXX 50 Index | | | Call | | | 6/17/16 | | EUR | | | 3,200.00 | | | | 84 | | | | (67,247 | ) |
S&P 500 Index | | | Call | | | 6/17/16 | | USD | | | 1,875.00 | | | | 15 | | | | (180,000 | ) |
EURO STOXX Utilities Index | | | Put | | | 3/18/16 | | EUR | | | 250.00 | | | | 36 | | | | (8,970 | ) |
FTSE 100 Index | | | Put | | | 3/18/16 | | GBP | | | 5,700.00 | | | | 20 | | | | (25,363 | ) |
See Notes to Financial Statements.
| | | | | | |
| | | BLACKROCK FUNDS | | JANUARY 31, 2016 | | 65 |
| | | | |
| Consolidated Schedule of Investments (continued) | | | BlackRock Macro Themes Fund | |
| | | | | | | | | | | | | | | | | | | | |
| Description1 | | Put/
Call | | | Expiration
Date | | Strike Price | | | Contracts | | Value | |
FTSE MIB Index | | | Put | | | 3/18/16 | | | EUR | | | | 21,000.00 | | | 15 | | $ | (100,340 | ) |
S&P 500 Index | | | Put | | | 3/18/16 | | | USD | | | | 1,875.00 | | | 6 | | | (20,400 | ) |
EURO STOXX 50 Index | | | Put | | | 6/17/16 | | | EUR | | | | 2,975.00 | | | 16 | | | (33,088 | ) |
Total | | | | | | | | | | | | | | | | | | $ | (465,313 | ) |
| | | | | | | | | | | | | | | | | | | | |
| | 1 | | All or a portion of security is held by a wholly owned subsidiary. See Note 1 of the Notes to Financial Statements for details on the wholly owned subsidiary. |
OTC Options Written
| | | | | | | | | | | | | | | | | | | | | | | | | | | | |
| Description1 | | Put/
Call | | | Counterparty | | Expiration
Date | | Strike
Price | | | Notional
Amount
(000) | | | Contracts | | | Value | |
USD Currency | | | Call | | | Bank of America N.A. | | 3/09/16 | | CNH | 7.00 | | | | USD | | | | 315 | | | | — | | | $ | (600 | ) |
USD Currency | | | Call | | | Citibank N.A. | | 3/09/16 | | CNH | 7.00 | | | | USD | | | | 580 | | | | — | | | | (1,106 | ) |
USD Currency | | | Call | | | HSBC Bank PLC | | 3/09/16 | | CNH | 7.00 | | | | USD | | | | 265 | | | | — | | | | (505 | ) |
SPDR Gold Shares (U.S.) | | | Call | | | Citibank N.A. | | 3/18/16 | | USD | 103.00 | | | | | | | | — | | | | 5,500 | | | | (26,538 | ) |
USD Currency | | | Call | | | Bank of America N.A. | | 4/19/16 | | JPY | 125.00 | | | | USD | | | | 1,375 | | | | — | | | | (8,492 | ) |
Total | | | | | | | | | | | | | | | | | | | | | | | | | | $ | (37,241 | ) |
| | | | | | | | | | | | | | | | | | | | | | | | | | | | |
| | 1 | | All or a portion of security is held by a wholly owned subsidiary. See Note 1 of the Notes to Financial Statements for details on the wholly owned subsidiary. |
Centrally Cleared Interest Rate Swaps
| | | | | | | | | | | | | | | | | | | | | | |
Fixed Rate | | | | | Floating Rate | | Effective
Date | | Expiration
Date | | Notional
Amount (000) | | | Unrealized Depreciation | |
| | 0.99%1 | | | | | 6-Month JPY LIBOR | | N/A | | 1/19/36 | | | JPY | | | | 4,000 | | | $ | (850 | ) |
| | 0.97%1 | | | | | 6-Month JPY LIBOR | | N/A | | 1/21/36 | | | JPY | | | | 4,000 | | | | (751 | ) |
| | 0.85%2 | | | | | 6-Month JPY LIBOR | | 2/02/163 | | 2/02/36 | | | JPY | | | | 7,985 | | | | (59 | ) |
| | Total | | | | | | | | | | | | | | | | | | | $ | (1,660 | ) |
| | | | | | | | | | | | | | | | | | | | | | |
| | 1 | | Fund pays the fixed rate and receives the floating rate. |
| | 2 | | Fund pays the floating rate and receives the fixed rate. |
OTC Credit Default Swaps — Buy Protection
| | | | | | | | | | | | | | | | | | | | | | | | | | | | |
| Issuer | | Pay
Fixed
Rate | | | Counterparty | | Expiration
Date | | Notional
Amount
(000) | | | Value | | | Premiums
Paid | | | Unrealized
Appreciation | |
Emirate of Abu Dhabi | | | 1.00 | % | | Barclays Bank PLC | | 12/20/20 | | | USD | | | | 6 | | | $ | 77 | | | $ | 9 | | | $ | 68 | |
Emirate of Abu Dhabi | | | 1.00 | % | | Barclays Bank PLC | | 12/20/20 | | | USD | | | | 5 | | | | 61 | | | | 26 | | | | 35 | |
Total | | | | | | | | | | | | | | | | | | $ | 138 | | | $ | 35 | | | $ | 103 | |
| | | | | | | | | | | | | | | | | | | | |
OTC Credit Default Swaps — Sell Protection
| | | | | | | | | | | | | | | | | | | | | | | | | | | | |
| Issuer | | Receive
Fixed
Rate | | | Counterparty | | Expiration
Date | | Credit
Rating1 | | | Notional
Amount
(000)2 | | | Value | | | Premiums
Received | | | Unrealized
Depreciation | |
Glencore International AG | | | 1.00 | % | | Barclays Bank PLC | | 9/20/20 | | | BBB | | | | EUR 30,000 | | | | $ | (8,675) | | | $ | (2,696) | | | $ | (5,979) |
| | 1 | | Using S&P’s rating of the issuer or the underlying securities of the index, as applicable. |
| | 2 | | The maximum potential amount the Fund may pay should a negative credit event take place as defined under the terms of the agreement. |
See Notes to Financial Statements.
| | | | | | |
| 66 | | BLACKROCK FUNDS | | JANUARY 31, 2016 | | |
| | | | |
| Consolidated Schedule of Investments (continued) | | | BlackRock Macro Themes Fund | |
OTC Interest Rate Swaps
| | | | | | | | | | | | | | | | | | | | | | | | |
Fixed Rate | | Floating Rate | | Counterparty | | Expiration
Date | | Notional Amount (000) | | | Value | | | Premiums
Paid
(Received) | | | Unrealized
Appreciation
(Depreciation) | |
1.89%1 | | 6-Month BUBOR | | Citibank N.A. | | 6/26/18 | | HUF | | | 17,100 | | | $ | (1,524 | ) | | | — | | | $ | (1,524 | ) |
1.91%1 | | 6-Month BUBOR | | Citibank N.A. | | 6/26/18 | | HUF | | | 17,100 | | | | (1,549 | ) | | | — | | | | (1,549 | ) |
1.86%1 | | 6-Month BUBOR | | Citibank N.A. | | 7/27/18 | | HUF | | | 4,070 | | | | (345 | ) | | | — | | | | (345 | ) |
1.83%1 | | 6-Month BUBOR | | Goldman Sachs International | | 7/27/18 | | HUF | | | 19,240 | | | | (1,583 | ) | | | — | | | | (1,583 | ) |
6.79%2,3 | | 1-day MIBOR | | Citibank N.A. | | 11/16/20 | | INR | | | 5,220 | | | | 993 | | | | — | | | | 993 | |
6.77%2,3 | | 1-day MIBOR | | Citibank N.A. | | 11/16/20 | | INR | | | 4,760 | | | | 846 | | | | — | | | | 846 | |
6.79%2,3 | | 1-day MIBOR | | JPMorgan Chase Bank N.A. | | 11/16/20 | | INR | | | 8,175 | | | | 1,530 | | | | — | | | | 1,530 | |
6.76%2,3 | | 1-day MIBOR | | JPMorgan Chase Bank N.A. | | 11/16/20 | | INR | | | 6,800 | | | | 1,144 | | | | — | | | | 1,144 | |
6.70%2,3 | | 1-day MIBOR | | Bank of America N.A. | | 11/17/20 | | INR | | | 5,800 | | | | 742 | | | | — | | | | 742 | |
6.68%2,3 | | 1-day MIBOR | | Goldman Sachs International | | 11/17/20 | | INR | | | 4,530 | | | | 551 | | | | — | | | | 551 | |
6.70%2,3 | | 1-day MIBOR | | Goldman Sachs International | | 11/17/20 | | INR | | | 3,405 | | | | 462 | | | | — | | | | 462 | |
Total | | | | | | | | | | | | | | $ | 1,267 | | | | — | | | $ | 1,267 | |
| | | | | | | | | | | | | | | | |
| | 1 | | Fund pays the fixed rate and receives the floating rate. |
| | 2 | | All or a portion of security is held by a wholly owned subsidiary. See Note 1 of the Notes to Financial Statements for details on the wholly owned subsidiary. |
| | 3 | | Fund pays the floating rate and receives the fixed rate. |
OTC Total Return Swaps
| | | | | | | | | | | | | | | | | | | | | | | | |
| Reference Entity1 | | Fixed Notional Amount/ Fixed Rate/ Floating Rate | | Counterparty | | Expiration
Date | | | Contract Amount/
Notional Amount (000) | | | Value | | | Premiums
Paid (Received) | | | Unrealized
Appreciation
(Depreciation) | |
JPEBEUOB Performance Shell Index7 | | 3-month LIBOR plus 0.39%2 | | JPMorgan Chase Bank N.A. | | | 2/01/16 | | | | 7,200 | 3 | | $ | (72,578 | ) | | | — | | | $ | (72,578 | ) |
JPEBRUOB Index7 | | 3-month LIBOR plus 0.43%2 | | JPMorgan Chase Bank N.A. | | | 2/01/16 | | | | 1,460 | 3 | | | (10,889 | ) | | | — | | | | (10,889 | ) |
JPEBRUOB Index7 | | 3-month LIBOR plus 0.43%2 | | JPMorgan Chase Bank N.A. | | | 2/01/16 | | | | 1,194 | 3 | | | (13,894 | ) | | | — | | | | (13,894 | ) |
Long Gilt British Future | | GBP 35,316,1804 | | Bank of America N.A. | | | 2/24/16 | | | | 3 | 3 | | | (11,112 | ) | | | — | | | | (11,112 | ) |
Long Gilt British Future | | GBP 35,131,4404 | | Bank of America N.A. | | | 2/24/16 | | | | 3 | 3 | | | (13,744 | ) | | | — | | | | (13,744 | ) |
U.S. Treasury Notes (10 Year) Future | | USD 454,413,6004 | | Bank of America N.A. | | | 2/25/16 | | | | 36 | 3 | | | (120,676 | ) | | | — | | | | (120,676 | ) |
U.S. Ultra Treasury Bonds Future | | USD 142,364,8804 | | Bank of America N.A. | | | 2/25/16 | | | | 3 | 3 | | | 24,013 | | | | — | | | | 24,013 | |
Merrill Lynch Commodity Volatility Carry Index7 | | 3-month T-Bill Auction Average Discount2 | | Bank of America N.A. | | | 3/16/16 | | | | 1,370 | 3 | | | (9,470 | ) | | | — | | | | (9,470 | ) |
Merrill Lynch Commodity Volatility Carry Index7 | | 3-month T-Bill Auction Average Discount2 | | Bank of America N.A. | | | 3/16/16 | | | | 1,370 | 3 | | | (10,685 | ) | | | — | | | | (10,685 | ) |
U.S. Treasury Notes (10 Year) Future | | USD 64,397,9504 | | Bank of America N.A. | | | 3/21/16 | | | | 5 | 3 | | | (3,911 | ) | | | — | | | | (3,911 | ) |
Dow Jones U.S. Select Home Builders Total Return Index | | 3-month LIBOR plus 0.50%5 | | Bank of America N.A. | | | 3/23/16 | | | | 80 | 3 | | | (54,008 | ) | | | — | | | | (54,008 | ) |
Dow Jones U.S. Select Home Builders Total Return Index | | 3-month LIBOR plus 0.35%5 | | Bank of America N.A. | | | 3/23/16 | | | | 19 | 3 | | | (12,811 | ) | | | — | | | | (12,811 | ) |
Dow Jones U.S. Select Home Builders Total Return Index | | 3-month LIBOR plus 0.55%5 | | Bank of America N.A. | | | 3/23/16 | | | | 19 | 3 | | | (12,832 | ) | | | — | | | | (12,832 | ) |
Goldman Sachs Volatility Carry Basket Index7 | | USD 200,0004 | | Goldman Sachs International | | | 4/07/16 | | | USD | 200 | | | | (11,181 | ) | | | — | | | | (11,181 | ) |
See Notes to Financial Statements.
| | | | | | |
| | | BLACKROCK FUNDS | | JANUARY 31, 2016 | | 67 |
| | | | |
| Consolidated Schedule of Investments (continued) | | | BlackRock Macro Themes Fund | |
| | | | | | | | | | | | | | | | | | | | | | | | |
| Reference Entity1 | | Fixed Notional Amount/ Fixed Rate/ Floating Rate | | Counterparty | | Expiration
Date | | | Contract Amount/
Notional Amount (000) | | | Value | | | Premiums
Paid (Received) | | | Unrealized
Appreciation
(Depreciation) | |
Goldman Sachs Volatility Carry Basket Index7 | | USD 200,0004 | | Goldman Sachs International | | | 4/07/16 | | | USD | 200 | | | $ | (11,918 | ) | | | — | | | $ | (11,918 | ) |
DB V2V Index7 | | USD 900,5174 | | Deutsche Bank AG | | | 7/15/16 | | | | 650 | 3 | | | (4,836 | ) | | | — | | | | (4,836 | ) |
JPM European Periphery Basket7 | | 3-month EURIBOR plus 0.35%2 | | JPMorgan Chase Bank N.A. | | | 8/11/16 | | | | 11,676 | 3 | | | (203,394 | ) | | | — | | | | (203,394 | ) |
Citi Emerging Lifestyle Trends Series 3 Basket Index7 | | 6-month LIBOR plus 0.22%2 | | Citibank N.A. | | | 9/02/16 | | | | 1,025 | 3 | | | (20,710 | ) | | | — | | | | (20,710 | ) |
DB Global Industrials Basket Performance Index7 | | 3-month LIBOR minus 0.26%6 | | Deutsche Bank AG | | | 10/17/16 | | | | 580 | 3 | | | 53,651 | | | | — | | | | 53,651 | |
DB Global Industrials Basket Performance Index7 | | 3-month LIBOR minus 0.26%6 | | Deutsche Bank AG | | | 10/17/16 | | | | 226 | 3 | | | 23,608 | | | | — | | | | 23,608 | |
DB Global Industrials Basket Performance Index7 | | 3-month LIBOR minus 0.26%6 | | Deutsche Bank AG | | | 10/17/16 | | | | 148 | 3 | | | 17,135 | | | | — | | | | 17,135 | |
MLBX WDC2 Total Return Index7 | | 3-month T-Bill Auction Average Discount2 | | Bank of America N.A. | | | 11/18/16 | | | | 185 | 3 | | | 10,676 | | | | — | | | | 10,676 | |
MLBX WDC2 Total Return Index7 | | 3-month T-Bill Auction Average Discount2 | | Bank of America N.A. | | | 11/18/16 | | | | 167 | 3 | | | 3,235 | | | | — | | | | 3,235 | |
MLBX WDC2 Total Return Index7 | | 3-month T-Bill Auction Average Discount2 | | Bank of America N.A. | | | 11/18/16 | | | | 67 | 3 | | | 1,033 | | | | — | | | | 1,033 | |
MLBX WDC2 Total Return Index7 | | 3-month T-Bill Auction Average Discount2 | | Bank of America N.A. | | | 11/18/16 | | | | 60 | 3 | | | (1,138 | ) | | | — | | | | (1,138 | ) |
MLBX WDC2 Total Return Index7 | | 3-month T-Bill Auction Average Discount2 | | Bank of America N.A. | | | 11/18/16 | | | | 38 | 3 | | | (427 | ) | | | — | | | | (427 | ) |
MLBX WDC2 Total Return Index7 | | 3-month T-Bill Auction Average Discount2 | | Bank of America N.A. | | | 11/18/16 | | | | 34 | 3 | | | (970 | ) | | | — | | | | (970 | ) |
ML Vortex Alpha Index7 | | USD 844,9862 | | Bank of America N.A. | | | 9/17/18 | | | | 4,497 | 3 | | | (4,187 | ) | | | — | | | | (4,187 | ) |
ML Vortex Alpha Index7 | | USD 580,0414 | | Bank of America N.A. | | | 9/17/18 | | | | 3,175 | 3 | | | 13,287 | | | | — | | | | 13,287 | |
Total | | | | | | | | | | | | | | $ | (458,733 | ) | | | — | | | $ | (458,733 | ) |
| | | | | | | | | | | | | | | | |
| | 1 | | All or a portion of security is held by a wholly owned subsidiary. See Note 1 of the Notes to Financial Statements for details on the wholly owned subsidiary. |
| | 2 | | Fund pays the floating rate and receives the total return of the reference entity. Net payment made at termination. |
| | 4 | | Fund pays the fixed amount and receives the total return of the reference entity. Net payment made at termination. |
| | 5 | | Fund pays the floating rate and receives the total return of the reference entity. |
| | 6 | | Fund pays the total return of the reference entity and receives the floating rate. Net payment made at termination. |
| | 7 | | Represents a custom basket swap that contains stocks and/or derivatives. |
|
| Transactions in Options Written for the Period Ended January 31, 2016 |
| | | | | | | | | | | | | | | | | | | | | | | | | | | | | | | | | | |
| | | Calls | | | | | Puts | |
| | | | | | Notional (000) | | | | | | | | | | | Notional (000) | | | | |
| | | Contracts | | | EUR | | | USD | | | Premiums
Received | | | | | Contracts | | | GBP | | | USD | | | Premiums
Received | |
Outstanding options, beginning of period | | | 5,345 | | | | — | | | | — | | | $ | 123,362 | | | | | | 174 | | | | — | | | | — | | | $ | 160,028 | |
Options written | | | 26,545 | | | | 4,160 | | | | 2,535 | | | | 617,833 | | | | | | 394 | | | | 3,400 | | | | 97,250 | | | | 457,672 | |
Options expired | | | (14,408 | ) | | | — | | | | — | | | | (48,020 | ) | | | | | (67 | ) | | | (3,400 | ) | | | — | | | | (78,085 | ) |
Options closed | | | (11,842 | ) | | | (4,160 | ) | | | — | | | | (398,677 | ) | | | | | (408 | ) | | | | | | | (97,250 | ) | | | (387,499 | ) |
| | | | | | | | | | |
Outstanding options, end of period | | | 5,640 | | | | — | | | | 2,535 | | | $ | 294,498 | | | | | | 93 | | | | — | | | | — | | | $ | 152,116 | |
| | | | | | | | | | |
See Notes to Financial Statements.
| | | | | | |
| 68 | | BLACKROCK FUNDS | | JANUARY 31, 2016 | | |
| | | | |
| Consolidated Schedule of Investments (continued) | | | BlackRock Macro Themes Fund | |
|
| Derivative Financial Instruments Categorized by Risk Exposure |
| | | | | | | | | | | | | | | | |
| As of period end, the fair values of derivative financial instruments located in the Statements of Assets and Liabilities were as follows: | | | | |
| | | | | | | | | | | | | | | | | | | | | | | | | | | | | | |
| Assets — Derivative Financial Instruments | | Commodity
Contracts | | | Credit
Contracts | | | Equity
Contracts | | | Foreign
Currency
Exchange
Contracts | | | Interest
Rate
Contracts | | | Other
Contracts | | | Total | |
Financial futures contracts | | Net unrealized appreciation1 | | | — | | | | — | | | $ | 98,469 | | | | — | | | $ | 44,465 | | | | — | | | $ | 142,934 | |
Forward foreign currency exchange contracts | | Unrealized appreciation on forward foreign currency exchange contracts | | | — | | | | — | | | | — | | | $ | 180,448 | | | | — | | | | — | | | | 180,448 | |
Options purchased | | Investments at value — unaffiliated2 | | | — | | | | — | | | | 362,743 | | | | 39,356 | | | | 13,600 | | | $ | 163 | 3 | | | 415,862 | |
Swaps — OTC | | Unrealized appreciation on OTC swaps; Swap premiums paid | | | — | | | $ | 138 | | | | 122,625 | | | | — | | | | 30,281 | | | | — | | | | 153,044 | |
Total | | | | | — | | | $ | 138 | | | $ | 583,837 | | | $ | 219,804 | | | $ | 88,346 | | | $ | 163 | | | $ | 892,288 | |
| | | | | | | | | | | | | | | | | | | | | | | | | | | | | | |
| Liabilities — Derivative Financial Instruments | | Commodity Contracts | | | Credit
Contracts | | | Equity
Contracts | | | Foreign
Currency
Exchange
Contracts | | | Interest
Rate
Contracts | | | Other
Contracts | | | Total | |
Financial futures contracts | | Net unrealized depreciation1 | | | — | | | | — | | | $ | 392,245 | | | | — | | | $ | 104,267 | | | | — | | | $ | 496,512 | |
Forward foreign currency exchange contracts | | Unrealized depreciation on forward foreign currency exchange contracts | | | — | | | | — | | | | — | | | $ | 188,777 | | | | — | | | | — | | | | 188,777 | |
Options written | | Options written at value | | | — | | | | — | | | | 491,851 | | | | 10,703 | | | | — | | | | — | | | | 502,554 | |
| | Unrealized depreciation on OTC swaps; | | | | | | | | | | | | | | | | | | | | | | | | | | | | |
Swaps — OTC | | Swap premiums received | | | — | | | $ | 8,675 | | | | 455,928 | | | | — | | | | 154,444 | | | | — | | | | 619,047 | |
Swaps — centrally cleared | | Net unrealized depreciation1 | | | | | | | — | | | | — | | | | — | | | | 1,660 | | | | — | | | | 1,660 | |
Total | | | | | — | | | $ | 8,675 | | | $ | 1,340,024 | | | $ | 199,480 | | | $ | 260,371 | | | | — | | | $ | 1,808,550 | |
| | 1 | | Includes cumulative appreciation (depreciation) on financial futures contracts and centrally cleared swaps, if any, as reported in the Consolidated Schedule of Investments. Only current day’s variation margin is reported within the Statements of Assets and Liabilities. |
| | 2 | | Includes options purchased at value as reported in the Consolidated Schedule of Investments. |
| | 3 | | Includes worst of put options at value. |
For the six months ended January 31, 2016, the effect of derivative financial instruments in the Statements of Operations was as follows:
| | | | | | | | | | | | | | | | | | | | | | | | | | | | |
| Net Realized Gain (Loss) from: | | Commodity Contracts | | | Credit
Contracts | | | Equity
Contracts | | | Foreign
Currency
Exchange
Contracts | | | Interest
Rate
Contracts | | | Other
Contracts | | | Total | |
Financial futures contracts | | | — | | | | — | | | $ | (365,772 | ) | | | — | | | $ | (24,848 | ) | | | — | | | $ | (390,620 | ) |
Forward foreign currency transactions | | | — | | | | — | | | | — | | | $ | 599,437 | | | | — | | | | — | | | | 599,437 | |
Options purchased1 | | | — | | | | — | | | | (150,044 | ) | | | 345 | | | | (12,105 | ) | | $ | (22,610 | ) | | | (184,414 | ) |
Options written | | | — | | | | — | | | | 212,201 | | | | (10,945 | ) | | | 36,898 | | | | — | | | | 238,154 | |
Swaps | | | — | | | $ | 4,779 | | | | (137,107 | ) | | | — | | | | (82,762 | ) | | | — | | | | (215,090 | ) |
Total | | | — | | | $ | 4,779 | | | $ | (440,722 | ) | | $ | 588,837 | | | $ | (82,817 | ) | | $ | (22,610 | ) | | $ | 47,467 | |
1 Options purchased are included in the net realized gain (loss) from investments. | | | | | |
| Net Change in Unrealized Appreciation (Depreciation) on: | | Commodity
Contracts | | | Credit
Contracts | | | Equity
Contracts | | | Foreign
Currency
Exchange
Contracts | | | Interest
Rate
Contracts | | | Other
Contracts | | | Total | |
Financial futures contracts | | | — | | | | — | | | $ | (286,348 | ) | | | — | | | $ | (61,990 | ) | | | — | | | $ | (348,338 | ) |
Forward foreign currency translations | | | — | | | | — | | | | — | | | $ | (334,985 | ) | | | — | | | | — | | | | (334,985 | ) |
Options purchased1 | | | — | | | | — | | | | 142,261 | | | | 12,837 | | | | (15,278 | ) | | $ | 4,078 | | | | 143,898 | |
Options written | | | — | | | | — | | | | (231,881 | ) | | | (900 | ) | | | — | | | | — | | | | (232,781 | ) |
Swaps | | | — | | | $ | (6,491 | ) | | | (582,702 | ) | | | — | | | | (61,967 | ) | | | — | | | | (651,160 | ) |
Total | | | — | | | $ | (6,491 | ) | | $ | (958,670 | ) | | $ | (323,048 | ) | | $ | (139,235 | ) | | $ | 4,078 | | | $ | (1,423,366 | ) |
| | 1 | | Options purchased are included in the net change in unrealized appreciation (depreciation) on investments. |
See Notes to Financial Statements.
| | | | | | |
| | | BLACKROCK FUNDS | | JANUARY 31, 2016 | | 69 |
| | | | |
| Consolidated Schedule of Investments (continued) | | | BlackRock Macro Themes Fund | |
|
| Average Quarterly Balances of Outstanding Derivative Financial Instruments |
| | | | |
Financial futures contracts: | | | | |
Average notional value of contracts — long. | | $ | 10,848,871 | |
Average notional value of contracts — short | | $ | 12,214,270 | |
Forward foreign currency exchange contracts: | | | | |
Average amounts purchased — in USD | | $ | 28,182,986 | |
Average amounts sold — in USD | | $ | 12,424,877 | |
Options: | | | | |
Average value of option contracts purchased | | $ | 338,856 | |
Average value of option contracts written | | $ | 332,539 | |
Average notional value of swaption contracts purchased | | $ | 5,245,706 | |
Average notional value of swaption contracts written | | $ | 5,245,706 | |
Credit default swaps: | | | | |
Average notional value — buy protection | | $ | 30,500 | |
Average notional value — sell protection | | $ | 57,744,172 | |
Interest rate swaps: | | | | |
Average notional value — pays fixed rate | | $ | 234,887 | |
Average notional value — receives fixed rate | | $ | 317,977 | |
Total return swaps: | | | | |
Average notional value | | $ | 16,777,015 | |
For more information about the Fund’s investment risks regarding derivative financial instruments, please refer to the Notes to Financial Statements. | |
|
| Derivative Financial Instruments – Offsetting as of Period End |
| | | | | | | | |
The Fund’s derivative assets and liabilities (by type) were as follows: | |
| | | Assets | | | Liabilities | |
Derivative Financial Instruments: | | | | | | | | |
Financial futures contracts | | $ | 113,131 | | | $ | 197,126 | |
Forward foreign currency exchange contracts | | | 180,448 | | | | 188,777 | |
Options | | | 415,862 | 1 | | | 502,554 | |
Swaps - Centrally cleared | | | — | | | | 1,660 | |
Swaps - OTC2 | | | 153,044 | | | | 619,047 | |
| | | | |
Total derivative assets and liabilities in the Statements of Assets and Liabilities | | $ | 862,485 | | | $ | 1,509,164 | |
Derivatives not subject to a Master Netting Agreement or similar agreement (“MNA”) | | | (468,299 | ) | | | (664,099 | ) |
| | | | |
Total derivative assets and liabilities subject to an MNA | | $ | 394,186 | | | $ | 845,065 | |
| | | | |
| | 1 | | Includes options purchased at value which is included in Investments at value — unaffiliated in the Statements of Assets and Liabilities and reported in the Consolidated Schedule of Investments. |
| | 2 | | Includes unrealized appreciation (depreciation) on OTC swaps and swap premiums paid/received in the Statements of Assets and Liabilities. |
See Notes to Financial Statements.
| | | | | | |
| 70 | | BLACKROCK FUNDS | | JANUARY 31, 2016 | | |
| | | | |
| Consolidated Schedule of Investments (continued) | | | BlackRock Macro Themes Fund | |
The following tables present the Fund’s derivative assets and liabilities by counterparty net of amounts for offset under an MNA and net of the related collateral received and pledged by the Fund:
| | | | | | | | | | | | | | | | |
| | | Gross Amounts Not Offset in the Statements of Assets and Liabilities
and Subject to an MNA | |
| Counterparty | | Derivative Assets
Subject to an MNA by
Counterparty | | | Derivatives Available
for Offset1 | | | Non-cash
Collateral
Received | | Cash
Collateral
Received | | Net Amount of
Derivative Assets2 | |
Bank of America N.A. | | | $ 81,543 | | | | $ (81,543 | ) | | — | | — | | | — | |
Barclays Bank PLC | | | 34,866 | | | | (34,866 | ) | | — | | — | | | — | |
Citibank N.A. | | | 30,538 | | | | (30,538 | ) | | — | | — | | | — | |
Deutsche Bank AG | | | 124,889 | | | | (42,040 | ) | | — | | — | | | $ 82,849 | |
Goldman Sachs International | | | 8,832 | | | | (8,832 | ) | | — | | — | | | — | |
HSBC Bank PLC | | | 22,953 | | | | (6,987 | ) | | — | | — | | | 15,966 | |
JPMorgan Chase Bank N.A. | | | 76,612 | | | | (76,612 | ) | | — | | — | | | — | |
Morgan Stanley & Co. International PLC | | | 1,066 | | | | (100 | ) | | — | | — | | | 966 | |
UBS AG | | | 8,592 | | | | (2,002 | ) | | — | | — | | | 6,590 | |
Westpac Banking Corp. | | | 4,295 | | | | (616 | ) | | — | | — | | | 3,679 | |
| | | | |
Total | | | $394,186 | | | | $(284,136 | ) | | — | | — | | | $110,050 | |
| | | | |
| | | | | | | | | | | | | | | | |
| Counterparty | | Derivative Liabilities
Subject to an MNA by
Counterparty | | | Derivatives Available
for Offset1 | | | Non-cash
Collateral
Pledged | | Cash
Collateral
Pledged | | Net Amount of
Derivative Liabilities3 | |
Bank of America N.A. | | | $265,597 | | | | $ (81,543 | ) | | — | | — | | | $184,054 | |
Barclays Bank PLC | | | 39,947 | | | | (34,866 | ) | | — | | — | | | 5,081 | |
Citibank N.A. | | | 71,862 | | | | (30,538 | ) | | — | | — | | | 41,324 | |
Commonwealth Bank of Australia | | | 4,377 | | | | — | | | — | | — | | | 4,377 | |
Deutsche Bank AG | | | 42,040 | | | | (42,040 | ) | | — | | — | | | — | |
Goldman Sachs International | | | 84,291 | | | | (8,832 | ) | | — | | — | | | 75,459 | |
HSBC Bank PLC | | | 6,987 | | | | (6,987 | ) | | — | | — | | | — | |
JPMorgan Chase Bank N.A. | | | 327,246 | | | | (76,612 | ) | | — | | — | | | 250,634 | |
Morgan Stanley & Co. International PLC | | | 100 | | | | (100 | ) | | — | | — | | | — | |
UBS AG | | | 2,002 | | | | (2,002 | ) | | — | | — | | | — | |
Westpac Banking Corp. | | | 616 | | | | (616 | ) | | — | | — | | | — | |
| | | | |
Total | | | $845,065 | | | | $(284,136 | ) | | — | | — | | | $560,929 | |
| | | | |
| | 1 | | The amount of derivatives available for offset is limited to the amount of derivative assets and/or liabilities that are subject to an MNA. |
| | 2 | | Net amount represents the net amount receivable from the counterparty in the event of default. |
| | 3 | | Net amount represents the net amount payable due to the counterparty in the event of default. Net amount may be offset further by the options written receivable/payable on the Statements of Assets and Liabilities. |
|
| Fair Value Hierarchy as of Period End |
Various inputs are used in determining the fair value of investments and derivative financial instruments. For information about the Fund’s policy regarding valuation of investments and derivative financial instruments, refer to the Notes to Financial Statements.
The following tables summarize the Fund’s investments and derivative financial instruments categorized in the disclosure hierarchy:
| | | | | | | | | | | | | | | | |
| | | Level 1 | | | Level 2 | | | Level 3 | | | Total | |
Assets: | | | | | | | | | | | | | | | | |
Investments: | | | | | | | | | | | | | | | | |
Long-Term Investments: | | | | | | | | | | | | | | | | |
Common Stocks | | $ | 1,362,400 | | | | — | | | | — | | | $ | 1,362,400 | |
Corporate Bonds | | | — | | | $ | 8,337,231 | | | | — | | | | 8,337,231 | |
Foreign Agency Obligations | | | — | | | | 184,786 | | | | — | | | | 184,786 | |
Foreign Government Obligations | | | — | | | | 4,106,075 | | | | — | | | | 4,106,075 | |
Investment Companies | | | 938,550 | | | | 215,572 | | | | — | | | | 1,154,122 | |
U.S. Treasury Obligations | | | — | | | | 3,933,360 | | | | — | | | | 3,933,360 | |
Short-Term Securities: | | | | | | | | | | | | | | | | |
Money Market Funds | | | 4,394,584 | | | | 508,486 | | | | — | | | | 4,903,070 | |
Options Purchased: | | | | | | | | | | | | | | | | |
Equity Contracts | | | 341,568 | | | | 21,175 | | | | — | | | | 362,743 | |
Foreign Currency Exchange Contracts | | | — | | | | 39,356 | | | | — | | | | 39,356 | |
Interest Rate Contracts | | | 13,600 | | | | — | | | | — | | | | 13,600 | |
Other Contracts | | | — | | | | 163 | | | | — | | | | 163 | |
| | | | |
Total | | $ | 7,050,702 | | | $ | 17,346,204 | | | | — | | | $ | 24,396,906 | |
| | | | |
See Notes to Financial Statements.
| | | | | | |
| | | BLACKROCK FUNDS | | JANUARY 31, 2016 | | 71 |
| | | | |
| Consolidated Schedule of Investments (concluded) | | | BlackRock Macro Themes Fund | |
| | | | | | | | | | | | | | | | | | | | |
| | | Level 1 | | Level 2 | | Level 3 | | Total |
Derivative Financial Instruments1 | | | | | | | | | | | | | | | | | | | | |
Assets: | | | | | | | | | | | | | | | | | | | | |
Credit contracts | | | | — | | | | $ | 103 | | | | | — | | | | $ | 103 | |
Equity contracts | | | $ | 98,469 | | | | | 122,625 | | | | | — | | | | | 221,094 | |
Foreign currency exchange contracts | | | | — | | | | | 180,448 | | | | | — | | | | | 180,448 | |
Interest rate contracts | | | | 44,465 | | | | | 30,281 | | | | | — | | | | | 74,746 | |
Liabilities: | | | | | | | | | | | | | | | | | | | | |
Credit contracts | | | | — | | | | | (5,979 | ) | | | | — | | | | | (5,979 | ) |
Equity contracts | | | | (857,558 | ) | | | | (482,466 | ) | | | | — | | | | | (1,340,024 | ) |
Foreign currency exchange contracts | | | | — | | | | | (199,480 | ) | | | | — | | | | | (199,480 | ) |
Interest rate contracts | | | | (104,267 | ) | | | | (156,104 | ) | | | | — | | | | | (260,371 | ) |
| | | | | |
Total | | | $ | (818,891 | ) | | | $ | (510,572 | ) | | | | — | | | | $ | (1,329,463 | ) |
| | | | | |
1 Derivative financial instruments are swaps, financial futures contracts, forward foreign currency exchange contracts and options written. Swaps, financial futures contracts and forward foreign currency exchange contracts are valued at the unrealized appreciation (depreciation) on the instrument and options written are shown at value. | |
|
| The Fund may hold assets and/or liabilities in which the fair value approximates the carrying amount for financial statement purposes. As of period end, such assets and/or liabilities are categorized within the disclosure hierarchy as follows: | |
| | | | | | | | | | | | | | | | | | | | |
| | | Level 1 | | Level 2 | | Level 3 | | Total |
Assets: | | | | | | | | | | | | | | | | | | | | |
Cash | | | $ | 79,027 | | | | | — | | | | | — | | | | $ | 79,027 | |
Cash pledged as collateral for exchange-traded options | | | | 3,943,124 | | | | | — | | | | | — | | | | | 3,943,124 | |
Cash pledged for centrally cleared swaps | | | | 3,000 | | | | | — | | | | | — | | | | | 3,000 | |
Cash pledged for financial futures contracts | | | | 492,700 | | | | | — | | | | | — | | | | | 492,700 | |
Foreign currency at value | | | | 186,400 | | | | | — | | | | | — | | | | | 186,400 | |
Liabilities: | | | | | | | | | | | | | | | | | | | | |
Collateral on securities loaned at value | | | | — | | | | $ | (508,486 | ) | | | | — | | | | | (508,486 | ) |
| | | | | |
Total | | | $ | 4,704,251 | | | | $ | (508,486 | ) | | | | — | | | | $ | 4,195,765 | |
| | | | | |
During the six months ended January 31, 2016, there were no transfers between levels.
See Notes to Financial Statements.
| | | | | | |
| 72 | | BLACKROCK FUNDS | | JANUARY 31, 2016 | | |
| | |
| Statements of Assets and Liabilities | | |
| | | | | | | | | | | | |
| January 31, 2016 (Unaudited) | | BlackRock
Commodity
Strategies Fund1 | | | BlackRock Global Long/Short Credit Fund | | | BlackRock
Macro Themes
Fund1 | |
| | | | | | | | | | | | |
| Assets | | | | | | | | | | | | |
Investments at value — unaffiliated2,3 | | $ | 106,600,186 | | | $ | 5,789,166,231 | | | $ | 19,493,836 | |
Investments at value — affiliated4 | | | 1,650,394 | | | | 444,946,963 | | | | 4,903,070 | |
Cash | | | 3,594,375 | | | | 271,975,405 | | | | 79,027 | |
Cash pledged: | | | | | | | | | | | | |
Collateral — options written | | | — | | | | — | | | | 3,943,124 | |
Collateral — OTC derivatives | | | — | | | | 29,070,000 | | | | — | |
Financial futures contracts | | | — | | | | 11,672,880 | | | | 492,700 | |
Centrally cleared swaps | | | — | | | | 20,770,760 | | | | 3,000 | |
Foreign currency at value5 | | | — | | | | 25,854,357 | | | | 186,400 | |
Receivables: | | | | | | | | | | | | |
Investments sold | | | 4,673,259 | | | | 184,084,129 | | | | 134,849 | |
Securities lending income — affiliated | | | 856 | | | | — | | | | 107 | |
Swaps | | | — | | | | 1,387,084 | | | | — | |
Capital shares sold | | | 1,278,730 | | | | 17,498,365 | | | | — | |
Dividends — affiliated | | | — | | | | — | | | | 936 | |
Dividends — unaffiliated | | | 115,901 | | | | 233,182 | | | | 1,006 | |
Interest | | | 10,616 | | | | 44,330,490 | | | | 172,987 | |
From the Manager | | | 14,243 | | | | — | | | | 650 | |
Swap premiums paid | | | — | | | | 25,274,924 | | | | 35 | |
Unrealized appreciation on: | | | | | | | | | | | | |
Forward foreign currency exchange contracts | | | — | | | | 44,697,950 | | | | 180,448 | |
OTC swaps | | | — | | | | 17,859,364 | | | | 153,009 | |
Variation margin receivable on financial futures contracts | | | — | | | | 141,971 | | | | 113,131 | |
Variation margin receivable on centrally cleared swaps | | | — | | | | 900,609 | | | | — | |
Prepaid expenses | | | 30,581 | | | | 60,544 | | | | 29,303 | |
| | | | |
Total assets | | | 117,969,141 | | | | 6,929,925,208 | | | | 29,887,618 | |
| | | | |
| | | | | | | | | | | | |
| Liabilities | | | | | | | | | | | | |
Investments sold short at value — unaffiliated6 | | | — | | | | 164,472,220 | | | | — | |
Investments sold short at value — affiliated7 | | | — | | | | 109,357,692 | | | | — | |
Cash received: | | | | | | | | | | | | |
Collateral — borrowed bond agreements | | | — | | | | 2,804,000 | | | | — | |
Collateral — OTC derivatives | | | — | | | | 5,410,000 | | | | — | |
Borrowed bonds at value8 | | | — | | | | 1,210,077,444 | | | | — | |
Collateral on securities loaned at value | | | 459,321 | | | | — | | | | 508,486 | |
Options written at value9 | | | — | | | | 689,777 | | | | 502,554 | |
Payables: | | | | | | | | | | | | |
Investments purchased — unaffiliated | | | 5,680,314 | | | | 174,246,491 | | | | 601,157 | |
Investments purchased — affiliated | | | — | | | | 10,381,878 | | | | — | |
Swaps | | | — | | | | 807,027 | | | | — | |
Administration fees | | | 5,127 | | | | 226,389 | | | | 1,071 | |
Capital shares redeemed | | | 825,420 | | | | 23,071,970 | | | | — | |
Custodian | | | 12,408 | | | | 167,038 | | | | 6,661 | |
Dividends on short sales — unaffiliated | | | — | | | | 106,662 | | | | — | |
Interest expense | | | — | | | | 12,016,147 | | | | — | |
Investment advisory fees | | | 82,789 | | | | 3,901,132 | | | | 7,062 | |
Offering costs | | | — | | | | — | | | | 50,179 | |
Officer’s and Trustees’ fees | | | 5,733 | | | | 31,677 | | | | 2,592 | |
Other accrued expenses | | | 2,980 | | | | 329,610 | | | | 15,998 | |
Other affiliates | | | 572 | | | | 72,440 | | | | — | |
Professional fees | | | 64,296 | | | | 116,899 | | | | 35,447 | |
Service and distribution fees | | | 6,807 | | | | 403,224 | | | | 43 | |
Transfer agent fees | | | 22,503 | | | | 1,302,985 | | | | 334 | |
Swap premiums received | | | — | | | | 32,817,837 | | | | 2,696 | |
Unrealized depreciation on: | | | | | | | | | | | | |
Forward foreign currency exchange contracts | | | — | | | | 28,377,099 | | | | 188,777 | |
OTC swaps | | | — | | | | 21,358,965 | | | | 616,351 | |
Unfunded floating rate loan interests | | | — | | | | 634,623 | | | | — | |
Variation margin payable on financial futures contracts | | | — | | | | 3,473,169 | | | | 197,126 | |
Variation margin payable on centrally cleared swaps | | | — | | | | — | | | | 1,660 | |
| | | | |
Total liabilities | | | 7,168,270 | | | | 1,806,654,395 | | | | 2,738,194 | |
| | | | |
Net Assets | | $ | 110,800,871 | | | $ | 5,123,270,813 | | | $ | 27,149,424 | |
| | | | |
1 Consolidated Statement of Assets and Liabilities | | | | | | | | | | | | |
2 Investments at cost — unaffiliated | | $ | 108,779,322 | | | $ | 6,142,879,369 | | | $ | 20,635,305 | |
3 Securities loaned at value | | $ | 339,486 | | | | — | | | $ | 511,075 | |
4 Investments at cost — affiliated | | $ | 1,650,394 | | | $ | 444,946,963 | | | $ | 4,903,070 | |
5 Foreign currency at cost | | | — | | | $ | 24,357,091 | | | $ | 186,859 | |
6 Proceeds received from investments sold short at value — unaffiliated | | | — | | | $ | 171,830,592 | | | | — | |
7 Proceeds received from investments sold short at value — affiliated | | | — | | | $ | 111,459,237 | | | | — | |
8 Proceeds received from borrowed bonds | | | — | | | $ | 1,234,534,715 | | | | — | |
9 Premiums received | | | — | | | $ | 1,591,991 | | | $ | 446,614 | |
See Notes to Financial Statements.
| | | | | | |
| | | BLACKROCK FUNDS | | JANUARY 31, 2016 | | 73 |
| | |
| Statements of Assets and Liabilities (concluded) | | |
| | | | | | | | | | | | |
| January 31, 2016 (Unaudited) | | BlackRock
Commodity
Strategies Fund1 | | | BlackRock
Global Long/Short
Credit Fund | | | BlackRock
Macro Themes
Fund1 | |
| | | | | | | | | | | | |
| Net Assets Consist of | | | | | | | | | | | | |
Paid-in capital | | $ | 297,534,829 | | | $ | 5,690,558,789 | | | $ | 30,005,035 | |
Undistributed (distributions in excess of) net investment income | | | (402,279 | ) | | | 65,105,538 | | | | (314,338 | ) |
Accumulated net realized loss | | | (184,143,006 | ) | | | (331,535,601 | ) | | | (488,557 | ) |
Net unrealized appreciation (depreciation) | | | (2,188,673 | ) | | | (300,857,913 | ) | | | (2,052,716 | ) |
| | | | |
Net Assets | | $ | 110,800,871 | | | $ | 5,123,270,813 | | | $ | 27,149,424 | |
| | | | |
| | | | | | | | | | | | |
| Net Asset Value | | | | | | | | | | | | |
Institutional | | | | | | | | | | | | |
Net assets | | $ | 92,997,517 | | | $ | 4,201,798,933 | | | $ | 27,010,045 | |
| | | | |
Shares outstanding2 | | | 15,664,936 | | | | 432,217,716 | | | | 2,997,481 | |
| | | | |
Net asset value | | $ | 5.94 | | | $ | 9.72 | | | $ | 9.01 | |
| | | | |
Investor A | | | | | | | | | | | | |
Net assets | | $ | 13,396,475 | | | $ | 644,031,280 | | | $ | 116,854 | |
| | | | |
Shares outstanding2 | | | 2,274,374 | | | | 66,351,275 | | | | 12,998 | |
| | | | |
Net asset value | | $ | 5.89 | | | $ | 9.71 | | | $ | 8.99 | |
| | | | |
Investor C | | | | | | | | | | | | |
Net assets | | $ | 4,406,879 | | | $ | 277,440,600 | | | $ | 22,525 | |
| | | | |
Shares outstanding2 | | | 772,800 | | | | 28,846,234 | | | | 2,500 | |
| | | | |
Net asset value | | $ | 5.70 | | | $ | 9.62 | | | $ | 9.01 | |
| | | | |
| | 1 | | Consolidated Statement of Assets and Liabilities. |
| | 2 | | Unlimited number of shares authorized, $0.001 par value. |
See Notes to Financial Statements.
| | | | | | |
| 74 | | BLACKROCK FUNDS | | JANUARY 31, 2016 | | |
| | | | | | | | | | | | |
| Six Months Ended January 31, 2016 (Unaudited) | | BlackRock
Commodity
Strategies Fund1 | | | BlackRock
Global Long/Short
Credit Fund | | | BlackRock
Macro Themes
Fund1 | |
| | | | | | | | | | | | |
| Investment Income | | | | | | | | | | | | |
Dividends — unaffiliated | | $ | 1,521,588 | | | $ | 2,859,098 | | | $ | 19,851 | |
Dividends — affiliated | | | 2,820 | | | | 544,304 | | | | 8,349 | |
Interest | | | 73,679 | | | | 123,479,713 | | | | 6,691 | |
Securities lending — affiliated — net | | | 44,294 | | | | — | | | | 107 | |
Foreign taxes withheld | | | (80,405 | ) | | | — | | | | (2,351 | ) |
| | | | |
Total income | | | 1,561,976 | | | | 126,883,115 | | | | 32,647 | |
| | | | |
| | | | | | | | | | | | |
| Expenses | | | | | | | | | | | | |
Investment advisory | | | 1,374,185 | | | | 25,249,127 | | | | 123,431 | |
Professional | | | 60,439 | | | | 135,008 | | | | 46,531 | |
Administration | | | 50,785 | | | | 1,023,877 | | | | 6,171 | |
Transfer agent — class specific | | | 45,122 | | | | 2,747,564 | | | | 222 | |
Service and distribution — class specific | | | 41,806 | | | | 2,666,075 | | | | 198 | |
Accounting services | | | 32,644 | | | | 587,328 | | | | 5,675 | |
Administration — class specific | | | 23,909 | | | | 429,543 | | | | 2,903 | |
Custodian | | | 12,483 | | | | 235,385 | | | | 7,034 | |
Officer and Trustees | | | 7,830 | | | | 80,876 | | | | 3,375 | |
Offering | | | — | | | | — | | | | 81,376 | |
Miscellaneous | | | 64,004 | | | | 505,956 | | | | 31,875 | |
Recoupment of past waived fees — class specific | | | — | | | | 4,992 | | | | — | |
| | | | |
Total expenses excluding interest and dividend expense | | | 1,713,207 | | | | 33,665,731 | | | | 308,791 | |
Interest expense | | | — | | | | 21,703,531 | | | | — | |
Dividend expense — affiliated | | | — | | | | 1,031,453 | | | | — | |
Dividend expense — unaffiliated | | | — | | | | 479,684 | | | | — | |
| | | | |
Total expenses | | | 1,713,207 | | | | 56,880,399 | | | | 308,791 | |
Less: | | | | | | | | | | | | |
Fees waived by the Manager | | | (111,216 | ) | | | (193,560 | ) | | | (106,768 | ) |
Administration fees waived | | | — | | | | — | | | | (4,277 | ) |
Administration fees waived — class specific | | | (3,016 | ) | | | — | | | | (1,891 | ) |
Transfer agent fees waived — class specific | | | (762 | ) | | | — | | | | (40 | ) |
Transfer agent fees reimbursed — class specific | | | (26,756 | ) | | | — | | | | (80 | ) |
Expenses reimbursed by the Manager | | | — | | | | — | | | | (21,477 | ) |
| | | | |
Total expenses after fees waived and/or reimbursed | | | 1,571,457 | | | | 56,686,839 | | | | 174,258 | |
| | | | |
Net investment income (loss) | | | (9,481 | ) | | | 70,196,276 | | | | (141,611 | ) |
| | | | |
| | | | | | | | | | | | |
| Realized and Unrealized Gain (Loss) | | | | | | | | | | | | |
Net realized gain (loss) from: | | | | | | | | | | | | |
Investments — unaffiliated | | | (69,197,611 | ) | | | (235,280,844 | ) | | | (683,863 | ) |
Investments — affiliated | | | — | | | | (296,056 | ) | | | 17,742 | |
Capital gain distributions received from affiliated investment companies | | | — | | | | 25,723 | | | | 198 | |
Options written | | | — | | | | (956,810 | ) | | | 238,154 | |
Financial futures contracts | | | — | | | | (12,613,555 | ) | | | (390,620 | ) |
Swaps | | | — | | | | 14,359,672 | | | | (215,090 | ) |
Foreign currency transactions | | | (152,352 | ) | | | 10,786,147 | | | | 566,457 | |
Short sales — unaffiliated | | | — | | | | 2,295,574 | | | | — | |
Short sales — affiliated | | | — | | | | 541,264 | | | | — | |
Borrowed bonds | | | — | | | | 21,267,414 | | | | — | |
| | | | |
| | | (69,349,963 | ) | | | (199,871,471 | ) | | | (467,022 | ) |
| | | | |
Net change in unrealized appreciation (depreciation) on: | | | | | | | | | | | | |
Investments — unaffiliated | | | 39,246,793 | | | | (56,395,576 | ) | | | 219,066 | |
Options written | | | — | | | | (736,163 | ) | | | (232,781 | ) |
Financial futures contracts | | | — | | | | (11,605,238 | ) | | | (348,338 | ) |
Swaps | | | — | | | | 6,313,070 | | | | (651,160 | ) |
Foreign currency translations | | | (6,309 | ) | | | 21,178,503 | | | | (285,957 | ) |
Unfunded loan commitments | | | — | | | | (617,759 | ) | | | — | |
Short sales — unaffiliated | | | — | | | | 5,439,700 | | | | — | |
Short sales — affiliated | | | — | | | | 1,852,302 | | | | — | |
Borrowed bonds | | | — | | | | 2,863,789 | | | | — | |
| | | | |
| | | 39,240,484 | | | | (31,707,372 | ) | | | (1,299,170 | ) |
| | | | |
Net realized and unrealized loss | | | (30,109,479 | ) | | | (231,578,843 | ) | | | (1,766,192 | ) |
| | | | |
Net Decrease in Net Assets Resulting from Operations | | $ | (30,118,960 | ) | | $ | (161,382,567 | ) | | $ | (1,907,803 | ) |
| | | | |
| | 1 | | Consolidated Statement of Operations. |
See Notes to Financial Statements.
| | | | | | |
| | | BLACKROCK FUNDS | | JANUARY 31, 2016 | | 75 |
| | |
| Statements of Changes in Net Assets | | |
| | | | | | | | | | | | | | | | |
| | | BlackRock
Commodity
Strategies Fund1 | | | BlackRock
Global Long/Short
Credit Fund | |
| Increase (Decrease) in Net Assets: | | Six Months Ended
January 31, 2016
(Unaudited) | | | Year Ended
July 31, 2015 | | | Six Months Ended
January 31, 2016
(Unaudited) | | | Year Ended
July 31, 2015 | |
| | | | | | | | | | | | | | | | |
| Operations | | | | | | | | | | | | | | | | |
Net investment income (loss) | | $ | (9,481 | ) | | $ | (100,867 | ) | | $ | 70,196,276 | | | $ | 157,310,075 | |
Net realized gain (loss) | | | (69,349,963 | ) | | | (82,373,021 | ) | | | (199,871,471 | ) | | | 212,452,698 | |
Net change in unrealized appreciation (depreciation) | | | 39,240,484 | | | | (58,093,131 | ) | | | (31,707,372 | ) | | | (375,824,275 | ) |
| | | | | | | | |
Net decrease in net assets resulting from operations | | | (30,118,960 | ) | | | (140,567,019 | ) | | | (161,382,567 | ) | | | (6,061,502 | ) |
| | | | | | | | |
| | | | | | | | | | | | | | | | |
| Distributions to Shareholders2 | | | | | | | | | | | | | | | | |
From net investment income: | | | | | | | | | | | | | | | | |
Institutional | | | — | | | | (89,086 | ) | | | (221,093,317 | ) | | | (154,488,941 | ) |
Investor A | | | — | | | | — | | | | (33,094,847 | ) | | | (35,435,750 | ) |
Investor C | | | — | | | | — | | | | (12,441,201 | ) | | | (10,075,168 | ) |
From net realized gain: | | | | | | | | | | | | | | | | |
Institutional | | | — | | | | — | | | | — | | | | (55,897,505 | ) |
Investor A | | | — | | | | — | | | | — | | | | (13,695,239 | ) |
Investor C | | | — | | | | — | | | | — | | | | (4,396,026 | ) |
| | | | | | | | |
Decrease in net assets resulting from distributions to shareholders | | | — | | | | (89,086 | ) | | | (266,629,365 | ) | | | (273,988,629 | ) |
| | | | | | | | |
| | | | | | | | | | | | | | | | |
| Capital Share Transactions | | | | | | | | | | | | | | | | |
Net increase (decrease) in net assets derived from capital share transactions | | | (223,979,062 | ) | | | 61,203,635 | | | | (329,205,860 | ) | | | (428,498,179 | ) |
| | | | | | | | |
| | | | | | | | | | | | | | | | |
| Net Assets | | | | | | | | | | | | | | | | |
Total decrease in net assets | | | (254,098,022 | ) | | | (79,452,470 | ) | | | (757,217,792 | ) | | | (708,548,310 | ) |
Beginning of period | | | 364,898,893 | | | | 444,351,363 | | | | 5,880,488,605 | | | | 6,589,036,915 | |
| | | | | | | | |
End of period | | $ | 110,800,871 | | | $ | 364,898,893 | | | $ | 5,123,270,813 | | | $ | 5,880,488,605 | |
| | | | | | | | |
Undistributed (distributions in excess of) net investment income, at end of period | | $ | (402,279 | ) | | $ | (392,798 | ) | | $ | 65,105,538 | | | $ | 261,538,627 | |
| | | | | | | | |
| | 1 | | Consolidated Statements of Changes in Net Assets. |
| | 2 | | Distributions for annual periods determined in accordance with federal income tax regulations. |
See Notes to Financial Statements.
| | | | | | |
| 76 | | BLACKROCK FUNDS | | JANUARY 31, 2016 | | |
| | |
| Statements of Changes in Net Assets (concluded) | | |
| | | | | | | | |
| | | BlackRock
Macro Themes
Fund1 | |
| Increase (Decrease) in Net Assets: | | Six Months Ended
January 31, 2016
(Unaudited) | | | Period
December 4, 20142
to July 31, 2015 | |
| | | | | | | | |
| Operations | | | | | | | | |
Net investment income (loss) | | $ | (141,611 | ) | | $ | 79,941 | |
Net realized gain (loss) | | | (467,022 | ) | | | 736,978 | |
Net change in unrealized appreciation (depreciation) | | | (1,299,170 | ) | | | (753,546 | ) |
| | | | |
Net increase (decrease) in net assets resulting from operations | | | (1,907,803 | ) | | | 63,373 | |
| | | | |
| | | | | | | | |
| Distributions to Shareholders3 | | | | | | | | |
From net investment income: | | | | | | | | |
Institutional | | | (1,089,851 | ) | | | (39,974 | ) |
Investor A | | | (4,492 | ) | | | (26 | ) |
Investor C | | | (660 | ) | | | (2 | ) |
| | | | |
Decrease in net assets resulting from distributions to shareholders | | | (1,095,003 | ) | | | (40,002 | ) |
| | | | |
| | | | | | | | |
| Capital Share Transactions | | | | | | | | |
Net increase in net assets derived from capital share transactions | | | 110,899 | | | | 30,017,960 | |
| | | | |
| | | | | | | | |
| Net Assets | | | | | | | | |
Total increase (decrease) in net assets | | | (2,891,907 | ) | | | 30,041,331 | |
Beginning of period | | | 30,041,331 | | | | — | |
| | | | |
End of period | | $ | 27,149,424 | | | $ | 30,041,331 | |
| | | | |
Undistributed (distributions in excess of) net investment income, at end of period | | $ | (314,338 | ) | | $ | 922,276 | |
| | | | |
| | 1 | | Consolidated Statements of Changes in Net Assets. |
| | 2 | | Commencement of operations. |
| | 3 | | Distributions for annual periods determined in accordance with federal income tax regulations. |
See Notes to Financial Statements.
| | | | | | |
| | | BLACKROCK FUNDS | | JANUARY 31, 2016 | | 77 |
| | | | |
| Consolidated Financial Highlights | | | BlackRock Commodity Strategies Fund | |
| | | | | | | | | | | | | | | | | | | | |
| | | Institutional | |
| | | Six Months
Ended
January 31,
2016 | | |
Year Ended July 31, | | | Period
October 3,
20111 to | |
| | | (Unaudited) | | | 2015 | | | 2014 | | | 2013 | | | July 31, 2012 | |
| | | | | | | | | | | | | | | | | | | | |
| Per Share Operating Performance | | | | | | | | | | | | | | | | | | | | |
Net asset value, beginning of period | | $ | 6.98 | | | $ | 9.89 | | | $ | 9.17 | | | $ | 9.93 | | | $ | 10.00 | |
| | | | |
Net investment income (loss)2 | | | 0.00 | 3 | | | 0.00 | 3 | | | (0.02 | ) | | | (0.03 | ) | | | (0.01 | ) |
Net realized and unrealized gain (loss) | | | (1.04 | ) | | | (2.91 | ) | | | 0.74 | | | | (0.73 | ) | | | 0.22 | |
| | | | |
Net increase (decrease) from investment operations | | | (1.04 | ) | | | (2.91 | ) | | | 0.72 | | | | (0.76 | ) | | | 0.21 | |
| | | | |
Distributions:4 | | | | | | | | | | | | | | | | | | | | |
From net investment income | | | — | | | | (0.00 | )5 | | | — | | | | (0.00 | )5 | | | (0.01 | ) |
From net realized gain | | | — | | | | — | | | | — | | | | — | | | | (0.27 | ) |
| | | | |
Total distributions | | | — | | | | (0.00 | )5 | | | — | | | | (0.00 | )5 | | | (0.28 | ) |
| | | | |
Net asset value, end of period | | $ | 5.94 | | | $ | 6.98 | | | $ | 9.89 | | | $ | 9.17 | | | $ | 9.93 | |
| | | | |
| | | | | | | | | | | | | | | | | | | | |
| Total Return6 | | | | | | | | | | | | | | | | | | | | |
Based on net asset value | | | (14.90 | )%7 | | | (29.41 | )% | | | 7.85 | % | | | (7.63 | )% | | | 2.00 | %7 |
| | | | |
| | | | | | | | | | | | | | | | | | | | |
| Ratios to Average Net Assets | | | | | | | | | | | | | | | | | | | | |
Total expenses8 | | | 1.37 | %9 | | | 1.33 | % | | | 1.33 | % | | | 1.38 | % | | | 1.87 | %9,10 |
| | | | |
Total expenses excluding recoupment of past waived and/or reimbursed fees8 | | | 1.37 | %9 | | | 1.33 | % | | | 1.33 | % | | | 1.38 | % | | | 1.87 | %9,10 |
| | | | |
Total expenses after fees waived and/or reimbursed8 | | | 1.28 | %9 | | | 1.28 | % | | | 1.29 | % | | | 1.29 | % | | | 1.30 | %9 |
| | | | |
Net investment income (loss)8 | | | 0.04 | %9 | | | 0.00 | %11 | | | (0.22 | )% | | | (0.24 | )% | | | (0.08 | )%9 |
| | | | |
| | | | | | | | | | | | | | | | | | | | |
| Supplemental Data | | | | | | | | | | | | | | | | | | | | |
Net assets, end of period (000) | | $ | 92,998 | | | $ | 348,529 | | | $ | 413,506 | | | $ | 378,747 | | | $ | 62,974 | |
| | | | |
Portfolio turnover rate | | | 93 | % | | | 85 | % | | | 71 | % | | | 63 | % | | | 127 | % |
| | | | |
| | 1 | | Commencement of operations. |
| | 2 | | Based on average shares outstanding. |
| | 3 | | Amount is less than $0.005 per share. |
| | 4 | | Distributions for annual periods determined in accordance with federal income tax regulations. |
| | 5 | | Amount is greater than $(0.005) per share. |
| | 6 | | Where applicable, assumes the reinvestment of distributions. |
| | 7 | | Aggregate total return. |
| | 8 | | Excludes expenses incurred indirectly as a result of investments in underlying funds as follows: |
| | | | | | | | | | | | | | | | | | | | |
| | | Six Months
Ended
January 31,
2016 (Unaudited) | | |
Year Ended July 31, | | | Period
October 3,
20111 to July 31, 2012 | |
| | | | 2015 | | | 2014 | | | 2013 | | |
Investments in underlying funds | | | 0.02 | % | | | 0.01 | % | | | 0.05 | % | | | 0.01 | % | | | — | |
| | 10 | | Organization costs were not annualized in the calculation of the expense ratios. If these expenses were annualized, the total expenses would have been 1.89%. |
| | 11 | | Amount is less than 0.005%. |
See Notes to Financial Statements.
| | | | | | |
| 78 | | BLACKROCK FUNDS | | JANUARY 31, 2016 | | |
| | | | |
| Consolidated Financial Highlights (continued) | | | BlackRock Commodity Strategies Fund | |
| | | | | | | | | | | | | | | | | | | | |
| | | Investor A | |
| | | Six Months
Ended
January 31,
2016 (Unaudited) | | |
Year Ended July 31, | | | Period
October 3,
20111 to July 31, 2012 | |
| | | | 2015 | | | 2014 | | | 2013 | | |
| | | | | | | | | | | | | | | | | | | | |
| Per Share Operating Performance | | | | | | | | | | | | | | | | | | | | |
Net asset value, beginning of period | | $ | 6.94 | | | $ | 9.85 | | | $ | 9.15 | | | $ | 9.93 | | | $ | 10.00 | |
| | | | |
Net investment loss2 | | | (0.01 | ) | | | (0.02 | ) | | | (0.04 | ) | | | (0.04 | ) | | | (0.02 | ) |
Net realized and unrealized gain (loss) | | | (1.04 | ) | | | (2.89 | ) | | | 0.74 | | | | (0.74 | ) | | | 0.22 | |
| | | | |
Net increase (decrease) from investment operations | | | (1.05 | ) | | | (2.91 | ) | | | 0.70 | | | | (0.78 | ) | | | 0.20 | |
| | | | |
Distributions:3 | | | | | | | | | | | | | | | | | | | | |
From net investment income | | | — | | | | — | | | | — | | | | — | | | | (0.00 | )4 |
From net realized gain | | | — | | | | — | | | | — | | | | — | | | | (0.27 | ) |
| | | | |
Total distributions | | | — | | | | — | | | | — | | | | — | | | | (0.27 | ) |
| | | | |
Net asset value, end of period | | $ | 5.89 | | | $ | 6.94 | | | $ | 9.85 | | | $ | 9.15 | | | $ | 9.93 | |
| | | | |
| | | | | | | | | | | | | | | | | | | | |
| Total Return5 | | | | | | | | | | | | | | | | | | | | |
Based on net asset value | | | (15.13 | )%6 | | | (29.54 | )% | | | 7.65 | % | | | (7.86 | )% | | | 1.97 | %6 |
| | | | |
| | | | | | | | | | | | | | | | | | | | |
| Ratios to Average Net Assets | | | | | | | | | | | | | | | | | | | | |
Total expenses7 | | | 1.96 | %8 | | | 1.85 | % | | | 1.78 | % | | | 1.79 | % | | | 2.08 | %8,9 |
| | | | |
Total expenses excluding recoupment of past waived and/or reimbursed fees7 | | | 1.96 | %8 | | | 1.85 | % | | | 1.78 | % | | | 1.79 | % | | | 2.08 | %8,9 |
| | | | |
Total expenses after fees waived and/or reimbursed7 | | | 1.50 | %8 | | | 1.50 | % | | | 1.50 | % | | | 1.50 | % | | | 1.50 | %8 |
| | | | |
Net investment loss7 | | | (0.36 | )%8 | | | (0.23 | )% | | | (0.43 | )% | | | (0.39 | )% | | | (0.26 | )%8 |
| | | | |
| | | | | | | | | | | | | | | | | | | | |
| Supplemental Data | | | | | | | | | | | | | | | | | | | | |
Net assets, end of period (000) | | $ | 13,396 | | | $ | 11,308 | | | $ | 21,402 | | | $ | 17,399 | | | $ | 15,274 | |
| | | | |
Portfolio turnover rate | | | 93 | % | | | 85 | % | | | 71 | % | | | 63 | % | | | 127 | % |
| | | | |
| | 1 | | Commencement of operations. |
| | 2 | | Based on average shares outstanding. |
| | 3 | | Distributions for annual periods determined in accordance with federal income tax regulations. |
| | 4 | | Amount is greater than $(0.005) per share. |
| | 5 | | Where applicable, excludes the effects of any sales charges and assumes the reinvestment of distributions. |
| | 6 | | Aggregate total return. |
| | 7 | | Excludes expenses incurred indirectly as a result of investments in underlying funds as follows: |
| | | | | | | | | | | | | | | | | | | | |
| | | Six Months
Ended
January 31,
2016 (Unaudited) | | |
Year Ended July 31, | | | Period
October 3,
20111 to July 31, 2012 | |
| | | | 2015 | | | 2014 | | | 2013 | | |
Investments in underlying funds | | | 0.02 | % | | | 0.01 | % | | | 0.05 | % | | | 0.01 | % | | | — | |
| | 9 | | Organization costs were not annualized in the calculation of the expense ratios. If these expenses were annualized, the total expenses would have been 2.08%. |
See Notes to Financial Statements.
| | | | | | |
| | | BLACKROCK FUNDS | | JANUARY 31, 2016 | | 79 |
| | | | |
| Consolidated Financial Highlights (concluded) | | | BlackRock Commodity Strategies Fund | |
| | | | | | | | | | | | | | | | | | | | |
| | | Investor C | |
| | | Six Months
Ended
January 31,
2016 | | |
Year Ended July 31, | | | Period
October 3,
20111 to | |
| | | (Unaudited) | | | 2015 | | | 2014 | | | 2013 | | | July 31, 2012 | |
| | | | | | | | | | | | | | | | | | | | |
| Per Share Operating Performance | | | | | | | | | | | | | | | | | | | | |
Net asset value, beginning of period | | $ | 6.74 | | | $ | 9.64 | | | $ | 9.02 | | | $ | 9.87 | | | $ | 10.00 | |
| | | | |
Net investment loss2 | | | (0.03 | ) | | | (0.08 | ) | | | (0.11 | ) | | | (0.11 | ) | | | (0.08 | ) |
Net realized and unrealized gain (loss) | | | (1.01 | ) | | | (2.82 | ) | | | 0.73 | | | | (0.74 | ) | | | 0.22 | |
| | | | |
Net increase (decrease) from investment operations | | | (1.04 | ) | | | (2.90 | ) | | | 0.62 | | | | (0.85 | ) | | | 0.14 | |
| | | | |
Distributions from net realized gain3 | | | — | | | | — | | | | — | | | | — | | | | (0.27 | ) |
| | | | |
Net asset value, end of period | | $ | 5.70 | | | $ | 6.74 | | | $ | 9.64 | | | $ | 9.02 | | | $ | 9.87 | |
| | | | |
| | | | | | | | | | | | | | | | | | | | |
| Total Return4 | | | | | | | | | | | | | | | | | | | | |
Based on net asset value | | | (15.43 | )%5 | | | (30.08 | )% | | | 6.87 | % | | | (8.61 | )% | | | 1.29 | %5 |
| | | | |
| | | | | | | | | | | | | | | | | | | | |
| Ratios to Average Net Assets | | | | | | | | | | | | | | | | | | | | |
Total expenses6 | | | 2.67 | %7 | | | 2.50 | % | | | 2.43 | % | | | 2.49 | % | | | 2.85 | %7,8 |
| | | | |
Total expenses excluding recoupment of past waived and/or reimbursed fees6 | | | 2.67 | %7 | | | 2.50 | % | | | 2.43 | % | | | 2.49 | % | | | 2.85 | %7,8 |
| | | | |
Total expenses after fees waived and/or reimbursed6 | | | 2.25 | %7 | | | 2.25 | % | | | 2.25 | % | | | 2.25 | % | | | 2.24 | %7 |
| | | | |
Net investment loss6 | | | (1.05 | )%7 | | | (0.99 | )% | | | (1.17 | )% | | | (1.14 | )% | | | (0.97 | )%7 |
| | | | |
| | | | | | | | | | | | | | | | | | | | |
| Supplemental Data | | | | | | | | | | | | | | | | | | | | |
Net assets, end of period (000) | | $ | 4,407 | | | $ | 5,062 | | | $ | 9,443 | | | $ | 10,332 | | | $ | 8,651 | |
| | | | |
Portfolio turnover rate | | | 93 | % | | | 85 | % | | | 71 | % | | | 63 | % | | | 127 | % |
| | | | |
| | 1 | | Commencement of operations. |
| | 2 | | Based on average shares outstanding. |
| | 3 | | Distributions for annual periods determined in accordance with federal income tax regulations. |
| | 4 | | Where applicable, excludes the effects of any sales charges and assumes the reinvestment of distributions. |
| | 5 | | Aggregate total return. |
| | 6 | | Excludes expenses incurred indirectly as a result of investments in underlying funds as follows: |
| | | | | | | | | | | | | | | | | | | | |
| | | Six Months
Ended
January 31,
2016 | | |
Year Ended July 31, | | | Period
October 3,
20111 to | |
| | | (Unaudited) | | | 2015 | | | 2014 | | | 2013 | | | July 31, 2012 | |
Investments in underlying funds | | | 0.02 | % | | | 0.01 | % | | | 0.05 | % | | | 0.01 | % | | | — | |
| | 8 | | Organization costs were not annualized in the calculation of the expense ratios. If these expenses were annualized, the total expenses would have been 2.85%. |
See Notes to Financial Statements.
| | | | | | |
| 80 | | BLACKROCK FUNDS | | JANUARY 31, 2016 | | |
| | | | |
| Financial Highlights | | | BlackRock Global Long/Short Credit Fund | |
| | | | | | | | | | | | | | | | | | | | |
| | | Institutional | |
| | | Six Months
Ended
January 31, 2016 (Unaudited) | | |
Year Ended July 31, | | | Period
September 30, 20111 to July 31, 2012 | |
| | | | 2015 | | | 2014 | | | 2013 | | |
| | | | | | | | | | | | | | | | | | | | |
| Per Share Operating Performance | | | | | | | | | | | | | | | | | | | | |
Net asset value, beginning of period | | $ | 10.51 | | | $ | 10.95 | | | $ | 10.63 | | | $ | 10.32 | | | $ | 10.00 | |
| | | | |
Net investment income2 | | | 0.13 | | | | 0.28 | | | | 0.20 | | | | 0.15 | | | | 0.06 | |
Net realized and unrealized gain (loss) | | | (0.42 | ) | | | (0.26 | ) | | | 0.26 | | | | 0.41 | | | | 0.30 | |
| | | | |
Net increase (decrease) from investment operations | | | (0.29 | ) | | | 0.02 | | | | 0.46 | | | | 0.56 | | | | 0.36 | |
| | | | |
Distributions from:3 | | | | | | | | | | | | | | | | | | | | |
Net investment income | | | (0.50 | ) | | | (0.34 | ) | | | (0.14 | ) | | | (0.13 | ) | | | (0.03 | ) |
Net realized gain | | | — | | | | (0.12 | ) | | | — | | | | (0.11 | ) | | | (0.01 | ) |
Return of capital | | | — | | | | — | | | | — | | | | (0.01 | ) | | | — | |
| | | | |
Total distributions | | | (0.50 | ) | | | (0.46 | ) | | | (0.14 | ) | | | (0.25 | ) | | | (0.04 | ) |
| | | | |
Net asset value, end of period | | $ | 9.72 | | | $ | 10.51 | | | $ | 10.95 | | | $ | 10.63 | | | $ | 10.32 | |
| | | | |
| | | | | | | | | | | | | | | | | | | | |
| Total Return4 | | | | | | | | | | | | | | | | | | | | |
Based on net asset value | | | (2.73 | )%5 | | | 0.20 | % | | | 4.36 | % | | | 5.45 | % | | | 3.55 | %5 |
| | | | |
| | | | | | | | | | | | | | | | | | | | |
| Ratios to Average Net Assets | | | | | | | | | | | | | | | | | | | | |
Total expenses6 | | | 1.89 | %7 | | | 1.73 | % | | | 1.61 | % | | | 1.56 | % | | | 1.73 | %7,8 |
| | | | |
Total expenses excluding recoupment of past waived and/or reimbursed fees6 | | | 1.89 | %7 | | | 1.73 | % | | | 1.61 | % | | | 1.54 | % | | | 1.73 | %7,8 |
| | | | |
Total expenses after fees waived and/or reimbursed6 | | | 1.89 | %7 | | | 1.72 | % | | | 1.59 | % | | | 1.53 | % | | | 1.46 | %7 |
| | | | |
Total expenses after fees waived, reimbursed and excluding interest and dividend expense6 | | | 1.07 | %7 | | | 1.07 | % | | | 1.03 | % | | | 1.18 | % | | | 1.20 | %7 |
| | | | |
Net investment income6 | | | 2.54 | %7 | | | 2.63 | % | | | 1.83 | % | | | 1.38 | % | | | 0.70 | %7 |
| | | | |
| | | | | | | | | | | | | | | | | | | | |
| Supplemental Data | | | | | | | | | | | | | | | | | | | | |
Net assets, end of period (000) | | $ | 4,201,799 | | | $ | 4,505,530 | | | $ | 4,623,194 | | | $ | 1,335,924 | | | $ | 133,444 | |
| | | | |
Portfolio turnover rate | | | 69 | % | | | 211 | % | | | 207 | % | | | 185 | % | | | 355 | % |
| | | | |
| | 1 | | Commencement of operations. |
| | 2 | | Based on average shares outstanding. |
| | 3 | | Distributions for annual periods determined in accordance with federal income tax regulations. |
| | 4 | | Where applicable, assumes the reinvestment of distributions. |
| | 5 | | Aggregate total return. |
| | 6 | | Excludes expenses incurred indirectly as a result of investments in underlying funds as follows: |
| | | | | | | | | | | | | | | | | | | | |
| | | Six Months
Ended
January 31, 2016 (Unaudited) | | | Year Ended July 31, | | | Period
September 30,
20111 to July 31, 2012 | |
| | | | 2015 | | | 2014 | | | 2013 | | |
Investments in underlying funds | | | 0.01 | % | | | — | | | | 0.05 | % | | | — | | | | — | |
| | 8 | | Organization costs were not annualized in the calculation of the expense ratios. If these expenses were annualized, the total expenses would have been 1.75%. |
See Notes to Financial Statements.
| | | | | | |
| | | BLACKROCK FUNDS | | JANUARY 31, 2016 | | 81 |
| | |
| Financial Highlights (continued) | | BlackRock Global Long/Short Credit Fund |
| | | | | | | | | | | | | | | | | | | | |
| | | Investor A | |
| | | Six Months
Ended
January 31, 2016 | | |
Year Ended July 31, | | | Period
September 30, 20111 to | |
| | | (Unaudited) | | | 2015 | | | 2014 | | | 2013 | | | July 31, 2012 | |
| | | | | | | | | | | | | | | | | | | | |
| Per Share Operating Performance | | | | | | | | | | | | | | | | | | | | |
Net asset value, beginning of period | | $ | 10.48 | | | $ | 10.93 | | | $ | 10.61 | | | $ | 10.30 | | | $ | 10.00 | |
| | | | |
Net investment income2 | | | 0.12 | | | | 0.25 | | | | 0.16 | | | | 0.12 | | | | 0.06 | |
Net realized and unrealized gain (loss) | | | (0.41 | ) | | | (0.27 | ) | | | 0.27 | | | | 0.42 | | | | 0.28 | |
| | | | |
Net increase (decrease) from investment operations | | | (0.29 | ) | | | (0.02 | ) | | | 0.43 | | | | 0.54 | | | | 0.34 | |
| | | | |
Distributions from:3 | | | | | | | | | | | | | | | | | | | | |
Net investment income | | | (0.48 | ) | | | (0.31 | ) | | | (0.11 | ) | | | (0.11 | ) | | | (0.03 | ) |
Net realized gain | | | — | | | | (0.12 | ) | | | — | | | | (0.11 | ) | | | (0.01 | ) |
Return of capital | | | — | | | | — | | | | — | | | | (0.01 | ) | | | — | |
| | | | |
Total distributions | | | (0.48 | ) | | | (0.43 | ) | | | (0.11 | ) | | | (0.23 | ) | | | (0.04 | ) |
| | | | |
Net asset value, end of period | | $ | 9.71 | | | $ | 10.48 | | | $ | 10.93 | | | $ | 10.61 | | | $ | 10.30 | |
| | | | |
| | | | | | | | | | | | | | | | | | | | |
| Total Return4 | | | | | | | | | | | | | | | | | | | | |
Based on net asset value | | | (2.85 | )%5 | | | (0.10 | )% | | | 4.09 | % | | | 5.23 | % | | | 3.32 | %5 |
| | | | |
| | | | | | | | | | | | | | | | | | | | |
| Ratios to Average Net Assets | | | | | | | | | | | | | | | | | | | | |
Total expenses6 | | | 2.16 | %7 | | | 1.98 | % | | | 1.91 | % | | | 1.79 | % | | | 1.93 | %7,8 |
| | | | |
Total expenses excluding recoupment of past waived and/or reimbursed fees6 | | | 2.16 | %7 | | | 1.98 | % | | | 1.91 | % | | | 1.77 | % | | | 1.93 | %7,8 |
| | | | |
Total expenses after fees waived and/or reimbursed6 | | | 2.16 | %7 | | | 1.98 | % | | | 1.89 | % | | | 1.75 | % | | | 1.66 | %7 |
| | | | |
Total expenses after fees waived, reimbursed and excluding interest and dividend expense6 | | | 1.35 | %7 | | | 1.33 | % | | | 1.32 | % | | | 1.40 | % | | | 1.39 | %7 |
| | | | |
Net investment income6 | | | 2.29 | %7 | | | 2.36 | % | | | 1.48 | % | | | 1.11 | % | | | 0.67 | %7 |
| | | | |
| | | | | | | | | | | | | | | | | | | | |
| Supplemental Data | | | | | | | | | | | | | | | | | | | | |
Net assets, end of period (000) | | $ | 644,031 | | | $ | 1,032,811 | | | $ | 1,575,812 | | | $ | 910,247 | | | $ | 71,053 | |
| | | | |
Portfolio turnover rate | | | 69 | % | | | 211 | % | | | 207 | % | | | 185 | % | | | 355 | % |
| | | | |
| | 1 | | Commencement of operations. |
| | 2 | | Based on average shares outstanding. |
| | 3 | | Distributions for annual periods determined in accordance with federal income tax regulations. |
| | 4 | | Where applicable, excludes the effects of any sales charges and assumes the reinvestment of distributions. |
| | 5 | | Aggregate total return. |
| | 6 | | Excludes expenses incurred indirectly as a result of investments in underlying funds as follows: |
| | | | | | | | | | | | | | | | | | | | |
| | | Six Months
Ended
January 31, 2016 (Unaudited) | | | Year Ended July 31, | | | Period
September 30,
20111 to July 31, 2012 | |
| | | | 2015 | | | 2014 | | | 2013 | | |
Investments in underlying funds | | | 0.01 | % | | | — | | | | 0.05 | % | | | — | | | | — | |
| | 8 | | Organization costs were not annualized in the calculation of the expense ratios. If these expenses were annualized, the total expenses would have been 1.93%. |
See Notes to Financial Statements.
| | | | | | |
| 82 | | BLACKROCK FUNDS | | JANUARY 31, 2016 | | |
| | |
| Financial Highlights (concluded) | | BlackRock Global Long/Short Credit Fund |
| | | | | | | | | | | | | | | | | | | | |
| | | Investor C | |
| | | Six Months
Ended
January 31, 2016 | | |
Year Ended July 31, | | | Period
September 30, 20111 to | |
| | | (Unaudited) | | | 2015 | | | 2014 | | | 2013 | | | July 31, 2012 | |
| | | | | | | | | | | | | | | | | | | | |
| Per Share Operating Performance | | | | | | | | | | | | | | | | | | | | |
Net asset value, beginning of period | | $ | 10.38 | | | $ | 10.87 | | | $ | 10.56 | | | $ | 10.26 | | | $ | 10.00 | |
| | | | |
Net investment income (loss)2 | | | 0.08 | | | | 0.17 | | | | 0.08 | | | | 0.04 | | | | (0.01 | ) |
Net realized and unrealized gain (loss) | | | (0.41 | ) | | | (0.26 | ) | | | 0.27 | | | | 0.41 | | | | 0.29 | |
| | | | |
Net increase (decrease) from investment operations | | | (0.33 | ) | | | (0.09 | ) | | | 0.35 | | | | 0.45 | | | | 0.28 | |
| | | | |
Distributions from:3 | | | | | | | | | | | | | | | | | | | | |
Net investment income | | | (0.43 | ) | | | (0.28 | ) | | | (0.04 | ) | | | (0.03 | ) | | | (0.01 | ) |
Net realized gain | | | — | | | | (0.12 | ) | | | — | | | | (0.11 | ) | | | (0.01 | ) |
Return of capital | | | — | | | | — | | | | — | | | | (0.01 | ) | | | — | |
| | | | |
Total distributions | | | (0.43 | ) | | | (0.40 | ) | | | (0.04 | ) | | | (0.15 | ) | | | (0.02 | ) |
| | | | |
Net asset value, end of period | | $ | 9.62 | | | $ | 10.38 | | | $ | 10.87 | | | $ | 10.56 | | | $ | 10.26 | |
| | | | |
| | | | | | | | | | | | | | | | | | | | |
| Total Return4 | | | | | | | | | | | | | | | | | | | | |
Based on net asset value | | | (3.25 | )%5 | | | (0.82 | )% | | | 3.31 | % | | | 4.39 | % | | | 2.79 | %5 |
| | | | |
| | | | | | | | | | | | | | | | | | | | |
| Ratios to Average Net Assets | | | | | | | | | | | | | | | | | | | | |
Total expenses6 | | | 2.89 | %7 | | | 2.72 | % | | | 2.63 | % | | | 2.50 | % | | | 2.66 | %7,8 |
| | | | |
Total expenses excluding recoupment of past waived and/or reimbursed fees6 | | | 2.89 | %7 | | | 2.72 | % | | | 2.63 | % | | | 2.48 | % | | | 2.66 | %7,8 |
| | | | |
Total expenses after fees waived and/or reimbursed6 | | | 2.88 | %7 | | | 2.72 | % | | | 2.62 | % | | | 2.47 | % | | | 2.40 | %7 |
| | | | |
Total expenses after fees waived, reimbursed and excluding interest and dividend expense6 | | | 2.07 | %7 | | | 2.07 | % | | | 2.05 | % | | | 2.12 | % | | | 2.14 | %7 |
| | | | |
Net investment income (loss)6 | | | 1.55 | %7 | | | 1.64 | % | | | 0.76 | % | | | 0.39 | % | | | (0.16 | )%7 |
| | | | |
| | | | | | | | | | | | | | | | | | | | |
| Supplemental Data | | | | | | | | | | | | | | | | | | | | |
Net assets, end of period (000) | | $ | 277,441 | | | $ | 342,148 | | | $ | 390,031 | | | $ | 156,619 | | | $ | 13,132 | |
| | | | |
Portfolio turnover rate | | | 69 | % | | | 211 | % | | | 207 | % | | | 185 | % | | | 355 | % |
| | | | |
| | 1 | | Commencement of operations. |
| | 2 | | Based on average shares outstanding. |
| | 3 | | Distributions for annual periods determined in accordance with federal income tax regulations. |
| | 4 | | Where applicable, excludes the effects of any sales charges and assumes the reinvestment of distributions. |
| | 5 | | Aggregate total return. |
| | 6 | | Excludes expenses incurred indirectly as a result of investments in underlying funds as follows: |
| | | | | | | | | | | | | | | | | | | | |
| | | Six Months
Ended
January 31, 2016 (Unaudited) | | | Year Ended July 31, | | | Period
September 30,
20111 to July 31, 2012 | |
| | | | 2015 | | | 2014 | | | 2013 | | |
Investments in underlying funds | | | 0.01 | % | | | — | | | | 0.05 | % | | | — | | | | — | |
| | 8 | | Organization costs were not annualized in the calculation of the expense ratios. If these expenses were annualized, the total expenses would have been 2.66%. |
See Notes to Financial Statements.
| | | | | | |
| | | BLACKROCK FUNDS | | JANUARY 31, 2016 | | 83 |
| | | | |
| Consolidated Financial Highlights | | | BlackRock Macro Themes Fund | |
| | | | | | | | | | | | | | | | | | | | | | | | |
| | | Institutional | | | Investor A | | | Investor C | |
| | | Six Months
Ended
January 31,
2016
(Unaudited) | | | Period
December 4,
20141 to
July 31,
2015 | | | Six Months
Ended
January 31,
2016
(Unaudited) | | | Period
December 4,
20141
to July 31,
2015 | | | Six Months
Ended
January 31,
2016
(Unaudited) | | | Period
December 4,
20141
to July 31,
2015 | |
| | | | | | | | | | | | | | | | | | | | | | | | |
| Per Share Operating Performance | | | | | | | | | | | | | | | | | | | | | | | | |
Net asset value, beginning of period | | $ | 10.01 | | | $ | 10.00 | | | $ | 9.99 | | | $ | 10.00 | | | $ | 9.95 | | | $ | 10.00 | |
| | | | |
Net investment income (loss)2 | | | (0.05 | ) | | | 0.03 | | | | (0.11 | ) | | | 0.01 | | | | (0.09 | ) | | | (0.04 | ) |
Net realized and unrealized loss | | | (0.59 | ) | | | (0.01 | ) | | | (0.53 | ) | | | (0.01 | ) | | | (0.59 | ) | | | (0.01 | ) |
| | | | |
Net increase (decrease) from investment operations | | | (0.64 | ) | | | 0.02 | | | | (0.64 | ) | | | — | | | | (0.68 | ) | | | (0.05 | ) |
| | | | |
Distributions from net investment income | | | (0.36 | ) | | | (0.01 | ) | | | (0.36 | ) | | | (0.01 | ) | | | (0.26 | ) | | | (0.00 | )3 |
| | | | |
Net asset value, end of period | | $ | 9.01 | | | $ | 10.01 | | | $ | 8.99 | | | $ | 9.99 | | | $ | 9.01 | | | $ | 9.95 | |
| | | | |
| | | | | | | | | | | | | | | | | | | | | | | | |
| Total Returns4,5 | | | | | | | | | | | | | | | | | | | | | | | | |
Based on net asset value | | | (6.47 | )% | | | 0.23 | %6 | | | (6.55 | )% | | | 0.00 | %6 | | | (6.88 | )% | | | (0.49 | )%6 |
| | | | | | | | | | | | | | | | | | | | | | | | |
| Ratios to Average Net Assets | | | | | | | | | | | | | | | | | | | | | | | | |
Total expenses7,8 | | | 1.84 | %9 | | | 2.72 | %10 | | | 2.20 | %9 | | | 3.28 | %10 | | | 3.09 | %9 | | | 4.02 | %10 |
| | | | |
Total expenses after fees waived and/or reimbursed7,8 | | | 1.20 | % | | | 1.20 | % | | | 1.45 | % | | | 1.45 | % | | | 2.20 | % | | | 2.20 | % |
| | | | |
Net investment income (loss)7,8 | | | (0.97 | )% | | | 0.41 | % | | | (2.31 | )% | | | 0.16 | % | | | (1.98 | )% | | | (0.59 | )% |
| | | | |
| | | | | | | | | | | | | | | | | | | | | | | | |
| Supplemental Data | | | | | | | | | | | | | | | | | | | | | | | | |
Net assets, end of period (000) | | $ | 27,010 | | | $ | 29,991 | | | $ | 117 | | | $ | 26 | | | $ | 23 | | | $ | 25 | |
| | | | |
Portfolio turnover rate | | | 54 | % | | | 68 | % | | | 54 | % | | | 68 | % | | | 54 | % | | | 68 | % |
| | | | |
| | 1 | | Commencement of operations. |
| | 2 | | Based on average shares outstanding. |
| | 3 | | Amount is greater than $(0.005) per share. |
| | 4 | | Where applicable, excludes the effects of any sales charges and assumes the reinvestment of distributions. |
| | 5 | | Aggregate total return. |
| | 6 | | For financial reporting purposes, the market value of a variance swap was adjusted as of report date. Accordingly, the net asset value (“NAV”) per share and total return performance presented herein are different than the information previously published on July 31, 2015. |
| | 7 | | Excludes expenses incurred indirectly as a result of investments in underlying funds as follows: |
| | | | |
| | | Six Months
Ended
January 31,
2016
(Unaudited) | | Period
December 4,
20141
to July 31, 2015 |
| Investments in underlying funds | | 0.06% | | 0.10% |
| | 9 | | Offering costs were not annualized in the calculation of the expense ratios. If these expenses were annualized, the total expenses for Institutional, Investor A and Investor C would have been 2.12%, 2.36% and 3.37%, respectively. |
| | 10 | | Organization and offering costs were not annualized in the calculation of the expense ratios. If these expenses were annualized, the total expenses for Institutional, Investor A and Investor C would have been 2.87%, 3.44% and 4.18%, respectively. |
See Notes to Financial Statements.
| | | | | | |
| 84 | | BLACKROCK FUNDS | | JANUARY 31, 2016 | | |
| | |
| Notes to Financial Statements (Unaudited) | | |
1. Organization:
BlackRock FundsSM (the “Trust”) is registered under the Investment Company Act of 1940, as amended (the “1940 Act”), as an open-end management investment company. The Trust is organized as a Massachusetts business trust. The following are referred to herein collectively as the “Funds” or individually, a “Fund”:
| | | | |
| Fund Name | | Herein Referred To As | | Diversification Classification |
BlackRock Commodity Strategies Fund | | Commodity Strategies | | Non-diversified |
BlackRock Global Long/Short Credit Fund | | Global Long/Short Credit | | Diversified |
BlackRock Macro Themes Fund | | Macro Themes | | Non-diversified |
Each Fund offers multiple classes of shares. All classes of shares have identical voting, dividend, liquidation and other rights and are subject to the same terms and conditions, except that certain classes bear expenses related to the shareholder servicing and distribution of such shares. Institutional Shares are sold only to certain eligible investors. Investor A and Investor C Shares are generally available through financial intermediaries. Each class has exclusive voting rights with respect to matters relating to its shareholder servicing and distribution expenditures.
| | | | | | | | | | | | | | | |
| Share Class | | Initial Sales Charge | | CDSC | | Conversion Privilege |
Institutional Shares | | | | No | | | | | No | | | | | None | |
Investor A Shares | | | | Yes | | | | | No | 1 | | | | None | |
Investor C Shares | | | | No | | | | | Yes | | | | | None | |
| | 1 | | Investor A Shares may be subject to a contingent deferred sales charge (“CDSC”) for certain redemptions where no initial sales charge was paid at the time of purchase. |
The Funds, together with certain other registered investment companies advised by the BlackRock Advisors, LLC (the “Manager”) or its affiliates, are included in a complex of open-end funds referred to as the Equity-Liquidity Complex.
Basis of Consolidation: The accompanying consolidated financial statements of Commodity Strategies and Macro Themes include the accounts of BlackRock Cayman Commodity Strategies Fund, Ltd. (“Cayman Commodity Strategies”) and BlackRock Cayman Macro Themes Fund, Ltd. (“Cayman Macro Themes”) (the “Subsidiaries”), respectively, which are wholly owned subsidiaries of each respective Fund and primarily invest in commodity-related instruments and other derivatives. The Subsidiaries enable the Funds to hold these commodity-related instruments and other derivatives and satisfy regulated investment company tax requirements. Each Fund may invest up to 25% of its total assets in its respective Subsidiary. The accompanying Consolidated Schedules of Investments and consolidated financial statements of each Fund include the positions and accounts, respectively, of its Subsidiary. The net assets of Cayman Commodity Strategies at January 31, 2016 were $1 representing 0.0% of Commodity Strategies’ consolidated net assets. The net assets of Cayman Macro Themes at January 31, 2016 were $5,896,449 representing 21.7% of Macro Themes’ consolidated net assets. Intercompany accounts and transactions, if any, have been eliminated. The Subsidiaries are subject to the same investment policies and restrictions that apply to the Funds, except that the Subsidiaries may invest without limitation in commodity-related instruments.
The following table shows a summary of the selected financial information of Cayman Macro Themes included in the consolidated financial statements:
| | | | |
| Consolidated Statements of Assets and Liabilities | | | | |
Total assets | | $ | 6,865,820 | |
Total liabilities | | | (969,371 | ) |
| | | | |
Net assets | | $ | 5,896,449 | |
| Consolidated Statements of Operations | | | | |
Net investment income | | $ | 3,393 | |
Net realized gain (loss) from: | | | | |
Investments — unaffiliated | | | (10,448 | ) |
Financial futures contracts | | | (363,463 | ) |
Foreign currency transactions | | | (17,652 | ) |
Options written | | | 238,154 | |
Swaps | | | (221,346 | ) |
| | | | |
| | | (374,755 | ) |
| | | | |
| | | | | | |
| | | BLACKROCK FUNDS | | JANUARY 31, 2016 | | 85 |
| | |
| Notes to Financial Statements (continued) | | |
| | | | |
Net change in unrealized appreciation (depreciation) on: | | | | |
Investments — unaffiliated | | $ | 144,532 | |
Financial futures contracts | | | (311,977 | ) |
Foreign currency transactions | | | (9,136 | ) |
Options written | | | (232,782 | ) |
Swaps | | | (638,515 | ) |
| | | | |
| | | (1,047,878 | ) |
| | | | |
Net realized and unrealized gain (loss) | | | (1,422,633 | ) |
| | | | |
Net decrease in net assets resulting from operations | | $ | (1,419,240 | ) |
| Consolidated Statements of Changes in Net Assets | | | | |
Net investment income | | $ | 3,393 | |
Net realized loss | | | (374,755 | ) |
Net change in unrealized appreciation (depreciation) | | | (1,047,878 | ) |
| | | | |
Net decrease in net assets resulting from operations | | $ | (1,419,240 | ) |
2. Significant Accounting Policies:
The financial statements are prepared in conformity with accounting principles generally accepted in the United States of America (“U.S. GAAP”), which may require management to make estimates and assumptions that affect the reported amounts of assets and liabilities in the financial statements, disclosure of contingent assets and liabilities at the date of the financial statements and the reported amounts of increases and decreases in net assets from operations during the reporting period. Actual results could differ from those estimates. Each Fund is considered an investment company under U.S. GAAP and follows the accounting and reporting guidance applicable to investment companies. Below is a summary of significant accounting policies:
Foreign Currency: Each Fund’s books and records are maintained in U.S. dollars. Purchases and sales of investments are recorded at the rates of exchange prevailing on the respective dates of such transactions. Generally, when the U.S. dollar rises in value against a foreign currency, the investments denominated in that currency will lose value; the opposite effect occurs if the U.S. dollar falls in relative value.
Each Fund does not isolate changes in the exchange rates from the changes in the market prices of investments held or sold for financial reporting purposes. Accordingly, the effects of changes in exchange rates on investments are not segregated in the Statements of Operations from the effects of changes in market prices of those investments, but are included as a component of net realized and unrealized gain (loss) from investments. Each Fund reports realized currency gains (losses) on foreign currency related transactions are reported as components of net realized gain (loss) for financial reporting purposes, whereas such components are generally treated as ordinary income for federal income tax purposes.
Defensive Positions: Investment policies may vary for temporary defensive purposes during periods in which the investment advisor believes that conditions in the securities markets or other economic, financial or political conditions warrant. Under such conditions, a Fund may invest up to 100% of its total assets in, U.S. Government securities, certificates of deposit, repurchase agreements that involve purchases of debt securities, bankers’ acceptances and other bank obligations, commercial paper, money market funds and/or other debt securities, or may hold its assets in cash. The investment advisor applies this defensive posture as applicable and consistent with each Fund prospectus.
Segregation and Collateralization: In cases where a Fund enters into certain investments (e.g., financial futures contracts, forward foreign currency exchange contracts, options written, swaps and short sales) or certain borrowings (e.g., reverse repurchase transactions) that would be treated as “senior securities” for 1940 Act purposes, a Fund may segregate or designate on its books and records cash or liquid assets having a market value at least equal to the amount of its future obligations under such investments or borrowings. Doing so allows the investment or borrowing to be excluded from treatment as a “senior security.” Furthermore, if required by an exchange or counterparty agreement, the Funds may be required to deliver/ deposit cash and/or securities to/with an exchange, or broker-dealer or custodian as collateral for certain investments or obligations.
Investment Transactions and Investment Income: For financial reporting purposes, investment transactions are recorded on the dates the transactions are entered into (the trade dates). Realized gains and losses on investment transactions are determined on the identified cost basis. Dividend income is recorded on the ex-dividend date. Dividends from foreign securities where the ex-dividend date may have passed are subsequently recorded when the Funds are informed of the ex-dividend date. Under the applicable foreign tax laws, a withholding tax at various rates may be imposed on capital gains, dividends and interest. Upon notification from issuers, some of the dividend income received from a real estate investment trust may be redesignated as a reduction of cost of the related investment and/or realized gain. Interest income, including amortization and accretion of premiums and discounts on debt securities, is recognized on the accrual basis. Income, expenses and realized and unrealized gains and losses are allocated daily to each class based on its relative net assets.
Distributions: Distributions paid by the Funds are recorded on the ex-dividend date. The character and timing of distributions are determined in accordance with federal income tax regulations, which may differ from U.S. GAAP.
| | | | | | |
| 86 | | BLACKROCK FUNDS | | JANUARY 31, 2016 | | |
| | |
| Notes to Financial Statements (continued) | | |
Net income and realized gains from investments held by the Subsidiaries are treated as ordinary income for tax purposes. If a net loss is realized by the Subsidiaries in any taxable year, the loss will generally not be available to offset the Funds’ ordinary income and/or capital gains for that year.
Offering Costs: Offering costs are amortized over a 12-month period beginning with the commencement of operations.
Indemnifications: In the normal course of business, the Funds enter into contracts that contain a variety of representations that provide general indemnification. The Funds’ maximum exposure under these arrangements is unknown because it involves future potential claims against the Funds, which cannot be predicted with any certainty.
Other: Expenses directly related to a Fund or its classes are charged to that Fund or the applicable class. Other operating expenses shared by several funds, including other funds managed by the Manager, are prorated among those funds on the basis of relative net assets or other appropriate methods. Expenses directly related to the Funds and other shared expenses prorated to the Funds are allocated daily to each class based on its relative net assets or other appropriate methods.
The Funds have an arrangement with their custodian whereby fees may be reduced by credits earned on uninvested cash balances, which, if applicable, are shown as fees paid indirectly in the Statements of Operations. The custodian imposes fees on overdrawn cash balances, which can be offset by accumulated credits earned or may result in additional custody charges.
3. Investment Valuation and Fair Value Measurements:
Investment Valuation Policies: The Funds’ investments are valued at fair value (also referred to as “market value” within the financial statements) as of the close of trading on the New York Stock Exchange (“NYSE”) (generally 4:00 p.m., Eastern time) (or if the reporting date falls on a day the NYSE is closed, investments are valued at fair value as of the report date). U.S. GAAP defines fair value as the price the Funds would receive to sell an asset or pay to transfer a liability in an orderly transaction between market participants at the measurement date. The Funds determine the fair values of their financial instruments using independent dealers or pricing services under policies approved by the Board of Trustees of the Trust (the “Board”). The BlackRock Global Valuation Methodologies Committee (the “Global Valuation Committee”) is the committee formed by management to develop global pricing policies and procedures and to provide oversight of the pricing function for the Funds for all financial instruments.
Fair Value Inputs and Methodologies: The following methods (or “techniques”) and inputs are used to establish the fair value of each Fund’s assets and liabilities:
| • | | Equity investments traded on a recognized securities exchange are valued at the official close price each day, if available. For equity investments traded on more than one exchange, the official close price on the exchange where the stock is primarily traded is used. Equity investments traded on a recognized exchange for which there were no sales on that day may be valued at the last available bid (long positions) or ask (short positions) price. |
| • | | Bond investments are valued on the basis of last available bid prices or current market quotations provided by dealers or pricing services. Floating rate loan interests are valued at the mean of the bid prices from one or more brokers or dealers as obtained from a pricing service. In determining the value of a particular investment, pricing services may use certain information with respect to transactions in such investments, quotations from dealers, pricing matrixes, market transactions in comparable investments, various relationships observed in the market between investments and calculated yield measures. Asset-backed and mortgage-backed securities are valued by independent pricing services using models that consider estimated cash flows of each tranche of the security, establish a benchmark yield and develop an estimated tranche-specific spread to the benchmark yield based on the unique attributes of the tranche. |
| • | | Generally, trading in foreign instruments is substantially completed each day at various times prior to the close of business on the NYSE. Occasionally, events affecting the values of such instruments may occur between the foreign market close and the close of business on the NYSE that may not be reflected in the computation of the Funds’ net assets. Each business day, the Funds use a pricing service to assist with the valuation of certain foreign exchange-traded equity securities and foreign exchange-traded and OTC options (the “Systematic Fair Value Price”). Using current market factors, the Systematic Fair Value Price is designed to value such foreign securities and foreign options at fair value as of the close of business on the NYSE, which follows the close of the local markets. |
| • | | Commodity-Linked Notes are valued utilizing quotes received daily by the Funds’ pricing service or through brokers. The Funds’ pricing service utilizes valuation models, which incorporate a number of transaction specific data factors, such as the performance return multiple and upfront interest paid, as well as the price of the underlying index. |
| • | | Investments in open-end U.S. mutual funds are valued at net asset value each business day. |
| | | | | | |
| | | BLACKROCK FUNDS | | JANUARY 31, 2016 | | 87 |
| | |
| Notes to Financial Statements (continued) | | |
| • | | The Funds value their investment in BlackRock Liquidity Series, LLC, Money Market Series (the “Money Market Series”) at fair value, which is ordinarily based upon its pro rata ownership in the underlying fund’s net assets. The Money Market Series seeks current income consistent with maintaining liquidity and preserving capital. Although the Money Market Series is not registered under the 1940 Act, its investments will follow the parameters of investments by a money market fund that is subject to Rule 2a-7 under the 1940 Act. The Funds may withdraw up to 25% of their investment daily, although the manager of the Money Market Series, in its sole discretion, may permit an investor to withdraw more than 25% on any one day. |
| • | | Financial futures contracts traded on exchanges are valued at their last sale price. |
| • | | Securities and other assets and liabilities denominated in foreign currencies are translated into U.S. dollars using exchange rates determined as of the close of business on the NYSE. Forward foreign currency exchange contracts are valued at the mean between the bid and ask prices and are determined as of the close of business on the NYSE. Interpolated values are derived when the settlement date of the contract is an interim date for which quotations are not available. |
| • | | Exchange-traded options are valued at the mean between the last bid and ask prices at the close of the options market in which the options trade. An exchange-traded option for which there is no mean price is valued at the last bid (long positions) or ask (short positions) price. If no bid or ask price is available, the prior day’s price will be used, unless it is determined that the prior day’s price no longer reflects the fair value of the option. OTC options and options on swaps (“swaptions”) are valued by an independent pricing service using a mathematical model, which incorporates a number of market data factors, such as the trades and prices of the underlying instruments. |
| • | | Swap agreements are valued utilizing quotes received daily by the Funds’ pricing service or through brokers, which are derived using daily swap curves and models that incorporate a number of market data factors, such as discounted cash flows, trades and values of the underlying reference instruments. |
If events (e.g., a company announcement, market volatility or a natural disaster) occur that are expected to materially affect the value of such instruments, or in the event that the application of these methods of valuation results in a price for an investment that is deemed not to be representative of the market value of such investment, or if a price is not available, the investment will be valued by the Global Valuation Committee, or its delegate, in accordance with a policy approved by the Board as reflecting fair value (“Fair Valued Investments”). When determining the price for Fair Valued Investments, the Global Valuation Committee, or its delegate, seeks to determine the price that each Fund might reasonably expect to receive or pay from the current sale or purchase of that asset or liability in an arm’s-length transaction. Fair value determinations shall be based upon all available factors that the Global Valuation Committee, or its delegate, deems relevant consistent with the principles of fair value measurement, which include the market approach, income approach and/or in the case of recent investments, the cost approach, as appropriate. The market approach generally consists of using comparable market transactions. The income approach generally is used to discount future cash flows to present value and is adjusted for liquidity as appropriate. These factors include but are not limited to: (i) attributes specific to the investment or asset; (ii) the principal market for the investment or asset; (iii) the customary participants in the principal market for the investment or asset; (iv) data assumptions by market participants for the investment or asset, if reasonably available; (v) quoted prices for similar investments or assets in active markets; and (vi) other factors, such as future cash flows, interest rates, yield curves, volatilities, prepayment speeds, loss severities, credit risks, recovery rates, liquidation amounts and/or default rates. Due to the inherent uncertainty of valuations of such investments, the fair values may differ from the values that would have been used had an active market existed. The Global Valuation Committee, or its delegate, employs various methods for calibrating valuation approaches for investments where an active market does not exist, including regular due diligence of each Fund’s pricing vendors, regular reviews of key inputs and assumptions, transactional back-testing or disposition analysis to compare unrealized gains and losses to realized gains and losses, reviews of missing or stale prices and large movements in market values and reviews of any market related activity. The pricing of all Fair Valued Investments is subsequently reported to the Board or a committee thereof on a quarterly basis.
Fair Value Hierarchy: Various inputs are used in determining the fair value of investments and derivative financial instruments. These inputs to valuation techniques are categorized into a fair value hierarchy consisting of three broad levels for financial statement purposes as follows:
| | • | | Level 1 — unadjusted price quotations in active markets/exchanges for identical assets or liabilities that each Fund has the ability to access |
| | • | | Level 2 — other observable inputs (including, but not limited to, quoted prices for similar assets or liabilities in markets that are active, quoted prices for identical or similar assets or liabilities in markets that are not active, inputs other than quoted prices that are observable for the assets or liabilities (such as interest rates, yield curves, volatilities, prepayment speeds, loss severities, credit risks and default rates) or other market–corroborated inputs) |
| | • | | Level 3 — unobservable inputs based on the best information available in the circumstances, to the extent observable inputs are not available (including each Fund’s own assumptions used in determining the fair value of investments and derivative financial instruments) |
The hierarchy gives the highest priority to unadjusted quoted prices in active markets for identical assets or liabilities (Level 1 measurements) and the lowest priority to unobservable inputs (Level 3 measurements). Accordingly, the degree of judgment exercised in determining fair value is greatest for instruments categorized in Level 3. The inputs used to measure fair value may fall into different levels of the fair value hierarchy. In such cases, for
| | | | | | |
| 88 | | BLACKROCK FUNDS | | JANUARY 31, 2016 | | |
| | |
| Notes to Financial Statements (continued) | | |
disclosure purposes, the fair value hierarchy classification is determined based on the lowest level input that is significant to the fair value measurement in its entirety. The significant unobservable inputs used by the Global Valuation Committee in determining the price for Fair Valued Investments are typically categorized as Level 3. The fair value hierarchy for each Fund’s investments and derivative financial instruments have been included in the Schedules of Investments.
Changes in valuation techniques may result in transfers into or out of an assigned level within the hierarchy. In accordance with each Fund’s policy, transfers between different levels of the fair value hierarchy are deemed to have occurred as of the beginning of the reporting period. The categorization of a value determined for investments and derivative financial instruments is based on the pricing transparency of the investments and derivative financial instruments and is not necessarily an indication of the risks associated with investing in those securities.
4. Securities and Other Investments:
Asset-Backed and Mortgage-Backed Securities: Asset-backed securities are generally issued as pass-through certificates or as debt instruments. Asset-backed securities issued as pass-through certificates represent undivided fractional ownership interests in an underlying pool of assets. Asset-backed securities issued as debt instruments, which are also known as collateralized obligations, are typically issued as the debt of a special purpose entity organized solely for the purpose of owning such assets and issuing such debt. Asset-backed securities are often backed by a pool of assets representing the obligations of a number of different parties. The yield characteristics of certain asset-backed securities may differ from traditional debt securities. One such major difference is that all or a principal part of the obligations may be prepaid at any time because the underlying assets (i.e., loans) may be prepaid at any time. As a result, a decrease in interest rates in the market may result in increases in the level of prepayments as borrowers, particularly mortgagors, refinance and repay their loans. An increased prepayment rate with respect to an asset-backed security will have the effect of shortening the maturity of the security. In addition, a Fund may subsequently have to reinvest the proceeds at lower interest rates. If a Fund has purchased such an asset-backed security at a premium, a faster than anticipated prepayment rate could result in a loss of principal to the extent of the premium paid.
For mortgage pass-through securities (the “Mortgage Assets”) there are a number of important differences among the agencies and instrumentalities of the U.S. Government that issue mortgage-related securities and among the securities that they issue. For example, mortgage-related securities guaranteed by Ginnie Mae are guaranteed as to the timely payment of principal and interest by Ginnie Mae and such guarantee is backed by the full faith and credit of the United States. However, mortgage-related securities issued by Freddie Mac and Fannie Mae, including Freddie Mac and Fannie Mae guaranteed mortgage pass-through certificates, which are solely the obligations of Freddie Mac and Fannie Mae, are not backed by or entitled to the full faith and credit of the United States, but are supported by the right of the issuer to borrow from the U.S. Treasury.
Non-agency mortgage-backed securities are securities issued by non-governmental issuers and have no direct or indirect government guarantees of payment and are subject to various risks. Non-agency mortgage loans are obligations of the borrowers thereunder only and are not typically insured or guaranteed by any other person or entity. The ability of a borrower to repay a loan is dependent upon the income or assets of the borrower. A number of factors, including a general economic downturn, acts of God, terrorism, social unrest and civil disturbances, may impair a borrower’s ability to repay its loans.
Collateralized Debt Obligations: Collateralized debt obligations (“CDOs”), include collateralized bond obligations (“CBOs”) and collateralized loan obligations (“CLOs”), are types of asset-backed securities. A CDO is an entity that is backed by a diversified pool of debt securities (CBOs) or syndicated bank loans (CLOs). The cash flows of the CDO can be split into multiple segments, called “tranches,” which will vary in risk profile and yield. The riskiest segment is the subordinated or “equity” tranche. This tranche bears the greatest risk of defaults from the underlying assets in the CDO and serves to protect the other, more senior, tranches from default in all but the most severe circumstances. Since it is shielded from defaults by the more junior tranches, a “senior” tranche will typically have higher credit ratings and lower yields than their underlying securities, and often receive investment grade ratings from one or more of the nationally recognized rating agencies. Despite the protection from the more junior tranches, senior tranches can experience substantial losses due to actual defaults, increased sensitivity to future defaults and the disappearance of one or more protecting tranches as a result of changes in the credit profile of the underlying pool of assets.
Inflation-Indexed Bonds: Inflation-indexed bonds are fixed income securities whose principal value is periodically adjusted according to the rate of inflation. If the index measuring inflation rises or falls, the principal value of inflation-indexed bonds will be adjusted upward or downward, and consequently the interest payable on these securities (calculated with respect to a larger or smaller principal amount) will be increased or reduced, respectively. Any upward or downward adjustment in the principal amount of an inflation-indexed bond will be included as interest income in the Statements of Operations, even though investors do not receive their principal until maturity. Repayment of the original bond principal upon maturity (as adjusted for inflation) is guaranteed in the case of U.S. Treasury inflation-indexed bonds. For bonds that do not provide a similar guarantee, the adjusted principal value of the bond repaid at maturity may be less than the original principal.
Multiple Class Pass-Through Securities: Multiple class pass-through securities, including collateralized mortgage obligations (“CMOs”) and commercial mortgage-backed securities may be issued by Ginnie Mae, U.S. Government agencies or instrumentalities or by trusts formed by private originators of,
| | | | | | |
| | | BLACKROCK FUNDS | | JANUARY 31, 2016 | | 89 |
| | |
| Notes to Financial Statements (continued) | | |
or investors in, mortgage loans. In general, CMOs are debt obligations of a legal entity that are collateralized by, a pool of residential or commercial mortgage loans or Mortgage Assets. The payments on these are used to make payments on the CMOs or multiple pass-through securities. Multiple class pass-through securities represent direct ownership interests in the Mortgage Assets. Classes of CMOs include interest only (“IOs”), principal only (“POs”), planned amortization classes and targeted amortization classes. IOs and POs are stripped mortgage-backed securities representing interests in a pool of mortgages, the cash flow from which has been separated into interest and principal components. IOs receive the interest portion of the cash flow while POs receive the principal portion. IOs and POs can be extremely volatile in response to changes in interest rates. As interest rates rise and fall, the value of IOs tends to move in the same direction as interest rates. POs perform best when prepayments on the underlying mortgages rise since this increases the rate at which the principal is returned and the yield to maturity on the PO. When payments on mortgages underlying a PO are slower than anticipated, the life of the PO is lengthened and the yield to maturity is reduced. If the underlying Mortgage Assets experience greater than anticipated prepayments of principal, a Fund’s initial investment in the IOs may not fully recoup.
Stripped Mortgage-Backed Securities: Stripped mortgage-backed securities issued by the U.S. Government, its agencies and instrumentalities. Stripped mortgage-backed securities are usually structured with two classes that receive different proportions of the interest (IOs) and principal (POs) distributions on a pool of Mortgage Assets. A Fund also may invest in stripped mortgage-backed securities that are privately issued.
Zero-Coupon Bonds: Zero-coupon bonds are normally issued at a significant discount from face value and do not provide for periodic interest payments. These may experience greater volatility in market value than other debt obligations of similar maturity which provide for regular interest payments.
Commodity-Linked Notes: Commodity-linked notes to provide exposure to the investment returns of the commodities markets, without investing directly in commodities. In a commodity-linked note, a Fund purchases a note and, in return, the issuer typically provides for an interest payment and a principal payment at maturity linked to the price movement of the underlying commodity index less an agreed-upon fee. These notes may be issued by U.S. and foreign banks, brokerage firms, insurance companies and other corporations. In addition to credit, interest rate and counterparty risk typically associated with traditional debt investments, commodity-linked notes are subject to risks affecting the underlying commodity index. The value of the commodity-linked notes may fluctuate by changes in overall market movements, volatility of the underlying benchmark, changes in interest rates or factors affecting a particular industry or commodity, such as drought, floods, weather, livestock disease, embargoes, tariffs and international economic, political and regulatory developments. The commodity-linked notes have an automatic redemption feature if the underlying index declines from the original trade date by the amount specified in the agreement. A Fund has the option to request prepayment from the issuer at any time.
Capital Securities and Trust Preferred Securities: Capital securities, including trust preferred securities, are typically issued by corporations, generally in the form of interest-bearing notes with preferred securities characteristics, or in the case of trust preferred securities, by an affiliated business trust of a corporation, generally in the form of beneficial interests in subordinated debentures or similarly structured securities. The securities can be structured as either fixed or adjustable coupon securities that can have either a perpetual or stated maturity date. For trust preferred securities, the issuing bank or corporation pays interest to the trust, which is then distributed to holders of the trust preferred securities as a dividend. Dividends can be deferred without creating an event of default or acceleration, although maturity cannot take place unless all cumulative payment obligations have been met. The deferral of payments does not affect the purchase or sale of these securities in the open market. Payments on these securities are treated as interest rather than dividends for federal income tax purposes. These securities generally are rated below that of the issuing company’s senior debt securities and are freely callable at the issuer’s option.
Preferred Stock: Preferred stock has a preference over common stock in liquidation (and generally in receiving dividends as well) but is subordinated to the liabilities of the issuer in all respects. As a general rule, the market value of preferred stock with a fixed dividend rate and no conversion element varies inversely with interest rates and perceived credit risk, while the market price of convertible preferred stock generally also reflects some element of conversion value. Because preferred stock is junior to debt securities and other obligations of the issuer, deterioration in the credit quality of the issuer will cause greater changes in the value of a preferred stock than in a more senior debt security with similar stated yield characteristics. Unlike interest payments on debt securities, preferred stock dividends are payable only if declared by the issuer’s board of directors. Preferred stock also may be subject to optional or mandatory redemption provisions.
Floating Rate Loan Interests: Floating rate loan interests are typically issued to companies (the “borrower”) by banks, other financial institutions, or privately and publicly offered corporations (the “lender”). Floating rate loan interests are generally non-investment grade, often involve borrowers whose financial condition is troubled or uncertain and companies that are highly leveraged. A Fund may invest in obligations of borrowers who are in bankruptcy proceedings. In addition, transactions in floating rate loan interests may settle on a delayed basis, which may result to proceeds from the sale to not be readily available for a Fund to make additional investments or meet its redemption obligations. Floating rate loan interests may include fully funded term loans or revolving lines of credit. Floating rate loan interests are typically senior in the corporate capital structure of the borrower. Floating rate loan interests generally pay interest at rates that are periodically determined by reference to a base lending rate plus a premium. The base lending rates are generally the lending rate offered by one or more European banks, such as the London Interbank Offered Rate (“LIBOR”), the prime rate offered by one or more U.S. banks or the certificate of deposit rate. Floating rate loan interests may involve foreign borrowers, and investments may be denominated in foreign currencies. These investments are treated as investments in debt securities for purposes of a Fund’s investment policies.
| | | | | | |
| 90 | | BLACKROCK FUNDS | | JANUARY 31, 2016 | | |
| | |
| Notes to Financial Statements (continued) | | |
When a Fund purchases a floating rate loan interest, it may receive a facility fee and when it sells a floating rate loan interest, it may pay a facility fee. On an ongoing basis, a Fund may receive a commitment fee based on the undrawn portion of the underlying line of credit amount of a floating rate loan interest. Facility and commitment fees are typically amortized to income over the term of the loan or term of the commitment, respectively. Consent and amendment fees are recorded to income as earned. Prepayment penalty fees, which may be received by a Fund upon the prepayment of a floating rate loan interest by a borrower, are recorded as realized gains. A Fund may invest in multiple series or tranches of a loan. A different series or tranche may have varying terms and carry different associated risks.
Floating rate loan interests are usually freely callable at the borrower’s option. A Fund may invest in such loans in the form of participations in loans (“Participations”) or assignments (“Assignments”) of all or a portion of loans from third parties. Participations typically will result in a Fund having a contractual relationship only with the lender, not with the borrower. A Fund has the right to receive payments of principal, interest and any fees to which it is entitled only from the lender selling the Participation and only upon receipt by the lender of the payments from the borrower. In connection with purchasing Participations, a Fund generally will have no right to enforce compliance by the borrower with the terms of the loan agreement, nor any rights of offset against the borrower. A Fund may not benefit directly from any collateral supporting the loan in which it has purchased the Participation. As a result, a Fund assumes the credit risk of both the borrower and the lender that is selling the Participation. A Fund’s investment in loan participation interests involves the risk of insolvency of the financial intermediaries who are parties to the transactions. In the event of the insolvency of the lender selling the Participation, a Fund may be treated as a general creditor of the lender and may not benefit from any offset between the lender and the borrower. Assignments typically result in a Fund having a direct contractual relationship with the borrower, and a Fund may enforce compliance by the borrower with the terms of the loan agreement.
In connection with floating rate loan interests, a Fund may also enter into unfunded floating rate loan interests (“commitments”). In connection with these commitments, Global Long/Short Credit earns a commitment fee, typically set as a percentage of the commitment amount. Such fee income, which is included in interest income in the Statements of Operations, is recognized ratably over the commitment period. Unfunded floating rate loan interests are marked-to-market daily, and any unrealized appreciation (depreciation) is included in the Statements of Assets and Liabilities and Statements of Operations. As of period end, Global Long/Short Credit had the following unfunded floating rate loan interests:
| | | | | | | | |
| Borrower | | Par | | Commitment
Balance | | Value | | Unrealized
Depreciation |
Telenet International Finance SA, Term Loan AA | | $9,610,000 | | $10,731,624 | | $10,097,001 | | $(634,623) |
Borrowed Bond Agreements: Certain Funds may enter into borrowed bond agreements. In a borrowed bond agreement, the Funds borrow a bond from a counterparty in exchange for cash collateral. The borrowed bond agreement contains a commitment that the security and the cash will be returned to the counterparty and the Funds at a mutually agreed upon date. Certain agreements have no stated maturity and can be terminated by either party at any time. Borrowed bond agreements are entered into primarily in connection with short sales of bonds. Earnings on cash collateral and compensation to the lender of the bond are based on agreed upon rates between the Funds and the counterparty. The value of the underlying cash collateral approximates the market value and accrued interest of the borrowed bond. To the extent that a borrowed bond transaction exceeds one business day, the value of the cash collateral in the possession of the counterparty is monitored on a daily basis to ensure the adequacy of the collateral. As the market value of the borrowed bond changes, the cash collateral is periodically increased or decreased with a frequency and in amounts prescribed in the borrowed bond agreement. The Funds may also experience delays in gaining access to the collateral.
Reverse Repurchase Agreements: Reverse repurchase agreements are agreements with qualified third party broker dealers in which a Fund sells securities to a bank or broker-dealer and agrees to repurchase the same securities at a mutually agreed upon date and price. A Fund receives cash from the sale to use for other investment purposes. During the term of the reverse repurchase agreement, a Fund continues to receive the principal and interest payments on the securities sold. Certain agreements have no stated maturity and can be terminated by either party at any time. Interest on the value of the reverse repurchase agreements issued and outstanding is based upon competitive market rates determined at the time of issuance. A Fund may utilize reverse repurchase agreements when it is anticipated that the interest income to be earned from the investment of the proceeds of the transaction is greater than the interest expense of the transaction. Reverse repurchase agreements involve leverage risk. If a Fund suffers a loss on its investment of the transaction proceeds from a reverse repurchase agreement, a Fund would still be required to pay the full repurchase price. Further, a Fund remains subject to the risk that the market value of the securities repurchased declines below the repurchase price. In such cases, a Fund would be required to return a portion of the cash received from the transaction or provide additional securities to the counterparty.
Cash received in exchange for securities delivered plus accrued interest due to the counterparty is recorded as a liability in the Statements of Assets and Liabilities at face value including accrued interest. Due to the short- term nature of the reverse repurchase agreements, face value approximates fair value. Interest payments made by a Fund to the counterparties are recorded as a component of interest expense in the Statements of Operations. In periods of increased demand for the security, a Fund may receive a fee for use of the security by the counterparty, which may result in interest income to a Fund.
| | | | | | |
| | | BLACKROCK FUNDS | | JANUARY 31, 2016 | | 91 |
| | |
| Notes to Financial Statements (continued) | | |
For the six months ended January 31, 2016, the average amount of reverse repurchase agreements outstanding and the daily weighted average interest rate for Global Long/Short Credit were $11,952,872 and (0.82)%, respectively.
Borrowed bond agreements and reverse repurchase transactions are entered into by the Funds under Master Repurchase Agreements (each, an “MRA”), which permit the Funds, under certain circumstances, including an event of default (such as bankruptcy or insolvency), to offset payables and/or receivables under the MRA with collateral held and/or posted to the counterparty and create one single net payment due to or from the Funds. With borrowed bond agreements and reverse repurchase transactions, typically the Funds and the counterparties are permitted to sell, re-pledge, or use the collateral associated with the transaction. Bankruptcy or insolvency laws of a particular jurisdiction may impose restrictions on or prohibitions against such a right of offset in the event of the MRA counterparty’s bankruptcy or insolvency. Pursuant to the terms of the MRA, the Funds receive or post securities as collateral with a market value in excess of the repurchase price to be paid or received by the Funds upon the maturity of the transaction. Upon a bankruptcy or insolvency of the MRA counterparty, the Funds are considered an unsecured creditor with respect to excess collateral and, as such, the return of excess collateral may be delayed.
As of period end, the following table is a summary of Global Long/Short Credit’s open borrowed bond agreements and reverse repurchase agreements by counterparty which are subject to offset under an MRA on a net basis:
| | | | | | | | | | | | | | | | | | | | | | | | | | | | | | | | | | | | | | | | |
| Counterparty | | Borrowed
Bond
Agreements1 | | Borrowed
Bonds at Value
including
Accrued
Interest2 | | Exposure Due (to) from
Counterparty before
Collateral | | Non-cash
Collateral
Received | | Cash
Collateral
Received | | Non-cash
Collateral
Pledged | | Net
Collateral
(Received)
Pledged | | Net Exposure
Due (to)/from
Counterparty3 |
Barclays Bank PLC | | | $ | 20,373,563 | | | | $ | (20,404,955 | ) | | | $ | (31,392 | ) | | | | — | | | | | — | | | | | — | | | | | — | | | | $ | (31,392 | ) |
Barclays Capital, Inc. | | | | 127,047,873 | | | | | (126,125,895 | ) | | | | 921,978 | | | | | — | | | | $ | (921,978 | ) | | | | — | | | | $ | (921,978 | ) | | | | — | |
BNP Paribas Securities Corp. | | | | 16,131,000 | | | | | (16,557,418 | ) | | | | (426,418 | ) | | | | — | | | | | — | | | | | — | | | | | — | | | | | (426,418 | ) |
Citigroup Global Markets Ltd. | | | | 5,285,229 | | | | | (5,009,978 | ) | | | | 275,251 | | | | | — | | | | | — | | | | | — | | | | | — | | | | | 275,251 | |
Citigroup Global Markets, Inc. | | | | 267,052,479 | | | | | (267,640,338 | ) | | | | (587,859 | ) | | | | — | | | | | — | | | | | — | | | | | — | | | | | (587,859 | ) |
Credit Suisse Securities (USA) LLC | | | | 45,248,965 | | | | | (45,363,589 | ) | | | | (114,624 | ) | | | | — | | | | | — | | | | $ | 114,624 | | | | | 114,624 | | | | | — | |
Deutsche Bank Securities, Inc. | | | | 90,683,186 | | | | | (90,789,398 | ) | | | | (106,212 | ) | | | | — | | | | | — | | | | | — | | | | | — | | | | | (106,212 | ) |
J.P. Morgan Securities LLC | | | | 277,714,931 | | | | | (276,878,250 | ) | | | | 836,681 | | | | $ | (836,681 | ) | | | | — | | | | | — | | | | | (836,681 | ) | | | | — | |
J.P. Morgan Securities PLC | | | | 24,863,111 | | | | | (23,859,483 | ) | | | | 1,003,628 | | | | | — | | | | | — | | | | | — | | | | | — | | | | | 1,003,628 | |
Merrill Lynch, Pierce, Fenner & Smith, Inc. | | | | 21,774,600 | | | | | (21,256,308 | ) | | | | 518,292 | | | | | — | | | | | — | | | | | — | | | | | — | | | | | 518,292 | |
RBC Capital Markets LLC | | | | 330,263,976 | | | | | (327,641,606 | ) | | | | 2,622,370 | | | | | (2,622,370 | ) | | | | — | | | | | — | | | | | (2,622,370 | ) | | | | — | |
| | | | | |
Total | | | $ | 1,226,438,913 | | | | $ | (1,221,527,218 | ) | | | $ | 4,911,695 | | | | $ | (3,459,051 | ) | | | $ | (921,978 | ) | | | $ | 114,624 | | | | $ | (4,266,405 | ) | | | $ | 645,290 | |
| | | | | |
| | 1 | | Included in Investments at value — unaffiliated in the Statements of Assets and Liabilities. |
| | 2 | | Includes accrued interest on borrowed bonds in the amount of $11,449,773 which is included in interest expense payable in the Statements of Assets and Liabilities. |
| | 3 | | Net exposure represents the net receivable (payable) that would be due from/to the counterparty in the event of default. |
When the Funds enter into an MRA and an International Swaps and Derivatives Association, Inc. Master Agreement (“ISDA Master Agreement”) and/or Master Securities Lending Agreements (each, an “MSLA”) with the same counterparty, the agreements may contain a set-off provision allowing a fund to offset a net amount payable with a net amount receivable upon default of the counterparty. Bankruptcy or insolvency laws of a particular jurisdiction may restrict or prohibit the right of offset in bankruptcy, insolvency or other events. For example, regardless of the contractual rights included in an MRA, such laws may prohibit the Funds from setting off amounts owed to a defaulting counterparty under an MRA against amounts owed to the Funds by affiliates of the defaulting counterparty. However, the insolvency regimes of many jurisdictions generally permit set-off of simultaneous payables and receivables with the same legal entity under certain types of financial contracts. These rules would apply upon a default of the legal entity, regardless of the existence of a contractual set-off right in those contracts.
In the event the counterparty of securities under an MRA files for bankruptcy or becomes insolvent, the Funds use of the proceeds from the agreement may be restricted while the counterparty, or its trustee or receiver, determines whether or not to enforce the Funds obligation to repurchase the securities.
Short Sales (Borrowed Bonds): Certain Funds may enter into short sale transactions in which the Funds sell a security they do not hold in anticipation of a decline in the market price of that security. When the Funds make a short sale, they will borrow the security sold short (borrowed bond) and deliver the security to the counterparty to which they sold the security short. An amount equal to the proceeds received by the Funds is reflected as an
| | | | | | |
| 92 | | BLACKROCK FUNDS | | JANUARY 31, 2016 | | |
| | |
| Notes to Financial Statements (continued) | | |
asset and an equivalent liability. The amount of the liability is subsequently marked-to-market to reflect the market value of the short sale. The Funds are required to repay the counterparty interest on the security sold short, which is shown as interest expense in the Statements of Operations. The Funds are exposed to market risk based on the amount, if any, that the market value of the security increases beyond the market value at which the position was sold. Thus, a short sale of a security involves the risk that instead of declining, the price of the security sold short will rise. The short sale of securities involves the possibility of a theoretically unlimited loss since there is a theoretically unlimited potential for the market price of the security sold short to increase. A gain, limited to the price at which the Funds sold the security short, or a loss, unlimited as to the dollar amount, will be recognized upon the termination of a short sale if the market price is either less than or greater than the proceeds originally received. There is no assurance the Funds will be able to close out a short position at a particular time or at an acceptable price.
Short Sales (Investments Sold Short): Certain Funds may enter into short sale transactions in which the Funds sell a security they do not hold in anticipation of a decline in the market price of that security. When the Funds make a short sale, they will borrow the security sold short from a broker/ counterparty and deliver the security to the purchaser. To close out a short position, the Funds deliver the same security to the broker and record a liability to reflect the obligation to return the security to the broker. The amount of the liability is subsequently marked-to-market to reflect the market value of the short sale. The Funds maintain a segregated account of securities or deposit cash with the broker-dealer as collateral for the short sales. Cash deposited with the broker is recorded as an asset in the Statements of Assets and Liabilities. Securities segregated as collateral are denoted in the Schedules of Investments. The Funds may pay a financing fee for the difference between the market value of the short position and the cash collateral deposited with the broker which would be recorded as interest expense. The Funds are required to repay the counterparty any dividends received on the security sold short, which is shown as dividend expense in the Statements of Operations. The Funds may pay a fee on the assets borrowed from the counterparty, which is shown as stock loan fees in the Statements of Operations. The Funds are exposed to market risk based on the amount, if any, that the market value of the security increases beyond the market value at which the position was sold. Thus, a short sale of a security involves the risk that instead of declining, the price of the security sold short will rise. The short sale of securities involves the possibility of a theoretically unlimited loss since there is a theoretically unlimited potential for the market price of the security sold short to increase. A gain, limited to the price at which the Funds sold the security short, or a loss, unlimited as to the dollar amount, will be recognized upon the termination of a short sale if the market price is either less than or greater than the proceeds originally received. There is no assurance the Funds will be able to close out a short position at a particular time or at an acceptable price.
Securities Lending: Certain Funds may lend their securities to approved borrowers, such as brokers, dealers and other financial institutions. The borrower pledges and maintains with the Funds collateral consisting of cash, an irrevocable letter of credit issued by a bank, or securities issued or guaranteed by the U.S. Government. The initial collateral received by a Fund is required to have a value of at least 102% of the current value of the loaned securities for securities traded on U.S. exchanges and a value of at least 105% for all other securities. The collateral is maintained thereafter at a value equal to at least 100% of the current market value of the securities on loan. The market value of the loaned securities is determined at the close of each business day of the Fund and any additional required collateral is delivered to the Fund, or excess collateral is returned by the Fund, on the next business day. During the term of the loan, the Fund is entitled to all distributions made on or in respect of the loaned securities. Loans of securities are terminable at any time and the borrower, after notice, is required to return borrowed securities within the standard time period for settlement of securities transactions.
The market value of any securities on loan, all of which were classified as common stocks in the Funds’ Schedules of Investments, and the value of the related collateral are shown separately in the Statements of Assets and Liabilities as a component of investments at value — unaffiliated, and collateral on securities loaned at value, respectively. As of period end, any securities on loan were collateralized by cash. The cash collateral invested by the securities lending agent, BlackRock Investment Management, LLC (“BIM”), if any, is disclosed in the Schedules of Investments.
Securities lending transactions are entered into by the Funds under MSLAs which provide the right, in the event of default (including bankruptcy or insolvency), for the non-defaulting party to liquidate the collateral and calculate a net exposure to the defaulting party or request additional collateral. In the event that a borrower defaults, the Funds, as lender, would offset the market value of the collateral received against the market value of the securities loaned. When the value of the collateral is greater than that of the market value of the securities loaned, the lender is left with a net amount payable to the defaulting party. However, bankruptcy or insolvency laws of a particular jurisdiction may impose restrictions on or prohibitions against such a right of offset in the event of an MSLA counterparty’s bankruptcy or insolvency. Under the MSLA, absent an event of default the borrower can resell or re-pledge the loaned securities, and a Fund can reinvest cash collateral received in connection with loaned securities. Upon an event of default, the parties’ obligations to return the securities or collateral to the other party are extinguished, and the parties can resell or re-pledge the loaned securities or the collateral received in connection with the loaned securities in order to satisfy the defaulting party’s net payment obligation for all transactions under the MSLA. The defaulting party remains liable for any deficiency.
| | | | | | |
| | | BLACKROCK FUNDS | | JANUARY 31, 2016 | | 93 |
| | |
| Notes to Financial Statements (continued) | | |
As of period end, the following table is a summary of the Funds’ securities lending agreements by counterparty which are subject to offset under an MSLA:
| | | | | | | | | | |
| Commodity Strategies | | | | | | | | |
| Counterparty | | Securities Loaned
at Value | | | Cash Collateral
Received1 | | | Net Amount |
Credit Suisse Securities (USA) LLC | | | $190,969 | | | | $(190,969) | | | — |
Merrill Lynch, Pierce, Fenner & Smith, Inc. | | | 33,967 | | | | (33,967) | | | — |
SG Americas Securities LLC | | | 114,550 | | | | (114,550) | | | — |
| | | |
Total | | | $339,486 | | | | $(339,486) | | | — |
| | | |
| | | | | | | | | | |
| Macro Themes | | | | | | | | |
| Counterparty | | | | | | | | |
Citigroup Global Markets, Inc. | | | $511,075 | | | | $(511,075) | | | — |
| | | |
| | 1 | | Collateral with a value of $459,321 and $508,486 has been received by Commodity Strategies and Macro Themes, respectively, in connection with securities lending agreements. Collateral received in excess of the value of securities loaned from the individual counterparty is not shown for financial reporting purposes in the table above. |
The risks of securities lending include the risk that the borrower may not provide additional collateral when required or may not return the securities when due. To mitigate these risks, the Funds benefit from a borrower default indemnity provided by BIM. BIM’s indemnity allows for full replacement of the securities loaned if the collateral received does not cover the value on the securities loaned in the event of borrower default. Each Fund could suffer a loss if the value of an investment purchased with cash collateral falls below the market value of loaned securities or if the value of an investment purchased with cash collateral falls below the value of the original cash collateral received.
5. Derivative Financial Instruments:
The Funds engage in various portfolio investment strategies using derivative contracts both to increase the returns of the Funds and/or to manage economically their exposure to certain risks such as credit risk, equity risk, interest rate risk or foreign currency exchange rate risk. These contracts may be transacted on an exchange or OTC.
Financial Futures Contracts: Certain Funds invest in long and/or short positions in financial futures contracts and options on financial futures contracts to gain exposure to, or economically hedge against, changes in interest rates (interest rate risk), changes in the value of equity securities (equity risk) or foreign currencies (foreign currency exchange risk). Financial futures contracts are agreements between the Funds and a counterparty to buy or sell a specific quantity of an underlying instrument at a specified price and at a specified date. Depending on the terms of the particular contract, financial futures contracts are settled either through physical delivery of the underlying instrument on the settlement date or by payment of a cash settlement amount on the settlement date.
Upon entering into a financial futures contract, the Funds are required to deposit initial margin with the broker in the form of cash or securities in an amount that varies depending on a contract’s size and risk profile. The initial margin deposit must then be maintained at an established level over the life of the contract. Securities deposited as initial margin are designated on the Schedules of Investments and cash deposited, if any, is recorded on the Statements of Assets and Liabilities as cash pledged for financial futures contracts. Pursuant to the contract, the Funds agree to receive from or pay to the broker an amount of cash equal to the daily fluctuation in value of the contract. Such receipts or payments are known as variation margin. Variation margin is recorded by the Funds as unrealized appreciation (depreciation) and, if applicable, as a receivable or payable for variation margin in the Statements of Assets and Liabilities.
When the contract is closed, the Funds record a realized gain or loss equal to the difference between the value of the contract at the time it was opened and the value at the time it was closed. The use of financial futures contracts involves the risk of an imperfect correlation in the movements in the price of financial futures contracts, interest rates or foreign currency exchange rates and the underlying assets.
Forward Foreign Currency Exchange Contracts: Certain Funds enter into forward foreign currency exchange contracts as an economic hedge against either specific transactions or portfolio instruments or to obtain exposure to, or hedge exposure away from, foreign currencies (foreign currency exchange rate risk). A forward foreign currency exchange contract is an agreement between two parties to buy and sell a currency at a set exchange rate on a future date. Forward foreign currency exchange contracts, when used by the Funds, help to manage the overall exposure to the currencies in which some of the investments held by the Funds are denominated. Non-deliverable forward foreign currency exchange contracts are settled with the counterparty in cash without the delivery of foreign currency. The contract is marked-to-market daily and the change in market value is recorded by the Funds as an unrealized gain or loss. When the contract is closed, the Funds record a realized gain or loss equal to the difference between the value at the time it was opened and the value at the time it was closed. The use of forward foreign currency exchange contracts involves the risk that the value of a forward foreign currency exchange contract changes unfavorably due to movements in the value of the referenced foreign currencies.
| | | | | | |
| 94 | | BLACKROCK FUNDS | | JANUARY 31, 2016 | | |
| | |
| Notes to Financial Statements (continued) | | |
Options: Certain Funds purchase and write call and put options to increase or decrease their exposure to underlying instruments (including credit risk and/or equity risk) and/or, in the case of options written, to generate gains from options premiums. A call option gives the purchaser (holder) of the option the right (but not the obligation) to buy, and obligates the seller (writer) to sell (when the option is exercised) the underlying instrument at the exercise or strike price at any time or at a specified time during the option period. A put option gives the holder the right to sell and obligates the writer to buy the underlying instrument at the exercise or strike price at any time or at a specified time during the option period. When the Funds purchase (write) an option, an amount equal to the premium paid (received) by the Funds is reflected as an asset (liability). The amount of the asset (liability) is subsequently marked-to-market to reflect the current market value of the option purchased (written). When an instrument is purchased or sold through an exercise of an option, the related premium paid (or received) is added to (or deducted from) the basis of the instrument acquired or deducted from (or added to) the proceeds of the instrument sold. When an option expires (or the Funds enter into a closing transaction), the Funds realize a gain or loss on the option to the extent of the premiums received or paid (or gain or loss to the extent the cost of the closing transaction exceeds the premiums received or paid). When the Funds write a call option, such option is “covered,” meaning that the Funds hold the underlying instrument subject to being called by the option counterparty. When the Funds write a put option, such option is covered by cash in an amount sufficient to cover the obligation.
Options on swaps (“swaptions”) are similar to options on securities except that instead of selling or purchasing the right to buy or sell a security, the writer or purchaser of the swaptions is granting or buying the right to enter into a previously agreed upon interest rate or credit default swap agreement (interest rate risk and/or credit risk) at any time before the expiration of the option.
The Funds also purchase or sell listed or OTC foreign currency options, foreign currency futures and related options on foreign currency futures as a short or long hedge against possible variations in foreign exchange rates or to gain exposure to foreign currencies (foreign currency exchange rate risk). When foreign currency is purchased or sold through an exercise of a foreign currency option, the related premium paid (or received) is added to (or deducted from) the basis of the foreign currency acquired or deducted from (or added to) the proceeds of the foreign currency sold (receipts from the foreign currency purchased). Such transactions may be effected with respect to hedges on non-U.S. dollar denominated instruments owned by the Funds but not yet delivered, or committed or anticipated to be purchased by the Funds.
In purchasing and writing options, the Funds bear the risk of an unfavorable change in the value of the underlying instrument or the risk that the Funds may not be able to enter into a closing transaction due to an illiquid market. Exercise of a written option could result in the Funds purchasing or selling a security when it otherwise would not, or at a price different from the current market value.
Swaps: Certain Funds enter into swap agreements in which the Funds and a counterparty agree either to make periodic net payments on a specified notional amount or a net payment upon termination. Swap agreements are privately negotiated in the OTC market and may be entered into as a bilateral contract (“OTC swaps”) or centrally cleared (“centrally cleared swaps”). Swaps are marked-to-market daily and changes in value are recorded as unrealized appreciation (depreciation).
For OTC swaps, any upfront premiums paid are recorded as assets and any upfront fees received are recorded as liabilities and are shown as swap premiums paid and swap premiums received, respectively, in the Statements of Assets and Liabilities and amortized over the term of the OTC swap. Payments received or made by the Funds for OTC swaps are recorded in the Statements of Operations as realized gains or losses, respectively. When an OTC swap is terminated, the Funds will record a realized gain or loss equal to the difference between the proceeds from (or cost of) the closing transaction and the Funds’ basis in the contract, if any. Generally, the basis of the contract is the premium received or paid.
In a centrally cleared swap, immediately following execution of the swap agreement, the swap agreement is novated to a central counterparty (the “CCP”) and the Funds’ counterparty on the swap agreement becomes the CCP. The Funds are required to interface with the CCP through a broker. Upon entering into a centrally cleared swap, the Funds are required to deposit initial margin with the broker in the form of cash or securities in an amount that varies depending on the size and risk profile of the particular swap. Securities deposited as initial margin are designated on the Schedules of Investments and cash deposited is recorded on the Statements of Assets and Liabilities as cash pledged for centrally cleared swaps. The daily change in valuation of centrally cleared swaps is recorded as a receivable or payable for variation margin in the Statements of Assets and Liabilities. Payments received from (paid to) the counterparty, including at termination, are recorded as realized gain (loss) in the Statements of Operations.
Swap transactions involve, to varying degrees, elements of interest rate, credit and market risk in excess of the amounts recognized in the Statements of Assets and Liabilities. Such risks involve the possibility that there will be no liquid market for these agreements, that the counterparty to the agreements may default on its obligation to perform or disagree as to the meaning of the contractual terms in the agreements, and that there may be unfavorable changes in interest rates and/or market values associated with these transactions.
| • | | Credit default swaps — Certain Funds enter into credit default swaps to manage their exposure to the market or certain sectors of the market, to reduce their risk exposure to defaults of corporate and/or sovereign issuers or to create exposure to corporate and/or sovereign issuers to which they are not otherwise exposed (credit risk). The Funds may either buy or sell (write) credit default swaps on single-name issuers (corporate or sovereign), a combination or basket of single-name issuers or traded indexes. Credit default swaps on single-name issuers are agreements in which |
| | | | | | |
| | | BLACKROCK FUNDS | | JANUARY 31, 2016 | | 95 |
| | |
| Notes to Financial Statements (continued) | | |
| | the protection buyer pays fixed periodic payments to the seller in consideration for a guarantee from the protection seller to make a specific payment should a negative credit event take place with respect to the referenced entity (e.g., bankruptcy, failure to pay, obligation accelerators, repudiation, moratorium or restructuring). Credit default swaps on traded indexes are agreements in which the buyer pays fixed periodic payments to the seller in consideration for a guarantee from the seller to make a specific payment should a write-down, principal or interest shortfall or default of all or individual underlying securities included in the index occur. As a buyer, if an underlying credit event occurs, the Funds will either (i) receive from the seller an amount equal to the notional amount of the swap and deliver the referenced security or underlying securities comprising the index, or (ii) receive a net settlement of cash equal to the notional amount of the swap less the recovery value of the security or underlying securities comprising the index. As a seller (writer), if an underlying credit event occurs, the Funds will either pay the buyer an amount equal to the notional amount of the swap and take delivery of the referenced security or underlying securities comprising the index or pay a net settlement of cash equal to the notional amount of the swap less the recovery value of the security or underlying securities comprising the index. |
| • | | Total return swaps — Certain Funds enter into total return swaps to obtain exposure to a security or market without owning such security or investing directly in that market or to transfer the risk/return of one market (e.g., fixed income) to another market (e.g., equity or commodity prices) (equity risk, commodity price risk and/or interest rate risk). Total return swaps are agreements in which there is an exchange of cash flows whereby one party commits to make payments based on the total return (coupons plus capital gains/losses) of an underlying instrument in exchange for fixed or floating rate interest payments. To the extent the total return of the instrument or index underlying the transaction exceeds or falls short of the offsetting interest rate obligation, the Fund will receive a payment from or make a payment to the counterparty. |
Certain Funds enter into total return swaps to obtain exposure to a portfolio of long and short securities without owning such securities. Under the terms of an agreement, the swap is designed to function as a portfolio of direct investments in long and short equity. This means that each Fund has the ability to trade in and out of long and short positions within the swap and will receive the economic benefits and risks equivalent to direct investment in these positions such as: capital appreciation (depreciation), corporate actions and dividends received and paid, all of which are reflected in the swap value. The swap value also includes interest charges and credits (“financing fees”) related to the notional values of the long and short positions and cash balances within the swap. These interest charges and credits are based on a specified benchmark rate plus or minus a specified spread determined based upon the country and/or currency of the positions in the portfolio. A change in the market value of a total return swap is included in change in unrealized appreciation (depreciation) on swaps in the Statements of Operations. Positions within the swap are reset periodically, and financing fees are reset monthly. During a reset, any unrealized gains (losses) on positions and accrued financing fees become available for cash settlement between the Funds and the swap counterparty. The amounts that are available for cash settlement are included in realized gains (losses) on swaps in the Statements of Operations. Cash settlement in and out of the swap may occur at a reset date or any other date, at the discretion of the Funds and the counterparty, over the life of the agreement, and is generally determined based on limits and thresholds established as part of an ISDA Master Agreement between the Funds and the counterparty. Certain swaps have no stated expiration and can be terminated by either party at any time.
| • | | Variance swap agreements — Certain Funds enter into variance swap agreements to gain or mitigate exposure to the underlying reference securities. Variance swap agreements involve two parties agreeing to exchange cash flows based on the measured variance (or square of volatility) of a specified underlying asset. One party agrees to exchange a “fixed rate” or strike price payment for the “floating rate” or realized price variance on the underlying asset with respect to the notional amount. At inception, the strike price is generally chosen such that the fair value of the swap is zero. At the maturity date, a net cash flow is exchanged, where the payoff amount is equivalent to the difference between the realized price variance of the underlying asset and the strike price multiplied by the notional amount. As a receiver of the realized price variance, each Fund would receive the payoff amount when the realized price variance of the underlying asset is greater than the strike price and would owe the payoff amount when the variance is less than the strike price. As a payer of the realized price variance, each Fund would owe the payoff amount when the realized price variance of the underlying asset is greater than the strike price and would receive the payoff amount when the variance is less than the strike. This type of agreement is essentially a forward contract on the future realized price variance of the underlying asset. |
| • | | Interest rate swaps — Certain Funds enter into interest rate swaps to gain or reduce exposure to interest rates or to manage duration, the yield curve or interest rate risk by economically hedging the value of the fixed rate bonds, which may decrease when interest rates rise (interest rate risk). Interest rate swaps are agreements in which one party pays a stream of interest payments, either fixed or floating, for another party’s stream of interest payments, either fixed or floating, on the same notional amount for a specified period of time. In more complex swaps, the notional principal amount may decline (or amortize) over time. |
| • | | Forward interest rate swaps — Certain Funds enter into forward interest rate swaps and forward total return swaps. In a forward swap, the Fund and the counterparty agree to make either periodic net payments beginning on a specified future effective date or a net payment at termination, unless terminated earlier. |
| | | | | | |
| 96 | | BLACKROCK FUNDS | | JANUARY 31, 2016 | | |
| | |
| Notes to Financial Statements (continued) | | |
Master Netting Arrangements: In order to better define the Funds’ contractual rights and to secure rights that will help them mitigate their counterparty risk, the Funds may enter into an International Swaps and Derivatives Association, Inc. Master Agreement (“ISDA Master Agreement”) or similar agreement with their counterparties. An ISDA Master Agreement is a bilateral agreement between each Fund and a counterparty that governs certain OTC derivatives and typically contains, among other things, collateral posting terms and netting provisions in the event of a default and/or termination event. Under an ISDA Master Agreement, each Fund may, under certain circumstances, offset with the counterparty certain derivative financial instruments’ payables and/or receivables with collateral held and/or posted and create one single net payment. The provisions of the ISDA Master Agreement typically permit a single net payment in the event of default including the bankruptcy or insolvency of the counterparty. Bankruptcy or insolvency laws of a particular jurisdiction may restrict or prohibit the right of offset in bankruptcy, insolvency or other events. In addition, certain ISDA Master Agreements allow counterparties to terminate derivative contracts prior to maturity in the event the Funds’ net assets decline by a stated percentage or the Funds fail to meet the terms of their ISDA Master Agreements. The result would cause the Funds to accelerate payment of any net liability owed to the counterparty.
Collateral Requirements: For derivatives traded under an ISDA Master Agreement, the collateral requirements are typically calculated by netting the mark-to-market amount for each transaction under such agreement and comparing that amount to the value of any collateral currently pledged by the Fund and the counterparty.
Cash collateral that has been pledged to cover obligations of the Funds and cash collateral received from the counterparty, if any, is reported separately on the Statements of Assets and Liabilities as cash pledged as collateral and cash received as collateral, respectively. Non-cash collateral pledged by the Funds, if any, is noted in the Schedules of Investments. Generally, the amount of collateral due from or to a party has to exceed a minimum transfer amount threshold (typically either $250,000 or $500,000) before a transfer is required, which is determined at the close of business of the Funds. Any additional required collateral is delivered to/pledged by the Funds on the next business day. Typically, a Fund’s counterparty is not permitted to sell, re-pledge or use cash and non-cash collateral it receives. A Fund generally agrees not to use non-cash collateral that it receives but may, absent default or certain other circumstances defined in the underlying ISDA Master Agreement, be permitted to use cash collateral received. In such cases, a Fund may pay interest pursuant to the collateral arrangement with the counterparty. To the extent amounts due to the Funds from their counterparties are not fully collateralized, the Funds bear the risk of loss from counterparty non-performance. Likewise, to the extent the Funds have delivered collateral to a counterparty and stands ready to perform under the terms of their agreement with such counterparty, the Funds bear the risk of loss from a counterparty in the amount of the value of the collateral in the event the counterparty fails to return such collateral. Based on the terms of agreements, collateral may not be required to all derivative contracts.
For financial reporting purposes, the Funds do not offset derivative assets and derivative liabilities that are subject to netting arrangements, if any, in the Statements of Assets and Liabilities.
6. Investment Advisory Agreement and Other Transactions with Affiliates:
The PNC Financial Services Group, Inc. is the largest stockholder and an affiliate of BlackRock, Inc. (“BlackRock”) for 1940 Act purposes.
Investment Advisory Fees
The Trust, on behalf of the Funds, entered into an Investment Advisory Agreement with the Manager, the Funds’ investment advisor, and an indirect, wholly owned subsidiary of BlackRock, to provide investment advisory services. The Manager is responsible for the management of each Fund’s portfolio and provides the personnel, facilities, equipment and certain other services necessary to the operations of each Fund. For such services, each Fund pays the Manager a monthly fee, based on each Fund’s average daily net assets at the following annual rates:
| | | | | | | | | | | | | | | |
| | | | | Global | | |
| | | Commodity Strategies | | Long/Short
Credit | | Macro
Themes |
| Average Daily Net Assets | | Investment Advisory Fee |
First $1 Billion | | | | 1.15 | % | | | | 0.95 | % | | | | 0.85 | % |
$1 Billion - $3 Billion | | | | 1.08 | % | | | | 0.89 | % | | | | 0.80 | % |
$3 Billion - $5 Billion | | | | 1.04 | % | | | | 0.86 | % | | | | 0.77 | % |
$5 Billion - $10 Billion | | | | 1.00 | % | | | | 0.83 | % | | | | 0.74 | % |
Greater than $10 Billion | | | | 0.98 | % | | | | 0.81 | % | | | | 0.72 | % |
The Manager, with the respect to each Fund, voluntarily agreed to waive its management fees by the amount of investment advisory fees each Fund pays to the Manager indirectly through its investment in affiliated money market funds. This amount is included in fees waived by the Manager in the Statements of Operations. However, the Manager does not waive its management fees by the amount of investment advisory fees paid in connection with the Fund’s investment in other affiliated investment companies, if any. For the six months ended January 31, 2016, the Manager waived $3,113, $193,560 and $1,051 for Commodity Strategies, Global Long/Short Credit and Macro Themes, respectively.
| | | | | | |
| | | BLACKROCK FUNDS | | JANUARY 31, 2016 | | 97 |
| | |
| Notes to Financial Statements (continued) | | |
For Commodity Strategies and Macro Themes, the Manager provides investment management and other services to the Subsidiaries. The Manager does not receive separate compensation from the Subsidiaries for providing investment management or administrative services. However, Commodity Strategies and Macro Themes pay the Manager based on the Funds’ net assets, which includes the assets of the Subsidiaries.
With respect to each Fund, the Manager entered into separate sub-advisory agreements with BlackRock International Limited (“BIL”), an affiliate of the Manager. With respect to Global Long/Short Credit, the Manager has also entered into a separate sub-advisory agreement with BlackRock (Singapore) Limited (“BRS”), which is also an affiliate of the Manager. The Manager pays BIL and BRS, for services they provide, a monthly fee that is a percentage of the investment advisory fees paid by each Fund to the Manager.
Service and Distribution Fees
The Trust, on behalf of the Funds, entered into a Distribution Agreement and a Distribution and a Service Plan with BlackRock Investments, LLC (“BRIL”), an affiliate of the Manager. Pursuant to the Distribution and Service Plan and in accordance with Rule 12b-1 under the 1940 Act, each Fund pays BRIL ongoing service and distribution fees. The fees are accrued daily and paid monthly at annual rates based upon the average daily net assets of the relevant share class of each Fund as follows:
| | | | | | | | | | |
| | | Investor A | | Investor C |
Service Fee | | | | 0.25 | % | | | | 0.25 | % |
Distribution Fee | | | | — | | | | | 0.75 | % |
Pursuant to sub-agreements with BRIL, broker-dealers and BRIL provide shareholder servicing and distribution services to each Fund. The ongoing service and/or distribution fee compensates BRIL and each broker-dealer for providing shareholder servicing and/or distribution related services to Investor A and Investor C shareholders.
For the six months ended January 31, 2016, the following table shows the class specific service and distribution fees borne directly by each class of each Fund:
| | | | | | | | | | | | |
| | | Investor A | | | Investor C | | | Total | |
Commodity Strategies | | $ | 17,531 | | | $ | 24,275 | | | $ | 41,806 | |
Global Long/Short Credit | | $ | 1,078,729 | | | $ | 1,587,346 | | | $ | 2,666,075 | |
Macro Themes | | $ | 79 | | | $ | 119 | | | $ | 198 | |
Other Fees
Pursuant to written agreements, certain financial intermediaries, some of which may be affiliates, provide the Funds with sub-accounting, recordkeeping, sub-transfer agency and other administrative services with respect to sub-accounts they service. For these services, these entities receive an asset-based fee or an annual fee per shareholder account, which will vary depending on share class and/or net assets. For the six months ended January 31, 2016, Global Long/Short Credit paid the following amounts to affiliates of BlackRock in return for these services, which are included in transfer agent — class specific in the Statements of Operations:
| | | | | | | | | | | | | | | | | | | | |
| | | Institutional | | Investor A | | Investor C | | Total |
Global Long/Short Credit | | | $ | 262,001 | | | | $ | 93 | | | | $ | 52 | | | | $ | 262,146 | |
The Manager maintains a call center, that is responsible for providing certain shareholder services to the Funds, Shareholder services include responding to inquiries and processing subscriptions and redemptions based upon instructions from shareholders. For the six months ended January 31, 2016, each Fund reimbursed the Manager the following amounts for costs incurred in running the call center, which are included in transfer agent — class specific in the Statements of Operations:
| | | | | | | | | | | | | | | | | | | | |
| | | Institutional | | Investor A | | Investor C | | Total |
Commodity Strategies | | | $ | 621 | | | | $ | 549 | | | | $ | 213 | | | | $ | 1,383 | |
Global Long/Short Credit | | | $ | 5,382 | | | | $ | 2,439 | | | | $ | 1,984 | | | | $ | 9,805 | |
For the six months ended January 31, 2016, the following table shows the class specific transfer agent fees borne directly by each class of each Fund:
| | | | | | | | | | | | | | | | |
| | | Institutional | | | Investor A | | | Investor C | | | Total | |
Commodity Strategies | | $ | 17,252 | | | $ | 21,373 | | | $ | 6,497 | | | $ | 45,122 | |
Global Long/Short Credit | | $ | 2,090,817 | | | $ | 513,512 | | | $ | 143,235 | | | $ | 2,747,564 | |
Macro Themes | | $ | 138 | | | $ | 53 | | | $ | 31 | | | $ | 222 | |
| | | | | | |
| 98 | | BLACKROCK FUNDS | | JANUARY 31, 2016 | | |
| | |
| Notes to Financial Statements (continued) | | |
The Trust, on behalf of the Funds, entered into an Administration Agreement with the Manager, an indirect, wholly owned subsidiary of BlackRock, to provide administrative services. For these services, the Manager receives an administration fee computed daily and payable monthly, based on a percentage of the average daily net assets of each Fund. The administration fee, which is shown as administration in the Statements of Operations, is paid at the annual rates below:
| | | | | |
| Average Daily Net Assets | | Administration Fee |
First $500 Million | | | | 0.425 | % |
$500 Million - $1 Billion | | | | 0.040 | % |
$1 Billion - $2 Billion | | | | 0.038 | % |
$2 Billion - $4 Billion | | | | 0.035 | % |
$4 Billion - $13 Billion | | | | 0.033 | % |
Greater than $13 Billion | | | | 0.030 | % |
In addition, the Manager charges each of the share classes an administration fee, which is shown as administration – class specific in the Statements of Operations, at an annual rate of 0.02% for Commodity Strategies and Macro Themes and 0.15% for Global Long/Short Credit of the average daily net assets of each respective class.
For the period ended January 31, 2016, the following table shows the class specific administration fees borne directly by each class of each Fund:
| | | | | | | | | | | | | | | | | | | | |
| | | Institutional | | Investor A | | Investor C | | Total |
Commodity Strategies | | | $ | 22,021 | | | | $ | 1,402 | | | | $ | 486 | | | | $ | 23,909 | |
Global Long/Short Credit | | | $ | 341,009 | | | | $ | 64,724 | | | | $ | 23,810 | | | | $ | 429,543 | |
Macro Themes | | | $ | 2,895 | | | | $ | 6 | | | | $ | 2 | | | | $ | 2,903 | |
The Manager may have, at its discretion, voluntarily waived all or any portion of their administration fees for a Fund or a share class, which are included in administration fees waived in the Statements of Operations.
For the six months ended January 31, 2016, affiliates earned underwriting discounts, direct commissions and dealer concessions on sales of each Fund’s Investor A Shares as follows:
| | | | | |
Commodity Strategies | | | $ | 1,643 | |
Global Long/Short Credit | | | $ | 7,749 | |
Macro Themes | | | $ | 256 | |
For the six months ended January 31, 2016, affiliates received CDSCs as follows:
| | | | | | | | | | |
| | | Investor A | | Investor C |
Commodity Strategies | | | $ | 1,535 | | | | $ | 1,039 | |
Global Long/Short Credit | | | $ | 32,873 | | | | $ | 27,676 | |
Expense Limitations, Waivers and Recoupments
The Manager, with respect to the Funds, contractually agreed to waive and/or reimburse fees or expenses in order to limit expenses, excluding interest expense, dividend expense, tax expense, acquired fund fees and expenses and certain other fund expenses, which constitute extraordinary expenses not incurred in the ordinary course of the Funds’ business. The expense limitations as a percentage of average daily net assets are as follows:
| | | | | | | | | | | | | | | |
| | | Institutional | | Investor A | | Investor C |
Commodity Strategies1 | | | | 1.30 | % | | | | 1.50 | % | | | | 2.25 | % |
Global Long/Short Credit1 | | | | 1.20 | % | | | | 1.40 | % | | | | 2.15 | % |
Macro Themes1 | | | | 1.20 | % | | | | 1.45 | % | | | | 2.20 | % |
| | 1 | | The Manager has agreed not to reduce or discontinue this contractual waiver or reimbursement prior to December 1, 2016 unless approved by the Board of Trustees, including a majority of the independent Trustees, or by a vote of a majority of the outstanding voting securities of such Fund. |
| | | | | | |
| | | BLACKROCK FUNDS | | JANUARY 31, 2016 | | 99 |
| | |
| Notes to Financial Statements (continued) | | |
These amounts waived or reimbursed are included in fees waived by Manager, and shown as administration fees waived — class specific, transfer agent fees waived — class specific and transfer agent fees reimbursed — class specific, respectively, in the Statements of Operations. For the period ended January 31, 2016, the Manager waived $108,103 and $105,717 of investment advisory fees for Commodity Strategies and Macro Themes, respectively, which is included in fees waived by Manager.
Class specific expense waivers or reimbursements are as follows:
| | | | | | | | | | | | | | | | | | | | |
| Administration Fees Waived | | Institutional | | Investor A | | Investor C | | Total |
Commodity Strategies | | | | $1,128 | | | | | $1,402 | | | | | $486 | | | | | $3,016 | |
Macro Themes | | | | $1,883 | | | | | $ 6 | | | | | $ 2 | | | | | $1,891 | |
| | | | | | | | | | | | | | | | | | | | |
| Transfer Agent Fees Waived | | Institutional | | Investor A | | Investor C | | Total |
Commodity Strategies | | | | — | | | | | $549 | | | | | $213 | | | | | $762 | |
Macro Themes | | | | $24 | | | | | $ 10 | | | | | $ 6 | | | | | $ 40 | |
| | | | | | | | | | | | | | | | | | | | |
| Transfer Agent Fees Reimbursed | | Institutional | | Investor A | | Investor C | | Total |
Commodity Strategies | | | | — | | | | | $20,583 | | | | | $6,173 | | | | | $26,756 | |
Macro Themes | | | | $16 | | | | | $ 41 | | | | | $ 23 | | | | | $ 80 | |
If during the Funds’ fiscal year the operating expenses of a share class, that at any time during the prior two fiscal years received a waiver or reimbursement from the Manager, are less than the expense limit for that share class, the Manager is entitled to be reimbursed by such share class up to the lesser of (a) the amount of fees waived and/or expenses reimbursed during those prior two fiscal years under the agreement and (b) the amount by which the expense limit for that share class exceeds the operating expenses of the share class for the current fiscal year, provided that: (1) the Fund, of which the share class is a part, has more than $50 million in assets for the fiscal year, and (2) the Manager or an affiliate continues to serve as the Fund’s investment advisor or administrator. In the event the expense limit for a share class is changed subsequent to a fiscal year in which the Manager becomes entitled to reimbursement for fees waived and/or reimbursed, the amount available to reimburse the Manager shall be calculated by reference to the expense limit for that share class in effect at the time the Manager became entitled to receive such reimbursement, rather than the subsequently changed expense limit for that share class.
For the six months ended January 31, 2016, the Manager recouped waivers and/or reimbursements previously recorded of $4,992 for Global Long/ Short Credit Investor A Shares.
On January 31, 2016, the Fund level and class specific waivers and/or reimbursements subject to possible future recoupment under the expense limitation agreement are as follows:
| | | | | | | | | | | | |
| | | Expires July 31, | |
| | | 2016 | | | 2017 | | | 2018 | |
Commodity Strategies | | | | | | | | | | | | |
Fund Level | | $ | 172,275 | | | $ | 187,877 | | | $ | 108,004 | |
Institutional | | | — | | | | — | | | $ | 1,128 | |
Investor A | | $ | 43,837 | | | $ | 43,817 | | | $ | 22,534 | |
Investor C | | $ | 13,297 | | | $ | 14,369 | | | $ | 6,871 | |
Macro Themes | | | | | | | | | | | | |
Fund Level | | | — | | | $ | 225,228 | | | $ | 131,471 | |
Institutional | | | — | | | $ | 3,392 | | | $ | 1,923 | |
Investor A | | | — | | | $ | 53 | | | $ | 57 | |
Investor C | | | — | | | $ | 52 | | | $ | 30 | |
| | | | | | |
| 100 | | BLACKROCK FUNDS | | JANUARY 31, 2016 | | |
| | |
| Notes to Financial Statements (continued) | | |
Securities Lending
The U.S. Securities and Exchange Commission has issued an exemptive order which permits BIM, an affiliate of the Manager, to serve as securities lending agent for the Funds, subject to applicable conditions. As securities lending agent, BIM bears all operational costs directly related to securities lending. The Funds are responsible for expenses in connection with the investment of cash collateral received for securities on loan (the “collateral investment expenses”). The cash collateral is invested in a private investment company managed by the Manager or its affiliates. However, BIM has agreed to cap the collateral investment expenses of the private investment company to an annual rate of 0.04%. The investment advisor to the private investment company will not charge any advisory fees with respect to shares purchased by the Funds.
Securities lending income is equal to the total of income earned from the reinvestment of cash collateral, net of fees and other payments to and from borrowers of securities, and less the collateral investment expenses. The Funds retain a portion of securities lending income and remits a remaining portion to BIM as compensation for its services as securities lending agent. Pursuant to a securities lending agreement, BIM may lend securities only when the difference between the borrower rebate rate and the risk free rate exceeds a certain level (such securities, the “specials only securities”).
Pursuant to such agreement, the Funds retain 80% of securities lending income. In addition, commencing the business day following the date that the aggregate securities lending income earned across certain funds in the Equity-Liquidity Complex in a calendar year exceeds a specified threshold, the Funds, pursuant to the securities lending agreement, will retain for the remainder of the calendar year securities lending income in an amount equal to 85% of securities lending income. The share of securities lending income earned by the Funds is shown as securities lending — affiliated — net in the Statements of Operations. For the six months ended January 31, 2016, Commodity Strategies, Global Long/Short Credit and Macro Themes paid BIM $10,868, $0 and $27 for securities lending agent services, respectively.
Officers and Trustees Fees
Certain officers and/or trustees of the Trust are officers and/or directors of BlackRock or its affiliates. The Funds reimburse the Manager for a portion of the compensation paid to the Trust’s Chief Compliance Officer, which is included in officer and trustees in the Statements of Operations.
Interfund Transactions
Global Long/Short Credit and Macro Themes may purchase securities from, or sell securities to, an affiliated fund provided the affiliation is due solely to having a common investment advisor, common officers, or common trustees. For the six months ended January 31, 2016, the purchase and sale transactions with an affiliated fund in compliance with Rule 17a-7 under the 1940 Act were as follows:
| | | | | | | | | | |
| | | Global Long/Short Credit | | Macro Themes |
Purchases | | | $ | 43,989,982 | | | | | — | |
Sales | | | $ | 16,904,438 | | | | $ | 9,782 | |
7. Purchases and Sales:
For the period ended January 31, 2016, purchases and sales of investments, including paydowns and excluding short-term securities, were as follows:
| | | | | | | | | | | | |
| Purchases | | Commodity
Strategies | | | Global Long/Short Credit | | | Macro
Themes | |
Non-U.S. Government Securities | | $ | 129,868,888 | | | $ | 2,437,704,824 | | | $ | 8,304,259 | |
U.S. Government Securities | | | — | | | | 1,123,962,005 | | | | 2,670,604 | |
| | | | |
Total Purchases | | $ | 129,868,888 | | | $ | 3,561,666,829 | | | $ | 10,974,863 | |
| | | | |
| | | | | | | | | | | | |
| Sales | | Commodity
Strategies | | | Global Long/Short Credit | | | Macro
Themes | |
Non-U.S. Government Securities | | $ | 248,704,627 | | | $ | 3,629,000,687 | | | $ | 10,169,421 | |
U.S. Government Securities | | | — | | | | 1,201,502,403 | | | | 299,917 | |
| | | | |
Total Sales | | $ | 248,704,627 | | | $ | 4,830,503,090 | | | $ | 10,469,338 | |
| | | | |
| | | | | | |
| | | BLACKROCK FUNDS | | JANUARY 31, 2016 | | 101 |
| | |
| Notes to Financial Statements (continued) | | |
8. Income Tax Information:
It is the Funds’ policy to comply with the requirements of the Internal Revenue Code of 1986, as amended, applicable to regulated investment companies, and to distribute substantially all of their taxable income to their shareholders. Therefore, no federal income tax provision is required.
Each Fund files U.S. federal and various state and local tax returns. No income tax returns are currently under examination. The statute of limitations on Commodity Strategies’ and Global Long/Short Credit’s U.S. federal tax returns remains open for each of the three years ended July 31, 2015 and the period ended July 31, 2012. The statute of limitations on Macro Themes’ U.S. federal tax return remains open for the period ended July 31, 2015. The statutes of limitations on each Fund’s state and local tax returns may remain open for an additional year depending upon the jurisdiction.
Management has analyzed tax laws and regulations and their application to the Funds as of January 31, 2016, inclusive of the open tax return years, and does not believe there are any uncertain tax positions that require recognition of a tax liability in the Funds’ financial statements.
As of period end, the Funds had capital loss carryforwards, with no expiration dates, available to offset future realized capital gains as follows:
| | | | | | | | | | | | | | | |
| |
| | | Commodity
Strategies | | Global
Long/Short
Credit | | Macro
Themes |
No expiration date | | | $ | 109,797,492 | | | | $ | 130,238,700 | | | | $ | 21,315 | |
As of period end, gross unrealized appreciation and depreciation based on cost for federal income tax purposes were as follows:
| | | | | | | | | | | | |
| | | Commodity
Strategies | | | Global Long/Short
Credit | | | Macro
Themes | |
Tax cost | | $ | 115,820,112 | | | $ | 6,593,764,187 | | | $ | 25,450,067 | |
| | | | |
Gross unrealized appreciation | | $ | 4,784,194 | | | $ | 37,474,537 | | | $ | 109,368 | |
Gross unrealized depreciation | | | (12,353,726 | ) | | | (397,125,530 | ) | | | (1,162,529 | ) |
| | | | |
Net unrealized depreciation | | $ | (7,569,532 | ) | | $ | (359,650,993 | ) | | $ | (1,053,161 | ) |
| | | | |
9. Bank Borrowings:
The Trust, on behalf of the Funds, along with certain other funds managed by the Manager and its affiliates (“Participating Funds”), is a party to a 364-day, $2.1 billion credit agreement with a group of lenders, under which the Funds may borrow to fund shareholder redemptions. Excluding commitments designated for certain individual funds, the Participating Funds, including the Funds, can borrow up to an aggregate commitment amount of $1.6 billion at any time outstanding, subject to asset coverage and other limitations as specified in the agreement. The credit agreement has the following terms: a fee of 0.06% per annum on unused commitment amounts and interest at a rate equal to the higher of (a) one-month LIBOR (but, in any event, not less than 0.00%) on the date the loan is made plus 0.80% per annum or (b) the Fed Funds rate (but, in any event, not less than 0.00%) in effect from time to time plus 0.80% per annum on amounts borrowed. The agreement expires in April 2016 unless extended or renewed. Participating Funds paid administration, legal and arrangement fees, which, if applicable, are included in miscellaneous expenses in the Statements of Operations, and along with commitment fees, were allocated among such funds based upon portions of the aggregate commitment available to them and relative net assets of Participating Funds. During the six months ended January 31, 2016, the Funds did not borrow under the credit agreement.
10. Principal Risks:
In the normal course of business, certain Funds invest in securities and enter into transactions where risks exist due to fluctuations in the market (market risk) or failure of the issuer to meet all its obligations, including the ability to pay principal and interest when due (issuer credit risk). The value of securities held by the Funds may decline in response to certain events, including those directly involving the issuers of securities owned by the Funds. Changes arising from the general economy, the overall market and local, regional or global political and/or social instability, as well as currency, interest rate and price fluctuations, may also affect the securities’ value.
Each Fund may be exposed to prepayment risk, which is the risk that borrowers may exercise their option to prepay principal earlier than scheduled during periods of declining interest rates, which would force each Fund to reinvest in lower yielding securities. Each Fund may also be exposed to reinvestment risk, which is the risk that income from each Fund’s portfolio will decline if each Fund invests the proceeds from matured, traded or called fixed income securities at market interest rates that are below each Fund portfolio’s current earnings rate.
| | | | | | |
| 102 | | BLACKROCK FUNDS | | JANUARY 31, 2016 | | |
| | |
| Notes to Financial Statements (continued) | | |
Counterparty Credit Risk: Similar to issuer credit risk, the Funds may be exposed to counterparty credit risk, or the risk that an entity may fail to or be unable to perform on its commitments related to unsettled or open transactions. The Funds manage counterparty credit risk by entering into transactions only with counterparties that the Manager believes have the financial resources to honor their obligations and by monitoring the financial stability of those counterparties. Financial assets, which potentially expose the Funds to market, issuer and counterparty credit risks, consist principally of financial instruments and receivables due from counterparties. The extent of the Funds’ exposure to market, issuer and counterparty credit risks with respect to these financial assets is approximately their value recorded in the Statements of Assets and Liabilities, less any collateral held by the Funds.
A derivative contract may suffer a mark-to-market loss if the value of the contract decreases due to an unfavorable change in the market rates or values of the underlying instrument. Losses can also occur if the counterparty does not perform under the contract.
The Fund’s risk of loss from counterparty credit risk on OTC derivatives is generally limited to the aggregate unrealized gain less the value of any collateral held by such Fund.
For OTC options purchased, each Fund bears the risk of loss in the amount of the premiums paid plus the positive change in market values net of any collateral held by the Funds should the counterparty fail to perform under the contracts. Options written by the Funds do not typically give rise to counterparty credit risk, as options written generally obligate the Funds, and not the counterparty, to perform. The Funds may be exposed to counterparty credit risk with respect to options written to the extent the Funds deposit collateral with their counterparty to a written option.
With exchange-traded options purchased and futures and centrally cleared swaps, there is less counterparty credit risk to the Funds since the exchange or clearinghouse, as counterparty to such instruments, guarantees against a possible default. The clearinghouse stands between the buyer and the seller of the contract; therefore, credit risk is limited to failure of the clearinghouse. While offset rights may exist under applicable law, a Fund does not have a contractual right of offset against a clearing broker or clearinghouse in the event of a default (including the bankruptcy or insolvency). Additionally, credit risk exists in exchange-traded futures and centrally cleared swaps with respect to initial and variation margin that is held in a clearing broker’s customer accounts. While clearing brokers are required to segregate customer margin from their own assets, in the event that a clearing broker becomes insolvent or goes into bankruptcy and at that time there is a shortfall in the aggregate amount of margin held by the clearing broker for all its clients, typically the shortfall would be allocated on a pro rata basis across all the clearing broker’s customers, potentially resulting in losses to the Funds.
Concentration Risk: Certain Funds invest a significant portion of their assets in fixed-income securities and/or use derivatives tied to the fixed-income markets. Changes in market interest rates or economic conditions may affect the value and/or liquidity of such investments. Interest rate risk is the risk that prices of bonds and other fixed-income securities will increase as interest rates fall and decrease as interest rates rise. The Funds may be subject to a greater risk of rising interest rates due to the current period of historically low rates.
Commodity Strategies invests a significant portion of its assets in securities in the materials and energy sectors. Changes in economic conditions affecting such sectors would have a greater impact on Commodity Strategies and could affect the value, income and/or liquidity of positions in such securities.
Global Long/Short Credit invests a substantial amount of its assets in issuers located in a single country or a limited number of countries. When Global Long/Short Credit concentrates its investments in this manner, it assumes the risk that economic, political and social conditions in those countries may have a significant impact on its investment performance. Foreign issuers may not be subject to the same uniform accounting, auditing and financial reporting standards and practices as used in the United States. Foreign securities markets may also be less liquid, more volatile, and less subject to governmental supervision not typically associated with investing in U.S. securities. Investment percentages in specific countries are presented in the Schedules of Investments.
Global Long/Short Credit invests a significant portion of its assets in securities of issuers located in Europe or with significant exposure to European issuers or countries. The European financial markets have recently experienced volatility and adverse trends due to concerns about economic downturns in, or rising government debt levels of, several European countries. These events may spread to other countries in Europe and may affect the value and liquidity of certain of Global Long/Short Credit’s investments.
| | | | | | |
| | | BLACKROCK FUNDS | | JANUARY 31, 2016 | | 103 |
| | |
| Notes to Financial Statements (continued) | | |
11. Capital Share Transactions:
Transactions in capital shares for each class were as follows:
| | | | | | | | | | | | | | | | |
| | | Six Months Ended
January 31, 2016 | | | Year Ended
July 31, 2015 | |
| Commodity Strategies | | Shares | | | Amount | | | Shares | | | Amount | |
Institutional | | | | | | | | | | | | | | | | |
Shares sold | | | 5,067,952 | | | $ | 32,619,495 | | | | 17,977,177 | | | $ | 149,387,904 | |
Shares issued in reinvestment of distributions | | | — | | | | — | | | | 10,565 | | | | 85,894 | |
Shares redeemed | | | (39,305,116 | ) | | | (260,981,778 | ) | | | (9,881,876 | ) | | | (81,650,117 | ) |
| | | | | | | | |
Net increase (decrease) | | | (34,237,164 | ) | | $ | (228,362,283 | ) | | | 8,105,866 | | | $ | 67,823,681 | |
| | | | | | | | |
| | | | | | | | | | | | | | | | |
Investor A | | | | | | | | | | | | | | | | |
Shares sold | | | 1,463,028 | | | $ | 9,231,550 | | | | 943,492 | | | $ | 7,864,459 | |
Shares redeemed | | | (817,980 | ) | | | (5,021,813 | ) | | | (1,487,782 | ) | | | (12,690,947 | ) |
| | | | | | | | |
Net increase (decrease) | | | 645,048 | | | $ | 4,209,737 | | | | (544,290 | ) | | $ | (4,826,488 | ) |
| | | | | | | | |
| | | | | | | | | | | | | | | | |
Investor C | | | | | | | | | | | | | | | | |
Shares sold | | | 245,413 | | | $ | 1,504,985 | | | | 299,272 | | | $ | 2,368,474 | |
Shares redeemed | | | (223,102 | ) | | | (1,331,501 | ) | | | (528,146 | ) | | | (4,162,032 | ) |
| | | | | | | | |
Net increase (decrease) | | | 22,311 | | | $ | 173,484 | | | | (228,874 | ) | | $ | (1,793,558 | ) |
| | | | | | | | |
Total Net Increase (Decrease) | | | (33,569,805 | ) | | $ | (223,979,062 | ) | | | 7,332,702 | | | $ | 61,203,635 | |
| | | | | | | | |
| | | | | | | | | | | | | | | | |
Global Long/Short Credit | | | | | | | | | | | | | | | | |
| | | | | | | | | | | | | | | | |
Institutional | | | | | | | | | | | | | | | | |
Shares sold | | | 133,060,592 | | | $ | 1,369,620,218 | | | | 228,253,989 | | | $ | 2,444,158,662 | |
Shares issued in reinvestment of distributions | | | 14,414,698 | | | | 141,840,624 | | | | 15,417,114 | | | | 159,875,473 | |
Shares redeemed | | | (144,090,789 | ) | | | (1,467,303,205 | ) | | | (236,987,664 | ) | | | (2,511,305,901 | ) |
| | | | | | | | |
Net increase | | | 3,384,501 | | | $ | 44,157,637 | | | | 6,683,439 | | | $ | 92,728,234 | |
| | | | | | | | |
| | | | | | | | | | | | | | | | |
Investor A | | | | | | | | | | | | | | | | |
Shares sold | | | 11,889,496 | | | $ | 121,124,966 | | | | 34,051,796 | | | $ | 363,097,514 | |
Shares issued in reinvestment of distributions | | | 3,298,567 | | | | 32,424,910 | | | | 4,692,418 | | | | 48,613,450 | |
Shares redeemed | | | (47,362,310 | ) | | | (484,955,095 | ) | | | (84,357,244 | ) | | | (902,901,373 | ) |
| | | | | | | | |
Net decrease | | | (32,174,247 | ) | | $ | (331,405,219 | ) | | | (45,613,030 | ) | | $ | (491,190,409 | ) |
| | | | | | | | |
| | | | | | | | | | | | | | | | |
Investor C | | | | | | | | | | | | | | | | |
Shares sold | | | 1,751,641 | | | $ | 17,715,879 | | | | 7,672,781 | | | $ | 81,545,683 | |
Shares issued in reinvestment of distributions | | | 1,183,266 | | | | 11,536,847 | | | | 1,340,373 | | | | 13,805,842 | |
Shares redeemed | | | (7,053,565 | ) | | | (71,211,004 | ) | | | (11,923,168 | ) | | | (125,387,529 | ) |
| | | | | | | | |
Net decrease | | | (4,118,658 | ) | | $ | (41,958,278 | ) | | | (2,910,014 | ) | | $ | (30,036,004 | ) |
| | | | | | | | |
Total Net Decrease | | | (32,908,404 | ) | | $ | (329,205,860 | ) | | | (41,839,605 | ) | | $ | (428,498,179 | ) |
| | | | | | | | |
| | | | | | |
| 104 | | BLACKROCK FUNDS | | JANUARY 31, 2016 | | |
| | |
| Notes to Financial Statements (concluded) | | |
| | | | | | | | | | | | | | | | |
| | | Six Months Ended
January 31, 2016 | | | Period from
December 4, 20141 to
July 31, 2015 | |
| Macro Themes | | Shares | | | Amount | | | Shares | | | Amount | |
Institutional | | | | | | | | | | | | | | | | |
Shares sold | | | 5,390 | | | $ | 51,703 | | | | 2,996,705 | | | $ | 29,967,000 | |
Shares issued in reinvestment of distributions | | | 278 | | | | 2,576 | | | | — | | | | — | |
Shares redeemed | | | (4,892 | ) | | | (44,026 | ) | | | — | | | | — | |
| | | | | | | | |
Net increase | | | 776 | | | $ | 10,253 | | | | 2,996,705 | | | $ | 29,967,000 | |
| | | | | | | | |
| | | | | | | | | | | | | | | | |
Investor A | | | | | | | | | | | | | | | | |
Shares sold | | | 10,015 | | | $ | 97,044 | | | | 2,595 | | | $ | 25,960 | |
Shares issued in reinvestment of distributions | | | 388 | | | | 3,602 | | | | — | | | | — | |
| | | | | | | | |
Net increase | | | 10,403 | | | $ | 100,646 | | | | 2,595 | | | $ | 25,960 | |
| | | | | | | | |
| | | | | | | | | | | | | | | | |
Investor C | | | | | | | | | | | | | | | | |
Shares sold | | | — | | | | — | | | | 2,500 | | | $ | 25,000 | |
| | | | | | | | |
Net increase | | | — | | | | — | | | | 2,500 | | | | 25,000 | |
| | | | | | | | |
Total Net Increase | | | 11,179 | | | $ | 110,899 | | | | 3,001,800 | | | $ | 30,017,960 | |
| | | | | | | | |
| | 1 | | Commencement of operations. |
At January 31, 2016, shares of Macro Themes owned by BlackRock HoldCo 2, Inc., an affiliate of the Funds, were as follows:
| | | | |
| Institutional | | Investor A | | Investor C |
2,995,000 | | 2,500 | | 2,500 |
12. Subsequent Events:
Management has evaluated the impact of all subsequent events on the Funds through the date the financial statements were issued and has determined that there were no subsequent events requiring adjustment or additional disclosure in the financial statements.
| | | | | | |
| | | BLACKROCK FUNDS | | JANUARY 31, 2016 | | 105 |
Rodney D. Johnson, Chair of the Board and Trustee
David O. Beim, Trustee
Susan J. Carter, Trustee
Collette Chilton, Trustee
Neil A. Cotty, Trustee
Frank J. Fabozzi, Trustee
Dr. Matina S. Horner, Trustee
Cynthia A. Montgomery, Trustee
Barbara G. Novick, Trustee
Joseph P. Platt, Trustee
Robert C. Robb, Jr., Trustee
Mark Stalnecker, Trustee
Kenneth L. Urish, Trustee
Claire A. Walton, Trustee
Frederick W. Winter, Trustee
John M. Perlowski, Trustee, President and Chief Executive Officer
Richard Hoerner, CFA, Vice President
Jennifer McGovern, Vice President
Neal Andrews, Chief Financial Officer
Jay Fife, Treasurer
Charles Park, Chief Compliance Officer
Fernanda Piedra, Anti-Money Laundering Compliance Officer
Benjamin Archibald, Secretary
Effective September 25, 2015, John M. Perlowski was appointed to serve as an Interested Trustee of the Trust.
Effective December 31, 2015, Herbert I. London and Toby Rosenblatt retired as Trustees of the Trust.
Effective February 5, 2016, Frank J. Fabozzi resigned as a Trustee of the Trust.
Effective February 8, 2016, Susan J. Carter, Neil A. Cotty and Claire A. Walton were appointed to serve as Trustees of the Trust.
| | | | | | |
| | | | |
Investment Advisor and Administrator BlackRock Advisors, LLC Wilmington, DE 19809 | | Sub-Advisors BlackRock International Limited Edinburgh, EH3 8BL United Kingdom BlackRock (Singapore) Limited1 079912 Singapore | | Accounting Agent and Transfer Agent BNY Mellon Investment Servicing (US) Inc. Wilmington, DE 19809 | | Custodian The Bank of New York Mellon New York, NY 10286 |
| | | | | | |
Distributor BlackRock Investments, LLC New York, NY 10022 | | Legal Counsel Sidley Austin LLP New York, NY 10019 | | Independent Registered Public Accounting Firm PricewaterhouseCoopers LLP Philadelphia, PA 19103 | | Address of the Trust 100 Bellevue Parkway Wilmington, DE 19809 |
| | 1 | | For Global Long/Short Credit. |
| | | | | | |
| 106 | | BLACKROCK FUNDS | | JANUARY 31, 2016 | | |
Householding
The Funds will mail only one copy of shareholder documents, including prospectuses, annual and semi-annual reports and proxy statements, to shareholders with multiple accounts at the same address. This practice is commonly called “householding” and is intended to reduce expenses and eliminate duplicate mailings of shareholder documents. Mailings of your shareholder documents may be householded indefinitely unless you instruct us otherwise. If you do not want the mailing of these documents to be combined with those for other members of your household, please call the Funds at (800) 441-7762.
Availability of Quarterly Schedule of Investments
The Funds file their complete schedules of portfolio holdings with the SEC for the first and third quarters of each fiscal year on Form N-Q. The Funds’ Forms N-Q are available on the SEC’s website at http://www.sec.gov and may also be reviewed and copied at the SEC’s Public Reference Room in Washington, D.C. Information on how to access documents on the SEC’s website without charge may be obtained by calling (800) SEC-0330. The Funds’ Forms N-Q may also be obtained upon request and without charge by calling (800) 441-7762.
Availability of Proxy Voting Policies and Procedures
A description of the policies and procedures that the Funds use to determine how to vote proxies relating to portfolio securities is available upon request and without charge (1) by calling (800) 441-7762; (2) at http://www.blackrock.com; and (3) on the SEC’s website at http://www.sec.gov.
Availability of Proxy Voting Record
Information about how the Funds voted proxies relating to securities held in the Funds’ portfolios during the most recent 12-month period ended June 30 is available upon request and without charge (1) at http://www.blackrock.com or by calling (800) 441-7762 and (2) on the SEC’s website at http://www.sec.gov.
BlackRock’s Mutual Fund Family
BlackRock offers a diverse lineup of open-end mutual funds crossing all investment styles and managed by experts in equity, fixed income and tax-exempt investing. Visit http://www.blackrock.com for more information.
Account Information
Call us at (800) 441-7762 from 8:00 AM to 6:00 PM EST on any business day to get information about your account balances, recent transactions and share prices. You can also reach us on the Web at http://www.blackrock.com/funds.
Automatic Investment Plans
Investor Class shareholders who want to invest regularly can arrange to have $50 or more automatically deducted from their checking or savings account and invested in any of the BlackRock funds.
Systematic Withdrawal Plans
Investor Class shareholders can establish a systematic withdrawal plan and receive periodic payments of $50 or more from their BlackRock funds, as long as their account balance is at least $10,000.
Retirement Plans
Shareholders may make investments in conjunction with Traditional, Rollover, Roth, Coverdell, Simple IRAs, SEP IRAs and 403(b) Plans.
| | | | | | |
| | | BLACKROCK FUNDS | | JANUARY 31, 2016 | | 107 |
| | |
| Additional Information (concluded) | | |
|
| BlackRock Privacy Principles |
BlackRock is committed to maintaining the privacy of its current and former fund investors and individual clients (collectively, “Clients”) and to safeguarding their non-public personal information. The following information is provided to help you understand what personal information BlackRock collects, how we protect that information and why in certain cases we share such information with select parties.
If you are located in a jurisdiction where specific laws, rules or regulations require BlackRock to provide you with additional or different privacy-related rights beyond what is set forth below, then BlackRock will comply with those specific laws, rules or regulations.
BlackRock obtains or verifies personal non-public information from and about you from different sources, including the following: (i) information we receive from you or, if applicable, your financial intermediary, on applications, forms or other documents; (ii) information about your transactions with us, our affiliates, or others; (iii) information we receive from a consumer reporting agency; and (iv) from visits to our websites.
BlackRock does not sell or disclose to non-affiliated third parties any non-public personal information about its Clients, except as permitted by law or as is necessary to respond to regulatory requests or to service Client accounts. These non-affiliated third parties are required to protect the confidentiality and security of this information and to use it only for its intended purpose.
We may share information with our affiliates to service your account or to provide you with information about other BlackRock products or services that may be of interest to you. In addition, BlackRock restricts access to non-public personal information about its Clients to those BlackRock employees with a legitimate business need for the information. BlackRock maintains physical, electronic and procedural safeguards that are designed to protect the non-public personal information of its Clients, including procedures relating to the proper storage and disposal of such information.
| | | | | | |
| 108 | | BLACKROCK FUNDS | | JANUARY 31, 2016 | | |
This report is intended for current holders. It is not authorized for use as an offer of sale or a solicitation of an offer to buy shares of the Funds unless preceded or accompanied by the Funds’ current prospectus. Past performance results shown in this report should not be considered a representation of future performance. Investment returns and principal value of shares will fluctuate so that shares, when redeemed, may be worth more or less than their original cost. Statements and other information herein are as dated and are subject to change.

| | |
| |
CSGLSCMT-1/16-SAR | |  |
JANUARY 31, 2016
| | | | |
SEMI-ANNUAL REPORT (UNAUDITED) | | | | BLACKROCK® |
| | | | |
| | BlackRock Short Obligations Fund | | of BlackRock FundsSM |
| | |
| Not FDIC Insured ¡ May Lose Value ¡ No Bank Guarantee | | |
| | |

| | Shareholders can sign up for e-mail notifications of quarterly statements, annual and semi-annual shareholder reports and prospectuses by enrolling in the electronic delivery program. Electronic copies of shareholder reports and prospectuses are also available on BlackRock’s website. TO ENROLL IN ELECTRONIC DELIVERY: Shareholders Who Hold Accounts with Investment Advisors, Banks or Brokerages: Please contact your financial advisor. Please note that not all investment advisors, banks or brokerages may offer this service. Shareholders Who Hold Accounts Directly with BlackRock: 1. Access the BlackRock website at blackrock.com 2. Select "Access Your Account" 3. Next, select "eDelivery" in the "Related Resources" box and follow the sign-up instructions |
| | | | | | |
| 2 | | BLACKROCK SHORT OBLIGATIONS FUND | | JANUARY 31, 2016 | | |
Dear Shareholder,
Diverging monetary policies and shifting economic outlooks across regions have been the overarching themes driving financial markets over the past couple of years. With U.S. growth outpacing the global economic recovery while inflationary pressures remained low, investors spent most of 2015 anticipating a short-term rate hike from the Federal Reserve, which ultimately came to fruition in December. In contrast, the European Central Bank and the Bank of Japan moved to a more accommodative stance over the year. In this environment, the U.S. dollar strengthened considerably, causing profit challenges for U.S. exporters and high levels of volatility in emerging market currencies and commodities.
Market volatility broadly increased in the latter part of 2015 and continued into 2016 given a collapse in oil prices and decelerating growth in China, while global growth and inflation failed to pick up. Oil prices were driven lower due to excess supply while the world’s largest oil producers had yet to negotiate a deal that would stabilize oil prices. In China, slower economic growth combined with a depreciating yuan and declining confidence in the country’s policymakers stoked worries about the potential impact to the broader global economy. After a long period in which global central bank policies had significant influence on investor sentiment and hence the direction of financial markets, in recent months, the underperformance of markets in Europe and Japan — where central banks had taken aggressive measures to stimulate growth and stabilize their currencies — highlighted the possibility that central banks could be losing their effectiveness.
In this environment, higher quality assets such as municipal bonds, U.S. Treasuries and investment grade corporate bonds outperformed risk assets including equities and high yield bonds. Large cap U.S. equities fared better than international developed and emerging markets.
At BlackRock, we believe investors need to think globally, extend their scope across a broad array of asset classes and be prepared to move freely as market conditions change over time. We encourage you to talk with your financial advisor and visit blackrock.com for further insight about investing in today’s markets.
Sincerely,

Rob Kapito
President, BlackRock Advisors, LLC

Rob Kapito
President, BlackRock Advisors, LLC
| | | | | | | | |
| Total Returns as of January 31, 2016 | |
| | | 6-month | | | 12-month | |
U.S. large cap equities
(S&P 500® Index) | | | (6.77 | )% | | | (0.67 | )% |
U.S. small cap equities
(Russell 2000® Index) | | | (15.80 | ) | | | (9.92 | ) |
International equities
(MSCI Europe, Australasia,
Far East Index) | | | (14.58 | ) | | | (8.43 | ) |
Emerging market equities
(MSCI Emerging Markets
Index) | | | (16.96 | ) | | | (20.91 | ) |
3-month Treasury bills
(BofA Merrill Lynch
3-Month U.S. Treasury
Bill Index) | | | 0.05 | | | | 0.05 | |
U.S. Treasury securities
(BofA Merrill Lynch
10- Year U.S. Treasury
Index) | | | 3.36 | | | | (0.41 | ) |
U.S. investment grade
bonds (Barclays U.S.
Aggregate Bond Index) | | | 1.33 | | | | (0.16 | ) |
Tax-exempt municipal
bonds (S&P Municipal
Bond Index) | | | 3.67 | | | | 2.66 | |
U.S. high yield bonds
(Barclays U.S. Corporate
High Yield 2% Issuer
Capped Index) | | | (7.75 | ) | | | (6.58 | ) |
|
| Past performance is no guarantee of future results. Index performance is shown for illustrative purposes only. You cannot invest directly in an index. | |
| | | | | | |
| | | THIS PAGE NOT PART OF YOUR FUND REPORT | | | | 3 |
| | |
| Fund Summary as of January 31, 2016 | | |
BlackRock Short Obligations Fund’s (the “Fund”) investment objective is to seek current income consistent with preservation of capital.
|
| Portfolio Management Commentary |
How did the Fund perform?
| • | | For the six-month period ended January 31, 2016, the Fund outperformed its benchmark, the BofA Merrill Lynch 6-Month U.S. Treasury Bill Index. |
What factors influenced performance?
| • | | The Fund’s relative outperformance was principally attributable to its overweight position within credit sectors relative to the benchmark. In addition, the Fund had a slightly underweight stance with respect to overall portfolio duration (and corresponding sensitivity to changes in interest rates) relative to the benchmark in anticipation of the U.S. Federal Reserve’s December 16 rate hike, which further contributed to Fund performance. |
| • | | Conversely, the Fund’s longer duration positioning within credit instruments detracted from returns as market volatility increased. |
Describe recent portfolio activity.
| • | | Over the period, the Fund’s portfolio positioning was held relatively constant. |
Describe Fund positioning at period end.
| • | | At the end of the period, the Fund was overweight in credit instruments and variable rate securities, and retained a shorter duration than the benchmark. |
The views expressed reflect the opinions of BlackRock as of the date of this report and are subject to change based on changes in market, economic or other conditions. These views are not intended to be a forecast of future events and are no guarantee of future results.
| | | | |
| Portfolio Composition | | Percent of
Net Assets | |
Corporate Bonds | | | 57 | % |
Certificates of Deposit | | | 14 | |
Commercial Paper | | | 13 | |
Repurchase Agreements | | | 9 | |
Asset-Backed Securities | | | 7 | |
| | | | |
| Maturity Breakdown | | Percent of
Net Assets | |
1-7 days | | | 6 | % |
8-14 days | | | 7 | |
15-30 days | | | 1 | |
31-60 days | | | 2 | |
61-90 days | | | 6 | |
91-120 days | | | 4 | |
121-150 days | | | 4 | |
> 150 days | | | 70 | |
| | | | | | |
| 4 | | BLACKROCK SHORT OBLIGATIONS FUND | | JANUARY 31, 2016 | | |
|
| Total Return Based on a $10,000 Investment |
| | 1 | Assuming transaction costs and other operating expenses, including investment advisory fees and administration fees, if any. Class K and Institutional Shares do not have a sales charge. |
| | 2 | Under normal market conditions, the Fund will invest in U.S. dollar denominated investment grade and short-term fixed and floating rate debt securities maturing in three years or less (with certain exceptions) and will maintain a dollar-weighted average maturity of 180 days or less and a dollar-weighted average life of 365 days or less. |
| | 3 | An unmanaged index that tracks 6-Month U.S. Treasury securities. |
| | 4 | Commencement of operations. |
| | | | | | | | | | | | | | | | | | | | |
| Performance Summary for the Period Ended January 31, 2016 | | | | | | | | | |
| | | | | | | | | | | | Average Annual Total Returns | |
| | | Standardized
30-Day Yield5 | | | Unsubsidized
30-Day Yield5 | | | 6-Month
Total Returns | | | 1 Year | | | Since Inception6 | |
Class K | | | 0.79 | % | | | 0.32 | % | | | 0.24 | % | | | 0.54 | % | | | 0.54 | % |
Institutional | | | 0.76 | | | | 0.27 | | | | 0.23 | | | | 0.42 | | | | 0.47 | |
BofA Merrill Lynch 6-Month U.S. Treasury Bill Index | | | — | | | | — | | | | 0.20 | | | | 0.28 | | | | 0.20 | |
| | 5 | | The standardized 30-day yield includes the effects of any waivers and/or reimbursements. The unsubsidized 30-day yield excludes the effects of any waivers and/or reimbursements. |
| | 6 | | The Fund commenced operations on November 15, 2012. |
| | | | Past performance is not indicative of future results. |
| | | | | | | | | | | | | | |
| Expense Example | | | | | | | | | | | | | | |
| | | Actual | | Hypothetical7 | | |
| | | Beginning Account Value August 1, 2015 | | Ending Account Value
January 31, 2016 | | Expenses Paid
During the Period8 | | Beginning Account Value August 1, 2015 | | Ending Account Value
January 31, 2016 | | Expenses Paid
During the Period8 | | Annualized
Expense Ratio |
Class K | | $1,000.00 | | $1,002.40 | | $0.50 | | $1,000.00 | | $1,024.63 | | $0.51 | | 0.10% |
Institutional | | $1,000.00 | | $1,002.30 | | $0.60 | | $1,000.00 | | $1,024.53 | | $0.61 | | 0.12% |
| | 7 | | Hypothetical 5% annual return before expenses is calculated by prorating the number of days in the most recent fiscal period divided by 366. |
| | 8 | | For each class of the Fund, expenses are equal to the annualized expense ratio for the class, multiplied by the average account value over the period, multiplied by 184/366 (to reflect the one-half year period shown). |
| | | | See “Disclosure of Expenses” on page 6 for further information on how expenses were calculated. |
| | | | | | |
| | | BLACKROCK SHORT OBLIGATIONS FUND | | JANUARY 31, 2016 | | 5 |
| • | | Class K and Institutional Shares are not subject to any sales charge. These shares bear no ongoing distribution or service fees and are available only to certain eligible investors. Prior to July 9, 2013, the Fund’s Institutional Shares performance results are those of BlackRock Shares restated to reflect Institutional Shares fees. On the close of business on September 1, 2015, all of the issued and outstanding BlackRock Shares of the Fund were redesignated as Class K Shares. |
Performance information reflects past performance and does not guarantee future results. Current performance may be lower or higher than the performance data quoted. Refer to www.blackrock.com/funds to obtain performance data current to the most recent month-end. Performance results do not reflect the deduction of taxes that a shareholder would pay on fund distributions or the redemption of fund shares. Figures shown in the performance tables on the previous pages assume reinvestment of these distributions, if any, at net asset value (“NAV”) on the ex-dividend/payable dates. Investment return and principal value of
shares will fluctuate so that shares, when redeemed, may be worth more or less than their original cost. Distributions paid to each class of shares will vary because of different levels of service, distribution and transfer agency fees applicable to each class, which are deducted from the income available to be paid to shareholders.
BlackRock Advisors, LLC (the “Manager”), the Fund’s investment advisor, waived and/or reimbursed a portion of the Fund’s expenses. Without such waiver and/or reimbursement, the Fund’s performance would have been lower. The Manager is under no obligation to continue waiving or reimbursing its fees after the applicable termination date of the agreement. See Note 5 of the Notes to Financial Statements for additional information on waivers and/or reimbursements. The standardized 30-day yield includes the effects of any waivers and/or reimbursements. The unsubsidized 30-day yield excludes the effects of any waivers and/or reimbursements.
Shareholders of the Fund may incur the following charges: (a) transactional expenses and (b) operating expenses, including investment advisory fees, administration fees, service and distribution fees, including 12b-1 fees, acquired fund fees and expenses, and other fund expenses. The expense examples on the previous pages (which are based on a hypothetical investment of $1,000 invested on August 1, 2015 and held through January 31, 2016) are intended to assist shareholders both in calculating expenses based on an investment in the Fund and in comparing these expenses with similar costs of investing in other mutual funds.
The expense example provides information about actual account values and actual expenses. In order to estimate the expenses a shareholder paid during the period covered by this report, shareholders can divide their account value by $1,000 and then multiply the result by the number corresponding to their Fund and share class under the heading entitled “Expenses Paid During the Period.”
The expense example also provides information about hypothetical account values and hypothetical expenses based on the Fund’s actual expense ratio and an assumed rate of return of 5% per year before expenses. In order to assist shareholders in comparing the ongoing expenses of investing in the Fund and other funds, compare the 5% hypothetical example with the 5% hypothetical example that appear in shareholder reports of other Funds.
The expenses shown in the expense example is intended to highlight shareholders’ ongoing costs only and do not reflect any transactional expenses, such as sales charges, if any. Therefore, the hypothetical example is useful in comparing ongoing expenses only, and will not help shareholders determine the relative total expenses of owning different funds. If these transactional expenses were included, shareholder expenses would have been higher.
| | | | | | |
| 6 | | BLACKROCK SHORT OBLIGATIONS FUND | | JANUARY 31, 2016 | | |
| | | | |
| Schedule of Investments January 31, 2016 (Unaudited) | | | (Percentages shown are based on Net Assets) | |
| | | | | | | | |
| Asset-Backed Securities | | Par
(000) | | | Value | |
CarMax Auto Owner Trust: | | | | | | | | |
0.82%, 6/15/18 | | $ | 214 | | | $ | 213,200 | |
1.09%, 4/15/19 | | | 500 | | | | 499,918 | |
CNH Equipment Trust: | | | | | | | | |
0.48%, 8/15/17 | | | 4 | | | | 4,092 | |
0.84%, 8/15/18 | | | 241 | | | | 240,269 | |
Honda Auto Receivables Owner Trust: | | | | | | | | |
0.69%, 8/21/17 | | | 249 | | | | 249,114 | |
0.92%, 11/20/17 | | | 300 | | | | 300,051 | |
0.82%, 7/21/18 | | | 500 | | | | 499,576 | |
Hyundai Auto Receivables Trust, 0.69%, 4/15/18 | | | 200 | | | | 199,453 | |
Nissan Auto Receivables Owner Trust, 0.67%, 9/15/17 | | | 207 | | | | 207,175 | |
Volkswagen Auto Loan Enhanced Trust, 0.42%, 3/20/17 | | | 5 | | | | 4,532 | |
Volkswagen Credit Auto Master Trust,
0.78%, 7/22/19 (a)(b) | | | 100 | | | | 98,946 | |
Total Asset-Backed Securities — 6.8% | | | | | | | 2,516,326 | |
| | | | | | | | |
| Corporate Bonds | | | | | | |
Automobiles — 5.4% | | | | | | | | |
Daimler Finance North America LLC, 2.95%, 1/11/17 (a) | | | 500 | | | | 506,600 | |
Volkswagen International Finance NV: | | | | | | | | |
2.88%, 4/01/16 (a) | | | 500 | | | | 500,622 | |
0.80%, 11/18/16 (a)(b) | | | 1,000 | | | | 986,726 | |
| | | | | | | | |
| | | | | | | | 1,993,948 | |
Banks — 26.7% | | | | | | | | |
Australia & New Zealand Banking Group Ltd., 1.00%, 1/10/17 (a)(b) | | | 250 | | | | 250,014 | |
Bank of Tokyo-Mitsubishi UFJ Ltd., 1.00%, 2/26/16 (a) | | | 500 | | | | 500,126 | |
Banque Federative du Credit Mutuel SA, 1.47%, 1/20/17 (a)(b) | | | 500 | | | | 501,361 | |
BP Capital Markets PLC: | | | | | | | | |
0.76%, 11/07/16 (b) | | | 750 | | | | 748,394 | |
0.69%, 2/10/17 (b) | | | 250 | | | | 249,321 | |
BPCE S.A., 1.19%, 2/10/17 (b) | | | 250 | | | | 250,559 | |
Canadian Imperial Bank of Commerce, 1.35%, 7/18/16 | | | 600 | | | | 601,438 | |
Capital One N.A., 1.51%, 8/17/18 (b) | | | 500 | | | | 503,171 | |
Commonwealth Bank of Australia: | | | | | | | | |
0.86%, 3/13/17 (a)(b) | | | 500 | | | | 499,571 | |
1.12%, 11/02/18 (a)(b) | | | 495 | | | | 495,133 | |
Credit Suisse, New York, 0.97%, 4/29/16 (b) | | | 500 | | | | 499,974 | |
JPMorgan Chase & Co., 0.88%, 2/15/17 (b) | | | 500 | | | | 499,927 | |
Macquarie Bank Ltd.: | | | | | | | | |
0.96%, 6/15/16 (a)(b) | | | 275 | | | | 274,953 | |
1.25%, 10/27/17 (a)(b) | | | 250 | | | | 248,713 | |
Mizuho Bank Ltd. New York, 1.06%, 5/17/17 (b) | | | 1,000 | | | | 1,000,000 | |
Nordea Bank AB, 1.37%, 9/17/18 (a)(b) | | | 500 | | | | 501,114 | |
Rabobank Nederland, New York, 0.95%, 4/28/17 (b) | | | 500 | | | | 499,491 | |
Suncorp Metway Ltd., 0.85%, 5/23/16 (a)(b) | | | 500 | | | | 500,000 | |
| | | | | | | | |
| Corporate Bonds | | Par
(000) | | | Value | |
Svenska Handelsbanken AB: | | | | | | | | |
1.02%, 3/21/16 (b) | | $ | 500 | | | $ | 500,283 | |
1.06%, 9/23/16 (b) | | | 250 | | | | 250,329 | |
UBS AG, Stamford, 1.10%, 9/26/16 (b) | | | 500 | | | | 500,104 | |
| | | | | | | | |
| | | | | | | | 9,873,976 | |
Beverages — 0.7% | | | | | | | | |
Sabmiller Holdings, Inc., 2.45%, 1/15/17 (a) | | | 250 | | | | 252,045 | |
Consumer Finance — 1.3% | | | | | | | | |
American Express Credit Corp., 1.11%, 11/05/18 (b) | | | 500 | | | | 499,053 | |
Diversified Financial Services — 3.7% | | | | | | | | |
Citigroup Inc., 1.31%, 12/07/18 (b) | | | 500 | | | | 497,975 | |
Shell International Finance BV: | | | | | | | | |
0.57%, 11/15/16 (b) | | | 375 | | | | 374,607 | |
0.66%, 5/10/17 (b) | | | 500 | | | | 498,652 | |
| | | | | | | | |
| | | | | | | | 1,371,234 | |
Diversified Telecommunication Services — 6.0% | | | | | | | | |
AT&T, Inc.: | | | | | | | | |
0.74%, 2/12/16 (b) | | | 500 | | | | 499,968 | |
2.95%, 5/15/16 | | | 290 | | | | 291,581 | |
Deutsche Telekom International Finance BV, 5.75%, 3/23/16 | | | 250 | | | | 251,724 | |
Verizon Communications, Inc.: | | | | | | | | |
2.04%, 9/15/16 (b) | | | 1,000 | | | | 1,005,887 | |
2.50%, 9/15/16 | | | 166 | | | | 167,307 | |
| | | | | | | | |
| | | | | | | | 2,216,467 | |
Food & Staples Retailing — 0.8% | | | | | | | | |
CVS Health Corp., 1.20%, 12/05/16 | | | 300 | | | | 299,918 | |
Health Care Equipment & Supplies — 2.8% | | | | | | | | |
Baxter International, Inc.: | | | | | | | | |
0.95%, 6/01/16 | | | 520 | | | | 519,833 | |
1.85%, 1/15/17 | | | 500 | | | | 502,575 | |
| | | | | | | | |
| | | | | | | | 1,022,408 | |
Health Care Providers & Services — 2.0% | | | | | | | | |
Principal Life Global Funding II, 0.78%, 5/27/16 (a)(b) | | | 500 | | | | 500,242 | |
Unitedhealth Group, Inc., 1.45%, 7/17/17 | | | 250 | | | | 250,737 | |
| | | | | | | | |
| | | | | | | | 750,979 | |
Insurance — 1.1% | | | | | | | | |
Metropolitan Life Global Funding I, 1.30%, 4/10/17 (a) | | | 410 | | | | 410,264 | |
Machinery — 2.7% | | | | | | | | |
John Deere Capital Corp.: | | | | | | | | |
1.07%, 7/11/17 (b) | | | 500 | | | | 500,423 | |
1.19%, 1/08/19 (b) | | | 500 | | | | 500,004 | |
| | | | | | | | |
| | | | | | | | 1,000,427 | |
Metals & Mining — 1.3% | | | | | | | | |
Rio Tinto Finance USA PLC, 1.37%, 6/17/16 (b) | | | 500 | | | | 498,851 | |
Oil, Gas & Consumable Fuels — 0.7% | | | | | | | | |
TransCanada Pipelines Ltd., 1.28%, 6/30/16 (b) | | | 250 | | | | 249,436 | |
See Notes to Financial Statements.
| | | | | | |
| | | BLACKROCK SHORT OBLIGATIONS FUND | | JANUARY 31, 2016 | | 7 |
| | |
| Schedule of Investments (continued) | | |
| | |
| | | | | | | | |
| Corporate Bonds | | Par (000) | | | Value | |
Pharmaceuticals — 0.7% | | | | | | | | |
Bayer US Finance LLC, 0.87%, 10/07/16 (a)(b) | | $ | 250 | | | $ | 249,711 | |
Specialty Retail — 0.5% | | | | | | | | |
Lowe’s Cos Inc., 1.10%, 9/14/18 (b) | | | 195 | | | | 195,338 | |
Wireless Telecommunication Services — 0.7% | | | | | | | | |
America Movil Sab de CV, 2.38%, 9/08/16 | | | 250 | | | | 250,622 | |
Total Corporate Bonds — 57.1% | | | | | | | 21,134,677 | |
Total Long-Term Investments (Cost — $23,677,158) — 63.9% | | | | | | | 23,651,003 | |
| | | | | | | | |
| Short-Term Securities | | | | | | |
| Certificates of Deposit | | | | | | |
Domestic — 1.4% | | | | | | | | |
Wells Fargo Bank N.A., 0.87%, 10/13/16 (b) | | | 500 | | | | 499,935 | |
Yankee — 12.8% (c) | | | | | | | | |
Bank of Montreal, Chicago, 0.76%, 11/30/16 (b) | | | 500 | | | | 499,856 | |
Mitsubishi UFJ Trust and Bank Corp., 0.75%, 4/08/16 | | | 250 | | | | 250,092 | |
Natixis, New York, 1.05%, 12/01/16 | | | 1,000 | | | | 1,000,420 | |
Toronto Dominion Bank, New York, 0.87%, 10/17/16 (b) | | | 1,500 | | | | 1,498,907 | |
Westpac Banking Corp New York, 0.87%, 10/21/16 (b) | | | 1,500 | | | | 1,497,965 | |
Total Certificates of Deposit — 14.2% | | | | | | | 5,247,175 | |
| | | | | | | | |
| Commercial Paper | | | | | | |
Lloyds Bank PLC, 1.00%, 10/21/16 (d) | | | 1,500 | | | | 1,488,994 | |
Macquarie Bank Ltd., 1.04%, 10/20/16 (a)(b) | | | 1,000 | | | | 999,805 | |
NBCuniversal Enterprise Inc, 0.65%, 2/09/16 (d) | | | 990 | | | | 989,862 | |
Omnicom Capital Inc, 0.67%, 2/10/16 (d) | | | 1,260 | | | | 1,259,807 | |
Total Commercial Paper — 12.8% | | | | | | | 4,738,468 | |
| | | | | | | | |
| Money Market Funds — 0.3% | | Shares | | | | |
BlackRock Liquidity Funds, TempFund, Institutional Class, 0.32% (e)(f) | | | 102,433 | | | | 102,433 | |
| | | | | | | | |
| | | | | | | |
| | | | | | | | |
| Repurchase Agreements | | Par
(000) | | | Value | |
Citigroup Global Markets, Inc.,
0.97%, 2/01/16 (g)
(Purchased on 1/29/16 to be repurchased at $500,041, collateralized by corporate/debt obligation, 1.50% due at 9/25/42, original par and fair value of $9,952,885 and $535,000, respectively) | |
$ |
500 |
| |
$ |
500,785 |
|
Total Value of Citigroup Global Markets, Inc.
(Collateral value of $535,000) | | | | | | | 500,785 | |
Merrill Lynch, Pierce, Fenner & Smith, Inc.,
0.87%, 2/01/16 (g)
(Purchased on 1/29/16 to be repurchased at $1,000,073, collateralized by corporate/debt obligation, 1.34% due at 12/21/36, original par and fair value of $11,495,531 and $1,250,000, respectively) | |
|
1,000 |
| |
|
1,000,515 |
|
Total Value of Merrill Lynch, Pierce, Fenner & Smith, Inc.
(Collateral value of $1,250,000) | | | | | | | 1,000,515 | |
Mizuho Securities USA, Inc.,
1.45%, 2/01/16 (g)
(Purchased on 1/29/16 to be repurchased at $750,090, collateralized by U.S Treasury Note, 1.88% due at 6/30/20, original par and fair value of $746,900 and $765,055, respectively) | |
|
750 |
| |
|
750,000 |
|
Total Value of Mizuho Securities USA, Inc.
(Collateral value of $765,055) | | | | | | | 750,000 | |
Wells Fargo Securities LLC,
0.89%, 4/05/16
(Purchased on 1/05/16 to be repurchased at $1,002,250, collateralized by various corporate/debt obligations, 3.62% to 5.61% due from 10/10/35 to 11/18/43, aggregate original par and fair value of $1,044,849 and $1,070,001, respectively) | |
|
1,000 |
| |
|
1,000,642 |
|
Total Value of Wells Fargo Securities LLC
(Collateral value of $1,070,001) | | | | | | | 1,000,642 | |
Total Repurchase Agreements — 8.8% | | | | | | | 3,251,942 | |
Total Short-Term Securities (Cost — $13,341,121) — 36.1% | | | | 13,340,018 | |
Total Investments (Cost — $37,018,279) — 100.0% | | | | 36,991,021 | |
Liabilities in Excess of Other Assets — 0.0% | | | | (17,485 | ) |
| | | | | | | | |
Net Assets — 100.0% | | | | | | $ | 36,973,536 | |
| | | | | | | | |
|
| Notes to Schedule of Investments |
| (a) | Security exempt from registration pursuant to Rule 144A under the Securities Act of 1933, as amended. These securities may be resold in transactions exempt from registration to qualified institutional investors. |
| (b) | Variable rate security. Rate as of period end. |
| (c) | Issuer is a U.S. branch of a foreign domiciled bank. |
| (d) | Rates are discount rates or a range of discount rates at the time of purchase. |
See Notes to Financial Statements.
| | | | | | |
| 8 | | BLACKROCK SHORT OBLIGATIONS FUND | | JANUARY 31, 2016 | | |
| | |
| Schedule of Investments (concluded) | | |
| (e) | During the period ended January 31, 2016, investments in issuers considered to be an affiliate of the Fund for purposes of Section 2(a)(3) of the Investment Company Act of 1940, as amended, were as follows: |
| | | | | | | | | | | | | | | | |
| Affiliate | | Shares Held at
July 31, 2015 | | | Net
Activity | | | Shares Held at
January 31, 2016 | | | Income | |
BlackRock Liquidity Funds, TempFund, Institutional Class | | | 47,370 | | | | 55,063 | | | | 102,433 | | | $ | 285 | |
| (f) | Current yield as of period end. |
| (g) | Variable rate security. Rate as of period end and maturity is the date the principal owed can be recovered through demand. |
| • | | For Fund compliance purposes, the Fund’s industry classifications refer to any one or more of the industry sub-classifications used by one or more widely recognized market indexes or ratings group indexes and/or as defined by Fund management. These definitions may not apply for purposes of this report, which may combine industry sub-classifications for reporting ease. |
|
| Fair Value Hierarchy as of Period End |
Various inputs are used in determining the fair value of investments. For information about the Fund’s policy regarding valuation of investments, refer to the Notes to Financial Statements.
The following table summarizes the Fund’s investments categorized in the disclosure hierarchy:
| | | | | | | | | | | | | | | | |
| | | Level 1 | | | Level 2 | | | Level 3 | | | Total | |
Assets: | | | | | | | | | | | | | | | | |
Investments:1 | | | | | | | | | | | | | | | | |
Long-Term Investments | | | — | | | $ | 23,151,003 | | | $ | 500,000 | | | $ | 23,651,003 | |
Short-Term Securities | | $ | 102,433 | | | | 13,237,585 | | | | — | | | | 13,340,018 | |
Total | | $ | 102,433 | | | $ | 36,388,588 | | | $ | 500,000 | | | $ | 36,991,021 | |
| | | | |
1 See above Schedule of Investments for values in each security type. | | | | |
During the period ended January 31, 2016, there were no transfers between Level 1 and Level 2.
A reconciliation of Level 3 investments is presented when the Fund had a significant amount of Level 3 investments at the beginning and/or end of the period in relation to net assets. The following table is a reconciliation of Level 3 investments for which significant unobservable inputs were used in determining fair value:
| | | | |
| | | Corporate
Bonds | |
Assets: | |
Opening Balance, as of July 31, 2015 | | $ | 500,000 | |
Transfers into Level 3 | | | — | |
Transfers out of Level 3 | | | — | |
Accrued discounts/premiums | | | — | |
Net realized gain (loss) | | | — | |
Net change in unrealized appreciation (depreciation)1,2 | | | — | |
Purchases | | | | |
Sales | | | — | |
| | | | |
Closing Balance, as of January 31, 2016 | | $ | 500,000 | |
| | | | |
Net change in unrealized appreciation (depreciation) on investments still held at January 31, 20162 | | | — | |
| | | | |
| | 1 | | Any difference between net change in unrealized appreciation (depreciation) and net change in unrealized appreciation (depreciation) on investments still held at January 31, 2016 is generally due to investments no longer held or categorized as Level 3 at period end. |
| | 2 | | Included in the related net change in unrealized appreciation (depreciation) in the Statement of Operations. |
The Fund’s investments that are categorized as Level 3 were valued utilizing third party pricing information without adjustment. Such valuations are based on unobservable inputs. A significant change in third party information could result in a significantly lower or higher value of such Level 3 investments.
See Notes to Financial Statements.
| | | | | | |
| | | BLACKROCK SHORT OBLIGATIONS FUND | | JANUARY 31, 2016 | | 9 |
| | |
| Statement of Assets and Liabilities | | |
| | | | |
| January 31, 2016 (Unaudited) | | | |
| | | | |
| Assets | | | | |
Investments at value — unaffiliated1 | | $ | 33,636,646 | |
Investments at value — affiliated2 | | | 102,433 | |
Repurchase agreements at value3 | | | 3,251,942 | |
Receivables: | | | | |
Interest — unaffiliated | | | 54,270 | |
Dividends — affiliated | | | 87 | |
From the Manager | | | 11,433 | |
Prepaid expenses | | | 20,009 | |
| | | | |
Total assets | | | 37,076,820 | |
| | | | |
| | | | |
| Liabilities | | | | |
Payables: | | | | |
Capital shares redeemed | | | 7,400 | |
Income dividends | | | 16,772 | |
Officer’s and Trustees’ fees | | | 2,582 | |
Other affiliates | | | 172 | |
Printing fees | | | 7,127 | |
Professional fees | | | 67,157 | |
Other accrued expenses | | | 2,074 | |
| | | | |
Total liabilities | | | 103,284 | |
| | | | |
Net Assets | | $ | 36,973,536 | |
| | | | |
| | | | |
| Net Assets Consist of | | | | |
Paid-in capital | | $ | 37,005,495 | |
Accumulated net realized loss | | | (4,701 | ) |
Net unrealized appreciation (depreciation) | | | (27,258 | ) |
| | | | |
Net Assets | | $ | 36,973,536 | |
| | | | |
| | | | |
| Net Asset Value | | | | |
Class K4 | | | | |
Net assets | | $ | 26,740,263 | |
| | | | |
Shares outstanding5 | | | 2,673,107 | |
| | | | |
Net asset value | | $ | 10.00 | |
| | | | |
Institutional | | | | |
Net assets | | $ | 10,233,273 | |
| | | | |
Shares outstanding5 | | | 1,023,915 | |
| | | | |
Net asset value | | $ | 9.99 | |
| | | | |
1 Investments at cost — unaffiliated | | $ | 33,665,846 | |
2 Investments at cost — affiliated | | $ | 102,433 | |
3 Repurchase agreements at cost | | $ | 3,250,000 | |
4 On the close of business on September 1, 2015, the Fund’s BlackRock Shares were redesignated as Class K Shares. | | | | |
5 Unlimited number of shares authorized, $0.001 par value. | | | | |
See Notes to Financial Statements.
| | | | | | |
| 10 | | BLACKROCK SHORT OBLIGATIONS FUND | | JANUARY 31, 2016 | | |
| | | | |
| Six Months Ended January 31, 2016 (Unaudited) | | | |
| | | | |
| Investment Income | |
Interest — unaffiliated | | $ | 211,061 | |
Dividends — affiliated | | | 285 | |
| | | | |
Total Income | | | 211,346 | |
| | | | |
| | | | |
| Expenses | | | | |
Investment advisory | | | 69,685 | |
Professional | | | 26,813 | |
Registration | | | 15,535 | |
Administration | | | 11,846 | |
Administration — class specific | | | 5,586 | |
Printing | | | 7,993 | |
Officer and Trustees | | | 3,821 | |
Accounting services | | | 2,785 | |
Custodian | | | 2,270 | |
Transfer agent — class specific | | | 157 | |
Recoupment of past waived and/or reimbursed — Institutional | | | 4 | |
Miscellaneous | | | 4,074 | |
| | | | |
Total expenses | | | 150,569 | |
Less: | | | | |
Fees waived by the Manager | | | (69,685 | ) |
Expenses reimbursed by the Manager | | | (35,434 | ) |
Administration fees waived | | | (11,846 | ) |
Administration fees waived — class specific | | | (4,535 | ) |
Transfer agent fees waived — class specific | | | (51 | ) |
Transfer agent fees reimbursed — class specific | | | (46 | ) |
| | | | |
Total expenses after fees waived and/or reimbursed | | | 28,972 | |
| | | | |
Net investment income | | | 182,374 | |
| | | | |
| | | | |
| Realized and Unrealized Gain (Loss) | | | | |
Net realized loss from investments | | | (12,172 | ) |
| | | | |
Net change in unrealized appreciation (depreciation) | | | (27,521 | ) |
| | | | |
Net realized and unrealized loss | | | (39,693 | ) |
| | | | |
Net Increase in Net Assets Resulting from Operations | | $ | 142,681 | |
| | | | |
See Notes to Financial Statements.
| | | | | | |
| | | BLACKROCK SHORT OBLIGATIONS FUND | | JANUARY 31, 2016 | | 11 |
| | |
| Statements of Changes in Net Assets | | |
| | | | | | | | |
| Increase (Decrease) in Net Assets: | | Six Months
Ended
January 31, 2016
(Unaudited) | | | Year Ended
July 31,
2015 | |
| | | | | | | | |
| Operations | | | | | | | | |
Net investment income | | $ | 182,374 | | | $ | 168,522 | |
Net realized gain (loss) | | | (12,172 | ) | | | 7,471 | |
Net change in unrealized appreciation (depreciation) | | | (27,521 | ) | | | (37,842 | ) |
| | | | |
Net increase in net assets resulting from operations | | | 142,681 | | | | 138,151 | |
| | | | |
| | | | | | | | |
| Distributions to Shareholders1 | | | | | | | | |
From net investment income: | | | | | | | | |
Class K2 | | | (148,995 | ) | | | (113,830 | ) |
Institutional | | | (33,379 | ) | | | (54,692 | ) |
| | | | |
Decrease in net assets resulting from distributions to shareholders | | | (182,374 | ) | | | (168,522 | ) |
| | | | |
| | | | | | | | |
| Capital Share Transactions | | | | | | | | |
Net increase (decrease) in net assets derived from capital share transactions | | | (14,829,214 | ) | | | 26,831,577 | |
| | | | |
| | | | | | | | |
| Net Assets | | | | | | | | |
Total increase (decrease) in net assets | | | (14,868,907 | ) | | | 26,801,206 | |
Beginning of period | | | 51,842,443 | | | | 25,041,237 | |
| | | | |
End of period | | $ | 36,973,536 | | | $ | 51,842,443 | |
| | | | |
| | 1 | | Distributions for annual periods determined in accordance with federal income tax regulations. |
| | 2 | | On the close of business on September 1, 2015, the Fund’s BlackRock Shares were redesignated as Class K Shares. |
See Notes to Financial Statements.
| | | | | | |
| 12 | | BLACKROCK SHORT OBLIGATIONS FUND | | JANUARY 31, 2016 | | |
| | | | | | | | | | | | | | | | |
| | | Class K1 | |
| | | Six Months
Ended
January 31,
2016 (Unaudited) | | | Year Ended July 31, | | | Period
November 15,
20122 to
July 31,
2013 | |
| | | | 2015 | | | 2014 | | |
| | | | | | | | | | | | | | | | |
| Per Share Operating Performance | | | | | | | | | | | | | | | | |
Net asset value, beginning of period | | $ | 10.01 | | | $ | 10.02 | | | $ | 10.01 | | | $ | 10.00 | |
| | | | |
Net investment income3 | | | 0.03 | | | | 0.06 | | | | 0.05 | | | | 0.03 | |
Net realized and unrealized gain (loss) | | | (0.01 | ) | | | (0.01 | ) | | | 0.00 | 4 | | | 0.01 | |
| | | | |
Net increase from investment operations | | | 0.02 | | | | 0.05 | | | | 0.05 | | | | 0.04 | |
| | | | |
Distributions:5 | | | | | | | | | | | | | | | | |
From net investment income | | | (0.03 | ) | | | (0.06 | ) | | | (0.04 | ) | | | (0.03 | ) |
From net realized gain | | | — | | | | — | | | | (0.00 | )6 | | | (0.00 | )6 |
| | | | |
Total distributions | | | (0.03 | ) | | | (0.06 | ) | | | (0.04 | ) | | | (0.03 | ) |
| | | | |
Net asset value, end of period | | $ | 10.00 | | | $ | 10.01 | | | $ | 10.02 | | | $ | 10.01 | |
| | | | |
| | | | | | | | | | | | | | | | |
| Total Return7 | | | | | | | | | | | | | | | | |
Based on net asset value | | | 0.24 | %8 | | | 0.47 | % | | | 0.59 | % | | | 0.43 | %8 |
| | | | |
| | | | | | | | | | | | | | | | |
| Ratios to Average Net Assets | | | | | | | | | | | | | | | | |
Total expenses | | | 0.54 | %9 | | | 0.99 | % | | | 1.15 | % | | | 1.00 | %9,10 |
| | | | |
Total expenses after fees waived and/or reimbursed | | | 0.10 | %9 | | | 0.10 | % | | | 0.10 | % | | | 0.13 | %9 |
| | | | |
Net investment income | | | 0.66 | %9 | | | 0.57 | % | | | 0.49 | % | | | 0.46 | %9 |
| | | | |
| | | | | | | | | | | | | | | | |
| Supplemental Data | | | | | | | | | | | | | | | | |
Net assets, end of period (000) | | $ | 26,740 | | | $ | 41,660 | | | $ | 15,029 | | | $ | 15,017 | |
| | | | |
Portfolio turnover rate | | | 72 | % | | | 68 | % | | | 50 | % | | | 35 | % |
| | | | |
| | 1 | | On the close of business on September 1, 2015, the Fund’s BlackRock Shares were redesignated as Class K Shares. |
| | 2 | | Commencement of operations. |
| | 3 | | Based on average shares outstanding. |
| | 4 | | Amount is less than $0.005 per share. |
| | 5 | | Distributions for annual periods determined in accordance with federal income tax regulations. |
| | 6 | | Amount is greater than $(0.005) per share. |
| | 7 | | Where applicable, assumes the reinvestment of distributions. |
| | 8 | | Aggregate total return. |
| | 10 | | Organization costs were not annualized in the calculation of the expense ratio. If these expenses were annualized, the total expenses for Class K Shares (formerly BlackRock Shares) would have been 1.00%. |
See Notes to Financial Statements.
| | | | | | |
| | | BLACKROCK SHORT OBLIGATIONS FUND | | JANUARY 31, 2016 | | 13 |
| | |
| Financial Highlights (concluded) | | |
| | | | | | | | | | | | | | | | |
| | | Institutional | |
| | | Six Months
Ended
January 31,
2016 (Unaudited) | | | Year Ended July 31, | | | Period
July 9,
20131 to
July 31,
2013 | |
| | | | 2015 | | | 2014 | | |
| Per Share Operating Performance | | | | | | | | | | | | | | | | |
Net asset value, beginning of period | | $ | 10.00 | | | $ | 10.01 | | | $ | 10.00 | | | $ | 10.00 | |
| | | | |
Net investment income2 | | | 0.03 | | | | 0.05 | | | | 0.05 | | | | 0.003 | |
Net realized and unrealized gain (loss) | | | (0.01 | ) | | | (0.01 | ) | | | 0.00 | 3 | | | 0.003 | |
| | | | |
Net increase from investment operations | | | 0.02 | | | | 0.04 | | | | 0.05 | | | | 0.00 | |
| | | | |
Distributions:4 | | | | | | | | | | | | | | | | |
From net investment income | | | (0.03 | ) | | | (0.05 | ) | | | (0.04 | ) | | | (0.00 | )5 |
From net realized gain | | | — | | | | — | | | | (0.00 | )5 | | | (0.00 | )5 |
| | | | |
Total distributions | | | (0.03 | ) | | | (0.05 | ) | | | (0.04 | ) | | | 0.00 | |
| | | | |
Net asset value, end of period | | $ | 9.99 | | | $ | 10.00 | | | $ | 10.01 | | | $ | 10.00 | |
| | | | |
| | | | | | | | | | | | | | | | |
| Total Return6 | | | | | | | | | | | | | | | | |
Based on net asset value | | | 0.23 | %7 | | | 0.45 | % | | | 0.56 | % | | | 0.03 | %7 |
| | | | |
| | | | | | | | | | | | | | | | |
| Ratios to Average Net Assets | | | | | | | | | | | | | | | | |
Total expenses | | | 0.55 | %8 | | | 1.02 | % | | | 1.15 | % | | | 1.53 | %8,9 |
| | | | |
Total expenses after fees waived and/or reimbursed | | | 0.12 | %8 | | | 0.12 | % | | | 0.13 | % | | | 0.13 | %8 |
| | | | |
Net investment income | | | 0.65 | %8 | | | 0.55 | % | | | 0.46 | % | | | 0.51 | %8 |
| | | | |
| | | | | | | | | | | | | | | | |
| Supplemental Data | | | | | | | | | | | | | | | | |
Net assets, end of period (000) | | $ | 10,233 | | | $ | 10,182 | | | $ | 10,012 | | | $ | 10,004 | |
| | | | |
Portfolio turnover rate | | | 72 | % | | | 68 | % | | | 50 | % | | | 35 | % |
| | | | |
| | 1 | | Commencement of operations. |
| | 2 | | Based on average shares outstanding. |
| | 3 | | Amount is less than $0.005 per share. |
| | 4 | | Distributions for annual periods determined in accordance with federal income tax regulations. |
| | 5 | | Amount is greater than $(0.005) per share. |
| | 6 | | Where applicable, assumes the reinvestment of distributions. |
| | 7 | | Aggregate total return. |
| | 9 | | Organization costs were not annualized in the calculation of the expense ratio. If these expenses were annualized, the total expenses for Institutional Shares would have been 1.53%. |
See Notes to Financial Statements.
| | | | | | |
| 14 | | BLACKROCK SHORT OBLIGATIONS FUND | | JANUARY 31, 2016 | | |
| | |
| Notes to Financial Statements (Unaudited) | | |
1. Organization:
BlackRock FundsSM (the “Trust”) is registered under the Investment Company Act of 1940, as amended (the “1940 Act”), as an open-end management investment company. The Trust is organized as a Massachusetts business trust. BlackRock Short Obligations Fund (the “Fund”) is a series of the Trust. The Fund is classified as diversified.
The Fund offers multiple classes of shares. All classes of shares are sold without a sales charge and only to certain eligible investors and have equal voting, dividend, liquidation and other rights, except that only shares of the respective classes are entitled to vote on matters concerning only that class.
The Fund, together with certain other registered investment companies advised by BlackRock Advisors, LLC (the “Manager”) or its affiliates, is included in a complex of open-end funds referred to as the Equity-Liquidity Complex.
2. Significant Accounting Policies:
The financial statements are prepared in conformity with accounting principles generally accepted in the United States of America (“U.S. GAAP”), which may require management to make estimates and assumptions that affect the reported amounts of assets and liabilities in the financial statements, disclosure of contingent assets and liabilities at the date of the financial statements and the reported amounts of increases and decreases in net assets from operations during the reporting period. Actual results could differ from those estimates. The Fund is considered an investment company under U.S. GAAP and follows the accounting and reporting guidance applicable to investment companies. Below is a summary of significant accounting policies:
Investment Transactions and Investment Income: For financial reporting purposes, investment transactions are recorded on the dates the transactions are entered into (the trade dates). Realized gains and losses on investment transactions are determined on the identified cost basis. Interest income, including amortization and accretion of premiums and discounts on debt securities, is recognized on the accrual basis. Income, expenses and realized and unrealized gains and losses are allocated daily to each class based on its relative net assets.
Distributions: Distributions from net investment income are declared daily and paid monthly. Distributions of capital gains are recorded on the ex-dividend dates. The character and timing of distributions are determined in accordance with federal income tax regulations, which may differ from U.S. GAAP.
Indemnifications: In the normal course of business, the Fund enters into contracts that contain a variety of representations that provide general indemnification. The Fund’s maximum exposure under these arrangements is unknown because it involves future potential claims against the Fund, which cannot be predicted with any certainty.
Other: Expenses directly related to the Fund or its classes are charged to the Fund or the applicable class. Other operating expenses shared by several funds, including other funds managed by the Manager, are prorated among those funds on the basis of relative net assets or other appropriate methods. Expenses directly related to the Fund and other shared expenses prorated to the Fund are allocated daily to each class based on its relative net assets or other appropriate methods.
The Fund has an arrangement with its custodian whereby fees may be reduced by credits earned on uninvested cash balances, which, if applicable, are shown as fees paid indirectly in the Statement of Operations. The custodian imposes fees on overdrawn cash balances, which can be offset by accumulated credits earned or may result in additional custody charges.
3. Investment Valuation and Fair Value Measurements:
Investment Valuation Policies: The Fund’s investments are valued at fair value (also referred to as “market value” within the financial statements) as of the close of trading on the New York Stock Exchange (“NYSE”) (generally 4:00 p.m., Eastern time, or if the reporting date falls on a day the NYSE is closed, investments are valued at fair value as of the report date). U.S. GAAP defines fair value as the price the Fund would receive to sell an asset or pay to transfer a liability in an orderly transaction between market participants at the measurement date. The Fund determines the fair values of its financial instruments using independent dealers or pricing services under policies approved by the Board of Trustees of the Trust (the “Board”). The BlackRock Global Valuation Methodologies Committee (the “Global Valuation Committee”) is the committee formed by management to develop global pricing policies and procedures and to provide oversight of the pricing function for the Fund for all financial instruments.
| | | | | | |
| | | BLACKROCK SHORT OBLIGATIONS FUND | | JANUARY 31, 2016 | | 15 |
| | |
| Notes to Financial Statements (continued) | | |
Fair Value Inputs and Methodologies: The following methods (or “techniques”) and inputs are used to establish the fair value of the Fund’s assets and liabilities:
| • | | Bond investments are valued on the basis of last available bid prices or current market quotations provided by dealers or pricing services. Floating rate loan interests are valued at the mean of the bid prices from one or more brokers or dealers as obtained from a pricing service. In determining the value of a particular investment, pricing services may use certain information with respect to transactions in such investments, quotations from dealers, pricing matrixes, market transactions in comparable investments, various relationships observed in the market between investments and calculated yield measures. Asset-backed and mortgage-backed securities are valued by independent pricing services using models that consider estimated cash flows of each tranche of the security, establish a benchmark yield and develop an estimated tranche-specific spread to the benchmark yield based on the unique attributes of the tranche. |
| • | | Investments in open-end U.S. mutual funds are valued at net asset value (“NAV”) each business day. |
If events (e.g., a company announcement, market volatility or a natural disaster) occur that are expected to materially affect the value of such instruments, or in the event that the application of these methods of valuation results in a price for an investment that is deemed not to be representative of the market value of such investment, or if a price is not available, the investment will be valued by the Global Valuation Committee, or its delegate, in accordance with a policy approved by the Board as reflecting fair value (“Fair Valued Investments”). When determining the price for Fair Valued Investments, the Global Valuation Committee, or its delegate, seeks to determine the price that the Fund might reasonably expect to receive or pay from the current sale or purchase of that asset or liability in an arm’s-length transaction. Fair value determinations shall be based upon all available factors that the Global Valuation Committee, or its delegate, deems relevant consistent with the principles of fair value measurement, which include the market approach, income approach and/or in the case of recent investments, the cost approach, as appropriate. The market approach generally consists of using comparable market transactions. The income approach generally is used to discount future cash flows to present value and is adjusted for liquidity as appropriate. These factors include but are not limited to: (i) attributes specific to the investment or asset; (ii) the principal market for the investment or asset; (iii) the customary participants in the principal market for the investment or asset; (iv) data assumptions by market participants for the investment or asset, if reasonably available; (v) quoted prices for similar investments or assets in active markets; and (vi) other factors, such as future cash flows, interest rates, yield curves, volatilities, prepayment speeds, loss severities, credit risks, recovery rates, liquidation amounts and/or default rates. Due to the inherent uncertainty of valuations of such investments, the fair values may differ from the values that would have been used had an active market existed. The Global Valuation Committee, or its delegate, employs various methods for calibrating valuation approaches for investments where an active market does not exist, including regular due diligence of the Fund’s pricing vendors, regular reviews of key inputs and assumptions, transactional back-testing or disposition analysis to compare unrealized gains and losses to realized gains and losses, reviews of missing or stale prices and large movements in market values and reviews of any market related activity. The pricing of all Fair Valued Investments is subsequently reported to the Board or a committee thereof on a quarterly basis.
Fair Value Hierarchy: Various inputs are used in determining the fair value of investments. These inputs to valuation techniques are categorized into a fair value hierarchy consisting of three broad levels for financial statement purposes as follows:
| | • | | Level 1 — unadjusted price quotations in active markets/exchanges for identical assets or liabilities that the Fund has the ability to access |
| | • | | Level 2 — other observable inputs (including, but not limited to, quoted prices for similar assets or liabilities in markets that are active, quoted prices for identical or similar assets or liabilities in markets that are not active, inputs other than quoted prices that are observable for the assets or liabilities (such as interest rates, yield curves, volatilities, prepayment speeds, loss severities, credit risks and default rates) or other market–corroborated inputs) |
| | • | | Level 3 — unobservable inputs based on the best information available in the circumstances, to the extent observable inputs are not available (including the Fund’s own assumptions used in determining the fair value of investments) |
The hierarchy gives the highest priority to unadjusted quoted prices in active markets for identical assets or liabilities (Level 1 measurements) and the lowest priority to unobservable inputs (Level 3 measurements). Accordingly, the degree of judgment exercised in determining fair value is greatest for instruments categorized in Level 3. The inputs used to measure fair value may fall into different levels of the fair value hierarchy. In such cases, for disclosure purposes, the fair value hierarchy classification is determined based on the lowest level input that is significant to the fair value measurement in its entirety. The significant unobservable inputs used by the Global Valuation Committee in determining the price for Fair Valued Investments are typically categorized as Level 3. The fair value hierarchy for the Fund’s investments has been included in the Schedule of Investments.
Changes in valuation techniques may result in transfers into or out of an assigned level within the hierarchy. In accordance with the Fund’s policy, transfers between different levels of the fair value hierarchy are deemed to have occurred as of the beginning of the reporting period. The categorization of a value determined for investments is based on the pricing transparency of the investments and is not necessarily an indication of the risks associated with investing in those securities.
| | | | | | |
| 16 | | BLACKROCK SHORT OBLIGATIONS FUND | | JANUARY 31, 2016 | | |
| | |
| Notes to Financial Statements (continued) | | |
4. Securities and Other Investments:
Asset-Backed and Mortgage-Backed Securities: Asset-backed securities are generally issued as pass-through certificates or as debt instruments. Asset-backed securities issued as pass-through certificates represent undivided fractional ownership interests in an underlying pool of assets. Asset-backed securities issued as debt instruments, which are also known as collateralized obligations, are typically issued as the debt of a special purpose entity organized solely for the purpose of owning such assets and issuing such debt. Asset-backed securities are often backed by a pool of assets representing the obligations of a number of different parties. The yield characteristics of certain asset-backed securities may differ from traditional debt securities. One such major difference is that all or a principal part of the obligations may be prepaid at any time because the underlying assets (i.e., loans) may be prepaid at any time. As a result, a decrease in interest rates in the market may result in increases in the level of prepayments as borrowers, particularly mortgagors, refinance and repay their loans. An increased prepayment rate with respect to an asset-backed security will have the effect of shortening the maturity of the security. In addition, the Fund may subsequently have to reinvest the proceeds at lower interest rates. If the Fund has purchased such an asset-backed security at a premium, a faster than anticipated prepayment rate could result in a loss of principal to the extent of the premium paid.
For mortgage pass through securities there are a number of important differences among the agencies and instrumentalities of the U.S. Government that issue mortgage-related securities and among the securities that they issue. For example, mortgage-related securities guaranteed by Ginnie Mae are guaranteed as to the timely payment of principal and interest by Ginnie Mae and such guarantee is backed by the full faith and credit of the United States. However, mortgage-related securities issued by Freddie Mac and Fannie Mae, including Freddie Mac and Fannie Mae guaranteed mortgage pass-through certificates, which are solely the obligations of Freddie Mac and Fannie Mae, are not backed by or entitled to the full faith and credit of the United States, but are supported by the right of the issuer to borrow from the U.S. Treasury.
Non-agency mortgage-backed securities are securities issued by non-governmental issuers and have no direct or indirect government guarantees of payment and are subject to various risks. Non-agency mortgage loans are obligations of the borrowers thereunder only and are not typically insured or guaranteed by any other person or entity. The ability of a borrower to repay a loan is dependent upon the income or assets of the borrower. A number of factors, including a general economic downturn, acts of God, terrorism, social unrest and civil disturbances, may impair a borrower’s ability to repay its loans.
Repurchase Agreements: Repurchase agreements are commitments to purchase a security from a counterparty who agrees to repurchase the same security at a mutually agreed upon date and price. On a daily basis, the counterparty is required to maintain collateral subject to the agreement and in value no less than the agreed upon repurchase amount. Pursuant to the custodial undertaking associated with a tri-party repo arrangement, an unaffiliated third party custodian maintains accounts to hold collateral for the Fund and its counterparties. Typically, the Fund and counterparty are not permitted to sell, re-pledge or use the collateral absent a default by the counterparty or the Fund, respectively.
In the event the counterparty defaults and the fair value of the collateral declines, the Fund could experience losses, delays and costs in liquidating the collateral.
Repurchase agreements are entered into by the Fund under Master Repurchase Agreements (each, an “MRA”). The MRA permits the Fund, under certain circumstances including an event of default (such as bankruptcy or insolvency), to offset payables and/or receivables with collateral held by and/or posted to the counterparty. As a result, one single net payment is created. Bankruptcy or insolvency laws of a particular jurisdiction may impose restrictions on or prohibitions against such a right of offset in the event of the MRA counterparty’s bankruptcy or insolvency. Based on the terms of the MRA, the Fund receives securities as collateral with a market value in excess of the repurchase price at maturity. Upon a bankruptcy or insolvency of the MRA counterparty, the Fund would recognize a liability with respect to such excess collateral. The liability reflects the Fund’s obligation under bankruptcy law to return the excess to the counterparty.
5. Investment Advisory Agreement and Other Transactions with Affiliates:
The PNC Financial Services Group, Inc. is the largest stockholder and an affiliate of BlackRock, Inc. (“BlackRock”) for 1940 Act purposes.
| | | | | | |
| | | BLACKROCK SHORT OBLIGATIONS FUND | | JANUARY 31, 2016 | | 17 |
| | |
| Notes to Financial Statements (continued) | | |
Investment Advisory Fees
The Trust, on behalf of the Fund, entered into an Investment Advisory Agreement with the Manager, the Fund’s investment advisor, an indirect, wholly owned subsidiary of BlackRock, to provide investment advisory and administration services. The Manager is responsible for the management of the Fund’s portfolio and provides the personnel, facilities, equipment and certain other services necessary to the operations of the Fund. For such services, the Fund pays the Manager a monthly fee based on a percentage of the Fund’s average daily net assets at the following annual rates:
| | | | |
| Average Daily Net Assets | | Investment Advisory Fee | |
First $1 Billion | | | 0.25 | % |
$1 billion - $3 Billion | | | 0.24 | % |
$3 billion - $5 Billion | | | 0.23 | % |
$5 billion - $10 Billion | | | 0.22 | % |
Greater than $10 Billion | | | 0.21 | % |
The Manager voluntarily agreed to waive its investment advisory fees by the amount of investment advisory fees the Fund pays to the Manager indirectly through its investment in affiliated money market funds. These amounts are included in fees waived by the Manager in the Statement of Operations. However, the Manager does not waive its investment advisory fees by the amount of investment advisory fees paid in connection with the Fund’s investments in other affiliated investment companies, if any. For the six months ended January 31, 2016, the Manager reimbursed $390, which is included in fees waived by the Manager the Statement of Operations.
Other Fees
Pursuant to written agreements, certain financial intermediaries, some of which may be affiliates, provide the Fund with sub-accounting, recordkeeping, sub-transfer agency and other administrative services with respect to sub-accounts they service. For these services, these entities receive an asset-based fee or an annual fee per shareholder account, which will vary depending on share class and/or net assets.
The Manager maintains a call center, that is responsible for providing certain shareholder services to the Fund. Shareholder services include responding to inquiries and processing subscriptions and redemptions based upon instructions from shareholders. For the six months ended January 31, 2016, the Fund reimbursed the Manager the following amounts for costs incurred in running the call center, which are included in transfer agent — class specific in the Statement of Operations.
| | | | |
Class K | | $ | 17 | |
Institutional | | $ | 52 | |
For the six months ended January 31, 2016, the following table shows the class specific transfer agent fees borne directly by each class of the Fund:
| | | | |
Class K | | $ | 100 | |
Institutional | | $ | 57 | |
The Trust, on behalf of the Fund, entered into an Administration Agreement with the Manager, an indirect, wholly owned subsidiary of BlackRock, to provide administrative services. For these services, the Manager receives an administration fee computed daily and payable monthly, based on a percentage of the average daily net assets of the Fund. The administration fee, which is shown as administration in the Statement of Operations, is paid at the annual rates below.
| | | | |
| Average Daily Net Assets | | Administration Fee | |
First $500 Million | | | 0.0425 | % |
$500 Million - $1 Billion | | | 0.0400 | % |
$1 Billion - $2 Billion | | | 0.0375 | % |
$2 Billion - $4 Billion | | | 0.0350 | % |
$4 Billion - $13 Billion | | | 0.0325 | % |
Greater than $13 Billion | | | 0.0300 | % |
In addition, the Manager charges each of the share classes an administration fee, which is shown as administration — class specific in the Statement of Operations, at an annual rate of 0.02% of the average daily net assets of each respective class.
| | | | | | |
| 18 | | BLACKROCK SHORT OBLIGATIONS FUND | | JANUARY 31, 2016 | | |
| | |
| Notes to Financial Statements (continued) | | |
For the six months ended January 31, 2016, the following table shows the class specific administration fees borne directly by each class of the Fund:
| | | | |
Class K | | $ | 4,558 | |
Institutional | | $ | 1,028 | |
The Manager may have, at its discretion, voluntarily waived all or any portion of its administration fees for the Fund or a share class, which are included administration fees waived and administration fees waived — class specific in the Statement of Operations.
Expense Limitations, Waivers and Recoupments
The Manager, with respect to the Fund, contractually or voluntarily agreed to waive and/or reimburse fees or expenses in order to limit expenses, excluding interest expense, dividend expense, tax expense, acquired fund fees and expenses, and certain other fund expenses, which constitute extraordinary expenses not incurred in the ordinary course of the Fund’s business. The expense limitations as a percentage of average daily net assets are as follows:
| | | | | | | | |
| | | Contractual1 | | | Voluntary2,3 | |
Class K | | | 0.30 | % | | | 0.10 | % |
Institutional | | | 0.35 | % | | | 0.20 | % |
| | 1 | | The Manager has agreed not to reduce or discontinue this contractual waiver or reimbursement prior to December 1, 2016 unless approved by the Board, including a majority of the independent trustees, or by a vote of majority of the outstanding voting securities of the Fund. |
| | 2 | | The voluntary waiver or reimbursement may be reduced or discontinued at any time. |
| | 3 | | Prior to December 17, 2012, the Fund had a voluntary expense cap of 0.25% and from December 17, 2012 to January 22, 2013 a voluntary expense cap of 0.18% with respect to Class K shares. |
These amounts waived or reimbursed are included in fees waived by the Manager and shown as administration fees waived, administration fees waived — class specific, transfer agent fees waived — class specific, transfer agent fees reimbursed — class specific and expenses reimbursed by the Manager, respectively, in the Statement of Operations. For the six months ended January 31, 2016, the Manager waived $69,295 of investment advisory fees, which is included in fees waived by the Manager in the Statement of Operations. The Manager reimbursed expenses, which are shown as expenses reimbursed by the Manager in the Statement of Operations.
Class specific waivers or reimbursements are as follows:
| | | | |
| Administration Fees Waived | |
Class K | | | $4,535 | |
| | | | |
| Transfer Agent Fees Waived | |
Class K | | | $51 | |
| | | | |
| Transfer Agent Fees Reimbursed | |
Class K | | | $46 | |
If during the Fund’s fiscal year the operating expenses of a share class, that at any time during the prior two fiscal years received a waiver or reimbursement from the Manager, are less than the expense limit for that share class, the Manager is entitled to be reimbursed by such share class up to the lesser of (a) the amount of fees waived or expenses reimbursed during those prior two fiscal years under the agreement and (b) the amount by which the expense limit for that share class exceeds the operating expenses of the share class for the current fiscal year, provided that: (1) the Fund, of which the share class is a part, has more than $50 million in assets for the fiscal year and (2) the Manager or an affiliate continues to serve as the Fund’s investment advisor or administrator. In the event the expense limit for a share class is changed subsequent to a fiscal year in which the Manager becomes entitled to reimbursement for fees waived or reimbursed, the amount available to reimburse the Manager shall be calculated by reference to the expense limit for that share class in effect at the time the Manager became entitled to receive such reimbursement, rather than the subsequently changed expense limit for that share class.
| | | | | | |
| | | BLACKROCK SHORT OBLIGATIONS FUND | | JANUARY 31, 2016 | | 19 |
| | |
| Notes to Financial Statements (continued) | | |
For the six months ended January 31, 2016, the Manager recouped waivers and/or reimbursements previously recorded of $4 for Institutional Shares.
On January 31, 2016, the Fund level and class specific waivers and/or reimbursements subject to possible future recoupment under the expense limitation agreement are as follows:
| | | | | | | | | | | | |
| | | Expiring July 31, | |
| | | 2016 | | | 2017 | | | 2018 | |
Fund Level | | $ | 205,526 | | | $ | 200,721 | | | $ | 116,575 | |
Class K | | $ | 3,826 | | | $ | 4,291 | | | $ | 4,632 | |
Officers and Trustees Fees
Certain officers and/or trustees of the Trust are officers and/or directors of BlackRock or its affiliates. The Fund reimburses the Manager for a portion of the compensation paid to the Trust’s Chief Compliance Officer, which is included in officer and trustees in the Statement of Operations.
6. Purchases and Sales:
For the six months ended January 31, 2016, purchases and sales of investments, excluding short-term securities, were $19,382,596 and $23,249,023, respectively.
7. Income Tax Information:
It is the Fund’s policy to comply with the requirements of the Internal Revenue Code of 1986, as amended, applicable to regulated investment companies, and to distribute substantially all of its taxable income to its shareholders. Therefore, no federal income tax provision is required.
The Fund files U.S. federal and various state and local tax returns. No income tax returns are currently under examination. The statute of limitations on the Fund’s U.S. federal tax returns remains open for each of the two years ended July 31, 2015 and the period ended July 31, 2013. The statutes of limitations on the Fund’s state and local tax returns may remain open for an additional year depending upon the jurisdiction.
Management has analyzed tax laws and regulations and their application to the Fund as of January 31, 2016, inclusive of the open tax return years, and does not believe there are any uncertain tax positions that require recognition of a tax liability in the Fund’s financial statements.
As of period end, gross unrealized appreciation and depreciation based on cost for federal income tax purposes were as follows:
| | | | |
Tax cost | | $ | 37,018,279 | |
| | | | |
Gross unrealized appreciation | | $ | 11,958 | |
Gross unrealized depreciation | | | (39,216 | ) |
| | | | |
Net unrealized depreciation | | $ | (27,258 | ) |
| | | | |
8. Bank Borrowings:
The Trust, on behalf of the Fund, along with certain other funds managed by the Manager and its affiliates (“Participating Funds”), is a party to a 364-day, $2.1 billion credit agreement with a group of lenders, under which the Fund may borrow to fund shareholder redemptions. Excluding commitments designated for certain funds, the Participating Funds, including the Fund, can borrow up to an aggregate commitment amount of $1.6 billion at any time outstanding, subject to asset coverage and other limitations as specified in the agreement. The credit agreement has the following terms: a fee of 0.06% per annum on unused commitment amounts and interest at a rate equal to the higher of (a) one-month LIBOR (but, in any event, not less than 0.00%) on the date the loan is made plus 0.80% per annum or (b) the Fed Funds rate (but, in any event, not less than 0.00%) in effect from time to time plus 0.80% per annum on amounts borrowed. The agreement expires in April 2016 unless extended or renewed. Participating Funds paid administration, legal and arrangement fees, which, if applicable, are included in miscellaneous expenses in the Statement of Operations, and along with commitment fees, were allocated among such funds based upon portions of the aggregate commitment available to them and relative net assets of Participating Funds. During the six months ended January 31, 2016, the Fund did not borrow under the credit agreement.
9. Principal Risks:
In the normal course of business, the Fund invests in securities and enters into transactions where risks exist due to fluctuations in the market (market risk) or failure of the issuer to meet all its obligations, including the ability to pay principal and interest when due (issuer credit risk). The value of securities held by the Fund may decline in response to certain events, including those directly involving the issuers of securities owned by the Fund.
| | | | | | |
| 20 | | BLACKROCK SHORT OBLIGATIONS FUND | | JANUARY 31, 2016 | | |
| | |
| Notes to Financial Statements (concluded) | | |
Changes arising from the general economy, the overall market and local, regional or global political or/and social instability, as well as currency, interest rate and price fluctuations, may also affect the securities’ value.
The Fund may be exposed to prepayment risk, which is the risk that borrowers may exercise their option to prepay principal earlier than scheduled during periods of declining interest rates, which would force the Fund to reinvest in lower yielding securities. The Fund may also be exposed to reinvestment risk, which is the risk that income from the Fund’s portfolio will decline if the Fund invests the proceeds from matured, traded or called fixed income securities at market interest rates that are below the Fund portfolio’s current earnings rate.
Counterparty Credit Risk: Similar to issuer credit risk, the Fund may be exposed to counterparty credit risk, or the risk that an entity may fail to or be unable to perform on its commitments related to unsettled or open transactions. The Fund manages counterparty credit risk by entering into transactions only with counterparties that the Manager believes have the financial resources to honor their obligations and by monitoring the financial stability of those counterparties. Financial assets, which potentially expose the Fund to market, issuer and counterparty credit risks, consist principally of financial instruments and receivables due from counterparties. The extent of the Fund’s exposure to market, issuer and counterparty credit risks with respect to these financial assets is approximately their value recorded in the Statement of Assets and Liabilities, less any collateral held by the Fund.
Concentration Risk: The Fund invests a significant portion of its assets in fixed-income securities and/or uses derivatives tied to the fixed-income markets. Changes in market interest rates or economic conditions may affect the value and/or liquidity of such investments. Interest rate risk is the risk that prices of bonds and other fixed-income securities will increase as interest rates fall and decrease as interest rates rise. The Fund may be subject to a greater risk of rising interest rates due to the current period of historically low rates.
10. Capital Share Transactions:
Transactions in capital shares for each class were as follows:
| | | | | | | | | | | | | | | | | | |
| | | Six Months Ended
January 31, 2016 | | | | | Year Ended
July 31, 2015 | |
| | | Shares | | | Amount | | | | | Shares | | | Amount | |
Class K1 | | | | | | | | | | | | | | | | | | |
Shares sold | | | 3,497,888 | | | $ | 35,013,856 | | | | | | 4,557,787 | | | $ | 45,623,450 | |
Shares issued in reinvestment of dividends | | | 9,833 | | | | 98,390 | | | | | | 2,836 | | | | 28,388 | |
Shares redeemed | | | (4,997,503 | ) | | | (50,000,000 | ) | | | | | (1,898,184 | ) | | | (19,000,818 | ) |
| | | | | | | | | | |
Net increase (decrease) | | | (1,489,782 | ) | | $ | (14,887,754 | ) | | | | | 2,662,439 | | | $ | 26,651,020 | |
| | | | | | | | | | |
| | | | | | | | | | | | | | | | | | |
Institutional | | | | | | | | | | | | | | | | | | |
Shares sold | | | 8,708 | | | $ | 87,000 | | | | | | 18,048 | | | $ | 180,486 | |
Shares issued in reinvestment of dividends | | | 74 | | | | 743 | | | | | | 7 | | | | 71 | |
Shares redeemed | | | (2,922 | ) | | | (29,203 | ) | | | | | — | | | | — | |
| | | | | | | | | | |
Net increase | | | 5,860 | | | $ | 58,540 | | | | | | 18,055 | | | $ | 180,557 | |
| | | | | | | | | | |
Total Net Increase (decrease) | | | (1,483,922 | ) | | $ | (14,829,214 | ) | | | | | 2,680,494 | | | $ | 26,831,577 | |
| | | | | | | | | | |
| | 1 | | On the close of business on September 1, 2015, the Fund’s BlackRock Shares were redesignated as Class K Shares. |
At January 31, 2016, 1,500,450 Class K Shares and 1,000,000 Institutional Shares of the Fund were owned by BlackRock HoldCo 2, Inc., an affiliate of the Fund.
11. Subsequent Events:
Management has evaluated the impact of all subsequent events on the Fund through the date the financial statements were issued and has determined that there were no subsequent events requiring adjustment or additional disclosure in the financial statements.
| | | | | | |
| | | BLACKROCK SHORT OBLIGATIONS FUND | | JANUARY 31, 2016 | | 21 |
Rodney D. Johnson, Chair of the Board and Trustee
David O. Beim, Trustee
Collette Chilton, Trustee
Frank J. Fabozzi, Trustee
Dr. Matina S. Horner, Trustee
Cynthia A. Montgomery, Trustee
Barbara G. Novick, Trustee
Joseph P. Platt, Trustee
Robert C. Robb, Jr., Trustee
Mark Stalnecker, Trustee
Kenneth L. Urish, Trustee
Frederick W. Winter, Trustee
John M. Perlowski, Trustee, President and Chief Executive Officer
Richard Hoerner, Vice President
Jennifer McGovern, Vice President
Neal J. Andrews, Chief Financial Officer
Jay M. Fife, Treasurer
Charles Park, Chief Compliance Officer
Fernanda Piedra, Anti-Money Laundering Compliance Officer
Benjamin Archibald, Secretary
Effective September 25, 2015, John M. Perlowski was appointed to serve as an Interested Trustee of the Trust.
Effective December 31, 2015, Herbert I. London and Toby Rosenblatt retired as Trustees of the Trust.
Effective February 5, 2016, Frank J. Fabozzi resigned as a Trustee of the Trust.
Effective February 8, 2016, Susan J. Carter, Neil A. Cotty and Claire A. Walton were appointed to serve as Trustees of the Trust.
| | | | | | |
| | | | |
Investment Advisor and Administrator BlackRock Advisors, LLC Wilmington, DE 19809 | | Accounting Agent and Transfer Agent BNY Mellon Investment Servicing (US) Inc. Wilmington, DE 19809 | | Independent Registered Public Accounting Firm PricewaterhouseCoopers LLP Philadelphia, PA 19103 | | Address of the Trust 100 Bellevue Parkway Wilmington, DE 19809 |
| | | | | | |
Custodian The Bank of New York Mellon New York, NY 10286 | | Distributor BlackRock Investments, LLC New York, NY 10022 | | Legal Counsel Sidley Austin LLP New York, NY 10019 | | |
| | | | | | |
| 22 | | BLACKROCK SHORT OBLIGATIONS FUND | | JANUARY 31, 2016 | | |
Householding
The Fund will mail only one copy of shareholder documents, including prospectuses, annual and semi-annual reports and proxy statements, to shareholders with multiple accounts at the same address. This practice is commonly called “householding” and is intended to reduce expenses and eliminate duplicate mailings of shareholder documents. Mailings of your shareholder documents may be householded indefinitely unless you instruct us otherwise. If you do not want the mailing of these documents to be combined with those for other members of your household, please call the Fund at (800) 537-4942.
Availability of Quarterly Schedule of Investments
The Fund files its complete schedule of portfolio holdings with the SEC for the first and third quarters of each fiscal year on Form N-Q. The Fund’s Forms N-Q are available on the SEC’s website at http://www.sec.gov and may also be reviewed and copied at the SEC’s Public Reference Room in Washington, D.C. Information on how to access documents on the SEC’s website without charge may be obtained by calling (800) SEC-0330. The Fund’s Forms N-Q may also be obtained upon request and without charge by calling (800) 537-4942.
Availability of Proxy Voting Policies and Procedures
A description of the policies and procedures that the Fund uses to determine how to vote proxies relating to portfolio securities is available upon request and without charge, (1) by calling (800) 537-4942; (2) at http://www.blackrock.com; and (3) on the SEC’s website at http://www.sec.gov.
Availability of Proxy Voting Record
Information about how the Fund voted proxies relating to securities held in the Fund’s portfolio during the most recent 12-month period ended June 30 is available upon request and without charge (1) at http://www.blackrock.com or by calling (800) 537-4942 and (2) on the SEC’s website at http:// www.sec.gov.
BlackRock’s Mutual Fund Family
BlackRock offers a diverse lineup of open-end mutual funds crossing all investment styles and managed by experts in equity, fixed income and tax-exempt investing. Visit http://www.blackrock.com for more information.
Account Information
Call us at (800) 537-4942 from 8:00 AM to 6:00 PM EST on any business day to get information about your account balances, recent transactions and share prices. You can also reach us on the Web at http://www.blackrock.com/funds.
Retirement Plans
Shareholders may make investments in conjunction with Traditional, Rollover, Roth, Coverdell, Simple IRAs, SEP IRAs and 403(b) Plans.
| | | | | | |
| | | BLACKROCK SHORT OBLIGATIONS FUND | | JANUARY 31, 2016 | | 23 |
| | |
| Additional Information (concluded) | | |
|
| BlackRock Privacy Principles |
BlackRock is committed to maintaining the privacy of its current and former fund investors and individual clients (collectively, “Clients”) and to safe-guarding their non-public personal information. The following information is provided to help you understand what personal information BlackRock collects, how we protect that information and why in certain cases we share such information with select parties.
If you are located in a jurisdiction where specific laws, rules or regulations require BlackRock to provide you with additional or different privacy-related rights beyond what is set forth below, then BlackRock will comply with those specific laws, rules or regulations.
BlackRock obtains or verifies personal non-public information from and about you from different sources, including the following: (i) information we receive from you or, if applicable, your financial intermediary, on applications, forms or other documents; (ii) information about your transactions with us, our affiliates, or others; (iii) information we receive from a consumer reporting agency; and (iv) from visits to our websites.
BlackRock does not sell or disclose to non-affiliated third parties any non-public personal information about its Clients, except as permitted by law or as is necessary to respond to regulatory requests or to service Client accounts. These non-affiliated third parties are required to protect the confidentiality and security of this information and to use it only for its intended purpose.
We may share information with our affiliates to service your account or to provide you with information about other BlackRock products or services that may be of interest to you. In addition, BlackRock restricts access to non-public personal information about its Clients to those BlackRock employees with a legitimate business need for the information. BlackRock maintains physical, electronic and procedural safeguards that are designed to protect the non-public personal information of its Clients, including procedures relating to the proper storage and disposal of such information.
| | | | | | |
| 24 | | BLACKROCK SHORT OBLIGATIONS FUND | | JANUARY 31, 2016 | | |
| | |
This report is intended for current holders. It is not authorized for use as an offer of sale or a solicitation of an offer to buy shares of the Fund unless preceded or accompanied by the Fund’s current prospectus. Past performance results shown in this report should not be considered a representation of future performance. Investment returns and principal value of shares will fluctuate so that shares, when redeemed, may be worth more or less than their original cost. Statements and other information herein are as dated and are subject to change. | |  |
| | |
SHORTS-1/16-SAR | |  |
JANUARY 31, 2016
| | | | |
SEMI-ANNUAL REPORT (UNAUDITED) | | | | BLACKROCK® |
BlackRock FundsSM
▶ BlackRock Multi-Asset Real Return Fund
▶ BlackRock Strategic Risk Allocation Fund
| | |
| Not FDIC Insured ¡ May Lose Value ¡ No Bank Guarantee | | |
| | |

| | Shareholders can sign up for e-mail notifications of quarterly statements, annual and semi-annual shareholder reports and prospectuses by enrolling in the electronic delivery program. Electronic copies of shareholder reports and prospectuses are also available on BlackRock’s website. TO ENROLL IN ELECTRONIC DELIVERY: Shareholders Who Hold Accounts with Investment Advisors, Banks or Brokerages: Please contact your financial advisor. Please note that not all investment advisors, banks or brokerages may offer this service. Shareholders Who Hold Accounts Directly with BlackRock: 1. Access the BlackRock website at blackrock.com 2. Select “Access Your Account” 3. Next, select “eDelivery” in the “Related Resources” box and follow the sign-up instructions |
| | | | | | |
| 2 | | BLACKROCK FUNDS | | JANUARY 31, 2016 | | |
Dear Shareholder,
Diverging monetary policies and shifting economic outlooks across regions have been the overarching themes driving financial markets over the past couple of years. With U.S. growth outpacing the global economic recovery while inflationary pressures remained low, investors spent most of 2015 anticipating a short-term rate hike from the Federal Reserve, which ultimately came to fruition in December. In contrast, the European Central Bank and the Bank of Japan moved to a more accommodative stance over the year. In this environment, the U.S. dollar strengthened considerably, causing profit challenges for U.S. exporters and high levels of volatility in emerging market currencies and commodities.
Market volatility broadly increased in the latter part of 2015 and continued into 2016 given a collapse in oil prices and decelerating growth in China, while global growth and inflation failed to pick up. Oil prices were driven lower due to excess supply while the world’s largest oil producers had yet to negotiate a deal that would stabilize oil prices. In China, slower economic growth combined with a depreciating yuan and declining confidence in the country’s policymakers stoked worries about the potential impact to the broader global economy. After a long period in which global central bank policies had significant influence on investor sentiment and hence the direction of financial markets, in recent months, the underperformance of markets in Europe and Japan — where central banks had taken aggressive measures to stimulate growth and stabilize their currencies — highlighted the possibility that central banks could be losing their effectiveness.
In this environment, higher quality assets such as municipal bonds, U.S. Treasuries and investment grade corporate bonds outperformed risk assets including equities and high yield bonds. Large cap U.S. equities fared better than international developed and emerging markets.
At BlackRock, we believe investors need to think globally, extend their scope across a broad array of asset classes and be prepared to move freely as market conditions change over time. We encourage you to talk with your financial advisor and visit blackrock.com for further insight about investing in today’s markets.
Sincerely,

Rob Kapito
President, BlackRock Advisors, LLC

Rob Kapito
President, BlackRock Advisors, LLC
| | | | | | | | |
| Total Returns as of January 31, 2016 | |
| | | 6-month | | | 12-month | |
U.S. large cap equities
(S&P 500® Index) | | | (6.77)% | | | | (0.67)% | |
U.S. small cap equities
(Russell 2000® Index) | | | (15.80) | | | | (9.92) | |
International equities
(MSCI Europe, Australasia, Far East Index) | | | (14.58) | | | | (8.43) | |
Emerging market equities
(MSCI Emerging Markets Index) | | | (16.96) | | | | (20.91) | |
3-month Treasury bills
(BofA Merrill Lynch
3-Month U.S. Treasury Bill Index) | | | 0.05 | | | | 0.05 | |
U.S. Treasury securities
(BofA Merrill Lynch
10- Year U.S. Treasury
Index) | | | 3.36 | | | | (0.41) | |
U.S. investment-grade
bonds (Barclays U.S.
Aggregate Bond Index) | | | 1.33 | | | | (0.16) | |
Tax-exempt municipal
bonds (S&P Municipal Bond Index) | | | 3.67 | | | | 2.66 | |
U.S. high yield bonds
(Barclays U.S. Corporate
High Yield 2% Issuer
Capped Index) | | | (7.75) | | | | (6.58) | |
|
| Past performance is no guarantee of future results. Index performance is shown for illustrative purposes only. You cannot invest directly in an index. | |
| | | | | | |
| | | THIS PAGE NOT PART OF YOUR FUND REPORT | | | | 3 |
| | | | |
| Fund Summary as of January 31, 2016 | | | BlackRock Multi-Asset Real Return Fund | |
BlackRock Multi-Asset Real Return Fund’s (the “Fund”) investment objective is to seek to generate returns in excess of the actual rate of inflation over a complete market cycle.
|
| Portfolio Management Commentary |
How did the Fund perform?
| • | | For the six-month period ended January 31, 2016, the Fund underperformed both benchmarks, the Barclays U.S. Treasury Inflation Protected Securities (“TIPS”) Index and the U.S. Consumer Price Index. |
What factors influenced performance?
| • | | Broad-based exposure to commodities via swaps on the S&P GSCI Commodity Index and the Bloomberg Brent Crude Commodity Sub-Index, Master Limited Partnerships (“MLPs”) and an energy exchange-traded fund (“ETF”) were the most significant detractors from performance during the period. In addition, an allocation to U.S. equities weighed on returns, particularly overweight positions to the financials and health care sectors, an equity wage thematic basket (i.e., stocks positioned to benefit from a stronger labor market and rising wages in the United States), and real estate investment trusts (“REITs”). Fixed-income allocations similarly hindered performance, including an allocation to floating-rate loans. Lastly, credit default swaps used to gain exposure to the high yield and commercial mortgage backed securities (“CMBS”) markets weighed on returns. |
| • | | Exposure to the iShares Gold ETF added to performance as assets flowed into the commodity amid financial market distress. |
Describe recent portfolio activity.
| • | | Over the six-month period, the Fund reduced overall exposure to equities, specifically health care and financials stocks, although this was |
| | partially offset by an increased allocation to an equity wage thematic basket. Within fixed income, the Fund increased exposure to TIPS, floating rate loans and high yield swaps. Within commodities, overall exposure was modestly lowered by reducing allocations to commodity swaps. However, the Fund increased exposure to gold and MLPs during the period. Across real estate, the Fund introduced a CMBS credit default swap and left its allocation in REITs largely unchanged. |
| • | | The Fund employs derivatives as part of its investment strategy. At the end of the period, derivative positions included total return swaps on the S&P GSCI Commodity Index and Bloomberg Brent Crude Commodity Sub-Index, to gain broad commodity and oil-related exposure, respectively. These derivative positions detracted from performance as commodities generally moved lower over the period. The Fund also held U.S. duration derivative positions as well as high yield and CMBS credit default swaps. These positions also detracted from overall performance. |
| • | | During the period, cash was used as collateral for derivative positions, including commodity and credit swaps. The Fund’s cash position did not have a material impact on performance. |
Describe Fund positioning at period end.
| • | | At period end, the Fund was diversified across the following asset classes: TIPS, floating rate loans, high yield, equities, commodities, real estate, MLPs and cash. |
The views expressed reflect the opinions of BlackRock as of the date of this report and are subject to change based on changes in market, economic or other conditions. These views are not intended to be a forecast of future events and are no guarantee of future results.
| | |
| Portfolio Composition | | Percent of Total Investments1 |
| | | | |
Investment Companies | | | 41 | % |
U.S. Treasury Obligations | | | 40 | |
Common Stocks | | | 19 | |
| | 1 | | Total investments exclude short-term securities. |
| | |
| Ten Largest Holdings | | Percent of Net Assets |
| | | | |
U.S. Treasury Inflation Indexed Notes | | | 28 | % |
BlackRock Floating Rate Income Portfolio, Institutional Class | | | 18 | |
U.S. Treasury Inflation Indexed Bonds | | | 9 | |
Financial Select Sector SPDR Fund | | | 6 | |
BlackRock Liquidity Series, LLC, Money Market Series | | | 6 | |
iShares Gold Trust | | | 5 | |
Health Care Select Sector SPDR Fund | | | 5 | |
Energy Select Sector SPDR Fund | | | 3 | |
BlackRock Liquidity Funds, TempFund, Institutional Class | | | 3 | |
Enterprise Products Partners LP - MLP | | | 1 | |
| | | | | | |
| 4 | | BLACKROCK FUNDS | | JANUARY 31, 2016 | | |
| | | | |
| | | | BlackRock Multi-Asset Real Return Fund | |
|
| Total Return Based on a $10,000 Investment |
| | 1 | Assuming maximum sales charges, if any, transaction costs and other operating expenses, including investment advisory fees and administration fees, if any. Institutional Shares do not have a sales charge. |
| | 2 | The Fund uses an asset allocation strategy, investing varying percentages of its portfolio in the following major categories: TIPS, equity securities, commodity-related securities, REITs, MLPs and bonds. |
| | 3 | An unmanaged index that measures the performance of the inflation-protected public obligations of the U.S. Treasury. |
| | 4 | A measure of the average change over time in the prices paid by urban consumers for a market basket of consumer goods and services. |
| | 5 | Commencement of operations. |
| | | | | | | | | | |
| Performance Summary for the Period Ended January 31, 2016 |
| | | | | Average Annual Total Returns6 |
| | | | | 1 Year | | Since Inception7 |
| | | 6-Month
Total Returns | | w/o sales
charge | | w/ sales
charge | | w/o sales
charge | | w/ sales
charge |
Institutional | | (7.97)% | | (7.78)% | | N/A | | (1.72)% | | N/A |
Investor A | | (8.05) | | (7.95) | | (12.78)% | | (2.00) | | (3.69)% |
Investor C | | (8.42) | | (8.71) | | (9.62) | | (2.70) | | (2.70) |
Barclays U.S. TIPS Index | | (0.52) | | (3.03) | | N/A | | (1.88) | | N/A |
U.S. Consumer Price Index | | (0.89) | | 0.73 | | N/A | | 0.88 | | N/A |
| | 6 | | Assuming maximum sales charges, if any. Average annual total returns with and without sales charges reflect reductions for distribution and service fees. See “About Fund Performance” on page 8 for a detailed description of share classes, including any related sales charges and fees. |
| | 7 | | The Fund commenced operations on December 27, 2012. |
| | | | N/A—Not applicable as share class and index do not have a sales charge. |
| | | | Past performance is not indicative of future results. |
| | | | | | | | | | | | | | | | | | | | | | | | | | | | | | | | | | | |
| Expense Example | |
| | | Actual | | Hypothetical9 | | |
| | | Beginning Account Value August 1, 2015 | | Ending Account Value January 31, 2016 | | Expenses Paid During the Period8 | | Beginning Account Value August 1, 2015 | | Ending Account Value January 31, 2016 | | Expenses Paid During the Period8 | | Annualized Expense Ratio |
Institutional | | | | $1,000.00 | | | | | $920.30 | | | | $ | 3.86 | | | | | $1,000.00 | | | | | $1,021.11 | | | | $ | 4.06 | | | | | 0.80 | % |
Investor A | | | | $1,000.00 | | | | | $919.50 | | | | $ | 5.07 | | | | | $1,000.00 | | | | | $1,019.86 | | | | $ | 5.33 | | | | | 1.05 | % |
Investor C | | | | $1,000.00 | | | | | $915.80 | | | | $ | 8.67 | | | | | $1,000.00 | | | | | $1,016.09 | | | | $ | 9.12 | | | | | 1.80 | % |
| | 8 | | For each class of the Fund, expenses are equal to the annualized expense ratio for the class, multiplied by the average account value over the period, multiplied by 184/366 (to reflect the one-half year period shown). |
| | 9 | | Hypothetical 5% annual return before expenses is calculated by prorating the number of days in the most recent fiscal period divided by 366. |
| | | | See “Disclosure of Expenses” on page 8 for further information on how expenses were calculated. |
| | | | | | |
| | | BLACKROCK FUNDS | | JANUARY 31, 2016 | | 5 |
| | | | |
| Fund Summary as of January 31, 2016 | | | BlackRock Strategic Risk Allocation Fund | |
BlackRock Strategic Risk Allocation Fund’s (the “Fund”) investment objective is to seek total return.
|
| Portfolio Management Commentary |
How did the Fund perform?
| • | | For the six-month period ended January 31, 2016, the Fund underperformed its benchmark, a blend of 60% MSCI World Index Hedged USD Net/40% Barclays U.S. Aggregate Bond Index returned (5.09)%. |
What factors influenced performance?
| • | | The Fund has a global multi-asset strategy designed to balance sources of risk and return more optimally than traditional asset allocation portfolios. The Fund will determine the appropriate allocation across classes by seeking a balance of exposure to risks such as interest rate, credit, inflation, liquidity, economic and emerging market risks. |
| • | | The Fund’s commodities exposure had the most significant negative impact on the Fund’s return for the period, driven in large part by a sharp decline in crude oil prices. Developed market small-cap equities and emerging market equities were the next largest detractors, while developed market large-cap equities and investment grade debt also hindered performance. |
| • | | On the positive side, exposure to developed market sovereign debt added to performance. This was the only positive contributor for the period as risk-based assets broadly sold off during the period as investors moved into “safe-haven” assets such as government bonds. |
| • | | The Fund uses derivatives as a part of its investment strategy. Derivatives are used by the Fund as a means of taking long-term positions in global markets and to |
| | | achieve and/or manage various risk exposures, which may include economic, interest rate, emerging markets, credit, inflation and liquidity risks. The Fund’s derivatives positions, in particular swaps designed to protect against any rapid rise in U.S. interest rates, had a negative impact on returns as rates declined over much of the period. This negative impact was somewhat offset by foreign currency transactions. |
| • | | The Fund held cash in reserve in order to meet any potential margin calls. The cash balance did not have a material impact on performance. |
Describe recent portfolio activity.
| • | | From a broad perspective, the decision was made in mid-October to return the Fund to its full risk level, as the sources of uncertainty that led to the de-risking in July appeared to have eased. However, investor sentiment again deteriorated as equities dropped sharply to start 2016, and the Fund reduced risk across all assets in early January. Sources of concern included increased uncertainty with respect to geopolitical risks and its impact on oil prices, confusion around foreign exchange policy and equity market controls in China, and early signs of a global economic slowdown. |
Describe Fund positioning at period end.
| • | | At period end, the Fund continued to seek to deliver total returns by balancing risks between bonds, equities and diversifying strategies. At the end of the period, the portfolio was underweight exposure to real (i.e., after inflation) interest rates, based on the view that real rates are likely to experience low returns and higher volatility as global interest rate expectations start to rise. The Fund remains balanced and continues to have protection in place against possible spikes in U.S. interest rates. Equities and fixed income each represented about 41% of total risk, with the remaining 17% of risk represented by volatility and commodities allocations. |
The views expressed reflect the opinions of BlackRock as of the date of this report and are subject to change based on changes in market, economic or other conditions. These views are not intended to be a forecast of future events and are no guarantee of future results.
| | |
| Portfolio Composition | | Percent of Total Investments1 |
| | | | |
Foreign Government Obligations | | | 83 | % |
Investment Companies | | | 17 | |
| | 1 | | Total investments exclude short-term securities, options purchased and options written. |
| | |
| Ten Largest Holdings | | Percent of Net Assets |
| | | | |
BlackRock Liquidity Funds, TempFund, Institutional Class | | | 37 | % |
Sweden Inflation Linked Bond | | | 9 | |
Australia Government Inflation Linked Bond | | | 8 | |
iShares TIPS Bond ETF | | | 7 | |
Republic of France Inflation Linked Bond | | | 7 | |
Canadian Government Inflation Linked Bond | | | 4 | |
United Kingdom Gilt Inflation Linked Bond | | | 4 | |
Deutsche Bundesrepublik Inflation Linked Bond | | | 2 | |
| | | | | | |
| 6 | | BLACKROCK FUNDS | | JANUARY 31, 2016 | | |
| | | | |
| | | | BlackRock Strategic Risk Allocation Fund | |
|
| Total Return Based on a $10,000 Investment |
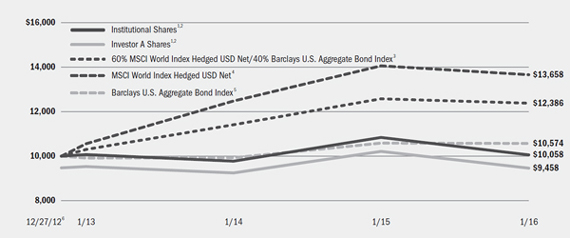
| | 1 | Assuming maximum sales charges, if any, transaction costs and other operating expenses, including investment advisory fees and administration fees, if any. Institutional Shares do not have a sales charge. |
| | 2 | The Fund invests in a broad range of global asset classes, such as equity securities, fixed and floating rate debt instruments, derivatives, other investment companies, real estate investment trusts (“REITS”) and commodity-related instruments. |
| | 3 | This customized weighted index is comprised of the returns of the 60% MSCI World Index Hedged USD Net/40% Barclays U.S. Aggregate Bond Index. |
| | 4 | An index composed of the following 23 developed market country indices: Australia, Austria, Belgium, Canada, Denmark, Finland, France, Germany, Hong Kong, Ireland, Israel, Italy, Japan, Netherlands, New Zealand, Norway, Portugal, Singapore, Spain, Sweden, Switzerland, the United Kingdom, and the United States and calculated with net dividends reinvested daily on the ex-dividends date 100% hedged to USD using 1-month forward exchange rates. |
| | 5 | A widely recognized unmanaged market-weighted index, comprised of investment-grade corporate bonds rated BBB or better, mortgages and U.S. Treasury and U.S. Government agency issues with at least one year to maturity. |
| | 6 | Commencement of operations. |
| | | | | | | | | | | | |
| Performance Summary for the Period Ended January 31, 2016 |
| | | | | Average Annual Total Returns7 |
| | | | | 1 Year | | | Since Inception8 |
| | | 6-Month
Total Returns | | w/o sales
charge | | w/ sales
charge | | | w/o sales
charge | | w/ sales
charge |
Institutional | | (6.80)% | | (7.18)% | | | N/A | | | 0.19% | | N/A |
Investor A | | (6.89) | | (7.45) | | | (12.31 | )% | | (0.06) | | (1.78)% |
Investor C | | (7.30) | | (8.05) | | | (8.94 | ) | | (0.82) | | (0.82) |
60% MSCI World Index Hedged USD Net/40% Barclays U.S. Aggregate Bond Index | | (5.09) | | (1.53) | | | N/A | | | 7.17 | | N/A |
MSCI World Index Hedged USD Net | | (9.46) | | (2.87) | | | N/A | | | 10.61 | | N/A |
Barclays U.S. Aggregate Bond Index | | 1.33 | | (0.16) | | | N/A | | | 1.82 | | N/A |
| | 7 | | Assuming maximum sales charges, if any. Average annual total returns with and without sales charges reflect reductions for distribution and service fees. See “About Fund Performance” on page 8 for a detailed description of share classes, including any related sales charges and fees. |
| | 8 | | The Fund commenced operations on December 27, 2012. |
| | | | N/A—Not applicable as share class and index do not have a sales charge. |
| | | | Past performance is not indicative of future results. |
| | | | | | | | | | | | | | | | | | | | | | | | | | | | | | | | | | | |
| Expense Example | |
| | | Actual | | Hypothetical10 | | |
| | | Beginning
Account Value
August 1, 2015 | | Ending
Account Value
January 31, 2016 | | Expenses Paid
During the Period9 | | Beginning
Account Value
August 1, 2015 | | Ending
Account Value
January 31, 2016 | | Expenses Paid
During the Period9 | | Annualized
Expense Ratio |
Institutional | | | $ | 1,000.00 | | | | $ | 932.00 | | | | $ | 4.86 | | | | $ | 1,000.00 | | | | $ | 1,020.11 | | | | $ | 5.08 | | | | | 1.00 | % |
Investor A | | | $ | 1,000.00 | | | | $ | 931.10 | | | | $ | 6.07 | | | | $ | 1,000.00 | | | | $ | 1,018.85 | | | | $ | 6.34 | | | | | 1.25 | % |
Investor C | | | $ | 1,000.00 | | | | $ | 927.00 | | | | $ | 9.69 | | | | $ | 1,000.00 | | | | $ | 1,015.08 | | | | $ | 10.13 | | | | | 2.00 | % |
| | 9 | | For each class of the Fund, expenses are equal to the annualized expense ratio for the class, multiplied by the average account value over the period, multiplied by 184/ 366 (to reflect the one-half year period shown). |
| | 10 | | Hypothetical 5% annual return before expenses is calculated by prorating the number of days in the most recent fiscal period divided by 366. |
| | | | See “Disclosure of Expenses” on page 8 for further information on how expenses were calculated. |
| | | | | | |
| | | BLACKROCK FUNDS | | JANUARY 31, 2016 | | 7 |
| • | | Institutional Shares are not subject to any sales charge. These shares bear no ongoing distribution or service fees and are available only to certain eligible investors. |
| • | | Investor A Shares are subject to a maximum initial sales charge (front-end load) of 5.25% and a service fee of 0.25% per year (but no distribution fee). Certain redemptions of these shares may be subject to a contingent deferred sales charge (“CDSC”) where no initial sales charge was paid at the time of purchase. These shares are generally available through financial intermediaries. |
| • | | Investor C Shares are subject to a 1.00% CDSC if redeemed within one year of purchase. In addition, these shares are subject to a distribution fee of 0.75% per year and a service fee of 0.25% per year. These shares are generally available through financial intermediaries. |
Performance information reflects past performance and does not guarantee future results. Current performance may be lower or higher than the performance data quoted. Refer to www.blackrock.com/funds to obtain performance data current to the most recent month end. Performance results do not reflect the deduction of taxes that a shareholder would pay on fund distributions or the redemption of fund shares.
Figures shown in the performance tables on the previous pages assume reinvestment of all distributions, if any, at net asset value on the ex-dividend date. Investment return and principal value of shares will fluctuate so that shares, when redeemed, may be worth more or less than their original cost. Distributions paid to each class of shares will vary because of the different levels of service, distribution and transfer agency fees applicable to each class, which are deducted from the income available to be paid to shareholders.
BlackRock Advisors, LLC (the “Manager”), the Funds’ investment advisor, has contractually agreed to waive and/or reimburse a portion of the Funds’ expenses. Without such waiver and/or reimbursement, the Funds’ performance would have been lower. The Manager is under no obligation to continue waiving and/or reimbursing its fees after the applicable termination date of such agreement. See Note 6 of the Notes to Consolidated Financial Statements for additional information on waivers and/or reimbursements.
Shareholders of these Funds may incur the following charges: (a) transactional expenses, such as sales charges; and (b) operating expenses, including investment advisory fees, administration fees, service and distribution fees, including 12b-1 fees, acquired fund fees and expenses and other fund expenses. The expense examples shown on the previous pages (which are based on a hypothetical investment of $1,000 invested on August 1, 2015 and held through January 31, 2016) are intended to assist shareholders both in calculating expenses based on an investment in each Fund and in comparing these expenses with similar costs of investing in other mutual funds.
The expense examples provide information about actual account values and actual expenses. In order to estimate the expenses a shareholder paid during the period covered by this report, shareholders can divide their account value by $1,000 and then multiply the result by the number corresponding to their Fund and share class under the headings entitled “Expenses Paid During the Period.”
The expense examples also provide information about hypothetical account values and hypothetical expenses based on a Fund’s actual expense ratio and an assumed rate of return of 5% per year before expenses. In order to assist shareholders in comparing the ongoing expenses of investing in these Funds and other funds, compare the 5% hypothetical examples with the 5% hypothetical examples that appear in shareholder reports of other funds.
The expenses shown in the expense examples are intended to highlight shareholders’ ongoing costs only and do not reflect any transactional expenses, such as sales charges, if any. Therefore, the hypothetical examples are useful in comparing ongoing expenses only, and will not help shareholders determine the relative total expenses of owning different funds. If these transactional expenses were included, shareholder expenses would have been higher.
| | | | | | |
| 8 | | BLACKROCK FUNDS | | JANUARY 31, 2016 | | |
| | |
| Derivative Financial Instruments | | |
The Funds may invest in various derivative financial instruments. Derivative financial instruments are used to obtain exposure to a security, index and/or market without owning or taking physical custody of securities or to manage market, equity, credit, interest rate, foreign currency exchange rate, commodity and/or other risks. Derivative financial instruments may give rise to a form of economic leverage. Derivative financial instruments also involve risks, including the imperfect correlation between the value of a derivative financial instrument and the underlying asset, possible default of the counterparty to the transaction or illiquidity of the derivative financial instrument. The Funds’ ability to use a derivative financial
instrument successfully depends on the investment advisor’s ability to predict pertinent market movements accurately, which cannot be assured. The use of derivative financial instruments may result in losses greater than if they had not been used, may limit the amount of appreciation a Fund can realize on an investment, and/or may result in lower distributions paid to shareholders. The Funds’ investments in these instruments, if any, are discussed in detail in the Notes to Consolidated Financial Statements.
| | | | | | |
| | | BLACKROCK FUNDS | | JANUARY 31, 2016 | | 9 |
| | | | |
| Consolidated Schedule of Investments January 31, 2016 (Unaudited) | | | BlackRock Multi-Asset Real Return Fund | |
| | | (Percentages shown are based on Net Assets) | |
| | | | | | | | |
| Common Stocks | | Shares | | | Value | |
Air Freight & Logistics — 0.0% | | | | | | | | |
CH Robinson Worldwide, Inc. | | | 235 | | | $ | 15,221 | |
Automobiles — 0.1% | | | | | | | | |
Ford Motor Co. | | | 2,010 | | | | 23,999 | |
General Motors Co. | | | 644 | | | | 19,088 | |
Harley-Davidson, Inc. | | | 316 | | | | 12,640 | |
| | | | | | | | |
| | | | | | | | 55,727 | |
Banks — 0.2% | | | | | | | | |
Bank of America Corp. | | | 2,483 | | | | 35,110 | |
Citigroup, Inc. | | | 519 | | | | 22,099 | |
JPMorgan Chase & Co. | | | 709 | | | | 42,186 | |
M&T Bank Corp. | | | 24 | | | | 2,644 | |
| | | | | | | | |
| | | | | | | | 102,039 | |
Beverages — 0.0% | | | | | | | | |
Monster Beverage Corp. (a) | | | 138 | | | | 18,634 | |
Biotechnology — 0.3% | | | | | | | | |
AbbVie, Inc. | | | 382 | | | | 20,972 | |
Alexion Pharmaceuticals, Inc. (a) | | | 32 | | | | 4,670 | |
Amgen, Inc. | | | 112 | | | | 17,106 | |
Biogen, Inc. (a) | | | 66 | | | | 18,022 | |
Celgene Corp. (a) | | | 222 | | | | 22,271 | |
Gilead Sciences, Inc. | | | 536 | | | | 44,488 | |
Regeneron Pharmaceuticals, Inc. (a) | | | 10 | | | | 4,201 | |
| | | | | | | | |
| | | | | | | | 131,730 | |
Capital Markets — 0.2% | | | | | | | | |
Affiliated Managers Group, Inc. (a) | | | 15 | | | | 2,013 | |
Ameriprise Financial, Inc. | | | 91 | | | | 8,249 | |
Franklin Resources, Inc. | | | 226 | | | | 7,833 | |
Goldman Sachs Group, Inc. | | | 456 | | | | 73,671 | |
| | | | | | | | |
| | | | | | | | 91,766 | |
Chemicals — 0.3% | | | | | | | | |
CF Industries Holdings, Inc. | | | 375 | | | | 11,250 | |
Dow Chemical Co. | | | 803 | | | | 33,726 | |
LyondellBasell Industries NV, Class A | | | 733 | | | | 57,152 | |
Monsanto Co. | | | 110 | | | | 9,966 | |
Mosaic Co. | | | 326 | | | | 7,857 | |
| | | | | | | | |
| | | | | | | | 119,951 | |
Communications Equipment — 0.1% | | | | | | | | |
Cisco Systems, Inc. | | | 1,282 | | | | 30,499 | |
QUALCOMM, Inc. | | | 765 | | | | 34,685 | |
| | | | | | | | |
| | | | | | | | 65,184 | |
Consumer Finance — 0.0% | | | | | | | | |
American Express Co. | | | 31 | | | | 1,658 | |
| | | | | | | | |
| Common Stocks | | Shares | | | Value | |
Diversified Consumer Services — 0.0% | | | | | | | | |
H&R Block, Inc. | | | 379 | | | $ | 12,905 | |
Diversified Financial Services — 0.1% | | | | | | | | |
Berkshire Hathaway, Inc., Class B (a) | | | 60 | | | | 7,786 | |
CME Group, Inc. | | | 330 | | | | 29,651 | |
Intercontinental Exchange, Inc. | | | 7 | | | | 1,847 | |
NASDAQ, Inc. | | | 37 | | | | 2,294 | |
| | | | | | | | |
| | | | | | | | 41,578 | |
Diversified Telecommunication Services — 0.1% | | | | | | | | |
AT&T, Inc. | | | 724 | | | | 26,107 | |
Verizon Communications, Inc. | | | 647 | | | | 32,331 | |
| | | | | | | | |
| | | | | | | | 58,438 | |
Electric Utilities — 0.1% | | | | | | | | |
NextEra Energy, Inc. | | | 354 | | | | 39,545 | |
Food & Staples Retailing — 0.4% | | | | | | | | |
Costco Wholesale Corp. | | | 723 | | | | 109,260 | |
CVS Health Corp. | | | 259 | | | | 25,017 | |
Sysco Corp. | | | 950 | | | | 37,820 | |
| | | | | | | | |
| | | | | | | | 172,097 | |
Food Products — 0.2% | | | | | | | | |
Archer-Daniels-Midland Co. | | | 1,148 | | | | 40,582 | |
JM Smucker Co. | | | 257 | | | | 32,978 | |
Kraft Heinz Co. | | | 395 | | | | 30,834 | |
| | | | | | | | |
| | | | | | | | 104,394 | |
Health Care Equipment & Supplies — 0.0% | | | | | | | | |
Intuitive Surgical, Inc. (a) | | | 10 | | | | 5,409 | |
Health Care Providers & Services — 0.5% | | | | | | | | |
Aetna, Inc. | | | 237 | | | | 24,136 | |
AmerisourceBergen Corp. | | | 762 | | | | 68,245 | |
Anthem, Inc. | | | 234 | | | | 30,535 | |
Cardinal Health, Inc. | | | 420 | | | | 34,175 | |
Express Scripts Holding Co. (a) | | | 458 | | | | 32,916 | |
McKesson Corp. | | | 277 | | | | 44,591 | |
UnitedHealth Group, Inc. | | | 37 | | | | 4,261 | |
| | | | | | | | |
| | | | | | | | 238,859 | |
Hotels, Restaurants & Leisure — 0.0% | | | | | | | | |
Hilton Worldwide Holdings, Inc. | | | 672 | | | | 11,968 | |
Household Durables — 0.1% | | | | | | | | |
DR Horton, Inc. | | | 716 | | | | 19,697 | |
Lennar Corp., Class A | | | 14 | | | | 590 | |
PulteGroup, Inc. | | | 308 | | | | 5,162 | |
| | | | | | | | |
| | | | | | | | 25,449 | |
| | | | | | | | | | |
| Portfolio Abbreviations | | | | | | | | |
| ASX | | Australian Securities Exchange | | ILS | | Israeli Shekel | | REIT | | Real Estate Investment Trust |
| AUD | | Australian Dollar | | INR | | Indian Rupee | | RUB | | Russian Ruble |
| BRL | | Brazilian Real | | JPY | | Japanese Yen | | S&P | | Standard & Poor’s |
| CAD | | Canadian Dollar | | KRW | | Korean Won | | SEK | | Swedish Krona |
| CBOE | | Chicago Board Option Exchange | | LIBOR | | London Interbank Offered Rate | | SGD | | Singapore Dollar |
| CHF | | Swiss Franc | | LP | | Limited Partnership | | SPDR | | Standard & Poor’s Depositary Receipts |
| ETF | | Exchange-Traded Fund | | MLP | | Master Limited Partnership | | SPI | | Share Price Index Futures |
| EUR | | Euro | | MYR | | Malaysian Ringgit | | TIPS | | Treasury Inflation Protected Securities |
| FTSE | | Financial Times Stock Exchange | | NOK | | Norwegian Krone | | TOPIX | | Tokyo Stock Price Index |
| GBP | | British Pound | | NZD | | New Zealand Dollar | | TWD | | Taiwan New Dollar |
| HKD | | Hong Kong Dollar | | OTC | | Over-the-Counter | | USD | | U.S. Dollar |
See Notes to Consolidated Financial Statements.
| | | | | | |
| 10 | | BLACKROCK FUNDS | | JANUARY 31, 2016 | | |
| | | | |
| Consolidated Schedule of Investments (continued) | | | BlackRock Multi-Asset Real Return Fund | |
| | | | |
| | | | | | | | |
| Common Stocks | | Shares | | | Value | |
Household Products — 0.1% | |
Procter & Gamble Co. | | | 561 | | | $ | 45,828 | |
Independent Power and Renewable Electricity Producers — 0.0% | |
NRG Energy, Inc. | | | 51 | | | | 543 | |
Industrial Conglomerates — 0.2% | |
General Electric Co. | | | 2,668 | | | | 77,639 | |
Insurance — 0.5% | |
Aflac, Inc. | | | 1,785 | | | | 103,459 | |
American International Group, Inc. | | | 240 | | | | 13,555 | |
Chubb Ltd. | | | 284 | | | | 32,112 | |
Genworth Financial, Inc., Class A (a) | | | 766 | | | | 2,129 | |
Lincoln National Corp. | | | 284 | | | | 11,207 | |
MetLife, Inc. | | | 266 | | | | 11,877 | |
Torchmark Corp. | | | 903 | | | | 49,069 | |
XL Group PLC | | | 1,131 | | | | 41,010 | |
| | | | | | | | |
| | | | | | | | 264,418 | |
Internet & Catalog Retail — 0.2% | |
Amazon.com, Inc. (a) | | | 93 | | | | 54,591 | |
Netflix, Inc. (a) | | | 427 | | | | 39,216 | |
Priceline Group, Inc. (a) | | | 11 | | | | 11,715 | |
| | | | | | | | |
| | | | | | | | 105,522 | |
Internet Software & Services — 0.5% | |
Alphabet, Inc., Class A (a) | | | 127 | | | | 96,691 | |
Alphabet, Inc., Class C (a) | | | 118 | | | | 87,668 | |
Facebook, Inc., Class A (a) | | | 538 | | | | 60,369 | |
| | | | | | | | |
| | | | | | | | 244,728 | |
IT Services — 0.3% | |
InterXion Holding NV (a) | | | 637 | | | | 20,008 | |
MasterCard, Inc., Class A | | | 463 | | | | 41,221 | |
Visa, Inc., Class A | | | 1,312 | | | | 97,731 | |
| | | | | | | | |
| | | | | | | | 158,960 | |
Leisure Products — 0.0% | |
Hasbro, Inc. | | | 56 | | | | 4,160 | |
Machinery — 0.1% | |
PACCAR, Inc. | | | 654 | | | | 32,092 | |
Pentair PLC | | | 220 | | | | 10,366 | |
| | | | | | | | |
| | | | | | | | 42,458 | |
Media — 0.1% | |
Discovery Communications, Inc., Class C (a) | | | 53 | | | | 1,442 | |
Scripps Networks Interactive, Inc., Class A | | | 168 | | | | 10,243 | |
Time Warner, Inc. | | | 102 | | | | 7,185 | |
Twenty-First Century Fox, Inc., Class A | | | 962 | | | | 25,945 | |
Viacom, Inc., Class B | | | 464 | | | | 21,177 | |
| | | | | | | | |
| | | | | | | | 65,992 | |
Multiline Retail — 0.0% | |
Kohl’s Corp. | | | 205 | | | | 10,199 | |
Multi-Utilities — 0.0% | |
Public Service Enterprise Group, Inc. | | | 112 | | | | 4,626 | |
Oil, Gas & Consumable Fuels — 4.7% | |
Anadarko Petroleum Corp. | | | 206 | | | | 8,053 | |
Antero Midstream Partners LP — MLP | | | 1,240 | | | | 24,626 | |
Apache Corp. | | | 46 | | | | 1,957 | |
Cabot Oil & Gas Corp. | | | 50 | | | | 1,038 | |
Chevron Corp. | | | 628 | | | | 54,303 | |
Columbia Pipeline Partners LP — MLP | | | 4,730 | | | | 72,369 | |
| | | | | | | | |
| Common Stocks | | Shares | | | Value | |
Oil, Gas & Consumable Fuels (continued) | | | | | |
ConocoPhillips | | | 327 | | | $ | 12,779 | |
Delek Logistics Partners LP — MLP | | | 2,400 | | | | 67,416 | |
Dominion Midstream Partners LP — MLP | | | 4,600 | | | | 128,340 | |
Energy Transfer Equity LP — MLP | | | 1,870 | | | | 16,232 | |
Energy Transfer Partners LP — MLP (a) | | | 1,610 | | | | 47,881 | |
Enterprise Products Partners LP — MLP | | | 10,600 | | | | 253,446 | |
EOG Resources, Inc. | | | 606 | | | | 43,038 | |
EQT Midstream Partners LP — MLP | | | 1,220 | | | | 83,045 | |
Exxon Mobil Corp. | | | 1,650 | | | | 128,453 | |
Genesis Energy LP — MLP | | | 2,720 | | | | 77,302 | |
Magellan Midstream Partners LP — MLP | | | 3,470 | | | | 222,878 | |
Marathon Oil Corp. | | | 886 | | | | 8,621 | |
Marathon Petroleum Corp. | | | 134 | | | | 5,600 | |
MPLX LP — MLP | | | 6,122 | | | | 188,374 | |
Murphy Oil Corp. | | | 61 | | | | 1,196 | |
ONEOK Partners LP — MLP | | | 1,420 | | | | 38,823 | |
ONEOK, Inc. | | | 993 | | | | 24,736 | |
Phillips 66 | | | 565 | | | | 45,285 | |
Phillips 66 Partners LP — MLP | | | 720 | | | | 40,810 | |
Plains All American Pipeline LP — MLP | | | 4,450 | | | | 93,939 | |
QEP Resources, Inc. | | | 98 | | | | 1,256 | |
Rose Rock Midstream LP — MLP | | | 520 | | | | 5,710 | |
Shell Midstream Partners LP — MLP | | | 6,480 | | | | 230,429 | |
Sunoco Logistics Partners LP — MLP | | | 3,890 | | | | 86,630 | |
Targa Resources Corp. | | | 260 | | | | 5,842 | |
Targa Resources Partners LP — MLP | | | 1,490 | | | | 20,473 | |
Tesoro Corp. | | | 92 | | | | 8,027 | |
Tesoro Logistics LP — MLP | | | 1,535 | | | | 68,047 | |
Valero Energy Corp. | | | 335 | | | | 22,736 | |
Valero Energy Partners LP — MLP | | | 1,060 | | | | 47,043 | |
Williams Cos., Inc. | | | 270 | | | | 5,211 | |
Williams Partners LP — MLP | | | 3,895 | | | | 85,768 | |
| | | | | | | | |
| | | | | | | | 2,277,712 | |
Pharmaceuticals — 0.2% | | | | | |
Bristol-Myers Squibb Co. | | | 143 | | | | 8,889 | |
Johnson & Johnson | | | 483 | | | | 50,445 | |
Merck & Co., Inc. | | | 333 | | | | 16,873 | |
Pfizer, Inc. | | | 1,072 | | | | 32,685 | |
| | | | | | | | |
| | | | | | | | 108,892 | |
Real Estate Investment Trusts (REITs) — 4.7% | | | | | |
Alexandria Real Estate Equities, Inc. | | | 540 | | | | 42,757 | |
Allied Properties Real Estate Investment Trust | | | 2,038 | | | | 48,444 | |
AvalonBay Communities, Inc. | | | 469 | | | | 80,429 | |
Beni Stabili SpA SIIQ | | | 43,768 | | | | 29,572 | |
Boston Properties, Inc. | | | 1,301 | | | | 151,189 | |
British Land Co. PLC | | | 8,381 | | | | 88,784 | |
Cambridge Industrial Trust | | | 61,100 | | | | 22,350 | |
CareTrust REIT, Inc. | | | 2,910 | | | | 29,857 | |
CubeSmart | | | 1,704 | | | | 53,318 | |
CyrusOne, Inc. | | | 361 | | | | 13,303 | |
Derwent London PLC | | | 740 | | | | 34,322 | |
Duke Realty Corp. | | | 1,700 | | | | 34,221 | |
Empiric Student Property PLC | | | 9,914 | | | | 15,928 | |
EPR Properties | | | 417 | | | | 24,999 | |
Equity One, Inc. | | | 1,549 | | | | 42,938 | |
Equity Residential | | | 1,160 | | | | 89,424 | |
Essex Property Trust, Inc. | | | 277 | | | | 59,031 | |
Extra Space Storage, Inc. | | | 664 | | | | 60,218 | |
Federal Realty Investment Trust | | | 83 | | | | 12,519 | |
See Notes to Consolidated Financial Statements.
| | | | | | |
| | | BLACKROCK FUNDS | | JANUARY 31, 2016 | | 11 |
| | | | |
| Consolidated Schedule of Investments (continued) | | | BlackRock Multi-Asset Real Return Fund | |
| | | | |
| | | | | | | | |
| Common Stocks | | Shares | | | Value | |
Real Estate Investment Trusts (REITs) (continued) | | | | | |
Gramercy Property Trust | | | 3,470 | | | $ | 25,366 | |
HCP, Inc. | | | 865 | | | | 31,088 | |
Host Hotels & Resorts, Inc. | | | 3,288 | | | | 45,539 | |
Japan Rental Housing Investments, Inc. | | | 76 | | | | 51,576 | |
Kenedix Retail REIT Corp. | | | 22 | | | | 44,721 | |
Kilroy Realty Corp. | | | 817 | | | | 45,646 | |
Kimco Realty Corp. | | | 1,213 | | | | 32,981 | |
Klepierre | | | 865 | | | | 37,491 | |
Macerich Co. | | | 443 | | | | 34,541 | |
Merlin Properties Socimi SA | | | 1,920 | | | | 22,297 | |
National Health Investors, Inc. | | | 493 | | | | 29,915 | |
Parkway Properties, Inc. | | | 2,137 | | | | 28,785 | |
Pebblebrook Hotel Trust | | | 753 | | | | 18,388 | |
Physicians Realty Trust | | | 921 | | | | 15,721 | |
Prologis, Inc. | | | 1,793 | | | | 70,770 | |
Retail Properties of America, Inc., Class A | | | 3,769 | | | | 58,457 | |
Sekisui House Reit, Inc. | | | 17 | | | | 18,386 | |
Simon Property Group, Inc. | | | 835 | | | | 155,544 | |
SL Green Realty Corp. | | | 529 | | | | 51,107 | |
STAG Industrial, Inc. | | | 1,629 | | | | 27,579 | |
STORE Capital Corp. | | | 937 | | | | 23,228 | |
Sunstone Hotel Investors, Inc. | | | 3,207 | | | | 38,099 | |
Taubman Centers, Inc. | | | 432 | | | | 30,689 | |
UDR, Inc. | | | 1,187 | | | | 42,245 | |
Vastned Retail NV | | | 887 | | | | 38,835 | |
Vicinity Centres | | | 40,520 | | | | 84,357 | |
Welltower, Inc. | | | 2,500 | | | | 155,550 | |
Wereldhave NV | | | 591 | | | | 32,287 | |
Westfield Corp. | | | 9,278 | | | | 66,046 | |
| | | | | | | | |
| | | | | | | | 2,290,837 | |
Real Estate Management & Development — 1.4% | | | | | |
Cheung Kong Property Holdings Ltd. | | | 20,500 | | | | 111,117 | |
China Resources Land Ltd. | | | 14,000 | | | | 34,599 | |
Deutsche Wohnen AG (a) | | | 1,746 | | | | 45,858 | |
Entra ASA (b) | | | 4,296 | | | | 33,828 | |
First Capital Realty, Inc. | | | 1,640 | | | | 21,915 | |
Heiwa Real Estate Co. Ltd. | | | 3,800 | | | | 39,360 | |
Howard Hughes Corp. (a) | | | 143 | | | | 13,589 | |
Kennedy Wilson Europe Real Estate PLC | | | 830 | | | | 13,238 | |
Kungsleden AB | | | 3,190 | | | | 21,333 | |
KWG Property Holding Ltd. | | | 49,500 | | | | 31,377 | |
LEG Immobilien AG | | | 340 | | | | 27,598 | |
Nomura Real Estate Holdings, Inc. | | | 2,900 | | | | 50,927 | |
St. Modwen Properties PLC | | | 4,182 | | | | 23,161 | |
Sumitomo Realty & Development Co. Ltd. | | | 3,000 | | | | 84,097 | |
Sun Hung Kai Properties Ltd. | | | 6,000 | | | | 65,096 | |
VIB Vermoegen AG | | | 820 | | | | 14,790 | |
Wharf Holdings Ltd. | | | 9,000 | | | | 42,118 | |
| | | | | | | | |
| | | | | | | | 674,001 | |
Road & Rail — 0.0% | | | | | |
Union Pacific Corp. | | | 203 | | | | 14,616 | |
| | | | | | | | |
| Common Stocks | | Shares | | | Value | |
Semiconductors & Semiconductor Equipment — 0.1% | | | | | |
Avago Technologies Ltd. | | | 400 | | | $ | 53,484 | |
Intel Corp. | | | 353 | | | | 10,950 | |
| | | | | | | | |
| | | | | | | | 64,434 | |
Software — 0.2% | | | | | |
Microsoft Corp. | | | 1,574 | | | | 86,712 | |
Specialty Retail — 0.1% | | | | | |
AutoNation, Inc. (a) | | | 386 | | | | 16,695 | |
CarMax, Inc. (a) | | | 298 | | | | 13,166 | |
GameStop Corp., Class A | | | 59 | | | | 1,546 | |
L Brands, Inc. | | | 84 | | | | 8,077 | |
Staples, Inc. | | | 362 | | | | 3,229 | |
Tractor Supply Co. | | | 87 | | | | 7,683 | |
| | | | | | | | |
| | | | | | | | 50,396 | |
Technology Hardware, Storage & Peripherals — 0.4% | | | | | |
Apple, Inc. | | | 1,659 | | | | 161,487 | |
SanDisk Corp. | | | 82 | | | | 5,797 | |
| | | | | | | | |
| | | | | | | | 167,284 | |
Textiles, Apparel & Luxury Goods — 0.1% | | | | | |
NIKE, Inc., Class B | | | 738 | | | | 45,763 | |
Tobacco — 0.5% | | | | | |
Altria Group, Inc. | | | 2,484 | | | | 151,797 | |
Reynolds American, Inc. | | | 1,712 | | | | 85,514 | |
| | | | | | | | |
| | | | | | | | 237,311 | |
Total Common Stocks — 17.1% | | | | | | | 8,355,583 | |
| | | | | | | | |
| Investment Companies | | | | | | |
Equity Funds — 19.2% | | | | | |
Energy Select Sector SPDR Fund | | | 27,469 | | | | 1,599,795 | |
Financial Select Sector SPDR Fund (c) | | | 130,767 | | | | 2,838,952 | |
Health Care Select Sector SPDR Fund | | | 34,723 | | | | 2,308,038 | |
iShares Gold Trust (a)(d)(e) | | | 248,203 | | | | 2,675,628 | |
| | | | | | | | |
| | | | | | | | 9,422,413 | |
Fixed Income Funds — 18.4% | | | | | | | | |
BlackRock Floating Rate Income Portfolio, Institutional Class (e) | | | 914,958 | | | | 8,994,035 | |
Total Investment Companies — 37.6% | | | | 18,416,448 | |
| | | | | | | | |
| | | | | | | |
See Notes to Consolidated Financial Statements.
| | | | | | |
| 12 | | BLACKROCK FUNDS | | JANUARY 31, 2016 | | |
| | | | |
| Consolidated Schedule of Investments (continued) | | | BlackRock Multi-Asset Real Return Fund | |
| | | | | | | | | | | | |
| U.S. Treasury Obligations | | | | | Par
(000) | | | Value | |
U.S. Treasury Inflation Indexed Bonds: | | | | | | | | | | | | |
2.38%, 1/15/25-1/15/27 | | | USD | | | | 779 | | | $ | 909,029 | |
2.00%, 1/15/26 | | | | | | | 359 | | | | 407,484 | |
1.75%, 1/15/28 | | | | | | | 289 | | | | 321,955 | |
3.63%, 4/15/28 | | | | | | | 242 | | | | 322,198 | |
2.50%, 1/15/29 | | | | | | | 276 | | | | 333,542 | |
3.88%, 4/15/29 | | | | | | | 296 | | | | 409,228 | |
3.38%, 4/15/32 | | | | | | | 114 | | | | 157,047 | |
2.13%, 2/15/40-2/15/41 | | | | | | | 349 | | | | 422,294 | |
0.75%, 2/15/42-2/15/45 | | | | | | | 765 | | | | 689,658 | |
0.63%, 2/15/43 | | | | | | | 253 | | | | 221,311 | |
1.38%, 2/15/44 | | | | | | | 380 | | | | 398,085 | |
U.S. Treasury Inflation Indexed Notes: | | | | | | | | | | | | |
0.13%, 4/15/17-7/15/24 | | | | | | | 6,625 | | | | 6,581,009 | |
2.63%, 7/15/17 | | | | | | | 269 | | | | 281,680 | |
1.63%, 1/15/18 | | | | | | | 283 | | | | 293,492 | |
1.38%, 7/15/18-1/15/20 | | | | | | | 637 | | | | 668,479 | |
2.13%, 1/15/19 | | | | | | | 260 | | | | 277,142 | |
1.88%, 7/15/19 | | | | | | | 295 | | | | 315,636 | |
1.25%, 7/15/20 | | | | | | | 550 | | | | 580,325 | |
1.13%, 1/15/21 | | | | | | | 629 | | | | 659,726 | |
0.63%, 7/15/21-1/15/26 | | | | | | | 1,702 | | | | 1,728,361 | |
0.38%, 7/15/23-7/15/25 | | | | | | | 1,505 | | | | 1,494,525 | |
0.25%, 1/15/25 | | | | | | | 747 | | | | 727,132 | |
Total U.S. Treasury Obligations — 37.2% | | | | | | | | 18,199,338 | |
| | | | | | | | |
| | | | | |
Value | |
Total Long-Term Investments (Cost — $47,119,868) — 91.9% | | | | | | $ | 44,971,369 | |
| | | | | | | | |
| Short-Term Securities | | Shares | | | | |
BlackRock Liquidity Funds, TempFund, Institutional Class, 0.32% (e)(f) | | | 1,450,990 | | | | 1,450,990 | |
| | | Beneficial
Interest
(000) | | | | |
BlackRock Liquidity Series, LLC, Money Market Series, 0.51% (e)(f)(g) | | | 2,796 | | | | 2,796,315 | |
Total Short-Term Securities (Cost — $4,247,305) — 8.7% | | | | | | | 4,247,305 | |
Total Investments (Cost — $51,367,173) — 100.6% | | | | 49,218,674 | |
Liabilities in Excess of Other Assets — (0.6)% | | | | (289,394) | |
| | | | | | | | |
Net Assets — 100.0% | | | | | | | $48,929,280 | |
| | | | | | | | |
|
| Notes to Consolidated Schedule of Investments |
| (a) | Non-income producing security. |
| (b) | Security exempt from registration pursuant to Rule 144A under the Securities Act of 1933, as amended. These securities may be resold in transactions exempt from registration to qualified institutional investors. |
| (c) | Security, or a portion of security, is on loan. |
| (d) | All or a portion of security is held by a wholly owned subsidiary. See Note 1 of the Notes to Consolidated Financial Statements for details on the wholly owned subsidiary. |
| (e) | During the six months ended January 31, 2016, investments in issuers considered to be affiliates of the Fund for purposes of Section 2(a)(3) of the Investment Company Act of 1940, as amended, were as follows: |
| | | | | | | | | | | | | | | | | | | | | | | | | | | | |
| Affiliate | | Shares/
Beneficial Interest
Held at July 31, 2015 | | | Shares/
Beneficial Interest
Purchased | | | Shares
Sold | | | Shares
Held at
January 31,
2016 | | | Value at
January 31,
2016 | | | Income | | | Realized
Loss | |
BlackRock Floating Rate Income Portfolio, Institutional Class | | | 1,125,585 | | | | 20,816 | | | | (231,443 | ) | | | 914,958 | | | | $8,994,035 | | | $ | 208,891 | | | | $(100,537 | ) |
BlackRock Liquidity Funds, TempFund, Institutional Class | | | 2,372,967 | | | | — | | | | (921,977 | )1 | | | 1,450,990 | | | | $1,450,990 | | | $ | 1,859 | | | | — | |
BlackRock Liquidity Series, LLC, Money Market Series | | | — | | | | $2,796,3152 | | | | — | | | | 2,796,315 | | | | $2,796,315 | | | $ | 670 | 3 | | | — | |
iShares Gold Trust | | | 248,203 | | | | — | | | | — | | | | 248,203 | | | | $2,675,628 | | | | — | | | | — | |
| 1 | Represents net shares sold. |
| 2 | Represents net beneficial interest purchased. |
| 3 | Represents securities lending income earned from the reinvestment of cash collateral from loaned securities, net of fees and collateral investment expenses, and other payments to and from borrowers of securities. |
| (f) | Current yield as of period end. |
| (g) | Security was purchased with the cash collateral from loaned securities. The Fund may withdraw up to 25% of its investment daily, although the manager of the BlackRock Liquidity Series, LLC, Money Market Series, in its sole discretion, may permit an investor to withdraw more than 25% on any one day. |
| | • | | For Fund compliance purposes, the Fund’s industry classifications refer to any one or more of the industry sub-classifications used by one or more widely recognized market indexes or ratings group indexes, and/or as defined by the investment advisor. These definitions may not apply for purposes of this report, which may combine such industry sub-classifications for reporting ease. |
See Notes to Consolidated Financial Statements.
| | | | | | |
| | | BLACKROCK FUNDS | | JANUARY 31, 2016 | | 13 |
| | | | |
| Consolidated Schedule of Investments (continued) | | | BlackRock Multi-Asset Real Return Fund | |
|
| Derivative Financial Instruments Outstanding as of Period End |
Financial Futures Contracts
| | | | | | | | | | | | | | | | |
Contracts
Short | | Issue | | Expiration | | Notional Value | | | Unrealized
Depreciation | |
| (33) | | U.S. Treasury Notes (10 Year) | | March 2016 | | | USD | | | | 4,276,078 | | | | $(106,044 | ) |
| | | | | | | | | | | | | | | | | | | | |
| Forward Foreign Currency Exchange Contracts | |
Currency Purchased | | | Currency Sold | | | Counterparty | | Settlement
Date | | | Unrealized
Appreciation
(Depreciation) | |
| AUD | | | 116,000 | | | USD | | | 80,108 | | | HSBC Bank PLC | | | 4/21/16 | | | | $ 1,670 | |
| CAD | | | 7,800 | | | USD | | | 5,342 | | | Royal Bank of Scotland PLC | | | 4/21/16 | | | | 227 | |
| CHF | | | 25,800 | | | USD | | | 25,820 | | | State Street Bank and Trust Co. | | | 4/21/16 | | | | (542 | ) |
| EUR | | | 34,000 | | | USD | | | 36,939 | | | BNP Paribas S.A. | | | 4/21/16 | | | | (22 | ) |
| EUR | | | 3,500 | | | USD | | | 3,826 | | | Morgan Stanley & Co. International PLC | | | 4/21/16 | | | | (25 | ) |
| EUR | | | 2,000 | | | USD | | | 2,186 | | | Northern Trust Corp. | | | 4/21/16 | | | | (15 | ) |
| GBP | | | 17,464 | | | USD | | | 24,742 | | | Morgan Stanley & Co. International PLC | | | 4/21/16 | | | | 148 | |
| ILS | | | 13,000 | | | USD | | | 3,278 | | | Morgan Stanley & Co. International PLC | | | 4/21/16 | | | | 12 | |
| JPY | | | 7,372,000 | | | USD | | | 63,493 | | | HSBC Bank PLC | | | 4/21/16 | | | | (2,469 | ) |
| NZD | | | 4,248 | | | USD | | | 2,695 | | | HSBC Bank PLC | | | 4/21/16 | | | | 42 | |
| SEK | | | 40,000 | | | USD | | | 4,717 | | | Goldman Sachs International | | | 4/21/16 | | | | (44 | ) |
| SEK | | | 198,000 | | | USD | | | 23,224 | | | Morgan Stanley & Co. International PLC | | | 4/21/16 | | | | (94 | ) |
| SEK | | | 59,000 | | | USD | | | 6,883 | | | State Street Bank and Trust Co. | | | 4/21/16 | | | | 9 | |
| SGD | | | 8,000 | | | USD | | | 5,606 | | | State Street Bank and Trust Co. | | | 4/21/16 | | | | — | |
| SGD | | | 1,000 | | | USD | | | 694 | | | State Street Bank and Trust Co. | | | 4/21/16 | | | | 7 | |
| SGD | | | 39,400 | | | USD | | | 27,321 | | | State Street Bank and Trust Co. | | | 4/21/16 | | | | 284 | |
| USD | | | 61,966 | | | AUD | | | 90,800 | | | Royal Bank of Scotland PLC | | | 4/21/16 | | | | (2,046 | ) |
| USD | | | 22,795 | | | EUR | | | 21,000 | | | State Street Bank and Trust Co. | | | 4/21/16 | | | | (6 | ) |
| USD | | | 3,285 | | | EUR | | | 3,000 | | | State Street Bank and Trust Co. | | | 4/21/16 | | | | 28 | |
| USD | | | 5,429 | | | EUR | | | 5,000 | | | UBS AG | | | 4/21/16 | | | | — | |
| USD | | | 4,308 | | | GBP | | | 3,000 | | | Bank of America N.A. | | | 4/21/16 | | | | 33 | |
| USD | | | 5,744 | | | GBP | | | 4,000 | | | Commonwealth Bank of Australia | | | 4/21/16 | | | | 43 | |
| USD | | | 5,714 | | | GBP | | | 4,000 | | | Morgan Stanley & Co. International PLC | | | 4/21/16 | | | | 13 | |
| USD | | | 2,850 | | | GBP | | | 2,000 | | | Royal Bank of Scotland PLC | | | 4/21/16 | | | | — | |
| USD | | | 1,426 | | | GBP | | | 1,000 | | | Royal Bank of Scotland PLC | | | 4/21/16 | | | | 1 | |
| USD | | | 5,698 | | | GBP | | | 4,000 | | | State Street Bank and Trust Co. | | | 4/21/16 | | | | (3 | ) |
| USD | | | 26,028 | | | HKD | | | 203,000 | | | Morgan Stanley & Co. International PLC | | | 4/21/16 | | | | (60 | ) |
| USD | | | 1,154 | | | HKD | | | 9,000 | | | Morgan Stanley & Co. International PLC | | | 4/21/16 | | | | (3 | ) |
| USD | | | 4,983 | | | HKD | | | 39,000 | | | Royal Bank of Scotland PLC | | | 4/21/16 | | | | (29 | ) |
| USD | | | 56,516 | | | HKD | | | 443,000 | | | State Street Bank and Trust Co. | | | 4/21/16 | | | | (415 | ) |
| USD | | | 3,194 | | | JPY | | | 386,000 | | | Goldman Sachs International | | | 4/21/16 | | | | (1 | ) |
| USD | | | 1,677 | | | JPY | | | 196,000 | | | HSBC Bank PLC | | | 4/21/16 | | | | 54 | |
| USD | | | 1,448 | | | JPY | | | 175,000 | | | Morgan Stanley & Co. International PLC | | | 4/21/16 | | | | (1 | ) |
| USD | | | 2,552 | | | JPY | | | 303,000 | | | Morgan Stanley & Co. International PLC | | | 4/21/16 | | | | 44 | |
| USD | | | 2,584 | | | JPY | | | 306,000 | | | Morgan Stanley & Co. International PLC | | | 4/21/16 | | | | 51 | |
| USD | | | 3,453 | | | JPY | | | 408,000 | | | Royal Bank of Scotland PLC | | | 4/21/16 | | | | 75 | |
| USD | | | 31,055 | | | NOK | | | 276,733 | | | Morgan Stanley & Co. International PLC | | | 4/21/16 | | | | (796 | ) |
| USD | | | 22,622 | | | SEK | | | 194,000 | | | Morgan Stanley & Co. International PLC | | | 4/21/16 | | | | (41 | ) |
| Total | | | | | | | | | | | | | | | | | | | $(3,871 | ) |
| | | | | | | | | | | | | | | | | | | | |
See Notes to Consolidated Financial Statements.
| | | | | | |
| 14 | | BLACKROCK FUNDS | | JANUARY 31, 2016 | | |
| | | | |
| Consolidated Schedule of Investments (continued) | | | BlackRock Multi-Asset Real Return Fund | |
| | | | | | | | | | | | | | | | | | | | |
Centrally Cleared Credit Default Swaps — Sell Protection | | | | | | | | | | | | | | | | | | | | |
| Index | | Receive
Fixed
Rate | | | | Expiration
Date | | Credit
Rating1 | | Notional
Amount (000)2 | | | Unrealized
Appreciation | |
CDX.NA.HY Series 25 Version 1 | | 5.00% | | | | 12/20/20 | | B+ | | | USD | | | | 5,572 | | | | $39,563 | |
| | 1 | | Using S&P’s rating of the issuer or the underlying securities of the index, as applicable. |
| | 2 | | The maximum potential amount the Fund may pay should a negative credit event take place as defined under the terms of the agreement. |
| | | | | | | | | | | | | | | | | | | | | | | | | | | | | | | | |
OTC Credit Default Swaps — Sell Protection | | | | | | | | | | | | | | | | | | | | | | | | | | |
| Index | | Receive
Fixed
Rate | | | Counterparty | | Expiration
Date | | Credit
Rating1 | | | Notional
Amount (000)2 | | | Value | | | Premiums
Received | | | Unrealized
Depreciation | |
CMBX.NA Series 7 BBB- | | | 3.00% | | | Credit Suisse International | | 1/17/47 | | | BBB- | | | | USD | | | | 2,000 | | | | $(259,861 | ) | | | $(101,176 | ) | | | $(158,685 | ) |
| | 1 | | Using S&P’s rating of the issuer or the underlying securities of the index, as applicable. |
| | 2 | | The maximum potential amount the Fund may pay should a negative credit event take place as defined under the terms of the agreement. |
| | | | | | | | | | | | | | | | | | | | | | | | | | | | |
OTC Total Return Swaps | | | | | | | | | | | | | | | | | | | | | | | | | |
| Reference Entity | | Fixed Amount | | | Counterparty | | | Expiration
Date | | | | Contracts | | | Value | | | Premiums
Paid
(Received) | | | Unrealized
Depreciation | |
Bloomberg Brent Crude Subindex1 | | | USD 663,065 | 2 | | | JPMorgan Chase Bank N.A. | | | 6/29/16 | | | | | 3,613 | | | | $ (54,035 | ) | | | — | | | | $ (54,035 | ) |
S&P GSCI Commodity Excess Return Index1 | | | USD 2,517,151 | 2 | | | JPMorgan Chase Bank N.A. | | | 6/29/16 | | | | | 12,632 | | | | (138,030 | ) | | | — | | | | (138,030 | ) |
Total | | | | | | | | | | | | | | | | | | | $(192,065 | ) | | | — | | | | $(192,065 | ) |
| | | | | | | | | | | | | | | | | | | | |
| | 1 | | All or a portion of security is held by a wholly owned subsidiary. See Note 1 of the Notes to Consolidated Financial Statements for details on the wholly owned subsidiary. |
| | 2 | | Fund receives the total return of the reference entity and pays the fixed amount. Net payment made at termination. |
| | | | | | | | | | | | | | | | |
OTC Total Return Swaps1 | | | | | | | | | | | | | | | | |
| Reference Entity | | Counterparty | | | Expiration
Date | | Notional
Amount | | | Unrealized
Appreciation | | | Net Value of
Reference
Entity |
Equity Securities Long: | | | Morgan Stanley | | | 2/3/16 | | | $10,649 | | | | $922 | | | $10,656 |
| | 1 | | The Fund receives or pays the total return on a portfolio of long and short positions underlying the total return swap. In addition, the Fund pays or receives a variable rate of interest, based on a specified benchmark, plus or minus 25 basis points. The benchmark and spread are determined based upon the country and/or currency of the individual underlying positions. The U.S. Federal Funds Rate is the specified benchmark used in determining the variable rate of interest. |
| | 2 | | Amount includes $85 of net dividends. |
See Notes to Consolidated Financial Statements.
| | | | | | |
| | | BLACKROCK FUNDS | | JANUARY 31, 2016 | | 15 |
| | | | |
| Consolidated Schedule of Investments (continued) | | | BlackRock Multi-Asset Real Return Fund | |
The following table represents the individual long positions and related values of the equity securities underlying the total return swap with Morgan Stanley, as of period end, expiration date 2/3/16:
| | | | | | | | |
| | | Shares | | | | Value | |
Reference Entity — Long | | | | | | | | |
Taubman Centers, Inc. | | 150 | | | | | $10,656 | |
|
| Derivative Financial Instruments Categorized by Risk Exposure |
As of period end, the fair values of derivative financial instruments located in the Consolidated Statements of Assets and Liabilities were as follows:
| | | | | | | | | | | | | | | | | | | | | | | | | | | | |
| | | | | Commodity
Contracts | | | Credit
Contracts | | | Equity
Contracts | | | Foreign
Currency
Exchange
Contracts | | | Interest
Rate
Contracts | | | Other
Contracts | | Total | |
Assets - Derivative Financial Instruments | | | | | | | | | | | | | | | | | | | | | | | | | | |
Forward foreign currency exchange contracts | | Unrealized appreciation on forward foreign currency exchange contracts | | | — | | | | — | | | | — | | | | $2,741 | | | | — | | | — | | | $ 2,741 | |
Swaps - OTC | | Unrealized appreciation on OTC swaps | | | — | | | | — | | | | $92 | | | | — | | | | — | | | — | | | 92 | |
Swaps - centrally cleared | | Net unrealized appreciation1 | | | — | | | | $ 39,563 | | | | — | | | | — | | | | — | | | — | | | 39,563 | |
| | | | | | |
Total | | | | | — | | | | $ 39,563 | | | | $92 | | | | $2,741 | | | | — | | | — | | | $ 42,396 | |
| | | | | | |
| | | | | | | | | | | | | | | | | | | | | | | | | | | | |
| | | | | Commodity
Contracts | | | Credit
Contracts | | | Equity
Contracts | | | Foreign
Currency
Exchange
Contracts | | | Interest
Rate
Contracts | | | Other
Contracts | | Total | |
Liabilities - Derivative Financial Instruments | | | | | | | | | | | | | | | | | | | | | | | | | | |
Financial futures contracts | | Net unrealized depreciation1 | | | — | | | | — | | | | — | | | | — | | | | $106,044 | | | — | | | $106,044 | |
Forward foreign currency exchange contracts | | Unrealized depreciation on forward foreign currency exchange contracts | | | — | | | | — | | | | — | | | | $6,612 | | | | — | | | — | | | 6,612 | |
Swaps - OTC | | Unrealized depreciation on OTC swaps; Swap premiums received | | | $192,065 | | | | $259,861 | | | | — | | | | — | | | | — | | | — | | | 451,926 | |
| | | | | | |
Total | | | | | $192,065 | | | | $259,861 | | | | — | | | | $6,612 | | | | $106,044 | | | — | | | $564,582 | |
| | | | | | |
| | 1 | | Includes cumulative appreciation (depreciation) on financial futures contracts and centrally cleared swaps, if any, as reported in the Consolidated Schedule of Investments. Only current day’s variation margin is reported within the Consolidated Statements of Assets and Liabilities. |
See Notes to Consolidated Financial Statements.
| | | | | | |
| 16 | | BLACKROCK FUNDS | | JANUARY 31, 2016 | | |
| | |
| Consolidated Schedule of Investments (continued) | | BlackRock Multi-Asset Real Return Fund |
For the six months ended January 31, 2016, the effect of derivative financial instruments in the Consolidated Statements of Operations was as follows:
| | | | | | | | | | | | | | | | | | | | | | | | | | |
| |
| | | Commodity
Contracts | | | Credit
Contracts | | | Equity
Contracts | | | Foreign
Currency
Exchange
Contracts | | | Interest
Rate
Contracts | | | Other
Contracts | | Total | |
| |
Net Realized Gain (Loss) from: | | | | | | | | | | | | | | | | | | | | | | | | | | |
Financial futures contracts | | | — | | | | — | | | | $166,408 | | | | — | | | | — | | | — | | $ | 166,408 | |
Foreign currency transactions | | | — | | | | — | | | | — | | | | $(2,738 | ) | | | — | | | — | | | (2,738 | ) |
Swaps | | $ | (2,294,025 | ) | | | $(85,028 | ) | | | — | | | | — | | | | — | | | — | | | (2,379,053 | ) |
| | | | |
Total | | $ | (2,294,025 | ) | | | $(85,028 | ) | | | $166,408 | | | | $(2,738 | ) | | | — | | | — | | $ | (2,215,383 | ) |
| | | | |
| | | | | | | | | | | | | | | | | | | | | | | | | | |
| |
| | | Commodity
Contracts | | | Credit
Contracts | | | Equity
Contracts | | | Foreign
Currency
Exchange
Contracts | | | Interest
Rate
Contracts | | | Other
Contracts | | Total | |
| |
Net Change in Unrealized Appreciation (Depreciation) on: | | | | | | | | | | | | | | | | | | | | | | | | | | |
Financial futures contracts | | | — | | | | — | | | | — | | | | — | | | $ | (106,044 | ) | | — | | $ | (106,044 | ) |
Foreign currency translations | | | — | | | | — | | | | — | | | | $(3,987 | ) | | | — | | | — | | | (3,987 | ) |
Swaps | | $ | 849,721 | | | | $(99,547 | ) | | | $ 92 | | | | — | | | | — | | | — | | | 750,266 | |
| | | | |
Total | | $ | 849,721 | | | | $(99,547 | ) | | | $ 92 | | | | $(3,987 | ) | | | (106,044 | ) | | — | | $ | 640,235 | |
| | | | |
|
|
| Average Quarterly Balances of Outstanding Derivative Financial Instruments |
|
| | | | |
| |
Financial futures contracts: | | | | |
Average notional value of contracts - long | | $ | 673,953 | |
Average notional value of contracts - short | | $ | 2,138,039 | |
Forward foreign currency exchange contracts: | | | | |
Average amounts purchased - in USD | | $ | 233,574 | |
Average amounts sold - in USD | | $ | 260,288 | |
Credit default swaps: | | | | |
Average notional value - sell protection | | $ | 8,822,000 | |
Total return swaps: | | | | |
Average notional value | | $ | 3,685,428 | |
| |
For more information about the Fund’s investment risks regarding derivative financial instruments, refer to the Notes to Consolidated Financial Statements.
|
|
| Derivative Financial Instruments — Offsetting as of Period End |
|
The Fund’s derivative assets and liabilities (by type) were as follows:
| | | | | | | | |
| |
| | | Assets | | | Liabilities | |
| |
Derivative Financial Instruments: | | | | | | | | |
Financial futures contracts | | | — | | | $ | 18,047 | |
Forward foreign currency exchange contracts | | $ | 2,741 | | | | 6,612 | |
Swaps - Centrally cleared | | | 30,773 | | | | — | |
Swaps - OTC1 | | | 92 | | | | 451,926 | |
| | | | |
Total derivative assets and liabilities in the Consolidated Statements of Assets and Liabilities | | $ | 33,606 | | | $ | 476,585 | |
Derivatives not subject to a Master Netting Agreement or similar agreement (“MNA”) | | | (30,773 | ) | | | (18,047 | ) |
| | | | |
Total derivative assets and liabilities subject to an MNA | | $ | 2,833 | | | $ | 458,538 | |
| | | | |
| | 1 | | Includes unrealized appreciation (depreciation) on OTC swaps and swap premiums paid/received in the Consolidated Statements of Assets and Liabilities. |
See Notes to Consolidated Financial Statements.
| | | | | | |
| | | BLACKROCK FUNDS | | JANUARY 31, 2016 | | 17 |
| | |
| Consolidated Schedule of Investments (continued) | | BlackRock Multi-Asset Real Return Fund |
The following tables present the Fund’s derivative assets and liabilities by counterparty net of amounts available for offset under a Master Netting Agreement (“MNA”) and net of the related collateral received and pledged by the Fund.
| | | | | | | | | | | | | | | | | | | | | | | | | |
| Counterparty | | Derivative Assets
Subject to an MNA by
Counterparty | | Derivatives Available
for Offset1 | | Non-cash
Collateral
Received | | Cash
Collateral
Received | | Net Amount of
Derivative Assets2 |
Bank of America N.A. | | | | $ 125 | | | | | — | | | | | — | | | | | — | | | | | $125 | |
Commonwealth Bank of Australia | | | | 43 | | | | | — | | | | | — | | | | | — | | | | | 43 | |
HSBC Bank PLC | | | | 1,766 | | | | $ | (1,766 | ) | | | | — | | | | | — | | | | | — | |
Morgan Stanley & Co. International PLC | | | | 268 | | | | | (268 | ) | | | | — | | | | | — | | | | | — | |
Royal Bank of Scotland PLC | | | | 303 | | | | | (303 | ) | | | | — | | | | | — | | | | | — | |
State Street Bank and Trust Co. | | | | 328 | | | | | (328 | ) | | | | — | | | | | — | | | | | — | |
Total | | | | $2,833 | | | | $ | (2,665 | ) | | | | — | | | | | — | | | | | $168 | |
| | | | | | | | | | | | | | | | | | | | | | | | | |
| Counterparty | | Derivative Liabilities
Subject to an MNA by
Counterparty | | Derivatives Available
for Offset1 | | Non-cash
Collateral
Pledged | | Cash
Collateral
Pledged | | Net Amount of
Derivative Liabilities3 |
BNP Paribas S.A. | | | $ | 22 | | | | | — | | | | | — | | | | | — | | | | $ | 22 | |
Credit Suisse International | | | | 259,861 | | | | | — | | | | | — | | | | | — | | | | | 259,861 | |
Goldman Sachs International | | | | 45 | | | | | — | | | | | — | | | | | — | | | | | 45 | |
HSBC Bank PLC | | | | 2,469 | | | | $ | (1,766 | ) | | | | — | | | | | — | | | | | 703 | |
JPMorgan Chase Bank N.A. | | | | 192,065 | | | | | — | | | | | — | | | | $ | (192,065 | ) | | | | — | |
Morgan Stanley & Co. International PLC | | | | 1,020 | | | | | (268 | ) | | | | — | | | | | — | | | | | 752 | |
Royal Bank of Scotland PLC | | | | 2,075 | | | | | (303 | ) | | | | — | | | | | — | | | | | 1,772 | |
State Street Bank and Trust Co. | | | | 966 | | | | | (328 | ) | | | | — | | | | | — | | | | | 638 | |
Northern Trust Corp. | | | | 15 | | | | | — | | | | | — | | | | | — | | | | | 15 | |
Total | | | $ | 458,538 | | | | $ | (2,665 | ) | | | | — | | | | $ | (192,065 | ) | | | $ | 263,808 | |
| | 1 | | The amount of derivatives available for offset is limited to the amount of assets and/or liabilities that are subject to an MNA. |
| | 2 | | Net amount represents the net amount receivable from the counterparty in the event of default. |
| | 3 | | Net amount represents the net amount payable due to the counterparty in the event of default. |
|
|
| Fair Value Hierarchy as of Period End |
|
Various inputs are used in determining the fair value of investments and derivative financial instruments. For information about the Fund’s policy regarding valuation of investments and derivative financial instruments, refer to the Notes to Consolidated Financial Statements.
The following tables summarize the Fund’s investments and derivative financial instruments categorized in the disclosure hierarchy:
| | | | | | | | | | | | | | |
| |
| | | Level 1 | | | Level 2 | | | Level 3 | | Total | |
| |
Assets: | | | | | | | | | | | | | | |
Investments: | | | | | | | | | | | | | | |
Long-Term Investments: | | | | | | | | | | | | | | |
Common Stocks1 | | $ | 7,206,710 | | | $ | 1,148,873 | | | — | | $ | 8,355,583 | |
Investment Companies | | | 18,416,448 | | | | — | | | — | | | 18,416,448 | |
U.S. Treasury Obligations | | | — | | | | 18,199,338 | | | — | | | 18,199,338 | |
Short-Term Securities | | | 1,450,990 | | | | 2,796,315 | | | — | | | 4,247,305 | |
| | | | |
Total | | $ | 27,074,148 | | | $ | 22,144,526 | | | — | | $ | 49,218,674 | |
| | | | |
| | 1 | | See above Consolidated Schedule of Investments for values in each industry. |
See Notes to Consolidated Financial Statements.
| | | | | | |
| 18 | | BLACKROCK FUNDS | | JANUARY 31, 2016 | | |
| | |
| Consolidated Schedule of Investments (concluded) | | BlackRock Multi-Asset Real Return Fund |
| | | | | | | | | | | | | | |
| |
| | | Level 1 | | | Level 2 | | | Level 3 | | Total | |
| |
Derivative Financial Instruments1 | | | | | | | | | | | | | | |
Assets: | | | | | | | | | | | | | | |
Credit contracts | | | — | | | $ | 39,563 | | | — | | $ | 39,563 | |
Equity contracts | | | — | | | | 92 | | | — | | | 92 | |
Foreign currency exchange contracts | | | — | | | | 2,741 | | | — | | | 2,741 | |
Liabilities: | | | | | | | | | | | | | | |
Commodity contracts | | | — | | | | (192,065 | ) | | — | | | (192,065 | ) |
Credit contracts | | | — | | | | (158,685 | ) | | — | | | (158,685 | ) |
Foreign currency exchange contracts | | | — | | | | (6,612 | ) | | — | | | (6,612 | ) |
Interest rate contracts | | $ | (106,044) | | | | — | | | — | | | (106,044 | ) |
| | | | |
Total | | $ | (106,044) | | | $ | (314,966 | ) | | — | | $ | (421,010 | ) |
| | | | |
1 Derivative financial instruments are swaps, financial futures contracts and forward foreign currency exchange contracts which are valued at the unrealized appreciation (depreciation) on the instrument. | |
The Fund may hold assets and/or liabilities in which the fair value approximates the carrying amount for financial statement purposes. As of period end, such assets and/or liabilities are categorized within the disclosure hierarchy as follows: | |
| |
| | | Level 1 | | | Level 2 | | | Level 3 | | Total | |
| |
Assets: | | | | | | | | | | | | | | |
Cash | | $ | 2,061,602 | | | | — | | | — | | $ | 2,061,602 | |
Foreign currency at value | | | 9,132 | | | | — | | | — | | | 9,132 | |
Cash pledged for financial futures contracts | | | 45,000 | | | | — | | | — | | | 45,000 | |
Cash pledged as collateral for OTC derivatives | | | 510,000 | | | | — | | | — | | | 510,000 | |
Cash pledged for centrally cleared swaps | | | 358,260 | | | | — | | | — | | | 358,260 | |
Liabilities: | | | | | | | | | | | | | | |
Collateral on securities loaned at value | | | — | | | $ | (2,796,315 | ) | | — | | | (2,796,315 | ) |
| | | | |
Total | | $ | 2,983,994 | | | $ | (2,796,315 | ) | | — | | $ | 187,679 | |
| | | | |
During the six months ended January 31, 2016, there were no transfers between levels.
See Notes to Consolidated Financial Statements.
| | | | | | |
| | | BLACKROCK FUNDS | | JANUARY 31, 2016 | | 19 |
| | | | |
| Consolidated Schedule of Investments January 31, 2016 (Unaudited) | | | BlackRock Strategic Risk Allocation Fund | |
| | | (Percentages shown are based on Net Assets) | |
| | | | | | | | | | | | |
| Foreign Government Obligations | | | | | Par
(000) | | | Value | |
Australia — 8.4% | | | | | | | | | | | | |
Australia Government Inflation Linked Bond: | | | | | | | | | | | | |
1.00%, 11/21/18 | | | AUD | | | | 813 | | | $ | 614,466 | |
4.00%, 8/20/20 | | | | | | | 171 | | | | 232,598 | |
1.25%, 2/21/22 | | | | | | | 433 | | | | 350,969 | |
3.00%, 9/20/25 | | | | | | | 464 | | | | 473,028 | |
2.50%, 9/20/30 | | | | | | | 436 | | | | 434,729 | |
2.00%, 8/21/35 | | | | | | | 391 | | | | 347,137 | |
| | | | | | | | | | | | |
| | | | | | | | | | | | 2,452,927 | |
Canada — 4.4% | | | | | | | | | | | | |
Canadian Government Inflation Linked Bond: | | | | | | | | | | | | |
4.25%, 12/01/26 | | | CAD | | | | 255 | | | | 378,075 | |
4.00%, 12/01/31 | | | | | | | 244 | | | | 374,153 | |
2.00%, 12/01/41 | | | | | | | 179 | | | | 192,686 | |
1.50%, 12/01/44 | | | | | | | 281 | | | | 266,082 | |
1.25%, 12/01/47 | | | | | | | 96 | | | | 83,040 | |
| | | | | | | | | | | | |
| | | | | | | | | | | | 1,294,036 | |
France — 6.5% | | | | | | | | | | | | |
Republic of France Inflation Linked Bond: | | | | | | | | | | | | |
0.45%, 7/25/16 | | | EUR | | | | 184 | | | | 210,589 | |
0.10%, 7/25/21 | | | | | | | 334 | | | | 381,302 | |
1.10%, 7/25/22 | | | | | | | 339 | | | | 444,188 | |
1.85%, 7/25/27 | | | | | | | 346 | | | | 497,688 | |
0.70%, 7/25/30 | | | | | | | 306 | | | | 368,013 | |
| | | | | | | | | | | | |
| | | | | | | | | | | | 1,901,780 | |
Germany — 1.7% | | | | | | | | | | | | |
Deutsche Bundesrepublik Inflation Linked Bond: | | | | | | | | | | | | |
0.75%, 4/15/18 | | | | | | | 119 | | | | 140,664 | |
1.75%, 4/15/20 | | | | | | | 46 | | | | 59,664 | |
0.10%, 4/15/23 | | | | | | | 157 | | | | 187,088 | |
0.50%, 4/15/30 | | | | | | | 75 | | | | 93,060 | |
| | | | | | | | | | | | |
| | | | | | | | | | | | 480,476 | |
Sweden — 8.9% | | | | | | | | | | | | |
Sweden Inflation Linked Bond: | | | | | | | | | | | | |
0.50%, 6/01/17 | | | SEK | | | | 3,515 | | | | 432,735 | |
4.00%, 12/01/20 | | | | | | | 855 | | | | 160,055 | |
0.25%, 6/01/22 | | | | | | | 4,880 | | | | 618,790 | |
1.00%, 6/01/25 | | | | | | | 3,410 | | | | 461,244 | |
3.50%, 12/01/28 | | | | | | | 4,335 | | | | 933,585 | |
| | | | | | | | | | | | |
| | | | | | | | | | | | 2,606,409 | |
| | | | | | | | | | | | |
| Foreign Government Obligations | | | | | Par (000) | | | Value | |
United Kingdom — 4.1% | | | | | | | | | | | | |
United Kingdom Gilt Inflation Linked Bond: | | | | | | | | | | | | |
0.13%, 3/22/24 | | | GBP | | | | 62 | | | $ | 101,990 | |
0.13%, 3/22/29 | | | | | | | 74 | | | | 129,635 | |
0.75%, 3/22/34 | | | | | | | 61 | | | | 126,804 | |
1.13%, 11/22/37 | | | | | | | 103 | | | | 276,762 | |
0.13%, 3/22/44 | | | | | | | 175 | | | | 348,623 | |
0.75%, 11/22/47 | | | | | | | 75 | | | | 212,992 | |
| | | | | | | | | | | | |
| | | | | | | | | | | | 1,196,806 | |
Total Foreign Government Obligations — 34.0% | | | | 9,932,434 | |
| | | | | | | | | | | | |
| Investment Companies | | | | | Shares | | | | |
Fixed Income Funds — 7.0% | | | | | | | | | | | | |
iShares TIPS Bond ETF (a) | | | | | | | 18,331 | | | | 2,042,073 | |
Total Long-Term Investments (Cost — $13,557,725) — 41.0% | | | | 11,974,507 | |
| | | | | | | | | | | | |
| Short-Term Securities | | | | | | | | | |
BlackRock Liquidity Funds, TempFund, Institutional Class, 0.32% (a)(b)(c) | | | | | | | 10,672,284 | | | | 10,672,284 | |
Total Short-Term Securities (Cost — $10,672,284) — 36.6% | | | | 10,672,284 | |
| | | | | | | | | | | | |
| Options Purchased | | | | | | | | | |
(Cost — $520,576) — 0.4% | | | | | | | | | | | 118,521 | |
Total Investments Before Options Written (Cost — $24,750,585) — 78.0% | | | | 22,765,312 | |
| | | | | | | | | | | | |
| Options Written | | | | | | | | | |
(Premiums Received — $92,774) — (0.5)% | | | | | | | | | | | (156,837 | ) |
Total Investments Net of Options Written — 77.5% | | | | 22,608,475 | |
Other Assets Less Liabilities — 22.5% | | | | 6,557,821 | |
| | | | | | | | | | | | |
Net Assets — 100.0% | | | | | | | | | | $ | 29,166,296 | |
| | | | | | | | | | | | |
|
| Notes to Consolidated Schedule of Investments |
| (a) | During the six months ended January 31, 2016, investments in issuers considered to be affiliates of the Fund for purposes of Section 2(a)(3) of the Investment Company Act of 1940, as amended, were as follows: |
| | | | | | | | | | | | | | | | | | | | | | | | |
| |
| Affiliate | | Shares
Held at
July 31,
2015 | | | Shares
Sold | | | Shares
Held at
January 31,
2016 | | | Value at January 31,
2016 | | | Income | | | Realized
Gain (Loss) | |
| |
BlackRock Liquidity Funds, TempFund, Institutional Class | | | 18,716,182 | | | | (8,043,898 | )1 | | | 10,672,284 | | | $ | 10,672,284 | | | $ | 10,567 | | | | $ 354 | |
iShares TIPS Bond ETF | | | 28,501 | | | | (10,170 | ) | | | 18,331 | | | $ | 2,042,073 | | | $ | 10,527 | | | | $(116,959 | ) |
| |
| | 1 | | Represents net shares sold. |
| (b) | All or a portion of security is held by a wholly owned subsidiary. See Note 1 of the Notes to Consolidated Financial Statements for details on the wholly owned subsidiary. |
| (c) | Current yield as of period end. |
See Notes to Consolidated Financial Statements.
| | | | | | |
| 20 | | BLACKROCK FUNDS | | JANUARY 31, 2016 | | |
| | | | |
| Consolidated Schedule of Investments (continued) | | | BlackRock Strategic Risk Allocation Fund | |
|
| Derivative Financial Instruments Outstanding as of Period End |
| | | | | | | | | | | | | | | | |
Financial Futures Contracts | | | | | | | | | | | | |
| |
Contracts
Long
(Short) | | Issue | | Expiration | | Notional Value | | | Unrealized
Appreciation
(Depreciation) | |
| |
1 | | ASX SPI 200 Index Futures1 | | March 2016 | | | USD | | | | 87,849 | | | | $ 1,626 | |
14 | | Australian Government Bonds (10 Year) | | March 2016 | | | USD | | | | 1,282,284 | | | | 28,000 | |
(16) | | CBOE Volatility Index Futures1 | | March 2016 | | | USD | | | | 341,200 | | | | 42,026 | |
16 | | E-Mini MSCI Emerging Markets Index Futures1 | | March 2016 | | | USD | | | | 598,240 | | | | (28,602 | ) |
(1) | | E-Mini S&P 500 Index | | March 2016 | | | USD | | | | 96,505 | | | | 5,430 | |
10 | | E-Mini S&P 500 Index1 | | March 2016 | | | USD | | | | 965,050 | | | | (53,502 | ) |
11 | | Euro STOXX 50 Index1 | | March 2016 | | | USD | | | | 360,824 | | | | (24,247 | ) |
2 | | FTSE 100 Index1 | | March 2016 | | | USD | | | | 171,188 | | | | (460 | ) |
15 | | Japanese Government Bonds (10 Year) | | March 2016 | | | USD | | | | 1,864,329 | | | | 21,413 | |
2 | | Russell 2000 Mini Index1 | | March 2016 | | | USD | | | | 206,280 | | | | (19,408 | ) |
1 | | TOPIX Index1 | | March 2016 | | | USD | | | | 118,862 | | | | (10,836 | ) |
| |
Total | | | | | | | | | | | | | | | $(38,560 | ) |
| | | | | | | | | | | | | | | | |
| | 1 | | All or a portion of security is held by a wholly owned subsidiary. See Note 1 of the Notes to Consolidated Financial Statements for details on the wholly owned subsidiary. |
| | | | | | | | | | | | | | | | | | | | |
Forward Foreign Currency Exchange Contracts | | | | | | | | |
| |
Currency Purchased | | | | | Currency Sold | | | | | Counterparty | | Settlement
Date | | | Unrealized
Appreciation
(Depreciation) | |
| |
AUD | | | 124,000 | 1 | | USD | | | 86,365 | | | JPMorgan Chase Bank N.A. | | | 3/02/16 | | | | $ 1,261 | |
BRL | | | 360,000 | 1 | | USD | | | 87,709 | | | Deutsche Bank AG | | | 3/02/16 | | | | 1,430 | |
CAD | | | 82,000 | 1 | | USD | | | 57,459 | | | JPMorgan Chase Bank N.A. | | | 3/02/16 | | | | 1,075 | |
EUR | | | 165,000 | 1 | | USD | | | 180,595 | | | JPMorgan Chase Bank N.A. | | | 3/02/16 | | | | (1,711 | ) |
EUR | | | 106,000 | 1 | | USD | | | 114,898 | | | JPMorgan Chase Bank N.A. | | | 3/02/16 | | | | 22 | |
JPY | | | 15,226,000 | 1 | | USD | | | 129,220 | | | JPMorgan Chase Bank N.A. | | | 3/02/16 | | | | (3,374 | ) |
KRW | | | 122,359,000 | 1 | | USD | | | 101,240 | | | UBS AG | | | 3/02/16 | | | | 735 | |
SEK | | | 615,000 | 1 | | USD | | | 71,931 | | | JPMorgan Chase Bank N.A. | | | 3/02/16 | | | | (215 | ) |
USD | | | 75,693 | 1 | | AUD | | | 106,000 | | | JPMorgan Chase Bank N.A. | | | 3/02/16 | | | | 786 | |
USD | | | 93,075 | 1 | | AUD | | | 128,000 | | | JPMorgan Chase Bank N.A. | | | 3/02/16 | | | | 2,622 | |
USD | | | 3,740,670 | 1 | | AUD | | | 5,198,062 | | | JPMorgan Chase Bank N.A. | | | 3/02/16 | | | | 67,385 | |
USD | | | 169,863 | 1 | | BRL | | | 658,000 | | | Deutsche Bank AG | | | 3/02/16 | | | | 6,938 | |
USD | | | 185,803 | 1 | | CAD | | | 258,000 | | | JPMorgan Chase Bank N.A. | | | 3/02/16 | | | | 1,636 | |
USD | | | 1,869,745 | 1 | | CAD | | | 2,489,724 | | | JPMorgan Chase Bank N.A. | | | 3/02/16 | | | | 92,517 | |
USD | | | 4,768,086 | 1 | | EUR | | | 4,485,702 | | | JPMorgan Chase Bank N.A. | | | 3/02/16 | | | | (95,065 | ) |
USD | | | 2,217,315 | 1 | | GBP | | | 1,471,006 | | | JPMorgan Chase Bank N.A. | | | 3/02/16 | | | | 121,188 | |
USD | | | 183,094 | 1 | | INR | | | 12,330,000 | | | UBS AG | | | 3/02/16 | | | | 2,429 | |
USD | | | 932,931 | 1 | | JPY | | | 114,357,633 | | | JPMorgan Chase Bank N.A. | | | 3/02/16 | | | | (12,261 | ) |
USD | | | 353,036 | 1 | | KRW | | | 405,539,000 | | | UBS AG | | | 3/02/16 | | | | 15,055 | |
USD | | | 92,907 | 1 | | MYR | | | 391,000 | | | JPMorgan Chase Bank N.A. | | | 3/02/16 | | | | (975 | ) |
USD | | | 68,750 | 1 | | RUB | | | 4,641,000 | | | UBS AG | | | 3/02/16 | | | | 7,804 | |
USD | | | 4,094,657 | 1 | | SEK | | | 35,748,468 | | | JPMorgan Chase Bank N.A. | | | 3/02/16 | | | | (74,006 | ) |
USD | | | 172,814 | 1 | | TWD | | | 5,613,000 | | | JPMorgan Chase Bank N.A. | | | 3/02/16 | | | | 4,431 | |
| |
Total | | | | | | | | | | | | | | | | | | | $139,707 | |
| | | | | | | | | | | | | | | | | | | | |
| 1 | All or a portion of security is held by a wholly owned subsidiary. See Note 1 of the Notes to Consolidated Financial Statements for details on the wholly owned subsidiary. |
See Notes to Consolidated Financial Statements.
| | | | | | |
| | | BLACKROCK FUNDS | | JANUARY 31, 2016 | | 21 |
| | | | |
| Consolidated Schedule of Investments (continued) | | | BlackRock Strategic Risk Allocation Fund | |
| | | | | | | | | | | | | | | | | | | | | | | | |
OTC Interest Rate Swaptions Purchased | | | | | | | | | | | | | | | | |
| |
| Description | | Counterparty | | Put/ Call | | Exercise Rate | | Pay/Receive Exercise Rate | | Floating Rate
Index | | Expiration
Date | | Notional
Amount (000) | | | Value | |
| |
10-Year Interest Rate Swap | | JPMorgan Chase Bank N.A. | | Put | | 2.60% | | Pay | | 3-month LIBOR | | 2/26/16 | | | USD | | | | 4,400 | | | | $ 27 | |
10-Year Interest Rate Swap | | JPMorgan Chase Bank N.A. | | Put | | 2.60% | | Pay | | 3-month LIBOR | | 2/26/16 | | | USD | | | | 900 | | | | 6 | |
10-Year Interest Rate Swap | | JPMorgan Chase Bank N.A. | | Put | | 2.85% | | Pay | | 3-month LIBOR | | 2/26/16 | | | USD | | | | 11,900 | | | | 5 | |
10-Year Interest Rate Swap | | JPMorgan Chase Bank N.A. | | Put | | 2.85% | | Pay | | 3-month LIBOR | | 2/26/16 | | | USD | | | | 2,500 | | | | 1 | |
10-Year Interest Rate Swap | | JPMorgan Chase Bank N.A. | | Put | | 2.60% | | Pay | | 3-month LIBOR | | 1/09/17 | | | USD | | | | 2,000 | | | | 20,276 | |
10-Year Interest Rate Swap | | JPMorgan Chase Bank N.A. | | Put | | 2.60% | | Pay | | 3-month LIBOR | | 1/09/17 | | | USD | | | | 2,000 | | | | 20,276 | |
10-Year Interest Rate Swap | | JPMorgan Chase Bank N.A. | | Put | | 2.85% | | Pay | | 3-month LIBOR | | 1/09/17 | | | USD | | | | 6,250 | | | | 38,965 | |
10-Year Interest Rate Swap | | JPMorgan Chase Bank N.A. | | Put | | 2.85% | | Pay | | 3-month LIBOR | | 1/09/17 | | | USD | | | | 6,250 | | | | 38,965 | |
| |
Total | | | | | | | | | | | | | | | | | | | | | | | $118,521 | |
| | | | | | | | | | | | | | | | | | | | | | | | |
OTC Interest Rate Swaptions Written | | | | | | | | | | | | | | | | |
| |
| Description | | Counterparty | | Put/
Call | | Exercise Rate | �� | Pay/Receive
Exercise Rate | | Floating Rate
Index | | Expiration
Date | | Notional
Amount (000) | | | Value | |
| |
10-Year Interest Rate Swap | | JPMorgan Chase Bank N.A. | | Call | | 1.90% | | Pay | | 3-month LIBOR | | 1/09/17 | | | USD | | | | 3,100 | | | | $ (78,418 | ) |
10-Year Interest Rate Swap | | JPMorgan Chase Bank N.A. | | Call | | 1.90% | | Pay | | 3-month LIBOR | | 1/09/17 | | | USD | | | | 3,100 | | | | (78,419 | ) |
| |
Total | | | | | | | | | | | | | | | | | | | | | | | $(156,837 | ) |
| | | | | | | | | | | | | | | | | | | | | | | | |
| | | | | | | | | | | | | | | | | | | | |
Centrally Cleared Credit Default Swaps — Sell Protection | | | | | | | | | | | | | | | | | | | | |
| |
| Index | | Receive
Fixed
Rate | | Expiration
Date | | | Credit
Rating1 | | Notional
Amount (000)2 | | | Unrealized
Appreciation
(Depreciation) | |
| |
CDX.NA.HY Series 25 Version 1 | | 5.00% | | | 12/20/20 | | | B+ | | | USD | | | | 2,390 | | | | $ 17,276 | |
CDX.NA.IG Series 25 Version 1 | | 1.00% | | | 12/20/20 | | | BBB+ | | | USD | | | | 5,980 | | | | (31,768 | ) |
iTraxx Crossover Series 24 Version 1 | | 5.00% | | | 12/20/20 | | | B+ | | | EUR | | | | 725 | | | | (16,989 | ) |
iTraxx Europe Series 24 Version 1 | | 1.00% | | | 12/20/20 | | | A- | | | EUR | | | | 5,150 | | | | (26,384 | ) |
| |
Total | | | | | | | | | | | | | | | | | | | $(57,865 | ) |
| | | | | | | | | | | | | | | | | | | | |
| | 1 | | Using S&P’s rating of the issuer or the underlying securities of the index, as applicable. |
| | 2 | | The maximum potential amount the Fund may pay should a negative credit event take place as defined under the terms of the agreement. |
| | | | | | | | | | | | | | | | | | | | | | | | | | | | |
OTC Credit Default Swaps — Sell Protection | | | | | | | | | |
| |
| Index | | Receive
Fixed
Rate | | Counterparty | | Expiration
Date | | Credit
Rating1 | | Notional
Amount
(000)2 | | | Value | | | Premiums
Received | | | Unrealized
Depreciation | |
| |
CDX.EM Series 24 Version 2 | | 1.00% | | JPMorgan Chase Bank N.A. | | 12/20/20 | | BB+ | | | USD | | | | 3,528 | | | | $(405,476 | ) | | | $(397,616 | ) | | | $(7,860 | ) |
| |
| | 1 | | Using S&P’s rating of the issuer or the underlying securities of the index, as applicable. |
| | 2 | | The maximum potential amount the Fund may pay should a negative credit event take place as defined under the terms of the agreement. |
See Notes to Consolidated Financial Statements.
| | | | | | |
| 22 | | BLACKROCK FUNDS | | JANUARY 31, 2016 | | |
| | | | |
| Consolidated Schedule of Investments (continued) | | | BlackRock Strategic Risk Allocation Fund | |
OTC Total Return Swaps
| | | | | | | | | | | | | | | | | | | | | | |
| Reference Entity | | Fixed Rate (Amount)/ Floating Rate | | Counterparty | | Expiration Date | | Contract Amount | | | Value | | | Premiums Paid (Received) | | | Unrealized Appreciation (Depreciation) | |
Canadian (10 Year) Bond Futures March 2016 | | CAD 1,714,0802 | | Bank of America N.A. | | 2/23/16 | | | 12 | | | $ | 39,335 | | | | — | | | | $ 39,335 | |
Long Gilt Futures March 2016 | | GBP 842,2402 | | Bank of America N.A. | | 2/24/16 | | | 7 | | | | 30,869 | | | | — | | | | 30,869 | |
U.S. Treasury (10 Year) Notes Futures March 2016 | | USD 5,571,8592 | | Bank of America N.A. | | 2/25/16 | | | 43 | | | | 149,125 | | | | — | | | | 149,125 | |
U.S. Treasury (10 Year) Notes Futures March 2016 | | USD 2,332,4062 | | Bank of America N.A. | | 2/25/16 | | | 18 | | | | 17,703 | | | | — | | | | 17,703 | |
Euro-Bund Futures March 2016 | | EUR 1,143,4502 | | Bank of America N.A. | | 3/04/16 | | | 7 | | | | 46,329 | | | | — | | | | 46,329 | |
FTSE EPRA/NAREIT Developed Index1 | | 3-month LIBOR minus 0.06%3 | | JPMorgan Chase Bank N.A. | | 3/18/16 | | | 56 | | | | (6,855 | ) | | | — | | | | (6,855 | ) |
MSCI Emerging Markets Net Total Return Index1 | | 3-month LIBOR plus 0.10%3 | | JPMorgan Chase Bank N.A. | | 3/18/16 | | | 2,362 | | | | (46,860 | ) | | | — | | | | (46,860 | ) |
S&P GSCI Excess Return on the Light Energy Index1 | | USD 713,7722 | | BNP Paribas S.A. | | 3/18/16 | | | 3,948 | | | | (113,096 | ) | | | — | | | | (113,096 | ) |
S&P GSCI Excess Return on the Light Energy Index1 | | USD 91,6622 | | BNP Paribas S.A. | | 3/18/16 | | | 507 | | | | (12,510 | ) | | | — | | | | (12,510 | ) |
FTSE EPRA/NAREIT Developed Index1 | | 3-month LIBOR3 | | JPMorgan Chase Bank N.A. | | 3/28/16 | | | 81 | | | | (17,469 | ) | | | — | | | | (17,469 | ) |
S&P GSCI Excess Return on the Light Energy Index1 | | USD 609,6352 | | JPMorgan Chase Bank N.A. | | 3/28/16 | | | 3,372 | | | | (14,898 | ) | | | — | | | | (14,898 | ) |
FTSE EPRA/NAREIT Developed Index1 | | 3-month LIBOR minus 0.14%3 | | JPMorgan Chase Bank N.A. | | 6/17/16 | | | 154 | | | | (18,802 | ) | | | — | | | | (18,802 | ) |
FTSE EPRA/NAREIT Developed Index1 | | 3-month LIBOR minus 0.14%3 | | JPMorgan Chase Bank N.A. | | 6/17/16 | | | 57 | | | | (6,959 | ) | | | — | | | | (6,959 | ) |
MSCI Emerging Markets Net Total Return Index1 | | 3-month LIBOR plus 0.10%3 | | BNP Paribas S.A. | | 6/17/16 | | | 2,478 | | | | (49,188 | ) | | | — | | | | (49,188 | ) |
MSCI World Small Cap Net Total Return Index1 | | 3-month LIBOR minus 0.14%3 | | JPMorgan Chase Bank N.A. | | 6/17/16 | | | 5,802 | | | | (120,386 | ) | | | — | | | | (120,386 | ) |
MSCI World Small Cap Net Total Return Index1 | | 3-month LIBOR minus 0.14%3 | | JPMorgan Chase Bank N.A. | | 6/17/16 | | | 724 | | | | (15,022 | ) | | | — | | | | (15,022 | ) |
MSCI World Small Cap Net Total Return Index1 | | 3-month LIBOR minus 0.14%3 | | JPMorgan Chase Bank N.A. | | 6/17/16 | | | 434 | | | | (9,005 | ) | | | — | | | | (9,005 | ) |
S&P GSCI Excess Return on the Light Energy Index1 | | USD 1,379,6332 | | BNP Paribas S.A. | | 6/20/16 | | | 7,631 | | | | (19,549 | ) | | | — | | | | (19,549 | ) |
Total | | | | | | | | | | | | $ | (167,238 | ) | | | — | | | | $(167,238 | ) |
| | | | | | | | | | | | | | |
| | 1 | | All or a portion of security is held by a wholly owned subsidiary. See Note 1 of the Notes to Consolidated Financial Statements for details on the wholly owned subsidiary. |
| | 2 | | Fund receives the total return of the reference entity and pays the fixed amount. Net payment made at termination. |
| | 3 | | Fund receives the total return of the reference entity and pays the floating amount. Net payment made at termination. |
See Notes to Consolidated Financial Statements.
| | | | | | |
| | | BLACKROCK FUNDS | | JANUARY 31, 2016 | | 23 |
| | | | |
| Consolidated Schedule of Investments (continued) | | | BlackRock Strategic Risk Allocation Fund | |
|
| Transactions in Options Written for the Period Ended January 31, 2016 |
| | | | | | | | |
| | | Calls | |
| | | Notional (000) | | | | |
| | | | |
| | | USD | | | Premiums Received | |
| | | | |
Outstanding options, beginning of period | | | — | | | | — | |
Options written | | | 6,200 | | | | $92,774 | |
| | | | |
Outstanding options, end of period | | | 6,200 | | | | $92,774 | |
| | | | |
|
| Derivative Financial Instruments Categorized by Risk Exposure |
As of period end, the fair values of derivative financial instruments located in the Consolidated Statements of Assets and Liabilities were as follows:
| | | | | | | | | | | | | | | | | | | | | | | | | | | | |
| | | | | Commodity Contracts | | | Credit
Contracts | | | Equity
Contracts | | | Foreign Currency Exchange Contracts | | | Interest Rate Contracts | | | Other Contracts | | Total | |
| Assets - Derivative Financial Instruments | | | | | | | | | | | | | | | | | | | | | | | | | | |
Financial futures contracts | | Net unrealized appreciation1 | | | — | | | | — | | | $ | 49,082 | | | | — | | | | $ 49,413 | | | — | | $ | 98,495 | |
Forward foreign currency exchange contracts | | Unrealized appreciation on forward foreign currency exchange contracts | | | — | | | | — | | | | — | | | | $327,314 | | | | — | | | — | | | 327,314 | |
Options purchased | | Investments at value – unaffiliated2 | | | — | | | | — | | | | — | | | | — | | | | 118,521 | | | — | | | 118,521 | |
Swaps - OTC | | Unrealized appreciation on OTC swaps; | | | — | | | | | | | | — | | | | — | | | | 283,361 | | | — | | | 283,361 | |
Swaps - centrally cleared | | Net unrealized appreciation1 | | | — | | | $ | 17,276 | | | | — | | | | — | | | | — | | | — | | | 17,276 | |
| | | |
Total | | | | | — | | | $ | 17,276 | | | $ | 49,082 | | | | $327,314 | | | | $451,295 | | | — | | $ | 844,967 | |
| | | | | | |
| | | | | | | | | | | | | | | | | | | | | | | | | | | | |
| | | | | Commodity Contracts | | | Credit Contracts | | | Equity Contracts | | | Foreign Currency Exchange Contracts | | | Interest Rate Contracts | | | Other Contracts | | Total | |
| Liabilities - Derivative Financial Instruments | | | | | | | | | | | | | | | | | | | | | | | | | | |
Financial futures contracts | | Net unrealized depreciation1 | | | — | | | | — | | | | $137,055 | | | | — | | | | — | | | — | | | $ 137,055 | |
Forward foreign currency exchange contracts | | Unrealized depreciation on forward foreign currency exchange contracts | | | — | | | | — | | | | — | | | | $187,607 | | | | — | | | — | | | 187,607 | |
Options written | | Options written, at value | | | — | | | | — | | | | — | | | | — | | | | $156,837 | | | — | | | 156,837 | |
Swaps - OTC | | Unrealized depreciation on OTC swaps; Swap premiums received | | | $160,053 | | | | $405,476 | | | | 290,546 | | | | — | | | | — | | | — | | | 856,075 | |
Swaps - centrally cleared | | Net unrealized depreciation1 | | | — | | | | 75,141 | | | | — | | | | — | | | | — | | | — | | | 75,141 | |
| | | |
Total | | | | | $160,053 | | | | $480,617 | | | | $427,601 | | | | $187,607 | | | | $156,837 | | | — | | | $1,412,715 | |
| | | | | | |
| | 1 | | Includes cumulative appreciation (depreciation) on financial futures contracts and centrally cleared swaps, if any, as reported in the Consolidated Schedule of Investments. Only current day’s variation margin is reported within the Consolidated Statements of Assets and Liabilities. |
| | 2 | | Includes options purchased at value as reported in the Consolidated Schedule of Investments. |
For the six months ended January 31, 2016, the effect of derivative financial instruments in the Consolidated Statements of Operations were as follows:
| | | | | | | | | | | | | | | | | | | | | | | | | | |
| | | Commodity Contracts | | | Credit Contracts | | | Equity Contracts | | | Foreign Currency Exchange Contracts | | | Interest Rate Contracts | | | Other Contracts | | Total | |
Net Realized Gain (Loss) from: | | | | | | | | | | | | | | | | | | | | | | | | | | |
Financial futures contracts | | | — | | | | — | | | | $ (502,164 | ) | | | — | | | | $128,652 | | | — | | | $ (373,512 | ) |
Foreign currency transactions | | | — | | | | — | | | | — | | | | $700,846 | | | | — | | | — | | | 700,846 | |
Swaps | | | $(773,312 | ) | | | $(222,164 | ) | | | (696,515 | ) | | | — | | | | 331,476 | | | — | | | (1,360,515 | ) |
| | | | |
Total | | | $(773,312 | ) | | | $(222,164 | ) | | | $(1,198,679 | ) | | | $700,846 | | | | $460,128 | | | — | | | $(1,033,181 | ) |
| | | | |
See Notes to Consolidated Financial Statements.
| | | | | | |
| 24 | | BLACKROCK FUNDS | | JANUARY 31, 2016 | | |
| | | | |
| Consolidated Schedule of Investments (continued) | | | BlackRock Strategic Risk Allocation Fund | |
| | | | | | | | | | | | | | | | | | | | | | | | | | |
| | | Commodity Contracts | | | Credit Contracts | | | Equity Contracts | | | Foreign Currency Exchange Contracts | | | Interest Rate Contracts | | | Other Contracts | | Total | |
Net Change in Unrealized Appreciation (Depreciation) on: | | | | | | | | | | | | | | | | | | | | | | | | | | |
Financial futures contracts | | | — | | | | — | | | | $ (33,865 | ) | | | — | | | | $ (46,435 | ) | | — | | | $ (80,300 | ) |
Foreign currency translations | | | — | | | | — | | | | — | | | | $(161,973 | ) | | | — | | | — | | | (161,973 | ) |
Options1 | | | — | | | | — | | | | — | | | | — | | | | (374,437 | ) | | — | | | (374,437 | ) |
Swaps | | | $140,759 | | | | $(63,920 | ) | | | (143,041 | ) | | | — | | | | 62,818 | | | — | | | (3,384 | ) |
| | | | |
Total | | | $140,759 | | | | $(63,920 | ) | | | $(176,906 | ) | | | $(161,973 | ) | | | $(358,054 | ) | | — | | | $(620,094 | ) |
| | | | |
| | 1 | | Options purchased are included in the net realized gain (loss) from investments and net change in unrealized appreciation (depreciation) on investments. |
|
| Average Quarterly Balances of Outstanding Derivative Financial Instruments |
| | | | |
Financial futures contracts: | | | | |
Average notional value of contracts - long | | | $ 8,037,894 | |
Average notional value of contracts - short | | | $ 435,415 | |
Forward foreign currency exchange contracts: | | | | |
Average amounts purchased - in USD | | | $19,163,153 | |
Average amounts sold - in USD | | | $ 414,709 | |
Average notional value of swaption contracts purchased | | | $27,950,000 | |
Average notional value of swaption contracts written | | | $ 3,100,000 | |
Credit default swaps: | | | | |
Average notional value - sell protection | | | $22,662,656 | |
Total return swaps: | | | | |
Average notional value | | | $25,450,585 | |
For more information about the Fund’s investment risks regarding derivative financial instruments, refer to the Notes to Consolidated Financial Statements.
|
| Derivative Financial Instruments — Offsetting as of Period End |
The Fund’s derivative assets and liabilities (by type) are as follows:
| | | | | | | | |
| | | Assets | | | Liabilities | |
Derivative Financial Instruments: | | | | | | | | |
Financial futures contracts | | $ | 100,297 | | | $ | 2,470 | |
Forward foreign currency exchange contracts | | | 327,314 | | | | 187,607 | |
Options | | | 118,521 | 1 | | | 156,837 | |
Swaps - Centrally cleared | | | 26,830 | | | | — | |
Swaps - OTC2 | | | 283,361 | | | | 856,075 | |
| | | | |
Total derivative assets and liabilities in the Statements of Assets and Liabilities | | $ | 737,802 | | | $ | 1,202,989 | |
Derivatives not subject to a Master Netting Agreement or similar agreement (“MNA”) | | | (127,127 | ) | | | (2,470 | ) |
| | | | |
Total derivative assets and liabilities subject to an MNA | | $ | 729,196 | | | $ | 1,200,519 | |
| | | | |
| | 1 | | Includes options purchased at value which is included as Investments at value - unaffiliated in the Consolidated Statements of Assets and Liabilities and reported in the Consolidated Schedule of Investments. |
| | 2 | | Includes unrealized appreciation (depreciation) on OTC swaps and swap premiums paid/received in the Consolidated Statements of Assets and Liabilities. |
See Notes to Consolidated Financial Statements.
| | | | | | |
| | | BLACKROCK FUNDS | | JANUARY 31, 2016 | | 25 |
| | | | |
| Consolidated Schedule of Investments (continued) | | | BlackRock Strategic Risk Allocation Fund | |
The following tables present the Fund’s derivative assets and liabilities by counterparty net of amounts available for offset under an MNA and net of the related collateral received and pledged by the Fund.
| | | | | | | | | | | | | | | | | | |
| | | | | | | | | | | | | | | |
| Counterparty | | Derivative Assets Subject to an MNA by Counterparty | | | Derivatives Available for Offset1 | | | Non-cash Collateral Received | | Cash Collateral
Received | | | Net Amount of
Derivative Assets2 | |
Bank of America N.A. | | | $283,361 | | | | — | | | — | | | — | | | | $283,361 | |
Deutsche Bank AG | | | 8,368 | | | | — | | | — | | | — | | | | 8,368 | |
JPMorgan Chase Bank N.A. | | | 411,444 | | | | $(411,444) | | | — | | | — | | | | — | |
UBS AG | | | 26,023 | | | | — | | | — | | | — | | | | 26,023 | |
| | | | |
Total | | | $729,196 | | | | $(411,444) | | | — | | | — | | | | $317,752 | |
| | | | |
| | | | | | | | | | | | | | | | | | |
| Counterparty | | Derivative Liabilities Subject to an MNA by Counterparty | | | Derivatives Available for Offset1 | | | Non-cash Collateral Pledged | | Cash Collateral Pledged | | | Net Amount of
Derivative Liabilities | |
BNP Paribas S.A. | | | $ 194,343 | | | | — | | | — | | | $(194,343) | | | | — | |
JPMorgan Chase Bank N.A. | | | 1,006,176 | | | | $(411,444) | | | — | | | (594,732) | | | | — | |
| | | | |
Total | | | $1,200,519 | | | | $(411,444) | | | — | | | (789,075) | | | | — | |
| | | | |
| | 1 | | The amount of derivatives available for offset is limited to the amount of assets and/or liabilities that are subject to an MNA. |
| | 2 | | Net amount represents the net amount receivable from the counterparty in the event of default. |
|
| Fair Value Hierarchy as of Period End |
Various inputs are used in determining the fair value of investments and derivative financial instruments. For information about the Fund’s policy regarding valuation of investments and derivative financial instruments, refer to the Notes to Consolidated Financial Statements.
The following tables summarize the Fund’s investments and derivative financial instruments categorized in the disclosure hierarchy:
| | | | | | | | | | | | | | |
| | | Level 1 | | | Level 2 | | | Level 3 | | Total | |
Assets: | | | | | | | | | | | | | | |
Investments: | | | | | | | | | | | | | | |
Long-Term Investments: | | | | | | | | | | | | | | |
Foreign Government Obligations | | | — | | | $ | 9,932,434 | | | — | | $ | 9,932,434 | |
Investment Companies | | $ | 2,042,073 | | | | — | | | — | | | 2,042,073 | |
Short-Term Securities | | | 10,672,284 | | | | — | | | — | | | 10,672,284 | |
Options Purchased: | | | | | | | | | | | | | | |
Interest Rate Contracts | | | — | | | | 118,521 | | | — | | | 118,521 | |
| | | | |
Total | | $ | 12,714,357 | | | $ | 10,050,955 | | | — | | $ | 22,765,312 | |
| | | | |
| | | | | | | | | | | | | | |
| | | Level 1 | | | Level 2 | | | Level 3 | | Total | |
Derivative Financial Instruments1 | | | | | | | | | | | | | | |
Assets: | | | | | | | | | | | | | | |
Credit contracts | | | — | | | $ | 17,276 | | | — | | $ | 17,276 | |
Equity contracts | | $ | 49,082 | | | | — | | | — | | | 49,082 | |
Foreign currency exchange contracts | | | — | | | | 327,314 | | | — | | | 327,314 | |
Interest rate contracts | | | 49,413 | | | | 283,361 | | | — | | | 332,774 | |
Liabilities: | | | | | | | | | | | | | | |
Commodity contracts | | | — | | | | (160,053 | ) | | — | | | (160,053 | ) |
Credit contracts | | | — | | | | (83,001 | ) | | — | | | (83,001 | ) |
Equity contracts | | | (137,055 | ) | | | (290,546 | ) | | — | | | (427,601 | ) |
Foreign currency exchange contracts | | | — | | | | (187,607 | ) | | — | | | (187,607 | ) |
Interest rate contracts | | | — | | | | (156,837 | ) | | — | | | (156,837 | ) |
| | | | |
Total | | $ | (38,560 | ) | | $ | (250,093 | ) | | — | | $ | (288,653 | ) |
| | | | |
| | 1 | | Derivative financial instruments are swaps, financial futures contracts, forward foreign currency exchange contracts and options written. Swaps, financial futures contracts and forward foreign currency exchange contracts are valued at the unrealized appreciation (depreciation) on the instrument and options written are shown at value. |
See Notes to Consolidated Financial Statements.
| | | | | | |
| 26 | | BLACKROCK FUNDS | | JANUARY 31, 2016 | | |
| | | | |
| Consolidated Schedule of Investments (concluded) | | | BlackRock Strategic Risk Allocation Fund | |
The Fund may hold assets in which the fair value approximates the carrying amount for financial statement purposes. As of period end, such assets are categorized within the disclosure hierarchy as follows:
| | | | | | | | | | | | |
| | | Level 1 | | | Level 2 | | Level 3 | | Total | |
Assets: | | | | | | | | | | | | |
Cash | | $ | 1 | | | — | | — | | $ | 1 | |
Foreign currency at value | | | 4,978,044 | | | — | | — | | | 4,978,044 | |
Cash pledged for financial futures contracts | | | 243,260 | | | — | | — | | | 243,260 | |
Cash pledged for centrally cleared swaps | | | 433,710 | | | — | | — | | | 433,710 | |
Cash pledged as collateral for OTC derivatives | | | 1,220,000 | | | — | | — | | | 1,220,000 | |
| | | | |
Total | | $ | 6,875,015 | | | — | | — | | $ | 6,875,015 | |
| | | | |
During the six months ended January 31, 2016, there were no transfers between levels.
See Notes to Consolidated Financial Statements.
| | | | | | |
| | | BLACKROCK FUNDS | | JANUARY 31, 2016 | | 27 |
| | |
| Consolidated Statements of Assets and Liabilities | | |
| | | | | | | | |
| January 31, 2016 (Unaudited) | | BlackRock Multi-Asset Real Return Fund | | | BlackRock Strategic Risk Allocation Fund | |
| | | | | | | | |
| Assets | | | | | | | | |
Investments at value — unaffiliated1,2 | | $ | 33,301,706 | | | $ | 10,050,955 | |
Investments at value — affiliated3 | | | 15,916,968 | | | | 12,714,357 | |
Cash | | | 2,061,602 | | | | 1 | |
Cash pledged: | | | | | | | | |
Collateral — OTC derivatives | | | 510,000 | | | | 1,220,000 | |
Financial futures contracts | | | 45,000 | | | | 243,260 | |
Centrally cleared swaps | | | 358,260 | | | | 433,710 | |
Foreign currency at value4 | | | 9,132 | | | | 4,978,044 | |
Receivables: | | | | | | | | |
Investments sold | | | 389,260 | | | | — | |
Securities lending income — affiliated | | | 589 | | | | — | |
Capital shares sold | | | 293,637 | | | | 47 | |
Dividends — affiliated | | | — | | | | 2,926 | |
Dividends — unaffiliated | | | 57,245 | | | | — | |
Interest | | | 22,690 | | | | 32,545 | |
From the Manager | | | 10,747 | | | | 4,521 | |
Unrealized appreciation on: | | | | | | | | |
Forward foreign currency exchange contracts | | | 2,741 | | | | 327,314 | |
OTC swaps | | | 92 | | | | 283,361 | |
Variation margin receivable on financial futures contracts | | | — | | | | 100,297 | |
Variation margin receivable on centrally cleared swaps | | | 30,773 | | | | 26,830 | |
Prepaid expenses | | | 24,947 | | | | 35,420 | |
| | | | |
Total assets | | | 53,035,389 | | | | 30,453,588 | |
| | | | |
| | | | | | | | |
| Liabilities | | | | | | | | |
Collateral on securities loaned at value | | | 2,796,315 | | | | — | |
Options written at value5 | | | — | | | | 156,837 | |
Payables: | | | | | | | | |
Investments purchased | | | 524,996 | | | | — | |
Capital shares redeemed | | | 190,056 | | | | 95 | |
Investment advisory fees | | | 11,643 | | | | 3,672 | |
Officer’s and Trustees’ fees | | | 2,801 | | | | 2,608 | |
Other accrued expenses | | | 100,137 | | | | 76,199 | |
Other affiliates | | | 1,755 | | | | 1,041 | |
Service and distribution fees | | | 1,821 | | | | 688 | |
Swap premiums received | | | 101,176 | | | | 397,616 | |
Unrealized depreciation on: | | | | | | | | |
Forward foreign currency exchange contracts | | | 6,612 | | | | 187,607 | |
OTC swaps | | | 350,750 | | | | 458,459 | |
Variation margin payable on financial futures contracts | | | 18,047 | | | | 2,470 | |
| | | | |
Total liabilities | | | 4,106,109 | | | | 1,287,292 | |
| | | | |
Net Assets | | $ | 48,929,280 | | | $ | 29,166,296 | |
| | | | |
| | | | | | | | |
| Net Assets Consist of | | | | | | | | |
Paid-in capital | | $ | 54,322,169 | | | $ | 33,215,444 | |
Distributions in excess of net investment income | | | (220,908 | ) | | | (548,379 | ) |
Accumulated net realized loss | | | (2,602,362 | ) | | | (1,246,992 | ) |
Net unrealized appreciation (depreciation) | | | (2,569,619 | ) | | | (2,253,777 | ) |
| | | | |
Net Assets | | $ | 48,929,280 | | | $ | 29,166,296 | |
| | | | |
1 Investments at cost — unaffiliated | | $ | 34,485,660 | | | $ | 11,957,873 | |
2 Securities loaned at value | | $ | 2,810,555 | | | | — | |
3 Investments at cost — affiliated | | $ | 16,881,513 | | | $ | 12,792,712 | |
3 Market value of securities loans | | | 2,810,555 | | | | — | |
4 Foreign currency at cost | | $ | 9,042 | | | $ | 5,050,211 | |
5 Premiums received | | | — | | | $ | 92,774 | |
See Notes to Consolidated Financial Statements.
| | | | | | |
| 28 | | BLACKROCK FUNDS | | JANUARY 31, 2016 | | |
| | |
| Consolidated Statements of Assets and Liabilities (concluded) | | |
| | | | | | | | |
| January 31, 2016 (Unaudited) | | BlackRock Multi-Asset Real Return Fund | | | BlackRock
Strategic Risk
Allocation Fund | |
| | | | | | | | |
| Net Asset Value | | | | | | | | |
Institutional | | | | | | | | |
Net assets | | $ | 44,787,238 | | | $ | 27,317,912 | |
| | | | |
Shares outstanding6 | | | 5,118,906 | | | | 3,079,449 | |
| | | | |
Net asset value | | $ | 8.75 | | | $ | 8.87 | |
| | | | |
Investor A | | | | | | | | |
Net assets | | $ | 2,689,285 | | | $ | 1,348,507 | |
| | | | |
Shares outstanding6 | | | 308,091 | | | | 152,188 | |
| | | | |
Net asset value | | $ | 8.73 | | | $ | 8.86 | |
| | | | |
Investor C | | | | | | | | |
Net assets | | $ | 1,452,757 | | | $ | 499,877 | |
| | | | |
Shares outstanding6 | | | 167,184 | | | | 56,551 | |
| | | | |
Net asset value | | $ | 8.69 | | | $ | 8.84 | |
| | | | |
| | 6 | | Unlimited number of shares authorized, $0.001 par value. |
See Notes to Consolidated Financial Statements.
| | | | | | |
| | | BLACKROCK FUNDS | | JANUARY 31, 2016 | | 29 |
| | |
| Consolidated Statements of Operations | | |
| | | | | | | | |
| Six Months Ended January 31, 2016 (Unaudited) | | BlackRock Multi-Asset Real Return Fund | | | BlackRock
Strategic Risk
Allocation Fund | |
| | | | | | | | |
| Investment Income | | | | | | | | |
Dividends — affiliated | | $ | 210,750 | | | $ | 21,094 | |
Dividends — unaffiliated | | | 211,278 | | | | — | |
Interest1 | | | (5,309 | )2 | | | 46,981 | |
Securities lending — affiliated — net | | | 670 | | | | — | |
Foreign taxes withheld | | | (1,320 | ) | | | — | |
| | | | |
Total income | | | 416,069 | | | | 68,075 | |
| | | | |
| | | | | | | | |
| Expenses | | | | | | | | |
Investment advisory | | | 171,743 | | | | 127,283 | |
Professional | | | 49,950 | | | | 56,910 | |
Accounting services | | | 8,795 | | | | 6,461 | |
Administration | | | 12,165 | | | | 7,213 | |
Registration | | | 27,328 | | | | 22,156 | |
Printing | | | 19,262 | | | | 14,216 | |
Service and distribution — class specific | | | 12,694 | | | | 5,063 | |
Administration — class specific | | | 5,748 | | | | 3,400 | |
Officer and Trustees | | | 3,835 | | | | 3,473 | |
Transfer agent — class specific | | | 23,655 | | | | 6,476 | |
Custodian | | | 8,305 | | | | 2,268 | |
Miscellaneous | | | 13,353 | | | | 8,950 | |
| | | | |
Total expenses | | | 356,833 | | | | 263,869 | |
Less: | | | | | | | | |
Fees waived by the Manager | | | (87,270 | ) | | | (78,838 | ) |
Administration fees waived | | | (227 | ) | | | (133 | ) |
Administration fees waived — class specific | | | (5,523 | ) | | | (3,399 | ) |
Transfer agent fees waived — class specific | | | (293 | ) | | | (198 | ) |
Transfer agent fees reimbursed — class specific | | | (20,925 | ) | | | (6,072 | ) |
Expenses reimbursed by Manager | | | (1,287 | ) | | | (522 | ) |
| | | | |
Total expenses after fees waived and reimbursed | | | 241,308 | | | | 174,707 | |
| | | | |
Net investment income (loss) | | | 174,761 | | | | (106,632 | ) |
| | | | |
| | | | | | | | |
| Realized and Unrealized Gain (Loss) | | | | | | | | |
Net realized gain (loss) from: | | | | | | | | |
Investments — unaffiliated | | | (15,407 | ) | | | 53,565 | |
Investments — affiliated | | | (100,537 | ) | | | (116,959 | ) |
Capital gain distributions received from affiliated investment companies | | | — | | | | 354 | |
Financial futures contracts | | | 166,408 | | | | (373,512 | ) |
Swaps | | | (2,379,053 | ) | | | (1,360,516 | ) |
Foreign currency transactions | | | (4,207 | ) | | | 714,118 | |
| | | | |
| | | (2,332,796 | ) | | | (1,082,950 | ) |
| | | | |
Net change in unrealized appreciation (depreciation) on: | | | | | | | | |
Investments — unaffiliated | | | (2,920,892 | ) | | | (897,923 | ) |
Investments — affiliated | | | (300,329 | ) | | | 72,285 | |
Options written | | | — | | | | (64,063 | ) |
Financial futures contracts | | | (106,044 | ) | | | (80,300 | ) |
Swaps | | | 750,266 | | | | (3,384 | ) |
Foreign currency translations | | | (3,869 | ) | | | (217,656 | ) |
| | | | |
| | | (2,580,868 | ) | | | (1,191,041 | ) |
| | | | |
Total realized and unrealized loss | | | (4,913,664 | ) | | | (2,273,991 | ) |
| | | | |
Net Decrease in Net Assets Resulting from Operations | | $ | (4,738,903 | ) | | $ | (2,380,623 | ) |
| | | | |
| | 1 | | Includes monthly inflationary and deflationary adjustments to income. See Note 4 of the Notes to Consolidated Financial Statements. |
| | 2 | | Includes amortization of bond premiums and deflationary adjustments for U.S. Treasury and Foreign Government Inflation Bonds which exceeded the aggregate of interest accrued to income for the period. |
See Notes to Consolidated Financial Statements.
| | | | | | |
| 30 | | BLACKROCK FUNDS | | JANUARY 31, 2016 | | |
| | |
| Consolidated Statements of Changes in Net Assets | | |
| | | | | | | | | | | | | | | | |
| | | BlackRock
Multi-Asset Real
Return Fund | | | BlackRock
Strategic Risk
Allocation Fund | |
| Increase (Decrease) in Net Assets: | | Six Months Ended January 31, 2016 (Unaudited) | | | Year Ended July 31, 2015 | | | Six Months Ended January 31, 2016 (Unaudited) | | | Year Ended July 31, 2015 | |
| | | | | | | | | | | | | | | | |
| Operations | | | | | | | | | | | | | | | | |
Net investment income (loss) | | $ | 174,761 | | | $ | 476,059 | | | $ | (106,632 | ) | | $ | (206,356 | ) |
Net realized gain (loss) | | | (2,332,796 | ) | | | (4,945,297 | ) | | | (1,082,950 | ) | | | 2,303,703 | |
Net change in unrealized appreciation (depreciation) | | | (2,580,868 | ) | | | (198,270 | ) | | | (1,191,041 | ) | | | (1,768,720 | ) |
| | | | | | | | |
Net increase (decrease) in net assets resulting from operations | | | (4,738,903 | ) | | | (4,667,508 | ) | | | (2,380,623 | ) | | | 328,627 | |
| | | | | | | | |
| | | | | | | | | | | | | | | | |
| Distributions to Shareholders1 | | | | | | | | | | | | | | | | |
From net investment income: | | | | | | | | | | | | | | | | |
Institutional | | | (685,024 | ) | | | (1,177,037 | ) | | | (1,283,526 | ) | | | (937,282 | ) |
Investor A | | | (36,647 | ) | | | (52,779 | ) | | | (59,585 | ) | | | (43,538 | ) |
Investor C | | | (3,336 | ) | | | (20,189 | ) | | | (15,733 | ) | | | (19,182 | ) |
From net realized gain: | | | | | | | | | | | | | | | | |
Institutional | | | — | | | | (1,400,718 | ) | | | — | | | | (65,224 | ) |
Investor A | | | — | | | | (76,175 | ) | | | — | | | | (3,192 | ) |
Investor C | | | — | | | | (46,178 | ) | | | — | | | | (1,627 | ) |
| | | | | | | | |
Decrease in net assets resulting from distributions to shareholders | | | (725,007 | ) | | | (2,773,076 | ) | | | (1,358,844 | ) | | | (1,070,045 | ) |
| | | | | | | | |
| | | | | | | | | | | | | | | | |
| Capital Share Transactions | | | | | | | | | | | | | | | | |
Net increase (decrease) in net assets derived from capital share transactions | | | (10,644,336 | ) | | | (4,546,434 | ) | | | (5,353,394 | ) | | | 11,260,213 | |
| | | | | | | | |
| | | | | | | | | | | | | | | | |
| Net Assets | | | | | | | | | | | | | | | | |
Total increase (decrease) in net assets | | | (16,108,246 | ) | | | (11,987,018 | ) | | | (9,092,861 | ) | | | 10,518,795 | |
Beginning of period | | | 65,037,526 | | | | 77,024,544 | | | | 38,259,157 | | | | 27,740,362 | |
| | | | | | | | |
End of period | | $ | 48,929,280 | | | $ | 65,037,526 | | | $ | 29,166,296 | | | $ | 38,259,157 | |
| | | | | | | | |
Undistributed (distributions in excess of) net investment income, end of period | | $ | (220,908 | ) | | $ | 329,338 | | | $ | (548,379 | ) | | $ | 917,097 | |
| | | | | | | | |
| | 1 | | Distributions for annual periods determined in accordance with federal income tax regulations. |
See Notes to Consolidated Financial Statements.
| | | | | | |
| | | BLACKROCK FUNDS | | JANUARY 31, 2016 | | 31 |
| | | | |
| Consolidated Financial Highlights | | | BlackRock Multi-Asset Real Return Fund | |
| | | | | | | | | | | | | | | | |
| | | Institutional | |
| | | Six Months Ended January 31, 2016 | | | Year Ended July 31, | | | Period December 27, 20121 to | |
| | (Unaudited) | | | 2015 | | | 2014 | | | July 31, 2013 | |
| Per Share Operating Performance | | | | | | | | | | | | | | | | |
Net asset value, beginning of period | | $ | 9.65 | | | $ | 10.66 | | | $ | 10.47 | | | $ | 10.00 | |
| | | | |
Net investment income2 | | | 0.03 | | �� | | 0.07 | | | | 0.18 | | | | 0.09 | |
Net realized and unrealized gain (loss) | | | (0.80 | ) | | | (0.71 | ) | | | 0.29 | | | | 0.38 | |
| | | | |
Net increase (decrease) from investment operations | | | (0.77 | ) | | | (0.64 | ) | | | 0.47 | | | | 0.47 | |
| | | | |
Distributions:3 | | | | | | | | | | | | | | | | |
From net investment income | | | (0.13 | ) | | | (0.17 | ) | | | (0.20 | ) | | | — | |
From net realized gain | | | — | | | | (0.20 | ) | | | (0.08 | ) | | | — | |
| | | | |
Total distributions | | | (0.13 | ) | | | (0.37 | ) | | | (0.28 | ) | | | — | |
| | | | |
Net asset value, end of period | | $ | 8.75 | | | $ | 9.65 | | | $ | 10.66 | | | $ | 10.47 | |
| | | | |
| | | | | | | | | | | | | | | | |
| Total Return4 | | | | | | | | | | | | | | | | |
Based on net asset value | | | (7.97 | )%5 | | | (5.99 | )% | | | 4.61 | % | | | 4.70 | %5 |
| | | | |
| | | | | | | | | | | | | | | | |
| Ratios to Average Net Assets | | | | | | | | | | | | | | | | |
Total expenses6 | | | 1.20 | %7 | | | 1.17 | % | | | 1.28 | % | | | 3.48 | %7,8 |
| | | | |
Total expenses after fees waived and reimbursed6 | | | 0.80 | %7 | | | 0.80 | % | | | 0.80 | % | | | 0.79 | %7 |
| | | | |
Net investment income6 | | | 0.66 | %7 | | | 0.70 | % | | | 1.73 | % | | | 1.47 | %7 |
| | | | |
| | | | | | | | | | | | | | | | |
| Supplemental Data | | | | | | | | | | | | | | | | |
Net assets, end of period (000) | | $ | 44,787 | | | | $ 60,082 | | | $ | 65,182 | | | $ | 11,915 | |
| | | | |
Portfolio turnover rate | | | 10 | % | | | 42 | % | | | 140 | % | | | 40 | % |
| | | | |
| | 1 | | Commencement of operations. |
| | 2 | | Based on average shares outstanding. |
| | 3 | | Distributions for annual periods determined in accordance with federal income tax regulations. |
| | 4 | | Where applicable, assumes the reinvestment of distributions. |
| | 5 | | Aggregate total return. |
| | 6 | | Excludes expenses incurred indirectly as a result of investments in underlying funds as follows: |
| | | | | | | | |
|
| | | Six Months Ended
January 31, 2016 | | Year Ended July 31, | | Period
December 27, 20121
to |
| | | (Unaudited) | | 2015 | | 2014 | | July 31, 2013 |
Investments in underlying funds | | 0.17% | | 0.20% | | 0.35% | | 0.41% |
| | 8 | | Organization costs were not annualized in the calculation of the expense ratios. If these expenses were annualized, the total expenses for Institutional Shares would have been 3.60%. |
See Notes to Consolidated Financial Statements.
| | | | | | |
| 32 | | BLACKROCK FUNDS | | JANUARY 31, 2016 | | |
| | | | |
| Consolidated Financial Highlights (continued) | | | BlackRock Multi-Asset Real Return Fund | |
| | | | | | | | | | | | | | | | |
| | | Investor A | |
| | | Six Months Ended January 31, 2016 | | | Year Ended July 31, | | | Period December 27,
20121 to | |
| | | (Unaudited) | | | 2015 | | | 2014 | | | July 31, 2013 | |
| Per Share Operating Performance | | | | | | | | | | | | | | | | |
Net asset value, beginning of period | | $ | 9.61 | | | $ | 10.62 | | | $ | 10.45 | | | $ | 10.00 | |
| | | | |
Net investment income2 | | | 0.01 | | | | 0.04 | | | | 0.15 | | | | 0.08 | |
Net realized and unrealized gain (loss) | | | (0.78 | ) | | | (0.71 | ) | | | 0.30 | | | | 0.37 | |
| | | | |
Net increase (decrease) from investment operations | | | (0.77 | ) | | | (0.67 | ) | | | 0.45 | | | | 0.45 | |
| | | | |
Distributions:3 | | | | | | | | | | | | | | | | |
From net investment income | | | (0.11 | ) | | | (0.14 | ) | | | (0.20 | ) | | | — | |
From net realized gain | | | — | | | | (0.20 | ) | | | (0.08 | ) | | | — | |
| | | | |
Total distributions | | | (0.11 | ) | | | (0.34 | ) | | | (0.28 | ) | | | — | |
| | | | |
Net asset value, end of period | | $ | 8.73 | | | $ | 9.61 | | | $ | 10.62 | | | $ | 10.45 | |
| | | | |
| | | | | | | | | | | | | | | | |
| Total Return4 | | | | | | | | | | | | | | | | |
Based on net asset value | | | (8.05 | )%5 | | | (6.30 | )% | | | 4.34 | % | | | 4.50 | %5 |
| | | | |
| | | | | | | | | | | | | | | | |
| Ratios to Average Net Assets | | | | | | | | | | | | | | | | |
Total expenses6 | | | 1.51 | %7 | | | 1.48 | % | | | 1.65 | % | | | 3.73 | %7,8 |
| | | | |
Total expenses after fees waived and reimbursed6 | | | 1.05 | %7 | | | 1.05 | % | | | 1.05 | % | | | 1.05 | %7 |
| | | | |
Net investment income6 | | | 0.32 | %7 | | | 0.38 | % | | | 1.40 | % | | | 1.34 | %7 |
| | | | |
| | | | | | | | | | | | | | | | |
| Supplemental Data | | | | | | | | | | | | | | | | |
Net assets, end of period (000) | | $ | 2,689 | | | $ | 2,917 | | | $ | 9,533 | | | $ | 464 | |
| | | | |
Portfolio turnover rate | | | 10 | % | | | 42 | % | | | 140 | % | | | 40 | % |
| | | | |
| | 1 | | Commencement of operations. |
| | 2 | | Based on average shares outstanding. |
| | 3 | | Distributions for annual periods determined in accordance with federal income tax regulations. |
| | 4 | | Where applicable, excludes the effects of any sales charges and assumes the reinvestment of distributions. |
| | 5 | | Aggregate total return. |
| | 6 | | Excludes expenses incurred indirectly as a result of investments in underlying funds as follows: |
| | | | | | | | |
| | | Six Months Ended
January 31, 2016 | | Year Ended July 31, | | Period
December 27, 20121
to |
| | | (Unaudited) | | 2015 | | 2014 | | July 31, 2013 |
Investments in underlying funds | | 0.17% | | 0.20% | | 0.35% | | 0.41% |
| | 8 | | Organization costs were not annualized in the calculation of the expense ratios. If these expenses were annualized, the total expenses for Investor A Shares would have been 3.85%. |
See Notes to Consolidated Financial Statements.
| | | | | | |
| | | BLACKROCK FUNDS | | JANUARY 31, 2016 | | 33 |
| | | | |
| Consolidated Financial Highlights (concluded) | | | BlackRock Multi-Asset Real Return Fund | |
| | | | | | | | | | | | | | | | |
| | | Investor C | |
| | | Six Months
Ended
January 31, 2016 | | | Year
Ended July 31, | | | Period
December 27,
20121 to | |
| | | (Unaudited) | | | 2015 | | | 2014 | | | July 31, 2013 | |
| Per Share Operating Performance | | | | | | | | | | | | | | | | |
Net asset value, beginning of period | | $ | 9.51 | | | $ | 10.53 | | | $ | 10.41 | | | $ | 10.00 | |
| | | | |
Net investment income (loss)2 | | | (0.01 | ) | | | (0.03 | ) | | | 0.09 | | | | 0.04 | |
Net realized and unrealized gain (loss) | | | (0.79 | ) | | | (0.70 | ) | | | 0.28 | | | | 0.37 | |
| | | | |
Net increase (decrease) from investment operations | | | (0.80 | ) | | | (0.73 | ) | | | 0.37 | | | | 0.41 | |
| | | | |
Distributions:3 | | | | | | | | | | | | | | | | |
From net investment income | | | (0.02 | ) | | | (0.09 | ) | | | (0.17 | ) | | | — | |
From net realized gain | | | — | | | | (0.20 | ) | | | (0.08 | ) | | | — | |
| | | | |
Total distributions | | | (0.02 | ) | | | (0.29 | ) | | | (0.25 | ) | | | — | |
| | | | |
Net asset value, end of period | | $ | 8.69 | | | $ | 9.51 | | | $ | 10.53 | | | $ | 10.41 | |
| | | | |
| | | | | | | | | | | | | | | | |
| Total Return4 | | | | | | | | | | | | | | | | |
Based on net asset value | | | (8.42 | )%5 | | | (6.95 | )% | | | 3.56 | % | | | 4.10 | %5 |
| | | | |
| | | | | | | | | | | | | | | | |
| Ratios to Average Net Assets | | | | | | | | | | | | | | | | |
Total expenses6 | | | 2.27 | %7 | | | 2.22 | % | | | 2.41 | % | | | 4.42 | %7,8 |
| | | | |
Total expenses after fees waived and reimbursed6 | | | 1.80 | %7 | | | 1.80 | % | | | 1.80 | % | | | 1.79 | %7 |
| | | | |
Net investment income (loss)6 | | | (0.31 | )%7 | | | (0.30 | )% | | | 0.87 | % | | | 0.66 | %7 |
| | | | |
| | | | | | | | | | | | | | | | |
| Supplemental Data | | | | | | | | | | | | | | | | |
Net assets, end of period (000) | | $ | 1,453 | | | $ | 2,038 | | | $ | 2,310 | | | $ | 271 | |
| | | | |
Portfolio turnover rate | | | 10 | % | | | 42 | % | | | 140 | % | | | 40 | % |
| | | | |
| | 1 | | Commencement of operations. |
| | 2 | | Based on average shares outstanding. |
| | 3 | | Distributions for annual periods determined in accordance with federal income tax regulations. |
| | 4 | | Where applicable, excludes the effects of any sales charges and assumes the reinvestment of distributions. |
| | 5 | | Aggregate total return. |
| | 6 | | Excludes expenses incurred indirectly as a result of investments in underlying funds as follows: |
| | | | | | | | |
| | | Six Months Ended
January 31, 2016 | | Year Ended July 31, | | Period
December 27, 20121
to |
| | | (Unaudited) | | 2015 | | 2014 | | July 31, 2013 |
Investments in underlying funds | | 0.17% | | 0.20% | | 0.35% | | 0.41% |
| | 8 | | Organization costs were not annualized in the calculation of the expense ratios. If these expenses were annualized, the total expenses for Investor C Shares would have been 4.54%. |
See Notes to Consolidated Financial Statements.
| | | | | | |
| 34 | | BLACKROCK FUNDS | | JANUARY 31, 2016 | | |
| | | | |
| Consolidated Financial Highlights | | | BlackRock Strategic Risk Allocation Fund | |
| | | | | | | | | | | | | | | | |
| | | Institutional | |
| | | Six Months
Ended January 31, 2016 | | | Year Ended July 31, | | | Period
December 27,
20121 to | |
| | | (Unaudited) | | | 2015 | | | 2014 | | | July 31, 2013 | |
| Per Share Operating Performance | | | | | | | | | | | | | | | | |
Net asset value, beginning of period | | $ | 9.96 | | | $ | 10.11 | | | $ | 9.54 | | | $ | 10.00 | |
| | | | |
Net investment loss2 | | | (0.03 | ) | | | (0.06 | ) | | | (0.07 | ) | | | (0.02 | ) |
Net realized and unrealized gain (loss) | | | (0.64 | ) | | | 0.28 | | | | 1.02 | | | | (0.40 | ) |
| | | | |
Net increase (decrease) from investment operations | | | (0.67 | ) | | | 0.22 | | | | 0.95 | | | | (0.42 | ) |
| | | | |
Distributions:3 | | | | | | | | | | | | | | | | |
From net investment income | | | (0.42 | ) | | | (0.35 | ) | | | (0.38 | ) | | | (0.04 | ) |
From net realized gain | | | — | | | | (0.02 | ) | | | — | | | | — | |
| | | | |
Total distributions | | | (0.42 | ) | | | (0.37 | ) | | | (0.38 | ) | | | (0.04 | ) |
| | | | |
Net asset value, end of period | | $ | 8.87 | | | $ | 9.96 | | | $ | 10.11 | | | $ | 9.54 | |
| | | | |
| | | | | | | | | | | | | | | | |
| Total Return4 | | | | | | | | | | | | | | | | |
Based on net asset value | | | (6.80 | )%5 | | | 2.24 | % | | | 10.24 | % | | | (4.25 | )%5 |
| | | | |
| | | | | | | | | | | | | | | | |
| Ratios to Average Net Assets | | | | | | | | | | | | | | | | |
Total expenses6 | | | 1.52 | %7 | | | 1.52 | % | | | 1.69 | % | | | 2.36 | %7,8 |
| | | | |
Total expenses after fees waived and reimbursed6 | | | 1.00 | %7 | | | 1.00 | % | | | 1.00 | % | | | 0.99 | %7 |
| | | | |
Net investment loss6 | | | (0.60 | )%7 | | | (0.61 | )% | | | (0.67 | )% | | | (0.35 | )%7 |
| | | | |
| | | | | | | | | | | | | | | | |
| Supplemental Data | | | | | | | | | | | | | | | | |
Net assets, end of period (000) | | $ | 27,318 | | | $ | 35,597 | | | $ | 26,325 | | | $ | 24,404 | |
| | | | |
Portfolio turnover rate | | | 0 | % | | | 4 | % | | | 77 | % | | | 59 | % |
| | | | |
| | 1 | | Commencement of operations. |
| | 2 | | Based on average shares outstanding. |
| | 3 | | Distributions for annual periods determined in accordance with federal income tax regulations. |
| | 4 | | Where applicable, assumes the reinvestment of distributions. |
| | 5 | | Aggregate total return. |
| | 6 | | Excludes expenses incurred indirectly as a result of investments in underlying funds as follows: |
| | | | | | | | |
| | | Six Months Ended January 31, 2016 | | Year Ended July 31, | | Period
December 27, 20121
to |
| | | (Unaudited) | | 2015 | | 2014 | | July 31, 2013 |
Investments in underlying funds | | 0.09% | | 0.09% | | 0.10% | | 0.18% |
| | 8 | | Organization costs were not annualized in the calculation of the expense ratios. If these expenses were annualized, the total expenses for Institutional Shares would have been 2.57%. |
See Notes to Consolidated Financial Statements.
| | | | | | |
| | | BLACKROCK FUNDS | | JANUARY 31, 2016 | | 35 |
| | | | |
| Consolidated Financial Highlights (continued) | | | BlackRock Strategic Risk Allocation Fund | |
| | | | | | | | | | | | | | | | |
| | | Investor A | |
| | | Six Months
Ended January 31, 2016 | | | Year Ended July 31, | | | Period
December 27,
20121 to | |
| | | (Unaudited) | | | 2015 | | | 2014 | | | July 31, 2013 | |
| Per Share Operating Performance | | | | | | | | | | | | | | | | |
Net asset value, beginning of period | | $ | 9.93 | | | $ | 10.09 | | | $ | 9.53 | | | $ | 10.00 | |
| | | | |
Net investment loss2 | | | (0.04 | ) | | | (0.09 | ) | | | (0.08 | ) | | | (0.02 | ) |
Net realized and unrealized gain (loss) | | | (0.64 | ) | | | 0.28 | | | | 1.00 | | | | (0.41 | ) |
| | | | |
Net increase (decrease) from investment operations | | | (0.68 | ) | | | 0.19 | | | | 0.92 | | | | (0.43 | ) |
| | | | |
Distributions:3 | | | | | | | | | | | | | | | | |
From net investment income | | | (0.39 | ) | | | (0.33 | ) | | | (0.36 | ) | | | (0.04 | ) |
From net realized gain | | | — | | | | (0.02 | ) | | | — | | | | — | |
| | | | |
Total distributions | | | (0.39 | ) | | | (0.35 | ) | | | (0.36 | ) | | | (0.04 | ) |
| | | | |
Net asset value, end of period | | $ | 8.86 | | | $ | 9.93 | | | $ | 10.09 | | | $ | 9.53 | |
| | | | |
| | | | | | | | | | | | | | | | |
| Total Return4 | | | | | | | | | | | | | | | | |
Based on net asset value | | | (6.89 | )%5 | | | 1.97 | % | | | 9.92 | % | | | (4.35 | )%5 |
| | | | |
| | | | | | | | | | | | | | | | |
| Ratios to Average Net Assets | | | | | | | | | | | | | | | | |
Total expenses6 | | | 1.94 | %7 | | | 1.94 | % | | | 2.09 | % | | | 2.38 | %7,8 |
| | | | |
Total expenses after fees waived and reimbursed6 | | | 1.25 | %7 | | | 1.25 | % | | | 1.25 | % | | | 1.24 | %7 |
| | | | |
Net investment loss6 | | | (0.85 | )%7 | | | (0.86 | )% | | | (0.81 | )% | | | (0.30 | )%7 |
| | | | |
| | | | | | | | | | | | | | | | |
| Supplemental Data | | | | | | | | | | | | | | | | |
Net assets, end of period (000) | | $ | 1,349 | | | $ | 1,811 | | | $ | 1,014 | | | $ | 378 | |
| | | | |
Portfolio turnover rate | | | 0 | % | | | 4 | % | | | 77 | % | | | 59 | % |
| | | | |
| | 1 | | Commencement of operations. |
| | 2 | | Based on average shares outstanding. |
| | 3 | | Distributions for annual periods determined in accordance with federal income tax regulations. |
| | 4 | | Where applicable, excludes the effects of any sales charges and assumes the reinvestment of distributions. |
| | 5 | | Aggregate total return. |
| | 6 | | Excludes expenses incurred indirectly as a result of investments in underlying funds as follows: |
| | | | | | | | |
| | | Six Months Ended
January 31, 2016 | | Year Ended July 31, | | Period
December 27, 20121
to |
| | | (Unaudited) | | 2015 | | 2014 | | July 31, 2013 |
Investments in underlying funds | | 0.09% | | 0.09% | | 0.10% | | 0.18% |
| | 8 | | Organization costs were not annualized in the calculation of the expense ratios. If these expenses were annualized, the total expenses for Investor A Shares would have been 2.59%. |
See Notes to Consolidated Financial Statements.
| | | | | | |
| 36 | | BLACKROCK FUNDS | | JANUARY 31, 2016 | | |
| | | | |
| Consolidated Financial Highlights (concluded) | | | BlackRock Strategic Risk Allocation Fund | |
| | | | | | | | | | | | | | | | |
| | | Investor C | |
| | | Six Months
Ended
January 31, 2016 | | | Year Ended July 31, | | | Period
December 27,
20121 to | |
| | | (Unaudited) | | | 2015 | | | 2014 | | | July 31, 2013 | |
| Per Share Operating Performance | | | | | | | | | | | | | | | | |
Net asset value, beginning of period | | $ | 9.84 | | | $ | 10.02 | | | $ | 9.48 | | | $ | 10.00 | |
| | | | |
Net investment loss2 | | | (0.08 | ) | | | (0.16 | ) | | | (0.16 | ) | | | (0.06 | ) |
Net realized and unrealized gain (loss) | | | (0.63 | ) | | | 0.29 | | | | 1.00 | | | | (0.42 | ) |
| | | | |
Net increase (decrease) from investment operations | | | (0.71 | ) | | | 0.13 | | | | 0.84 | | | | (0.48 | ) |
| | | | |
Distributions:3 | | | | | | | | | | | | | | | | |
From net investment income | | | (0.29 | ) | | | (0.29 | ) | | | (0.30 | ) | | | (0.04 | ) |
From net realized gains | | | — | | | | (0.02 | ) | | | — | | | | — | |
| | | | |
Total distributions | | | (0.29 | ) | | | (0.31 | ) | | | (0.30 | ) | | | (0.04 | ) |
| | | | |
Net asset value, end of period | | $ | 8.84 | | | $ | 9.84 | | | $ | 10.02 | | | $ | 9.48 | |
| | | | |
| | | | | | | | | | | | | | | | |
| Total Return4 | | | | | | | | | | | | | | | | |
Based on net asset value | | | (7.30 | )%5 | | | 1.32 | % | | | 9.09 | % | | | (4.86 | )%5 |
| | | | |
| | | | | | | | | | | | | | | | |
| Ratios to Average Net Assets | | | | | | | | | | | | | | | | |
Total expenses6 | | | 2.60 | %7 | | | 2.59 | % | | | 2.80 | % | | | 3.00 | %7,8 |
| | | | |
Total expenses after fees waived and reimbursed6 | | | 2.00 | %7 | | | 2.00 | % | | | 2.00 | % | | | 1.98 | %7 |
| | | | |
Net investment loss6 | | | (1.60 | )%7 | | | (1.56 | )% | | | (1.67 | )% | | | (0.98 | )%7 |
| | | | |
| | | | | | | | | | | | | | | | |
| Supplemental Data | | | | | | | | | | | | | | | | |
Net assets, end of period (000) | | $ | 500 | | | $ | 851 | | | $ | 402 | | | $ | 313 | |
| | | | |
Portfolio turnover rate | | | 0 | % | | | 4 | % | | | 77 | % | | | 59 | % |
| | | | |
| | 1 | | Commencement of operations. |
| | 2 | | Based on average shares outstanding. |
| | 3 | | Distributions for annual periods determined in accordance with federal income tax regulations. |
| | 4 | | Where applicable, excludes the effects of any sales charges and assumes the reinvestment of distributions. |
| | 5 | | Aggregate total return. |
| | 6 | | Excludes expenses incurred indirectly as a result of investments in underlying funds as follows: |
| | | | | | | | |
| | | Six Months Ended
January 31, 2016 | | Year Ended July 31, | | Period
December 27, 20121
to |
| | | (Unaudited) | | 2015 | | 2014 | | July 31, 2013 |
Investments in underlying funds | | 0.09% | | 0.09% | | 0.10% | | 0.18% |
| | 8 | | Organization costs were not annualized in the calculation of the expense ratios. If these expenses were annualized, the total expenses for Investor C Shares would have been 3.21%. |
See Notes to Consolidated Financial Statements.
| | | | | | |
| | | BLACKROCK FUNDS | | JANUARY 31, 2016 | | 37 |
| | |
| Notes to Consolidated Financial Statements (Unaudited) | | |
1. Organization:
BlackRock FundsSM (the “Trust”) is registered under the Investment Company Act of 1940, as amended (the “1940 Act”), as an open-end management investment company. The Trust is organized as a Massachusetts business trust. The following are referred to herein collectively as the “Funds” or individually, a “Fund”:
| | | | |
| Fund Name | | Herein Referred To As | | Diversification Classification |
BlackRock Multi-Asset Real Return Fund | | Multi-Asset Real Return | | Diversified |
BlackRock Strategic Risk Allocation Fund | | Strategic Risk Allocation | | Non-diversified |
Each Fund offers multiple classes of shares. All classes of shares have identical voting, dividend, liquidation and other rights and are subject to the same terms and conditions, except that each share class bears certain expenses and may have a conversion privilege as outlined below. Institutional Shares are sold only to certain eligible investors. Investor A and Investor C Shares are generally available through financial intermediaries. Each class has exclusive voting rights with respect to matters relating to its shareholder servicing and distribution expenditures.
| | | | | | | | | | | | | | | |
| Share Class | | Initial Sales Charge | | CDSC | | Conversion
Privilege |
Institutional Shares | | | | No | | | | | No | | | | | None | |
Investor A Shares | | | | Yes | | | | | No | 1 | | | | None | |
Investor C Shares | | | | No | | | | | Yes | | | | | None | |
| | 1 | | Investor A Shares may be subject to a contingent deferred sales charge (“CDSC”) for certain redemptions where no initial sales charge was paid at the time of purchase. |
As of January 31, 2016, Strategic Risk Allocation’s investment in BlackRock Liquidity Funds, TempFund was 37% of the Fund’s net assets. The financial statements of BlackRock Liquidity Funds, TempFund, including the Schedules of Investments, can be read in conjunction with Strategic Risk Allocation’s financial statements. BlackRock Liquidity Funds, TempFund financial statements are included in filings under BlackRock Liquidity Funds, which are available, without charge, on the U.S. Securities and Exchange Commission’s (“SEC’s”) website at http://www.sec.gov.
The Funds, together with certain other registered investment companies advised by BlackRock Advisors, LLC (the “Manager”) or its affiliates, are included in a complex of open-end funds referred to as the Equity-Liquidity Complex.
Basis of Consolidation: The accompanying consolidated financial statements of Multi-Asset Real Return and Strategic Risk Allocation include the accounts of BlackRock Cayman Multi-Asset Real Return Fund Ltd. (“Cayman Multi-Asset Real Return”) and BlackRock Cayman Strategic Risk Allocation Fund Ltd. (“Cayman Strategic Risk Allocation”) (the “Subsidiaries”), which are wholly owned subsidiaries of the respective Fund and primarily invest in commodity-related instruments and other derivatives. The Subsidiaries enable the Funds to hold these commodity-related instruments and other derivatives and satisfy regulated investment company tax requirements. Each Fund may invest up to 25% of its total assets measured at the time of investment in its respective Subsidiary. The net assets of Cayman Multi-Asset Real Return as of period end were $5,056,483, which is 10.3% of Multi-Asset Real Return’s consolidated net assets. The net assets of Cayman Strategic Risk Allocation as of period end were $2,775,995, which is 9.5% of Strategic Risk Allocation’s consolidated net assets. The accompanying Consolidated Schedules of Investments and consolidated financial statements of each Fund include the positions and accounts, respectively, of its Subsidiary. Intercompany accounts and transactions, if any, have been eliminated. The Subsidiaries are subject to the same investment policies and restrictions that apply to the Funds, except that the Subsidiaries may invest without limitation in commodity-related instruments.
The following table shows a summary of the selected financial information of each Subsidiary included in the consolidated financial statements:
| | | | | | | | | | |
| | | Cayman
Multi-Asset
Real Return | | | | | Cayman
Strategic Risk
Allocation | |
Consolidated Statements of Assets and Liabilities | | | | | | | | | | |
Total assets | | $ | 5,056,483 | | | | | | $ 2,775,995 | |
Total liabilities | | | — | | | | | | — | |
| | | | |
Net assets | | $ | 5,056,483 | | | | | | $ 2,775,995 | |
| | | | |
| | | | | | | | | | |
Consolidated Statements of Operations | | | | | | | | | | |
Net investment income (loss) | | $ | (3 | ) | | | | | $ 1,873 | |
Net realized gain (loss) from: | | | | | | | | | | |
Financial futures contracts | | | — | | | | | | (513,324 | ) |
Swaps | | | (2,294,025 | ) | | | | | (1,471,822 | ) |
Foreign currency transactions | | | — | | | | | | 712,883 | |
| | | | |
| | $ | (2,294,025 | ) | | | | | $(1,272,263 | ) |
| | | | |
| | | | | | |
| 38 | | BLACKROCK FUNDS | | JANUARY 31, 2016 | | |
| | |
| Notes to Consolidated Financial Statements (continued) | | |
| | | | | | | | | | |
| | | Cayman
Multi-Asset
Real Return | | | | | Cayman
Strategic Risk
Allocation | |
Net change in unrealized appreciation (depreciation) | | | | | | | | | | |
Investments - affiliated | | $ | 49,641 | | | | | | — | |
Financial futures contracts | | | — | | | | | | $ (46,793 | ) |
Swaps | | | 849,721 | | | | | | (2,282 | ) |
Foreign currency translations | | | — | | | | | | (161,973 | ) |
| | | | |
| | | 899,362 | | | | | | (211,048 | ) |
| | | | |
Net decrease in net assets resulting from operations | | $ | (1,394,666 | ) | | | | | $(1,481,438 | ) |
| | | | |
| | | | | | | | | | |
Consolidated Statements of Changes in Net Assets | | | | | | | | | | |
Net investment income | | $ | 137 | | | | | | $ 4,062 | |
Net realized loss | | | (7,217,219 | ) | | | | | (117,511 | ) |
Net change in unrealized appreciation (depreciation) | | | (30,647 | ) | | | | | 341,258 | |
| | | | |
Net increase (decrease) in net assets resulting from operations | | $ | (7,247,729 | ) | | | | | $ 227,809 | |
| | | | |
2. Significant Accounting Policies:
The consolidated financial statements are prepared in conformity with accounting principles generally accepted in the United States of America (“U.S. GAAP”), which may require management to make estimates and assumptions that affect the reported amounts of assets and liabilities in the consolidated financial statements, disclosure of contingent assets and liabilities at the date of the consolidated financial statements and the reported amounts of increases and decreases in net assets from operations during the reporting period. Actual results could differ from those estimates. Each Fund is considered an investment company under U.S. GAAP and follows the accounting and reporting guidance applicable to investment companies. Below is a summary of significant accounting polices:
Foreign Currency: Each Fund’s books and records are maintained in U.S. dollars. Purchases and sales of investments are recorded at the rates of exchange prevailing on the respective dates of such transactions. Generally, when the U.S. dollar rises in value against a foreign currency, the investments denominated in that currency will lose value; the opposite effect occurs if the U.S. dollar falls in relative value.
Each Fund does not isolate the portion of the results of operations arising as a result of changes in the foreign exchange rates from the changes in the market prices of investments held or sold for financial reporting purposes. Accordingly, the effects of changes in exchange rates on investments are not segregated in the Consolidated Statements of Operations from the effects of changes in market prices of those investments, but are included as a component of net realized and unrealized gain (loss) from investments. Realized currency gains (losses) on foreign currency related transactions are reported as components of net realized gain (loss) for financial reporting purposes, whereas such components are generally treated as ordinary income for federal income tax purposes.
Defensive Positions: Investment policies may vary for temporary defensive purposes during periods in which the investment advisor believes that conditions in the securities markets or other economic, financial or political conditions warrant. Under such conditions, a Fund may invest up to 100% of its total assets in U.S. Government securities, certificates of deposit, repurchase agreements that involve purchases of debt securities, bankers’ acceptances and other bank obligations, commercial paper, money market funds and/or other debt securities, or may hold its assets in cash. The Manager applies this defensive posture as applicable and consistent with each Fund prospectus.
Segregation and Collateralization: In cases where a Fund enters into certain investments (e.g., financial futures contracts, forward foreign currency exchange contracts, options written and swaps) that would be treated as “senior securities” for 1940 Act purposes, a Fund may segregate or designate on its books and records cash or liquid assets having a market value at least equal to the amount of its future obligations under such investments. Doing so allows the investment to be excluded from treatment as a “senior security.” Furthermore, if required by an exchange or counterparty agreement, the Funds may be required to deliver/deposit cash and/or securities to/with an exchange, or broker-dealer or custodian as collateral for certain investments or obligations.
Investment Transactions and Investment Income: For financial reporting purposes, investment transactions are recorded on the dates the transactions are entered into (the trade dates). Realized gains and losses on investment transactions are determined on the identified cost basis. Dividend income is recorded on the ex-dividend date. Dividends from foreign securities where the ex-dividend date may have past are subsequently recorded when the Funds are informed of the ex-dividend date. Under the applicable foreign tax laws, a withholding tax at various rates may be imposed on capital gains, dividends and interest. Upon notification from issuers, some of the dividend income received from a real estate investment trust may be redesignated
| | | | | | |
| | | BLACKROCK FUNDS | | JANUARY 31, 2016 | | 39 |
| | |
| Notes to Consolidated Financial Statements (continued) | | |
as a reduction of cost of the related investment and/or realized gain. Interest income, including amortization and accretion of premiums and discounts on debt securities, is recognized on the accrual basis. Income, expenses and realized and unrealized gains and losses are allocated daily to each class based on its relative net assets.
Distributions: Distributions paid by the Funds are recorded on the ex-dividend date. The character and timing of distributions are determined in accordance with federal income tax regulations, which may differ from U.S. GAAP.
Net income and realized gains from investments held by the Subsidiaries are treated as ordinary income for tax purposes. If a net loss is realized by the Subsidiaries in any taxable year, the loss will generally not be available to offset the Funds’ ordinary income and/or capital gains for that year.
Indemnifications: In the normal course of business, a Fund enters into contracts that contain a variety of representations that provide general indemnification. A Fund’s maximum exposure under these arrangements is unknown because it involves future potential claims against a Fund, which cannot be predicted with any certainty.
Other: Expenses directly related to a Fund or its classes are charged to that Fund or the applicable class. Other operating expenses shared by several funds, including other funds managed by the Manager, are prorated among those funds on the basis of relative net assets or other appropriate methods. Expenses directly related to the Funds and other shared expenses prorated to the Funds are allocated daily to each class based on its relative net assets or other appropriate methods.
The Funds have an arrangement with their custodian whereby fees may be reduced by credits earned on uninvested cash balances, which, if applicable, are shown as fees paid indirectly in the Consolidated Statements of Operations. The custodian imposes fees on overdrawn cash balances, which can be offset by accumulated credits earned or may result in additional custody charges.
3. Investment Valuation and Fair Value Measurements:
Investment Valuation Policies: The Funds’ investments are valued at fair value (also referred to as “market value” within the consolidated financial statements) as of the close of trading on the New York Stock Exchange (“NYSE”) (generally 4:00 p.m., Eastern time) (or if the reporting date falls on a day the NYSE is closed, investments are valued at fair value as of the report date). U.S. GAAP defines fair value as the price the Funds would receive to sell an asset or pay to transfer a liability in an orderly transaction between market participants at the measurement date. The Funds determine the fair values of their financial instruments using independent dealers or pricing services under policies approved by the Board of Trustees of the Trust (the “Board”). The BlackRock Global Valuation Methodologies Committee (the “Global Valuation Committee”) is the committee formed by management to develop global pricing policies and procedures and to provide oversight of the pricing function for the Funds for all financial instruments.
Fair Value Inputs and Methodologies: The following methods (or “techniques”) and inputs are used to establish the fair value of each Fund’s assets and liabilities:
| • | | Equity investments traded on a recognized securities exchange are valued at the official close price each day, if available. For equity investments traded on more than one exchange, the official close price on the exchange where the stock is primarily traded is used. Equity investments traded on a recognized exchange for which there were no sales on that day may be valued at the last available bid (long positions) or ask (short positions) price. |
| • | | Bond investments are valued on the basis of last available bid prices or current market quotations provided by dealers or pricing services. Floating rate loan interests are valued at the mean of the bid prices from one or more brokers or dealers as obtained from a pricing service. In determining the value of a particular investment, pricing services may use certain information with respect to transactions in such investments, quotations from dealers, pricing matrixes, market transactions in comparable investments, various relationships observed in the market between investments and calculated yield measures. Asset-backed and mortgage-backed securities are valued by independent pricing services using models that consider estimated cash flows of each tranche of the security, establish a benchmark yield and develop an estimated tranche-specific spread to the benchmark yield based on the unique attributes of the tranche. |
| • | | Generally, trading in foreign instruments is substantially completed each day at various times prior to the close of business on the NYSE. Occasionally, events affecting the values of such instruments may occur between the foreign market close and the close of business on the NYSE that may not be reflected in the computation of the Funds’ net assets. Each business day, the Funds use a pricing service to assist with the valuation of certain foreign exchange-traded equity securities and foreign exchange-traded and over-the-counter (“OTC”) options (the “Systematic Fair Value Price”). Using current market factors, the Systematic Fair Value Price is designed to value such foreign securities and foreign options at fair value as of the close of business on the NYSE, which follows the close of the local markets. |
| | | | | | |
| 40 | | BLACKROCK FUNDS | | JANUARY 31, 2016 | | |
| | |
| Notes to Consolidated Financial Statements (continued) | | |
| • | | Investments in open-end U.S. mutual funds are valued at net asset value each business day. |
| • | | The Funds value their investment in BlackRock Liquidity Series, LLC, Money Market Series (the “Money Market Series”) at fair value, which is ordinarily based upon its pro rata ownership in the underlying fund’s net assets. The Money Market Series seeks current income consistent with maintaining liquidity and preserving capital. Although the Money Market Series is not registered under the 1940 Act, its investments may follow the parameters of investments by a money market fund that is subject to Rule 2a-7 under the 1940 Act. The Funds may withdraw up to 25% of its investment daily, although the manager of the Money Market Series, in its sole discretion, may permit an investor to withdraw more than 25% on any one day. |
| • | | Financial futures contracts traded on exchanges are valued at their last sale price. |
| • | | Securities and other assets and liabilities denominated in foreign currencies are translated in U.S. dollars using exchange rates determined as of the close of business on the NYSE. Forward foreign currency exchange contracts are valued at the mean between the bid and ask prices and are determined as of the close of business on the NYSE. Interpolated values are derived when the settlement date of the contract is an interim date for which quotations are not available. |
| • | | OTC options and options on swaps (“swaptions”) are valued by an independent pricing service using a mathematical model, which incorporates a number of market data factors, such as the trades and prices of the underlying instruments. |
| • | | Swap agreements are valued utilizing quotes received daily by the Funds’ pricing service or through brokers, which are derived using daily swap curves and models that incorporate a number of market data factors, such as discounted cash flows, trades and values of the underlying reference instruments. |
If events (e.g., a company announcement, market volatility or a natural disaster) occur that are expected to materially affect the value of such instruments, or in the event that the application of these methods of valuation results in a price for an investment that is deemed not to be representative of the market value of such instrument, or if a price is not available, the investment will be valued by the Global Valuation Committee, or its delegate, in accordance with a policy approved by the Board as reflecting fair value (“Fair Valued Investments”). When determining the price for Fair Valued Investments, the Global Valuation Committee, or its delegate, seeks to determine the price that each Fund might reasonably expect to receive or pay from the current sale or purchase of that asset or liability in an arm’s length transaction. Fair value determinations shall be based upon all available factors that the Global Valuation Committee, or its delegate, deems relevant consistent with principles of fair value measurement. The pricing of all Fair Valued Investments is subsequently reported to the Board or a committee thereof on a quarterly basis.
Fair Value Hierarchy: Various inputs are used in determining the fair value of investments and derivative financial instruments. These inputs to valuation techniques are categorized into a fair value hierarchy consisting of three broad levels for financial statement purposes as follows:
| | • | | Level 1 — unadjusted price quotations in active markets/exchanges for identical assets or liabilities that each Fund has the ability to access |
| | • | | Level 2 — other observable inputs (including, but not limited to, quoted prices for similar assets or liabilities in markets that are active, quoted prices for identical or similar assets or liabilities in markets that are not active, inputs other than quoted prices that are observable for the assets or liabilities (such as interest rates, yield curves, volatilities, prepayment speeds, loss severities, credit risks and default rates) or other market-corroborated inputs) |
| | • | | Level 3 — unobservable inputs based on the best information available in the circumstances, to the extent observable inputs are not available (including each Fund’s own assumptions used in determining the fair value of investments and derivative financial instruments) |
The hierarchy gives the highest priority to unadjusted quoted prices in active markets for identical assets or liabilities (Level 1 measurements) and the lowest priority to unobservable inputs (Level 3 measurements). Accordingly, the degree of judgment exercised in determining fair value is greatest for instruments categorized in Level 3. The inputs used to measure fair value may fall into different levels of the fair value hierarchy. In such cases, for disclosure purposes, the fair value hierarchy classification is determined based on the lowest level input that is significant to the fair value measurement in its entirety. The significant unobservable inputs used by the Global Valuation Committee in determining the price for Fair Valued Investments are typically categorized as Level 3. The fair value hierarchy for each Fund’s investments and derivative instruments have been included in the Consolidated Schedules of Investments.
Changes in valuation techniques may result in transfers into or out of an assigned level within the hierarchy. In accordance with each Fund’s policy, transfers between different levels of the fair value hierarchy are deemed to have occurred as of the beginning of the reporting period. The categorization
| | | | | | |
| | | BLACKROCK FUNDS | | JANUARY 31, 2016 | | 41 |
| | |
| Notes to Consolidated Financial Statements (continued) | | |
of a value determined for investments and derivative financial instruments is based on the pricing transparency of the investments and derivative financial instruments and is not necessarily an indication of the risks associated with investing in those securities.
4. Securities and Other Investments:
Inflation-Indexed Bonds: Inflation-indexed bonds are fixed income securities whose principal value is periodically adjusted according to the rate of inflation. If the index measuring inflation rises or falls, the principal value of inflation-indexed bonds will be adjusted upward or downward, and consequently the interest payable on these securities (calculated with respect to a larger or smaller principal amount) will be increased or reduced, respectively. Any upward or downward adjustment in the principal amount of an inflation-indexed bond will be included as interest income in the Consolidated Statements of Operations, even though investors do not receive their principal until maturity. Repayment of the original bond principal upon maturity (as adjusted for inflation) is guaranteed in the case of U.S. Treasury inflation-indexed bonds. For bonds that do not provide a similar guarantee, the adjusted principal value of the bond repaid at maturity may be less than the original principal.
Securities Lending: The Funds may lend their securities to approved borrowers, such as brokers, dealers and other financial institutions. The borrower pledges and maintains with the Funds collateral consisting of cash, an irrevocable letter of credit issued by a bank, or securities issued or guaranteed by the U.S. Government. The initial collateral received by each Fund is required to have a value of at least 102% of the current value of the loaned securities for securities traded on U.S. exchanges and a value of at least 105% for all other securities. The collateral is maintained thereafter at a value equal to at least 100% of the current market value of the securities on loan. The market value of the loaned securities is determined at the close of each business day of the Fund and any additional required collateral is delivered to the Fund, or excess collateral is returned by the Fund, on the next business day. During the term of the loan, the Funds are entitled to all distributions made on or in respect of the loaned securities. Loans of securities are terminable at any time and the borrower, after notice, is required to return borrowed securities within the standard time period for settlement of securities transactions.
The market value of securities on loan, all of which were classified as common stocks in the Funds’ Consolidated Schedule of Investments, and the value of the related collateral are shown separately in the Consolidated Statements of Assets and Liabilities as a component of investments at value — unaffiliated, and collateral on securities loaned at value, respectively. As of period end, any securities on loan were collateralized by cash. The cash collateral invested by the securities lending agent, BlackRock Investment Management, LLC (“BIM”), if any, is disclosed in the Consolidated Schedule of Investments.
Securities lending transactions are entered into by the Funds under Master Securities Lending Agreements (each, an “MSLA”) which provide the right, in the event of default (including bankruptcy or insolvency), for the non-defaulting party to liquidate the collateral and calculate a net exposure to the defaulting party or request additional collateral. In the event that a borrower defaults, the Funds, as lender, would offset the market value of the collateral received against the market value of the securities loaned. When the value of the collateral is greater than that of the market value of the securities loaned, the lender is left with a net amount payable to the defaulting party. However, bankruptcy or insolvency laws of a particular jurisdiction may impose restrictions on or prohibitions against such a right of offset in the event of an MSLA counterparty’s bankruptcy or insolvency. Under the MSLA, absent an event of default the borrower can resell or re-pledge the loaned securities, and a Fund can reinvest cash collateral received in connection with loaned securities. Upon an event of default, the parties’ obligations to return the securities or collateral to the other party are extinguished, and the parties can resell or re-pledge the loaned securities or the collateral received in connection with the loaned securities in order to satisfy the defaulting party’s net payment obligation for all transactions under the MSLA. The defaulting party remains liable for any deficiency.
As of period end, the following table is a summary of Multi-Asset Real Return securities lending agreements by counterparty which are subject to offset under an MSLA:
| | | | | | | | | | | | |
| Counterparty | | Securities Loaned at Value | | | Cash Collateral Received1 | | | Net Amount | |
Citigroup Global Markets, Inc. | | $ | 2,810,555 | | | $ | (2,810,555 | ) | | | — | |
| | 1 | | Collateral with a value of $2,796,315 has been received in connection with securities lending agreements. Collateral received in excess of the value of securities loaned from the individual counterparty is not shown for financial reporting purposes in the table above. |
The risks of securities lending include the risk that the borrower may not provide additional collateral when required or may not return the securities when due. To mitigate these risks, the Funds benefit from a borrower default indemnity provided by BIM. BIM’s indemnity allows for full replacement of the securities loaned if the collateral received does not cover the value on the securities loaned in the event of borrower default. Each Fund could
| | | | | | |
| 42 | | BLACKROCK FUNDS | | JANUARY 31, 2016 | | |
| | |
| Notes to Consolidated Financial Statements (continued) | | |
suffer a loss if the value of an investment purchased with cash collateral falls below the market value of loaned securities or if the value of an investment purchased with cash collateral falls below the value of the original cash collateral received.
5. Derivative Financial Instruments:
The Funds engage in various portfolio investment strategies using derivative contracts both to increase the returns of the Funds and/or to manage economically their exposure to certain risks such as credit risk, equity risk, interest rate risk, foreign currency exchange rate risk, commodity price risk or other risk (e.g., inflation risk). These contracts may be transacted on an exchange or OTC.
Financial Futures Contracts: The Funds invest in long and/or short positions in financial futures contracts and options on financial futures contracts to gain exposure to, or economically hedge against, changes in interest rates (interest rate risk) or changes in the value of equity securities (equity risk). Financial futures contracts are agreements between the Funds and a counterparty to buy or sell a specific quantity of an underlying instrument at a specified price and at a specified date. Depending on the terms of the particular contract, financial futures contracts are settled either through physical delivery of the underlying instrument on the settlement date or by payment of a cash settlement amount on the settlement date.
Upon entering into a financial futures contract, the Funds are required to deposit initial margin with the broker in the form of cash or securities in an amount that varies depending on a contract’s size and risk profile. The initial margin deposit must then be maintained at an established level over the life of the contract. Securities deposited as initial margin are designated on the Consolidated Schedules of Investments and cash deposited, if any, is recorded on the Consolidated Statements of Assets and Liabilities as cash pledged for financial futures contracts. Pursuant to the contract, the Funds agree to receive from or pay to the broker an amount of cash equal to the daily fluctuation in value of the contract. Such receipts or payments are known as variation margin. Variation margin is recorded by the Funds as unrealized appreciation (depreciation) and, if applicable, as a receivable or payable for the variation margin in the Consolidated Statements of Assets and Liabilities.
When the contract is closed, the Funds record a realized gain or loss equal to the difference between the value of the contract at the time it was opened and the value at the time it was closed. The use of financial futures contracts involves the risk of an imperfect correlation in the movements in the price of financial futures contracts, interest or foreign currency exchange rates and the underlying assets.
Forward Foreign Currency Exchange Contracts: The Funds enter into forward foreign currency exchange contracts as an economic hedge against either specific transactions or portfolio instruments or to obtain exposure to, or hedge exposure away from, foreign currencies (foreign currency exchange rate risk). A forward foreign currency exchange contract is an agreement between two parties to buy and sell a currency at a set exchange rate on a future date. Forward foreign currency exchange contracts, when used by the Funds, help to manage the overall exposure to the currencies in which some of the investments held by the Funds are denominated. Non-deliverable forward foreign currency exchange contracts are settled with the counterparty in cash without the delivery of foreign currency. The contract is marked-to-market daily and the change in market value is recorded by the Funds as an unrealized gain or loss. When the contract is closed, the Funds record a realized gain or loss equal to the difference between the value at the time it was opened and the value at the time it was closed. The use of forward foreign currency exchange contracts involves the risk that the value of a forward foreign currency exchange contract changes unfavorably due to movements in the value of the referenced foreign currencies.
Options: The Funds purchase and write call and put options to increase or decrease their exposure to underlying instruments (including interest rate risk) and/or, in the case of options written, to generate gains from options premiums. A call option gives the purchaser (holder) of the option the right (but not the obligation) to buy, and obligates the seller (writer) to sell (when the option is exercised), the underlying instrument at the exercise or strike price at any time or at a specified time during the option period. A put option gives the holder the right to sell and obligates the writer to buy the underlying instrument at the exercise or strike price at any time or at a specified time during the option period. When the Funds purchase (write) an option, an amount equal to the premium paid (received) by the Funds are reflected as an asset (liability). The amount of the asset (liability) is subsequently marked-to-market to reflect the current market value of the option purchased (written). When an instrument is purchased or sold through an exercise of an option, the related premium paid (or received) is added to (or deducted from) the basis of the instrument acquired or deducted from (or added to) the proceeds of the instrument sold. When an option expires (or the Funds enter into a closing transaction), the Funds realize a gain or loss on the option to the extent of the premiums received or paid (or gain or loss to the extent the cost of the closing transaction exceeds the premiums received or paid). When the Funds write a call option, such option is “covered,” meaning that the Funds hold the underlying instrument subject to being called by the option counterparty. When the Funds write a put option, such option is covered by cash in an amount sufficient to cover the obligation.
Options on swaps (“swaptions”) are similar to options on securities except that instead of selling or purchasing the right to buy or sell a security, the writer or purchaser of the swaptions is granting or buying the right to enter into a previously agreed upon interest rate or credit default swap agreement (interest rate risk and/or credit risk) at any time before the expiration of the option.
| | | | | | |
| | | BLACKROCK FUNDS | | JANUARY 31, 2016 | | 43 |
| | |
| Notes to Consolidated Financial Statements (continued) | | |
In purchasing and writing options, the Funds bear the risk of an unfavorable change in the value of the underlying instrument or the risk that the Funds may not be able to enter into a closing transaction due to an illiquid market. Exercise of a written option could result in the Funds purchasing or selling a security when it otherwise would not, or at a price different from the current market value.
Swaps: The Funds enter into swap agreements, in which the Funds and a counterparty agree either to make periodic net payments on a specified notional amount or a net payment upon termination. Swap agreements are privately negotiated in the OTC market and may be entered into as a bilateral contract (“OTC swaps”) or centrally cleared (“centrally cleared swaps”). Swaps are marked-to-market daily and changes in value are recorded as unrealized appreciation (depreciation).
For OTC swaps, any upfront premiums paid are recorded as assets and any upfront fees received are recorded as liabilities and are shown as swap premiums paid and swap premiums received, respectively, in the Consolidated Statements of Assets and Liabilities and amortized over the term of the OTC swap. Payments received or made by the Funds for OTC swaps are recorded in the Consolidated Statements of Operations as realized gains or losses, respectively. When an OTC swap is terminated, the Funds will record a realized gain or loss equal to the difference between the proceeds from (or cost of) the closing transaction and the Funds’ basis in the contract, if any. Generally, the basis of the contract is the premium received or paid.
In a centrally cleared swap, immediately following execution of the swap agreement, the swap agreement is novated to a central counterparty (the “CCP”) and the Funds’ counterparty on the swap agreement becomes the CCP. The Funds are required to interface with the CCP through a broker. Upon entering into a centrally cleared swap, the Funds are required to deposit initial margin with the broker in the form of cash or securities in an amount that varies depending on the size and risk profile of the particular swap. Securities deposited as initial margin are designated on the Consolidated Schedules of Investments and cash deposited is recorded on the Consolidated Statements of Assets and Liabilities as cash pledged for centrally cleared swaps. The daily change in valuation of centrally cleared swaps is recorded as a receivable or payable for variation margin in the Consolidated Statements of Assets and Liabilities. Payments received from (paid to) the counterparty, including at termination, are recorded as realized gain (loss) in the Consolidated Statements of Operations.
Swap transactions involve, to varying degrees, elements of interest rate, credit and market risk in excess of the amounts recognized in the Consolidated Statements of Assets and Liabilities. Such risks involve the possibility that there will be no liquid market for these agreements, that the counterparty to the agreements may default on its obligation to perform or disagree as to the meaning of the contractual terms in the agreements, and that there may be unfavorable changes in interest rates and/or market values associated with these transactions.
| • | | Credit default swaps — The Funds enter into credit default swaps to manage their exposure to the market or certain sectors of the market, to reduce their risk exposure to defaults of corporate and/or sovereign issuers or to create exposure to corporate and/or sovereign issuers to which they are not otherwise exposed (credit risk). The Funds may either buy or sell (write) credit default swaps on single-name issuers (corporate or sovereign), a combination or basket of single-name issuers or traded indexes. Credit default swaps on single-name issuers are agreements in which the protection buyer pays fixed periodic payments to the seller in consideration for a guarantee from the protection seller to make a specific payment should a negative credit event take place with respect to the referenced entity (e.g., bankruptcy, failure to pay, obligation accelerators, repudiation, moratorium or restructuring). Credit default swaps on traded indexes are agreements in which the buyer pays fixed periodic payments to the seller in consideration for a guarantee from the seller to make a specific payment should a write-down, principal or interest shortfall or default of all or individual underlying securities included in the index occur. As a buyer, if an underlying credit event occurs, the Funds will either (i) receive from the seller an amount equal to the notional amount of the swap and deliver the referenced security or underlying securities comprising the index, or (ii) receive a net settlement of cash equal to the notional amount of the swap less the recovery value of the security or underlying securities comprising the index. As a seller (writer), if an underlying credit event occurs, the Funds will either pay the buyer an amount equal to the notional amount of the swap and take delivery of the referenced security or underlying securities comprising the index or pay a net settlement of cash equal to the notional amount of the swap less the recovery value of the security or underlying securities comprising the index. |
| • | | Total return swaps — The Funds enter into total return swaps to obtain exposure to a security or market without owning such security or investing directly in that market or to transfer the risk/return of one market (e.g., fixed income) to another market (e.g., equity or commodity prices) (equity risk, commodity price risk and/or interest rate risk). Total return swaps are agreements in which there is an exchange of cash flows whereby one party commits to make payments based on the total return (coupons plus capital gains/losses) of an underlying instrument in exchange for fixed or floating rate interest payments. To the extent the total return of the instrument or index underlying the transaction exceeds or falls short of the offsetting interest rate obligation, the Funds will receive a payment from or make a payment to the counterparty. |
| • | | Total return swaps (basket swaps) — The Funds enter into total return swap agreements to obtain exposure to a portfolio of long and short securities without owning such securities. Under the terms of an agreement, the swap is designed to function as a portfolio of direct investments in long |
| | | | | | |
| 44 | | BLACKROCK FUNDS | | JANUARY 31, 2016 | | |
| | |
| Notes to Consolidated Financial Statements (continued) | | |
| | and short equity. This means that each Fund has the ability to trade in and out of long and short positions within the swap and will receive the economic benefits and risks equivalent to direct investment in these positions such as: capital appreciation (depreciation), corporate actions and dividends received and paid, all of which are reflected in the swap value. The swap value also includes interest charges and credits (“financing fees”) related to the notional values of the long and short positions and cash balances within the swap. These interest charges and credits are based on a specified benchmark rate plus or minus a specified spread determined based upon the country and/or currency of the positions in the portfolio. A change in the market value of a total return swap is included in change in unrealized appreciation (depreciation) on swaps in the Consolidated Statements of Operations. Positions within the swap are reset periodically, and financing fees are reset monthly. During a reset, any unrealized gains (losses) on positions and accrued financing fees become available for cash settlement between the Funds and the swap counterparty. The amounts that are available for cash settlement are included in realized gains (losses) on swaps in the Consolidated Statements of Operations. Cash settlement in and out of the swap may occur at a reset date or any other date, at the discretion of the Funds and the counterparty, over the life of the agreement, and is generally determined based on limits and thresholds established as part of an International Swaps and Derivatives Association, Inc. Master Agreement (“ISDA Master Agreement”) between the Funds and the counterparty. Certain swaps have no stated expiration and can be terminated by either party at any time. |
Master Netting Arrangements: In order to better define the Funds’ contractual rights and to secure rights that will help them mitigate their counterparty risk, the Funds may enter into an International Swaps and Derivatives Association, Inc. Master Agreement (“ISDA Master Agreement”) or similar agreement with their counterparties. An ISDA Master Agreement is a bilateral agreement between each Fund and a counterparty that governs certain OTC derivatives and typically contains, among other things, collateral posting terms and netting provisions in the event of a default and/or termination event. Under an ISDA Master Agreement, each Fund may, under certain circumstances, offset with the counterparty certain derivative financial instruments’ payables and/or receivables with collateral held and/or posted and create one single net payment. The provisions of the ISDA Master Agreement typically permit a single net payment in the event of default including the bankruptcy or insolvency of the counterparty. Bankruptcy or insolvency laws of a particular jurisdiction may restrict or prohibit the right of offset in bankruptcy, insolvency or other events. In addition, certain ISDA Master Agreements allow counterparties to terminate derivative contracts prior to maturity in the event the Funds’ net assets decline by a stated percentage or the Funds fail to meet the terms of their ISDA Master Agreements. The result would cause the Funds to accelerate payment of any net liability owed to the counterparty.
Collateral Requirements: For derivatives traded under an ISDA Master Agreement, the collateral requirements are typically calculated by netting the mark-to-market amount for each transaction under such agreement and comparing that amount to the value of any collateral currently pledged by the Funds and the counterparty.
Cash collateral that has been pledged to cover obligations of the Funds and cash collateral received from the counterparty, if any, is reported separately on the Consolidated Statements of Assets and Liabilities as cash pledged as collateral and cash received as collateral, respectively. Non-cash collateral pledged by the Funds, if any, is noted in the Consolidated Schedules of Investments. Generally, the amount of collateral due from or to a party has to exceed a minimum transfer amount threshold (typically either $250,000 or $500,000) before a transfer is required, which is determined at the close of business of the Funds. Any additional required collateral is delivered to/pledged by the Funds on the next business day. Typically, a Fund’s counterparty is not permitted to sell, re-pledge or use cash and non-cash collateral it receives. A Fund generally agrees not to use non-cash collateral that it receives but may, absent default or certain other circumstances defined in the underlying ISDA Master Agreement, be permitted to use cash collateral received. In such cases, a Fund may pay interest pursuant to the collateral arrangement with the counterparty. To the extent amounts due to the Funds from their counterparties are not fully collateralized, the Funds bear the risk of loss from counterparty non-performance. Likewise, to the extent the Funds have delivered collateral to a counterparty and stands ready to perform under the terms of their agreement with such counterparty, the Funds bear the risk of loss from a counterparty in the amount of the value of the collateral in the event the counterparty fails to return such collateral. Based on the terms of agreements, collateral may not be required to all derivative contracts.
6. Investment Advisory Agreement and Other Transactions with Affiliates:
The PNC Financial Services Group, Inc. is the largest stockholder and an affiliate of BlackRock, Inc. (“BlackRock”) for 1940 Act purposes.
Investment Advisory Fees
The Trust, on behalf of the Funds, entered into an Investment Advisory Agreement with the Manager, the Funds’ investment advisor, an indirect, wholly owned subsidiary of BlackRock, to provide investment advisory and administration services. The Manager is responsible for the management of each Fund’s portfolio and provides the personnel, facilities, equipment and certain other services necessary to the operations of each Fund. For such
| | | | | | |
| | | BLACKROCK FUNDS | | JANUARY 31, 2016 | | 45 |
| | |
| Notes to Consolidated Financial Statements (continued) | | |
services, each Fund pays the Manager a monthly fee based on a percentage of each Fund’s average daily net assets at the following annual rates:
| | | | |
| | | Multi-Asset
Real Return | | Strategic Risk
Allocation |
| Average Daily Net Assets | | Investment Advisory Fees |
First $1 Billion | | 0.60% | | 0.75% |
$1 Billion - $3 Billion | | 0.56% | | 0.71% |
$3 Billion - $5 Billion | | 0.54% | | 0.68% |
$5 Billion - $10 Billion | | 0.52% | | 0.65% |
Greater than $10 Billion | | 0.51% | | 0.64% |
The Manager, with respect to each Fund, voluntarily agreed to waive its management fees by the amount of investment advisory fees each Fund pays to the Manager indirectly through its investment in affiliated money market funds. In addition, for Multi-Asset Real Return, the Manager has contractually agreed to waive the management fee on assets estimated to be attributed to the Fund’s investments in other equity and fixed income mutual funds managed by BlackRock or its affiliates. These amounts are included in fees waived by the Manager in the Consolidated Statements of Operations. However, for Strategic Risk Allocation, the Manager does not waive its management fees by the amount of investment advisory fees paid in connection with the Fund’s investments in other affiliated investment companies, if any. For the six months ended January 31, 2016, the amounts waived were as follows:
| | | | |
Multi-Asset Real Return | | $ | 31,596 | |
Strategic Risk Allocation | | $ | 4,801 | |
The Manager provides investment management and other services to the Subsidiaries. The Manager does not receive separate compensation from the Subsidiaries for providing investment management or administrative services. However, the Funds pay the Manager based on the Funds’ net assets, which includes the assets of the Subsidiaries.
The Manager, with respect to each Fund, entered into separate sub-advisory agreements with BlackRock International Limited (“BIL”), an affiliate of the Manager. With respect to Multi-Asset Real Return, the Manager has also entered into a separate sub-advisory agreement with BlackRock (Singapore) Limited (“BRS”), which is also an affiliate of the Manager. The Manager pays BIL and BRS, as applicable, for services they provide a monthly fee that is a percentage of the investment advisory fees paid by the Funds to the Manager.
Service and Distribution Fees
The Trust, on behalf of the Funds, entered into a Distribution Agreement and a Distribution and Service Plan with BlackRock Investments, LLC (“BRIL”), an affiliate of the Manager. Pursuant to the Distribution and Service Plan and in accordance with Rule 12b-1 under the 1940 Act, each Fund pays BRIL ongoing service and distribution fees. The fees are accrued daily and paid monthly at annual rates based upon the average daily net assets of the relevant share class of each Fund as follows:
| | | | | | |
| | | Service
Fee | | | Distribution
Fee |
Investor A | | | 0.25% | | | — |
Investor C | | | 0.25% | | | 0.75% |
Pursuant to sub-agreements with BRIL, broker-dealers and BRIL provide shareholder servicing and distribution services to the Funds. The ongoing service and/or distribution fee compensates BRIL and each broker-dealer for providing shareholder servicing and/or distribution related services to the shareholders.
For the six months ended January 31, 2016, the following table shows the class specific service and distribution fees borne directly by each share class of each Fund:
| | | | | | | | |
| | | Investor A | | Investor C | | Total | |
Multi-Asset Real Return | | $4,027 | | $8,667 | | | $12,694 | |
Strategic Risk Allocation | | $1,948 | | $3,115 | | | $ 5,063 | |
Other Fees
Pursuant to written agreements, certain financial intermediaries, some of which may be affiliates, provide the Funds with sub-accounting, recordkeeping, sub-transfer agency and other administrative services with respect to sub-accounts they service. For these services, these entities receive an asset-based fee or an annual fee per shareholder account, which will vary depending on share class and/or net assets.
| | | | | | |
| 46 | | BLACKROCK FUNDS | | JANUARY 31, 2016 | | |
| | |
| Notes to Consolidated Financial Statements (continued) | | |
The Manager maintains a call center, that is responsible for providing certain shareholder services to the Funds. Shareholder services include responding to inquiries and processing subscriptions and redemptions based upon instructions from shareholders. For the six months ended January 31, 2016, each Fund reimbursed the Manager the following amounts for costs incurred in running the call center, which are included in transfer agent — class specific in the Consolidated Statements of Operations:
| | | | | | | | |
| | | Institutional | | Investor A | | Investor C | | Total |
Multi-Asset Real Return | | $101 | | $100 | | $98 | | $299 |
Strategic Risk Allocation | | $108 | | $ 62 | | $29 | | $199 |
For the six months ended January 31, 2016, the following table shows the class specific transfer agent fees borne directly by each class of each Fund:
| | | | | | | | |
| | | Institutional | | Investor A | | Investor C | | Total |
Multi-Asset Real Return | | $20,220 | | $2,165 | | $1,270 | | $23,655 |
Strategic Risk Allocation | | $ 4,561 | | $1,537 | | $ 378 | | $ 6,476 |
The Trust, on behalf of the Funds, entered into an Administration Agreement with the Manager, an indirect, wholly-owned subsidiary of BlackRock, to provide administrative services. For these services, the Manager receives an administration fee computed daily and payable monthly, based on a percentage of the average daily net assets of the Funds. The administration fees, which is shown as administration in the Consolidated Statements of Operations, is paid at the annual rates below.
| | |
| Average Daily Net Assets | | Administration Fees |
First $500 Million | | 0.0425% |
$500 Million - $1 Billion | | 0.0400% |
$1 Billion - $2 Billion | | 0.0375% |
$2 Billion - $4 Billion | | 0.0350% |
$4 Billion - $13 Billion | | 0.0325% |
Greater than $13 Billion | | 0.0300% |
In addition, the Manager charges each of the share classes an administration fee, which is shown as administration — class specific in the Consolidated Statements of Operations, at an annual rate of 0.02% of the average daily net assets of each respective class.
For the six months ended January 31, 2016, the following table shows the class specific administration fees borne directly by each class of each Fund:
| | | | | | | | |
| | | Institutional | | Investor A | | Investor C | | Total |
Multi-Asset Real Return | | $5,252 | | $322 | | $174 | | $5,748 |
Strategic Risk Allocation | | $3,182 | | $156 | | $ 62 | | $3,400 |
The Manager may have, at its discretion, voluntarily waived all or any portion of its administration fees for a Fund or a share class, which are included in administration fees waived and administration fees waived — class specific in the Consolidated Statements of Operations.
For the six months ended January 31, 2016, affiliates earned underwriting discounts, direct commissions and dealer concessions on sales of the Funds’ Investor A Shares as follows:
| | | | |
Multi-Asset Real Return | | $ | 141 | |
Strategic Risk Allocation | | $ | 56 | |
For the six months ended January 31, 2016, affiliates received CDSCs of $369 for Investor C Shares of Multi-Asset Real Return.
Expense Limitations, Waivers and Recoupments
The Manager, with respect to each Fund, contractually agreed to waive and/or reimburse fees or expenses in order to limit expenses, excluding interest expense, dividend expense, tax expense, acquired fund fees and expenses and certain other fund expenses, which constitute extraordinary expenses not incurred in the ordinary course of the Funds’ business.
| | | | | | |
| | | BLACKROCK FUNDS | | JANUARY 31, 2016 | | 47 |
| | |
| Notes to Consolidated Financial Statements (continued) | | |
The Manager has agreed not to reduce or discontinue these contractual expense limitations prior to December 1, 2016 unless approved by the Board, including a majority of the Independent Trustees or by a vote of a majority of the outstanding voting securities of a fund. The expense limitations as a percentage of average daily net assets are as follows:
| | | | | | | | | | | | |
| | | Institutional | | | Investor A | | | Investor C | |
Multi-Asset Real Return | | | 0.80% | | | | 1.05% | | | | 1.80% | |
Strategic Risk Allocation | | | 1.00% | | | | 1.25% | | | | 2.00% | |
These amounts waived and/or reimbursed are included in fees waived by the Manager, and shown as administration fees waived — class specific, transfer agent fees waived — class specific and transfer agent fees reimbursed — class specific, respectively, in the Consolidated Statements of Operations. For the six months ended January 31, 2016, the amounts included in fees waived by the Manager were as follows:
| | | | |
Multi-Asset Real Return | | | $55,674 | |
Strategic Risk Allocation | | | $74,037 | |
Class specific expense waivers or reimbursements are as follows:
| | | | | | | | |
| Administration Fees Waived | | Institutional | | Investor A | | Investor C | | Total |
Multi-Asset Real Return | | $5,028 | | $322 | | $173 | | $5,523 |
Strategic Risk Allocation | | $3,181 | | $156 | | $ 62 | | $3,399 |
| | | | | | | | |
| Transfer Agent Fees Waived | | Institutional | | Investor A | | Investor C | | Total |
Multi-Asset Real Return | | $ 96 | | $99 | | $98 | | $293 |
Strategic Risk Allocation | | $107 | | $62 | | $29 | | $198 |
| | | | | | | | |
| Transfer Agent Fees Reimbursed | | Institutional | | Investor A | | Investor C | | Total |
Multi-Asset Real Return | | $17,897 | | $1,879 | | $1,149 | | $20,925 |
Strategic Risk Allocation | | $ 4,262 | | $1,471 | | $ 339 | | $ 6,072 |
If during a Fund’s fiscal year the operating expenses of a share class, that at any time during the prior two fiscal years received a waiver and/or reimbursement from the Manager, are less than the expense limit for that share class, the Manager is entitled to be reimbursed by such share class up to the lesser of (a) the amount of fees waived and/or expenses reimbursed during those prior two fiscal years under the agreement and (b) the amount by which the expense limit for that share class exceeds the operating expenses of the share class for the current fiscal year, provided that: (1) each Fund, of which the share class is a part, has more than $50 million in assets for the fiscal year, and (2) the Manager or an affiliate continues to serve as a Fund’s investment advisor or administrator. In the event the expense limit for a share class is changed subsequent to a fiscal year in which the Manager becomes entitled to reimbursement for fees waived and/or reimbursed, the amount available to reimburse the Manager shall be calculated by reference to the expense limit for that share class in effect at the time the Manager became entitled to receive such reimbursement, rather than the subsequently changed expense limit for that share class.
On January 31, 2016, the Fund level and class specific waivers and/or reimbursements subject to possible future recoupment under the expense limitation agreement are as follows:
| | | | | | | | | | | | |
| | | Expiring July 31, | |
| | | 2016 | | | 2017 | | | 2018 | |
Multi-Asset Real Return | | | | | | | | | | | | |
Fund Level | | $ | 115,838 | | | $ | 112,927 | | | $ | 57,188 | |
Institutional | | $ | 25,915 | | | $ | 56,679 | | | $ | 23,021 | |
Investor A | | $ | 2,291 | | | $ | 7,648 | | | $ | 2,301 | |
Investor C | | $ | 1,234 | | | $ | 3,102 | | | $ | 1,420 | |
Strategic Risk Allocation | | | | | | | | | | | | |
Fund Level | | $ | 162,792 | | | $ | 151,290 | | | $ | 74,692 | |
Institutional | | $ | 6,828 | | | $ | 8,688 | | | $ | 7,550 | |
Investor A | | $ | 641 | | | $ | 2,796 | | | $ | 1,689 | |
Investor C | | $ | 480 | | | $ | 603 | | | $ | 430 | |
| | | | | | |
| 48 | | BLACKROCK FUNDS | | JANUARY 31, 2016 | | |
| | |
| Notes to Consolidated Financial Statements (continued) | | |
Securities Lending
The U.S. Securities and Exchange Commission has issued an exemptive order which permits BIM, an affiliate of the Manager, to serve as securities lending agent for the Funds, subject to applicable conditions. As securities lending agent, BIM bears all operational costs directly related to securities lending. The Funds are responsible for expenses in connection with the investment of cash collateral received for securities on loan (the “collateral investment expenses”). The cash collateral is invested in a private investment company managed by the Manager or its affiliates. However, BIM has agreed to cap the collateral investment expenses of the private investment company to an annual rate of 0.04%. The investment advisor to the private investment company will not charge any advisory fees with respect to shares purchased by the Funds.
Securities lending income is equal to the total of income earned from the reinvestment of cash collateral, net of fees and other payments to and from borrowers of securities, and less the collateral investment expenses. Each Fund retains a portion of securities lending income and remits a remaining portion to BIM as compensation for its services as securities lending agent. Pursuant to a securities lending agreement, BIM may lend securities only when the difference between the borrower rebate rate and the risk free rate exceeds a certain level (such securities, the “specials only securities”).
Pursuant to such agreement, each Fund retains 80% of securities lending income. In addition, commencing the business day following the date that the aggregate securities lending income earned across certain funds in the Equity-Liquidity Complex in a calendar year exceeds a specified threshold, each Fund, pursuant to the securities lending agreement, will retain for the remainder of the calendar year securities lending income in an amount equal to 85% of securities lending income.
The share of securities lending income earned by each Fund is shown as securities lending — affiliated — net in the Consolidated Statements of Operations. For the six months ended January 31, 2016, Multi-Asset Real Return paid BIM $167 for securities lending agent services.
Officer and Trustees Fees
Certain officers and/or trustees of the Trust are officers and/or directors of BlackRock or its affiliates. The Funds reimburse the Manager for a portion of the compensation paid to the Trust’s Chief Compliance Officer, which is included in officer and trustees in the Consolidated Statements of Operations.
7. Purchases and Sales:
For the six months ended January 31, 2016, purchases and sales of investments, excluding short-term securities were as follows:
| | | | | | | | |
| Purchases | | Multi-Asset
Real Return | | | Strategic Risk
Allocation | |
Non-U.S. Government Securities | | | $3,482,587 | | | | — | |
U.S. Government Securities | | | 1,690,153 | | | | — | |
| | | | |
Total Purchases | | | $5,172,740 | | | | — | |
| | | | |
| | | | | | | | |
| Sales | | Multi-Asset
Real Return | | | Strategic Risk
Allocation | |
Non-U.S. Government Securities | | | $11,757,812 | | | | $5,526,591 | |
U.S. Government Securities | | | 6,284,677 | | | | — | |
| | | | |
Total Sales | | | $18,042,489 | | | | $5,526,591 | |
| | | | |
8. Income Tax Information:
It is the Funds’ policy to comply with the requirements of the Internal Revenue Code of 1986, as amended, applicable to regulated investment companies, and to distribute substantially all of their taxable income to their shareholders. Therefore, no federal income tax provision is required.
The Funds file U.S. federal and various state and local tax returns. No income tax returns are currently under examination. The statute of limitations on the Funds’ U.S. federal tax returns remains open for the two years ended July 31, 2015 and the period ended July 31, 2013. The statutes of limitations on the Funds’ state and local tax returns may remain open for an additional year depending upon the jurisdiction.
Management has analyzed tax laws and regulations and their application to the Funds as of January 31, 2016, inclusive of the open tax return years, and does not believe there are any uncertain tax positions that require recognition of a tax liability in the Funds’ consolidated financial statements.
As of period end, Multi-Asset Real Return had a capital loss carryforward of $201,973, with no expiration dates, available to offset future realized capital gains.
| | | | | | |
| | | BLACKROCK FUNDS | | JANUARY 31, 2016 | | 49 |
| | |
| Notes to Consolidated Financial Statements (continued) | | |
As of period end, gross unrealized appreciation and depreciation based on cost for federal income tax purposes were as follows:
| | | | | | | | |
| |
| | | Multi-Asset
Real Return | | | Strategic Risk
Allocation | |
| | | | |
Tax cost | | $ | 51,263,530 | | | $ | 24,842,006 | |
| | | | |
Gross unrealized appreciation | | $ | 1,142,590 | | | $ | 18,251 | |
Gross unrealized depreciation | | | (3,187,446 | ) | | | (2,094,945 | ) |
| | | | |
Net unrealized depreciation | | $ | (2,044,856 | ) | | $ | (2,076,694 | ) |
| | | | |
9. Bank Borrowings:
The Trust, on behalf of the Funds, along with certain other funds managed by the Manager and its affiliates (“Participating Funds”), is a party to a 364-day, $2.1 billion credit agreement with a group of lenders, under which the Funds may borrow to fund shareholder redemptions. Excluding commitments designated for certain funds, the Participating Funds, including the Funds, can borrow up to an aggregate commitment amount of $1.6 billion at any time outstanding, subject to asset coverage and other limitations as specified in the agreement. The credit agreement has the following terms: a fee of 0.06% per annum on unused commitment amounts and interest at a rate equal to the higher of (a) one-month LIBOR (but in any event, not less than 0.00%) on the date the loan is made plus 0.80% per annum or (b) the Fed Funds rate (but in any event, not less than 0.00%) in effect from time to time plus 0.80% per annum on amounts borrowed. The agreement expires in April 2016 unless extended or renewed. Participating Funds paid administration, legal and arrangement fees, which, if applicable, are included in miscellaneous expenses in the Consolidated Statements of Operations, and along with commitment fees, were allocated among such funds based upon portions of the aggregate commitment available to them and relative net assets of Participating Funds. During the six months ended January 31, 2016, the Funds did not borrow under the credit agreement.
10. Principal Risks:
In the normal course of business, the Funds invest in securities and enter into transactions where risks exist due to fluctuations in the market (market risk) or failure of the issuer of a security to meet all its obligations, including to pay principal and interest when due (issuer credit risk). The value of securities held by the Funds may decline in response to certain events, including those directly involving the issuers whose securities are owned by the Funds. Changes arising from the general economy, the overall market and local, regional or global political and/or social instability, as well as currency, interest rate and price fluctuations, may also affect the securities’ value.
Each Fund may be exposed to prepayment risk, which is the risk that borrowers may exercise their option to prepay principal earlier than scheduled during periods of declining interest rates, which would force each Fund to reinvest in lower yielding securities. Each Fund may also be exposed to reinvestment risk, which is the risk that income from each Fund’s portfolio will decline if each Fund invests the proceeds from matured, traded or called fixed income securities at market interest rates that are below each Fund portfolio’s current earnings rate.
Counterparty Credit Risk: Similar to issuer credit risk, the Funds may be exposed to counterparty credit risk, or the risk that an entity may fail to or be unable to perform on its commitments related to unsettled or open transactions. The Funds manages counterparty credit risk by entering into transactions only with counterparties that the Manager believes have the financial resources to honor their obligations and by monitoring the financial stability of those counterparties. Financial assets, which potentially expose the Funds to market, issuer and counterparty credit risks, consist principally of financial instruments and receivables due from counterparties. The extent of the Funds’ exposure to market, issuer and counterparty credit risks with respect to these financial assets is approximately their value recorded in the Consolidated Statements of Assets and Liabilities, less any collateral held by the Funds.
A derivative contract may suffer a mark-to-market loss if the value of the contract decreases due to an unfavorable change in the market rates or values of the underlying instrument. Losses can also occur if the counterparty does not perform under the contract.
The Funds’ risk of loss from counterparty credit risk on OTC derivatives is generally limited to the aggregate unrealized gain less the value of any collateral held by such Fund.
For OTC options purchased, each Fund bears the risk of loss in the amount of the premiums paid plus the positive change in market values net of any collateral held by the Funds should the counterparty fail to perform under the contracts. Options written by the Funds do not typically give rise to counterparty credit risk, as options written generally obligate the Funds, and not the counterparty, to perform. The Funds may be exposed to counterparty credit risk with respect to options written to the extent the Funds deposit collateral with its counterparty to a written option.
With exchange-traded futures and centrally cleared swaps, there is less counterparty credit risk to the Funds since the exchange or clearinghouse, as counterparty to such instruments, guarantees against a possible default. The clearinghouse stands between the buyer and the seller of the contract;
| | | | | | |
| 50 | | BLACKROCK FUNDS | | JANUARY 31, 2016 | | |
| | |
| Notes to Consolidated Financial Statements (continued) | | |
therefore, credit risk is limited to failure of the clearinghouse. While offset rights may exist under applicable law, a Fund does not have a contractual right of offset against a clearing broker or clearinghouse in the event of a default (including the bankruptcy or insolvency). Additionally, credit risk exists in exchange-traded futures with respect to initial and variation margin that is held in a clearing broker’s customer accounts. While clearing brokers are required to segregate customer margin from their own assets, in the event that a clearing broker becomes insolvent or goes into bankruptcy and at that time there is a shortfall in the aggregate amount of margin held by the clearing broker for all its clients, typically the shortfall would be allocated on a pro rata basis across all the clearing broker’s customers, potentially resulting in losses to the Funds.
Concentration Risk: The Funds invest a significant portion of their assets in fixed-income securities and/or use derivatives tied to the fixed-income markets. Changes in market interest rates or economic conditions may affect the value and/or liquidity of such investments. Interest rate risk is the risk that prices of bonds and other fixed-income securities will increase as interest rates fall and decrease as interest rates rise. The Funds may be subject to a greater risk of rising interest rates due to the current period of historically low rates.
11. Capital Share Transactions:
Transactions in capital shares for each class were as follows:
| | | | | | | | | | | | | | | | | | |
| | | Six Months
Ended
January 31, 2016 | | | | | Year
Ended
July 31, 2015 | |
| Multi-Asset Real Return | | Shares | | | Amount | | | | | Shares | | | Amount | |
Institutional | | | | | | | | | | | | | | | | | | |
Shares sold | | | 455,917 | | | | $ 4,201,000 | | | | | | 2,762,567 | | | | $ 27,927,767 | |
Shares issued in reinvestment of distributions | | | 15,886 | | | | 142,655 | | | | | | 85,894 | | | | 834,881 | |
Shares redeemed | | | (1,580,822) | | | | (14,624,915) | | | | | | (2,737,572) | | | | (27,070,579) | |
| | | | | | | | | | |
Net increase (decrease) | | | (1,109,019) | | | | $(10,281,260) | | | | | | 110,889 | | | | $ 1,692,069 | |
| | | | | | | | | | |
| | | | | | | | | | | | | | | | | | |
Investor A | | | | | | | | | | | | | | | | | | |
Shares sold | | | 150,964 | | | | $ 1,395,597 | | | | | | 155,266 | | | | $ 1,591,010 | |
Shares issued in reinvestment of distributions | | | 3,958 | | | | 35,460 | | | | | | 12,726 | | | | 123,436 | |
Shares redeemed | | | (150,379) | | | | (1,359,908) | | | | | | (762,189) | | | | (7,914,129) | |
| | | | | | | | | | |
Net increase (decrease) | | | 4,543 | | | | $ 71,149 | | | | | | (594,197) | | | | $(6,199,683) | |
| | | | | | | | | | |
| | | | | | | | | | | | | | | | | | |
Investor C | | | | | | | | | | | | | | | | | | |
Shares sold | | | 36,793 | | | | $ 333,192 | | | | | | 55,003 | | | | $ 555,355 | |
Shares issued in reinvestment of distributions | | | 364 | | | | 3,252 | | | | | | 6,861 | | | | 66,138 | |
Shares redeemed | | | (84,259) | | | | (770,669) | | | | | | (67,026) | | | | (660,313) | |
| | | | | | | | | | |
Net decrease | | | (47,102) | | | | $ (434,225) | | | | | | (5,162) | | | | $ (38,820) | |
| | | | | | | | | | |
Total Net Decrease | | | (1,151,578) | | | | $(10,644,336) | | | | | | (488,470) | | | | $(4,546,434) | |
| | | | | | | | | | |
| | | | | | | | | | | | | | | | | | |
| Strategic Risk Allocation | | | | | | | | | | | | | | |
Institutional | | | | | | | | | | | | | | | | | | |
Shares sold | | | 45,561 | | | | $ 442,289 | | | | | | 1,124,130 | | | | $11,494,501 | |
Shares issued in reinvestment of distributions | | | 19,705 | | | | 177,740 | | | | | | 2,482 | | | | 24,495 | |
Shares redeemed | | | (559,901) | | | | (5,401,043) | | | | | | (157,069) | | | | (1,573,355) | |
| | | | | | | | | | |
Net increase (decrease) | | | (494,635) | | | | $(4,781,014) | | | | | | 969,543 | | | | $ 9,945,641 | |
| | | | | | | | | | |
| | | | | | | | | | | | | | | | | | |
Investor A | | | | | | | | | | | | | | | | | | |
Shares sold | | | 13,323 | | | | $ 125,137 | | | | | | 118,385 | | | | $1,207,729 | |
Shares issued in reinvestment of distributions | | | 6,504 | | | | 58,600 | | | | | | 4,654 | | | | 45,839 | |
Shares redeemed | | | (49,991) | | | | (471,040) | | | | | | (41,191) | | | | (413,225) | |
| | | | | | | | | | |
Net increase (decrease) | | | (30,164) | | | | $(287,303) | | | | | | 81,848 | | | | $ 840,343 | |
| | | | | | | | | | |
| | | | | | |
| | | BLACKROCK FUNDS | | JANUARY 31, 2016 | | 51 |
| | |
| Notes to Consolidated Financial Statements (concluded) | | |
| | | | | | | | | | | | | | | | | | |
| | | Six Months
Ended
January 31, 2016 | | | | | Year
Ended
July 31, 2015 | |
| Strategic Risk Allocation (concluded) | | Shares | | | Amount | | | | | Shares | | | Amount | |
Investor C | | | | | | | | | | | | | | | | | | |
Shares sold | | | 6,290 | | | $ | 58,650 | | | | | | 102,446 | | | $ | 1,032,359 | |
Shares issued in reinvestment of distributions | | | 1,605 | | | | 14,432 | | | | | | 1,984 | | | | 19,449 | |
Shares redeemed | | | (37,872 | ) | | | (358,159) | | | | | | (57,989 | ) | | | (577,579) | |
| | | | | | | | | | |
Net increase (decrease) | | | (29,977 | ) | | $ | (285,077) | | | | | | 46,441 | | | $ | 474,229 | |
| | | | | | | | | | |
Total Net Increase (Decrease) | | | (554,776 | ) | | $ | (5,353,394) | | | | | | 1,097,832 | | | $ | 11,260,213 | |
| | | | | | | | | | |
At January 31, 2016, shares owned by BlackRock HoldCo 2, Inc., an affiliate of Strategic Risk Allocation, were as follows:
| | | | | | |
| | | Institutional | | Investor A | | Investor C |
Shares | | 2,504,182 | | 2,509 | | 2,509 |
12. Subsequent Events:
Management has evaluated the impact of all subsequent events on the Funds through the date the consolidated financial statements were issued and has determined that there were no subsequent events requiring adjustment or additional disclosure in the consolidated financial statements.
| | | | | | |
| 52 | | BLACKROCK FUNDS | | JANUARY 31, 2016 | | |
Rodney D. Johnson, Chair of the Board and Trustee
David O. Beim, Trustee
Collette Chilton, Trustee
Frank J. Fabozzi, Trustee
Dr. Matina S. Horner, Trustee
Cynthia A. Montgomery, Trustee
Joseph P. Platt, Trustee
Robert C. Robb, Jr., Trustee
Mark Stalnecker, Trustee
Kenneth L. Urish, Trustee
Frederick W. Winter, Trustee
Barbara G. Novick, Trustee
John M. Perlowski, Trustee, President and Chief Executive Officer
Richard Hoerner, CFA, Vice President
Jennifer McGovern, Vice President
Neal J. Andrews, Chief Financial Officer
Jay M. Fife, Treasurer
Charles Park, Chief Compliance Officer
Fernanda Piedra, Anti-Money Laundering Compliance Officer
Benjamin Archibald, Secretary
Effective September 25, 2015, John M. Perlowski was appointed to serve as an Interested Trustee of the Trust.
Effective December 31, 2015, Herbert I. London and Toby Rosenblatt retired as Trustees of the Trust.
Effective February 5, 2016, Frank J. Fabozzi resigned as a Trustee of the Trust.
Effective February 8, 2016, Susan J. Carter, Neil A. Cotty and Claire A. Walton were appointed to serve as Trustees of the Trust.
| | | | | | |
| | | | |
Investment Advisor and Administrator BlackRock Advisors, LLC Wilmington, DE 19809 | | Sub-Advisors BlackRock International Limited Edinburgh, United Kingdom EH3 8BL BlackRock (Singapore) Limited1 079912 Singapore | | Accounting Agent and Transfer Agent BNY Mellon Investment Servicing (US) Inc. Wilmington, DE 19809 | | Custodian The Bank of New York Mellon New York, NY 10286 |
| | | | | | |
Distributor BlackRock Investments, LLC New York, NY 10022 | | Legal Counsel Sidley Austin LLP New York, NY 10019 | | Independent Registered Public Accounting Firm Deloitte & Touche LLP Philadelphia, PA 19103 | | Address of the Trust 100 Bellevue Parkway Wilmington, DE 19809 |
| | 1 | | For Multi-Asset Real Return. |
| | | | | | |
| | | BLACKROCK FUNDS | | JANUARY 31, 2016 | | 53 |
Householding
The Funds will mail only one copy of shareholder documents, including prospectuses, annual and semi-annual reports and proxy statements, to shareholders with multiple accounts at the same address. This practice is commonly called “householding” and is intended to reduce expenses and eliminate duplicate mailings of shareholder documents. Mailings of your shareholder documents may be householded indefinitely unless you instruct us otherwise. If you do not want the mailing of these documents to be combined with those for other members of your household, please call the Funds at (800) 441-7762.
Availability of Quarterly Schedule of Investments
The Funds file their complete schedule of portfolio holdings with the SEC for the first and third quarters of each fiscal year on Form N-Q. The Funds’ Forms N-Q are available on the SEC’s website at http://www.sec.gov and may also be reviewed and copied at the SEC’s Public Reference Room in Washington, DC. Information on how to access documents on the SEC’s website without charge may be obtained by calling (800) SEC-0330. The Funds’ Forms N-Q may also be obtained upon request and without charge by calling (800) 441-7762.
Availability of Proxy Voting Policies and Procedures
A description of the policies and procedures that the Funds use to determine how to vote proxies relating to portfolio securities is available upon request and without charge, (1) by calling (800) 441-7762; (2) at http://www.blackrock.com; and (3) on the SEC’s website at http://www.sec.gov.
Availability of Proxy Voting Record
Information about how the Funds voted proxies relating to securities held in the Funds’ portfolios during the most recent 12-month period ended June 30 is available upon request and without charge (1) at http://www.blackrock.com or by calling (800) 441-7762 and (2) on the SEC’s website at http://www.sec.gov.
BlackRock’s Mutual Fund Family
BlackRock offers a diverse lineup of open-end mutual funds crossing all investment styles and managed by experts in equity, fixed income and tax-exempt investing. Visit http://www.blackrock.com for more information.
Account Information
Call us at (800) 441-7762 from 8:00 AM to 6:00 PM EST on any business day to get information about your account balances, recent transactions and share prices. You can also reach us on the Web at http://www.blackrock.com/funds.
Automatic Investment Plans
Investor Class shareholders who want to invest regularly can arrange to have $50 or more automatically deducted from their checking or savings account and invested in any of the BlackRock funds.
Systematic Withdrawal Plans
Investor Class shareholders can establish a systematic withdrawal plan and receive periodic payments of $50 or more from their BlackRock funds, as long as their account balance is at least $10,000.
Retirement Plans
Shareholders may make investments in conjunction with Traditional, Rollover, Roth, Coverdell, Simple IRAs, SEP IRAs and 403(b) Plans.
| | | | | | |
| 54 | | BLACKROCK FUNDS | | JANUARY 31, 2016 | | |
| | |
| Additional Information (concluded) | | |
|
| BlackRock Privacy Principles |
BlackRock is committed to maintaining the privacy of its current and former fund investors and individual clients (collectively, “Clients”) and to safeguarding their non-public personal information. The following information is provided to help you understand what personal information BlackRock collects, how we protect that information and why in certain cases we share such information with select parties.
If you are located in a jurisdiction where specific laws, rules or regulations require BlackRock to provide you with additional or different privacy-related rights beyond what is set forth below, then BlackRock will comply with those specific laws, rules or regulations.
BlackRock obtains or verifies personal non-public information from and about you from different sources, including the following: (i) information we receive from you or, if applicable, your financial intermediary, on applications, forms or other documents; (ii) information about your transactions with us, our affiliates, or others; (iii) information we receive from a consumer reporting agency; and (iv) from visits to our websites.
BlackRock does not sell or disclose to non-affiliated third parties any non-public personal information about its Clients, except as permitted by law or as is necessary to respond to regulatory requests or to service Client accounts. These non-affiliated third parties are required to protect the confidentiality and security of this information and to use it only for its intended purpose.
We may share information with our affiliates to service your account or to provide you with information about other BlackRock products or services that may be of interest to you. In addition, BlackRock restricts access to non-public personal information about its Clients to those BlackRock employees with a legitimate business need for the information. BlackRock maintains physical, electronic and procedural safeguards that are designed to protect the non-public personal information of its Clients, including procedures relating to the proper storage and disposal of such information.
| | | | | | |
| | | BLACKROCK FUNDS | | JANUARY 31, 2016 | | 55 |
| | |
This report is intended for current holders. It is not authorized for use as an offer of sale or a solicitation of an offer to buy shares of the Fund unless preceded or accompanied by the Fund’s current prospectus. Past performance results shown in this report should not be considered a representation of future performance. Investment returns and principal value of shares will fluctuate so that shares, when redeemed, may be worth more or less than their original cost. Statements and other information herein are as dated and are subject to change. | | 
|
| | |
MRRSRA-1/16-SAR | |  |
| Item 2 – | Code of Ethics – Not Applicable to this semi-annual report |
| Item 3 – | Audit Committee Financial Expert – Not Applicable to this semi-annual report |
| Item 4 – | Principal Accountant Fees and Services – Not Applicable to this semi-annual report |
| Item 5 – | Audit Committee of Listed Registrants – Not Applicable |
(a) The registrant’s Schedule of Investments is included as part of the Report to Stockholders filed under Item 1 of this Form.
(b) Not Applicable due to no such divestments during the semi-annual period covered since the previous Form N-CSR filing.
| Item 7 – | Disclosure of Proxy Voting Policies and Procedures for Closed-End Management Investment Companies – Not Applicable |
| Item 8 – | Portfolio Managers of Closed-End Management Investment Companies – Not Applicable |
| Item 9 – | Purchases of Equity Securities by Closed-End Management Investment Company and Affiliated Purchasers – Not Applicable |
| Item 10 – | Submission of Matters to a Vote of Security Holders –There have been no material changes to these procedures. |
| Item 11 – | Controls and Procedures |
(a) – The registrant’s principal executive and principal financial officers, or persons performing similar functions, have concluded that the registrant’s disclosure controls and procedures (as defined in Rule 30a-3(c) under the Investment Company Act of 1940, as amended (the “1940 Act”)) are effective as of a date within 90 days of the filing of this report based on the evaluation of these controls and procedures required by Rule 30a-3(b) under the 1940 Act and Rule 15d-15(b) under the Securities Exchange Act of 1934, as amended.
(b) – There were no changes in the registrant’s internal control over financial reporting (as defined in Rule 30a-3(d) under the 1940 Act) that occurred during the second fiscal quarter of the period covered by this report that have materially affected, or are reasonably likely to materially affect, the registrant’s internal control over financial reporting.
| Item 12 – | Exhibits attached hereto |
(a)(1) – Code of Ethics – Not Applicable to this semi-annual report
(a)(2) – Certifications – Attached hereto
(a)(3) – Not Applicable
(b) – Certifications – Attached hereto
2
Pursuant to the requirements of the Securities Exchange Act of 1934 and the Investment Company Act of 1940, the registrant has duly caused this report to be signed on its behalf by the undersigned, thereunto duly authorized.
BlackRock Funds
| | |
| By: | | /s/ John M. Perlowski |
| | John M. Perlowski |
| | Chief Executive Officer (principal executive officer) of |
| | BlackRock Funds |
Date: April 1, 2016
Pursuant to the requirements of the Securities Exchange Act of 1934 and the Investment Company Act of 1940, this report has been signed below by the following persons on behalf of the registrant and in the capacities and on the dates indicated.
| | |
| By: | | /s/ John M. Perlowski |
| | John M. Perlowski |
| | Chief Executive Officer (principal executive officer) of |
| | BlackRock Funds |
Date: April 1, 2016
| | |
| By: | | /s/ Neal J. Andrews |
| | Neal J. Andrews |
| | Chief Financial Officer (principal financial officer) of |
| | BlackRock Funds |
Date: April 1, 2016
3