UNITED STATES
SECURITIES AND EXCHANGE COMMISSION
Washington, D.C. 20549
FORM N-CSR
CERTIFIED SHAREHOLDER REPORT OF REGISTERED MANAGEMENT INVESTMENT
COMPANIES
Investment Company Act file number: 811-05742
Name of Fund: BlackRock Funds
BlackRock Disciplined Small Cap Core Fund
Fund Address: 100 Bellevue Parkway, Wilmington, DE 19809
Name and address of agent for service: John M. Perlowski, Chief Executive Officer, BlackRock Funds, 55 East 52nd
Street, New York, NY 10055
Registrant’s telephone number, including area code: (800) 441-7762
Date of fiscal year end: 05/31/2016
Date of reporting period: 11/30/2015
Item 1 – Report to Stockholders
NOVEMBER 30, 2015
| | | | |
SEMI-ANNUAL REPORT (UNAUDITED) | | | | BLACKROCK® |
| | | | |
| | BlackRock Disciplined Small Cap Core Fund | | of BlackRock FundsSM |
| | | | |
| | BlackRock Small Cap Growth Fund II | | of BlackRock Series, Inc. |
| | |
| Not FDIC Insured ¡ May Lose Value ¡ No Bank Guarantee | | |
| | |
| | |

| | Shareholders can sign up for e-mail notifications of quarterly statements, annual and semi-annual shareholder reports and prospectuses by enrolling in the electronic delivery program. Electronic copies of shareholder reports and prospectuses are also available on BlackRock’s website. TO ENROLL IN ELECTRONIC DELIVERY: Shareholders Who Hold Accounts with Investment Advisors, Banks or Brokerages: Please contact your financial advisor. Please note that not all investment advisors, banks or brokerages may offer this service. Shareholders Who Hold Accounts Directly with BlackRock: 1. Access the BlackRock website at blackrock.com 2. Select “Access Your Account” 3. Next, select “eDelivery” in the “Related Resources” box and follow the sign-up instructions |
| | | | | | |
| 2 | | SEMI-ANNUAL REPORT | | NOVEMBER 30, 2015 | | |
Dear Shareholder,
Diverging monetary policies and shifting economic outlooks across regions have been the overarching themes driving financial markets over the past couple of years. With U.S. growth outpacing the global economic recovery in 2015, the Federal Reserve (the “Fed”) has been posturing for a change from its low-rate policy while the European Central Bank (ECB) and the Bank of Japan have taken a more accommodative stance. In this environment, the U.S. dollar strengthened considerably, causing profit challenges for U.S. exporters and high levels of volatility in emerging market currencies and commodity prices. After plunging in late 2014, oil prices have been particularly volatile and below the historical norm due to an ongoing imbalance in global supply and demand.
Global market volatility increased in the summer of 2015, beginning with a sharp, but temporary, sell-off in June as Greece’s long-brewing debt troubles came to an impasse. These concerns abated with the passing of austerity and reform measures in July, but the market’s calm was short-lived as signs of weakness in China’s economy sparked a significant decline in Chinese equities. Higher volatility spread through markets globally in the third quarter as further indications of a deceleration in China stoked worries about the broader global economy, resulting in the worst quarterly performance for equities since 2011. Given a dearth of evidence of global growth, equity markets became more reliant on central bank policies to drive performance. As such, equities powered higher in October when China’s central bank provided more stimulus, the ECB poised for more easing and soft U.S. data pushed back expectations for a Fed rate hike. As the period came to a close, volatility crept higher and asset prices again weakened as investors digested more mixed economic data against a backdrop of generally high valuations.
At BlackRock, we believe investors need to think globally, extend their scope across a broad array of asset classes and be prepared to move freely as market conditions change over time. We encourage you to talk with your financial advisor and visit blackrock.com for further insight about investing in today’s markets.
Sincerely,

Rob Kapito
President, BlackRock Advisors, LLC

Rob Kapito
President, BlackRock Advisors, LLC
| | | | | | | | | | |
| Total Returns as of November 30, 2015 |
| | | 6-month | | 12-month |
U.S. large cap equities (S&P 500® Index) | | | | (0.21 | )% | | | | 2.75 | % |
U.S. small cap equities (Russell 2000® Index) | | | | (3.21 | ) | | | | 3.51 | |
International equities (MSCI Europe, Australasia, Far East Index) | | | | (7.42 | ) | | | | (2.94 | ) |
Emerging market equities (MSCI Emerging Markets Index) | | | | (17.67 | ) | | | | (16.99 | ) |
3-month Treasury bills (BofA Merrill Lynch
3-Month U.S. Treasury Bill Index) | | | | 0.01 | | | | | 0.02 | |
U.S. Treasury securities (BofA Merrill Lynch 10-Year U.S. Treasury Index) | | | | (0.21 | ) | | | | 1.60 | |
U.S. investment-grade bonds (Barclays U.S. Aggregate Bond Index) | | | | (0.12 | ) | | | | 0.97 | |
Tax-exempt municipal bonds (S&P Municipal Bond Index) | | | | 2.24 | | | | | 3.14 | |
U.S. high yield bonds (Barclays U.S. Corporate High Yield 2% Issuer Capped Index) | | | | (5.80 | ) | | | | (3.38 | ) |
|
| Past performance is no guarantee of future results. Index performance is shown for illustrative purposes only. You cannot invest directly in an index. | |
| | | | | | |
| | | THIS PAGE NOT PART OF YOUR FUND REPORT | | | | 3 |
| | | | |
| Fund Summary as of November 30, 2015 | | | BlackRock Disciplined Small Cap Core Fund | |
BlackRock Disciplined Small Cap Core Fund’s (the “Fund”) investment objective is to seek capital appreciation over the long term.
|
| Portfolio Management Commentary |
How did the Fund perform?
| • | | For the six-month period ended November 30, 2015, the Fund outperformed its benchmark, the Russell 2000® Index. |
What factors influenced performance?
| • | | The most significant positive contributions to the Fund’s performance came from stock selection within the health care and telecommunication services (“telecom”) sectors. Within health care, Sucampo Pharmaceuticals, Inc. appreciated significantly early in the period on the company’s plans to submit an application with the U.S. Food and Drug Administration (FDA) for pediatric use of its constipation drug Amitiza. Shares of the company were further boosted by a revision in the FDA’s draft guidance for generic drugmakers regarding bioequivalence to Amitiza. An overweight position in over-the-counter health care product company Prestige Brands Holdings, Inc. rose on news that the company would acquire privately held DenTek Oral Care in a deal expected to increase revenues by $60 million a year. Within telecom, Inteliquent, Inc., a carrier for communication service providers, saw its shares rise on news of a breakthrough business agreement with T-Mobile, the fastest growing provider of wireless services to U.S. consumers. The benefits from the agreement were seen in Inteliquent, Inc.’s third quarter results, which exceeded estimates as the company quickly transitioned a significant portion of the total expected traffic from T-Mobile. |
| • | | The most significant detractor from the Fund’s performance was stock selection within the industrials sector. In particular, an overweight posi- |
| | tion in ARC Document Solutions, Inc., a provider of specialized document solutions to architecture, engineering and construction firms, fell sharply after the company missed third quarter earnings and revenue estimates, and lowered its full-year earnings forecast. Also within industrials, an overweight in commercial interior flooring and carpet manufacturer Interface, Inc. declined due to the negative impact of weaker foreign currencies on overseas sales revenues. An overweight position in Virginia-based manufacturer of wallboard and gypsum-based products Continental Building Products, Inc. fell considerably on weaker-than-expected industrywide wallboard shipments, lower research analyst estimates and extreme weather and flooding along the eastern coast of the United States. |
Describe recent portfolio activity.
| • | | During the six-month period, the Fund decreased its overall weightings in the consumer discretionary and telecom sectors and increased its overall weighting in financials and industrials. |
Describe portfolio positioning at period end.
| • | | Relative to the Russell 2000® Index, the Fund ended the period with its largest sector overweight in consumer discretionary and its most significant underweight in utilities. |
The views expressed reflect the opinions of BlackRock as of the date of this report and are subject to change based on changes in market, economic or other conditions. These views are not intended to be a forecast of future events and are no guarantee of future results.
| | | | | |
| Ten Largest Holdings | | Percent of
Net Assets |
Umpqua Holdings Corp. | | | | 2 | % |
Manhattan Associates, Inc. | | | | 2 | |
Fidelity Southern Corp. | | | | 2 | |
South State Corp. | | | | 2 | |
EverBank Financial Corp. | | | | 2 | |
Jack in the Box, Inc. | | | | 2 | |
Central Pacific Financial Corp. | | | | 2 | |
Masimo Corp. | | | | 1 | |
LogMeIn, Inc. | | | | 1 | |
Seacoast Banking Corp. | | | | 1 | |
| | | | | |
| Sector Allocation | | Percent of
Net Assets |
Financials | | | | 25 | % |
Information Technology | | | | 18 | |
Health Care | | | | 17 | |
Consumer Discretionary | | | | 14 | |
Industrials | | | | 13 | |
Energy | | | | 4 | |
Materials | | | | 3 | |
Utilities | | | | 3 | |
Consumer Staples | | | | 2 | |
Short-Term Securities | | | | 3 | |
Liabilities in Excess of Other Assets | | | | (2 | ) |
For Fund compliance purposes, the Fund’s sector classifications refer to any one or more of the sector sub-classifications used by one or more widely recognized market indexes or ratings group indexes, and/or as defined by the investment advisor. These definitions may not apply for purposes of this report, which may combine such sector sub-classifications for reporting ease.
| | | | | | |
| 4 | | SEMI-ANNUAL REPORT | | NOVEMBER 30, 2015 | | |
| | | | |
| | | | BlackRock Disciplined Small Cap Core Fund | |
|
| Total Return Based on a $10,000 Investment |
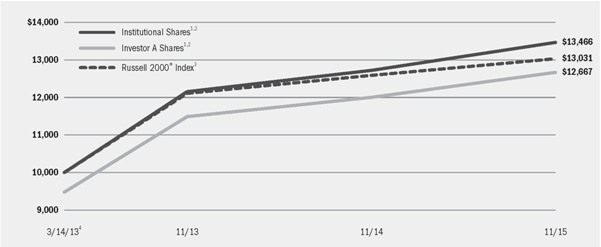
| | 1 | Assuming maximum sales charges, if any, transaction costs and other operating expenses, including investment advisory fees and administration fees, if any. Institutional Shares do not have a sales charge. |
| | 2 | Under normal circumstances, the Fund seeks to invest at least 80% of its net assets plus any borrowings for investment purposes in equity securities or other financial instruments that are components of, or have market capitalizations similar to, the securities included in the Russell 2000® Index. |
| | 3 | An unmanaged index that is a subset of the Russell 3000® Index representing approximately 10% of the total market capitalization of that index. It includes approximately 2000 of the smallest securities based on a combination of their market cap and current index membership. |
| | 4 | Commencement of operations. |
| | | | | | | | | | | | | | | | | | | | | | | | | | | | | | | | | | | | | | | | |
| Performance Summary for the Period Ended November 30, 2015 | | | | | | | | | | | | | | | | |
| | | | | | | | | | | | | | |
| | | | | | | Average Annual Total Returns5 |
| | | | | | | 1 Year | | | | Since Inception6 |
| | | 6-Month
Total Returns | | | | w/o sales
charge | | w/ sales
charge | | | | w/o sales
charge | | w/ sales
charge |
Institutional | | (2.53)% | | | | 5.88% | | N/A | | | | 11.58% | | N/A |
Investor A | | (2.70) | | | | 5.58 | | 0.04% | | | | 11.29 | | 9.10% |
Investor C | | (3.08) | | | | 4.71 | | 3.71 | | | | 10.44 | | 10.44 |
Russell 2000® Index | | (3.21) | | | | 3.51 | | N/A | | | | 10.26 | | N/A |
| | 5 | | Assuming maximum sales charges, if any. Average annual total returns with and without sales charges reflect reductions for distribution and service fees. See “About Fund Performance” on page 8 for a detailed description of share classes, including any related sales charges and fees. |
| | 6 | | The Fund commenced operations on March 14, 2013. |
| | | | N/A—Not applicable as share class and index do not have a sales charge. |
| | | | Past performance is not indicative of future results. |
| | | | | | | | | | | | | | | | |
| | | Actual | | | | Hypothetical8 | | |
| | | Beginning
Account Value
June 1, 2015 | | Ending
Account Value
November 30, 2015 | | Expenses Paid
During the Period7 | | | | Beginning
Account Value
June 1, 2015 | | Ending
Account Value
November 30, 2015 | | Expenses Paid
During the Period7 | | Annualized
Expense
Ratio9 |
Institutional | | $1,000.00 | | $974.70 | | $3.51 | | | | $1,000.00 | | $1,021.45 | | $3.59 | | 0.71% |
Investor A | | $1,000.00 | | $973.00 | | $4.74 | | | | $1,000.00 | | $1,020.20 | | $4.85 | | 0.96% |
Investor C | | $1,000.00 | | $969.20 | | $8.42 | | | | $1,000.00 | | $1,016.45 | | $8.62 | | 1.71% |
| | 7 | | For each class of the Fund, expenses are equal to the annualized expense ratio for the class, multiplied by the average account value over the period, multiplied by 183/366 (to reflect the one-half year period shown). |
| | 8 | | Hypothetical 5% annual return before expenses is calculated by prorating the number of days in the most recent fiscal half year divided by 366. |
| | 9 | | Includes certain tax expenses which are included in miscellaneous expenses in the Statements of Operations. Excluding such tax expenses, the annualized expense ratios would have been 0.70%, 0.95% and 1.70%, respectively. |
| | | | See “Disclosure of Expenses” on page 8 for further information on how expenses were calculated. |
| | | | | | |
| | | SEMI-ANNUAL REPORT | | NOVEMBER 30, 2015 | | 5 |
| | | | |
| Fund Summary as of November 30, 2015 | | | BlackRock Small Cap Growth Fund II | |
��
BlackRock Small Cap Growth Fund II’s (the “Fund”) investment objective is to seek long-term capital growth. In other words, the Fund tries to choose investments that will increase in value. Current income from dividends and interest will not be an important consideration in selecting portfolio securities.
|
| Portfolio Management Commentary |
On June 23, 2015, the Fund’s Investor B Shares converted to Investor A Shares.
How did the Fund perform?
| • | | For the six-month period ended November 30, 2015, through its investment in BlackRock Master Small Cap Growth Portfolio (the “Master Portfolio”), the Fund underperformed its benchmark, the Russell 2000® Growth Index. |
What factors influenced performance?
| • | | The underperformance of the Master Portfolio was attributable mostly to stock selection within the information technology sector. In particular, an overweight position in storage hardware and systems company Quantum Corp. depreciated sharply after the release of disappointing earnings and revenue results and reduced forward earnings guidance, driven by overall weakness in the general-purpose storage market. An underweight position in public sector-focused software solution firm Tyler Technologies, Inc. also detracted from performance. Shares of Tyler Technologies, Inc. rose sharply on news of plans to acquire computer-aided dispatch software firm New World Systems in a deal that would immediately add to earnings per share, and the stock price was further supported as the company’s third quarter earnings and revenues exceeded estimates. An overweight position in gaming product and cash access solutions company Everi Holdings, Inc., formerly known as Global Cash Access Holdings, Inc., depreciated significantly after second quarter earnings came in under expectations. The company also lowered its guidance for full year 2015, citing headwinds from ongoing product development costs and one-time costs related to rebranding activities. |
| • | | Conversely, stock selection within the health care and telecommunication services (“telecom”) sectors contributed to performance. Within health care, Sucampo Pharmaceuticals, Inc. appreciated significantly early in the period on the company’s plans to submit an application with the U.S. Food and Drug Administration (FDA) for pediatric use of its constipation drug Amitiza. Shares of the company were further boosted by a revision in the FDA’s draft guidance for generic drugmakers regarding bioequivalence to Amitiza. An overweight position in over-the-counter health care product company Prestige Brands Holdings, Inc. rose on news that the company would acquire privately held DenTek Oral Care in a deal expected to increase revenues by $60 million a year. Within telecom, Inteliquent, Inc., a carrier for communication service providers, saw its shares rise on news of a breakthrough business agreement with T-Mobile, the fastest growing provider of wireless services to U.S. consumers. The benefits from the agreement were seen in Inteliquent, Inc.’s third quarter results, which exceeded estimates as the company quickly transitioned a significant portion of the total expected traffic from T-Mobile. |
Describe recent portfolio activity.
| • | | During the six-month period, the Master Portfolio increased its overall weighting in the materials sector and decreased its overall weighting in financials. |
Describe portfolio positioning at period end.
| • | | Relative to the Russell 2000® Growth Index, the Master Portfolio ended the period with its largest sector overweight in consumer discretionary and its most significant underweight in consumer staples. |
The views expressed reflect the opinions of BlackRock as of the date of this report and are subject to change based on changes in market, economic or other conditions. These views are not intended to be a forecast of future events and are no guarantee of future results.
| | | | | | |
| 6 | | SEMI-ANNUAL REPORT | | NOVEMBER 30, 2015 | | |
| | | | |
| | | | BlackRock Small Cap Growth Fund II | |
|
| Total Return Based on a $10,000 Investment |
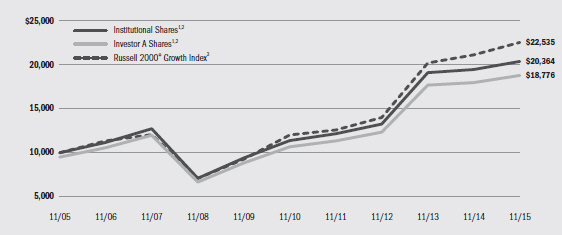
| | 1 | Assuming maximum sales charges, if any, transaction costs and other operating expenses, including administration fees, if any. Institutional Shares do not have a sales charge. |
| | 2 | The Fund invests all of its assets in the Master Portfolio. The Master Portfolio will, under normal circumstances, invest at least 80% of its net assets (plus any borrowings for investment purposes) in equity securities of small cap companies and at least 80% of its net assets (plus any borrowings for investment purposes) in securities or instruments of issuers located in the United States. |
| | 3 | An unmanaged index that measures performance of the small-cap growth segment of the U.S. equity universe. It includes those Russell 2000® Index companies with higher price-to-value ratios and higher forecasted growth values. |
| | | | | | | | | | | | | | | | | | | | | | | | | | | | | | | | | | | |
| Performance Summary for the Period Ended November 30, 2015 | | | | | | |
| | | | | Average Annual Total Returns4 |
| | | | | 1 Year | | 5 Years | | 10 Years |
| | | 6-Month
Total Returns | | w/o sales
charge | | w/ sales
charge | | w/o sales
charge | | w/ sales
charge | | w/o sales
charge | | w/ sales
charge |
Institutional | | | | (5.44 | )% | | | | 4.63 | % | | | | N/A | | | | | 12.36 | % | | | | N/A | | | | | 7.37 | % | | | | N/A | |
Investor A | | | | (5.50 | ) | | | | 4.44 | | | | | (1.04 | )% | | | | 12.03 | | | | | 10.83 | % | | | | 7.08 | | | | | 6.50 | % |
Investor C | | | | (5.98 | ) | | | | 3.49 | | | | | 2.54 | | | | | 11.04 | | | | | 11.04 | | | | | 6.10 | | | | | 6.10 | |
Class R | | | | (5.67 | ) | | | | 4.17 | | | | | N/A | | | | | 11.72 | | | | | N/A | | | | | 6.72 | | | | | N/A | |
Russell 2000® Growth Index | | | | (3.48 | ) | | | | 6.63 | | | | | N/A | | | | | 13.41 | | | | | N/A | | | | | 8.46 | | | | | N/A | |
| | 4 | | Assuming maximum sales charges, if any. Average annual total returns with and without sales charges reflect reductions for distribution and service fees. See “About Fund Performance” on page 8 for a detailed description of share classes, including any related sales charges and fees. |
| | | | N/A—Not applicable as share class and index do not have a sales charge. |
| | | | Past performance is not indicative of future results. |
| | | | | | | | | | | | | | | | |
| Expense Example | | | | | | | | | | | | | | |
| | | Actual | | | | Hypothetical6 | | |
| | | Beginning Account Value June 1, 2015 | | Ending Account Value November 30, 2015 | | Expenses Paid During the Period5 | | | | Beginning Account Value June 1, 2015 | | Ending Account Value November 30, 2015 | | Expenses Paid During the Period5 | | Annualized Expense Ratio |
Institutional | | $1,000.00 | | $945.60 | | $ 5.69 | | | | $1,000.00 | | $1,019.15 | | $ 5.91 | | 1.17% |
Investor A | | $1,000.00 | | $945.00 | | $ 6.86 | | | | $1,000.00 | | $1,017.95 | | $ 7.11 | | 1.41% |
Investor C | | $1,000.00 | | $940.20 | | $11.06 | | | | $1,000.00 | | $1,013.60 | | $11.48 | | 2.28% |
Class R | | $1,000.00 | | $943.30 | | $ 8.11 | | | | $1,000.00 | | $1,016.65 | | $ 8.42 | | 1.67% |
| | 5 | | For each class of the Fund, expenses are equal to the annualized expense ratio for the class, multiplied by the average account value over the period, multiplied by 183/ 366 (to reflect the one-half year period shown). Because the Fund invests all of its assets in the Master Portfolio, the expense example reflects the net expenses of both the Fund and the Master Portfolio in which it invests. |
| | 6 | | Hypothetical 5% annual return before expenses is calculated by prorating the number of days in the most recent fiscal half year divided by 366. |
| | | | See “Disclosure of Expenses” on page 8 for further information on how expenses were calculated. |
| | | | | | |
| | | SEMI-ANNUAL REPORT | | NOVEMBER 30, 2015 | | 7 |
| • | | Institutional Shares are not subject to any sales charge. These shares bear no ongoing distribution or service fees and are available only to certain eligible investors. |
| • | | Investor A Shares are subject to a maximum initial sales charge (front-end load) of 5.25% and a service fee of 0.25% per year (but no distribution fee). Certain redemptions of these shares may be subject to a contingent deferred sales charge (“CDSC”) where no initial sales charge was paid at the time of purchase. These shares are generally available through financial intermediaries. |
On June 23, 2015, all issued and outstanding Investor B Shares, which were previously available only in BlackRock Small Cap Growth Fund II, were converted into Investor A Shares with the same relative aggregate net asset value (“NAV”).
| • | | Investor C Shares are subject to a 1.00% CDSC if redeemed within one year of purchase. In addition, these shares are subject to a distribution fee of 0.75% per year and a service fee of 0.25% per year. These shares are generally available through financial intermediaries. |
| • | | Class R Shares (available only in BlackRock Small Cap Growth Fund II) are not subject to any sales charge. These shares are subject to a distribution fee of 0.25% per year and a service fee of 0.25% per year. These shares are available only to certain employer-sponsored retirement plans. |
Performance information reflects past performance and does not guarantee future results. Current performance may be lower or higher than the performance data quoted. Refer to www.blackrock.com/funds to obtain performance data current to the most recent month end. Performance results do not reflect the deduction of taxes that a shareholder would pay on fund distributions or the redemption of fund shares. Figures shown in the performance tables on the previous pages assume reinvestment of all distributions, if any, at NAV on the ex-dividend date. Investment return and principal value of shares will fluctuate so that shares, when redeemed, may be worth more or less than their original cost. Distributions paid to each class of shares will vary because of the different levels of service, distribution and transfer agency fees applicable to each class, which are deducted from the income available to be paid to shareholders.
BlackRock Advisors, LLC (the “Manager”), BlackRock Disciplined Small Cap Core Fund’s investment advisor, has contractually agreed to waive and/or reimburse a portion of the Fund’s expenses. Without such waiver and/or reimbursement, the Fund’s performance would have been lower. The Manager is under no obligation to continue waiving and/or reimbursing its fees after the applicable termination date of such agreement. See Note 6 of the Notes to Financial Statements for additional information on waivers and/or reimbursements.
Shareholders of these Funds may incur the following charges: (a) transactional expenses, such as sales charges; and (b) operating expenses, including investment advisory fees, administration fees, service and distribution fees, including 12b-1 fees, acquired fund fees and expenses, and other fund expenses. The expense examples on the previous pages (which are based on a hypothetical investment of $1,000 invested on June 1, 2015 and held through November 30, 2015) are intended to assist shareholders both in calculating expenses based on an investment in each Fund and in comparing these expenses with similar costs of investing in other mutual funds.
The expense examples provide information about actual account values and actual expenses. In order to estimate the expenses a shareholder paid during the period covered by this report, shareholders can divide their account value by $1,000 and then multiply the result by the number corresponding to their Fund and share class under the heading entitled “Expenses Paid During the Period.”
The expense examples also provide information about hypothetical account values and hypothetical expenses based on a Fund’s actual expense ratio and an assumed rate of return of 5% per year before expenses. In order to assist shareholders in comparing the ongoing expenses of investing in these Funds and other funds, compare the 5% hypothetical examples with the 5% hypothetical examples that appear in shareholder reports of other funds.
The expenses shown in the expense examples are intended to highlight shareholders’ ongoing costs only and do not reflect any transactional expenses, such as sales charges, if any. Therefore, the hypothetical examples are useful in comparing ongoing expenses only, and will not help shareholders determine the relative total expenses of owning different funds. If these transactional expenses were included, shareholder expenses would have been higher.
|
| Derivative Financial Instruments |
BlackRock Disciplined Small Cap Core Fund and the Master Portfolio may invest in various derivative financial instruments. Derivative financial instruments are used to obtain exposure to a security, index and/or market without owning or taking physical custody of securities or to manage market, equity, credit, interest rate, foreign currency exchange rate, commodity and/or other risks. Derivative financial instruments may give rise to a form of economic leverage. Derivative financial instruments also involve risks, including the imperfect correlation between the value of a derivative financial instrument and the underlying asset, possible default of the counterparty to the transaction or illiquidity of the derivative
financial instrument. The Fund’s and Master Portfolio’s ability to use a derivative financial instrument successfully depends on the investment advisor’s ability to predict pertinent market movements accurately, which cannot be assured. The use of derivative financial instruments may result in losses greater than if they had not been used, may limit the amount of appreciation the Fund and Master Portfolio can realize on an investment and/or may result in lower distributions paid to shareholders. The Fund’s and Master Portfolio’s investments in these instruments are discussed in detail in the Fund’s and Master Portfolio’s Notes to Financial Statements.
| | | | | | |
| 8 | | SEMI-ANNUAL REPORT | | NOVEMBER 30, 2015 | | |
| | | | |
| Schedule of Investments November 30, 2015 (Unaudited) | | | BlackRock Disciplined Small Cap Core Fund | |
| | | (Percentages shown are based on Net Assets) | |
| | | | | | | | |
| Common Stocks | | Shares | | | Value | |
Aerospace & Defense — 0.7% | | | | | | | | |
AAR Corp. | | | 435 | | | $ | 10,684 | |
Aerojet Rocketdyne Holdings, Inc. (a) | | | 96 | | | | 1,684 | |
DigitalGlobe, Inc. (a) | | | 1,488 | | | | 25,147 | |
Esterline Technologies Corp. (a) | | | 154 | | | | 14,642 | |
Vectrus, Inc. (a) | | | 643 | | | | 15,535 | |
| | | | | | | | |
| | | | | | | | 67,692 | |
Airlines — 0.9% | | | | | | | | |
Hawaiian Holdings, Inc. (a) | | | 46 | | | | 1,665 | |
JetBlue Airways Corp. (a) | | | 3,538 | | | | 87,530 | |
| | | | | | | | |
| | | | | | | | 89,195 | |
Auto Components — 1.6% | | | | | | | | |
American Axle & Manufacturing Holdings, Inc. (a) | | | 1,157 | | | | 26,333 | |
Cooper Standard Holdings, Inc. (a) | | | 214 | | | | 15,823 | |
Horizon Global Corp. (a) | | | 2,855 | | | | 24,810 | |
Lear Corp. | | | 190 | | | | 23,921 | |
Metaldyne Performance Group, Inc. | | | 54 | | | | 1,216 | |
Shiloh Industries, Inc. (a) | | | 145 | | | | 996 | |
Tenneco, Inc. (a) | | | 597 | | | | 32,166 | |
Tower International, Inc. | | | 933 | | | | 28,606 | |
| | | | | | | | |
| | | | | | | | 153,871 | |
Banks — 10.2% | | | | | | | | |
Camden National Corp. | | | 75 | | | | 3,371 | |
Central Pacific Financial Corp. | | | 6,299 | | | | 146,389 | |
Chemical Financial Corp. | | | 23 | | | | 848 | |
Fidelity Southern Corp. | | | 7,156 | | | | 161,869 | |
First Busey Corp. | | | 1,166 | | | | 25,640 | |
First Midwest Bancorp, Inc. | | | 505 | | | | 9,868 | |
Great Western Bancorp, Inc. | | | 890 | | | | 26,896 | |
Heritage Commerce Corp. | | | 3,760 | | | | 40,608 | |
Metro Bancorp, Inc. | | | 66 | | | | 2,243 | |
Seacoast Banking Corp. (a) | | | 8,077 | | | | 129,636 | |
South State Corp. | | | 2,058 | | | | 161,779 | |
Umpqua Holdings Corp. | | | 10,844 | | | | 194,324 | |
Western Alliance Bancorp (a) | | | 948 | | | | 36,773 | |
Wintrust Financial Corp. | | | 1,447 | | | | 76,156 | |
| | | | | | | | |
| | | | | | | | 1,016,400 | |
Beverages — 0.6% | | | | | | | | |
Castle Brands, Inc. (a) | | | 2,255 | | | | 2,977 | |
National Beverage Corp. (a) | | | 104 | | | | 4,519 | |
Primo Water Corp. (a) | | | 5,684 | | | | 50,531 | |
| | | | | | | | |
| | | | | | | | 58,027 | |
Biotechnology — 6.1% | | | | | | | | |
ACADIA Pharmaceuticals, Inc. (a) | | | 116 | | | | 4,402 | |
Acorda Therapeutics, Inc. (a) | | | 762 | | | | 29,101 | |
Anacor Pharmaceuticals, Inc. (a) | | | 373 | | | | 43,540 | |
BioSpecifics Technologies Corp. (a) | | | 259 | | | | 12,549 | |
Catalyst Biosciences, Inc. | | | 617 | | | | 1,808 | |
Cepheid, Inc. (a) | | | 134 | | | | 4,816 | |
Cerulean Pharma, Inc. (a) | | | 1,127 | | | | 3,651 | |
ChemoCentryx, Inc. (a) | | | 2,174 | | | | 16,414 | |
Chiasma, Inc. (a) | | | 140 | | | | 3,107 | |
China Biologic Products, Inc. (a) | | | 154 | | | | 18,098 | |
Clovis Oncology, Inc. (a) | | | 12 | | | | 377 | |
| | | | | | | | |
| Common Stocks | | Shares | | | Value | |
Biotechnology (continued) | | | | | | | | |
Concert Pharmaceuticals, Inc. (a) | | | 502 | | | $ | 11,511 | |
Cytokinetics, Inc. (a) | | | 1,111 | | | | 13,132 | |
Dyax Corp. (a) | | | 1,234 | | | | 41,536 | |
Dynavax Technologies Corp. (a) | | | 996 | | | | 27,778 | |
Emergent BioSolutions, Inc. (a) | | | 689 | | | | 25,955 | |
Enzon Pharmaceuticals, Inc. | | | 8,722 | | | | 6,331 | |
EPIRUS Biopharmaceuticals, Inc. (a) | | | 345 | | | | 1,680 | |
FibroGen, Inc. (a) | | | 221 | | | | 6,573 | |
Genomic Health, Inc. (a) | | | 744 | | | | 22,558 | |
Halozyme Therapeutics, Inc. (a) | | | 1,697 | | | | 30,207 | |
Histogenics Corp. (a) | | | 540 | | | | 1,777 | |
Ignyta, Inc. (a) | | | 640 | | | | 9,408 | |
Immune Design Corp. (a) | | | 270 | | | | 5,651 | |
Infinity Pharmaceuticals, Inc. (a) | | | 621 | | | | 5,477 | |
Isis Pharmaceuticals, Inc. (a) | | | 61 | | | | 3,723 | |
Ligand Pharmaceuticals, Inc. (a) | | | 214 | | | | 22,915 | |
Merrimack Pharmaceuticals, Inc. (a) | | | 479 | | | | 4,507 | |
MiMedx Group, Inc. (a) | | | 591 | | | | 5,295 | |
Momenta Pharmaceuticals, Inc. (a) | | | 1,371 | | | | 24,486 | |
Myriad Genetics, Inc. (a) | | | 586 | | | | 25,491 | |
Neurocrine Biosciences, Inc. (a) | | | 351 | | | | 19,084 | |
Novavax, Inc. (a) | | | 274 | | | | 2,345 | |
Ocata Therapeutics, Inc. (a)(b) | | | 233 | | | | 1,999 | |
PDL BioPharma, Inc. | | | 3,589 | | | | 13,584 | |
Peregrine Pharmaceuticals, Inc. (a) | | | 2,138 | | | | 2,758 | |
PTC Therapeutics, Inc. (a) | | | 197 | | | | 5,918 | |
Radius Health, Inc. (a) | | | 67 | | | | 4,074 | |
Raptor Pharmaceutical Corp. (a) | | | 1,701 | | | | 10,750 | |
Repligen Corp. (a) | | | 867 | | | | 24,649 | |
Rigel Pharmaceuticals, Inc. (a) | | | 6,610 | | | | 21,681 | |
Strongbridge Biopharma PLC | | | 1,872 | | | | 13,460 | |
Tobira Therapeutics, Inc. (a) | | | 1,614 | | | | 21,628 | |
Trevena, Inc. (a) | | | 695 | | | | 8,750 | |
Ultragenyx Pharmaceutical, Inc. (a) | | | 75 | | | | 7,374 | |
United Therapeutics Corp. (a) | | | 87 | | | | 13,279 | |
| | | | | | | | |
| | | | | | | | 605,187 | |
Building Products — 1.6% | | | | | | | | |
Apogee Enterprises, Inc. | | | 77 | | | | 3,867 | |
Continental Building Products, Inc. (a) | | | 1,648 | | | | 30,060 | |
Gibraltar Industries, Inc. (a) | | | 1,378 | | | | 36,779 | |
Insteel Industries, Inc. | | | 413 | | | | 10,077 | |
Universal Forest Products, Inc. | | | 949 | | | | 73,320 | |
| | | | | | | | |
| | | | | | | | 154,103 | |
Capital Markets — 0.4% | | | | | | | | |
Ashford, Inc. (a) | | | 37 | | | | 2,288 | |
Investment Technology Group, Inc. | | | 597 | | | | 11,982 | |
Janus Capital Group, Inc. | | | 592 | | | | 9,348 | |
Piper Jaffray Cos. (a) | | | 289 | | | | 11,713 | |
Stifel Financial Corp. (a) | | | 60 | | | | 2,722 | |
| | | | | | | | |
| | | | | | | | 38,053 | |
Chemicals — 1.2% | | | | | | | | |
Advanced Emissions Solutions, Inc. (a) | | | 3,745 | | | | 22,077 | |
AgroFresh Solutions, Inc. | | | 1,044 | | | | 6,734 | |
Axiall Corp. | | | 107 | | | | 2,230 | |
Innophos Holdings, Inc. | | | 67 | | | | 1,991 | |
Innospec, Inc. | | | 249 | | | | 14,542 | |
| | | | | | | | | | |
| Portfolio Abbreviations |
| | | | | |
| CVR | | Contingent Value Rights | | | | | | | | |
| REIT | | Real Estate Investment Trust | | | | | | | | |
See Notes to Financial Statements.
| | | | | | |
| | | SEMI-ANNUAL REPORT | | NOVEMBER 30, 2015 | | 9 |
| | | | |
| Schedule of Investments (continued) | | | BlackRock Disciplined Small Cap Core Fund | |
| | | | |
| | | | | | | | |
| Common Stocks | | Shares | | | Value | |
Chemicals (continued) | | | | | | | | |
Olin Corp. | | | 147 | | | $ | 3,200 | |
Sensient Technologies Corp. | | | 544 | | | | 36,361 | |
Stepan Co. | | | 297 | | | | 15,462 | |
Trinseo SA (b) | | | 489 | | | | 13,966 | |
| | | | | | | | |
| | | | | | | | 116,563 | |
Commercial Services & Supplies — 2.3% | | | | | | | | |
ABM Industries, Inc. | | | 88 | | | | 2,611 | |
ARC Document Solutions, Inc. (a) | | | 11,327 | | | | 57,315 | |
Herman Miller, Inc. | | | 962 | | | | 30,505 | |
Interface, Inc. | | | 3,821 | | | | 75,961 | |
Knoll, Inc. | | | 1,861 | | | | 41,463 | |
Quad/Graphics, Inc. | | | 1,983 | | | | 20,465 | |
| | | | | | | | |
| | | | | | | | 228,320 | |
Communications Equipment — 1.7% | | | | | | | | |
Calix, Inc. (a) | | | 3,133 | | | | 24,813 | |
Digi International, Inc. (a) | | | 696 | | | | 8,707 | |
Ixia (a) | | | 3,345 | | | | 43,686 | |
Lumentum Holdings, Inc. (a) | | | 1,284 | | | | 25,680 | |
MRV Communications, Inc. (a) | | | 194 | | | | 2,782 | |
NETGEAR, Inc. (a) | | | 600 | | | | 26,466 | |
PC-Tel, Inc. | | | 4,682 | | | | 24,955 | |
ShoreTel, Inc. (a) | | | 1,065 | | | | 10,927 | |
| | | | | | | | |
| | | | | | | | 168,016 | |
Construction & Engineering — 1.5% | | | | | | | | |
Comfort Systems U.S.A., Inc. | | | 2,758 | | | | 87,539 | |
Dycom Industries, Inc. (a) | | | 551 | | | | 48,146 | |
Orion Marine Group, Inc. (a) | | | 2,383 | | | | 10,438 | |
| | | | | | | | |
| | | | | | | | 146,123 | |
Construction Materials — 0.1% | | | | | | | | |
Headwaters, Inc. (a) | | | 694 | | | | 13,304 | |
Consumer Finance — 0.8% | | | | | | | | |
Consumer Portfolio Services, Inc. (a) | | | 10,331 | | | | 48,349 | |
Emergent Capital, Inc. (a) | | | 7,494 | | | | 32,074 | |
| | | | | | | | |
| | | | | | | | 80,423 | |
Containers & Packaging — 0.6% | | | | | | | | |
Graphic Packaging Holding Co. | | | 4,242 | | | | 57,988 | |
Diversified Consumer Services — 0.7% | | | | | | | | |
Cambium Learning Group, Inc. (a) | | | 5,248 | | | | 27,237 | |
Collectors Universe, Inc. | | | 790 | | | | 12,608 | |
K12, Inc. (a) | | | 2,832 | | | | 28,716 | |
Steiner Leisure Ltd. (a) | | | 72 | | | | 4,527 | |
| | | | | | | | |
| | | | | | | | 73,088 | |
Diversified Financial Services — 0.2% | | | | | | | | |
Marlin Business Services Corp. | | | 1,110 | | | | 19,403 | |
Diversified Telecommunication Services — 0.4% | | | | | | | | |
Inteliquent, Inc. | | | 1,909 | | | | 36,672 | |
Premiere Global Services, Inc. (a) | | | 261 | | | | 3,620 | |
| | | | | | | | |
| | | | | | | | 40,292 | |
Electric Utilities — 0.7% | | | | | | | | |
Cleco Corp. | | | 339 | | | | 16,987 | |
IDACORP, Inc. | | | 320 | | | | 21,773 | |
Portland General Electric Co. | | | 921 | | | | 34,003 | |
| | | | | | | | |
| | | | | | | | 72,763 | |
Electrical Equipment — 0.1% | | | | | | | | |
SL Industries, Inc. (a) | | | 386 | | | | 13,375 | |
Electronic Equipment, Instruments & Components — 2.4% | | | | | | | | |
Benchmark Electronics, Inc. (a) | | | 829 | | | | 17,790 | |
Fabrinet | | | 376 | | | | 8,998 | |
| | | | | | | | |
| Common Stocks | | Shares | | | Value | |
Electronic Equipment, Instruments & Components (continued) | |
Kimball Electronics, Inc. (a) | | | 475 | | | $ | 5,444 | |
Littelfuse, Inc. | | | 95 | | | | 10,313 | |
Multi-Fineline Electronix, Inc. (a) | | | 2,323 | | | | 57,332 | |
OSI Systems, Inc. (a) | | | 252 | | | | 23,595 | |
Radisys Corp. (a) | | | 16,757 | | | | 44,406 | |
RealD, Inc. (a) | | | 227 | | | | 2,384 | |
Tech Data Corp. (a) | | | 655 | | | | 44,311 | |
Vishay Precision Group, Inc. (a) | | | 2,192 | | | | 26,370 | |
| | | | | | | | |
| | | | | | | | 240,943 | |
Energy Equipment & Services — 0.9% | | | | | | | | |
Aspen Aerogels, Inc. (a) | | | 4,696 | | | | 30,524 | |
Bristow Group, Inc. | | | 144 | | | | 4,399 | |
Dawson Geophysical Co. (a) | | | 11,309 | | | | 50,099 | |
Gulf Island Fabrication, Inc. | | | 433 | | | | 4,287 | |
Matrix Service Co. (a) | | | 60 | | | | 1,379 | |
North Atlantic Drilling Ltd. | | | 1,416 | | | | 777 | |
PHI, Inc. (a) | | | 116 | | | | 2,479 | |
| | | | | | | | |
| | | | | | | | 93,944 | |
Food & Staples Retailing — 0.5% | | | | | | | | |
SUPERVALU, Inc. (a) | | | 6,671 | | | | 44,829 | |
Food Products — 0.7% | | | | | | | | |
Cal-Maine Foods, Inc. (b) | | | 835 | | | | 45,516 | |
Omega Protein Corp. (a) | | | 143 | | | | 3,515 | |
Pilgrim’s Pride Corp. | | | 992 | | | | 21,358 | |
| | | | | | | | |
| | | | | | | | 70,389 | |
Gas Utilities — 0.4% | | | | | | | | |
Southwest Gas Corp. | | | 546 | | | | 30,620 | |
WGL Holdings, Inc. | | | 84 | | | | 5,179 | |
| | | | | | | | |
| | | | | | | | 35,799 | |
Health Care Equipment & Supplies — 3.8% | | | | | | | | |
Alphatec Holdings, Inc. (a) | | | 5,403 | | | | 1,243 | |
AngioDynamics, Inc. (a) | | | 4,063 | | | | 48,350 | |
ICU Medical, Inc. (a) | | | 702 | | | | 79,635 | |
Lantheus Holdings, Inc. (a) | | | 1,731 | | | | 6,128 | |
Masimo Corp. (a) | | | 3,384 | | | | 140,368 | |
Merit Medical Systems, Inc. (a) | | | 405 | | | | 7,845 | |
NuVasive, Inc. (a) | | | 154 | | | | 8,030 | |
Orthofix International NV (a) | | | 284 | | | | 11,235 | |
RTI Surgical, Inc. (a) | | | 9,434 | | | | 36,981 | |
STERIS PLC | | | 32 | | | | 2,444 | |
SurModics, Inc. (a) | | | 138 | | | | 2,906 | |
Symmetry Surgical, Inc. (a) | | | 3,597 | | | | 32,733 | |
| | | | | | | | |
| | | | | | | | 377,898 | |
Health Care Providers & Services — 3.9% | | | | | | | | |
Alliance HealthCare Services, Inc. (a) | | | 332 | | | | 2,991 | |
AMN Healthcare Services, Inc. (a) | | | 1,745 | | | | 51,478 | |
Cross Country Healthcare, Inc. (a) | | | 173 | | | | 3,157 | |
Five Star Quality Care, Inc. (a) | | | 6,151 | | | | 22,082 | |
Health Net, Inc. (a) | | | 667 | | | | 42,194 | |
Molina Healthcare, Inc. (a) | | | 710 | | | | 42,785 | |
Surgical Care Affiliates, Inc. (a) | | | 983 | | | | 36,538 | |
Team Health Holdings, Inc. (a) | | | 2,085 | | | | 114,967 | |
VCA, Inc. (a) | | | 1,323 | | | | 72,805 | |
| | | | | | | | |
| | | | | | | | 388,997 | |
Hotels, Restaurants & Leisure — 4.2% | | | | | | | | |
BFC Financial Corp., Class A (a) | | | 5,961 | | | | 21,400 | |
Boyd Gaming Corp. (a) | | | 688 | | | | 13,478 | |
Brinker International, Inc. | | | 61 | | | | 2,783 | |
Caesars Acquisition Co., Class A (a) | | | 240 | | | | 1,896 | |
Century Casinos, Inc. (a) | | | 657 | | | | 4,402 | |
Cheesecake Factory, Inc. | | | 128 | | | | 6,033 | |
See Notes to Financial Statements.
| | | | | | |
| 10 | | SEMI-ANNUAL REPORT | | NOVEMBER 30, 2015 | | |
| | | | |
| Schedule of Investments (continued) | | | BlackRock Disciplined Small Cap Core Fund | |
| | | | |
| | | | | | | | |
| Common Stocks | | Shares | | | Value | |
Hotels, Restaurants & Leisure (continued) | | | | | | | | |
Cracker Barrel Old Country Store, Inc. (b) | | | 563 | | | $ | 70,893 | |
Eldorado Resorts, Inc. (a) | | | 4,050 | | | | 39,245 | |
Intrawest Resorts Holdings, Inc. (a) | | | 3,176 | | | | 29,219 | |
Isle of Capri Casinos, Inc. (a) | | | 614 | | | | 11,322 | |
J. Alexander’s Holdings, Inc. (a) | | | 521 | | | | 5,543 | |
Jack in the Box, Inc. | | | 2,047 | | | | 151,765 | |
Luby’s, Inc. (a) | | | 3,133 | | | | 14,976 | |
Vail Resorts, Inc. | | | 329 | | | | 39,677 | |
| | | | | | | | |
| | | | | | | | 412,632 | |
Household Durables — 1.0% | | | | | | | | |
Installed Building Products, Inc. (a) | | | 108 | | | | 2,706 | |
La-Z-Boy, Inc. | | | 2,037 | | | | 54,612 | |
Lennar Corp., B Shares | | | 94 | | | | 3,910 | |
LGI Homes, Inc. (a) | | | 33 | | | | 1,098 | |
WCI Communities, Inc. (a) | | | 574 | | | | 13,897 | |
ZAGG, Inc. (a) | | | 2,320 | | | | 23,942 | |
| | | | | | | | |
| | | | | | | | 100,165 | |
Household Products — 0.2% | | | | | | | | |
Central Garden & Pet Co., Class A | | | 1,220 | | | | 19,264 | |
Oil-Dri Corp. of America | | | 61 | | | | 1,904 | |
| | | | | | | | |
| | | | | | | | 21,168 | |
Independent Power and Renewable Electricity Producers — 0.4% | |
Dynegy, Inc. (a) | | | 613 | | | | 9,882 | |
Talen Energy Corp. (a) | | | 2,711 | | | | 21,119 | |
TerraForm Global, Inc., Class A | | | 995 | | | | 4,010 | |
| | | | | | | | |
| | | | | | | | 35,011 | |
Insurance — 2.4% | | | | | | | | |
American Equity Investment Life Holding Co. | | | 3,352 | | | | 89,867 | |
American National Insurance Co. | | | 19 | | | | 2,040 | |
CNO Financial Group, Inc. | | | 1,070 | | | | 21,646 | |
Employers Holdings, Inc. | | | 71 | | | | 1,946 | |
Fidelity & Guaranty Life | | | 3,084 | | | | 79,197 | |
First American Financial Corp. | | | 106 | | | | 4,181 | |
National General Holdings Corp. | | | 592 | | | | 12,971 | |
Symetra Financial Corp. | | | 423 | | | | 13,316 | |
Universal Insurance Holdings, Inc. (b) | | | 699 | | | | 13,805 | |
| | | | | | | | |
| | | | | | | | 238,969 | |
Internet & Catalog Retail — 0.1% | | | | | | | | |
U.S. Auto Parts Network, Inc. (a) | | | 2,124 | | | | 5,268 | |
Internet Software & Services — 3.1% | | | | | | | | |
Constant Contact, Inc. (a) | | | 178 | | | | 5,570 | |
Demand Media, Inc. (a) | | | 2,925 | | | | 17,667 | |
IntraLinks Holdings, Inc. (a) | | | 399 | | | | 4,082 | |
Limelight Networks, Inc. (a) | | | 7,655 | | | | 12,937 | |
LogMeIn, Inc. (a) | | | 1,960 | | | | 139,983 | |
Monster Worldwide, Inc. | | | 648 | | | | 4,173 | |
QuinStreet, Inc. (a) | | | 12,978 | | | | 63,462 | |
SciQuest, Inc. (a) | | | 2,614 | | | | 33,747 | |
Tremor Video, Inc. (a) | | | 1,388 | | | | 2,845 | |
Web.com Group, Inc. (a) | | | 817 | | | | 19,780 | |
XO Group, Inc. (a) | | | 435 | | | | 7,325 | |
| | | | | | | | |
| | | | | | | | 311,571 | |
IT Services — 1.9% | | | | | | | | |
Computer Task Group, Inc. | | | 4,137 | | | | 27,842 | |
Convergys Corp. | | | 110 | | | | 2,834 | |
Datalink Corp. (a) | | | 2,672 | | | | 19,639 | |
Euronet Worldwide, Inc. (a) | | | 159 | | | | 12,357 | |
Everi Holdings, Inc. (a) | | | 1,346 | | | | 5,142 | |
Higher One Holdings, Inc. (a) | | | 15,035 | | | | 47,661 | |
Lionbridge Technologies, Inc. (a) | | | 1,589 | | | | 8,422 | |
Net 1 UEPS Technologies, Inc. (a) | | | 1,328 | | | | 20,093 | |
| | | | | | | | |
| Common Stocks | | Shares | | | Value | |
IT Services (continued) | | | | | | | | |
Science Applications International Corp. | | | 867 | | | $ | 43,558 | |
| | | | | | | | |
| | | | | | | | 187,548 | |
Leisure Products — 0.9% | | | | | | | | |
Brunswick Corp. | | | 1,184 | | | | 62,314 | |
Marine Products Corp. | | | 1,745 | | | | 12,250 | |
Nautilus, Inc. (a) | | | 740 | | | | 14,215 | |
| | | | | | | | |
| | | | | | | | 88,779 | |
Life Sciences Tools & Services — 0.9% | | | | | | | | |
Harvard Bioscience, Inc. (a) | | | 4,026 | | | | 12,762 | |
INC Research Holdings, Inc., Class A (a) | | | 1,713 | | | | 81,025 | |
| | | | | | | | |
| | | | | | | | 93,787 | |
Machinery — 2.6% | | | | | | | | |
Accuride Corp. (a) | | | 1,385 | | | | 3,573 | |
Blount International, Inc. (a) | | | 1,296 | | | | 7,517 | |
Briggs & Stratton Corp. | | | 1,324 | | | | 25,209 | |
Commercial Vehicle Group, Inc. (a) | | | 7,761 | | | | 26,387 | |
FreightCar America, Inc. | | | 53 | | | | 1,285 | |
Global Brass & Copper Holdings, Inc. | | | 2,094 | | | | 48,706 | |
Greenbrier Cos., Inc. | | | 922 | | | | 31,237 | |
Hardinge, Inc. | | | 96 | | | | 934 | |
Hillenbrand, Inc. | | | 69 | | | | 2,090 | |
Hyster-Yale Materials Handling, Inc. | | | 194 | | | | 11,219 | |
John Bean Technologies Corp. | | | 56 | | | | 2,738 | |
L.B. Foster Co., Class A | | | 286 | | | | 3,546 | |
LS Starrett Co., Class A | | | 525 | | | | 5,807 | |
Meritor, Inc. (a) | | | 98 | | | | 1,053 | |
SPX Corp. | | | 2,037 | | | | 22,488 | |
Supreme Industries, Inc., Class A | | | 4,420 | | | | 35,360 | |
Wabash National Corp. (a) | | | 2,354 | | | | 30,531 | |
| | | | | | | | |
| | | | | | | | 259,680 | |
Media — 0.9% | | | | | | | | |
Crown Media Holdings, Inc., Class A (a) | | | 181 | | | | 1,026 | |
Entercom Communications Corp., Class A (a) | | | 2,548 | | | | 30,856 | |
Harte-Hanks, Inc. | | | 15,923 | | | | 59,870 | |
| | | | | | | | |
| | | | | | | | 91,752 | |
Metals & Mining — 0.5% | | | | | | | | |
Kaiser Aluminum Corp. | | | 71 | | | | 6,086 | |
Worthington Industries, Inc. | | | 1,517 | | | | 46,678 | |
| | | | | | | | |
| | | | | | | | 52,764 | |
Multiline Retail — 0.6% | | | | | | | | |
Burlington Stores, Inc. (a) | | | 1,252 | | | | 60,234 | |
Oil, Gas & Consumable Fuels — 3.0% | | | | | | | | |
Abraxas Petroleum Corp. (a) | | | 11,530 | | | | 15,220 | |
Alon USA Energy, Inc. | | | 266 | | | | 4,679 | |
Archrock, Inc. | | | 1,809 | | | | 19,121 | |
DHT Holdings, Inc. | | | 6,302 | | | | 47,265 | |
Enviva Partners LP | | | 629 | | | | 9,630 | |
Evolution Petroleum Corp. | | | 7,442 | | | | 45,768 | |
Exterran Corp. (a) | | | 288 | | | | 4,715 | |
Gener8 Maritime, Inc. (a) | | | 4,560 | | | | 44,186 | |
Isramco, Inc. (a) | | | 119 | | | | 10,948 | |
Noble Energy, Inc. | | | 203 | | | | 7,444 | |
Nordic American Tankers Ltd. | | | 451 | | | | 6,675 | |
Oasis Petroleum, Inc. (a) | | | 661 | | | | 7,595 | |
PDC Energy, Inc. (a) | | | 447 | | | | 25,251 | |
RSP Permian, Inc. (a) | | | 74 | | | | 2,100 | |
Scorpio Tankers, Inc. | | | 3,742 | | | | 32,368 | |
Transatlantic Petroleum Ltd. | | | 1,890 | | | | 2,930 | |
Triangle Petroleum Corp. (a)(b) | | | 11,937 | | | | 9,144 | |
W&T Offshore, Inc. | | | 343 | | | | 1,286 | |
See Notes to Financial Statements.
| | | | | | |
| | | SEMI-ANNUAL REPORT | | NOVEMBER 30, 2015 | | 11 |
| | | | |
| Schedule of Investments (continued) | | | BlackRock Disciplined Small Cap Core Fund | |
| | | | |
| | | | | | | | |
| Common Stocks | | Shares | | | Value | |
Oil, Gas & Consumable Fuels (continued) | | | | | | | | |
Western Refining, Inc. | | | 36 | | | $ | 1,629 | |
| | | | | | | | |
| | | | | | | | 297,954 | |
Paper & Forest Products — 0.5% | | | | | | | | |
Boise Cascade Co. (a) | | | 674 | | | | 21,096 | |
Domtar Corp. | | | 682 | | | | 28,023 | |
| | | | | | | | |
| | | | | | | | 49,119 | |
Personal Products — 0.0% | | | | | | | | |
USANA Health Sciences, Inc. (a) | | | 27 | | | | 3,616 | |
Pharmaceuticals — 1.8% | | | | | | | | |
Endo International PLC (a) | | | 56 | | | | 3,443 | |
Furiex Pharmaceuticals, Inc. — CVR (a) | | | 11 | | | | 110 | |
Juniper Pharmaceuticals, Inc. (a) | | | 1,681 | | | | 19,903 | |
Lannett Co., Inc. (a) | | | 156 | | | | 5,766 | |
Marinus Pharmaceuticals, Inc. (a) | | | 600 | | | | 4,362 | |
Prestige Brands Holdings, Inc. (a) | | | 1,882 | | | | 95,775 | |
SciClone Pharmaceuticals, Inc. (a) | | | 1,359 | | | | 12,462 | |
Sucampo Pharmaceuticals, Inc., Class A (a) | | | 1,410 | | | | 24,182 | |
ZS Pharma, Inc. (a) | | | 101 | | | | 9,086 | |
| | | | | | | | |
| | | | | | | | 175,089 | |
Professional Services — 1.7% | | | | | | | | |
Insperity, Inc. | | | 1,241 | | | | 53,562 | |
Kforce, Inc. | | | 2,018 | | | | 54,365 | |
RPX Corp. (a) | | | 2,852 | | | | 39,557 | |
Volt Information Sciences, Inc. (a) | | | 1,060 | | | | 8,904 | |
Willdan Group, Inc. (a) | | | 1,030 | | | | 9,064 | |
| | | | | | | | |
| | | | | | | | 165,452 | |
Real Estate Investment Trusts (REITs) — 8.3% | | | | | | | | |
Arbor Realty Trust, Inc. | | | 18,671 | | | | 128,456 | |
Armada Hoffler Properties, Inc. | | | 268 | | | | 3,026 | |
Ashford Hospitality Prime, Inc. | | | 359 | | | | 5,098 | |
Chatham Lodging Trust | | | 3,854 | | | | 87,833 | |
Colony Capital, Inc., Class A | | | 461 | | | | 9,432 | |
CoreSite Realty Corp. | | | 63 | | | | 3,690 | |
DiamondRock Hospitality Co. | | | 6,969 | | | | 77,565 | |
DuPont Fabros Technology, Inc. | | | 737 | | | | 24,350 | |
EPR Properties | | | 536 | | | | 30,037 | |
Equity LifeStyle Properties, Inc. | | | 513 | | | | 32,001 | |
FelCor Lodging Trust, Inc. | | | 867 | | | | 6,953 | |
Gramercy Property Trust, Inc. | | | 1,075 | | | | 25,682 | |
Hersha Hospitality Trust | | | 2,422 | | | | 57,183 | |
InfraREIT, Inc. (a) | | | 2,944 | | | | 59,380 | |
LaSalle Hotel Properties | | | 545 | | | | 15,374 | |
Lexington Realty Trust | | | 3,701 | | | | 31,792 | |
New Residential Investment Corp. | | | 951 | | | | 12,097 | |
Northstar Realty Finance Corp. (a) | | | 322 | | | | 5,809 | |
Pebblebrook Hotel Trust | | | 1,506 | | | | 47,966 | |
PS Business Parks, Inc. | | | 782 | | | | 69,144 | |
RLJ Lodging Trust | | | 2,857 | | | | 69,711 | |
Strategic Hotels & Resorts, Inc. | | | 1,507 | | | | 21,339 | |
Summit Hotel Properties, Inc. | | | 192 | | | | 2,559 | |
| | | | | | | | |
| | | | | | | | 826,477 | |
Real Estate Management & Development — 0.7% | | | | | | | | |
AV Homes, Inc. (a) | | | 1,505 | | | | 20,950 | |
FRP Holdings, Inc. (a) | | | 510 | | | | 15,805 | |
Marcus & Millichap, Inc. (a) | | | 885 | | | | 29,037 | |
RE/MAX Holdings, Inc., Class A | | | 137 | | | | 5,139 | |
| | | | | | | | |
| | | | | | | | 70,931 | |
| | | | | | | | |
| Common Stocks | | Shares | | | Value | |
Road & Rail — 1.0% | | | | | | | | |
Ryder System, Inc. | | | 641 | | | $ | 42,280 | |
Swift Transportation Co. (a) | | | 3,288 | | | | 52,509 | |
| | | | | | | | |
| | | | | | | | 94,789 | |
Semiconductors & Semiconductor Equipment — 3.7% | | | | | | | | |
Ambarella, Inc. (b) | | | 59 | | | | 3,706 | |
Axcelis Technologies, Inc. (a) | | | 8,834 | | | | 23,322 | |
Cascade Microtech, Inc. (a) | | | 1,700 | | | | 27,625 | |
Cirrus Logic, Inc. (a) | | | 312 | | | | 10,315 | |
Fairchild Semiconductor International, Inc. | | | 647 | | | | 12,642 | |
Integrated Device Technology, Inc. (a) | | | 2,063 | | | | 57,847 | |
IXYS Corp. | | | 944 | | | | 12,017 | |
MaxLinear, Inc., Class A (a) | | | 888 | | | | 15,540 | |
Microsemi Corp. (a) | | | 795 | | | | 28,628 | |
MKS Instruments, Inc. | | | 123 | | | | 4,535 | |
Monolithic Power Systems, Inc. | | | 277 | | | | 18,927 | |
OmniVision Technologies, Inc. (a) | | | 326 | | | | 9,519 | |
Photronics, Inc. (a) | | | 390 | | | | 4,278 | |
Sigma Designs, Inc. (a) | | | 381 | | | | 3,309 | |
Synaptics, Inc. (a) | | | 81 | | | | 7,271 | |
Tessera Technologies, Inc. | | | 4,048 | | | | 128,929 | |
Ultra Clean Holdings, Inc. (a) | | | 614 | | | | 3,113 | |
| | | | | | | | |
| | | | | | | | 371,523 | |
Software — 4.7% | | | | | | | | |
Aspen Technology, Inc. (a) | | | 1,269 | | | | 55,773 | |
Exa Corp. (a) | | | 5,290 | | | | 56,973 | |
Gigamon, Inc. (a) | | | 298 | | | | 8,073 | |
Imperva, Inc. (a) | | | 83 | | | | 6,194 | |
Infoblox, Inc. (a) | | | 1,032 | | | | 15,521 | |
Manhattan Associates, Inc. (a) | | | 2,167 | | | | 165,992 | |
MicroStrategy, Inc., Class A (a) | | | 12 | | | | 2,080 | |
Monotype Imaging Holdings, Inc. | | | 585 | | | | 15,462 | |
Pegasystems, Inc. | | | 1,638 | | | | 48,387 | |
Progress Software Corp. (a) | | | 1,231 | | | | 29,532 | |
Take-Two Interactive Software, Inc. (a) | | | 319 | | | | 11,283 | |
Telenav, Inc. (a) | | | 887 | | | | 6,307 | |
Upland Software, Inc. (a) | | | 2,955 | | | | 21,660 | |
Zix Corp. (a) | | | 4,965 | | | | 27,854 | |
| | | | | | | | |
| | | | | | | | 471,091 | |
Specialty Retail — 2.8% | | | | | | | | |
Aaron’s, Inc. (a) | | | 1,200 | | | | 29,124 | |
American Eagle Outfitters, Inc. | | | 2,323 | | | | 36,169 | |
Barnes & Noble, Inc. | | | 3,174 | | | | 40,627 | |
Chico’s FAS, Inc. | | | 5,313 | | | | 63,756 | |
Express, Inc. (a) | | | 1,045 | | | | 17,493 | |
Finish Line, Inc., Class A | | | 198 | | | | 3,285 | |
Group 1 Automotive, Inc. | | | 290 | | | | 23,554 | |
Haverty Furniture Cos., Inc. | | | 156 | | | | 3,766 | |
hhgregg, Inc. (a) | | | 558 | | | | 2,299 | |
Murphy U.S.A., Inc. (a) | | | 183 | | | | 10,899 | |
Rent-A-Center, Inc. | | | 163 | | | | 2,797 | |
Sonic Automotive, Inc., Class A | | | 658 | | | | 15,963 | |
Stage Stores, Inc. | | | 989 | | | | 7,655 | |
Tilly’s, Inc., Class A (a) | | | 859 | | | | 5,300 | |
West Marine, Inc. (a) | | | 1,526 | | | | 14,024 | |
| | | | | | | | |
| | | | | | | | 276,711 | |
Technology Hardware, Storage & Peripherals — 0.0% | | | | | | | | |
Avid Technology, Inc. (a) | | | 415 | | | | 3,150 | |
See Notes to Financial Statements.
| | | | | | |
| 12 | | SEMI-ANNUAL REPORT | | NOVEMBER 30, 2015 | | |
| | | | |
| Schedule of Investments (continued) | | | BlackRock Disciplined Small Cap Core Fund | |
| | | | | | | | |
| Common Stocks | | Shares | | | Value | |
Textiles, Apparel & Luxury Goods — 1.3% | | | | | | | | |
Columbia Sportswear Co. | | | 76 | | | $ | 3,559 | |
Culp, Inc. | | | 1,402 | | | | 39,508 | |
Deckers Outdoor Corp. (a) | | | 882 | | | | 43,165 | |
Skechers U.S.A., Inc., Class A (a) | | | 1,327 | | | | 40,075 | |
| | | | | | | | |
| | | | | | | | 126,307 | |
Thrifts & Mortgage Finance — 2.8% | | | | | | | | |
Anchor BanCorp Wisconsin, Inc. (a) | | | 638 | | | | 26,790 | |
EverBank Financial Corp. | | | 8,872 | | | | 153,131 | |
Flagstar Bancorp, Inc. (a) | | | 3,558 | | | | 87,384 | |
MGIC Investment Corp. (a) | | | 872 | | | | 8,319 | |
Radian Group, Inc. | | | 385 | | | | 5,486 | |
| | | | | | | | |
| | | | | | | | 281,110 | |
Tobacco — 0.4% | | | | | | | | |
Vector Group Ltd. | | | 1,535 | | | | 38,851 | |
Trading Companies & Distributors — 0.6% | | | | | | | | |
CAI International, Inc. (a) | | | 1,796 | | | | 20,079 | |
Neff Corp., Class A (a) | | | 4,552 | | | | 37,827 | |
| | | | | | | | |
| | | | | | | | 57,906 | |
Water Utilities — 1.4% | | | | | | | | |
California Water Service Group | | | 5,560 | | | | 125,267 | |
Connecticut Water Service, Inc. | | | 149 | | | | 5,410 | |
Middlesex Water Co. | | | 215 | | | | 5,510 | |
| | | | | | | | |
| | | | | | | | 136,187 | |
Wireless Telecommunication Services — 0.0% | | | | | | | | |
Leap Wireless International, Inc. — CVR (a) | | | 216 | | | | 544 | |
Total Common Stocks — 99.4% | | | | | | | 9,871,120 | |
| | | | | | | | |
| Other Interests (c) | | Beneficial
Interest
(000) | | | Value | |
Professional Services — 0.0% | | | | | | | | |
Dolan Co., Escrow (a) | | | $ 2 | | | | $ 39 | |
Total Other Interests — 0.0% | | | | | | | 39 | |
Total Long-Term Investments (Cost — $9,508,228) — 99.4% | | | | | | | 9,871,159 | |
| | | | | | | | |
| Short-Term Securities | | Shares | | | | |
BlackRock Liquidity Funds, TempFund, Institutional Class, 0.14% (d)(e) | | | 128,665 | | | | 128,665 | |
| | | Beneficial
Interest
(000) | | | | |
BlackRock Liquidity Series, LLC, Money Market Series, 0.27% (d)(e)(f) | | | $166 | | | | 166,267 | |
Total Short-Term Securities (Cost — $294,932) — 3.0% | | | | | | | 294,932 | |
Total Investments (Cost — $9,803,160) — 102.4% | | | | | | | 10,166,091 | |
Liabilities in Excess of Other Assets — (2.4)% | | | | | | | (235,721 | ) |
| | | | | | | | |
Net Assets — 100.0% | | | | | | $ | 9,930,370 | |
| | | | | | | | |
|
| Notes to Schedule of Investments |
| (a) | Non-income producing security. |
| (b) | Security, or a portion of security, is on loan. |
| (c) | Other interests represent beneficial interests in liquidation trusts and other reorganization or private entities. |
| (d) | During the six months ended November 30, 2015, investments in issuers considered to be affiliates of the Fund for purposes of Section 2(a)(3) of the Investment Company Act of 1940, as amended, were as follows: |
| | | | | | | | | | | | | | | | |
| Affiliate | | Shares/
Beneficial
Interest
Held at
May 31, 2015 | | | Net
Activity | | | Shares/ Beneficial Interest Held at
November 30, 2015 | | | Income | |
BlackRock Liquidity Funds, TempFund, Institutional Class | | | 161,872 | | | | (33,207 | ) | | | 128,665 | | | $ | 84 | |
BlackRock Liquidity Series, LLC, Money Market Series | | | $129,625 | | | | $36,642 | | | | $166,267 | | | $ | 1,373 | 1 |
| | 1 | | Represents securities lending income earned from the reinvestment of cash collateral from loaned securities, net of fees and collateral investment expenses, and other payments to and from borrowers of securities. |
| (e) | Represents the current yield as of period end. |
| (f) | Security was purchased with the cash collateral from loaned securities. The Fund may withdraw up to 25% of its investment daily, although the manager of the BlackRock Liquidity Series, LLC, Money Market Series, in its sole discretion, may permit an investor to withdraw more than 25% on any one day. |
| • | | For Fund compliance purposes, the Fund’s industry classifications refer to any one or more of the industry sub-classifications used by one or more widely recognized market indexes or ratings group indexes, and/or as defined by the investment advisor. These definitions may not apply for purposes of this report, which may combine such industry sub-classifications for reporting ease. |
See Notes to Financial Statements.
| | | | | | |
| | | SEMI-ANNUAL REPORT | | NOVEMBER 30, 2015 | | 13 |
| | | | |
| Schedule of Investments (continued) | | | BlackRock Disciplined Small Cap Core Fund | |
|
| Derivative Financial Instruments Outstanding as of Period End |
| | | | | | | | | | | | |
| Financial Futures Contracts | | | | | | | | |
Contracts
Long | | Issue | | Expiration | | Notional
Value | | | Unrealized
Appreciation | |
| 1 | | E-Mini Russell 2000 Futures | | December 2015 | | $ | 119,590 | | | | $5,417 | |
|
| Derivative Financial Instruments Categorized by Risk Exposure |
As of period end, fair values of derivative financial instruments located in the Statements of Assets and Liabilities were as follows:
| | | | | | | | | | | | | | | | | | | | | | | | | | | | | | | | | | | | | |
| | | | | Commodity
Contracts | | Credit
Contracts | | Equity
Contracts | | Foreign
Currency
Exchange
Contracts | | Interest Rate
Contracts | | Other
Contracts | | Total |
Assets — Derivative Financial Instruments | | | | | | | | | | | | | | | | | | | | | | | | | | | | | | | |
Financial futures contracts | | Net unrealized appreciation1 | | | | — | | | | | — | | | | | $5,417 | | | | | — | | | | | — | | | | | — | | | | $ | 5,417 | |
| | 1 | | Includes cumulative appreciation (depreciation) on financial futures contracts, if any, as reported in the Schedule of Investments. Only current day’s variation margin is reported within the Statements of Assets and Liabilities. |
For the six months ended November 30, 2015, the effect of derivative financial instruments in the Statements of Operations were as follows:
| | | | | | | | | | | | | | | | | | | | | | | | | | | | |
| Net Realized Loss from: | | Commodity
Contracts | | | Credit
Contracts | | | Equity
Contracts | | | Foreign
Currency
Exchange
Contracts | | | Interest Rate
Contracts | | | Other
Contracts | | | Total | |
Financial futures contracts | | | — | | | | — | | | | $(4,002 | ) | | | — | | | | — | | | | — | | | $ | (4,002 | ) |
Net Change in Unrealized Appreciation (Depreciation) on: | | | | | | | | | | | | | | | | | | | | | | | | | | | | |
Financial futures contracts | | | — | | | | — | | | | $ 5,419 | | | | — | | | | — | | | | — | | | $ | 5,419 | |
|
| Average Quarterly Balances of Outstanding Derivative Financial Instruments |
| | | | |
Financial futures contracts: | | | | |
Average notional value of contract — long | | $ | 117,670 | |
For more information about the Fund’s investment risks regarding derivative financial instruments, refer to the Notes to Financial Statements.
|
| Fair Value Hierarchy as of Period End |
Various inputs are used in determining the fair value of investments and derivative financial instruments. For information about the Fund’s policy regarding valuation of investments and derivative financial instruments, refer to the Notes to Financial Statements.
The following tables summarize the Fund’s investments and derivative financial instruments categorized in the disclosure hierarchy:
| | | | | | | | | | | | | | | | | | | | |
| | | Level 1 | | Level 2 | | Level 3 | | Total |
Assets: | | | | | | | | | | | | | | | | | | | | |
Investments: | | | | | | | | | | | | | | | | | | | | |
Long-Term Investments1 | | | $ | 9,870,466 | | | | | — | | | | $ | 693 | | | | $ | 9,871,159 | |
Short-Term Securities | | | | 128,665 | | | | $ | 166,267 | | | | | — | | | | | 294,932 | |
| | | | | |
Total | | | $ | 9,999,131 | | | | $ | 166,267 | | | | $ | 693 | | | | $ | 10,166,091 | |
| | | | | |
1 See above Schedule of Investments for values in each industry. Investments categorized as Level 3 are included in Pharmaceuticals, Wireless Telecommunications Services and Other Interests. | |
| | | | | | | | | | | | | | | | | | | | |
| | | Level 1 | | Level 2 | | Level 3 | | Total |
Derivative Financial Instruments2 | | | | | | | | | | | | | | | | | | | | |
Assets: | | | | | | | | | | | | | | | | | | | | |
Equity contracts | | | $ | 5,417 | | | | | — | | | | | — | | | | $ | 5,417 | |
2 Derivative financial instruments are financial futures contracts, which are valued at the unrealized appreciation (depreciation) on the instrument. | |
See Notes to Financial Statements.
| | | | | | |
| 14 | | SEMI-ANNUAL REPORT | | NOVEMBER 30, 2015 | | |
| | | | |
| Schedule of Investments (concluded) | | | BlackRock Disciplined Small Cap Core Fund | |
The Fund may hold assets and/or liabilities in which the fair value approximates the carrying amount for financial statement purposes. As of period end, such assets and/or liabilities are categorized within the disclosure hierarchy as follows:
| | | | | | | | | | | | | | | | | | | | |
| | | Level 1 | | Level 2 | | Level 3 | | Total |
Assets: | | | | | | | | | | | | | | | | | | | | |
Cash pledged for financial futures contracts | | | $ | 6,000 | | | | | — | | | | | — | | | | $ | 6,000 | |
Liabilities: | | | | | | | | | | | | | | | | | | | | |
Collateral on securities loaned at value | | | | — | | | | $ | (166,267 | ) | | | | — | | | | | (166,267 | ) |
Total | | | $ | 6,000 | | | | $ | (166,267 | ) | | | | — | | | | $ | (160,267 | ) |
| | | | | |
During the six months ended November 30, 2015, there were no transfers between levels.
See Notes to Financial Statements.
| | | | | | |
| | | SEMI-ANNUAL REPORT | | NOVEMBER 30, 2015 | | 15 |
| | |
| Statements of Assets and Liabilities | | |
| | | | | | | | |
| November 30, 2015 (Unaudited) | | BlackRock
Disciplined Small
Cap Core Fund | | | BlackRock
Small Cap
Growth Fund II | |
| | | | | | | | |
| Assets | | | | | | | | |
Investments at value — unaffiliated (including securities loaned at value of $157,312) (cost — $9,508,228) | | $ | 9,871,159 | | | | — | |
Investments at value — affiliated (cost — $294,932) | | | 294,932 | | | | — | |
Investments at value — Master Portfolio (cost — $185,658,346) | | | — | | | $ | 196,548,022 | |
Cash pledged for financial futures contracts | | | 6,000 | | | | — | |
Receivables: | | | | | | | | |
Investments sold | | | 117,586 | | | | — | |
Securities lending income — affiliated | | | 559 | | | | — | |
Capital shares sold | | | 28 | | | | 116,149 | |
Dividends | | | 10,486 | | | | — | |
From the Manager | | | 27,972 | | | | — | |
Withdrawals from the Master Portfolio | | | — | | | | 216,778 | |
Prepaid expenses | | | 14,165 | | | | 39,005 | |
| | | | |
Total assets | | | 10,342,887 | | | | 196,919,954 | |
| | | | |
| | | | | | | | |
| Liabilities | | | | | | | | |
Collateral on securities loaned at value | | | 166,267 | | | | — | |
Payables: | | | | | | | | |
Investments purchased | | | 149,404 | | | | — | |
Administration fees | | | — | | | | 32,095 | |
Capital shares redeemed | | | 1,000 | | | | 332,927 | |
Officer’s and Trustees’/Directors’ fees | | | 1,129 | | | | 165 | |
Other accrued expenses | | | 38,260 | | | | 31,779 | |
Other affiliates | | | — | | | | 3,438 | |
Professional fees | | | 54,365 | | | | 36,769 | |
Service and distribution fees | | | 1,005 | | | | 54,345 | |
Transfer agent fees | | | 597 | | | | 129,592 | |
Variation margin payable on financial futures contracts | | | 490 | | | | — | |
| | | | |
Total liabilities | | | 412,517 | | | | 621,110 | |
| | | | |
Net Assets | | $ | 9,930,370 | | | $ | 196,298,844 | |
| | | | |
| | | | | | | | |
| Net Assets Consist of | | | | | | | | |
Paid-in capital | | $ | 9,276,456 | | | $ | 180,175,021 | |
Undistributed (accumulated) net investment income (loss) | | | 41,932 | | | | (577,912 | ) |
Undistributed net realized gain | | | 243,634 | | | | — | |
Undistributed net realized gain allocated from the Master Portfolio | | | — | | | | 5,812,059 | |
Net unrealized appreciation (depreciation) | | | 368,348 | | | | — | |
Net unrealized appreciation (depreciation) allocated from the Master Portfolio | | | — | | | | 10,889,676 | |
| | | | |
Net Assets | | $ | 9,930,370 | | | $ | 196,298,844 | |
| | | | |
See Notes to Financial Statements.
| | | | | | |
| 16 | | SEMI-ANNUAL REPORT | | NOVEMBER 30, 2015 | | |
| | |
| Statements of Assets and Liabilities (concluded) | | |
| | | | | | | | |
| November 30, 2015 (Unaudited) | | BlackRock
Disciplined Small
Cap Core Fund | | | BlackRock
Small Cap
Growth Fund II | |
| | | | | | | | |
| Net Asset Value | | | | | | | | |
Institutional | | | | | | | | |
Net assets | | $ | 5,948,809 | | | $ | 65,582,653 | |
| | | | |
Shares outstanding | | | 528,416 | 1 | | | 4,986,189 | 2 |
| | | | |
Net asset value | | $ | 11.26 | | | $ | 13.15 | |
| | | | |
Investor A | | | | | | | | |
Net assets | | $ | 3,579,372 | | | $ | 70,221,164 | |
| | | | |
Shares outstanding | | | 318,879 | 1 | | | 5,656,061 | 2 |
| | | | |
Net asset value | | $ | 11.22 | | | $ | 12.42 | |
| | | | |
Investor C | | | | | | | | |
Net assets | | $ | 402,189 | | | $ | 38,674,505 | |
| | | | |
Shares outstanding | | | 36,256 | 1 | | | 3,866,312 | 2 |
| | | | |
Net asset value | | $ | 11.09 | | | $ | 10.00 | |
| | | | |
Class R | | | | | | | | |
Net assets | | | — | | | $ | 21,820,522 | |
| | | | |
Shares outstanding | | | — | | | | 1,922,951 | 2 |
| | | | |
Net asset value | | | — | | | $ | 11.35 | |
| | | | |
| | 1 | | Unlimited number of shares authorized, $0.001 par value. |
| | 2 | | 100 million shares authorized, $0.0001 par value. |
See Notes to Financial Statements.
| | | | | | |
| | | SEMI-ANNUAL REPORT | | NOVEMBER 30, 2015 | | 17 |
| | | | | | | | |
| Six Months Ended November 30, 2015 (Unaudited) | | BlackRock
Disciplined Small
Cap Core Fund | | | BlackRock
Small Cap
Growth Fund II | |
| | | | | | | | |
| Investment Income | | | | | | | | |
Dividends — unaffiliated | | $ | 79,228 | | | | — | |
Securities lending — affiliated — net | | | 1,373 | | | | — | |
Dividends — affiliated | | | 84 | | | | — | |
Net investment income allocated from the Master Portfolio: | | | | | | | | |
Dividends — unaffiliated | | | — | | | $ | 914,209 | |
Securities lending — affiliated — net | | | — | | | | 83,128 | |
Dividends — affiliated | | | — | | | | 1,043 | |
Expenses | | | — | | | | (834,324 | ) |
Fees waived | | | — | | | | 167,835 | |
| | | | |
Total income | | | 80,685 | | | | 331,891 | |
| | | | |
| | | | | | | | |
| Expenses | | | | | | | | |
Professional | | | 51,541 | | | | 26,832 | |
Registration | | | 23,767 | | | | 33,638 | |
Investment advisory | | | 21,268 | | | | — | |
Printing | | | 11,637 | | | | 21,460 | |
Custodian | | | 9,227 | | | | — | |
Pricing | | | 5,956 | | | | — | |
Service and distribution — class specific | | | 5,600 | | | | 355,031 | |
Accounting services | | | 4,376 | | | | — | |
Officer and Trustees/Directors | | | 3,759 | | | | 71 | |
Transfer agent — class specific | | | 2,865 | | | | 268,963 | |
Administration | | | 2,009 | | | | 207,522 | |
Administration — class specific | | | 944 | | | | — | |
Miscellaneous | | | 5,480 | | | | 6,425 | |
| | | | |
Total expenses | | | 148,429 | | | | 919,942 | |
Less: | | | | | | | | |
Fees waived and/or reimbursed by the Manager | | | (103,713 | ) | | | — | |
Administration fees waived | | | (2,009 | ) | | | — | |
Administration fees waived — class specific | | | (942 | ) | | | — | |
Transfer agent fees reimbursed — class specific | | | (2,803 | ) | | | — | |
| | | | |
Total expenses after fees waived and/or reimbursed | | | 38,962 | | | | 919,942 | |
| | | | |
Net investment income (loss) | | | 41,723 | | | | (588,051 | ) |
| | | | |
| | | | | | | | |
| Realized and Unrealized Gain (Loss) | | | | | | | | |
Net realized gain (loss) from: | | | | | | | | |
Investments | | | 277,826 | | | | — | |
Financial futures contracts | | | (4,002 | ) | | | — | |
Investments and financial futures contracts allocated from the Master Portfolio | | | — | | | | 7,334,584 | |
| | | | |
| | | 273,824 | | | | 7,334,584 | |
| | | | |
Net change in unrealized appreciation (depreciation) on: | | | | | | | | |
Investments | | | (529,389 | ) | | | — | |
Financial futures contracts | | | 5,419 | | | | — | |
Investments and financial futures contracts allocated from the Master Portfolio | | | — | | | | (18,859,164 | ) |
| | | | |
| | | (523,970 | ) | | | (18,859,164 | ) |
| | | | |
Net realized and unrealized loss | | | (250,146 | ) | | | (11,524,580 | ) |
| | | | |
Net Decrease in Net Assets Resulting from Operations | | $ | (208,423 | ) | | $ | (12,112,631 | ) |
| | | | |
See Notes to Financial Statements.
| | | | | | |
| 18 | | SEMI-ANNUAL REPORT | | NOVEMBER 30, 2015 | | |
| | |
| Statements of Changes in Net Assets | | |
| | | | | | | | | | | | | | | | |
| | | BlackRock Disciplined
Small Cap Core Fund | | | BlackRock Small Cap
Growth Fund II | |
| Increase (Decrease) in Net Assets: | | Six Months
Ended
November 30,
2015
(Unaudited) | | | Year Ended
May 31, 2015 | | | Six Months
Ended
November 30,
2015
(Unaudited) | | | Year Ended
May 31, 2015 | |
| | | | | | | | | | | | | | | | |
| Operations | | | | | | | | | | | | | | | | |
Net investment income (loss) | | $ | 41,723 | | | $ | 45,249 | | | $ | (588,051 | ) | | $ | (1,468,865 | ) |
Net realized gain | | | 273,824 | | | | 307,278 | | | | 7,334,584 | | | | 19,291,678 | |
Net change in unrealized appreciation (depreciation) | | | (523,970 | ) | | | 411,992 | | | | (18,859,164 | ) | | | 9,638,941 | |
| | | | | | | | |
Net increase (decrease) in net assets resulting from operations | | | (208,423 | ) | | | 764,519 | | | | (12,112,631 | ) | | | 27,461,754 | |
| | | | | | | | |
| | | | | | | | | | | | | | | | |
| Distributions to Shareholders1 | | | | | | | | | | | | | | | | |
From net investment income: | | | | | | | | | | | | | | | | |
Institutional | | | (16,321 | ) | | | (19,895 | ) | | | — | | | | — | |
Investor A | | | (5,331 | ) | | | (2,806 | ) | | | — | | | | — | |
From net realized gain: | | | | | | | | | | | | | | | | |
Institutional | | | (84,851 | ) | | | (581,949 | ) | | | (3,727,177 | ) | | | (9,205,191 | ) |
Investor A | | | (39,508 | ) | | | (98,084 | ) | | | (3,893,386 | ) | | | (9,863,810 | ) |
Investor B | | | — | | | | — | | | | — | | | | (165,249 | ) |
Investor C | | | (4,594 | ) | | | (11,182 | ) | | | (2,362,838 | ) | | | (6,724,128 | ) |
Class R | | | — | | | | — | | | | (1,238,546 | ) | | | (3,743,363 | ) |
| | | | | | | | |
Decrease in net assets resulting from distributions to shareholders | | | (150,605 | ) | | | (713,916 | ) | | | (11,221,947 | ) | | | (29,701,741 | ) |
| | | | | | | | |
| | | | | | | | | | | | | | | | |
| Capital Share Transactions | | | | | | | | | | | | | | | | |
Net increase (decrease) in net assets derived from capital share transactions | | | 1,118,906 | | | | 2,024,918 | | | | 580,079 | | | | (10,300,360 | ) |
| | | | | | | | |
| | | | | | | | | | | | | | | | |
| Net Assets | | | | | | | | | | | | | | | | |
Total increase (decrease) in net assets | | | 759,878 | | | | 2,075,521 | | | | (22,754,499 | ) | | | (12,540,347 | ) |
Beginning of period | | | 9,170,492 | | | | 7,094,971 | | | | 219,053,343 | | | | 231,593,690 | |
| | | | | | | | |
End of period | | $ | 9,930,370 | | | $ | 9,170,492 | | | $ | 196,298,844 | | | $ | 219,053,343 | |
| | | | | | | | |
Undistributed (accumulated) net investment income (loss), end of period | | $ | 41,932 | | | $ | 21,861 | | | $ | (577,912 | ) | | $ | 10,139 | |
| | | | | | | | |
| 1 | | Distributions for annual periods determined in accordance with federal income tax regulations. |
See Notes to Financial Statements.
| | | | | | |
| | | SEMI-ANNUAL REPORT | | NOVEMBER 30, 2015 | | 19 |
| | | | |
| Financial Highlights | | | BlackRock Disciplined Small Cap Core Fund | |
| | | | | | | | | | | | | | | | |
| | | Institutional | |
| | | Six Months
Ended
November 30,
2015 | | | Year Ended May 31, | | | Period
March 14, 20131 to May 31, 2013 | |
| | | (Unaudited) | | | 2015 | | | 2014 | | |
| | | | | | | | | | | | | | | | |
| Per Share Operating Performance | |
Net asset value, beginning of period | | $ | 11.74 | | | $ | 11.80 | | | $ | 10.37 | | | $ | 10.00 | |
| | | | |
Net investment income2 | | | 0.06 | | | | 0.08 | | | | 0.07 | | | | 0.02 | |
Net realized and unrealized gain (loss) | | | (0.35 | ) | | | 1.02 | | | | 2.06 | | | | 0.35 | |
| | | | |
Net increase (decrease) from investment operations | | | (0.29 | ) | | | 1.10 | | | | 2.13 | | | | 0.37 | |
| | | | |
Distributions:3 | | | | | | | | | | | | | | | | |
From net investment income | | | (0.03 | ) | | | (0.04 | ) | | | (0.15 | ) | | | — | |
From net realized gain | | | (0.16 | ) | | | (1.12 | ) | | | (0.55 | ) | | | — | |
| | | | |
Total distributions | | | (0.19 | ) | | | (1.16 | ) | | | (0.70 | ) | | | — | |
| | | | |
Net asset value, end of period | | $ | 11.26 | | | $ | 11.74 | | | $ | 11.80 | | | $ | 10.37 | |
| | | | |
| | | | | | | | | | | | | | | | |
| Total Return4 | |
Based on net asset value | | | (2.53 | )%5 | | | 10.24 | % | | | 20.85 | % | | | 3.70 | %5 |
| | | | |
| | | | | | | | | | | | | | | | |
| Ratios to Average Net Assets | |
Total expenses | | | 2.97 | %6 | | | 3.43 | % | | | 6.26 | % | | | 7.68 | %6,7 |
| | | | |
Total expenses after fees waived and/or reimbursed | | | 0.71 | %6,8 | | | 0.70 | % | | | 0.71 | %8 | | | 0.70 | %6 |
| | | | |
Net investment income | | | 0.99 | %6 | | | 0.66 | % | | | 0.61 | % | | | 0.93 | %6 |
| | | | |
| | | | | | | | | | | | | | | | |
| Supplemental Data | |
Net assets, end of period (000) | | $ | 5,949 | | | $ | 6,122 | | | $ | 6,095 | | | $ | 5,181 | |
| | | | |
Portfolio turnover rate | | | 85 | % | | | 148 | % | | | 145 | % | | | 67 | % |
| | | | |
| | 1 | | Commencement of operations. |
| | 2 | | Based on average shares outstanding. |
| | 3 | | Distributions for annual periods determined in accordance with federal income tax regulations. |
| | 4 | | Where applicable, assumes the reinvestment of distributions. |
| | 5 | | Aggregate total return. |
| | 7 | | Organization costs were not annualized in the calculation of the expense ratios. If these expenses were annualized, the total expenses would have been 8.75%. |
| | 8 | | Includes certain tax expenses. Excluding such tax expenses, total expenses after fees waived and/or reimbursed would have been 0.70%. |
See Notes to Financial Statements.
| | | | | | |
| 20 | | SEMI-ANNUAL REPORT | | NOVEMBER 30, 2015 | | |
| | | | |
| Financial Highlights (continued) | | | BlackRock Disciplined Small Cap Core Fund | |
| | | | | | | | | | | | | | | | |
| | | Investor A | |
| | | Six Months Ended November 30, 2015 | | | Year Ended May 31, | | | Period March 14, 20131 | |
| | | (Unaudited) | | | 2015 | | | 2014 | | | to May 31, 2013 | |
| | | | | | | | | | | | | | | | |
| Per Share Operating Performance | | | | | | | | | | | | | | | | |
Net asset value, beginning of period | | $ | 11.71 | | | $ | 11.78 | | | $ | 10.37 | | | $ | 10.00 | |
| | | | |
Net investment income (loss)2 | | | 0.04 | | | | 0.05 | | | | (0.01 | ) | | | 0.01 | |
Net realized and unrealized gain (loss) | | | (0.35 | ) | | | 1.01 | | | | 2.10 | | | | 0.36 | |
| | | | |
Net increase (decrease) from investment operations | | | (0.31 | ) | | | 1.06 | | | | 2.09 | | | | 0.37 | |
| | | | |
Distributions:3 | | | | | | | | | | | | | | | | |
From net investment income | | | (0.02 | ) | | | (0.02 | ) | | | (0.13 | ) | | | — | |
From net realized gain | | | (0.16 | ) | | | (1.11 | ) | | | (0.55 | ) | | | — | |
| | | | |
Total distributions | | | (0.18 | ) | | | (1.13 | ) | | | (0.68 | ) | | | — | |
| | | | |
Net asset value, end of period | | $ | 11.22 | | | $ | 11.71 | | | $ | 11.78 | | | $ | 10.37 | |
| | | | |
| | | | | | | | | | | | | | | | |
| Total Return4 | | | | | | | | | | | | | | | | |
Based on net asset value | | | (2.70 | )%5 | | | 9.96 | % | | | 20.49 | % | | | 3.70 | %5 |
| | | | |
| | | | | | | | | | | | | | | | |
| Ratios to Average Net Assets | | | | | | | | | | | | | | | | |
Total expenses | | | 3.35 | %6 | | | 3.70 | % | | | 8.25 | % | | | 8.16 | %6,7 |
| | | | |
Total expenses after fees waived and/or reimbursed | | | 0.96 | %6,8 | | | 0.95 | % | | | 0.95 | % | | | 0.95 | %6 |
| | | | |
Net investment income (loss) | | | 0.77 | %6 | | | 0.43 | % | | | (0.11 | )% | | | 0.67 | %6 |
| | | | |
| | | | | | | | | | | | | | | | |
| Supplemental Data | | | | | | | | | | | | | | | | |
Net assets, end of period (000) | | $ | 3,579 | | | $ | 2,736 | | | $ | 899 | | | $ | 21 | |
| | | | |
Portfolio turnover rate | | | 85 | % | | | 148 | % | | | 145 | % | | | 67 | % |
| | | | |
| | 1 | | Commencement of operations. |
| | 2 | | Based on average shares outstanding. |
| | 3 | | Distributions for annual periods determined in accordance with federal income tax regulations. |
| | 4 | | Where applicable, excludes the effects of any sales charges and assumes the reinvestment of distributions. |
| | 5 | | Aggregate total return. |
| | 7 | | Organization costs were not annualized in the calculation of the expense ratios. If these expenses were annualized, the total expenses would have been 9.23%. |
| | 8 | | Includes certain tax expenses. Excluding such tax expenses, total expenses after fees waived and/or reimbursed would have been 0.95%. |
See Notes to Financial Statements.
| | | | | | |
| | | SEMI-ANNUAL REPORT | | NOVEMBER 30, 2015 | | 21 |
| | | | |
| Financial Highlights (concluded) | | | BlackRock Disciplined Small Cap Core Fund | |
| | | | | | | | | | | | | | | | |
| | | Investor C | |
| | | Six Months Ended November 30, 2015 | | | Year Ended May 31, | | | Period
March 14, 20131 | |
| | | (Unaudited) | | | 2015 | | | 2014 | | | to May 31, 2013 | |
| | | | | | | | | | | | | | | | |
| Per Share Operating Performance | | | | | | | | | | | | | | | | |
Net asset value, beginning of period | | $ | 11.60 | | | $ | 11.71 | | | $ | 10.35 | | | $ | 10.00 | |
| | | | |
Net investment income (loss)2 | | | 0.00 | 3 | | | (0.04 | ) | | | (0.06 | ) | | | (0.00 | )4 |
Net realized and unrealized gain (loss) | | | (0.35 | ) | | | 1.02 | | | | 2.05 | | | | 0.35 | |
| | | | |
Net increase (decrease) from investment operations | | | (0.35 | ) | | | 0.98 | | | | 1.99 | | | | 0.35 | |
| | | | |
Distributions:5 | | | | | | | | | | | | | | | | |
From net investment income | | | — | | | | — | | | | (0.08 | ) | | | — | |
From net realized gain | | | (0.16 | ) | | | (1.09 | ) | | | (0.55 | ) | | | — | |
| | | | |
Total distributions | | | (0.16 | ) | | | (1.09 | ) | | | (0.63 | ) | | | — | |
| | | | |
Net asset value, end of period | | $ | 11.09 | | | $ | 11.60 | | | $ | 11.71 | | | $ | 10.35 | |
| | | | |
| | | | | | | | | | | | | | | | |
| Total Return6 | | | | | | | | | | | | | | | | |
Based on net asset value | | | (3.08 | )%7 | | | 9.22 | % | | | 19.53 | % | | | 3.50 | %7 |
| | | | |
| | | | | | | | | | | | | | | | |
| Ratios to Average Net Assets | | | | | | | | | | | | | | | | |
Total expenses | | | 4.15 | %8 | | | 4.56 | % | | | 7.86 | % | | | 8.91 | %8,9 |
| | | | |
Total expenses after fees waived and/or reimbursed | | | 1.71 | %8,10 | | | 1.70 | % | | | 1.71 | %10 | | | 1.70 | %8 |
| | | | |
Net investment income (loss) | | | 0.01 | %8 | | | (0.36 | )% | | | (0.53 | )% | | | (0.08 | )%8 |
| | | | |
| | | | | | | | | | | | | | | | |
| Supplemental Data | | | | | | | | | | | | | | | | |
Net assets, end of period (000) | | $ | 402 | | | $ | 313 | | | $ | 101 | | | $ | 21 | |
| | | | |
Portfolio turnover rate | | | 85 | % | | | 148 | % | | | 145 | % | | | 67 | % |
| | | | |
| | 1 | | Commencement of operations. |
| | 2 | | Based on average shares outstanding. |
| | 3 | | Amount is less than $0.005 per share. |
| | 4 | | Amount is greater than $(0.005) per share. |
| | 5 | | Distributions for annual periods determined in accordance with federal income tax regulations. |
| | 6 | | Where applicable, excludes the effects of any sales charges and assumes the reinvestment of distributions. |
| | 7 | | Aggregate total return. |
| | 9 | | Organization costs were not annualized in the calculation of the expense ratios. If these expenses were annualized, the total expenses would have been 9.98%. |
| | 10 | | Includes certain tax expenses. Excluding such tax expenses, total expenses after fees waived and/or reimbursed would have been 1.70%. |
See Notes to Financial Statements.
| | | | | | |
| 22 | | SEMI-ANNUAL REPORT | | NOVEMBER 30, 2015 | | |
| | | | |
| Financial Highlights | | | BlackRock Small Cap Growth Fund II | |
| | | | | | | | | | | | | | | | | | | | | | | | |
| | | Institutional | |
| | | Six Months
Ended
November 30, 2015 | | | Year Ended May 31, | |
| | | (Unaudited) | | | 2015 | | | 2014 | | | 2013 | | | 2012 | | | 2011 | |
| | | | | | | | | | | | | | | | | | | | | | | | |
| Per Share Operating Performance | | | | | | | | | | | | | | | | | | | | | | | | |
Net asset value, beginning of period | | $ | 14.62 | | | $ | 14.63 | | | $ | 15.20 | | | $ | 13.22 | | | $ | 15.67 | | | $ | 11.64 | |
| | | | |
Net investment loss1 | | | (0.01 | ) | | | (0.04 | ) | | | (0.06 | ) | | | (0.01 | ) | | | (0.12 | ) | | | (0.13 | ) |
Net realized and unrealized gain (loss) | | | (0.72 | ) | | | 1.79 | | | | 3.00 | | | | 3.72 | | | | (2.03 | ) | | | 4.16 | 2 |
| | | | |
Net increase (decrease) from investment operations | | | (0.73 | ) | | | 1.75 | | | | 2.94 | | | | 3.71 | | | | (2.15 | ) | | | 4.03 | |
| | | | |
Distributions from net realized gain3 | | | (0.74 | ) | | | (1.76 | ) | | | (3.51 | ) | | | (1.73 | ) | | | (0.30 | ) | | | — | |
| | | | |
Net asset value, end of period | | $ | 13.15 | | | $ | 14.62 | | | $ | 14.63 | | | $ | 15.20 | | | $ | 13.22 | | | $ | 15.67 | |
| | | | |
| | | | | | | | | | | | | | | | | | | | | | | | |
| Total Return4 | | | | | | | | | | | | | | | | | | | | | | | | |
Based on net asset value | | | (5.44 | )%5 | | | 13.44 | % | | | 21.70 | % | | | 30.95 | % | | | (13.97 | )% | | | 34.62 | %6 |
| | | | |
| | | | | | | | | | | | | | | | | | | | | | | | |
| Ratios to Average Net Assets7 | | | | | | | | | | | | | | | | | | | | | | | | |
Total expenses | | | 1.17 | %8,9 | | | 1.14 | %9 | | | 1.14 | %9 | | | 1.26 | %10 | | | 1.29 | %11 | | | 1.24 | %11 |
| | | | |
Net investment loss | | | (0.21 | )%8 | | | (0.28 | )% | | | (0.41 | )% | | | (0.04 | )% | | | (0.84 | )% | | | (0.99 | )% |
| | | | |
| | | | | | | | | | | | | | | | | | | | | | | | |
| Supplemental Data | | | | | | | | | | | | | | | | | | | | | | | | |
Net assets, end of period (000) | | $ | 65,583 | | | $ | 73,608 | | | $ | 74,962 | | | $ | 65,186 | | | $ | 58,673 | | | $ | 155,169 | |
| | | | |
Portfolio turnover rate of the Master Portfolio | | | 71 | % | | | 140 | % | | | 152 | % | | | 165 | % | | | 143 | % | | | 127 | % |
| | | | |
| | 1 | | Based on average shares outstanding. |
| | 2 | | Includes redemption fees, which are less than $0.005 per share. |
| | 3 | | Distributions for annual periods determined in accordance with federal income tax regulations. |
| | 4 | | Where applicable, assumes the reinvestment of distributions. |
| | 5 | | Aggregate total return. |
| | 6 | | Includes redemption fees received by the Fund, which had no impact on the Fund’s total return. |
| | 7 | | Includes the Fund’s share of the Master Portfolio’s allocated net expenses and/or net investment loss. |
| | 9 | | Includes the Fund’s share of the Master Portfolio’s allocated fees waived of 0.16%. |
| | 10 | | Includes the Fund’s share of the Master Portfolio’s allocated fees waived of 0.01%. |
| | 11 | | Includes the Fund’s share of the Master Portfolio’s allocated fees waived of less than 0.01%. |
See Notes to Financial Statements.
| | | | | | |
| | | SEMI-ANNUAL REPORT | | NOVEMBER 30, 2015 | | 23 |
| | | | |
| Financial Highlights (continued) | | | BlackRock Small Cap Growth Fund II | |
| | | | | | | | | | | | | | | | | | | | | | | | |
| | | Investor A | |
| | | Six Months
Ended
November 30,
2015 | | | Year Ended May 31, | |
| | | (Unaudited) | | | 2015 | | | 2014 | | | 2013 | | | 2012 | | | 2011 | |
| | | | | | | | | | | | | | | | | | | | | | | | |
| Per Share Operating Performance | | | | | | | | | | | | | | | | | | | | | | | | |
Net asset value, beginning of period | | $ | 13.83 | | | $ | 13.93 | | | $ | 14.63 | | | $ | 12.81 | | | $ | 15.22 | | | $ | 11.34 | |
| | | | |
Net investment loss1 | | | (0.03 | ) | | | (0.07 | ) | | | (0.13 | ) | | | (0.05 | ) | | | (0.14 | ) | | | (0.16 | ) |
Net realized and unrealized gain (loss) | | | (0.67 | ) | | | 1.70 | | | | 2.88 | | | | 3.57 | | | | (1.97 | ) | | | 4.04 | 2 |
| | | | |
Net increase (decrease) from investment operations | | | (0.70 | ) | | | 1.63 | | | | 2.75 | | | | 3.52 | | | | (2.11 | ) | | | 3.88 | |
| | | | |
Distributions from net realized gain3 | | | (0.71 | ) | | | (1.73 | ) | | | (3.45 | ) | | | (1.70 | ) | | | (0.30 | ) | | | — | |
| | | | |
Net asset value, end of period | | $ | 12.42 | | | $ | 13.83 | | | $ | 13.93 | | | $ | 14.63 | | | $ | 12.81 | | | $ | 15.22 | |
| | | | |
| | | | | | | | | | | | | | | | | | | | | | | | |
| Total Return4 | | | | | | | | | | | | | | | | | | | | | | | | |
Based on net asset value | | | (5.50 | )%5 | | | 13.24 | % | | | 21.08 | % | | | 30.45 | % | | | (14.12 | )% | | | 34.22 | %6 |
| | | | |
| | | | | | | | | | | | | | | | | | | | | | | | |
| Ratios to Average Net Assets7 | | | | | | | | | | | | | | | | | | | | | | | | |
Total expenses | | | 1.41 | %8,9 | | | 1.36 | %9 | | | 1.62 | %9 | | | 1.62 | %10 | | | 1.57 | %11 | | | 1.53 | %11 |
| | | | |
Net investment loss | | | (0.45 | )%8 | | | (0.49 | )% | | | (0.88 | )% | | | (0.34 | )% | | | (1.11 | )% | | | (1.28 | )% |
| | | | |
| | | | | | | | | | | | | | | | | | | | | | | | |
| Supplemental Data | | | | | | | | | | | | | | | | | | | | | | | | |
Net assets, end of period (000) | | $ | 70,221 | | | $ | 76,423 | | | $ | 80,144 | | | $ | 73,799 | | | $ | 75,467 | | | $ | 219,005 | |
| | | | |
Portfolio turnover rate of the Master Portfolio | | | 71 | % | | | 140 | % | | | 152 | % | | | 165 | % | | | 143 | % | | | 127 | % |
| | | | |
| | 1 | | Based on average shares outstanding. |
| | 2 | | Includes redemption fees, which are less than $0.005 per share. |
| | 3 | | Distributions for annual periods determined in accordance with federal income tax regulations. |
| | 4 | | Where applicable, excludes the effects of any sales charges and assumes the reinvestment of distributions. |
| | 5 | | Aggregate total return. |
| | 6 | | Includes redemption fees received by the Fund, which had no impact on the Fund’s total return. |
| | 7 | | Includes the Fund’s share of the Master Portfolio’s allocated net expenses and/or net investment loss. |
| | 9 | | Includes the Fund’s share of the Master Portfolio’s allocated fees waived of 0.16%. |
| | 10 | | Includes the Fund’s share of the Master Portfolio’s allocated fees waived of 0.02%. |
| | 11 | | Includes the Fund’s share of the Master Portfolio’s allocated fees waived of less than 0.01%. |
See Notes to Financial Statements.
| | | | | | |
| 24 | | SEMI-ANNUAL REPORT | | NOVEMBER 30, 2015 | | |
| | | | |
| Financial Highlights (continued) | | | BlackRock Small Cap Growth Fund II | |
| | | | | | | | | | | | | | | | | | | | | | | | |
| | | Investor C | |
| | | Six Months
Ended
November 30,
2015 | | | Year Ended May 31, | |
| | | (Unaudited) | | | 2015 | | | 2014 | | | 2013 | | | 2012 | | | 2011 | |
| | | | | | | | | | | | | | | | | | | | | | | | |
| Per Share Operating Performance | | | | | | | | | | | | | | | | | | | | | | | | |
Net asset value, beginning of period | | $ | 11.23 | | | $ | 11.71 | | | $ | 12.79 | | | $ | 11.44 | | | $ | 13.76 | | | $ | 10.35 | |
| | | | |
Net investment loss1 | | | (0.07 | ) | | | (0.15 | ) | | | (0.19 | ) | | | (0.15 | ) | | | (0.25 | ) | | | (0.26 | ) |
Net realized and unrealized gain (loss) | | | (0.55 | ) | | | 1.38 | | | | 2.47 | | | | 3.15 | | | | (1.77 | ) | | | 3.67 | 2 |
| | | | |
Net increase (decrease) from investment operations | | | (0.62 | ) | | | 1.23 | | | | 2.28 | | | | 3.00 | | | | (2.02 | ) | | | 3.41 | |
| | | | |
Distributions from net realized gain3 | | | (0.61 | ) | | | (1.71 | ) | | | (3.36 | ) | | | (1.65 | ) | | | (0.30 | ) | | | — | |
| | | | |
Net asset value, end of period | | $ | 10.00 | | | $ | 11.23 | | | $ | 11.71 | | | $ | 12.79 | | | $ | 11.44 | | | $ | 13.76 | |
| | | | |
| | | | | | | | | | | | | | | | | | | | | | | | |
| Total Return4 | | | | | | | | | | | | | | | | | | | | | | | | |
Based on net asset value | | | (5.98 | )%5 | | | 12.24 | % | | | 20.24 | % | | | 29.31 | % | | | (14.98 | )% | | | 32.95 | %6 |
| | | | |
| | | | | | | | | | | | | | | | | | | | | | | | |
| Ratios to Average Net Assets7 | | | | | | | | | | | | | | | | | | | | | | | | |
Total expenses | | | 2.28 | %8,9 | | | 2.29 | %9 | | | 2.30 | %9 | | | 2.52 | %10 | | | 2.52 | %11 | | | 2.48 | %11 |
| | | | |
Net investment loss | | | (1.32 | )%8 | | | (1.42 | )% | | | (1.55 | )% | | | (1.29 | )% | | | (2.10 | )% | | | (2.24 | )% |
| | | | |
| | | | | | | | | | | | | | | | | | | | | | | | |
| Supplemental Data | | | | | | | | | | | | | | | | | | | | | | | | |
Net assets, end of period (000) | | $ | 38,675 | | | $ | 44,179 | | | $ | 45,686 | | | $ | 43,649 | | | $ | 40,529 | | | $ | 62,040 | |
| | | | |
Portfolio turnover rate of the Master Portfolio | | | 71 | % | | | 140 | % | | | 152 | % | | | 165 | % | | | 143 | % | | | 127 | % |
| | | | |
| | 1 | | Based on average shares outstanding. |
| | 2 | | Includes redemption fees, which are less than $0.005 per share. |
| | 3 | | Distributions for annual periods determined in accordance with federal income tax regulations. |
| | 4 | | Where applicable, excludes the effects of any sales charges and assumes the reinvestment of distributions. |
| | 5 | | Aggregate total return. |
| | 6 | | Includes redemption fees received by the Fund, which had no impact on the Fund’s total return. |
| | 7 | | Includes the Fund’s share of the Master Portfolio’s allocated net expenses and/or net investment loss. |
| | 9 | | Includes the Fund’s share of the Master Portfolio’s allocated fees waived of 0.16%. |
| | 10 | | Includes the Fund’s share of the Master Portfolio’s allocated fees waived of 0.02%. |
| | 11 | | Includes the Fund’s share of the Master Portfolio’s allocated fees waived of less than 0.01%. |
See Notes to Financial Statements.
| | | | | | |
| | | SEMI-ANNUAL REPORT | | NOVEMBER 30, 2015 | | 25 |
| | | | |
| Financial Highlights (concluded) | | | BlackRock Small Cap Growth Fund II | |
| | | | | | | | | | | | | | | | | | | | | | | | |
| | | Class R | |
| | | Six Months
Ended
November 30,
2015 | | | Year Ended May 31, | |
| | | (Unaudited) | | | 2015 | | | 2014 | | | 2013 | | | 2012 | | | 2011 | |
| | | | | | | | | | | | | | | | | | | | | | | | |
| Per Share Operating Performance | | | | | | | | | | | | | | | | | | | | | | | | |
Net asset value, beginning of period | | $ | 12.67 | | | $ | 12.95 | | | $ | 13.80 | | | $ | 12.19 | | | $ | 14.55 | | | $ | 10.88 | |
| | | | |
Net investment loss1 | | | (0.05 | ) | | | (0.10 | ) | | | (0.12 | ) | | | (0.08 | ) | | | (0.19 | ) | | | (0.20 | ) |
Net realized and unrealized gain (loss) | | | (0.61 | ) | | | 1.55 | | | | 2.70 | | | | 3.38 | | | | (1.87 | ) | | | 3.87 | 2 |
| | | | |
Net increase (decrease) from investment operations | | | (0.66 | ) | | | 1.45 | | | | 2.58 | | | | 3.30 | | | | (2.06 | ) | | | 3.67 | |
| | | | |
Distributions from net realized gain3 | | | (0.66 | ) | | | (1.73 | ) | | | (3.43 | ) | | | (1.69 | ) | | | (0.30 | ) | | | — | |
| | | | |
Net asset value, end of period | | $ | 11.35 | | | $ | 12.67 | | | $ | 12.95 | | | $ | 13.80 | | | $ | 12.19 | | | $ | 14.55 | |
| | | | |
| | | | | | | | | | | | | | | | | | | | | | | | |
| Total Return4 | | | | | | | | | | | | | | | | | | | | | | | | |
Based on net asset value | | | (5.67 | )%5 | | | 12.84 | % | | | 21.07 | % | | | 30.05 | % | | | (14.43 | )% | | | 33.73 | %6 |
| | | | |
| | | | | | | | | | | | | | | | | | | | | | | | |
| Ratios to Average Net Assets7 | | | | | | | | | | | | | | | | | | | | | | | | |
Total expenses | | | 1.67 | %8,9 | | | 1.73 | %9 | | | 1.67 | %9 | | | 1.89 | %10 | | | 1.91 | %11 | | | 1.90 | %11 |
| | | | |
Net investment loss | | | (0.71 | )%8 | | | (0.86 | )% | | | (0.92 | )% | | | (0.60 | )% | | | (1.49 | )% | | | (1.65 | )% |
| | | | |
| | | | | | | | | | | | | | | | | | | | | | | | |
| Supplemental Data | | | | | | | | | | | | | | | | | | | | | | | | |
Net assets, end of period (000) | | $ | 21,821 | | | $ | 24,581 | | | $ | 29,585 | | | $ | 30,932 | | | $ | 37,237 | | | $ | 59,251 | |
| | | | |
Portfolio turnover rate of the Master Portfolio | | | 71 | % | | | 140 | % | | | 152 | % | | | 165 | % | | | 143 | % | | | 127 | % |
| | | | |
| | 1 | | Based on average shares outstanding. |
| | 2 | | Includes redemption fees, which are less than $0.005 per share. |
| | 3 | | Distributions for annual periods determined in accordance with federal income tax regulations. |
| | 4 | | Where applicable, assumes the reinvestment of distributions. |
| | 5 | | Aggregate total return. |
| | 6 | | Includes redemption fees received by the Fund, which had no impact on the Fund’s total return. |
| | 7 | | Includes the Fund’s share of the Master Portfolio’s allocated net expenses and/or net investment loss. |
| | 9 | | Includes the Fund’s share of the Master Portfolio’s allocated fees waived of 0.16%. |
| | 10 | | Includes the Fund’s share of the Master Portfolio’s allocated fees waived of 0.01%. |
| | 11 | | Includes the Fund’s share of the Master Portfolio’s allocated fees waived of less than 0.01%. |
See Notes to Financial Statements.
| | | | | | |
| 26 | | SEMI-ANNUAL REPORT | | NOVEMBER 30, 2015 | | |
| | |
| Notes to Financial Statements (Unaudited) | | |
1. Organization:
BlackRock Disciplined Small Cap Core Fund (“Disciplined Small Cap Core Fund”), a series of BlackRock FundsSM (the “Trust”), and BlackRock Small Cap Growth Fund II (“Small Cap Growth Fund II”), a series of BlackRock Series, Inc. (the “Corporation”) (collectively, the “Funds” or individually, a “Fund”), are each registered under the Investment Company Act of 1940, as amended (the “1940 Act”), as a diversified, open-end management investment company. The Trust is organized as a Massachusetts business trust. The Corporation is organized as a Maryland corporation. Small Cap Growth Fund II seeks to achieve its investment objective by investing all of its assets in BlackRock Master Small Cap Growth Portfolio (the “Master Portfolio”), a series of BlackRock Master LLC (the “Master LLC”), an affiliate of Small Cap Growth Fund II, which has the same investment objective and strategies as Small Cap Growth Fund II. The value of Small Cap Growth Fund II’s investment in the Master Portfolio reflects Small Cap Growth Fund II’s proportionate interest in the net assets of the Master Portfolio. The performance of Small Cap Growth Fund II is directly affected by the performance of the Master Portfolio. At November 30, 2015, the percentage of the Master Portfolio owned by Small Cap Growth Fund II was 100%. The financial statements of the Master Portfolio, including the Schedule of Investments, are included elsewhere in this report and should be read in conjunction with Small Cap Growth Fund II’s financial statements.
Each Fund offers multiple classes of shares. All classes of shares have identical voting, dividend, liquidation and other rights and are subject to the same terms and conditions, except that certain classes bear expenses related to the shareholder servicing and distribution of such shares. Institutional Shares are sold only to certain eligible investors. Investor A and Investor C Shares are generally available through financial intermediaries. Class R Shares are available only to certain employer-sponsored retirement plans. Each class has exclusive voting rights with respect to matters relating to its shareholder servicing and distribution expenditures.
| | | | | | | | | | | | | | | |
| Share Class | | Initial Sales Charge | | CDSC | | Conversion Privilege |
Institutional and Class R Shares | | No | | | | No | | | None |
Investor A Shares | | Yes | | | | No | 1 | | None |
Investor C Shares | | No | | | | Yes | | | None |
| | 1 | | Investor A Shares may be subject to a CDSC for certain redemptions where no initial sales charge was paid at the time of purchase. |
On June 23, 2015, all of the issued and outstanding Investor B Shares of Small Cap Growth Fund II were converted into Investor A Shares with the same relative aggregate NAV.
The Funds, together with certain other registered investment companies advised by the Manager or its affiliates, are included in a complex of open-end funds referred to as the Equity-Liquidity Complex.
2. Significant Accounting Policies:
The financial statements are prepared in conformity with accounting principles generally accepted in the United States of America (“U.S. GAAP”), which may require management to make estimates and assumptions that affect the reported amounts of assets and liabilities in the financial statements, disclosure of contingent assets and liabilities at the date of the financial statements and the reported amounts of increases and decreases in net assets from operations during the reporting period. Actual results could differ from those estimates. Each Fund is considered an investment company under U.S. GAAP and follows the accounting and reporting guidance applicable to investment companies. Below is a summary of significant accounting policies:
Segregation and Collateralization: In cases where Disciplined Small Cap Core Fund enters into certain investments (e.g., financial futures contracts) that would be treated as “senior securities” for 1940 Act purposes, Disciplined Small Cap Core Fund may segregate or designate on its books and records cash or liquid assets having a market value at least equal to the amount of its future obligations under such investments. Doing so allows the investment to be excluded from treatment as a “senior security.” Furthermore, if required by an exchange or counterparty agreement, Disciplined Small Cap Core Fund may be required to deliver/deposit cash and/or securities to/with an exchange, or broker-dealer or custodian as collateral for certain investments or obligations.
Investment Transactions and Investment Income: For Disciplined Small Cap Core Fund, for financial reporting purposes, investment transactions are recorded on the dates the transactions are entered into (the trade dates). Realized gains and losses on investment transactions are determined on the identified cost basis. Dividend income is recorded on the ex-dividend date. Upon notification from issuers, some of the dividend income received from a real estate investment trust may be redesignated as a reduction of cost of the related investment and/or realized gain. For Small Cap Growth Fund II, for financial reporting purposes, contributions to and withdrawals from the Master Portfolio are accounted on a trade date basis. Small Cap Growth Fund II records daily its proportionate share of the Master Portfolio’s income, expenses and realized and unrealized gains and losses. In addition, Small Cap Growth Fund II accrues its own expenses. Income, expenses and realized and unrealized gains and losses are allocated daily to each class based on its relative net assets.
Distributions: Distributions paid by the Funds are recorded on the ex-dividend date. The character and timing of distributions are determined in accordance with federal income tax regulations, which may differ from U.S. GAAP.
| | | | | | |
| | | SEMI-ANNUAL REPORT | | NOVEMBER 30, 2015 | | 27 |
| | |
| Notes to Financial Statements (continued) | | |
Indemnifications: In the normal course of business, a Fund enters into contracts that contain a variety of representations that provide general indemnification. A Fund’s maximum exposure under these arrangements is unknown because it involves future potential claims against a Fund, which cannot be predicted with any certainty.
Other: Expenses directly related to a Fund or its classes are charged to that Fund or the applicable class. Other operating expenses shared by several funds, including other funds managed by the Manager, are prorated among those funds on the basis of relative net assets or other appropriate methods. Expenses directly related to the Funds and other shared expenses prorated to the Funds are allocated daily to each class based on its relative net assets or other appropriate methods.
Disciplined Small Cap Core Fund has an arrangement with its custodian whereby fees may be reduced by credits earned on uninvested cash balances, which, if applicable, are shown as fees paid indirectly in the Statements of Operations. The custodian imposes fees on overdrawn cash balances, which can be offset by accumulated credits earned or may result in additional custody charges.
3. Investment Valuation and Fair Value Measurements:
Investment Valuation Policies: Disciplined Small Cap Core Fund’s investments are valued at fair value (also referred to as “market value” within the financial statements) as of the close of trading on the New York Stock Exchange (“NYSE”) (generally 4:00 p.m., Eastern time). U.S. GAAP defines fair value as the price Disciplined Small Cap Core Fund would receive to sell an asset or pay to transfer a liability in an orderly transaction between market participants at the measurement date. Disciplined Small Cap Core Fund determines the fair values of its financial instruments using independent dealers or pricing services under policies approved by the Board of Trustees of the Trust (the “Board”). The BlackRock Global Valuation Methodologies Committee (the “Global Valuation Committee”) is the committee formed by management to develop global pricing policies and procedures and to provide oversight of the pricing function for Disciplined Small Cap Core Fund for all financial instruments.
Small Cap Growth Fund II’s policy is to fair value its financial instruments at fair value. Small Cap Growth Fund II records its investment in the Master Portfolio at fair value based on Small Cap Growth Fund II’s proportionate interest in the net assets of the Master Portfolio. Valuation of securities held by the Master Portfolio is discussed in Note 3 of the Master Portfolio’s Notes to Financial Statements, which are included elsewhere in this report.
Fair Value Inputs and Methodologies: The following methods (or “techniques”) and inputs are used to establish the fair value of Disciplined Small Cap Core Fund’s assets and liabilities:
| • | | Equity investments traded on a recognized securities exchange are valued at the official close price each day, if available. For equity investments traded on more than one exchange, the official close price on the exchange where the stock is primarily traded is used. Equity investments traded on a recognized exchange for which there were no sales on that day may be valued at the last available bid (long positions) or ask (short positions) price. |
| • | | Investments in open-end registered investment companies are valued at NAV each business day. |
| • | | Disciplined Small Cap Core Fund values its investment in BlackRock Liquidity Series, LLC, Money Market Series (the “Money Market Series”) at fair value, which is ordinarily based upon its pro rata ownership in the underlying fund’s net assets. The Money Market Series seeks current income consistent with maintaining liquidity and preserving capital. Although the Money Market Series is not registered under the 1940 Act, its investments will follow the parameters of investments by a money market fund that is subject to Rule 2a-7 under the 1940 Act. Disciplined Small Cap Core Fund may withdraw up to 25% of its investment daily, although the manager of the Money Market Series, in its sole discretion, may permit an investor to withdraw more than 25% on any one day. |
| • | | Financial futures contracts traded on exchanges are valued at their last sale price. |
If events (e.g., a company announcement, market volatility or a natural disaster) occur that are expected to materially affect the value of such instruments, or in the event that the application of these methods of valuation results in a price for an investment that is deemed not to be representative of the market value of such investment, or if a price is not available, the investment will be valued by the Global Valuation Committee, or its delegate, in accordance with a policy approved by the Board as reflecting fair value (“Fair Valued Investments”). When determining the price for Fair Valued Investments, the Global Valuation Committee, or its delegate, seeks to determine the price that Disciplined Small Cap Core Fund might reasonably expect to receive or pay from the current sale or purchase of that asset or liability in an arm’s-length transaction. Fair value determinations shall be based upon all available factors that the Global Valuation Committee, or its delegate, deems relevant consistent with the principles of fair value measurement, which include the market approach, income approach and/or in the case of recent investments, the cost approach, as appropriate. The market approach generally consists of using comparable market transactions. The income approach generally is used to discount future cash flows to present value and is adjusted for liquidity as appropriate. These factors include but are not limited to: (i) attributes specific to the investment or asset; (ii) the principal market for the investment or asset; (iii) the customary participants in the principal market for the investment or asset; (iv) data assumptions by market participants for the investment or asset, if reasonably available; (v) quoted prices for similar investments or assets in active markets; and (vi) other factors, such as future cash flows, interest rates, yield curves, volatilities, prepayment speeds, loss severities, credit risks, recovery rates, liquidation amounts and/or default rates. Due to the inherent uncertainty of valuations of such investments, the fair values may differ from the values
| | | | | | |
| 28 | | SEMI-ANNUAL REPORT | | NOVEMBER 30, 2015 | | |
| | |
| Notes to Financial Statements (continued) | | |
that would have been used had an active market existed. The Global Valuation Committee, or its delegate, employs various methods for calibrating valuation approaches for investments where an active market does not exist, including regular due diligence of the Disciplined Small Cap Core Fund’s pricing vendors, regular reviews of key inputs and assumptions, transactional back-testing or disposition analysis to compare unrealized gains and losses to realized gains and losses, reviews of missing or stale prices and large movements in market values and reviews of any market related activity. The pricing of all Fair Valued Investments is subsequently reported to the Board or a committee thereof on a quarterly basis.
Fair Value Hierarchy: Various inputs are used in determining the fair value of investments and derivative financial instruments. These inputs to valuation techniques are categorized into a fair value hierarchy consisting of three broad levels for financial statement purposes as follows:
| • | | Level 1 — unadjusted price quotations in active markets/exchanges for identical assets or liabilities that Disciplined Small Cap Core Fund has the ability to access |
| • | | Level 2 — other observable inputs (including, but not limited to, quoted prices for similar assets or liabilities in markets that are active, quoted prices for identical or similar assets or liabilities in markets that are not active, inputs other than quoted prices that are observable for the assets or liabilities (such as interest rates, yield curves, volatilities, prepayment speeds, loss severities, credit risks and default rates) or other market–corroborated inputs) |
| • | | Level 3 — unobservable inputs based on the best information available in the circumstances, to the extent observable inputs are not available (including Disciplined Small Cap Core Fund’s own assumptions used in determining the fair value of investments and derivative financial instruments) |
The hierarchy gives the highest priority to unadjusted quoted prices in active markets for identical assets or liabilities (Level 1 measurements) and the lowest priority to unobservable inputs (Level 3 measurements). Accordingly, the degree of judgment exercised in determining fair value is greatest for instruments categorized in Level 3. The inputs used to measure fair value may fall into different levels of the fair value hierarchy. In such cases, for disclosure purposes, the fair value hierarchy classification is determined based on the lowest level input that is significant to the fair value measurement in its entirety. The significant unobservable inputs used by the Global Valuation Committee in determining the price for Fair Valued Investments are typically categorized as Level 3. The fair value hierarchy for Disciplined Small Cap Core Fund’s investments and derivative financial instruments have been included in the Schedule of Investments.
Changes in valuation techniques may result in transfers into or out of an assigned level within the hierarchy. In accordance with Disciplined Small Cap Core Fund’s policy, transfers between different levels of the fair value hierarchy are deemed to have occurred as of the beginning of the reporting period. The categorization of a value determined for investments and derivative financial instruments is based on the pricing transparency of the investments and derivative financial instruments and is not necessarily an indication of the risks associated with investing in those securities.
4. Securities and Other Investments:
Securities Lending: Disciplined Small Cap Core Fund may lend its securities to approved borrowers, such as brokers, dealers and other financial institutions. The borrower pledges and maintains with Disciplined Small Cap Core Fund collateral consisting of cash, an irrevocable letter of credit issued by a bank, or securities issued or guaranteed by the U.S. Government. The initial collateral received by Disciplined Small Cap Core Fund is required to have a value of at least 102% of the current value of the loaned securities for securities traded on U.S. exchanges and a value of at least 105% for all other securities. The collateral is maintained thereafter, at a value equal to at least 100% of the current market value of the securities on loan. The market value of the loaned securities is determined at the close of each business day of Disciplined Small Cap Core Fund and any additional required collateral is delivered to Disciplined Small Cap Core Fund, or excess collateral returned by Disciplined Small Cap Core Fund, on the next business day. During the term of the loan, Disciplined Small Cap Core Fund is entitled to all distributions made on or in respect of the loaned securities. Loans of securities are terminable at any time and the borrower, after notice, is required to return borrowed securities within the standard time period for settlement of securities transactions.
The market value of securities on loan, all of which were classified as common stocks in the Disciplined Small Cap Core Fund’s Schedule of Investments, and the value of the related collateral are shown separately in the Statements of Assets and Liabilities as a component of investments at value — unaffiliated, and collateral on securities loaned at value, respectively. As of period end, any securities on loan were collateralized by cash. The cash collateral invested by the securities lending agent, BlackRock Investment Management, LLC (“BIM”), if any, is disclosed in the Schedule of Investments.
Securities lending transactions are entered into by Disciplined Small Cap Core Fund under Master Securities Lending Agreements (each, an “MSLA”), which provide the right, in the event of default (including bankruptcy or insolvency), for the non-defaulting party to liquidate the collateral and calculate a net exposure to the defaulting party or request additional collateral. In the event that a borrower defaults, Disciplined Small Cap Core Fund, as lender, would offset the market value of the collateral received against the market value of the securities loaned. When the value of the collateral is greater than that of the market value of the securities loaned, the lender is left with a net amount payable to the defaulting party. However, bankruptcy or insolvency laws of a particular jurisdiction may impose restrictions on or prohibitions against such a right of offset in the event of an MSLA
| | | | | | |
| | | SEMI-ANNUAL REPORT | | NOVEMBER 30, 2015 | | 29 |
| | |
| Notes to Financial Statements (continued) | | |
counterparty’s bankruptcy or insolvency. Under the MSLA, absent an event of default the borrower can resell or re-pledge the loaned securities, and Disciplined Small Cap Core Fund can reinvest cash collateral received in connection with loaned securities. Upon an event of default, the parties’ obligations to return the securities or collateral to the other party are extinguished, and the parties can resell or re-pledge the loaned securities or the collateral received in connection with the loaned securities.
As of period end, the following table is a summary of Disciplined Small Cap Core Fund’s securities lending agreements by counterparty, which are subject to offset under an MSLA:
| | | | | | | | | | | | | | | |
| Counterparty | | Securities Loaned
at Value | | Cash Collateral
Received1 | | Net Amount |
BNP Paribas Prime Brokerage, Inc. | | | $ | 8,387 | | | | $ | (8,387 | ) | | | | — | |
Citigroup Global Markets, Inc. | | | | 17,466 | | | | | (17,466 | ) | | | | — | |
Credit Suisse Securities (USA) LLC | | | | 45,025 | | | | | (45,025 | ) | | | | — | |
Deutsche Bank Securities, Inc. | | | | 12,844 | | | | | (12,844 | ) | | | | — | |
JP Morgan Clearing Corp. | | | | 22,719 | | | | | (22,719 | ) | | | | — | |
Merrill Lynch, Pierce, Fenner & Smith, Inc. | | | | 36,265 | | | | | (36,265 | ) | | | | — | |
Morgan Stanley | | | | 14,606 | | | | | (14,606 | ) | | | | — | |
Total | | | $ | 157,312 | | | | $ | (157,312 | ) | | | | — | |
| | 1 | | Collateral with a value of $166,267 has been received in connection with securities lending agreements. Collateral received in excess of the value of securities loaned from the individual counterparty is not shown for financial reporting purposes in the table above. |
The risks of securities lending include the risk that the borrower may not provide additional collateral when required or may not return the securities when due. To mitigate these risks, Disciplined Small Cap Core Fund benefits from a borrower default indemnity provided by BIM. BIM’s indemnity allows for full replacement of the securities loaned if the collateral received does not cover the value on the securities loaned in the event of borrower default. Disciplined Small Cap Core Fund could suffer a loss if the value of an investment purchased with cash collateral falls below the market value of loaned securities or if the value of an investment purchased with cash collateral falls below the value of the original cash collateral received.
5. Derivative Financial Instruments:
Disciplined Small Cap Core Fund engages in various portfolio investment strategies using derivative contracts both to increase the returns of Disciplined Small Cap Core Fund and/or to manage economically its exposure to certain risks such as equity risk. These contracts may be transacted on an exchange.
Financial Futures Contracts: Disciplined Small Cap Core Fund invests in long and/or short positions in financial futures contracts and options on financial futures contracts to gain exposure to, or economically hedge against, changes in the value of equity securities (equity risk). Financial futures contracts are agreements between Disciplined Small Cap Core Fund and a counterparty to buy or sell a specific quantity of an underlying instrument at a specified price and at a specified date. Depending on the terms of the particular contract, financial futures contracts are settled either through physical delivery of the underlying instrument on the settlement date or by payment of a cash settlement amount on the settlement date.
Upon entering into a financial futures contract, Disciplined Small Cap Core Fund is required to deposit initial margin with the broker in the form of cash or securities in an amount that varies depending on a contract’s size and risk profile. The initial margin deposit must then be maintained at an established level over the life of the contract. Securities deposited as initial margin are designated on the Schedule of Investments and cash deposited, if any, is recorded on the Statements of Assets and Liabilities as cash pledged for financial futures contracts. Pursuant to the contract, Disciplined Small Cap Core Fund agrees to receive from or pay to the broker an amount of cash equal to the daily fluctuation in value of the contract. Such receipts or payments are known as variation margin. Variation margin is recorded by Disciplined Small Cap Core Fund as unrealized appreciation (depreciation) and, if applicable, as a receivable or payable for variation margin in the Statements of Assets and Liabilities.
When the contract is closed, Disciplined Small Cap Core Fund records a realized gain or loss equal to the difference between the value of the contract at the time it was opened and the value at the time it was closed. The use of financial futures contracts involves the risk of an imperfect correlation in the movements in the price of financial futures contracts and the underlying assets.
6. Investment Advisory Agreement and Other Transactions with Affiliates:
The PNC Financial Services Group, Inc. is the largest stockholder and an affiliate of BlackRock, Inc. (“BlackRock”) for 1940 Act purposes.
The Trust, on behalf of Disciplined Small Cap Core Fund, entered into an Investment Advisory Agreement with the Manager, Disciplined Small Cap Core Fund’s investment advisor, an indirect, wholly owned subsidiary of BlackRock, to provide investment advisory services. The Manager is responsible for the management of Disciplined Small Cap Core Fund’s portfolio and provides the personnel, facilities, equipment and certain other services necessary to the operations of Disciplined Small Cap Core Fund. For such services, Disciplined Small Cap Core Fund pays the Manager a monthly fee based
| | | | | | |
| 30 | | SEMI-ANNUAL REPORT | | NOVEMBER 30, 2015 | | |
| | |
| Notes to Financial Statements (continued) | | |
on a percentage of Disciplined Small Cap Core Fund’s average daily net assets at the following annual rates:
| | |
| Average Daily Net Assets | | Investment Advisory Fee |
First $1 billion | | 0.45% |
$1 billion - $3 billion | | 0.42% |
$3 billion - $5 billion | | 0.41% |
$5 billion - $10 billion | | 0.39% |
Greater than $10 billion | | 0.38% |
The Manager, with respect to Disciplined Small Cap Core Fund, voluntarily agreed to waive its investment advisory fees by the amount of investment advisory fees Disciplined Small Cap Core Fund pays to the Manager indirectly through its investment in affiliated money market funds. This amount is included in fees waived and/or reimbursed by the Manager in the Statements of Operations. However, the Manager does not waive its investment advisory fees by the amount of investment advisory fees paid in connection with Disciplined Small Cap Core Fund’s investment in other affiliated investment companies, if any. For the six months ended November 30, 2015, the amount waived was $96.
The Corporation, on behalf of Small Cap Growth Fund II, entered into an Administration Agreement with BlackRock Advisors, LLC (in such capacity, the “Administrator”), an indirect, wholly owned subsidiary of BlackRock, to provide administrative services (other than investment advice and related portfolio activities). For such services, Small Cap Growth Fund II pays the Administrator a monthly fee at an annual rate of 0.20% of the average daily value of Small Cap Growth Fund II’s net assets. Small Cap Growth Fund II does not pay an investment advisory fee or investment management fee.
The Corporation and the Trust, on behalf of the Funds, entered into a Distribution Agreement and Distribution Plans with BlackRock Investments, LLC (“BRIL”), an affiliate of the Manager/Administrator. Pursuant to the Distribution Plans and in accordance with Rule 12b-1 under the 1940 Act, each Fund pays BRIL ongoing service and distribution fees. The fees are accrued daily and paid monthly at annual rates based upon the average daily net assets of the relevant share class of each Fund as follows:
| | | | | | | | | | | | | | | | |
| | | Investor A | | | Investor B1 | | | Investor C | | | Class R | |
Service Fee | | | 0.25% | | | | 0.25% | | | | 0.25% | | | | 0.25% | |
Distribution Fee | | | — | | | | 0.75% | | | | 0.75% | | | | 0.25% | |
| | 1 | | On June 23, 2015, Investor B Shares of Small Cap Growth Fund II converted to Investor A Shares. |
Pursuant to sub-agreements with BRIL, broker-dealers and BRIL provide shareholder servicing and distribution services to the Funds. The ongoing service and/or distribution fee compensates BRIL and each broker-dealer for providing shareholder servicing and/or distribution related services to the shareholders.
For the six months ended November 30, 2015, the following table shows the class specific service and distribution fees borne directly by each class of each Fund:
| | | | | | | | | | | | | | | | | | | | |
| | | Investor A | | | Investor B1 | | | Investor C | | | Class R | | | Total | |
Disciplined Small Cap Core Fund | | | $ 3,897 | | | | — | | | | $ 1,703 | | | | — | | | | $ 5,600 | |
Small Cap Growth Fund II | | | $92,088 | | | | $165 | | | | $205,376 | | | | $57,402 | | | | $355,031 | |
| | 1 | On June 23, 2015, Investor B Shares of Small Cap Growth Fund II converted to Investor A Shares. |
Pursuant to written agreements, certain financial intermediaries, some of which may be affiliates, provide the Funds with sub-accounting, recordkeeping, sub-transfer agency and other administrative services with respect to sub-accounts they service. For these services, these entities receive an asset based fee or an annual fee per shareholder account, which will vary depending on share class and/or net assets.
The Manager maintains a call center, which is responsible for providing certain shareholder services to the Funds, such as responding to shareholder inquiries and processing transactions based upon instructions from shareholders with respect to the subscription and redemption of Fund shares. For the six months ended November 30, 2015, each Fund reimbursed the Manager the following amounts for costs incurred in running the call center, which are included in transfer agent — class specific in the Statements of Operations:
| | | | | | | | | | | | | | | | | | | | | | | | |
| | | Institutional | | | Investor A | | | Investor B1 | | | Investor C | | | Class R | | | Total | |
Disciplined Small Cap Core Fund | | | $ 30 | | | | $113 | | | | — | | | | $ 46 | | | | — | | | | $ 189 | |
Small Cap Growth Fund II | | | $130 | | | | $658 | | | | $5 | | | | $354 | | | | $59 | | | | $1,206 | |
| | 1 | | On June 23, 2015, Investor B Shares of Small Cap Growth Fund II converted to Investor A Shares. |
| | | | | | |
| | | SEMI-ANNUAL REPORT | | NOVEMBER 30, 2015 | | 31 |
| | |
| Notes to Financial Statements (continued) | | |
For the six months ended November 30, 2015, the following table shows the class specific transfer agent fees borne directly by each class of each Fund:
| | | | | | | | | | | | | | | | | | | | | | | | |
| | | Institutional | | | Investor A | | | Investor B1 | | | Investor C | | | Class R | | | Total | |
Disciplined Small Cap Core Fund | | | $ 231 | | | | $ 2,299 | | | | — | | | | $ 335 | | | | — | | | | $ 2,865 | |
Small Cap Growth Fund II | | | $83,674 | | | | $85,085 | | | | $254 | | | | $71,796 | | | | $28,154 | | | | $268,963 | |
| | 1 | On June 23, 2015, Investor B Shares of Small Cap Growth Fund II converted to Investor A Shares. |
The Trust, on behalf of Disciplined Small Cap Core Fund, entered into an Administration Agreement with the Manager to provide administrative services. For these services, the Manager receives an administration fee computed daily and payable monthly, based on a percentage of the average daily net assets of Disciplined Small Cap Core Fund. The administration fee, which is shown as administration in the Statements of Operations, is paid at the annual rates below.
| | |
| Average Daily Net Assets | | Administration Fee |
First $500 Million | | 0.0425% |
$500 Million - $1 Billion | | 0.0400% |
$1 Billion - $2 Billion | | 0.0375% |
$2 Billion - $4 Billion | | 0.0350% |
$4 Billion - $13 Billion | | 0.0325% |
Greater than $13 Billion | | 0.0300% |
In addition, the Manager charges each of the share classes an administration fee, which is shown as administration — class specific in the Statements of Operations, at an annual rate of 0.02% of the average daily net assets of each respective class.
For the six months ended November 30, 2015, the following table shows the class specific administration fees borne directly by each share class of Disciplined Small Cap Core Fund:
| | | | | | |
| Institutional | | Investor A | | Investor C | | Total |
$ 598 | | $ 312 | | $ 34 | | $ 944 |
The Manager, with respect to Disciplined Small Cap Core Fund, contractually agreed to waive and/or reimburse fees or expenses in order to limit expenses, excluding interest expense, dividend expense, tax expense, acquired fund fees and expenses and certain other fund expenses, which constitute extraordinary expenses not incurred in the ordinary course of Disciplined Small Cap Core Fund’s business. The expense limitations as a percentage of average daily net assets are as follows: 0.70% for Institutional; 0.95% for Investor A and 1.70% for Investor C. The Manager has agreed not to reduce or discontinue this contractual waiver or reimbursement prior to October 1, 2016 unless approved by the Board, including a majority of the independent trustees.
These amounts waived or reimbursed are included in fees waived and/or reimbursed by the Manager, and shown as administration fees waived, administration fees waived — class specific and transfer agent fees reimbursed — class specific, respectively, in the Statements of Operations. For the six months ended November 30, 2015, the amount included in fees waived and/or reimbursed by the Manager was $103,617 for Disciplined Small Cap Core Fund.
| | | | | | |
| 32 | | SEMI-ANNUAL REPORT | | NOVEMBER 30, 2015 | | |
| | |
| Notes to Financial Statements (continued) | | |
Class specific waivers and reimbursements are as follows for Disciplined Small Cap Core Fund:
| | | | | | | | | | | | | | | | |
| | | Institutional | | | Investor A | | | Investor C | | | Total | |
Administration Fees Waived | | | $596 | | | | $ 312 | | | | $ 34 | | | | $ 942 | |
Transfer Agent Fees Reimbursed | | | $208 | | | | $2,271 | | | | $324 | | | | $2,803 | |
If during Disciplined Small Cap Core Fund’s fiscal year the operating expenses of a share class, that at any time during the prior two fiscal years received a waiver or reimbursement from the Manager, are less than the expense limit for that share class, the Manager is entitled to be reimbursed by such share class up to the lesser of (a) the amount of fees waived or expenses reimbursed during those prior two fiscal years under the agreement and (b) the amount by which the expense limit for that share class exceeds the operating expenses of the share class for the current fiscal year, provided that: (1) Disciplined Small Cap Core Fund, of which the share class is a part, has more than $50 million in assets for the fiscal year and (2) the Manager or an affiliate continues to serve as Disciplined Small Cap Core Fund’s investment advisor or administrator. In the event the expense limit for a share class is changed subsequent to a fiscal year in which the Manager becomes entitled to reimbursement for fees waived or reimbursed, the amount available to reimburse the Manager shall be calculated by reference to the expense limit for that share class in effect at the time the Manager became entitled to receive such reimbursement, rather than the subsequently changed expense limit for that share class.
On November 30, 2015, Fund level and class specific waivers and/or reimbursements subject to possible future recoupment under the expense limitation agreement for Disciplined Small Cap Core Fund are as follows:
| | | | | | | | | | | | |
| | | Expiring May 31, | |
| | | 2016 | | | 2017 | | | 2018 | |
Fund Level | | $ | 342,873 | | | $ | 203,594 | | | $ | 105,626 | |
Institutional | | $ | 1,565 | | | $ | 1,660 | | | $ | 804 | |
Investor A | | $ | 378 | | | $ | 2,999 | | | $ | 2,583 | |
Investor C | | $ | 123 | | | $ | 470 | | | $ | 358 | |
For the six months ended November 30, 2015, affiliates earned underwriting discounts, direct commissions and dealer concessions on sales of Disciplined Small Cap Core Fund’s Investor A Shares of $152 and Small Cap Growth Fund II’s Investor A Shares of $2,473.
For the six months ended November 30, 2015, affiliates received CDSCs in the amount of $148 for Disciplined Small Cap Core Fund’s Investor C Shares and $881 for Small Cap Growth Fund II’s Investor C Shares.
The U.S. Securities and Exchange Commission has issued an exemptive order which permits BIM, an affiliate of the Manager, to serve as securities lending agent for Disciplined Small Cap Core Fund, subject to applicable conditions. As securities lending agent, BIM bears all operational costs directly related to securities lending. Disciplined Small Cap Core Fund is responsible for expenses in connection with the investment of cash collateral received for securities on loan (the “collateral investment expenses”). The cash collateral is invested in a private investment company managed by the Manager or its affiliates. However, BIM has agreed to cap the collateral investment expenses of the private investment company to an annual rate of 0.04%. The investment advisor to the private investment company will not charge any advisory fees with respect to shares purchased by Disciplined Small Cap Core Fund.
Securities lending income is equal to the total of income earned from the reinvestment of cash collateral, net of fees and other payments to and from borrowers of securities, and less the collateral investment expenses. Disciplined Small Cap Core Fund retains a portion of securities lending income and remits a remaining portion to BIM as compensation for its services as securities lending agent. Pursuant to a securities lending agreement, BIM may lend securities only when the difference between the borrower rebate rate and the risk free rate exceeds a certain level (such securities, the “specials only securities”).
Pursuant to such agreement, Disciplined Small Cap Core Fund retains 80% of securities lending income. In addition, commencing the business day following the date that the aggregate securities lending income earned across certain funds in the Equity-Liquidity Complex in a calendar year exceeds a specified threshold, Disciplined Small Cap Core Fund, pursuant to the securities lending agreement, will retain for the remainder of the calendar year securities lending income in an amount equal to 85% of securities lending income.
The share of securities lending income earned by Disciplined Small Cap Core Fund is shown as securities lending — affiliated — net in the Statements of Operations. For the six months ended November 30, 2015, Disciplined Small Cap Core Fund paid BIM $312 for securities lending agent services.
Certain officers and/or trustees/directors of the Trust/Corporation are officers and/or directors of BlackRock or its affiliates. The Funds reimburse the Manager/Administrator for a portion of the compensation paid to the Trust’s/Corporation’s Chief Compliance Officer, which is included in officer and trustees/directors in the Statements of Operations.
| | | | | | |
| | | SEMI-ANNUAL REPORT | | NOVEMBER 30, 2015 | | 33 |
| | |
| Notes to Financial Statements (continued) | | |
7. Purchases and Sales:
For the six months ended November 30, 2015, purchases and sales of investments, excluding short-term securities, were $8,919,650 and $7,839,033, respectively, for Disciplined Small Cap Core Fund.
8. Income Tax Information:
It is the Funds’ policy to comply with the requirements of the Internal Revenue Code of 1986, as amended, applicable to regulated investment companies, and to distribute substantially all of their taxable income to their shareholders. Therefore, no federal income tax provision is required.
Each Fund files U.S. federal and various state and local tax returns. No income tax returns are currently under examination. The statute of limitations on Small Cap Growth Fund II’s U.S. federal tax returns remains open for each of the four years ended May 31, 2015. The statutes of limitations on Disciplined Small Cap Core Fund’s U.S. federal, state and local tax returns remain open for the two years ended May 31, 2015 and the period ended May 31, 2013. The statutes of limitations on Small Cap Growth Fund II’s state and local tax returns may remain open for an additional year depending upon the jurisdiction.
Management has analyzed tax laws and regulations and their application to the Funds as of November 30, 2015, inclusive of the open tax return years, and does not believe that there are any uncertain tax positions that require recognition of a tax liability in the Funds’ financial statements.
As of period end, gross unrealized appreciation and depreciation based on cost for federal income tax purposes for Disciplined Small Cap Core Fund were as follows:
| | | | | | |
Tax cost | | | | $ | 9,833,139 | |
| | | |
Gross unrealized appreciation | | | | $ | 902,720 | |
Gross unrealized depreciation | | | | | (569,768 | ) |
| | | |
Net unrealized appreciation | | | | $ | 332,952 | |
| | | |
9. Bank Borrowings:
The Trust/Corporation, on behalf of the Funds, along with certain other funds managed by the Manager and its affiliates (“Participating Funds”), is a party to a 364-day, $2.1 billion credit agreement with a group of lenders, under which the Funds may borrow to fund shareholder redemptions. Excluding commitments designated for certain funds, the Participating Funds, including the Funds, can borrow up to an aggregate commitment amount of $1.6 billion at any time outstanding, subject to asset coverage and other limitations as specified in the agreement. The credit agreement has the following terms: a fee of 0.06% per annum on unused commitment amounts and interest at a rate equal to the higher of (a) one-month LIBOR (but, in any event, not less than 0.00%) on the date the loan is made plus 0.80% per annum or (b) the Fed Funds rate (but, in any event, not less than 0.00%) in effect from time to time plus 0.80% per annum on amounts borrowed. The agreement expires in April 2016 unless extended or renewed. Participating Funds paid administration, legal and arrangement fees, which, if applicable, are included in miscellaneous expenses in the Statements of Operations, and along with commitment fees, were allocated among such funds based upon portions of the aggregate commitment available to them and relative net assets of Participating Funds. During the six months ended November 30, 2015, the Funds did not borrow under the credit agreement.
10. Principal Risks:
In the normal course of business, Disciplined Small Cap Core Fund invests in securities and enters into transactions where risks exist due to fluctuations in the market (market risk) or failure of the issuer to meet all its obligations, including the ability to pay principal and interest when due (issuer credit risk). The value of securities held by Disciplined Small Cap Core Fund may decline in response to certain events, including those directly involving the issuers of securities owned by Disciplined Small Cap Core Fund. Changes arising from the general economy, the overall market and local, regional or global political or/and social instability, as well as currency, interest rate and price fluctuations, may also affect the securities’ value.
Counterparty Credit Risk: Similar to issuer credit risk, Disciplined Small Cap Core Fund may be exposed to counterparty credit risk, or the risk that an entity may fail to or be unable to perform on its commitments related to unsettled or open transactions. Disciplined Small Cap Core Fund manages counterparty credit risk by entering into transactions only with counterparties that the Manager believes have the financial resources to honor their obligations and by monitoring the financial stability of those counterparties. Financial assets, which potentially expose Disciplined Small Cap Core Fund to market, issuer and counterparty credit risks, consists principally of financial instruments and receivables due from counterparties. The extent of the Disciplined Small Cap Core Fund’s exposure to market, issuer and counterparty credit risks with respect to these financial assets is approximately their value recorded in the Statements of Assets and Liabilities, less any collateral held by Disciplined Small Cap Core Fund.
A derivative contract may suffer a mark-to-market loss if the value of the contract decreases due to an unfavorable change in the market rates or values of the underlying instrument. Losses can also occur if the counterparty does not perform under the contract.
| | | | | | |
| 34 | | SEMI-ANNUAL REPORT | | NOVEMBER 30, 2015 | | |
| | |
| Notes to Financial Statements (continued) | | |
With exchange-traded futures, there is less counterparty credit risk to Disciplined Small Cap Core Fund since the exchange or clearinghouse, as counterparty to such instruments, guarantees against a possible default. The clearinghouse stands between the buyer and the seller of the contract; therefore, credit risk is limited to failure of the clearinghouse. While offset rights may exist under applicable law, Disciplined Small Cap Core Fund does not have a contractual right of offset against a clearing broker or clearinghouse in the event of a default (including the bankruptcy or insolvency). Additionally, credit risk exists in exchange-traded futures with respect to initial and variation margin that is held in a clearing broker’s customer accounts. While clearing brokers are required to segregate customer margin from their own assets, in the event that a clearing broker becomes insolvent or goes into bankruptcy and at that time there is a shortfall in the aggregate amount of margin held by the clearing broker for all its clients, typically the shortfall would be allocated on a pro rata basis across all the clearing broker’s customers, potentially resulting in losses to Disciplined Small Cap Core Fund.
Concentration Risk: As of period end, Disciplined Small Cap Core Fund invested a significant portion of its assets in securities in the financials sector. Changes in economic conditions affecting such sector would have a greater impact on Disciplined Small Cap Core Fund and could affect the value, income and/or liquidity of positions in such securities.
11. Capital Share Transactions:
Transactions in capital shares for each class were as follows:
| | | | | | | | | | | | | | | | | | |
| | | Six Months Ended
November 30, 2015 | | | | | Year Ended
May 31, 2015 | |
| Disciplined Small Cap Core Fund | �� | Shares | | | Amount | | | | | Shares | | | Amount | |
| Institutional | | | | | | | | | | | | | | |
Shares sold | | | 6,574 | | | | $ 73,853 | | | | | | 5,401 | | | | $ 62,833 | |
Shares issued in reinvestment of distributions | | | 418 | | | | 4,975 | | | | | | 2,385 | | | | 26,151 | |
Shares redeemed | | | (123 | ) | | | (1,368 | ) | | | | | (2,843 | ) | | | (33,145 | ) |
| | | | | | | | | | |
Net increase | | | 6,869 | | | | $ 77,460 | | | | | | 4,943 | | | | $ 55,839 | |
| | | | | | | | | | |
| | | | | | | | | | | | | | | | | | |
| Investor A | | | | | | | | | | | | | | |
Shares sold | | | 104,216 | | | | $1,150,402 | | | | | | 172,856 | | | | $1,936,647 | |
Shares issued in reinvestment of distributions | | | 3,743 | | | | 44,470 | | | | | | 9,046 | | | | 98,613 | |
Shares redeemed | | | (22,714 | ) | | | (256,999 | ) | | | | | (24,615 | ) | | | (275,559 | ) |
| | | | | | | | | | |
Net increase | | | 85,245 | | | | $ 937,873 | | | | | | 157,287 | | | | $1,759,701 | |
| | | | | | | | | | |
| | | | | | | | | | | | | | | | | | |
| Investor C | | | | | | | | | | | | | | |
Shares sold | | | 10,575 | | | | $ 117,618 | | | | | | 22,030 | | | | $ 249,581 | |
Shares issued in reinvestment of distributions | | | 362 | | | | 4,270 | | | | | | 830 | | | | 8,996 | |
Shares redeemed | | | (1,651 | ) | | | (18,315 | ) | | | | | (4,534 | ) | | | (49,199 | ) |
| | | | | | | | | | |
Net increase | | | 9,286 | | | | $ 103,573 | | | | | | 18,326 | | | | $ 209,378 | |
| | | | | | | | | | |
Total Net Increase | | | 101,400 | | | | $1,118,906 | | | | | | 180,556 | | | | $2,024,918 | |
| | | | | | | | | | |
| | | | | | |
| | | SEMI-ANNUAL REPORT | | NOVEMBER 30, 2015 | | 35 |
| | |
| Notes to Financial Statements (concluded) | | |
| | | | | | | | | | | | | | | | | | |
| | | Six Months Ended
November 30, 2015 | | | | | Year Ended
May 31, 2015 | |
| Small Cap Growth Fund II | | Shares | | | Amount | | | | | Shares | | | Amount | |
| Institutional | | | | | | | | | | | | | | |
Shares sold | | | 632,187 | | | | $ 8,748,182 | | | | | | 1,357,054 | | | | $ 18,837,252 | |
Shares issued in reinvestment of distributions | | | 231,243 | | | | 3,322,971 | | | | | | 641,647 | | | | 8,548,838 | |
Shares redeemed | | | (910,578 | ) | | | (12,407,856 | ) | | | | | (2,089,980 | ) | | | (29,234,714 | ) |
| | | | | | | | | | |
Net decrease | | | (47,148 | ) | | | $ (336,703 | ) | | | | | (91,279 | ) | | | $ (1,848,624 | ) |
| | | | | | | | | | |
| | | | | | | | | | | | | | | | | | |
| Investor A | | | | | | | | | | | | | | |
Shares received from conversion1 | | | 10,222 | | | | $ 146,887 | | | | | | — | | | | — | |
Shares sold and automatic conversion of shares | | | 656,348 | | | | 8,540,297 | | | | | | 1,253,475 | | | | $ 16,515,474 | |
Shares issued in reinvestment of distributions | | | 274,681 | | | | 3,730,206 | | | | | | 747,480 | | | | 9,406,206 | |
Shares redeemed | | | (810,353 | ) | | | (10,463,094 | ) | | | | | (2,229,258 | ) | | | (29,243,032 | ) |
| | | | | | | | | | |
Net increase (decrease) | | | 130,898 | | | | $ 1,954,296 | | | | | | (228,303 | ) | | | $ (3,321,352 | ) |
| | | | | | | | | | |
| | | | | | | | | | | | | | | | | | |
| Investor B | | | | | | | | | | | | | | |
Shares sold | | | 476 | | | | $ 5,460 | | | | | | 7,715 | | | | $ 118,484 | |
Shares issued in reinvestment of distributions | | | — | | | | — | | | | | | 15,217 | | | | 158,129 | |
Shares converted1 | | | (12,512 | ) | | | (146,887 | ) | | | | | — | | | | — | |
Shares redeemed and automatic conversion of shares | | | (11,105 | ) | | | (129,938 | ) | | | | | (102,983 | ) | | | (1,128,381 | ) |
| | | | | | | | | | |
Net decrease | | | (23,141 | ) | | | $ (271,365 | ) | | | | | (80,051 | ) | | | $ (851,768 | ) |
| | | | | | | | | | |
| | | | | | | | | | | | | | | | | | |
| Investor C | | | | | | | | | | | | | | |
Shares sold | | | 176,939 | | | | $ 1,853,465 | | | | | | 556,168 | | | | $ 6,018,188 | |
Shares issued in reinvestment of distributions | | | 195,536 | | | | 2,145,066 | | | | | | 589,715 | | | | 6,084,229 | |
Shares redeemed | | | (439,645 | ) | | | (4,589,630 | ) | | | | | (1,113,071 | ) | | | (11,963,035 | ) |
| | | | | | | | | | |
Net increase (decrease) | | | (67,170 | ) | | | $ (591,099 | ) | | | | | 32,812 | | | | $ 139,382 | |
| | | | | | | | | | |
| | | | | | | | | | | | | | | | | | |
| Class R | | | | | | | | | | | | | | |
Shares sold | | | 269,008 | | | | $ 3,191,974 | | | | | | 473,726 | | | | $ 5,716,765 | |
Shares issued in reinvestment of distributions | | | 99,715 | | | | 1,238,454 | | | | | | 322,982 | | | | 3,743,117 | |
Shares redeemed | | | (386,347 | ) | | | (4,605,478 | ) | | | | | (1,141,216 | ) | | | (13,877,880 | ) |
| | | | | | | | | | |
Net decrease | | | (17,624 | ) | | | $ (175,050 | ) | | | | | (344,508 | ) | | | $ (4,417,998 | ) |
| | | | | | | | | | |
Total Net Increase (Decrease) | | | (24,185 | ) | | | $ 580,079 | | | | | | (711,329 | ) | | | $(10,300,360 | ) |
| | | | | | | | | | |
| | 1 | | On June 23, 2015, Investor B Shares converted to Investor A Shares. |
At November 30, 2015, 496,000 Institutional Shares, 2,000 Investor A Shares and 2,000 Investor C Shares of Disciplined Small Cap Core Fund were owned by BlackRock HoldCo 2, Inc., an affiliate of Disciplined Small Cap Core Fund.
12. Subsequent Events:
Management has evaluated the impact of all subsequent events on the Funds through the date the financial statements were issued and has determined that there were no subsequent events requiring adjustment or additional disclosure in the financial statements.
| | | | | | |
| 36 | | SEMI-ANNUAL REPORT | | NOVEMBER 30, 2015 | | |
| | | | |
| Master Portfolio Information | | | BlackRock Master Small Cap Growth Portfolio | |
| | | | | |
| Ten Largest Holdings | | Percent of Net Assets |
Manhattan Associates, Inc. | | | | 3 | % |
Jack in the Box, Inc. | | | | 2 | |
LogMeIn, Inc. | | | | 2 | |
Team Health Holdings, Inc. | | | | 2 | |
Masimo Corp. | | | | 2 | |
Prestige Brands Holdings, Inc. | | | | 2 | |
Tessera Technologies, Inc. | | | | 2 | |
Cracker Barrel Old Country Store, Inc. | | | | 1 | |
ICU Medical, Inc. | | | | 1 | |
RPX Corp. | | | | 1 | |
| | | | | |
| Sector Allocation | | Percent of Net Assets |
Health Care | | | | 27 | % |
Information Technology | | | | 25 | |
Consumer Discretionary | | | | 17 | |
Industrials | | | | 13 | |
Financials | | | | 7 | |
Materials | | | | 4 | |
Consumer Staples | | | | 3 | |
Energy | | | | 2 | |
Telecommunication Services | | | | 1 | |
Short-Term Securities | | | | 3 | |
Liabilities in Excess of Other Assets | | | | (2 | ) |
For Master Portfolio compliance purposes, the Master Portfolio’s sector classifications refer to any one or more of the sector sub-classifications used by one or more widely recognized market indexes or ratings group indexes, and/or as defined by the investment advisor. These definitions may not apply for purposes of this report, which may combine such sector sub-classifications for reporting ease.
| | | | | | |
| | | SEMI-ANNUAL REPORT | | NOVEMBER 30, 2015 | | 37 |
| | | | |
| Schedule of Investments November 30, 2015 (Unaudited) | | | BlackRock Master Small Cap Growth Portfolio | |
| | | (Percentages shown are based on Net Assets) | |
| | | | | | | | |
| Common Stocks | | Shares | | | Value | |
Aerospace & Defense — 0.7% | | | | | | | | |
Aerojet Rocketdyne Holdings, Inc. (a) | | | 1,374 | | | $ | 24,100 | |
Astronics Corp. (a) | | | 507 | | | | 19,616 | |
DigitalGlobe, Inc. (a) | | | 21,247 | | | | 359,074 | |
HEICO Corp., Class A | | | 4,162 | | | | 180,631 | |
Vectrus, Inc. (a) | | | 32,536 | | | | 786,070 | |
| | | | | | | | |
| | | | | | | | 1,369,491 | |
Air Freight & Logistics — 0.1% | | | | | | | | |
Hub Group, Inc., Class A (a) | | | 5,237 | | | | 201,782 | |
Airlines — 1.0% | | | | | | | | |
Hawaiian Holdings, Inc. (a) | | | 10,682 | | | | 386,688 | |
JetBlue Airways Corp. (a) | | | 63,480 | | | | 1,570,495 | |
| | | | | | | | |
| | | | | | | | 1,957,183 | |
Auto Components — 1.7% | | | | | | | | |
Cooper-Standard Holdings, Inc. (a) | | | 358 | | | | 26,471 | |
Horizon Global Corp. (a) | | | 10,828 | | | | 94,095 | |
Lear Corp. | | | 790 | | | | 99,461 | |
Tenneco, Inc. (a) | | | 23,745 | | | | 1,279,381 | |
Tower International, Inc. | | | 61,343 | | | | 1,880,776 | |
| | | | | | | | |
| | | | | | | | 3,380,184 | |
Banks — 2.1% | | | | | | | | |
Central Pacific Financial Corp. | | | 50,626 | | | | 1,176,548 | |
Fidelity Southern Corp. | | | 34,174 | | | | 773,016 | |
South State Corp. | | | 6,242 | | | | 490,684 | |
Umpqua Holdings Corp. | | | 86,635 | | | | 1,552,499 | |
Western Alliance Bancorp (a) | | | 1,934 | | | | 75,020 | |
| | | | | | | | |
| | | | | | | | 4,067,767 | |
Beverages — 0.3% | | | | | | | | |
National Beverage Corp. (a) | | | 1,850 | | | | 80,383 | |
Primo Water Corp. (a) | | | 54,876 | | | | 487,848 | |
| | | | | | | | |
| | | | | | | | 568,231 | |
Biotechnology — 11.8% | | | | | | | | |
ACADIA Pharmaceuticals, Inc. (a) | | | 15,350 | | | | 582,533 | |
Acceleron Pharma, Inc. (a) | | | 497 | | | | 21,306 | |
Achillion Pharmaceuticals, Inc. (a) | | | 8,212 | | | | 83,598 | |
Acorda Therapeutics, Inc. (a) | | | 13,891 | | | | 530,497 | |
Adamas Pharmaceuticals, Inc. (a) | | | 7,425 | | | | 118,577 | |
Aduro Biotech, Inc. (a)(b) | | | 7,835 | | | | 242,807 | |
Alder Biopharmaceuticals, Inc. (a) | | | 7,323 | | | | 272,855 | |
Amicus Therapeutics, Inc. (a) | | | 9,973 | | | | 107,010 | |
Anacor Pharmaceuticals, Inc. (a) | | | 10,609 | | | | 1,238,389 | |
Ardelyx, Inc. (a) | | | 13,042 | | | | 255,102 | |
ARIAD Pharmaceuticals, Inc. (a) | | | 12,316 | | | | 78,946 | |
Array BioPharma, Inc. (a) | | | 18,566 | | | | 73,521 | |
BIND Therapeutics, Inc. (a) | | | 23,650 | | | | 111,155 | |
BioSpecifics Technologies Corp. (a) | | | 4,505 | | | | 218,267 | |
Cara Therapeutics, Inc. (a) | | | 14,640 | | | | 242,292 | |
Catalyst Pharmaceuticals, Inc. (a) | | | 56,223 | | | | 152,645 | |
Celldex Therapeutics, Inc. (a) | | | 17,636 | | | | 317,624 | |
Cepheid, Inc. (a) | | | 14,990 | | | | 538,741 | |
Cerulean Pharma, Inc. (a)(b) | | | 34,682 | | | | 112,370 | |
ChemoCentryx, Inc. (a) | | | 16,143 | | | | 121,880 | |
Chiasma, Inc. (a) | | | 6,937 | | | | 153,932 | |
Chimerix, Inc. (a) | | | 5,553 | | | | 224,341 | |
China Biologic Products, Inc. (a) | | | 1,496 | | | | 175,810 | |
| | | | | | | | |
| Common Stocks | | Shares | | | Value | |
Biotechnology (continued) | | | | | | | | |
Clovis Oncology, Inc. (a) | | | 4,461 | | | $ | 140,298 | |
Concert Pharmaceuticals, Inc. (a) | | | 11,899 | | | | 272,844 | |
Cytokinetics, Inc. (a) | | | 19,856 | | | | 234,698 | |
Dyax Corp. (a) | | | 37,614 | | | | 1,266,087 | |
Dynavax Technologies Corp. (a) | | | 15,609 | | | | 435,335 | |
Eagle Pharmaceuticals, Inc. (a) | | | 2,930 | | | | 268,505 | |
Emergent BioSolutions, Inc. (a) | | | 10,184 | | | | 383,631 | |
Enanta Pharmaceuticals, Inc. (a) | | | 5,990 | | | | 188,685 | |
Enzon Pharmaceuticals, Inc. | | | 121,911 | | | | 88,495 | |
EPIRUS Biopharmaceuticals, Inc. (a) | | | 12,876 | | | | 62,706 | |
Exact Sciences Corp. (a) | | | 3,219 | | | | 29,261 | |
Exelixis, Inc. (a) | | | 21,208 | | | | 121,310 | |
FibroGen, Inc. (a) | | | 16,029 | | | | 476,702 | |
Five Prime Therapeutics, Inc. (a) | | | 9,812 | | | | 377,271 | |
Flexion Therapeutics, Inc. (a) | | | 3,439 | | | | 66,854 | |
Genomic Health, Inc. (a) | | | 10,771 | | | | 326,577 | |
Halozyme Therapeutics, Inc. (a) | | | 34,316 | | | | 610,825 | |
Ignyta, Inc. (a) | | | 15,293 | | | | 224,807 | |
Immune Design Corp. (a) | | | 10,534 | | | | 220,477 | |
ImmunoGen, Inc. (a) | | | 5,236 | | | | 71,053 | |
Infinity Pharmaceuticals, Inc. (a) | | | 29,645 | | | | 261,469 | |
Insmed, Inc. (a) | | | 3,147 | | | | 51,328 | |
Ironwood Pharmaceuticals, Inc. (a) | | | 12,409 | | | | 151,390 | |
Isis Pharmaceuticals, Inc. (a) | | | 748 | | | | 45,658 | |
Kindred Biosciences, Inc. (a) | | | 18,689 | | | | 74,569 | |
Kite Pharma, Inc. (a) | | | 4,283 | | | | 352,791 | |
Ligand Pharmaceuticals, Inc. (a) | | | 5,796 | | | | 620,636 | |
Lion Biotechnologies, Inc. (a) | | | 6,278 | | | | 45,704 | |
Loxo Oncology, Inc. (a) | | | 1,993 | | | | 65,629 | |
MacroGenics, Inc. (a) | | | 1,767 | | | | 61,103 | |
Merrimack Pharmaceuticals, Inc. (a) | | | 38,146 | | | | 358,954 | |
MiMedx Group, Inc. (a) | | | 41,794 | | | | 374,474 | |
Momenta Pharmaceuticals, Inc. (a) | | | 23,941 | | | | 427,586 | |
Myriad Genetics, Inc. (a) | | | 12,850 | | | | 558,975 | |
Neurocrine Biosciences, Inc. (a) | | | 20,860 | | | | 1,134,158 | |
Novavax, Inc. (a) | | | 65,085 | | | | 557,128 | |
Ocata Therapeutics, Inc. (a) | | | 7,988 | | | | 68,537 | |
OncoGenex Pharmaceuticals, Inc. (a) | | | 26,951 | | | | 69,534 | |
Oncothyreon, Inc. (a) | | | 24,464 | | | | 86,847 | |
Ophthotech Corp. (a) | | | 2,231 | | | | 141,825 | |
OPKO Health, Inc. (a) | | | 12,247 | | | | 133,982 | |
Orexigen Therapeutics, Inc. (a) | | | 12,365 | | | | 29,552 | |
PDL BioPharma, Inc. | | | 32,570 | | | | 123,277 | |
Peregrine Pharmaceuticals, Inc. (a) | | | 103,560 | | | | 133,592 | |
Pfenex, Inc. (a) | | | 8,818 | | | | 135,974 | |
Portola Pharmaceuticals, Inc. (a) | | | 7,326 | | | | 363,443 | |
Progenics Pharmaceuticals, Inc. (a) | | | 10,778 | | | | 72,428 | |
Prothena Corp. PLC (a) | | | 4,348 | | | | 306,708 | |
PTC Therapeutics, Inc. (a) | | | 12,655 | | | | 380,156 | |
Radius Health, Inc. (a) | | | 8,263 | | | | 502,473 | |
Raptor Pharmaceutical Corp. (a) | | | 46,304 | | | | 292,641 | |
Repligen Corp. (a) | | | 12,998 | | | | 369,533 | |
Retrophin, Inc. (a) | | | 11,899 | | | | 265,943 | |
Rigel Pharmaceuticals, Inc. (a) | | | 79,369 | | | | 260,330 | |
Sangamo BioSciences, Inc. (a) | | | 40,841 | | | | 338,163 | |
Sarepta Therapeutics, Inc. (a) | | | 5,215 | | | | 191,703 | |
Strongbridge Biopharma PLC | | | 7,322 | | | | 52,645 | |
TESARO, Inc. (a) | | | 1,634 | | | | 83,399 | |
| | | | | | | | | | |
| Portfolio Abbreviations |
| ADR | | American Depositary Receipts | | | | | | | | |
| CVR | | Contingent Value Rights | | | | | | | | |
| REIT | | Real Estate Investment Trust | | | | | | | | |
See Notes to Financial Statements.
| | | | | | |
| 38 | | SEMI-ANNUAL REPORT | | NOVEMBER 30, 2015 | | |
| | | | |
| Schedule of Investments (continued) | | | BlackRock Master Small Cap Growth Portfolio | |
| | | | |
| | | | | | | | |
| Common Stocks | | Shares | | | Value | |
Biotechnology (continued) | | | | | | | | |
Threshold Pharmaceuticals, Inc. (a) | | | 54,537 | | | $ | 190,334 | |
Tonix Pharmaceuticals Holding Corp. (a) | | | 8,120 | | | | 58,870 | |
Trevena, Inc. (a) | | | 21,473 | | | | 270,345 | |
Ultragenyx Pharmaceutical, Inc. (a) | | | 6,914 | | | | 679,784 | |
United Therapeutics Corp. (a) | | | 951 | | | | 145,151 | |
Verastem, Inc. (a) | | | 9,516 | | | | 21,601 | |
vTv Therapeutics, Inc., Class A (a) | | | 9,148 | | | | 62,115 | |
Xencor, Inc. (a) | | | 13,978 | | | | 224,766 | |
ZIOPHARM Oncology, Inc. (a) | | | 16,445 | | | | 215,101 | |
| | | | | | | | |
| | | | | | | | 23,252,923 | |
Building Products — 1.7% | | | | | | | | |
Apogee Enterprises, Inc. | | | 7,936 | | | | 398,546 | |
Continental Building Products, Inc. (a) | | | 85,293 | | | | 1,555,744 | |
Gibraltar Industries, Inc. (a) | | | 10,734 | | | | 286,490 | |
Insteel Industries, Inc. | | | 1,128 | | | | 27,523 | |
Masonite International Corp. (a) | | | 6,939 | | | | 457,696 | |
NCI Building Systems, Inc. (a) | | | 2,763 | | | | 32,769 | |
Universal Forest Products, Inc. | | | 8,251 | | | | 637,472 | |
| | | | | | | | |
| | | | | | | | 3,396,240 | |
Capital Markets — 0.5% | | | | | | | | |
BGC Partners, Inc., Class A | | | 20,103 | | | | 182,636 | |
Financial Engines, Inc. | | | 1,713 | | | | 61,719 | |
Greenhill & Co., Inc. | | | 4,263 | | | | 113,012 | |
Investment Technology Group, Inc. | | | 13,920 | | | | 279,374 | |
Westwood Holdings Group, Inc. | | | 6,734 | | | | 392,929 | |
| | | | | | | | |
| | | | | | | | 1,029,670 | |
Chemicals — 1.6% | | | | | | | | |
A. Schulman, Inc. | | | 935 | | | | 32,360 | |
Advanced Emissions Solutions, Inc. (a) | | | 25,707 | | | | 151,543 | |
AgroFresh Solutions, Inc. | | | 15,993 | | | | 103,155 | |
Chemtura Corp. (a) | | | 6,789 | | | | 208,558 | |
Innophos Holdings, Inc. | | | 3,056 | | | | 90,824 | |
Innospec, Inc. | | | 10,789 | | | | 630,078 | |
Koppers Holdings, Inc. | | | 5,853 | | | | 133,624 | |
PolyOne Corp. | | | 5,462 | | | | 196,523 | |
Sensient Technologies Corp. | | | 12,571 | | | | 840,246 | |
Stepan Co. | | | 3,873 | | | | 201,628 | |
Trinseo SA | | | 19,256 | | | | 549,951 | |
| | | | | | | | |
| | | | | | | | 3,138,490 | |
Commercial Services & Supplies — 2.5% | | | | | | | | |
ABM Industries, Inc. | | | 5,074 | | | | 150,546 | |
ARC Document Solutions, Inc. (a) | | | 84,354 | | | | 426,831 | |
Herman Miller, Inc. | | | 48,050 | | | | 1,523,666 | |
Interface, Inc. | | | 67,802 | | | | 1,347,904 | |
Knoll, Inc. | | | 54,970 | | | | 1,224,732 | |
Quad/Graphics, Inc. | | | 13,035 | | | | 134,521 | |
West Corp. | | | 2,033 | | | | 51,842 | |
| | | | | | | | |
| | | | | | | | 4,860,042 | |
Communications Equipment — 1.9% | | | | | | | | |
Calix, Inc. (a) | | | 78,220 | | | | 619,502 | |
Ciena Corp. (a) | | | 9,870 | | | | 247,145 | |
Infinera Corp. (a) | | | 5,944 | | | | 133,859 | |
Ixia (a) | | | 47,445 | | | | 619,632 | |
Lumentum Holdings, Inc. (a) | | | 25,578 | | | | 511,560 | |
NETGEAR, Inc. (a) | | | 6,877 | | | | 303,344 | |
PC-Tel, Inc. | | | 8,560 | | | | 45,625 | |
ShoreTel, Inc. (a) | | | 120,670 | | | | 1,238,074 | |
| | | | | | | | |
| | | | | | | | 3,718,741 | |
Construction & Engineering — 1.4% | | | | | | | | |
Comfort Systems U.S.A., Inc. | | | 50,957 | | | | 1,617,375 | |
| | | | | | | | |
| Common Stocks | | Shares | | | Value | |
Construction & Engineering (continued) | | | | | | | | |
Dycom Industries, Inc. (a) | | | 12,314 | | | $ | 1,075,997 | |
| | | | | | | | |
| | | | | | | | 2,693,372 | |
Construction Materials — 0.3% | | | | | | | | |
Headwaters, Inc. (a) | | | 8,377 | | | | 160,587 | |
Summit Materials, Inc., Class A (a) | | | 4,754 | | | | 108,249 | |
U.S. Concrete, Inc. | | | 3,968 | | | | 233,041 | |
| | | | | | | | |
| | | | | | | | 501,877 | |
Consumer Finance — 0.2% | | | | | | | | |
Consumer Portfolio Services, Inc. (a) | | | 17,485 | | | | 81,830 | |
Emergent Capital, Inc. (a) | | | 74,474 | | | | 318,749 | |
Nicholas Financial, Inc. (a) | | | 800 | | | | 10,304 | |
| | | | | | | | |
| | | | | | | | 410,883 | |
Containers & Packaging — 0.3% | | | | | | | | |
Graphic Packaging Holding Co. | | | 43,434 | | | | 593,743 | |
Distributors — 0.8% | | | | | | | | |
Core-Mark Holding Co., Inc. | | | 17,832 | | | | 1,520,891 | |
Diversified Consumer Services — 0.6% | | | | | | | | |
Bright Horizons Family Solutions, Inc. (a) | | | 2,975 | | | | 197,332 | |
Collectors Universe, Inc. | | | 19,531 | | | | 311,715 | |
Houghton Mifflin Harcourt Co. (a) | | | 18,551 | | | | 366,568 | |
K12, Inc. (a) | | | 18,645 | | | | 189,060 | |
Steiner Leisure Ltd. (a) | | | 2,876 | | | | 180,843 | |
| | | | | | | | |
| | | | | | | | 1,245,518 | |
Diversified Telecommunication Services — 1.0% | | | | | | | | |
IDT Corp., Class B | | | 4,717 | | | | 58,915 | |
Inteliquent, Inc. | | | 95,079 | | | | 1,826,468 | |
| | | | | | | | |
| | | | | | | | 1,885,383 | |
Electrical Equipment — 0.1% | | | | | | | | |
AZZ, Inc. | | | 1,773 | | | | 105,564 | |
Energy Focus, Inc. (a) | | | 1,825 | | | | 29,218 | |
LSI Industries, Inc. | | | 11,763 | | | | 139,039 | |
| | | | | | | | |
| | | | | | | | 273,821 | |
Electronic Equipment, Instruments & Components — 2.0% | | | | | |
Benchmark Electronics, Inc. (a) | | | 6,297 | | | | 135,134 | |
Electro Rent Corp. | | | 6,372 | | | | 65,950 | |
Fabrinet | | | 3,739 | | | | 89,474 | |
Littelfuse, Inc. | | | 288 | | | | 31,265 | |
Multi-Fineline Electronix, Inc. (a) | | | 21,472 | | | | 529,929 | |
Newport Corp. (a) | | | 53,463 | | | | 886,951 | |
OSI Systems, Inc. (a) | | | 8,155 | | | | 763,553 | |
RealD, Inc. (a) | | | 78,975 | | | | 829,238 | |
Rogers Corp. (a) | | | 4,617 | | | | 255,920 | |
Tech Data Corp. (a) | | | 4,274 | | | | 289,136 | |
| | | | | | | | |
| | | | | | | | 3,876,550 | |
Energy Equipment & Services — 0.2% | | | | | | | | |
Aspen Aerogels, Inc. (a) | | | 10,192 | | | | 66,248 | |
C&J Energy Services Ltd. (b) | | | 22,795 | | | | 135,858 | |
CHC Group Ltd. | | | 72,314 | | | | 19,525 | |
Pacific Drilling SA | | | 51,293 | | | | 67,194 | |
PHI, Inc. (a) | | | 1,188 | | | | 25,388 | |
| | | | | | | | |
| | | | | | | | 314,213 | |
Food & Staples Retailing — 0.5% | | | | | | | | |
SUPERVALU, Inc. (a) | | | 142,283 | | | | 956,142 | |
Food Products — 0.7% | | | | | | | | |
Cal-Maine Foods, Inc. (b) | | | 15,458 | | | | 842,616 | |
Omega Protein Corp. (a) | | | 853 | | | | 20,967 | |
Pilgrim’s Pride Corp. (b) | | | 22,509 | | | | 484,619 | |
See Notes to Financial Statements.
| | | | | | |
| | | SEMI-ANNUAL REPORT | | NOVEMBER 30, 2015 | | 39 |
| | | | |
| Schedule of Investments (continued) | | | BlackRock Master Small Cap Growth Portfolio | |
| | | | |
| | | | | | | | |
| Common Stocks | | Shares | | | Value | |
Food Products (continued) | | | | | | | | |
Seaboard Corp. (a) | | | 16 | | | $ | 52,800 | |
| | | | | | | | |
| | | | | | | | 1,401,002 | |
Health Care Equipment & Supplies — 5.6% | | | | | | | | |
ABIOMED, Inc. (a) | | | 1,436 | | | | 117,135 | |
Anika Therapeutics, Inc. (a) | | | 11,866 | | | | 497,897 | |
Atrion Corp. | | | 130 | | | | 54,717 | |
ICU Medical, Inc. (a) | | | 19,421 | | | | 2,203,118 | |
iRadimed Corp. (a) | | | 1,704 | | | | 52,841 | |
LivaNova PLC | | | 2,754 | | | | 164,827 | |
Masimo Corp. (a) | | | 70,890 | | | | 2,940,517 | |
Merit Medical Systems, Inc. (a) | | | 42,492 | | | | 823,070 | |
Natus Medical, Inc. (a) | | | 7,491 | | | | 365,411 | |
NuVasive, Inc. (a) | | | 27,958 | | | | 1,457,730 | |
NxStage Medical, Inc. (a) | | | 2,355 | | | | 45,946 | |
OraSure Technologies, Inc. (a) | | | 13,926 | | | | 87,038 | |
Orthofix International NV (a) | | | 5,123 | | | | 202,666 | |
RTI Surgical, Inc. (a) | | | 148,808 | | | | 583,327 | |
SeaSpine Holdings Corp. (a) | | | 20,306 | | | | 334,643 | |
STERIS PLC | | | 5,567 | | | | 425,207 | |
SurModics, Inc. (a) | | | 13,088 | | | | 275,633 | |
Symmetry Surgical, Inc. (a) | | | 45,452 | | | | 413,613 | |
| | | | | | | | |
| | | | | | | | 11,045,336 | |
Health Care Providers & Services — 4.7% | | | | | | | | |
Air Methods Corp. (a) | | | 803 | | | | 35,091 | |
Alliance HealthCare Services, Inc. (a) | | | 7,018 | | | | 63,232 | |
AMN Healthcare Services, Inc. (a) | | | 61,563 | | | | 1,816,109 | |
BioTelemetry, Inc. (a) | | | 6,774 | | | | 85,420 | |
Cross Country Healthcare, Inc. (a) | | | 1,351 | | | | 24,656 | |
Five Star Quality Care, Inc. (a) | | | 61,307 | | | | 220,092 | |
Molina Healthcare, Inc. (a) | | | 24,580 | | | | 1,481,191 | |
Surgical Care Affiliates, Inc. (a) | | | 48,954 | | | | 1,819,620 | |
Team Health Holdings, Inc. (a) | | | 55,736 | | | | 3,073,283 | |
WellCare Health Plans, Inc. (a) | | | 6,998 | | | | 577,195 | |
| | | | | | | | |
| | | | | | | | 9,195,889 | |
Hotels, Restaurants & Leisure — 5.6% | | | | | | | | |
Bloomin’ Brands, Inc. | | | 1,719 | | | | 29,756 | |
Boyd Gaming Corp. (a) | | | 30,623 | | | | 599,905 | |
Cheesecake Factory, Inc. | | | 15,624 | | | | 736,359 | |
Cracker Barrel Old Country Store, Inc. (b) | | | 18,928 | | | | 2,383,414 | |
Dave & Buster’s Entertainment, Inc. (a) | | | 5,665 | | | | 217,196 | |
Eldorado Resorts, Inc. (a) | | | 9,682 | | | | 93,819 | |
Intrawest Resorts Holdings, Inc. (a) | | | 21,675 | | | | 199,410 | |
Isle of Capri Casinos, Inc. (a) | | | 39,607 | | | | 730,353 | |
J. Alexander’s Holdings, Inc. (a) | | | 17,652 | | | | 187,817 | |
Jack in the Box, Inc. | | | 51,936 | | | | 3,850,535 | |
Marriott Vacations Worldwide Corp. | | | 6,798 | | | | 413,522 | |
Red Robin Gourmet Burgers, Inc. (a) | | | 1,466 | | | | 98,926 | |
SeaWorld Entertainment, Inc. | | | 4,174 | | | | 73,087 | |
Vail Resorts, Inc. | | | 12,276 | | | | 1,480,486 | |
| | | | | | | | |
| | | | | | | | 11,094,585 | |
Household Durables — 0.7% | | | | | | | | |
Installed Building Products, Inc. (a) | | | 3,492 | | | | 87,510 | |
La-Z-Boy, Inc. | | | 15,627 | | | | 418,960 | |
TopBuild Corp. (a) | | | 13,942 | | | | 424,673 | |
WCI Communities, Inc. (a) | | | 1,459 | | | | 35,322 | |
ZAGG, Inc. (a) | | | 49,857 | | | | 514,524 | |
| | | | | | | | |
| | | | | | | | 1,480,989 | |
Household Products — 0.1% | | | | | | | | |
Central Garden & Pet Co., Class A | | | 7,391 | | | | 116,704 | |
Independent Power and Renewable Electricity Producers — 0.1% | | | | | |
Talen Energy Corp. (a) | | | 16,012 | | | | 124,733 | |
| | | | | | | | |
| Common Stocks | | Shares | | | Value | |
Independent Power and Renewable Electricity Producers (continued) | | | | | |
TerraForm Global, Inc., Class A | | | 17,948 | | | $ | 72,330 | |
| | | | | | | | |
| | | | | | | | 197,063 | |
Insurance — 0.7% | | | | | | | | |
American Equity Investment Life Holding Co. | | | 6,390 | | | | 171,316 | |
Employers Holdings, Inc. | | | 4,248 | | | | 116,438 | |
Fidelity & Guaranty Life | | | 21,350 | | | | 548,268 | |
Hallmark Financial Services, Inc. (a) | | | 6,947 | | | | 88,574 | |
National General Holdings Corp. | | | 7,466 | | | | 163,580 | |
Universal Insurance Holdings, Inc. (b) | | | 17,509 | | | | 345,803 | |
| | | | | | | | |
| | | | | | | | 1,433,979 | |
Internet & Catalog Retail — 0.3% | | | | | | | | |
1-800-Flowers.com, Inc., Class A (a) | | | 11,329 | | | | 87,573 | |
Blue Nile, Inc. (a) | | | 3,167 | | | | 115,469 | |
Liberty TripAdvisor Holdings, Inc., Class A | | | 14,397 | | | | 431,046 | |
Nutrisystem, Inc. | | | 745 | | | | 17,090 | |
U.S. Auto Parts Network, Inc. (a) | | | 1,846 | | | | 4,578 | |
| | | | | | | | |
| | | | | | | | 655,756 | |
Internet Software & Services — 4.3% | | | | | | | | |
Apigee Corp. (a) | | | 19,602 | | | | 139,566 | |
Apigee Corp. (Acquired 4/13/15, cost $89,907) (a)(c) | | | 4,065 | | | | 28,943 | |
Appfolio, Inc., Class A (a) | | | 4,234 | | | | 69,395 | |
Bankrate, Inc. (a) | | | 7,966 | | | | 116,144 | |
Carbonite, Inc. (a) | | | 4,153 | | | | 40,492 | |
Constant Contact, Inc. (a) | | | 7,089 | | | | 221,815 | |
Envestnet, Inc. (a) | | | 5,131 | | | | 166,604 | |
Five9, Inc. (a) | | | 11,454 | | | | 76,169 | |
IntraLinks Holdings, Inc. (a) | | | 28,433 | | | | 290,870 | |
Limelight Networks, Inc. (a) | | | 112,423 | | | | 189,995 | |
LogMeIn, Inc. (a) | | | 45,658 | | | | 3,260,894 | |
NIC, Inc. | | | 24,909 | | | | 508,393 | |
QuinStreet, Inc. (a) | | | 194,009 | | | | 948,704 | |
SciQuest, Inc. (a) | | | 72,055 | | | | 930,230 | |
Spark Networks, Inc. (a) | | | 14,804 | | | | 57,291 | |
Support.com, Inc. (a) | | | 60,276 | | | | 67,509 | |
United Online, Inc. (a) | | | 6,199 | | | | 71,289 | |
Web.com Group, Inc. (a) | | | 20,314 | | | | 491,802 | |
XO Group, Inc. (a) | | | 42,647 | | | | 718,175 | |
| | | | | | | | |
| | | | | | | | 8,394,280 | |
IT Services — 3.2% | | | | | | | | |
Datalink Corp. (a) | | | 35,033 | | | | 257,493 | |
EPAM Systems, Inc. (a) | | | 6,671 | | | | 525,208 | |
Euronet Worldwide, Inc. (a) | | | 17,431 | | | | 1,354,737 | |
Everi Holdings, Inc. (a) | | | 109,859 | | | | 419,661 | |
Evertec, Inc. | | | 926 | | | | 15,909 | |
ExlService Holdings, Inc. (a) | | | 1,299 | | | | 60,754 | |
Hackett Group, Inc. | | | 5,267 | | | | 99,757 | |
Heartland Payment Systems, Inc. | | | 2,678 | | | | 212,473 | |
Higher One Holdings, Inc. (a) | | | 7,054 | | | | 22,361 | |
Lionbridge Technologies, Inc. (a) | | | 65,812 | | | | 348,804 | |
Net 1 UEPS Technologies, Inc. (a) | | | 38,837 | | | | 587,604 | |
Science Applications International Corp. | | | 39,497 | | | | 1,984,329 | |
Sykes Enterprises, Inc. (a) | | | 5,246 | | | | 166,928 | |
Travelport Worldwide Ltd. | | | 15,759 | | | | 209,752 | |
| | | | | | | | |
| | | | | | | | 6,265,770 | |
Leisure Products — 1.0% | | | | | | | | |
Brunswick Corp. | | | 26,769 | | | | 1,408,852 | |
Nautilus, Inc. (a) | | | 26,892 | | | | 516,595 | |
| | | | | | | | |
| | | | | | | | 1,925,447 | |
See Notes to Financial Statements.
| | | | | | |
| 40 | | SEMI-ANNUAL REPORT | | NOVEMBER 30, 2015 | | |
| | | | |
| Schedule of Investments (continued) | | | BlackRock Master Small Cap Growth Portfolio | |
| | | | |
| | | | | | | | |
| Common Stocks | | Shares | | | Value | |
Life Sciences Tools & Services — 1.3% | |
Cambrex Corp. (a) | | | 15,472 | | | $ | 829,763 | |
Harvard Bioscience, Inc. (a) | | | 37,642 | | | | 119,325 | |
INC Research Holdings, Inc., Class A (a) | | | 33,032 | | | | 1,562,414 | |
| | | | | | | | |
| | | | | | | | 2,511,502 | |
Machinery — 2.7% | |
Blount International, Inc. (a) | | | 53,733 | | | | 311,651 | |
Briggs & Stratton Corp. | | | 20,577 | | | | 391,786 | |
Commercial Vehicle Group, Inc. (a) | | | 18,240 | | | | 62,016 | |
Global Brass & Copper Holdings, Inc. | | | 55,726 | | | | 1,296,187 | |
Greenbrier Cos., Inc. | | | 13,893 | | | | 470,695 | |
Hillenbrand, Inc. | | | 1,809 | | | | 54,795 | |
Hyster-Yale Materials Handling, Inc. | | | 6,805 | | | | 393,533 | |
John Bean Technologies Corp. | | | 5,098 | | | | 249,292 | |
Luxfer Holdings PLC — ADR | | | 89,637 | | | | 916,986 | |
Milacron Holdings Corp. (a) | | | 2,098 | | | | 30,883 | |
SPX Corp. | | | 40,932 | | | | 451,889 | |
Wabash National Corp. (a) | | | 55,218 | | | | 716,177 | |
| | | | | | | | |
| | | | | | | | 5,345,890 | |
Marine — 0.1% | |
Matson, Inc. | | | 4,912 | | | | 254,000 | |
Media — 0.7% | |
Crown Media Holdings, Inc., Class A (a) | | | 54,901 | | | | 311,289 | |
Gray Television, Inc. (a) | | | 16,549 | | | | 277,196 | |
Harte-Hanks, Inc. | | | 88,092 | | | | 331,226 | |
IMAX Corp. (a) | | | 4,537 | | | | 171,862 | |
New Media Investment Group, Inc. | | | 1,153 | | | | 20,996 | |
Time, Inc. | | | 5,246 | | | | 87,293 | |
Tribune Publishing Co. | | | 11,007 | | | | 112,051 | |
| | | | | | | | |
| | | | | | | | 1,311,913 | |
Metals & Mining — 0.4% | |
Worthington Industries, Inc. | | | 25,443 | | | | 782,881 | |
Multiline Retail — 0.9% | |
Burlington Stores, Inc. (a) | | | 35,838 | | | | 1,724,166 | |
Oil, Gas & Consumable Fuels — 1.6% | |
Alon USA Energy, Inc. | | | 4,356 | | | | 76,622 | |
Archrock, Inc. | | | 18,494 | | | | 195,482 | |
Ardmore Shipping Corp. | | | 3,477 | | | | 43,532 | |
Carrizo Oil & Gas, Inc. (a) | | | 3,815 | | | | 154,050 | |
Cheniere Energy Partners LP Holdings LLC | | | 8,398 | | | | 147,133 | |
DHT Holdings, Inc. | | | 81,174 | | | | 608,805 | |
Evolution Petroleum Corp. | | | 28,131 | | | | 173,006 | |
Exterran Corp. (a) | | | 1,690 | | | | 27,665 | |
Gener8 Maritime, Inc. (a) | | | 49,324 | | | | 477,950 | |
Isramco, Inc. (a)(b) | | | 232 | | | | 21,344 | |
Matador Resources Co. (a) | | | 2,327 | | | | 59,804 | |
PDC Energy, Inc. (a) | | | 590 | | | | 33,329 | |
Scorpio Tankers, Inc. | | | 57,057 | | | | 493,543 | |
Triangle Petroleum Corp. (a)(b) | | | 93,864 | | | | 71,900 | |
VAALCO Energy, Inc. (a) | | | 32,626 | | | | 66,883 | |
Western Refining, Inc. | | | 11,457 | | | | 518,544 | |
| | | | | | | | |
| | | | | | | | 3,169,592 | |
Paper & Forest Products — 1.1% | |
Boise Cascade Co. (a) | | | 43,751 | | | | 1,369,406 | |
Clearwater Paper Corp. (a) | | | 15,418 | | | | 752,553 | |
| | | | | | | | |
| | | | | | | | 2,121,959 | |
Personal Products — 0.2% | |
USANA Health Sciences, Inc. (a) | | | 2,741 | | | | 367,130 | |
Pharmaceuticals — 3.3% | |
ANI Pharmaceuticals, Inc. (a) | | | 2,684 | | | | 117,613 | |
Catalent, Inc. (a) | | | 4,277 | | | | 119,114 | |
| | | | | | | | |
| Common Stocks | | Shares | | | Value | |
Pharmaceuticals (continued) | |
Durata Therapeutics, Inc. — CVR | | | 1,930 | | | $ | 309 | |
Furiex Pharmaceuticals, Inc. — CVR (a) | | | 1,957 | | | | 19,570 | |
Juniper Pharmaceuticals, Inc. (a) | | | 24,958 | | | | 295,503 | |
Lannett Co., Inc. (a) | | | 5,835 | | | | 215,662 | |
Marinus Pharmaceuticals, Inc. (a) | | | 6,801 | | | | 49,443 | |
Pernix Therapeutics Holdings, Inc. (a) | | | 20,073 | | | | 60,219 | |
Phibro Animal Health Corp., Class A | | | 3,034 | | | | 98,514 | |
Prestige Brands Holdings, Inc. (a) | | | 54,750 | | | | 2,786,228 | |
SciClone Pharmaceuticals, Inc. (a) | | | 132,447 | | | | 1,214,539 | |
Sucampo Pharmaceuticals, Inc., Class A (a) | | | 50,270 | | | | 862,131 | |
TherapeuticsMD, Inc. (a) | | | 22,939 | | | | 172,272 | |
Theravance, Inc. | | | 7,277 | | | | 67,312 | |
ZS Pharma, Inc. (a) | | | 3,995 | | | | 359,390 | |
| | | | | | | | |
| | | | | | | | 6,437,819 | |
Professional Services — 2.2% | |
Insperity, Inc. | | | 3,626 | | | | 156,498 | |
Kforce, Inc. | | | 77,395 | | | | 2,085,021 | |
RPX Corp. (a) | | | 152,707 | | | | 2,118,046 | |
WageWorks, Inc. (a) | | | 714 | | | | 30,374 | |
| | | | | | | | |
| | | | | | | | 4,389,939 | |
Real Estate Investment Trusts (REITs) — 2.2% | |
Chatham Lodging Trust | | | 25,093 | | | | 571,869 | |
CoreSite Realty Corp. | | | 2,519 | | | | 147,538 | |
DiamondRock Hospitality Co. | | | 28,822 | | | | 320,789 | |
DuPont Fabros Technology, Inc. | | | 4,397 | | | | 145,277 | |
EPR Properties | | | 6,820 | | | | 382,193 | |
FelCor Lodging Trust, Inc. | | | 5,541 | | | | 44,439 | |
Hersha Hospitality Trust | | | 15,097 | | | | 356,440 | |
InfraREIT, Inc. (a) | | | 36,815 | | | | 742,559 | |
Lexington Realty Trust | | | 24,945 | | | | 214,278 | |
New Residential Investment Corp. | | | 2,757 | | | | 35,069 | |
PS Business Parks, Inc. | | | 2,426 | | | | 214,507 | |
RLJ Lodging Trust | | | 41,700 | | | | 1,017,480 | |
Summit Hotel Properties, Inc. | | | 6,719 | | | | 89,564 | |
| | | | | | | | |
| | | | | | | | 4,282,002 | |
Real Estate Management & Development — 0.5% | |
Marcus & Millichap, Inc. (a) | | | 30,126 | | | | 988,434 | |
RE/MAX Holdings, Inc., Class A | | | 1,122 | | | | 42,086 | |
| | | | | | | | |
| | | | | | | | 1,030,520 | |
Road & Rail — 0.7% | |
ArcBest Corp. | | | 1,225 | | | | 29,498 | |
Roadrunner Transportation Systems, Inc. (a) | | | 7,230 | | | | 79,675 | |
Swift Transportation Co. (a) | | | 75,894 | | | | 1,212,027 | |
| | | | | | | | |
| | | | | | | | 1,321,200 | |
Semiconductors & Semiconductor Equipment — 4.3% | |
Advanced Energy Industries, Inc. (a) | | | 1,625 | | | | 47,401 | |
Ambarella, Inc. (b) | | | 6,717 | | | | 421,895 | |
Axcelis Technologies, Inc. (a) | | | 8,802 | | | | 23,237 | |
Cascade Microtech, Inc. (a) | | | 10,578 | | | | 171,893 | |
Cirrus Logic, Inc. (a) | | | 14,891 | | | | 492,296 | |
Integrated Device Technology, Inc. (a) | | | 73,781 | | | | 2,068,819 | |
Intermolecular, Inc. (a) | | | 33,345 | | | | 75,693 | |
MaxLinear, Inc., Class A (a) | | | 19,069 | | | | 333,708 | |
Microsemi Corp. (a) | | | 31,413 | | | | 1,131,182 | |
Monolithic Power Systems, Inc. | | | 8,454 | | | | 577,662 | |
Synaptics, Inc. (a) | | | 5,444 | | | | 488,708 | |
Tessera Technologies, Inc. | | | 82,073 | | | | 2,614,025 | |
| | | | | | | | |
| | | | | | | | 8,446,519 | |
Software — 8.5% | |
A10 Networks, Inc. (a) | | | 6,471 | | | | 49,891 | |
Aspen Technology, Inc. (a) | | | 40,501 | | | | 1,780,019 | |
See Notes to Financial Statements.
| | | | | | |
| | | SEMI-ANNUAL REPORT | | NOVEMBER 30, 2015 | | 41 |
| | | | |
| Schedule of Investments (continued) | | | BlackRock Master Small Cap Growth Portfolio | |
| | | | |
| | | | | | | | |
| Common Stocks | | Shares | | | Value | |
Software (continued) | | | | | | | | |
AVG Technologies NV | | | 21,869 | | | $ | 461,217 | |
ePlus, Inc. (a) | | | 4,473 | | | | 394,474 | |
Exa Corp. (a) | | | 13,614 | | | | 146,623 | |
Fair Isaac Corp. | | | 3,040 | | | | 289,560 | |
FleetMatics Group PLC | | | 11,228 | | | | 670,312 | |
Gigamon, Inc. (a) | | | 24,204 | | | | 655,686 | |
Guidewire Software, Inc. (a) | | | 6,883 | | | | 408,368 | |
Imperva, Inc. (a) | | | 8,580 | | | | 640,325 | |
Infoblox, Inc. (a) | | | 44,966 | | | | 676,289 | |
Manhattan Associates, Inc. (a) | | | 61,722 | | | | 4,727,905 | |
Mentor Graphics Corp. | | | 3,582 | | | | 67,091 | |
MicroStrategy, Inc., Class A (a) | | | 3,269 | | | | 566,747 | |
Monotype Imaging Holdings, Inc. | | | 19,536 | | | | 516,336 | |
Pegasystems, Inc. | | | 19,930 | | | | 588,732 | |
Progress Software Corp. (a) | | | 1,891 | | | | 45,365 | |
Qlik Technologies, Inc. (a) | | | 33,562 | | | | 1,067,607 | |
Silver Spring Networks, Inc. (a) | | | 1,843 | | | | 24,567 | |
Synchronoss Technologies, Inc. (a) | | | 5,531 | | | | 217,755 | |
Take-Two Interactive Software, Inc. (a) | | | 19,962 | | | | 706,056 | |
TiVo, Inc. (a) | | | 110,722 | | | | 995,391 | |
Tyler Technologies, Inc. (a) | | | 1,641 | | | | 292,820 | |
Verint Systems, Inc. (a) | | | 11,826 | | | | 554,048 | |
Zix Corp. (a) | | | 33,488 | | | | 187,868 | |
| | | | | | | | |
| | | | | | | | 16,731,052 | |
Specialty Retail — 2.6% | | | | | | | | |
Aaron’s, Inc. (a) | | | 39,404 | | | | 956,335 | |
American Eagle Outfitters, Inc. | | | 59,857 | | | | 931,973 | |
Barnes & Noble, Inc. | | | 55,487 | | | | 710,234 | |
Chico’s FAS, Inc. | | | 76,126 | | | | 913,512 | |
Citi Trends, Inc. | | | 5,617 | | | | 111,385 | |
Express, Inc. (a) | | | 30,210 | | | | 505,715 | |
Group 1 Automotive, Inc. | | | 3,397 | | | | 275,904 | |
Haverty Furniture Cos., Inc. | | | 9,098 | | | | 219,626 | |
New York & Co., Inc. (a) | | | 21,065 | | | | 46,343 | |
Select Comfort Corp. (a) | | | 14,266 | | | | 336,963 | |
Sonic Automotive, Inc., Class A | | | 3,323 | | | | 80,616 | |
Stage Stores, Inc. | | | 11,281 | | | | 87,315 | |
| | | | | | | | |
| | | | | | | | 5,175,921 | |
Technology Hardware, Storage & Peripherals — 0.4% | | | | | | | | |
Avid Technology, Inc. (a) | | | 35,635 | | | | 270,470 | |
Nimble Storage, Inc. (a) | | | 3,555 | | | | 37,221 | |
Quantum Corp. (a) | | | 514,906 | | | | 453,581 | |
| | | | | | | | |
| | | | | | | | 761,272 | |
Textiles, Apparel & Luxury Goods — 1.8% | | | | | | | | |
Columbia Sportswear Co. | | | 1,921 | | | | 89,960 | |
Culp, Inc. | | | 36,952 | | | | 1,041,307 | |
Deckers Outdoor Corp. (a) | | | 19,134 | | | | 936,418 | |
Oxford Industries, Inc. | | | 6,254 | | | | 424,897 | |
Skechers U.S.A., Inc., Class A (a) | | | 28,168 | | | | 850,674 | |
Vince Holding Corp. (a) | | | 25,761 | | | | 133,442 | |
| | | | | | | | |
| | | | | | | | 3,476,698 | |
Thrifts & Mortgage Finance — 1.4% | | | | | | | | |
Anchor BanCorp Wisconsin, Inc. (a) | | | 891 | | | | 37,413 | |
EverBank Financial Corp. | | | 112,716 | | | | 1,945,478 | |
Flagstar Bancorp, Inc. (a) | | | 18,508 | | | | 454,556 | |
HomeStreet, Inc. (a) | | | 1,678 | | | | 36,362 | |
LendingTree, Inc. (a) | | | 499 | | | | 50,838 | |
MGIC Investment Corp. (a) | | | 13,073 | | | | 124,716 | |
United Community Financial Corp. | | | 2,703 | | | | 15,894 | |
Walker & Dunlop, Inc. (a) | | | 695 | | | | 20,530 | |
| | | | | | | | |
| | | | | | | | 2,685,787 | |
| | | | | | | | |
| Common Stocks | | Shares | | | Value | |
Tobacco — 0.8% | | | | | | | | |
Vector Group Ltd. | | | 66,351 | | | $ | 1,679,344 | |
Trading Companies & Distributors — 0.1% | | | | | |
CAI International, Inc. (a) | | | 11,641 | | | | 130,146 | |
Neff Corp., Class A (a) | | | 9,938 | | | | 82,585 | |
Willis Lease Finance Corp. (a) | | | 3,171 | | | | 55,461 | |
| | | | | | | | |
| | | | | | | | 268,192 | |
Water Utilities — 0.1% | | | | | | | | |
California Water Service Group | | | 12,759 | | | | 287,460 | |
Wireless Telecommunication Services — 0.0% | |
Leap Wireless International, Inc. — CVR (a) | | | 3,374 | | | | 8,502 | |
Total Common Stocks — 98.2% | | | | | | | 192,991,197 | |
| | | | | | | | |
| Other Interests (d) | | Beneficial
Interest
(000) | | | | |
Professional Services — 0.0% | | | | | | | | |
Dolan Co., Escrow (a) | | $ | 9 | | | | 177 | |
Total Other Interests — 0.0% | | | | | | | 177 | |
| | | | | | | | |
| Preferred Stocks | | Shares | | | | |
Household Durables — 0.0% | | | | | | | | |
AliphCom: | | | | | | | | |
Series 6 (Acquired 6/03/14,
cost $0) (a)(c) | | | 2,066 | | | | 83 | |
Series 8 (Acquired 8/31/15, cost $294,992) (a)(c) | | | 49,410 | | | | 64,727 | |
| | | | | | | | |
| | | | | | | | 64,810 | |
Software — 0.8% | | | | | | | | |
Illumio Inc., Series C (Acquired 3/10/15, cost $250,317) (a)(c) | | | 77,790 | | | | 255,952 | |
MongoDB: | | | | | | | | |
Series C (Acquired 12/19/13, cost $379,504) (a)(c) | | | 15,128 | | | | 286,222 | |
Series D (Acquired 12/19/13, cost $118,056) (a)(c) | | | 4,706 | | | | 89,038 | |
Series E (Acquired 12/19/13, cost $4,168) (a)(c) | | | 166 | | | | 3,141 | |
Palantir Technologies, Inc., Series I (Acquired 2/06/14, cost $500,000) (a)(c) | | | 81,566 | | | | 928,221 | |
| | | | | | | | |
| | | | | | | | 1,562,574 | |
Total Preferred Stocks — 0.8% | | | | | | | 1,627,384 | |
| | | | | | | | |
| | | | | | | |
See Notes to Financial Statements.
| | | | | | |
| 42 | | SEMI-ANNUAL REPORT | | NOVEMBER 30, 2015 | | |
| | | | |
| Schedule of Investments (continued) | | | BlackRock Master Small Cap Growth Portfolio | |
| | | | | | | | |
| Warrants | | Shares | | | Value | |
Pharmaceuticals — 0.0% | | | | | | | | |
Alexza Pharmaceuticals, Inc.
(Issued/Exercisable 5/06/11, 1 Share for 1 Warrant, Expires 5/06/16, Strike Price $17.70) (a) | | | 222,516 | | | | — | |
Total Warrants — 0.0% | | | | | | | — | |
Total Long-Term Investments (Cost — $183,760,319) — 99.0% | | | $ | 194,618,758 | |
| | | | | | | | |
| Short-Term Securities | | | | | | |
BlackRock Liquidity Funds, TempFund, Institutional Class, 0.14% (e)(f) | | | 1,682,553 | | | | 1,682,553 | |
| | | | | | | | |
| | | Beneficial
Interest
(000) | | | Value | |
BlackRock Liquidity Series, LLC, Money Market
Series, 0.27% (e)(f)(g) | | $ | 4,770 | | | $ | 4,770,374 | |
Total Short-Term Securities (Cost — $6,452,927) — 3.3% | | | | 6,452,927 | |
Total Investments (Cost — $190,213,246) — 102.3% | | | | 201,071,685 | |
Liabilities in Excess of Other Assets — (2.3)% | | | | | | | (4,523,663 | ) |
| | | | | | | | |
Net Assets — 100.0% | | | | | | $ | 196,548,022 | |
| | | | | | | | |
|
| Notes to Schedule of Investments |
| (a) | Non-income producing security. |
| (b) | Security, or a portion of security, is on loan. |
| (c) | Restricted security as to resale, excluding 144A securities. As of period end, the Master Portfolio held restricted securities with a current value of $1,656,327 and an original cost of $1,636,944, which was 0.8% of its net assets. |
| (d) | Other interests represent beneficial interests in liquidation trusts and other reorganization or private entities. |
| (e) | During the six months ended November 30, 2015, investments in issuers considered to be affiliates of the Master Portfolio for purposes of Section 2(a)(3) of the Investment Company Act of 1940, as amended, were as follows: |
| | | | | | | | | | | | | | | | |
| Affiliate | | Shares/ Beneficial
Interest Held at
May 31, 2015 | | | Net Activity | | | Shares/ Beneficial Interest Held at
November 30, 2015 | | | Income | |
BlackRock Liquidity Funds, TempFund, Institutional Class | | | 2,469,135 | | | | (786,582 | ) | | | 1,682,553 | | | | $ 1,043 | |
BlackRock Liquidity Series, LLC, Money Market Series | | | $3,200,215 | | | | $1,570,159 | | | | $4,770,374 | | | | $83,128 | 1 |
| | 1 | Represents securities lending income earned from the reinvestment of cash collateral from loaned securities, net of fees and collateral investment expenses, and other payments to and from borrowers of securities. |
| (f) | Represents the current yield as of period end. |
| (g) | Security was purchased with the cash collateral from loaned securities. The Master Portfolio may withdraw up to 25% of its investment daily, although the manager of the BlackRock Liquidity Series, LLC, Money Market Series, in its sole discretion, may permit an investor to withdraw more than 25% on any one day. |
| • | | For Master Portfolio compliance purposes, the Master Portfolio’s industry classifications refer to any one or more of the industry sub-classifications used by one or more widely recognized market indexes or ratings group indexes, and/or as defined by the investment advisor. These definitions may not apply for purposes of this report, which may combine such industry sub-classifications for reporting ease. |
|
| Derivative Financial Instruments Outstanding as of Period End |
| | | | | | | | | | | | | | | | |
| Financial Futures Contracts | | | | | | | | | | |
Contracts
Long | | Issue | | | Expiration | | | Notional
Value | | | Unrealized
Appreciation | |
| 19 | | | E-Mini Russell 2000 Futures | | | | December 2015 | | | | $2,272,210 | | | | $31,237 | |
See Notes to Financial Statements.
| | | | | | |
| | | SEMI-ANNUAL REPORT | | NOVEMBER 30, 2015 | | 43 |
| | | | |
| Schedule of Investments (continued) | | | BlackRock Master Small Cap Growth Portfolio | |
|
| Derivative Financial Instruments Categorized by Risk Exposure |
As of period end, fair values of derivative financial instruments located in the Statement of Assets and Liabilities were as follows:
| | | | | | | | | | | | | | | | |
| | | | | Commodity
Contracts | | Credit
Contracts | | Equity
Contracts | | Foreign
Currency
Exchange
Contracts | | Interest Rate
Contracts | | Other
Contracts | | Total |
Assets — Derivative Financial Instruments | | | | | | | | | | | | | | |
Financial futures contracts | | Net unrealized appreciation1 | | — | | — | | $31,237 | | — | | — | | — | | $31,237 |
| | 1 | | Includes cumulative appreciation (depreciation) on financial futures contracts, if any, as reported in the Schedule of Investments. Only current day’s variation margin is reported within the Statement of Assets and Liabilities. |
For the six months ended November 30, 2015, the effect of derivative financial instruments in the Statement of Operations were as follows:
| | | | | | | | | | | | | | | | | | | | | | | | | | | | |
| Net Realized Loss from: | | Commodity
Contracts | | | Credit
Contracts | | | Equity
Contracts | | | Foreign
Currency
Exchange
Contracts | | | Interest Rate
Contracts | | | Other
Contracts | | | Total | |
Financial futures contracts | | | — | | | | — | | | $ | (109,706 | ) | | | — | | | | — | | | | — | | | $ | (109,706 | ) |
Net Change in Unrealized Appreciation (Depreciation) on: | | | | | | | | | | | | | | | | | | | | | | | | | | | | |
Financial futures contracts | | | — | | | | — | | | $ | 39,734 | | | | — | | | | — | | | | — | | | $ | 39,734 | |
| | | | | | | | | | | | | | | | | | | | | | | | | | | | |
| Average Quarterly Balances of Outstanding Derivative Financial Instruments: | |
| | | | |
| | | | |
Financial futures contracts: | | | | |
Average notional value of contracts — long | | $ | 2,119,980 | |
For more information about the Master Portfolio’s investment risks regarding derivative financial instruments, refer to the Notes to Financial Statements.
See Notes to Financial Statements.
| | | | | | |
| 44 | | SEMI-ANNUAL REPORT | | NOVEMBER 30, 2015 | | |
| | | | |
| Schedule of Investments (continued) | | | BlackRock Master Small Cap Growth Portfolio | |
| | |
| Fair Value Hierarchy as of Period End | | |
Various inputs are used in determining the fair value of investments and derivative financial instruments. For information about the Master Portfolio’s policy regarding valuation of investments and derivative financial instruments, refer to the Notes to Financial Statements.
The following tables summarize the Fund’s investments and derivative financial instruments categorized in the disclosure hierarchy:
| | | | | | | | | | | | | | | | | | | | |
| | | Level 1 | | Level 2 | | Level 3 | | Total |
Assets: | | | | | | | | | | | | | | | | | | | | |
Investments: | | | | | | | | | | | | | | | | | | | | |
Long-Term Investments: | | | | | | | | | | | | | | | | | | | | |
Common Stocks: | | | | | | | | | | | | | | | | | | | | |
Aerospace & Defense | | | $ | 1,369,491 | | | | | — | | | | | — | | | | $ | 1,369,491 | |
Air Freight & Logistics | | | | 201,782 | | | | | — | | | | | — | | | | | 201,782 | |
Airlines | | | | 1,957,183 | | | | | — | | | | | — | | | | | 1,957,183 | |
Auto Components | | | | 3,380,184 | | | | | — | | | | | — | | | | | 3,380,184 | |
Banks | | | | 4,067,767 | | | | | — | | | | | — | | | | | 4,067,767 | |
Beverages | | | | 568,231 | | | | | — | | | | | — | | | | | 568,231 | |
Biotechnology | | | | 23,252,923 | | | | | — | | | | | — | | | | | 23,252,923 | |
Building Products | | | | 3,396,240 | | | | | — | | | | | — | | | | | 3,396,240 | |
Capital Markets | | | | 1,029,670 | | | | | — | | | | | — | | | | | 1,029,670 | |
Chemicals | | | | 3,138,490 | | | | | — | | | | | — | | | | | 3,138,490 | |
Commercial Services & Supplies | | | | 4,860,042 | | | | | — | | | | | — | | | | | 4,860,042 | |
Communications Equipment | | | | 3,718,741 | | | | | — | | | | | — | | | | | 3,718,741 | |
Construction & Engineering | | | | 2,693,372 | | | | | — | | | | | — | | | | | 2,693,372 | |
Construction Materials | | | | 501,877 | | | | | — | | | | | — | | | | | 501,877 | |
Consumer Finance | | | | 410,883 | | | | | — | | | | | — | | | | | 410,883 | |
Containers & Packaging | | | | 593,743 | | | | | — | | | | | — | | | | | 593,743 | |
Distributors | | | | 1,520,891 | | | | | — | | | | | — | | | | | 1,520,891 | |
Diversified Consumer Services | | | | 1,245,518 | | | | | — | | | | | — | | | | | 1,245,518 | |
Diversified Telecommunication Services | | | | 1,885,383 | | | | | — | | | | | — | | | | | 1,885,383 | |
Electrical Equipment | | | | 273,821 | | | | | — | | | | | — | | | | | 273,821 | |
Electronic Equipment, Instruments & Components | | | | 3,876,550 | | | | | — | | | | | — | | | | | 3,876,550 | |
Energy Equipment & Services | | | | 314,213 | | | | | — | | | | | — | | | | | 314,213 | |
Food & Staples Retailing | | | | 956,142 | | | | | — | | | | | — | | | | | 956,142 | |
Food Products | | | | 1,401,002 | | | | | — | | | | | — | | | | | 1,401,002 | |
Health Care Equipment & Supplies | | | | 11,045,336 | | | | | — | | | | | — | | | | | 11,045,336 | |
Health Care Providers & Services | | | | 9,195,889 | | | | | — | | | | | — | | | | | 9,195,889 | |
Hotels, Restaurants & Leisure | | | | 11,094,585 | | | | | — | | | | | — | | | | | 11,094,585 | |
Household Durables | | | | 1,480,989 | | | | | — | | | | | — | | | | | 1,480,989 | |
Household Products | | | | 116,704 | | | | | — | | | | | — | | | | | 116,704 | |
Independent Power and Renewable Electricity Producers | | | | 197,063 | | | | | — | | | | | — | | | | | 197,063 | |
Insurance | | | | 1,433,979 | | | | | — | | | | | — | | | | | 1,433,979 | |
Internet & Catalog Retail | | | | 655,756 | | | | | — | | | | | — | | | | | 655,756 | |
Internet Software & Services | | | | 8,365,337 | | | | $ | 28,943 | | | | | — | | | | | 8,394,280 | |
IT Services | | | | 6,265,770 | | | | | — | | | | | — | | | | | 6,265,770 | |
Leisure Products | | | | 1,925,447 | | | | | — | | | | | — | | | | | 1,925,447 | |
Life Sciences Tools & Services | | | | 2,511,502 | | | | | — | | | | | — | | | | | 2,511,502 | |
Machinery | | | | 5,345,890 | | | | | — | | | | | — | | | | | 5,345,890 | |
Marine | | | | 254,000 | | | | | — | | | | | — | | | | | 254,000 | |
Media | | | | 1,311,913 | | | | | — | | | | | — | | | | | 1,311,913 | |
Metals & Mining | | | | 782,881 | | | | | — | | | | | — | | | | | 782,881 | |
Multiline Retail | | | | 1,724,166 | | | | | — | | | | | — | | | | | 1,724,166 | |
Oil, Gas & Consumable Fuels | | | | 3,169,592 | | | | | — | | | | | — | | | | | 3,169,592 | |
Paper & Forest Products | | | | 2,121,959 | | | | | — | | | | | — | | | | | 2,121,959 | |
Personal Products | | | | 367,130 | | | | | — | | | | | — | | | | | 367,130 | |
Pharmaceuticals | | | | 6,417,940 | | | | | — | | | | $ | 19,879 | | | | | 6,437,819 | |
Professional Services | | | | 4,389,939 | | | | | — | | | | | — | | | | | 4,389,939 | |
Real Estate Investment Trusts (REITs) | | | | 4,282,002 | | | | | — | | | | | — | | | | | 4,282,002 | |
Real Estate Management & Development | | | | 1,030,520 | | | | | — | | | | | — | | | | | 1,030,520 | |
Road & Rail | | | | 1,321,200 | | | | | — | | | | | — | | | | | 1,321,200 | |
Semiconductors & Semiconductor Equipment | | | | 8,446,519 | | | | | — | | | | | — | | | | | 8,446,519 | |
Software | | | | 16,731,052 | | | | | — | | | | | — | | | | | 16,731,052 | |
See Notes to Financial Statements.
| | | | | | |
| | | SEMI-ANNUAL REPORT | | NOVEMBER 30, 2015 | | 45 |
| | | | |
| Schedule of Investments (concluded) | | | BlackRock Master Small Cap Growth Portfolio | |
| | | | | | | | | | | | | | | | | | | | |
| | | Level 1 | | Level 2 | | Level 3 | | Total |
Specialty Retail | | | $ | 5,175,921 | | | | | — | | | | | — | | | | $ | 5,175,921 | |
Technology Hardware, Storage & Peripherals | | | | 761,272 | | | | | — | | | | | — | | | | | 761,272 | |
Textiles, Apparel & Luxury Goods | | | | 3,476,698 | | | | | — | | | | | — | | | | | 3,476,698 | |
Thrifts & Mortgage Finance | | | | 2,685,787 | | | | | — | | | | | — | | | | | 2,685,787 | |
Tobacco | | | | 1,679,344 | | | | | — | | | | | — | | | | | 1,679,344 | |
Trading Companies & Distributors | | | | 268,192 | | | | | — | | | | | — | | | | | 268,192 | |
Water Utilities | | | | 287,460 | | | | | — | | | | | — | | | | | 287,460 | |
Wireless Telecommunication Services | | | | — | | | | | — | | | | $ | 8,502 | | | | | 8,502 | |
Other Interests | | | | — | | | | | — | | | | | 177 | | | | | 177 | |
Preferred Stocks | | | | — | | | | | — | | | | | 1,627,384 | | | | | 1,627,384 | |
Warrants | | | | — | | | | | — | | | | | — | | | | | — | |
Short-Term Securities | | | | 1,682,553 | | | | $ | 4,770,374 | | | | | — | | | | | 6,452,927 | |
| | | | | |
Total | | | $ | 194,616,426 | | | | $ | 4,799,317 | | | | $ | 1,655,942 | | | | $ | 201,071,685 | |
| | | | | |
| | | | | | | | | | | | | | | | | | | | |
| | | Level 1 | | Level 2 | | Level 3 | | Total |
Derivative Financial Instruments1 | | | | | | | | | | | | | | | | | | | | |
Assets: | | | | | | | | | | | | | | | | | | | | |
Equity contracts | | | $ | 31,237 | | | | | — | | | | | — | | | | $ | 31,237 | |
1 Derivative financial instruments are financial futures contracts, which are valued at the unrealized appreciation (depreciation) on the instrument. | |
|
| The Master Portfolio may hold assets and/or liabilities in which the fair value approximates the carrying amount for financial statement purposes. As of period end, such assets and/or liabilities are categorized within the disclosure hierarchy as follows: | |
| | | | | | | | | | | | | | | | | | | | |
| | | Level 1 | | Level 2 | | Level 3 | | Total |
Assets: | | | | | | | | | | | | | | | | | | | | |
Cash | | | $ | 2,393 | | | | | — | | | | | — | | | | $ | 2,393 | |
Cash pledged for financial futures contracts | | | | 87,200 | | | | | — | | | | | — | | | | | 87,200 | |
Liabilities: | | | | | | | | | | | | | | | | | | | | |
Collateral on securities loaned at value | | | | — | | | | $ | (4,770,374 | ) | | | | — | | | | | (4,770,374 | ) |
| | | | | |
Total | | | $ | 89,593 | | | | $ | (4,770,374 | ) | | | | — | | | | $ | (4,680,781 | ) |
| | | | | |
| | | | |
| During the six months ended November 30, 2015, there were no transfers between levels. | | | | | | | | | | | | | | | | | | | | |
See Notes to Financial Statements.
| | | | | | |
| 46 | | SEMI-ANNUAL REPORT | | NOVEMBER 30, 2015 | | |
| | | | |
| Statement of Assets and Liabilities | | | BlackRock Master Small Cap Growth Portfolio | |
| | | | |
| November 30, 2015 (Unaudited) | | | |
| | | | |
| Assets | | | | |
Investments at value — unaffiliated (including securities loaned at value of $ 4,611,830) (cost — $183,760,319) | | $ | 194,618,758 | |
Investments at value — affiliated (cost — $ 6,452,927) | | | 6,452,927 | |
Cash | | | 2,393 | |
Cash pledged for financial futures contracts | | | 87,200 | |
Receivables: | | | | |
Investments sold | | | 886,571 | |
Securities lending income — affiliated | | | 23,643 | |
Dividends | | | 148,374 | |
Prepaid expenses | | | 878 | |
| | | | |
Total assets | | | 202,220,744 | |
| | | | |
| | | | |
| Liabilities | | | | |
Collateral on securities loaned at value | | | 4,770,374 | |
Payables: | | | | |
Investments purchased | | | 516,685 | |
Directors’ fees | | | 2,360 | |
Investment advisory fees | | | 86,672 | |
Other accrued expenses | | | 70,557 | |
Other affiliates | | | 419 | |
Withdrawals to investors | | | 216,778 | |
Variation margin payable on financial futures contracts | | | 8,877 | |
| | | | |
Total liabilities | | | 5,672,722 | |
| | | | |
Net Assets | | $ | 196,548,022 | |
| | | | |
| | | | |
| Net Assets Consist of | | | | |
Investors’ capital | | $ | 185,658,346 | |
Net unrealized appreciation (depreciation) | | | 10,889,676 | |
| | | | |
Net Assets | | $ | 196,548,022 | |
| | | | |
See Notes to Financial Statements.
| | | | | | |
| | | SEMI-ANNUAL REPORT | | NOVEMBER 30, 2015 | | 47 |
| | | | |
| Statement of Operations | | | BlackRock Master Small Cap Growth Portfolio | |
| | | | |
| Six Months Ended November 30, 2015 (Unaudited) | | | |
| | | | |
| Investment Income | | | | |
Dividends — unaffiliated | | $ | 914,209 | |
Securities lending — affiliated — net | | | 83,128 | |
Dividends — affiliated | | | 1,043 | |
| | | | |
Total income | | | 998,380 | |
| | | | |
| | | | |
| Expenses | | | | |
Investment advisory | | | 727,213 | |
Custodian | | | 32,462 | |
Professional | | | 27,697 | |
Accounting services | | | 27,255 | |
Directors | | | 6,319 | |
Printing | | | 4,103 | |
Miscellaneous | | | 9,275 | |
| | | | |
Total expenses | | | 834,324 | |
Less fees waived by the Manager | | | (167,835 | ) |
| | | | |
Total expenses after fees waived | | | 666,489 | |
| | | | |
Net investment income | | | 331,891 | |
| | | | |
| | | | |
| Realized and Unrealized Gain (Loss) | | | | |
Net realized gain (loss) from: | | | | |
Investments | | | 7,444,290 | |
Financial futures contracts | | | (109,706 | ) |
| | | | |
| | | 7,334,584 | |
| | | | |
Net change in unrealized appreciation (depreciation) on: | | | | |
Investments | | | (18,898,898 | ) |
Financial futures contracts | | | 39,734 | |
| | | | |
| | | (18,859,164 | ) |
| | | | |
Net realized and unrealized loss | | | (11,524,580 | ) |
| | | | |
Net Decrease in Net Assets Resulting from Operations | | $ | (11,192,689 | ) |
| | | | |
See Notes to Financial Statements.
| | | | | | |
| 48 | | SEMI-ANNUAL REPORT | | NOVEMBER 30, 2015 | | |
| | | | |
| Statements of Changes in Net Assets | | | BlackRock Master Small Cap Growth Portfolio | |
| | | | | | | | |
| Decrease in Net Assets: | | Six Months
Ended
November 30,
2015
(Unaudited) | | | Year Ended
May 31, 2015 | |
| | | | | | | | |
| Operations | | | | | | | | |
Net investment income | | $ | 331,891 | | | $ | 526,907 | |
Net realized gain | | | 7,334,584 | | | | 19,291,678 | |
Net change in unrealized appreciation (depreciation) | | | (18,859,164 | ) | | | 9,638,941 | |
| | | | |
Net increase (decrease) in net assets resulting from operations | | | (11,192,689 | ) | | | 29,457,526 | |
| | | | |
| | | | | | | | |
| Capital Transactions | | | | | | | | |
Proceeds from contributions | | | 22,339,378 | | | | 47,206,163 | |
Value of withdrawals | | | (33,942,448 | ) | | | (89,207,603 | ) |
| | | | |
Net decrease in net assets derived from capital transactions | | | (11,603,070 | ) | | | (42,001,440 | ) |
| | | | |
| | | | | | | | |
| Net Assets | | | | | | | | |
Total decrease in net assets | | | (22,795,759 | ) | | | (12,543,914 | ) |
Beginning of period | | | 219,343,781 | | | | 231,887,695 | |
| | | | |
End of period | | $ | 196,548,022 | | | $ | 219,343,781 | |
| | | | |
| | | | |
| Financial Highlights | | | BlackRock Master Small Cap Growth Portfolio | |
| | | | | | | | | | | | | | | | | | | | | | | | |
| | | Six Months
Ended
November 30,
2015 | | | Year Ended May 31, | |
| | | (Unaudited) | | | 2015 | | | 2014 | | | 2013 | | | 2012 | | | 2011 | |
| | | | | | | | | | | | | | | | | | | | | | | | |
| Total Return | | | | | | | | | | | | | | | | | | | | | | | | |
Total return | | | (5.18)% | 1 | | | 14.11% | | | | 22.22% | | | | 31.47% | | | | (13.48)% | | | | 35.13% | |
| | | | |
| | | | | | | | | | | | | | | | | | | | | | | | |
| Ratios to Average Net Assets | | | | | | | | | | | | | | | | | | | | | | | | |
Total expenses | | | 0.80% | 2 | | | 0.79% | | | | 0.80% | | | | 0.79% | | | | 0.77% | | | | 0.76% | |
| | | | |
Total expenses after fees waived | | | 0.64% | 2 | | | 0.63% | | | | 0.64% | | | | 0.77% | | | | 0.77% | | | | 0.76% | |
| | | | |
Net investment income (loss) | | | 0.32% | 2 | | | 0.23% | | | | 0.10% | | | | 0.47% | | | | (0.32)% | | | | (0.51)% | |
| | | | |
| | | | | | | | | | | | | | | | | | | | | | | | |
| Supplemental Data | | | | | | | | | | | | | | | | | | | | | | | | |
Net assets, end of period (000) | | $ | 196,548 | | | $ | 219,344 | | | $ | 231,888 | | | $ | 216,189 | | | $ | 216,838 | | | $ | 504,292 | |
| | | | |
Portfolio turnover rate | | | 71% | | | | 140% | | | | 152% | | | | 165% | | | | 143% | | | | 127% | |
| | | | |
| | 1 | | Aggregate total return. |
See Notes to Financial Statements.
| | | | | | |
| | | SEMI-ANNUAL REPORT | | NOVEMBER 30, 2015 | | 49 |
| | | | |
| Notes to Financial Statements (Unaudited) | | | BlackRock Master Small Cap Growth Portfolio | |
1. Organization:
BlackRock Master Small Cap Growth Portfolio (the “Master Portfolio”), a series of BlackRock Master LLC (the “Master LLC”), is registered under the Investment Company Act of 1940, as amended (the “1940 Act”), as a diversified, open-end management investment company. The Master LLC is organized as a Delaware limited liability company. The Limited Liability Company Agreement of the Master LLC permits the Board of Directors of the Master LLC (the “Board”) to issue non-transferable interests in the Master LLC, subject to certain limitations.
The Master Portfolio, together with certain other registered investment companies advised by BlackRock Advisors, LLC (the “Manager”) or its affiliates, is included in a complex of open-end funds referred to as the Equity-Liquidity Complex.
2. Significant Accounting Policies:
The financial statements are prepared in conformity with accounting principles generally accepted in the United States of America (“U.S. GAAP”), which may require management to make estimates and assumptions that affect the reported amounts of assets and liabilities in the financial statements, disclosure of contingent assets and liabilities at the date of the financial statements and the reported amounts of increases and decreases in net assets from operations during the reporting period. Actual results could differ from those estimates. The Master Portfolio is considered an investment company under U.S. GAAP and follows the accounting and reporting guidance applicable to investment companies. Below is a summary of significant accounting policies:
Segregation and Collateralization: In cases where the Master Portfolio enters into certain investments (e.g., financial futures contracts) that would be treated as “senior securities” for 1940 Act purposes, the Master Portfolio may segregate or designate on its books and records cash or liquid assets having a market value at least equal to the amount of its future obligations under such investments. Doing so allows the investment to be excluded from treatment as a “senior security.” Furthermore, if required by an exchange or counterparty agreement, the Master Portfolio may be required to deliver/deposit cash and/or securities to/with an exchange, or broker-dealer or custodian as collateral for certain investments or obligations.
Investment Transactions and Investment Income: For financial reporting purposes, investment transactions are recorded on the dates the transactions are entered into (the trade dates). Realized gains and losses on investment transactions are determined on the identified cost basis. Dividend income is recorded on the ex-dividend date. Upon notification from issuers, some of the dividend income received from a real estate investment trust may be redesignated as a reduction of cost of the related investment and/or realized gain.
Indemnification: In the normal course of business, the Master Portfolio enters into contracts that contain a variety of representations that provide general indemnification. The Master Portfolio’s maximum exposure under these arrangements is unknown because it involves future potential claims against the Master Portfolio, which cannot be predicted with any certainty.
Other: Expenses directly related to the Master Portfolio are charged to the Master Portfolio. Other operating expenses shared by several funds, including other funds managed by the Manager, are prorated among those funds on the basis of relative net assets or other appropriate methods.
The Master Portfolio has an arrangement with its custodian whereby fees may be reduced by credits earned on uninvested cash balances, which, if applicable, are shown as fees paid indirectly in the Statement of Operations. The custodian imposes fees on overdrawn cash balances, which can be offset by accumulated credits earned or may result in additional custody charges.
3. Investment Valuation and Fair Value Measurements:
Investment Valuation Policies: The Master Portfolio’s investments are valued at fair value (also referred to as “market value” within the financial statements) as of the close of trading on the New York Stock Exchange (“NYSE”) (generally 4:00 p.m., Eastern time). U.S. GAAP defines fair value as the price the Master Portfolio would receive to sell an asset or pay to transfer a liability in an orderly transaction between market participants at the measurement date. The Master Portfolio determines the fair values of its financial instruments using independent dealers or pricing services under policies approved by the Board. The BlackRock Global Valuation Methodologies Committee (the “Global Valuation Committee”) is the committee formed by management to develop global pricing policies and procedures and to provide oversight of the pricing function for the Master Portfolio for all financial instruments.
Fair Value Inputs and Methodologies: The following methods (or “techniques”) and inputs are used to establish the fair value of the Master Portfolio’s assets and liabilities:
| • | | Equity investments traded on a recognized securities exchange are valued at the official close price each day, if available. For equity investments traded on more than one exchange, the official close price on the exchange where the stock is primarily traded is used. Equity investments traded on a recognized exchange for which there were no sales on that day may be valued at the last available bid (long positions) or ask (short positions) price. |
| • | | Investments in open-end registered investment companies are valued at NAV each business day. |
| | | | | | |
| 50 | | SEMI-ANNUAL REPORT | | NOVEMBER 30, 2015 | | |
| | | | |
| Notes to Financial Statements (continued) | | | BlackRock Master Small Cap Growth Portfolio | |
| • | | The Master Portfolio values its investment in BlackRock Liquidity Series, LLC, Money Market Series (the “Money Market Series”) at fair value, which is ordinarily based upon its pro rata ownership in the underlying fund’s net assets. The Money Market Series seeks current income consistent with maintaining liquidity and preserving capital. Although the Money Market Series is not registered under the 1940 Act, its investments will follow the parameters of investments by a money market fund that is subject to Rule 2a-7 under the 1940 Act. The Master Portfolio may withdraw up to 25% of its investment daily, although the manager of the Money Market Series, in its sole discretion, may permit an investor to withdraw more than 25% on any one day. |
| • | | Financial futures contracts traded on exchanges are valued at their last sale price. |
If events (e.g., a company announcement, market volatility or a natural disaster) occur that are expected to materially affect the value of such instruments, or in the event that the application of these methods of valuation results in a price for an investment that is deemed not to be representative of the market value of such investment, or if a price is not available, the investment will be valued by the Global Valuation Committee, or its delegate, in accordance with a policy approved by the Board as reflecting fair value (“Fair Valued Investments”). When determining the price for Fair Valued Investments, the Global Valuation Committee, or its delegate, seeks to determine the price that the Master Portfolio might reasonably expect to receive or pay from the current sale or purchase of that asset or liability in an arm’s-length transaction. Fair value determinations shall be based upon all available factors that the Global Valuation Committee, or its delegate, deems relevant consistent with the principles of fair value measurement, which include the market approach, income approach and/or in the case of recent investments, the cost approach, as appropriate. The market approach generally consists of using comparable market transactions. The income approach generally is used to discount future cash flows to present value and is adjusted for liquidity as appropriate. These factors include but are not limited to: (i) attributes specific to the investment or asset; (ii) the principal market for the investment or asset; (iii) the customary participants in the principal market for the investment or asset; (iv) data assumptions by market participants for the investment or asset, if reasonably available; (v) quoted prices for similar investments or assets in active markets; and (vi) other factors, such as future cash flows, interest rates, yield curves, volatilities, prepayment speeds, loss severities, credit risks, recovery rates, liquidation amounts and/or default rates. Due to the inherent uncertainty of valuations of such investments, the fair values may differ from the values that would have been used had an active market existed. The Global Valuation Committee, or its delegate, employs various methods for calibrating valuation approaches for investments where an active market does not exist, including regular due diligence of the Master Portfolio’s pricing vendors, regular reviews of key inputs and assumptions, transactional back-testing or disposition analysis to compare unrealized gains and losses to realized gains and losses, reviews of missing or stale prices and large movements in market values and reviews of any market related activity. The pricing of all Fair Valued Investments is subsequently reported to the Board or a committee thereof on a quarterly basis.
Fair Value Hierarchy: Various inputs are used in determining the fair value of investments and derivative financial instruments. These inputs to valuation techniques are categorized into a fair value hierarchy consisting of three broad levels for financial statement purposes as follows:
| • | | Level 1 — unadjusted price quotations in active markets/exchanges for identical assets or liabilities that the Master Portfolio has the ability to access |
| • | | Level 2 — other observable inputs (including, but not limited to, quoted prices for similar assets or liabilities in markets that are active, quoted prices for identical or similar assets or liabilities in markets that are not active, inputs other than quoted prices that are observable for the assets or liabilities (such as interest rates, yield curves, volatilities, prepayment speeds, loss severities, credit risks and default rates) or other market–corroborated inputs) |
| • | | Level 3 — unobservable inputs based on the best information available in the circumstances, to the extent observable inputs are not available (including the Master Portfolio’s own assumptions used in determining the fair value of investments and derivative financial instruments) |
The hierarchy gives the highest priority to unadjusted quoted prices in active markets for identical assets or liabilities (Level 1 measurements) and the lowest priority to unobservable inputs (Level 3 measurements). Accordingly, the degree of judgment exercised in determining fair value is greatest for instruments categorized in Level 3. The inputs used to measure fair value may fall into different levels of the fair value hierarchy. In such cases, for disclosure purposes, the fair value hierarchy classification is determined based on the lowest level input that is significant to the fair value measurement in its entirety. The significant unobservable inputs used by the Global Valuation Committee in determining the price for Fair Valued Investments are typically categorized as Level 3. The fair value hierarchy the Master Portfolio’s investments and derivative financial instruments have been included in the Schedule of Investments.
Changes in valuation techniques may result in transfers into or out of an assigned level within the hierarchy. In accordance with the Master Portfolio’s policy, transfers between different levels of the fair value hierarchy are deemed to have occurred as of the beginning of the reporting period. The categorization of a value determined for investments and derivative financial instruments is based on the pricing transparency of the investments and derivative financial instruments and is not necessarily an indication of the risks associated with investing in those securities.
| | | | | | |
| | | SEMI-ANNUAL REPORT | | NOVEMBER 30, 2015 | | 51 |
| | | | |
| Notes to Financial Statements (continued) | | | BlackRock Master Small Cap Growth Portfolio | |
4. Securities and Other Investments:
Preferred Stock: Preferred stock has a preference over common stock in liquidation (and generally in receiving dividends as well) but is subordinated to the liabilities of the issuer in all respects. As a general rule, the market value of preferred stock with a fixed dividend rate and no conversion element varies inversely with interest rates and perceived credit risk, while the market price of convertible preferred stock generally also reflects some element of conversion value. Because preferred stock is junior to debt securities and other obligations of the issuer, deterioration in the credit quality of the issuer will cause greater changes in the value of a preferred stock than in a more senior debt security with similar stated yield characteristics. Unlike interest payments on debt securities, preferred stock dividends are payable only if declared by the issuer’s board of directors. Preferred stock also may be subject to optional or mandatory redemption provisions.
Warrants: Warrants entitle the Master Portfolio to purchase a specified number of shares of common stock and are non-income producing. The purchase price and number of shares are subject to adjustment under certain conditions until the expiration date of the warrants, if any. If the price of the underlying stock does not rise above the exercise price before the warrant expires, the warrant generally expires without any value and the Master Portfolio will lose any amount it paid for the warrant. Thus, investments in warrants may involve more risk than investments in common stock. Warrants may trade in the same markets as their underlying stock; however, the price of the warrant does not necessarily move with the price of the underlying stock.
Securities Lending: The Master Portfolio may lend its securities to approved borrowers, such as brokers, dealers and other financial institutions. The borrower pledges and maintains with the Master Portfolio collateral consisting of cash, an irrevocable letter of credit issued by a bank, or securities issued or guaranteed by the U.S. Government. The initial collateral received by the Master Portfolio is required to have a value of at least 102% of the current value of the loaned securities for securities traded on U.S. exchanges and a value of at least 105% for all other securities. The collateral is maintained thereafter, at a value equal to at least 100% of the current market value of the securities on loan. The market value of the loaned securities is determined at the close of each business day of the Master Portfolio, or excess collateral returned by the Master Portfolio, on the next business day. During the term of the loan, the Master Portfolio is entitled to all distributions made on or in respect of the loaned securities. Loans of securities are terminable at any time and the borrower, after notice, is required to return borrowed securities within the standard time period for settlement of securities transactions.
The market value of securities on loan, all of which were classified as common stocks in the Master Portfolio’s Schedule of Investments, and the value of the related collateral are shown separately in the Statement of Assets and Liabilities as a component of investments at value — unaffiliated, and collateral on securities loaned at value, respectively. As of period end, any securities on loan were collateralized by cash. The cash collateral invested by the securities lending agent, BlackRock Investment Management, LLC (“BIM”), if any, is disclosed in the Schedule of Investments.
Securities lending transactions are entered into by the Master Portfolio under Master Securities Lending Agreements (each, an “MSLA”), which provide the right, in the event of default (including bankruptcy or insolvency), for the non-defaulting party to liquidate the collateral and calculate a net exposure to the defaulting party or request additional collateral. In the event that a borrower defaults, the Master Portfolio, as lender, would offset the market value of the collateral received against the market value of the securities loaned. When the value of the collateral is greater than that of the market value of the securities loaned, the lender is left with a net amount payable to the defaulting party. However, bankruptcy or insolvency laws of a particular jurisdiction may impose restrictions on or prohibitions against such a right of offset in the event of an MSLA counterparty’s bankruptcy or insolvency. Under the MSLA, absent an event of default the borrower can resell or re-pledge the loaned securities, and the Master Portfolio can reinvest cash collateral received in connection with loaned securities. Upon an event of default, the parties’ obligations to return the securities or collateral to the other party are extinguished, and the parties can resell or re-pledge the loaned securities or the collateral received in connection with the loaned securities.
As of period end, the following table is a summary of the Master Portfolio’s securities lending agreements by counterparty, which are subject to offset under an MSLA:
| | | | | | | | | | |
| Counterparty | | Securities Loaned
at Value | | | Cash Collateral
Received1 | | | Net Amount |
BNP Paribas Prime Brokerage, Inc. | | $ | 33,857 | | | $ | (33,857 | ) | | — |
Citigroup Global Markets, Inc. | | | 37,776 | | | | (37,776 | ) | | — |
Credit Suisse Securities (USA) LLC | | | 502,308 | | | | (502,308 | ) | | — |
Deutsche Bank Securities, Inc. | | | 41,428 | | | | (41,428 | ) | | — |
Goldman Sachs & Co. | | | 1,079,784 | | | | (1,079,784 | ) | | — |
JP Morgan Clearing Corp. | | | 335,750 | | | | (335,750 | ) | | — |
Morgan Stanley | | | 2,350,458 | | | | (2,350,458 | ) | | — |
SG Americas Securities LLC | | | 52,683 | | | | (52,683 | ) | | — |
UBS Securities LLC | | | 177,786 | | | | (177,786 | ) | | — |
| | | |
Total | | $ | 4,611,830 | | | $ | (4,611,830 | ) | | — |
| | | |
| | 1 | | Collateral with a value of $4,770,374 has been received in connection with securities lending agreements. Collateral received in excess of the value of securities loaned from the individual counterparty is not shown for financial reporting purposes in the table above. |
| | | | | | |
| 52 | | SEMI-ANNUAL REPORT | | NOVEMBER 30, 2015 | | |
| | | | |
| Notes to Financial Statements (continued) | | | BlackRock Master Small Cap Growth Portfolio | |
The risks of securities lending include the risk that the borrower may not provide additional collateral when required or may not return the securities when due. To mitigate these risks, the Master Portfolio benefits from a borrower default indemnity provided by BIM. BIM’s indemnity allows for full replacement of the securities loaned if the collateral received does not cover the value on the securities loaned in the event of borrower default. The Master Portfolio could suffer a loss if the value of an investment purchased with cash collateral falls below the market value of loaned securities or if the value of an investment purchased with cash collateral falls below the value of the original cash collateral received.
5. Derivative Financial Instruments:
The Master Portfolio engages in various portfolio investment strategies using derivative contracts both to increase the returns of the Master Portfolio and/or to manage economically its exposure to certain risks such as equity risk. These contracts may be transacted on an exchange.
Financial Futures Contracts: The Master Portfolio invests in long and/or short positions in financial futures contracts and options on financial futures contracts to gain exposure to, or economically hedge against, changes in the value of equity securities (equity risk). Financial futures contracts are agreements between the Master Portfolio and a counterparty to buy or sell a specific quantity of an underlying instrument at a specified price and at a specified date. Depending on the terms of the particular contract, financial futures contracts are settled either through physical delivery of the underlying instrument on the settlement date or by payment of a cash settlement amount on the settlement date.
Upon entering into a financial futures contract, the Master Portfolio is required to deposit initial margin with the broker in the form of cash or securities in an amount that varies depending on a contract’s size and risk profile. The initial margin deposit must then be maintained at an established level over the life of the contract. Securities deposited as initial margin are designated on the Schedule of Investments and cash deposited, if any, is recorded on the Statement of Assets and Liabilities as cash pledged for financial futures contracts. Pursuant to the contract, the Master Portfolio agrees to receive from or pay to the broker an amount of cash equal to the daily fluctuation in value of the contract. Such receipts or payments are known as variation margin. Variation margin is recorded by the Master Portfolio as unrealized appreciation (depreciation) and, if applicable, as a receivable or payable for variation margin in the Statement of Assets and Liabilities.
When the contract is closed, the Master Portfolio records a realized gain or loss equal to the difference between the value of the contract at the time it was opened and the value at the time it was closed. The use of financial futures contracts involves the risk of an imperfect correlation in the movements in the price of financial futures contracts and the underlying assets.
6. Investment Advisory Agreement and Other Transactions with Affiliates:
The PNC Financial Services Group, Inc. is the largest stockholder and an affiliate of BlackRock, Inc. (“BlackRock”) for 1940 Act purposes.
The Master LLC, on behalf of the Master Portfolio, entered into an Investment Advisory Agreement with the Manager, the Master Portfolio’s investment advisor, an indirect, wholly owned subsidiary of BlackRock, to provide investment advisory and administration services. The Manager is responsible for the management of the Master Portfolio’s portfolio and provides the personnel, facilities, equipment and certain other services necessary to the operations of the Master Portfolio. For such services, the Master Portfolio pays the Manager a monthly fee based on a percentage of the Master Portfolio’s average daily net assets at the following annual rates:
| | | | | |
| Average Daily Net Assets | | Investment Advisory Fee |
First $1 billion | | | | 0.70 | % |
$1 billion - $3 billion | | | | 0.66 | % |
$3 billion - $5 billion | | | | 0.63 | % |
$5 billion - $10 billion | | | | 0.61 | % |
Greater than $10 billion | | | | 0.60 | % |
The Manager, with respect to the Master Portfolio, entered into a contractual agreement to waive 0.16% of its investment advisory fees as a percentage of the Master Portfolio’s average daily net assets until October 1, 2016. The contractual agreement may be terminated upon 90 days’ notice by a majority of the independent Directors of the Master LLC or by a vote of a majority of the outstanding voting securities of the Master Portfolio. For the six months ended November 30, 2015, the Manager waived $166,220 of investment advisory fees, which is included in fees waived by the Manager in the Statement of Operations.
The Manager, with respect to the Master Portfolio, voluntarily agreed to waive its investment advisory fees by the amount of investment advisory fees the Master Portfolio pays to the Manager indirectly through its investment in affiliated money market funds. This amount is included in fees waived by the Manager in the Statement of Operations. However, the Manager does not waive its investment advisory fees by the amount of investment advisory fees paid in connection with the Master Portfolio’s investments in other affiliated investment companies, if any. For the six months ended November 30, 2015, the amount waived was $1,615.
For the six months ended November 30, 2015, the Master Portfolio reimbursed the Manager $1,144 for certain accounting services, which is included in accounting services in the Statement of Operations.
| | | | | | |
| | | SEMI-ANNUAL REPORT | | NOVEMBER 30, 2015 | | 53 |
| | | | |
| Notes to Financial Statements (continued) | | | BlackRock Master Small Cap Growth Portfolio | |
The U.S. Securities and Exchange Commission has issued an exemptive order which permits BIM, an affiliate of the Manager, to serve as securities lending agent for the Master Portfolio, subject to applicable conditions. As securities lending agent, BIM bears all operational costs directly related to securities lending. The Master Portfolio is responsible for expenses in connection with the investment of cash collateral received for securities on loan (the “collateral investment expenses”). The cash collateral is invested in a private investment company managed by the Manager or its affiliates. However, BIM has agreed to cap the collateral investment expenses of the private investment company to an annual rate of 0.04%. The investment advisor to the private investment company will not charge any advisory fees with respect to shares purchased by the Master Portfolio.
Securities lending income is equal to the total of income earned from the reinvestment of cash collateral, net of fees and other payments to and from borrowers of securities, and less the collateral investment expenses. The Master Portfolio retains a portion of securities lending income and remits a remaining portion to BIM as compensation for its services as securities lending agent. Pursuant to a securities lending agreement, BIM may lend securities only when the difference between the borrower rebate rate and the risk free rate exceeds a certain level (such securities, the “specials only securities”).
Pursuant to such agreement, the Master Portfolio retains 80% of securities lending income. In addition, commencing the business day following the date that the aggregate securities lending income earned across certain funds in the Equity-Liquidity Complex in a calendar year exceeds a specified threshold, the Master Portfolio, pursuant to the securities lending agreement, will retain for the remainder of the calendar year securities lending income in an amount equal to 85% of securities lending income.
The share of securities lending income earned by the Master Portfolio is shown as securities lending — affiliated — net in the Statement of Operations. For the six months ended November 30, 2015, the Master Portfolio paid BIM $19,505 for securities lending agent services.
Certain officers and/or directors of the Master LLC are officers and/or directors of BlackRock or its affiliates.
7. Purchases and Sales:
For the six months ended November 30, 2015, purchases and sales of investments, excluding short-term securities, were $144,878,748 and $155,387,454, respectively.
8. Income Tax Information:
The Master Portfolio is disregarded as an entity separate from its owner for tax purposes. As such, the owner of the Master Portfolio is treated as the owner of the net assets, income, expenses and realized and unrealized gains and losses of the Master Portfolio. Therefore, no federal income tax provision is required. It is intended that the Master Portfolio’s assets will be managed so the owner of the Master LLC can satisfy the requirements of Subchapter M of the Internal Revenue Code of 1986, as amended.
As of period end, gross unrealized appreciation and depreciation based on cost for federal income tax purposes were as follows:
| | | | |
Tax cost | | $ | 191,734,111 | |
| | | | |
Gross unrealized appreciation | | $ | 24,906,851 | |
Gross unrealized depreciation | | | (15,569,277 | ) |
| | | | |
Net unrealized appreciation | | $ | 9,337,574 | |
| | | | |
9. Bank Borrowings:
The Master LLC, on behalf of the Master Portfolio, along with certain other funds managed by the Manager and its affiliates (“Participating Funds”), is a party to a 364-day, $2.1 billion credit agreement with a group of lenders, under which the Master Portfolio may borrow to fund shareholder redemptions. Excluding commitments designated for certain funds, the Participating Funds, including the Master Portfolio, can borrow up to an aggregate commitment amount of $1.6 billion at any time outstanding, subject to asset coverage and other limitations as specified in the agreement. The credit agreement has the following terms: a fee of 0.06% per annum on unused commitment amounts and interest at a rate equal to the higher of (a) one-month LIBOR (but, in any event, not less than 0.00%) on the date the loan is made plus 0.80% per annum or (b) the Fed Funds rate (but, in any event, not less than 0.00%) in effect from time to time plus 0.80% per annum on amounts borrowed. The agreement expires in April 2016 unless extended or renewed. Participating Funds paid administration, legal and arrangement fees, which, if applicable, are included in miscellaneous expenses in the Statement of Operations, and along with commitment fees, were allocated among such funds based upon portions of the aggregate commitment available to them and relative net assets of Participating Funds. During the six months ended November 30, 2015, the Master Portfolio did not borrow under the credit agreement.
10. Principal Risks:
In the normal course of business, the Master Portfolio invests in securities and enters into transactions where risks exist due to fluctuations in the market (market risk) or failure of the issuer to meet all its obligations, including the ability to pay principal and interest when due (issuer credit risk).
| | | | | | |
| 54 | | SEMI-ANNUAL REPORT | | NOVEMBER 30, 2015 | | |
| | | | |
| Notes to Financial Statements (concluded) | | | BlackRock Master Small Cap Growth Portfolio | |
The value of securities held by the Master Portfolio may decline in response to certain events, including those directly involving the issuers of securities owned by the Master Portfolio. Changes arising from the general economy, the overall market and local, regional or global political or/and social instability, as well as currency, interest rate and price fluctuations, may also affect the securities’ value.
Counterparty Credit Risk: Similar to issuer credit risk, the Master Portfolio may be exposed to counterparty credit risk, or the risk that an entity may fail to or be unable to perform on its commitments related to unsettled or open transactions. The Master Portfolio manages counterparty credit risk by entering into transactions only with counterparties that the Manager believes have the financial resources to honor their obligations and by monitoring the financial stability of those counterparties. Financial assets, which potentially expose the Master Portfolio to market, issuer and counterparty credit risks, consist principally of financial instruments and receivables due from counterparties. The extent of the Master Portfolio’s exposure to market, issuer and counterparty credit risks with respect to these financial assets is approximately their value recorded in the Statement of Assets and Liabilities, less any collateral held by the Master Portfolio.
A derivative contract may suffer a mark-to-market loss if the value of the contract decreases due to an unfavorable change in the market rates or values of the underlying instrument. Losses can also occur if the counterparty does not perform under the contract.
With exchange-traded futures, there is less counterparty credit risk to the Master Portfolio since the exchange or clearinghouse, as counterparty to such instruments, guarantees against a possible default. The clearinghouse stands between the buyer and the seller of the contract; therefore, credit risk is limited to failure of the clearinghouse. While offset rights may exist under applicable law, the Master Portfolio does not have a contractual right of offset against a clearing broker or clearinghouse in the event of a default (including the bankruptcy or insolvency). Additionally, credit risk exists in exchange-traded futures with respect to initial and variation margin that is held in a clearing broker’s customer accounts. While clearing brokers are required to segregate customer margin from their own assets, in the event that a clearing broker becomes insolvent or goes into bankruptcy and at that time there is a shortfall in the aggregate amount of margin held by the clearing broker for all its clients, typically the shortfall would be allocated on a pro rata basis across all the clearing broker’s customers, potentially resulting in losses to the Master Portfolio.
Concentration Risk: As of period end, the Master Portfolio invested a significant portion of its assets in securities in the health care and information technology sectors. Changes in economic conditions affecting such sectors would have a greater impact on the Master Portfolio and could affect the value, income and/or liquidity of positions in such securities.
11. Subsequent Events:
Management has evaluated the impact of all subsequent events on the Master Portfolio through the date the financial statements were issued and has determined that there were no subsequent events requiring adjustment or additional disclosure in the financial statements.
| | | | | | |
| | | SEMI-ANNUAL REPORT | | NOVEMBER 30, 2015 | | 55 |
| | |
| Officers and Directors/Trustees | | |
Rodney D. Johnson, Chair of the Board and Director/Trustee
David O. Beim, Director/Trustee
Collette Chilton, Director/Trustee
Frank J. Fabozzi, Director/Trustee
Dr. Matina S. Horner, Director/Trustee
Herbert I. London, Director/Trustee
Cynthia A. Montgomery, Director/Trustee
Barbara G. Novick, Director/Trustee
Joseph P. Platt, Director/Trustee
Robert C. Robb, Jr., Director/Trustee
Toby Rosenblatt, Director/Trustee
Mark Stalnecker, Director/Trustee
Kenneth L. Urish, Director/Trustee
Frederick W. Winter, Director/Trustee
John M. Perlowski, Director/Trustee, President and Chief Executive Officer
Richard Hoerner, CFA, Vice President1
Jennifer McGovern, Vice President
Neal Andrews, Chief Financial Officer
Jay Fife, Treasurer
Charles Park, Chief Compliance Officer
Fernando Piedra, Anti-Money Laundering Officer
Benjamin Archibald, Secretary
Effective September 25, 2015, John M. Perlowski was appointed to serve as a Director/Trustee of the Trust/Corporation/Master LLC.
| | | | | | |
| | | | |
Investment Advisor and Administrator BlackRock Advisors, LLC Wilmington, DE 19809 | | Accounting Agent and Transfer Agent BNY Mellon Investment Servicing (US) Inc. Wilmington, DE 19809 | | Independent Registered Public Accounting Firm Deloitte & Touche LLP Philadelphia, PA 19103 | | Address of the Funds 100 Bellevue Parkway Wilmington, DE 19809 |
| | | | | | |
Custodians Brown Brothers Harriman & Co.1 Boston, MA 02109 | | Distributor BlackRock Investments, LLC New York, NY 10022 | | Legal Counsel Sidley Austin LLP New York, NY 10019 | | |
| | | | | | |
The Bank of New York Mellon2 New York, NY 10286 | | | | | | |
| 1 | | For BlackRock Master Small Cap Growth Portfolio. |
| 2 | | For BlackRock Disciplined Small Cap Core Fund. |
| | | | | | |
| 56 | | SEMI-ANNUAL REPORT | | NOVEMBER 30, 2015 | | |
Householding
The Funds will mail only one copy of shareholder documents, including prospectuses, annual and semi-annual reports and proxy statements, to shareholders with multiple accounts at the same address. This practice is commonly called “householding” and is intended to reduce expenses and eliminate duplicate mailings of shareholder documents. Mailings of your shareholder documents may be householded indefinitely unless you instruct us otherwise. If you do not want the mailing of these documents to be combined with those for other members of your household, please call the Funds at (800) 441-7762.
Availability of Quarterly Schedule of Investments
The Funds/Master Portfolio file their complete schedule of portfolio holdings with the SEC for the first and third quarters of each fiscal year on Form N-Q. The Funds’/Master Portfolio’s Forms N-Q are available on the SEC’s website at http://www.sec.gov and may also be reviewed and copied at the SEC’s Public Reference Room in Washington, D.C. Information on how to access documents on the SEC’s website without charge may be obtained by calling (800) SEC-0330. The Funds’/Master Portfolio’s Forms N-Q may also be obtained upon request and without charge by calling (800) 441-7762.
Availability of Proxy Voting Policies and Procedures
A description of the policies and procedures that the Funds/Master Portfolio use to determine how to vote proxies relating to portfolio securities is available upon request and without charge (1) by calling (800) 441-7762; (2) at http://www.blackrock.com; and (3) on the SEC’s website at http://www.sec.gov.
Availability of Proxy Voting Record
Information about how the Funds/Master Portfolio voted proxies relating to securities held in the Funds’/Master Portfolio’s portfolios during the most recent 12-month period ended June 30 is available upon request and without charge (1) at http://www.blackrock.com or by calling (800) 441-7762 and (2) on the SEC’s website at http://www.sec.gov.
BlackRock’s Mutual Fund Family
BlackRock offers a diverse lineup of open-end mutual funds crossing all investment styles and managed by experts in equity, fixed income and tax-exempt investing. Visit http://www.blackrock.com for more information.
Account Information
Call us at (800) 441-7762 from 8:00 AM to 6:00 PM EST on any business day to get information about your account balances, recent transactions and share prices. You can also reach us on the Web at http://www.blackrock.com/funds.
Automatic Investment Plans
Investor Class shareholders who want to invest regularly can arrange to have $50 or more automatically deducted from their checking or savings account and invested in any of the BlackRock funds.
Systematic Withdrawal Plans
Investor Class shareholders can establish a systematic withdrawal plan and receive periodic payments of $50 or more from their BlackRock funds, as long as their account balance is at least $10,000.
Retirement Plans
Shareholders may make investments in conjunction with Traditional, Rollover, Roth, Coverdell, Simple IRAs, SEP IRAs and 403(b) Plans.
| | | | | | |
| | | ANNUAL REPORT | | NOVEMBER 30, 2015 | | 57 |
| | |
| Additional Information (concluded) | | |
|
| BlackRock Privacy Principles |
BlackRock is committed to maintaining the privacy of its current and former fund investors and individual clients (collectively, “Clients”) and to safeguarding their non-public personal information. The following information is provided to help you understand what personal information BlackRock collects, how we protect that information and why in certain cases we share such information with select parties.
If you are located in a jurisdiction where specific laws, rules or regulations require BlackRock to provide you with additional or different privacy-related rights beyond what is set forth below, then BlackRock will comply with those specific laws, rules or regulations.
BlackRock obtains or verifies personal non-public information from and about you from different sources, including the following: (i) information we receive from you or, if applicable, your financial intermediary, on applications, forms or other documents; (ii) information about your transactions with us, our affiliates, or others; (iii) information we receive from a consumer reporting agency; and (iv) from visits to our websites.
BlackRock does not sell or disclose to non-affiliated third parties any non-public personal information about its Clients, except as permitted by law or as is necessary to respond to regulatory requests or to service Client accounts. These non-affiliated third parties are required to protect the confidentiality and security of this information and to use it only for its intended purpose.
We may share information with our affiliates to service your account or to provide you with information about other BlackRock products or services that may be of interest to you. In addition, BlackRock restricts access to non-public personal information about its Clients to those BlackRock employees with a legitimate business need for the information. BlackRock maintains physical, electronic and procedural safeguards that are designed to protect the non-public personal information of its Clients, including procedures relating to the proper storage and disposal of such information.
| | | | | | |
| 58 | | ANNUAL REPORT | | NOVEMBER 30, 2015 | | |
This report is intended for current holders. It is not authorized for use as an offer of sale or a solicitation of an offer to buy shares of the Funds unless preceded or accompanied by that Fund’s current prospectus. Past performance results shown in this report should not be considered a representation of future performance. Investment returns and principal value of shares will fluctuate so that shares, when redeemed, may be worth more or less than their original cost. Statements and other information herein are as dated and are subject to change.

| | |
SC2-11/15-SAR | |  |
| | |
| Item 2 – | | Code of Ethics – Not Applicable to this semi-annual report |
| |
| Item 3 – | | Audit Committee Financial Expert – Not Applicable to this semi-annual report |
| |
| Item 4 – | | Principal Accountant Fees and Services – Not Applicable to this semi-annual report |
| |
| Item 5 – | | Audit Committee of Listed Registrants – Not Applicable |
| |
| Item 6 – | | Investments |
| | (a) The registrant’s Schedule of Investments is included as part of the Report to Stockholders filed under Item 1 of this Form. |
| | (b) Not Applicable due to no such divestments during the semi-annual period covered since the previous Form N-CSR filing. |
| |
| Item 7 – | | Disclosure of Proxy Voting Policies and Procedures for Closed-End Management Investment Companies – Not Applicable |
| |
| Item 8 – | | Portfolio Managers of Closed-End Management Investment Companies – Not Applicable |
| |
| Item 9 – | | Purchases of Equity Securities by Closed-End Management Investment Company and Affiliated Purchasers – Not Applicable |
| |
| Item 10 – | | Submission of Matters to a Vote of Security Holders –There have been no material changes to these procedures. |
| |
| Item 11 – | | Controls and Procedures |
| |
| | (a) – The registrant’s principal executive and principal financial officers, or persons performing similar functions, have concluded that the registrant’s disclosure controls and procedures (as defined in Rule 30a-3(c) under the Investment Company Act of 1940, as amended (the “1940 Act”)) are effective as of a date within 90 days of the filing of this report based on the evaluation of these controls and procedures required by Rule 30a-3(b) under the 1940 Act and Rule 15d-15(b) under the Securities Exchange Act of 1934, as amended. |
| |
| | (b) – There were no changes in the registrant’s internal control over financial reporting (as defined in Rule 30a-3(d) under the 1940 Act) that occurred during the second fiscal quarter of the period covered by this report that have materially affected, or are reasonably likely to materially affect, the registrant’s internal control over financial reporting. |
| |
| Item 12 – | | Exhibits attached hereto |
| |
| | (a)(1) – Code of Ethics – Not Applicable to this semi-annual report |
| |
| | (a)(2) – Certifications – Attached hereto |
| |
| | (a)(3) – Not Applicable |
| |
| | (b) – Certifications – Attached hereto |
2
Pursuant to the requirements of the Securities Exchange Act of 1934 and the Investment Company Act of 1940, the registrant has duly caused this report to be signed on its behalf by the undersigned, thereunto duly authorized.
| | | | | | |
| | BlackRock Funds | | |
| | | |
| | By: | | /s/ John M. Perlowski | | |
| | | | John M. Perlowski | | |
| | | | Chief Executive Officer (principal executive officer) of BlackRock Funds |
| | | |
| | Date: | | January 29, 2016 | | |
| |
| | Pursuant to the requirements of the Securities Exchange Act of 1934 and the Investment Company Act of 1940, this report has been signed below by the following persons on behalf of the registrant and in the capacities and on the dates indicated. |
| | | |
| | By: | | /s/ John M. Perlowski | | |
| | | | John M. Perlowski | | |
| | | | Chief Executive Officer (principal executive officer) of BlackRock Funds |
| | | |
| | Date: | | January 29, 2016 | | |
| | | |
| | By: | | /s/ Neal J. Andrews | | |
| | | | Neal J. Andrews | | |
| | | | Chief Financial Officer (principal financial officer) of BlackRock Funds |
| | | |
| | Date: | | January 29, 2016 | | |
3