SUMMARY
This supplement revises and replaces the second paragraph on page 2 of the Prospectus under the heading “SUMMARY—Legacy 1 Class and Legacy 2 Class Units” in its entirety as follows:
As of August 1, 2013, through their respective trading companies, each of Rabar Market Research, Inc., EMC Capital Management, Inc., Eckhardt Trading Company, or ETC, Winton Capital Management Limited, Transtrend B.V., Amplitude Capital International Limited, Alder Capital Limited, Denali Asset Management, LLLP, Lynx Asset Management AB, or Lynx, Quantica Capital AG and Eagle Trading Systems Inc., or Eagle, serve as Grant Park’s commodity trading advisors with respect to the Legacy 1 Class and Legacy 2 Class units. Effective August 1, 2013, Grant Park will no longer trade through Quantitative Investment Management (QIM) or Sunrise Capital Partners. The trading advisors and their respective asset allocations with respect to the Legacy 1 Class and Legacy 2 Class units are the same as with respect to the fund’s Class A and Class B units. As of August 1, 2013, with respect to the Class A and Class B units and the Legacy 1 Class and Legacy 2 Class, each of Amplitude, Transtrend, Winton, Rabar, EMC, ETC, Alder, Denali, Lynx, Quantica and Eagle manage between 5% and 20% of Grant Park’s net assets.
This supplement revises and replaces the fourth paragraph on page 2 of the Prospectus under the heading “SUMMARY—Global 1 Class, Global 2 Class and Global 3 Class” in its entirety as follows:
As of August 1, 2013, through their respective trading companies, each of Rabar, EMC, ETC, Winton, Transtrend, Amplitude, Alder, Denali, Lynx, Quantica, and Eagle serve as Grant Park’s commodity trading advisors with respect to the Global 1 Class, Global 2 Class and Global 3 Class units. Effective August 1, 2013, Grant Park will no longer trade through Quantitative Investment Management (QIM) or Sunrise Capital Partners. As of August 1, 2013, with respect to the Global 1 Class, Global 2 Class and Global 3 Class units, each of Rabar, EMC, ETC, Winton, Transtrend, Amplitude, Alder, Denali, Lynx, Quantica, and Eagle manage between 5% and 20% of Grant Park’s net assets.
This supplement revises and replaces the text on page 3 of the Prospectus under the heading “SUMMARY—Breakeven Amounts for Each Class of Units” in its entirety as follows:
The following summarizes the approximate dollar returns and percentage returns required for the redemption value of a hypothetical $1,000 initial investment in offered units to equal the amount invested 12 months after the investment was made. The breakeven summary for the Global 3 Class units shows the amount required to “break-even” both with and without an early redemption fee which, for purposes of this summary, the highest early redemption fee has been presented to approximate the effect that payment of an early redemption fee will have on a redemption of such units during the first year of investment.
• Legacy 1 Class: 5.36% (or $53.56).
• Legacy 2 Class: 5.63% (or $56.34).
• Global 1 Class: 4.75% (or $47.51).
• Global 2 Class: 5.03% (or $50.25).
• Global 3 Class: 6.97% (or $69.66) without highest early redemption fee, or 8.47% (or $84.66) with highest early redemption fee.
See “Summary – Breakeven Analysis” beginning on page 12 for detailed breakeven analysis of the offered units.
This supplement revises and replaces the second paragraph on page 5 of the Prospectus under the heading “SUMMARY—Plan of Distribution—What is the difference between Legacy 1 Class, the Legacy 2 Class, the Global 1 Class, the Global 2 Class and the Global 3 Class Units” in its entirety as follows:
As of August 1, 2013, the trading advisors for the Legacy 1 Class and Legacy 2 Class units are Rabar, EMC, ETC, Winton, Transtrend, Amplitude, Alder, Denali, Lynx, Quantica and Eagle. The trading advisors, asset allocations and trading philosophy with respect to the Legacy 1 Class and Legacy 2 Class units are the same as those utilized for Grant Park’s Class A and Class B units. As of August 1, 2013, the trading advisors for the Global 1 Class, Global 2 Class and Global 3 Class units are Rabar, EMC, ETC, Winton, Transtrend, Amplitude, Alder, Denali, Lynx, Quantica, and Eagle. The investment process is uniquely managed for each class of units.
This supplement revises and replaces the first and second paragraphs on page 8-9 of the Prospectus under the heading “SUMMARY—The Trading Advisors” in its entirety as follows:
As of August 1, 2013, Grant Park trades through its eleven independent professional commodity trading advisors: Rabar Market Research, Inc., EMC Capital Management, Inc., Eckhardt Trading Company (or ETC), Winton Capital Management Limited, Transtrend B.V., Amplitude Capital International Limited, Alder Capital Limited, Denali Asset Management, LLLP, Lynx Asset Management AB, Quantica Capital AG, and Eagle Trading Systems Inc. (or Eagle). Each of the trading advisors is registered as a commodity trading advisor under the Commodity Exchange Act and is a member of the NFA. The general partner may terminate or replace any or all of the trading advisors, or add additional trading advisors, at any time in its sole discretion.
Rabar Market Research, Inc. is located at 10 Bank Street, Suite 830, White Plains, New York 10606, and its telephone number is (914) 682-8363. EMC Capital Management, Inc. is located at 2201 Waukegan Road, Suite 240 West, Bannockburn, Illinois 60015, and its telephone number is (847) 267-8700. ETC is located at 1314 North Dearborn Parkway, Carriage House, Chicago, Illinois 60610, and its telephone number is (312) 787-1107. Winton Capital Management Limited is located at 1-5 St. Mary Abbott’s Place, London, W8 6LS, United Kingdom, and its telephone number is +44-20-7610-5350. The business office of Transtrend B.V. is located at Weena 723, Unit C5.070, 3013 AM Rotterdam, The Netherlands and its telephone number is +31-10-453-6500. Amplitude Capital International Limited is located at Grand Pavilion Commercial Centre, 1st Floor, 802 West Bay Road, P.O. Box 31855, KY1 1207 Cayman Islands, and its telephone number is (345) 943-2295. Alder Capital Limited is located at 61 Merrion Square, Dublin 2, Ireland, and its telephone number is +353-1-614-7232. Denali Asset Management, LLLP is located at 5020 Anchor Way, 2nd Floor, Christiansted, Virgin Islands 00826-4633, and its telephone number is (340) 778-7744. Lynx Asset Management AB is located at Norrmalmstorg 12, Box 7060, Stockholm, Sweden, SE-103 86 and its telephone number is +46-8-663-3360. Quantica Capital AG is located at Freier Platz 10, Schaffhausen, CH-8200, Switzerland, and its telephone number is +41-52-630-00-70. Eagle Trading Systems Inc. is located at 47 Hulfish St, Suite 410, Princeton, NJ 08542 and its telephone number is (609) 688-2060.
This supplement revises and replaces the paragraph titled, “Incentive Fees,” on page 11 of the Prospectus under the heading “SUMMARY—Fees and Expenses—Incentive Fees” in its entirety as follows:
Incentive Fees—Grant Park currently pays each trading advisor a quarterly incentive fee based on any new trading profits achieved on the trading advisor’s allocated net assets at the end of each calendar quarter. Generally, new trading profits means the net increase in trading profits, realized and unrealized, experienced by the trading advisor on its allocated net assets from the most recent prior period in which an incentive fee was paid to the trading advisor, or if an incentive fee has yet to be paid to that trading advisor, the trading advisor’s initial allocation of net assets. Currently, the incentive fees payable to each of Grant Park’s trading advisors are as
follows: 20.0% to Rabar, 22.5% to EMC, 24.0% to ETC, 20.0% to Winton, 22.5% to Transtrend, 23.5% to Amplitude, 22.0% to Alder, 24.0% to Denali, 23.0% to Lynx, 20.0% to Quantica, and 23.5% to Eagle. The method of calculating new trading profits on the allocated net assets of each trading advisor is described in “FEES AND EXPENSES—Fees and Expenses Paid by Grant Park—Incentive Fees.”
This supplement revises and replaces the Breakeven Analysis tables on page 13-18 of the Prospectus under the heading “SUMMARY—Breakeven Analysis” in its entirety as follows:
Legacy 1 Class Breakeven Analysis
(1) The minimum investment required to invest in the Legacy 1 Class units is $10,000. For ease of comparability, $1,000 will be deemed to be the assumed selling price per unit of a Legacy 1 Class unit, and, as described below, a Legacy 2 Class unit, a Global 1 Class unit, a Global 2 Class unit and a Global 3 Class unit, for purposes of the breakeven analysis.
(2) Reflects incentive fees payable to Amplitude, EMC, ETC, Rabar, Winton, Transtrend, Alder, Denali, Lynx, Quantica and Eagle assuming they manage between 5% and 20% of invested assets and assuming each of the advisors have equivalent performance returns for the 12-month period. Actual incentive fees are calculated quarterly on the basis of each trading advisor’s individual performance, not the overall performance of Grant Park or the Legacy 1 Class units. Because incentive fees payable to certain of these trading advisors are calculated on the basis of trading profits realized on the assets they manage after deduction for the allocable portion of only certain expenses charged to Grant Park, these advisors would receive an incentive fee before Grant Park has recouped all expenses and reaches the “break-even” level. Incentive fees payable to certain other of these trading advisors are calculated after deduction for the allocable portion of expenses charged to Grant Park. These advisors would not receive an incentive fee before Grant Park has recouped all expenses.
(3) The brokerage charge is paid to the general partner on a monthly basis. Effective the initial closing date, the brokerage charge for the Legacy 1 Class units equals 0.4167 % per month, a rate of 5.00% annually, of such units’ month-end adjusted net assets. Out of this amount, the general partner pays all clearing, execution and give-up, floor brokerage, exchange and NFA fees, any other transaction costs, selling agent compensation, selling agent service fees and consulting fees to the trading advisors. The general partner retains the balance as payment for its services to Grant Park. Bid-ask spreads on Grant Park’s forward and other non-exchange traded contracts are not included in this breakeven table due to the difficulty of determining those spreads.
(4) Grant Park is responsible for ongoing operating expenses, up to an amount not to exceed 0.25% of Grant Park’s average net assets per year. This amount is used for purposes of this breakeven analysis.
(5) Grant Park’s organization and offering expenses are paid by the general partner and then reimbursed to the general partner by Grant Park. To pay this reimbursement, effective the initial closing
date, Legacy 1 Class units are assessed at an annual rate of 30 basis points (0.30%) of adjusted net assets, calculated and payable monthly on the basis of month-end adjusted net assets of the applicable class.
(6) Grant Park earns interest on free cash balances held in its futures trading accounts. Interest is estimated for these purposes at a rate of 0.40% per year.
Legacy 2 Class Breakeven Analysis
| | | Legacy 2 Class Units | |
Assumed initial selling price per unit(1) | | $ | 1,000.00 | |
Trading advisors’ incentive fees(2) | | $ | 2.34 | |
Brokerage charge(3) (5.25%) | | $ | 52.50 | |
Operating expenses(4) (0.25%) | | $ | 2.50 | |
Offering expenses(5) (0.30%) | | $ | 3.00 | |
Interest income(6) (0.40%) | | $ | (4.00 | ) |
Amount of trading income required for the redemption value at the end of one year to equal the initial selling price of the unit | | $ | 56.34 | |
| Percentage of initial selling price per Legacy 2 Class unit | | | 5.63 | % |
(1) The minimum investment required to invest in the Legacy 2 Class units is $10,000. For ease of comparability, $1,000 will be deemed to be the assumed selling price per unit of a Legacy 2 Class unit, and, as described above, a Legacy 1 Class unit, and, as described below, a Global 1 Class unit, a Global 2 Class unit and a Global 3 Class unit, for purposes of the breakeven analysis.
(2) Reflects incentive fees payable to Amplitude, EMC, ETC, Rabar, Winton, Transtrend, Alder, Denali, Lynx, Quantica and Eagle assuming they manage between 5% and 20% of invested assets and assuming each of the advisors have equivalent performance returns for the 12-month period. Actual incentive fees are calculated quarterly on the basis of each trading advisor’s individual performance, not the overall performance of Grant Park or the Legacy 2 Class units. Because incentive fees payable to certain of these trading advisors are calculated on the basis of trading profits realized on the assets they manage after deduction for the allocable portion of only certain expenses charged to Grant Park, these advisors would receive an incentive fee before Grant Park has recouped all expenses and reaches the “break-even” level. Incentive fees payable to certain other of these trading advisors are calculated after deduction for the allocable portion of expenses charged to Grant Park. These advisors would not receive an incentive fee before Grant Park has recouped all expenses.
(3) The brokerage charge is paid to the general partner on a monthly basis. Effective the initial closing date, the brokerage charge for the Legacy 2 Class units equals 0.4375% per month, a rate of 5.25% annually, of such units’ month-end adjusted net assets. Out of this amount, the general partner pays all clearing, execution and give-up, floor brokerage, exchange and NFA fees, any other transaction costs, selling agent compensation, selling agent service fees and consulting fees to the trading advisors. The general partner retains the balance as payment for its services to Grant Park. Bid-ask spreads on Grant Park’s forward and other non-exchange traded contracts are not included in this breakeven table due to the difficulty of determining those spreads.
(4) Grant Park is responsible for ongoing operating expenses, up to an amount not to exceed 0.25% of Grant Park’s average net assets per year. This amount is used for purposes of this breakeven analysis.
(5) Grant Park’s organization and offering expenses are paid by the general partner and then reimbursed to the general partner by Grant Park. To pay this reimbursement, effective the initial closing date, Legacy 2 Class units are assessed at an annual rate of 30 basis points (0.30%) of adjusted net assets, calculated and payable monthly on the basis of month-end adjusted net assets of the applicable class.
(6) Grant Park earns interest on free cash balances held in its futures trading accounts. Interest is estimated for these purposes at a rate of 0.40% per year.
Global 1 Class Breakeven Analysis
| | | Global 1 Class Units | |
Assumed initial selling price per unit(1) | | $ | 1,000.00 | |
Trading advisors’ incentive fees(2) | | $ | 1.51 | |
Brokerage charge(3) (4.45%) | | $ | 44.50 | |
Operating expenses(4) (0.25%) | | $ | 2.50 | |
Offering expenses(5) (0.30%) | | $ | 3.00 | |
Interest income(6) (0.40%) | | $ | (4.00 | ) |
Amount of trading income required for the redemption value at the end of one year to equal the initial selling price of the unit | | $ | 47.51 | |
| Percentage of initial selling price per Global 1 Class unit | | | 4.75 | % |
(1) The minimum investment required to invest in the Global 1 Class units is $5,000. For ease of comparability, $1,000 will be deemed to be the assumed selling price per unit of a Global 1 Class unit, and, as described above, a Legacy 1 Class unit and a Legacy 2 Class unit, and, as described below, a Global 2 Class unit and a Global 3 Class unit, for purposes of the breakeven analysis.
(2) Reflects incentive fees payable to Amplitude, EMC, ETC, Rabar, Winton, Transtrend, Alder, Denali, Lynx, Quantica, and Eagle assuming they manage between 5% and 20% of invested assets and assuming each of the advisors have equivalent performance returns for the 12-month period. Actual incentive fees are calculated quarterly on the basis of each trading advisor’s individual performance, not the overall performance of Grant Park or the Global 1 Class units. Because incentive fees payable to certain of these trading advisors are calculated on the basis of trading profits realized on the assets they manage after deduction for the allocable portion of only certain expenses charged to Grant Park, these advisors would receive an incentive fee before Grant Park has recouped all expenses and reaches the “break-even” level. Incentive fees payable to certain other of these trading advisors are calculated after deduction for the allocable portion of expenses charged to Grant Park. These advisors would not receive an incentive fee before Grant Park has recouped all expenses.
(3) The brokerage charge is paid to the general partner on a monthly basis. Effective the initial closing date, the brokerage charge for the Global 1 Class units equals 0.3708% per month, a rate of 4.45% annually, of such units’ month-end adjusted net assets. Out of this amount, the general partner pays all clearing, execution and give-up, floor brokerage, exchange and NFA fees, any other transaction costs, selling agent compensation, selling agent service fees and consulting fees to the trading advisors. The general partner retains the balance as payment for its services to Grant Park. Bid-ask spreads on Grant Park’s forward and other non-exchange traded contracts are not included in this breakeven table due to the difficulty of determining those spreads.
(4) Grant Park is responsible for ongoing operating expenses, up to an amount not to exceed 0.25% of Grant Park’s average net assets per year. This amount is used for purposes of this breakeven analysis.
(5) Grant Park’s organization and offering expenses are paid by the general partner and then reimbursed to the general partner by Grant Park. To pay this reimbursement, effective the initial closing date, Global 1 Class units are assessed at an annual rate of 30 basis points (0.30%) of adjusted net assets, calculated and payable monthly on the basis of month-end adjusted net assets of the applicable class.
(6) Grant Park earns interest on free cash balances held in its futures trading accounts. Interest is
estimated for these purposes at a rate of 0.40% per year.
Global 2 Class Breakeven Analysis
| | | Global 2 Class Units | |
Assumed initial selling price per unit(1) | | $ | 1,000.00 | |
Trading advisors’ incentive fees(2) | | $ | 1.75 | |
Brokerage charge(3) (4.70%) | | $ | 47.00 | |
Operating expenses(4) (0.25%) | | $ | 2.50 | |
Offering expenses(5) (0.30%) | | $ | 3.00 | |
Interest income(6) (0.40%) | | $ | (4.00 | ) |
Amount of trading income required for the redemption value at the end of one year to equal the initial selling price of the unit | | $ | 50.25 | |
| Percentage of initial selling price per Global 2 Class unit | | | 5.03 | % |
(1) The minimum investment required to invest in the Global 2 Class units is $5,000. For ease of comparability, $1,000 will be deemed to be the assumed selling price per unit of a Global 2 Class unit, and, as described above, a Legacy 1 Class unit, a Legacy 2 Class unit and a Global 1 Class unit, and, as described below, a Global 3 Class unit, for purposes of the breakeven analysis.
(2) Reflects incentive fees payable to Amplitude, EMC, ETC, Winton, Transtrend, Alder, Denali, Lynx, Quantica, and Eagle assuming they manage between 5% and 20% of invested assets and assuming each of the advisors have equivalent performance returns for the 12-month period. Actual incentive fees are calculated quarterly on the basis of each trading advisor’s individual performance, not the overall performance of Grant Park or the Global 2 Class units. Because incentive fees payable to certain of these trading advisors are calculated on the basis of trading profits realized on the assets they manage after deduction for the allocable portion of only certain expenses charged to Grant Park, these advisors would receive an incentive fee before Grant Park has recouped all expenses and reaches the “break-even” level. Incentive fees payable to certain other of these trading advisors are calculated after deduction for the allocable portion of expenses charged to Grant Park. These advisors would not receive an incentive fee before Grant Park has recouped all expenses.
(3) The brokerage charge is paid to the general partner on a monthly basis. Effective the initial closing date, the brokerage charge for the Global 2 Class units equals 0.3917% per month, a rate of 4.70% annually, of such units’ month-end adjusted net assets. Out of this amount, the general partner pays all clearing, execution and give-up, floor brokerage, exchange and NFA fees, any other transaction costs, selling agent compensation, selling agent service fees and consulting fees to the trading advisors. The general partner retains the balance as payment for its services to Grant Park. Bid-ask spreads on Grant Park’s forward and other non-exchange traded contracts are not included in this breakeven table due to the difficulty of determining those spreads.
(4) Grant Park is responsible for ongoing operating expenses, up to an amount not to exceed 0.25% of Grant Park’s average net assets per year. This amount is used for purposes of this breakeven analysis.
(5) Grant Park’s organization and offering expenses are paid by the general partner and then reimbursed to the general partner by Grant Park. To pay this reimbursement, effective the initial closing date, Global 2 Class units are assessed at an annual rate of 30 basis points (0.30%) of adjusted net assets, calculated and payable monthly on the basis of month-end adjusted net assets of the applicable class.
(6) Grant Park earns interest on free cash balances held in its futures trading accounts. Interest is estimated for these purposes at a rate of 0.40% per year.
Global 3 Class Breakeven Analysis
| | | Global 3 Class Units | |
Assumed initial selling price per unit(1) | | $ | 1,000.00 | |
Trading advisors’ incentive fees(2) | | $ | 3.66 | |
Brokerage charge(3) (6.45%) …………………………………………………………………………………………………. | | $ | 64.50 | |
Operating expenses(4) (0.25%) ……………………………………………………………………………………………… | | $ | 2.50 | |
Offering expenses(5) (0.30%) ………………………………………………………………………………………………… | | $ | 3.00 | |
Interest income(6) (0.40%)….…….………………………………………………………………………………………….. | | $ | (4.00 | ) |
| | | | | |
Amount of trading income required for the redemption value at the end of one year to equal the initial selling price of the unit, without early redemption fee | | $ | 69.66 | |
| | | | | |
| Percentage of initial selling price per unit, without early redemption fee | | | 6.97 | % |
| Early redemption fee(7) (1.50%) | | $ | 15.00 | |
| | | | | |
| Amount of trading income required for the redemption value at the end of one year to | | | | |
| equal the initial selling price per Global 3 Class unit, with the highest early redemption fee | | $ | 84.66 | |
| | | | | |
| Percentage of initial selling price per Global 3 Class unit, with the highest early redemption fee | | | 8.47 | % |
(1) The minimum investment required to invest in the Global 3 Class units is $5,000. For ease of comparability, $1,000 will be deemed to be the assumed selling price per unit of a Global 3 Class unit, and, as described above, a Legacy 1 Class unit, a Legacy 2 Class unit and a Global 1 Class unit, and a Global 2 Class unit, for purposes of the breakeven analysis.
(2) Reflects incentive fees payable to Amplitude, EMC, ETC, Winton, Transtrend, Alder, Denali, Lynx, Quantica, and Eagle assuming they manage between 5% and 20% of invested assets and assuming each of the advisors have equivalent performance returns for the 12-month period. Actual incentive fees are calculated quarterly on the basis of each trading advisor’s individual performance, not the overall performance of Grant Park or the Global 3 Class units. Because incentive fees payable to certain of these trading advisors are calculated on the basis of trading profits realized on the assets they manage after deduction for the allocable portion of only certain expenses charged to Grant Park, these advisors would receive an incentive fee before Grant Park has recouped all expenses and reaches the “break-even” level. Incentive fees payable to certain other of these trading advisors are calculated after deduction for the allocable portion of expenses charged to Grant Park. These advisors would not receive an incentive fee before Grant Park has recouped all expenses.
(3) The brokerage charge is paid to the general partner on a monthly basis. Effective the initial closing date, the brokerage charge for the Global 3 Class units equals 0.5375% per month, a rate of 6.45% annually, of such units’ month-end adjusted net assets. Out of this amount, the general partner pays all clearing, execution and give-up, floor brokerage, exchange and NFA fees, any other transaction costs, selling agent compensation, selling agent service fees and consulting fees to the trading advisors. The general partner retains the balance as payment for its services to Grant Park. Bid-ask spreads on Grant Park’s forward and other non-exchange traded contracts are not included in this breakeven table due to the difficulty of determining those spreads.
(4) Grant Park is responsible for ongoing operating expenses, up to an amount not to exceed 0.25% of Grant Park’s average net assets per year. This amount is used for purposes of this breakeven analysis.
(5) Grant Park’s organization and offering expenses are paid by the general partner and then reimbursed to the general partner by Grant Park. To pay this reimbursement, effective the initial closing date, Global 3 Class units are assessed at an annual rate of 30 basis points (0.30%) of adjusted net assets, calculated and payable monthly on the basis of month-end adjusted net assets of the applicable class.
(6) Grant Park earns interest on free cash balances held in its futures trading accounts. Interest is estimated for these purposes at a rate of 0.40% per year.
(7) Global 3 Class limited partners are prohibited from redeeming such units for three months following the subscription for units. Thereafter, Global 3 Class limited partners causing redemption of their units on or before the one-year anniversary of their subscription for the redeemed units will pay an early redemption fee of 1.5%, 1.0% or 0.5% of the net asset value of the redeemed units, depending on when the units are redeemed during the first year. For purposes of this breakeven analysis, the highest early redemption fee has been presented to approximate the effect a payment of an early redemption fee would have on a redemption of Global 3 Class units at an undetermined point during the first year of investment. Because the highest early redemption fee has been used and the other fees and expenses shown assume an investment in Grant Park for one year, the breakeven analysis does not reflect the actual amount required to “break-even” for Global 3 Class units that are redeemed prior to the one-year anniversary of the investment, which will vary depending on the date of redemption.
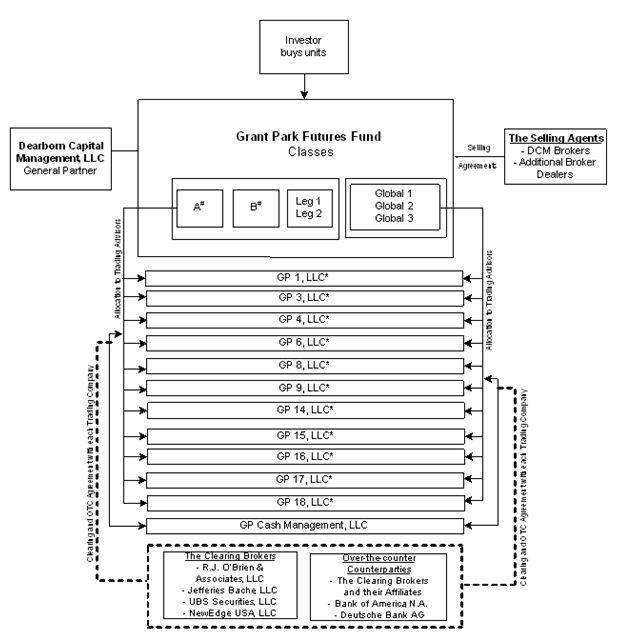
This supplement revises and replaces the chart included on page 19 of the Prospectus under the heading “SUMMARY—Organizational Chart” in its entirety as follows:
Notes:
# Classes A and B are closed to new investment. These classes are no longer offered by the Selling Agents.
* Grant Park invests through an individual trading company for each trading advisor. An Advisory Agreement is entered by each trading advisor, its corresponding trading company, Dearborn Capital Management, L.L.C., as general partner, and, in the case of some trading advisors, Grant Park.
THE TRADING ADVISORS
This supplement revises and replaces the first five paragraphs and the chart on pages 39-40 of the Prospectus under the heading “THE TRADING ADVISORS” in its entirety as follows:
As of August 1, 2013, the general partner has retained Rabar Market Research, Inc., EMC Capital Management, Inc., Eckhardt Trading Company, or ETC, Transtrend B.V., Winton Capital Management Limited, Amplitude Capital International Limited, Alder Capital Limited, Denali Asset Management, LLLP, Lynx Asset Management AB, Quantica Capital AG, and Eagle Trading Systems Inc. as Grant Park’s trading advisors. The table below illustrates the trading advisors for each class of Grant Park’s outstanding limited partnership units:
| | | | | | | | | | | | |
Class A | X | X | X | X | X | X | X | X | X | X | X |
Class B | X | X | X | X | X | X | X | X | X | X | X |
Legacy 1 | X | X | X | X | X | X | X | X | X | X | X |
Legacy 2 | X | X | X | X | X | X | X | X | X | X | X |
Global 1 | X | X | X | X | X | X | X | X | X | X | X |
Global 2 | X | X | X | X | X | X | X | X | X | X | X |
Global 3 | X | X | X | X | X | X | X | X | X | X | X |
The trading advisors and their respective asset allocations with respect to the Legacy 1 Class and the Legacy 2 Class units are the same as with respect to the Class A and Class B units. As of August 1, 2013, with respect to the Class A and Class B units and the Legacy 1 Class and Legacy 2 Class, each of Rabar, EMC, ETC, Winton, Transtrend, Amplitude, Alder, Denali, Lynx, Quantica, and Eagle manage between 5% to 20% of Grant Park’s net assets.
As of August 1, 2013, for the Global 1 Class, Global 2 Class and Global 3 Class units, between 5% to 20% of Grant Park’s assets are allocated to each of Rabar, EMC, ETC, Winton, Transtrend, Amplitude, Alder, Denali, Lynx, Quantica, and Eagle.
The general partner may, in its sole discretion, reallocate assets among the trading advisors upon termination of a trading advisor or retention of any new trading advisors, or at the commencement of any month. Consequently, the allocation for all classes of units is subject to change.
Rabar and EMC have been trading on behalf of Grant Park since January 1989 and ETC has been trading on behalf of Grant Park since April 1998. Winton began trading for Grant Park on August 1, 2004. Transtrend began trading on July 1, 2008. Amplitude began trading on behalf of Grant Park on February 1, 2010. Alder and Denali each began trading for Grant Park on February 1, 2011. Lynx began trading on behalf of Grant Park on November 1, 2012. Quantica began trading for Grant Park on February 1, 2013 and Eagle began trading for Grant Park effective July 1, 2013. As of August 1, 2013, QIM and Sunrise no longer trade on behalf of Grant Park. The general partner may, in its sole discretion, reallocate assets among the trading advisors upon termination of a trading advisor or retention of any new trading advisors, or at the commencement of any month. Consequently, the current apportionment is subject to change.
This supplement revises and replaces the first paragraph on page 46 of the Prospectus under the heading “THE TRADING ADVISORS—Winton Capital Management Limited—Management” in its entirety as follows:
Management
The listed principals of Winton are David Winton Harding, Amal Osman Ali Murgian, Martin John Hunt, Anthony Daniell, Matthew D. Beddall, Rajeev Patel, Tony Fenner-Leitao, Jeremy Dawson, and Nicola Malhotra. Peter Sullivan and Sandra Dawson are principals of Winton whose status is currently pending. Jeremy Dawson, Nicola Malhotra, Peter Sullivan, and Sandra Dawson do not participate in making trading decisions or operational decisions and do not supervise persons so engaged.
This supplement revises and replaces the first paragraph on page 55 of the Prospectus under the heading “THE TRADING ADVISORS—Amplitude Capital International Limited—Management” in its entirety as follows:
Management
The listed principals of Amplitude Capital International Limited are Karsten Schroeder, Shamil Chandaria, Steffen Bendel, John D. Harrison, Peter Voss, Heiko Zuehlke, Gary Linford, Nicola Harrison, Matthias Ackermand, Mark Fagan, K13 Capital Limited, Star Bird Holdings Limited, Wakaluba Investments Limited, Scientific Investments Ltd., and Baltic Amber Investments Limited.
This supplement revises and replaces the eleventh paragraph on page 56 of the Prospectus under the heading “THE TRADING ADVISORS—Amplitude Capital International Limited—Management” in its entirety as follows:
Mark Fagan is a director of Amplitude and was appointed to this position in January 2013. Mr. Fagan does not take part in any trading or operational activities of Amplitude nor does he actively market Amplitude’s services. Mr. Fagan also serves as a Senior Manager at HighWater Limited, a company management firm that specializes in provision of independent directors and related services to the alternative investment industry. Prior to joining HighWater Limited in June 2011, Mr. Fagan served as an Investment Advisor at RBC Dominion Securities between June 2010 and May 2011. Between June 2003 and May 2010, he served as a Portfolio Manager and Performance Analyst at Butterfield Bank. Mr. Fagan became registered as a listed principal of Amplitude effective April 2013.
This supplement revises and replaces the first paragraph on page 48 of the Prospectus under the heading “THE TRADING ADVISORS—Transtrend B.V.—Management” in its entirety as follows:
Management
The listed principals of Transtrend are Johannes P.A. van den Broek, Harold M. De Boer, Mark H.A. Van Dongen, Andre P. Honig, Robeco Nederland B.V., and Gijsbert Albertus Verwilst.
This supplement replaces the seventh paragraph on page 49 of the Prospectus under the heading “THE TRADING ADVISORS—Transtrend B.V.—Management” in its entirety as follows:
Gijs A.M. Verwilst joined Transtrend as Chief Compliance Officer in March 2013, and has been listed as a principal of Transtrend since May 2013. Mr. Verwilst graduated in 2003 with a master’s degree in Tax Law from Maastricht University in The Netherlands. He completed a post graduate course in securities law in 2007. He started his career at Loyens & Loeff (a Dutch law firm) and KPMG Meijburg & Co (Tax Lawyers) as a tax lawyer, where he advised clients (large corporate and financial institutions) on Dutch corporate income tax and international tax structures from January 2003 until July 2004 and July 2004 until September 2005 respectively. Subsequently, Mr. Verwilst worked as a senior officer in the Strategy, Policy and International Affairs department of the Netherlands Authority for the Financial Markets (AFM) from September 2005 until April 2010. In that capacity he was a member of the Investment Management Expert Group of the Committee of European Securities Regulators (“CESR”, currently named ESMA). He joined the Investment Management Group of a Dutch law firm, De Brauw Blackstone Westbroek, as a senior associate in April 2010, where he was involved in structuring institutional investment funds and advising clients on financial markets regulation until March 2013.
This supplement revises and replaces the first paragraph on page 49 of the Prospectus under the heading “THE TRADING ADVISORS—Transtrend B.V.—Shareholder” in its entirety as follows:
100% of the voting interest in Transtrend is owned by Robeco Nederland B.V., which is a 100% subsidiary of Robeco Groep N.V., which in its turn is owned approximately 90.01% by Orix Corporation and the remainder by Cooperatieve Centrale Raiffeisen-Boerenleenbank B.A. (Rabobank Nederland). Robeco Nederland B.V. has been listed as a Principal since July 8, 2002.
This supplement revises and replaces the eighth paragraph on page 56 of the Prospectus under the heading “THE TRADING ADVISORS—Amplitude Capital International Limited—Management” in its entirety as follows:
Gary Linford is the Founder and majority shareholder of Highwater Limited, a company regulated by Cayman Islands Monetary Authority for the provision of independent director services to Cayman funds. In this capacity Gary Linford is a director of the Amplitude Dynamic Trading Fund, the Klassik Fund and the Sinfonie Fund, and a director and beneficiary shareholder of Amplitude Capital International Limited. He was appointed to this position in August 2009. Mr. Linford does not take part in any trading or operational activities of Amplitude nor does he actively market Amplitude’s services. Mr. Linford became registered as a listed principal of Amplitude effective January 2010. Highwater also put forward Mr. Linford and he serves as a non-executive director who is not involved in day-to-day activities of BFAM Asian Opportunities GP Limited and BFAM Asian Opportunities Master GP Limited and has held this position since May 2012. He became a listed principal of BFAM Asian Opportunities GP Limited and BFAM Asian Opportunities Master GP Limited in October 2012. Both entities have been registered with the NFA as Commodity Pool Operators since January 2013. Highwater also put forward Mr. Linford who serves as a non-executive director of Cantab Capital Cayman Limited, a registered Commodity Pool Operator. Mr. Linford is not involved in the day-to-day activities of Cantab Capital Cayman Limited. He became a listed principal of Cantab Capital Cayman Limited effective June 2013. All three appointments to Amplitude, BFAM and CANTAB are in a non-executive capacity where no employment contract exists.
This supplement revises and replaces the ninth paragraph on page 61 of the Prospectus under the heading “THE TRADING ADVISORS—Lynx Asset Management AB—Management” in its entirety as follows:
Patrik Brummer has been listed as a principal of Lynx since August 2011 due to his holdings in Brummer & Partners, a holding company that wholly or partly owns fund management companies and fund services companies, and has been the Chairman and a Partner of Brummer & Partners since May 1995. Patrik Brummer is also a listed principal of Canosa Capital LLP, a fund management company based in the United Kingdom, due to his holdings in Brummer & Partners. Mr. Brummer has been a listed principal of Canosa Capital since June 2013. Canosa Capital has been registered as a commodity pool operator effective July 2013 and is currently pending registration as an NFA member and as a swap firm. Mr. Brummer has no active role in the operation of Canosa Capital. Between 1969 and 1973, Mr. Brummer studied at the Stockholm School of Economics, from which he graduated in May 1973. Following graduation, Mr. Brummer was on sabbatical until August 1973, when he joined Alfred Berg. By the time he left in 1995, he had become group chief executive of Alfred Berg with responsibility for the group’s strategic development. Mr. Brummer left Alfred Berg in April 1995 to set up Brummer & Partners in May 1995.
This supplement revises and updates the discussion in the Prospectus under the heading “The Trading Advisors” by removing the 15 paragraphs on pages 50 through 52 under the heading “Quantitative Investment Management LLC (QIM)” and the 22 paragraphs on pages 52 through 55 under the heading “Sunrise Capital Partners, LLC” in their entirety and by adding the following paragraphs on page 63 immediately following the last paragraph under the heading “THE TRADING ADVISORS—Quantica Capital AG—Quantica’s Trading Program” in its entirety as follows:
Eagle Trading Systems Inc.
Eagle Trading Systems Inc. is a Delaware corporation, formed in May 1993 to provide commodity trading advisory services to selected clients. Eagle has been registered with the CFTC as a commodity pool operator and a commodity trading advisor since June 1993 and has been a member of the NFA since June 1993. Eagle has also been approved as a forex firm since September 2010. Additionally, Eagle became registered as an investment advisor with the SEC in June 2009. The business offices of Eagle are located at 47 Hulfish Street, Suite 410, Princeton, NJ 08542. The firm’s telephone number is (609) 688-2060.
Management
The listed principals of Eagle are Menachem Sternberg, Liora Sternberg, Eileen Kovacs, Michael Emanuel, Donald Johnston, and Gil Sternberg.
Menachem Sternberg is the Chairman of the Board, Chief Executive Officer and President of Eagle and has served in these positions since January 1997. Mr. Sternberg is a member of the NFA, and is listed as a Principal and registered an Associated Person of Eagle. Mr. Sternberg’s membership in the NFA and his listing as a Principal and registration as an Associated Person of Eagle took effect in February 1997, March 1997, and April 1997, respectively. Mr. Sternberg is also a shareholder of Eagle. Mr. Sternberg has also been registered as a FOREX Associated Person of Eagle since September 2010.
Liora Sternberg is a Principal of Eagle by nature of being a shareholder of Eagle. Mrs. Sternberg does not participate in making trading or operational decisions for Eagle, nor does she supervise persons so engaged. She has been listed as a principal of Eagle since June 1993.
Eileen Kovacs is the Chief Financial Officer and Co-Chief Operating Officer of Eagle. From June 2009 to June 2010, Ms. Kovacs also served as Eagle’s Chief Compliance Officer. Ms. Kovacs joined Eagle in May 2003 and is responsible for all aspects of Eagle’s financial operations including controllership, regulatory compliance, tax
compliance, corporate administrative functions, and human resources. Ms. Kovacs is a member of the NFA, and is listed as a Principal and registered as an Associated Person of Eagle. Ms. Kovacs’s membership in the NFA and her listing as a Principal and registration as an Associated Person of Eagle took effect in June 2003, September 2005 and August 2003, respectively. Ms. Kovacs has also been registered as a FOREX Associated Person of Eagle since September 2010.
Michael Emanuel is the General Counsel, Chief Compliance Officer and co-Chief Operating Officer of Eagle. Prior to joining Eagle in June 2010, Mr. Emanuel was Senior Fund and Compliance Counsel at Harbinger Capital Partners in New York from June 2009 to June 2010, where he was responsible for legal and compliance issues related to Harbinger's funds and advisory business. Prior to joining Harbinger, Mr. Emanuel was General Counsel and Chief Compliance Officer at Loeb Partners Corporation in New York, a multi strategy advisor, family office and broker-dealer, from January 2004 to January 2009. Between January 2009 and June 2009, Mr. Emanuel was on sabbatical. Mr. Emanuel is a member of the NFA, and is listed as a Principal and registered as an Associated Person of Eagle. Mr. Emanuel’s membership in the NFA and his listing as a Principal and registration as an Associated Person of Eagle took effect in June 2010, August 2011 and August 2011, respectively. Mr. Emanuel has also been registered as a FOREX Associated Person of Eagle since November 2011.
Donald Johnston is the Chief Marketing Officer of Eagle. Mr. Johnston joined Eagle in January 2013 and is responsible for all aspects of Eagle’s marketing and client relations. Prior to joining Eagle, Mr. Johnston served as Managing Director, Investor Relations of Optima Fund Management, an Investment Adviser Firm registered with the SEC, where he was employed from January 2005 to December 2012. Mr. Johnston is a member of the NFA, and is listed as a Principal and registered as an Associated Person of Eagle. Mr. Johnston’s membership in the NFA and his listing as a Principal and registration as an Associated Person of Eagle took effect in January 2013, March 2013 and March 2013, respectively. Mr. Johnston has also been registered as a FOREX Associated Person of Eagle since January 2013.
Gil Sternberg is a Director of Eagle. Mr. Sternberg joined Eagle in September 2002 and functioned as a Senior Systems Designer and then Head of Systems Development. Mr. Sternberg then served as Eagle’s Director of Systems Development from June 2006 until December 2007. Beginning in February 2007, Mr. Sternberg became the Managing Director of Eagle Trading Systems (R&D) Ltd. (“Eagle R&D”), a company organized and operated under the laws of the State of Israel. Eagle R&D is a majority-owned subsidiary of Eagle, with its own staff of employees. Eagle R&D specializes in research and systems development. Pursuant to a contract between Eagle and Eagle R&D, Eagle R&D expands many of the research and systems development tasks which he was responsible for overseeing in his role as Eagle’s Director of Systems Development, while enhancing Eagle’s research and systems development capabilities. Mr. Sternberg is a member of the NFA, and is listed as a Principal and registered as an Associated Person of Eagle. Mr. Sternberg’s membership in the NFA and his listing as a Principal and registration as an Associated Person of Eagle took effect in November 2003, June 2006, and December 2003, respectively. Mr. Sternberg has also been registered as a FOREX Associated Person of Eagle since October 2010.
Except as described in this paragraph, there have been no civil, criminal, or administrative actions against Eagle or its principals. On May 31, 2012, Eagle reached a negotiated settlement with the CME Group regarding a position limit violation. A copy of the settlement can be found on Eagle’s BASIC page on the NFA website under Regulatory Actions. A copy of the offer of settlement to the CME Group regarding the issue is available upon request.
Eagle’s Trading Program
Eagle will use its Eagle Global Program, “Eagle Global”, in managing assets for Grant Park. Eagle commenced trading pursuant to Eagle Global beginning August 1995.
Eagle Global is a technical, trend-following system developed, based on Eagle's extensive experience in observing and trading the global markets, to capture a well-structured trading philosophy. The trading philosophy incorporates trend following elements, money management principles, predetermined risk parameters and
volatility adjustment features. Eagle Global is designed to trade in a wide range of global futures markets - currencies, fixed income, energies, commodities and stock indices - that exhibit orderly intermediate and long-term trends, adjusts to changes in market environment with no predetermined allocation to any one sector. Eagle Global analyzes typical behavior and volatility patterns of various markets. Eagle Global seeks markets with potentially good risk/reward profiles while attempting to avoid markets characterized by excessive volatility and sharp price corrections. An attempt is made to participate in markets which exhibit favorable “signal to noise” characteristics. Money management and risk control disciplines serve to limit downside risk.
PERFORMANCE INFORMATION
This supplement revises and replaces the table on page 65 of the Prospectus captioned “PERFORMANCE OF GRANT PARK—CLASS A UNITS” in its entirety as follows:
PERFORMANCE OF GRANT PARK - CLASS A UNITS
(Unaudited)
As required by CFTC regulations, the past performance record of Grant Park’s Class A units for the last five full calendar years and the first five months of 2013 is presented below. The past performance record of Grant Park’s Class A units since inception January 1989 appears in Part Two: Statement of Additional Information.
While the performance record set forth in the table below has not been independently audited, the General Partner believes that the information presented is accurate. All performance information is shown net of fees and expenses.
| Name | Grant Park Futures Fund Limited Partnership (Class A units) |
| Type | Privately offered (through February 2003); Publicly offered beginning June 30, 2003; Multi-advisor |
| Inception of Trading | January 1989 |
| Aggregate Gross Subscriptions at 05/31/2013 | $147,153,661 |
| Net Asset Value at 05/31/2013 | $28,649,490 |
Worst Monthly Percentage Draw-Down (Since 1/08)(1) | -7.95% 01/10 |
Worst Peak-to-Valley Draw-Down (Since 1/08)(2) | -24.14% (12/08 - 05/13) |
| | | | | | | | | | | | | | | | | | | |
| | | | | | Rate of Return(3) | | | | | | | |
| | | 2013 | | | 2012 | | | 2011 | | | 2010 | | | 2009 | | | 2008 | |
| | | | | | | | | | | | | | | | | | | |
January | | | 1.47 | % | | | 0.00 | % | | | -0.52 | % | | | -7.95 | % | | | -0.91 | % | | | 2.49 | % |
| February | | | -2.86 | % | | | 0.80 | % | | | 2.26 | % | | | 0.63 | % | | | -0.80 | % | | | 9.66 | % |
March | | | 1.22 | % | | | -2.21 | % | | | -2.48 | % | | | 4.08 | % | | | -3.26 | % | | | -0.63 | % |
April | | | 1.01 | % | | | 0.00 | % | | | 3.79 | % | | | 1.80 | % | | | -1.73 | % | | | -0.13 | % |
May | | | -2.83 | % | | | 6.19 | % | | | -6.93 | % | | | -3.83 | % | | | 1.64 | % | | | 2.11 | % |
June | | | | | | | -4.88 | % | | | -3.79 | % | | | -0.21 | % | | | -3.41 | % | | | 3.06 | % |
| | | | | | | | | | | | | | | | | | | |
| | | | | | Rate of Return(3) | | | | | | | |
| | | 2013 | | | 2012 | | | 2011 | | | 2010 | | | 2009 | | | 2008 | |
| | | | | | | | | | | | | | | | | | | |
| July | | | | | | | 3.56 | % | | | 3.02 | % | | | -1.66 | % | | | -1.26 | % | | | -5.06 | % |
August | | | | | | | -1.30 | % | | | -1.81 | % | | | 2.77 | % | | | 1.15 | % | | | -2.41 | % |
September | | | | | | | -2.13 | % | | | -1.64 | % | | | 3.24 | % | | | 1.17 | % | | | 1.31 | % |
October | | | | | | | -5.64 | % | | | -4.51 | % | | | 4.33 | % | | | -2.59 | % | | | 4.76 | % |
November | | | | | | | -0.63 | % | | | -0.57 | % | | | -2.58 | % | | | 4.24 | % | | | 2.76 | % |
December | | | | | | | 0.52 | % | | | -0.05 | % | | | 4.57 | % | | | -3.57 | % | | | 1.08 | % |
Year | | | -2.07 | % | | | -6.13 | % | | | -12.95 | % | | | 4.45 | % | | | -9.23 | % | | | 19.91 | % |
______________________________________________________________________
(1) Worst Monthly Percentage Draw-Down is the largest monthly loss experienced by Grant Park in any calendar month expressed as a percentage of total equity in Grant Park and includes the month and year of that draw-down.
(2) Worst Peak-to-Valley Draw-Down is the greatest cumulative percentage decline in month-end net asset value of Grant Park due to losses sustained by Grant Park during a period in which the initial month-end net asset value of Grant Park is not equaled or exceeded by a subsequent month-end net asset value of Grant Park and includes the time period in which the draw-down occurred.
(3) The monthly rate of return is computed by dividing monthly performance by beginning monthly equity plus additions less redemptions. The monthly rates are then compounded to arrive at the annual rate of return.
PAST PERFORMANCE IS NOT NECESSARILY INDICATIVE OF FUTURE RESULTS
This supplement revises and replaces the table on page 66 of the Prospectus captioned “PERFORMANCE OF GRANT PARK—CLASS B UNITS” in its entirety as follows:
PERFORMANCE OF GRANT PARK - CLASS B UNITS
(Unaudited)
As required by CFTC regulations, the past performance record of Grant Park’s Class B units for the last five full calendar years and the first five months of 2013 is presented below. The past performance record of Grant Park’s Class A units since inception January 1989 appears in Part Two: Statement of Additional Information.
While the performance record set forth in the table below has not been independently audited, the General Partner believes that the information presented is accurate. All performance information is shown net of fees and expenses.
Name | Grant Park Futures Fund Limited Partnership (Class B units) |
Type | Public; Multi-advisor |
Inception of Trading | August 2003 |
| Aggregate Gross Subscriptions at 05/31/2013 | $872,734,726 |
Net Asset Value at 05/31/2013 | $288,587,868 |
Worst Monthly Percentage Draw-Down(1) (Since 1/08) | -8.00% 01/10 |
Worst Peak-to-Valley Draw-Down(2) (Since 1/08) | -26.30% (12/08 - 05/13) |
| | | Rate of Return(3) | |
| | | | | | | | | | | | | | | | | | | |
| | | 2013 | | | 2012 | | | 2011 | | | 2010 | | | 2009 | | | 2008 | |
| | | | | | | | | | | | | | | | | | | |
January | | | 1.42 | % | | | -0.06 | % | | | -0.58 | % | | | -8.00 | % | | | -0.98 | % | | | 2.42 | % |
| February | | | -2.91 | % | | | 0.75 | % | | | 2.20 | % | | | 0.57 | % | | | -0.88 | % | | | 9.58 | % |
| | | Rate of Return(3) | |
| | | | | | | | | | | | | | | | | | | |
| | | 2013 | | | 2012 | | | 2011 | | | 2010 | | | 2009 | | | 2008 | |
| | | | | | | | | | | | | | | | | | | |
March | | | 1.17 | % | | | -2.27 | % | | | -2.53 | % | | | 4.03 | % | | | -3.33 | % | | | -0.70 | % |
April | | | 0.96 | % | | | -0.05 | % | | | 3.74 | % | | | 1.74 | % | | | -1.78 | % | | | -0.20 | % |
May | | | -2.88 | % | | | 6.13 | % | | | -6.98 | % | | | -3.88 | % | | | 1.58 | % | | | 2.03 | % |
June | | | | | | | -4.93 | % | | | -3.84 | % | | | -0.27 | % | | | -3.46 | % | | | 2.99 | % |
| July . | | | | | | | 3.51 | % | | | 2.96 | % | | | -1.71 | % | | | -1.32 | % | | | -5.12 | % |
August | | | | | | | -1.36 | % | | | -1.86 | % | | | 2.71 | % | | | 1.09 | % | | | -2.48 | % |
September | | | | | | | -2.19 | % | | | -1.69 | % | | | 3.21 | % | | | 1.12 | % | | | 1.24 | % |
October | | | | | | | -5.69 | % | | | -4.57 | % | | | 4.27 | % | | | -2.64 | % | | | 4.69 | % |
November | | | | | | | -0.68 | % | | | -0.62 | % | | | -2.63 | % | | | 4.19 | % | | | 2.69 | % |
December | | | | | | | 0.46 | % | | | -0.11 | % | | | 4.52 | % | | | -3.63 | % | | | 1.01 | % |
Year | | | -2.32 | % | | | -6.74 | % | | | -13.52 | % | | | 3.80 | % | | | -9.87 | % | | | 18.88 | % |
______________________________________________________________________
(1) Worst Monthly Percentage Draw-Down is the largest monthly loss experienced by Grant Park in any calendar month expressed as a percentage of total equity in Grant Park and includes the month and year of that draw-down.
(2) Worst Peak-to-Valley Draw-Down is the greatest cumulative percentage decline in month-end net asset value of Grant Park due to losses sustained by Grant Park during a period in which the initial month-end net asset value of Grant Park is not equaled or exceeded by a subsequent month-end net asset value of Grant Park and includes the time period in which the draw-down occurred.
(3) The monthly rate of return is computed by dividing monthly performance by beginning monthly equity plus additions less redemptions. The monthly rates are then compounded to arrive at the annual rate of return.
PAST PERFORMANCE IS NOT NECESSARILY INDICATIVE OF FUTURE RESULTS
This supplement revises and replaces the table on page 67 of the Prospectus captioned “PERFORMANCE OF GRANT PARK—LEGACY 1 UNITS” in its entirety as follows:
PERFORMANCE OF GRANT PARK - Legacy 1 Units
(Unaudited)
As required by CFTC regulations, the past performance record of Grant Park’s Legacy 1 Class units from April 1, 2009 through May 31, 2013, is presented below. While the performance record set forth in the table below has not been independently audited, the general partner believes that the information presented is accurate. All performance information is shown net of fees and expenses.
Name | Grant Park Futures Fund Limited Partnership (Legacy 1 Class) |
Type | Public |
Inception of Trading | April 2009 |
| Aggregate Gross Subscriptions at 05/31/2013 | $8,338,177 |
Net Asset Value at 05/31/2013 | $4,231,912 |
Worst Monthly Percentage Draw-Down (Since April 2009)(1) | -7.77% 01/10 |
Worst Peak-to-Valley Draw-Down (Since April 2009)(2) | -18.46% (04/11 - 05/13) |
| | | Rate of Return(3) | |
| | | 2013 | | | 2012 | | | 2011 | | | 2010 | | | 2009 | |
| | | | | | | | | | | | | | | | |
| January | | | 1.66 | % | | | 0.18 | % | | | -0.35 | % | | | -7.77 | % | | | --- | |
| February | | | -2.68 | % | | | 1.00 | % | | | 2.37 | % | | | 0.82 | % | | | --- | |
| March | | | 1.40 | % | | | -2.03 | % | | | -2.21 | % | | | 4.15 | % | | | --- | |
| April | | | 1.19 | % | | | 0.18 | % | | | 3.84 | % | | | 1.77 | % | | | -1.59 | % |
| May | | | -2.66 | % | | | 6.24 | % | | | -6.63 | % | | | -3.53 | % | | | 1.66 | % |
| June | | | | | | | -4.57 | % | | | -3.62 | % | | | -0.03 | % | | | -3.10 | % |
| July . | | | | | | | 3.73 | % | | | 3.23 | % | | | -1.50 | % | | | -1.08 | % |
| August | | | | | | | -1.10 | % | | | -1.62 | % | | | 2.86 | % | | | 1.27 | % |
| September | | | | | | | -1.93 | % | | | -1.47 | % | | | 3.24 | % | | | 1.21 | % |
| October | | | | | | | -5.45 | % | | | -4.34 | % | | | 4.35 | % | | | -2.42 | % |
| November | | | | | | | -0.44 | % | | | -0.40 | % | | | -2.32 | % | | | 4.04 | % |
| December | | | | | | | 0.71 | % | | | 0.14 | % | | | 4.67 | % | | | -3.19 | % |
| Year | | | -1.17 | % | | | -3.96 | % | | | -11.00 | % | | | 6.09 | % | | | -3.39 | % |
______________________________________________________________________
(1) Worst Monthly Percentage Draw-Down is the largest monthly loss experienced by Grant Park in any calendar month expressed as a percentage of total equity in Grant Park and includes the month and year of that draw-down.
(2) Worst Peak-to-Valley Draw-Down is the greatest cumulative percentage decline in month-end net asset value of Grant Park due to losses sustained by Grant Park during a period in which the initial month-end net asset value of Grant Park is not equaled or exceeded by a subsequent month-end net asset value of Grant Park and includes the time period in which the draw-down occurred.
(3) The monthly rate of return is computed by dividing monthly performance by beginning monthly equity plus additions less redemptions. The monthly rates are then compounded to arrive at the annual rate of return.
PAST PERFORMANCE IS NOT NECESSARILY INDICATIVE OF FUTURE RESULTS
This supplement revises and replaces the table on page 68 of the Prospectus captioned “PERFORMANCE OF GRANT PARK—LEGACY 2 UNITS” in its entirety as follows:
PERFORMANCE OF GRANT PARK - Legacy 2 Units
(Unaudited)
As required by CFTC regulations, the past performance record of Grant Park’s Legacy 2 Class units from April 1, 2009 through May 31, 2013, is presented below. While the performance record set forth in the table below has not been independently audited, the general partner believes that the information presented is accurate. All performance information is shown net of fees and expenses.
Name | Grant Park Futures Fund Limited Partnership (Legacy 2 Class) |
Type | Public |
Inception of Trading | April 2009 |
| Aggregate Gross Subscriptions at 05/31/2013 | $20,474,409 |
Net Asset Value at 05/31/2013 | $9,816,559 |
Worst Monthly Percentage Draw-Down (Since April 2009)(1) | -7.79% 01/10 |
Worst Peak-to-Valley Draw-Down (Since April 2009)(2) | -19.07% (04/11 - 05/13) |
| | | Rate of Return(3) | |
| | | 2013 | | | 2012 | | | 2011 | | | 2010 | | | 2009 | |
| | | | | | | | | | | | | | | | |
| January | | | 1.64 | % | | | 0.17 | % | | | -0.37 | % | | | -7.79 | % | | | --- | |
| February | | | -2.70 | % | | | 0.98 | % | | | 2.33 | % | | | 0.80 | % | | | --- | |
| March | | | 1.39 | % | | | -2.04 | % | | | -2.22 | % | | | 4.13 | % | | | --- | |
| April | | | 1.17 | % | | | 0.16 | % | | | 3.77 | % | | | 1.72 | % | | | -1.61 | % |
| May | | | -2.67 | % | | | 6.16 | % | | | -6.63 | % | | | -3.53 | % | | | 1.62 | % |
| June | | | | | | | -4.60 | % | | | -3.66 | % | | | -0.05 | % | | | -3.12 | % |
| July . | | | | | | | 3.71 | % | | | 3.18 | % | | | -1.52 | % | | | -1.09 | % |
| August | | | | | | | -1.12 | % | | | -1.69 | % | | | 2.82 | % | | | 1.26 | % |
| September | | | | | | | -1.94 | % | | | -1.57 | % | | | 3.20 | % | | | 1.21 | % |
| October | | | | | | | -5.47 | % | | | -4.40 | % | | | 4.31 | % | | | -2.44 | % |
| November | | | | | | | -0.46 | % | | | -0.42 | % | | | -2.34 | % | | | 4.04 | % |
| December | | | | | | | 0.69 | % | | | 0.12 | % | | | 4.62 | % | | | -3.22 | % |
| Year | | | -1.26 | % | | | -4.26 | % | | | -11.45 | % | | | 5.73 | % | | | -3.55 | % |
______________________________________________________________________
(1) Worst Monthly Percentage Draw-Down is the largest monthly loss experienced by Grant Park in any calendar month expressed as a percentage of total equity in Grant Park and includes the month and year of that draw-down.
(2) Worst Peak-to-Valley Draw-Down is the greatest cumulative percentage decline in month-end net asset value of Grant Park due to losses sustained by Grant Park during a period in which the initial month-end net asset value of Grant Park is not equaled or exceeded by a subsequent month-end net asset value of Grant Park and includes the time period in which the draw-down occurred.
(3) The monthly rate of return is computed by dividing monthly performance by beginning monthly equity plus additions less redemptions. The monthly rates are then compounded to arrive at the annual rate of return.
PAST PERFORMANCE IS NOT NECESSARILY INDICATIVE OF FUTURE RESULTS
This supplement revises and replaces the table on page 69 of the Prospectus captioned “PERFORMANCE OF GRANT PARK—GLOBAL 1 UNITS” in its entirety as follows:
PERFORMANCE OF GRANT PARK - Global 1 Units
(Unaudited)
As required by CFTC regulations, the past performance record of Grant Park’s Global 1 Class units from April 1, 2009 through May 31, 2013 is presented below. While the performance record set forth in the table below has not been independently audited, the general partner believes that the information presented is accurate. All performance information is shown net of fees and expenses.
Name | Grant Park Futures Fund Limited Partnership (Global 1 Class) |
Type | Public |
Inception of Trading | April 2009 |
| Aggregate Gross Subscriptions at 05/31/2013 | $22,027,368 |
Net Asset Value at 05/31/2013 | $11,473,774 |
Worst Monthly Percentage Draw-Down (Since April 2009)(1) | -7.80% 01/10 |
Worst Peak-to-Valley Draw-Down (Since April 2009)(2) | -17.70% (05/09 - 02/13) |
| | | Rate of Return(3) | |
| | | 2013 | | | 2012 | | | 2011 | | | 2010 | | | 2009 | |
| | | | | | | | | | | | | | | | |
| January | | | 1.69 | % | | | 0.39 | % | | | -0.74 | % | | | -7.80 | % | | | --- | |
| February | | | -2.63 | % | | | 0.96 | % | | | 2.00 | % | | | 0.71 | % | | | --- | |
| March | | | 1.47 | % | | | -1.97 | % | | | -1.85 | % | | | 3.65 | % | | | --- | |
| April | | | 1.22 | % | | | 0.27 | % | | | 2.92 | % | | | 1.52 | % | | | -0.28 | % |
| May | | | -2.61 | % | | | 6.32 | % | | | -6.49 | % | | | -2.21 | % | | | 2.02 | % |
| June | | | | | | | -4.59 | % | | | -3.33 | % | | | 0.29 | % | | | -3.21 | % |
| July . | | | | | | | 3.85 | % | | | 3.09 | % | | | -2.51 | % | | | -1.26 | % |
| August | | | | | | | -1.15 | % | | | -1.25 | % | | | 2.71 | % | | | 1.11 | % |
| September | | | | | | | -1.85 | % | | | -1.34 | % | | | 1.97 | % | | | 1.18 | % |
| October | | | | | | | -5.36 | % | | | -4.01 | % | | | 3.70 | % | | | -3.22 | % |
| November | | | | | | | -0.43 | % | | | -0.39 | % | | | -2.13 | % | | | 3.75 | % |
| December | | | | | | | 0.77 | % | | | 0.06 | % | | | 3.59 | % | | | -4.21 | % |
| Year | | | -0.95 | % | | | -3.30 | % | | | -11.18 | % | | | 2.88 | % | | | -4.32 | % |
______________________________________________________________________
(1) Worst Monthly Percentage Draw-Down is the largest monthly loss experienced by Grant Park in any calendar month expressed as a percentage of total equity in Grant Park and includes the month and year of that draw-down.
(2) Worst Peak-to-Valley Draw-Down is the greatest cumulative percentage decline in month-end net asset value of Grant Park due to losses sustained by Grant Park during a period in which the initial month-end net asset value of Grant Park is not equaled or exceeded by a subsequent month-end net asset value of Grant Park and includes the time period in which the draw-down occurred.
(3) The monthly rate of return is computed by dividing monthly performance by beginning monthly equity plus additions less redemptions. The monthly rates are then compounded to arrive at the annual rate of return.
PAST PERFORMANCE IS NOT NECESSARILY INDICATIVE OF FUTURE RESULTS
This supplement revises and replaces the table on page 70 of the Prospectus captioned “PERFORMANCE OF GRANT PARK—GLOBAL 2 UNITS” in its entirety as follows:
PERFORMANCE OF GRANT PARK - Global 2 Units
(Unaudited)
As required by CFTC regulations, the past performance record of Grant Park’s Global 2 Class units from April 1, 2009 through May 31, 2013, is presented below. While the performance record set forth in the table below has not been independently audited, the general partner believes that the information presented is accurate. All performance information is shown net of fees and expenses.
| Name | Grant Park Futures Fund Limited Partnership (Global 2 Class) |
| Type | Public |
| Inception of Trading | April 2009 |
| Aggregate Gross Subscriptions at 05/31/2013 | $41,025,136 |
| Net Asset Value at 05/31/2013 | $23,030,696 |
Worst Monthly Percentage Draw-Down (Since April 2009)(1) | -7.82% 01/10 |
Worst Peak-to-Valley Draw-Down (Since April 2009)(2) | -18.68% (5/09 - 5/13) |
| | | Rate of Return(3) | |
| | | 2013 | | | 2012 | | | 2011 | | | 2010 | | | 2009 | |
| | | | | | | | | | | | | | | | |
| January | | | 1.67 | % | | | 0.37 | % | | | -0.76 | % | | | -7.82 | % | | | --- | |
| February | | | -2.65 | % | | | 0.94 | % | | | 1.99 | % | | | 0.69 | % | | | --- | |
| March | | | 1.45 | % | | | -1.99 | % | | | -1.89 | % | | | 3.56 | % | | | --- | |
| April | | | 1.20 | % | | | 0.25 | % | | | 2.91 | % | | | 1.50 | % | | | -0.30 | % |
| May | | | -2.63 | % | | | 6.27 | % | | | -6.53 | % | | | -2.24 | % | | | 1.97 | % |
| June | | | | | | | -4.59 | % | | | -3.36 | % | | | 0.29 | % | | | -3.24 | % |
| July . | | | | | | | 3.80 | % | | | 3.07 | % | | | -2.53 | % | | | -1.28 | % |
| August | | | | | | | -1.16 | % | | | -1.28 | % | | | 2.70 | % | | | 1.09 | % |
| September | | | | | | | -1.85 | % | | | -1.36 | % | | | 1.94 | % | | | 1.10 | % |
| October | | | | | | | -5.38 | % | | | -4.03 | % | | | 3.68 | % | | | -3.24 | % |
| November | | | | | | | -0.45 | % | | | -0.41 | % | | | -2.15 | % | | | 3.61 | % |
| December | | | | | | | 0.75 | % | | | 0.04 | % | | | 3.56 | % | | | -4.17 | % |
| Year | | | -1.05 | % | | | -3.55 | % | | | -11.43 | % | | | 2.56 | % | | | -4.64 | % |
(1) Worst Monthly Percentage Draw-Down is the largest monthly loss experienced by Grant Park in any calendar month expressed as a percentage of total equity in Grant Park and includes the month and year of that draw-down.
(2) Worst Peak-to-Valley Draw-Down is the greatest cumulative percentage decline in month-end net asset value of Grant Park due to losses sustained by Grant Park during a period in which the initial month-end net asset value of Grant Park is not equaled or exceeded by a subsequent month-end net asset value of Grant Park and includes the time period in which the draw-down occurred.
(3) The monthly rate of return is computed by dividing monthly performance by beginning monthly equity plus additions less redemptions. The monthly rates are then compounded to arrive at the annual rate of return.
PAST PERFORMANCE IS NOT NECESSARILY INDICATIVE OF FUTURE RESULT
This supplement revises and replaces the table on page 71 of the Prospectus captioned “PERFORMANCE OF GRANT PARK—GLOBAL 3 UNITS” in its entirety as follows:
PERFORMANCE OF GRANT PARK - Global 3 Units
(Unaudited)
As required by CFTC regulations, the past performance record of Grant Park’s Global 3 Class units from April 1, 2009 through May 31, 2013 is presented below. While the performance record set forth in the table below has not been independently audited, the general partner believes that the information presented is accurate. All performance information is shown net of fees and expenses.
Name | Grant Park Futures Fund Limited Partnership (Global 3 Class) |
Type | Public |
Inception of Trading | April 2009 |
| Aggregate Gross Subscriptions at 05/31/2013 | $333,123,782 |
Net Asset Value at 05/31/2013 | $205,261,004 |
Worst Monthly Percentage Draw-Down (Since April 2009)(1) | -7.95% 01/10 |
Worst Peak-to-Valley Draw-Down (Since April 2009)(2) | -24.36% (05/09 - 05/13) |
| | | Rate of Return(3) | |
| | | 2013 | | | 2012 | | | 2011 | | | 2010 | | | 2009 | |
| | | | | | | | | | | | | | | | |
| January | | | 1.53 | % | | | 0.22 | % | | | -0.91 | % | | | -7.95 | % | | | --- | |
| February | | | -2.79 | % | | | 0.79 | % | | | 1.76 | % | | | 0.54 | % | | | --- | |
| March | | | 1.30 | % | | | -2.13 | % | | | -2.01 | % | | | 3.40 | % | | | --- | |
| April | | | 1.06 | % | | | 0.10 | % | | | 2.75 | % | | | 1.33 | % | | | -0.44 | % |
| May | | | -2.76 | % | | | 6.16 | % | | | -6.67 | % | | | -2.38 | % | | | 1.77 | % |
| June | | | | | | | -4.73 | % | | | -3.50 | % | | | 0.10 | % | | | -3.49 | % |
| July | | | | | | | 3.66 | % | | | 2.92 | % | | | -2.67 | % | | | -1.43 | % |
| August | | | | | | | -1.31 | % | | | -1.43 | % | | | 2.54 | % | | | 0.94 | % |
| September | | | | | | | -2.00 | % | | | -1.52 | % | | | 1.79 | % | | | 0.96 | % |
| October | | | | | | | -5.52 | % | | | -4.17 | % | | | 3.51 | % | | | -3.38 | % |
| November | | | | | | | -0.60 | % | | | -0.56 | % | | | -2.28 | % | | | 3.52 | % |
| December | | | | | | | 0.60 | % | | | -0.11 | % | | | 3.40 | % | | | -4.36 | % |
| Year | | | -1.74 | % | | | -5.19 | % | | | -13.05 | % | | | 0.68 | % | | | -6.04 | % |
| (1) | Worst Monthly Percentage Draw-Down is the largest monthly loss experienced by Grant Park in any calendar month expressed as a percentage of total equity in Grant Park and includes the month and year of that draw-down. |
| (2) | Worst Peak-to-Valley Draw-Down is the greatest cumulative percentage decline in month-end net asset value of Grant Park due to losses sustained by Grant Park during a period in which the initial month-end net asset value of Grant Park is not equaled or exceeded by a subsequent month-end net asset value of Grant Park and includes the time period in which the draw-down occurred. |
| (3) | The monthly rate of return is computed by dividing monthly performance by beginning monthly equity plus additions less redemptions. The monthly rates are then compounded to arrive at the annual rate of return. |
PAST PERFORMANCE IS NOT NECESSARILY INDICATIVE OF FUTURE RESULTS
THE CLEARING BROKERS
This supplement deletes the second paragraph on page 84 of the Prospectus under the heading “THE CLEARING BROKERS—Jefferies Bache, LLC—Legal Proceedings” in its entirety.
This supplement deletes the second paragraph on page 86 of the Prospectus under the heading “THE CLEARING BROKERS—Newedge USA, LLC—Legal Proceedings” in its entirety.
This supplement inserts the following paragraph on page 86 of the Prospectus after the fourth paragraph under the heading “THE CLEARING BROKERS—Newedge USA, LLC—Legal Proceedings” as follows:
In July 2013, Newedge USA settled, without admitting or denying the allegations, a matter brought by FINRA, on its behalf and on behalf of NYSE/NYSE ARCA, BATS and NASDAQ exchanges, involving rules and regulations pertaining to supervision of equities direct market access and sponsored access business, Regulation SHO and books and records retention. In connection with this matter, Newedge USA paid a fine of $9,500,000. In addition, Newedge USA agreed to retain an independent consultant to review its policies, systems, procedures and training relating to these areas and to implement the recommendation of such consultant based on its review and written reports.
This supplement deletes the seventh paragraph on page 87 of the Prospectus under the heading “THE CLEARING BROKERS—UBS Securities LLC—Legal Proceedings” in its entirety.
MANAGEMENT’S DISCUSSION AND ANALYSIS OF FINANCIAL CONDITION AND RESULTS OF OPERATIONS
This supplement revises and replaces the third and fourth paragraphs on page 72 of the Prospectus under the heading “MANAGEMENT’S DISCUSSION AND ANALYSIS OF FINANCIAL CONDITION AND RESULTS OF OPERATIONS—Organization of Grant Park” in their entirety as follows:
Effective August 1, 2013, there are no assets allocated to GP 5, GP 7, GP 11, and GP 12.
Grant Park invests through the trading companies with independent professional commodity trading advisors retained by the general partner. As of August 1, 2013, Rabar, EMC, ETC, Winton, Transtrend, Amplitude, Alder, Denali, Lynx, Quantica, and Eagle serve as Grant Park’s commodity trading advisors. Each of the trading
advisors is registered as a commodity trading advisor under the Commodity Exchange Act and is a member of the NFA. As of August 1, 2013, the general partner allocated Grant Park’s net assets through the respective trading companies among Rabar, EMC, ETC, Winton, Transtrend, Amplitude, Alder, Denali, Lynx, Quantica, and Eagle. No more than 20% of Grant Park’s assets are allocated to any one trading company and in turn, any one trading advisor. The general partner may terminate or replace the trading advisors or retain additional trading advisors in its sole discretion.
FEES AND EXPENSES
This supplement revises and replaces the first paragraph on pages 91-92 of the Prospectus under the heading “FEES AND EXPENSES—Fees and Expenses Paid by Grant Park—Incentive Fees” in its entirety as follows:
Grant Park pays each trading advisor a quarterly incentive fee based on any new trading profits achieved on the trading advisor’s allocated net assets at the end of each calendar period. Generally, new trading profits means the net increase in trading profits, realized and unrealized, experienced by the trading advisor on its allocated net assets from the most recent prior period in which an incentive fee was paid to the trading advisor, or if an incentive fee has yet to be paid to that trading advisor, the trading advisor’s initial allocation of net assets. Currently, the incentive fees payable to each of Grant Park’s trading advisors are as follows: 20.0% to Rabar, 22.5% to EMC, 24.0% to ETC, 20.0% to Winton, 22.5% to Transtrend, 23.5% to Amplitude, 22.0% to Alder, 24.0% to Denali, 23.0% to Lynx, 20.0% to Quantica, and 23.5% to Eagle.
This supplement revises and replaces the first paragraph on page 96 of the Prospectus under the heading “FEES AND EXPENSES—Fees and Expenses Paid by the General Partner—Trading Advisor Consulting Fees” in its entirety as follows:
Each trading advisor receives a consulting fee, payable by the general partner not Grant Park, ranging from 0% to 2% per year, computed and accrued monthly on the basis of the trading advisors allocated net assets either at the beginning of the month or at month-end and paid, depending on the trading advisor, either monthly or quarterly. As of August 1, 2013, the consulting fees payable to each of Grant Park’s trading advisors are as follows: Between 0.0% and 2.0% to Rabar, 1.5% to EMC, 1.0% to ETC, 1.0% to Winton, 1.5% to Transtrend, 1.5% to Amplitude, 1.0% to Alder, 1.0% to Denali, 0.5% to Lynx, 1.0% to Quantica, and 1.5% to Eagle. No advisor fees are payable with respect to certain advisors.
POTENTIAL ADVANTAGES OF INVESTMENT
This supplement revises and replaces the first paragraph on page 156 of the Prospectus under the heading “POTENTIAL ADVANTAGES OF INVESTMENT—Professional Trading” in its entirety as follows:
As of August 1, 2013, Grant Park’s trading decisions are made by Rabar Market Research, Inc., EMC Capital, Management, Inc., Eckhardt Trading Company, Winton Capital Management Limited, Transtrend B.V., Amplitude Capital International Limited, Alder Capital Limited, Denali Asset Management, LLLP, Lynx Asset Management AB, Quantica Capital AG, and Eagle Trading Systems Inc. Each trading advisor uses its own proprietary trading program.
SUPPLEMENTAL PERFORMANCE INFORMATION
This supplement revises and replaces the chart on page 179 of the Prospectus titled, “SUPPLEMENTAL PERFORMANCE INFORMATION – Trading Advisor Overview” as follows:
SUPPLEMENTAL PERFORMANCE INFORMATION
Trading Advisor Overview
December 31, 2012
| | | Amplitude Capital International Ltd. | Denali Asset Management, LLLP | Eagle Trading Systems Inc. | | | | | | | Winton Capital Management Ltd |
| Firm Assets Under Management | $516M | $1.2B | $1.1B | $2.5B | $551.3M | $89.3M | $5.1B | $3.4B | $341.3M | $8.6B | $25.6B |
Program | Alder Global 20 | Sinfonie | Global Macro Discretionary | Eagle Global | Standard Plus | Classic | Lynx | Global | Diversified | Diversified Trend Program - Enhanced Risk (USD) | Diversified |
| Program Assets Under Management | $499M | $305.60 | $1.1B | $901.0M | $159.4M | $89.3M | $5.1B | $3.9B | $277.4M | $6.8B | $25.2B |
Program Inception | Feb-01 | Sep-09 | Jun-00 | Aug-95 | Oct-91 | Jan-85 | May-00 | Dec-01 | Jan-89 | Jan-95 | Oct-97 |
| Began Trading for Grant Park | Feb-11 | Apr-10 | Feb-11 | Jul-13 | Jun-07 | Jan-89 | Nov-12 | Oct-08 | Jan-89 | Jul-08 | Aug-04 |
| Margin/Equity Average | 9.10% | 15.19% | 2.16% | 20.00% | 9.54% | 13.00% | 12.50% | 11.00% | 9.08% | 15.00% | 6.20% |
| Roundturns per Million | 125 | 6000 | 3,000 to 6,000 | 800 | 1,342 | 2000 | 1500-2000 | 1200 | 1006 | 1200 | 661 |
| Approximate Number of Markets Traded | Pairs and Crosses using 7 currencies - total universe of 21 possible currency pairs | 74 | 100 | 37 | 64 | 80 | 60 | 60 | 109 | 478 | 100+ |
| Number of Trading Systems | 1 | 2 | 0 | 1 | Multiple | 6 | 34 | 1 | Multiple | Multiple | Multiple |
| Time Horizon (average holding period) | 6 days | 2 Days | 1-5 days | 47 day | 2.6 - 60+ days | 28 days | 6-8 weeks | 6-7 Days | 28 days | Approx. 5 weeks | Ranges from short- to long-term |
| Compounded Annual ROR Since Inception | 6.50% | -0.14% | 14.75% | 14.14% | 19.92% | 21.13% | 12.16% | 11.86% | 12.02% | 14.14% | 14.80% |
| Compounded Annual ROR Last 5 Years * | 3.40% | -0.14% | 6.30% | 12.37% | 2.64% | 4.80% | 6.35% | 5.85% | 5.95% | 3.94% | 6.25% |
| Worst Drawdown Period Since Inception | May-2003 to Aug-2004 | Sep-2009 to Feb-2010 | Sep-2003 to Nov-2003 | Oct-2003 to Sep-2004 | Dec-1991 to May-1992 | Jun-1995 to May-1996 | Oct 2011 - Dec 2012 | Sep-2009 to Jun-2011 | June 1995-August 1998 | Feb-2009 to Jan-2010 | Oct-2001 to Feb-2002 |
| Worst Drawdown Percentage Since Inception | -28.50% | -11.63% | -10.71% | -32.08% | -40.39% | -45.16% | -12.40% | -11.74% | -29.81% | -15.15% | -25.59% |
| Worst Drawdown Period Last 5 Years * | Apr-2011 to Apr-2012 | Sep-2009 to Feb-2010 | Oct-2011 to Dec-2012 | Nov-2009 to Aug-2010 | Apr-2011 to Nov-2011 | Dec-2008 to Feb-2010 | Oct 2011 - Dec 2012 | Sep-2009 to Jun-2011 | May 2011-Present (measured monthly) | Feb-2009 to Jan-2010 | Jan-2009 to Jul-2009 |
| Worst Drawdown Percentage Last 5 Years * | -20.60% | -11.63% | -7.07% | -17.19% | -24.81% | -24.56% | -12.40% | -11.74% | -24.49% | -15.15% | -9.31% |
| Annualized Standard Deviation Since Inception | 15.70% | 13.16% | 11.44% | 23.45% | 29.38% | 48.24% | 14.56% | 10.55% | 21.95% | 14.14% | 17.53% |
| Annualized Standard Deviation Last 5 Years * | 14.50% | 13.16% | 7.56% | 19.11% | 16.89% | 18.56% | 15.97% | 10.13% | 16.12% | 10.67% | 9.35% |
* 5 year period=1/2008 to 12/2012 or since inception for shorter track records.
Notes:
(1) The range and average of margin to equity ratio for Rabar is computed without giving effect to certain foreign currency contracts which are traded in the OTC foreign exchange markets. Depending upon the margin requirements imposed by the particular clearing firm, inclusion of these markets would likely increase the range and average of the margin to equity ratio, in some cases significantly.
This table and chart was prepared by Dearborn Capital Management, L.L.C.
based on unaudited information provided to Dearborn by each trading advisor.
See the glossary in Appendix E for definitions relevant to this table.
ALL PERFORMANCE REPORTED IS NET OF FEES AND EXPENSES.
PAST PERFORMANCE IS NOT INDICATIVE OF FUTURE RESULTS.