UNITED STATES
SECURITIES AND EXCHANGE COMMISSION
Washington, D.C. 20549
FORM 20-F
| ¨ | REGISTRATION STATEMENT PURSUANT TO SECTION 12(b) OR (g) OF THE SECURITIES EXCHANGE ACT OF 1934 |
| ý | ANNUAL REPORT PURSUANT TO SECTION 13 OR 15(d) OF THE SECURITIES EXCHANGE ACT OF 1934 |
For the fiscal year ended March 31, 2002
| ¨ | TRANSITION REPORT PURSUANT TO SECTION 13 OR 15(d) OF THE SECURITIES EXCHANGE ACT OF 1934 |
Commission File Number 0-17551
DYNAMIC OIL & GAS, INC.
(formerly Dynamic Oil Limited)
(Exact name of Registrant as specified in its charter)
Province of British Columbia (Canada)
(Jurisdiction of incorporation or organization)
205 - 10711 Cambie Road
Richmond, British Columbia V6X 3G5, Canada
(Address of principal executive offices)
Securities registered or to be registered pursuant to Section 12(b) of the Act: None
Securities registered pursuant to Section 12(g) of the Act:
Common Stock Without Par Value
Securities for which there is a reporting obligation pursuant to Section 15(d) of the Act: None
Indicate the number of outstanding shares of each of the Issuer’s classes of capital or common stock as of the close of the period covered by the Annual Report:
| Title of Each Class | Outstanding at August 19, 2002 |
| Common Stock Without Par Value | 20,462,230 Shares |
Indicate by check mark whether the registrant (1) has filed all reports required to be filed by Section 13 or 15(d) of the Securities Exchange Act of 1934 during the preceding 12 months (or for such shorter period that the Company was required to file such reports), and (2) has been subject to such filing requirements for the past 90 days. Yes X No
Indicate by check mark which financial statement item the Company has elected to follow. Item 17. X Item 18.
TABLE OF CONTENTS
| Page
|
| Glossary of Terms | 3 |
| | |
| Part I. | |
| Item 1. Identity of Directors, Senior Management and Advisers | N/A |
| Item 2. Offer Statistics and Expected Timetable | N/A |
| Item 3. Key Information | 6 |
| Item 4. Our Information | 13 |
| Item 5. Operating and Financial Review and Prospects | 31 |
| Item 6. Directors, Senior Management and Employees | 42 |
| Item 7. Major Shareholders and Related Party Transactions | 51 |
| Item 8. Financial Information | 51 |
| Item 9. The Offer and Listing | 52 |
| Item 10. Additional Information | 53 |
| Item 11. Quantitative and Qualitative Disclosures About Market Risk | 62 |
| Item 12. Description of Securities Other than Equity Securities | 64 |
| | |
| Part II. | |
| Item 13. Defaults, Dividend Arrearages and Delinquencies | 65 |
| Item 14. Material Modifications to the Rights of Security Holders and Use of Proceeds | 65 |
| Item 15. [Reserved] | n/a |
| Item 16. [Reserved] | n/a |
| | |
| Part III. | |
| Item 17. Financial Statements | 65 |
| Item 18. Financial Statements | 65 |
| Item 19. Exhibits | 65 |
Glossary of Terms
|
Air drilling | A method of drilling that uses compressed air as a medium for transporting drill cuttings to surface. |
Basal Quartz zone
| A name generally applied to the Ellerslie formation as it occupies the “bottom” sandstone of the Mannville Group of lower Cretaceous age about 124 millions years of age. |
| Bbl or Barrel | 42 U.S. gallons liquid volume of crude oil or natural gas liquids. |
| Bcf | Billion cubic feet of gas. Usual expression of proved reserve gas volume. |
Belly River formation | Late Cretaceous Age sandstones and shales deposited from 75 to 84 million years ago. |
Blairmore formation | Formation encompassing clastic sediments deposited in the Early Cretaceous Age from about 100 to 120 million years ago. |
Blue Sky formation | Sandstones of the Lower Cretaceous, about 112 million years old, occurring in Northern Alberta and NE BC. |
BOE
| Barrels of Oil Equivalent. Generally one barrel of oil equals six mcf of gas. Allows reserves of oil and gas to be added together. |
| BOE/d | An expression of barrels of oil equivalent produced per day. |
Carbonates | Rocks composed predominantly of Calcium Carbonate (CaCO3). |
Condensate
| A mixture comprising pentanes and heavier hydrocarbons recovered as a liquid from field separators, scrubbers or other gathering facilities or at the inlet of a processing plant before the gas is processed. |
| Cretaceous Age | Rocks from 144 million to 66.4 million years of age. |
Crown royalty | An amount payable to the government of the applicable Canadian province in relation to the production of petroleum, natural gas or related hydrocarbons from an oil or gas well located on Crown lands. |
Crude oil
| A mixture, consisting mainly of pentanes and heavier hydrocarbons that may contain sulphur compounds, that is liquid at the conditions under which its volume is measured or estimated, but excluding such liquids obtained from the processing of natural gas. |
| Depletion | The reduction in petroleum reserves due to production. |
| Development or developed | Refers to the phase in which a proven oil or gas field is brought into production by drilling and completing production wells and the wells, in most cases, are connected to a petroleum gathering system. |
| Devonian Age | Rocks from 408 million to 360 million years of age. |
Discovery | The location, learned through drilling of a well, where there exists an accumulation of gas, condensate or oil reserves. The size of the reserves may be estimated but not precisely quantified and may or may not be commercially economic, depending on a number of factors. |
Drill stem test
| A method of packing off the pressure of drilling mud weight to allow a prospective oil or gas formation to flow into the drill stem pipe. Drill stem test results assist in evaluating the potential of the zone to flow or to be pumped commercially. |
Dry hole | A well drilled without finding commercially economic quantities of hydrocarbons. |
Ellerlsie zone or formation
| A name applied to a group of sandstones that are clear and quartzose with good porosity and permeability for oil and gas about 124 millions years of age. |
Exploration well | A well drilled in a prospect without knowledge of the underlying sedimentary rock or the contents of the underlying rock. |
Farmin
| By way of agreement, a party earns (farmin) an interest in lands comprising petroleum and natural gas rights from another party by drilling a well or similar activity which evaluates, explores or develops the lands for the production of petroleum substances. |
Farmout | By way of agreement, a party gives up (farmout) an interest in lands comprising petroleum and natural gas rights to another party who earns the interest by drilling a well or similar activity which evaluates, explores or develops the lands for the production of petroleum substances. |
Field | An area that is producing, or has been proven to be capable of producing, hydrocarbons. |
Field netbacks | Revenues from the sale of all commodities produced, less applicable resource and production royalties, less operating costs. |
| Formation | A reference to a group of rocks of the same age extending over a substantial area of a basin. |
Freehold royalty | An amount payable to a mineral rights holder in relation to the production of petroleum, natural gas or related hydrocarbons from an oil or gas well located on non-Crown lands. |
GAAP | Generally accepted accounting principles. |
Geology | The science relating to the history and development of the Earth. |
Glauconite
| A sand group from the Upper Mannville (Lower Cretaceous Age) about 110 million years ago with a green mineral constituent. |
| Gross acres | The total acreage in which the Company has an interest. |
Hackett formation | A sand package that occurs at the base of the Mannville Formation (Lower Cretaceous Age), 118 to 120 million years old. |
Hectare | A land measurement equaling 2.471 acres. |
Horizontal well
| A vertical well bore which is gradually deviated (usually horizontally to 90 0) in order to intersect the targeted formation. |
| Hydrocarbon | The general term for oil, gas, condensate, liquids and other petroleum products. |
| Jean Marie formation | A patch reef carbonate reservoir within the Winterburn Group of the Upper Devonian Age, about 367 to 369 million years old. The Jean Marie is found in NE British Columbia and is the stratigraphic equivalent to the lower Nisku formation in Alberta. |
| kilometer | A measurement of distance equaling 0.621 miles or 3,281 feet. |
| Leduc (D-3) formation | An reefal carbonate reservoir found within Woodbend Group of the Upper Devonian Age, about 369 to 373 million years old. These ancient Leduc reefs were the initial target for oil and gas exploration in Alberta. Leduc No. 1, approximately 30 km. South of St. Albert, was the discovery well for conventional oil in Western Canada. |
| Logs | Recordings from electrical and radioactive source devices that are run down wellbores to measure petrophysical properties of the adjacent rocks. |
| Lower Mannville gas | Any gas sands found in the lower half of the Lower Cretaceous Age zones, about 110 million years old. These sands may comprise the Ostracod, Basal Quartz or Ellerlsie zones. |
| mbbl | 1,000 barrels of oil and/or natural gas liquids. |
| mboe | 1,000 barrels of oil equivalent. See ‘BOE’ for further details. |
| mcf | 1,000 cubic feet of natural gas. |
| mcf/d | 1,000 cubic feet of natural gas production per day. Usually used to express the production rate of a group of gas wells. |
| meter | A physical measurement equaling 3.281 feet. |
| Mineral taxes (freehold) | An amount levied by the government of Alberta in relation to the production of petroleum, natural gas or related hydrocarbons from an oil or gas well located on non-government (freehold) lands in Alberta. |
| mmcf | 1,000,000 cubic feet of natural gas. |
mmcf/d
| 1,000,000 cubic feet of natural gas production per day. Usually used to express the production rate of a gas well or group of gas wells. |
Natural gas
| The lighter hydrocarbons and associated non-hydrocarbon substances occurring naturally in an underground reservoir, which under atmospheric conditions are essentially a gas, but which may contain liquids. |
| NGL’s | Natural gas liquids. Hydrocarbon components recovered from raw natural gas as liquids by processing through extraction plants or recovered from field separators, scrubbers or other gathering facilities. These liquids include the hydrocarbon components ethane, propane, butane and pentane plus, or combinations thereof. |
| Net acres | The percentage of gross acreage in which the Company has a working interest. |
| Nisku (D-2) formation | A reefal carbonate reservoir in the Winterburn Group of the Upper Devonian Age, about 367 to 369 million years old. The Nisku is found exclusively within Alberta but it is a stratigraphic equivalent to the Jean Marie formation in British Columbia. |
Ostracod zone
| Rocks from the Lower Cretaceous Age approximately 119 million years ago comprised of sandstones and marlstones which contain a small fossil named Ostracod. |
Ostracod well
| A gas well capable of producing commercially from the Lower Cretaceous Age Ostracod zone. |
| Operator | That party to a joint venture agreement whose responsibility it is to carry out all exploratory, development, maintenance and record-keeping duties on behalf of other joint venture partners in relation to hydrocarbon extraction on the joint-ventured lands. |
| Overriding royalty | An amount payable to a third party other than crown or freehold in relation to the production of petroleum, natural gas or related hydrocarbons from an oil or gas well located on lands in which the interest of the third party usually arises out of a separate agreement. |
| Pentanes | A hydrocarbon by-product of natural gas generally referred to as condensate that is of the paraffin series having a chemical formula of C5H12 and having all its carbon atoms joined in a straight chain. |
| Permeability | Capacity of a rock for transmitting a fluid. |
| Permit or licence area | An area that is granted for a prescribed period of time for exploration, development or production under specific contractual or legislative conditions. |
| Pipeline | A system of interconnected pipes that gather and transport hydrocarbons from a well or field to a processing plant or to a facility that is built to take the hydrocarbons for further transport, such as a gas liquefaction plant. |
Probable reserves
| Those reserves which analysis of drilling, geological, geophysical and engineering data do not demonstrate to be proved with current technology and under existing economic conditions, but where such analysis suggests the likelihood of their existence and future recovery. Probable reserves to be obtained will be the increased recovery beyond estimated proved reserves that can be realistically estimated for the pool through enhanced recovery processes which can reasonably be expected to be instituted in the future. |
Proved reserves
| Those reserves estimated as recoverable with current technology and under existing economic conditions, from that portion of a reservoir which can be reasonably evaluated as economically productive through analysis of drilling, geological, geophysical and engineering data. This includes the reserves to be obtained by enhanced recovery processes demonstrated to be economically and technically successful in the subject reservoir. |
| Quartzose | Rocks composed of mostly quartz. |
Raw gas
| Gaseous effluent from a wellhead or pipeline that is not processed. Contains water vapor, carbon dioxide, nitrogen and possibly hydrogen sulphide (H2S) gas. |
Reservoir rock
| Porous limestones, dolomites or sandstones which can trap oil and/or gas in interconnected holes, like a sponge. |
| Royalty | A stated or determinable percentage of the proceeds received from the sale of hydrocarbons calculated as prescribed in applicable legislation or in the agreement with the royalty holder. |
| Seals | Impermeable barriers to hydrocarbon flow such as shale, lime muds, salt or anhydrite. |
| Seismic | A geophysical technique using low frequency sound waves to determine the subsurface structure of sedimentary rocks. |
Sour gas
| Raw gas with an amount of hydrogen sulphide (H2S) gas above pipeline requirements of 10 parts H2S per million raw gas. |
| Source rock | Usually shales and clays with a high carbon content deposited in a marine environment. |
| Sweet gas | Natural gas containing no hydrogen sulphide (H2S) gas. |
| Stabilized absolute open flow | The maximum rate of gas production that a wellhead will produce assuming no back pressure when the well is stable. |
| Tertiary sediment | Soft rock of sands, clays, coals and siltstones from 66.4 to 1.6 million years old. |
| Undeveloped | Prior to the time in which a proven oil or gas field is brought into production by drilling and completing production wells. |
| Vertical well | A well bore that intersects the section(s) containing hydrocarbons at about 900. |
Viking gas well
| A well capable of commercial gas production from the Upper Cretaceous Viking sands deposited about 97.5 million years ago. |
| Wabamun (D-1) formation | Cyclical ramp carbonates deposited approximately 360 – 367 million years ago during the Upper Devonian Age period. |
| Working interest | Those lands in which the Company receives its share acreage net production revenues. |
Item 1. Identity of Directors, Senior Management and Advisers
Item 2. Offer Statistics and Expected Timetable
Selected Financial Data
The following table summarizes certain of our financial information that is derived from and should be read in conjunction with our financial statements and “Item 5 – Operating and Financial Review and Prospects” included elsewhere in this report. The selected financial data has been prepared in accordance with Canadian Generally Accepted Accounting Principles (Canadian GAAP). The financial statements and the notes thereto included in Item 17 in this report are also prepared under Canadian GAAP. Included in Note 11 to the financial statements is the reconciliation between Canadian GAAP and United States generally accepted accounting principles (U.S. GAAP). Unless otherwise stated in this report, all references to dollars are to Canadian dollars.
Selected Financial Data Presented According to Canadian GAAP
|
| For the years ended March 31 ($ 000’s) | 2002 | 2001 | 2000 | 1999 | 1998 |
| Statements of Operations | | | | | |
| Gross revenues | 26,402 | 34,463 | 15,770 | 9,495 | 2,149 |
| Net revenues | 14,215 | 20,524 | 7,438 | 3,857 | 892 |
| Funds flow from operations | 11,337 | 18,168 | 5,634 | 2,634 | (143) |
| Funds flow per share, basic ($) | 0.55 | 0.91 | 0.29 | 0.13 | (0.01) |
| Funds flow per share, diluted ($) | 0.55 | 0.89 | 0.28 | 0.13 | (0.01) |
| (Loss) earnings before taxes | (5,420) | 14,449 | 2,871 | 1,212 | (2,361) |
| Net (loss) earnings | (3,519) | 9,714 | 4,079 | 1,212 | (2,361) |
| Common shares – weighted avg. (# 000’s) | 20,365 | 19,938 | 19,710 | 19,892 | 16,253 |
Net (loss) earnings per share, basic ($)
Net (loss) earnings per share, diluted ($) | (0.17)
(0.17) | 0.49
0.48 | 0.21
0.20 | 0.06
0.06 | (0.15)
(0.13) |
| | | | | | |
| Balance Sheets | | | | | |
| Working capital (deficiency) | (13,281) | 1,969 | (3,716) | (1,225) | (4,233) |
| Total assets | 37,152 | 29,991 | 18,811 | 12,487 | 13,185 |
| Current liabilities | 19,625 | 6,210 | 7,717 | 3,950 | 7,532 |
| Long-term liabilities | 824 | 540 | 402 | 404 | 370 |
| Deferred gain on sale | 109 | 340 | 652 | 997 | - |
| Future income tax liability | - | 2,955 | - | - | - |
Net assets
Share capital | 16,593
20,915 | 19,947
20,642 | 10,041
20,420 | 7,136
21,080 | 5,283
20,195 |
| Deficit | (4,322) | (695) | (10,379) | (13,944) | (14,912) |
Selected Financial Data Presented According to U.S. GAAPThe following table reflects the major differences in the application of Canadian GAAP and U.S. GAAP:
| |
| For the years ended March 31 ($ 000’s) | 2002 | 2001 | 2000 | 1999 | 1998 |
| Statements of Operations | | | | | |
| Net (loss) earnings under Canadian GAAP | (3,519) | 9,714 | 4,079 | 1,212 | (2,361) |
| Reconciling adjustments * | �� | | | | |
| Compensatory stock options issued | - | - | - | (8) | - |
| Options issued for services | - | (20) | - | - | - |
| Ceiling test adjustment to natural gas properties | (216) | - | (145) | - | - |
| Income taxes | 669 | (577) | - | - | - |
| Net (loss) earnings under U.S. GAAP | (3,066) | 9,117 | 3,934 | 1,204 | (2,361) |
| Net (loss) earnings/share, U.S. GAAP basic ($) | (0.15) | 0.46 | 0.20 | 0.06 | (0.15) |
| Net (loss) earnings/share, U.S. GAAP diluted ($) | (0.15) | 0.45 | 0.19 | 0.06 | (0.13) |
|
| After adjusting for certain differences, selected balance sheet items under U.S. GAAP would become: |
| Balance Sheets | | | | | |
| Future income tax liability | - | 3,532 | - | - | - |
| Share capital * | 21,883 | 21,610 | 21,368 | 21,802 | 21,152 |
| Deficit | (5,422) | (2,356) | (11,473) | (14,896) | (15,869) |
* For complete explanations of the reconciling adjustments shown below, see Note 11 attached to the Financial
Statements presented under Item 17 to this report. |
Dividends
We have never paid or declared dividends on our shares of common stock and we do not intend to do so for the foreseeable future. We intend to use our retained earnings to finance growth.
Our financial statements, as provided under Items 8 and 17, are presented in Canadian dollars. For comparison purposes, exchange rates into U.S. dollars (the host country currency) are provided. The following tables set forth the average, end, high and low exchange rates for the months indicated and the average exchange rates for the years indicated, based on the noon U.S. dollar buying rate in New York City for cable transfers in Canadian dollars as certified for customs purposes by the Federal Reserve Bank of New York (Canadian Dollar = U.S. $1.00).
Exchange Rates for Canadian Versus U.S. Dollars
The exchange rate as of August 13, 2002 was CDN $1.5658 per U.S. $1.00.
| Exchange Rates for Canadian Versus U.S. Dollars |
| (High/Low Rates for Recent Months) | High | Low |
| July, 2002 | 1.5880 | 1.5145 |
| June, 2002 | 1.5499 | 1.5108 |
| May, 2002 | 1.5708 | 1.5275 |
| April, 2002 | 1.5995 | 1.5632 |
| March, 2002 | 1.5958 | 1.5767 |
| February, 2002 | 1.6112 | 1.5885 |
| Exchange Rates for Canadian Versus U.S. Dollars |
| Years Ended March 31 | Average ($) |
| 2002 | 1.57 |
| 2001 | 1.50 |
| 2000 | 1.47 |
| 1999 | 1.50 |
| 1998 | 1.40 |
Capitalization and Indebtedness
Reasons for the Offer and Use of Proceeds
Risk Factors
Commodity Price Fluctuations
Our products, including natural gas, NGL’s and oil, and other hydrocarbon products, are commodities. Because our contracts do not fix a long-term price for the products we purchase or sell, market changes in the price of such products have a direct and immediate effect (whether favorable or adverse) upon our revenues and profitability. Prices for products may be subject to material change in response to relatively minor changes in supply and demand, general economic conditions and other market conditions over which we have no control. Other conditions affecting our business include the level of domestic oil and gas production, the availability and prices of competing commodities and of alternative energy sources, the availability of local, intraprovincial and interprovincial transportation systems with adequate capacity, the proximity of gas production to gas pipelines and facilities, the availabili ty of pipeline capacity, government regulation, the seasons, the weather and the impact of energy conservation efforts.
Availability of Natural Gas Supply
We must connect new wells to our gathering systems, contract for new natural gas supplies with third party pipelines or acquire additional gathering systems in order to maintain or increase throughput levels to offset current annual production volumes. Historically, while certain individual facilities have experienced decreases in dedicated reserves, we have connected new wells and contracted for new supplies with third-party pipelines which more than offset production depletion of our existing wells. Our ability to connect new wells to existing facilities is dependent upon levels of our oil and gas development activity near existing facilities. Significant competition for connections to newly drilled wells exists in every geographic area served by us. Significant competition also exists for the acquisition of existing gathering systems. There can be no assurance that we will renew our existing supply contracts or that we will be able to acquire new supplies of natural gas at a rate necessary to offset depletion of wells currently under contract. In the event such circumstances were to occur, our field netbacks would decrease until, and if, such circumstances could be resolved.
Dependence on Third Party Pipelines
In fiscal 2002, substantially all our sales of natural gas were effected through deliveries to local third party gathering systems to processing plants in Alberta owned by ATCO Midstream Ltd. and Northwestern Utilities Limited. In addition, we rely on access to interprovincial pipelines for the sale and distribution of substantially all of our gas. As a result, a curtailment of our sale of natural gas by pipelines or by third-party gathering systems, an impairment of our ability to transport natural gas on interprovincial pipelines or a material increase in the rates charged to us for the transportation of natural gas by reason of a change in federal or provincial regulations or for any other reason, could have a material adverse effect upon us. In such event, we would have to obtain other transportation arrangements or we would have to construct alternative pipelines. There c an be no assurance that we would have economical transportation
alternatives or that it would be feasible for us to construct pipelines. In the event such circumstances were to occur, our field netbacks from the affected wells would be suspended until, and if, such circumstances could be resolved.
Operating History and Significant Historical Operating Losses
We commenced operations in 1979. We have one major property, which began as a one-well producing property in 1985. By fiscal 1999, the property became our major producing property with up to twenty-four producing natural gas and oil wells. Due to the relatively short four-year production history from the majority of wells on the property, proved reserves and future production attributable to this property are somewhat more susceptible to estimation discrepancies than fields with longer production histories.
We first experienced earnings in fiscal 1999 of $1,211,638 as compared with losses of $2,361,280 and $910,926 in fiscal years 1998 and 1997, respectively. In fiscals 2000 and 2001, we reported earnings of $4,078,577 and $9,714,030 respectively and in fiscal 2002, we returned to a loss of $3,519,085. As of March 31, 2002, we had an accumulated deficit of $4,321,539. Our future viability must continue to be considered in light of the risks and difficulties frequently encountered by companies engaged in the junior stages of oil and gas exploration, development and production activities.
Dependence on Key Personnel
Our success depends in large part on the personal efforts of our President & Chief Executive Officer, Wayne J. Babcock, our Vice President & Chief Operating Officer, Donald K. Umbach, our Vice President of Exploration, James R. Britton, and our Chief Financial Officer & Corporate Secretary, Michael A. Bardell. The loss of the services of any of these persons could have a material adverse effect on us.
Risks Pertaining to Acquisitions and Joint Ventures
Part of our business strategy is to expand through acquisitions. Our future growth is partially dependent upon our ability to complete suitable acquisitions and effectively integrate acquired assets into our operations. Suitable acquisitions, on terms acceptable to us, may not be available in the future or may require us to assume certain liabilities, including, without limitation, environmental liabilities, known or unknown.
Potential Variability in Quarterly Operating Results
Demand for our products will generally increase during the winter because they are often used as heating fuels. The amount of such increased demand will depend to some extent upon the severity of winter. Accordingly, our net operating revenues are likely to increase during winter months although the amount of increase and its effect on profitability cannot be predicted. Because of the seasonality of our business and continuous fluctuations in the prices of our products, our operating results for any past quarterly period may not necessarily be indicative of results for future periods and there can be no assurance that we will be able to maintain steady levels of profitability on a quarterly or annual basis in the future.
Dependence on One Major Property
Currently, our major producing asset is our property located at St. Albert, Alberta. While the St. Albert property as of March 31, 2002 has developed into 16 separate, mutually-exclusive oil and gas pools stacked in 7 productive formations (3 oil and 4 gas), each pool has its own reserves and future production risk, and thus it is important for us to establish producing fields in other areas. Unless we can successfully drill for or acquire economically viable reserves of oil and/or natural gas in other areas, as our production depletes the reserves at St. Albert, our revenue may be materially adversely affected.
Limited Financial Resources We expect to continue to produce enough cash flow, along with our bank credit facility, to support land acquisitions, drilling operations, facilities construction and general /administration costs. At this time, we believe that our cash flow and credit facility will be sufficient to support our business activities without securing significant

|
additional financing in the near future. If it were to become necessary to raise significant additional financing, any arrangements that may be entered into could be expensive to us. There can be no assurance that we will be able to raise additional capital in light of factors such as the market demand for our securities, the state of financial markets for independent oil companies (including the markets for debt), oil and gas prices and general market conditions. (See "Operating and Financial Review and Prospects" for a discussion of our capital budget). We expect to continue using our bank credit facility to borrow funds to supplement our available cash. The amount we may borrow under the credit facility may not exceed a borrowing base determined by the lender based on its projections of our future production, future costs of production, taxes, commodity prices and other factors. We cannot control the assumptions the lender uses to calculate the borrowing base. The lender may, without our consent, adjust the borrowing base at any time. If our borrowings under the credit facility exceed the borrowing base, the lender may require that we repay the excess. If this were to occur, we may have to sell assets or seek financing from other sources. We can make no assurances that we would be successful in selling assets at prices acceptable to us or arranging substitute financing. For a description of our bank credit facility and its principal terms and conditions, see "Operating and Financial Review and Prospects” under Item 5, and Note 3 attached to the Financial Statements under Item 17 of this report.
Exploration and Development Risks
Exploration and development of natural gas and oil involves a high degree of risk that no commercial production will be obtained or that the production will be insufficient to recover drilling and completion costs. The costs of drilling, completing and operating wells is sometimes uncertain, and cost overruns in exploration and development operations can adversely affect the economics of a project. Our drilling operations may be curtailed, delayed or canceled as a result of numerous factors, including title problems, equipment failures, weather conditions, marine accidents, fires and explosions, compliance with governmental requirements, and shortages or delays in the delivery of equipment. Furthermore, completion of a well does not ensure a profit on the investment or a recovery of drilling, completion and tie-in costs.
We have historically invested a significant portion of our capital budget in drilling exploratory wells in search of unproved oil and gas reserves. We cannot be certain that the exploratory wells we drill will be productive or that we will recover all or any portion of our investments. In order to increase the chances for exploratory success, we often invest in seismic or other geoscience data to assist us in identifying potential drilling objectives. Additionally, the cost of drilling, completing and testing exploratory wells is often uncertain at the time of our initial investment. Depending on complications encountered while drilling, the final cost of the well may significantly exceed that which we originally estimated.
Operating Hazards and Uninsured Risks
The oil and gas business involves a variety of operating risks, including fire, explosion, pipe failure, casing collapse, abnormally pressured formations, and environmental hazards such as oil spills, gas leaks and discharges of toxic gases. The occurrence of any of these events with respect to any property operated or owned (in whole or in part) by us could have a material adverse impact on us. We, and the operators of our properties, maintain insurance in accordance with customary industry practices and in amounts that we believe to be reasonable. However, insurance coverage is not always economically feasible and is not obtained to cover all types of operational risks. The occurrence of a significant event that is not fully insured could have a material adverse effect on our financial condition.
Drilling and Operating Risks
Our oil and gas operations are subject to all of the risks and hazards typically associated with drilling for, and production and transportation of, oil and gas. These risks include the necessity of spending large amounts of money for identification and acquisition of properties and for drilling and completion of wells. In the drilling of exploratory or development wells, failures and losses may occur before any deposits of oil or gas are found. The presence of unanticipated pressure or irregularities in formations, blowouts or accidents may cause such activity to be unsuccessful, resulting in a loss of our investment in such activity. If we find oil or gas we cannot assume that it can be produced in economic quantities sufficient to justify the cost of continuing such operations or that it can be marketed satisfactorily.
Drilling Plans Subject to Change
This report includes descriptions of our future drilling plans with respect to our prospects. A prospect is a property on which our geoscientists have identified what they believe, based on available seismic and geological information, to be indications of hydrocarbons. Our prospects are in various stages of review. Whether or not we ultimately drill a prospect may depend on the following factors: receipt of additional seismic data or reprocessing of existing data; material changes in oil or gas prices; the costs and availability of drilling equipment; success or failure of wells drilled in similar formations or which would use the same production facilities; availability and cost of capital; changes in the estimates of costs to drill or complete wells; our ability to attract other industry partners to acquire a portion of the working interest to reduce exposure to costs and drilling risks; decisions of our joint working interest owne rs; and restrictions imposed by governmental agencies. We will continue to gather data about our prospects, and it is possible that additional information may cause us to alter our drilling schedule or determine that a prospect should not be pursued at all.
Replacement of Reserves
In general, the rate of production from natural gas and oil properties declines as reserves are depleted. The rate of decline depends on reservoir characteristics and other factors. Except to the extent we acquire properties containing proved reserves or conduct successful exploration and development activities, or both, our estimated proved reserves will decline as reserves are produced. Our future natural gas and oil production, and therefore cash flow and income, are highly dependent upon our level of success in finding or acquiring additional economically recoverable reserves. The business of exploring for, developing and acquiring reserves is capital intensive. To the extent cash flow from operations is reduced and external sources of capital become limited or unavailable, our ability to make the necessary capital investment to maintain or expand our asset base of natural gas and oil reserves could be materially impair ed.
Dependence on Few Customers
In fiscal 2002, the majority of our total natural gas sales were split evenly between two customers and our total natural gas liquids, between three different customers. We do not believe that the loss of one of our customers would have a material adverse effect on us because of the availability of other customers willing or interested in purchasing our products.
Information relating to proved natural gas and oil reserves owned by us and those attributable to our producing properties is based upon engineering estimates. Reserve engineering is a subjective process of estimating the recovery from underground accumulations of natural gas and oil that cannot be measured in an exact manner, and the accuracy of any reserve estimate is a function of the quality of available data and of engineering and geological interpretation and judgment. Estimates of economically recoverable oil and gas reserves depend upon a number of variable factors and assumptions, such as historical production from the area compared with production from other producing areas, the effects of governmental regulations, future oil and gas prices, future operating costs, excise taxes, development costs and workover and remedial costs, all of which may vary considerably from actual results. Because all reserve estimates are to some degree speculative, th e quantities of natural gas and oil that are ultimately recovered, production and operating costs, the amount and timing of future development expenditures and future natural gas and oil sales prices may all vary from those assumed in these estimates and such variances may be material. Additionally, different reserve engineers may make different estimates of reserve quantities based on the same data.
Shortage of Supplies and Equipment
Our ability to conduct operations in a timely and cost effective manner is subject to the availability of oil and gas field supplies, rigs, equipment and service crews. Although none are expected currently, any shortage of certain types of supplies and equipment could result in delays in our operations as well as in higher operating and capital costs.
Government Regulation and Environmental Matters
We are subject to various federal and provincial laws and regulations including environmental laws and regulations. We believe that we are in substantial compliance with such laws and regulations, however, such laws and regulations may change in the future in a manner which will increase the burden and cost of compliance. In addition, we could incur significant liability for damages, cleanup costs and penalties in the event of certain discharges into the environment.
Certain laws and governmental regulations may impose liability on us for personal injuries, clean-up costs, environmental damages and property damages, as well as administrative, civil and criminal penalties. We maintain limited insurance coverage for sudden and accidental environmental damages, but do not maintain insurance coverage for the full potential liability that could be caused by sudden and accidental environmental damage. Accordingly, we may be subject to liability or may be required to cease production from properties in the event of such damages.
The main bodies of regulations that apply to us in the areas in which we have significant field operations are The Oil and Gas Conservation Act of Alberta and The Petroleum and Natural Gas Act of British Columbia.
Interruption From Severe Weather
Presently, our operations are conducted principally in the central region of Alberta and the northeastern region of British Columbia. The weather during colder seasons in these areas can be extreme and can cause interruption or delays in our drilling and construction operations.
Competition
The natural gas and oil industry is highly competitive. We experience competition in all aspects of our business, including acquiring reserves, leases, licenses and concessions, obtaining the equipment and labor needed to conduct operations and market natural gas and oil. Our competitors include multinational energy companies, other independent natural gas and oil concerns and individual producers and operators. Because both natural gas and oil are fungible commodities, the principal form of competition with respect to product sales is price competition. Many competitors have financial and other resources substantially greater than those available to ours and, accordingly, may be better positioned to acquire and exploit prospects, hire personnel and market production. In addition, many of our larger competitors may be better able to respond to factors such as changes in worldwide natural gas or oi l prices or levels of production, the cost and availability of alternative fuels or the application of government regulations. Such factors, which are beyond our control, may affect demand for our natural gas and oil production. We expect a high degree of competition to continue.
Item 4. Our Information
Our History and Development
Dynamic Oil & Gas, Inc. (formerly Dynamic Oil Limited) was incorporated under the Company Act of the Province of British Columbia, Canada on March 27, 1979. We have one wholly-owned, inactive subsidiary incorporated in Texas, called Seabird Oil & Gas, Inc.
Our principal executive office is located in rented space at Suite 205-10711 Cambie Road, Richmond, British Columbia V6X 3G5 Canada. Our telephone number is (800) 663-8072.
Capital Expenditures and Exploration Expenses Over the Past Three Years
Over the past three fiscal years, our capital expenditures aggregated $39.4 million, with the major expenditures as follows:
| $ | | $14.7 million for the acquisition of additional working interest holdings in our producing assets at St. Albert, Alberta. Through this acquisition, our interests increased to 75% from 50% in the majority of gas-related assets and to 75% from 25% in all oil-related assets;
|
| $ | | $7.8 million on the continuing development of the St. Albert, Alberta, Canada property. This money was spent on drilling, re-completing and tying-in of natural gas wells, as well as constructing several new production-enhancing facilities;
|
| $ | | $8.3 million on land acquisitions, exploratory drilling and facilities construction at Peavey/Morinville in Alberta, Canada; and
|
| $ | | $2.9 million (net) on land acquisitions and exploration of a prospective natural gas property at Orion in northeast British Columbia, Canada.
|
During the last three fiscal years, we spent $7.9 million on exploration expenses. Exploration expenses are mainly comprised of costs for seismic, new property investigations and unsuccessful drilling attempts. Under our ‘successful efforts’ accounting policy, we reclassify costs for unsuccessful drilling attempts from capital expenditures to exploration expenses. The $7.9 million is itemized as follows:
| $ | | $5.5 million on unsuccessful drilling attempts;
|
| $ | | $1.9 million on conducting seismic surveys or acquiring seismic survey data; and
|
| $ | | $0.5 million on investigating new properties.
|
Capital Expenditures and Exploration Expenses Anticipated in Fiscal 2003
On April 11, 2002, our Board of Directors approved our capital budget which authorized us to spend a total of $17.0 million in capital expenditures for fiscal 2003 as follows:
| $ | | $0.7 million for the acquisition of new prospective lands in the central region of Alberta and in the northeastern region of British Columbia;
|
| $ | | $7.3 million on drilling, re-completions, tie-ins and facilities at St. Albert, our main property in central Alberta;
|
| $ | | $1.5 million on drilling, tie-ins and facilities on our properties at Halkirk in central Alberta;
|
| $ | | $6.0 million on exploratory drilling and tie-ins on our land interests at Orion and Cypress (see “Recent Material Event” below) in northeastern British Columbia; and
|
| $ | | $1.5 million on drilling on two central Alberta land interests owned by us.
|
We have also approved an exploration expense budget of $1.1 million to acquire seismic data on our land interests in central Alberta and northeastern British Columbia.
We expect funds for our capital expenditure and exploration expense plans for fiscal 2003 to be sourced from funds flow from our operations and from our bank credit facility (see Note 3 to the Financial Statements under Item 17 in this report). In the event that our funding sources are insufficient to accomplish the expenditure and exploration plans for fiscal 2003, we will be forced to curtail certain of such expenditures.
Recent Material Event
On June 10, 2002, we announced our Farmout and Option Agreement (the “Farmout Agreement”) in the Orion area of northeastern British Columbia. Under the terms of the Farmout Agreement, the farmee will have the right to earn a sliding scale interest in three designated blocks of our Orion acreage, comprising 28,334 gross acres (21,665 net) by drilling up to four horizontal test wells into the Upper Devonian Age, Jean Marie formation. The first well, a commitment well, must be drilled by September 30, 2002. To continue earning under the Farmout Agreement, the farmee has sixty days from rig release date of the first well to commit to drill the first of three option wells. The first option well must be drilled by April 15, 2003. The second and third option wells must be drilled by April 15, 2004. Upon completion of the terms of the Farmout Agreement, we will retain an interest in the three blocks rangin g from 20% to 50%, with a net average working interest of approximately 32%. We continue to hold a total of 1,669 gross acres (1,669 net) in the Orion area that is not subject to the Farmout Agreement.
On July 30, 2002, we announced our Participation and Farmin Agreement (the “Farmin Agreement”) in the Cypress area of northeast British Columbia. Under the Farmin Areement, we will have the right to earn a net average working interest of 35% in two out of eight land blocks comprising approximately 5,120 acres, by paying 50% of the cost to drill two test wells. The first well, a commitment well and the second an option well, are expected to cost us $1.3 million and $0.9 million, respectively. Upon completion of the terms of the Farmin Agreement, we will have the right to earn a 50% working interest in the two test-well land blocks, subject to a convertible 15% gross overriding royalty, and a 30% working interest in the remaining six land blocks.
Share Repurchases
During the last three fiscal years, we spent $1.1 million on the re-purchase and cancellation of over 1.1 million of our outstanding shares of common stock at prices ranging from $1.48 to $2.07 per share.
Business Overview
Our principal business is acquiring, exploring and developing natural gas and oil properties. Our natural gas and oil properties are located in the Canadian provinces of Alberta, British Columbia and Saskatchewan. Over each of the past three years, we have explored for, produced and marketed natural gas, natural gas liquids and oil. We intend to continue this type of business activity.
Concentration of Commodities
We derive our revenue principally from the sale of natural gas and natural gas liquids. As a result, our revenues are determined, to a large degree, by prevailing spot prices for natural gas and natural gas liquids. The market prices for natural gas and natural gas liquids are dictated by supply and demand. Accordingly, our income and cash flows will be greatly affected by changes in prices for natural gas and natural gas liquids. We will experience reduced cash flows and may experience operating losses when prices for natural gas and natural gas liquids are low (see Item 5 Operating and Financial Review Prospects and Item 11 Quantitative and Qualitative Disclosures About Market Risk).
Under extreme circumstances, our natural gas sales may not generate sufficient revenue to meet our financial obligations and to fund planned capital expenditures. Moreover, significant price decreases could negatively affect our reserves by reducing the quantities of reserves that are recoverable on an economic basis, necessitating write-downs to reflect the realizable value of the reserves in the lower-price environment.
We are unable to control the market prices for natural gas, natural gas liquids and oil (collectively, “hydrocarbons”). Such market prices depend on numerous factors that include:
| $ | | the proximity of hydrocarbon pipelines or other economically-feasible transportation;
|
| $ | | the availability of pipeline capacity;
|
| $ | | the demand for hydrocarbons by utilities and other end users;
|
| $ | | the availability of alternative fuel sources;
|
| $ | | the effects of weather variability; and
|
| $ | | the effects of regulations pertaining to the transporting, marketing and exporting of hydrocarbons within Canada.
|
Because of these and other factors, we may be unable to market all of the natural gas, natural gas liquids and oil that we have available for sale. Additionally, we may be unable to obtain favorable prices for the oil and gas that we produce.
Concentration of Operations
Our main producing property is located at St. Albert, Alberta. Of our total production in fiscal 2002, 84% came from the St. Albert property. The remainder originated from six other Alberta fields: Peavey/Morinville, Halkirk, Westlock, Legal, Simonette and Stanmore. In fiscal 2001, 82% of our production came from the St. Albert field, while the remainder came from six other fields: Peavey/Morinville, Westlock, Legal, Simonette, Redwater and Stanmore. In fiscal 2000, 95% of our production came from the St. Albert field, while the remainder originated from five other fields: Peavey/Morinville, Westlock, Legal, Simonette and Redwater.
Revenue Breakdown
During the past three fiscal years, our total revenue was $76.6 million. Of this total, 79% came from the sales of natural gas, 18% came from the sales of natural gas liquids and 3% came from the sales of oil. Additionally, virtually all of such revenue originated from our properties and interests in the Province of Alberta. The breakdown for each of the past three fiscal years is shown in the table below:
| Natural gas, liquids and oil sales $(000’s) | 2002 | 2001 | 2000 |
| Natural gas | 20,944 | 28,006 | 11,660 |
| Natural gas liquids | 4,442 | 5,935 | 3,620 |
| Oil | 1,016 | 522 | 490 |
| Total | 26,402 | 34,463 | 15,770 |
Seasonality and Raw Materials
The seasonality of our main revenue-generating commodity, natural gas, is affected solely by the North American climate. Typically, there are two ‘peak’ seasons and two corresponding ‘shoulder’ seasons for natural gas sales. Winter is generally the higher-demand period due to cold-weather heating requirements. The summer is the next highest period of demand due to hot-weather air conditioning requirements.
Natural gas is becoming increasingly important as an energy source to power natural gas-fired electric power generating facilities (co-gen facilities). We believe that as more co-gen facilities are approved, constructed and put into operation, the demand for natural gas during shoulder seasons will remain relatively strong.
We do not rely on the availability of raw materials, because we operate in an extractive industry.
Marketing
We market our natural gas through direct sales and through the use of aggregators. Aggregators, when used, act as our marketing agents selling natural gas for us via a mix of spot, short term (less than one year) and long term
contracts. We cannot affect the mix of spot, short term and long term contracts that are managed by aggregators, nor are we privy to the exact amount of volume sold into each contract type throughout the year. Based on information provided by aggregators, the table below approximates our mix of contract types for each of the past three fiscal years.
Of our total gas sold during fiscal 2002, 53% was sold into aggregator portfolios. The remaining 47% was sold directly by us into the spot market. In fiscal years 2001 and 2000, the percentage of total gas sold to aggregators was 77% and 86%, respectively, with the remainder sold by us in the spot market. The percentage of total gas sold into aggregator portfolios decreased by 24% in fiscal 2002 from fiscal 2001 due mainly to the fact that in fiscal 2002 we sold more natural gas into the spot market.
The table below combines all contract types, aggregated and not-aggregated, to approximate the percentage of our natural gas being sold into each contract type in each of the three fiscal years.
| Approximate mix of gas contract types | 2002 | 2001 | 2000 |
| Spot market – not aggregated | 47% | 23% | 14% |
| Spot market – aggregated | 27% | 19% | 22% |
| Total spot market | 74% | 42% | 36% |
| Short-term – aggregated (less than one year) | 1% | 9% | 11% |
| Long-term – aggregated | 25% | 49% | 53% |
| Total | 100% | 100% | 100% |
All of our natural gas liquids are sold directly into the non-aggregated spot market under arm’s length contracts.
During fiscal 2002, we increased our percentage of total natural gas sales exposed to spot market pricing by approximately 76% over fiscal 2001. The main reason for this significant increase is the sales of new natural gas production generated from the St. Albert acquisition into the spot market in fiscal 2002. Although the percentage of total natural gas sales exposed to spot market activity increased, weighted average spot prices of natural gas declined in fiscal 2002 from fiscal 2001, thereby contributing to a decrease in total revenues (see “Natural Gas, Liquids and Oil Revenues” below). Total gas sales exposed to spot market pricing in fiscal 2001 increased by 17% over fiscal 2000.
Supply Contracts or Agreements
Under various supply contracts and agreements, the commitment period under which we are required to supply natural gas and natural gas liquids, ranges from terminable within thirty days notice to no termination prior to exhaustion of hydrocarbon reserves. Under these various contracts and agreements, we are not obligated to provide a fixed quantity of supply, as all supply is on a best-efforts basis.
Presently, we regularly compete with other companies in bidding for the acquisition of petroleum interests from the Alberta and British Columbia governments and other corporations or individuals holding such interests. Further, we regularly compete for the availability of drilling rigs, production equipment, processing facilities, pipeline capacity and other transportation services. We do not have a competitive position that allows us any material or significant advantages compared to other companies within the same industry. Many competitors have substantially greater financial and other resources than we do. For example, in the 2002 Canadian Energy Survey of 2001 Results prepared by PriceWaterhouseCoopers, we ranked thirty-sixth and thirty-fifth in size out of one hundred Canadian exploration and production companies according to gross revenues and cash flow from operations, respectively.
Government regulations have a material effect on us to the extent that they require us to conduct field operations and hydrocarbon extraction activities within prescribed environmentally-safe, sensitive regulations. Also, government regulations may restrict the commencement or re-commencement of field activities in certain properties in which we hold an interest for the purpose of exploration.
Examples of types of governmental laws and regulations that may have a material effect on our business include:
| $ | | requirements to acquire permits before commencement of drilling operations;
|
| $ | | requirements to restrict the substances that can be released into the environment in connection with
|
| $ | | drilling and production activities;
|
| $ | | limitations on, or prohibitions to, drilling in protected areas such as offshore areas; and
|
| $ | | requirements to mitigate and remediate the effects caused by drilling and production operations.
|
Properties, Plant and Equipment
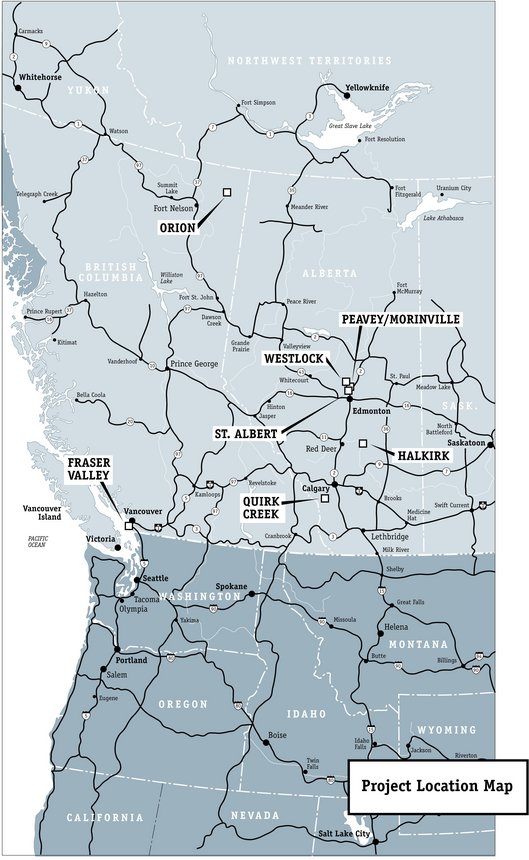
We own interests in certain properties located in the Western Provinces of Canada. For purposes of identification, discussion and differentiation, we have named them based on their location. They are as follows:
| Central Alberta | British Columbia | Southern Saskatchewan |
| St. Albert | Orion (northeastern B.C.) | Elmore |
| Peavey/Morinville | Cypress (northeastern B.C. | Rapdan |
| Westlock | Fraser Valley (southwestern B.C.) | |
| Simonette | | |
| Redwater | | |
| Virgo | | |
| Stanmore | | |
| Halkirk | | |
| Alexander | | |
| Quirk Creek (Foothills) | | |
As shown in the table below, our land holdings as of March 31, 2002 total 150,171 gross acres and 86,251 net acres. Our weighted average working interest in all of these properties was approximately 57%. The remaining 43% was held by joint venture, industry partners who share a common interest in exploring or developing the property in question. Of total land holdings as of March 31, 2002, our developed acreage comprises 24,110 gross acres (17,089 net) and our undeveloped acreage comprised 126,061 gross acres (69,162 net). In fiscals 2001/2000, our total developed acreage comprised 18,175/16,103 gross acres and 11,078/9,184 net acres, respectively, while our total undeveloped acreage comprised 126,271/103,097 gross acres and 78,949/55,752 net acres, respectively. Our weighted average working interest in all properties was 63% in fiscal 2001 and 54% in fiscal 2000.
Our total land holdings increased during fiscal 2002 by 23,900 gross acres (7,302 net) or 19%, to 150,171 acres (86,251 net) over fiscal 2001. These additions were spread among four properties, Halkirk, Peavey/Morinville, St. Albert and Quirk Creek, and two other central Alberta properties.
| Land Holdings (acres) | | | | | | |
| As at March 31, 2002 | Developed | Undeveloped | Total | Weighted Average |
| Area | Gross | Net | Gross | Net | Gross | Net | Working Interest |
| Halkirk | 3,840 | 3,456 | 3,200 | 3,200 | 7,040 | 6,656 | 95% |
| Peavey/Morinville | 7,363 | 5,037 | 6,630 | 4,405 | 13,993 | 9,442 | 67% |
| St.Albert | 9,057 | 5,884 | 6,293 | 4,319 | 15,350 | 10,203 | 66% |
| Quirk Creek | - | - | 19,040 | 9,520 | 19,040 | 9,520 | 50% |
| Orion | - | - | 30,003 | 23,334 | 30,003 | 23,334 | 78% |
| Fraser Valley | - | - | 54,332 | 18,109 | 54,332 | 18,109 | 33% |
| Other Alberta | 3,850 | 2,712 | 6,563 | 6,275 | 10,413 | 8,987 | 86% |
| Total | 24,110 | 17,089 | 126,061 | 69,162 | 150,171 | 86,251 | 57% |
Using the property names as shown in the above table, details of each property as to its size, productive capacity, extent of utilization of our facilities, location and products produced are described below. Tables including
information about natural gas, natural gas liquids and oil are included near the end of this section. Maps are also included to show the physical location of each property.
St. Albert/Big Lake is located in central Alberta near the City of Edmonton. The area is prospective for remaining recoverable oil from six established oil pools within the Leduc (D-3), Nisku (D-2) and Wabamun (D-1) formations. These formations are underlying multiple pools of stacked, natural gas-bearing sandstones of Cretaceous Age draped over two, underlying reef structures. We own a weighted average working interest of 66% in 15,350 gross acres (10,203 net) of land including 6,293 gross undeveloped acres (4,319 net). In addition, we also own a weighted average 66% share of various overriding royalty interests associated with an additional 4,729 gross acres (3,121 net).
Acquisition Activity in Fiscal 2002
Effective April 1, 2001 as announced on June 29, 2001, we increased our interest at St. Albert under a purchase and sale agreement with Fletcher Challenge Oil & Gas, Inc. (“Fletcher”). Under the agreement, we acquired 50% of Fletcher’s interest in the shallow gas wells and facilities and 67% of Fletcher’s interest in the oil wells and facilities and assumed the duties of Operator effective June 30, 2001.
Wells and facilities
As of the end of fiscal 2002, we owned and operated a 75% working interest in fourteen producing gas wells, six producing oil wells and various working interests ranging between 25% - 83% in four other producing gas wells, five suspended potential gas wells and six additional wells awaiting further evaluation. We own a 25% interest in a ten-mile sales gas pipeline system and in a significant gas processing facility capable of processing 15 mmcf/d of sour gas and 15 mmcf/d of sweet gas. Further, we own a 75% interest in an oil battery capable of processing 2,400 boe/d.
In fiscal 2002, we conducted re-entry/workover operations on five previously suspended or low production wells resulting in four natural gas wells and one unsuccessful attempt. Over the past three years, we focused exploration and development at St. Albert on shallow gas prospects until we pursued a new oil target within the established Devonian Age pools by drilling a successful Nisku (D-2) oil well in February 2002. By the end of fiscal 2002, the Nisku well had averaged 89 boe/d over a 57-day production period.
We increased our average daily production rates at St. Albert in fiscal 2002 by 547 boe/d or 25%, to 2,717 boe/d over fiscal 2001. The increase was primarily due to the acquisition of an additional interest from Fletcher. Production increases at year-end came as a result of a modification to a sour compressor facility and the successful workover of five previously suspended or low producing wells. We exited the year producing 3,224 boe/d from the St. Albert field. At the close of fiscal 2002, our independent proved natural gas, natural gas liquids and oil reserves were estimated at 7,201 mboe and risked probable reserves were estimated at 338 mboe.
Historically, St. Albert has produced in excess of 23 million barrels of oil and 83,000 mmcf of raw gas. Prospectively, we identified several potential targets for additional oil and gas recovery on the property. We have budgeted eight new wells at St. Albert in fiscal 2003, six wells targeting the remaining oil potential in the established oil pools and two wells targeting new gas reserves.
Peavey/Morinville, Alberta
Peavey/Morinville is approximately nineteen kilometres north of the City of Edmonton. The area is prospective for multiple oil and natural gas-bearing sandstones of Cretaceous Age. These sands are stratigraphically controlled and structurally draped over highs in the Leduc reef. Presently, we own a weighted average 67% working interest in approximately twenty-six square kilometers of 3-D seismic data and 13,993 gross acres (9,442 net) of land including 6,630 gross acres (4,405 net) of undeveloped land.
Peavey/Morinville is approximately nineteen kilometres north of the City of Edmonton. The area is prospective for multiple oil and natural gas-bearing sandstones of Cretaceous Age. These sands are stratigraphically controlled and structurally draped over highs in the Leduc reef. Presently, we own a weighted average 67% working interest in approximately twenty-six square kilometers of 3-D seismic data and 13,993 gross acres (9,442 net) of land including 6,630 gross acres (4,405 net) of undeveloped land.
We operate and hold a weighted average working interest of 77% in seven producing gas wells in this area and 100% working interest in a 5.5 mmcf/d compression/dehydrator facility. At the end of fiscal 2002, approximately 0.8 mmcf/d of third party production was being processed through this facility. We hold various working interests ranging between 35% and 96% in eleven shut-in or suspended gas wells, one potential oil well and two wells awaiting abandonment.
The average annual daily production rate from the property remained steady between fiscals 2001 and 2002 at close to 290 boe/d. However, due to the unexpected influx of water, the year-end exit rate in fiscal 2002 decreased by 269 boe/d or 62%, to 165 boe/d from fiscal 2001. As a result, our independent estimate of proved reserves was revised downward in fiscal 2002 by 1,143 mboe or 61%, to 742 mboe from fiscal 2001.
Presently, we are examining ways to maximize the value in this property. The property contains a substantial network of pipelines including a gas compression facility, eleven shut-in or suspended gas wells, 6,630 gross acres of undeveloped land and is covered by approximately twenty-six square kilometres of 3-D seismic data. Among the possibilities, we are considering the property as prospective for coal bed methane development.
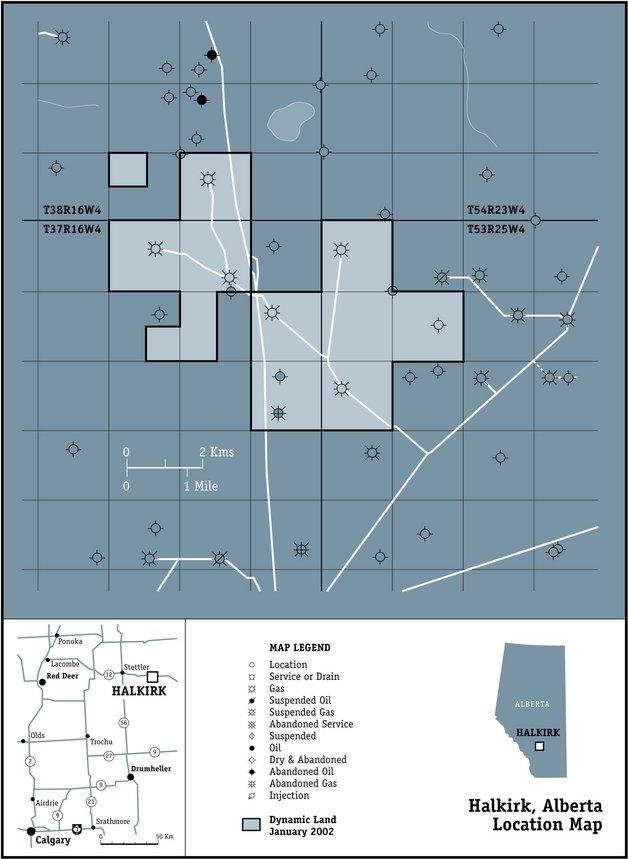
Property Description
Halkirk is located approximately one hundred and seventy kilometers northeast of the City of Calgary, Alberta. The area is prospective for the development of three sweet gas horizons: the Belly River, Viking, and Hackett formations. The primary target for reserves is the Viking “C” sand with an average net pay thickness of 5.3 meters. The area is also close to existing gas processing facilities. We own a weighted average 95% working interest in 7,040 gross acres (6,656 net) of land including 3,200 gross undeveloped acres (3,200 net). We increased our land holdings in the area by 2,880 gross acres (2,880 net) during fiscal 2002.
Wells and Facilities
We operate and own a weighted average working interest of 92% in seven natural gas wells on the property including six producing and one capped gas well. In fiscal 2002, we drilled five of the seven wells resulting in four gas wells and one capped gas well. During the year, six of the wells were connected by pipeline to a third-party gas processing facility in the area.
Production and Reserves
Production from the field began in late October 2001 and closed out fiscal 2002 averaging 252 boe/d. Fiscal 2002 independent, proved natural gas reserves were estimated at 595 mboe and risked probable reserves were estimated at 313 mboe.
The Viking C formation provides access to lower-risk natural gas reserves that we believe to be long-life reserves. Eight additional drilling targets have been identified on the existing land block with four of the eight locations planned for fiscal 2003.
Quirk Creek
Property Description
Quirk Creek is located in the foothills of southern Alberta approximately forty-two kilometers southwest of Calgary. We are targeting new reserves of sweet natural gas in a thick section of sandstones in the Cretaceous Age Blairmore Group at depths up to 1,800 meters. The gas is contained within sediments that are highly fractured due to the presence of northwest/southeast trending thrust faults that run through the area. At the end of fiscal 2002, we held a 50% working interest in 19,040 gross acres (9,520 net) of undeveloped land.
Under a Farmout and Option Agreement with a large integrated oil and gas company, we participated with another junior company in drilling one exploration well at Quirk Creek in March 2002. Under the agreement, we earned a 50% interest in 1,280 gross acres of land, plus an option to drill up to three additional wells in the area to earn 50% in another 7,680 gross acres. The well was drilled to a depth of 1,825 meters using air drilling techniques. Several shows of gas were reported during the drilling operation, although no commercial quantities of gas were encountered or indicated on logs. Post-drilling analysis of the well indicates anticipated rock fractures were encountered, however, these fractures were predominately healed or closed at that location.
In addition to considering our options under the Farmout and Option Agreement, we identified two re-entry opportunities on lands we own that could provide a more cost-effective way to further test this thick Blairmore Group of sediments for commercial quantities of sweet natural gas. Re-entry work is planned in fiscal 2003.
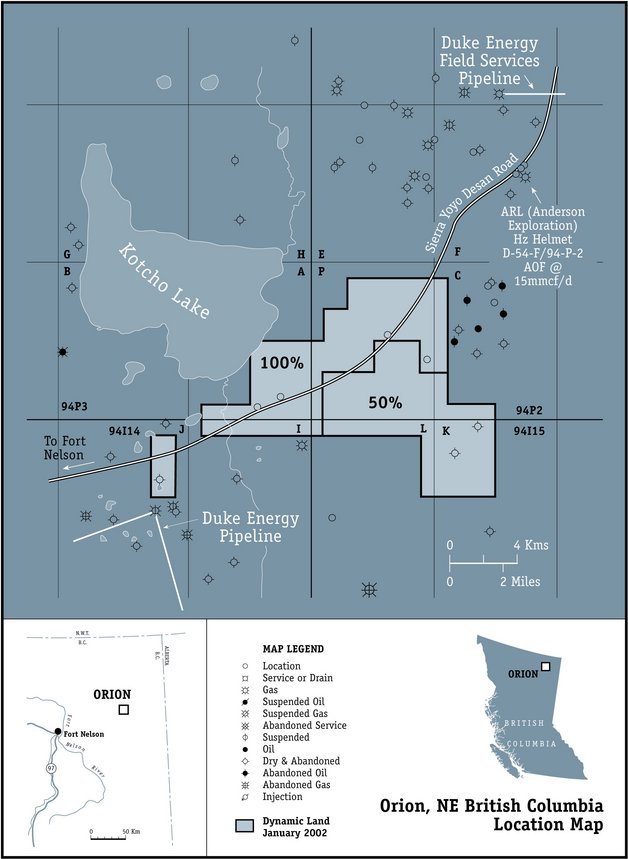
Orion, NE British Columbia
Orion is strategically located between the Sierra and Helmet natural gas fields. Located near Kotcho Lake, the acreage is approximately fifty-six kilometers west of the Alberta border and one hundred and twelve kilometers south of the Northwest Territories. The property is dissected by the Sierra Yoyo Desan Road, which provides year-round access for drilling operations. The Jean Marie formation is considered to be a regional platform carbonate with extensive patch-reef development at sub-surface depths of between 1,000 – 1,400 meters. The formation averages one hundred and ninety meters thick and is draped over deep-seated substructures. A prolific open fracture network enhances reservoir permeability. As at the end of fiscal 2002, we held a weighted average working interest of 78% in 30,003 gross acres (23,334 net) of undeveloped land.
We own a working interest of 100% in one suspended potential natural gas well. In fiscal 2002, we perforated and tested the Bluesky and Wabamun formations in the well. It is currently suspended as a potential natural gas well pending further evaluation and development of a sales pipeline system. The property is located at the termination of two major pipeline systems. The Duke Energy Pipeline System is located seven kilometers south of the property and connects to Fort Nelson, further extending south to Washington State. A second pipeline, the Duke Energy Field Services Pipeline System, is accessible on the north boundary of the property and connects to Tooga Compressor Station, further extending east to Alberta.
Fiscal 2003 Plans
On June 10, 2002 we announced the terms of a Farmout and Option Agreement with a large independent Canadian oil and gas company (the “farmee”) on the Orion property. Under the terms of the Farmout and Option Agreement, the farmee will have the right to earn a sliding scale interest in three designated blocks of the farmee’s Orion acreage comprising 28,334 gross acres (21,665 net) by drilling up to four horizontal test wells into the Upper Devonion Age, Jean Marie formation. The first well, a commitment well, must be drilled by the end of September 2002. To continue earning under the Farmout Agreement, the farmee has sixty days from rig release date of the first well to commit to drill the first of three option wells. The first option well must be drilled by April 15, 2003. The second and third option wells must be drilled by April 15, 2004.
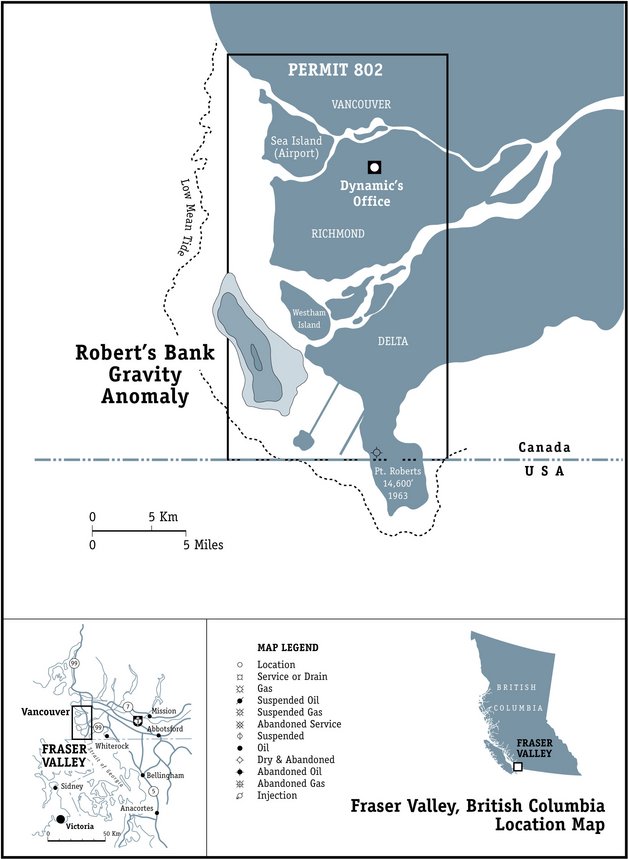
Fraser Valley, British Columbia
Permit 802, located in the southwestern area of the Province of British Columbia, includes all petroleum and natural gas rights onshore in an area known as the Fraser Valley and in adjacent offshore area. Although structural control is limited, government gravity and proprietary on-shore seismic data support the presence of a large structural feature approximately nineteen square kilometers in area lying just offshore within the boundaries of the Permit.
Fiscal 2002 Project Status
We were inactive in the Fraser Valley during fiscal 2002. Under a joint venture agreement with Conoco Canada Limited, we continue to own a 33% working interest in approximately 54,332 gross undeveloped acres (18,109 net) of onshore and offshore petroleum and natural gas rights associated with Permit 802, a validated British Columbia Exploration Permit.
While commercial gas is yet to be discovered in this area, we have identified additional drill targets that we believe are prospective for natural gas accumulation.
Presently, areas offshore are subject to a restricted access moratorium for petroleum and natural gas activities. More recently, the British Columbia Government has established a task force to study the possibility of removing this moratorium and has begun the public consultation process. We will continue to monitor any changes in the legislation that may apply to Permit 802 and adjacent areas of potential interest.
Other producing properties outside of St. Albert, Peavey/Morinville and Halkirk comprise 10,412 gross acres and 8,987 net acres for a weighted average working interest of 86%. They produced 29 mboe of natural gas and oil during fiscal 2002, representing approximately 2% of our total fiscal 2002 production. This production was generated from six properties: Alexander; Elmore; Rapdan; Simonette; Stanmore and Westlock. The majority of this production was natural gas from Stanmore and Westlock, two single-well properties in Alberta.
Reserves of Natural Gas, Natural Gas Liquids and Oil
Our independent reserve estimates effective April 1 for each of the last three fiscal years prepared by Status Engineering Associates of Calgary, Alberta (“Status”) are shown in the following tables:
| Petroleum and natural gas reserves | | |
| (Before royalties) | Natural Gas | NGL’s / Oil | Equivalent * |
Fiscal 2002 | (mmcf)
| (mbbls) | (mboe)
|
| Proved producing | 31,099 | 1,908 | 7,091 |
| Proved non-producing | 8,972 | 229 | 1,724 |
| Probable (50% risked) | 4,669 | 321 | 1,099 |
| Total Fiscal 2002 | 44,740 | 2,458 | 9,915 |
Fiscal 2001
Proved producing | 30,885 | 1,387 | 6,535 |
| Proved non-producing | 8,586 | 127 | 1,558 |
| Probable (50% risked) | 6,326 | 27 | 1,081 |
| Total Fiscal 2001 | 45,797 | 1,541 | 9,174 |
Increase (decrease) % (net of production) from 2001 to 2002 | (2%) | 60% | 8% |
Fiscal 2000
Proved producing | 29,243 | 1,758 | 6,632 |
| Proved non-producing | 11,518 | 448 | 2,368 |
| Probable (50% risked) | 4,004 | 11 | 678 |
| Total Fiscal 2000 | 44,765 | 2,217 | 9,678 |
Increase (decrease) % (net of production) from 2000 to 2001 | 2% | (31)% | (5)% |
* Natural gas is converted into barrels of oil equivalent on the basis of 6 mcf = 1 barrel.
During fiscal 2002, our estimated reserves of natural gas decreased by 1,057 mmcf or 2% to 44,740 mmcf from fiscal 2001. Factors contributing to this decrease were our total annual production, and a downward revision in the previous reserve estimates made on the Peavey/Morinville property. These factors were largely offset by new reserves added through the acquisition of additional working interests at St. Albert.
Most of the natural gas production at St. Albert contains natural gas liquids, while gas from Peavey/Morinville does not. It is for this reason that estimated reserves of natural gas liquids (“NGL’s”) increased, net of annual production, by 424 mbbls or 29%, to 1,901 mbbls (total NGL’s/oil = 2,458 mbbls) over fiscal 2001.
We produced from six St. Albert oil wells during fiscals 2002 and 2001. The acquisition of additional interests at St. Albert during fiscal 2002 was the principal reason that estimated oil reserves, net of annual production, increased by 493 mbbls or 770%, to 557 mbbls (total NGL’s/oil = 2,458 mbbls) over fiscal 2001.
New extensions and discoveries at St. Albert and Halkirk during fiscal 2002 added 623 mboe to our estimated reserve base, 62% of which was oil and 38% natural gas and natural gas liquids.
On an equivalent basis, our total estimated reserves increased in fiscal 2002 by 741 mboe or 8%, to 9,915 mboe over fiscal 2001.
During fiscal 2001, estimated reserves of natural gas increased (net of annual production) by 2% over fiscal 2000. Of the fiscal 2001 increase in natural gas reserves, most of it was lower in natural gas liquids content than gas reserves of fiscal 2000, which explains the 31% decrease of reserves of natural gas liquids between the two years.
| Petroleum and natural gas reserves reconciliations | |
| | Natural Gas | NGL’s/Oil | Equivalent |
| | (mmcf) | (mbbls) | (mboe) |
| Opening reserves, fiscal 2000 | 44,765 | 2,217 | 9,678 |
| Revisions of Previous Estimates | (2,351) | (497) | (889) |
| Production * | (4,557) | (206) | (965) |
| Extensions and discoveries | 7,940 | 27 | 1,350 |
| Reserves, fiscal 2001 | 45,797 | 1,541 | 9,174 |
| Acquisitions | 12,359 | 804 | 2,864 |
| Revisions of Previous Estimates | (9,185) | (38) | (1,569) |
| Production * | (5,514) | (258) | (1,177) |
| Extensions and discoveries | 1,283 | 409 | 623 |
| Year end reserves, fiscal 2002 | 44,740 | 2,458 | 9,915 |
* For production history of fiscal years 2001 and 2000, see section entitled, “Production Volumes” under Item 5, Operating and
Financial Review and Prospects in this report.
Our net present value (“NPV”) was determined according to the Canadian Provincial Securities Administrators’ National Policy No. 2-B, using estimated constant prices for commodities and associated operating costs. This determination closely aligns with NPV determinations in the U.S., where actual year-end constant prices/costs are used.
Discounted net present value $(000’s) | | | |
| (Before taxes, after royalties) | 0% | 10% | 15% | 20% |
| Proved producing | 87,581 | 59,874 | 52,110 | 46,344 |
| Proved non-producing | 18,242 | 10,608 | 8,513 | 6,984 |
| Total proved | 105,823 | 70,482 | 60,623 | 53,328 |
| Total probable | 10,687 | 6,044 | 4,616 | 3,522 |
| Total proved and probable, fiscal 2002 | 116,510 | 76,526 | 65,239 | 56,850 |
| Total proved and probable, fiscal 2001 | 224,918 | 142,273 | 120,047 | 103,873 |
| Total proved and probable, fiscal 2000 | 84,231 | 54,404 | 46,107 | 39,960 |
In determining the “NPV” at the end of fiscal 2002, Status used a constant estimated natural gas price of $3.77/mcf, based on 1,000 BTU per standard cubic foot. For oil, a constant estimated price of $29.35/barrel was used, based on 40 API oil priced at $30.90 at Edmonton, Alberta. These prices represent Status’ expectations of our weighted average prices achievable over the nine-month period April to December 2002, using contract terms and conditions in existence at our March 31, 2002 fiscal year end. Our actual weighted average prices for the month of March 2002 were $3.24/mcf for natural gas and $33.27/barrel for oil.
At the end of fiscal 2002, our estimated 10% discounted NPV of proved and 50% probable reserves was $76.5 million. This represents an estimated NPV of $3.74 per share (weighted average number of shares of common stock outstanding as at March 31, 2002 = 20.5 million, basic).
At the end of fiscal 2001, our estimated 10% discounted NPV of proved and 50% probable reserves was $142.3 million, based on estimated constant prices of $7.22/mcf for natural gas and $38.18/bbl for oil. This represented an estimated NPV of $7.14 per share (weighted average number of shares of common stock outstanding as at March 31, 2001 = 19.9 million, basic). Our actual weighted average prices for the month of March 2001 were $6.75/mcf for natural gas and $41.19/bbl for oil.
At the end of fiscal 2000, our estimated 10% discounted NPV of proved and 50% probable reserves was $54.4 million, based on estimated constant prices of $2.80/mcf for natural gas and $28.00/bbl for oil. This represented an estimated NPV of $2.76 per share (weighted average number of shares of common stock outstanding as at March 31, 2000 = 19.7 million, basic). Our actual weighted average prices for the month of March 2000 were $3.14/mcf and $40.44/bbl for oil.
We have no oil and gas reserves applicable to long-term supplies or similar agreements with foreign governments in which we act as a producer.
Item 5. Operating and Financial Review and Prospects
Forward-Looking Information and Safe Harbor Statement under the Private Securities Litigation Reform Act of 1995.
Certain statements in this report, including those appearing under this Item 5, constitute “forward-looking statements” within the meaning of the United States Private Securities Litigation Reform Act of 1995, Section 21E of the United States Securities Exchange Act of 1934, as amended, and Section 27A of the United States Securities Act of 1933, as amended. Additionally, forward-looking statements may be made orally or in press releases, conferences, reports, on our worldwide website or otherwise, in the future, by or on behalf of us. Such statements are generally identifiable by the words used such as “plan”, “expect”, “estimate”, “budget”, “anticipate”, “believe” or other similar words.
The forward-looking statements are subject to known and unknown risks and uncertainties and other factors which may cause actual results, levels of activity and achievements to differ materially from those expressed or implied by such statements. Such factors include, among others: market prices for natural gas, natural gas liquids and oil products; the ability to produce and transport natural gas, natural gas liquids and oil; the results of exploration and development drilling and related activities; economic conditions in the countries and provinces in which we carry on business, especially economic slowdown; actions by governmental authorities including increases in taxes, changes in environmental and other regulations, and renegotiations of contracts; political uncertainty, including actions by insurgent groups or other conflict and the negotiation and closing of material contracts. The impact of any one factor on a particular forward-looking statement is not determinable with certainty as such factors are interdependent upon other factors; our course of action would depend upon our assessment of the future considering all information then available. In that regard, any statements as to future natural gas, natural gas liquids or oil production levels; capital expenditures; the allocation of capital expenditures to exploration and development activities; sources of funding for our capital program; drilling of new wells; demand for natural gas, natural gas liquids and oil products; expenditures and allowances relating to environmental matters; dates by which certain areas will be developed or will come on-stream; expected finding and development costs; future production rates; ultimate recoverability of reserves; dates by which transactions are expected to close; cash flows; uses of cash flows; collectibility of receivables; availability of trade credit; expected operating costs; expenditures and allowances relating to environmental matters; debt levels; an d changes in any of the foregoing are forward-looking statements, and there can be no assurance that the expectations conveyed by such forward-looking statements will, in fact, be realized.
Although we believe that the expectations conveyed by the forward-looking statements are reasonable based on information available to us on the date such forward-looking statements were made, no assurances can be given as to future results, levels of activity, achievements or financial condition.
We wish to caution readers not to place undue reliance on any forward-looking statement and to recognize that the statements are predictions of future results, which may not occur as anticipated. Actual results could differ materially from those anticipated in the forward-looking statements and from historical results, due to the risks and uncertainties described above, as well as others not now anticipated. The foregoing statements are not exclusive and further information concerning us, including factors that potentially could materially affect our financial results, may emerge from time to time. We assume no obligation to update forward-looking statements to reflect actual results or changes in factors or assumptions affecting such forward-looking statements.
The following discussion and analysis should be read in conjunction with the financial statements and related notes. The financial statements are prepared in accordance with Canadian generally accepted accounting principles. A disclosure of the differences between Canadian GAAP and US GAAP is provided in Note 11 of the financial statements under Item 17 of this report.
For comparison purposes, discussion and analysis provides, in tabular form, our operating and financial results for the years ended March 31, 2002, 2001 and 2000.
We operated thirteen of fourteen gross wells drilled during fiscal 2002, resulting in seven natural gas wells, two potential natural gas wells, one oil well and four dry holes achieving an overall net-well success rate of 75%. In addition, we operated five re-entry/workover operations on previously suspended or low productivity wells in St. Albert that resulted in four natural gas wells and one unsuccessful attempt. Of the successful wells, two were new pool discoveries.
| Drilling Activity | | | |
| | 2002 | 2001 | 2000 |
| | Gross | Net | Gross | Net | Gross | Net |
| Gas completions | 7 | 6.1 | 11 | 8.7 | 4 | 3.6 |
| Potential/suspended gas wells | 2 | 1.4 | 3 | 2 | - | - |
| Oil completions | 1 | 0.7 | 1 | 0.9 | - | - |
| Dry and abandoned | 4 | 2.8 | 2 | 1.9 | 2 | 1.2 |
| Total | 14 | 11.0 | 17 | 12.5 | 6 | 4.8 |
| Success rate | | 75% | | 85% | | 75% |
During fiscal 2001, we participated in drilling 17 wells, achieving an overall net-well success rate of 85% and in fiscal 2000, a total of 6 wells were drilled at a net-well success rate of 75%.
Summary of Operating and Financial Results
Unless otherwise noted, amounts in the following discussion and analysis tables are in thousands of Canadian dollars, and production volumes are before royalties.
In fiscal 2002, we acquired additional working interest holdings in our producing assets at St. Albert, Alberta (the “St. Albert acquisition”). Through the St. Albert acquisition, our interests increased to 75% from 50% in the majority of gas-related assets and to 75% from 25% in all oil-related assets. Including the effect of the St. Albert acquisition, our product sales mix in fiscal 2002 was 98% weighted toward natural gas and natural gas liquids.
In fiscal 2002, total revenues decreased by $8.1 million or 23%, to $26.4 million from fiscal 2001. Revenues decreased by $13.1 million or 162% due to the variance in weighted average commodity prices between fiscal 2002 and 2001. Offsetting this decrease was an increase in revenues of $5.0 million or 62% due to higher volume sales of all our commodities in fiscal 2002 over fiscal 2001.
The following table reflects an analysis of price-volumes variances in our revenues for natural gas, natural gas liquids and oil between 2002 and the previous two years:
| Increase (decrease) in revenues resulting from variances in: | 2002 Compared to: |
| | 2001 | % | 2000 | % |
| Natural gas | | | | |
| Price | (10,791) | (134) | 4,740 | 45 |
| Volume sales | 3,728 | 46 | 4,544 | 43 |
| Natural gas liquids | | | | |
| Price | (2,197) | (27) | 494 | 4 |
| Volume sales | 705 | 9 | 328 | 3 |
| Oil | | | | |
| Price | (85) | (1) | 77 | 1 |
| Volume sales | 579 | 7 | 449 | 4 |
| Total | (8,061) | (100) | 10,632 | 100 |
Due to higher volumes of natural gas sales in fiscal 2002, mainly from the St. Albert acquisition, revenues from natural gas increased by $3.7 million or 46% of total revenues over fiscal 2001. Offsetting this increase was a decrease in natural gas revenues of $10.8 million or 134% of total revenues caused by the variance in weighted average prices between fiscals 2002 and 2001. In fiscal 2002, weighted average prices for natural gas returne d to more normal levels from unprecedented high weighted average prices in fiscal 2001.
Due to higher volumes of natural gas liquids sales in fiscal 2002 from the St. Albert acquisition, revenues from natural gas liquids increased by $1.0 million or 9% of total revenues over fiscal 2001. Offsetting this increase was a decrease in natural gas liquids revenues of $2.2 million or 27% caused by the variance in weighted average prices between fiscals 2002 and 2001.
Changes in oil revenues due to the variances in weighted average prices between fiscal 2002 and fiscals 2000 and 2001 were relatively minor. Changes in oil revenues due to additional sales volume variances, however, increased by $0.4 million and $0.6 million between fiscal 2002 and fiscals 2000 and 2001, respectively.
Compared to fiscal 2000, revenues from natural gas in fiscal 2002 increased by $4.7 million or 45% of total revenues due to the variance in weighted average prices and by $4.5 million or 43% of total revenues due to a higher volume of natural gas sales between the two years.
Also compared to fiscal 2000, revenues from natural gas liquids increased by $0.5 million or 4% of total revenues due to the variance in weighted average prices and by $0.3 million or 3% of total revenues due to a higher volume of natural gas liquids sales between the two years.
Funds flow from operations during fiscal 2002 decreased by $6.8 million or 38%, to $11.3 million from fiscal 2001, mainly due to the lower weighted average natural gas prices as discussed above. On a per share basis, funds flow from operations was $0.55 and $0.91 per share basic in fiscals 2002 and 2001, respectively. Funds flow in fiscal 2002 combined with our operating line were sufficient to finance our total capital expenditures amounting to $22.1 million, two-thirds of which was used for the St. Albert acquisition. Capital expenditures in fiscal 2001 amounted to $11.6 million.
Funds flow from operations increased in fiscal 2001 over fiscal 2000 by $12.5 million or 222%, to $18.2 million, mainly due to the higher weighted average natural gas prices in fiscal 2001 as discussed above. On a per share basis, funds flow from operations was $0.29 per share basic in fiscal 2000.
| Funds flow from operations, earnings | 2002 | 2001 | 2000 |
| and return on equity * | Total | % Change | Total | % Change | Total |
| Funds flow from operations | 11,337 | (38) | 18,168 | 222 | 5,634 |
| - per share ($) | 0.55 | (40) | 0.91 | 213 | 0.29 |
| Net (loss) earnings | (3,519) | (136) | 9,714 | 138 | 4,078 |
| - per share ($) | (0.17) | (135) | 0.49 | 133 | 0.21 |
| Shareholder’s equity | 16,593 | (17) | 19,946 | 99 | 10,040 |
| Average (loss) return on equity (%) | (21) | (143) | 49 | 20 | 41 |
* When comparing these particular measurements with those of other industry members, see comments relating to facilities leasing costs in “Production Costs” below.
Our earnings decreased in fiscal 2002 by $13.2 million or 136% from fiscal 2001, to a net loss of $3.5 million. Based on independent reserves estimated during the latter half of fiscal 2002, we evaluated the asset carrying values of our Peavey/Morinville property and made a decision with respect to further development of the property. We recorded a non-cash ceiling test write-down of our Peavey/Morinville assets by $6.7 million (see further comment under Item 4 Properties, Plant and Equipment - “Production and Reserves”). This write-down contributed significantly towards our fiscal 2002 net loss of $3.5 million or $0.17 per share.
The average annual daily production rate from the property remained steady between fiscals 2001 and 2002 at close to 290 boe/d. However, due to the unexpected influx of water, the year-end exit rate in fiscal 2002 decreased by
269 boe/d or 62%, to 165 boe/d from fiscal 2001. As a result, our independent estimate of proved reserves was revised downward in fiscal 2002 by 1,143 mboe or 61%, to 742 mboe from fiscal 2001.
In fiscals 2001 and 2000, earnings were $9.7 million ($0.49 per share) and $4.1 million ($0.21 per share), respectively.
Our overall reserves in fiscal 2002 increased by 741 mboe or 8%, to 9,915 mboe over fiscal 2001. The St. Albert acquisition increased reserves by 2,864 mboe, 72% of which was natural gas. New extensions and discoveries at St. Albert and Halkirk further increased reserves by 623 mboe, 34% of which was natural gas. Offsetting these increases were decreases due to revisions of previous reserve estimates and higher annual production volumes. Revisions to previous reserve estimates amounted to a reduction of 1,569 mboe, an amount that was applicable to the Peavey/Morinville property. Annual production increased by 212 mboe or 22%, to 1,177 mboe.
In fiscals 2001 and 2000, overall total reserves were 9.2 mboe and 9.7 mboe, respectively. Of total reserves, 83% were natural gas in fiscal 2001 and 77% in fiscal 2000.
Volumes, Prices, Gross Revenues, Royalties, Operating Costs, Administrative Costs and Other
In fiscal 2002, daily production volumes increased over fiscal 2001 by an average of 581 boe per day or 22%, to 3,225 boe per day. This was due to increases in natural gas production of 437 boe per day, in natural gas liquids production of 101 boe per day, and in oil production of 43 boe per day. Of our total annual production of 1,177 mboe in fiscal 2002, 78% was natural gas compared to 79% of fiscal 2001’s total 965 mboe and 76% of fiscal 2000’s total 947 mboe.
Of our total production in fiscal 2002, 84% came from the St. Albert field while the remainder originated from six other fields: Peavey/Morinville, Halkirk, Westlock, Legal, Simonette, and Stanmore. The St. Albert acquisition contributed a net daily production increase of 547 boe per day or 94% of our total daily production increase of 581 boe per day over fiscal 2001.
| Daily production rates and | 2002 | 2001 | 2000 |
| total annual production | Average | % Change | Average | % Change | Average |
| Natural gas (mcf/d) | 15,107 | 21 | 12,486 | 6 | 11,798 |
| Natural gas liquids (bbls/d) | 631 | 19 | 530 | (9) | 585 |
| Oil (bbls/d) | 76 | 130 | 33 | (21) | 42 |
| Equivalent (boe/d) | 3,225 | 22 | 2,644 | 2 | 2,593 |
| Total annual production (mboe) | 1,177 | 22 | 965 | 2 | 947 |
| Gas weighting (%) | 78 | | 79 | 4 | 76 |
In fiscal 1998, we signed a long-term, firm-service sales contract regarding our St. Albert natural gas production. Spot market sales at that time were limited to our production of natural gas liquids. Since then, we have sold other available natural gas production directly into the spot market.
In fiscal 2002, weighted average prices in the table below show percentage decreases in all commodities compared to fiscal 2001. Compared to fiscal 2000, however, weighted average prices of all commodities were higher in both fiscals 2002 and 2001.
| Weighted average prices | 2002 | 2001 | 2000 |
| | Average | % Change | Average | % Change | Average |
| Natural gas ($/mcf) | 3.81 | (39) | 6.22 | 129 | 2.72 |
| Natural gas liquids ($/bbl) | 19.30 | (37) | 30.64 | 80 | 16.98 |
| Oil ($/bbl) | 34.33 | (21) | 43.60 | 38 | 31.53 |
| Equivalent ($/boe) | 22.26 | (38) | 35.66 | 113 | 16.74 |
* See Item 4 Our Information – Business Overview – “Marketing” for information on our mix of gas contract types.
To date, we have not undertaken any derivative or hedging activities.
Natural Gas, Liquids and Oil Revenues
Total revenues in fiscal 2002 decreased by $8.1 million or 23%, to $26.4 million from fiscal 2001. Due to higher volume sales of all commodities in fiscal 2002, total revenues increased by $5.0 million or 62% over fiscal 2001 (see variance analysis table above in “Summary of Operating and Financial Results” under Item 5 in this report). Offsetting this increase was a decrease in total revenues from all products of $13.1 million or 162% caused by the variance in weighted average prices of all commodities for fiscals 2002 and 2001.
Compared to fiscal 2000, total revenues increased in fiscal 2002 by $5.3 million or 50% due to higher volume sales of all commodities and by $$5.3 million or 50% due to the variance in weighted average prices between the two years (see variance analysis table above in Item 5 – Operating Results - “Summary of Operating and Financial Results”).
| Natural gas, liquids and oil gross revenues | 2002 | 2001 | 2000 |
| | Total | % Change | Total | % Change | Total |
| Natural gas | 20,944 | (25) | 28,006 | 140 | 11,660 |
| Natural gas liquids | 4,442 | (25) | 5,935 | 64 | 3,620 |
| Oil | 1,016 | 95 | 522 | 7 | 490 |
| Total | 26,402 | (23) | 34,463 | 119 | 15,770 |
The amount that we must pay in terms of royalties and mineral taxes is closely related to our realized weighted average commodity prices. In general, therefore, a trend exists between these items. Total royalties including mineral taxes decreased in fiscal 2002 by $3.0 million or 32%, to $6.3 million from fiscal 2001 (see Item 5 – Operating Results - “Product Prices” under Item 5 in this report).
In fiscal 2002, Crown royalties decreased by $1.6 million or 55%, to $1.3 million from fiscal 2001. Approximately 15% of the decrease was due to the reversal of a prior-year estimate that was based on available Alberta reference prices in fiscal 2001 during a time of volatile natural gas prices. Another 14% was due to lower production from wells attracting crown royalties and the remainder to lower commodity prices used to calculate royalty bases.
In fiscal 2001, Crown royalties increased by 182% whereas freehold and overriding royalties increased by 113%. The primary reason for this increase was that new wells coming on-line in fiscal 2001 attracted Crown royalties and outweighed those attracting freehold royalties.
In fiscal 2002, freehold and overriding royalties decreased by $2.0 million or 33%, to $4.1 million from fiscal 2001. The St. Albert acquisition was burdened with overriding royalties payable to the previous owner. The elimination of this burden accounted for approximately 7% of the decrease in freehold and overriding royalties. The balance is due to lower commodity prices used to calculate royalty bases.
Freehold mineral taxes increased in fiscal 2002 over fiscal 2001 despite an overall decrease in commodity prices. This non-recurring increase was due to a payment in fiscal 2002 of certain mineral taxes associated with fiscal 2001 production.
Alberta Royalty Tax Credits (ARTC) in fiscal 2002 decreased by $0.3 million or 68%, to $0.2 million from fiscal 2001 due to lower Crown royalties on wells eligible for ARTC. In fiscal 2000, a non-recurring change to prior year estimates resulted in an ARTC total that was not meaningful for purposes of year-to-year comparison. Industry advisors indicate that the ARTC is a reasonably secure benefit to Alberta producers through to the end of calendar year 2004.
| Royalties and mineral taxes | 2002 | 2001 | 2000 |
| | Total | % Change | Total | % Change | Total |
| Crown | 1,317 | (55) | 2,958 | 182 | 1,050 |
| Freehold and overriding | 4,067 | (33) | 6,106 | 113 | 2,872 |
| Freehold mineral taxes * | 1,116 | 41 | 794 | 48 | 535 |
| | 6,500 | (34) | 9,858 | 121 | 4,457 |
| ARTC | (159) | 68 | (499) | - | 7 |
| Total | 6,341 | (32) | 9,359 | 110 | 4,464 |
* Based on curent industry trend, we reclassified mineral taxes from Production costs to Royalties in fiscal 2002. For comparison purposes, prior year amounts have been restated in the Statements of Operations and Deficit in the Financial Statements under Item 17 of this report.
Of our total production costs in fiscal 2002, 82% were incurred at St. Albert. Corporate unit production costs of $4.97 per boe were therefore influenced mostly by St. Albert. Unit production costs at St. Albert in fiscal 2002 were $4.84 per boe compared to $4.77 per boe in fiscal 2001, an increase of 1%. In fiscal 2000, St. Albert unit production costs were $4.05 per boe.
| Production costs | 2002 | 2001 | 2000 |
| | Total | % Change | Total | % Change | Total |
| Production costs * - total | 5,846 | 28 | 4,580 | 24 | 3,690 |
| Per boe ($) | 4.97 | 5 | 4.75 | 20 | 3.90 |
* Based on curent industry trend, we reclassified mineral taxes from Production costs to Royalties in fiscal 2002. For comparison purposes, prior year amounts have been restated in the Statements of Operations and Deficit in the Financial Statements under Item 17 of this report.
* Based on curent industry trend, we reclassified mineral taxes from Production costs to Royalties in fiscal 2002. For comparison purposes, prior year amounts have been restated in the Statements of Operations and Deficit in the Financial Statements under Item 17 of this report.
In fiscal 1998, we agreed to sell and lease back to Enercap Corporation of Calgary, Alberta (“Enercap”) certain gas processing facilities at St. Albert. The initial term of the leaseback is five years, payments having begun late in fiscal 1998. For industry comparison purposes, it is useful to analyze the effect on total production costs of the Enercap sale and leaseback transaction.
In fiscal 2002, facilities leaseback costs totaled $0.9 million or $0.84 per boe. Comparatively, facilities leaseback costs in fiscal 2001 totaled $1.4 million or $1.38 per boe. In fiscal 2000 , they totaled $1.5 million or $1.58 per boe. After taking into account unit facilities leaseback costs, unit production costs in fiscal 2002 were $4.13 per boe ($4.97 less $0.84). Comparatively, unit production costs were $3.37 per boe ($4.75 less $1.38) in fiscal 2001 and $2.32 per boe ($3.90 less $1.58) in fiscal 2000. On this basis, unit production costs in fiscal 2002 increased by $0.76 per boe or 23% over fiscal 2001.
One key reason for the increased unit production costs in fiscal 2002 over fiscal 2001 is that increased natural gas production through the St. Albert acquisition is high in liquid content, therefore, more costly to produce. Simultaneously, natural gas production very low in liquid content from the Peavey/Morinville field decreased during fiscal 2002, thereby adding to the overall unit production cost increase. In addition, the cost of utilities during fiscal 2002 was higher than in fiscal 2001.
Unit production costs in fiscal 2001 increased over fiscal 2000 by $0.85 per boe or 20% due mainly to costs to operate newly-added compression facilities and higher electrical costs at St. Albert.
According to the 2002 Canadian Energy Survey prepared by PricewaterhouseCoopers, the industry unit production cost average for calendar 2001 is $6.63 per boe for conventional oil and gas trusts and $6.11 per boe for the top 100 Canadian Exploration and Production companies ranked by gross revenues.
In fiscal 2003, facilities leaseback costs will be $0.5 million. We are intending, during fiscal 2003, to exercise our option to purchase the assets under the leaseback for a price of $780,000. (See Notes 4 and 12 to the Financial Statements under Item 17 of this report for further details on the St. Albert gas facility operating lease commitments).
General and Administrative Expenses
Total general and administrative expenses increased in fiscal 2002 by $0.8 million or 50%, to $2.3 million. During the year, we completed the St. Albert acquisition and became Operator of the property. As Operator, we took on significant new responsibilities requiring broader staff coverage and outside services. Due mostly to the hiring of four new staff, salaries and benefits increased by $0.5 million in fiscal 2002. Also due to the St. Albert acquisition, interest, insurance and professional fees increased in fiscal 2002 over fiscal 2001.
Beginning in fiscal 2001 and continuing in fiscal 2002, we increased our responsibility as Operator of several new joint venture partnerships. In the role of Operator, we were entitled to specified rates of cost recovery pursuant to joint venture agreements. Therefore, in fiscals 2002 and 2001, cost recoveries reduced our general and administrative expenses. Cost recoveries in fiscal 2002 increased 124%, to $0.5 million over fiscal 2001, and in fiscal 2001 cost recoveries increased 694%, to $0.2 million over fiscal 2000.
Interest Expense on Operating Loan
During fiscal 2002, our bank revised our revolving, demand credit facility. The amount of the facility increased from $10 million to $25 million and then decreased to $21 million. The facility is collateralized by a general assignment of book debts and a floating charge debenture of $35 million. The interest rate charged by our bank in fiscals 2002, 2001 and 2000 was the federal prime rate established by the Bank of Canada, plus 3/8%.
As at March 31, 2002, we had a balance outstanding on our bank facility of $14.8 million. At year-end fiscal 2001 there was no outstanding balance and at fiscal 2000 year-end, the amount outstanding was $6.0 million. Pursuant to EIC-122, as issued by the Canadian Institute of Chartered Accountants’ Emerging Issues Committee, the year-end balances have been classified as a current liability.
The average level of our operating loan during its usage period of ten months in fiscal 2002 was $12.7 million ($10.5 million annualized), while the effective borrowing rate was 4.7%. Comparatively, the average level of the operating loan during its nine-month usage period in fiscal 2001 was $3.4 million at an effective borrowing rate of 6.9%. In fiscal 2000, the average level of the operating loan was $2.6 million at an effective borrowing rate of 6.8%.
In fiscal 2002, interest expense on the operating loan increased by $0.3 million or 106%, to $0.5 million. During the year, we utilized our bank credit facility to acquire an additional interest in our St. Albert property. Our share of the purchase price paid for this acquisition was $14.7 million.
| Financing costs | 2002 | 2001 | 2000 |
| | Total | % Change | Total | % Change | Total |
| Interest expense on operating loan * | 495 | 106 | 240 | 24 | 194 |
| Funds flow times interest coverage | 23 | (70) | 76 | 162 | 29 |
| Average cost per boe ($) | 0.42 | 68 | 0.25 | 19 | 0.21 |
* See Notes 1 and 3 to the Financial Statements under Item 17 in this report for further details on EIC-122 and the Operating loan.
Ceiling Test, Amortization and Depletion
We annually conduct a ceiling test in accordance with accounting guidelines applicable to the operations of all oil and gas companies that follow the successful efforts method of accounting. The test prescribes that the carrying value of petroleum and natural gas properties shall be limited to their estimated future net revenues from proved producing reserves less well reclamation costs.
At each fiscal year-end a portion of oil and gas projects, for which costs have been incurred, have not yet been assigned proved producing reserves. In fiscal 2002, 95% of total costs incurred were attracting amortization and depletion expense (“A&D”) while the remainder yet needed to be assigned proved producing reserves. This represented an increase over fiscals 2001 and 2000 of 20% (95% compared to 75%).
One reason for the 20% increase in A&D is that, during fiscal 2002, we re-evaluated five potential natural gas wells in which it had participated in years prior. Previously, these wells had been completed and suspended pending further evaluation, however, field activities conducted in fiscal 2002 proved these wells unsuccessful. Costs
incurred on these five unsuccessful attempts amounting to $2.1 million were expensed and therefore removed from the group of assets that yet needed to be assigned proved producing reserves (see “Exploration Expenses” below). The other reason for this increase is that projects in progress at the close of fiscal 2001 began producing during fiscal 2002, thereby attracting A&D.
The ratio of A&D to asset costs attracting A&D, should remain fairly consistent from year to year, unless the results of ceiling test adjustments cause significant acceleration of A&D on material properties. In fiscal 2002, the ratio increased to 1:4 from 1:7 and 1:9 from fiscals 2001 and 2000, respectively.
During the last half of fiscal 2002, significant ceiling test adjustments were recorded. Of the $6.8 million in ceiling test adjustments recorded, the Peavey/Morinville property accounted for 99%. Based on independent reserve estimates effective April 1, 2002, we re-evaluated our asset carrying values and made a decision with respect to further development of the property. Without factoring in fiscal 2002 ceiling test adjustments, the ratio of A&D to asset costs attracting A&D would have been 1:9, a factor more consistent with those of fiscals 2001 and 2000. As at March 31, 2002, we had a total remaining net book value of Peavey/Morinville assets of $1.5 million. Compared to fiscal 2002, relatively minor amounts were recorded as ceiling test adjustments in fiscals 2001 and 2000.
| Amortization and Depletion | 2002 | 2001 | 2000 |
| | Total | % Change | Total | % Change | Total |
| Amortization and depletion expense (“A&D”) | 5,336 | 72 | 3,097 | 100 | 1,551 |
| Ceiling test adjustments | 6,783 | - | 36 | (61) | 93 |
| Total A&D * | 12,119 | 287 | 3,133 | 91 | 1,644 |
| Assets attracting A&D | 47,525 | 112 | 22,435 | 54 | 14,566 |
| Total assets | 49,907 | 67 | 29,874 | 54 | 19,356 |
| Percent of assets attracting A&D to total assets | 95 | 27 | 75 | - | 75 |
| Ratio of A&D to assets attracting A&D | 1:4 | | 1:7 | | 1:9 |
* On the Statement of Operations and Deficit, Amortization and Depletion expense of $12,172,943 includes additional debit and credit items. (See Schedule 2: Amortization and Depletion appended to the Notes to the Financial Statements under Item 17 in this report for details).
Fiscal 2002 is the fourth full year of the initial five-year term of the St. Albert sale and leaseback agreement. Amortization of the deferred gain realized on the sale of $0.2 million was recorded (fiscal 2001 - $0.3 million, fiscal 2000 - $0.4 million). (See “Production Costs” above for further discussion on the agreement).
Exploration Expenses
Our exploration expenses in fiscal 2002 increased by $2.7 million or 142%, to $4.6 million over fiscal 2001. The most significant increase in exploration costs was due to the expensing of drilling costs associated with unsuccessful wells that were drilled during fiscal 2002 and prior.
Four wells drilled by us during fiscal 2002 were unsuccessful, two at Peavey/Morinville and one each at Quirk Creek and Alexander. We also conducted a re-entry/workover operation on one St. Albert well that was unsuccessful. In fiscal 2002, we expensed $1.7 million in costs incurred on these five unsuccessful attempts.
Five wells drilled by us prior to fiscal 2002 were also unsuccessful, four at Peavey/Morinville and one at Orion. Previously, these wells had been completed and suspended pending further evaluation. However, our field activities conducted in fiscal 2002 proved these wells unsuccessful. In fiscal 2002, we expensed $2.1 million in costs incurred on these five unsuccessful attempts.
Our exploration expenses associated with seismic programs conducted during fiscal 2002 amounted to $0.6 million. One third of this amount was incurred at St. Albert and Peavey/Morinville, the remainder at other central Alberta properties. Included in our fiscal 2003 exploration budget is $1.1 million for seismic programs.
Our exploration expenses were $1.9 million in fiscal 2001, an amount that included the costs of a seismic program and two unsuccessful wells at Peavey/Morinville, and one other seismic program at Orion. In fiscal 2000, total exploration expenses of $1.3 million included the costs of a seismic program and an unsuccessful well at St. Albert, a seismic program at Peavey/Morinville and an unsuccessful well at Two Creeks, Alberta.
Gain on Sale of Natural Gas and Oil Interests
In fiscal 2002, we had no significant transactions to report. In fiscal 2001, we sold a 50% interest in a portion of our Orion leases in northeast British Columbia in exchange for a farmin agreement with another company. The proceeds on the sale were $1.0 million and the associated gain amounted to $0.6 million. In fiscal 2000, there were no gain or loss on sale transactions to report.
Income Taxes
We use the liability method of tax allocation in accounting for income taxes. Future tax assets and liabilities are determined based on differences between the financial reporting and tax bases of assets and liabilities, and measured using the substantially enacted rates and laws that will be in effect when the differences are expected to reverse.
The effective income tax rate of fiscal 2002 was a recovery of 35.1%, compared with an expense of 32.8% in fiscal 2001. In fiscal 2000, the effective income tax rate was a recovery of 42.1%. As at March 31 for each of the last three years, we had the following income tax pools available to shelter future income from taxes.
| Income tax pools available | 2002 | 2001 | 2000 | Maximum annual deduction |
| Canadian exploration expense | - | - | 5,219 | 100% |
| Non-capital losses | - | - | 318 | 100% |
| Share issue costs | - | - | 95 | 100% |
| Canadian development expense | 3,772 | 3,307 | 1,732 | 30% |
| Undepreciated capital costs | 10,297 | 5,554 | 3,274 | 20% – 100% |
| Canadian oil and gas property expense | 16,471 | 3,986 | 4,460 | 10% |
| Total | 30,540 | 12,847 | 15,098 | |
Inflation
We operate in Canada only, where inflation for our operational costs is at low levels, i.e. in the 2% to 5% range.
Impact of Foreign Currency Fluctuations
We hold our cash reserves and receive the majority of our revenues in Canadian dollars. We incur the majority of our expenses and capital expenditures also in Canadian dollars. Therefore, an increase or decrease in the value of the Canadian dollar versus the U.S. dollar would have a minimal effect on us.
Government Policies
We are subject to regulations of the Government of Canada and the Governments of Alberta and British Columbia. Such regulations may relate directly and indirectly to our operations including production, marketing and sale of hydrocarbons, royalties, taxation, environmental matters and other factors. There is no assurance that the laws relating to our operations will not change in a manner that may materially and adversely affect us, however, there has been no material impact on us in the past three fiscal years.
Liquidity and Capital Resources
As at March 31, 2002, we had a working capital deficit of $13.3 million that included a balance owing to our corporate bank of $14.8 million under an operating loan. This resulted in a net debt years-to-repay ratio for fiscal 2002 of 1.2:1. Comparatively, the net debt years-to-repay ratios for fiscals 2001 and 2000 were nil and 0.7:1, respectively.
As at March 31, 2002, our bank made available to us under a revolving, demand credit facility an amount of $21.0 million. Principal balances outstanding bear interest at the federal prime rate established by the Bank of Canada plus 3/8% and are collateralized by a general assignment of book debts and a floating charge debenture of $35.0 million covering all our assets. A standby fee of 0.125% per annum is levied on the unused portion of the facility.
Under the sale and leaseback transaction that we concluded in fiscal 1998, we agreed to sell and lease back to Enercap certain gas processing facilities at St. Albert. Accordingly, we have a future facilities leasing commitment of $0.5 million payable to Enercap extending into fiscal 2003. In fiscal 2003, we have the option for $0.8 million to repurchase the gas processing facilities from Enercap and we intend to exercise the option.
After adjusting the March 31, 2002 net working capital deficit of $13.3 million by the Enercap leasing commitments and future removal and site restoration costs, the net debt years-to-repay ratio for fiscal 2002 is 1.3:1. Comparatively, the adjusted net debt years-to-repay ratio for fiscals 2001 and 2000 were nil and 1.2:1, respectively.
| Debt and future items, to funds flow | 2002 | 2001 | 2000 |
| (Years-to-repay ratios) | Total | % Change | Total | % Change | Total |
| Funds flow from operations | 11,337 | (38) | 18,168 | 222 | 5,634 |
| Working capital | (13,281) | (775) | 1,969 | 153 | (3,716) |
| Years to repay net debt | 1.2:1 | | - | | 0.7: 1 |
| Future removal and site restoration | (824) | (53) | (540) | (34) | (402) |
| Future facilities leasing commitments * | (468) | 68 | (1,453) | (48) | (2,788) |
| Net debt adjusted for future items | (14,573) | - | (24) | 100 | (6,906) |
| Years to repay net debt & future items | 1.3:1 | | - | | 1.2:1 |
* We intend, during fiscal 2003, to exercise our option to purchase the assets under lease for a price of $780,000. (See Notes 4 and 12 to the Financial Statements under Item 17 in this report for further details on our St. Albert gas facility operating lease commitments).
During fiscal 2002, we repurchased in the open market and canceled 178,800 shares of common stock for $0.3 million. During fiscal 2001, we repurchased in the open market and canceled 897,300 shares of common stock for $1.5 million. (See Note 14 to the Financial Statements under Item 17 in this report for details of a bid authorization dated beyond the fiscal year ended March 31, 2002).
We believe that cash generated from our operating activities and excess committed borrowing capacity will be sufficient to fund our fiscal 2003 capital expenditure and exploration expense program and to meet financial obligations as they become due.
Our financial instruments consist of cash and cash equivalents, accounts receivable, bank indebtedness, operating loan and accounts payable. The carrying values of these financial instruments approximate their fair value.
Substantially all of our accounts receivable at March 31, 2002 and 2001 result from the sale of natural gas, natural gas liquids and oil to other companies in the oil and gas industry. This concentration of customer type may impact our overall credit risk, either positively or negatively, in that such entities may be similarly affected by industry-wide changes in economic or other conditions. Historically to date, we have incurred no credit losses on our receivables.
We have no agreements with management, investors, shareholders or anyone else respecting the raising of additional capital through stock issuances at this time, nor are we investigating such possibilities at this time.
Capital Expenditures
Our capital expenditures significantly increased in fiscal 2002 by $10.5 million or 91%, to $22.1 million over fiscal 2001. This was comprised of field expenditures of $22.0 million and office expenditures of $0.1 million.
Of the $22.0 million spent on field expenditures in fiscal 2002, we spent 80% at St. Albert, 14% at Halkirk, 3% at Peavey/Morinville and 3% at Alexander and two other central Alberta properties. Included in the amount spent at St. Albert was $14.7 million for the purchase price of the St. Albert acquisition.
Of the $7.7 million spent on drilling, completions and tie-ins in fiscal 2002, 5% was on exploratory drilling, 8% on development drilling, 41% on completions and 46% on equipping.
Our capital expenditures in fiscals 2001 and 2000 amounted to $11.6 million and $5.7 million, respectively. Accounting for part of the expenditures, were the costs of participating in drilling seventeen wells in fiscal 2001, compared to six in fiscal 2000. Expenditures in fiscal 2001 were incurred at St. Albert, Peavey/Morinville, Halkirk and Orion. Expenditures in fiscal 2000 were incurred at St. Albert, Peavey/Morinville and Orion.
| Capital expenditures | 2002 | % Change | 2001 | % Change | 2000 |
| Drilling, completions and tie-ins | 7,678 | 11 | 6,939 | 150 | 2,777 |
| Facilities | 1,757 | (50) | 3,522 | 245 | 1,022 |
| Land acquisitions | 12,560 | 1105 | 1,042 | (43) | 1,828 |
| Field expenditures | 21,995 | 91 | 11,503 | 104 | 5,627 |
| Furniture, fixtures and computer | 116 | 47 | 79 | (21) | 100 |
| Total | 22,111 | 91 | 11,582 | 102 | 5,727 |
Of the $17.0 million that we budgeted for capital expenditures in fiscal 2003, we believe that 52% will be spent on exploration projects and 48% on development projects.
Outlook for Fiscal 2003
During fiscal 2003, we expect to conduct an active development program in central Alberta. Our drilling plans include a nine-well program for new natural gas and oil reserves at St. Albert and a four-well program for new natural gas reserves at Halkirk. We also plan completions and various production-enhancing projects on both properties. During fiscal 2003, we expect to invest $8.2 million in development projects.
We also plan to increase exploration activities during fiscal 2003. Plans include the drilling of up to four wells and one re-entry in central Alberta. We may also drill up to three wells in northeastern British Columbia. During fiscal 2003, we expect to invest $9.9 million in exploration projects.
Ultimately, our growth rate in fiscal year 2003 will depend on commodity prices, our drilling successes and our production rates from existing wells.
We favour natural gas and intend to grow our natural gas reserves in Western Canada. We own at St. Albert, however, a 75% working interest in mineral rights that we believe have several oil targets, and associated infrastructure with ample capacity. We plan drilling for these oil targets in fiscal 2003.
St. Albert is a prime, core property for us. It produces natural gas, natural gas liquids and oil, and we believe it remains prospective for all three. We have an objective to establish other core properties and our fiscal 2003 plans include projects aimed at that objective.
Sensitivity Analysis
In fiscal 2002, our total gross revenue was comprised of 80% natural gas and 17% natural gas liquids. Accordingly, our funds flow is very sensitive to fluctuations in the price of these two commodities. Based on sales volumes, weighted average prices of natural gas and natural gas liquids, and the average annual operating loan balance outstanding during fiscal 2002, the following table shows the effect on our funds flow of certain changes in volume, price and interest rates.
| Sensitivity Analysis | | | | | | |
| Changes in | | Effect on Funds flow |
| Volume | Price | Rate | | $(000’s) | $/share |
| Natural gas production (mmcf/d) | 1 | - | - | | 1,389 | 0.070 |
| Natural gas price ($/mcf) | - | 0.10 | - | | 547 | 0.027 |
| Natural gas liquids (bbls/d) | 100 | - | - | | 704 | 0.034 |
| Natural gas liquids ($/bbl) | - | 1.00 | - | | 230 | 0.011 |
| Interest rate (%) | - | - | 1 | | 33 | 0.002 |
Item 6. Directors, Senior Management and Employees
Directors and Senior Management
The following is information regarding our Directors, Senior Management and Employees as of March 31, 2002.
| Name | Position Held | Age | Residence |
| Directors and Executive Officers: | | |
| Wayne J. Babcock | President & CEO, Director | 59 | Vancouver, B.C. |
| Donald K. Umbach | Vice President & COO, Director | 48 | Vancouver, B.C. |
| John A. Greig | Director | 61 | Vancouver, B.C. |
| Jonathan A. Rubenstein | Director | 53 | Vancouver, B.C. |
| David J. Jennings | Director | 39 | Vancouver, B.C. |
| John Lagadin | Director | 64 | Calgary, Alta. |
| Michael A. Bardell | CFO & Corporate Secretary | 56 | Vancouver, B.C. |
| James R. Britton | Vice President, Exploration | 68 | Vancouver, B.C. |
Wayne Babcock
President and Chief Executive Officer |  |
| Wayne Babcock, P. Geoph., holds a degree in Geophysics from the University of British Columbia and joined Amoco Canada Petroleum Company Ltd. in 1966. Before establishing the Company in 1979, Mr. Babcock managed Amoco's geophysical exploration of Saskatchewan and Southern Alberta, Canada's western sedimentary basin. He is a member of the Alberta Association of Professional Engineers, Geologists and Geophysicists, the Canadian Institute of Energy and is on the Board of Directors of Redcorp Ventures, a Toronto-listed mining company. Mr. Babcock has been our President, Chief Executive Officer and a Director si nce 1979. |
Donald
Umbach
Vice President and Chief Operating Officer |  |
| Donald Umbach holds diplomas in Business Administration & Petroleum Land Management from the Mount Royal College of Calgary, Alberta and is a member of the Canadian Association of Petroleum Landmen. He has over 20 years experience in the Canadian oil and gas industry, beginning with Hudson's Bay Oil & Gas Limited, followed by a time with a junior oil and gas company. Prior to his joining us in 1987, Mr. Umbach was principle of his own Petroleum Landman consulting firm. Mr. Umbach is our Vice President and Chief Operating Officer. |
|
John Greig
Director |  |
| John Greig, M.Sc./P.Geol., holds a B.Sc. (honours) in Geology from McGill University in Montreal and a M.Sc. in Geology from the University of Alberta. He is the founder and member of the Board of Directors of publicly-traded exploration companies, including, Redcorp Ventures Ltd., and Eurozinc Mining Corp. Mr. Greig is also a director and the Chairman of Cumberland Resources. Mr. Greig has been a director of us since July 1990. |
Jonathan Rubenstein
Director |  |
Between 1977 and 1994, Mr. Rubenstein was in private law practice undertaking matters in the areas of corporate commercial law, securities law, natural resource law, international law and environmental law. Since 1994 he has worked in senior positions with international mining companies based in Vancouver.
Mr. Rubenstein has been a director of us since July 1990. Mr. Rubenstein is a director of the following public companies: Redcorp Ventures Ltd., Cumberland Resources, Canico Resource Corp. and Commander Resources L td. |
David Jennings
Director |  |
| David Jennings is a principal of the law firm Irwin, White & Jennings in Vancouver, Canada. Over the past decade Mr. Jennings has specialized in corporate finance and securities law with several publicly-traded companies. Mr. Jennings' practice includes initial public and additional offerings, debt offerings, venture capital financings, take-over bids and issuer bids, proxy contests, reorganizations, corporate governance matters and related transactions. Mr. Jennings was the past Chair of the Securities Subsection of the Canadian Bar Association, British Columbia branch, a past member of the Vancouver Stock Exchange Advisory Committee, and a member of the British Columbia Securities Commission Law Advisory Committee. Mr. Jennings has written articles and lectured on the areas of corporate and securities law and venture capital financing. Mr. Jennings has been a director of us since August, 1999. |
|
John Lagadin
Director |  |
| Mr. Lagadin's list of achievements includes: founder of the C$5.5 billion Alliance Natural Gas Pipeline; founder and president of Direct Energy Marketing Limited, which grew to be the largest independent gas marketer in Canada; co-founder and financier of Municipal Gas Corporation, an aggregator of residential and commercial gas customers; founder of Energy Exchange Inc., the first commodity-styled, web-based electronic exchange for the sale and purchase of natural gas; and most recently investor and President of GeoScope Exploration Technologies, Inc., a company using proprietary, state-of-the-art seismic interpretation techniques to explore for oil & gas. Mr. Lagadin holds a Bachelor of Science degree in Geological Engineering from Michigan Technology University. Recently, he was awarded the Centennial Leadership Award by the Association of Professional Engineers, Geologists and Geophysicists of Alberta, in recognition of his achievements in the natural gas industry. He is currently an independent businessman. Mr. Lagadin is a member of the Board of Directors of Cabre Exploration, Petro-Reef Resources and Direct Energy Marketing. Mr. Lagadin has been a director of us since August, 2000. |
Mike Bardell
Chief Financial Officer and Corporate Secretary |  |
| Michael Bardell holds a diploma in finance and accounting and has over 30 years experience developing and directing financial, computer and money management systems. Beginning his career with Hudson's Bay Oil and Gas, he later held senior management positions in junior oil and gas companies, and in the drilling service industry. Before joining the Company, he was controller for one of the world's largest sulphur marketing consortiums consisting of 28 major energy companies including Gulf Canada, Chevron Canada, Canadian Occidental and Union Oil. Mr. Bardell was our controller from 1988 to 1999 and our Chief Fi nancial Officer from 1999 to present. |
Jim Britton
Vice President, Exploration |  |
| Jim Britton, P.Eng., has a B.A.Sc. in Geological Engineering from the University of Toronto and is a member of the British Columbia Association of Petroleum Engineers and the Association of Professional Engineers, Geologists and Geophysicists of Alberta. Mr. Britton is our Vice President, Exploration and has been associated with us since 1986. |
None of our officers or employees have any family relationship with one another. To the best of our knowledge, there are no arrangements or understandings with major shareholders, customers, suppliers or others, pursuant to which any person referred to above was selected as a director or member of senior management.
Compensation
Total Compensation Paid, and Benefits Granted to Named Executive Officers and Directors
The following table sets forth all annual and long-term compensation for services in all capacities to us for the last full fiscal year ended March 31, 2002 in respect of each of the individuals comprised of our Chief Executive Officer and our other four most highly compensated executive officers whose individual total compensation exceeded $100,000 and any individual who would have satisfied these criteria but for the fact he was not serving as an officer at the end of the last full fiscal year (collectively, “the Named Executive Officers”). The information is presented in accordance with applicable Canadian regulations regarding reporting financial information on individual persons.
Named Executive Officers
Name/Position |
Salary |
Bonus | Other Annual Compensation (1) | Options Granted
(#) (2) |
Exercise
Price |
Expiry Date |
Wayne J. Babcock
President & CEO |
112,008 |
Nil |
318,841 |
60,000 |
$1.75 |
28-Feb-2007 |
Donald K. Umbach
Vice President & COO |
112,008 |
Nil |
318,841 |
60,000 |
$1.75 |
28-Feb-2007 |
David G. Grohs,
Manager, Engineering |
133,875 |
Nil |
Nil |
20,000 |
$1.75 |
28-Feb-2007 |
Michael A. Bardell,
CFO & Corporate Secretary |
100,000 |
33,500 |
Nil |
40,000 |
$1.75 |
28-Feb-2007 |
James R. Britton
Vice-Pres., Exploration |
72,000 |
Nil |
318,841 |
30,000 |
$1.75 |
28-Feb-2007 |
(1) The other annual compensation paid is in respect to payments to each of three Named Executive Officers pursuant to royalty agreements. We pay an overriding royalty interest of 1% of our share of gross monthly production of all petroleum substances produced or deemed to be produced and marketed from or allocated to each well on all lands acquired by us since June 1, 1986 (for two Named Executive Officers) and June 1, 1987 (for the third Named Executive Officer).
(2) We have a formalized stock option plan for the discretionary granting of incentive stock options to the Named Executive Officers. The options indicated above were granted pursuant to that plan.
During the fiscal year ended March 31, 2002, we paid to our senior officers total compensation (including as applicable, payments made pursuant to royalty agreements, an aggregate sum of $1,386,039.
As of July 13, 1990, we had overriding royalty agreements with two of the Named Executive Officers and as of August 31, 1990, we had an overriding royalty agreement with a third Named Executive Officer. Each of the overriding royalty agreements requires us to pay an overriding royalty interest of 1% of our share of gross monthly production of all petroleum substances produced or deemed to be produced and marketed from or allocated to each well on all lands acquired by us since June 1, 1986 for two of the Named Executive Officers and June 1, 1987 for the third Named Executive Officer.
As of our most recently completed fiscal year, we had employment contracts with all of the Named Executive Officers. Each of the contracts has standard employment provisions, including salary, benefits, vacation time, non-competition and confidentiality provisions. In addition, each of the contracts requires the Named Executive Officer not to voluntarily leave his employ during actions taken by third parties to acquire control of us. If a Named Executive Officer resigns within 6 months of a change of control of us for the sole reason that a change of control of us has occurred, the Named Executive Officer may receive a severance package including an amount equal to 12 months’ salary and the
economic benefit of any stock options then outstanding. If the Named Executive Officer is terminated by us without cause, such officer may receive a severance package including an amount equal to 24 months’ salary, the economic benefit of any stock options then outstanding, and certain health and insurance benefits for a period not to exceed 12 months.
Other than the overriding royalty agreements and employment contracts described above, we had as of the end of the most recent fiscal year no compensatory plan or arrangement in respect of compensation received or that may be received by the Named Executive Officers to compensate Named Executive Officers in the event of the termination of employment (resignation, retirement, change of control) or in the event of a change in responsibilities following a change in control, where in respect of the Named Executive Officer the value of such compensation exceeds $100,000.
The following table sets forth all compensation for services in all capacities to us for the last full fiscal year ended March 31, 2002 in respect of each of the outside, independent directors.
Outside Directors
Name/Position |
Salary (1) |
Bonus |
Other Annual Compensation | Options Granted
(#) (2) |
Exercise
Price |
Expiry Date |
John A. Greig
Director |
Nil |
Nil |
Nil | 17,500
15,000 | $2.15
$2.10 | 30-Apr-2011
23-Aug-2011 |
Jonathan A. Rubenstein
Director |
Nil |
Nil |
Nil | 17,500
15,000 | $2.15
$2.10 | 30-Apr-2011
23-Aug-2011 |
John Lagadin
Director |
Nil |
Nil |
Nil |
15,000 |
$2.10 |
23-Aug-2011 |
David J. Jennings (3)
Director |
Nil |
Nil |
Nil | 17,500
15,000 | $2.15
$2.10 | 30-Apr-2011
23-Aug-2011 |
(1) During our last completed fiscal year, we did not pay any cash compensation to our directors (outside and inside), in their capacities as such.
(2) We have a formalized stock option plan for the non-discretionary, annual granting of incentive stock options to outside directors. The options indicated above were granted pursuant to that plan.
(3) At our Annual General Meeting held on August 25, 1999, our shareholders approved the nomination of David J. Jennings for election as director for a three-year term. Mr. Jennings performs legal work on our behalf as a Barrister and Solicitor with the firm of Irwin, White & Jennings (1999). He was formerly a Partner in the firm of DuMoulin Black (1995-99). Mr. Jennings’ fiscal year 2002 legal fees amounted to $27,507.
Non-Cash Compensation to Directors, Officers and Employees
We have a formalized incentive stock option plan for our directors, officers and employees. The purpose of such options is to assist us in compensating, attracting, motivating and retaining those persons and to closely align the personal interests of such persons to that of our shareholders.
The following table shows the number of shares of common stock subject to outstanding stock options held by our directors or officers, as a group as of July 31, 2002.
| Stock Options Outstanding as of July 31, 2002 | |
| (Directors/Officers, as a group) | | |
| Expiry Date | Exercise Price | Number of Shares of Common Stock |
| April 22, 2003 | $1.72 | 563,000 |
| January 24, 2005 | $1.45 | 25,000 |
| September 29, 2005 | $2.10 | 300,000 |
| August 17, 2010 | $1.72 | 112,500 |
| September 29, 2010 | $2.10 | 18,750 |
| April 30, 2011 | $2.15 | 52,500 |
| August 23, 2011 | $2.10 | 60,000 |
| February 28, 2007 | $1.75 | 190,000 |
| April 20, 2012 | $1.65 | 57,500 |
| Total | | 1,379,250 |
The following table shows the number of shares of common stock subject to outstanding stock options held by employees and consultants who are neither our directors nor officers as of July 31, 2002.
Stock Options Outstanding as of July 31, 2002 |
| (Non-Directors/Non-Officers) |
| Expiry Date | Exercise Price | Number of Shares of Common Stock |
| April 22, 2003 | $1.72 | 177,000 |
| July 14, 2003 | $1.72 | 40,000 |
| January 24, 2005 | $1.45 | 20,000 |
| August 1, 2005 | $1.75 | 30,000 |
| September 29,2005 | $2.10 | 53,000 |
| March 1, 2006 | $2.17 | 21,000 |
| April 1, 2006 | $1.70 | 90,000 |
| April 15, 2006 | $2.25 | 60,000 |
| February 28, 2007 | $1.75 | 117,500 |
| Total | | 608,500 |
The following table sets forth details of all grants of stock options during the most recently completed fiscal year to each of the Named Executive Officers.
| Stock Options Granted to Named Executive Officers | |
Name |
Number of
Securities Under Options Granted | % of Total Options Granted in Fiscal year |
Exercise Price (1) |
Expiration Date |
| Wayne J. Babcock | 60,000 | 11 | $1.75 | Feb. 28, 2007 |
| Donald K. Umbach | 60,000 | 11 | $1.75 | Feb. 28, 2007 |
| David G. Grohs | 20,000 | 4 | $1.75 | Feb. 28, 2007 |
| Michael A. Bardell | 40,000 | 7 | $1.75 | Feb. 28, 2007 |
| James R. Britton | 30,000 | 5 | $1.75 | Feb. 28, 2007 |
(1) The exercise price of options is based on the closing market price of our shares of common stock of the day preceeding the grant of such options.
During fiscal 2002, 495,100 options were exercised by executive officers, employee directors or nondirectors for total proceeds to us of $439,420.
The following table sets forth details of all exercises of stock options during fiscal year 2002 and the number of stock options held as of the end of fiscal year 2002 by each of the Named Executive Officers. The table also sets forth the fiscal year-end value of unexercised in-the-money options/SAR’s on an aggregated basis.
| Stock Options Exercised and Held by Named Executive Officers | |
| | | | Number of | Dollar Value of |
| | | | Unexercised | Unexercised |
| |
Number of |
Aggregate | Options/SAR’s
At Fiscal Year-End (3) | In-the-Money Options/SAR’s
At Fiscal Year-End (3)(4) |
Name | Securities Acquired On Exercise (1) | Dollar Value Realized (2) | Exercisable/
Unexercisable | Exercisable/
Unexercisable |
| Wayne J. Babcock | 82,600 | 156,002 | 305,000/60,000 | 47,150/12,000 |
| Donald K. Umbach | 102,500 | 205,375 | 260,000/60,000 | 36,800/12,000 |
| David G. Grohs | Nil | Nil | Nil/110,000 | Nil/26,500 |
| Michael A. Bardell | 106,000 | 237,350 | 135,000/40,000 | 19,550/8,000 |
| James R. Britton | 31,500 | 58,275 | 135,000/30,000 | 19,550/6,000 |
(1) Number of shares of common stock acquired on the exercise of stock options.
(2) Calculated using the average of the high and low prices for a round lot of our shares of common stock on the Toronto Stock Exchange on the day of exercise.
(3) No SARs have been granted, therefore, the numbers relate solely to stock options.
(4) Value of unexercised in-the-money options calculated using the closing price of our shares of common stock on the Toronto Stock Exchange on March 31, 2002, less the exercise price of in-the-money stock options.
Board Practices
Term of Office
At our annual general meeting held on August 27, 1998, our shareholders approved amending our Articles to provide that approximately one-third of the members of the Board of Directors be elected annually for three-year terms. At the end of the last fiscal year ended March 31, 2001, we had a total of six directors, two of which had one year remaining, two had two years remaining and two had three years remaining.
| Name | Term of Office Remaining | Held Office Since |
Directors: | | |
| Wayne J. Babcock | Three year | 1980 |
| Donald K. Umbach | Three year | 1986 |
| John A. Greig | Two years | 1991 |
| Jonathan A. Rubenstein | Two years | 1991 |
| David J. Jennings | One year | 1999 |
| John Lagadin | One year | 2000 |
Audit and Reserves Committee, Compensation Committee and Corporate Governance Committee
The following table sets forth details relating our Audit and Reserves Committee, Compensation Committee and Corporate Governance Committee for the last full fiscal year ended March 31, 2002.
| Name | Committee |
| Directors: | |
| John A. Greig | Audit and Reserves Chair, Compensation, Corporate Governance |
| Jonathan A. Rubenstein | Compensation Chair, Audit and Reserves, Corporate Governance |
| David J. Jennings | Corporate Governance Chair, Audit and Reserves, Compensation |
| John Lagadin | Audit and Reserves |
The Audit and Reserves Committee is mandated to (i) assist the Board of Directors in fulfilling its fiduciary responsibilities relating to accounting and reporting practices and internal controls, (ii) review audited financial statements and management’s discussion and analysis of operations with the auditors, (iii) review the annual report and all interim reports of the auditors, (iv) ensure that no restrictions are placed by management on the scope of the auditor's review and examination of our accounts, (v) review the annual estimated reserves determined by independent engineers, (vi) recommend to the Board of Directors the firm of independent engineers to be appointed by the Board of Directors to evaluate our annual reserves and (vii) recommend to the Board of Directors the firm of auditors to be nominated by the Board of Directors for appointment by the shareholders at the annual general meeting
The Compensation Committee is mandated to consider and make recommendations to the Board of Directors for appropriate compensation packages for our executive officers and directors. The guiding philosophy of the Compensation Committee in determining compensation for executives has been to provide a compensation package that is flexible, entrepreneurial and geared towards attracting, retaining and motivating executive officers. The policies of the Compensation Committee encourage performance by executives to enhance our growth and profitability. Achievement of these objectives is intended to contribute to an increase in shareholder value. The Compensation Committee expects to accomplish this through defining the key components for executive officer compensation, being a base salary comparable to executive salaries in established peer group companies, and long-term incentives in the form of stock options. Short-term incentives in the fo rm of a cash bonus could be paid for significant contributions to us. In combination, these elements are designed to recognize those activities of management that advance our short and long-term business objectives. The Compensation Committee meets as required, but not less than annually.
The Compensation Committee met twice during the fiscal year ended March 31, 2002. We have never provided compensation in the form of any plan providing compensation intended to serve as incentive for performance to occur over a period longer than one fiscal year and has not set aside or accrued for pensions. However, the shareholders previously approved royalty agreements with Named Executive Officers whereby we pay an overriding royalty interest of 1% of our share of gross monthly production of all petroleum substances produced or deemed to be produced and marketed from or allocated to each well on all lands acquired by us since June 1, 1986 (two Named Executive Officers) and since June 1, 1987 (the third Named Executive Officer). During the past year, members of the Compensation
Committee recommended, and the Board of Directors approved, the granting of 307,500 options to our directors, officers and employees. There were no option repricings during the year. Also, on October 23, 2001, the Compensation Committee resolved to increase the salary level of one executive position by a percentage of 39% over base salary. No subsequent increases have been made to salary levels.
In fiscal 1999 the Compensation Committee retained the services of William M. Mercer Inc. (“Mercer”) of Calgary, Alberta to conduct a thorough executive compensation review. As a result of the Mercer report, the Compensation Committee found that the salary levels of our executives were “outside and below the ranges of salaries for executives in comparable positions in the peer group of oil and gas producing companies”. On June 30, 1999, the Committee resolved to increase by $40,000, the base salary levels of each of the President and Chief Executive Officer, and the Vice President and Chief Operating Officer, and the Vice President, Exploration. After giving effect to these adjustments, the salary of these three executives were in the lowest quartile of the peer group of companies. Also on June 30, 1999, the Compensation Committee resolved to increase the salary levels of three other execut ive positions by percentages ranging from 43% to 47% over base salary. No subsequent increases have been made to the salary levels.
The Compensation Committee further resolved that, consistent with the peer group of companies, all the above executive positions would be eligible for discretionary stock option participation.
Our Board of Directors is composed of six directors. None of the members of the Audit and Reserves, Compensation and Corporate Governance Committees has any indebtedness to us nor does any have any material interest, or have any associates or affiliates which have any material interest, direct or indirect, in any actual or proposed transaction in the last fiscal year which has materially affected or would materially affect us.
Employees
As of March 31, 2002, we employed thirteen people full time in our Richmond, British Columbia office. The persons employed are the President & CEO, the Vice President & COO, the CFO & Corporate Secretary, the Vice President, Exploration, and nine persons occupied with technical support, company and joint venture accounting, financial reporting, office management and land administration.
In addition to the foregoing, we also receive technical services from a number of exploration, geophysical, geological, engineering and accounting consultants.
Share Ownership
The following table sets forth the Common Stock ownership of each of our directors and officers. All ownership shown is of record and reflects beneficial ownership as of July 31, 2002, and represents the number of shares of common stock beneficially owned, directly or indirectly, or controlled by the person listed. Unless otherwise indicated, such shares are held directly.
| Share Ownership of Directors and Officers | | |
Name |
Position | Number of Shares of Common Stock | Percent of Class |
| Wayne J. Babcock | President & CEO, Director | 634,893 | 3.1 |
| Donald K. Umbach | Vice President & COO, Director | 257,016 | 1.3 |
| John A. Greig | Director | 140,077 | 0.7 |
| Jonathan A. Rubenstein | Director | 31,063 | 0.2 |
| David J. Jennings | Director | 20,000 | 0.1 |
| John Lagadin | Director | Nil | - |
| Michael A. Bardell | CFO & Corporate Secretary | 136,374 | 0.7 |
| James R. Britton | Vice President, Exploration | 110,500 | 0.5 |
Item 7. Major Shareholders and Related Party Transactions
Major Shareholders
To the best of our knowledge, no person beneficially owns, directly or indirectly, or exercises control or direction over shares carrying more than five percent of the voting rights of our shares. All of our shares are common stock without par value, each possessing equal voting rights. There is no other class of shares authorized.
Related Party Transactions
Please see the description of our Overriding Royalty Agreements in Item 10 – “Material Contracts and Agreements – Overriding Royalty Agreements”.
Interests of Experts and Counsel
Item 8. Financial Information
Financial Statements and Other Financial Information
Financial statements are provided under Item 17.There are no material legal proceedings to which we are subject or which are anticipated or threatened.
We have never paid dividends to shareholders nor is there a policy in place to so do. All cash flow generated by us is reinvested in our operations.
Significant Changes
We announced the following significant events subsequent to March 31, 2002:
| · | | Pursuant to a normal course issuer bid commencing May 1, 2002 and terminating March 31, 2003 or earlier, we were authorized to repurchase and cancel up to 1,000,000 shares of our common stock on the open market through the facilities of the Toronto Stock Exchange and The NASDAQ SmallCap Market. As at August 5, 2002 we did not yet repurchase and cancel any shares of common stock pursuant to this bid.
|
| · | | On June 10, 2002, we announced our Farmout and Option Agreement (the “Farmout Agreement”) in the Orion area of northeastern British Columbia. Under the terms of the Farmout Agreement, the farmee will have the right to earn a sliding scale interest in three designated blocks of our Orion acreage, comprising 28,334 gross acres (21,665 net) by drilling up to four horizontal test wells into the Upper Devonian Age, Jean Marie formation. The first well, a commitment well, must be drilled by September 30, 2002. To continue earning under the Farmout Agreement, the farmee has sixty days from rig release date of the first well to commit to drill the first of three option wells. The first option well must be drilled by April 15, 2003. The second and third option wells must be drilled by April 15, 2004. Upon completion of the terms of the Farmout Agreement, we will retain an interest in the three blocks ranging from 20% to 50%, with a net weighted average working interest of approximately 32%. We continue to hold a total of 1,669 gross acres (1,669 net) in the Orion area that is not subject to the Farmout Agreement.
|
| · | | On July 30, 2002, we announced our Participation and Farmin Agreement (the “Farmin Agreement”) in the Cypress area of northeast British Columbia. Under the terms of the Farmin Agreement, we will have the right to earn a net weighted average working interest of 35% in two out of eight land blocks comprising approximately 5,120 acres, by paying 50% of the cost to drill two test wells. The first well, a commitment well and the second an option well, are expected to cost us $1.3 million and $0.9 million, respectively. Upon completion of the terms of the Farmin Agreement, we will have the right to earn a 50% working interest in the two test-well land blocks, subject to a convertible 15% gross overriding royalty, and a 30% working interest in the remaining six land blocks.
|
Item 9. The Offer and Listing
Markets and Price History of the Stock
Our shares of common stock are traded in Canada on the Toronto Stock Exchange (“TSX”) under the symbol “DOL” and in the United States through the National Association of Securities Dealers Automated Quotation System ("NASDAQ") SmallCap under the symbol “DYOLF”. Our shares of common stock began trading in Canada on the TSX on May 27, 1999. Prior to that date, our shares of common stock traded in Canada on the Vancouver Stock Exchange (“VSE”). We chose to de-list our shares of common stock from trading on the Vancouver Stock Exchange on August 25, 1999 in favour of our TSX listing.
As of August 5, 2002, we had 20,462,230 shares of common stock outstanding. At that date, we estimate 66 shareholders of record resident in Canada holding 9,651,886 shares of common stock and 872 shareholders of record resident in the United States holding 10,805,144 shares of common stock. Our shares of common stock are issued in registered form and the number of shares of common stock reported to be held by record holders in Canada and the United States is taken from the records of The CIBC Mellon Trust Company, the registrar and transfer agent for our shares of common stock. For U.S. reporting purposes, we are a foreign private issuer.
The high and low prices for our common stock for the five most recently completed fiscal years on the VSE (up to August 24, 1999), on the TSX (starting May 27, 1999) and on NASDAQ SmallCap are as follows:
| | VSE/TSX (in Cdn $) | NASDAQ SmallCap (in U.S. $) |
| Year | High | Low | High | Low |
| 2002 | 2.63 | 1.55 | 1.75 | 0.92 |
| 2001 | 3.00 | 1.55 | 2.06 | 1.00 |
| 2000 | 2.05 | 1.44 | 1.50 | 0.97 |
| 1999 | 1.90 | 1.40 | 1.38 | 0.88 |
| 1998 | 2.64 | 1.30 | 1.94 | 0.88 |
The high and low prices for our common stock for each quarter for the last two fiscal years on the TSX and on The NASDAQ SmallCap Market are as follows:
Prices of Common Stock | TSX (Cdn $) | (NASDAQ Small Cap (U.S. $) |
| 2001-2002 | High | Low | High | Low |
| Q1 ended June 30, 2001 | 2.52 | 1.69 | 1.75 | 1.06 |
| Q2 ended September 30, 2001 | 2.35 | 1.55 | 1.55 | 0.92 |
| Q3 ended December 31, 2001 | 2.05 | 1.56 | 1.31 | 1.02 |
| Q4 ended March 31, 2002 | 2.05 | 1.60 | 1.34 | 1.00 |
| 2000-2001 | | | | |
| Q1 ended June 30, 2000 | 2.10 | 1.55 | 1.34 | 1.00 |
| Q2 ended September 30, 2000 | 2.21 | 1.65 | 1.50 | 1.44 |
| Q3 ended December 31, 2000 | 3.00 | 2.20 | 2.03 | 1.75 |
| Q4 ended March 31, 2001 | 2.75 | 1.88 | 2.06 | 1.09 |
The high and low prices for our common stock for the most recent six months on the TSX and on The NASDAQ SmallCap Market are as follows:
| | TSX (in Cdn $) | NASDAQ SmallCap (in U.S. $) |
| Year | High | Low | High | Low |
| Jul/2002 | 1.80 | 1.60 | 1.15 | 1.07 |
| Jun//2002 | 2.00 | 1.60 | 1.25 | 1.09 |
| May/2002 | 1.78 | 1.60 | 1.17 | 1.03 |
| Apr/2002 | 1.88 | 1.65 | 1.19 | 1.01 |
| Mar/2002 | 2.05 | 1.65 | 1.34 | 1.02 |
| Feb/2002 | 1.77 | 1.60 | 1.10 | 1.00 |
Item 10. Additional Information
Memorandum and Articles of Association
Our objects and purposes as set forth in our Memorandum and Articles
Our Memorandum and Articles (the “Articles”) are silent as to our objects and purposes. However, under the laws of British Columbia, we have the rights of a natural person, subject to restrictions imposed by statute, and accordingly, our objects and purposes are not limited to any particular activities.
Matters relating to our Directors
Director’s power to vote on a proposal, arrangement or contract in which the director is materially interested
Part 15.1 of our Articles provides: “A Director who is, in any way, directly or indirectly interested in an existing or proposed contract or transaction with the Company or who holds any office or possesses any property whereby, directly or indirectly, a duty or interest might be created to conflict with his duty or interest as a Director shall declare the nature and extent of his interest in such contract or transaction or of the conflict or potential conflict with his duty and interest as a Director, as the case may be, in accordance with the provisions of the British Columbia Company Act (the “Company Act”).” Part 15.2 states: “A Director shall not vote in respect of any such contract or transaction with the Company in which he is interested [subject to certain exclusions as set forth in this Part] and if he shall do so his vote shall not be counted, but he shall be counted in the quorum present at the meeting at which suc h vote is taken.”
Director’s power, in the absence of an independent quorum, to vote compensation to themselves or any members of their body
Part 12.2 of our Articles provides: “The remuneration of the Directors as such may from time to time be determined by the Directors or, if the Directors shall so decide, by the members. Such remuneration may be in addition to any salary or other remuneration paid to any officer or employee of the Company as such who is also a Director.”
Borrowing powers exercisable by the directors and how such borrowing powers can be varied
Part 8.1 of our Articles provides: “The Directors may from time to time on behalf of the Company . . . borrow money in such manner and amount, on such security, from such sources and upon such terms and conditions as they think fit, issue bonds, debentures and other debt obligations either outright or as security for any liability or obligation of the Company or any other person, and mortgage . . . or give other security on the undertaking, or on the whole or any part of the property and assets, of the Company (both present and future).” Part 8.2 states: “Any bonds, debentures or other debt obligations of the Company may be issued at a discount, premium or otherwise, and with any special privileges as to redemption, surrender, drawing, allotment of or conversion into or exchange for shares or other securities, attending and voting at general meetings of the Company, appointment or election of Directors or otherwise and may by their terms be assign able free from any equities between the Company and the person to whom they were issued or any subsequent holder thereof, all as the Directors may determine.”
The borrowing powers of our directors may only be varied by an amendment to our Articles. A vote of at least three-quarters of our issued and outstanding shares cast at a duly called meeting is required to approve such an amendment.
Retirement or non-retirement of directors under an age limit requirement
Our Articles are silent with regard to the retirement or non-retirement of directors under an age limit requirement.
Number of shares, if any required for director’s qualification
Part 12.3 of our Articles states that “a Director shall not be required to hold a share in the capital of the Company as qualification for his office but shall be qualified as required by the Company Act to become or act as a Director.”
Rights, preferences and restrictions attaching to each class of sharesWe have only one class of shares, our common shares.
Dividend rights, including time limit after which dividend entitlement lapses
Our shareholders have the right to receive dividends if, as and when declared by the Board of Directors. Neither the Company Act nor our Articles provides for lapses in dividend entitlement.
Each of our common shares entitles its holder to one vote at any annual or special meeting of our shareholders.
Rights to share in surplus in event of liquidation
In the event of our liquidation, dissolution or winding-up or other distribution of our assets, the holders of common shares will be entitled to receive, on a pro rata basis, all of the assets remaining after we have paid out our liabilities.
We may purchase or otherwise acquire any of our shares at the price and upon the terms specified by resolution of our Directors and we may redeem any class of our shares in accordance with any special rights and restrictions attaching to those shares. There are no present special redemption rights or restrictions attached to our shares.
Holders of common shares do not have rights to share in our profits. There are no sinking fund provisions with respect to our common shares. Common shareholders have no liability as to further capital calls by us. There are no provisions discriminating against any existing or prospective holder of our common shares as a result of such shareholder owning a substantial number of common shares. Holders of common shares do not have pre-emptive rights.
Actions necessary to change the rights of holders of our stock
In order to change the rights of all the holders of our issued and outstanding shares, a vote of at least three-quarters of all issued and outstanding shares cast at a duly called meeting is required. In order to change the rights of holders of a particular class of our stock, a vote of at least three-quarters of the issued and outstanding shares of that class cast at a duly called meeting of that class is required. If the change of rights of one class adversely affects any other class of our stock that is senior or equal to that class, then a vote of at least three-quarters of the issued and outstanding shares of the adversely affected class cast at a duly called meeting of that class is also required. We currently have only one class of shares, the common shares.
Conditions governing manner in which annual general meetings and extraordinary general meetings of shareholders are convoked
Annual Meeting
Part 9.1 of our Articles states: “Subject to any extensions of time permitted pursuant to the Company Act, . . . an annual general meeting shall be held once in every calendar year at such time (not being more than thirteen months after the holding of the last preceding annual general meeting) and place as may be determined by the Directors.”
Part 9.4 of our Articles states: “The Directors may, whenever they think fit, convene an extraordinary general meeting. An extraordinary general meeting, if requisitioned in accordance with the Company Act, shall be convened by the Directors or, if not convened by the Directors, may be convened by the requisitionists as provided in the Company Act.” Part 9.6 of our Articles provides: “A notice convening a general meeting specifying the place, the day, and the hour of the meeting, and, in case of special business, the general nature of that business, shall be given as such provided in the Company Act and in the manner hereinafter in these Articles mentioned, or in such other manner (if any) as may be prescribed by ordinary resolution, whether previous notice thereof has been given or not, to such persons as are entitled by law or under these Articles to receive such notice from the Company.”
In addition, registered holders of at least five percent of our issued and outstanding shares may request a meeting of shareholders by giving written notice of such request to us. Upon receiving proper notice, we have up to twenty-one days to respond and then up to four months to hold the requested meeting. We may choose to satisfy the request for a meeting by calling our own meeting within the four month time period.
Limitations on rights to own securities of the Company
The Investment Canada Act (the “ICA”), enacted on June 20, 1985, requires prior notification to the Government of Canada on the “acquisition of control” of Canadian businesses by non-Canadians, as defined in the ICA. Certain acquisitions of control, discussed below, are reviewed by the Government of Canada. The term “acquisition of control” is defined as any one or more non-Canadian persons acquiring all or substantially all of the assets used in the Canadian business, or the acquisition of the voting shares of a Canadian corporation carrying on the Canadian business or the acquisition of the voting interests of an entity controlling or carrying on the Canadian business. The acquisition of the majority of the outstanding shares is deemed to be an “acquisition of control” of a corporation. The acquisition of less than a majority, but one-third or more, of the voting shares of a corporation is presumed to be an “acquis ition of control” of a corporation unless it can be established that the purchaser will not control the corporation.
Investments requiring notification and review are all direct acquisitions of Canadian businesses with assets of Cdn. $5,000,000 or more (subject to the comments below on investors), and all indirect acquisitions of Canadian businesses (subject to the comments below on WTO investors) with assets of more than Cdn. $50,000,000 or with assets of between Cdn. $5,000,000 and Cdn. $50,000,000 which represent more than 50% of the value of the total international transaction. In addition, specific acquisitions or new business in designated types of business activities related to Canada’s cultural heritage or national identity could be reviewed if the Government of Canada considers that it is in the public interest to do so.
The ICA was amended with the implementation of the Agreement establishing the World Trade Organization (“WTO”) to provide for special review thresholds for “WTO investors”, as defined in the ICA. “WTO investor” generally means:
| (a) | | an individual, other than a Canadian, who is a national of a WTO member (such as, for example, the United States), or who has the right of permanent residence in relation to that WTO member;
|
| (b) | | governments of WTO members; and
|
| (c) | | entities that are not Canadian controlled, but which are WTO investor controlled, as determined by rules specified in the ICA.
|
The special review thresholds for WTO investors do not apply, and the general rules described above do apply, to the acquisition of control of certain types of businesses specified in the ICA, including a business that is a “cultural business”. If the WTO investor rules apply, an investment in our shares by or from a WTO investor will be reviewable only if it is an investment to acquire control of us and the value of our assets is equal to or greater than a specified amount (the “WTO Review Threshold”). The WTO Review Threshold is adjusted annually by a formula relating to increases in the nominal gross domestic product of Canada. The 2002 WTO Review Threshold was $218,000,000.
If any non-Canadian, whether or not a WTO investor, acquires control of us by the acquisition of shares, but the transaction is not reviewable as described above, the non-Canadian is required to notify the Canadian government and to provide certain basic information relating to the investment. A non-Canadian, whether or not a WTO investor, is also required to provide a notice to the government on the establishment of a new Canadian business. If our business is then a prescribed type of business activity related to Canada’s cultural heritage or national identity, and if the Canadian government considers it to be in the public interest to do so, then the Canadian government may give a notice in writing within 21 days requiring the investment to be reviewed.
|
For non-Canadians (other than WTO investors), an indirect acquisition of control, by the acquisition of voting interests of an entity that directly or indirectly controls us, is reviewable if the value of our assets is then Cdn. $50,000,000 or more. If the WTO investor rules apply, then this requirement does not apply to a WTO investor, or to a person acquiring the entity from a WTO investor. Special rules specified in the ICA apply if the value of our assets is more than 50% of the value of the entity so acquired. By these special rules, if the non-Canadian (whether or not a WTO investor) is acquiring control of an entity that directly or indirectly controls us, and the value of our assets and all other entities carrying on business in Canada, calculated in the manner provided in the ICA and the regulations under the ICA, is more than 50% of the value, calculated in the manner provided in the ICA and the regulations under the ICA, of the assets of all entities, the control of which is acquired, directly or indirectly, in the transaction of which the acquisition of control of us forms a part, then the thresholds for a direct acquisition of control as discussed above will apply, that is, a WTO Review Threshold of Cdn. $218,000,000 (in 2002) for a WTO investor or threshold of Cdn. $5,000,000 for a non-Canadian other than a WTO investor. If the value exceeds that level, then the transaction must be reviewed in the same manner as a direct acquisition of control by the purchase of our shares.
If an investor is reviewable, an application for review in the form prescribed by the regulations is normally required to be filed with the Director appointed under the ICA (the “Director”) prior to the investment taking place and the investment may not be consummated until the review has been completed. There are, however, certain exceptions. Applications concerning indirect acquisitions may be filed up to 30 days after the investment is consummated and applications concerning reviewable investments in culture-sensitive sectors are required upon receipt of a notice for review. In addition, the Minister (a person designated as such under the ICA) may permit an investment to be consummated prior to completion of the review, if he is satisfied that delay would cause undue hardship to the acquiror or jeopardize the operations of the Canadian business that is being acquired. The Director will submit the application to the Minister, together with any other information or written undertakings given by the acquiror and any representation submitted to the Director by a province that is likely to be significantly affected by the investment.
The Minister will then determine whether the investment is likely to be of net benefit to Canada, taking into account the information provided and having regard to certain factors of assessment where they are relevant. Some of the factors to be considered are:
| (a) | | the effect of the investment on the level and nature of economic activity in Canada, including the effect on employment, on resource processing, and on the utilization of parts, components and services produced in Canada;
|
| (b) | | the effect of the investment on exports from Canada;
|
| (c) | | the degree and significance of participation by Canadians in the Canadian business and in any industry in Canada of which it forms a part;
|
| (d) | | the effect of the investment on productivity, industrial efficiency, technological development, product innovation and product variety in Canada;
|
| (e) | | the effect of the investment on competition within any industry or industries in Canada;
|
| (f) | | the compatibility of the investment with national industrial, economical and cultural policies;
|
| (g) | | the compatibility of the investment with national industrial, economic and cultural policies taking into consideration industrial, economic and cultural objectives enunciated by the government or legislature of any province likely to be significantly affected by the investment; and
|
| (h) | | the contribution of the investment to Canada’s ability to compete in world markets.
|
To ensure prompt review, the ICA sets certain time limits for the Director and the Minister. Within 45 days after a completed application has been received, the Minister must notify the acquiror that he is satisfied that the investment is likely to be of net benefit to Canada, or that he is unable to complete his review, in which case he shall
have 30 additional days to complete his review (unless the acquiror agrees to a longer period), or he is not satisfied that the investment is likely to be of net benefit to Canada.
Where the Minister has advised the acquiror that he is not satisfied that the investment is likely to be of net benefit to Canada, the acquiror has the right to make representations and submit undertakings within 30 days of the date of the notice (or any other further period that is agreed upon between the acquiror and the Minister). On the expiration of the 30-day period (or the agreed extension), the Minister must quickly notify the acquiror that he is now satisfied that the investment is likely to be of net benefit to Canada or that he is not satisfied that the investment is likely to be of net benefit to Canada. In the latter case, the acquiror may not proceed with the investment or, if the investment has already been consummated, must divest itself of control of the Canadian business.
The ICA provides civil remedies for non-compliance with any provision. There are also criminal penalties for breach of confidentiality or providing false information.
Except as provided in the ICA, there are no limitations under the laws of Canada, the Province of British Columbia or in any of our constituent documents on the right of non-Canadians to hold or vote our common shares.
Provisions of our Memorandum or Articles that have the effect of delaying, deferring or preventing a change in control of us and that would operate only with respect to a merger, acquisition, or corporate restructuring involving us
There are no such limitations in our Memorandum or Articles, but see discussion of our Permitted Bid Shareholder Protection Rights Plan in “Item 14. Material Modifications to the Rights of Security Holders and Use of Proceeds – Shareholder Rights Plan.”
Provisions of our Memorandum or Articles governing the ownership threshold above which shareholder ownership must be disclosed
There are no such provisions in our Memorandum or Articles.
Significant differences between law applicable to us and law of the United States with respect to the matters addressed above in this Item 10.
The British Columbia Securities Act provides that a person that has direct or indirect beneficial ownership of, control or direction over, or a combination of direct or indirect beneficial ownership of, and of control or direction over, securities of the issuer carrying more than 10% of the voting rights attached to all the issuer’s outstanding voting securities must, within 10 days of becoming an “insider”, file an insider report in the required form effective the date on which the person became an insider, disclosing any direct or indirect beneficial ownership of, or control or direction over, securities of the reporting issuer. The British Columbia Securities Act also provides for the filing of a report by an “insider” of a reporting issuer who acquires or transfers securities of the issuer. This insider report must be filed within 10 days after the end of the month in which the change takes place.
The U.S. rules governing the ownership threshold above which shareholder ownership must be disclosed are more stringent than those under the British Columbia Securities Act. Section 13 of the Exchange Act imposes reporting requirements on persons who acquire beneficial ownership (as such term is defined in the Rule 13d-3 under the Exchange Act) of more than 5 percent of a class of an equity security registered under Section 12 of the Exchange Act. In general, such persons must file, within 10 days after such acquisition, a report of beneficial ownership with the Securities and Exchange Commission containing the information prescribed by the regulations under Section 13 of the Exchange Act. This information is also required to be sent to the issuer of the securities and to each exchange where the securities are traded.
Material Contracts and Agreements
We have entered into the following ten agreements in the two-year period immediately preceding this report. Any other contracts/agreements that we have entered into during the same period are considered to be immaterial and in the ordinary course of our business.
Transportation and Processing Agreement between ATCO Midstream Ltd. and us dated November 1, 2000 for the transportation and processing of natural gas produced by us from our Peavey/Morinville properties. The agreement was effective November 1, 2000 and is a one-year, renewable agreement.
Purchase and Sale Agreement dated June 26, 2001 between Fletcher Challenge Oil & Gas Inc. as “Vendor”, and Trioco Resources Inc., Energy North Inc. and us collectively as “Purchaser”. The agreement provided for the joint purchase by the Purchaser from the Vendor of certain petroleum and natural gas rights, tangibles and miscellaneous interests called the “Assets” in the St. Albert area of Alberta. The effective date was April 1, 2001 and the closing date was June 29, 2001. The purchase price paid was $34 million, of which our share (net of interim adjustments) was $15.5 million.
Contribution, Mutual Interest and Exclusion Agreement dated June 29, 2001 among Trioco Resources Inc., Energy North Inc. and us, whereby we agreed to purchase the assets at St. Albert pursuant to the Purchase and Sale Agreement (see June 26, 2001 agreement above). The agreement sets out the respective participating interests and liabilities of the parties pursuant to the Purchase and Sale Agreement.
Employment Agreements with UsWayne Babcock, President and Chief Executive Officer, dated July 11, 2000.
Donald K. Umbach, Vice President and Chief Operating Officer, dated July 11, 2000.
James Britton, Vice President, Exploration, dated July 11, 2000.
Michael Bardell, Chief Financial Officer, dated July 11, 2000.
David Grohs, Manager Engineering, dated March 5, 2001.
Jonathan White, Senior Geologist, dated March 12, 2001.
Each of the contracts has standard employment provisions, including salary, benefits, vacation time, non-competition and confidentiality provisions. In addition, each of the contracts requires the employee not to voluntarily leave the our employ during actions taken by third parties to acquire control of us. If an employee resigns within six months of a change of control of us for the sole reason that a change of control of us has occurred, the employee may receive a severance package including an amount equal to 12 months’ salary and the economic benefit of any stock options then outstanding. If the employee is terminated by us without cause, such officer may receive a severance package including an amount equal to 24 months’ salary, the economic benefit of any stock options then outstanding, and certain health and insurance benefits for a period not to exceed 12 months.
GasEDI Base Contract for Short-Term Sale and Purchase of Natural Gas dated October 15, 2001 for the short-term sale and purchase of natural gas between Nexen Marketing (“Nexen”) and us. Under the contract, Nexen agreed to hold and manage on our behalf all transportation agreements related to the contract, and to purchase all of our natural gas produced monthly from the St. Albert, Alexander, Peavey/Morinville, Halkirk and Stanmore fields. The monthly purchase price (“the Price”) payable to us is the calculated arithmetic average of the regional daily spot gas price index. Also under the contract, a portion of the gas produced monthly is re-purchased by us at the Price for re-sale to Progas Limited pursuant to a Gas Purchase Contract dated July 11, 1997 between Progas Limited and us.
Exchange Controls
U.S. shareholders may experience impediments to the enforcement of civil liabilities in the United States against foreign persons such as an officer, director or expert acting on our behalf in Canada. Such difficulty arises out of the uncertainty as to whether a court in the United States would have jurisdiction over a foreign person in the
United States, whether a U.S. judgment is enforceable under Canadian law and whether suits under federal securities laws could initially be brought in Canada.
There are no governmental laws, decrees, or regulations in Canada which restrict the export or import of capital or which affect the remittance of dividends, interest, or other payments to nonresident holders of the common stock. However, any such remittance to a nonresident of the United States may be subject to a 15% withholding tax pursuant to Article XI of the reciprocal tax treaty between Canada and the United States.
Except as provided in the Investment Canada Act ("the Act"), there are no limitations under the laws of Canada, the Province of British Columbia or in the charter or any other of our constituent documents on the right of foreigners to hold and/or vote the Common Stock.
The Act requires a nonmaking an investment to acquire control of a Canadian business, the gross assets of which exceed certain defined threshold levels, to file an application for review with Investment Canada, a federal agency created by the Act.
As a result of the CanadaFree Trade Agreement, the Act was amended in January 1989 to provide distinct threshold levels for Americans who acquire control of a Canadian business.
A Canadian business is defined in the Act as a business carried on in Canada that has a place of business in Canada, an individual or individuals in Canada who are employed or selfin connection with the business, and assets in Canada used in carrying on the business.
An American, as defined in the Act, includes: an individual who is an American national or a lawful permanent resident of the United States; a government or government agency of the United States; an Americanentity, corporation or limited partnership; and an American corporation, limited partnership or trust of which two-thirds of its Board of Directors, general partners or trustees, as the case may be, are Canadians or Americans.
The following investments by a nonare subject to review by Investment Canada:
i. all direct acquisitions of control of Canadian businesses with assets of $5 million or more;
ii. all indirect acquisitions of control of Canadian business with assets of $50 million or more if such assets represent less than 50% of the value of the assets of the entities, the control of which is being acquired;
and
iii. all indirect acquisitions of control of Canadian businesses with assets of $5 million or more if such assets represent more than 50% of the value of the assets of the entities, the control of which is being acquired.
Review by Investment Canada is required when investments by Americans exceed $150 million for direct acquisitions of control. For the purpose of the Act, direct acquisition of control means purchase of the voting interest of a corporation, partnership, joint venture or trust carrying on a Canadian business, or any purchase of all or substantially all of the assets used in carrying on a Canadian business.
If the Minister responsible for Investment Canada is not satisfied that the investment is likely to be a net benefit to Canada, the nonshall not implement the investment or, if the investment has been implemented, shall divest himself of control of the business that is the subject of the investment.
A nonmaking the following investment: (i) an investment to establish a new Canadian business; and (ii) an investment to acquire control of a Canadian business which investment is not subject to review under the Act, must notify Investment Canada, within prescribed time limits, of such investment.
Impact of the North American Free Trade Agreement
The investment provisions of the North American Free Trade Agreement ("NAFTA") are fundamentally based on the basic structure, which was established under the Free Trade Agreement ("FTA") between Canada and the United States.
Basically, the same rules that currently apply to American investors in regard to the Investment Canada Act ("ICA"), will also be applicable to Mexican investors under NAFTA. However, under NAFTA, the annual increment in the minimum dollar threshold for direct acquisitions will be increased from where it is under the FTA by an amount equal to the increase in the gross domestic product during that year over the immediately prior year, as opposed to comparing current levels to the gross domestic product price index in 1992 (as under the FTA).
Canada, Mexico and the United States have agreed, under Article 1102 of NAFTA, to accord "national treatment" to investors from each other's country in relation to the establishment, acquisition, expansion, management, conduct, operation and sale or other disposition of investments. Under this principle, each party is to accord the investors of another party treatment no less favorable than it accords, in like circumstances, to its own investors with respect to such investments. The same principle extends to the investments of investors of another party within the territory of the host country.
Article 1103 of NAFTA obligates each party to accord to investors of each other party treatment no less favorable than it accords in like circumstances to investors of another party or of any nonwith respect to the establishment, acquisition, expansion, management, conduct, operation and sale or other disposition of investments. The same principle extends to the investments of investors of another party.
The effect of this provision is to ensure that any more favorable investment rules accorded to investors of third countries are similarly extended to investors of each of the other NAFTA parties.
In common with the approach taken under the FTA, NAFTA contains provisions in Article 1106 prohibiting the imposition of significant tradeperformance requirements by a NAFTA country in connection with any investments in its territory. The prohibited performance requirements include those relating to export levels, domestic content, local sourcing, product mandates, tradetechnology transfers and product mandating.
In this regard, it should be noted that the restrictions relating to performance requirements, which tie the volume or value of exports from the host country or its foreign exchange earnings, as well as provisions relating to technology transfer and product mandating, represent additions in NAFTA over and above what was contained in the FTA. In the past, under the ICA and the Foreign Investment Review Act, Canada has often required undertakings from foreign investors in regard to product mandates. Canada has also occasionally insisted on foreign investors committing to give preference to local Canadian sources for goods and services. Article 1106 prohibits the enforcement of any commitment or undertaking to such effect, as well as the imposition of such commitments or undertakings. Therefore, while the basic structure of the ICA has been preserved under NAFTA, Canada will no longer be able to enforce any undertakings or commitme nts of the type described in Article 1106.
Except with the above noted minor exceptions, NAFTA has had little if any effect on the provision of the ICA.
The following paragraphs set forth certain United States and Canadian federal income tax considerations in connection with the purchase or sale of our shares of common stock.
The tax considerations are stated in general terms and are not intended to be advice to any particular shareholder. Each prospective investor is urged to consult his or her own tax advisor regarding the tax consequences of his or her purchase, ownership and disposition of shares of common stock.
The discussion set forth below is based upon the provisions of the Income Tax Act (Canada) (the "Tax Act"), the Internal Revenue Code of 1986, as amended (the "Code") and the Convention between Canada and the United States of America with respect to Taxes on Income and on Capital (the "Convention"), as well as United States Treasury regulations and rulings and judicial decisions. Except as otherwise specifically stated, the following discussion does not take into account or anticipate any changes to such laws, whether by legislative action or judicial decision. The discussion does not take into account the provincial tax laws of Canada or the tax laws of the various state and local jurisdictions in the United States.
Canadian Federal Income Tax Considerations
The following discussion applies only to citizens and residents of the United States and United States corporations ("United States Taxpayers") who are not resident in Canada and will not be resident in Canada and who do not use or hold nor are deemed to use or hold such shares of common stock in carrying on a business in Canada.
The payment of cash dividends and stock dividends on the shares of common stock will generally be subject to Canadian withholding tax. The rate of the withholding tax will be 25% or such lesser amount as may be provided by treaty between Canada and the country of residence of the recipient. Under the Convention, the withholding tax generally would be reduced to 15%.
Neither Canada nor any province thereof currently imposes any estate taxes or succession duties. Provided a holder of shares of common stock not, within the preceding five years, owned (either alone or together with persons with whom he or she does not deal at arm's length) 25% or more of the shares of common stock, the disposition (or deemed disposition arising on death) of such shares of common stock will not be subject to the capital gains provisions of the Tax Act.
United States Federal Income Tax Considerations
United States citizens, residents or corporations owning shares of common stock must generally treat the gross amount of dividends paid by us without reduction for the amount of Canadian withholding tax, as dividend income for United States federal income tax purposes to the extent of our current and accumulated earnings and profits. Such dividends will generally not be eligible for the "dividends received" deduction allowed to United States corporations under Section 243 of the Code. The amount of Canadian withholding tax on dividends may be available subject to certain limitations as a foreign tax credit or, alternatively, as a deduction. In computing the limitation on foreign tax credit, dividends paid by us might, depending on the circumstances, be treated in substantial part as income from sources within the United States, pursuant to Section 904(g) of the Code. Also, dividends paid by us will generally be "passive i ncome" subject to a separate limitation on foreign tax credits.
The tax law contains provisions relating to so"passive foreign investment companies" ("PFIC's") that might have applied to us. If the PFIC provisions applied, certain tax and interest would apply to certain distributions by us and upon a disposition of shares of common stock by U.S. persons.
The sale of a share of our common stock generally result in the recognition of gain or loss to the holder in an amount equal to the difference between the amount realized and the holder's adjusted basis in such share. Provided the holder is not a dealer in the share sold, and the common share would be a capital asset to the holder, gain or loss upon the sale of the share will be longor shortcapital gain or loss, depending on whether the share has been held for more than one year and whether or not the PFIC provisions apply to us. The maximum federal tax rate on net long-term capital gains recognized by non-corporate taxpayers is 20%. The maximum federal tax rate on net capital gains recognized by corporations is 35%.
Capital losses are deductible to the extent of capital gains. Noncorporate taxpayers may deduct excess losses, whether shortor longto the extent of $3,000 a year ($1,500 in the case of a married individual filing separately). Noncorporate taxpayers may carry forward unused capital losses indefinitely. Unused capital losses of a corporate taxpayer may be carried back three years and carried forward five years.
Financing Exploration and Development Drilling Through Canadian Income Tax Incentives
In order to encourage investment in the exploration for and development of its mineral deposits, Canada has amended the Income Tax Act of Canada so as to allow Canadian taxpayers making investments in oil and gas companies to deduct on their personal income tax return qualifying amounts spent by the oil and gas company on Canadian property. Qualifying amounts cover 100% of annual "exploration" expenses and up to $1.0 million of annual "development" expenses. In addition to being able to deduct their investment as an expense, the investor receives stock in the company for his or her investment. The terms of this type of investment are usually set forth in a "Flow Through Agreement" in which the company agrees not to take as an income tax deduction the amount of the proceeds expended for exploration and/or development work, but to allow the deduction to “flow through” to the investors. This flowtype of financi ng is of benefit only to Canadian taxpayers.
Under the Flowtype of financing, the investors pay their subscription amount to us. Shares of common stock are issued to the investor, and we covenant to renounce to the investor, with an effective date of December 31 of a particular year, certain exploratory or specified development expenses incurred by us under a flow through share arrangement within the first 60 days of the year following that particular year.
During fiscals 2002, 2001 and 2000 we did not raise any flowfunding.
Item 11. Quantitative and Qualitative Disclosures About Market Risk
The oil and gas industry is exposed to a variety of risks including the uncertainty of finding and recovering new economic reserves, the performance of hydrocarbon reservoirs, securing markets for production, commodity prices, interest rate fluctuations, potential damage to or malfunction of equipment and changes to income tax, royalty, environmental or other governmental regulations.
We mitigate these risks to the extent we are able by:
| · | | employing highly-skilled staff and focusing them in areas where they have a strong knowledge base in order to maximize value.
|
| · | | utilizing competent, professional consultants as support teams to company staff.
|
| · | | performing careful and thorough geophysical, geological and engineering analyses of each prospect.
|
| · | | using current, cost-effective and where feasible, leading-edge technology.
|
| · | | maintaining adequate levels of property liability and business interruption insurance.
|
| · | | focusing on a limited number of core properties.
|
| · | | striving to be a low-cost producer to maximize netbacks.
|
| · | | maintaining a balanced portfolio of sales contracts.
|
| · | | staying informed about industry changes and trends through appropriate association memberships, publications, subscriptions and conferences.
|
Market risk is the possibility that a change in the prices for natural gas, natural gas liquids, condensate and oil, foreign currency exchange rates, or interest rates will cause the value of a financial instrument to decrease or become more costly to settle. Our financial instruments in fiscal 2002 consist of cash and cash equivalents, accounts receivable, bank indebtedness, operating loan and accounts payable.
We are exposed to commodity price risks, interest rate risks and credit risk. We have no risks associated with foreign currency exchange rates.
Commodity Price Risks and Credit Risk
As an independent oil and gas producer, our gross revenues, funds flow from operations, earnings, reserve values, access to capital and future rate-of-growth are substantially dependent upon the prevailing prices of natural gas, natural gas liquids and crude oil. Prevailing prices for such commodities can be subject to wide fluctuations in response to relatively minor changes in supply and demand, and a variety of additional factors beyond our control.
Prices for natural gas and certain other by-products associated with natural gas are influenced solely by the forces of the North American marketplace, whereas the prices for condensate and oil are influenced by the forces of the world marketplace. Historically, prices received for all commodities produced by us have been volatile and unpredictable, and such volatility is expected to continue.
We use a sensitivity analysis technique to evaluate the hypothetical effect that changes in the market value of natural gas and natural gas liquids (representing 96% of fiscal 2002’s gross revenues) may have on the fair value our gross revenues. The following table demonstrates the effects of declines in the weight-averaged prices of our main revenue-generating commodities (see also “Sensitivity Analysis” under Item 5. in this report).
Weighted Average Prices and the Effect of Adversity
| |
Weight-Averaged Prices Achieved | Fiscal 2002 Weighted Average Prices
After Consideration of Adversity % |
| Commodity Type | Q4, Fiscal 2002 | Fiscal 2002 | 10% | 20% | 30% |
| Natural gas ($/mcf) | $3.42 | $3.81 | $3.43 | $3.05 | $2.67 |
| Natural gas liquids $/bbl) | $14.99 | $19.30 | $17.37 | $15.44 | $13.51 |
The following table demonstrates the effects of weight-averaged pricing adversity as applied to our fiscal 2002 gross revenues. Our funds flow from operations and earnings before taxes would experience the same effects.
Impact on Gross Revenues (in $000’s) After Consideration of Pricing Adversity
| Commodity Type | Q4, 2002 | Fiscal 2002 | 10% | 20% | 30% |
| Natural gas | 5,076 | 20,944 | 18,850 | 16,755 | 14,661 |
| Natural gas liquids | 1,132 | 4,442 | 3,998 | 3,554 | 3,109 |
We have not undertaken any transactions of a hedging nature in an effort to achieve more predictable cash flows and earnings from the sale of any portion of its gas, liquids or oil production. We undertake a periodic review to decide how hedging some of its natural gas might affect its overall contract mix. Hedging may assist in limiting the downside risk of adverse price movements, however, it may also limit future revenues from favorable price movements.
A financial swap is a derivative instrument whereby we and a third party agree to settle, at specified intervals, the difference between an agreed fixed commodity price, interest rate or exchange rate and floating prices or rates calculated by reference to an agreed notional volume or principal amount. We are currently not using swap contracts and has no obligation to deliver or receive quantities of natural gas, liquids or oil pursuant to a swap.
In fiscal 2002, the majority of our total natural gas sales were split evenly between two customers and our total natural gas liquids between three different customers. We do not believe that the loss of one of our customers would have a material adverse effect on us because of the availability of other customers willing or interested in purchasing our natural gas and natural gas liquids.
In addition to market risk, our financial instruments involve, to varying degrees, risk associated with trade credit and risk associated with operatorship of joint venture properties. For example, approximately 45% of our year 2002 balance of accounts receivable is due from four customers, subject to normal credit risk. Further, while our largest producing properties during fiscal 2002 were self-operated, six out of thirteen active properties in which we have interests are operated by other industry companies. We do not require collateral or other security to support financial instruments nor do we provide collateral or security to counterparties. Currently, we do not expect nonby any counterparty.
ProGas, a Calgary based natural gas marketing company, is a ‘netback aggregator’ owned 100% by BP Amoco. ProGas has a broad, long-term, contracted natural gas reserve supply of over 3.5 trillion cubic feet, dedicated by us and over 170 other contributing producers, thereby helping us to mitigate potential financial penalties by giving greater flexibility to ProGas to contract without requiring supply warranties. We have contracted 50% of our 75% working interest in St. Albert natural gas to ProGas pursuant to a ‘life-of-reserves’ agreement.
The netback price paid by ProGas to us and other contributing gas producers is determined monthly by deducting transportation and operating costs from the pooled sales revenue. ProGas does not charge a marketing fee, but recovers its cost of doing business through a fixed monthly amount as approved by its producers.
ProGas maintains a diverse portfolio of spot (one month or less), short-term (less than one year) and long(one year and greater) sales contracts, diverse both in terms of geographic distribution and by type of market served (local distribution
systems, cogen, industrial or pipeline). Risk exposure is minimized through the use of a variety of pricing mechanisms and other terms to ensure the o verall market portfolio covers a wide range of scenarios.
In order to maximize the netback price while at the same time limit price volatility that is generally associated with spot pricing, ProGas purchases gas from us on the basis of a conglomerate of market prices. As an example, in March, 2002, of the total gas purchased by ProGas from us, approximately 27% was based on spot pricing, 1% on short-term pricing and 25% on long-term pricing. Further, in March 2002, ProGas utilized 17 individual price drivers with 16 unique delivery points to establish price matrices. Examples of price drivers used: AECO (Alberta Energy Company), NYMEX (New York Mercantile Exchange), Chicago, Louisiana/Oklahoma and Michigan.
If we desire to pursue hedging transactions, ProGas, in conjunction with a third party provider, offers hedging services.
We are exposed to interest rate risk relating to existing debt pursuant to a revolving credit facility. We do not engage in interest rate swaps to hedge the interest rate exposure associated with the credit agreement. If market interest rates for shortborrowings increase by 1%, the increase in our interest expense would be immaterial (see “Sensitivity Analysis” under Item 5 in this report).
We are party to a gas facility processing lease agreement requiring minimum annual lease payments until Year 2003. Under the terms of this agreement, the interest rate element is fixed, thereby eliminating interest rate risk concerns relative to the lease payments.
Item 12. Description of Securities Other than Equity Securities
Item 13. Defaults, Dividend Arrearages and Delinquencies
Item 14. Material Modifications to the Rights of Security Holders and Use of Proceeds
Our Board of Directors adopted a Permitted Bid Shareholder Protection Rights Plan (“Rights Plan”) that was ratified by the shareholders at our Annual General Meeting on August 23, 2001.
The Plan is designed to ensure that all of our shareholders are treated equally if a takeover bid is made for our shares of common stock, and that sufficient time is available for our directors and all shareholders to evaluate fully any offer and pursue alternatives to maximize shareholder value.
Item 15. [Reserved] ......................n/a
Item 16. [Reserved] ......................n/a
Part III.
Item 17. Financial Statements
| Auditors’ Report | F-1 |
| Balance Sheets as of March 31, 2002 and March 31, 2001 | F-2 |
| Statements of Operations and Deficit for the years ended March 31, 2002, 2001 and 2000 | F-3 |
| Statements of Cash Flows for the years ended March 31, 2002, 2001 and 2000 | F-4 |
| Notes to Financial Statements | F-5 |
Item 18. Financial Statements
Item 19. Exhibits
(a) Financial Statements: See Contents of our Financial Statements.
(b) Exhibits: See Index to Exhibits.
Financial Statements
Dynamic Oil & Gas, Inc.
CONSENT OF INDEPENDENT CHARTERED ACCOUNTANTS
We consent to the use of our report dated June 14, 2002 with respect to the financial statements of Dynamic Oil Limited included in its Annual Report (Form 20-F) for the year ended March 31, 2002.
| Vancouver, Canada, | /s/ ERNST & YOUNG LLP |
| August 16, 2002. | Chartered Accountants |
Dynamic Oil & Gas, Inc.
NOTES TO FINANCIAL STATEMENTS
(in Canadian dollars)
March 31, 2002, 2001 and 2000
|
AUDITORS’ REPORT
To the Shareholders of
Dynamic Oil & Gas, Inc.We have audited the balance sheets of Dynamic Oil & Gas, Inc. as at March 31, 2002 and 2001 and the statements of operations and deficit and cash flows for each of the years in the three year period ended March 31, 2002. These financial statements are the responsibility of the Company’s management. Our responsibility is to express an opinion on these financial statements based on our audits.
We conducted our audits in accordance with auditing standards generally accepted in Canada and the United States. Those standards require that we plan and perform an audit to obtain reasonable assurance whether the financial statements are free of material misstatement. An audit includes examining, on a test basis, evidence supporting the amounts and disclosures in the financial statements. An audit also includes assessing the accounting principles used and significant estimates made by management, as well as evaluating the overall financial statement presentation.
In our opinion, these financial statements present fairly, in all material respects, the financial position of the Company as at March 31, 2002 and 2001 and the results of its operations and its cash flows for each of the years in the three year period ended March 31, 2002 in accordance with Canadian generally accepted accounting principles. As required by the Company Act of British Columbia, we report that, in our opinion, these principles have been applied on a consistent basis.
| Vancouver, Canada, | /s/ ERNST & YOUNG LLP |
| June 14, 2002. | Chartered Accountants |
Incorporated under the laws of British Columbia
BALANCE SHEETS
(in Canadian dollars)
As at March 31
| | 2002 | 2001 |
| | $ | $ |
| | | |
| ASSETS [note 3] | | |
| Current | | |
| Cash and cash equivalents | — | 3,493,448 |
| Accounts receivable [note 9] | 5,979,532 | 4,444,834 |
| Prepaid expenses | 365,227 | 240,466 |
| Total current assets | 6,344,759 | 8,178,748 |
| Future income tax asset [note 6] | 279,000 | — |
| Natural gas and oil interests [note 2] | 30,365,636 | 21,678,527 |
| Capital assets [note 2] | 162,499 | 133,380 |
| | 37,151,894 | 29,990,655 |
| | | |
| LIABILITIES AND SHAREHOLDERS’ EQUITY | | |
| Current | | |
| Bank indebtedness | 842,812 | — |
| Operating loan [note 3] | 14,750,000 | — |
| Accounts payable and accrued liabilities | 3,611,314 | 5,664,739 |
| Income taxes payable [note 6] | 421,360 | 545,144 |
| Total current liabilities | 19,625,486 | 6,209,883 |
| Deferred gain on sale [note 4] | 109,327 | 339,601 |
| Provision for future removal and site restoration | 824,098 | 539,730 |
| Future income tax liability [note 6] | — | 2,955,000 |
| Total liabilities | 20,558,911 | 10,044,214 |
| Share capital [note 5] | 20,914,522 | 20,641,720 |
| Deficit | (4,321,539) | (695,279) |
| Total shareholders’ equity | 16,592,983 | 19,946,441 |
| | 37,151,894 | 29,990,655 |
Commitments [note 12]
See accompanying notes and schedules
On behalf of the Board:
Director
/s/Wayne J. Babcock | Director
/s/Donald K. Umbach |
STATEMENTS OF OPERATIONS AND DEFICIT
(in Canadian dollars)
Years ended March 31
| | 2002 | 2001 | 2000 |
| | $ | $ | $ |
| | | | |
| REVENUE | | | |
| Natural gas, liquids and oil sales | 26,401,872 | 34,462,676 | 15,770,327 |
| Royalties [note 10] | (6,500,447) | (9,857,954) | (4,634,996) |
| Production costs | (5,845,958) | (4,579,845) | (3,690,464) |
| | 14,055,467 | 20,024,877 | 7,444,867 |
| Alberta royalty tax credit | 159,274 | 498,773 | (7,134) |
| | 14,214,741 | 20,523,650 | 7,437,733 |
| | | | |
| EXPENSES | | | |
| General and administrative [schedule 1] | 2,347,212 | 1,569,175 | 1,618,821 |
| Interest expense on operating loan | 494,685 | 240,420 | 194,487 |
| Interest income | (22,066) | (25,601) | (9,583) |
| | 2,819,831 | 1,783,994 | 1,803,725 |
| | | | |
| Earnings from operations before | | | |
| the following: | 11,394,910 | 18,739,656 | 5,634,008 |
| Amortization and depletion [schedule 2] | 12,172,943 | 3,006,964 | 1,464,155 |
| Exploration expenses [schedule 3] | 4,646,018 | 1,923,194 | 1,299,276 |
| Gain on sale of natural gas and oil interests | (4,566) | (639,532) | — |
| (Loss) earnings before taxes | (5,419,485) | 14,449,030 | 2,870,577 |
| Current income tax expense [note 6] | 57,600 | 572,000 | — |
| Future income tax (recovery) expense [note 6] | (1,958,000) | 4,163,000 | (1,208,000) |
| Net (loss) earnings | (3,519,085) | 9,714,030 | 4,078,577 |
| | | | |
| Deficit, beginning of year | (695,279) | (10,379,392) | (13,943,643) |
| Premium on purchase and cancellation of | | | |
| common shares [note 5[e]] | (107,175) | (29,917) | (510,094) |
| Share issue costs | — | — | (4,232) |
| Deficit, end of year | (4,321,539) | (695,279) | (10,379,392) |
| | | | |
| Earnings per share [note 7] | | | |
| basic | (0.17) | 0.49 | 0.21 |
| diluted | (0.17) | 0.48 | 0.20 |
See accompanying notes and schedules
STATEMENTS OF CASH FLOWS
(in Canadian dollars)
Years ended March 31
| | 2002 | 2001 | 2000 |
| | $ | $ | $ |
| | | | |
| OPERATING ACTIVITIES | | | |
| (Loss) earnings | (3,519,085) | 9,714,030 | 4,078,577 |
| Add (deduct) items not involving cash: | | | |
| Amortization and depletion | 12,172,943 | 3,006,964 | 1,464,155 |
| Future income taxes | (1,958,000) | 4,163,000 | (1,208,000) |
| Exploration expenses | 4,646,018 | 1,923,194 | 1,299,276 |
| Gain on sale of natural gas and oil interests | (4,566) | (639,532) | — |
| Funds flow from operations | 11,337,310 | 18,167,656 | 5,634,008 |
| Changes in non-cash working capital affecting | | | |
| operating activities [note 8[a]] | (1,558,807) | 1,096,162 | (963,834) |
| Cash provided by operating activities | 9,778,503 | 19,263,818 | 4,670,174 |
| | | | |
| FINANCING ACTIVITIES | | | |
| Bank indebtedness | 842,812 | — | — |
| Operating loan | 14,750,000 | (6,000,000) | 3,750,000 |
| Shares issued for cash | 455,420 | 200,000 | 121,000 |
| Share repurchases | (289,793) | (89,689) | (1,376,723) |
| Share issue costs | — | — | (4,232) |
| Cash provided by (used in) financing activities | 15,758,439 | (5,889,689) | 2,490,045 |
| | | | |
| INVESTING ACTIVITIES | | | |
| Purchase of capital assets | (116,180) | (78,749) | (100,113) |
| Natural gas and oil interests | (21,994,897) | (11,502,902) | (5,626,771) |
| Exploration expenses | (4,646,018) | (1,923,194) | (1,299,276) |
| Proceeds on sale of natural gas and oil interests | 4,566 | 1,072,395 | — |
| Changes in non-cash working capital affecting | | | |
| investing activities [note 8[b]] | (2,277,861) | 1,109,888 | 824,512 |
| Cash used in financing activities | (29,030,390) | (11,322,562) | (6,201,648) |
| | | | |
| (Decrease) increase in cash and cash equivalents | (3,493,448) | 2,051,567 | 958,571 |
| Cash and cash equivalents, beginning of year | 3,493,448 | 1,441,881 | 483,310 |
| Cash and cash equivalents, end of year | — | 3,493,448 | 1,441,881 |
| Supplemental disclosures of cash flow information | | | |
| Cash paid during the year for: | | | |
| Interest | 589,549 | 259,230 | 213,109 |
| Income taxes | 1,167,720 | 26,856 | — |
| | | | |
| Funds flow from operations per share [note 7] | | | |
| - basic | 0.55 | 0.91 | 0.29 |
| - diluted | 0.55 | 0.89 | 0.28 |
See accompanying notes and schedules
Dynamic Oil & Gas, Inc.
NOTES TO FINANCIAL STATEMENTS
(in Canadian dollars)
March 31, 2002, 2001 and 2000 |
1. SUMMARY OF SIGNIFICANT ACCOUNTING POLICIES
Dynamic Oil & Gas, Inc. (the “Company”) is engaged in the acquisition, exploration, development and production of natural gas and oil interests. The Company’s operations are conducted in Western Canada.
Accounting principles
The Company prepares its accounts in accordance with Canadian generally accepted accounting principles which, as applied in these financial statements, conform in all material respects with United States generally accepted accounting principles, except as explained in note 11.
Use of estimates
The preparation of financial statements in conformity with generally accepted accounting principles requires management to make certain estimates and assumptions that affect the reported amounts of assets and liabilities and disclosure of contingent assets and liabilities as of the date of the financial statements and the reported amounts of revenues and expenses during the reporting period. Actual results may differ from these estimates.
Natural gas and oil interests
The Company uses the successful efforts method to account for its natural gas and oil interests. Lease acquisition costs are amortized over their holding period prior to the discovery of proved reserves. Geological and geophysical costs are expensed in the period in which they are incurred and costs of drilling an unsuccessful well are expensed when it becomes known the well did not result in a discovery of proved reserves. All other costs of exploring and developing for proved reserves become capitalized natural gas and oil interests.
The cost of proved producing interests including related plant and equipment are depleted on a unit-of-production basis, based on proved producing natural gas and oil reserves.
Natural gas and oil interests are recorded at cost less accumulated provisions for depreciation, depletion and amortization. Natural gas and oil interests are assessed periodically for impairment whenever events or conditions indicate that their net carrying amount may not be recoverable from estimated future cash flows.
Dynamic Oil & Gas, Inc.
NOTES TO FINANCIAL STATEMENTS
(in Canadian dollars)
March 31, 2002, 2001 and 2000
|
1. SUMMARY OF SIGNIFICANT ACCOUNTING POLICIES (cont’d.)
Cash and cash equivalents
Cash and cash equivalents are recorded at cost, which approximates current market value.
Cash and cash equivalents is comprised of cash balances held at financial institutions and in bankers acceptances with an average interest rate of 4.5% and original maturities of three months or less.
Joint interests
Substantially all of the acquisition, exploration, development and production activities of the Company are conducted jointly with others. These financial statements reflect only the Company’s proportionate interest in such activities.
Future removal and site restoration
Costs for the future removal and site restoration of natural gas and oil interests are based on estimates of liabilities and year of abandonment. The estimates of the liabilities are based on engineering estimates which consider past experience, current regulations, technology and industry standards. Costs are amortized to earnings on a straight-line basis to the year of abandonment.
Capital assets
Capital assets are recorded at cost, less accumulated amortization. Amortization is provided on a straight-line basis at the following rates:
| Furniture, fixtures and equipment | - 10% per annum |
| Computer equipment | - 33.3% per annum |
Income taxes
The liability method of tax allocation is used in accounting for income taxes. Under this method, future tax assets and liabilities are determined based on differences between the financial reporting and tax bases of assets and liabilities, and measured using the substantially enacted tax rates and laws that will be in effect when the differences are expected to reverse.
Dynamic Oil & Gas, Inc.
NOTES TO FINANCIAL STATEMENTS
(in Canadian dollars)
March 31, 2002, 2001 and 2000
|
1. SUMMARY OF SIGNIFICANT ACCOUNTING POLICIES (cont’d.)
Stock-based compensation plan
The Company has one stock-based compensation plan. No compensation expense is recognized for this plan when stock options are issued to directors, officers, employees or consultants. Any consideration paid by option holders on exercise of stock options is credited to share capital.
Foreign currency translation
Cash and other monetary assets and liabilities representing amounts in foreign currencies owing to or by the Company are translated at year-end rates. Non-monetary assets and liabilities are translated at historical rates. Revenues and expenses are translated at the actual rate of exchange in effect at the time of the transaction. Translation gains and losses are included in income in the period incurred.
Measurement uncertainty
The amounts recorded for depletion and amortization of natural gas and oil interests and the provision for future removal and site restoration are based on estimates. Assessments for impairments in asset carrying costs are based on estimates of proved producing reserves, production rates, natural gas and oil prices, future costs and other relevant assumptions. By their nature these estimates are subject to measurement uncertainty and the effect on the financial statements of changes in such estimates in future years could be significant.
Revenue recognition
Revenues from crude oil, natural gas and natural gas liquids are recorded when title passes to customers.
Deferred gain on sale and lease back
The deferred gain is amortized to income over the lease back term.
Dynamic Oil & Gas, Inc.
NOTES TO FINANCIAL STATEMENTS
(in Canadian dollars)
March 31, 2002, 2001 and 2000
|
1. SUMMARY OF SIGNIFICANT ACCOUNTING POLICIES (cont’d.)
Earnings per share
Effective January 1, 2001, the Company adopted, on a retroactive basis, the new recommendations of the CICA with respect to the presentation and computation of earnings per share. The new recommendations require the presentation of basic and diluted earnings per share figures for net income on the Statements of Operations. The treasury stock method is to be used for determining the dilutive effect of warrants and options. Prior to the adoption of the new recommendations, the imputed earnings method was used. The 2001 and 2000 comparative Financial Statements and Notes to the Financial Statements have been restated to conform to the 2001 presentation. Application of the new recommendations in 2001 had no impact on the basic and diluted earnings per share figures and in 2000 diluted earnings per share were increased by $0.01.
Operating loan
In October 2001, the Canadian Institute of Chartered Accountants’ Emerging Issues Committee (EIC) issued EIC-122, “Balance Sheet Classification of Callable Debt Obligations and Debt Obligations Expected to be Refinanced”. As a result of applying these new recommendations, the Company’s obligations that by their terms are due on demand, even though liquidation may not be expected within one year, are re-classified from long-term to current liabilities. As a result, at March 31, 2002 the outstanding balance of the Company’s operating loan of $14,750,000 [2001 - $nil] has been classified as a current liability [note 3].
2. NATURAL GAS AND OIL INTERESTS, AND CAPITAL ASSETS
| | | Accumulated | |
| | amortization and | Net book |
| Cost | depletion | value |
| $ | $ | $ |
| | | | |
| 2002 | | | |
| Natural gas and oil interests | 49,453,746 | 19,088,110 | 30,365,636 |
| Furniture, fixtures and computer equipment | 453,733 | 291,234 | 162,499 |
| | | | |
| 2001 | | | |
| Natural gas and oil interests | 29,536,063 | 7,857,536 | 21,678,527 |
| Furniture, fixtures and computer equipment | 337,554 | 204,174 | 133,380 |
Dynamic Oil & Gas, Inc.
NOTES TO FINANCIAL STATEMENTS
(in Canadian dollars)
March 31, 2002, 2001 and 2000
|
2. NATURAL GAS AND OIL INTERESTS, AND CAPITAL ASSETS (cont’d.)
In 2002, the Company recorded asset write-downs of $6,783,248 [2001 - $35,712; 2000 - $93,058] to reflect the excess of the net book value of the Company’s natural gas and oil interests over its estimated recoverable amounts. The Company’s assets at Peavey/Morinville were written down by $6,697,431 and at Simonette by $85,817. The write-downs were included in amortization and depletion expense.
Acquisition of Additional St. Albert oil and gas interest
Effective April 1, 2001, the Company acquired additional interests in its St. Albert, Alberta property from Fletcher Challenge Oil & Gas Inc. The closing date of the purchase and sale agreement was June 29, 2001. Dynamic’s interest in the property’s assets, pursuant to the acquisition, increased as follows:
| Previous | New |
| Description of assets | interest | interest |
| | |
| Producing gas wells - 19 | 50% | 75% |
| Producing oil wells - 7 | 25% | 75% |
| Oil battery - 1 | 25% | 75% |
| Solution gas plant - 1 | — | 25% |
| Sales gas pipeline complete with facilities - 1 | — | 25% |
Pursuant to the sale and leaseback agreement dated December 18, 1997 [see note 12[a]], the Company has the option to repurchase a 50% interest in the solution gas plant and sales gas pipeline complete with certain gathering and processing facilities. The Company currently leases the 50% option interest, however, 75% of the net income from the operation of the facilities belongs to Dynamic. Under the June 29, 2001 purchase and sale agreement, 25% of all of the assets described above have been acquired on an equal share basis by two other partner companies. Dynamic has become the Operator of the property.
Dynamic’s share of the purchase price paid for these new assets was $14,739,471.
Dynamic Oil & Gas, Inc.
NOTES TO FINANCIAL STATEMENTS
(in Canadian dollars)
March 31, 2002, 2001 and 2000
|
3. OPERATING LOAN
The Company’s bank, the National Bank of Canada, revised the amount made available to the Company under a revolving, demand credit facility during 2002. The amount of the facility increased from $10,000,000 to $25,000,000 and then decreased to $21,000,000. Principal balances outstanding bear interest at prime plus 3/8% and are collateralized by a general assignment of book debts and a floating charge debenture of $35,000,000 covering all assets of the Company. The effective average interest paid during 2002 was 4.7% [2001 - 6.9%]. A standby fee of 0.125% per annum is levied on the unused portion of the facility.
4. ST. ALBERT SALE AND LEASEBACK
On December 18, 1997, the Company agreed to sell and lease back, for an initial term of five years, its St. Albert gas processing facilities to Enercap Corporation of Calgary, Alberta (“Enercap”). The impact on the Company of the sale was a reduction of natural gas and oil interests of $3,427,846, the elimination of a debenture payable in 1998 to Enercap of $4,832,352 and a gain on sale of $1,404,506. The gain is being deferred and amortized to income over the leaseback term [see note 12[a]].
5. SHARE CAPITAL
Authorized 60,000,000 common shares without par value.
[a] The Company had the following shares issued and outstanding:
| | 2002 | 2001 | 2000 |
| | # | $ | # | $ | # | $ |
| | | | | | | |
| Outstanding, beginning | | | | | | |
| of year | 20,145,930 | 20,641,720 | 19,848,256 | 20,419,742 | 20,388,732 | 21,079,371 |
| | | | | | | |
| Shares issued for cash: | | | | | | |
| Stock options exercised | 495,100 | 455,420 | 279,000 | 200,000 | 222,500 | 121,000 |
| Issued on conversion of | | | | | | |
| collateralized convertible | | | | | | |
| debt [note 5[d]] | — | — | 76,774 | 81,750 | 76,224 | 86,000 |
| Share repurchases and | | | | | | |
| cancellations | (178,800) | (182,618) | (58,100) | (59,772) | (839,200) | (866,629) |
| Outstanding, end of year | 20,462,230 | 20,914,522 | 20,145,930 | 20,641,720 | 19,848,256 | 20,419,742 |
Dynamic Oil & Gas, Inc.
NOTES TO FINANCIAL STATEMENTS
(in Canadian dollars)
March 31, 2002, 2001 and 2000
|
5. SHARE CAPITAL (cont’d.)
[b] Under the Company’s stock option plan, the Company has granted options to inside directors, officers, employees and consultants with a maximum term of five years. Those granted prior to February 28, 2001 vest upon date of grant; those granted after February 28, 2001 vest in equal amounts over three years from the date of grant.
Also under the plan, options granted to the Company’s outside directors have a maximum term of ten years and vest upon date of grant.
The exercise price of each option granted under the plan equals the amount designated in the individual agreement, which is based on the fair value of the stock at the date of grant.
A summary of the status of the Company stock option plan as of March 31, 2002, 2001 and 2000 is presented below:
| 2002 | 2001 | 2000 |
| | Number | Weighted | Number | Weighted | Number | Weighted |
| of | average | of | average | of | average |
| shares | option price | shares | option price | shares | option price |
| # | $ | # | $ | # | $ |
| | | | | | | |
| Outstanding at beginning of year | 1,855,350 | 1.29 | 1,599,100 | 1.29 | 1,776,600 | 1.19 |
| Granted | 570,000 | 1.87 | 535,250 | 2.00 | 45,000 | 1.45 |
| Exercised | (495,100) | 0.92 | (279,000) | 0.72 | (222,500) | 0.54 |
| Outstanding at end of year | 1,930,250 | 1.83 | 1,855,350 | 1.29 | 1,599,100 | 1.29 |
| Options exercisable at year end | 1,458,750 | 1.84 | 1,855,350 | 1.29 | 1,599,100 | 1.29 |
Dynamic Oil & Gas, Inc.
NOTES TO FINANCIAL STATEMENTS
(in Canadian dollars)
March 31, 2002, 2001 and 2000
|
5. SHARE CAPITAL (cont’d.)
[c] The Company has options outstanding and exercisable as follows:
| Exercise price | |
| Number | $ | Expiry date |
| | | |
| 740,000 | 1.72 | April 22, 2003 |
| 40,000 | 1.72 | July 14, 2003 |
| 45,000 | 1.45 | January 24, 2005 |
| 30,000 | 1.75 | August 1, 2005 |
| 353,000 | 2.10 | September 29, 2005 |
| 112,500 | 1.72 | August 17, 2010 |
| 18,750 | 2.10 | September 29, 2010 |
| 7,000 | 2.17 | March 1, 2006 |
| 52,500 | 2.15 | April 30, 2011 |
| 60,000 | 2.10 | August 23, 2011 |
| 1,458,750 | 1.84 | |
These options have a weighted average remaining contractual life of 3.06 years.
[d] The Company issued on November 15, 1995 convertible debentures of $1,000,000 that were collateralized by a general security agreement charging all Company assets. Interest was to be paid monthly at an annual rate of 10% with the principal to be repaid at any time after November 15, 1996 but no later than November 15, 2000. At the option of the debenture holders, all principal amounts were converted into common shares of the Company in the fiscal years and at weighted average prices in the table below.
| | Shares issued | Weighted | Original principal |
| Years of | upon conversion | average price | amounts converted |
| conversion | # | $ | $ |
| | | | |
| 2001 | 76,774 | 1.06 | 81,750 |
| 2000 | 76,224 | 1.13 | 86,000 |
| 1997-1999 | 1,152,557 | 0.72 | 832,250 |
| Total | 1,305,555 | 0.77 | 1,000,000 |
Dynamic Oil & Gas, Inc.
NOTES TO FINANCIAL STATEMENTS
(in Canadian dollars)
March 31, 2002, 2001 and 2000
|
5. SHARE CAPITAL (cont’d.)
[e] Pursuant to the following normal course issuer bids, the Company was authorized to repurchase and cancel common shares on the open market through the facilities of the Toronto Stock Exchange and NASDAQ:
| Normal course issuer bid date of | Share repurchases/ |
| Commencement | Termination | cancellations authorized |
| | |
| 9-Apr-01 | 31-Mar-02 | 1,000,000 |
| 1-Oct-99 | 30-Sep-00 | 1,000,000 |
| 17-Aug-98 | 16-Aug-99 | 980,680 |
Under these normal course issuer bids, the Company purchased and recorded the following:
| | 2002 | 2001 | 2000 |
| | # | $ | # | $ | # | $ |
| | | | | | | |
| Bid termination date: 31-Mar-02 | (178,800) | (289,793) | — | — | — | — |
| Bid termination date: 30-Sep-00 | — | — | (58,100) | (89,689) | (372,900) | (571,607) |
| Bid termination date: 16-Aug-99 | — | — | — | — | (466,300) | (805,116) |
| | (178,800) | (289,793) | (58,100) | (89,689) | (839,200) | (1,376,723) |
| Average purchase price | $1.62 | | $1.54 | | $1.64 | |
| Recorded as an increase of deficit | | 107,175 | | 29,917 | | 510,094 |
| Recorded as a reduction of share capital | | (182,618) | | (59,772) | | (866,629) |
Dynamic Oil & Gas, Inc.
NOTES TO FINANCIAL STATEMENTS
(in Canadian dollars)
March 31, 2002, 2001 and 2000
|
6. INCOME TAXES
Future income taxes reflect the net tax effects of temporary differences between the carrying amounts of assets and liabilities for financial reporting purposes and the amounts used for income tax purposes. Significant components of the Company’s future tax liabilities as of March 31, 2002 are as follows:
| 2002 | 2001 |
| | $ | $ |
| | | |
| Long term future tax assets (liabilities): | | |
| CCA in excess of book depreciation | (46,000) | (3,289,000) |
| Finance charges | 2,000 | 8,000 |
| Deferred gain recognized for tax purposes | 46,000 | 126,000 |
| Provision for future removal and site restoration costs | 277,000 | 200,000 |
| Net future tax assets (liabilities) | 279,000 | (2,955,000) |
Significant components of the provision for income taxes attributable to continuing operations are as follows:
| Liability method |
| 2002 | 2001 | 2000 |
| | $ | $ | $ |
| | | | |
| Current tax expense | 57,600 | 572,000 | — |
| Future income tax benefit resulting from | | | |
| recognition of loss carryforwards | — | — | (144,000) |
| Future income tax benefit resulting from | | | |
| recognition of attributed royalty income | | | |
| carryforwards | — | — | (98,000) |
| Future income tax expense (benefit) relating to | | | |
| origination and reversal of temporary | | | |
| differences | (2,666,800) | 4,740,000 | (966,000) |
| Effect of changes in tax rates | 708,800 | (577,000) | — |
| Income tax (recovery) expense | (1,900,400) | 4,735,000 | (1,208,000) |
Dynamic Oil & Gas, Inc.
NOTES TO FINANCIAL STATEMENTS
(in Canadian dollars)
March 31, 2002, 2001 and 2000
|
6. INCOME TAXES (cont’d.)
The reconciliation of income tax attributable to continuing operations computed at the statutory tax rates to income tax (recovery) expense is:
| Liability method |
| 2002 | 2001 | 2000 |
| | $ | % | $ | % | $ | % |
| | | | | | | |
| Tax at combined federal | | | | | | |
| and provincial rates | (2,371,000) | 43.75 | 6,483,000 | 44.87 | 1,295,000 | 45.12 |
| Tax effect of non-deductible | | | | | | |
| crown royalties | 1,068,000 | | 1,329,000 | | 701,000 | |
| Tax effect of income not | | | | | | |
| taxable | (64,900) | | (224,000) | | 3,000 | |
| Amortization of deferred | | | | | | |
| gain previously recognized | | | | | | |
| for tax purposes | — | | — | | (156,000) | |
| Tax effect of origination and | | | | | | |
| reversal of temporary differences | — | | — | | 389,000 | |
| Tax effect of resource allowance | (1,290,300) | | (2,295,000) | | (736,000) | |
| Utilization of non-capital losses | | | | | | |
| not previously recognized for | | | | | | |
| accounting purposes | — | | — | | (1,496,000) | |
| Recognition of loss carryforwards | | | | | | |
| still available | — | | — | | (144,000) | |
| Recognition of attributed royalty | | | | | | |
| income carryforwards still available | — | | 0051— | | (98,000) | |
| Large Corporation Tax in excess of | | | | | | |
| surtax | 49,000 | | 19,000 | | — | |
| Recognition of benefit of | | | | | | |
| temporary differences | — | | — | | (966,000) | |
| Effect of changes in tax rates | 708,800 | | (577,000) | | — | |
| | (1,900,400) | | 4,735,000 | | (1,208,000) | |
Dynamic Oil & Gas, Inc.
NOTES TO FINANCIAL STATEMENTS
(in Canadian dollars)
March 31, 2002, 2001 and 2000
|
7. EARNINGS PER SHARE AND FUNDS FLOW FROM OPERATIONS
Basic net (loss) earnings per share was calculated on the basis of the weighted average number of shares outstanding for the year of 20,365,031 [2001 - 19,937,585; 2000 - 19,709,904]. The weighted average number of shares outstanding for the diluted calculation in 2002 was 20,466,543 [2001 - 20,444,979; 2000 - 20,174,485].
| 2002 | 2001 | 2000 |
| | $ | $ | $ |
| | | | |
| Numerator | | | |
| Net (loss) earnings for the year | (3,519,085) | 9,714,030 | 4,078,577 |
| | | | |
| Denominator | | | |
| Weighted average number of common | | | |
| shares outstanding | 20,365,031 | 19,937,585 | 19,709,904 |
| Effect of dilutive stock options | 101,512 | 507,934 | 464,581 |
| | 20,466,543 | 20,444,979 | 20,174,485 |
| | | | |
| Basic (loss) earnings per share | (0.17) | 0.49 | 0.21 |
| Diluted (loss) earnings per share | (0.17) | 0.48 | 0.20 |
Funds flow from operations per share (basic and diluted) is calculated by dividing the funds flow from operations by the weighted average number of common shares outstanding as indicated above.
8. CHANGES IN NON-CASH WORKING CAPITAL BALANCES
[a] Changes affecting operating activities comprise:
| 2002 | 2001 | 2000 |
| | $ | $ | $ |
| | | | |
| Accounts receivable | (581,264) | (2,463,146) | (352,708) |
| Prepaid expenses | (124,761) | (122,782) | (23,928) |
| Accounts payable and accrued liabilities | (728,998) | 3,136,946 | (587,198) |
| Income taxes payable | (123,784) | 545,144 | — |
| | (1,558,807) | 1,096,162 | (963,834) |
Dynamic Oil & Gas, Inc.
NOTES TO FINANCIAL STATEMENTS
(in Canadian dollars)
March 31, 2002, 2001 and 2000
|
8. CHANGES IN NON-CASH WORKING CAPITAL BALANCES (cont’d.)
[b] Changes affecting investing activities comprise:
| 2002 | 2001 | 2000 |
| | $ | $ | $ |
| | | | |
| Accounts receivable | (953,434) | 217,404 | 302,402 |
| Accounts payable | (1,324,427) | 892,484 | 522,110 |
| | (2,277,861) | 1,109,888 | 824,512 |
9. FINANCIAL INSTRUMENTS
The Company’s financial instruments consist of cash and cash equivalents, accounts receivable, bank indebtedness, operating loan and accounts payable. The carrying values of these financial instruments approximate their fair value.
Substantially all of the Company’s accounts receivable at March 31, 2002 and 2001 result from the sale of natural gas, natural gas liquids and oil to other companies in the oil and gas industry. This concentration of customers may impact the Company’s overall credit risk, either positively or negatively, in that such entities may be similarly affected by industry-wide changes in economic or other conditions. Historically to date, the Company has incurred no credit losses against its receivables.
10. OVERRIDING ROYALTY
Three officers of the Company receive compensation pursuant to royalty agreements that have previously been approved by shareholders. The Company pays an overriding royalty interest of 1% of the Company’s share of gross monthly production of all petroleum substances produced or deemed to be produced and marketed from or allocated to each well on all lands acquired by the Company since June 1, 1986 for two of the three officers and June 1, 1987 for the third officer. In 2002, the overriding royalty expense included in royalties is $745,994 [2001 - $934,338; 2000 - $366,746].
Dynamic Oil & Gas, Inc.
NOTES TO FINANCIAL STATEMENTS
(in Canadian dollars)
March 31, 2002, 2001 and 2000
|
11. RECONCILIATION OF GENERALLY ACCEPTED ACCOUNTING PRINCIPLES
The Company prepares its accounts in accordance with Canadian generally accepted accounting principles (Canadian GAAP) which for the most part, parallel United States generally accepted accounting principles (U.S. GAAP). The following tables reflect the major differences in accounting principles.
Consolidated net (loss) earnings under U.S. GAAP would be:
| 2002 | 2001 | 2000 |
| For the years ended March 31 | $ | $ | $ |
| | | | |
| Net (loss) earnings under Canadian GAAP | (3,519,085) | 9,714,030 | 4,078,577 |
| Adjustments | | | |
| Options issued for services [a] | — | (20,100) | — |
| Ceiling test adjustment to natural gas | | | |
| properties [b] | (216,100) | — | (145,050) |
| Income taxes [c] | 669,100 | (577,000) | — |
| Net (loss) earnings and comprehensive | | | |
| (loss) earnings under U.S. GAAP | (3,066,085) | 9,116,930 | 3,933,527 |
| Common shares - weighted average | 20,365,031 | 19,937,585 | 19,709,904 |
| Net (loss) earnings per common share under | | | |
| U.S. GAAP | | | |
| - basic | (0.15) | 0.46 | 0.20 |
| - diluted | (0.15) | 0.45 | 0.19 |
After adjusting for certain differences, selected consolidated balance sheet items under U.S. GAAP would be:
| 2002 | 2001 |
| | Canadian | U.S. | Canadian | U.S. |
| basis | basis | basis | basis |
| $ | $ | $ | $ |
| | | | | |
| Future income tax asset [c] | 279,000 | 371,100 | — | — |
| Future income tax liability [c] | — | — | 2,955,000 | 3,532,000 |
| Natural gas and oil interests [b] | 30,365,636 | 30,149,536 | 21,678,527 | 21,678,527 |
| Share capital [a, d] | 20,914,522 | 21,882,682 | 20,641,720 | 21,609,880 |
| Deficit [a, b, c, d] | (4,321,539) | (5,421,657) | (695,279) | (2,355,572) |
Dynamic Oil & Gas, Inc.
NOTES TO FINANCIAL STATEMENTS
(in Canadian dollars)
March 31, 2002, 2001 and 2000
|
11. RECONCILIATION OF GENERALLY ACCEPTED ACCOUNTING PRINCIPLES (cont’d.)
[a] Stock-based compensation
Under Canadian GAAP, no compensation expense is recognized when stock options are issued to directors, employees or consultants. Under U.S. GAAP, the Company accounts for stock-based compensation arrangements using the intrinsic value method in accordance with the provisions of Accounting Principles Board Opinion No. 25, “Accounting for Stock Issued to Employees” (“APB 25”) for employees and directors and the fair value method under Statement of Financial Accounting Standards No. 123, “Accounting for Stock-Based Compensation” (“SFAS 123”) for consultants. Under APB 25, compensation expense for employees and directors is based on the difference between the fair value of the Company’s stock and the exercise price if any, on the date of the grant. Under SFAS 123, the Company accounts for stock options issued to consultants at fair value. The Company uses the Black-Scholes option pricing model to determ ine the fair value of stock options granted to consultants. While the Company follows APB 25 for employees and directors, it does comply with the disclosure provisions of SFAS 123.
Under US GAAP, certain stock options issued by the Company would be considered compensatory in nature and such stock options are charged to compensation expense and credited to share capital.
During 2002, the Company’s option grants included 20,000 stock options issued to a consultant for services at $1.75 per option, resulting in administrative expense recorded in the U.S. GAAP financial statements of $nil in accordance with SFAS 123. These options vest over three years in increments of 6,667 per year beginning February 28, 2003 and expiring on February 28, 2007. At the time of the grant, the fair value of the options was $14,800, an amount that will be recognized as compensation expense evenly over the next three years as the options vest.
During 2002, the Company’s option grants consisted of 550,000 options issued to employees and directors with exercise prices equal to the fair value of the Company’s stock and, in accordance with APB 25 no compensation expense was required to be recorded.
During 2001, the Company’s option grants included 30,000 stock options issued to a consultant for services at $1.75 per option, resulting in administrative expense recorded in the U.S. GAAP financial statements of $20,100 in accordance with SFAS 123. The remainder of options issued in 2001 were issued to employees and directors with exercise prices equal to the fair value of the Company’s stock and, in accordance with APB 25 no compensation expense was required to be recorded.
During 2000, the Company’s option grants consisted of 45,000 options issued to employees and directors with exercise prices equal to the fair value of the Company’s stock and, in accordance with APB 25 no compensation expense was required to be recorded.
Dynamic Oil & Gas, Inc.
NOTES TO FINANCIAL STATEMENTS
(in Canadian dollars)
March 31, 2002, 2001 and 2000
|
11. RECONCILIATION OF GENERALLY ACCEPTED ACCOUNTING PRINCIPLES (cont’d.)
Prior to 2000, there had been $1,519,021 of compensatory stock options issued in accordance with APB 25.
The Company has adopted the disclosure-only provisions of SFAS 123, “Accounting for Stock-Based Compensation” for stock based awards to employees and directors. Had compensation cost for the Company’s stock option plan been determined based on the fair value at the grant date for awards in 2002, 2001 and 2000 consistent with the provisions of SFAS No. 123, the Company’s net (loss) earnings would have been decreased to the pro forma amounts indicated below:
| 2002 | 2001 | 2000 |
| | $ | $ | $ |
| | | | |
| Net (loss) earnings, U.S. basis as reported | (3,066,085) | 9,116,930 | 3,933,527 |
| Pro forma net (loss) earnings, U.S. basis | | | |
| under SFAS 123 | (3,229,062) | 8,716,719 | 3,875,027 |
| (Loss) earnings per share, U.S. basis as reported | (0.15) | 0.46 | 0.20 |
| (Loss) earnings per share, U.S. basis | | | |
| under SFAS 123 | (0.16) | 0.44 | 0.20 |
The Black Scholes options valuation model was used to estimate the fair value of trade options, which have no vesting restrictions and are fully transferable. In addition, option valuation models require the input of highly subjective assumptions including the expected stock price volatility. As the Company’s employee and director stock options have characteristics different from those of traded options, and changes in the subjective input assumptions can materially affect the fair value estimate, the existing models do not necessarily provide a reliable single measure of the fair value of its employee and director stock options. The fair value of option grants using the Black Scholes model is estimated on the date of grant using the following weighted-average assumptions:
| 2002 | 2001 | 2000 |
| | $ | $ | $ |
| | | | |
| Dividend yield | 0% | 0% | 0% |
| Expected volatility | 57% | 48% | 88% |
| Risk-free interest rate | 5% | 6% | 5% |
| Expected lives | 3 years | 3 years | 3 years |
Dynamic Oil & Gas, Inc.
NOTES TO FINANCIAL STATEMENTS
(in Canadian dollars)
March 31, 2002, 2001 and 2000
|
11. RECONCILIATION OF GENERALLY ACCEPTED ACCOUNTING PRINCIPLES (cont’d.)
The weighted average fair value per share of stock options granted during fiscal 2002 is $0.83 [2001 - $0.81; 2000 - $1.30].
[b] Under the successful efforts method of accounting, according to Canadian GAAP, the net carrying cost of oil and gas properties in producing cost centres is limited to an estimated recoverable amount, which is the aggregate of future net operating revenues from proved producing reserves net of certain costs (the “Canadian ceiling test”). Under U.S. GAAP, costs accumulated in each cost centre are limited to an amount equal to the present value, using an annual cash flow discount rate of 10%, of the estimated future net operating revenues from proved producing reserves (the “U.S. ceiling test”).
[c] Effective April 1, 1999, the Company adopted the new Canadian GAAP recommendations with respect to income taxes which requires application of the liability method of tax allocation, similar to the requirements under US GAAP. However, there remains a difference between Canadian and US GAAP as Canadian GAAP requires that deferred income tax balances be adjusted to reflect substantively enacted rates rather than the current legislated tax rates under US GAAP.
[d] Share issue costs are charged directly to retained earnings under Canadian GAAP and are charged directly to share capital under US GAAP. The total share issue costs charged to share capital to date at March 31, 2002 and 2001 was $570,961.
12. COMMITMENTS
[a] On December 18, 1997, the Company agreed to sell and lease back under an operating lease, for an initial term of five years, its St. Albert gas processing facilities to Enercap Corporation of Calgary, Alberta [note 4]. Under the terms of the agreement, the Company is committed to future lease payments over the one remaining year of the initial term as shown in the table below.
Lease costs pursuant to the leaseback agreement are recorded as production costs.
At the end of the initial period of the leaseback (November 30, 2002), the Company has the option to repurchase the gas processing facilities for $780,000. The Company intends to exercise this option.
Dynamic Oil & Gas, Inc.
NOTES TO FINANCIAL STATEMENTS
(in Canadian dollars)
March 31, 2002, 2001 and 2000
|
12. COMMITMENTS (cont’d.)
[b] The Company has entered into an operating lease in respect of its office premises. Minimum payments under this lease commitment, including estimated operating costs over the next two years are also included in the table below.
| Gas | |
| processing | Office |
| facilities | premises |
| $ | $ |
| | | |
| 2003 | 467,811 | 72,329 |
| 2004 | — | 60,274 |
| | 467,811 | 132,603 |
13. ECONOMIC DEPENDENCY
The St. Albert property in Alberta is a core property for the Company and the majority of gas production from the property is pipelined and processed through facilities owned and operated by Atco Midstream (“Atco”) of Calgary, Alberta.
Effective November 1, 1997, the Company and its then joint interest partner, Fletcher Challenge Energy Canada Inc. signed a ten-year, firm service, sour gas processing and transportation agreement with Atco for a maximum daily quantity of 15 million cubic feet of gas per day to be processed at Atco’s Carbondale plant.
Effective December 15, 1998, a similar agreement was signed by the partners and Atco to process sweet gas at Atco’s Villenueve plant, also for a maximum daily quantity of 15 million cubic feet of gas per day.
Both agreements include an automatic renewal for a further ten years, subject to fee re-negotiation.
Dynamic Oil & Gas, Inc.
NOTES TO FINANCIAL STATEMENTS
(in Canadian dollars)
March 31, 2002, 2001 and 2000
|
14. SUBSEQUENT EVENTS
Normal course issuer bid
Pursuant to a normal course issuer bid commencing May 1, 2002 and terminating March 31, 2003 or earlier, the Company was authorized to repurchase and cancel up to 1,000,000 common shares on the open market through the facilities of the Toronto Stock Exchange and NASDAQ. To date, there have been no repurchases made.
15. COMPARATIVE FIGURES
Certain comparative figures have been reclassified to conform with the current year’s presentation.
Dynamic Oil & Gas, Inc.
Schedule 1
GENERAL AND ADMINISTRATIVE
(in Canadian dollars)
Years ended March 31
| | 2002 | 2001 | 2000 |
| | $ | $ | $ |
| | | | |
| Advertising and promotion | 250,792 | 218,880 | 233,098 |
| Insurance | 122,583 | 43,034 | 40,967 |
| Interest | 98,087 | 18,469 | 16,551 |
| Office and printing | 432,947 | 231,490 | 219,330 |
| Professional fees | 530,203 | 402,925 | 351,673 |
| Provincial capital taxes | 83,062 | 37,000 | — |
| Regulatory and other fees | 72,472 | 70,219 | 107,658 |
| Rent | 89,581 | 84,646 | 67,183 |
| Salaries and benefits (1) | 1,086,958 | 633,601 | 572,577 |
| Telephone | 16,423 | 13,354 | 18,406 |
| Travel | 23,054 | 20,361 | 17,167 |
| Cost recoveries | (458,950) | (204,804) | (25,789) |
| | 2,347,212 | 1,569,175 | 1,618,821 |
(1) The Company also pays overriding royalties to three officers as described in note 10.
Schedule 2
AMORTIZATION AND DEPLETION
(in Canadian dollars)
Years ended March 31
| | 2002 | 2001 | 2000 |
| | $ | $ | $ |
| | | | |
| Amortization and depletion | 12,118,849 | 3,132,663 | 1,644,209 |
| Future removal and site restoration provision | 284,368 | 184,925 | 166,205 |
| Amortization of deferred financing costs | — | 1,412 | 6,122 |
| Amortization of deferred gain on sale | (230,274) | (312,036) | (352,381) |
| | 12,172,943 | 3,006,964 | 1,464,155 |
Dynamic Oil & Gas, Inc.
NOTES TO FINANCIAL STATEMENTS
(in Canadian dollars)
March 31, 2002, 2001 and 2000
|
Dynamic Oil & Gas, Inc.
Schedule 3
EXPLORATION EXPENSES
(in Canadian dollars)
Years ended March 31
| | 2002 | 2001 | 2000 |
| | $ | $ | $ |
| | | | |
| Drilling | 3,821,374 | 667,684 | 948,372 |
| Seismic data activity | 649,216 | 1,101,969 | 184,997 |
| Non-producing lease rentals | 64,605 | 51,856 | 28,460 |
| Property investigations | 110,823 | 101,685 | 137,447 |
| | 4,646,018 | 1,923,194 | 1,299,276 |
Signatures
We hereby certify that we meet all of the requirements for filing on Form 20and that we have duly caused and authorized the undersigned to sign this Annual Report on our behalf.
Date: August 19, 2002
Dynamic Oil & Gas, Inc.
By: /s/ Michael A. Bardell
Michael A. Bardell
Chief Financial Officer & Corporate Secretary
INDEX TO EXHIBITS
| Exhibit Numbers | EXHIBITS | Sequentially Numbered Page |
| 1(i) and 2(a)(i) | Certificate of Incorporation and Articles/By(1) | |
| 1(i) and 2(a)(i) | Certificate of Increase of Authorized Capital of the Company and Name Change.(3) | |
| 1(i) and 2(a)(i) | Corporate Governance Committee Guidelines | |
| 2(a)(ii) | Shareholder Rights Plan Agreement.(3) | |
| 4 (i) | Joint Bidding Agreement by and between Imperial Oil Limited St. Albert Property Package, dated February 5, 1997. (1) | |
(ii)
| Agreement of Purchase and Sale by and between Imperial Oil Resources and Fletcher Challenge Energy Canada, Inc., dated March 13, 1997. (1) | |
(iii)
| Agreement for Purchase and Sale by and between Dynamic Oil Limited and Oiltec Resources Ltd., dated June 6, 1997. (1) | |
(iv)
| Sour Gas Processing and Transportation Agreement by and between ATCO Gas Services Ltd. And Fletcher Challenge Energy Canada and Dynamic Oil Limited, dated July 11, 1997. (1) | |
(v)
| Gas Purchase Contract by and between Dynamic Oil Limited and Progas Limited, dated November 1, 1997. (1) | |
(vi)
| Joint Operating Agreement (Shallow Rights) by and between Fletcher Challenge Energy Canada Inc. and Dynamic Oil Limited, dated May 30, 1997.(2) | |
(vii)
| Joint Operating Agreement (Deep Rights) by and between Fletcher Challenge Energy Canada Inc. and Dynamic Oil Limited, dated May 30, 1997.(2) | |
(viii)
| Joint Acquisition Agreement St. Albert Area by and between Fletcher Challenge Energy Canada Inc. and Dynamic Oil Limited, dated May 30, 1997.(2) | |
(ix)
| Sale Agreement by and between Enercap Corporation and Dynamic Oil Limited, dated November 28, 1997.(2) | |
(x)
| Gas Processing Agreement by and between Enercap Corporation and Dynamic Oil Limited, dated December 17, 1997.(2) | |
(xi)
| Management Services Agreement by and between Enercap Corporation and Dynamic Oil Limited, dated December 17, 1997.(2) | |
(xii)
| Demand Debenture and Negative Pledge by Dynamic Oil Limited in favor of Enercap Corporation, dated December 17, 1997.(2) | |
(xiii)
| Purchaser’s Lenders Undertaking by and among Dynamic Oil Limited, Montreal Trust Company of Canada and Enercap Corporation, dated December 17, 1997.(2) | |
(xiv)
| Sweet Gas Processing and Transportation Agreement between ATCO Gas Services Ltd. and Dynamic Oil & Gas Inc., dated December 16, 1998. (3) | |
| (xv) | Natural Gas Sales Agreement between Producers Marketing Ltd. and Dynamic Oil & Gas, Inc., dated November 1, 1999 (re: Dynamic’s interests at Peavey/Morinville in Alberta). (4) | |
| (xvi) | Transportation and Processing Agreement between ATCO Midstream Ltd. and Dynamic Oil & Gas, Inc. dated November 1, 2000 (re: Dynamic’s interests at Peavey/Morinville in Alberta). (5) | |
| (xvii) | Purchase and Sale Agreement between Fletcher Challenge Oil & Gas Inc. and Dynamic Oil & Gas, Inc. et al, dated June 26, 2001 (re: acquisition of Fletcher’s interest in St. Albert property by Dynamic, Trioco Resources Inc. and Energy North Inc.) (5) | |
| (xviii) | Contribution, Mutual Interest and Exclusion Agreement between Dynamic Oil & Gas, Inc., Trioco Resources Inc. and Energy North Inc. dated June 29, 2001 (re: Joint bidding agreement in connection with the Purchase and Sale Agreement of Fletcher’s St. Albert interest described above. (5) | |
| (xix) | Employment Agreement, dated July 11, 2000 between Dynamic Oil & Gas, Inc. and Wayne Babcock. (5) | |
| (xx) | Employment Agreement, dated July 11, 2000 between Dynamic Oil & Gas, Inc. and Donald K. Umbach. (5) | |
| (xxi) | Employment Agreement, dated July 11, 2000 between Dynamic Oil & Gas, Inc. and James Britton. (5) | |
| (xxii) | Employment Agreement, dated July 11, 2000 between Dynamic Oil & Gas, Inc. and Michael Bardell. (5) | |
| (xxiii) | Employment Agreement, dated March 5, 2001 between Dynamic Oil & Gas, Inc. and David Grohs. (5) | |
| (xxiv) | Employment Agreement, dated March 12, 2001 between Dynamic Oil & Gas, Inc. and Jonathan White. (5) | |
| (xxv) | Overriding Royalty Agreement dated July 13, 1990 between Dynamic Oil Limited and Wayne J. Babcock. (6) | |
| (xxvi) | Overriding Royalty Agreement dated July 13, 1990 between Dynamic Oil Limited and Donzoil Ltd. (6) | |
| (xxvii) | Overriding Royalty Agreement dated August 31, 1990 between Dynamic Oil Limited and James R. Britton. (6) | |
| (xxviii) | GasEDI Base Contract for Short-Term Sale and Purchase of Natural Gas dated October 15, 2001 between Nexen Marketing and Dynamic Oil & Gas, Inc. (6) | |
| 6 | Statement re: Earnings Per Share Calculation. (5) | |
| 10.1 | Certification Pursuant to 18 U.S.C. Section 1350, as Adopted Pursuant to Section 906 of the Sarbanes-Oxley Act of 2002. (6) | |
| 10.2 | Certification Pursuant to 18 U.S.C. Section 1350, as Adopted Pursuant to Section 906 of the Sarbanes-Oxley Act of 2002. (6) | |
Unless otherwise noted, each exhibit to this Annual Report has been filed by us with previous Annual Reports under the exhibit number indicated in parentheses following that Exhibit reference and under the same Exhibit Number as filed herewith. All such Exhibits are incorporated by reference.
(1) Form 20-F Annual Report filed on September 30, 1997 under Exhibit No 3.
(2) Form 20-F Annual Report filed on August 18, 1998 under Exhibit No. 3.
(3) Form 20-F Annual Report filed on September 9, 1999 under Exhibit No. 3.
(4) Form 20-F Annual Report filed on August 16, 2000 under Exhibit No. 3.
(5) Form 20-F Annual Report filed on August 15, 2001 under Exhibit No. 4.
(6) Filed herewith.