| |  |
| | |
| UNITED STATES |
SECURITIES AND EXCHANGE COMMISSION
Washington, D.C. 20549
FORM 20-F/A
¨ REGISTRATION STATEMENT PURSUANT TO SECTION 12(b) OR (g) OF THE SECURITIES EXCHANGE ACT OF 1934
OR
x ANNUAL REPORT PURSUANT TO SECTION 13 OR 15(d) OF THE SECURITIES EXCHANGE ACT OF 1934
OR
¨ TRANSITION REPORT PURSUANT TO SECTION 13 OR 15(d) OF THE SECURITIES EXCHANGE ACT OF 1934
Commission File Number 0-17551
DYNAMIC OIL & GAS, INC.
(formerly Dynamic Oil Limited)
(Exact name of Registrant as specified in its charter)
Province of British Columbia (Canada)
(Jurisdiction of incorporation or organization)
#230 – 10991 Shellbridge Way
Richmond, British Columbia V6X 3C6, Canada
(Address of principal executive offices)
Securities registered or to be registered pursuant to Section 12(b) of the Act:
None
Securities registered pursuant to Section 12(g) of the Act:
Common Stock Without Par Value
Securities for which there is a reporting obligation pursuant to Section 15(d) of the Act:
None
The number of outstanding shares of our Common Stock outstanding as of December 31, 2003 was 22,194,778.
Indicate by check mark whether the registrant (1) has filed all reports required to be filed by Section 13 or 15(d) of the
Securities Exchange Act of 1934 during the preceding 12 months (or for such shorter period that the registrant was
required to file such reports), and (2) has been subject to such filing requirements for the past 90 days.
Yes x No ¨
Indicate by check mark which financial statement item the registrant has elected to follow.
Item 17. x Item 18. ¨
1
| | |
| | |
| TABLE OF CONTENTS |
2
| | |
| | |
| Glossary of Terms |
| Air drilling | A method of drilling that uses compressed air as a medium for transporting drill cuttings to surface. |
| Basal Quartz zone | A name generally applied to the Ellerslie formation as it occupies the “bottom” sandstone of the Lower Mannville gas formation of lower Cretaceous Age about 124 millions years of age. |
| Bbl or Barrel | 42 U.S. gallons liquid volume of crude oil or natural gas liquids. |
| Bcf | Billion cubic feet of gas. Usual expression of proved reserve gas volume. |
| Belly River formation | Late Cretaceous Age sandstones and shales deposited from 75 to 84 million years ago. |
| Blairmore formation | Formation encompassing clastic sediments deposited in the Early Cretaceous Age from about 100 to 120 million years ago. |
| Bluesky formation | Sandstones of the lower Cretaceous Age, about 112 million years old, occurring in Northern Alberta and NE BC. |
| boe | Barrels of Oil Equivalent. Generally one barrel of oil equals six mcf of gas. Allows reserves of oil and gas to be added together. |
| boe/d | An expression of barrels of oil equivalent produced per day. |
| Carbonates | Rocks composed predominantly of Calcium Carbonate (CaCO3). |
| Condensate | A mixture comprising pentanes and heavier hydrocarbons recovered as a liquid from field separators, scrubbers or other gathering facilities or at the inlet of a processing plant before the gas is processed. |
| Cretaceous Age | Rocks from 144 million to 66.4 million years of age. |
| Crown royalty | An amount payable to the government of the applicable Canadian province in relation to the production of petroleum, natural gas or related hydrocarbons from an oil or gas well located on Crown lands. |
| Crude oil | A mixture, consisting mainly of pentanes and heavier hydrocarbons that may contain sulphur compounds, that is liquid at the conditions under which its volume is measured or estimated, but excluding such liquids obtained from the processing of natural gas. |
| Debolt | From the Mississipian Age, approximately 340 million years old, and is comprised most of shales that are separated by regional disconformities. |
| Depletion | The reduction in petroleum reserves due to production. |
| Development or developed | Refers to the phase in which a proven oil or gas field is brought into production by drilling and completing production wells and the wells, in most cases, are connected to a petroleum gathering system. |
| Devonian Age | Rocks from 408 million to 360 million years of age. |
| Discovery | The location, learned through drilling of a well, where there exists an accumulation of gas, condensate or oil reserves. The size of the reserves may be estimated but not precisely quantified and may or may not be commercially economic, depending on a number of factors. |
| Drill stem test | A method of packing off the pressure of drilling mud weight to allow a prospective oil or gas formation to flow into the drill stem pipe. Drill stem test results assist in evaluating the potential of the zone to flow or to be pumped commercially. |
| Dry hole | A well drilled without finding commercially economic quantities of hydrocarbons. |
| Ellerlsie zone or formation | A name applied to a group of sandstones that are clear and Quartzose with good porosity and permeability for oil and gas about 124 millions years of age. |
| Exploration well | A well drilled in a prospect without knowledge of the underlying sedimentary rock or the contents of the underlying rock. |
| Farmin | By way of agreement, a party earns (farmin) an interest in lands comprising petroleum and natural gas rights from another party by drilling a well or similar activity that evaluates, explores or develops the lands for the production of petroleum substances. Farmout By way of agreement, a party gives up (farmout) an interest in lands comprising petroleum and natural gas rights to another party who earns the interest by drilling a well or similar activity that evaluates, explores or develops the lands for the production of petroleum substances. |
| Field | An area that is producing, or has been proven to be capable of producing, hydrocarbons. |
| Field netbacks | Revenues from the sale of all commodities produced, less applicable resource and production royalties, less operating costs. |
3
| Formation | A reference to a group of rocks of the same age extending over a substantial area of a basin. |
| Freehold royalty | An amount payable to a mineral rights holder in relation to the production of petroleum, natural gas or related hydrocarbons from an oil or gas well located on non-Crown lands. |
| GAAP | Generally accepted accounting principles. |
| Geology | The science relating to the history and development of the Earth. |
| Glauconite | A sand group from the upper Mannville formation (lower Cretaceous Age) about 110 million years ago with a green mineral constituent. |
| Gross acres | The total acreage in which the Company has an interest. |
| Hackett formation | A sand package that occurs at the base of the Lower Mannville gas formation (lower Cretaceous Age), 118 to 120 million years old. |
| Hectare | A land measurement equaling 2.471 acres. |
| Horizontal well | A vertical well bore that is gradually deviated (usually horizontally to 90o) in order to intersect the targeted formation. |
| Hydrocarbon | The general term for oil, gas, condensate, liquids and other petroleum products. |
| Jean Marie formation | A patch reef carbonate reservoir within the Upper Devonian Age formation, about 367 to 369 million years old. The Jean Marie is found in NE British Columbia and is the stratigraphic equivalent to the lower Nisku formation in Alberta. |
| kilometer | A measurement of distance equaling 0.621 miles or 3,281 feet. |
| Leduc D-3 formation | A reefal carbonate reservoir found within the Upper Devonian Age formation, about 369 to 373 million years old. These ancient Leduc reefs were the initial target for oil and gas exploration in Alberta. Leduc No. 1, approximately 30 km. South of St. Albert, was the discovery well for conventional oil in Western Canada. |
| Logs | Recordings from electrical and radioactive source devices that are run down wellbores to measure petrophysical properties of the adjacent rocks. |
| Lower Mannville gas | Any gas sands found in the lower half of the lower Cretaceous Age zones, about 110 million years old. These sands may comprise the Ostracod, Basal Quartz or Ellerlsie zones. |
| Mbbl | 1,000 barrels of oil and/or natural gas liquids. |
| mboe | 1,000 barrels of oil equivalent. See ‘boe’ for further details. |
| mcf | 1,000 cubic feet of natural gas. |
| mcf/d | 1,000 cubic feet of natural gas production per day. Usually used to express the production rate of a group of gas wells. |
| Mannville | From the early Cretaceous period, approximately 110 million years old and represents a major episode of subsidence and sedimentation. |
| Meter | A physical measurement equaling 3.281 feet. |
| Mineral taxes (freehold) | An amount levied by the government of Alberta in relation to the production of petroleum, natural gas or related hydrocarbons from an oil or gas well located on non-government (freehold) lands in Alberta. |
| Mississipian Age | Rocks from 360 to 325 million years of age. |
| Mmcf | 1,000,000 cubic feet of natural gas. |
| mmcf/d | 1,000,000 cubic feet of natural gas production per day. Usually used to express the production rate of a gas well or group of gas wells. |
| NYMEX | New York Mercantile Exchange, the largest physical commodity exchange in the world. |
| Natural gas | The lighter hydrocarbons and associated non-hydrocarbon substances occurring naturally in an underground reservoir, which under atmospheric conditions are essentially a gas, but that may contain liquids. |
| NGL’s | Natural gas liquids. Hydrocarbon components recovered from raw natural gas as liquids by processing through extraction plants or recovered from field separators, scrubbers or other gathering facilities. These liquids include the hydrocarbon components ethane, propane, butane and pentane plus, or combinations thereof. |
| Net acres | The percentage of gross acreage in which the Company has a working interest. |
| Nisku D-2 formation | A reefal carbonate reservoir in the Winterburn Group of the upper Devonian Age, about 367 to 369 million years old. The Nisku is found exclusively within Alberta but it is a stratigraphic equivalent to the Jean Marie formation in British Columbia. |
| Ostracod zone | Rocks from the lower Cretaceous Age approximately 119 million years ago comprised of sandstones and marlstones that contain a small fossil named Ostracod. |
4
| Ostracod well | A gas well capable of producing commercially from the lower Cretaceous Age Ostracod zone. |
| Operator | That party to a joint venture agreement whose responsibility it is to carry out all exploratory, development, maintenance and record-keeping duties on behalf of other joint venture partners in relation to hydrocarbon extraction on the joint-ventured lands. |
| Overriding royalty | An amount payable to a third party other than Crown or freehold royalties in relation to the production of petroleum, natural gas or related hydrocarbons from an oil or gas well located on lands in which the interest of the third party usually arises out of a separate agreement. |
| Pentanes | A hydrocarbon by-product of natural gas generally referred to as condensate that is of the paraffin series having a chemical formula of C5H12and having all its carbon atoms joined in a straight chain. |
| Permeability | Capacity of a rock for transmitting a fluid. |
| Permit or licence area | An area that is granted for a prescribed period of time for exploration, development or production under specific contractual or legislative conditions. |
| Pipeline | A system of interconnected pipes that gather and transport hydrocarbons from a well or field to a processing plant or to a facility that is built to take the hydrocarbons for further transport, such as a gas liquefaction plant. |
| Proved reserves | Those reserves estimated as recoverable with current technology and under existing economic conditions, from that portion of a reservoir that can be reasonably evaluated as economically productive through analysis of drilling, geological, geophysical and engineering data. This includes the reserves to be obtained by enhanced recovery processes demonstrated to be economically and technically successful in the subject reservoir. |
| Quartzose | Rocks composed of mostly quartz. |
| Raw gas | Gaseous effluent from a wellhead or pipeline that is not processed. Contains water vapor, carbon dioxide, nitrogen and possibly hydrogen sulphide (H2S) gas. |
| Reservoir rock | Porous limestones, dolomites or sandstones that can trap oil and/or gas in interconnected holes, like a sponge. |
| Royalty | A stated or determinable percentage of the proceeds received from the sale of hydrocarbons calculated as prescribed in applicable legislation or in the agreement with the royalty holder. |
| Seals | Impermeable barriers to hydrocarbon flow such as shale, lime muds, salt or anhydrite. Seismic A geophysical technique using low frequency sound waves to determine the subsurface structure of sedimentary rocks. |
| Slave Point | From the middle Devonion Age, approximately 375 million years old and is restricted to open-marine carbonate, dominated by shales and argillaceous carbonates. |
| Sour gas | Raw gas with an amount of hydrogen sulphide (H2S) gas above pipeline requirements of 10 parts H2S per million raw gas. |
| Source rock | Usually shales and clays with a high carbon content deposited in a marine environment. |
| Sweet gas | Natural gas containing no hydrogen sulphide (H2S) gas. |
| Stabilized absolute open flow | The maximum rate of gas production that a wellhead will produce assuming no backpressure when the well is stable. |
| Tertiary sediment | Soft rock of sands, clays, coals and siltstones from 66.4 to 1.6 million years old. |
| Triassic Age | Rocks from 245 to 208 million years of age. |
| Undeveloped | Prior to the time in which a proven oil or gas field is brought into production by drilling and completing production wells. |
| Vertical well | A well bore that intersects the section(s) containing hydrocarbons at about 90o. |
| Viking | From the middle Cretaceous Age, 98 – 133 Million years old, and is comprised of interbedded, predominatly marine influenced sandstones and shales. |
| Viking gas well | A well capable of commercial gas production from the upper Cretaceous Age Viking formation sands deposited about 98 million years ago. |
| Wabamun D-1 formation | Cyclical ramp carbonates deposited approximately 360 – 367 million years ago during the upper Devonian Age period. |
| Working interest | Those lands in which the Company receives its share acreage of net production revenues. |
5
| | |
| | |
| Part I. |
THIS ANNUAL REPORT AMENDS OUR ANNUAL REPORT ON FORM 20-F FILED ON MAY 19, 2004. THE ONLY DIFFERENCE IN THIS REPORT IS THAT IT INCLUDES MAPS OF OUR VARIOUS PROPERTIES THAT, DUE TO FILE SIZE DIFFICULTIES, WERE NOT INCLUDED IN THE PREVIOUS REPORT.
The year covered by this annual report, Fiscal 2003, coincides with the calendar year and is the first full year since we changed our fiscal year end to December 31 from March 31. Prior to this filing, our most recently filed annual report covered the nine-month period from April 1, 2002 to December 31, 2002. In this report, we may refer to the 12-month period ended December 31, 2003 as “Fiscal 2003”, the nine-month period ended December 31, 2002 as “Nine-Month Fiscal Transition 2002”, the 12-month periods ended March 31, 2002 and 2001 as “Fiscal 2002” and “Fiscal 2001”, respectively, and the 12-month period ending December 31, 2004 as “Fiscal 2004”.
Where useful for comparison purposes, we indicated that we annualized our Nine-Month Fiscal Transition 2002 numbers by multiplying the numbers by four-thirds. However, this method does not reflect actual results for the three-month extrapolated period and such results may differ from the outcome achieved by this calculation.
Item 1. Identity of Directors, Senior Management and Advisers
Not applicable.
Item 2. Offer Statistics and Expected Timetable
Not applicable.
Item 3. Key Information
Selected Financial Data
The following tables summarize certain of our financial information that is derived from and should be read in conjunction with our Financial Statements and Item 5 – “Operating and Financial Review and Prospects” included elsewhere in this Report. The selected financial data has been prepared in accordance with Canadian Generally Accepted Accounting Principles (Canadian GAAP). The Financial Statements and the notes thereto included pursuant to Item 17 of this Report are also prepared under Canadian GAAP. Included in Note 12 to the Financial Statements is the reconciliation between Canadian GAAP and United States generally accepted accounting principles (U.S. GAAP). Unless otherwise stated in this Report, all references to dollars are in Canadian dollars.
Certain of the comparative figures have been restated to conform to the current period’s presentation as described in Note 3 to the Financial Statements.
Selected Financial Data Presented According to Canadian GAAP| | As at | | As at | | | | | | | |
| | December | | December | | | | | | | |
| | 31 | | 31 | | As at March 31 | |
| ($ 000’s) | 2003 | | 2002 | | 2002 | | 2001 | | 2000 | |
| Balance Sheets | | | | | | | | | | |
| Working capital (deficiency) | (19,313 | ) | (16,818 | ) | (13,281 | ) | 1,969 | | (3,716 | ) |
| Total assets | 64,768 | | 44,227 | | 37,732 | | 29,991 | | 18,811 | |
| Current liabilities | 26,632 | | 23,729 | | 19,625 | | 6,210 | | 7,717 | |
| Long-term liabilities | 1,588 | | 1,087 | | 1,082 | | 540 | | 402 | |
| Deferred gain on sale | - | | - | | 109 | | 340 | | 652 | |
| Future income tax liability | 5,618 | | 844 | | - | | 2,955 | | - | |
| Net assets | 30,931 | | 18,568 | | 16,916 | | 19,947 | | 10,040 | |
| Share capital | 27,747 | | 20,721 | | 20,915 | | 20,642 | | 20,420 | |
| Retained Earnings (deficit) | 2,825 | | (2,153 | ) | (4,025 | ) | (695 | ) | (10,379 | ) |
6
| | | | | Nine-Month | | | | | | |
| | | | | Fiscal | | | | | | | |
| | | Fiscal | | Transition | | Fiscal | | Fiscal | | Fiscal | |
| ($ 000’s, except per share data) | | 2003 | | 2002 | | 2002 | | 2001 | | 2000 | |
| Statements of Operations | | | | | | | | | | | |
| Gross revenues | | 46,848 | | 24,123 | | 26,402 | | 34,463 | | 15,770 | |
| Gross revenues less royalties | | | | | | | | | | | |
| and production costs | | 27,499 | | 13,309 | | 14,215 | | 20,524 | | 7,438 | |
| Cash flow from operations(1) | | 23,097 | | 10,810 | | 11,337 | | 18,168 | | 5,634 | |
| Cash flow per share, basic ($) | | 1.08 | | 0.53 | | 0.56 | | 0.91 | | 0.29 | |
| Cash flow per share, diluted ($) | | 1.05 | | 0.53 | | 0.55 | | 0.84 | | 0.26 | |
| Earnings (loss) before taxes | | 7,189 | | 3,186 | | (5,259 | ) | 14,449 | | 2,871 | |
| Net earnings (loss) | | 4,978 | | 2,004 | | (3,412 | ) | 9,714 | | 4,079 | |
| Common shares – weighted avg. (# 000’s) | | 21,394 | | 20,357 | | 20,365 | | 19,938 | | 19,710 | |
| Common shares – outstanding (# 000’s) | | 22,195 | | 20,273 | | 20,462 | | 20,146 | | 19,848 | |
| Net (loss) earnings per share, basic ($) | | 0.23 | | 0.10 | | (0.17 | ) | 0.49 | | 0.21 | |
| Net (loss) earnings per share, diluted ($) | | 0.23 | | 0.10 | | (0.17 | ) | 0.48 | | 0.20 | |
| (1) | Cash flow from operations is a non-GAAP measure that does not have standardized meaning as prescribed by GAAP and is therefore unlikely to be comparable to similar measures presented by other companies. We consider it a key measure as it demonstrates our ability to generate the cash flow necessary to fund future growth through capital investment and to repay debt. Below is the determination of the non-GAAP measure by utilizing existing GAAP measures. |
| | | | | Nine-Month | | | | | | | |
| ($000’s) | | | | Fiscal | | | | | | | |
| | | Fiscal 2003 | | Transition 2002 | | Fiscal 2002 | | Fiscal 2001 | | Fiscal 2000 | |
| Cash flow from operating activities | | | | | | | | | | | |
| (GAAP measure) | | 28,294 | | 11,457 | | 9,779 | | 19,264 | | 4,670 | |
| Changes in non-cash working capital | | | | | | | | | | | |
| (GAAP measure) | | (5,197 | ) | (647 | ) | 1,558 | | (1,096 | ) | 964 | |
| Cash flow from operations | | | | | | | | | | | |
| (non-GAAP measure) | | 23,097 | | 10,810 | | 11,337 | | 18,168 | | 5,634 | |
7
| | |
| | |
| Selected Financial Data Presented According to U.S. GAAP |
The following tables show the major differences in the application of Canadian GAAP and U.S. GAAP.
| | As at | | As at | | | | | | | |
| | December 31 | | December 31 | | As at March 31 | |
| ($ 000’s) | 2003 | | 2002 | | 2002 | | 2001 | | 2000 | |
| | | | | | | | | | | |
| Balance Sheets | | | | | | | | | | |
| Future income tax asset | - | | - | | 371 | | - | | 242 | |
| Future income tax liability | - | | 541 | | - | | 3,532 | | - | |
| | | | | | | | | | | |
| Natural gas and oil interests | 56,902 | | 36,236 | | 30,150 | | 21,679 | | 13,721 | |
| Share capital* | 28,721 | | 21,694 | | 21,883 | | 21,610 | | 21,368 | |
| Retained earnings (deficit) | 1,331 | | (3,636 | ) | (5,422 | ) | (2,356 | ) | (11,473 | ) |
| * | For further explanation of the reconciling adjustments shown below, see Note 12 to the Financial Statements presented under Item 17 to this Report. |
| | | | Nine-Month | | | | | | | |
| ($ 000’s) | | | Fiscal | | | | | | | |
| | Fiscal | | Transition | | Fiscal | | Fiscal | | Fiscal | |
| | 2003 | | 2002 | | 2002 | | 2001 | | 2000 | |
| Net earnings (loss) under | | | | | | | | | | |
| Canadian GAAP | 4,978 | | 2,004 | | (3,412 | ) | 9,714 | | 4,079 | |
| Amortization and depletion | - | | (65 | ) | (141 | ) | - | | - | |
| Accretion of asset retirement | | | | | | | | | | |
| obligation | - | | 40 | | 36 | | - | | - | |
| Options issued for services | - | | (3 | ) | - | | (20 | ) | - | |
| Write-downs on natural gas and oil | | | | | | | | | | |
| properties | (125 | ) | (209 | ) | (141 | ) | - | | (145 | ) |
| Income taxes | - | | - | | 709 | | (577 | ) | - | |
| Net earnings (loss) before cumulative | | | | | | | | | | |
| effect of change in accounting | | | | | | | | | | |
| principle under U.S. GAAP | 4,853 | | 1,767 | | (2,949 | ) | 9,117 | | 3,934 | |
| Cumulative effect of change in | | | | | | | | | | |
| accounting principle, net of | | | | | | | | | | |
| applicable taxes | 133 | | - | | - | | - | | - | |
| Net earnings (loss) under | | | | | | | | | | |
| U.S. GAAP after cumulative effect | | | | | | | | | | |
| of change in accounting principle | 4,986 | | 1,767 | | (2,949 | ) | 9,117 | | 3,934 | |
| Net earnings (loss) per common share | | | | | | | | | | |
| under U.S. GAAP, before change in | | | | | | | | | | |
| accounting policy | | | | | | | | | | |
| basic | 0.23 | | 0.09 | | (0.14 | ) | 0.46 | | 0.20 | |
| diluted | 0.22 | | 0.09 | | (0.14 | ) | 0.45 | | 0.19 | |
| Net earnings (loss) per common share | | | | | | | | | | |
| under U.S. GAAP, after change in | | | | | | | | | | |
| accounting policy | | | | | | | | | | |
| basic | 0.23 | | 0.09 | | (0.14 | ) | 0.46 | | 0.20 | |
| diluted | 0.23 | | 0.09 | | (0.14 | ) | 0.45 | | 0.19 | |
Dividends
We have never paid or declared dividends on our shares of Common Stock and we do not intend to do so in the foreseeable future. We intend to use our retained earnings to finance growth.
8
| | |
| | |
| Exchange Rates |
Our Financial Statements, as provided under Items 8 and 17 and all dollar amounts presented in this report, are presented in Canadian dollars, unless otherwise expressly stated. For comparison purposes, exchange rates into U.S. dollars are provided. The following tables set forth the exchange rate as of the latest practicable date, high and low exchange rates for the months indicated and the average exchange rates for the reporting periods indicated, based on the noon U.S. dollar buying rate in New York City for cable transfers in Canadian dollars as certified for customs purposes by the Federal Reserve Bank of New York (Canadian Dollar = U.S. $1.00).
Exchange Rates for Canadian Versus U.S. Dollars
The exchange rate as of May 5, 2004 was CDN $1.37 per U.S. $1.00.
Exchange Rates for Canadian Versus U.S. Dollars| (High/low rates for latest six months) | High | | Low | |
| April, 2004 | 1.37 | | 1.31 | |
| March, 2004 | 1.35 | | 1.31 | |
| February, 2004 | 1.34 | | 1.31 | |
| January, 2004 | 1.33 | | 1.27 | |
| December, 2003 | 1.34 | | 1.29 | |
| November , 2003 | 1.34 | | 1.30 | |
Exchange Rates for Canadian Versus U.S. Dollars| | Average ($) | |
| For the twelve-month period ended December 31, 2003 | 1.40 | |
| For the nine-month period ended December 31, 2002 | 1.56 | |
| For the twelve-month period ended March 31, 2002 | 1.57 | |
| For the twelve month period ended March 31, 2001 | 1.50 | |
| For the twelve month period ended March 31, 2000 | 1.47 | |
Capitalization and Indebtedness
Not applicable.
Reasons for the Offer and Use of Proceeds
Not applicable.
Risk Factors
Set forth below are risk factors that could materially adversely affect our cash flow from operations, operating results and financial condition.
Business Risk Management
The natural gas and oil industry is highly competitive, particularly in the following areas:
| | • | searching for and developing new reserves of natural gas and crude oil; |
| | • | constructing pipelines and facilities required to transport or process produced commodities; and |
| | • | operating facilities related to the production of natural gas and crude oil. |
Our competitors include major integrated oil and gas companies and numerous other independent oil and gas companies.
Commodity Price Fluctuations
Our products, including natural gas, NGL’s and oil, and other hydrocarbon products, are commodities. Because our contracts do not fix a long-term price for the products we purchase or sell, market changes in the price of such products have a direct and immediate effect (whether favorable or adverse) upon our revenues and profitability.
9
Prices for products may be subject to material change in response to relatively minor changes in supply and demand, general economic conditions and other market conditions over which we have no control. Other conditions affecting our business include the level of domestic oil and gas production, the availability and prices of competing commodities and of alternative energy sources, the availability of local, intraprovincial and interprovincial transportation systems with adequate capacity, the proximity of gas production to gas pipelines and facilities, the availability of pipeline capacity, government regulation, the seasons, the weather and the impact of energy conservation efforts.
Availability of Natural Gas Supply
We must connect new wells to our gathering systems, contract for new natural gas supplies with third party pipelines or acquire additional gathering systems in order to maintain or increase throughput levels to offset current annual production volumes. Historically, while certain individual facilities have experienced decreases in dedicated reserves, we have connected new wells and contracted for new supplies with third-party pipelines that more than offset production depletion of our existing wells. Our ability to connect new wells to existing facilities is dependent upon levels of our oil and gas development activity near existing facilities. Significant competition for connections to newly drilled wells exists in every geographic area served by us. Significantcompetition also exists for the acquisition of existing gathering systems. There can be no assurance that we will renew our existing supply contracts or that we will be able to acquire new supplies of natural gas at a rate necessary to offset depletion of wells currently under contract. In the event such circumstances were to occur, our field netbacks would decrease until, and if, such circumstances could be resolved.
Dependence on Third-Party Pipelines
In Fiscal 2003, substantially all our sales of natural gas were effected through deliveries to local third-party gathering systems to processing plants in Alberta owned by ATCO Midstream Ltd. and Northwestern Utilities Limited. In addition, we rely on access to interprovincial pipelines for the sale and distribution of substantially all of our gas. As a result, a curtailment of our sale of natural gas by pipelines or by third-party gathering systems, an impairment of our ability to transport natural gas on interprovincial pipelines or a material increase in the rates charged to us for the transportation of natural gas by reason of a change in federal or provincial regulations or for any other reason, could have a material adverse effect upon us. In such event, we would have to obtain other transportation arrangements or we would have to construct alternative pipelines. There can be no assurance that we would have economical transportation alternatives or that it would be feasible for us to construct pipelines. In the event such circumstances were to occur, our field netbacks from the affected wells would be suspended until, and if, such circumstances could be resolved.
Operating History
We commenced operations in 1979. We have one major property, that began as a one-well producing property in 1985. By Fiscal 1999, the property became our major producing property with up to twenty-four producing natural gas and oil wells. Although production history from the majority of wells on the property is beyond five years, proved reserves and future production attributable to this property are somewhat more susceptible to estimation discrepancies than fields with longer production histories.
We first experienced earnings in Fiscal 1999 of $1,211,638. In Fiscal 2000 and Fiscal 2001, we reported earnings of $4,078,577 and $9,714,030 respectively and in Fiscal 2002, we had a loss of $3,412,452. In Nine-Month Fiscal Transition 2002, and in Fiscal 2003 we again reported earnings of $2,004,306 and $4,978,302, respectively. As at December 31, 2003, we had an accumulated retained earnings of $2,825,311. Our future viability should be considered in light of the risks and difficulties frequently encountered by companies engaged in the junior stages of oil and gas exploration, development and production activities.
Dependence on Key Personnel
Our success depends in large part on the professional efforts and expertise of our President & Chief Executive Officer, Wayne J. Babcock, our Vice President & Chief Operating Officer, Donald K. Umbach, our Vice President of Production, David G. Grohs and our Chief Financial Officer & Corporate Secretary, Michael A. Bardell. The loss of the services of any of these persons could have a material adverse effect on us.
10
| | |
| | |
| Risks Pertaining to Acquisitions and Joint Ventures |
Part of our business strategy is to expand through acquisitions and is therefore dependent upon our ability to complete suitable acquisitions and effectively integrate acquired assets into our operations. Suitable acquisitions, on terms acceptable to us, may not be available in the future or may require us to assume certain liabilities, including, without limitation, environmental liabilities, known or unknown.
Potential Variability in Quarterly Operating Results
Demand for our products will generally increase during the winter because they are often used as heating fuels. The amount of such increased demand will depend to some extent upon the severity of winter. Accordingly, our net operating revenues are likely to increase during winter months although the amount of increase and its effect on profitability cannot be predicted. Because of the seasonality of our business and continuous fluctuations in the prices of our products, our operating results for any past quarterly period may not necessarily be indicative of results for future periods and there can be no assurance that we will be able to maintain steady levels of profitability on a quarterly or annual basis in the future.
Dependence on One Major Property
During Fiscal 2003, our core property at St. Albert, Alberta, contributed 85% of our total production. While the St. Albert property has developed into 16 separate, mutually-exclusive oil and gas pools stacked in 7 productive formations (4 natural gas and 3 crude oil), each pool has its own reserves and future production risk, and thus it is important for us to establish producing fields in other areas. Unless we can successfully drill for or acquire economically viable reserves of natural gas and crude oil in other areas, as our production depletes the reserves at St. Albert, our revenue may be materially adversely affected.
Limited Financial Resources
We expect the combination of cash flow from operations, our bank credit facility and a recently-announced private placement, to support land acquisitions, drilling operations, facilities construction and general /administration costs in Fiscal 2004. If warranted, we would seek term debt to finance construction of long-life facilities and equity to fuel accelerated, project exploration plans. There can be no assurance that we will be able to raise additional capital in light of factors such as the market demand for our securities, the state of financial markets for independent oil companies (including the markets for debt), oil and gas prices and general market conditions. (See Item 5 - "Operating and Financial Review and Prospects" for a discussion of our capital budget).
We expect to continue using our bank credit facility to supplement our available cash. The amount we may borrow under the credit facility may not exceed a borrowing base determined by the lender based on its projections of our proved reserves, future production, future costs of production, taxes, commodity prices and other factors. We cannot control the assumptions the lender uses to calculate the borrowing base. The lender may, without our consent, adjust the borrowing base at any time. If our borrowings under the credit facility exceed the borrowing base, the lender may require that we repay the excess. If this were to occur, we may have to sell assets or seek financing from other sources. We can make no assurances that we would be successful in selling assets at prices acceptable to us or arranging substitute financing. For a description of our bank credit facility and its principal terms and conditions, see Item 5 - "Operating and Financial Review and Prospects”, and Note 5 to our Financial Statements.
Exploration and Development Risks
Exploration and development of natural gas and oil involves a high degree of risk that no commercial production will be obtained or that the production will be insufficient to recover drilling and completion costs. The costs of drilling, completing and operating wells is sometimes uncertain, and cost overruns in exploration and development operations can adversely affect the economics of a project. Our drilling operations may be curtailed, delayed or canceled as a result of numerous factors, including title problems, equipment failures, weather conditions, marine accidents, fires and explosions, compliance with governmental requirements, and shortages or delays in the delivery of equipment. Furthermore, completion of a well does not ensure a profit on the investment or a recovery of drilling, completion and tie-in costs.
11
We have historically invested a significant portion of our capital budget in drilling exploratory wells in search of unproved oil and gas reserves. We cannot be certain that the exploratory wells we drill will be productive or that we will recover all or any portion of our investments. In order to increase the chances for exploratory success, we often invest in seismic or other geoscience data to assist us in identifying potential drilling objectives. Additionally, the cost of drilling, completing and testing exploratory wells is often uncertain at the time of our initial investment. Depending on complications encountered while drilling, the final cost of the well may significantly exceed that which we originally estimated.
Operating Hazards and Uninsured Risks
The oil and gas business involves a variety of operating risks, including fire, explosion, pipe failure, casing collapse, abnormally pressured formations, adverse weather conditions, governmental and political actions, premature reservoir declines, and environmental hazards such as oil spills, gas leaks and discharges of toxic gases. The occurrence of any of these events with respect to any property operated or owned (in whole or in part) by us could have a material adverse impact on us. We, and the operators of our properties, maintain insurance in accordance with customary industry practices and in amounts that we believe to be reasonable. However, insurance coverage is not always economically feasible and is not obtained to cover all types of operational risks. The occurrence of a significant event that is not fully insured could have a material adverse effect on our financial condition.
As our reserves of natural gas, natural gas liquids and crude oil decline, our success at replacing and adding to them is highly reliant on further exploration and development. To the extent we succeed, our operating cash flows and other capital sources may become insufficient so as to impair our ability to re-invest capital.
Drilling Plans Subject to Change
This Report includes descriptions of our future drilling plans with respect to our prospects. A prospect is a property on which our geoscientists have identified what they believe, based on available seismic and geological information, to be indications of hydrocarbons. Our prospects are in various stages of review. Whether or not we ultimately drill a prospect may depend on the following factors: receipt of additional seismic data or reprocessing of existing data; material changes in oil or gas prices; the costs and availability of drilling equipment; success or failure of wells drilled in similar formations or which would use the same production facilities; availability and cost of capital; changes in the estimates of costs to drill or complete wells; our ability to attract other industry partners to acquire a portion of the working interest to reduce exposure to costs and drilling risks; decisions of our joint working interest owners; and restrictions imposed by governmental agencies. We will continue to gather data about our prospects, and it is possible that additional information may cause us to alter our drilling schedule or determine that a prospect should not be pursued at all.
Replacement of Reserves
In general, the rate of production from natural gas and oil properties declines as reserves are depleted. The rate of decline depends on reservoir characteristics and other factors. Except to the extent we acquire properties containing proved reserves or conduct successful exploration and development activities, or both, our estimated proved reserves will decline as reserves are produced. Our future natural gas and oil production, and therefore cash flow from operations and net earnings, are highly dependent upon our level of success in finding or acquiring additional economically recoverable reserves. The business of exploring for, developing and acquiring reserves is capital intensive. To the extent cash flow from operations is reduced and external sources of capital become limited or unavailable, our ability to make the necessary capital investment to maintain or expand our asset base of natural gas and oil reserves could be materially impaired.
Estimating of Reserves and Future Net Cash Flows Risk
Estimating natural gas, natural gas liquids and crude oil reserves, and future net cash flows includes numerous uncertainties, many of which may be beyond our control. Such estimates are essential in our decision-making, as to whether further investment is warranted. These estimates are derived from several factors and assumptions, some of which are:
| | • | reservoir characteristics based on variable geological, geophysical and engineering assessments; |
| | • | future rates of production based on historical draw-down rates; |
12
| | • | future net cash flows based on commodity price/quality assumptions, production costs, taxes and investment decisions; |
| | • | recoverable reserves based on estimated future net cash flows; and |
| | • | compliance expectations based on assumed federal, provincial and environmental laws and regulations. |
Ultimately, actual production rates, reserves recovered, commodity prices, production costs, government regulations or taxation may differ materially from those assumed in earlier reserve estimates. Higher or lower differences could materially impact our production, revenues, production costs, depletion expense, taxes and capital expenditures.
Reserve estimates and net present values reported by us elsewhere in this Report are based on estimated commodity prices and associated production costs that are assumed constant for the life of the reserves. Actual future prices and costs may be materially higher or lower.
Shortage of Supplies and Equipment
Our ability to conduct operations in a timely and cost effective manner is subject to the availability of natural gas and crude oil field supplies, rigs, equipment and service crews. Although none are expected currently, any shortage of certain types of supplies and equipment could result in delays in our operations as well as in higher operating and capital costs.
Restoration, Safety and Environmental Risk
All our operations are in western Canada and, in particular, the western provinces of Alberta and British Columbia. Certain laws and regulations exist that require companies engaged in petroleum activities to obtain necessary safety and environmental permits to operate. Such legislation may restrict or delay us from conducting operations in certain geographical areas. Further, such laws and regulations may impose liability on us for remedial and clean-up costs, personal injuries related to safety and environmental damages.
To ensure that we provide for future estimated asset retirement obligations, we recognized $0.1 million in our Statement of Operations and Deficit during Fiscal 2003, bringing our total recognized amount in our Fiscal 2003 Balance Sheet to $1.6 million. We engage independent engineering consultants to assist in assessing our total asset retirement obligations related to removal and clean-up costs. While we cannot predict their ultimate cost, we currently estimate the future cost to clean up all our operating facilities to be $3.3 million.
While our safety and environmental activities have been prudent and have enabled us to operate successfully in managing such risks, there can be no assurance that we will always be successful in protecting ourselves from the impact of all such risks. Consistent with our growth in other areas, we seek opportunities for performance improvement in our operating practices.
Government Regulation and Environmental Matters
We are subject to various federal and provincial laws and regulations including environmental laws and regulations. We believe that we are in substantial compliance with such laws and regulations, however, such laws and regulations may change in the future in a manner that will increase the burden and cost of compliance. In addition, we could incur significant liability for damages, cleanup costs and penalties in the event of certain discharges into the environment.
Certain laws and governmental regulations may impose liability on us for personal injuries, clean-up costs, environmental damages and property damages, as well as administrative, civil and criminal penalties. We maintain limited insurance coverage for sudden and accidental environmental damages, but do not maintain insurance coverage for the full potential liability that could be caused by sudden and accidental environmental damage. Accordingly, we may be subject to liability or may be required to cease production from properties in the event of such damages.
The main bodies of regulations that apply to us in the areas in which we have significant field operations are The Oil and Gas Conservation Act of Alberta and The Petroleum and Natural Gas Act of British Columbia.
13
| | |
| | |
| Kyoto Protocol Risk |
The Kyoto Protocol treaty (Protocol) was established in 1997 to reduce emissions of greenhouse gases (GHG) that are believed to be responsible for increasing the Earth’s surface temperatures and affecting the global climate change. Canada ratified the Protocol in December 2002. Since the implementation of the Protocol, approximately 160 countries have committed to reduce GHG internationally. Although, today, the Protocol has not been legally made effective internationally, Canada alone has committed to meet a 6% reduction of emission over base-year 1990 during the period 2008 to 2012. Canadian government assurances of cost and volume limits suggest that incremental risks and liabilities attributable to addressing Protocol related policies are manageable. While we believe we are a low-emission producer, it is not possible to predict the impact of how Protocol-related issues will ultimately be resolved and to what extent their impact will affect our future unit operating costs and capital expenditures.
Interruption From Severe Weather
Presently, our operations are conducted principally in the central region of Alberta and the northeastern region of British Columbia. The weather during colder seasons in these areas can be extreme and can cause interruption or delays in our drilling and construction operations.
Competition
The natural gas and oil industry is highly competitive. We experience competition in all aspects of our business, including acquiring reserves, leases, licenses and concessions, obtaining the equipment and labor needed to conduct operations and market natural gas and oil. Our competitors include multinational energy companies, other independent natural gas and oil concerns and individual producers and operators. Because both natural gas and oil are fungible commodities, the principal form of competition with respect to product sales is price competition. Many competitors have financial and other resources substantially greater than those available to us and, accordingly, may be better positioned to acquire and exploit prospects, hire personnel and market production. In addition, many of our larger competitors may be better able to respond to factors such as changes in worldwide natural gas or oil prices, levels of production, the cost and availability of alternative fuels or the application of government regulations. Such factors, which are beyond our control, may affect demand for our natural gas and oil production. We expect a high degree of competition to continue.
Item 4. Our Information
Our History and Development
Dynamic Oil & Gas, Inc. (formerly Dynamic Oil Limited) was incorporated under the Company Act of the Province of British Columbia, Canada on March 27, 1979.
Our principal executive office is located in rented space at Suite 230-10991 Shellbridge Way, Richmond, British Columbia V6X 3C6. Our telephone number is (800) 663-8072. Our web address iswww.dynamicoil.com.
14
| | |
| | |
| Capital Expenditures Over the Past Three Reporting Periods |
Over the past three reporting periods our capital expenditures aggregated $66.4 million, an amount that is broken down by reporting period and spending classification in the following table:
| | | | Nine- Month | | | | | |
| | | | Fiscal | | | | | |
| | Fiscal | | Transition | | | | Three-Fiscal | |
| ($000’s) | 2003 | | 2002 | | Fiscal 2002 | | Period Total | |
| Land acquisitions | 5,103 | | 2,568 | | 12,560 | | 20,231 | |
| Gross overriding royalty | | | | | | | | |
| interest acquisition(1) | 9,711 | | - | | - | | 9,711 | |
| Drilling, completions and | | | | | | | | |
| equipping: | | | | | | | | |
| Exploratory | 5,717 | | 4,914 | | - | | 10,631 | |
| Development | 9,460 | | 4,232 | | 7,678 | | 21,370 | |
| Facilities and pipelining | 1,448 | | 780 | | 1,757 | | 3,985 | |
| Other | 308 | | 84 | | 116 | | 508 | |
| Total | 31,747 | | 12,578 | | 22,111 | | 66,436 | |
| (1) | On July 7, 2003, we repurchased from three of our officers their gross overriding royalty interests for and aggregate of $6,516,000. The aggregate purchase price was paid by the issuance of 1,050,666 of our common stock and the payment of $1,000,000 in cash. The repurchased overriding royalty interest of $9,711,000 shown above is comprised of the aggregate repurchase price of $6,516,000 paid to the sellers, plus the related future income taxes of $3,195,308 which require recognition in accordance with current accounting rules under Canadian GAAP. (For further details, see Note 7[d] to our Financial Statements under Item 17 to this Report). |
In the table above, the total three-year aggregated amount of $66.4 million is itemized further by reporting period as follows:
Fiscal 2003
During Fiscal 2003, our capital expenditures totaled $31.7 million, an amount that is broken down by spending classification and property in the following table:
| | Land and Gross | | | | | | | | | |
| | Overriding | | Drilling, | | | | | | | |
| | Royalty | | Completions | | Facilities and | | | | | |
| ($ 000’s) | Acquisitions | | and Equipping | | Pipelining | | Other | | Total | |
| Alberta | | | | | | | | | | |
| St. Albert | 49 | | 5,951 | | 882 | | - | | 6,882 | |
| Wimborne | 1,694 | | 626 | | - | | - | | 2,320 | |
| Halkirk | - | | 537 | | 27 | | - | | 564 | |
| Peavey/Morinville | - | | 160 | | 44 | | - | | 204 | |
| Other Alberta | - | | 42 | | 1 | | - | | 43 | |
| Total Alberta | 1,743 | | 7,316 | | 954 | | - | | 10,013 | |
| Cypress/Chowade | 2,779 | | 5,689 | | 494 | | - | | 8,962 | |
| Orion | 581 | | 2,172 | | - | | - | | 2,753 | |
| Total British Columbia | 3,360 | | 7,861 | | 494 | | - | | 11,715 | |
| Gross overriding royalty | | | | | | | | | | |
| acquisition and other assets | 9,711 | | - | | - | | 308 | | 10,019 | |
| Total | 14,814 | | 15,177 | | 1,448 | | 308 | | 31,747 | |
Land and Gross Overriding Royalty Acquisitions
During Fiscal 2003, our investment in land increased by $5.1 million in the following areas: $2.8 million at Cypress/Chowade (9,740 net acres); $1.7 million at Wimborne (5,995 net acres); and $0.6 million at Orion (8,545 net acres).
Also during Fiscal 2003, we invested $6.5 million in the repurchase of certain gross overriding royalty interests (“GORR”) that previously burdened our total current and future corporate production by 3%. The carrying value of the repurchase has been adjusted upward by a non-cash amount of $3.2 million, as required by Canadian GAAP.
15
This non-cash adjustment represents a future tax liability that is created due to the total payment being part shares and part cash. The resulting $9.7 million has been allocated to all properties with proved, producing reserves as of July 7, 2003, the effective date of the repurchase. (For further details of the GORR repurchase, see Note 7[d] to our Financial Statements).
Drilling, Completions, Equipping, Facilities and Pipelining
During Fiscal 2003, expenditures incurred on drilling, completions, equipping, facilities and pipelining totaled $16.6 million. These expenditures were split evenly between Alberta and British Columbia, as follows:
Alberta
St. Albert - A total of six wells were drilled, four targeting crude oil and two targeting natural gas. All wells were successful and each was completed in a single zone. Crude oil completions were in the Nisku D-2 and the Leduc D-3 formations, while natural gas completions were in the Ostracod zone. Upgrades to field compression, salt water injection facilities and our crude oil tank farm were also conducted.
Wimborne – During the year, we drilled our first-ever tests for natural gas at Wimborne. We drilled two Cretaceous Age wells, one of which was successful and completed as a standing gas well.
Halkirk – Two development wells targeting natural gas in the Viking formation were drilled during the year. One was successful and completed as a producing well.
British Columbia
Cypress/Chowade –During the year, we participated in drilling three natural gas exploration wells, targeting Triassic Age reservoirs. All three wells were cased and tied-in. A field compressor was also added.
Nine-Month Fiscal Transition 2002
During this period, we invested an aggregate of$12.6 million, $6.2 million or 49% of which was spent on Alberta properties and $6.4 million or 51% on British Columbia properties. Of the amount invested in Alberta, $5.0 million was for land, drilling, completions, equipping and facilities at St. Albert and the balance of $1.2 million was for drilling, completions and equipping at Halkirk. Of the amount invested in British Columbia, $5.0 million was for drilling, completions and equipping at Cypress/Chowade and the balance of $1.4 million was for land acquisitions at Orion.
Fiscal 2002
During this period, we invested an aggregate of $22.1 million, $7.3 million of which was spent at St. Albert for drilling, completions and equipping. The balance of $14.8 million was spent mostly to acquire additional working interests at St. Albert.
Exploration Expenses Over the Past Three Reporting Periods
Over the past three fiscal reporting periods our exploration expenses aggregated $10.2 million, an amount that is broken down by fiscal reporting period and spending classification in the following table:
| | | | | Nine- Month | | | | | |
| | | | | Fiscal | | | | | |
| ($000’s) | | | | Transition | | | | Three-Fiscal | |
| | | Fiscal 2003 | | 2002 | | Fiscal 2002 | | Period Total | |
| Drilling(1) | | 1,278 | | 325 | | 3,821 | | 5,424 | |
| Seismic data activity | | 2,349 | | 934 | | 649 | | 3,932 | |
| Other | | 439 | | 187 | | 176 | | 802 | |
| Total exploration expenses | | 4,066 | | 1,446 | | 4,646 | | 10,158 | |
| (1) | We follow the successful efforts method of accounting, whereby costs of drilling an unsuccessful well are expensed when it becomes known the well did not result in a discovery of proved reserves. |
16
| | |
| | |
| Fiscal 2004 – Budgeted Capital Expenditures and Exploration Expenses |
During Fiscal 2004, our budgeted capital expenditures and exploration expenses total $37.1 million, an amount that is broken down by spending classification and property in the following table:
| | | | Drilling, | | | | Seismic | | | |
| | Land | | Completions | | Facilities and | | and | | | |
| ($ 000’s) | Acquisitions | | and Equipping | | Pipelining | | Other | | Total | |
| Alberta | | | | | | | | | | |
| St. Albert | - | | 5,587 | | 1,256 | | - | | 6,843 | |
| Wimborne | - | | 842 | | 49 | | - | | 891 | |
| Halkirk | - | | - | | 100 | | - | | 100 | |
| Peavey/Morinville | - | | - | | - | | 256 | | 256 | |
| Alexander | - | | - | | 350 | | - | | 350 | |
| Other | 937 | | - | | - | | - | | 937 | |
| Total Alberta | 937 | | 6,429 | | 1,755 | | 256 | | 9,377 | |
| British Columbia | | | | | | | | | | |
| Cypress/Chowade | 3,015 | | 9,169 | | 8,902 | | 550 | | 21,636 | |
| Orion | - | | 2.988 | | 300 | | 1,200 | | 4,488 | |
| Total British Columbia | 3,015 | | 12,157 | | 9,202 | | 1,750 | | 26,124 | |
| Contingency | - | | - | | - | | 1,550 | | 1,550 | |
| Total | 3,952 | | 18,586 | | 10,957 | | 3,556 | | 37,051 | |
Our Fiscal 2004 capital budget focuses on three primary objectives:
| | • | To continue to optimize production and cash flow at our St. Albert property. As our primary producing asset, St. Albert contributed 85% of our total production in Fiscal 2003; |
| | • | To generate reserve and production growth in 2004 through the development of drilling opportunities, pipelining and facility projects; and |
| | • | To establish new core areas for future growth through our exploration efforts at Cypress/Chowade, Orion and Wimborne. |
In total, our budget for Fiscal 2004, is allocated 25% to Alberta, 71% to British Columbia and 4% to properties yet to be allocated between the two provinces.
Our 2004 capital and exploration expense program is based on our targeted daily average production rates (see Item 5 – “Outlook for Fiscal 2004”), and estimated weighted average prices for natural gas ranging from $5.84 to $6.95 per mcf and for crude oil from $36.44 to $43.09 per barrel (see Item 5 – “Liquidity and Capital Resources – Sources and Uses of Cash”). While we do not currently anticipate any difficulties in meeting the majority of our obligations with cash flows from operations, our bank credit facility and our recently-announced private placement, our board of directors may choose to modify our spending plans in order to fine-tune our cash flow timing differences or seek further equity financing for projects of high impact potential.
Recent Material Events
On April 30, 2004, we entered into a bought-deal private placement with both Octagon Capital Corporation as lead underwriter and Raymond James Ltd. Pursuant to the terms of the agreement, we have agreed to issue, by way of private placement, 2,000,000 flow-through common shares at $5.60 each on a firm underwriting basis. As well, at the option of the underwriters, exercised at least one business day before closing, we have agreed to issue 400,000 non-flow through common shares at $4.55 each. If the underwriters exercise their option, the total gross proceeds of the offering will be $13,020,000.
Under the Income Tax Act (Canada), the concept of flow-through shares is that an investor subscribes for shares of a corporation and the corporation uses the subscription funds to incur expenses which it renounces to the investor. By virtue of such renunciation, the expenses incurred by the corporation are treated as resource expenses of the investor for purposes of the Income Tax Act (Canada). Such flow-through shares can be sold only to Canadian residents.
17
The net proceeds of the share offering will be used to accelerate our continued exploration and development of our core natural gas properties at Cypress/Chowade and Orion in northeast British Columbia. Proceeds from the flow-through shares will be used to incur qualifying Canadian Exploration Expense (“CEE”) as defined in the Income Tax Act (Canada) and we will renounce, for the 2004 taxation year, such CEE in favour of the original holders of the flow-through shares in an amount equal to the issue price for each flow-through share. Closing is subject to normal closing conditions including obtaining required regulatory approvals and is scheduled to occur on or about May 19, 2004.
None of the shares will be offered to U.S. residents and will not be and have not been registered under the United States Securities Act of 1933 and may not be re-offered or sold in the United States absent registration or an applicable exemption from the registration requirement.
Share Repurchases
During the last three reporting periods, we spent an aggregate $0.6 million on the repurchase of outstanding common shares, $0.3 million in each of Nine-Month Fiscal Transition 2002 and Fiscal 2002. We did not repurchase any shares in Fiscal 2003. The number of common shares repurchased was over 0.4 million at prices ranging from $1.62 to $1.72 per share.
Business Overview
General
Our principal business is acquiring, exploring and developing natural gas and crude oil properties. Our natural gas and crude oil properties are located in the Canadian provinces of Alberta, British Columbia and Saskatchewan. Over each of the past three years, we have explored for, produced and marketed natural gas, natural gas liquids and crude oil. We intend to continue this type of business activity.
The oil and gas industry deals in two basic forms of ownership interests namely Working Interests and Overriding Royalties:
| | (i) | Working Interest (WI): means the percentage of undivided interest held by a Joint Operator (i.e. leaseholder) in a specific tract of land (i.e. joint lands). The Working Interests held by all Joint Operators in any specific tract of joint lands must total 100%. Each W.I. party is responsible for its WI percentage share of costs incurred to conduct "work" (i.e. drilling, seismic, production etc.) on the joint lands. Working Interests are always considered to be an active interest in the costs, risks and benefits associated with the joint lands and operations conducted thereon and the oil or gas produced there from. |
| | | |
| | (ii) | Overriding Royalties (ORR): Overriding Royalties are a specified share of oil and/or gas as and when produced. ORR's are free and clear of costs, risk and expense to the holder of the ORR. Usually ORR's are based on gross production and as such are referred to as "Gross" Overriding Royalties or GORR's. ORR's are considered a passive interest in as much as the holder of an ORR is not subject to any cost, risk or expense nor is the ORR holder involved in any decision-making with respect to the royalty lands. |
The majority of our interests are Working Interests and our Overriding Royalty interests would typically be immaterial.
Concentration of Commodities
We derive our revenue principally from the sale of natural gas, natural gas liquids and crude oil. As a result, our revenues are determined, to a large degree, by prevailing spot prices for natural gas, natural gas liquids and crude oil. The market prices for our commodities are dictated by supply and demand. Accordingly, our cash flow from operations and net earnings are greatly affected by changes in prices for natural gas, natural gas liquids and crude oil. We will experience reduced cash flows and may experience operating losses when prices for natural gas, natural gas liquids and crude oil are low (see Item 5 – “Operating and Financial Review Prospects” and Item 11 - “Quantitative and Qualitative Disclosures About Market Risk”).
18
Under extreme circumstances, our commodity sales may not generate sufficient revenue to meet our financial obligations and to fund planned capital expenditures. Moreover, significant price decreases could negatively affect our reserves by reducing the quantities of reserves that are recoverable on an economic basis, necessitating write-downs to reflect the realizable value of the reserves in the lower-price environment.
We are unable to control the market prices for natural gas, natural gas liquids and crude oil. Such market prices depend on numerous factors that include:
| | • | the extent of domestic production and exportation of natural gas, natural gas liquids and crude oil; |
| | • | the proximity of pipelines or other economically-feasible transportation; |
| | • | the availability of pipeline capacity; |
| | • | the demand for natural gas, natural gas liquids and crude oil by utilities and other end users; |
| | • | the availability of alternative fuel sources; |
| | • | the effects of weather variability; and |
| | • | the effects of regulations on transporting, marketing and exporting natural gas, natural gas liquids and crude oil within Canada. |
Because of these and other factors, we may be unable to market all of the natural gas, natural gas liquids and crude oil that we have available for sale. Additionally, we may be unable to obtain favorable prices for the natural gas, natural gas liquids and crude oil that we produce.
Concentration of Operations
Our main producing property is located at St. Albert, Alberta. Of our total production in Fiscal 2003, 85% came from the St. Albert property. The remainder originated mainly from seven other fields: Halkirk, Cypress/Chowade, Peavey/Morinville, Alexander, Simonette, Stanmore and Westlock. In Nine-Month Fiscal Transition 2002, 85% of our production came from the St. Albert field, while the remainder came from six other fields: Halkirk, Peavey/Morinville, Alexander, Westlock, Simonette and Stanmore. In Fiscal 2002, 84% of our production came from the St. Albert field, while the remainder originated from five other fields: Peavey/Morinville, Halkirk, Westlock, Simonette, and Stanmore.
Revenue Breakdown
Our total revenue for the past three reporting periods was $85.0 million. Of this total, 78% came from the sales of natural gas, 17% came from the sales of natural gas liquids and 5% came from the sales of crude oil. Additionally, virtually all of such revenue originated from our properties and interests in the Province of Alberta. The breakdown for each of the past three reporting periods is shown in the table below:
The following table shows our natural gas, natural gas liquids and crude oil revenue for the periods presented:
Natural Gas, Natural Gas Liquids and Crude Oil Revenue
| | | | Nine Month Fiscal | | | |
| ($ 000’s) | Fiscal 2003 | | Transition 2002 | | Fiscal 2002 | |
| Natural gas | 30,649 | | 17,058 | | 20,944 | |
| Natural gas liquids | 6,646 | | 4,012 | | 4,442 | |
| Crude oil | 9,553 | | 3,053 | | 1,016 | |
| Total | 46,848 | | 24,123 | | 26,402 | |
Seasonality and Raw Materials
The seasonality of our main revenue-generating commodity, natural gas, is affected solely by the North American climate. Typically, there are two ‘peak’ seasons and two corresponding ‘shoulder’ seasons for natural gas sales. Winter is generally the higher-demand period due to cold-weather heating requirements. The summer is the next highest period of demand due to hot-weather air conditioning requirements.
19
Natural gas is becoming increasingly important as an energy source to power natural gas-fired electric power generating facilities (co-gen facilities). We believe that as more co-gen facilities are approved, constructed and put into operation, the demand for natural gas during shoulder seasons will remain relatively strong.
We do not rely on the availability of raw materials, because we operate in an extractive industry.
Marketing
Natural gas -Our natural gas portfolio is split between two primary markets, one is the Alberta Spot Market that trades at the AECO storage hub (www.encanastorage.com), the other is an aggregator pool called ProGas (www.progas.com).
AECO, an intra-Alberta trading hub, offers producers the opportunity to participate in natural gas transactions for terms of one day, one month, summer and winter blocks, and annually. We are currently selling our uncommitted natural gas volumes into the AECO daily spot market, however, our marketing strategy includes securing monthly and term deals, if optimal.
ProGas, a wholly-owned subsidiary of BP Canada, ‘aggregates’ supplies of natural gas to sell into a basket of daily, short term (less than one year) and long-term contracts, both domestic and export. Producers realize a netback price for their natural gas, which is a blend of all contract types weighted toward NYMEX-based prices.
During Fiscal 2003, we sold 46% of our natural gas to ProGas and 54% into the AECO daily spot market. During Nine-Month Fiscal Transition 2002 and Fiscal 2002, we sold 51% and 53% to ProGas, respectively, and the balances to AECO.
Natural gas liquids and crude oil -We market our natural gas liquids and crude oil based on monthly prices posted by the major purchasers at Edmonton, Alberta. These prices correlate closely to the price of the West Texas Intermediate, allowing for quality adjustments and location differentials.
Supply Contracts or Agreements
Under various supply contracts and agreements, the commitment period under which we are required to supply natural gas and natural gas liquids, ranges from terminable within thirty days notice to no termination prior to exhaustion of hydrocarbon reserves. Under these various contracts and agreements, we are not obligated to provide a fixed quantity of supply, as all supply is on a best-efforts basis.
Competition
Presently, we regularly compete with other companies in bidding for the acquisition of petroleum interests from the Alberta and British Columbia governments and other corporations or individuals holding such interests. Further, we regularly compete for the availability of drilling rigs, production equipment, processing facilities, pipeline capacity and other transportation services. We do not have a competitive position that allows us any material or significant advantages compared to other companies within the same industry. Many competitors have substantially greater financial and other resources than we do. For example, in the 2003 Canadian Energy Survey of 2002 Results prepared by PriceWaterhouseCoopers, we ranked thirty-third and thirty-ninth in size out of one hundred Canadian exploration and production companies according to gross revenues and cash flow from operations, respectively.
Governmental Regulations
Government regulations have a material effect on us to the extent that they require us to conduct field operations and hydrocarbon extraction activities within prescribed environmentally-safe, sensitive regulations. Also, government regulations may restrict the commencement or re-commencement of field activities in certain properties in which we hold an interest for the purpose of exploration. Examples of types of governmental laws and regulations that may have a material effect on our business include:
| | • | requirements to acquire permits before commencing drilling operations; |
| | • | requirements to restrict the substances that can be released into the environment in connection with drilling and production activities; |
| | • | limitations on, or prohibitions to, drilling in protected areas such as offshore areas; and |
| | • | requirements to mitigate and remediate the effects caused by drilling and production operations. |
20
| | |
| | |
| Properties, Plant and Equipment |
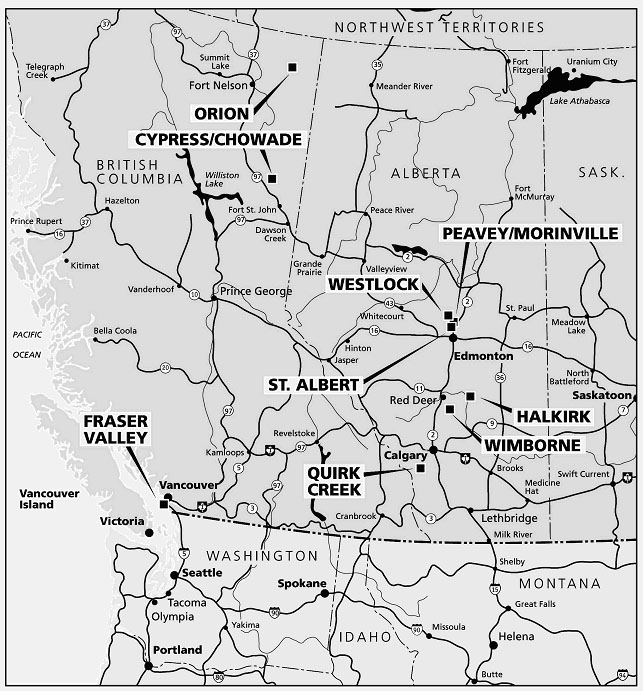
We own interests in certain properties located in the Western Provinces of Canada. For purposes of identification, discussion and differentiation, we have named them based on their location. They are as follows:
| Central Alberta | British Columbia | Southern Saskatchewan |
| St. Albert | Stanmore | Cypress/Chowade (northeastern B.C.) | Elmore |
| Halkirk | Westlock | Orion (northeastern B.C.) | Rapdan |
| Peavey/Morinville | Wimborne | Fraser Valley (southwestern B.C.) | |
| Alexander | Quirk Creek | | |
| Simonette | | | |
Our total land holdings increased during Fiscal 2003 by 11,177 net acres (29,283 gross) or 10%. This increase was mainly spread between two key properties, Wimborne, Alberta and Cypress/Chowade, British Columbia. Some of the net increase was offset with minor land reductions at St. Albert, Halkirk and Peavey/Morinville, Alberta. We had significant land reductions at Quirk Creek, Alberta of 2,400 net acres (4,800 gross). Of our total land holdings, 100,256 net acres (189,290 gross) or 82% was undeveloped.
Land Holdings (acres)As at December 31, 2003
| | Developed | | Undeveloped | | Total | | Weighted | |
| Area | Gross | | Net | | Gross | | Net | | Gross | | Net | | Avg WI % | |
| Alberta | | | | | | | | | | | | | | |
| St. Albert | 9,308 | | 6,060 | | 4,442 | | 3,150 | | 13,750 | | 9,210 | | 67% | |
| Halkirk | 3,840 | | 3,456 | | 2,880 | | 2,880 | | 6,720 | | 6,336 | | 94% | |
| Peavey/Morinville | 6,787 | | 4,921 | | 4,766 | | 2,954 | | 11,553 | | 7,875 | | 68% | |
| Quirk Creek | - | | - | | 6,560 | | 3,280 | | 6,560 | | 3,280 | | 50% | |
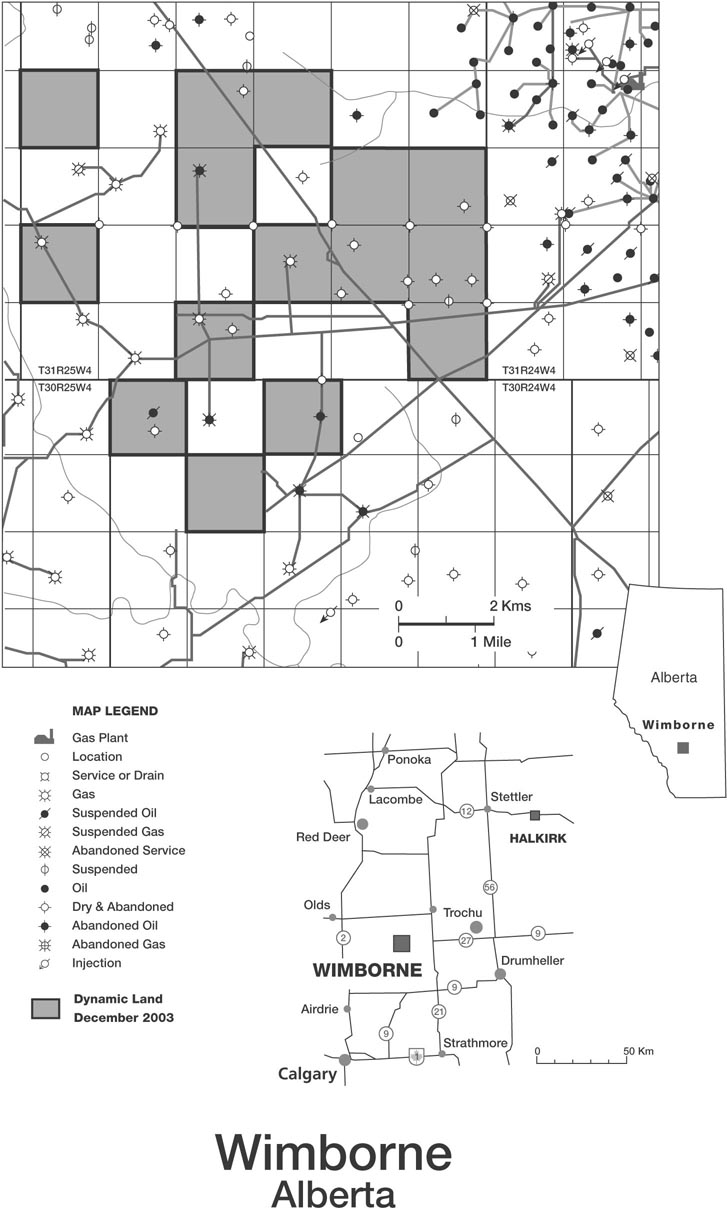
| Wimborne | 640 | | 640 | | 9,035 | | 8,555 | | 9,675 | | 9,195 | | 95% | |
| Other(1) | 3,527 | | 2,689 | | 3,340 | | 3,072 | | 6,867 | | 5,761 | | 84% | |
| | 24,102 | | 17,766 | | 31,023 | | 23,891 | | 55,125 | | 41,657 | | 76% | |
| British Columbia | | | | | | | | | | | | | | |
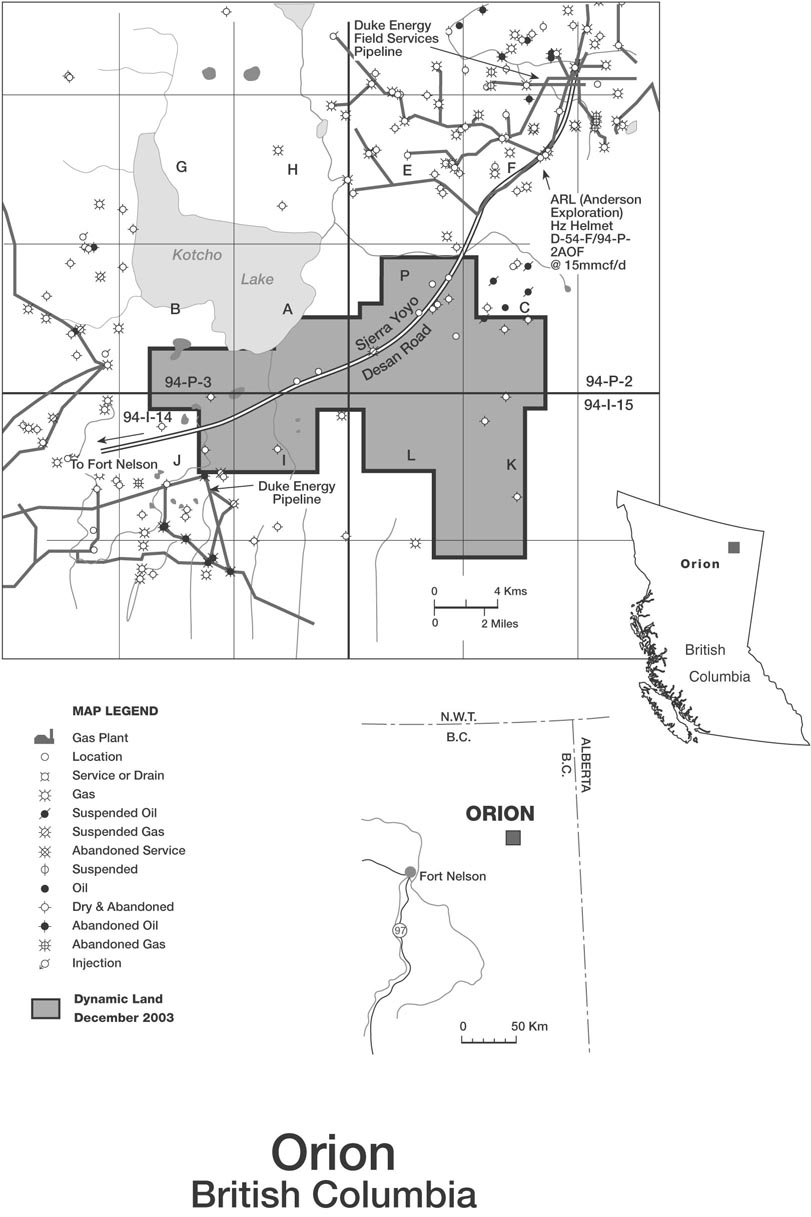
| Cypress/Chowade | 5,976 | | 2,564 | | 39,154 | | 12,953 | | 45,130 | | 15,517 | | 34% | |
| Orion | 2,003 | | 1,335 | | 64,611 | | 45,134 | | 66,614 | | 46,469 | | 70% | |
| Fraser Valley | - | | - | | 54,502 | | 18,278 | | 54,502 | | 18,278 | | 34% | |
| | 7,979 | | 3,899 | | 158,267 | | 76,365 | | 166,246 | | 80,264 | | 48% | |
| Total to Dec 31, 2003 | 32,081 | | 21,665 | | 189,290 | | 100,256 | | 221,371 | | 121,921 | | 55% | |
| Total to Dec 31 2002 | 30,170 | | 20,248 | | 161,918 | | 90,496 | | 192,088 | | 110,744 | | 58% | |
| Increase (decrease) | 1,911 | | 1,417 | | 27,372 | | 9,760 | | 29,283 | | 11,177 | | | |
| Increase (decrease) % | 6% | | 7% | | 17% | | 11% | | 15% | | 10% | | | |
| (1) | Includes our Saskatchewan interests, which are too immaterial to warrant separate disclosure. |
Our weighted average working interest of all our Alberta properties was 76% versus 48% in British Columbia. In total, our weighted average working interests decreased by 3% to 55%, mainly due to a proportionately larger increase in undeveloped acreage at Cypress/Chowade having a weighted average working interest of 34%.
Alberta Properties
St.Albert
St. Albert is located in central Alberta, northwest of the City of Edmonton and near the City of St. Albert.
Geological Description
The property is comprised of two Devonian Age reef structures, which are associated with 16, separate Cretaceous Age natural gas and Devonian Age crude oil pools stacked in seven productive formations, four are natural gas and three crude oil. For purposes of project identification, we refer to these structures as the “north pool” and the “south pool”. Historically, the property has produced in excess of 22.5 million barrels of crude oil and 109 billion cubic feet of raw natural gas from both pools. They continue to remain prospective for recoverable oil from six established Devonian Age pools in the Leduc D-3, Nisku D-2 and Wabamun D-1 formations.
21
| | |
| | |
| Land Holdings |
We own 9,210 net acres (13,750 gross) of various crown and freehold petroleum and natural gas leases for a weighted average working interest of 67%. Of our net acreage, 34% is undeveloped.
Seismic
We own a 37.5% working interest in a proprietary 3D seismic database covering 12 square kilometers.
Wells and Facilities
We own a 75% working interest in 17 producing gas wells; from a 44% to 77% working interest in another four; and a 75% working interest in seven producing oil wells. In addition, we own a 75% working interest in one oil battery, one solution gas plant, one sour gas compressor, two sweet gas compressors and a 13 kilometer, 6” sour gas pipeline.
Fiscal 2003 Activities
In the south pool, we drilled three wells targeting remaining Devonian Age oil reserves. Two of these wells encountered oil pay in the Leduc D-3 formation and one well, while unsuccessful in the Leduc D-3 formation, was later completed as a Nisku D-2 formation oil well. In the north pool, we drilled one well also targeting remaining Devonian Age oil reserves. While the well was unsuccessful in the Leduc D-3 formation, it was later completed as a Nisku D-2 formation oil well.
We drilled two successful wells targeting remaining natural gas in the Ostracod zone. We were able to minimize surface and environmental impacts by re-entering existing well bores in all of our drilling activity. We addressed declining reservoir pressures in various sweet gas pools by adding third-party owned compression at the nearby Villeneuve and Carbondale gas plants.
Fiscal 2004 Outlook
Our budget for Fiscal 2004 focuses on continued optimization of the field. All projects are geared toward recovery of remaining crude oil and natural gas reserves from known pools. Our development drilling, re-completions and work-overs will specifically target the Leduc D-3, and Nisku D-2 oil formations, and the Ostracod zone and Belly River formations.
Our investment at St. Albert includes numerous wells and facilities. For this reason, we communicate with the public in the area and work closely with government regulators.
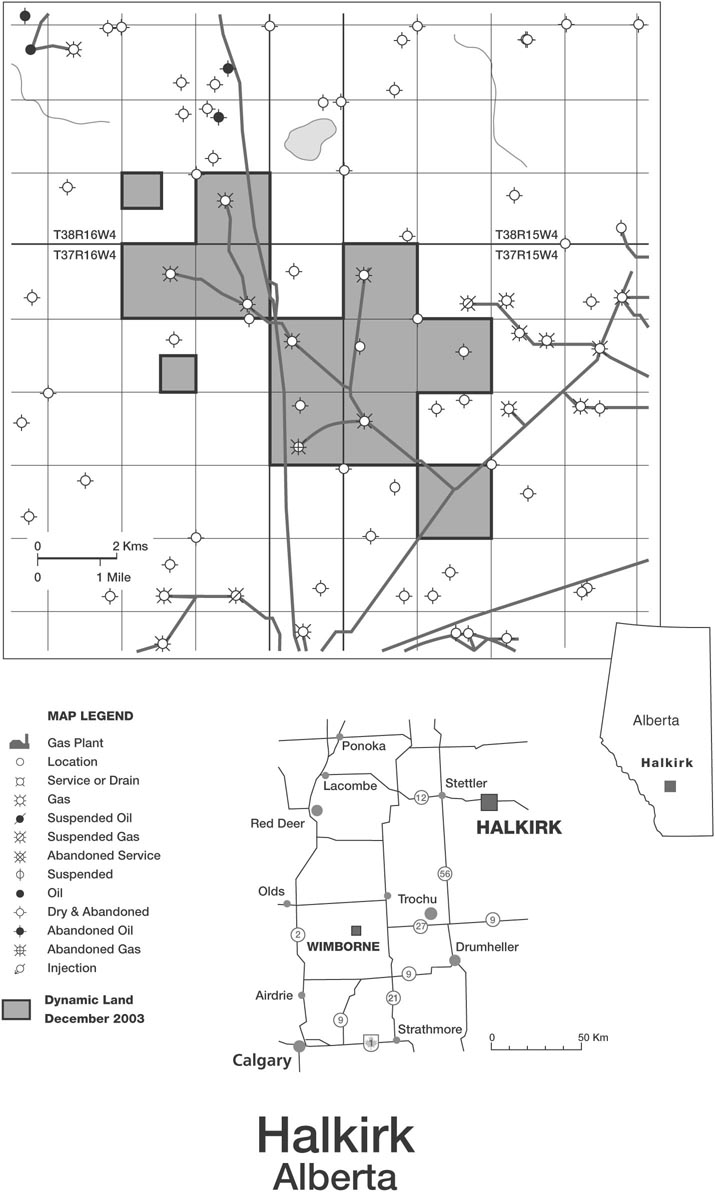
Halkirk
Halkirk is located in central Alberta approximately 168 kilometers northeast of Calgary.
Geological Description
This area is prospective for multiple, sweet natural gas-bearing Cretaceous Age sandstone reservoirs. The primary target for reserves is the Viking formation with an average net pay thickness of approximately five meters.
Land Holdings
We own 6,336 net acres (6,720 gross) of crown and freehold petroleum and natural gas leases for a weighted average working interest of 94%. Of our net acreage, 45% is undeveloped.
Wells and Facilities
We own a 100% working interest in five producing and two standing natural gas wells. We also own an 80% working interest before payout (of our initial capital expenditures) and a 48% working interest after payout in three producing gas wells. All of our natural gas production is processed at the Maple Glen Gas Plant under a third-party custom processing agreement.
Fiscal 2003 Activities
We drilled one successful infill Viking formation gas well and one unsuccessful step-out well. A “step-out” well is a well drilled near a proven well, but located in an unproven area to determine the boundaries of the producing formation. We acquired 320 net acres (100%) of new petroleum and natural gas rights.
22
| | |
| | |
| Fiscal 2004 Outlook |
Our reserves at Halkirk are based on a 160-acre drainage area. We have identified opportunities to down-space production in the future by drilling additional infill wells to increase reserve allocations and production. An “infill well” is drilled between established producing wells to increase production. No new wells are budgeted for Fiscal 2004.
Wimborne
Wimborne is located in south-central Alberta approximately 112 kilometers northeast of Calgary.
Geological Description
The area is prospective for multiple Cretaceous Age sandstone reservoirs containing natural gas and natural gas liquids. Additional potential exists for crude oil and natural gas within deeper Mississippian and Devonian Age carbonate reservoirs.
Land Holdings
We own 9,195 net acres (9,675 gross) of petroleum and natural gas rights for a weighted average working interest of 95%. Of our total net holdings, 93% is undeveloped.
Seismic
We own a licensed copy of a high quality, 3D seismic database covering 260 square kilometers.
Wells and Facilities
We own a 100% working interest in one standing gas well. The property is in close proximity to existing natural gas pipelines and processing facilities.
Fiscal 2003 Activities
We drilled one successful gas well and one unsuccessful well. We acquired a 100% working interest in approximately ten new sections (6,475 acres) of crown petroleum and natural gas leases.
Fiscal 2004 Outlook
Our large 3D seismic database is expected to enhance our long-term exploration and development strategy for the area. Through it, we have identified up to six exploration targets on our lands, three of which are planned for drilling this year.
British Columbia Properties
Cypress/Chowade
Cypress/Chowade is located in the foothills of northern British Columbia approximately 100 kilometers northwest of Fort St. John.
Geological Description
The area is prospective for multiple, natural gas-bearing Triassic Age sandstone and carbonate reservoirs and deep Mississippian Age carbonate reservoirs contained within classic foothill anticlines that trend northwest-southeast through the area.
Land Holdings
We have crown petroleum and natural gas leases over 15,517 net acres (45,130 gross) for a weighted average working interest of 34%. Of our total net acreage, 83% is undeveloped.
Seismic
We own a licensed copy of a large 2D seismic database and a 100% working interest in 15 kilometers of 2D proprietary seismic data.
Wells and Facilities
We own between 30% - 50% working interests in two producing gas wells and six standing shut-in gas wells, which are currently producing. In five of these eight wells, our interest converts from 50% working interest to 30% working interest at payout. All of our fiscal 2003 gas production was processed at Cypress Gas Plant under a third-party custom processing agreement. A major expansion of pipeline and processing facilities is required to develop this area.
23
| | |
| | |
| Fiscal 2003 Activities |
We participated in drilling two successful exploration wells targeting multi-zone natural-gas bearing reservoirs of Triassic Age. We also participated in one exploration well to test and evaluate the Mississippian Age Debolt formation. While the well was unsuccessful in the Debolt formation, it was cased as a potential gas well in two Triassic-Age formations. We acquired 9,356 net acres (28,350 gross), equipped four wells for tie-in and added a field compressor.
Fiscal 2004 Outlook
We plan to drill three exploratory outpost wells and three development wells. We have budgeted to cover our half of the cost to construct a 30 mmcf/d sour gas plant, acid gas injection facilities and a 32 kilometer, 8” diameter sales pipeline to Sikanni, British Columbia. The initial leg of the proposed 8” diameter sales pipeline was scheduled for construction in the first quarter. We plan to have three of our six standing shut-in gas wells on stream in the first quarter and the remaining three wells on stream later in the year. We have seismically identified more than 30 potential exploration and development locations on company-owned lands. We plan to continue an aggressive land acquisition strategy.
Orion
Orion is strategically located between the Sierra and Helmet natural gas fields approximately 56 kilometers west of the Alberta border and 112 kilometers south of the Northwest Territories border. The property is dissected by the Sierra Yoyo Desan Road, which provides year-round access for drilling operations.
A large independent Canadian oil and gas company has referred to the regional Devonian Age Jean Marie carbonate reservoir in this area as “The Greater Sierra Gas Play” and has described the area as the largest gas play discovered in Western Canada. Orion is a part of this area and is a key element in our long-term growth strategy.
Geological Description
The area is prospective for natural gas exploration and development in Cretaceous Age Bluesky sandstone reservoirs and Mississippian and Devonian Age Debolt, Jean Marie and Slave Point formation carbonate reservoirs.
Land Holdings
We hold under lease 46,469 net acres (66,614 gross) for a weighted average working interest of 70%. Approximately 97% of our net holdings are undeveloped.
Wells and Facilities
The property presently has three potential gas wells; one Bluesky formation and two Devonian Age Jean Marie formation horizontal wells. All three wells are standing awaiting further evaluation. We own a 100% working interest in the Bluesky formation and one Devonian Age Jean Marie formation well, a 15% gross overriding royalty (before payout) and a 50% working interest (after payout) in the other Devonian Age Jean Marie formation well.
Two major pipeline systems terminate at the edge of our property. To the southwest, the Duke Energy Pipeline System connects to Fort Nelson for delivery to Washington State and to the northeast, the Duke Energy Field Services Pipeline System connects to Tooga Compressor Station for delivery to Alberta.
Fiscal 2003 Activities
We drilled one horizontal well at 100% working interest to test the Devonian Age Jean Marie formation. The well tested gas at rates below commercial quantities and is being retained as a potential gas well pending further evaluation.
Fiscal 2004 Outlook
We plan to drill two 100% working interest exploration wells; one to test the Devonian Age Slave Point formation and one to test the Cretaceous Age Bluesky formation. We plan to shoot 90 square kilometers of proprietary 3D seismic data.
24
| | |
| | |
| Fraser Valley |
The property is located in the Lower Mainland area of southwest British Columbia near Vancouver.
Land Holdings
Under a joint venture agreement with Conoco Canada Limited, we continue to hold a weighted average working interest of 34% in approximately 18,278 net acres (54,502 gross) of undeveloped onshore and offshore petroleum and natural gas rights associated with Permit 802, a validated British Columbia Exploration Permit. Permit 802 is under provincial jurisdiction and includes offshore petroleum and natural gas rights in the Georgia Basin, located in the Strait of Georgia between the Lower Mainland and Vancouver Island.
Fiscal 2003 Activities
We were inactive in the Fraser Valley area during Fiscal 2003.
Fiscal 2004 Outlook
Presently, areas offshore are subject to a restricted-access moratorium for petroleum and natural gas activities, however, discussions are underway between the Provincial and Federal Governments in regards to lifting the moratorium. The Provincial Government has indicated its desire to move forward and the Federal Government is currently conducting a public review to identify environmental and social concerns arising from offshore activities along the Pacific West Coast. A final decision is expected in 2004. We have identified through analysis of our proprietary onshore 2D seismic data, a large structural feature approximately 19 square kilometersin size extending offshore. Government-owned gravity data supports our interpretations and refers to the feature as the Robert’s Bank Gravity Anomaly. The Geological Survey of Canada has assigned the Georgia Basin a reserve estimate of 6.5 trillion cubic feet of natural gas. A commercial quantity of gas is yet to be discovered in the area. We plan to be inactive in the Fraser Valley in 2004.
Other Non-Core Properties
Peavey/Morinville, Quirk Creek, Alexander, Simonette, Stanmore, and Westlock in Alberta and Elmore and Rapdan in Saskatchewan comprise 16,916 net acres (24,980 gross) with a weighted average working interest of 68%. Of our total net acreage, 53% is undeveloped.
Estimated Reserves of Crude Oil, Natural Gas and Natural Gas Liquids
As a Canadian issuer, we are required under Canadian law to comply with National Instrument 51-101 “Standards of Disclosure for Oil and Gas Activities”(NI 51-101) issued by the Canadian Securities Administrators, in all of our reserves related disclosures. Canadian NI 51-101 was effective September 30, 2003 and applies to financial years ended on or after December 31, 2003. Canadian NI 51-101 mandates significant changes in the way reporting issuers are required to determine and publicly disclose information relating to oil and gas reserves.
Under NI 51-101, proved reservesis an estimate, the premise of which means there must be at least a ninety percent probability that actual quantities of crude oil and natural gas proved reserves recovered will equal or exceed the estimated proved reserves.
The purpose of Canadian NI 51-101 is to enhance the quality, consistency, timeliness and comparability of crude oil and natural gas activities by reporting issuers and elevate reserves reporting to a higher level of confidence and accountability.
However, in the United States, registrants, including foreign private issuers like us, are required to disclose proved reserves using the standards contained in the United States Securities and Exchange Commission (“SEC”) Regulation S-X. Under certain circumstances, applicable U.S. law permits us to comply with our own country’s law if the requirements vary. We believe that the standards for determining proved reserves under NI 51-101 meet or exceed those set forth under U.S. law and thus we have presented our proved reserves under NI 51-101 only.
In the process of estimating our proved reserves on a constant-pricing basis, and their associated net present values, our actual December 31, 2003 weighted average commodity prices received and our associated operating costs incurred have been assumed to remain constant over the life of the reserves. The prices used for natural gas, natural gas liquids and crude oil were $6.18 per mcf, $25.38 per barrel and $39.69 per barrel, respectively.
25
The crude oil and natural gas industry commonly applies a conversion factor to production and estimated proved reserve volumes of natural gas in order to determine an “all commodity equivalency” referred to as barrels of oil equivalent (“boe”). The conversion factor we have applied in this Annual Report on Form 20-F is the current convention used by many oil and gas companies, where six thousand cubic feet (“mcf”) is equal to one barrel (“bbl”). A boe is based on an energy equivalency conversion method primarily applicable at the burner tip. It may not represent equivalency at the wellhead and may be misleading if used in isolation.
The reserve data set out in the summary table below is based on an independent engineering evaluation of our estimated proved oil and gas reserves effective January 1, 2004, as conducted by Sproule Associates Limited (“Sproule”). This evaluation was prepared in accordance with the definitions under NI 51-101.
Summary of Company Interest Estimated Reserves (After Royalties)| | Light and | | | | | | Natural Gas | | | |
| | Medium Oil | | Heavy Oil | | Natural Gas(1) | | Liquids | | Total(1) | |
| | (mbbl) | | (mbbl) | | (mmcf) | | (mbbl) | | (mboe) | |
| Proved | | | | | | | | | | |
| Developed producing | 214 | | 4 | | 14,963 | | 792 | | 3,504 | |
| Developed non-producing | 55 | | - | | 1,832 | | 4 | | 364 | |
| Undeveloped | 138 | | - | | 2,758 | | 17 | | 615 | |
| Total proved | 407 | | 4 | | 19,553 | | 813 | | 4,483 | |
| (1) | Estimates of reserves of natural gas includes solution gas. |
Estimated Reserves Reconciliation
The following reconciliation shows the changes in our estimated reserves before royalties that occurred during Fiscal 2003. Opening reserves as at January 1, 2003 were evaluated pursuant to the Canadian standards in effect at that time entitled,“Guide for Engineers and Geologists Submitting Oil and Gas Reports to Canadian Provincial Securities Administrators” (National Policy 2-B) while closing reserves as at January 1, 2004 were determined pursuant to the definitions of NI 51-101. Reserve definitions under these two standards differ and therefore are not directly comparable. For purposes of reconciliation, the line item referred to as ‘revisions’ includes the variance between the two standards.
Reconciliation of Company Interest Proved Reserves (After Royalties)| | Light and | | | | | | Natural Gas | | | |
| | Medium Oil | | Heavy Oil | | Natural Gas(1) | | Liquids | | Total(1) | |
| | (mbbl) | | (mbbl) | | (mmcf) | | (mbbl) | | (mboe) | |
| December 31, 2003 | 997 | | 2 | | 24,781 | | 1,170 | | 6,299 | |
| Extensions | 83 | | - | | 432 | | 3 | | 158 | |
| Discoveries | - | | - | | 499 | | - | | 83 | |
| Revisions | (491 | ) | 2 | | (2,268 | ) | (162 | ) | (1,029 | ) |
| Production | (182 | ) | - | | (3,891 | ) | (198 | ) | (1,028 | ) |
| December 31, 2003 | 407 | | 4 | | 19,553 | | 813 | | 4,483 | |
| (1) | Estimates of reserves of natural gas includes solution gas. |
Net Present Values of Reserves
In the following two tables, we present Sproule’s estimated net present values effective January 1, 2004. It is not implicit that the undiscounted and discounted net present values presented represent the fair market values of our reserves, as the use of other assumptions could give rise to different results.
Net Present Value of Company Interest Estimated Reserves (After Royalties)| ($000’s) | | Before Income Taxes | | After Income Taxes | |
| | | Discount Rate | | Discount Rate | |
| | | 0% | | 10% | | 0% | | 10% | |
| Proved | | | | | | | | | |
| Developed producing | | 99,917 | | 72,958 | | 80,156 | | 57,511 | |
| Developed non-producing | | 4,684 | | 2,756 | | 728 | | (486 | ) |
| Undeveloped | | 16,445 | | 12,229 | | 10,139 | | 7,373 | |
| Total proved | | 121,046 | | 87,943 | | 91,023 | | 64,397 | |
26
In accordance with SEC regulations, the above disclosure of our reserve information is on an after-royalties basis. As our production is on a before-royalties basis consistent with other Canadian oil and gas companies, we also disclose our estimated proved reserves compliant with NI 51-101 on a before-royalties basis under constant price and operating cost assumptions as follows:
Summary of Company Interest Estimated Reserves (Before Royalties)| | Light and | | | | | | Natural Gas | | | |
| | Medium Oil | | Heavy Oil | | Natural Gas(1) | | Liquids | | Total(1) | |
| | (mbbl) | | (mbbl) | | (mmcf) | | (mbbl) | | (mboe) | |
| Proved | | | | | | | | | | |
| Developed producing | 261 | | 5 | | 18,175 | | 962 | | 4,257 | |
| Developed non-producing | 79 | | - | | 2,640 | | 5 | | 524 | |
| Undeveloped | 158 | | - | | 3,678 | | 20 | | 791 | |
| Total proved | 498 | | 5 | | 24,493 | | 987 | | 5,572 | |
| (1) | Estimates of reserves of natural gas includes solution gas. |
Reconciliation of Company Interest Proved Reserves(Before Royalties)| | Light and | | | | | | Natural Gas | | | |
| | Medium Oil | | Heavy Oil | | Natural Gas(1) | | Liquids | | Total(1) | |
| | (mbbl) | | (mbbl) | | (mmcf) | | (mbbl) | | (mboe) | |
| December 31, 2002 | 1,403 | | 3 | | 31,782 | | 1,483 | | 8,185 | |
| Extensions | 102 | | - | | 527 | | 3 | | 193 | |
| Discoveries | - | | - | | 608 | | - | | 101 | |
| Revisions | (785 | ) | 3 | | (3,661 | ) | (258 | ) | (1,649 | ) |
| Production | (222 | ) | (1 | ) | (4,763 | ) | (241 | ) | (1,258 | ) |
| December 31, 2003 | 498 | | 5 | | 24,493 | | 987 | | 5,572 | |
| (1) | Estimates of reserves of natural gas includes solution gas. |
On the next several pages, maps help to locate our various property locations that are detailed above.
27
28
29
30
31
32
33
34
| | |
| | |
| Item 5. Operating and Financial Review and Prospects |
The year covered by this annual report, Fiscal 2003, coincides with the calendar year and is the first full year since we changed our fiscal year end to December 31 from March 31. Prior to this filing, our most recently filed annual report covered the nine-month period from April 1, 2002 to December 31, 2002. In this report, we may refer to the 12-month period ended December 31, 2003 as “Fiscal 2003”, the nine-month period ended December 31, 2002 as “Nine-Month Fiscal Transition 2002”, the 12-month periods ended March 31, 2002 and 2001 as “Fiscal 2002” and “Fiscal 2001”, respectively, and the 12-month period ending December 31, 2004 as “Fiscal 2004”.
Where useful for comparison purposes, we indicated that we annualized our Nine-Month Fiscal Transition 2002 numbers by multiplying the numbers by four-thirds. However, this method does not reflect actual results for the three-month extrapolated period and such results may differ from the outcome achieved by this calculation.
Forward-Looking Information and Safe Harbor Statement under the Private Securities Litigation Reform Act of 1995.
Certain statements in this Report, including those appearing under this Item 5, constitute “forward-looking statements” within the meaning of the United States Private Securities Litigation Reform Act of 1995, Section 21E of the United States Securities Exchange Act of 1934, as amended, and Section 27A of the United States Securities Act of 1933, as amended. Additionally, forward-looking statements may be made orally or in press releases, conferences, reports, on our worldwide website or otherwise, in the future, by or on behalf of us. Such statements are generally identifiable by the terminology used such as “plans”, “expects, “estimates”, “budgets”, “intends”, anticipates”, “believes”, “projects”, “indicates”, “targets”, “objective”, “could”, “may” or other similar words.
The forward-looking statements are subject to known and unknown risks and uncertainties and other factors that may cause actual results, levels of activity and achievements to differ materially from those expressed or implied by such statements. Such factors include, among others: market prices for natural gas, natural gas liquids and oil products; the ability to produce and transport natural gas, natural gas liquids and oil; the results of exploration and development drilling and related activities; economic conditions in the countries and provinces in which we carry on business, especially economic slowdown; actions by governmental authorities including increases in taxes, changes in environmental and other regulations, and renegotiations of contracts; political uncertainty, including actions by insurgent groups or other conflict and the negotiation and closing of material contracts. The impact of any one factor on a particular forward-looking statement is not determinable with certainty as such factors are interdependent upon other factors; our course of action would depend upon our assessment of the future considering all information then available. In that regard, any statements as to future natural gas, natural gas liquids or oil production levels; capital expenditures; the allocation of capital expenditures to exploration and development activities; sources of funding for our capital program; drilling of new wells; demand for natural gas, natural gas liquids and oil products; expenditures and allowances relating to environmental matters; dates by which certain areas will be developed or will come on-stream; expected finding and development costs; future production rates; ultimate recoverability of reserves; dates by which transactions are expected to close; cash flows; uses of cash flows; collectibility of receivables; availability of trade credit; expected operating costs; expenditures and allowances relating to environmental matters; debt levels; and changes in any of the foregoing are forward-looking statements, and there can be no assurance that the expectations conveyed by such forward-looking statements will, in fact, be realized.
Although we believe that the expectations conveyed by the forward-looking statements are reasonable based on information available to us on the date such forward-looking statements were made, no assurances can be given as to future results, levels of activity, achievements or financial condition.
We wish to caution readers not to place undue reliance on any forward-looking statement and to recognize that the statements are predictions of future results, which may not occur as anticipated. Actual results could differ materially from those anticipated in the forward-looking statements and from historical results, due to the risks and uncertainties described above, as well as others not now anticipated. The foregoing statements are not exclusive and further information concerning us, including factors that potentially could materially affect our financial results, may emerge from time to time. We do not intend to update forward-looking statements to reflect actual results or changes in factors or assumptions affecting such forward-looking statements.
35
| | |
| | |
| Operating Results |
Summary
During Fiscal 2003, we operated or participated in 14 drilled wells resulting in eight gas wells, four oil wells and two dry wells for an overall net working interest success rate of 80%. Of the 12 successful wells, six development wells were drilled at St. Albert, two exploration wells were drilled at Wimborne, one development well at Halkirk, Alberta and three exploration wells were drilled at Cypress/Chowade in British Columbia.
| Drilling Activity | | | | | | | | | | | | |
| | | | | | | | Nine-Month | | | | | |
| | Fiscal 2003 | | Fiscal Transition 2002 | | Fiscal 2002 | |
| | Gross | | Net W.I. | | Gross | | Net W.I. | | Gross | | Net W.I. | |
| Natural gas | 8 | | 5.3 | | 7 | | 4.3 | | 9 | | 7.5 | |
| Crude oil | 4 | | 3 | | 2 | | 1.5 | | 1 | | 0.7 | |
| Dry | 2 | | 2 | | - | | - | | 4 | | 2.8 | |
| Total | 14 | | 10.3 | | 9 | | 5.8 | | 14 | | 11.0 | |
| Success rate | | | 80% | | | | 100% | | | | 75% | |
Management’s Discussion and Analysis of Financial Condition and Results of Operations
The following should be read in conjunction with our Financial Statements and the Notes to the Financial Statements included in this Report. The Financial Statements have been prepared in accordance with Canadian GAAP. The impact of significant differences between Canadian GAAP and U.S. GAAP is disclosed in Note 12 to our Financial Statements.
Unless otherwise noted, tabular amounts are in thousands of Canadian dollars, and sales volumes, production volumes and reserves are before royalties. We have presented our working interest before royalties, as we measure our performance on this basis, which is consistent with other Canadian oil and gas companies.
Due to the differing lengths of the reporting periods in this discussion and analysis, results in these periods are not comparable. Accordingly, percentage changes in these results are not meaningful. In the tables in this discussion and analysis, these are indicated as “n/m”.
Where useful for comparison purposes, annualized numbers relating to Nine-Month Fiscal Transition 2002 are presented by multiplying the nine-month numbers by four-thirds. This method, however, does not reflect actual results for the applicable extrapolated period and as such differs from the results achieved by this calculation.
Due to certain accounting policy changes effected in Fiscal 2003, we have restated prior comparative information in order to conform to the presentation adopted (see Note 3 to our Financial Statements).
36
| | |
| | |
| Executive Overview |
Key Measures for the Comparative Periods Presented
| | | | Nine- Month | | | |
| | | | Fiscal | | | |
| | | | Transition | | | |
| ($ 000’s unless otherwise stated) | Fiscal 2003 | | 2002 | | Fiscal 2002 | |
| Gross revenues | 46,848 | | 24,123 | | 26,402 | |
| Cash flow from operations(1) | 23,097 | | 10,810 | | 11,337 | |
| Cash flow from operations per share($/share )(1) | 1.08 | | 0.53 | | 0.56 | |
| Net earnings (loss) | 4,978 | | 2,004 | | (3,412 | ) |
| Net earnings (loss) per share($/share) | 0.23 | | 0.10 | | (0.17 | ) |
| | | | | | | |
| Daily average production(boe/d) | 3,447 | | 3,332 | | 3,225 | |
| Total production(mboe) | 1,258 | | 916 | | 1,177 | |
| | | | | | | |
| Capital expenditures | 31,747 | | 12,578 | | 22,111 | |
| Net debt(2) | 19,313 | | 16,818 | | 13,281 | |
| Net debt to cash flow (times)(3) | 0.8:1 | | 1.6:1 | | 1.2:1 | |
| Net debt to cash flow annualized(times)(4) | 0.8:1 | | 1.2:1 | | 1.2:1 | |
Our gross revenueurs, cash flow from operations and total production were record highs during Fiscal 2003.
Comparisons of our results of Fiscal 2003 versus Nine-Month Fiscal Transition 2002 were significantly affected by the three-month difference in period length. Two other significant factors contributed to the difference in many of our key measures between the two periods - gross revenues were greater in Fiscal 2003 due to a 50% increase in our weighted average price for natural gas and our crude oil sales increased by 125%.
Daily average production of all commodities grew by 3% to 3,447 boe/d. Total production of all products was 1,258 mboe versus 916 mboe. This would have represented a 3% increase, had Nine-Month Fiscal Transition 2002 been annualized to 1,221 mboe.
Our net earnings for Fiscal 2003 were the second highest in corporate history. The main reasons for this were the same key factors that generated higher gross revenues, cash flow from operations and total production outlined above. The impact of these factors on net earnings was lessened, however, by two main areas of expense - amortization and depletion, and exploration expenses which were higher by $5.7 million and $2.6 million, respectively. Amortization and depletion expense reflected: new capital expenditures related to production optimizations and leasehold acquisitions; the effects of transitioning to new reserve definitions (discussed below); and the repurchase of certain gross overriding royalty interests that previously burdened our total current and future corporate production by 3%. Exploration expenses reflected higher costs for seismic data gathering and for the drilling of two unsuccessful wells, compared to no unsuccessful wells in Nine-Month Fiscal Transition 2002.
| (1) | Cash flow from operations is a non-GAAP measure that does not have standardized meaning as prescribed by GAAP and therefore may or may not be comparable to similar measures presented by other companies. We consider it a key measure as it demonstrates our ability to generate the cash flow necessary to fund future growth through capital investment and to repay debt. |
| | | | Nine-Month | | | |
| | | | Fiscal | | | |
| ($000’s) | | | Transition | | | |
| | Fiscal 2003 | | 2002 | | Fiscal 2002 | |
| Cash provided by operating activities (GAAP) | 28,294 | | 11,457 | | 9,779 | |
| Changes in non-cash working capital affecting | | | | | | |
| operating (GAAP) | (5,197 | ) | (647 | ) | 1,558 | |
| Cash flow from operations (non-GAAP) | 23,097 | | 10,810 | | 11,337 | |
| (2) | Net debt is working capital. We have no long-term debt. |
| (3) | Net debt divided by cash flow from operations. |
| (4) | Net debt divided by cash flow from operations annualized. |
37
During Fiscal 2003, our total estimated proved ‘assigned’ reserves after royalties decreased by 1,816 mboe or 29%, to 4,483 mboe. We added 291 mboe to estimated proved reserves through extensions and discoveries, however, under Canadian NI 51-101, revisions decreased estimated proved reserves by 1,029 mboe.
Our primary strategy is to build through grassroots exploration and development. In particular, we remain committed to natural gas-based projects, as we believe it is a clean, secure and abundant energy source. Our secondary strategy is to target specific acquisitions that we believe will lead to higher returns and future prospects for exploration and development. Throughout 2003, we increased our total capital investment to $31.7 million and advanced our strategies in the following ways:
| | • | During Fiscal 2003, we spent $5.1 million on the acquisition of new lands. Our land holdings targeting natural gas increased by 11,177 net acres (29,283 gross). This new acreage was located at Wimborne, Alberta and Cypress/Chowade, British Columbia; In addition, we repurchased three gross overriding royalty interests that previously burdened all our current and future corporate production from all producing and prospectively-producing properties by a total of 3%; |
| | | |
| | • | We invested $15.2 million in the drilling of 14 gross exploratory and development wells (10.3 net), with an overall net working interest success rate of 80%. Of these wells, ten targeted natural gas and four targeted crude oil. Of the ten natural gas wells, two were unsuccessful. Four of the eight successful gas wells were drilled in British Columbia, three at Cypress/Chowade and one at Orion. The remaining four were drilled in Alberta, two at St. Albert, one at Halkirk and one at Wimborne. All four successful crude oil wells were at St. Albert; and |
| | | |
| | • | Our investment in facilities, pipelining and other assets grew by $1.8 million. Half of this capital was incurred at St. Albert to expand infrastructure that supports production optimization of existing reserves, while most of the balance was spent at Cypress/Chowade for new facilities construction. |
In order to finance our record-high capital investment program described above, we took certain measures to expand our liquidity and capital resources. We issued 1.1 million common shares from treasury at a deemed price of $5.25 per share, to pay for 85% of the repurchase of the gross overriding royalty interests referred to above and we increased our revolving, demand bank operating loan facility to $25.0 million from $21.0 million. These measures, accompanied by record cash flows and $1.5 million from option exercises improved our debt-to-cash-flow ratio from 1.2:1 to 0.8:1.
Our planned activity for Fiscal 2004 continues our primary strategy. We have budgeted to invest a record-high $37.1 million on capital expenditures and exploration expenses. The allocation of this budget reflects our changing focus – to invest proportionately more in northeast British Columbia. Seventy-one percent of our investment is budgeted for Cypress/Chowade and Orion, British Columbia. The majority of the remainder is earmarked for St. Albert and Wimborne, Alberta.
We expect a 13% growth in daily average production in Fiscal 2004, subject mostly to timing of regulatory approvals, third-party transportation and processing negotiations, and equipment availability. Based on our forecast of strong commodity prices, supported by our bank loan facility and our recently-announced private placement, we expect to meet our 2004 cash requirements.
38
| | |
| | |
| Financial Results |
Cash Flow from Operations and Net Earnings
Fiscal 2003 vs Nine-Month Fiscal Transition 2002
Cash flow from operations was $23.1 million versus $10.8 million. Two variances accounted for the difference of $12.3 million between these two results:
Variances involving revenue Our variance analysis table below shows greater cash flow from operations in Fiscal 2003 mainly due to:
| | • | A volume-based variance in revenue of $12.7 million that mainly reflects that the reporting periods differed in length by three months; and |
| | • | A price-based variance in revenue of $10.0 million that reflects we realized higher weighted average prices in Fiscal 2003 than in Nine-Month Fiscal Transition 2002. |
Variances involving cash expenses
The main expense categories that accounted for $10.4 million lesser cash flows from operations, in Fiscal 2003 were:
| | • | Royalties expense – greater by $7.0 million; |
| | • | Production costs – greater by $1.5 million; |
| | • | General and administrative expenses – greater by $1.6 million; and |
| | • | Net interest expense – greater by $0.3 million. |
Net earnings were $5.0 million versus $2.0 million. In accounting for the difference of $3.0 million between these two results, the same variances that affected our cash flows from operations referred to above were further affected by the following:
Variances involving non-cash expenses| | • | Amortization and depletion expense – greater by $5.7 million; |
| | • | Exploration expenses – greater by $2.6 million; and |
| | • | Future income taxes and various other expenses – greater by $1.0 million. |
Nine-Month Fiscal Transition 2002 vs Fiscal 2002
Cash flow from operations was $10.8 million versus $11.3 million. In accounting for the difference of $0.5 million between these two results, higher weighted average prices realized in all commodities added $3.0 million. Due mainly to the differing lengths of the reporting periods, cash flow from operations was less by a net of $3.5 million ($5.3 million that related to the smaller volume of sales and $1.8 million that related to greater royalties expense).
Net earnings were $2.0 million versus a deficit of $3.4 million. In accounting for the difference of $5.4 million between these two results, the same variances that affected our cash flows from operations referred to above were further affected by less non-cash net expenses of $6.1 million as follows: $5.7 million that related to less amortization and depletion expense; $3.3 million that related to less exploration expense; and $2.9 million that related to greater future income tax expense.
The cash and non-cash expense variances discussed in this section reflect mainly the differing lengths of the reporting periods to which we refer. Later in this discussion and analysis, we analyze significant increases and decreases to these expense categories as they relate to the production levels of each period.
39
| | |
| | |
| Revenue |
Revenue Variances by Commodity between the Comparative Periods Presented| | | Fiscal 2003 vs Nine-Month Fiscal | | Nine-Month Fiscal Transition | |
| ($000’s) | | Transition 2002 | | 2002 vs Fiscal 2002 | |
| | | Volume- | | Price- | | | | Volume- | | Price- | | | |
| | | based | | based | | Total | | based | | based | | Total | |
| Natural gas | | 4,984 | | 8,607 | | 13,591 | | (6,090 | ) | 2,152 | | (3,943 | ) |
| Natural gas liquids | | 1,332 | | 1,302 | | 2,634 | | (737 | ) | 307 | | (430 | ) |
| Crude oil | | 6,384 | | 116 | | 6,500 | | 1,573 | | 521 | | 2,094 | |
| Total | | 12,700 | | 10,025 | | 22,725 | | (5,259 | ) | 2,980 | | (2,279 | ) |
Fiscal 2003 vs Nine-Month Fiscal Transition 2002
Revenues were $46.8 million versus $24.1 million, a change of $22.7 million. While much of this change is a result of comparing a twelve-month period to a nine-month period, $12.7 million was due to volume-based variances and $10.0 million was due to price-based variances.
Nine-Month Fiscal Transition 2002 vs Fiscal 2002
Revenues were $24.1 million versus $26.4 million, a downward net change of $2.3 million. While much of this change is a result of comparing a nine-month period to a twelve-month period, a decrease of $5.3 million was due to volume-based variances and an increase of $3.0 million was due to price-based variances.
Daily Average Production Rates and Total Production
Daily Average Production Rates by Commodity and Field, and Total Production
For the Comparative Periods Presented| | | | | | Nine- Month | | | | | |
| | | | | | Fiscal | | | | | |
| (Units as stated) | | | % | | Transition | | % | | | |
| | Fiscal 2003 | | Chg | | 2002 | | Chg | | Fiscal 2002 | |
| Daily average production rates | | | | | | | | | | |
| Natural gas (mcf/d) | | | | | | | | | | |
| St. Albert | 9,936 | | (13 | ) | 11,360 | | (6 | ) | 12,101 | |
| Halkirk | 1,188 | | (13 | ) | 1,368 | | 67 | | 822 | |
| Peavey/Morinville | 504 | | (26 | ) | 678 | | (60 | ) | 1,716 | |
| Other Alberta | 666 | | (13 | ) | 768 | | (55 | ) | 468 | |
| Cypress/Chowade, British Columbia | 756 | | - | | - | | - | | - | |
| Total natural gas (mcf/d) | 13,050 | | (8 | ) | 14,174 | | (6 | ) | 15,107 | |
| Total natural gas (boe/d 6:1) | 2,175 | | (8 | ) | 2,363 | | (6 | ) | 2,518 | |
| Natural gas liquids (bbl/d) | | | | | | | | | | |
| St. Albert | 656 | | (5 | ) | 689 | | 10 | | 627 | |
| Other Alberta | 6 | | (33 | ) | 9 | | 125 | | 4 | |
| Total natural gas liquids (bbl/d) | 662 | | (5 | ) | 698 | | 11 | | 631 | |
| Crude oil (bbl/d) | | | | | | | | | | |
| St. Albert | 609 | | 126 | | 270 | | 275 | | 72 | |
| Other, Saskatchewan | 1 | | - | | 1 | | (75 | ) | 4 | |
| Total crude oil (bbl/d) | 610 | | 125 | | 271 | | 257 | | 76 | |
| Total daily average production (boe/d) | 3,447 | | 3 | | 3,332 | | 3 | | 3,225 | |
| Total production all products (mboe) | 1,258 | | n/m | | 916 | | n/m | | 1,177 | |
Fiscal 2003 vs Nine-Month Fiscal Transition 2002
Total production of all products was 1,258 mboe versus 916 mboe. This would have represented an increase of 3%, had Nine-Month Fiscal Transition 2002 been annualized to 1,221 mboe.
Our total daily average production of all commodities increased by 115 boe/d or 3%, to 3,447 boe/d. Of this increase, natural gas and natural gas liquids decreased in aggregate by 224 boe/d or 7%, while crude oil increased by 339 boe/d or 125%. The aggregate decrease in natural gas and natural gas liquids was mostly the net result of a decrease due
40
to natural declines in reservoir pressures at St. Albert and an increase due to the start-up of two new wells at Cypress/Chowade. The increase in average daily crude oil production was due to the start up of two new wells in Fiscal 2003 and of one well in late Nine-Month Fiscal Transition 2002. All three crude oil wells were at St. Albert.
Nine-Month Fiscal Transition 2002vs Fiscal 2002
Total daily average production of all products increased by a net 107 boe/d or 3%, to 3,332 boe/d. Of this net increase, natural gas and natural gas liquids decreased in aggregate by 88 boe/d or 3%, while crude oil increased by 195 boe/d or 257%. For the most part, the decrease in natural gas and natural gas liquids was due to naturally declining reservoir pressures at St. Albert. The increase in crude oil was due to the start-up of flush production from a new oil well at St. Albert.
Weighted Average Commodity Prices
Weighted Average Commodity Prices for the Comparative Periods Presented| | | | | | Nine- | | | | | |
| | | | | | Month | | | | | |
| | | | | | Fiscal | | | | | |
| | | | % | | Transition | | % | | | |
| (Units as stated) | Fiscal 2003 | | Chg | | 2002 | | Chg | | Fiscal 2002 | |
| Natural gas($/mcf) | 6.56 | | 50 | | 4.36 | | 14 | | 3.81 | |
| Natural gas liquids($/bbl) | 27.68 | | 32 | | 20.90 | | 8 | | 19.30 | |
| Crude oil($/bbl) | 42.98 | | 4 | | 41.40 | | 21 | | 34.33 | |
Fiscal 2003 vs Nine-Month Fiscal Transition 2002
Our weighted average prices of natural gas, natural gas liquids and crude oil increased by 50%, 32% and 4%, respectively.
At the beginning of Fiscal 2003, stronger industry-wide prices for natural gas reflected an extended period of winter cold and lower inventory supplies in North America. Late in the year, natural gas prices again strengthened due to fears of cold weather in the east. During most of Fiscal 2003, industry-wide prices for crude oil were stronger, due in large measure to continuing geo-political uncertainties and tighter North American supplies. Additionally, demand for crude oil in Asia grew and the relative value of the U.S. dollar declined.
Our natural gas liquids were 45% natural gas-based and 55% crude oil-based, therefore, our weighted average price for liquids followed the respective trends mentioned above.
Nine-Month Fiscal Transition 2002 vs Fiscal 2002
Weighted average prices realized from the sale of all our commodities increased by percentages ranging from 8% to 21%.
Hedging
We have no hedge positions, however, by varying our product sales mix of natural gas, natural gas liquids and crude oil, we manage the potential risk of single-product price volatility. Further, we vary our natural gas sales mix between AECO-spot prices and aggregator-based prices (which are, in turn, based on a blend of AECO-spot, long-term and NYMEX contracts).
41
Royalties, Mineral Taxes and Royalty Credits
Royalties, Mineral Taxes, Royalty Credits and Unit Total Royalties For the Comparative Periods Presented| | | | | | Nine- | | | | | |
| | | | | | Month | | | | | |
| | | | | | Fiscal | | | | | |
| | | | % | | Transition | | % | | | |
| ($ 000’s unless otherwise stated) | Fiscal 2003 | | Chg | | 2002 | | Chg | | Fiscal 2002 | |
| Crown | 4,698 | | n/m | | 1,252 | | n/m | | 1,317 | |
| Freehold and overriding | 6,818 | | n/m | | 3,327 | | n/m | | 4,067 | |
| Freehold mineral taxes | 1,346 | | n/m | | 943 | | n/m | | 1,116 | |
| Royalty tax credit (Alberta) | (401 | ) | n/m | | (178 | ) | n/m | | (159 | ) |
| Royalty drilling credit (British Columbia) | (122 | ) | - | | - | | - | | - | |
| Total royalties | 12,339 | | n/m | | 5,344 | | n/m | | 6,341 | |
| Unit total royalties per boe($) | 9.81 | | 68 | | 5.83 | | 8 | | 5.39 | |
Fiscal 2003 vsNine-Month Fiscal Transition 2002
Total royalties were $12.3 million versus $5.3 million. This would have represented an increase of 73%, had Nine-Month Fiscal Transition 2002 been annualized to $7.1 million.
Unit royalties expense increased by a net $3.98 or 68%, to $9.81 per boe. The main factors causing increases in unit royalties expense were higher commodity prices and heavier-than-average royalty obligations applied to two new St. Albert oil wells. The main factor causing a decrease in unit royalties was our July 7, 2003 repurchase of three gross overriding royalty interests that previously burdened our total current and future corporate production by an aggregate of 3% (see Note 7[d] to our Financial Statements for further details).
Nine-Month Fiscal Transition 2002 vs Fiscal 2002
Total royalties were $5.3 million versus $6.3 million. This would have represented an increase of 13%, had Nine-Month Fiscal Transition 2002 been annualized to $7.1 million.
Unit royalties expense increased by $0.44 or 8% to $5.83 per boe primarily due to royalty obligations associated with production of prior periods and higher commodity prices.
Production Costs
Production Costs and Unit Production Costs for the Comparative Periods Presented| | | | | | Nine- | | | | | |
| | | | | | Month | | | | | |
| | | | | | Fiscal | | | | | |
| | | | % | | Transition | | % | | | |
| ($ 000’s unless otherwise stated) | Fiscal 2003 | | Chg | | 2002 | | Chg | | Fiscal 2002 | |
| Production costs | 7,011 | | n/m | | 5,470 | | n/m | | 5,846 | |
| Unit production costs per($) | 5.57 | | (7 | ) | 5.97 | | 20 | | 4.97 | |
Fiscal 2003 vs Nine-Month Fiscal Transition 2002
Total production costs were $7.0 million versus $5.5 million. This would have represented a decrease of 4%, had Nine-Month Fiscal Transition 2002 been annualized to $7.3 million.
Unit production costs decreased by a net of $0.40 or 7%, to $5.57 per boe mainly due to the elimination of monthly processing charges for St. Albert facilities acquired at the close of the prior period, pursuant to a sales and leaseback agreement.
Nine-Month Fiscal Transition 2002 vs Fiscal 2002
Total production costs were $5.5 million versus $5.8 million. This would have represented an increase of 26%, had Nine-Month Fiscal Transition 2002 been annualized to $7.3 million.
42
Unit production costs increased by $1.00 or 20%, to $5.97 per boe mainly due to higher costs for electricity, facilities maintenance and field compression charges, most of which were at St. Albert.
Amortization and Depletion Expense (A&D)
A&D Expense and Unit A&D Expense for the Comparative Periods Presented| | | | | | Nine- | | | | | |
| | | | | | Month | | | | | |
| | | | | | Fiscal | | | | | |
| | | | % | | Transition | | % | | | |
| ($ 000’s unless otherwise stated) | Fiscal 2003 | | Chg | | 2002 | | Chg | | Fiscal 2002 | |
| A&D before the following: | 11,606 | | n/m | | 5,924 | | n/m | | 5,336 | |
| Ceiling test adjustment | 316 | | 29 | | 445 | | (93 | ) | 6,783 | |
| Depletion of asset retirement cost | 99 | | 57 | | 63 | | (7 | ) | 68 | |
| Amortization of deferred items | - | | - | | (109 | ) | 53 | | (230 | ) |
| Total A&D expense | 12,021 | | n/m | | 6,323 | | n/m | | 11,957 | |
| Unit A&D expense per boe($) | 9.55 | | 38 | | 6.90 | | (32 | ) | 10.16 | |
Fiscal 2003 vs Nine-Month Fiscal Transition 2002
Our total A&D expense was $12.0 million versus $6.3 million. This would have represented an increase of 43%, had Nine-Month Fiscal Transition 2002 been annualized to $8.4 million.
Unit A&D expense increased by a net of $2.65 or 38%, to $9.55 per boe due mainly to the following:
| | • | An increase of $1.23 per boe due to higher capital-to-reserve ratios. Most of this increase is for recent crude oil discoveries and natural gas optimizations at St. Albert; |
| | • | An increase of $0.98 per boe due to additional depletion related to the July 7, 2003 repurchase of gross overriding royalty interests that previously burdened our total current and future corporate production by 3% (see Note 7[d] to our Financial Statements for further details); and |
| | • | An increase of $0.55 per boe due to significant growth in our leasehold base. |
Nine-Month Fiscal Transition 2002 vs Fiscal 2002
Our total A&D expense was $6.3 million versus $12.0 million. This would have represented a decrease of 30%, had Nine-Month Fiscal Transition 2002 been annualized to $8.4 million.
Unit A&D expense decreased by a net of $3.26 or 32%, to $6.90 per boe due primarily to a Peavey/Morinville ceiling test adjustment recorded in Fiscal 2002.
Exploration Expenses
Exploration Expenses and Unit Exploration Expenses for the Comparative Periods Presented| | | | | | Nine- | | | | | |
| | | | | | Month | | | | | |
| | | | | | Fiscal | | | | | |
| | | | % | | Transition | | % | | | |
| ($ 000’s unless otherwise stated) | Fiscal 2003 | | Chg | | 2002 | | Chg | | Fiscal 2002 | |
| Drilling(1) | 1,278 | | n/m | | 325 | | n/m | | 3,821 | |
| Seismic data activity | 2,349 | | n/m | | 934 | | n/m | | 649 | |
| Other | 439 | | n/m | | 187 | | n/m | | 176 | |
| Total exploration expenses | 4,066 | | n/m | | 1,446 | | n/m | | 4,646 | |
| Unit exploration expenses per boe($) | 3.23 | | 104 | | 1.58 | | (60 | ) | 3.95 | |
| (1) | We follow the successful efforts method of accounting, whereby costs of drilling an unsuccessful well are expensed when it becomes known the well did not result in a discovery of proved reserves. |
Fiscal 2003 vs Nine-Month Fiscal Transition 2002
Total exploration expenses were $4.1 million versus $1.4 million. This would have represented an increase of 116%, had Nine-Month Fiscal Transition 2002 been annualized to $1.9 million.
43
Unit exploration expenses increased by $1.65 or 104%, to $3.23 per boe. While we recognized one unsuccessful drilling attempt at each of Wimborne and Halkirk, there were none in Nine-Month Fiscal Transition 2002. Costs of seismic data also increased due to the gathering of data at Wimborne, Cypress/Chowade and Orion.
Nine-Month Fiscal Transition 2002 vs Fiscal 2002
Total exploration expenses were $1.4 million versus $4.6 million. This would have represented a decrease of 59%, had Nine-Month Fiscal Transition 2002 been annualized to $1.9 million.
Unit exploration expenses decreased by $2.37 or 60%, to $1.58 per boe. The main reason for this decrease was that all drilling attempts were successful in Nine-Month Fiscal Transition 2002 compared to a total of ten unsuccessful wells in Fiscal 2002, six at Peavey/Morinville, one each at Quirk Creek, Alexander and Orion, and one reentry/workover at St. Albert.
Interest Expense - Net
Net Interest Expense and Unit Net Interest Expense for the Comparative Periods Presented| | | | | | Nine- | | | | | |
| | | | | | Month | | | | | |
| | | | | | Fiscal | | | | | |
| | | | % | | Transition | | % | | | |
| ($ 000’s unless otherwise stated) | Fiscal 2003 | | Chg | | 2002 | | Chg | | Fiscal 2002 | |
| Net interest expense | 713 | | n/m | | 453 | | n/m | | 472 | |
| Unit interest expense per boe($) | 0.57 | | 16 | | 0.49 | | 23 | | 0.40 | |
Fiscal 2003 vs Nine-Month Fiscal Transition 2002
Net interest was $0.7 million versus $0.5 million. This would have represented minimal change, had Nine-Month Fiscal Transition 2002 been annualized to $0.7 million.
The average daily balance of our bank operating facility increased by $1.8 million or 14%, to $14.3 million, and the closing balance was $13.3 million. The effective interest rates were 5.1% in Fiscal 2003 and 5.0% in Nine-Month Fiscal Transition 2002.
Nine-Month Fiscal Transition 2002 vs Fiscal 2002
There was no material variance between periods in our net interest expense because our operating loan was used for nine months in both periods at an average balance outstanding of approximately $12.5 million. The effective interest rates in Nine-Month Fiscal Transition 2002 and Fiscal 2002 were 5.0% and 4.7%, respectively.
General and Administrative Expenses (G&A)
G&A Expenses and Unit G&A Expenses for the Comparative Periods Presented| | | | | | Nine- | | | | | |
| | | | | | Month | | | | | |
| | | | | | Fiscal | | | | | |
| | | | % | | Transition | | % | | | |
| ($ 000’s unless otherwise stated) | Fiscal 2003 | | Chg | | 2002 | | Chg | | Fiscal 2002 | |
| G&A expenses | 3,415 | | n/m | | 1,839 | | n/m | | 2,347 | |
| Unit G&A expenses per boe($) | 2.71 | | 35 | | 2.01 | | (4 | ) | 1.99 | |
Fiscal 2003 vs Nine-Month Fiscal Transition 2002
Our G&A expenses were $3.4 million versus $1.8 million. This would have represented an increase of 42%, had Nine-Month Fiscal Transition 2002 been annualized to $2.4 million.
Unit G&A expenses increased by a net $0.70 or 35%, to $2.71 per boe. Of this increase, 40% was due to the first-time recognition of stock-based compensation made available to directors and employees under our corporate stock option plan (see Note 3 to our Financial Statements for further details). Other increases were mainly attributed to: new staff hires and certain salary adjustments; computer technical and software support; gas marketing advice; and other essential professional services.
44
| | |
| | |
| Nine-Month Fiscal Transition 2002 vs Fiscal 2002 |
Our G&A expenses were $1.8 million versus $2.3 million. This would have represented an increase of 4%, had Nine-Month Fiscal Transition 2002 been annualized to $2.4 million.Unit G&A expenses remained relatively unchanged between periods.
Income Tax Expense
We use the liability method of tax allocation in accounting for income taxes. Future tax assets and liabilities are determined based on differences between the financial reporting and tax bases of assets and liabilities, and measured using the substantially-enacted rates and laws that will be in effect when the differences are expected to reverse.
Current and Future Income Tax Expenses (Recoveries) for the Comparative Periods Presented| | | | | | Nine- | | | | | |
| | | | | | Month | | | | | |
| | | | | | Fiscal | | | | | |
| | | | % | | Transition | | % | | | |
| ($ 000’s) | Fiscal 2003 | | Chg | | 2002 | | Chg | | Fiscal 2002 | |
| Current income tax expense | 632 | | n/m | | 207 | | n/m | | 58 | |
| Future income tax expense | 1,579 | | n/m | | 975 | | n/m | | (1,904 | ) |
| Total income tax expense | 2,211 | | n/m | | 1,182 | | n/m | | (1,846 | ) |
Fiscal 2003 vs Nine-Month Fiscal Transition 2002
Total income tax expense increased to $2.2 million from $1.2 million. This increase was consistent with our pre-tax earnings. Our effective tax rate was 30.9%, which was in line with statutory tax rates.
Nine-Month Fiscal Transition 2002 vs Fiscal 2002
Total income tax expense increased to $1.2 million from a recovery of $1.8 million. This increase was consistent with our pre-tax earnings. Our effective tax rate was 37.1%, which was in line with statutory tax rates.
Income Tax Pools Available for Deduction Against Future Taxable Income For the Comparative Periods Presented| | | | Nine- | | | | | |
| | | | Month | | | | | |
| | | | Fiscal | | | | Maximum | |
| | | | Transition | | | | Annual | |
| ($ 000’s) | Fiscal 2003 | | 2002 | | Fiscal 2002 | | Deduction | |
| Canadian exploration expense | - | | 1,586 | | - | | 100% | |
| Canadian development expense | 8,893 | | 5,246 | | 3,772 | | 30% | |
| Undepreciated capital costs | 10,934 | | 10,356 | | 10,297 | | 20% -100% | |
| Canadian oil and gas property expense | 21,168 | | 17,417 | | 16,471 | | 10% | |
| Total income tax pools | 40,995 | | 34,605 | | 30,540 | | | |
At the end of each comparative period presented above, we had total income tax pools available for deduction against future taxable income, each pool allowing maximum annual deductions ranging from 10% – 100%.
Critical Accounting Policies
Our critical accounting policies are defined as those that are important to the portrayal of our financial position and operations and require us to make judgments based on underlying estimates and assumptions about future events and their effects. Such underlying estimates and assumptions are based on historical experience and other factors that we believe to be reasonable under the circumstances. These estimates and assumptions are subject to change as new events occur, as more industry experience is acquired, as additional information is obtained and as our operating environment changes. We believe the following are the most critical areas where estimates and our accounting policies can materially impact our Financial Statements. For information concerning our other significant accounting policies, see Note 2 to our Financial Statements.
45
| | |
| | |
| Reserves Estimates |
On an annual basis, we engage independent petroleum consultants to conduct evaluations of our reserves. The accuracy of reserves estimates is a matter of interpretation and judgment and is a function of the quality and quantity of available data gathered over time. For further details and a discussion of the risks involved in the reserves estimating process, see Item 3 under “Risk Factors - Estimating of Reserves and Future Net Cash Flows Risk”.
Natural Gas and Oil Interests
We follow the successful efforts method of accounting for our natural gas and oil activities, as described in Note 2 to our Financial Statements. The application of this method requires us to make significant judgments and decisions based on available geological, geophysical, engineering and economic data. The results from drilling can take considerable time to analyze and when it is determined that drilling has been unsuccessful in establishing commercial reserves, the costs of drilling are written off and reported as exploration expense. Drilling costs for wells that have been successful in establishing commercial reserves are capitalized as natural gas and oil interests on our balance sheet.
Where we assess that the estimated undiscounted future cash flows are either partially or fully below the book value of a property as recorded in our natural gas and oil interests (“ceiling test”), we either partially or fully adjust the book value downward and record a depletion expense on our income statement accordingly (“ceiling test adjustment”).
Estimates of undiscounted future cash flows that we use for conducting ceiling tests are subject to significant judgment decisions based on assumptions of highly uncertain future factors such as, natural gas and crude oil prices, production quantities, estimates of recoverable reserves and operating costs. Given the significant assumptions required and the strong possibility that actual future factors will differ, we consider the ceiling test to be a critical accounting procedure.
During Fiscal 2003, property ceiling tests resulted in an adjustment to the book value of our Cypress/Chowade property. The total adjustment amounted to $0.3 million.
During Nine-Month Transition 2002, our property ceiling tests resulted in adjustments to the book values of four properties: Alexander, Halkirk, Morinville/Peavey and Virgo. Total adjustments amounted of $0.4 million, Halkirk accounting for 74% and Alexander 21% of the total.
During Fiscal 2002, ceiling test adjustments totaled $6.8 million, 99% of which related to the Peavey/Morinville property.
Accounting Policy Changes
Canadian Pronouncements
Effective March 31, 2004, all reporting issuers in Canada are subject to new disclosure requirements as per National Instrument 51-102 “Continuous Disclosure Obligations”. This new instrument proposes shorter reporting periods for filing of annual and interim Financial Statements, management’s discussion and analysis and Canadian Annual Information Form (AIF). The instrument also requires enhanced disclosure in the annual and interim Financial Statements, management’s discussion and analysis and AIF. Under this new instrument, it will no longer be mandatory for us to mail annual and interim Financial Statements and management’s discussion and analysis to shareholders, but rather these documents will be provided on an “as requested” basis. We continue to assess the implications of this new instrument.
Effective December 31, 2003, we early-adopted the amended standard CICA 3870,Stock-Based Compensation and Other Stock-Based Payments.The amended standard has an expanded requirement to apply the fair-value based method of accounting for all stock-based payments, direct awards of stock and awards that call for settlement in cash, including those granted to directors, employees and non-employees. Prior to its amendment, CICA 3870 was first adopted by us on April 1, 2002. During the period April 1, 2002 to December 31, 2002, we used the fair-value based method to account only for stock options granted to non-employees. (See Note 3 to our Financial Statements for further details).
46
In December 2002, the Canadian Institute of Chartered Accountants (“CICA”) approved a new standard (“CICA 3110”),Asset Retirement Obligations. Although it is effective for fiscal years beginning on or after January 1, 2004, we early-adopted it as of December 31, 2003. The standard requires liability recognition for long-lived asset retirement obligations such as our wellsites and associated facilities. Initial measurement of the liabilities is their fair values, which is based on their discounted future value. This fair value is capitalized as part of the cost of the related assets and depleted to expense on the unit-of-production method. The liabilities accrete until we expect to settle the obligations. (See Note 3 to our Financial Statements for further details).
Other accounting standards issued by the CICA during the year ended December 31, 2003 are not expected to materially impact us.
U.S. Pronouncements
The following standards issued by the FASB do not impact us at this time:
Interpretation No. 46, “Consolidation of Variable Interest Entities”, effective December 31, 2004.
FAS No. 150, “Accounting for Certain Financial Instruments with Characteristics of both Liabilities and Equity”, effective for financial statements issued after June 15, 2003.
FAS No. 132 (revised 2003), “Employers’ Disclosures about Pensions and Other Post Retirements Benefits - an amendment of SFAS No. 87, 88 and 106”, effective for financial statements issued after December 15, 2003.
FAS No. 149, “Amendment of Statement 133 on Derivative Instruments and Hedging Activities”, effective for contracts entered into or modified after June 30, 2003.
We continue to assess the applicability of these standards.
Inflation
We operate in Canada only, where inflation for our operational costs is at low levels, i.e. in the 2%-5% range.
Impact of Foreign Currency Fluctuations
We hold our cash reserves and receive the majority of our revenues in Canadian dollars. We incur the majority of our expenses and capital expenditures also in Canadian dollars. Therefore, an increase or decrease in the value of the Canadian dollar versus the U.S. dollar would have a minimal effect on us.
Government Policies
We are subject to regulations of the Government of Canada and the Governments of Alberta and British Columbia. Such regulations may relate directly and indirectly to our operations including production, marketing and sale of hydrocarbons, royalties, taxation, environmental matters and other factors. There is no assurance that the laws relating to our operations will not change in a manner that may materially and adversely affect us, however, there has been no material impact on us from changes to such laws in the past three fiscal periods.
Liquidity and Capital Resources
Sources and Uses of Cash
Our main business strategy is to focus on growth through full-cycle exploration and development. We supplement our main strategy with targeted acquisitions when appropriate. To carry out these capital-intensive strategies, we require cash flow from operations and an operating bank line of credit. If warranted, we would seek term debt to finance construction of long-life facilities and equity to fuel accelerated, project exploration plans.
47
Operating activities - In any given year, our operating activities may result in cash flow timing differences where capital expenditures exceed cash flow from operations. The two key underlying drivers behind this are:
| | • | Volatility in our weighted average commodity prices; and |
| | • | Cash flow timing differences arising from the development of longer-term projects. |
Five-Year Historical Cash Flow Information| | | | | | Nine-Month | | | | | | | | | | |
| | | | | | Fiscal | | | | | | | | | | |
| | | Fiscal | | | Transition | | | | | | | | | Fiscal | |
| ($ 000’s unless otherwise stated) | | 2003 | | | 2002 | | | Fiscal 2002 | | | Fiscal 2001 | | | 2000 | |
| Weighted average commodity price volatility: | | | | | | | | | | | | | | | |
| Natural gas | $ | 6.56 | | $ | 4.36 | | $ | 3.81 | | $ | 6.22 | | $ | 2.72 | |
| Crude oil | $ | 42.98 | | $ | 41.40 | | $ | 34.33 | | $ | 43.60 | | $ | 16.74 | |
| | | | | | | | | | | | | | | | |
| Timing differences between: | | | | | | | | | | | | | | | |
| Cash flow from operations(1); and | | 23,097 | | | 10,810 | | | 11,337 | | | 18,168 | | | 5,634 | |
| Capital expenditures, exploration | | | | | | | | | | | | | | | |
| expenses and proceeds on sale | | | | | | | | | | | | | | | |
| of natural gas and oil interests | | (27,102 | ) | | (14,022 | ) | | (26,753 | ) | | (12,432 | ) | | (7,026 | ) |
| Total timing differences | | (4,005 | ) | | (3,212 | ) | | (15,416 | ) | | 5,736 | | | (1,392 | ) |
| | | | | | | | | | | | | | | | |
| Cash used in investing activities: | | | | | | | | | | | | | | | |
| Bank operating indebtedness | | 2,041 | | | (2,997 | ) | | 15,593 | | | (6,000 | ) | | 3,750 | |
| Issuance of common shares | | 1,511 | | | - | | | 455 | | | 200 | | | 117 | |
| Repurchases of common shares | | - | | | (326 | ) | | (290 | ) | | (90 | ) | | (1,377 | ) |
| | | 3,552 | | | (3,323 | ) | | 15,758 | | | (5,890 | ) | | 2,490 | |
| Changes in non-cash working capital | | (453 | ) | | (6,535 | ) | | 342 | | | (154 | ) | | 1,098 | |
| (1) | Included in our cash flow from operations are payments relating to the leasing of our office space (see “Contractual Obligations and Commitments” below). |
Financing activities –In 1999, we first established a revolving, demand bank operating loan facility with our corporate bank. On May 16, 2003, our loan was increased to $25.0 million from $21.0 million. Principal balances outstanding are charged interest at prime plus three-eighths of a percent (at December 31, 2003, the bank’s prime rate was 4.5%) and are collateralized by a general assignment of book debts and a floating charge debenture of $35.0 million covering all our assets. A standby fee of one-eighth of a percent per annum is levied on the unused portion of the facility.
The facility is subject to a semi-annual review. The next review will be undertaken on May 27, 2004. This review will include assessments of our January 1, 2004 reserves and daily production estimates and a full evaluation of our financial position and operations. As at December 31, 2003, the undrawn balance of our loan facility was $10.4 million, after allowing for bank indebtedness of $1.4 million. Repayment is in full, monthly. Our loan agreement contains covenants that require prior approval of our bank (e.g. mergers, capital distributions, other pledges of security and asset disposals). At December 31, 2003, we were compliant with all covenants.
The winter season is often the best time for our drilling activities, therefore, dependence on our borrowing facility may tend to be heavier at those times.
During Fiscal 2003, we repurchased certain gross overriding royalty interests that previously burdened our total current and future production by 3%. The transaction was financed through the payment of $1.0 million in cash and the issuance of 1.05 million common shares at a deemed price of $5.25 per share.
Over the past five fiscal periods, our aggregate cash inflows arising from the issuance of common shares have amounted to $2.3 million. During the same period, cash outflows from the repurchase of common shares were $2.1 million, bringing the effect of all stock transactions to a net cash inflow of $0.2 million.
48
At December 31, 2003, our authorized capital was 60,000,000 common shares without par value, of which 22,194,778 were issued and outstanding. Also outstanding were 1,615,834 options at prices ranging from $1.45 to $5.43 per share, each option entitling the holder to acquire one common share. The weighted average remaining contractual exercise life of these options was 4.3 years. As at December 31, 2003, we had 1,970,870 common shares reserved for issuance under our 2003 Stock Option Plan.
On April 30, 2004, we entered into a bought-deal private placement with both Octagon Capital Corporation as lead underwriter and Raymond James Ltd. Pursuant to the terms of the agreement, we have agreed to issue, by way of private placement, 2,000,000 flow-through common shares at $5.60 each on a firm underwriting basis. As well, at the option of the underwriters, exercised at least one business day before closing, we have agreed to issue 400,000 common shares at $4.55 each. If the underwriters exercise their option, the total gross proceeds of the offering will be $13,020,000.
The net proceeds of the share offering will be used to accelerate our continued exploration and development of our core natural gas properties at Cypress/Chowade and Orion in northeast British Columbia. Proceeds from the flow-through shares will be used to incur qualifying Canadian Exploration Expense (“CEE”) as defined in the Income Tax Act (Canada) and we will renounce, for the 2004 taxation year, such CEE in favour of the original holders of the flow-through shares in an amount equal to the issue price for each flow-through share. Closing is subject to normal closing conditions including obtaining required regulatory approvals and is scheduled to occur on or about May 19, 2004.
We expect to source the financing costs related to the bought-deal financing agreement above from the undrawn portion of our line of credit. To the extent that underwriters exercise their option to acquire non-flow-through shares, proceeds from the sale of those shares of our Common Stock would be added to the undrawn line of credit balance.
Working capital – Changes in our working capital and net debt levels are primarily dependent upon our cash flow from operations, the amount of our capital expenditures and exploration expenses, and the timing of incurred field activities.
Our sales receivables and trade payables are settled in accordance with normal industry standards while we maintain our working capital liquidity by drawing from and repaying our unutilized bank credit facility as needed.
Our year end debt level, comprised of working capital and the outstanding balance of our operating bank loan, reflects a debt-to-cash-flow ratio of 0.8:1 (Nine-Month Fiscal Transition 2002 – 1.2:1 annualized; Fiscal 2002 – 1.2:1, Fiscals 2001 and 2000 – nil).
Cash Requirements
Our future liquidity is dependent upon cash flows generated from our operational activities, our capital investment programs and the flexibility of capital sources. Changes in the weighted average prices we obtain for the sales of our commodities will impact our cash flow from operations and the extent to which we may draw from, or have made available to us, bank operating credit for 2004 (see Item 11 - “Weighted Average Prices and the Effect of Adversity”).
Cash Management
As in most upstream oil and gas companies, we manage our cash throughout both positive and negative commodity price cycles. We work toward accomplishing all projects specified in our annual capital expenditures and exploration expense budget, however, in the event our commodity prices increase or decrease materially, we may choose to expand or contract our spending plans, as warranted.
Increases or decreases in our capital spending activities may have corresponding effects on our production, net revenues, operating loan interest expense and income-related taxes, and counter-effects on our amortization and depletion expense.
49
| | |
| | |
| Outlook for Fiscal 2004 |
Our primary strategy is to grow organically through the drill bit by pursuing a forward-looking exploration strategy. We believe that northeast British Columbia offers some of the best opportunities in the western Canadian sedimentary basin for long-term sustainable growth. Of our current total net undeveloped land holdings, 76% are located in British Columbia.
Our capital expenditure and exploration expense budget for Fiscal 2004 is $37.1 million, of which we plan to invest $26.1 million or 71% in northeast British Columbia. (For full details, see Item 4 – “Fiscal 2004 – Budgeted Capital Expenditures and Exploration Expenses”).
British Columbia has become an attractive province for oil and gas investment by implementing several new initiatives: enhancing existing energy policies; streamlining regulations; increasing investments in infrastructure; and implementing new royalty incentives.
Our Fiscal 2004 target daily average and exit production rates are 3,900 and 4,400 boe per day, respectively. Our target production rates do not include potential increases resulting from work being conducted during the year on certain undeveloped properties. A discussion of these properties and their potential impact on 2004 production follows the table below (see Item 5 - “Undeveloped Properties (Those Not Considered in 2004 Target Production Rates”)):
2004 Target Daily Averages (by Property) and Exit Production Rates| | Target Daily | |
| (Units as stated) | Production Rates | |
| Natural gas (mcf/d) | | |
| St. Albert | 9,320 | |
| Halkirk | 965 | |
| Peavey/Morinville | 785 | |
| Other Alberta (four properties) | 790 | |
| Cypress/Chowade, British Columbia | 4,850 | |
| Total natural gas (mcf/d) | 16,710 | |
| Total natural gas (boe/d 6:1) | 2,785 | |
| Natural gas liquids (bbl/d) | | |
| St. Albert | 600 | |
| Other Alberta (four properties) | 10 | |
| Total natural gas liquids (bbl/d) | 610 | |
| Crude oil | | |
| St. Albert | 505 | |
| Total crude oil (bbl/d) | 505 | |
| Target daily average production rate (boe/d) | 3,900 | |
| Target daily exit production rate (boe/d) | 4,400 | |
Developed Properties(Those Considered in 2004 Target Production Rates)
Alberta
St. Albert- As stated above, work will continue to optimize production throughout the year. Crude oil zones of continuing interest to us are the Wabamum D-1 formation, Nisku D-2 formation, and Leduc D-3 formation, while natural gas zones of interest are the Ostracod zone and Belly River formation. The timing of our activities is subject to seasonal road-use restrictions and regulatory approvals.
British Columbia
Cypress/Chowade– Included in our budget is our 50% share of a 32 kilometer, 8” sales pipeline to the Sikanni, British Columbia and a 30 mmcf/d sour gas plant. The initial leg of the pipeline was scheduled for construction in the first quarter of 2004. The second leg of the pipeline and the gas plant are scheduled for construction in the fourth quarter of 2004. The impact of these facilities is expected to have a marginal impact on our 2004 target production rates due to the estimated timing of their start-up. Timing is subject to regulatory approvals, negotiation of third-party processing agreements and the availability of equipment.
50
| | |
| | |
| Undeveloped Properties(Those Not Considered in 2004 Target Production Rates) |
Alberta
Wimborne – We have budgeted three exploration gas wells, scheduled for drilling in the third quarter of 2004. Our estimated resource potential of each well is eight bcf with approximate production rates ranging from four – six mmcf/d. Each well is budgeted at a 30% working interest.
We are prospecting for Cretaceous Age sandstone reservoirs in a complex, fluvial environment using an extensive 3D seismic database. Each well is targeting a separate and distinct seismic anomaly. One of these seismic anomalies is analogous to a multi-well producing gas pool approximately ten kilometers away.
The area is accessible year round and is in close proximity to third-party transportation and processing facilities. If successful, we expect tie-in to occur late in 2004, subject to regulatory approvals and negotiation of third-party agreements.
British Columbia
Cypress/Chowade – We have budgeted three, exploration multi-zone outpost gas wells, scheduled for drilling in the second and third quarters of 2004. Based on nearby wells, our estimated resource potential of each of our wells ranges between three and five bcf per zone, and approximate production rates range between one – five mmcf/d per zone. Each well is budgeted at a 30% working interest.
During 2003, we participated in nine wells resulting in eight gas wells and one unsuccessful well, for an overall drilling success rate of 89%. Our 2004 wells are targeting multi-zone, natural gas-bearing Triassic Age sandstone and carbonate reservoirs. Our locations have been selected by correlating 2D seismic data and drilling results.
Orion –We have budgeted two 100% exploration gas wells, scheduled for drilling in the third quarter of 2004. One is drilling for a Slave Point formation target and the other a Bluesky formation target.
Based on information available to us on an offset Slave Point formation producing well, we estimate our Slave Point formation well could encounter an estimated pool size of 25 bcf and produce between five – ten mmcf/d. Similar information on several producing offset Bluesky formation wells suggests we could reasonably expect our Bluesky formation well to encounter an estimated pool size of 12 bcf and produce between one – three mmcf/d per well.
The proposed Slave Point formation well is approximately two kilometers away from a producing Slave Point formation gas well in the adjacent spacing unit. The proposed Bluesky formation well is offset by a multi-well, producing Bluesky formation gas pool approximately the same distance away. Both wells are targeting seismic features identified on our lands using 3D seismic data.
The nearest tie-in point for the wells is two kilometers away. If one or both wells are successful, tie-ins are expected to occur in late 2004 or early 2005. Tie-ins are subject to regulatory approvals, winter access-only conditions, availability of equipment, and negotiation of third-party transportation and processing.
Sensitivity Analysis
The following table shows the effect on cash flow of certain changes in volume, price and interest rates. Numbers presented reflect the sensitivity impact on our estimated Fiscal 2004 activity.
| | | | ————Changes in———— | | Effect on Cash Flow |
| Sensitivities | | | Volume | | Price | | Rate | | $(000’s) |
| Production | – natural gas (mmcf/d) | | 1 | | - | | - | | 2,310 | |
| | – natural gas liquids (bbl/d)) | | 100 | | - | | - | | 931 | |
| | – crude oil (bbl/d) | | 100 | | - | | - | | 1,406 | |
| Price | – natural gas ($/mcf) | | - | | 0.50 | | - | | 3,073 | |
| | – natural gas liquids ($/bbl) | | - | | 1.00 | | - | | 192 | |
| | – crude oil ($/bbl) | | - | | 1.00 | | - | | 128 | |
| Interest rate | (%) | | - | | - | | 1 | | 230 |
51
| | |
| Contractual Obligations and Commitments | |
We have an operating lease in respect of our office premises, as discussed in Note 13 to our Financial Statements. Additionally, we have asset retirement obligations relating to the clean up and restoration of wellsites and associated production facilities.
| Commitments – Cash and Non-Cash Type Obligations |
| Payments or Work Commitments Due |
| By Period |
| | | | < 1 | | 1 - 3 | | 4 – 5> | | 5 |
| ($000’s) | Total | | Year | | Years | | Years | | Years |
| Cash type: operating lease obligations (office space) | 912 | | 203 | | 620 | | 89 | | - |
| Non-cash type: asset retirement obligations(1) | 3,308 | | 149 | | 93 | | 92 | | 2,974 |
| Total | 4,220 | | 352 | | 713 | | 181 | | 2,974 |
| (1)Asset retirement obligations represent estimates of clean-up and restoration commitments and are undiscounted. |
As at December 31, 2003, we recognized $1.6 million on our balance sheet for future asset retirement obligations. We engage independent engineering consultants to assist in assessing our total future asset retirement liabilities. While we cannot predict their ultimate cost, we currently estimate the total cost to clean up all our operating facilities to be $3.3 million.
Off-Balance Sheet Arrangments
As at December 31, 2003, we had no off-balance sheet arrangements.
Item 6. Directors, Senior Management and Employees
Directors and Senior Management
The following is information regarding our Directors, Senior Management and Employees as of December 31, 2003.
| Name | Position Held | Age | Residence |
| Directors and Executive Officers: | | | |
| Wayne J. Babcock | President & CEO, Director | 60 | Vancouver, B.C. |
| Donald K. Umbach | Vice President & COO, Director | 50 | Vancouver, B.C. |
| John A. Greig | Director | 62 | Vancouver, B.C. |
| Jonathan A. Rubenstein | Director | 54 | Vancouver, B.C. |
| David J. Jennings | Director | 40 | Vancouver, B.C. |
| John Lagadin | Director | 66 | Calgary, Alta. |
| William B. Thompson | Director | 59 | Kelowna, B.C. |
| Michael A. Bardell | CFO & Corporate Secretary | 57 | Vancouver, B.C. |
| David G. Grohs | Vice President, Production | 38 | Vancouver, B.C. |
52
Wayne J. Babcock
President, Chief
Executive Officer,
Director |  |
Mr. Babcock, P. Geoph., holds a degree in Geophysics from the University of British Columbia and joined Amoco Canada Petroleum Company Ltd. in 1966.
Before establishing the Company in 1979, Mr. Babcock managed Amoco's geophysical exploration of Saskatchewan and Southern Alberta, Canada's western sedimentary basin.
He is a member of the Alberta Association of Professional Engineers, Geologists and Geophysicists, the Canadian Institute of Energy and is on the Board of Directors of Redcorp Ventures Ltd., a Toronto-listed mining company.
Mr. Babcock has been our President, Chief Executive Officer and a Director since 1979.
Donald K. Umbach
Vice President,
Chief Operating
Officer, Director |  |
Mr. Umbach holds diplomas in Business Administration & Petroleum Land Management from the Mount Royal College of Calgary, Alberta and is a member of the Canadian Association of Petroleum Landmen. He has over 30 years experience in the Canadian oil and gas industry, beginning with Hudson's Bay Oil & Gas Limited, followed by a time with a junior oil and gas company. Prior to his joining us in 1987, Mr. Umbach was principal of his own Petroleum Landman consulting firm. Mr. Umbach is a director of ours and is Vice President and Chief Operating Officer and has been such since 1999.
John A. Greig
Director |  |
Mr. Greig, M.Sc./P.Geol., holds a B.Sc. (honours) in Geology from McGill University in Montreal and a M.Sc. in Geology from the University of Alberta.
Mr. Greig has been a director of ours since 1990 and is presently director and chairman of Cumberland Resources Ltd. He is also director of Blackstone Ventures Inc. Eurozinc Mining Corp., and Diamondex Resources Ltd.
53
Jonathan A. Rubenstein
Director |  |
Between 1977 and 1994, Mr. Rubenstein was in private law practice undertaking matters in the areas of corporate commercial law, securities law, natural resource law, international law and environmental law.
Since 1994, he worked in senior positions with international mining companies based in Vancouver.
Mr. Rubenstein has been a director of ours since July 1990.
Mr. Rubenstein is a director of the following public companies: Redcorp Ventures Ltd., Cumberland Resources Ltd. and Canico Resource Corp.
David J. Jennings
Director |  |
Mr. Jennings is a principal of the law firm Irwin, White & Jennings in Vancouver, Canada and has been such since 1999.
Over the past decade Mr. Jennings has specialized in corporate finance and securities law with several publicly-traded companies. Mr. Jennings' practice includes initial public and additional offerings, debt offerings, venture capital financings, take-over bids and issuer bids, proxy contests, reorganizations, corporate governance matters and related transactions.
Mr. Jennings was the past Chair of the Securities Subsection of the Canadian Bar Association, British Columbia branch, and a member of the British Columbia Securities Commission Law Advisory Committee. Mr. Jennings has written articles and lectured on the areas of corporate and securities law and venture capital financing. Mr. Jennings received his B.A. from the University of Western Ontario in 1984 and his J.D. from the University of Toronto in 1988. Mr. Jennings has been a director of ours since August, 1999.
54
John Lagadin
Director |  |
Mr. Lagadin's list of achievements includes: founder of the C$5.5 billion Alliance Natural Gas Pipeline; founder and president of Direct Energy Marketing Limited, which grew to be the largest independent gas marketer in Canada; co-founder and financier of Municipal Gas Corporation, an aggregator of residential and commercial gas customers; founder of Energy Exchange Inc., the first commodity-styled, web-based electronic exchange for the sale and purchase of natural gas; and most recently investor and President of GeoScope Exploration Technologies, Inc., a company using proprietary, state-of-the-art seismic interpretation techniques to explore for oil & gas.
He is an independent businessman who invests in private start-up businesses and public companies with less than 10% ownership. He also manages family trust affairs.
Mr. Lagadin holds a Bachelor of Science degree in Geological Engineering from Michigan Technology University. Recently, he was awarded the Centennial Leadership Award by the Association of Professional Engineers, Geologists and Geophysicists of Alberta, in recognition of his achievements in the natural gas industry.
Mr. Lagadin is a member of the Board of Directors of Cabre Exploration, Petro-Reef Resources and Direct Energy Marketing. Mr. Lagadin has been a director of ours since August, 2000.
William B. Thompson
Director |  |
Mr. Thompson holds a BSc in physics from the University of British Columbia and is a graduate of the Stanford Executive Program. He is a member in good standing of the Professional Engineers Geologists and Geophysicists Associations of Alberta and British Columbia.
Mr. Thompson has a distinguished background in Western Canada’s oil and natural gas industry. From 1967 to 1976, Mr. Thompson worked as a district geophysicist headquartered at the Calgary and Houston offices of Amoco. During the next twenty-four years, he held numerous senior executive responsibilities for Petro-Canada of Calgary, Alberta, including the positions of Vice-President Provincial and Frontier Exploration, and Vice-President Business Analysis and Support Services.
In 1989, Mr. Thompson served on the Executive Committee of the Canadian Petroleum Association and for the four-year period ending 1992, he served as a director of PanArctic Oil Limited. From 1985 to 1990 he served as a director, and in 1989 he was Chairman of the British Columbia Division of the Canadian Petroleum Association. Mr. Thompson has been a director of ours since December 2002.
55
Michael A. Bardell
Chief Financial
Officer, Corporate
Secretary |  |
Mr. Bardell holds a diploma in finance and accounting and has over 35 years experience developing and directing financial, computer and money management systems. Beginning his career with Hudson's Bay Oil and Gas, he later held senior management positions in junior oil and gas companies, and in the drilling service industry.
Before joining the Company, he was controller for one of the world's largest sulphur marketing consortiums consisting of 28 major energy companies including Gulf Canada, Chevron Canada, Canadian Occidental and Union Oil.
Mr. Bardell was our controller from 1988 to 1999 and our Chief Financial Officer from 1999 to present. Mr. Bardell is a member of Financial Executives International.
David G. Grohs
Vice-President
Production |  |
Mr. Grohs holds a Bachelor of Applied Science degree in Mechanical Engineering from the University of British Columbia and is a registered professional engineer in the provinces of British Columbia and Alberta. He has 15 years experience in the Canadian oil and gas industry, including positions with Shell Canada Limited, Numac Energy Inc., and ENCO Gas, Ltd. David Grohs is responsible for production operations, engineering and acquisitions.
None of our directors, officers or employees have any family relationship with one another. To the best of our knowledge, there are no arrangements or understandings with major shareholders, customers, suppliers or others, pursuant to which any person referred to above was selected as a director or member of senior management.
Compensation
Total Compensation Paid, and Benefits Granted to Named Executive Officers and Directors
The following table sets forth all annual and long-term compensation for services in all capacities to us for Fiscal 2003 in respect of each of the individuals comprised of the Chief Executive Officer and our other four most highly compensated executive officers whose individual total compensation for Fiscal 2003 exceeded $100,000 and any individual who would have satisfied these criteria but for the fact that the individual was not serving as an officer at the end of Fiscal 2003 (collectively “the Named Executive Officers”). The information is presented in accordance with applicable Canadian and U.S. regulations regarding reporting financial information on individual persons.
56
| Named Executive Officers | | | | | |
| | | | | | Other Annual | | Options | | Exercise | |
| Name/Position | Salary | | Bonus | | Compensation(1) | | Granted(2) | | Price | |
| | ($) | | ($) | | ($) | | (#) | | ($) | Expiry Date |
| Wayne J. Babcock | | | | | | | | | | |
| President & CEO | 152,310 | | Nil | | 2,491,351 | | 35,000 | | 4.66 | July 15, 2008 |
| Donald K. Umbach | | | | | | | | | | |
| Vice President & COO | 143,096 | | Nil | | 2,491,351 | | 35,000 | | 4.66 | July 15, 2008 |
| David G. Grohs, | | | | | | | | | | |
| Vice-President, Production | 140,805 | | 53,000 | | Nil | | 20,000 | | 4.66 | July 15, 2008 |
| Michael A. Bardell, | | | | | | | | | | |
| CFO & Corporate Secretary | 104,300 | | 20,000 | | Nil | | 20,000 | | 4.66 | July 15, 2008 |
| James R. Britton(3) | | | | | | | | | | |
| Vice-President, Exploration | 79,363 | | Nil | | 2,491,351 | | 15,000 | | 4.66 | July 15, 2008 |
(1)The Other Annual Compensation paid during reporting periods is in respect to payments made to certain of the Named Executive Officers pursuant to royalty agreements previously approved by our shareholders. During the period January 1 to July 7, 2003, amounts paid pursuant to each of the three overriding royalty agreement was $319,351. On July 7, 2003, we repurchased from each the three Named Executive Officers, gross overriding royalty interests that previously burdened total current and future corporate production by 1% (for a total of 3%). We paid an aggregate of $6,516,000 to eliminate these obligations under the three overriding royalty agreements. The aggregate purchase price was paid by the issuance of 1,050,666 of our common shares and the payment of $1,000,000 in cash. The number of common shares was based on a deemed price of $5.25 per share, such price having been determined according to a daily volume-weighted average price formula applied to recent trading as required by the rules of the Toronto Stock Exchange.
(2)We have a formalized stock option plan for the discretionary granting to the Named Executive Officers of incentive stock options that are exercisable for shares of our Common Stock.
(3)Mr. Britton retired effective October 27, 2003.
As of July 13, 1990, we had overriding management royalty agreements with Wayne J. Babcock and Donald K. Umbach and as of August 31, 1990, we had an overriding management royalty agreement with James R. Britton. Each of the overriding management royalty agreements required us to pay an overriding royalty interest of 1% of our share of gross monthly production of all petroleum substances produced or deemed to be produced and marketed from or allocated to each well on all lands acquired by us since June 1, 1986 for Mr. Babcock and Mr. Umbach and since June 1, 1987 for Mr. Britton. As explained further in Note 1 above, we purchased these royalty agreements from Messrs. Babcock, Umbach and Britton in July 2003, thereby ending the overriding royalty arrangements with such persons.
During Fiscal 2003, we paid cash compensation to our officers in the aggregate sum of $2,650,927. This amount includes a one-time cash payment of $1,958,053 and a one-time issuance of shares valued at $5,516,000 pursuant to the repurchase of the gross overriding royalty agreements as described in Note 1 above.
As of our most recently completed fiscal year, we had employment contracts with all of the Named Executive Officers. Each of the contracts has standard employment provisions, including salary, benefits, vacation time, non-competition and confidentiality provisions. In addition, each of the contracts requires the Named Executive Officer not to voluntarily leave his employ during actions taken by third parties to acquire control of us. If a Named Executive Officer resigns within six months of a change of control of us for the sole reason that a change of control of us has occurred, the Named Executive Officer may receive a severance package including an amount equal to 12 months salary and the economic benefit of any stock options then outstanding. If the Named Executive Officer is terminated by us without cause, such officer may receive a severance package including an amount equal to 24 months salary, the economic benefit of any stock options then outstanding, and certain health and insurance benefits for a period not to exceed 12 months.
Other than employment contracts described above, we had, as of the end of Fiscal 2003, no compensatory plan or arrangement in respect of compensation received or that may be received by the Named Executive Officers to compensate Named Executive Officers in the event of the termination of employment (resignation, retirement, change of control) or in the event of a change in responsibilities following a change in control, where in respect of the Named Executive Officer the value of such compensation exceeds $100,000, a threshold required by Canadian securities regulations.
The following table sets forth all compensation for services in all capacities to us for Fiscal 2003 in respect of each of the non-employee directors. None of our directors have service contracts with the company relating to their serving as a director, and none of the directors will receive benefits upon termination of their position as a director. Directors who are a member of an official standing committee (i.e. audit, reserves audit, corporate governance,
57
compensation or any other) are granted 5,000 options annually and directors who chair such committees are granted 2,500 options annually in addition to those identified above.
| Compensation of Non-Employee Directors | | | |
| | | | Other Annual | Options | Exercise | |
| Name/Position | Salary(1) | Bonus | Compensation | Granted (#)(2) | Price | Expiry Date |
| John A. Greig | Nil | Nil | Nil | 17,500 | $4.10 | Apr 29, 2013 |
| | | | | 15,000 | $5.30 | Jun 18, 2008 |
| Jonathan A. Rubenstein | Nil | Nil | Nil | 17,500 | $4.10 | Apr 29, 2013 |
| | | | | 15,000 | $5.30 | Jun 18, 2008 |
| David J. Jennings(3) | Nil | Nil | Nil | 12,500 | $4.10 | Apr 29, 2013 |
| | | | | 15,000 | $5.43 | Aug 21, 2008 |
| John Lagadin | Nil | Nil | Nil | 2,500 | $3.91 | Apr 2, 2013 |
| | | | | 7,500 | $4.10 | Apr 29, 2013 |
| | | | | 15,000 | $5.43 | Aug 21, 2008 |
| William B. Thompson(4) | Nil | Nil | Nil | 10,000 | $3.91 | Apr 2, 2013 |
| | | | | 10,000 | $4.10 | Apr 29, 2013 |
| | | | | 15,000 | $5.30 | Jun 18, 2008 |
(1) During Fiscal 2003 , we did not pay any cash compensation to our directors (employee and non-employee), in their capacities as such.
(2)We have a formalized stock option plan for the non-discretionary, annual granting of incentive stock options to outside directors that are exercisable for shares of our Common Stock. The options indicated above were granted pursuant to that plan.
(3)At our Annual General Meeting held on August 25, 1999, our shareholders approved the nomination of David J. Jennings for election as director for a three-year term. He was subsequently re-appointed at the 2002 Annual General Meeting for an additional three-year term. Mr. Jennings performs legal work on our behalf as a Barrister and Solicitor with the firm of Irwin, White & Jennings (1999). Mr. Jennings’ Fiscal 2003 legal fees amounted to approximately $67,000 (Cdn.).
(4) Mr. Thompson was appointed as a director through board nomination on December 17, 2002 and was subsequently re-elected at the 2003 Annual General Meeting for an additional three-year term.
Non-Cash Compensation to Directors, Officers and Employees
We have a formalized incentive stock option plan for our directors, officers and employees. The purpose of such options is to assist us in compensating, attracting, motivating and retaining those persons and to closely align the personal interests of such persons to that of our shareholders.
The following table shows the number of shares of Common Stock subject to outstanding stock options held by our directors or officers, as a group as of May 5, 2004.
| Stock Options Outstanding as of May 5, 2004 | | |
| (Directors/Officers, as a group) | | |
| | | Number of Shares of |
| Expiry Date | Exercise Price | Common Stock |
| January 23, 2005 | $1.45 | 25,000 |
| September 28, 2005 | $2.10 | 300,000 |
| April 3, 2006 | $1.70 | 30,000 |
| February 27, 2007 | $1.75 | 210,000 |
| June 18, 2008 | $5.30 | 45,000 |
| July 15, 2008 | $4.66 | 125,000 |
| August 21, 2008 | $5.43 | 30,000 |
| April 30, 2009 | $4.75 | 65,000 |
| August 16, 2010 | $1.72 | 112,500 |
| September 28, 2010 | $2.10 | 18,750 |
| April 29, 2011 | $2.15 | 52,500 |
| August 22, 2011 | $2.10 | 60,000 |
| April 29, 2012 | $1.65 | 57,500 |
| August 21, 2012 | $1.75 | 60,000 |
| December 16, 2012 | $2.95 | 15,000 |
| April 2, 2013 | $3.91 | 12,500 |
| April 29, 2013 | $4.10 | 65,000 |
| Total | | 1,283,750 |
58
The following table shows the number of shares of Common Stock subject to outstanding stock options held by employees and consultants who are neither our directors nor officers as of May 5, 2004.
| Stock Options Outstanding as of May 5, 2004 | | |
| (Non-Directors/Non-Officers) | | |
| | | Number of Shares of |
| Expiry Date | Exercise Price | Common Stock |
| January 23, 2005 | $1.45 | 20,000 |
| July 30, 2005 | $1.75 | 30,000 |
| September 28,2005 | $2.10 | 48,000 |
| February 28, 2006 | $2.17 | 20,250 |
| April 14, 2006 | $2.25 | 30,800 |
| February 27, 2007 | $1.75 | 88,334 |
| February 16, 2008 | $3.80 | 30,000 |
| July 15, 2008 | $4.66 | 108,500 |
| Total | | 375,884 |
Stock Options Granted to and Exercised by Named Executive Officers
During Fiscal 2003 there were a total of 125,000 options granted to the Named Executive Officers as a group.
During Fiscal 2003, there were a total of 623,000 options exercised by named executive officers, employee directors and non-employee directors.
The following table sets forth details of the number of stock options held as of May 5, 2003 by each of the Named Executive Officers. The table also sets forth the May 5, 2004 value of unexercised in-the-money options on an aggregated basis. We have no stock appreciation rights outstanding.
| Stock Options Held by Named Executive Officers | |
| | | Dollar Value of Unexercised In-the- |
| | Number of Unexercised Options | Money Options Held At |
| | Held At May 5, 2004 | May 5, 2004(1) |
| Name | Exercisable / Unexercisable | Exercisable / Unexercisable |
| Wayne J. Babcock | 140,000/55,000 | $385,000/$63,150 |
| Donald K. Umbach | 140,000/55,000 | $385,000/$63,150 |
| David G. Grohs | 43,333/26,667 | $131,499/$21,801 |
| Michael A. Bardell | 76,667/33,333 | $212,500/$41,800 |
| James R. Britton | 70,000/25,000 | $192,500/$31,350 |
(1)Value of unexercised in-the-money options calculated using the closing price of our shares of Common Stock on the Toronto Stock Exchange on May 5, 2004, less the exercise price of in-the-money stock options.
Options and Bonus Shares
During the year ended December 31, 2003, members of the Compensation Committee recommended, and the Board of Directors approved, the granting of 138,500 options to our employees. There were no option re-pricings during the year ended December 31, 2003. The Compensation Committee also affirmed a recommendation from our President and our Chief Operating Officer for the distribution of a special cash bonus to our Vice President, Production reflecting his exceptional performance. At the 2003 Annual General Meeting, a stock bonus plan was approved by our shareholders that provides for up to 50,000 bonus shares in the aggregate to be issued to eligible directors, officers or employees. There were no bonus shares issued in Fiscal 2003 pursuant to the 2003 Incentive Stock Bonus Plan. The Committee intends to continue a conservative approach to the issuance of these bonus shares.
The maximum number of bonus shares and options under the 2003 Incentive Stock Option Plan available to any one eligible director, officer or employee under the Bonus Plan and the 2003 Incentive Stock Option Plan is 5% of the outstanding shares of the Company.
59
Board Practices
Term of Office
At our annual general meeting held on August 27, 1998, our shareholders approved amending our Articles of Incorporation to provide that approximately one-third of the members of the Board of Directors be elected annually for three-year terms. At the end of Fiscal 2003, we had seven directors. The terms of all seven expire at the annual meeting of shareholders as follows:
- two in Fiscal 2004;
- two in Fiscal 2005; and
- three in Fiscal 2006.
| Name | Term of Office Remaining | Held Office Since |
| Wayne J. Babcock | One year | 1980 |
| Donald K. Umbach | One year | 1986 |
| John A. Greig | Three years | 1991 |
| Jonathan A. Rubenstein | Three years | 1991 |
| David J. Jennings | Two years | 1999 |
| John Lagadin | Two years | 2000 |
| William B. Thompson | Three years | 2002 |
Our executive officers are not appointed by the Board of Directors for any specific term but serve until they resign, their successor is duly elected and qualified, or they are removed from office or otherwise disqualified from service as one of our officers.
Committees: Audit, Audit Reserves, Compensation and Corporate Governance
The following table sets forth details relating to the composition of our Board Committees as of the end of Fiscal 2003.
| List of Directors, Committees and Committee Members | | | | |
| | | | | | |
| | | Corporate | | Audit | |
| | Full Board | Governance | Compensation | Reserves | Audit |
| Non-Employee Directors | | | | | |
| John Greig | x | x | x | | Chair |
| Jonathan Rubenstein | x | x | Chair | | x |
| David Jennings | x | Chair | x | | |
| John Lagadin | x | | | Chair | |
| Bill Thompson | x | | | x | x |
| | | | | | |
| Employee Directors | | | | | |
| Wayne Babcock | Chair | | | | |
| Don Umbach | x | | | | |
Audit Committee - the Audit Committee is mandated to:
assist the Board of Directors in fulfilling its fiduciary responsibilities relating to accounting and reporting practices and internal controls;
Review audited financial statements and management’s discussion and analysis of operations with the auditors;
review the annual report and all interim reports with the auditors;
ensure that no restrictions are placed by management on the scope of the auditor's review and examination of our accounts; and
recommend to the Board of Directors the firm of auditors to be nominated by the Board of Directors for appointment by the shareholders at the annual general meeting.
60
Reserves Audit Committee - the Reserves Audit Committee is mandated to:
- assist the Board of Directors in fulfilling its oversight responsibilities with respect to our annual reserves estimates;
- recommend to the Board of Directors for appointment, the firm of independent qualified engineers to evaluate our annual reserves;
- examine the work scope, information access, resolved opinion differences and determine the independence of the independent engineering firm; and
- review the annual estimated reserves as prepared by the independent engineers.
Corporate Governance Committee – the Corporate Governance Committee is mandated to deal generally with corporate governance obligations and opportunities presented to us. It has prepared written mandates that define the stewardship responsibilities of the Board of Directors and its committees, implemented a risk management system, and ensured that effective communications systems are in place among the Company, its shareholders and the public. As well, the Corporate Governance Committee recommends nominees for the Board of Directors, and oversees the effective functioning of the Board of Directors and its relationship with management. In all activities the Corporate Governance Committee adheres to Canadian and U.S. statutory obligations to ensure we are in compliance with all applicable laws.
Compensation Committee - the Compensation Committee is mandated to consider and make recommendations to the Board of Directors for appropriate compensation packages for our executive officers and directors. The guiding philosophy of the Compensation Committee in determining compensation for executives has been to provide a compensation package that is flexible, entrepreneurial and geared towards attracting, retaining and motivating executive officers. The policies of the Compensation Committee encourage performance by executives to enhance our growth and profitability. Achievement of these objectives is intended to contribute to an increase in shareholder value.
Royalty Interests Acquired
We have never had a pension plan or provided compensation in the form of any plan intended to serve as incentive for long term performance greater than one financial year. However, the shareholders previously approved royalty agreements with certain officers whereby we paid annually an overriding royalty interest of 1% of our share of gross monthly production of all petroleum substances produced or deemed to be produced and marketed from or allocated to each well on all lands acquired by us since June 1, 1986 (two Named Executive Officers) and since June 1, 1987 (the third Named Executive Officer). During the year ended December 31, 2003, the Compensation Committee of the Board of Directors negotiated and reached agreements with each of Mr. Wayne J. Babcock, Mr. Donald K. Umbach and Mr. James R. Britton to repurchase the overriding royalty interests for an aggregate purchase price of $6,516,000. Under the terms of the repurchase documents, the aggregate purchase price was paid by the issuance of 1,050,666 common shares of the Company and the payment of $1,000,000 in cash. The number of common shares issued was based on a price of $5.25 per share, such price having been determined according to a daily volume-weighted average price formula applied to trading at the time of the repurchase as required by the rules of the Toronto Stock Exchange. The Compensation Committee and our independent directors determined that the purchase price was fair based upon reports by Sproule Associates Limited of Calgary, Alberta, a fairness opinion prepared by Octagon Capital Corporation of Toronto, Ontario, and input from other advisors. The repurchase transaction was completed on July 7, 2003.
Salaries and Bonuses
Since 1999 the Compensation Committee has retained the services of William M. Mercer Inc. (“Mercer”) of Calgary, Alberta to conduct thorough executive compensation reviews. As a result of the Mercer report received in 2003, the Compensation Committee found that the salary levels of our Company’s executives were “outside and below the ranges of salaries for executives in comparable positions in the peer group of oil and gas producing companies”. As a result of this, and following the closing of our acquisition of the aforementioned royalties, the Committee resolved to increase the base annual salary levels of each of the President and Chief Executive Officer, and the Vice President and Chief Operating Officer from $116,800 to $190,000 and from $116,800 to $171,000, respectively, and also to institute discretionary bonus provisions in the employment arrangements for these officers. The distribution of such bonuses by the committee for Fiscal 2003 has not yet been considered.
61
After giving effect to these adjustments, the salary of each of these two executives remain below the mean of the salaries paid for the same positions by a selected peer group of companies. No subsequent increases, other than cost of living increases, have been made to the salary levels for the year ended December 31, 2003.
The Compensation Committee considers it prudent to ensure that remuneration arrangements for key executives are competitive with our peers and include an element of reward where warranted to reflect above-average performance.
The Compensation Committee further resolved that, consistent with our peer group of companies, all the above executive positions would be eligible for discretionary stock option participation.
Retirement Payment
Mr. James R. Britton was paid a retirement amount of about $19,000 to reward him at the end of his many years of service to us.
Indebtedness and Material Interest of Committee Members
Our Board of Directors is composed of seven directors. None of the members of the Audit, Audit Reserves, Compensation and Corporate Governance Committees has any indebtedness to us nor does any have any material interest, or have any associates or affiliates that have any material interest, direct or indirect, in any actual or proposed transaction in the last fiscal year that has materially affected or would materially affect us. Additionally, no employee directors serve on any of our Board committees.
Employees
As of December 31, 2003, we employed twenty-one people full time in our Richmond, British Columbia office, as compared with sixteen as of December 31, 2002. The persons employed are the President & CEO, the Vice President & COO, the CFO & Corporate Secretary, the Vice President, Production and seventeen persons occupied with technical support, company and joint venture accounting, financial reporting, office management and land administration. None of our employees are related.
In addition to the foregoing, we also receive technical services from a number of exploration, geophysical, geological, engineering, accounting and legal consultants.
Beneficial Share Ownership
The following table sets forth the Common Stock ownership of each of our directors and officers. All ownership shown is of record and reflects beneficial ownership as of May 5, 2004, and represents the number of shares of Common Stock beneficially owned, directly or indirectly, or controlled by the person listed. Unless otherwise indicated, such shares are held directly.
| Beneficial Share Ownership of Directors and Officers | | |
| | | Number of Shares of | Percent of |
| Name | Position | Common Stock(1) | Class |
| Wayne J. Babcock | President & CEO, Director | 1,293,607 | 5.5 |
| Donald K. Umbach | Vice President & COO, Director | 680,254 | 2.9 |
| John A. Greig | Director | 263,077 | 1.1 |
| Jonathan A. Rubenstein | Director | 178,313 | 0.8 |
| David J. Jennings | Director | 157,500 | 0.7 |
| John Lagadin | Director | 95,000 | 0.4 |
| William B. Thompson | Director | 60,000 | 0.3 |
| Michael A. Bardell | CFO & Corporate Secretary | 298,041 | 1.3 |
| David G. Grohs | Vice President, Production | 58,333 | 0.2 |
| (1)Includes options exercisable within 60 days of May 4, 2004. | | |
62
Item 7. Major Shareholders and Related Party Transactions
Major Shareholders
To the best of our knowledge, no person beneficially owns, directly or indirectly, or exercises control or direction over shares constituting more than five percent of the voting rights of our shares, other than our President and CEO, Wayne Babcock, who beneficially owns approximately 5.5% of our outstanding shares. Over the past three fiscal years, Mr. Babcock increased his beneficial ownership by 741,314 shares of Common Stock. Of this increase, 413,714 shares or 56% were acquired upon our repurchase in Fiscal 2003 of his gross overriding royalty interest that previously burdened our total current and future production by 1% (see Note 7(d) to our Financial Statements). The balance of the increase in his beneficial ownership was mostly due to his exercise of stock options.
All of our outstanding shares are Common Stock without par value, each possessing equal voting rights. There is no other class of shares authorized.
Related Party Transactions
Please see the description of our Gross Overriding Royalty Agreements in Item 10 – “Material Contracts and Agreements – Gross Overriding Royalty Repurchase Agreements”.
Interests of Experts and Counsel
None.
Item 8. Financial Information
Financial Statements and Other Financial Information
Financial statements are provided under Item 17.
There are no material legal proceedings to which we are subject or that are anticipated or threatened.
We have never paid dividends to shareholders nor is there a policy in place to so do. All cash flow generated by us is reinvested in our operations.
Significant Changes
During the period of January 1, 2004 to the date of this Report, no significant change has occurred.
Item 9. The Offer and Listing
Markets and Price History of the Stock
Our shares of Common Stock are traded in Canada on the Toronto Stock Exchange (“TSX”) under the symbol “DOL” and in the United States through the National Association of Securities Dealers Automated Quotation System ("NASDAQ") SmallCap under the symbol “DYOLF”. Our shares of Common Stock began trading in Canada on the TSX on May 27, 1999. Prior to that date, our shares of Common Stock traded in Canada on the Vancouver Stock Exchange (“VSE”). We chose to de-list our shares of Common Stock from trading on the Vancouver Stock Exchange on August 25, 1999 in favour of our TSX listing.
As of May 5, 2002, we had 21,051,196 shares of Common Stock outstanding. At that date, we estimate 66 shareholders of record resident in Canada holding 10,352,352 shares of common stock and 821 shareholders of record resident in the United States holding 10,698,844 shares of Common Stock. Our shares of Common Stock are issued in registered form and the number of shares of Common Stock reported to be held by record holders in Canada and the United States is taken from the records of The CIBC Mellon Trust Company, the registrar and transfer agent for our shares of Common Stock. For U.S. reporting purposes, we are a foreign private issuer.
63
The high and low prices for our Common Stock for the five most recent reporting periods on the VSE (up to August 24, 1999), on the TSX (starting May 27, 1999) and on The NASDAQ SmallCap Market are as follows:
| | TSX (in Cdn $) | | NASDAQ SmallCap(in U.S. $) |
| | High | Low | High | Low |
| Fiscal 2003 | 6.49 | 3.10 | 4.97 | 1.99 |
| Nine-Month Fiscal Transition 2002 | 4.45 | 1.60 | 3.05 | 1.01 |
| Fiscal 2002 | 2.63 | 1.55 | 1.75 | 0.92 |
| Fiscal 2001 | 3.00 | 1.55 | 2.06 | 1.00 |
| Fiscal 2000 | 2.05 | 1.44 | 1.50 | 0.97 |
| Fiscal 1999 | 1.90 | 1.40 | 1.38 | 0.88 |
The high and low prices for our common stock for each quarter for the last two reporting periods on the TSX and on The NASDAQ SmallCap Market are as follows:
| Prices of Common Stock | | TSX (in Cdn $) | NASDAQ Small Cap (in U.S. $) |
| | High | Low | High | Low |
| Fiscal 2003 | | | | |
| Q1 ended March 31, 2003 | 4.10 | 3.22 | 3.00 | 1.99 |
| Q2 ended June 30, 2003 | 5.75 | 3.91 | 4.25 | 2.33 |
| Q3 ended September 30, 2003 | 5.93 | 4.15 | 4.25 | 2.90 |
| Q4 ended December 31, 2003 | 6.49 | 4.61 | 4.97 | 3.50 |
| Nine-Month Fiscal Transition 2002 | | | | |
| Q1 ended June 30, 2002 | 2.00 | 1.60 | 1.25 | 1.01 |
| Q2 ended September 30, 2002 | 2.25 | 1.60 | 1.39 | 1.05 |
| Q3 ended December 31, 2002 | 4.45 | 1.90 | 3.05 | 1.18 |
| Fiscal 2002 | | | | |
| Q1 ended June 30, 2001 | 2.52 | 1.69 | 1.75 | 1.06 |
| Q2 ended September 30, 2001 | 2.35 | 1.55 | 1.55 | 0.92 |
| Q3 ended December 31, 2001 | 2.05 | 1.56 | 1.31 | 1.02 |
| Q4 ended March 31, 2002 | 2.05 | 1.60 | 1.34 | 1.00 |
The high and low prices for our common stock for the most recent six months on the TSX and on The NASDAQ SmallCap Market are as follows:
| | TSX (in Cdn $) | | NASDAQ SmallCap(in U.S. $) |
| Year | High | Low | High | Low |
| Apr/2004 | 5.00 | 4.40 | 3.83 | 3.33 |
| Mar/2004 | 5.00 | 4.10 | 3.90 | 3.11 |
| Feb/2004 | 5.48 | 4.76 | 4.28 | 3.52 |
| Jan/2004 | 6.49 | 4.69 | 5.04 | 3.51 |
| Dec/2003 | 6.49 | 4.75 | 4.97 | 3.80 |
| Nov/2003 | 5.50 | 4.61 | 4.17 | 3.53 |
Item 10. Additional Information
Memorandum and Articles of Association
Our objects and purposes as set forth in our Memorandum and Articles
Our Memorandum and Articles (the “Articles”) are silent as to our objects and purposes. However, under the laws of British Columbia, we have the rights of a natural person, subject to restrictions imposed by statute, and accordingly, our objects and purposes are not limited to any particular activities.
64
| | |
| Matters relating to our Directors | |
Director’s power to vote on a proposal, arrangement or contract in which the director is materially interested - Part 15.1 of our Articles provides: “A Director who is, in any way, directly or indirectly interested in an existing or proposed contract or transaction with the Company or who holds any office or possesses any property whereby, directly or indirectly, a duty or interest might be created to conflict with his duty or interest as a Director shall declare the nature and extent of his interest in such contract or transaction or of the conflict or potential conflict with his duty and interest as a Director, as the case may be, in accordance with the provisions of the British Columbia Company Act (the “Company Act”).” Part 15.2 states: “A Director shall not vote in respect of any such contract or transaction with the Company in which he is interested [subject to certain exclusions as set forth in this Part] and if he shall do so his vote shall not be counted, but he shall be counted in the quorum present at the meeting at which such vote is taken.”
Director’s power, in the absence of an independent quorum, to vote compensation to themselves or any members of their body -Part 12.2 of our Articles provides: “The remuneration of the Directors as such may from time to time be determined by the Directors or, if the Directors shall so decide, by the members [i.e. shareholders]. Such remuneration may be in addition to any salary or other remuneration paid to any officer or employee of the Company as such who is also a Director.”
Borrowing powers exercisable by the directors and how such borrowing powers can be varied -Part 8.1 of our Articles provides: “The Directors may from time to time on behalf of the Company . . . borrow money in such manner and amount, on such security, from such sources and upon such terms and conditions as they think fit, issue bonds, debentures and other debt obligations either outright or as security for any liability or obligation of the Company or any other person, and mortgage . . . or give other security on the undertaking, or on the whole or any part of the property and assets, of the Company (both present and future).” Part 8.2 states: “Any bonds, debentures or other debt obligations of the Company may be issued at a discount, premium or otherwise, and with any special privileges as to redemption, surrender, drawing, allotment of or conversion into or exchange for shares or other securities, attending and voting at general meetings of the Company, appointment or election of Directors or otherwise and may by their terms be assignable free from any equities between the Company and the person to whom they were issued or any subsequent holder thereof, all as the Directors may determine.”
The borrowing powers of our directors may only be varied by an amendment to our Articles. A vote of at least three-quarters of our issued and outstanding shares cast at a duly called meeting is required to approve such an amendment.
Retirement or non-retirement of directors under an age limit requirement -Our Articles are silent with regard to the retirement or non-retirement of directors under an age limit requirement.
Number of shares, if any required for director’s qualification -Part 12.3 of our Articles states that “a Director shall not be required to hold a share in the capital of the Company as qualification for his office but shall be qualified as required by the Company Act to become or act as a Director.”
Rights, preferences and restrictions attaching to each class of shares
We have only one class of shares, our common shares.
Dividend rights, including time limit after which dividend entitlement lapses -Our shareholders have the right to receive dividends if, as and when declared by the Board of Directors. Neither the Company Act nor our Articles provides for lapses in dividend entitlement.
Voting rights -Each of our common shares entitles its holder to one vote at any annual or special meeting of our shareholders.
Rights to share in surplus in event of liquidation -In the event of our liquidation, dissolution or winding-up or other distribution of our assets, the holders of common shares will be entitled to receive, on a pro rata basis, all of the assets remaining after we have paid out our liabilities.
65
Redemption –We may purchase or otherwise acquire any of our shares at the price and upon the terms specified by resolution of our Directors and we may redeem any class of our shares in accordance with any special rights and restrictions attaching to those shares. There are no present special redemption rights or restrictions attached to our shares.
Other -Holders of common shares do not have rights to share in our profits. There are no sinking fund provisions with respect to our common shares. Common shareholders have no liability as to further capital calls by us. There are no provisions discriminating against any existing or prospective holder of our common shares as a result of such shareholder owning a substantial number of common shares. Holders of common shares do not have pre-emptive rights.
Actions necessary to change the rights of holders of our stock
In order to change the rights of all the holders of our issued and outstanding shares, a vote of at least three-quarters of all issued and outstanding shares cast at a duly called meeting is required. In order to change the rights of holders of a particular class of our stock, a vote of at least three-quarters of the issued and outstanding shares of that class cast at a duly called meeting of that class is required. If the change of rights of one class adversely affects any other class of our stock that is senior or equal to that class, then a vote of at least three-quarters of the issued and outstanding shares of the adversely affected class cast at a duly called meeting of that class is also required. We currently have only one class of shares, the common shares.
Conditions governing manner in which annual general meetings and extraordinary general meetings of shareholders are convoked
Annual Meeting -Part 9.1 of our Articles states: “Subject to any extensions of time permitted pursuant to the Company Act, . . . an annual general meeting shall be held once in every calendar year at such time (not being more than thirteen months after the holding of the last preceding annual general meeting) and place as may be determined by the Directors.”
Special Meeting -Part 9.4 of our Articles states: “The Directors may, whenever they think fit, convene an extraordinary general meeting. An extraordinary general meeting, if requisitioned in accordance with the Company Act, shall be convened by the Directors or, if not convened by the Directors, may be convened by the requisitionists as provided in the Company Act.” Part 9.6 of our Articles provides: “A notice convening a general meeting specifying the place, the day, and the hour of the meeting, and, in case of special business, the general nature of that business, shall be given as such provided in the Company Act and in the manner hereinafter in these Articles mentioned, or in such other manner (if any) as may be prescribed by ordinary resolution, whether previous notice thereof has been given or not, to such persons as are entitled by law or under these Articles to receive such notice from the Company.”
In addition, registered holders of at least five percent of our issued and outstanding shares may request a meeting of shareholders by giving written notice of such request to us. Upon receiving proper notice, we have up to twenty-one days to respond and then up to four months to hold the requested meeting. We may choose to satisfy the request for a meeting by calling our own meeting within the four month time period.
Limitations on rights to own securities of the Company
Except as provided in theInvestment Canada Act (the "Act"), enacted on June 20, 1985, as amended, as further amended by theNorth American Free Trade Agreement (NAFTA) Implementation Act (Canada) and theWorld Trade Organization (WTO) Agreement Implementation Act, there are no limitations under the laws of Canada, the Province of British Columbia or in the charter or any other of our constituent documents on the right of non-Canadians to hold and/or vote the Common Stock.
The Act requires a non-Canadian who is a WTO investor (defined below) making a direct acquisition of control of a Canadian business with assets of $237 million or more (for 2004), to file an application for review with Investment Canada, a federal agency created by the Act. At present we would constitute a Canadian business under the Act, although at present our asset value does not exceed the $237 million threshold. Under the Act, control of a corporation is deemed to be acquired through the acquisition of a majority of the voting shares of a corporation, and is presumed to be acquired where one-third or more, but less than a majority, of the voting shares of a corporation are acquired, unless it can be established that the Company is not controlled in fact through the ownership of voting shares.
66
If the non-Canadian investor is not a WTO investor, additional types of indirect acquisitions are reviewable and the financial thresholds for reviews are significantly less. As well, if a Canadian business is involved in cultural businesses, financial services, uranium or transportation services, the financial thresholds for reviews are significantly less. We are engaged in none of those businesses.
For the purposes of determining who is a “WTO investor” when an acquisition of a Canadian business occurs, the Act provides a definition that includes: an individual who is a national or a lawful permanent resident of a state that is a member of the World Trade Organization (“WTO”) (which includes the United States of America and an additional 146 member states); a government or government agency of a WTO state; an entity that is controlled by a WTO investor-controlled entity (other than a Canadian–controlled entity); and a corporation, limited partnership or trust which is not a Canadian-controlled entity of which two-thirds of its Board of Directors, general partners or trustees, as the case may be, are Canadian or WTO investors.
If a review occurs and the Minister responsible for Investment Canada is not satisfied that the investment is likely to be a net benefit to Canada, the non-Canadian shall not implement the investment or, if the investment has been implemented, shall divest himself of control of the business that is the subject of the investment.
A non-Canadian making (i) an investment to establish a new Canadian business or (ii) an investment to acquire control of a Canadian business which is not subject to review under the Act, must notify Investment Canada, before the investment is completed or within 30 days afterward, of such investment. It is intended that investments requiring only notification will proceed without government intervention unless the investment is in a specific type of business activity related to Canada's cultural heritage or national identity.
Provisions of our Memorandum or Articles that have the effect of delaying, deferring or preventinga change in control of us and that would operate only with respect to a merger, acquisition, or corporate restructuring involving us
There are no such limitations in our Memorandum or Articles. However, all of our executive officers have contractual rights under employment agreements to have their stock options vest immediately and obtain 12 to 24 months severance pay in the event of a change of control of our company.
As well, under British Columbia corporate legislation, some business combinations, including a merger or reorganization or the sale, lease or other disposition of all or a substantial part of our assets, must be approved by at least three-quarters of the votes cast by our shareholders or, in some cases, holders of each class of shares. In some cases, a business combination must be approved by a court. Shareholders may also have a right to dissent from the transaction, in which case, we would be required to pay dissenting shareholders the fair value of their common shares provided they have followed the required procedures.
Also, see discussion of our Permitted Bid Shareholder Protection Rights Plan in “Item 14. Material Modifications to the Rights of Security Holders and Use of Proceeds – Shareholder Rights Plan.”
Provisions of our Memorandum or Articles governing the ownership threshold above whichshareholder ownership must be disclosed
There are no such provisions in our Memorandum or Articles.
Significant differences between law applicable to us and law of the United States with respect to thematters addressed above in this Item 10.
Canadian securities legislation provides that a person that has direct or indirect beneficial ownership of, control or direction over, or a combination of direct or indirect beneficial ownership of, and of control or direction over, securities of the issuer carrying more than 10% of the voting rights attached to all the issuer’s outstanding voting securities must, within 10 days of becoming an “insider”, file an insider report in the required form effective the date on which the person became an insider, disclosing any direct or indirect beneficial ownership of, or control or direction over, securities of the reporting issuer. Canadian securities legislation also provides for the filing of a report by an “insider” of a reporting issuer who acquires or transfers securities of the issuer. This insider report must be filed within 10 days after the end of the month in which the change takes place.
67
The U.S. rules governing the ownership threshold above which shareholder ownership must be disclosed are more stringent than those under Canadian securities legislation. Section 13 of the Exchange Act imposes reporting requirements on persons who acquire beneficial ownership (as such term is defined in the Rule 13d-3 under the Exchange Act) of more than 5% of a class of an equity security registered under Section 12 of the Exchange Act. In general, such persons must file, within 10 days after such acquisition, a report of beneficial ownership with the Securities and Exchange Commission containing the information prescribed by the regulations under Section 13 of the Exchange Act. This information is also required to be sent to the issuer of the securities and to each exchange where the securities are traded.
Material Contracts and Agreements
During Fiscal 2003, we entered into three contracts to repurchase certain gross overriding royalty interests from three of our officers. Each royalty interest burdened our share of gross production of all petroleum substances by 1% on lands acquired by us since June 1, 1986 for two of the three officers and June 1, 1987 for the third officer. Apart from these three overriding royalty repurchase agreements, all other contracts/agreements we entered into during Fiscal 2003 are considered to be immaterial and in the ordinary course of our business.
Gross Overriding Royalty Repurchase Agreements dated July 6, 2003, repurchased by us from each of three of our officers. The gross overriding royalty interests previously burdened our total current and future corporate production by 3%. The Company paid an aggregate of $6,516,000 to eliminate the obligations under the three overriding royalty agreements. The aggregate purchase price was paid by our issuance of 1,050,666 shares of our Common Stock and the payment of $1,000,000 in cash. The number of shares of our Common Stock issued was based on a price of $5.25 per share, such price having been determined according to a daily volume-weighted average price formula applied to recent trading as required by the rules of the Toronto Stock Exchange.
68
Exchange Controls
U.S. shareholders may experience impediments to the enforcement of civil liabilities in the United States against foreign persons such as an officer, director or expert acting on our behalf in Canada. Such difficulty arises out of the uncertainty as to whether a court in the United States would have jurisdiction over a foreign person in the United States, whether a U.S. judgment is enforceable under Canadian law and whether suits under federal securities laws could initially be brought in Canada.
There are no governmental laws, decrees, or regulations in Canada that restrict the export or import of capital or that affect the remittance of dividends, interest, or other payments to nonresident holders of the Common Stock. However, any such remittance to a non-corporate resident of the United States may be subject to a 15% withholding tax pursuant to Article XI of the reciprocal tax treaty between Canada and the United States.
Except as provided in theInvestment Canada Act (the "Act"), enacted on June 20, 1985, as amended, as further amended by theNorth American Free Trade Agreement (NAFTA) Implementation Act (Canada) and theWorld Trade Organization (WTO) Agreement Implementation Act, there are no limitations under the laws of Canada, the Province of British Columbia or in the charter or any other of our constituent documents on the right of non-Canadians to hold and/or vote the Common Stock (see further comments under Item 10 – “Limitations on rights to own securities of the Company”).
Taxation
The following paragraphs set forth certain United States and Canadian federal income tax considerations in connection with the payment of dividends on and purchase or sale of our shares of Common Stock. The tax considerations are stated in general terms and are not intended to be advice to any particular shareholder. Each prospective investor is urged to consult his or her own tax advisor regarding the tax consequences of his or her purchase, ownership and disposition of shares of Common Stock.
The discussion set forth below is based upon the provisions of the Income Tax Act (Canada) (the "Tax Act"), the Internal Revenue Code of 1986, as amended (the "Code") and the Convention between Canada and the United States of America with respect to Taxes on Income and on Capital (the "Convention"), as well as United States Treasury regulations and rulings and judicial decisions. Except as otherwise specifically stated, the following discussion does not take into account or anticipate any changes to such laws, whether by legislative action or judicial decision. The discussion does not take into account the provincial tax laws of Canada or the tax laws of the various state and local jurisdictions in the United States.
Canadian Federal Income Tax Considerations
The following discussion applies only to citizens and residents of the United States and United States corporations who are not resident in Canada and will not be resident in Canada and who do not use or hold nor are deemed to use or hold such shares of Common Stock in carrying on a business in Canada.
The payment of cash dividends and stock dividends on the shares of Common Stock will generally be subject to Canadian withholding tax. The rate of the withholding tax will be 25% or such lesser amount as may be provided by treaty between Canada and the country of residence of the recipient. Under the Convention, the withholding tax generally would be reduced to 15%.
Neither Canada nor any province thereof currently imposes any estate taxes or succession duties. Provided a holder of shares of Common Stock has not, within the preceding five years, owned (either alone or together with persons with whom he or she does not deal at arm's length) 25% or more of the shares of Common Stock, the disposition (or deemed disposition arising on death) of such shares of Common Stock will not be subject to the capital gains provisions of the Tax Act.
69
United States Federal Income Tax Considerations
The following discussion is addressed to US holders. As used in this section, the term "US holder" means a holder that is (1) an individual citizen or resident of the United States, (2) a corporation, partnership or other entity created or organized in or under the laws of the United States or any political subdivision thereof, (3) an estate the income of which is subject to United States federal income taxation regardless of its source, or (4) a trust if a court within the United States is able to exercise primary supervision over the administration of the trust and one or more United States persons have the authority to control all substantial decisions of the trust, or a trust that has elected to be treated as a United States person. The discussion does not address all aspects of United States federal income taxation that may be relevant to US holders in light of their particular circumstances, nor does it address the United States federal income tax consequences to US holders that are subject to special rules under the Code, including, but not limited to, (i) dealers or traders in securities, (ii) financial institutions, (iii) tax-exempt organizations or qualified retirement plans, (iv) insurance companies, (v) persons holding Common Stock as a hedge or as part of a straddle, constructive sale, conversion transaction, or other risk management transaction, and (vi) holders who hold their Common Stock other than as a capital asset.
Dividends
Subject to the discussion of the "passive foreign investment company" rules below, a US holder owning shares of Common Stock must generally treat the gross amount of dividends paid by us to the extent of our current and accumulated earnings and profits without reduction for the amount of Canadian withholding tax, as dividend income for United States federal income tax purposes. To the extent that distributions exceed our current or accumulated earnings and profits, they will be treated first as a tax-free return of capital, which will reduce the holder's adjusted tax basis in his or her Common Stock (but not below zero), then as capital gain. The dividends generally will not be eligible for the "dividends received" deduction allowed to United States corporations. The amount of Canadian withholding tax on dividends may be available, subject to certain limitations, as a foreign tax credit or, alternatively, as a deduction (see discussion at "Foreign Tax Credit" below). Dividends paid by us will be treated as income from sources outside the United States, but generally will be "passive income," or in the case of certain types of taxpayers, "financial services income" for foreign tax credit purposes.
If we make a dividend distribution in Canadian dollars, the U.S. dollar value of the distribution on the date of receipt is the amount includible in income. Any subsequent gain or loss in respect of the Canadian dollars received arising from exchange rate fluctuations generally will be U.S. source ordinary income or loss.
Long-term capital gain of noncorporate taxpayers generally is eligible for preferential tax rates. Additionally, for taxable years beginning after December 31, 2002 and before January 1, 2009, subject to certain exceptions, dividends received by certain noncorporate taxpayers from “qualified foreign corporations” are taxed at the same preferential rates that apply to long-term capital gain. The maximum federal tax rate on net long-term capital gains recognized by noncorporate taxpayers currently is 15%. Provided that we are not a “passive foreign investment company,” as discussed below, we currently should meet the definition of “qualified foreign corporation.” As a consequence, dividends paid to certain noncorporate taxpayers should be taxed at the preferential rates.
Sale or Exchange of Common Stock
Subject to the discussion of the "passive foreign investment company" rules below, the sale of a share of our Common Stock generally results in the recognition of gain or loss to the US holder in an amount equal to the difference between the amount realized and the US holder's adjusted tax basis in such share. Gain or loss upon the sale of the share will be long-term or short-term capital gain or loss, depending on whether the share has been held for more than one year. The maximum federal tax rate on net long-term capital gains currently is 15% for noncorporate taxpayers and 35% for corporations. Capital gain that is not long-term capital gain is taxed at ordinary income rates. The deductibility of capital losses is subject to certain limitations.
Foreign Tax Credit
Subject to the limitations set forth in the Code, as modified by the Convention, a US holder may elect to claim a credit against his or her U.S. federal income tax liability for Canadian income tax withheld from dividends received in respect of shares of our Common Stock. Holders of our Common Stock and prospective US holders of our Common Stock should be aware that dividends we pay generally will constitute “passive income” for purposes of the
70
foreign tax credit, which could reduce the amount of foreign tax credit available to them. The rules relating to the determination of the foreign tax credit are complex. US holders of our Common Stock and prospective US holders of our Common Stock should consult their own tax advisors to determine whether and to what extent they would be entitled to such credit. Holders who itemize deductions may instead claim a deduction for Canadian income tax withheld.
Passive Foreign Investment Company Considerations
Special rules apply to US holders that hold stock in a "passive foreign investment company" ("PFIC"). A non-U.S. corporation generally will be a PFIC for any taxable year in which either (i) 75% or more of its gross income is passive income or (ii) 50% or more of the average value of its assets consists of assets that produce, or that are held for the production of, passive income. For this purpose, passive income generally includes, among other things, interest, dividends, rents, royalties and gains from certain commodities transactions.
We believe that we should not be classified as a PFIC for the current taxable year or prior taxable years, and we do not anticipate being a PFIC with respect to future taxable years. However, there can be no assurance that we will not be considered a PFIC for any taxable year, because (1) the application of the PFIC rules to our circumstances is unclear and (2) status under the PFIC rules is based in part on factors not entirely within our control (such as market capitalization). Furthermore, there can be no assurance that the Internal Revenue Service will not challenge our determination concerning our PFIC status. Therefore, US holders and prospective US holders are urged to consult with their own tax advisors with respect to the application of the PFIC rules to them.
If, contrary to our expectations, we were to be classified as a PFIC for any taxable year, a US holder may be subject to an increased tax liability (including an interest charge) upon the receipt of certain distributions from us or upon the sale, exchange or other disposition of Common Stock, unless such US holder timely makes one of two elections. First, if, for any taxable year that we are treated as a PFIC, a US holder makes a timely election to treat us as a qualified electing fund ("QEF") with respect to such Holder's interest in Common Stock, the electing US holder would be required to include annually in gross income (1) such Holder's pro rata share of our ordinary earnings, and (2) such Holder's pro rata share of any of our net capital gain, regardless of whether such income or gain is actually distributed. In general, a US holder may make a QEF election for any taxable year at any time on or before the due date (including extensions) for filing such Holder's United States federal income tax return for such taxable year. However, Treasury regulations provide that a US holder may be entitled to make a retroactive QEF election for a taxable year after the election's due date if certain conditions are satisfied. In the event of a determination by us or the Internal Revenue Service that we are a PFIC, we intend to comply with all record-keeping, reporting and other requirements so that US holders, at their option, may maintain a QEF election with respect to us. However, if meeting those record-keeping and reporting requirements becomes onerous, we may decide, in our sole discretion, that such compliance is impractical, and will notify US holders accordingly.
As an alternative to the QEF election, US holders may elect to mark their Common Stock to its market value (a "mark-to-market election"). If a valid mark-to-market election is made, the electing US holder generally will recognize ordinary income for the taxable year an amount equal to the excess, if any, of the fair market value of their Common Stock as of the close of such taxable year over the US holder's adjusted tax basis in the Common Stock. In addition, the US holder generally is allowed a deduction for the lesser of (1) the excess, if any, of the US holder's adjusted tax basis in the Common Stock over the fair market value of the Common Stock as of the close of the taxable year, or (2) the excess, if any of (A) the mark-to-market gains for the Common Stock included in gross income by the US holder for prior taxable years, over (B) the mark-to-market losses for Common Stock that were allowed as deductions for prior tax years.
The PFIC rules are complex. Accordingly, US holders and prospective US holders of our Common Stock are strongly urged to consult their own tax advisors concerning the impact of these rules, including the making of QEF or mark-to-market elections, on their investment or prospective investment in our Common Stock.
Financing Exploration and Development Drilling Through Canadian Income Tax Incentives
In order to encourage investment in the exploration for and development of its mineral deposits, Canada has amended the Income Tax Act of Canada so as to allow Canadian taxpayers making investments in oil and gas companies to deduct on their personal income tax return qualifying amounts spent by the oil and gas company on Canadian property. Qualifying amounts cover 100% of annual “exploration” expenses. In addition to being able to deduct their investment as an expense, the investor receives stock in the company for his or her investment. The terms of this type of
71
investment are usually set forth in a "Flow Through Agreement" in which the company agrees not to take as an income tax deduction the amount of the proceeds expended for exploration and/or development work, but to allow the deduction to “flow through” to the investors. This flow-through type of financing is of benefit only to Canadian taxpayers.
Under the Flow-Through type of financing, the investors pay their subscription amount to us. Shares of Common Stock are issued to the investor, and we covenant to renounce to the investor, with an effective date of December 31 of a particular year, certain exploratory or specified development expenses incurred by us under a flow through share arrangement within the first 60 days of the year following that particular year.
During Fiscal 2003, Nine-Month Fiscal Transition 2002, Fiscal 2002 and Fiscal 2001 we did not raise any flow-through funding.
Item 11. Quantitative and Qualitative Disclosures About Market Risk
The oil and gas industry is exposed to a variety of risks including the uncertainty of finding and recovering new economic reserves, the performance of hydrocarbon reservoirs, securing markets for production, commodity prices, interest rate fluctuations, potential damage to or malfunction of equipment and changes to income tax, royalty, environmental or other governmental regulations.
We mitigate these risks to the extent we are able by:
- employing highly-skilled staff and focusing them in areas where they have a strong knowledge base in order to maximize value.
- utilizing competent, professional consultants as support teams to company staff.
- performing careful and thorough geophysical, geological and engineering analyses of each prospect.
- using current, cost-effective and where feasible, leading-edge technology.
- maintaining adequate levels of property liability and business interruption insurance.
- focusing on a limited number of core properties.
- striving to be a low-cost producer to maximize Field netbacks.
- maintaining a balanced portfolio of sales contracts.
- staying informed about industry changes and trends through appropriate association memberships, publications, subscriptions and conferences.
Market risk is the possibility that a change in the prices for natural gas, natural gas liquids, condensate and oil, foreign currency exchange rates, or interest rates will cause the value of a financial instrument to decrease or become more costly to settle. Our financial instruments in Fiscal 2003 consist of cash and cash equivalents, accounts receivable, bank indebtedness, operating loan and accounts payable.
We are exposed to commodity price risks, interest rate risks and credit risk. We have no risks associated with foreign currency exchange rates.
Commodities Price Risk
Our future financial performance remains closely linked to hydrocarbon commodity prices, which can be influenced by many factors including global and regional supply and demand, worldwide political events and weather. These factors, among others, can result in a high degree of price volatility.
Natural gas -Our natural gas portfolio is split between two primary markets, one is the Alberta Spot Market, which trades at the AECO storage hub(www.encanastorage.com/), the other is an aggregator pool called ProGas(www.progas.com).
AECO, an intra-Alberta trading hub, offers producers the opportunity to participate in natural gas transactions for terms of one day, one month, summer and winter blocks, and annually. We are currently selling our uncommitted natural gas volumes into the AECO daily spot market, however, our marketing strategy includes securing monthly and term deals, if optimal.
72
ProGas, a wholly-owned subsidiary of BP Canada, ‘aggregates’ supplies of natural gas to sell into a basket of daily, short term (less than one year) and long-term contracts, both domestic and export. Producers realize a netback price for their natural gas, which is a blend of all contract types and weighted toward NYMEX-based prices.
During Fiscal 2003, we sold 46% of our natural gas to ProGas and 54% into the AECO daily spot market. During Nine-Month Fiscal Transition 2002 and Fiscal 2002, we sold 51% and 53% to ProGas, respectively, and the balances at AECO.
Natural gas liquids and crude oil -We market our natural gas liquids and crude oil based on monthly prices posted by the major purchasers at Edmonton, Alberta. These prices correlate closely to the price of West Texas Intermediate (one of the world’s crude oil benchmarks followed by market analysts, investors and industry), allowing for quality adjustments and location differentials.
We currently have no hedge positions, however, we manage our potential exposure to commodity price volatilities through diversification as follows:
Commodity mix – our sales portfolio is comprised of natural gas, crude oil and natural gas liquids. Crude oil and natural gas liquids are sold at prices with volatilities that differ from those of natural gas; and
Natural gas pricing mix – AECO pricing typically has a close correlation to NYMEX pricing, however, when the two become disconnected due to market dynamics, we are well-positioned to take advantage of premium pricing in either market area.
A financial swap is a derivative instrument whereby we and a third party agree to settle, at specified intervals, the difference between an agreed fixed commodity price, interest rate or exchange rate and floating prices or rates calculated by reference to an agreed notional volume or principal amount. We are currently not using swap contracts and have no obligation to deliver or receive quantities of natural gas, natural gas liquids or crude oil pursuant to a swap.
Weighted Average Prices and the Effect of Adversity
We use a sensitivity analysis technique to evaluate the hypothetical effect that changes in the market value of natural gas, natural gas liquids and crude oil may have on the fair value of our gross revenues. The following table demonstrates the effects of declines in the weight-averaged prices of our revenue-generating commodities (see also Item 5 – “Liquidity and Capital Resources - Sensitivity Analysis”).
| | Weight-Averaged Prices | | | | |
| Fiscal 2003 | | | Achieved | | After Consideration of Adversity % |
| | Final | | Entire | | | | |
| | Quarter | | Period | | 10% | 20% | 30% |
| Natural gas ($/mcf) | 5.73 | | 6.56 | | 5.90 | 5.25 | 4.59 |
| Natural gas liquids ($/bbl) | 25.58 | | 27.68 | | 24.91 | 22.14 | 19.38 |
| Crude oil ($/bbl) | 28.63 | | 42.98 | | 38.68 | 34.38 | 30.09 |
Impact on Gross Revenues After Consideration of Pricing Adversity
The following table demonstrates the effects of weight-averaged pricing adversity as applied to our Fiscal 2003 gross revenues. Our cash flow from operations and earnings before taxes would experience the same effects.
| Fiscal 2003 | Weight-Averaged Prices | | | | |
| ($ 000’s) | | | Achieved | | After Consideration of Adversity % |
| | Final | | Entire | | | | |
| Commodity Type | Quarter | | Period | | 10% | 20% | 30% |
| Natural gas | 7,091 | | 30,649 | | 27,584 | 24,519 | 21,454 |
| Natural gas liquids | 1,682 | | 6,646 | | 5,981 | 5,317 | 4,652 |
| Crude oil | 862 | | 9,553 | | 8,598 | 7,642 | 6,687 |
73
Credit Risk
In addition to market risk, our financial instruments involve, to varying degrees, risk associated with trade credit and risk associated with operatorship of joint venture properties. All of our accounts receivable are with customers or joint venture partners in the energy industry and are subject to normal industry credit risk. For example, approximately 58% of our December 31, 2003 balance of accounts receivable is due from fivecustomers, subject to normal credit risk. Further, while our largest producing properties during Fiscal 2003 were self-operated, five out of eleven active properties in which we have interests are operated by other industry companies.
We do not require collateral or other security to support financial instruments nor do we provide collateral or security to counterparties. Currently, we do not expect non-performance by any counterparty. While there can be no assurance that our no-loss record will continue, the parties who are obligated to us contractually have been consistently reliable in the past.
Interest Rate Risk
We use a revolving, floating rate credit facility, therefore, we are exposed to fluctuations in short-term interest rates. Our current borrowing rate applied to the facility is Canadian Dollar Prime plus three-eighths of a percent per annum. To minimize our exposure to rate variability, we occasionally invest a portion of our undrawn borrowing capacity in Banker’s Acceptances. We are charged a standby fee of one-eighth of a percent per annum on our undrawn borrowing capacity.
We do not engage in interest rate swaps to hedge the interest rate exposure associated with the credit agreement. If market interest rates for short-term borrowings increase by 1%, the increase in our interest expense would be immaterial (see Item 5 - “Liquidity and Capital Resources - Sensitivity Analysis”).
At December 31, 2003, we had floating debt outstanding of $13.3 million (December 31, 2002 – $11.1 million, March 31, 2002 - $14.8 million).
Item 12. Description of Securities Other than Equity Securities
Not applicable.
Part II.
Item 13. Defaults, Dividend Arrearages and Delinquencies
None
Item 14. Material Modifications to the Rights of Security Holders and Use of Proceeds
Shareholder Rights Plan
Our Board of Directors adopted a Permitted Bid Shareholder Protection Rights Plan (“Rights Plan”) that was ratified by the shareholders at our Annual General Meeting on August 23, 2001.
The Plan is designed to ensure that all of our shareholders are treated equally if a takeover bid is made for our shares of Common Stock, and that sufficient time is available for our directors and all shareholders to evaluate fully any offer and pursue alternatives to maximize shareholder value.
Our Shareholders re-adopted a Permitted Bid Shareholder Protection Rights Plan (“Rights Plan”) at our Annual General Meeting on August 23, 2001.
The Rights Plan is designed to ensure that all of our shareholders are treated equally if a takeover bid is made for our shares of Common Stock, and that sufficient time is available for our directors and all shareholders to evaluate fully any offer and pursue alternatives to maximize shareholder value. The Rights Plan provides our board of directors and shareholders with 60 days, which is longer than provided by applicable laws, to fully consider any unsolicited take-over bid without undue pressure, to allow our board of directors, if appropriate, to consider other alternatives to
74
maximize shareholder value and to allow additional time for competing bids to emerge. If a bid is made to all shareholders, which is held open for at least 60 days and is accepted by shareholders holding more than 50% of the outstanding common shares, or is otherwise permitted by our board of directors, then the Rights Plan will not affect the rights of shareholders. Otherwise, all shareholders, except the parties making a take-over bid, will be able to acquire a number of additional common shares equal to 100% of their existing outstanding holdings at half the market price. Thus, any party making a take-over bid not permitted by the Rights Plan could suffer significant dilution. The Rights Plan is valid until the first shareholders meeting held after August 23, 2004.
Item 15. Controls and Procedures
Within the 90 days prior to the date of this Report, we carried out an evaluation, under the supervision and with the participation of our management, including our Company's Chief Executive Office and Chief Financial Officer, of the effectiveness of the design and operation of our disclosure controls and procedures pursuant to Exchange Act Rule 13a-14. Based upon that evaluation, our Chief Executive Officer and Chief Financial Officer concluded that our disclosure controls and procedures are effective in timely alerting them to material information relating to us required to be included in our periodic SEC filings. There have been no significant changes in our internal controls or in other factors that could significantly affect internal controls subsequent to the date we carried out its evaluation.
Our CEO and CFO do not expect that our disclosure controls or our internal controls will prevent all error and all fraud. A control system, no matter how well conceived and operated, can provide only reasonable, not absolute, assurance that the objectives of the system are met. Further, the design of a control system must reflect the fact that there are resource constraints, and the benefits of controls must be considered relative to their costs. Because of the inherent limitations in all control systems, no evaluation of controls can provide absolute assurance that all control issues and instances of fraud, if any, within the Company have been detected. These inherent limitations include the realities that judgments in decision-making can be faulty, and that breakdowns can occur because of simple error or mistake. Additionally, controls can be circumvented by the individual acts of some persons, by collusion of two or more people, or by management override of the control. The design of any system of controls also is based partly on certain assumptions about the likelihood of future events, and there can be no assurance that any design will succeed in achieving its stated goals under all potential future conditions.
Item 16(A). Audit Committee Financial Expert
The Board of Directors has determined that Mr. Jonathan Rubenstein and Mr. William Thompson possess the necessary attributes for designation as the Company's audit committee financial experts and the Board has designated Mr. Jonathan Rubenstein and Mr. William Thompson as its audit committee financial experts.
Item 16(B). Code of Ethics
Our website at http://www.dynamicoil.com/corporate/conductethics.htm contains our combined Code of Conduct and Ethics, which applies to all of our directors, officers and employees. Any amendment to the Code of Conduct and Ethics that applies to our directors or executive officers will be disclosed on our website, and any waiver of the Code of Conduct and Ethics for directors or executive officers may be made only by our Board of Directors or our Audit Committee and will be disclosed on our website.
Item 16(C). Principal Accountant Fees and Services
Reserved
Item 16(D). Exemption from the Listing Standards for Audit Committees
Reserved
Item 16(E). Purchases of Equity Securities by the Issuer and Affiliated Purchasers
Reserved
75
Part III.
Item 17. Financial Statements
Item 18. Financial Statements
(a)See Item 17.
(b)n/a
Item 19. Exhibits
(a) Financial Statements:See Contents of our Financial Statements.
(b) Exhibits:See Index to Exhibits.
76
Signatures
The registrant hereby certifies that it meets all of the requirements for filing on Form 20-F and that it has duly caused and authorized the undersigned to sign this annual report on its behalf.
Date: May 20, 2004
Dynamic Oil & Gas, Inc.
By: /s/ Michael A.
Bardell Michael A. Bardell
Chief Financial Officer & Corporate Secretary
77
INDEX TO EXHIBITS
| Exhibit Numbers | EXHIBITS |
| | |
| 1(a) and 2(a)(i) | Certificate of Incorporation and Articles/By-laws (1) |
| 1(b) and 2(a)(ii) | Certificate of Increase of Authorized Capital of the Company and Name Change (2) |
| 1(c) and 2(a)(iii) | Amendment to Articles of Incorporation re Staggered Board (5) |
| 1(d) and 2(a)(iv) | Corporate Governance Committee Guidelines (3) |
| 2(a)(v) | Shareholder Rights Plan Agreement (2) |
| 4(i) | Sour Gas Processing and Transportation Agreement by and between ATCO Gas Services Ltd. And Fletcher Challenge Energy Canada and Dynamic Oil Limited, dated July 11, 1997 (1) |
| (ii) | Gas Purchase Contract by and between Dynamic Oil Limited and Progas Limited, dated November 1, 1997 (1) |
| (iii) | Sweet Gas Processing and Transportation Agreement between ATCO Gas Services Ltd. and Dynamic Oil & Gas Inc., dated December 16, 1998 (2) |
| (iv) | Purchase and Sale Agreement between Fletcher Challenge Oil & Gas Inc. and Dynamic Oil & Gas, Inc. et al, dated June 26, 2001 (re: acquisition of Fletcher’s interest in St. Albert property by Dynamic, Trioco Resources Inc. and Energy North Inc.) (4) |
| (v) | Contribution, Mutual Interest and Exclusion Agreement between Dynamic Oil & Gas, Inc., Trioco Resources Inc. and Energy North Inc. dated June 29, 2001 (re: Joint bidding agreement in connection with the Purchase and Sale Agreement of Fletcher’s St. Albert interest described above (4) |
| (vi) | Employment Agreement, dated July 11, 2000 between Dynamic Oil & Gas, Inc. and Wayne Babcock (4) |
| (vii) | Employment Agreement, dated July 11, 2000 between Dynamic Oil & Gas, Inc. and Donald K. Umbach (4) |
| (viii) | Employment Agreement, dated July 11, 2000 between Dynamic Oil & Gas, Inc. and James Britton (4) |
| (ix) | Employment Agreement, dated July 11, 2000 between Dynamic Oil & Gas, Inc. and Michael Bardell (4) |
| (x) | Employment Agreement, dated March 5, 2001 between Dynamic Oil & Gas, Inc. and David Grohs (4) |
| (xi) | Employment Agreement, dated March 12, 2001 between Dynamic Oil & Gas, Inc. and Jonathan White (4) |
| (xii) | Overriding Royalty Agreement dated July 13, 1990 between Dynamic Oil Limited and Wayne J. Babcock (4) |
| (xiii) | Overriding Royalty Agreement dated July 13, 1990 between Dynamic Oil Limited and Donzoil Ltd (4) |
| (xiv) | Overriding Royalty Agreement dated August 31, 1990 between Dynamic Oil Limited and James R. Britton (5) |
| (xv) | Overriding Royalty Repurchase Agreement dated July 6, 2003 between Dynamic Oil & Gas, Inc. and Wayne J. Babcock (6) |
| (xvi) | Overriding Royalty Repurchase Agreement dated July 6, 2003 between Dynamic Oil & Gas, Inc. and Donzoil Ltd (6) |
| (xvii) | Overriding Royalty Repurchase Agreement dated July 6, 2003 between Dynamic Oil & Gas, Inc. and James R. Britton (6) |
71
INDEX TO EXHIBITS continued
Unless otherwise noted, each exhibit to this Report has been filed by us with previous Annual Reports under the exhibit number indicated in parentheses following that Exhibit reference and under the same Exhibit Number as filed here with. All such Exhibits are incorporated by reference.
(1) Form 20-F Annual Report filed on September 30, 1997.
(2) Form 20-F Annual Report filed on September 9, 1999.
(3) Form 20-F Annual Report filed on August 16, 2000.
(4) Form 20-F Annual Report filed on August 15, 2001.
(5) Form 20-F Annual Report filed on August 19, 2002.
(6) Filed herewith.
72
Financial Statements
Dynamic Oil & Gas, Inc.
December 31, 2003 and 2002
AUDITORS’ REPORT
To the Shareholders of
Dynamic Oil & Gas, Inc.
We have audited the balance sheets ofDynamic Oil & Gas, Inc.as of December 31, 2003 and 2002 and the statements of operations and retained earnings and cash flows for the year ended December 31, 2003, the nine months ended December 31, 2002 and the year ended March 31, 2002. These financial statements are the responsibility of the Company’s management. Our responsibility is to express an opinion on these financial statements based on our audits.
We conducted our audits in accordance with auditing standards generally accepted in Canada and the United States. Those standards require that we plan and perform an audit to obtain reasonable assurance whether the financial statements are free of material misstatement. An audit includes examining, on a test basis, evidence supporting the amounts and disclosures in the financial statements. An audit also includes assessing the accounting principles used and significant estimates made by management, as well as evaluating the overall financial statement presentation.
In our opinion, these financial statements present fairly, in all material respects, the financial position of the Company as at December 31, 2003 and 2002 and the results of its operations and its cash flows for the year ended December 31, 2003, the nine months ended December 31, 2002 and the year ended March 31, 2002 in accordance with Canadian generally accepted accounting principles. As required by the Company Act of British Columbia, we report that, in our opinion, these principles have been applied, except for the change in the method of accounting for stock-based compensation and asset retirement obligations as explained in note 3, on a basis consistent with that of the preceding year.
| | | |
Vancouver, Canada,
March 22, 2004 (except for Note 18, which is as of April 30, 2004). | | Chartered Accountants |
F-1
Dynamic Oil & Gas, Inc.
Incorporated under the laws of British Columbia
BALANCE SHEETS
(in Canadian dollars)
As at December 31
| | 2003 | | 2002 | |
| | $ | | $ | |
| | | | | |
| ASSETS[note 5] | | | | |
| Current | | | | |
| Accounts receivable[note 11] | 6,962,387 | | 6,426,761 | |
| Prepaid expenses | 356,449 | | 351,771 | |
| Income taxes receivable | — | | 131,772 | |
| Total current assets | 7,318,836 | | 6,910,304 | |
| Natural gas and oil interests[notes 3, 4] | 57,083,789 | | 37,148,539 | |
| Capital assets[note 4] | 365,561 | | 168,366 | |
| | 64,768,186 | | 44,227,209 | |
| | | | | |
| LIABILITIES AND SHAREHOLDERS’ EQUITY | | | | |
| Current | | | | |
| Bank indebtedness | 1,386,238 | | 1,519,923 | |
| Operating loan[note 5] | 13,250,000 | | 11,075,000 | |
| Accounts payable and accrued liabilities | 11,335,946 | | 11,133,844 | |
| Income taxes payable | 659,519 | | — | |
| Total current liabilities | 26,631,703 | | 23,728,767 | |
| Asset retirement obligations[note 6] | 1,587,733 | | 1,087,223 | |
| Future income tax liability[note 8] | 5,617,723 | | 843,581 | |
| Total liabilities | 33,837,159 | | 25,659,571 | |
| Commitments[note 13] | | | | |
| | | | | |
| Shareholders’ equity | | | | |
| Share capital[note 7] | 27,747,487 | | 20,720,629 | |
| Contributed surplus[note 7[c]] | 358,229 | | — | |
| Retained earnings (deficit) | 2,825,311 | | (2,152,991 | |
| Total shareholders’ equity | 30,931,027 | | 18,567,638 | |
| | 64,768,186 | | 44,227,209 | |
See accompanying notes
On behalf of the Board:
F-2
Dynamic Oil & Gas, Inc.
STATEMENTS OF OPERATIONS AND
RETAINED EARNINGS
(in Canadian dollars)
| | | | Nine | | | |
| | Year ended | | months ended | | Year ended | |
| | December 31, | | December 31, | | March 31, | |
| | 2003 | | 2002 | | 2002 | |
| | $ | | $ | | $ | |
| | | | | | | |
| REVENUE | | | | | | |
| Natural gas, liquids and oil sales | 46,847,927 | | 24,122,754 | | 26,401,872 | |
| Royalties[note 7[d]] | (12,861,990 | ) | (5,521,583 | ) | (6,500,447 | ) |
| Production costs | (7,010,610 | ) | (5,470,467 | ) | (5,845,958 | ) |
| | 26,975,327 | | 13,130,704 | | 14,055,467 | |
| Royalty tax credit - Alberta | 401,365 | | 178,098 | | 159,274 | |
| Royalty credit - British Columbia | 121,913 | | — | | — | |
| | 27,498,605 | | 13,308,802 | | 14,214,741 | |
| | | | | | | |
| EXPENSES | | | | | | |
| General and administrative | 3,414,751 | | 1,839,496 | | 2,347,212 | |
| Interest expense | 724,897 | | 454,251 | | 494,685 | |
| Interest income | (11,675 | ) | (1,732 | ) | (22,066 | ) |
| Accretion of asset retirement obligation[note 6] | 93,843 | | 63,876 | | 55,286 | |
| | 4,221,816 | | 2,355,891 | | 2,875,117 | |
| | | | | | | |
| Earnings from operations before the following: | 23,276,789 | | 10,952,911 | | 11,339,624 | |
| Amortization and depletion[note 4] | 12,021,474 | | 6,322,863 | | 11,956,944 | |
| Exploration expenses | 4,065,885 | | 1,446,178 | | 4,646,018 | |
| Gain on sale of natural gas and oil interests | — | | (2,139 | ) | (4,566 | ) |
| Earnings (loss) before taxes | 7,189,430 | | 3,186,009 | | (5,258,772 | ) |
| Income tax expense (recovery)[note 8] | | | | | | |
| - Current | 632,294 | | 207,000 | | 57,600 | |
| - Future | 1,578,834 | | 974,703 | | (1,903,920 | ) |
| Net earnings (loss) | 4,978,302 | | 2,004,306 | | (3,412,452 | ) |
| | | | | | | |
| Deficit, beginning of period - as previously reported | (2,475,932 | ) | (4,321,539 | ) | (695,279 | ) |
| Retroactive adjustment for changes in | | | | | | |
| accounting policy[note 3[b]] | 322,941 | | 296,298 | | 189,665 | |
| Deficit, beginning of period - as restated | (2,152,991 | ) | (4,025,241 | ) | (505,614 | ) |
| Premium on purchase and cancellation of | | | | | | |
| common shares[note 7[e]] | — | | (132,056 | ) | (107,175 | ) |
| Retained earnings (deficit), end of period | 2,825,311 | | (2,152,991 | ) | (4,025,241 | ) |
| | | | | | | |
| Net earnings (loss) per share[note 9] | | | | | | |
| basic | 0.23 | | 0.10 | | (0.17 | ) |
| diluted | 0.23 | | 0.10 | | (0.17 | ) |
See accompanying notes
F-3
Dynamic Oil & Gas, Inc.
STATEMENTS OF CASH FLOWS
(in Canadian dollars)
| | | | Nine | | | |
| | Year ended | | months ended | | Year ended | |
| | December 31, | | December 31, | | March 31, | |
| | 2003 | | 2002 | | 2002 | |
| | $ | | $ | | $ | |
| | | | | | | |
| OPERATING ACTIVITIES | | | | | | |
| Net earnings (loss) | 4,978,302 | | 2,004,306 | | (3,412,452 | ) |
| Add (deduct) items not involving cash: | | | | | | |
| Accretion of asset retirement obligation[note 6] | 93,843 | | 63,876 | | 55,286 | |
| Amortization and depletion | 12,021,474 | | 6,322,863 | | 11,956,944 | |
| Stock based compensation[note 3[a]] | 358,229 | | — | | — | |
| Future income tax expense (recovery) | 1,578,834 | | 974,703 | | (1,903,920 | ) |
| Exploration expenses | 4,065,885 | | 1,446,178 | | 4,646,018 | |
| Gain on sale of natural gas and oil interests | — | | (2,139 | ) | (4,566 | ) |
| | 23,096,567 | | 10,809,787 | | 11,337,310 | |
| Changes in non-cash working capital affecting | | | | | | |
| operating activities[note 10[a]] | 5,197,611 | | 646,829 | | (1,558,807 | ) |
| Cash provided by operating activities | 28,294,178 | | 11,456,616 | | 9,778,503 | |
| | | | | | | |
| FINANCING ACTIVITIES | | | | | | |
| Bank indebtedness | (133,685 | ) | 677,111 | | 842,812 | |
| Operating loan | 2,175,000 | | (3,675,000 | ) | 14,750,000 | |
| Shares issued for cash | 1,510,858 | | — | | 455,420 | |
| Share repurchases | — | | (325,948 | ) | (289,793 | ) |
| Cash provided by (used in) financing activities | 3,552,173 | | (3,323,837 | ) | 15,758,439 | |
| | | | | | | |
| INVESTING ACTIVITIES | | | | | | |
| Purchase of capital assets | (308,387 | ) | (84,420 | ) | (116,180 | ) |
| Natural gas and oil interests | (22,727,557 | ) | (12,493,116 | ) | (21,994,897 | ) |
| Exploration expenses | (4,065,885 | ) | (1,446,178 | ) | (4,646,018 | ) |
| Proceeds on sale of natural gas and oil interests | — | | 2,139 | | 4,566 | |
| Changes in non-cash working capital affecting | | | | | | |
| investing activities[note 10[b]] | (4,744,522 | ) | 5,888,796 | | (2,277,861 | ) |
| Cash used in investing activities | (31,846,351 | ) | (8,132,779 | ) | (29,030,390 | ) |
| | | | | | | |
| Decrease in cash and cash equivalents | — | | — | | (3,493,448 | ) |
| Cash and cash equivalents, beginning of period | — | | — | | 3,493,448 | |
| Cash and cash equivalents, end of period | — | | — | | — | |
| | | | | | | |
| Supplemental disclosures of cash flow information | | | | | | |
| Cash paid during the year for: | | | | | | |
| Interest | 555,536 | | 459,237 | | 589,549 | |
| Income taxes | (150,408 | ) | 760,132 | | 1,167,720 | |
See accompanying notes
F-4
Dynamic Oil & Gas, Inc.
NOTES TO FINANCIAL STATEMENTS
(in Canadian dollars)
December 31, 2003
1. DESCRIPTION OF BUSINESS
Dynamic Oil & Gas, Inc. (the “Company”) was incorporated under the laws of the Province of British Columbia on March 27, 1979. The Company’s principle business is the acquisition, exploration, development and production of natural gas and oil interests in Western Canada.
2. SUMMARY OF SIGNIFICANT ACCOUNTING POLICIES
Accounting principles
The Company prepares its accounts in accordance with Canadian generally accepted accounting principles which, as applied in these financial statements, conform in all material respects with the accounting principles generally accepted in the United States, except as explained in Note 12.
Change in fiscal year end
Effective December 31, 2002, the Company changed its fiscal year end from March 31 to December 31. The following is a summary of selected financial information for the comparative twelve month periods ended December 31, 2003, 2002 and 2001.
Results of operations and cash flows
| | December 31, | | December 31, | | December 31, | |
| | 2003 | | 2002 | | 2001 | |
| Twelve months ended | $ | | $ | | $ | |
| | [audited] | | [unaudited] | | [unaudited] | |
| | | | | | | |
| Revenue | 46,847,927 | | 30,730,477 | | 31,658,397 | |
| Net earnings | 4,978,302 | | 2,034 | | 2,449,690 | |
| Net earnings per share | | | | | | |
| basic | 0.23 | | 0.02 | | 0.12 | |
| diluted | 0.23 | | 0.02 | | 0.12 | |
| Cash flows | | | | | | |
| provided by operating activities | 28,294,178 | | 15,215,456 | | 14,949,163 | |
| provided by (used in) financing activities | 3,552,173 | | (4,331,528 | ) | 12,972,031 | |
| used in investing activities | (31,846,351 | ) | (10,900,821 | ) | (29,877,314 | ) |
F-5
Dynamic Oil & Gas, Inc.
NOTES TO FINANCIAL STATEMENTS
(in Canadian dollars)
December 31, 2003
2. SUMMARY OF SIGNIFICANT ACCOUNTING POLICIES (cont’d.)
Use of estimates
The preparation of financial statements in conformity with Canadian generally accepted accounting principles requires management to make certain estimates and assumptions that affect the reported amounts of assets and liabilities and disclosure of contingent assets and liabilities as of the date of the financial statements and the reported amounts of revenues and expenses during the reporting period. Actual results may differ from these estimates.
Natural gas and oil interests
The Company uses the successful efforts method to account for its natural gas and oil interests. Lease acquisition costs are amortized over their holding period prior to the discovery of proved producing reserves. Geological and geophysical costs are expensed in the period in which they are incurred and costs of drilling an unsuccessful well are expensed when it becomes known the well did not result in a discovery of proved reserves. All other costs of exploring and developing for proved reserves become capitalized natural gas and oil interests.
The costs of proved producing interests including related plant and equipment are depleted on a unit-of-production basis, based on gross proved producing natural gas and oil reserves.
Natural gas and oil interests are recorded at cost less accumulated provisions for potential, amortization and depletion. Natural gas and oil interests are assessed periodically for potential impairment on a field-by-field basis. Any impairment loss is the difference between the carrying value of the asset and its net recoverable amount (undiscounted).
Joint interests
Substantially all acquisition, exploration, development and production activities of the Company are conducted jointly with others. These financial statements reflect only the Company’s proportionate interest in such activities.
Capital assets
Capital assets are recorded at cost, less accumulated amortization. Amortization is provided on a straight-line basis at the following rates:
| | Furniture and fixtures | - 10.0% per annum |
| | Computer equipment | - 33.3% per annum |
F-6
Dynamic Oil & Gas, Inc.
NOTES TO FINANCIAL STATEMENTS
(in Canadian dollars)
December 31, 2003
2. SUMMARY OF SIGNIFICANT ACCOUNTING POLICIES (cont’d.)
Income taxes
The liability method is used in accounting for income taxes. Under this method, future income tax assets and liabilities are determined based on differences between the financial reporting and tax bases of assets and liabilities, and measured using the substantially enacted tax rates and laws that will be in effect when the differences are expected to reverse.
Asset retirement obligations
The Company recognizes the fair value of an asset retirement obligation (“ARO”) in the period in which it is incurred when a reasonable estimate of the fair value can be made. The fair value of the estimated ARO is recorded as a long-term liability, with a corresponding increase in the carrying amount of the related asset. The capitalized amount is depleted on a unit-of-production basis over the life of associated proved producing reserves. The liability amount is increased each reporting period due to the passage of time and the amount of accretion is charged to net earnings in the period. Revisions to the estimated timing of cash flows or to the original estimated undiscounted cost also result in an increase or decrease to the ARO. Actual costs incurred upon settlement of the ARO are charged against the ARO to the extent of the accreted liability recorded. Any difference between the actual costs incurred upon settlement of the ARO and the recorded liability is recognized as a gain or loss in the Company’s net earnings at that time.
Revenue recognition
Revenues from natural gas, natural gas liquids and crude oil are recorded when delivered and title passes to customers.
Stock-based compensation
The Company grants stock options to employees, directors and consultants pursuant to a stock option plan described in note 7(b). The Company uses the fair value method of accounting for all stock-based awards granted, modified or settled since January 1, 2003 [note 3]. For awards granted, modified or settled prior to January 1, 2003, the Company discloses the pro forma effects to the net earnings (loss) and net earnings (loss) per share for the period as if the fair market value had been used at the date of grant. The pro forma information is presented in note 7(c).
F-7
Dynamic Oil & Gas, Inc.
NOTES TO FINANCIAL STATEMENTS
(in Canadian dollars)
December 31, 2003
2. SUMMARY OF SIGNIFICANT ACCOUNTING POLICIES (cont’d.)
Foreign currency translation
All monetary assets and liabilities expressed in foreign currencies are translated at rates of exchange in effect at the end of the year. All other assets and liabilities are translated at the rates prevailing at the dates the assets were acquired or liabilities incurred. The resulting foreign currency translation gains and losses are included in the determination of net earnings. Revenues and expenses are translated at the average exchange rate for the period.
Measurement uncertainty
The amounts recorded for depletion and amortization of natural gas and oil interests and asset retirement obligations are based on estimates. Assessments for impairments in asset carrying costs are based on estimates of proved producing reserves, production rates, natural gas and oil prices, future costs and other relevant assumptions. By their nature these estimates are subject to measurement uncertainty and the effect on the financial statements of changes in such estimates in future years could be significant.
Earnings per share
The Company utilizes the treasury stock method in the determination of diluted per share amounts. Under this method, the diluted weighted average number of shares is calculated assuming that the proceeds arising from the exercise of outstanding, in-the-money options, are used to purchase common shares of the Company at their average market price for the period.
Comparative figures
Certain of the comparative figures have been restated to conform to the current period’s presentation.
F-8
Dynamic Oil & Gas, Inc.
NOTES TO FINANCIAL STATEMENTS
(in Canadian dollars)
December 31, 2003
3. CHANGE IN ACCOUNTING POLICIES
[a] Stock-based compensation
Effective January 1, 2003, the Company early-adopted the amended standard of accounting for stock-based compensation as required by CICA Handbook section 3870, “Stock-based compensation and other stock-based payments” (“CICA 3870”). The amended standard has an expanded requirement to apply the fair-value based method of accounting for all stock-based payments, direct awards of stock and awards that call for settlement in cash and other assets. Prior to its amendment, CICA 3870 was first adopted by the Company on April 1, 2002. During the period April 1, 2002 to December 31, 2002, the Company used the fair-value based method to account for stock options granted to non-employees and elected to use the intrinsic value method to account for stock options granted to directors and employees under its stock option plan.
Under the fair-value based method, compensation costs attributable to all share options are measured at fair value at the grant date and expensed over the vesting period with a corresponding increase to contributed surplus. Pursuant to the transition rules relating to the amended standard, the expense recognized relates to all stock options granted during the year ended December 31, 2003. Consideration paid for shares on exercise of the share options is credited to share capital.
The adoption of the amended standard resulted in the Company recognizing an expense of $358,229 or $0.02 per share for the year ended December 31, 2003 [note 7[c]].
[b] Asset retirement obligations
Effective January 1, 2003, the Company early-adopted the new recommendations for accounting for obligations associated with the retirement of tangible long-lived assets and the associated asset retirement costs as required by CICA Handbook section 3110, “Asset Retirement Obligations” (“CICA 3110”) [see note 6]. CICA 3110 requires liability recognition for retirement obligations associated with tangible long-lived assets, such as producing wellsites and associated facilities, and includes those for which a company faces a legal settlement obligation or has made promissory estoppel.
The estimates of the obligations are based on engineering estimates, which consider past experience, current regulations, technology and industry standards. The amount of the liability is subject to re-measurement at each reporting period. The associated retirement costs are capitalized as part of the carrying amount of the long-lived assets and depleted over time on a unit-of-production basis. This differs from the prior practice, which involved accruing for the estimated removal and site restoration liability through charges to earnings over the estimated life of reserves. The Company has applied the changes retroactively and prior periods have been restated, for comparative purposes. The restatement did not impact the net earnings per share for those periods.
F-9
Dynamic Oil & Gas, Inc.
NOTES TO FINANCIAL STATEMENTS
(in Canadian dollars)
December 31, 2003
3. CHANGE IN ACCOUNTING POLICIES (cont’d.)
Following is a summary of the after-tax changes reflected in the statements of operations and balance sheets presented:
| | | | Nine | | | |
| | Year ended | | Months ended | | Year ended | |
| | December 31, | | March 31, | | March 31, | |
| | 2002 | | 2002 | | 2002 | |
| | $ | | $ | | $ | |
| | | | | | | |
| Net increase (decrease) in earnings | | | | | | |
| before tax | (67,733 | ) | 40,046 | | 160,713 | |
| Net increase (decrease) in future | | | | | | |
| income tax expense | — | | 13,043 | | 54,030 | |
| Net increase (decrease) in earnings | (67,733 | ) | 26,643 | | 106,633 | |
| Assets (natural gas and oil interests) | 859,573 | | 580,463 | | 520,449 | |
| Liabilities | 377,688 | | 257,442 | | 416,829 | |
4. NATURAL GAS AND OIL INTERESTS, AND CAPITAL ASSETS
| | | | Accumulated | | | |
| | | | amortization and | | Net book | |
| | Cost | | depletion | | value | |
| | $ | | $ | | $ | |
| | | | | | | |
| December 31, 2003 | | | | | | |
| Natural gas and oil interests | 94,425,822 | | 37,342,033 | | 57,083,789 | |
| Furniture, fixtures and computer equipment | 770,910 | | 405,349 | | 365,561 | |
| | | | | | | |
| December 31, 2002 | | | | | | |
| Natural gas and oil interests | 62,580,290 | | 25,431,751 | | 37,148,539 | |
| Furniture, fixtures and computer equipment | 538,153 | | 369,787 | | 168,366 | |
At December 31, 2003, costs of $16,238,852 [2002 - $8,796,000] related to non-producing assets have been excluded from the calculation of amortization and depletion.
In the year ended December 31, 2003, the Company recorded asset write-downs of $316,213 [nine-month period ended December 31, 2002 - $445,467; year ended March 31, 2002 - $6,783,248] to reflect the excess of the net book value of the Company’s natural gas and oil interests over its estimated recoverable amounts. The write-downs were included in amortization and depletion expense.
F-10
Dynamic Oil & Gas, Inc.
NOTES TO FINANCIAL STATEMENTS
(in Canadian dollars)
December 31, 2003
5. OPERATING LOAN
During 2003, the Company’s bank, the National Bank of Canada, increased to $25,000,000 from $21,000,000, the amount made available to the Company under a revolving, demand credit facility. Principal balances outstanding bear interest at prime plus 3/8% (bank prime rate at December 31, 2003 - 4.5%; December 31, 2002 - 4.5%). They are collateralized by a general assignment of book debts and a floating charge debenture of $38,000,000 covering all the assets of the Company. The effective average interest paid during the year ended December 31, 2003 was 5.1% [during the nine-month period ended December 31, 2002 - 5.0%; year ended March 31, 2002 - 4.7%]. A standby fee of 0.125% per annum is levied on the unused portion of the facility and is included in interest expense.
6. ASSET RETIREMENT OBLIGATION
The following table presents the reconciliation of the beginning and ending aggregate carrying amount of the obligation associated with the retirement of oil and gas properties:
| | December 31, | | December 31, | | March 31, | |
| | 2003 | | 2002 | | 2002 | |
| | $ | | $ | | $ | |
| | | | | | | |
| Asset retirement obligation, beginning of period | 1,087,223 | | 956,559 | | 776,711 | |
| Liabilities incurred | 406,667 | | 66,788 | | 124,562 | |
| Accretion expense | 93,843 | | 63,876 | | 55,286 | |
| Asset retirement obligation, end of period | 1,587,733 | | 1,087,223 | | 956,559 | |
The total undiscounted amount of estimated cash flows required to settle the obligation is $3,308,669 [for the nine-months ended December 31, 2002 - $2,109,750; year ended March 31, 2002 - $2,304,984], which has been discounted using an average credit-adjusted risk free rate of 6.6%. These payments are expected to be made over the next 53 years with the majority of costs incurred between 2018 and 2020.
F-11
Dynamic Oil & Gas, Inc.
NOTES TO FINANCIAL STATEMENTS
(in Canadian dollars)
December 31, 2003
7. SHARE CAPITAL
The Company is authorized to issue 60,000,000 common shares without par value.
[a] Issued and outstanding
The following table sets forth the issued and outstanding common shares:
| | Number of | | | |
| | Shares | | $ | |
| | | | | |
| Balance, December 31, 2002 | 20,272,530 | | 20,720,629 | |
| Stock options exercised | 871,582 | | 1,510,858 | |
| Shares issued to repurchase gross overriding | | | | |
| royalty interests[note 7[d]] | 1,050,666 | | 5,516,000 | |
| Balance, December 31, 2003 | 22,194,778 | | 27,747,487 | |
[b] Stock option plan and options outstanding
Under the Company’s stock option plan, the Company has the ability to grant options to inside directors, officers, employees and non-employees with a maximum term of five years. Those granted prior to February 28, 2001 vest upon date of grant; those granted on February 28, 2001 and thereafter, vest in equal amounts over three years from the date of grant.
In addition, options granted to the Company’s outside directors prior to June 19, 2003 had a maximum term of ten years and those granted on June 19, 2003 and thereafter, have a maximum term of five years. All options granted to outside directors vest upon date of grant.
During the year ended December 31, 2003, options issued totaled 421,000 [268,500 to either inside directors, officers, employees or non-employees; 152,500 to outside directors]. The exercise price of each option granted under the plan equals the amount designated in the individual agreement, which is based on the fair value of the stock at the date of grant.
F-12
Dynamic Oil & Gas, Inc.
NOTES TO FINANCIAL STATEMENTS
(in Canadian dollars)
December 31, 2003
7. SHARE CAPITAL (cont’d.)
A summary of the status of the Company’s stock option plan as of December 31, 2003 is presented below:
| | December 31, | | December 31, | | March 31, | |
| | 2003 | | 2002 | | 2002 | |
| | Number | | Weighted | | Number | | Weighted | | Number | | Weighted | |
| | of | | average | | of | | average | | of | | average | |
| | shares | | option price | | shares | | option price | | shares | | option price | |
| | # | | $ | | # | | $ | | # | | $ | |
| | | | | | | | | | | | | |
| Outstanding at beginning | | | | | | | | | | | | |
| of period | 2,077,750 | | 1.83 | | 1,930,250 | | 1.83 | | 1,855,350 | | 1.29 | |
| Granted | 421,000 | | 4.61 | | 147,500 | | 1.88 | | 570,000 | | 1.87 | |
| Exercised | (871,582 | ) | 1.73 | | — | | — | | (495,100 | ) | 0.92 | |
| Forfeited | (11,334 | ) | 2.83 | | — | | — | | — | | — | |
| Outstanding at period end | 1,615,834 | | 2.61 | | 2,077,750 | | 1.83 | | 1,930,250 | | 1.83 | |
| Options exercisable at | | | | | | | | | | | | |
| period end | 1,081,667 | | 2.33 | | 1,641,250 | | 1.84 | | 1,458,750 | | 1.84 | |
Exercise prices for the options outstanding as of December 31, 2003 ranged from $1.45 to $5.43 per share. These options have a weighted average remaining contractual life of 4.33 years.
At December 31, 2003 the following stock options were outstanding and exercisable:
| | | Options outstanding | | Options exercisable |
| | | | | Weighted | | Weighted average | | Number of | | Weighted |
| | | Number of | | average | | remaining | | options | | average |
| Exercise | | shares under | | exercise | | contractual | | currently | | exercise |
| price | | option | | price | | life | | exercisable | | price |
| $ | | # | | $ | | (years) | | # | | $ |
| | | | | | | | | | | |
| 1.00 - 1.49 | | 45,000 | | 1.45 | | 1.07 | | 45,000 | | 1.45 |
| 1.50 - 1.99 | | 588,334 | | 1.73 | | 4.76 | | 356,667 | | 1.72 |
| 2.00 - 2.49 | | 549,500 | | 2.12 | | 3.19 | | 512,500 | | 2.11 |
| 2.50 - 2.99 | | 15,000 | | 2.95 | | 8.97 | | 15,000 | | 2.95 |
| 3.50 - 3.99 | | 42,500 | | 3.83 | | 5.70 | | 12,500 | | 3.91 |
| 4.00 - 4.99 | | 65,000 | | 4.10 | | 9.33 | | 65,000 | | 4.10 |
| 4.50 - 4.99 | | 235,500 | | 4.66 | | 4.54 | | — | | — |
| 5.00 - 5.49 | | 75,000 | | 5.35 | | 4.54 | | 75,000 | | 5.35 |
| | | 1,615,834 | | 2.61 | | 4.33 | | 1,081,667 | | 2.33 |
F-13
Dynamic Oil & Gas, Inc.
NOTES TO FINANCIAL STATEMENTS
(in Canadian dollars)
December 31, 2003
7. SHARE CAPITAL (cont’d.)
[c] Pro forma net earnings - fair value based method of accounting for stock options
During the year ended December 31, 2003, the Company used the fair-value based method to account stock options granted to directors, employees and non-employees, resulting in a decrease to earnings and a corresponding increase to contributed surplus of $358,229. During the nine-month period ended December 31, 2002, the Company used the same method to expense only those stock options granted to non-employees. The following table shows pro forma net earnings and net earnings per common share had the Company applied the fair-value based method of accounting for all stock options outstanding:
| | | Nine months |
| | Year ended | ended |
| | December 31, | December 31, |
| | 2003 | 2002 |
| | $ | $ |
| | | |
| Net earnings: | | |
| as reported | 4,978,302 | 2,004,306 |
| pro forma | 4,856,567 | 1,798,630 |
| Basic net earnings per common share: | | |
| as reported | 0.23 | 0.10 |
| pro forma | 0.23 | 0.09 |
| Diluted net earnings per common share: | | |
| as reported | 0.23 | 0.10 |
| pro forma | 0.22 | 0.09 |
F-14
Dynamic Oil & Gas, Inc.
NOTES TO FINANCIAL STATEMENTS
(in Canadian dollars)
December 31, 2003
7. SHARE CAPITAL (cont’d.)
The Black-Scholes options valuation model was used to estimate the fair value of stock options. In addition, option valuation models require the input of highly subjective assumptions including the expected stock price volatility. As the Company’s director and employee stock options may have characteristics different from those of non-employee options, and changes in the subjective input assumptions can materially affect the fair value estimate, the existing models do not necessarily provide a reliable single measure of the fair value of its stock options. The fair value of option grants using the Black-Scholes model is estimated on the date of grant using the following weighted-average assumptions:
| | | | Nine months | |
| | Year ended | | ended | |
| | December 31, | | December 31, | |
| | 2003 | | 2002 | |
| | $ | | $ | |
| | | | | |
| Dividend yield | 0% | | 0% | |
| Expected volatility | 51% | | 57% | |
| Risk-free interest rate | 4% | | 5% | |
| Expected lives | 3 years | | 3 years | |
The weighted average fair value per share of stock options granted during the year ended December 31, 2003 was $1.78 [nine-month period ended December 31, 2002 - $0.91].
[d] Repurchase of gross overriding royalty interests
Three of the Company’s officers were entitled to receive compensation pursuant to royalty agreements that had previously been approved by shareholders. The royalty agreements provided for payment of an overriding interest of 1% of the Company’s share of gross production of all petroleum substances on lands acquired by the Company since June 1, 1986 for two of the three officers and June 1, 1987 for the third officer.
On July 7, 2003, the Company repurchased from the three Company officers their gross overriding royalty interests for $6,516,000. The aggregate purchase price was paid by the issuance of 1,050,666 common shares of the Company and the payment of $1,000,000 in cash. The number of common shares was based on a price of $5.25 per share, such price being the daily volume-weighted average price for July 7, 2003. The transaction was recorded at the exchange amount determined by an independent valuation.
The gross overriding royalty expense pursuant to the agreements, was $752,362 during the period January 1 to July 7, 2003 [nine-month period ended December 31, 2002 - $681,493; year ended March 31, 2002 - $745,994].
F-15
Dynamic Oil & Gas, Inc.
NOTES TO FINANCIAL STATEMENTS
(in Canadian dollars)
December 31, 2003
7. SHARE CAPITAL (cont’d.)
The repurchased overriding royalty interest included in natural gas and oil interests in these financial statements is $9,711,308. This carrying value is comprised of the aggregate repurchase price of $6,516,000 paid to the vendors, plus the related future income taxes of $3,195,308 which require recognition in accordance with current accounting rules under CICA Handbook section 3465.
[e] Issuer bids
Pursuant to the following normal course issuer bids, the Company was authorized to repurchase and cancel common shares on the open market through the facilities of the Toronto Stock Exchange and NASDAQ:
| Normal course issuer bid date of | Authorized share |
| Commencement | Termination | Repurchases / cancellations |
| | | |
| 1-May-02 | 31-Mar-03 | 1,000,000 |
| 9-Apr-01 | 31-Mar-02 | 1,000,000 |
Under these normal course issuer bids, the Company purchased and recorded the following:
| | Year ended | | Nine months ended | | Year ended | |
| | December 31, | | December 31, | | March 31, | |
| | 2003 | | 2002 | | 2002 | |
| | # | | $ | | # | | $ | | # | | $ | |
| | | | | | | | | | | | | |
| Bid termination date: 31-Mar-03 | — | | — | | (189,700 | ) | (325,948 | ) | — | | — | |
| Bid termination date: 31-Mar-02 | — | | — | | — | | — | | (178,800 | ) | (289,793 | ) |
| | — | | — | | (189,700 | ) | (325,948 | ) | (178,800 | ) | (289,793 | ) |
| Average purchase price | — | | | | 1.72 | | | | 1.62 | | | |
| Recorded as an increase of deficit | | | — | | | | 132,056 | | | | 107,175 | |
| Recorded as a reduction of share capital | | | — | | | | (193,892 | ) | | | (182,618 | ) |
F-16
Dynamic Oil & Gas, Inc.
NOTES TO FINANCIAL STATEMENTS
(in Canadian dollars)
December 31, 2003
8. INCOME TAXES
Future income taxes reflect the net tax effects of temporary differences between the carrying amounts of assets and liabilities for financial reporting purposes and the amounts used for income tax purposes. Significant components of the Company’s future tax assets and liabilities are as follows:
| | December 31, | | December 31, | |
| | 2003 | | 2002 | |
| | $ | | $ | |
| | | | | |
| Long term future tax assets (liabilities): | | | | |
| CCA in excess of book depreciation | (5,843,546 | ) | (1,015,300 | ) |
| Finance charges | 100 | | 1,000 | |
| Provision for asset retirement obligations | 225,723 | | 170,719 | |
| Net future tax (liabilities) assets | (5,617,723 | ) | (843,581 | ) |
The reconciliation of income tax attributable to operations computed at the statutory tax rates to income tax (recovery) expense is:
| | Year ended | | Nine months ended | | Year ended |
| | December 31, | | December 31, | | March 31, |
| | 2003 | | 2002 | | 2002 |
| | $ | | % | | $ | | % | | $ | | % |
| | | | | | | | | | | | |
| Tax at combined federal and | | | | | | | | | | | |
| provincial rates | 2,962,000 | | 41.20 | | 1,350,000 | | 42.37 | | (2,300,700 | ) | 43.75 |
| Tax effect of: | | | | | | | | | | | |
| Non-deductible expenses | 1,929,000 | | | | 898,400 | | | | 1,068,000 | | |
| Income not taxable | (165,400 | ) | | | (70,500 | ) | | | (64,900 | ) | |
| Resource allowance | (2,218,342 | ) | | | (1,021,197 | ) | | | (1,306,520 | ) | |
| Large corporation tax in excess of surtax | 90,000 | | | | 25,000 | | | | 49,000 | | |
| Effect of changes in tax rates | (386,130 | ) | | | — | | | | 708,800 | | |
| | 2,211,128 | | | | 1,181,703 | | | | (1,846,320 | ) | |
9. NET EARNINGS PER SHARE
Basic net earnings (loss) per share were calculated on the basis of the weighted average number of shares outstanding for the year ended December 31, 2003 of 21,393,902 [the nine-month period ended December 31, 2002 - 20,357,153; year ended March 31, 2002 - 20,365,031]. The weighted average number of shares outstanding for the diluted calculation for the year ended December 31, 2003 was 21,947,801 [nine-month period ended December 31, 2002 - 20,554,231; year ended March 31, 2002 - 20,466,543].
F-17
Dynamic Oil & Gas, Inc.
NOTES TO FINANCIAL STATEMENTS
(in Canadian dollars)
December 31, 2003
9. NET EARNINGS PER SHARE (cont’d.)
| | Year ended | | Nine months ended | | Year ended | |
| | December 31, | | December 31, | | March 31, | |
| | 2003 | | 2002 | | 2003 | |
| | $ | | $ | | $ | |
| | | | | | | |
| Numerator | | | | | | |
| Net earnings (loss) for the period | 4,978,302 | | 2,004,306 | | (3,412,452 | ) |
| | | | | | | |
| Denominator | | | | | | |
| Weighted average number of common | | | | | | |
| shares outstanding | 21,393,902 | | 20,357,153 | | 20,365,031 | |
| Effect of dilutive stock options | 553,899 | | 197,078 | | 101,512 | |
| | 21,947,801 | | 20,554,231 | | 20,466,543 | |
| | | | | | | |
| Basic earnings (loss) per share | 0.23 | | 0.10 | | (0.17 | ) |
| Diluted earnings (loss) per share | 0.23 | | 0.10 | | (0.17 | ) |
10. CHANGES IN NON-CASH WORKING CAPITAL BALANCES
[a] Changes affecting operating activities comprise:
| | December 31, | | December 31, | | March 31, | |
| | 2003 | | 2002 | | 2003 | |
| | $ | | $ | | $ | |
| | | | | | | |
| Accounts receivable | 1,299,019 | | (968,683 | ) | (581,264 | ) |
| Prepaid expenses | (4,678 | ) | 13,456 | | (124,761 | ) |
| Accounts payable and accrued liabilities | 3,111,979 | | 2,155,188 | | (728,998 | ) |
| Income taxes payable | 791,291 | | (553,132 | ) | (123,784 | ) |
| | 5,197,611 | | 646,829 | | (1,558,807 | ) |
F-18
Dynamic Oil & Gas, Inc.
NOTES TO FINANCIAL STATEMENTS
(in Canadian dollars)
December 31, 2003
10. CHANGES IN NON-CASH WORKING CAPITAL BALANCES (cont’d.)
[b] Changes affecting investing activities comprise:
| | December 31, | | December 31, | | March 31, | |
| | 2003 | | 2002 | | 2003 | |
| | $ | | $ | | $ | |
| | | | | | | |
| Accounts receivable | (1,834,645 | ) | 521,453 | | (953,434 | ) |
| Accounts payable and accrued liabilities | (2,909,877 | ) | 5,367,343 | | (1,324,427 | ) |
| | (4,744,522 | ) | 5,888,796 | | (2,277,861 | ) |
11. FINANCIAL INSTRUMENTS
The Company’s financial instruments consist of accounts receivable, bank indebtedness, operating loan, accounts payable and income taxes payable. The carrying values of these financial instruments approximate their fair value.
Substantially all of the Company’s accounts receivable at December 31, 2003, and 2002 result from the sale of natural gas, natural gas liquids and oil to other companies in the oil and gas industry. This concentration of customers may impact the Company’s overall credit risk, either positively or negatively, in that such entities may be similarly affected by industry-wide changes in economic or other conditions. Historically to date, the Company has not incurred credit losses against its receivables. At December 31, 2003 nine customers represent 80% of the accounts receivable balance, [December 31, 2002 - five customers represent 56% of accounts receivable].
F-19
Dynamic Oil & Gas, Inc.
NOTES TO FINANCIAL STATEMENTS
(in Canadian dollars)
December 31, 2003
12. RECONCILIATION TO US GENERALLY ACCEPTED ACCOUNTING PRINCIPLES
The Company prepares its accounts in accordance with Canadian generally accepted accounting principles (Canadian GAAP), which for the most part, are similar to United States generally accepted accounting principles (U.S. GAAP). The following tables reflect the major differences in accounting principles.
Consolidated net earnings (loss) under U.S. GAAP would be:
| | | | Nine months | | | |
| | Year ended | | ended | | Year ended | |
| | December 31, | | December 31, | | March 31, | |
| | 2003 | | 2002 | | 2003 | |
| | $ | | $ | | $ | |
| | | | | | | |
| Net earnings (loss) under Canadian GAAP | 4,978,302 | | 2,004,306 | | (3,412,452 | ) |
| Amortization and depletion [a] | — | | (65,471 | ) | (140,399 | ) |
| Accretion of asset retirement obligation [a] | — | | 40,242 | | 35,936 | |
| Options issued for services [b] | — | | (3,108 | ) | — | |
| Write-down on natural gas and oil | | | | | | |
| properties [c] | (125,580 | ) | (209,160 | ) | (140,465 | ) |
| Income taxes [d] | — | | — | | 708,800 | |
| Net earnings (loss) before cumulative | | | | | | |
| effect of change in accounting principle | | | | | | |
| under U.S. GAAP | 4,852,722 | | 1,766,809 | | (2,948,580 | ) |
| Cumulative effect of change in accounting | | | | | | |
| principle, net of applicable taxes [a] | 133,276 | | — | | — | |
| Net earnings (loss) under U.S. GAAP after | | | | | | |
| cumulative effect of change in accounting | | | | | | |
| principle | 4,985,998 | | 1,766,809 | | (2,948,580 | ) |
| | | | | | | |
| Net earnings (loss) per common share under U.S. GAAP, | | | | | | |
| before change in accounting policy | | | | | | |
| basic | 0.23 | | 0.09 | | (0.14 | ) |
| diluted | 0.22 | | 0.09 | | (0.14 | ) |
| | | | | | | |
| Net earnings (loss) per common share under U.S. GAAP, | | | | | | |
| after change in accounting policy | | | | | | |
| basic | 0.23 | | 0.09 | | (0.14 | ) |
| diluted | 0.23 | | 0.09 | | (0.14 | ) |
F-20
Dynamic Oil & Gas, Inc.
NOTES TO FINANCIAL STATEMENTS
(in Canadian dollars)
December 31, 2003
12. RECONCILIATION TO US GENERALLY ACCEPTED ACCOUNTING PRINCIPLES (cont’d.)
After certain differences have been adjusted for, selected balance sheet items under Canadian and U.S. GAAP would be:
| | December 31 | | December 31 | |
| | 2003 | | 2002 | |
| | Canadian | | U.S. | | Canadian | | U.S. | |
| | GAAP | | GAAP | | GAAP | | GAAP | |
| | $ | | $ | | $ | | $ | |
| | | | | | | | | |
| Future income tax liability [d] | — | | — | | 843,581 | | 540,900 | |
| Natural gas and oil interests [c] | 57,083,789 | | 56,901,789 | | 37,148,539 | | 36,236,076 | |
| Share capital [b, e] | 27,747,487 | | 28,720,580 | | 20,720,629 | | 21,693,722 | |
| Retained earnings (deficit) | | | | | | | | |
| [a, b, c, d, e] | 2,825,311 | | 1,331,150 | | (2,152,991 | ) | (3,635,999 | ) |
| [a] | Asset retirement obligation During 2003, the Company early-adopted CICA Handbook section 3110 - “Asset Retirement Obligations” for Canadian GAAP and SFAS 143 - “Accounting for Asset Retirement Obligations” for U.S. GAAP. The transitional provisions differ between Canadian GAAP and U.S. GAAP in that Canadian GAAP requires restatement of comparative amounts whereas U.S. GAAP does not allow restatement, but rather requires a cumulative catch-up adjustment to net earnings. An adjustment to net earnings under Canadian GAAP has been recorded to reflect the December 31, 2002 and March 31, 2002 comparative amounts prior to restatement in accordance with U.S. GAAP. |
F-21
Dynamic Oil & Gas, Inc.
NOTES TO FINANCIAL STATEMENTS
(in Canadian dollars)
December 31, 2003
| 12. | RECONCILIATION TO US GENERALLY ACCEPTED ACCOUNTING PRINCIPLES (cont’d.) |
| | |
| [b] | Stock-based compensation Prior to the adoption of CICA 3870, on April 1, 2002, no compensation expense was recognized under Canadian GAAP when stock options were issued to directors, employees or non-employees. This resulted in a U.S. GAAP difference for the years ended March 31, 2002 as the Company had adopted the disclosure-only provisions of Statement of Financial Accounting Standards No. 123, “Accounting for Stock-Based Compensation” for stock based awards to employees and directors, which were adopted subsequently in the December 31, 2002 financial statements for Canadian GAAP under the original disclosure requirements of CICA 3870. Had compensation cost for the Company’s stock option plan been determined based on the fair value at the grant date for awards in the year ended March 31, 2002 consistent with the provisions of SFAS No. 123, the Company’s net loss and net loss per share would have been increased to the pro forma amounts indicated below: |
| | | Year ended | |
| | | March 31, | |
| | | 2002 | |
| | | $ | |
| | | | |
| | Net earnings (loss) | | |
| | as reported | (3,412,452 | ) |
| | pro forma | (3,249,470 | ) |
| | Basic net earnings (loss) per common share | | |
| | as reported | (0.17 | ) |
| | pro forma | (0.16 | ) |
| | Diluted net earnings (loss) per common share | | |
| | as reported | (0.17 | ) |
| | pro forma | (0.16 | ) |
F-22
Dynamic Oil & Gas, Inc.
NOTES TO FINANCIAL STATEMENTS
(in Canadian dollars)
December 31, 2003
| 12. | RECONCILIATION TO US GENERALLY ACCEPTED ACCOUNTING PRINCIPLES (cont’d.) For the year ended December 31, 2003, and 2002, the net earnings (loss) that would be disclosed for SFAS No. 123 is consistent with the amounts shown in note 7[c]. The weighted average assumptions used in the Black-Scholes valuation (refer to note 7[c] for discussion of the model) for the year ended March 31, 2002 were as follows: |
| | | Year ended | |
| | | March 31, | |
| | | 2002 | |
| | | $ | |
| | | | |
| | Dividend yield | 0% | |
| | Expected volatility | 57% | |
| | Risk-free interest rate | 5% | |
| | Expected lives | 3 years | |
| | |
| [c] | Under both Canadian and US GAAP, property, plant and equipment must be assessed for potential impairments. Under U.S. GAAP, if the sum of the expected future cash flows (undiscounted and without interest charges) is less than the carrying amount of the asset, then an impairment loss (the amount by which the carrying amount of the asset exceeds the fair value of the asset) should be recognized. Fair value is calculated as the present value of estimated expected future cash flows. As disclosed in note 1, under Canadian GAAP, the impairment loss is the difference between the carrying value of the asset and its net recoverable amount (undiscounted). The resulting differences in recorded carrying values of impaired assets result in further differences in amortization and depletion expense in subsequent years. The CICA has adopted a new standard effective for 2004 that will eliminate this Canadian/US GAAP difference. |
| | |
| [d] | Effective April 1, 1999, the Company adopted the new Canadian GAAP recommendations with respect to income taxes which requires application of the liability method of tax allocation, similar to the requirements under U.S. GAAP. There remains, however, a difference between Canadian and U.S. GAAP, as Canadian GAAP requires that future income tax balances be adjusted to reflect substantively enacted rates rather than the currently legislated tax rates used to account for deferred income taxes under U.S. GAAP. |
| | |
| [e] | Share issue costs are charged directly to retained earnings under Canadian GAAP and to share capital under U.S. GAAP. The total share issue costs charged to share capital were $570,961. |
F-23
Dynamic Oil & Gas, Inc.
NOTES TO FINANCIAL STATEMENTS
(in Canadian dollars)
December 31, 2003
| 12. | RECONCILIATION TO US GENERALLY ACCEPTED ACCOUNTING PRINCIPLES (cont’d.) |
| | |
| [f] | New accounting pronouncements In January 2003, the FASB issued Interpretation No. 46 “Consolidation of Variable Interest Entities” (FIN No. 46R) (revised December 2003). FIN No. 46R clarifies the application of Accounting Research Bulletin No. 51, Consolidated Financial Statements, to only certain entities in which equity investors do not have the characteristics of a controlling financial interest or do not have sufficient equity at risk for the entity to finance its activities without additional subordinated financial support from other parties. FIN No. 46R applies immediately to variable interest entities created after January 31, 2003, and the variable interest entities obtained after that date. It applies at the end of the first annual reporting period beginning after June 15, 2003, to variable interest in which an enterprise holds a variable interest which was acquired before February 1, 2003. Adoption of FIN No. 46R on January 1, 2004 does not impact the Company’s financial position or results of operations. A similar guideline has been introduced in Canada, Accounting Guideline 15 “Consolidation of Variable Interest Entities”. This guideline applies to annual and interim periods beginning on or after November 1, 2004. |
| | |
| 13.COMMITMENTS The Company has entered into an operating lease in respect of its office premises. The minimum payments under this lease commitment, including estimated operating costs are as follows: |
| | | $ |
| | | |
| 2004 | | 202,905 |
| 2005 | | 208,461 |
| 2006 | | 202,905 |
| 2007 | | 208,461 |
| 2008 | | 89,364 |
| | | 912,096 |
F-24
Dynamic Oil & Gas, Inc.
NOTES TO FINANCIAL STATEMENTS
(in Canadian dollars)
December 31, 2003
14. ECONOMIC DEPENDENCY
The St. Albert property in Alberta is a core property of the Company and the majority of gas production from the property is pipelined and processed through facilities owned and operated by Atco Midstream (“Atco”) of Calgary, Alberta.
Effective November 1, 1997, the Company and its then joint interest partner, Fletcher Challenge Energy Canada Inc. signed a ten-year, firm service, sour gas processing and transportation agreement with Atco for a maximum daily quantity of 15 million cubic feet of gas per day to be processed at Atco’s Carbondale plant.
Effective December 15, 1998, a similar agreement was signed by the partners and Atco to process sweet gas at Atco’s Villenueve plant, also for a maximum daily quantity of 15 million cubic feet of gas per day.
Both agreements include an automatic renewal for a further ten years, subject to fee renegotiation.
15. SUBSEQUENT EVENT
On April 30, 2004, we entered into a bought-deal financing agreement with both Octagon Capital Corporation as lead underwriter and Raymond James Ltd. Pursuant to the terms of the agreement, we have agreed to issue, by way of private placement 2,000,000 flow-through shares at $5.60 each on a firm underwriting basis. As well, at the option of the underwriters, exercised at least one business day before closing, we have agreed to issue 400,000 common shares at $4.55 each. If the underwriters exercise their option, the total gross proceeds of the offering will be $13,020,000.
The net proceeds of the share offering will be used to accelerate our continued exploration and development of our core natural gas properties at Cypress/Chowade and Orion in northeast British Columbia. Proceeds from the flow-through shares will be used to incur qualifying Canadian Exploration Expense (“CEE”) as defined in the Income Tax Act (Canada) and we will renounce, for the 2004 taxation year, such CEE in favour of the original holders of the flow-through shares in an amount equal to the issue price for each flow-through share. Closing is subject to normal closing conditions including obtaining required regulatory approvals and is scheduled to occur on or about May 19, 2004.
F-25