UNITED STATES
SECURITIES AND EXCHANGE COMMISSION
WASHINGTON, D.C. 20549
FORM 10-Q
(Mark One)
| x | QUARTERLY REPORT UNDER SECTION 13 OR 15(d) OF THE SECURITIES EXCHANGE ACT OF 1934 |
For the quarterly period ended March 31, 2006
| ¨ | TRANSITION REPORT PURSUANT TO SECTION 13 OR 15(d) OF THE SECURITIES EXCHANGE ACT OF 1934 (NO FEE REQUIRED) |
For the transition period from to
Commission File Number 0-27558

CYTYC CORPORATION
(Exact name of registrant as specified in its charter)
| | |
| DELAWARE | | 02-0407755 |
(State or other jurisdiction of incorporation or organization) | | (I.R.S. Employer Identification No.) |
250 Campus Drive, Marlborough, MA 01752
(Address of principal executive offices, including Zip Code)
(508) 263-2900
(Registrant’s telephone number, including area code)
Indicate by check mark whether the registrant: (1) has filed all reports required to be filed by Section 13 or 15(d) of the Securities Exchange Act of 1934 during the preceding 12 months (or for such shorter period that the registrant was required to file such reports), and (2) has been subject to such filing requirements for the past 90 days. Yes x No ¨
Indicate by check mark whether the registrant is a large accelerated filer, an accelerated filer, or a non-accelerated filer. See definition of “accelerated filer and large accelerated filer” in Rule 12b-2 of the Exchange Act. (Check one):
Large accelerated filer x Accelerated filer ¨ Non-accelerated filer ¨
Indicate by check mark whether the registrant is a shell company (as defined in Rule 12b-2 of the Act). Yes ¨ No x
Indicate the number of shares outstanding of each of the issuer’s classes of common stock, as of the latest practicable date: The number of shares of the issuer’s Common Stock, $0.01 par value per share, outstanding as of April 30, 2006 was 114,335,226.
Total Number of Pages: 30
Exhibit index located on page 30
CYTYC CORPORATION
INDEX TO FORM 10-Q
2
REPORT OF INDEPENDENT REGISTERED PUBLIC ACCOUNTING FIRM
To the Board of Directors and Stockholders of
Cytyc Corporation
250 Campus Drive
Marlborough, Massachusetts
We have reviewed the accompanying condensed consolidated balance sheet of Cytyc Corporation and subsidiaries as of March 31, 2006, and the related condensed consolidated statements of income and cash flows for the three-month periods ended March 31, 2006 and 2005. These interim financial statements are the responsibility of the Company’s management.
We conducted our reviews in accordance with standards of the Public Company Accounting Oversight Board (United States). A review of interim financial information consists principally of applying analytical procedures and making inquiries of persons responsible for financial and accounting matters. It is substantially less in scope than an audit conducted in accordance with standards of the Public Company Accounting Oversight Board (United States), the objective of which is the expression of an opinion regarding the financial statements taken as a whole. Accordingly, we do not express such an opinion.
Based on our reviews, we are not aware of any material modifications that should be made to such condensed consolidated interim financial statements for them to be in conformity with accounting principles generally accepted in the United States of America.
As discussed in Note 8 to the condensed consolidated interim financial statements, the Company changed its method of accounting for stock-based compensation on January 1, 2006, as required by Statement of Financial Accounting Standards No. 123R,Share-Based Payment.
We have previously audited, in accordance with standards of the Public Company Accounting Oversight Board (United States), the consolidated balance sheet of Cytyc Corporation and subsidiaries as of December 31, 2005, and the related consolidated statements of income, stockholders’ equity, and cash flows for the year then ended (not presented herein); and in our report dated February 16, 2006, we expressed an unqualified opinion on those consolidated financial statements. In our opinion, the information set forth in the accompanying condensed consolidated balance sheet as of December 31, 2005 is fairly stated, in all material respects, in relation to the consolidated balance sheet from which it has been derived.
/s/ Deloitte & Touche LLP
Boston, Massachusetts
May 9, 2006
3
Part I FINANCIAL INFORMATION
Item 1. Condensed Consolidated Financial Statements
CYTYC CORPORATION
CONDENSED CONSOLIDATED BALANCE SHEETS
(in thousands, except share and per share amounts)
| | | | | | | | |
| | | March 31,
2006 | | | December 31,
2005 | |
| | | (unaudited) | | | | |
| ASSETS | | | | | | | | |
Current assets: | | | | | | | | |
Cash and cash equivalents | | $ | 122,292 | | | $ | 123,468 | |
Investment securities | | | 100,510 | | | | 97,151 | |
Accounts receivable, net of allowance of $1,538 and $1,592 at March 31, 2006 and
December 31, 2005, respectively | | | 81,616 | | | | 82,833 | |
Inventories, net | | | 26,888 | | | | 24,033 | |
Deferred tax assets, net | | | 8,165 | | | | 4,266 | |
Prepaid expenses and other current assets | | | 4,472 | | | | 5,539 | |
| | | | | | | | |
Total current assets | | | 343,943 | | | | 337,290 | |
| | | | | | | | |
Property and equipment, net | | | 121,287 | | | | 113,610 | |
| | | | | | | | |
Intangible assets: | | | | | | | | |
Patents and developed technology, net of accumulated amortization of $15,415 and
$13,018 at March 31, 2006 and December 31, 2005, respectively | | | 190,175 | | | | 192,572 | |
Goodwill | | | 387,662 | | | | 389,385 | |
| | | | | | | | |
Total intangible assets | | | 577,837 | | | | 581,957 | |
| | | | | | | | |
Other assets, net | | | 7,487 | | | | 7,022 | |
| | | | | | | | |
Total assets | | $ | 1,050,554 | | | $ | 1,039,879 | |
| | | | | | | | |
| LIABILITIES AND STOCKHOLDERS’ EQUITY | | | | | | | | |
Current liabilities: | | | | | | | | |
Accounts payable | | $ | 13,322 | | | $ | 10,627 | |
Accrued expenses | | | 40,612 | | | | 74,291 | |
Deferred revenue | | | 4,982 | | | | 4,265 | |
| | | | | | | | |
Total current liabilities | | | 58,916 | | | | 89,183 | |
| | | | | | | | |
Deferred tax liabilities, net | | | 77,505 | | | | 70,101 | |
| | |
Long-term debt and other non-current liabilities | | | 253,985 | | | | 252,244 | |
| | |
Commitments and contingencies (Note 12) | | | | | | | | |
| | |
Stockholders’ equity: | | | | | | | | |
Preferred stock, $0.01 par value—Authorized—5,000,000 shares
No shares issued or outstanding | | | — | | | | — | |
Common stock, $0.01 par value—Authorized—400,000,000 shares
Issued—133,582,299 and 132,743,281 shares in 2006 and 2005, respectively
Outstanding—115,347,891 and 115,273,391 shares in 2006 and 2005, respectively | | | 1,336 | | | | 1,327 | |
Additional paid-in capital | | | 570,327 | | | | 545,761 | |
Treasury stock, at cost: 18,234,408 and 17,469,890 shares in 2006 and 2005, respectively | | | (229,772 | ) | | | (207,503 | ) |
Accumulated other comprehensive income | | | 2,175 | | | | 2,048 | |
Retained earnings | | | 316,082 | | | | 286,718 | |
| | | | | | | | |
Total stockholders’ equity | | | 660,148 | | | | 628,351 | |
| | | | | | | | |
Total liabilities and stockholders’ equity | | $ | 1,050,554 | | | $ | 1,039,879 | |
| | | | | | | | |
The accompanying notes are an integral part of these condensed consolidated financial statements.
4
CYTYC CORPORATION
CONDENSED CONSOLIDATED STATEMENTS OF INCOME
(in thousands, except per share data)
(unaudited)
| | | | | | | | |
| | | Three Months Ended March 31, | |
| | | 2006 | | | 2005 | |
Net sales | | $ | 140,540 | | | $ | 113,405 | |
Cost of sales (1) | | | 29,789 | | | | 23,927 | |
| | | | | | | | |
Gross profit | | | 110,751 | | | | 89,478 | |
| | | | | | | | |
Operating expenses: | | | | | | | | |
Research and development (1) | | | 10,311 | | | | 6,799 | |
Sales and marketing (1) | | | 40,133 | | | | 29,683 | |
General and administrative (1) | | | 14,025 | | | | 10,707 | |
Arbitration decision | | | — | | | | 7,807 | |
| | | | | | | | |
Total operating expenses | | | 64,469 | | | | 54,996 | |
| | | | | | | | |
Income from operations | | | 46,282 | | | | 34,482 | |
Other expense, net: | | | | | | | | |
Interest income | | | 1,830 | | | | 892 | |
Interest expense | | | (1,792 | ) | | | (1,792 | ) |
Other | | | (77 | ) | | | (683 | ) |
| | | | | | | | |
Total other expense, net | | | (39 | ) | | | (1,583 | ) |
| | | | | | | | |
Income before provision for income taxes | | | 46,243 | | | | 32,899 | |
Provision for income taxes (1) | | | 16,879 | | | | 12,008 | |
| | | | | | | | |
Net income | | $ | 29,364 | | | $ | 20,891 | |
| | | | | | | | |
Net income per common and potential common share: | | | | | | | | |
Basic | | $ | 0.25 | | | $ | 0.18 | |
| | | | | | | | |
Diluted | | $ | 0.24 | | | $ | 0.18 | |
| | | | | | | | |
Weighted average common and potential common shares outstanding: | | | | | | | | |
Basic | | | 115,481 | | | | 113,661 | |
Diluted | | | 125,877 | | | | 125,771 | |
| | |
(1) Balance includes stock-based compensation under SFAS 123R as follows (see Note 8): | | | | | | | | |
Cost of sales | | $ | 361 | | | $ | — | |
Research and development | | | 844 | | | | — | |
Sales and marketing | | | 2,651 | | | | — | |
General and administrative | | | 2,169 | | | | — | |
| | | | | | | | |
Stock-based compensation expense, gross | | | 6,025 | | | | — | |
Effect on income taxes | | | (1,963 | ) | | | — | |
| | | | | | | | |
Total stock-based compensation expense, net | | $ | 4,062 | | | $ | — | |
| | | | | | | | |
The accompanying notes are an integral part of these condensed consolidated financial statements.
5
CYTYC CORPORATION
CONDENSED CONSOLIDATED STATEMENTS OF CASH FLOWS
(in thousands)
(unaudited)
| | | | | | | | |
| | | Three Months Ended
March 31, | |
| | | 2006 | | | 2005 | |
Cash flows from operating activities: | | | | | | | | |
Net income | | $ | 29,364 | | | $ | 20,891 | |
Adjustments to reconcile net income to net cash provided by operating activities: | | | | | | | | |
Depreciation and amortization | | | 7,643 | | | | 4,833 | |
Provision for doubtful accounts | | | 73 | | | | 134 | |
Amortization of deferred financing costs | | | 386 | | | | 386 | |
Revenue relating to license issued in exchange for preferred stock | | | (387 | ) | | | — | |
Stock-based compensation expense pursuant to SFAS No. 123R | | | 6,025 | | | | — | |
Compensation expense related to issuance of stock to directors and executives | | | 395 | | | | 423 | |
Change in deferred income taxes | | | 5,200 | | | | 14,933 | |
Changes in assets and liabilities, excluding effects of acquisitions: | | | | | | | | |
Accounts receivable | | | 1,384 | | | | (2,660 | ) |
Inventories | | | (2,833 | ) | | | (1,165 | ) |
Prepaid expenses and other current assets | | | 1,076 | | | | (712 | ) |
Accounts payable | | | 2,682 | | | | (1,436 | ) |
Accrued expenses | | | (12,046 | ) | | | (1,684 | ) |
Deferred revenue | | | 698 | | | | 853 | |
Tax benefit from exercise of stock options | | | 1,507 | | | | 2,132 | |
| | | | | | | | |
Net cash provided by operating activities | | | 41,167 | | | | 36,928 | |
| | | | | | | | |
Cash flows from investing activities: | | | | | | | | |
Acquisition of Proxima Therapeutics, Inc., net of cash acquired | | | (21,074 | ) | | | (156,886 | ) |
(Increase) decrease in other assets | | | (463 | ) | | | 46 | |
Increase in equipment under customer usage agreements | | | (7,254 | ) | | | (7,055 | ) |
Purchases of property and equipment, net | | | (4,118 | ) | | | (3,820 | ) |
Increase in patents and developed technology | | | (473 | ) | | | — | |
Purchases of investment securities | | | (23,425 | ) | | | (1,514 | ) |
Proceeds from sales and maturities of investment securities | | | 20,097 | | | | 98,049 | |
| | | | | | | | |
Net cash used in investing activities | | | (36,710 | ) | | | (71,180 | ) |
| | | | | | | | |
Cash flows from financing activities: | | | | | | | | |
Purchase of treasury shares | | | (22,269 | ) | | | — | |
Proceeds from exercise of stock options | | | 15,292 | | | | 5,517 | |
Excess tax benefit from exercise of stock options | | | 1,354 | | | | — | |
| | | | | | | | |
Net cash (used in) provided by financing activities | | | (5,623 | ) | | | 5,517 | |
| | | | | | | | |
Effect of exchange rate changes on cash | | | (10 | ) | | | (159 | ) |
| | | | | | | | |
Net decrease in cash and cash equivalents | | | (1,176 | ) | | | (28,894 | ) |
Cash and cash equivalents, beginning of period | | | 123,468 | | | | 86,277 | |
| | | | | | | | |
Cash and cash equivalents, end of period | | $ | 122,292 | | | $ | 57,383 | |
| | | | | | | | |
The accompanying notes are an integral part of these condensed consolidated financial statements.
6
CYTYC CORPORATION
NOTES TO CONDENSED CONSOLIDATED FINANCIAL STATEMENTS (Unaudited)
(1) Basis of Presentation
The accompanying condensed consolidated financial statements of Cytyc Corporation and subsidiaries (the “Company” or “Cytyc”) have been prepared pursuant to the rules and regulations of the Securities and Exchange Commission (the “SEC”). Certain information and footnote disclosures normally included in financial statements prepared in accordance with accounting principles generally accepted in the United States have been condensed or omitted pursuant to such rules and regulations. These financial statements should be read in conjunction with the financial statements and notes included in the Company’s Annual Report on Form 10-K for the year ended December 31, 2005.
The notes and accompanying condensed consolidated financial statements are unaudited. The information furnished reflects all adjustments, which, in the opinion of management, are necessary for a fair presentation of results for the interim periods. Such adjustments consisted only of normal recurring items. The interim periods are not necessarily indicative of the results expected for the full year or any future period.
The preparation of these condensed consolidated financial statements in conformity with accounting principles generally accepted in the United States requires management to make estimates and assumptions that affect the reported amounts of assets and liabilities and disclosures of contingent assets and liabilities at the date of the financial statements and the reported amounts of net sales and expenses during the reporting period. Actual results could differ from those estimates.
As described in Note 8, on January 1, 2006, the Company changed its method of accounting for stock-based compensation, as required by Statement of Financial Accounting Standards (“SFAS”) No. 123R,Share-Based Payment.
(2) Acquisition Activity
(a) Acquisition of Proxima Therapeutics, Inc.
On March 7, 2005, the Company acquired Proxima Therapeutics, Inc. (“Proxima”), a privately held company located in Alpharetta, Georgia, in a non-taxable transaction (the “Merger”). As a result of the Merger, all of Proxima’s fully-diluted equity immediately prior to the Merger was automatically converted into the right to receive an initial cash payment of approximately $160 million, plus contingent earn-out payments tied to future performance milestones. The contingent earn-out payments are based on incremental sales growth in the breast-related products during 2005 and 2006, are subject to an aggregate cap of $65 million and are recorded as additional goodwill when earned. In March 2006, the Company paid $21.1 million for the contingent earn-out payments relating to incremental sales growth in the breast-related products during 2005. The Company also recorded $1.0 million of deferred tax assets relating to these earn-out payments.
The initial purchase price payment was paid with Cytyc’s available cash. Pursuant to the agreement for the Merger, $15.8 million of the purchase price was placed in escrow to satisfy potential claims. The purchase price was supported by estimates of future sales and earnings of Proxima, as well as the value of sales force and other projected synergies. During the three months ended March 31, 2006, the Company released the $15.8 million, plus interest, from escrow to the former Proxima shareholders.
The aggregate purchase price for Proxima, including the contingent earn-out payments relating to 2005 performance milestones, was $184.2 million, of which $181.1 million represented cash payable to Proxima shareholders and $3.1 million represented acquisition-related fees and expenses. The acquisition was accounted for as a purchase in accordance with SFAS No. 141,Business Combinations, and accordingly, the results of operations of Proxima were included in the consolidated statement of income from the date of the acquisition.
7
CYTYC CORPORATION
NOTES TO CONDENSED CONSOLIDATED FINANCIAL STATEMENTS (Unaudited) — Continued
Purchase Price Allocation
The following table summarizes the fair values of the assets acquired and liabilities assumed at the date of acquisition (“Original Amount”) and includes the contingent earn-out payments relating to 2005 performance milestones, for an aggregate purchase price of approximately $184.2 million, including acquisition costs:
| | | | | | | | | | | |
| | | Original
Amount | | | Contingent
Earn-out and
Subsequent
Adjustments | | Amount as of
March 31,
2006 | |
| | | (in thousands) | |
Current assets | | $ | 6,622 | | | $ | — | | $ | 6,622 | |
Property and equipment | | | 379 | | | | — | | | 379 | |
Patents and developed technology | | | 101,900 | | | | — | | | 101,900 | |
Goodwill | | | 76,279 | | | | 19,428 | | | 95,707 | |
Other assets | | | 507 | | | | — | | | 507 | |
Current liabilities | | | (4,143 | ) | | | 114 | | | (4,029 | ) |
Long-term liabilities | | | (587 | ) | | | — | | | (587 | ) |
Net deferred tax liability and valuation allowance—long-term | | | (17,827 | ) | | | 1,532 | | | (16,295 | ) |
| | | | | | | | | | | |
| | $ | 163,130 | | | $ | 21,074 | | $ | 184,204 | |
| | | | | | | | | | | |
As part of the purchase price allocation, all tangible and intangible assets and liabilities were identified and valued. Of the total purchase price, the Company allocated $2.9 million to acquired net tangible assets. The net deferred tax liability of $16.3 million is primarily comprised of $23.0 million of deferred tax assets, net of a $1.1 million valuation allowance, relating to acquired net operating losses and tax credits and deferred tax liabilities of $39.3 million relating to patents and developed technology. The Company determined the fair value of Proxima’s tangible assets and liabilities based on a review of Proxima’s historical and then current financial statements and an understanding of the ongoing nature of the assets and liabilities.
The Company also allocated $101.9 million to the acquired patents and developed technology, primarily associated with the MammoSite® Radiation Therapy System (“MammoSite”). The acquired patents expire at various dates through 2023. Based on the average life of the patent portfolio, the remaining economic life of the developed technology is expected to be approximately 15 years. The Company is amortizing the patents and developed technology over this period using the cash flow method, under which amortization is calculated and recognized based upon the Company’s estimated net cash flows over the life of the intangible asset, reflecting the pattern in which the economic benefits of the intangible asset are consumed in accordance with SFAS No. 142,Goodwill and Other Intangible Assets. The Company believes the patents provide sufficient coverage for differentiated products to sustain some competitive advantage in the marketplace over the average remaining life of the patents.
The Company valued the intangible assets acquired, including the portfolio of patents and technologies associated with MammoSite and the GliaSite® Radiation Therapy System, based on present value calculations of income using risk-adjusted cash flows for each product, an analysis of company accomplishments, an assessment of overall contributions, as well as project risks. The projections used in the valuation are based on estimates of relevant market sizes and growth factors, expected trends in technology, and the nature and expected timing of new product introductions by the Company and its competitors, as well as estimates of cost of sales, operating expenses, and income taxes resulting from the acquired products. In addition, the projections reflect the Company’s expectation that improvements to the current devices will continue to be made over the life cycle of the product lines. As a result, the completed technology that existed as of the acquisition date was assumed to represent a declining percentage of the devices’ technological composition over time.
The rate utilized to discount the net cash flows to their present value was based on estimated weighted-average cost of capital calculations. A discount rate of 25% was used to value the acquired intangible assets. This discount rate is higher than the Company’s weighted-average cost of capital due to the early-stage life cycle of the acquired products and related inherent uncertainties surrounding the successful commercialization and development of the acquired intangible assets, the useful life of such technology, the profitability levels of such technology, and the uncertainty of technological advances that were unknown at that time.
The projections used to value the tangible assets and liabilities, as well as identifiable intangible assets, reflected no material change in historical pricing, margins or expense levels specifically associated with these acquired net assets. There have been no variations from the Company’s underlying projections and assumptions as compared to actual operating results that would have had a material impact on the valuation.
8
CYTYC CORPORATION
NOTES TO CONDENSED CONSOLIDATED FINANCIAL STATEMENTS (Unaudited) — Continued
Goodwill
The excess of the purchase price, including contingent earn-out payments relating to 2005 performance milestones, over the fair value of tangible and identifiable intangible net assets was allocated to goodwill, which is non-deductible for tax purposes and totaled $95.7 million. In accordance with SFAS No. 142, this amount will not be systematically amortized. Instead, the Company will perform an annual assessment for impairment by applying a fair-value-based test.
(b) Pro Forma results
The following unaudited pro forma financial information for the three months ended March 31, 2005 presents the combined results of operations of Cytyc and Proxima as if the acquisition had occurred as of January 1, 2005 and include $2.8 million of transaction fees and expenses incurred by Proxima, prior to the acquisition, related to the Merger. The pro forma adjustments are based upon available information and certain assumptions that management believes are reasonable. The unaudited pro forma financial information is not intended to represent or be indicative of the consolidated results of operations or financial condition of the Company that would have been reported had the acquisition been completed as of the January 1, 2005, and should not be taken as representative of the future consolidated results of operations or financial condition of the Company.
Pro forma results for the three months ended March 31, 2005 were as follows:
| | | |
| | | Amount |
| | | (in thousands,
except per share
amounts) |
Net sales | | $ | 117,600 |
Net income | | $ | 17,605 |
| |
Net income per common share: | | | |
Basic | | $ | 0.15 |
| | | |
Diluted | | $ | 0.15 |
| | | |
(3) Amortization of Intangible Assets
Amortization expense related to identifiable intangible assets that will continue to be amortized in the future, which consists of the Company’s acquired patents and developed technology, was approximately $2.4 million and $1.2 million for the three months ended March 31, 2006 and 2005, respectively. Estimated amortization expense related to identifiable intangible assets is as follows:
| | | |
| | | Amount |
| | | (in thousands) |
Remaining nine months ending December 31, 2006 | | $ | 8,498 |
Year ending December 31, 2007 | | | 14,539 |
Year ending December 31, 2008 | | | 17,326 |
Year ending December 31, 2009 | | | 19,607 |
Year ending December 31, 2010 | | | 19,194 |
Year ending December 31, 2011 | | | 17,917 |
Thereafter | | | 93,094 |
| | | |
Total | | $ | 190,175 |
| | | |
(4) Investment Securities
Investment securities consist of auction rate securities and municipal bonds, all of which are classified as available-for-sale. At March 31, 2006, the Company’s investment securities had contractual maturities at various dates through March 2007. The fair value of available-for-sale securities was determined based on quoted market prices at the reporting date for those securities. Available-for-sale securities are shown in the consolidated financial statements at fair market value. The Company has the ability and intent to hold securities when fair value is less than cost.
At March 31, 2006 and December 31, 2005, investment securities consisted of $79.5 million and $65.1 million, respectively, of auction rate securities (“ARS”) classified as available-for-sale. Although the ARS generally have original maturities in excess of
9
CYTYC CORPORATION
NOTES TO CONDENSED CONSOLIDATED FINANCIAL STATEMENTS (Unaudited) — Continued
one year from date of purchase, the underlying interest rates on these securities typically reset within one month. Therefore, these ARS are priced and subsequently traded as investment securities because of remarketing and the interest rate reset feature.
At March 31, 2006 and December 31, 2005, the cost basis, aggregate fair value and gross unrealized holding gains and losses by major security type were as follows:
| | | | | | | | | | | | | |
| | | Amortized Cost | | Gross Unrealized Holding
Gains | | Gross Unrealized Holding Losses | | | Fair Value |
| | | (in thousands) |
March 31, 2006 | | | | | | | | | | | | | |
| | | | |
Auction rate securities (average interest rate reset of 0.6 months) | | $ | 79,500 | | $ | — | | $ | — | | | $ | 79,500 |
Municipal bonds (average maturity of 4.0 months) | | | 21,055 | | | — | | | (45 | ) | | | 21,010 |
| | | | | | | | | | | | | |
| | $ | 100,555 | | $ | — | | $ | (45 | ) | | $ | 100,510 |
| | | | | | | | | | | | | |
December 31, 2005 | | | | | | | | | | | | | |
Auction rate securities (average interest rate reset of 0.6 months) | | $ | 65,075 | | $ | — | | $ | — | | | $ | 65,075 |
Municipal bonds (average maturity of 5.2 months) | | | 32,152 | | | — | | | (76 | ) | | | 32,076 |
| | | | | | | | | | | | | |
| | $ | 97,227 | | $ | — | | $ | (76 | ) | | $ | 97,151 |
| | | | | | | | | | | | | |
(5) Other Balance Sheet Information
Components of selected captions in the condensed consolidated balance sheets at March 31, 2006 and December 31, 2005 consisted of:
| | | | | | |
| | | March 31,
2006 | | December 31,
2005 |
| | | (in thousands) |
Inventories | | | | | | |
Raw material | | $ | 9,280 | | $ | 9,000 |
Work-in-process | | | 3,421 | | | 3,436 |
Finished goods | | | 14,187 | | | 11,597 |
| | | | | | |
| | $ | 26,888 | | $ | 24,033 |
| | | | | | |
Property and Equipment | | | | | | |
Property and equipment | | $ | 107,355 | | $ | 101,604 |
Equipment under customer usage agreements | | | 74,090 | | | 66,832 |
| | | | | | |
| | | 181,445 | | | 168,436 |
Less—accumulated depreciation and amortization | | | 60,158 | | | 54,826 |
| | | | | | |
| | $ | 121,287 | | $ | 113,610 |
| | | | | | |
Accrued Expenses | | | | | | |
Accrued compensation | | $ | 13,568 | | $ | 20,999 |
Accrued acquisition (Proxima earn-out) | | | — | | | 20,906 |
Accrued taxes | | | 16,087 | | | 8,860 |
Other accruals | | | 10,957 | | | 23,526 |
| | | | | | |
| | $ | 40,612 | | $ | 74,291 |
| | | | | | |
10
CYTYC CORPORATION
NOTES TO CONDENSED CONSOLIDATED FINANCIAL STATEMENTS (Unaudited) — Continued
The Company records a liability for product warranty obligations at the time of sale based upon historical warranty experience. The term of the warranty is generally twelve months. Product warranty obligations are included in accrued expenses. Changes in the product warranty obligations for the three months ended March 31, 2006 and 2005 were as follows:
| | | | | | | | |
| | | Three Months Ended
March 31, | |
| | | 2006 | | | 2005 | |
| | | (in thousands) | |
Balance, beginning of year | | $ | 426 | | | $ | 397 | |
New warranties | | | 135 | | | | 39 | |
Payments | | | (83 | ) | | | (29 | ) |
Adjustments | | | — | | | | (27 | ) |
| | | | | | | | |
Balance, March 31 | | $ | 478 | | | $ | 380 | |
| | | | | | | | |
(6) Other Assets
In March 2006, the Company entered into a private equity investment agreement with a corporation, in which the Company received shares of preferred stock in exchange for granting a non-exclusive license to certain patents of the Company. The Company is accounting for this investment under the cost method, since it does not have the ability to exercise significant influence and, as of March 31, 2006, holds less than 20 percent of the corporation’s voting stock, among other factors. The Company’s determination of whether it has significant influence over an investment requires judgment. If at any time the investment exceeds 20 percent of the corporation’s voting stock or the Company determines that it has the ability to exercise significant influence over the investee, among other factors, the Company will begin to account for its investment under the equity method. In addition, the Company will regularly review its investment for impairment indicators. To date, no impairment indicators have been identified relating to this investment.
(7) Net Income Per Common Share
Basic net income per share is computed by dividing net income by the weighted average number of common shares outstanding. Diluted net income per share is computed by dividing net income by the weighted average number of common shares and potential common shares from outstanding stock options and convertible debt. Potential common shares for outstanding stock options are calculated using the treasury stock method and represent incremental shares issuable upon exercise of the Company’s outstanding stock options. The treasury stock is affected by the amount of stock-based compensation attributable to future services and therefore not yet recognized. The Company’s adoption of SFAS No. 123R on January 1, 2006 resulted in an increase in unrecognized stock-based compensation expense relating to unvested employee stock awards, which reduced the dilutive effect of assumed exercises of stock options for the three months ended March 31, 2006 by approximately two million shares.
11
CYTYC CORPORATION
NOTES TO CONDENSED CONSOLIDATED FINANCIAL STATEMENTS (Unaudited) — Continued
The following table provides a reconciliation of the net income and weighted average common shares used in calculating basic and diluted net income per share for the three months ended March 31, 2006 and 2005:
| | | | | | |
| | | Three Months Ended
March 31, |
| | | 2006 | | 2005 |
| | | (in thousands, except per
share data) |
Numerator: | | | | | | |
Net income, as reported, for basic earnings per share | | $ | 29,364 | | $ | 20,891 |
Interest expense, net of tax | | | 1,138 | | | 1,138 |
| | | | | | |
Net income, as adjusted, for diluted earnings per share | | $ | 30,502 | | $ | 22,029 |
| | | | | | |
Denominator: | | | | | | |
Basic weighted average common shares outstanding | | | 115,481 | | | 113,661 |
Dilutive effect of assumed exercise of stock options | | | 1,970 | | | 3,684 |
Dilutive effect of assumed conversion of convertible debt | | | 8,426 | | | 8,426 |
| | | | | | |
Weighted average common shares outstanding assuming dilution | | | 125,877 | | | 125,771 |
| | | | | | |
Basic net income per common share | | $ | 0.25 | | $ | 0.18 |
| | | | | | |
Diluted net income per common and potential common share | | $ | 0.24 | | $ | 0.18 |
| | | | | | |
Diluted weighted average common shares outstanding for the three months ended March 31, 2006 and 2005 excludes 50,875 and 5,015,175 potential common shares, respectively, from stock options outstanding, because the exercise prices of such stock options were higher than the average closing price of the Company’s common stock as quoted on The NASDAQ National Market during the periods mentioned and, accordingly, their effect would be anti-dilutive.
(8) Stock-Based Compensation and Stock Incentive Plans
(a) Stock-Based Compensation
In December 2004, the Financial Accounting Standards Board (“FASB”) issued SFAS No. 123R, which requires all stock-based compensation to employees, including grants of employee stock options, to be recognized in the financial statements based on their fair values. The Company adopted SFAS No. 123R on January 1, 2006 using the modified prospective method and accordingly, prior period amounts have not been restated. In order to determine the fair value of stock options and employee stock purchase plan shares, the Company is using the Black-Scholes option pricing model and is applying the multiple-option valuation approach to the stock option valuation. The Company is recognizing stock-based compensation expense on a straight-line basis over the requisite service period of the awards for options granted following the adoption of SFAS No. 123R. For unvested stock options outstanding as of January 1, 2006, the Company will continue to recognize stock-based compensation expense using the accelerated amortization method prescribed in FASB Interpretation No. 28,Accounting for Stock Appreciation Rights and Other Variable Stock Option or Award Plans.
Estimates of the fair value of equity awards will be affected by the future market price of the Company’s common stock, as well as the actual results of certain assumptions used to value the equity awards. These assumptions include, but are not limited to, the related income tax impact, the expected volatility of the common stock, the number of stock options to be forfeited and exercised by employees, and the expected term of options granted.
As noted above, the fair value of stock options and employee stock purchase plan shares is determined by using the Black-Scholes option pricing model and applying the multiple-option valuation approach to the stock option valuation. The options have graded-vesting on an annual basis over an average vesting period of four years. In applying the multiple-option approach, each option “tranche” is separately valued based upon when the tranche vests. The Company estimates the expected option term by calculating the average period of time before the employees exercise their options and adds this to the vesting period of each tranche. Historically, this period of time has averaged one year from the date the options vest. The expected term of employee stock purchase plan shares is the average of the remaining purchase periods under each offering period. For equity awards granted prior to the adoption of SFAS No. 123R, the volatility of the common stock was estimated using historical volatility. For equity awards granted since January 1, 2006, the volatility of the common stock is estimated using a combination of historical and implied volatility, as discussed in Staff Accounting Bulletin (“SAB”) No. 107. By using this combination, the Company is taking into consideration the historical realized volatility, as well as factoring in estimates of future volatility that the Company believes will differ from historical volatility as a result of the Company’s product diversification over the last two years, the market performance of the common stock, the volume of activity of the underlying shares, the availability of actively traded common stock options, and overall market conditions.
12
CYTYC CORPORATION
NOTES TO CONDENSED CONSOLIDATED FINANCIAL STATEMENTS (Unaudited) — Continued
The risk-free interest rate used in the Black-Scholes option pricing model is determined by looking at historical U.S. Treasury zero-coupon bond issues with remaining terms equal to the expected terms of the equity awards. In addition, an expected dividend yield of zero is used in the option valuation model, because the Company does not expect to pay any cash dividends in the foreseeable future. Lastly, in accordance with SFAS No. 123R, the Company is required to estimate forfeitures at the time of grant and revise those estimates in subsequent periods if actual forfeitures differ from those estimates. In order to determine an estimated pre-vesting option forfeiture rate, the Company used historical forfeiture data. This estimated forfeiture rate has been applied to all unvested options outstanding as of January 1, 2006 and to all options granted since January 1, 2006. Therefore, stock-based compensation expense is recorded only for those options that are expected to vest.
The tax benefit related to the $6.0 million of stock-based compensation expense recorded during the three months ended March 31, 2006 was $1.9 million.
Prior to January 1, 2006, the Company accounted for stock options using the intrinsic value method, pursuant to the provisions of Accounting Principles Board Opinion No. 25,Accounting for Stock Issued to Employees. Under this method, stock-based compensation expense was measured as the difference between the option’s exercise price and the market price of the Company’s common stock on the date of grant. Historically, under this method, stock-based compensation had not been material because stock options are granted at the market price of the common stock on the date of grant. Had the Company accounted for stock awards pursuant to the provisions of SFAS No. 123,Accounting for Stock-Based Compensation, net income and net income per share would have been as follows for the three months ended March 31, 2005:
| | | |
| | | Three Months Ended |
| | | March 31, 2005 |
| | | (in thousands, except
per share amounts) |
Net income as reported | | $ | 20,891 |
Assumed stock-based compensation cost, net of tax | | | 6,276 |
| | | |
Pro forma net income | | $ | 14,615 |
| | | |
Net income per common share: | | | |
Basic — as reported | | $ | 0.18 |
| | | |
Basic — pro forma | | $ | 0.13 |
| | | |
Diluted — as reported | | $ | 0.18 |
| | | |
Diluted — pro forma | | $ | 0.12 |
| | | |
The underlying assumptions used in the Black-Scholes model were as follows for options granted during the three months ended:
| | | | | | |
| | | March 31, | |
| | | 2006 | | | 2005 | |
Risk-free interest rate | | 4.6 | % | | 3.7 | % |
Expected dividend yield | | — | | | — | |
Expected lives (in years) | | 3.5 | | | 3.5 | |
Expected volatility | | 32 | % | | 61 | % |
Prior to the adoption of SFAS 123R, the Company presented all tax benefits for deductions resulting from the exercise of stock options and disqualifying dispositions as operating cash flows in the condensed consolidated statement of cash flows. SFAS No. 123R generally requires the benefits of tax deductions in excess of recognized compensation expense to be reported within cash flows from financing activities.
As of March 31, 2006, total unrecognized stock-based compensation expense relating to unvested employee stock awards, adjusted for estimated forfeitures, was $38.4 million. This amount is expected to be recognized over a weighted-average period of 3.5 years. If actual forfeitures differ from current estimates, total unrecognized stock-based compensation expense will be adjusted for future changes in estimated forfeitures.
13
CYTYC CORPORATION
NOTES TO CONDENSED CONSOLIDATED FINANCIAL STATEMENTS (Unaudited) — Continued
(b) Stock Incentive Plans
The Cytyc Corporation 2004 Omnibus Stock Plan (the “2004 Omnibus Plan”), which is the Company’s primary plan for grants of equity, provides for the issuance of up to 12,250,000 shares of the Company’s common stock, no more than 8,200,000 of which shares may be issued as awards other than stock options or stock appreciation rights. The 2004 Omnibus Plan provides for grant of various incentives, including stock options and other stock-based awards. At March 31, 2006, 5,285,303 shares were available for future grant under the 2004 Omnibus Plan. Prior to the approval of the 2004 Omnibus Plan, the Company had various employee and director equity compensation plans, including the 1998 Stock Plan, the 1995 Stock Plan, the 1995 Non-Employee Director Stock Option Plan and the 2001 Non-Employee Director Stock Option Plan. These plans were terminated with the adoption of the 2004 Omnibus Plan and no further awards may be issued under these plans.
The following table summarizes options outstanding, by stock plan, as of March 31, 2006:
| | |
2004 Omnibus Plan | | 6,875,464 |
1995 Stock Plan | | 10,305,462 |
1998 Stock Plan | | 5,307 |
1995 Non-Employee Director Stock Option Plan | | 180,000 |
2001 Non-Employee Director Stock Option Plan | | 908,000 |
| | |
| | 18,274,233 |
| | |
The following schedule summarizes the activity under the Company’s stock plans for the three months ended March 31, 2006:
| | | | | | | | | |
| | | Number of Shares | | | Range of Exercise Prices | | Weighted Average Exercise Price
per share |
Outstanding, December 31, 2005 | | 16,710,904 | | | $ | 0.44 — $28.45 | | $ | 19.20 |
Granted | | 2,676,319 | | | | 19.35 — 30.11 | | | 28.40 |
Exercised | | (832,018 | ) | | | 2.69 — 28.45 | | | 18.50 |
Canceled | | (280,972 | ) | | | 8.00 — 29.24 | | | 21.17 |
| | | | | | | | | |
Outstanding, March 31, 2006 | | 18,274,233 | | | $ | 0.44 — $30.11 | | $ | 20.55 |
| | | | | | | | | |
Exercisable, March 31, 2006 | | 9,166,241 | | | $ | 0.44 — $30.11 | | $ | 18.95 |
| | | | | | | | | |
Exercisable, December 31, 2005 | | 9,206,763 | | | $ | 0.44 — $28.45 | | $ | 18.70 |
| | | | | | | | | |
The weighted average fair value per share of options granted during the three months ended March 31, 2006 and 2005 was $8.45 and $11.25, respectively.
The total intrinsic value of options exercised during the three months ended March 31, 2006 and 2005 was $9.1 million and $5.9 million, respectively. The intrinsic value is calculated as the difference between the market value of the Company’s common stock on date of exercise and the exercise price per share.
14
CYTYC CORPORATION
NOTES TO CONDENSED CONSOLIDATED FINANCIAL STATEMENTS (Unaudited) — Continued
The following table summarizes information about stock options outstanding at March 31, 2006:
| | | | | | | | | | |
| | | Options Outstanding | | Options Exercisable |
Range of Exercise Prices | | Number of Shares | | Weighted Average
Remaining
Contractual Life
(in years) | | Weighted Average
Exercise Price per Share | | Number of Shares | | Weighted Average
Exercise Price per share |
$ 0.44 – $10.80 | | 1,985,597 | | 3.20 | | $ 8.97 | | 1,287,476 | | $ 8.28 |
10.81 – 12.46 | | 490,568 | | 5.77 | | 11.46 | | 398,248 | | 11.44 |
12.52 – 12.65 | | 1,925,074 | | 3.65 | | 12.65 | | 793,636 | | 12.65 |
12.71 – 19.35 | | 1,897,025 | | 6.33 | | 16.42 | | 1,178,574 | | 16.05 |
19.38 – 21.90 | | 2,199,816 | | 5.56 | | 21.00 | | 1,551,235 | | 20.73 |
21.92 – 23.48 | | 1,930,292 | | 6.30 | | 22.68 | | 866,762 | | 22.13 |
23.51 – 24.46 | | 2,765,889 | | 5.80 | | 24.28 | | 1,691,580 | | 24.32 |
24.55 – 26.69 | | 2,024,422 | | 4.76 | | 26.19 | | 1,324,150 | | 26.40 |
26.71 – 28.37 | | 438,650 | | 9.07 | | 27.55 | | 70,412 | | 27.35 |
28.39 – 30.11 | | 2,616,900 | | 6.20 | | 28.44 | | 4,168 | | 28.43 |
| | | | | | | | | | | |
$ 0.44 – $30.11 | | 18,274,233 | | 5.39 | | $20.55 | | 9,166,241 | | $18.95 |
| | | | | | | | | | | |
The aggregate intrinsic value of dilutive options outstanding and options exercisable as of March 31, 2006 was $140.1 million and $84.6 million, respectively. The intrinsic value is calculated as the difference between the market value of the Company’s common stock as of March 31, 2006 and the exercise price per share. The market value as of March 31, 2006 was $28.18 as quoted on The NASDAQ National Market.
(9) Comprehensive Income
Comprehensive income for the three months ended March 31, 2006 and 2005 was as follows:
| | | | | | | |
| | | Three Months Ended
March 31, | |
| | | 2006 | | 2005 | |
| | | (in thousands) | |
Net income | | $ | 29,364 | | $ | 20,891 | |
Other comprehensive income, net of tax: | | | | | | | |
Unrealized gains (losses) on investment securities | | | 20 | | | (4 | ) |
Foreign currency translation adjustments | | | 107 | | | (298 | ) |
| | | | | | | |
Comprehensive income | | $ | 29,491 | | $ | 20,589 | |
| | | | | | | |
| (10) | Stock Repurchase Program |
Under the current stock repurchase program, the Company is authorized to repurchase up to $200 million of its common stock through open market purchases or private transactions that will be made from time to time as market conditions allow. The stock repurchase program is expected to be in effect for a maximum of four years. Shares repurchased under this program will be held in the Company’s treasury. The stock repurchase program may be suspended or discontinued at any time without prior notice. During the three months ended March 31, 2006, the Company repurchased 764,518 shares with an aggregate cost of $22.3 million. As of March 31, 2006, 18,234,408 shares with an aggregate cost of $229.8 million are held in treasury.
SFAS No. 131,Disclosures About Segments of an Enterprise and Related Information, requires certain financial and supplementary information to be disclosed for each reportable operating segment of an enterprise, as defined. Prior to the fourth quarter of fiscal year 2005, the Company operated its business in two segments, worldwide diagnostic products and worldwide surgical products. Beginning in the fourth quarter of fiscal year 2005, the Company changed its management structure as a result of the growth in its international business and began to operate its business in three reportable segments. Financial information for these segments is included below for all periods presented and each segment is described as follows:
15
CYTYC CORPORATION
NOTES TO CONDENSED CONSOLIDATED FINANCIAL STATEMENTS (Unaudited) — Continued
Domestic Diagnostic Products— This segment develops and markets the ThinPrep® System in the United States primarily for use in diagnostic cytology testing applications focused on women’s health. The ThinPrep System is widely used for cervical cancer screening and is the platform from which the Company launched its expansion into breast cancer risk assessment with the FirstCyte® Breast Test. The ThinPrep System consists of any one or more of the following: the ThinPrep 2000 Processor, ThinPrep 3000 Processor, ThinPrep Imaging System, and related reagents, filters, and other supplies, such as the ThinPrep Pap Test and the Company’s proprietary ThinPrep PreservCyt Solution.
Domestic Surgical Products— This segment manufactures the NovaSure® System, an innovative endometrial ablation device to treat menorrhagia, or excessive menstrual bleeding, the MammoSite Radiation Therapy System, a device for the treatment of early-stage breast cancer, and the GliaSite Radiation Therapy System for the treatment of malignant brain tumors, and markets these products in the Unites States.
International— This segment markets the Company’s diagnostic and surgical products outside of the United States through the Company’s subsidiaries, branch office and distributors. Products sold by the Company’s international segment are manufactured at domestic and international manufacturing locations.
The Company’s chief decision maker, who is the Chief Executive Officer, regularly evaluates the operating team of each segment on their ability to generate net sales and gross profit. Selling, general and administrative functions, as well as the treasury function, are administered on a global basis and therefore these expenses are currently recorded where disbursed. As such, the Company does not currently allocate these expenses across its three segments. The Company’s operating results, by segment, are as follows:
| | | | | | |
| | | March 31, |
| | | 2006 | | 2005 |
| | | (in thousands) |
Net sales: | | | | | | |
Domestic diagnostic products | | $ | 80,696 | | $ | 75,000 |
Domestic surgical products | | | 44,704 | | | 25,843 |
International | | | 15,140 | | | 12,562 |
| | | | | | |
Total net sales | | $ | 140,540 | | $ | 113,405 |
| | | | | | |
Gross profit and net income: | | | | | | |
Domestic diagnostic products | | $ | 62,872 | | $ | 59,766 |
Domestic surgical products | | | 38,007 | | | 20,414 |
International | | | 9,872 | | | 9,298 |
| | | | | | |
Total gross profit | | | 110,751 | | | 89,478 |
Corporate expenses | | | 81,387 | | | 68,587 |
| | | | | | |
Net income | | $ | 29,364 | | $ | 20,891 |
| | | | | | |
SFAS No. 131 also requires that certain enterprise-wide disclosures be made related to products and services, geographic areas and significant customers. During the three months ended March 31, 2006 and 2005, the Company derived its sales from the following geographies (as a percentage of net sales):
| | | | |
| | | March 31, |
| | | 2006 | | 2005 |
United States | | 89% | | 89% |
International | | 11% | | 11% |
| | | | |
| | 100% | | 100% |
| | | | |
During the three months ended March 31, 2006, no customer represented 10% or more of consolidated net sales. During the three months ended March 31, 2005, net sales to one customer within the Company’s domestic diagnostic products business represented 12% of consolidated net sales.
The Company operates manufacturing facilities in the United States and Costa Rica and has several offices, primarily for sales and distribution, throughout the world. Property and equipment is primarily located within the domestic diagnostic products segment in the United States.
16
CYTYC CORPORATION
NOTES TO CONDENSED CONSOLIDATED FINANCIAL STATEMENTS (Unaudited) — Continued
The following table summarizes the Company’s intangible assets, by segment:
| | | | | | | | | |
| | | Patents and
Developed
Technology,
net | | Goodwill | | Total Intangible
Assets |
| | | (in thousands) |
March 31, 2006 | | | | | | | | | |
Domestic diagnostic products | | $ | 13,601 | | $ | 91,098 | | $ | 104,699 |
Domestic surgical products | | | 176,574 | | | 296,564 | | | 473,138 |
| | | | | | | | | |
| | $ | 190,175 | | $ | 387,662 | | $ | 577,837 |
| | | | | | | | | |
December 31, 2005 | | | | | | | | | |
Domestic diagnostic products | | $ | 13,982 | | $ | 91,098 | | $ | 105,080 |
Domestic surgical products | | | 178,590 | | | 298,287 | | | 476,877 |
| | | | | | | | | |
| | $ | 192,572 | | $ | 389,385 | | $ | 581,957 |
| | | | | | | | | |
Amortization expense related to identifiable intangible assets that will continue to be amortized within domestic diagnostic products was approximately $0.4 million during the three months ended March 31, 2006 and 2005. Amortization expense related to identifiable intangible assets that will continue to be amortized within domestic surgical products was approximately $2.0 million and $0.8 million during the three months ended March 31, 2006 and 2005, respectively.
(12) Commitments and Contingencies
Commitments— Part of the purchase price for Proxima includes contingent earn-out payments tied to future performance milestones (see Note 2).
Contingencies— On November 17, 2003, DEKA Products Limited Partnership (“DEKA”) initiated arbitration proceedings against Cytyc alleging that Cytyc underpaid royalties due to DEKA pursuant to a cross-license agreement entered into in 1993 (the “1993 DEKA Agreement”). The dispute concerned the method of calculating royalties on the sale of the single use disposable ThinPrep Pap Test kit. In March 2005, the arbitration panel issued a partial final award in which it agreed with DEKA’s interpretation of the 1993 DEKA Agreement and on April 26, 2005, issued its final decision which Cytyc appealed. Cytyc recorded a pre-tax charge in the three months ended March 31, 2005 in the amount of $7.8 million, which was in addition to the $1.3 million previously recorded. Subsequently, each month, Cytyc recorded an accrual for the difference between the quarterly payments to DEKA and the amounts calculated pursuant to the arbitration panel decision. As a result of a final decision of the United States Court of Appeals for the First Circuit in February 2006, the Company paid DEKA $11.4 million. Prospectively, the Company will pay DEKA a one percent royalty on applicable net sales of ThinPrep Pap Test disposable components, however this royalty is not expected to be material to the Company’s future operating results or financial position.
On June 16, 2003, Cytyc filed a suit for Declaratory Judgment in United States District Court for the District of Massachusetts asking the court to determine and declare that certain of TriPath Imaging, Inc.’s (“TriPath”) patents are invalid and not infringed by the Company’s ThinPrep Imaging System. On June 17, 2003, TriPath announced that it had filed a lawsuit against the Company in the United States District Court for the Middle District of North Carolina alleging patent infringement, false advertising, defamation, intentional interference, unfair competition, and unfair and deceptive trade practices. These cases were since consolidated into a single action to be heard in the United States District Court for the District of Massachusetts. The Court has scheduled a hearing for August 2, 2006 to hear oral arguments on summary judgment motions. The Company continues to believe that the claims against it are without merit and intends to vigorously defend this suit. Given the stage and current status of the litigation, the Company is unable to reasonably estimate the ultimate outcome of this case.
The Company is also involved in ordinary, routine litigation incidental to its business. Although the outcomes of these other lawsuits and claims are uncertain, management does not believe that, individually or in the aggregate, these other lawsuits and claims will have a material adverse effect on the Company’s business, financial condition, results of operations or liquidity.
17
Item 2. Management’s Discussion and Analysis of Financial Condition and Results of Operations
The following discussion should be read in conjunction with our consolidated financial statements and the related notes appearing in our annual report on Form 10-K for the year ended December 31, 2005. Our discussion contains forward-looking statements that involve risks and uncertainties, such as our plans, objectives, expectations and intentions. Actual results and events could differ materially from those anticipated in these forward-looking statements as a result of a number of factors, including those referred to or set forth below under Part II. Item 1A. “Risk Factors”.
Overview
Cytyc Corporation is a diversified women’s health company that designs, develops, manufactures, and markets innovative and clinically effective products. Our products cover a range of women’s health applications, including cervical cancer screening, treatment of excessive menstrual bleeding, radiation treatment of early-stage breast cancer and breast cancer risk assessment. We operate our business in three segments: domestic diagnostic products, domestic surgical products and international. Our domestic diagnostics products segment develops and markets the ThinPrep® System in the United States primarily for use in cytology testing applications focused on women’s health, such as cervical cancer screening. Our domestic surgical products segment manufactures the NovaSure® System, an innovative endometrial ablation device to treat menorrhagia, or excessive menstrual bleeding, the MammoSite® Radiation Therapy System, a device for the treatment of breast cancer that positions radiation sources directly into the post-lumpectomy site to optimize radiation treatment delivery while minimizing damage to healthy tissue, and the GliaSite® Radiation Therapy System for the treatment of malignant brain tumors. The domestic surgical products segment markets these products in the United States. Our international segment markets our diagnostic and surgical products outside of the United States through our subsidiaries and distributors in locations such as Canada, Europe, Australia and Hong Kong.
Critical Accounting Estimates
Our discussion and analysis of our financial condition and results of operations are based upon our consolidated financial statements, which have been prepared in accordance with accounting principles generally accepted in the United States. The preparation of these financial statements requires us to make estimates and judgments that affect the reported amounts of assets, liabilities, sales and expenses, and related disclosure of contingent assets and liabilities. A “critical accounting estimate” is one which is both important to the portrayal of our financial condition and results and requires management’s most difficult, subjective or complex judgments, often as a result of the need to make estimates about the effect of matters that are inherently uncertain. We continuously evaluate our critical accounting estimates. We base our estimates on historical experience and on various other assumptions that are believed to be reasonable under the circumstances, the results of which form the basis for making judgments about the carrying values of assets and liabilities that are not readily apparent from other sources. Actual results may differ from these estimates under different assumptions or conditions.
Valuation of Long-Lived Assets, Intangibles and Goodwill. Tangible and intangible assets acquired in a business combination, including acquired in-process research and development, are recorded under the purchase method of accounting at their estimated fair values at the date of acquisition. The fair values of acquired assets are determined by management using relevant information and assumptions and assisted, in certain situations, by independent appraisers. Fair value of acquired intangible assets is generally calculated as the present value of estimated future cash flows using a risk-adjusted discount rate, which requires significant management judgment with respect to sales and expense growth rates, analyses of project accomplishments, assessment of overall contributions, project risks and the selection and use of an appropriate discount rate. Amortization of all our intangible assets with defined lives, including those acquired individually, is calculated either using the straight-line or cash flow method. The cash flow method requires management’s estimate of net cash flows over the life of the intangible asset, reflecting the pattern in which the economic benefits of the intangible asset are expected to be consumed.
We assess the impairment of long-lived assets, identifiable intangible assets and goodwill whenever events or changes in circumstances indicate that the carrying value may not be recoverable and at least annually in the case of goodwill. If it is determined that the carrying value of long-lived assets, intangible assets or goodwill might not be recoverable based upon the existence of one or more indicators of impairment, we would measure any impairment based on a projected discounted cash flow method if the undiscounted cash flows did not exceed the carrying value of such assets. No such impairment charges have been recorded to date. We are required to perform an impairment review for goodwill on an annual basis, or earlier if indicators of potential impairment exist. Based on our impairment review during 2005, the carrying amount of goodwill did not exceed its fair value and, accordingly, no impairment loss exists. At March 31, 2006, we had $577.8 million of net intangible assets, of which $387.7 million represented goodwill. An impairment of our intangible assets could result in a material, non-cash expense in our consolidated statement of income.
Income Taxes and Deferred Taxes. We file income tax returns in eleven countries as well as many states and other localities. We must estimate our income tax expense after considering, among other factors, differing tax rates between jurisdictions, allocation factors, tax credits, non-deductible items and changes in enacted tax rates. Deferred taxes arise because of the different treatment
18
between financial statement accounting and tax accounting, known as “temporary differences.” We record the tax effect of these temporary differences as “deferred tax assets” and “deferred tax liabilities” on our consolidated balance sheet. Deferred tax assets generally result in tax deductions or credits subsequent to the period in which the related item was recorded in the consolidated statement of income. Deferred tax liabilities typically reflect a current tax deduction for which the related item has not yet been recorded in the consolidated statement of income. The carrying value of our deferred tax assets assumes that we will be able to generate sufficient future taxable income in certain tax jurisdictions, based on estimates and assumptions, to fully recover the net carrying value of the assets. If these estimates and related assumptions change in the future, we may be required to record a valuation allowance against our deferred tax assets resulting in additional income tax expense in our consolidated statement of income.
As part of the purchase price for Proxima Therapeutics, Inc. (“Proxima”) in March 2005, we recorded a net deferred tax liability of $16.3 million. This balance primarily is comprised of $23.0 million of deferred tax assets, net of a $1.1 million valuation allowance relating to acquired net operating losses and tax credits, and deferred tax liabilities of $39.3 million relating to patents and developed technology. If we are unable to realize the benefits of these net operating losses, tax credits and other tax assets in future years, we may be required to record additional tax expense in our consolidated statement of income.
The calculation of our tax liabilities involves dealing with uncertainties in the application of complex tax regulations. We are currently undergoing various audits on both the Federal and State levels. We expect the majority of these audits to conclude at various dates throughout 2006. Although we believe we have adequate reserves for potential assessments, we recognize liabilities for potential tax audit issues in the United States and other tax jurisdictions based on our estimate of whether, and to the extent to which, additional taxes will be due. If we ultimately determine that payment of these amounts is unnecessary, we will reverse the liabilities and recognize a tax benefit during the period in which we determine that the liabilities are no longer necessary or, if the reversal relates to deferred tax assets recorded in connection with an acquisition, we would adjust the carrying value of goodwill.
Legal Proceedings. We are involved in various legal actions, the outcomes of which are not within our complete control and may not be known for prolonged periods of time. In some actions, the claimants seek damages, as well as other relief, which, if granted, would require significant expenditures. We record a liability in our consolidated financial statements for these actions when a loss is known or considered probable and the amount can be reasonably estimated. We review these estimates each accounting period as additional information is known and adjust the loss provision when appropriate. If the loss is not probable or cannot be reasonably estimated, a liability is not recorded in the consolidated financial statements. During the three months ended March 31, 2005, we recorded a pre-tax charge in the amount of $7.8 million, which was in addition to the $1.3 million we had previously recorded, in connection with an arbitration panel’s decision regarding the DEKA Products Limited Partnership proceeding against Cytyc. Subsequently, each month, Cytyc recorded an accrual for the difference between the quarterly payments to DEKA and the amounts calculated pursuant to the arbitration panel decision. In February 2006, we paid DEKA $11.4 million for Retroactive Royalties, interest on the Retroactive Royalties and a percent of fiscal year 2005 net sales, pursuant to the arbitration panel’s final decision. Prospectively, we will pay DEKA a one percent royalty on applicable net sales of ThinPrep Pap Test disposable components, however we do not expect this royalty to be material to our future operating results or financial position. Our significant legal proceedings are discussed in Note 12 to our condensed consolidated financial statements and in Part II, Item 1. “Legal Proceedings” of this Form 10-Q, as well as in our annual report on Form 10-K for the year ended December 31, 2005.
Stock-based Compensation. In December 2004, the Financial Accounting Standards Board (“FASB”) issued Statement of Financial Accounting Standards (“SFAS”) No. 123R,Share-Based Payment. SFAS No. 123R requires all stock-based compensation to employees, including grants of employee stock options, to be recognized in the financial statements based on their fair values. We adopted SFAS No. 123R on January 1, 2006 using the modified prospective method and accordingly, prior period amounts have not been restated. In order to determine the fair value of our stock options and employee stock purchase plan shares, we are using the Black-Scholes option pricing model and are applying the multiple-option valuation approach to the stock option valuation. We are recognizing stock-based compensation expense on a straight-line basis over the requisite service period of the awards for options granted following the adoption of SFAS No. 123R. For unvested stock awards outstanding as of January 1, 2006, we will continue to recognize stock-based compensation expense using the accelerated amortization method prescribed in FASB Interpretation No. 28,Accounting for Stock Appreciation Rights and Other Variable Stock Option or Award Plans.
Our estimates of the fair value of equity awards will be affected by the future market price of our common stock, as well as the actual results of certain assumptions used to value the equity awards. These assumptions include, but are not limited to, the related income tax impact, the expected volatility of the common stock, the number of stock options to be forfeited and exercised by employees, and the expected term of options granted.
As noted above, we determine the fair value of stock options and employee stock purchase plan shares by using the Black-Scholes option pricing model and applying the multiple-option valuation approach to the stock option valuation. The options have graded-vesting on an annual basis over an average vesting period of four years. In applying the multiple-option approach, we separately value each option “tranche” based on when the tranche vests. We estimate the expected option term by calculating the average period of time before the employees exercise their options and add this to the vesting period of each tranche. Historically, this period of time has averaged one
19
year from the date the options vest. The expected term of employee stock purchase plan shares is the average of the remaining purchase periods under each offering period. For equity awards granted prior to the adoption of SFAS No. 123R, we estimated the volatility of the common stock using historical volatility. For equity awards granted since January 1, 2006, we are estimating the volatility of the common stock using a combination of historical and implied volatility, as discussed in Staff Accounting Bulletin (“SAB”) No. 107. By using this combination, we are taking into consideration the historical realized volatility, as well as factoring in estimates of future volatility that we believe will differ from historical as a result of our product diversification over the last two years, the market performance of our common stock, the volume of activity of the underlying shares, the availability of actively traded options of our common stock, and overall market conditions.
We determine the risk-free interest rate used in the Black-Scholes option pricing model by looking at historical U.S. Treasury zero-coupon bond issues with remaining terms equal to the expected terms of the equity awards. In addition, we use an expected dividend yield of zero in the option valuation model, because we do not expect to pay any cash dividends in the foreseeable future. Lastly, in accordance with SFAS No. 123R, we are required to estimate forfeitures at the time of grant and revise those estimates in subsequent periods if actual forfeitures differ from those estimates. In order to determine an estimated pre-vesting option forfeiture rate, we used historical forfeiture data. This estimated forfeiture rate has been applied to all unvested options outstanding as of January 1, 2006 and to all options granted since January 1, 2006. Therefore, stock-based compensation expense is recorded only for those options that are expected to vest.
The tax benefit related to the $6.0 million of stock-based compensation expense recorded during the three months ended March 31, 2006 was $1.9 million.
Prior to January 1, 2006, we accounted for stock options using the intrinsic value method, pursuant to the provisions of Accounting Principles Board Opinion No. 25,Accounting for Stock Issued to Employees. Under this method, stock-based compensation expense was measured as the difference between the option’s exercise price and the market price of our common stock on the date of grant. Historically, under this method, stock-based compensation had not been material because we grant stock options at the market price of the common stock on the date of grant.
Prior to the adoption of SFAS 123R, we presented all tax benefits for deductions resulting from the exercise of stock options and disqualifying dispositions as operating cash flows in our condensed consolidated statement of cash flows. SFAS No. 123R requires the benefits of tax deductions in excess of recognized compensation expense to be reported within cash flows from financing activities. This requirement could result in a reduction in net operating cash flows and an increase in net financing cash flows in periods after January 1, 2006. However, total cash flows will remain unchanged from what would have been reported under prior accounting rules.
As of March 31, 2006, total unrecognized stock-based compensation expense relating to unvested employee stock awards, adjusted for estimated forfeitures, was $38.4 million. This amount is expected to be recognized over a weighted-average period of 3.5 years. If actual forfeitures differ from current estimates, total unrecognized stock-based compensation expense will be adjusted for future changes in estimated forfeitures.
The above list is not intended to be a comprehensive list of all of our accounting estimates. In many cases, the accounting treatment of a particular transaction is specifically dictated by generally accepted accounting principles, with little need for management’s judgment in their application. There are also areas in which management’s judgment in selecting any available alternative would not produce a materially different result. See our audited consolidated financial statements and notes thereto
included in our annual report on Form 10-K for the fiscal year ended December 31, 2005 which contain accounting policies and other disclosures required by generally accepted accounting principles in the United States.
20
Results of Operations
Net Sales
| | | | | | | | |
| | | Three Months Ended March 31, |
| | | 2006 | | 2005 | | %
Change |
| | | ($ in millions) |
Domestic Diagnostic Products | | $ | 80.7 | | $ | 75.0 | | 8% |
Domestic Surgical Products (1) | | | 44.7 | | | 25.8 | | 73% |
International (2) | | | 15.1 | | | 12.6 | | 21% |
| | | | | | | | |
Total Company | | $ | 140.5 | | $ | 113.4 | | 24% |
| | | | | | | | |
| | (1) | Our operating results for the three months ended March 31, 2005 include the results of Proxima from the date of acquisition (March 7, 2005). |
| | (2) | The international segment includes international sales of our diagnostic products of $14.0 million and $12.0 million during the three months ended March 31, 2006 and 2005, respectively. This segment also includes international sales of our surgical products of $1.1 million and $0.6 million during the three months ended March 31, 2006 and 2005, respectively. |
Net sales for each segment as a percentage of total consolidated net sales is as follows (dollars in millions):
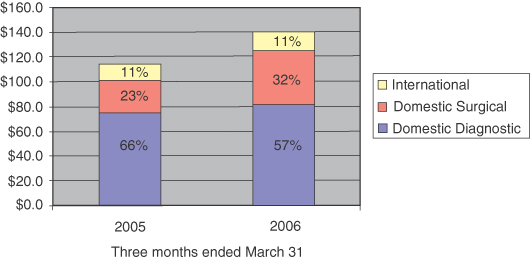
Our domestic diagnostic net sales increased 8% during the three months ended March 31, 2006 as compared to the same period of 2005, due primarily to the continued increased adoption and utilization of the ThinPrep Imaging System across our customer base. During the three months ended March 31, 2006, no customer represented 10% or more of our consolidated net sales. Net sales to one customer represented 12% of our consolidated net sales for the three months ended March 31, 2005.
21
Our domestic surgical net sales increased 73% during the three months ended March 31, 2006 as compared to the same period of 2005, reflecting growth in unit sales and increased pricing of the NovaSure single-use disposable devices, as well as sales of the MammoSite Radiation Therapy single-use disposable devices. Domestic net sales of our NovaSure System represented 84% and 94% of the domestic surgical products segment’s net sales during the three months ended March 31, 2006 and 2005, respectively, and net sales of the MammoSite System represented 14% and 5% of the domestic surgical products segment’s net sales during the three months ended March 31, 2006 and 2005, respectively. Our operating results for the three months ended March 31, 2005 include the results of Proxima from the date of acquisition (March 7, 2005).
Net sales in our international segment, which is comprised of net sales to customers outside the United States of both diagnostic and surgical products, increased 21% during the three months ended March 31, 2006 as compared to the same period of 2005, reflecting higher unit sales of the ThinPrep Pap Test and the NovaSure single-use disposable devices and, to a lesser degree, an increase in average pricing.
Gross Margin
Our gross margin was 79% during the three months ended March 31, 2006 and 2005. The gross margin remained consistent, even with the inclusion of $0.3 million of stock-based compensation expense within cost of sales during the three months ended March 31, 2006. This consistency in gross margin resulted from the impact of domestic net sales of the ThinPrep Pap Test and increasing sales of the higher-margin NovaSure and MammoSite disposable devices, offset by increased placements of the ThinPrep Imaging System and growth in international sales of our diagnostic products, both of which generally have lower profit margins.
Operating Expenses
Total operating expenses increased to $64.4 million for the three months ended March 31, 2006, an increase of 17% as compared to $55.0 million for the same period of 2005. Operating expenses during the three months ended March 31, 2006 include $5.7 million of stock-based compensation expense pursuant to the provisions of SFAS No. 123R. As a result of the adoption of SFAS No. 123R on January 1, 2006, as required, we will continue to recognized all stock-based compensation to employees, including grants of employee stock options, in the financial statements based on their fair values. Operating expenses during the three months ended March 31, 2005 include a $7.8 million charge as a result of an arbitration decision (see Note 12 to our condensed consolidated financial statements and Part II, Item 1. “Legal Proceedings” in this Form 10-Q). The following is a summary of operating expenses for the three months ended March 31, 2006 and 2005:
| | | | | | | | | | |
| | | Three Months Ended March 31, |
| | | 2006 | | 2005 |
| | | $ | | % of
Sales | | $ | | % of
Sales |
| | | ($ in millions) |
Research and development(includes stock-based compensation expense under SFAS No. 123R of $0.8 million in 2006) | | $ | 10.3 | | 7% | | $ | 6.8 | | 6% |
Sales and marketing(includes stock-based compensation expense under SFAS No. 123R of $2.7 million in 2006) | | | 40.1 | | 29% | | | 29.7 | | 26% |
General and administrative(includes stock-based compensation expense under SFAS No. 123R of $2.2 million in 2006) | | | 14.0 | | 10% | | | 10.7 | | 9% |
Arbitration decision | | | — | | — | | | 7.8 | | 7% |
| | | | | | | | | | |
Total operating expenses | | $ | 64.4 | | 46% | | $ | 55.0 | | 48% |
| | | | | | | | | | |
22
Research and Development
Our core research and development strategy is to enhance our existing product lines, such as the ThinPrep Imaging System, the NovaSure System and the MammoSite Radiation Therapy System, through operational enhancements and cost reductions, as well as to continue to develop additional innovative medical diagnostic and surgical devices and therapeutic applications for women’s health. Our research and development costs increased to $10.3 million for the three months ended March 31, 2006, an increase of 52% as compared to the same period of 2005, primarily reflecting: (1) $0.8 million of stock-based compensation expense recorded pursuant to SFAS No. 123R; (2) $1.2 million of incremental non-cash amortization of our developed technology intangible assets, primarily resulting from our acquisitions of Proxima in March 2005 and Novacept in March 2004, which is amortized using the cash flow method; (3) incremental expenses supporting the MammoSite Radiation Therapy System, which were included in our operating results for the full first quarter of 2006 as compared to less than one month during the first quarter of 2005; and (4) increased engineering costs to continue to improve the NovaSure System and the MammoSite Radiation Therapy System, as well as incremental clinical trial costs in support of the FirstCyte Breast Test.
Sales and Marketing
Sales and marketing costs increased to $40.1 million for the three months ended March 31, 2006, an increase of 35% as compared to the same period of 2005, primarily due to incremental sales and marketing costs of our domestic surgical products business. These costs reflect: (1) the expansion of our domestic sales force resulting from the acquisition of Proxima in March 2005; (2) the continued growth in the sales force to support increased sales of our NovaSure System; (3) customer training costs associated with increased sales of our surgical products to new customers; and (4) marketing costs associated with a direct-to-consumer market program launched after the first quarter of 2005 for our NovaSure product, as well as with trade shows during the period. These incremental costs were slightly offset by a decrease in costs related to the integration and cross-training of our sales forces, as the majority of these costs were incurred during 2005 following the Proxima acquisition. The higher sales and marketing costs also reflect $2.7 million of stock-based compensation expense during the three months ended March 31, 2006 pursuant to SFAS No. 123R.
General and Administrative
General and administrative costs increased to $14.0 million for the three months ended March 31, 2006, an increase of 31% as compared to the same period of 2005, primarily due to: (1) $2.2 million of stock-based compensation expense during the three months ended March 31, 2006 pursuant to SFAS No. 123R; (2) increased personnel and facility costs to support the growth of our business; (3) increased efforts to enhance our management information systems; (4) increased costs relating to product liability insurance largely due to the expansion of our business as a result of the Proxima acquisition in March 2005; and (5) legal costs associated with the growth of our intellectual property portfolio, slightly offset by a decrease in costs associated with litigation (see Note 12 to our condensed consolidated financial statements and Part II, Item 1. “Legal Proceedings” in this Form 10-Q).
Arbitration Decision
On November 17, 2003, DEKA Products Limited Partnership (“DEKA”) initiated arbitration proceedings against us alleging that we underpaid royalties due to DEKA pursuant to a cross-license agreement entered into in 1993 (the “1993 DEKA Agreement”) (see Note 12 to our condensed consolidated financial statements and Part II, Item 1. “Legal Proceedings” in this Form 10-Q for details). The dispute concerned the method of calculating royalties on the sale of the single use disposable ThinPrep Pap Test kit. In March 2005, the arbitration panel issued a partial final award in which it agreed with DEKA’s interpretation of the 1993 DEKA Agreement and on April 26, 2005, issued its final decision which we appealed. We recorded a pre-tax charge in the three months ended March 31, 2005 in the amount of $7.8 million, which was in addition to the $1.3 million previously recorded. Subsequently, each month, we recorded an accrual for the difference between the quarterly payments to DEKA and the amounts calculated pursuant to the arbitration panel decision. As a result of a final decision of the United States Court of Appeals for the First Circuit in February 2006, we paid DEKA $11.4 million. Prospectively, we will pay DEKA a one percent royalty on applicable net sales of ThinPrep Pap Test disposable components, however we do not expect this royalty to be material to our future operating results or financial position.
Other Expense, net
We recorded interest expense of $1.8 million for the three months ended March 31, 2006 and 2005, related to our 2.25% convertible notes due 2024, which were issued on March 22, 2004, including amortization of $0.4 million of deferred financing costs in each of these periods associated with the issuance of these notes. Interest income increased to $1.8 million for the three months ended March 31, 2006 as compared to $0.9 million for the same period of 2005, as the average interest rate and the average total balance of our cash, cash equivalents and investment securities were higher during the three months ended March 31, 2006 as compared to the same period of 2005.
23
Income Taxes
Our effective tax rate for the three months ended March 31, 2006 and 2005 was 36.5%. We estimate that our effective tax rate for fiscal year 2006 will remain 36.5% as we continue to recognize savings from tax planning initiatives which began in 2003, as well as the American Jobs Creation Act of 2004.
Liquidity and Capital Resources
At March 31, 2006, we had cash, cash equivalents and investment securities totaling $222.8 million. Cash provided by operations was $41.2 million for the three months ended March 31, 2006, an increase of 11% compared to $36.9 million during the same period of 2005, primarily as a result of increasing net sales, offset by our $11.4 million payment to DEKA relating to the arbitration panel decision (see Note 12 to our condensed consolidated financial statements) in the first quarter of 2006. Our net accounts receivable decreased one percent to $81.6 million at March 31, 2006 as compared to $82.8 million at December 31, 2005, in spite of an increase in net sales during the first quarter of 2006 as compared to the fourth quarter of 2005, as a result of the timing of cash collections. Our Days Sales Outstanding improved from 53 days at December 31, 2005 to 52 days at March 31, 2006. We have had no significant issues of collectibility. The term “Days Sales Outstanding”, which we calculate by dividing gross trade accounts receivable at the end of the quarter by our average consolidated daily net sales for the quarter, refers to the estimated number of days’ worth of sales that are outstanding and unpaid at any given time. Our inventories increased 12% to $26.9 million at March 31, 2006 as compared to $24.0 million at December 31, 2005, primarily reflecting an increase in inventory to support the growth in net sales in our domestic surgical products business.
Our investing activities used cash of $36.7 million during the three months ended March 31, 2006, primarily related to the payment of $21.1 million to the former Proxima shareholders for the contingent earn-out payments relating to incremental sales growth in our breast-related products during 2005 (see Note 2 to our condensed consolidated financial statements). During the three months ended March 31, 2006, we invested $7.3 million in equipment under customer usage agreements, of which $6.4 million represented ThinPrep Imaging System units. We also made $4.1 million of capital expenditures during the three months ended March 31, 2006, related primarily to our investment in manufacturing processes and information systems to support the growth of our business, as well as costs to manufacture the ThinPrep Imaging System units to be placed at customer sites under usage agreements. During the three months ended March 31, 2005, our investing activities used cash of $71.2 million, primarily related to the purchase of Proxima in March 2005, partially offset by proceeds from sales of investment securities. We paid $163.1 million to purchase Proxima (of which $158.1 million was paid during the three months ended March 31, 2005), including $3.1 million of acquisition-related costs, using a combination of cash, cash equivalents and investment securities to fund the purchase. In addition, during the three months ended March 31, 2005, we invested $7.1 million in equipment under customer usage agreements, of which $5.7 million represented ThinPrep Imaging System units.
Our financing activities during the three months ended March 31, 2006 used cash of $5.6 million, primarily reflecting our repurchase of $22.3 million of our common stock as part of our stock repurchase program, partially offset by proceeds of $15.3 million from the exercise of stock options. Our financing activities during the three months ended March 31, 2005 generated cash of $5.5 million as a result of proceeds from the exercise of stock options.
Long-Term Debt and Contractual Obligations. As of March 31, 2006, we had no material additions to the contractual cash obligations described in our annual report on Form 10-K for the fiscal year ended December 31, 2005.
We expect that our cash and cash equivalents, investment securities and cash flows from operating activities will be sufficient to meet our projected operating cash needs, including capital expenditures, lease and purchase commitments and tax payments. However, from time to time, we review our capital structure and financing arrangements. As a result of these reviews, we may periodically elect to pursue alternatives to our current structure, including the refinancing of our existing debt securities, the issuance of additional debt securities and the emplacement of a credit facility. In addition, if we make future acquisitions, we may be required to seek additional capital.
24
Item 3. Quantitative and Qualitative Disclosures About Market Risk
Derivative Financial Instruments, Other Financial Instruments, and Derivative Commodity Instruments. We do not participate in derivative financial instruments, other financial instruments for which the fair value disclosure would be required under SFAS No. 107,Disclosures about Fair Value of Financial Instruments, or derivative commodity instruments. All of our investments are in investment-grade municipal bonds and auction rate securities that are carried at fair value on our books. Accordingly, we have no quantitative information concerning the market risk of participating in such investments.
Primary Market Risk Exposures. Our primary market risk exposures are in the areas of interest rate risk and foreign currency exchange rate risk. Our investment portfolio of cash equivalents and investment securities is subject to interest rate fluctuations, but we believe this risk is immaterial due to the short-term nature of these investments. Our business outside the United States is conducted primarily in local currency, except in Costa Rica, where the majority of business is conducted in the U.S. dollar. We have no foreign exchange contracts, option contracts, or other foreign hedging arrangements. We estimate that any market risk associated with our foreign operations is not significant and is unlikely to have a material adverse effect on our business, financial condition or results of operations.
| Item 4. | Controls and Procedures |
(a)Evaluation of Disclosure Controls and Procedures. As of the end of the period covered by this report, we carried out an evaluation, under the supervision and with the participation of our management, including our Chief Executive Officer and Chief Financial Officer, of the effectiveness of our disclosure controls and procedures (as defined in Rules 13a-15(e) and 15d-15(e) of the Securities Exchange Act of 1934). Based on this evaluation, our Chief Executive Officer and Chief Financial Officer have concluded that our disclosure controls and procedures are effective in timely notification to them of information we are required to disclose in our periodic SEC filings and in ensuring that this information is recorded, processed, summarized and reported within the time periods specified in the SEC’s rules and regulations.
(b)Changes in Internal Control. During the period covered by this report, there have been no significant changes in our internal control over financial reporting that have materially affected, or were reasonably likely to materially affect, our internal control over financial reporting.
25
PART II — OTHER INFORMATION
Item 1. Legal Proceedings
As a result of the arbitration panel’s decision regarding our arbitration proceeding with DEKA (see Note 12 to our condensed consolidated financial statements), we recorded a pre-tax charge in the three months ended March 31, 2005 in the amount of $7.8 million, which was in addition to the $1.3 million previously recorded. Subsequently, each month, we recorded an accrual for the difference between the quarterly payments to DEKA and the amounts calculated pursuant to the arbitration panel decision. As a result of a final decision of the United States Court of Appeals for the First Circuit in February 2006, we paid DEKA $11.4 million. Prospectively, we will pay DEKA a one percent royalty on applicable net sales of ThinPrep Pap Test disposable components, however we do not expect this royalty to be material to our future operating results or financial position.
On June 16, 2003, we filed a suit for Declaratory Judgment in United States District Court for the District of Massachusetts asking the court to determine and declare that certain of TriPath Imaging, Inc.’s (“TriPath”) patents are invalid and not infringed by our ThinPrep Imaging System. On June 17, 2003, TriPath announced that it had filed a lawsuit against us in the United States District Court for the Middle District of North Carolina alleging patent infringement, false advertising, defamation, intentional interference, unfair competition, and unfair and deceptive trade practices. The cases were since consolidated into a single action to be heard in the United States District Court for the District of Massachusetts. The Court has scheduled a hearing for August 2, 2006 to hear oral arguments on summary judgment motions. We continue to believe that the claims against us are without merit and intend to vigorously defend this suit. Given the stage and current status of the litigation, we are unable to reasonably estimate the ultimate outcome of this case.
We are subject to legal claims and assertions in the ordinary course of business. Except for the matters described in our annual report on Form 10-K for the year ended December 31, 2005 filed with the SEC, we are not aware of any such claims or assertions that could have a material effect on us.
Item 1A. Risk Factors
The forward-looking statements in this Form 10-Q are made under the safe harbor provisions of Section 21E of the Securities Exchange Act of 1934, as amended. Our operating results and financial condition have varied and may in the future vary significantly depending on a number of factors. Statements in this Form 10-Q which are not strictly historical statements, including, without limitation, statements regarding management’s expectations for future growth and plans and objectives for future management and operations, domestic and international marketing and sales plans, key customer relationships, product plans and performance, research and development plans, the successful integration of new technologies or businesses, regulatory uncertainties, potential savings to the healthcare system, management’s assessment of market factors, costs and uncertainties related to current or future litigation, as well as statements regarding our strategy and plans, constitute forward-looking statements that involve risks and uncertainties. In some cases these forward-looking statements can be identified by the use of words such as “may,” “will,” “could,” “should,” “would,” “expect,” “project,” “predict,” “potential” or the negative of these words or comparable words.
In addition to the risk factor below related to stock-based compensation expense, our risk factors listed under “Certain Factors Which May Affect Future Results” in our annual report on Form 10-K for the fiscal year ended December 31, 2005, among others, could cause actual results to differ materially from those contained in forward-looking statements made in this report and presented elsewhere by management from time to time. Such factors, among others, may have a material adverse effect upon our business, financial condition, and results of operations. We undertake no obligation to update publicly or revise any forward-looking statements, whether as a result of new information, future events or otherwise. Accordingly, you are cautioned not to place undue reliance on forward-looking statements, which speak only as of the date on which they are made.
The implementation of SFAS No. 123R has reduced and will continue to reduce our reported earnings, which could result in a decline in our stock price.
As part of our compensation to employees, we issue equity awards, primarily in the form of stock options. Many of the companies within our industry and with whom we compete for skilled employees use stock-based compensation as a means to attain these employees. While we have structured the estimated cost of our equity program to be comparable to other companies within our industry and similar to our size, not all companies use equity awards as part of their compensation packages nor do they issue the
26
same level of equity awards. As a result, the impact of the implementation of SFAS No. 123R may be more significant for us as compared to other companies. To the extent investors believe the costs incurred for SFAS No. 123R are higher than those incurred by other companies, our stock price could be negatively impacted.
Item 2. Unregistered Sales of Equity Securities and Use of Proceeds
(c) Issuer purchases of equity securities:
| | | | | | | | | | |
Period | | Total Number
of Shares
Purchased | | Average
Price Paid
per Share | | Total Number of
Shares
Purchased as
Part of Publicly
Announced Plans
or Programs | | Approximate
Dollar Value of
Shares that
May Yet Be
Purchased
Under the
Plans or
Programs |
January 2006 | | — | | $ | — | | — | | $ | 200,000,000 |
February 2006 | | 50,000 | | | 29.35 | | 50,000 | | | 198,532,360 |
March 2006 | | 714,518 | | | 29.11 | | 714,518 | | | 177,730,716 |
| | | | | | | | | | |
Total | | 764,518 | | $ | 29.13 | | 764,518 | | | |
| | | | | | | | | | |
We are authorized to repurchase up to $200 million of our common stock through open market purchases or private transactions that will be made from time to time as market conditions allow. The stock repurchase program is expected to be in effect for a maximum of four years. Shares repurchased under this program will be held in our treasury. The stock repurchase program may be suspended or discontinued at any time without prior notice. During the three months ended March 31, 2006, we repurchased a total of 764,518 shares with an aggregate cost of $22.3 million.
The current stock repurchase program was approved by our Board of Directors on November 21, 2005. Prior to this time, we repurchased our common shares under the former stock repurchase program and as of December 31, 2005, we had repurchased 17,469,890 shares under the previous repurchase program, with an aggregate cost of $207.5 million.
27
Item 6. Exhibits
| | |
| Exhibit No. | | Description |
| 3.1(1) | | Fourth Restated Certificate of Incorporation of Cytyc Corporation. |
| |
| 3.2(2) | | Second Amended and Restated By-Laws of Cytyc Corporation. |
| |
| 4.1(3) | | Specimen certificate representing the Common Stock. |
| |
| 4.2(4) | | Rights Agreement, dated as of August 27, 1997, between Cytyc Corporation and BankBoston, N.A (the “Rights Agreement”) which includes as Exhibit A the Form of Certificate of Designations, as Exhibit B the Form of Rights Certificate, and as Exhibit C the Summary of Rights to Purchase Preferred Stock. |
| |
| 4.3(5) | | Amendment No. 1 to Rights Agreement, dated as of June 22, 1998, between Cytyc Corporation and BankBoston, N.A., amending the Rights Agreement. |
| |
| 4.4(6) | | Amendment to the Rights Agreement, dated as of January 3, 2003, among Cytyc Corporation, BankBoston, N.A. and EquiServe Trust Company, N.A. |
| |
| 4.5(7) | | Amendment No. 2 to Rights Agreement, dated as of November 6, 2003, between Cytyc Corporation and EquiServe Trust Company, N.A., amending the Rights Agreement. |
| |
| 10.1(8) | | Summary of Director Compensation. |
| |
| 15 * | | Letter on Unaudited Interim Financial Information |
| |
| 31.1 * | | Certification of Patrick J. Sullivan, Chief Executive Officer and President, pursuant to Rules 13a-14 and 15d-14 under the Securities Exchange Act of 1934, as adopted pursuant to Section 302 of the Sarbanes-Oxley Act of 2002. |
| |
| 31.2 * | | Certification of Timothy M. Adams, Vice President, Chief Financial Officer, pursuant to Rules 13a-14 and 15d-14 under the Securities Exchange Act of 1934, as adopted pursuant to Section 302 of the Sarbanes-Oxley Act of 2002. |
| |
| 32.1 * | | Certification of Patrick J. Sullivan, Chief Executive Officer and President, pursuant to 18 U.S.C. Section 1350, as Adopted Pursuant to Section 906 of the Sarbanes-Oxley Act of 2002. |
| |
| 32.2 * | | Certification of Timothy M. Adams, Vice President, Chief Financial Officer, pursuant to 18 U.S.C. Section 1350, as Adopted Pursuant to Section 906 of the Sarbanes-Oxley Act of 2002. |
| (1) | Incorporated herein by reference to Exhibit 3.2 to our Current Report on Form 8-K, filed September 20, 2005. |
| (2) | Incorporated herein by reference to Exhibit 3.1 to our Current Report on Form 8-K, filed September 19, 2005. |
| (3) | Incorporated herein by reference to the exhibits to our Registration Statement on Form S-1 (File No. 333-00300). |
| (4) | Incorporated herein by reference to Exhibit 4.1 to our Current Report on Form 8-K, filed August 29, 1997. |
| (5) | Incorporated herein by reference to Exhibit 4.2 to our Quarterly Report on Form 10-Q, filed August 13, 1998. |
| (6) | Incorporated herein by reference to Exhibit 4.4 to our Annual Report on Form 10-K, filed January 30, 2004. |
| (7) | Incorporated herein by reference to Exhibit 4.4 to our Quarterly Report on Form 10-Q, filed November 12, 2003. |
| (8) | Incorporated herein by reference to Exhibit 10.1 to our Current Report on Form 8-K, filed March 29, 2006. |
28
SIGNATURES
Pursuant to the requirements of Section 13 or 15(d) of the Securities Exchange Act of 1934, the registrant has duly caused this report to be signed on its behalf by the undersigned thereunto duly authorized.
| | | | |
| | CYTYC CORPORATION |
| | |
Date: May 10, 2006 | | By: | | /s/ PATRICK J. SULLIVAN |
| | | | Patrick J. Sullivan |
| | | | Chief Executive Officer and President |
| | | | |
Date: May 10, 2006 | | By: | | /s/ TIMOTHY M. ADAMS |
| | | | Timothy M. Adams |
| | | | Vice President, Chief Financial Officer and Treasurer |
29
EXHIBIT INDEX
| | |
| Exhibit No. | | Description |
| |
| 3.1(1) | | Fourth Restated Certificate of Incorporation of Cytyc Corporation. |
| |
| 3.2(2) | | Second Amended and Restated By-Laws of Cytyc Corporation. |
| |
| 4.1(3) | | Specimen certificate representing the Common Stock. |
| |
| 4.2(4) | | Rights Agreement, dated as of August 27, 1997, between Cytyc Corporation and BankBoston, N.A (the “Rights Agreement”) which includes as Exhibit A the Form of Certificate of Designations, as Exhibit B the Form of Rights Certificate, and as Exhibit C the Summary of Rights to Purchase Preferred Stock. |
| |
| 4.3(5) | | Amendment No. 1 to Rights Agreement, dated as of June 22, 1998, between Cytyc Corporation and BankBoston, N.A., amending the Rights Agreement. |
| |
| 4.4(6) | | Amendment to the Rights Agreement, dated as of January 3, 2003, among Cytyc Corporation, BankBoston, N.A. and EquiServe Trust Company, N.A. |
| |
| 4.5(7) | | Amendment No. 2 to Rights Agreement, dated as of November 6, 2003, between Cytyc Corporation and EquiServe Trust Company, N.A., amending the Rights Agreement. |
| |
| 10.1(8) | | Summary of Director Compensation. |
| |
| 15 * | | Letter on Unaudited Interim Financial Information |
| |
| 31.1 * | | Certification of Patrick J. Sullivan, Chief Executive Officer and President, pursuant to Rules 13a-14 and 15d-14 under the Securities Exchange Act of 1934, as adopted pursuant to Section 302 of the Sarbanes-Oxley Act of 2002. |
| |
| 31.2 * | | Certification of Timothy M. Adams, Vice President, Chief Financial Officer, pursuant to Rules 13a-14 and 15d-14 under the Securities Exchange Act of 1934, as adopted pursuant to Section 302 of the Sarbanes-Oxley Act of 2002. |
| |
| 32.1 * | | Certification of Patrick J. Sullivan, Chief Executive Officer and President, pursuant to 18 U.S.C. Section 1350, as Adopted Pursuant to Section 906 of the Sarbanes-Oxley Act of 2002. |
| |
| 32.2 * | | Certification of Timothy M. Adams, Vice President, Chief Financial Officer, pursuant to 18 U.S.C. Section 1350, as Adopted Pursuant to Section 906 of the Sarbanes-Oxley Act of 2002. |
| (1) | Incorporated herein by reference to Exhibit 3.2 to our Current Report on Form 8-K, filed September 20, 2005. |
| (2) | Incorporated herein by reference to Exhibit 3.1 to our Current Report on Form 8-K, filed September 19, 2005. |
| (3) | Incorporated herein by reference to the exhibits to our Registration Statement on Form S-1 (File No. 333-00300). |
| (4) | Incorporated herein by reference to Exhibit 4.1 to our Current Report on Form 8-K, filed August 29, 1997. |
| (5) | Incorporated herein by reference to Exhibit 4.2 to our Quarterly Report on Form 10-Q, filed August 13, 1998. |
| (6) | Incorporated herein by reference to Exhibit 4.4 to our Annual Report on Form 10-K, filed January 30, 2004. |
| (7) | Incorporated herein by reference to Exhibit 4.4 to our Quarterly Report on Form 10-Q, filed November 12, 2003. |
| (8) | Incorporated herein by reference to Exhibit 10.1 to our Current Report on Form 8-K, filed March 29, 2006. |
30