Some of the information contained in this quarterly report on Form 10-Q may constitute “forward-looking statements” within the meaning of the “safe-harbor” provisions of the Private Securities Litigation Reform Act of 1995. When we use words such as “believe,” “estimate,” “anticipate,” “expect,” “project,” “likely,” “may” and similar expressions, we do so to identify forward-looking statements. Such statements are based on our then current expectations and are subject to a number of risks and uncertainties that could cause actual results to differ materially from those addressed in the forward-looking statements. Unless the context requires otherwise, all references herein to “Tredegar,” “we,” “us” or “our” are to Tredegar Corporation and its consolidated subsidiaries.
Third-quarter 2008 income from continuing operations was $11.1 million (33 cents per share) compared with $6.2 million (16 cents per share) in the third quarter of 2007. Income from continuing operations for the first nine months of 2008 was $23.7 million (69 cents per share) compared with $27.9 million (71 cents per share) in the first nine months of 2007. Losses related to plant shutdowns, asset impairments and restructurings are described in Note 2 on page 6. Gains and losses from the sale of assets and other special items are described in Note 6 on page 9. The following tables present Tredegar’s net sales and operating profit by segment for the third quarter and nine months ended September 30, 2008 and 2007:
Net sales (sales less freight) and operating profit from ongoing operations are the measures of sales and operating profit used by the chief operating decision maker of each segment for purposes of assessing performance.
Film Products. Net sales (sales less freight) in Film Products were down 2.2% in the third quarter of 2008 compared with 2007, while operating profit from ongoing operations decreased 34% in the same period. Volume was 56.1 million pounds in the third quarter of 2008, down 6.5% from 60.0 million pounds in the third quarter of 2007.
Net sales in Film Products for the first nine months of 2008 were down slightly from the first nine months of 2007. Operating profit from ongoing operations was down 25.4% in the first nine months of 2008 versus 2007. Volume was 170.8 million pounds in the first nine months of 2008, down 8.0% from 185.7 million pounds in the first nine months of 2007.
Volume was down in the third quarter and first nine months of 2008 compared with last year due primarily to competitive pressures, particularly for personal care and surface protection materials. Net sales declined compared to last year due to lower volume, partially offset by appreciation of the U.S. dollar value of currencies for operations outside of the U.S. and higher selling prices from the pass-through of higher resin costs.
Operating profit from ongoing operations decreased in the third quarter and first nine months of 2008 versus 2007 due primarily to lower volume and a lag in the pass-through of higher resin costs, partially offset by cost reduction efforts and the benefit from appreciation of the U.S. dollar value of currencies for operations outside of the U.S. Film Products has index-based pass-through raw material cost agreements for the majority of its business. However, under certain agreements, changes in resin prices are not passed through for an average period of 90 days. The estimated resin lag was an unfavorable $4 million in the third quarter of 2008, an unfavorable $7.2 million for the first nine months of 2008, an unfavorable $1 million for the third quarter of 2007 and an unfavorable $500,000 for the first nine months of 2007. We estimate that the change in value of foreign currencies relative to the U.S. Dollar had a positive impact on operating profit of $1.3 million in the third quarter of 2008 compared with the third quarter of 2007, and $3.7 million in the first nine months of 2008 compared with the first nine months of 2007.
Future operating profit levels in films will depend on our ability to deliver product innovations, reduce costs and manage the business under significantly greater global economic uncertainty.
Capital expenditures in Film Products were $9.5 million in the first nine months of 2008 compared with $11.7 million in the first nine months of last year, and are projected to be approximately $15 million in 2008. Depreciation expense was $26.3 million in the first nine months of 2008 compared with $25 million in the first nine months of last year, and is projected to be approximately $35 million in 2008.
Aluminum Extrusions. Net sales from continuing operations in Aluminum Extrusions were down 3.2% in the third quarter of 2008 compared with 2007, while operating profit from ongoing U.S. operations was flat for the same period. Volume from continuing operations decreased to 35.3 million pounds in the third quarter of 2008, down 11.1% from 39.7 million pounds in the third quarter of 2007.
Net sales in Aluminum Extrusions for the first nine months of 2008 were down 7.5% from the first nine months of 2007. Operating profit from ongoing U.S. operations in the first nine months of 2008 was down 44% versus last year. Volume was 107.9 million pounds in the first nine months of 2008, down 12.7% from 123.6 million pounds in the first nine months of 2007.
16
The decreases in net sales in the third quarter and first nine months of 2008 compared with last year was mainly due to lower volume, partially offset by higher selling prices from the pass-through of higher average aluminum costs. Shipments declined in most markets. Operating profit from ongoing U.S. operations was flat during the third quarter of 2008 compared with last year as a favorable change of $1 million in insurance costs offset the adverse impact of the decline in volume. Operating profit from ongoing U.S. operations declined during the first nine months of 2008 compared with last year mainly due to lower volume. We continue to be very focused on reducing costs in light of the decline in volume and market conditions.
Capital expenditures for continuing operations in Aluminum Extrusions were $4.3 million in the first nine months of 2008 compared with $3.5 million in the first nine months of last year, and are projected to be approximately $11 million in 2008. In January 2008, Tredegar announced plans to spend approximately $24 million over the following 18 months to expand the capacity at its plant in Carthage, Tennessee. In the first nine months of 2008, approximately 70% of the sales of aluminum extrusions from operations in the U.S. were related to non-residential construction, and this additional capacity will increase Tredegar’s capabilities in this sector. Depreciation expense was $6.0 million in the first nine months of 2008 compared with $6.3 million in the first nine months of last year, and is projected to be approximately $8.1 million in 2008.
On February 12, 2008, we sold our aluminum extrusions business in Canada for a purchase price of $25.5 million to an affiliate of H.I.G. Capital. The purchase price is subject to adjustment based upon the actual working capital of the business at the time of sale. The final purchase price is estimated at $24.6 million, with the decline from the amount estimated at February 12, 2008 due to the excess of estimated working capital over actual working capital. We expect to realize cash income tax benefits in 2008 from the sale of approximately $12 million. All historical results for this business have been reflected as discontinued operations.
Other Items. Net pension income from continuing operations was $617,000 in the third quarter and $3.7 million in the first nine months of 2008, an unfavorable change of $73,000 and favorable change of $1.6 million (3 cents per share after taxes), respectively, from amounts recognized in the comparable periods of 2007. Most of the favorable change in the first nine months of 2008 relate to a pension plan that is reflected in “Corporate expenses, net” in the segment operating profit table on page 15. We contributed approximately $167,000 to our pension plans for continuing operations in 2007 and expect to contribute a similar amount in 2008. Corporate expenses, net for the first nine months of 2008 compared with last year also declined due to lower costs for certain performance-based compensation programs.
At September 30, 2008, the fair value of the assets of our pension plans was estimated at $235 million, down from $284 million at December 31, 2007. The significant decline was mainly due to the drop in global stock prices and benefit payments to retirees of approximately $2.4 million per quarter. The projected benefit obligation at December 31, 2008 is approximately $202 million at a discount rate of 6.75% and $197 million at a discount rate of 7.0%. Subsequent to September 30, 2008, global stock prices continued to decline which likely resulted in a decline in the value of our pension assets below the projected pension obligation. Based on global stock market valuations in October 2008, the minimum required contribution to our pension plans in 2009 is estimated at $5 to $10 million and the corresponding decline in net pension income in 2009 compared with 2008 is estimated at $500,000 to $2 million. The actual contribution required for 2009 and the pension income or expense for 2009 will be based on pension asset and liability valuation information as of December 31, 2008.
Interest expense declined slightly in the third quarter and first nine months of 2008 compared with last year as higher average debt levels were offset by lower average interest rates.
17
The effective tax rate used to compute income taxes from continuing operations was 39.7% in the third quarter of 2008 compared with 52.9% in the third quarter of 2007, and 37.5% in the first nine months of 2008 compared with 40.1% in the first nine months of 2007. The decrease in the effective tax rate during the third quarter of 2008 versus last year was mainly due to the adjustment of income taxes during the third quarter of each year to the rate that results in a year-to-date effective tax rate that is equal to the rate estimated for that entire year. The decrease in the effective tax rate for continuing operations for the first nine months of 2008 versus 2007 was primarily due to the reversal in 2008 of $1.1 million of valuation allowances on capital loss carry-forwards recognized in 2007 (see Note 6 on page 9 for more information), partially offset by higher effective tax rates for operations outside of the U.S., lower income tax benefits expected for the Domestic Production Activities Deduction and expiration at December 31, 2007 of the research & development tax credit.
Our investment in Harbinger Capital Partners Special Situations Fund, L.P. had a reported capital account value of $17.2 million at September 30, 2008, compared with $23.0 million at December 31, 2007. This investment has a carrying value in our balance sheet of $10 million, which represents the amount invested on April 2, 2007.
Our share repurchases in 2008 are summarized in Note 10 on page 14. Additional information on net capitalization and other credit measures are provided in the liquidity and capital resources section beginning on page 22.
Critical Accounting Policies
In the ordinary course of business, we make a number of estimates and assumptions relating to the reporting of results of operations and financial position in the preparation of financial statements in conformity with generally accepted accounting principles. We believe the estimates, assumptions and judgments described in the section “Management’s Discussion and Analysis of Financial Condition and Results of Operations – Critical Accounting Policies” of our Annual Report on Form 10-K for the year ended December 31, 2007, have the greatest potential impact on our financial statements, so we consider these to be our critical accounting policies. These policies include our accounting for impairment of long-lived assets and goodwill, investment accounted for under the fair value method, pension benefits and income taxes. These policies require management to exercise judgments that are often difficult, subjective and complex due to the necessity of estimating the effect of matters that are inherently uncertain. Actual results could differ significantly from those estimates under different assumptions and conditions. We believe the consistent application of these policies enables us to provide readers of our financial statements with useful and reliable information about our operating results and financial condition. Since December 31, 2007, there have been no changes in these policies that have had a material impact on results of operations or financial position. Losses related to plant shutdowns, asset impairments and restructurings are described in Note 2 on page 6. Gains and losses from the sale of assets and other special items are described in Note 6 on page 9.
Recently Issued Accounting Standards
The Financial Accounting Standards Board recently issued Statement of Financial Accounting Standards (“SFAS”) No. 161, Disclosures about Derivative Instruments and Hedging Activities, an amendment of FASB Statement No. 133, to enhance the current disclosure framework in SFAS No. 133, Accounting for Derivative Instruments and Hedging Activities. SFAS No. 161 addresses concerns that the disclosures required by SFAS No. 133 do not provide adequate information about the impact derivative instruments can have on an entity’s financial position, results of operations and cash flows. SFAS 161 amends and expands the disclosures required by SFAS 133 so that they provide an enhanced understanding of (i) how and why an entity uses derivative instruments, (ii) how derivative instruments and related hedged items are accounted for under SFAS 133 and its related interpretations, and (iii) how derivative instruments affect an entity’s financial position, financial performance, and cash flows. The
18
new disclosure guidance will apply to all interim and annual reporting periods for which a balance sheet and income statement are presented. SFAS 161 is effective for both interim and annual reporting periods beginning after November 15, 2008, with early application encouraged. SFAS 161 encourages, but does not require, comparative disclosures for earlier periods at initial adoption. We do not believe that the adoption of SFAS 161 will have a material impact on our financial statements and related disclosures.
Results of Operations
Third Quarter 2008 Compared with Third Quarter 2007
Overall, sales in the third quarter of 2008 decreased 2.4% compared with 2007. Net sales (sales less freight) decreased 2.2% in Film Products primarily due to lower volume, partially offset by appreciation of the U.S. dollar value of currencies for operations outside of the U.S. and higher selling prices from the pass-through of higher resin costs. Volume was down in the third quarter compared with last year primarily due to competitive pressures, particularly for personal care materials. Net sales decreased 3.2% in Aluminum Extrusions due to lower volume partially offset by higher selling prices from the pass-through of higher average aluminum costs. Shipments declined in most markets. For more information on net sales and volume, see the executive summary beginning on page 15.
Consolidated gross profit (sales minus cost of goods sold and freight) as a percentage of sales decreased to 12.2% in the third quarter of 2008 from 15.5% in 2007. The gross profit margin decreased in Film Products and Aluminum Extrusions primarily because of the decline in volume noted above. In addition, the gross profit margin in Film Products was adversely impacted by a lag in the pass-through of higher resin costs, partially offset by cost reduction efforts.
As a percentage of sales, selling, general and administrative and R&D expenses were 7.3% in the third quarter of 2008, down from 8.0% in the third quarter of last year. The decrease is primarily due to lower selling, general and administrative expenses in Film Products from cost reduction efforts.
Losses related to plant shutdowns, asset impairments and restructurings are described in Note 2 on page 6. Gains and losses from the sale of assets and other special items are described in Note 6 on page 9.
Interest income, which is included in “Other income (expense), net” in the consolidated statements of income, was $209,000 in the third quarter of 2008 and $289,000 in 2007. Interest expense declined slightly in third quarter of 2008 compared with last year as higher average debt levels were offset by lower average interest rates. Average debt outstanding and interest rates were as follows:
| | | | | | | |
|
|
|
|
| | Three Months
Ended Sept 30 | |
| |
|
|
(In Millions) | | 2008 | | 2007 | |
|
|
|
|
|
|
Floating-rate debt with interest charged on a rollover basis at one-month LIBOR: | | | | | | | |
Average outstanding debt balance | | $ | 42.4 | | $ | 30.9 | |
Average interest rate | | | 3.2 | % | | 6.2 | % |
Fixed-rate and other debt: | | | | | | | |
Average outstanding debt balance | | $ | 1.8 | | $ | 2.2 | |
Average interest rate | | | 4.5 | % | | 3.7 | % |
|
|
|
|
|
|
|
|
Total debt: | | | | | | | |
|
Average outstanding debt balance | | $ | 44.2 | | $ | 33.1 | |
Average interest rate | | | 3.3 | % | | 6.0 | % |
|
|
|
|
|
|
|
|
19
The effective tax rate used to compute income taxes from continuing operations was 39.7% in the third quarter of 2008 compared with 52.9% in the third quarter of 2007, and 37.5% in the first nine months of 2008 compared with 40.1% in the first nine months of 2007. The decrease in the effective tax rate during the third quarter of 2008 versus last year was mainly due to the adjustment of income taxes during the third quarter of each year to the rate that results in a year-to-date effective tax rate that is equal to the rate estimated for that entire year. The decrease in the effective tax rate for continuing operations for the first nine months of 2008 versus 2007 was primarily due to the reversal in 2008 of $1.1 million of valuation allowances on capital loss carry-forwards recognized in 2007 (see Note 6 on page 9 for more information), partially offset by higher effective tax rates for operations outside of the U.S., lower income tax benefits expected for the Domestic Production Activities Deduction and expiration at December 31, 2007 of the research & development tax credit.
First Nine Months of 2008 Compared with First Nine Months of 2007
Overall, sales in the first nine months of 2008 decreased by 3.2% compared with 2007. Net sales (sales less freight) decreased slightly in Film Products primarily due to lower volume, partially offset by appreciation of the U.S. dollar value of currencies for operations outside of the U.S. and higher selling prices from the pass-through of higher resin costs. Volume was down in the first nine months of 2008 compared with last year due primarily to competitive pressures, particularly for personal care materials and surface protection films. Net sales decreased 7.5% in Aluminum Extrusions due to lower volume partially offset by higher selling prices from the pass-through of higher average aluminum costs. Shipments declined in most markets. For more information on net sales and volume, see the executive summary beginning on page 15.
Consolidated gross profit (sales minus cost of goods sold and freight) as a percentage of sales decreased to 12.9% in the first nine months of 2008 from 15.2% in 2007. The gross profit margin decreased in Film Products and Aluminum Extrusions primarily because of the decline in volume noted above. In addition, the gross profit margin in Film Products was adversely impacted by a lag in the pass-through of higher resin costs, partially offset by cost reduction efforts.
As a percentage of sales, selling, general and administrative and R&D expenses were 7.6% in the first nine months of 2008, a decrease from 7.8% in 2007. The decrease is primarily due to higher pension income, lower costs for certain performance-based compensation programs and lower selling, general and administrative expenses in Film Products from cost reduction efforts.
Losses related to plant shutdowns, asset impairments and restructurings are described in Note 2 on page 6. Gains and losses from the sale of assets and other special items are described in Note 6 on page 9.
20
Interest income, which is included in “Other income (expense), net” in the consolidated statements of income, was $655,000 in the first nine months of 2008 and $960,000 in 2007. Interest expense declined slightly in the first nine months of 2008 versus 2007 as higher average debt levels were offset by lower average interest rates. Average debt outstanding and interest rates were as follows:
| | | | | | | |
|
|
|
|
| | Nine Months
Ended Sept 30 | |
| |
|
|
(In Millions) | | 2008 | | 2007 | |
|
|
|
|
|
|
Floating-rate debt with interest charged on a rollover basis at one-month LIBOR: | | | | | | | |
Average outstanding debt balance | | $ | 54.3 | | $ | 40.5 | |
Average interest rate | | | 3.9 | % | | 6.1 | % |
Fixed-rate and other debt: | | | | | | | |
Average outstanding debt balance | | $ | 1.9 | | $ | 2.3 | |
Average interest rate | | | 4.1 | % | | 3.9 | % |
|
|
|
|
|
|
|
|
Total debt: | | | | | | | |
Average outstanding debt balance | | $ | 56.2 | | $ | 42.8 | |
Average interest rate | | | 3.9 | % | | 6.0 | % |
|
|
|
|
|
|
|
|
The effective tax rate used to compute income taxes from continuing operations was 37.5% in the first nine months of 2008 compared with 40.1% in the first nine months of 2007. The decrease in the effective tax rate for continuing operations for the first nine months of 2008 versus 2007 was primarily due to the reversal in 2008 of $1.1 million of valuation allowances on capital loss carry-forwards recognized in 2007 (see Note 6 on page 9 for more information), partially offset by higher effective tax rates for operations outside of the U.S., lower income tax benefits expected for the Domestic Production Activities Deduction and expiration at December 31, 2007 of the research & development tax credit.
21
Liquidity and Capital Resources
Changes in operating assets and liabilities from December 31, 2007 to September 30, 2008 are summarized below:
| | |
• | Accounts receivable increased $17.5 million (18.0%). |
| | |
| – | Accounts receivable in Film Products increased by $2.8 million. Days sales outstanding (“DSO”) increased to 47 at September 30, 2008 compared with 45 at December 31, 2007, and was within the range experienced over the last twelve months. |
| | |
| – | Accounts receivable for continuing operations in Aluminum Extrusions increased by $14.7 million. DSO was 43 at September 30, 2008 compared with 40 at December 31, 2007, and was within the range experienced over the last twelve months. |
| | |
• | Inventories declined $13.8 million (28.4%). |
| | |
| – | Inventories in Film Products decreased by approximately $5.7 million. Inventory days decreased to 36 at September 30, 2008 compared with 43 days at December 31, 2007, primarily due to an overall effort to reduce inventory levels. |
| | |
| – | Inventories for continuing operations in Aluminum Extrusions decreased by approximately $8.1 million. Inventory days decreased to 19 at September 30, 2008 compared with 35 at December 31, 2007, primarily due to cyclical fluctuations and an overall effort to reduce inventory levels. |
| | |
• | Net property, plant and equipment was down $19.2 million or 7.1% due primarily to depreciation for continuing operations of $32.3 million compared with capital expenditures of $13.8 million and machinery and equipment asset impairments in Film Products of $2.1 million, partially offset by appreciation of foreign currencies relative to the U.S. Dollar (favorable impact of $1.4 million). |
| | |
• | Accounts payable increased by $8.9 million (13.2%). |
| | |
| – | Accounts payable in Film Products increased by $2.0 million. Accounts payable days were 30 at September 30, 2008 compared with 30 at December 31, 2007, and were within the range experienced over the last twelve months. |
| | |
| – | Accounts payable for continuing operations in Aluminum Extrusions increased by $11.3 million. Accounts payable days increased to 41 at September 30, 2008 from 37 at December 31, 2007, primarily due to cyclical fluctuations and improved payable terms with suppliers. |
| | |
| – | Accounts payable decreased at corporate by $4.4 million due primarily to $3.4 million payable at December 31, 2007 to a securities broker relating to our repurchase of Tredegar common stock (no balance was outstanding for this item at September 30, 2008). |
| | |
• | Accrued expenses increased by $5.7 million (16.9%) due primarily to timing of payments. |
| | |
• | Net deferred income tax liabilities in excess of assets increased by $19.2 million and income taxes recoverable increased by $13.7 million due primarily to the movement between these line items in the balance sheet. |
Cash provided by operating activities was $60.4 million in the first nine months of 2008 compared with $74.4 million in the first nine months of 2007. The change is primarily related to normal volatility of working capital components and lower income from continuing operations.
Cash provided by investing activities was $11.4 million in the first nine months of 2008, compared with cash used in investing activities of $34.5 million in the first nine months of 2007. The change between periods is primarily due to proceeds received in 2008 from the sale of the aluminum extrusions business in Canada of $23.6 million and investments and purchases of real estate of $2.1 million in 2008, down from $22.6 million last year.
22
Net cash flow used in financing activities was $73.5 million in the first nine months of 2008 and related to net repayments on our revolving credit facility with excess cash flow of $53.7 million, the payment of regular quarterly dividends of $4.1 million (4 cents per share per quarter) and repurchases of Tredegar common stock ($19.8 million including settlement of $3.4 million; see more information in Note 10 on page 14), partially offset by proceeds from the exercise of stock options of $4.1 million.
Further information on cash flows for the nine months ended September 30, 2008 and 2007 are provided in the consolidated statements of cash flows on page 4.
Net capitalization and indebtedness as defined under our revolving credit agreement as of September 30, 2008 are as follows:
| | | | |
|
|
|
|
|
Net Capitalization and Indebtedness as of Sept 30, 2008
(In Thousands) |
|
Net capitalization: | | | | |
Cash and cash equivalents | | $ | 46,624 | |
Debt: | | | | |
$300 million revolving credit agreement maturing December 15, 2010 | | | 27,000 | |
Other debt | | | 1,535 | |
| |
|
| |
Total debt | | | 28,535 | |
| |
|
| |
Debt net of cash and cash equivalents | | | (18,089 | ) |
Shareholders’ equity | | | 488,286 | |
| |
|
| |
Net capitalization | | $ | 470,197 | |
| |
|
| |
Indebtedness as defined in revolving credit agreement: | | | | |
Total debt | | $ | 28,535 | |
Face value of letters of credit | | | 5,458 | |
Liabilities relating to derivative financial instruments | | | 3,862 | |
| |
|
| |
Indebtedness | | $ | 37,855 | |
|
|
|
|
|
Under the revolving credit agreement, borrowings are permitted up to $300 million, and $242 million was available to borrow at September 30, 2008. The credit spread and commitment fees charged on the unused amount under the revolving credit agreement at various indebtedness-to-adjusted EBITDA levels are as follows:
| | | | | | |
|
Pricing Under Revolving Credit Agreement (Basis Points) |
|
Indebtedness-to-Adjusted
EBITDA Ratio | | Credit Spread
Over LIBOR | | Commitment
Fee |
|
|
|
|
|
> 2.50x but <= 3x | | 125 | | | 25 | |
> 1.75x but <= 2.50x | | 100 | | | 20 | |
> 1x but <=1.75x | | 87.5 | | | 17.5 | |
<= 1x | | 75 | | | 15 | |
|
|
|
|
|
|
|
At September 30, 2008, the interest rate on debt under the revolving credit agreement was priced at one-month LIBOR plus the applicable credit spread of 75 basis points.
23
The computations of adjusted EBITDA, adjusted EBIT, the leverage ratio and interest coverage ratio as defined in the revolving credit agreement are presented below along with the related most restrictive covenants. Adjusted EBITDA and adjusted EBIT as defined in the revolving credit agreement are not intended to represent cash flow from operations as defined by GAAP and should not be considered as either an alternative to net income or to cash flow.
| | | | |
|
Computations of Adjusted EBITDA, Adjusted EBIT, Leverage Ratio and
Interest Coverage Ratio as Defined in Revolving Credit Agreement Along with Related Most
Restrictive Covenants
As of and for the Twelve Months Ended September 30, 2008 (In Thousands) |
|
Computations of adjusted EBITDA and adjusted EBIT as defined in revolving credit agreement for the twelve months ended September 30, 2008: | | | | |
Net income | | $ | 36,155 | |
Plus: | | | | |
After-tax losses related to discontinued operations | | | — | |
Total income tax expense for continuing operations | | | 19,867 | |
Interest expense | | | 2,633 | |
Charges related to stock option grants and awards accounted for under the fair value-based method | | | 793 | |
Losses related to the application of the equity method of accounting | | | — | |
Depreciation and amortization expense for continuing operations | | | 43,581 | |
All non-cash losses and expenses, plus cash losses and expenses not to exceed $10,000, for continuing operations that are classified as unusual, extraordinary or which are related to plant shutdowns, asset impairments and/or restructurings (cash-related of $3,960) | | | 6,876 | |
Minus: | | | | |
After-tax income related to discontinued operations | | | (5,391 | ) |
Total income tax benefits for continuing operations | | | — | |
Interest income | | | (907 | ) |
All non-cash gains and income, plus cash gains and income not to exceed $10,000, for continuing operations that are classified as unusual, extraordinary or which are related to plant shutdowns, asset impairments and/or restructurings (cash-related of $5,199) | | | (10,199 | ) |
Plus or minus, as applicable, pro forma EBITDA adjustments associated with acquisitions and asset dispositions | | | — | |
| |
|
| |
Adjusted EBITDA as defined in revolving credit agreement | | | 93,408 | |
Less: Depreciation and amortization expense for continuing operations (including pro forma for acquisitions and asset dispositions) | | | (43,581 | ) |
| |
|
| |
Adjusted EBIT as defined in revolving credit agreement | | $ | 49,827 | |
| |
|
| |
Shareholders’ equity at September 30, 2008 | | $ | 488,286 | |
Computations of leverage and interest coverage ratios as defined in revolving credit agreement: | | | | |
Leverage ratio (indebtedness-to-adjusted EBITDA) | | | .41x | |
Interest coverage ratio (adjusted EBIT-to-interest expense) | | | 18.92x | |
Most restrictive covenants as defined in revolving credit agreement: | | | | |
Maximum permitted aggregate amount of dividends that can be paid by Tredegar during the term of the revolving credit agreement ($100,000 plus 50% of net income generated after October 1, 2005) | | $ | 138,569 | |
Minimum adjusted shareholders’ equity permitted ($315,000 plus 50% of net income generated, to the extent positive, after July 1, 2007) | | $ | 333,078 | |
Maximum leverage ratio permitted: | | | | |
Ongoing (2.75x effective January 1, 2009) | | | 3.00x | |
Pro forma for acquisitions | | | 2.50x | |
Minimum interest coverage ratio permitted | | | 2.50x | |
|
|
|
|
|
24
Noncompliance with any one or more of the debt covenants may have a material adverse effect on financial condition or liquidity in the event such noncompliance cannot be cured or should we be unable to obtain a waiver from the lenders. Renegotiation of the covenant(s) through an amendment to the credit agreement may effectively cure the noncompliance, but may have an effect on financial condition or liquidity depending upon how the covenant is renegotiated.
We believe that the borrowing availability under our revolving credit agreement, our current cash balances and our cash flow from operations will be sufficient to satisfy our working capital, capital expenditure and dividend requirements for the foreseeable future.
Item 3. Quantitative and Qualitative Disclosures About Market Risk.
Tredegar has exposure to the volatility of interest rates, polyethylene and polypropylene resin prices, aluminum ingot and scrap prices, energy prices, foreign currencies and emerging markets. See the liquidity and capital resources section beginning on page 22 regarding credit agreements and interest rate exposures.
Changes in resin prices, and the timing of those changes, could have a significant impact on profit margins in Film Products. Profit margins in Aluminum Extrusions are sensitive to fluctuations in aluminum ingot and scrap prices as well as natural gas prices (natural gas is the principal energy source used to operate our casting furnaces). There is no assurance of our ability to pass through higher raw material and energy costs to our customers.
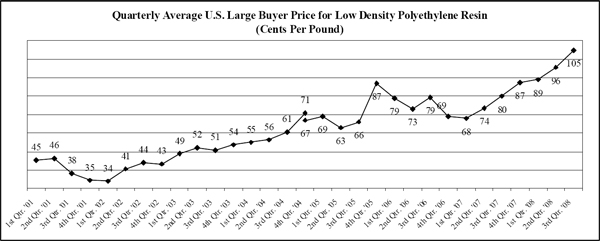
See the executive summary beginning on page 15 for discussion regarding the impact of the lag in the pass-through of resin price changes. The volatility of average quarterly prices of low density polyethylene resin in the U.S. (a primary raw material for Film Products) is shown in the chart below.
|
|
Source: Quarterly averages computed by Tredegar using monthly data provided by Chemical Data Inc. (“CDI”). In January 2005, CDI reflected a 4 cents per pound non-market adjustment based on their estimate of the growth of discounts over the 2000 to 2003 period. The 4th quarter 2004 average rate of 67 cents per pound is shown on a pro forma basis as if the non-market adjustment was made in October 2004. |
Resin prices in Europe, Asia and South America have exhibited similar trends. The price of resin is driven by several factors including supply and demand and the price of oil, ethylene and natural gas. To address fluctuating resin prices, Film Products has index-based pass-through raw material cost agreements for the majority of its business. However, under certain agreements, changes in resin prices are not passed through for an average period of 90 days.
25
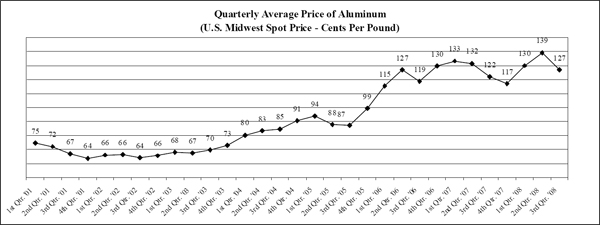
In the normal course of business, we enter into fixed-price forward sales contracts with certain customers for the sale of fixed quantities of aluminum extrusions at scheduled intervals. In order to hedge our exposure to aluminum price volatility (see the chart below) under these fixed-price arrangements, which generally have a duration of not more than 12 months, we enter into a combination of forward purchase commitments and futures contracts to acquire or hedge aluminum, based on the scheduled deliveries.
|
|
Source: Quarterly averages computed by Tredegar using daily closing data provided by Bloomberg. |
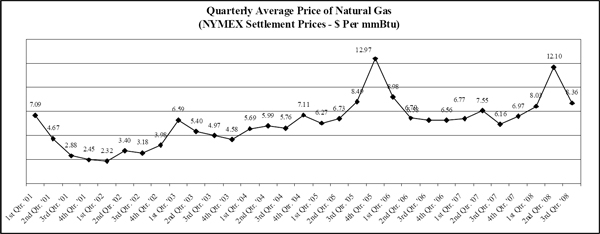
In Aluminum Extrusions, we hedge from time-to-time a portion of our exposure to natural gas price volatility by entering into fixed-price forward purchase contracts with our natural gas suppliers. We estimate that, in an unhedged situation, every $1 per mmBtu per month change in the market price of natural gas has a $95,000 impact on the continuing monthly operating profit for our U.S. operations in Aluminum Extrusions. In September 2005, we announced an energy surcharge for our aluminum extrusions business in the U.S. to be applied when the NYMEX natural gas price is in excess of $8.85 per mmBtu. During the first nine months of 2008, significantly higher natural gas costs were mostly offset by this energy surcharge.
|
|
Source: Quarterly averages computed by Tredegar using monthly NYMEX settlement prices. |
26
We sell to customers in foreign markets through our foreign operations and through exports from U.S. plants. The percentage of sales and total assets for continuing manufacturing operations related to foreign markets for the first nine months of 2008 and 2007 are as follows:
| | | | | | | | | |
|
Percentage of Net Sales from Continuing Manufacturing
Operations Related to Foreign Markets* | |
|
| | Nine Months Ended Sept 30 | |
| |
|
| | 2008 | | 2007 | |
| |
| |
|
| | Exports
From U.S. | | Foreign
Operations | | Exports
From U.S. | | Foreign
Operations | |
| |
| |
| |
| |
|
|
Canada | | 5 | % | — | % | 5 | % | — | % |
Europe | | 1 | | 18 | | 1 | | 16 | |
Latin America | | — | | 3 | | — | | 3 | |
Asia | | 2 | | 8 | | 4 | | 6 | |
|
|
|
|
|
|
|
|
|
|
Total | | 8 | % | 29 | % | 10 | % | 25 | % |
|
|
|
|
|
|
|
|
|
|
* Based on consolidated net sales from continuing manufacturing operations (excludes AFBS). |
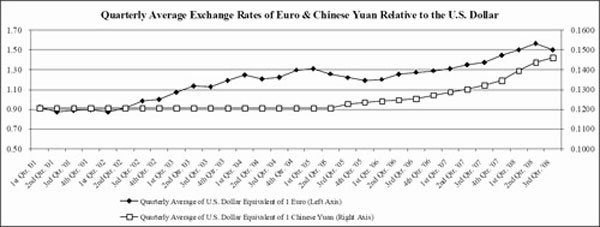
We attempt to match the pricing and cost of our products in the same currency and generally view the volatility of foreign currencies (see trends for the Euro and Chinese Yuan in the chart below) and emerging markets, and the corresponding impact on earnings and cash flow, as part of the overall risk of operating in a global environment. Exports from the U.S. are generally denominated in U.S. Dollars. Our foreign currency exposure on income from continuing foreign operations relates to the Euro, the Chinese Yuan, the Hungarian Forint and the Brazilian Real.
In Film Products, where we are typically able to match the currency of our sales and costs, we estimate that the change in value of foreign currencies relative to the U.S. Dollar had a positive impact on operating profit of $1.3 million in the third quarter of 2008 compared with the third quarter of 2007, and $3.7 million in the first nine months of 2008 compared with the first nine months of 2007.
Trends for the Euro and Chinese Yuan are shown in the chart below:
|
|
|
Source: Quarterly averages computed by Tredegar using daily closing data provided by Bloomberg. |
27
Item 4. Controls and Procedures.
Pursuant to Rule 13a-15(b) under the Securities Exchange Act of 1934, we carried out an evaluation, with the participation of our management, including our principal executive officer and principal financial officer, of the effectiveness of our disclosure controls and procedures (as defined under Rule 13a-15(e) under the Securities Exchange Act of 1934) as of the end of the period covered by this report. Based upon that evaluation, our principal executive officer and principal financial officer concluded that our disclosure controls and procedures are effective to ensure that information required to be disclosed by us in the reports that we file or submit under the Exchange Act, is recorded, processed, summarized and reported, within the time periods specified in the SEC’s rules and forms, and that such information is accumulated and communicated to our management, including our principal executive officer and principal financial officer, as appropriate, to allow timely decisions regarding required disclosure.
There has been no change in our internal control over financial reporting during the quarter ended September 30, 2008, that has materially affected, or is reasonably likely to materially affect, our internal control over financial reporting.
28
PART II - OTHER INFORMATION
Item 1A. Risk Factors.
There are a number of risks and uncertainties that can have a material effect on the operating results of our businesses and our financial condition. These risk factors have not changed materially since the filing of our Annual Report on Form 10-K for the year ended December 31, 2007.
Item 2. Unregistered Sales of Equity Securities and Use of Proceeds.
See Note 10 on page 14 for the information required by this item.
Item 6. Exhibits.
| |
Exhibit Nos. |
|
|
31.1 | Certification of John D. Gottwald, President and Chief Executive Officer (Principal Executive Officer) of Tredegar Corporation, pursuant to Rules 13a-14(a) and 15d-14(a) promulgated under the Securities Exchange Act of 1934, as adopted pursuant to Section 302 of the Sarbanes-Oxley Act of 2002. |
| |
31.2 | Certification of D. Andrew Edwards, Vice President, Chief Financial Officer and Treasurer (Principal Financial Officer) of Tredegar Corporation, pursuant to Rules 13a-14(a) and 15d-14(a) promulgated under the Securities Exchange Act of 1934, as adopted pursuant to Section 302 of the Sarbanes-Oxley Act of 2002. |
| |
32.1 | Certification of John D. Gottwald, President and Chief Executive Officer (Principal Executive Officer) of Tredegar Corporation, pursuant to 18 U.S.C. Section 1350, as adopted pursuant to Section 906 of the Sarbanes-Oxley Act of 2002. |
| |
32.2 | Certification of D. Andrew Edwards, Vice President, Chief Financial Officer and Treasurer (Principal Financial Officer) of Tredegar Corporation, pursuant to 18 U.S.C. Section 1350, as adopted pursuant to Section 906 of the Sarbanes-Oxley Act of 2002. |
SIGNATURES
Pursuant to the requirements of the Securities Exchange Act of 1934, the Registrant has duly caused this report to be signed on its behalf by the undersigned thereunto duly authorized.
| | |
| | Tredegar Corporation |
| | (Registrant) |
| | |
| | |
Date: | November 5, 2008 | /s/ D. Andrew Edwards |
|
|
|
| | D. Andrew Edwards |
| | Vice President, Chief Financial Officer and |
| | Treasurer |
| | (Principal Financial and Accounting Officer) |
29