Net sales (sales less freight) and operating profit from ongoing operations are the measures of sales and operating profit used by the chief operating decision maker of each segment for purposes of assessing performance.
Net sales declined due to lower volume across all market segments, most notably surface protection and personal care materials, and the unfavorable impact of changes in the U.S. dollar value of currencies for operations outside the U.S. We believe volume declines in the first quarter of 2009 compared with the first quarter of 2008 were primarily driven by the economic downturn and customer inventory adjustments.
Operating profit from ongoing operations increased in the first quarter of 2009 compared with the prior year due primarily to the favorable impact of the lag in the pass-through of lower average resin costs. Excluding the resin lag, ongoing operating profit declined $1.9 million due to lower sales volume and the unfavorable impact of currency rate changes, partially offset by cost reduction efforts. Film Products has index-based pass-through raw material cost agreements for the majority of its business. However, under certain agreements, changes in resin prices are not passed through for an average period of 90 days. The estimated favorable impact of the lag in the pass-through of changes in average resin costs was $2.9 million in the first quarter of 2009, compared to an unfavorable impact of $1.2 million in the first quarter of 2008. The Company estimates that changes in the U.S. dollar value of currencies for operations outside of the U.S. had an unfavorable impact on operating profit of $650,000 in the first quarter of 2009 compared with the first quarter of 2008.
We continue to be very focused on reducing costs. During the first quarter of 2009, we recognized severance and other employee-related costs of $1.1 million relating to a reduction in Film Products’ workforce (approximately 50 people) that is expected to save $1.4 million in the remainder of 2009 and $2.5 million on an annualized basis. During the first quarter of 2008, we recognized restructuring and asset impairment charges of $3.7 million, including charges relating to a reduction of the Film Products’ workforce (approximately 90 people) that is expected to save $4.2 million on an annualized basis.
Capital expenditures in Film Products were $4.1 million in the first quarter of 2009 compared with $3.2 million in the first quarter of last year, and are projected to be approximately $20 million in 2009. Depreciation expense was $7.9 million in the first quarter of 2009 compared with $8.8 million in the first quarter of last year, and is projected to be approximately $32 million in 2009.
The decreases in net sales and the reported loss from ongoing U.S. operations were primarily due to lower volume in the first quarter of 2009 compared with the first quarter of last year as order rates deteriorated during the current quarter. Extremely challenging market conditions led to shipment declines in all markets. Shipments for non-residential construction, which comprised approximately 72% of total volume in 2008, declined by approximately 32.6% during the first quarter of 2009 compared to the first quarter of 2008. The aluminum extrusions industry is in the third year of recession. We are very focused on controlling our variable costs and reducing fixed costs to minimize the adverse impact of the volume drop on
profits. Total full-time employees in Aluminum Extrusions were 1,128 at December 31, 2007, 972 at December 31, 2008 and 861 at March 31, 2009.
As described in Note 3 on page 7, we recognized a non-cash goodwill impairment charge of $30.6 million ($30.6 million after tax) in Aluminum Extrusions in the first quarter of 2009.
Capital expenditures for continuing operations in Aluminum Extrusions were $5.2 million in the first quarter of 2009 compared with $810,000 in the first quarter of last year. Capital expenditures are projected to be approximately $21 million in 2009, of which $16 million relates to the 18-month project to expand the capacity at the Carthage, Tennessee manufacturing facility. This new capacity will be dedicated to serving customers in the non-residential construction sector. Depreciation expense was $1.9 million in the first quarter of 2009 compared with $2.0 million in the first quarter of last year, and is projected to be approximately $8.1 million in 2009.
Other Items. Net pension income from continuing operations was $757,000 in the first quarter of 2009, an unfavorable change of $802,000 (one cent per share after tax) from amounts recognized in the first quarter 2008. We contributed approximately $122,000 to our pension plans in 2008 and expect to contribute $4.4 million in 2009. During 2008, the fair value of the assets of our pension plans declined by approximately $89.6 million to $194.5 million at December 31, 2008, due to the drop in global stock prices and benefit payments to retirees of $10.2 million.
Interest expense was $204,000 in the first quarter of 2009, a decrease from $881,000 in the first quarter of last year due to lower average debt levels as well as lower average interest rates.
The effective tax rates for the first quarter of 2009 and 2008 have been distorted versus the rates typically expected due to the $30.6 million ($30.6 million after tax) goodwill impairment relating to the aluminum extrusions business (see Note 3 on page 7), the recognition of a valuation allowance of $1.9 million in 2009 related to the expected limitations on the utilization of assumed capital losses on certain investments and the reversal of valuation allowances on capital loss carry-forwards of $534,000 in 2008. Excluding the goodwill impairment and the valuation allowance activity noted above, the decrease in the effective tax rate for continuing operations for the first quarter (42.3% in 2009 versus 44.7% in 2008) was mainly due to lower effective tax rates for operations outside the U.S, partially offset by higher state income taxes and lower income tax benefits expected for the Domestic Production Activities Deduction.
Our investment in Harbinger Capital Partners Special Situations Fund, L.P. (“Harbinger Fund”) had a reported capital account value of $10.0 million at March 31, 2009, compared with $10.1 million at December 31, 2008. This investment has a carrying value in Tredegar’s balance sheet of $10.0 million (included in “Other assets and deferred charges”), which represents the amount invested on April 2, 2007.
Net capitalization and other credit measures are provided in the liquidity and capital resources section beginning on page 22.
Critical Accounting Policies
In the ordinary course of business, we make a number of estimates and assumptions relating to the reporting of results of operations and financial position in the preparation of financial statements in conformity with generally accepted accounting principles. We believe the estimates, assumptions and judgments described in the section “Management’s Discussion and Analysis of Financial Condition and Results of Operations – Critical Accounting Policies” of our Annual Report on Form 10-K for the year ended December 31, 2008, have the greatest potential impact on our financial statements, so we consider these to be our critical accounting policies. These policies include our accounting for impairment of long-lived assets and goodwill, investment accounted for under the fair value method, pension benefits and income
19
taxes. These policies require management to exercise judgments that are often difficult, subjective and complex due to the necessity of estimating the effect of matters that are inherently uncertain. Actual results could differ significantly from those estimates under different assumptions and conditions. We believe the consistent application of these policies enables us to provide readers of our financial statements with useful and reliable information about our operating results and financial condition. Since December 31, 2008, there have been no changes in these policies that have had a material impact on results of operations or financial position. See Note 2 on page 6 for losses related to plant shutdowns, asset impairments, restructurings and other occurring during 2009 and the comparable period in 2008.
Recently Issued Accounting Standards
The Financial Accounting Standards Board (FASB) recently issued FASB Staff Position No. FAS 132(R)-1, Employees’ Disclosures about Postretirement Benefit Plan Assets (FSP No. FAS 132(R)-1). FSP No. FAS 132(R)-1 amends Statement of Financial Accounting Standards No. 132(R), Employers’ Disclosures about Pensions and Other Postretirement Benefits, an amendment of FASB Statements No. 87, 88 and 106, to include objectives for disclosing information about postretirement benefit plan assets, thereby addressing financial statement user concerns regarding the lack of transparency previously surrounding such disclosures. Disclosures are intended to provide users with an understanding of (1) how investment allocation decisions are made, including an understanding of investment policies and strategies, (2) major classes of plan assets, (3) the inputs and valuation techniques used to measure fair value of plan assets, (4) the effect of fair value measurements using significant unobservable inputs (Level 3) on changes in plan assets, and (5) significant concentrations of risk within plan assets. FSP No. FAS 132(R)-1 is effective for annual periods ending after December 15, 2009. We do not believe that the adoption of FSP No. FAS 132(R)-1 will have a material impact on our financial statements and related disclosures.
Results of Operations
First Quarter 2009 Compared with First Quarter 2008
Overall, sales in the first quarter of 2009 decreased by 33.0% compared with the first quarter of 2008. Net sales (sales less freight) decreased 20.8% in Film Products primarily due to a lower volume in all markets and the unfavorable impact of currency exchange rates. Net sales from ongoing operations decreased 50.5% in Aluminum Extrusions due to lower volume and lower average selling prices which were driven by lower average aluminum costs. Volumes in Aluminum Extrusions decreased 36.8% to 23.5 million pounds in the first quarter of 2009 compared with 37.1 million pounds in the first quarter of 2008. Shipments declined in all markets. For more information on net sales and volume, see the executive summary beginning on page 17.
Consolidated gross profit (sales minus cost of goods sold and freight) as a percentage of sales increased to 16.1% in the first quarter of 2009 from 12.7% in 2008. The gross profit margin increased in Film Products primarily due to the positive impact of the lag in the pass-through of lower average resin costs and cost reduction efforts. Gross profit margin in Aluminum Extrusions decreased as a result of volume declines noted above.
As a percentage of sales, selling, general and administrative and R&D expenses were 11.3% in the first quarter of 2009, up from 8.3% in the first quarter of last year. The increase is primarily due to the decline in sales noted above.
Plant shutdowns, asset impairments, restructurings and other in the first quarter of 2009 shown in the segment operating profit table on page 17 include:
20
| |
• | A pretax charge of $1.6 million for severance and other employee-related costs in connection with restructurings in Film Products ($1.1 million), Aluminum Extrusions ($369,000) and corporate headquarters ($178,000, included in “Corporate expenses, net” in the net sales and operating profit by segment table on page 17); |
| |
• | Pretax losses of $609,000 for timing differences between the recognition of realized losses on aluminum futures contracts and related revenues from the delayed fulfillment by customers of fixed-price forward purchase commitments (included in “Cost of goods sold” in the consolidated statements of income, see Note 10 on page 14 for additional detail); and |
| |
• | A pretax gain of $275,000 on the sale of equipment (included in “Other income (expense), net in the consolidated statements of income) from a previously shutdown films manufacturing facility in LaGrange, Georgia. |
See the executive summary beginning on page 17 for information on our cost reduction efforts. Gain on sale of assets and other special items are described in Note 2 on page 6.
Plant shutdowns, asset impairments, restructurings and other in the first quarter of 2008 shown in the segment operating profit table on page 17 include:
| |
• | A pretax charge of $2.3 million for severance and other employee-related costs in connection with restructurings in Films Products ($2.1 million) and Aluminum Extrusions ($235,000); and |
| |
• | A pretax charge of $1.6 million for asset impairment in Film Products. |
Interest income, which is included in “Other income (expense), net” in the consolidated statements of income, was $259,000 in the first quarter of 2009 and $258,000 in the first quarter of 2008. Interest expense was $204,000 in the first quarter of 2009, a decrease from $881,000 in the first quarter of last year due to reduced average debt levels and lower average interest rates. Average debt outstanding and interest rates were as follows:
| | | | | | | |
| | | | |
| | Three Months
Ended March 31 | |
| | | |
(In Millions) | | 2009 | | 2008 | |
| | | | | | |
Floating-rate debt with interest charged on a rollover basis at one-month LIBOR plus a credit spread: | | | | | | | |
Average outstanding debt balance | | $ | 16.2 | | $ | 69.5 | |
Average interest rate | | | 1.2 | % | | 4.6 | % |
Fixed-rate and other debt: | | | | | | | |
Average outstanding debt balance | | $ | 1.6 | | $ | 2.0 | |
Average interest rate | | | 2.1 | % | | 3.5 | % |
| | | | | | | | |
Total debt: | | | | | | | |
Average outstanding debt balance | | $ | 17.8 | | $ | 71.5 | |
Average interest rate | | | 1.3 | % | | 4.6 | % |
| | | | | | | | |
The effective tax rates for the first quarter of 2009 and 2008 have been distorted versus the rates typically expected due to the $30.6 million ($30.6 million after tax) goodwill impairment relating to the aluminum extrusions business (see Note 3), the recognition of a valuation allowance of $1.9 million in 2009 related to the expected limitations on the utilization of assumed capital losses on certain investments and the reversal of valuation allowances on capital loss carry-forwards of $534,000 in 2008. Excluding the goodwill impairment and the valuation allowance activity noted above, the decrease in the effective tax rate for continuing operations for the first quarter (42.3% in 2009 versus 44.7% in 2008) was mainly due to lower effective tax rates for operations outside the U.S, partially offset by higher state income taxes and lower income tax benefits expected for the Domestic Production Activities Deduction.
21
Liquidity and Capital Resources
Changes in operating assets and liabilities from December 31, 2008 to March 31, 2009 are summarized below:
| | |
• | Accounts receivable decreased $11.5 million (12.6%). |
| | |
| – | Accounts receivable in Film Products decreased by $6.0 million. Days sales outstanding (“DSO”) increased to 48 at March 31, 2009 compared with 45 at December 31, 2008, which is within the range experienced over the past twelve months. |
| | |
| – | Accounts receivable for continuing operations in Aluminum Extrusions decreased by $5.5 million. DSO was 47 at March 31, 2009 compared with 43 at December 31, 2008, primarily as a result of the rapid decline in net sales during the first quarter of 2009. In addition, we have seen some slowness in customer payments during the current quarter. |
| | |
• | Inventories declined $9.6 million (26.2%). |
| | |
| – | Inventories in Film Products decreased by approximately $3.6 million. Inventory days increased to 38 at March 31, 2009 compared with 36 days at December 31, 2008, which is within the range experienced over the past twelve months. |
| | |
| – | Inventories for Aluminum Extrusions decreased by approximately $6.0 million. Inventory days decreased to 28 at March 31, 2009 compared with 30 at December 31, 2008, primarily due to efforts to reduce inventory levels in light of current economic conditions and lower average aluminum costs. |
| | |
• | Net property, plant and equipment decreased $5.0 million (2.1%) due primarily to depreciation for continuing operations of $9.8 million compared with capital expenditures of $9.3 million, as well as the appreciation of the U.S. Dollar relative to foreign currencies (unfavorable impact of $4.5 million). |
| | |
• | Goodwill and other intangibles decreased by $31.1 million (23.0%) primarily due to the goodwill impairment charge of $30.6 million related to our aluminum extrusions business (see Note 3 on page 7). |
| | |
• | Accounts payable decreased by $10.9 million (19.8%). |
| | |
| – | Accounts payable in Film Products decreased by $383,000, or 1.4%. Accounts payable days were 29 at March 31, 2009 compared with 25 at December 31, 2008, which is within the range experienced over the last twelve months. |
| | |
| – | Accounts payable for continuing operations in Aluminum Extrusions decreased by $10.8 million, or 38.9%, due to lower sales volume and lower average aluminum costs. |
| | |
| – | Accounts payable increased at corporate by $232,000. |
| | |
• | Accrued expenses increased by $2.3 million (6.1%) primarily due to higher severance and payroll-related accruals. |
| | |
• | Long-term debt balances decreased by $13.1 million (57.9%) as we continue to use cash flows from operations to reduce borrowings under our revolving credit facility. |
| | |
• | Net deferred income tax liabilities in excess of assets increased by $1.4 million and income taxes recoverable decreased by $1.6 million due primarily to the movement between these line items in the balance sheet. |
Cash provided by operating activities was $33.3 million in the first quarter of 2009 compared with $6.2 million in 2008. The change is primarily related to normal volatility of working capital components and lower net income.
Cash used in investing activities was $10.6 million in the first quarter of 2009, compared with cash provided by investing activities of $19.8 million in the first quarter of 2008. The change between periods is primarily due to 2008 proceeds received from the sale of the aluminum extrusions business in Canada of $23.6 million.
22
Net cash flow used in financing activities was $14.4 million in the first quarter of 2009 and related to net repayments on our revolving credit facility with excess cash flow of $13.1 million and the payment of regular quarterly dividends of $1.4 million (4 cents per share).
Further information on cash flows for the quarters ended March 31, 2009 and 2008 are provided in the consolidated statements of cash flows on page 4.
Net capitalization and indebtedness as defined under our revolving credit agreement as of March 31, 2009 are as follows:
| | | | |
| | | | | |
Net Capitalization and Indebtedness as of March 31, 2009
(In Thousands) |
| | | | | |
Net capitalization: | | | | |
Cash and cash equivalents | | $ | 53,281 | |
Debt: | | | | |
$300 million revolving credit agreement maturing December 15, 2010 | | | 8,000 | |
Other debt | | | 1,567 | |
| | | | |
Total debt | | | 9,567 | |
| | | | |
Cash and cash equivalents net of debt | | | (43,714 | ) |
Shareholders’ equity | | | 387,611 | |
| | | | |
Net capitalization | | $ | 343,897 | |
| | | | |
Indebtedness as defined in revolving credit agreement: | | | | |
Total debt | | $ | 9,567 | |
Face value of letters of credit | | | 6,113 | |
Liabilities relating to derivative financial instruments, net of cash deposits | | | 7,193 | |
| | | | |
Indebtedness | | $ | 22,873 | |
| | | | | |
Under the revolving credit agreement, borrowings are permitted up to $300 million, and $235.2 million was available to borrow at March 31, 2009. The credit spread and commitment fees charged on the unused amount under the revolving credit agreement at various indebtedness-to-adjusted EBITDA levels are as follows:
| | | | | | | |
| | | | | | | | |
Pricing Under Revolving Credit Agreement (Basis Points) |
| | | | | | | | |
Indebtedness-to-Adjusted
EBITDA Ratio | | | Credit Spread
Over LIBOR | | | Commitment
Fee | |
| | | | | | | | |
> 2.50x but <= 3x | | | 125 | | | 25 | |
> 1.75x but <= 2.50x | | | 100 | | | 20 | |
> 1x but <=1.75x | | | 87.5 | | | 17.5 | |
<= 1x | | | 75 | | | 15 | |
| | | | | | | | |
At March 31, 2009, the interest rate on debt under the revolving credit agreement was priced at one-month LIBOR plus the applicable credit spread of 75 basis points.
The computations of adjusted EBITDA, adjusted EBIT, the leverage ratio and interest coverage ratio as defined in the revolving credit agreement are presented below along with the related most restrictive covenants. Adjusted EBITDA and adjusted EBIT as defined in the revolving credit agreement are not intended to represent cash flow from operations as defined by GAAP and should not be considered as either an alternative to net income or to cash flow.
23
| | | | |
| | | | |
| | | | | |
Computations of Adjusted EBITDA, Adjusted EBIT, Leverage Ratio and
Interest Coverage Ratio as Defined in Revolving Credit Agreement Along with Related Most
Restrictive Covenants
As of and for the Twelve Months Ended March 31, 2009 (In Thousands) |
| | | | | |
Computations of adjusted EBITDA and adjusted EBIT as defined in revolving credit agreement for the twelve months ended March 31, 2009: | | | | |
Net loss | | $ | (2,943 | ) |
Plus: | | | | |
After-tax losses related to discontinued operations | | | — | |
Total income tax expense for continuing operations | | | 21,953 | |
Interest expense | | | 1,716 | |
Charges related to stock option grants and awards accounted for under the fair value-based method | | | 984 | |
Losses related to the application of the equity method of accounting | | | — | |
Depreciation and amortization expense for continuing operations | | | 41,682 | |
All non-cash losses and expenses, plus cash losses and expenses not to exceed $10,000, for continuing operations that are classified as unusual, extraordinary or which are related to plant shutdowns, asset impairments and/or restructurings (cash-related of $2,180) | | | 40,973 | |
Minus: | | | | |
After-tax income related to discontinued operations | | | — | |
Total income tax benefits for continuing operations | | | — | |
Interest income | | | (1,006 | ) |
All non-cash gains and income, plus cash gains and income not to exceed $10,000, for continuing operations that are classified as unusual, extraordinary or which are related to plant shutdowns, asset impairments and/or restructurings (cash-related of $3,912) | | | (9,512 | ) |
Plus or minus, as applicable, pro forma EBITDA adjustments associated with acquisitions and asset dispositions | | | — | |
| | | | |
Adjusted EBITDA as defined in revolving credit agreement | | | 93,847 | |
Less: Depreciation and amortization expense for continuing operations (including pro forma for acquisitions and asset dispositions) | | | (41,682 | ) |
| | | | |
Adjusted EBIT as defined in revolving credit agreement | | $ | 52,165 | |
| | | | |
Shareholders’ equity at March 31, 2009 as defined in revolving credit agreement | | $ | 453,153 | |
Computations of leverage and interest coverage ratios as defined in revolving credit agreement: | | | | |
Leverage ratio (indebtedness-to-adjusted EBITDA) | | | .24x | |
Interest coverage ratio (adjusted EBIT-to-interest expense) | | | 30.40x | |
Most restrictive covenants as defined in revolving credit agreement: | | | | |
Maximum permitted aggregate amount of dividends that can be paid by Tredegar during the term of the revolving credit agreement ($100,000 plus 50% of net income generated after October 1, 2005) | | $ | 141,638 | |
Minimum adjusted shareholders’ equity permitted ($315,000 plus 50% of net income generated, to the extent positive, after July 1, 2007) | | $ | 336,147 | |
Maximum leverage ratio permitted: | | | | |
Ongoing | | | 2.75x | |
Pro forma for acquisitions | | | 2.50x | |
Minimum interest coverage ratio permitted | | | 2.50x | |
| | | | | |
24
Noncompliance with any one or more of the debt covenants may have a material adverse effect on financial condition or liquidity in the event such noncompliance cannot be cured or should we be unable to obtain a waiver from the lenders. Renegotiation of the covenant(s) through an amendment to the credit agreement may effectively cure the noncompliance, but may have an effect on financial condition or liquidity depending upon how the covenant is renegotiated.
We believe that the borrowing availability under our revolving credit agreement, our current cash balances and our cash flow from operations will be sufficient to satisfy our working capital, capital expenditure and dividend requirements for the foreseeable future.
Item 3. Quantitative and Qualitative Disclosures About Market Risk.
Tredegar has exposure to the volatility of interest rates, polyethylene and polypropylene resin prices, aluminum ingot and scrap prices, energy prices, foreign currencies and emerging markets. See the liquidity and capital resources section beginning on page 22 regarding credit agreements and interest rate exposures.
Changes in resin prices, and the timing of those changes, could have a significant impact on profit margins in Film Products. Profit margins in Aluminum Extrusions are sensitive to fluctuations in aluminum ingot and scrap prices as well as natural gas prices (natural gas is the principal energy source used to operate our casting furnaces). There is no assurance of our ability to pass through higher raw material and energy costs to our customers.
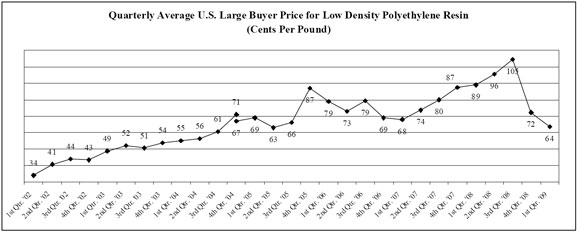
See the executive summary beginning on page 17 for discussion regarding the impact of the lag in the pass-through of resin price changes. The volatility of average quarterly prices of low density polyethylene resin in the U.S. (a primary raw material for Film Products) is shown in the chart below.
Source: Quarterly averages computed by Tredegar using monthly data provided by Chemical Data Inc. (“CDI”). In January 2005, CDI reflected a 4 cents per pound non-market adjustment based on their estimate of the growth of discounts over the 2000 to 2003 period. The 4th quarter 2004 average rate of 67 cents per pound is shown on a pro forma basis as if the non-market adjustment was made in October 2004.
Resin prices in Europe, Asia and South America have exhibited similar trends. The price of resin is driven by several factors including supply and demand and the price of oil, ethylene and natural gas. To address fluctuating resin prices, Film Products has index-based pass-through raw material cost agreements for the majority of its business. However, under certain agreements, changes in resin prices are not passed through for an average period of 90 days.
25
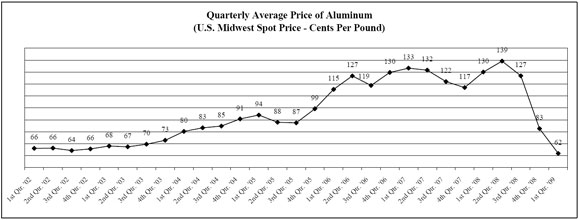
In the normal course of business, we enter into fixed-price forward sales contracts with certain customers for the sale of fixed quantities of aluminum extrusions at scheduled intervals. In order to hedge our exposure to aluminum price volatility (see the chart below) under these fixed-price arrangements, which generally have a duration of not more than 12 months, we enter into a combination of forward purchase commitments and futures contracts to acquire or hedge aluminum, based on the scheduled deliveries. See Note 8 on page 10 for additional information.
Source: Quarterly averages computed by Tredegar using daily closing data provided by Bloomberg.
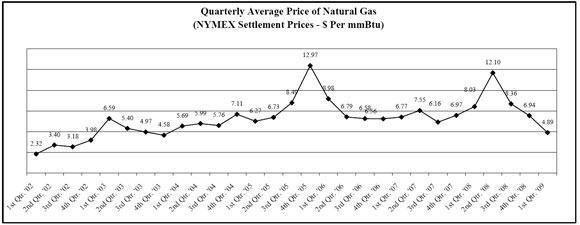
In Aluminum Extrusions, we hedge from time-to-time a portion of our exposure to natural gas price volatility by entering into fixed-price forward purchase contracts with our natural gas suppliers. We estimate that, in an unhedged situation, every $1 per mmBtu per month change in the market price of natural gas has an $85,000 impact on the continuing monthly operating profit for our U.S. operations in Aluminum Extrusions. In September 2005, we announced an energy surcharge for our aluminum extrusions business in the U.S. to be applied when the NYMEX natural gas price is in excess of $8.85 per mmBtu.
Source: Quarterly averages computed by Tredegar using monthly NYMEX settlement prices.
26
We sell to customers in foreign markets through our foreign operations and through exports from U.S. plants. The percentage of sales and total assets for continuing manufacturing operations related to foreign markets for the first quarters of 2009 and 2008 are as follows:
| | | | | | | | | | | | | |
| | | | | | | | | | | | | | |
Percentage of Net Sales from Continuing Manufacturing
Operations Related to Foreign Markets* |
| | | | | | | | | | | | | | |
| | Three Months Ended March 31 | |
| | | |
| | 2009 | | 2008 | |
| | | | | |
| | Exports
From U.S. | | Foreign
Operations | | Exports
From U.S. | | Foreign
Operations | |
| | | | | | | | | |
Canada | | | 7 | % | | — | % | | 5 | % | | — | % |
Europe | | | 1 | | | 18 | | | 1 | | | 18 | |
Latin America | | | — | | | 3 | | | — | | | 3 | |
Asia | | | 4 | | | 6 | | | 2 | | | 7 | |
| | | | | | | | | | | | | | |
Total | | | 12 | % | | 27 | % | | 8 | % | | 28 | % |
| | | | | | | | | | | | | | |
|
* Based on consolidated net sales from continuing manufacturing operations (excludes AFBS). |
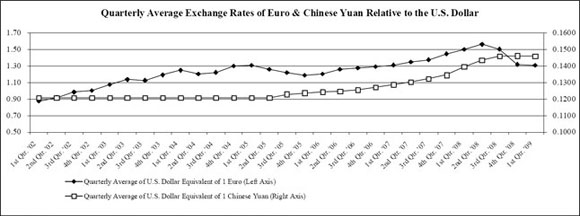
We attempt to match the pricing and cost of our products in the same currency and generally view the volatility of foreign currencies (see trends for the Euro and Chinese Yuan in the chart below) and emerging markets, and the corresponding impact on earnings and cash flow, as part of the overall risk of operating in a global environment. Exports from the U.S. are generally denominated in U.S. Dollars. Our foreign currency exposure on income from continuing foreign operations relates to the Euro, the Chinese Yuan, the Hungarian Forint and the Brazilian Real.
In Film Products, where we are typically able to match the currency of our sales and costs, we estimate that the change in value of foreign currencies relative to the U.S. Dollar had a negative impact on operating profit of approximately $650,000 in the first quarter of 2009 compared with the first quarter of 2008.
Trends for the Euro and Chinese Yuan are shown in the chart below:
Source: Quarterly averages computed by Tredegar using daily closing data provided by Bloomberg.
27
Item 4. Controls and Procedures.
Pursuant to Rule 13a-15(b) under the Securities Exchange Act of 1934, we carried out an evaluation, with the participation of our management, including our principal executive officer and principal financial officer, of the effectiveness of our disclosure controls and procedures (as defined under Rule 13a-15(e) under the Securities Exchange Act of 1934) as of the end of the period covered by this report. Based upon that evaluation, our principal executive officer and principal financial officer concluded that our disclosure controls and procedures are effective to ensure that information required to be disclosed by us in the reports that we file or submit under the Exchange Act, is recorded, processed, summarized and reported, within the time periods specified in the SEC’s rules and forms, and that such information is accumulated and communicated to our management, including our principal executive officer and principal financial officer, as appropriate, to allow timely decisions regarding required disclosure.
There has been no change in our internal control over financial reporting during the quarter ended March 31, 2009, that has materially affected, or is reasonably likely to materially affect, our internal control over financial reporting.
PART II - OTHER INFORMATION
Item 1A. Risk Factors.
There are a number of risks and uncertainties that can have a material effect on the operating results of our businesses and our financial condition. These risk factors have not changed materially since the filing of our Annual Report on Form 10-K for the year ended December 31, 2008.
Item 6. Exhibits.
| |
Exhibit Nos. |
|
31.1 | Certification of John D. Gottwald, President and Chief Executive Officer of Tredegar Corporation, pursuant to Rules 13a-14(a) and 15d-14(a) promulgated under the Securities Exchange Act of 1934, as adopted pursuant to Section 302 of the Sarbanes-Oxley Act of 2002. |
| |
31.2 | Certification of D. Andrew Edwards, Vice President, Chief Financial Officer and Treasurer (Principal Financial Officer) of Tredegar Corporation, pursuant to Rules 13a-14(a) and 15d-14(a) promulgated under the Securities Exchange Act of 1934, as adopted pursuant to Section 302 of the Sarbanes-Oxley Act of 2002. |
| |
32.1 | Certification of John D. Gottwald, President and Chief Executive Officer of Tredegar Corporation, pursuant to 18 U.S.C. Section 1350, as adopted pursuant to Section 906 of the Sarbanes-Oxley Act of 2002. |
| |
32.2 | Certification of D. Andrew Edwards, Vice President, Chief Financial Officer and Treasurer (Principal Financial Officer) of Tredegar Corporation, pursuant to 18 U.S.C. Section 1350, as adopted pursuant to Section 906 of the Sarbanes-Oxley Act of 2002. |
28
SIGNATURES
Pursuant to the requirements of the Securities Exchange Act of 1934, the Registrant has duly caused this report to be signed on its behalf by the undersigned thereunto duly authorized.
| | | | |
| | | Tredegar Corporation | |
| | | (Registrant) | |
| | | | |
Date: | May 7, 2009 | | /s/ D. Andrew Edwards | |
| | | | |
| | | D. Andrew Edwards | |
| | | Vice President, Chief Financial Officer and Treasurer | |
| | | (Principal Financial and Accounting Officer) | |
29