| FREE WRITING PROSPECTUS | ||
| FILED PURSUANT TO RULE 433 | ||
| REGISTRATION FILE NO.: 333-206677-23 | ||
 |  |
Free Writing Prospectus
Structural and Collateral Term Sheet
$722,448,985
(Approximate Initial Pool Balance)
$629,633,000
(Approximate Aggregate Certificate Balance of Offered Certificates)
Wells Fargo Commercial Mortgage Trust 2018-C43
as Issuing Entity
Wells Fargo Commercial Mortgage Securities, Inc.
as Depositor
Barclays Bank PLC
Wells Fargo Bank, National Association
BSPRT Finance, LLC
C-III Commercial Mortgage LLC
Rialto Mortgage Finance, LLC
as Sponsors and Mortgage Loan Sellers
Commercial Mortgage Pass-Through Certificates
Series 2018-C43
March 5, 2018
WELLS FARGO SECURITIES Co-Lead Manager and Joint Bookrunner | BARCLAYS Co-Lead Manager and Joint Bookrunner | |
Academy Securities Co-Manager |
STATEMENT REGARDING THIS FREE WRITING PROSPECTUS
The depositor has filed a registration statement (including a prospectus) with the Securities and Exchange Commission (‘‘SEC’’) (SEC File No. 333-206677) for the offering to which this communication relates. Before you invest, you should read the prospectus in the registration statement and other documents the depositor has filed with the SEC for more complete information about the depositor, the issuing entity and this offering. You may get these documents for free by visiting EDGAR on the SEC Web site at www.sec.gov. Alternatively, the depositor, any underwriter, or any dealer participating in the offering will arrange to send you the prospectus after filing if you request it by calling toll free 1-800-745-2063 (8 a.m. – 5 p.m. EST) or by emailing wfs.cmbs@wellsfargo.com.
Nothing in this document constitutes an offer of securities for sale in any jurisdiction where the offer or sale is not permitted. The information contained herein is preliminary as of the date hereof, supersedes any such information previously delivered to you and will be superseded by any such information subsequently delivered and ultimately by the final prospectus relating to the securities. These materials are subject to change, completion, supplement or amendment from time to time.
This free writing prospectus has been prepared by the underwriters for information purposes only and does not constitute, in whole or in part, a prospectus for the purposes of Directive 2003/71/EC (as amended) and/or Part VI of the Financial Services and Markets Act 2000, as amended, or other offering document.
STATEMENT REGARDING ASSUMPTIONS AS TO SECURITIES, PRICING ESTIMATES AND OTHER INFORMATION
The attached information contains certain tables and other statistical analyses (the “Computational Materials”) which have been prepared in reliance upon information furnished by the Mortgage Loan Sellers. Numerous assumptions were used in preparing the Computational Materials, which may or may not be reflected herein. As such, no assurance can be given as to the Computational Materials’ accuracy, appropriateness or completeness in any particular context; or as to whether the Computational Materials and/or the assumptions upon which they are based reflect present market conditions or future market performance. The Computational Materials should not be construed as either projections or predictions or as legal, tax, financial or accounting advice. You should consult your own counsel, accountant and other advisors as to the legal, tax, business, financial and related aspects of a purchase of these securities. Any weighted average lives, yields and principal payment periods shown in the Computational Materials are based on prepayment and/or loss assumptions, and changes in such prepayment and/or loss assumptions may dramatically affect such weighted average lives, yields and principal payment periods. In addition, it is possible that prepayments or losses on the underlying assets will occur at rates higher or lower than the rates shown in the attached Computational Materials. The specific characteristics of the securities may differ from those shown in the Computational Materials due to differences between the final underlying assets and the preliminary underlying assets used in preparing the Computational Materials. The principal amount and designation of any security described in the Computational Materials are subject to change prior to issuance. None of Wells Fargo Securities, LLC, Barclays Capital Inc., Academy Securities, Inc., or any of their respective affiliates, make any representation or warranty as to the actual rate or timing of payments or losses on any of the underlying assets or the payments or yield on the securities. The information in this presentation is based upon management forecasts and reflects prevailing conditions and management’s views as of this date, all of which are subject to change. In preparing this presentation, we have relied upon and assumed, without independent verification, the accuracy and completeness of all information available from public sources or which was provided to us by or on behalf of the Mortgage Loan Sellers or which was otherwise reviewed by us.
This free writing prospectus contains certain forward-looking statements. If and when included in this free writing prospectus, the words “expects”, “intends”, “anticipates”, “estimates” and analogous expressions and all statements that are not historical facts, including statements about our beliefs or expectations, are intended to identify forward-looking statements. Any forward-looking statements are made subject to risks and uncertainties which could cause actual results to differ materially from those stated. Those risks and uncertainties include, among other things, declines in general economic and business conditions, increased competition, changes in demographics, changes in political and social conditions, regulatory initiatives and changes in customer preferences, many of which are beyond our control and the control of any other person or entity related to this offering. The forward-looking statements made in this free writing prospectus are made as of the date stated on the cover. We have no obligation to update or revise any forward-looking statement.
Wells Fargo Securities is the trade name for the capital markets and investment banking services of Wells Fargo & Company and its subsidiaries, including but not limited to Wells Fargo Securities, LLC, a member of NYSE, FINRA, NFA and SIPC, Wells Fargo Prime Services, LLC, a member of FINRA, NFA and SIPC, and Wells Fargo Bank, N.A. Wells Fargo Securities, LLC and Wells Fargo Prime Services, LLC are distinct entities from affiliated banks and thrifts.
IMPORTANT NOTICE REGARDING THE OFFERED CERTIFICATES
The information herein is preliminary and may be supplemented or amended prior to the time of sale. In addition, the Offered Certificates referred to in these materials and the asset pool backing them are subject to modification or revision (including the possibility that one or more classes of certificates may be split, combined or eliminated at any time prior to issuance or availability of a final prospectus) and are offered on a “when, as and if issued” basis.
The underwriters described in these materials may from time to time perform investment banking services for, or solicit investment banking business from, any company named in these materials. The underwriters and/or their affiliates or respective employees may from time to time have a long or short position in any security or contract discussed in these materials.
The information contained herein supersedes any previous such information delivered to any prospective investor and will be superseded by information delivered to such prospective investor prior to the time of sale.
IMPORTANT NOTICE RELATING TO AUTOMATICALLY-GENERATED EMAIL DISCLAIMERS
Any legends, disclaimers or other notices that may appear at the bottom of any email communication to which this free writing prospectus is attached relating to (1) these materials not constituting an offer (or a solicitation of an offer), (2) any representation that these materials are accurate or complete and may not be updated or (3) these materials possibly being confidential, are not applicable to these materials and should be disregarded. Such legends, disclaimers or other notices have been automatically generated as a result of these materials having been sent via Bloomberg or another system.
THE INFORMATION IN THIS STRUCTURAL AND COLLATERAL TERM SHEET IS NOT COMPLETE AND MAY BE AMENDED PRIOR TO THE TIME OF SALE. THIS TERM SHEET IS NOT AN OFFER TO SELL THESE SECURITIES AND IT IS NOT A SOLICITATION OF AN OFFER TO BUY THESE SECURITIES IN ANY JURISDICTION WHERE THE OFFER OR SALE IS NOT PERMITTED.
2
| Wells Fargo Commercial Mortgage Trust 2018-C43 | Certificate Structure |
I. Certificate Structure
| Class | Expected Ratings (DBRS/Fitch/Moody’s)(1) | Approximate Initial Certificate Balance or Notional Amount(2) | Approx. Initial Credit Support(3) | Pass-Through Rate Description | Weighted Average Life (Years)(4) | Expected Principal Window(4) | Certificate Principal to Value Ratio(5) | Certificate Principal U/W NOI Debt Yield(6) | ||||||||
| Offered Certificates | ||||||||||||||||
| A-1 | AAA(sf)/AAAsf/Aaa(sf) | $22,182,000 | 30.000% | (7) | 2.78 | 04/18 – 01/23 | 42.6% | 15.9% | ||||||||
| A-2 | AAA(sf)/AAAsf/Aaa(sf) | $7,539,000 | 30.000% | (7) | 4.86 | 01/23 – 02/23 | 42.6% | 15.9% | ||||||||
| A-SB | AAA(sf)/AAAsf/Aaa(sf) | $40,193,000 | 30.000% | (7) | 7.21 | 02/23 – 08/27 | 42.6% | 15.9% | ||||||||
| A-3 | AAA(sf)/AAAsf/Aaa(sf) | $200,000,000 | 30.000% | (7) | 9.75 | 08/27 – 01/28 | 42.6% | 15.9% | ||||||||
| A-4 | AAA(sf)/AAAsf/Aaa(sf) | $223,916,000 | 30.000% | (7) | 9.88 | 01/28 – 02/28 | 42.6% | 15.9% | ||||||||
| X-A | AAA(sf)/AAAsf/Aaa(sf) | $493,830,000(8) | N/A | Variable(9) | N/A | N/A | N/A | N/A | ||||||||
| X-B | A(sf)/A-sf/NR | $135,803,000(10) | N/A | Variable(11) | N/A | N/A | N/A | N/A | ||||||||
| A-S | AAA(sf)/AAAsf/Aa3(sf) | $73,192,000 | 19.625% | (7) | 9.92 | 02/28 – 03/28 | 48.9% | 13.9% | ||||||||
| B | AA(sf)/AA-sf/NR | $32,628,000 | 15.000% | (7) | 9.97 | 03/28 – 03/28 | 51.7% | 13.1% | ||||||||
| C | A(low)(sf)/A-sf/NR | $29,983,000 | 10.750% | (7) | 9.97 | 03/28 – 03/28 | 54.3% | 12.5% | ||||||||
| Non-Offered Certificates | ||||||||||||||||
| X-D | BBB(sf)/BBB-sf/NR | $26,455,000(12) | N/A | Variable(13) | N/A | N/A | N/A | N/A | ||||||||
| D | BBB(low)(sf)/BBB-sf/NR | $26,455,000 | 7.000% | (7) | 9.97 | 03/28 – 03/28 | 56.6% | 12.0% | ||||||||
| E | BB(low)(sf)/BB-sf/NR | $18,519,000 | 4.375% | (7) | 9.97 | 03/28 – 03/28 | 58.2% | 11.6% | ||||||||
| F | B(low)(sf)/B-sf/NR | $8,818,000 | 3.125% | (7) | 9.97 | 03/28 – 03/28 | 59.0% | 11.5% | ||||||||
| G | NR/NR/NR | $22,046,433 | 0.000% | (7) | 9.97 | 03/28 – 03/28 | 60.9% | 11.1% | ||||||||
| Non-Offered Eligible Vertical Interest | ||||||||||||||||
| Vertical RR Interest | NR/NR/NR | $16,977,551.15 | N/A | WAC(14) | 9.43 | 04/18 – 03/28 | N/A | N/A | ||||||||
Notes:
| (1) | The expected ratings presented are those of DBRS, Inc. (“DBRS”), Fitch Ratings, Inc. (“Fitch”) and Moody’s Investors Service, Inc. (“Moody’s”), which the depositor hired to rate the Offered Certificates. One or more other nationally recognized statistical rating organizations that were not hired by the depositor may use information they receive pursuant to Rule 17g-5 under the Securities Exchange Act of 1934, as amended (the “Exchange Act”) or otherwise, to rate or provide market reports and/or published commentary related to the Offered Certificates. We cannot assure you as to what ratings a non-hired nationally recognized statistical rating organization would assign or that its reports will not express differing, possibly negative, views of the mortgage loans and/or the Offered Certificates. The ratings of each class of Offered Certificates address the likelihood of the timely distribution of interest and, except in the case of the Class X-A and X-B Certificates, the ultimate distribution of principal due on those classes on or before the Rated Final Distribution Date. See “Risk Factors—Other Risks Relating to the Certificates—Nationally Recognized Statistical Rating Organizations May Assign Different Ratings to the Certificates; Ratings of the Certificates Reflect Only the Views of the Applicable Rating Agencies as of the Dates Such Ratings Were Issued; Ratings May Affect ERISA Eligibility; Ratings May Be Downgraded” and “Ratings” in the Preliminary Prospectus, expected to be dated March 6, 2018 (the “Preliminary Prospectus”). DBRS, Fitch and Moody’s have informed us that the “sf” designation in their ratings represents an identifier for structured finance product ratings. |
| (2) | The certificate balances and notional amounts set forth in the table are approximate. The actual initial certificate balances and notional amounts may be larger or smaller in connection with any variation in the certificate balance of the Vertical RR Interest and/or the Horizontal Risk Retention Certificates (as defined in the Preliminary Prospectus) following the calculation of the actual fair value of all of the ABS interests (as such term is defined in Regulation RR) issued by the issuing entity, as described under “Credit Risk Retention” in the Preliminary Prospectus. The actual initial certificate balances and notional amounts also depend on the initial pool balance of the mortgage loans definitively included in the pool of mortgage loans, which aggregate cut-off date balance may be as much as 5% larger or smaller than the amount presented in the Preliminary Prospectus. |
| (3) | The approximate initial credit support with respect to the Class A-1, A-2, A-SB, A-3 and A-4 Certificates represents the approximate credit enhancement for the Class A-1, A-2, A-SB, A-3 and A-4 Certificates in the aggregate. The Vertical RR Interest only provides credit support to the limited extent that losses incurred on the underlying mortgage loans are allocated to it, on the one hand, and to the Offered Certificates and the Non-Offered Certificates, on the other hand,pro rata, in accordance with their respective Percentage Allocation Entitlements. |
| (4) | Weighted Average Lives and Expected Principal Windows are calculated based on an assumed prepayment rate of 0% CPR and the “Structuring Assumptions” described under “Yield and Maturity Considerations—Weighted Average Life” in the Preliminary Prospectus. |
| (5) | The Certificate Principal to Value Ratio for each Class of Certificates (other than the Class A-1, A-2, A-SB, A-3 and A-4 Certificates) is calculated as the product of (a) the weighted average Cut-off Date LTV Ratio for the mortgage loans and (b) a fraction, the numerator of which is the total initial Certificate Balance of such Class of Certificates and all Classes of Principal Balance Certificates (as defined in the Preliminary Prospectus) senior to such Class of Certificates and the denominator of which is the total initial Certificate Balance of all of the Principal Balance Certificates (other than the Vertical RR Interest). The Certificate Principal to Value Ratio for each of the Class A-1, A-2, A-SB, A-3 and A-4 Certificates is calculated in the aggregate for those Classes as if they were a single Class and is calculated as the product of (a) the weighted average Cut-off Date LTV Ratio for the mortgage loans and (b) a fraction, the numerator of which is the total initial aggregate Certificate Balances of such Classes of Certificates and the denominator of which is the total initial Certificate Balance of all of the Principal Balance Certificates (other than the Vertical RR Interest). In any event, however, excess mortgaged property value associated with a mortgage loan will not be available to offset losses on any other mortgage loan. |
| (6) | The Certificate Principal U/W NOI Debt Yield for each Class of Certificates (other than the Class A-1, A-2, A-SB, A-3 and A-4 Certificates) is calculated as the product of (a) the weighted average U/W NOI Debt Yield for the mortgage loans and (b) a fraction, the numerator of which is the total initial Certificate Balance of all of the Classes of Principal Balance Certificates (other than the Vertical RR Interest) and the denominator of which is the total initial Certificate Balance for such Class of Certificates and all Classes of Principal Balance Certificates senior to such Class of Certificates. The Certificate Principal U/W NOI Debt Yield for each of the Class A-1, A-2, A-SB, A-3 and A-4 Certificates is calculated in the aggregate for those Classes as if they were a single Class and is calculated as the product of (a) the weighted average U/W NOI Debt Yield for the mortgage loans and (b) a fraction, the numerator of which is the total initial Certificate Balance of all of the Classes of Principal Balance Certificates (other than the Vertical RR Interest) and the denominator of which is the total aggregate initial Certificate Balances for the Class A-1, A-2, A-SB, A-3 and A-4 Certificates. In any event, however, cash flow from each mortgaged property supports only the related mortgage loan and will not be available to support any other mortgage loan. |
THE INFORMATION IN THIS STRUCTURAL AND COLLATERAL TERM SHEET IS NOT COMPLETE AND MAY BE AMENDED PRIOR TO THE TIME OF SALE. THIS TERM SHEET IS NOT AN OFFER TO SELL THESE SECURITIES AND IT IS NOT A SOLICITATION OF AN OFFER TO BUY THESE SECURITIES IN ANY JURISDICTION WHERE THE OFFER OR SALE IS NOT PERMITTED.
3
| Wells Fargo Commercial Mortgage Trust 2018-C43 | Certificate Structure |
| (7) | The pass-through rates for the Class A-1, A-2, A-SB, A-3, A-4, A-S, B, C, D, E, F and G Certificates in each case will be one of the following: (i) a fixed rateper annum, (ii) a variable rate per annum equal to the weighted average of the net mortgage interest rates on the mortgage loans for the related distribution date, (iii) a variable rateper annum equal to the lesser of (a) a fixed rate and (b) the weighted average of the net mortgage interest rates on the mortgage loans for the related distribution date or (iv) a variable rateper annum equal to the weighted average of the net mortgage interest rates on the mortgage loans for the related distribution date minus a specified percentage. For purposes of the calculation of the weighted average of the net mortgage interest rates on the mortgage loans for each distribution date, the mortgage interest rates will be adjusted as necessary to a 30/360 basis. |
| (8) | The Class X-A Certificates are notional amount certificates. The Notional Amount of the Class X-A Certificates will be equal to the aggregate Certificate Balance of the Class A-1, A-2, A-SB, A-3 and A-4 Certificates outstanding from time to time. The Class X-A Certificates will not be entitled to distributions of principal. |
| (9) | The pass-through rate for the Class X-A Certificates for any distribution date will be aper annum rate equal to the excess, if any, of (a) the weighted average of the net mortgage interest rates on the mortgage loans for the related distribution date, over (b) the weighted average of the pass-through rates on the Class A-1, A-2, A-SB, A-3 and A-4 Certificates for the related distribution date, weighted on the basis of their respective Certificate Balances outstanding immediately prior to that distribution date. For purposes of the calculation of the weighted average of the net mortgage interest rates on the mortgage loans for each distribution date, the mortgage interest rates will be adjusted as necessary to a 30/360 basis. |
| (10) | The Class X-B Certificates are notional amount certificates. The Notional Amount of the Class X-B Certificates will be equal to the aggregate Certificate Balance of the Class A-S, B and C Certificates outstanding from time to time. The Class X-B Certificates will not be entitled to distributions of principal. |
| (11) | The pass-through rate for the Class X-B Certificates for any distribution date will be aper annum rate equal to the excess, if any, of (a) the weighted average of the net mortgage interest rates on the mortgage loans for the related distribution date, over (b) the weighted average of the pass-through rates on the Class A-S, B and C Certificates for the related distribution date, weighted on the basis of their respective Certificate Balances outstanding immediately prior to that distribution date. For purposes of the calculation of the weighted average of the net mortgage interest rates on the mortgage loans for each distribution date, the mortgage interest rates will be adjusted as necessary to a 30/360 basis. |
| (12) | The Class X-D Certificates are notional amount certificates. The Notional Amount of the Class X-D Certificates will be equal to the Certificate Balance of the Class D Certificates outstanding from time to time. The Class X-D Certificates will not be entitled to distributions of principal. |
| (13) | The pass-through rate for the Class X-D Certificates for any distribution date will be aper annum rate equal to the excess, if any, of (a) the weighted average of the net mortgage interest rates on the mortgage loans for the related distribution date, over (b) the pass-through rate on the Class D Certificates for the related distribution date. For purposes of the calculation of the weighted average of the net mortgage interest rates on the mortgage loans for each distribution date, the mortgage interest rates will be adjusted as necessary to a 30/360 basis. |
| (14) | The effective interest rate for the Vertical RR Interest will be the weighted average of the net mortgage interest rates on the mortgage loans for the related distribution date, adjusted as necessary to a 30/360 basis. |
THE INFORMATION IN THIS STRUCTURAL AND COLLATERAL TERM SHEET IS NOT COMPLETE AND MAY BE AMENDED PRIOR TO THE TIME OF SALE. THIS TERM SHEET IS NOT AN OFFER TO SELL THESE SECURITIES AND IT IS NOT A SOLICITATION OF AN OFFER TO BUY THESE SECURITIES IN ANY JURISDICTION WHERE THE OFFER OR SALE IS NOT PERMITTED.
4
| Wells Fargo Commercial Mortgage Trust 2018-C43 | Transaction Highlights |
II. Transaction Highlights
Mortgage Loan Sellers:
| Mortgage Loan Seller | Number of Mortgage Loans | Number of Mortgaged Properties | Aggregate Cut-off Date Balance | % of Initial Pool Balance | ||||
| Barclays Bank PLC | 11 | 55 | $263,101,121 | 36.4% | ||||
| Wells Fargo Bank, National Association | 17 | 20 | 226,917,078 | 31.4 | ||||
| BSPRT Finance, LLC | 6 | 14 | 79,333,178 | 11.0 | ||||
| C-III Commercial Mortgage LLC | 22 | 30 | 79,065,982 | 10.9 | ||||
| Rialto Mortgage Finance, LLC | 7 | 13 | 74,031,625 | 10.2 | ||||
Total | 63 | 132 | $722,448,985 | 100.0% |
Loan Pool:
| Initial Pool Balance: | $722,448,985 |
| Number of Mortgage Loans: | 63 |
| Average Cut-off Date Balance per Mortgage Loan: | $11,467,444 |
| Number of Mortgaged Properties: | 132 |
| Average Cut-off Date Balance per Mortgaged Property(1): | $5,473,098 |
| Weighted Average Mortgage Interest Rate: | 4.649% |
| Ten Largest Mortgage Loans as % of Initial Pool Balance: | 49.4% |
| Weighted Average Original Term to Maturity or ARD (months): | 119 |
| Weighted Average Remaining Term to Maturity or ARD (months): | 118 |
| Weighted Average Original Amortization Term (months)(2): | 355 |
| Weighted Average Remaining Amortization Term (months)(2): | 354 |
| Weighted Average Seasoning (months): | 1 |
| (1) | Information regarding mortgage loans secured by multiple properties is based on an allocation according to relative appraised values or the allocated loan amounts or property-specific release prices set forth in the related loan documents or such other allocation as the related mortgage loan seller deemed appropriate. |
| (2) | Excludes any mortgage loan that does not amortize. |
Credit Statistics:
| Weighted Average U/W Net Cash Flow DSCR(1): | 1.89x |
| Weighted Average U/W Net Operating Income Debt Yield(1): | 11.1% |
| Weighted Average Cut-off Date Loan-to-Value Ratio(1): | 60.9% |
| Weighted Average Balloon or ARD Loan-to-Value Ratio(1): | 54.7% |
| % of Mortgage Loans with Additional Subordinate Debt(2): | 18.5% |
| % of Mortgage Loans with Single Tenants(3): | 27.2% |
| (1) | With respect to any mortgage loan that is part of a whole loan, loan-to-value ratio, debt service coverage ratio and debt yield calculations include the relatedpari passucompanion loan(s) but exclude any related subordinate debt (unless otherwise stated). The debt service coverage ratio, debt yield and loan-to-value ratio information do not take into account any subordinate debt (whether or not secured by the related mortgaged property), that currently exists or is allowed under the terms of any mortgage loan. See “Description of the Mortgage Pool—Mortgage Pool Characteristics” in the Preliminary Prospectus and Annex A-1 to the Preliminary Prospectus. |
| (2) | The percentage figure expressed as “% of Mortgage Loans with Additional Subordinate Debt” is determined as a percentage of the initial pool balance and does not take into account any future subordinate debt (whether or not secured by the mortgaged property), if any, that may be permitted under the terms of any mortgage loan or the pooling and servicing agreement. See “Description of the Mortgage Pool—Additional Indebtedness—Other Unsecured Indebtedness” in the Preliminary Prospectus. |
| (3) | Excludes mortgage loans that are secured by multiple single tenant properties. |
THE INFORMATION IN THIS STRUCTURAL AND COLLATERAL TERM SHEET IS NOT COMPLETE AND MAY BE AMENDED PRIOR TO THE TIME OF SALE. THIS TERM SHEET IS NOT AN OFFER TO SELL THESE SECURITIES AND IT IS NOT A SOLICITATION OF AN OFFER TO BUY THESE SECURITIES IN ANY JURISDICTION WHERE THE OFFER OR SALE IS NOT PERMITTED.
5
| Wells Fargo Commercial Mortgage Trust 2018-C43 | Certificate Structure |
Loan Structural Features:
Amortization:Based on the Initial Pool Balance, 67.8% of the mortgage pool (52 mortgage loans) has scheduled amortization, as follows:
42.7% (25 mortgage loans) provides for an interest-only period followed by an amortization period; and
25.1% (27 mortgage loans) requires amortization during the entire loan term.
Interest-Only:Based on the Initial Pool Balance, 32.2% of the mortgage pool (11 mortgage loans) provides for interest-only payments during the entire loan term. The Weighted Average Cut-off Date Loan-to-Value Ratio and Weighted Average U/W Net Cash Flow DSCR for those mortgage loans are 58.3% and 2.38x, respectively.
Hard Lockboxes: Based on the Initial Pool Balance, 51.9% of the mortgage pool (15 mortgage loans) have hard lockboxes in place.
Reserves:The mortgage loans require amounts to be escrowed monthly as follows (excluding any mortgage loans with springing provisions):
| Real Estate Taxes: | 86.6% of the pool |
| Insurance: | 40.9% of the pool |
| Capital Replacements: | 80.1% of the pool |
| TI/LC: | 63.6% of the pool(1) |
| (1) | The percentage of Initial Pool Balance for mortgage loans with TI/LC reserves is based on the aggregate principal balance allocable to loans that include retail, office, mixed use and industrial properties. |
Call Protection/Defeasance: Based on the Initial Pool Balance, the mortgage pool has the following call protection and defeasance features:
90.9% of the mortgage pool (58 mortgage loans) features a lockout period, then defeasance only until an open period;
8.1% of the mortgage pool (4 mortgage loans) features a lockout period, then the greater of a prepayment premium or yield maintenance until an open period;
1.0% of the mortgage pool (1 mortgage loan) features a lockout period, then the greater of a prepayment premium or yield maintenance or defeasance until an open period; and
Prepayment restrictions for each mortgage loan reflect the entire life of the mortgage loan. Please refer to Annex A-1 to the Preliminary Prospectus and the footnotes related thereto for further information regarding individual loan call protection.
THE INFORMATION IN THIS STRUCTURAL AND COLLATERAL TERM SHEET IS NOT COMPLETE AND MAY BE AMENDED PRIOR TO THE TIME OF SALE. THIS TERM SHEET IS NOT AN OFFER TO SELL THESE SECURITIES AND IT IS NOT A SOLICITATION OF AN OFFER TO BUY THESE SECURITIES IN ANY JURISDICTION WHERE THE OFFER OR SALE IS NOT PERMITTED.
6
| Wells Fargo Commercial Mortgage Trust 2018-C43 | Issue Characteristics |
| III. | Issue Characteristics | |
| Securities Offered: | $629,633,000 approximate monthly pay, multi-class, commercial mortgage REMIC pass-through certificates consisting of ten classes (Classes A-1, A-2, A-SB, A-3, A-4, A-S, B, C, X-A and X-B), which are offered pursuant to a registration statement filed with the SEC (such classes of certificates, the “Offered Certificates”). | |
| Mortgage Loan Sellers: | Barclays Bank PLC (“Barclays”), Wells Fargo Bank, National Association (“WFB”), BSPRT Finance, LLC (“BSPRT”), C-III Commercial Mortgage LLC (“CIIICM”) and Rialto Mortgage Finance, LLC (“RMF”). | |
| Joint Bookrunners and Co-Lead Managers: | Wells Fargo Securities, LLC and Barclays Capital Inc. | |
| Co-Managers: | Academy Securities, Inc. | |
| Rating Agencies: | DBRS, Inc., Fitch Ratings, Inc. and Moody’s Investors Service, Inc. | |
| Master Servicer: | Wells Fargo Bank, National Association | |
| Special Servicer: | Midland Loan Services, a Division of PNC Bank, National Association | |
| Certificate Administrator: | Wells Fargo Bank, National Association | |
| Trustee: | Wilmington Trust, National Association | |
| Operating Advisor: | Park Bridge Lender Services LLC | |
| Asset Representations Reviewer: | Park Bridge Lender Services LLC | |
| Initial Majority Controlling Class Certificateholder: | KKR Real Estate Credit Opportunity Partners Aggregator I L.P. or an affiliate | |
| U.S. Credit Risk Retention: | For a discussion on the manner in which the U.S. credit risk retention requirements will be satisfied by Wells Fargo Bank, National Association, as the retaining sponsor, see “Credit Risk Retention” in the Preliminary Prospectus.
This transaction is being structured with (a) a “third party purchaser” that will acquire an “eligible horizontal residual interest”, which will be comprised of the Class E, F and G certificates (the “horizontal risk retention certificates”) and (b) a “retaining sponsor” that will acquire an “eligible vertical interest”, which will be comprised of the Vertical RR Interest. The retaining sponsor is expected to offset a portion of its risk retention requirement by the portion of the Vertical RR Interest acquired on the closing date and retained by Barclays Bank PLC, one of the originators. KKR Real Estate Credit Opportunity Partners Aggregator I L.P. (in partial satisfaction of the retention obligations of Wells Fargo Bank, National Association, as the retaining sponsor) will be contractually obligated to retain the horizontal risk retention certificates for a minimum of five years after the closing date, subject to certain permitted exceptions provided for under the risk retention rules. During this time, KKR Real Estate Credit Opportunity Partners Aggregator I L.P. will agree to comply with hedging, transfer and financing restrictions that are applicable to third party purchasers under the credit risk retention rules. For additional information, see “Credit Risk Retention” in the Preliminary Prospectus. | |
| EU Credit Risk Retention | None of the sponsors, the depositor or the issuing entity intends to retain a material net economic interest in the securitization constituted by the issue of the Offered Certificates in accordance with the EU risk retention and due diligence requirements or to take any other action which may be required by EEA-regulated investors for the purposes of their compliance with the EU risk retention and due diligence requirements or similar requirements. | |
| Risk Retention Consultation Party: | Wells Fargo Bank, National Association | |
| Cut-off Date: | The Cut-off Date with respect to each mortgage loan is the due date for the monthly debt service payment that is due in March 2018 (or, in the case of any mortgage loan that has its first due date in April 2018, the date that would have been its due date in March 2018 under the terms of that mortgage loan if a monthly debt service payment were scheduled to be due in that month). | |
| Expected Closing Date: | On or about March 27, 2018. | |
| Determination Dates: | The 11th day of each month (or if that day is not a business day, the next succeeding business day), commencing in April 2018. |
THE INFORMATION IN THIS STRUCTURAL AND COLLATERAL TERM SHEET IS NOT COMPLETE AND MAY BE AMENDED PRIOR TO THE TIME OF SALE. THIS TERM SHEET IS NOT AN OFFER TO SELL THESE SECURITIES AND IT IS NOT A SOLICITATION OF AN OFFER TO BUY THESE SECURITIES IN ANY JURISDICTION WHERE THE OFFER OR SALE IS NOT PERMITTED.
7
| Wells Fargo Commercial Mortgage Trust 2018-C43 | Issue Characteristics |
| Distribution Dates: | The fourth business day following the Determination Date in each month, commencing in April 2018. | |
| Rated Final Distribution Date: | The Distribution Date in March 2051. | |
| Interest Accrual Period: | With respect to any Distribution Date, the calendar month immediately preceding the month in which such Distribution Date occurs. | |
| Day Count: | The Offered Certificates will accrue interest on a 30/360 basis. | |
| Minimum Denominations: | $10,000 for each Class of Offered Certificates (other than the Class X-A and X-B Certificates) and $1,000,000 for the Class X-A and X-B Certificates. Investments may also be made in any whole dollar denomination in excess of the applicable minimum denomination. | |
| Clean-up Call: | 1.0% | |
| Delivery: | DTC, Euroclear and Clearstream Banking | |
| ERISA/SMMEA Status: | Each Class of Offered Certificates is expected to be eligible for exemptive relief under ERISA. No Class of Offered Certificates will be SMMEA eligible. | |
| Risk Factors: | THE CERTIFICATES INVOLVE CERTAIN RISKS AND MAY NOT BE SUITABLE FOR ALL INVESTORS. SEE THE “RISK FACTORS” SECTION OF THE PRELIMINARY PROSPECTUS. | |
| Bond Analytics Information: | The Certificate Administrator will be authorized to make distribution date statements, CREFC® reports and certain supplemental reports (other than confidential information) available to certain financial modeling and data provision services, including Bloomberg, L.P., Trepp, LLC, Intex Solutions, Inc., Markit Group Limited, Interactive Data Corp., BlackRock Financial Management, Inc., CMBS.com, Inc., Moody’s Analytics, MBS Data, LLC and Thomson Reuters Corporation. |
THE INFORMATION IN THIS STRUCTURAL AND COLLATERAL TERM SHEET IS NOT COMPLETE AND MAY BE AMENDED PRIOR TO THE TIME OF SALE. THIS TERM SHEET IS NOT AN OFFER TO SELL THESE SECURITIES AND IT IS NOT A SOLICITATION OF AN OFFER TO BUY THESE SECURITIES IN ANY JURISDICTION WHERE THE OFFER OR SALE IS NOT PERMITTED.
8
| Wells Fargo Commercial Mortgage Trust 2018-C43 | Characteristics of the Mortgage Pool |
IV. Characteristics of the Mortgage Pool(1)
A. Ten Largest Mortgage Loans
| Mortgage Loan Seller | Mortgage Loan Name | City | State | Number of Mortgage Loans / Mortgaged Properties | Mortgage Loan Cut-off Date Balance ($) | % of Initial Pool Balance (%) | Property Type | Number of SF | Cut-off Date Balance Per SF | Cut-off Date LTV Ratio (%) | Balloon or ARD LTV Ratio (%) | U/W NCF DSCR (x) | U/W NOI Debt Yield (%) |
| Barclays Bank PLC | Moffett Towers II - Building 2 | Sunnyvale | CA | 1 / 1 | $54,000,000 | 7.5% | Office | 362,563 | $455 | 47.0% | 42.4% | 2.08x | 11.9% |
| WFB | Airport Business Center | Irvine | CA | 1 / 1 | 50,000,000 | 6.9 | Industrial | 1,170,571 | 128 | 61.3 | 61.3 | 2.12 | 9.8 |
| Barclays Bank PLC | The SoCal Portfolio | Various | CA | 1 / 24 | 45,000,000 | 6.2 | Various | 2,194,425 | 104 | 59.4 | 54.7 | 1.48 | 10.2 |
| Barclays Bank PLC | Southpoint Office Center | Bloomington | MN | 1 / 1 | 37,200,000 | 5.1 | Office | 366,808 | 101 | 74.4 | 63.2 | 1.82 | 12.4 |
| Barclays Bank PLC | ExchangeRight Net Leased Portfolio #19 | Various | Various | 1 / 21 | 35,840,000 | 5.0 | Various | 257,355 | 139 | 60.7 | 60.7 | 2.37 | 9.9 |
| Barclays Bank PLC | Houston Distribution Center | Katy | TX | 1 / 1 | 34,949,034 | 4.8 | Industrial | 1,500,596 | 56 | 58.2 | 48.2 | 1.44 | 10.6 |
| WFB | Apple Campus 3 | Sunnyvale | CA | 1 / 1 | 30,000,000 | 4.2 | Office | 882,657 | 385 | 44.0 | 44.0 | 3.55 | 12.2 |
| RMF | Walmart Supercenter Houston | Houston | TX | 1 / 1 | 26,500,000 | 3.7 | Retail | 177,514 | 149 | 62.1 | 62.1 | 1.74 | 8.0 |
| WFB | 35 Waterview Boulevard | Parsippany | NJ | 1 / 1 | 22,000,000 | 3.0 | Office | 172,498 | 128 | 72.6 | 61.1 | 1.75 | 12.0 |
| WFB | FedEx Distribution Center | Groveport | OH | 1 / 1 | 21,100,000 | 2.9 | Industrial | 305,250 | 69 | 66.6 | 66.6 | 1.77 | 9.0 |
| Top Three Total/Weighted Average | 3 / 26 | $149,000,000 | 20.6% | 55.5% | 52.5% | 1.91x | 10.7% | ||||||
| Top Five Total/Weighted Average | 5 / 48 | $222,040,000 | 30.7% | 59.5% | 55.6% | 1.97x | 10.8% | ||||||
| Top Ten Total/Weighted Average | 10 / 53 | $356,589,034 | 49.4% | 59.5% | 55.4% | 2.01x | 10.7% | ||||||
| Non-Top Ten Total/Weighted Average | 53 / 79 | $365,859,951 | 50.6% | 62.2% | 54.1% | 1.77x | 11.6% | ||||||
| (1) | With respect to any mortgage loan that is part of a whole loan, Cut-off Date Balance Per SF, loan-to-value ratio, debt service coverage ratio and debt yield calculations include the relatedpari passu companion loan(s) but exclude any related subordinate debt (unless otherwise stated). With respect to each mortgage loan, debt service coverage ratio, debt yield and loan-to-value ratio information do not take into account subordinate debt (whether or not secured by the related mortgaged property), if any, that currently exists or is allowed under the terms of such mortgage loan. |
THE INFORMATION IN THIS STRUCTURAL AND COLLATERAL TERM SHEET IS NOT COMPLETE AND MAY BE AMENDED PRIOR TO THE TIME OF SALE. THIS TERM SHEET IS NOT AN OFFER TO SELL THESE SECURITIES AND IT IS NOT A SOLICITATION OF AN OFFER TO BUY THESE SECURITIES IN ANY JURISDICTION WHERE THE OFFER OR SALE IS NOT PERMITTED.
9
| Wells Fargo Commercial Mortgage Trust 2018-C43 | Characteristics of the Mortgage Pool |
B. Summary of the Whole Loans
| Property Name | Mortgage Loan Seller in WFCM 2018-C43 | Note(s)(1) | Original Balance | Holder of Note(1) | Lead Servicer for Whole Loan | Master Servicer Under Lead Securitization Servicing Agreement | Special Servicer Under Lead Securitization Servicing Agreement |
| Moffett Towers II - Building 2 | Barclays | A-1 | $54,000,000 | WFCM 2018-C43 | Yes | Wells Fargo Bank, National Association | Midland Loan Services, a Division of PNC Bank, National Association |
| A-2 | $29,750,000 | Barclays Bank PLC | No | ||||
| A-3 | $40,000,000 | WFCM 2017-C42 | No | ||||
| A-4 | $41,250,000 | BANK 2018-BNK10 | No | ||||
| Airport Business Center | WFB | A-1 | $60,000,000 | WFB | Yes(2) | Wells Fargo Bank, National Association(2) | Midland Loan Services, a Division of PNC Bank, National Association(2) |
| A-2 | $50,000,000 | WFCM 2018-C43 | No | ||||
| A-3 | $40,000,000 | WFB | No | ||||
| The SoCal Portfolio | Barclays | A-1-1 | $50,000,000 | CGCMT 2018-B2 | Yes(3) | Midland Loan Services, a Division of PNC Bank, National Association(3) | LNR Partners LLC3) |
| A-1-2 | $35,000,000 | Citi Real Estate Funding Inc. | No | ||||
| A-1-3 | $15,000,000 | Citi Real Estate Funding Inc. | No | ||||
| A-1-4 | $37,580,000 | Cantor Commercial Real Estate Lending, L.P. | No | ||||
| A-2-1 | $45,000,000 | WFCM 2018-C43 | No | ||||
| A-2-2 | $46,720,000 | Barclays Bank PLC | No | ||||
| Houston Distribution Center | Barclays | A-1 | $35,000,000 | UBS 2018-C8 | Yes | Midland Loan Services, a Division of PNC Bank, National Association | Midland Loan Services, a Division of PNC Bank, National Association |
| A-2 | $14,000,000 | UBS 2018-C8 | No | ||||
| A-3 | $35,000,000 | WFCM 2018-C43 | No | ||||
| Apple Campus 3 | WFB | A-1 | $80,000,000 | WFB | No | Wells Fargo Bank, National Association
| Torchlight Loan Services, LLC |
| A-2 | $30,000,000 | WFCM 2018-C43 | No | ||||
| A-3 | $94,000,000 | BANK 2018-BNK10 | Yes | ||||
| A-4 | $68,000,000 | BMARK 2018-B2 | No | ||||
| A-5 | $68,000,000 | Goldman Sachs Mortgage Company | No |
| (1) | Unless otherwise indicated, each note not currently held by a securitization trust is expected to be contributed to a future securitization. No assurance can be provided that any such note will not be split further. |
| (2) | The related whole loan is expected to initially be serviced under the WFCM 2018-C43 pooling and servicing agreement until the securitization of the related “lead” pari passu note (namely, the related pari passu note marked “Yes” in the column entitled “Lead Servicer for Whole Loan”), after which the related whole loan will be serviced under the pooling and servicing agreement governing such securitization of the related “lead” pari passu note. The master servicer and special servicer for such securitization will be identified in a notice, report or statement to holders of the WFCM 2018-C43 certificates after the closing of such securitization. |
| (3) | The CGCMT 2018-B2 transaction is expected to close on March 20, 2018. |
THE INFORMATION IN THIS STRUCTURAL AND COLLATERAL TERM SHEET IS NOT COMPLETE AND MAY BE AMENDED PRIOR TO THE TIME OF SALE. THIS TERM SHEET IS NOT AN OFFER TO SELL THESE SECURITIES AND IT IS NOT A SOLICITATION OF AN OFFER TO BUY THESE SECURITIES IN ANY JURISDICTION WHERE THE OFFER OR SALE IS NOT PERMITTED.
10
| Wells Fargo Commercial Mortgage Trust 2018-C43 | Characteristics of the Mortgage Pool |
C. Mortgage Loans with Additional Secured and Mezzanine Financing
| Loan No. | Mortgage Loan Seller | Mortgage Loan Name | Mortgage Loan Cut-off Date Balance ($) | % of Initial Pool Balance (%) | Sub Debt Cut-off Date Balance ($) | Mezzanine Debt Cut-off Date Balance ($) | Total Debt Interest Rate (%)(1) | Mortgage Loan U/W NCF DSCR (x)(2) | Total Debt U/W NCF DSCR (x) | Mortgage Loan Cut-off Date U/W NOI Debt Yield (%)(2) | Total Debt Cut-off Date U/W NOI Debt Yield (%) | Mortgage Loan Cut-off Date LTV Ratio (%)(2) | Total Debt Cut-off Date LTV Ratio (%) |
| 1 | Barclays Bank PLC | Moffett Towers II - Building 2 | $54,000,000 | 7.5% | NAP | $105,000,000 | 4.5060% | 2.08x | 1.23x | 11.9% | 7.3% | 47.0% | 76.9% |
| 2 | WFB | Airport Business Center | 50,000,000 | 6.9 | NAP | 20,000,000 | 4.7081 | 2.12 | 1.74 | 9.8 | 8.6 | 61.3 | 69.5 |
| 7 | WFB | Apple Campus 3 | 30,000,000 | 4.2 | NAP | 235,000,000 | 4.1599 | 3.55 | 1.70 | 12.2 | 7.2 | 44.0 | 74.3 |
| Total/Weighted Average | $134,000,000 | 18.5% | NAP | $360,000,000 | 4.5039% | 2.42x | 1.53x | 11.2% | 7.8% | 51.7% | 73.6% | ||
| (1) | Total Debt Interest Rate for any specified mortgage loan reflects the weighted average of the interest rates on the respective components of the total debt. |
| (2) | With respect to any mortgage loan that is part of a whole loan, the loan-to-value ratio, debt service coverage ratio and debt yield calculations include the related pari passu companion loan(s). |
THE INFORMATION IN THIS STRUCTURAL AND COLLATERAL TERM SHEET IS NOT COMPLETE AND MAY BE AMENDED PRIOR TO THE TIME OF SALE. THIS TERM SHEET IS NOT AN OFFER TO SELL THESE SECURITIES AND IT IS NOT A SOLICITATION OF AN OFFER TO BUY THESE SECURITIES IN ANY JURISDICTION WHERE THE OFFER OR SALE IS NOT PERMITTED.
11
| Wells Fargo Commercial Mortgage Trust 2018-C43 | Characteristics of the Mortgage Pool |
| D. | Previous Securitization History(1) |
| Loan No. | Mortgage Loan Seller | Mortgage Loan or Mortgaged Property Name | City | State | Property Type | Mortgage Loan or Mortgaged Property Cut-off Date Balance ($) | % of Initial Pool Balance (%) | Previous Securitization |
| 2 | WFB | Airport Business Center | Irvine | CA | Industrial | $50,000,000 | 6.9% | MSBAM 2014-C19 |
| 5.04 | Barclays Bank PLC | Walgreens - Gainesville (13th), FL | Gainesville | FL | Retail | 2,992,481 | 0.4 | MSC 1998-WF2 |
| 22 | WFB | Mill Creek | Buford | GA | Retail | 9,769,000 | 1.4 | WFRBS 2012-C10 |
| 25 | WFB | 2900 Westchester | Purchase | NY | Office | 8,487,283 | 1.2 | GFCM 2003-1 |
| 26 | CIIICM | Twin Oaks Shopping Center | Montgomery | AL | Retail | 8,025,000 | 1.1 | BSCMS 2006-PW14 |
| 36 | WFB | Newport News Flex Portfolio | Newport News | VA | Industrial | 5,581,904 | 0.8 | WFCM 2014-LC18 |
| 47 | CIIICM | College MHC | Milwaukee | WI | Manufactured Housing Community | 3,300,000 | 0.5 | WFRBS 2014-C25 |
| 49 | CIIICM | Shoppes of Crossroads Commons | Plover | WI | Retail | 3,084,876 | 0.4 | MSC 2008-T29 |
| 52 | CIIICM | Bonnet Lake MHP | Avon Park | FL | Manufactured Housing Community | 2,790,000 | 0.4 | UBSBB 2012-C2 |
| 57 | CIIICM | Hammondell MHP | Winter Haven | FL | Manufactured Housing Community | 2,451,000 | 0.3 | UBSBB 2012-C2 |
| 60 | CIIICM | Marshfield MHP | Marshfield | WI | Manufactured Housing Community | 2,065,207 | 0.3 | GSMS 2013-GC12 |
| Total | $98,546,751 | 13.6% |
| (1) | The table above represents the most recent securitization with respect to the mortgaged property securing the related mortgage loan, based on information provided by the related borrower or obtained through searches of a third-party database. While loans secured by the above mortgaged properties may have been securitized multiple times in prior transactions, mortgage loans in this securitization are only listed in the above chart if the mortgage loan paid off a loan in another securitization. The information has not otherwise been confirmed by the mortgage loan sellers. |
THE INFORMATION IN THIS STRUCTURAL AND COLLATERAL TERM SHEET IS NOT COMPLETE AND MAY BE AMENDED PRIOR TO THE TIME OF SALE. THIS TERM SHEET IS NOT AN OFFER TO SELL THESE SECURITIES AND IT IS NOT A SOLICITATION OF AN OFFER TO BUY THESE SECURITIES IN ANY JURISDICTION WHERE THE OFFER OR SALE IS NOT PERMITTED.
12
| Wells Fargo Commercial Mortgage Trust 2018-C43 | Characteristics of the Mortgage Pool |
| E. | Mortgage Loans with Scheduled Balloon Payments and Related Classes |
| Class A-2(1) | ||||||||||||||||||||||||||||||||||||||||
| Loan No. | Mortgage Loan Seller | Mortgage Loan Name | State | Property Type | Mortgage Loan Cut-off Date Balance ($) | % of Initial Pool Balance (%) | Mortgage Loan Balance at ARD ($) | % of Class A-2 Certificate Principal Balance (%)(2) | Rooms / Pads | Loan per | U/W NCF DSCR (x) | U/W NOI Debt Yield (%) | Cut-off Date LTV Ratio (%) | Balloon Or ARD LTV Ratio (%) | Rem. IO Period (mos.) | Rem. Term to ARD (mos.) | ||||||||||||||||||||||||
| 38 | WFB | Holiday Inn Express Greenville Airport | SC | Hospitality | $4,962,889 | 0.7 | % | $4,603,608 | 61.1 | % | 83 | $59,794 | 1.88 | x | 14.5 | % | 68.0 | % | 63.1 | % | 0 | 59 | ||||||||||||||||||
| 60 | CIIICM | Marshfield MHP | WI | Manufactured Housing Community | 2,065,207 | 0.3 | 1,925,158 | 25.5 | 190 | 10,870 | 1.55 | 11.1 | 66.6 | 62.1 | 0 | 58 | ||||||||||||||||||||||||
| Total/Weighted Average | $7,028,096 | 1.0 | % | $6,528,766 | 86.6 | % | 1.78 | x | 13.5 | % | 67.6 | % | 62.8 | % | 0 | 59 | ||||||||||||||||||||||||
| (1) | The table above presents the mortgage loan(s) whose balloon payments would be applied to pay down the principal balance of the Class A-2 Certificates, assuming a 0% CPR and applying the “Structuring Assumptions” described in the Preliminary Prospectus, including the assumptions that (i) none of the mortgage loans in the pool experience prepayments prior to maturity (or, in the case of an ARD loan, its anticipated repayment date), defaults or losses; (ii) there are no extensions of maturity dates of any mortgage loans in the pool; and (iii) each mortgage loan in the pool is paid in full on its stated maturity date (or, in the case of an ARD loan, its anticipated repayment date). Each Class of Certificates evidences undivided ownership interests in the entire pool of mortgage loans. Debt service coverage ratio, debt yield and loan-to-value ratio information do not take into account subordinate debt (whether or not secured by the related mortgaged property), if any, that currently exists or is allowed under the terms of any mortgage loan. See Annex A-1 to the Preliminary Prospectus. |
| (2) | Reflects the percentage equal to the Balloon Balance divided by the initial Class A-2 Certificate Balance. |
THE INFORMATION IN THIS STRUCTURAL AND COLLATERAL TERM SHEET IS NOT COMPLETE AND MAY BE AMENDED PRIOR TO THE TIME OF SALE. THIS TERM SHEET IS NOT AN OFFER TO SELL THESE SECURITIES AND IT IS NOT A SOLICITATION OF AN OFFER TO BUY THESE SECURITIES IN ANY JURISDICTION WHERE THE OFFER OR SALE IS NOT PERMITTED.
13
| Wells Fargo Commercial Mortgage Trust 2018-C43 | Characteristics of the Mortgage Pool |
| F. | Property Type Distribution(1) |
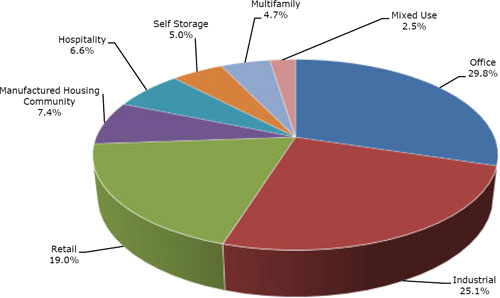
| Property Type | Number of Mortgaged Properties | Aggregate Cut-off Date Balance ($) | % of Initial Pool Balance (%) | Weighted Average Cut-off Date LTV Ratio (%) | Weighted Average Balloon or ARD LTV Ratio (%) | Weighted Average U/W NCF DSCR (x) | Weighted Average U/W NOI Debt Yield (%) | Weighted Average U/W NCF Debt Yield (%) | Weighted Average Mortgage Rate (%) | ||||||||||||||||
| Office | 20 | $214,952,294 | 29.8 | % | 58.4 | % | 52.7 | % | 2.18 | x | 12.0 | % | 11.1 | % | 4.168 | % | |||||||||
| Suburban | 16 | 201,604,294 | 27.9 | 58.4 | 52.4 | 2.20 | 12.2 | 11.2 | 4.135 | ||||||||||||||||
| Medical | 4 | 13,348,000 | 1.8 | 59.8 | 56.7 | 1.89 | 9.9 | 9.4 | 4.677 | ||||||||||||||||
| Industrial | 17 | 181,296,184 | 25.1 | 59.8 | 55.8 | 1.81 | 10.8 | 9.8 | 4.794 | ||||||||||||||||
| Flex | 7 | 81,819,657 | 11.3 | 59.1 | 58.0 | 2.02 | 10.5 | 9.7 | 4.593 | ||||||||||||||||
| Warehouse Distribution | 3 | 45,346,527 | 6.3 | 59.0 | 49.8 | 1.48 | 10.9 | 9.6 | 5.082 | ||||||||||||||||
| Warehouse | 2 | 31,600,000 | 4.4 | 60.2 | 57.4 | 1.79 | 10.4 | 9.7 | 4.863 | ||||||||||||||||
| Manufacturing | 4 | 13,330,000 | 1.8 | 64.1 | 59.0 | 1.73 | 12.2 | 10.9 | 4.820 | ||||||||||||||||
| Manufacturing/Warehouse | 1 | 9,200,000 | 1.3 | 62.6 | 55.3 | 1.69 | 12.4 | 10.8 | 4.880 | ||||||||||||||||
| Retail | 41 | 137,431,128 | 19.0 | 62.9 | 58.3 | 1.81 | 9.8 | 9.3 | 4.640 | ||||||||||||||||
| Single Tenant | 21 | 59,276,084 | 8.2 | 61.3 | 61.0 | 2.06 | 9.0 | 8.9 | 4.250 | ||||||||||||||||
| Unanchored | 11 | 38,136,972 | 5.3 | 63.6 | 55.0 | 1.38 | 9.8 | 9.0 | 5.142 | ||||||||||||||||
| Anchored | 7 | 36,245,786 | 5.0 | 64.5 | 57.7 | 1.91 | 11.1 | 10.3 | 4.721 | ||||||||||||||||
| Shadow Anchored | 2 | 3,772,285 | 0.5 | 67.0 | 56.3 | 1.42 | 10.1 | 9.2 | 4.939 | ||||||||||||||||
| Manufactured Housing Community | 27 | 53,215,127 | 7.4 | 64.0 | 54.3 | 1.53 | 10.5 | 10.3 | 5.289 | ||||||||||||||||
| Manufactured Housing Community | 27 | 53,215,127 | 7.4 | 64.0 | 54.3 | 1.53 | 10.5 | 10.3 | 5.289 | ||||||||||||||||
| Hospitality | 7 | 48,027,533 | 6.6 | 60.7 | 47.3 | 1.91 | 15.0 | 13.3 | 5.152 | ||||||||||||||||
| Limited Service | 7 | 48,027,533 | 6.6 | 60.7 | 47.3 | 1.91 | 15.0 | 13.3 | 5.152 | ||||||||||||||||
| Self Storage | 10 | 35,762,082 | 5.0 | 63.6 | 54.5 | 1.41 | 9.5 | 9.3 | 5.140 | ||||||||||||||||
| Self Storage | 10 | 35,762,082 | 5.0 | 63.6 | 54.5 | 1.41 | 9.5 | 9.3 | 5.140 | ||||||||||||||||
| Multifamily | 6 | 34,046,625 | 4.7 | 64.8 | 58.8 | 1.96 | 10.5 | 10.0 | 4.672 | ||||||||||||||||
| Garden | 6 | 34,046,625 | 4.7 | 64.8 | 58.8 | 1.96 | 10.5 | 10.0 | 4.672 | ||||||||||||||||
| Mixed Use | 4 | 17,718,012 | 2.5 | 62.6 | 55.8 | 1.50 | 10.2 | 9.4 | 4.760 | ||||||||||||||||
| Office/Industrial | 1 | 7,930,000 | 1.1 | 66.6 | 57.1 | 1.53 | 10.1 | 9.4 | 4.600 | ||||||||||||||||
| Office/Retail | 2 | 6,598,958 | 0.9 | 59.4 | 54.7 | 1.48 | 10.2 | 9.4 | 4.890 | ||||||||||||||||
| Retail/Education | 1 | 3,189,054 | 0.4 | 59.4 | 54.7 | 1.48 | 10.2 | 9.4 | 4.890 | ||||||||||||||||
| Total/Weighted Average: | 132 | $722,448,985 | 100.0 | % | 60.9 | % | 54.7 | % | 1.89 | x | 11.1 | % | 10.3 | % | 4.649 | % | |||||||||
| (1) | Because this table presents information relating to the mortgaged properties and not the mortgage loans, the information for mortgage loans secured by more than one mortgaged property is based on allocated amounts (allocating the principal balance of the mortgage loan to each of those properties according to the relative appraised values of the mortgaged properties or the allocated loan amounts or property-specific release prices set forth in the related mortgage loan documents or such other allocation as the related mortgage loan seller deemed appropriate). With respect to any mortgage loan that is part of a whole loan, the loan-to-value ratio, debt service coverage ratio and debt yield calculations include the related pari passu companion loan(s) but exclude any related subordinate debt (unless otherwise stated). With respect to each mortgage loan, debt service coverage ratio, debt yield and loan-to-value ratio information do not take into account any subordinate debt (whether or not secured by the related mortgaged property) that currently exists or is allowed under the terms of such mortgage loan. See Annex A-1 to the Preliminary Prospectus. |
THE INFORMATION IN THIS STRUCTURAL AND COLLATERAL TERM SHEET IS NOT COMPLETE AND MAY BE AMENDED PRIOR TO THE TIME OF SALE. THIS TERM SHEET IS NOT AN OFFER TO SELL THESE SECURITIES AND IT IS NOT A SOLICITATION OF AN OFFER TO BUY THESE SECURITIES IN ANY JURISDICTION WHERE THE OFFER OR SALE IS NOT PERMITTED.
14
| Wells Fargo Commercial Mortgage Trust 2018-C43 | Characteristics of the Mortgage Pool |
| G. | Geographic Distribution(1)(2) |
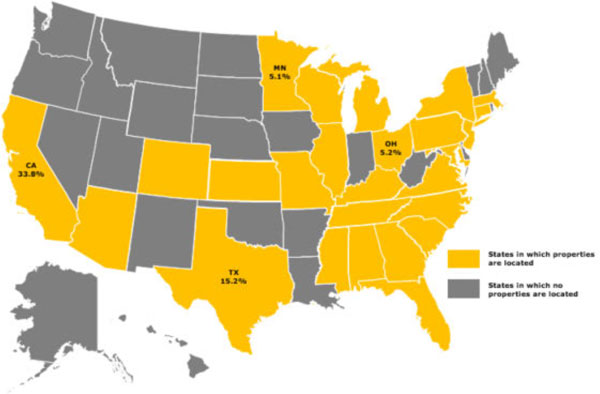
| Location | Number of Mortgaged Properties | Aggregate Cut-off Date Balance ($) | % of Initial Pool Balance (%) | Weighted Average Cut-off Date LTV Ratio (%) | Weighted Average Balloon or ARD LTV Ratio (%) | Weighted Average U/W NCF DSCR (x) | Weighted Average U/W NOI Debt Yield (%) | Weighted Average U/W NCF Debt Yield (%) | Weighted Average Mortgage Rate (%) | |||||||||||||||||
| California | 36 | $244,158,508 | 33.8 | % | 53.7 | % | 50.8 | % | 2.14 | x | 11.1 | % | 10.5 | % | 4.293 | % | ||||||||||
| Northern California | 10 | 126,252,250 | 17.5 | 48.1 | 44.3 | 2.45 | 12.2 | 11.5 | 3.891 | |||||||||||||||||
| Southern California | 26 | 117,906,258 | 16.3 | 59.6 | 57.8 | 1.81 | 10.0 | 9.4 | 4.723 | |||||||||||||||||
| Texas | 12 | 109,924,800 | 15.2 | 62.0 | 55.9 | 1.72 | 9.8 | 9.1 | 4.707 | |||||||||||||||||
| Ohio | 9 | 37,587,965 | 5.2 | 65.4 | 62.6 | 1.76 | 9.7 | 9.3 | 4.908 | |||||||||||||||||
| Minnesota | 1 | 37,200,000 | 5.1 | 74.4 | 63.2 | 1.82 | 12.4 | 10.8 | 4.305 | |||||||||||||||||
| Other(3) | 74 | 293,577,711 | 40.6 | 64.1 | 55.5 | 1.76 | 11.7 | 10.7 | 4.935 | |||||||||||||||||
| Total/Weighted Average | 132 | $722,448,985 | 100.0 | % | 60.9 | % | 54.7 | % | 1.89 | x | 11.1 | % | 10.3 | % | 4.649 | % | ||||||||||
| (1) | The mortgaged properties are located in 26 states. |
| (2) | Because this table presents information relating to the mortgaged properties and not the mortgage loans, the information for mortgage loans secured by more than one mortgaged property is based on allocated amounts (allocating the principal balance of the mortgage loan to each of those properties according to the relative appraised values of the mortgaged properties or the allocated loan amounts or property-specific release prices set forth in the related mortgage loan documents or such other allocation as the related mortgage loan seller deemed appropriate). With respect to any mortgage loan that is part of a whole loan, the loan-to-value ratio, debt service coverage ratio and debt yield calculations include the relatedpari passu companion loan(s) but exclude any related subordinate debt (unless otherwise stated). With respect to each mortgage loan, debt service coverage ratio, debt yield and loan-to-value ratio information do not take into account any subordinate debt (whether or not secured by the related mortgaged property) that currently exists or is allowed under the terms of such mortgage loan. See Annex A-1 to the Preliminary Prospectus. |
| (3) | Includes 22 other states. |
THE INFORMATION IN THIS STRUCTURAL AND COLLATERAL TERM SHEET IS NOT COMPLETE AND MAY BE AMENDED PRIOR TO THE TIME OF SALE. THIS TERM SHEET IS NOT AN OFFER TO SELL THESE SECURITIES AND IT IS NOT A SOLICITATION OF AN OFFER TO BUY THESE SECURITIES IN ANY JURISDICTION WHERE THE OFFER OR SALE IS NOT PERMITTED.
15
| Wells Fargo Commercial Mortgage Trust 2018-C43 | Characteristics of the Mortgage Pool |
H. Characteristics of the Mortgage Pool(1)
| CUT-OFF DATE BALANCE | |||
| Range of Cut-off Date Balances ($) | Number of Mortgage Loans | Aggregate Cut- off Date Balance | Percent by Aggregate Cut- off Date Pool Balance (%) |
| 1,416,828 - 2,000,000 | 3 | $4,982,912 | 0.7% |
| 2,000,001 - 3,000,000 | 11 | 28,318,290 | 3.9 |
| 3,000,001 - 4,000,000 | 7 | 24,307,647 | 3.4 |
| 4,000,001 - 5,000,000 | 5 | 23,105,889 | 3.2 |
| 5,000,001 - 6,000,000 | 2 | 10,831,904 | 1.5 |
| 6,000,001 - 7,000,000 | 4 | 24,840,295 | 3.4 |
| 7,000,001 - 8,000,000 | 5 | 37,460,000 | 5.2 |
| 8,000,001 - 9,000,000 | 3 | 25,127,500 | 3.5 |
| 9,000,001 - 10,000,000 | 3 | 29,353,919 | 4.1 |
| 10,000,001 - 15,000,000 | 5 | 64,705,158 | 9.0 |
| 15,000,001 - 20,000,000 | 3 | 50,826,437 | 7.0 |
| 20,000,001 - 30,000,000 | 6 | 141,600,000 | 19.6 |
| 30,000,001 - 50,000,000 | 5 | 202,989,034 | 28.1 |
| 50,000,001 - 54,000,000 | 1 | 54,000,000 | 7.5 |
| Total: | 63 | $722,448,985 | 100.0% |
| Average | $11,467,444 | ||
| UNDERWRITTEN NOI DEBT SERVICE COVERAGE RATIO | |||
| Range of U/W NOI DSCRs (x) | Number of Mortgage Loans | Aggregate Cut- off Date Balance | Percent by Aggregate Cut- off Date Pool Balance (%) |
| 1.28 - 1.30 | 2 | $6,466,084 | 0.9% |
| 1.31 - 1.40 | 8 | 51,803,405 | 7.2 |
| 1.41 - 1.50 | 5 | 47,820,437 | 6.6 |
| 1.51 - 1.60 | 8 | 67,859,876 | 9.4 |
| 1.61 - 1.70 | 9 | 66,324,985 | 9.2 |
| 1.71 - 1.80 | 4 | 43,732,045 | 6.1 |
| 1.81 - 1.90 | 5 | 66,529,508 | 9.2 |
| 1.91 - 2.00 | 4 | 44,907,283 | 6.2 |
| 2.01 - 2.50 | 12 | 242,484,793 | 33.6 |
| 2.51 - 3.00 | 2 | 19,000,650 | 2.6 |
| 3.01 - 3.50 | 2 | 27,984,919 | 3.9 |
| 3.51 - 3.84 | 2 | 37,535,000 | 5.2 |
| Total: | 63 | $722,448,985 | 100.0% |
| Weighted Average: | 2.02x | ||
| UNDERWRITTEN NCF DEBT SERVICE COVERAGE RATIO | |||
Range of U/W NCF DSCRs (x) | Number of Mortgage Loans | Aggregate Cut- off Date Balance | Percent by Aggregate Cut- off Date Pool Balance (%) |
| 1.25 - 1.30 | 4 | $14,680,059 | 2.0% |
| 1.31 - 1.40 | 11 | 83,059,867 | 11.5 |
| 1.41 - 1.50 | 9 | 111,158,910 | 15.4 |
| 1.51 - 1.60 | 5 | 24,728,998 | 3.4 |
| 1.61 - 1.70 | 10 | 67,098,506 | 9.3 |
| 1.71 - 1.80 | 7 | 104,317,283 | 14.4 |
| 1.81 - 1.90 | 6 | 83,462,889 | 11.6 |
| 1.91 - 2.00 | 1 | 5,581,904 | 0.8 |
| 2.01 - 2.50 | 5 | 149,940,000 | 20.8 |
| 2.51 - 3.50 | 3 | 40,885,569 | 5.7 |
| 3.51 - 3.65 | 2 | 37,535,000 | 5.2 |
| Total: | 63 | $722,448,985 | 100.0% |
| Weighted Average | 1.89x | ||
| LOAN PURPOSE | |||
| Loan Purpose | Number of Mortgage Loans | Aggregate Cut- off Date Balance | Percent by Aggregate Cut- off Date Pool Balance (%) |
| Refinance | 34 | $374,882,480 | 51.9% |
| Acquisition | 24 | 251,377,471 | 34.8 |
| Recapitalization | 4 | 88,549,034 | 12.3 |
| Acquisition/Refinance | 1 | 7,640,000 | 1.1 |
| Total: | 63 | $722,448,985 | 100.0% |
| MORTGAGE RATE | |||
| Range of Mortgage Rates (%) | Number of Mortgage Loans | Aggregate Cut- off Date Balance | Percent by Aggregate Cut- off Date Pool Balance (%) |
| 3.365 - 3.500 | 1 | $30,000,000 | 4.2% |
| 3.501 - 3.750 | 1 | 54,000,000 | 7.5 |
| 3.751 - 4.000 | 2 | 20,435,650 | 2.8 |
| 4.001 - 4.250 | 2 | 53,840,000 | 7.5 |
| 4.251 - 4.500 | 5 | 124,350,000 | 17.2 |
| 4.501 - 4.750 | 2 | 15,085,000 | 2.1 |
| 4.751 - 5.000 | 20 | 233,755,339 | 32.4 |
| 5.001 - 5.250 | 14 | 121,487,970 | 16.8 |
| 5.251 - 5.500 | 6 | 25,245,694 | 3.5 |
| 5.501 - 5.750 | 8 | 35,457,707 | 4.9 |
| 5.751 - 6.250 | 1 | 6,191,625 | 0.9 |
| 6.251 - 6.310 | 1 | 2,600,000 | 0.4 |
| Total: | 63 | $722,448,985 | 100.0% |
| Weighted Average: | 4.649% | ||
| UNDERWRITTEN NOI DEBT YIELD | |||
| Range of U/W NOI Debt Yields (%) | Number of Mortgage Loans | Aggregate Cut- off Date Balance | Percent by Aggregate Cut- off Date Pool Balance (%) |
| 8.0 | 1 | $26,500,000 | 3.7% |
| 8.1 - 9.0 | 4 | 30,466,084 | 4.2 |
| 9.1 - 10.0 | 16 | 186,013,842 | 25.7 |
| 10.1 - 11.0 | 12 | 137,548,484 | 19.0 |
| 11.1 - 12.0 | 12 | 126,158,856 | 17.5 |
| 12.1 - 13.0 | 7 | 120,017,283 | 16.6 |
| 13.1 - 14.0 | 5 | 53,814,508 | 7.4 |
| 14.1 - 15.0 | 3 | 19,160,010 | 2.7 |
| 15.1 - 19.0 | 2 | 12,785,000 | 1.8 |
| 19.1 - 19.3 | 1 | 9,984,919 | 1.4 |
| Total: | 63 | $722,448,985 | 100.0% |
| Weighted Average | 11.1% | ||
| UNDERWRITTEN NCF DEBT YIELD | |||
| Range of U/W NCF Debt Yields (%) | Number of Mortgage Loans | Aggregate Cut- off Date Balance | Percent by Aggregate Cut- off Date Pool Balance (%) |
| 7.9 - 8.0 | 1 | $26,500,000 | 3.7% |
| 8.1 - 9.0 | 10 | 88,589,792 | 12.3 |
| 9.1 - 10.0 | 20 | 264,734,044 | 36.6 |
| 10.1 - 11.0 | 11 | 100,204,781 | 13.9 |
| 11.1 - 12.0 | 14 | 170,490,439 | 23.6 |
| 12.1 - 13.0 | 4 | 49,160,010 | 6.8 |
| 13.1 - 14.0 | 1 | 5,250,000 | 0.7 |
| 14.1 - 16.0 | 1 | 7,535,000 | 1.0 |
| 16.1 - 16.9 | 1 | 9,984,919 | 1.4 |
| Total: | 63 | $722,448,985 | 100.0% |
| Weighted Average | 10.3% | ||
| ORIGINAL TERM TO MATURITY OR ARD | |||
| Original Terms to Maturity or ARD (months) | Number of Mortgage Loans | Aggregate Cut- off Date Balance | Percent by Aggregate Cut- off Date Pool Balance (%) |
| 60 | 2 | $7,028,096 | 1.0% |
| 120 | 61 | 715,420,889 | 99.0 |
| Total: | 63 | $722,448,985 | 100.0% |
| Weighted Average | 119 months | ||
| (1) | With respect to any mortgage loan that is part of a whole loan, the loan-to-value ratio, debt service coverage ratio and debt yield calculations include the relatedpari passucompanion loan(s) but exclude any related subordinate debt (unless otherwise stated). With respect to each mortgage loan, debt service coverage ratio, debt yield and loan-to-value ratio information do not take into account any subordinate debt (whether or not secured by the related mortgaged property) that currently exists or is allowed under the terms of such mortgage loan. See Annex A-1 to the Preliminary Prospectus. Prepayment provisions for each mortgage loan reflects the entire life of the loan (from origination to maturity or ARD). |
THE INFORMATION IN THIS STRUCTURAL AND COLLATERAL TERM SHEET IS NOT COMPLETE AND MAY BE AMENDED PRIOR TO THE TIME OF SALE. THIS TERM SHEET IS NOT AN OFFER TO SELL THESE SECURITIES AND IT IS NOT A SOLICITATION OF AN OFFER TO BUY THESE SECURITIES IN ANY JURISDICTION WHERE THE OFFER OR SALE IS NOT PERMITTED.
16
| Wells Fargo Commercial Mortgage Trust 2018-C43 | Characteristics of the Mortgage Pool |
| REMAINING TERM TO MATURITY OR ARD | |||
| Range of Remaining Terms to Maturity or ARD (months) | Number of Mortgage Loans | Aggregate Cut- off Date Balance | Percent by Aggregate Cut- off Date Pool Balance (%) |
| 58 - 112 | 2 | $7,028,096 | 1.0% |
| 113 - 120 | 61 | 715,420,889 | 99.0 |
| Total: | 63 | $722,448,985 | 100.0% |
| Weighted Average | 118 months | ||
| ORIGINAL AMORTIZATION TERM(2) | |||
| Original Amortization Terms (months) | Number of Mortgage Loans | Aggregate Cut- off Date Balance | Percent by Aggregate Cut- off Date Pool Balance (%) |
| Non- Amortizing | 11 | $232,975,650 | 32.2% |
| 240 | 1 | 8,615,217 | 1.2 |
| 300 | 3 | 24,533,178 | 3.4 |
| 360 | 48 | 456,324,940 | 63.2 |
| Total: | 63 | $722,448,985 | 100.0% |
| Weighted Average(3) | 355 months | ||
| (2) | The original amortization term shown for any mortgage loan that is interest-only for part of its term does not include the number of months in its interest-only period and reflects only the number of months as of the commencement of amortization remaining from the end of such interest-only period. |
| (3) | Excludes the non-amortizing mortgage loans. |
| REMAINING AMORTIZATION TERM(4) | |||
| Range of Remaining Amortization Terms (months) | Number of Mortgage Loans | Aggregate Cut- off Date Balance | Percent by Aggregate Cut- off Date Pool Balance (%) |
| Non- Amortizing | 11 | $232,975,650 | 32.2% |
| 236 - 297 | 1 | 8,615,217 | 1.2 |
| 298 - 300 | 3 | 24,533,178 | 3.4 |
| 301 - 360 | 48 | 456,324,940 | 63.2 |
| Total: | 63 | $722,448,985 | 100.0% |
| Weighted Average(5) | 354 months | ||
| (4) | The remaining amortization term shown for any mortgage loan that is interest-only for part of its term does not include the number of months in its interest-only period and reflects only the number of months as of the commencement of amortization remaining from the end of such interest-only period. |
| (5) | Excludes the non-amortizing mortgage loans. |
| LOCKBOXES | |||
| Type of Lockbox | Number of Mortgage Loans | Aggregate Cut- off Date Balance | Percent by Aggregate Cut- off Date Pool Balance (%) |
| Springing | 42 | $302,465,327 | 41.9% |
| Hard/Springing Cash Management | 9 | 195,715,471 | 27.1 |
| Hard/Upfront Cash Management | 6 | 178,930,000 | 24.8 |
| None | 6 | 45,338,187 | 6.3 |
| Total: | 63 | $722,448,985 | 100.0% |
| PREPAYMENT PROVISION SUMMARY(6) | |||
| Prepayment Provision | Number of Mortgage Loans | Aggregate Cut- off Date Balance | Percent by Aggregate Cut- off Date Pool Balance (%) |
| Lockout / Defeasance / Open | 58 | $656,814,951 | 90.9% |
| Lockout / GRTR 1% or YM / Open | 4 | 58,479,034 | 8.1 |
| Lockout / GRTR 1% or YM or Defeasance / Open | 1 | 7,155,000 | 1.0 |
| Total: | 63 | $722,448,985 | 100.0% |
| (6) | As a result of property releases or the application of funds in a performance reserve, partial principal prepayments could occur during a period that voluntary principal prepayments are otherwise prohibited. |
| CUT-OFF DATE LOAN-TO-VALUE RATIO | |||
| Range of Cut-off Date LTV Ratios (%) | Number of Mortgage Loans | Aggregate Cut- off Date Balance | Percent by Aggregate Cut- off Date Pool Balance (%) |
| 43.8 - 45.0 | 2 | $34,550,000 | 4.8% |
| 45.1 - 50.0 | 5 | 85,335,000 | 11.8 |
| 50.1 - 55.0 | 2 | 12,774,919 | 1.8 |
| 55.1 - 60.0 | 10 | 131,651,825 | 18.2 |
| 60.1 - 65.0 | 20 | 255,054,270 | 35.3 |
| 65.1 - 70.0 | 16 | 108,536,471 | 15.0 |
| 70.1 - 75.0 | 8 | 94,546,500 | 13.1 |
| Total: | 63 | $722,448,985 | 100.0% |
| Weighted Average | 60.9% | ||
| BALLOON OR ARD LOAN-TO-VALUE RATIO | |||
| Range of Balloon or ARD LTV Ratios (%) | Number of Mortgage Loans | Aggregate Cut- off Date Balance | Percent by Aggregate Cut- off Date Pool Balance (%) |
| 36.6 - 40.0 | 3 | $23,665,217 | 3.3% |
| 40.1 - 45.0 | 5 | 103,974,919 | 14.4 |
| 45.1 - 50.0 | 11 | 92,902,870 | 12.9 |
| 50.1 - 55.0 | 12 | 106,733,149 | 14.8 |
| 55.1 - 60.0 | 17 | 132,970,084 | 18.4 |
| 60.1 - 65.0 | 13 | 233,077,746 | 32.3 |
| 65.1 - 66.6 | 2 | 29,125,000 | 4.0 |
| Total: | 63 | $722,448,985 | 100.0% |
| Weighted Average | 54.7% | ||
| AMORTIZATION TYPE | |||
| Amortization Type | Number of Mortgage Loans | Aggregate Cut- off Date Balance | Percent by Aggregate Cut- off Date Pool Balance (%) |
| Interest-only, Amortizing Balloon | 24 | $294,803,000 | 40.8% |
| Interest-only, Balloon | 10 | 202,975,650 | 28.1 |
| Amortizing Balloon | 27 | 181,340,335 | 25.1 |
| Interest-only, ARD | 1 | 30,000,000 | 4.2 |
| Interest-only, Amortizing ARD | 1 | 13,330,000 | 1.8 |
| Total: | 63 | $722,448,985 | 100.0% |
| ORIGINAL TERM OF INTEREST-ONLY PERIOD FOR PARTIAL IO LOANS | |||
| IO Terms (months) | Number of Mortgage Loans | Aggregate Cut- off Date Balance | Percent by Aggregate Cut- off Date Pool Balance (%) |
| 6 | 1 | $4,075,000 | 0.6% |
| 12 | 4 | 31,700,000 | 4.4 |
| 23 | 1 | 2,319,000 | 0.3 |
| 24 | 11 | 117,286,000 | 16.2 |
| 36 | 4 | 35,755,000 | 4.9 |
| 60 | 4 | 117,830,000 | 16.3 |
| Total: | 25 | $308,133,000 | 42.8% |
| Weighted Average | 38 months | ||
| SEASONING | |||
| Seasoning (months) | Number of Mortgage Loans | Aggregate Cut- off Date Balance | Percent by Aggregate Cut-off Date Pool Balance (%) |
| 0 | 18 | $188,215,500 | 26.1% |
| 1 | 21 | 302,294,333 | 41.8 |
| 2 | 12 | 133,231,960 | 18.4 |
| 3 | 7 | 74,844,297 | 10.4 |
| 4 | 2 | 11,700,093 | 1.6 |
| 5 | 2 | 8,616,828 | 1.2 |
| 7 | 1 | 3,545,975 | 0.5 |
| Total: | 63 | $722,448,985 | 100.0% |
| Weighted Average | 1 month | ||
THE INFORMATION IN THIS STRUCTURAL AND COLLATERAL TERM SHEET IS NOT COMPLETE AND MAY BE AMENDED PRIOR TO THE TIME OF SALE. THIS TERM SHEET IS NOT AN OFFER TO SELL THESE SECURITIES AND IT IS NOT A SOLICITATION OF AN OFFER TO BUY THESE SECURITIES IN ANY JURISDICTION WHERE THE OFFER OR SALE IS NOT PERMITTED.
17
| Wells Fargo Commercial Mortgage Trust 2018-C43 | Certain Terms and Conditions |
| V. | Certain Terms and Conditions |
| Allocation Between the Vertical RR Interest and the Other Certificates: | Amounts available for distributions to the holders of the Certificates (including the Vertical RR Interest) will be allocated between amounts available for distribution to the holders of the Vertical RR Interest, on the one hand, and to all other Certificates, referred to herein as the “Non-Sponsor Retained Certificates”, on the other hand. The portion of aggregate available funds allocable to (a) the Vertical RR Interest will be the product of such aggregate available funds multiplied by a fraction, expressed as a percentage, the numerator of which is the initial certificate balance of the Vertical RR Interest, and the denominator of which is the aggregate initial certificate balance of all of the Classes of Principal Balance Certificates; and (b) the Non-Sponsor Retained Certificates will at all times be the product of such aggregate available funds multiplied by the difference between 100% and the percentage referenced in clause (a) (each, the respective “Percentage Allocation Entitlement”). |
| Interest Entitlements: | The interest entitlement of each Class of Non-Sponsor Retained Certificates on each Distribution Date generally will be the interest accrued during the related Interest Accrual Period on the related Certificate Balance or Notional Amount at the related pass-through rate, net of any prepayment interest shortfalls allocated to that Class for such Distribution Date as described below. If prepayment interest shortfalls arise from voluntary prepayments (without Master Servicer consent) on particular non-specially serviced loans during any collection period, the Master Servicer is required to make a compensating interest payment to offset those shortfalls, generally up to an amount equal to the portion of its master servicing fees that accrue at 0.25 basis pointsper annum. The remaining amount of prepayment interest shortfalls will be allocated between the Vertical RR Interest, on the one hand, and the Non-Sponsor Retained Certificates, on the other hand, in accordance with their respective Percentage Allocation Entitlements. The prepayment interest shortfalls allocated to the Non-Sponsor Retained Certificates (other than the Class V and R Certificates) will be allocated among such Classes of Certificates entitled to interest, on apro ratabasis, based on their respective amounts of accrued interest for the related Distribution Date, to reduce the interest entitlement on each such class of Certificates. If a Class receives less than the entirety of its interest entitlement on any Distribution Date, then the shortfall (excluding any shortfall due to prepayment interest shortfalls), together with interest thereon, will be added to its interest entitlement for the next succeeding Distribution Date. |
| Aggregate Principal Distribution Amount: | The Aggregate Principal Distribution Amount for each Distribution Date generally will be the aggregate amount of principal received or advanced in respect of the mortgage loans, net of any non-recoverable advances and interest thereon and workout-delayed reimbursement amounts that are reimbursed to the Master Servicer, the Special Servicer or the Trustee during the related collection period. Non-recoverable advances and interest thereon are reimbursable from principal collections and advances before reimbursement from other amounts. Workout-delayed reimbursement amounts are reimbursable from principal collections. The Non-Sponsor Retained Certificates will be entitled to the portion of the Aggregate Principal Distribution Amount equal to their Percentage Allocation Entitlement, which is referred to herein as the “Principal Distribution Amount”. |
| Subordination, Allocation of Losses and Certain Expenses | The chart below describes the manner in which the payment rights of certain Classes of Non-Sponsor Retained Certificates will be senior or subordinate, as the case may be, to the payment rights of other Classes of Non-Sponsor Retained Certificates. The chart also shows the allocation between the Vertical RR Interest and the Non-Sponsor Retained Certificates and the corresponding entitlement to receive principal and/or interest of certain Classes of Non-Sponsor Retained Certificates (other than excess interest that accrues on each mortgage loan that has an anticipated repayment date) on any distribution date in descending order. It also shows the manner in which losses are allocated between the Vertical RR Interest and the Non-Sponsor Retained Certificates and the manner in which the Non-Sponsor Retained Certificate allocations are further allocated to certain Classes of those Certificates in ascending order (beginning with the Non-Offered Certificates, and other than the Class V and R certificates and the Vertical RR Interest) to reduce the balance of each such class to zero;provided that no principal payments or mortgage loan losses will be allocated to the Class X-A, X-B, X-D, V or R Certificates, although principal payments and losses may reduce the notional amounts of the Class X-A, X-B and X-D certificates and, therefore, the amount of interest they accrue. |
THE INFORMATION IN THIS STRUCTURAL AND COLLATERAL TERM SHEET IS NOT COMPLETE AND MAY BE AMENDED PRIOR TO THE TIME OF SALE. THIS TERM SHEET IS NOT AN OFFER TO SELL THESE SECURITIES AND IT IS NOT A SOLICITATION OF AN OFFER TO BUY THESE SECURITIES IN ANY JURISDICTION WHERE THE OFFER OR SALE IS NOT PERMITTED.
18
| Wells Fargo Commercial Mortgage Trust 2018-C43 | Certain Terms and Conditions |
 | |
| (1) | The Class X-A, X-B and X-D Certificates are interest-only certificates. | |
| (2) | The Class X-D Certificates and the Vertical RR Interest are Non-Offered Certificates. | |
| (3) | Other than the Class X-D, V and R Certificates and the Vertical RR Interest. |
| Distributions: | On each Distribution Date, funds available for distribution from the mortgage loans, net of specified trust fees, expenses and reimbursements, that are allocable to the Non-Sponsor Retained Certificates will generally be distributed in the following amounts and order of priority (in each case to the extent of remaining available funds): |
| 1. Class A-1, A-2, A-SB, A-3, A-4, X-A, X-B and X-D Certificates: To interest on the Class A-1, A-2, A-SB, A-3, A-4, X-A, X-B and X-D Certificates,pro rata, according to their respective interest entitlements. | |
| 2. Class A-1, A-2, A-SB, A-3 and A-4 Certificates: To principal on the Class A-1, A-2, A-SB, A-3 and A-4 Certificates in the following amounts and order of priority: (i) first, to principal on the Class A-SB Certificates, in an amount up to the Principal Distribution Amount for such Distribution Date until their Certificate Balance is reduced to the Class A-SB Planned Principal Balance for such Distribution Date; (ii) second, to principal on the Class A-1 Certificates until their Certificate Balance is reduced to zero, up to the remainder of the Principal Distribution Amount for such Distribution Date; (iii) third, to principal on the Class A-2 Certificates until their Certificate Balance is reduced to zero, up to the remainder of the Principal Distribution Amount for such Distribution Date; (iv) fourth, to principal on the Class A-3 Certificates, until their Certificate Balance is reduced to zero, up to the remainder of the Principal Distribution Amount for such Distribution Date; (v) fifth, to principal on the Class A-4 Certificates until their Certificate Balance is reduced to zero, up to the remainder of the Principal Distribution Amount for such Distribution Date; and (vi) sixth, to principal on the Class A-SB Certificates until their Certificate Balance is reduced to zero, up to the remainder of the Principal Distribution Amount for such Distribution Date. However, if the Certificate Balance of each Class of Principal Balance Certificates, other than the Class A-1, A-2, A-SB, A-3 and A-4 Certificates and the Vertical RR Interest, has been reduced to zero as a result of the allocation of Mortgage Loan losses and expenses and any of the Class A-1, A-2, A-SB, A-3 and A-4 Certificates remains outstanding, then the Principal Distribution Amount will be distributed to the Class A-1, A-2, A-SB, A-3 and A-4 Certificates,pro rata, based on their respective outstanding Certificate Balances, until their Certificate Balances have been reduced to zero. |
THE INFORMATION IN THIS STRUCTURAL AND COLLATERAL TERM SHEET IS NOT COMPLETE AND MAY BE AMENDED PRIOR TO THE TIME OF SALE. THIS TERM SHEET IS NOT AN OFFER TO SELL THESE SECURITIES AND IT IS NOT A SOLICITATION OF AN OFFER TO BUY THESE SECURITIES IN ANY JURISDICTION WHERE THE OFFER OR SALE IS NOT PERMITTED.
19
| Wells Fargo Commercial Mortgage Trust 2018-C43 | Certain Terms and Conditions |
| 3. Class A-1, A-2, A-SB, A-3 and A-4 Certificates: To reimburse the holders of the Class A-1, A-2, A-SB, A-3 and A-4 Certificates,pro rata, on the basis of previously allocated unreimbursed losses, for any previously unreimbursed losses (plus interest thereon) on the mortgage loans that were previously allocated in reduction of the Certificate Balances of such Classes. | |
4. Class A-S Certificates: To make distributions on the Class A-S Certificates as follows: (a) first, to interest on the Class A-S Certificates in the amount of the interest entitlement for that Class; (b) next, to the extent of the portion of the Principal Distribution Amount remaining after distributions in respect of principal to each Class with a higher distribution priority (in this case, the Class A-1, A-2, A-SB, A-3 and A-4 Certificates), to principal on the Class A-S Certificates until their Certificate Balance is reduced to zero; and (c) next, to reimburse the holders of the Class A-S Certificates for any previously unreimbursed losses (plus interest thereon) on the mortgage loans that were previously allocated to that Class in reduction of their Certificate Balance.
5. Class B Certificates: To make distributions on the Class B Certificates as follows: (a) first, to interest on the Class B Certificates in the amount of the interest entitlement for that Class; (b) next, to the extent of the portion of the Principal Distribution Amount remaining after distributions in respect of principal to each Class with a higher distribution priority (in this case, the Class A-1, A-2, A-SB, A-3, A-4 and A-S Certificates), to principal on the Class B Certificates until their Certificate Balance is reduced to zero; and (c) next, to reimburse the holders of the Class B Certificates for any previously unreimbursed losses (plus interest thereon) on the mortgage loans that were previously allocated to that Class in reduction of their Certificate Balance.
6. Class C Certificates: To make distributions on the Class C Certificates as follows: (a) first, to interest on the Class C Certificates in the amount of the interest entitlement for that Class; (b) next, to the extent of the portion of the Principal Distribution Amount remaining after distributions in respect of principal to each Class with a higher distribution priority (in this case, the Class A-1, A-2, A-SB, A-3, A-4, A-S and B Certificates), to principal on the Class C Certificates until their Certificate Balance is reduced to zero; and (c) next, to reimburse the holders of the Class C Certificates for any previously unreimbursed losses (plus interest thereon) on the mortgage loans that were previously allocated to that Class in reduction of their Certificate Balance.
7. After the Class A-1, A-2, A-SB, A-3, A-4, A-S, B and C Certificates are paid all amounts to which they are entitled, the remaining funds available for distribution will be used to pay interest, principal and loss reimbursement amounts on the Class D, E, F and G Certificates sequentially in that order in a manner analogous to the Class C Certificates. |
| Allocation of Yield Maintenance and Prepayment Premiums: | If any yield maintenance charge or prepayment premium is collected during any particular collection period with respect to any mortgage loan, then on the Distribution Date corresponding to that collection period, the certificate administrator will pay that yield maintenance charge or prepayment premium (net of liquidation fees payable therefrom) in the following manner: (x)(1) to each of the Class A-1, A-2, A-SB, A-3, A-4, A-S, B, C and D Certificates, the product of (a) the Non-Sponsor Retained Certificates’ Percentage Allocation Entitlement of the yield maintenance charge or prepayment premium, (b) the related Base Interest Fraction (as defined in the Preliminary Prospectus) for such Class, and (c) a fraction, the numerator of which is equal to the amount of principal distributed to such Class for that Distribution Date, and the denominator of which is the total amount of principal distributed to all Principal Balance Certificates (other than the Vertical RR Interest) for that Distribution Date, (2) to the Class X-A Certificates, the excess, if any, of (a) the product of (i) the Non-Sponsor Retained Certificates’ Percentage Allocation Entitlement of such yield maintenance charge or prepayment premium and (ii) a fraction, the numerator of which is equal to the amount of principal distributed to the Class A-1, A-2, A-SB, A-3 and A-4 Certificates for that Distribution Date, and the denominator of which is the total amount of principal distributed to all Principal Balance Certificates (other than the Vertical RR Interest) for that Distribution Date, over (b) the amount of such yield maintenance charge or prepayment premium distributed to the Class A-1, A-2, A-SB, A-3 and A-4 Certificates as described above, and (3) to the Class X-B Certificates, any remaining portion of the Non-Sponsor Retained Percentage of such yield maintenance charge or prepayment premium not distributed as described above and (y) to the Vertical RR Interest, its Percentage Allocation Entitlement of the yield maintenance charges or prepayment premiums.
No prepayment premiums or yield maintenance charges will be distributed to the holders of the Class X-D, E, F, G, V or R certificates. For a description of when prepayment premiums and yield maintenance charges are generally required on the mortgage loans, see Annex A-1 to the Preliminary Prospectus. See also “Risk Factors—Risks Relating to the Mortgage Loans—Risks Relating to Enforceability of Yield Maintenance Charges, Prepayment Premiums or Defeasance |
THE INFORMATION IN THIS STRUCTURAL AND COLLATERAL TERM SHEET IS NOT COMPLETE AND MAY BE AMENDED PRIOR TO THE TIME OF SALE. THIS TERM SHEET IS NOT AN OFFER TO SELL THESE SECURITIES AND IT IS NOT A SOLICITATION OF AN OFFER TO BUY THESE SECURITIES IN ANY JURISDICTION WHERE THE OFFER OR SALE IS NOT PERMITTED.
20
| Wells Fargo Commercial Mortgage Trust 2018-C43 | Certain Terms and Conditions |
| Provisions” and “Risk Factors—Other Risks Relating to the Certificates—Your Yield May Be Affected by Defaults, Prepayments and Other Factors” in the Preliminary Prospectus. Prepayment premiums and yield maintenance charges will be distributed on each Distribution Date only to the extent they are actually received on the mortgage loans as of the related Determination Date. | |
| Realized Losses: | The Certificate Balances of the Class A-1, A-2, A-SB, A-3, A-4, A-S, B, C, D, E, F and G Certificates will be reduced without distribution on any Distribution Date as a write-off to the extent of the Non-Sponsor Retained Certificates’ Percentage Allocation Entitlement of any losses realized on the mortgage loans allocated to such Class on such Distribution Date. Such losses will be applied in the following order, in each case until the related Certificate Balance is reduced to zero: first, to the Class G Certificates; second, to the Class F Certificates; third, to the Class E Certificates; fourth, to the Class D Certificates; fifth, to the Class C Certificates; sixth, to the Class B Certificates; seventh, to the Class A-S Certificates; and, finally,pro rata, to the Class A-1, A-2, A-SB, A-3 and A-4 Certificates based on their outstanding Certificate Balances.
The notional amount of the Class X-A Certificates will be reduced by the amount of all losses that are allocated to the Class A-1, A-2, A-SB, A-3 or A-4 Certificates as write-offs in reduction of their Certificate Balances. The notional amount of the Class X-B Certificates will be reduced by the amount of all losses that are allocated to the Class A-S, B or C Certificates as write-offs in reduction of their Certificate Balances. The notional amount of the Class X-D Certificates will be reduced by the amount of all losses that are allocated to the Class D Certificates as write-offs in reduction of its Certificate Balance.
|
| P&I Advances: | The Master Servicer or, if the Master Servicer fails to do so, the Trustee, will be obligated to advance delinquent debt service payments (other than balloon payments, excess interest and default interest) and assumed debt service payments on mortgage loans with delinquent balloon payments (excluding any related companion loan), except to the extent any such advance is deemed non-recoverable from collections on the related mortgage loan. In addition, if an Appraisal Reduction Amount exists for a given mortgage loan, the interest portion of any P&I advance for such mortgage loan will be reduced, which will have the effect of reducing the amount of interest available for distribution to the Certificates, which with respect to the Non-Sponsor Retained Certificates will be applied in reverse alphabetical order of their Class designations (except that interest payments on the Class A-1, A-2, A-SB, A-3, A-4, X-A, X-B and X-D Certificates would be affected on apari passu basis). |
| Servicing Advances: | The Master Servicer or, if the Master Servicer fails to do so, the Trustee, will be obligated to make servicing advances, including the payment of delinquent property taxes, insurance premiums and ground rent, except to the extent that those advances are deemed non-recoverable from collections on the related mortgage loan. The Master Servicer or the Trustee, as applicable, will have the primary obligation to make any required servicing advances with respect to any serviced whole loan. With respect to any non-serviced whole loan, the master servicer or trustee, as applicable, under the related lead securitization servicing agreement will have the primary obligation to make any required servicing advances with respect to such non-serviced whole loan. |
Appraisal Reduction Amounts and Collateral Deficiency Amounts:
| An “Appraisal Reduction Amount” generally will be created in the amount, if any, by which the principal balance of a required appraisal loan (which is a mortgage loan with respect to which certain defaults, modifications or insolvency events have occurred as further described in the Preliminary Prospectus) plus other amounts overdue or advanced in connection with such mortgage loan exceeds 90% of the appraised value of the related mortgaged property plus certain escrows and reserves (including letters of credit) held with respect to the mortgage loan. With respect to any whole loan, any Appraisal Reduction Amount will be allocated,pro rata, to the related mortgage loan and the relatedpari passu companion loan(s).
A mortgage loan will cease to be a required appraisal loan when the same has ceased to be a specially serviced loan (if applicable), has been brought current for at least three consecutive months and no other circumstances exist that would cause such mortgage loan to be a required appraisal loan.
A “Collateral Deficiency Amount” will exist with respect to any mortgage loan that is modified into an AB loan structure and remains a corrected mortgage loan and will generally equal the excess of (i) the stated principal balance of such AB modified loan (taking into account the related junior note(s) and anypari passu notes included therein), over (ii) the sum of (in the case of a whole loan, solely to the extent allocable to the subject mortgage loan) (x) the most recent appraised value of the related mortgaged property plus (y) solely to the extent not reflected or taken into account in such appraised value and to the extent on deposit with, or otherwise under the control of, the lender as of the date of such determination, any capital or additional collateral contributed by the related borrower at the time the mortgage loan (and as part of the modification thereto) became an AB modified loan plus (z) any other escrows or |
THE INFORMATION IN THIS STRUCTURAL AND COLLATERAL TERM SHEET IS NOT COMPLETE AND MAY BE AMENDED PRIOR TO THE TIME OF SALE. THIS TERM SHEET IS NOT AN OFFER TO SELL THESE SECURITIES AND IT IS NOT A SOLICITATION OF AN OFFER TO BUY THESE SECURITIES IN ANY JURISDICTION WHERE THE OFFER OR SALE IS NOT PERMITTED.
21
| Wells Fargo Commercial Mortgage Trust 2018-C43 | Certain Terms and Conditions |
| reserves (in addition to any amounts set forth in the immediately preceding clause (y)) held with respect to the mortgage loan as of the date of such determination. | |
| A “Cumulative Appraisal Reduction Amount” with respect to any mortgage loan will be the sum of any Appraisal Reduction Amount and any Collateral Deficiency Amount. | |
| Appraisal Reduction Amounts will affect the amount of debt service advances in respect of the related mortgage loan. Additionally, Cumulative Appraisal Reduction Amounts will be taken into account in the determination of the identity of the Class whose majority constitutes the “majority controlling class certificateholder” and is entitled to appoint the directing certificateholder. | |
Clean-Up Call and Exchange Termination:
| On each Distribution Date occurring after the aggregate unpaid principal balance of the pool of mortgage loans is less than 1.0% of the principal balance of the mortgage loans as of the cut-off date, certain specified persons will have the option to purchase all of the remaining mortgage loans (and the trust’s interest in all property acquired through exercise of remedies in respect of any mortgage loan) at the price specified in the Preliminary Prospectus. Exercise of the option will terminate the trust and retire the then-outstanding certificates.
If the aggregate Certificate Balances of each of the Class A-1, A-2, A-SB, A-3, A-4, A-S, B, C and D Certificates have been reduced to zero, the trust may also be terminated in connection with an exchange of all the then-outstanding certificates (other than the Class V and Class R Certificates and the Vertical RR Interest) for the mortgage loans and REO properties then remaining in the issuing entity, subject to payment of a price specified in the Preliminary Prospectus, but all of the holders of those outstanding Classes (other than the Class V and R Certificates and Vertical RR Interest) of certificates would have to voluntarily participate in the exchange.
|
| Liquidation Loan Waterfall: | Following the liquidation of any loan or property, the net liquidation proceeds generally will be applied (after reimbursement of advances and certain trust fund expenses), first, as a recovery of accrued interest, other than delinquent interest that was not advanced as a result of Appraisal Reduction Amounts, second, as a recovery of principal until all principal has been recovered, and then as a recovery of delinquent interest that was not advanced as a result of Appraisal Reduction Amounts. Please see “Description of the Certificates—Distributions—Application Priority of Mortgage Loan Collections or Whole Loan Collections” in the Preliminary Prospectus. |
| Control Eligible Certificates: | The Class E, F and G Certificates. |
| Directing Certificateholder/ Controlling Class: | A directing certificateholder may be appointed by the “majority controlling class certificateholder”, which will be the holder(s) of a majority of the “controlling class”, which means the most subordinate class of Certificates among the Control Eligible Certificates.
The “Controlling Class” will be, as of any time of determination, the most subordinate class of Control Eligible Certificates then outstanding that has an aggregate Certificate Balance (as notionally reduced by any Allocated Cumulative Appraisal Reduction Amounts allocable to such class(es)) at least equal to 25% of the initial Certificate Balance of that class;provided,however, that if at any time the Certificate Balances of the certificates other than the Control Eligible Certificates and the Vertical RR Interest have been reduced to zero as a result of principal payments on the Mortgage Loans, then the Controlling Class will be the most subordinate class of Control Eligible Certificates that has a Certificate Balance greater than zero without regard to any Allocated Cumulative Appraisal Reduction Amounts. The Controlling Class as of the Closing Date will be the Class G Certificates.
|
| Control and Consultation: | The rights of various parties to replace the Special Servicer and approve or consult with respect to major actions of the Special Servicer will vary according to defined periods. |
| A “Control Termination Event” will occur when the Class E Certificates have a Certificate Balance (taking into account the application of any Allocated Cumulative Appraisal Reduction Amounts to notionally reduce the Certificate Balance of such class) of less than 25% of the initial Certificate Balance of that Class;provided,however, that a Control Termination Event will not be deemed continuing in the event that the Certificate Balances of the certificates other than the Control Eligible Certificates and the Vertical RR Interest have been reduced to zero as a result of principal payments on the Mortgage Loans. | |
| A “Consultation Termination Event” will occur when there is no class of Control Eligible Certificates that has a then-outstanding Certificate Balance at least equal to 25% of the initial Certificate Balance of that Class, in each case, without regard to the application of any Allocated Cumulative Appraisal Reduction Amounts;provided,however, that a Consultation Termination Event will not be deemed continuing in the event that the Certificate Balances of the certificates other than the Control Eligible Certificates and the Vertical RR Interest have been reduced to zero as a result of principal payments on the Mortgage Loans. |
THE INFORMATION IN THIS STRUCTURAL AND COLLATERAL TERM SHEET IS NOT COMPLETE AND MAY BE AMENDED PRIOR TO THE TIME OF SALE. THIS TERM SHEET IS NOT AN OFFER TO SELL THESE SECURITIES AND IT IS NOT A SOLICITATION OF AN OFFER TO BUY THESE SECURITIES IN ANY JURISDICTION WHERE THE OFFER OR SALE IS NOT PERMITTED.
22
| Wells Fargo Commercial Mortgage Trust 2018-C43 | Certain Terms and Conditions |
If no Control Termination Event has occurred and is continuing, except with respect to the Excluded Loans (as defined below) with respect to the directing certificateholder and except with respect to Servicing Shift Whole Loans (as defined below) (i) the directing certificateholder will be entitled to grant or withhold approval of asset status reports prepared, and material servicing actions proposed, by the Special Servicer, and (ii) the directing certificateholder will be entitled to terminate and replace the Special Servicer with or without cause, and appoint itself or another person as the successor special servicer. It will be a condition to such appointment that DBRS, Fitch and Moody’s (and any rating agency rating any securities backed by anypari passu companion loan(s) serviced under this transaction) confirm that the appointment would not result in a qualification, downgrade or withdrawal of any of their then-current ratings of certificates (and any certificates backed by anypari passu companion loan(s) serviced under this transaction).
If a Control Termination Event has occurred and is continuing but no Consultation Termination Event has occurred and is continuing, the Special Servicer will be required to consult with the directing certificateholder (other than with respect to Excluded Loans as to such party) in connection with asset status reports and material special servicing actions.
If a Consultation Termination Event has occurred and is continuing, in general, no directing certificateholder will be recognized or have any right to terminate the Special Servicer or approve, direct or consult with respect to servicing matters.
With respect to each serviced whole loan that is not a Servicing Shift Whole Loan, the rights of the directing certificateholder described above will be subject to the consultation rights of the holders of the relatedpari passu companion loans. Those consultation rights will generally extend to asset status reports and material special servicing actions involving the related whole loan, will be as set forth in the related intercreditor agreement, and will be in addition to the rights of the directing certificateholder in this transaction described above.
With respect to each whole loan marked with footnote (2) under “IV. Characteristics of the Mortgage Pool—B. Summary of the Whole Loans” (each, a “Servicing Shift Whole Loan”), prior to date of securitization of the related controllingpari passucompanion loan (such date, a “Servicing Shift Securitization Date”), the holder of the related controllingpari passu companion loan will have certain control rights regarding the servicing of the related whole loan under the WFCM 2018-C43 pooling and servicing agreement, including the right to approve or disapprove various material servicing actions involving the related whole loan.
With respect to (x) each non-serviced whole loan and (y) each Servicing Shift Whole Loan after its Servicing Shift Securitization Date, the applicable servicing agreement for the related controllingpari passu companion loan(s) generally grants (or will grant) the directing certificateholder under the related securitization control rights that may include the right to approve or disapprove various material servicing actions involving the related whole loan. The directing certificateholder for this securitization (so long as no Consultation Termination Event has occurred and is occurring) generally will nonetheless have the right to be consulted on a non-binding basis with respect to such actions. For purposes of the servicing of any such whole loan contemplated by this paragraph, the occurrence and continuance of a Control Termination Event or Consultation Termination Event under this securitization will not limit the control or other rights of the directing certificateholder (or equivalent) under the securitization of the related controllingpari passu companion loan(s).
The control rights and consent and consultation rights described in the three preceding paragraphs are subject to various limitations, conditions and exceptions as described in the Preliminary Prospectus.
Notwithstanding any contrary description set forth above, in the event that, with respect to any mortgage loan, (a) with respect to the directing certificateholder, the majority controlling class certificateholder or the directing certificateholder or (b) with respect to the risk retention consultation party, the risk retention consultation party or the holder of the majority of the Vertical RR Interest, in either case, is a Borrower Party, the majority controlling class certificateholder and the directing certificateholder will have no right to receive asset status reports or such other information as may be specified in the pooling and servicing agreement, to grant or withhold approval of, or consult with respect to, asset status reports prepared, and material servicing actions proposed, by the Special Servicer, with respect to such mortgage loan, and such mortgage loan will be referred to as an “Excluded Loan” as to such party.
In addition, notwithstanding any contrary description set forth above, in the event that, with respect to any mortgage loan, a controlling class certificateholder is a Borrower Party, such controlling class certificateholder will have no right to receive asset status reports or such other information as may be specified in the pooling and servicing agreement with respect to such mortgage loan, and such controlling class certificateholder will be referred to as an “excluded controlling class holder”. |
THE INFORMATION IN THIS STRUCTURAL AND COLLATERAL TERM SHEET IS NOT COMPLETE AND MAY BE AMENDED PRIOR TO THE TIME OF SALE. THIS TERM SHEET IS NOT AN OFFER TO SELL THESE SECURITIES AND IT IS NOT A SOLICITATION OF AN OFFER TO BUY THESE SECURITIES IN ANY JURISDICTION WHERE THE OFFER OR SALE IS NOT PERMITTED.
23
| Wells Fargo Commercial Mortgage Trust 2018-C43 | Certain Terms and Conditions |
| “Borrower Party” means a borrower, a mortgagor or a manager of a mortgaged property, an Accelerated Mezzanine Loan Lender, or any Borrower Party Affiliate. “Accelerated Mezzanine Loan Lender” means a mezzanine lender under a mezzanine loan that has been accelerated or as to which foreclosure or enforcement proceedings have been commenced against the equity collateral pledged to secure such mezzanine loan. “Borrower Party Affiliate” means, with respect to a borrower, a mortgagor, a manager of a Mortgaged Property or an Accelerated Mezzanine Loan Lender, (x) any other person controlling or controlled by or under common control with such borrower, mortgagor, manager or Accelerated Mezzanine Loan Lender, as applicable, or (y) any other person owning, directly or indirectly, 25% or more of the beneficial interests in such borrower, mortgagor, manager or Accelerated Mezzanine Loan Lender. | |
| Risk Retention Consultation Party: | A risk retention consultation party may be appointed by the holder or holders of more than 50% of the Vertical RR Interest, by Certificate Balance. The majority Vertical RR Interest holder will have a continuing right to appoint, remove or replace the risk retention consultation party in its sole discretion. This right may be exercised at any time and from time to time.
Except with respect to an Excluded Loan as to such party, the risk retention consultation party will be entitled to consult with the Special Servicer, upon request of the risk retention consultation party, with respect to certain material servicing actions proposed by the Special Servicer.
|
| Replacement of Special Servicer: | If a Control Termination Event has occurred and is continuing, the Special Servicer (other than with respect to a Servicing Shift Whole Loan) may be removed and replaced without cause upon the affirmative direction of certificate owners holding not less than 66-2/3% of a certificateholder quorum, following a proposal from certificate owners holding not less than 25% of the appraisal-reduced voting rights of all Certificates. The certificateholders who initiate a vote on a termination and replacement of the Special Servicer without cause must cause DBRS, Fitch and Moody’s to confirm the then-current ratings of the certificates (or decline to review the matter) and cause the payment of the fees and expenses incurred in the replacement. If no Control Termination Event has occurred and is continuing, the Special Servicer (other than with respect to a Servicing Shift Whole Loan) may be replaced by the directing certificateholder, subject to DBRS, Fitch and Moody’s (and any Rating Agency rating any securities backed by anypari passu companion loan(s) serviced under this transaction) confirming the then-current ratings of the Certificates (and any certificates backed by anypari passucompanion loans serviced under this transaction) or declining to review the matter.
In addition, if at any time the Operating Advisor determines, in its sole discretion exercised in good faith, that (i) the Special Servicer is not performing its duties as required under the pooling and servicing agreement in accordance with the Servicing Standard and (ii) the replacement of the Special Servicer would be in the best interest of the certificateholders as a collective whole, then, the Operating Advisor will have the right to recommend the replacement of the Special Servicer and will submit its formal recommendation to the Trustee and the Certificate Administrator (along with its rationale, its proposed replacement special servicer and other relevant information justifying its recommendation).
The Operating Advisor’s recommendation to replace the Special Servicer must be confirmed by an affirmative vote of holders of Principal Balance Certificates evidencing at least a majority of a quorum of certificateholders (which, for this purpose, is the holders of Principal Balance Certificates that (i) evidence at least 20% of the Voting Rights (taking into account the application of any cumulative appraisal reduction amounts to notionally reduce the respective Certificate Balances) of all Principal Balance Certificates on an aggregate basis, and (ii) consist of at least three certificateholders or certificate owners that are not risk retention affiliated with each other). In the event the holders of Principal Balance Certificates evidencing at least a majority of a quorum of certificateholders elect to remove and replace the Special Servicer (which requisite affirmative votes must be received within 180 days of the posting of the notice of the Operating Advisor’s recommendation to replace the Special Servicer to the Certificate Administrator’s website), the Certificate Administrator will be required to receive a Rating Agency Confirmation from each of the Rating Agencies at that time.
|
| Excluded Special Servicer: | In the event that, with respect to any mortgage loan, the Special Servicer is a Borrower Party, the Special Servicer will be required to resign as special servicer of such mortgage loan (referred to as an “excluded special servicer loan”). If no Control Termination Event has occurred and is continuing, the directing certificateholder will be entitled to appoint (and may replace with or without cause) a separate special servicer that is not a Borrower Party (referred to as an “excluded special servicer”) with respect to such excluded special servicer loan unless such excluded special servicer loan is also an excluded loan. Otherwise, upon resignation of the Special Servicer with respect to an excluded special servicer loan, the resigning Special Servicer will be required to appoint the excluded special servicer. |
THE INFORMATION IN THIS STRUCTURAL AND COLLATERAL TERM SHEET IS NOT COMPLETE AND MAY BE AMENDED PRIOR TO THE TIME OF SALE. THIS TERM SHEET IS NOT AN OFFER TO SELL THESE SECURITIES AND IT IS NOT A SOLICITATION OF AN OFFER TO BUY THESE SECURITIES IN ANY JURISDICTION WHERE THE OFFER OR SALE IS NOT PERMITTED.
24
| Wells Fargo Commercial Mortgage Trust 2018-C43 | Certain Terms and Conditions |
| Appraisal Remedy: | If the Class of Certificates comprising the controlling class loses its status as controlling class because of the application of an Appraisal Reduction Amount or Collateral Deficiency Amount, the holders of a majority of the voting rights of such Class may require the Special Servicer to order a second appraisal for any mortgage loan in respect of which an Appraisal Reduction Amount or Collateral Deficiency Amount has been applied. The Special Servicer must thereafter determine whether, based on its assessment of such second appraisal, any recalculation of the Appraisal Reduction Amount or Collateral Deficiency Amount is warranted. Such Class will not be able to exercise any direction, control, consent and/or similar rights of the controlling class unless and until reinstated as the controlling class through such determination; and pending such determination, the rights of the controlling class will be exercised by the Control Eligible Certificates, if any, that would be the controlling class taking into account the subject appraisal reduction amount. |
| Sale of Defaulted Assets: | There will be no “fair value” purchase option. Instead, the pooling and servicing agreement will authorize the Special Servicer to sell defaulted mortgage loans serviced by such Special Servicer to the highest bidder in a manner generally similar to sales of REO properties.
The sale of a defaulted loan (other than a non-serviced whole loan) for less than par plus accrued interest and certain other fees and expenses owed on the loan will be subject to consent or consultation rights of the directing certificateholder and/or Operating Advisor, as described in the Preliminary Prospectus. Generally speaking, the holder of apari passu companion loan will have consent and/or consultation rights, as described in the Preliminary Prospectus.
With respect to (x) any serviced whole loan and (y) any Servicing Shift Whole Loan prior to its Servicing Shift Securitization Date, if such whole loan becomes a defaulted loan under the WFCM 2018-C43 pooling and servicing agreement, the Special Servicer will generally be required to sell both the mortgage loan and the relatedpari passu companion loan(s) as a single whole loan.
With respect to (x) each non-serviced whole loan and (y) each Servicing Shift Whole Loan after its related Servicing Shift Securitization Date, the applicable servicing agreement governing the servicing of such whole loan generally will provide that, if the relatedpari passu companion loan(s) serviced under such agreement become a defaulted loan under such servicing agreement, then the related special servicer may offer to sell to any person (or may offer to purchase) for cash such whole loan during such time as such applicablepari passucompanion loan(s) constitute a defaulted loan under such servicing agreement. Generally speaking, in connection with any such sale, the related special servicer is required to sell both the mortgage loan and the related pari passu companion loan(s) as a whole loan. The directing certificateholder for this securitization generally will have consent and/or consultation rights as the holder of an interest in the related mortgage loan, as described in the Preliminary Prospectus.
The procedures for the sale of any whole loan that becomes a defaulted whole loan, and any associated consultation rights, are subject to various limitations, conditions and exceptions as described in the Preliminary Prospectus.
|
| “As-Is” Appraisals: | Appraisals must be conducted on an “as-is” basis, and must be no more than 12 months old, for purposes of determining Appraisal Reduction Amounts and market value in connection with REO sales. Required appraisals may consist of updates of prior appraisals. Internal valuations by the Special Servicer are permitted if the principal balance of a mortgage loan is less than $2,000,000. |
| Operating Advisor: | The Operating Advisor will have certain review and consultation rights relating to the performance of the Special Servicer and with respect to its actions taken in connection with the resolution and/or liquidation of Specially Serviced Loans. With respect to each mortgage loan or Serviced Whole Loan (in each case, other than a Non-Serviced Mortgage Loan), the Operating Advisor will be responsible for:
● reviewing the actions of the Special Servicer with respect to any Specially Serviced Loan;
● reviewing (i) all reports by the Special Servicer made available to Privileged Persons on the Certificate Administrator’s website and (ii) each Asset Status Report (as defined in the Preliminary Prospectus) (after the occurrence and during the continuance of an Operating Advisor Consultation Event (as defined below)) and Final Asset Status Report (as defined in the Preliminary Prospectus); |
THE INFORMATION IN THIS STRUCTURAL AND COLLATERAL TERM SHEET IS NOT COMPLETE AND MAY BE AMENDED PRIOR TO THE TIME OF SALE. THIS TERM SHEET IS NOT AN OFFER TO SELL THESE SECURITIES AND IT IS NOT A SOLICITATION OF AN OFFER TO BUY THESE SECURITIES IN ANY JURISDICTION WHERE THE OFFER OR SALE IS NOT PERMITTED.
25
| Wells Fargo Commercial Mortgage Trust 2018-C43 | Certain Terms and Conditions |
● recalculating and verifying the accuracy of the mathematical calculations by the special servicer and the corresponding application of the non-discretionary portion of the applicable formulas required to be utilized in connection with Appraisal Reduction Amounts, Collateral Deficiency Amounts and net present value calculations used in the Special Servicer’s determination of what course of action to take in connection with the workout or liquidation of a Specially Serviced Loan; and
● preparing an annual report (if any mortgage loan (other than any Non-Serviced Mortgage Loan) or Serviced Whole Loan was a Specially Serviced Loan at any time during the prior calendar year or an Operating Advisor Consultation Event (as defined below) occurred during the prior calendar year) that sets forth whether the Operating Advisor believes, in its sole discretion exercised in good faith, that the Special Servicer is operating in compliance with the Servicing Standard with respect to its performance of its duties under the pooling and servicing agreement with respect to Specially Serviced Loans (and, after the occurrence and continuance of an Operating Advisor Consultation Event (as defined below), with respect to major decisions on non-Specially Serviced Loans) during the prior calendar year on an “asset-level basis”. The Operating Advisor will identify (1) which, if any, standards the Operating Advisor believes, in its sole discretion exercised in good faith, the Special Servicer has failed to comply and (2) any material deviations from the Special Servicer’s obligations under the pooling and servicing agreement with respect to the resolution or liquidation of any Specially Serviced Loan or REO Property (other than with respect to any REO Property related to any Non-Serviced Mortgage Loan or any Servicing Shift Mortgage Loan). In preparing any Operating Advisor Annual Report (as defined in the Preliminary Prospectus), the Operating Advisor will not be required to report on instances of non-compliance with, or deviations from, the Servicing Standard or the Special Servicer’s obligations under the pooling and servicing agreement that the Operating Advisor determines, in its sole discretion exercised in good faith, to be immaterial.
With respect to each mortgage loan (other than any Non-Serviced Mortgage Loan) or Serviced Whole Loan, after the Operating Advisor has received notice that an Operating Advisor Consultation Event (as defined below) has occurred and is continuing, in addition to the duties described above, the Operating Advisor will be required to perform the following additional duties:
● to consult (on a non-binding basis) with the Special Servicer in respect of asset status reports and
● to consult (on a non-binding basis) with the Special Servicer with respect to “major decisions” processed by the Special Servicer.
An “Operating Advisor Consultation Event” will occur when the Certificate Balances of the Class E, F and G certificates in the aggregate (taking into account the application of any Allocated Cumulative Appraisal Reduction Amounts to notionally reduce the Certificate Balances of such classes) is 25% or less of the initial Certificate Balances of such classes in the aggregate.
| |
| Asset Representations Reviewer: | The Asset Representations Reviewer will be required to review certain delinquent mortgage loans after a specified delinquency threshold has been exceeded (an “Asset Review Trigger”) and the required percentage of certificateholders vote to direct a review of such delinquent loans. An Asset Review Trigger will occur when either (1) mortgage loans with an aggregate outstanding principal balance of 25.0% or more of the aggregate outstanding principal balance of all of the mortgage loans (including any REO loans (or a portion of any REO loan in the case of a whole loan) held by the issuing entity as of the end of the applicable collection period are delinquent loans or (2) at least 15 mortgage loans are delinquent loans as of the end of the applicable collection period and the outstanding principal balance of such delinquent loans in the aggregate constitutes at least 20.0% of the aggregate outstanding principal balance of all of the mortgage loans (including any REO loans (or a portion of any REO loan in the case of a whole loan)) held by the issuing entity as of the end of the applicable collection period. See “Pooling and Servicing Agreement—The Asset Representations Reviewer—Asset Review” in the Preliminary Prospectus.
The Asset Representations Reviewer may be terminated and replaced without cause. Upon (i) the written direction of certificateholders evidencing not less than 25% of the voting rights (without regard to the application of any Allocated Cumulative Appraisal Reduction Amounts) requesting a vote to terminate and replace the Asset Representations Reviewer with a proposed successor Asset Representations Reviewer that is an eligible asset representations reviewer, and (ii) payment by such holders to the certificate administrator of the reasonable fees and
|
THE INFORMATION IN THIS STRUCTURAL AND COLLATERAL TERM SHEET IS NOT COMPLETE AND MAY BE AMENDED PRIOR TO THE TIME OF SALE. THIS TERM SHEET IS NOT AN OFFER TO SELL THESE SECURITIES AND IT IS NOT A SOLICITATION OF AN OFFER TO BUY THESE SECURITIES IN ANY JURISDICTION WHERE THE OFFER OR SALE IS NOT PERMITTED.
26
| Wells Fargo Commercial Mortgage Trust 2018-C43 | Certain Terms and Conditions |
| expenses to be incurred by the certificate administrator in connection with administering such vote, the certificate administrator will promptly provide notice to all certificateholders and the Asset Representations Reviewer of such request by posting such notice on its internet website, and by mailing such notice to all certificateholders and the Asset Representations Reviewer. Upon the written direction of certificateholders evidencing at least 75% of a certificateholder quorum (without regard to the application of any Allocated Cumulative Appraisal Reduction Amounts), the Trustee will terminate all of the rights and obligations of the Asset Representations Reviewer under the pooling and servicing agreement by written notice to the Asset Representations Reviewer, and the proposed successor Asset Representations Reviewer will be appointed. See “Pooling and Servicing Agreement—The Asset Representations Reviewer” in the Preliminary Prospectus. |
| Dispute Resolution Provisions: | The mortgage loan sellers will be subject to the dispute resolution provisions set forth in the pooling and servicing agreement to the extent those provisions are triggered with respect to any mortgage loan sold to the depositor by a mortgage loan seller and such mortgage loan seller will be obligated under the related mortgage loan purchase agreement to comply with all applicable provisions and to take part in any mediation or arbitration proceedings that may result.
Generally, in the event that a Repurchase Request (as defined in the Preliminary Prospectus) is not “Resolved” (as defined below) within 180 days after the related mortgage loan seller receives such Repurchase Request, then the enforcing servicer will be required to send a notice to the “Initial Requesting Certificateholder” (if any) and the Certificate Administrator indicating the enforcing servicer’s intended course of action with respect to the Repurchase Request. If (a) the enforcing servicer’s intended course of action with respect to the Repurchase Request does not involve pursuing further action to exercise rights against the related mortgage loan seller with respect to the Repurchase Request and the Initial Requesting Certificateholder, if any, or any other certificateholder or certificate owner wishes to exercise its right to refer the matter to mediation (including non-binding arbitration) or arbitration, or (b) the enforcing servicer’s intended course of action is to pursue further action to exercise rights against the related mortgage loan seller with respect to the Repurchase Request but the Initial Requesting Certificateholder, if any, or any other certificateholder or certificate owner does not agree with the dispute resolution method selected by the enforcing servicer, then the Initial Requesting Certificateholder, if any, or such other certificateholder or certificate owner may deliver a written notice to the Special Servicer indicating its intent to exercise its right to refer the matter to either mediation or arbitration.
“Resolved” means, with respect to a Repurchase Request, (i) that the related Material Defect has been cured, (ii) the related mortgage loan has been repurchased in accordance with the related mortgage loan purchase agreement, (iii) a mortgage loan has been substituted for the related mortgage loan in accordance with the related mortgage loan purchase agreement, (iv) the applicable mortgage loan seller has made a Loss of Value Payment (as defined in the Preliminary Prospectus), (v) a contractually binding agreement is entered into between the enforcing servicer, on behalf of the issuing entity, and the related mortgage loan seller that settles the related mortgage loan seller’s obligations under the related mortgage loan purchase agreement or (vi) the related mortgage loan is no longer property of the issuing entity as a result of a sale or other disposition in accordance with the pooling and servicing agreement. See “Pooling and Servicing Agreement—Dispute Resolution Provisions” in the Preliminary Prospectus.
|
| Investor Communications: | The certificate administrator is required to include on any Form 10–D any request received from a certificateholder to communicate with other certificateholders related to certificateholders exercising their rights under the terms of the pooling and servicing agreement. Any certificateholder wishing to communicate with other certificateholders regarding the exercise of its rights under the terms of the pooling and servicing agreement will be able to deliver a written request signed by an authorized representative of the requesting investor to the certificate administrator. |
| Certain Fee Offsets: | If a workout fee is earned by the Special Servicer following a loan default with respect to any mortgage loan that it services, then certain limitations will apply based on modification fees paid by the borrower. The modification fee generally must not exceed 1% of the principal balance of the loan as modified in any 12-month period. In addition, if the loan re-defaults, any subsequent workout fee on that loan must be reduced by a portion of the modification fees paid by the borrower in the previous 12-months. Likewise, liquidation fees collected in connection with a liquidation or partial liquidation of a mortgage loan must be reduced by a portion of the modification fees paid by the borrower in the previous 12 months. |
THE INFORMATION IN THIS STRUCTURAL AND COLLATERAL TERM SHEET IS NOT COMPLETE AND MAY BE AMENDED PRIOR TO THE TIME OF SALE. THIS TERM SHEET IS NOT AN OFFER TO SELL THESE SECURITIES AND IT IS NOT A SOLICITATION OF AN OFFER TO BUY THESE SECURITIES IN ANY JURISDICTION WHERE THE OFFER OR SALE IS NOT PERMITTED.
27
| Wells Fargo Commercial Mortgage Trust 2018-C43 | Certain Terms and Conditions |
| Deal Website: | The Certificate Administrator will be required to maintain a deal website, which will include, among other items: (a) summaries of asset status reports prepared by the Special Servicer, (b) inspection reports, (c) appraisals, (d) various “special notices” described in the Preliminary Prospectus, (e) the “Investor Q&A Forum”, (f) a voluntary “Investor Registry” and (g) the “Risk Retention” tab. Investors may access the deal website following execution of a certification and confidentiality agreement. |
| Initial Majority Controlling Class Certificateholder: | It is expected that KKR Real Estate Credit Opportunity Partners Aggregator I L.P. or an affiliate will be the initial majority controlling class certificateholder. |
| Whole Loans: | Each of the mortgaged properties identified above under “IV. Characteristics of the Mortgage Pool—B. Summary of the Whole Loans” secures both a mortgage loan to be included in the trust fund and one or more other mortgage loans that will not be included in the trust fund, each of which will bepari passu or subordinate in right of payment with the mortgage loan included in the trust fund. We refer to each such group of mortgage loans as a “whole loan”. Such “—Summary of the Whole Loans” section includes further information regarding the various notes in each whole loan, the holders of such notes, the lead servicing agreement for each such whole loan, and the master servicer and special servicer under such lead servicing agreement. |
THE INFORMATION IN THIS STRUCTURAL AND COLLATERAL TERM SHEET IS NOT COMPLETE AND MAY BE AMENDED PRIOR TO THE TIME OF SALE. THIS TERM SHEET IS NOT AN OFFER TO SELL THESE SECURITIES AND IT IS NOT A SOLICITATION OF AN OFFER TO BUY THESE SECURITIES IN ANY JURISDICTION WHERE THE OFFER OR SALE IS NOT PERMITTED.
28
(THIS PAGE INTENTIONALLY LEFT BLANK)
THE INFORMATION IN THIS STRUCTURAL AND COLLATERAL TERM SHEET IS NOT COMPLETE AND MAY BE AMENDED PRIOR TO THE TIME OF SALE. THIS TERM SHEET IS NOT AN OFFER TO SELL THESE SECURITIES AND IT IS NOT A SOLICITATION OF AN OFFER TO BUY THESE SECURITIES IN ANY JURISDICTION WHERE THE OFFER OR SALE IS NOT PERMITTED.
29
| MOFFETT TOWERS II – BUILDING 2 |

THE INFORMATION IN THIS STRUCTURAL AND COLLATERAL TERM SHEET IS NOT COMPLETE AND MAY BE AMENDED PRIOR TO THE TIME OF SALE. THIS TERM SHEET IS NOT AN OFFER TO SELL THESE SECURITIES AND IT IS NOT A SOLICITATION OF AN OFFER TO BUY THESE SECURITIES IN ANY JURISDICTION WHERE THE OFFER OR SALE IS NOT PERMITTED.
30
| MOFFETT TOWERS II – BUILDING 2 |

THE INFORMATION IN THIS STRUCTURAL AND COLLATERAL TERM SHEET IS NOT COMPLETE AND MAY BE AMENDED PRIOR TO THE TIME OF SALE. THIS TERM SHEET IS NOT AN OFFER TO SELL THESE SECURITIES AND IT IS NOT A SOLICITATION OF AN OFFER TO BUY THESE SECURITIES IN ANY JURISDICTION WHERE THE OFFER OR SALE IS NOT PERMITTED.
31
| No. 1 – Moffett Towers II - Building 2 | ||||||||
| Loan Information | Property Information | |||||||
| Mortgage Loan Seller: | Barclays Bank PLC | Single Asset/Portfolio: | Single Asset | |||||
| Credit Assessment | Property Type: | Office | ||||||
| (DBRS/Fitch/Moody’s): | BBB/BBB-/NR | Specific Property Type: | Suburban | |||||
| Original Principal Balance(1): | $54,000,000 | Location: | Sunnyvale, CA | |||||
| Cut-off Date Balance(1): | $54,000,000 | Size(5): | 362,563 SF | |||||
| % of Initial Pool Balance: | 7.5% | Cut-off Date Balance Per SF(1)(5): | $455.09 | |||||
| Loan Purpose: | Refinance | Year Built/Renovated: | 2017/NAP | |||||
| Borrower Name: | MT2 B2 LLC | Title Vesting: | Fee | |||||
| Borrower Sponsor: | The Jay Paul Company | Property Manager: | Self-managed | |||||
| Mortgage Rate: | 3.6189% | 4thMost Recent Occupancy (As of)(6): | NAP | |||||
| Note Date: | November 16, 2017 | 3rdMost Recent Occupancy (As of)(6): | NAP | |||||
| Anticipated Repayment Date: | NAP | 2ndMost Recent Occupancy (As of)(6): | NAP | |||||
| Maturity Date: | December 6, 2027 | Most Recent Occupancy (As of)(6): | NAP | |||||
| IO Period: | 60 months | Current Occupancy (As of): | 100.0% (12/1/2017) | |||||
| Loan Term (Original): | 120 months | |||||||
| Seasoning: | 3 months | |||||||
| Amortization Term (Original): | 360 months | Underwriting and Financial Information: | ||||||
| Loan Amortization Type: | Interest-only, Amortizing Balloon | 4thMost Recent NOI (As of)(6): | NAP | |||||
| Interest Accrual Method: | Actual/360 | 3rdMost Recent NOI (As of)(6): | NAP | |||||
| Call Protection(2): | L(27),D(86),O(7) | 2ndMost Recent NOI (As of)(6): | NAP | |||||
| Lockbox Type: | Hard/Upfront Cash Management | Most Recent NOI (As of)(6): | NAP | |||||
| Additional Debt(1): | Yes | |||||||
| Additional Debt Type(1)(3): | Pari Passu; Mezzanine | |||||||
| U/W Revenues: | $22,525,092 | |||||||
| U/W Expenses: | $2,840,101 | |||||||
| U/W NOI: | $19,684,992 | |||||||
| Escrows and Reserves(4): | U/W NCF: | $18,805,659 | ||||||
| U/W NOI DSCR(1): | 2.18x | |||||||
| Type: | Initial | Monthly(4) | Cap (If Any) | U/W NCF DSCR(1): | 2.08x | |||
| Taxes | $0 | $111,859 | NAP | U/W NOI Debt Yield(1): | 11.9% | |||
| Insurance | $0 | Springing | NAP | U/W NCF Debt Yield(1): | 11.4% | |||
| Rent Concessions Reserve | $8,332,337 | $0 | NAP | As-Is Appraised Value: | $351,000,000 | |||
| TI/LC Reserve | $19,433,495 | $0 | NAP | As-Is Appraisal Valuation Date: | October 18, 2017 | |||
| Debt Service Reserve | $1,000,000 | Springing | NAP | Cut-off Date LTV Ratio(1): | 47.0% | |||
| Parking Abatement Reserve | $2,700,000 | Springing | NAP | LTV Ratio at Maturity or ARD(1): | 42.4% | |||
| Amenities Rent Reserve | $286,310 | Springing | NAP | |||||
| (1) | See “The Mortgage Loan” section. All statistical information related to balance per square foot, loan-to-value ratios, debt service coverage ratios and debt yields are based on the Moffett Towers II - Building 2 Whole Loan (as defined below). The Cut-off Date LTV Ratio, LTV Ratio at Maturity or ARD, U/W NCF DSCR and U/W NOI Debt Yield based on the Moffett Towers II - Building 2 Whole Loan and the Moffett Towers II - Building 2 Mezzanine Loan (as defined below) (together, the “Moffett Towers II - Building 2 Total Debt”), are 76.9%, 72.3%, 1.23x and 7.3%, respectively. |
| (2) | The lockout period will be at least 27 payments, beginning with and including the first payment date of January 6, 2018. Defeasance of the Moffett Towers II - Building 2 Mortgage Loan (as defined below) is permitted at any time after the earlier to occur of (i) two years after the closing date of the securitization that includes the last note to be securitized or (ii) November 16, 2020. The assumed lockout period of 27 payments is based on the expected WFCM 2018-C43 securitization trust closing date in March 2018. |
| (3) | See “Subordinate and Mezzanine Indebtedness” section. |
| (4) | Certain springing Escrows and Reserves are required on a one-time basis. See “Escrows” section. |
| (5) | Size of 362,563 square feet is comprised of 350,633 square feet of office space in the Moffett Towers II - Building 2 Property (as defined below) along with 11,930 square feet of space allocated to the Moffett Towers II - Building 2 Property in a 59,650 square foot fitness/amenities building, based on a specified to-be 20.0% share in the common elements of the Moffett Towers II Campus (as defined below). See “Amenities and Common Areas” section. |
| (6) | Historical occupancy, operating and financial information is unavailable as the Moffett Towers II - Building 2 Property (as defined below) was built in 2017. |
The Mortgage Loan.The mortgage loan (the “Moffett Towers II - Building 2 Mortgage Loan”) is part of a whole loan (the “Moffett Towers II - Building 2 Whole Loan”) evidenced by fourpari passu notes secured by a first mortgage encumbering the fee simple interest in a Class A office building fully leased to a wholly-owned subsidiary of Amazon.com, Inc. (“Amazon”) located in Sunnyvale, California (the “Moffett Towers II - Building 2 Property”). The Moffett Towers II - Building 2 Whole Loan was co-originated on November 16, 2017 by Barclays Bank PLC and Morgan Stanley Bank, N.A. The Moffett Towers II - Building 2 Whole Loan had an original principal balance of $165,000,000, has an outstanding principal balance as of the Cut-off Date of $165,000,000 and accrues interest at an interest rate of 3.6189%per annum. The Moffett Towers II - Building 2 Whole Loan had an initial term of 120 months, has a remaining term of 117 months as of the Cut-off Date and requires interest-only payments for the first 60 payment periods followed by payments of principal and interest based on a 30-year amortization schedule. The Moffett Towers II - Building 2 Whole Loan matures on December 6, 2027.
THE INFORMATION IN THIS STRUCTURAL AND COLLATERAL TERM SHEET IS NOT COMPLETE AND MAY BE AMENDED PRIOR TO THE TIME OF SALE. THIS TERM SHEET IS NOT AN OFFER TO SELL THESE SECURITIES AND IT IS NOT A SOLICITATION OF AN OFFER TO BUY THESE SECURITIES IN ANY JURISDICTION WHERE THE OFFER OR SALE IS NOT PERMITTED.
32
| MOFFETT TOWERS II – BUILDING 2 |
Note A-1, which will be contributed to the WFCM 2018-C43 securitization trust, had an original principal balance of $54,000,000, has an outstanding principal balance as of the Cut-off Date of $54,000,000 and represents the controlling interest in the Moffett Towers II – Building 2 Whole Loan. The non-controlling Note A-3, had an original principal balance of $40,000,000, has an outstanding principal balance as of the Cut-off Date of $40,000,000 and was contributed to the WFCM 2017-C42 securitization trust. The non-controlling Note A-4, had an original principal balance of $41,250,000, has an outstanding principal balance as of the Cut-off Date of $41,250,000 and was contributed to the BANK 2018-BNK10 securitization trust. The non-controlling Note A-2 is expected to be contributed to a future securitization trust or trusts (Note A-2, Note A-3 and Note A-4, collectively, the “Moffett Towers II – Building 2 Companion Loans”). The lender provides no assurances that any non-securitized notes will not be split further. See“Description of the Mortgage Pool—The Whole Loans—The Serviced Pari Passu Whole Loans”in the Preliminary Prospectus.
Note Summary
| Notes | Original Balance | Note Holder | Controlling Interest | |
| A-1 | $54,000,000 | WFCM 2018-C43 | Yes | |
| A-2 | $29,750,000 | Barclays Bank PLC | No | |
| A-3 | $40,000,000 | WFCM 2017-C42 | No | |
| A-4 | $41,250,000 | BANK 2018-BNK10 | No | |
| Total | $165,000,000 |
Following the lockout period, on any date before June 6, 2027, the borrower has the right to defease the Moffett Towers II - Building 2 Whole Loan in whole, but not in part. The lockout period will expire on the earlier to occur of (i) two years after the closing date of the securitization that includes the last note to be securitized or (ii) November 16, 2020. The Moffett Towers II - Building 2 Whole Loan is prepayable without penalty on or after June 6, 2027.
Sources and Uses
| Sources | Uses | |||||||
| Original whole loan amount | $165,000,000 | 61.1% | Loan payoff | $207,408,056 | 76.8% | |||
| Mezzanine loan | 105,000,000 | 38.9 | Reserves | 31,752,142 | 11.8 | |||
| Return of equity | 20,183,519 | 7.5 | ||||||
| Closing costs | 10,656,282 | 3.9 | ||||||
| Total Sources | $270,000,000 | 100.0% | Total Uses | $270,000,000 | 100.0% |
The Property.The Moffett Towers II - Building 2 Property is a newly-constructed, eight-story, Class A office building totaling 350,633 square feet in Sunnyvale, California. As of December 1, 2017, the Moffett Towers II – Building 2 Property was 100.0% leased to a wholly-owned subsidiary of Amazon on a triple-net basis through April 2028, with two, seven-year extension options and no early termination options. Amazon serves as guarantor of the lease and, as of the origination date, has taken possession of the Moffett Towers II - Building 2 Property and commenced the build out of its space. Outstanding rent concessions and tenant improvement allowances related to the Amazon lease were deposited into escrow by the borrower on the origination date (See “Escrows” section).
The Moffett Towers II - Building 2 Property comprises a portion of the first phase (“Phase I”) of the planned approximately 1.8 million square foot, five-building Moffett Towers II office campus (the “Moffett Towers II Campus”) located on 47.3 acres in Sunnyvale, California. Phase I of the Moffett Towers II Campus development includes the Moffett Towers II - Building 2 Property and an adjacent surface parking lot (completed in 2017) as well as the 350,633 square foot Moffett Towers II - Building 1 (April 2018 expected completion), an enclosed parking structure (April 2018 expected completion) and a 59,650 square foot fitness/amenities building (July 2018 expected completion). The Moffett Towers II - Building 2 Property will feature access to the fitness/amenities building and the enclosed parking structure once completed pursuant to a declaration of covenants, conditions, restrictions and easement and charges agreement (see “Amenities and Common Areas” section). Inclusive of the future enclosed parking structure (of which 361 spaces are dedicated to Amazon pursuant to its lease) and the completed surface parking lot (of which 707 spaces are dedicated to Amazon pursuant to its lease), the Moffett Towers II - Building 2 Property has a parking ratio of 3.3 spaces per 1,000 square feet. On the origination date, the Moffett Towers II - Building 2 Guarantor (as defined below) executed a separate guaranty for the completion and delivery of the fitness/amenities building and the enclosed parking structure (see “Completion Guaranty” section). Additionally, the Moffett Towers II - Building 2 Whole Loan documents require upfront and springing reserves related to the completion and delivery of the fitness/amenities building and the enclosed parking structure (see “Escrows” section). Subsequent phases of the Moffett Towers II Campus development are expected to include the construction of three additional 350,633 square foot Class A office buildings as well as two separate enclosed parking structures.
Amazon (NASDAQ: AMZN) is an American e-commerce company headquartered in Seattle, Washington. Founded in 1994, Amazon is now one of the largest online retailers in the world selling a wide range of products, services and entertainment to consumers. Amazon has reported that it increased net income from an approximately $241.0 million loss in 2014 to an approximately $2.4 billion profit in 2016 with total net sales of approximately $136.0 billion in 2016. Most recently, net sales increased to $43.7 billion in the third quarter of 2017, up approximately 34.0% from one year earlier. Amazon employed approximately 341,400 employees as of December 31, 2016.
The Moffett Towers II - Building 2 Property is expected to house Amazon’s Lab126, a research and development subsidiary that designs and engineers high-profile consumer electronics. Lab126 began in 2004, originally creating the Kindle family of products and has since produced numerous devices such as Amazon’s Fire tablets, Fire TV and Amazon Echo. Lab126 is headquartered in the nearby Moffett Towers I property, which is located approximately 0.5 miles from the Moffett Towers II - Building 2 Property.
THE INFORMATION IN THIS STRUCTURAL AND COLLATERAL TERM SHEET IS NOT COMPLETE AND MAY BE AMENDED PRIOR TO THE TIME OF SALE. THIS TERM SHEET IS NOT AN OFFER TO SELL THESE SECURITIES AND IT IS NOT A SOLICITATION OF AN OFFER TO BUY THESE SECURITIES IN ANY JURISDICTION WHERE THE OFFER OR SALE IS NOT PERMITTED.
33
| MOFFETT TOWERS II – BUILDING 2 |
The following table presents certain information relating to the tenancy at the Moffett Towers II - Building 2 Property:
Major Tenants
| Tenant Name | Credit Rating (Fitch/Moody’s/S&P)(1) | Tenant NRSF(2) | % of NRSF(2) | Annual U/W Base Rent PSF(2)(3)(4)(5) | Annual U/W Base Rent(3)(4)(5) | % of Total Annual U/W Base Rent | Lease Expiration Date |
| Major Tenant | |||||||
| Amazon | NR/Baa1/AA- | 362,563 | 100.0% | $55.81 | $20,233,410 | 100.0% | 4/30/2028(6) |
| Total Major Tenant | 362,563 | 100.0% | $55.81 | $20,233,410 | 100.0% | ||
| Vacant Space | 0 | 0.0% | |||||
| Collateral Total | 362,563 | 100.0% | |||||
| (1) | Certain ratings are those of the parent company whether or not the parent company guarantees the lease. |
| (2) | Tenant NRSF of 362,563 square feet is comprised of 350,633 square feet of office space in the Moffett Towers II - Building 2 Property along with 11,930 square feet of space allocated to the Moffett Towers II - Building 2 Property in a 59,650 square foot fitness/amenities building, based on a specified to-be 20.0% share in the common elements of the Moffett Towers II Campus. See “Amenities and Common Areas” section. |
| (3) | Annual U/W Base Rent PSF and Annual U/W Base Rent include $2,830,405 of straight-line rent through the maturity date of the Moffett Towers II - Building 2 Whole Loan. |
| (4) | Amazon has five months of free rent and eight months of waived fitness/amenities use fees remaining, all of which were deposited into escrow on the origination date. The borrower also deposited $286,310 into escrow on the origination date for an amenities rent reserve, which represents six months of use fees due for the fitness/amenities building commencing on the targeted completion and delivery date (July 31, 2018) of such fitness/amenities building to Amazon in accordance with the Amazon lease (see “Escrows” section). |
| (5) | Amazon is entitled to a base rent abatement in the amount of $15,000 per day for each day elapsing beyond the targeted completion and delivery date (April 15, 2018) of the 361-spaces allocated to Amazon within the enclosed parking structure in accordance with the Amazon lease. An amount equal to 180 days of base rent abatements ($2,700,000) was deposited into escrow on the origination date (see “Escrows” section). |
| (6) | Amazon has two, seven-year lease renewal options. |
The following table presents certain information relating to the lease rollover schedule at the Moffett Towers II - Building 2 Property:
Lease Expiration Schedule(1)
| Year Ending December 31, | No. of Leases Expiring | Expiring NRSF | % of Total NRSF | Cumulative Expiring NRSF | Cumulative % of Total NRSF | Annual U/W Base Rent(2) | % of Annual U/W Base Rent(2) | Annual U/W Base Rent PSF(2) |
| MTM | 0 | 0 | 0.0% | 0 | 0.0% | $0 | 0.0% | $0.00 |
| 2018 | 0 | 0 | 0.0% | 0 | 0.0% | $0 | 0.0% | $0.00 |
| 2019 | 0 | 0 | 0.0% | 0 | 0.0% | $0 | 0.0% | $0.00 |
| 2020 | 0 | 0 | 0.0% | 0 | 0.0% | $0 | 0.0% | $0.00 |
| 2021 | 0 | 0 | 0.0% | 0 | 0.0% | $0 | 0.0% | $0.00 |
| 2022 | 0 | 0 | 0.0% | 0 | 0.0% | $0 | 0.0% | $0.00 |
| 2023 | 0 | 0 | 0.0% | 0 | 0.0% | $0 | 0.0% | $0.00 |
| 2024 | 0 | 0 | 0.0% | 0 | 0.0% | $0 | 0.0% | $0.00 |
| 2025 | 0 | 0 | 0.0% | 0 | 0.0% | $0 | 0.0% | $0.00 |
| 2026 | 0 | 0 | 0.0% | 0 | 0.0% | $0 | 0.0% | $0.00 |
| 2027 | 0 | 0 | 0.0% | 0 | 0.0% | $0 | 0.0% | $0.00 |
| 2028 | 1 | 362,563 | 100.0% | 362,563 | 100.0% | $20,233,410 | 100.0% | $55.81 |
| Thereafter | 0 | 0 | 0.0% | 362,563 | 100.0% | $0 | 0.0% | $0.00 |
| Vacant | 0 | 0 | 0.0% | 362,563 | 100.0% | $0 | 0.0% | $0.00 |
| Total/Weighted Average | 1 | 362,563 | 100.0% | $20,233,410 | 100.0% | $55.81 |
| (1) | Information obtained from the underwritten rent roll. |
| (2) | Annual U/W Base Rent, % of Annual U/W Base Rent and Annual U/W Base Rent PSF include $2,830,405 of straight-line rent through the maturity date of the Moffett Towers II - Building 2 Whole Loan. |
The following table presents historical occupancy percentages at the Moffett Towers II - Building 2 Property:
Historical Occupancy
12/31/2013(1) | 12/31/2014(1) | 12/31/2015(1) | 12/31/2016(1) | 12/1/2017(2) | ||||
| NAP | NAP | NAP | NAP | 100.0% |
| (1) | Historical Occupancy prior to 12/6/2017 is not applicable as the Moffett Towers II - Building 2 Property was built in 2017. |
| (2) | Information obtained from the underwritten rent roll. |
THE INFORMATION IN THIS STRUCTURAL AND COLLATERAL TERM SHEET IS NOT COMPLETE AND MAY BE AMENDED PRIOR TO THE TIME OF SALE. THIS TERM SHEET IS NOT AN OFFER TO SELL THESE SECURITIES AND IT IS NOT A SOLICITATION OF AN OFFER TO BUY THESE SECURITIES IN ANY JURISDICTION WHERE THE OFFER OR SALE IS NOT PERMITTED.
34
| MOFFETT TOWERS II – BUILDING 2 |
Underwritten Net Cash Flow. The following table presents certain information relating to the underwritten net cash flow at the Moffett Towers II - Building 2 Property:
Cash Flow Analysis(1)
| U/W | % of U/W Effective Gross Income | U/W $ per SF | |||
| Base Rent(2) | $20,233,410 | 89.8% | $55.81 | ||
| Grossed Up Vacant Space | 0 | 0.0 | 0.00 | ||
| Total Reimbursables | 2,751,378 | 12.2 | 7.59 | ||
| Less Vacancy & Credit Loss(3) | (459,696) | (2.0) | (1.27) | ||
| Effective Gross Income | $22,525,092 | 100.0% | $62.13 | ||
| Total Operating Expenses | $2,840,101 | 12.6% | $7.83 | ||
| Net Operating Income | $19,684,992 | 87.4% | $54.29 | ||
| TI/LC | 806,820 | 3.6 | 2.23 | ||
| Capital Expenditures | 72,513 | 0.3 | 0.20 | ||
| Net Cash Flow | $18,805,659 | 83.5% | $51.87 | ||
| NOI DSCR(4) | 2.18x | ||||
| NCF DSCR(4) | 2.08x | ||||
| NOI DY(4) | 11.9% | ||||
| NCF DY(4) | 11.4% |
| (1) | Historical Cash Flows are not available as the Moffett Towers II - Building 2 Property was built in 2017. |
| (2) | U/W Base Rent includes $2,830,405 of straight-line rent through the maturity date of the Moffett Towers II - Building 2 Whole Loan. |
| (3) | The underwritten economic vacancy is 2.0%. The Moffett Towers II - Building 2 Property was 100.0% occupied as of December 1, 2017. |
| (4) | Debt service coverage ratios and debt yields are based on the Moffett Towers II - Building 2 Whole Loan. |
Appraisal.As of the appraisal valuation date of October 18, 2017 the Moffett Towers II - Building 2 Property had an “as-is” appraised value of $351,000,000. The appraiser also concluded to a “hypothetical go dark” appraised value of $246,600,000.
Environmental Matters. According to a Phase I environmental site assessment (“ESA”) dated October 19, 2017, a recognized environmental condition (“REC”) was determined to exist at the Moffett Towers II - Building 2 Property. The Moffett Towers II - Building 2 Property was part of a larger campus historically used by Lockheed Martin for aerospace manufacturing, research and development that covered approximately 660 acres, known as the Lockheed Martin Plant One Campus. The Lockheed Martin Plant One Campus is included in a Site Cleanup Requirements Order issued by the Regional Water Quality Control Board (“RWQCB”) which applies to a large portion of the Lockheed Martin Plant One Campus. No significant sources of soil or groundwater pollution have been identified on the Moffett Towers II - Building 2 Property during historical or more recent investigations of the Plant One Campus. The responsible party associated with this release has been identified by state and Federal regulatory agencies as Lockheed Martin, and Lockheed Martin is currently conducting response actions under state and Federal oversight. Although there is an active regulatory status, the ESA concluded, given the absence of impact, that no further action is warranted and the REC will not prevent or impede the use of the Moffett Towers II - Building 2 Property. The REC is further described under “Description of the Mortgage Pool—Mortgage Pool Characteristics–Environmental Considerations” in the Preliminary Prospectus.
Market Overview and Competition.The Moffett Towers II - Building 2 Property is located in Moffett Park, in the northern portion of the Sunnyvale submarket within Silicon Valley. Moffett Park is a 519-acre area comprised of recently developed office spaces and research and development buildings. Notable high technology firms currently in Moffett Park include Google Inc., Hewlett Packard, Juniper Networks, Lab 126 (an Amazon subsidiary), Lockheed-Martin, Microsoft, Motorola, NetApp and Rambus. The Moffett Towers II - Building 2 Property is just north of State Highway 237, which forms the southern border of the Moffett Park area and provides access from Interstate 680 and Interstate 280 to the northeast and U.S. Highway 101 in Sunnyvale to the southwest. U.S. Highway 101 runs northward through San Francisco and southward through San Jose, terminating in the city of Los Angeles. The Santa Clara County Transit System provides bus service county-wide with stops near the Moffett Towers II - Building 2 Property. In addition, a Santa Clara Light Rail System station is located directly across the street from the Moffett Towers II - Building 2 Property and services the surrounding residential communities.
According to the appraisal, overall vacancy in Silicon Valley and the Sunnyvale submarket was 11.1% and 2.4%, respectively, as of the second quarter of 2017. In the first half of 2017, 315,272 square feet of office space was delivered to the Sunnyvale submarket, with 426,404 square feet of absorption. According to the appraisal, as of the second quarter of 2017, new supply under construction in Silicon Valley stood at approximately 2.8 million square feet, which consisted of approximately 0.7 million square feet of build-to-suit construction and 2.1 million square feet of speculative construction. As of the second quarter of 2017, the total office average asking rent for the Sunnyvale submarket was $52.20 per square foot (fully-serviced), which is in-line with the Silicon Valley total office average asking rent of $53.40 per square foot (fully-serviced). Within the Sunnyvale submarket, the average asking rent for Class A office properties is $58.20 per square foot (fully-serviced).
THE INFORMATION IN THIS STRUCTURAL AND COLLATERAL TERM SHEET IS NOT COMPLETE AND MAY BE AMENDED PRIOR TO THE TIME OF SALE. THIS TERM SHEET IS NOT AN OFFER TO SELL THESE SECURITIES AND IT IS NOT A SOLICITATION OF AN OFFER TO BUY THESE SECURITIES IN ANY JURISDICTION WHERE THE OFFER OR SALE IS NOT PERMITTED.
35
| MOFFETT TOWERS II – BUILDING 2 |
The following table presents certain information relating to comparable leases to the Moffett Towers II - Building 2 Property:
Comparable Leases(1)
| Property Name/Location | Year Built | Class | Stories | Total GLA (SF) | Tenant Name | Lease Date/Term | Lease Area (SF) | Annual Base Rent PSF | Lease Type |
Towers at Great America Santa Clara, CA | 2002 | A | 6 | 374,214 | Macom Connectivity | May 2017 / 1 Yr | 55,393 | $42.00 | NNN |
Santa Clara Square Ph. II Bldg. 4 Santa Clara, CA | 2016 | A | 6 | 220,156 | AMD | Aug. 2016 / 10 Yrs | 220,156 | $42.60 | NNN |
Moffett Gateway Santa Clara, CA | 2016 | A | 7 | 612,796 | Google, Inc. | July 2016 / 11 Yrs | 612,796 | $44.40 | NNN |
Santa Clara Square Ph. II Bldg. 5 Santa Clara, CA | 2016 | A | 6 | 220,156 | Cambridge Industries | May 2016 / 7 Yrs | 74,376 | $43.80 | NNN |
Central & Wolfe Campus Sunnyvale, CA | 2018 (Est.) | A | 4 | 871,214 | Apple, Inc. | Sep. 2015 / 13 Yrs | 871,214 | $40.08 | NNN |
599 Castro Mountain View, CA | 2017 | A | 4 | 94,918 | Pure Storage | Aug. 2017 / 7 Yrs | 45,000 | $90.00 | NNN |
| (1) | Information obtained from the appraisal. |
The Borrower.The borrower for the Moffett Towers II - Building 2 Whole Loan is MT2 B2 LLC, a Delaware limited liability company and a special purpose entity with two independent directors (the “Moffett Towers II - Building 2 Borrower”). Legal counsel to the Moffett Towers II Building 2 Borrower delivered a non-consolidation opinion in connection with the origination of the Moffett Towers II - Building 2 Whole Loan. Paul Guarantor LLC, a Delaware limited liability company, (the “Moffett Towers II - Building 2 Guarantor”) is the guarantor of certain nonrecourse carveouts under the Moffett Towers II - Building 2 Whole Loan. Paul Guarantor LLC is wholly owned by the Jay Paul Revocable Living Trust, of which Jay Paul is trustee and grantor. The Moffett Towers II – Building 2 Guarantor will be required to maintain a minimum net worth, excluding its interest in the Moffett Towers II - Building 2 Property, of $225,000,000 and liquidity of at least $10,000,000.
The Borrower Sponsor.The borrower sponsor is The Jay Paul Company, a privately held, opportunity-driven real estate firm based in San Francisco, California. Founded in 1975, Jay Paul Company concentrates on the acquisition, development, and management of commercial properties throughout California. Jay Paul Company has developed over 11.0 million square feet of institutional quality space. Jay Paul Company’s portfolio includes other properties in Moffett Park, including Moffett Gateway, Moffett Towers and Moffett Towers II. Jay Paul Company is currently redeveloping over 55 acres in Moffett Park, including Moffett Place, a new, Class A office development, which is expected to contain approximately 1.9 million square feet of net rentable building area, in six, eight-story buildings.
Escrows.The Moffett Towers II - Building 2 Whole Loan documents provide for upfront reserves in the amount of $19,433,495 for outstanding tenant improvements relating to the Amazon space and $8,332,337 for outstanding rent concessions due under the Amazon lease.
The Moffett Towers II - Building 2 Whole Loan documents also provide for upfront reserves in the amount of $2,700,000 for a parking rent abatement reserve and $286,310 for an amenities rent reserve related to the completion and delivery of the enclosed parking structure and the fitness/amenities building, respectively, which amounts were deposited into a lender-controlled account (the “Parking and Amenities Building Account”). The parking rent abatement reserve represents 180 days of base rent abatements ($15,000 per day) due to Amazon for each day elapsing beyond the targeted completion and delivery date (April 15, 2018) of the 361 spaces allocated to Amazon within the enclosed parking structure, in accordance with the Amazon lease. The amenities rent reserve represents six months of use fees due for the fitness/amenities building, pursuant to the Amazon lease, commencing on the targeted completion and delivery date (July 31, 2018) of such fitness/amenities building to Amazon in accordance with the Amazon lease (use fees that would be due for the fitness/amenities building following the origination date through July 31, 2018 are included in the $8,332,337 upfront reserve for outstanding rent concessions due under the Amazon lease). If the terms of the Required Parking Spaces Satisfaction (as defined below) have not been satisfied on or prior to September 15, 2018, the Moffett Towers II - Building 2 Borrower will be required to deposit an additional $2,700,000 into the Parking and Amenities Building Account. If the terms of the Amenities Building Satisfaction (as defined below) have not been satisfied on or prior to January 31, 2019, the Moffett Towers II - Building 2 Borrower will be required to deposit an additional $286,310 (the “Additional Amenities Rent Amount”) into the Parking and Amenities Building Account. Amounts on deposit in the Parking and Amenities Building Account will be held by the lender as additional collateral for the Moffett Towers II - Building 2 Whole Loan. Provided no event of default under the Moffett Towers II - Building 2 Whole Loan is continuing, the amounts deposited into the Parking and Amenities Building Account will be released to the Moffett Towers II - Building 2 Borrower upon the occurrence of the related Required Parking Spaces Satisfaction or Amenities Building Satisfaction, as applicable.
A “Required Parking Spaces Satisfaction” will occur on the date that (i) the Moffett Towers II - Building 2 Borrower delivers evidence reasonably acceptable to the lender that the Moffett Towers II - Building 2 Borrower has delivered 361 additional spaces to Amazon pursuant to its lease and (ii) Amazon has delivered written confirmation that (a) the Moffett Towers II - Building 2 Borrower has delivered 361 additional spaces to Amazon pursuant to its lease and (b) Amazon is no longer entitled to base rent abatement related to the delivery of the enclosed parking structure pursuant to its lease.
THE INFORMATION IN THIS STRUCTURAL AND COLLATERAL TERM SHEET IS NOT COMPLETE AND MAY BE AMENDED PRIOR TO THE TIME OF SALE. THIS TERM SHEET IS NOT AN OFFER TO SELL THESE SECURITIES AND IT IS NOT A SOLICITATION OF AN OFFER TO BUY THESE SECURITIES IN ANY JURISDICTION WHERE THE OFFER OR SALE IS NOT PERMITTED.
36
| MOFFETT TOWERS II – BUILDING 2 |
An “Amenities Building Satisfaction” will occur on the date that (i) the Moffett Towers II - Building 2 Borrower delivers evidence reasonably acceptable to the lender that the amenities building has been completed in conformance with all applicable requirements and (ii) Amazon has delivered written confirmation that the amenities building is useable and has commenced the payment of the use fees applicable to the amenities building pursuant to the Amazon lease.
Additionally, the Moffett Towers II - Building 2 Whole Loan documents provide for an upfront reserve in the amount of $1,000,000 for a debt service reserve which amount was deposited into a lender-controlled account (the “Debt Service Reserve Account”). If the Required Parking Spaces Satisfaction has not occurred on or prior to September 15, 2018, the Moffett Towers II - Building 2 Borrower will be required to deposit an additional $1,000,000 into the Debt Service Reserve Account. Provided no event of default under the Moffett Towers II - Building 2 Whole Loan is continuing, amounts remaining in the Debt Service Reserve Account will be released to the Moffett Towers II - Building 2 Borrower upon the occurrence of the Required Parking Spaces Satisfaction.
The Moffett Towers II - Building 2 Whole Loan documents require monthly reserve deposits for real estate taxes in an amount equal to one-twelfth of the real estate taxes that the lender estimates will be payable during the next twelve months, initially $111,859. The Moffett Towers II - Building 2 Whole Loan documents do not require ongoing monthly escrows for insurance premiums as long as the Moffett Towers II - Building 2 Borrower provides the lender with evidence that the Moffett Towers II - Building 2 Property is insured via an acceptable blanket insurance policy and such policy is in full force and effect. The Moffett Towers II - Building 2 Whole Loan documents do not provide for monthly reserve deposits for capital expenditures at origination, but provide for the lender to reassess the amount necessary for capital expenditures at the Moffett Towers II - Building 2 Property and may require monthly capital expenditures reserve deposits if necessary to maintain proper operation of the Moffett Towers II - Building 2 Property.
Lockbox and Cash Management.The Moffett Towers II - Building 2 Whole Loan is structured with a hard lockbox and an in-place cash management. The Moffett Towers II - Building 2 Borrower was required at origination to deliver letters to all tenants at the Moffett Towers II - Building 2 Property directing them to pay all rents directly into a lender-controlled lockbox account. All funds received by the Moffett Towers II - Building 2 Borrower or the manager are required to be deposited in the lockbox account within one business day following receipt. Funds on deposit in the lockbox account are required to be swept on each business day into a lender-controlled cash management account and applied on each payment date to the payment of debt service, the funding of required reserves, budgeted monthly operating expenses, common charges under various reciprocal easement agreements, including the CCR (as defined below), approved extraordinary operating expenses, debt service on the Moffett Towers II - Building 2 Mezzanine Loan (as defined below) and, during a Lease Sweep Period (as defined below), to the payment of an amount equal to $438,291 to fund a lease sweep reserve account (the “Lease Sweep Reserve Account”) until the aggregate funds swept in the Lease Sweep Reserve Account during such lease sweep equals the Lease Sweep Reserve Threshold (as defined below) and then to the Debt Service Reserve Account until the aggregate funds transferred to the Lease Sweep Reserve Account and the Debt Service Reserve Account during such lease sweep equals the Lease Sweep and Debt Service Reserve Cap (as defined below). Provided no Trigger Period (as defined below) is continuing, excess cash in the deposit account will be disbursed to the Moffett Towers II - Building 2 Borrower in accordance with the Moffett Towers II - Building 2 Whole Loan documents. If a Trigger Period is continuing (other than a Trigger Period due to a Lease Sweep Period), excess cash in the deposit account will be transferred to an account (the “Cash Collateral Account”) held by the lender as additional collateral for the Moffett Towers II - Building 2 Whole Loan.
A “Trigger Period” will commence upon the earlier of the following:
| (i) | an event of default under the Moffett Towers II - Building 2 Whole Loan; |
| (ii) | if, as of the last day of any calendar quarter during the term of the Moffett Towers II - Building 2 Whole Loan (a) the credit rating of a Lease Sweep Tenant Party (as defined below) under a Lease Sweep Lease (as defined below) by Fitch, Moody’s or S&P is less than “BBB-”, “Baa3” or “BBB-”, respectively and (b) the debt service coverage ratio falls below 1.50x based on the Moffett Towers II - Building 2 Whole Loan or 1.10x based on the Moffett Towers II - Building 2 Total Debt (a “Low Debt Service Period”); |
| (iii) | the commencement of a Lease Sweep Period; or |
| (iv) | an event of default under the Moffett Towers II - Building 2 Mezzanine Loan |
A Trigger Period will end:
| (a) | with regard to clause (i) and (iv) above, upon the cure of such event of default; |
| (b) | with regard to clause (ii) above, upon the earlier to occur of (1) the date that the debt service coverage ratio is at least 1.50x based on the Moffett Towers II - Building 2 Whole Loan and 1.10x based on the Moffett Towers II - Building 2 Total Debt for two consecutive calendar quarters and (2) the balance of funds on deposit in the Cash Collateral Account is equal to $17,531,650 ($50.00 per square foot); and |
| (c) | with regard to clause (iii) above, upon the ending of such Lease Sweep Period. |
A “Lease Sweep Period” will commence following the earliest to occur of any of the following (each a “Lease Sweep Event”):
| (i) | with respect to the Amazon lease, Amazon fails to renew or extend such lease on or prior to December 6, 2025; |
| (ii) | the date on which, with respect to any Lease Sweep Lease, (a) a Lease Sweep Tenant Party cancels or terminates its Lease Sweep Lease with respect to all or a Material Termination Portion (as defined below) of the Lease Sweep Space (as defined below) subject to such Lease Sweep Lease prior to the then current expiration date under such Lease Sweep Lease, or (b) a Lease Sweep Tenant Party delivers to the Moffett Towers II - Building 2 Borrower notice that it is |
THE INFORMATION IN THIS STRUCTURAL AND COLLATERAL TERM SHEET IS NOT COMPLETE AND MAY BE AMENDED PRIOR TO THE TIME OF SALE. THIS TERM SHEET IS NOT AN OFFER TO SELL THESE SECURITIES AND IT IS NOT A SOLICITATION OF AN OFFER TO BUY THESE SECURITIES IN ANY JURISDICTION WHERE THE OFFER OR SALE IS NOT PERMITTED.
37
| MOFFETT TOWERS II – BUILDING 2 |
canceling or terminating its Lease Sweep Lease with respect to all or a Material Termination Portion of the Lease Sweep Space subject to such Lease Sweep Lease (the affected space being the “Terminated Space”); provided, however, no Lease Sweep Period will commence pursuant to this clause (ii) if, in connection with such termination or cancellation (or delivery of notice of termination or cancellation), the Moffett Towers II - Building 2 Borrower simultaneously enters into a replacement lease with an entity or a wholly-owned subsidiary of an entity rated “BBB-” or equivalent by at least two of Fitch, Moody’s and S&P (an “Investment Grade Entity”) covering the Terminated Space, provided that such replacement lease is a qualified lease and the occupancy conditions, as specified in the Moffett Towers II - Building 2 Whole Loan documents, are satisfied with respect to such replacement lease on or prior to the date of such termination or cancellation (or delivery of notice of termination or cancellation);
| (iii) | the date on which, with respect to any Lease Sweep Lease, a Lease Sweep Tenant Party ceases operating its business (i.e., “goes dark”) at 20.0% or more of its Lease Sweep Space on a rentable square foot basis (a “Dark Period Event” and the affected space, the “Dark Space”), provided, however, that if the Lease Sweep Tenant Party either (a) is an Investment Grade Entity or (b) has subleased the Dark Space portion of its premises to an Investment Grade Entity who has accepted delivery thereof (i.e., the lease has commenced) and is paying unabated rent at a contract rate no less than the contract rate required under the Lease Sweep Lease, such Lease Sweep Tenant Party will not be deemed to have “gone dark” for purposes of this clause (iii) and no Lease Sweep Period will commence pursuant to this clause (iii); |
| (iv) | upon an event of default under a Lease Sweep Lease by the tenant thereunder that continues beyond any applicable notice and cure period; |
| (v) | upon a Lease Sweep Tenant Party being subject to an insolvency proceeding; or |
| (vi) | the date on which Amazon is no longer an Investment Grade Entity (an “Amazon Downgrade Event”). |
A Lease Sweep Period (other than a Lease Sweep Period triggered by clause (v) above) will not be triggered (or, if already triggered, may be terminated) if the Moffett Towers II - Building 2 Borrower delivers to the lender an acceptable letter of credit in an amount equal to $12,272,155 ($35.00 per square foot) provided, if such Lease Sweep Period is triggered by clause (iii) or (vi) above, such acceptable letter of credit will be in an amount equal to $17,531,650 ($50.00 per square foot).
A Lease Sweep Period will end on the earliest of the applicable of the following to occur:
| (a) | with regard to clauses (i) and (ii) above, the date on which, with respect to each Lease Sweep Space (1) in the case of clause (i), the Lease Sweep Tenant Parties have exercised a renewal or an extension right under their respective Lease Sweep Lease, provided that the Lease Sweep Lease in question is a qualified lease and the occupancy conditions, as specified in the Moffett Towers II - Building 2 Whole Loan documents, are satisfied, (2) in the case of clauses (i) and (ii) above, one or more replacement tenants acceptable to the lender (in its sole but good faith discretion) execute and deliver replacement lease(s) covering the Requisite Lease Sweep Space (as defined below), provided that such replacement lease(s) are qualified leases and the occupancy conditions, as specified in the Moffett Towers II - Building 2 Whole Loan documents, are satisfied or (3) a combination of lease renewals or extensions (as described in subclause (1) of this clause (a)) and replacement lease(s) (as described in subclause (2) of this clause (a)) occurs; |
| (b) | with regard to clauses (iii) and (vi) above, the date on which either (1) one or more replacement tenants acceptable to the lender (in its sole but good faith discretion) execute and deliver replacement lease(s) covering the Requisite Lease Sweep Space, provided that such replacement tenant(s) and lease(s) are qualified leases and the occupancy conditions, as specified in the Moffett Towers II - Building 2 Whole Loan documents, are satisfied or (2) for a Dark Period Event or an Amazon Downgrade Event, Amazon is restored as an Investment Grade Entity or the entirety of the Lease Sweep Space has been sublet to an Investment Grade Entity who has accepted delivery thereof (i.e., the lease has commenced) and is paying unabated rent at a contract rate no less than the contract rate required under the Lease Sweep Lease; |
| (c) | with regard to clause (iv) above, the date on which the event of default has been cured and no other event of default under such Lease Sweep Lease occurs for a period of three consecutive months following such cure; |
| (d) | with regard to clause (v) above, the Lease Sweep Tenant Party insolvency proceeding has terminated and the applicable Lease Sweep Lease has been affirmed, assumed or assigned in a manner satisfactory to the lender; and |
| (e) | with regard to clauses (i), (ii), (iii), (iv) and (vi) above, the date on which the aggregate amount of funds transferred into the Lease Sweep Reserve Account and the Debt Service Reserve Account equals the applicable Lease Sweep And Debt Reserve Cap (as defined below) and if a Lease Sweep Period is continuing due to the occurrence of more than one Lease Sweep Event, the aggregate amount of funds required to be transferred over the course of the Lease Sweep Period will be equal to the amount of the largest Lease Sweep and Debt Service Reserve Cap applicable to all then-continuing Lease Sweep Periods, such that each Lease Sweep Period will be treated as concurrent and not duplicative or independent of another. |
The “Lease Sweep and Debt Service Reserve Cap” means (a) with respect to a Lease Sweep Period continuing solely pursuant to clause (i) and/or (iv) above, $12,272,155 ($35.00 per square foot), (b) with respect to a Lease Sweep Period continuing solely pursuant to clause (ii) above, $35.00 per square foot of the Terminated Space, (c) with respect to a Lease Sweep Period continuing pursuant to clause (iii) above, whether or not a Lease Sweep Period pursuant to clauses (i), (ii) and/or (iv) above is concurrently continuing, $50.00 per square foot of Dark Space or (d) with respect to clause (vi) above, whether or not a Lease Sweep Period pursuant to clauses (i), (ii), (iii) and/or (iv) above is concurrently continuing, $17,531,650 ($50.00 per square foot).
THE INFORMATION IN THIS STRUCTURAL AND COLLATERAL TERM SHEET IS NOT COMPLETE AND MAY BE AMENDED PRIOR TO THE TIME OF SALE. THIS TERM SHEET IS NOT AN OFFER TO SELL THESE SECURITIES AND IT IS NOT A SOLICITATION OF AN OFFER TO BUY THESE SECURITIES IN ANY JURISDICTION WHERE THE OFFER OR SALE IS NOT PERMITTED.
38
| MOFFETT TOWERS II – BUILDING 2 |
The “Lease Sweep Reserve Threshold” means (a) with respect to a Lease Sweep Period continuing solely pursuant to clauses (i), (iv) and/or (vi) above, $10,518,990 ($30.00 per square foot) or (b) with respect to a Lease Sweep Period continuing solely pursuant to clause (ii) and/or (iii) above, $30.00 per square foot of the Dark Space or Terminated Space.
The “Lease Sweep Space” means the space demised under a Lease Sweep Lease.
A “Lease Sweep Lease” is the Amazon lease or any replacement lease or leases which cover at least 75.0% of the rentable square feet demised under the Amazon lease as of November 16, 2017 (the “Requisite Lease Sweep Space”).
A “Lease Sweep Tenant Party” is a tenant under a Lease Sweep Lease or its direct or indirect parent company (if any).
A “Material Termination Portion” is, with respect to any space under a Lease Sweep Lease, if the tenant under a Lease Sweep Lease cancels or terminates its Lease Sweep Lease with respect to at least 40,000 square feet of space (or, if a full floor of space is less than 40,000 square feet, a full floor of space) but less than the entirety of the space under such Lease Sweep Lease, the portion of space under the Lease Sweep Lease affected by such cancellation or termination.
Property Management. The Moffett Towers II - Building 2 Property is managed by an affiliate of the Moffett Towers II - Building 2 Borrower.
Assumption.The Moffett Towers II - Building 2 Borrower has, at any time following the securitization of the Moffett Towers II – Building 2 Whole Loan, the right to transfer the Moffett Towers II - Building 2 Property, provided that certain conditions are satisfied, including: (i) no event of default under the Moffett Towers II – Building 2 Whole Loan documents or mezzanine loan documents has occurred and is continuing, (ii) the Moffett Towers II - Building 2 Borrower has provided the lender with 60 days’ prior written notice, (iii) the proposed transferee qualifies as a qualified transferee under the Moffett Towers II - Building 2 Whole Loan documents, (iv) the payment of a transfer fee of 0.5% of the then outstanding principal balance of the Moffett Towers II - Building 2 Whole Loan in the case of the first transfer, and 1.0% of the then outstanding principal balance of the Moffett Towers II - Building 2 Whole Loan in the case of any subsequent transfer, and (v) the lender has received rating agency confirmation that such assumption will not result in a downgrade of the respective ratings assigned to the Series 2018-C43 certificates and similar confirmations from each rating agency rating any securities backed by any of the Moffett Towers II - Building 2 Companion Loans.
Partial Release. Not permitted.
Real Estate Substitution.Not permitted.
Subordinate and Mezzanine Indebtedness.Barclays Bank PLC funded a $105,000,000 mezzanine loan (the “Moffett Towers II - Building 2 Mezzanine Loan”) to MT2 B2 MEZZ LLC (the “Moffett Towers II - Building 2 Mezzanine Borrower”), a Delaware limited liability company owning 100.0% of the borrower under the Moffett Towers II - Building 2 Whole Loan. The Moffett Towers II - Building 2 Mezzanine Loan is secured by a pledge of the Moffett Towers II - Building 2 Mezzanine Borrower’s interest in the Moffett Towers II - Building 2 Borrower under the Moffett Towers II - Building 2 Whole Loan. The Moffett Towers II - Building 2 Mezzanine Loan accrues interest at a rate of 5.900% perannumand requires interest-only payments through the maturity date of December 6, 2027. The rights of the lender of the Moffett Towers II - Building 2 Mezzanine Loan are further described under “Description of the Mortgage Pool—Additional Indebtedness—Mezzanine Indebtedness” in the Preliminary Prospectus.
Amenities and Common Areas. The Moffett Towers II - Building 2 Property will feature access to the fitness/amenities building and the enclosed parking structure (the “Common Area Spaces”) once completed. To govern access to the Common Area Spaces, the Moffett Towers II - Building 2 Borrower is subject to a declaration of covenants, conditions, restrictions and easement and charges agreement (the “CCR”) made by MT II LLC, an affiliate of the borrower sponsor and the owner of the non-collateral buildings at the Moffett Towers II Campus. The CCR grants the Moffett Towers II - Building 2 Borrower non-exclusive easement rights over the Common Area Spaces and contemplates that the Common Area Spaces that it governs will be expanded over time as the remaining portions of the Moffett Towers II Campus are completed. Ownership of the Common Area Spaces governed by the CCR is held by Moffett Towers II Association LLC (the “Association”), whose membership is comprised of the Moffett Towers II - Building 2 Borrower and MT II LLC. The Association is obligated to maintain insurance coverage over the Common Area Spaces and is also responsible for maintenance of the Common Area Spaces, subject to the terms of the Amazon leases. The CCR delineates shares of the voting interest in the Association based on the number of completed buildings at the Moffett Towers II Campus, with each completed building entitled to a proportionate share of the voting interest. As of the origination date, the Moffett Towers II - Building 2 Borrower was the sole voting member of the Association. The CCR provides that as each of the four non-collateral buildings at the Moffett Towers II Campus is completed, the respective owner of each non-collateral building will obtain a share of the voting interest in the Association proportionate to the number of then completed buildings at the Moffett Towers II Campus (both collateral and non-collateral). Provided that all five buildings are completed in accordance with the Moffett Towers II Campus development plan, each building will be entitled to a one-fifth (or 20.0%) share of the voting interest in the Association.
Completion Guaranty. On the origination date, the Moffett Towers II - Building 2 Guarantor executed a separate guaranty for the completion and delivery of the fitness/amenities building and the enclosed parking structure. Among other things, the completion guaranty provides that in the event that neither the Moffett Towers II - Building 2 Borrower nor MT II LLC (an affiliate of the borrower sponsor and the owner of the non-collateral buildings at the Moffett Towers II Campus) is able to complete and deliver the fitness/amenities building and the enclosed parking structure (or otherwise achieve the Required Parking Spaces Satisfaction) on or prior to the one year anniversary of the respective targeted completion date of each (i.e., July 31, 2019 in the case of the fitness/amenities building; April 15, 2019 in the case of the enclosed parking structure or Required Parking Spaces Satisfaction), the Moffett Towers II - Building 2 Guarantor is required to pay any costs, expenses or liabilities incurred by the lender to effectuate the completion and delivery of such fitness/amenities building and enclosed parking structure (or otherwise achieve the Required Parking Spaces Satisfaction).
THE INFORMATION IN THIS STRUCTURAL AND COLLATERAL TERM SHEET IS NOT COMPLETE AND MAY BE AMENDED PRIOR TO THE TIME OF SALE. THIS TERM SHEET IS NOT AN OFFER TO SELL THESE SECURITIES AND IT IS NOT A SOLICITATION OF AN OFFER TO BUY THESE SECURITIES IN ANY JURISDICTION WHERE THE OFFER OR SALE IS NOT PERMITTED.
39
| MOFFETT TOWERS II – BUILDING 2 |
Ground Lease.None.
Terrorism Insurance.The Moffett Towers II - Building 2 Whole Loan documents require that the “all risk” insurance policy required to be maintained by the Moffett Towers II - Building 2 Borrower provide coverage for terrorism in an amount equal to the full replacement cost of the Moffett Towers II - Building 2 Property, or that if the Terrorism Risk Insurance Program Reauthorization Act is no longer in effect and such policies contain an exclusion for acts of terrorism, the Moffett Towers II - Building 2 Borrower will obtain, to the extent available, a stand-alone policy that provides the same coverage as the policies would have if such exclusion did not exist.
THE INFORMATION IN THIS STRUCTURAL AND COLLATERAL TERM SHEET IS NOT COMPLETE AND MAY BE AMENDED PRIOR TO THE TIME OF SALE. THIS TERM SHEET IS NOT AN OFFER TO SELL THESE SECURITIES AND IT IS NOT A SOLICITATION OF AN OFFER TO BUY THESE SECURITIES IN ANY JURISDICTION WHERE THE OFFER OR SALE IS NOT PERMITTED.
40
(THIS PAGE INTENTIONALLY LEFT BLANK)
THE INFORMATION IN THIS STRUCTURAL AND COLLATERAL TERM SHEET IS NOT COMPLETE AND MAY BE AMENDED PRIOR TO THE TIME OF SALE. THIS TERM SHEET IS NOT AN OFFER TO SELL THESE SECURITIES AND IT IS NOT A SOLICITATION OF AN OFFER TO BUY THESE SECURITIES IN ANY JURISDICTION WHERE THE OFFER OR SALE IS NOT PERMITTED.
41
| AIRPORT BUSINESS CENTER |
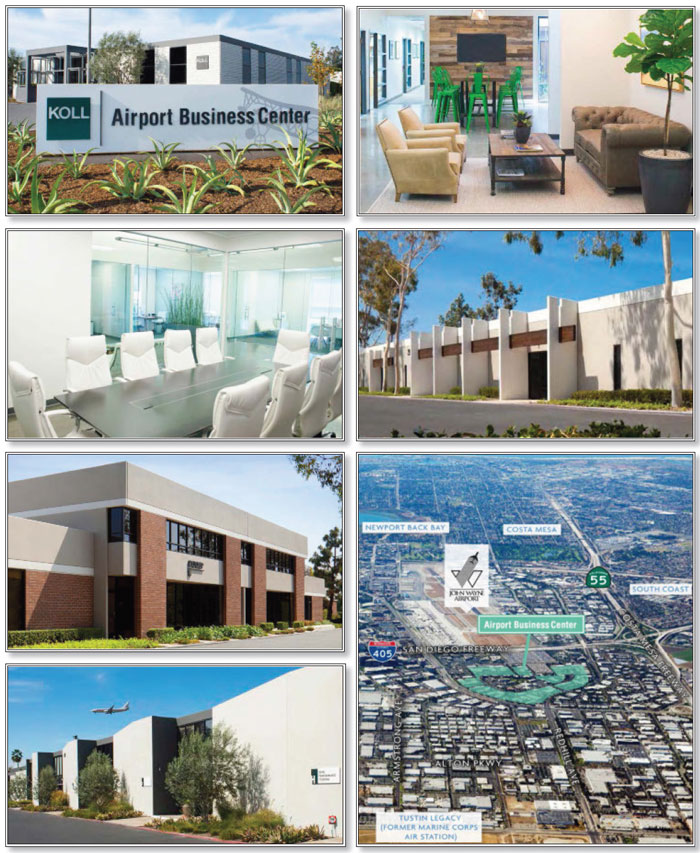
THE INFORMATION IN THIS STRUCTURAL AND COLLATERAL TERM SHEET IS NOT COMPLETE AND MAY BE AMENDED PRIOR TO THE TIME OF SALE. THIS TERM SHEET IS NOT AN OFFER TO SELL THESE SECURITIES AND IT IS NOT A SOLICITATION OF AN OFFER TO BUY THESE SECURITIES IN ANY JURISDICTION WHERE THE OFFER OR SALE IS NOT PERMITTED.
42
| AIRPORT BUSINESS CENTER |
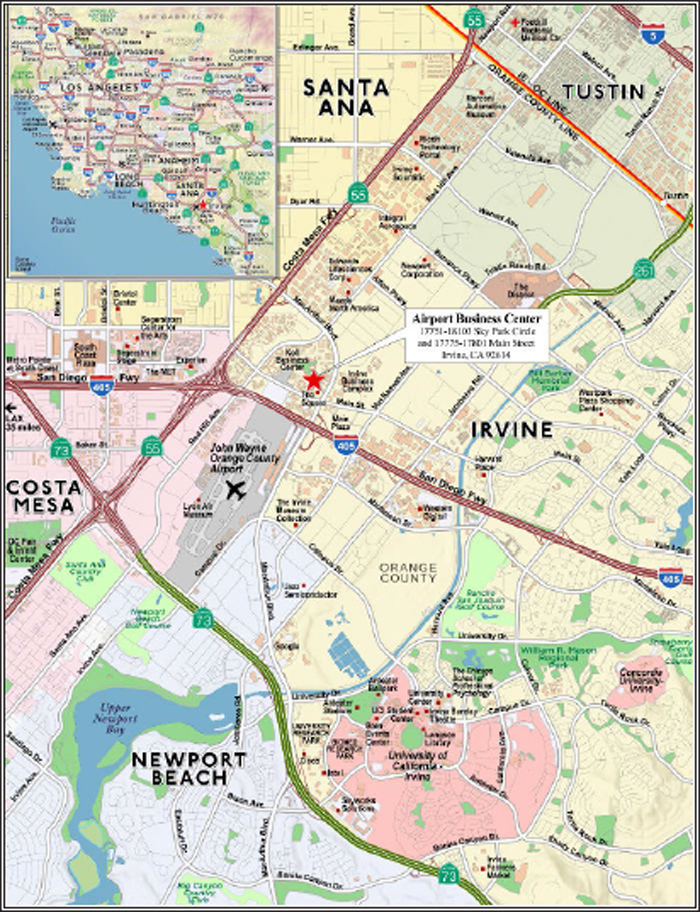
THE INFORMATION IN THIS STRUCTURAL AND COLLATERAL TERM SHEET IS NOT COMPLETE AND MAY BE AMENDED PRIOR TO THE TIME OF SALE. THIS TERM SHEET IS NOT AN OFFER TO SELL THESE SECURITIES AND IT IS NOT A SOLICITATION OF AN OFFER TO BUY THESE SECURITIES IN ANY JURISDICTION WHERE THE OFFER OR SALE IS NOT PERMITTED.
43
| No. 2 – Airport Business Center | ||||||
| Loan Information | Property Information | |||||
| Mortgage Loan Seller: | Wells Fargo Bank, National Association | Single Asset/Portfolio: | Single Asset | |||
| Credit Assessment (DBRS/Fitch/Moody’s): | NR/NR/NR | Property Type: | Industrial | |||
| Original Principal Balance(1): | $50,000,000 | Specific Property Type: | Flex | |||
| Cut-off Date Balance(1): | $50,000,000 | Location: | Irvine, CA | |||
| % of Initial Pool Balance: | 6.9% | Size: | 1,170,571 SF | |||
| Loan Purpose: | Refinance | Cut-off Date Balance Per SF(1): | $128.14 | |||
| Borrower Name: | AIC Owner, LLC | Year Built/Renovated: | 1969/2005 | |||
| Sponsors: | DK Properties, L.P. | Title Vesting: | Fee | |||
| Mortgage Rate: | 4.375% | Property Manager: | Self-managed | |||
| Note Date: | January 24, 2018 | 4thMost Recent Occupancy (As of): | 91.0% (12/31/2013) | |||
| Anticipated Repayment Date: | NAP | 3rdMost Recent Occupancy (As of): | 93.0% (12/31/2014) | |||
| Maturity Date: | February 7, 2028 | 2rdMost Recent Occupancy (As of): | 96.0% (12/31/2015) | |||
| IO Period: | 120 months | Most Recent Occupancy (As of): | 97.0% (12/31/2016) | |||
| Loan Term (Original): | 120 months | Current Occupancy (As of): | 96.8% (1/31/2018) | |||
| Seasoning: | 1 month | |||||
| Amortization Term (Original): | NAP | Underwriting and Financial Information: | ||||
| Loan Amortization Type: | Interest-only, Balloon | |||||
| Interest Accrual Method: | Actual/360 | 4thMost Recent NOI (As of): | $11,321,411 (12/31/2014) | |||
| Call Protection: | L(25),D(91),O(4) | 3rdMost Recent NOI (As of): | $12,153,147 (12/31/2015) | |||
| Lockbox Type: | Hard/Upfront Cash Management | 2ndMost Recent NOI (As of): | $12,904,375 (12/31/2016) | |||
| Additional Debt(1)(2): | Yes | Most Recent NOI (As of): | $13,635,662 (TTM 10/31/17) | |||
| Additional Debt Type(1)(2): | Pari Passu;Mezzanine | |||||
| U/W Revenues: | $18,889,349 | |||||
| U/W Expenses: | $4,222,532 | |||||
| U/W NOI: | $14,666,817 | |||||
| U/W NCF: | $14,116,649 | |||||
| U/W NOI DSCR(1)(2): | 2.20x | |||||
| Escrows and Reserves(3): | U/W NCF DSCR(1)(2): | 2.12x | ||||
| U/W NOI Debt Yield(1)(2): | 9.8% | |||||
| Type: | Initial | Monthly | Cap (If Any) | U/W NCF Debt Yield(1)(2): | 9.4% | |
| Taxes | $52,146 | $52,144 | NAP | As-Is Appraised Value: | $244,600,000 | |
| Insurance | $31,883 | $17,474 | NAP | As-Is Appraisal Valuation Date: | December 13, 2017 | |
| Replacement Reserves | $0 | $21,418 | $525,000 | Cut-off Date LTV Ratio(1)(2): | 61.3% | |
| TI/LC Reserves | $0 | $73,015 | NAP | LTV Ratio at Maturity(1)(2): | 61.3% | |
| (1) | See “The Mortgage Loan” section. All statistical information related to balances per square foot, loan-to-value ratios, debt service coverage ratios and debt yields are based on the Airport Business Center Whole Loan (as defined below). |
| (2) | See “Subordinate and Mezzanine Indebtedness” section. The equity interest in the borrower has been pledged to secure mezzanine indebtedness with an original principal balance of $20,000,000. All statistical information related to the balance per square foot, loan-to-value ratios, debt service coverage ratios and debt yields are based solely on the Airport Business Center Whole Loan. As of the Cut-off Date, the U/W NOI DSCR, U/W NCF DSCR, U/W NOI Debt Yield, U/W NCF Debt Yield, Cut-off Date LTV Ratio and LTV Ratio at Maturity based on the Airport Business Center Total Debt (as defined below) are 1.81x, 1.74x, 8.6%, 8.3%, 69.5% and 69.5%, respectively. |
| (3) | See “Escrows” section. |
The Mortgage Loan. The mortgage loan (the “Airport Business Center Mortgage Loan”) is part of a whole loan (the “Airport Business Center Whole Loan”) evidenced by threepari passu notes secured by a first mortgage encumbering the fee interest in an industrial flex business park located in Irvine, California (the “Airport Business Center Property”). The Airport Business Center Whole Loan was originated on January 24, 2018 by Wells Fargo Bank, National Association. The Airport Business Center Whole Loan had an original principal balance of $150,000,000, has an outstanding principal balance as of the Cut-off Date of $150,000,000 and accrues interest at an interest rate of 4.375%per annum. The Airport Business Center Whole Loan had an initial term of 120 months, has a remaining term of 119 months as of the Cut-off Date and requires payments of interest-only through the loan term. The Airport Business Center Mortgage Loan matures on February 7, 2028.
Note A-2, which will be contributed to the WFCM 2018-C43 securitization trust, had an original principal balance of $50,000,000 and has an outstanding principal balance as of the Cut-off Date of $50,000,000. Notes A-1 and A-3, which have an original principal balance of $60,000,000 and $40,000,000 respectively, are currently held by Wells Fargo Bank, National Association and are expected to be contributed to future securitization trusts. The mortgage loans evidenced by Notes A-1 and A-3 are collectively referred to herein as the “Airport Business Center Companion Loans”. The lender provides no assurances that any non-securitizedpari passu notes will not be split further. See “Description of the Mortgage Pool—The Whole Loans—The Serviced Whole Loans” and “Pooling and Servicing Agreement” in the Preliminary Prospectus.
THE INFORMATION IN THIS STRUCTURAL AND COLLATERAL TERM SHEET IS NOT COMPLETE AND MAY BE AMENDED PRIOR TO THE TIME OF SALE. THIS TERM SHEET IS NOT AN OFFER TO SELL THESE SECURITIES AND IT IS NOT A SOLICITATION OF AN OFFER TO BUY THESE SECURITIES IN ANY JURISDICTION WHERE THE OFFER OR SALE IS NOT PERMITTED.
44
| AIRPORT BUSINESS CENTER |
Note Summary
| Notes | Original Balance | Note Holder | Controlling Interest | |
| A-1 | $60,000,000 | Wells Fargo Bank, National Association | Yes | |
| A-2 | $50,000,000 | WFCM 2018-C43 | No | |
| A-3 | $40,000,000 | Wells Fargo Bank, National Association | No | |
| Total | $150,000,000 |
Following the lockout period, on any date before November 7, 2027, the borrower has the right to defease the Airport Business Center Whole Loan in whole, but not in part. In addition, the Airport Business Center Whole Loan is prepayable without penalty on or after November 7, 2027. The lockout period will expire on the earlier to occur of (i) two years after the closing date of the securitization that includes the last note to be securitized and (ii) July 7, 2021.
Sources and Uses
| Sources | Uses | |||||||
| Original whole loan amount | $150,000,000 | 88.2% | Loan payoff(1) | $166,738,568 | 98.1% | |||
| Mezzanine debt(2) | 20,000,000 | 11.8 | Upfront reserves | $84,029 | 0.0 | |||
| Closing costs | 1,652,636 | 1.0 | ||||||
| Return of equity | 1,524,767 | 0.9 | ||||||
| Total Sources | $170,000,000 | 100.0% | Total Uses | $170,000,000 | 100.0% | |||
| (1) | The Airport Business Center Property was previously securitized in the MSBAM 2014-C19 transaction. Loan payoff includes the existing senior loan ($138,323,068) and existing mezzanine loan ($28,415,500). |
| (2) | See “Subordinate and Mezzanine Indebtedness” section. |
The Property. The Airport Business Center Property is a class B industrial/flex and office development totaling 1,170,571 square feet and located in Irvine, California. Originally built by the borrower sponsor in phases between 1969 and 1978 and most recently renovated in 2005, the Airport Business Center Property comprises 68 one- and two-story buildings spanning approximately 76.6 acres. The Airport Business Center Property is situated within the approximate 4,000-acre Irvine Business Complex, a master planned business park spanning five Orange County cities. The net rentable area of the Airport Business Center Property contains approximately 73.9% industrial/flex, 23.5% office and 2.1% retail tenants. Clear heights at the Airport Business Center Property range from 11 feet, 4 inches to 16 feet, 10 inches. The Airport Business Center Property comprises 2,985 surface parking spaces, resulting in a parking ratio of 2.6 spaces per 1,000 square feet of rentable area.
As of January 31, 2018, the Airport Business Center Property was 96.8% occupied by approximately 440 tenants with no single tenant accounting for more than 1.8% of the net rentable area or 1.5% of underwritten base rent. The Airport Business Center Property has averaged 94.8% occupancy over the past five years and 90.8% occupancy since 1990.
THE INFORMATION IN THIS STRUCTURAL AND COLLATERAL TERM SHEET IS NOT COMPLETE AND MAY BE AMENDED PRIOR TO THE TIME OF SALE. THIS TERM SHEET IS NOT AN OFFER TO SELL THESE SECURITIES AND IT IS NOT A SOLICITATION OF AN OFFER TO BUY THESE SECURITIES IN ANY JURISDICTION WHERE THE OFFER OR SALE IS NOT PERMITTED.
45
| AIRPORT BUSINESS CENTER |
The following table presents certain information relating to the tenancy at the Airport Business Center Property:
Major Tenants
| Tenant Name | Credit Rating (Fitch/ Moody’s/ S&P) | Tenant NRSF | % of NRSF | Annual U/W Base Rent PSF(1) | Annual U/W Base Rent(1) | % of Total Annual U/W Base Rent | Lease Expiration Date | |
| Major Tenants | ||||||||
| Just Food For Dogs, LLC | NR/NR/NR | 18,142 | 1.5% | $15.13(2) | $274,531 | 1.5% | 6/30/2028 | |
| American Pacific Printers College, Inc. | NR/NR/NR | 21,240 | 1.8% | $12.54(3) | $266,400 | 1.4% | Various(3) | |
| AIDS Services Foundation | NR/NR/NR | 12,520 | 1.1% | $17.64(4) | $220,792 | 1.2% | Various(4) | |
| Southwind Kayak Center, Inc. | NR/NR/NR | 10,431 | 0.9% | $17.03(5) | $177,623 | 1.0% | Various(5) | |
| PAS MRO, Inc. | NR/NR/NR | 13,817 | 1.2% | $12.29(6) | $169,857 | 0.9% | Various(6) | |
| Total Major Tenants | 76,150 | 6.5% | $14.57 | $1,109,203 | 6.0% | |||
| Non-Major Tenants | 1,057,087 | 90.3% | $16.55(7) | $17,314,800 | 94.0% | |||
| Occupied Collateral Total | 1,133,237 | 96.8% | $16.42(7) | $18,424,003 | 100.0% | |||
| Vacant Space | 37,334 | 3.2% | ||||||
| Collateral Total | 1,170,571 | 100.0% | ||||||
| (1) | Annual U/W Base Rent PSF and Annual U/W Base Rent include contractual rent steps through February 2019 totaling $555,991. |
| (2) | Just Food For Dogs, LLC leases two spaces: 9,914 square feet with an Annual U/W Base Rent PSF of $14.40 and Lease Expiration Date of June 30, 2028; and 8,228 square feet with an Annual U/W Base Rent PSF of $16.01 and Lease Expiration Date of June 30, 2028. The lease covering the 9,914 square foot space has a free rent period that expires on June 30, 2018. |
| (3) | American Pacific Printers College, Inc. leases three spaces: 2,040 square feet on a month-to-month basis with an U/W Base Rent PSF of $12.00; 4,800 square feet with an Annual U/W Base Rent PSF of $12.60 and Lease Expiration Date of January 31, 2019; and 14,400 square feet with an Annual U/W Base Rent PSF of $12.60 and Lease Expiration Date of February 28, 2019. |
| (4) | AIDS Services Foundation leases two spaces: 11,787 square feet with an Annual U/W Base Rent PSF of $17.40 and Lease Expiration Date of April 30, 2021; and 733 square feet with an Annual U/W Base Rent PSF of $21.42 and Lease Expiration Date of October 14, 2018. |
| (5) | Southwind Kayak Center, Inc. leases three spaces: 4,750 square feet with an Annual U/W Base Rent PSF of $18.00 and Lease Expiration Date of September 30, 2019; and 1,186 square feet with an Annual U/W Base Rent PSF of $14.00 and Lease Expiration Date of September 30, 2019; and 4,495 square feet with an Annual U/W Base Rent PSF of $16.80 and Lease Expiration Date of March 31, 2025. |
| (6) | PAS MRO, Inc. leases three spaces: 9,726 square feet with an Annual U/W Base Rent PSF of $11.04 and Lease Expiration Date of May 31, 2018; 1,466 square feet with an Annual U/W Base Rent PSF of $11.04 and Lease Expiration Date of May 31, 2018; and 2,625 square feet with an Annual U/W Base Rent PSF of $17.64 and Lease Expiration Date of January 31, 2020; |
| (7) | Non-Major Tenants includes approximately 10,962 square feet related to the management office and engineer office, which have no attributed Annual U/W Base Rent. The Annual U/W Base Rent PSF for Non-Major Tenants and Occupied Collateral Total excludes the space related to the management office and engineer office. |
The following table presents certain information relating to the lease rollover schedule at the Airport Business Center Property:
Lease Expiration Schedule(1)(2)
| Year Ending December 31, | No. of Leases Expiring | Expiring NRSF | % of Total NRSF | Cumulative Expiring NRSF | Cumulative % of Total NRSF | Annual U/W Base Rent | % of Total Annual U/W Base Rent | Annual U/W Base Rent PSF |
| MTM(3) | 49 | 86,232 | 7.4% | 86,232 | 7.4% | $1,187,293 | 6.4% | $15.77(3) |
| 2018 | 141 | 303,924 | 26.0% | 390,156 | 33.3% | $4,842,038 | 26.3% | $15.93 |
| 2019 | 132 | 264,446 | 22.6% | 654,602 | 55.9% | $4,424,563 | 24.0% | $16.73 |
| 2020 | 92 | 218,474 | 18.7% | 873,076 | 74.6% | $3,584,549 | 19.5% | $16.41 |
| 2021 | 30 | 112,022 | 9.6% | 985,098 | 84.2% | $1,871,113 | 10.2% | $16.70 |
| 2022 | 33 | 87,897 | 7.5% | 1,072,995 | 91.7% | $1,550,280 | 8.4% | $17.64 |
| 2023 | 11 | 32,831 | 2.8% | 1,105,826 | 94.5% | $531,625 | 2.9% | $16.19 |
| 2024 | 0 | 0 | 0.0% | 1,105,826 | 94.5% | $0 | 0.0% | $0.00 |
| 2025 | 1 | 4,495 | 0.4% | 1,110,321 | 94.9% | $75,516 | 0.4% | $16.80 |
| 2026 | 0 | 0 | 0.0% | 1,110,321 | 94.9% | $0 | 0.0% | $0.00 |
| 2027 | 2 | 4,774 | 0.4% | 1,115,095 | 95.3% | $82,495 | 0.4% | $17.28 |
| 2028 | 2 | 18,142 | 1.5% | 1,133,237 | 96.8% | $274,531 | 1.5% | $15.13 |
| Thereafter | 0 | 0 | 0.0% | 1,133,237 | 96.8% | $0 | 0.0% | $0.00 |
| Vacant | 0 | 37,334 | 3.2% | 1,170,571 | 100.0% | $0 | 0.0% | $0.00 |
| Total/Weighted Average | 493 | 1,170,571 | 100.0% | $18,424,003 | 100.0% | $16.42(4) |
| (1) | Information obtained from the underwritten rent roll. |
| (2) | Certain tenants may have lease termination options that are exercisable prior to the originally stated expiration date of the subject lease and that are not considered in the Lease Expiration Schedule. |
| (3) | MTM includes approximately 10,962 square feet related to the management office and engineer office, which have no leases and no attributed Annual U/W Base Rent. The Annual U/W Base Rent PSF for MTM excludes the space related to the management office and engineer office. |
| (4) | Weighted Average Annual U/W Base Rent PSF excludes vacant, management office and engineer office spaces. |
THE INFORMATION IN THIS STRUCTURAL AND COLLATERAL TERM SHEET IS NOT COMPLETE AND MAY BE AMENDED PRIOR TO THE TIME OF SALE. THIS TERM SHEET IS NOT AN OFFER TO SELL THESE SECURITIES AND IT IS NOT A SOLICITATION OF AN OFFER TO BUY THESE SECURITIES IN ANY JURISDICTION WHERE THE OFFER OR SALE IS NOT PERMITTED.
46
| AIRPORT BUSINESS CENTER |
The following table presents historical occupancy percentages at the Airport Business Center Property:
Historical Occupancy
12/31/2013(1) | 12/31/2014(1) | 12/31/2015(1) | 12/31/2016(1) | 1/31/2018(2) |
| 91.0% | 93.0% | 96.0% | 97.0% | 96.8% |
| (1) | Information obtained from the borrower. |
| (2) | Information obtained from the underwritten rent roll. |
Operating History and Underwritten Net Cash Flow. The following table presents certain information relating to the historical operating performance and underwritten net cash flow at the Airport Business Center Property:
Cash Flow Analysis
| 2014 | 2015 | 2016 | TTM 10/31/2017 | U/W | % of U/W Effective Gross Income | U/W $ per SF | ||||||||
| Base Rent | $13,840,135 | $15,111,231 | $15,773,702 | $16,464,277 | $18,424,003(1) | 97.5% | $15.74 | |||||||
| Grossed Up Vacant Space | 0 | 0 | 0 | 0 | 606,526 | 3.2 | 0.52 | |||||||
| Total Recoveries | 1,010,672 | 1,091,842 | 1,217,145 | 1,293,413 | 1,283,612 | 6.8 | 1.10 | |||||||
| Other Income | 241,346 | 131,003 | 155,864 | 159,400 | 159,400 | 0.8 | 0.14 | |||||||
| Less Vacancy & Credit Loss | 0 | 0 | 0 | 0 | (1,584,192)(2) | (8.4) | (1.35) | |||||||
| Effective Gross Income | $15,092,153 | $16,334,076 | $17,146,711 | $17,917,090 | $18,889,349 | 100.0% | $16.14 | |||||||
| Total Operating Expenses | 3,770,742 | 4,180,929 | 4,242,336 | 4,281,428 | 4,222,532 | 22.4% | 3.61 | |||||||
| Net Operating Income | $11,321,411 | $12,153,147 | $12,904,375 | $13,635,662 | $14,666,817 | 77.6% | $12.53 | |||||||
| TI/LC | 0 | 0 | 0 | 0 | 292,643 | 1.5 | 0.25 | |||||||
| Capital Expenditures | 0 | 0 | 0 | 0 | 257,526 | 1.4 | 0.22 | |||||||
| Net Cash Flow | $11,321,411 | $12,153,147 | $12,904,375 | $13,635,662 | $14,116,648 | 74.7% | $12.06 | |||||||
| NOI DSCR(3) | 1.70x | 1.83x | 1.94x | 2.05x | 2.20x | |||||||||
| NCF DSCR(3) | 1.70x | 1.83x | 1.94x | 2.05x | 2.12x | |||||||||
| NOI DY(3) | 7.5% | 8.1% | 8.6% | 9.1% | 9.8% | |||||||||
| NCF DY(3) | 7.5% | 8.1% | 8.6% | 9.1% | 9.4% |
|
| (1) | U/W Base Rent is higher than TTM 10/31/2017 due to the inclusion of rent bumps through February 2019 totaling $555,991 in addition to the borrower sponsor signing 205 renewal leases totaling 42.4% of underwritten base rent and 7 new leases totaling 2.4% of underwritten base rent since January 2017. |
| (2) | The underwritten economic vacancy is 8.3%. The Airport Business Center Property was 96.8% physically occupied as of January 31, 2018. |
| (3) | The debt service coverage ratios and debt yields shown are based on the Airport Business Center Whole Loan. |
Appraisal.As of the appraisal valuation date of December 13, 2017, the Airport Business Center Property had an “as-is” appraised value of $244,600,000. The appraiser also concluded to a land value of $158,500,000 as of December 13, 2017.
Environmental Matters. According to the Phase I environmental site assessment dated January 18, 2018, there was no evidence of any recognized environmental conditions at the Airport Business Center Property.
Market Overview and Competition. The Airport Business Center Property is located in Irvine, California, within the Irvine Business Complex and approximately one mile northeast of John Wayne Airport. The Irvine Business Complex encompasses approximately 4,000 acres within the cities of Irvine, Newport Beach, Santa Ana, Costa Mesa and Tustin. The Airport Business Center Property is situated to the southeast of the intersection of Macarthur Boulevard and Red Hill Avenue with access to Costa Mesa Freeway (State Route 55) approximately 0.5 mile to the northwest, and access to the San Diego Freeway (Interstate 405) approximately 0.75 mile to the south.
The Airport Business Center Property is situated approximately 3.8 miles northwest of the University of California-Irvine, which had a 2017 total enrollment of approximately 36,000 students. In addition, the Airport Business Center Property is situated approximately 3.0 miles east of South Coast Plaza (one of the five highest grossing shopping malls in the United States) and 9.3 miles west of Irvine Spectrum Center (an outdoor shopping center with various shopping, restaurant and entertainment options). According to a third-party market research report, the estimated 2017 population within a one-, three- and five-mile radius of the Airport Business Center Property was approximately 4,339, 180,021, and 617,144, respectively; while the 2017 estimated average household income within the same radii was $103,619, $98,864, and $96,263, respectively.
According to the appraisal, the Airport Business Center Property is situated within the Airport Area submarket of the Orange County market. As of the third quarter of 2017, the submarket reported a total inventory of 1,590industrial buildings totaling approximately 52.9 million square feet with a 2.6% vacancy rate and 245office buildings totaling approximately 18.9 million square feet with an 11.4% vacancy rate. The appraiser identified five comparableindustrial buildings for the Airport Business Center Property totaling 493,464 square feet, which reported an average occupancy rate of approximately 97.9%; and the appraiser identified four comparableoffice buildings for the Airport Business Center Property totaling 179,262 square feet, which reported an average occupancy rate of approximately 99.4%. The appraiser concluded to market rents for the Airport Business Center Property ranging from $14.40 per square foot to $19.20 per square foot, modified gross.
THE INFORMATION IN THIS STRUCTURAL AND COLLATERAL TERM SHEET IS NOT COMPLETE AND MAY BE AMENDED PRIOR TO THE TIME OF SALE. THIS TERM SHEET IS NOT AN OFFER TO SELL THESE SECURITIES AND IT IS NOT A SOLICITATION OF AN OFFER TO BUY THESE SECURITIES IN ANY JURISDICTION WHERE THE OFFER OR SALE IS NOT PERMITTED.
47
| AIRPORT BUSINESS CENTER |
The following tables present certain information relating to comparable industrial properties and leases to the Airport Business Center Property:
Comparable Properties (Industrial)(1)
| McFadden Centre | Grand Commerce Center | Alton Plaza | Holland Business Center | Main & Red Hill Business Center | |
| Location | Santa Ana, CA | Santa Ana, CA | Irvine, CA | Irvine, CA | Irvine, CA |
| Distance from Subject | 4.0 miles | 4.1 miles | 9.9 miles | 10.3 miles | 1.0 mile |
| Year Built/Renovated | 1988/NAV | 1980/NAV | 1989/NAV | 2005/NAV | 1981/NAV |
| Total GLA | 184,737 SF | 99,160 SF | 15,100 SF | 10,575 SF | 183,892 SF |
| Total Occupancy | 100% | 95% | 100% | 100% | 97% |
| (1) | Information obtained from the appraisal. |
Comparable Leases (Industrial)(1)
| Property Name | Tenant Name | Lease Date/ Term | Lease Area (SF) | Annual Base Rent PSF | Tenant Improvements PSF | Lease Type |
| McFadden Centre | American Stitch Design | Apr. 2017 / 3.0 Years | 3,210 | $14.52 | $0.00 | Modified Gross |
| Grand Commerce Center | Mid America Sales | Feb. 2017 / 3.0 Years | 1,635 | $13.20 | $0.00 | Modified Gross |
| Alton Plaza | Wachter, Inc. | Feb. 2016 / 5.3 Years | 5,238 | $14.16 | $0.00 | NNN |
| Holland Business Center | Evets Corporation | May 2016 / 3.0 Years | 5,070 | $16.80 | $0.00 | Modified Gross |
| Main & Red Hill Business Center | Confidential | Sept. 2017 / 4.1 Years | 4,012 | $13.80 | $0.00 | NNN |
| (1) | Information obtained from the appraisal. |
The following tables present certain information relating to comparable office properties and lease to the Airport Business Center Property:
Comparable Properties (Office)(1)
| 16530 Bake Pkwy | Centerpointe 1, 2, 3 & 6 | Executive Park III | 15300 Barranca Parkway | |
| Location | Irvine, CA | Irvine, CA | Irvine, CA | Irvine, CA |
| Distance from Subject | 9.0 miles | 3.0 miles | 0.7 mile | 9.2 miles |
| Year Built/Renovated | 2006/NAV | 1979/NAV | 1985/NAV | 1997/NAV |
| Total GLA | 19,998 SF | 105,577 SF | 21,271 SF | 32,416 SF |
| Total Occupancy | 100% | 99% | 100% | 100% |
| (1) | Information obtained from the appraisal. |
Comparable Leases (Office)(1)
| Property Name | Tenant Name | Lease Date/ Term | Lease Area (SF) | Annual Base Rent PSF | Tenant Improvements PSF | Lease Type |
| 16530 Bake Pkwy | Roka Sports | Mar. 2017 / 3.2 Years | 3,363 | $24.00 | $10.00 | Gross |
| Centerpointe 1, 2, 3 & 6 | Sims Law Firm | Feb. 2017 / 4.1 Years | 2,889 | $26.40 | $0.00 | Gross |
| Executive Park III | Langan Engineering | Dec. 2016 / 3.0 Years | 1,001 | $26.40 | $0.00 | Gross |
| 15300 Barranca Parkway | BBMC Mortgage | Mar. 2017 / 3.8 Years | 8,376 | $22.20 | $0.00 | Gross |
| (1) | Information obtained from the appraisal. |
THE INFORMATION IN THIS STRUCTURAL AND COLLATERAL TERM SHEET IS NOT COMPLETE AND MAY BE AMENDED PRIOR TO THE TIME OF SALE. THIS TERM SHEET IS NOT AN OFFER TO SELL THESE SECURITIES AND IT IS NOT A SOLICITATION OF AN OFFER TO BUY THESE SECURITIES IN ANY JURISDICTION WHERE THE OFFER OR SALE IS NOT PERMITTED.
48
| AIRPORT BUSINESS CENTER |
The Borrower.The borrower is AIC Owner, LLC, a Delaware limited liability company and single purpose entity with two independent directors. Legal counsel to the borrower delivered a non-consolidation opinion in connection with the origination of the Airport Business Center Whole Loan. DK Properties, L.P. is the guarantor of certain nonrecourse carveouts under the Airport Business Center Whole Loan.
The Borrower Sponsor.The borrower sponsor is DK Properties, L.P., which is an affiliate of The Koll Company (“Koll”), a privately held full service real estate firm based in Irvine, California. Since formation in 1962, Koll has acquired and developed, in partnership with institutional and private investors, over 100 million square feet of office, industrial, retail and resort properties throughout multiple markets. One of Koll’s primary focuses is on the acquisition and management of multi-tenant industrial properties. Koll has had continued ownership and management of the Airport Business Center Property since the company purchased the land and initiated construction in 1969.
Escrows.The loan documents provide for upfront escrows in the amount of $52,146 for real estate taxes and $31,883 for insurance premiums. The loan documents also provide for ongoing monthly escrows in an amount equal to $52,144 for real estate taxes, $17,474 for insurance premiums, $73,015 for tenant improvements and leasing commissions (“TI/LCs”) and $21,418 for capital expenditures (subject to a cap of $525,000). The borrower has the right to use funds in the TI/LC reserve account for preparation of tenant-ready speculative spaces in an amount no more than $10 per rentable square foot of such tenant-ready speculative space and no more than $250,000 in any 12-month period, subject to certain conditions outlined in the loan documents.
Lockbox and Cash Management.The Airport Business Center Whole Loan requires a lender-controlled lockbox account, which is already in-place, and that the borrower direct all tenants to pay rent directly into such lockbox account. The loan documents also require that all rents received by the borrower or the property manager be deposited into the lockbox account within one business day of receipt. All funds in the lockbox account are required to be swept each business day into the cash management account controlled by the lender and disbursed on each payment date in accordance with the loan documents. Prior to the occurrence of a Cash Trap Event Period (as defined below), all excess funds are required to be distributed to the borrower. During a Cash Trap Event Period, all excess funds are required to be swept to an excess cash flow subaccount.
A “Cash Trap Event Period” will commence upon the earlier of the following:
| (i) | the occurrence of an event of default under the Airport Business Center Whole Loan or the Airport Business Center Mezzanine Loan (see “Subordinate and Mezzanine Indebtedness” section); |
| (ii) | the debt yield based on the Airport Business Center Total Debt (see “Subordinate and Mezzanine Indebtedness” section) falling below 6.50% at the end of any fiscal quarter; or |
| (iii) | the property manager becoming insolvent or filing for bankruptcy. |
A Cash Trap Event Period will end upon the occurrence of the following:
| ● | with regard to clause (i), upon the cure of such event of default; |
| ● | with regard to clause (ii), upon the debt yield based on the Airport Business Center Total Debt being equal to or greater than 6.75% for two consecutive fiscal quarters; or |
| ● | with regard to clause (iii), upon the bankruptcy or insolvency proceedings having terminated or (b) a new approved property manager being appointed in accordance with the loan documents. |
Property Management.The Airport Business Center Property is managed by an affiliate of the borrower.
Assumption.The Airport Business Center borrower has a one-time right to transfer the Airport Business Center Property, provided that certain other conditions are satisfied, including, but not limited to: (i) no event of default or monetary default has occurred and is continuing; (ii) the lender’s reasonable determination that the proposed transferee and guarantor satisfy the lender’s credit review and underwriting standards, taking into consideration transferee experience, financial strength and general business standing; (iii) if requested by the lender, rating agency confirmation from DBRS, Fitch, and Moody’s that the transfer will not result in a downgrade, withdrawal or qualification of the respective ratings assigned to the Series WFCM 2018-C43 certificates and similar confirmations from each rating agency rating any securities backed by any of the Airport Business Center Companion Loans with respect to the ratings of such securities; and (iv) the entire Airport Business Center Mezzanine Loan (see “Subordinate and Mezzanine Indebtedness” section) has been simultaneously defeased.
Partial Release.Not permitted.
Real Estate Substitution.Not permitted.
Subordinate and Mezzanine Indebtedness.BSREF Holdings LLC, a Delaware limited liability company related to Brookfield Real Estate Financial Partners LLC, funded a $20,000,000 mezzanine loan (the “Airport Business Center Mezzanine Loan”) to AIC Mezz, LLC, a Delaware limited liability company (the “Airport Business Center Mezzanine Borrower”) (collectively, the Airport Business Center Whole Loan and the Airport Business Center Mezzanine Loan are referred to herein as the “Airport Business Center Total Debt”). The Airport Business Center Mezzanine Loan is secured by a pledge of the Airport Business Center Mezzanine Borrower’s interest in the borrower under the Airport Business Center Whole Loan. The Airport Business Center Mezzanine Loan accrues interest at a rate of 7.206%per annumand requires interest-only payments through the maturity date of February 7, 2028 (co-terminous with the Airport Business Center Whole Loan).
Ground Lease.None.
Terrorism Insurance.The Airport Business Center Whole Loan documents require that the “all risk” insurance policy required to be maintained by the borrower provide coverage for terrorism in an amount equal to the full replacement cost of the Airport Business
THE INFORMATION IN THIS STRUCTURAL AND COLLATERAL TERM SHEET IS NOT COMPLETE AND MAY BE AMENDED PRIOR TO THE TIME OF SALE. THIS TERM SHEET IS NOT AN OFFER TO SELL THESE SECURITIES AND IT IS NOT A SOLICITATION OF AN OFFER TO BUY THESE SECURITIES IN ANY JURISDICTION WHERE THE OFFER OR SALE IS NOT PERMITTED.
49
| AIRPORT BUSINESS CENTER |
Center Property, as well as business interruption insurance covering no less than the 12-month period following the occurrence of a casualty event, together with a 12-month extended period of indemnity (provided that if TRIPRA or a similar statute is not in effect, the borrower will not be obligated to pay terrorism insurance premiums in excess of two times the premium for the casualty and business interruption coverage on a stand-alone basis).
Earthquake Insurance.The loan documents do not require earthquake insurance. The seismic report indicated a probable maximum loss for the entire Airport Business Center Property of 8.0%.
THE INFORMATION IN THIS STRUCTURAL AND COLLATERAL TERM SHEET IS NOT COMPLETE AND MAY BE AMENDED PRIOR TO THE TIME OF SALE. THIS TERM SHEET IS NOT AN OFFER TO SELL THESE SECURITIES AND IT IS NOT A SOLICITATION OF AN OFFER TO BUY THESE SECURITIES IN ANY JURISDICTION WHERE THE OFFER OR SALE IS NOT PERMITTED.
50
(THIS PAGE INTENTIONALLY LEFT BLANK)
THE INFORMATION IN THIS STRUCTURAL AND COLLATERAL TERM SHEET IS NOT COMPLETE AND MAY BE AMENDED PRIOR TO THE TIME OF SALE. THIS TERM SHEET IS NOT AN OFFER TO SELL THESE SECURITIES AND IT IS NOT A SOLICITATION OF AN OFFER TO BUY THESE SECURITIES IN ANY JURISDICTION WHERE THE OFFER OR SALE IS NOT PERMITTED.
51
| THE SOCAL PORTFOLIO |
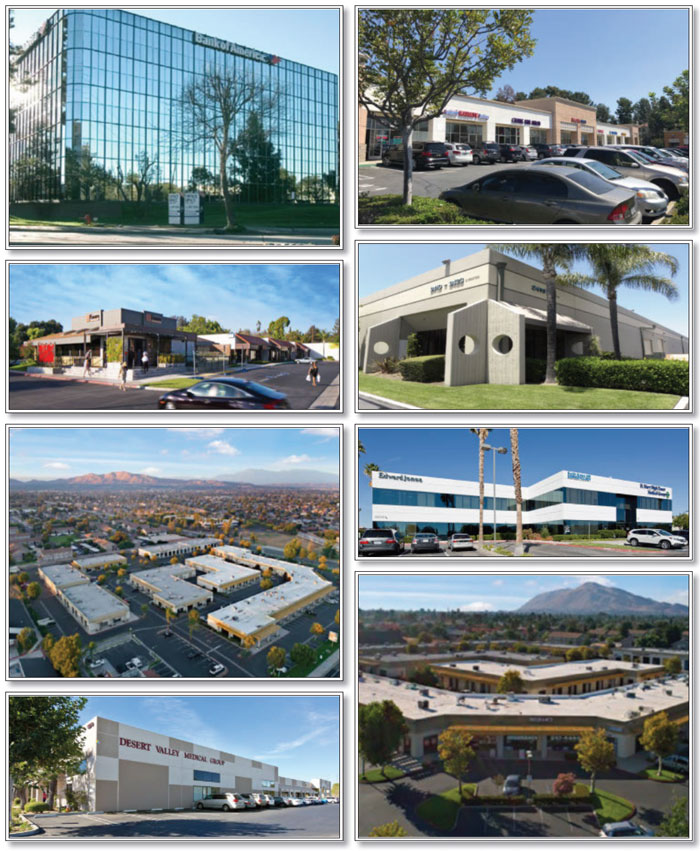
THE INFORMATION IN THIS STRUCTURAL AND COLLATERAL TERM SHEET IS NOT COMPLETE AND MAY BE AMENDED PRIOR TO THE TIME OF SALE. THIS TERM SHEET IS NOT AN OFFER TO SELL THESE SECURITIES AND IT IS NOT A SOLICITATION OF AN OFFER TO BUY THESE SECURITIES IN ANY JURISDICTION WHERE THE OFFER OR SALE IS NOT PERMITTED.
52
| THE SOCAL PORTFOLIO |
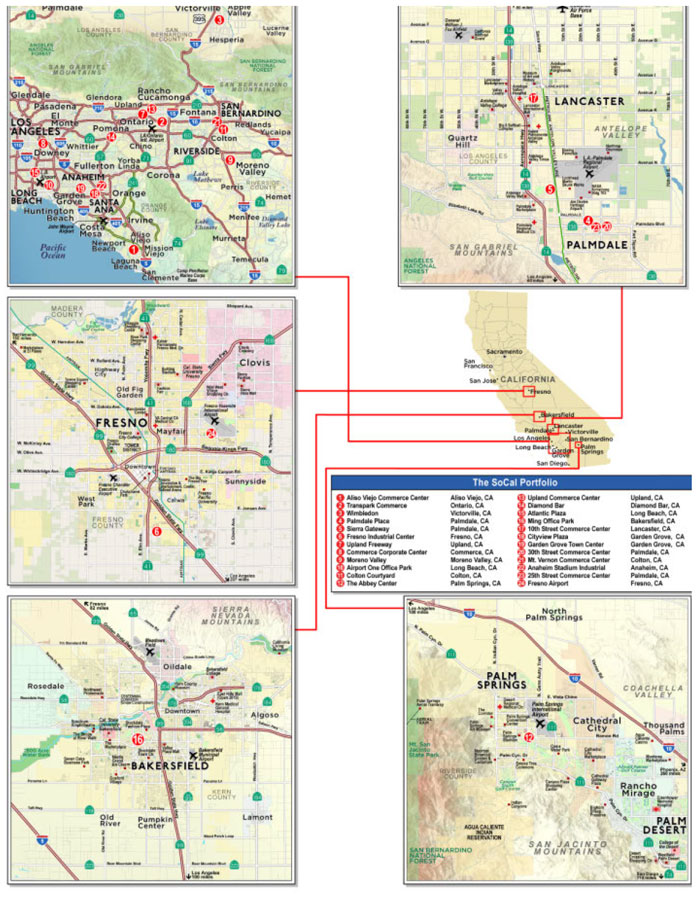
THE INFORMATION IN THIS STRUCTURAL AND COLLATERAL TERM SHEET IS NOT COMPLETE AND MAY BE AMENDED PRIOR TO THE TIME OF SALE. THIS TERM SHEET IS NOT AN OFFER TO SELL THESE SECURITIES AND IT IS NOT A SOLICITATION OF AN OFFER TO BUY THESE SECURITIES IN ANY JURISDICTION WHERE THE OFFER OR SALE IS NOT PERMITTED.
53
| No. 3 – The SoCal Portfolio | |||||||
| Loan Information | Property Information | ||||||
| Mortgage Loan Seller: | Barclays Bank PLC | Single Asset/Portfolio: | Portfolio | ||||
| Credit Assessment (DBRS/Fitch/Moody’s): | NR/NR/NR | Property Type: | Various – See Table | ||||
| Original Principal Balance(1): | $45,000,000 | Specific Property Type: | Various – See Table | ||||
| Cut-off Date Principal Balance(1): | $45,000,000 | Location: | Various – See Table | ||||
| % of Initial Pool Balance: | 6.2% | Size: | 2,194,425 SF | ||||
| Loan Purpose: | Refinance | Cut-off Date Balance Per SF(1): | $104.49 | ||||
| Borrower Name(2): | Various | Year Built/Renovated: | Various | ||||
| Borrower Sponsors: | The Abbey Company | Title Vesting: | Various | ||||
| Mortgage Rate: | 4.890% | Property Manager: | Self-managed | ||||
| Note Date: | February 6, 2018 | 4thMost Recent Occupancy (As of)(5)(6): | 71.4% (12/31/2013) | ||||
| Anticipated Repayment Date: | NAP | 3rdMost Recent Occupancy (As of)(5)(6): | 73.5% (12/31/2014) | ||||
| Maturity Date: | February 6, 2028 | 2ndMost Recent Occupancy (As of)(5)(6): | 73.8% (12/31/2015) | ||||
| IO Period: | 60 months | Most Recent Occupancy (As of)(5)(6): | 80.5% (12/31/2016) | ||||
| Loan Term (Original): | 120 months | Current Occupancy (As of): | 83.8% (1/31/2018) | ||||
| Seasoning: | 1 month | ||||||
| Amortization Term (Original): | 360 months | Underwriting and Financial Information: | |||||
| Loan Amortization Type: | Interest-only, Amortizing Balloon | ||||||
| Interest Accrual Method: | Actual/360 | 4thMost Recent NOI (As of)(6): | $15,260,323 (12/31/2014) | ||||
| Call Protection(3): | L(25),D(89),O(6) | 3rdMost Recent NOI (As of)(6): | $17,503,312 (12/31/2015) | ||||
| Lockbox Type: | Hard/Springing Cash Management | 2ndMost Recent NOI (As of)(6): | $19,069,525 (12/31/2016) | ||||
| Additional Debt(1): | Yes | Most Recent NOI (As of)(6)(7): | $20,073,198 (TTM 10/31/2017) | ||||
| Additional Debt Type(1): | Pari Passu | ||||||
| U/W Revenues: | $35,466,096 | ||||||
| U/W Expenses: | $12,079,824 | ||||||
| U/W NOI(7): | $23,386,272 | ||||||
| U/W NCF: | $21,584,994 | ||||||
| Escrows and Reserves(4): | U/W NOI DSCR(1): | 1.60x | |||||
| U/W NCF DSCR(1): | 1.48x | ||||||
| Type: | Initial | Monthly | Cap (If Any) | U/W NOI Debt Yield(1): | 10.2% | ||
| Taxes | $0 | $219,172 | NAP | U/W NCF Debt Yield(1): | 9.4% | ||
| Insurance | $0 | Springing | NAP | As-Is Appraised Value(8): | $386,140,000 | ||
| Replacement Reserves | $0 | $35,400 | $1,000,000 | As-Is Appraisal Valuation Date(8): | Various | ||
| TI/LC Reserves | $8,000,000 | $228,586 | (4) | Cut-off Date LTV Ratio(1)(8): | 59.4% | ||
| Other(4) | $4,863,915 | (4) | NAP | LTV Ratio at Maturity or ARD(1)(8): | 54.7% | ||
| (1) | See “The Mortgage Loan” section. All statistical financial information related to balance per square foot, loan-to-value ratios, debt service coverage ratios and debt yields are based on the funded outstanding principal balance of the SoCal Portfolio Whole Loan (as defined below). |
| (2) | See “The Borrowers” section. |
| (3) | The defeasance lockout period will be at least 25 payment dates beginning with and including the first payment date of March 6, 2018. Defeasance of the SoCal Portfolio Whole Loan is permitted after the date that is the earlier to occur of (i) two years after the closing date of the securitization that includes the last note to be securitized, and (ii) February 6, 2021. The assumed lockout period of 25 payments is based on the expected WFCM 2018-C43 securitization trust closing date in March 2018. |
| (4) | See “Escrows” section. |
| (5) | Information obtained from the borrowers and represents average occupancy for the SoCal Portfolio Properties (as defined below) for the year indicated. The increase in occupancy from 12/31/2015 to 12/31/2016 corresponds to approximately $14.0 million of tenant improvement and leasing commissions and capital expenditures in the SoCal Portfolio Properties in 2015 and 2016. |
| (6) | The increase from 4th Most Recent NOI to Most Recent NOI is attributable to occupancy increasing from 71.4% as of 12/31/2013 to 83.8% as of 1/31/2018. |
| (7) | The increase from Most Recent NOI to U/W NOI is attributable to rent abatements, new leasing at the SoCal Portfolio Properties, contractual rent steps through February 2019 totalling $599,676 and the present value of rent steps for investment grade tenants totalling $488,001. |
| (8) | See “Appraisals” section. |
The Mortgage Loan.The mortgage loan (the “The SoCal Portfolio Mortgage Loan”) is part of a whole loan (the “SoCal Portfolio Whole Loan”) that is evidenced by sixpari passu promissory notes (Notes A-1-1, A-1-2, A-1-3, A-1-4, A-2-1 and A-2-2) that are secured by a first mortgage encumbering 24 office, retail, mixed use and industrial properties located in Central and Southern California, totaling 2,194,425 square feet (the “The SoCal Portfolio Properties”). The SoCal Portfolio Whole Loan was originated on February 6, 2018 by Barclays Bank PLC and Citi Real Estate Funding Inc. The SoCal Portfolio Whole Loan had an original principal balance of $229,300,000, has an outstanding principal balance as of the Cut-off Date of $229,300,000 and accrues interest at an interest rate of 4.890%per annum. The SoCal Portfolio Whole Loan had an initial term of 120 months, has a remaining term of 119 months as of the Cut-off Date and requires interest-only payments for the first 60 payments, after which payments of interest and principal will be based on a 30-year amortization schedule. The SoCal Portfolio Whole Loan matures on February 6, 2028.
THE INFORMATION IN THIS STRUCTURAL AND COLLATERAL TERM SHEET IS NOT COMPLETE AND MAY BE AMENDED PRIOR TO THE TIME OF SALE. THIS TERM SHEET IS NOT AN OFFER TO SELL THESE SECURITIES AND IT IS NOT A SOLICITATION OF AN OFFER TO BUY THESE SECURITIES IN ANY JURISDICTION WHERE THE OFFER OR SALE IS NOT PERMITTED.
54
| THE SOCAL PORTFOLIO |
The SoCal Portfolio Mortgage Loan is evidenced by Note A-2-1, which will be contributed to the WFCM 2018-C43 securitization trust, had an original principal balance of $45,000,000, has an outstanding principal balance as of the Cut-off Date of $45,000,000 and represents a non-controlling interest in the SoCal Portfolio Whole Loan. The controlling Note A-1-1 had an original principal balance of $50,000,000, has an outstanding principal balance as of the Cut-off Date of $50,000,000, is currently held by Citi Real Estate Funding Inc. and is expected to be contributed to the CGCMT 2018-B2 securitization trust. The non-controlling Note A-1-2 and Note A-1-3 had an aggregate original principal balance of $50,000,000, have an aggregate outstanding principal balance as of the Cut-off Date of $50,000,000, are currently held by Citi Real Estate Funding Inc. and are expected to be contributed to one or more future securitizations. The non-controlling note A-1-4 had an original principal balance of $37,580,000, has an outstanding principal balance as of the Cut-off Date of $37,580,000, is currently held by Cantor Commercial Real Estate Lending, L.P. and is expected to be contributed to one or more future securitizations. The non-controlling note A-2-2 had an original principal balance of $46,720,000, has an outstanding principal balance as of the Cut-off Date of $46,720,000, is currently held by Barclays Bank PLC and is expected to be contributed to one or more future securitizations. See“Description of the Mortgage Pool—The Whole Loans—The Non-Serviced Pari Passu Whole Loans” and“Pooling and Servicing Agreement” in the Preliminary Prospectus.
Note Summary
| Notes | Original Balance | Note Holder | Controlling Interest | |
| A-1-1 | $50,000,000 | CGCMT 2018-B2 (expected) | Yes | |
| A- 1-2 | $35,000,000 | Citi Real Estate Funding Inc. | No | |
| A-1-3 | $15,000,000 | Citi Real Estate Funding Inc. | No | |
| A-1-4 | $37,580,000 | Cantor Commercial Real Estate Lending L.P. | No | |
| A-2-1 | $45,000,000 | WFCM 2018-C43 | No | |
| A-2-2 | $46,720,000 | Barclays Bank PLC | No | |
| Total | $229,300,000 |
Following the lockout period, the borrowers have the right to defease the SoCal Portfolio Whole Loan in whole, or in part (see “Partial Release” section), on any date before September 6, 2027. In addition, the SoCal Portfolio Whole Loan is prepayable without penalty on or after September 6, 2027. The lockout period will expire on the earlier to occur of (i) two years after the closing date of the securitization that includes the last note to be securitized and (ii) February 6, 2021.
Sources and Uses
| Sources | Uses | |||||||
| Original loan amount | $229,300,000 | 98.6% | Loan payoff | $215,200,917 | 92.6% | |||
| Other sources(1) | 1,635,345 | 0.7 | Reserves | 12,863,915 | 5.5 | |||
| Sponsor’s new cash contribution | 1,560,056 | 0.7 | Closing costs | 4,430,569 | 1.9 | |||
| Total Sources | $232,495,401 | 100.0% | Total Uses | $232,495,401 | 100.0% |
| (1) | Other sources represent the return of taxes and insurance funds that were held in reserve in connection with the prior loan encumbering the SoCal Portfolio Properties. |
The Properties. The SoCal Portfolio Properties are comprised of 24 properties totaling 2,194,425 square feet located primarily in southern California. The SoCal Portfolio Properties were built between 1968 and 1991 and range in size from 12,610 square feet to 265,898 square feet. The breakdown of property types across the SoCal Portfolio Properties is eight office (36.0% of allocated loan amount), ten retail (34.6% of allocated loan amount), three mixed-use (21.8% of allocated loan amount) and three industrial (7.6% of allocated loan amount) properties. The borrower sponsor has owned all of the SoCal Portfolio Properties for at least 16 years with 20 of the 24 properties being acquired by the borrower sponsor prior to 2000. The SoCal Portfolio Properties exhibited a total portfolio occupancy of 83.8% as of January 31, 2018. No individual property makes up more than 12.1% of the allocated loan amount and no individual tenant makes up more than 4.8% of total UW base rent or 4.0% of total square feet across the SoCal Portfolio Properties. Additionally, five of the seven largest tenants by base rent are investment grade tenants as rated by at least one rating agency.
The following tables present certain information relating to the SoCal Portfolio Properties:
| Property Type | # of Properties | Net Rentable Area (SF) | % of Net Rentable Area | Allocated Loan Amount | % of Allocated Loan Amount | Underwritten Net Cash Flow | % of Underwritten Net Cash Flow |
| Office | 8 | 880,804 | 40.1% | $82,634,684 | 36.0% | $7,980,791 | 37.0% |
| Retail | 10 | 563,890 | 25.7% | $79,285,474 | 34.6% | $6,943,789 | 32.1% |
| Mixed Use | 3 | 364,302 | 16.6% | $49,875,359 | 21.8% | $5,116,034 | 23.7% |
| Industrial | 3 | 385,429 | 17.6% | $17,504,484 | 7.6% | $1,544,381 | 7.2% |
| Total/Weighted Average | 24 | 2,194,425 | 100.0% | $229,300,000 | 100.0% | $21,584,994 | 100.0% |
THE INFORMATION IN THIS STRUCTURAL AND COLLATERAL TERM SHEET IS NOT COMPLETE AND MAY BE AMENDED PRIOR TO THE TIME OF SALE. THIS TERM SHEET IS NOT AN OFFER TO SELL THESE SECURITIES AND IT IS NOT A SOLICITATION OF AN OFFER TO BUY THESE SECURITIES IN ANY JURISDICTION WHERE THE OFFER OR SALE IS NOT PERMITTED.
55
| THE SOCAL PORTFOLIO |
The following table presents certain information relating to the SoCal Portfolio Properties:
| Property Name | City(1) | Property Type | Allocated Whole Loan Cut-off Date Principal Balance | % of Portfolio Cut-off Date Principal Balance | Occupancy as of 1/31/2018 | Net Rentable Area (SF) | Appraised Value |
| Aliso Viejo Commerce Center | Aliso Viejo | Retail | $27,761,791 | 12.1% | 89.7% | 65,107 | $39,500,000 |
| Transpark Commerce | Ontario | Office | $25,143,236 | 11.0% | 74.4% | 204,099 | $35,300,000 |
| Wimbledon | Victorville | Mixed Use | $22,230,241 | 9.7% | 94.7% | 123,948 | $30,700,000 |
| Palmdale Place | Palmdale | Mixed Use | $16,250,000 | 7.1% | 89.1% | 129,294 | $31,700,000 |
| Sierra Gateway | Palmdale | Office | $14,800,000 | 6.5% | 76.6% | 133,851 | $23,000,000 |
| Fresno Industrial Center | Fresno | Industrial | $14,000,000 | 6.1% | 97.2% | 265,898 | $19,400,000 |
| Upland Freeway | Upland | Retail | $13,032,927 | 5.7% | 94.4% | 116,061 | $21,100,000 |
| Commerce Corporate Center | Commerce | Office | $13,000,000 | 5.7% | 93.1% | 68,513 | $18,700,000 |
| Moreno Valley | Moreno Valley | Mixed Use | $11,395,118 | 5.0% | 94.0% | 111,060 | $16,100,000 |
| Airport One Office Park | Long Beach | Office | $11,394,743 | 5.0% | 100.0% | 88,284 | $16,100,000 |
| Colton Courtyard | Colton | Retail | $7,375,987 | 3.2% | 65.2% | 122,082 | $20,300,000 |
| The Abbey Center | Palm Springs | Office | $7,244,116 | 3.2% | 86.5% | 67,335 | $10,800,000 |
| Upland Commerce Center | Upland | Retail | $6,879,276 | 3.0% | 86.0% | 47,677 | $12,000,000 |
| Diamond Bar | Diamond Bar | Retail | $6,650,000 | 2.9% | 100.0% | 20,528 | $9,170,000 |
| Atlantic Plaza | Long Beach | Retail | $6,000,000 | 2.6% | 100.0% | 32,728 | $8,650,000 |
| Ming Office Park | Bakersfield | Office | $5,552,589 | 2.4% | 56.5% | 117,924 | $18,100,000 |
| 10th Street Commerce Center | Lancaster | Retail | $4,913,128 | 2.1% | 52.3% | 96,589 | $18,900,000 |
| Cityview Plaza | Garden Grove | Office | $4,500,000 | 2.0% | 96.4% | 148,271 | $8,850,000 |
| Garden Grove Town Center | Garden Grove | Retail | $3,502,732 | 1.5% | 100.0% | 12,610 | $4,770,000 |
| 30th Street Commerce Center | Palmdale | Retail | $1,875,896 | 0.8% | 49.5% | 33,020 | $7,130,000 |
| Mt. Vernon Commerce Center | Colton | Industrial | $1,754,484 | 0.8% | 77.8% | 29,600 | $3,420,000 |
| Anaheim Stadium Industrial | Anaheim | Industrial | $1,750,000 | 0.8% | 100.0% | 89,931 | $3,360,000 |
| 25th Street Commerce Center | Palmdale | Retail | $1,293,737 | 0.6% | 58.8% | 17,488 | $4,320,000 |
| Fresno Airport | Fresno | Office | $1,000,000 | 0.4% | 47.0% | 52,527 | $4,770,000 |
| Total/Weighted Average | $229,300,000 | 100.0% | 83.8% | 2,194,425 | $386,140,000 |
| (1) | All properties are located in the state of California. |
THE INFORMATION IN THIS STRUCTURAL AND COLLATERAL TERM SHEET IS NOT COMPLETE AND MAY BE AMENDED PRIOR TO THE TIME OF SALE. THIS TERM SHEET IS NOT AN OFFER TO SELL THESE SECURITIES AND IT IS NOT A SOLICITATION OF AN OFFER TO BUY THESE SECURITIES IN ANY JURISDICTION WHERE THE OFFER OR SALE IS NOT PERMITTED.
56
| THE SOCAL PORTFOLIO |
Thefollowing table presents certain information relating to the tenancy at theSoCal Portfolio Properties:
Major Tenants(1)
| Credit Rating (Fitch/ Moody’s/ S&P)(2) | Tenant NRSF | % of NRSF | Annual U/W Base Rent PSF(3) | Annual U/W Base Rent(3) | % of Total Annual U/W Base Rent | Lease Expiration Date | |
| Major Tenants | |||||||
| The Capital Group Companies(4) | NR/NR/NR | 88,284 | 4.0% | $17.19 | $1,517,300 | 4.8% | 4/30/2025(4) |
| County of Los Angeles(5) | AA-/Aa2/AA | 58,755 | 2.7% | $21.32 | $1,252,415 | 3.9% | 2/29/2020 |
| Antelope Valley Community College District(6) | NR/Aa2/AA | 50,720 | 2.3% | $21.53 | $1,092,031 | 3.4% | 10/31/2046(6) |
| County of San Bernardino(7) | AA+/A1/AA- | 34,469 | 1.6% | $28.78 | $992,034 | 3.1% | 9/30/2024(7) |
| GSA (United States of America)(8) | AAA/Aaa/AA+ | 30,483 | 1.4% | $29.02 | $884,656 | 2.8% | Various |
| Heritage Victor Valley Medical Group(9) | NR/NR/NR | 41,875 | 1.9% | $19.45 | $814,387 | 2.6% | Various |
| Fiat Chrysler Automobiles(10) | BB/Baa3/BB+ | 27,965 | 1.3% | $22.55 | $630,690 | 2.0% | 7/31/2028(10) |
| The Abbey Management Co., LLC(11) | NR/NR/NR | 27,663 | 1.3% | $22.28 | $616,225 | 1.9% | Various |
| Stantec Consulting Services Inc.(12) | NR/NR/NR | 25,203 | 1.1% | $21.96 | $553,458 | 1.7% | 3/31/2023(12) |
| Candor-AGS, Inc.(13) | NR/NR/NR | 125,183 | 5.7% | $4.22 | $527,796 | 1.7% | 5/31/2020(13) |
| Total Major Tenants | 510,600 | 23.3% | $17.39 | $8,880,993 | 27.8% | ||
| Non-Major Tenants | 1,328,177 | 60.5% | $17.33 | $23,013,546 | 72.2% | ||
| Occupied Collateral Total | 1,838,777 | 83.8% | $17.35 | $31,894,539 | 100.0% | ||
| Vacant Space | 355,648 | 16.2% | |||||
| Collateral Total | 2,194,425 | 100.0% | |||||
| (1) | Information obtained from the underwritten rent roll. |
| (2) | Credit ratings are those of the parent company whether or not the parent company guarantees the lease. |
| (3) | Annual U/W Base Rent PSF and Annual U/W Base Rent include contractual rent steps through February 2019, totaling $599,676 and the present value of rent steps for investment grade rated tenants totaling $488,001. |
| (4) | The Capital Group Companies is a tenant at the Airport One Office Park property. The Capital Group Companies has two months of free rent in 2022, which was reserved for upfront. The Capital Group has two, five-year extension options. |
| (5) | The County of Los Angeles leases 49,500 square feet used by the Department of Children and Family Services at the Sierra Gateway property expiring February 29, 2020 and 9,255 square feet used by the Department of Mental Health at the Palmdale Place property on a month-to-month basis. The 9,255 square foot space has been month-to-month since August 31, 2017 while the County of Los Angeles has been negotiating a lease renewal at the Palmdale Place Property. |
| (6) | Antelope Valley Community College District is a tenant at the Palmdale Place property. Antelope Valley Community College District has four, 15-year extension options. |
| (7) | County of San Bernardino is a tenant at the Transpark Commerce property. County of San Bernardino has one month of free rent in 2018 and one month of free rent in 2019, which was reserved for upfront. County of San Bernardino has two, five-year extension options. |
| (8) | GSA (United States of America) leases its 30,483 square feet across four of the SoCal Portfolio Properties. 8,892 square feet expires on January 14, 2019, 8,434 square feet expires on January 31, 2022, 4,996 square feet expiring on May 16, 2025, 3,929 square feet expires on March 31, 2018, 3,000 square feet expires on August 5, 2021, and 1,232 square feet expires on December 20, 2022. GSA (United States of America) has the option to terminate the 8,892 square foot space that expires on January 14, 2019 at any time by giving at least 180 days prior written notice. GSA (United States of America) has the option to terminate the 4,996 square foot space that expires on May 16, 2025 at any time after May 16, 2020 by giving at least 90 days prior written notice. |
| (9) | Heritage Victor Valley Medical Group is a tenant at the Wimbledon property. Heritage Victor Valley Medical Group leases 12,915 square feet expiring on September 30, 2024, 12,283 square feet expiring on October 31, 2018, 5,151 square feet expiring on November 30, 2018, 4,384 square feet expiring on April 30, 2020, 3,942 square feet expiring on January 31, 2020 and 3,200 square feet expiring on February 29, 2024. Heritage Victor Valley Medical Group has a three year renewal option with 180 days’ notice related to the 12,283 square feet space that expires on October 31, 2018. |
| (10) | Fiat Chrysler Automobiles is a tenant at the Transpark Commerce property. Fiat Chrysler Automobiles has two, five-year extension options. |
| (11) | The Abbey Management Co., LLC leases 27,663 square feet across eight of the SoCal Portfolio Properties. 10,018 square feet expire on May 31, 2020, 5,519 square feet expire on August 31, 2022, 3,715 square feet expire on May 31, 2018, 3,199 square feet expire on January 31, 2021, 2,368 square feet expire on August 31, 2018, 1,278 square feet expire on November 30, 2022, 945 square feet expire on November 30, 2020 and 621 square feet expire on September 30, 2022. The Abbey Management Co., LLC can terminate all of its leases upon 30 days’ notice. The Abbey Management Co., LLC is a borrower sponsor affiliate. |
| (12) | Stantec Consulting Services Inc. is a tenant at the Ming Office Park property. Stantec Consulting Services Inc. has five months of free rent in 2018, which was reserved for upfront. Stantec Consulting Services Inc. has three, 5-year extension options. |
| (13) | Candor-AGS, Inc. is a tenant at the Fresno Industrial Center property. Candor-AGS, Inc. has two, three-year extension options. |
THE INFORMATION IN THIS STRUCTURAL AND COLLATERAL TERM SHEET IS NOT COMPLETE AND MAY BE AMENDED PRIOR TO THE TIME OF SALE. THIS TERM SHEET IS NOT AN OFFER TO SELL THESE SECURITIES AND IT IS NOT A SOLICITATION OF AN OFFER TO BUY THESE SECURITIES IN ANY JURISDICTION WHERE THE OFFER OR SALE IS NOT PERMITTED.
57
| THE SOCAL PORTFOLIO |
The following table presents certain information relating to the lease rollover schedule at the SoCal Portfolio Properties:
Lease Expiration Schedule(1)(2)
| Year Ending December 31, | No. of Leases Expiring | Expiring NRSF | % of Total NRSF | Cumulative Expiring NRSF | Cumulative % of Total NRSF | Annual U/W Base Rent | % of Total Annual U/W Base Rent | Annual U/W Base Rent PSF(3) |
| MTM | 9 | 25,194 | 1.1% | 25,194 | 1.1% | $399,849 | 1.3% | $15.87 |
| 2018 | 67 | 214,118 | 9.8% | 239,312 | 10.9% | 3,593,142 | 11.3% | $16.78 |
| 2019 | 97 | 249,933 | 11.4% | 489,245 | 22.3% | 4,039,741 | 12.7% | $16.16 |
| 2020 | 93 | 398,320 | 18.2% | 887,565 | 40.4% | 5,610,555 | 17.6% | $14.09 |
| 2021 | 62 | 165,102 | 7.5% | 1,052,667 | 48.0% | 3,246,167 | 10.2% | $19.66 |
| 2022 | 65 | 212,902 | 9.7% | 1,265,569 | 57.7% | 4,015,405 | 12.6% | $18.86 |
| 2023 | 29 | 170,313 | 7.8% | 1,435,882 | 65.4% | 2,710,868 | 8.5% | $15.92 |
| 2024 | 13 | 90,138 | 4.1% | 1,526,020 | 69.5% | 2,167,815 | 6.8% | $24.05 |
| 2025 | 11 | 156,516 | 7.1% | 1,682,536 | 76.7% | 2,858,241 | 9.0% | $18.26 |
| 2026 | 4 | 24,625 | 1.1% | 1,707,161 | 77.8% | 479,916 | 1.5% | $19.49 |
| 2027 | 5 | 35,657 | 1.6% | 1,742,818 | 79.4% | 519,565 | 1.6% | $14.57 |
| 2028 | 4 | 45,239 | 2.1% | 1,788,057 | 81.5% | 1,161,245 | 3.6% | $25.67 |
| Thereafter | 1 | 50,720 | 2.3% | 1,838,777 | 83.8% | 1,092,031 | 3.4% | $21.53 |
| Vacant | 0 | 355,648 | 16.2% | 2,194,425 | 100.0% | 0 | 0.0% | $0.00 |
| Total/Weighted Average | 460 | 2,194,425 | 100.0% | $31,894,539 | 100.0% | $17.35 |
| (1) | Information obtained from the underwritten rent roll. |
| (2) | Certain tenants may have lease termination options that are exercisable prior to the originally stated expiration date of the subject lease and that are not considered in the Lease Expiration Schedule. |
| (3) | Weighted Average U/W Base Rent PSF excludes vacant space. |
The following table presents historical occupancy percentages at the SoCal Portfolio Properties:
Historical Occupancy
12/31/2013(1) | 12/31/2014(1) | 12/31/2015(1)(2) | 12/31/2016(1)(2) | 1/31/2018(3) | ||||
| 71.4% | 73.5% | 73.8% | 80.5% | 83.8% |
| (1) | Information obtained from the borrower and represents average occupancy for the SoCal Portfolio Properties. |
| (2) | The increase in occupancy from 12/31/2015 to 12/31/2016 corresponds to approximately $14.0 million of tenant improvement and leasing commissions and capital expenditures in the SoCal Portfolio Properties in 2015 and 2016. |
| (3) | Information obtained from the underwritten rent roll. |
Operating History and Underwritten Net Cash Flow. The following table presents certain information relating to the historical operating performance and the underwritten net cash flow at the SoCal Portfolio Properties:
Cash Flow Analysis
| 2014 | 2015 | 2016 | TTM 10/31/2017 | U/W | % of U/W Effective Gross Income | U/W $ per SF | |||||||||
| Base Rent | $22,635,136 | $24,966,236 | $26,195,773 | $27,378,658(1) | $31,894,539(1)(2) | 89.9% | $14.53 | ||||||||
| Grossed Up Vacant Space | 0 | 0 | 0 | 0 | 7,076,821 | 20.0 | 3.22 | ||||||||
| Total Reimbursables | 3,383,522 | 3,469,630 | 4,056,635 | 4,228,189 | 3,599,321 | 10.1 | 1.64 | ||||||||
| Other Income | 209,157 | 165,397 | 187,042 | 177,985 | 0 | 0.0 | 0.00 | ||||||||
| Less Vacancy & Free Rent | 0 | 0 | 0 | 0 | (7,104,585)(3) | (20.0) | (3.24) | ||||||||
| Effective Gross Income | $26,227,815 | $28,601,263 | $30,439,450 | $31,784,832 | $35,466,096 | 100.0% | $16.16 | ||||||||
| Total Operating Expenses | $10,967,492 | $11,097,950 | $11,369,925 | $11,711,633 | $12,079,824 | 34.1% | $5.50 | ||||||||
| Net Operating Income(4) | $15,260,323 | $17,503,313 | $19,069,526 | $20,073,199 | $23,386,272 | 65.9% | $10.66 | ||||||||
| TI/LC | 0 | 0 | 0 | 0 | 1,376,463 | 3.9 | 0.63 | ||||||||
| Capital Expenditures | 0 | 0 | 0 | 0 | 424,815 | 1.2 | 0.19 | ||||||||
| Net Cash Flow | $15,260,323 | $17,503,313 | $19,069,526 | $20,073,199 | $21,584,994 | 60.9% | $9.84 | ||||||||
| NOI DSCR(5) | 1.05x | 1.20x | 1.31x | 1.38x | 1.60x | ||||||||||
| NCF DSCR(5) | 1.05x | 1.20x | 1.31x | 1.38x | 1.48x | ||||||||||
| NOI DY(5) | 6.7% | 7.6% | 8.3% | 8.8% | 10.2% | ||||||||||
| NCF DY(5) | 6.7% | 7.6% | 8.3% | 8.8% | 9.4% | ||||||||||
| (1) | The increase from TTM 10/31/2017 Base Rent to U/W Base Rent is primarily from rent abatements and new leasing at the SoCal Portfolio Properties. Over 60 new or renewal leases have been executed at the SoCal Portfolio Properties from August 2017 through December 2017, totalling over 150,000 square feet. |
| (2) | U/W Base Rent includes contractual rent steps through February 2019, totaling $599,676 and the present value of rent steps for investment grade tenants totaling $488,001. |
| (3) | The underwritten economic vacancy is 16.7%. The SoCal Portfolio Properties are 83.8% occupied as of January 31, 2018. |
| (4) | The increase from 2014 net operating income to TTM 10/31/2017 net operating income is attributable to occupancy increasing from 71.4% as of 12/31/2013 to 83.8% as of 1/31/2018. |
| (5) | The debt service coverage ratios and debt yields are based on the SoCal Portfolio Whole Loan. |
THE INFORMATION IN THIS STRUCTURAL AND COLLATERAL TERM SHEET IS NOT COMPLETE AND MAY BE AMENDED PRIOR TO THE TIME OF SALE. THIS TERM SHEET IS NOT AN OFFER TO SELL THESE SECURITIES AND IT IS NOT A SOLICITATION OF AN OFFER TO BUY THESE SECURITIES IN ANY JURISDICTION WHERE THE OFFER OR SALE IS NOT PERMITTED.
58
| THE SOCAL PORTFOLIO |
Appraisals.The SoCal Portfolio Properties were valued individually by appraisals dated from November 23, 2017 to December 9, 2017, with the individual values reflecting a cumulative “as-is” appraised value of $386,140,000. Additionally, 14 of the appraisals provided a corresponding “stabilized” value dated from May 1, 2018 to February 1, 2020, which provide for a cumulative “stabilized” appraised value of $411,510,000.
Environmental Matters.According to the Phase I environmental site assessments performed at the SoCal Portfolio Properties from December 6, 2017 to December 15, 2017, there was no evidence of any recognized environmental conditions (“REC”), with the exception of a REC identified at the 30th Street Commerce Center Property. The Phase I environmental site assessment obtained for the 30th Street Commerce Center Property (the “ESA”) identified a REC in connection with a drycleaner tenant, which has operated at the 30th Street Commerce Center Property from approximately 1987 to the present. The drycleaner tenant previously utilized Tetrachloroethene (“PCE”) as a cleaning solvent until the former PCE dry cleaning machine was replaced with the existing hydrocarbon machine. A sub slab depressurization (“SSD”) system was installed in January 2016, and has been operating with monthly monitoring since its installation. The ESA noted that since July 2016, the data has indicated stable to decreasing trends but the continued presence of PCE in soil vapor. The ESA recommended that the SSD system continue to operate at the 30th Street Commerce Center Property. An environmental consultant estimated the cost of operating the SSD system to be approximately $5,000 per year. The ongoing operation of the SSD system is considered a REC.
Market Overview and Competition.The SoCal Portfolio Properties are located primarily in southern California within four different metropolitan statistical areas (“MSAs”), the Los Angeles-Long Beach-Anaheim, California MSA, the Riverside-San Bernardino-Ontario, California MSA, the Fresno California MSA and the Bakersfield, California MSA. See the tables below for demographic summaries of each MSA as well as each SoCal Portfolio Property’s three mile radius demographics and third quarter 2017 CoStar data for each SoCal Portfolio Property’s submarket related to vacancy rates and average asking rents.
| MSA, | Estimated 2017 Population | Average Household Income |
| Los Angeles-Long Beach-Anaheim, California MSA | 13,505,354 | $95,979 |
| Riverside-San Bernardino-Ontario, California MSA | 4,542,092 | $80,989 |
| Fresno California MSA | 989,303 | $71,247 |
| Bakersfield, California MSA | 897,549 | $71,956 |
THE INFORMATION IN THIS STRUCTURAL AND COLLATERAL TERM SHEET IS NOT COMPLETE AND MAY BE AMENDED PRIOR TO THE TIME OF SALE. THIS TERM SHEET IS NOT AN OFFER TO SELL THESE SECURITIES AND IT IS NOT A SOLICITATION OF AN OFFER TO BUY THESE SECURITIES IN ANY JURISDICTION WHERE THE OFFER OR SALE IS NOT PERMITTED.
59
| THE SOCAL PORTFOLIO |
The following table presents certain information relating to the markets and submarkets for the SoCal Portfolio Properties:
MSA/Property Name | Property Type | Allocated Loan Balance | % Allocated Loan Balance | Estimated 2017 3-mile population(1) | Estimated 2017 3-mile average household income(1) | CoStar Q3 2017 Submarket Vacancy Rate(1) | CoStar Q3 | ||||||||
| Los Angeles-Long Beach- Anaheim, California MSA | |||||||||||||||
| 1. Aliso Viejo Commerce Center | Retail | $27,761,791 | 12.1% | 117,048 | $143,075 | 6.1% | $36.24 | ||||||||
| 2. Palmdale Place | Mixed Use | 16,250,000 | 7.1 | 91,940 | $56,970 | 7.1% | $20.64 | ||||||||
| 3. Sierra Gateway | Office | 14,800,000 | 6.5 | 45,569 | $64,815 | 11.7% | $27.36 | ||||||||
| 4. Commerce Corporate Center | Office | 13,000,000 | 5.7 | 285,547 | $54,922 | 5.7% | $26.88 | ||||||||
| 5. Airport One Office Park | Office | 11,394,743 | 5.0 | 209,537 | $92,984 | 5.9% | $27.48 | ||||||||
| 6. Diamond Bar | Retail | 6,650,000 | 2.9 | 88,780 | $117,892 | 4.8% | $23.76 | ||||||||
| 7. Atlantic Plaza | Retail | 6,000,000 | 2.6 | 222,506 | $75,864 | 4.0% | $25.44 | ||||||||
| 8. 10thStreet Commerce Center | Retail | 4,913,128 | 2.1 | 108,567 | $65,180 | 7.1% | $20.64 | ||||||||
| 9. Cityview Plaza | Office | 4,500,000 | 2.0 | 285,041 | $74,770 | 5.1% | $20.88 | ||||||||
| 10. Garden Grove Town Center | Retail | 3,502,732 | 1.5 | 307,079 | $74,560 | 5.0% | $26.52 | ||||||||
| 11. 30thStreet Commerce Center | Retail | 1,875,896 | 0.8 | 94,574 | $56,656 | 7.1% | $20.64 | ||||||||
| 12. Anaheim Stadium Industrial | Industrial | 1,750,000 | 0.8 | 242,186 | $77,761 | 1.2% | $10.92 | ||||||||
| 13. 25thStreet Commerce Center | Retail | 1,293,737 | 0.6 | 94,574 | $56,656 | 7.1% | $20.64 | ||||||||
| Total/Weighted Average | $113,692,027 | 49.6% | 150,040 | $88,865 | |||||||||||
| Riverside-San Bernardino-Ontario, California MSA | |||||||||||||||
| 1. Transpark Commerce | Office | $25,143,236 | 11.0% | 90,310 | $66,638 | 8.2% | $22.10 | ||||||||
| 2. Wimbledon | Mixed Use | 22,230,241 | 9.7 | 61,223 | $63,876 | 5.8% | $14.52 | ||||||||
| 3. Upland Freeway | Retail | 13,032,927 | 5.7 | 197,498 | $73,803 | 7.9% | $20.52 | ||||||||
| 4. Moreno Valley | Mixed Use | 11,395,118 | 5.0 | 148,277 | $63,775 | 5.3% | $21.60 | ||||||||
| 5. Colton Courtyard | Retail | 7,375,987 | 3.2 | 72,483 | $68,123 | 8.3% | $21.60 | ||||||||
| 6. The Abbey Center | Office | 7,244,116 | 3.2 | 57,711 | $77,681 | 10.2% | $21.39 | ||||||||
| 7. Upland Commerce Center | Retail | 6,879,276 | 3.0 | 187,747 | $82,335 | 7.9% | $20.52 | ||||||||
| 8. Mt. Vernon Commerce Center | Industrial | 1,754,484 | 0.8 | 83,332 | $65,052 | 6.8% | $11.64 | ||||||||
| Total/Weighted Average | $95,055,385 | 41.5% | 108,208 | $68,695 | |||||||||||
| Fresno, California MSA | |||||||||||||||
| 1. Fresno Industrial Center | Industrial | $14,000,000 | 6.1% | 52,913 | $41,851 | 4.0% | $4.08 | ||||||||
| 2. Fresno Airport | Office | 1,000,000 | 0.4 | 156,366 | $47,342 | 9.3% | $13.92 | ||||||||
| Total/Weighted Average | $15,000,000 | 6.5% | 59,810 | $42,217 | |||||||||||
| Bakersfield, California MSA | |||||||||||||||
| 1. Ming Office Park | Office | $5,552,589 | 2.4% | 137,102 | $68,911 | 9.2% | $19.80 | ||||||||
| Total/Weighted Average | $5,552,589 | 2.4% | 137,102 | 68,911 |
| (1) | Information obtained from the appraisal. |
The Borrowers.The borrowers consist of 27 single-purpose limited liability companies, each with two independent directors. Legal counsel to the borrowers delivered a non-consolidation opinion in connection with the origination of the SoCal Portfolio Whole Loan. Donald G. Abbey, a principal of The Abbey Company is the guarantor of certain nonrecourse carveouts under the SoCal Portfolio Whole Loan. See “Description of the Mortgage Pool—Loan Purpose; Default History, Bankruptcy Issues and Other Proceedings”in the Preliminary Prospectus.
The Borrower Sponsor.The borrower sponsor is The Abbey Company. The Abbey Company is a privately-held real estate investment and management firm founded in 1990 by Donald G. Abbey, who has 33 years of experience in the real estate industry. The Abbey Company acquires multi-tenant commercial properties in southern California and has established a local presence in the southern California market with offices in Los Angeles, Orange, Riverside, San Bernardino, San Diego and Sacramento counties. The Abbey Company handles all aspects of real estate ownership, including in-house leasing, management, construction, property services and acquisitions. The Abbey Company has a senior management team of eight professionals and over 75 total employees, with a current portfolio size of over 34 properties encompassing around 2.3 million square feet and approximately 1,000 tenants.
Escrows.The SoCal Portfolio Whole Loan documents provide for upfront reserves in the amount of (i) $8,000,000 for future tenant improvements and leasing commissions, (ii) $1,559,061 related to outstanding tenant improvements and leasing commissions for existing tenants, (iii) $1,107,960 for free rent related to existing tenants, (iv) $1,000,000 for costs related to extending the ground leases at the Anaheim Stadium Industrial property and the Cityview Plaza property, (v) $977,151 for deferred maintenance and (vi) $219,743 to pay for ground rent payable under the existing terms of the ground leases encumbering the SoCal Portfolio Properties with a leasehold ownership interest.
The SoCal Portfolio Whole Loan documents provide for ongoing monthly escrows of (i) one-twelfth of the taxes that the lender estimates will be payable over the then-succeeding 12-month period (initially estimated to be $219,172), (ii) one-twelfth of the amount that the lender estimates will be necessary to pay insurance premiums over the then-succeeding 12-month period, provided that insurance is not covered under an acceptable blanket policy, (iii) one-twelfth of the ground rent that the lender estimates will be payable over the then-succeeding 12-month period (initially estimated to be $109,872) (See “Ground Leases” below); (iv) $35,400 for replacement reserves subject to a cap of $1,000,000 and (v) monthly TI/LC reserve deposits (a) through and including the
THE INFORMATION IN THIS STRUCTURAL AND COLLATERAL TERM SHEET IS NOT COMPLETE AND MAY BE AMENDED PRIOR TO THE TIME OF SALE. THIS TERM SHEET IS NOT AN OFFER TO SELL THESE SECURITIES AND IT IS NOT A SOLICITATION OF AN OFFER TO BUY THESE SECURITIES IN ANY JURISDICTION WHERE THE OFFER OR SALE IS NOT PERMITTED.
60
| THE SOCAL PORTFOLIO |
monthly payment date occurring in February 2023 of approximately $1.25 per square foot per annum (initially $228,586) and (b) from and after the monthly payment date occurring in March 2023 $0.75 per square foot per annum. If the amount in the TI/LC reserve equals or exceeds (a) $5,000,000 through and including the monthly payment date occurring in February 2023 or (b) $2,000,000 from and after the monthly payment date in March 2023 through the maturity date, monthly TI/LC reserve payments will be waived, provided monthly TI/LC reserve payments will be reinstated up to the respective TI/LC reserve cap amount once the amount in the TI/LC reserve falls below $5,000,000 through and including the monthly payment date occurring in February 2023 or $2,000,000 from and after the monthly payment date occurring in March 2023 through the maturity date.
Lockbox and Cash Management. The SoCal Portfolio Whole Loan requires a lender-controlled lockbox account, which is already in place, and that the borrower and property manager direct all tenants under Major Leases (as defined below) to pay rent payments directly into such lockbox account. The SoCal Portfolio Whole Loan documents also require that all rents received by the borrower or property manager be deposited into the lockbox account within two business day of receipt. During a Cash Management Trigger Event (as defined below), all funds in the clearing account are required to be transferred on a daily basis into a deposit account established and maintained by the lender, and applied to all required payments and reserves as set forth in the SoCal Portfolio Whole Loan documents. Provided no Trigger Period (as defined below) is continuing, excess cash in the deposit account is required to be disbursed to the borrower in accordance with the SoCal Portfolio Whole Loan documents. To the extent a Trigger Period has occurred and is continuing, excess cash is held by the lender as an additional reserve. Upon an event of default under the SoCal Portfolio Whole Loan documents, the lender may apply funds held in such order of priority as it may determine.
A “Major Lease” means as to each individual property (i) any lease which, individually or when aggregated with all other leases at the applicable individual property with the same tenant or its affiliate, either (a) accounts for 15% or more of the total gross revenues for the applicable individual property (provided that such lease does not constitute a Major Lease if such lease accounts for less than 0.50% of the total gross revenues for the portfolio), or (b) demises 15,000 rentable square feet or more of the applicable individual property’s gross leasable area (provided that such lease does not constitute a major lease pursuant to this clause (b) if such lease demises less than 0.75% of the total rentable square feet for the portfolio), (ii) any lease which contains any option, offer, right of first refusal or other similar entitlement to purchase all or any portion of any individual property, (iii) any lease entered into during the continuance of an event of default and (iv) any instrument guaranteeing or providing credit support for any lease meeting the requirements of (i), (ii) and/or (iii) above.
A “Cash Management Trigger Event” will commence upon the earliest to occur of (i) an event of default, (ii) the net operating income debt yield falling below 7.75%, and will end upon (a) with respect to clause (i) above, the date on which such event of default is cured, (b) with respect to clause (ii) above, the net operating income debt yield being at least 8.0% for two consecutive calendar quarters. A cure of any Cash Management Trigger Event may occur no more than one time during the term of the SoCal Portfolio Whole Loan.
A “Trigger Period” will commence upon the earliest to occur of (i) an event of default, (ii) the net operating income debt yield falling below 7.25%, and will end upon (a) with respect to clause (i) above, the date on which such event of default is cured, (b) with respect to clause (ii) above, the net operating income debt yield being at least 7.5% for two consecutive calendar quarters.
Property Management. The SoCal Portfolio Properties are managed by The Abbey Management Company LLC, an affiliate of the borrowers.
Assumption.The borrowers have the right to transfer all of the SoCal Portfolio Properties at any time other than the 60 days prior to or following any secondary market transaction, provided that certain conditions are satisfied, including (i) no event of default has occurred and is continuing; (ii) the lender has reasonably determined that the proposed transferee and guarantor satisfy the lender’s credit review and underwriting standards, taking into consideration transferee experience, financial strength and general business standing; (iii) execution of a recourse guaranty and an environmental indemnity by an affiliate of the transferee; and (iv) the lender has received confirmation from Moody’s, Fitch and DBRS that such assumption will not result in a downgrade, withdrawal or qualification of the respective ratings assigned to the Series 2018-C43 certificates and similar confirmations from each rating agency rating any securities backed by any The SoCal Portfolio pari passu companion loans with respect to the ratings of such securities.
Partial Release.Following the lockout period, the borrowers are permitted to partially release any of the Socal Portfolio Properties, subject to certain conditions including (i) no event of default has occurred and is continuing; (ii) the defeasance of an amount of principal equal to the Release Amount (as defined below); (iii) the principal balance is reduced by an amount that would result in the net operating income debt yield (as calculated in the SoCal Portfolio Whole Loan documents) of the remaining SoCal Portfolio Properties following the release being no less than the greater of (a) 10.2% and (b) the debt yield of the SoCal Portfolio Properties immediately prior to the release; (iv) the principal balance is reduced by an amount that would result in the loan-to-value ratio (as calculated in the SoCal Portfolio Whole Loan documents) of the remaining SoCal Portfolio Properties following the release being no greater than than the lesser of (a) 59.5% and (b) the debt yield of the SoCal Portfolio Properties immediately prior to the release; and (v) the lender receives a legal opinion that the release satisfies REMIC requirements.
The “Release Amount” will be an amount equal to the greater of (i) 120% of the allocated loan amount for the individual SoCal Portfolio property to be released and (ii) the net sales proceeds applicable to such property.
Real Estate Substitution.Not permitted.
Subordinate and Mezzanine Indebtedness.None.
THE INFORMATION IN THIS STRUCTURAL AND COLLATERAL TERM SHEET IS NOT COMPLETE AND MAY BE AMENDED PRIOR TO THE TIME OF SALE. THIS TERM SHEET IS NOT AN OFFER TO SELL THESE SECURITIES AND IT IS NOT A SOLICITATION OF AN OFFER TO BUY THESE SECURITIES IN ANY JURISDICTION WHERE THE OFFER OR SALE IS NOT PERMITTED.
61
| THE SOCAL PORTFOLIO |
Ground Leases.The borrowers’ interest in one of the eight buildings of the Palmdale Place Property is encumbered by a ground lease with an initial expiration date of March 31, 2052, with three, 10-year renewal options remaining. The Airport One Office Park Property is encumbered by a ground lease with an initial expiration of January 12, 2040, with two, five-year renewal options remaining. The Cityview Plaza Property is encumbered by a ground lease with an expiration date of September 30, 2035. The Anaheim Stadium Industrial Property is encumbered by a ground lease with an expiration date of April 30, 2034. In connection with the origination of SoCal Portfolio Whole Loan, the borrowers escrowed $1,000,000 into a ground lease extension reserve, which funds are to be used to extend the term of both the Cityview Plaza Property and Anaheim Stadium Industrial Property ground leases. Should the borrowers not extend the term of either the Cityview Plaza Property or Anaheim Stadium Industrial Property ground leases on or prior to February 6, 2020 pursuant to terms reasonably acceptable by the lender, the borrowers must commence making monthly deposits into the ground lease extension reserve of $55,000 until the ground lease extension reserve funds reach an amount equal to the allocated loan amount of the applicable property or properties. In the event one of the ground leases are extended, the lender will release an appropriate pro rata share of the reserve to the borrowers.
Terrorism Insurance.The SoCal Portfolio Whole Loan documents require that the “all risk” insurance policy required to be maintained by the borrowers provide coverage for terrorism in an amount equal to the full replacement cost of the SoCal Portfolio Properties. The SoCal Portfolio Whole Loan documents also require business interruption insurance for a period of at least 18 months that covers loss or damage by terrorist acts, together with a six-month extended period of indemnity; provided that such coverage is available.
Earthquake Insurance. The loan documents do not require earthquake insurance. All of the properties in the portfolio are located in Seismic Zone 4. The seismic reports indicated scenario expected losses for the properties ranging from 3% to 19%.
THE INFORMATION IN THIS STRUCTURAL AND COLLATERAL TERM SHEET IS NOT COMPLETE AND MAY BE AMENDED PRIOR TO THE TIME OF SALE. THIS TERM SHEET IS NOT AN OFFER TO SELL THESE SECURITIES AND IT IS NOT A SOLICITATION OF AN OFFER TO BUY THESE SECURITIES IN ANY JURISDICTION WHERE THE OFFER OR SALE IS NOT PERMITTED.
62
(THIS PAGE INTENTIONALLY LEFT BLANK)
THE INFORMATION IN THIS STRUCTURAL AND COLLATERAL TERM SHEET IS NOT COMPLETE AND MAY BE AMENDED PRIOR TO THE TIME OF SALE. THIS TERM SHEET IS NOT AN OFFER TO SELL THESE SECURITIES AND IT IS NOT A SOLICITATION OF AN OFFER TO BUY THESE SECURITIES IN ANY JURISDICTION WHERE THE OFFER OR SALE IS NOT PERMITTED.
63
| SOUTHPOINT OFFICE CENTER |
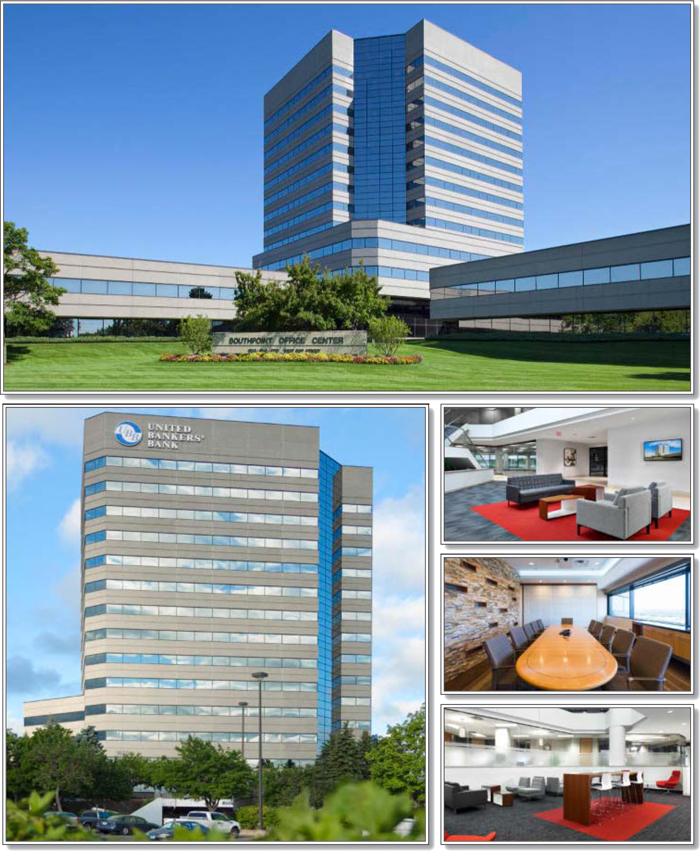
THE INFORMATION IN THIS STRUCTURAL AND COLLATERAL TERM SHEET IS NOT COMPLETE AND MAY BE AMENDED PRIOR TO THE TIME OF SALE. THIS TERM SHEET IS NOT AN OFFER TO SELL THESE SECURITIES AND IT IS NOT A SOLICITATION OF AN OFFER TO BUY THESE SECURITIES IN ANY JURISDICTION WHERE THE OFFER OR SALE IS NOT PERMITTED.
64
| SOUTHPOINT OFFICE CENTER |

THE INFORMATION IN THIS STRUCTURAL AND COLLATERAL TERM SHEET IS NOT COMPLETE AND MAY BE AMENDED PRIOR TO THE TIME OF SALE. THIS TERM SHEET IS NOT AN OFFER TO SELL THESE SECURITIES AND IT IS NOT A SOLICITATION OF AN OFFER TO BUY THESE SECURITIES IN ANY JURISDICTION WHERE THE OFFER OR SALE IS NOT PERMITTED.
65
| No. 4 – Southpoint Office Center | ||||||
| Loan Information | Property Information | |||||
| Mortgage Loan Seller: | Barclays Bank PLC | Single Asset/Portfolio: | Single Asset | |||
| Credit Assessment (DBRS/Fitch/Moody’s): | NR/NR/NR | Property Type: | Office | |||
| Original Principal Balance: | $37,200,000 | Specific Property Type: | Suburban | |||
| Cut-off Date Balance: | $37,200,000 | Location: | Bloomington, MN | |||
| % of Initial Pool Balance: | 5.1% | Size: | 366,808 SF | |||
| Loan Purpose: | Acquisition | Cut-off Date Balance Per SF: | $101.42 | |||
| Borrower: | MSP Southpoint Equities LLC | Year Built/Renovated: | 1984/2016 | |||
| Borrower Sponsor: | Felton Properties, Inc. | Title Vesting: | Fee | |||
| Mortgage Rate: | 4.305% | Property Manager: | Self-managed | |||
| Note Date: | January 19, 2018 | 4thMost Recent Occupancy: | 94.6% (12/31/2013) | |||
| Anticipated Repayment Date: | NAP | 3rdMost Recent Occupancy: | 92.9% (12/31/2014) | |||
| Maturity Date: | February 6, 2028 | 2ndMost Recent Occupancy: | 93.2% (12/31/2015) | |||
| IO Period: | 24 months | Most Recent Occupancy (As of): | 93.8% (12/31/2016) | |||
| Loan Term (Original): | 120 months | Current Occupancy (As of): | 91.5% (11/1/2017) | |||
| Seasoning: | 1 month | |||||
| Amortization Term (Original): | 360 months | Underwriting and Financial Information: | ||||
| Loan Amortization Type: | Interest-only, Amortizing Balloon | |||||
| Interest Accrual Method: | Actual/360 | 4thMost Recent NOI(3): | NAV | |||
| Call Protection: | L(25),D(91),O(4) | 3rdMost Recent NOI: | $4,132,442 (12/31/2015) | |||
| Lockbox Type: | Springing | 2ndMost Recent NOI: | $4,368,486 (12/31/2016) | |||
| Additional Debt(1): | Yes | Most Recent NOI: | $4,517,722 (TTM 10/31/2017) | |||
| Additional Debt Type(1): | Future Mezzanine | |||||
| U/W Revenues: | $8,850,791 | |||||
| U/W Expenses: | $4,234,206 | |||||
| U/W NOI: | $4,616,585 | |||||
| U/W NCF: | $4,019,499 | |||||
| U/W NOI DSCR: | 2.09x | |||||
| Escrows and Reserves(2): | U/W NCF DSCR: | 1.82x | ||||
| U/W NOI Debt Yield: | 12.4% | |||||
| Type: | Initial | Monthly | Cap (If Any) | U/W NCF Debt Yield: | 10.8% | |
| Taxes | $393,930 | $131,310 | NAP | As-Is Appraised Value: | $50,000,000 | |
| Insurance | $0 | Springing | NAP | As-Is Appraisal Valuation Date: | November 7, 2017 | |
| Replacement Reserves | $1,000,000 | $6,113 | NAP | Cut-off Date LTV Ratio(1): | 74.4% | |
| TI/LC Reserve | $337,072 | $30,567 | $1,100,000 | LTV Ratio at Maturity or ARD(1): | 63.2% | |
| (1) | See “Future Mezzanine Indebtedness” section. |
| (2) | See “Escrows” section. |
| (3) | According to the borrower sponsor, financial information prior to 2015 was not provided by the seller of the Southpoint Office Center Property (as defined below). |
The Mortgage Loan.The mortgage loan (the “Southpoint Office Center Mortgage Loan”) is evidenced by a promissory note secured by a first mortgage encumbering the fee simple interest in a 366,808 square foot, Class A office tower with two adjacent east and west buildings located in Bloomington, Minnesota (the “Southpoint Office Center Property”). The Southpoint Office Center Mortgage Loan was originated on January 19, 2018 by Barclays Bank PLC. The Southpoint Office Center Mortgage Loan had an original principal balance of $37,200,000, has an outstanding principal balance as of the Cut-off Date of $37,200,000 and accrues interest at an interest rate of 4.305%per annum. The Southpoint Office Center Mortgage Loan had an initial term of 120 months, has a remaining term of 119 months as of the Cut-off Date and requires payments of interest-only until February 6, 2020, after which payments of interest and principal based on a 30-year amortization schedule are required through the term of the Southpoint Office Center Mortgage Loan. The Southpoint Office Center Mortgage Loan matures on February 6, 2028.
Following the lockout period, on any date before November 6, 2027, the Southpoint Office Center Borrower (as defined below) has the right to defease the Southpoint Office Center Mortgage Loan in whole, but not in part. The Southpoint Center Mortgage Loan is prepayable without penalty on or after November 6, 2027.
THE INFORMATION IN THIS STRUCTURAL AND COLLATERAL TERM SHEET IS NOT COMPLETE AND MAY BE AMENDED PRIOR TO THE TIME OF SALE. THIS TERM SHEET IS NOT AN OFFER TO SELL THESE SECURITIES AND IT IS NOT A SOLICITATION OF AN OFFER TO BUY THESE SECURITIES IN ANY JURISDICTION WHERE THE OFFER OR SALE IS NOT PERMITTED.
66
| SOUTHPOINT OFFICE CENTER |
Sources and Uses
| Sources | Uses | |||||
| Original loan amount | $37,200,000 | 74.6% | Purchase price | $46,928,622 | 94.1% | |
| Borrower sponsors’ new cash contribution | $12,656,851 | 25.4 | Reserves | 1,731,002 | 3.5 | |
| Closing costs | 1,197,227 | 2.4 | ||||
| Total Sources | $49,856,851 | 100.0% | Total Uses | $49,856,851 | 100.0% |
The Property.The Southpoint Office Center Property consists of a 366,808 square foot, Class A 14-story office tower with two adjacent east and west buildings located in Bloomington, Minnesota, at the I-494/US Highway 169 interchange, just southwest of the Minneapolis / St. Paul International Airport. Constructed in 1984, the Southpoint Office Center Property has undergone approximately $5.0 million of renovations since 2006, including new building lobbies in 2016, modernized tower elevators, roof and parking lot replacements, new restrooms and upgraded HVAC controls. Since 2010, the Southpoint Office Center Property has been LEED Silver certified and features an Energy Star rating of 95. Additional amenities at the Southpoint Office Center Property include a fitness center, cafeteria, convenience store and after hours security. The Southpoint Office Center Property sits on an 11.3-acre site and features both surface and underground garage parking totaling 1,408 spaces (approximately 3.8 per 1,000 square foot).
The Southpoint Office Center Property is leased to 38 tenants across a range of industries, including government, insurance, financial services, technology and construction industries. The largest tenants at the Southpoint Office Center Property include Wells Fargo Bank (20.1% of U/W base rent), United Bankers Bank (11.6% of U/W base rent) and Health Fitness Corporation (10.4% of U/W base rent). No other tenant accounts for more than 5.6% of U/W base rent. Wells Fargo Bank (NYSE: WFC; Fitch/Moody’s/S&P: A+/A2/A) has been a tenant at the Southpoint Office Center Property for 13.3 years and most recently extended its term from July 2015 through October 2020. According to the sponsor, the Southpoint Office Center Property serves as the main office of United Bankers Bank, which has been a tenant at the Southpoint Office Center Property for 27.8 years and most recently extended its term from June 2015 through December 2025. United Bankers Bank offers personal banking, wealth management, loans, saving accounts, leasing, retirement plans, investment management and insurance services in the United States, with over $887.0 million of assets as of December 31, 2017. According to the sponsor, the Southpoint Office Center Property serves as the main office of Health Fitness Corporation, which has been a tenant at the Southpoint Office Center Property for 6.0 years. Health Fitness Corporation manages approximately 400 corporate and hospital-based fitness centers across the United States, along with providing a wide range of additional preventative health services to corporations. As of November 1, 2017, the Southpoint Office Center Property was 91.5% occupied by 38 tenants.
The following table presents certain information relating to the tenancy at the Southpoint Office Center Property:
Major Tenants
| Tenant Name | Credit Rating (Fitch/Moody’s/ S&P)(1) | Tenant NRSF | % of NRSF | Annual U/W Base Rent PSF(2) | Annual U/W Base Rent(2) | % of Total Annual U/W Base Rent | Lease Expiration Date |
| Major Tenant | |||||||
| Wells Fargo Bank | A+/A2/A | 66,832 | 18.2% | $14.03 | $937,613 | 20.1% | 10/31/2020(3) |
| United Bankers Bank | NR/NR/NR | 41,709 | 11.4% | $13.03 | $543,564 | 11.6% | 12/31/2025(4) |
| Health Fitness Corporation | NR/NR/NR | 30,101 | 8.2% | $16.11 | $484,889 | 10.4% | 5/31/2020(5) |
| UMB Financial Corporation | NR/NR/A- | 17,978 | 4.9% | $12.24 | $220,051 | 4.7% | 5/31/2019 |
| Ecologic Analytics, LLC | NR/NR/NR | 17,294 | 4.7% | $15.00 | $259,410 | 5.6% | 11/30/2019(6) |
| McDonald’s Corporation | BBB/Baa1/BBB+ | 17,294 | 4.7% | $14.00 | $242,116 | 5.2% | 01/31/2019(7) |
| The Strayer University Corporation | NR/NR/NR | 16,370 | 4.5% | $13.50 | $220,995 | 4.7% | 08/31/2019 |
| Stewart Title Company | NR/NR/NR | 16,055 | 4.4% | $14.10 | $226,376 | 4.8% | 04/30/2020(8) |
| Minnesota Society of CPAs | NR/NR/NR | 13,653 | 3.7% | $14.63 | $199,743 | 4.3% | 03/31/2022(9) |
| United States Department of Agriculture | AAA/Aaa/AA+ | 11,209 | 3.1% | $12.50 | $140,113 | 3.0% | 10/31/2020(10) |
| Total Major Tenants | 248,495 | 67.7% | $13.98 | $3,474,869 | 74.4% | ||
| Non-Major Tenants | 87,036 | 23.7% | $13.75 | $1,197,134 | 25.6% | ||
| Occupied Collateral Total | 335,531 | 91.5% | $13.92 | $4,672,003 | 100.0% | ||
| Vacant Space | 31,277 | 8.5% | |||||
| Collateral Total | 366,808 | 100.0% | |||||
| (1) | Certain ratings are those of the parent company whether or not the parent guarantees the lease. |
| (2) | Annual U/W Base Rent PSF and Annual U/W Base Rent include contractual rent steps through February 2019, totaling $147,520 and straight-lined rent for three investment grade tenants, Metropolitan Life Insurance Company, Wells Fargo Bank and Altria Group Distribution Company, totaling $42,443. |
| (3) | Wells Fargo Bank has one, five-year lease renewal option. |
| (4) | United Bankers Bank has two, five-year lease renewal options. United Bankers Bank has the option to terminate its lease effective December 31, 2022, upon one year’s notice and the payment of a termination fee. |
| (5) | Health Fitness Corporation has one, five-year lease renewal option. |
| (6) | Ecologic Analytics, LLC has two, five-year lease renewal options. |
| (7) | McDonald’s Corporation has two, five-year lease renewal options. |
| (8) | Stewart Title Company has one, three-year lease renewal option. |
| (9) | Minnesota Society of CPAs has one, five-year lease renewal option. |
| (10) | United States Department of Agriculture has one, five-year lease renewal option. United States Department of Agriculture has the right to terminate its lease at the end of any calendar month, upon 180 days’ written notice. |
THE INFORMATION IN THIS STRUCTURAL AND COLLATERAL TERM SHEET IS NOT COMPLETE AND MAY BE AMENDED PRIOR TO THE TIME OF SALE. THIS TERM SHEET IS NOT AN OFFER TO SELL THESE SECURITIES AND IT IS NOT A SOLICITATION OF AN OFFER TO BUY THESE SECURITIES IN ANY JURISDICTION WHERE THE OFFER OR SALE IS NOT PERMITTED.
67
| SOUTHPOINT OFFICE CENTER |
The following table presents certain information relating to the lease rollover schedule at the Southpoint Office Center Property:
Lease Expiration Schedule(1)(2)
| Year Ending December 31, | No. of Leases Expiring | Expiring NRSF | % of Total NRSF | Cumulative Expiring NRSF | Cumulative % of Total NRSF | Annual U/W Base Rent | % of Total Annual U/W Base Rent | Annual U/W Base Rent PSF(3) |
| MTM | 0 | 0 | 0.0% | 0 | 0.0% | $0 | 0.0% | $0.00 |
| 2018 | 7 | 17,987 | 4.9% | 17,987 | 4.9% | $182,920 | 3.9% | $10.17 |
| 2019 | 8 | 83,768 | 22.8% | 101,755 | 27.7% | $1,166,569 | 25.0% | $13.93 |
| 2020 | 7 | 130,653 | 35.6% | 232,408 | 63.4% | $1,886,668 | 40.4% | $14.44 |
| 2021 | 2 | 4,901 | 1.3% | 237,309 | 64.7% | $77,895 | 1.7% | $15.89 |
| 2022 | 8 | 40,480 | 11.0% | 277,789 | 75.7% | $613,765 | 13.1% | $15.16 |
| 2023 | 2 | 12,039 | 3.3% | 289,828 | 79.0% | $172,598 | 3.7% | $14.34 |
| 2024 | 1 | 1,957 | 0.5% | 291,785 | 79.5% | $28,025 | 0.6% | $14.32 |
| 2025 | 1 | 41,709 | 11.4% | 333,494 | 90.9% | $543,564 | 11.6% | $13.03 |
| 2026 | 0 | 0 | 0.0% | 333,494 | 90.9% | $0 | 0.0% | $0.00 |
| 2027 | 0 | 0 | 0.0% | 333,494 | 90.9% | $0 | 0.0% | $0.00 |
| 2028 | 0 | 0 | 0.0% | 333,494 | 90.9% | $0 | 0.0% | $0.00 |
| Thereafter(4) | 2 | 2,037 | 0.6% | 335,531 | 91.5% | $0 | 0.0% | $0.00 |
| Vacant | 0 | 31,277 | 8.5% | 366,808 | 100.0% | $0 | 0.0% | $0.00 |
| Total/Wtd. Average | 38 | 366,808 | 100.0% | $4,672,003 | 100.0% | $13.92 |
| (1) | Information obtained from the underwritten rent roll. |
| (2) | Certain tenants may have lease termination options that are exercisable prior to the originally stated expiration date of the subject lease and that are not considered in the Lease Expiration Schedule. |
| (3) | Weighted Average U/W Base Rent PSF excludes vacant space. |
| (4) | “Thereafter” represents conference room and corridor space that has no attributable rent. |
The following table presents historical occupancy percentages at the Southpoint Office Center Property:
Historical Occupancy(1)
12/31/2013(2) | 12/31/2014(2) | 12/31/2015(2) | 12/31/2016(2) | 11/1/2017(3) | ||||
| 94.6% | 92.9% | 93.2% | 93.8% | 91.5% |
| (1) | The Southpoint Office Center Property has been 91.9% occupied on average between 2006 and 2016. |
| (2) | Information obtained from the borrower. |
| (3) | Information obtained from the underwritten rent roll. |
Operating History and Underwritten Net Cash Flow. The following table presents certain information relating to the underwritten net cash flow at the Southpoint Office Center Property:
Cash Flow Analysis
| 2015 | 2016 | TTM 10/31/2017 | U/W | % of U/W Effective | U/W $ per SF | |||||||
| Base Rent | $4,245,817 | $4,302,184 | $4,324,286 | $4,672,003(1) | 52.8% | $12.74 | ||||||
| Percentage Rent | 24,449 | 23,401 | 23,847 | 23,847 | 0.3 | 0.07 | ||||||
| Grossed Up Vacant Space | 0 | 0 | 0 | 458,839 | 5.2 | 1.25 | ||||||
| Total Reimbursables | 4,325,140 | 4,447,449 | 4,459,921 | 4,444,735 | 50.2 | 12.12 | ||||||
| Other Income | 75,731 | 80,325 | 71,192 | 71,192 | 0.8 | 0.19 | ||||||
| Less Vacancy & Credit Loss | 0 | 0 | 0 | (819,824)(2) | (9.3) | (2.24) | ||||||
| Effective Gross Income | $8,671,137 | $8,853,360 | $8,879,247 | $8,850,791 | 100.0% | $24.13 | ||||||
| Total Operating Expenses | $4,538,695 | $4,484,874 | $4,361,525 | $4,234,206 | 47.8% | $11.54 | ||||||
| Net Operating Income | $4,132,442 | $4,368,486 | $4,517,722 | $4,616,585 | 52.2% | $12.59 | ||||||
| TI/LC | 0 | 0 | 0 | 523,725 | 5.9 | 1.43 | ||||||
| Capital Expenditures | 0 | 0 | 0 | 73,362 | 0.8 | 0.20 | ||||||
| Net Cash Flow | $4,132,442 | $4,368,486 | $4,517,722 | $4,019,499 | 45.4% | $10.96 | ||||||
| NOI DSCR | 1.87x | 1.98x | 2.04x | 2.09x | ||||||||
| NCF DSCR | 1.87x | 1.98x | 2.04x | 1.82x | ||||||||
| NOI DY | 11.1% | 11.7% | 12.1% | 12.4% | ||||||||
| NCF DY | 11.1% | 11.7% | 12.1% | 10.8% |
| (1) | U/W Base Rent includes contractual rent steps through February 2019, totaling $147,520 and straight-line rent through maturity totaling $42,443 for three investment grade tenants. |
| (2) | The underwritten economic vacancy is 8.5%. The Southpoint Office Center Property was 91.5% leased as of November 1, 2017. |
THE INFORMATION IN THIS STRUCTURAL AND COLLATERAL TERM SHEET IS NOT COMPLETE AND MAY BE AMENDED PRIOR TO THE TIME OF SALE. THIS TERM SHEET IS NOT AN OFFER TO SELL THESE SECURITIES AND IT IS NOT A SOLICITATION OF AN OFFER TO BUY THESE SECURITIES IN ANY JURISDICTION WHERE THE OFFER OR SALE IS NOT PERMITTED.
68
| SOUTHPOINT OFFICE CENTER |
Appraisal.As of the appraisal valuation date of November 7, 2017, the Southpoint Office Center Property had an “as-is” appraised value of $50,000,000.
Environmental Matters. According to a Phase I environmental site assessment dated November 10, 2017, there was no evidence of any recognized environmental conditions at the Southpoint Office Center Property.
Market Overview and Competition.The Southpoint Office Center Property is located in the 494 Corridor submarket of the Bloomington market, just southwest of the Minneapolis International Airport. I-494 is immediately to the north and I-35W is immediately to the east of the Southpoint Office Center Property. According to the appraisal, the “I-494 Strip” area is Bloomington’s major commercial district and has witnessed significant growth and redevelopment over the past several years. The dominant land use in the Southpoint Office Center Property neighborhood is the Mall of America, the largest shopping mall in the United States which has over 40 million visitors annually. As of the third quarter of 2017, the 494 Corridor office submarket had approximately 17.2 million square feet of office inventory, average asking rents of $14.59 per square foot and a vacancy rate of 16.7%. According to the appraisal, the 2017 estimated population within a one-, three- and five-mile radius of the Southpoint Office Center Property was 11,977, 110,114 and 228,797, respectively; while the 2017 estimated average household income within the same radii was $67,685, $78,880 and $104,766, respectively.
The following table presents certain information relating to comparable office leases for the Southpoint Office Center Property:
Comparable Leases(1)
| Property Name/Location | Year Built / Renovated | Occupancy | Net Rentable Area | Base Rent (PSF) | Lease Type |
7700 France Edina, MN | 1979 / 1986 | 78% | 306,707 | $10.00 - $13.25 | NNN |
Edinborough Corporate Center Edina, MN | 1986 / NAV | 90% | 101,624 | $13.25 - $15.38 | NNN |
Minnesota Center Bloomington, MN | 1986 / 2015 | 97% | 276,425 | $14.00 - $16.00 | NNN |
Grandview Square Edina, MN | 2001 / NAV | 100% | 96,248 | $15.00 - $18.25 | NNN |
7500 Flying Cloud Eden Prairie, MN | 1986 / NAV | 83% | 201,591 | $13.50 - $16.20 | NNN |
International Plaza Bloomington, MN | 1984 / 2015 | 86% | 280,244 | $14.50 - $14.75 | NNN |
France Place Bloomington, MN | 1981 / NAV | 98% | 204,245 | $14.50 - $15.73 | NNN |
Normandale Place Office Bloomington, MN | 1973 / 2007 | 81% | 82,017 | $13.00 - $14.00 | NNN |
| (1) | Information obtained from the appraisal and third party reports. |
The Borrower.The borrower for the Southpoint Office Center Mortgage Loan is MSP Southpoint Equities LLC, a Delaware limited liability company and a special purpose entity with one independent director (the “Southpoint Office Center Borrower”). Legal counsel to the Southpoint Office Center Borrower delivered a non-consolidation opinion in connection with the origination of the Southpoint Office Center Mortgage Loan. William D. Felton is the guarantor of certain nonrecourse carveouts under the Southpoint Office Center Mortgage Loan.
The Borrower Sponsor.The borrower sponsor is Felton Properties, Inc., a commercial real estate company formed by William and Matthew Felton in 1997. Felton Properties, Inc. owns and manages approximately 3.1 million square feet of real estate in Oregon, Washington, Colorado, Utah and Minnesota. Through institutional and private partnerships, Felton Properties Inc. has closed more than 30 acquisitions over the past 10 years, representing over $600.0 million in transactional volume.See “Description of the Mortgage Pool—Loan Purpose; Default History, Bankruptcy Issues and Other Proceedings” in the Preliminary Prospectus.
Escrows.The Southpoint Office Center Mortgage Loan documents provide for upfront reserves in the amount of $1,000,000 for replacement reserves, $337,072 for outstanding tenant improvements and leasing commissions and $393,930 for real estate taxes.
The Southpoint Office Center Mortgage Loan documents require monthly reserve deposits for (a) real estate taxes in an amount equal to one-twelfth of an amount which would be sufficient to pay the taxes payable during the next ensuing twelve months, initially $131,310, (b) tenant improvements and leasing commissions (“TI/LCs”) in an amount equal to $30,567 subject to a cap of $1,100,000 and (c) replacement reserves in an amount equal to $6,113. Additionally, during the continuance of a Trigger Period (as defined below) caused by a Wells Fargo Trigger Event (as defined below) the Southpoint Office Center Borrower is required to deposit all excess cash flow after payment of all sums due and payable under the Southpoint Office Center Mortgage Loan documents into a Wells Fargo reserve to be used for releasing costs relating to the Wells Fargo leased space until the Wells Fargo reserve equals the Wells Fargo Reserve Cap Amount (as defined below). The Southpoint Office Center Mortgage Loan documents do not require ongoing monthly escrows for insurance premiums as long as the Southpoint Office Center Borrower provides the lender with evidence that the Southpoint Office Center Property is insured via an acceptable blanket insurance policy and such policy is in full force and effect.
THE INFORMATION IN THIS STRUCTURAL AND COLLATERAL TERM SHEET IS NOT COMPLETE AND MAY BE AMENDED PRIOR TO THE TIME OF SALE. THIS TERM SHEET IS NOT AN OFFER TO SELL THESE SECURITIES AND IT IS NOT A SOLICITATION OF AN OFFER TO BUY THESE SECURITIES IN ANY JURISDICTION WHERE THE OFFER OR SALE IS NOT PERMITTED.
69
| SOUTHPOINT OFFICE CENTER |
A “Trigger Period” will commence upon the earlier of the following:
| (i) | the occurrence and continuance of an event of default; |
| (ii) | the net cash flow debt service coverage ratio being less than 1.15x for any two consecutive calendar quarters; or |
| (iii) | the date that is the earlier to occur of (a) nine months prior to the expiration of the Wells Fargo lease, unless Wells Fargo has renewed for no less than 50.0% of the Wells Fargo leased space prior to such date or (b) the date on which Wells Fargo provides notice to the Southpoint Office Center Borrower that it will not renew the Wells Fargo lease for at least 50.0% of the Wells Fargo leased space (a “Wells Fargo Trigger Event”). |
A “Trigger Period” will end:
| (a) | with regard to clause (i), upon the cure of such event of default; |
| (b) | with regard to clause (ii), upon the net cash flow debt service coverage ratio being equal to or greater than 1.15x for any two consecutive calendar quarters. With regard to clause (ii), the Southpoint Office Center Borrower has the option to post cash or a letter of credit in an amount equal to such prepayment as would result in the achievement of such net cash flow debt service coverage ratio; and |
| (c) | with regard to clause (iii), upon the earlier to occur of (x) at least 50.0% of the Wells Fargo leased space having been leased to one or more replacement tenants reasonably acceptable to the lender for an initial term of no less than five years, such replacement tenant(s) having commenced paying rent and being in actual occupancy and all TI/LC obligations and free rent periods having expired or been satisfied, (y) Wells Fargo having renewed the Wells Fargo lease for no less than 50.0% of the Wells Fargo leased space; or (z) the balance on deposit in the Wells Fargo Reserve equaling or exceeding the Wells Fargo Reserve Cap Amount or the Southpoint Office Center Borrower depositing cash or a letter of credit in the amount necessary to achieve a minimum balance equal to the Wells Fargo Reserve Cap Amount in the Wells Fargo Reserve. |
The “Wells Fargo Reserve Cap Amount” means $1,300,000 reduced pro rata by the actual amount of square feet renewed by Wells Fargo or a replacement tenant.
Lockbox and Cash Management.Upon the occurrence and during the continuance of a Trigger Period, the Southpoint Office Center Borrower will be required to establish a lender-controlled lockbox account and direct all tenants to deposit all rents directly into such lockbox account. Additionally, all revenues and other monies received by the Southpoint Office Center Borrower or property manager relating to the Southpoint Office Center Property will be required to be deposited into the lockbox account immediately upon receipt. During a Trigger Period, all excess cash flow after payment of all sums due and payable under the Southpoint Office Center Mortgage Loan documents (including any Wells Fargo Reserve funds) and all operating expenses will be retained by the lender as additional collateral.
Property Management. The Southpoint Office Center Property is managed by Amber Felton Management Corporation, an affiliate of the Southpoint Office Center Borrower.
Assumption.The Southpoint Office Center Borrower has the right to transfer the Southpoint Office Center Property, at any time after the earlier to occur of (x) two years after the closing date of the securitization or (y) January 19, 2021, provided that certain conditions are satisfied, including: (i) no event of default has occurred and is continuing, (ii) the Southpoint Office Center Borrower has provided the lender with at least 90 days prior written notice, (iii) the proposed transferee qualifies as a qualified transferee under the Southpoint Office Center Mortgage Loan documents and (iv) the lender has received confirmation from DBRS, Fitch and Moody’s that such assumption will not result in a downgrade of the respective ratings assigned to the Series 2018-C43 certificates.
Real Estate Substitution.Not permitted.
Future Mezzanine Indebtedness.Provided no event of default has occurred and is continuing, the Southpoint Office Center Borrower is permitted to incur future mezzanine indebtedness at any time after two years after the closing date of the securitization, provided that certain requirements pursuant to the Southpoint Office Center Mortgage Loan documents are met, including: (a) the mezzanine lender enters into an intercreditor agreement acceptable to the rating agencies and reasonably acceptable to the lender, (b) the mezzanine loan has a term that is coterminous or in excess of the term of the Southpoint Office Center Mortgage Loan, (c) the combined loan-to-value ratio for the Southpoint Office Center Mortgage Loan and permitted mezzanine loan is not greater than 74.4%, (d) the debt service coverage ratio of the Southpoint Office Center Mortgage Loan and the permitted mezzanine loan is equal to or greater than 1.82x, (e) the debt yield of the Southpoint Office Center Mortgage Loan and the permitted mezzanine loan is equal to or greater than 12.4% and (f) a rating agency confirmation is received from each of DBRS, Fitch and Moody’s that the future mezzanine indebtedness will not result in a downgrade, withdrawal or qualification of the respective ratings assigned to the Series 2018-C43 certificates.
Ground Lease.None.
Terrorism Insurance. The Southpoint Office Center Mortgage Loan documents require that the “all risk” insurance policy required to be maintained by the Southpoint Office Center Borrower provide coverage for terrorism in an amount equal to the full replacement cost of the Southpoint Office Center Property, provided that, if the Terrorism Risk Insurance Program Reauthorization Act of 2015 (or a subsequent statute, extension or reauthorization) is not in effect, the Southpoint Office Center Borrower will not be required to pay annual premiums for terrorism insurance in excess of an amount equal to two times the premium for a separate “Special Form” or “All Risks” policy or equivalent policy insuring the Southpoint Office Center Property. The Southpoint Office Center Mortgage Loan documents also require business interruption insurance covering no less than an amount equal to 100% of the projected gross income from the Southpoint Office Center Property on an actual loss sustained basis for a 12-month period following the occurrence of a casualty event.
THE INFORMATION IN THIS STRUCTURAL AND COLLATERAL TERM SHEET IS NOT COMPLETE AND MAY BE AMENDED PRIOR TO THE TIME OF SALE. THIS TERM SHEET IS NOT AN OFFER TO SELL THESE SECURITIES AND IT IS NOT A SOLICITATION OF AN OFFER TO BUY THESE SECURITIES IN ANY JURISDICTION WHERE THE OFFER OR SALE IS NOT PERMITTED.
70��
(THIS PAGE INTENTIONALLY LEFT BLANK)
THE INFORMATION IN THIS STRUCTURAL AND COLLATERAL TERM SHEET IS NOT COMPLETE AND MAY BE AMENDED PRIOR TO THE TIME OF SALE. THIS TERM SHEET IS NOT AN OFFER TO SELL THESE SECURITIES AND IT IS NOT A SOLICITATION OF AN OFFER TO BUY THESE SECURITIES IN ANY JURISDICTION WHERE THE OFFER OR SALE IS NOT PERMITTED.
71
| EXCHANGERIGHT NET LEASED PORTFOLIO #19 |
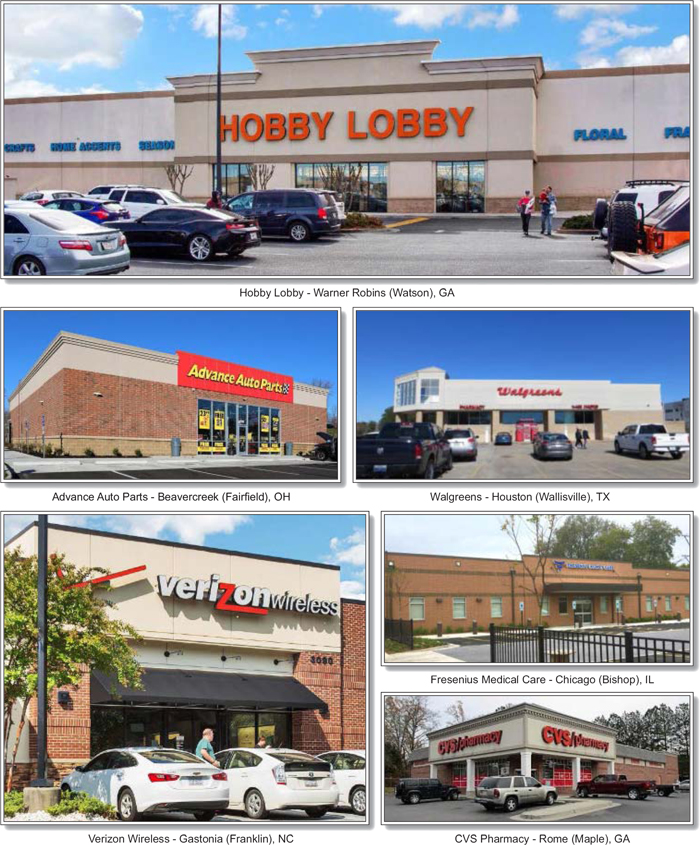
THE INFORMATION IN THIS STRUCTURAL AND COLLATERAL TERM SHEET IS NOT COMPLETE AND MAY BE AMENDED PRIOR TO THE TIME OF SALE. THIS TERM SHEET IS NOT AN OFFER TO SELL THESE SECURITIES AND IT IS NOT A SOLICITATION OF AN OFFER TO BUY THESE SECURITIES IN ANY JURISDICTION WHERE THE OFFER OR SALE IS NOT PERMITTED.
72
| EXCHANGERIGHT NET LEASED PORTFOLIO #19 |
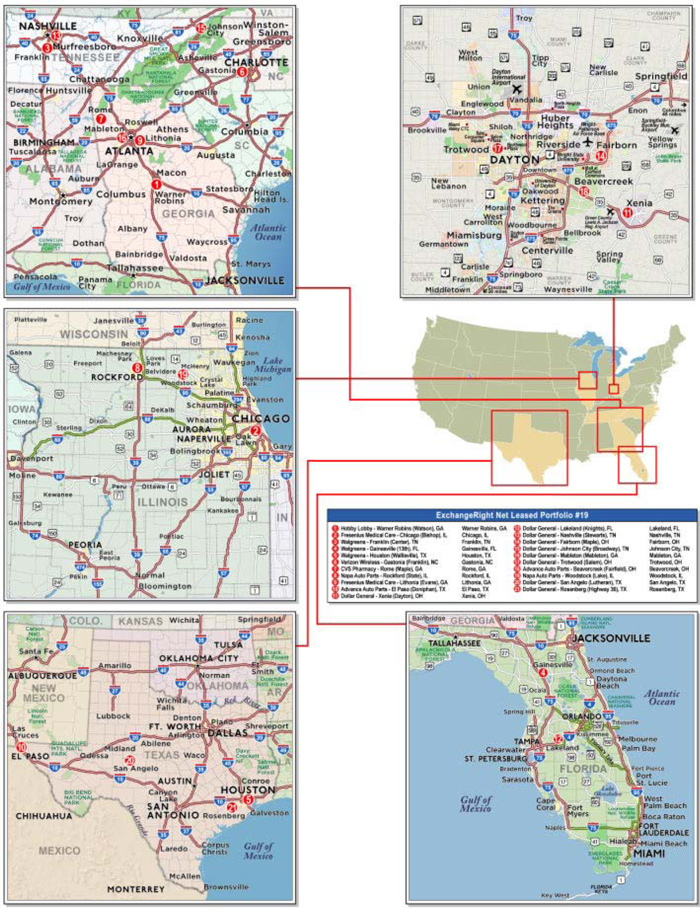
THE INFORMATION IN THIS STRUCTURAL AND COLLATERAL TERM SHEET IS NOT COMPLETE AND MAY BE AMENDED PRIOR TO THE TIME OF SALE. THIS TERM SHEET IS NOT AN OFFER TO SELL THESE SECURITIES AND IT IS NOT A SOLICITATION OF AN OFFER TO BUY THESE SECURITIES IN ANY JURISDICTION WHERE THE OFFER OR SALE IS NOT PERMITTED.
73
| No. 5 – ExchangeRight Net Leased Portfolio #19 | |||||||
| Loan Information | Property Information | ||||||
| Mortgage Loan Seller: | Barclays Bank PLC | Single Asset/Portfolio: | Portfolio | ||||
Credit Assessment (DBRS/Fitch/Moody’s): | NR/NR/NR | Property Type: | Various | ||||
| Original Principal Balance: | $35,840,000 | Specific Property Type: | Various | ||||
| Cut-off Date Balance: | $35,840,000 | Location(3): | Various | ||||
| % of Initial Pool Balance: | 5.0% | Size: | 257,355 SF | ||||
| Loan Purpose: | Acquisition | Cut-off Date Balance Per SF: | $139.26 | ||||
| Borrower Name(1): | ExchangeRight Net Leased Portfolio 19 DST | Year Built/Renovated(3): | Various | ||||
| Borrower Sponsor: | ExchangeRight Real Estate | Title Vesting: | Fee | ||||
| Mortgage Rate: | 4.0533% | Property Manager: | Self-managed | ||||
| Note Date: | December 21, 2017 | 4thMost Recent Occupancy(4): | NAV | ||||
| Anticipated Repayment Date: | NAP | 3rdMost Recent Occupancy(4): | NAV | ||||
| Maturity Date: | January 6, 2028 | 2ndMost Recent Occupancy(4): | NAV | ||||
| IO Period: | 120 months | Most Recent Occupancy(4): | NAV | ||||
| Loan Term (Original): | 120 months | Current Occupancy (As of): | 100.0% (3/1/2018) | ||||
| Seasoning: | 2 months | ||||||
| Amortization Term (Original): | NAP | Underwriting and Financial Information: | |||||
| Loan Amortization Type: | Interest-only, Balloon | ||||||
| Interest Accrual Method: | Actual/360 | 4thMost Recent NOI(5): | NAV | ||||
| Call Protection: | L(26),D(90),O(4) | 3rdMost Recent NOI(5): | NAV | ||||
| Lockbox Type: | Hard/Springing Cash Management | 2ndMost Recent NOI(5): | NAV | ||||
| Additional Debt: | None | Most Recent NOI(5): | NAV | ||||
| Additional Debt Type: | NAP | ||||||
| U/W Revenues: | $4,035,673 | ||||||
| U/W Expenses: | $476,309 | ||||||
| U/W NOI: | $3,559,364 | ||||||
| Escrows and Reserves(2): | U/W NCF: | $3,496,424 | |||||
| U/W NOI DSCR: | 2.42x | ||||||
| Type: | Initial | Monthly | Cap (If Any) | U/W NCF DSCR: | 2.37x | ||
| Taxes | $90,618 | $16,962 | NAP | U/W NOI Debt Yield: | 9.9% | ||
| Insurance | $0 | Springing | NAP | U/W NCF Debt Yield: | 9.8% | ||
| Replacement Reserves | $232,887 | $1,725 | NAP | As-Is Appraised Value(6): | $59,040,000 | ||
| TI/LC Reserve | $500,000 | Springing | NAP | As-Is Appraisal Valuation Date(6): | Various | ||
| Deferred Maintenance | $56,584 | $0 | NAP | Cut-off Date LTV Ratio: | 60.7% | ||
| Gastonia Property REA Reserve | $40,000 | $0 | NAP | LTV Ratio at Maturity or ARD: | 60.7% | ||
| (1) | See “The Borrower” section. |
| (2) | See “Escrows” section. |
| (3) | See “The Properties” section. |
| (4) | See “Historical Occupancy” section. |
| (5) | See “Cash Flow Analysis” section. Historical cash flows are unavailable as the ExchangeRight Properties were acquired by ExchangeRight (as defined below) between October 2017 and December 2017. According to ExchangeRight (as defined below), the sellers of the ExchangeRight Properties did not provide historical operating statements to ExchangeRight. |
| (6) | See “Appraisal” section. Each of the ExchangeRight Properties was valued individually. The appraisals are dated from October 19, 2017 to December 5, 2017. |
The Mortgage Loan. The mortgage loan (the “ExchangeRight Mortgage Loan”) is evidenced by a single promissory note that is secured by a first mortgage encumbering 21 cross-collateralized, triple-net leased, retail and medical office properties located in Georgia, Texas, Illinois, Tennessee, Ohio, Florida and North Carolina (the “ExchangeRight Properties”). The ExchangeRight Mortgage Loan was originated on December 21, 2017 by Barclays Bank PLC. The ExchangeRight Mortgage Loan had an original principal balance of $35,840,000, has an outstanding principal balance as of the Cut-off Date of $35,840,000 and accrues interest at an interest rate of 4.0533%per annum. The ExchangeRight Mortgage Loan had an initial term of 120 months, has a remaining term of 118 months as of the Cut-off Date and requires interest-only payments through the term of the ExchangeRight Mortgage Loan. The ExchangeRight Mortgage Loan matures on January 6, 2028.
Following the lockout period, the borrower has the right to defease the ExchangeRight Mortgage Loan in whole or in part (in connection with the release of the Verizon Wireless – Gastonia, North Carolina property, as described in the “Partial Release” section below), on any date before October 6, 2027. In addition, the ExchangeRight Mortgage Loan is prepayable without penalty on or after October 6, 2027.
THE INFORMATION IN THIS STRUCTURAL AND COLLATERAL TERM SHEET IS NOT COMPLETE AND MAY BE AMENDED PRIOR TO THE TIME OF SALE. THIS TERM SHEET IS NOT AN OFFER TO SELL THESE SECURITIES AND IT IS NOT A SOLICITATION OF AN OFFER TO BUY THESE SECURITIES IN ANY JURISDICTION WHERE THE OFFER OR SALE IS NOT PERMITTED.
74
EXCHANGERIGHT NET LEASED PORTFOLIO #19
Sources and Uses
| Sources | Uses | |||||||
| Original loan amount | $35,840,000 | 59.7% | Purchase price | $58,281,255 | 97.1% | |||
| Sponsor’s new cash contribution | 24,172,126 | 40.3 | Reserves | 920,088 | 1.5 | |||
| Closing costs | 810,782 | 1.4 | ||||||
| Total Sources | $60,012,126 | 100.0% | Total Uses | $60,012,126 | 100.0% |
The Properties. The ExchangeRight Properties are comprised of 19 retail and 2 medical office properties totaling 257,355 square feet located in Georgia (four properties, 24.0% of the allocated cut-off date balance), Texas (four properties, 16.3% of the allocated cut-off date balance), Illinois (three properties, 15.8% of the allocated cut-off date balance), Tennessee (three properties, 14.4% of the allocated cut-off date balance), Ohio (four properties, 12.0% of the allocated cut-off date balance), Florida (two properties, 11.7% of the allocated cut-off date balance) and North Carolina (one property, 5.8% of the allocated cut-off date balance). Built between 1975 and 2017, the ExchangeRight Properties range in size from 5,069 square feet to 55,000 square feet. As of March 1, 2018, the ExchangeRight Properties were 100.0% occupied.
The ExchangeRight Properties include nationally recognized credit-tenants, such as Dollar General (rated Baa2/BBB by Moody’s/S&P), Walgreens (rated BBB/Baa2/BBB by Fitch/Moody’s/S&P), Fresenius Medical Care (rated BBB-/BBB- by Fitch/S&P), Advance Auto Parts (rated Baa2/BBB- by Moody’s/S&P), Verizon Wireless (rated A-/Baa1/BBB+ by Fitch/Moody’s/S&P) and CVS Pharmacy (rated Baa1/BBB- by Moody’s/S&P). Credit rated tenants occupy 18 of the 21 properties representing 80.8% of underwritten base rent (leases are directly with rated entities or are guaranteed by such entities, with the exception of Advance Auto Parts and Verizon Wireless). The ExchangeRight Properties have a weighted average remaining initial lease term of approximately 12.8 years. If the fully extended lease maturity dates are used, the weighted average remaining lease term is approximately 32.9 years. Leases representing approximately 67.4% of the net rentable area and 70.8% of the underwritten base rent expire after the ExchangeRight Mortgage Loan maturity date. No individual property accounts for more than 12.5% of the underwritten base rent of the ExchangeRight Properties. The largest property, Hobby Lobby – Warner Robins comprises approximately 55,000 square feet (21.4% of the total net rentable area) and $467,500 of the underwritten base rent (12.5% of underwritten base rent). Excluding Hobby Lobby – Warner Robins, no individual property accounts for more than 9.6% of the underwritten base rent.
Thefollowing table presents certain information relating to theExchangeRight Properties:
| Tenant Name | City, State | Allocated Cutoff Date Balance | % of Portfolio Cut-off Date Balance | Occupancy | Year Built/ Renovated | Net Rentable Area (SF) | Allocated Cut-off Date LTV | Appraised Value(1) | |||
| Hobby Lobby | Warner Robins, Georgia | $4,440,000 | 12.4% | 100% | 2005/NAP | 55,000 | 61.2% | $7,250,000 | |||
| Fresenius Medical Care | Chicago, Illinois | $3,260,000 | 9.1% | 100% | 2016/NAP | 10,277 | 61.5% | $5,300,000 | |||
| Walgreens | Franklin, Tennessee | $3,020,000 | 8.4% | 100% | 2003/NAP | 13,650 | 59.5% | $5,075,000 | |||
| Walgreens | Gainesville, Florida | $2,992,481 | 8.3% | 100% | 1997/NAP | 13,905 | 57.3% | $5,220,000 | |||
| Walgreens | Houston, Texas | $2,800,000 | 7.8% | 100% | 2000/NAP | 15,120 | 61.5% | $4,550,000 | |||
| Verizon Wireless | Gastonia, North Carolina | $2,090,000 | 5.8% | 100% | 2007/NAP | 5,069 | 58.9% | $3,550,000 | |||
| CVS Pharmacy | Rome, Georgia | $1,790,000 | 5.0% | 100% | 1998/NAP | 10,167 | 61.7% | $2,900,000 | |||
| Napa Auto Parts | Rockford, Illinois | $1,500,000 | 4.2% | 100% | 1991/2017 | 14,860 | 62.5% | $2,400,000 | |||
| Fresenius Medical Care | Lithonia, Georgia | $1,420,000 | 4.0% | 100% | 2005/NAP | 7,740 | 63.1% | $2,250,000 | |||
| Advance Auto Parts | El Paso, Texas | $1,400,000 | 3.9% | 100% | 1975/2017 | 11,250 | 62.2% | $2,250,000 | |||
| Dollar General | Xenia, Ohio | $1,380,000 | 3.9% | 100% | 2016/NAP | 10,566 | 66.2% | $2,085,000 | |||
| Dollar General | Lakeland, Florida | $1,190,000 | 3.3% | 100% | 2017/NAP | 9,026 | 60.1% | $1,980,000 | |||
| Dollar General | Nashville, Tennessee | $1,170,000 | 3.3% | 100% | 2013/NAP | 12,406 | 60.9% | $1,920,000 | |||
| Dollar General | Fairborn, Ohio | $1,037,122 | 2.9% | 100% | 2016/NAP | 9,100 | 64.0% | $1,620,000 | |||
| Dollar General | Johnson City, Tennessee | $985,000 | 2.7% | 100% | 2014/NAP | 9,026 | 69.9% | $1,410,000 | |||
| Dollar General | Mableton, Georgia | $960,000 | 2.7% | 100% | 2017/NAP | 9,026 | 62.3% | $1,540,000 | |||
| Dollar General | Trotwood, Ohio | $950,000 | 2.7% | 100% | 2016/NAP | 7,489 | 69.6% | $1,365,000 | |||
| Advance Auto Parts | Beavercreek, Ohio | $929,718 | 2.6% | 100% | 2016/NAP | 6,895 | 44.8% | $2,075,000 | |||
| Napa Auto Parts | Woodstock, Illinois | $900,000 | 2.5% | 100% | 1984/2017 | 8,657 | 62.1% | $1,450,000 | |||
| Dollar General | San Angelo, Texas | $880,000 | 2.5% | 100% | 2016/NAP | 9,100 | 64.7% | $1,360,000 | |||
| Dollar General | Rosenberg, Texas | $745,679 | 2.1% | 100% | 2016/NAP | 9,026 | 50.0% | $1,490,000 | |||
| Total/Weighted Average | $35,840,000 | 100.0% | 100.0% | 257,355 | 60.7% | $59,040,000 | |||||
| (1) | In addition, each appraisal provides a “go dark” value for the related property. The ExchangeRight Properties have an aggregate “go dark” value of $36,460,000. |
THE INFORMATION IN THIS STRUCTURAL AND COLLATERAL TERM SHEET IS NOT COMPLETE AND MAY BE AMENDED PRIOR TO THE TIME OF SALE. THIS TERM SHEET IS NOT AN OFFER TO SELL THESE SECURITIES AND IT IS NOT A SOLICITATION OF AN OFFER TO BUY THESE SECURITIES IN ANY JURISDICTION WHERE THE OFFER OR SALE IS NOT PERMITTED.
75
EXCHANGERIGHT NET LEASED PORTFOLIO #19
The following table presents certain information relating to the tenancies at the ExchangeRight Properties:
Major Tenants(1)
| Tenant Name | Credit Rating (Fitch/Moody’s/ S&P)(2) | Number of Properties | Tenant NRSF | % of NRSF | Annual U/W Base Rent PSF | Annual U/W Base Rent | % of Total Annual U/W Base Rent | Lease Expiration Date | |
| Major Tenants | |||||||||
| Dollar General | NR/Baa2/BBB | 9 | 84,765 | 32.9% | $11.27 | $955,045 | 25.5% | Various(3) | |
| Walgreens | BBB/Baa2/BBB | 3 | 42,675 | 16.6% | $21.76 | $928,766 | 24.8% | Various(4) | |
| Fresenius Medical Care | BBB-/Baa3/BBB- | 2 | 18,017 | 7.0% | $27.93 | $503,293 | 13.4% | Various(5) | |
| Hobby Lobby | NR/NR/NR | 1 | 55,000 | 21.4% | $8.50 | $467,500 | 12.5% | 2/28/2027(6) | |
| Advance Auto Parts | NR/Baa2/BBB- | 2 | 18,145 | 7.1% | $14.25 | $258,604 | 6.9% | Various(7) | |
| Napa Auto Parts | NR/NR/NR | 2 | 23,517 | 9.1% | $10.69 | $251,400 | 6.7% | 12/31/2037(8) | |
| Verizon Wireless | A-/Baa1/BBB+ | 1 | 5,069 | 2.0% | $42.00 | $212,898 | 5.7% | 1/31/2028(9) | |
| CVS Pharmacy | NR/Baa1/BBB+ | 1 | 10,167 | 4.0% | $16.42 | $166,906 | 4.5% | 9/30/2037(10) | |
| Occupied Collateral Total | 21 | 257,355 | 100.0% | $14.55 | $3,744,413 | 100.0% | |||
| Vacant Space | 0 | 0.0% | |||||||
| Collateral Total | 257,355 | 100.0% | |||||||
| (1) | Tenants are not required to report sales information. |
| (2) | Certain ratings are those of the parent company whether or not the parent guarantees the lease. |
| (3) | Dollar General is a tenant at nine ExchangeRight Properties and leases 12,406 square feet at the Dollar General - Nashville property under a lease that expires on January 31, 2028 and has three five-year renewal options; 10,566 square feet at the Dollar General - Xenia property under a lease that expires on August 31, 2031 and has three five-year renewal options; 9,100 square feet at the Dollar General - Fairborn property under a lease that expires on June 30, 2031 and has three five-year renewal options; 9,100 square feet at the Dollar General – San Angelo property under a lease that expires on April 30, 2031 and has three five-year renewal options; 9,026 square feet at the Dollar General - Lakeland property under a lease that expires on September 30, 2032 and has four five-year renewal options; 9,026 square feet at the Dollar General – Mableton property under a lease that expires on September 30, 2032 and has five five-year renewal options; 9,026 square feet at the Dollar General - Rosenberg property under a lease that expires on April 30, 2031 and has three five-year renewal options; 9,026 square feet at the Dollar General – Johnson City property under a lease that expires on September 30, 2029 and has five five-year renewal options; and 7,489 square feet at the Dollar General - Trotwood property under a lease that expires on August 31, 2031 and has three five-year renewal options. |
| (4) | Walgreens is a tenant at three ExchangeRight Properties and leases 15,120 square feet at the Walgreens - Houston property under a lease that expires on May 1, 2027 and has seven five-year renewal options; 13,905 square feet at the Walgreens – Gainesville property under a lease that expires on July 31, 2027 and has eight five-year renewal options; and 13,650 square feet at the Dollar General - Franklin property under a lease that expires on July 31, 2028 and has ten five-year renewal options. |
| (5) | Fresenius Medical Care is a tenant at two ExchangeRight Properties and leases 10,277 square feet at the Fresenius Medical Care - Chicago property under a lease that expires on October 18, 2031 and has three five-year renewal options; and 7,740 square feet at the Fresenius Medical Care - Lithonia property under a lease that expires on November 30, 2032 and has three five-year renewal options. |
| (6) | Hobby Lobby has two five-year renewal options. |
| (7) | Advance Auto Parts is a tenant at two ExchangeRight Properties and leases 11,250 square feet at the Advance Auto Parts - El Paso property under a lease that expires on December 31, 2032 and has three five-year renewal options; and 6,895 square feet at the Advance Auto Parts - Beavercreek property under a lease that expires on August 31, 2031 and has three five-year renewal options. |
| (8) | Napa Auto Parts is a tenant at two ExchangeRight Properties and leases 14,860 square feet at the Napa Auto Parts – Rockford property under a lease that expires on December 31, 2037 and has four five-year renewal options; and 8,657 square feet at the Napa Auto Parts – Woodstock property under a lease that expires on December 31, 2037 and has four five-year renewal options. |
| (9) | Verizon Wireless has two five-year renewal options. |
| (10) | CVS Pharmacy has six five-year renewal options. |
The following table presents certain information relating to the lease rollover schedule at the ExchangeRight Properties:
Lease Expiration Schedule(1)
| Year Ending December 31, | No. of Leases Expiring | Expiring NRSF | % of Total NRSF | Cumulative Expiring NRSF | Cumulative % of Total NRSF | Annual U/W Base Rent | % of Total Annual U/W Base Rent | Annual U/W Base Rent PSF |
| MTM | 0 | 0 | 0.0% | 0 | 0.0% | $0 | 0.0% | $0.00 |
| 2018 | 0 | 0 | 0.0% | 0 | 0.0% | $0 | 0.0% | $0.00 |
| 2019 | 0 | 0 | 0.0% | 0 | 0.0% | $0 | 0.0% | $0.00 |
| 2020 | 0 | 0 | 0.0% | 0 | 0.0% | $0 | 0.0% | $0.00 |
| 2021 | 0 | 0 | 0.0% | 0 | 0.0% | $0 | 0.0% | $0.00 |
| 2022 | 0 | 0 | 0.0% | 0 | 0.0% | $0 | 0.0% | $0.00 |
| 2023 | 0 | 0 | 0.0% | 0 | 0.0% | $0 | 0.0% | $0.00 |
| 2024 | 0 | 0 | 0.0% | 0 | 0.0% | $0 | 0.0% | $0.00 |
| 2025 | 0 | 0 | 0.0% | 0 | 0.0% | $0 | 0.0% | $0.00 |
| 2026 | 0 | 0 | 0.0% | 0 | 0.0% | $0 | 0.0% | $0.00 |
| 2027 | 3 | 84,025 | 32.6% | 84,025 | 32.6% | $1,092,266 | 29.2% | $13.00 |
| 2028 | 3 | 31,125 | 12.1% | 115,150 | 44.7% | $641,495 | 17.1% | $20.61 |
| Thereafter | 15 | 142,205 | 55.3% | 257,355 | 100.0% | $2,010,652 | 53.7% | $14.14 |
| Vacant | 0 | 0 | 0.0% | 257,355 | 100.0% | $0 | 0.0% | $0.00 |
| Total/Weighted Average | 21 | 257,355 | 100.0% | $3,744,413 | 100.0% | $14.55 |
| (1) | Information obtained from the underwritten rent roll. |
THE INFORMATION IN THIS STRUCTURAL AND COLLATERAL TERM SHEET IS NOT COMPLETE AND MAY BE AMENDED PRIOR TO THE TIME OF SALE. THIS TERM SHEET IS NOT AN OFFER TO SELL THESE SECURITIES AND IT IS NOT A SOLICITATION OF AN OFFER TO BUY THESE SECURITIES IN ANY JURISDICTION WHERE THE OFFER OR SALE IS NOT PERMITTED.
76
EXCHANGERIGHT NET LEASED PORTFOLIO #19
The following table presents historical occupancy percentages at the ExchangeRight Properties:
Historical Occupancy
12/31/2014(1) | 12/31/2015(1) | 12/31/2016(1) | 12/31/2017(1) | 3/1/2018(2) |
| NAV | NAV | NAV | NAV | 100.0% |
| (1) | The ExchangeRight Properties were acquired by ExchangeRight between October 2017 and December 2017. According to ExchangeRight, the sellers of the ExchangeRight Properties did not provide historical operating statements to ExchangeRight. |
| (2) | Information obtained from the underwritten rent roll. |
Operating History and Underwritten Net Cash Flow. The followingtable presents certain information relating to the underwritten net cash flow at theExchangeRight Properties:
Cash Flow Analysis(1)
| U/W | % of U/W Effective Gross Income | U/W $/SF | ||||
| Base Rent(2) | $3,744,413 | 92.8% | $14.55 | |||
| Grossed Up Vacant Space | 0 | 0.0 | 0.00 | |||
| Total Reimbursables(3) | 393,460 | 9.7 | 1.53 | |||
| Other Income | 0 | 0.0 | 0.00 | |||
| Less Vacancy & Free Rent(4) | (102,199) | (2.5) | (0.40) | |||
| Effective Gross Income | $4,035,673 | 100.0% | $15.68 | |||
| Total Operating Expenses | $476,309 | 11.8% | $1.85 | |||
| Net Operating Income | $ 3,559,364 | 88.2% | $13.83 | |||
| TI/LC(5) | 37,712 | 0.9 | 0.15 | |||
| Replacement Reserves | 25,228 | 0.6 | 0.10 | |||
| Net Cash Flow | $ 3,496,424 | 86.6% | $13.59 | |||
| NOI DSCR | 2.42x | |||||
| NCF DSCR | 2.37x | |||||
| NOI DY | 9.9% | |||||
| NCF DY | 9.8% | |||||
| (1) | According to ExchangeRight, the sellers of the ExchangeRight Properties did not provide historical operating statements to ExchangeRight. |
| (2) | U/W Base Rent is inclusive of $49,938 of straight-line rent for Fresenius Medical Care – Lithonia and Fresenius Medical Care – Chicago, two investment grade tenants. |
| (3) | Total Reimbursables are underwritten based on tenant leases and discussions with ExchangeRight. There are no reimbursements at three of the properties as the tenants pay for the respective property expenses directly. The remaining eighteen tenants reimburse either property taxes, insurance or operating expenses or some combination of the three. |
| (4) | The underwritten economic vacancy is 5.0% at the property level except for thirteen properties (Fresenius Medical Care – Chicago, CVS Pharmacy – Rome, Fresenius Medical Care – Lithonia, Dollar General – Xenia, Advance Auto Parts - El Paso, Advance Auto Parts – Beavercreek, Dollar General – Lakeland, Dollar General – Fairborn, Dollar General – Mableton, Dollar General – Rosenberg, Dollar General - Johnson City, Dollar General – Trotwood and Dollar General - San Angelo), which are underwritten to a 0.0% economic vacancy. The thirteen properties are 100.0% occupied by investment grade tenants with at least 11 years remaining on the initial lease term. The overall underwritten blended economic vacancy is 2.5%. The ExchangeRight Properties are 100.0% physically occupied as of March 1, 2018. |
| (5) | U/W TI/LC is inclusive of a straight-line credit for the upfront TI/LC Reserve equal to $50,000, which is 10.0% of the upfront TI/LC Reserve of $500,000. |
Appraisal.The ExchangeRight Properties were valued individually, with the individual values reflecting a cumulative “as-is” appraised value of $59,040,000. The appraisals are dated from October 19, 2017 to December 5, 2017. Additionally, each appraisal provided a corresponding “go dark” value which equates to a cumulative “go dark” appraised value of $36,460,000 for the ExchangeRight Properties.
Environmental Matters. According to the Phase I environmental site assessment, dated October 30, 2017, the Advance Auto Parts – Beavercreek property had a record of two underground storage tanks (USTs) on the northern portion of the property, with no record of removal, and a history of automotive service operations at the property. A Phase II environmental site assessment dated December 8, 2017, identified no evidence of existing USTs and no evidence of any significant impact to the subsurface conditions from the former USTs and automotive service operations. No further action is recommended. According to the Phase I environmental site assessments dated from October 23, 2017 to December 14, 2017, there were no recognized environmental conditions at any of the other ExchangeRight Properties.
The Borrower. The borrower is ExchangeRight Net Leased Portfolio 19 DST, a Delaware Statutory Trust (the
“ExchangeRight Borrower”). At loan origination, the ExchangeRight Properties were conveyed and assumed from ExchangeRight Net Leased Portfolio 19, LLC to and by the ExchangeRight Borrower. The ExchangeRight Borrower has master leased the ExchangeRight Properties to a master lessee affiliated with the sponsors. The master lessee is structured as a special purpose entity. The master lessee’s interest in all tenant rents are assigned to the ExchangeRight Borrower, which in turn assigned its interest to the lender. The lender has the ability to cause the ExchangeRight Borrower to terminate the master lease. The sponsors have a 100% ownership interest in the master lessee. The master lease is subordinate to the ExchangeRight Mortgage Loan. There is one
THE INFORMATION IN THIS STRUCTURAL AND COLLATERAL TERM SHEET IS NOT COMPLETE AND MAY BE AMENDED PRIOR TO THE TIME OF SALE. THIS TERM SHEET IS NOT AN OFFER TO SELL THESE SECURITIES AND IT IS NOT A SOLICITATION OF AN OFFER TO BUY THESE SECURITIES IN ANY JURISDICTION WHERE THE OFFER OR SALE IS NOT PERMITTED.
77
EXCHANGERIGHT NET LEASED PORTFOLIO #19
independent director for the borrowing entity and one independent director for the master lessee. Legal counsel to the ExchangeRight Borrower delivered a non-consolidation opinion in connection with the origination of the ExchangeRight Mortgage Loan. David Fisher, Joshua Ungerecht and Warren Thomas, all of whom are managing members of ExchangeRight Real Estate, LLC, are the guarantors of certain nonrecourse carveouts under the ExchangeRight Mortgage Loan. See“Description of the Mortgage Pool—Delaware Statutory Trusts” in the Preliminary Prospectus.
The Borrower Sponsor.The borrower sponsor is ExchangeRight Real Estate (“ExchangeRight”). ExchangeRight has more than $1.1 billion of assets and more than 10 million square feet under management. ExchangeRight has more than 400 investment-grade retail and class B/B+ multifamily properties located across 28 states. Warren Thomas was involved in a foreclosure in 2013 unrelated to the ExchangeRight Properties.See “Description of the Mortgage Pool—Loan Purpose; Default History, Bankruptcy Issues and Other Proceedings” in the Preliminary Prospectus.
Escrows.The ExchangeRight Mortgage Loan documents provide for upfront reserves in the amount of $500,000 for future TI/LC reserves, $232,887 for replacement reserves, $90,618 for real estate taxes, $56,584 for deferred maintenance, and $40,000 for a Gastonia Property REA Reserve related to the Verizon Wireless – Gastonia, North Carolina Purchase Option described below.
The ExchangeRight Mortgage Loan documents require monthly deposits for (a) real estate taxes in an amount equal to one-twelfth of an amount which would be sufficient to pay the taxes payable during the next ensuing twelve months, initially $16,962 and (b) replacement reserves in an amount equal to $1,725. The ExchangeRight Borrower will not be required to make monthly deposits for real estate taxes for any of the individual ExchangeRight Properties provided (i) no Cash Sweep Period (as defined below) has occurred and is continuing, (ii) no default exists under the applicable lease of the tenant at such individual property, (iii) the tenant under such lease remains liable for paying all taxes directly to the applicable taxing authorities and (iv) the ExchangeRight Borrower has provided written evidence that all such taxes for such individual property have been paid in full at least 15 days prior to the due date of such taxes. The ExchangeRight Mortgage Loan documents do not require monthly escrows for insurance provided that the insurance required is maintained under an acceptable blanket insurance policy. If an event of default has occurred and is continuing, the ExchangeRight Borrower is required to deposit $15,056 on a monthly basis into the TI/LC reserve and any termination fee payable to the ExchangeRight Borrower.
Lockbox and Cash Management.The ExchangeRight Mortgage Loan is structured with a hard lockbox and springing cash management. The ExchangeRight Borrower was required at origination to deliver letters to the tenants at the ExchangeRight Properties directing them to pay all rents directly into a lender-controlled lockbox account. Additionally, all revenues and other monies received by the ExchangeRight Borrower or property manager relating to the ExchangeRight Properties are required to be deposited into the lockbox account immediately upon receipt. During the occurrence and continuance of a Cash Sweep Period (as defined below), all funds are required to be swept each business day into the cash management account controlled by the lender and disbursed on each payment date in accordance with the ExchangeRight Mortgage Loan documents, with all excess cash flow to be held as additional security for the ExchangeRight Mortgage Loan.
A “Cash Sweep Period” will commence upon the earlier of the following:
| (i) | the occurrence and continuance of an event of default; |
| (ii) | the net cash flow debt service coverage ratio being less than 1.45x; or |
| (iii) | the date that is 36 months prior to the maturity date. |
A “Cash Sweep Period” will end upon the earlier of the following:
| (a) | the payment date next occurring following: |
| (x) | with regard to clause (i), upon the cure of such event of default; |
| (y) | with regard to clause (ii), upon the net cash flow debt service coverage ratio being equal to or greater than 1.45x for any two consecutive calendar quarters; or |
| (z) | with regard to clause (iii), the occurrence of a qualified transfer under the ExchangeRight Mortgage Loan documents, provided that the approved transferee: (a) must maintain a minimum net worth of at least $200,000,000 and total assets of at least $400,000,000, (b) must execute and deliver a full recourse guaranty guaranteeing payment of the entire amount of the debt, (c) must at all times own no less than 100% of the legal and beneficial ownership interests in the ExchangeRight Borrower, (d) must not be a Delaware statutory trust and (e) will cause the ExchangeRight Borrower to convert to a limited liability company. |
| (b) | The payment in full of all principal and interest on the ExchangeRight Mortgage Loan and all other amounts payable under the ExchangeRight Mortgage Loan documents. |
Property Management. The ExchangeRight Properties are managed by an affiliate of the ExchangeRight Borrower.
Assumption. The ExchangeRight Borrower has the right to transfer all of the ExchangeRight Properties provided that certain conditions are satisfied, including: (i) no event of default has occurred and is continuing, (ii) the ExchangeRight Borrower has provided the lender with at least 60 days prior written notice, (iii) the proposed transferee qualifies as a qualified transferee under the ExchangeRight Mortgage Loan documents, (iv) the delivery of a REMIC opinion, an insolvency opinion and other opinions required by the lender; (v) the lender has received confirmation from DBRS, Fitch and Moody’s that such assumption will not result in a downgrade of the respective ratings assigned to the WFCM 2018-C43 certificates and (vi) other conditions set forth in the ExchangeRight Mortgage Loan documents.
Right of First Refusal.The sole tenants at the Walgreens – Gainesville, Walgreens – Franklin and Walgreens – Houston properties each have a right of first offer (“ROFO”) with respect to offers to purchase their respective properties. The Optionee (as defined below) at the Verizon Wireless – Gastonia, North Carolina property has a right of first refusal (“ROFR”) to purchase the property. Walgreens has agreed in subordination, nondisturbance and attornment agreements that such ROFOs will not apply to a foreclosure
THE INFORMATION IN THIS STRUCTURAL AND COLLATERAL TERM SHEET IS NOT COMPLETE AND MAY BE AMENDED PRIOR TO THE TIME OF SALE. THIS TERM SHEET IS NOT AN OFFER TO SELL THESE SECURITIES AND IT IS NOT A SOLICITATION OF AN OFFER TO BUY THESE SECURITIES IN ANY JURISDICTION WHERE THE OFFER OR SALE IS NOT PERMITTED.
78
EXCHANGERIGHT NET LEASED PORTFOLIO #19
or deed-in-lieu of foreclosure or any other enforcement action under the ExchangeRight Mortgage Loan; provided, however, that such ROFOs will apply to subsequent purchasers of the applicable ExchangeRight Properties. The Optionee has agreed in a Release of Right of First Refusal agreement that the ROFR will not apply to any foreclosure sale, deed-in-lieu of foreclosure, exercise of power of sale or exercise of any other remedies by the lender or the first transfer of the Verizon Wireless – Gastonia, North Carolina property by the lender or its nominee following such foreclosure, deed-in-lieu of foreclosure, power of sale or exercise of remedies.
Purchase Option.The successor in title to the developer of the Verizon Wireless – Gastonia, North Carolina property (the “Optionee”), has an option to purchase the Verizon Wireless – Gastonia, North Carolina property upon the violation of any provision of the Declaration of Easements and Restrictive Covenants, dated April 19, 1995, and the subsequent failure to cure any such violation within 60 days of written notice to the landlord of any violation from the Optionee (the “Gastonia Property Purchase Option”). On the date of origination, $40,000 was reserved (estimated amount of common area maintenance payable for one year), which will be disbursed upon the termination of the purchase option. In the event the Optionee exercises the purchase option to purchase the Verizon Wireless – Gastonia, North Carolina property, the Optionee will pay the purchase price directly to the lender.
Partial Release.The ExchangeRight Borrower may release the Verizon Wireless – Gastonia, North Carolina property in connection with the exercise of the Gastonia Property Purchase Option upon satisfaction of certain requirements set forth in the ExchangeRight Mortgage Loan documents, including satisfaction of the REMIC requirements, provided: (i) no event of default has occurred or is continuing; (ii) the ExchangeRight Borrower will convey the Gastonia property, concurrently with the release, to the Optionee or such other entity designated by the Optionee, provided such entity is not an affiliate of ExchangeRight Borrower; (iii) the ExchangeRight Borrower will provide an endorsement to the title insurance policy and (iv) (a) if the Gastonia Property Purchase Option is exercised by the Optionee prior to the permitted defeasance date, the ExchangeRight Borrower may partially prepay the ExchangeRight Mortgage Loan in an amount equal to $2,612,500 plus a yield maintenance premium, or (b) if the Gastonia Property Purchase Option is exercised by the Optionee after the permitted defeasance date, the ExchangeRight Borrower may partially defease the ExchangeRight Mortgage Loan, upon delivery of defeasance collateral in an amount equal to $2,612,500 and delivery of a rating agency confirmation.
Real Estate Substitution.Not permitted.
Subordinate and Mezzanine Indebtedness.Not permitted.
Ground Lease.None.
Terrorism Insurance.The ExchangeRight Mortgage Loan documents require that the “all risk” insurance policy required to be maintained by the ExchangeRight Borrower provide coverage for terrorism in an amount equal to 100% of the full replacement cost of the ExchangeRight Properties. The ExchangeRight Mortgage Loan documents also require business interruption insurance covering no less than the 12-month period following the occurrence of a casualty event, together with a three-month extended period of indemnity.
THE INFORMATION IN THIS STRUCTURAL AND COLLATERAL TERM SHEET IS NOT COMPLETE AND MAY BE AMENDED PRIOR TO THE TIME OF SALE. THIS TERM SHEET IS NOT AN OFFER TO SELL THESE SECURITIES AND IT IS NOT A SOLICITATION OF AN OFFER TO BUY THESE SECURITIES IN ANY JURISDICTION WHERE THE OFFER OR SALE IS NOT PERMITTED.
79
| HOUSTON DISTRIBUTION CENTER |

THE INFORMATION IN THIS STRUCTURAL AND COLLATERAL TERM SHEET IS NOT COMPLETE AND MAY BE AMENDED PRIOR TO THE TIME OF SALE. THIS TERM SHEET IS NOT AN OFFER TO SELL THESE SECURITIES AND IT IS NOT A SOLICITATION OF AN OFFER TO BUY THESE SECURITIES IN ANY JURISDICTION WHERE THE OFFER OR SALE IS NOT PERMITTED.
80
| HOUSTON DISTRIBUTION CENTER |
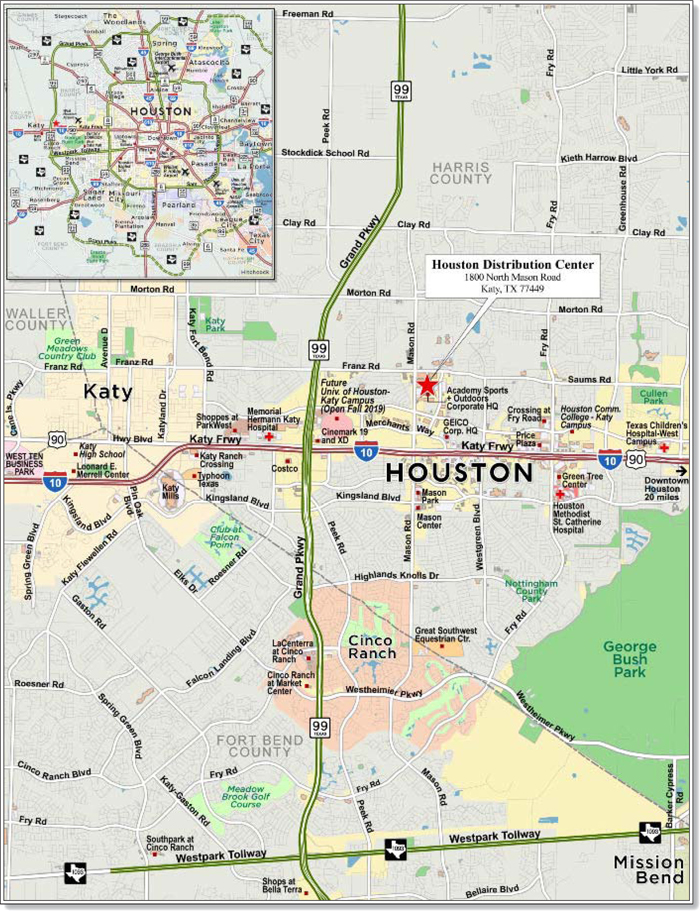
THE INFORMATION IN THIS STRUCTURAL AND COLLATERAL TERM SHEET IS NOT COMPLETE AND MAY BE AMENDED PRIOR TO THE TIME OF SALE. THIS TERM SHEET IS NOT AN OFFER TO SELL THESE SECURITIES AND IT IS NOT A SOLICITATION OF AN OFFER TO BUY THESE SECURITIES IN ANY JURISDICTION WHERE THE OFFER OR SALE IS NOT PERMITTED.
81
| No. 6 – Houston Distribution Center | ||||||||
| Loan Information | Property Information | |||||||
| Mortgage Loan Seller: | Barclays Bank PLC | Single Asset/Portfolio: | Single Asset | |||||
| Credit Assessment | Property Type: | Industrial | ||||||
| (DBRS/Fitch/Moody’s): | NR/NR/NR | Specific Property Type: | Warehouse Distribution | |||||
| Original Principal Balance(1): | $35,000,000 | Location: | Katy, TX | |||||
| Cut-off Date Balance(1): | $34,949,034 | Size: | 1,500,596 SF | |||||
| % of Initial Pool Balance: | 4.8% | Cut-off Date Balance Per SF(1): | $55.90 | |||||
| Loan Purpose(2): | Recapitalization | Year Built/Renovated: | 1973, 2000-2005/NAP | |||||
| Borrower Name: | Spirit AS Katy TX, LP | Title Vesting: | Fee | |||||
| Borrower Sponsor: | Spirit Realty, L.P. | Property Manager: | Self-managed | |||||
| Mortgage Rate: | 5.141% | 4thMost Recent Occupancy (As of): | 100.0% (12/31/2014) | |||||
| Note Date: | January 22, 2018 | 3rdMost Recent Occupancy (As of): | 100.0% (12/31/2015) | |||||
| Anticipated Repayment Date: | NAP | 2ndMost Recent Occupancy (As of): | 100.0% (12/31/2016) | |||||
| Maturity Date: | February 1, 2028 | Most Recent Occupancy (As of): | 100.0% (12/31/2017) | |||||
| IO Period: | 0 months | Current Occupancy (As of): | 100.0% (3/1/2018) | |||||
| Loan Term (Original): | 120 months | |||||||
| Seasoning: | 1 month | |||||||
| Amortization Term (Original): | 360 months | Underwriting and Financial Information: | ||||||
| Loan Amortization Type: | Amortizing Balloon | 4thMost Recent NOI (As of)(5): | NAV | |||||
| Interest Accrual Method: | Actual/360 | 3rdMost Recent NOI (As of): | $8,901,505 (12/31/2015) | |||||
| Call Protection: | L(25),GRTR 1% or YM(91),O(4) | 2ndMost Recent NOI (As of): | $9,016,467 (12/31/2016) | |||||
| Lockbox Type: | Hard/Springing Cash Management | Most Recent NOI (As of): | $9,160,273 (12/31/2017) | |||||
| Additional Debt(1): | Yes | |||||||
| Additional Debt Type(1): | Pari Passu | |||||||
| U/W Revenues: | $9,141,820 | |||||||
| U/W Expenses: | $274,255 | |||||||
| U/W NOI: | $8,867,565 | |||||||
| U/W NCF: | $7,892,178 | |||||||
| U/W NOI DSCR(1): | 1.61x | |||||||
| Escrows and Reserves(3): | U/W NCF DSCR(1): | 1.44x | ||||||
| U/W NOI Debt Yield(1): | 10.6% | |||||||
| Type: | Initial | Monthly | Cap (If Any) | U/W NCF Debt Yield(1): | 9.4% | |||
| Taxes | $0 | Springing | NAP | As-Is Appraised Value(4): | $144,000,000 | |||
| Insurance | $0 | Springing | NAP | As-Is Appraisal Valuation Date: | October 17, 2017 | |||
| Replacement Reserve | $0 | $31,262 | NAP | Cut-off Date LTV Ratio(1)(4): | 58.2% | |||
| TI/LC Reserve | $0 | $50,020 | NAP | LTV Ratio at Maturity or ARD(1)(4): | 48.2% | |||
| (1) | See “The Mortgage Loan” section. All statistical information related to balance per square foot, loan-to-value ratios, debt service coverage ratios and debt yields are based on the Houston Distribution Center Whole Loan (as defined below). |
| (2) | The Houston Distribution Center Property (as defined below) was unencumbered prior to the funding of the Houston Distribution Center Whole Loan. |
| (3) | See “Escrows” section. |
| (4) | The appraisal concluded a hypothetical “dark value” of $96,000,000 for the Houston Distribution Center Property. The Cut-off Date LTV Ratio and Maturity Date LTV Ratio based on the hypothetical “dark value” are 87.4% and 72.2%, respectively. |
| (5) | Financial information prior to 2015 was not provided by the sponsor. The Houston Distribution Center Property has been 100.0% leased by Academy Sports since 1990. The Academy Sports lease is absolute net and all expenses are paid directly by the tenant. |
The Mortgage Loan.The mortgage loan (the “Houston Distribution Center Mortgage Loan”) is part of a whole loan (the “Houston Distribution Center Whole Loan”) evidenced by threepari passu notes. The Houston Distribution Center Whole Loan is secured by a first mortgage encumbering the fee simple interest in a single-tenant 1,500,596 square foot industrial warehouse and distribution center property in Katy, Texas (the “Houston Distribution Center Property”). The Houston Distribution Center Whole Loan was co-originated on January 22, 2018 by Barclays Bank PLC and Société Générale. The Houston Distribution Center Whole Loan had an original principal balance of $84,000,000, has an outstanding principal balance as of the Cut-off Date of $83,877,682 and accrues interest at an interest rate of 5.141%per annum. The Houston Distribution Center Whole Loan had an initial term of 120 months, has a remaining term of 119 months as of the Cut-off Date and requires payments of principal and interest based on a 30-year amortization schedule. The Houston Distribution Center Whole Loan matures on February 1, 2028.
Note A-3, which will be contributed to the WFCM 2018-C43 securitization trust, had an original principal balance of $35,000,000, has an outstanding principal balance as of the Cut-off Date of $34,949,034 and represents a non-controlling interest in the Houston Distribution Center Whole Loan. The controlling Note A-1 and the non-controlling Note A-2, had an aggregate original principal balance of $49,000,000, have an aggregate outstanding principal balance as of the Cut-off Date of $48,928,648 and were contributed to the UBS 2018-C8 securitization trust. See“Description of the Mortgage Pool—The Whole Loans—The Non-Serviced Pari Passu Whole Loans” in the Preliminary Prospectus.
THE INFORMATION IN THIS STRUCTURAL AND COLLATERAL TERM SHEET IS NOT COMPLETE AND MAY BE AMENDED PRIOR TO THE TIME OF SALE. THIS TERM SHEET IS NOT AN OFFER TO SELL THESE SECURITIES AND IT IS NOT A SOLICITATION OF AN OFFER TO BUY THESE SECURITIES IN ANY JURISDICTION WHERE THE OFFER OR SALE IS NOT PERMITTED.
82
| HOUSTON DISTRIBUTION CENTER |
Note Summary
| Notes | Original Balance | Note Holder | Controlling Interest | |
| A-1 | $35,000,000 | UBS 2018-C8 | Yes | |
| A-2 | $14,000,000 | UBS 2018-C8 | No | |
| A-3 | $35,000,000 | WFCM 2018-C43 | No | |
| Total | $84,000,000 |
Sources and Uses
| Sources | Uses | |||||||
| Original whole loan amount | $84,000,000 | 100.0% | Return of equity | $83,131,776 | 99.0% | |||
| Closing costs | 868,224 | 1.0 | ||||||
| Total Sources | $84,000,000 | 100.0% | Total Uses | $84,000,000 | 100.0% |
The Property.The Houston Distribution Center Property is a 1,500,596 square foot single-tenant industrial warehouse and distribution facility, located on a 93.5-acre site in Katy, Texas. The Houston Distribution Center Property consists of four buildings, two of which were constructed in 1973 and comprise approximately 35.5% of the total square feet of the Houston Distribution Center Property. The other two buildings were developed by the sole tenant, Academy Sports, between 2000 and 2005 and comprise approximately 64.5% of the total square feet of the Houston Distribution Center Property. The Houston Distribution Center Property is comprised of 1,425,596 square feet of industrial warehouse space (95.0% of net rentable area) and 75,000 square feet of office space (5.0% of net rentable area).
As of March 1, 2018, the Houston Distribution Center Property was 100.0% leased to Academy Sports, which utilizes the Houston Distribution Center Property as its primary distribution center and office space for merchandising and e-commerce employees. The Houston Distribution Center Property is located immediately north of Academy Sports’ approximately 220,000 square foot corporate headquarters. The Houston Distribution Center Property houses 1,300 Academy Sports employees, and services approximately 45.0% of its retail locations nationwide. Academy Sports has occupied 100.0% of the Houston Distribution Center Property since 1990 and has invested $15.0 million in the space, including developing more than 975,000 square feet of expansion space and building out extensive racking systems, conveyor belts, and other distribution technology.
Founded in 1938 by Max Gochman, Academy Sports offers a mix of merchandise that extends beyond traditional sporting goods, carrying an extensive line of name-brand clothing, shoes, and equipment for competitive sports, physical fitness training, and outdoor recreational activities, such as camping, hunting, fishing, and boating. Academy Sports also offers a variety of products through a private label, including licensed products for apparel, footwear, barbecue equipment and outdoor equipment. Academy Sports generates annual sales exceeding $4.7 billion from its 230 stores across 16 states. Academy Sports employs more than 23,000 people throughout the south, southeast and midwest United States. Kohlberg Kravis Roberts & Co L.P. (an affiliate of the directing certificateholder under this securitization and the securitization governing the servicing of the Houston Distribution Center Whole Loan) acquired Academy Sports in 2011. Academy Sports commenced its current NNN lease on January 18, 2007, which runs through January 31, 2027, and has eight five-year renewal options remaining with no termination options.
The Houston Distribution Center Property features 31 to 50 foot clear ceiling heights and 247 dock high loading doors, some of which have built-up concrete ramps that permit drive-in access. There are 967 parking spaces, resulting in a parking ratio of 0.6 spaces per 1,000 square feet of net rentable area.
The following table presents certain information relating to the tenancy at the Houston Distribution Center Property:
Major Tenants
| Tenant Name | Credit Rating (Fitch/Moody’s/S&P) | Tenant NRSF | % of NRSF | Annual U/W Base Rent PSF(1) | Annual U/W Base Rent(1) | % of Total Annual U/W Base Rent | Lease Expiration Date |
| Major Tenant | |||||||
| Academy Sports | NR/NR/NR | 1,500,596 | 100.0% | $6.23 | $9,348,713 | 100.0% | 1/31/2027(2) |
| Total Major Tenant | 1,500,596 | 100.0% | $6.23 | $9,348,713 | 100.0% | ||
| Vacant Space | 0 | 0.0% | |||||
| Collateral Total | 1,500,596 | 100.0% | |||||
| (1) | Annual U/W Base Rent PSF and Annual U/W Base Rent include rent steps through February 2018, totaling $143,417. |
| (2) | Academy Sports has eight, five-year renewal options. |
THE INFORMATION IN THIS STRUCTURAL AND COLLATERAL TERM SHEET IS NOT COMPLETE AND MAY BE AMENDED PRIOR TO THE TIME OF SALE. THIS TERM SHEET IS NOT AN OFFER TO SELL THESE SECURITIES AND IT IS NOT A SOLICITATION OF AN OFFER TO BUY THESE SECURITIES IN ANY JURISDICTION WHERE THE OFFER OR SALE IS NOT PERMITTED.
83
| HOUSTON DISTRIBUTION CENTER |
The following table presents certain information relating to the lease rollover schedule at the Houston Distribution Center Property:
Lease Expiration Schedule(1)
| Year Ending December 31, | No. of Leases Expiring | Expiring NRSF | % of Total NRSF | Cumulative Expiring NRSF | Cumulative % of Total NRSF | Annual U/W Base Rent(2) | % of Annual U/W Base Rent(2) | Annual U/W Base Rent PSF(2) |
| MTM | 0 | 0 | 0.0% | 0 | 0.0% | $0 | 0.0% | $0.00 |
| 2018 | 0 | 0 | 0.0% | 0 | 0.0% | $0 | 0.0% | $0.00 |
| 2019 | 0 | 0 | 0.0% | 0 | 0.0% | $0 | 0.0% | $0.00 |
| 2020 | 0 | 0 | 0.0% | 0 | 0.0% | $0 | 0.0% | $0.00 |
| 2021 | 0 | 0 | 0.0% | 0 | 0.0% | $0 | 0.0% | $0.00 |
| 2022 | 0 | 0 | 0.0% | 0 | 0.0% | $0 | 0.0% | $0.00 |
| 2023 | 0 | 0 | 0.0% | 0 | 0.0% | $0 | 0.0% | $0.00 |
| 2024 | 0 | 0 | 0.0% | 0 | 0.0% | $0 | 0.0% | $0.00 |
| 2025 | 0 | 0 | 0.0% | 0 | 0.0% | $0 | 0.0% | $0.00 |
| 2026 | 0 | 0 | 0.0% | 0 | 0.0% | $0 | 0.0% | $0.00 |
| 2027 | 1 | 1,500,596 | 100.0% | 1,500,596 | 100.0% | $9,348,713 | 100.0% | $6.23 |
| Thereafter | 0 | 0 | 0.0% | 1,500,596 | 100.0% | $0 | 0.0% | $0.00 |
| Vacant | 0 | 0 | 0.0% | 1,500,596 | 100.0% | $0 | 0.0% | $0.00 |
| Total/Weighted Average | 1 | 1,500,596 | 100.0% | $9,348,713 | 100.0% | $6.23 |
| (1) | Information obtained from the underwritten rent roll. |
| (2) | Annual U/W Base Rent, % of Annual U/W Base Rent and Annual U/W Base Rent PSF include rent steps through February 2018, totaling $143,417. |
The following table presents historical occupancy percentages at the Houston Distribution Center Property:
Historical Occupancy
12/31/2014(1) | 12/31/2015(1) | 12/31/2016(1) | 12/31/2017(1) | 3/1/2018(2) | ||||
| 100.0% | 100.0% | 100.0% | 100.0% | 100.0% |
| (1) | Information obtained from the Houston Distribution Center Borrower. |
| (2) | Information obtained from the underwritten rent roll. |
Underwritten Net Cash Flow. The following table presents certain information relating to the underwritten net cash flow at the Houston Distribution Center Property:
Cash Flow Analysis
| 2015 | 2016 | 2017 | U/W | % of U/W Effective Gross Income | U/W $ per SF | |||||||
| Base Rent(1) | $8,924,229 | $9,058,093 | $9,193,964 | $9,348,713 | 102.3% | $6.23 | ||||||
| Grossed Up Vacant Space | 0 | 0 | 0 | 0 | 0.0 | 0.00 | ||||||
| Total Reimbursables(2) | 0 | 0 | 0 | 274,255 | 3.0 | 0.18 | ||||||
| Less Vacancy & Credit Loss(3) | 0 | 0 | 0 | (481,148) | (5.3) | (0.32) | ||||||
| Effective Gross Income | $8,924,229 | $9,058,093 | $9,193,964 | $9,141,820 | 100.0% | $6.09 | ||||||
| Total Operating Expenses | $22,724 | $41,626 | $33,691 | $274,255 | 3.0% | $0.18 | ||||||
| Net Operating Income | $8,901,505 | $9,016,467 | $9,160,273 | $8,867,565 | 97.0% | $5.91 | ||||||
| TI/LC | 0 | 0 | 0 | 600,238 | 6.6 | 0.40 | ||||||
| Capital Expenditures | 0 | 0 | 0 | 375,149 | 4.1 | 0.25 | ||||||
| Net Cash Flow | $8,901,505 | $9,016,467 | $9,160,273 | $7,892,178 | 86.3% | $5.26 | ||||||
| NOI DSCR(4) | 1.62x | 1.64x | 1.67x | 1.61x | ||||||||
| NCF DSCR(4) | 1.62x | 1.64x | 1.67x | 1.44x | ||||||||
| NOI DY(4) | 10.6% | 10.7% | 10.9% | 10.6% | ||||||||
| NCF DY(4) | 10.6% | 10.7% | 10.9% | 9.4% |
| (1) | U/W Base Rent includes rent steps through February 2018 totaling $143,417. |
| (2) | The Academy Sports lease is absolute net and all expenses are paid directly by the tenant. Total Reimbursables is a pass-through adjustment to offset the 3.0% underwritten management fee. |
| (3) | The underwritten economic vacancy is 5.0%. The Houston Distribution Center Property was 100.0% occupied as of March 1, 2018. |
| (4) | Debt service coverage ratios and debt yields are based on the Houston Distribution Center Whole Loan. |
THE INFORMATION IN THIS STRUCTURAL AND COLLATERAL TERM SHEET IS NOT COMPLETE AND MAY BE AMENDED PRIOR TO THE TIME OF SALE. THIS TERM SHEET IS NOT AN OFFER TO SELL THESE SECURITIES AND IT IS NOT A SOLICITATION OF AN OFFER TO BUY THESE SECURITIES IN ANY JURISDICTION WHERE THE OFFER OR SALE IS NOT PERMITTED.
84
| HOUSTON DISTRIBUTION CENTER |
Appraisal.As of the appraisal valuation date of October 17, 2017 the Houston Distribution Center Property had an “as-is” appraised value of $144,000,000. The appraisal also provided a “hypothetical go dark” appraised value of $96,000,000.
Environmental Matters. According to a Phase I environmental site assessment dated October 23, 2017, there was no evidence of any recognized environmental conditions at the Houston Distribution Center Property.
Market Overview and Competition.The Houston Distribution Center Property is located at 1800 North Mason Road in Katy, Texas, approximately 20.0 miles west of the Houston central business district. The Houston Distribution Center Property is accessible by Interstate 10, which is located approximately one mile south of the Houston Distribution Center Property, and provides east and west access to and from Houston. According to the appraisal, the Houston Distribution Center Property’s neighborhood consists of a variety of commercial and residential land uses. The area immediately surrounding the Houston Distribution Center Property is relatively new, consisting primarily of residential properties built from 1990 to the present. According to a third party market research provider, the median home value within a three-mile radius is approximately $148,028.
The Houston Distribution Center Property is located in Katy, Texas within the Houston-The Woodlands-Sugar Land, Texas metropolitan statistical area (the “Houston MSA”). Moody’s Economy.com reports that the Houston MSA had a population of approximately 6.9 million as of August 2017, which represents a 1.9% increase over 2016. According to a third party market research report, the estimated 2017 population within a one-, three- and five-mile radius of the Houston Distribution Center Property is 13,077, 119,179 and 257,478, respectively. The estimated 2017 average household income within a one-, three- and five-mile radius of the Houston Distribution Center Property is $88,085, $94,176 and $111,168, respectively. According to a third party market research report, the Houston Distribution Center Property is located within the Northwest Industrial Submarket. The existing inventory as of the second quarter 2017 was 146,074,764 square feet with a vacancy rate of 4.9% and asking rent of $7.44 per square foot.
The following table presents certain information relating to comparable leases to the Houston Distribution Center Property:
Comparable Leases(1)
| Property Name/Location | Year Built | Distance to subject (miles) | Occupancy | Clear Height | Lease Size (SF) | Annual Base Rent PSF | Lease Type |
Ellington Trade Center Houston, TX | 2009 | 47.3 | 99.0% | 24 ft. | 513,800 | $6.50 | NNN |
Amazon Schertz Fulfillment Center Schertz, TX | 2013 | 162.7 | 100.0% | 32 ft. | 1,262,294 | $5.04 | NNN |
Amazon Fulfillment Center San Marcos, TX | 2016 | 147.3 | 100.0% | 41 ft. | 855,000 | $6.25 | NNN |
Claymoore I & II Houston, TX | 1998 | 15.9 | 93.0% | 24 ft. | 742,250 | $5.50 | NNN |
Bayou Bend Business Park Houston, TX | 2014 | 25.3 | 100.0% | 24 ft. | 378,380 | $3.55 | NNN |
| (1) | Information obtained from the appraisal. |
The Borrower.The borrower for the Houston Distribution Center Whole Loan is Spirit AS Katy TX, LP, a Delaware limited partnership and a special purpose entity with two independent directors (the “Houston Distribution Center Borrower”). Legal counsel to the Houston Distribution Center Borrower delivered a non-consolidation opinion in connection with the origination of the Houston Distribution Center Whole Loan. Spirit Realty, L.P., a Delaware limited partnership, (the “Houston Distribution Center Guarantor”) is the guarantor of certain nonrecourse carveouts under the Houston Distribution Center Whole Loan. The Houston Distribution Center Borrower and the Houston Distribution Center Guarantor are managed and majority owned by Spirit Realty Capital, Inc.
The Borrower Sponsor.The borrower sponsor is Spirit Realty, L.P., which is majority owned by Spirit Realty Capital Inc. (“Spirit”) (NYSE: SRC), a REIT primarily investing in real estate subject to long-term net leases. As of September 30, 2017, Spirit’s gross investment in real estate properties and loans totaled approximately $8.0 billion, representing investments in 2,423 properties, which were 99.1% occupied and leased to 421 tenants operating in 30 different industries across 49 states with only Texas accounting for more than 10.0% of Spirit’s real estate investment portfolio rental revenue. Spirit has recently announced that it plans to transfer its ownership interest in the Houston Distribution Center Property to its newly formed Spirit Master Trust Agreement REIT (“SMTA”). The transfer is expected to occur in the first half of 2018. SMTA will have approximately $2.7 billion in assets under management, comprised of over 925 properties.
Escrows.The Houston Distribution Center Whole Loan documents provide for ongoing monthly escrows of (a) $31,262 for capital expenditures and (b) $50,020 for tenant improvements and leasing commissions. Ongoing monthly escrows for real estate taxes are waived, provided that (a) no event of default has occurred and is continuing, (b) Academy Sports (or replacement tenant) is in occupancy of the Houston Distribution Center Property and is required by the terms of the Academy Sports lease (or replacement tenant lease) to pay all real estate taxes and other charges directly to the applicable taxing authorities and actually does pay such real estate taxes and other charges directly to the applicable taxing authorities, (c) the Houston Distribution Center Borrower has provided written evidence acceptable to the lender that all real estate taxes and other charges for the applicable tax parcels have been paid in full prior to the date such payment is due, and (d) the Academy Sports lease (or replacement tenant lease) is in full force and effect. Ongoing monthly escrows for insurance premiums are waived, provided that (a) no event of default has occurred and is continuing, and (b) the Houston Distribution Center Borrower has provided the lender with reasonably satisfactory evidence
THE INFORMATION IN THIS STRUCTURAL AND COLLATERAL TERM SHEET IS NOT COMPLETE AND MAY BE AMENDED PRIOR TO THE TIME OF SALE. THIS TERM SHEET IS NOT AN OFFER TO SELL THESE SECURITIES AND IT IS NOT A SOLICITATION OF AN OFFER TO BUY THESE SECURITIES IN ANY JURISDICTION WHERE THE OFFER OR SALE IS NOT PERMITTED.
85
| HOUSTON DISTRIBUTION CENTER |
(as determined by the lender) that the Houston Distribution Center Property is insured in accordance with the Houston Distribution Center Whole Loan documents pursuant to a blanket insurance policy reasonably acceptable to lender.
Lockbox and Cash Management.The Houston Distribution Center Whole Loan is structured with a hard lockbox and springing cash management. The Houston Distribution Center Borrower was required at origination to deliver letters to the tenants at the Houston Distribution Center Property directing them to pay all rents directly into a lender-controlled lockbox account. All funds received by the Houston Distribution Center Borrower or manager are required to be deposited in the lockbox account within two business days following receipt. During the occurrence and continuance of a Cash Sweep Period (as defined below), all funds are required to be swept each business day into the cash management account controlled by the lender and disbursed on each payment date in accordance with the Houston Distribution Center Whole Loan documents, with all excess cash flow to be deposited to a rollover reserve account if such Cash Sweep Period is caused by a Tenant Trigger Period (as defined below), and otherwise to an excess cash reserve to be held as additional security for the Houston Distribution Center Whole Loan.
A “Cash Sweep Period” will commence following the earliest to occur of any of the following:
| (i) | the maturity date of the Houston Distribution Center Whole Loan; |
| (ii) | an event of default under the Houston Distribution Center Whole Loan; |
| (iii) | as of the last day of any calendar quarter, the debt service coverage ratio falls below 1.20x based on the Houston Distribution Center Whole Loan; or |
| (iv) | the commencement of a Tenant Trigger Period (as defined below). |
A Cash Sweep Period will end if:
| (a) | if the Houston Distribution Center Whole Loan has been repaid in full; |
| (b) | the maturity date of the Houston Distribution Center Whole Loan has not yet occurred; and |
| (c) | (x) with respect to the matters described in clause (ii) above, such event of default has been cured and no other event of default has occurred and is continuing, |
(y) with respect to the matter described in clause (iii) above, lender has determined that the Houston Distribution Center Property has achieved a debt service coverage ratio of at least 1.20x for two consecutive calendar quarters or
(z) with respect to the matter described in clause (iv) above, such Tenant Trigger Period has ended.
A “Tenant Trigger Period” will commence following the earliest to occur of any of the following:
| (i) | the date that is 12 months prior to the end of the term of any Major Lease (as defined below) (including any renewal terms); |
| (ii) | the date required under a Major Lease by which the applicable Major Tenant (as defined below) is required to give notice of its exercise of a renewal option thereunder (and such renewal has not been so exercised); |
| (iii) | the date any Major Lease is surrendered, cancelled or terminated prior to its then current expiration date; |
| (iv) | the date any Major Tenant discontinues its business at its premises (i.e.,”goes dark”) or gives notice that it intends to discontinue its business; |
| (v) | the occurrence and continuance (beyond any applicable notice and cure periods) of a default under any Major Lease by the applicable Major Tenant thereunder; or |
| (vi) | the occurrence of a bankruptcy action with respect to a Major Tenant. |
A Tenant Trigger Period will end upon:
| (a) | the reasonable determination by the lender that sufficient funds have been accumulated in the special rollover reserve account to pay for all anticipated expenses in connection with the re-leasing of the space under the applicable Major Lease that gave rise to the subject Tenant Trigger Period, including brokerage commissions and tenant improvements, and any anticipated shortfalls of payments required under the Houston Distribution Center Whole Loan documents during any period of time that rents are insufficient as a result of down-time or free rent periods, or |
| (b) | the occurrence of any of the following: |
(x) with respect to a Tenant Trigger Period caused by a matter described in clauses (i), (ii), (iii) or (iv) above, upon the earlier to occur of:
(A) the date on which the subject Major Tenant irrevocably exercises its renewal or extension option (or otherwise enters into an extension agreement with the Houston Distribution Center Borrower reasonably acceptable to the lender) with respect to all of the space demised under its Major Lease, and in the lender’s reasonable judgment, sufficient funds have been accumulated in the special rollover reserve account (during the continuance of the subject Tenant Trigger Period) to pay for all anticipated approved Major Lease leasing expenses for such Major Lease and any other anticipated expenses in connection with such renewal or extension, or
(B) the date on which all of the space demised under the subject Major Lease that gave rise to the subject Tenant Trigger Period has been fully leased pursuant to a replacement lease or replacement leases approved by the lender, and entered into in accordance with the Houston Distribution Center Whole Loan documents, and all approved Major Lease leasing expenses (and any other expenses in connection with the re-tenanting of such space) have been paid in full;
(y) with respect to a Tenant Trigger Period caused by a matter described in clause (v) above, if the subject Major Tenant default has been cured, and no other Major Tenant default has occurred for a period of six consecutive months following such cure; or
(z) with respect to a Tenant Trigger Period caused by a matter described in clause (vi) above, if the applicable Major Tenant bankruptcy action has terminated and the applicable Major Lease has been affirmed, assumed or assigned in a manner reasonably satisfactory to the lender.
A “Major Lease” means the Academy Sports lease, and any other lease which, together with all other leases to the same tenant or its affiliates, demises twenty-percent or more of the rentable square feet of the Houston Distribution Center Property.
THE INFORMATION IN THIS STRUCTURAL AND COLLATERAL TERM SHEET IS NOT COMPLETE AND MAY BE AMENDED PRIOR TO THE TIME OF SALE. THIS TERM SHEET IS NOT AN OFFER TO SELL THESE SECURITIES AND IT IS NOT A SOLICITATION OF AN OFFER TO BUY THESE SECURITIES IN ANY JURISDICTION WHERE THE OFFER OR SALE IS NOT PERMITTED.
86
| HOUSTON DISTRIBUTION CENTER |
A “Major Tenant” means any tenant under either a Major Lease, or under one or more leases (leased by such tenant and/or its affiliates), which when taken together cover in the aggregate twenty-percent or more of the rentable square feet of the Houston Distribution Center Property.
Property Management. The Houston Distribution Center Property is managed by an affiliate of the Houston Distribution Center Borrower.
Assumption.The Houston Distribution Center Borrower has the right to transfer the Houston Distribution Center Property, provided that certain conditions are satisfied, including: (i) no event of default under the Houston Distribution Center Whole Loan documents has occurred and is continuing, (ii) the Houston Distribution Center Borrower has provided the lender with 60 days’ prior written notice, (iii) the proposed transferee is controlled by a person that qualifies as a qualified transferee under the Houston Distribution Center Whole Loan documents, (iv) the payment of a transfer fee of 0.5% of the then outstanding principal balance of the Houston Distribution Center Whole Loan, (v) the lender has received rating agency confirmation that such assumption will not result in a downgrade of the respective ratings assigned to the WFCM 2018-C43 certificates and similar confirmations from each rating agency rating any securities backed by any of the Houston Distribution Center Companion Loans and (vi) other conditions set forth in the Houston Distribution Center Whole Loan documents.
Right of First Refusal.Academy Sports has a right of first refusal (“ROFR”) with respect to offers to purchase the Houston Distribution Center Property. The ROFR is inapplicable to the sale of the Houston Distribution Center Property to an affiliate of the Houston Distribution Center Borrower, a foreclosure or a deed-in-lieu.
Purchase Option. Academy Sports has a purchase option related to a condemnation. In the event of a taking of any portion of the building on the Houston Distribution Center Property, at least 10.0% of the Houston Distribution Center Property, the truck courts thereon or primary access thereto, the loss of which even after restoration would be, in Academy Sports’ reasonable business judgement, materially adverse to the business operations of Academy Sports, Academy Sports has the right to terminate their lease with the purchase of the Houston Distribution Center Property for $102,000,000, plus other amounts payable under their lease.
Partial Release. Not permitted.
Real Estate Substitution.Not permitted.
Subordinate and Mezzanine Indebtedness.Not permitted.
Ground Lease.None.
Terrorism Insurance.The Houston Distribution Center Whole Loan documents require that the “all risk” insurance policy required to be maintained by the Houston Distribution Center Borrower provide coverage for terrorism in an amount equal to the full replacement cost of the Houston Distribution Center Property. The Houston Distribution Center Whole Loan documents also require business interruption insurance covering no less than an amount equal to 100.0% of the projected gross income from the Houston Distribution Center Property on an actual loss sustained basis for a 18-month period following the occurrence of a casualty event, together with a 6-month extended period of indemnity.
THE INFORMATION IN THIS STRUCTURAL AND COLLATERAL TERM SHEET IS NOT COMPLETE AND MAY BE AMENDED PRIOR TO THE TIME OF SALE. THIS TERM SHEET IS NOT AN OFFER TO SELL THESE SECURITIES AND IT IS NOT A SOLICITATION OF AN OFFER TO BUY THESE SECURITIES IN ANY JURISDICTION WHERE THE OFFER OR SALE IS NOT PERMITTED.
87
| APPLE CAMPUS 3 |

THE INFORMATION IN THIS STRUCTURAL AND COLLATERAL TERM SHEET IS NOT COMPLETE AND MAY BE AMENDED PRIOR TO THE TIME OF SALE. THIS TERM SHEET IS NOT AN OFFER TO SELL THESE SECURITIES AND IT IS NOT A SOLICITATION OF AN OFFER TO BUY THESE SECURITIES IN ANY JURISDICTION WHERE THE OFFER OR SALE IS NOT PERMITTED.
88
| APPLE CAMPUS 3 |
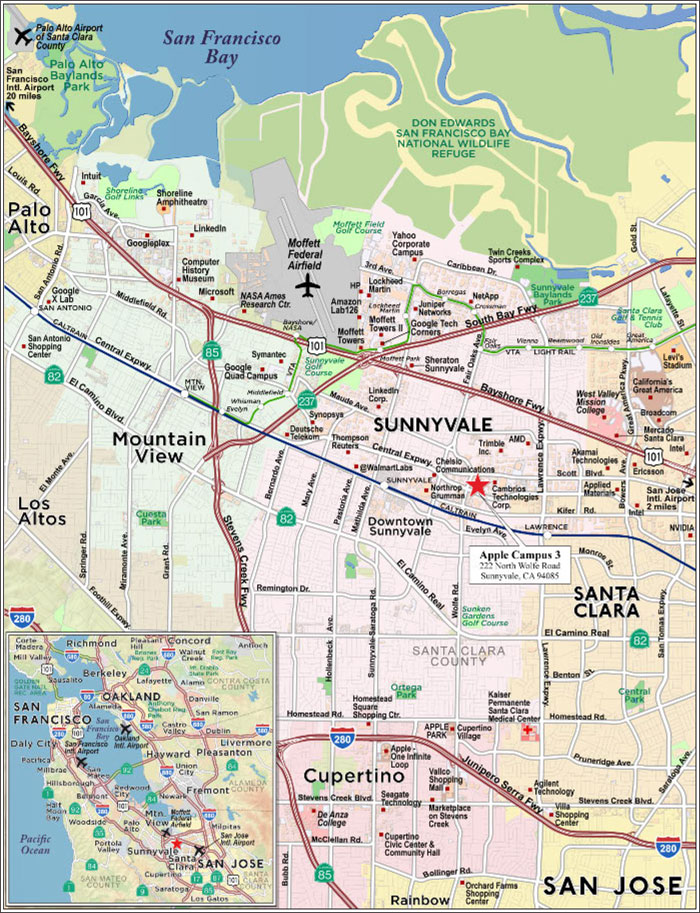
THE INFORMATION IN THIS STRUCTURAL AND COLLATERAL TERM SHEET IS NOT COMPLETE AND MAY BE AMENDED PRIOR TO THE TIME OF SALE. THIS TERM SHEET IS NOT AN OFFER TO SELL THESE SECURITIES AND IT IS NOT A SOLICITATION OF AN OFFER TO BUY THESE SECURITIES IN ANY JURISDICTION WHERE THE OFFER OR SALE IS NOT PERMITTED.
89
| No. 7 – Apple Campus 3 | ||||||
| Loan Information | Property Information | |||||
| Mortgage Loan Seller: | Wells Fargo Bank, National Association | Single Asset/Portfolio: | Single Asset | |||
| Credit Assessment (DBRS/Fitch/Moody’s): | AA(high)/BBB-sf/Baa2 | Property Type: | Office | |||
| Original Principal Balance(1): | $30,000,000 | Specific Property Type: | Suburban | |||
| Cut-off Date Balance(1): | $30,000,000 | Location: | Sunnyvale, CA | |||
| % of Initial Pool Balance: | 4.2% | Size: | 882,657 SF | |||
| Loan Purpose: | Refinance | Cut-off Date Balance Per SF(1): | $385.20 | |||
| Borrower Name: | CW SPE LLC | Year Built/Renovated: | 2017/NAP | |||
| Borrower Sponsor: | Paul Guarantor LLC | Title Vesting: | Fee | |||
| Mortgage Rate: | 3.365% | Property Manager: | Self-managed | |||
| Note Date: | December 14, 2017 | 4thMost Recent Occupancy(4): | NAV | |||
| Anticipated Repayment Date: | January 6, 2028 | 3rdMost Recent Occupancy(4): | NAV | |||
| Maturity Date: | April 6, 2031 | 2ndMost Recent Occupancy(4): | NAV | |||
| IO Period: | 120 months | Most Recent Occupancy(4): | NAV | |||
| Loan Term (Original): | 120 months | Current Occupancy(5): | 100.0% (3/1/2018) | |||
| Seasoning: | 2 months | |||||
| Amortization Term (Original): | NAP | Underwriting and Financial Information: | ||||
| Loan Amortization Type: | Interest-only, ARD | |||||
| Interest Accrual Method: | Actual/360 | 4thMost Recent NOI(4): | NAV | |||
| Call Protection: | L(26),D(87),O(7) | 3rdMost Recent NOI(4): | NAV | |||
| Lockbox Type: | Hard/Upfront Cash Management | 2ndMost Recent NOI(4): | NAV | |||
| Additional Debt(1)(2): | Yes | Most Recent NOI(4): | NAV | |||
| Additional Debt Type(1)(2): | Pari Passu;Mezzanine | |||||
| U/W Revenues: | $46,190,545 | |||||
| U/W Expenses: | $4,804,932 | |||||
| Escrows and Reserves(3): | U/W NOI: | $41,385,613 | ||||
| U/W NCF: | $41,209,082 | |||||
| Type: | Initial | Monthly | Cap (If Any) | �� | U/W NOI DSCR(1): | 3.57x |
| Taxes | $0 | $249,368 | NAP | U/W NCF DSCR(1)(2): | 3.55x | |
| Insurance | $0 | Springing | NAP | U/W NOI Debt Yield(1)(2): | 12.2% | |
| Replacement Reserves | $0 | Springing | NAP | U/W NCF Debt Yield(1): | 12.1% | |
| TI/LC Reserves | $2,979,839 | $0 | NAP | Stabilized Appraised Value(6): | $773,600,000 | |
| Rent Concession Reserve | $42,706,326 | $0 | NAP | Stabilized Appraisal Valuation Date(6): | June 1, 2019 | |
| Punchlist Reserve | $93,750 | Springing | NAP | Cut-off Date LTV Ratio(1)(2)(6): | 44.0% | |
| LTV Ratio at ARD(1)(2)(6): | 44.0% | |||||
| (1) | See “The Mortgage Loan” section. All statistical information related to balances per square foot, loan-to-value ratios, debt service coverage ratios and debt yields are based on the Apple Campus 3 Whole Loan (as defined below). |
| (2) | See “Subordinate and Mezzanine Indebtedness” section. The equity interest in the borrower has been pledged to secure senior mezzanine indebtedness with an original principal balance of $117,500,000 and junior mezzanine indebtedness with an original principal balance of $117,500,000. All statistical information related to the balance per square foot, loan-to-value ratios, debt service coverage ratios and debt yields are based solely on the Apple Campus 3 Whole Loan. As of the Cut-off Date, the U/W NCF DSCR, U/W NOI Debt Yield, Cut-off Date LTV Ratio and LTV Ratio at ARD based on the Apple Campus 3 Total Debt (as defined below) are 1.70x, 7.2%, 74.3% and 74.3%, respectively. |
| (3) | See “Escrows” section. |
| (4) | Historical occupancy and financial information is not applicable as the Apple Campus 3 Property (as defined below) was built in 2017. |
| (5) | Apple has taken possession of its space, is currently constructing its interior improvements and is expected to begin taking occupancy in September 2018. |
| (6) | See “Appraisal” section. The stabilized appraised value shown assumes that contractual tenant improvement and leasing commission (“TI/LC”) obligations have been fulfilled and there is no outstanding free rent. The borrower deposited upfront reserves totaling $45,779,915 for such contractual TI/LC obligations and free rent (see “Escrows” section). The As-Is Appraised Value is $624,600,000 as of November 7, 2017, equating to a Cut-off Date LTV Ratio and LTV Ratio at ARD of 54.4%. |
The Mortgage Loan. The mortgage loan (the “Apple Campus 3 Mortgage Loan”) is part of a whole loan (the “Apple Campus 3 Whole Loan”) evidenced by fivepari passu notes secured by a first mortgage encumbering the fee interest in a 882,657 square foot, four-story, class A, single-tenant office building located in Sunnyvale, California (the “Apple Campus 3 Property”). The Apple Campus 3 Whole Loan was co-originated on December 14, 2017 by Wells Fargo Bank, National Association; Deutsche Bank AG, New York Branch; and Goldman Sachs Mortgage Company. The Apple Campus 3 Whole Loan had an original principal balance of $340,000,000, has an outstanding principal balance as of the Cut-off Date of $340,000,000 and accrues interest at an interest rate of 3.365%per annum (the “Initial Interest Rate”) through the anticipated repayment date (“ARD”); provided, however, that upon the occurrence and continuance of an event of default, the Apple Campus 3 Whole Loan accrues interest at an interest rate equal to the Initial Interest Rate plus 5.000%. The Apple Campus 3 Whole Loan had an initial term of 120 months, has a remaining term to the ARD of 118 months as of the Cut-off Date and requires payments of interest only through the ARD. The ARD is January 6, 2028 and the final maturity date is April 6, 2031. In the event the Apple Campus 3 Whole Loan is not paid off in full on or before the ARD,
THE INFORMATION IN THIS STRUCTURAL AND COLLATERAL TERM SHEET IS NOT COMPLETE AND MAY BE AMENDED PRIOR TO THE TIME OF SALE. THIS TERM SHEET IS NOT AN OFFER TO SELL THESE SECURITIES AND IT IS NOT A SOLICITATION OF AN OFFER TO BUY THESE SECURITIES IN ANY JURISDICTION WHERE THE OFFER OR SALE IS NOT PERMITTED.
90
| APPLE CAMPUS 3 |
the borrower will be required to make (a) interest payments based on an interest rate equal to the greater of (i) the Initial Interest Rate plus 1.500%per annum, and (ii) the swap rate plus 1.500%per annum; provided, however, that upon the occurrence and continuance of an event of default, the interest rate will be equal to (1) the greater of (i) and (ii), plus (2) 5.000%; and (b) principal payments based on a 30-year amortization assuming the Initial Interest Rate. The ARD automatically triggers a Cash Trap Event Period (see “Lockbox and Cash Management” section) whereby all excess cash flow will be used to pay down the principal balance of the Apple Campus 3 Whole Loan. See “Description of the Mortgage Pool—Certain Terms of the Mortgage Pool—ARD Loans” in the Preliminary Prospectus.
Note A-2, which will be contributed to the WFCM 2018-C43 securitization trust, had an original principal balance of $30,000,000 and has an outstanding principal balance as of the Cut-off Date of $30,000,000. The controlling Note A-3 had an original principal balance of $94,000,000, had an outstanding principal balance as of the Cut-off Date of $94,000,000, and was contributed to the BANK 2018-BNK10 securitization trust. The non-controlling Note A-4 had an original principal balance of $68,000,000, had an outstanding principal balance as of the Cut-off Date of $68,000,000, and was contributed to the BMARK 2018-B2 securitization trust. The remaining non-controlling Notes A-1 and A-5, which have an aggregate original principal balance of $148,000,000, are currently held by Wells Fargo Bank, National Association (Note A-1) and Goldman Sachs Mortgage Company (Note A-5) and are expected to be contributed to future securitization trusts. The mortgage loans evidenced by Notes A-1, A-3, A-4 and A-5 are collectively referred to herein as the “Apple Campus 3 Companion Loans”. The lender provides no assurances that any non-securitizedpari passunotes will not be split further. See “Description of the Mortgage Pool—The Whole Loans—The Non-Serviced Pari Passu Whole Loans” and “Pooling and Servicing Agreement” in the Preliminary Prospectus.
Note Summary
| Notes | Original Balance | Note Holder | Controlling Interest | |
| A-1 | $80,000,000 | Wells Fargo Bank | No | |
| A-2 | $30,000,000 | WFCM 2018-C43 | No | |
| A-3 | $94,000,000 | BANK 2018-BNK10 | Yes | |
| A-4 | $68,000,000 | BMARK 2018-B2 | No | |
| A-5 | $68,000,000 | Goldman Sachs Mortgage Company | No | |
| Total | $340,000,000 |
Following the lockout period, on any date before July 6, 2027, the borrower has the right to defease the Apple Campus 3 Whole Loan in whole, but not in part. In addition, the Apple Campus 3 Whole Loan is prepayable without penalty on or after July 6, 2027. The lockout period will expire on the earlier to occur of (i) two years after the closing date of the securitization that includes the last note to be securitized and (ii) December 14, 2021.
Sources and Uses
| Sources | Uses | |||||||
| Original loan amount | $340,000,000 | 59.1% | Loan payoff | $385,679,999 | 67.1% | |||
| Mezzanine debt | 235,000,000 | 40.9 | Reserves | 45,779,915 | 8.0 | |||
| Closing costs | 2,636,016 | 0.5 | ||||||
| Return of equity | 140,904,070 | 24.5 | ||||||
| Total Sources | $575,000,000 | 100.0% | Total Uses | $575,000,000 | 100.0% | |||
The Property. The Apple Campus 3 Property is a class A LEED Platinum office campus totaling 882,657 square feet and located in Sunnyvale, California. Built in 2017 and situated on a 17.8-acre site, the Apple Campus 3 Property comprises three interconnected, four-story office buildings totaling approximately 849,000 square feet, an amenities facility, outdoor common area and a seven-story parking structure. The Apple Campus 3 Property is 100.0% leased to Apple Inc. (“Apple”; NYSE: AAPL) through February 2031, with two, seven-year extension options and no termination options. Apple took possession of the Apple Campus 3 Property on December 1, 2017 and is currently constructing its interior improvements. As of January 2018, Apple is expected to begin taking occupancy of its space at the Apple Campus 3 Property in September 2018.
The interconnected office buildings within the Apple Campus 3 Property comprise Building A (308,659 square feet), Building B (269,997 square feet) and Building C (270,002 square feet), and the combined office floorplates average approximately 180,000 square feet. The amenities facility at the Apple Campus 3 Property totals approximately 34,000 square feet and is expected to serve as a cafeteria for Apple employees. Building A, Building B, the parking structure and the amenities building are collectively known as “Phase I” of the Apple Campus 3 Property; and Building C is known as “Phase 2”. Amenities at the Apple Campus 3 Property include a fitness/wellness center, coffee bar, general store, barber shop, bike repair shop, dry cleaning/laundry service and a conference center. Additional outdoor amenities at the Apple Campus 3 Property include a mini amphitheater situated in the center courtyard, outdoor seating, sport courts and athletic fields, bus/shuttle stops and green roof accessibility on the third floor of the office buildings.
According to the appraisal, as of 2016, Apple was the second largest employer in Sunnyvale, California, and the second largest space user in Silicon Valley. The Apple Campus 3 Property is situated approximately 3.5 miles north of both Apple Park and One Infinite Loop. Apple Park is Apple’s new 175-acre corporate headquarters campus, which comprises the 2.8 million square foot “spaceship” structure in addition to several associated research and development buildings. One Infinite Loop was originally developed as Apple’s headquarters in 1993 and totals approximately 850,000 square feet.
THE INFORMATION IN THIS STRUCTURAL AND COLLATERAL TERM SHEET IS NOT COMPLETE AND MAY BE AMENDED PRIOR TO THE TIME OF SALE. THIS TERM SHEET IS NOT AN OFFER TO SELL THESE SECURITIES AND IT IS NOT A SOLICITATION OF AN OFFER TO BUY THESE SECURITIES IN ANY JURISDICTION WHERE THE OFFER OR SALE IS NOT PERMITTED.
91
| APPLE CAMPUS 3 |
The following table presents certain information relating to the tenancy at the Apple Campus 3 Property:
Major Tenant
| Tenant Name | Credit Rating (Fitch/ Moody’s/ S&P)(1) | Tenant NRSF | % of NRSF | Annual U/W Base Rent PSF(2) | Annual U/W Base Rent(2) | % of Total Annual U/W Base Rent | Lease Expiration Date |
| Major Tenant | |||||||
| Apple(3) | NR/Aa1/AA+ | 882,657 | 100.0% | $48.35 | $42,675,300 | 100.0% | 2/28/2031(4) |
| Total Major Tenant | 882,657 | 100.0% | $48.35 | $42,675,300 | 100.0% | ||
| Vacant Space | 0 | 0.0% | |||||
| Collateral Total | 882,657 | 100.0% | |||||
| (1) | The entity on the lease is Apple Inc., which is the rated entity. |
| (2) | Annual U/W Base Rent PSF and Annual U/W Base Rent reflect the average rent over the remaining lease term. Apple is currently in a free rent period, as outlined in the footnote below, and will begin paying rent of $41.28 per square foot on Phase I in February 2019 and Phase II in June 2019. |
| (3) | Apple has taken possession of its space and is currently constructing its interior improvements. Apple is currently in a free rent period for (i) Phase 1 (approximately 69.4% of its space) through and including December 2018 and (ii) Phase 2 (approximately 30.6% of its space) through and including May 2019. In January 2019, Apple will pay reduced rent of approximately $6.93 per square foot on Phase I only. Through and including February 2018, Apple is required to pay reimbursements for utilities only, and commencing March 2018, the tenant will be required to pay reimbursements for utilities, operating expenses, taxes and insurance. All future rent credits and abatements under the Apple lease were reserved at the origination of the Apple Campus 3 Whole Loan (see “Escrows” section). |
| (4) | Apple has two, 7-year renewal options at 95% of fair market value with 360 days’ written notice. |
The following table presents certain information relating to the lease rollover schedule at the Apple Campus 3 Property:
Lease Expiration Schedule(1)
| Year Ending December 31, | No. of Leases Expiring | Expiring NRSF | % of Total NRSF | Cumulative Expiring NRSF | Cumulative % of Total NRSF | Annual U/W Base Rent | % of Total Annual U/W Base Rent | Annual U/W Base Rent PSF |
| MTM | 0 | 0 | 0.0% | 0 | 0.0% | $0 | 0.0% | $0.00 |
| 2018 | 0 | 0 | 0.0% | 0 | 0.0% | $0 | 0.0% | $0.00 |
| 2019 | 0 | 0 | 0.0% | 0 | 0.0% | $0 | 0.0% | $0.00 |
| 2020 | 0 | 0 | 0.0% | 0 | 0.0% | $0 | 0.0% | $0.00 |
| 2021 | 0 | 0 | 0.0% | 0 | 0.0% | $0 | 0.0% | $0.00 |
| 2022 | 0 | 0 | 0.0% | 0 | 0.0% | $0 | 0.0% | $0.00 |
| 2023 | 0 | 0 | 0.0% | 0 | 0.0% | $0 | 0.0% | $0.00 |
| 2024 | 0 | 0 | 0.0% | 0 | 0.0% | $0 | 0.0% | $0.00 |
| 2025 | 0 | 0 | 0.0% | 0 | 0.0% | $0 | 0.0% | $0.00 |
| 2026 | 0 | 0 | 0.0% | 0 | 0.0% | $0 | 0.0% | $0.00 |
| 2027 | 0 | 0 | 0.0% | 0 | 0.0% | $0 | 0.0% | $0.00 |
| 2028 | 0 | 0 | 0.0% | 0 | 0.0% | $0 | 0.0% | $0.00 |
| Thereafter | 1 | 882,657 | 100.0% | 882,657 | 100.0% | $42,675,300 | 100.0% | $48.35 |
| Vacant | 0 | 0 | 0.0% | 882,657 | 100.0% | $0 | 0.0% | $0.00 |
| Total/Weighted Average | 1 | 882,657 | 100.0% | $42,675,300 | 100.0% | $48.35 |
| (1) | Information obtained from the underwritten rent roll. |
The following table presents historical occupancy percentages at the Apple Campus 3 Property:
Historical Occupancy
12/31/2013(1) | 12/31/2014(1) | 12/31/2015(1) | 12/31/2016(1) | 3/1/2018(2)(3) | ||||
| NAP | NAP | NAP | NAP | 100.0% |
| (1) | The Apple Campus 3 Property was built in 2017. |
| (2) | Apple has taken possession of its space at the Apple Campus 3 Property and is currently constructing its interior improvements. As of January 2018, Apple is expected to begin taking occupancy of its space at the Apple Campus 3 Property in September 2018. |
| (3) | Information obtained from the underwrittenrent roll. |
THE INFORMATION IN THIS STRUCTURAL AND COLLATERAL TERM SHEET IS NOT COMPLETE AND MAY BE AMENDED PRIOR TO THE TIME OF SALE. THIS TERM SHEET IS NOT AN OFFER TO SELL THESE SECURITIES AND IT IS NOT A SOLICITATION OF AN OFFER TO BUY THESE SECURITIES IN ANY JURISDICTION WHERE THE OFFER OR SALE IS NOT PERMITTED.
92
| APPLE CAMPUS 3 |
Operating History and Underwritten Net Cash Flow. The following table presents certain information relating to the underwritten net cash flow at the Apple Campus 3 Property:
Cash Flow Analysis(1)
| U/W | % of U/W Effective Gross Income | U/W $ per SF | ||||
| Base Rent | $42,675,300(2) | 92.4% | $48.35 | |||
| Grossed Up Vacant Space | 0 | 0.0 | 0.00 | |||
| Total Reimbursables | 3,981,816 | 8.6 | 4.51 | |||
| Other Income | 0 | 0.0 | 0.00 | |||
| Less Vacancy & Credit Loss | (466,571)(3) | (1.0) | (0.53) | |||
| Effective Gross Income | $46,190,545 | 100.0% | $52.33 | |||
| Total Operating Expenses | $4,804,932 | 10.4% | $5.44 | |||
| Net Operating Income | $41,385,613 | 89.6% | $46.89 | |||
| TI/LC | 0 | 0.0 | 0.00 | |||
| Capital Expenditures | 176,531 | 0.4 | 0.20 | |||
| Net Cash Flow | $41,209,082 | 89.2% | $46.69 | |||
| NOI DSCR(4) | 3.57x | |||||
| NCF DSCR(4) | 3.55x | |||||
| NOI DY(4) | 12.2% | |||||
| NCF DY(4) | 12.1% |
| (1) | Historical operating statements are not applicable, as the Apple Campus 3 Property was built in 2017. |
| (2) | Base Rent reflects the average rent over the lease term (see “Major Tenant” section). |
| (3) | The underwritten economic vacancy is 1.0%. The Apple Campus 3 Property was 100.0% leased as of March 1, 2018. |
| (4) | The debt service coverage ratios and debt yields are based on the Apple Campus 3 Whole Loan. |
Appraisal.The appraiser concluded to an “as-stabilized” appraised value of $773,600,000 with a valuation date of June 1, 2019, which assumes that contractual TI/LC obligations have been fulfilled and there is no outstanding free rent. The borrower deposited upfront reserves totaling $45,779,915 for such TI/LC obligations and free rent periods (see “Escrows” section). As of the appraisal valuation date of November 7, 2017 the Apple Campus 3 Property had an “as-is” appraised value of $624,600,000. The appraiser also concluded to a “Go Dark” value of $566,750,000 as of November 7, 2017.
Environmental Matters. According to the Phase I Environmental Assessment dated November 20, 2017, there are recognized environmental conditions (“RECs”) at the Apple Campus 3 Property related to (i) potential soil, gas and groundwater contamination and (ii) residual soil impacts and possible vapor intrusion concerns. The Phase I assessment recommended no further action aside from continued implementation of a site management plan and vapor-intrusion mitigation system. In regard to the groundwater contamination, the responsible parties are Advanced Micro Devices, Inc., Northrop Grumman and Locus Technologies (a subsidiary of the Philips Electronics Company). The RECs are further described under “Description of the Mortgage Pool—Mortgage Pool Characteristics—Environmental Considerations” in the Preliminary Prospectus.
Market Overview and Competition. The Apple Campus 3 Property is located in Sunnyvale, California near the intersection of Central Expressway and Wolfe Road. Sunnyvale is the seventh most populous city in the San Francisco Bay Area and one of the major cities comprising Silicon Valley. According to a third party market research report, as of the third quarter of 2017, the San Jose/Sunnyvale/Santa Clara metropolitan statistical area had an unemployment rate of 3.2% and reported an 8.9% GDP growth rate over the past five years, compared to an overall 2.4% growth rate for the United States.
The Apple Campus 3 Property is centrally located within 1.4 miles of two Santa Clara Valley Transportation Authority Light Rail stations (the Sunnyvale station in the Heritage District Downtown and the Lawrence Station in eastern Sunnyvale), 3.9 miles from the Downtown Mountain View Caltrain Station, and within close proximity to highways 101, 280, 237 and 85. According to a third-party market research report, the 2017 estimated population within a one-, three- and five-mile radius of the Apple Campus 3 Property was 26,490, 193,228, and 466,901, respectively; while the 2017 estimated average household income within the same radii was $121,630, $133,362, and $141,198, respectively.
According to a third-party market research report, as of the third quarter of 2017, the Sunnyvale submarket contained approximately 10.9 million square feet of office space exhibiting a vacancy rate of approximately 3.1% and an average asking rental rate of $64.44 per square foot, gross. The appraiser identified 15 comparable class A office properties totaling approximately 2.4 million square feet, which reported a 99.7% occupancy rate and average asking rents of $50.58 per square foot, triple net.
THE INFORMATION IN THIS STRUCTURAL AND COLLATERAL TERM SHEET IS NOT COMPLETE AND MAY BE AMENDED PRIOR TO THE TIME OF SALE. THIS TERM SHEET IS NOT AN OFFER TO SELL THESE SECURITIES AND IT IS NOT A SOLICITATION OF AN OFFER TO BUY THESE SECURITIES IN ANY JURISDICTION WHERE THE OFFER OR SALE IS NOT PERMITTED.
93
| APPLE CAMPUS 3 |
The following table presents certain information relating to comparable office leases for the Apple Campus 3 Property:
Comparable Leases(1)
| Property Name/Location | Year Built/ Renovated | Total GLA (SF) | Distance from Subject | Tenant Name | Lease Date/Term | Lease Area (SF) | Annual Base Rent PSF | Lease Type |
Moffett Towers II 905 11th Avenue Sunnyvale, CA | 2016/NAV | 350,663 | 3.0 mile | Lab 126 | March 2017/ 10.0 Yrs | 350,663 | $47.40 | NNN |
Moffett Gateway 1225 Crossman Avenue Sunnyvale, CA | 2016/NAV | 298,924 | 2.3 miles | Google, Inc. | November 2016/ 11.0 Yrs | 298,924 | $44.40 | NNN |
10900 Tantau Avenue Cupertino, CA | 2008/NAV | 102,540 | 3.5 miles | Panasonic | May 2017/ 5.0 Yrs | 43,034 | $51.00 | NNN |
Tree Farm 4440 El Camino Real Los Altos, CA | 1999/NAV | 96,562 | 6.8 mile | Toyota | March 2017/ 5.5 Yrs | 96,562 | $63.00 | NNN |
Moffett Tower II Bldg. 2 905 11th Avenue Sunnyvale, CA | 2017/NAV | 362,600 | 3.0 miles | Amazon | December 2016/ 10.0 Yrs | 362,600 | $48.00 | NNN |
| (1) | Information obtained from third party market report |
The Borrower.The borrower is CW SPE LLC, a Delaware limited liability company and single purpose entity with two independent directors. Legal counsel to the borrower delivered a non-consolidation opinion in connection with the origination of the Apple Campus 3 Whole Loan. Paul Guarantor LLC is the guarantor of certain nonrecourse carveouts under the Apple Campus 3 Whole Loan. The Apple Campus 3 Borrower is affiliated with the borrower under the Moffett Towers II – Building 2 Mortgage Loan.
The Borrower Sponsor.The borrower sponsor is Paul Guarantor LLC, which is 100% directly owned by Jay Paul Company, a privately held real estate firm based in San Francisco, California. Founded in 1975, Jay Paul Company concentrates on the acquisition, development, and management of commercial properties throughout California. Jay Paul Company has developed over 11.0 million square feet of institutional quality space, and since 2000, has closed on more than $12.0 billion in debt and equity financings.
Escrows.The Apple Campus 3 Whole Loan documents provide for upfront escrows in the amount of $42,706,326 for rent abatement periods, $2,979,839 for outstanding TI/LCs, and $93,750 for the estimated cost to complete outstanding punchlist items. The Apple Campus 3 Whole Loan documents provide for ongoing monthly escrows of $249,368 for real estate taxes. The Apple Campus 3 Whole Loan documents provide for additional reserves in the amount of 125% of any additional punchlist items received from Apple (following origination, an additional $506,100 was deposited due to additional punchlist items identified by Apple).
The Apple Campus 3 Whole Loan documents do not require ongoing monthly escrows for insurance premiums as long as (i) no event of default has occurred and is continuing; (ii) the borrower provides the lender with evidence that the Apple Campus 3 Property’s insurance coverage is included in a blanket policy and such policy is in full force and effect; and (iii) the borrower pays all applicable insurance premiums and provides the lender with evidence of renewals. The Apple Campus 3 Whole Loan documents do not require ongoing monthly escrows for replacement reserves as long as no “Cash Trap Event Period” (as defined in the “Lockbox and Cash Management” section) has occurred and is continuing.
Lockbox and Cash Management.The Apple Campus 3 Whole Loan requires a lender-controlled lockbox account, which is already in-place, and that the borrower direct the tenant to pay its rent directly into such lockbox account. The loan documents also require that all rents received by the borrower or the property manager be deposited into the lockbox account within one business day of receipt. Prior to the occurrence of a Cash Trap Event Period (as defined below), all excess funds are required to be distributed to the borrower. During a Cash Trap Event Period, all excess funds are required to be swept to a lender-controlled cash management account. During a Lease Sweep Period (as defined below), the borrower is required to make minimum monthly deposits of $1,838,869 into a leasing reserve (regardless of the amount of available excess cash flow).
A “Cash Trap Event Period” will commence upon the earlier of the following:
| (i) | the occurrence of an event of default under the Apple Campus 3 Whole Loan, the Apple Campus 3 Senior Mezzanine Loan or the Apple Campus 3 Junior Mezzanine Loan (see “Subordinate and Mezzanine Indebtedness” section); |
| (ii) | the occurrence of a Lease Sweep Period (as defined below); |
| (iii) | the debt service coverage ratio based on the Apple Campus 3 Whole Loan falling below 1.85x (based on a hypothetical 30-year amortization period), or the debt service coverage ratio based on the Apple Campus 3 Total Debt (see “Subordinate and Mezzanine Indebtedness” section) falling below 1.10x (based on a hypothetical 30-year amortization period) at the end of any calendar quarter; or |
| (iv) | the ARD. |
THE INFORMATION IN THIS STRUCTURAL AND COLLATERAL TERM SHEET IS NOT COMPLETE AND MAY BE AMENDED PRIOR TO THE TIME OF SALE. THIS TERM SHEET IS NOT AN OFFER TO SELL THESE SECURITIES AND IT IS NOT A SOLICITATION OF AN OFFER TO BUY THESE SECURITIES IN ANY JURISDICTION WHERE THE OFFER OR SALE IS NOT PERMITTED.
94
| APPLE CAMPUS 3 |
A Cash Trap Event Period will end upon the occurrence of the following:
| ● | with regard to clause (i), the cure of such event of default; |
| ● | with regard to clause (ii), a Lease Sweep Period Cure Event (as defined below); |
| ● | with regard to clause (iii), the debt service coverage ratio based on the Apple Campus 3 Whole Loan (based on a hypothetical 30-year amortization schedule) being equal to 1.85x or greater, and the debt service coverage ratio based on the Apple Campus 3 Total Debt (based on a hypothetical 30-year amortization schedule) being equal to 1.10x or greater for two consecutive calculation dates; or |
| ● | with regard to clause (iv), the Apple Campus 3 Whole Loan being repaid in full. |
A “Lease Sweep Period” will commence upon the earlier of the following (for clauses (i), (iii), (iv) and (v) below, the term ‘Apple’ includes any replacement tenant that occupies at least 75% of the space currently occupied by Apple):
| (i) | Apple cancels, terminates or gives notice of its intent to cancel or terminate its lease on at least 40,000 square feet; |
| (ii) | Apple is no longer an Investment Grade Entity (as defined below); |
| (iii) | Apple goes dark in 20% or more of its space; provided, however, that a Lease Sweep Period will not commence as long as Apple remains an Investment Grade Entity; |
| (iv) | Apple defaults under its lease beyond any applicable notice and cure period; or |
| (v) | Apple becomes insolvent or files for bankruptcy. |
A “Lease Sweep Period Cure Event” will occur upon the following:
| ● | with regard to clause (i), (a) a Qualified Re-Leasing Event (as defined below), or (b) total swept funds equating to $35.00 per square foot of such applicable space (or borrower delivering to the lender an acceptable letter of credit in such amount); |
| ● | with regard to clauses (ii) or (iii), (a) a Qualified Re-Leasing Event, (b) Apple restoring its status as an Investment Grade Entity; (c) the applicable space being subleased to an Investment Grade Entity who has accepted delivery of the space and is paying unabated rent in an amount no less than the contract rate of the primary lease; or (d) total swept funds equating to $50.00 per square foot of (x) the Apple lease space with respect to clause (ii) and (y) the applicable space with respect to clause (iii) (or borrower delivering to the lender an acceptable letter of credit in such amount); provided, however, that once total swept funds in the leasing reserve equate to $35.00 per square foot of the applicable space, additional funds will be deposited into a debt service reserve account until such $50.00 per square foot cap is met; |
| ● | with regard to clause (iv), (a) the cure of such event of default and no other default occurring for a period of three consecutive months, or (b) total swept funds equating to $35.00 per square foot (or borrower delivering to the lender an acceptable letter of credit in such amount); |
| ● | with regard to clause (v), the bankruptcy or insolvency proceedings having terminated and the lease having been affirmed or assigned in a manner satisfactory to the lender. |
An “Investment Grade Entity” means an entity that is rated ‘BBB-’, or equivalent, or higher by at least two of Fitch, Moody’s and S&P.
A “Qualified Re-Leasing Event” will occur upon one or more replacement tenants acceptable to lender executing leases covering at least 75% of the space currently occupied by Apple with (i) terms extending at least three years beyond the Maturity Date of the Apple Campus 3 Whole Loan; (ii) economic terms at least as favorable as those in the lease being replaced; (iii) such replacement tenants having taken possession of such space and paying full unabated rent or such abatement has been reserved; (iv) and all tenant improvements and leasing commissions having been paid or reserved.
Property Management.The Apple Campus 3 Property is managed by an affiliate of the borrower.
Assumption.The Apple Campus 3 borrower has the right to transfer the Apple Campus 3 Property, provided that certain other conditions are satisfied, including, but not limited to: (i) no event of default has occurred and is continuing; (ii) the lender’s reasonable determination that the proposed transferee and guarantor satisfy the lender’s credit review and underwriting standards, taking into consideration transferee experience, financial strength and general business standing; and (iii) if requested by the lender, rating agency confirmation from DBRS, Fitch, and Moody’s that the transfer will not result in a downgrade, withdrawal or qualification of the respective ratings assigned to the Series WFCM 2018-C43 certificates and similar confirmations from each rating agency rating any securities backed by any of the Apple Campus 3 Companion Loans with respect to the ratings of such securities.
Rights of First Offer. Apple has a right of first offer to purchase the Apple Campus 3 Property if the borrower markets the property for sale (the “Apple ROFO”). The Apple ROFO is not extinguished by foreclosure; however, the Apple ROFO does not apply to foreclosure or deed-in-lieu thereof.
Partial Release.Not permitted.
Real Estate Substitution.Not permitted.
Subordinate and Mezzanine Indebtedness.Wells Fargo Bank, National Association; Deutsche Bank AG, New York Branch; and Goldman Sachs Mortgage Company (collectively, the “Mezzanine Co-Lenders”) funded a $117,500,000 senior mezzanine loan to CW Mezz LLC (the “Apple Campus 3 Senior Mezzanine Loan”) and a $117,500,000 junior mezzanine loan to Central Wolfe LLC (the “Apple Campus 3 Junior Mezzanine Loan”)(collectively, the Apple Campus 3 Whole Loan, Apple Campus 3 Senior Mezzanine Loan and Apple Campus 3 Junior Mezzanine Loan are referred to herein as the “Apple Campus 3 Total Debt”). The Apple Campus 3 Senior Mezzanine Loan and the Apple Campus 3 Junior Mezzanine Loan are coterminous with the Apple Campus 3 Whole Loan and require interest-only payments. The Apple Campus 3 Senior Mezzanine Loan accrues interest at a fixed interest rate equal to 4.620% per annum (the “Senior Mezzanine Initial Interest Rate”), and the Apple Campus 3 Junior Mezzanine Loan accrues interest at a fixed interest rate equal to 6.000% per annum (the “Junior Mezzanine Initial Interest Rate”). In the event the Apple Campus 3 Senior Mezzanine Loan and/or the Apple Campus 3 Junior Mezzanine Loan are not paid off in full on or before the ARD, the borrower will be
THE INFORMATION IN THIS STRUCTURAL AND COLLATERAL TERM SHEET IS NOT COMPLETE AND MAY BE AMENDED PRIOR TO THE TIME OF SALE. THIS TERM SHEET IS NOT AN OFFER TO SELL THESE SECURITIES AND IT IS NOT A SOLICITATION OF AN OFFER TO BUY THESE SECURITIES IN ANY JURISDICTION WHERE THE OFFER OR SALE IS NOT PERMITTED.
95
| APPLE CAMPUS 3 |
required to make interest payments based on an interest rate equal to the greater of (i) the Senior Mezzanine Initial Interest Rate or the Junior Mezzanine Initial Interest Rate, as applicable, plus 1.500% per annum, and (ii) the swap rate plus 1.500% per annum; provided, however, that upon the occurrence and continuance of an event of default, the interest rate will be equal to (1) the greater of (i) and (ii), plus (2) 5.000%. An intercreditor agreement is in place with respect to the Apple Campus 3 Whole Loan, the Apple Campus 3 Senior Mezzanine Loan and the Apple Campus 3 Junior Mezzanine Loan.
Ground Lease.None.
Terrorism Insurance.The Apple Campus 3 Whole Loan documents require that the “all risk” insurance policy required to be maintained by the borrower provide coverage for terrorism in an amount equal to the full replacement cost of the Apple Campus 3 Property, as well as business interruption insurance covering no less than the 24-month period following the occurrence of a casualty event, together with a 12-month extended period of indemnity.
Earthquake Insurance.The loan documents require earthquake insurance. At the time of closing, earthquake insurance coverage is in-place for the Apple Campus 3 Property. The seismic report indicated a probable maximum loss of 10.0% for the Apple Campus 3 Property.
THE INFORMATION IN THIS STRUCTURAL AND COLLATERAL TERM SHEET IS NOT COMPLETE AND MAY BE AMENDED PRIOR TO THE TIME OF SALE. THIS TERM SHEET IS NOT AN OFFER TO SELL THESE SECURITIES AND IT IS NOT A SOLICITATION OF AN OFFER TO BUY THESE SECURITIES IN ANY JURISDICTION WHERE THE OFFER OR SALE IS NOT PERMITTED.
96
(THIS PAGE INTENTIONALLY LEFT BLANK)
THE INFORMATION IN THIS STRUCTURAL AND COLLATERAL TERM SHEET IS NOT COMPLETE AND MAY BE AMENDED PRIOR TO THE TIME OF SALE. THIS TERM SHEET IS NOT AN OFFER TO SELL THESE SECURITIES AND IT IS NOT A SOLICITATION OF AN OFFER TO BUY THESE SECURITIES IN ANY JURISDICTION WHERE THE OFFER OR SALE IS NOT PERMITTED.
97
WALMART SUPERCENTER HOUSTON |
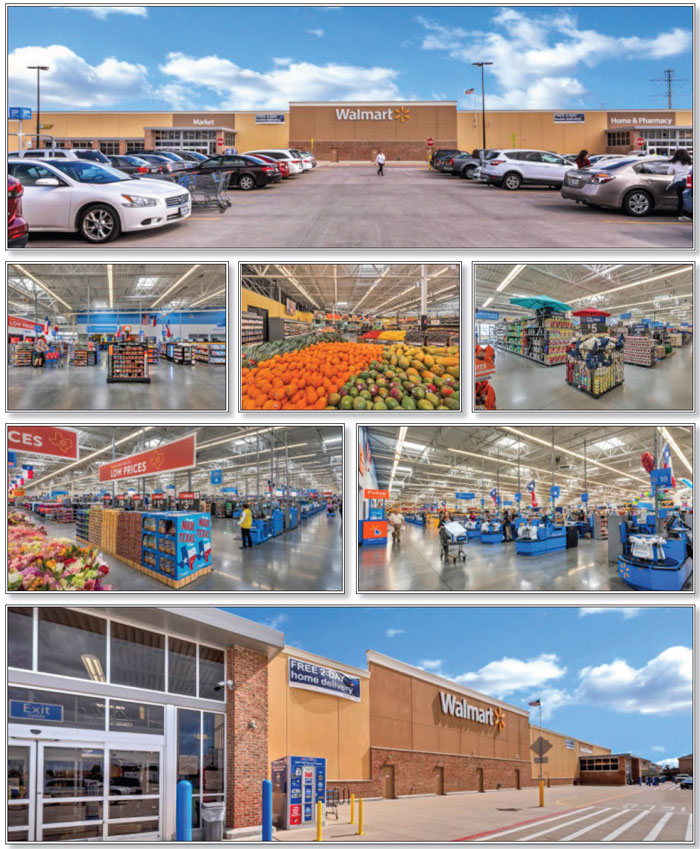
THE INFORMATION IN THIS STRUCTURAL AND COLLATERAL TERM SHEET IS NOT COMPLETE AND MAY BE AMENDED PRIOR TO THE TIME OF SALE. THIS TERM SHEET IS NOT AN OFFER TO SELL THESE SECURITIES AND IT IS NOT A SOLICITATION OF AN OFFER TO BUY THESE SECURITIES IN ANY JURISDICTION WHERE THE OFFER OR SALE IS NOT PERMITTED.
98
WALMART SUPERCENTER HOUSTON |

THE INFORMATION IN THIS STRUCTURAL AND COLLATERAL TERM SHEET IS NOT COMPLETE AND MAY BE AMENDED PRIOR TO THE TIME OF SALE. THIS TERM SHEET IS NOT AN OFFER TO SELL THESE SECURITIES AND IT IS NOT A SOLICITATION OF AN OFFER TO BUY THESE SECURITIES IN ANY JURISDICTION WHERE THE OFFER OR SALE IS NOT PERMITTED.
99
| No. 8 – Walmart Supercenter Houston | ||||||||||
| Loan Information | Property Information | |||||||||
| Mortgage Loan Seller: | Rialto Mortgage Finance, LLC | Single Asset/Portfolio: | Single Asset | |||||||
| Credit Assessment (DBRS/Fitch/Moody’s): | NR/NR/NR | Property Type: | Retail | |||||||
| Original Principal Balance: | $26,500,000 | Specific Property Type: | Single Tenant | |||||||
| Cut-off Date Balance: | $26,500,000 | Location: | Houston, TX | |||||||
| % of Initial Pool Balance: | 3.7% | Size: | 177,514 SF | |||||||
| Loan Purpose(1): | Recapitalization | Cut-off Date Balance Per SF: | $149.28 | |||||||
| Borrower Name: | Houston Galleria Retail DST | Year Built/Renovated: | 2015/NAP | |||||||
| Borrower Sponsor: | Midway Risknet Partners I, L. P. | Title Vesting: | Fee | |||||||
| Mortgage Rate: | 4.440% | Property Manager: | Self-managed | |||||||
| 4thMost Recent Occupancy(3): | NAV | |||||||||
| Note Date: | February 14, 2018 | 3rdMost Recent Occupancy (As of): | 100.0% (12/31/2015) | |||||||
| Anticipated Repayment Date: | NAP | 2ndMost Recent Occupancy (As of): | 100.0% (12/31/2016) | |||||||
| Maturity Date: | March 6, 2028 | Most Recent Occupancy (As of): | 100.0% (12/31/2017) | |||||||
| IO Period: | 120 months | Current Occupancy (As of): | 100.0% (3/1/2018) | |||||||
| Loan Term (Original): | 120 months | |||||||||
| Seasoning: | 0 months | Underwriting and Financial Information: | ||||||||
| Amortization Term (Original): | NAP | 4thMost Recent NOI(3): | NAV | |||||||
| Loan Amortization Type: | Interest-only, Balloon | 3rdMost Recent NOI (As of)(3): | $982,258 (12/31/2015) | |||||||
| Interest Accrual Method: | Actual/360 | 2ndMost Recent NOI (As of): | $2,100,000 (12/31/2016) | |||||||
| Call Protection: | L(24),D(92),O(4) | Most Recent NOI (As of): | $2,100,000 (12/31/2017) | |||||||
| Lockbox Type: | Springing | |||||||||
| Additional Debt: | None | U/W Revenues: | $3,347,667 | |||||||
| Additional Debt Type: | NAP | U/W Expenses: | $1,239,654 | |||||||
| U/W NOI: | $2,108,013 | |||||||||
| U/W NCF: | $2,081,386 | |||||||||
| Escrows and Reserves(2): | U/W NOI DSCR: | 1.77x | ||||||||
| U/W NCF DSCR: | 1.74x | |||||||||
| Type: | Initial | Monthly | Cap (If Any) | U/W NOI Debt Yield: | 8.0% | |||||
| Taxes | $0 | Springing | NAP | U/W NCF Debt Yield: | 7.9% | |||||
| Insurance | $0 | Springing | NAP | As-Is Appraised Value: | $42,670,000 | |||||
| Replacement Reserves | $0 | $0 | NAP | As-Is Appraisal Valuation Date: | February 8, 2018 | |||||
| TI/LC Reserve | $0 | $0 | NAP | Cut-off Date LTV Ratio: | 62.1% | |||||
| Environmental Reserve | $35,000 | $0 | NAP | LTV Ratio at Maturity or ARD: | 62.1% | |||||
| Contingency Reserve | $60,000 | Springing | NAP | |||||||
| (1) | Prior to the closing of the Walmart Supercenter Houston Mortgage Loan, the Borrower acquired the Walmart Supercenter Houston Property from an affiliate of the borrower for $42.8 million on an all cash basis. |
| (2) | See “Escrows and Reserves”section. |
| (3) | The Walmart Supercenter Houston Property was constructed in 2015. |
The Mortgage Loan. The mortgage loan (the “Walmart Supercenter Houston Mortgage Loan”) is evidenced by a single promissory note that is secured by a first mortgage encumbering a retail property located in Houston, Texas (the “Walmart Supercenter Houston Property”). The Walmart Supercenter Houston Mortgage Loan was originated on February 14, 2018 by Rialto Mortgage Finance, LLC. The Walmart Supercenter Houston Mortgage Loan had an original principal balance of $26,500,000, has an outstanding principal balance as of the Cut-off Date of $26,500,000 and accrues interest at an interest rate of 4.440%per annum. The Walmart Supercenter Houston Mortgage Loan had an initial term of 120 months, has a remaining term of 120 months as of the Cut-off Date and requires interest-only payments through the term of the Walmart Supercenter Houston Mortgage Loan. The Walmart Supercenter Houston Mortgage Loan matures on March 6, 2028.
Following the lockout period, the borrower has the right to defease the Walmart Supercenter Houston Mortgage Loan in whole, but not in part, on any date before December 6, 2027. In addition, the Walmart Supercenter Houston Mortgage Loan is prepayable without penalty on or after December 6, 2027.
THE INFORMATION IN THIS STRUCTURAL AND COLLATERAL TERM SHEET IS NOT COMPLETE AND MAY BE AMENDED PRIOR TO THE TIME OF SALE. THIS TERM SHEET IS NOT AN OFFER TO SELL THESE SECURITIES AND IT IS NOT A SOLICITATION OF AN OFFER TO BUY THESE SECURITIES IN ANY JURISDICTION WHERE THE OFFER OR SALE IS NOT PERMITTED.
100
WALMART SUPERCENTER HOUSTON |
Sources and Uses
| Sources | Uses | |||||||
| Original loan amount | $26,500,000 | 100.0% | Return of Equity(1) | $23,041,312 | 86.9% | |||
| Closing Costs | 3,363,688 | 12.7 | ||||||
| Upfront Reserve | 95,000 | 0.4 | ||||||
| Total Sources | $26,500,000 | 100.0% | Total Uses | $26,500,000 | 100.0% |
| (1) | Prior to the closing of the Walmart Supercenter Houston Mortgage Loan, the Borrower acquired the Walmart Supercenter Houston Property from an affiliate of the borrower for $42.8 million on an all cash basis. |
The Property.The Walmart Supercenter Houston Property is a one story, single-tenant retail property containing approximately 177,514 square feet located in Houston, Texas. The Walmart Supercenter Houston Property was constructed in 2015 and is situated on a 16.4-acre parcel. Parking is provided by 716 surface parking spaces, resulting in a parking ratio of 4.03 spaces per 1,000 square feet of rentable area. As of March 1, 2018, the Walmart Supercenter Houston Property was 100.0% leased to Walmart Supercenter.
Wal-Mart Stores, Inc. (“Walmart”) is headquartered in Bentonville, Arkansas. The company was founded by Sam Walton in 1962 and incorporated in 1969. As of January 31, 2017, Walmart reported total annual revenue of approximately $485.9 billion and 11,695 stores and clubs in 28 countries and e-commerce websites in 11 countries, under a total of 59 banners. As of January 31, 2017, Walmart employed approximately with 2.3 million employees. Walmart estimates that each week approximately 260 million customers visit its stores and clubs. Walmart Supercenters offer a one store shopping experience by combining a grocery store with fresh produce, bakery, deli and dairy products with electronics, apparel, toys and home furnishing. Most of the Walmart Supercenters are open 24 hours and many include specialty shops such as banks, hair and nail salons, restaurants or vision centers. As of January 31, 2017, there were 3,522 Walmart Supercenters in 49 of the 50 U.S. states, the District of Columbia, and Puerto Rico.
The following table presents certain information relating to the tenancies at the Walmart Supercenter Houston Property:
Major Tenants
| Tenant Name | Credit Rating (Fitch/ Moody’s/ S&P)(1) | Tenant NRSF | % of NRSF | Annual U/W Base Rent PSF | Annual U/W Base Rent | % of Total Annual U/W Base Rent | Sales PSF(2) | Occupancy Cost | Lease Expiration Date |
| Major Tenant | |||||||||
| Walmart Supercenter(3) | AA/Aa2/AA | 177,514 | 100.0% | $11.83 | $2,100,000 | 100.0% | $388.14 | 4.9% | 7/12/2035(4) |
| Occupied Collateral Total | 177,514 | 100.0% | $11.83 | $2,100,000 | 100.0% | ||||
| Vacant Space | 0 | 0.0% | |||||||
| Collateral Total | 177,514 | 100.0% | |||||||
| (1) | Certain ratings are those of the parent company whether or not the parent guarantees the lease. |
| (2) | Sales PSF were provided by a third party market research company as of August 17, 2017. |
| (3) | Walmart Supercenter has two termination options relating to the environmental condition of the Walmart Supercenter Houston Property. First, in the event that the premises becomes untenantable in whole or in part for a period of 120 days due to an environmental condition not caused by the tenant, the tenant may terminate the lease. Second, the tenant may engage an independent third party consultant to study the environmental condition of the Walmart Supercenter Houston Property. If the consultant determines that an environmental condition exists that unreasonably and substantially endangers the life or health of persons occupying the premises, then the borrower may hire a consultant to study the environmental condition. If the borrower’s consultant disagrees with the initial consultant, then the two consultants are required to hire a third consultant to decide which report is correct. If the initial consultant’s conclusion is upheld, then Walmart Supercenter may terminate the lease upon 60 days prior notice to the borrower provided that the borrower has a 45 day period within which to remedy the condition such that it no longer unreasonably and substantially endangers the life or health of persons occupying the premises. |
| (4) | Walmart Supercenter has six, 5-year renewal options remaining. |
The following table presents certain information relating to the historical sales at the Walmart Supercenter Houston Property:
Historical Sales (PSF)
| Tenant Name | 2015 | 2016 | 2017(1) | Average National Sales (PSF)(2) | Current Occupancy Cost |
| Walmart Supercenter | NAV | NAV | $388 | $440 | 4.9% |
| (1) | Historical Sales (PSF) are based on a third party market research provider as of August 17, 2017. |
| (2) | Average National Sales (PSF) is provided from Wal-Mart Stores, Inc., 10-K as of January 31, 2017. |
THE INFORMATION IN THIS STRUCTURAL AND COLLATERAL TERM SHEET IS NOT COMPLETE AND MAY BE AMENDED PRIOR TO THE TIME OF SALE. THIS TERM SHEET IS NOT AN OFFER TO SELL THESE SECURITIES AND IT IS NOT A SOLICITATION OF AN OFFER TO BUY THESE SECURITIES IN ANY JURISDICTION WHERE THE OFFER OR SALE IS NOT PERMITTED.
101
WALMART SUPERCENTER HOUSTON |
The following table presents certain information relating to the lease rollover schedule at the Walmart Supercenter Houston Property:
Lease Expiration Schedule(1)
| Year Ending December 31, | No. of Leases Expiring | Expiring NRSF | % of Total NRSF | Cumulative Expiring NRSF | Cumulative% of Total NRSF | Annual U/W Base Rent | % of Total Annual U/W Base Rent | Annual U/W Base Rent PSF(2) |
| MTM | 0 | 0 | 0.0% | 0 | 0.0% | $0 | 0.0% | $0.00 |
| 2018 | 0 | 0 | 0.0% | 0 | 0.0% | $0 | 0.0% | $0.00 |
| 2019 | 0 | 0 | 0.0% | 0 | 0.0% | $0 | 0.0% | $0.00 |
| 2020 | 0 | 0 | 0.0% | 0 | 0.0% | $0 | 0.0% | $0.00 |
| 2021 | 0 | 0 | 0.0% | 0 | 0.0% | $0 | 0.0% | $0.00 |
| 2022 | 0 | 0 | 0.0% | 0 | 0.0% | $0 | 0.0% | $0.00 |
| 2023 | 0 | 0 | 0.0% | 0 | 0.0% | $0 | 0.0% | $0.00 |
| 2024 | 0 | 0 | 0.0% | 0 | 0.0% | $0 | 0.0% | $0.00 |
| 2025 | 0 | 0 | 0.0% | 0 | 0.0% | $0 | 0.0% | $0.00 |
| 2026 | 0 | 0 | 0.0% | 0 | 0.0% | $0 | 0.0% | $0.00 |
| 2027 | 0 | 0 | 0.0% | 0 | 0.0% | $0 | 0.0% | $0.00 |
| 2028 | 0 | 0 | 0.0% | 0 | 0.0% | $0 | 0.0% | $0.00 |
| Thereafter | 1 | 177,514 | 100.0% | 177,514 | 100.0% | $2,100,000 | 100.0% | $11.83 |
| Vacant | 0 | 0 | 0.0% | 177,514 | 100.0% | $0 | 0.0% | $0.00 |
| Total/Weighted Average | 1 | 177,514 | 100.0% | $2,100,000 | 100.0% | $11.83 |
| (1) | Information obtained from the underwritten rent roll and does not consider termination options. |
| (2) | Weighted Average Annual U/W Base Rent PSF excludes vacant space. |
The following table presents historical occupancy percentages at the Walmart Supercenter Houston Property:
Historical Occupancy
2014(1) | 2015(1) | 2016(1) | 2017(1) | 3/1/2018(2) |
| NAV | 100.0% | 100.0% | 100.0% | 100.0% |
| (1) | Information obtained from the borrower. The Walmart Supercenter Houston Property was constructed in 2015. |
| (2) | Information obtained from the underwritten rent roll. |
Operating History and Underwritten Net Cash Flow. The following table presents certain information relating to the historical operating performance and underwritten net cash flow at the Walmart Supercenter Houston Property:
Cash Flow Analysis
| 2015 | 2016 | 2017 | U/W | % of U/W Effective Gross Income | U/W $ per SF | ||||||||
| Base Rent | $982,258 | $2,100,000 | $2,100,000 | $2,100,000 | 62.7% | $11.83 | |||||||
| Rent Steps | 0 | 0 | 0 | 0 | 0.0 | 0.00 | |||||||
| Grossed Up Vacant Space | 0 | 0 | 0 | 0 | 0.0 | 0.00 | |||||||
| Total Reimbursables | 0 | 0 | 0 | 1,247,667 | 37.3 | 7.03 | |||||||
| Other Income | 0 | 0 | 0 | 0 | 0.0 | 0.00 | |||||||
| Less Vacancy & Credit Loss | 0 | 0 | 0 | 0 | 0.0 | 0.00 | |||||||
| Effective Gross Income | $982,258 | $2,100,000 | $2,100,000 | $3,347,667 | 100.0% | $18.86 | |||||||
| Total Operating Expenses | $0 | $0 | $0 | $1,239,654 | 37.0% | $6.98 | |||||||
| Net Operating Income | $982,258 | $2,100,000 | $2,100,000 | $2,108,013 | 63.0% | $11.88 | |||||||
| TI/LC | 0 | 0 | 0 | 0 | 0.0 | 0.00 | |||||||
| Capital Expenditures | 0 | 0 | 0 | 26,627 | 0.8 | 0.15 | |||||||
| Net Cash Flow | $982,258 | $2,100,000 | $2,100,000 | $2,081,386 | 62.2% | $11.73 | |||||||
| NOI DSCR | 0.82x | 1.76x | 1.76x | 1.77x | |||||||||
| NCF DSCR | 0.82x | 1.76x | 1.76x | 1.74x | |||||||||
| NOI DY | 3.7% | 7.9% | 7.9% | 8.0% | |||||||||
| NCF DY | 3.7% | 7.9% | 7.9% | 7.9% |
Appraisal.As of the appraisal valuation date of February 8, 2018, theWalmart Supercenter Houston Propertyhad an “as-is” appraised value of $42,670,000.
Environmental Matters.According to a Phase I environmental assessment dated February 12, 2018, there was evidence of a recognized environmental condition at the Walmart Supercenter Houston Property. Prior to the construction of the Walmart Supercenter Houston Property, soil and groundwater contamination was discovered stemming from prior industrial uses at the Walmart Supercenter Houston Property and remediation has been ongoing under the supervision of the Texas Commission on Environmental Quality since 1998. The Phase I environmental assessment identified groundwater impacts in excess of regulatory limits from the former on-site operations. The prior owner is required to indemnify the borrower and Walmart for any costs of investigation, cleanup, and monitoring liability relating to the condition. At origination, the borrower obtained a $10,000,000 environmental impairment liability insurance policy through February 14, 2028 under which the lender was a named insured and the
THE INFORMATION IN THIS STRUCTURAL AND COLLATERAL TERM SHEET IS NOT COMPLETE AND MAY BE AMENDED PRIOR TO THE TIME OF SALE. THIS TERM SHEET IS NOT AN OFFER TO SELL THESE SECURITIES AND IT IS NOT A SOLICITATION OF AN OFFER TO BUY THESE SECURITIES IN ANY JURISDICTION WHERE THE OFFER OR SALE IS NOT PERMITTED.
102
WALMART SUPERCENTER HOUSTON |
policy premiums have been paid in full. At origination, the borrower reserved $35,000 with lender to cover the expected premiums necessary to extend the term of such policy for three years past the maturity date of the loan. See “Description of the Mortgage Pool—Mortgage Pool Characteristics—Environmental Considerations” in the Preliminary Prospectus.
Market Overview and Competition.The Walmart Supercenter Houston Property is located in Houston, Harris County, Texas, within the Houston-The Woodlands-Sugar Land metropolitan statistical area (“Houston MSA”). Demand drivers in the Houston MSA include energy, manufacturing, and logistics sectors. Twenty Fortune 500 companies have headquarters in Houston, including Waste Management, Halliburton, and Sysco. The Houston MSA is the U.S. energy headquarters and a world center for virtually every segment of the oil and gas industry including exploration, production, transmission, marketing, supply, and technology.
The Walmart Supercenter Houston Property is located in the Uptown area of Houston which is commonly referred to as the Galleria area, a mixture of office, retail, residential and hotel properties located along the West Loop from Richmond Avenue north to Buffalo Bayou and west to Yorktown. With more than 23.6 million square feet of commercial office space, Uptown Houston represents approximately 12% of Houston’s total office space. Uptown Houston is the 17th largest business center in the U.S. and compares in size to the downtowns of Los Angeles and Denver. Uptown Houston is home to approximately 2,000 companies, ranging from small-to large-sized commercial businesses, representing a variety of diverse industries. Uptown Houston offers more than 5.0 million square feet of gross leasable retail space, more than any other retail destination in Houston. The Galleria is ranked the fifth largest retail complex in the country featuring more than 375 stores and restaurants, an ice rink and two Westin hotels. This shopping complex includes Neiman Marcus, Cartier, Gucci, Macy’s, Tiffany & Co., Saks Fifth Avenue, The Sharper Image, Ralph Lauren Collection, Christian Dior, St. John, and Nordstrom. There are three office towers, two hotels, 2.4 million square feet of retail space, and a variety of restaurants.
Primary access to the Walmart Supercenter Houston Property’s neighborhood is provided by US Highway 59 and Loop 610. The Southwest Freeway provides access to the Houston central business district as well to Sugar Land and Victoria to the southwest. Loop 610 traverses the area in a north-south direction, circumnavigating the city of Houston at a distance of approximately 6.0 miles. Additionally, Interstate Highway 10 is a major east/west thoroughfare that also provides direct access to the central business district. More specifically, the Walmart Supercenter Houston Property is situated along South Rice and Anderson Street. South Rice Avenue, is a north/south street improved with two lanes of traffic in each direction. Anderson Street, is a north/south street improved with one lane of traffic in each direction. According to the appraisal, South Rice Avenue at Glenmount Drive averages approximately 13,006 vehicles per day.
According to the appraisal, the 2017 population within a one, three and five-mile radius of the Walmart Supercenter Houston Property was 25,849, 228,556 and 523,539, respectively. The 2017 average household income within the same one, three and five-mile radii was $103,577, $124,764 and $117,300, respectively.
According to the appraisal, the Walmart Supercenter Houston Property is located in the Houston Area retail market, which had an estimated inventory of 382 million square feet of retail space as of year-end 2017. The Houston Area retail market reported an overall vacancy rate of 5.3%, with an average rental rate of $16.86 per square feet.
According to the appraisal, the Walmart Supercenter Houston Property is located in the Southwest retail submarket, which had an estimated inventory of 58.9 million square feet of retail space as of year-end 2017. The Southwest retail submarket reported an overall vacancy rate of 5.7%, with an average rental rate of $15.75 per square feet.
THE INFORMATION IN THIS STRUCTURAL AND COLLATERAL TERM SHEET IS NOT COMPLETE AND MAY BE AMENDED PRIOR TO THE TIME OF SALE. THIS TERM SHEET IS NOT AN OFFER TO SELL THESE SECURITIES AND IT IS NOT A SOLICITATION OF AN OFFER TO BUY THESE SECURITIES IN ANY JURISDICTION WHERE THE OFFER OR SALE IS NOT PERMITTED.
103
WALMART SUPERCENTER HOUSTON |
The following table presents certain information relating to comparable retail properties for Walmart Supercenter Houston Property:
Competitive Set(1)
| Property Name/ Location | Year Built/ Renovated | Anchor Tenants | Total GLA (SF) | Total Occupancy | Distance from Subject | Tenant Name | Lease Date /Term | Lease Area (SF) | Annual Base Rent PSF | Lease Type |
Walmart Supercenter Houston (Subject) Houston, TX | 2015/NAP | Walmart Supercenter | 177,514 | 100.0% | -- | Walmart Supercenter | July 2015 / 25 Yrs | 177,514 | $11.83 | NNN |
Fry’s Electronics, Concord, CA | 1979/NAP | Fry’s Electronics | 104,160 | 100.0% | 1,914 miles | Fry’s Electronics | June 2015 / 10 Yrs | 104,160 | $11.25 | NNN |
Mills Fleet Farm, Sioux City, IA | 2018/NAP | Mills Fleet Farm | 220,933 | 100.0% | 1,000 miles | Mills Fleet Farm | Sep. 2018 / 20 Yrs | 220,933 | $12.42 | NNN |
Cabela’s, Rogers, AR | 2012/NAP | Cabela’s | 104,427 | 100.0% | 536 miles | Cabela’s | Sep. 2017 / 22 Yrs | 104,427 | $16.54 | NNN |
| Proposed Walmart Center, Katy TX | NAP/NAP | Wal Mart | 41,839 | 100.0% | 22.4 miles | Wal Mart | NAP / NAP | 41,839 | $13.38 | NNN |
Dick’s Sporting Goods Katy, TX | 2016/NAP | Dick’s Sporting Good | 105,000 | 100.0% | 24.1 miles | Dick’s Sporting Goods | Nov. 2016 / 15.3 Yrs | 105,000 | $13.84 | NNN |
Container Store The Woodlands, TX | 1997/2011 | Container Store | 25,083 | 100.0% | 36.6 miles | Container Store | Nov. 2011 / 12 Yrs | 25,083 | $17.00 | NNN |
Nordstrom Rack – Centre at Post Oak Houston, TX | 1995/NAP | Nordstrom Rack | 30,017 | 100.0% | 2.0 miles | Nordstrom Rack | Feb. 2010 / 10 Yrs | 30,017 | $27.50 | NNN |
Bed Bath & Beyond Houston, TX | 2002/NAP | Bed Bath & Beyond | 40,000 | 100.0% | 4.8 miles | Bed Bath & Beyond | June 2012 / 5 Yrs | 40,000 | $23.00 | NNN |
Ashley Furniture Houston, TX | 1996/2010 | Ashley Furniture | 42,684 | 100.0% | 2.2 miles | Ashley Furniture | Nov. 2009 / 15 Yrs | 42,684 | $20.00 | NNN |
Former Babies R’ Us Houston, TX | 1995/NAP | NAP | 40,000 | 0.0% | 12.6 miles | NAP | NAP | 40,000 | $15.00 | NNN |
| (1) | Information obtained from the appraisal dated February 12, 2018. |
The Borrower.The borrower is Houston Galleria Retail DST, a single-purpose Delaware statutory trust. At loan origination, the beneficial interests in the Delaware statutory trust interests were sold on an all equity basis and without any debt on the Walmart Supercenter Houston Property as the construction loan was paid off prior to the origination of the Walmart Supercenter Houston Mortgage Loan. There are two independent directors for the borrowing entity. The borrower trust manager is a single-purpose Delaware limited liability company with one independent manager. Legal counsel to the borrower delivered a non-consolidation opinion in connection with the origination of the Walmart Supercenter Houston Mortgage Loan. Midway Risknet Partners I, L.P. (“Midway Risknet L.P.”), is the guarantor of certain nonrecourse carveouts under the Walmart Supercenter Mortgage Loan. See“Description of the Mortgage Pool—Mortgage Pool Characteristics—Delaware Statutory Trusts”in the Preliminary Prospectus.
The Sponsor.The borrower sponsor and guarantor, Midway Risknet L.P., is owned and controlled by Bradley R. Freels, the chairman of the Midway Companies. Midway Companies (“Midway”) is a privately owned, fully integrated real estate investment and development firm that has provided a high level of quality, service and value to its clients and investors for more than 49 years. The Midway portfolio of projects completed and underway consists of approximately 45 million square feet of properties ranging from mixed-use centers, corporate headquarters, multi-family, entertainment, hospitality, business and industrial parks, and master-planned resort and residential communities. Entities affiliated with the borrower sponsor filed for Chapter 11 bankruptcy protection in April 2011. A plan of reorganization was approved and the bankruptcy was discharged. See “Description of the Mortgage Pool—Mortgage Pool Characteristics—Loan Purpose; Default History, Bankruptcy Issues and Other Proceedings” in the Preliminary Prospectus.
Escrows and Reserves.The loan documents provide for upfront reserves of $60,000 for a contingency reserve and $35,000 for an environmental reserve (as described under “Environmental Matters” above). Monthly real estate tax reserves are not required so long as (i) the lease with the Critical Tenant (as defined below) is in full force and effect with no defaults by any party; (ii) the terms of the Critical Tenant Lease (as defined below) require the tenant to directly pay all real estate taxes due with respect to the Walmart Supercenter Houston Property; (iii) the tenant pays all real estate taxes on time prior to delinquency and, upon request by the lender, promptly provides to the lender evidence of payment of the real estate taxes; and (iv) a Critical Tenant Trigger Event (as defined below) is not in effect and no event of default exists. Monthly insurance reserves are not required so long as (i) the borrower maintains the blanket insurance policy required under the loan documents in full force and effect; (ii) the borrower delivers to the lender within fifteen days prior to the expiration of the blanket insurance policy, the certificates of insurance evidencing coverage accompanied by evidence of payment of the insurance premiums due under the policy. The borrower is required to make monthly deposits into the contingency reserve in an amount equal to the difference between (i) $60,000 and (ii) the balance of the
THE INFORMATION IN THIS STRUCTURAL AND COLLATERAL TERM SHEET IS NOT COMPLETE AND MAY BE AMENDED PRIOR TO THE TIME OF SALE. THIS TERM SHEET IS NOT AN OFFER TO SELL THESE SECURITIES AND IT IS NOT A SOLICITATION OF AN OFFER TO BUY THESE SECURITIES IN ANY JURISDICTION WHERE THE OFFER OR SALE IS NOT PERMITTED.
104
WALMART SUPERCENTER HOUSTON |
contingency funds on deposit in the contingency account, which amounts may be used for any necessary contingency (as described in the loan documents) that arises at the Walmart Supercenter Property or in connection with the Walmart Supercenter Houston Loan.
Lockbox and Cash Management.Upon the occurrence and during the continuance of a Cash Management Trigger Event (as defined below) the borrower is required to establish a lender-controlled lockbox account and instruct tenants to deposit rents into such lockbox account. The Walmart Supercenter Houston Mortgage Loan documents also require that all revenues received by the borrower or the property manager be deposited into the lockbox account within two business days of receipt. Pursuant to the Walmart Supercenter Houston Mortgage Loan documents, all excess funds on deposit will be applied as follows (a) if a Cash Sweep Event (as defined below) period is not in effect, to the borrower; and (b) if a Cash Sweep Event Period is in effect due to the existence of a Critical Tenant Trigger Event (as defined below) to the Critical Tenant TI/LC account until the applicable Critical Tenant Trigger Event cure has occurred. If no Cash Sweep Event is in effect and a Critical Tenant Trigger Event is not in effect, then funds will be applied to the excess cash flow account.
A “Cash Management Trigger Event” will commence upon (i) the occurrence and continuation of an event of default; (ii) the borrower’s second late debt service payment within a 12-month period; (iii) any bankruptcy action of the borrower, the guarantor or the property manager; (iv) a Cash Management DSCR Trigger Event (as defined below); or (v) a Critical Tenant Trigger Event (as defined below). A Cash Management Trigger Event will end with respect to clause (i) above, when such event of default has been cured; with respect to clause (ii) above, when the debt service payments have been paid on time for 12 consecutive months; with respect to clause (iii) above, when such bankruptcy petition has been discharged, stayed, or dismissed within 60 days of such filing among other conditions for the borrower or guarantor and within 120 days for the property manager, and certain other conditions have been satisfied; with respect to clause (iv) above, the date the trailing 12-month amortizing net operating income debt service coverage ratio is greater than 1.20x for two consecutive calendar quarters, and certain other conditions have been satisfied; and with respect to clause (v) above, the date a Critical Tenant Trigger Event cure has occurred.
A “Cash Management DSCR Trigger Event” will occur on any day the net operating debt service coverage ratio, based on the trailing 12-month period immediately preceding the date of such determination, is less than 1.15x.
A “Cash Sweep Event” will occur upon (i) the occurrence and continuation of an event of default; (ii) any bankruptcy action of the borrower, the guarantor or the property manager; (iii) the occurrence of a Cash Sweep DSCR Trigger Event; or (iv) the occurrence of a Critical Tenant Trigger Event (as defined below). A Cash Sweep Event will end with respect to clause (i) above, when such event of default has been cured; with respect to clause (ii) above, when such bankruptcy petition has been discharged, stayed, or dismissed within 60 days of such filing borrower or guarantor and within 120 days for the property manager, and certain other condition have been satisfied; with respect to clause (iii) above, the date the trailing 12-month amortizing net operating income debt service coverage ratio is greater than 1.20x for two consecutive calendar quarters, and certain other conditions have been satisfied; and with respect to clause (iv) above, the date on which a Critical Tenant Trigger Event cure has occurred.
A “Cash Sweep DSCR Trigger Event” will occur upon any date the net operating debt service coverage ratio, based on the trailing 12-month period immediately preceding the date of such determination, is less than 1.15x.
A “Critical Tenant Trigger Event” will occur (i) if Wal-Mart Stores Texas, LLC or any other tenant occupying the space currently occupied by such tenant (the “Critical Tenant” and each related lease, a “Critical Tenant Lease”) gives notice of its intention to terminate, or not extend or renew its lease; (ii) on or prior to the date that is twelve (12) months prior to the expiration date, if the Critical Tenant fails to give notice of its election to renew its lease; (iii) on or prior to the date by which the Critical Tenant is required under its lease to notify the borrower of its election to renew its lease, if the Critical Tenant fails to give such notice; (iv) if an event of default under the Critical Tenant Lease occurs or is continuing; (v) if a bankruptcy action with respect to the Critical Tenant or guarantor occurs; (vi) if the Critical Tenant discontinues its normal business operations; or (vii) the Critical Tenant or any guarantor is downgraded below “BBB” or the equivalent by any credit reporting agency. A Critical Tenant Trigger Event will end (a) with respect to clauses (i), (ii) or (iii), the date that (1) a Critical Tenant Lease extension is executed and delivered to the lender by the borrower and the related tenant improvements costs, leasing commissions and other material costs and expenses have been deposited into the Critical Tenant TI/LC account; or (2) a Critical Tenant Space Re-tenanting Event (as defined below) has occurred; (b) with respect to clause (iv), after a cure of applicable event of default; (c) with respect to clause (v), after an affirmation of the Critical Tenant Lease in the applicable bankruptcy proceedings provided the Critical Tenant is actually paying all rents and other amounts under its lease; (d) with respect to clause (vi), the Critical Tenant re-commences its normal business operations or a Critical Tenant Space Re-tenanting Event (as defined below) has occurred; or (e) with respect to clause (vii), the date the credit rating of the related Critical Tenant and/or the lease guarantor is no longer rated less than a “BBB” or the equivalent by any credit rating agency.
A “Critical Tenant Space Re-tenanting Event” will occur on the date each of the following conditions has been satisfied: (i) the Critical Tenant space has been leased to one or more replacement tenants for a term of at least ten years and on terms that are reasonably acceptable to the lender; (ii) all tenant improvement costs, leasing commissions and other material costs and expenses relating to the re-letting of the space have been paid in full; and (iii) the replacement tenant(s) are conducting normal business operations at the related Critical Tenant space.
Property Management.The Walmart Supercenter Houston Property is managed by an affiliate of the borrower sponsor.
Assumption.The borrower has the right to transfer the Walmart Supercenter Houston Property, provided that no event of default has occurred and is continuing and certain other conditions are satisfied, including (i) the lender’s reasonable determination that the proposed transferee and guarantor satisfy the lender’s credit review and underwriting standards, taking into consideration transferee experience, financial strength and general business standing; (ii) execution of a recourse guaranty and an environmental indemnity by an affiliate of the transferee; and (iii) if requested by the lender, rating agency confirmation from Fitch, KBRA and Moody’s that
THE INFORMATION IN THIS STRUCTURAL AND COLLATERAL TERM SHEET IS NOT COMPLETE AND MAY BE AMENDED PRIOR TO THE TIME OF SALE. THIS TERM SHEET IS NOT AN OFFER TO SELL THESE SECURITIES AND IT IS NOT A SOLICITATION OF AN OFFER TO BUY THESE SECURITIES IN ANY JURISDICTION WHERE THE OFFER OR SALE IS NOT PERMITTED.
105
WALMART SUPERCENTER HOUSTON |
the transfer will not result in a downgrade, withdrawal or qualification of the respective ratings assigned to the WFCM 2018-C43 certificates.
Partial Release.Not permitted.
Real Estate Substitution.Not permitted.
Subordinate and Mezzanine Indebtedness.Not permitted.
Ground Lease.None.
Terrorism Insurance.The Walmart Supercenter Houston Mortgage Loan documents require that the “all risk” insurance policy required to be maintained by the borrowers provide coverage for terrorism in an amount equal to the full replacement cost of the Walmart Supercenter Houston Property, as well as business interruption insurance covering no less than the 18-month period following the occurrence of a casualty event, together with a 6-month extended period of indemnity.
THE INFORMATION IN THIS STRUCTURAL AND COLLATERAL TERM SHEET IS NOT COMPLETE AND MAY BE AMENDED PRIOR TO THE TIME OF SALE. THIS TERM SHEET IS NOT AN OFFER TO SELL THESE SECURITIES AND IT IS NOT A SOLICITATION OF AN OFFER TO BUY THESE SECURITIES IN ANY JURISDICTION WHERE THE OFFER OR SALE IS NOT PERMITTED.
106
(THIS PAGE INTENTIONALLY LEFT BLANK)
THE INFORMATION IN THIS STRUCTURAL AND COLLATERAL TERM SHEET IS NOT COMPLETE AND MAY BE AMENDED PRIOR TO THE TIME OF SALE. THIS TERM SHEET IS NOT AN OFFER TO SELL THESE SECURITIES AND IT IS NOT A SOLICITATION OF AN OFFER TO BUY THESE SECURITIES IN ANY JURISDICTION WHERE THE OFFER OR SALE IS NOT PERMITTED.
107
(THIS PAGE INTENTIONALLY LEFT BLANK)
THE INFORMATION IN THIS STRUCTURAL AND COLLATERAL TERM SHEET IS NOT COMPLETE AND MAY BE AMENDED PRIOR TO THE TIME OF SALE. THIS TERM SHEET IS NOT AN OFFER TO SELL THESE SECURITIES AND IT IS NOT A SOLICITATION OF AN OFFER TO BUY THESE SECURITIES IN ANY JURISDICTION WHERE THE OFFER OR SALE IS NOT PERMITTED.
108
| 35 WATERVIEW BOULEVARD |

THE INFORMATION IN THIS STRUCTURAL AND COLLATERAL TERM SHEET IS NOT COMPLETE AND MAY BE AMENDED PRIOR TO THE TIME OF SALE. THIS TERM SHEET IS NOT AN OFFER TO SELL THESE SECURITIES AND IT IS NOT A SOLICITATION OF AN OFFER TO BUY THESE SECURITIES IN ANY JURISDICTION WHERE THE OFFER OR SALE IS NOT PERMITTED.
109
| 35 WATERVIEW BOULEVARD |
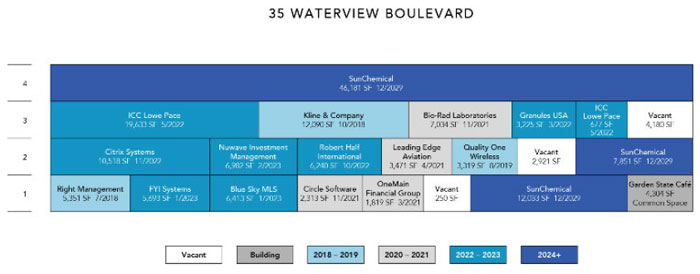
THE INFORMATION IN THIS STRUCTURAL AND COLLATERAL TERM SHEET IS NOT COMPLETE AND MAY BE AMENDED PRIOR TO THE TIME OF SALE. THIS TERM SHEET IS NOT AN OFFER TO SELL THESE SECURITIES AND IT IS NOT A SOLICITATION OF AN OFFER TO BUY THESE SECURITIES IN ANY JURISDICTION WHERE THE OFFER OR SALE IS NOT PERMITTED.
110
| 35 WATERVIEW BOULEVARD |
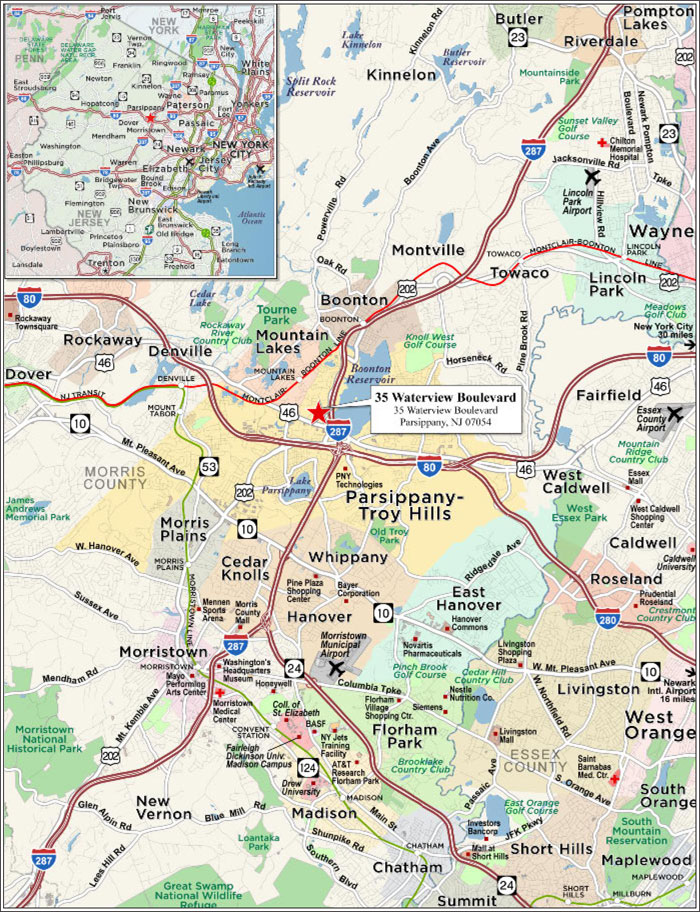
THE INFORMATION IN THIS STRUCTURAL AND COLLATERAL TERM SHEET IS NOT COMPLETE AND MAY BE AMENDED PRIOR TO THE TIME OF SALE. THIS TERM SHEET IS NOT AN OFFER TO SELL THESE SECURITIES AND IT IS NOT A SOLICITATION OF AN OFFER TO BUY THESE SECURITIES IN ANY JURISDICTION WHERE THE OFFER OR SALE IS NOT PERMITTED.
111
| No. 9 – 35 Waterview Boulevard | ||||||
| Loan Information | Property Information | |||||
| Mortgage Loan Seller: | Wells Fargo Bank, National Association | Single Asset/Portfolio: | Single Asset | |||
Credit Assessment (DBRS/Fitch/Moody’s): | NR/NR/NR | Property Type: | Office | |||
| Original Principal Balance: | $22,000,000 | Specific Property Type: | Suburban | |||
| Cut-off Date Balance: | $22,000,000 | Location: | Parsippany, NJ | |||
| % of Initial Pool Balance: | 3.0% | Size: | 172,498 SF | |||
| Loan Purpose: | Acquisition | Cut-off Date Balance Per SF: | $127.54 | |||
| Borrower Names: | 35 Waterview Blvd LLC | Year Built/Renovated: | 1990/NAP | |||
| Borrower Sponsors: | Joseph Popack | Title Vesting: | Fee | |||
| Mortgage Rate: | 4.865% | Property Manager: | Self-managed | |||
| Note Date: | February 15, 2018 | 4thMost Recent Occupancy (As of): | 92.8% (12/31/2013) | |||
| Anticipated Repayment Date: | NAP | 3rdMost Recent Occupancy (As of): | 87.0% (12/31/2014) | |||
| Maturity Date: | March 11, 2028 | 2ndMost Recent Occupancy (As of): | 95.7% (12/31/2015) | |||
| IO Period: | 12 months | Most Recent Occupancy (As of): | 93.2% (12/31/2016) | |||
| Loan Term (Original): | 120 months | Current Occupancy (As of): | 95.7% (11/10/2017) | |||
| Seasoning: | 0 months | |||||
| Amortization Term (Original): | 360 months | |||||
| Loan Amortization Type: | Interest-only, Amortizing Balloon | |||||
| Interest Accrual Method: | Actual/360 | Underwriting and Financial Information: | ||||
| Call Protection: | L(24),D(92),O(4) | 4thMost Recent NOI (As of): | $2,483,890 (12/31/2014) | |||
| Lockbox Type: | Hard/Springing Cash Management | 3rdMost Recent NOI (As of)(2): | $2,629,965 (12/31/2015) | |||
| Additional Debt: | None | 2ndMost Recent NOI (As of)(2): | $2,935,302 (12/31/2016) | |||
| Additional Debt Type: | NAP | Most Recent NOI (As of): | $2,838,842 (TTM 10/31/2017) | |||
| U/W Revenues: | $4,210,919 | |||||
| U/W Expenses: | $1,565,174 | |||||
| Escrows and Reserves(1): | U/W NOI: | $2,645,745 | ||||
| U/W NCF: | $2,448,228 | |||||
| Type: | Initial | Monthly | Cap (If Any) | U/W NOI DSCR: | 1.90x | |
| Taxes | $85,267 | $42,635 | NAP | U/W NCF DSCR: | 1.75x | |
| Insurance | $0 | Springing | NAP | U/W NOI Debt Yield: | 12.0% | |
| Immediate Repairs | $24,563 | $0 | NAP | U/W NCF Debt Yield: | 11.1% | |
| Replacement Reserve | $0 | $2,875 | NAP | As-Is Appraised Value(3): | $30,300,000 | |
| TI/LC Reserve | $500,000 | $21,562 | $517,494 | As-Is Appraisal Valuation Date(3): | November 27, 2017 | |
| Existing TI/LC Obligations | $1,091,397 | $0 | NAP | Cut-off Date LTV Ratio(3): | 72.6% | |
| Rent Concession Reserve | $156,504 | $0 | NAP | LTV Ratio at Maturity or ARD(3): | 61.1% | |
| (1) | See “Escrows” section. |
| (2) | See “Cash Flow Analysis” section. |
| (3) | The LTV ratios shown are based on the appraiser’s hypothetical market value as stabilized, which assumes the cost of all outstanding tenant improvements and free rent are escrowed. All outstanding tenant improvements and free rent were reserved for upon the origination of the 35 Waterview Boulevard Mortgage Loan. Based on the as-is appraised value of $29,800,000 (as of November 27, 2017), the Cut-off Date LTV Ratio is 73.8%. |
The Mortgage Loan. The mortgage loan (the “35 Waterview Boulevard Mortgage Loan”) is evidenced by a single promissory note secured by a first mortgage encumbering an office building located in Parsippany, Morris County, New Jersey (the “35 Waterview Boulevard Property”). The 35 Waterview Boulevard Mortgage Loan was originated on February 15, 2018 by Wells Fargo Bank, National Association. The 35 Waterview Boulevard Mortgage Loan had an original principal balance of $22,000,000, has an outstanding principal balance as of the Cut-off Date of $22,000,000 and accrues interest at an interest rate of 4.865%per annum. The 35 Waterview Boulevard Mortgage Loan had an initial term of 120 months, has a remaining term of 120 months as of the Cut-off Date and requires interest-only payments for the first 12 months following origination and, thereafter, requires payments of principal and interest based on a 30-year amortization schedule. The 35 Waterview Boulevard Mortgage Loan matures on March 11, 2028.
Following the lockout period, the borrower has the right to defease the 35 Waterview Boulevard Mortgage Loan in whole, but not in part, on any date before December 11, 2027. In addition, the 35 Waterview Boulevard Mortgage Loan is prepayable without penalty on or after December 11, 2027.
THE INFORMATION IN THIS STRUCTURAL AND COLLATERAL TERM SHEET IS NOT COMPLETE AND MAY BE AMENDED PRIOR TO THE TIME OF SALE. THIS TERM SHEET IS NOT AN OFFER TO SELL THESE SECURITIES AND IT IS NOT A SOLICITATION OF AN OFFER TO BUY THESE SECURITIES IN ANY JURISDICTION WHERE THE OFFER OR SALE IS NOT PERMITTED.
112
| 35 WATERVIEW BOULEVARD |
Sources and Uses
| Sources | Uses | |||||||
| Original loan amount | $22,000,000 | 72.0% | Purchase price | $29,500,000 | 96.6% | |||
| Sponsor’s new cash equity | 8,547,753 | 28.0 | Seller credit(1) | (1,805,663) | (5.9) | |||
| Upfront reserves | 1,857,730 | 6.1 | ||||||
| Closing costs | 995,685 | 3.3 | ||||||
| Total Sources | $30,547,753 | 100.0% | Total Uses | $30,547,753 | 100.0% | |||
| (1) | The seller credit represents unfunded tenant improvements and leasing commissions and free rent periods. |
The Property.The 35 Waterview Boulevard Property comprises a four-story class A office building totaling 172,498 square feet of rentable area located in Parsippany, Morris County, New Jersey. Built in 1990, the 35 Waterview Boulevard Property is situated on a 13.0-acre parcel of land with primary frontage on Waterview Boulevard. The 35 Waterview Boulevard Property features 618 surface parking spaces, indicating a parking ratio of 3.6 spaces per 1,000 square feet of net rentable area. As of November 10, 2017, the 35 Waterview Boulevard Property was 95.7% occupied by 16 tenants. The 35 Waterview Boulevard Property has averaged 93.7% occupancy since 2010, never falling below 87.0% during that period.
The 35 Waterview Boulevard Property serves as the global headquarters for Sun Chemical Management, L.L.C. (“Sun Chemical”), which is the largest tenant (38.3% of net rentable area; 44.8% of underwritten base rent). Sun Chemical has been at the 35 Waterview Boulevard Property since 2004 and exercised a 12-year renewal in 2017. According to the company’s website, Sun Chemical is a recognized leader in printing inks, coatings and supplies and also develops a wide range of pigments and advanced materials, including liquid compounds, solid compounds and application materials. Sun Chemical operates more than 176 manufacturing, sales and service locations in Europe, Asia and the Americas. Together with its parent company, DIC Group, Sun Chemical has annual sales of more than $7.5 billion. Sun Chemical’s main research and development center and a separate manufacturing facility are located approximately 23.6 and 23.0 miles, respectively, east of the 35 Waterview Boulevard Property in Carlstadt and East Rutherford, New Jersey, respectively.
The second largest tenant at the 35 Waterview Boulevard Property is ICC Lowe Pace LLC (“ICC”), which was originally the healthcare marketing arm of the advertising agency Lowe & Partners (11.8% of net rentable area; 11.9% of underwritten base rent). In 2015 and 2016, FCB Health consolidated and merged the ICC and Pace agencies into one entity that was rebranded as FCBCure. With over 130 full time employees, FCBCure is a full-service agency dedicated to healthcare advertising. FCB Health reported an 11% increase in revenue in 2016, to an estimated $165 million. The tenant has been at the 35 Waterview Boulevard Property since 1996.
Other than Sun Chemical and ICC, no tenant accounts for more than 7.0% of the total net rentable area or 7.1% of underwritten base rent.
THE INFORMATION IN THIS STRUCTURAL AND COLLATERAL TERM SHEET IS NOT COMPLETE AND MAY BE AMENDED PRIOR TO THE TIME OF SALE. THIS TERM SHEET IS NOT AN OFFER TO SELL THESE SECURITIES AND IT IS NOT A SOLICITATION OF AN OFFER TO BUY THESE SECURITIES IN ANY JURISDICTION WHERE THE OFFER OR SALE IS NOT PERMITTED.
113
| 35 WATERVIEW BOULEVARD |
The following table presents certain information relating to the tenancy at the 35 Waterview Boulevard Property:
Major Tenants
| Tenant Name | Credit Rating (Fitch/Moody’s/ S&P)(1) | Tenant NRSF | % of NRSF | Annual U/W Base Rent PSF(2) | Annual U/W Base Rent(2) | % of Total Annual U/W Base Rent | Lease Expiration Date |
| Major Tenants | |||||||
| Sun Chemical | NR/Baa2/NR | 66,065 | 38.3% | $29.50(3) | $1,948,873(3) | 44.8% | 12/31/2029(4)(5) |
| ICC | NR/NR/NR | 20,310 | 11.8% | $25.57(6) | $519,259(6) | 11.9% | 5/31/2022(7)(8) |
| Kline & Company Inc. | NR/NR/NR | 12,090 | 7.0% | $25.50 | $308,295 | 7.1% | 10/31/2018(9) |
| Citrix Systems, Inc. | BBB/Ba1/BBB | 10,518 | 6.1% | $26.16(10) | $275,203(10) | 6.3% | 11/30/2022 |
| Nuwave Investment Management | NR/NR/NR | 6,982 | 4.0% | $25.00 | $174,550 | 4.0% | 2/28/2023(11)(12) |
| Total Major Tenants | 115,965 | 67.2% | $27.82 | $3,226,180 | 74.2% | ||
| Non-Major Tenants | 49,182 | 28.5% | $22.82 | $1,122,530 | 25.8% | ||
| Occupied Collateral Total | 165,147 | 95.7% | $26.33 | $4,348,710 | 100.0% | ||
| Vacant Space | 7,351 | 4.3% | |||||
| Collateral Total | 172,498 | 100.0% | |||||
| (1) | Certain ratings are those of the parent company whether or not the parent company guarantees the lease. |
| (2) | Annual U/W Base Rent PSF and Annual U/W Base Rent include contractual rent steps through November 2018 (totaling $5,689) and straight-line rent averaging for investment grade tenants over the loan term for Sun Chemical and over the lease term for Citrix Systems, Inc. (totaling $210,403). |
| (3) | Sun Chemical’s Annual U/W Base Rent PSF and Annual U/W Base Rent are based on the tenant’s average rental rate over the loan term. Sun Chemical currently pays rent of $26.50 per square foot. |
| (4) | Sun Chemical has one, 5-year renewal option, with 12 months’ notice, at fair market rental rate as determined in the lease. |
| (5) | Sun Chemical has a one-time right to terminate its lease on December 31, 2024 if the company moves out of New Jersey or is acquired by a third party and ceases all operations in both Morris and Somerset counties, New Jersey. With respect to the termination option, Sun Chemical is required to provide 18 months’ notice and pay a termination fee equal to $1,028,197. In addition, a Cash Trap Event Period will commence upon Sun Chemical exercising its termination option (see “Lockbox and Cash Management” section). |
| (6) | ICC’s rented area includes 677 square feet of storage spaced leased pursuant to a license agreement. The Annual U/W Base Rent PSF for the storage space is $13.00 and the Annual U/W Base Rent PSF for the 19,633 square foot office space is $26.00. |
| (7) | ICC has two, 5-year renewal options, with 12 months’ notice, at 95% fair market rental rate as determined in the lease. |
| (8) | ICC has the one-time right to surrender up to 10% of its gross rentable square footage on December 1, 2019 upon 12 months’ notice and payment of a surrender fee of $71.24 per square foot. |
| (9) | Kline & Company Inc. has one, 5-year renewal option, with 12 months’ notice, at fair market rental rate as determined in the lease, but in no event will the base rent be less than $24.00 per square foot. |
| (10) | Citrix Systems, Inc.’s Annual U/W Base Rent PSF and Annual U/W Base Rent are based on the tenant’s average rental rate over the remaining lease term. Citrix Systems, Inc. currently pays rent of $25.00 per square foot. |
| (11) | Nuwave Investment Management has one, 5-year renewal option, with 15 months’ notice at fair market rental rate as determined in the lease. |
| (12) | Nuwave Investment Management has a one-time right to terminate effective February 28, 2021 with 9 months’ notice and payment of a termination fee equal to $42,758. |
THE INFORMATION IN THIS STRUCTURAL AND COLLATERAL TERM SHEET IS NOT COMPLETE AND MAY BE AMENDED PRIOR TO THE TIME OF SALE. THIS TERM SHEET IS NOT AN OFFER TO SELL THESE SECURITIES AND IT IS NOT A SOLICITATION OF AN OFFER TO BUY THESE SECURITIES IN ANY JURISDICTION WHERE THE OFFER OR SALE IS NOT PERMITTED.
114
| 35 WATERVIEW BOULEVARD |
The following table presents certain information relating to the lease rollover schedule at the 35 Waterview Boulevard Property:
Lease Expiration Schedule(1)(2)
| Year Ending December 31, | No. of Leases Expiring | Expiring NRSF | % of Total NRSF | Cumulative Expiring NRSF | Cumulative % of Total NRSF | Annual U/W Base Rent | % of Total Annual U/W Base Rent | Annual U/W Base Rent PSF(4) |
| MTM(3) | 1 | 4,304 | 2.5% | 4,304 | 2.5% | $0(3) | 0.0% | $0.00(3) |
| 2018 | 2 | 17,441 | 10.1% | 21,745 | 12.6% | $444,746 | 10.2% | $25.50 |
| 2019 | 1 | 3,319 | 1.9% | 25,064 | 14.5% | $86,294 | 2.0% | $26.00 |
| 2020 | 0 | 0 | 0.0% | 25,064 | 14.5% | $0 | 0.0% | $0.00 |
| 2021 | 4 | 14,637 | 8.5% | 39,701 | 23.0% | $364,693 | 8.4% | $24.92 |
| 2022 | 5 | 40,293 | 23.4% | 79,994 | 46.4% | $1,027,967 | 23.6% | $25.51 |
| 2023 | 3 | 19,088 | 11.1% | 99,082 | 57.4% | $476,137 | 10.9% | $24.94 |
| 2024 | 0 | 0 | 0.0% | 99,082 | 57.4% | $0 | 0.0% | $0.00 |
| 2025 | 0 | 0 | 0.0% | 99,082 | 57.4% | $0 | 0.0% | $0.00 |
| 2026 | 0 | 0 | 0.0% | 99,082 | 57.4% | $0 | 0.0% | $0.00 |
| 2027 | 0 | 0 | 0.0% | 99,082 | 57.4% | $0 | 0.0% | $0.00 |
| 2028 | 0 | 0 | 0.0% | 99,082 | 57.4% | $0 | 0.0% | $0.00 |
| Thereafter | 1 | 66,065 | 38.3% | 165,147 | 95.7% | $1,948,873 | 44.8% | $29.50 |
| Vacant | 0 | 7,351 | 4.3% | 172,498 | 100.0% | $0 | 0.0% | $0.00 |
| Total/Weighted Average | 17 | 172,498 | 100.0% | $4,348,710 | 100.0% | $26.33 |
| (1) | Information obtained from the underwritten rent roll. |
| (2) | Certain tenants may have lease termination options that are exercisable prior to the originally stated expiration date of the subject lease and that are not considered in the Lease Expiration Schedule. |
| (3) | MTM includes 4,304 square feet of café space, which has no lease and no attributed Annual U/W Base Rent. |
| (4) | Weighted Average Annual U/W Base Rent PSF and Total Annual U/W Base Rent exclude vacant space. |
The following table presents historical occupancy percentages at the 35 Waterview Boulevard Property:
Historical Occupancy
12/31/2013(1) | 12/31/2014(1) | 12/31/2015(1) | 12/31/2016(1) | 11/10/2017(2) | ||||
| 92.8% | 87.0% | 95.7% | 93.2% | 95.7% |
| (1) | Information obtained from the borrower. |
| (2) | Information obtained from the underwritten rent roll. |
Operating History and Underwritten Net Cash Flow. The following table presents certain information relating to the historical operating performance and underwritten net cash flow at the 35 Waterview Boulevard Property:
Cash Flow Analysis
| 2014 | 2015 | 2016 | TTM 10/31/2017 | U/W | % of U/W Effective Gross Income | U/W $ per SF | |
| Base Rent | $3,891,310 | $4,083,151 | $4,334,290 | $4,232,140 | $4,348,710 | 103.3% | $25.21 |
| Grossed Up Vacant Space | 0 | 0 | 0 | 0 | 187,449 | 4.5 | 1.09 |
| Total Recoveries | 90,864 | 89,438 | 110,075 | 103,742 | 103,798 | 2.5 | 0.60 |
| Other Income | 22,126 | 12,072 | 19,768 | 24,578 | 24,578 | 0.6 | 0.14 |
| Less Vacancy & Credit Loss | 0 | 0 | 0 | 0 | (453,616)(1) | (10.8) | (2.63) |
| Effective Gross Income | $4,004,300 | $4,184,661 | $4,464,133 | $4,360,460 | $4,210,919 | 100.0% | $24.41 |
| Total Operating Expenses | 1,520,410 | 1,554,696 | 1,528,831 | 1,521,618 | 1,565,174 | 37.2% | 9.07 |
|
|
|
|
|
|
| |
| Net Operating Income | $2,483,890 | $2,629,965(2) | $2,935,302(2) | $2,838,842 | $2,645,745 | 62.8% | $15.34 |
| TI/LC | 0 | 0 | 0 | 0 | 163,017 | 3.9 | 0.95 |
| Capital Expenditures | 0 | 0 | 0 | 0 | 34,500 | 0.8 | 0.20 |
| Net Cash Flow | $2,483,890 | $2,629,965 | $2,935,302 | $2,838,842 | $2,448,228 | 58.1% | $14.19 |
| NOI DSCR | 1.78x | 1.88x | 2.10x | 2.03x | 1.90x | ||
| NCF DSCR | 1.78x | 1.88x | 2.10x | 2.03x | 1.75x | ||
| NOI DY | 11.3% | 12.0% | 13.3% | 12.9% | 12.0% | ||
| NCF DY | 11.3% | 12.0% | 13.3% | 12.9% | 11.1% |
| (1) | The underwritten economic vacancy is 10.0%. The 35 Waterview Boulevard Property was 95.7% physically occupied as of November 10, 2017. |
| (2) | The increase in Net Operating Income from 2015 to 2016 was driven primarily by five new leases totaling approximately 20,725 square feet (12.0% net rentable area) signed from June 2015 to February 2016. |
Appraisal.As of the appraisal valuation date of November 27, 2017, the 35 Waterview Boulevard Property had a hypothetical market “as-stabilized” value of $30,300,000, assuming the cost of all outstanding tenant improvements and free rent was escrowed. All outstanding tenant improvements and free rent were reserved for upon the origination of the 35 Waterview Boulevard Mortgage Loan.
Environmental Matters.According to the Phase I environmental report dated July 21, 2017, there was no evidence of any recognized environmental conditions at the 35 Waterview Boulevard Property.
THE INFORMATION IN THIS STRUCTURAL AND COLLATERAL TERM SHEET IS NOT COMPLETE AND MAY BE AMENDED PRIOR TO THE TIME OF SALE. THIS TERM SHEET IS NOT AN OFFER TO SELL THESE SECURITIES AND IT IS NOT A SOLICITATION OF AN OFFER TO BUY THESE SECURITIES IN ANY JURISDICTION WHERE THE OFFER OR SALE IS NOT PERMITTED.
115
| 35 WATERVIEW BOULEVARD |
Market Overview and Competition.The 35 Waterview Boulevard Property is located in Parsippany, Morris County, New Jersey, approximately 1.8 miles north of Interstate 80. The 35 Waterview Boulevard Property has access to Route 46 approximately 0.5 mile to the southwest, Route 202 approximately 0.3 mile to the east and Interstate 287 approximately 0.5 mile to the east. Surrounding development along Route 46 comprises big box retail options including Harmons, Marshalls and HomeGoods, all within 0.9 mile of the 35 Waterview Boulevard Property. The surrounding area also features an assortment of dining options and is located less than 25 miles from Newark Liberty International Airport. In addition, a shopping center currently under construction at the corner of Route 46 and Waterview Blvd-NJ, 0.4 miles southwest of the 35 Waterview Boulevard Property, is expected to be anchored by Whole Foods. Per the appraisal, the estimated 2017 population within a one-, three- and five-mile radius of the 35 Waterview Boulevard Property was 6,919, 61,744, 132,286, respectively; and the estimated 2017 average household income within the same radii was $120,875, $123,166 and $136,939, respectively.
Per a third-party market research report, the 35 Waterview Boulevard Property is situated within the Parsippany submarket of the Northern New Jersey office market. As of year-end 2017, the submarket reported a total inventory of 401 office buildings totaling 21.5 million square feet with a 17.2% vacancy rate and average asking rents of $26.00 per square foot. The appraiser concluded to market rents for the 35 Waterview Boulevard Property of $25.50 per square foot, modified gross. According to the appraisal, the 35 Waterview Boulevard Property is situated within the Waterview Corporate Center, which contains six class A office buildings totaling approximately 979,000 square feet. These six buildings were constructed between 1984 and 2001, are currently 93.2% leased and have averaged 94.7% occupancy since 2011.
The following table presents certain information relating to comparable office leases for the35 Waterview Boulevard Property:
Comparable Leases(1)
| Property Name/Location | Year Built/ Renovated | Total GLA (SF) | Distance from Subject | Tenant Name | Lease Date/Term (Months) | Lease Area (SF) | Annua Base Rent PSF | Annual Escalations |
Morris Corporate Center I 300 Interpace Parkway Parsippany, NJ | 1986 | 261,332 | 1.7 miles | Kia Motors | Aug 2017 / 120 Months | 9,783 | $27.00 | $0.50/PSF |
7 Campus Drive Parsippany, NJ | 1982 | 154,395 | 4.0 miles | Centenary College | Mar 2017 / 138 Months | 20,978 | $25.00 | $0.50/PSF |
Mount Kemble Corporate Center - Building B 360 Mount Kemble Avenue Morristown, NJ | 2001 | 117,000 | 11.5 miles | NFP Property & Casualty | Dec 2016 / 88 Months
| 3,884 | $25.25 | 2.75% |
Washington Office Center 44 Whippany Rd, Morristown, NJ | 1984 | 220,160 | 6.7 miles | Meridian Capital Partners | Jul 2016 / 24 Months
| 1,746 | $25.00 | $0.50/PSF |
7 Sylvan Way 7 Sylvan Way, Parsippany, NJ | 1985 | 150,069 | 3.6 miles | Ferraro Foods | Mar 2016 / 144 Months
| 48,600 | $27.50 | $0.50/PSF |
| (1) | Information obtained from the appraisal and third party reports. |
The Borrower.The borrower for the 35 Waterview Boulevard Mortgage Loan is 35 Waterview Blvd LLC, a Delaware limited liability company and a special purpose entity with one independent director. Joseph Popack is the guarantor of certain nonrecourse carveouts under the 35 Waterview Boulevard Mortgage Loan.
The Borrower Sponsor.The borrower sponsor is Joseph Popack, a commercial real estate professional with over 45 years of experience. As of year-end 2017, Mr. Popack’s real estate portfolio consists of approximately 55 commercial real estate properties in New York, Georgia, Florida and Toronto, including four office properties totaling approximately 619,000 square feet. Mr. Popack also owns Chase Abstract (a title company) and MPower Energy (an electric and gas supplier).
Escrows.The loan documents provide for upfront reserves of $85,267 for real estate taxes, $24,563 for immediate repairs, $500,000 for general tenant improvements and leasing commissions (“TI/LC”), $1,091,397 for outstanding TI/LC related to Sun Chemical ($1,007,253) and Citrix Systems, Inc. ($84,144), and $156,504 for outstanding rent concessions related to multiple tenants. The loan documents also provide for ongoing monthly reserves of $42,635 for realestate taxes, $2,875 for replacement reserves, and $21,562 for general TI/LCs (subject to a cap of $517,494).
The loan documents do not require ongoing monthly escrows for insurance premiums as long as (i) no event of default has occurred and is continuing; (ii) the borrower provides the lender with evidence that the 35 Waterview Boulevard Property’s insurance coverage is included in a blanket policy and such policy is in full force and effect; and (iii) the borrower pays all applicable insurance premiums and provides the lender with evidence of renewals.
Lockbox and Cash Management.The 35 Waterview Boulevard Mortgage Loan requires a hard lockbox which is already in-place and springing cash management. The borrower is required to direct all tenants to pay rent directly into such lockbox account. The loan documents also require that all rents received by the borrower or the property manager be deposited into the lockbox account within one business day of receipt. Prior to the occurrence of a Cash Trap Event Period (as defined below), all funds are required to be distributed to the borrower. During a Cash Trap Event Period, all funds are required to be swept to a lender-controlled cash management account.
THE INFORMATION IN THIS STRUCTURAL AND COLLATERAL TERM SHEET IS NOT COMPLETE AND MAY BE AMENDED PRIOR TO THE TIME OF SALE. THIS TERM SHEET IS NOT AN OFFER TO SELL THESE SECURITIES AND IT IS NOT A SOLICITATION OF AN OFFER TO BUY THESE SECURITIES IN ANY JURISDICTION WHERE THE OFFER OR SALE IS NOT PERMITTED.
116
| 35 WATERVIEW BOULEVARD |
A “Cash Trap Event Period” will commence upon the earlier of the following:
| (i) | the occurrence of an event of default; |
| (ii) | the net cash flow debt service coverage ratio falling below 1.30x at the end of any calendar quarter; or |
| (iii) | the occurrence of an Anchor Tenant Trigger Event (as defined below). |
A Cash Trap Event Period will end upon the occurrence of the following:
| ● | with regard to clause (i), upon the cure of such event of default; |
| ● | with regard to clause (ii), upon the debt service coverage ratio being equal to or greater than 1.30x for two consecutive calendar quarters; or |
| ● | with regard to clause (iii), upon an Anchor Tenant Cure Event (as defined below). |
An “Anchor Tenant Trigger Event” will commence upon Sun Chemical exercising its termination option (see “Major Tenants” table).
An “Anchor Tenant Cure Event” will occur upon the borrower replacing Sun Chemical with a new tenant or tenants acceptable to the lender pursuant to a new lease acceptable to the lender, and such tenant has taken occupancy, commenced normal business operations at the entire premises formerly occupied by Sun Chemical and payment of rent.
Property Management.The 35 Waterview Boulevard Property is managed by an affiliate of the borrower.
Assumption.The borrower has the two-time right, commencing 12 months after loan origination, to transfer the 35 Waterview Boulevard Property, provided that certain conditions are satisfied, including (i) no event of default has occurred and is continuing; (ii) the lender has reasonably determined that the proposed transferee and guarantor satisfy the lender’s credit review and underwriting standards, taking into consideration the transferee’s experience, financial strength and general business standing; and (iii) if required by the lender, rating agency confirmation from DBRS, Fitch and Moody’s that the transfer will not result in a downgrade, withdrawal or qualification of the respective ratings assigned to the Series 2018-C43 certificates.
Partial Release.Not permitted.
Real Estate Substitution.Not permitted.
Subordinate and Mezzanine Indebtedness. Not permitted.
Ground Lease. None.
Terrorism Insurance.The loan documents require that the “all risk” insurance policy required to be maintained by the borrower provide coverage for terrorism in an amount equal to the full replacement cost of the 35 Waterview Boulevard Property. The loan documents also require business interruption insurance covering no less than the 12-month period following the occurrence of a casualty event, together with a 6-month extended period of indemnity.
THE INFORMATION IN THIS STRUCTURAL AND COLLATERAL TERM SHEET IS NOT COMPLETE AND MAY BE AMENDED PRIOR TO THE TIME OF SALE. THIS TERM SHEET IS NOT AN OFFER TO SELL THESE SECURITIES AND IT IS NOT A SOLICITATION OF AN OFFER TO BUY THESE SECURITIES IN ANY JURISDICTION WHERE THE OFFER OR SALE IS NOT PERMITTED.
117
| FEDEX DISTRIBUTION CENTER |
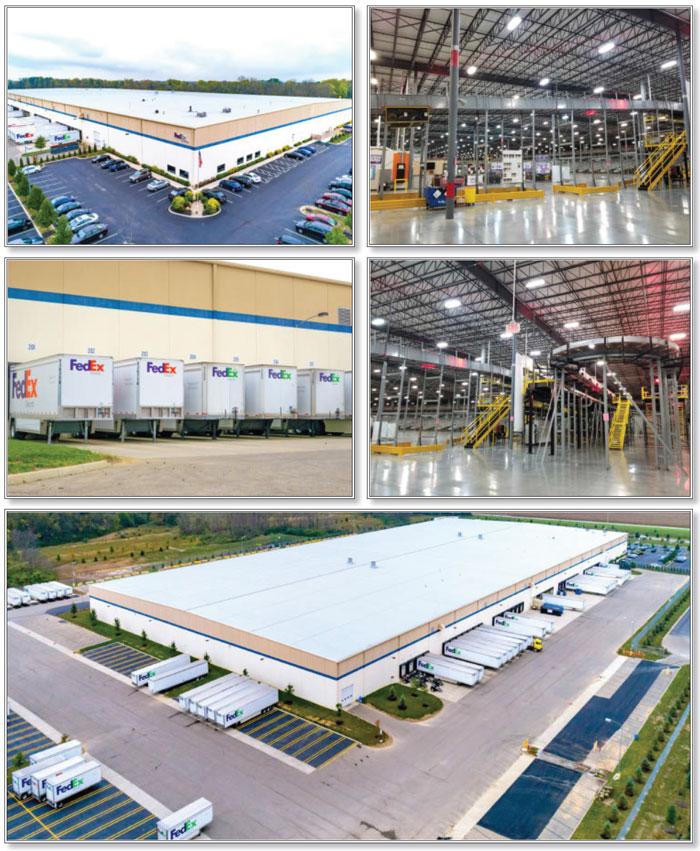
THE INFORMATION IN THIS STRUCTURAL AND COLLATERAL TERM SHEET IS NOT COMPLETE AND MAY BE AMENDED PRIOR TO THE TIME OF SALE. THIS TERM SHEET IS NOT AN OFFER TO SELL THESE SECURITIES AND IT IS NOT A SOLICITATION OF AN OFFER TO BUY THESE SECURITIES IN ANY JURISDICTION WHERE THE OFFER OR SALE IS NOT PERMITTED.
118
| FEDEX DISTRIBUTION CENTER |
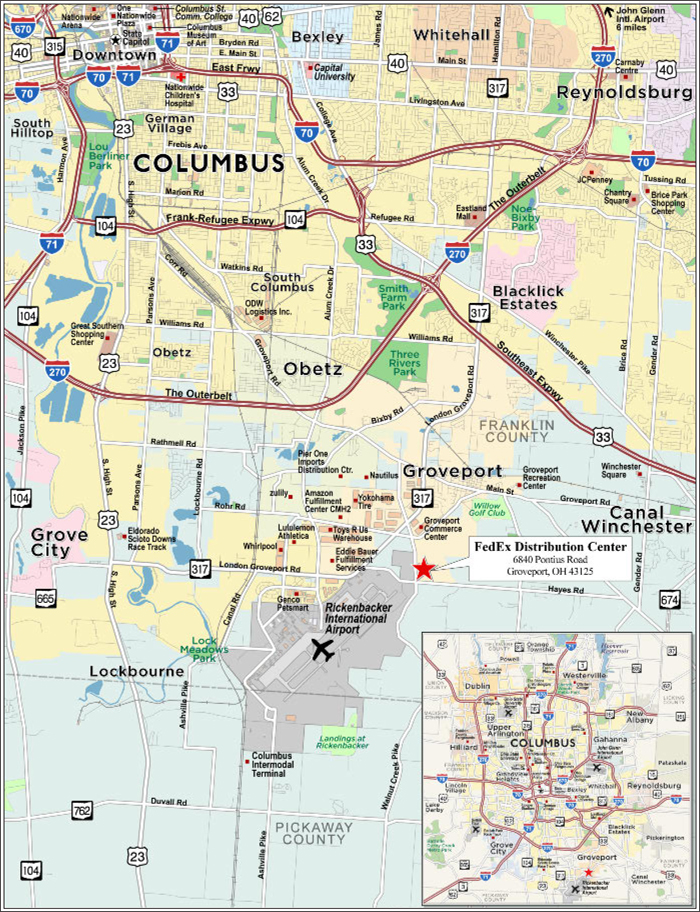
THE INFORMATION IN THIS STRUCTURAL AND COLLATERAL TERM SHEET IS NOT COMPLETE AND MAY BE AMENDED PRIOR TO THE TIME OF SALE. THIS TERM SHEET IS NOT AN OFFER TO SELL THESE SECURITIES AND IT IS NOT A SOLICITATION OF AN OFFER TO BUY THESE SECURITIES IN ANY JURISDICTION WHERE THE OFFER OR SALE IS NOT PERMITTED.
119
| No. 10 – FedEx Distribution Center | |||||||
| Loan Information | Property Information | ||||||
| Mortgage Loan Seller: | Wells Fargo Bank, National Association | Single Asset/Portfolio: | Single Asset | ||||
Credit Assessment (DBRS/Fitch/Moody’s): | NR/NR/NR | Property Type: | Industrial | ||||
| Original Principal Balance: | $21,100,000 | Specific Property Type: | Warehouse | ||||
| Cut-off Date Balance: | $21,100,000 | Location: | Groveport, OH | ||||
| % of Initial Pool Balance: | 2.9% | Size: | 305,250 SF | ||||
| Loan Purpose: | Acquisition | Cut-off Date Balance Per SF: | $69.12 | ||||
| Borrowers Name: | Zeller-401 FX TIC, L.L.C.; Zeller-FX TIC, L.L.C. | Year Built/Renovated: | 2013/NAP | ||||
| Borrower Sponsor: | Paul M. Zeller | Title Vesting: | Fee | ||||
| Mortgage Rate: | 4.760% | Property Manager: | Self-managed | ||||
| Note Date: | February 23, 2018 | 4thMost Recent Occupancy (As of): | 100.0% (12/31/2014) | ||||
| Anticipated Repayment Date: | NAP | 3rdMost Recent Occupancy (As of): | 100.0% (12/31/2015) | ||||
| Maturity Date: | March 11, 2028 | 2ndMost Recent Occupancy (As of): | 100.0% (12/31/2016) | ||||
| IO Period: | 120 months | Most Recent Occupancy (As of): | 100.0% (12/31/2017) | ||||
| Loan Term (Original): | 120 months | Current Occupancy (As of): | 100.0% (3/1/2018) | ||||
| Seasoning: | 0 months | ||||||
| Amortization Term (Original): | NAP | Underwriting and Financial Information: | |||||
| Loan Amortization Type: | Interest-only, Balloon | ||||||
| Interest Accrual Method: | Actual/360 | 4thMost Recent NOI(2): | NAV | ||||
| Call Protection: | L(24),D(89),O(7) | 3rdMost Recent NOI(2): | NAV | ||||
| Lockbox Type: | Hard/Upfront Cash Management | 2ndMost Recent NOI(2): | NAV | ||||
| Additional Debt: | None | Most Recent NOI(2): | NAV | ||||
| Additional Debt Type: | NAP | U/W Revenues: | $2,229,886 | ||||
| U/W Expenses: | $339,324 | ||||||
| U/W NOI: | $1,890,562 | ||||||
| U/W NCF: | $1,805,807 | ||||||
| U/W NOI DSCR: | 1.86x | ||||||
| U/W NCF DSCR: | 1.77x | ||||||
| U/W NOI Debt Yield: | 9.0% | ||||||
| Escrows and Reserves(1): | U/W NCF Debt Yield: | 8.6% | |||||
| Type: | Initial | Monthly | Cap (If Any) | As-Is Appraised Value: | $31,700,000 | ||
| Taxes | $33,793 | $10,500 | NAP | As-Is Appraisal Valuation Date: | January 23, 2018 | ||
| Insurance | $0 | Springing | NAP | Cut-off Date LTV Ratio: | 66.6% | ||
| Replacement Reserves | $0 | $2,500 | $60,000(1) | LTV Ratio at Maturity: | 66.6% | ||
| (1) | See “Escrows” section. |
| (2) | No historical financial information is available as the borrower recently acquired the FedEx Distribution Center (as defined in “The Mortgage Loan” section) and the tenant is responsible for all operating expenses. The FedEx Distribution Center Property (as defined in “The Mortgage Loan” section) has been 100.0% occupied by FedEx Ground Package System, Inc. since the building was constructed in 2013. |
The Mortgage Loan. The mortgage loan (the “FedEx Distribution Center Mortgage Loan”) is evidenced by a single promissory note secured by a first mortgage encumbering the fee interest in an industrial warehouse facility located in Groveport, Ohio (the “FedEx Distribution Center Property”). The FedEx Distribution Center Mortgage Loan was originated on February 23, 2018 by Wells Fargo Bank, National Association. The FedEx Distribution Center Mortgage Loan had an original principal balance of $21,100,000, has an outstanding principal balance as of the Cut-off Date of $21,100,000 and accrues interest at an interest rate of 4.760%per annum. The FedEx Distribution Center Mortgage Loan had an initial term of 120 months, has a remaining term of 120 months as of the Cut-off Date and requires payments of interest-only through the term of the FedEx Distribution Center Mortgage Loan. The FedEx Distribution Center Mortgage Loan matures on March 11, 2028.
Following the lockout period, the borrower has the right to defease the FedEx Distribution Center Mortgage Loan in whole, but not in part, on any date before September 11, 2027. In addition, the FedEx Distribution Center Mortgage Loan is prepayable without penalty on or after September 11, 2027.
THE INFORMATION IN THIS STRUCTURAL AND COLLATERAL TERM SHEET IS NOT COMPLETE AND MAY BE AMENDED PRIOR TO THE TIME OF SALE. THIS TERM SHEET IS NOT AN OFFER TO SELL THESE SECURITIES AND IT IS NOT A SOLICITATION OF AN OFFER TO BUY THESE SECURITIES IN ANY JURISDICTION WHERE THE OFFER OR SALE IS NOT PERMITTED.
120
| FEDEX DISTRIBUTION CENTER |
Sources and Uses
| Sources | Uses | |||||
| Original whole loan amount | $21,100,000 | 63.4% | Purchase price | $31,600,000 | 94.9% | |
| Sponsor’s new cash contribution | $12,192,160 | 36.6 | Closing costs | $1,658,367 | 5.0 | |
| Reserves | $33,793 | 0.1 | ||||
| Total Sources | $33,292,160 | 100.0% | Total Uses | $33,292,160 | 100.0% |
The Property.The FedEx Distribution Center Property is a class A build-to-suit industrial warehouse facility totaling 305,250 square feet and located in Groveport, Ohio, approximately 14.0 miles southeast of the Columbus central business district. The FedEx Distribution Center Property is fully leased to FedEx Ground Package System, Inc. (“FedEx Ground”) through August 31, 2027 on a triple-net lease with two, five-year renewal options. The lease is guaranteed by FedEx Ground’s parent company, FedEx Corporation (“FedEx”) (NYSE: FDX; rated Baa2/BBB by Moody’s/S&P, respectively). Built in 2013 for FedEx Ground, the FedEx Distribution Center Property is situated on a 40.7-acre site and features 32-foot clear height, an early suppression fast response (ESFR) fire sprinkler system, 88 dock-high doors, 2 drive-in doors, and recently expanded parking and truck storage that offers 420 trailer parking stalls and 170-foot truck courts. The FedEx Distribution Center Property comprises grade-level office space totaling approximately 9,158 square feet (3.0% of net rentable area) and approximately 296,092 square feet of warehouse and distribution space (97.0% of net rentable area). The FedEx Distribution Center Property is fully fenced and secured with staffed security stations at both the employee entrance and loading facilities, and has metal detectors and cameras for interior security.
The FedEx Distribution Center Property is one of 31 FedEx SmartPost distribution centers in the United States. SmartPost is a FedEx Ground service that specializes in the consolidation and delivery of high volumes of low-weight, less time-sensitive business-to-consumer packages primarily using the U.S. Postal Service for last-mile delivery to residences. The FedEx Distribution Center Property is the only facility within the FedEx SmartPost distribution network that distributes packages between hubs and not directly to the end consumer, and therefore all of the other 30 SmartPost hubs rely on this facility. In June 2017, FedEx Ground extended the term of its lease from August 31, 2023 to August 31, 2027.
Founded in 1971, FedEx is the largest express transportation company in the world and the leader in package delivery and freight with $60.3 billion in revenue for fiscal year 2017. FedEx is organized into four primary segments: FedEx Express, FedEx Ground, FedEx Freight and FedEx Services. Each segment provides specialized shipping services from packages and freight delivery to international trade services and customs brokerage. FedEx employs over 400,000 people worldwide, ships over 14.0 million packages per business day and receives over 125.0 million package status tracking requests per day as of November 30, 2017. The company’s FedEx Ground segment, a leading North American ground small-package delivery services provider, provides business-to-business day-certain package shipping and ground delivery services in the United States and Canada, as well as residential delivery through its FedEx Home Delivery service. FedEx Ground alone ships more than 8.0 million packages per day on average, operates over 60,000 motorized vehicles and employs over 95,000 people in 37 FedEx Ground Hubs and 31 FedEx SmartPost Distribution Centers as of November 30, 2017.
The following table presents certain information relating to the tenancy at FedEx Distribution Center Property:
Major Tenant
| Tenant Name | Credit Rating (Fitch/Moody’s/ S&P) | Tenant NRSF | % of NRSF | Annual U/W Base Rent PSF | Annual U/W Base Rent | % of Total Annual U/W Base Rent | Lease Expiration Date | ||||||
| Major Tenant | |||||||||||||
| FedEx Ground | NR/Baa2/BBB(1) | 305,250 | 100.0% | $6.54(2) | $1,996,929(2) | 100.0% | 8/31/2027(3) | ||||||
| Total Major Tenants | 305,250 | 100.0% | $6.54 | $1,996,929 | 100.0% | ||||||||
| Vacant Space | 0 | 0.0% | |||||||||||
| Collateral Total | 305,250 | 100.0% | |||||||||||
| (1) | FedEx Corporation, the rated entity, guarantees the lease. |
| (2) | Annual U/W Base Rent PSF and Annual U/W Base Rent represent the tenant’s contractual rent bump in September 2018. FedEx Ground currently pays an Annual U/W Base Rent PSF of $6.04. |
| (3) | FedEx Ground has two, five-year lease extension options with nine months’ notice. The annual rents for the first and second extension options are $2,106,880 ($6.90 per square foot) and $2,212,224 ($7.25 per square foot), respectively. |
THE INFORMATION IN THIS STRUCTURAL AND COLLATERAL TERM SHEET IS NOT COMPLETE AND MAY BE AMENDED PRIOR TO THE TIME OF SALE. THIS TERM SHEET IS NOT AN OFFER TO SELL THESE SECURITIES AND IT IS NOT A SOLICITATION OF AN OFFER TO BUY THESE SECURITIES IN ANY JURISDICTION WHERE THE OFFER OR SALE IS NOT PERMITTED.
121
| FEDEX DISTRIBUTION CENTER |
The following table presents certain information relating to the lease rollover schedule at FedEx Distribution Center Property:
Lease Expiration Schedule(1)
| Year Ending December 31, | No. of Leases Expiring | Expiring NRSF | % of Total NRSF | Cumulative Expiring NRSF | Cumulative % of Total NRSF | Annual U/W Base Rent | % of Total Annual U/W Base Rent | Annual U/W Base Rent PSF |
| MTM | 0 | 0 | 0.0% | 0 | 0.0% | $0 | 0.0% | $0.00 |
| 2018 | 0 | 0 | 0.0% | 0 | 0.0% | $0 | 0.0% | $0.00 |
| 2019 | 0 | 0 | 0.0% | 0 | 0.0% | $0 | 0.0% | $0.00 |
| 2020 | 0 | 0 | 0.0% | 0 | 0.0% | $0 | 0.0% | $0.00 |
| 2021 | 0 | 0 | 0.0% | 0 | 0.0% | $0 | 0.0% | $0.00 |
| 2022 | 0 | 0 | 0.0% | 0 | 0.0% | $0 | 0.0% | $0.00 |
| 2023 | 0 | 0 | 0.0% | 0 | 0.0% | $0 | 0.0% | $0.00 |
| 2024 | 0 | 0 | 0.0% | 0 | 0.0% | $0 | 0.0% | $0.00 |
| 2025 | 0 | 0 | 0.0% | 0 | 0.0% | $0 | 0.0% | $0.00 |
| 2026 | 0 | 0 | 0.0% | 0 | 0.0% | $0 | 0.0% | $0.00 |
| 2027 | 1 | 305,250 | 100.0% | 305,250 | 100.0% | $1,996,929 | 100.0% | $6.54 |
| 2028 | 0 | 0 | 0.0% | 305,250 | 100.0% | $0 | 0.0% | $0.00 |
| Thereafter | 0 | 0 | 0.0% | 305,250 | 100.0% | $0 | 0.0% | $0.00 |
| Vacant | 0 | 0 | 0.0% | 305,250 | 100.0% | $0 | 0.0% | $0.00 |
| Total/Weighted Average | 1 | 305,250 | 100.0% | $1,996,929 | 100.0% | $6.54 |
| (1) | Information obtained from the underwritten rent roll. |
The following table presents historical occupancy percentages at FedEx Distribution Center Property:
Historical Occupancy
12/31/2014(1) | 12/31/2015(1) | 12/31/2016(1) | 12/31/2017(1) | 3/1/2018(2) | ||||
| 100.0% | 100.0% | 100.0% | 100.0% | 100.0% |
| (1) | Information obtained from the FedEx Ground lease. |
| (2) | Information obtained from the underwritten rent roll. |
Operating History and Underwritten Net Cash Flow. The following table presents certain information relating to the underwritten net cash flow at FedEx Distribution Center Property:
Cash Flow Analysis(1)
| As-Is(2) | U/W | % of U/W Effective Gross Income | U/W $ per SF | |||||
| Base Rent | $1,844,304 | $1,996,929(3) | 89.6% | $6.54 | ||||
| Grossed Up Vacant Space | 0 | 0 | 0.0 | 0.00 | ||||
| Total Reimbursables | 0 | 332,803 | 14.9 | 1.09 | ||||
| Less Vacancy & Credit Loss | 0 | (99,846)(4) | (4.5) | (0.33) | ||||
| Effective Gross Income | $1,844,304 | $2,229,886 | 100.0% | $7.31 | ||||
| Total Operating Expenses | $0 | $339,324(5) | 15.2% | $1.11 | ||||
| Net Operating Income | $1,844,304 | $1,890,562 | 84.8% | $6.19 | ||||
| TI/LC | 0 | 54,230 | 2.4 | 0.18 | ||||
| Capital Expenditures | 0 | 30,525 | 1.4 | 0.10 | ||||
| Net Cash Flow | $1,844,304 | $1,805,807 | 81.0% | $5.92 | ||||
| NOI DSCR | 1.81x | 1.86x | ||||||
| NCF DSCR | 1.81x | 1.77x | ||||||
| NOI DY | 8.7% | 9.0% | ||||||
| NCF DY | 8.7% | 8.6% |
| (1) | No historical financial information is available as the borrower recently acquired the FedEx Distribution Center Property and the tenant is responsible for all operating expenses. |
| (2) | The As-Is cash flow represents FedEx Ground’s current rental rate as of the Cut-off Date. The tenant is responsible for all operating expenses. |
| (3) | U/W Base Rent includes FedEx Ground’s contractual rent bump in September 2018 totaling $152,625. |
| (4) | The underwritten economic vacancy is 5.0%. The FedEx Distribution Center Property was 100.0% occupied as of March 1, 2018. |
| (5) | The FedEx Distribution Center Property is subject to Community Reinvestment Area Program-based tax abatements through and including the 2028 tax year. Real estate taxes were underwritten based on the 2017 abated taxes of $109,584 compared to the 2017 unabated taxes of $440,158. The FedEx Ground lease is triple net, whereby the tenant is responsible for all operating expenses, including taxes. |
Appraisal.As of the appraisal valuation date of January 23, 2018, the FedEx Distribution Center Property had an “as-is” appraised value of $31,700,000. The appraiser also concluded to a dark value of $25,200,000 as of January 23, 2018.
Environmental Matters. According to a Phase I environmental site assessment dated January 29, 2018, there was no evidence of any recognized environmental conditions at FedEx Distribution Center Property.
THE INFORMATION IN THIS STRUCTURAL AND COLLATERAL TERM SHEET IS NOT COMPLETE AND MAY BE AMENDED PRIOR TO THE TIME OF SALE. THIS TERM SHEET IS NOT AN OFFER TO SELL THESE SECURITIES AND IT IS NOT A SOLICITATION OF AN OFFER TO BUY THESE SECURITIES IN ANY JURISDICTION WHERE THE OFFER OR SALE IS NOT PERMITTED.
122
| FEDEX DISTRIBUTION CENTER |
Market Overview and Competition.The FedEx Distribution Center Property is located in Groveport, Ohio, approximately 4.5 miles southeast of Interstate 270, which serves as an outerbelt of the Columbus metropolitan statistical area connecting Interstate 70, Interstate 71, and US Route 33. The region benefits from its centralized location, as approximately 50.0% of the U.S. population is within a one day truck drive. The FedEx Distribution Center Property is located adjacent to Rickenbacker International Airport, one of the world’s only cargo-dedicated airports offering worldwide access to global networks and freight hubs in Asia, Europe and the Middle East. Rickenbacker International Airport features two 12,000-foot runways and handled over 91,000 tons of air freight in 2016. The area also benefits from the Rickenbacker Intermodal terminal with services provided by Norfolk Southern and CSX, two of the nation’s largest rail providers offering coast-to-coast intermodal shipping options. Additionally, in conjunction with the Heartland Corridor project, the terminal provides next-day rail service to and from the port of Norfolk, Virginia. The FedEx Distribution Center Property is located in the Foreign-Trade Zone 138 (FTZ 138) which is headquartered at Rickenbacker Inland Port and rated among the top 10 Foreign-Trade Zones in the country with more than $7.8 billion of goods moved through in 2015. The Foreign Trade Zone helps businesses inside the 25-county Central Ohio service area lower costs and boost profits by deferring, reducing and eliminating customs duties.
Per the appraisal, the FedEx Distribution Center Property is located within the Southeast submarket of the Columbus industrial market. Multiple Fortune 500 firms and nationally recognized companies occupy space within the submarket including Amazon, Whirlpool, Xerox, Kraft, Eddie Bauer, GAP, Honeywell, Walmart, Lululemon Athletica, and PetSmart. Per a third-party market research report, as of year-end 2017, the Southeast submarket reported an inventory of 433 buildings totaling approximately 60.3 million square feet with a 9.0% vacancy rate. The appraiser identified six comparable FedEx Ground warehouse properties totaling approximately 1.6 million square feet, which reported a 100.0% occupancy rate and average asking rents of $6.52 per square foot, triple net. The appraiser concluded to a market rent for the FedEx Distribution Center Property of $6.50 per square foot.
The following table presents certain information relating to comparable industrial leases for FedEx Distribution Center Property:
Comparable Leases(1)
| Property Name/Location | Year Built/ Renovated | Tenant Name | Total SF | Clear Height (ft) | Dock Doors | Lease Date / Term | Rent PSF | Lease Type |
6016 Collet Rd., Farmington, NY | 2016/NAP | FedEx Ground | 225,198 | 24 | 61 | July 2016 / 10 Yrs. | $6.60 | NNN |
| 3887 E. Washington Rd., Saginaw, MI | 2016/NAP | FedEx Ground Package | 213,508 | NAV | 43 | June 2016 / 10 Yrs. | $4.42 | NNN |
3779 Lake Shore Rd., Buffalo, NY | 2016/NAP | FedEx Ground | 338,584 | 30 | NAV | April 2016 / 15 Yrs. | $6.82 | NNN |
515 Freeport Rd., Pittston, PA | 2015/NAP | FedEx Ground | 312,356 | NAV | NAV | March 2016 / 15 Yrs. | $7.32 | NNN |
12900 Plantside Dr., Louisville, KY | 2015/NAP | FedEx Ground Package | 303,369 | 34 | 99 | October 2015 / 15 Yrs. | $8.16 | NNN |
10905 Gateway Blvd., New Haven, IN | 2014/NAP | FedEx Ground Package | 177,956 | 25 | 48 | June 2014 / 10 Yrs. | $5.78 | NNN |
| (1) | Information obtained from the appraisal. |
The Borrower.The borrower comprises two tenants in common: Zeller-401 FX TIC, L.L.C. and Zeller-FX TIC, L.L.C., each a Delaware limited liability company and single purpose entity. The Zeller Family Group, L.L.C. is the guarantor of certain nonrecourse carveouts under the FedEx Distribution Center Mortgage Loan.
The Borrower Sponsors.The borrower sponsor is Paul M. Zeller, the managing principal and CEO of Zeller Realty Group, L.L.C. (“Zeller”). Zeller is a privately held commercial real estate investment and development firm headquartered in Chicago, Illinois. Zeller’s current portfolio includes 23 investment properties, representing over 9.7 million square feet throughout the country, valued at approximately $2.5 billion as of December 1, 2017. Mr. Zeller combines an extensive background in commercial real estate development, finance, asset management and operations management.
Escrows.The FedEx Distribution Center Mortgage Loan documents provide for upfront reserves at origination in the amount of $33,793 for real estate taxes.
The FedEx Distribution Center Mortgage Loan documents provide for ongoing monthly escrows of $10,500 for real estate taxes and $2,500 for replacement reserves (subject to a cap of $60,000 as long as no event of default has occurred and is continuing, and the FedEx Distribution Center Property is being adequately maintained, as determined by the lender). The loan documents do not require ongoing monthly escrows for insurance premiums as long as (i) no Cash Trap Event Period (as defined in the “Lockbox and Cash Management” section) has occurred and is continuing and (ii) the borrower provides the lender with evidence that the FedEx Distribution Center Property is insured (which may be via an acceptable blanket or umbrella insurance policy) and such policy is in full force and effect.
THE INFORMATION IN THIS STRUCTURAL AND COLLATERAL TERM SHEET IS NOT COMPLETE AND MAY BE AMENDED PRIOR TO THE TIME OF SALE. THIS TERM SHEET IS NOT AN OFFER TO SELL THESE SECURITIES AND IT IS NOT A SOLICITATION OF AN OFFER TO BUY THESE SECURITIES IN ANY JURISDICTION WHERE THE OFFER OR SALE IS NOT PERMITTED.
123
| FEDEX DISTRIBUTION CENTER |
Lockbox and Cash Management.The FedEx Distribution Center Mortgage Loan requires a lender-controlled lockbox account, which is in place, and that the borrower directs the tenant to pay its rents directly into such lockbox account. The FedEx Distribution Center Mortgage Loan documents also require that all rents received by the borrower or the property manager be deposited into the lockbox account within five business days of receipt. Prior to the occurrence of a Cash Trap Event Period (as defined below), all excess cash flow is required to be distributed to the borrower. During a Cash Trap Event Period, all excess funds are required to be swept to a lender-controlled cash management account.
A “Cash Trap Event Period” will commence upon the earlier of the following:
| (i) | the occurrence and continuance of an event of default; or |
| (ii) | a Major Tenant Event (as defined below). |
A Cash Trap Event Period will end:
| ● | with regard to clause (i), upon the cure of such event of default; or |
| ● | with regard to clause (ii), upon a Major Tenant Cure Event (as defined below). |
A “Major Tenant Event” means, with respect to FedEx Ground (or any successors or replacement tenants), a period that commences upon the earlier of:
| (i) | the date such tenant terminates its lease, gives notice of, or commences a legal proceeding asserting its intent to do so; |
| (ii) | the date such tenant goes dark or gives notice of its intent to do so, or fails to be open for business at the property during customary hours other than on a temporary basis of not more than 60 days for the purposes of a major upgrade to equipment or automated operations systems; |
| (iii) | the date such tenant does not renew or extend its lease per the terms and conditions set forth in its lease on or before the earlier of (i) 18 months prior to the stated expiration date or (ii) the deadline to renew in the lease; or |
| (iv) | such tenants’ long term credit rating is downgraded below ‘Baa3’ by Moody’s or ‘BBB-’ by S&P or Fitch. |
A “Major Tenant Cure Event” will occur:
| ● | With regard to clause (i), upon the occurrence of a Major Tenant Re-Tenanting Event (as defined below). |
| ● | With regard to clause (ii), upon (a) the occurrence of a Major Tenant Re-Tenanting Event; or (b) the tenant recommencing operations for all or substantially all of its space and is open during customary business hours for one calendar quarter. |
| ● | With regard to clause (iii), upon (a) the occurrence of a Major Tenant Re-Tenanting Event; or (b) the tenant exercising the renewal or extension option per the terms and conditions set forth in its lease. |
| ● | With regard to clause (iv), upon (a) the occurrence of a Major Tenant Re-Tenanting Event; or (b) such tenant maintaining a long term credit rating of ‘BBB-’ or higher, or equivalent by all of S&P, Moody’s and Fitch for two consecutive calendar quarters. |
A “Major Tenant Re-Tenanting Event” will occur upon the borrower replacing the applicable major tenant with a new tenant or tenants reasonably acceptable to the lender pursuant to a new lease reasonably acceptable to the lender and covering all or substantially all of the space previously occupied by such major tenant, and such tenant having taken occupancy, commenced operations and paying of full, unabated rent (or any free or abated rent has been reserved) and paid all tenant improvement costs and leasing commissions.
Property Management. FedEx Distribution Center Property is managed by an affiliate of the borrower.
Assumption.The borrower has the two-time right to transfer FedEx Distribution Center Property provided that certain conditions are satisfied, including (i) no event of default under the FedEx Distribution Center Mortgage Loan documents has occurred and is continuing; (ii) the lender reasonably determines that the proposed transferee and guarantor satisfy the lender’s credit review and underwriting standards, taking into consideration the transferee’s experience, financial strength and general business standing; and (iii) if requested by lender, rating agency confirmation from DBRS, Fitch, and Moody’s that the sale and assumption will not result in a downgrade, withdrawal or qualification of the respective ratings assigned to the Series 2018-C43 certificates.
Right of First Offer and Right of First Refusal.None
Partial Release. Not permitted.
Real Estate Substitution.Not permitted.
Subordinate and Mezzanine Indebtedness.Not permitted.
Ground Lease. None.
Terrorism Insurance.The FedEx Distribution Center Mortgage Loan documents require that the “all risk” insurance policy required to be maintained by the borrower or by the tenant so long as (i) its lease remains in full force and effect and no default exists and (ii) the tenant or its guarantor or parent maintains a rating by S&P of at least ‘BBB-’ provide coverage for terrorism in an amount equal to the full replacement cost of the FedEx Distribution Center Property, as well as business interruption insurance covering no less than the 12 months following the occurrence of a casualty event, together with a six-month extended period of indemnity.
THE INFORMATION IN THIS STRUCTURAL AND COLLATERAL TERM SHEET IS NOT COMPLETE AND MAY BE AMENDED PRIOR TO THE TIME OF SALE. THIS TERM SHEET IS NOT AN OFFER TO SELL THESE SECURITIES AND IT IS NOT A SOLICITATION OF AN OFFER TO BUY THESE SECURITIES IN ANY JURISDICTION WHERE THE OFFER OR SALE IS NOT PERMITTED.
124
(THIS PAGE INTENTIONALLY LEFT BLANK)
THE INFORMATION IN THIS STRUCTURAL AND COLLATERAL TERM SHEET IS NOT COMPLETE AND MAY BE AMENDED PRIOR TO THE TIME OF SALE. THIS TERM SHEET IS NOT AN OFFER TO SELL THESE SECURITIES AND IT IS NOT A SOLICITATION OF AN OFFER TO BUY THESE SECURITIES IN ANY JURISDICTION WHERE THE OFFER OR SALE IS NOT PERMITTED.
125
| No. 11 – Riverside and Rialto Industrial Portfolio | ||||||
| Loan Information | Property Information | |||||
| Mortgage Loan Seller: | BSPRT Finance, LLC | Single Asset/Portfolio: | Portfolio | |||
Credit Assessment (DBRS/Fitch/Moody’s): | NR/NR/NR | Property Type: | Industrial | |||
| Original Principal Balance: | $21,000,000 | Specific Property Type(3): | Flex | |||
| Cut-off Date Balance: | $21,000,000 | Location(3): | Various | |||
| % of Initial Pool Balance: | 2.9% | Size: | 407,112 SF | |||
| Loan Purpose: | Recapitalization | Cut-off Date Balance Per SF: | $51.58 | |||
| Borrowers: | Rialto Circle 142, LLC; Magnolia Avenue Holdings LLC; Riverside Circle 152, LLC | Year Built/Renovated(3): | Various/NAP | |||
| Borrower Sponsors: | DT Grat JMT, LLC | Title Vesting: | Fee | |||
| Mortgage Rate: | 4.990% | Property Manager: | Circle Management, Inc. | |||
| Note Date: | February 9, 2018 | 4th Most Recent Occupancy(4): | NAV | |||
| Anticipated Repayment Date: | NAP | 3rd Most Recent Occupancy(4): | NAV | |||
| Maturity Date: | March 6, 2028 | 2nd Most Recent Occupancy (As of): | 95.3% (12/31/2016) | |||
| IO Period: | 120 months | Most Recent Occupancy (As of): | 97.3% (12/31/2017) | |||
| Loan Term (Original): | 120 months | Current Occupancy (As of)(3): | 95.8% (Various) | |||
| Seasoning: | 0 months | |||||
| Amortization Term (Original): | NAP | |||||
| Loan Amortization Type: | Interest-only, Balloon | |||||
| Interest Accrual Method: | Actual/360 | Underwriting and Financial Information: | ||||
| Call Protection(1): | L(24),D(92),O(4) | |||||
| Lockbox Type: | Hard/Springing Cash Management | 4th Most Recent NOI(4): | NAV | |||
| Additional Debt: | None | 3rd Most Recent NOI(4): | NAV | |||
| Additional Debt Type: | NAP | 2nd Most Recent NOI (As of): | $1,872,924 (12/31/2016) | |||
| Most Recent NOI (As of): | $1,930,827 (12/31/2017) | |||||
| U/W Revenues: | $2,864,906 | |||||
| U/W Expenses: | $629,570 | |||||
| U/W NOI: | $2,235,337 | |||||
| U/W NCF: | $1,968,578 | |||||
| Escrows and Reserves: | U/W NOI DSCR: | 2.10x | ||||
| U/W NCF DSCR: | 1.85x | |||||
| Type: | Initial | Monthly | Cap (If Any) | U/W NOI Debt Yield: | 10.6% | |
| Taxes | $0 | $20,834 | NAP | U/W NCF Debt Yield: | 9.4% | |
| Insurance | $6,919 | $1,730 | NAP | As-Is Appraised Value: | $37,450,000 | |
| Deferred Maintenance | $50,940 | $0 | NAP | As-Is Appraisal Valuation Date: | October 30, 2017 | |
| TI/LC Reserve | $250,000 | $16,963(2) | NAP | Cut-off Date LTV Ratio: | 56.1% | |
| Replacement Reserve | $0 | $4,716 | NAP | LTV Ratio at Maturity: | 56.1% | |
| (1) | Partial defeasance of the Riverside and Rialto Industrial Portfolio Mortgage Loan (as defined below) is permitted following the lockout period. Additionally, partial release of the Rialto Industrial Property (as defined below) is permitted, subject to certain conditions, including, (i) no event of default has occurred and remains uncured, (ii) the collateral after release has an LTV no greater than the lesser of (a) LTV in-place at origination and (b) LTV in-place immediately prior to the release of the Rialto Industrial Property, (iii) the collateral after the release has a DSCR equal to or greater than the greater of (a) the DSCR in-place at origination and (b) the DSCR in-place immediately prior to the release, and (iv) payment of the release price, which is the greater of (a) 120.0% of the allocated loan amount of for the Rialto Industrial Property and (b) 100.0% of the net sale proceeds. |
| (2) | Monthly contributions to the TI/LC Reserve will decrease to $13,230 should the borrower elect to release the Rialto Industrial Property. |
| (3) | See “Portfolio Summary” Table. |
| (4) | Historical information is not available due to Sponsor acquisition of the Riverside Industrial Property (as defined below) in April 2015 and acquisition of the Rialto Industrial Property in July 2014. Additionally, the Rialto Industrial Property lacked an in-place tenant until commencement of the lease for United Pipe and Steel Corp in March 2015. |
The Riverside and Rialto Industrial Portfolio mortgage loan (“Riverside and Rialto Industrial Portfolio Mortgage Loan”) is evidenced by a single promissory note that is secured by a first mortgage encumbering the fee interest in two industrial warehouse and flex facilities in California, the Riverside Industrial property (“Riverside Industrial Property”) and the Rialto Industrial property (“Rialto Industrial Property”, and collectively with the Riverside Industrial Property, the “Riverside and Rialto Industrial Portfolio Properties”). On February 9, 2018, the Riverside and Rialto Industrial Portfolio Mortgage Loan was originated by BSPRT Finance, LLC, with an original principal balance and Cut-off Date balance of $21,000,000 and accrues interest at an interest rate of 4.990%per annum.The Riverside and Rialto Industrial Portfolio Mortgage Loan has an initial and remaining term as of the Cut-off Date of 120 months and requires payments of interest-only throughout the loan term. The Riverside and Rialto Industrial Portfolio Mortgage Loan matures on March 6, 2028.
THE INFORMATION IN THIS STRUCTURAL AND COLLATERAL TERM SHEET IS NOT COMPLETE AND MAY BE AMENDED PRIOR TO THE TIME OF SALE. THIS TERM SHEET IS NOT AN OFFER TO SELL THESE SECURITIES AND IT IS NOT A SOLICITATION OF AN OFFER TO BUY THESE SECURITIES IN ANY JURISDICTION WHERE THE OFFER OR SALE IS NOT PERMITTED.
126
RIVERSIDE AND RIALTO INDUSTRIAL PORTFOLIO
Following the lockout period, the borrower has the right to defease the Riverside and Rialto Industrial Portfolio Mortgage Loan in whole, and in part, on any date before December 6, 2027. In addition, the Riverside and Rialto Industrial Portfolio Mortgage Loan is prepayable without penalty on or after December 6, 2027.
Sources and Uses
| Sources | Uses | |||||||
| Original Loan Amount | $21,000,000 | 100.0% | Return of Equity(1) | $20,284,690 | 96.6% | |||
| Upfront Reserves | 307,859 | 1.5 | ||||||
| Closing Costs | 407,451 | 1.9 | ||||||
| Total Sources | $21,000,000 | 100.0% | Total Uses | $21,000,000 | 100.0% |
| (1) | At origination, approximately $3.1 million of loan proceeds were used to pay off an intercompany loan on the Riverside Industrial Property. |
The Properties. The Riverside Industrial Property is located in Riverside, California, comprises fourteen industrial buildings totaling 317,512 square feet of rentable area, and is situated on an 15.4-acre site. 70% of net rentable area at the Riverside Industrial Property is demised as industrial space and the remaining 30% of net rentable area demised as office space. The Riverside Industrial Property has 16-24 foot clear heights, 6 dock high doors, 65 drive-in doors and 377 surface parking spaces. The Rialto Industrial Property is located in Rialto, California and comprises an industrial distribution building totaling 89,600 square feet of rentable area situated on a 7.1-acre site. 97% of net rentable area at the Riverside Industrial Property is demised for industrial use and the remainder demised as office space. The Rialto Industrial Property features 18-foot clear heights, 14 dock high doors, 5 drive-in doors and 13 parking spaces, with room for 48 total parking spaces at the property.
The Riverside and Rialto Industrial Portfolio Properties total 407,112 square feet and are comprised of 309,170 square feet of industrial space (76.0% of net rentable area) and 97,941 square feet of office space (24.0% of net rentable area). The Riverside Industrial Property as of January 1, 2018 is 94.6% occupied by a granular rent roll of 50 tenants, with no tenant comprising more than 7.8% of portfolio net rentable area. The Rialto Industrial Property as of March 1, 2018 is 100.0% occupied and leased to United Pipe and Steel Corp. Collectively, the Riverside and Rialto Industrial Portfolio Properties are 95.8% occupied.
The Riverside and Rialto Industrial Portfolio Properties are located in the Inland Empire, which encompasses Riverside and San Bernardino counties, and is the fifth-largest industrial market in the nation in terms of inventory. Inland Empire benefits from its proximity to the coastal regions of Los Angeles and Orange County, specifically the Ports of Los Angeles and Long Beach, and serves as a key distribution and manufacturing epicenter in the area. Employment in the area is concentrated around transportation and utilities, representing 24.5% of the workforce, the public sector, representing 17.0% of the workforce, and construction, representing 7.0% of the workforce. The largest private employers in the area include the University of California, Los Angeles, Kaiser Permanente, University of Southern California and Northrop Grumman Corp. As of third quarter 2017, overall industrial inventory in the Inland Empire represents approximately 512.1 million square feet and overall vacancy is 4.0%, representing the lowest vacancy in a decade.
According to a third party market research report, the Riverside Industrial Property is located within the Riverside warehouse and flex submarkets. As of 2017, the Riverside warehouse submarket contained approximately 29.5 million square feet, a 2.7% vacancy rate and average asking rent of $7.36 per square foot. The Riverside flex submarket as of 2017 contained 2.5 million square feet, a 7.1% vacancy rate and an average asking rent of $12.00 per square feet. According to a third party market research report, the 2017 population within a 1-, 3-, and 5- mile radius was approximately 19,653, 114,418 and 259,904 respectively. Additionally, average household income in 2017 within a 1-, 3- and 5- mile radius was $71,257, $78,918 and $76,722 respectively.
According to a third party market research report, the Rialto Industrial Property is located within the San Bernardino warehouse submarket. As 2017, the submarket contained approximately 96.2 million square feet, an 8.2% vacancy rate and an average asking rent of $7.94 per square foot. The submarket has experienced average rent growth of 62.0% since 2013. The Rialto Industrial Property’s proximity to three highways, Interstate 15, Interstate 215, and Interstate 10, its location north of the Metrolink San Bernardino train line, and its location 5 miles away from San Bernardino Airport makes the property ideally located for a wholesale distributor. The 2017 population within a 1-, 3-, and 5- mile radius was approximately 21,724, 180,135 and 370,274 respectively. Additionally, the 2017 average household income in a 1-, 3-, and 5-mile radius was $49,950, $56,591, and $56,995 respectively.
The following table presents certain information relating to Riverside and Rialto Industrial Portfolio Properties:
Portfolio Summary
| Property Name | Location | Property Type | Allocated Cut- Off Date Principal Balance | % of Portfolio Cut-off Date Principal Balance | Occupancy(1) | Year Built/ Renovated | Net Rentable Area (SF) | Appraised Value | Allocated LTV |
| Riverside Industrial | Riverside, CA | Industrial (Flex) | $17,700,000 | 84.3% | 94.6% | 1973-1978/NAP | 317,512 | $30,000,000 | 59.0% |
| Rialto Industrial | Rialto, CA | Industrial (Flex) | $3,300,000 | 15.7% | 100.0% | 1959-2001/NAP | 89,600 | $7,450,000 | 44.3% |
| Total/Weighted Average | $21,000,000 | 100.0% | 95.8% | 407,112 | $37,450,000 | 56.1% | |||
| (1) | Information obtained from the underwritten rent roll dated January 1, 2018 for the Riverside Industrial Property. As of March 1, 2018, 100.0% of the Rialto Industrial Property was occupied. |
THE INFORMATION IN THIS STRUCTURAL AND COLLATERAL TERM SHEET IS NOT COMPLETE AND MAY BE AMENDED PRIOR TO THE TIME OF SALE. THIS TERM SHEET IS NOT AN OFFER TO SELL THESE SECURITIES AND IT IS NOT A SOLICITATION OF AN OFFER TO BUY THESE SECURITIES IN ANY JURISDICTION WHERE THE OFFER OR SALE IS NOT PERMITTED.
127
RIVERSIDE AND RIALTO INDUSTRIAL PORTFOLIO
Major Tenants(1)
| Tenant Name | Property Name | Credit Rating (Fitch/ Moody’s/ S&P) | Tenant NRSF | % of NRSF(2) | Annual U/W Base Rent PSF | Annual U/W Base Rent | % of Total Annual U/W Base Rent | Lease Expiration Date |
| Major Tenants | ||||||||
| United Pipe and Steel Corp(3) | Rialto Industrial | NR/NR/NR | 89,600 | 22.0% | $5.63 | $504,000 | 18.90% | 2/28/2031 |
| Vie Logistics, Inc. | Riverside Industrial | NR/NR/NR | 30,421 | 7.5% | $5.52 | $167,928 | 6.3% | 10/31/2018 |
| Bay Area Traffic Solutions, Inc | Riverside Industrial | NR/NR/NR | 21,402 | 5.3% | $7.57 | $162,120 | 6.1% | 5/31/2021 |
| Pacific Consolidated(4) | Riverside Industrial | NR/NR/NR | 31,624 | 7.8% | $4.49 | $141,840 | 5.3% | 11/30/2023 |
| Independent Masonry | Riverside Industrial | NR/NR/NR | 21,764 | 5.3% | $6.50 | $141,468 | 5.3% | 12/31/2019 |
| Total Major Tenants | 194,811 | 47.9% | $5.74 | $1,117,356 | 41.9% | |||
| Non-Major Tenants | 195,174 | 47.9% | $7.94 | $1,549,499 | 58.1% | |||
| Occupied Collateral Total | 389,985 | 95.8% | $6.84 | $2,666,855 | 100.0% | |||
| Vacant Space | 17,127 | 4.2% | ||||||
| Collateral Total | 407,112 | 100.0% | ||||||
| (1) | Information obtained from the underwritten rent roll dated January 1, 2018 for the Riverside Industrial Property. As of March 1, 2018, 100.0% of the Rialto Industrial Property was occupied. |
| (2) | % of NRSF shown represents net rentable area across the Riverside and Rialto Industrial Portfolio Properties. |
| (3) | The United Pipe and Steel Corp lease has no termination options. |
| (4) | Pacific Consolidated has the right to terminate its lease after the sixtieth month on August 1, 2020, subject to 12 months written notice and payment of a $75,000 termination fee. |
The following table presents certain information relating to the lease rollover schedule at the Riverside and Rialto Industrial Portfolio Properties:
Lease Expiration Schedule(1)(2)(3)
| Year Ending December 31, | No. of Leases Expiring | Expiring NRSF | % of Total NRSF | Cumulative Expiring NRSF | Cumulative % of Total NRSF | Annual U/W Base Rent | % of Total Annual U/W Base Rent | Annual U/W Base Rent PSF(4) |
| MTM | 8 | 25,721 | 6.3% | 25,721 | 6.3% | $174,996 | 6.6% | $6.80 |
| 2018 | 10 | 68,784 | 16.9% | 94,505 | 23.2% | $458,796 | 17.2% | $6.67 |
| 2019 | 15 | 69,523 | 17.1% | 164,028 | 40.3% | $520,452 | 19.5% | $7.49 |
| 2020 | 10 | 42,100 | 10.3% | 206,128 | 50.6% | $349,476 | 13.1% | $8.30 |
| 2021 | 5 | 51,839 | 12.7% | 257,967 | 63.4% | $430,655 | 16.1% | $8.31 |
| 2022 | 2 | 10,794 | 2.7% | 268,761 | 66.0% | $86,640 | 3.2% | $8.03 |
| 2023 | 1 | 31,624 | 7.8% | 300,385 | 73.8% | $141,840 | 5.3% | $4.49 |
| 2024 | 0 | 0 | 0 | 300,385 | 73.8% | 0 | 0 | 0 |
| 2025 | 0 | 0 | 0 | 300,385 | 73.8% | 0 | 0 | 0 |
| 2026 | 0 | 0 | 0 | 300,385 | 73.8% | 0 | 0 | 0 |
| 2027 | 0 | 0 | 0 | 300,385 | 73.8% | 0 | 0 | 0 |
| 2028 | 0 | 0 | 0 | 300,385 | 73.8% | 0 | 0 | 0 |
| Thereafter | 1 | 89,600 | 22.0% | 389,985 | 95.8% | $504,000 | 18.9% | $5.63 |
| Vacant | 0 | 17,127 | 4.2% | 407,112 | 100.0% | 0 | 0 | 0 |
| Total/Weighted Average | 52 | 407,112 | 100.0% | $2,666,855 | 100.0% | $6.84 |
| (1) | Information obtained from the underwritten rent roll dated January 1, 2018. As of March 1, 2018, 100.0% of the Rialto Industrial Property was occupied. |
| (2) | Certain tenants may have multiple leases across the Riverside and Rialto Industrial Portfolio Properties space. |
| (3) | Certain tenants may have lease termination options that are exercisable prior to the stated expiration of the subject lease and that are not considered in the Lease Expiration Schedule. |
| (4) | Weighted Average Annual U/W Base Rent PSF excludes vacant space. |
THE INFORMATION IN THIS STRUCTURAL AND COLLATERAL TERM SHEET IS NOT COMPLETE AND MAY BE AMENDED PRIOR TO THE TIME OF SALE. THIS TERM SHEET IS NOT AN OFFER TO SELL THESE SECURITIES AND IT IS NOT A SOLICITATION OF AN OFFER TO BUY THESE SECURITIES IN ANY JURISDICTION WHERE THE OFFER OR SALE IS NOT PERMITTED.
128
RIVERSIDE AND RIALTO INDUSTRIAL PORTFOLIO
The following table presents historical occupancy percentages at the Riverside and Rialto Industrial Portfolio Properties:
Historical Occupancy
12/31/2015(1) | 12/31/2016 | 12/31/2017 | Various(2) | |||
| NAV | 95.3% | 97.3% | 95.8% |
| (1) | The borrower sponsor acquired the Riverside Industrial Property in April 2015 and the Rialto Industrial Property in July 2014, prior to the commencement of the United Pipe and Steel Corp’s lease. As a result, historical occupancy prior to 2015 is unavailable. |
| (2) | Information obtained from the underwritten rent roll dated January 1, 2018. As of March 1, 2018, 100.0% of the Rialto Industrial Property was occupied. |
Operating History and Underwritten Net Cash Flow. The following table presents certain information relating to the underwritten net cash flow at the Riverside and Rialto Industrial Portfolio Properties:
Cash Flow Analysis(1)
| 2016 | 2017 | U/W | % of U/W Effective Gross Income | U/W $ per SF | |
| Base Rent | $2,328,873 | $2,427,372 | $2,807,916(2) | 98.0% | $6.90 |
| Total Recoveries | 181,505 | 177,103 | 245,644 | 8.6 | $0.60 |
| Other Income(3) | 1,582 | 2,268 | 2,268 | 0.1 | $0.01 |
| Less Vacancy & Credit Loss | (13,936) | 0 | (190,921)(4) | (6.7) | ($0.47) |
| Effective Gross Income | $2,498,025 | $2,606,742 | $2,864,906 | 100.0% | $7.04 |
| Total Operating Expenses | 625,101 | 675,916 | $629,570 | 22.0 | $1.55 |
| Net Operating Income | $1,872,924 | $1,930,827 | $2,235,337 | 78.0% | $5.49 |
| Replacement Reserves | 0 | 0 | 56,587 | 2.0 | $0.14 |
| TI/LC | 0 | 0 | 210,172(5) | 7.3 | $0.52 |
| Net Cash Flow | $1,872,924 | $1,930,827 | $1,968,578 | 68.7% | $4.84 |
| NOI DSCR | 1.76x | 1.82x | 2.10x | ||
| NCF DSCR | 1.76x | 1.82x | 1.85x | ||
| NOI DY | 8.9% | 9.2% | 10.6% | ||
| NCF DY | 8.9% | 9.2% | 9.4% |
| (1) | Historical statements are unavailable due to sponsor acquisition of the Riverside Industrial Property in April 2015 and the Rialto Industrial Property in July 2014. |
| (2) | Vacant space at the Riverside Industrial Property is grossed up to the appraiser’s concluded market rents. |
| (3) | Other Income consists of late fees from month-to-month tenants. |
| (4) | The underwritten economic vacancy is 6.3%. The Riverside and Rialto Industrial Portfolio Properties were 95.8% physically occupied as of January 1, 2018. As of March 1, 2018, 100.0% of the Rialto Industrial Property was physically occupied. |
| (5) | U/W TI/LC includes a $25,000 TI/LC credit representing 10.0% of the upfront TI/LC reserve. |
The following table presents certain information relating to comparable industrial leases to the Riverside Industrial Property:
Comparable Leases(1)
| Property Name/Location | Year Built | Tenant Name | Total SF(2) | Distance to Subject | Clear Height (ft) | Dock-High/Drive-In Doors | Initial Rent PSF | Lease Type |
6692 Doolittle Avenue Riverside, CA | 2005 | Dash-Express | 10,437 | 4.5 miles | 18’-20’ | 3 | $8.40 | Industrial Gross |
| 3093 Mission Inn Avenue Riverside, CA | 1980 | CWC Consulting | 10,620 | 9.4 miles | 14’-16’ | 4 | $6.60 | Industrial Gross |
| 6975 Arlington Avenue Riverside, CA | 2007 | Sunrise Custom Storage | 11,954 | 4.5 miles | 18’ | 2 | $7.20 | Industrial Gross |
| 3493 Durahart Street Riverside, CA | 1986 | Sizewise Rentals | 14,400 | 10.2 miles | 20’ | 3 | $6.60 | Industrial Gross |
191 Granite Street Corona, CA | 1990 | Custom Lumber Design | 55,360 | 1.0 mile | 22’ | 10 | $6.48 | Industrial Gross |
1390-1391 Dodson Way Riverside, CA | 1980 | Dave Carter & Associates | 48,998 | 11.2 miles | 18’ | 8 | $6.84 | Industrial
|
1880 Iowa Avenue Riverside, CA | 1991 | Volume Snacks | 66,079 | 11.3 miles | 24’ | 7 | $7.68 | Industrial Gross |
| (1) | Information obtained from the appraisal. |
| (2) | Total SF presented represents the net rentable area at each property. |
THE INFORMATION IN THIS STRUCTURAL AND COLLATERAL TERM SHEET IS NOT COMPLETE AND MAY BE AMENDED PRIOR TO THE TIME OF SALE. THIS TERM SHEET IS NOT AN OFFER TO SELL THESE SECURITIES AND IT IS NOT A SOLICITATION OF AN OFFER TO BUY THESE SECURITIES IN ANY JURISDICTION WHERE THE OFFER OR SALE IS NOT PERMITTED.
129
RIVERSIDE AND RIALTO INDUSTRIAL PORTFOLIO
The following table presents certain information relating to comparable industrial leases to the Riverside Industrial Property:
Comparable Leases(1)
| Property Name/Location | Year Built | Tenant Name | Total SF(2) | Distance to Subject | Clear Height (ft) | Dock- High/Drive-In Doors | Initial Rent PSF | Lease Type |
2850 Cedar Street Ontario, CA | 1990 | VSMPO-Tirus, Inc. | 87,812 | 12.2 miles | 24’ | 16 | $7.08 | Industrial Gross |
| 2180 Wineville Avenue Ontario, CA | 1996 | OEC Distribution | 81,063 | 9.8 miles | 26’ | 15 | $7.80 | Industrial Gross |
10509 Business Drive Fontana, CA | 1989 | MORSCO Supply Co. | 130,788 | 7.4 miles | 24’ | 13 | $6.60 | Industrial Gross |
1651 Carlos Avenue Ontario, CA | 1989 | DHL Express | 147,500 | 13.1 miles | 26’ | 8 | $6.36 | Net |
12250 East Fourth Street Rancho Cucamonga, CA | 1989 | Transtar Industries | 150,080 | 9.1 miles | 26’ | 22 | $5.76 | Net |
| (1) | Information obtained from the appraisal. |
| (2) | Total SF presented represents the net rentable area at each property. |
THE INFORMATION IN THIS STRUCTURAL AND COLLATERAL TERM SHEET IS NOT COMPLETE AND MAY BE AMENDED PRIOR TO THE TIME OF SALE. THIS TERM SHEET IS NOT AN OFFER TO SELL THESE SECURITIES AND IT IS NOT A SOLICITATION OF AN OFFER TO BUY THESE SECURITIES IN ANY JURISDICTION WHERE THE OFFER OR SALE IS NOT PERMITTED.
130
(THIS PAGE INTENTIONALLY LEFT BLANK)
THE INFORMATION IN THIS STRUCTURAL AND COLLATERAL TERM SHEET IS NOT COMPLETE AND MAY BE AMENDED PRIOR TO THE TIME OF SALE. THIS TERM SHEET IS NOT AN OFFER TO SELL THESE SECURITIES AND IT IS NOT A SOLICITATION OF AN OFFER TO BUY THESE SECURITIES IN ANY JURISDICTION WHERE THE OFFER OR SALE IS NOT PERMITTED.
131
| No. 12 – Albany Capital Self Storage Portfolio | ||||||||
| Loan Information | Property Information | |||||||
| Mortgage Loan Seller: | Rialto Mortgage Finance, LLC | Single Asset/Portfolio: | Portfolio | |||||
| Credit Assessment (DBRS/Fitch/Moody’s): | NR/NR/NR | Property Type: | Self Storage | |||||
| Original Principal Balance: | $21,000,000 | Specific Property Type: | Self Storage | |||||
| Cut-off Date Principal Balance: | $21,000,000 | Location: | Various - See Table | |||||
| % of Initial Pool Balance: | 2.9% | Size: | 237,275 SF | |||||
| Loan Purpose: | Refinance | Cut-off Date Principal Balance Per SF: | $88.50 | |||||
| Borrower Names(1): | Various | Year Built/Renovated: | Various - See Table | |||||
| Sponsor(2): | Robert Moser; Prime Storage Fund I, LLC | Title Vesting: | Fee | |||||
| Mortgage Rate: | 5.1300% | Property Manager: | Self - managed | |||||
| 4thMost Recent Occupancy (As of) | 90.3% (12/31/2013) | |||||||
| Note Date: | January 31, 2018 | 3rdMost Recent Occupancy (As of): | 94.0% (12/31/2014) | |||||
| Anticipated Repayment Date: | NAP | 2ndMost Recent Occupancy (As of): | 92.2% (12/31/2015) | |||||
| Maturity Date: | February 6, 2028 | Most Recent Occupancy (As of): | 94.2% (12/31/2016) | |||||
| IO Period: | 24 months | Current Occupancy (As of): | 92.6% (12/26/2017) | |||||
| Loan Term (Original): | 120 months | |||||||
| Seasoning: | 1 month | Underwriting and Financial Information: | ||||||
| Amortization Term (Original): | 360 months | |||||||
| Loan Amortization Type: | Interest-only, Amortizing Balloon | 3rdMost Recent NOI (As of): | $1,762,391 (12/31/2015) | |||||
| Interest Accrual Method: | Actual/360 | 2ndMost Recent NOI (As of)(5): | $1,768,169 (2016 - 10 Months Annualized ) | |||||
| Call Protection(3): | L(25),D(91),O(4) | Most Recent NOI (As of): | $1,949,606 (12/31/2017) | |||||
| Lockbox Type: | Springing | |||||||
| Additional Debt(4): | Yes | U/W Revenues: | $2,888,009 | |||||
| Additional Debt Type(4): | Future Mezzanine | U/W Expenses: | $965,580 | |||||
| U/W NOI: | $1,922,430 | |||||||
| U/W NCF: | $1,886,838 | |||||||
| U/W NOI DSCR: | 1.40x | |||||||
| Escrows and Reserves: | U/W NCF DSCR: | 1.37x | ||||||
| U/W NOI Debt Yield: | 9.2% | |||||||
| Type: | Initial | Monthly | Cap (If Any) | U/W NCF Debt Yield: | 9.0% | |||
| Taxes | $87,143 | $27,664 | NAP | As-Is Appraised Value(6): | $33,440,000 | |||
| Insurance | $8,527 | $1,353 | NAP | As-Is Appraisal Valuation Date: | December 21, 2017 | |||
| Replacement Reserves | $0 | $2,966 | NAP | Cut-off Date LTV Ratio(6): | 62.8% | |||
| Deferred Maintenance | $33,685 | $0 | NAP | LTV Ratio at Maturity or ARD(6): | 54.5% | |||
| (1) | The borrowers are: Prime Storage Central, LLC; Prime Storage Altamont, LLC; Prime Storage Cohoes, LLC and Prime Storage Pittsfield, LLC. Each of the borrowers is a New York limited liability company and single purpose entity with one independent director in its organizational structure. Legal counsel to the borrowers delivered a non-consolidation opinion in connection with the origination of the Albany Capital Self Storage Portfolio Mortgage Loan. Robert Moser and Prime Storage Fund I, LLC are the guarantors of certain non-recourse carveouts under the Albany Capital Self Storage Portfolio Mortgage Loan. |
| (2) | The sponsor reported prior foreclosure litigation. See “Description of the Mortgage Pool – Loan Purpose; Default History, Bankruptcy Issues and Other Proceedings” in the Preliminary Prospectus. |
| (3) | Following the lockout period and prior to November 6, 2027, the borrowers are permitted to partially release any constituent properties in connection with a partial defeasance, subject to certain conditions, including (i) no event of default has occurred and is continuing; (ii) partial defeasance of 115.0% of the released property’s original allocated loan balance; (iii) the amortizing debt service coverage ratio (based upon the trailing 12-month period immediately preceding the date of such determination) with respect to the remaining properties will be no less than the greater of (a) 1.37x and (b) the amortizing debt service coverage ratio immediately prior to the release; and (iv) the loan-to-value ratio with respect to the remaining properties will be no greater than the lesser of (a) 62.8%, and (b) the loan to value ratio immediately prior to the release. |
| (4) | The loan documents permit mezzanine financing subject to certain conditions, including: (i) no event of default under the related loan documents has occurred or is continuing; (ii) the execution of an intercreditor agreement in form and substance acceptable to the lender; (iii) the combined loan-to-value ratio is not greater than 62.8%; (iv) the combined amortizing debt service coverage ratio is not less than 1.37x; and (v) receipt of rating agency confirmation from each of Fitch, KBRA and Moody’s that the mezzanine financing will not result in a downgrade, withdrawal or qualification of the respective ratings assigned to the Series 2018-C43 Certificates. |
| (5) | See “Cash Flow Analysis” section. |
| (6) | As of the appraisal valuation date of December 21, 2017, the Albany Capital Self Storage Portfolio Properties had a portfolio “as-is” appraised value of $33,440,000. As of December 21, 2017, the Albany Capital Self Storage Portfolio Properties had an aggregate “as-is” appraised value of $30,870,000. |
The Mortgage Loan. The Albany Capital Self Storage Portfolio mortgage loan is evidenced by a single promissory note that is secured by four first mortgages encumbering four self storage properties located in New York and Massachusetts (the “Albany Capital Self Storage Portfolio Properties”). The Albany Capital Self Storage Portfolio mortgage loan was originated on January 31, 2018 by Rialto Mortgage Finance, LLC. The Albany Capital Self Storage Portfolio mortgage loan had an original principal balance of $21,000,000, has an outstanding principal balance as of the Cut-off Date of $21,000,000 and accrues interest at an interest rate of 5.1300%per annum. The Albany Capital Self Storage Portfolio mortgage loan had an initial term of 120 months, has a remaining
THE INFORMATION IN THIS STRUCTURAL AND COLLATERAL TERM SHEET IS NOT COMPLETE AND MAY BE AMENDED PRIOR TO THE TIME OF SALE. THIS TERM SHEET IS NOT AN OFFER TO SELL THESE SECURITIES AND IT IS NOT A SOLICITATION OF AN OFFER TO BUY THESE SECURITIES IN ANY JURISDICTION WHERE THE OFFER OR SALE IS NOT PERMITTED.
132
| ALBANY CAPITAL SELF STORAGE PORTFOLIO |
term of 119 months as of the Cut-off Date and requires payments of interest-only for the first 24 months following origination and thereafter payments of principal and interest based on a 30-year amortization schedule.
Following the lockout period, the borrower has the right to defease the Albany Capital Self Storage Portfolio Mortgage Loan in whole or in part, on any date before November 6, 2027. In addition, the Albany Capital Self Storage Portfolio Mortgage Loan is prepayable without penalty on or after November 6, 2027.
Sources and Uses
| Sources | Uses | |||||||
| Original loan amount | $21,000,000 | 100.0% | Loan Payoff | $17,841,043 | 85.0% | |||
| Closing Costs | 670,670 | 3.2 | ||||||
| Reserves | 129,355 | 0.6 | ||||||
| Return of Equity | 2,358,933 | 11.2 | ||||||
| Total Sources | $21,000,000 | 100.0% | Total Uses | $21,000,000 | 100.0% |
The Properties.The Albany Capital Self Storage Portfolio Properties comprise four self storage properties totaling 237,275 square feet located in New York and Massachusetts. The Albany Capital Self Storage Portfolio Properties contain 2,054 non-climate controlled units (92.9% of net rentable square feet). The Albany Capital Self Storage Portfolio Properties also include five flex spaces (7.1% of net rentable area), two parking spaces and a billboard. As of December 26, 2017, the Albany Capital Self Storage Portfolio Properties were 92.6% occupied.
The following table presents certain information relating to the unit mix of the Albany Capital Self Storage Portfolio Properties:
| Property Name – Location | Allocated Cut-off Date Balance | % of Portfolio Cut-off Date Balance | Occupancy | Year Built/ Renovated | Net Rentable Area (SF) | As-Is Appraised Value | Allocated Cut-off Date LTV |
| Prime Altamont (Rotterdam) – Schenectady, NY | $5,900,000 | 28.1% | 93.3% | 1999/NAP | 74,500 | $8,930,000 | 66.1% |
| Prime Cohoes – Cohoes, NY | $5,150,000 | 24.5% | 95.5% | 1990/NAP | 59,350 | $7,360,000 | 70.0% |
| Prime Pittsfield – Pittsfield, MA | $5,150,000 | 24.5% | 94.5% | 2005/NAP | 52,050 | $7,380,000 | 69.8% |
Prime Albany (Central Ave) – | $4,800,000 | 22.9% | 86.2% | 1960/NAP | 51,375 | $7,200,000 | 66.7% |
| Total/Weighted Average | $21,000,000 | 100.0% | 92.6% | 237,275 | $33,440,000(1) | 62.8%(1) |
| (1) | The Total Appraised Value and Weighted Average Allocated Cut-off Date LTV represent the portfolio “as-is” appraised value. As of the appraisal valuation date of December 21, 2017, the aggregate “as-is” appraised value of the Albany Capital Self Storage Portfolio Properties was $30,870,000, which represents a Cut-off Date LTV Ratio and LTV Ratio at Maturity of 68.0% and 59.0%, respectively. |
The following table presents historical occupancy percentages at the Albany Capital Self Storage Portfolio Properties:
Historical Occupancy
2013(1) | 2014(1) | 2015(1) | 2016(1) | 12/26/2017(2) | ||||
| 90.3% | 94.0% | 92.2% | 94.2% | 92.6% |
| (1) | Information obtained from the borrower. |
| (2) | Information obtained from the underwritten rent roll. |
THE INFORMATION IN THIS STRUCTURAL AND COLLATERAL TERM SHEET IS NOT COMPLETE AND MAY BE AMENDED PRIOR TO THE TIME OF SALE. THIS TERM SHEET IS NOT AN OFFER TO SELL THESE SECURITIES AND IT IS NOT A SOLICITATION OF AN OFFER TO BUY THESE SECURITIES IN ANY JURISDICTION WHERE THE OFFER OR SALE IS NOT PERMITTED.
133
| ALBANY CAPITAL SELF STORAGE PORTFOLIO |
Operating History and Underwritten Net Cash Flow.The following table presents certain information relating to the historical operating performance and Underwritten Net Cash Flow at the Albany Capital Self Storage Portfolio Properties:
Cash Flow Analysis
| 2015 | 2016 (10 mos. Annualized)(1) | 2017 | U/W | % of U/W Effective Gross Income | U/W $ per SF | |||||||
| Base Rent | $2,518,248 | $2,485,110 | $2,691,545 | $2,670,808 | 92.5% | $11.26 | ||||||
| Grossed Up Vacant Space | 0 | 0 | 0 | 241,020 | 8.3 | 1.02 | ||||||
| Concessions | 0 | 0 | 0 | 0 | 0.0 | 0.00 | ||||||
| Other Income(2) | 202,736 | 244,453 | 237,473 | 237,473 | 8.2 | 1.00 | ||||||
| Less Vacancy & Credit Loss | 0 | 0 | 0 | (261,292)(3) | (9.0) | (1.10) | ||||||
| Effective Gross Income | $2,720,984 | $2,729,563 | $2,929,018 | $2,888,009 | 100.0% | $12.17 | ||||||
| Total Operating Expenses | $958,592 | $961,394 | $979,412 | $965,580 | 33.4% | $4.07 | ||||||
| Net Operating Income | $1,762,391 | $1,768,169 | $1,949,606 | $1,922,430 | 66.6% | $8.10 | ||||||
| Capital Expenditures | 0 | 0 | 0 | 35,591 | 1.2 | 0.15 | ||||||
| Net Cash Flow | $1,762,391 | $1,768,169 | $1,949,606 | $1,886,838 | 65.3% | $7.95 | ||||||
| NOI DSCR | 1.28x | 1.29x | 1.42x | 1.40x | ||||||||
| NCF DSCR | 1.28x | 1.29x | 1.42x | 1.37x | ||||||||
| NOI DY | 8.4% | 8.4% | 9.3% | 9.2% | ||||||||
| NCF DY | 8.4% | 8.4% | 9.3% | 9.0% |
| (1) | The Albany Capital Self Storage Portfolio Properties were acquired in March 2016. The sellers did not provide January and February 2016 financial statements. |
| (2) | Other Income includes retail revenue, late fees, application fees, late insufficient fund fees and miscellaneous fees. |
| (3) | The underwritten economic vacancy is 8.3%. The Albany Capital Self Storage Portfolio Properties were 92.6% physically occupied as of December 26, 2017. |
THE INFORMATION IN THIS STRUCTURAL AND COLLATERAL TERM SHEET IS NOT COMPLETE AND MAY BE AMENDED PRIOR TO THE TIME OF SALE. THIS TERM SHEET IS NOT AN OFFER TO SELL THESE SECURITIES AND IT IS NOT A SOLICITATION OF AN OFFER TO BUY THESE SECURITIES IN ANY JURISDICTION WHERE THE OFFER OR SALE IS NOT PERMITTED.
134
(THIS PAGE INTENTIONALLY LEFT BLANK)
THE INFORMATION IN THIS STRUCTURAL AND COLLATERAL TERM SHEET IS NOT COMPLETE AND MAY BE AMENDED PRIOR TO THE TIME OF SALE. THIS TERM SHEET IS NOT AN OFFER TO SELL THESE SECURITIES AND IT IS NOT A SOLICITATION OF AN OFFER TO BUY THESE SECURITIES IN ANY JURISDICTION WHERE THE OFFER OR SALE IS NOT PERMITTED.
135
| No. 13 – Forest Office Park | |||||||
| Loan Information | Property Information | ||||||
| Mortgage Loan Seller: | Wells Fargo Bank, National Association | Single Asset/Portfolio: | Single Asset | ||||
| Credit Assessment (DBRS/Fitch/Moody’s): | NR/NR/NR | Property Type: | Office | ||||
| Original Principal Balance: | $18,000,000 | Specific Property Type: | Suburban | ||||
| Cut-off Date Principal Balance: | $18,000,000 | Location: | Richmond, VA | ||||
| % of Initial Pool Balance: | 2.5% | Size: | 229,065 SF | ||||
| Loan Purpose: | Refinance | Cut-off Date Balance Per SF: | $78.58 | ||||
| Borrower Name: | Forest Office Park Investor, LLC | Year Built/Renovated: | 1975/NAP | ||||
| Sponsors: | Allen C. De Olazarra | Title Vesting: | Fee | ||||
| Mortgage Rate: | 4.210% | Property Manager: | Self-managed | ||||
| Note Date: | December 28, 2017 | 4thMost Recent Occupancy (As of): | 95.1% (12/31/2013) | ||||
| Anticipated Repayment Date: | NAP | 3rdMost Recent Occupancy (As of): | 94.5% (12/31/2014) | ||||
| Maturity Date: | January 11, 2028 | 2ndMost Recent Occupancy (As of): | 91.0% (12/31/2015) | ||||
| IO Period: | 120 months | Most Recent Occupancy (As of): | 93.0% (12/31/2016) | ||||
| Loan Term (Original): | 120 months | Current Occupancy (As of): | 93.9% (12/27/2017) | ||||
| Seasoning: | 2 months | ||||||
| Amortization Term (Original): | NAP | Underwriting and Financial Information: | |||||
| Loan Amortization Type: | Interest-only, Balloon | 4thMost Recent NOI (As of): | $1,548,228 (12/31/2014) | ||||
| Interest Accrual Method: | Actual/360 | 3rdMost Recent NOI (As of): | $1,755,656 (12/31/2015) | ||||
| Call Protection: | L(26),D(90),O(4) | 2ndMost Recent NOI (As of): | $2,340,472 (12/31/2016) | ||||
| Lockbox Type: | Springing | Most Recent NOI (As of): | $2,331,041 (12/31/2017) | ||||
| Additional Debt: | None | ||||||
| Additional Debt Type: | NAP | U/W Revenues: | $3,914,464 | ||||
| U/W Expenses: | $1,528,599 | ||||||
| U/W NOI: | $2,385,864 | ||||||
| Escrows and Reserves: | U/W NCF: | $2,057,169 | |||||
| U/W NOI DSCR : | 3.11x | ||||||
| Type: | Initial | Monthly | Cap(If Any) | U/W NCF DSCR : | 2.68x | ||
| Taxes | $32,019 | $16,009 | NAP | U/W NOI Debt Yield : | 13.3% | ||
| Insurance | $0 | Springing(1) | NAP | U/W NCF Debt Yield : | 11.4% | ||
| Replacement Reserves | $0 | $4,581 | NAP | As-Is Appraised Value: | $28,600,000 | ||
| Leasing Commission Reserves | $0 | $9,544 | $687,000(2) | As-Is Appraisal Valuation Date: | December 11, 2017 | ||
| Existing TI/LC Reserve | $1,089,296(3) | $0 | NAP | Cut-off Date LTV Ratio: | 62.9% | ||
| COVA TI/LC Reserve | $0 | (4) | $1,700,000 | LTV Ratio at Maturity or ARD: | 62.9% | ||
| (1) | Ongoing monthly reserves for insurance are not required so long as (i) no event of default has occurred and is continuing; (ii) the Forest Office Park Property is insured via an acceptable blanket insurance policy; and (iii) the borrower provides the lender with evidence of renewal of the insurance policies and timely proof of payment of insurance premiums. |
| (2) | Springing monthly reserves for leasing commissions are required above the cap upon (i) the occurrence and continuance of an event of default or (ii) the net cash flow debt yield being less than 8.0%. In addition, if Commonwealth of Virginia (“COVA”) fails to provide lease renewal notice by June 30, 2024 and the balance of the leasing commission reserve account is less than $250,000 at such time, the borrower is required to deposit an amount that, when added to the then-current account balance, causes the account balance to be equal to or greater than $250,000. |
| (3) | Represents outstanding tenant improvement and leasing commission obligations for COVA ($384,717), USDA ($653,258) and Sentara ($51,321). |
| (4) | Commencing July 2021, the borrower is required to make ongoing monthly deposits of $47,722 for tenant improvements and leasing commissions incurred with respect to the space currently occupied by COVA (subject to a cap of $1,700,000, as long as no event of default is continuing). Provided no event of default is continuing, the borrower will no longer be required to make deposits into the COVA TI/LC Reserve account and lender is required to disburse all funds remaining on deposit, provided that (a) COVA has renewed all of its space for at least five years on economic terms equal to or greater than those of its current lease; or (b) COVA has renewed a portion of its space and one or more tenants satisfactory to lender have leased the remaining portion of the space with a term of at least five years, with COVA and any replacement tenants being in occupancy, open for business and paying full, unabated rent with all tenant improvements and leasing commissions having been paid, provided that the debt yield is equal to or greater than the greater of (i) the then current debt yield, and (ii) 10.8%. In addition, provided no event of default is continuing, and COVA has renewed all of its space for at least three years on economic terms equal to or greater than those of its current lease, lender is required to disburse all funds on deposit in the COVA TI/LC Reserve account in excess of $575,000, and the borrower is required to make ongoing monthly deposits of $47,917 (subject to a cap of $1,700,000, as long as no event of default is continuing). |
The Forest Office Park mortgage loan is evidenced by a single promissory note that is secured by a first mortgage encumbering the borrower’s fee interest in five office buildings totaling 229,065 square feet and located in Richmond, Virginia (the “Forest Office Park Property”). The Forest Office Park Property was developed between 1975 and 1979 and features five adjacent two-story buildings and 979 surface parking spaces resulting in a parking ratio of 4.3 spaces per 1,000 square feet of rentable space. The Forest Office Park Property is located within the Forest Office Park, a 19-building office park totaling 710,000 square feet with approximately 200 tenants. As of 2016, the Richmond-Petersburg Metropolitan Statistical Area had an estimated population of approximately 1.3 million people; while the 2016 estimated average household income was $79,982. As of December 27, 2017 the Forest Office Park Property was 93.9% occupied by 9 tenants, and has averaged 91.4% occupancy over the past 10 years. Approximately 88.5% of the net rentable area and 94.6% of underwritten base rent at the Forest Office Park comprises investment grade tenants.
THE INFORMATION IN THIS STRUCTURAL AND COLLATERAL TERM SHEET IS NOT COMPLETE AND MAY BE AMENDED PRIOR TO THE TIME OF SALE. THIS TERM SHEET IS NOT AN OFFER TO SELL THESE SECURITIES AND IT IS NOT A SOLICITATION OF AN OFFER TO BUY THESE SECURITIES IN ANY JURISDICTION WHERE THE OFFER OR SALE IS NOT PERMITTED.
136
FOREST OFFICE PARK |
According to a third party market research report, the Forest Office Park Property is located within the Glenside/Broad Street’s submarket of the Richmond office market. As of the fourth quarter of 2017, the Glenside/Broad Street’s office submarket contained a total inventory of 127 buildings totaling approximately 5.2 million square feet with a 6.0% vacancy rate and average asking rent of $19.61, gross.
Sources and Uses
| Sources | Uses | |||||||
| Original loan amount | $18,000,000 | 100.0% | Loan payoff | $15,817,683 | 87.9% | |||
| Reserves | 1,121,315 | 6.2 | ||||||
| Return of equity | 447,015 | 2.5 | ||||||
| Closing costs | 613,988 | 3.4 | ||||||
| Total Sources | $18,000,000 | 100.0% | Total Uses | $18,000,000 | 100.0% |
The following table presents certain information relating to the tenancy at the Forest Office Park Property:
Major Tenants
| Tenant Name | Credit Rating (Fitch/ Moody’s/ S&P)(1) | Tenant NRSF | % of NRSF | Annual U/W Base Rent PSF(2) | Annual U/W Base Rent(2) | % of Total Annual U/W Base Rent | Lease Expiration Date |
| Major Tenants | |||||||
| Commonwealth of Virginia | AAA/Aaa/AAA | 127,983 | 55.9% | $18.61 | $2,381,764 | 59.7% | 6/30/2025(3)(4) |
| USDA | AAA/Aaa/AA+ | 48,787 | 21.3% | $18.58 | $906,511 | 22.7% | 7/31/2033(5) |
| Sentara Healthcare System | NR/Aa2/AA | 19,791 | 8.6% | $18.46 | $365,342 | 9.2% | 2/29/2024(6) |
| CSX Transportation | NR/Baa1/BBB+ | 6,219 | 2.7% | $19.14 | $119,032 | 3.0% | 5/31/2019 |
| Encompass Home Health | NR/Ba3/BB- | 4,032 | 1.8% | $17.50 | $70,580 | 1.8% | 2/28/2022 |
| Total Major Tenants | 206,812 | 90.3% | $18.58 | $3,843,229 | 96.3% | ||
| Non-Major Tenants | 8,366 | 3.7% | $17.43 | $145,787 | 3.7% | ||
| Occupied Collateral Total | 215,178 | 93.9% | $18.54 | $3,989,016 | 100.0% | ||
| Vacant Space | 13,887 | 6.1% | |||||
| Collateral Total | 229,065 | 100.0% | |||||
| (1) | Certain ratings are those of the parent company whether or not the parent guarantees the lease. |
| (2) | Annual U/W Base Rent PSF and Annual U/W Base Rent include contractual rent steps through November 2018 and rent averaging for three investment grade tenants over the lesser of the remaining lease term or loan term totaling $348,754. |
| (3) | COVA has one, 5-year renewal option, with 12 months’ notice, at fair market rental rate as determined in the lease not to exceed 102% of the base rent payable during the last month of the immediately preceding initial term. |
| (4) | COVA (a) has the right to terminate its lease if there is a dissolution or restructuring of the tenant; (b) has the right to terminate its lease if any session of Virginia General Assembly does not appropriate funds for the continuance of its lease; (c) has the right to terminate its lease on approximately 3,141 square feet of space on July 1, 2018 with six months’ notice; and (d) has the right to terminate its lease on up to 15% of its total rentable square footage on July 1, 2020 with nine months’ notice. |
| (5) | USDA has the right to terminate its lease at any time commencing August 1, 2028 with 120 days’ notice. |
| (6) | Sentara Healthcare System (a) has the right to terminate its lease for the 3,676 sq. ft. expansion space on August 1, 2019 with 6 months’ notice and payment of a termination fee in an amount equal to the unamortized tenant improvement and leasing costs; and (b) has the right to terminate its entire leased premises on September 30, 2022 with 6 months’ notice and payment of a termination fee in an amount equal to the unamortized tenant improvement and leasing costs. |
THE INFORMATION IN THIS STRUCTURAL AND COLLATERAL TERM SHEET IS NOT COMPLETE AND MAY BE AMENDED PRIOR TO THE TIME OF SALE. THIS TERM SHEET IS NOT AN OFFER TO SELL THESE SECURITIES AND IT IS NOT A SOLICITATION OF AN OFFER TO BUY THESE SECURITIES IN ANY JURISDICTION WHERE THE OFFER OR SALE IS NOT PERMITTED.
137
FOREST OFFICE PARK |
The following table presents certain information relating to the lease rollover schedule at the Forest Office Park Property:
Lease Expiration Schedule(1)(2)
| Year Ending December 31, 2017 | No. of Leases Expiring | Expiring NRSF | % of Total NRSF | Cumulative Expiring NRSF | Cumulative % of Total NRSF | Annual U/W Base Rent | % of Total Annual U/W Base Rent | Annual U/W Base Rent PSF(3) |
| MTM | 0 | 0 | 0.0% | 0 | 0.0% | $0 | 0.0% | $0.00 |
| 2018 | 0 | 0 | 0.0% | 0 | 0.0% | $0 | 0.0% | $0.00 |
| 2019 | 2 | 7,896 | 3.4% | 7,896 | 3.4% | $148,262 | 3.7% | $18.78 |
| 2020 | 1 | 2,012 | 0.9% | 9,908 | 4.3% | $36,297 | 0.9% | $18.04 |
| 2021 | 1 | 2,201 | 1.0% | 12,109 | 5.3% | $33,291 | 0.8% | $15.13 |
| 2022 | 1 | 4,032 | 1.8% | 16,141 | 7.0% | $70,580 | 1.8% | $17.50 |
| 2023 | 1 | 2,476 | 1.1% | 18,617 | 8.1% | $46,970 | 1.2% | $18.97 |
| 2024 | 1 | 19,791 | 8.6% | 38,408 | 16.8% | $365,342 | 9.2% | $18.46 |
| 2025 | 1 | 127,983 | 55.9% | 166,391 | 72.6% | $2,381,764 | 59.7% | $18.61 |
| 2026 | 0 | 0 | 0.0% | 166,391 | 72.6% | $0 | 0.0% | $0.00 |
| 2027 | 0 | 0 | 0.0% | 166,391 | 72.6% | $0 | 0.0% | $0.00 |
| 2028 | 0 | 0 | 0.0% | 166,391 | 72.6% | $0 | 0.0% | $0.00 |
| Thereafter | 1 | 48,787 | 21.3% | 215,178 | 93.9% | $906,511 | 22.7% | $18.58 |
| Vacant | 0 | 13,887 | 6.1% | 229,065 | 100.0% | $0 | 0.0% | $0.00 |
| Total/Weighted Average | 9 | 229,065 | 100.0% | $3,989,016 | 100.0% | $18.54 |
| (1) | Information obtained from the underwritten rent roll. |
| (2) | Certain tenants may have lease termination options that are exercisable prior to the originally stated expiration date of the subject lease and that are not considered in the Lease Expiration Schedule. |
| (3) | Weighted Average Annual U/W Base Rent PSF excludes vacant space. |
The following table presents historical occupancy percentages at the Forest Office Park Property:
Historical Occupancy
12/31/2013(1) | 12/31/2014(1) | 12/31/2015(2) | 12/31/2016(2) | 12/27/2017(3) | ||||
| 95.1% | 94.5% | 91.0% | 93.0% | 93.9% |
| (1) | Information obtained from the borrower. |
| (2) | Information obtained from the appraisal. |
| (3) | Information obtained from the underwritten rent roll. |
Operating History and Underwritten Net Cash Flow.The following table presents certain information relating to the historical operating performance and underwritten net cash flow at the Forest Office Park Property:
Cash Flow Analysis
| 2014 | 2015 | 2016 | 2017 | U/W | % of U/W Effective Gross Income | U/W $ per SF | ||||||||
| Base Rent | $2,811,917 | $3,081,816 | $3,482,954 | $3,594,781 | $3,989,016(1) | 101.9% | $17.41 | |||||||
| Grossed Up Vacant Space | 0 | 0 | 0 | 0 | 236,079 | 6.0 | 1.03 | |||||||
| Total Reimbursement | 4,967 | 30,821 | 172,757 | 80,895 | 111,878 | 2.9 | 0.49 | |||||||
| Other Income(2) | 0 | 0 | 15,045 | 180,887 | 0 | 0.0 | 0.00 | |||||||
| Less Vacancy & Credit Loss | 0 | 0 | 0 | (4,735) | (422,509)(3) | (10.8) | (1.84) | |||||||
| Effective Gross Income | $2,816,884 | $3,112,637 | $3,670,756 | $3,851,828 | $ 3,914,464 | 100.0% | $17.09 | |||||||
| Total Operating Expenses | $1,268,656 | $1,356,981 | $1,330,284 | $1,520,787 | $1,528,599 | 39.1% | $6.67 | |||||||
| Net Operating Income(4) | $1,548,228 | $1,755,656 | $2,340,472 | $2,331,041 | $2,385,864 | 60.9% | $10.42 | |||||||
| Replacement Reserves | 0 | 0 | 0 | 0 | 54,976 | 1.4 | 0.24 | |||||||
| Tenant Improvements | 0 | 0 | 0 | 0 | 200,259 | 5.1 | 0.87 | |||||||
| Leasing Commissions | 0 | 0 | 0 | 0 | 73,461 | 1.9 | 0.32 | |||||||
| Net Cash Flow | $1,548,228 | $1,755,656 | $2,340,472 | $2,331,041 | $2,057,169 | 52.6% | $8.98 | |||||||
| NOI DSCR | 2.02x | 2.29x | 3.05x | 3.03x | 3.11x | |||||||||
| NCF DSCR | 2.02x | 2.29x | 3.05x | 3.03x | 2.68x | |||||||||
| NOI DY | 8.6% | 9.8% | 13.0% | 13.0% | 13.3% | |||||||||
| NCF DY | 8.6% | 9.8% | 13.0% | 13.0% | 11.4% |
(1) | U/W Base Rent includes contractual rent steps through November 2018 and rent averaging for three investment grade tenants over the lesser of the remaining lease term or loan term totalling $348,754. |
| (2) | Other Income includes the amortized FF&E Allowance for the Commonwealth of Virginia. |
| (3) | The underwritten economic vacancy is 10.0%. The Forest Office Park Property was 93.9% physically occupied as of December 27, 2017. |
| (4) | The increase in Net Operating income from 2014 to 2015 and from 2015 to 2016 was due in part to Commonwealth of Virginia renewing its lease in July 2015 at a rental rate higher than that of its previous lease and receiving a partial rent abatement due to a renovation project. |
THE INFORMATION IN THIS STRUCTURAL AND COLLATERAL TERM SHEET IS NOT COMPLETE AND MAY BE AMENDED PRIOR TO THE TIME OF SALE. THIS TERM SHEET IS NOT AN OFFER TO SELL THESE SECURITIES AND IT IS NOT A SOLICITATION OF AN OFFER TO BUY THESE SECURITIES IN ANY JURISDICTION WHERE THE OFFER OR SALE IS NOT PERMITTED.
138
FOREST OFFICE PARK |
The following table presents certain information relating to comparable Office leases for the Forest Office Park Property:
Comparable Office Leases(1)
| Property Name/Location | Year Built/ Renovated | Stories | Total GLA (SF) | Distance from Subject | Lease Date / Term(2) | Lease Area (SF)(2) | Annual Base Rent PSF(2) | Lease Type |
Campbell Building 8002 Discovery Dr. Richmond, VA
| 1980/NAP | 4 | 55,024 | 0.1 miles | Jan. 2016 – Mar. 2017 / 2.0 – 10.4 Yrs
| 1,587 – 6,157 | $16.25 - $19.75 | Gross |
The Dale Building 1504 Santa Rosa Rd. Richmond, VA
| 1979/NAP | 2 | 38,649 | 0.2 miles | Jun. 2015 – Nov. 2016 / 2.0 – 5.2 Yrs
| 506 – 5,040 | $14.00 - $20.74 | Gross |
Nelson Building 1503 Santa Rosa Rd. Richmond, VA
| 1974/NAP | 2 | 38,914 | 0.2 miles | May 2015 – Mar. 2017 / 3.2 – 6.0 Yrs
| 1,307 – 6,526 | $16.00 - $16.53 | Gross |
Koger Building 8001 Franklin Farms Dr. Richmond, VA
| 1974/NAP | 2 | 44,487 | 0.1 miles | Nov. 2014 – Mar. 2017 / 1.0 – 5.4 Yrs
| 834 – 10,079 | $15.00 - $17.35 | Gross |
Glen Forest Office Park 7204 Glen Forest Dr. Richmond, VA
| 1987/NAP | 3 | 40,448 | 0.8 miles | Feb. 2015 – Mar. 2017 / 3.1 – 5.3 Yrs
| 1,003 – 2,677 | $16.50 - $18.50 | Gross |
| (1) | Information obtained from the appraisal and a third party research report. |
| (2) | The appraiser provided four comparable leases for each of the five properties shown on the table above. The information shown represents the ranges of such leases. |
THE INFORMATION IN THIS STRUCTURAL AND COLLATERAL TERM SHEET IS NOT COMPLETE AND MAY BE AMENDED PRIOR TO THE TIME OF SALE. THIS TERM SHEET IS NOT AN OFFER TO SELL THESE SECURITIES AND IT IS NOT A SOLICITATION OF AN OFFER TO BUY THESE SECURITIES IN ANY JURISDICTION WHERE THE OFFER OR SALE IS NOT PERMITTED.
139
| No. 14 – Connecticut Industrial Portfolio | ||||||
| Loan Information | Property Information | |||||
| Mortgage Loan Seller: | BSPRT Finance, LLC | Single Asset/Portfolio: | Portfolio | |||
Credit Assessment (DBRS/Fitch/Moody’s): | NR/NR/NR | Property Type: | Industrial | |||
| Original Principal Balance: | $16,850,000 | Specific Property Type(3): | Various | |||
| Cut-off Date Balance: | $16,850,000 | Location: | Meriden, CT | |||
| % of Initial Pool Balance: | 2.3% | Size: | 568,084 SF | |||
| Loan Purpose: | Acquisition | Cut-off Date Balance Per SF: | $29.66 | |||
| Borrowers: | Sky 103, LLC | Year Built/Renovated(3): | Various/NAP | |||
| Borrower Sponsors: | Sky Management Services LLC | Title Vesting: | Fee | |||
| Mortgage Rate: | 4.880% | Property Manager: | Self-managed | |||
| Note Date: | February 16, 2018 | 4th Most Recent Occupancy(4): | NAV | |||
| Anticipated Repayment Date: | NAP | 3rd Most Recent Occupancy (As of): | 77.7% (12/31/2015) | |||
| Maturity Date: | March 6, 2028 | 2nd Most Recent Occupancy (As of): | 100.0% (12/31/2016) | |||
| IO Period: | 36 months | Most Recent Occupancy (As of): | 100.0% (12/31/2017) | |||
| Loan Term (Original): | 120 months | Current Occupancy (As of): | 100.0% (Various) | |||
| Seasoning: | 0 months | |||||
| Amortization Term (Original): | 360 months | |||||
| Loan Amortization Type: | Interest-only, Amortizing Balloon | |||||
| Interest Accrual Method: | Actual/360 | |||||
| Call Protection: | L(24),D(92),O(4) | |||||
| Lockbox Type: | Springing | |||||
| Additional Debt: | None | Underwriting and Financial Information:
| ||||
| Additional Debt Type: | NAP | |||||
| 4th Most Recent NOI(4): | NAV | |||||
| 3rd Most Recent NOI (As of): | $1,384,289 (12/31/2015) | |||||
| 2nd Most Recent NOI (As of): | $1,618,750 (12/31/2016) | |||||
| Escrows and Reserves: | Most Recent NOI (As of)(5): | $2,081,562 (Annualized 9 12/31/2017) | ||||
| U/W Revenues: | $2,749,723 | |||||
| Type: | Initial | Monthly | Cap (If Any) | U/W Expenses: | $653,327 | |
| Taxes: | $0 | $24,417 | NAP | U/W NOI: | $2,096,396 | |
| Insurance: | $36,005 | $4,001 | NAP | U/W NCF: | $1,812,354 | |
| Deferred Maintenance: | $86,125 | $0 | NAP | U/W NOI DSCR: | 1.96x | |
| TI/LC Reserve(1): | $0 | $18,936 | $900,000 | U/W NCF DSCR: | 1.69x | |
| Replacement Reserve: | $0 | $4,734 | NAP | U/W NOI Debt Yield: | 12.4% | |
| Ongoing Environmental Remediation Reserve: | $239,531 | $0 | NAP | U/W NCF Debt Yield: | 10.8% | |
| CT Transfer – Environmental Reserve: | $250,000 | $0 | NAP | As-Is Appraised Value: | $26,900,000 | |
| Outstanding TI Allowances – Bob’s: | $241,333 | $0 | NAP | As-Is Appraisal Valuation Date: | December 13, 2017 | |
| Outstanding TI Allowances – Fosdick: | $94,241 | $0 | NAP | Cut-off Date LTV Ratio: | 62.6% | |
| Fosdick Reserve | $0 | Springing(2) | NAP | LTV Ratio at Maturity or ARD: | 55.3% | |
| (1) | The TI/LC Reserve is subject to a cap of $900,000. Monthly deposits on the reserve will decrease to $9,468 after the third year of the loan term. |
| (2) | Monthly contribution to the Fosdick Reserve will be $45,000 after December 31, 2018, unless there is a Fosdick Renewal, as defined in the loan documents. A “Fosdick Renewal” is defined as, among other conditions outlined in the loan documents, the lender’s receipt of evidence that (i) the Fosdick tenant has renewed or extended its lease for its entire leased space and (ii) Fosdick is occupying its space and is paying full, unabated rent. |
| (3) | See “Portfolio Summary” Table. |
| (4) | A third party property manager was put in place in 2015 and historical financials prior to 2015 were not available. |
| (5) | 2017 financials represent a trailing nine months annualized amount. The seller of the Connecticut Industrial Portfolio Properties (as defined below) took title of the property in April 2017. The seller did not have financial information for the first 3 months of 2017. |
The Connecticut Industrial Portfolio mortgage loan (“Connecticut Industrial Portfolio Mortgage Loan”) is evidenced by a single promissory note that is secured by a first mortgage encumbering the fee interest in two industrial facilities in Meriden, Connecticut: the 160 Corporate Court property (“160 Corporate Court Property”) and the 550 Research Parkway property (“550 Research Parkway Property”, and collectively with the 160 Corporate Court Property “Connecticut Industrial Portfolio Properties”). On February 16, 2018, the Connecticut Industrial Portfolio Mortgage Loan was originated by BSPRT Finance, LLC, with an original principal balance and Cut-off Date balance of $16,850,000 and accrues interest at an interest rate of 4.880%per annum.The Connecticut Industrial
THE INFORMATION IN THIS STRUCTURAL AND COLLATERAL TERM SHEET IS NOT COMPLETE AND MAY BE AMENDED PRIOR TO THE TIME OF SALE. THIS TERM SHEET IS NOT AN OFFER TO SELL THESE SECURITIES AND IT IS NOT A SOLICITATION OF AN OFFER TO BUY THESE SECURITIES IN ANY JURISDICTION WHERE THE OFFER OR SALE IS NOT PERMITTED.
140
CONNECTICUT INDUSTRIAL PORTFOLIO
Portfolio Mortgage Loan has an initial and remaining term, as of the Cut-off Date, of 120 months and requires payments of interest-only for the first 36 months of the loan term. The Connecticut Industrial Mortgage Loan matures on March 6, 2028.
Following the lockout period, the borrower has the right to defease the Connecticut Industrial Portfolio Mortgage Loan in whole, but not in part, on any date before December 6, 2027. In addition, the Connecticut Industrial Portfolio Mortgage Loan is prepayable without penalty on or after December 6, 2027.
Sources and Uses
| Sources | Uses | |||||||
| Mortgage Loan | $16,850,000 | 67.4% | Purchase Price | $23,661,550 | 94.6% | |||
| Sponsor Equity(1) | 8,161,714 | 32.6 | Upfront Reserves(1) | 947,235 | 3.8 | |||
| Closing Costs | 402,928 | 1.6 | ||||||
| Total Sources | $25,011,714 | 100.0% | Total Uses | $25,011,714 | 100.0% |
| (1) | Includes an outstanding tenant improvement seller credit of $335,574 which was fully reserved at closing. |
The Properties. The Connecticut Industrial Portfolio Properties are comprised of two adjacent buildings, the 160 Corporate Court Property, an industrial warehouse distribution property located on Corporate Court, and the 550 Research Parkway Property, an industrial manufacturing warehouse property located on Research Parkway, in Meriden, Connecticut. The Connecticut Industrial Portfolio Properties are situated on a 52.2-acre parcel and collectively feature 633 parking spaces, representing approximately 1.1 spaces per 1,000 SF of collective net rentable area at the properties.
The 160 Corporate Court Property was constructed in 1987, has 23-27 foot clear heights, 51 loading docks, 1 drive-in dock and significant outside storage for trailer parking. Approximately 40,000 square feet, about 16.6% of net rentable area, features an office buildout. The 160 Corporate Court Property is 100.0% leased and occupied as of March 1, 2018 by Bob’s Stores. Bob’s Stores operates a chain of 35 apparel and activewear stores throughout the Northeast and is owned by Sports Direct, the U.K’s largest sporting goods retailer. The 550 Research Parkway Property was constructed in 1968 and has 20 foot clear heights. Approximately 5.6% of net rentable area is used as office space. The 550 Research Parkway Property features numerous specialty buildouts, including laboratory areas, clean rooms, climate controlled rooms and hazardous materials storage areas. Approximately $5 million has been invested into facility improvements over the past 2.5 years, including upgrades to plumbing, floors, HVAC and specialty rooms, among other areas. As of January 1, 2018, the 550 Research Parkway Property was 100.0% occupied by two tenants, Medline Industries, Inc. and Fosdick Fufillment Corp.
The Connecticut Industrial Portfolio Properties benefit from proximity to major roadways including Interstate 91 (2.0 miles away), the Merritt Parkway (1.2 miles away), CT Route 66/I-691 (2.1 miles away) and Route 5 (2.2 miles away), which provide regional access in the Northeast and serve as a midpoint between Boston and New York City for regional distribution. Additionally, the properties benefit from nearby access to public transportation, including the M-link Route along East Main Street approximately 1.3 miles north of the properties and regional access provided by Amtrak’s Meriden Station approximately 3.0 miles northeast of the properties.
The Connecticut Industrial Portfolio Properties are located in the New Haven MSA, which includes New Haven County, New Haven, Waterbury and 24 towns. The New Haven MSA benefits from its close proximity to New York and Boston. Manufacturing is an important component of the New Haven MSA’s economy, with healthcare, business, financial services and retail trade beginning to play a larger role. Furthermore, the New Haven MSA benefits from its education and economic connections to Yale University, which has an impact of $2 billion a year. Local healthcare and pharmaceutical firms, along with Yale Medical School, constitute one of the largest major concentrations of biomedical research in the nation. The largest employers in the New Haven MSA represent a variety of industries including education, healthcare, and wholesale. Top employers in the area include Yale University, Yale-New Haven Health System, Bozzuto’s Inc., and Southern Connecticut State University.
According to the appraiser, the Connecticut Industrial Portfolio Properties are part of the New Haven County Industrial Market. Over the past five years, vacancy rates have declined from 12.6% in 2013 to 5.3% as of year-end 2017. Over the past five years, the market has seen a 1.9% compound average growth rate in asking rent per square foot, with asking rents per square foot at $5.38 as of year-end 2017. According to a third party market research report, the Connecticut Industrial Portfolio Properties are located in the Meriden Industrial submarket. As of fourth quarter, 2017, the submarket contains approximately 4.7 million square feet of logistics, specialized industrial and flex space inventory, a 3.7% vacancy rate and average asking rent of $5.23 per square foot.
As of year-end 2017, supply in the area was approximately 67.3 million square feet and net absorption was approximately 1.1 million square feet. The estimated 2017 household population in a 1-, 3- and 5- mile radius of the properties was 2,631, 39,968 and 95,256 respectively. The 2017-estimated household income in a 1-, 3-, and 5- mile radius of the properties was $99,322, $78,752 and $86,690 respectively.
THE INFORMATION IN THIS STRUCTURAL AND COLLATERAL TERM SHEET IS NOT COMPLETE AND MAY BE AMENDED PRIOR TO THE TIME OF SALE. THIS TERM SHEET IS NOT AN OFFER TO SELL THESE SECURITIES AND IT IS NOT A SOLICITATION OF AN OFFER TO BUY THESE SECURITIES IN ANY JURISDICTION WHERE THE OFFER OR SALE IS NOT PERMITTED.
141
CONNECTICUT INDUSTRIAL PORTFOLIO
The following table presents certain information relating to Connecticut Industrial Portfolio Properties:
Portfolio Summary
| Property Name | Location | Specific Property Type | Allocated Cut- Off Date Principal Balance | % of Portfolio Cut-off Date Principal Balance | Occupancy(1) | Year | Net Rentable Area (SF) | Appraised Value | Allocated LTV |
| 160 Corporate Court | Meriden, CT | Warehouse Distribution | $7,650,000 | 45.4% | 100.0% | 1987/NAP | 241,333 | $11,900,000 | 64.3% |
| 550 Research Parkway | Meriden, CT | Manufacturing/Distribution | $9,200,000 | 54.6% | 100.0% | 1968/NAP | 326,751 | $15,000,000 | 61.3% |
| Total/Weighted Average | $16,850,000 | 100.0% | 100.0% | 568,084 | $26,900,000 | 62.6% | |||
| (1) | Information obtained from the underwritten rent roll dated January 1, 2018 for the 550 Research Parkway Property. As of March 1, 2018, 100.0% of the 160 Corporate Court Property was occupied. |
Major Tenants(1)
| Tenant Name | Property Name | Credit Rating (Fitch/ Moody’s/ S&P)(2) | Tenant NRSF | % of NRSF(6) | Annual U/W Base Rent PSF(1) | Annual U/W Base Rent(1) | % of Total Annual U/W Base Rent | Lease Expiration Date |
| Major Tenants | ||||||||
| Bob’s (Sports Direct) | 160 Corporate Court | NR/NR/NR | 241,333 | 42.5% | $4.44 | $1,070,795 | 45.6% | 2/17/2023 |
| Medline Industries, Inc.(3) | 550 Research Parkway | NR/Baa1/A- | 200,000 | 35.2% | $4.21 | $842,000 | 35.8% | 4/30/2020(4) |
| Fosdick Fulfillment Corp. | 550 Research Parkway | NR/NR/NR | 126,751 | 22.3% | $3.45 | $437,028 | 18.6% | 12/31/2019(5) |
| Total Major Tenants | 568,084 | 100.0% | $4.14 | $2,349,822 | 100.0% | |||
| Occupied Collateral Total | 568,084 | 100.0% | $4.14 | $2,349,822 | 100.0% | |||
| Vacant Space | 0 | 0.0% | ||||||
| Collateral Total | 568,084 | 100.0% | ||||||
| (1) | Information obtained from the underwritten rent roll date January 1, 2018 for the 550 Research Parkway Property. As of March 1, 2018, 100.0% of the 160 Corporate Court property was occupied. |
| (2) | Certain ratings are of the parent, company, whether or not the parent company guarantees the lease. |
| (3) | The Clorox Co. serves as the guarantor of the Medline Industries, Inc. lease. Credit ratings shown are of The Clorox Co. |
| (4) | The Medline Industries, Inc. lease features one, three-year extension option. |
| (5) | The Fosdick Fufillment Corp. lease features two, three-year extension options. |
| (6) | % of NRSF shown represents net rentable area across the Connecticut Industrial Portfolio Properties. |
The following table presents certain information relating to the lease rollover schedule at the Connecticut Industrial Portfolio Properties:
Lease Expiration Schedule(1)
| Year Ending December 31, | No. of Leases Expiring | Expiring NRSF | % of Total NRSF | Cumulative Expiring NRSF | Cumulative % of Total NRSF | Annual U/W Base Rent | % of Total Annual U/W Base Rent | Annual U/W Base Rent PSF(2) |
| MTM | 0 | 0 | 0.0% | 0 | 0.0% | $0 | 0.0% | $0.00 |
| 2018 | 0 | 0 | 0.0% | 0 | 0.0% | $0 | 0.0% | $0.00 |
| 2019 | 1 | 126,751 | 22.3% | 126,751 | 22.3% | $437,028 | 18.6% | $3.45 |
| 2020 | 1 | 200,000 | 35.2% | 326,751 | 57.5% | $842,000 | 35.8% | $4.21 |
| 2021 | 0 | 0 | 0.0% | 326,751 | 57.5% | $0 | 0.0% | $0.00 |
| 2022 | 0 | 0 | 0.0% | 326,751 | 57.5% | $0 | 0.0% | $0.00 |
| 2023 | 1 | 241,333 | 42.5% | 568,084 | 100.0% | $1,070,795 | 45.6% | $4.44 |
| 2024 | 0 | 0 | 0.0% | 568,084 | 100.0% | $0 | 0.0% | $0.00 |
| 2025 | 0 | 0 | 0.0% | 568,084 | 100.0% | $0 | 0.0% | $0.00 |
| 2026 | 0 | 0 | 0.0% | 568,084 | 100.0% | $0 | 0.0% | $0.00 |
| 2027 | 0 | 0 | 0.0% | 568,084 | 100.0% | $0 | 0.0% | $0.00 |
| 2028 | 0 | 0 | 0.0% | 568,084 | 100.0% | $0 | 0.0% | $0.00 |
| Thereafter | 0 | 0 | 0.0% | 568,084 | 100.0% | $0 | 0.0% | $0.00 |
| Vacant | 0 | 0 | 0.0% | 568,084 | 100.0% | $0 | 0.0% | $0.00 |
| Total/Weighted Average | 3 | 568,084 | 100.0% | $2,349,822 | 100.0% | $4.14 |
| (1) | Information obtained from the underwritten rent roll dated January 1, 2018 for the 550 Research Parkway Property. As of March 1, 2018, 100.0% of the 160 Corporate Court Property was occupied. |
| (2) | Weighted Average Annual U/W Base Rent PSF excludes vacant space. |
THE INFORMATION IN THIS STRUCTURAL AND COLLATERAL TERM SHEET IS NOT COMPLETE AND MAY BE AMENDED PRIOR TO THE TIME OF SALE. THIS TERM SHEET IS NOT AN OFFER TO SELL THESE SECURITIES AND IT IS NOT A SOLICITATION OF AN OFFER TO BUY THESE SECURITIES IN ANY JURISDICTION WHERE THE OFFER OR SALE IS NOT PERMITTED.
142
CONNECTICUT INDUSTRIAL PORTFOLIO
The following table presents historical occupancy percentages at the Connecticut Industrial Portfolio Properties:
Historical Occupancy
12/31/2014(1) | 12/31/2015 | 12/31/2016 | Various(2) | |||
| NAV | 77.7% | 100.0% | 100.0% |
| (1) | A third party manager was put in place in 2015 and historical financials prior to 2015 were not available. |
| (2) | Information obtained from the underwritten rent roll dated January 1, 2018 for the 550 Research Parkway Property. As of March 1, 2018, 100.0% of the 160 Corporate Court Property was occupied. |
Operating History and Underwritten Net Cash Flow. The following table presents certain information relating to the underwritten net cash flow at the Connecticut Industrial Portfolio Properties:
Cash Flow Analysis(1)
| 2015 | 2016 | T-9 Annualized 2017(2) | U/W | % of U/W Effective Gross Income | U/W $ per SF | |
| Base Rent | $1,826,477 | $1,966,762 | $2,270,406 | $2,349,822(3) | 85.5% | $4.14 |
| Total Recoveries | 224,496 | 282,403 | 475,602 | 544,623 | 19.8% | $0.96 |
| Other Income | 1,510 | 0 | 504 | 0 | 0.0% | $0.00 |
| Less Vacancy & Credit Loss | 0 | 0 | $0 | (144,722)(4) | (5.3%) | ($0.25) |
| Effective Gross Income | $2,052,483 | $2,249,165 | $2,746,511 | $2,749,723 | 100.0% | $4.84 |
| Total Operating Expenses | 668,194 | 630,415 | 664,950 | $653,327 | 23.8% | $1.15 |
| Net Operating Income | $1,384,289 | $1,618,750 | $2,081,562 | $2,096,396 | 76.2% | $3.69 |
| Replacement Reserves | 0 | 0 | 0 | 56,808 | 2.1% | $0.10 |
| TI/LC | $0 | $0 | $0 | $227,234 | 8.3% | $0.40 |
| Net Cash Flow | $1,384,289 | $1,618,750 | $2,081,562 | $1,812,354 | 65.9% | $3.19 |
| NOI DSCR | 1.29x | 1.51x | 1.94x | 1.96x | ||
| NCF DSCR | 1.29x | 1.51x | 1.94x | 1.69x | ||
| NOI DY | 8.2% | 9.6% | 12.4% | 12.4% | ||
| NCF DY | 8.2% | 9.6% | 12.4% | 10.8% |
| (1) | A third party manager was put in place in 2015 and historical financials prior to 2015 were not available. |
| (2) | Financial statements were not available for the first three months on 2017. 2017 figures presented represent the annualized nine months. |
| (3) | Base rent includes rent steps taken through January 30, 2019. |
| (4) | The underwritten economic vacancy is 5.0%. The 550 Research Parkway Property was 100.0% physically occupied as of January 1, 2018. As of March 1, 2018, 100.0% of the 160 Corporate Court Property was occupied. |
The following table presents certain information relating to comparable industrial leases to the Connecticut Industrial Portfolio Properties:
Comparable Leases(1)
| Property Name/Location | Year Built | Tenant Name | Warehouse Size SF | Office Size SF | Distance to Subject | Initial Rent PSF | Lease Type |
Amphenol Corporation 358 Hall Avenue Wallingford, CT
Cheshire Industrial | 1920 | Amphenol Corporation | 171,440 | 26,230 | 5.0 miles | $4.65 | Absolute Net |
250 Knotter Drive Cheshire, CT Cheshire Commerce Center
| 1973 | Atlantic Inertial Systems | 140,000 | 20,000 | 8.3 miles | $7.29 | NNN |
181 West Johnson Avenue Cheshire, CT North Haven Industrial | 1960 | Fosdick Fufillment Corp. | 124,544 | 5,000 | 7.4 miles | $4.00 | Gross |
297 State Street North Haven, CT | 1995 | Fufillment Works | 198,927 | NAP | 11.4 miles | $3.90 | NNN |
| 1-800-Pack-Rat LLC | 71,670 | 4,600 | $4.61 | NNN |
| (1) | Information obtained from the appraisal. |
THE INFORMATION IN THIS STRUCTURAL AND COLLATERAL TERM SHEET IS NOT COMPLETE AND MAY BE AMENDED PRIOR TO THE TIME OF SALE. THIS TERM SHEET IS NOT AN OFFER TO SELL THESE SECURITIES AND IT IS NOT A SOLICITATION OF AN OFFER TO BUY THESE SECURITIES IN ANY JURISDICTION WHERE THE OFFER OR SALE IS NOT PERMITTED.
143
| No. 15 – Galleria Oaks | ||||||
| Loan Information | Property Information | |||||
| Mortgage Loan Seller: | Barclays Bank PLC | Single Asset/Portfolio: | Single Asset | |||
| Credit Assessment | Property Type: | Retail | ||||
| (DBRS/Fitch/Moody’s): | NR/NR/NR | Specific Property Type: | Unanchored | |||
| Original Principal Balance(1): | $16,000,000 | Location: | Austin, TX | |||
| Cut-off Date Balance(1): | $15,976,437 | Size: | 98,522 SF | |||
| % of Initial Pool Balance: | 2.2% | Cut-off Date Balance Per SF(3): | $162.16 | |||
| Loan Purpose: | Refinance | Year Built/Renovated: | 1989/NAP | |||
| Borrower: | WC Galleria Oaks Center, LLC | Title Vesting: | Fee | |||
| Borrower Sponsor: | World Class Capital Group | Property Manager: | WCRE Management, LLC | |||
| Mortgage Rate: | 5.040% | 4th Most Recent Occupancy(4): | 73.4% (12/31/2013) | |||
| Note Date: | January 31, 2018 | 3rd Most Recent Occupancy(4): | 70.7% (12/31/2014) | |||
| Anticipated Repayment Date: | NAP | 2nd Most Recent Occupancy(4): | 72.5% (12/31/2015) | |||
| Maturity Date: | February 6, 2028 | Most Recent Occupancy (As of)(4): | 74.1% (12/31/2016) | |||
| IO Period: | None | Current Occupancy (As of)(4): | 85.3% (10/31/2017) | |||
| Loan Term (Original): | 120 months | |||||
| Seasoning: | 1 month | Underwriting and Financial Information: | ||||
| Amortization Term (Original): | 360 months | |||||
| Loan Amortization Type: | Amortizing Balloon | 4th Most Recent NOI(4): | $1,015,543 (12/31/2014) | |||
| Interest Accrual Method: | Actual/360 | 3rd Most Recent NOI(4): | $1,129,136 (12/31/2015) | |||
| Call Protection: | L(25),D(88),O(7) | 2nd Most Recent NOI(4): | $1,126,978 (12/31/2016) | |||
| Lockbox Type: | Hard/Springing Cash Management | Most Recent NOI(4): | $1,300,011 (12/31/2017) | |||
| Additional Debt: | None | |||||
| Additional Debt Type: | NAP | |||||
| U/W Revenues: | $2,020,834 | |||||
| U/W Expenses: | $642,697 | |||||
| U/W NOI: | $1,378,137 | |||||
| Escrows and Reserves: | U/W NCF: | $1,293,736 | ||||
| U/W NOI DSCR(3): | 1.41x | |||||
| Type: | Initial | Monthly | Cap (If Any) | U/W NCF DSCR(3): | 1.33x | |
| Taxes | $60,571 | $30,285 | NAP | U/W NOI Debt Yield(3): | 9.2% | |
| Insurance(2) | $0 | Springing | NAP | U/W NCF Debt Yield(3): | 8.6% | |
| Replacement Reserves | $59,000 | $1,232 | $73,892 | As-Is Appraised Value: | $23,000,000 | |
| TI/LC Reserve | $0 | $7,389 | $266,009 | As-Is Appraisal Valuation Date: | September 6, 2017 | |
| Deferred Maintenance | $35,181 | $0 | NAP | Cut-off Date LTV Ratio(3): | 69.5% | |
| Earnout Holdback Reserve(1) | $925,000 | $0 | NAP | LTV Ratio at Maturity or ARD(3): | 57.3% | |
| (1) | Original Principal Balance and Cut-off Date Balance include a $925,000 Earnout Holdback Reserve that was deposited into escrow by the borrower on the origination date. The Earnout Holdback Reserve may be disbursed to the borrower in whole or in part, subject to the satisfaction of certain conditions of the loan documents, including: (i) no event of default is continuing, (ii) the debt service coverage ratio, as calculated under the loan documents, is not less than 1.40x on the date of such disbursement, (iii) the debt yield, as calculated under the loan documents, is not less than 8.75% on the date of such disbursement, (iv) if a disbursement of the Earnout Holdback Reserve funds will be used for purposes other than the payment of tenant improvement and leasing commission costs, then for the six month period preceding the date of disbursement, the Galleria Oaks Property (as defined below) is required to be at least 90.0% leased to tenants which are in possession of their respective spaces and are not in default under their respective leases, (v) the borrower will not have the right to request release of more than $200,000 for the payment of tenant improvement and leasing commission costs and (vi) the borrower’s request for the disbursement of the Earnout Holdback Reserve funds must be in writing and the borrower will not have the right to request a disbursement of Earnout Holdback Reserve funds more than two times prior to July 31, 2020. Amounts remaining in the Earnout Holdback Reserve on July 31, 2020 will be applied by the lender to pay down the mortgage loan, accompanied by the applicable prepayment yield maintenance premium to be paid by the borrower. |
| (2) | Ongoing monthly reserves for insurance are not required so long as insurance requirements are being satisfied by a blanket policy acceptable to the lender. |
| (3) | Cut-off Date Balance Per SF, Cut-off Date LTV Ratio and LTV Ratio at Maturity or ARD figures are calculated based on the Original Principal Balance of $16,000,000; however, U/W NOI DSCR, U/W NCF DSCR, U/W NOI Debt Yield and U/W NCF Debt Yield are calculated net of the $925,000 Earnout Holdback Reserve. The U/W NOI DSCR, U/W NCF DSCR, U/W NOI Debt Yield and U/W NCF Debt Yield based on the Original Principal Balance of $16,000,000 is 8.6%, 8.1%, 1.33x and 1.25x, respectively. |
| (4) | See “Historical Occupancy” and “Cash Flow Analysis” sections. The increase from 12/31/2015 occupancy to 10/31/2017 occupancy is primarily attributable to the lease-up of 27,518 square feet to nine tenants in 2016 and 2017; the corresponding $373,837 of additional base rent is reflected in the increase from 3rd Most Recent NOI to Most Recent NOI. |
The mortgage loan is evidenced by a single promissory note secured by the fee interest in a neighborhood shopping center located in Austin, Texas (the “Galleria Oaks Property”). The Galleria Oaks Property was built in 1989, consists of 98,522 square feet and is situated on a 10.8-acre site. The Galleria Oaks Property contains 547 surface parking spaces, resulting in a parking ratio of 5.9 spaces per 1,000 square feet of rentable area. As of October 31, 2017, the Galleria Oaks Property was 85.3% occupied by 25 tenants and the property management office.
The Galleria Oaks Property is located in Austin, the state capital of Texas, which is one of the fastest growing economies in the United States, according to the appraisal. The Galleria Oaks Property fronts U.S. Highway 183, one of the main thoroughfares in Austin, and is located in a well-established area of the city that contains many commercial and residential developments. According
THE INFORMATION IN THIS STRUCTURAL AND COLLATERAL TERM SHEET IS NOT COMPLETE AND MAY BE AMENDED PRIOR TO THE TIME OF SALE. THIS TERM SHEET IS NOT AN OFFER TO SELL THESE SECURITIES AND IT IS NOT A SOLICITATION OF AN OFFER TO BUY THESE SECURITIES IN ANY JURISDICTION WHERE THE OFFER OR SALE IS NOT PERMITTED.
144
GALLERIA OAKS
to the appraisal, the 2016 population within a one-, three- and five-mile radius of the Galleria Oaks Property was 14,702, 95,626, and 204,910, respectively; and the average household income within the same radii was $84,489, $94,602 and $102,560, respectively.
Sources and Uses
| Sources | Uses | |||||
| Original loan amount | $16,000,000 | 86.3% | Loan payoff | $17,193,371 | 92.8% | |
| Borrower sponsors’ new cash contribution | 2,529,540 | 13.7 | Earnout Holdback(1) | 925,000 | 5.0 | |
| Closing costs | 256,417 | 1.4 | ||||
| Reserves | 154,752 | 0.8 | ||||
| Total Sources | $18,529,540 | 100.0% | Total Uses | $18,529,540 | 100.0% |
| (1) | On the origination date, the borrower deposited $925,000 into escrow for an Earnout Holdback Reserve. The Earnout Holdback Reserve may be disbursed to the borrower in whole or in part, subject to the satisfaction of certain conditions of the loan documents, including: (i) no event of default is continuing, (ii) the debt service coverage ratio, as calculated under the loan documents, is not less than 1.40x on the date of such disbursement, (iii) the debt yield, as calculated under the loan documents, is not less than 8.75% on the date of such disbursement, (iv) if a disbursement of the Earnout Holdback Reserve funds will be used for purposes other than the payment of tenant improvement and leasing commission costs, then for the six month period preceding the date of disbursement, the Galleria Oaks Property is required to be at least 90.0% leased to tenants which are in possession of their respective spaces and are not in default under their respective leases, (v) the borrower will not have the right to request release of more than $200,000 for the payment of tenant improvement and leasing commission costs and (vi) the borrower’s request for the disbursement of the Earnout Holdback Reserve funds must be in writing and the borrower will not have the right to request a disbursement of Earnout Holdback Reserve funds more than two times prior to July 31, 2020. Amounts remaining in the Earnout Holdback Reserve on July 31, 2020 will be applied by the lender to pay down the mortgage loan, accompanied by the applicable prepayment yield maintenance premium to be paid by the borrower. |
The following table presents certain information relating to the tenancy at the Galleria Oaks Property:
Major Tenants(1)
| Tenant Name | Credit Rating (Fitch/Moody’s/ S&P)(2) | Tenant NRSF | % of NRSF | Annual U/W Base Rent PSF(3) | Annual U/W Base Rent(3) | % of Total Annual U/W Base Rent | Lease Expiration Date | |
| Major Tenant | ||||||||
| North Austin Bingo | NR/NR/NR | 10,113 | 10.3% | $12.25 | $123,884 | 8.5% | 1/31/2028 | |
| WellMed Medical Management, Inc | A-/A3/A+ | 10,000 | 10.2% | $19.13 | $191,300 | 13.1% | 9/30/2023(4) | |
| Discount Tire Co. | NR/NR/NR | 6,892 | 7.0% | $13.08 | $90,147 | 6.2% | 8/31/2019(5) | |
| AAA Texas | NR/NR/NR | 6,006 | 6.1% | $19.00 | $114,114 | 7.8% | 4/30/2019(6) | |
| Texas Card House | NR/NR/NR | 5,473 | 5.6% | $13.91 | $76,102 | 5.2% | 5/31/2022(7) | |
| A+A Sichuan China | NR/NR/NR | 5,470 | 5.6% | $17.00 | $92,990 | 6.4% | 5/31/2020(8) | |
| The Sherwin-Williams Company | BBB/Baa3/BBB | 5,000 | 5.1% | $15.60 | $78,000 | 5.4% | 4/30/2019(9) | |
| Total Major Tenants | 48,954 | 49.7% | $15.66 | $766,537 | 52.7% | |||
| Non-Major Tenants(10) | 35,125 | 35.7% | $20.18 | $688,701 | 47.3% | |||
| Occupied Collateral Total(10) | 84,079 | 85.3% | $17.52 | $1,455,239 | 100.0% | |||
| Vacant Space | 14,443 | 14.7% | ||||||
| Collateral Total | 98,522 | 100.0% | ||||||
| (1) | Information obtained from the underwritten rent roll. |
| (2) | Certain ratings are those of the parent company whether or not the parent guarantees the lease. |
| (3) | Annual U/W Base Rent PSF and Annual U/W Base Rent include contractual rent steps through February 2019, totaling $23,632. |
| (4) | WellMed Medical Management, Inc has one, five-year lease renewal option. |
| (5) | Discount Tire Co. has four, five-year lease renewal options. |
| (6) | AAA Texas has two, five-year lease renewal options. |
| (7) | Texas Card House has three, three-year lease renewal options |
| (8) | A+A Sichuan China has one, five-year lease renewal option. |
| (9) | The Sherwin-Williams Company has two, five-year lease renewal options. |
| (10) | Non-Major Tenants and Occupied Collateral Total Annual U/W Base Rent PSF excludes the management office (1,005 square feet), to which no underwritten base rent is attributed. |
THE INFORMATION IN THIS STRUCTURAL AND COLLATERAL TERM SHEET IS NOT COMPLETE AND MAY BE AMENDED PRIOR TO THE TIME OF SALE. THIS TERM SHEET IS NOT AN OFFER TO SELL THESE SECURITIES AND IT IS NOT A SOLICITATION OF AN OFFER TO BUY THESE SECURITIES IN ANY JURISDICTION WHERE THE OFFER OR SALE IS NOT PERMITTED.
145
GALLERIA OAKS
The following table presents certain information relating to the lease rollover schedule at the Galleria Oaks Property:
Lease Expiration Schedule(1)(2)
| Year Ending December 31, | No. of Leases Expiring | Expiring NRSF | % of Total NRSF | Cumulative Expiring NRSF | Cumulative % of Total NRSF | Annual U/W Base Rent | % of Total Annual U/W Base Rent | Annual U/W Base Rent PSF(3)(4) |
| 2018 | 3 | 6,060 | 6.2% | 6,060 | 6.2% | $118,796 | 8.2% | $19.60 |
| 2019 | 6 | 22,441 | 22.8% | 28,501 | 28.9% | $360,805 | 24.8% | $16.08 |
| 2020 | 4 | 12,658 | 12.8% | 41,159 | 41.8% | $197,878 | 13.6% | $15.63 |
| 2021 | 3 | 7,320 | 7.4% | 48,479 | 49.2% | $245,956 | 16.9% | $33.60 |
| 2022 | 5 | 11,709 | 11.9% | 60,188 | 61.1% | $166,688 | 11.5% | $14.24 |
| 2023 | 1 | 10,000 | 10.2% | 70,188 | 71.2% | $191,300 | 13.1% | $19.13 |
| 2024 | 1 | 966 | 1.0% | 71,154 | 72.2% | $18,905 | 1.3% | $19.57 |
| 2025 | 0 | 0 | 0.0% | 71,154 | 72.2% | $0 | 0.0% | $0.00 |
| 2026 | 0 | 0 | 0.0% | 71,154 | 72.2% | $0 | 0.0% | $0.00 |
| 2027 | 1 | 1,807 | 1.8% | 72,961 | 74.1% | $31,026 | 2.1% | $17.17 |
| 2028 | 1 | 10,113 | 10.3% | 83,074 | 84.3% | $123,884 | 8.5% | $12.25 |
| Thereafter(4) | 1 | 1,005 | 1.0% | 84,079 | 85.3% | $0 | 0.0% | $0.00 |
| Vacant | 0 | 14,443 | 14.7% | 98,522 | 100.0% | $0 | 0.0% | $0.00 |
| Total/Weighted Average | 26 | 98,522 | 100.0% | $1,455,239 | 100.0% | $17.52 |
| (1) | Information obtained from the underwritten rent roll. |
| (2) | Certain tenants may have lease termination options that are exercisable prior to the originally stated expiration date of the subject lease and that are not considered in the Lease Expiration Schedule. |
| (3) | Weighted Average U/W Base Rent PSF excludes vacant space. |
| (4) | Thereafter includes the management office (1,005 square feet), to which no underwritten base rent is attributed. Thereafter and Total/Weighted Average Annual U/W Base Rent PSF exclude the square footage associated with this space. |
The following table presents historical occupancy percentages at the Galleria Oaks Property:
Historical Occupancy
12/31/2013(1) | 12/31/2014(1) | 12/31/2015(1)(2) | 12/31/2016(1) | 10/31/2017(2)(3) | ||||
| 73.4% | 70.7% | 72.5% | 74.1% | 85.3% |
| (1) | Information obtained from the borrower. |
| (2) | The increase from 12/31/2015 occupancy to 10/31/2017 occupancy is primarily attributable to the lease-up of 27,518 square feet to nine tenants in 2016 and 2017. |
| (3) | Information obtained from the underwritten rent roll. |
Operating History and Underwritten Net Cash Flow. The following table presents certain information relating to the underwritten net cash flow at the Galleria Oaks Property:
Cash Flow Analysis
| 2014 | 2015 | 2016 | 2017 | U/W | % of U/W Effective Gross Income | U/W $ per SF | ||||||||
| Base Rent(1) | $1,158,674 | $1,273,508 | $1,308,211(1) | $1,383,103(1) | $1,455,239(1) | 72.0% | $14.77 | |||||||
| Grossed Up Vacant Space | 0 | 0 | 0 | 0 | 314,353 | 15.6 | 3.19 | |||||||
| Total Reimbursables | 272,737 | 311,389 | 435,942 | 529,284 | 636,141 | 31.5 | 6.46 | |||||||
| Other Income | 23,478 | 14,588 | 10,753 | 31,893 | 23,671 | 1.2 | 0.24 | |||||||
| Less Vacancy & Credit Loss | 0 | 0 | 0 | 0 | (408,570)(2) | (20.2) | (4.15) | |||||||
| Effective Gross Income | $1,454,889 | $1,599,485 | $1,754,907 | $1,944,280 | $2,020,834 | 100.0% | $20.51 | |||||||
| Total Operating Expenses | $439,346 | $470,349 | $627,929 | $644,269 | $642,697 | 31.8% | $6.52 | |||||||
| Net Operating Income | $1,015,543 | $1,129,136 | $1,126,978 | $1,300,011 | $1,378,137 | 68.2% | $13.99 | |||||||
| TI/LC | 0 | 0 | 0 | 0 | 69,623 | 3.4 | 0.71 | |||||||
| Capital Expenditures | 0 | 0 | 0 | 0 | 14,778 | 0.7 | 0.15 | |||||||
| Net Cash Flow | $1,015,543 | $1,129,136 | $1,126,978 | $1,300,011 | $1,293,736 | 64.0% | $13.13 | |||||||
| NOI DSCR | 1.04x | 1.16x | 1.16x | 1.33x | 1.41x | |||||||||
| NCF DSCR | 1.04x | 1.16x | 1.16x | 1.33x | 1.33x | |||||||||
| NOI DY | 6.7% | 7.5% | 7.5% | 8.6% | 9.2% | |||||||||
| NCF DY | 6.7% | 7.5% | 7.5% | 8.6% | 8.6% |
| (1) | U/W Base Rent is based on the rent roll dated as of October 31, 2017, and includes rent steps through February 2019 totalling $23,632. Increases in historical Base Rent and Total Reimbursables are primarily attributable to the lease-up of 27,518 square feet to nine tenants in 2016 and 2017. |
| (2) | Vacancy is underwritten to 16.8%. The Galleria Oakes Property was 85.3% occupied as of October 31, 2017. |
THE INFORMATION IN THIS STRUCTURAL AND COLLATERAL TERM SHEET IS NOT COMPLETE AND MAY BE AMENDED PRIOR TO THE TIME OF SALE. THIS TERM SHEET IS NOT AN OFFER TO SELL THESE SECURITIES AND IT IS NOT A SOLICITATION OF AN OFFER TO BUY THESE SECURITIES IN ANY JURISDICTION WHERE THE OFFER OR SALE IS NOT PERMITTED.
146
GALLERIA OAKS
The following table presents certain information relating to comparable office leases for the Galleria Oaks Property:
Comparable Leases(1)
| Property Name/Location | Distance from Subject | Tenant Name | Lease Date/Term | Lease Area (SF) | Annual Base Rent PSF | Lease Type |
| 13450 Research Boulevard Austin, TX | 0.3 miles | Clean Slate Wax Studio | June 2016 / 60 Months | 1,700 | $22.00 | NNN |
| 3801 Capital of Texas Highway Austin, TX | 7.5 miles | American Capital Mortgage | March 2015 / 60 Months | 2,469 | $22.00 | NNN |
| 109 Cypress Creek Road Cedar Park, TX | 4.3 miles | Confidential | July 2017 / 36 Months | 3,300 | $22.00 | NNN |
| 13401 North Highway, Suite 402 Austin, TX | 4.3 miles | Confidential | July 2017 / 60 Months | 1,822 | $22.00 | NNN |
| 11815 Ranch Road 620 North, Suite 5 Austin, TX | 2.3 miles | Confidential | March 2017 / 60 Months | 2,247 | $18.00 | NNN |
| (1) | Information obtained from the appraisal. |
THE INFORMATION IN THIS STRUCTURAL AND COLLATERAL TERM SHEET IS NOT COMPLETE AND MAY BE AMENDED PRIOR TO THE TIME OF SALE. THIS TERM SHEET IS NOT AN OFFER TO SELL THESE SECURITIES AND IT IS NOT A SOLICITATION OF AN OFFER TO BUY THESE SECURITIES IN ANY JURISDICTION WHERE THE OFFER OR SALE IS NOT PERMITTED.
147
| Wells Fargo Commercial Mortgage Trust 2018-C43 |
| VI. | Transaction Contact Information |
Questions regarding this Structural and Collateral Term Sheet may be directed to any of the following individuals:
| Wells Fargo Securities, LLC | |
| Brigid Mattingly | Tel. (312) 269-3062 |
| A.J. Sfarra | Tel. (212) 214-5613 |
| Alex Wong | Tel. (212) 214-5615 |
| Barclays Capital Inc. | |
| Daniel Vinson | Tel. (212) 528-8224 |
| Brian Wiele | Tel. (212) 412-5780 |
| Brian La Belle | Tel. (212) 526-1809 |
THE INFORMATION IN THIS STRUCTURAL AND COLLATERAL TERM SHEET IS NOT COMPLETE AND MAY BE AMENDED PRIOR TO THE TIME OF SALE. THIS TERM SHEET IS NOT AN OFFER TO SELL THESE SECURITIES AND IT IS NOT A SOLICITATION OF AN OFFER TO BUY THESE SECURITIES IN ANY JURISDICTION WHERE THE OFFER OR SALE IS NOT PERMITTED.
148