Exhibit (17)(f)
| | |
| ANNUAL REPORT 2009 | | JULY 31, 2009 |
| | |
DOMINI SOCIAL EQUITY FUND®
INVESTOR SHARES, CLASS R SHARES, CLASS A SHARES & INSTITUTIONAL SHARES
DOMINI EUROPEAN SOCIAL EQUITY FUNDSM
INVESTOR SHARES & CLASS A SHARES
DOMINI PACASIA SOCIAL EQUITY FUNDSM
INVESTOR SHARES & CLASS A SHARES
DOMINI EUROPEAN PACASIA SOCIAL EQUITY FUNDSM
INVESTOR SHARES & CLASS A SHARES
DOMINI SOCIAL BOND FUND®
INVESTOR SHARES
KEEP IN TOUCH WITH DOMINI
A report like this comes twice a year, but your dollars work for change all year long. Sign up for Domini Updates at www.domini.com to receive:
| • | | Our e-newsletter Investing Matters, with news on how your funds are making a difference. |
| • | | Domini Action Alerts that help you speak out on issues from child labor to global warming. |
We will never sell or rent your email address to anyone, for any reason. (Please visit our website for more information about our Privacy Policy.) And you can, of course, unsubscribe at any time.
SIGN UP FOR E-DELIVERY
If you invest directly with Domini, you can also avoid an annual fee of $15 by signing up for paperless E-Delivery of your statements and reports – just log into your account and select E-Delivery from the “Account Maintenance” drop-down menu. If you invest through a financial advisor, brokerage firm, or employer-sponsored retirement plan, why not ask your advisor or plan sponsor how to receive your documents electronically? It can reduce your carbon footprint, save trees, and unclutter your life, all with just a few strokes of your keyboard!
TABLE OF CONTENTS
| | |
 | | LETTER FROM THE PRESIDENT Dear Fellow Shareholders: The year ended July 31, 2009, is one most investors would like to forget. For the twelve-month period the Standard & Poor’s 500 was down 20%. This dismal performance was matched in other parts of the world. In Japan the Nikkei was down 19.5% and in Europe, the MSCI Europe index was down 25%. This would be troubling enough, but added to this is the volatility factor. Each of these regions of the world was actually much worse six months ago, and each has rallied in excess of over 45% since their lows. What is an investor to do? The year proved that our global system of finance deeply affects the day-to-day lives of individuals. The phrase “sophisticated investment vehicles” gets bandied about by those on Wall Street who earn their fortunes trading credit default swaps on rapid trading platforms, but to the millions who lost their homes, lost their jobs, and lost hope for their children, these vehicles were just irresponsible tricks to siphon money out of the real economy and into the pockets of a few. Last July 31 we were in the midst of an election to select the 44th President of the United States. On that date, Quinnipiac University published results from their most recent poll. Their report indicated that most Americans were concerned about energy prices, the war in Iraq, and the upcoming election. They were not thinking about a global financial meltdown of cataclysmic proportions. The month of August saw markets holding fairly steady, but then September hit. That month U.S. markets saw a decline of almost 9%, contributing to a loss of almost 22% for the year ending September 30. The cause had nothing to do with either fluctuations in the price of oil (which we recently learned was caused by speculators and not supply and demand) or the war in Iraq. The cause, we discovered, was that there was far too little regulation of speculators on Wall Street and no regulation of “sophisticated investment vehicles.” By late March 2009 we began to see signs of hope. They were fragile, mostly just indicators that the rate of decline was slowing, and not much to cheer about generally. But with the markets so battered, it was enough to bring some investors back to the stock market. By April real signs of improvement began. By April 15, 2009, Goldman Sachs issued a statement that it believed it would be able to return bailout funds shortly. Wells Fargo, another major recipient of TARP money, announced earnings that far exceeded analysts’ expectations due to strong increases in its lending business. The market had been anxiously awaiting any sign that our banks were improving, and this earnings report was taken as a broad sign that the frozen credit markets may finally be thawing. The bull market had begun. |
| |
| |
| |
| |
| |
| |
| |
2
| | |
Responsible investors were absolutely correct in calling on Congress and thought leaders to address predatory lending. Had our calls been heeded it would have removed the peg that failed, leading to this mess. But there is a more important lesson to be learned. Disclosure and transparency are essential to maintaining a competitive and functional economy. The events of the past year were largely precipitated by practices not widely known and nowhere tracked. And the same can be said for the climate crisis and continuing widespread human rights abuses. This cannot be allowed to go on. At Domini Social Investments we have a long history of pushing for greater disclosure and have seen tremendous effect. But more needs to be done. While social investors have opened up many company practices, there is no systematic set of regulations or even standard industry practice in the United States to allow stakeholders to accurately measure what a company adds or detracts from society. We believe that the Global Reporting Initiative is the best model in place and have been asking companies to follow its guidelines, but voluntary reporting is not sufficient. We would like to see government recognize that the events of the past year were exacerbated by the secrecy financial institutions were allowed to operate under. We hope that a broad set of new mandatory disclosure requirements, including the social and environmental impact of corporate practices, will be instituted, and after many years, we believe our voices are now being heard. Thank you for your continued support of socially responsible investing and of Domini Social Investments. We appreciate the opportunity to serve you. Very truly yours, 
Amy Domini amy@domini.com | |  |
| |
| |
| |
| |
3
| | |
| | DOMINI NEWS Amy Domini Receives Award for Professional Ethics On March 31, Amy Domini received Villanova University’s 2009 Praxis Award in Professional Ethics. Recipients exemplify ethical behavior in their respective fields, promote and encourage integrity, work toward a greater good, conduct research in the field of ethics, or influence the practice of ethics through professional works or leadership. Domini’s Foreign Funds Are Going International The Domini European Social Equity Fund, Domini PacAsia Social Equity Fund, and Domini European PacAsia Social Equity Fund will be changing their investment strategies and reorganizing into one new international Domini fund. The new fund will have the same investment objective, policies and restrictions, investment management personnel, services, net expenses, and distribution arrangements as each of the existing funds. Its new international strategy will permit investment in the stocks of companies located in Europe, the Asia-Pacific region, and throughout the rest of the world, including emerging-market countries. These changes are scheduled to be effective after the close of business on November 27, 2009. How will this affect me? If you are a shareholder in one of Domini’s foreign funds on November 27, 2009, you will become a shareholder of a new international Domini fund, receiving shares of the international fund equal in value to your foreign fund shares as of the close of business on November 27. The reorganization is expected to be a tax-free transaction for federal income tax purposes and will not trigger any redemption fees. Do I need to do anything? No. The exchange of your shares for international fund shares will happen automatically. Will fund expenses go up? No. The net operating expenses of the international fund will be the same as those of Domini’s foreign funds. Will the managers change? No. The international fund will continue to be managed by Domini, with Wellington Management acting as the subadvisor. What is the benchmark for the international strategy? The Morgan Stanley Capital International Europe Australasia Far East Index (MSCI EAFE). Who pays for the costs of these changes? Domini Social Investments LLC. Investing internationally involves special risks, such as currency fluctuations, social and economic instability, differing securities regulations and accounting standards, limited public information, possible changes in taxation, and periods of illiquidity. |
| |
| |
| |
| |
| |
| |
| |
4
| | |
DOMINI ACTIVISM Celebrating 15 Years of Shareholder Activism Domini filed its first shareholder resolution fifteen years ago, in 1994. Since then, we have filed a total of 200 resolutions with 83 companies, and engaged in numerous long-term dialogues with corporate management on a range of social, environmental, and governance issues. Working with a variety of committed people and organizations, Domini has worked on your behalf to alleviate poverty among coffee farmers, improve conditions for factory workers, and protect forests. Visit the Shareholder Activism section of our website to read our second-quarter Social Impact Update reviewing highlights of the past 15 years: • Procter & Gamble Markets Fair Trade Coffee • Gap Releases First Social Responsibility Report • JPMorgan Adopts Comprehensive Environmental Policy • Apple Adopts Code of Conduct • Domini Raises Alert on Nanomaterials, Toxics • Lifting the Veil on Corporate Political Contributions None of these successes would have been possible without your support. We thank you for your commitment to make a difference in the world through the way you invest. To receive email updates, please sign up for “Domini Updates” on our home page. Domini Executive Selected for SEC Investor Advisory Committee Domini Social Investments’ Managing Director and General Counsel, Adam Kanzer, has been appointed to the Securities and Exchange Commission’s newly formed Investor Advisory Committee. The 18-member committee was established to provide the SEC with the views of a broad spectrum of investors on the Commission’s regulatory agenda. Committee members will serve for a term of two years. Domini Advises U.K. Parliamentary Committee on Human Rights In June, Domini was invited to meet with the United Kingdom’s Joint Parliamentary Committee on Human Rights to provide evidence in its current inquiry into business and human rights. We provided several written reports and responded to a range of questions relating to human rights investment criteria, the influence of social investors, shareholder activism tactics, and the merits of mandatory social and environmental corporate disclosure. The Committee expects to produce a report to the U.K. government in the fall. | | |
| |
| |
| |
| |
5
| | |
| | SUSTAINABILITY REPORTING Sustainability reporting by corporations has long been one of Domini’s key areas of focus. After more than a decade of advocacy on the part of social investors, environmentalists, labor and community groups — and dramatic changes by governments around the world — the Securities and Exchange Commission is reexamining its environmental disclosure rules and we are optimistic that our call for greater disclosure of corporate social performance will get a fair hearing as well. For those who care about corporate accountability, the stakes are high. The Power of Information The value of increased disclosure by corporations has long been clear. In 1913, future Supreme Court justice Louis Brandeis wrote that “sunlight is said to be the best of disinfectants; electric light the most efficient policeman.” Publicity, he wrote, is “justly commended as a remedy for social and industrial diseases.” Provide investors with useful information, Brandeis believed, and they will use it to steer away from trouble. At the same time, the act of disclosure itself will help to reform harmful practices. In 1933 and 1934, in the midst of the Great Depression, the Roosevelt administration created the Securities and Exchange Commission (SEC) and instituted securities regulations to address the broad social and economic harm caused by unregulated capital markets. These regulations required publicly traded companies to disclose their financial status and to publicly discuss risks that may affect the firm. Today, corporate sustainability reports provide investors and other stakeholders with a more complete picture of a company’s business prospects, as well as its impact on society and the environment. These reports can also drive improvements within a company by providing a means for management to measure and benchmark their progress towards publicly stated goals. The best reports can create an opportunity for dialogue. Kimberly-Clark, for example, provides detailed information on the forestry certification systems it utilizes in the production of its paper products. This information allowed Domini to identify gaps in the company’s forestry policies. Our engagement, in collaboration with Greenpeace, helped to convince the company to improve its forestry policies and study how to increase the use of recycled materials. A Boom In Reporting Throughout the world we are seeing a dramatic growth in voluntary corporate social responsibility and sustainability reporting. According to the Corporate Register, the number of such reports released by corporations has grown from approximately 26 in 1992 to over 3,000 today. These |
| |
| |
| |
| |
| |
| |
| |
6
| | |
REPORTING AS YOU GO Timberland is an example of a company taking innovative steps to draw attention to its sustainability data. The company now reports on social and environmental key performance indicators on a quarterly basis, with occasional updates in between. These reports are published on the social networking website JustMeans. For a quick overview, Timberland provides a quarterly “dashboard” that offers metrics in what it calls its “four pillars”: Energy, Product, Workplace, and Service. For the first quarter of 2009, Timberland reported 5,308 tons of carbon emissions, 38.6% of cotton sourced that is organic, and 1% of product purchased from “high risk” factories (down from 34% in 2007). reports, issued in response to a variety of pressures, vary widely in quality, but the trend is towards increasingly transparent and reliable reports. Much of this progress is taking place outside the U.S. In December 2008, Domini and the Social Investment Forum released Innovations in Social and Environmental Disclosure Outside the United States, a detailed report that presents case studies of five countries where governments and stock exchanges have taken the lead in requiring corporate social and environmental disclosure: Brazil, France, Malaysia, South Africa, and Sweden. In a number of countries, sustainability reporting is actually required. France requires key sustainability data to be published in corporate annual reports, and the Swedish government decided in 2007 to require all 55 fully or partially state-owned companies to produce reports in accordance with GRI guidelines. GLOBAL REPORTING INITIATIVE The Global Reporting Initiative (GRI), founded in 1997-1998 by Ceres, has become the de facto global standard for corporate sustainability reporting. By providing a framework for consistent reporting, the GRI seeks to make “disclosure on economic, environmental, and social performance ... as commonplace and comparable as financial reporting.” More than 1,000 companies and organizations worldwide currently use the GRI framework as the basis for their reporting. However, only about 100 U.S. companies do so. Social Investors Move the U.S. Forward For decades, investors have been asking companies to report on their social and environmental impact. Many of these requests have come in the form of shareholder resolutions filed since the early 1970s by members of the Interfaith Center on Corporate Responsibility (ICCR), a pioneer | | |
| |
| |
| |
| |
7
| | |
| | in the use of shareholder resolutions to address corporate social and environmental performance. In the early years, most of these proposals received votes in the single-digit range. Over the past five years, however, shareholder resolutions asking for sustainability reports have averaged 25% support. These votes convey a strong message to management and government regulators that a broad range of investors now consider this information to be “material” to their investment decisions. When the Domini Social Equity Fund was launched in 1991, it was still relatively uncommon for investors to consider social and environmental factors. The investment landscape has changed dramatically since then. For example, in 2005 UN Secretary General Kofi Annan launched the Principles for Responsible Investment, a set of six principles committing investors to consider social and environmental factors in their decisions and to engage directly with companies on these issues. Investors managing $18 trillion have signed on to the principles. We believe that a combination of mandatory and voluntary sustainability reporting is essential for the implementation of responsible investment practices in the 21st century. Mandatory reporting will ensure that all companies report consistently and reliably on the sustainability issues of greatest importance. Voluntary reporting will allow companies to tell their stories in their own words. A Critical Moment A critical moment in this long path toward greater corporate sustainability reporting has now arrived. In 2007, the Investor Network on Climate Risk (INCR), a project of Ceres, petitioned the SEC asking for improved GAP RAISES THE BAR In May 2004, after two years of dialogue between Gap and a coalition of socially responsible investors including Domini and ICCR, the company released its first Social Responsibility Report. For the first time, a clothing retailer had publicly rated the way its suppliers treated their employees. Gap’s report presented a rating system for evaluating factory performance on a broad range of labor rights. The report provided regional compliance indicators, revealed the number of supplier facilities it had audited by region and, perhaps most importantly, discussed problems that were found and what the company was doing to correct them. Gap set a high bar — not only for its competitors in the apparel industry, but for companies in other industries, many of which provide no data at all. In July, Gap issued its fourth report. |
| |
| |
| |
| |
| |
| |
| |
8
| | |
“climate risk” disclosure from public companies and subsequently met with the SEC to press its case. In June 2009, INCR again submitted a letter to the SEC with the backing of investors managing $1.4 trillion, restating its call for climate risk disclosure, and advocating mandatory sustainability reporting using the GRI format. In March 2009, Domini participated in a Social Investment Forum (SIF, the trade association for the socially responsible investing community) meeting at the SEC to discuss the merits of mandatory sustainability reporting. We then worked with SIF to submit a proposal in July 2009 seeking a rule that would require companies to produce an annual sustainability report consistent with the GRI guidelines. The proposal also asks the Commission to clarify that companies are already required to disclose the long-term risks imposed by various social and environmental issues. The proposal was endorsed by 50 investment groups, including ICCR and Ceres, and the number has since grown to 85. In June 2009, the SEC announced the creation of an Investor Advisory Committee, including a Domini executive tasked to represent social investors. The committee began its work in July, addressing among other things the question of expanded social and environmental reporting. We’re returning to first principles by asking the SEC to institute mandatory social and environmental disclosure. Although voluntary reporting serves a valuable role, we believe that investors, workers, and communities cannot continue to rely only on voluntary, anecdotal, and spotty data on these crucial issues. The holdings discussed above can be found in the portfolio of the Domini Social Equity Fund, included herein. The composition of the Fund’s portfolio is subject to change. Investing internationally involves special risks, such as currency fluctuations, social and economic instability, differing securities regulations and accounting standards, limited public information, possible changes in taxation, and periods of illiquidity. The preceding profiles should not be deemed an offer to sell or a solicitation of an offer to buy the stock of any of the companies noted, or a recommendation concerning the merits of any of these companies as an investment. Domini’s General Counsel is a member of the Securities and Exchange Commission’s Investor Advisory Committee. This essay represents Domini’s views and does not necessarily reflect either the views of the committee, or the views or regulatory agenda of the Commission, the Commissioners, or Commission staff. This material must be preceded or accompanied by the Fund’s current prospectus. DSIL Investment Services LLC, Distributor. 09/09 | | |
| |
| |
| |
| |
9
DOMINI SOCIAL EQUITY FUND
Performance Commentary
For the year ended July 31, 2009, the Fund’s Investor shares declined -17.48%, outperforming the S&P 500, which fell -19.96%.
The following were among the companies held in the Fund’s portfolio that helped performance the most, relative to the S&P 500:
| | • | | Shares of Citigroup fell in October 2008 amid fears about its viability, and stabilized in late November when the government provided additional capital and limited the company’s losses on certain toxic assets. The stock fell again in the first quarter of 2009. Not holding the stock during the first half of the year helped performance. |
| | • | | McDonald’s benefited from increasing global and U.S. sales, and its stock lost considerably less than the index. |
| | • | | Verizon Communications significantly outperformed the benchmark, with a small positive return for the year. |
The following were among the companies in the portfolio that hurt the Fund’s relative performance the most:
| | • | | The stock of Genworth Financial fell after the company said it was examining strategic alternatives for its U.S. mortgage insurance business. The company was downgraded by Moody’s. |
| | • | | The oil and gas company Unit was hurt as oil prices declined. |
| | • | | Shares of American Capital fell in the latter half of 2008 when the company announced it would pay no further dividends for the year, given the volatile market and increasing write-downs. |
The Fund was helped by its stock selection in the financial, materials, and energy sectors. The Fund was hurt by weak stock selection in the industrials and consumer staples sectors.
10
TEN LARGEST HOLDINGS
| | | | | | | | |
COMPANY | | % NET
ASSETS | | | COMPANY | | % NET
ASSETS | |
Johnson & Johnson | | 4.6 | % | | JPMorgan Chase | | 2.7 | % |
Microsoft | | 3.6 | % | | AT&T | | 2.4 | % |
IBM | | 3.4 | % | | Apache | | 2.0 | % |
Amgen | | 2.9 | % | | Google | | 2.0 | % |
Apple | | 2.8 | % | | Southwestern Energy | | 1.8 | % |
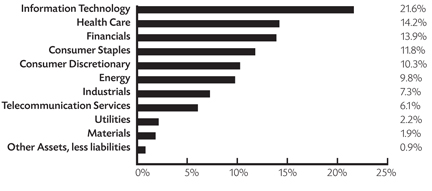
PORTFOLIO HOLDINGS BY INDUSTRY SECTOR (% OF NET ASSETS)
11
AVERAGE ANNUAL TOTAL RETURNS
| | | | | | | | |
| | | | | Investor shares | | | S&P 500 | |
| As of 7-31-09 | | 1 Year | | -17.48 | % | | -19.96 | % |
| | 5 Year | | -1.37 | % | | -0.14 | % |
| | 10 Year | | -2.35 | % | | -1.19 | % |
| | Since Inception (6-3-91) | | 6.75 | % | | 7.40 | % |
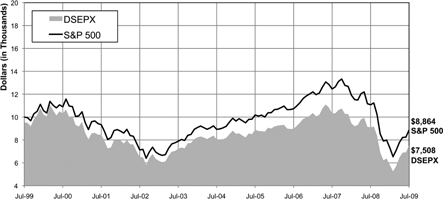
COMPARISON OF $10,000 INVESTMENT IN THE DOMINI SOCIAL EQUITY FUND INVESTOR SHARES AND S&P 500

Past performance is no guarantee of future results. The Fund’s returns quoted above represent past performance after all expenses. Economic and market conditions change, and both will cause investment return, principal value, and yield to fluctuate so that an investor’s shares, when redeemed, may be worth more or less than their original cost. Current performance may be lower or higher than the performance data quoted. For performance information current to the most recent month-end, call 1-800-582-6757 or visit www.domini.com. A 2.00% redemption fee is charged on sales or exchanges of shares made less than 30 days after the settlement of purchase or acquisition through exchange, with certain exceptions. Performance data quoted above does not reflect the deduction of this fee, which would reduce the performance quoted. See the Fund’s prospectus for further information.
For the period reported in its current prospectus, the Fund’s gross annual operating expenses totaled 1.24% of net assets. Until November 26, 2009, Domini has contractually agreed to waive certain fees and/or reimburse certain expenses, including management fees, so that expenses paid by the Fund will not exceed, on a per annum basis, 1.20% of its average daily net assets representing Investor shares, absent an earlier modification by the Board of Trustees, which oversees the Funds.
The table and the graph do not reflect the deduction of taxes that a shareholder would pay on Fund distributions or the redemption of Fund shares. Total return for the Domini Social Equity Fund is based on the Fund’s net asset values and assumes all dividends and capital gains were reinvested. An investment in the Fund is not a bank deposit and is not insured. You may lose money. Certain fees payable by the Fund were waived during the period, and the Fund’s average annual total returns would have been lower had these not been waived. The Standard & Poor’s 500 Index (S&P 500) is an unmanaged index of common stocks. Investors cannot invest directly in the S&P 500.
12
AVERAGE ANNUAL TOTAL RETURNS
| | | | | | | | |
| | | | | Class R
Shares1 | | | S&P
500 | |
| As of 7-31-09 | | 1 Year | | -17.23 | % | | -19.96 | % |
| | 5 Year | | -1.05 | % | | -0.14 | % |
| | 10 Year | | -2.18 | % | | -1.19 | % |
| | Since Inception (6-3-91) | | 6.85 | % | | 7.40 | % |
COMPARISON OF $10,000 INVESTMENT IN THE DOMINI SOCIAL EQUITY FUND CLASS R SHARES AND S&P 5001

Past performance is no guarantee of future results. The Fund’s returns quoted above represent past performance after all expenses. Economic and market conditions change, and both will cause investment return, principal value, and yield to fluctuate so that an investor’s shares, when redeemed, may be worth more or less than their original cost. Current performance may be lower or higher than the performance data quoted. For performance information current to the most recent month-end, call 1-800-582-6757 or visit www.domini.com. A 2.00% redemption fee is charged on sales or exchanges of shares made less than 30 days after the settlement of purchase or acquisition through exchange, with certain exceptions. Performance data quoted above does not reflect the deduction of this fee, which would reduce the performance quoted. See the Fund’s prospectus for further information.
For the period reported in its current prospectus, the Fund’s gross annual operating expenses totaled 0.85% of net assets. Until November 30, 2009, Domini has contractually agreed to waive certain fees and/or reimburse certain expenses, including management fees, so that expenses paid by the Fund will not exceed, on a per annum basis, 0.90% of its average daily net assets representing Class R shares, absent an earlier modification by the Board of Trustees, which oversees the Funds.
The table and the graph do not reflect the deduction of taxes that a shareholder would pay on Fund distributions or the redemption of Fund shares. Total return for the Domini Social Equity Fund is based on the Fund’s net asset values and assumes all dividends and capital gains were reinvested. An investment in the Fund is not a bank deposit and is not insured. You may lose money. Certain fees payable by the Fund were waived during the period, and the Fund’s average annual total returns would have been lower had these not been waived.
The Standard & Poor’s 500 Index (S&P 500) is an unmanaged index of common stocks. Investors cannot invest directly in the S&P 500.
| 1 | Reflects the performance of the Investor shares for periods prior to the offering of Class R shares, which commenced operations November 28, 2003. This performance has not been adjusted to take into account the lower expenses applicable to Class R shares. |
13
AVERAGE ANNUAL TOTAL RETURNS
| | | | | | | | | | | |
| | | Class A shares
(with 4.75%
maximum
Sales Charge) 1 | | | Class A
shares (without
Sales Charge) 1 | | | S&P
500 | |
| As of 7-31-09 | | 1 Year | | -21.40 | % | | -17.48 | % | | -19.96 | % |
| | 5 Year | | -2.32 | % | | -1.37 | % | | -0.14 | % |
| | 10 Year | | -2.83 | % | | -2.35 | % | | -1.19 | % |
| | Since Inception (6-3-91) | | 6.46 | % | | 6.75 | % | | 7.40 | % |
COMPARISON OF $10,000 INVESTMENT IN THE DOMINI SOCIAL EQUITY FUND CLASS A SHARES AND S&P 500 (with 4.75% maximum sales charge)1
Past performance is no guarantee of future results. The Fund’s returns quoted above represent past performance after all expenses. Economic and market conditions change, and both will cause investment return, principal value, and yield to fluctuate so that an investor’s shares, when redeemed, may be worth more or less than their original cost. Current performance may be lower or higher than the performance data quoted. For performance information current to the most recent month-end, call 1-800-582-6757 or visit www.domini.com. A 2.00% redemption fee is charged on sales or exchanges of shares made less than 30 days after the settlement of purchase or acquisition through exchange, with certain exceptions. Performance data quoted above does not reflect the deduction of this fee, which would reduce the performance quoted. See the Fund’s prospectus for further information.
For the period reported in its current prospectus, the Fund’s gross annual operating expenses totaled 4.11% of net assets. Until November 30, 2009, Domini has contractually agreed to waive certain fees and/or reimburse certain expenses, including management fees, so that expenses paid by the Fund will not exceed, on a per annum basis, 1.18% of its average daily net assets representing Class A shares, absent an earlier modification by the Board of Trustees, which oversees the Funds.
The table and the graph do not reflect the deduction of taxes that a shareholder would pay on Fund distributions or the redemption of Fund shares. Total return for the Domini Social Equity Fund is based on the Fund’s net asset values and assumes all dividends and capital gains were reinvested. An investment in the Fund is not a bank deposit and is not insured. You may lose money. Certain fees payable by the Fund were waived during the period, and the Fund’s average annual total returns would have been lower had these not been waived.
The Standard & Poor’s 500 Index (S&P 500) is an unmanaged index of common stocks. Investors cannot invest directly in the S&P 500.
| 1 | Class A shares were not offered prior to November 28, 2008. All performance information for time periods beginning prior to November 28, 2008, is the performance of the Investor shares. This performance has not been adjusted to reflect the lower expenses of the Class A shares. |
14
AVERAGE ANNUAL TOTAL RETURNS
| | | | | | | | |
| | | Institutional
Shares1 | | | S&P
500 | |
| As of 7-31-09 | | 1 Year | | -17.48 | % | �� | -19.96 | % |
| | 5 Year | | -1.37 | % | | -0.14 | % |
| | 10 Year | | -2.35 | % | | -1.19 | % |
| | Since Inception (6-3-91) | | 6.75 | % | | 7.40 | % |
COMPARISON OF $2 MILLION INVESTMENT IN THE DOMINI SOCIAL EQUITY FUND INSTITUTIONAL SHARES AND S&P 5001

Past performance is no guarantee of future results. The Fund’s returns quoted above represent past performance after all expenses. Economic and market conditions change, and both will cause investment return, principal value, and yield to fluctuate so that an investor’s shares, when redeemed, may be worth more or less than their original cost. Current performance may be lower or higher than the performance data quoted. For performance information current to the most recent month-end, call 1-800-582-6757 or visit www.domini.com. A 2.00% redemption fee is charged on sales or exchanges of shares made less than 30 days after the settlement of purchase or acquisition through exchange, with certain exceptions. Performance data quoted above does not reflect the deduction of this fee, which would reduce the performance quoted. See the Fund’s prospectus for further information.
For the period reported in its current prospectus, the Fund’s gross annual operating expenses totaled 0.85% of net assets. Until November 26, 2009, Domini has contractually agreed to waive certain fees and/or reimburse certain expenses, including management fees, so that expenses paid by the Fund will not exceed, on a per annum basis, 0.65% of its average daily net assets representing Institutional shares, absent an earlier modification by the Board of Trustees, which oversees the Funds.
The table and the graph do not reflect the deduction of taxes that a shareholder would pay on Fund distributions or the redemption of Fund shares. Total return for the Domini Social Equity Fund is based on the Fund’s net asset values and assumes all dividends and capital gains were reinvested. An investment in the Fund is not a bank deposit and is not insured. You may lose money. Certain fees payable by the Fund were waived during the period, and the Fund’s average annual total returns would have been lower had these not been waived.
The Standard & Poor’s 500 Index (S&P 500) is an unmanaged index of common stocks. Investors cannot invest directly in the S&P 500.
| 1 | Institutional shares were not offered prior to November 28, 2008. All performance information for time periods beginning prior to November 28, 2008, is the performance of the Investor shares. This performance has not been adjusted to reflect the lower expenses of the Institutional shares. |
15
DOMINI SOCIAL EQUITY FUND
PORTFOLIOOF INVESTMENTS
July 31, 2009
| | | | | |
SECURITY | | SHARES | | VALUE |
| Consumer Discretionary - 10.3% | | | | | |
Amazon.com Inc (a) | | 81,500 | | $ | 6,989,439 |
American Eagle Outfitters Inc | | 1,004 | | | 14,448 |
AutoNation Inc (a) | | 83,000 | | | 1,716,440 |
AutoZone Inc (a) | | 34,947 | | | 5,366,810 |
Best Buy Co Inc | | 78,972 | | | 2,951,184 |
Big Lots Inc (a) | | 132,900 | | | 3,062,016 |
Black & Decker Corp | | 600 | | | 22,560 |
Centex Corp (a) | | 226,300 | | | 2,468,933 |
Coach Inc | | 200,100 | | | 5,920,959 |
Comcast Corp Cl A | | 5,067 | | | 75,296 |
DIRECTV Group Inc/ The (a) | | 129,100 | | | 3,343,690 |
DR Horton Inc | | 217,839 | | | 2,524,754 |
Expedia Inc (a) | | 119,700 | | | 2,478,987 |
Gap Inc/The | | 266,197 | | | 4,344,335 |
Home Depot Inc | | 3,244 | | | 84,149 |
JC Penney Co Inc | | 67,924 | | | 2,047,909 |
Johnson Controls Inc | | 1,648 | | | 42,650 |
Kohl’s Corp (a) | | 85,700 | | | 4,160,735 |
Liz Claiborne Inc | | 5,757 | | | 18,192 |
Lowe’s Cos Inc | | 2,876 | | | 64,595 |
Ltd Brands Inc | | 1,668 | | | 21,584 |
Macy’s Inc | | 314,600 | | | 4,376,086 |
McDonald’s Corp | | 74,720 | | | 4,114,083 |
Meredith Corp | | 1,350 | | | 35,735 |
NIKE Inc Cl B | | 1,070 | | | 60,605 |
Nordstrom Inc | | 895 | | | 23,664 |
Office Depot Inc (a) | | 455,100 | | | 2,070,705 |
Pulte Homes Inc | | 1,079 | | | 12,268 |
Radio One Inc Cl A (a) | | 18,076 | | | 10,936 |
Ross Stores Inc | | 85,500 | | | 3,769,695 |
Scholastic Corp | | 884 | | | 19,934 |
Staples Inc | | 2,258 | | | 47,463 |
Starbucks Corp (a) | | 2,578 | | | 45,631 |
Target Corp | | 1,523 | | | 66,433 |
Tiffany & Co | | 692 | | | 20,642 |
Timberland Co/The Cl A (a) | | 995 | | | 13,572 |
Time Warner Cable Inc (a) | | 554 | | | 18,315 |
Time Warner Inc | | 221,374 | | | 5,901,831 |
VF Corp | | 554 | | | 35,838 |
Viacom Inc Cl B (a) | | 1,481 | | | 34,300 |
Walt Disney Co/The | | 3,915 | | | 98,345 |
Washington Post Co/ The Cl B | | 95 | | | 42,893 |
Whirlpool Corp | | 500 | | | 28,545 |
| | | | | |
| | | | | 68,567,184 |
| | | | | |
| | |
| Consumer Staples - 11.8% | | | | | |
Avon Products Inc | | 2,173 | | | 70,362 |
Bunge Ltd | | 64,400 | | | 4,506,067 |
Coca-Cola Co/The | | 163,128 | | | 8,130,300 |
Colgate-Palmolive Co | | 97,016 | | | 7,027,839 |
Costco Wholesale Corp | | 2,126 | | | 105,237 |
CVS Caremark Corp | | 138,600 | | | 4,640,328 |
Hershey Co/The | | 2,246 | | | 89,728 |
Kimberly-Clark Corp | | 89,101 | | | 5,207,953 |
Kraft Foods Inc Cl A | | 5,682 | | | 161,028 |
Kroger Co/The | | 160,277 | | | 3,426,722 |
PepsiCo Inc/NC | | 180,959 | | | 10,269,423 |
Procter & Gamble Co/The | | 211,223 | | | 11,724,989 |
Safeway Inc | | 258,900 | | | 4,900,977 |
Sara Lee Corp | | 567,700 | | | 6,040,328 |
SUPERVALU Inc | | 315,100 | | | 4,672,933 |
Sysco Corp | | 331,800 | | | 7,883,568 |
Whole Foods Market Inc (a) | | 1,587 | | | 38,390 |
| | | | | |
| | | | | 78,896,172 |
| | | | | |
| | |
| Energy - 9.8% | | | | | |
Anadarko Petroleum Corp | | 4,531 | | | 218,394 |
Apache Corp | | 155,662 | | | 13,067,825 |
Devon Energy Corp | | 40,600 | | | 2,358,454 |
ENSCO International Inc | | 72,800 | | | 2,758,392 |
EOG Resources Inc | | 3,418 | | | 253,035 |
National Oilwell Varco Inc (a) | | 136,200 | | | 4,895,028 |
Nexen Inc | | 112,200 | | | 2,334,882 |
Noble Corp (a) | | 92,100 | | | 3,118,506 |
Pioneer Natural Resources Co | | 72,400 | | | 2,067,020 |
Southwestern Energy Co (a) | | 293,600 | | | 12,163,848 |
Talisman Energy Inc | | 453,400 | | | 6,982,805 |
Tidewater Inc | | 87,600 | | | 3,942,000 |
XTO Energy Inc | | 276,500 | | | 11,123,595 |
| | | | | |
| | | | | 65,283,784 |
| | | | | |
| | |
| Financials - 13.9% | | | | | |
American Express Co | | 4,919 | | | 139,355 |
Annaly Capital Management Inc | | 296,000 | | | 4,987,600 |
Banco Santander SA ADR | | 194,800 | | | 2,816,808 |
Bank of America Corp | | 382,842 | | | 5,662,233 |
16
DOMINI SOCIAL EQUITY FUND / PORTFOLIOOF INVESTMENTS
July 31, 2009
| | | | | |
SECURITY | | SHARES | | VALUE |
Financials (Continued) | | | | | |
Bank of New York Mellon Corp/The | | 258,900 | | $ | 7,078,326 |
Chubb Corp | | 79,100 | | | 3,652,838 |
Citigroup Inc | | 10,300 | | | 32,651 |
Comerica Inc | | 114,300 | | | 2,724,912 |
First Horizon National Corp (a) | | 267,800 | | | 3,433,196 |
Genworth Financial Inc | | 334,300 | | | 2,306,670 |
Goldman Sachs Group Inc/The | | 64,000 | | | 10,451,200 |
Hudson City Bancorp Inc | | 365,600 | | | 5,140,336 |
JPMorgan Chase & Co | | 466,395 | | | 18,026,167 |
Keycorp | | 221,100 | | | 1,277,958 |
MetLife Inc | | 199,700 | | | 6,779,815 |
NYSE Euronext | | 139,652 | | | 3,763,621 |
Popular Inc | | 11,219 | | | 14,248 |
State Street Corp | | 66,700 | | | 3,355,010 |
US Bancorp | | 5,831 | | | 119,011 |
Wells Fargo & Co | | 426,356 | | | 10,428,668 |
| | | | | |
| | | | | 92,190,623 |
| | | | | |
| | |
| Health Care - 14.2% | | | | | |
Amgen Inc (a) | | 307,265 | | | 19,145,683 |
Becton Dickinson and Co | | 54,955 | | | 3,580,318 |
Biogen Idec Inc (a) | | 56,300 | | | 2,677,065 |
Boston Scientific Corp (a) | | 233,600 | | | 2,508,864 |
Forest Laboratories Inc (a) | | 199,700 | | | 5,158,251 |
Gilead Sciences Inc (a) | | 151,110 | | | 7,393,812 |
Intuitive Surgical Inc (a) | | 8,900 | | | 2,023,148 |
Johnson & Johnson | | 501,027 | | | 30,507,534 |
King Pharmaceuticals Inc (a) | | 355,100 | | | 3,220,757 |
McKesson Corp | | 131,500 | | | 6,726,225 |
Medtronic Inc | | 205,683 | | | 7,285,292 |
Watson Pharmaceuticals Inc (a) | | 129,500 | | | 4,497,535 |
| | | | | |
| | | | | 94,724,484 |
| | | | | |
| | |
| Industrials - 7.3% | | | | | |
3M Co | | 103,828 | | | 7,321,950 |
Cooper Industries Ltd Cl A | | 205,888 | | | 6,784,010 |
CSX Corp | | 107,000 | | | 4,292,840 |
Cummins Inc | | 59,236 | | | 2,547,740 |
Emerson Electric Co | | 3,634 | | | 132,205 |
First Solar Inc (a) | | 12,346 | | | 1,906,099 |
Flowserve Corp | | 25,400 | | | 2,051,558 |
Herman Miller Inc | | 2,241 | | | 37,223 |
Illinois Tool Works Inc | | 3,600 | | | 145,980 |
Interface Inc Cl A | | 5,681 | | | 39,426 |
JetBlue Airways Corp (a) | | 4,861 | | | 24,840 |
Norfolk Southern Corp | | 92,400 | | | 3,996,300 |
Pitney Bowes Inc | | 104,900 | | | 2,166,185 |
Quanta Services Inc (a) | | 171,000 | | | 3,986,010 |
RR Donnelley & Sons Co | | 431,668 | | | 6,000,185 |
Ryder System Inc | | 122,300 | | | 4,296,399 |
Southwest Airlines Co | | 5,734 | | | 45,012 |
SunPower Corp Cl A (a) | | 479 | | | 15,424 |
United Parcel Service Inc Cl B | | 45,950 | | | 2,468,894 |
| | | | | |
| | | | | 48,258,280 |
| | | | | |
| | |
| Information Technology - 21.6% | | | | | |
Agilent Technologies Inc (a) | | 1,560 | | | 36,223 |
Apple Inc (a) | | 114,465 | | | 18,702,435 |
Applied Materials Inc | | 6,140 | | | 84,732 |
Cisco Systems Inc (a) | | 483,859 | | | 10,649,737 |
Dell Inc (a) | | 360,185 | | | 4,819,275 |
eBay Inc (a) | | 91,776 | | | 1,950,240 |
EMC Corp/ Massachusetts (a) | | 4,400 | | | 66,264 |
Google Inc (a) | | 29,395 | | | 13,023,455 |
Hewlett-Packard Co | | 101,998 | | | 4,416,513 |
Intel Corp | | 414,386 | | | 7,976,931 |
International Business Machines Corp | | 191,918 | | | 22,632,890 |
JDS Uniphase Corp (a) | | 545,900 | | | 3,198,974 |
Juniper Networks Inc (a) | | 1,500 | | | 39,195 |
Micron Technology Inc (a) | | 567,200 | | | 3,624,408 |
Microsoft Corp | | 1,019,927 | | | 23,988,683 |
Motorola Inc | | 7,500 | | | 53,700 |
National Semiconductor Corp | | 343,500 | | | 5,173,110 |
Oracle Corp | | 427,400 | | | 9,458,362 |
Power Integrations Inc | | 1,419 | | | 41,563 |
QUALCOMM Inc | | 3,351 | | | 154,850 |
Salesforce.com Inc (a) | | 73,900 | | | 3,202,826 |
17
DOMINI SOCIAL EQUITY FUND / PORTFOLIOOF INVESTMENTS
July 31, 2009
| | | | | |
SECURITY | | SHARES | | VALUE |
Information Technology (Continued) | | | | | |
SanDisk Corp (a) | | 98,700 | | $ | 1,758,834 |
Symantec Corp (a) | | 272,800 | | | 4,072,904 |
Texas Instruments Inc | | 4,455 | | | 107,143 |
Total System Services Inc | | 300,200 | | | 4,406,936 |
Xerox Corp | | 4,497 | | | 36,830 |
| | | | | |
| | | | | 143,677,013 |
| | | | | |
| | |
| Materials - 1.9% | | | | | |
Eastman Chemical Co | | 99,300 | | | 4,931,237 |
International Paper Co | | 7,165 | | | 134,774 |
Lubrizol Corp | | 124,400 | | | 7,206,492 |
MeadWestvaco Corp | | 4,506 | | | 87,822 |
Nucor Corp | | 1,282 | | | 57,011 |
| | | | | |
| | | | | 12,417,336 |
| | | | | |
| | |
| Telecommunication Services - 6.1% | | | | | |
AT&T Inc | | 618,819 | | | 16,231,622 |
France Telecom SA ADR | | 254,930 | | | 6,482,870 |
Sprint Nextel Corp (a) | | 268,859 | | | 1,075,436 |
Telefonica SA ADR | | 44,300 | | | 3,306,552 |
United States Cellular Corp (a) | | 52,100 | | | 1,866,222 |
Verizon Communications Inc | | 363,091 | | | 11,644,328 |
| | | | | |
| | | | | 40,607,030 |
| | | | | |
| | |
| Utilities - 2.2% | | | | | |
AES Corp/The (a) | | 516,600 | | | 6,607,314 |
National Grid PLC ADR | | 88,000 | | | 4,120,160 |
Pepco Holdings Inc | | 286,300 | | | 4,116,994 |
| | | | | |
| | | | | 14,844,468 |
| | | | | |
| | |
| Total Investments - 99.1% | | | | | |
(Cost $620,886,836) (b) | | | | $ | 659,466,374 |
| | |
Other Assets, less liabilities - 0.9% | | | | | 6,022,513 |
| | | | | |
| | |
| Net Assets - 100.0% | | | | $ | 665,488,887 |
| | | | | |
| (a) | Non-income producing security. |
| (b) | The aggregate cost for federal income tax purposes is $623,332,417. The aggregate gross unrealized appreciation is $83,683,988 and the aggregate gross unrealized depreciation is $47,550,031, resulting in net unrealized appreciation of $36,133,957. |
ADR - American Depository Receipt
SEE NOTES TO FINANCIAL STATEMENTS
18
THIS PAGE INTENTIONALLY LEFT BLANK
DOMINI EUROPEAN SOCIAL EQUITY FUND
Performance Commentary
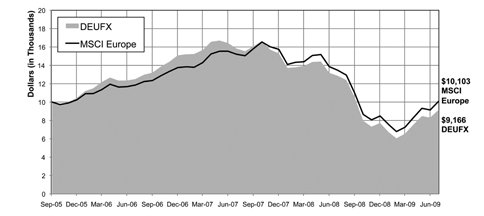
For the year ended July 31, 2009, the Fund’s Investor shares declined -28.70%, lagging the MSCI Europe index, which fell by -24.96%.
The following were among the companies held in the Fund’s portfolio that helped performance the most, relative to the MSCI Europe:
| | • | | Stock in the French pharmaceutical company Sanofi-Aventis rose in the first half of the period on speculation that it would acquire the Czech pharmaceutical company Zentiva. |
| | • | | The Italian bank UniCredit saw shares decline in the first half of the year, but gained in the second half during which the Fund held its stock. |
| | • | | France Telecom lost less than the benchmark, helped by increasing confidence in cash flow generation and an attractive dividend yield. |
The following were among the companies in the portfolio that hurt the Fund’s relative performance the most:
| | • | | Royal Bank of Scotland and Bank of Ireland were badly hurt by the continuing credit crisis. |
| | • | | The stock of Swiss Reinsurance declined as a result of weak 2008 results and the company’s announcement of a capital raise. |
The Fund’s relative performance was helped by its stock selection in the materials sector and by its overweighting to the telecommunications and healthcare sectors. The Fund was hurt the most by weak stock selection in the financial, consumer discretionary, and industrials sectors.
20
TEN LARGEST HOLDINGS
| | | | | | | | |
COMPANY | | % NET
ASSETS | | | COMPANY | | % NET
ASSETS | |
| Novartis | | 4.0 | % | | GlaxoSmithKline | | 2.9 | % |
| Banco Santander | | 3.6 | % | | Vivendi | | 2.7 | % |
| Vodafone Group | | 3.5 | % | | StatoilHydro | | 2.5 | % |
| Sanofi-Aventis | | 3.1 | % | | Roche Holdings | | 2.5 | % |
| BG Group | | 3.0 | % | | Telefonica | | 2.3 | % |
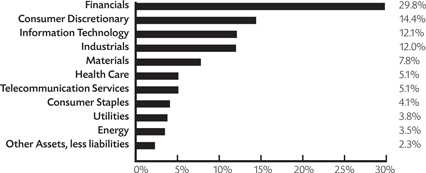
PORTFOLIO HOLDINGS BY INDUSTRY SECTOR (% OF NET ASSETS)

PORTFOLIO HOLDINGS BY COUNTRY (% OF NET ASSETS)

21
AVERAGE ANNUAL TOTAL RETURNS
| | | | | | | | |
| | | | | Investor shares | | | MSCI
Europe | |
| As of 7-31-09 | | 1 Year | | -28.70 | % | | -24.96 | % |
| | 3 Year | | -9.84 | % | | -5.20 | % |
| | Since Inception (10-3-05) | | -2.25 | % | | 0.27 | % |
COMPARISON OF $10,000 INVESTMENT IN THE DOMINI EUROPEAN SOCIAL EQUITY FUND INVESTOR SHARES AND MSCI EUROPE1
Past performance is no guarantee of future results. The Fund’s returns quoted above represent past performance after all expenses. Economic and market conditions change, and both will cause investment return, principal value, and yield to fluctuate so that an investor’s shares, when redeemed, may be worth more or less than their original cost. Current performance may be lower or higher than the performance data quoted. For performance information current to the most recent month-end, call 1-800-582-6757 or visit www.domini.com. A 2.00% redemption fee is charged on sales or exchanges of shares made less than 30 days after the settlement of purchase or acquisition through exchange, with certain exceptions. Performance data quoted above does not reflect the deduction of this fee, which would reduce the performance quoted. See the Fund’s prospectus for further information.
For the period reported in its current prospectus, the Fund’s gross annual operating expenses totaled 1.80% of net assets. Until November 30, 2009, Domini has contractually agreed to waive certain fees and/or reimburse certain expenses, including management fees, so that expenses paid by the Fund will not exceed, on a per annum basis, 1.60% of its average daily net assets representing Investor shares, absent an earlier modification by the Board of Trustees, which oversees the Funds.
Investing internationally involves special risks, such as currency fluctuations, social and economic instability, differing securities regulations and accounting standards, limited public information, possible changes in taxation, and periods of illiquidity.
The table and the graph do not reflect the deduction of taxes that a shareholder would pay on Fund distributions or the redemption of Fund shares. Total return for the Domini European Social Equity Fund is based on the Fund’s net asset values and assumes all dividends and capital gains were reinvested. An investment in the Fund is not a bank deposit and is not insured. You may lose money. Certain fees payable by the Fund were waived during the period, and the Fund’s average annual total returns would have been lower had these not been waived.
The Morgan Stanley Capital International (MSCI Europe) is an unmanaged index of common stocks. Investors cannot invest directly in the MSCI Europe.
22
AVERAGE ANNUAL TOTAL RETURNS
| | | | | | | | | | | |
| | | | | Class A shares shares
(with 4.75% maxi-
mum Sales Charge)1 | | | Class A shares
shares (without
Sales Charge)1 | | | MSCI Europe | |
As of 7-31-09 | | 1 Year | | -32.08 | % | | -28.70 | % | | -24.96 | % |
| | 3 Year | | -11.30 | % | | -9.84 | % | | -5.20 | % |
| | Since Inception (10-3-05) | | -3.48 | % | | -2.25 | % | | 0.27 | % |
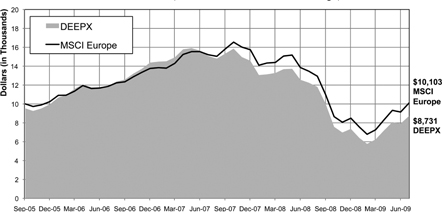
COMPARISON OF $10,000 INVESTMENT IN THE DOMINI EUROPEAN SOCIAL EQUITY FUND CLASS A SHARES AND MSCI EUROPE (with 4.75% maximum sales charge)1
Past performance is no guarantee of future results. The Fund’s returns quoted above represent past performance after all expenses. Economic and market conditions change, and both will cause investment return, principal value, and yield to fluctuate so that an investor’s shares, when redeemed, may be worth more or less than their original cost. Current performance may be lower or higher than the performance data quoted. For performance information current to the most recent month-end, call 1-800-582-6757 or visit www.domini.com. A 2.00% redemption fee is charged on sales or exchanges of shares made less than 30 days after the settlement of purchase or acquisition through exchange, with certain exceptions. Performance data quoted above does not reflect the deduction of this fee, which would reduce the performance quoted. See the Fund’s prospectus for further information.
For the period reported in its current prospectus, the Fund’s gross annual operating expenses totaled 3.71% of net assets. Until November 30, 2009, Domini has contractually agreed to waive certain fees and/or reimburse certain expenses, including management fees, so that expenses paid by the Fund will not exceed, on a per annum basis, 1.57% of its average daily net assets representing Class A shares, absent an earlier modification by the Board of Trustees, which oversees the Funds.
Investing internationally involves special risks, such as currency fluctuations, social and economic instability, differing securities regulations and accounting standards, limited public information, possible changes in taxation, and periods of illiquidity.
The table and the graph do not reflect the deduction of taxes that a shareholder would pay on Fund distributions or the redemption of Fund shares. Total return for the Domini European Social Equity Fund is based on the Fund’s net asset values and assumes all dividends and capital gains were reinvested. An investment in the Fund is not a bank deposit and is not insured. You may lose money. Certain fees payable by the Fund were waived during the period, and the Fund’s average annual total returns would have been lower had these not been waived.
The Morgan Stanley Capital International (MSCI Europe) is an unmanaged index of common stocks. Investors cannot invest directly in the MSCI Europe.
| 1 | Class A shares were not offered prior to November 28, 2008. All performance information for time periods beginning prior to November 28, 2008, is the performance of the Investor shares. This performance has not been adjusted to reflect the lower expenses of the Class A shares. |
23
DOMINI EUROPEAN SOCIAL EQUITY FUND
PORTFOLIOOF INVESTMENTS
July 31, 2009
| | | | | | | |
COUNTRY/SECURITY | | INDUSTRY | | SHARES | | VALUE |
Austria – 1.8% | | | | | | | |
Immoeast AG (a) | | Real Estate | | 35,335 | | $ | 97,186 |
IMMOFINANZ AG (a) | | Real Estate | | 51,385 | | | 107,091 |
OMV AG | | Energy | | 19,758 | | | 780,132 |
| | | | | | | |
| | | | | | | 984,409 |
| | | | | | | |
Belgium – 1.9% | | | | | | | |
Delhaize Group | | Food & Staples Retailing | | 8,294 | | | 589,940 |
Fortis (a) | | Diversified Financials | | 77,101 | | | 298,416 |
KBC Ancora (a) | | Diversified Financials | | 11,437 | | | 130,367 |
| | | | | | | |
| | | | | | | 1,018,723 |
| | | | | | | |
Denmark – 0.9% | | | | | | | |
FLSmidth & Co A/S (a) | | Capital Goods | | 2,805 | | | 121,240 |
H Lundbeck A S | | Pharma, Biotech & Life Sciences | | 13,973 | | | 269,384 |
Novo Nordisk AS | | Pharma, Biotech & Life Sciences | | 1,888 | | | 110,544 |
| | | | | | | |
| | | | | | | 501,168 |
| | | | | | | |
Finland – 0.8% | | | | | | | |
Kone OYJ Cl B | | Capital Goods | | 5,962 | | | 201,764 |
Nokia OYJ | | Technology Hardware & Equipment | | 4,483 | | | 59,363 |
Tietoenator OYJ | | Software & Services | | 9,433 | | | 160,751 |
| | | | | | | |
| | | | | | | 421,878 |
| | | | | | | |
France – 17.8% | | | | | | | |
AXA SA | | Insurance | | 7,448 | | | 156,596 |
BNP Paribas | | Banks | | 14,706 | | | 1,066,449 |
Ciments Francais SA Cl A | | Materials | | 596 | | | 57,906 |
Credit Agricole SA | | Banks | | 22,376 | | | 317,712 |
Eiffage SA | | Capital Goods | | 5,670 | | | 376,007 |
France Telecom SA | | Telecommunication Services | | 37,371 | | | 927,728 |
Gecina SA | | Real Estate | | 1,189 | | | 97,366 |
Natixis (a) | | Banks | | 168,640 | | | 436,816 |
Peugeot SA (a) | | Automobiles & Components | | 15,850 | | | 478,190 |
PPR | | Retailing | | 3,223 | | | 357,282 |
Publicis Groupe SA | | Media | | 5,763 | | | 203,772 |
Sanofi-Aventis SA | | Pharma, Biotech & Life Sciences | | 25,144 | | | 1,638,378 |
Schneider Electric SA | | Capital Goods | | 6,812 | | | 615,583 |
SCOR SE | | Insurance | | 4,728 | | | 112,914 |
STMicroelectronics NV | | Semiconductors & Semiconductor Equipment | | 62,091 | | | 471,750 |
Unibail-Rodamco SE | | Real Estate | | 1,592 | | | 276,715 |
Vinci SA | | Capital Goods | | 9,145 | | | 462,992 |
Vivendi SA | | Media | | 55,600 | | | 1,420,855 |
Wendel | | Capital Goods | | 1,672 | | | 66,350 |
| | | | | | | |
| | | | | | | 9,541,361 |
| | | | | | | |
24
DOMINI EUROPEAN SOCIAL EQUITY FUND / PORTFOLIOOF INVESTMENTS
July 31, 2009
| | | | | | | |
COUNTRY/SECURITY | | INDUSTRY | | SHARES | | VALUE |
Germany – 9.2% | | | | | | | |
Allianz SE | | Insurance | | 5,906 | | $ | 579,427 |
Continental AG (a) | | Automobiles & Components | | 3,091 | | | 105,832 |
Deutsche Lufthansa AG | | Transportation | | 35,400 | | | 475,786 |
Deutsche Telekom AG | | Telecommunication Services | | 87,280 | | | 1,112,434 |
Hannover Rueckvers (a) | | Insurance | | 5,035 | | | 203,800 |
Henkel AG & Co KGaA | | Household & Personal Products | | 26,200 | | | 958,342 |
Infineon Technologies AG (a) | | Semiconductors & Semiconductor Equipment | | 32,077 | | | 131,429 |
Linde AG | | Materials | | 1,820 | | | 170,868 |
Metro AG | | Food & Staples Retailing | | 1,519 | | | 87,499 |
Muenchener Ruckvers AG | | Insurance | | 3,123 | | | 469,728 |
Prosiebensat1 Media AG | | Media | | 20,292 | | | 127,734 |
Suedzucker AG | | Food & Beverage | | 25,045 | | | 523,381 |
| | | | | | | |
| | | | | | | 4,946,260 |
| | | | | | | |
Greece – 0.9% | | | | | | | |
Public Power Corp (a) | | Utilities | | 22,585 | | | 489,904 |
| | | | | | | |
| | | | | | | 489,904 |
| | | | | | | |
Ireland – 0.8% | | | | | | | |
Anglo Irish Bank Ltd (a)(c) | | Banks | | 80,825 | | | 0 |
Kerry Group Cl A | | Food & Beverage | | 1,978 | | | 46,608 |
DCC Plc | | Capital Goods | | 4,183 | | | 88,957 |
Smurfit Kappa Group PLC | | Materials | | 53,973 | | | 313,733 |
| | | | | | | |
| | | | | | | 449,298 |
| | | | | | | |
Italy – 4.9% | | | | | | | |
Banco Popolare (a) | | Banks | | 12,593 | | | 101,231 |
Buzzi Unicem SPA | | Materials | | 17,964 | | | 267,673 |
Exor SPA | | Diversified Financials | | 3,335 | | | 55,887 |
Fiat SPA (a) | | Automobiles & Components | | 13,210 | | | 145,708 |
Intesa Sanpaolo SpA (a) | | Banks | | 14,473 | | | 53,606 |
Italcementi SpA | | Materials | | 35,479 | | | 461,506 |
Telecom Italia SpA | | Telecommunication Services | | 399,353 | | | 621,669 |
Unicredit SPA (a) | | Banks | | 317,243 | | | 924,280 |
| | | | | | | |
| | | | | | | 2,631,560 |
| | | | | | | |
Japan – 0.4% | | | | | | | |
Nippon Mining Holdings Inc | | Energy | | 33,500 | | | 158,359 |
Toyo Seikan Kaisha Ltd | | Materials | | 3,500 | | | 74,636 |
| | | | | | | |
| | | | | | | 232,995 |
| | | | | | | |
Netherlands – 4.1% | | | | | | | |
Corporate Express NV (a)(c) | | Commercial Services & Supplies | | 10,034 | | | 131,588 |
ING Groep NV | | Diversified Financials | | 22,190 | | | 283,076 |
Koninklijke Ahold NV | | Food & Staples Retailing | | 85,791 | | | 970,486 |
Koninklijke DSM NV | | Materials | | 4,790 | | | 170,319 |
SNS Reaal | | Diversified Financials | | 44,181 | | | 252,430 |
Unilever NV | | Food & Beverage | | 13,326 | | | 362,178 |
| | | | | | | |
| | | | | | | 2,170,077 |
| | | | | | | |
Norway – 3.2% | | | | | | | |
Fred Olsen Energy ASA | | Energy | | 7,500 | | | 271,641 |
Statoilhydro ASA | | Energy | | 62,674 | | | 1,333,728 |
TGS NopecGeophysical (a) | | Energy | | 7,800 | | | 88,037 |
| | | | | | | |
| | | | | | | 1,693,406 |
| | | | | | | |
25
DOMINI EUROPEAN SOCIAL EQUITY FUND / PORTFOLIOOF INVESTMENTS
July 31, 2009
| | | | | | | |
COUNTRY/SECURITY | | INDUSTRY | | SHARES | | VALUE |
Poland – 0.5% | | | | | | | |
Polskie Gornictwo Naftowe I Gazownictwo SA (a) | | Energy | | 172,992 | | $ | 263,432 |
| | | | | | | |
| | | | | | | 263,432 |
| | | | | | | |
Spain – 8.3% | | | | | | | |
Banco Santander SA | | Banks | | 133,096 | | | 1,917,160 |
Bankinter SA | | Banks | | 4,137 | | | 46,746 |
Banco Bilbao Vizcaya Argentaria SA | | Banks | | 65,267 | | | 1,065,972 |
Criteria Caixacorp SA | | Diversified Financials | | 38,803 | | | 185,669 |
Telefonica SA | | Telecommunication Services | | 48,808 | | | 1,207,843 |
| | | | | | | |
| | | | | | | 4,423,390 |
| | | | | | | |
Sweden – 4.3% | | | | | | | |
Assa Abloy AB Cl B | | Capital Goods | | 34,887 | | | 569,853 |
Boliden AB | | Materials | | 28,980 | | | 309,280 |
Electrolux AB Cl B (a) | | Consumer Durables & Apparel | | 16,315 | | | 302,325 |
Niscayah Group AB Cl B | | Commercial & Professional Services | | 77,254 | | | 135,732 |
Svenska Cellulosa Cl B | | Materials | | 37,136 | | | 472,783 |
Telefonaktiebolaget LM Ericsson Cl B | | Technology Hardware & Equipment | | 54,626 | | | 530,866 |
| | | | | | | |
| | | | | | | 2,320,839 |
| | | | | | | |
Switzerland – 8.3% | | | | | | | |
Baloise Holding AG | | Insurance | | 2,535 | | | 200,680 |
Clariant AG (a) | | Materials | | 23,722 | | | 176,331 |
Holcim Ltd (a) | | Materials | | 5,311 | | | 320,264 |
Novartis AG | | Pharma, Biotech & Life Sciences | | 47,373 | | | 2,154,179 |
Roche Holdings AG | | Pharma, Biotech & Life Sciences | | 8,482 | | | 1,327,960 |
Schindler Holding AG | | Capital Goods | | 3,940 | | | 252,599 |
| | | | | | | |
| | | | | | | 4,432,013 |
| | | | | | | |
United Kingdom – 28.1% | | | | | | | |
Antofagasta PLC | | Materials | | 52,209 | | | 655,220 |
Autonomy Corp PLC (a) | | Software & Services | | 3,900 | | | 75,971 |
Aviva PLC | | Insurance | | 117,713 | | | 684,490 |
Barclays PLC | | Banks | | 190,926 | | | 956,860 |
BG Group PLC | | Energy | | 96,924 | | | 1,605,247 |
Compass Group PLC | | Consumer Services | | 8,417 | | | 45,002 |
Experian PLC | | Commercial & Professional Services | | 98,814 | | | 809,265 |
GlaxoSmithKline PLC | | Pharma, Biotech & Life Sciences | | 82,887 | | | 1,578,889 |
Home Retail Group PLC | | Retailing | | 14,413 | | | 75,029 |
HSBC Holdings PLC | | Banks | | 112,043 | | | 1,125,183 |
ICAP PLC | | Diversified Financials | | 68,584 | | | 516,207 |
International Power PLC | | Utilities | | 110,296 | | | 466,735 |
Investec PLC | | Diversified Financials | | 30,010 | | | 200,998 |
J Sainsbury PLC | | Food & Staples Retailing | | 68,602 | | | 361,098 |
Kingfisher PLC | | Retailing | | 143,964 | | | 507,772 |
National Grid PLC | | Utilities | | 13,975 | | | 129,396 |
Next PLC | | Retailing | | 4,523 | | | 127,849 |
Old Mutual PLC | | Insurance | | 441,166 | | | 700,815 |
RSA Insurance Group PLC | | Insurance | | 84,727 | | | 177,828 |
Sage Group PLC/The | | Software & Services | | 33,344 | | | 108,016 |
Standard Chartered PLC | | Banks | | 17,772 | | | 418,674 |
Thomas Cook Group PLC | | Consumer Services | | 71,098 | | | 255,777 |
26
DOMINI EUROPEAN SOCIAL EQUITY FUND / PORTFOLIOOF INVESTMENTS
July 31, 2009
| | | | | | | |
COUNTRY/SECURITY | | INDUSTRY | | SHARES | | VALUE |
United Kingdom (Continued) | | | | | | | |
Thomson Reuters PLC | | Media | | 19,395 | | $ | 615,749 |
Travis Perkins PLC | | Capital Goods | | 4,849 | | | 65,477 |
Trinity Mirror Plc | | Media | | 75,285 | | | 102,033 |
Unilever PLC | | Food & Beverage | | 30,407 | | | 796,482 |
Vodafone Group PLC | | Telecommunication Services | | 909,715 | | | 1,850,525 |
| | | | | | | |
| | | | | | | 15,012,587 |
| | | | | | | |
United States – 2.2% | | | | | | | |
Eastman Chemical Co | | Materials | | 1,400 | | | 69,524 |
Lubrizol Corp | | Materials | | 1,900 | | | 110,067 |
Noble Corp (a) | | Energy | | 8,400 | | | 284,424 |
Rock Tenn Co Cl A | | Materials | | 1,200 | | | 53,952 |
Southwestern Energy Co (a) | | Energy | | 15,800 | | | 654,594 |
| | | | | | | |
| | | | | | | 1,172,561 |
| | | | | | | |
| | | |
Total Investments – 98.4% (Cost $55,730,636) (b) | | | | | | | 52,705,861 |
| | | | | | | |
| | | |
Other Assets, less liabilities – 1.6% | | | | | | | 837,281 |
| | | | | | | |
| | | |
Net Assets – 100.0% | | | | | | $ | 53,543,142 |
| | | | | | | |
| (a) | Non-income producing security. |
| (b) | The aggregate cost for federal income tax purposes is $56,279,089. The aggregate gross unrealized appreciation is $6,207,649 and the aggregate gross unrealized depreciation is $9,780,877, resulting in net unrealized depreciation of $3,573,228. |
| (c) | Securities for which there are no such quotations or valuations are valued at fair value as determined in good faith by or at the direction of the Fund’s Board of Trustees. |
SEE NOTES TO FINANCIAL STATEMENTS
27
DOMINI PACASIA SOCIAL EQUITY FUND
Performance Commentary
For the year ended July 31, 2009, the Fund’s Investor shares declined -14.56%, lagging the MSCI All Country Asia Pacific index, which fell -13.06%.
The following were among the companies held in the Fund’s portfolio that helped performance the most, relative to the MSCI All Country Asia Pacific index:
| | • | | The Hong Kong auto and electric appliance company BYD gained dramatically, helped by Chinese demand for automobiles and improved sales of handset telephones. |
| | • | | Despite mixed results in fiscal 2008, stock in the Chinese property developer Agile Property Holdings rose due to positive projections. |
| | • | | The Singaporean investment holding company Jardine Cycle & Carriage gained due to strong results in the first quarter of 2009 and improving fundamentals. |
The following were among the companies in the portfolio that hurt the Fund’s relative performance the most:
| | • | | Stock in the Australian company BlueScope Steel declined as previously solid domestic demand for steel turned weaker and overseas demand worsened. |
| | • | | Stock in the Japanese financial company Orix declined as the market became concerned about the company’s ability to obtain financing. |
| | • | | Stock in the Australian financial company Babcock & Brown declined in the latter half of 2008, mostly due to the ongoing credit crisis. |
The Fund’s relative performance was helped by its stock selection in the industrials, financial, and consumer discretionary sectors. The Fund was hurt by stock selection in the telecommunications and healthcare sectors.
28
TEN LARGEST HOLDINGS
| | | | | | | | |
COMPANY | | % NET
ASSETS | | | COMPANY | | % NET
ASSETS | |
Takeda Pharmaceutical | | 2.3 | % | | National Australia Bank | | 1.9 | % |
Honda Motor | | 2.1 | % | | LG Electronics | | 1.8 | % |
Astellas Pharma | | 2.0 | % | | Seven & I Holdings | | 1.8 | % |
Nissan Motor | | 2.0 | % | | Quanta Computer | | 1.6 | % |
Toppan Printing | | 2.0 | % | | AGL Energy | | 1.6 | % |
PORTFOLIO HOLDINGS BY INDUSTRY SECTOR (% OF NET ASSETS)
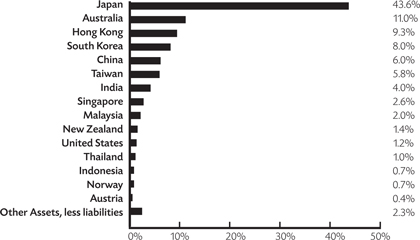
PORTFOLIO HOLDINGS BY COUNTRY (% OF NET ASSETS)
29
AVERAGE ANNUAL TOTAL RETURNS
| | | | | | | | |
| | | Investor
shares | | | MSCI AC
Asia Pacific | |
As of 7-31-09 | | 1 Year | | -14.56 | % | | -13.06 | % |
| | Since Inception (12-27-06) | | -9.70 | % | | -5.67 | % |
COMPARISON OF $10,000 INVESTMENT IN THE DOMINI PACASIA SOCIAL EQUITY FUND INVESTOR SHARES AND MSCI AC ASIA PACIFIC

Past performance is no guarantee of future results. The Fund’s returns quoted above represent past performance after all expenses. Economic and market conditions change, and both will cause investment return, principal value, and yield to fluctuate so that an investor’s shares, when redeemed, may be worth more or less than their original cost. Current performance may be lower or higher than the performance data quoted. For performance information current to the most recent month-end, call 1-800-582-6757 or visit www.domini.com. A 2.00% redemption fee is charged on sales or exchanges of shares made less than 30 days after the settlement of purchase or acquisition through exchange, with certain exceptions. Performance data quoted above does not reflect the deduction of this fee, which would reduce the performance quoted. See the Fund’s prospectus for further information.
For the period reported in its current prospectus, the Fund’s gross annual operating expenses totaled 2.48% of net assets. Until November 30, 2009, Domini has contractually agreed to waive certain fees and/or reimburse certain expenses, including management fees, so that expenses paid by the Fund will not exceed, on a per annum basis, 1.60% of its average daily net assets representing Investor shares, absent an earlier modification by the Board of Trustees, which oversees the Funds.
Investing internationally involves special risks, such as currency fluctuations, social and economic instability, differing securities regulations and accounting standards, limited public information, possible changes in taxation, and periods of illiquidity.
The table and the graph do not reflect the deduction of taxes that a shareholder would pay on Fund distributions or the redemption of Fund shares. Total return for the Domini PacAsia Social Equity Fund is based on the Fund’s net asset values and assumes all dividends and capital gains were reinvested. An investment in the Fund is not a bank deposit and is not insured. You may lose money. Certain fees payable by the Fund were waived during the period, and the Fund’s average annual total returns would have been lower had these not been waived.
The Morgan Stanley Capital International All Country Asia Pacific (MSCI AC Asia Pacific) index is an unmanaged index of common stocks. Investors cannot invest directly in an index.
30
AVERAGE ANNUAL TOTAL RETURNS
| | | | | | | | | | | |
| | | Class A shares (with
4.75% maximum
Sales Charge)1 | | | Class A shares
(without Sales
Charge)1 | | | MSCI AC Asia
Pacific | |
| As of 7-31-09 | | 1 Year | | -18.62 | % | | -14.56 | % | | -13.06 | % |
| | Since Inception (12-27-06) | | -11.38 | % | | -9.70 | % | | -5.67 | % |
COMPARISON OF $10,000 INVESTMENT IN THE DOMINI PACASIA SOCIAL EQUITY FUND CLASS A SHARES AND MSCI AC ASIA PACIFIC (with 4.75% maximum sales charge)1

Past performance is no guarantee of future results. The Fund’s returns quoted above represent past performance after all expenses. Economic and market conditions change, and both will cause investment return, principal value, and yield to fluctuate so that an investor’s shares, when redeemed, may be worth more or less than their original cost. Current performance may be lower or higher than the performance data quoted. For performance information current to the most recent month-end, call 1-800-582-6757 or visit www.domini.com. A 2.00% redemption fee is charged on sales or exchanges of shares made less than 30 days after the settlement of purchase or acquisition through exchange, with certain exceptions. Performance data quoted above does not reflect the deduction of this fee, which would reduce the performance quoted. See the Fund’s prospectus for further information.
For the period reported in its current prospectus, the Fund’s gross annual operating expenses totaled 9.30% of net assets. Until November 30, 2009, Domini has contractually agreed to waive certain fees and/or reimburse certain expenses, including management fees, so that expenses paid by the Fund will not exceed, on a per annum basis, 1.57% of its average daily net assets representing Class A shares, absent an earlier modification by the Board of Trustees, which oversees the Funds.
Investing internationally involves special risks, such as currency fluctuations, social and economic instability, differing securities regulations and accounting standards, limited public information, possible changes in taxation, and periods of illiquidity.
The table and the graph do not reflect the deduction of taxes that a shareholder would pay on Fund distributions or the redemption of Fund shares. Total return for the Domini PacAsia Social Equity Fund is based on the Fund’s net asset values and assumes all dividends and capital gains were reinvested. An investment in the Fund is not a bank deposit and is not insured. You may lose money. Certain fees payable by the Fund were waived during the period, and the Fund’s average annual total returns would have been lower had these not been waived.
The Morgan Stanley Capital International All Country Asia Pacific (MSCI AC Asia Pacific) index is an unmanaged index of common stocks. Investors cannot invest directly in an index.
| 1 | Class A shares were not offered prior to November 28, 2008. All performance information for time periods beginning prior to November 28, 2008, is the performance of the Investor shares. This performance has not been adjusted to reflect the lower expenses of the Class A shares. |
31
DOMINI PACASIA SOCIAL EQUITY FUND
PORTFOLIOOF INVESTMENTS
July 31, 2009
| | | | | | | |
COUNTRY/SECURITY | | INDUSTRY | | SHARES | | VALUE |
Australia – 11.0% | | | | | | | |
AGL Energy Ltd | | Utilities | | 27,660 | | $ | 342,628 |
Amcor Ltd/Australia | | Materials | | 8,640 | | | 35,555 |
Asciano Group (a) | | Transportation | | 45,947 | | | 61,117 |
Bendigo and Adelaide Bank Ltd | | Banks | | 13,131 | | | 89,515 |
BlueScope Steel Ltd | | Materials | | 83,457 | | | 233,817 |
CFS Retail Property Trust | | Real Estate | | 28,220 | | | 40,235 |
Computershare Ltd | | Software & Services | | 2,780 | | | 22,719 |
Fairfax Media Ltd | | Media | | 64,733 | | | 79,378 |
National Australia Bank Ltd | | Banks | | 20,278 | | | 410,158 |
OneSteel Ltd | | Materials | | 44,517 | | | 110,658 |
Origin Energy Ltd | | Energy | | 8,139 | | | 98,112 |
QBE Insurance Group Ltd | | Insurance | | 7,610 | | | 123,368 |
Suncorp-Metway Ltd | | Insurance | | 43,756 | | | 258,273 |
Telstra Corp Ltd | | Telecommunication Services | | 64,483 | | | 189,236 |
Westpac Banking Corp | | Banks | | 16,400 | | | 295,724 |
| | | | | | | |
| | | | | | | 2,390,493 |
| | | | | | | |
Austria – 0.4% | | | | | | | |
OMV AG | | Energy | | 2,445 | | | 96,539 |
| | | | | | | |
| | | | | | | 96,539 |
| | | | | | | |
China – 6.0% | | | | | | | |
Agile Property Holdings Ltd | | Real Estate | | 145,260 | | | 205,050 |
Byd Co Ltd (a) | | Capital Goods | | 21,846 | | | 120,927 |
Chaoda Modern Agriculture Holdings Ltd | | Food & Beverage | | 246,000 | | | 167,914 |
China Life Insurance Co Ltd | | Insurance | | 31,190 | | | 138,442 |
Guangzhou R&F Properties Co Ltd | | Real Estate | | 18,800 | | | 41,481 |
Hengan International Group Co Ltd | | Household & Personal Products | | 9,566 | | | 55,668 |
Hopson Development Holdings Ltd | | Real Estate | | 41,357 | | | 66,384 |
Ping An Insurance Group Co of China Ltd | | Insurance | | 2,500 | | | 22,113 |
Semiconductor Manufacturing International Corp (a) | | Semiconductors & Semiconductor Equipment | | 1,252,000 | | | 67,850 |
Shenzhen Investment Ltd | | Real Estate | | 64,000 | | | 31,711 |
Shimao Property Holdings Ltd | | Real Estate | | 81,000 | | | 163,044 |
Soho China Ltd | | Real Estate | | 215,000 | | | 136,767 |
TPV Technology Ltd | | Technology Hardware & Equipment | | 150,950 | | | 82,194 |
| | | | | | | |
| | | | | | | 1,299,545 |
| | | | | | | |
Hong Kong – 9.3% | | | | | | | |
Esprit Holdings Ltd | | Retailing | | 6,500 | | | 46,715 |
First Pacific Co | | Food & Beverage | | 78,389 | | | 50,067 |
Great Eagle Holdings Ltd | | Real Estate | | 27,874 | | | 64,523 |
Guoco Group Ltd | | Diversified Financials | | 10,000 | | | 94,193 |
Henderson Land Development Co Ltd | | Real Estate | | 29,733 | | | 197,004 |
Hongkong Land Holdings Ltd | | Real Estate | | 25,000 | | | 97,250 |
Hysan Development Co Ltd | | Real Estate | | 36,191 | | | 98,299 |
Jardine Matheson Holdings Ltd | | Capital Goods | | 6,111 | | | 175,997 |
32
DOMINI PACASIA SOCIAL EQUITY FUND / PORTFOLIOOF INVESTMENTS
July 31, 2009
| | | | | | | |
COUNTRY/SECURITY | | INDUSTRY | | SHARES | | VALUE |
Hong Kong (Continued) | | | | | | | |
Jardine Strategic Holdings Ltd | | Capital Goods | | 9,531 | | $ | 154,974 |
New World Development Ltd | | Real Estate | | 92,406 | | | 220,104 |
PCCW Ltd | | Telecommunication Services | | 79,000 | | | 21,508 |
Sino Land Co | | Real Estate | | 24,664 | | | 50,346 |
Sun Hung Kai Properties Ltd | | Real Estate | | 6,065 | | | 91,953 |
Swire Pacific Ltd Cl A | | Real Estate | | 24,167 | | | 270,669 |
Techtronic Industries Co | | Consumer Durables & Apparel | | 55,500 | | | 46,262 |
Wharf Holdings Ltd | | Real Estate | | 33,675 | | | 158,597 |
Wheelock & Co Ltd | | Real Estate | | 63,221 | | | 177,426 |
| | | | | | | |
| | | | | | | 2,015,887 |
| | | | | | | |
India – 4.0% | | | | | | | |
Hero Honda Motors Ltd | | Automobiles & Components | | 7,379 | | | 246,216 |
JSW Steel Ltd | | Materials | | 9,830 | | | 142,899 |
Mahanagar Telephone Nigam | | Telecommunication Services | | 48,494 | | | 103,663 |
Punjab National Bank Ltd | | Banks | | 13,468 | | | 193,804 |
Sterlite Industries India Ltd | | Materials | | 10,813 | | | 145,451 |
Videocon Industries Ltd | | Consumer Durables & Apparel | | 11,549 | | | 43,679 |
| | | | | | | |
| | | | | | | 875,712 |
| | | | | | | |
Indonesia – 0.7% | | | | | | | |
Perusahaan Gas Negara PT | | Utilities | | 433,000 | | | 152,695 |
| | | | | | | |
| | | | | | | 152,695 |
| | | | | | | |
Japan – 43.6% | | | | | | | |
Aeon Co Ltd | | Food & Staples Retailing | | 9,464 | | | 91,463 |
Alps Electric Co Ltd | | Technology Hardware & Equipment | | 6,600 | | | 36,606 |
Amada Co Ltd | | Capital Goods | | 45,189 | | | 285,768 |
Aoyama Trading Co Ltd | | Retailing | | 7,790 | | | 130,931 |
Asahi Kasei Corp | | Materials | | 28,640 | | | 147,119 |
Astellas Pharma Inc | | Pharma, Biotech & Life Sciences | | 11,684 | | | 443,083 |
Brother Industries Ltd | | Technology Hardware & Equipment | | 5,952 | | | 53,333 |
Central Japan Railway Co | | Transportation | | 43 | | | 257,923 |
Chiba Bank Ltd/The | | Banks | | 15,000 | | | 96,749 |
COMSYS Holdings Corp | | Capital Goods | | 11,500 | | | 132,402 |
Credit Saison Co Ltd | | Diversified Financials | | 12,700 | | | 164,895 |
Daicel Chemical Industries Ltd | | Materials | | 7,000 | | | 44,341 |
Daito Trust Construction Co Ltd | | Real Estate | | 2,000 | | | 97,904 |
Daiwa House Industry Co Ltd | | Real Estate | | 9,769 | | | 100,466 |
Eisai Co Ltd | | Pharma, Biotech & Life Sciences | | 4,600 | | | 162,845 |
FamilyMart Co Ltd | | Food & Staples Retailing | | 2,400 | | | 77,651 |
FUJIFILM Holdings Corp | | Consumer Durables & Apparel | | 10,018 | | | 325,181 |
Fukuoka Financial Group Inc | | Banks | | 24,983 | | | 108,913 |
Hokuhoku Financial Group Inc | | Banks | | 61,846 | | | 140,330 |
Honda Motor Co Ltd | | Automobiles & Components | | 14,498 | | | 464,509 |
Japan Retail Fund Investment Corp | | Real Estate | | 28 | | | 139,713 |
Kamigumi Co Ltd | | Transportation | | 4,000 | | | 33,153 |
KDDI Corp | | Telecommunication Services | | 27 | | | 142,381 |
Konica Minolta Holdings Inc | | Technology Hardware & Equipment | | 17,000 | | | 184,831 |
33
DOMINI PACASIA SOCIAL EQUITY FUND / PORTFOLIOOF INVESTMENTS
July 31, 2009
| | | | | | | |
COUNTRY/SECURITY | | INDUSTRY | | SHARES | | VALUE |
Japan (Continued) | | | | | | | |
Kyocera Corp | | Technology Hardware & Equipment | | 2,675 | | $ | 214,124 |
Leopalace21 Corp | | Real Estate | | 5,185 | | | 44,173 |
Mitsui Fudosan Co Ltd | | Real Estate | | 5,486 | | | 100,275 |
Mitsui OSK Lines Ltd | | Transportation | | 18,394 | | | 111,491 |
Mitsumi Electric Co Ltd | | Technology Hardware & Equipment | | 3,400 | | | 83,397 |
Nintendo Co Ltd | | Software & Services | | 493 | | | 132,527 |
Nippon Express Co Ltd | | Transportation | | 27,691 | | | 126,536 |
Nippon Mining Holdings Inc | | Energy | | 15,041 | | | 71,101 |
Nissan Motor Co Ltd | | Automobiles & Components | | 59,337 | | | 429,468 |
Nitto Denko Corp | | Materials | | 2,100 | | | 67,283 |
Nomura Holdings Inc | | Diversified Financials | | 16,051 | | | 139,779 |
NTT Data Corp | | Software & Services | | 48 | | | 160,849 |
ORIX Corp | | Diversified Financials | | 3,993 | | | 251,253 |
Ricoh Co Ltd | | Technology Hardware & Equipment | | 8,010 | | | 104,506 |
Rohm Co Ltd | | Semiconductors & Semiconductor Equipment | | 4,300 | | | 318,000 |
Seiko Epson Corp | | Technology Hardware & Equipment | | 3,455 | | | 52,844 |
Seino Holdings Corp | | Transportation | | 27,800 | | | 216,396 |
Seven & I Holdings Co Ltd | | Food & Staples Retailing | | 16,579 | | | 386,631 |
Sony Corp | | Consumer Durables & Apparel | | 11,094 | | | 311,744 |
Sumitomo Trust & Banking Co Ltd/The | | Banks | | 32,290 | | | 175,705 |
Takeda Pharmaceutical Co Ltd | | Pharma, Biotech & Life Sciences | | 12,646 | | | 508,789 |
Tokuyama Corp | | Materials | | 18,629 | | | 140,116 |
Tokyo Gas Co Ltd | | Utilities | | 33,000 | | | 120,290 |
Tokyo Steel Manufacturing Co Ltd | | Materials | | 15,500 | | | 170,965 |
Toppan Printing Co Ltd | | Commercial & Professional Services | | 42,297 | | | 429,213 |
Toyo Seikan Kaisha Ltd | | Materials | | 15,779 | | | 336,482 |
Yamada Denki Co Ltd | | Retailing | | 1,640 | | | 101,989 |
Yamaguchi Financial Group Inc | | Banks | | 1,172 | | | 15,943 |
Yamato Holdings Co Ltd | | Transportation | | 20,773 | | | 307,029 |
| | | | | | | |
| | | | | | | 9,491,388 |
| | | | | | | |
Malaysia – 2.0% | | | | | | | |
AMMB Holdings Bhd | | Diversified Financials | | 65,600 | | | 74,494 |
MMC Corp Bhd | | Commercial & Professional Services | | 31,600 | | | 21,799 |
PPB Group Bhd | | Food & Beverage | | 17,291 | | | 72,158 |
RHB Capital Bhd | | Banks | | 16,800 | | | 21,939 |
Telekom Malaysia Bhd | | Telecommunication Services | | 135,400 | | | 114,931 |
Tenaga Nasional Bhd | | Utilities | | 60,056 | | | 138,951 |
| | | | | | | |
| | | | | | | 444,272 |
| | | | | | | |
New Zealand – 1.4% | | | | | | | |
Telecom Corp of New Zealand Ltd | | Telecommunication Services | | 126,259 | | | 231,081 |
Vector Ltd | | Utilities | | 56,693 | | | 75,021 |
| | | | | | | |
| | | | | | | 306,102 |
| | | | | | | |
34
DOMINI PACASIA SOCIAL EQUITY FUND / PORTFOLIOOF INVESTMENTS
July 31, 2009
| | | | | | | |
COUNTRY/SECURITY | | INDUSTRY | | SHARES | | VALUE |
| Norway – 0.7% | | | | | | | |
Fred Olsen Energy ASA | | Energy | | 2,100 | | $ | 76,060 |
StatoilHydro ASA | | Energy | | 3,465 | | | 73,736 |
| | | | | | | |
| | | | | | | 149,796 |
| | | | | | | |
| Singapore – 2.6% | | | | | | | |
CapitaCommercial Trust | | Real Estate | | 88,000 | | | 52,175 |
DBS Group Holdings Ltd | | Banks | | 2,300 | | | 22,138 |
Jardine Cycle & Carriage Ltd | | Retailing | | 20,662 | | | 338,146 |
STATS ChipPAC Ltd (a) | | Semiconductors & Semiconductor Equipment | | 43,000 | | | 22,364 |
Suntec Real Estate Investment Trust | | Real Estate | | 72,000 | | | 54,423 |
Venture Corp Ltd | | Technology Hardware & Equipment | | 10,000 | | | 66,225 |
| | | | | | | |
| | | | | | | 555,471 |
| | | | | | | |
| South Korea – 8.0% | | | | | | | |
Dongbu Insurance Co Ltd | | Insurance | | 1,650 | | | 42,250 |
GS Holdings Corp | | Energy | | 3,018 | | | 80,967 |
Hana Financial Group Inc | | Banks | | 2,348 | | | 66,911 |
Korea Investment Holdings Co Ltd | | Diversified Financials | | 2,780 | | | 90,765 |
Korea Zinc Co Ltd | | Materials | | 1,074 | | | 122,860 |
KT Corp | | Telecommunication Services | | 5,961 | | | 192,682 |
LG Corp | | Capital Goods | | 3,278 | | | 176,684 |
LG Electronics Inc | | Consumer Durables & Apparel | | 3,800 | | | 400,668 |
LG Telecom Ltd | | Telecommunication Services | | 15,570 | | | 109,530 |
Lotte Shopping Co Ltd | | Retailing | | 642 | | | 160,735 |
Woori Finance Holdings Co Ltd (a) | | Banks | | 14,177 | | | 162,178 |
Woori Investment & Securities Co Ltd | | Diversified Financials | | 9,150 | | | 137,824 |
| | | | | | | |
| | | | | | | 1,744,054 |
| | | | | | | |
| Taiwan – 5.8% | | | | | | | |
Acer Inc | | Technology Hardware & Equipment | | 42,928 | | | 90,547 |
Advanced Semiconductor Engineering Inc | | Semiconductors & Semiconductor Equipment | | 78,000 | | | 56,227 |
Compal Electronics Inc | | Technology Hardware & Equipment | | 163,000 | | | 159,979 |
HTC Corp (a) | | Technology Hardware & Equipment | | 5,161 | | | 70,396 |
Lite-On Technology Corp | | Technology Hardware & Equipment | | 154,000 | | | 175,320 |
MediaTek Inc | | Semiconductors & Semiconductor Equipment | | 9,495 | | | 136,457 |
Mega Financial Holding Co Ltd | | Banks | | 155,000 | | | 80,788 |
Quanta Computer Inc | | Technology Hardware & Equipment | | 182,709 | | | 345,837 |
Taiwan Cooperative Bank | | Banks | | 229,008 | | | 141,001 |
| | | | | | | |
| | | | | | | 1,256,552 |
| | | | | | | |
| Thailand – 1.0% | �� | | | | | | |
Bangkok Bank PCL | | Banks | | 66,718 | | | 220,563 |
| | | | | | | |
| | | | | | | 220,563 |
| | | | | | | |
35
DOMINI PACASIA SOCIAL EQUITY FUND / PORTFOLIOOF INVESTMENTS
July 31, 2009
| | | | | | | |
COUNTRY/SECURITY | | INDUSTRY | | SHARES | | VALUE |
| United States – 1.2% | | | | | | | |
National Oilwell Varco Inc (a) | | Energy | | 600 | | $ | 21,564 |
Noble Corp (a) | | Energy | | 1,326 | | | 44,898 |
Southwestern Energy Co (a) | | Energy | | 3,706 | | | 153,540 |
Tidewater Inc | | Energy | | 743 | | | 33,435 |
| | | | | | | |
| | | | | | | 253,437 |
| | | | | | | |
| | | |
Total Investments – 97.7% (Cost $20,391,888) (b) | | | | | | | 21,252,506 |
| | | | | | | |
| | | |
| Other Assets, less liabilities – 2.3% | | | | | | | 493,177 |
| | | | | | | |
| | | |
| Net Assets – 100.0% | | | | | | $ | 21,745,683 |
| | | | | | | |
| (a) | Non-income producing security. |
| (b) | The aggregate cost for federal income tax purposes is $21,023,853. The aggregate gross unrealized appreciation is $2,892,838 and the aggregate gross unrealized depreciation is $2,664,185, resulting in net unrealized depreciation of $228,653. |
SEE NOTES TO FINANCIAL STATEMENTS
36
THIS PAGE INTENTIONALLY LEFT BLANK
DOMINI EUROPEAN PACASIA SOCIAL EQUITY FUND
Performance Commentary
For the year ended July 31, 2009, the Fund’s Investor shares declined -25.72%, lagging the MSCI EAFE index, which fell -22.16%.
The following were among the companies held in the Fund’s portfolio that helped performance the most, relative to the MSCI EAFE:
| | • | | The stock of the British bank Barclays rose during the latter half of the year as the company announced it would sell its asset management division, Barclays Global Investors. |
| | • | | Stock in the French pharmaceutical company Sanofi-Aventis rose in the first half of the period on speculation that it would acquire the Czech pharmaceutical company Zentiva. |
| | • | | The Singaporean investment holding company Jardine Cycle & Carriage gained due to strong results in the first quarter of 2009 and improving fundamentals. |
The following were among the companies in the portfolio that hurt the Fund’s relative performance the most:
| | • | | Royal Bank of Scotland and Bank of Ireland were badly hurt by the continuing credit crisis. |
| | • | | Shares of HSBC Holdings dropped at the beginning of 2009 on increasing fears of further write-downs, and the possibility of a cut in dividends and a capital raise. |
The Fund benefited the most from its stock selection in the information technology sector, and its overweighting to the healthcare sector. The Fund was hurt the most by stock selection in the financial, consumer discretionary, and energy sectors.
38
TEN LARGEST HOLDINGS
| | | | | | | | |
COMPANY | | % NET
ASSETS | | | COMPANY | | % NET
ASSETS | |
Vodafone Group | | 2.7 | % | | StatoilHydro | | 2.0 | % |
Novartis | | 2.5 | % | | Takeda Pharmaceutical | | 1.6 | % |
Sanofi-Aventis | | 2.5 | % | | Telefonica | | 1.5 | % |
Banco Santander | | 2.4 | % | | Vivendi | | 1.5 | % |
GlaxoSmithKline | | 2.0 | % | | Barclays | | 1.5 | % |
PORTFOLIO HOLDINGS BY INDUSTRY SECTOR (% OF NET ASSETS)
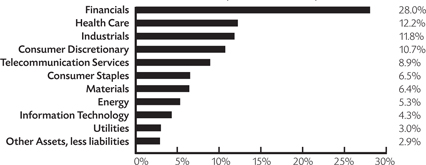
PORTFOLIO HOLDINGS BY COUNTRY (% OF NET ASSETS)

39
AVERAGE ANNUAL TOTAL RETURNS
| | | | | | | | |
| | | | | Investor
shares | | | MSCI EAFE | |
As of 7-31-09 | | 1 Year | | -25.72 | % | | -22.16 | % |
| | Since Inception (12-27-06) | | -15.60 | % | | -10.04 | % |
COMPARISON OF $10,000 INVESTMENT IN THE DOMINI EUROPEAN PACASIA SOCIAL EQUITY FUND INVESTOR SHARES AND MSCI EAFE

Past performance is no guarantee of future results. The Fund’s returns quoted above represent past performance after all expenses. Economic and market conditions change, and both will cause investment return, principal value, and yield to fluctuate so that an investor’s shares, when redeemed, may be worth more or less than their original cost. Current performance may be lower or higher than the performance data quoted. For performance information current to the most recent month-end, call 1-800-582-6757 or visit www.domini.com. A 2.00% redemption fee is charged on sales or exchanges of shares made less than 30 days after the settlement of purchase or acquisition through exchange, with certain exceptions. Performance data quoted above does not reflect the deduction of this fee, which would reduce the performance quoted. See the Fund’s prospectus for further information.
For the period reported in its current prospectus, the Fund’s gross annual operating expenses totaled 3.19% of net assets. Until November 30, 2009, Domini has contractually agreed to waive certain fees and/or reimburse certain expenses, including management fees, so that expenses paid by the Fund will not exceed, on a per annum basis, 1.60% of its average daily net assets representing Investor shares, absent an earlier modification by the Board of Trustees, which oversees the Funds.
Investing internationally involves special risks, such as currency fluctuations, social and economic instability, differing securities regulations and accounting standards, limited public information, possible changes in taxation, and periods of illiquidity.
The table and the graph do not reflect the deduction of taxes that a shareholder would pay on Fund distributions or the redemption of Fund shares. Total return for the Domini European PacAsia Social Equity Fund is based on the Fund’s net asset values and assumes all dividends and capital gains were reinvested. An investment in the Fund is not a bank deposit and is not insured. You may lose money. Certain fees payable by the Fund were waived during the period, and the Fund’s average annual total returns would have been lower had these not been waived.
The Morgan Stanley Capital International Europe Australasia Far East (MSCI EAFE) index is an unmanaged index of common stocks. Investors cannot invest directly in an index.
40
AVERAGE ANNUAL TOTAL RETURNS
| | | | | | | | | | | |
| | | | | Class A shares (with
4.75% maximum
Sales Charge)1 | | | Class A shares
(without Sales
Charge)1 | | | MSCI EAFE | |
As of 7-31-09 | | 1 Year | | -29.24 | % | | -25.72 | % | | -22.16 | % |
| | Since Inception (12-27-06) | | -17.16 | % | | -15.60 | % | | -10.04 | % |
COMPARISON OF $10,000 INVESTMENT IN THE DOMINI EUROPEAN PACASIA SOCIAL EQUITY FUND CLASS A SHARES AND MSCI EAFE (with 4.75% maximum sales charge)1
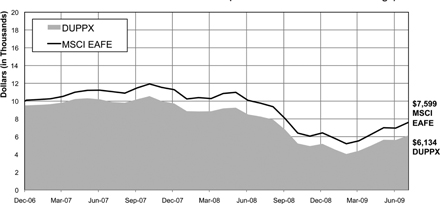
Past performance is no guarantee of future results. The Fund’s returns quoted above represent past performance after all expenses. Economic and market conditions change, and both will cause investment return, principal value, and yield to fluctuate so that an investor’s shares, when redeemed, may be worth more or less than their original cost. Current performance may be lower or higher than the performance data quoted. For performance information current to the most recent month-end, call 1-800-582-6757 or visit www.domini.com. A 2.00% redemption fee is charged on sales or exchanges of shares made less than 30 days after the settlement of purchase or acquisition through exchange, with certain exceptions. Performance data quoted above does not reflect the deduction of this fee, which would reduce the performance quoted. See the Fund’s prospectus for further information.
For the period reported in its current prospectus, the Fund’s gross annual operating expenses totaled 10.79% of net assets. Until November 30, 2009, Domini has contractually agreed to waive certain fees and/or reimburse certain expenses, including management fees, so that expenses paid by the Fund will not exceed, on a per annum basis, 1.57% of its average daily net assets representing Class A shares, absent an earlier modification by the Board of Trustees, which oversees the Funds.
Investing internationally involves special risks, such as currency fluctuations, social and economic instability, differing securities regulations and accounting standards, limited public information, possible changes in taxation, and periods of illiquidity.
The table and the graph do not reflect the deduction of taxes that a shareholder would pay on Fund distributions or the redemption of Fund shares. Total return for the Domini European PacAsia Social Equity Fund is based on the Fund’s net asset values and assumes all dividends and capital gains were reinvested. An investment in the Fund is not a bank deposit and is not insured. You may lose money. Certain fees payable by the Fund were waived during the period, and the Fund’s average annual total returns would have been lower had these not been waived.
The Morgan Stanley Capital International Europe Australasia Far East (MSCI EAFE) index is an unmanaged index of common stocks. Investors cannot invest directly in an index.
| 1 | Class A shares were not offered prior to November 28, 2008. All performance information for time periods beginning prior to November 28, 2008, is the performance of the Investor shares. Unless otherwise noted, this performance has not been adjusted to reflect the lower expenses of the Class A shares, but does, where noted, reflect an adjustment for the maximum applicable sales charges of 4.75%. |
41
DOMINI EUROPEAN PACASIA SOCIAL EQUITY FUND
PORTFOLIOOF INVESTMENTS
July 31, 2009
| | | | | | | |
COUNTRY/SECURITY | | INDUSTRY | | SHARES | | VALUE |
| Australia – 4.2% | | | | | | | |
AGL Energy Ltd | | Utilities | | 28,821 | | $ | 357,008 |
BlueScope Steel Ltd | | Materials | | 24,489 | | | 68,610 |
National Australia Bank Ltd | | Banks | | 9,897 | | | 200,184 |
OneSteel Ltd | | Materials | | 11,862 | | | 29,486 |
Origin Energy Ltd | | Energy | | 7,880 | | | 94,990 |
Suncorp-Metway Ltd | | Insurance | | 40,631 | | | 239,828 |
Westpac Banking Corp | | Banks | | 9,158 | | | 165,137 |
| | | | | | | |
| | | | | | | 1,155,243 |
| | | | | | | |
| Austria – 1.1% | | | | | | | |
EVN AG | | Utilities | | 1,434 | | | 23,828 |
Immoeast AG (a) | | Real Estate | | 29,148 | | | 80,170 |
Mayr Melnhof Karton AG | | Materials | | 302 | | | 28,164 |
OMV AG | | Energy | | 4,516 | | | 178,311 |
| | | | | | | |
| | | | | | | 310,473 |
| | | | | | | |
| Belgium – 1.8% | | | | | | | |
D’ieteren SA | | Retailing | | 118 | | | 25,346 |
Delhaize Group | | Food & Staples Retailing | | 3,621 | | | 257,556 |
Fortis (a) | | Diversified Financials | | 30,803 | | | 119,222 |
Omega Pharma SA | | Health Care Equipment & Services | | 801 | | | 25,097 |
UCB SA | | Pharma, Biotech & Life Sciences | | 2,011 | | | 66,145 |
| | | | | | | |
| | | | | | | 493,366 |
| | | | | | | |
| China – 0.3% | | | | | | | |
Agile Property Holdings Ltd | | Real Estate | | 38,000 | | | 53,641 |
Chaoda Modern Agriculture Holdings Ltd | | Food & Beverage | | 49,920 | | | 34,074 |
| | | | | | | |
| | | | | | | 87,715 |
| | | | | | | |
| Denmark – 1.1% | | | | | | | |
FLSmidth & Co A/S (a) | | Capital Goods | | 2,624 | | | 113,418 |
H Lundbeck A/S | | Pharma, Biotech & Life Sciences | | 6,932 | | | 133,641 |
Novo Nordisk A/S | | Pharma, Biotech & Life Sciences | | 881 | | | 51,583 |
| | | | | | | |
| | | | | | | 298,642 |
| | | | | | | |
| Finland – 0.2% | | | | | | | |
Kone OYJ Cl B | | Capital Goods | | 1,533 | | | 51,879 |
| | | | | | | |
| | | | | | | 51,879 |
| | | | | | | |
| France – 12.9% | | | | | | | |
BNP Paribas | | Banks | | 4,653 | | | 337,425 |
Ciments Francais SA Cl A | | Materials | | 916 | | | 88,997 |
Credit Agricole SA | | Banks | | 7,978 | | | 113,278 |
Eiffage SA | | Capital Goods | | 2,411 | | | 159,886 |
France Telecom SA | | Telecommunication Services | | 14,564 | | | 361,548 |
Gecina SA | | Real Estate | | 698 | | | 57,159 |
Natixis (a) | | Banks | | 59,202 | | | 153,347 |
PEUGEOT SA (a) | | Automobiles & Components | | 5,105 | | | 154,016 |
PPR | | Retailing | | 1,053 | | | 116,729 |
Sanofi-Aventis SA | | Pharma, Biotech & Life Sciences | | 10,276 | | | 669,582 |
42
DOMINI EUROPEAN PACASIA SOCIAL EQUITY FUND / PORTFOLIOOF INVESTMENTS
July 31, 2009
| | | | | | | |
COUNTRY/SECURITY | | INDUSTRY | | SHARES | | VALUE |
France (Continued) | | | | | | | |
Schneider Electric SA | | Capital Goods | | 3,034 | | $ | 274,175 |
SCOR SE | | Insurance | | 4,010 | | | 95,767 |
Societe BIC SA | | Commercial & Professional Services | | 1,202 | | | 71,684 |
Vinci SA | | Capital Goods | | 7,240 | | | 366,546 |
Vivendi | | Media | | 16,008 | | | 409,084 |
Wendel | | Capital Goods | | 1,877 | | | 74,485 |
| | | | | | | |
| | | | | | | 3,503,708 |
| | | | | | | |
| Germany – 6.0% | | | | | | | |
Allianz SE | | Insurance | | 1,447 | | | 141,962 |
Continental AG (a) | | Automobiles & Components | | 875 | | | 29,959 |
Deutsche Lufthansa AG | | Transportation | | 6,962 | | | 93,571 |
Deutsche Telekom AG | | Telecommunication Services | | 29,440 | | | 375,230 |
Hannover Rueckversicherung AG (a) | | Insurance | | 1,759 | | | 71,199 |
Henkel AG & Co KGaA | | Household & Personal Products | | 6,342 | | | 231,977 |
Infineon Technologies AG (a) | | Semiconductors & Semiconductor Equipment | | 20,531 | | | 84,122 |
Muenchener Rueckversicherungs AG | | Insurance | | 1,862 | | | 280,062 |
ProSiebenSat.1 Media AG | | Media | | 7,554 | | | 47,551 |
Salzgitter AG | | Materials | | 715 | | | 72,124 |
Suedzucker AG | | Food & Beverage | | 10,548 | | | 220,428 |
| | | | | | | |
| | | | | | | 1,648,185 |
| | | | | | | |
| Greece – 0.7% | | | | | | | |
Public Power Corp SA (a) | | Utilities | | 8,209 | | | 178,066 |
| | | | | | | |
| | | | | | | 178,066 |
| | | | | | | |
| Hong Kong – 4.7% | | | | | | | |
First Pacific Co | | Food & Beverage | | 78,000 | | | 49,820 |
Great Eagle Holdings Ltd | | Real Estate | | 28,145 | | | 65,151 |
Guoco Group Ltd | | Diversified Financials | | 7,000 | | | 65,935 |
Henderson Land Development Co Ltd | | Real Estate | | 9,000 | | | 59,632 |
Hongkong Land Holdings Ltd | | Real Estate | | 45,000 | | | 175,050 |
Hysan Development Co Ltd | | Real Estate | | 20,223 | | | 54,928 |
Jardine Matheson Holdings Ltd | | Capital Goods | | 2,714 | | | 78,163 |
Jardine Strategic Holdings Ltd | | Capital Goods | | 7,366 | | | 119,771 |
New World Development Ltd | | Real Estate | | 69,864 | | | 166,410 |
Swire Pacific Ltd Cl A | | Real Estate | | 15,466 | | | 173,218 |
Wharf Holdings Ltd | | Real Estate | | 30,192 | | | 142,194 |
Wheelock & Co Ltd | | Real Estate | | 48,250 | | | 135,410 |
| | | | | | | |
| | | | | | | 1,285,682 |
| | | | | | | |
| Ireland – 0.5% | | | | | | | |
Anglo Irish Bank Ltd (a)(c) | | Banks | | 57,849 | | | 0 |
DCC Plc | | Capital Goods | | 2,717 | | | 57,780 |
Smurfit Kappa Group PLC | | Materials | | 13,883 | | | 80,699 |
| | | | | | | |
| | | | | | | 138,479 |
| | | | | | | |
43
DOMINI EUROPEAN PACASIA SOCIAL EQUITY FUND / PORTFOLIOOF INVESTMENTS
July 31, 2009
| | | | | | | |
COUNTRY/SECURITY | | INDUSTRY | | SHARES | | VALUE |
| Italy – 3.5% | | | | | | | |
Banco Popolare SC (a) | | Banks | | 3,764 | | $ | 30,258 |
Buzzi Unicem SpA | | Materials | | 8,246 | | | 122,871 |
Exor SpA | | Diversified Financials | | 3,392 | | | 56,842 |
Italcementi SpA | | Materials | | 8,204 | | | 106,716 |
Telecom Italia SpA | | Telecommunication Services | | 184,241 | | | 286,806 |
UniCredit SpA (a) | | Insurance | | 124,240 | | | 361,970 |
| | | | | | | |
| | | | | | | 965,463 |
| | | | | | | |
| Japan – 22.3% | | | | | | | |
Aeon Co Ltd | | Food & Staples Retailing | | 12,385 | | | 119,694 |
Amada Co Ltd | | Capital Goods | | 26,861 | | | 169,866 |
Aoyama Trading Co Ltd | | Retailing | | 4,596 | | | 77,249 |
Asahi Kasei Corp | | Materials | | 13,000 | | | 66,780 |
Astellas Pharma Inc | | Pharma, Biotech & Life Sciences | | 9,800 | | | 371,638 |
Brother Industries Ltd | | Technology Hardware & Equipment | | 3,300 | | | 29,570 |
Central Japan Railway Co | | Transportation | | 20 | | | 119,964 |
Chiba Bank Ltd/The | | Banks | | 12,012 | | | 77,476 |
COMSYS Holdings Corp | | Capital Goods | | 3,300 | | | 37,994 |
Credit Saison Co Ltd | | Diversified Financials | | 7,941 | | | 103,105 |
Daito Trust Construction Co Ltd | | Real Estate | | 1,900 | | | 93,009 |
Daiwa House Industry Co Ltd | | Real Estate | | 3,000 | | | 30,852 |
FamilyMart Co Ltd | | Food & Staples Retailing | | 3,100 | | | 100,299 |
FUJIFILM Holdings Corp | | Consumer Durables & Apparel | | 7,505 | | | 243,610 |
Fukuoka Financial Group Inc | | Banks | | 32,451 | | | 141,469 |
Hokuhoku Financial Group Inc | | Banks | | 50,000 | | | 113,451 |
Honda Motor Co Ltd | | Automobiles & Components | | 9,163 | | | 293,578 |
Japan Retail Fund Investment Corp | | Real Estate | | 15 | | | 74,846 |
Kamigumi Co Ltd | | Transportation | | 11,000 | | | 91,171 |
KDDI Corp | | Telecommunication Services | | 15 | | | 79,101 |
Konica Minolta Holdings Inc | | Technology Hardware & Equipment | | 12,373 | | | 134,524 |
Kyocera Corp | | Technology Hardware & Equipment | | 1,691 | | | 135,358 |
Leopalace21 Corp | | Real Estate | | 4,900 | | | 41,745 |
Nintendo Co Ltd | | Software & Services | | 272 | | | 73,118 |
Nippon Express Co Ltd | | Transportation | | 6,000 | | | 27,417 |
Nippon Mining Holdings Inc | | Energy | | 7,929 | | | 37,481 |
Nissan Motor Co Ltd | | Automobiles & Components | | 44,427 | | | 321,553 |
NTT Data Corp | | Software & Services | | 18 | | | 60,318 |
ORIX Corp | | Diversified Financials | | 3,000 | | | 188,770 |
Ricoh Co Ltd | | Technology Hardware & Equipment | | 4,484 | | | 58,502 |
Rohm Co Ltd | | Semiconductors & Semiconductor Equipment | | 3,737 | | | 276,364 |
Seiko Epson Corp | | Technology Hardware & Equipment | | 2,885 | | | 44,126 |
Seino Holdings Corp | | Transportation | | 15,893 | | | 123,711 |
Seven & I Holdings Co Ltd | | Food & Staples Retailing | | 11,700 | | | 272,850 |
Sony Corp | | Consumer Durables & Apparel | | 3,359 | | | 94,389 |
Sumitomo Trust & Banking Co Ltd/The | | Banks | | 22,338 | | | 121,551 |
44
DOMINI EUROPEAN PACASIA SOCIAL EQUITY FUND / PORTFOLIOOF INVESTMENTS
July 31, 2009
| | | | | | | |
COUNTRY/SECURITY | | INDUSTRY | | SHARES | | VALUE |
Japan (Continued) | | | | | | | |
Takeda Pharmaceutical Co Ltd | | Pharma, Biotech & Life Sciences | | 11,100 | | $ | 446,589 |
Tokuyama Corp | | Materials | | 7,608 | | | 57,223 |
Tokyo Gas Co Ltd | | Utilities | | 23,000 | | | 83,838 |
Tokyo Steel Manufacturing Co Ltd | | Materials | | 18,095 | | | 199,588 |
Toppan Printing Co Ltd | | Commercial & Professional Services | | 35,154 | | | 356,728 |
Toyo Seikan Kaisha Ltd | | Materials | | 8,419 | | | 179,532 |
Yamada Denki Co Ltd | | Retailing | | 470 | | | 29,228 |
Yamaguchi Financial Group Inc | | Banks | | 3,755 | | | 51,082 |
Yamato Holdings Co Ltd | | Transportation | | 15,941 | | | 235,611 |
| | | | | | | |
| | | | | | | 6,085,918 |
| | | | | | | |
| Netherlands – 2.1% | | | | | | | |
ING Groep NV | | Diversified Financials | | 8,441 | | | 107,681 |
Koninklijke Ahold NV | | Food & Staples Retailing | | 26,606 | | | 300,973 |
SNS Reaal | | Diversified Financials | | 21,305 | | | 121,727 |
TomTom NV (a) | | Consumer Durables & Apparel | | 2,935 | | | 32,082 |
| | | | | | | |
| | | | | | | 562,463 |
| | | | | | | |
| New Zealand – 0.8% | | | | | | | |
Telecom Corp of New Zealand Ltd | | Telecommunication Services | | 99,051 | | | 181,284 |
Vector Ltd | | Utilities | | 30,860 | | | 40,837 |
| | | | | | | |
| | | | | | | 222,121 |
| | | | | | | |
| Norway – 3.0% | | | | | | | |
Fred Olsen Energy ASA | | Energy | | 6,309 | | | 228,505 |
Seadrill Ltd | | Energy | | 1,600 | | | 25,575 |
StatoilHydro ASA | | Energy | | 25,189 | | | 536,032 |
TGS Nopec Geophysical Co ASA (a) | | Energy | | 3,298 | | | 37,224 |
| | | | | | | |
| | | | | | | 827,336 |
| | | | | | | |
| Singapore – 1.2% | | | | | | | |
CapitaCommercial Trust | | Real Estate | | 51,000 | | | 30,238 |
Jardine Cycle & Carriage Ltd | | Retailing | | 15,817 | | | 258,855 |
Suntec Real Estate Investment Trust | | Real Estate | | 60,000 | | | 45,352 |
| | | | | | | |
| | | | | | | 334,445 |
| | | | | | | |
| South Korea – 0.3% | | | | | | | |
LG Electronics Inc | | Consumer Durables & Apparel | | 756 | | | 79,712 |
| | | | | | | |
| | | | | | | 79,712 |
| | | | | | | |
| Spain – 5.3% | | | | | | | |
Banco Bilbao Vizcaya Argentaria SA | | Banks | | 17,553 | | | 286,684 |
Banco Santander SA | | Banks | | 45,670 | | | 657,846 |
Criteria Caixacorp SA | | Diversified Financials | | 16,576 | | | 79,315 |
Telefonica SA | | Telecommunication Services | | 16,795 | | | 415,623 |
| | | | | | | |
| | | | | | | 1,439,468 |
| | | | | | | |
45
DOMINI EUROPEAN PACASIA SOCIAL EQUITY FUND / PORTFOLIOOF INVESTMENTS
July 31, 2009
| | | | | | | |
COUNTRY/SECURITY | | INDUSTRY | | SHARES | | VALUE |
| Sweden – 2.3% | | | | | | | |
Assa Abloy AB Cl B | | Capital Goods | | 7,767 | | $ | 126,869 |
Boliden AB | | Materials | | 13,336 | | | 142,324 |
Electrolux AB Cl B (a) | | Consumer Durables & Apparel | | 2,219 | | | 41,119 |
Securitas AB Cl B | | Commercial & Professional Services | | 4,538 | | | 42,357 |
SSAB AB Cl A | | Materials | | 1,852 | | | 24,023 |
Svenska Cellulosa AB Cl B | | Materials | | 7,020 | | | 89,372 |
Telefonaktiebolaget LM Ericsson Cl B | | Technology Hardware & Equipment | | 16,310 | | | 158,504 |
| | | | | | | |
| | | | | | | 624,568 |
| | | | | | | |
| Switzerland – 4.4% | | | | | | | |
Clariant AG (a) | | Materials | | 5,246 | | | 38,995 |
Novartis AG | | Pharma, Biotech & Life Sciences | | 15,171 | | | 689,866 |
Roche Holding AG | | Pharma, Biotech & Life Sciences | | 2,129 | | | 333,321 |
Schindler Holding AG | | Capital Goods | | 1,275 | | | 81,742 |
Schindler Holding AG | | Capital Goods | | 810 | | | 51,930 |
| | | | | | | |
| | | | | | | 1,195,854 |
| | | | | | | |
| Taiwan – 0.4% | | | | | | | |
Quanta Computer Inc | | Technology Hardware & Equipment | | 50,156 | | | 94,937 |
| | | | | | | |
| | | | | | | 94,937 |
| | | | | | | |
| United Kingdom – 18.0% | | | | | | | |
Antofagasta PLC | | Materials | | 27,396 | | | 343,819 |
Autonomy Corp PLC (a) | | Software & Services | | 1,500 | | | 29,219 |
Aviva PLC | | Insurance | | 42,777 | | | 248,744 |
Barclays PLC | | Banks | | 81,431 | | | 408,106 |
BG Group PLC | | Energy | | 18,079 | | | 299,423 |
Carphone Warehouse Group PLC | | Retailing | | 30,719 | | | 91,415 |
Experian PLC | | Commercial & Professional Services | | 36,293 | | | 297,232 |
GlaxoSmithKline PLC | | Pharma, Biotech & Life Sciences | | 28,243 | | | 537,992 |
Home Retail Group PLC | | Retailing | | 9,072 | | | 47,226 |
HSBC Holdings PLC | | Banks | | 27,924 | | | 280,425 |
ICAP PLC | | Diversified Financials | | 7,909 | | | 59,528 |
International Power PLC | | Utilities | | 29,729 | | | 125,803 |
Investec PLC | | Diversified Financials | | 37,348 | | | 250,146 |
J Sainsbury PLC | | Food & Staples Retailing | | 27,585 | | | 145,198 |
Kingfisher PLC | | Retailing | | 36,614 | | | 129,140 |
Next PLC | | Retailing | | 3,623 | | | 102,409 |
Old Mutual PLC | | Insurance | | 202,326 | | | 321,405 |
Reckitt Benckiser Group PLC | | Household & Personal Products | | 562 | | | 26,796 |
Standard Chartered PLC | | Banks | | 5,237 | | | 123,373 |
Thomas Cook Group PLC | | Consumer Services | | 34,233 | | | 123,154 |
Thomson Reuters PLC | | Media | | 5,729 | | | 181,883 |
Vodafone Group PLC | | Telecommunication Services | | 355,506 | | | 723,164 |
| | | | | | | |
| | | | | | | 4,895,600 |
| | | | | | | |
46
DOMINI EUROPEAN PACASIA SOCIAL EQUITY FUND / PORTFOLIOOF INVESTMENTS
July 31, 2009
| | | | | | | |
Total Investments – 97.1% (Cost $25,154,136) (b) | | | | | | $ | 26,479,323 |
| | | | | | | |
| | | |
| Other Assets, less liabilities – 2.9% | | | | | | | 792,077 |
| | | | | | | |
| | | |
| Net Assets – 100.0% | | | | | | $ | 27,271,400 |
| | | | | | | |
| (a) | Non-income producing security. |
| (b) | The aggregate cost for federal income tax purposes is $25,775,155. The aggregate gross unrealized appreciation is $2,727,171 and the aggregate gross unrealized depreciation is $2,023,003, resulting in net unrealized appreciation of $704,168. |
| (c) | Securities for which there are no such quotations or valuations are valued at fair value as determined in good faith by or at the direction of the Fund’s Board of Trustees. |
SEE NOTES TO FINANCIAL STATEMENTS
47
DOMINI SOCIAL BOND FUND
Performance Commentary
For the year ended July 31, 2009, the Fund returned 9.15%, outperforming the Barclays Capital Intermediate Aggregate (BCIA) index, which returned 7.59%.
The Fund’s performance benefited the most from strong security selection among corporate bonds and commercial mortgage-backed securities. The Fund was also helped by its investment in project loans. A project loan is a community-focused investment that helps provide financing for developments like low-income housing projects and nursing homes. The Fund was hurt by its underweighting to mortgage-backed securities (residential).
As of July 31, 2009, the Domini Social Bond Fund was a Lipper Leader in four categories — Total Return, Preservation, Tax Efficiency and Expense — placing the fund in the top 20% of its peers for each category.
PORTFOLIO COMPOSITION (% OF NET ASSETS)

| | | | | | | | |
| | | Total
Return1 | | Tax
Efficiency2 | | Preservation3 | | Expense4 |
| | | US - BBB Corporate Debt | | US - Fixed
Income | | US - No-
Load
BBB
Corporate
Debt |
Overall & 3 Year Rating
(Number of funds in peer group) | | 
119 | |
119 | |
4074 | |
36 |
5 Year Rating
(Number of funds in peer group) | | 
99 | |
99 | |
3612 | |
4 |
All Lipper ratings reflect historical performance as of 7/31/09: 1. Total Return rating reflects funds’ historical total return performance relative to peers; 2. Tax Efficiency (US) rating reflects funds’ historical success in postponing taxable distributions relative to peers. Tax Efficiency (US) offers no benefit to investors in tax-sheltered accounts such as retirement plans. 3. Preservation rating reflects funds’ historical loss avoidance relative to other funds within the same asset class; Preservation ratings are relative, rather than absolute, measures, and funds named Lipper Leaders for Preservation may still experience losses periodically. 4. Expense rating reflects funds’ expense minimization relative to peers with similar load structures. A “5” rating is Lipper’s top rating, representing “Lipper Leader” status. The Lipper ratings are subject to change every month and are based on an equal-weighted average of percentile ranks for the Total Return, Preservation, Tax Efficiency, and Expense metrics over three-, five-, and ten-year periods (if applicable). The highest 20% of funds in each peer group are named Lipper Leader or a score of 5, the next 20% receive a score of 4, the middle 20% are scored 3, the next 20% are scored 2, and the lowest 20% are scored 1. Lipper ratings are not intended to predict future results, and Lipper does not guarantee the accuracy of this information. More information is available at www.lipperweb.com. Lipper Leader Copyright 2009.
48
AVERAGE ANNUAL TOTAL RETURNS
| | | | | | | | |
| | | | | Investor shares | | | BCIA | |
As of 7-31-09 | | 1 Year | | 9.15 | % | | 7.59 | % |
| | 5 Year | | 4.67 | % | | 5.02 | % |
| | Since Inception (6-1-00) | | 5.65 | % | | 6.23 | % |
COMPARISON OF $10,000 INVESTMENT IN THE DOMINI SOCIAL BOND FUND AND BCIA
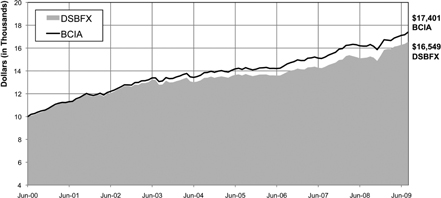
Past performance is no guarantee of future results. The Fund’s returns quoted above represent past performance after all expenses. Economic and market conditions change, and both will cause investment return, principal value, and yield to fluctuate so that an investor’s shares, when redeemed, may be worth more or less than their original cost. Current performance may be lower or higher than the performance data quoted. For performance information current to the most recent month-end, call 1-800-582-6757 or visit www.domini.com. A 2.00% redemption fee is charged on sales or exchanges of shares made less than 30 days after the settlement of purchase or acquisition through exchange, with certain exceptions. Performance data quoted above does not reflect the deduction of this fee, which would reduce the performance quoted. See the Fund’s prospectus for further information.
For the period reported in its current prospectus, the Fund’s gross annual operating expenses totaled 1.43% of net assets. Until November 30, 2009, Domini has contractually agreed to waive fees and reimburse expenses to limit the Fund’s expenses, on a per annum basis, to 0.95% of its average daily net assets, absent an earlier modification by the Board of Trustees, which oversees the Funds.
The table does not reflect the deduction of taxes that a shareholder would pay on Fund distributions or the redemption of Fund shares. Total return for the Domini Social Bond Fund is based on the Fund’s net asset values and assumes all dividends and capital gains were reinvested. An investment in the Fund is not a bank deposit and is not insured. You may lose money. Certain fees payable by the Fund were waived during the period, and the Fund’s average annual total returns would have been lower had these not been waived.
The Domini Social Bond Fund is not insured and is subject to market risks, interest rate risks, and credit risks. You may lose money.
During periods of rising interest rates, bond funds can lose value. The Fund’s community development investments may be unrated and may carry greater risks than the Fund’s other holdings. The Fund currently holds a large percentage of its portfolio in mortgage-backed securities. During periods of falling interest rates these securities may prepay the principal due, which may lower the Fund’s return by causing it to reinvest at lower interest rates.
49
DOMINI SOCIAL BOND FUND
PORTFOLIOOF INVESTMENTS
July 31, 2009
| | | | | | |
| | | Principal
Amount | | Value
Note (1) |
U.S. Government Agency Obligations – 29.8% | | | | | | |
Fannie Mae: | | | | | | |
1.875%, 4/20/2012 | | $ | 2,500,000 | | $ | 2,515,293 |
2.500%, 5/15/2014 | | | 4,840,000 | | | 4,783,435 |
5.000%, 10/15/2011 | | | 3,353,000 | | | 3,625,374 |
Federal Agriculture Mortgage Corporation: | | | | | | |
6.680%, 6/10/2014 | | | 1,000,000 | | | 1,165,152 |
Freddie Mac: | | | | | | |
1.500%, 1/7/2011 | | | 4,600,000 | | | 4,642,831 |
3.750%, 6/28/2013 | | | 525,000 | | | 553,429 |
3.750%, 3/27/2019 | | | 4,920,000 | | | 4,897,535 |
5.500%, 9/15/2011 | | | 3,017,000 | | | 3,285,435 |
U.S. Small Business Administration: | | | | | | |
2003-10C 1, 3.530%, 5/1/2013 | | | 178,932 | | | 182,483 |
2003-20D 1, 4.760%, 4/1/2023 | | | 349,754 | | | 363,132 |
2003-20E 1, 4.640%, 5/1/2023 | | | 344,026 | | | 355,873 |
2003-20F 1, 4.070%, 6/1/2023 | | | 291,715 | | | 290,848 |
2003-20G 1, 4.350%, 7/1/2023 | | | 165,969 | | | 170,861 |
| | | | | | |
TOTAL U.S. GOVERNMENT AGENCY OBLIGATIONS
(Cost $26,064,843) | | | | | | 26,831,681 |
| | | | | | |
| | |
U.S. Government Agency Mortgage Securities – 35.1% | | | | | | |
Fannie Mae: | | | | | | |
13743, 7.270%, VR, 11/1/2019 | | | 4,452 | | | 4,497 |
250168, 8.000%, 12/1/2009 | | | 1,424 | | | 1,444 |
252120, 7.500%, 8/1/2025 | | | 20,606 | | | 22,844 |
387231, 5.010%, 1/1/2015 | | | 1,010,871 | | | 1,071,085 |
463031, 4.360%, 12/1/2015 (c) | | | 1,500,000 | | | 1,532,813 |
696355, 5.500%, 3/1/2033 | | | 865,789 | | | 901,245 |
789089, 5.500%, 8/1/2019 | | | 380,203 | | | 401,101 |
874332, 6.030%, 2/1/2022 | | | 1,136,984 | | | 1,232,648 |
895098, 7.000%, 8/1/2036 | | | 1,257,030 | | | 1,371,892 |
937881, 5.500%, 6/1/2022 | | | 1,079,963 | | | 1,132,744 |
995346, 6.500%, 9/1/2036 | | | 1,292,819 | | | 1,390,491 |
387621, 5.040%, 10/1/2023 | | | 401,404 | | | 402,328 |
873384, 5.170%, 2/1/2021 | | | 292,220 | | | 297,209 |
Fannie Mae CMO: | | | | | | |
1990-99 K, 6.500%, 8/25/2020 | | | 11,487 | | | 12,438 |
1993-106 Z, 7.000%, 6/25/2013 | | | 5,201 | | | 5,548 |
2003-66 MB, 3.500%, 5/25/2023 | | | 376,547 | | | 379,724 |
2003-73 GA, 3.500%, 5/25/2031 | | | 433,591 | | | 434,604 |
2005-M1 A, 4.479%, 10/26/2031 | | | 137,759 | | | 142,339 |
Freddie Mac: | | | | | | |
A18404, 5.500%, 2/1/2034 | | | 455,478 | | | 473,704 |
A30028, 6.000%, 11/1/2034 | | | 193,737 | | | 204,335 |
A51729, 6.500%, 8/1/2036 | | | 1,029,230 | | | 1,099,476 |
A62612, 5.500%, 6/1/2037 | | | 987,430 | | | 1,024,011 |
A69304, 5.500%, 11/1/2037 | | | 524,776 | | | 544,217 |
B11108, 5.500%, 11/1/2018 | | | 725,661 | | | 766,455 |
50
DOMINI SOCIAL BOND FUND / PORTFOLIOOF INVESTMENTS
July 31, 2009
| | | | | | |
| | | Principal
Amount | | Value
Note (1) |
U.S. Government Agency Mortgage Securities (Continued) | | | | | | |
B11109, 4.500%, 11/1/2018 | | $ | 889,629 | | $ | 928,095 |
C77635, 5.500%, 2/1/2033 | | | 971,912 | | | 1,011,410 |
Freddie Mac CMO: | | | | | | |
1208 D, 3.080%, VR, 2/15/2022 | | | 15,106 | | | 15,498 |
2302 J, 6.500%, 4/15/2031 | | | 69,442 | | | 73,671 |
2628 LE, 3.250%, 6/15/2033 | | | 261,382 | | | 263,121 |
Ginnie Mae CMO: | | | | | | |
2002-26 C, 5.988%, VR, 2/16/2024 | | | 87,296 | | | 88,464 |
2002-37 C, 5.878%, 6/16/2024 | | | 460,607 | | | 481,982 |
2002-9 C, 6.269%, 10/16/2027 | | | 885,398 | | | 948,113 |
2003-78 C, 5.382%, VR, 2/16/2031 | | | 1,000,000 | | | 1,072,434 |
2004-6 C, 4.660%, 7/16/2033 | | | 1,000,000 | | | 1,045,995 |
2004-77 AB, 4.368%, 11/16/2030 | | | 668,278 | | | 693,789 |
2005-42 B, 4.571%, 9/16/2027 | | | 1,000,000 | | | 1,043,755 |
2005-67 B, 4.751%, 10/16/2026 | | | 1,000,000 | | | 1,038,449 |
2005-87, 4.449%, 3/16/2025 | | | 652,934 | | | 670,365 |
2005-89, 4.811%, 5/16/2027 | | | 793,639 | | | 824,498 |
2006-9 B, 5.269%, 3/16/2037 | | | 1,000,000 | | | 1,064,644 |
Government National Mortgage Association: | | | | | | |
2038, 8.500%, 7/20/2025 | | | 6,194 | | | 7,064 |
2380, 8.500%, 2/20/2027 | | | 11,962 | | | 13,661 |
3233, 5.500%, 5/20/2017 | | | 356,591 | | | 375,146 |
615760, 5.500%, 8/15/2028 | | | 323,463 | | | 339,566 |
696520, 6.000%, 8/15/2038 | | | 1,119,262 | | | 1,176,878 |
703850, 5.500%, 11/20/2038 | | | 1,030,737 | | | 1,074,167 |
720334, 4.500%, 7/20/2039 | | | 1,577,739 | | | 1,589,282 |
696471, 6.000%, 8/15/2038 | | | 870,610 | | | 915,427 |
| | | | | | |
TOTAL U.S. GOVERNMENT AGENCY MORTGAGE SECURITIES
(Cost $30,279,598) | | | | | | 31,604,666 |
| | | | | | |
| | |
Corporate Obligations – 22.2% | | | | | | |
Air Products & Chemicals, 4.150%, 2/1/2013 | | | 700,000 | | | 712,632 |
Bank of New York Mellon-Mtn, 4.950%, 11/1/2012 | | | 700,000 | | | 748,679 |
CenterPoint Energy, Inc., 7.875%, 4/1/2013 | | | 700,000 | | | 754,761 |
Cisco Systems Inc., 5.500%, 2/22/2016 | | | 600,000 | | | 658,163 |
Coca-Cola Co, 5.350%, 11/15/2017 | | | 700,000 | | | 762,132 |
Comcast Corporation, 4.950%, 6/15/2016 | | | 600,000 | | | 613,037 |
Goldman Sachs Group Inc., 6.150%, 4/1/2018 | | | 700,000 | | | 749,214 |
Hewlett-Packard Co., 4.500%, 3/1/2013 | | | 700,000 | | | 742,358 |
IBM Corp, 5.700%, 9/14/2017 | | | 700,000 | | | 767,209 |
Johnson & Johnson, 5.550%, 8/15/2017 | | | 700,000 | | | 782,782 |
Kellogg Co., 4.250%, 3/6/2013 | | | 700,000 | | | 729,292 |
Kimberly-Clark, 6.125%, 8/1/2017 | | | 700,000 | | | 776,861 |
Kraft Foods Inc, 6.125%, 8/23/2018 | | | 700,000 | | | 768,765 |
Kroger Co., 7.500%, 1/15/2014 | | | 700,000 | | | 797,763 |
Northern Trust Company, 5.200%, 11/9/2012 | | | 700,000 | | | 746,996 |
Nucor Corp, 5.850%, 6/1/2018 | | | 700,000 | | | 753,609 |
NYSE EuroNext, 4.800%, 6/28/2013 | | | 700,000 | | | 732,757 |
51
DOMINI SOCIAL BOND FUND / PORTFOLIOOF INVESTMENTS
July 31, 2009
| | | | | | |
| | | Principal
Amount | | Value
Note (1) |
Corporate Obligations (Continued) | | | | | | |
Oracle Corp., 5.750%, 4/15/2018 | | $ | 700,000 | | $ | 771,599 |
PACCAR Inc, 6.375%, 2/15/2012 | | | 700,000 | | | 756,037 |
PepsiCo Inc., 7.900%, 11/1/2018 | | | 700,000 | | | 882,451 |
Praxair Inc., 4.625%, 3/30/2015 | | | 647,000 | | | 678,830 |
Procter & Gamble Company, 4.600%, 1/15/2014 | | | 700,000 | | | 749,084 |
Roche Holdings Inc, 6.000%, 3/1/2019 | | | 700,000 | | | 777,740 |
SBC Communications, 5.100%, 9/15/2014 | | | 600,000 | | | 643,563 |
Verizon Communications, 5.550%, 2/15/2016 | | | 700,000 | | | 747,033 |
Xerox Corporation, 6.350%, 5/15/2018 | | | 700,000 | | | 701,036 |
Illinois Tool Works, Inc., 6.250%, 4/1/2019 | | | 700,000 | | | 762,111 |
| | | | | | |
TOTAL CORPORATE OBLIGATIONS
(Cost $18,413,252) | | | | | | 20,066,494 |
| | | | | | |
| | |
Corporate Mortgage Securities – 1.6% | | | | | | |
CRFCM 2004-1A A 144A, 5.500%, 4/25/2035 | | | 1,395,516 | | | 1,473,678 |
| | | | | | |
TOTAL CORPORATE MORTGAGE SECURITIES
(Cost $1,395,516) | | | | | | 1,473,678 |
| | | | | | |
| | |
State & Municipal Obligations – 3.0% | | | | | | |
City of Cleveland, OH, 4.350%, 12/1/2011 (Insurer: AMBAC) | | | 500,000 | | | 512,525 |
Hudson County, NJ, Improvement Authority, 7.290%, 9/1/2009 (Insurer: AMBAC) | | | 175,000 | | | 175,625 |
Kentucky State Property and Buildings Commission, 3.960%, 10/1/2009 (Insurer: MBIA) | | | 300,000 | | | 301,467 |
Los Angeles, CA, Community Redevelopment Agency, 6.600%, 9/1/2020 (Insurer: FSA) | | | 515,000 | | | 467,605 |
North Carolina State University at Raleigh, 6.160%, 10/1/2009 | | | 400,000 | | | 400,924 |
Pennsylvania Economic Development Financing Authority, 5.650%, 6/1/2015 (Insurer: FGIC) | | | 380,000 | | | 392,911 |
State of Mississippi, 3.510%, 11/1/2009 | | | 500,000 | | | 503,220 |
| | | | | | |
TOTAL STATE & MUNICIPAL OBLIGATIONS
(Cost $2,807,416) | | | | | | 2,754,277 |
| | | | | | |
| | |
Certificates of Deposit – 4.3% | | | | | | |
Central Bank of Kansas City, 2.150%, 5/30/2010 (a) | | | 250,000 | | | 250,000 |
Citizens Savings Bank & Trust, 1.500%, 6/30/2010 (a) | | | 250,000 | | | 250,000 |
City First Bank of D.C., 1.600%, 2/5/2010 (a) | | | 100,000 | | | 100,000 |
City National Bank of New Jersey, 3.440%, 11/14/2009 (a) | | | 200,000 | | | 200,000 |
Community Commerce Bank, 1.750%, 6/1/2010 (a) | | | 100,000 | | | 100,000 |
Communitywide Federal Credit Union, 3.000%, 1/29/2010 (a) | | | 100,000 | | | 100,000 |
Dakotaland Federal Credit Union, 1.640%, 4/22/2010 (a) | | | 250,000 | | | 250,000 |
Delta Southern Bank, 1.990%, 6/21/2010 (a) | | | 250,000 | | | 250,000 |
Elk Horn Bank & Trust, 1.850%, 6/20/2010 (a) | | | 250,000 | | | 250,000 |
First Bank of the Delta, N.A., 2.000%, 6/24/2010 (a) | | | 100,000 | | | 100,000 |
Harbor Bank of Maryland, 1.350%, 7/25/2010 (a) | | | 250,000 | | | 250,000 |
Latino Community Credit Union, 1.750%, 6/1/2010 (a) | | | 250,000 | | | 250,000 |
Legacy Bank, 1.400%, 7/26/2010 (a) | | | 100,000 | | | 100,000 |
Liberty Bank and Trust Co., 2.680%, 12/4/2009 (a) | | | 200,000 | | | 200,000 |
Louisville Community Bank, 2.250%, 6/25/2010 (a) | | | 250,000 | | | 250,000 |
52
DOMINI SOCIAL BOND FUND / PORTFOLIOOF INVESTMENTS
July 31, 2009
| | | | | | |
| | | Principal
Amount | | Value
Note (1) |
Certificates of Deposit (Continued) | | | | | | |
Northside Community Federal Credit Union, 2.000%, 6/27/2010 (a) | | $ | 100,000 | | $ | 100,000 |
Santa Cruz Community Credit Union, 1.340%, 3/1/2010 (a) | | | 100,000 | | | 100,000 |
Self-Help Credit Union, 3.350%, 12/12/2009 (a) | | | 100,000 | | | 100,000 |
ShoreBank Pacific, 3.000%, 11/6/2009 (a) | | | 200,000 | | | 200,000 |
University National Bank, 1.580%, 7/26/2010 (a) | | | 250,000 | | | 250,000 |
Wainwright Bank & Trust Co., 2.470%, 1/24/2010 (a) | | | 200,000 | | | 200,000 |
| | | | | | |
TOTAL CERTIFICATES OF DEPOSIT
(Cost $3,850,000) | | | | | | 3,850,000 |
| | | | | | |
| | |
Cash Equivalents – 0.4% | | | | | | |
Money Market Demand Accounts: | | | | | | |
Self-Help Money Market Demand, 1.080%, 8/17/2009 (a) | | | 240,544 | | | 240,544 |
University National Bank, 0.150%, 8/17/2009 (a) | | | 111,008 | | | 111,008 |
| | | | | | |
TOTAL CASH EQUIVALENTS
(Cost $351,552) | | | | | | 351,552 |
| | | | | | |
| | |
Total Investments – 96.4%
(Cost $83,162,177) (b) | | | | | | 86,932,348 |
Other Assets, less liabilities – 3.6% | | | | | | 3,210,100 |
| | | | | | |
| | |
Net Assets – 100.0% | | | | | $ | 90,142,448 |
| | | | | | |
| (a) | Securities (other than short-term obligations with remaining maturities of less than 60 days) for which there are no such quotations or valuations are valued at fair value as determined in good faith by or at the direction of the Fund’s Board of Trustees. |
| (b) | The aggregate cost for federal income tax purposes is $83,174,508. The aggregate gross unrealized appreciation is $3,852,485, and the aggregate gross unrealized depreciation is $94,645, resulting in net unrealized appreciation of $3,757,840. |
| (c) | Securities for which there are no such quotations or valuations are valued at fair value as determined in good faith by or at the direction of the Fund’s Board of Trustees. |
AMBAC — American Municipal Bond Assurance Corporation
CMO — Collateralized Mortgage Obligation
FGIC — Financial Guarantee Insurance Company
FSA — Financial Security Assurance Company
MBIA — Municipal Bond Investors Assurance
VR — Variable interest rate. Rate shown is that on July 31, 2009.
144A — Security that may be sold to qualified institutional buyers under Rule 144A of the Securities Act of 1933, as amended. This security has been determined to be liquid under guidelines established by the Fund’s Board of Trustees.
SEE NOTES TO FINANCIAL STATEMENTS
53
DOMINI FUNDS EXPENSE EXAMPLE (Unaudited)
As a shareholder of the Domini Funds, you incur two types of costs:
(1) Transaction costs such as redemption fees deducted from any redemption or exchange proceeds if you sell or exchange shares of the fund after holding them less than 30 days and sales charges (loads) on Class A shares and
(2) Ongoing costs, including management fees, distribution (12b-1) fees, and other Fund expenses.
This example is intended to help you understand your ongoing costs (in dollars) of investing in the Fund and to compare these costs with the ongoing costs of investing in other mutual funds. The example is based on an investment of $1,000 invested on February 1, 2009, and held through July 31, 2009.
Certain Account Fees
Some accounts are subject to recurring annual service fees and maintenance fees that are not included in the expenses shown in the table. If your account was subject to these fees, then the actual account values at the end of the period would be lower and the actual expense would be higher. You may avoid the annual service fee by choosing paperless electronic delivery of statements, prospectuses, shareholder reports and other materials.
Actual Expenses
The line of the table captioned “Actual Expenses” below provides information about actual account value and actual expenses. You may use the information in this line, together with the amount invested, to estimate the expenses that you paid over the period as follows:
(1) Divide your account value by $1,000.
(2) Multiply your result in step 1 by the number in the first line under the heading “Expenses Paid During Period” in the table. The result equals the estimated expenses you paid on your account during the period.
Hypothetical Expenses
The second line of the tables below provides information about hypothetical account values and hypothetical expenses based on the Fund’s actual expense ratio and an assumed rate of return of 5% per year before expenses, which is not the Fund’s return. The hypothetical account values and expenses may not be used to estimate actual ending account balance or expenses you paid for the period. You may use this information to compare the ongoing costs of investing in the Fund and other mutual funds. To do so, compare this 5% hypothetical example with the 5% hypothetical example that appears in the shareholder reports of the other funds.
54
Please note that the expenses shown in the table are meant to highlight your ongoing costs only and do not reflect any transactional costs, such as redemption fees. Therefore, the second line of the tables is useful in comparing ongoing costs only, and will not help you determine the relative total costs of owning different funds. In addition, if these transactional costs were included, your costs would have been higher.
| | | | | | | | | | | | |
Fund Name | | Expenses | | Beginning
Account Value
as of 2/1/2009 | | Ending
Account Value
as of 7/31/2009 | | Expenses Paid
During Period
2/1/2009 –
7/31/2009 | |
Domini Social Equity Fund Investor Shares | | Actual Expenses | | $ | 1,000.00 | | $ | 1,291.50 | | $ | 6.82 | 1 |
| | Hypothetical Expenses (5% return before expenses) | | $ | 1,000.00 | | $ | 1,018.84 | | $ | 6.01 | 1 |
Domini Social Equity Fund Class A Shares | | Actual Expenses | | $ | 1,000.00 | | $ | 1,293.20 | | $ | 6.71 | 1 |
| | Hypothetical Expenses (5% return before expenses) | | $ | 1,000.00 | | $ | 1,018.94 | | $ | 5.91 | 1 |
Domini Social Equity Fund Institutional Shares | | Actual Expenses | | $ | 1,000.00 | | $ | 1,294.70 | | $ | 3.70 | 1 |
| | Hypothetical Expenses (5% return before expenses) | | $ | 1,000.00 | | $ | 1,021.57 | | $ | 3.26 | 1 |
Domini Social Equity Fund Class R Shares | | Actual Expenses | | $ | 1,000.00 | | $ | 1,294.50 | | $ | 4.84 | 1 |
| | Hypothetical Expenses (5% return before expenses) | | $ | 1,000.00 | | $ | 1,020.58 | | $ | 4.26 | 1 |
Domini European Social Equity Fund Investor Shares | | Actual Expenses | | $ | 1,000.00 | | $ | 1,365.60 | | $ | 9.38 | 2 |
| | Hypothetical Expenses (5% return before expenses) | | $ | 1,000.00 | | $ | 1,016.86 | | $ | 8.00 | 2 |
Domini European Social Equity Fund Class A Shares | | Actual Expenses | | $ | 1,000.00 | | $ | 1,366.70 | | $ | 9.21 | 2 |
| | Hypothetical Expenses (5% return before expenses) | | $ | 1,000.00 | | $ | 1,017.01 | | $ | 7.85 | 2 |
Domini PacAsia Social Equity Fund Investor Shares | | Actual Expenses | | $ | 1,000.00 | | $ | 1,397.40 | | $ | 9.51 | 3 |
| | Hypothetical Expenses (5% return before expenses) | | $ | 1,000.00 | | $ | 1,016.86 | | $ | 8.00 | 3 |
Domini PacAsia Social Equity Fund Class A Shares | | Actual Expenses | | $ | 1,000.00 | | $ | 1,398.40 | | $ | 9.34 | 3 |
| | Hypothetical Expenses (5% return before expenses) | | $ | 1,000.00 | | $ | 1,017.01 | | $ | 7.85 | 3 |
Domini European PacAsia Social Equity Fund Investor Shares | | Actual Expenses | | $ | 1,000.00 | | $ | 1,348.60 | | $ | 9.32 | 4 |
| | Hypothetical Expenses (5% return before expenses) | | $ | 1,000.00 | | $ | 1,016.86 | | $ | 8.00 | 4 |
Domini European PacAsia Social Equity Fund Class A Shares | | Actual Expenses | | $ | 1,000.00 | | $ | 1,349.70 | | $ | 9.15 | 4 |
| | Hypothetical Expenses (5% return before expenses) | | $ | 1,000.00 | | $ | 1,017.01 | | $ | 7.85 | 4 |
Domini Social Bond Fund | | Actual Expenses | | $ | 1,000.00 | | $ | 1,039.60 | | $ | 4.80 | 5 |
| | Hypothetical Expenses (5% return before expenses) | | $ | 1,000.00 | | $ | 1,020.08 | | $ | 4.76 | 5 |
| 1 | Expenses are equal to the Fund’s annualized expense ratio of 1.20% for Investor shares, or 1.18% for Class A shares, or 0.65% for Institutional Class, or 0.85% for Class R shares, multiplied by average account value over the period, multiplied by 181, and divided by 365. |
| 2 | Expenses are equal to the Fund’s annualized expense ratio of 1.60% for Investor shares, or 1.57% for Class A shares, multiplied by average account value over the period, multiplied by 181, and divided by 365. |
| 3 | Expenses are equal to the Fund’s annualized expense ratio of 1.60% for Investor shares, or 1.57% for Class A shares, multiplied by average account value over the period, multiplied by 181, and divided by 365. |
| 4 | Expenses are equal to the Fund’s annualized expense ratio of 1.60% for Investor shares, or 1.57% for Class A shares, multiplied by average account value over the period, multiplied by 181, and divided by 365. |
| 5 | Expenses are equal to the Fund’s annualized expense ratio of 0.95%, multiplied by average account value over the period, multiplied by 181, and divided by 365. |
55
STATEMENTS OF ASSETS AND LIABILITIES
July 31, 2009
|
ASSETS |
Investments at value (Cost $620,886,836, $55,730,636, $20,391,888 and $25,154,136, respecitvely) |
Cash |
Foreign currency, at value (cost $0, $0, $2,353, and $0, respectively) |
Dividend and interest receivables |
Tax reclaim receivable |
Receivable for capital shares |
Total assets |
LIABILITIES |
Payable for capital shares |
Management /Sponsorship fee payable |
Distribution fee payable |
Other accrued expenses |
Foreign Tax Payable |
Total liabilities |
NET ASSETS |
|
NET ASSETS CONSIST OF |
Paid-in capital |
Undistributed net investment income (loss) |
Accumulated net realized gain (loss) |
Net unrealized appreciation (depreciation) |
|
NET ASSETS |
|
NET ASSET VALUE PER SHARE |
Investor Shares |
Net assets |
Outstanding shares of beneficial interest |
Net asset value and offering price per share* |
|
Class A Shares |
Net assets |
Outstanding shares of beneficial interest |
Net asset value * |
Maximum offering price per share (net asset value per share / (1-4.75%)) |
|
Institutional shares |
Net assets |
Outstanding shares of beneficial interest |
Net asset value and offering price per share* |
|
Class R shares |
Net assets |
Outstanding shares of beneficial interest |
|
Net asset value and offering price per share* |
| * | Redemption price is equal to net asset value less any applicable redemption fees retained by the Fund. |
56
| | | | | | | | | | | | | | |
Domini Social Equity
Fund | | | Domini European
Social Equity Fund | | | Domini PacAsia Social
Equity Fund | | | Domini European
PacAsia Social
Equity Fund | |
| | | | | | | | | | | | | | |
| $ | 659,466,374 | | | $ | 52,705,861 | | | $ | 21,252,506 | | | $ | 26,479,323 | |
| | | | | | | | | | | | | | | |
| | | | | | | | | | | | | | |
| | 5,658,149 | | | | 701,311 | | | | 404,201 | | | | 681,922 | |
| | — | | | | — | | | | 2,352 | | | | — | |
| | 916,789 | | | | 101,799 | | | | 43,108 | | | | 48,792 | |
| | 94,338 | | | | 266,024 | | | | 507 | | | | 36,633 | |
| | 420,524 | | | | 23,231 | | | | 119,688 | | | | 70,630 | |
| | | | | | | | | | | | | | | |
| | 666,556,174 | | | | 53,798,226 | | | | 21,822,362 | | | | 27,317,300 | |
| | | | | | | | | | | | | | | |
| | | | | | | | | | | | | | |
| | 197,361 | | | | 124,107 | | | | 3,276 | | | | 8,337 | |
| | 345,172 | | | | 42,536 | | | | 16,997 | | | | 21,359 | |
| | 109,991 | | | | 7,080 | | | | — | | | | — | |
| | 409,105 | | | | 81,361 | | | | 15,693 | | | | 14,954 | |
| | 5,658 | | | | — | | | | 40,713 | | | | 1,250 | |
| | | | | | | | | | | | | | | |
| | 1,067,287 | | | | 255,084 | | | | 76,679 | | | | 45,900 | |
| | | | | | | | | | | | | | | |
| $ | 665,488,887 | | | $ | 53,543,142 | | | $ | 21,745,683 | | | $ | 27,271,400 | |
| | | | | | | | | | | | | | | |
| | | | | | | | | | | | | | |
| $ | 960,605,176 | | | $ | 104,741,017 | | | $ | 31,735,123 | | | $ | 35,934,119 | |
| | 1,106 | | | | (104,979 | ) | | | 48,070 | | | | 60,772 | |
| | (333,696,933 | ) | | | (48,067,663 | ) | | | (10,898,156 | ) | | | (10,048,989 | ) |
| | 38,579,538 | | | | (3,025,233 | ) | | | 860,646 | | | | 1,325,498 | |
| | | | | | | | | | | | | | | |
| $ | 665,488,887 | | | $ | 53,543,142 | | | $ | 21,745,683 | | | $ | 27,271,400 | |
| | | | | | | | | | | | | | | |
| | | | | | | | | | | | | | |
| | | | | | | | | | | | | | |
| $ | 550,374,032 | | | $ | 51,579,713 | | | $ | 21,196,850 | | | $ | 26,714,652 | |
| | | | | | | | | | | | | | | |
| | 24,105,862 | | | | 6,975,187 | | | | 2,870,514 | | | | 4,417,551 | |
| | | | | | | | | | | | | | | |
| $ | 22.83 | | | $ | 7.39 | | | $ | 7.38 | | | $ | 6.05 | |
| | | | | | | | | | | | | | | |
| | | |
| | | | | | | | | | | | | | |
| $ | 1,164,837 | | | $ | 1,963,429 | | | $ | 548,833 | | | $ | 556,748 | |
| | | | | | | | | | | | | | | |
| | 152,738 | | | | 265,243 | | | | 74,329 | | | | 88,433 | |
| | | | | | | | | | | | | | | |
| $ | 7.63 | | | $ | 7.40 | | | $ | 7.38 | | | $ | 6.30 | |
| | | | | | | | | | | | | | | |
| $ | 8.01 | | | $ | 7.77 | | | $ | 7.75 | | | $ | 6.61 | |
| | | | | | | | | | | | | | | |
| | | |
| | | | | | | | | | | | | | |
| $ | 83,776,403 | | | | | | | | | | | | | |
| | | | | | | | | | | | | | | |
| | 5,836,400 | | | | | | | | | | | | | |
| | | | | | | | | | | | | | | |
| $ | 14.35 | | | | | | | | | | | | | |
| | | | | | | | | | | | | | | |
| | | |
| | | | | | | | | | | | | | |
| $ | 30,173,615 | | | | | | | | | | | | | |
| | | | | | | | | | | | | | | |
| | 4,256,529 | | | | | | | | | | | | | |
| | | | | | | | | | | | | | | |
| $ | 7.09 | | | | | | | | | | | | | |
| | | | | | | | | | | | | | | |
SEE NOTES TO FINANCIAL STATEMENTS
57
STATEMENTS OF OPERATIONS
For the Year Ended July 31, 2009
|
| |
INCOME |
Dividends (net of foreign taxes $175,430, $215,174, $81,429 and $73,542, respectively) |
Interest |
Investment Income |
EXPENSES |
Management /Sponsorship fees |
Distribution fees - Investor shares |
Distribution fees - Class A shares |
Transfer agent fees - Investor shares |
Transfer agent fees - Class A shares |
Transfer agent fees - Institutional shares |
Transfer agent fees - Class R shares |
Accounting and Custody fees |
Shareholder Service fees - Investor shares |
Shareholder Service fees - Class A shares |
Shareholder Service fees - Institutional shares |
Shareholder Service fees - Class R shares |
Professional fees |
Trustees fees |
Registration fees - Investor shares |
Registration fees - Class A shares |
Registration fees - Institutional shares |
Registration fees - Class R shares |
Miscellaneous |
Shareholder Communication fees |
Total expenses |
Fees paid indirectly |
Fees waived and expenses reimbursed |
Net expenses |
|
NET INVESTMENT INCOME (LOSS) |
|
REALIZED AND UNREALIZED GAIN (LOSS) FROM INVESTMENTS AND FOREIGN CURRENCY |
|
NET REALIZED GAIN (LOSS) FROM |
Investments |
Foreign Currency |
Net realized gain (loss) |
|
NET CHANGES IN UNREALIZED APPRECIATION (DEPRECIATION) FROM |
Investments |
Translation of assets and liabilities in foreign currencies |
Net change in unrealized appreciation (depreciation) |
|
NET REALIZED AND UNREALIZED GAIN (LOSS) |
|
NET INCREASE (DECREASE) IN NET ASSETS RESULTING FROM OPERATIONS |
58
| | | | | | | | | | | | |
Domini Social Equity
Fund | | Domini European
Social Equity Fund | | | Domini PacAsia Social
Equity Fund | | | Domini European PacAsia Social
Equity Fund | |
| | | | | | | | | | | | |
| $15,146,666 | | $ | 1,951,173 | | | $ | 548,234 | | | $ | 742,268 | |
| 4,674 | | | 513 | | | | 363 | | | | 323 | |
| | | | | | | | | | | | | |
| 15,151,340 | | | 1,951,686 | | | | 548,597 | | | | 742,591 | |
| | | | | | | | | | | | | |
| | | | | | | | | | | | |
| 4,647,399 | | | 543,865 | | | | 182,345 | | | | 196,436 | |
| 1,340,181 | | | 132,974 | | | | 44,738 | | | | 48,272 | |
| 1,589 | | | 2,832 | | | | 838 | | | | 831 | |
| 1,134,367 | | | 171,940 | | | | 59,491 | | | | 71,056 | |
| 2,767 | | | 7,903 | | | | 2,601 | | | | 1,625 | |
| 617 | | | — | | | | — | | | | — | |
| 27,467 | | | — | | | | — | | | | — | |
| 169,773 | | | 151,461 | | | | 119,232 | | | | 121,515 | |
| 89,851 | | | 16,136 | | | | 4,980 | | | | 4,980 | |
| 508 | | | 1,354 | | | | 394 | | | | 259 | |
| 99 | | | — | | | | — | | | | — | |
| 58 | | | — | | | | — | | | | — | |
| 88,743 | | | 32,614 | | | | 40,374 | | | | 38,625 | |
| 86,154 | | | 8,146 | | | | 2,459 | | | | 2,681 | |
| 32,882 | | | 24,717 | | | | 25,179 | | | | 29,644 | |
| 6,406 | | | 9,590 | | | | 6,097 | | | | 8,795 | |
| 7,526 | | | — | | | | — | | | | — | |
| 18,747 | | | — | | | | — | | | | — | |
| 56,083 | | | 1,794 | | | | 4,600 | | | | 3,707 | |
| 43,275 | | | 3,827 | | | | 391 | | | | 2,609 | |
| | | | | | | | | | | | | |
| 7,754,492 | | | 1,109,153 | | | | 493,719 | | | | 531,035 | |
| | | | | | | | | | | | | |
| (6,264) | | | (1,155 | ) | | | (256 | ) | | | (442 | ) |
| (804,368) | | | (234,628 | ) | | | (201,580 | ) | | | (216,626 | ) |
| | | | | | | | | | | | | |
| 6,943,860 | | | 873,370 | | | | 291,883 | | | | 313,967 | |
| | | | | | | | | | | | | |
| 8,207,480 | | | 1,078,316 | | | | 256,714 | | | | 428,624 | |
| | | | | | | | | | | | | |
| | | | | | | | | | | | |
| | | | | | | | | | | | |
| | | | | | | | | | | | |
| (202,647,888) | | | (40,622,828 | ) | | | (9,287,586 | ) | | | (7,908,685 | ) |
| 41,657 | | | 4,703 | | | | (39,649 | ) | | | (68,868 | ) |
| | | | | | | | | | | | | |
| (202,606,231) | | | (40,618,125 | ) | | | (9,327,235 | ) | | | (7,977,553 | ) |
| | | | | | | | | | | | |
| | | | | | | | | | | | |
| (31,758,481) | | | 6,030,597 | | | | 3,666,565 | | | | 3,295,642 | |
| (35) | | | (31,984 | ) | | | 1,307 | | | | (833 | ) |
| | | | | | | | | | | | | |
| (31,758,516) | | | 5,998,613 | | | | 3,667,872 | | | | 3,294,809 | |
| | | | | | | | | | | | | |
| | | |
| (234,364,747) | | | (34,619,512 | ) | | | (5,659,363 | ) | | | (4,682,744 | ) |
| | | | | | | | | | | | | |
| | | |
| $(226,157,267) | | $ | (33,541,196 | ) | | $ | (5,402,649 | ) | | $ | (4,254,120 | ) |
| | | | | | | | | | | | | |
SEE NOTES TO FINANCIAL STATEMENTS
59
STATEMENTS OF CHANGES IN NET ASSETS
| | | | | | | | |
| | | Domini Social Equity Fund | |
| | | Year Ended
July 31, 2009 | | | Year Ended
July 31, 2008 | |
INCREASE IN NET ASSETS | | | | | | | | |
FROM OPERATIONS | | | | | | | | |
Net investment income (loss) | | $ | 8,207,480 | | | $ | 8,575,342 | |
Net realized gain (loss) | | | (202,606,231 | ) | | | (51,371,339 | ) |
Net change in unrealized appreciation (depreciation) | | | (31,758,516 | ) | | | (76,607,356 | ) |
| | | | | | | | |
Net Increase (Decrease) in Net Assets Resulting from Operations | | | (226,157,267 | ) | | | (119,403,353 | ) |
| | | | | | | | |
| | |
DISTRIBUTIONS AND/OR DIVIDENDS | | | | | | | | |
Dividends to shareholders from net investment income: | | | | | | | | |
Investor shares | | | (5,561,668 | ) | | | (6,060,756 | ) |
Class A shares | | | (20,113 | ) | | | — | |
Institutional shares | | | (970,433 | ) | | | — | |
Class R shares | | | (1,597,664 | ) | | | (2,286,155 | ) |
Distributions to shareholders from net realized gain: | | | | | | | | |
Investor shares | | | — | | | | (52,928,942 | ) |
Institutional shares | | | — | | | | — | |
Class R shares | | | — | | | | (8,221,225 | ) |
Tax return of capital distribution | | | (3,659,576 | ) | | | — | |
| | | | | | | | |
Net Decrease in Net Assets from Distributions and/or Dividends | | | (11,809,454 | ) | | | (69,497,078 | ) |
| | | | | | | | |
| | |
CAPITAL SHARE TRANSACTIONS | | | | | | | | |
Proceeds from sale of shares | | | 152,676,604 | | | | 93,803,248 | |
Net asset value of shares issued in Fund Reorganizations (Note 7) | | | 84,696,299 | | | | — | |
Net asset value of shares issued in reinvestment of distributions and dividends | | | 11,335,263 | | | | 67,811,977 | |
Redemption fees | | | 13,653 | | | | 44,415 | |
Payments for shares redeemed | | | (172,870,501 | ) | | | (269,176,137 | ) |
| | | | | | | | |
Net Increase (Decrease) in Net Assets from Capital Share Transactions | | | 75,851,318 | | | | (107,516,497 | ) |
| | | | | | | | |
Total Increase (Decrease) in Net Assets | | | (162,115,403 | ) | | | (296,416,928 | ) |
| | | | | | | | |
NET ASSETS | | | | | | | | |
Beginning of period | | $ | 827,604,290 | | | $ | 1,124,021,218 | |
| | | | | | | | |
End of period | | $ | 665,488,887 | | | $ | 827,604,290 | |
| | | | | | | | |
Undistributed net investment income (loss) | | $ | 1,106 | | | $ | 916,218 | |
| | | | | | | | |
60
| | | | | | | | | | | | | | | | | | | | | | |
Domini European Social
Equity Fund | | | Domini PacAsia Social
Equity Fund | | | Domini European PacAsia
Social Equity Fund | |
Year Ended
July 31, 2009 | | | Year Ended
July 31, 2008 | | | Year Ended
July 31, 2009 | | | Year Ended
July 31, 2008 | | | Year Ended
July 31, 2009 | | | Year Ended
July 31, 2008 | |
| | | | | | | | | | | | | | | | | | | | | | |
| | | | | | | | | | | | | | | | | | | | | | |
| $ | 1,078,316 | | | $ | 3,859,247 | | | $ | 256,714 | | | $ | 390,679 | | | $ | 428,624 | | | $ | 472,635 | |
| | (40,618,125 | ) | | | (8,025,804 | ) | | | (9,327,235 | ) | | | (1,567,838 | ) | | | (7,977,553 | ) | | | (2,011,119 | ) |
| | 5,998,613 | | | | (19,000,563 | ) | | | 3,667,872 | | | | (3,882,351 | ) | | | 3,294,809 | | | | (1,680,652 | ) |
| | | | | | | | | | | | | | | | | | | | | | | |
| | (33,541,196 | ) | | | (23,167,120 | ) | | | (5,402,649 | ) | | | (5,059,510 | ) | | | (4,254,120 | ) | | | (3,219,136 | ) |
| | | | | | | | | | | | | | | | | | | | | | | |
| | | | | | | | | | | | | | | | | | | | | | |
| | | | | | | | | | | | | | | | | | | | | | |
| | (1,157,083 | ) | | | (3,901,561 | ) | | | (262,733 | ) | | | (351,538 | ) | | | (395,022 | ) | | | (475,269 | ) |
| | (38,581 | ) | | | — | | | | (2,127 | ) | | | — | | | | (7,526 | ) | | | — | |
| | — | | | | — | | | | — | | | | — | | | | — | | | | — | |
| | — | | | | — | | | | — | | | | — | | | | — | | | | — | |
| | | | | | | | | | | | | | | | | | | | | | |
| | — | | | | (10,897,064 | ) | | | (5,019 | ) | | | (288,026 | ) | | | — | | | | (91,142 | ) |
| | — | | | | — | | | | — | | | | — | | | | — | | | | — | |
| | — | | | | — | | | | — | | | | — | | | | — | | | | — | |
| | — | | | | (450,755 | ) | | | — | | | | — | | | | — | | | | — | |
| | | | | | | | | | | | | | | | | | | | | | | |
| | (1,195,664 | ) | | | (15,249,380 | ) | | | (269,879 | ) | | | (639,564 | ) | | | (402,548 | ) | | | (566,411 | ) |
| | | | | | | | | | | | | | | | | | | | | | | |
| | | | | |
| | | | | | | | | | | | | | | | | | | | | | |
| | 17,049,363 | | | | 19,547,037 | | | | 3,856,526 | | | | 10,894,798 | | | | 13,617,554 | | | | 14,396,289 | |
| | 1,893,850 | | | | — | | | | 564,388 | | | | — | | | | 580,722 | | | | — | |
| | 797,775 | | | | 12,773,572 | | | | 139,934 | | | | 432,773 | | | | 311,982 | | | | 535,338 | |
| | 8,067 | | | | — | | | | — | | | | 103 | | | | 115 | | | | 831 | |
| | (25,202,790 | ) | | | (28,018,394 | ) | | | (4,512,089 | ) | | | (4,321,976 | ) | | | (4,210,723 | ) | | | (2,857,794 | ) |
| | | | | | | | | | | | | | | | | | | | | | | |
| | (5,453,735 | ) | | | 4,302,215 | | | | 48,759 | | | | 7,005,698 | | | | 10,299,650 | | | | 12,074,664 | |
| | | | | | | | | | | | | | | | | | | | | | | |
| | (40,190,595 | ) | | | (34,114,285 | ) | | | (5,623,769 | ) | | | 1,306,624 | | | | 5,642,982 | | | | 8,289,117 | |
| | | | | | | | | | | | | | | | | | | | | | | |
| | | | | | | | | | | | | | | | | | | | | | |
| $ | 93,733,737 | | | $ | 127,848,022 | | | $ | 27,369,452 | | | $ | 26,062,828 | | | $ | 21,628,418 | | | $ | 13,339,301 | |
| | | | | | | | | | | | | | | | | | | | | | | |
| $ | 53,543,142 | | | $ | 93,733,737 | | | $ | 21,745,683 | | | $ | 27,369,452 | | | $ | 27,271,400 | | | $ | 21,628,418 | |
| | | | | | | | | | | | | | | | | | | | | | | |
| $ | (104,979 | ) | | $ | — | | | $ | 48,070 | | | $ | 40,927 | | | $ | 60,772 | | | $ | (19,634 | ) |
| | | | | | | | | | | | | | | | | | | | | | | |
SEE NOTES TO FINANCIAL STATEMENTS
61
DOMINI SOCIAL EQUITY FUND INVESTOR SHARES
FINANCIAL HIGHLIGHTS
| | | | | | | | | | | | | | | | | | | | |
| | | Year Ended July 31, | |
| | | 2009 | | | 2008 | | | 2007 | | | 2006 | | | 2005 | |
For a share outstanding for the period: | | | | | | | | | | | | | | | | | | | | |
Net asset value, beginning of period | | $ | 28.19 | | | $ | 34.00 | | | $ | 29.73 | | | $ | 29.74 | | | $ | 27.18 | |
| | | | | | | | | | | | | | | | | | | | |
Income from investment operations: | | | | | | | | | | | | | | | | | | | | |
Net investment income (loss) | | | 0.28 | | | | 0.29 | | | | 0.23 | | | | 0.23 | | | | 0.34 | |
Net realized and unrealized gain (loss) on investments | | | (5.32 | ) | | | (4.08 | ) | | | 4.26 | | | | (0.02 | ) | | | 2.56 | |
| | | | | | | | | | | | | | | | | | | | |
Total income (loss) from investment operations | | | (5.04 | ) | | | (3.79 | ) | | | 4.49 | | | | 0.21 | | | | 2.90 | |
| | | | | | | | | | | | | | | | | | | | |
Less dividends and distributions: | | | | | | | | | | | | | | | | | | | | |
Dividends to shareholders from net investment income | | | (0.22 | ) | | | (0.22 | ) | | | (0.22 | ) | | | (0.22 | ) | | | (0.34 | ) |
Distributions to shareholders from net realized gain (loss) | | | — | | | | (1.80 | ) | | | — | | | | — | | | | — | |
Tax return of capital | | | (0.10 | )5 | | | — | | | | — | | | | — | | | | — | |
| | | | | | | | | | | | | | | | | | | | |
Total distributions | | | (0.32 | ) | | | (2.02 | ) | | | (0.22 | ) | | | (0.22 | ) | | | (0.34 | ) |
| | | | | | | | | | | | | | | | | | | | |
Redemption fee proceeds | | | 0.00 | 1 | | | 0.00 | 1 | | | 0.00 | 1 | | | 0.00 | 1 | | | 0.00 | 1 |
| | | | | | | | | | | | | | | | | | | | |
Net asset value, end of period | | $ | 22.83 | | | $ | 28.19 | | | $ | 34.00 | | | $ | 29.73 | | | $ | 29.74 | |
| | | | | | | | | | | | | | | | | | | | |
Total return 2 | | | -17.48 | % | | | -11.84 | % | | | 15.11 | % | | | 0.72 | % | | | 10.68 | % |
Portfolio turnover | | | 82 | % | | | 70 | % | | | 126 | % | | | 12 | % | | | 9 | % |
Ratios/supplemental data (annualized): | | | | | | | | | | | | | | | | | | | | |
Net assets, end of period (in millions) | | $ | 550 | | | $ | 775 | | | $ | 1,066 | | | $ | 1,092 | | | $ | 1,271 | |
Ratio of expenses to average net assets | | | 1.18 | %3, 4 | | | 1.15 | %3 | | | 1.08 | %3 | | | 0.95 | %3 | | | 0.95 | %3 |
Ratio of net investment income (loss) to average net assets | | | 1.27 | % | | | 0.86 | % | | | 0.66 | % | | | 0.74 | % | | | 1.20 | % |
| 1 | Amount represents less than 0.005 per share. |
| 2 | Not annualized for periods less than one year. |
| 3 | Reflects a waiver of fees by the Manager, the Sponsor, and the Distributor of the Fund. Had the Manager, the Sponsor, and the Distributor not waived their fees or reimbursed expenses, the ratio of expenses to average net assets would have been 1.31%, 1.24%, 1.23%, 1.14%, and 1.13%, for the years ended July 31, 2009, 2008, 2007, 2006, and 2005, respectively. |
| 4 | Ratio of expenses to average net assets includes indirectly paid expenses. Excluding indirectly paid expenses the ratio of expenses to average net assets for the period ended July 31, 2009 would have been 1.18%. |
| 5 | Based on average shares outstanding. |
SEE NOTES TO FINANCIAL STATEMENTS
62
DOMINI SOCIAL EQUITY FUND CLASS A SHARES
FINANCIAL HIGHLIGHTS
| | | | |
| | | For the Period
November 28, 2008
(commencement of
operations) through
July 31, 2009 | |
For a share outstanding for the period: | | | | |
Net asset value, beginning of period | | $ | 6.57 | |
| | | | |
Income from investment operations: | | | | |
Net investment income (loss) | | | 0.06 | |
Net realized and unrealized gain (loss) on investments | | | 1.21 | |
| | | | |
Total income from investment operations | | | 1.27 | |
| | | | |
Less dividends and/or distributions: | | | | |
Dividends to shareholders from net investment income | | | (0.15 | ) |
Distributions to shareholders from net realized gain | | | — | |
Tax return of capital | | | (0.06 | )5 |
| | | | |
Total distributions | | | (0.21 | ) |
| | | | |
Redemption fee proceeds | | | — | |
| | | | |
Net asset value, end of period | | $ | 7.63 | |
| | | | |
Total return 2 | | | 20.66 | % |
Portfolio turnover | | | 82 | % |
Ratios/supplemental data (annualized): | | | | |
Net assets, end of period (in millions) | | $ | 1 | |
Ratio of expenses to average net assets | | | 1.18 | %3, 4 |
Ratio of net investment income (loss) to average net assets | | | 1.13 | % |
| 2 | Total Return does not reflect sales commissions and is not annualized for periods less than one year. |
| 3 | Reflects a waiver of fees by the Manager, the Sponsor, and the Distributor of the Fund. Had the Manager, the Sponsor and the Distributor not waived their fees or reimbursed expenses, the ratio of expenses to average net assets would have been 3.31% for the period ended July 31, 2009. |
| 4 | Ratio of expenses to average net assets includes indirectly paid expenses. Excluding indirectly paid expenses the ratio of expenses to average net assets for the period ended July 31, 2009 would have been 1.18%. |
| 5 | Based on average shares outstanding. |
SEE NOTES TO FINANCIAL STATEMENTS
63
DOMINI SOCIAL EQUITY FUND INSTITUTIONAL SHARES
FINANCIAL HIGHLIGHTS
| | | | |
| | | For the Period
November 28, 2008
(commencement of
operations) through
July 31, 2009 | |
For a share outstanding for the period: | | | | |
Net asset value, beginning of period | | $ | 12.13 | |
| | | | |
Income from investment operations: | | | | |
Net investment income (loss) | | | 0.13 | |
Net realized and unrealized gain (loss) on investments | | | 2.31 | |
| | | | |
Total income from investment operations | | | 2.44 | |
| | | | |
Less dividends and/or distributions: | | | | |
Dividends to shareholders from net investment income | | | (0.15 | ) |
Distributions to shareholders from net realized gain | | | — | |
Tax return of capital | | | (0.07 | )5 |
| | | | |
Total distributions | | | (0.22 | ) |
| | | | |
Redemption fee proceeds | | | — | |
| | | | |
Net asset value, end of period | | $ | 14.35 | |
| | | | |
Total return 2 | | | 20.93 | % |
Portfolio turnover | | | 82 | % |
Ratios/supplemental data (annualized): | | | | |
Net assets, end of period (in millions) | | $ | 84 | |
Ratio of expenses to average net assets | | | 0.65 | %3,4 |
Ratio of net investment income (loss) to average net assets | | | 1.68 | % |
| 2 | Not annualized for periods less than one year. |
| 3 | Reflects a waiver of fees by the Manager and the Sponsor of the Fund. Had the Manager and the Sponsor not waived their fees or reimbursed expenses, the ratio of expenses to average net assets would have been 0.80% for the period ended July 31, 2009. |
| 4 | Ratio of expenses to average net assets includes indirectly paid expenses. Excluding indirectly paid expenses the ratio of expenses to average net assets for the period ended July 31, 2009 would have been 0.65%. |
| 5 | Based on average shares outstanding. |
SEE NOTES TO FINANCIAL STATEMENTS
64
DOMINI SOCIAL EQUITY FUND CLASS R SHARES
FINANCIAL HIGHLIGHTS
| | | | | | | | | | | | | | | | | | | | |
| | | Year Ended July 31, | |
| | | 2009 | | | 2008 | | | 2007 | | | 2006 | | | 2005 | |
For a share outstanding for the period: | | | | | | | | | | | | | | | | | | | | |
Net asset value, beginning of period | | $ | 9.37 | | | $ | 12.85 | | | $ | 11.25 | | | $ | 11.25 | | | $ | 10.28 | |
| | | | | | | | | | | | | | | | | | | | |
Income from investment operations: | | | | | | | | | | | | | | | | | | | | |
Net investment income (loss) | | | (0.05 | ) | | | 0.17 | | | | 0.12 | | | | 0.11 | | | | 0.15 | |
Net realized and unrealized gain (loss) on investments | | | (1.74 | ) | | | (1.40 | ) | | | 1.62 | | | | 0.01 | | | | 0.98 | |
| | | | | | | | | | | | | | | | | | | | |
Total income (loss) from investment operations | | | (1.79 | ) | | | (1.23 | ) | | | 1.74 | | | | 0.12 | | | | 1.13 | |
| | | | | | | | | | | | | | | | | | | | |
Less dividends and/or distributions: | | | | | | | | | | | | | | | | | | | | |
Dividends to shareholders from net investment income | | | (0.33 | ) | | | (0.45 | ) | | | (0.14 | ) | | | (0.12 | ) | | | (0.16 | ) |
Distributions to shareholders from net realized gain (loss) | | | — | | | | (1.80 | ) | | | — | | | | — | | | | — | |
Tax return of capital | | | (0.16 | )5 | | | — | | | | — | | | | — | | | | — | |
| | | | | | | | | | | | | | | | | | | | |
Total distributions | | | (0.49 | ) | | | (2.25 | ) | | | (0.14 | ) | | | (0.12 | ) | | | (0.16 | ) |
| | | | | | | | | | | | | | | | | | | | |
Redemption fee proceeds | | | 0.00 | 1 | | | 0.00 | 1 | | | 0.00 | 1 | | | 0.00 | 1 | | | 0.00 | 1 |
| | | | | | | | | | | | | | | | | | | | |
Net asset value, end of period | | $ | 7.09 | | | $ | 9.37 | | | $ | 12.85 | | | $ | 11.25 | | | $ | 11.25 | |
| | | | | | | | | | | | | | | | | | | | |
Total return 2 | | | -17.23 | % | | | -11.52 | % | | | 15.43 | % | | | 1.04 | % | | | 11.04 | % |
Portfolio turnover | | | 82 | % | | | 70 | % | | | 126 | % | | | 12 | % | | | 9 | % |
Ratios/supplemental data (annualized): | | | | | | | | | | | | | | | | | | | | |
Net assets, end of period (in millions) | | $ | 30 | | | $ | 52 | | | $ | 58 | | | $ | 45 | | | $ | 60 | |
Ratio of expenses to average net assets | | | 0.85 | %3,4 | | | 0.85 | %3 | | | 0.78 | %3 | | | 0.63 | %3 | | | 0.62 | %3 |
Ratio of net investment income (loss) to average net assets | | | 1.62 | % | | | 1.13 | % | | | 0.89 | % | | | 1.07 | % | | | 1.35 | % |
| 1 | Amount represents less than 0.005 per share. |
| 2 | Not annualized for periods less than one year. |
| 3 | Reflects a waiver of fees by the Manager and the Sponsor of the Fund. Had the Manager and the Sponsor not waived their fees or reimbursed expenses, the ratio of expenses to average net assets would have been 0.97%, 0.85%, 0.89%, 0.78%, and 0.74% for the years ended July 31, 2009, 2008, 2007, 2006, and 2005, respectively. |
| 4 | Ratio of expenses to average net assets includes indirectly paid expenses. Excluding indirectly paid expenses the ratio of expenses to average net assets for the period ended July 31, 2009 would have been 0.85%. |
| 5 | Based on average shares outstanding. |
SEE NOTES TO FINANCIAL STATEMENTS
65
DOMINI EUROPEAN SOCIAL EQUITY FUND INVESTOR SHARES
FINANCIAL HIGHLIGHTS
| | | | | | | | | | | | | | | | |
| | | Year ended January 31, | | | For the period
October 3, 2005
(commencement of
operations) through | |
| | | 2009 | | | 2008 | | | 2007 | | | July 31, 2006 | |
For a share outstanding for the period: | | | | | | | | | | | | | | | | |
Net asset value, beginning of period | | $ | 10.61 | | | $ | 14.89 | | | $ | 12.30 | | | $ | 10.00 | |
| | | | | | | | | | | | | | | | |
Income from investment operations: | | | | | | | | | | | | | | | | |
Net investment income (loss) | | | 0.14 | | | | 0.44 | | | | 0.36 | | | | 0.19 | |
Net realized and unrealized gain (loss) on investments | | | (3.20 | ) | | | (2.94 | ) | | | 2.88 | | | | 2.31 | |
| | | | | | | | | | | | | | | | |
Total income (loss) from investment operations | | | (3.06 | ) | | | (2.50 | ) | | | 3.24 | | | | 2.50 | |
| | | | | | | | | | | | | | | | |
Less dividends and/or distributions: | | | | | | | | | | | | | | | | |
Dividends to shareholders from net investment income | | | (0.16 | ) | | | (0.45 | ) | | | (0.34 | ) | | | (0.20 | ) |
Distributions to shareholders from net realized gain | | | — | | | | (1.28 | ) | | | (0.31 | ) | | | — | |
Tax return of capital | | | — | | | | (0.05 | )3 | | | — | | | | — | |
| | | | | | | | | | | | | | | | |
Total distributions | | | (0.16 | ) | | | (1.78 | ) | | | (0.65 | ) | | | (0.20 | ) |
| | | | | | | | | | | | | | | | |
Redemption fee proceeds | | | 0.00 | 1 | | | 0.00 | 1 | | | 0.00 | 1 | | | 0.00 | 1 |
| | | | | | | | | | | | | | | | |
Net asset value, end of period | | $ | 7.39 | | | $ | 10.61 | | | $ | 14.89 | | | $ | 12.30 | |
| | | | | | | | | | | | | | | | |
Total return 2 | | | -28.70 | % | | | -18.76 | % | | | 26.49 | % | | | 25.11 | % |
Portfolio turnover | | | 98 | % | | | 92 | % | | | 88 | % | | | 69 | % |
Ratios/supplemental data (annualized): | | | | | | | | | | | | | | | | |
Net assets, end of period (in millions) | | $ | 52 | | | $ | 94 | | | $ | 128 | | | $ | 55 | |
Ratio of expenses to average net assets | | | 1.60 | %4,5 | | | 1.60 | %4 | | | 1.60 | %4 | | | 1.59 | %4 |
Ratio of net investment income (loss) to average net assets | | | 1.97 | % | | | 3.41 | % | | | 3.02 | % | | | 3.11 | % |
| 1 | Amount represents less than 0.005 per share. |
| 2 | Not annualized for periods less than one year. |
| 3 | Based on average shares outstanding. |
| 4 | Reflects a waiver of fees by the Manager and the Distributor of the Fund. Had the Manager and the Distributor not waived their fees or reimbursed expenses, the ratio of expenses to average net assets would have been 2.00%, 1.80%, 1.79% and 1.87% for the periods ended July 31, 2009, 2008, 2007 and 2006. |
| 5 | Ratio of expenses to average net assets includes indirectly paid expenses. Excluding indirectly paid expenses the ratio of expenses to average net assets for the period ended July 31, 2009 would have been 1.60%. |
SEE NOTES TO FINANCIAL STATEMENTS
66
DOMINI EUROPEAN SOCIAL EQUITY FUND CLASS A SHARES
FINANCIAL HIGHLIGHTS
| | | | |
| | | For the Period
November 28, 2008
(commencement of
operations) through
July 31, 2009 | |
For a share outstanding for the period: | | | | |
Net asset value, beginning of period | | $ | 6.03 | |
| | | | |
Income from investment operations: | | | | |
Net investment income (loss) | | | 0.12 | |
Net realized and unrealized gain (loss) on investments | | | 1.40 | |
| | | | |
Total income from investment operations | | | 1.52 | |
| | | | |
Less dividends and/or distributions: | | | | |
Dividends to shareholders from net investment income | | | (0.15 | ) |
Distributions to shareholders from net realized gain | | | — | |
| | | | |
Total distributions | | | (0.15 | ) |
| | | | |
Redemption fee proceeds | | | — | |
| | | | |
Net asset value, end of period | | $ | 7.40 | |
| | | | |
Total return 2 | | | 25.34 | % |
Portfolio turnover | | | 98 | % |
Ratios/supplemental data (annualized): | | | | |
Net assets, end of period (in millions) | | $ | 2 | |
Ratio of expenses to average net assets | | | 1.57 | %3,4 |
Ratio of net investment income (loss) to average net assets | | | 2.78 | % |
| 2 | Total Return does not reflect sales commissions and is not annualized for periods less than one year. |
| 3 | Reflects a waiver of fees by the Manager and the Distributor of the Fund. Had the Manager and the Distributor not waived their fees or reimbursed expenses, the ratio of expenses to average net assets would have been 3.85% for the period ended July 31, 2009. |
| 4 | Ratio of expenses to average net assets includes indirectly paid expenses. Excluding indirectly paid expenses the ratio of expenses to average net assets for the period ended July 31, 2009 would have been 1.57%. |
SEE NOTES TO FINANCIAL STATEMENTS
67
DOMINI PACASIA SOCIAL EQUITY FUND INVESTOR SHARES
FINANCIAL HIGHLIGHTS
| | | | | | | | | | | | |
| | | | | | | | | For the period
December 27, 2006
(commencement of
operations) through
July 31, 2007 | |
| | | Year ended July 31, | | |
| | | 2009 | | | 2008 | | |
For a share outstanding for the period: | | | | | | | | | | | | |
Net asset value, beginning of period | | $ | 8.78 | | | $ | 10.64 | | | $ | 10.00 | |
| | | | | | | | | | | | |
Income from investment operations: | | | | | | | | | | | | |
Net investment income (loss) | | | 0.09 | | | | 0.14 | | | | 0.02 | |
Net realized and unrealized gain (loss) on investments | | | (1.40 | ) | | | (1.77 | ) | | | 0.64 | |
| | | | | | | | | | | | |
Total income (loss) from investment operations | | | (1.31 | ) | | | (1.63 | ) | | | 0.66 | |
| | | | | | | | | | | | |
Less dividends and/or distributions: | | | | | | | | | | | | |
Dividends to shareholders from net investment income | | | (0.09 | ) | | | (0.13 | ) | | | (0.02 | ) |
Distributions to shareholders from net realized gain | | | 0.00 | 1 | | | (0.10 | ) | | | — | |
| | | | | | | | | | | | |
Total distributions | | | (0.09 | ) | | | (0.23 | ) | | | (0.02 | ) |
| | | | | | | | | | | | |
Redemption fee proceeds | | | — | | | | 0.00 | 1 | | | 0.00 | 1 |
| | | | | | | | | | | | |
Net asset value, end of period | | $ | 7.38 | | | $ | 8.78 | | | $ | 10.64 | |
| | | | | | | | | | | | |
Total return 2 | | | -14.56 | % | | | -15.72 | % | | | 6.56 | % |
Portfolio turnover | | | 88 | % | | | 98 | % | | | 41 | % |
Ratios/supplemental data (annualized): | | | | | | | | | | | | |
Net assets, end of period (in millions) | | $ | 21 | | | $ | 27 | | | $ | 26 | |
Ratio of expenses to average net assets | | | 1.60 | %3,4 | | | 1.60 | %3 | | | 1.59 | %3 |
Ratio of net investment income (loss) to average net assets | | | 1.42 | % | | | 1.34 | % | | | 0.48 | % |
| 1 | Amount represents less than 0.005 per share. |
| 2 | Not annualized for periods less than one year. |
| 3 | Reflects a waiver of fees by the Manager and the Distributor of the Fund. Had the Manager and the Distributor not waived their fees or reimbursed expenses, the ratio of expenses to average net assets would have been 2.60%, 2.48% and 3.22% for the years ended July 31, 2009, 2008 and 2007, respectively. |
| 4 | Ratio of expenses to average net assets includes indirectly paid expenses. Excluding indirectly paid expenses the ratio of expenses to average net assets for the period ended July 31, 2009 would have been 1.60%. |
SEE NOTES TO FINANCIAL STATEMENTS
68
DOMINI PACASIA SOCIAL EQUITY FUND CLASS A SHARES
FINANCIAL HIGHLIGHTS
| | | | |
| | | For the Period
November 28, 2008
(commencement of
operations) through
July 31, 2009 | |
For a share outstanding for the period: | | | | |
Net asset value, beginning of period | | $ | 5.36 | |
Income from investment operations: | | | | |
Net investment income (loss) | | | 0.03 | |
Net realized and unrealized gain (loss) on investments | | | 2.02 | |
| | | | |
Total income from investment operations | | | 2.05 | |
| | | | |
Less dividends and/or distributions: | | | | |
Dividends to shareholders from net investment income | | | (0.03 | ) |
Distributions to shareholders from net realized gain | | | — | |
| | | | |
Total distributions | | | (0.03 | ) |
| | | | |
Redemption fee proceeds | | | — | |
| | | | |
Net asset value, end of period | | $ | 7.38 | |
| | | | |
Total return 2 | | | 38.27 | % |
Portfolio turnover | | | 88 | % |
Ratios/supplemental data (annualized): | | | | |
Net assets, end of period (in millions) | | $ | 1 | |
Ratio of expenses to average net assets | | | 1.57 | %3,4 |
Ratio of net investment income (loss) to average net assets | | | 0.73 | % |
| 2 | Total Return does not reflect sales commissions and is not annualized for periods less than one year. |
| 3 | Reflects a waiver of fees by the Manager and the Distributor of the Fund. Had the Manager and the Distributor not waived their fees or reimbursed expenses, the ratio of expenses to average net assets would have been 8.51% for the period ended July 31, 2009. |
| 4 | Ratio of expenses to average net assets includes indirectly paid expenses. Excluding indirectly paid expenses the ratio of expenses to average net assets for the period ended July 31, 2009 would have been 1.57%. |
SEE NOTES TO FINANCIAL STATEMENTS
69
DOMINI EUROPEAN PACASIA SOCIAL EQUITY FUND INVESTOR SHARES
FINANCIAL HIGHLIGHTS
| | | | | | | | | | | | |
| | | Year ended July 31, | | | For the period
December 27, 2006
(commencement of
operations) through | |
| | | 2009 | | | 2008 | | | July 31, 2007 | |
For a share outstanding for the period: | | | | | | | | | | | | |
Net asset value, beginning of period | | $ | 8.29 | | | $ | 10.25 | | | $ | 10.00 | |
| | | | | | | | | | | | |
Income from investment operations: | | | | | | | | | | | | |
Net investment income (loss) | | | 0.11 | | | | 0.25 | | | | 0.16 | |
Net realized and unrealized gain (loss) on investments | | | (2.25 | ) | | | (1.90 | ) | | | 0.22 | |
| | | | | | | | | | | | |
Total income (loss) from investment operations | | | (2.14 | ) | | | (1.65 | ) | | | 0.38 | |
| | | | | | | | | | | | |
Less dividends and/or distributions: | | | | | | | | | | | | |
Dividends to shareholders from net investment income | | | (0.10 | ) | | | (0.25 | ) | | | (0.13 | ) |
Distributions to shareholders from net realized gain | | | — | | | | (0.06 | ) | | | — | |
| | | | | | | | | | | | |
Total distributions | | | (0.10 | ) | | | (0.31 | ) | | | (0.13 | ) |
| | | | | | | | | | | | |
Redemption fee proceeds | | | 0.00 | 1 | | | 0.00 | 1 | | | 0.00 | 1 |
| | | | | | | | | | | | |
Net asset value, end of period | | $ | 6.05 | | | $ | 8.29 | | | $ | 10.25 | |
| | | | | | | | | | | | |
Total return 2 | | | -25.72 | % | | | -16.48 | % | | | 3.82 | % |
Portfolio turnover | | | 85 | % | | | 91 | % | | | 46 | % |
Ratios/supplemental data (annualized): | | | | | | | | | | | | |
Net assets, end of period (in millions) | | $ | 27 | | | $ | 22 | | | $ | 13 | |
Ratio of expenses to average net assets | | | 1.60 | %3,4 | | | 1.60 | %3 | | | 1.58 | %3 |
Ratio of net investment income (loss) to average net assets | | | 2.18 | % | | | 2.77 | % | | | 3.96 | % |
| 1 | Amount represents less than 0.005 per share. |
| 2 | Not annualized for periods less than one year. |
| 3 | Reflects a waiver of fees by the Manager and the Distributor of the Fund. Had the Manager and the Distributor not waived their fees or reimbursed expenses, the ratio of expenses to average net assets would have been 2.63%, 3.19% and 5.87% for the years ended July 31, 2009, 2008 and 2007, respectively. |
| 4 | Ratio of expenses to average net assets includes indirectly paid expenses. Excluding indirectly paid expenses the ratio of expenses to average net assets for the period ended July 31, 2009 would have been 1.60%. |
SEE NOTES TO FINANCIAL STATEMENTS
70
DOMINI EUROPEAN PACASIA SOCIAL EQUITY FUND CLASS A SHARES
FINANCIAL HIGHLIGHTS
| | | | |
| | | For the Period
November 28, 2008
(commencement of
operations) through
July 31, 2009 | |
For a share outstanding for the period: | | | | |
Net asset value, beginning of period | | $ | 5.13 | |
| | | | |
Income from investment operations: | | | | |
Net investment income (loss) | | | 0.08 | |
Net realized and unrealized gain (loss) on investments | | | 1.17 | |
| | | | |
Total income from investment operations | | | 1.25 | |
| | | | |
Less dividends and/or distributions: | | | | |
Dividends to shareholders from net investment income | | | (0.08 | ) |
Distributions to shareholders from net realized gain | | | — | |
| | | | |
Total distributions | | | (0.08 | ) |
| | | | |
Redemption fee proceeds | | | — | |
| | | | |
Net asset value, end of period | | $ | 6.30 | |
| | | | |
Total return 2 | | | 24.45 | % |
Portfolio turnover | | | 85 | % |
Ratios/supplemental data (annualized): | | | | |
Net assets, end of period (in millions) | | $ | 1 | |
Ratio of expenses to average net assets | | | 1.57 | %3,4 |
Ratio of net investment income (loss) to average net assets | | | 2.31 | % |
| 2 | Total Return does not reflect sales commissions and is not annualized for periods less than one year. |
| 3 | Reflects a waiver of fees by the Manager and the Distributor of the Fund. Had the Manager and the Distributor not waived their fees or reimbursed expenses, the ratio of expenses to average net assets would have been 6.86% for the period ended July 31, 2009. |
| 4 | Ratio of expenses to average net assets includes indirectly paid expenses. Excluding indirectly paid expenses the ratio of expenses to average net assets for the period ended July 31, 2009 would have been 1.58%. |
SEE NOTES TO FINANCIAL STATEMENTS
71
DOMINI SOCIAL EQUITY FUND
DOMINI EUROPEAN SOCIAL EQUITY FUND
DOMINI PACASIA SOCIAL EQUITY FUND
DOMINI EUROPEAN PACASIA SOCIAL EQUITY FUND
NOTES TO FINANCIAL STATEMENTS
JULY 31, 2009
1. ORGANIZATION AND SIGNIFICANT ACCOUNTING POLICIES
The Domini Social Investment Trust is a Massachusetts business trust registered under the Investment Company Act of 1940 as an open-end management investment company. The Domini Social Investment Trust comprises five separate series: Domini Social Equity Fund, Domini European Social Equity Fund, Domini PacAsia Social Equity Fund, Domini European PacAsia Social Equity Fund, and Domini Social Bond Fund (each the “Fund,” collectively the “Funds”). The financial statements of the Domini Social Bond Fund are included on page 92 of this report. The Domini Social Equity Fund offers Investor shares, Class A shares, Institutional shares and Class R shares. The Domini European Social Equity Fund, the Domini PacAsia Social Equity Fund and the Domini European PacAsia Social Equity Fund offer Investor shares and Class A shares. The Investor shares, Institutional shares and Class R shares are sold at their offering price, which is net asset value. The Class A shares are sold with a front-end sales charge (load) of up to 4.75%. Class R shares are generally available only to certain eligible retirement plans and endowments, foundations, religious organizations, and other tax-exempt entities that are approved by the Fund’s Distributor. All classes of shares have identical rights and voting privileges with respect to the Fund in general and exclusive voting rights on matters that affect that class alone. Earnings, net assets, and net asset value per share may differ due to each class having its own expenses, such as transfer and shareholder servicing agent fees and registration fees, directly attributable to that class. Class R shares are not subject to distribution and service fees.
The Board of Trustees of the Trust and the Domini Advisor Trust, an affiliated Domini fund, approved an Agreement and Plan of Reorganization providing for the transfer of all assets and liabilities of the Domini Advisor Trust in exchange for the issuance of Class A shares of the Domini Social Equity Fund, Domini European Social Equity Fund, Domini PacAsia Social Equity Fund, and Domini European PacAsia Social Equity Fund in a tax-free reorganization that took place at the close of business on November 28, 2008. Prior to this merger, Class A shares of the Trust had not commenced operations.
72
The Board of Trustees of the Trust and the Domini Institutional Trust, an affiliated Domini fund, approved an Agreement and Plan of Reorganization providing for the transfer of all assets and liabilities of each series of the Domini Institutional Trust in exchange for the issuance of Institutional shares of the Domini Social Equity Fund in a tax-free reorganization that took place at the close of business on November 28, 2008. Prior to this merger, Institutional shares of the Trust had not commenced operations.
The preparation of financial statements in conformity with U.S. generally accepted accounting principles requires management to make estimates and assumptions that affect the reported amounts of assets and liabilities and disclosure of contingent liabilities at the date of the financial statements and the reported amounts of revenues and expenses during the reporting period. Actual results could differ from those estimates. The following is a summary of the Funds’ significant accounting policies.
(A) Valuation of Investments. Securities listed or traded on national securities exchanges are valued at the last sale price reported by the security’s primary exchange or, if there have been no sales that day, at the mean of the current bid and ask price that represents the current value of the security. Securities listed on the NASDAQ National Market System are valued using the NASDAQ Official Closing Price (the “NOCP”). If an NOCP is not available for a security listed on the NASDAQ National Market System, the security will be valued at the last sale price or, if there have been no sales that day, at the mean of the current bid and ask price. Securities for which market quotations are not readily available or as a result of an event occurring after the close of the foreign market but before pricing the Funds are valued at fair value as determined in good faith under procedures established by and under the supervision of the Funds’ Board of Trustees. Securities that are primarily traded on foreign exchanges generally are valued at the closing price of such securities on their respective exchanges, except that if the Trusts’ manager or submanager, as applicable, is of the opinion that such price would result in an inappropriate value for a security, including as a result of an occurrence subsequent to the time a value was so established, then the fair value of those securities may be determined by consideration of other factors (including the use of an independent pricing service) by or under the direction of the Board of Trustees or its delegates.
The FASB issued Statement of Financial Accounting Standards No. 157 (“SFAS No. 157”), “Fair Value Measurements.” The new accounting statement defines fair value, establishes a framework for measuring fair value in generally accepted accounting principles (“GAAP”), and expands disclosures about fair value measurements. SFAS No. 157 defines fair value as the price that would be received to sell an asset or paid to transfer a liability in an orderly transaction between market participants at the measurement date (an exit price). SFAS No. 157 also stipulates that, as a
73
market-based measurement, fair value measurement should be determined based on the assumptions that market participants would use in pricing the asset or liability, and establishes a fair value hierarchy that distinguishes between (a) market participant assumptions developed based on market data obtained from sources independent of the reporting entity (observable inputs) and (b) the reporting entity’s own assumptions about market participant assumptions developed based on the best information available in the circumstances (unobservable inputs).
Level 1 – quoted prices in active markets for identical securities
Level 2 – other significant observable inputs (including quoted prices for similar securities, interest rates, and evaluated quotation obtained from pricing services)
Level 3 – significant unobservable inputs (including the Funds’ own assumptions in determining the fair value of investments)
The inputs or methodology used for valuing securities are not an indication of the risk associated with investing in those securities.
The following is a summary of the inputs used by the Domini Social Equity Fund, as of July 31, 2009, in valuing the Fund’s assets carried at fair value:
| | | | | | | | | | | | |
| | | Level 1 -
Quoted Prices | | Level 2 -
Other Significant
Observable Inputs | | Level 3 -
Significant
Unobservable Inputs | | Total |
Common Stocks | | | | | | | | | | | | |
Consumer Discretionary | | $ | 68,567,184 | | $ | — | | $ | — | | $ | 68,567,184 |
Consumer Staples | | | 78,896,172 | | | — | | | — | | | 78,896,172 |
Energy | | | 65,283,784 | | | — | | | — | | | 65,283,784 |
Financials | | | 92,190,623 | | | — | | | — | | | 92,190,623 |
Health Care | | | 94,724,484 | | | — | | | — | | | 94,724,484 |
Industrials | | | 48,258,280 | | | — | | | — | | | 48,258,280 |
Information Technology | | | 143,677,013 | | | — | | | — | | | 143,677,013 |
Materials | | | 12,417,336 | | | — | | | — | | | 12,417,336 |
Telecommunication Services | | | 40,607,030 | | | — | | | — | | | 40,607,030 |
Utilities | | | 14,844,468 | | | — | | | — | | | 14,844,468 |
| | | | | | | | | | | | |
Total | | $ | 659,466,374 | | | — | | | — | | $ | 659,466,374 |
| | | | | | | | | | | | |
74
The following is a summary of the inputs used by the Domini European Social Equity Fund, as of July 31, 2009, in valuing the Fund’s assets carried at fair value:
| | | | | | | | | | | | |
| | | Level 1 -
Quoted Prices | | Level 2 -
Other Significant
Observable Inputs | | Level 3 -
Significant
Unobservable Inputs | | Total |
Common Stocks | | | | | | | | | | | | |
Consumer Discretionary | | $ | 4,870,908 | | $ | — | | $ | — | | $ | 4,870,908 |
Consumer Staples | | | 4,696,016 | | | — | | | — | | | 4,696,016 |
Energy | | | 5,439,594 | | | — | | | — | | | 5,439,594 |
Financials | | | 14,218,376 | | | — | | | — | | | 14,218,376 |
Health Care | | | 7,079,334 | | | — | | | — | | | 7,079,334 |
Industrials | | | 4,241,606 | | | — | | | 131,588 | | | 4,373,194 |
Information Technology | | | 1,538,146 | | | — | | | — | | | 1,538,146 |
Materials | | | 3,684,060 | | | — | | | — | | | 3,684,060 |
Telecommunication Services | | | 5,720,198 | | | — | | | — | | | 5,720,198 |
Utilities | | | 1,086,035 | | | — | | | — | | | 1,086,035 |
| | | | | | | | | | | | |
Total | | $ | 52,574,273 | | | — | | $ | 131,588 | | $ | 52,705,861 |
| | | | | | | | | | | | |
The following is a summary of the inputs used by the Domini PacAsia Social Equity Fund, as of July 31, 2009, in valuing the Fund’s assets carried at fair value:
| | | | | | | | | | | | |
| | | Level 1 -
Quoted Prices | | Level 2 -
Other Significant
Observable Inputs | | Level 3 -
Significant
Unobservable Inputs | | Total |
Common Stocks | | | | | | | | | | | | |
Consumer Discretionary | | $ | 3,125,620 | | $ | — | | $ | — | | $ | 3,125,620 |
Consumer Staples | | | 901,553 | | | — | | | — | | | 901,553 |
Energy | | | 749,952 | | | — | | | — | | | 749,952 |
Financials | | | 6,479,981 | | | — | | | — | | | 6,479,981 |
Health Care | | | 1,114,716 | | | — | | | — | | | 1,114,716 |
Industrials | | | 2,611,410 | | | — | | | — | | | 2,611,410 |
Information Technology | | | 2,637,131 | | | — | | | — | | | 2,637,131 |
Materials | | | 1,697,545 | | | — | | | — | | | 1,697,545 |
Telecommunication Services | | | 1,105,013 | | | — | | | — | | | 1,105,013 |
Utilities | | | 829,585 | | | — | | | — | | | 829,585 |
| | | | | | | | | | | | |
Total | | $ | 21,252,506 | | | — | | | — | | $ | 21,252,506 |
| | | | | | | | | | | | |
75
The following is a summary of the inputs used by the Domini European PacAsia Social Equity Fund, as of July 31, 2009, in valuing the Fund’s assets carried at fair value:
| | | | | | | | | | | | |
| | | Level 1 -
Quoted Prices | | Level 2 -
Other Significant
Observable Inputs | | Level 3 -
Significant
Unobservable Inputs | | Total |
Common Stocks | | | | | | | | | | | | |
Consumer Discretionary | | $ | 2,929,284 | | $ | — | | $ | — | | $ | 2,929,284 |
Consumer Staples | | | 1,759,666 | | | — | | | — | | | 1,759,666 |
Energy | | | 1,437,542 | | | — | | | — | | | 1,437,542 |
Financials | | | 7,653,308 | | | — | | | — | | | 7,653,308 |
Health Care | | | 3,325,454 | | | — | | | — | | | 3,325,454 |
Industrials | | | 3,223,949 | | | — | | | — | | | 3,223,949 |
Information Technology | | | 1,178,663 | | | — | | | — | | | 1,178,663 |
Materials | | | 1,739,320 | | | — | | | — | | | 1,739,320 |
Telecommunication Services | | | 2,422,756 | | | — | | | — | | | 2,422,756 |
Utilities | | | 809,381 | | | — | | | — | | | 809,381 |
| | | | | | | | | | | | |
Total | | $ | 26,479,323 | | | — | | | — | | $ | 26,479,323 |
| | | | | | | | | | | | |
Following is a reconciliation of Level 3 assets for which significant unobservable inputs were used to determine fair value:
| | | | | | | | |
| | | Domini European
Social Equity Fund | | | Domini European
PacAsia Social Equity Fund | |
Investments in Securities | | | | | | | | |
Balance as of July 31, 2008 | | $ | — | | | $ | — | |
Realized Gain (loss) | | | — | | | | — | |
Change in unrealized appreciation (depreciation) | | | (3,629 | ) | | | (12,190 | ) |
Net purchases (sales) | | | | | | | — | |
Transfers in and/or out of Level Three | | | 135,217 | | | | 12,190 | |
| | | | | | | | |
Balance as of July 31, 2009 | | $ | 131,588 | | | $ | — | |
| | | | | | | | |
The change in unrealized appreciation (depreciation) included in earnings relating to securities still held at July 31, 2009 was $(631,275) for the Domini European Social Equity Fund and $(163,752) for the Domini European PacAsia Social Equity Fund.
(B) Repurchase Agreements. The Funds may enter into repurchase agreements with selected banks or broker-dealers. Each repurchase agreement is recorded at cost, which approximates fair value. The Funds require that collateral, represented by securities (primarily U.S. government agency securities), in a repurchase transaction be maintained in a segregated account with a custodian bank in a manner sufficient to enable each Fund to obtain those securities in the event of a default of the counterparty. In the event of default or bankruptcy by another party to the repurchase agreement, retention of the collateral may be subject to legal proceedings.
76
(C) Foreign Currency Translation. Securities and other assets and liabilities denominated in foreign currencies are translated into U.S. dollar amounts on the date of valuation. Purchases and sales of securities, and income and expense items denominated in foreign currencies, are translated into U.S. dollar amounts on the respective dates of such transactions. Occasionally, events may impact the availability or reliability of foreign exchange rates used to convert the U.S. dollar equivalent value. If such an event occurs, the foreign exchange rate will be valued at fair value using procedures established and approved by the Board of Trustees.
The Funds do not separately report the effect of fluctuations in foreign exchange rates from changes in market prices on securities held. Such fluctuations are included with the net realized and unrealized gain or loss from investments.
Realized foreign exchange gains or losses arise from sales of foreign currencies, currency gains or losses realized between the trade and settlement dates on securities transactions, and the difference between the recorded amounts of dividends, interest, and foreign withholding taxes and the U.S. dollar equivalent of the amounts actually received or paid. Net unrealized foreign exchange gains and losses arise from changes in fair value of assets and liabilities other than investments in securities held at the end of the reporting period, resulting from changes in exchange rates.
(D) Foreign Currency Contracts. When the Funds purchase or sell foreign securities they may enter into foreign exchange contracts to minimize foreign exchange risk from the trade date to the settlement date of the transactions. A foreign exchange contract is an agreement between two parties to exchange different currencies at an agreed-upon exchange rate on a specified date.
(E) Investment Transactions, Investment Income and Dividends to Shareholders. The Funds earn income daily, net of Fund expenses. Dividends to shareholders of the Domini European Social Equity Fund, the Domini PacAsia Social Equity Fund, and the Domini European PacAsia Social Equity Fund are usually declared and paid semi-annually from net investment income. Dividends to shareholders of the Domini Social Equity Fund are usually declared and paid quarterly from net investment income. Distributions to shareholders of realized capital gains, if any, are made annually. Distributions are determined in conformity with income tax regulations, which may differ from generally accepted accounting principles. Reclassifications have been made to the Funds’ components of net assets to reflect income and gains available for distribution (or available capital loss carryovers, as applicable) under income tax regulations.
77
Investment transactions are accounted for on trade date. Realized gains and losses from security transactions are determined on the basis of identified cost. Interest income is recorded on an accrual basis. Dividend income, net of any applicable withholding tax, is recorded on the ex-dividend date or for certain foreign securities, when the information becomes available to the Funds.
(F) Federal Taxes. Each Fund’s policy is to comply with the provisions of the Internal Revenue Code applicable to regulated investment companies and to distribute substantially all of its taxable income, including net realized gains, if any, within the prescribed time periods. Accordingly, no provision for federal income or excise tax is deemed necessary.
(G) Redemption Fees. Redemptions and exchanges of Fund shares held less than 30 days may be subject to the Funds’ redemption fee, which is 2% of the amount redeemed. Such fees are retained by the Funds and are recorded as an adjustment to paid-in capital.
(H) Other. Income, expenses (other than those attributable to a specific class), gains, and losses are allocated on a daily basis to each class of shares based upon the relative proportion of net assets represented by such class. Operating expenses directly attributable to a specific class are charged against the operations of that class.
(I) Indemnification. The Funds’ organizational documents provide current and former trustees and officers with a limited indemnification against liabilities arising in connection with the performance of their duties to the Funds. In the normal course of business, the Funds may also enter into contracts that provide general indemnifications. The Funds’ maximum exposure under these arrangements is unknown as this would be dependent on future claims that may be made against the Funds. The risk of material loss from such claims is considered remote.
2. TRANSACTIONS WITH AFFILIATES
(A) Manager/Sponsor. The Funds have retained Domini Social Investments LLC (Domini) to serve as investment manager and administrator. Domini is registered as an investment advisor under the Investment Advisers Act of 1940. The services provided by Domini consist of investment supervisory services, overall operational support, and administrative services. The administrative services include the provision of general office facilities and supervising the overall administration of the Funds. For its services under the Management Agreements, Domini receives from each Fund a fee accrued daily and paid monthly at the annual rate below of the respective Funds’ average daily net assets before any fee waivers:
78
| | |
| Domini Social Equity Fund | | 0.30% of the first $2 billion of net assets managed, |
| |
| | 0.29% of the next $1 billion of net assets managed, and |
| |
| | 0.28% of net assets managed in excess of $3 billion |
| |
| Domini European Social Equity Fund, | | 1.00% of the first $250 million of net assets managed, |
Domini PacAsia Social Equity Fund, and Domini European PacAsia Social | | 0.94% of the next $250 million of net assets managed, and |
| Equity Fund | | 0.88% of net assets managed in excess of $500 million |
Pursuant to a Sponsorship Agreement (with respect to the Domini Social Equity Fund) Domini provides the Funds with the administrative personnel and services necessary to operate the Funds. In addition to general administrative services and facilities for the Funds similar to those provided by Domini under the Management Agreements, Domini answers questions from the general public and the media regarding the securities holdings of the Funds. For these services and facilities, Domini receives fees accrued daily and paid monthly from the Funds at the annual rate below of the respective Funds’ average daily net assets before any fee waivers:
| | |
| Domini Social Equity Fund | | 0.45% of the first $2 billion of net assets managed, |
| |
| | 0.44% of the next $1 billion of net assets managed, and |
| |
| | 0.43% of net assets managed in excess of $3 billion |
Effective November 28, 2008, Domini reduced its fees and reimbursed expenses to the extent necessary to keep the aggregate annual operating expenses of the Domini Social Equity Fund at no greater than 1.20%, 1.18%, 0.65%, and 0.90% of the average daily net assets representing Investor shares, Class A shares, Institutional shares, and Class R shares, respectively. For the periods prior to November 28, 2008, similar arrangements were in effect. The waivers currently in effect for Class A shares and Class R shares of the Domini Social Equity Fund are contractual and in effect until November 30, 2010, absent an earlier modification by the Board of Trustees, which oversees the Funds. Effective November 27, 2009, and through November 30, 2010, Domini has contractually agreed to waive certain fees and/or reimburse certain expenses of the Investor shares and Institutional shares of the Domini Social Equity Fund, so that expenses, net of waivers and reimbursements, will not exceed on a per annum basis, 1.25% and 0.75%, respectively, absent an earlier modification by the Board, which oversees the Fund.
Effective November 28, 2008, Domini reduced its fees and reimbursed expenses to the extent necessary to keep the aggregate annual operating expenses of the Domini European Social Equity Fund, the Domini PacAsia Social Equity Fund, and the Domini European PacAsia Social Equity Fund at no greater than 1.60% and 1.57% of the average daily net assets representing Investor shares and Class A shares, respectively. For the period prior to November 28, 2008, similar arrangements were in effect. The waivers currently in effect are contractual and in effect until
79
November 30, 2010, absent an earlier modification by the Board of Trustees, which oversees the Funds.
For the year ended July 31, 2009, Domini waived fees and reimbursed expenses as follows:
| | | | | | |
| | | FEE
WAIVED | | EXPENSES
REIMBURSED |
Domini Social Equity Fund | | $ | 394,028 | | $ | 169,195 |
Domini European Social Equity Fund | | | — | | | 211,939 |
Domini PacAsia Social Equity Fund | | | — | | | 175,970 |
Domini European PacAsia Social Equity Fund | | | — | | | 197,157 |
(B) Submanager. Wellington Management Company, LLP (Wellington) provides investment submanagement services to the Funds on a day-to-day basis pursuant to Submanagement Agreements with Domini.
(C) Distributor. The Board of Trustees of the Funds has adopted a Distribution Plan with respect to the Funds’ Investor shares and Class A shares in accordance with Rule 12b-1 under the Act. DSIL Investment Services LLC, a wholly owned subsidiary of Domini (DSILD), acts as agent of the Funds in connection with the offering of Investor shares of the Funds pursuant to a Distribution Agreement. Under the Distribution Plan, the Funds pay expenses incurred in connection with the sale of Investor shares and Class A shares and pay DSILD a distribution fee at an aggregate annual rate not to exceed 0.25% of the average daily net assets representing the Investor shares and Class A shares. For the year ended July 31, 2009, fees waived were as follows:
| | | |
| | | FEES
WAIVED |
Domini Social Equity Fund Investor shares | | $ | 239,478 |
Domini Social Equity Fund Class A shares | | | 1,002 |
Domini European Social Equity Fund Investor shares | | | 19,323 |
Domini European Social Equity Fund Class A shares | | | 2,012 |
Domini PacAsia Social Equity Fund Investor shares | | | 24,181 |
Domini PacAsia Social Equity Fund Class A shares | | | 564 |
Domini European PacAsia Social Equity Fund Investor shares | | | 18,339 |
Domini European PacAsia Social Equity Fund Class A shares | | | 469 |
DSIL Investment Services, LLC (DSIL), the Fund’s Distributor, has received commissions related to the sales of fund shares. For the year ended July 31, 2009, DSIL received $2,421, $521, $494, and $1,947 from the Domini Social Equity Fund Class A shares, the Domini European Social Equity Fund Class A shares, the Domini PacAsia Social Equity Fund Class A shares and the Domini European PacAsia Social Equity Fund Class A shares, respectively.
(D) Shareholder Service Agent. The Trust has retained Domini to provide certain shareholder services with respect to the Domini Social Equity Fund,
80
Domini European Social Equity Fund, Domini PacAsia Social Equity Fund, and Domini European PacAsia Social Equity Fund and their shareholders, which services were previously provided by PNC Global Investment Servicing (“PNC”) or another fulfillment and mail service provider and are supplemental to services currently provided by PNC, pursuant to a transfer agency agreement between each Fund and PNC. For these services, Domini receives fees from each Fund paid monthly at an annual rate of $4.00 per active account. For the year ended July 31, 2009, Domini waived fees as follows:
| | | |
| | | FEES WAIVED |
Domini Social Equity Fund Investor shares | | $ | — |
Domini Social Equity Fund Class A shares | | | 508 |
Domini Social Equity Fund Institutional shares | | | 99 |
Domini Social Equity Fund Class R shares | | | 58 |
Domini European Social Equity Fund Investor shares | | | — |
Domini European Social Equity Fund Class A shares | | | 1,354 |
Domini PacAsia Social Equity Fund Investor shares | | | 471 |
Domini PacAsia Social Equity Fund Class A shares | | | 394 |
Domini European PacAsia Social Equity Fund Investor shares | | | 402 |
Domini European PacAsia Social Equity Fund Class A shares | | | 259 |
3. INVESTMENT TRANSACTIONS
For the year ended July 31, 2009, cost of purchase and proceeds from sales of investments other than short-term obligations were as follows:
| | | | | | |
| | | PURCHASES | | SALES |
Domini Social Equity Fund | | $ | 550,494,753 | | $ | 656,709,039 |
Domini European Social Equity Fund | | | 55,387,616 | | | 67,628,938 |
Domini PacAsia Social Equity Fund | | | 16,594,704 | | | 18,222,844 |
Domini European PacAsia Social Equity Fund | | | 25,592,855 | | | 17,049,750 |
Per the Funds’ arrangement with State Street Bank & Trust (“State Street”), credits realized as a result of uninvested cash balances are used to reduce a portion of the Funds’ expenses. For the year ended July 31, 2009, custody fees of the Funds, under these arrangements, were reduced by $6,264, $1,155, $256 and $442 for the Domini Social Equity Fund, Domini European Social Equity Fund, Domini PacAsia Social Equity Fund and Domini European PacAsia Social Equity Fund, respectively.
81
4. SUMMARY OF SHARE TRANSACTIONS
| | | | | | | | | | | | |
| | | SHARES | |
| Year ended July 31, 2009 | | Sold | | Issued in Fund
Reorganization
(Note 7) | | Issued in
reinvestment
of dividends
and
distributions | | Redeemed | | | Net increase
(decrease) | |
Domini Social Equity Fund | | | | | | | | | | | | |
Investor shares | | 2,501,478 | | — | | 455,794 | | (6,356,864 | ) | | (3,399,592 | ) |
Class A shares | | 23,190 | | 145,233 | | 4,716 | | (20,401 | ) | | 152,738 | |
Institutional shares | | 348,867 | | 6,906,162 | | 132,150 | | (1,550,779 | ) | | 5,836,400 | |
Class R shares | | 990,945 | | — | | 426,790 | | (2,725,852 | ) | | (1,308,117 | ) |
| | | | | | | | | | | | |
Total | | 3,864,480 | | 7,051,395 | | 1,019,450 | | (10,653,896 | ) | | 1,281,429 | |
| | | | | | | | | | | | |
| | | | | |
Domini European Social Equity Fund | | | | | | | | | | | | |
Investor shares | | 1,822,407 | | — | | 113,581 | | (3,798,553 | ) | | (1,862,565 | ) |
Class A shares | | 27,331 | | 313,818 | | 5,050 | | (80,956 | ) | | 265,243 | |
| | | | | | | | | | | | |
Total | | 1,849,738 | | 313,818 | | 118,631 | | (3,879,509 | ) | | (1,597,322 | ) |
| | | | | | | | | | | | |
| | | | | |
Domini PacAsia Social Equity Fund | | | | | | | | | | | | |
Investor shares | | 482,695 | | — | | 25,257 | | (753,533 | ) | | (245,581 | ) |
Class A shares | | 8,962 | | 105,252 | | 248 | | (40,133 | ) | | 74,329 | |
| | | | | | | | | | | | |
Total | | 491,657 | | 105,252 | | 25,505 | | (793,666 | ) | | (171,252 | ) |
| | | | | | | | | | | | |
| | | | | |
Domini European PacAsia Social Equity Fund | | | | | | | | | | | | |
Investor shares | | 2,487,852 | | — | | 56,052 | | (736,317 | ) | | 1,807,587 | |
Class A shares | | 27,413 | | 113,178 | | 1,016 | | (53,174 | ) | | 88,433 | |
| | | | | | | | | | | | |
Total | | 2,515,265 | | 113,178 | | 57,068 | | (789,491 | ) | | 1,896,020 | |
| | | | | | | | | | | | |
| | | | | | | | | | |
| | | SHARES | |
| Year ended July 31, 2008 | | Sold | | Issued in
reinvestment
of dividends
and
distributions | | Redeemed | | | Net increase
(decrease) | |
Domini Social Equity Fund | | | | | | | | | | |
Investor shares | | 2,547,779 | | 1,783,318 | | (8,182,129 | ) | | (3,851,032 | ) |
Class R shares | | 1,199,994 | | 970,913 | | (1,109,185 | ) | | 1,061,722 | |
| | | | | | | | | | |
Total | | 3,747,773 | | 2,754,231 | | (9,291,314 | ) | | (2,789,310 | ) |
| | | | | | | | | | |
| | | | |
Domini European Social Equity Fund | | | | | | | | | | |
Investor shares | | 1,491,479 | | 977,126 | | (2,215,650 | ) | | 252,955 | |
| | | | | | | | | | |
| | | | |
Domini PacAsia Social Equity Fund | | | | | | | | | | |
Investor shares | | 1,066,817 | | 40,463 | | (440,052 | ) | | 667,228 | |
| | | | | | | | | | |
| | | | |
Domini European PacAsia Social Equity Fund | | | | | | | | | | |
Investor shares | | 1,561,328 | | 56,597 | | (309,075 | ) | | 1,308,850 | |
| | | | | | | | | | |
82
| | | | | | | | | | | | | | |
| DOLLARS | |
| Sold | | Issued in Fund
Reorganization
(Note 7) | | Issued in
reinvestment
of dividends
and
distributions | | Redeemed | | | Redemption
fees | | Net increase
(decrease) | |
| | | | | | | | | | | | | | |
| $ | 48,962,679 | | — | | 7,704,530 | | (133,498,097 | ) | | 11,824 | | $ | (76,819,064 | ) |
| | 967,470 | | 954,140 | | 24,852 | | (130,531 | ) | | — | | | 1,815,931 | |
| | 95,684,259 | | 83,742,159 | | 1,305,641 | | (18,986,075 | ) | | — | | | 161,745,984 | |
| | 7,062,196 | | — | | 2,300,240 | | (20,255,798 | ) | | 1,829 | | | (10,891,533 | ) |
| | | | | | | | | | | | | | | |
| $ | 152,676,604 | | 84,696,299 | | 11,335,263 | | (172,870,501 | ) | | 13,653 | | $ | 75,851,318 | |
| | | | | | | | | | | | | | | |
| | | | | | | | | | | | | | |
| | | | | | | | | | | | | | |
| $ | 15,435,121 | | — | | 763,030 | | (24,738,067 | ) | | 8,067 | | $ | (8,531,849 | ) |
| | 1,614,242 | | 1,893,850 | | 34,745 | | (464,723 | ) | | — | | | 3,078,114 | |
| | | | | | | | | | | | | | | |
| $ | 17,049,363 | | 1,893,850 | | 797,775 | | (25,202,790 | ) | | 8,067 | | $ | (5,453,735 | ) |
| | | | | | | | | | | | | | | |
| | | | | | | | | | | | | | |
| | | | | | | | | | | | | | |
| $ | 3,426,112 | | — | | 138,241 | | (4,310,177 | ) | | — | | $ | (745,824 | ) |
| | 430,414 | | 564,388 | | 1,693 | | (201,912 | ) | | — | | | 794,583 | |
| | | | | | | | | | | | | | | |
| $ | 3,856,526 | | 564,388 | | 139,934 | | (4,512,089 | ) | | — | | $ | 48,759 | |
| | | | | | | | | | | | | | | |
| | | | | | | | | | | | | | |
| | | | | | | | | | | | | | |
| $ | 13,041,102 | | — | | 306,068 | | (3,942,904 | ) | | 115 | | $ | 9,404,381 | |
| | 576,452 | | 580,722 | | 5,914 | | (267,819 | ) | | — | | | 895,269 | |
| | | | | | | | | | | | | | | |
| $ | 13,617,554 | | 580,722 | | 311,982 | | (4,210,723 | ) | | 115 | | $ | 10,299,650 | |
| | | | | | | | | | | | | | | |
| | | | | | | | | | | | |
| DOLLARS | |
| Sold | | Issued in
reinvestment
of dividends
and
distributions | | Redeemed | | | Redemption
fees | | Net increase
(decrease) | |
| | | | | | | | | | | | |
| $ | 80,700,602 | | 57,313,585 | | (256,906,770 | ) | | 40,794 | | $ | (118,851,789 | ) |
| | 13,102,646 | | 10,498,392 | | (12,269,367 | ) | | 3,621 | | | 11,335,292 | |
| | | | | | | | | | | | | |
| $ | 93,803,248 | | 67,811,977 | | (269,176,137 | ) | | 44,415 | | $ | (107,516,497 | ) |
| | | | | | | | | | | | | |
| | | | | | | | | | | | |
| | | | | | | | | | | | |
| $ | 19,547,037 | | 12,773,572 | | (28,018,394 | ) | | — | | $ | 4,302,215 | |
| | | | | | | | | | | | | |
| | | | | | | | | | | | |
| | | | | | | | | | | | |
| $ | 10,894,798 | | 432,773 | | (4,321,976 | ) | | 103 | | $ | 7,005,698 | |
| | | | | | | | | | | | | |
| | | | | | | | | | | | |
| | | | | | | | | | | | |
| $ | 14,396,289 | | 535,338 | | (2,857,794 | ) | | 831 | | $ | 12,074,664 | |
| | | | | | | | | | | | | |
83
5. FEDERAL TAX STATUS
The tax basis of the components of net assets for the Funds at July 31, 2009, is as follows:
| | | | | | | | | | | | | | | | |
| | | Domini Social
Equity Fund | | | Domini
European Social
Equity Fund | | | Domini PacAsia
Social Equity
Fund | | | Domini European
PacAsia Social
Equity Fund | |
Undistributed ordinary income | | $ | — | | | $ | 47,149 | | | $ | 182,082 | | | $ | 255,990 | |
Undistributed long term capital gains | | | — | | | | — | | | | — | | | | — | |
Capital losses, other losses and other temporary differences | | | (331,250,246 | ) | | | (47,671,339 | ) | | | (10,400,203 | ) | | | (9,623,189 | ) |
Unrealized appreciation/ (depreciation) | | | 36,133,957 | | | | (3,573,685 | ) | | | 228,681 | | | | 704,480 | |
| | | | | | | | | | | | | | | | |
Distributable net earnings/(deficit) | | $ | (295,116,289 | ) | | $ | (51,197,875 | ) | | $ | (9,989,440 | ) | | $ | (8,662,719 | ) |
| | | | | | | | | | | | | | | | |
The difference between components of Distributable Earnings on a tax basis and the amounts reflected in the statement of assets and liabilities is primarily due to differences in book and tax policies and capital loss carryovers.
For the year ended July 31, 2009, the Funds made the following reclassifications to the components of net assets to align financial reporting with tax reporting:
| | | | | | | | | | | | | | | | |
| | | Domini Social
Equity Fund | | | Domini
European Social
Equity Fund | | | Domini PacAsia
Social Equity
Fund | | | Domini European
PacAsia Social
Equity Fund | |
Paid-in capital | | $ | 15,864,689 | | | $ | (2,331,733 | ) | | $ | (224,396 | ) | | $ | 22,375 | |
Undistributed net investment income (loss) | | | 2,686,862 | | | | 12,369 | | | | 15,288 | | | | 54,330 | |
Accumulated net realized gain (loss) | | | (18,551,551 | ) | | | 2,319,364 | | | | 209,108 | | | | (76,705 | ) |
During the period from November 1, 2008, through July 31, 2009, the Funds’ net realized capital losses were as follows:
| | | | |
Domini Social Equity Fund | | $ | (167,277,601 | ) |
Domini European Social Equity Fund | | | (29,947,916 | ) |
Domini PacAsia Social Equity Fund | | | (5,911,785 | ) |
Domini European PacAsia Social Equity Fund | | | (5,826,741 | ) |
These losses are deferred and will be recognized on August 1, 2009, for tax purposes.
The Funds have accumulated capital loss carryforwards that will expire as follows:
84
| | | | | | | | | | | | |
| Year ending | | Domini Social
Equity Fund | | Domini
European Social
Equity Fund | | Domini PacAsia
Social Equity
Fund | | Domini European
PacAsia Social
Equity Fund |
| 2010 | | $ | 15,381,994 | | $ | — | | $ | — | | $ | — |
| 2011 | | | 8,523,190 | | | — | | | — | | | — |
| 2012 | | | 2,943,543 | | | — | | | — | | | — |
| 2013 | | | 16,615,434 | | | — | | | — | | | — |
| 2014 | | | — | | | — | | | — | | | — |
| 2015 | | | 477,972 | | | — | | | — | | | 17,025 |
| 2016 | | | 22,120,249 | | | 687,583 | | | 168,510 | | | 444,931 |
| 2017 | | | 107,195,693 | | | 17,035,840 | | | 4,319,907 | | | 3,334,492 |
| | | | | | | | | | | | |
| | $ | 173,258,075 | | $ | 17,723,423 | | $ | 4,488,417 | | $ | 3,796,448 |
| | | | | | | | | | | | |
To the extent that the Funds realize future net capital gains, those gains will be offset by any unused capital loss carryforwards.
For federal income tax purposes, dividends paid were characterized as follows:
| | | | | | | | | | | | | | | | | | | | | | | | |
| | | Domini Social
Equity Fund | | Domini European
Social Equity Fund | | Domini PacAsia
Social Equity Fund | | Domini European PacAsia
Social Equity Fund |
| | | Year Ended
July 31, 2009 | | Year Ended
July 31, 2008 | | Year Ended
July 31, 2009 | | Year Ended
July 31, 2008 | | Year Ended
July 31, 2009 | | Year Ended
July 31, 2008 | | Year Ended
July 31, 2009 | | Year Ended
July 31, 2008 |
Ordinary income | | $ | 8,149,878 | | $ | 8,346,911 | | $ | 1,195,664 | | $ | 9,902,214 | | $ | 269,879 | | $ | 639,564 | | $ | 402,548 | | $ | 566,411 |
Long-term capital gain | | | — | | | 61,150,167 | | | — | | | 4,896,411 | | | — | | | — | | | — | | | — |
Return of capital | | | 3,659,576 | | | — | | | — | | | 450,755 | | | — | | | — | | | — | | | — |
| | | | | | | | | | | | | | | | | | | | | | | | |
Total | | $ | 11,809,454 | | $ | 69,497,078 | | $ | 1,195,664 | | $ | 15,249,380 | | $ | 269,879 | | $ | 639,564 | | $ | 402,548 | | $ | 566,411 |
| | | | | | | | | | | | | | | | | | | | | | | | |
As of July 31, 2009, tax years 2006 through 2009 remain subject to examination by the Funds’ major tax jurisdictions, which include the United States of America, the Commonwealth of Massachusetts, and New York State.
6. OTHER ACCOUNTING PRONOUNCEMENTS
In March 2008, the Financial Accounting Standards Board (“FASB”) issued Statement of Financial Accounting Standards (“SFAS”) No. 161, “Disclosures about Derivative Instruments and Hedging Activities.” This standard requires enhanced disclosures about derivative and hedging activities, including qualitative disclosures about how and why the Funds use derivative instruments, how these activities are accounted for, and their effect on the Funds’ financial position, financial performance, and cash flows. SFAS No. 161 is effective for financial statements issued for
85
fiscal years beginning after November 15, 2008, and interim periods within those fiscal years. At this time, management is evaluating the implications of SFAS No. 161 and its impact on the Funds’ financial statements and related disclosures.
7. REORGANIZATION TRANSACTIONS
(A) The Domini Social Equity Portfolio Class A Shares and the Domini Institutional Social Equity Fund. On September 3, 2008, the Board of Trustees of the Domini Social Equity Fund and the Domini Social Equity Portfolio approved an Agreement and Plan of Reorganization providing for the transfer of all assets and liabilities of the Domini Social Equity Portfolio in exchange for the issuance of the newly established Class A shares of the Domini Social Equity Fund in a tax-free reorganization that took place at the close of business on November 28, 2008. The reorganization resulted in the exchange of 145,233 Class A shares of the Domini Social Equity Fund for 145,233 shares of the Domini Social Equity Portfolio each valued at $954,140 (including $831,643 of unrealized depreciation for the Domini Social Equity Portfolio). Aggregate net assets of Class A shares of the Domini Social Equity Fund and the Domini Social Equity Portfolio were $0 and $954,140, respectively, immediately prior to the merger.
On September 3, 2008, the Board of Trustees of the Domini Social Equity Fund and the Domini Institutional Social Equity Fund approved an Agreement and Plan of Reorganization providing for the transfer of all assets and liabilities of the Domini Institutional Social Equity Fund in exchange for the issuance of the newly established Institutional class shares of the Domini Social Equity Fund in a tax-free reorganization that took place at the close of business on November 28, 2008. The reorganization resulted in the exchange of 6,906,162 institutional shares of the Domini Social Equity Fund for 6,906,162 shares of the Domini Institutional Social Equity Fund each valued at $83,742,159 (including $92,743,938 of unrealized depreciation and $25,863,688 of accumulated realized loss for the Domini Institutional Social Equity Fund). Aggregate net assets of institutional shares of the Domini Social Equity Fund and the Domini Institutional Social Equity Fund were $0 and $83,742,159, respectively, immediately prior to the merger.
(B) The Domini European Social Equity Portfolio, Class A Shares. On September 3, 2008, the Board of Trustees of the Domini European Social Equity Fund and the Domini European Social Equity Portfolio approved an Agreement and Plan of Reorganization providing for the transfer of all assets and liabilities of the Domini European Social Equity Portfolio in exchange for the issuance of the newly established Class A shares of the Domini European Social Equity Fund in a tax-free reorganization that
86
took place at the close of business on November 28, 2008. The reorganization resulted in the exchange of 313,818 Class A shares of the Domini European Social Equity Fund for 313,818 shares of the Domini European Social Equity Portfolio each valued at $1,893,850 (including $1,305,421 of unrealized depreciation and $1,058,049 of accumulated realized loss for the Domini European Social Equity Portfolio). Aggregate net assets of Class A shares of the Domini European Social Equity Fund and the Domini European Social Equity Portfolio were $0 and $1,893,850, respectively, immediately prior to the merger.
(C) The Domini PacAsia Social Equity Portfolio, Class A Shares. On September 3, 2008, the Board of Trustees of the Domini PacAsia Social Equity Fund and the Domini PacAsia Social Equity Portfolio approved an Agreement and Plan of Reorganization providing for the transfer of all assets and liabilities of the Domini PacAsia Social Equity Portfolio in exchange for the issuance of the newly established Class A shares of the Domini PacAsia Social Equity Fund in a tax-free reorganization that took place at the close of business on November 28, 2008. The reorganization resulted in the exchange of 105,252 Class A shares of the Domini PacAsia Social Equity Fund for 105,252 shares of the Domini PacAsia Social Equity Portfolio each valued at $564,388 (including $352,307 of unrealized depreciation and $205,865 of accumulated realized loss for the Domini PacAsia Social Equity Portfolio). Aggregate net assets of Class A shares of the Domini PacAsia Social Equity Fund and the Domini PacAsia Social Equity Portfolio were $0 and $564,388, respectively, immediately prior to the merger.
(D) The Domini European PacAsia Social Equity Portfolio, Class A Shares. On September 3, 2008, the Board of Trustees of the Domini European PacAsia Social Equity Fund and the Domini European PacAsia Social Equity Portfolio approved an Agreement and Plan of Reorganization providing for the transfer of all assets and liabilities of the Domini European PacAsia Social Equity Portfolio in exchange for the issuance of the newly established Class A shares of the Domini European PacAsia Social Equity Fund in a tax-free reorganization that took place at the close of business on November 28, 2008. The reorganization resulted in the exchange of 113,178 Class A shares of the Domini European PacAsia Social Equity Fund for 113,178 shares of the Domini European PacAsia Social Equity Portfolio each valued at $580,722 (including $426,952 of unrealized depreciation and $229,794 of accumulated realized loss for the Domini European PacAsia Social Equity Portfolio). Aggregate net assets of Class A shares of the Domini European PacAsia Social Equity Fund and the Domini European PacAsia Social Equity Portfolio were $0 and $580,722, respectively, immediately prior to the merger.
87
Effective November 28, 2008, the Board of Trustees approved the withdrawal of the Domini Social Equity Fund, Domini European Social Equity Fund, Domini PacAsia Social Equity Fund and Domini European PacAsia Social Equity Fund’s investment from its corresponding Trust and the direct investment in securities by each such Fund.
Each component on the Statement of Operations includes an amount that was allocated from the Trust to each Fund for the period August 1, 2008 through November 28, 2008. For the year ending July 31, 2009, the following amounts allocated from the Trust were included in the Statement of Operations:
| | | | | | | | | | | | | | | | |
| | | Domini Social
Equity Fund | | | Domini European
Social
Equity Fund | | | Domini PacAsia
Social
Equity Fund | | | Domini European
PacAsia
Social Equity Fund | |
Investment Income | | $ | 6,116,975 | | | $ | 564,939 | | | $ | 280,938 | | | $ | 172,717 | |
Expenses | | | 906,539 | | | | 127,871 | | | | 62,427 | | | | 44,982 | |
Net Realized Gain (Loss) | | | (73,710,306 | ) | | | (16,503,050 | ) | | | (3,945,998 | ) | | | (2,473,690 | ) |
8. PENDING FUND REORGANIZATION
The Domini European PacAsia Social Equity Fund, Domini European Social Equity Fund, and Domini PacAsia Social Equity Fund (collectively, the “Foreign Funds”) will be changing their investment strategies and names to Domini International Social Equity Fund I, Domini International Social Equity Fund II, and Domini International Social Equity Fund III, respectively, and reorganizing into one new international Domini fund which has the same investment objective, policies and restrictions, investment adviser, subadviser, net expenses, and distribution arrangements as each Foreign Fund at the time of the transaction. These changes were unanimously approved by the Board of Trustees of the Funds on July 24, 2009, and are scheduled to be effective after the close of business on November 27, 2009. Pursuant to the Agreement and Plan of Reorganization approved by the Board, the new international Domini fund will acquire all the assets and liabilities of each Foreign Fund in exchange for shares of the new fund (each a “Reorganization”). The Reorganization is expected to be a tax-free transaction for federal income tax purposes and will not trigger any redemption fees. The net operating expenses paid by shareholders of each Foreign Fund will not increase as a result of the Reorganization. Costs related to these changes will be paid by Domini Social Investments LLC. Following the Reorganization, the Foreign Funds will no longer be available for investment. The Domini European PacAsia Social Equity Fund (to be renamed the Domini International Social Equity Fund I) will be the accounting survivor of the Reorganization.
88
9. SUBSEQUENT EVENTS
The Funds have evaluated the need for disclosures and/or adjustments resulting from subsequent events through September 25, 2009, the date the financial statements were issued. This evaluation determined that there are no subsequent events that necessitated disclosures and/or adjustments.
89
Report of Independent Registered Public Accounting Firm
The Board of Trustees and Investors
Domini Social Investments:
We have audited the accompanying statements of assets and liabilities, including the portfolios of investments, of Domini Social Equity Fund, Domini European Social Equity Fund, Domini PacAsia Social Equity Fund, and Domini European PacAsia Social Equity Fund (collectively the “Funds”), each a fund within the series of Domini Social Investment Trust, as of July 31, 2009, and the related statements of operations for the year then ended, statements of changes in net assets for each of the years in the two-year period then ended, and financial highlights for each of the years or periods in the five-year period then ended. These financial statements and financial highlights are the responsibility of the Funds’ management. Our responsibility is to express an opinion on these financial statements and financial highlights based on our audits.
We conducted our audits in accordance with the standards of the Public Company Accounting Oversight Board (United States). Those standards require that we plan and perform the audit to obtain reasonable assurance about whether the financial statements and financial highlights are free of material misstatement. An audit includes examining, on a test basis, evidence supporting the amounts and disclosures in the financial statements. Our procedures included confirmation of securities owned as of July 31, 2009, by correspondence with the custodian. An audit also includes assessing the accounting principles used and significant estimates made by management, as well as evaluating the overall financial statement presentation. We believe that our audits provide a reasonable basis for our opinion.
In our opinion, the financial statements and financial highlights referred to above present fairly, in all material respects, the financial position of the aforementioned Funds as of July 31, 2009, the results of their operations for the year then ended, and the changes in their net assets for each of the years in the two-year period then ended, and financial highlights for each of the years or periods in the five-year period then ended, in conformity with U.S. generally accepted accounting principles.
Boston, Massachusetts
September 25, 2009

90
THIS PAGE INTENTIONALLY LEFT BLANK
DOMINI SOCIAL BOND FUND
STATEMENT OF ASSETS AND LIABILITIES
July 31, 2009
| | | | |
ASSETS: | | | | |
Investments at value (cost $83,162,177) | | $ | 86,932,348 | |
Cash | | | 5,462,577 | |
Interest receivable | | | 794,877 | |
Receivable for securities sold | | | 101,080 | |
Receivable for capital shares | | | 105,819 | |
| | | | |
Total assets | | | 93,396,701 | |
| | | | |
| |
LIABILITIES: | | | | |
Payable for securities purchased | | | 2,990,876 | |
Payable for capital shares | | | 177,608 | |
Management fee payable | | | 30,099 | |
Other accrued expenses | | | 41,400 | |
Dividend payable | | | 14,270 | |
| | | | |
Total liabilities | | | 3,254,253 | |
| | | | |
NET ASSETS | | $ | 90,142,448 | |
| | | | |
| |
NET ASSETS CONSIST OF: | | | | |
Paid-in capital | | | 86,719,952 | |
Undistributed net investment income | | | 1,310 | |
Accumulated net realized loss from investments | | | (348,985 | ) |
Net unrealized appreciation from investments | | | 3,770,171 | |
| | | | |
| | $ | 90,142,448 | |
| | | | |
| |
NET ASSET VALUE PER SHARE | | | | |
Net asset value and offering price per share* | | | | |
($90,142,448 ÷ 7,933,589 outstanding shares of beneficial interest) | | $ | 11.36 | |
| | | | |
| * | Redemption price is equal to net asset value less any applicable redemption fees retained by the Fund. |
SEE NOTES TO FINANCIAL STATEMENTS
92
DOMINI SOCIAL BOND FUND
STATEMENT OF OPERATIONS
For the Year Ended July 31, 2009
| | | | |
INCOME: | | | | |
Interest income | | $ | 3,522,534 | |
| |
EXPENSES: | | | | |
Management fee | | | 310,027 | |
Administrative fee | | | 193,767 | |
Distribution fees | | | 193,767 | |
Transfer agent fees | | | 195,921 | |
Accounting and custody fees | | | 71,625 | |
Registration | | | 30,471 | |
Professional fees | | | 27,937 | |
Shareholding servicing fees | | | 15,999 | |
Shareholder communications | | | 12,202 | |
Trustees fees | | | 8,403 | |
Miscellaneous | | | 2,661 | |
| | | | |
Total Expenses | | | 1,062,780 | |
Fees Paid Indirectly | | | (3,020 | ) |
Fees waived and expense reimbursed | | | (323,811 | ) |
| | | | |
Net Expenses | | | 735,949 | |
| | | | |
NET INVESTMENT INCOME | | | 2,786,585 | |
| | | | |
| |
NET REALIZED AND UNREALIZED GAIN/(LOSS): | | | | |
Net realized gain on investments | | | 56,335 | |
Net change in unrealized appreciation (depreciation) on investments | | | 3,888,946 | |
| | | | |
Net realized and unrealized gain (loss) from investments | | | 3,945,281 | |
| | | | |
| |
NET INCREASE IN NET ASSETS RESULTING FROM OPERATIONS | | $ | 6,731,866 | |
| | | | |
SEE NOTES TO FINANCIAL STATEMENTS
93
DOMINI SOCIAL BOND FUND
STATEMENTS OF CHANGES IN NET ASSETS
| | | | | | | | |
| | | Year Ended
July 31, 2009 | | | Year Ended
July 31, 2008 | |
INCREASE IN NET ASSETS: | | | | | | | | |
FROM OPERATIONS: | | | | | | | | |
Net investment income (loss) | | $ | 2,786,585 | | | $ | 2,853,203 | |
Net realized gain (loss) on investments | | | 56,335 | | | | 233,229 | |
Net change in unrealized appreciation (depreciation) on investments | | | 3,888,946 | | | | 847,803 | |
| | | | | | | | |
Net Increase (Decrease) in Net Assets Resulting from Operations | | | 6,731,866 | | | | 3,934,235 | |
| | | | | | | | |
| | |
DISTRIBUTIONS AND DIVIDENDS: | | | | | | | | |
Dividends to shareholders from net investment income | | | (2,786,585 | ) | | | (2,853,203 | ) |
Distributions to shareholders from net realized gain | | | — | | | | — | |
| | | | | | | | |
Net Decrease in Net Assets from Distributions and Dividends | | | (2,786,585 | ) | | | (2,853,203 | ) |
| | | | | | | | |
| | |
CAPITAL SHARE TRANSACTIONS: | | | | | | | | |
Proceeds from sale of shares | | | 27,101,913 | | | | 16,053,424 | |
Net asset value of shares issued in reinvestment of distributions and dividends | | | 2,395,592 | | | | 2,701,567 | |
Redemption fee | | | 4,768 | | | | 867 | |
Payment for shares redeemed | | | (15,854,826 | ) | | | (19,598,704 | ) |
| | | | | | | | |
Net Increase in Net Assets from Capital Share Transactions | | | 13,647,447 | | | | (842,846 | ) |
| | | | | | | | |
Total Increase (Decrease) in Net Assets | | | 17,592,728 | | | | 238,186 | |
| | | | | | | | |
| | |
NET ASSETS: | | | | | | | | |
Beginning of period | | | 72,549,720 | | | | 72,311,534 | |
| | | | | | | | |
End of period (including undistributed net investment income (loss) of $1,310 and $(13,711), respectively) | | $ | 90,142,448 | | | $ | 72,549,720 | |
| | | | | | | | |
| | |
CAPITAL SHARE TRANSACTIONS IN SHARES: | | | | | | | | |
Sold | | | 2,443,549 | | | | 1,476,449 | |
Issued in reinvestment of distributions and/or dividends | | | 217,642 | | | | 248,197 | |
Redeemed | | | (1,451,698 | ) | | | (1,804,156 | ) |
| | | | | | | | |
Net Increase (Decrease) | | | 1,209,493 | | | | (79,510 | ) |
| | | | | | | | |
SEE NOTES TO FINANCIAL STATEMENTS
94
DOMINI SOCIAL BOND FUND
FINANCIAL HIGHLIGHTS
| | | | | | | | | | | | | | | | | | | | |
| | | Year Ended July 31, | |
| | | 2009 | | | 2008 | | | 2007 | | | 2006 | | | 2005 | |
For a share outstanding for the period: | | | | | | | | | | | | | | | | | | | | |
Net asset value, beginning of period | | $ | 10.79 | | | $ | 10.63 | | | $ | 10.59 | | | $ | 10.88 | | | $ | 10.91 | |
| | | | | | | | | | | | | | | | | | | | |
| | | | | |
Income from investment operations: | | | | | | | | | | | | | | | | | | | | |
Net investment income (loss) | | | 0.40 | | | | 0.43 | | | | 0.43 | | | | 0.40 | | | | 0.38 | |
Net realized and unrealized gain (loss) on investments | | | 0.57 | | | | 0.16 | | | | 0.04 | | | | (0.29 | ) | | | (0.03 | ) |
| | | | | | | | | | | | | | | | | | | | |
Total income from investment operations | | | 0.97 | | | | 0.59 | | | | 0.47 | | | | 0.11 | | | | 0.35 | |
| | | | | | | | | | | | | | | | | | | | |
| | | | | |
Less dividends and distributions: | | | | | | | | | | | | | | | | | | | | |
Dividends to shareholders from net investment income | | | (0.40 | ) | | | (0.43 | ) | | | (0.43 | ) | | | (0.40 | ) | | | (0.38 | ) |
Distributions to shareholders from net realized gain | | | — | | | | — | | | | — | | | | — | | | | — | |
| | | | | | | | | | | | | | | | | | | | |
Total dividends and distributions | | | (0.40 | ) | | | (0.43 | ) | | | (0.43 | ) | | | (0.40 | ) | | | (0.38 | ) |
| | | | | | | | | | | | | | | | | | | | |
| | | | | |
Redemption fee proceeds | | | — | 1 | | | — | 1 | | | — | 1 | | | — | 1 | | | — | 1 |
| | | | | | | | | | | | | | | | | | | | |
| | | | | |
Net asset value, end of period | | $ | 11.36 | | | $ | 10.79 | | | $ | 10.63 | | | $ | 10.59 | | | $ | 10.88 | |
| | | | | | | | | | | | | | | | | | | | |
| | | | | |
Total return | | | 9.15 | % | | | 5.58 | % | | | 4.49 | % | | | 1.06 | % | | | 3.25 | % |
Portfolio turnover | | | 33 | % | | | 64 | % | | | 54 | % | | | 34 | % | | | 25 | % |
Ratios/supplemental data (annualized): | | | | | | | | | | | | | | | | | | | | |
Net assets, end of period (000s) | | $ | 90,142 | | | $ | 72,550 | | | $ | 72,312 | | | $ | 65,305 | | | $ | 64,009 | |
Ratio of expenses to average net assets | | | 0.95 | %2,3 | | | 0.95 | %2 | | | 0.95 | %2 | | | 0.95 | %2 | | | 0.95 | %2 |
Ratio of net investment income to average net assets | | | 3.60 | % | | | 3.96 | % | | | 4.03 | % | | | 3.76 | % | | | 3.48 | % |
| 1 | Amount represents less than $0.005 per share. |
| 2 | Reflects a waiver of fees by the Manager due to a contractual fee waiver. Had the Manager and the Distribution not waived their fees and reimbursed expenses, the ratio of expenses to average net assets would have been 1.37%, 1.43%, 1.48%, 1.32% and 1.47%, for the years ended July 31, 2009, 2008, 2007, 2006 and 2005, respectively. |
| 3 | Ratio of expenses to average net assets includes indirectly paid expenses. Excluding indirectly paid expenses the ratio of expenses to average net assets would have been 0.95%. |
SEE NOTES TO FINANCIAL STATEMENTS
95
DOMINI SOCIAL BOND FUND
NOTES TO FINANCIAL STATEMENTS
JULY 31, 2009
1. ORGANIZATION AND SIGNIFICANT ACCOUNTING POLICIES
Domini Social Bond Fund (the “Fund”) is a series of the Domini Social Investment Trust. The Trust is a Massachusetts business trust registered under the Investment Company Act of 1940 as an open-end management investment company. The Fund seeks to provide its shareholders with a high level of current income and total return by investing in bonds and other debt instruments that are consistent with the Fund’s social and environmental standards and the submanager’s security selection approach.
The preparation of financial statements in conformity with U.S. generally accepted accounting principles requires management to make estimates and assumptions that affect the reported amounts of assets and liabilities and disclosure of contingent liabilities at the date of the financial statements and the reported amounts of revenues and expenses during the reporting period. Actual results could differ from those estimates. The following is a summary of the Fund’s significant accounting policies.
(A) Valuation of Investments. Bonds and other fixed-income securities (other than obligations with maturities of 60 days or less) are valued on the basis of valuations furnished by an independent pricing service, use of which has been approved by the Board of Trustees of the Fund. In making such valuations, the pricing service utilizes both dealer-supplied valuations and electronic data processing techniques that take into account appropriate factors such as institutional-size trading in similar groups of securities, yield, quality, coupon rate, maturity, type of issue, trading characteristics, and other market data, without exclusive reliance upon quoted prices or exchange or over-the-counter prices, since such valuations are believed to reflect more accurately the fair value of such securities. Short-term obligations (maturing in 60 days or less) are valued at amortized cost, which constitutes fair value as determined by the Board of Trustees of the Fund.
Securities (other than short-term obligations with remaining maturities of 60 days or less) for which there are no such quotations or valuations are valued at fair value as determined in good faith by or at the direction of the Fund’s Board of Trustees.
The FASB issued Statement of Financial Accounting Standards No. 157 (“SFAS No. 157”), “Fair Value Measurements.” The new accounting statement defines fair value, establishes a framework for measuring fair value in generally accepted accounting principles (“GAAP”), and expands
96
disclosures about fair value measurements. SFAS No. 157 defines fair value as the price that would be received to sell an asset or paid to transfer a liability in an orderly transaction between market participants at the measurement date (an exit price). SFAS No. 157 also stipulates that, as a market-based measurement, fair value measurement should be determined based on the assumptions that market participants would use in pricing the asset or liability, and establishes a fair value hierarchy that distinguishes between (a) market participant assumptions developed based on market data obtained from sources independent of the reporting entity (observable inputs) and (b) the reporting entity’s own assumptions about market participant assumptions developed based on the best information available in the circumstances (unobservable inputs). These inputs are summarized into three broad levels:
Level 1 – quoted prices in active markets for identical securities
Level 2 – other significant observable inputs (including quoted prices for similar securities, interest rates, and evaluated quotation obtained from pricing services)
Level 3 – significant unobservable inputs (including the Fund’s own assumptions in determining the fair value of investments)
The inputs or methodology used for valuing securities are not an indication of the risk associated with investing in those securities.
The following is a summary of the inputs used by the Domini Social Bond Fund, as of July 31, 2009, in valuing the Fund’s assets carried at fair value:
| | | | | | | | | | | | |
| | | Level 1 -
Quoted Prices | | Level 2 -
Other Significant
Observable Inputs | | Level 3 -
Significant
Unobservable Inputs | | Total |
U.S. Government Agency Obligations | | $ | — | | $ | 26,831,681 | | $ | — | | $ | 26,831,681 |
U.S. Government Agency Mortgage Securities | | | — | | | 30,071,853 | | | 1,532,813 | | | 31,604,666 |
Corporate Obligations | | | — | | | 20,066,494 | | | — | | | 20,066,494 |
Corporate Mortgage Securities | | | — | | | 1,473,678 | | | — | | | 1,473,678 |
State & Municipal Obligations | | | — | | | 2,754,277 | | | — | | | 2,754,277 |
Certificates of Deposit | | | — | | | 3,850,000 | | | — | | | 3,850,000 |
Cash Equivalents | | | — | | | 351,552 | | | — | | | 351,552 |
| | | | | | | | | | | | |
Total | | $ | — | | $ | 85,399,535 | | $ | 1,532,813 | | $ | 86,932,348 |
| | | | | | | | | | | | |
97
Following is a reconciliation of Level 3 assets for which significant unobservable inputs were used to determine fair value:
| | | |
Investments in Securities | | | — |
Balance as of July 31, 2008 | | $ | — |
Realized gain (loss) | | | — |
Change in unrealized appreciation (depreciation) | | | 4,688 |
Net purchases (sales) | | | 1,528,125 |
Transfers in and/or out of Level Three | | | — |
| | | |
Balance as of July 31, 2009 | | $ | 1,532,813 |
| | | |
The change in unrealized appreciation (depreciation) included in earnings relating to securities still held at July 31, 2009 was $4,688 for the Domini Social Bond.
(B) Repurchase Agreements. The Fund may enter into repurchase agreements with selected banks or broker-dealers. Each repurchase agreement is recorded at cost, which approximates fair value. The Fund requires that collateral, represented by securities (primarily U.S. government agency securities) in a repurchase transaction, be maintained in a segregated account with a custodian bank in a manner sufficient to enable the Fund to obtain those securities in the event of a default of the counterparty. In the event of default or bankruptcy by another party to the repurchase agreement, retention of the collateral may be subject to legal proceedings.
(C) Investment Transactions, Investment Income, and Dividends to Shareholders. Investment transactions are recorded on trade date. Dividends to shareholders are usually declared daily and paid monthly from net investment income. Distributions to shareholders of realized capital gains, if any, are made annually. Distributions are determined in conformity with income tax regulations, which may differ from generally accepted accounting principles. Reclassifications have been made to the Fund’s components of net assets to reflect income and gains available for distribution (or available capital loss carryovers, as applicable) under income tax regulations.
(D) Federal Taxes. The Fund’s policy is to comply with the provisions of the Internal Revenue Code applicable to regulated investment companies and to distribute substantially all of its taxable income, including net realized gains, if any, within the prescribed time periods. Accordingly, no provision for federal income or excise tax is deemed necessary.
(E) Redemption Fees. Redemptions and exchanges of Fund shares held less than 30 days may be subject to the Fund’s redemption fee, which is 2% of the amount redeemed. Such fees are retained by the Fund and are recorded as an adjustment to paid-in capital.
98
(F) Indemnification. The Fund’s organizational documents provide current and former trustees and officers with a limited indemnification against liabilities arising in connection with the performance of their duties to the Fund. In the normal course of business, the Fund may also enter into contracts that provide general indemnifications. The Fund’s maximum exposure under these arrangements is unknown as this would be dependent on future claims that may be made against the Fund. The risk of material loss from such claims is considered remote.
2. TRANSACTIONS WITH AFFILIATES
(A) Manager/Administrator. The Fund has retained Domini Social Investments LLC (Domini) to serve as investment manager and administrator. The services provided by Domini consist of investment supervisory services, overall operational support, and administrative services, including the provision of general office facilities and supervising the overall administration of the Fund. For its services under the Management Agreement, Domini receives from the Fund a fee accrued daily and paid monthly at an annual rate equal to 0.40% of the Fund’s average daily net assets. For its services under the Administration Agreement, Domini receives from the Fund a fee accrued daily and paid monthly at an annual rate equal to 0.25% of the Fund’s average daily net assets. For the period from November 30, 2008, until November 30, 2009, Domini is waiving its fee and reimbursing expenses to the extent necessary to keep the aggregate annual operating expenses of the Fund (excluding brokerage fees and commissions, interest, taxes, and other extraordinary expenses), net of waivers and reimbursements, at no greater than 0.95% of the Fund’s average daily net assets. A similar fee waiver arrangement was in effect in prior periods. For the year ended July 31, 2009, Domini reimbursed expenses totaling $114,045.
(B) Submanager. Seix Investment Advisors LLC (“Seix”), a wholly owned subsidiary of RidgeWorth Capital Management, Inc. (“RidgeWorth”) (formerly known as Trusco Capital Management, Inc.) provides investment submanagement services to the Fund on a day-to-day basis pursuant to a Submanagement Agreement with Domini. Prior to April 25, 2008, the submanager’s predecessor, Seix Investment Advisors, Inc., the former fixed-income division of RidgeWorth, provided investment submanagement services to the Fund. RidgeWorth is a wholly owned subsidiary of SunTrust Banks, Inc. Seix Advisors was spun off into Seix in connection with a corporate reorganization of RidgeWorth.
(C) Distributor. The Board of Trustees of the Fund has adopted a Distribution Plan in accordance with Rule 12b-1 under the Act. DSIL Investment Services LLC, a wholly owned subsidiary of Domini (DSILD), acts as agent of the Fund in connection with the offering of shares of the Fund pursuant to a Distribution Agreement. Under the Distribution Plan, the Fund pays expenses incurred in connection with the sale of Fund shares and pays DSILD a
99
distribution fee at an aggregate annual rate not to exceed 0.25% of the Fund’s average daily net assets. For the year ended July 31, 2009, fees waived totaled $193,767.
(D) Shareholder Service Agent. The Trust has retained Domini to provide certain shareholder services to the Fund and its shareholders, which services were previously provided by PNC Global Investment Servicing (“PNC”) or another fulfillment and mail service provider and are supplemental to services currently provided by PNC, pursuant to a transfer agency agreement between each Fund and PNC. For these services, Domini receives a fee from the Fund paid monthly at an annual rate of $4.00 per active account. For the year ended July 31, 2009, Domini waived fees of $15,999.
3. INVESTMENT TRANSACTIONS
For the year ended July 31, 2009, cost of purchase and proceeds from sales of investments other than short-term obligations were as follows:
| | | | | | |
| | | Purchases | | Sales |
Government Securities | | $ | 33,701,282 | | $ | 15,350,272 |
Corporate Obligations | | | 6,977,548 | | | 8,733,160 |
State & Municipal Obligations | | | — | | | — |
Per the Funds’ arrangement with State Street Bank & Trust (“State Street”), credits realized as a result of uninvested cash balances are used to reduce a portion of the Funds’ expenses. For the year ended July 31, 2009, custody fees of the Funds, under this arrangement, were reduced by $3,020.
4. FEDERAL TAX STATUS
The tax basis of the components of net assets at July 31, 2009, is as follows:
| | | | |
Undistributed ordinary income | | $ | 15,580 | |
Capital losses, other losses and other temporary differences | | | (350,924 | ) |
Unrealized appreciation/(depreciation) | | | 3,757,840 | |
| | | | |
Distributable net earnings/(deficit) | | $ | 3,422,496 | |
| | | | |
The difference between components of Distributable Earnings on a tax basis and the amounts reflected in the statement of assets and liabilities is primarily due to dividends payable, wash sales and post-October losses.
For the year ended July 31, 2009, the Fund reclassified $15,021 from accumulated net realized gains to undistributed net investment income to align financial reporting and tax reporting.
During the period from November 1, 2008 through July 31, 2009, the Fund had net realized capital losses of $14,511, which will be deferred and will be recognized on August 1, 2009, for tax purposes.
The Fund has accumulated capital loss carryforwards of $322,143, of
100
which $15,015 will expire in the year 2014, $210,355 will expire in the year 2015, and $96,773 will expire in the year 2017. To the extent that the Fund realizes future net capital gains, those gains will be offset by any unused capital loss carryforwards.
For federal income tax purposes, dividends paid were characterized as follows:
| | | | | | |
| | | YEAR ENDING JULY 31, |
| | | 2009 | | 2008 |
Ordinary income | | $ | 2,786,585 | | $ | 2,853,203 |
Long-term capital gain | | | — | | | — |
| | | | | | |
Total | | $ | 2,786,585 | | $ | 2,853,203 |
| | | | | | |
As of July 31, 2009, tax years 2006 through 2009 remain subject to examination by the Fund’s major tax jurisdictions, which include the United States of America, the Commonwealth of Massachusetts, and New York State.
5. OTHER ACCOUNTING PRONOUNCEMENTS
In March 2008, the Financial Accounting Standards Board (“FASB”) issued State of Financial Accounting Standards (“SFAS”) No. 161, “Disclosures about Derivative Instruments and Hedging Activities.” This standard requires enhanced disclosures about derivative and hedging activities, including qualitative disclosures about how and why the Fund uses derivative instruments, how these activities are accounted for, and their effect on the Fund’s financial position, financial performance, and cash flows. SFAS No. 161 is effective for financial statements issued for fiscal years beginning after November 15, 2008, and interim periods within those fiscal years. At this time, management is evaluating the implications of SFAS No. 161 and its impact on the Fund’s financial statements and related disclosures.
6. SUBSEQUENT EVENTS
The Fund has evaluated the need for disclosures and/or adjustments resulting from subsequent events through September 25, 2009, the date the financial statements were issued. This evaluation determined that there are no subsequent events that necessitated disclosures and/or adjustments.
101
Report of Independent Registered Public Accounting Firm
The Board of Trustees and Investors
Domini Social Investment Trust:
We have audited the accompanying statements of assets and liabilities, including the portfolio of investments, of Domini Social Bond Fund, a Fund in the series of Domini Social Investment Trust, as of July 31, 2009, and the related statements of operations for the year then ended, statements of changes in net assets for the two-year period then ended, and financial highlights for each of the years in the five-year period then ended. These financial statements and financial highlights are the responsibility of the Fund’s management. Our responsibility is to express an opinion on these financial statements and financial highlights based on our audits.
We conducted our audits in accordance with the standards of the Public Company Accounting Oversight Board (United States). Those standards require that we plan and perform the audit to obtain reasonable assurance about whether the financial statements and financial highlights are free of material misstatement. An audit includes examining, on a test basis, evidence supporting the amounts and disclosures in the financial statements. Our procedures included confirmation of securities owned as of July 31, 2009, by correspondence with the custodian. An audit also includes assessing the accounting principles used and significant estimates made by management, as well as evaluating the overall financial statement presentation. We believe that our audits provide a reasonable basis for our opinion.
In our opinion, the financial statements and financial highlights referred to above present fairly, in all material respects, the financial position of the aforementioned Fund as of July 31, 2009, the results of their operations for the year then ended, and the changes in their net assets for each of the years in the two-year period then ended, and financial highlights for each of the years in the five-year period then ended, in conformity with U.S. generally accepted accounting principles.
Boston, Massachusetts
September 25, 2009
102
THE DOMINI FUNDS
TAX INFORMATION (UNAUDITED)
FOR THE YEAR ENDED JULY 31, 2009
The amount of long-term capital gains paid for the year ended July 31, 2009 was as follows:
| | | |
Domini Social Equity Fund | | $ | — |
Domini European Social Equity Fund | | | — |
Domini PacAsia Social Equity Fund | | | — |
Domini European PacAsia Social Equity Fund | | | — |
Domini Social Bond Fund | | | — |
For dividends paid from net investment income during the year ended July 31, 2009, the Funds designated the following as Qualified Dividend Income:
| | | |
Domini Social Equity Fund | | $ | 11,809,454 |
Domini European Social Equity Fund | | | 1,195,664 |
Domini PacAsia Social Equity Fund | | | 269,879 |
Domini European PacAsia Social Equity Fund | | | 402,548 |
Domini Social Bond Fund | | | — |
Of the ordinary distributions made by the Domini Social Bond Fund during the fiscal year ended July 31, 2009, 68% has been derived from investments in US Government and Agency Obligations. All or a portion of the distributions from this income may be exempt from taxation at the state level. Consult your tax advisor for state specific information.
For corporate shareholders, 100% of dividends paid from net investment income for the Domini Social Equity Fund and 0.32% for the Domini European Equity Fund were eligible for the corporate dividends received deduction.
| | | | | | | | | | | | |
| | | Foreign Tax Paid | | Foreign Source Income |
| | | TOTAL | | PER SHARE | | TOTAL | | PER SHARE |
Domini European Social Equity Fund | | $ | 199,310 | | $ | 0.02 | | $ | 2,160,561 | | $ | 0.30 |
Domini PacAsia Social Equity Fund | | | 42,256 | | | 0.01 | | | 629,183 | | | 0.21 |
Domini European PacAsia Social Equity Fund | | | 14,260 | | | 0.003 | | | 815,810 | | | 0.18 |
The foreign taxes paid or withheld per share represent taxes incurred by the Funds on interest and dividends received by the Fund from foreign sources. Foreign taxes paid or withheld should be included in taxable income with an offsetting deduction from gross income or as a credit for taxes paid to foreign governments. Consult your tax advisor regarding the appropriate treatment of foreign taxes paid.
103
BOARD OF TRUSTEES’ APPROVAL OF MANAGEMENT AND SUBMANAGEMENT AGREEMENTS
Domini manages the assets of the Domini Social Equity Fund (the “Equity Fund”), Domini European Social Equity Fund (the “European Fund”), Domini European PacAsia Social Equity Fund (the “European PacAsia Fund”), Domini PacAsia Social Equity Fund (the “PacAsia Fund”), and the Domini Social Bond Fund (the “Bond Fund”) (each a “Fund,” and collectively the “Funds”). Wellington Management Company LLP (“Wellington Management”) is the submanager of the Equity Fund, European Fund, European PacAsia Fund, and PacAsia Fund. Seix Investment Advisors, LLC (“Seix”) is the submanager of the Bond Fund. Set forth below is a discussion of the Board of Trustees’ considerations and determinations with respect to the management and submanagement agreements for the Funds during the most recent fiscal half-year period ended July 31, 2009.
***
At a meeting held on April 24, 2009, the Trustees approved the continuance of the management and submanagement agreements for the Equity Fund, European Fund, PacAsia Fund, European PacAsia Fund, and the Bond Fund. In connection with that meeting, the Trustees reviewed extensive information provided by Domini, Wellington Management, and Seix regarding, among other things: the nature and quality of services provided; legal, regulatory, and compliance matters; the fees to be paid to Domini; the fees to be paid by Domini to Wellington Management and Seix; comparable fees paid by other funds; and certain other information.
In reaching their determination to approve the above-referenced agreements, the Trustees considered a variety of factors they believed relevant and balanced a number of considerations. The Trustees did not identify any particular information or factor that was all-important or controlling. The primary factors considered and the conclusions reached are described below.
EQUITY FUND
APPROVAL OF MANAGEMENT AND SUBMANAGEMENT AGREEMENTS
Nature, Quality, and Extent of Services Provided. The Trustees noted that pursuant to the Equity Fund’s management agreement, Domini, subject to the direction of the Board, is responsible for providing advice and guidance with respect to the Equity Fund and for managing the investment of the assets of the Equity Fund, which it does by engaging and overseeing the activities of Wellington Management. They considered that under the management agreement, Domini is responsible for applying social and environmental standards to a universe of securities. In addition, they noted that Domini manages the Equity Fund’s business and affairs, including
104
coordination of the activities of service providers, pursuant to a sponsorship agreement. The Trustees considered the scope and quality of the services provided by Wellington Management, such as the provision of the day-today portfolio management of the Equity Fund, including making purchases and sales of socially screened portfolio securities consistent with the Equity Fund’s investment objective and policies.
The Trustees considered the professional experience, tenure, and qualifications of the portfolio management team and the other senior personnel at Domini and Wellington Management. They also considered Domini’s capabilities and experience in the development and application of social and environmental standards and its reputation, leadership in the socially responsible investment community, and quality of management and administrative services provided to the Fund. In addition, they considered the compliance policies, procedures, and record of Domini and Wellington Management. The Trustees concluded that Domini and Wellington Management had the necessary capabilities, resources, and personnel to continue providing services under the management and submanagement agreements.
Investment Results. The Trustees reviewed information provided to them by Domini regarding the investment returns of the Equity Fund for each full calendar year since inception as of December 31, 2008, and for the year-to-date, 6-month, and 1-, 3-, 5-, and 10-year periods ended February 28, 2009, and December 31, 2008, as well as cumulative performance from inception through February 28, 2009, and December 31, 2008. They considered the performance of the S&P 500 Index, the benchmark for the Equity Fund for the same period, as well as the performance of the peer group. The Trustees noted that the Equity Fund had underperformed the S&P 500 for the relevant periods. The Trustees noted that the Equity Fund had transitioned from an index to an active strategy on November 30, 2006, and that the Fund had experienced returns closer to the median of its peer group since the change to an active strategy. The Trustees considered the information provided regarding Wellington Management’s quantitative model, recent changes to Wellington Management’s quantitative management team, the relatively short tenure of Wellington Management as the Fund’s submanager, the legacy performance of the Fund, and the unfavorable recent market conditions. The Trustees concluded that they would continue to monitor closely the performance of the Equity Fund.
Fees and Other Expenses. The Trustees considered the management and submanagement fees paid to Domini and Wellington Management with respect to the Equity Fund, and each entity’s fee waiver arrangements. The Trustees also considered the sponsorship fee rate paid by the Equity Fund to Domini under the sponsorship agreement. The Trustees considered the fees that each of Domini and Wellington Management charges its other
105
clients with similar investment objectives and strategies. The Trustees considered that Domini (and not the Equity Fund) pays Wellington Management from its advisory fee. The Trustees considered the level of the Equity Fund’s aggregate management and sponsorship fees versus the median management and administrative fees for a relevant peer group, taking into account the agreed-upon waiver of management fees and submanagement fees under both current and proposed arrangements, and noted that such fees were slightly less than the median management and administrative fees of the peer group. The Trustees considered that the submanagement fees Wellington Management receives with respect to the Equity Fund were within the general range of the fees Wellington Management receives with respect to the management of the assets of its other clients. The Trustees reviewed the total expense ratio of the Equity Fund versus the median total expense ratio for a relevant peer group, taking into account the agreed-upon waiver of management fees and submanagement fees under both current and proposed arrangements, and noted that each of the current and proposed net total expense ratios of the Equity Fund were slightly higher than the median total expense ratio of the peer group. In light of the foregoing, and taking into account such other matters as the Trustees considered relevant in the exercise of their reasonable judgment, the Trustees concluded that the management and submanagement fees payable with respect to the Equity Fund were reasonable and supported continuance of the management and submanagement agreements.
Costs of Services Provided and Profitability. The Trustees reviewed information provided to them by Domini concerning the costs borne by and profitability of Domini with respect to the advisory and sponsorship services provided, along with a description of the methodology used by Domini in preparing the profitability information. The Trustees also reviewed the financial results realized by Domini as of December 31, 2008. The Trustees concluded that they were satisfied that Domini’s level of profitability with respect to the Equity Fund was reasonable in view of the nature, quality, and extent of services provided.
The Trustees also reviewed Wellington Management’s consolidated balance sheet at December 31, 2007, and its pro-forma income statement for the year ended December 31, 2007, which reflected partnership income as if the firm was in corporate form. The pro-forma statement identified the revenues generated by the Equity Fund as a separate item and reflected assumptions and estimates regarding operating expenses. Based on the information provided, the Trustees concluded that they were satisfied that Wellington Management’s level of profitability with respect to the Equity Fund was not excessive in view of the nature, quality, and extent of services provided to the Equity Fund.
106
Economies of Scale. The Trustees also considered whether economies of scale would be realized by Domini and Wellington Management as assets grew and the extent to which economies of scale were reflected in the fees charged under the management and submanagement agreements. The Trustees noted that there were breakpoints in the fees charged under the management and submanagement agreements, and also considered the fee waivers proposed by Domini. They concluded that breakpoints were an effective way to share economies of scale with shareholders and that this was a positive factor in support of approval of the continuance of the management and submanagement agreements.
Other Benefits. The Trustees considered the other benefits that Domini, Wellington Management, and their respective affiliates receive from their relationship with the Equity Fund. The Trustees reviewed the character and amount of payments received by Domini and its affiliates in connection with the Equity Fund, including sponsorship fees. The Trustees considered that Domini’s profitability would be lower if the benefits related to distribution fees, sales charges, and submanagement fee waivers were not received. The Trustees considered the brokerage practices of Domini and Wellington Management, including their use of soft dollar arrangements. The Trustees also considered the intangible benefits that would continue to accrue to Domini, Wellington Management, and each of their respective affiliates by virtue of their relationship with the Equity Fund and the other Domini funds. The Trustees concluded that the benefits received by Domini, Wellington Management, and their respective affiliates were reasonable and supported the approval of the continuance of the management and submanagement agreements.
DOMINI EUROPEAN SOCIAL EQUITY FUND
DOMINI EUROPEAN PACASIA SOCIAL EQUITY FUND
DOMINI PACASIA SOCIAL EQUITY FUND
Nature, Quality, and Extent of Services Provided. The Trustees noted that pursuant to the Fund’s management agreement, Domini, subject to the direction of the Board, is responsible for providing advice and guidance with respect to each Fund and for managing the investment of the assets of the Funds, which it does by engaging and overseeing the activities of Wellington Management. They considered that under the management agreement, Domini is responsible for applying social and environmental standards to a universe of securities. The Trustees considered the scope and quality of the services provided by Wellington Management pursuant to the submanagement agreement, such as the provision of the day-to-day portfolio management of each Fund, including making purchases and sales of socially screened portfolio securities consistent with each Fund’s investment objective and policies.
107
The Trustees considered the professional experience, tenure, and qualifications of each of the portfolio management teams and the other senior personnel at Domini and Wellington Management. They also considered Domini’s capabilities and experience in the development and application of social and environmental standards and its reputation and leadership in the socially responsible investment community, and quality of management and administrative services provided to the Fund. In addition, they considered the compliance policies, procedures, and record of Domini and Wellington Management. The Trustees concluded that Domini and Wellington Management had the necessary capabilities, resources, and personnel to continue providing services under the management and submanagement agreements.
Investment Results.
European Fund
The Trustees reviewed the investment performance of the European Fund for each full calendar year since inception (October 31, 2005) as of December 31, 2008, and for the year-to-date, 6-month, 1-year, 3-year, and since-inception periods ended February 28, 2009, as well as the European Fund’s cumulative performance from inception through December 31, 2008, and through February 28, 2009. They compared those returns to the returns of the European Fund’s benchmark, the MSCI Europe Index, for the same periods, and the performance of the relevant peer group of funds as classified by Strategic Insight. The Trustees noted that the European Fund had underperformed its benchmark for those periods and since inception. The Trustees also considered the responses Domini provided regarding the quantitative model used by the submanager in the management of the European Fund and the unfavorable recent market conditions. The Trustees concluded that they would continue to monitor closely the performance of the European Fund.
PacAsia Fund and European PacAsia Fund
The Trustees reviewed the investment performance of the PacAsia Fund and European PacAsia Fund for each full calendar year since inception (December 31, 2006) as of December 31, 2008, and for the year-to-date, 6-month, 1-year, and since-inception periods ended February 28, 2009, as well as each Fund’s cumulative performance from inception through December 31, 2008, and through February 28, 2009. They compared those returns to the returns of the applicable benchmark for the PacAsia Fund (MSCI AC Asia Pacific Index) and the European PacAsia Fund (MSCI EAFE Index), for the same periods, and the performance of the relevant peer group of funds as classified by Strategic Insight. The Trustees noted that each Fund had underperformed its benchmark for those periods and since inception. The Trustees also considered the responses Domini provided regarding the quantitative model used by the submanager in the
108
management of the PacAsia Fund and European PacAsia Fund and the unfavorable recent market conditions. The Trustees concluded that they would continue to monitor closely the performance of each Fund.
Fees and Other Expenses. The Trustees considered the management and submanagement fees paid to Domini and Wellington Management with respect to each Fund, and each entity’s fee waiver arrangements. The Trustees considered the fees that each of Domini and Wellington Management charges its other clients with similar investment objectives. The Trustees considered that Domini (and not the Funds) pays Wellington Management from its advisory fee. The Trustees considered the level of each Fund’s management fees versus the median management and administrative fees for a relevant peer group, taking into account the agreed-upon waiver of management and submanagement fees, and noted that such fees were lower than the median management and administrative fees of the peer group. The Trustees considered that the submanagement fees Wellington Management receives with respect to each Fund are within the general range of the fees Wellington Management receives with respect to the management of the assets of its other clients with similar investment objectives and strategies. The Trustees reviewed the total expense ratio of each of the Funds versus the median total expense ratio for a relevant peer group, taking into account the agreed-upon waiver of management and submanagement fees, and noted that the total expense ratio of each Fund, after giving effect to contractual expense waivers, was lower than the median total expense ratio of the peer group. In light of the foregoing, and taking into account such other matters as the Trustees considered relevant in the exercise of their reasonable judgment, the Trustees concluded that the management and submanagement fees payable with respect to each Fund were reasonable and supported continuance of the management and submanagement agreements.
Costs of Services Provided and Profitability. The Trustees reviewed information provided to them by Domini concerning the costs borne by and profitability of Domini with respect to the advisory services provided, along with a description of the methodology used by Domini in preparing the profitability information. The Trustees also reviewed the financial results realized by Domini as of December 31, 2008. The Trustees concluded that they were satisfied that Domini’s level of profitability with respect to the Funds was reasonable in view of the nature, quality, and extent of services provided.
The Trustees also reviewed Wellington Management’s consolidated balance sheet at December 31, 2007, and its pro-forma income statement for the year ended December 31, 2007, which reflected partnership income as if the firm was in corporate form. The pro-forma statement identified the revenues generated by each Fund as a separate item and reflected assumptions and estimates regarding operating expenses. Based on the information
109
provided, the Trustees concluded that they were satisfied that Wellington Management’s level of profitability with respect to the Funds was not excessive in view of the nature, quality, and extent of services provided to each Fund.
Economies of Scale. The Trustees also considered whether economies of scale would be realized by Domini and Wellington Management as assets grew and the extent to which economies of scale were reflected in the fees charged under the management and submanagement agreements. The Trustees noted that there were breakpoints in the fees charged under the management and submanagement agreements, and also considered the fee waivers proposed by Domini. They concluded that breakpoints were an effective way to share economies of scale with shareholders and that this was a positive factor in support of approval of the continuance of the management and submanagement agreements.
Other Benefits. The Trustees considered the other benefits that Domini, Wellington Management, and their respective affiliates receive from their relationship with the Funds. The Trustees reviewed the character and amount of payments received by Domini and its affiliates in connection with each Fund. The Trustees considered that Domini’s profitability would be lower if the benefits related to distribution fees, sales charges, and submanagement fee waivers were not received. The Trustees considered the brokerage practices of Domini and Wellington Management, including their use of soft dollar arrangements. The Trustees also considered the intangible benefits that would continue to accrue to Domini, Wellington Management, and each of their respective affiliates by virtue of their relationship with each Fund and the other Domini funds. The Trustees concluded that the benefits received by Domini, Wellington Management, and their respective affiliates were reasonable and supported the approval of the continuance of the management and submanagement agreements.
DOMINI SOCIAL BOND FUND
Nature, Quality, and Extent of Services Provided. The Trustees noted that pursuant to the management agreement for the Bond Fund, Domini, subject to the direction of the Board, is responsible for providing advice and guidance and for managing the investment of the assets of the Bond Fund, which it does by engaging and overseeing the activities of Seix. They considered that under the management agreement, Domini is responsible for applying social and environmental screens to a universe of securities. They also noted that Domini is responsible for administrative services to the Fund pursuant to an administration agreement. The Trustees considered the scope and quality of the services provided by Seix pursuant to the sub-management agreement, as amended, such as the provision of the day-to-day
110
portfolio management of the Bond Fund, including making purchases and sales of socially screened portfolio securities consistent with the Bond Fund’s investment objective and policies.
The Trustees considered the professional experience, tenure, and qualifications of the portfolio management team and the other senior personnel at Domini and Seix. They also considered Domini’s capabilities and experience in the development and application of social and environmental standards and its reputation and leadership in the socially responsible investment community. The Trustees considered the information they had received from Domini concerning Domini’s social research team and the fact that Domini was responsible for the Bond Fund’s community development investments. They considered the quality of the management and administrative services Domini provided to the Bond Fund. In addition, they considered the compliance policies, procedures, and record of Domini and Seix. The Trustees concluded that they were satisfied with the nature, quality, and extent of services provided by Domini and Seix to the Bond Fund under the management and submanagement agreements.
Investment Results. The Trustees reviewed information provided to them by Domini regarding the investment returns of the Bond Fund for each full calendar year since inception as of December 31, 2008, and for the year-to-date, 6-month, 1-, 3-, and 5-year periods ended February 28, 2009. They considered the performance of the Bond Fund’s benchmark, the Barclays Capital Intermediate Aggregate Index, and other relevant benchmarks for the same period and the performance of the Bond Fund’s peer group. The Trustees noted that the Bond Fund had outperformed or performed comparably with its benchmark for each period except the 5-year and since-inception periods, but that the Fund’s performance relative to the benchmark had improved since Seix was engaged as the Fund’s submanager four years ago. The Trustees also considered the Fund’s relatively strong performance compared to the performance of its relevant peer group for the 1-, 3-, and 5-year periods ended February 28, 2009. In light of the foregoing, the Trustees concluded that the performance of the Bond Fund was sufficient to warrant continuance of the management and submanagement agreements.
Fees and Other Expenses. The Trustees considered the management and submanagement fees paid to Domini and Seix with respect to the Bond Fund. The Trustees also considered the administrative fees paid by the Bond Fund to Domini. The Trustees considered the fees that Seix charges its other clients with similar investment objectives. The Trustees considered that Domini (and not the Bond Fund) pays Seix from its advisory fee. The Trustees considered the level of the Bond Fund’s management and administrative fees versus the median management and administrative fees for a relevant peer group and compared the Bond Fund’s total expense ratio
111
to the median total expense ratios of those peers, taking into account the agreed-upon waiver of fees, and noted that such fees were about the same as the median management and administrative fees of a relevant peer group. The Trustees considered that the submanagement fees Seix receives with respect to the Bond Fund are consistent with the fees Seix charges with respect to its other clients with similar investment objectives and strategies. The Trustees reviewed the total expense ratio of the Bond Fund versus the median total expense ratio for a relevant peer group, taking into account the agreed-upon waiver of management fees, and noted that the total expense ratio of the Bond Fund, after giving effect to contractual expense waivers, was slightly higher than the median total expense ratio of the relevant peer group. In light of the foregoing, and taking into account and the relatively small size of the Bond Fund and such other matters as the Trustees considered relevant in the exercise of their reasonable judgment, the Trustees concluded that the management and submanagement fees payable with respect to the Bond Fund are reasonable and supported continuance of the management and submanagement agreements.
Costs of Services Provided and Profitability. The Trustees reviewed information provided to them by Domini concerning the costs borne by and profitability of Domini with respect to the advisory and administrative services provided to the Bond Fund in 2008, along with a description of the methodology used by Domini in preparing the profitability information. The Trustees also reviewed the financial results realized by Domini as of December 31, 2008. The Trustees concluded that they were satisfied that Domini’s level of profitability with respect to the Bond Fund was reasonable in view of the nature, quality, and extent of services provided.
The Trustees also reviewed the most recent annual report for SunTrust Banks, Inc. (the parent company of Seix). The Trustees considered Seix’s profit margin with respect to the Bond Fund in comparison to the industry data provided by Domini. Based on the information provided, the Trustees concluded that they were satisfied that Seix’s level of profitability with respect to the Bond Fund was not excessive in view of the nature, quality, and extent of services provided.
Economies of Scale. The Trustees also considered whether economies of scale would be realized by Domini and Seix as assets grew and the extent to which economies of scale were reflected in the fees charged under the management and submanagement agreements. The Trustees noted that there were breakpoints in the fees charged under each agreement, and also considered the fee waivers proposed by Domini. They concluded that breakpoints were an effective way to share economies of scale with shareholders and that this was a positive factor in support of approval of the continuance of the management and submanagement agreements.
112
Other Benefits. The Trustees considered the other benefits that Domini, Seix, and their respective affiliates receive from their relationship with the Bond Fund, noting that Seix and its affiliates provide no other services to the Domini funds. The Trustees reviewed the character and amount of payments received by Domini and its affiliates in connection with the Bond Fund and the other Domini funds. The Trustees considered that Domini’s profitability would be lower if the benefits related to distribution fees and administrative services were not received. The Trustees considered the brokerage practices of Domini and Seix, and noted that neither Domini nor Seix received the benefit of “soft dollar” commissions in connection with the Bond Fund. The Trustees also considered the intangible benefits that would continue to accrue to Domini, Seix, and each of their respective affiliates by virtue of their relationship with the Bond Fund and the other Domini funds. The Trustees concluded that the benefits received by Domini, Seix, and their respective affiliates were reasonable and supported the approval of the continuance of the management and submanagement agreements.
113
TRUSTEES AND OFFICERS
The following table presents information about each Trustee and each Officer of the Domini Social Investment Trust (the “Trust”) as of July 31, 2009. Asterisks indicate that those Trustees and Officers are “interested persons” (as defined in the Investment Company Act of 1940) of the Trust. Each Trustee and each Officer of the Trust noted as an interested person is interested by virtue of his or her position with Domini Social Investments LLC as described below. Unless otherwise indicated below, the address of each Trustee and each Officer is 536 Broadway, 7th Floor, New York, NY 10012 (new address effective November 30, 2009: 532 Broadway, 9th Floor, New York, NY 10012). Neither the Funds nor the Trust holds annual shareholder meetings for the purpose of electing Trustees, and Trustees are not elected for fixed terms. This means that each Trustee will be elected to hold office until his or her successor is elected or until he or she retires, resigns, dies, or is removed from office. No Trustee or Officer is a director of a public company or a registered investment company other than, with respect to the Trustees, the Domini Funds.
INTERESTED TRUSTEE AND OFFICER
| | | | |
Name, Age, Position(s) Held, and Length of Time Served | | Principal Occupation(s) During Past 5 Years and Other Directorships Held | | Number of Funds
and Portfolios in the
Domini Family of
Funds Overseen by
Trustee |
Amy L. Domini* (59) Chair, Trustee, and President of the Trust since 1990 | | CEO (since 2002), President (2002-2005), and Manager (since 1997), Domini Social Investments LLC; Manager, DSIL Investment Services LLC (since 1998); Manager, Domini Holdings LLC (holding company) (since 2002); Director, Tom’s of Maine, Inc. (natural care products) (2004); Board Member, Progressive Government Institute (nonprofit education on executive branch of the federal government) (2003-2005); Board Member, Financial Markets Center (nonprofit financial markets research and education resources provider) (2002-2004); Trustee, New England Quarterly (periodical) (since 1998); Trustee, Episcopal Church Pension Fund (1994-2006); Private Trustee, Loring, Wolcott & Coolidge Office (fiduciary) (since 1987); Partners for the Common Good (community development nonprofit) (2005-2008). | | 5 |
| |
DISINTERESTED TRUSTEES | | |
Name, Age, Position(s) Held,
and Length of Time Served | | Principal Occupation(s) During Past 5 Years and Other Directorships Held | | Number of Funds
and Portfolios in the
Domini Family of
Funds Overseen by
Trustee |
Julia Elizabeth Harris (61) Trustee of the Trust since 1999 | | Director and President, Alpha Global Solutions, LLC (agribusiness) (since 2004); Trustee, Fiduciary Trust Company (financial institution) (2001-2005); Executive Vice President, UNC Partners, Inc. (financial management) (since 1990). | | 5 |
114
DISINTERESTED TRUSTEES (continued)
| | | | |
Name, Age, Position(s) Held, and Length of Time Served | | Principal Occupation(s) During Past 5 Years and Other Directorships Held | | Number of Funds
and Portfolios in the
Domini Family of
Funds Overseen by
Trustee |
Kirsten S. Moy (62) Trustee of the Trust since 1999 | | Board Member, Community Reinvestment Fund (since 2003); Director, Economic Opportunities Program, The Aspen Institute (research and education) (since 2001); Director, NCB Capital Impact (2006-2008); Director, Low Income Investment Fund (community revitalization nonprofit) (since 2009). | | 5 |
| | |
William C. Osborn (65) Trustee of the Trust since 1990 | | Manager, Massachusetts Green Energy Fund Management 1, LLC (venture capital) (since 2004); Manager, Commons Capital Management LLC (venture capital) (since 2000); Director, Porogen, Inc. (biotechnology) (since 2008); Director, Bandgap Engineering, Inc. (renewable energy technology) (since 2008); Director, GreenTech Media, Inc. (online media) (since 2008); Special Partner/Consultant, Arete Corporation (venture capital) (1999-2007); Director, CTP Hydrogen, Inc. (hydrogen generation technology) (since 2005); Director, World Power Technologies, Inc. (power equipment production) (1999-2004); Director, Investors’ Circle (socially responsible investor network) (1999-2004). | | 5 |
| | |
Karen Paul (64) Trustee of the Trust since 1990 | | Visiting Professor, Escuela Graduado Administración Dirección Empresas, Instituto Tecnológico y de Estudios Superiores de Monterrey (2004); Professor of Management and International Business, Florida International University (since 1990). | | 5 |
| | |
Gregory A. Ratliff (49) Trustee of the Trust since 1999 | | Senior Program Officer, Bill & Melinda Gates Foundation (since 2007); Community Investment Consultant (self-employment) (since 2002). | | 5 |
| | |
John L. Shields (56) Trustee of the Trust since 2004 | | Principal, MainStay Consulting Group, LLC (management consulting firm) (since 2006); Director, Adverplex, Inc. (technology company) (since 2008); Advisory Board Member, Vestmark, Inc. (software company) (since 2003); CEO, Open Investing, Inc. (investment adviser) (2006-2007); CEO, Harris Insight Funds Trust (mutual funds) (2005-2006); Managing Director, Navigant Consulting, Inc. (management consulting firm) (2004-2006); Managing Principal, Shields Smith & Webber LLC (management consulting firm) (2002-2004). | | 5 |
| | |
OFFICERS | | | | |
| | |
Name, Age, Position(s) Held, and Length of Time Served | | Principal Occupation(s) During Past 5 Years and Other Directorships Held | | Number of Funds
and Portfolios in the
Domini Family of
Funds Overseen by
Trustee |
Megan L. Dunphy* (39) Secretary of the Trust since 2005 | | Mutual Fund Counsel, Domini Social Investments LLC (since 2005); Secretary, Domini Funds (since 2005); Counsel, ING (formerly Aetna Financial Services) (financial services) (1999-2004). | | N/A |
115
OFFICERS (continued)
| | | | |
Name, Age, Position(s) Held, and Length of Time Served | | Principal Occupation(s) During Past 5 Years and Other Directorships Held | | Number of Funds
and Portfolios in the
Domini Family of
Funds Overseen by
Trustee |
Adam M. Kanzer* (43) Chief Legal Officer of the Trust since 2003 Vice President of the Trust since 2007 | | Managing Director (since 2007), General Counsel and Director of Shareholder Advocacy (since 1998) and Chief Compliance Officer (April 2005-May 2005), Domini Social Investments LLC; Chief Legal Officer (since 2003), Chief Compliance Officer (April 2005 to July 2005), Vice President (since 2007), Domini Funds. | | N/A |
| | |
| Carole M. Laible* (45) Treasurer of the Trust since 1997 Vice President of the Trust since 2007 | | President (since 2005), Member (since 2006), Chief Operating Officer (since 2002), and Financial/Compliance Officer (1997-2003), Domini Social Investments LLC; President and CEO (since 2002), Chief Compliance Officer (since 2001), Chief Financial Officer, Secretary, and Treasurer (since 1998), DSIL Investment Services LLC; Treasurer (since 1997), Vice President (since 2007), Domini Funds. | | N/A |
| | |
| Douglas Lowe* (53) Assistant Secretary of the Trust since 2007 | | Senior Compliance Manager and Counsel, Domini Social Investments LLC (since 2006); Assistant Secretary, Domini Funds (since 2007); Executive Director, Morgan Stanley (2002 to 2005). | | N/A |
| | |
Steven D. Lydenberg* (63) Vice President of the Trust since 1990 | | Chief Investment Officer (since 2003) and Member (since 1997), Domini Social Investments LLC; Vice President, Domini Funds (since 1990). | | N/A |
| | |
Meaghan O’Rourke* (29) Assistant Secretary of the Trust since 2007 | | Senior Compliance Analyst (since 2009), Compliance Associate (2005-2009), Institutional Client Relationships Associate (2004 to 2005), Administrative Assistant (2002 to 2004), Domini Social Investments LLC; Assistant Secretary, Domini Funds (since 2007). | | N/A |
| | |
| Christina Povall* (39) Assistant Treasurer of the Trust since 2007 | | Director of Finance, Domini Social Investments LLC (since 2004); Assistant Treasurer, Domini Funds (since 2007); Senior Manager, PricewaterhouseCoopers LLP (independent registered public accounting firm) (1999-2004). | | N/A |
| | |
Maurizio Tallini* (35) Chief Compliance Officer of the Trust since 2005 Vice President of the Trust since 2007 | | Member (since 2007), Managing Director (since 2007), Chief Compliance Officer (since 2005), Domini Social Investments LLC; Vice President (since 2007), Chief Compliance Officer (since 2005), Domini Funds; Venture Capital Controller, Rho Capital Partners (venture capital) (2001-2005). | | N/A |
The Funds’ Statement of Additional Information includes additional information about the Trustees and is available without charge, upon request, by calling the following toll-free number: 1-800-582-6757.
116
PROXY VOTING INFORMATION
The Domini Funds have established Proxy Voting Policies and Procedures that the Funds use to determine how to vote proxies relating to portfolio securities. The Domini Funds’ Proxy Voting Policies and Procedures are available, free of charge, by calling 1-800-762-6814, by visiting www. domini.com/shareholder-advocacy/Proxy-Voting/index.htm, or by visiting the EDGAR database on the Securities and Exchange Commission’s (SEC) website at http://www.sec.gov. All proxy votes cast for the Domini Funds are posted to Domini’s website on an ongoing basis over the course of the year. An annual record of all proxy votes cast for the Funds during the most recent 12-month period ended June 30 can be obtained, free of charge, at www.domini.com, and on the EDGAR database on the SEC’s website at http://www.sec.gov.
QUARTERLY PORTFOLIO SCHEDULE INFORMATION
The Domini Funds file their complete schedule of portfolio holdings with the SEC for the first and third quarters of each fiscal year on Form N-Q. The Domini Funds’ Forms N-Q are available on the EDGAR database on the SEC’s website at http://www.sec.gov. These Forms may also be reviewed and copied at the SEC’s Public Reference Room in Washington, D.C. Information about the operation of the Public Reference Room may be obtained by calling 1-800-SEC-0330. The information on Form N-Q is also available to be viewed at www.domini.com.
117
THIS PAGE INTENTIONALLY LEFT BLANK
THIS PAGE INTENTIONALLY LEFT BLANK
DOMINI FUNDS
P.O. Box 9785
Providence, RI 02940-9785
1-800-582-6757
www.domini.com
Investment Manager, Sponsor, and Distributor:
Domini Social Investments LLC (Investment Manager and Sponsor)
DSIL Investment Services LLC (Distributor)
536 Broadway, 7th floor
New York, NY 10012
New address as of November 30, 2009:
532 Broadway, 9th Floor
New York, NY 10012
Investment Submanagers:
Domini Social Equity Fund
Domini European Social Equity Fund
Domini PacAsia Social Equity Fund
Domini European PacAsia Social Equity Fund
Wellington Management Company, LLP
75 State Street
Boston, MA 02109
Domini Social Bond Fund
Seix Investment Advisors LLC
10 Mountain View Road, Suite C-200
Upper Saddle River, NJ 07458
Transfer Agent:
PNC Global Investment Servicing
760 Moore Road
King of Prussia, PA 19406
Custodian:
State Street Bank and Trust Company
200 Clarendon Street
Boston, MA 02116
Independent Registered Public Accounting Firm:
KPMG LLP
99 High Street
Boston, MA 02110
Legal Counsel:
Bingham McCutchen LLP
One Federal Street
Boston, MA 02110
120
| | | | |
| Domini Social Equity Fund | | Domini PacAsia Social Equity Fund | | 
|
| Investor Shares: CUSIP 257132100 | DSEFX | | Investor Shares: CUSIP 257132605 | DPAFX | |
| Class R Shares: CUSIP 257132308 | DSFRX | | Class A Shares: CUSIP 257132878 | DPAPX | |
| Class A Shares: CUSIP 257132860 | DSEPX | | | |
| Institutional Shares: CUSIP 257132852 | DIEQX | | Domini European PacAsia Social Equity Fund | |
| | Investor Shares: CUSIP 257132704 | DUPFX | |
| Domini European Social Equity Fund | | Class A Shares: CUSIP 257132886 | DUPPX | |
| Investor Shares: CUSIP 257132506 | DEUFX | | | |
| Class A Shares: CUSIP 257132803 | DEEPX | | Domini Social Bond Fund | |
| | Investor Shares: CUSIP 257132209 | DSBFX | |
Printed on elemental chlorine free paper from well-managed forests, containing 10% post consumer waste. | |