UNITED STATES
SECURITIES AND EXCHANGE COMMISSION
Washington, D.C. 20549
FORM N-CSR
CERTIFIED SHAREHOLDER REPORT OF REGISTERED
MANAGEMENT INVESTMENT COMPANIES
Investment Company Act File Number 811-5823
DOMINI INVESTMENT TRUST
(Exact Name of Registrant as Specified in Charter)
532 Broadway, 9th Floor, New York, New York 10012
(Address of Principal Executive Offices)
Amy Domini Thornton
Domini Impact Investments LLC
532 Broadway, 9th Floor
New York, New York 10012
(Name and Address of Agent for Service)
Registrant’s Telephone Number, including Area Code: 212-217-1100
Date of Fiscal Year End: July 31
Date of Reporting Period: January 31, 2017
Item 1. Reports to Stockholders.
A copy of the report transmitted to stockholders pursuant to Rule 30e-1 under the Investment Company Act of 1940 follows.

Domini. SEMI ANNUAL REPORT 2017 (UNAUDITED) DOMINI IMPACT EQUITY FUND SMDOMINI IMPACT INTERNATIONAL EQUITY FUND SM DOMINI IMPACT BOND FUND SM
|
| KEEP IN TOUCH WITH DOMINI |
A report like this comes twice a year, but your dollars work for change all year long. Stay connected with us on Facebook and Twitter:  facebook.com/dominifunds facebook.com/dominifunds
 twitter.com/dominifunds twitter.com/dominifunds
|
|
| SIGN UP FOR E-DELIVERY |
If you invest directly with Domini, you can avoid an annual fee of $15 by signing up for paperless E-Delivery of your statements, reports and tax forms — just log into your account, go to “Account Options,” and select “E-Delivery Option.” If you invest through a financial advisor, brokerage firm, or employer-sponsored retirement plan, why not ask your advisor or plan sponsor how to receive your documents electronically? It can reduce your carbon footprint, save trees, and unclutter your life, all with just a few strokes of your keyboard! |
TABLE OF CONTENTS
THE WAY YOU INVEST MATTERS®
LETTER FROM THE PRESIDENT
Dear Fellow Shareholders:
The six months ending January 31, 2017 saw the election of President Donald Trump and with him, a shift in national priorities. As a general statement, the stock market does not like uncertainty. It would have been understandable, therefore, if the markets had fallen off with this election. But they did not. Most likely, investors were attracted by the tremendous stimulative effect that a trillion dollars spent on infrastructure could have. Secondarily, a lower tax rate would put more money in corporate pockets, making companies worth more, at least in the short term. Setting aside what one thinks about these ideas from a policy perspective, the market reaction to them is somewhat predictable.
Small investors often do best when they do little. Setting an allocation and sticking with it, adding when possible, spending when necessary, but generally setting a direction and staying the course, is a tried and true means to save. But there are very large investors, primarily in the form of hedge funds, that follow a different philosophy. These investment pools frequently move in and out of market sectors based on a bet. The big money today seems firmly set on a bet that the infrastructure plan will become reality and that American companies will continue to grow.
Impact investors seek to make a difference, in any stock market environment. We at Domini Impact Investments feel strongly that our work to seek better outcomes for people and the planet cannot be relegated to the back seat while we attempt to analyze Washington’s next move. We have a job to do and it continues.
Migrant and temporary workers are a particularly vulnerable segment of the global economy. Although in many industries the use of temporary workers is extremely entrenched — think of the need for extra hands during the Christmas holidays — a national dialogue over what it means to be a temporary worker and what corporations who depend upon them ought to consider, is overdue. Whether the issue is access to company sponsored health care or longer hours than longer-term workers, the areas for discussion are ripe. A discussion is needed, because when the temporary worker is from another country, either as a documented worker or not, the worker may be unable to express his or her own needs.
The Pew Charitable Trusts have published a state-by-state, industry-by-industry analysis on immigrant employment. In it, we learn that there are some sectors of our economy where an immigrant is more likely to hold a position than a citizen by birth.
2
THE WAY YOU INVEST MATTERS®
For instance, the economic sector called administrative services, which includes cleaning services, is a field in which an immigrant is 1.7 times more likely to hold a job than a U.S.-born worker. In agriculture and construction the figure is 1.5 times. In leisure, that figure drops to 1.4 times. Does it matter? The same report tells us that these industries generate 13 percent of America’s GDP.
When 13 percent of a nation’s economic well-being is heavily dependent on immigrants, a broad and constructive dialogue over immigration policy becomes an economic one. And economic policy is core to the health of investment returns. Once again, as socially responsible investors, we find ourselves at the pivot point where what is best for ordinary people and what is best for investors comes together.
We have, for nearly two decades, addressed a variety of worker concerns with the companies we invest in. We have had highly successful results in many cases. We hope that our successes will lead corporations to encourage their peers to take a greater interest in what their purchasing of supplies or services means to each individual in its supply chain.
This report takes a look at some of the most severe risks workers face when they leave their home country for work elsewhere, and our responses to these concerns. As your representatives, we have continued to do what we can to be a useful link between the corporate world and Main Street, and to focus our attention on the most vulnerable among us.
Thank you for your investment, and for your decision to be a more responsible investor. The way we invest matters.
Very truly yours,

Amy Domini
amy@domini.com
3
THE WAY YOU INVEST MATTERS®
DOMINI NEWS
New Name, Same Domini
Beginning with the inception of our first mutual fund in 1991, Domini has made it a priority to focus on incorporating social and environmental standards into our investment process seeking triple bottom-line results: positive for people, planet, and profits. Over the years, what began as a small movement blossomed into an entire and thriving industry. However, the vocabulary has varied — ethical investing, socially responsible investing, values investing, ESG investing, sustainable investing, and more recently, impact investing.
We believe “impact investing” most clearly and effectively communicates the intentionality of our work. Therefore, on November 30, 2016, we changed our name. Domini Social Investments LLC became Domini Impact Investments LLC. We renamed our mutual funds as well. All else — our investment standards as well as our investment process — remains unchanged.
As one of the pioneers in the industry, we are pleased to be part of an expanding group of investors that put their investment choices to work for positive impact.
Domini Joins Factory Farming and Safer Chemicals Initiatives
Over the years, we have found that we can be most effective when we collaborate with others. We are pleased to announce the following new and enhanced commitments to these partnerships:
Domini has joined FAIRR (Farm Animal Investment Risk and Return), a collaborative investor initiative based in London focused on raising awareness — and engaging with companies — about the social, environmental and financial risks of industrial farming. The coalition currently represents more than $1 trillion in assets. Learn more at www.fairr.org.
We also joined the Chemical Footprint Project, an effort backed by $2.3 trillion to encourage companies to select safer chemicals and reduce the use of chemicals of high concern. Visit www.chemicalfootprint.org.
We were also honored to join a new Human Rights Advisory Committee formed by the Interfaith Center on Corporate Responsibility (ICCR) to provide input on ICCR’s shareholder strategies related to corporate human rights impacts.
4
THE WAY YOU INVEST MATTERS®
Domini Impact International Equity Fund Investor (DOMIX) and Institutional (DOMOX) Share Classes Maintain Four and Five Star Overall Morningstar Ratings, Respectively, For the Year
| | | | |
| We apply social, environmental and governance standards to all of our investments, believing they help identify opportunities to provide competitive returns to our fund shareholders while also helping to create a more just and sustainable global economic system. | | |  | |
| We are pleased to announce that the Domini Impact International Equity Fund Investor share class (DOMIX) received an Overall Morningstar rating of four-stars as of February 28, 2017, based on risk-adjusted return. The Fund’s Class A (DOMAX) (load waived)* and Institutional (DOMOX) share classes each received an Overall Morningstar rating of five-stars as of February 28, 2017, based on risk-adjusted return. | |
|
| The Fund’s Investor, Class A (load waived) and Institutional Shares received five stars for the last 3 and 5 years rated against 275 and 223 U.S. domiciled Foreign Large Value funds, respectively, and three stars for the past 10 years, rated against 139 U.S. domiciled Foreign Large Value funds. | |
*The Fund’s Class A shares are intended for investors who invest through a financial advisor. They carry a front-end sales charge (load) of up to 4.75% that is paid to the advisor buying the Fund on behalf of the investor. If you do not invest through a financial advisor, please refer to the Investor shares.
Past performance is no guarantee of future results. Investment return, principal value, and yield will fluctuate so that an investor’s shares, when redeemed, may be worth more or less than their original cost. An investment in the Fund is subject to market, sector concentration and style risks. Investing internationally involves special risks, including currency fluctuations, political and economic instability, increased volatility and differing securities regulations and accounting standards. The fund may focus its investments in certain regions or industries, thereby increasing its potential vulnerability to market volatility. You may lose money.
For each fund with at least a three-year history, Morningstar calculates a Morningstar Rating™ based on a Morningstar Risk-Adjusted Return measure that accounts for variation in a funds’ monthly performance (including the effects of sales charges, loads, and redemption fees), placing more emphasis on downward variations and rewarding consistent performance. The top 10% of funds in each category receive 5 stars, the next 22.5% receive 4 stars, the next 35% receive 3 stars, the next 22.5% receive 2 stars, and the bottom 10% receive 1 star. The Overall Morningstar Rating for a fund is derived from a weighted average of the performance figures associated with its three-, five-, and ten-year (if applicable) Morningstar Rating metrics.
Fees have been waived or expenses advanced during the period on which the Fund’s ranking is based, which may have had a material effect on the total return or yield for that period, and therefore the rating for the period.
© 2017 Morningstar. All Rights Reserved. The information contained herein: (1) is proprietary to Morningstar and/or its content providers; (2) may not be copied or distributed; and (3) is not warranted to be accurate, complete or timely. Neither Morningstar nor its content providers are responsible for any damages or losses arising from any use of this information.
5
THE WAY YOU INVEST MATTERS®
ADVOCACY UPDATE
Preserving Biodiversity
The earth is losing species at an alarming rate, driven by a range of factors, from climate change to land use changes. Deforestation in Indonesia, for example, driven in part by global demand for palm oil, threatens the orangutan, as well as many other unique organisms. Commercial demand for paper and timber, beef and soy are also driving global deforestation. Pollinators, including honeybees, provide irreplaceable services to humanity worth billions of dollars a year. These pollinators, however, are also under threat by widespread use of systemic pesticides.
We believe that investors can, and must, do something about this. In 2014, we helped convince Pepsi to adopt a set of forestry commitments. In the Fall, we joined other investors in submitting a shareholder proposal to Pepsi on pesticide pollution. We’d like to see the company apply responsible pesticide management practices across its global agricultural supply chain. We are also asking Kraft Heinz to report on its efforts to address deforestation and human rights abuses connected to the sourcing of palm oil, paper, beef, soy and sugar.
Chipotle Commits to Sustainability Reporting
After more than three years of encouragement by Domini, Chipotle has agreed to publish a report discussing its approach to the key sustainability challenges it faces. We look forward to working with their team over the course of the year on their first sustainability report.
Addressing Climate Change
In January, Domini joined more than 630 corporations and investors in a public statement to the incoming administration expressing strong support for the Paris Agreement on climate change. The statement was released in November and again in January, and received global press coverage. The statement is available at www.lowcarbonusa.org.
Opposing Discrimination
We were pleased to sign investor letters backed by trillions in assets, opposing bills in North Carolina and Texas that would prohibit transgender people from using restrooms consistent with their gender identity. The investor statement helped to draw renewed attention to these discriminatory bills. We also signed letters to twelve companies that participate in the Pink Dot gathering in Singapore, a celebration of the LGBT community. The government of Singapore criminalizes homosexual conduct and issued a warning regarding the event. The letter encouraged these companies to stay the course.
Visit www.domini.com to learn more about our work on your behalf to engage corporations on social and environmental issues.
6
THE WAY YOU INVEST MATTERS®
PROTECTING MIGRANT WORKERS
What distinguishes Domini from your typical mutual fund manager? We believe it is our recognition that what we do together as investors has an impact on the world around us.
Impact is a word that gets used quite a lot these days. It can mean different things to different people. We don’t see impact as a special bonus provided to those investors that ask for it. We see impact as an implicit component of every investment decision we make. All investors have impacts — both positive and negative. It is our job as investment managers to strive to have a positive impact.
Guided by our Impact Investment Standards, focused on universal human dignity and environmental sustainability, we have identified a few key areas where we believe we can make a positive contribution. This essay focuses on one such area — the treatment of some of the most vulnerable workers in global supply chains.
* * *
In a tightly interconnected world, investors can no longer afford to ignore the social and environmental costs of business as usual. For decades, responsible investors have joined with civil society organizations, corporations and public institutions to address working conditions in global supply chains and, although problems persist, we’ve made significant headway.
Twenty years ago, companies argued that they carried no responsibility for working conditions in factories they did not own. We no longer hear that argument. While it is true that these human rights abuses occur at factories and fields owned by third-parties, global companies can exercise significant influence. According to the United Nations Guiding Principles on Business and Human Rights, adopted in 2011, global businesses are obligated to identify these problems and do what they can to address them.
Around the world, approximately 150 million people leave their countries each year in search of economic opportunities elsewhere, often passing through the hands of unscrupulous recruiters with every incentive to take advantage of their vulnerable situation. Many workers find themselves working months on the job simply to pay off exorbitant recruitment fees. In other words, they are working for no pay at all. This is known as ‘bonded labor’ — a form of forced labor where a person is working to pay off a debt. It is considered the most common, and least known, form of modern slavery.
7
THE WAY YOU INVEST MATTERS®
The International Labor Organization estimates that almost 21 million people are trapped in conditions of forced labor, generating over $150 billion for other parties. More than 75% of these workers work within the private sector, particularly in industries such as agriculture, construction and manufacturing.
Migrant workers are among the most vulnerable members of the global workforce and are subject to multiple forms of abuse across industries.
While attention has been paid to conditions in the factory or on the farm, less attention has been paid to the path migrant workers take to get to the workplace, and the unique risks they face. Today, that is changing.
What Can Investors Do?
Our experience teaches us that investors can have significant influence over corporate practices.
Domini has worked closely with the Interfaith Center on Corporate Responsibility (ICCR), a coalition of faith-based and socially responsible investors, since our inception. ICCR has launched a “No Fees Initiative” to address unethical recruitment practices, based on three pillars:
1. No Fees: Workers should not be obligated to pay for their job and should be immediately reimbursed for any fees charged. If a worker is indebted to her recruiter, she can effectively work months without pay. She may even feel honor-bound to repay these unjust debts. According to a 2014 US Department of Labor-funded study, “92 percent of the migrant workers in Malaysia’s electronics industry had paid recruitment fees and…92% of that group had paid fees that exceeded legal or industry standards.”
2. Workers should be provided with contracts in their own language: If a worker’s contract is written in another language, he can’t agree to the terms of his employment, and he can’t understand his legal rights.
3. No passport retention: If a worker cannot retain her passport or other identify documents, then she is unable to go home.
These are the most common factors that hold these workers in debt bondage, often without their awareness.
According to Know the Chain, a project led by Humanity United that ranks companies in the apparel, tech and food and beverage sectors on their responses to forced labor issues, corporate awareness of unethical recruitment practices is very low. For example, in the tech sector, out of twenty companies reviewed, “only four of the companies demonstrate awareness of the risks of forced labor that can arise from the use of recruitment agencies.” Know the Chain awarded the industry an average of 20 points out of 100 on recruitment issues.
8
THE WAY YOU INVEST MATTERS®
Investors have important opportunities to raise awareness of the problem, set expectations and engage with companies to eradicate these practices.
The Corporate Response
Many of us first learned about the extreme conditions migrant workers can face after a series of articles broke in the Guardian and the Associated Press in 2014 and 2015, uncovering slavery in the Thai shrimp supply chain. Our research department spotted the issue early, leading to decisions to continue excluding Thai Union Manufacturing (TUM) and Charoen Pokphand (CP) Foods, two Thai companies at the heart of the controversy, from the Domini Funds. We made those decisions before these stories broke.
Often, we are unable to obtain reliable information about labor issues from the companies themselves. In the absence of corporate reporting, we must rely on what we know about these industries and the regions where they operate. Reliable NGOs can be an invaluable source of information. In this case, a report published by Finnwatch in 2013 highlighted problems identified by interviewed workers including accusations of low wages, child labor, a large migrant workforce, and unpaid compensation and leave. The report stated that about half of TUM’s employees were Thai citizens and the rest were migrant workers from Myanmar and Cambodia. Finnwatch reported that violations of migrants’ rights are common in Thailand. The NGO also reported the company’s denial of these allegations.
Under the spotlight of public attention, conditions are changing. Large consumer-facing brands like Costco and (William) Morrisons (United Kingdom) are taking action as part of the Seafood Task Force (www.seafoodtaskforce.global), a multi-stakeholder alliance which aims to tackle forced labor and human trafficking in Thailand’s seafood supply chain. The ability to track workers far out at sea is one critical piece of the problem they are trying to solve. CP Foods and Thai Union are also engaged, and working to improve their practices.
Unfortunately, the flawed recruitment system that produced those horrifying conditions also serves a wide range of industries. And in those industries as well, several long-term Domini Funds holdings have taken leadership.
HP Inc. reports that it was the first IT company to develop its own foreign migrant worker standard, a standard that addresses each of the three pillars of ICCR’s initiative. But the company took a step further that gets much closer to the root of the problem: HP is the first company in its industry to require direct employment of foreign migrant workers in its supply chain. Its policy, and the audit tools it has developed to enforce it,
9
THE WAY YOU INVEST MATTERS®
were developed in collaboration with Verité, a well-respected international nonprofit that promotes safe, fair, and legal working conditions, with particular expertise in combatting forced labor in supply chains.
When a person works in a factory, but is employed by the labor agency that recruited them, they are at far greater risk of exploitation. According to Verité, “HP’s standard requiring direct hiring will remove a key obstacle to ethical treatment of migrant workers. The standard sets a new bar and will likely result in substantial financial benefit to foreign migrant workers in HP’s supply chain, and we hope other companies will adopt similar policies.” We agree, and are raising this issue with other companies. Direct employment may be the solution to this problem, but we will need to overcome objections from factory owners and others that argue that it is too expensive or burdensome for small suppliers to adopt.
Companies realize that they need to work collaboratively to find solutions to these endemic problems. Leading companies in the electronics industry have turned to the Electronics Industry Citizenship Coalition (EICC). EICC members share a common code of conduct for their supply chains and a common factory audit process. Thanks to the leadership of companies like HP, the EICC code of conduct now addresses unethical recruitment practices.
Another important collaborative effort cuts across industries. The Coca-Cola Company, HP Inc., Hewlett Packard Enterprise, IKEA and Unilever launched the Leadership Group for Responsible Recruitment, focused on promoting ethical recruitment and combating the exploitation of migrant workers in global supply chains across industries. Walmart and Marks & Spencer (M&S) have joined the initiative, which is supported by the Institute for Human Rights and Business, ICCR, the International Organization for Migration and Verité. The Leadership Group is working to champion the “Employer Pays Principle”, which states that no worker should pay for a job — those costs should be borne by the employer.
* * *
Case Study: Turning Words into Deeds
In many instances, Domini has acted as a catalyst for change, helping to set a company on a new course that may produce substantial benefits in the future. Apple is a case in point.
In 2004, when we first reached out to Apple, the company was silent about working conditions in its supply chain, and did not have a policy to protect the rights of these workers. We changed that. After months of dialogue with Domini, Apple adopted a strong code of conduct, committing it to uphold core labor rights in its global supply chain.
10
THE WAY YOU INVEST MATTERS®
Only words on paper. But when a corporation adopts a policy, it works to implement it. That code provided the foundation upon which to build a labor standards program. The company soon began public reporting, to ensure a degree of public accountability. Public reporting is needed to ensure effective implementation of these kinds of policies, and to educate others about the kinds of problems that are found, the tactics that work and those that don’t. It is also a necessary mechanism for building trust with investors, consumers and other stakeholders, a valuable asset for any global brand. Our engagement also provided the foundation for a dialogue we have maintained with the company ever since.
Today, Apple is far more transparent about problems in its supply chain, and actively works to address them. Visit www.apple.com and click on “Supplier Responsibility” to read the story of Rechel Ragas, a factory worker recruited from the Philippines to Taiwan in search of higher wages. Apple reports that “to secure a factory position there, Rechel had to use a job broker agency that charged her more money than she made in an entire year working in her home country.” When Apple uncovered these fees — fees that were legal, but violated Apple’s policies — it ensured that she received full reimbursement. As a result, she was able to return home six months earlier than she had planned. Apple is the only company we are aware of that discloses the amount of recruitment fees it has reimbursed to workers: $25.6 million since 2008, including $4.7 million in 2015.
The company has not solved all of the problems it has found in its supply chain. We don’t demand perfection — not because we don’t want to see it, but because we don’t expect to find it. We do expect companies to acknowledge these challenges and demonstrate how they are meeting them.
Apple has come a long way since 2004 and, although we would never claim that our efforts were responsible for all of this hard work, we believe we have had an impact.
* * *
We applaud the EICC’s efforts to address unethical recruitment issues, but still believe the industry should be doing more. On behalf of a group of institutional investors affiliated with ICCR, we wrote to IBM and Motorola Solutions with a series of questions about how they ensure that workers in their supply chains are free of these abuses. We also signed letters to Broadcom, Canon, Cisco, EMC, Hitachi, Johnson Controls, Medtronic, Microsoft, Qualcomm, Texas Instruments and Xerox.
We followed our letter to Motorola with a shareholder proposal on the topic, which prompted a constructive conversation with the company.
11
THE WAY YOU INVEST MATTERS®
Motorola Solutions has policies in place to address these issues, and as an EICC member, has adopted a “no fees” commitment. The company tells us that it is actively working through the EICC to develop more effective responses to these unethical recruitment practices. We recognize these efforts, but believe that investors have insufficient information to gauge how well the company is addressing these serious risks to workers. Our proposal seeks to rectify that by requesting an annual report disclosing the company’s efforts to ensure that its global supply chain is free of forced or bonded labor, including any efforts to reimburse workers for recruitment fees that were paid in violation of company policies. We look forward to continuing our dialogue with the company.
Out of twenty apparel companies, Know the Chain found only seven that were aware of the risks of exploitation to migrant workers. They found only two companies that encouraged the direct hiring of workers in their supply chain.
Adidas (Germany) received the top ranking in Know the Chain’s 2016 survey, and the top score for worker recruitment practices. Know the Chain praised Adidas’ “strong awareness” of the risks facing migrant workers and listed a number of leading practices. Of particular importance, if an agency is involved in the recruitment process, Adidas requires that workers sign contracts directly with the factory, not with the recruitment firm. The company requires suppliers to disclose the recruitment firms it uses, and to monitor all recruiters. The Adidas Group publishes a list of names and addresses for its primary factories, subcontractors and licensees, a practice adopted by leading companies in the apparel and electronics sectors.
We recently met with Gap to discuss its approach to these issues, including the possibility of adopting a direct employment policy, and wrote to Ralph Lauren, Michael Kors (where we ultimately submitted a shareholder proposal), Nike, L Brands (Victoria’s Secret, Bath & Body Works) and Coach.
Ralph Lauren reports that it is working towards a “recruitment fee–free” environment for all workers. The company reported to Know the Chain that an audit had uncovered that a group of new Bangladeshi workers had recently started work in one of its supplier facilities in Jordan, and had paid recruitment fees. The factory is now fully reimbursing the 33 workers affected over a period of 3 months.
These kinds of reports should help to illustrate a basic point — these problems are out there to be found and addressed. No company’s supply chain is immune. Our letter prompted a constructive conversation with the company, which we look forward to continuing. We appreciate the
12
THE WAY YOU INVEST MATTERS®
company’s recognition of the plight of migrant workers and are encouraging clearer commitments and more transparent reporting.
Another long-term Domini holding that has taken leadership on these issues is Unilever (Netherlands, United Kingdom). The company ranks first on Know the Chain’s benchmark for the food and beverage sector, because of its commitment to traceability. The company’s commitment to eradicating modern slavery and human trafficking is impressive given that it reportedly has 76,000 suppliers. Unilever is working to reduce the number of recruiters used by factories. It reports that it uses very limited numbers of recruiters in North America, Europe and South America, but larger numbers in Asia and Africa.
* * *
Consider how you might handle the daily struggles these migrant workers take on, day after day. They are working far from home for people that speak another language. They may not be in the job they thought they bargained for. Those in the fishing industry may never have seen the sea before. Many find that their paycheck is considerably less than expected, but they have no option but to keep working — they have family back home depending on them.
We invest in companies that can make a significant difference in the lives of migrant workers. That means that we can make a significant difference, as long as we refuse to turn a blind eye, and we persist in raising these concerns and pressing each company that recognizes the issue to do more.
The holdings discussed above can be found in the portfolios of the Domini Funds, included herein. The following companies discussed above are not currently eligible for investment by the Domini Funds: Canon, Charoen Pokphand (CP) Foods, Hitachi, Medtronic, Thai Union, and Walmart. Broadcom, Dell EMC, Johnson Controls, Marks & Spencer, Qualcomm, Texas Instruments and Xerox are eligible for investment, but not currently held by the Domini Funds. IKEA is not publicly traded. The composition of the Funds’ portfolios is subject to change.
An investment in the Domini Funds is not insured and is subject to market, sector concentration and style risks. You may lose money. Investing internationally involves special risks, such as currency fluctuations, social and economic instability, differing securities regulations and accounting standards, limited public information, possible changes in taxation, and periods of illiquidity.
The preceding profiles should not be deemed an offer to sell or a solicitation of an offer to buy the stock or bonds of any of the companies noted, or a recommendation concerning the merits of any of these companies as an investment. This material must be preceded or accompanied by a current prospectus. DSIL Investment Services LLC, Distributor. 04/17
13
DOMINI IMPACT EQUITY FUND
Fund Performance and Holdings
The table and bar charts below provide information as of January 31, 2017, about the ten largest holdings of the Domini Impact Equity Fund and its portfolio holdings by industry sector:
TEN LARGEST HOLDINGS (Unaudited)
| | | | | | | | | | |
| | | | |
| SECURITY DESCRIPTION | | % NET
ASSETS | | | SECURITY DESCRIPTION | | % NET
ASSETS | |
| Verizon Communications Inc | | | 3.4% | | | Intel Corporation | | | 2.7% | |
| Amazon.com Inc | | | 3.1% | | | Consolidated Edison Inc | | | 2.7% | |
| Prudential Financial Inc | | | 3.0% | | | Gilead Sciences Inc | | | 2.5% | |
| Cummins Inc | | | 2.8% | | | Sysco Corporation | | | 2.5% | |
| Alphabet Inc Cl A | | | 2.7% | | | Applied Materials Inc | | | 2.3% | |
PORTFOLIO HOLDINGS BY INDUSTRY SECTOR (% OF NET ASSETS) (Unaudited)
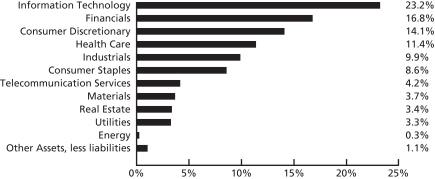
The holdings mentioned above are described in the Domini Impact Equity Fund’s Portfolio of Investments (as of 1/31/17), included herein. The composition of the Fund’s portfolio is subject to change.
14
| | | | | | | | | | | | | | |
DOMINI IMPACT EQUITY FUND AVERAGE ANNUAL TOTAL RETURNS (Unaudited) |
| | | Investor
shares | | Class A shares
(with 4.75%
maximum
Sales Charge)1 | | Class A shares
(without
Sales Charge)1 | | Institutional
shares2 | | Class R
shares3 | | S&P 500 |
As of
1/31/17 | | 1 Year | | 21.43% | | 15.54% | | 21.30% | | 21.91% | | 21.99% | | 20.04% |
| | 5 Year | | 10.78% | | 9.71% | | 10.79% | | 11.22% | | 11.16% | | 14.09% |
| | 10 Year | | 5.44% | | 4.93% | | 5.44% | | 5.44% | | 5.80% | | 6.99% |
| | | Since
Inception
(6/3/91) | | 8.26% | | 8.05% | | 8.26% | | 8.26% | | 8.44% | | 9.34% |
Past performance is no guarantee of future results. The Fund’s returns quoted above represent past performance after all expenses and waivers in effect during the periods shown. Investment return, principal value, and yield will fluctuate. Your shares, when redeemed, may be worth more or less than their original cost. Call 1-800-582-6757 or visit www.domini.com for performance information current to the most recent month-end, which may be lower or higher. A 2.00% fee applies to sales/exchanges made less than 30 days after the settlement of purchase/exchange, with certain exceptions. Quoted performance data does not reflect the deduction of this fee, which would reduce the performance quoted. See the Fund’s prospectus for further information.
On November 30, 2006, the Fund changed from a passive to active management strategy. Performance from Fund inception through November 29, 2006 reflects the former passive investment strategy.
Per the prospectus dated November 30, 2016, the Fund’s annual operating expenses totaled 1.14% (gross/net) (Investor shares), 1.41% (gross)/1.18% (net) (Class A shares), 0.81% (gross)/0.80% (net) (Institutional shares), and 0.82% (gross/net) (Class R shares) of net assets representing each share class, respectively. Until 11/30/17, the Fund’s Manager has contractually agreed to limit certain ordinary expenses to 1.25% (Investor), 1.18% (Class A), 0.80% (Institutional) and 0.90% (Class R) of the Fund’s average daily net assets representing each share class, absent an earlier modification by the Fund’s Board. The Fund’s total returns may have been lower without these limits.
The table does not reflect the deduction of taxes that a shareholder would pay on Fund distributions or the redemption of Fund shares. Total return for the Fund is based on the Fund’s net asset values and assumes all dividend and capital gains were reinvested.
An investment in the Fund is not a bank deposit and is not insured. The Fund is subject to market, sector concentration, style and foreign investing risks. You may lose money.
The Standard & Poor’s 500 (S&P 500) Index is an unmanaged index of common stocks. You cannot invest directly in an index.
1Class A shares were not offered prior to November 28, 2008. All performance information for time periods beginning prior to November 28, 2008 is the performance of the Investor shares. This performance has not been adjusted to reflect the lower expenses of the Class A shares, but does, where noted, reflect an adjustment for the maximum applicable sales charge of 4.75%.
2Institutional shares were not offered prior to November 28, 2008. All performance information for time periods beginning prior to November 28, 2008 is the performance of the Investor shares. This performance has not been adjusted to reflect the lower expenses of the Institutional shares.
3Class R shares were not offered prior to November 28, 2003. All performance information for the portion of the period prior to November 28, 2003 is the performance of the Investor shares and has not been adjusted to reflect the lower expenses of the Class R shares.
15
DOMINI IMPACT EQUITY FUND
PORTFOLIOOF INVESTMENTS
January 31, 2017 (Unaudited)
| | | | | | | | |
| SECURITY | | SHARES | | | VALUE | |
| | | | | | | | |
Common Stocks – 98.9% | |
Consumer Discretionary – 14.1% | |
Amazon.com Inc (a) | | | 33,734 | | | $ | 27,779,274 | |
Best Buy Co Inc | | | 866 | | | | 38,554 | |
CBS Corp Cl B | | | 37,300 | | | | 2,405,477 | |
Chipotle Mexican Grill Inc (a) | | | 35 | | | | 14,750 | |
Coach Inc | | | 348 | | | | 12,998 | |
Comcast Corp Cl A | | | 81,300 | | | | 6,131,646 | |
Foot Locker Inc | | | 143,736 | | | | 9,851,665 | |
Gap Inc/The | | | 445 | | | | 10,248 | |
Home Depot Inc/The | | | 218 | | | | 29,992 | |
JC Penney Co Inc (a) | | | 1,546 | | | | 10,281 | |
Kohl’s Corp | | | 239,572 | | | | 9,542,153 | |
L Brands Inc | | | 219 | | | | 13,186 | |
Lear Corp | | | 42,000 | | | | 5,967,780 | |
Lowe’s Cos Inc | | | 364 | | | | 26,601 | |
Marriott International Inc/MD Cl A | | | 146 | | | | 12,352 | |
Michael Kors Holdings Ltd (a) | | | 229,309 | | | | 9,816,718 | |
NIKE Inc Cl B | | | 376 | | | | 19,890 | |
Nissan Motor Co Ltd ADR | | | 119,100 | | | | 2,361,753 | |
Nordstrom Inc | | | 353,434 | | | | 15,628,851 | |
Ralph Lauren Corp | | | 26,282 | | | | 2,324,117 | |
Ross Stores Inc | | | 242,200 | | | | 16,011,842 | |
Scripps Networks Interactive Inc Cl A | | | 52,429 | | | | 3,992,993 | |
Staples Inc | | | 666 | | | | 6,127 | |
Starbucks Corp | | | 414 | | | | 22,861 | |
Target Corp | | | 181 | | | | 11,671 | |
Visteon Corp (a) | | | 165,641 | | | | 14,836,464 | |
Walt Disney Co/The | | | 242 | | | | 26,777 | |
| | | | | | | | |
| | | | | | | 126,907,021 | |
| | | | | | | | |
|
Consumer Staples – 8.6% | |
Avon Products Inc (a) | | | 2,873 | | | | 16,865 | |
Campbell Soup Co | | | 191 | | | | 11,886 | |
| | | | | | | | |
| SECURITY | | SHARES | | | VALUE | |
| | | | | | | | |
Consumer Staples (Continued) | |
Coca-Cola Co/The | | | 292 | | | $ | 12,138 | |
Colgate-Palmolive Co | | | 134,774 | | | | 8,703,705 | |
Costco Wholesale Corp | | | 120 | | | | 19,674 | |
Estee Lauder Cos Inc/The Cl A | | | 29,137 | | | | 2,366,216 | |
General Mills Inc | | | 175 | | | | 10,934 | |
Kimberly-Clark Corp | | | 141 | | | | 17,079 | |
Kraft Heinz Co/The | | | 223 | | | | 19,912 | |
Kroger Co/The | | | 860 | | | | 29,206 | |
Loblaw Companies Ltd | | | 175,282 | | | | 9,194,658 | |
Mondelez International Inc Cl A | | | 265 | | | | 11,734 | |
PepsiCo Inc | | | 199,317 | | | | 20,685,118 | |
Procter & Gamble Co/The | | | 155 | | | | 13,578 | |
Spectrum Brands Holdings Inc | | | 18,000 | | | | 2,401,020 | |
Sysco Corp | | | 420,895 | | | | 22,080,152 | |
Walgreens Boots Alliance Inc | | | 150,283 | | | | 12,314,189 | |
Whole Foods Market Inc | | | 248 | | | | 7,495 | |
| | | | | | | | |
| | | | | | | 77,915,559 | |
| | | | | | | | |
|
Energy – 0.3% | |
Dril-Quip Inc (a) | | | 37,674 | | | | 2,343,323 | |
| | | | | | | | |
| | | | | | | 2,343,323 | |
| | | | | | | | |
|
Financials – 16.8% | |
AGNC Investment Corp | | | 109,628 | | | | 2,046,755 | |
Aflac Inc | | | 110,300 | | | | 7,719,897 | |
American Express Co | | | 191 | | | | 14,589 | |
American International Group Inc | | | 71,984 | | | | 4,625,692 | |
Annaly Capital Management Inc | | | 266,418 | | | | 2,722,792 | |
Bank of Montreal | | | 34,100 | | | | 2,578,983 | |
Bank of Nova Scotia/The | | | 46,382 | | | | 2,772,716 | |
16
DOMINI IMPACT EQUITY FUND
PORTFOLIOOF INVESTMENTS (continued)
January 31, 2017 (Unaudited)
| | | | | | | | |
| SECURITY | | SHARES | | | VALUE | |
| | | | | | | | |
Financials (Continued) | |
Canadian Imperial Bank of Commerce | | | 38,800 | | | $ | 3,305,760 | |
Fifth Third Bancorp | | | 637,526 | | | | 16,639,429 | |
Hartford Financial Services Group Inc/The | | | 147,598 | | | | 7,189,499 | |
Intercontinental Exchange Inc | | | 195 | | | | 11,380 | |
Invesco Mortgage Capital Inc | | | 150,735 | | | | 2,196,209 | |
Lincoln National Corp | | | 53,106 | | | | 3,585,186 | |
MFA Financial Inc | | | 1,061,084 | | | | 8,371,953 | |
MetLife Inc | | | 272,319 | | | | 14,816,877 | |
Morgan Stanley | | | 65,492 | | | | 2,782,755 | |
National Bank of Canage | | | 147,043 | | | | 6,335,114 | |
PNC Financial Services Group Inc/The | | | 190 | | | | 22,887 | |
Popular Inc | | | 242,800 | | | | 10,787,604 | |
Prudential Financial Inc | | | 253,472 | | | | 26,642,442 | |
Regions Financial Corp | | | 273,143 | | | | 3,935,991 | |
Two Harbors Investment Corp | | | 268,300 | | | | 2,352,991 | |
US Bancorp | | | 346 | | | | 18,217 | |
Unum Group | | | 437,681 | | | | 19,883,848 | |
| | | | | | | | |
| | | | | | | 151,359,566 | |
| | | | | | | | |
|
Health Care – 11.4% | |
Allergan PLC (a) | | | 21,145 | | | | 4,628,429 | |
Becton Dickinson and Co | | | 72,328 | | | | 12,823,031 | |
Biogen Inc (a) | | | 42,139 | | | | 11,682,616 | |
Bruker Corp | | | 278,895 | | | | 6,618,178 | |
Edwards Lifesciences Corp (a) | | | 105,351 | | | | 10,138,980 | |
Gilead Sciences Inc | | | 305,710 | | | | 22,148,690 | |
Hill-Rom Holdings Inc | | | 40,225 | | | | 2,368,046 | |
| | | | | | | | |
| SECURITY | | SHARES | | | VALUE | |
| | | | | | | | |
Health Care (Continued) | |
Merck & Co Inc | | | 307,178 | | | $ | 19,041,964 | |
Quest Diagnostics Inc | | | 21,939 | | | | 2,016,633 | |
Taro Pharmaceutical Industries Ltd (a) | | | 63,503 | | | | 6,635,428 | |
Thermo Fisher Scientific Inc | | | 33,217 | | | | 5,061,939 | |
| | | | | | | | |
| | | | | | | 103,163,934 | |
| | | | | | | | |
|
Industrials – 9.9% | |
3M Co | | | 115 | | | | 20,104 | |
Alaska Air Group Inc | | | 198,899 | | | | 18,660,704 | |
Carlisle Cos Inc | | | 21,000 | | | | 2,291,310 | |
Cummins Inc | | | 173,086 | | | | 25,445,373 | |
Herman Miller Inc | | | 64,000 | | | | 1,996,800 | |
JetBlue Airways Corp (a) | | | 1,688 | | | | 33,102 | |
LSC Communications Inc | | | 409 | | | | 10,724 | |
Masco Corp | | | 467,242 | | | | 15,395,624 | |
PACCAR Inc | | | 228,194 | | | | 15,359,738 | |
Quanta Services Inc (a) | | | 66,401 | | | | 2,383,132 | |
RR Donnelley & Sons Co | | | 569 | | | | 9,758 | |
Robert Half International Inc | | | 23,290 | | | | 1,096,027 | |
United Parcel Service Inc Cl B | | | 131 | | | | 14,296 | |
United Rentals Inc (a) | | | 52,783 | | | | 6,677,577 | |
| | | | | | | | |
| | | | | | | 89,394,269 | |
| | | | | | | | |
|
Information Technology – 23.2% | |
Advanced Micro Devices Inc (a) | | | 3,150 | | | | 32,666 | |
Alphabet Inc Cl A (a) | | | 29,894 | | | | 24,518,760 | |
Apple Inc | | | 152,800 | | | | 18,542,280 | |
Applied Materials Inc | | | 616,403 | | | | 21,111,803 | |
Cisco Systems Inc | | | 504 | | | | 15,483 | |
Citrix Systems Inc (a) | | | 203,529 | | | | 18,559,810 | |
Conduent Inc (a) | | | 126,295 | | | | 1,889,373 | |
17
DOMINI IMPACT EQUITY FUND
PORTFOLIOOF INVESTMENTS (continued)
January 31, 2017 (Unaudited)
| | | | | | | | |
| SECURITY | | SHARES | | | VALUE | |
| | | | | | | | |
Information Technology (Continued) | |
eBay Inc (a) | | | 649,300 | | | $ | 20,667,219 | |
F5 Networks Inc (a) | | | 134,863 | | | | 18,075,688 | |
First Solar Inc (a) | | | 358 | | | | 11,166 | |
HP Inc | | | 373,400 | | | | 5,619,670 | |
Hewlett Packard Enterprise Co | | | 497,214 | | | | 11,276,814 | |
Intel Corp | | | 655,644 | | | | 24,140,812 | |
International Business Machines Corp | | | 52 | | | | 9,075 | |
Lam Research Corp | | | 127,945 | | | | 14,695,763 | |
Microsoft Corp | | | 134,227 | | | | 8,677,776 | |
Motorola Solutions Inc | | | 201 | | | | 16,223 | |
NetApp Inc | | | 89,350 | | | | 3,423,892 | |
Synopsys Inc (a) | | | 123,235 | | | | 7,750,249 | |
Teradata Corp (a) | | | 259,033 | | | | 7,605,209 | |
VMware Inc Cl A (a) | | | 28,200 | | | | 2,468,628 | |
Yahoo! Inc (a) | | | 649 | | | | 28,601 | |
| | | | | | | | |
| | | | | | | 209,136,960 | |
| | | | | | | | |
|
Materials – 3.7% | |
Domtar Corp | | | 227,700 | | | | 9,948,213 | |
Nucor Corp | | | 230 | | | | 13,361 | |
Sherwin-Williams Co/The | | | 31,425 | | | | 9,547,229 | |
Steel Dynamics Inc | | | 398,113 | | | | 13,460,201 | |
WestRock Co | | | 256 | | | | 13,660 | |
| | | | | | | | |
| | | | | | | 32,982,664 | |
| | | | | | | | |
|
Real Estate – 3.4% | |
American Homes 4 Rent Cl A | | | 392,170 | | | | 8,737,548 | |
| | | | | | | | |
| SECURITY | | SHARES | | | VALUE | |
| | | | | | | | |
Real Estate (Continued) | |
Mack-Cali Realty Corp | | | 238,623 | | | $ | 6,686,216 | |
Omega Healthcare Investors Inc | | | 135,542 | | | | 4,346,832 | |
Physicians Realty Trust | | | 122,800 | | | | 2,277,940 | |
Retail Properties of America Inc Cl A | | | 408,026 | | | | 6,108,149 | |
STORE Capital Corp | | | 104,000 | | | | 2,460,640 | |
| | | | | | | | |
| | | | | | | 30,617,325 | |
| | | | | | | | |
|
Telecommunication Services – 4.2% | |
AT&T Inc | | | 60,138 | | | | 2,535,418 | |
Telephone & Data Systems Inc | | | 146,076 | | | | 4,477,229 | |
Verizon Communications Inc | | | 625,573 | | | | 30,659,333 | |
| | | | | | | | |
| | | | | | | 37,671,980 | |
| | | | | | | | |
|
Utilities – 3.3% | |
Consolidated Edison Inc | | | 323,681 | | | | 24,065,682 | |
Southwest Gas Holdings Inc | | | 70,277 | | | | 5,662,218 | |
| | | | | | | | |
| | | | | | | 29,727,900 | |
| | | | | | | | |
| |
Total Investments – 98.9% (Cost $775,658,677) (b) | | | | 891,220,501 | |
| |
Other Assets, less liabilities – 1.1% | | | | 9,511,063 | |
| | | | | | | | |
| |
Net Assets – 100.0% | | | $ | 900,731,564 | |
| | | | | | | | |
(a) Non-income producing security.
(b) The aggregate cost for federal income tax purposes is $776,083,870. The aggregate gross unrealized appreciation is $133,073,020 and the aggregate gross unrealized depreciation is $17,936,389, resulting in net unrealized appreciation of $115,136,631.
ADR — American Depository Receipt
SEE NOTES TO FINANCIAL STATEMENTS
18
DOMINI IMPACT INTERNATIONAL EQUITY FUND
Fund Performance and Holdings
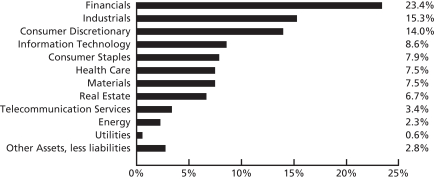
The table and bar charts below provide information as of January 31, 2017, about the ten largest holdings of the Domini Impact International Equity Fund and its portfolio holdings by industry sector and country:
TEN LARGEST HOLDINGS (Unaudited)
| | | | | | | | | | |
| | | | |
| SECURITY DESCRIPTION | | % NET
ASSETS | | | SECURITY DESCRIPTION | | % NET
ASSETS | |
| Sanofi | | | 2.7% | | | Central Japan Railway Co | | | 1.8% | |
| Nissan Motor Co Ltd | | | 2.3% | | | ING Groep NV | | | 1.7% | |
| Norsk Hydro ASA | | | 2.1% | | | Kingfisher PLC | | | 1.7% | |
| Cie de Saint-Gobain | | | 2.0% | | | Vivendi SA | | | 1.7% | |
| Swiss Re AG | | | 1.8% | | | Peugeot SA | | | 1.6% | |
PORTFOLIO HOLDINGS BY INDUSTRY SECTOR (% OF NET ASSETS) (Unaudited)
19
PORTFOLIO HOLDINGS BY COUNTRY (% OF NET ASSETS) (Unaudited)
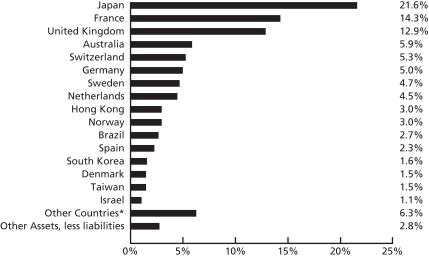
*Other countries include Singapore (0.9%), Turkey (0.8%), Finland (0.6%), Hungary (0.6%), Italy (0.6%), South Africa (0.6%), China (0.5%), Panama (0.5%), United States (0.5%), New Zealand (0.4%), Belgium (0.2%), Indonesia (0.1%), and Ireland (0.0%).
The holdings mentioned above are described in the Domini Impact International Equity Fund’s Portfolio of Investments (as of 1/31/17), included herein. The composition of the Fund’s portfolio is subject to change.
20
| | | | | | | | | | | | |
DOMINI IMPACT INTERNATIONAL EQUITY FUND AVERAGE ANNUAL TOTAL RETURNS (Unaudited) |
| | | Investor
shares | | Class A shares
(with 4.75%
maximum
Sales Charge)1 | | Class A shares
(without Sales
Charge)1 | | Institutional
shares2 | | MSCI EAFE |
| As of 1/31/17 | | 1 Year | | 12.66% | | 7.21% | | 12.55% | | 13.13% | | 12.59% |
| | 5 Year | | 9.04% | | 8.01% | | 9.07% | | 9.04% | | 6.52% |
| | 10 Year | | 0.90% | | 0.42% | | 0.90% | | 0.90% | | 1.44% |
| | | Since
Inception
(12/27/06) | | 0.94% | | 0.44% | | 0.94% | | 0.94% | | 1.60% |
Past performance is no guarantee of future results. The Fund’s returns quoted above represent past performance after all expenses and waivers in effect during the periods shown. Investment return, principal value, and yield will fluctuate. Your shares, when redeemed, may be worth more or less than their original cost. Call 1-800-582-6757 or visit www.domini.com for performance information current to the most recent month-end, which may be lower or higher. A 2.00% fee applies to sales/exchanges made less than 30 days after the settlement of purchase/exchange, with certain exceptions. Quoted performance data does not reflect the deduction of this fee, which would reduce the performance quoted. See the Fund’s prospectus for further information.
Per the prospectus dated November 30, 2016, the Fund’s annual operating expenses totaled 1.52% (gross/net) (Investor shares), 1.59% (gross)/1.53% (net) (Class A shares), and 1.10% (gross/net) (Institutional shares) of net assets representing each share class, respectively. Until 11/30/17, the Fund’s Manager has contractually agreed to limit certain ordinary expenses to 1.60% (Investor), 1.57 (Class A) and 1.27% (Institutional) of the Fund’s average daily net assets representing each share class, respectively, absent an earlier modification by the Fund’s Board. The Fund’s total return may have been lower without this limit.
The table does not reflect the deduction of taxes that a shareholder would pay on Fund distributions or the redemption of Fund shares. Total return for the Fund is based on the Fund’s net asset values and assumes all dividend and capital gains were reinvested.
An investment in the Fund is not a bank deposit and is not insured. You may lose money. The Fund is subject to market, sector concentration and style risks. Investing internationally involves special risks, such as currency fluctuations, social and economic instability, differing securities regulations and accounting standards, limited public information, possible changes in taxation and periods of illiquidity. These risks are magnified in emerging markets.
The MSCI EAFE Index is an unmanaged index of common stocks. You cannot invest directly in an index.
1Class A shares were not offered prior to November 28, 2008. All performance information for time periods beginning prior to November 28, 2008 is the performance of the Investor shares. This performance has not been adjusted to reflect the lower expenses of the Class A shares, but, where noted, does reflect an adjustment for the maximum applicable sales charges of 4.75%.
2Institutional shares were not offered prior to November 30, 2012. All performance information for time periods beginning prior to November 30, 2012, is the performance of the Investor shares. This performance has not been adjusted to reflect the lower expenses of the Institutional shares.
21
DOMINI IMPACT INTERNATIONAL FUND
PORTFOLIOOF INVESTMENTS
January 31, 2017 (Unaudited)
| | | | | | | | | | |
| COUNTRY/SECURITY | | INDUSTRY | | SHARES | | | VALUE | |
Common Stock – 97.2% | | | | | | | | | | |
Australia – 5.9% | | | | | | | | | | |
Alumina Ltd | | Materials | | | 1,265,549 | | | $ | 1,863,838 | |
Bendigo & Adelaide Bank Ltd | | Banks | | | 535,800 | | | | 5,104,744 | |
BlueScope Steel Ltd | | Materials | | | 460,803 | | | | 3,921,466 | |
Challenger Ltd/Australia | | Diversified Financials | | | 393,576 | | | | 3,292,590 | |
Dexus Property Group | | Real Estate | | | 1,555,007 | | | | 10,600,740 | |
Fortescue Metals Group Ltd | | Materials | | | 1,404,272 | | | | 7,099,912 | |
Harvey Norman Holdings Ltd | | Retailing | | | 789,972 | | | | 2,998,536 | |
Mirvac Group | | Real Estate | | | 1,535,141 | | | | 2,365,766 | |
Sims Metal Management Ltd | | Materials | | | 389,690 | | | | 3,310,372 | |
| | | | | | | | | | |
| | | | | | | | | 40,557,964 | |
| | | | | | | | | | |
| | | | | | | | | | |
Belgium – 0.2% | | | | | | | | | | |
Ageas | | Insurance | | | 34,099 | | | | 1,458,555 | |
| | | | | | | | | | |
| | | | | | | | | 1,458,555 | |
| | | | | | | | | | |
| | | | | | | | | | |
Brazil – 2.7% | | | | | | | | | | |
Banco Bradesco SA Pfd Shs | | Banks | | | 285,120 | | | | 2,964,099 | |
Banco do Brasil SA | | Banks | | | 366,996 | | | | 3,629,765 | |
Cia de Transmissao de Energia Eletrica Paulista Pfd Shs | | Utilities | | | 46,596 | | | | 973,265 | |
Itau Unibanco Holding SA Pfd Shs | | Banks | | | 199,100 | | | | 2,357,209 | |
Itausa – Investimentos Itau SA Pfd Shs | | Banks | | | 1,221,600 | | | | 3,604,078 | |
Localiza Rent a Car SA | | Transportation | | | 139,361 | | | | 1,632,661 | |
M Dias Branco SA | | Food & Beverage | | | 84,705 | | | | 3,337,088 | |
| | | | | | | | | | |
| | | | | | | | | 18,498,165 | |
| | | | | | | | | | |
| | | | | | | | | | |
China – 0.5% | | | | | | | | | | |
Belle International Holdings Ltd | | Consumer Durables & Apparel | | | 2,091,142 | | | | 1,282,818 | |
Nine Dragons Paper Holdings Ltd | | Materials | | | 1,343,073 | | | | 1,554,356 | |
Ping An Insurance Group Co of China Ltd Cl H | | Insurance | | | 174,088 | | | | 899,680 | |
| | | | | | | | | | |
| | | | | | | | | 3,736,854 | |
| | | | | | | | | | |
| | | | | | | | | | |
Denmark – 1.5% | | | | | | | | | | |
TDC A/S (a) | | Telecommunication Services | | | 188,621 | | | | 993,564 | |
Vestas Wind Systems A/S | | Capital Goods | | | 137,092 | | | | 9,593,930 | |
| | | | | | | | | | |
| | | | | | | | | 10,587,494 | |
| | | | | | | | | | |
| | | | | | | | | | |
22
DOMINI IMPACT INTERNATIONAL FUND
PORTFOLIOOF INVESTMENTS (continued)
January 31, 2017 (Unaudited)
| | | | | | | | | | |
| COUNTRY/SECURITY | | INDUSTRY | | SHARES | | | VALUE | |
Finland – 0.6% | | | | | | | | | | |
Kesko OYJ Cl B | | Food & Staples Retailing | | | 79,158 | | | $ | 4,007,833 | |
| | | | | | | | | | |
| | | | | | | | | 4,007,833 | |
| | | | | | | | | | |
| | | | | | | | | | |
France – 14.3% | | | | | | | | | | |
Carrefour SA | | Food & Staples Retailing | | | 345 | | | | 8,447 | |
Casino Guichard Perrachon SA | | Food & Staples Retailing | | | 49,369 | | | | 2,662,319 | |
Cie de Saint-Gobain | | Capital Goods | | | 279,340 | | | | 13,735,667 | |
Cie Generale des Etablissements Michelin | | Automobiles & Components | | | 52,292 | | | | 5,616,160 | |
CNP Assurances | | Insurance | | | 139,941 | | | | 2,629,208 | |
Credit Agricole SA | | Banks | | | 711,736 | | | | 9,433,910 | |
Faurecia | | Automobiles & Components | | | 23,241 | | | | 1,009,058 | |
Orange SA | | Telecommunication Services | | | 681,477 | | | | 10,549,966 | |
Peugeot SA (a) | | Automobiles & Components | | | 599,321 | | | | 11,140,205 | |
Renault SA | | Automobiles & Components | | | 57,291 | | | | 5,162,422 | |
Sanofi | | Pharma, Biotech & Life Sciences | | | 229,528 | | | | 18,477,316 | |
STMicroelectronics NV | | Semiconductors & Semiconductor Equipment | | | 477,178 | | | | 6,288,795 | |
Vivendi SA | | Media | | | 621,909 | | | | 11,385,326 | |
| | | | | | | | | | |
| | | | | | | | | 98,098,799 | |
| | | | | | | | | | |
| | | | | | | | | | |
Germany – 5.0% | | | | | | | | | | |
adidas AG | | Consumer Durables & Apparel | | | 27,901 | | | | 4,391,729 | |
Allianz SE | | Insurance | | | 58,991 | | | | 9,996,248 | |
Henkel AG & Co KGaA Pfd Shs | | Household & Personal Products | | | 63,882 | | | | 7,780,503 | |
Innogy SE (a) | | Utilities | | | 32,002 | | | | 1,095,812 | |
METRO AG | | Food & Staples Retailing | | | 189,513 | | | | 6,473,941 | |
Suedzucker AG | | Food & Beverage | | | 166,254 | | | | 4,389,356 | |
| | | | | | | | | | |
| | | | | | | | | 34,127,589 | |
| | | | | | | | | | |
| | | | | | | | | | |
Hong Kong – 3.0% | | | | | | | | | | |
Cheung Kong Property Holdings Ltd | | Real Estate | | | 185,665 | | | | 1,229,894 | |
Great Eagle Holdings Ltd | | Real Estate | | | 187,289 | | | | 853,250 | |
Hongkong Land Holdings Ltd | | Real Estate | | | 193,945 | | | | 1,309,129 | |
Hysan Development Co Ltd | | Real Estate | | | 291,833 | | | | 1,335,173 | |
Wharf Holdings Ltd/The | | Real Estate | | | 1,037,387 | | | | 7,827,848 | |
Wheelock & Co Ltd | | Real Estate | | | 1,009,838 | | | | 6,162,350 | |
Xinyi Glass Holdings Ltd | | Automobiles & Components | | | 1,843,104 | | | | 1,665,108 | |
| | | | | | | | | | |
| | | | | | | | | 20,382,752 | |
| | | | | | | | | | |
| | | | | | | | | | |
Hungary – 0.6% | | | | | | | | | | |
OTP Bank PLC | | Banks | | | 36,529 | | | | 1,122,876 | |
Richter Gedeon Nyrt | | Pharma, Biotech & Life Sciences | | | 150,532 | | | | 3,241,958 | |
| | | | | | | | | | |
| | | | | | | | | 4,364,834 | |
| | | | | | | | | | |
23
DOMINI IMPACT INTERNATIONAL FUND
PORTFOLIOOF INVESTMENTS (continued)
January 31, 2017 (Unaudited)
| | | | | | | | | | |
| COUNTRY/SECURITY | | INDUSTRY | | SHARES | | | VALUE | |
Indonesia – 0.1% | | | | | | | | | | |
Telekomunikasi Indonesia Persero Tbk PT | | Telecommunication Services | | | 3,315,495 | | | $ | 960,941 | |
| | | | | | | | | | |
| | | | | | | | | 960,941 | |
| | | | | | | | | | |
| | | | | | | | | | |
Israel – 1.1% | | | | | | | | | | |
Mobileye NV (a) | | Software & Services | | | 47,972 | | | | 2,060,877 | |
Taro Pharmaceutical Industries Ltd (a) | | Pharma, Biotech & Life Sciences | | | 49,308 | | | | 5,152,193 | |
| | | | | | | | | | |
| | | | | | | | | 7,213,070 | |
| | | | | | | | | | |
| | | | | | | | | | |
Ireland – 0% | | | | | | | | | | |
Irish Bank Resolution Corp Ltd/Old (a) (c) | | Banks | | | 138,674 | | | | 0 | |
| | | | | | | | | | |
| | | | | | | | | 0 | |
| | | | | | | | | | |
| | | | | | | | | | |
Italy – 0.6% | | | | | | | | | | |
A2A SpA | | Utilities | | | 1,977,348 | | | | 2,636,960 | |
Recordati SpA | | Pharma, Biotech & Life Sciences | | | 60,966 | | | | 1,733,460 | |
| | | | | | | | | | |
| | | | | | | | | 4,370,420 | |
| | | | | | | | | | |
| | | | | | | | | | |
Japan – 21.6% | | | | | | | | | | |
Aeon Mall Co Ltd | | Real Estate | | | 40,942 | | | | 596,082 | |
Asahi Glass Co Ltd | | Capital Goods | | | 1,409,866 | | | | 10,519,986 | |
Astellas Pharma Inc | | Pharma, Biotech & Life Sciences | | | 240,266 | | | | 3,230,225 | |
Central Japan Railway Co | | Transportation | | | 74,123 | | | | 12,029,556 | |
Dai Nippon Printing Co Ltd | | Commercial & Professional Services | | | 845,134 | | | | 8,625,885 | |
Daiichi Sankyo Co Ltd | | Pharma, Biotech & Life Sciences | | | 149,961 | | | | 3,362,883 | |
FUJIFILM Holdings Corp | | Technology Hardware & Equipment | | | 20,044 | | | | 778,970 | |
Ibiden Co Ltd | | Technology Hardware & Equipment | | | 454,759 | | | | 6,503,771 | |
K’s Holdings Corp | | Retailing | | | 172,942 | | | | 3,129,317 | |
Medipal Holdings Corp | | Health Care Equipment & Services | | | 227,876 | | | | 3,702,289 | |
Mitsubishi Gas Chemical Co Inc | | Materials | | | 247,706 | | | | 4,772,590 | |
Mitsui Fudosan Co Ltd | | Real Estate | | | 445,191 | | | | 10,347,255 | |
Mixi Inc | | Software & Services | | | 108,442 | | | | 4,715,288 | |
MS&AD Insurance Group Holdings Inc | | Insurance | | | 321,023 | | | | 10,821,961 | |
Nintendo Co Ltd | | Software & Services | | | 13,694 | | | | 2,812,394 | |
Nippon Electric Glass Co Ltd | | Technology Hardware & Equipment | | | 716,261 | | | | 4,142,002 | |
Nissan Motor Co Ltd | | Automobiles & Components | | | 1,590,580 | | | | 15,810,428 | |
Nomura Holdings Inc | | Diversified Financials | | | 1,161,043 | | | | 7,255,552 | |
Nomura Real Estate Holdings Inc | | Real Estate | | | 104,485 | | | | 1,805,226 | |
NTN Corp | | Capital Goods | | | 5,300 | | | | 22,551 | |
ORIX Corp | | Diversified Financials | | | 385,541 | | | | 5,846,045 | |
24
DOMINI IMPACT INTERNATIONAL FUND
PORTFOLIOOF INVESTMENTS (continued)
January 31, 2017 (Unaudited)
| | | | | | | | | | |
| COUNTRY/SECURITY | | INDUSTRY | | SHARES | | | VALUE | |
Japan (Continued) | | | | | | | | | | |
Rohm Co Ltd | | Semiconductors & Semiconductor Equipment | | | 83,568 | | | $ | 5,374,482 | |
Seiko Epson Corp | | Technology Hardware & Equipment | | | 217,373 | | | | 4,500,968 | |
Seino Holdings Co Ltd | | Transportation | | | 208,293 | | | | 2,414,589 | |
Sumitomo Dainippon Pharma Co Ltd | | Pharma, Biotech & Life Sciences | | | 89,177 | | | | 1,508,266 | |
T&D Holdings Inc | | Insurance | | | 180,694 | | | | 2,702,184 | |
Toppan Printing Co Ltd | | Commercial & Professional Services | | | 891,626 | | | | 8,783,595 | |
Yamada Denki Co Ltd | | Retailing | | | 288,500 | | | | 1,594,022 | |
| | | | | | | | | | |
| | | | | | | | | 147,708,362 | |
| | | | | | | | | | |
| | | | | | | | | | |
Netherlands – 4.5% | | | | | | | | | | |
ABN AMRO Group NV | | Banks | | | 256,645 | | | | 6,032,500 | |
ING Groep NV | | Banks | | | 834,956 | | | | 11,955,967 | |
Koninklijke Vopak NV | | Energy | | | 96,420 | | | | 4,138,347 | |
NN Group NV | | Insurance | | | 238,849 | | | | 8,448,404 | |
| | | | | | | | | | |
| | | | | | | | | 30,575,218 | |
| | | | | | | | | | |
| | | | | | | | | | |
New Zealand – 0.4% | | | | | | | | | | |
Fletcher Building Ltd | | Materials | | | 155,275 | | | | 1,195,400 | |
Spark New Zealand Ltd | | Telecommunication Services | | | 559,214 | | | | 1,439,155 | |
| | | | | | | | | | |
| | | | | | | | | 2,634,555 | |
| | | | | | | | | | |
| | | | | | | | | | |
Norway – 3.0% | | | | | | | | | | |
Norsk Hydro ASA | | Materials | | | 2,566,189 | | | | 14,655,917 | |
Subsea 7 SA (a) | | Energy | | | 441,851 | | | | 6,020,054 | |
| | | | | | | | | | |
| | | | | | | | | 20,675,971 | |
| | | | | | | | | | |
| | | | | | | | | | |
Panama – 0.5% | | | | | | | | | | |
Copa Holdings SA Cl A | | Transportation | | | 34,297 | | | | 3,343,615 | |
| | | | | | | | | | |
| | | | | | | | | 3,343,615 | |
| | | | | | | | | | |
| | | | | | | | | | |
Singapore – 0.9% | | | | | | | | | | |
DBS Group Holdings Ltd | | Banks | | | 479,141 | | | | 6,451,806 | |
| | | | | | | | | | |
| | | | | | | | | 6,451,806 | |
| | | | | | | | | | |
| | | | | | | | | | |
South Africa – 0.6% | | | | | | | | | | |
MTN Group Ltd | | Telecommunication Services | | | 1,029 | | | | 9,578 | |
Nedbank Group Ltd | | Banks | | | 154,938 | | | | 2,669,002 | |
Tiger Brands Ltd | | Food & Beverage | | | 43,280 | | | | 1,302,285 | |
| | | | | | | | | | |
| | | | | | | | | 3,980,865 | |
| | | | | | | | | | |
| | | | | | | | | | |
South Korea – 1.6% | | | | | | | | | | |
Industrial Bank of Korea (a) | | Banks | | | 301,943 | | | | 3,299,782 | |
LG Corp (a) | | Capital Goods | | | 30,088 | | | | 1,532,751 | |
25
DOMINI IMPACT INTERNATIONAL FUND
PORTFOLIOOF INVESTMENTS (continued)
January 31, 2017 (Unaudited)
| | | | | | | | | | |
| COUNTRY/SECURITY | | INDUSTRY | | SHARES | | | VALUE | |
South Korea (Continued) | | | | | | | | | | |
LG Display Co Ltd | | Technology Hardware & Equipment | | | 130,224 | | | $ | 3,434,615 | |
LG Electronics Inc | | Consumer Durables & Apparel | | | 23,510 | | | | 1,120,776 | |
LG Uplus Corp | | Telecommunication Services | | | 124,478 | | | | 1,221,108 | |
| | | | | | | | | | |
| | | | | | | | | 10,609,032 | |
| | | | | | | | | | |
| | | | | | | | | | |
Spain – 2.3% | | | | | | | | | | |
Aena SA | | Transportation | | | 50,443 | | | | 7,323,923 | |
Banco Santander SA | | Banks | | | 240,544 | | | | 1,338,513 | |
Mapfre SA | | Insurance | | | 2,333,019 | | | | 7,059,624 | |
| | | | | | | | | | |
| | | | | | | | | 15,722,060 | |
| | | | | | | | | | |
Sweden – 4.7% | | | | | | | | | | |
Atlas Copco AB Cl A | | Capital Goods | | | 89,990 | | | | 2,885,535 | |
Electrolux AB Ser B | | Consumer Durables & Apparel | | | 277,499 | | | | 7,380,630 | |
Holmen AB Cl B | | Materials | | | 30,067 | | | | 1,099,618 | |
Investor AB Cl B | | Diversified Financials | | | 104,039 | | | | 4,152,467 | |
Millicom International Cellular SA | | Telecommunication Services | | | 32,206 | | | | 1,593,795 | |
Oriflame Holding AG | | Household & Personal Products | | | 67,672 | | | | 2,053,013 | |
Sandvik AB | | Capital Goods | | | 754,013 | | | | 10,178,175 | |
SSAB AB Cl B (a) | | Materials | | | 942,199 | | | | 3,172,064 | |
| | | | | | | | | | |
| | | | | | | | | 32,515,297 | |
| | | | | | | | | | |
| | | | | | | | | | |
Switzerland – 5.3% | | | | | | | | | | |
Logitech International SA | | Technology Hardware & Equipment | | | 171,780 | | | | 4,918,696 | |
Lonza Group AG | | Pharma, Biotech & Life Sciences | | | 59,168 | | | | 10,848,866 | |
Swiss Life Holding AG | | Insurance | | | 27,274 | | | | 8,268,451 | |
Swiss Re AG | | Insurance | | | 129,802 | | | | 12,117,133 | |
| | | | | | | | | | |
| | | | | | | | | 36,153,146 | |
| | | | | | | | | | |
| | | | | | | | | | |
Taiwan – 1.5% | | | | | | | | | | |
Inventec Corp | | Technology Hardware & Equipment | | | 1,279,780 | | | | 959,447 | |
Lite-On Technology Corp | | Technology Hardware & Equipment | | | 2,019,731 | | | | 3,041,259 | |
Taiwan Semiconductor Manufacturing Co Ltd | | Semiconductors & Semiconductor Equipment | | | 325,373 | | | | 1,925,499 | |
United Microelectronics Corp | | Semiconductors & Semiconductor Equipment | | | 6,109,928 | | | | 2,212,330 | |
Wistron Corp | | Technology Hardware & Equipment | | | 2,451,811 | | | | 2,084,501 | |
| | | | | | | | | | |
| | | | | | | | | 10,223,036 | |
| | | | | | | | | | |
| | | | | | | | | | |
Turkey – 0.8% | | | | | | | | | | |
Turkiye Is Bankasi | | Banks | | | 2,256,683 | | | | 3,562,539 | |
26
DOMINI IMPACT INTERNATIONAL FUND
PORTFOLIOOF INVESTMENTS (continued)
January 31, 2017 (Unaudited)
| | | | | | | | | | |
| COUNTRY/SECURITY | | INDUSTRY | | SHARES | | | VALUE | |
Turkey (Continued) | | | | | | | | | | |
Turkiye Vakiflar Bankasi TAO | | Banks | | | 1,677,175 | | | $ | 2,181,236 | |
| | | | | | | | | | |
| | | | | | | | | 5,743,775 | |
| | | | | | | | | | |
| | | | | | | | | | |
United Kingdom – 12.9% | | | | | | | | | | |
3i Group PLC | | Diversified Financials | | | 957,818 | | | | 8,435,220 | |
Auto Trader Group PLC | | Software & Services | | | 685,812 | | | | 3,451,282 | |
Barratt Developments PLC | | Consumer Durables & Apparel | | | 1,008,636 | | | | 6,061,848 | |
Coca-Cola HBC AG | | Food & Beverage | | | 331,990 | | | | 7,568,304 | |
Inchcape PLC | | Retailing | | | 423,702 | | | | 3,824,704 | |
J Sainsbury PLC | | Food & Staples Retailing | | | 1,762,564 | | | | 5,718,888 | |
Johnson Matthey PLC | | Materials | | | 217,541 | | | | 8,897,612 | |
Kingfisher PLC | | Retailing | | | 2,699,557 | | | | 11,418,409 | |
Melrose Industries PLC | | Capital Goods | | | 1,495,919 | | | | 3,674,637 | |
Persimmon PLC | | Consumer Durables & Apparel | | | 45,993 | | | | 1,116,193 | |
Petrofac Ltd | | Energy | | | 180,363 | | | | 2,080,809 | |
Royal Mail PLC | | Transportation | | | 1,618,418 | | | | 8,380,722 | |
Schroders PLC | | Diversified Financials | | | 26,279 | | | | 970,028 | |
Segro PLC | | Real Estate | | | 196,635 | | | | 1,141,689 | |
Unilever PLC | | Household & Personal Products | | | 237 | | | | 9,623 | |
Vodafone Group PLC | | Telecommunication Services | | | 2,605,036 | | | | 6,369,622 | |
Wm Morrison Supermarkets PLC | | Food & Staples Retailing | | | 3,074,950 | | | | 9,133,756 | |
| | | | | | | | | | |
| | | | | | | | | 88,253,346 | |
| | | | | | | | | | |
| | | | | | | | | | |
United States – 0.5% | | | | | | | | | | |
Core Laboratories NV | | Energy | | | 29,028 | | | | 3,391,341 | |
| | | | | | | | | | |
| | | | | | | | | 3,391,341 | |
| | | | | | | | | | |
| | |
Total Investments – 97.2% (Cost $603,603,439) (b) | | | | | | | 666,346,695 | |
| | |
Other Assets, less liabilities – 2.8% | | | | | | | 19,220,166 | |
| | | | | | | | | | |
| | | |
Net Assets – 100.0% | | | | | | | | $ | 685,566,861 | |
| | | | | | | | | | |
(a) Non-income producing security.
(b) The aggregate cost for federal income tax purposes is $609,153,580. The aggregate gross unrealized appreciation is $76,747,080 and the aggregate gross unrealized depreciation is $19,553,965, resulting in net unrealized appreciation of $57,193,115.
(c) Securities for which there are no such quotations or valuations are valued at fair value as determined in good faith by or at the direction of the Fund’s Board of Trustees.
SEE NOTES TO FINANCIAL STATEMENTS
27
DOMINI IMPACT BOND FUND
Fund Performance and Holdings
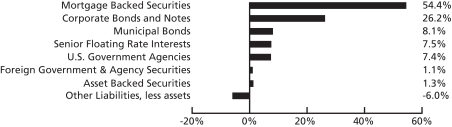
The bar chart below provides information as of January 31, 2017, about the percentage of the Domini Impact Bond Fund’s portfolio holdings invested in various types of debt obligations:
PORTFOLIO COMPOSITION (% OF NET ASSETS) (Unaudited)
28
| | | | | | | | |
DOMINI IMPACT BOND FUND AVERAGE ANNUAL TOTAL RETURNS (Unaudited) |
| | | Investor shares | | Institutional shares1 | | Bloomberg
Barclays U.S.
Aggregate Index |
| As of 1/31/17 | | 1 Year | | 2.22% | | 2.44% | | 1.45% |
| | 5 Year | | 1.32% | | 1.57% | | 2.10% |
| | 10 Year | | 3.53% | | 3.53% | | 4.38% |
| | | Since Inception (6/1/00) | | 4.24% | | 4.24% | | 5.21% |
Past performance is no guarantee of future results. The Fund’s returns quoted above represent past performance after all expenses and waivers in effect during the periods shown. Investment return, principal value, and yield will fluctuate. Your shares, when redeemed, may be worth more or less than their original cost. Call 1-800-582-6757 or visit www.domini.com for performance information current to the most recent month-end, which may be lower or higher. A 2.00% fee applies to sales/exchanges made less than 30 days after the settlement of purchase/exchange, with certain exceptions. Quoted performance data does not reflect the deduction of this fee, which would reduce the performance quoted. See the Fund’s prospectus for further information.
Per the prospectus dated November 30, 2016, the Fund’s annual operating expenses totaled 1.19% (gross)/0.93% (net) (Investor shares) and 1.22% (gross)/0.63% (net) (Institutional shares) of net assets representing each share class, respectively. Until 11/30/17, the Fund’s Manager has contractually agreed to limit certain ordinary expenses to 0.95% (Investor) and 0.65% (Institutional) of the Fund’s average daily net assets representing each share class, respectively, absent an earlier modification by the Fund’s Board. The Fund’s total returns would have been lower without these limits.
The table does not reflect the deduction of taxes that a shareholder would pay on Fund distributions or the redemption of Fund shares. Total return for the Fund is based on the Fund’s net asset values and assumes all dividend and capital gains were reinvested.
An investment in the Fund is not a bank deposit and is not insured. You may lose money. The Fund is subject to credit, interest rate, liquidity and market risks. During periods of rising interest rates, the Fund can lose value. The Fund’s community development investments may be unrated and may carry greater risk than the Fund’s other holdings. The Fund currently holds a large percentage of its portfolio in mortgage-backed securities. During periods of falling interest rates these securities may prepay the principal due, which may lower the Fund’s return by causing it to reinvest at lower interest rates.
Investments in derivatives can be volatile. Potential risks include currency risk, leverage risk (the risk that small market movements may result in large changes in the value of an investment), liquidity risk, index risk, pricing risk, and counterparty risk (the risk that the counterparty may be unwilling or unable to honor its obligations). TBA (To Be Announced) securities involve the risk that the security the Fund buys will lose value prior to its delivery. There also is the risk that the security will not be issued or that the other party to the transaction will not meet its obligation, which can adversely affect the Fund’s results.
The reduction or withdrawal of historical financial market support activities by the U.S. Government and Federal Reserve, or other governments/central banks could negatively impact financial markets generally, and increase market, liquidity and interest rate risks which could adversely affect the Fund’s returns.
The Bloomberg Barclays U.S. Aggregate Bond Index (BBUSA) is an index representing securities that are U.S. domestic, taxable, and dollar denominated and covering the U.S investment grade fixed rate bond market, with index components for government and corporate securities and asset-backed securities. You cannot invest directly in an index.
1Institutional shares were not offered prior to November 30, 2011. All performance information for time periods beginning prior to November 30, 2011, is the performance of the Investor shares. This performance has not been adjusted to reflect the lower expenses of the Institutional shares.
29
DOMINI IMPACT BOND FUND
PORTFOLIOOF INVESTMENTS
January 31, 2017 (Unaudited)
| | | | | | | | |
| | | Principal
Amount | | | Value | |
Mortgage Backed Securities – 54.4% | | | | | | | | |
Agency Collateralized Mortgage Obligations – 1.1% | | | | | | | | |
Fannie Mae Connecticut Avenue Securities | | | | | | | | |
5.121%, VR, 4/25/2029 | | $ | 235,000 | | | $ | 248,428 | |
4.323%, VR, 7/25/2029 (b) | | | 120,000 | | | | 122,053 | |
FNR 2017 17 BC, 3.500%, 3/25/2027 (f) | | | 368,000 | | | | 383,396 | |
FHR 3877 LM, 3.500%, 6/15/2026 | | | 780,000 | | | | 817,105 | |
| | | | | | | | |
| | | | | | | 1,570,982 | |
| | | | | | | | |
| | | | | | | | |
Commercial Mortgage Backed Securities – 5.7% | | | | | | | | |
Banc of America Commercial Mortgage Trust 2015-UBS7,
3.705%, 9/15/2048 | | | 150,000 | | | | 157,383 | |
BWAY 2013-1515 Mortgage Trust 144A,
2.809%, 3/10/2033 (e) | | | 182,552 | | | | 183,980 | |
Citigroup Commercial Mortgage Trust 2015-P1,
3.717%, 9/15/2048 | | | 384,000 | | | | 400,892 | |
Commercial Mortgage Trust | | | | | | | | |
3.350%, 2/10/2048 | | | 326,000 | | | | 330,265 | |
3.612%, 10/10/2048 | | | 115,000 | | | | 118,951 | |
3.630%, 10/10/2048 | | | 260,000 | | | | 268,326 | |
3.644%, 12/10/2047 | | | 325,000 | | | | 335,508 | |
144A, 3.424%, 3/10/2031 (e) | | | 640,000 | | | | 664,372 | |
144A, 3.726%, 3/10/2031 (e) | | | 644,000 | | | | 665,582 | |
CSAIL Commercial Mortgage Trust | | | | | | | | |
3.505%, 4/15/2050 | | | 394,000 | | | | 407,433 | |
3.808%, 11/15/2048 | | | 388,000 | | | | 404,757 | |
Hudson Yards 144A, 2.835%, 8/10/2038 (e) | | | 1,000,000 | | | | 965,296 | |
Morgan Stanley Baml Trust | | | | | | | | |
2.918%, 2/15/2046 | | | 360,000 | | | | 364,835 | |
3.102%, 5/15/2046 | | | 300,000 | | | | 306,012 | |
3.526%, 12/15/2047 | | | 180,167 | | | | 186,197 | |
3.741%, 8/15/2047 | | | 300,000 | | | | 314,531 | |
3.892%, 6/15/2047 | | | 300,000 | | | | 317,364 | |
4.051%, 4/15/2047 | | | 300,000 | | | | 320,600 | |
4.084%, VR, 7/15/2046 | | | 150,000 | | | | 161,847 | |
4.259%, VR, 10/15/2046 | | | 300,000 | | | | 325,882 | |
OBP Depositor LLC Trust 2010-OBP 144A,
4.646%, 7/15/2045 (e) | | | 806,000 | | | | 857,329 | |
Wells Fargo Commercial Mortgage Trust,
3.718%, 12/15/2048 | | | 318,000 | | | | 330,061 | |
| | | | | | | | |
| | | | | | | 8,387,403 | |
| | | | | | | | |
| | | | | | | | |
Federal Home Loan Mortgage Corporation – 15.2% | | | | | | | | |
849167, 2.905%, VR, 10/1/2043 (d) | | | 488,032 | | | | 499,705 | |
A12413, 5.000%, 8/1/2033 (d) | | | 32,755 | | | | 35,968 | |
A37619, 4.500%, 9/1/2035 (d) | | | 235,042 | | | | 253,666 | |
A87874, 4.000%, 8/1/2039 (d) | | | 84,383 | | | | 89,214 | |
A89148, 4.000%, 10/1/2039 (d) | | | 132,218 | | | | 139,432 | |
A89384, 4.000%, 10/1/2039 (d) | | | 169,089 | | | | 178,347 | |
30
DOMINI IMPACT BOND FUND
PORTFOLIOOF INVESTMENTS (continued)
January 31, 2017 (Unaudited)
| | | | | | | | |
| | | Principal
Amount | | | Value | |
Federal Home Loan Mortgage Corporation (Continued) | | | | | | | | |
A89729, 4.000%, 11/1/2039 (d) | | $ | 82,635 | | | $ | 87,153 | |
A93101, 5.000%, 7/1/2040 (d) | | | 144,805 | | | | 157,744 | |
A93996, 4.500%, 9/1/2040 (d) | | | 68,706 | | | | 74,011 | |
A94362, 4.000%, 10/1/2040 (d) | | | 210,044 | | | | 222,497 | |
A94742, 4.000%, 11/1/2040 (d) | | | 34,260 | | | | 36,239 | |
A95084, 4.000%, 11/1/2040 (d) | | | 30,545 | | | | 32,100 | |
A95085, 4.000%, 11/1/2040 (d) | | | 266,261 | | | | 280,142 | |
A95796, 4.000%, 12/1/2040 (d) | | | 125,516 | | | | 132,055 | |
A97047, 4.500%, 2/1/2041 (d) | | | 139,412 | | | | 150,464 | |
FHR 3806 L, 3.500%, 2/15/2026 (f) | | | 847,000 | | | | 890,130 | |
FHR 3800 CB, 3.500%, 2/15/2026 | | | 383,000 | | | | 404,723 | |
FHR 3768 CB, 3.500%, 12/15/2025 | | | 343,000 | | | | 360,073 | |
G01779, 5.000%, 4/1/2035 (d) | | | 42,572 | | | | 46,662 | |
G01828, 4.500%, 4/1/2035 (d) | | | 201,789 | | | | 217,774 | |
G01837, 5.000%, 7/1/2035 (d) | | | 284,808 | | | | 311,819 | |
G01838, 5.000%, 7/1/2035 (d) | | | 50,159 | | | | 55,028 | |
G02424, 5.500%, 12/1/2036 (d) | | | 198,455 | | | | 220,224 | |
G04997, 5.000%, 1/1/2037 (d) | | | 176,140 | | | | 191,693 | |
G05052, 5.000%, 10/1/2033 (d) | | | 18,978 | | | | 20,880 | |
G06079, 6.000%, 7/1/2039 (d) | | | 173,014 | | | | 195,803 | |
G06990, 5.500%, 8/1/2040 (d) | | | 269,640 | | | | 298,976 | |
G08347, 4.500%, 6/1/2039 (d) | | | 427,496 | | | | 460,249 | |
G08499, 3.000%, 7/1/2042 (d) | | | 92,688 | | | | 92,285 | |
G08741, 3.000%, 1/1/2047 (d) | | | 4,189,900 | | | | 4,148,274 | |
G14599, 2.500%, 11/1/2027 (d) | | | 273,266 | | | | 276,523 | |
G30614, 3.500%, 12/1/2032 (d) | | | 412,142 | | | | 427,887 | |
J17791, 3.000%, 1/1/2027 (d) | | | 366,410 | | | | 376,398 | |
J20118, 2.500%, 8/1/2027 (d) | | | 96,109 | | | | 97,227 | |
Q00291, 5.000%, 4/1/2041 (d) | | | 121,997 | | | | 132,856 | |
Q01807, 4.500%, 7/1/2036 (d) | | | 189,629 | | | | 204,682 | |
Q06160, 4.000%, 2/1/2037 (d) | | | 71,479 | | | | 75,110 | |
Q17103, 4.000%, 6/1/2041 (d) | | | 18,005 | | | | 18,932 | |
Q33602, 3.000%, 5/1/2045 (d) | | | 735,292 | | | | 728,334 | |
Z40004, 6.000%, 8/1/2036 (d) | | | 29,620 | | | | 33,626 | |
FHLMC TBA 30 YR, 3.500%, 2/13/2047 (c) | | | 7,500,000 | | | | 7,660,699 | |
FHLMC TBA 30 Yr, 4.000%, 2/13/2047 (c) | | | 900,000 | | | | 944,191 | |
FHLMC TBA 30 Yr, 4.000%, 3/13/2047 (c) | | | 900,000 | | | | 942,223 | |
| | | | | | | | |
| | | | | | | 22,202,018 | |
| | | | | | | | |
| | | | | | | | |
Federal National Mortgage Association – 30.9% | | | | | | | | |
190370, 6.000%, 6/1/2036 (d) | | | 140,129 | | | | 158,669 | |
469829, 2.720%, 12/1/2018 (d) | | | 1,642,741 | | | | 1,670,875 | |
469879, 3.220%, 12/1/2021 (d) | | | 1,005,714 | | | | 1,047,099 | |
471333, 3.120%, 8/1/2022 (d) | | | 1,850,414 | | | | 1,905,250 | |
471478, 2.610%, 8/1/2022 (d) | | | 1,379,531 | | | | 1,396,937 | |
745044, 4.500%, 8/1/2035 (d) | | | 58,726 | | | | 63,440 | |
745327, 6.000%, 3/1/2036 (d) | | | 389,047 | | | | 441,547 | |
889529, 6.000%, 3/1/2038 (d) | | | 66,700 | | | | 76,641 | |
31
DOMINI IMPACT BOND FUND
PORTFOLIOOF INVESTMENTS (continued)
January 31, 2017 (Unaudited)
| | | | | | | | |
| | | Principal
Amount | | | Value | |
Federal National Mortgage Association (Continued) | | | | | | | | |
890248, 6.000%, 8/1/2037 (d) | | $ | 33,733 | | | $ | 38,739 | |
930672, 4.500%, 3/1/2039 (d) | | | 211,477 | | | | 229,373 | |
932441, 4.000%, 1/1/2040 (d) | | | 627,540 | | | | 659,185 | |
995082, 5.500%, 8/1/2037 (d) | | | 121,629 | | | | 136,293 | |
995243, 4.500%, 8/1/2038 (d) | | | 162,235 | | | | 174,818 | |
AA9846, 4.000%, 8/1/2039 (d) | | | 99,331 | | | | 104,483 | |
AB1343, 4.500%, 8/1/2040 (d) | | | 193,224 | | | | 209,292 | |
AB1763, 4.000%, 11/1/2030 (d) | | | 39,231 | | | | 41,548 | |
AB4168, 3.500%, 1/1/2032 (d) | | | 347,574 | | | | 360,983 | |
AB6472, 2.000%, 10/1/2027 (d) | | | 345,317 | | | | 342,915 | |
AC1877, 4.500%, 9/1/2039 (d) | | | 90,497 | | | | 97,458 | |
AC2817, 4.000%, 10/1/2039 (d) | | | 51,421 | | | | 54,015 | |
AC5401, 5.000%, 10/1/2039 (d) | | | 10,311 | | | | 11,253 | |
AC9564, 4.500%, 2/1/2040 (d) | | | 79,310 | | | | 85,883 | |
AD1649, 4.000%, 3/1/2040 (d) | | | 90,223 | | | | 94,837 | |
AD8033, 4.000%, 8/1/2040 (d) | | | 33,475 | | | | 35,246 | |
AE0215, 4.000%, 12/1/2039 (d) | | | 81,590 | | | | 85,642 | |
AE0216, 4.000%, 8/1/2040 (d) | | | 182,908 | | | | 192,348 | |
AE0624, 4.000%, 11/1/2040 (d) | | | 80,358 | | | | 84,498 | |
AE0625, 4.000%, 12/1/2040 (d) | | | 106,491 | | | | 113,039 | |
AE4113, 4.000%, 10/1/2040 (d) | | | 59,604 | | | | 62,942 | |
AE4192, 4.000%, 10/1/2040 (d) | | | 283,654 | | | | 300,164 | |
AE5143, 4.000%, 11/1/2040 (d) | | | 46,136 | | | | 48,613 | |
AI7951, 4.500%, 8/1/2036 (d) | | | 81,854 | | | | 88,499 | |
AJ5974, 4.000%, 12/1/2036 (d) | | | 61,170 | | | | 64,752 | |
AL0005, 4.500%, 1/1/2041 (d) | | | 75,737 | | | | 81,591 | |
AL0049, 6.000%, 12/1/2035 (d) | | | 65,361 | | | | 73,838 | |
AL1627, 4.500%, 9/1/2041 (d) | | | 140,165 | | | | 151,361 | |
AM3278, 2.850%, 5/1/2023 (d) | | | 713,796 | | | | 724,727 | |
AM4796, 3.300%, 12/1/2023 (d) | | | 749,333 | | | | 775,786 | |
AM5146, 3.470%, 1/1/2024 (d) | | | 563,834 | | | | 589,150 | |
AM5197, 4.200%, 1/1/2030 (d) | | | 1,177,286 | | | | 1,270,574 | |
AM6266, 3.580%, 7/1/2030 (d) | | | 974,246 | | | | 991,576 | |
AM7507, 3.080%, 12/1/2024 (d) | | | 1,061,906 | | | | 1,083,363 | |
AM7598, 3.070%, 12/1/2024 (d) | | | 1,410,063 | | | | 1,437,517 | |
AM8148, 2.680%, 3/1/2027 (d) | | | 1,000,000 | | | | 978,029 | |
AM8659, 2.880%, 4/1/2031 (d) | | | 1,271,532 | | | | 1,212,212 | |
AM9154, 3.180%, 6/1/2030 (d) | | | 1,071,701 | | | | 1,071,727 | |
AM9239, 3.030%, 6/1/2025 (d) | | | 980,524 | | | | 990,831 | |
AN1767, 2.980%, 6/1/2031 (d) | | | 990,392 | | | | 970,084 | |
AN1840, 2.450%, 6/1/2026 (d) | | | 1,500,000 | | | | 1,452,342 | |
AN2787, 2.600%, 9/1/2028 (d) | | | 1,150,000 | | | | 1,103,884 | |
AN2791, 2.440%, 9/1/2026 (d) | | | 1,143,045 | | | | 1,105,337 | |
AP9592, 3.500%, 10/1/2032 (d) | | | 286,507 | | | | 297,725 | |
AR1524, 2.000%, 1/1/2028 (d) | �� | | 283,165 | | | | 276,653 | |
AR9198, 3.000%, 3/1/2043 (d) | | | 847,132 | | | | 843,122 | |
AS3608, 2.500%, 12/1/2043 (d) | | | 388,284 | | | | 369,544 | |
AS8449, 2.500%, 12/1/2031 | | | 45,973 | | | | 46,021 | |
32
DOMINI IMPACT BOND FUND
PORTFOLIOOF INVESTMENTS (continued)
January 31, 2017 (Unaudited)
| | | | | | | | |
| | | Principal
Amount | | | Value | |
Federal National Mortgage Association (Continued) | | | | | | | | |
AW4685, 2.655%, VR, 5/1/2044 (d) | | $ | 148,130 | | | $ | 151,814 | |
AY3370, 2.500%, 4/1/2045 | | | 285,070 | | | | 270,637 | |
AY5876, 2.500%, 6/1/2030 | | | 472,459 | | | | 472,950 | |
BC1171, 3.500%, 6/1/2046 | | | 2,458,030 | | | | 2,514,387 | |
BE1416, 2.500%, 11/1/2031 | | | 223,873 | | | | 224,106 | |
BE2456, 2.500%, 12/1/2031 | | | 497,411 | | | | 497,928 | |
MA0639, 4.000%, 2/1/2041 (d) | | | 146,650 | | | | 154,551 | |
MA0919, 3.500%, 12/1/2031 (d) | | | 20,287 | | | | 21,078 | |
MA0949, 3.500%, 1/1/2032 (d) | | | 198,929 | | | | 206,685 | |
MA1630, 4.000%, 10/1/2033 (d) | | | 213,054 | | | | 225,768 | |
MA1931, 2.500%, 6/1/2024 | | | 735,762 | | | | 748,201 | |
FNMA TBA 15 Yr , 2.500%, 3/16/2032 (c) | | | 1,000,000 | | | | 998,555 | |
FNMA TBA 15 Yr, 2.500%, 2/16/2032 (c) | | | 1,000,000 | | | | 1,000,078 | |
FNMA TBA 15 Yr, 3.000%, 2/16/2032 (c) | | | 2,600,000 | | | | 2,667,640 | |
FNMA TBA 30 Yr, 3.500%, 2/13/2047 (c) | | | 2,521,000 | | | | 2,576,343 | |
FNMA TBA 30 Yr, 3.500%, 3/13/2047 (c) | | | 2,500,000 | | | | 2,549,706 | |
FNMA TBA 30 Yr, 4.000%, 2/13/2047 (c) | | | 700,000 | | | | 734,398 | |
FNMA TBA 30 Yr, 4.000%, 3/13/2047 (c) | | | 600,000 | | | | 628,289 | |
| | | | | | | | |
| | | | | | | 45,017,384 | |
| | | | | | | | |
| | | | | | | | |
Government National Mortgage Association – 1.5% | | | | | | | | |
GNMA II TBA 30 Yr, 3.500%, 2/21/2047 (c) | | | 1,200,000 | | | | 1,243,594 | |
GNMA II TBA 30 Yr, 4.500%, 2/21/2047 (c) | | | 900,000 | | | | 965,215 | |
| | | | | | | | |
| | | | | | | 2,208,809 | |
| | | | | | | | |
Total Mortgage Backed Securities
(Cost $79,829,298) | | | | | | | 79,386,596 | |
| | | | | | | | |
| | | | | | | | |
Corporate Bonds and Notes – 26.2% | | | | | | | | |
Communications – 2.9% | | | | | | | | |
AT&T Inc | | | | | | | | |
1.623%, VR, 3/11/2019 | | | 525,000 | | | | 523,855 | |
3.950%, 1/15/2025 | | | 445,000 | | | | 440,763 | |
4.750%, 5/15/2046 | | | 65,000 | | | | 59,597 | |
CBS Corp, 2.900%, 1/15/2027 | | | 400,000 | | | | 367,870 | |
Charter Communications Operating LLC senior secured note, 6.484%, 10/23/2045 | | | 300,000 | | | | 342,203 | |
Cox Communications Inc 144A, 4.800%, 2/1/2035 (e) | | | 200,000 | | | | 184,923 | |
Gray Television Inc 144A, 5.875%, 7/15/2026 (e) | | | 200,000 | | | | 199,250 | |
Interpublic Group of Cos Inc/The, 4.200%, 4/15/2024 | | | 250,000 | | | | 257,223 | |
SFR Group SA senior secured note 144A,
7.375%, 5/1/2026 (e) | | | 200,000 | | | | 206,000 | |
Sprint Communications Inc 144A, 7.000%, 3/1/2020 (e) | | | 375,000 | | | | 408,281 | |
Time Warner Cable LLC senior secured note | | | | | | | | |
6.750%, 7/1/2018 | | | 275,000 | | | | 292,843 | |
7.300%, 7/1/2038 | | | 175,000 | | | | 214,871 | |
Time Warner Inc, 3.600%, 7/15/2025 | | | 325,000 | | | | 319,166 | |
Verizon Communications Inc, 5.150%, 9/15/2023 | | | 426,000 | | | | 471,098 | |
| | | | | | | | |
| | | | | | | 4,287,943 | |
| | | | | | | | |
| | | | | | | | |
33
DOMINI IMPACT BOND FUND
PORTFOLIOOF INVESTMENTS (continued)
January 31, 2017 (Unaudited)
| | | | | | | | |
| | | Principal
Amount | | | Value | |
Consumer Discretionary – 2.7% | | | | | | | | |
ACCO Brands Corp 144A, 5.250%, 12/15/2024 (e) | | $ | 130,000 | | | $ | 131,151 | |
Avis Budget Car Rental LLC / Avis Budget Finance Inc 144A, 6.375%, 4/1/2024 (e) | | | 295,000 | | | | 291,313 | |
Delphi Automotive PLC | | | | | | | | |
3.150%, 11/19/2020 | | | 240,000 | | | | 244,367 | |
4.150%, 3/15/2024 | | | 401,000 | | | | 413,917 | |
ERAC USA Finance LLC 144A, 3.850%, 11/15/2024 (e) | | | 500,000 | | | | 508,714 | |
Hertz Corp/The 144A, 5.500%, 10/15/2024 (e) | | | 125,000 | | | | 105,625 | |
Home Depot Inc/The, 5.950%, 4/1/2041 | | | 420,000 | | | | 533,133 | |
Lear Corp, 4.750%, 1/15/2023 | | | 173,000 | | | | 180,773 | |
Lennar Corp, 4.125%, 1/15/2022 | | | 245,000 | | | | 247,989 | |
Marriott International Inc/MD, 2.875%, 3/1/2021 | | | 500,000 | | | | 504,689 | |
Northeastern University, 5.285%, 3/1/2032 | | | 100,000 | | | | 107,564 | |
O’Reilly Automotive Inc | | | | | | | | |
3.800%, 9/1/2022 | | | 155,000 | | | | 160,488 | |
3.850%, 6/15/2023 | | | 550,000 | | | | 567,104 | |
| | | | | | | | |
| | | | | | | 3,996,827 | |
| | | | | | | | |
| | | | | | | | |
Consumer Staples – 0.6% | | | | | | | | |
JM Smucker Co/The, 4.250%, 3/15/2035 | | | 380,000 | | | | 385,359 | |
TreeHouse Foods Inc 144A, 6.000%, 2/15/2024 (e) | | | 530,000 | | | | 558,488 | |
| | | | | | | | |
| | | | | | | 943,847 | |
| | | | | | | | |
| | | | | | | | |
Energy – 0.6% | | | | | | | | |
Spectra Energy Capital LLC, 8.000%, 10/1/2019 | | | 750,000 | | | | 849,846 | |
| | | | | | | | |
| | | | | | | 849,846 | |
| | | | | | | | |
| | | | | | | | |
Financials – 12.0% | | | | | | | | |
AerCap Ireland Capital DAC / AerCap Global Aviation Trust, 3.500%, 5/26/2022 | | | 750,000 | | | | 749,482 | |
AIA Group Ltd 144A, 4.500%, 3/16/2046 (e) | | | 325,000 | | | | 329,163 | |
Air Lease Corp, 3.875%, 4/1/2021 | | | 225,000 | | | | 234,000 | |
Aircastle Ltd, 5.000%, 4/1/2023 | | | 140,000 | | | | 142,461 | |
American Express Credit Corp, 1.296%, VR, 9/22/2017 | | | 500,000 | | | | 500,441 | |
American Tower Corp, 5.000%, 2/15/2024 | | | 362,000 | | | | 388,722 | |
Aon PLC, 4.750%, 5/15/2045 | | | 225,000 | | | | 228,576 | |
AXA SA subordinated note, 8.600%, 12/15/2030 | | | 400,000 | | | | 555,000 | |
Boston Properties LP, 3.650%, 2/1/2026 | | | 430,000 | | | | 426,804 | |
BPCE SA | | | | | | | | |
2.250%, 1/27/2020 | | | 500,000 | | | | 497,863 | |
144A, 4.875%, 4/1/2026 (e) | | | 500,000 | | | | 502,703 | |
Brandywine Operating Partnership LP, 4.550%, 10/1/2029 | | | 725,000 | | | | 706,176 | |
Capital One Financial Corp subordinated note | | | | | | | | |
3.750%, 7/28/2026 | | | 80,000 | | | | 77,463 | |
4.200%, 10/29/2025 | | | 155,000 | | | | 155,643 | |
Cooperatieve Rabobank UA, 3.950%, 11/9/2022 | | | 375,000 | | | | 384,195 | |
Credit Agricole SA/London 144A, 4.125%, 1/10/2027 (e) | | | 510,000 | | | | 508,719 | |
34
DOMINI IMPACT BOND FUND
PORTFOLIOOF INVESTMENTS (continued)
January 31, 2017 (Unaudited)
| | | | | | | | |
| | | Principal
Amount | | | Value | |
Financials (Continued) | | | | | | | | |
Crown Castle International Corp, 3.700%, 6/15/2026 | | $ | 300,000 | | | $ | 292,888 | |
Discover Financial Services, 3.750%, 3/4/2025 | | | 325,000 | | | | 317,958 | |
Duke Realty LP | | | | | | | | |
3.625%, 4/15/2023 | | | 200,000 | | | | 202,795 | |
4.375%, 6/15/2022 | | | 250,000 | | | | 267,258 | |
Fifth Third Bancorp subordinated note, 8.250%, 3/1/2038 | | | 425,000 | | | | 594,277 | |
Hartford Financial Services Group Inc/The junior secured note, 8.125%, VR, 6/15/2068 | | | 275,000 | | | | 294,938 | |
Huntington Bancshares Inc/OH | | | | | | | | |
3.150%, 3/14/2021 | | | 425,000 | | | | 431,027 | |
1.700%, 2/26/2018 | | | 380,000 | | | | 380,445 | |
ING Bank NV 144A, 2.000%, 11/26/2018 (e) | | | 500,000 | | | | 499,450 | |
Kimco Realty Corp, 3.400%, 11/1/2022 | | | 160,000 | | | | 162,690 | |
Liberty Property LP, 3.250%, 10/1/2026 | | | 165,000 | | | | 158,288 | |
Marsh & McLennan Cos Inc, 3.300%, 3/14/2023 | | | 100,000 | | | | 101,771 | |
Metropolitan Life Global Funding I 144A,
2.300%, 4/10/2019 (e) | | | 500,000 | | | | 503,758 | |
Morgan Stanley subordinated note | | | | | | | | |
3.950%, 4/23/2027 | | | 210,000 | | | | 205,758 | |
5.000%, 11/24/2025 | | | 700,000 | | | | 744,768 | |
National City Corp subordinated note, 6.875%, 5/15/2019 | | | 275,000 | | | | 303,931 | |
Regency Centers LP, 3.750%, 6/15/2024 | | | 300,000 | | | | 303,446 | |
Regions Financial Corp, 3.200%, 2/8/2021 | | | 500,000 | | | | 509,205 | |
Reinsurance Group of America Inc | | | | | | | | |
3.950%, 9/15/2026 | | | 250,000 | | | | 250,493 | |
4.700%, 9/15/2023 | | | 164,000 | | | | 175,391 | |
Santander UK PLC subordinated note 144A,
5.000%, 11/7/2023 (e) | | | 650,000 | | | | 674,268 | |
Standard Chartered PLC subordinated note 144A,
5.700%, 3/26/2044 (e) | | | 250,000 | | | | 250,760 | |
Swedbank AB 144A, 2.200%, 3/4/2020 (e) | | | 650,000 | | | | 645,663 | |
TIAA Asset Management Finance Co LLC 144A,
4.125%, 11/1/2024 (e) | | | 160,000 | | | | 162,960 | |
Total System Services Inc, 3.800%, 4/1/2021 | | | 600,000 | | | | 619,571 | |
Unum Group, 3.000%, 5/15/2021 | | | 180,000 | | | | 179,797 | |
US Bancorp subordinated note, 3.600%, 9/11/2024 | | | 493,000 | | | | 503,866 | |
Ventas Realty LP, 3.500%, 2/1/2025 | | | 500,000 | | | | 491,906 | |
Vornado Realty LP, 2.500%, 6/30/2019 | | | 325,000 | | | | 326,588 | |
Voya Financial Inc, 5.650%, VR, 5/15/2053 | | | 130,000 | | | | 130,975 | |
Welltower Inc, 5.250%, 1/15/2022 | | | 400,000 | | | | 440,902 | |
| | | | | | | | |
| | | | | | | 17,515,202 | |
| | | | | | | | |
| | | | | | | | |
Health Care – 3.8% | | | | | | | | |
Actavis Funding SCS | | | | | | | | |
3.000%, 3/12/2020 | | | 420,000 | | | | 426,860 | |
3.800%, 3/15/2025 | | | 280,000 | | | | 279,978 | |
Allina Health System, 4.805%, 11/15/2045 | | | 660,000 | | | | 701,519 | |
Boston Medical Center Corp, 4.519%, 7/1/2026 | | | 455,000 | | | | 473,849 | |
35
DOMINI IMPACT BOND FUND
PORTFOLIOOF INVESTMENTS (continued)
January 31, 2017 (Unaudited)
| | | | | | | | |
| | | Principal
Amount | | | Value | |
Health Care (Continued) | | | | | | | | |
Celgene Corp, 3.875%, 8/15/2025 | | $ | 325,000 | | | $ | 329,385 | |
Children’s Hospital Corp/The, 4.115%, 1/1/2047 | | | 230,000 | | | | 232,781 | |
City of Hope senior secured note, 5.623%, 11/15/2043 | | | 250,000 | | | | 293,945 | |
Kaiser Foundation Hospitals, 3.500%, 4/1/2022 | | | 110,000 | | | | 113,813 | |
Mayo Clinic, 4.128%, 11/15/2052 | | | 165,000 | | | | 162,671 | |
Memorial Sloan-Kettering Cancer Center, 4.200%, 7/1/2055 | | | 60,000 | | | | 59,391 | |
Mylan Inc, 2.600%, 6/24/2018 | | | 400,000 | | | | 401,972 | |
New York and Presbyterian Hospital/The | | | | | | | | |
4.024%, 8/1/2045 | | | 365,000 | | | | 357,025 | |
4.063%, 8/1/2056 | | | 250,000 | | | | 235,992 | |
Ochsner Clinic Foundation, 5.897%, 5/15/2045 | | | 650,000 | | | | 760,886 | |
Orlando Health Obligated Group, 4.416%, 10/1/2044 | | | 395,000 | | | | 382,776 | |
Thermo Fisher Scientific Inc, 4.150%, 2/1/2024 | | | 265,000 | | | | 278,283 | |
| | | | | | | | |
| | | | | | | 5,491,126 | |
| | | | | | | | |
| | | | | | | | |
Industrials – 1.8% | | | | | | | | |
Canadian Pacific Railway Co, 4.500%, 1/15/2022 | | | 400,000 | | | | 430,709 | |
CNH Industrial Capital LLC, 4.875%, 4/1/2021 | | | 750,000 | | | | 782,812 | |
Illinois Tool Works Inc, 4.875%, 9/15/2041 | | | 175,000 | | | | 197,746 | |
Ryder System Inc | | | | | | | | |
2.350%, 2/26/2019 | | | 500,000 | | | | 503,256 | |
2.500%, 5/11/2020 | | | 145,000 | | | | 145,329 | |
United Rentals North America Inc, 4.625%, 7/15/2023 | | | 500,000 | | | | 512,500 | |
| | | | | | | | |
| | | | | | | 2,572,352 | |
| | | | | | | | |
| | | | | | | | |
Materials – 0.5% | | | | | | | | |
Ardagh Packaging Finance PLC / Ardagh Holdings USA Inc senior secured note 144A, 4.156%, VR, 5/15/2021 (e) | | | 470,000 | | | | 483,513 | |
Standard Industries Inc/NJ 144A, 5.125%, 2/15/2021 (e) | | | 180,000 | | | | 189,000 | |
| | | | | | | | |
| | | | | | | 672,513 | |
| | | | | | | | |
| | | | | | | | |
Technology – 1.0% | | | | | | | | |
Broadcom Corp / Broadcom Cayman Finance Ltd 144A,
3.625%, 1/15/2024 (e) | | | 355,000 | | | | 355,992 | |
CDW LLC / CDW Finance Corp, 5.000%, 9/1/2023 | | | 145,000 | | | | 148,263 | |
Microsoft Corp, 3.700%, 8/8/2046 | | | 395,000 | | | | 362,302 | |
SS&C Technologies Holdings Inc, 5.875%, 7/15/2023 | | | 65,000 | | | | 67,925 | |
TSMC Global Ltd 144A, 1.625%, 4/3/2018 (e) | | | 523,000 | | | | 521,603 | |
| | | | | | | | |
| | | | | | | 1,456,085 | |
| | | | | | | | |
| | | | | | | | |
Utilities – 0.3% | | | | | | | | |
Consolidated Edison Co of New York Inc,
3.300%, 12/1/2024 | | | 500,000 | | | | 505,497 | |
| | | | | | | | |
| | | | | | | 505,497 | |
| | | | | | | | |
Total Corporate Bonds and Notes
(Cost $38,047,928) | | | | | | | 38,291,238 | |
| | | | | | | | |
| | | | | | | | |
36
DOMINI IMPACT BOND FUND
PORTFOLIOOF INVESTMENTS (continued)
January 31, 2017 (Unaudited)
| | | | | | | | |
| | | Principal
Amount | | | Value | |
Municipal Bonds – 8.1% | | | | | | | | |
American Municipal Power Inc, 6.270%, 2/15/2050 | | $ | 300,000 | | | $ | 360,318 | |
Bay Area Toll Authority | | | | | | | | |
6.918%, 4/1/2040 | | | 125,000 | | | | 169,941 | |
7.043%, 4/1/2050 | | | 325,000 | | | | 460,775 | |
City of Chicago IL | | | | | | | | |
6.207%, 1/1/2032 | | | 250,000 | | | | 225,168 | |
7.045%, 1/1/2029 | | | 295,000 | | | | 300,581 | |
City of Los Angeles Department of Airports,
3.887%, 5/15/2038 | | | 140,000 | | | | 139,685 | |
Commonwealth of Massachusetts, 3.277%, 6/1/2046 | | | 130,000 | | | | 119,275 | |
Cook County Community High School District No 228 Bremen, 5.019%, 12/1/2041 | | | 435,000 | | | | 442,539 | |
Hillsborough County Aviation Authority, 3.549%, 10/1/2022 | | | 190,000 | | | | 195,200 | |
Indiana Finance Authority, 3.624%, 7/1/2036 | | | 235,000 | | | | 223,988 | |
Los Angeles County Public Works Financing Authority,
7.488%, 8/1/2033 | | | 290,000 | | | | 388,684 | |
Maryland Health & Higher Educational Facilities Authority | | | | | | | | |
3.968%, 7/1/2027 | | | 205,000 | | | | 205,312 | |
4.068%, 7/1/2028 | | | 240,000 | | | | 240,307 | |
4.168%, 7/1/2029 | | | 40,000 | | | | 40,048 | |
Massachusetts Health & Educational Facilities Authority,
6.432%, 10/1/2035 | | | 420,000 | | | | 482,912 | |
Metropolitan Government Nashville & Davidson County Health & Educational Facs Bd, 4.053%, 7/1/2026 | | | 270,000 | | | | 279,172 | |
Michigan Finance Authority | | | | | | | | |
2.057%, 4/1/2018 | | | 250,000 | | | | 249,418 | |
2.267%, 4/1/2019 | | | 260,000 | | | | 257,309 | |
2.491%, 4/1/2020 | | | 250,000 | | | | 245,470 | |
2.741%, 4/1/2021 | | | 320,000 | | | | 311,517 | |
New Jersey Economic Development Authority,
3.882%, 6/15/2019 | | | 270,000 | | | | 269,978 | |
New Jersey Turnpike Authority | | | | | | | | |
7.102%, 1/1/2041 | | | 225,000 | | | | 315,230 | |
7.414%, 1/1/2040 | | | 200,000 | | | | 290,526 | |
New York Transportation Development Corp,
3.473%, 7/1/2028 | | | 500,000 | | | | 480,005 | |
Oregon Health & Science University, 5.000%, 7/1/2045 | | | 350,000 | | | | 377,920 | |
Pennsylvania Industrial Development Authority 144A,
3.556%, 7/1/2024 (e) | | | 505,000 | | | | 500,001 | |
Puerto Rico Commonwealth Government Employees Retirement System | | | | | | | | |
6.150%, 7/1/2038 (f) | | | 825,000 | | | | 367,125 | |
6.200%, 7/1/2039 (f) | | | 125,000 | | | | 55,625 | |
Shelby County Health Educational & Housing Facilities Board | | | | | | | | |
4.000%, 9/1/2021 | | | 250,000 | | | | 255,028 | |
4.000%, 9/1/2022 | | | 250,000 | | | | 253,995 | |
State of California, 7.625%, 3/1/2040 | | | 525,000 | | | | 768,653 | |
37
DOMINI IMPACT BOND FUND
PORTFOLIOOF INVESTMENTS (continued)
January 31, 2017 (Unaudited)
| | | | | | | | |
| | | Principal
Amount | | | Value | |
Municipal Bonds (Continued) | | | | | | | | |
State of Illinois | | | | | | | | |
3.860%, 4/1/2021 | | $ | 215,000 | | | $ | 211,186 | |
5.100%, 6/1/2033 | | | 335,000 | | | | 307,004 | |
5.547%, 4/1/2019 | | | 325,000 | | | | 338,832 | |
5.877%, 3/1/2019 | | | 410,000 | | | | 434,899 | |
Washington State Housing Finance Commission | | | | | | | | |
4.000%, 1/1/2024 | | | 800,000 | | | | 784,551 | |
144A, 4.375%, 1/1/2021 (f) | | | 400,000 | | | | 400,744 | |
| | | | | | | | |
Total Municipal Bonds
(Cost $11,923,158) | | | | | | | 11,748,921 | |
| | | | | | | | |
| | | | | | | | |
Senior Floating Rate Interests – 7.5% | | | | | | | | |
Communications – 1.8% | | | | | | | | |
Charter Communications Operating LLC term loan,
3.026%, 1/15/2024 | | | 297,750 | | | | 299,185 | |
Mission Broadcasting Inc term loan B, 0.000%, 1/17/2024 (g) | | | 25,558 | | | | 25,846 | |
Nexstar Broadcasting Inc term loan B, 0.000%, 1/17/2024 (g) | | | 277,395 | | | | 280,516 | |
SFR Group SA, 4.289%, 1/14/2025 | | | 744,384 | | | | 751,097 | |
Sprint Communications Inc. term loan B, 0.000%, 2/2/2024 (g) | | | 410,000 | | | | 410,000 | |
Univision Communications Inc term loan, 4.000%, 3/1/2020 | | | 489,520 | | | | 491,186 | |
Ziggo BV | | | | | | | | |
Term Loan B1, 3.517%, 1/15/2022 | | | 184,894 | | | | 185,703 | |
Term Loan B2A, 3.517%, 1/15/2022 | | | 109,574 | | | | 110,054 | |
Term Loan B3, 4.074%, 1/15/2022 | | | 34,048 | | | | 34,197 | |
| | | | | | | | |
| | | | | | | 2,587,784 | |
| | | | | | | | |
| | | | | | | | |
Consumer Discretionary – 1.3% | | | | | | | | |
AMC Entertainment Holdings Inc term loan,
3.526%, 12/15/2023 | | | 100,000 | | | | 101,042 | |
American Builders & Contractors Supply Co Inc term loan B, 3.526%, 10/31/2023 | | | 900,000 | | | | 908,015 | |
Camelot Finance LP term loan, 4.750%, 10/3/2023 | | | 139,650 | | | | 141,029 | |
Harbor Freight Tools USA Inc term loan, 3.778%, 8/19/2023 | | | 243,775 | | | | 246,416 | |
KAR Auction Services Inc term loan B, 4.500%, 3/9/2023 | | | 148,875 | | | | 150,921 | |
On Assignment Inc term loan B, 3.528%, 6/3/2022 | | | 365,770 | | | | 369,885 | |
| | | | | | | | |
| | | | | | | 1,917,308 | |
| | | | | | | | |
| | | | | | | | |
Consumer Staples – 1.2% | | | | | | | | |
BJ’s Wholesale Club Inc first lien, 4.500%, 9/26/2019 | | | 479,351 | | | | 482,346 | |
Coty Inc term loan B, 3.271%, 10/27/2022 | | | 203,465 | | | | 206,517 | |
Energizer Holdings Inc term loan B, 3.313%, 6/30/2022 | | | 615,625 | | | | 619,216 | |
Galleria Co term loan B, 3.813%, 9/29/2023 | | | 410,000 | | | | 413,200 | |
| | | | | | | | |
| | | | | | | 1,721,279 | |
| | | | | | | | |
| | | | | | | | |
Financials – 0.6% | | | | | | | | |
DTZ US Borrower LLC term loan, 4.250%, 11/4/2021 | | | 492,500 | | | | 495,681 | |
Frank Russell Co term loan, 6.750%, 6/1/2023 | | | 447,750 | | | | 455,865 | |
| | | | | | | | |
| | | | | | | 951,546 | |
| | | | | | | | |
| | | | | | | | |
38
DOMINI IMPACT BOND FUND
PORTFOLIOOF INVESTMENTS (continued)
January 31, 2017 (Unaudited)
| | | | | | | | |
| | | Principal
Amount | | | Value | |
Health Care – 0.2% | | | | | | | | |
Alere Inc term loan B, 4.250%, 6/18/2022 | | $ | 249,367 | | | $ | 249,835 | |
| | | | | | | | |
| | | | | | | 249,835 | |
| | | | | | | | |
| | | | | | | | |
Industrials – 0.2% | | | | | | | | |
Avolon Holdings Ltd. term loan B, 0.000%, 1/13/2022 (g) | | | 240,000 | | | | 243,350 | |
| | | | | | | | |
| | | | | | | 243,350 | |
| | | | | | | | |
| | | | | | | | |
Materials – 0.5% | | | | | | | | |
Ardagh Holdings USA Inc term loan, 4.009%, 12/17/2021 | | | 466,069 | | | | 472,113 | |
Nexeo Solutions LLC term loan B, 5.250%, 6/9/2023 | | | 283,575 | | | | 286,942 | |
| | | | | | | | |
| | | | | | | 759,055 | |
| | | | | | | | |
| | | | | | | | |
Technology – 1.4% | | | | | | | | |
CDW LLC term loan, 3.250%, 8/17/2023 | | | 489,907 | | | | 493,615 | |
Dell International LLC term loan B, 4.030%, 9/7/2023 | | | 279,300 | | | | 282,020 | |
Equinix Inc. term loan B, 3.278%, 1/8/2023 | | | 153,838 | | | | 155,568 | |
NXP BV term loan, 3.240%, 12/7/2020 | | | 287,209 | | | | 288,944 | |
ON Semiconductor Corp term loan B, 4.028%, 3/31/2023 | | | 349,125 | | | | 353,174 | |
SS&C European Holdings SARL term loan B2,
4.028%, 7/8/2022 | | | 27,717 | | | | 28,055 | |
SS&C Technologies Inc term loan B1, 4.028%, 7/8/2022 | | | 284,654 | | | | 288,123 | |
Zayo Group LLC | | | | | | | | |
Term loan B, 0.000%, 1/19/2024 (g) | | | 94,500 | | | | 95,504 | |
Term loan B, 0.000%, 1/12/2024 (g) | | | 45,500 | | | | 45,983 | |
| | | | | | | | |
| | | | | | | 2,030,986 | |
| | | | | | | | |
| | | | | | | | |
Utilities – 0.3% | | | | | | | | |
Calpine Corp term loan B, 3.750%, 1/15/2023 | | | 415,800 | | | | 418,529 | |
| | | | | | | | |
| | | | | | | 418,529 | |
| | | | | | | | |
Total Senior Floating Rate Interests
(Cost $10,730,831) | | | | | | | 10,879,672 | |
| | | | | | | | |
| | | | | | | | |
U.S. Government Agencies – 7.4% | | | | | | | | |
FNMA, 1.500%, 6/22/2020 | | | 5,328,000 | | | | 5,310,918 | |
FNMA, 5.625%, 7/15/2037 (d) | | | 4,054,000 | | | | 5,418,025 | |
| | | | | | | | |
Total U.S. Government Agencies
(Cost $11,162,380) | | | | | | | 10,728,943 | |
| | | | | | | | |
| | | | | | | | |
Asset Backed Securities – 1.3% | | | | | | | | |
Carmax Auto Owner Trust | | | | | | | | |
1.900%, 4/15/2022 | | | 95,000 | | | | 93,479 | |
2.150%, 5/15/2019 | | | 750,000 | | | | 753,604 | |
2.160%, 12/15/2021 | | | 135,000 | | | | 134,383 | |
2.200%, 6/15/2022 | | | 75,000 | | | | 73,859 | |
2.560%, 2/15/2022 | | | 260,000 | | | | 259,938 | |
2.580%, 11/16/2020 | | | 130,000 | | | | 130,417 | |
39
DOMINI IMPACT BOND FUND
PORTFOLIOOF INVESTMENTS (continued)
January 31, 2017 (Unaudited)
| | | | | | | | |
| | | Principal
Amount | | | Value | |
Asset Backed Securities (Continued) | | | | | | | | |
CNH Equipment Trust, 1.930%, 3/15/2024 | | $ | 20,000 | | | $ | 19,611 | |
SBA Tower Trust 144A, 3.869%, VR, 10/15/2049 (e) | | | 500,000 | | | | 504,055 | |
| | | | | | | | |
Total Asset Backed Securities
(Cost $1,968,684) | | | | | | | 1,969,346 | |
| | | | | | | | |
| | | | | | | | |
Foreign Government & Agency Securities – 0.7% | | | | | | | | |
Province of Ontario, 1.950%, 1/27/2023 | | | 1,000,000 | CAD | | | 765,231 | |
Romania Government Bond, 1.350%, 2/25/2019 | | | 1,160,000 | RON | | | 277,755 | |
| | | | | | | | |
Total Foreign Government & Agency Securities
(Cost $1,028,492) | | | | | | | 1,042,986 | |
| | | | | | | | |
Total Long Term Investments – 105.6%
(Cost $154,690,771) | | | | | | | 154,047,702 | |
| | | | | | | | |
| | | | | | | | |
Short Term Investments – 0.4% | | | | | | | | |
Romania T-Bill, 0.010%, 6/26/2017 | | | 2,385,000 | RON | | | 571,541 | |
| | | | | | | | |
Total Short Term Investments
(Cost $592,268) | | | | | | | 571,541 | |
| | | | | | | | |
| | |
Total Investments – 106.0% (Cost $155,283,039) (a) | | | | | | | 154,619,243 | |
| | |
Other Liabilities, less assets – (6.0)% | | | | | | | (8,761,913) | |
| | | | | | | | |
| | |
Net Assets – 100.0% | | | | | | $ | 145,857,330 | |
| | | | | | | | |
(a) The aggregate cost for book and federal income purposes is $155,374,295. The aggregate gross unrealized appreciation is $1,515,723, and the aggregate gross unrealized depreciation is $2,270,775, resulting in net unrealized depreciation of $755,052.
(b) Securities for which there are no such quotations or valuations are valued at fair value as determined in good faith by or at the direction of the Fund’s Board of Trustees.
(c) A portion or all of the security was purchased as a when issued or delayed delivery security.
(d) A portion or all of the security was segregated for collateral for when issued or delayed delivery securities.
(e) This security has been determined to be liquid under guidelines established by the Fund’s Board of Trustees.
(f) This security has been determined to be illiquid under guidelines established by the Fund’s Board of Trustees.
(g) Represents an unsettled loan contract. The coupon rate will be determined at time of settlement.
The principal amount is stated in U.S. dollars unless otherwise indicated.
TBA — To Be Announced
VR — Variable interest rate. Rate shown is that on January 31, 2017.
144A — Security that may be sold to qualified institutional buyers under Rule 144A of the Securities Act of 1933, as amended. At January 31, 2017, the aggregate value of these securities was $12,962,656, representing 8.9% of net assets.
CAD — Canadian Dollar
RON — Romanian Leu
40
DOMINI IMPACT BOND FUND
PORTFOLIOOF INVESTMENTS (continued)
January 31, 2017 (Unaudited)
At January 31, 2017, the Fund had the following forward currency contracts outstanding:
| | | | | | | | | | | | | | | | | | |
| Counterparty | | Currency | | Contract Type | | | Settlement Date | | | Value | | | Unrealized Appreciation (Depreciation) | |
UBS AG | | CAD | | | Sell | | | | 3/15/2017 | | | $ | 762,738 | | | $ | (3,556 | ) |
Citibank N.A. | | RON | | | Sell | | | | 6/26/2017 | | | | 574,264 | | | | 21,175 | |
JP Morgan Chase Bank | | RON | | | Sell | | | | 8/28/2017 | | | | 175,959 | | | | 10,360 | |
BNP Parabas SA | | RON | | | Sell | | | | 8/28/2017 | | | | 107,263 | | | | 6,185 | |
| | | | | | | | | | | | | | |
| | | | | | | | | | | | $ | 1,620,224 | | | $ | 34,164 | |
| | | | | | | | | | | | | | | | | | |
At January 31, 2017, the Fund had the following centrally cleared interest rate swap contracts outstanding:
| | | | | | | | | | | | | | | | | | |
| Description | | Counterparty/ Exchange | | Expiration
Date | | | Notional Amount | | | Value | | | Unrealized Appreciation (Depreciation) | |
Receive Floating rate 3 month USD BBA LIBOR Pay Fixed rate 1.473% | | Morgan Stanley/
LCH | | | 1/25/2019 | | | $ | 7,130,000 | | | $ | 7,127,767 | | | $ | 2,233 | |
Receive Floating rate 3 month USD BBA LIBOR Pay Fixed rate 1.524% | | Morgan Stanley/
LCH | | | 1/28/2019 | | | | 7,130,000 | | | | 7,134,531 | | | | (4,531 | ) |
Receive Floating rate 3 month USD BBA LIBOR Pay Fixed rate 2.750% | | Morgan Stanley/
LCH | | | 9/21/2046 | | | | 4,119,000 | | | | 4,226,384 | | | | (382,323 | ) |
Receive Floating rate 3 month USD BBA LIBOR Pay Fixed rate 2.250% | | Morgan Stanley/
LCH | | | 9/21/2046 | | | | 9,302,000 | | | | 9,231,704 | | | | 588,676 | |
Receive Floating rate 12 month USD Fed Fund Pay Fixed rate 1.000% | | Morgan Stanley/
LCH | | | 9/29/2026 | | | | 1,001,000 | | | | 1,084,183 | | | | 53,866 | |
| | | | | | | | | | | | | | | | | | |
| | | | | | | | $ | 28,682,000 | | | $ | 28,804,569 | | | $ | 257,921 | |
| | | | | | | | | | | | | | | | | | |
At January 31, 2017, the Fund had the following OTC interest rate swap contracts outstanding:
| | | | | | | | | | | | | | | | | | | | | | |
| | | Rate Type | | | | | | | | | | | | | |
| Counterparty | | Payments
made by the Fund | | Payments
received by the
Fund | | | Expiration
Date | | | Notional Amount | | | Value | | | Unrealized Appreciation (Depreciation) | |
Deutsche Bank AG | | 1.898% | | | USA-CPI-U | | | | 7/15/2024 | | | $ | 4,928,000 | | | $ | 5,109,947 | | | $ | 181,947 | |
| | | | | | | | | | | | | | | | | | | | | | |
| | | | | | | | | | | | $ | 4,928,000 | | | $ | 5,109,947 | | | $ | 181,947 | |
| | | | | | | | | | | | | | | | | | | | | | |
41
DOMINI IMPACT BOND FUND
PORTFOLIOOF INVESTMENTS (continued)
January 31, 2017 (Unaudited)
At January 31, 2017, the Fund had the following centrally cleared credit default swap contracts outstanding:
| | | | | | |
| Description | | Counterparty/ Exchange | | Buy/Sell
Protection(g) | | Rating of Reference
Entity (Moody’s/S&P) |
CDX-NAIG Series 27, Version 1,
5 Year Index | | Morgan Stanley/ICE | | Sell | | Baa1/BBB+ |
CDX-NAHY Series 27, Version 1,
5 Year Index | | Morgan Stanley/ICE | | Sell | | B2/B+ |
iTraxx Europe Series 26, Version 1,
5 Year Index (EUR) | | Morgan Stanley/ICE | | Sell | | Baa1/BBB+ |
iTraxx Europe Crossover Series 26, Version 1, 5 Year Index (EUR) | | Morgan Stanley/ICE | | Sell | | B1/B+ |
| | | | | | |
| | | | | | |
| | | | | | |
At January 31, 2017, the Fund had the following OTC credit default swap contracts outstanding:
| | | | | | |
| Description | | Counterparty | | Buy/Sell
Protection(g) | | Rating of Reference
Entity (Moody’s/S&P) |
CMBX NA AAA.6 | | Credit Suisse International | | Sell | | Aaa/AAA |
CMBX NA AAA.6 | | Morgan Stanley & Co. International PLC | | Sell | | Aaa/AAA |
CMBX NA AAA.6 | | Morgan Stanley & Co. International PLC | | Sell | | Aaa/AAA |
CMBX NA AAA.6 | | Morgan Stanley & Co. International PLC | | Sell | | Aaa/AAA |
CMBX.NA.AAA.6 | | Deutsche Bank London | | Sell | | Aaa/AAA |
| | | | | | |
| | | | | | |
| | | | | | |
LCH — London Clearing House
ICE — Intercontinental Exchange
(g) If the Fund is a seller of protection and a credit event occurs, as defined under the terms of that particular swap agreement, the Fund will either (i) pay to the buyer of protection an amount equal to the notional amount of the swap and take delivery of the referenced obligation or underlying securities comprising the referenced index or (ii) pay a net settlement amount in the form of cash or securities equal to the notional amount of the swap less the recovery value of the referenced obligation of underlying securities comprising the referenced index.
(h) The maximum potential amount the Fund could be required to pay as a seller of credit protection or receive as a buyer of credit protection if a credit event occurs as defined under the terms of that particular swap agreement.
(i) The prices and resulting values for credit default swap agreements on credit indices serve as an indicator of the current status of the payment/performance risk and represent the likelihood of an expected liability (or profit) for the credit derivative should the notional amount of the swap agreement be closed/sold as of the period end. Increasing market values, in absolute terms when compared to the notional amount of the swap, represent a deterioration of the referenced entity’s credit soundness and a greater likelihood or risk of default or other credit event occurring as defined under the terms of the agreement.
42
| | | | | | | | | | | | | | | | |
| Fixed Rate | | Expiration
Date | | | Notional Amount(h) | | | Value(i) | | | Unrealized Appreciation (Depreciation) | |
| | | | |
| 1.00% | | | 12/20/2021 | | | $ | 2,816,000 | | | $ | 2,859,320 | | | $ | 5,813 | |
| | | | |
| 5.00% | | | 12/20/2021 | | | | 166,000 | | | | 176,257 | | | | (359 | ) |
| | | | |
| 1.00% | | | 12/20/2021 | | | | 682,000 | | | | 746,428 | | | | 2,230 | |
| | | | |
| 5.00% | | | 12/20/2021 | | | | 580,000 | | | | 681,575 | | | | 12,165 | |
| | | | | | | | | | | | | | | | |
| | | | | | $ | 4,244,000 | | | $ | 4,463,580 | | | $ | 19,849 | |
| | | | | | | | | | | | | | | | |
| | | | | | | | | | | | | | | | | | | | | | |
Upfront
Premium (Received)
Paid | | | Fixed Rate | | | Expiration
Date | | | Notional Amount(h) | | | Value(i) | | | Unrealized Appreciation (Depreciation) | |
| $ | 5,720 | | | | 0.50% | | | | 5/11/2063 | | | $ | 154,889 | | | $ | 154,800 | | | $ | 5,566 | |
| | 64,963 | | | | 0.50% | | | | 5/11/2063 | | | | 1,981,575 | | | | 1,980,442 | | | | 62,541 | |
| | 5,243 | | | | 0.50% | | | | 5/11/2063 | | | | 154,889 | | | | 154,800 | | | | 5,048 | |
| | 4,065 | | | | 0.50% | | | | 5/11/2063 | | | | 119,914 | | | | 119,845 | | | | 3,960 | |
| | 4,912 | | | | 0.50% | | | | 5/11/2063 | | | | 144,896 | | | | 144,813 | | | | 4,785 | |
| | | | | | | | | | | | | | | | | | | | | | |
| | | | | | | | | | | | $ | 2,556,163 | | | $ | 2,554,700 | | | $ | 81,900 | |
| | | | | | | | | | | | | | | | | | | | | | |
SEE NOTES TO FINANCIAL STATEMENTS
43
DOMINI FUNDS EXPENSE EXAMPLE (Unaudited)
As a shareholder of the Domini Funds, you incur two types of costs:
(1) Transaction costs such as redemption fees deducted from any redemption or exchange proceeds if you sell or exchange shares of the fund after holding them less than 30 days and sales charges (loads) on Class A shares and
(2) Ongoing costs, including management fees, distribution (12b-1) fees, and other Fund expenses.
This example is intended to help you understand your ongoing costs (in dollars) of investing in the Fund and to compare these costs with the ongoing costs of investing in other mutual funds. The example is based on an investment of $1,000 invested on August 1, 2016, and held through January 31, 2017.
Certain Account Fees
Some accounts are subject to recurring annual service fees and maintenance fees that are not included in the expenses shown in the table. If your account was subject to these fees, then the actual account values at the end of the period would be lower and the actual expense would be higher. You may avoid the annual service fee by choosing paperless electronic delivery of statements, prospectuses, shareholder reports and other materials.
Actual Expenses
The line of the table captioned ‘‘Actual Expenses’’ below provides information about actual account value and actual expenses. You may use the information in this line, together with the amount invested, to estimate the expenses that you paid over the period as follows:
(1) Divide your account value by $1,000.
(2) Multiply your result in step 1 by the number in the first line under the heading ‘‘Expenses Paid During Period’’ in the table.
The result equals the estimated expenses you paid on your account during the period.
Hypothetical Expenses
The second line of the table below provides information about hypothetical account values and hypothetical expenses based on the Fund’s actual expense ratio and an assumed rate of return of 5% per year before expenses, which is not the Fund’s return. The hypothetical account values and expenses may not be used to estimate actual ending account balance or expenses you paid for the period. You may use this information to compare the ongoing costs of investing in the Fund and other mutual funds. To do so, compare this 5% hypothetical example with the 5% hypothetical example that appears in the shareholder reports of the other funds.
44
Please note that the expenses shown in the table are meant to highlight your ongoing costs only and do not reflect any transactional costs, such as redemption fees. Therefore, the second line of the table is useful in comparing ongoing costs only, and will not help you determine the relative total costs of owning different funds. In addition, if these transactional costs were included, your costs would have been higher.
| | | | | | | | |
| Fund Name | | Expenses | | Beginning
Account Value
as of 8/1/2016 | | Ending Account
Value as of
1/31/2017 | | Expenses Paid
During Period
8/1/2016 –
1/31/2017 |
Domini Impact
Equity Fund
Investor Shares | | Actual Expenses | | $1,000.00 | | $1,080.10 | | $6.061 |
| | Hypothetical Expenses
(5% return before expenses) | | $1,000.00 | | $1,019.38 | | $5.881 |
Domini Impact
Equity Fund
Class A Shares | | Actual Expenses | | $1,000.00 | | $1,079.50 | | $6.161 |
| | Hypothetical Expenses
(5% return before expenses) | | $1,000.00 | | $1,019.28 | | $5.981 |
Domini Impact
Equity Fund
Institutional Shares | | Actual Expenses | | $1,000.00 | | $1,082.40 | | $4.201 |
| | Hypothetical Expenses
(5% return before expenses) | | $1,000.00 | | $1,021.18 | | $4.071 |
Domini Impact
Equity Fund
Class R Shares | | Actual Expenses | | $1,000.00 | | $1,081.90 | | $4.411 |
| | Hypothetical Expenses
(5% return before expenses) | | $1,000.00 | | $1,020.97 | | $4.281 |
| Domini Impact International Equity Fund Investor Shares | | Actual Expenses | | $1,000.00 | | $1,051.80 | | $7.632 |
| | Hypothetical Expenses
(5% return before expenses) | | $1,000.00 | | $1,017.77 | | $7.502 |
| Domini Impact International Equity Fund Class A Shares | | Actual Expenses | | $1,000.00 | | $1,050.20 | | $7.982 |
| | Hypothetical Expenses
(5% return before expenses) | | $1,000.00 | | $1,017.42 | | $7.852 |
| Domini Impact International Equity Fund Institutional Shares | | Actual Expenses | | $1,000.00 | | $1,052.90 | | $5.642 |
| | Hypothetical Expenses
(5% return before expenses) | | $1,000.00 | | $1,019.72 | | $5.542 |
Domini Impact
Bond Fund Investor Shares | | Actual Expenses | | $1,000.00 | | $970.40 | | $4.723 |
| | Hypothetical Expenses
(5% return before expenses) | | $1,000.00 | | $1,020.42 | | $4.843 |
Domini Impact
Bond Fund Institutional Shares | | Actual Expenses | | $1,000.00 | | $971.80 | | $3.233 |
| | Hypothetical Expenses
(5% return before expenses) | | $1,000.00 | | $1,021.93 | | $3.313 |
1Expenses are equal to the Fund’s annualized expense ratio of 1.16% for Investor shares, or 1.18% for Class A shares, or 0.80% for Institutional Class, or 0.84% for Class R shares, multiplied by average account value over the period, multiplied by 184, and divided by 365.
2Expenses are equal to the Fund’s annualized expense ratio of 1.47% for Investor shares, or 1.54% for Class A shares, or 1.09% for Institutional shares, multiplied by average account value over the period, multiplied by 184, and divided by 365.
3Expenses are equal to the Fund’s annualized expense ratio of 0.95% for Investor Shares, or 0.65% for Institutional Class, multiplied by average account value over the period, multiplied by 184, and divided by 365.
45
STATEMENTS OF ASSETS AND LIABILITIES
January 31, 2017 (Unaudited)
| | | | | | | | |
| | | Domini Impact
Equity Fund | | | Domini Impact
International
Equity Fund | |
ASSETS | | | | | | | | |
Investments at value (cost $775,658,677, and $603,603,439, respectively) | | $ | 891,220,501 | | | $ | 666,346,695 | |
Cash | | | 10,064,917 | | | | 16,461,358 | |
Foreign currency, at value (cost $0, and $333, respectively) | | | - | | | | 337 | |
Receivable for capital shares | | | 238,441 | | | | 3,757,043 | |
Dividend receivable | | | 803,357 | | | | 1,097,466 | |
Tax reclaim receivable | | | 492 | | | | 456,841 | |
| | | | | | | | |
Total assets | | | 902,327,708 | | | | 688,119,740 | |
| | | | | | | | |
LIABILITIES | | | | | | | | |
Payable for securities purchased | | | - | | | | 438,332 | |
Payable for capital shares | | | 640,937 | | | | 943,509 | |
Management /Sponsorship fee payable | | | 576,563 | | | | 535,435 | |
Distribution fee payable | | | 143,824 | | | | 106,011 | |
Other accrued expenses | | | 220,876 | | | | 325,597 | |
Foreign tax payable | | | 13,944 | | | | 203,995 | |
| | | | | | | | |
Total liabilities | | | 1,596,144 | | | | 2,552,879 | |
| | | | | | | | |
NET ASSETS | | $ | 900,731,564 | | | $ | 685,566,861 | |
| | | | | | | | |
NET ASSETS CONSIST OF | | | | | | | | |
Paid-in capital | | $ | 784,044,981 | | | $ | 658,567,405 | |
Undistributed net investment income (loss) | | | (4,874,313) | | | | (5,933,257) | |
Accumulated net realized gain (loss) | | | 5,997,051 | | | | (29,819,018) | |
Net unrealized appreciation (depreciation) | | | 115,563,845 | | | | 62,751,731 | |
| | | | | | | | |
NET ASSETS | | $ | 900,731,564 | | | $ | 685,566,861 | |
| | | | | | | | |
NET ASSET VALUE PER SHARE | | | | | | | | |
Investor Shares | | | | | | | | |
Net assets | | $ | 663,893,858 | | | $ | 431,870,846 | |
| | | | | | | | |
Outstanding shares of beneficial interest | | | 15,131,990 | | | | 56,392,323 | |
| | | | | | | | |
Net asset value and offering price per share* | | $ | 43.87 | | | $ | 7.66 | |
| | | | | | | | |
Class A Shares | | | | | | | | |
Net assets | | $ | 8,655,501 | | | $ | 65,620,952 | |
| | | | | | | | |
Outstanding shares of beneficial interest | | | 1,268,641 | | | | 8,148,885 | |
| | | | | | | | |
Net asset value* | | $ | 6.82 | | | $ | 8.05 | |
| | | | | | | | |
Maximum offering price per share (net asset value per share / (1-4.75%)) | | $ | 7.16 | | | $ | 8.45 | |
| | | | | | | | |
Institutional shares | | | | | | | | |
Net assets | | $ | 184,912,453 | | | $ | 188,075,063 | |
| | | | | | | | |
Outstanding shares of beneficial interest | | | 7,998,846 | | | | 24,575,901 | |
| | | | | | | | |
Net asset value and offering price per share* | | $ | 23.12 | | | $ | 7.65 | |
| | | | | | | | |
Class R shares | | | | | | | | |
Net assets | | $ | 43,269,752 | | | | | |
| | | | | | | | |
Outstanding shares of beneficial interest | | | 7,760,094 | | | | | |
| | | | | | | | |
Net asset value and offering price per share* | | $ | 5.58 | | | | | |
| | | | | | | | |
* Redemption price is equal to net asset value less any applicable redemption fees retained by the Fund.
SEE NOTES TO FINANCIAL STATEMENTS
46
STATEMENTS OF OPERATIONS
For the Six Months Ended January 31, 2017 (Unaudited)
| | | | | | | | |
| | Domini Impact
Equity Fund | | | Domini Impact
International
Equity Fund | |
INCOME | | | | | | | | |
Dividends (net of foreign taxes $61,146, and $445,630, respectively) | | $ | 9,778,105 | | | $ | 4,556,191 | |
| | | | | | | | |
Investment Income | | | 9,778,105 | | | | 4,556,191 | |
| | | | | | | | |
EXPENSES | | | | | | | | |
Management /Sponsorship fees | | | 3,395,784 | | | | 3,023,102 | |
Distribution fees – Investor shares | | | 827,343 | | | | 500,877 | |
Distribution fees – Class A shares | | | 10,682 | | | | 72,938 | |
Transfer agent fees – Investor shares | | | 308,397 | | | | 316,441 | |
Transfer agent fees – Class A shares | | | 5,335 | | | | 56,997 | |
Transfer agent fees – Institutional shares | | | 2,935 | | | | 3,131 | |
Transfer agent fees – Class R shares | | | 909 | | | | - | |
Custody and Accounting fees | | | 89,993 | | | | 267,480 | |
Miscellaneous | | | 53,507 | | | | 2,007 | |
Registration fees – Investor shares | | | 15,761 | | | | 30,251 | |
Registration fees – Class A shares | | | 14,470 | | | | 19,030 | |
Registration fees – Institutional shares | | | 14,955 | | | | 25,001 | |
Registration fees – Class R shares | | | 14,567 | | | | - | |
Shareholder Service fees – Investor shares | | | 30,165 | | | | 19,448 | |
Shareholder Service fees – Class A shares | | | 533 | | | | 5,782 | |
Shareholder Service fees – Institutional shares | | | 85 | | | | 289 | |
Shareholder Service fees – Class R shares | | | 105 | | | | - | |
Shareholder Communication fees | | | 25,741 | | | | 16,032 | |
Trustees fees | | | 18,666 | | | | 12,847 | |
Professional fees | | | 11,832 | | | | 13,914 | |
| | | | | | | | |
Total expenses | | | 4,841,765 | | | | 4,385,567 | |
Fees waived and expenses reimbursed | | | (18,730) | | | | (19,785) | |
| | | | | | | | |
Net expenses | | | 4,823,035 | | | | 4,365,782 | |
| | | | | | | | |
NET INVESTMENT INCOME (LOSS) | | | 4,955,070 | | | | 190,409 | |
| | | | | | | | |
REALIZED AND UNREALIZED GAIN (LOSS) FROM INVESTMENTS AND FOREIGN CURRENCY | | | | | | | | |
NET REALIZED GAIN (LOSS) FROM: | | | | | | | | |
Investments | | | 30,996,586 | | | | (4,868,758) | |
Foreign Currency | | | 2,748 | | | | (311,384) | |
| | | | | | | | |
Net realized gain (loss) | | | 30,999,334 | | | | (5,180,142) | |
NET CHANGES IN UNREALIZED APPRECIATION (DEPRECIATION) FROM: | | | | | | | | |
Investments | | | 33,802,760 | | | | 37,749,297 | |
Translation of assets and liabilities in foreign currencies | | | 2,039 | | | | 44,316 | |
| | | | | | | | |
Net change in unrealized appreciation (depreciation) | | | 33,804,799 | | | | 37,793,613 | |
| | | | | | | | |
NET REALIZED AND UNREALIZED GAIN (LOSS) | | | 64,804,133 | | | | 32,613,471 | |
| | | | | | | | |
NET INCREASE (DECREASE) IN NET ASSETS RESULTING FROM OPERATIONS | | $ | 69,759,203 | | | $ | 32,803,880 | |
| | | | | | | | |
SEE NOTES TO FINANCIAL STATEMENTS
47
DOMINI IMPACT EQUITY FUND
STATEMENTS OF CHANGES IN NET ASSETS
| | | | | | | | |
| | | Six Months
Ended
January 31, 2017
(unaudited) | | | Year Ended
July 31, 2016 | |
INCREASE IN NET ASSETS | | | | | | | | |
FROM OPERATIONS | | | | | | | | |
Net investment income (loss) | | $ | 4,955,070 | | | $ | 20,065,234 | |
Net realized gain (loss) | | | 30,999,334 | | | | 8,238,864 | |
Net change in unrealized appreciation (depreciation) | | | 33,804,799 | | | | (57,998,308) | |
| | | | | | | | |
Net Increase (Decrease) in Net Assets Resulting from Operations | | | 69,759,203 | | | | (29,694,210) | |
| | | | | | | | |
DISTRIBUTIONS AND/OR DIVIDENDS | | | | | | | | |
Dividends to shareholders from net investment income: | | | | | | | | |
Investor shares | | | (3,565,551) | | | | (7,760,110) | |
Class A shares | | | (414,948) | | | | (644,111) | |
Institutional shares | | | (3,170,592) | | | | (6,399,233) | |
Class R shares | | | (2,673,873) | | | | (4,453,212) | |
Distributions to shareholders from net realized gain: | | | | | | | | |
Investor shares | | | (10,974,157) | | | | (34,944,459) | |
Class A shares | | | (810,823) | | | | (2,048,824) | |
Institutional shares | | | (5,617,485) | | | | (19,710,187) | |
Class R shares | | | (4,749,954) | | | | (12,600,332) | |
Tax return of capital distribution | | | | | | | | |
Investor shares | | | - | | | | (142,401) | |
Class A shares | | | - | | | | (1,843) | |
Institutional shares | | | - | | | | (44,435) | |
Class R shares | | | - | | | | (9,599) | |
| | | | | | | | |
Net Decrease in Net Assets from Distributions and/or Dividends | | | (31,977,383) | | | | (88,758,746) | |
| | | | | | | | |
CAPITAL SHARE TRANSACTIONS | | | | | | | | |
Proceeds from sale of shares | | | 23,594,331 | | | | 65,303,360 | |
Net asset value of shares issued in reinvestment of distributions and dividends | | | 30,817,443 | | | | 86,546,917 | |
Payments for shares redeemed | | | (104,825,952) | | | | (174,857,028) | |
Redemption fees | | | 2,291 | | | | 11,090 | |
| | | | | | | | |
Net Increase (Decrease) in Net Assets from Capital Share Transactions | | | (50,411,887) | | | | (22,995,661) | |
| | | | | | | | |
Total Increase (Decrease) in Net Assets | | | (12,630,067) | | | | (141,448,617) | |
| | | | | | | | |
NET ASSETS | | | | | | | | |
Beginning of period | | $ | 913,361,631 | | | $ | 1,054,810,248 | |
| | | | | | | | |
End of period | | $ | 900,731,564 | | | $ | 913,361,631 | |
| | | | | | | | |
Undistributed net investment income (loss) | | $ | (4,874,313) | | | $ | (4,419) | |
| | | | | | | | |
SEE NOTES TO FINANCIAL STATEMENTS
48
DOMINI IMPACT INTERNATIONAL EQUITY FUND
STATEMENTS OF CHANGES IN NET ASSETS
| | | | | | | | |
| | | Six Months
Ended
January 31, 2017
(unaudited) | | | Year Ended
July 31, 2016 | |
INCREASE IN NET ASSETS | | | | | | | | |
FROM OPERATIONS | | | | | | | | |
Net investment income (loss) | | $ | 190,409 | | | $ | 8,857,333 | |
Net realized gain (loss) | | | (5,180,142) | | | | (22,594,223) | |
Net change in unrealized appreciation (depreciation) | | | 37,793,613 | | | | (3,357,498) | |
| | | | | | | | |
Net Increase (Decrease) in Net Assets Resulting from Operations | | | 32,803,880 | | | | (17,094,388) | |
| | | | | | | | |
DISTRIBUTIONS AND/OR DIVIDENDS | | | | | | | | |
Dividends to shareholders from net investment income: | | | | | | | | |
Investor shares | | | (5,223,449) | | | | (3,272,324) | |
Class A shares | | | (760,184) | | | | (494,389) | |
Institutional shares | | | (3,008,134) | | | | (1,952,818) | |
Class R shares | | | - | | | | - | |
Distributions to shareholders from net realized gain: | | | | | | | | |
Investor shares | | | - | | | | (8,095,893) | |
Class A shares | | | - | | | | (1,288,949) | |
Institutional shares | | | - | | | | (2,922,571) | |
Class R shares | | | - | | | | - | |
Tax return of capital distribution | | | | | | | | |
Investor shares | | | - | | | | - | |
Class A shares | | | - | | | | - | |
Institutional shares | | | - | | | | - | |
Class R shares | | | - | | | | - | |
| | | | | | | | |
Net Decrease in Net Assets from Distributions and/or Dividends | | | (8,991,767) | | | | (18,026,944) | |
| | | | | | | | |
CAPITAL SHARE TRANSACTIONS | | | | | | | | |
Proceeds from sale of shares | | | 136,211,731 | | | | 373,227,416 | |
Net asset value of shares issued in reinvestment of distributions and dividends | | | 6,707,653 | | | | 14,258,096 | |
Payments for shares redeemed | | | (88,076,281) | | | | (177,027,885) | |
Redemption fees | | | 10,106 | | | | 23,851 | |
| | | | | | | | |
Net Increase (Decrease) in Net Assets from Capital Share Transactions | | | 54,853,209 | | | | 210,481,478 | |
| | | | | | | | |
Total Increase (Decrease) in Net Assets | | | 78,665,322 | | | | 175,360,146 | |
| | | | | | | | |
NET ASSETS | | | | | | | | |
Beginning of period | | $ | 606,901,539 | | | $ | 431,541,393 | |
| | | | | | | | |
End of period | | $ | 685,566,861 | | | $ | 606,901,539 | |
| | | | | | | | |
Undistributed net investment income (loss) | | $ | (5,933,257) | | | $ | 2,868,101 | |
| | | | | | | | |
SEE NOTES TO FINANCIAL STATEMENTS
49
DOMINI IMPACT EQUITY FUND — INVESTOR SHARES
FINANCIAL HIGHLIGHTS
| | | | | | | | | | | | | | | | | | | | | | | | |
| | | Six Months
Ended
January 31, 2017
(unaudited) | | | Year Ended July 31, | |
| | | | 2016 | | | 2015 | | | 2014 | | | 2013 | | | 2012 | |
For a share outstanding for the period: | | | | | | | | | | | | | | | | | | | | | | | | |
Net asset value, beginning of period | | | $41.49 | | | | $45.38 | | | | $46.82 | | | | $39.22 | | | | $32.66 | | | | $31.56 | |
| | | | | | | | | | | | | | | | | | | | | | | | |
Income from investment operations: | | | | | | | | | | | | | | | | | | | | | | | | |
Net investment income (loss) | | | 0.27 | | | | 0.90 | | | | 0.52 | 5 | | | 0.39 | | | | 0.37 | | | | 0.36 | |
Net realized and unrealized gain (loss) on investments | | | 3.06 | | | | (2.10) | | | | 1.86 | | | | 7.47 | | | | 6.43 | | | | 0.95 | |
| | | | | | | | | | | | | | | | | | | | | | | | |
Total income from investment operations | | | 3.33 | | | | (1.20) | | | | 2.38 | | | | 7.86 | | | | 6.80 | | | | 1.31 | |
| | | | | | | | | | | | | | | | | | | | | | | | |
Less dividends and distributions: | | | | | | | | | | | | | | | | | | | | | | | | |
Dividends to shareholders from net investment income | | | (0.23) | | | | (0.48) | | | | (0.36) | | | | (0.26) | | | | (0.24) | | | | (0.21) | |
Distributions to shareholders from net realized gain | | | (0.72) | | | | (2.20) | | | | (3.46) | | | | - | | | | - | | | | - | |
Tax return of capital 5 | | | - | | | | (0.01) | | | | - | | | | - | | | | - | | | | - | |
| | | | | | | | | | | | | | | | | | | | | | | | |
Total distributions | | | (0.95) | | | | (2.69) | | | | (3.82) | | | | (0.26) | | | | (0.24) | | | | (0.21) | |
| | | | | | | | | | | | | | | | | | | | | | | | |
Redemption fee proceeds 5 | | | 0.00 | 1 | | | 0.00 | 1 | | | 0.00 | 1 | | | 0.00 | 1 | | | 0.00 | 1 | | | 0.00 | 1 |
| | | | | | | | | | | | | | | | | | | | | | | | |
Net asset value, end of period | | | $43.87 | | | | $41.49 | | | | $45.38 | | | | $46.82 | | | | $39.22 | | | | $32.66 | |
| | | | | | | | | | | | | | | | | | | | | | | | |
Total return 2 | | | 8.01% | | | | -2.47% | | | | 5.21% | | | | 20.07% | | | | 20.87% | | | | 4.15% | |
Portfolio turnover | | | 41% | | | | 91% | | | | 103% | | | | 86% | | | | 97% | | | | 94% | |
Ratios/supplemental data (annualized): | | | | | | | | | | | | | | | | | | | | | | | | |
Net assets, end of period (in millions) | | | $664 | | | | $656 | | | | $752 | | | | $699 | | | | $625 | | | | $546 | |
Ratio of expenses to average net assets | | | 1.16% | | | | 1.14% | | | | 1.16% | | | | 1.20% | | | | 1.24% | 4 | | | 1.25% | 3,4 |
Ratio of gross expenses to average net assets | | | 1.16% | | | | 1.14% | | | | 1.16% | | | | 1.20% | | | | 1.24% | | | | 1.26% | |
Ratio of net investment income (loss) to average net assets | | | 1.00% | | | | 2.06% | | | | 1.10% | | | | 0.80% | | | | 0.96% | | | | 1.06% | |
1 Amount represents less than 0.005 per share.
2 Not annualized for periods less than one year.
3 Reflects a waiver of fees by the Manager, the Sponsor, and the Distributor of the Fund.
4 Ratio of expenses to average net assets includes indirectly paid expenses. Excluding indirectly paid expenses the ratio of expenses to average net assets would have been 1.24%, and 1.25%, for the years ended July 31, 2013, and 2012, respectively.
5 Based on average shares outstanding.
SEE NOTES TO FINANCIAL STATEMENTS
50
DOMINI IMPACT EQUITY FUND — CLASS A SHARES
FINANCIAL HIGHLIGHTS
| | | | | | | | | | | | | | | | | | | | | | | | |
| | | Six Months
Ended
January 31, 2017
(unaudited) | | | Year Ended July 31, | |
| | | | 2016 | | | 2015 | | | 2014 | | | 2013 | | | 2012 | |
For a share outstanding for the period: | | | | | | | | | | | | | | | | | | | | | | | | |
Net asset value, beginning of period | | | $7.33 | | | | $10.54 | | | | $13.87 | | | | $11.84 | | | | $10.16 | | | | $10.12 | |
| | | | | | | | | | | | | | | | | | | | | | | | |
Income from investment operations: | | | | | | | | | | | | | | | | | | | | | | | | |
Net investment income (loss) | | | 0.16 | | | | 0.33 | | | | 0.12 | 5 | | | 0.25 | | | | 0.22 | | | | 0.37 | |
Net realized and unrealized gain (loss) on investments | | | 0.42 | | | | (0.69) | | | | 0.53 | | | | 2.12 | | | | 1.86 | | | | 0.05 | |
| | | | | | | | | | | | | | | | | | | | | | | | |
Total income from investment operations | | | 0.58 | | | | (0.36) | | | | 0.65 | | | | 2.37 | | | | 2.08 | | | | 0.42 | |
| | | | | | | | | | | | | | | | | | | | | | | | |
Less dividends and/or distributions: | | | | | | | | | | | | | | | | | | | | | | | | |
Dividends to shareholders from net investment income | | | (0.37) | | | | (0.65) | | | | (0.52) | | | | (0.34) | | | | (0.40) | | | | (0.38) | |
Distributions to shareholders from net realized gain | | | (0.72) | | | | (2.20) | | | | (3.46) | | | | - | | | | - | | | | - | |
Tax return of capital 5 | | | - | | | | (0.00) | 1 | | | - | | | | - | | | | - | | | | - | |
| | | | | | | | | | | | | | | | | | | | | | | | |
Total distributions | | | (1.09) | | | | (2.85) | | | | (3.98) | | | | (0.34) | | | | (0.40) | | | | (0.38) | |
| | | | | | | | | | | | | | | | | | | | | | | | |
Redemption fee proceeds | | | - | | | | - | | | | - | | | | - | | | | - | | | | - | |
| | | | | | | | | | | | | | | | | | | | | | | | |
Net asset value, end of period | | | $6.82 | | | | $7.33 | | | | $10.54 | | | | $13.87 | | | | $11.84 | | | | $10.16 | |
| | | | | | | | | | | | | | | | | | | | | | | | |
Total return 2 | | | 7.95% | | | | -2.61% | | | | 5.19% | | | | 20.17% | | | | 20.88% | | | | 4.20% | |
Portfolio turnover | | | 41% | | | | 91% | | | | 103% | | | | 86% | | | | 97% | | | | 94% | |
Ratios/supplemental data (annualized): | | | | | | | | | | | | | | | | | | | | | | | | |
Net assets, end of period (in millions) | | | $9 | | | | $8 | | | | $11 | | | | $8 | | | | $5 | | | | $4 | |
Ratio of expenses to average net assets | | | 1.18% | 3 | | | 1.18% | 3 | | | 1.18% | 3 | | | 1.18% | 3 | | | 1.18% | 3,4 | | | 1.18% | 3,4 |
Ratio of gross expenses to average net assets | | | 1.54% | | | | 1.41% | | | | 1.39% | | | | 1.54% | | | | 1.74% | | | | 2.09% | |
Ratio of net investment income (loss) to average net assets | | | 0.98% | | | | 2.00% | | | | 1.06% | | | | 0.83% | | | | 1.02% | | | | 1.09% | |
2 Total return does not reflect sales commissions and is not annualized for periods less than one year.
3 Reflects a waiver of fees by the Manager, the Sponsor, and the Distributor of the Fund.
4 Ratio of expenses to average net assets includes indirectly paid expenses. Excluding indirectly paid expenses the ratio of expenses to average net assets would have been 1.18%, and 1.18% for the years ended July 31, 2013, and 2012, respectively.
5 Based on average shares outstanding.
SEE NOTES TO FINANCIAL STATEMENTS
51
DOMINI IMPACT EQUITY FUND — INSTITUTIONAL SHARES
FINANCIAL HIGHLIGHTS
| | | | | | | | | | | | | | | | | | | | | | | | |
| | | Six Months
Ended
January 31, 2017
(unaudited) | | | Year Ended July 31, | |
| | | | 2016 | | | 2015 | | | 2014 | | | 2013 | | | 2012 | |
For a share outstanding for the period: | | | | | | | | | | | | | | | | | | | | | | | | |
Net asset value, beginning of period | | | $22.40 | | | | $25.95 | | | | $28.49 | | | | $23.94 | | | | $20.12 | | | | $19.65 | |
| | | | | | | | | | | | | | | | | | | | | | | | |
Income from investment operations: | | | | | | | | | | | | | | | | | | | | | | | | |
Net investment income (loss) | | | 0.06 | | | | 0.55 | | | | 0.40 | 5 | | | 0.32 | | | | 0.29 | | | | 0.33 | |
Net realized and unrealized gain (loss) on investments | | | 1.78 | | | | (1.20) | | | | 1.11 | | | | 4.60 | | | | 3.96 | | | | 0.57 | |
| | | | | | | | | | | | | | | | | | | | | | | | |
Total income from investment operations | | | 1.84 | | | | (0.65) | | | | 1.51 | | | | 4.92 | | | | 4.25 | | | | 0.90 | |
| | | | | | | | | | | | | | | | | | | | | | | | |
Less dividends and/or distributions: | | | | | | | | | | | | | | | | | | | | | | | | |
Dividends to shareholders from net investment income | | | (0.40) | | | | (0.70) | | | | (0.59) | | | | (0.37) | | | | (0.43) | | | | (0.43) | |
Distributions to shareholders from net realized gain | | | (0.72) | | | | (2.20) | | | | (3.46) | | | | - | | | | - | | | | - | |
Tax return of capital 5 | | | - | | | | (0.00) | 1 | | | - | | | | - | | | | - | | | | - | |
| | | | | | | | | | | | | | | | | | | | | | | | |
Total distributions | | | (1.12) | | | | (2.90) | | | | (4.05) | | | | (0.37) | | | | (0.43) | | | | (0.43) | |
| | | | | | | | | | | | | | | | | | | | | | | | |
Redemption fee proceeds 5 | | | 0.00 | 1 | | | 0.00 | 1 | | | 0.00 | 1 | | | 0.00 | 1 | | | 0.00 | 1 | | | - | |
| | | | | | | | | | | | | | | | | | | | | | | | |
Net asset value, end of period | | | $23.12 | | | | $22.40 | | | | $25.95 | | | | $28.49 | | | | $23.94 | | | | $20.12 | |
| | | | | | | | | | | | | | | | | | | | | | | | |
Total return 2 | | | 8.24% | | | | -2.14% | | | | 5.56% | | | | 20.59% | | | | 21.36% | | | | 4.62% | |
Portfolio turnover | | | 41% | | | | 91% | | | | 103% | | | | 86% | | | | 97% | | | | 94% | |
Ratios/supplemental data (annualized): | | | | | | | | | | | | | | | | | | | | | | | | |
Net assets, end of period (in millions) | | | $185 | | | | $205 | | | | $237 | | | | $260 | | | | $216 | | | | $182 | |
Ratio of expenses to average net assets | | | 0.80% | | | | 0.80% | 3 | | | 0.80% | 3 | | | 0.80% | 3 | | | 0.80% | 3,4 | | | 0.80% | 3,4 |
Ratio of gross expenses to average net assets | | | 0.80% | | | | 0.81% | | | | 0.80% | | | | 0.81% | | | | 0.81% | | | | 0.83% | |
Ratio of net investment income (loss) to average net assets | | | 1.37% | | | | 2.40% | | | | 1.47% | | | | 1.19% | | | | 1.41% | | | | 1.49% | |
1 Amount represents less than 0.005 per share.
2 Not annualized for periods less than one year.
3 Reflects a waiver of fees by the Manager, and the Sponsor of the Fund.
4 Ratio of expenses to average net assets includes indirectly paid expenses. Excluding indirectly paid expenses the ratio of expenses to average net assets would have been 0.80%, 0.80%, for the years ended July 31, 2013, and 2012, respectively.
5 Based on average shares outstanding.
SEE NOTES TO FINANCIAL STATEMENTS
52
DOMINI IMPACT EQUITY FUND — CLASS R SHARES
FINANCIAL HIGHLIGHTS
| | | | | | | | | | | | | | | | | | | | | | | | |
| | | Six Months
Ended
January 31, 2017
(unaudited) | | | Year Ended July 31, | |
| | | | 2016 | | | 2015 | | | 2014 | | | 2013 | | | 2012 | |
For a share outstanding for the period: | | | | | | | | | | | | | | | | | | | | | | | | |
Net asset value, beginning of period | | | $6.20 | | | | $9.40 | | | | $12.81 | | | | $10.94 | | | | $9.41 | | | | $9.40 | |
| | | | | | | | | | | | | | | | | | | | | | | | |
Income from investment operations: | | | | | | | | | | | | | | | | | | | | | | | | |
Net investment income (loss) | | | 0.23 | | | | 0.49 | | | | 0.15 | 5 | | | 1.00 | | | | (0.03) | | | | 1.16 | |
Net realized and unrealized gain (loss) on investments | | | 0.27 | | | | (0.79) | | | | 0.49 | | | | 1.23 | | | | 1.98 | | | | (0.74) | |
| | | | | | | | | | | | | | | | | | | | | | | | |
Total income from investment operations | | | 0.50 | | | | (0.30) | | | | 0.64 | | | | 2.23 | | | | 1.95 | | | | 0.42 | |
| | | | | | | | | | | | | | | | | | | | | | | | |
Less dividends and/or distributions: | | | | | | | | | | | | | | | | | | | | | | | | |
Dividends to shareholders from net investment income | | | (0.40) | | | | (0.70) | | | | (0.59) | | | | (0.36) | | | | (0.42) | | | | (0.41) | |
Distributions to shareholders from net realized gain | | | (0.72) | | | | (2.20) | | | | (3.46) | | | | - | | | | - | | | | - | |
Tax return of capital 5 | | | - | | | | (0.00) | 1 | | | - | | | | - | | | | - | | | | - | |
| | | | | | | | | | | | | | | | | | | | | | | | |
Total distributions | | | (1.12) | | | | (2.90) | | | | (4.05) | | | | (0.36) | | | | (0.42) | | | | (0.41) | |
| | | | | | | | | | | | | | | | | | | | | | | | |
Redemption fee proceeds 5 | | | 0.00 | 1 | | | 0.00 | 1 | | | 0.00 | 1 | | | 0.00 | 1 | | | 0.00 | 1 | | | 0.00 | 1 |
| | | | | | | | | | | | | | | | | | | | | | | | |
Net asset value, end of period | | | $5.58 | | | | $6.20 | | | | $9.40 | | | | $12.81 | | | | $10.94 | | | | $9.41 | |
| | | | | | | | | | | | | | | | | | | | | | | | |
Total return 2 | | | 8.19% | | | | -2.22% | | | | 5.55% | | | | 20.52% | | | | 21.21% | | | | 4.58% | |
Portfolio turnover | | | 41% | | | | 91% | | | | 103% | | | | 86% | | | | 97% | | | | 94% | |
Ratios/supplemental data (annualized): | | | | | | | | | | | | | | | | | | | | | | | | |
Net assets, end of period (in millions) | | | $43 | | | | $44 | | | | $55 | | | | $49 | | | | $28 | | | | $26 | |
Ratio of expenses to average net assets | | | 0.84% | | | | 0.82% | | | | 0.85% | | | | 0.90% | | | | 0.90% | 4 | | | 0.90% | 3,4 |
Ratio of gross expenses to average net assets | | | 0.84% | | | | 0.82% | | | | 0.85% | | | | 0.90% | | | | 0.90% | | | | 0.91% | |
Ratio of net investment income (loss) to average net assets | | | 1.32% | | | | 2.39% | | | | 1.41% | | | | 1.07% | | | | 1.31% | | | | 1.38% | |
1 Amount represents less than 0.005 per share.
2 Not annualized for periods less than one year.
3 Reflects a waiver of fees by the Manager, and the Sponsor, of the Fund.
4 Ratio of expenses to average net assets includes indirectly paid expenses. Excluding indirectly paid expenses the ratio of expenses to average net assets would have been 0.90%, and 0.90% for the years ended July 31, 2013, and 2012, respectively.
5 Based on average shares outstanding.
SEE NOTES TO FINANCIAL STATEMENTS
53
DOMINI IMPACT INTERNATIONAL EQUITY FUND — INVESTOR SHARES
FINANCIAL HIGHLIGHTS
| | | | | | | | | | | | | | | | | | | | | | | | |
| | | Six Months
Ended
January 31, 2017
(unaudited) | | | Year Ended July 31, | |
| | | | 2016 | | | 2015 | | | 2014 | | | 2013 | | | 2012 | |
For a share outstanding for the period: | | | | | | | | | | | | | | | | | | | | | | | | |
Net asset value, beginning of period | | | $7.38 | | | | $8.05 | | | | $8.26 | | | | $7.67 | | | | $5.98 | | | | $7.43 | |
| | | | | | | | | | | | | | | | | | | | | | | | |
Income from investment operations: | | | | | | | | | | | | | | | | | | | | | | | | |
Net investment income (loss) | | | - | | | | 0.12 | | | | 0.13 | | | | 0.14 | | | | 0.11 | | | | 0.09 | |
Net realized and unrealized gain (loss) on investments | | | 0.38 | | | | (0.53) | | | | 0.20 | | | | 0.85 | | | | 1.64 | | | | (1.04) | |
| | | | | | | | | | | | | | | | | | | | | | | | |
Total income from investment operations | | | 0.38 | | | | (0.41) | | | | 0.33 | | | | 0.99 | | | | 1.75 | | | | (0.95) | |
| | | | | | | | | | | | | | | | | | | | | | | | |
Less dividends and/or distributions: | | | | | | | | | | | | | | | | | | | | | | | | |
Dividends to shareholders from net investment income | | | (0.10) | | | | (0.07) | | | | (0.11) | | | | (0.25) | | | | (0.06) | | | | (0.28) | |
Distributions to shareholders from net realized gain | | | - | | | | (0.19) | | | | (0.43) | | | | (0.15) | | | | - | | | | (0.20) | |
Tax return of capital 5 | | | - | | | | - | | | | - | | | | - | | | | - | | | | (0.02) | |
| | | | | | | | | | | | | | | | | | | | | | | | |
Total distributions | | | (0.10) | | | | (0.26) | | | | (0.54) | | | | (0.40) | | | | (0.06) | | | | (0.50) | |
| | | | | | | | | | | | | | | | | | | | | | | | |
Redemption fee proceeds 5 | | | 0.00 | 1 | | | 0.00 | 1 | | | 0.00 | 1 | | | 0.00 | 1 | | | 0.00 | 1 | | | 0.00 | 1 |
| | | | | | | | | | | | | | | | | | | | | | | | |
Net asset value, end of period | | | $7.66 | | | | $7.38 | | | | $8.05 | | | | $8.26 | | | | $7.67 | | | | $5.98 | |
| | | | | | | | | | | | | | | | | | | | | | | | |
Total return 2 | | | 5.18% | | | | -5.12% | | | | 4.65% | | | | 13.15% | | | | 29.26% | | | | -12.38% | |
Portfolio turnover | | | 42% | | | | 89% | | | | 88% | | | | 86% | | | | 87% | | | | 110% | |
Ratios/supplemental data (annualized): | | | | | | | | | | | | | | | | | | | | | | | | |
Net assets, end of period (in millions) | | | $432 | | | | $385 | | | | $320 | | | | $232 | | | | $160 | | | | $127 | |
Ratio of expenses to average net assets | | | 1.47% | | | | 1.52% | | | | 1.59% | | | | 1.60% | 3 | | | 1.60% | 3,4 | | | 1.60% | 3,4 |
Ratio of gross expenses to average net assets | | | 1.47% | | | | 1.52% | | | | 1.59% | | | | 1.62% | | | | 1.68% | | | | 1.74% | |
Ratio of net investment income (loss) to average net assets | | | -0.04% | | | | 1.59% | | | | 1.32% | | | | 1.43% | | | | 1.70% | | | | 1.64% | |
1 Amount represents less than 0.005 per share.
2 Not annualized for periods less than one year.
3 Reflects a waiver of fees by the Manager, and the Distributor of the Fund.
4 Ratio of expenses to average net assets includes indirectly paid expenses. Excluding indirectly paid expenses the ratio of expenses to average net assets would have been 1.60%, and 1.60% for the years ended July 31, 2013, and 2012, respectively.
5 Based on average shares outstanding.
SEE NOTES TO FINANCIAL STATEMENTS
54
DOMINI IMPACT INTERNATIONAL EQUITY FUND — CLASS A SHARES
FINANCIAL HIGHLIGHTS
| | | | | | | | | | | | | | | | | | | | | | | | |
| | | Six Months
Ended
January 31, 2017
(unaudited) | | | Year Ended July 31, | |
| | | | 2016 | | | 2015 | | | 2014 | | | 2013 | | | 2012 | |
For a share outstanding for the period: | | | | | | | | | | | | | | | | | | | | | | | | |
Net asset value, beginning of period | | | $7.76 | | | | $8.45 | | | | $8.64 | | | | $8.00 | | | | $6.24 | | | | $7.73 | |
| | | | | | | | | | | | | | | | | | | | | | | | |
Income from investment operations: | | | | | | | | | | | | | | | | | | | | | | | | |
Net investment income (loss) | | | (0.01) | | | | 0.11 | | | | 0.14 | | | | 0.14 | | | | 0.12 | | | | 0.14 | |
Net realized and unrealized gain (loss) on investments | | | 0.40 | | | | (0.54) | | | | 0.21 | | | | 0.90 | | | | 1.71 | | | | (1.12) | |
| | | | | | | | | | | | | | | | | | | | | | | | |
Total income from investment operations | | | 0.39 | | | | (0.43) | | | | 0.35 | | | | 1.04 | | | | 1.83 | | | | (0.98) | |
| | | | | | | | | | | | | | | | | | | | | | | | |
Less dividends and/or distributions: | | | | | | | | | | | | | | | | | | | | | | | | |
Dividends to shareholders from net investment income | | | (0.10) | | | | (0.07) | | | | (0.11) | | | | (0.25) | | | | (0.07) | | | | (0.29) | |
Distributions to shareholders from net realized gain | | | - | | | | (0.19) | | | | (0.43) | | | | (0.15) | | | | - | | | | (0.20) | |
Tax return of capital 5 | | | - | | | | - | | | | - | | | | - | | | | - | | | | (0.02) | |
| | | | | | | | | | | | | | | | | | | | | | | | |
Total distributions | | | (0.10) | | | | (0.26) | | | | (0.54) | | | | (0.40) | | | | (0.07) | | | | (0.51) | |
Redemption fee proceeds 5 | | | 0.00 | 1 | | | 0.00 | 1 | | | 0.00 | 1 | | | 0.00 | 1 | | | - | | | | - | |
| | | | | | | | | | | | | | | | | | | | | | | | |
Net asset value, end of period | | | $8.05 | | | | $7.76 | | | | $8.45 | | | | $8.64 | | | | $8.00 | | | | $6.24 | |
| | | | | | | | | | | | | | | | | | | | | | | | |
Total return 2 | | | 5.02% | | | | -5.07% | | | | 4.71% | | | | 13.16% | | | | 29.30% | | | | -12.26% | |
Portfolio turnover | | | 42% | | | | 89% | | | | 88% | | | | 86% | | | | 87% | | | | 110% | |
Ratios/supplemental data (annualized): | | | | | | | | | | | | | | | | | | | | | | | | |
Net assets, end of period (in millions) | | | $66 | | | | $55 | | | | $51 | | | | $29 | | | | $13 | | | | $6 | |
Ratio of expenses to average net assets | | | 1.54% | 3 | | | 1.53% | 3 | | | 1.57% | 3 | | | 1.57% | 3 | | | 1.57% | 3,4 | | | 1.57% | 3,4 |
Ratio of gross expenses to average net assets | | | 1.61% | | | | 1.59% | | | | 1.68% | | | | 1.82% | | | | 2.13% | | | | 2.33% | |
Ratio of net investment income (loss) to average net assets | | | -0.12% | | | | 1.47% | | | | 1.46% | | | | 1.51% | | | | 1.91% | | | | 1.85% | |
1 Amount represents less than 0.005 per share.
2 Total return does not reflect sales commissions and is not annualized for periods less than one year.
3 Reflects a waiver of fees by the Manager, and the Distributor of the Fund.
4 Ratio of expenses to average net assets includes indirectly paid expenses. Excluding indirectly paid expenses the ratio of expenses to average net assets would have been 1.57%, and 1.57% for the years ended July 31, 2013, and 2012, respectively.
5 Based on average shares outstanding.
SEE NOTES TO FINANCIAL STATEMENTS
55
DOMINI IMPACT INTERNATIONAL EQUITY FUND — INSTITUTIONAL SHARES
FINANCIAL HIGHLIGHTS
| | | | | | | | | | | | | | | | | | | | |
| | | Six Months
Ended
January 31, 2017
(unaudited) | | | Year Ended July 31 | | | For the Period
November 30, 2012
(commencement
of operations)
through
July 31, 2013 | |
| | | | 2016 | | | 2015 | | | 2014 | | |
For a share outstanding for the period: | | | | | | | | | | | | | | | | | | | | |
Net asset value, beginning of period | | | $7.39 | | | | $8.07 | | | | $8.28 | | | | $7.66 | | | | $6.59 | |
| | | | | | | | | | | | | | | | | | | | |
Income from investment operations: | | | | | | | | | | | | | | | | | | | | |
Net investment income (loss) | | | 0.01 | | | | 0.15 | | | | 0.16 | | | | 0.13 | | | | 0.11 | |
Net realized and unrealized gain (loss) on investments | | | 0.37 | | | | (0.54) | | | | 0.21 | | | | 0.89 | | | | 1.04 | |
| | | | | | | | | | | | | | | | | | | | |
Total income from investment operations | | | 0.38 | | | | (0.39) | | | | 0.37 | | | | 1.02 | | | | 1.15 | |
| | | | | | | | | | | | | | | | | | | | |
Less dividends and/or distributions: | | | | | | | | | | | | | | | | | | | | |
Dividends to shareholders from net investment income | | | (0.12) | | | | (0.10) | | | | (0.15) | | | | (0.25) | | | | (0.08) | |
Distributions to shareholders from net realized gain | | | - | | | | (0.19) | | | | (0.43) | | | | (0.15) | | | | - | |
| | | | | | | | | | | | | | | | | | | | |
Total distributions | | | (0.12) | | | | (0.29) | | | | (0.58) | | | | (0.40) | | | | (0.08) | |
| | | | | | | | | | | | | | | | | | | | |
Redemption fee proceeds 5 | | | 0.00 | 1 | | | 0.00 | 1 | | | 0.00 | 1 | | | 0.00 | 1 | | | - | |
| | | | | | | | | | | | | | | | | | | | |
Net asset value, end of period | | | $7.65 | | | | $7.39 | | | | $8.07 | | | | $8.28 | | | | $7.66 | |
| | | | | | | | | | | | | | | | | | | | |
Total return 2 | | | 5.29% | | | | -4.74% | | | | 5.24% | | | | 13.60% | | | | 17.50% | |
Portfolio turnover | | | 42% | | | | 89% | | | | 88% | | | | 86% | | | | 87% | |
Ratios/supplemental data (annualized): | | | | | | | | | | | | | | | | | | | | |
Net assets, end of period (in millions) | | | $188 | | | | $167 | | | | $61 | | | | $39 | | | | $25 | |
Ratio of expenses to average net assets | | | 1.09% | | | | 1.10% | | | | 1.15% | 3 | | | 1.16% | | | | 1.25% | 3,4 |
Ratio of gross expenses to average net assets | | | 1.09% | | | | 1.10% | | | | 1.15% | | | | 1.16% | | | | 1.25% | |
Ratio of net investment income (loss) to average net assets | | | 0.35% | | | | 2.22% | | | | 1.78% | | | | 1.82% | | | | 2.40% | |
1 Amount represents less than 0.005 per share.
2 Not annualized for periods less than one year.
3 Reflects a waiver of fees by the Manager of the Fund.
4 Ratio of expenses to average net assets includes indirectly paid expenses. Excluding indirectly paid expenses the ratio of expenses to average net assets would have been 1.25% for the period ended July 31, 2013.
5 Based on average shares outstanding.
SEE NOTES TO FINANCIAL STATEMENTS
56
DOMINI IMPACT EQUITY FUND
DOMINI IMPACT INTERNATIONAL EQUITY FUND
NOTES TO FINANCIAL STATEMENTS
January 31, 2017 (Unaudited)
1. ORGANIZATION AND SIGNIFICANT ACCOUNTING POLICIES
The Domini Investment Trust (formerly Domini Social Investment Trust) is a Massachusetts business trust registered under the Investment Company Act of 1940 as an open-end management investment company. The Domini Investment Trust comprises three separate series: Domini Impact Equity Fund (formerly, Domini Social Equity Fund), Domini Impact International Equity Fund (formerly, Domini International Social Equity Fund), and Domini Impact Bond Fund (formerly Domini Social Bond Fund) (each the “Fund,” collectively the “Funds”). The financial statements of the Domini Impact Bond Fund are included on page 70 of this report. The Domini Impact Equity Fund offers Investor shares, Class A shares, Institutional shares and Class R shares. Class R shares of the Domini Impact Equity Fund commenced on November 28, 2003. Class A and Institutional shares of the Domini Impact Equity Fund commenced on November 28, 2008. The Domini Impact International Equity Fund offers Investor shares, Class A shares and Institutional Shares. Class A and Institutional shares of the Domini Impact International Equity Fund were not offered prior to November 28, 2008 and November 30, 2012, respectively. The Investor shares, Institutional shares and Class R shares are sold at their offering price, which is net asset value. The Class A shares are sold with a front-end sales charge (load) of up to 4.75%. The Institutional shares may only be purchased by or for the benefit of investors that meet the minimum investment requirements, fall within the following categories: endowments, foundations, religious organizations and other nonprofit entities, individuals, retirement plan sponsors, family office clients, certain corporate or similar institutions, or omnibus accounts maintained by financial intermediaries and that are approved by the Fund’s Distributor. Class R shares are generally available only to certain eligible retirement plans and endowments, foundations, religious organizations, and other tax-exempt entities that are approved by the Fund’s Distributor. All classes of shares have identical rights and voting privileges with respect to the Fund in general and exclusive voting rights on matters that affect that class alone. Earnings, net assets, and net asset value per share may differ due to each class having its own expenses, such as transfer and shareholder servicing agent fees and registration fees, directly attributable to that class. Class R and Institutional shares are not subject to distribution and service fees.
The preparation of financial statements in conformity with U.S. generally accepted accounting principles requires management to make estimates and assumptions that affect the reported amounts of assets and liabilities and disclosure of contingent liabilities at the date of the financial statements and the
57
DOMINI IMPACT EQUITY FUND
DOMINI IMPACT INTERNATIONAL EQUITY FUND
NOTES TO FINANCIAL STATEMENTS (continued)
January 31, 2017 (Unaudited)
reported amounts of revenues and expenses during the reporting period. Actual results could differ from those estimates. The following is a summary of the Funds’ significant accounting policies.
(A) Valuation of Investments. Securities listed or traded on national securities exchanges are valued at the last sale price reported by the security’s primary exchange or, if there have been no sales that day, at the mean of the current bid and ask price that represents the current value of the security. Securities listed on the NASDAQ National Market System are valued using the NASDAQ Official Closing Price (the “NOCP”). If an NOCP is not available for a security listed on the NASDAQ National Market System, the security will be valued at the last sale price or, if there have been no sales that day, at the mean of the current bid and ask price. Securities for which market quotations are not readily available or as a result of an event occurring after the close of the foreign market but before pricing the Funds are valued at fair value as determined in good faith under procedures established by and under the supervision of the Funds’ Board of Trustees. Securities that are primarily traded on foreign exchanges generally are valued at the closing price of such securities on their respective exchanges, except that if the Trusts’ manager or submanager, as applicable, is of the opinion that such price would result in an inappropriate value for a security, including as a result of an occurrence subsequent to the time a value was so established, then the fair value of those securities may be determined by consideration of other factors (including the use of an independent pricing service) by or under the direction of the Board of Trustees or its delegates.
The Funds follow a fair value hierarchy that distinguishes between (a) market participant assumptions developed based on market data obtained from sources independent of the reporting entity (observable inputs) and (b) the Fund’s own assumptions about market participant assumptions developed based on the best information available in the circumstances (unobservable inputs). These inputs are used in determining the value of the Funds’ investments and are summarized in the following fair value hierarchy:
Level 1 — quoted prices in active markets for identical securities
Level 2 — other significant observable inputs (including quoted prices for similar securities, interest rates, and evaluated quotation obtained from pricing services)
Level 3 — significant unobservable inputs (including the Funds’ own assumptions in determining the fair value of investments)
58
DOMINI IMPACT EQUITY FUND
DOMINI IMPACT INTERNATIONAL EQUITY FUND
NOTES TO FINANCIAL STATEMENTS (continued)
January 31, 2017 (Unaudited)
The inputs or methodology used for valuing securities are not an indication of the risk associated with investing in those securities. The following is a summary of the inputs used by the Domini Impact Equity Fund, as of January 31, 2017, in valuing the Fund’s assets carried at fair value:
| | | | | | | | | | | | | | | | |
| | | Level 1 -
Quoted Prices | | | Level 2 -
Other
Significant
Observable
Inputs | | | Level 3 -
Significant
Unobservable
Inputs | | | Total | |
| | | | | | | | | | | | | | | | |
Common Stocks | | | | | | | | | | | | | | | | |
Consumer Discretionary | | $ | 126,907,021 | | | $ | - | | | $ | - | | | $ | 126,907,021 | |
Consumer Staples | | | 77,915,559 | | | | - | | | | - | | | | 77,915,559 | |
Energy | | | 2,343,323 | | | | - | | | | - | | | | 2,343,323 | |
Financials | | | 151,359,566 | | | | - | | | | - | | | | 151,359,566 | |
Health Care | | | 103,163,934 | | | | - | | | | - | | | | 103,163,934 | |
Industrials | | | 89,394,269 | | | | - | | | | - | | | | 89,394,269 | |
Information Technology | | | 209,136,960 | | | | - | | | | - | | | | 209,136,960 | |
Materials | | | 32,982,664 | | | | - | | | | - | | | | 32,982,664 | |
Real Estate | | | 30,617,325 | | | | - | | | | - | | | | 30,617,325 | |
Telecommunication Services | | | 37,671,980 | | | | - | | | | - | | | | 37,671,980 | |
Utilities | | | 29,727,900 | | | | - | | | | - | | | | 29,727,900 | |
| | | | | | | | | | | | | | | | |
Total | | $ | 891,220,501 | | | $ | - | | | $ | - | | | $ | 891,220,501 | |
| | | | | | | | | | | | | | | | |
The following is a summary of the inputs used by the Domini Impact International Equity Fund, as of January 31, 2017, in valuing the Fund’s assets carried at fair value:
| | | | | | | | | | | | | | | | |
| | | Level 1 -
Quoted Prices | | | Level 2 -
Other
Significant
Observable
Inputs | | | Level 3 -
Significant
Unobservable
Inputs | | | Total | |
| | | | | | | | | | | | | | | | |
Common Stocks | | | | | | | | | | | | | | | | |
Consumer Discretionary | | $ | 96,107,690 | | | $ | - | | | $ | - | | | $ | 96,107,690 | |
Consumer Staples | | | 54,445,356 | | | | - | | | | - | | | | 54,445,356 | |
Energy | | | 15,630,551 | | | | - | | | | - | | | | 15,630,551 | |
Financials | | | 160,061,375 | | | | - | | | | - | | | | 160,061,375 | |
Health Care | | | 51,257,455 | | | | - | | | | - | | | | 51,257,455 | |
Industrials | | | 104,677,779 | | | | - | | | | - | | | | 104,677,779 | |
Information Technology | | | 59,205,175 | | | | - | | | | - | | | | 59,205,175 | |
Materials | | | 51,543,146 | | | | - | | | | - | | | | 51,543,146 | |
Real Estate | | | 45,574,402 | | | | - | | | | - | | | | 45,574,402 | |
Telecommunication Services | | | 23,137,729 | | | | - | | | | - | | | | 23,137,729 | |
Utilities | | | 4,706,037 | | | | - | | | | - | | | | 4,706,037 | |
| | | | | | | | | | | | | | | | |
Total | | $ | 666,346,695 | | | $ | - | | | $ | - | | | $ | 666,346,695 | |
| | | | | | | | | | | | | | | | |
59
DOMINI IMPACT EQUITY FUND
DOMINI IMPACT INTERNATIONAL EQUITY FUND
NOTES TO FINANCIAL STATEMENTS (continued)
January 31, 2017 (Unaudited)
The following is a reconciliation of Level 3 assets for which significant unobservable inputs were used to determine fair value:
| | | | |
| | | Domini
International
Social Equity
Fund | |
Investments in Securities | | | | |
Balance as of July 31, 2016 | | $ | - | |
Realized Gain (loss) | | | - | |
Change in unrealized appreciation (depreciation) | | | 1,904,212 | |
Purchases | | | - | |
Sales | | | - | |
Transfers in and/or out of Level Three | | | (1,904,212) | |
| | | | |
Balance as of January 31, 2017 | | $ | - | |
| | | | |
The change in unrealized appreciation (depreciation) included in earnings relating to securities still held at January 31, 2017: | | $ | - | |
| | | | |
For the Domini Impact International Equity Fund transfers from Level 1 to Level 3 included securities valued at $37,957,668 that were transferred as a result of quoted prices in active markets not being readily available. Transfers out of Level 3 into Level 1 included securities valued at $39,861,880 because market values were readily available from a pricing agent for which fair value factors were previously applied.
(B) Foreign Currency Translation. Securities and other assets and liabilities denominated in foreign currencies are translated into U.S. dollar amounts on the date of valuation. Purchases and sales of securities, and income and expense items denominated in foreign currencies, are translated into U.S. dollar amounts on the respective dates of such transactions. Occasionally, events impact the availability or reliability of foreign exchange rates used to convert the U.S. dollar equivalent value. If such an event occurs, the foreign exchange rate will be valued at fair value using procedures established and approved by the Board of Trustees. The Funds do not separately report the effect of fluctuations in foreign exchange rates from changes in market prices on securities held. Such fluctuations are included with the net realized and unrealized gain or loss from investments. Realized foreign exchange gains or losses arise from sales of foreign currencies, currency gains or losses realized between the trade and settlement dates on securities transactions, and the difference between the recorded amounts of dividends, interest, and foreign withholding taxes and the U.S. dollar equivalent of the amounts actually received or paid. Net unrealized foreign exchange gains and losses arise from changes in fair value of assets and
60
DOMINI IMPACT EQUITY FUND
DOMINI IMPACT INTERNATIONAL EQUITY FUND
NOTES TO FINANCIAL STATEMENTS (continued)
January 31, 2017 (Unaudited)
liabilities other than investments in securities held at the end of the reporting period, resulting from changes in exchange rates.
(C) Foreign Currency Contracts. When the Funds purchase or sell foreign securities they enter into foreign exchange contracts to minimize foreign exchange risk from the trade date to the settlement date of the transactions. A foreign exchange contract is an agreement between two parties to exchange different currencies at an agreed-upon exchange rate on a specified date. The Domini Impact Equity Fund and the Domini Impact International had no open foreign currency spot contracts as of January 31, 2017.
(D) Investment Transactions, Investment Income and Dividends to Shareholders. The Funds earn income daily, net of Fund expenses. Dividends to shareholders of the Domini Impact International Equity Fund are usually declared and paid semiannually from net investment income. Dividends to shareholders of the Domini Impact Equity Fund are usually declared and paid quarterly from net investment income. Distributions to shareholders of realized capital gains, if any, are made annually. Distributions are determined in conformity with income tax regulations, which may differ from generally accepted accounting principles. Reclassifications have been made to the Funds’ components of net assets to reflect income and gains available for distribution (or available capital loss carryovers, as applicable) under income tax regulations.
Investment transactions are accounted for on trade date. Realized gains and losses from security transactions are determined on the basis of identified cost. Interest income is recorded on an accrual basis. Dividend income, net of any applicable withholding tax, is recorded on the ex-dividend date or for certain foreign securities, when the information becomes available to the Funds.
(E) Federal Taxes. Each Fund’s policy is to comply with the provisions of the Internal Revenue Code applicable to regulated investment companies and to distribute substantially all of its taxable income, including net realized gains, if any, within the prescribed time periods. Accordingly, no provision for federal income or excise tax is deemed necessary. As of January 31, 2017, tax years 2013 through 2016 remain subject to examination by the Funds’ major tax jurisdictions, which include the United States of America, the Commonwealth of Massachusetts, and New York State.
(F) Redemption Fees. Redemptions and exchanges of Fund shares held less than 30 days may be subject to the Funds’ redemption fee, which is 2% of the amount redeemed. The fee is imposed to offset transaction costs and other expenses associated with short-term investing. The fee may be waived in certain
61
DOMINI IMPACT EQUITY FUND
DOMINI IMPACT INTERNATIONAL EQUITY FUND
NOTES TO FINANCIAL STATEMENTS (continued)
January 31, 2017 (Unaudited)
circumstances at the discretion of the Funds. Such fees are retained by the Funds and are recorded as an adjustment to paid-in capital.
(G) Other. Income, expenses (other than those attributable to a specific class), gains, and losses are allocated on a daily basis to each class of shares based upon the relative proportion of net assets represented by such class. Operating expenses directly attributable to a specific class are charged against the operations of that class.
(H) Indemnification. The Funds’ organizational documents provide current and former trustees and officers with a limited indemnification against liabilities arising in connection with the performance of their duties to the Funds. In the normal course of business, the Funds may also enter into contracts that provide general indemnifications. The Funds’ maximum exposure under these arrangements is unknown as this would be dependent on future claims that may be made against the Funds. The risk of material loss from such claims is considered remote.
2. TRANSACTIONS WITH AFFILIATES
(A) Manager/Sponsor. The Funds have retained Domini Impact Investments LLC (Domini) to serve as investment manager and administrator. Domini is registered as an investment advisor under the Investment Advisers Act of 1940. The services provided by Domini consist of investment supervisory services, overall operational support, and administrative services. The administrative services include the provision of general office facilities and supervising the overall administration of the Funds. For its services under the Management Agreements, Domini receives from each Fund a fee accrued daily and paid monthly at the annual rate below of the respective Funds’ average daily net assets before any fee waivers:
| | |
| Domini Impact Equity Fund | | 0.30% of the first $2 billion of net assets managed, |
| | 0.29% of the next $1 billion of net assets managed, and |
| | 0.28% of net assets managed in excess of $3 billion |
| | |
| Domini Impact International Equity Fund | | 1.00% of the first $250 million of net assets managed, |
| | 0.94% of the next $250 million of net assets managed, and |
| | 0.88% of net assets managed in excess of $500 million |
Pursuant to a Sponsorship Agreement (with respect to the Domini Impact Equity Fund) Domini provides the Funds with the administrative personnel and services necessary to operate the Funds. In addition to general administrative services and facilities for the Funds similar to those provided by Domini under the Management Agreements, Domini answers questions from the general
62
DOMINI IMPACT EQUITY FUND
DOMINI IMPACT INTERNATIONAL EQUITY FUND
NOTES TO FINANCIAL STATEMENTS (continued)
January 31, 2017 (Unaudited)
public and the media regarding the securities holdings of the Funds. For these services and facilities, Domini receives fees accrued daily and paid monthly from the Funds at the annual rate below of the respective Funds’ average daily net assets before any fee waivers:
| | |
| Domini Impact Equity Fund | | 0.45% of the first $2 billion of net assets managed, |
| | 0.44% of the next $1 billion of net assets managed, and |
| | 0.43% of net assets managed in excess of $3 billion |
Effective November 30, 2016, Domini reduced its fees and reimbursed expenses, not including reorganization related expenses, to the extent necessary to keep the aggregate annual operating expenses of the Domini Impact Equity Fund at no greater than 1.25%, 1.18%, 0.80%, and 0.90% of the average daily net assets representing Investor shares, Class A shares, Institutional shares and Class R shares, respectively. For the periods prior to November 30, 2016, similar arrangements were in effect. The waivers currently in effect are contractual and in effect until November 30, 2017, absent an earlier modification by the Board of Trustees which oversees the Funds. Effective November 30, 2016, Domini reduced its fees and reimbursed expenses to the extent necessary to keep the aggregate annual operating expenses, not including reorganization expenses, of the Domini Impact International Equity Fund no greater than 1.60%, 1.57% and 1.27% of the average daily net assets representing Investor shares, Class A shares and Institutional Shares, respectively. For the periods prior to November 30, 2016, similar arrangements were in effect. The waivers currently in effect are contractual and in effect until November 30, 2017, absent an earlier modification by the Board of Trustees which oversees the Funds. For the six months ended January 31, 2017, Domini waived fees and reimbursed expenses as follows:
| | | | | | | | |
| | | FEES WAIVED | | | EXPENSES REIMBURSED | |
| | | | | | | | |
Domini Impact Equity Fund | | $ | - | | | $ | 9,880 | |
Domini Impact International Equity Fund | | | - | | | | - | |
Fees waived and/or expenses reimbursed under the Expense Limitation Agreement are only recoverable by Domini and/or its affiliates in the current fiscal year to the extent actual Fund expenses are less than the contractual expense cap during such year.
As of January 31, 2017, Domini owned less than 1% of any class of the outstanding shares of each Fund.
(B) Submanager. Wellington Management Company LLP (Wellington), a Delaware limited liability partnership, provides investment submanagement services to the Funds on a day-to-day basis pursuant to Submanagement
Agreements with Domini.
63
DOMINI IMPACT EQUITY FUND
DOMINI IMPACT INTERNATIONAL EQUITY FUND
NOTES TO FINANCIAL STATEMENTS (continued)
January 31, 2017 (Unaudited)
(C) Distributor. The Board of Trustees of the Funds has adopted a Distribution Plan with respect to the Funds’ Investor shares and Class A shares in accordance with Rule 12b-1 under the Act. DSIL Investment Services LLC, a wholly owned subsidiary of Domini (DSILD), acts as agent of the Funds in connection with the offering of Investor shares of the Funds pursuant to a Distribution Agreement. Under the Distribution Plan, the Funds pay expenses incurred in connection with the sale of Investor shares and Class A shares and pay DSILD a distribution fee at an aggregate annual rate not to exceed 0.25% of the average daily net assets representing the Investor shares and Class A shares. For the six months ended January 31, 2017, fees waived were as follows:
| | | | |
| | | FEES WAIVED | |
Domini Impact Equity Fund Investor shares | | $ | - | |
Domini Impact Equity Fund Class A shares | | | 8,850 | |
Domini Impact International Equity Fund Investor shares | | | - | |
Domini Impact International Equity Fund Class A shares | | | 19,785 | |
DSIL Investment Services, LLC, (DSIL) the Funds’ Distributor, has received commissions related to the sales of fund shares. For the six months ended January 31, 2017, DSIL received $1,893, and $4,386 from the Domini Impact Equity Fund Class A Shares, and the Domini Impact International Equity Fund Class A shares, respectively.
(D) Shareholder Service Agent. The Trust has retained Domini to provide certain shareholder services with respect to the Domini Impact Equity Fund, and Domini Impact International Equity Fund and their shareholders, which services were previously provided by BNY Asset Servicing (“BNY”) or another fulfillment and mail service provider and are supplemental to services currently provided by BNY, pursuant to a transfer agency agreement between each Fund and BNY. For these services, Domini receives fees from each Fund paid monthly at an annual rate of $4.00 per active account. For the six months ended January 31, 2017, there were no fees waived.
(E) Trustees and Officers. Each of the Independent Trustees receives an annual retainer for serving as a Trustee of the Trust of $14,000. The Lead Independent Trustee and Chair of the Audit Committee receive an additional chairperson fee of $5,000. Each Independent Trustee also receives $1,500 for attendance at each meeting of the Board of the Trust (reduced to $625 in the event that a Trustee participates at an in-person meeting by telephone). In addition, each Trustee receives reimbursement for reasonable expenses incurred in attending meetings. These expenses are allocated on a pro-rata basis to each shares class of a Fund according to their respective net assets.
64
DOMINI IMPACT EQUITY FUND
DOMINI IMPACT INTERNATIONAL EQUITY FUND
NOTES TO FINANCIAL STATEMENTS (continued)
January 31, 2017 (Unaudited)
As of January 31, 2017, all Trustees and officers of the Trust as a group owned less than 1% of each Fund’s outstanding shares.
3. INVESTMENT TRANSACTIONS
For the six months ended January 31, 2017, cost of purchase and proceeds from sales of investments other than short-term obligations were as follows:
| | | | | | | | |
| | | PURCHASE | | | SALES | |
Domini Impact Equity Fund | | $ | 364,824,186 | | | $ | 448,376,542 | |
Domini Impact International Equity Fund | | | 298,427,040 | | | | 263,944,961 | |
65
DOMINI IMPACT EQUITY FUND
DOMINI IMPACT INTERNATIONAL EQUITY FUND
NOTES TO FINANCIAL STATEMENTS (continued)
January 31, 2017 (Unaudited)
4. SUMMARY OF SHARE TRANSACTIONS
| | | | | | | | | | | | | | | | |
| | | Six Months Ended
January 31, 2017 | | | Year Ended
July 31, 2016 | |
| | | Shares | | | Amount | | | Shares | | | Amount | |
| | | | |
Domini Impact Equity Fund | | | | | | | | | | | | | | | | |
| | | | |
Investor Shares | | | | | | | | | | | | | | | | |
Shares sold | | | 333,546 | | | $ | 14,202,135 | | | | 946,947 | | | $ | 38,245,827 | |
Shares issued in reinvestment of dividends and distributions | | | 321,526 | | | | 14,002,465 | | | | 1,022,290 | | | | 41,403,426 | |
Shares redeemed | | | (1,334,696) | | | | (56,880,966) | | | | (2,736,834) | | | | (111,244,077) | |
Redemption fees | | | - | | | | 566 | | | | - | | | | 8,929 | |
| | | | | | | | | | | | | | | | |
Net increase (decrease) | | | (679,624) | | | $ | (28,675,800) | | | | (767,597) | | | $ | (31,585,895) | |
| | | | | | | | | | | | | | | | |
| | | | |
Class A Shares | | | | | | | | | | | | | | | | |
Shares sold | | | 62,897 | | | $ | 456,763 | | | | 206,193 | | | $ | 1,609,232 | |
Shares issued in reinvestment of dividends and distributions | | | 172,689 | | | | 1,175,431 | | | | 348,082 | | | | 2,564,298 | |
Shares redeemed | | | (124,584) | | | | (904,874) | | | | (396,575) | | | | (3,154,114) | |
Redemption fees | | | - | | | | - | | | | - | | | | - | |
| | | | | | | | | | | | | | | | |
Net increase (decrease) | | | 111,002 | | | $ | 727,320 | | | | 157,700 | | | $ | 1,019,416 | |
| | | | | | | | | | | | | | | | |
| | | | |
Institutional Shares | | | | | | | | | | | | | | | | |
Shares sold | | | 331,120 | | | $ | 7,570,693 | | | | 911,656 | | | $ | 20,564,743 | |
Shares issued in reinvestment of dividends and distributions | | | 359,815 | | | | 8,260,329 | | | | 1,170,773 | | | | 25,713,177 | |
Shares redeemed | | | (1,830,033) | | | | (41,381,465) | | | | (2,081,982) | | | | (46,764,660) | |
Redemption fees | | | - | | | | 1,193 | | | | - | | | | 2,125 | |
| | | | | | | | | | | | | | | | |
Net increase (decrease) | | | (1,139,098) | | | $ | (25,549,250) | | | | 447 | | | $ | (484,615) | |
| | | | | | | | | | | | | | | | |
| | | | |
Class R Shares | | | | | | | | | | | | | | | | |
Shares sold | | | 222,679 | | | $ | 1,364,740 | | | | 700,694 | | | $ | 4,883,558 | |
Shares issued in reinvestment of dividends and distributions | | | 1,324,218 | | | | 7,379,218 | | | | 2,696,629 | | | | 16,866,016 | |
Shares redeemed | | | (916,710) | | | | (5,658,647) | | | | (2,095,090) | | | | (13,694,177) | |
Redemption fees | | | - | | | | 532 | | | | - | | | | 36 | |
| | | | | | | | | | | | | | | | |
Net increase (decrease) | | | 630,187 | | | $ | 3,085,843 | | | | 1,302,233 | | | $ | 8,055,433 | |
| | | | | | | | | | | | | | | | |
| | | | |
Total | | | | | | | | | | | | | | | | |
Shares sold | | | 950,242 | | | $ | 23,594,331 | | | | 2,765,490 | | | $ | 65,303,360 | |
Shares issued in reinvestment of dividends and distributions | | | 2,178,248 | | | | 30,817,443 | | | | 5,237,774 | | | | 86,546,917 | |
Shares redeemed | | | (4,206,023) | | | | (104,825,952) | | | | (7,310,481) | | | | (174,857,028) | |
Redemption fees | | | - | | | | 2,291 | | | | - | | | | 11,090 | |
| | | | | | | | | | | | | | | | |
Net increase (decrease) | | | (1,077,533) | | | $ | (50,411,887) | | | | 692,783 | | | $ | (22,995,661) | |
| | | | | | | | | | | | | | | | |
66
DOMINI IMPACT EQUITY FUND
DOMINI IMPACT INTERNATIONAL EQUITY FUND
NOTES TO FINANCIAL STATEMENTS (continued)
January 31, 2017 (Unaudited)
| | | | | | | | | | | | | | | | |
| | | Six Months Ended
January 31, 2017 | | | Year Ended
July 31, 2016 | |
| | | Shares | | | Amount | | | Shares | | | Amount | |
| | | |
Domini Impact International Equity Fund | | | | | | | | | | | | | |
| | | | |
Investor Shares | | | | | | | | | | | | | | | | |
Shares sold | | | 11,188,431 | | | $ | 83,255,368 | | | | 30,048,006 | | | $ | 219,906,322 | |
Shares issued in reinvestment of dividends and distributions | | | 601,781 | | | | 4,386,983 | | | | 1,379,616 | | | | 10,002,392 | |
Shares redeemed | | | (7,511,161) | | | | (55,539,342) | | | | (19,052,183) | | | | (137,921,955) | |
Redemption fees | | | - | | | | 9,410 | | | | - | | | | 19,441 | |
| | | | | | | | | | | | | | | | |
Net increase (decrease) | | | 4,279,051 | | | $ | 32,112,419 | | | | 12,375,439 | | | $ | 92,006,200 | |
| | | | | | | | | | | | | | | | |
| | | | |
Class A Shares | | | | | | | | | | | | | | | | |
Shares sold | | | 1,927,373 | | | $ | 14,921,956 | | | | 3,345,919 | | | $ | 25,706,276 | |
Shares issued in reinvestment of dividends and distributions | | | 94,699 | | | | 725,394 | | | | 224,297 | | | | 1,709,871 | |
Shares redeemed | | | (979,833) | | | | (7,643,959) | | | | (2,487,440) | | | | (18,672,019) | |
Redemption fees | | | - | | | | 410 | | | | - | | | | 381 | |
| | | | | | | | | | | | | | | | |
Net increase (decrease) | | | 1,042,239 | | | $ | 8,003,801 | | | | 1,082,776 | | | $ | 8,744,509 | |
| | | | | | | | | | | | | | | | |
| | | | |
Institutional Shares | | | | | | | | | | | | | | | | |
Shares sold | | | 5,125,914 | | | $ | 38,034,407 | | | | 17,538,735 | | | $ | 127,614,818 | |
Shares issued in reinvestment of dividends and distributions | | | 219,131 | | | | 1,595,276 | | | | 351,789 | | | | 2,545,833 | |
Shares redeemed | | | (3,360,607) | | | | (24,892,980) | | | | (2,805,570) | | | | (20,433,911) | |
Redemption fees | | | - | | | | 286 | | | | - | | | | 4,029 | |
| | | | | | | | | | | | | | | | |
Net increase (decrease) | | | 1,984,438 | | | $ | 14,736,989 | | | | 15,084,954 | | | $ | 109,730,769 | |
| | | | | | | | | | | | | | | | |
| | | | |
Total | | | | | | | | | | | | | | | | |
Shares sold | | | 18,241,718 | | | $ | 136,211,731 | | | | 50,932,660 | | | $ | 373,227,416 | |
Shares issued in reinvestment of dividends and distributions | | | 915,611 | | | | 6,707,653 | | | | 1,955,702 | | | | 14,258,096 | |
Shares redeemed | | | (11,851,601) | | | | (88,076,281) | | | | (24,345,193) | | | | (177,027,885) | |
Redemption fees | | | - | | | | 10,106 | | | | - | | | | 23,851 | |
| | | | | | | | | | | | | | | | |
Net increase (decrease) | | | 7,305,728 | | | $ | 54,853,209 | | | | 28,543,169 | | | $ | 210,481,478 | |
| | | | | | | | | | | | | | | | |
67
DOMINI IMPACT EQUITY FUND
DOMINI IMPACT INTERNATIONAL EQUITY FUND
NOTES TO FINANCIAL STATEMENTS (continued)
January 31, 2017 (Unaudited)
5. FEDERAL TAX STATUS
The tax basis of the components of net assets for the Funds at July 31, 2016, is as follows:
| | | | | | | | |
| | | Domini
Impact Equity
Fund | | | Domini Impact
International
Equity Fund | |
Undistributed ordinary income | | $ | - | | | $ | 7,891,648 | |
Capital losses, other losses and other temporary differences | | | (2,261,005) | | | | (23,462,301) | |
Unrealized appreciation/(depreciation) | | | 81,165,768 | | | | 18,757,996 | |
| | | | | | | | |
Distributable net earnings/(deficit) | | $ | 78,904,763 | | | $ | 3,187,343 | |
| | | | | | | | |
The difference between components of Distributable Earnings on a tax basis and the amounts reflected in the statement of assets and liabilities is primarily due to differences in book and tax policies. For the year ended July 31, 2016, the Funds made the following reclassifications to the components of net assets to align financial reporting with tax reporting:
| | | | | | | | |
| | | Domini
Impact Equity
Fund | | | Domini Impact
International
Equity Fund | |
Paid-in capital | | $ | (198,278) | | | $ | - | |
Undistributed net investment income (loss) | | | (614,709) | | | | 1,260,701 | |
Accumulated net realized gain (loss) | | | 812,987 | | | | (1,260,701) | |
During the period November 1, 2015 through July 31, 2016, the Domini Impact Equity Fund and the Domini Impact International Equity Fund had net realized capital losses of $2,256,586 and $19,593,199, respectively. The Domini Impact Equity Fund also had ordinary losses of $4,419. These losses are deferred and will be recognized on August 1, 2016, for tax purposes.
The Funds have accumulated capital loss carryforwards that will expire as follows:
| | | | | | | | |
| Year Ending | | Domini
Impact Equity
Fund | | | Domini Impact
International
Equity Fund | |
Unlimited | | | - | | | $ | 3,528,939 | |
2017 | | | - | | | | 170,081 | |
| | | | | | | | |
| | | - | | | $ | 170,081 | |
| | | | | | | | |
To the extent that the Funds realize future net capital gains, those gains will be offset by any unused capital loss carryforwards. Under recently enacted Regulated Investment Company Modernization Act of 2010, the Funds will be
68
DOMINI IMPACT EQUITY FUND
DOMINI IMPACT INTERNATIONAL EQUITY FUND
NOTES TO FINANCIAL STATEMENTS (continued)
January 31, 2017 (Unaudited)
permitted to carry forward capital losses incurred in taxable years beginning after December 22, 2010, for an unlimited time period. However, any losses incurred during those future taxable years will be required to be utilized prior to the losses incurred in pre-enactment taxable years. As a result of this
ordering rule, pre-enactment capital loss carryforwards may be more likely to expire unused. Additionally, post-enactment capital losses that are carried forward will retain their character as either short-term or long-term capital losses rather than being considered all short-term as under previous law.
For federal income tax purposes, dividends paid were characterized as follows:
| | | | | | | | | | | | | | | | |
| | | Domini Impact Equity Fund | | | Domini Impact
International Equity Fund | |
| | | Year Ended
July 31, 2016 | | | Year Ended
July 31, 2015 | | | Year Ended
July 31, 2016 | | | Year Ended
July 31, 2015 | |
Ordinary income | | $ | 24,441,067 | | | $ | 14,291,218 | | | $ | 7,042,460 | | | $ | 4,781,207 | |
Long-term capital gain | | | 64,119,401 | | | | 103,057,752 | | | | 10,984,484 | | | | 16,856,941 | |
Return of Capital | | | 198,278 | | | | - | | | | - | | | | - | |
| | | | | | | | | | | | | | | | |
Total | | $ | 88,758,746 | | | $ | 117,348,970 | | | $ | 18,026,944 | | | $ | 21,638,148 | |
| | | | | | | | | | | | | | | | |
The Funds are subject to the provisions of Accounting Standards Codification ASC 740 Income Taxes (ASC 740). ASC 740 sets forth a minimum threshold for financial statement recognition of the benefit of a tax position taken or expected to be taken in a tax return. The Funds did not have a liability to record for any unrecognized tax benefits in the accompanying financial statements. No provision has been made for taxes on income, capital gains or unrealized appreciation on securities held or for excise tax on income and capital gains.
69
DOMINI IMPACT BOND FUND
STATEMENT OF ASSETS AND LIABILITIES
January 31, 2017 (Unaudited)
| | | | |
ASSETS: | | | | |
Investments at value (cost $155,283,039) | | $ | 154,619,243 | |
Cash | | | 15,134,672 | |
Foreign currency (cost $13,633) | | | 14,061 | |
Cash held at other banks (cost $2,010) | | | 2,075 | |
Colleratal on certain derivative contracts | | | 453,652 | |
Receivable for securities sold | | | 16,696,792 | |
Interest receivable | | | 835,832 | |
Receivable for capital shares | | | 276,494 | |
Unrealized appreciation on OTC swap contracts | | | 263,847 | |
Receivable for variation margin swaps | | | 664,983 | |
Premium received swap contracts | | | 98,532 | |
Unrealized appreciation on forward currency contracts | | | 37,720 | |
Interest reclaim receivable | | | 828 | |
| | | | |
Total assets | | | 189,098,731 | |
| | | | |
LIABILITIES: | | | | |
Payable for securities purchased | | | 41,954,008 | |
Payable for capital shares | | | 173,774 | |
Payable for variation margin swaps | | | 387,213 | |
Cash due to broker (cost $375,998) | | | 382,305 | |
Premium paid on OTC swap contracts | | | 83,361 | |
Management fee payable | | | 80,793 | |
Distribution fee payable | | | 37,387 | |
Other accrued expenses | | | 35,548 | |
Dividend payable | | | 20,296 | |
Unrealized depreciation on forward currency contracts | | | 3,556 | |
Interest payable | | | 83,160 | |
| | | | |
Total liabilities | | | 43,241,401 | |
| | | | |
NET ASSETS | | $ | 145,857,330 | |
| | | | |
NET ASSETS CONSIST OF: | | | | |
Paid-in capital | | $ | 146,746,109 | |
Undistributed net investment loss | | | (91,810) | |
Accumulated net realized loss | | | (703,012) | |
Net unrealized depreciation | | | (93,957) | |
| | | | |
| | $ | 145,857,330 | |
| | | | |
NET ASSET VALUE PER SHARE | | | | |
Investor Shares | | | | |
Net assets | | $ | 141,648,909 | |
| | | | |
Outstanding shares of beneficial interest | | | 12,774,442 | |
| | | | |
Net asset value and offering price per share* | | $ | 11.09 | |
| | | | |
Institutional Shares | | | | |
Net assets | | $ | 4,208,421 | |
| | | | |
Outstanding shares of beneficial interest | | | 380,455 | |
| | | | |
Net asset value and offering price per share* | | $ | 11.06 | |
| | | | |
* Redemption price is equal to net asset value less any applicable redemption fees retained by the Fund.
SEE NOTES TO FINANCIAL STATEMENTS
70
DOMINI IMPACT BOND FUND
STATEMENT OF OPERATIONS
For the Six Months Ended January 31, 2017 (Unaudited)
| | | | |
INCOME: | | | | |
Interest income | | $ | 2,156,839 | |
| | | | |
EXPENSES: | | | | |
Management fee | | | 295,535 | |
Administrative fee | | | 184,709 | |
Distribution fees – Investor shares | | | 180,146 | |
Transfer agent fees – Investor shares | | | 86,024 | |
Transfer agent fees – Institutional shares | | | 70 | |
Accounting and custody fees | | | 59,709 | |
Professional fees | | | 8,081 | |
Registration – Investor shares | | | 10,912 | |
Registration – Institutional shares | | | 6,200 | |
Shareholding servicing fees – Investor shares | | | 7,025 | |
Shareholding servicing fees – Institutional shares | | | 6 | |
Shareholder communications | | | 7,992 | |
Miscellaneous | | | 10,613 | |
Trustees fees | | | 2,563 | |
| | | | |
Total expenses | | | 859,585 | |
Fees waived and expense reimbursed | | | (163,128) | |
| | | | |
Net expenses | | | 696,457 | |
| | | | |
NET INVESTMENT INCOME | | | 1,460,382 | |
| | | | |
REALIZED AND UNREALIZED GAINS (LOSSES) | | | | |
NET REALIZED GAIN/(LOSS) FROM: | | | | |
Investments | | | (485,424) | |
Swap contracts | | | 245,411 | |
Futures contracts | | | (35,408) | |
Foreign currency | | | 34,540 | |
Options | | | (627) | |
| | | | |
Net realized gain (loss) | | | (241,508) | |
| | | | |
NET CHANGES IN UNREALIZED APPRECIATION (DEPRECIATION) FROM: | | | | |
Investments | | | (6,064,534) | |
Swap contracts | | | 444,866 | |
Futures | | | 9,531 | |
Translation of assets and liabilities in foreign currencies | | | 24,577 | |
| | | | |
Net change in unrealized appreciation (depreciation) | | | (5,585,560) | |
| | | | |
NET REALIZED AND UNREALIZED GAIN (LOSS) | | | (5,827,068) | |
| | | | |
NET INCREASE (DECREASE) IN NET ASSETS RESULTING FROM OPERATIONS | | $ | (4,366,686) | |
| | | | |
SEE NOTES TO FINANCIAL STATEMENTS
71
DOMINI IMPACT BOND FUND
STATEMENTS OF CHANGES IN NET ASSETS
| | | | | | | | |
| | | Six Months
Ended
January 31, 2017
(unaudited) | | | Year Ended
July 31, 2016 | |
INCREASE IN NET ASSETS: | | | | | | | | |
FROM OPERATIONS: | | | | | | | | |
Net investment income (loss) | | $ | 1,460,382 | | | $ | 2,876,709 | |
Net realized gain (loss) on investments | | | (241,508) | | | | 657,181 | |
Net change in unrealized appreciation (depreciation) on investments | | | (5,585,560) | | | | 5,499,895 | |
| | | | | | | | |
Net Increase (Decrease) in Net Assets Resulting from Operations | | | (4,366,686) | | | | 9,033,785 | |
| | | | | | | | |
DISTRIBUTIONS AND DIVIDENDS: | | | | | | | | |
Dividends to shareholders from net investment income: | | | | | | | | |
Investor shares | | | (1,444,706) | | | | (2,794,993) | |
Institutional shares | | | (42,032) | | | | (55,786) | |
Distributions to shareholders from net realized gain: | | | | | | | | |
Investor shares | | | (667,809) | | | | (699,959) | |
Institutional shares | | | (20,201) | | | | (9,583) | |
| | | | | | | | |
Net Decrease in Net Assets from Distributions and Dividends | | | (2,174,748) | | | | (3,560,321) | |
| | | | | | | | |
CAPITAL SHARE TRANSACTIONS: | | | | | | | | |
Proceeds from sale of shares | | | 18,456,057 | | | | 28,148,855 | |
Net asset value of shares issued in reinvestment of distributions and dividends | | | 2,047,129 | | | | 3,337,264 | |
Payment for shares redeemed | | | (15,550,890) | | | | (21,135,652) | |
Redemption fee | | | 3,894 | | | | 2,901 | |
| | | | | | | | |
Net Increase in Net Assets from Capital Share Transactions | | | 4,956,190 | | | | 10,353,368 | |
| | | | | | | | |
Total Increase (Decrease) in Net Assets | | | (1,585,244) | | | | 15,826,832 | |
| | | | | | | | |
NET ASSETS: | | | | | | | | |
Beginning of period | | $ | 147,442,574 | | | $ | 131,615,742 | |
| | | | | | | | |
End of period | | $ | 145,857,330 | | | $ | 147,442,574 | |
| | | | | | | | |
Undistributed net investment income (loss) | | $ | (91,810) | | | $ | (65,454) | |
| | | | | | | | |
SEE NOTES TO FINANCIAL STATEMENTS
72
DOMINI IMPACT BOND FUND — INVESTOR SHARES
FINANCIAL HIGHLIGHTS
| | | | | | | | | | | | | | | | | | | | | | | | |
| | | Six Months
Ended
January 31, 2017
(unaudited) | | | Year Ended July 31, | |
| | | | 2016 | | | 2015 | | | 2014 | | | 2013 | | | 2012 | |
For a share outstanding for the period: | | | | | | | | | | | | | | | | | | | | | | | | |
Net asset value, beginning of period | | | $11.60 | | | | $11.16 | | | | $11.24 | | | | $11.15 | | | | $11.64 | | | | $11.61 | |
| | | | | | | | | | | | | | | | | | | | | | | | |
Income from investment operations: | | | | | | | | | | | | | | | | | | | | | | | | |
Net investment income (loss) | | | 0.11 | | | | 0.24 | | | | 0.17 | | | | 0.16 | | | | 0.16 | | | | 0.21 | |
Net realized and unrealized gain (loss) on investments | | | (0.46) | | | | 0.50 | | | | (0.07) | | | | 0.13 | | | | (0.38) | | | | 0.34 | |
| | | | | | | | | | | | | | | | | | | | | | | | |
Total income from investment operations | | | (0.35) | | | | 0.74 | | | | 0.10 | | | | 0.29 | | | | (0.22) | | | | 0.55 | |
| | | | | | | | | | | | | | | | | | | | | | | | |
Less dividends and distributions: | | | | | | | | | | | | | | | | | | | | | | | | |
Dividends to shareholders from net investment income | | | (0.11) | | | | (0.24) | | | | (0.17) | | | | (0.16) | | | | (0.16) | | | | (0.21) | |
Distributions to shareholders from net realized gain | | | (0.05) | | | | (0.06) | | | | (0.01) | | | | (0.04) | | | | (0.11) | | | | (0.31) | |
| | | | | | | | | | | | | | | | | | | | | | | | |
Total dividends and distributions | | | (0.16) | | | | (0.30) | | | | (0.18) | | | | (0.20) | | | | (0.27) | | | | (0.52) | |
| | | | | | | | | | | | | | | | | | | | | | | | |
Redemption fee proceeds 5 | | | 0.00 | 1 | | | 0.00 | 1 | | | 0.00 | 1 | | | 0.00 | 1 | | | 0.00 | 1 | | | 0.00 | 1 |
| | | | | | | | | | | | | | | | | | | | | | | | |
Net asset value, end of period | | | $11.09 | | | | $11.60 | | | | $11.16 | | | | $11.24 | | | | $11.15 | | | | $11.64 | |
| | | | | | | | | | | | | | | | | | | | | | | | |
Total return 2 | | | -2.96% | | | | 6.73% | | | | 0.89% | | | | 2.59% | | | | -2.01% | | | | 4.80% | |
Portfolio turnover | | | 168% | | | | 297% | | | | 348% | | | | 120% | | | | 129% | | | | 126% | |
Ratios/supplemental data (annualized): | | | | | | | | | | | | | | | | | | | | | | | | |
Net assets, end of period (in millions) | | | $142 | | | | $144 | | | | $129 | | | | $126 | | | | $130 | | | | $138 | |
Ratio of expenses to average net assets | | | 0.95% | 3 | | | 0.93% | 3 | | | 0.95% | 3 | | | 0.95% | 3 | | | 0.95% | 3,4 | | | 0.95% | 3,4 |
Ratio of gross expenses to average net assets | | | 1.16% | | | | 1.19% | | | | 1.24% | | | | 1.24% | | | | 1.24% | | | | 1.28% | |
Ratio of net investment income to average net assets | | | 1.97% | | | | 2.13% | | | | 1.52% | | | | 1.42% | | | | 1.35% | | | | 1.76% | |
1 Amount represents less than $0.005 per share.
2 Not annualized for periods less than one year.
3 Reflects a waiver of fees by the Manager and the Distributor of the Fund.
4 Ratio of expenses to average net assets includes indirectly paid expenses. Excluding indirectly paid expenses the ratio of expenses to average net assets would have been 0.95% and 0.95% for the years ended July 31, 2013, and 2012, respectively.
5 Based on average shares outstanding.
SEE NOTES TO FINANCIAL STATEMENTS
73
DOMINI IMPACT BOND FUND — INSTITUTIONAL SHARES
FINANCIAL HIGHLIGHTS
| | | | | | | | | | | | | | | | | | | | | | | | |
| | | Six Months
Ended
January 31,
2017
(unaudited) | | | For the year ended July 31, | | | For the period
November 30, 2011
(commencement
of operations)
through July 31,
2012 | |
| | | | 2016 | | | 2015 | | | 2014 | | | 2013 | | |
For a share outstanding for the period: | | | | | | | | | | | | | | | | | | | | | | | | |
Net asset value, beginning of period | | | $11.57 | | | | $11.14 | | | | $11.23 | | | | $11.15 | | | | $11.64 | | | | $11.74 | |
| | | | | | | | | | | | | | | | | | | | | | | | |
Income from investment operations: | | | | | | | | | | | | | | | | | | | | | | | | |
Net investment income (loss) | | | 0.13 | | | | 0.27 | | | | 0.20 | | | | 0.19 | | | | 0.19 | | | | 0.15 | |
Net realized and unrealized gain (loss) on investments | | | (0.46) | | | | 0.49 | | | | (0.09) | | | | 0.12 | | | | (0.38) | | | | 0.21 | |
| | | | | | | | | | | | | | | | | | | | | | | | |
Total income from investment operations | | | (0.33) | | | | 0.76 | | | | 0.11 | | | | 0.31 | | | | (0.19) | | | | 0.36 | |
| | | | | | | | | | | | | | | | | | | | | | | | |
Less dividends and distributions: | | | | | | | | | | | | | | | | | | | | | | | | |
Dividends to shareholders from net investment income | | | (0.13) | | | | (0.27) | | | | (0.20) | | | | (0.19) | | | | (0.19) | | | | (0.15) | |
Distributions to shareholders from net realized gain | | | (0.05) | | | | (0.06) | | | | (0.01) | | | | (0.04) | | | | (0.11) | | | | (0.31) | |
| | | | | | | | | | | | | | | | | | | | | | | | |
Total dividends and distributions | | | (0.18) | | | | (0.33) | | | | (0.21) | | | | (0.23) | | | | (0.30) | | | | (0.46) | |
| | | | | | | | | | | | | | | | | | | | | | | | |
Redemption fee proceeds 5 | | | 0.00 | 1 | | | 0.00 | 1 | | | 0.01 | | | | - | | | | - | | | | - | |
| | | | | | | | | | | | | | | | | | | | | | | | |
Net asset value, end of period | | | $11.06 | | | | $11.57 | | | | $11.14 | | | | $11.23 | | | | $11.15 | | | | $11.64 | |
| | | | | | | | | | | | | | | | | | | | | | | | |
Total return 2 | | | -2.82% | | | | 6.96% | | | | 1.10% | | | | 2.80% | | | | -1.72% | | | | 3.17% | |
Portfolio turnover | | | 168% | | | | 297% | | | | 348% | | | | 120% | | | | 129% | | | | 126% | |
Ratios/supplemental data (annualized): | | | | | | | | | | | | | | | | | | | | | | | | |
Net assets, end of period (in millions) | | | $4 | | | | $3 | | | | $2 | | | | $4 | | | | $3 | | | | $1 | |
Ratio of expenses to average net assets | | | 0.65% | 3 | | | 0.63% | 3 | | | 0.65% | 3 | | | 0.65% | 3 | | | 0.65% | 3,4 | | | 0.65% | 3,4 |
Ratio of gross expenses to average net assets | | | 1.14% | | | | 1.22% | | | | 1.07% | | | | 1.02% | | | | 0.97 | | | | 3.99 | |
Ratio of net investment income to average net assets | | | 2.27% | | | | 2.46% | | | | 1.79% | | | | 1.73% | | | | 1.54% | | | | 1.88% | |
1 Amount represents less than $0.005 per share.
2 Not annualized for periods less than one year.
3 Reflects a waiver of fees by the Manager of the Fund.
4 Ratio of expenses to average net assets includes indirectly paid expenses. Excluding indirectly paid expenses the ratio of expenses to average net assets would have been 0.65% and 0.65% for the years ended July 31, 2013 and 2012, respectively.
5 Based on average shares outstanding.
SEE NOTES TO FINANCIAL STATEMENTS
74
DOMINI IMPACT BOND FUND
NOTES TO FINANCIAL STATEMENTS
January 31, 2017 (Unaudited)
1. ORGANIZATION AND SIGNIFICANT ACCOUNTING POLICIES
The Domini Impact Bond Fund (formerly Domini Social Bond Fund) (the “Fund”) is a series of the Domini Investment Trust (formerly Domini Social Investment Trust). The Trust is a Massachusetts business trust registered under the Investment Company Act of 1940 as an open-end management investment company. The Fund offers Investor Shares and Institutional Shares. Institutional shares were not offered prior to November 30, 2011. Each class of shares is sold at its offering price, which is net asset value. The Institutional shares may only be purchased by or for the benefit of investors that meet the minimum investment requirements, fall within the following categories: endowments, foundations, religious organizations and other nonprofit entities, individuals, retirement plan sponsors, family office clients, certain corporate or similar institutions, or omnibus accounts maintained by financial intermediaries and that are approved by the Fund’s Distributor. Both classes of shares have identical rights and voting privileges with respect to the Fund in general and exclusive voting rights on matters that affect that class alone. Earnings, net assets, and net asset value per share may differ due to each class having its own expenses, such as transfer and shareholder servicing agent fees and registration fees, directly attributable to that class. Institutional shares are not subject to distribution fees. The Fund seeks to provide its shareholders with a high level of current income and total return by investing in bonds and other debt instruments that are consistent with the Fund’s social and environmental standards and the submanager’s security selection approach.
The preparation of financial statements in conformity with U.S. generally accepted accounting principles requires management to make estimates and assumptions that affect the reported amounts of assets and liabilities and disclosure of contingent liabilities at the date of the financial statements and the reported amounts of revenues and expenses during the reporting period. Actual results could differ from those estimates. The following is a summary of the Fund’s significant accounting policies.
(A) Valuation of Investments. Bonds and other fixed-income securities (other than obligations with maturities of 60 days or less) are valued on the basis of valuations furnished by an independent pricing service, use of which has been approved by the Board of Trustees of the Fund. In making such valuations, the pricing service utilizes both dealer-supplied valuations and electronic data processing techniques that take into account appropriate factors such as institutional-size trading in similar groups of securities, yield, quality, coupon rate, maturity, type of issue, trading characteristics, and other market data, without exclusive reliance upon quoted prices or exchange or over-the-counter
75
DOMINI IMPACT BOND FUND
NOTES TO FINANCIAL STATEMENTS (continued)
January 31, 2017 (Unaudited)
prices, since such valuations are believed to reflect more accurately the fairvalue of such securities. Short-term obligations of sufficient credit quality (maturing in 60 days or less) are valued at amortized cost, which constitutes fair value as determined by the Board of Trustees of the Fund. Securities (other than short-term obligations with remaining maturities of 60 days or less) for which there are no such quotations or valuations are valued at fair value as determined in good faith by or at the direction of the Fund’s Board of Trustees. The Funds follow a fair value hierarchy that distinguishes between (a) market participant assumptions developed based on market data obtained from sources independent of the reporting entity (observable inputs) and (b) the Fund’s own assumptions about market participant assumptions developed based on the best information available in the circumstances (unobservable inputs). These inputs are used in determining the value of the Funds’ investments and are summarized in the following fair value hierarchy:
Level 1 — quoted prices in active markets for identical securities
Level 2 — other significant observable inputs (including quoted prices for similar securities, interest rates, and evaluated quotation obtained from pricing services)
Level 3 — significant unobservable inputs (including the Funds’ own assumptions in determining the fair value of investments) The inputs or methodology used for valuing securities are not an indication of the risk associated with investing in those securities.
The following is a summary of the inputs used, as of January 31, 2017, in valuing the Fund’s assets carried at fair value:
| | | | | | | | | | | | | | | | |
| | | Level 1 -
Quoted Prices | | | Level 2 -
Other
Significant
Observable
Inputs | | | Level 3 -
Significant
Unobservable
Inputs | | | Total | |
| | | | | | | | | | | | | | | | |
| | | | |
Assets: | | | | | | | | | | | | | | | | |
Investments in Securities: | | | | | | | | | | | | | | | | |
Mortgage Backed Securities | | $ | - | | | $ | 79,264,543 | | | $ | 122,053 | | | $ | 79,386,596 | |
Corporate Bonds and Notes | | | - | | | | 38,291,238 | | | | - | | | | 38,291,238 | |
Municipal Bonds | | | - | | | | 11,748,921 | | | | - | | | | 11,748,921 | |
Senior Floating Rate Interests | | | - | | | | 10,879,672 | | | | | | | | 10,879,672 | |
U.S. Government Agencies | | | - | | | | 10,728,943 | | | | - | | | | 10,728,943 | |
Asset Backed Securities | | | - | | | | 1,969,346 | | | | - | | | | 1,969,346 | |
Foreign Government & Agency Securities | | | - | | | | 1,614,527 | | | | - | | | | 1,614,527 | |
| | | | | | | | | | | | | | | | |
Total Investment in Securities | | $ | - | | | $ | 154,497,190 | | | $ | 122,053 | | | $ | 154,619,243 | |
| | | | | | | | | | | | | | | | |
76
DOMINI IMPACT BOND FUND
NOTES TO FINANCIAL STATEMENTS (continued)
January 31, 2017 (Unaudited)
| | | | | | | | | | | | | | | | |
| | | Level 1 -
Quoted Prices | | | Level 2 -
Other
Significant
Observable
Inputs | | | Level 3 -
Significant
Unobservable
Inputs | | | Total | |
| | | | | | | | | | | | | | | | |
Other Financial Instruments: | | | | | | | | | | | | | | | | |
Foreign Exchange Contracts | | $ | - | | | $ | 37,720 | | | $ | - | | | $ | 37,720 | |
SWAP Contracts | | | - | | | | 263,847 | | | | - | | | | 263,847 | |
| | | | | | | | | | | | | | | | |
Total Other Financial Instruments | | $ | - | | | $ | 301,567 | | | $ | - | | | $ | 301,567 | |
| | | | | | | | | | | | | | | | |
Liabilities: | | | | | | | | | | | | | | | | |
Other Financial Instruments: | | | | | | | | | | | | | | | | |
Foreign Exchange Contracts | | $ | - | | | $ | 3,556 | | | $ | - | | | $ | 3,556 | |
| | | | | | | | | | | | | | | | |
Total Other Financial Instruments | | $ | - | | | $ | 3,556 | | | $ | - | | | $ | 3,556 | |
| | | | | | | | | | | | | | | | |
The following is a reconciliation of Level 3 assets for which significant unobservable inputs were used to determine fair value:
| | | | |
| | | | |
Investments in Securities | | | | |
Balance as of July 31, 2016 | | $ | 260,722 | |
Realized gain (loss) | | | - | |
Change in unrealized appreciation (depreciation) | | | 20,013 | |
Purchases | | | - | |
Sales | | | - | |
Transfers in and/or out of level three | | | (158,682) | |
| | | | |
Balance as of January 31, 2017 | | $ | 122,053 | |
| | | | |
The change in unrealized appreciation (depreciation) included in earnings relating to securities still held at January 31, 2017 | | $ | 25 | |
| | | | |
Transfers from Level 2 to Level 3 included securities valued at $3,666,884 that were transferred as a result of quoted prices in active markets not being readily available. Transfers out of Level 3 into Level 2 included securities valued at $3,825,566 because market values were readily available from a pricing agent for which fair value factors were previously applied. The Level 3 security was valued using a pricing vendor other than the Fund’s primary pricing vendor.
(B) Foreign Currency Translation. Securities and other assets and liabilities denominated in foreign currencies are translated into U.S. dollar amounts on the date of valuation. Purchases and sales of securities, and income and expense items denominated in foreign currencies, are translated into U.S. dollar amounts on the respective dates of such transactions. Occasionally, events impact the availability or reliability of foreign exchange rates used to convert the U.S. dollar equivalent value. If such an event occurs, the foreign exchange rate will be valued at fair value using procedures established and approved by the Board of Trustees. The Funds do not separately report the effect of fluctuations in
77
DOMINI IMPACT BOND FUND
NOTES TO FINANCIAL STATEMENTS (continued)
January 31, 2017 (Unaudited)
foreign exchange rates from changes in market prices on securities held. Such fluctuations are included with the net realized and unrealized gain or loss from investments. Realized foreign exchange gains or losses arise from sales of foreign currencies, currency gains or losses realized between the trade and settlement dates on securities transactions, and the difference between the recorded amounts of dividends, interest, and foreign withholding taxes and the U.S. dollar equivalent of the amounts actually received or paid. Net unrealized foreign exchange gains and losses arise from changes in fair value of assets and liabilities other than investments in securities held at the end of the reporting period, resulting from changes in exchange rates.
(C) Foreign Currency Contracts. When the Funds purchase or sell foreign securities they enter into foreign exchange contracts to minimize foreign exchange risk from the trade date to the settlement date of the transactions. A foreign exchange contract is an agreement between two parties to exchange different currencies at an agreed-upon exchange rate on a specified date. The Fund had $759,214 outstanding in open foreign currency spot contracts as of January 31, 2017.
(D) Securities Purchased on a When-Issued or Delayed Delivery Basis. The Fund may invest in when-issued or delayed delivery securities where the price of the security is fixed at the time of the commitment but delivery and payment take place beyond customary settlement time. These securities are subject to market fluctuation, and no interest accrues on the security to the purchaser during this period. The payment obligation and the interest rate that will be received on the securities are each fixed at the time the purchaser enters into the commitment. Purchasing obligations on a when-issued or delayed delivery basis is a form of leveraging and can involve a risk that the yields available in the market when the delivery takes place may actually be higher than those obtained in the transaction, which could result in an unrealized loss at the time of delivery. The Fund establishes a segregated account consisting of liquid securities equal to the amount of the commitments to purchase securities on such basis.
(E) Derivative Financial Instruments. The Fund may invest in derivatives in order to hedge market risks, or to seek to increase the Fund’s income or gain. Derivatives in certain circumstances may require that the Fund segregate cash or other liquid assets to the extent the Fund’s obligations are not otherwise covered through ownership of the underlying security, financial instrument, or currency. Derivatives involve special risks, including possible default by the other party to the transaction, illiquidity, and the risk that the use of derivatives could result in greater losses than if it had not been used. Some derivative transactions, including options, swaps, forward contracts, and options on foreign currencies, are entered into directly by the counterparties or through
78
DOMINI IMPACT BOND FUND
NOTES TO FINANCIAL STATEMENTS (continued)
January 31, 2017 (Unaudited)
financial institutions acting as market makers (OTC derivatives), rather than being traded on exchanges or in markets registered with the Commodity Futures Trading Commission or the SEC.
(F) Option Contracts. The Fund may purchase or write option contracts primarily to manage and/or gain exposure to interest rate, foreign exchange rate and credit risk. An option is a contract entitling the holder to purchase or sell a specific amount of shares or units of an asset or notional amount of a swap (swaption), at a specified price. Options purchased are recorded as an asset while options written are recorded as a liability. Upon exercise of an option, the acquisition cost or sales proceeds of the underlying investment is adjusted by any premium received or paid. Upon expiration of an option, any premium received or paid is recorded as a realized gain or loss. Upon closing an option other than through expiration or exercise, the difference between the premium and the cost to close the position is recorded as a realized gain or loss. There are no purchased option contracts outstanding at January 31, 2017.
(G) Futures Contracts. The Fund may purchase and sell futures contracts based on various securities, securities indexes, and other financial instruments and indexes. The Fund intends to use futures contracts for hedging purposes. Futures contracts provide for the future sale by one party and purchase by another party of a specified amount of a specified security or financial instrument at a specified future time and at a specified price. When the Fund purchases or sells a futures contract, the Fund must allocate certain of its assets as an initial deposit on the contract. The futures contract is marked to market daily thereafter, and the Fund may be required to pay or entitled to receive additional “variation margin,” based on decrease or increase in the value of the futures contract. There were no futures contracts outstanding at January 31, 2017.
(H) Forward Currency Contracts. The Fund may enter into forward currency contracts with counterparties to hedge the value of portfolio securities denominated in particular currencies against fluctuations in relative value or to generate income or gain. These contracts are used to hedge foreign exchange risk and to gain exposure on currency. The U.S. dollar value of forward currency contracts is determined using current forward exchange rates supplied by a quotation service. The fair value of the contract will fluctuate with changes in currency exchange rates. The contract is marked to market daily and the change in fair value is recorded as an unrealized gain or loss. The Fund record a realized gain or loss equal to the difference between the value of the contract at the time it was opened and the value at the time it was closed when the contract matures or by delivery of the currency. The Fund could be exposed to risk if the value of the currency changes unfavorably, if the counterparties to the contracts
79
DOMINI IMPACT BOND FUND
NOTES TO FINANCIAL STATEMENTS (continued)
January 31, 2017 (Unaudited)
are unable to meet the terms of their contracts or if the Fund is unable to enter into a closing position. Risk may exceed amounts recognized on the Statement of Assets and Liabilities. Forward currency contracts outstanding at January 31, 2017 are listed in the Fund’s Portfolio of Investments.
(I) Interest Rate Swap Contracts. The Fund may enter into interest rate swap contracts to hedge interest rate risk. An interest rate swap is an agreement between the Fund and a counterparty to exchange cash flows based on the difference between two interest rates, applied to a notional amount. Interest rate swap contracts are marked to market daily based upon quotations from an independent pricing service or market maker. Any change on an OTC interest rate swap is recorded as an unrealized gain or loss on the Statement of Assets and Liabilities. Daily fluctuations in the value of centrally cleared interest rate swaps are settled though a central clearing agent and are recorded in variation margin on the Statement of Assets and Liabilities and recorded as unrealized gain or loss. OTC and centrally cleared interest rate swap contracts outstanding at January 31, 2017, are listed in the Fund’s Portfolio of Investments.
(J) Credit Default Swap Contracts. The Fund may enter into credit default swap contracts primarily to manage and/or gain exposure to credit risk. A credit default swap is an agreement between the fund and a counterparty whereby the buyer of the contract receives credit protection and the seller of the contract guarantees the credit worthiness of a referenced debt obligation. These agreements may be privately negotiated in the over-the-counter market (“OTC credit default swaps”) or may be executed in a multilateral trade facility platform, such as a registered exchange (“centrally cleared credit default swaps”). The underlying referenced debt obligation may be a single issuer of corporate or sovereign debt, a credit index, or a tranche of a credit index. In the event of a default of the underlying referenced debt obligation, the buyer is entitled to receive the notional amount of the credit default swap contract from the seller in exchange for the referenced debt obligation, a net settlement amount equal to the notional amount of the credit default swap less the recovery value of the referenced debt obligation, or other agreed upon amount. For centrally cleared credit default swaps, required initial margins are pledged by the fund, and the daily change in fair value is accounted for as a variation margin payable or receivable on the Statements of Assets and Liabilities. Over the term of the contract, the buyer pays the seller a periodic stream of payments, provided that no event of default has occurred. Such periodic payments are accrued daily as an unrealized appreciation or depreciation until the payments are made, at which time they are realized. Payments received or paid to initiate a credit default swap contract are reflected on the Statements of Assets and Liabilities and represent compensating factors between stated terms
80
DOMINI IMPACT BOND FUND
NOTES TO FINANCIAL STATEMENTS (continued)
January 31, 2017 (Unaudited)
of the credit default swap agreement and prevailing market conditions (credit spreads and other relevant factors). These upfront payments are amortized over the term of the contract as a realized gain or loss on the Statements of Operations. OTC and centrally cleared credit default swap contracts outstanding at January 31, 2017 are listed in the Fund’s Portfolio of Investments.
(K) Master Agreements. The Fund is a party to ISDA (International Swaps and Derivatives Association, Inc.) Master Agreements that govern OTC derivative and foreign exchange contracts (Master Agreements) with certain counterparties entered into from time to time. The Master Agreements may contain provisions regarding, among other things, the parties’ general obligations, representations, agreements, collateral requirements, events of default and early termination. With respect to certain counterparties, in accordance with the terms of the Master Agreements, collateral posted to the Fund is held in a segregated account by the Fund’s custodian and with respect to those amounts which can be sold or repledged, are presented in the Fund’s portfolio. Collateral pledged by the Fund is segregated by the Fund’s custodian and identified in the Fund’s portfolio. Collateral can be in the form of cash or other marketable securities as agreed to by the Fund and the applicable counterparty. Collateral requirements are determined based on the Fund’s net position with each counterparty.
With respect to ISDA Master Agreements, termination events applicable to the counterparty include certain deteriorations in the credit quality of the counterparty. Termination events applicable to the Fund include failure of the Fund to maintain certain net asset levels and/or limit the decline in net assets over various periods of time. In the event of default or early termination, the ISDA Master Agreement gives the non-defaulting party the right to net and close-out all transactions traded, whether or not arising under the ISDA agreement, to one net amount payable by one counterparty to the other. However, absent an event of default or early termination, OTC derivative assets and liabilities are presented gross and not offset in the Statements of Assets and Liabilities. Early termination by the counterparty may result in an immediate payment by the Fund of any net liability owed to that counterparty under the ISDA agreement.
In a centrally cleared swap, while the Fund enters into an agreement with a clearing broker to execute contracts with a counterparty, the performance of the swap is guaranteed by the central clearinghouse, which reduces the Fund’s exposure to counterparty risk. The Fund is still exposed to the counterparty risk through the clearing broker and clearinghouse. The clearinghouse attempts to
81
DOMINI IMPACT BOND FUND
NOTES TO FINANCIAL STATEMENTS (continued)
January 31, 2017 (Unaudited)
minimize this risk to its participants through the use of mandatory margin requirements, daily cash settlements and other procedures. Likewise, the clearing broker reduces its risk through margin requirements and required segregation of customer balances.
(L) Investment Transactions, Investment Income, and Dividends to Shareholders. The Fund earns income daily, net of Fund expenses. Dividends to shareholders are usually declared daily and paid monthly from net investment income. Distributions to shareholders of realized capital gains, if any, are made annually. Distributions are determined in conformity with income tax regulations, which may differ from generally accepted accounting principles. Reclassifications have been made to the Fund’s components of net assets to reflect income and gains available for distribution (or available capital loss carryovers, as applicable) under income tax regulations. Investment transactions are accounted for on trade date. Realized gains and losses from security transactions are determined on the basis of identified cost. Interest income is recorded on an accrual basis.
(M) Federal Taxes. The Fund’s policy is to comply with the provisions of the Internal Revenue Code applicable to regulated investment companies and to distribute substantially all of its taxable income, including net realized gains, if any, within the prescribed time periods. Accordingly, no provision for federal income or excise tax is deemed necessary. As of January 31, 2017, tax years 2013 through 2016 remain subject to examination by the Fund’s major tax jurisdictions, which include the United States of America, the Commonwealth of Massachusetts, and New York State.
(N) Redemption Fees. Redemptions and exchanges of Fund shares held less than 30 days may be subject to the Fund’s redemption fee, which is 2% of the amount redeemed. The fee is imposed to offset transaction costs and other expenses associated with short-term investing. The fee may be waived in certain circumstances at the discretion of the Fund. Such fees are retained by the Fund and are recorded as an adjustment to paid-in capital.
(O) Other. Income, expenses (other than those attributable to a specific class), gains, and losses are allocated on a daily basis to each class of shares based upon the relative proportion of net assets represented by such class. Operating expenses directly attributable to a specific class are charged against the operations of that class.
(P) Indemnification. The Fund’s organizational documents provide current and former trustees and officers with a limited indemnification against liabilities arising in connection with the performance of their duties to the Fund. In the
82
DOMINI IMPACT BOND FUND
NOTES TO FINANCIAL STATEMENTS (continued)
January 31, 2017 (Unaudited)
normal course of business, the Fund may also enter into contracts that provide general indemnifications. The Fund’s maximum exposure under these arrangements is unknown as this would be dependent on future claims that may be made against the Fund. The risk of material loss from such claims is considered remote.
2. TRANSACTIONS WITH AFFILIATES
(A) Manager/Administrator. The Fund has retained Domini Impact Investments LLC (Domini) to serve as investment manager and administrator. The services provided by Domini consist of investment supervisory services, overall operational support, and administrative services, including the provision of general office facilities and supervising the overall administration of the Fund. For its services under the Management Agreement, Domini receives from the Fund a fee accrued daily and paid monthly at an annual rate equal to 0.40% of the first $500 million of the Fund’s net assets managed, 0.38% of the next $500 million of the Fund’s net assets managed, and 0.35% of net assets managed in excess of $1 billion. For its services under the Administration Agreement, Domini receives from the Fund a fee accrued daily and paid monthly at an annual rate equal to 0.25% of the Fund’s average daily net assets. For the period from November 30, 2016, until November 30, 2017, Domini is waiving its fee and reimbursing expenses to the extent necessary to keep the aggregate annual operating expenses of the Fund (excluding brokerage fees and commissions, interest, taxes, and other extraordinary expenses), net of waivers and reimbursements, at no greater than 0.95% and 0.65% of the average daily net assets representing Investor shares and Institutional shares, respectively. A similar fee waiver arrangement was in effect in prior periods. For the six months ended January 31, 2017, Domini reimbursed expenses totaling $95,206.
Fees waived and/or expenses reimbursed under the Expense Limitation Agreement are only recoverable by Domini and/or its affiliates in the current fiscal year to the extent actual Fund expenses are less than the contractual expense cap during such year.
As of January 31, 2017, Domini owned less than 1% of any class of the outstanding Shares of the Fund.
(B) Submanager. Wellington Management Company LLP (Wellington), a Delaware limited liability partnership, provides investment management services to the Fund on a day-to-day basis pursuant to a submanagement agreement with Domini. Prior to January 7, 2015, Seix Investment Advisors LLC (“Seix”), a wholly owned subsidiary of RidgeWorth LLC (formerly known as RidgeWorth Capital Management, Inc.), and its predecessors, provided investment submanagement services to the Fund.
83
DOMINI IMPACT BOND FUND
NOTES TO FINANCIAL STATEMENTS (continued)
January 31, 2017 (Unaudited)
(C) Distributor. The Board of Trustees of the Fund has adopted a Distribution Plan in accordance with Rule 12b-1 under the Act. DSIL Investment Services LLC, a wholly owned subsidiary of Domini (DSILD), acts as agent of the Fund in connection with the offering of shares of the Fund pursuant to a Distribution Agreement. Under the Distribution Plan, the Fund pays expenses incurred in connection with the sale of Investor shares and pays DSILD a distribution fee at an aggregate annual rate not to exceed 0.25% of the average daily net assets representing the Investor shares. For the six months ended January 31, 2017, fees waived by the Investor shares totaled $67,916.
(D) Shareholder Service Agent. The Trust has retained Domini to provide certain shareholder services to the Fund and its shareholders, which services were previously provided by BNY Asset Servicing (“BNY”) or another fulfillment and mail service provider and are supplemental to services currently provided by BNY, pursuant to a transfer agency agreement between each Fund and BNY. For these services, Domini receives a fee from the Fund paid monthly at an annual rate of $4.00 per active account. For the six months ended January 31, 2017, Domini waived fees as follows:
| | | | |
| | | FEES WAIVED | |
Domini Impact Bond Fund Investor shares | | $ | - | |
Domini Impact Bond Fund Institutional shares | | | 6 | |
(E) Trustees and Officers. Each of the Independent Trustees receives an annual retainer for serving as a Trustee of the Trust of $14,000. The Lead Independent Trustee and Chair of the Audit Committee receive an additional chairperson fee of $5,000. Each Independent Trustee also receives $1,500 for attendance at each meeting of the Board of the Trust (reduced to $625 in the event that a Trustee participates at an in-person meeting by telephone). In addition, each Trustee receives reimbursement for reasonable expenses incurred in attending meetings. These expenses are allocated on a pro-rata basis to each shares class of a Fund according to their respective net assets.
As of January 31, 2017, all Trustees and officers of the Trust as a group owned less than 1% of the Fund’s outstanding shares.
3. INVESTMENT TRANSACTIONS
For the six months ended January 31, 2017, cost of purchase and proceeds from sales of investments other than short-term obligations were as follows:
| | | | | | | | |
| | | PURCHASES | | | SALES | |
U.S. Government Securities | | $ | 263,871,319 | | | $ | 277,805,795 | |
Investments in Securities | | | 17,155,383 | | | | 14,178,784 | |
84
DOMINI IMPACT BOND FUND
NOTES TO FINANCIAL STATEMENTS (continued)
January 31, 2017 (Unaudited)
4. SUMMARY OF SHARE TRANSACTIONS
| | | | | | | | | | | | | | | | |
| | | Six Months Ended January 31, 2017 | | | Year Ended July 31, 2016 | |
| | | Shares | | | Amount | | | Shares | | | Amount | |
| | | | |
Investor Shares | | | | | | | | | | | | | | | | |
Shares sold | | | 1,473,956 | | | $ | 16,648,050 | | | | 2,293,262 | | | $ | 25,800,027 | |
Shares issued in reinvestment of dividends and distributions | | | 178,235 | | | | 1,999,882 | | | | 292,524 | | | | 3,279,951 | |
Shares redeemed | | | (1,313,567) | | | | (14,851,730) | | | | (1,732,531) | | | | (19,432,723) | |
Redemption fees | | | - | | | | 3,740 | | | | - | | | | 2,900 | |
| | | | | | | | | | | | | | | | |
Net increase (decrease) | | | 338,624 | | | $ | 3,799,942 | | | | 853,255 | | | $ | 9,650,155 | |
| | | | | | | | | | | | | | | | |
| | | | |
Institutional Shares | | | | | | | | | | | | | | | | |
Shares sold | | | 159,534 | | | $ | 1,808,007 | | | | 210,616 | | | $ | 2,348,828 | |
Shares issued in reinvestment of dividends and distributions | | | 4,214 | | | | 47,247 | | | | 5,092 | | | | 57,313 | |
Shares redeemed | | | (61,779) | | | | (699,160) | | | | (152,917) | | | | (1,702,929) | |
Redemption fees | | | - | | | | 154 | | | | - | | | | 1 | |
| | | | | | | | | | | | | | | | |
Net increase (decrease) | | | 101,969 | | | $ | 1,156,248 | | | | 62,791 | | | $ | 703,213 | |
| | | | | | | | | | | | | | | | |
| | | | |
Total | | | | | | | | | | | | | | | | |
Shares sold | | | 1,633,490 | | | $ | 18,456,057 | | | | 2,503,878 | | | $ | 28,148,855 | |
Shares issued in reinvestment of dividends and distributions | | | 182,449 | | | | 2,047,129 | | | | 297,616 | | | | 3,337,264 | |
Shares redeemed | | | (1,375,346) | | | | (15,550,890) | | | | (1,885,448) | | | | (21,135,652) | |
Redemption fees | | | - | | | | 3,894 | | | | - | | | | 2,901 | |
| | | | | | | | | | | | | | | | |
Net increase (decrease) | | | 440,593 | | | $ | 4,956,190 | | | | 916,046 | | | $ | 10,353,368 | |
| | | | | | | | | | | | | | | | |
85
DOMINI IMPACT BOND FUND
NOTES TO FINANCIAL STATEMENTS (continued)
January 31, 2017 (Unaudited)
5. SUMMARY OF DERIVATIVE ACTIVITY
At January 31, 2017, the Fund’s investments in derivative contracts are reflected on the Statement of Assets and Liabilities as follows:
| | | | | | | | | | | | |
| | | Asset Derivatives | | | Liability Derivatives | |
Derivative Contracts Not
Accounted for as
Hedging Instruments | | Statement of Assets
and Liabilities Location | | Fair Value | | | Statement of Assets
and Liabilities Location | | Fair Value | |
Interest rate contracts | | Variation Margin / Unrealized appreciation on OTC swap contracts / Net assets consist of - net unrealized appreciation | | $ | 826,722 | | | Variation Margin / Unrealized depreciation on OTC swap contracts / Net assets consist of - net unrealized depreciation | | $ | 386,854 | |
| | | | | | | | | | | | |
Credit contracts | | Variation Margin / Unrealized appreciation on OTC swap contracts / Net assets consist of - net unrealized appreciation (depreciation) | | | 102,108 | | | Variation Margin / Unrealized depreciation on OTC swap contracts / Net assets consist of - net unrealized appreciation (depreciation) | | | 359 | |
| | | | | | | | | | | | |
Foreign exchange contracts | | Unrealized appreciation on forward currency contracts | | | 37,720 | | | Unrealized depreciation on forward currency contracts | | | 3,556 | |
| | | | | | | | | | | | |
Total | | $ | 966,550 | | | | | $ | 390,769 | |
| | | | | | | | | | | | |
86
DOMINI IMPACT BOND FUND
NOTES TO FINANCIAL STATEMENTS (continued)
January 31, 2017 (Unaudited)
For the six months ended January 31, 2017, the effect of derivative contracts on the Fund’s Statement of Operations was as follows:
| | | | | | | | | | |
Derivative Contracts Not
Accounted for as Hedging
Instruments | | Statement of Operations
Location | | Realized Gain
(Loss) | | | Change in Unrealized
Appreciation
(Depreciation) | |
Interest rate contracts | | Net realized gain (loss) from swap contracts/ Net change in unrealized appreciation (depreciation) from investments, futures and swap contracts | | $ | 367,430 | | | $ | 367,877 | |
| | | | | | | | | | |
Credit contracts | | Net realized gain (loss) from swap contracts/ Net change in unrealized appreciation (depreciation) from investments, futures and swap contracts | | | (122,019 | ) | | | 76,989 | |
| | | | | | | | | | |
Foreign exchange contracts | | Net realized gain (loss) from foreign currency/ Net change in unrealized appreciation (depreciation) from translation of assets and liabilities in foreign currencies | | | 34,540 | | | | 33,655 | |
| | | | | | | | | | |
Futures contracts | | Net realized gain (loss) from futures contracts/ Net change in unrealized appreciation (depreciation) from investments, futures and swap contracts | | | (35,408 | ) | | | 9,531 | |
| | | | | | | | | | |
Options purchases | | Net realized gain (loss) from options contracts/ Net change in unrealized appreciation (depreciation) from investments, futures and swap contracts | | | (627 | ) | | | - | |
| | | | | | | | | | |
Total | | $ | 243,916 | | | $ | 488,052 | |
| | | | | | | | | | |
87
DOMINI IMPACT BOND FUND
NOTES TO FINANCIAL STATEMENTS (continued)
January 31, 2017 (Unaudited)
6. OFFSETTING OF FINANCIAL AND DERIVATIVE ASSETS AND LIABILITIES
The following table summarizes any derivatives, at the end of the reporting period, that are subject to a master netting agreement or similar agreement. For financial reporting purposes, the Fund does not offset assets and liabilities that are subject to the master netting agreements in the Statement of Assets and Liabilities.
| | | | | | | | | | | | | | | | |
| | | Credit
Suisse
International | | | Deutsche
Bank AG | | | Morgan
Stanley | | | Total | |
| | | | |
Assets: | | | | | | | | | | | | | | | | |
Cash held at other banks | | $ | 2,075 | | | $ | - | | | $ | - | | | $ | 2,075 | |
Unrealized appreciation on OTC swaps contracts* | | | 5,566 | | | | 186,732 | | | | 71,549 | | | | 263,847 | |
Receivable for variation margin swaps | | | - | | | | - | | | | 664,983 | | | | 664,983 | |
| | | | | | | | | | | | | | | | |
| | | | |
Total Assets | | | 7,641 | | | | 186,732 | | | | 736,532 | | | | 930,905 | |
| | | | |
Liabilities: | | | | | | | | | | | | | | | | |
Cash due to brokers | | | 1,226 | | | | - | | | | 381,079 | | | | 382,305 | |
Payable for variation margin swaps | | | - | | | | - | | | | 387,213 | | | | 387,213 | |
| | | | | | | | | | | | | | | | |
| | | | |
Total Liabilities | | | 1,226 | | | | - | | | | 768,292 | | | | 769,518 | |
| | | | | | | | | | | | | | | | |
| | | | |
Total Derivative Net Assets | | | 6,415 | | | | 186,732 | | | | (31,760) | | | | 161,387 | |
| | | | | | | | | | | | | | | | |
Total collateral received (pledged) | | | - | | | | - | | | | 453,652 | | | | 453,652 | |
| | | | | | | | | | | | | | | | |
| | | | |
Net Amount | | $ | 6,415 | | | $ | 186,732 | | | $ | 421,892 | | | $ | 615,039 | |
| | | | | | | | | | | | | | | | |
* Excludes premiums if any. Included in unrealized appreciation/depreciation on OTC swap contracts on the Statement of Assets and Liabilities.
7. SUMMARY OF DERIVATIVE ACTIVITY
The volume of activity for the reporting period for any derivative type that was held during the period is listed below and was as follows based on an average of the holdings at the end of each fiscal quarter:
| | | | |
Futures contracts (number of contracts) | | | 4 | |
Forward currency contracts (contract amount) | | $ | 1,461,991 | |
OTC interest rate swap contracts (notional) | | $ | 4,928,000 | |
Centrally cleared interest rate swap contracts (notional) | | $ | 28,537,500 | |
OTC credit default contracts (notional) | | $ | 2,556,709 | |
Centrally cleared credit default contracts (notional) | | $ | 3,986,500 | |
88
DOMINI IMPACT BOND FUND
NOTES TO FINANCIAL STATEMENTS (continued)
January 31, 2017 (Unaudited)
8. FEDERAL TAX STATUS
The tax basis of the components of net assets at July 31, 2016 is as follows:
| | | | |
Undistributed ordinary income | | $ | 351,508 | |
Capital losses, other losses and other temporary differences | | | (27,942) | |
Unrealized appreciation/(depreciation) | | | 5,329,089 | |
| | | | |
Distributable net earnings/(deficit) . . . | | $ | 5,652,655 | |
| | | | |
The difference between components of Distributable Earnings on a tax basis and the amounts reflected in the statement of assets and liabilities are primarily due to wash sales.
For the year ended July 31, 2016, the Fund reclassified $74,403 from undistributed net investment income to accumulated net realized gains to align financial reporting and tax reporting.
Under recently enacted Regulated Investment Company Modernization Act of 2010, the Fund will be permitted to carry forward capital losses incurred in taxable years beginning after December 22, 2010, for an unlimited time period. However, any losses incurred during those future taxable years will be required to be utilized prior to the losses incurred in pre-enactment taxable years. As a result of this ordering rule, pre-enactment capital loss carryforwards may be more likely to expire unused. Additionally, post-enactment capital losses that are carried forward will retain their character as either short-term or long-term capital losses rather than being considered all short-term as under previous law.
For federal income tax purposes, dividends paid were characterized as follows:
| | | | | | | | |
| | | Year Ended | |
| | | 2016 | | | 2015 | |
| | | | | | | | |
Ordinary income | | $ | 3,172,492 | | | $ | 2,032,471 | |
Long-term capital gain | | | 387,829 | | | | 121,129 | |
| | | | | | | | |
Total | | $ | 3,560,321 | | | $ | 2,153,600 | |
| | | | | | | | |
The Fund is subject to the provisions of Accounting Standards Codification ASC 740 Income Taxes (ASC 740). ASC 740 sets forth a minimum threshold for financial statement recognition of the benefit of a tax position taken or expected to be taken in a tax return. The Fund did not have a liability to record for any unrecognized tax benefits in the accompanying financial statements. No provision has been made for taxes on income, capital gains or unrealized appreciation on securities held or for excise tax on income and capital gains.
89
PROXY VOTING INFORMATION
The Domini Funds have established Proxy Voting Policies and Procedures that the Funds use to determine how to vote proxies relating to portfolio securities. The Domini Funds’ Proxy Voting Policies and Procedures are available, free of charge, by calling 1-800-762-6814, by visiting www.domini.com/domini-funds/proxy-voting, or by visiting the EDGAR database on the Securities and Exchange Commission’s (SEC) website at http://www.sec.gov. All proxy votes cast for the Domini Funds are posted to Domini’s website on an ongoing basis over the course of the year. An annual record of all proxy votes cast for the Funds during the most recent 12-month period ended June 30 can be obtained, free of charge, at www.domini.com, and on the EDGAR database on the SEC’s website at http://www.sec.gov.
QUARTERLY PORTFOLIO SCHEDULE INFORMATION
The Domini Funds file their complete schedule of portfolio holdings with the SEC for the first and third quarters of each fiscal year on Form N-Q. The Domini Funds’ Forms N-Q are available on the EDGAR database on the SEC’s website at http://www.sec.gov. These Forms may also be reviewed and copied at the SEC’s Public Reference Room in Washington, D.C. Information about the operation of the Public Reference Room may be obtained by calling 1-800-SEC-0330. The information on Form N-Q is also available to be viewed at www.domini.com.
90
DOMINI FUNDS
P.O. Box 9785
Providence, RI 02940-9785
1-800-582-6757
www.domini.com
Investment Manager, Sponsor, and Distributor:
Domini Impact Investments LLC (Investment Manager and Sponsor)
DSIL Investment Services LLC (Distributor)
532 Broadway, 9th Floor
New York, NY 10012
Investment Submanager:
Domini Impact Equity Fund
Domini Impact International Equity Fund
Domini Impact Bond Fund
Wellington Management Company LLP
280 Congress Street
Boston, MA 02210
Transfer Agent:
BNY Mellon Asset Servicing
760 Moore Road
King of Prussia, PA 19406
Custodian:
State Street Bank and Trust Company
1 Iron Street
Boston, MA 02210
Independent Registered Public Accounting Firm:
KPMG LLP
Two Financial Center
60 South Street
Boston, MA 02111
Legal Counsel:
Morgan, Lewis & Bockius LLP
One Federal Street
Boston, MA 02110
Domini Funds Investing for GoodSM P.O. Box9785 | Providence, RI 02940 1282103 -800-582-6757 | www.domini.com -facebook.com/dominifunds 03Apr17 twitter.com/dominifunds Domini Impact Equity Fund SM Investor Shares: CUSIP 257132100 | DSEFX Class 20:28 AShares: CUSIP 257132860 | DSEPX Institutional Shares: CUSIP 257132852 | DIEQX Class RShares: CUSIP 257132308 | DSFRX Domini Impact International Equity FundSM Investor Shares: CUSIP 257132704| DOMIX Class A Shares: CUSIP 257132886 | DOMAX Institutional Shares: CUSIP 257132811 | DOMOX Domini Impact Bond FundSM Investor Shares: CUSIP 257132209 | DSBFX Institutional Shares: CUSIP 257132829 | DSBIX Printed on elemental chlorine free paper from well-managed forests, containing 10% post-consumer waste. Presorted Standard U.S.Postage PAID Lancaster,PA Permit No.1793
Item 2. Code of Ethics.
(a) Not applicable to a semi-annual report.
(c) Not applicable.
(d) Not applicable.
Item 3. Audit Committee Financial Expert.
Not applicable to a semi-annual report.
Item 4. Principal Accountant Fees and Services.
Not applicable to a semi-annual report.
Item 5. Audit Committee of Listed Registrants.
Not applicable to the registrant.
Item 6. Schedule of Investments.
(a) The Schedule of Investments is included as part of the report to stockholders filed under Item 1.
(b) Not applicable.
| Item 7. | Disclosure of Proxy Voting Policies and Procedures for Closed-End Management Investment Companies. |
Not applicable to the registrant.
Item 8. Portfolio Managers of Closed-End Management Investment Companies.
Not applicable to the registrant.
| Item 9. | Purchases of Equity Securities by Closed-End Management Investment Company and Affiliated Purchasers. |
Not applicable to the registrant.
Item 10. Submission of Matters to a Vote of Security Holders.
There have been no material changes to the procedures by which shareholders may submit recommendations for nominees to the registrant’s Board of Trustees.
Item 11. Controls and Procedures.
(a) Within 90 days prior to the filing of this report on Form N-CSR, Amy L. Thornton, the registrant’s President and Principal Executive Officer, and Carole M. Laible, the registrant’s Treasurer and Principal Financial Officer, reviewed the registrant’s disclosure controls and procedures (as defined in Rule 30a-3(c) of the Investment Company Act of 1940) and evaluated their effectiveness. Based on their evaluation, Ms. Thornton and Ms. Laible determined that the disclosure controls and procedures adequately ensure that information required to be disclosed by the registrant in this report on Form N-CSR is recorded, processed, summarized, and reported within the time periods required by the Securities and Exchange Commission’s rules and forms.
(b) There were no changes in the registrant’s internal control over financial reporting (as defined in Rule 30a-3(d) under the Investment Company Act of 1940) that occurred during the second fiscal quarter of the period covered by this report that have materially affected, or are reasonably likely to materially affect, the registrant’s internal control over financial reporting.
Item 12. Exhibits.
(a)(1) Not applicable to a semi-annual report.
(a)(2) Separate certifications required by Rule 30a-2(a) under the Investment Company Act of 1940 for each principal executive officer and principal financial officer of the registrant are filed herewith.
(a)(3) Not applicable to the registrant.
(b) A single certification required by Rule 30a-2(b) under the Investment Company Act of 1940, Rule 13a-14b or Rule 15d-14(b) under the Securities Exchange Act of 1934, and Section 1350 of Chapter 63 of Title 18 of the United States Code for the chief executive officer and the chief financial officer of the registrant is filed herewith.
SIGNATURES
Pursuant to the requirements of the Securities Exchange Act of 1934 and the Investment Company Act of 1940, the registrant has duly caused this report to be signed on its behalf by the undersigned, thereunto duly authorized.
| | |
DOMINI INVESTMENT TRUST |
| By: | | /s/ Amy L. Thornton |
| | Amy L. Thornton |
| | President |
Date: April 6, 2017
Pursuant to the requirements of the Securities Exchange Act of 1934 and the Investment Company Act of 1940, this report has been signed below by the following persons on behalf of the registrant and in the capacities and on the dates indicated.
| | |
| By: | | /s/ Amy L. Thornton |
| | Amy L. Thornton |
| | President (Principal Executive Officer) |
| | |
Date: April 6, 2017 |
| By: | | /s/ Carole M. Laible |
| | Carole M. Laible |
| | Treasurer (Principal Financial Officer) |
Date: April 6, 2017