UNITED STATES
SECURITIES AND EXCHANGE COMMISSION
Washington, D.C. 20549
FORMN-CSR
CERTIFIED SHAREHOLDER REPORT OF REGISTERED
MANAGEMENT INVESTMENT COMPANIES
Investment Company Act File Number811-5823
DOMINI INVESTMENT TRUST
(Exact Name of Registrant as Specified in Charter)
180 Maiden Lane, Suite 1302, New York, New York 10038
(Address of Principal Executive Offices)
Amy Domini Thornton
Domini Impact Investments LLC
180 Maiden Lane, Suite 1302
New York, New York 10038
(Name and Address of Agent for Service)
Registrant’s Telephone Number, including Area Code:212-217-1100
Date of Fiscal Year End: July 31
Date of Reporting Period: January 31, 2019
| Item 1. | Reports to Stockholders. |
A copy of the report transmitted to stockholders pursuant to Rule30e-1 under the Investment Company Act of 1940 follows.
SEMI-ANNUAL REPORT 2019 JANUARY 31, 2019 (UNAUDITED) DOMINI EQUITY FUNDSM DOMINI IMPACT EQUITY FUNDSM DOMINI IMPACT BOND FUNDSM

Beginning with the inception of our first mutual fund in 1991, we have made it apriority to focus on incorporating social and environmental standards intoour investment process seeking triple bottom-line results: positivefor people, planet, and profits. These standards guide our investmentsacross all our funds. Sharing them is justone way that Domini executes on our own transparency goals. Learn morebyvisiting domini.com/standards SIGN UP FORE-DELIVERY If you invest directly with Domini, you can avoid an annual fee of $15 by signing up for paperlessE-Delivery of your statements, reports and tax forms — just log into your account, go to “Account Options,” and select“E-Delivery Option.” If you invest through a financial advisor, brokerage firm, or employer-sponsored retirement plan, why not ask your advisor or plan sponsor how to receive your documents electronically? It can reduce your carbon footprint, save trees, and unclutter your life, all with just a few strokes of your keyboard!
TABLE OF CONTENTS
INVESTINGIN DIVERSITY
LETTER TO SHAREHOLDERS
Dear Fellow Shareholder,
The publication of our Semi-Annual Report gives us an opportunity to consider an issue of importance. In this report, we discuss some of the opportunities inherent in living and working in a world filled with human diversity, and some of the challenges that arise as we emerge from a more closed society.
Most Americans neither have the ability nor the desire to be a monoculture. We celebrate the foods, religions, exercise routines, fabrics, and cultures — for instance — of many peoples. And yet, in seemingly blind contradiction, we all too often make incorrect and even hurtful assumptions about the cultural sources of these pleasures. Social scientists insist that cultural bias is pervasive. As believers of scientific evidence, your fund managers recognize this fact and attempt to address it. Domini Impact Investments hold as twin goals universal human dignity and ecological sustainability. We cannot sit back and ignore inherent bias.
We have three basic tools at our disposal. First, we use standards to rank investments. These standards specifically address the ways that our investment might help, or harm, differing parties. Second, we engage with companies, through conversation, letter writing, and shareholder campaigns, to encourage behavior that will ameliorate the worst outcomes of specific business practices. Third, we invest directly into entities that, by virtue of their business practices, are a solution to issues of concern to us all. In regard to diversity, we use all three. The existence of a gender or racially diverse board is, in and of itself, indicative that the corporation in question is holding itself out as having moved beyond the norms of yesteryear. The pushing for great diversity by our letters, phone calls and other actions, leads to conversations that often result in such appointments. Some bonds we invest in provide loans to entities that strengthenat-risk communities that can help weaken, and hope to eventually stop, the cycle of poverty.
One of the more remarkable developments over the past two years has been the emergence of CEOs who speak out specifically on the issue. The pharmaceutical company, Merck, is run by CEO Kenneth C. Frazier, an African American who quit President Trump’s Advisory Council after hearing the President’s comments regarding the incident in Charlottesville last year. PayPal CEO Dan Schulman has recently been the subject of numerous spiteful articles as a result of stating, “Probably the most important value to us is diversity and inclusion” and speaking positively of the work done by Southern Poverty Law Center.
2
INVESTINGIN DIVERSITY
This is new. Companies’ leadership did not respond to public events historically. But important as this development is, it is not enough. True behavior change takes not only education but also, generally speaking, exposure. Robert Putnam’s breakthrough 1993 book,Making Democracy Work: Civic Traditions in Modern Italy led the reader through the core necessities to building trust and what he labeled ‘social capital.’ To unfairly summarize a complex subject, the research strongly suggests that meeting people for a common purpose, such as attending church or playing soccer, leads to higher employment, safer streets, and a more livable community.
In 2009 the United Nations published a principal ofnon-discrimination “to guarantee that human rights are exercised without discrimination of any kind based on race, color, sex, language, religion, political or other opinion, national or social origin, property, birth or other status such as disability, age, marital and family status, sexual orientation and gender identity, health status, place of residence, economic and social situation.” This is a tall order. It takes diligence to guarantee human rights.
Nonetheless the goal is present and the benefits are clear. Your fund management works to remove some of the most evident barriers. As with every challenge that we at Domini Impact Investments face, our first step toward solutions is to search for data. We believe that it takes facts to build knowledge and that with knowledge, effective action can be shaped. This is why we track the diversity statistics of management and boards at corporations. It is why we note with interest products or services provided to potentially disenfranchised populations. Collecting publicly available data is step one of achange-for-the-better agenda.
You will read on the following pages just how the three approaches presented in the third paragraph of this letter have made a difference. Our shareholders do, in fact, join the multitude of voices that strive to make a meaningful contribution to the future. We are proud to be of some assistance in the effort. After all, many voices build a wholesome dialog; prejudice should not be tolerated in the country called a melting pot.
We at Domini Impact Investments believe that the investor has a role to play in furthering the right to living with dignity. We have many initiatives in this work. Thank you for your investment and for the effect is has to help better the lives of others.
| | |

Carole Laible CEO | | 
Amy Domini Founder and Chair |
3
INVESTINGIN DIVERSITY
Investing in Diversity
Diversity-related metrics are an integral part of the research process for Domini. We believe strong corporate diversity can mitigate risk to investors and an equitable workplace can enhance corporate performance. Companies with diverse management may be more likely to innovate thanks to a multiplicity of ideas and perspectives. Leadership with a range of backgrounds may be more likely to understand customer needs, anticipate societal trends and changes, and cultivate cooperation and connections within their workforce and communities. Having diverse leadership also helps deter discriminatory practices and foster a culture of tolerance and inclusiveness throughout an organization. Diverse organizations have been shown to have more positive workplace cultures and are thus better positioned to recruit and retain talent.
Around the world and across industries, we see signs of progress on corporate diversity. But women and minorities are still underrepresented on boards of directors and at all levels of management. Businesses are missing out on the benefits of diversity. Women also receive lower wages, leading to significant wealth gaps over the course of their careers. In the U.S., women in professional and management positions earn around $0.73 for every dollar a man makes. Women of color experience an even larger gap. Efforts to close these gaps have made only halting progress, both in the US and around the world. The impact of this lackluster improvement in workplace representation and equality has been stark in light of ongoing revelations about the scale andcover-ups of workplace sexual assault and harassment.
Higher levels of diversity could improve economic development and GDP growth around the world. Repeated research has confirmed that higher levels of diversity correlate with better long-term corporate performance. A company with low diversity may miss the most qualified candidates and have poor workplace culture. Lack of diversity can be a material risk for companies, particularly from litigation, as in recent high-profile cases of pay discrimination with large settlements and legal awards. Further, at the most basic level, support for diversity is in line with international human rights standards.
In 2018, we released our refreshed Impact Investment Standards, which serve as the backbone of our work. Our standards highlight the importance of companies’ consideration of diversity and what we look for, particularly as it applies to their employees, suppliers, and boards. Our standards for diversity in the workplace exemplify our approach for determining which companies we invest in:
Diversity in the workforce, whether related to gender, ethnicity or race, age, sexual orientation, disability, economic or class background,
4
INVESTINGIN DIVERSITY
religion, and political opinion, can be a hallmark of a well-managed corporation. A diverse workforce can help companies better understand the needs and desires of the full range of their current and prospective customers; anticipate new societal trends and emerging issues; foster understanding, mutual respect, and cooperation among their workforce; and improve a company’s ability to recruit from the widest possible pool of talent. Diversity, particularly among positions of authority, can indicate a corporate culture based on merit and open to new ideas and perspectives.
We look for companies that have substantial representation of women and minorities among management- level positions, particularly in senior line executives; companies that have created a notably open work environment for minority groups — for example, for LGBTQ+ employees; and companies with strong programs for training on sexual harassment and respect for diversity. Conversely, we view with concern companies that have a record of diversity-related controversies and regulatory sanctions, including those related to sexual harassment and discrimination.
(Domini Impact Investment Standards, January 2019,pp.34-35)
We look favorably on diversity across all industries as an indicator of company culture and commitment to a just and equitable workplace. Diversity among senior management, executive-level, and board-level employees has additional importance when it may directly impact services that a company provides and markets that it serves, for example in the financial and banking services industry and among advertising, media distribution & production companies. In these industries we consider diversity to be a Key Performance Indicator (KPI) that demonstrates quality of management. Beyond minority and female CEOs, management teams, and boards, we also look for initiatives to promote further improvement on diversity including strong disclosure practices and internal auditing to assess pay gaps.
While diverse leadership is not a guarantee of strong performance or a diverse workforce, Key Bank is a case where it has led to both. The firm has notably diverse leadership. Women and minorities account for 36% of Key Bank’s management team and 44% of its board. Key Bank’s CEO, Beth Mooney, is the first woman to head aTop-20 bank in the U.S., and under her tenure the company has rolled out a $16.5 billion community development investment plan, including funds for affordable housing, and increased products forlow-income and underserved consumers.
Accenture is another example of a company that through conscious planning has nurtured a diverse workforce in order to cultivate a progressive corporate culture. Already ranked number 1 on Thomson
5
INVESTINGIN DIVERSITY
Reuters Index of The World’s Most Diverse and Inclusive Companies, Accenture further seeks to increase diversity by pursuing the goal of having a50-50 female-male workforce by 2025. According to Ellyn Shook, Accenture’s chief leadership and human resources officer, “we believe that diversity is a source of innovation, creativity and competitive advantage and creates a workplace where everyone feels equally accepted with a real sense of belonging.” In addition to setting goals for gender equality, they also have programs dedicated to improving the workspace for people with disabilities in order to remove barriers of entry into the workforce, as well as programs to help promote a welcoming, safe community for LGBTQ+ employees. It is through this sort of sensible, dynamic governance that we believe will help build a more equal and innovative future.
Strong Signals through Proxy Voting
Early this year Domini strengthened our proxy voting guidelines on diversity, now among the most rigorous in the industry. We felt this move was necessary to push more strongly towards our goal of a supportive, fair, and inclusive workplace. As of 2018, only 21.2% of board seats in the S&P 500 were filled by women. In a true meritocracy, a corporate board reflects the markets it serves. Companies have made some progress in representation of women in recent years, but more is needed, and proxy voting is a strong tool to communicate the demand for change.
Our policy has several layers of thresholds related to both racial, ethnic and gender diversity. We look for a minimum of 40% or three (whichever is greater) female board members. While racial and ethnic diversity are important globally, good data only exists in the United States, Australia, the United Kingdom, and Canada, so in these countries we look for at least 40% or three (whichever is greater)non-Caucasian board nominees. This figure is derived from research suggesting that this threshold is necessary to see significant benefits from resulting from diversity.
When board diversity is below the 40% threshold, we vote against members of the nominating committee, because they are the highest source of responsibility at the board level. When diversity is below a 30% threshold, we vote against the committee and all male nominees. If there are no women on the board, we vote against the entire board. In this case, we have sent letters to laggards, explaining our vote against them and the reasoning behind it.
Advocating for Diversity
Domini is awomen-led and founded firm, a rarity in the mutual fund world. Four out of five members of our executive team are women, including our chair, CEO, CFO, and General Counsel. This leadership is
6
INVESTINGIN DIVERSITY
reflected in the makeup of our firm, which is 54% women. Thanks to this strong performance on diversity, we have a solid platform from which to push other companies to improve.
We have a long history of engagement on diversity issues. Last year, Domini joined the Thirty Percent Coalition, an alliance of large asset owners, city and state treasurers and asset managers working to advance corporate board diversity. The name of the group refers to the minimum level of racial, ethnic, and gender diverse board members the group would like to see at public companies. The coalition advances this goal through letter writing campaigns and direct dialogue. These engagements are often multi-year, using shareholder resolutions as a tool of last resort. Much of the work has focused on laggards: companies with no or only one female board member. We have also focused engaging with all male boards, particularly in Japan. Progress is still limited, given Japan’s historically low levels of management diversity. The Japanese pension fund giant GPIF’s entrance into the Thirty Percent Coalition in 2016, followed by the selection of gender-focused index in 2018, sent ripples through the corporate and investment worlds.
While there remains a dire need for advancement on representation and fair pay, investors can play a substantial part in pushing the pace of change. There is a clear business case for the value of diversity to companies and their shareholders, but diversity may also make companies better neighbors and better able to serve diverse customers bases. Through setting standards related to diversity, having a strong proxy voting policy, and communicating our policies to companies and other investors, Domini is able to create lasting change and a better environment for our investments and our communities.
The holdings discussed above can be found in the Portfolio of Investments of the Domini Impact Equity Fund, included herein. The composition of the Domini Funds’ portfolios is subject to change.
An investment in the Domini Impact Equity Fund is not a bank deposit and is not insured. Investment return, principal value, and yield will fluctuate. Your shares, when redeemed, may be worth more or less than their original cost. You may lose money.
An investment in the Fund is subject to market, market sector, impact investing, and foreign investing risks. Investing internationally involves special risks, such as currency fluctuations, social and economic instability, differing security regulations and accounting standards, limited public information, possible changes in taxation, and periods of illiquidity.
This report is not authorized for distribution to prospective investors of the Domini Funds referenced herein unless preceded or accompanied by a current prospectus for the relevant Fund. Nothing contained herein is to be considered a recommendation concerning the merits of any noted company or security, or an offer of sale or a solicitation of an offer to buy shares of any Fund or issuer referenced in this report. Such offering is only made by prospectus, which includes details as to the offering price and other material information. Carefully consider the Funds’ investment objectives, risk factors and charges and expenses before investing. This and other information can be found in the Funds’ prospectus, which may be obtained by calling1-800-582-6757, or at www.domini.com. Please read the prospectus carefully before investing. The Domini Funds are distributed by DSIL Investment Services LLC (DSILD), member FINRA. Domini Impact Investments LLC is each Fund’s investment manager. The Funds are subadvised by unaffiliated entities. 3/19
7
DOMINI IMPACT INTERNATIONAL EQUITY FUND
Fund Performance and Holdings
The table and bar charts below provide information as of January 31, 2019, about the ten largest holdings of the Domini Impact International Equity Fund and its portfolio holdings by industry sector and country:
TEN LARGEST HOLDINGS (Unaudited)
| | | | | | | | | | |
| | | | |
| SECURITY DESCRIPTION | | % NET
ASSETS | | | SECURITY DESCRIPTION | | % NET
ASSETS | |
| | | | |
| Sanofi | | | 3.1% | | | Kering SA | | | 2.0% | |
| | | | |
| Novartis AG | | | 3.1% | | | Coca-Cola Euro Partners PLC | | | 1.8% | |
| | | | |
| Nissan Motor Co Ltd | | | 2.4% | | | AXA SA | | | 1.8% | |
| | | | |
| Allianz SE | | | 2.2% | | | Central Japan Railway Co | | | 1.7% | |
| | | | |
| Sandvik AB | | | 2.1% | | | Koninklijke Ahold Delhaize NV | | | 1.7% | |
PORTFOLIO HOLDINGS BY INDUSTRY SECTOR (% OF NET ASSETS) (Unaudited)
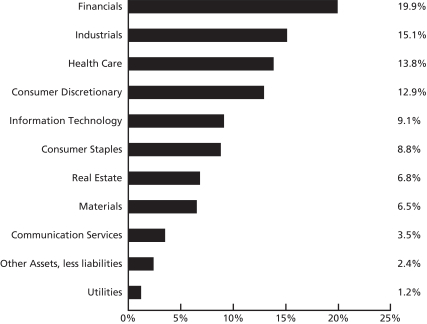
The Global Industry Classification Standard (“GICS”) was developed by and is the exclusive property and a service mark of MSCI Inc. (“MSCI”) and Standard & Poor’s, a division of The McGraw-Hill Companies, Inc. (“S&P”) and is licensed for use by Domini Impact Investments. Neither MSCI, S&P nor any third party involved in making or compiling the GICS or any GICS classifications makes any express or implied warranties or representations with respect to such standard or classification nor shall any such party have any liability therefrom.
8
PORTFOLIO HOLDINGS BY COUNTRY (% OF NET ASSETS) (Unaudited)
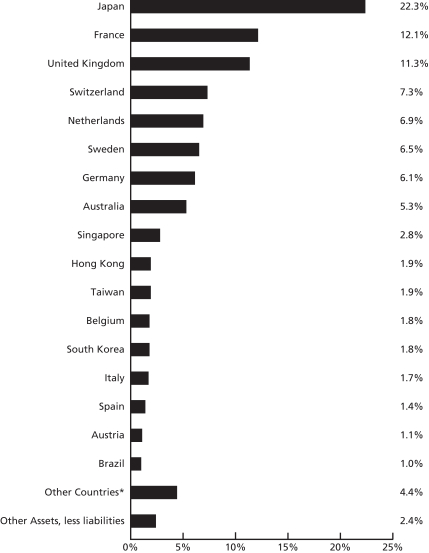
The holdings mentioned above are described in the Domini Impact International Equity Fund’s Portfolio of Investments (as of 1/31/19), included herein. The composition of the Fund’s portfolio is subject to change.
*Other countries include Denmark (0.9%), Turkey (0.6%), Hungary (0.5%), India (0.4%), Israel (0.4%), Mexico (0.4%), South Africa (0.4%), China (0.3%), Finland (0.3%), Norway (0.2%), and Ireland (0.0%).
9
| | | | | | | | | | | | | | |
| |
DOMINI IMPACT INTERNATIONAL EQUITY FUND AVERAGE ANNUAL TOTAL RETURNS (Unaudited) |
| | | | | | |
| | | Investor
shares | | Class A shares
(with 4.75%
maximum
Sales Charge) | | Class A
shares (without
Sales
Charge) | | Institutional
shares1 | | Class Y
Shares2 | | MSCI EAFE
(net) |
| | | | | | | |
| As of 1/31/19 | | 1 Year | | -15.12% | | -19.27% | | -15.25% | | -14.89% | | -15.12% | | -12.51% |
| | | | | | | |
| | 5 Year | | 3.44% | | 2.39% | | 3.39% | | 3.82% | | 3.44% | | 2.66% |
| | | | | | | |
| | | 10 Year | | 9.50% | | 8.96% | | 9.50% | | 9.50% | | 9.50% | | 8.11% |
Past performance is no guarantee of future results.The Fund’s returns quoted above represent past performance after all expenses. The returns reflect any applicable expense waivers in effect during the periods shown. Without such waivers, Fund performance would be lower. Investment return, principal value, and yield will fluctuate. Your shares, when redeemed, may be worth more or less than their original cost.Call1-800-762-6814 or visit www.domini.com for performance information current to the most recentmonth-end, which may be lower or higher than the performance data quoted. A 2.00% redemption fee applies on sales or exchanges of shares made less than 30 days after the settlement of purchase or acquisition through exchange, with certain exceptions. Quoted performance data does not reflect the deduction of this fee, which would reduce the performance quoted. See the prospectus for further information.
An investment in the Fund is not a bank deposit and is not insured. You may lose money. The Fund is subject to market, market segment, style and foreign investing risks. Investing internationally involves special risks, such as currency fluctuations, social and economic instability, differing security regulations and accounting standards limited public information possible changes in taxation, and periods of illiquidity.
Per the prospectus dated December 1, 2018, the Fund’s annual operating expenses totaled: 1.41% (Investor), 1.47%/1.43% (gross/net) (Class A), 1.02% (Institutional), 1.13% (gross/net) (Class Y). The Fund’s adviser has contractually agreed to waive certain fees and/or reimburse certain ordinary operating expenses in order to limit Class A and Class Y share expenses to 1.43% and 1.15%, respectively until November 30, 2019, absent an earlier modification approved by the Fund’s Board of Trustees.
The table does not reflect the deduction of fees and taxes that a shareholder would pay on Fund distributions or the redemption of Fund shares. Total return is based on the Fund’s net asset values and assumes all dividends and capital gains were reinvested.
The Morgan Stanley Capital International Europe Australasia Far East (MSCI EAFE) index (net) is an unmanaged index of common stocks. MSCI EAFE (net) includes the reinvestment of dividends net of withholding tax, but does not reflect other fees, expenses or taxes. It is not available for direct investment.
1Institutional shares were not offered prior to November 30, 2012. All performance information for time periods beginning prior to November 30, 2012, is the performance of the Investor shares. This performance has not been adjusted to reflect the lower expenses of the Institutional shares.
2Class Y shares did not commence operations until July 23, 2018. All performance information for time periods beginning prior to July 23, 2018 is the performance of the Investor Shares. This performance has not been adjusted to reflect the lower expenses of the Class Y shares.
10
DOMINI IMPACT INTERNATIONAL EQUITY FUND
PORTFOLIOOF INVESTMENTS
January 31, 2019 (Unaudited)
| | | | | | | | | | |
| COUNTRY/SECURITY | | INDUSTRY | | SHARES | | | VALUE | |
| Common Stock – 97.6% | |
Australia – 5.3% | |
BlueScope Steel Ltd | | Materials | | | 1,282,054 | | | $ | 11,749,573 | |
Dexus | | Real Estate | | | 1,304,145 | | | | 10,953,537 | |
Flight Centre Travel Group Ltd | | Consumer Services | | | 148,717 | | | | 4,681,129 | |
Fortescue Metals Group Ltd | | Materials | | | 3,317,746 | | | | 13,747,737 | |
Goodman Group | | Real Estate | | | 409,661 | | | | 3,497,381 | |
GPT Group/The | | Real Estate | | | 573,999 | | | | 2,434,572 | |
Harvey Norman Holdings Ltd | | Retailing | | | 689,641 | | | | 1,698,838 | |
Mirvac Group | | Real Estate | | | 7,518,213 | | | | 13,223,050 | |
Vicinity Centres | | Real Estate | | | 1,529,930 | | | | 2,921,801 | |
| | | | | | | | | | |
| | | | | | | | | 64,907,618 | |
| | | | | | | | | | |
| | | | | | | | | | |
Austria – 1.1% | |
Raiffeisen Bank International AG | | Banks | | | 262,333 | | | | 6,956,710 | |
Verbund AG | | Utilities | | | 134,688 | | | | 6,900,683 | |
| | | | | | | | | | |
| | | | | | | | | 13,857,393 | |
| | | | | | | | | | |
| | | | | | | | | | |
Belgium – 1.8% | |
Ageas | | Insurance | | | 186,584 | | | | 8,697,084 | |
Colruyt SA | | Food & Staples Retailing | | | 46,142 | | | | 3,322,004 | |
UCB SA | | Pharma, Biotech & Life Sciences | | | 117,327 | | | | 10,192,062 | |
| | | | | | | | | | |
| | | | | | | | | 22,211,150 | |
| | | | | | | | | | |
| | | | | | | | | | |
Brazil – 1.0% | |
Banco do Brasil SA | | Banks | | | 459,355 | | | | 6,544,486 | |
Itausa – Investimentos Itau SA | | Banks | | | 861,100 | | | | 3,193,397 | |
Porto Seguro SA | | Insurance | | | 147,537 | | | | 2,271,407 | |
| | | | | | | | | | |
| | | | | | | | | 12,009,290 | |
| | | | | | | | | | |
| | | | | | | | | | |
China – 0.3% | |
Future Land Development Holdings Ltd | | Real Estate | | | 1,646,367 | | | | 1,395,161 | |
Tingyi Cayman Islands Holding Corp | | Food & Beverage | | | 2,109,280 | | | | 2,937,656 | |
| | | | | | | | | | |
| | | | | | | | | 4,332,817 | |
| | | | | | | | | | |
| | | | | | | | | | |
Denmark – 0.9% | |
DSV A/S | | Transportation | | | 57,998 | | | | 4,639,748 | |
FLSmidth & Co A/S | | Capital Goods | | | 38,945 | | | | 1,829,717 | |
GN Store Nord A/S | | Health Care Equipment & Services | | | 58,691 | | | | 2,535,987 | |
Vestas Wind Systems A/S | | Capital Goods | | | 33,137 | | | | 2,745,736 | |
| | | | | | | | | | |
| | | | | | | | | 11,751,188 | |
| | | | | | | | | | |
| | | | | | | | | | |
11
DOMINI IMPACT INTERNATIONAL EQUITY FUND
PORTFOLIOOF INVESTMENTS (continued)
January 31, 2019 (Unaudited)
| | | | | | | | | | |
| COUNTRY/SECURITY | | INDUSTRY | | SHARES | | | VALUE | |
Finland – 0.3% | |
Valmet OYJ | | Capital Goods | | | 194,086 | | | $ | 4,383,785 | |
| | | | | | | | | | |
| | | | | | | | | 4,383,785 | |
| | | | | | | | | | |
| | | | | | | | | | |
France – 12.1% | |
AXA SA | | Insurance | | | 946,869 | | | | 22,012,725 | |
Capgemini SE | | Software & Services | | | 107,081 | | | | 11,854,964 | |
Carrefour SA | | Food & Staples Retailing | | | 365 | | | | 7,236 | |
CNP Assurances | | Insurance | | | 202,651 | | | | 4,615,470 | |
Credit Agricole SA | | Banks | | | 231,361 | | | | 2,649,051 | |
Eiffage SA | | Capital Goods | | | 114,227 | | | | 10,728,137 | |
Eutelsat Communications SA | | Media & Entertainment | | | 58,235 | | | | 1,238,046 | |
Kering SA | | Consumer Durables & Apparel | | | 48,457 | | | | 24,362,786 | |
Peugeot SA | | Automobiles & Components | | | 734,906 | | | | 18,532,883 | |
Sanofi | | Pharma, Biotech & Life Sciences | | | 433,465 | | | | 37,769,670 | |
Schneider Electric SE | | Capital Goods | | | 74,160 | | | | 5,287,512 | |
Teleperformance | | Commercial & Professional Services | | | 59,217 | | | | 10,216,676 | |
| | | | | | | | | | |
| | | | | | | | | 149,275,156 | |
| | | | | | | | | | |
| | | | | | | | | | |
Germany – 6.1% | |
adidas AG | | Consumer Durables & Apparel | | | 64,261 | | | | 15,328,406 | |
Allianz SE | | Insurance | | | 129,804 | | | | 27,609,403 | |
CECONOMY AG | | Retailing | | | 497,200 | | | | 2,339,099 | |
HUGO BOSS AG | | Consumer Durables & Apparel | | | 41,445 | | | | 2,979,012 | |
Merck KGaA | | Pharma, Biotech & Life Sciences | | | 78,695 | | | | 8,283,475 | |
SAP SE | | Software & Services | | | 139,286 | | | | 14,438,755 | |
Wacker Chemie AG | | Materials | | | 45,610 | | | | 4,837,250 | |
| | | | | | | | | | |
| | | | | | | | | 75,815,400 | |
| | | | | | | | | | |
| | | | | | | | | | |
Hong Kong – 1.9% | |
AIA Group Ltd | | Insurance | | | 232,248 | | | | 2,097,205 | |
Hongkong Land Holdings Ltd | | Real Estate | | | 697,620 | | | | 5,018,606 | |
Kerry Properties Ltd | | Real Estate | | | 851,179 | | | | 3,535,592 | |
Swire Pacific Ltd Cl A | | Real Estate | | | 264,282 | | | | 3,130,127 | |
Swire Properties Ltd | | Real Estate | | | 905,378 | | | | 3,534,055 | |
Wharf Holdings Ltd/The | | Real Estate | | | 1,372,526 | | | | 4,148,699 | |
Wheelock & Co Ltd | | Real Estate | | | 297,708 | | | | 1,908,603 | |
| | | | | | | | | | |
| | | | | | | | | 23,372,887 | |
| | | | | | | | | | |
| | | | | | | | | | |
Hungary – 0.5% | |
OTP Bank Nyrt | | Banks | | | 136,789 | | | | 5,652,878 | |
| | | | | | | | | | |
| | | | | | | | | 5,652,878 | |
| | | | | | | | | | |
| | | | | | | | | | |
India – 0.4% | |
Dr Reddy’s Laboratories Ltd | | Pharma, Biotech & Life Sciences | | | 81,629 | | | | 3,121,799 | |
12
DOMINI IMPACT INTERNATIONAL EQUITY FUND
PORTFOLIOOF INVESTMENTS (continued)
January 31, 2019 (Unaudited)
| | | | | | | | | | |
| COUNTRY/SECURITY | | INDUSTRY | | SHARES | | | VALUE | |
India(Continued) | |
Wipro Ltd | | Software & Services | | | 363,301 | | | $ | 1,883,822 | |
| | | | | | | | | | |
| | | | | | | | | 5,005,621 | |
| | | | | | | | | | |
| | | | | | | | | | |
Ireland- 0.0% | |
Irish Bank Resolution Corp Ltd/Old (a)(c) | | Banks | | | 138,674 | | | | 0 | |
| | | | | | | | | | |
| | | | | | | | | 0 | |
| | | | | | | | | | |
| | | | | | | | | | |
Israel – 0.4% | |
Check Point Software Technologies Ltd (a) | | Software & Services | | | 48,694 | | | | 5,449,832 | |
| | | | | | | | | | |
| | | | | | | | | 5,449,832 | |
| | | | | | | | | | |
| | | | | | | | | | |
Italy – 1.7% | |
A2A SpA | | Utilities | | | 4,253,966 | | | | 7,781,222 | |
CNH Industrial NV | | Capital Goods | | | 1,308,289 | | | | 12,890,835 | |
| | | | | | | | | | |
| | | | | | | | | 20,672,057 | |
| | | | | | | | | | |
| | | | | | | | | | |
Japan – 22.3% | |
Amada Holdings Co Ltd | | Capital Goods | | | 422,192 | | | | 4,253,015 | |
Brother Industries Ltd | | Technology Hardware & Equipment | | | 448,072 | | | | 7,568,247 | |
Central Japan Railway Co | | Transportation | | | 99,282 | | | | 21,475,778 | |
Dai Nippon Printing Co Ltd | | Commercial & Professional Services | | | 383,241 | | | | 8,877,858 | |
FUJIFILM Holdings Corp | | Technology Hardware & Equipment | | | 160,183 | | | | 6,888,453 | |
Hachijuni Bank Ltd/The | | Banks | | | 1,127,837 | | | | 4,998,363 | |
House Foods Group Inc | | Food & Beverage | | | 32,852 | | | | 1,144,738 | |
Ibiden Co Ltd | | Technology Hardware & Equipment | | | 113,786 | | | | 1,660,187 | |
K’s Holdings Corp | | Retailing | | | 765,107 | | | | 7,629,851 | |
Kose Corp | | Household & Personal Products | | | 81,543 | | | | 11,980,747 | |
KYORIN Holdings Inc | | Pharma, Biotech & Life Sciences | | | 104,344 | | | | 2,217,567 | |
Matsumotokiyoshi Holdings Co Ltd | | Food & Staples Retailing | | | 106,781 | | | | 3,301,581 | |
Medipal Holdings Corp | | Health Care Equipment & Services | | | 254,296 | | | | 5,874,561 | |
MINEBEA MITSUMI Inc | | Capital Goods | | | 105,825 | | | | 1,742,241 | |
Mitsubishi Estate Co Ltd | | Real Estate | | | 90,054 | | | | 1,596,382 | |
Mitsubishi Gas Chemical Co Inc | | Materials | | | 687,998 | | | | 10,891,314 | |
Mitsui Fudosan Co Ltd | | Real Estate | | | 560,607 | | | | 13,631,752 | |
Mixi Inc | | Media & Entertainment | | | 216,700 | | | | 5,498,177 | |
MS&AD Insurance Group Holdings Inc | | Insurance | | | 267,005 | | | | 7,911,195 | |
Murata Manufacturing Co Ltd | | Technology Hardware & Equipment | | | 135,802 | | | | 20,417,411 | |
Nikon Corp | | Consumer Durables & Apparel | | | 712,571 | | | | 12,194,474 | |
13
DOMINI IMPACT INTERNATIONAL EQUITY FUND
PORTFOLIOOF INVESTMENTS (continued)
January 31, 2019 (Unaudited)
| | | | | | | | | | |
| COUNTRY/SECURITY | | INDUSTRY | | SHARES | | | VALUE | |
Japan(Continued) | |
Nippon Electric Glass Co Ltd | | Technology Hardware & Equipment | | | 118,041 | | | $ | 3,290,149 | |
Nissan Motor Co Ltd | | Automobiles & Components | | | 3,410,866 | | | | 29,154,206 | |
Nitto Denko Corp | | Materials | | | 69,602 | | | | 3,940,490 | |
Nomura Real Estate Holdings Inc | | Real Estate | | | 63,243 | | | | 1,229,351 | |
NTN Corp | | Capital Goods | | | 5,300 | | | | 17,432 | |
ORIX Corp | | Diversified Financials | | | 1,222,812 | | | | 18,460,770 | |
Ricoh Co Ltd | | Technology Hardware & Equipment | | | 282,053 | | | | 3,007,299 | |
Seino Holdings Co Ltd | | Transportation | | | 416,167 | | | | 5,758,448 | |
Shionogi & Co Ltd | | Pharma, Biotech & Life Sciences | | | 283,657 | | | | 17,510,574 | |
Sony Corp | | Consumer Durables & Apparel | | | 68,006 | | | | 3,410,546 | |
Sumitomo Dainippon Pharma Co Ltd | | Pharma, Biotech & Life Sciences | | | 108,204 | | | | 2,549,773 | |
Suzuken Co Ltd/Aichi Japan | | Health Care Equipment & Services | | | 75,672 | | | | 3,976,670 | |
Taiyo Yuden Co Ltd | | Technology Hardware & Equipment | | | 75,389 | | | | 1,329,652 | |
Toppan Printing Co Ltd | | Commercial & Professional Services | | | 541,358 | | | | 8,880,066 | |
Toyo Seikan Group Holdings Ltd | | Materials | | | 348,727 | | | | 7,856,479 | |
Yamazaki Baking Co Ltd | | Food & Beverage | | | 118,527 | | | | 2,330,197 | |
| | | | | | | | | | |
| | | | | | | | | 274,455,994 | |
| | | | | | | | | | |
| | | | | | | | | | |
Mexico – 0.4% | |
Grupo Financiero Banorte SAB de CV | | Banks | | | 854,366 | | | | 4,775,101 | |
| | | | | | | | | | |
| | | | | | | | | 4,775,101 | |
| | | | | | | | | | |
| | | | | | | | | | |
Netherlands – 6.9% | |
ABN AMRO Group NV | | Banks | | | 430,557 | | | | 10,763,083 | |
Aegon NV | | Insurance | | | 1,091,680 | | | | 5,638,053 | |
ASR Nederland NV | | Insurance | | | 123,306 | | | | 5,213,766 | |
Coca-Cola European Partners PLC | | Food & Beverage | | | 477,226 | | | | 22,706,413 | |
Koninklijke Ahold Delhaize NV | | Food & Staples Retailing | | | 784,778 | | | | 20,727,321 | |
Koninklijke Philips NV | | Health Care Equipment & Services | | | 137,989 | | | | 5,453,772 | |
NN Group NV | | Insurance | | | 335,786 | | | | 14,214,657 | |
| | | | | | | | | | |
| | | | | | | | | 84,717,065 | |
| | | | | | | | | | |
| | | | | | | | | | |
Norway – 0.2% | |
Orkla ASA | | Food & Beverage | | | 249,439 | | | | 2,018,547 | |
| | | | | | | | | | |
| | | | | | | | | 2,018,547 | |
| | | | | | | | | | |
| | | | | | | | | | |
14
DOMINI IMPACT INTERNATIONAL EQUITY FUND
PORTFOLIOOF INVESTMENTS (continued)
January 31, 2019 (Unaudited)
| | | | | | | | | | |
| COUNTRY/SECURITY | | INDUSTRY | | SHARES | | | VALUE | |
Singapore – 2.8% | |
CapitaLand Ltd | | Real Estate | | | 813,430 | | | $ | 2,018,994 | |
ComfortDelGro Corp Ltd | | Transportation | | | 4,300,966 | | | | 7,471,782 | |
United Overseas Bank Ltd | | Banks | | | 651,426 | | | | 12,222,575 | |
Yangzijiang Shipbuilding Holdings Ltd | | Capital Goods | | | 11,782,095 | | | | 12,328,278 | |
| | | | | | | | | | |
| | | | | | | | | 34,041,629 | |
| | | | | | | | | | |
| | | | | | | | | | |
South Africa – 0.4% | |
Mondi Ltd | | Materials | | | 187,077 | | | | 4,649,755 | |
| | | | | | | | | | |
| | | | | | | | | 4,649,755 | |
| | | | | | | | | | |
| | | | | | | | | | |
South Korea – 1.8% | |
BNK Financial Group Inc | | Banks | | | 445,386 | | | | 2,946,270 | |
Industrial Bank of Korea | | Banks | | | 495,138 | | | | 6,342,256 | |
LG Display Co Ltd | | Technology Hardware & Equipment | | | 143,172 | | | | 2,438,595 | |
LG Uplus Corp | | Telecommunication Services | | | 394,345 | | | | 5,359,967 | |
Woori Bank (a) (c) | | Banks | | | 412,218 | | | | 5,551,202 | |
| | | | | | | | | | |
| | | | | | | | | 22,638,290 | |
| | | | | | | | | | |
| | | | | | | | | | |
Spain – 1.4% | |
Banco Santander SA | | Banks | | | 2,078 | | | | 9,880 | |
Telefonica SA | | Telecommunication Services | | | 2,015,114 | | | | 17,376,314 | |
| | | | | | | | | | |
| | | | | | | | | 17,386,194 | |
| | | | | | | | | | |
| | | | | | | | | | |
Sweden – 6.5% | |
Alfa Laval AB | | Capital Goods | | | 487,767 | | | | 11,059,914 | |
Castellum AB | | Real Estate | | | 177,504 | | | | 3,365,538 | |
Fabege AB | | Real Estate | | | 236,445 | | | | 3,450,594 | |
Holmen AB Cl B | | Materials | | | 34,332 | | | | 735,834 | |
Industrivarden AB Cl C | | Diversified Financials | | | 361,096 | | | | 7,445,318 | |
Sandvik AB | | Capital Goods | | | 1,621,851 | | | | 25,920,073 | |
SSAB AB Cl A | | Materials | | | 419,784 | | | | 1,664,266 | |
Svenska Cellulosa AB SCA Cl B | | Materials | | | 1,692,088 | | | | 14,885,370 | |
Telefonaktiebolaget LM Ericsson | | Technology Hardware & Equipment | | | 1,247,462 | | | | 11,120,566 | |
| | | | | | | | | | |
| | | | | | | | | 79,647,473 | |
| | | | | | | | | | |
| | | | | | | | | | |
Switzerland – 7.3% | |
Chocoladefabriken Lindt & Spruengli AG | | Food & Beverage | | | 1,494 | | | | 9,522,091 | |
Novartis AG | | Pharma, Biotech & Life Sciences | | | 429,852 | | | | 37,615,297 | |
Swiss Life Holding AG | | Insurance | | | 36,048 | | | | 14,906,869 | |
Swiss Re AG | | Insurance | | | 53,200 | | | | 5,114,212 | |
Swisscom AG | | Telecommunication Services | | | 25,039 | | | | 12,029,677 | |
Vifor Pharma AG | | Pharma, Biotech & Life Sciences | | | 81,408 | | | | 10,385,675 | |
| | | | | | | | | | |
| | | | | | | | | 89,573,821 | |
| | | | | | | | | | |
| | | | | | | | | | |
15
DOMINI IMPACT INTERNATIONAL EQUITY FUND
PORTFOLIOOF INVESTMENTS (continued)
January 31, 2019 (Unaudited)
| | | | | | | | | | |
| COUNTRY/SECURITY | | INDUSTRY | | SHARES | | | VALUE | |
Taiwan – 1.9% | |
Asia Cement Corp | | Materials | | | 4,604,127 | | | $ | 5,535,832 | |
AU Optronics Corp | | Technology Hardware & Equipment | | | 13,639,926 | | | | 5,346,833 | |
Lite-On Technology Corp | | Technology Hardware & Equipment | | | 1,977,512 | | | | 2,952,910 | |
Novatek Microelectronics Corp | | Semiconductors & Semiconductor Equipment | | | 858,761 | | | | 4,511,524 | |
United Microelectronics Corp | | Semiconductors & Semiconductor Equipment | | | 12,227,181 | | | | 4,669,777 | |
| | | | | | | | | | |
| | | | | | | | | 23,016,876 | |
| | | | | | | | | | |
| | | | | | | | | | |
Turkey – 0.6% | |
Turkiye Garanti Bankasi AS | | Banks | | | 2,424,803 | | | | 4,246,589 | |
Turkiye Is Bankasi AS | | Banks | | | 3,138,113 | | | | 3,447,447 | |
| | | | | | | | | | |
| | | | | | | | | 7,694,036 | |
| | | | | | | | | | |
| | | | | | | | | | |
United Kingdom – 11.3% | |
3i Group PLC | | Diversified Financials | | | 1,126,535 | | | | 12,609,868 | |
Auto Trader Group PLC | | Media & Entertainment | | | 283,147 | | | | 1,704,254 | |
Berkeley Group Holdings PLC | | Consumer Durables & Apparel | | | 281,099 | | | | 13,880,975 | |
Burberry Group PLC | | Consumer Durables & Apparel | | | 609,034 | | | | 14,439,195 | |
Ferguson PLC | | Capital Goods | | | 271,945 | | | | 18,263,755 | |
GlaxoSmithKline PLC | | Pharma, Biotech & Life Sciences | | | 943,153 | | | | 18,374,125 | |
Hikma Pharmaceuticals PLC | | Pharma, Biotech & Life Sciences | | | 191,068 | | | | 4,054,088 | |
J Sainsbury PLC | | Food & Staples Retailing | | | 4,244,620 | | | | 15,940,435 | |
Micro Focus International PLC | | Software & Services | | | 171,228 | | | | 3,274,061 | |
Next PLC | | Retailing | | | 127,895 | | | | 8,157,831 | |
Royal Mail PLC | | Transportation | | | 1,918,710 | | | | 6,780,268 | |
Segro PLC | | Real Estate | | | 338,394 | | | | 2,885,032 | |
Standard Chartered PLC | | Banks | | | 694,194 | | | | 5,615,191 | |
Unilever PLC | | Household & Personal Products | | | 237 | | | | 12,487 | |
Wm Morrison Supermarkets PLC | | Food & Staples Retailing | | | 4,129,193 | | | | 12,735,205 | |
| | | | | | | | | | |
| | | | | | | | | 138,726,770 | |
| | | | | | | | | | |
| | |
Total Investments – 97.6%(Cost $1,168,324,469) (b) | | | | | | | 1,202,038,623 | |
| | |
| Other Assets, less liabilities – 2.4% | | | | | 29,835,035 | |
| | | | | | | | | | |
| | | |
| Net Assets – 100.0% | | | | | | | $1,231,873,658 | |
| | | | | | | | | | |
(a)Non-income producing security.
(b) The aggregate cost for federal income tax purposes is $1,176,698,530. The aggregate gross unrealized appreciation is $90,517,408 and the aggregate gross unrealized depreciation is $65,177,315, resulting in net unrealized appreciation of $25,340,093.
(c) Securities for which there are no such quotations or valuations are valued at fair value as determined in good faith by or at the direction of the Fund’s Board of Trustees.
As of the date of this report, certain foreign securities were fair valued by an independent pricing service under the direction of the Board of Trustees or its delegates in accordance with the Trust’s Valuation and Pricing Policies and Procedures.
SEE NOTES TO FINANCIAL STATEMENTS
16
DOMINI IMPACT EQUITY FUND
Fund Performance and Holdings
The table and bar charts below provide information as of January 31, 2019, about the ten largest holdings of the Domini Impact Equity Fund and its portfolio holdings by industry sector:
TEN LARGEST HOLDINGS (Unaudited)
| | | | | | | | | | |
| | | | |
| SECURITY DESCRIPTION | | % NET
ASSETS | | | SECURITY DESCRIPTION | | % NET
ASSETS | |
| | | | |
| Microsoft Corp | | | 4.9% | | | Pfizer Inc | | | 1.5% | |
| | | | |
| Amazon.com Inc | | | 4.3% | | | Procter & Gamble Co/The | | | 1.4% | |
| | | | |
| Apple Inc | | | 4.3% | | | Visa Inc Cl A | | | 1.4% | |
| | | | |
| Alphabet Inc Cl A | | | 4.1% | | | Verizon Communications Inc | | | 1.4% | |
| | | | |
| Bank of America Corp | | | 1.6% | | | Cisco Systems Inc | | | 1.3% | |
PORTFOLIO HOLDINGS BY INDUSTRY SECTOR (% OF NET ASSETS) (Unaudited)
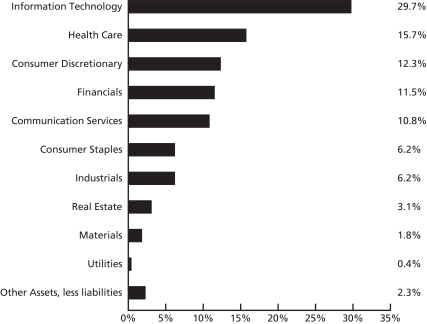
The holdings mentioned above are described in the Domini Impact Equity Fund’s Portfolio of Investments (as of 1/31/19), included herein. The composition of the Fund’s portfolio is subject to change.
The Global Industry Classification Standard (“GICS”) was developed by and is the exclusive property and a service mark of MSCI Inc. (“MSCI”) and Standard & Poor’s, a division of The McGraw-Hill Companies, Inc. (“S&P”) and is licensed for use by Domini Impact Investments. Neither MSCI, S&P nor any third party involved in making or compiling the GICS or any GICS classifications makes any express or implied warranties or representations with respect to such standard or classification nor shall any such party have any liability therefrom.
17
| | | | | | | | | | | | | | |
| |
DOMINI IMPACT EQUITY FUND AVERAGE ANNUAL TOTAL RETURNS (Unaudited) |
| | | | | | |
| | | Investor
shares | | Class A shares
(with 4.75%
maximum
Sales Charge) | | Class A shares
(without Sales
Charge) | | Institutional
shares | | Class R
shares | | S&P 500 |
| | | | | | | |
| As of 1/31/19 | | 1 Year | | -7.10% | | -11.50% | | -7.09% | | -6.75% | | -6.85% | | -2.31% |
| | | | | | | |
| | 5 Year | | 6.50% | | 5.44% | | 6.47% | | 6.88% | | 6.81% | | 10.96% |
| | | | | | | |
| | | 10 Year | | 12.82% | | 12.30% | | 12.85% | | 13.28% | | 13.19% | | 15.00% |
NOTE: The Fund’s current investment strategy commenced on December 1, 2018 with SSGA Funds Management, Inc as its subadviser. Performance information for periods prior to December 1, 2018 reflects the investment strategies employed during those periods.
Past performance is no guarantee of future results.The Fund’s returns quoted above represent past performance after all expenses. The returns reflect any applicable expense waivers in effect during the periods shown. Without such waivers, Fund performance would be lower. Investment return, principal value, and yield will fluctuate. Your shares, when redeemed, may be worth more or less than their original cost. Call1-800-762-6814 or visit www.domini.com for performance information current to the most recentmonth-end, which may be lower or higher than the performance data quoted. A 2.00% redemption fee applies on sales or exchanges of shares made less than 30 days after the settlement of purchase or acquisition through exchange, with certain exceptions. Quoted performance data does not reflect the deduction of this fee, which would reduce the performance quoted. See the prospectus for further information.
An investment in the Fund is not a bank deposit and is not insured. You may lose money. The Fund is subject to market, market segment, style and foreign investing risks. Investing internationally involves special risks, such as currency fluctuations, social and economic instability, differing security regulations and accounting standards limited public information possible changes in taxation, and periods of illiquidity.
Per the prospectus dated December 1, 2018, the Fund’s annual operating expenses totaled 1.06% (gross/net) (Investor), 1.34% (gross)/1.09% (net) (Class A), 0.72% (gross/net) (Institutional), 0.80% (gross/net) (Class R). The Fund’s adviser has contractually agreed to waive certain fees and/or reimburse certain ordinary operating expenses in order to limit Investor, Class A, Institutional and Class R share expenses to 1.09%, 1.09%, 0.74%, and 0.80% through November 30, 2019, absent an earlier modification approved by the Funds’ Board of Trustees.
The table does not reflect the deduction of taxes that a shareholder would pay on Fund distributions or the redemption of Fund shares. Total return for the Fund is based on the Fund’s net asset values and assumes all dividend and capital gains were reinvested.
The Standard & Poor’s 500 Index (S&P 500) is an unmanaged index of common stocks. Investors cannot invest directly in the S&P 500.
18
DOMINI IMPACT EQUITY FUND
PORTFOLIOOF INVESTMENTS
January 31, 2019 (Unaudited)
| | | | | | | | |
| SECURITY | | SHARES | | | VALUE | |
| Common Stocks – 97.7% | |
| Communication Services – 10.8% | |
AT&T Inc | | | 307,551 | | | $ | 9,244,983 | |
Alphabet Inc Cl A (a) | | | 26,262 | | | | 29,568,122 | |
CenturyLink Inc | | | 47,100 | | | | 721,572 | |
Charter Communications Inc Cl A (a) | | | 7,300 | | | | 2,416,665 | |
Comcast Corp Cl A | | | 201,300 | | | | 7,361,541 | |
Electronic Arts Inc (a) | | | 13,700 | | | | 1,263,688 | |
Interpublic Group of Cos Inc/The | | | 17,000 | | | | 386,750 | |
Netflix Inc (a) | | | 19,000 | | | | 6,450,500 | |
New York Times Co/The Cl A | | | 6,900 | | | | 177,399 | |
Omnicom Group Inc | | | 9,900 | | | | 771,012 | |
Sprint Corp (a) | | | 27,600 | | | | 172,224 | |
TELUS Corp | | | 26,500 | | | | 928,295 | |
Take-Two Interactive Software Inc (a) | | | 5,181 | | | | 546,855 | |
TripAdvisor Inc (a) | | | 4,700 | | | | 269,686 | |
Verizon Communications Inc | | | 180,063 | | | | 9,914,269 | |
Walt Disney Co/The | | | 63,342 | | | | 7,063,900 | |
| | | | | | | | |
| | | | | | | 77,257,461 | |
| | | | | | | | |
|
| Consumer Discretionary – 12.3% | |
Advance Auto Parts Inc | | | 2,957 | | | | 470,754 | |
Amazon.com Inc (a) | | | 18,039 | | | | 31,004,170 | |
Best Buy Co Inc | | | 10,103 | | | | 598,502 | |
Booking Holdings Inc (a) | | | 1,962 | | | | 3,595,973 | |
BorgWarner Inc | | | 8,800 | | | | 359,920 | |
Capri Holdings Ltd (a) | | | 6,635 | | | | 281,855 | |
CarMax Inc (a) | | | 7,700 | | | | 452,606 | |
Chipotle Mexican Grill Inc (a) | | | 1,188 | | | | 629,177 | |
Cie Generale des Etablissements Michelin SCA ADR | | | 39,700 | | | | 862,086 | |
eBay Inc (a) | | | 40,400 | | | | 1,359,460 | |
Expedia Group Inc | | | 5,200 | | | | 620,100 | |
Fast Retailing Co Ltd ADR | | | 24,000 | | | | 1,098,120 | |
Gap Inc/The | | | 12,345 | | | | 314,057 | |
Garmin Ltd | | | 5,800 | | | | 401,244 | |
Gentex Corp | | | 12,000 | | | | 254,160 | |
Genuine Parts Co | | | 6,200 | | | | 618,884 | |
Home Depot Inc/The | | | 48,618 | | | | 8,922,862 | |
Kohl’s Corp | | | 7,212 | | | | 495,392 | |
L Brands Inc | | | 10,719 | | | | 298,417 | |
LKQ Corp (a) | | | 12,600 | | | | 330,372 | |
Lennar Corp Cl A | | | 12,800 | | | | 606,976 | |
Lowe’s Cos Inc | | | 33,364 | | | | 3,208,282 | |
Marriott International Inc/MD Cl A | | | 12,209 | | | | 1,398,297 | |
Mohawk Industries Inc (a) | | | 2,800 | | | | 360,612 | |
NIKE Inc Cl B | | | 55,076 | | | | 4,509,623 | |
NVR Inc (a) | | | 150 | | | | 399,000 | |
Nordstrom Inc | | | 5,309 | | | | 246,391 | |
O’Reilly Automotive Inc (a) | | | 3,600 | | | | 1,240,776 | |
Ralph Lauren Corp | | | 2,439 | | | | 283,265 | |
19
DOMINI IMPACT EQUITY FUND
PORTFOLIOOF INVESTMENTS (continued)
January 31, 2019 (Unaudited)
| | | | | | | | |
| SECURITY | | SHARES | | | VALUE | |
|
| Consumer Discretionary(Continued) | |
Sony Corp ADR | | | 54,700 | | | $ | 2,741,564 | |
Starbucks Corp | | | 53,014 | | | | 3,612,374 | |
Tapestry Inc | | | 12,348 | | | | 477,991 | |
Target Corp | | | 22,933 | | | | 1,674,109 | |
Tenneco Inc Cl A | | | 2,298 | | | | 79,695 | |
Tesla Inc (a) | | | 11,166 | | | | 3,428,185 | |
Tiffany & Co | | | 5,100 | | | | 452,523 | |
Toyota Motor Corp ADR | | | 51,900 | | | | 6,392,523 | |
Ulta Beauty Inc (a) | | | 2,500 | | | | 729,800 | |
Under Armour Inc Cl A (a) | | | 15,100 | | | | 313,174 | |
Vail Resorts Inc | | | 1,800 | | | | 338,868 | |
Veoneer Inc (a) | | | 32,109 | | | | 957,169 | |
Wayfair Inc Cl A (a) | | | 2,700 | | | | 295,542 | |
Weight Watchers International Inc (a) | | | 36,512 | | | | 1,168,384 | |
Williams-Sonoma Inc | | | 3,600 | | | | 195,948 | |
| | | | | | | | |
| | | | | | | 88,079,182 | |
| | | | | | | | |
|
| Consumer Staples – 6.2% | |
Campbell Soup Co | | | 8,791 | | | | 311,465 | |
Church & Dwight Co Inc | | | 10,800 | | | | 697,788 | |
Clorox Co/The | | | 5,700 | | | | 845,766 | |
Colgate-Palmolive Co | | | 38,053 | | | | 2,461,268 | |
Costco Wholesale Corp | | | 18,920 | | | | 4,060,800 | |
Coty Inc Cl A | | | 20,700 | | | | 160,632 | |
Estee Lauder Cos Inc/The Cl A | | | 9,556 | | | | 1,303,630 | |
General Mills Inc | | | 26,375 | | | | 1,172,105 | |
JM Smucker Co/The | | | 4,746 | | | | 497,760 | |
Kimberly-Clark Corp | | | 15,141 | | | | 1,686,405 | |
Kraft Heinz Co/The | | | 27,823 | | | | 1,337,173 | |
Kroger Co/The | | | 36,101 | | | | 1,022,741 | |
Lamb Weston Holdings Inc | | | 6,400 | | | | 462,720 | |
Mondelez International Inc Cl A | | | 62,965 | | | | 2,912,761 | |
PepsiCo Inc | | | 60,561 | | | | 6,823,408 | |
Procter & Gamble Co/The | | | 106,255 | | | | 10,250,420 | |
Sprouts Farmers Market Inc (a) | | | 6,600 | | | | 158,268 | |
SunOpta Inc (a) | | | 356,643 | | | | 1,483,635 | |
Sysco Corp | | | 21,248 | | | | 1,356,685 | |
Unilever PLC ADR | | | 49,000 | | | | 2,577,400 | |
Walgreens Boots Alliance Inc | | | 35,648 | | | | 2,575,924 | |
| | | | | | | | |
| | | | | | | 44,158,754 | |
| | | | | | | | |
|
| Financials – 11.5% | |
Affiliated Managers Group Inc | | | 2,400 | | | | 251,880 | |
Aflac Inc | | | 32,852 | | | | 1,567,040 | |
Amalgamated Bank Cl A | | | 39,280 | | | | 704,683 | |
American Express Co | | | 30,591 | | | | 3,141,696 | |
Aon PLC | | | 10,500 | | | | 1,640,415 | |
Arthur J Gallagher & Co | | | 8,100 | | | | 605,151 | |
BB&T Corp | | | 33,300 | | | | 1,625,040 | |
20
DOMINI IMPACT EQUITY FUND
PORTFOLIOOF INVESTMENTS (continued)
January 31, 2019 (Unaudited)
| | | | | | | | |
| SECURITY | | SHARES | | | VALUE | |
| | | | | | | | |
|
| Financials(Continued) | |
Bank of America Corp | | | 390,208 | | | $ | 11,109,222 | |
Bank of Montreal | | | 28,400 | | | | 2,078,596 | |
Bank of Nova Scotia/The | | | 54,339 | | | | 3,094,063 | |
BlackRock Inc | | | 4,900 | | | | 2,033,892 | |
CME Group Inc | | | 15,400 | | | | 2,807,112 | |
Capital One Financial Corp | | | 20,759 | | | | 1,672,968 | |
Chubb Ltd | | | 19,100 | | | | 2,541,255 | |
Cincinnati Financial Corp | | | 6,800 | | | | 551,616 | |
Citigroup Inc | | | 107,900 | | | | 6,955,234 | |
Comerica Inc | | | 7,054 | | | | 555,432 | |
Cullen/Frost Bankers Inc | | | 2,700 | | | | 262,656 | |
Discover Financial Services | | | 14,800 | | | | 998,852 | |
E*TRADE Financial Corp | | | 11,014 | | | | 513,913 | |
East West Bancorp Inc | | | 6,500 | | | | 327,080 | |
Everest Re Group Ltd | | | 1,800 | | | | 394,290 | |
Federal Agricultural Mortgage Corp Cl C | | | 15,532 | | | | 1,098,889 | |
Franklin Resources Inc | | | 12,700 | | | | 376,047 | |
Hartford Financial Services Group Inc/The | | | 15,900 | | | | 746,028 | |
Huntington Bancshares Inc/OH | | | 46,100 | | | | 610,364 | |
Intercontinental Exchange Inc | | | 24,595 | | | | 1,887,912 | |
Invesco Ltd | | | 18,500 | | | | 337,070 | |
KeyCorp | | | 45,300 | | | | 746,091 | |
MSCI Inc | | | 3,800 | | | | 647,026 | |
Marsh & McLennan Cos Inc | | | 21,900 | | | | 1,931,361 | |
Moody’s Corp | | | 7,300 | | | | 1,157,123 | |
Morgan Stanley | | | 57,792 | | | | 2,444,602 | |
Nasdaq Inc | | | 5,100 | | | | 449,004 | |
Northern Trust Corp | | | 9,200 | | | | 813,832 | |
PNC Financial Services Group Inc/The | | | 18,590 | | | | 2,280,435 | |
People’s United Financial Inc | | | 16,700 | | | | 273,546 | |
Principal Financial Group Inc | | | 12,600 | | | | 630,882 | |
Prudential Financial Inc | | | 17,987 | | | | 1,657,322 | |
Raymond James Financial Inc | | | 5,400 | | | | 434,700 | |
Regions Financial Corp | | | 43,728 | | | | 663,354 | |
Reinsurance Group of America Inc | | | 2,800 | | | | 404,460 | |
S&P Global Inc | | | 10,900 | | | | 2,088,985 | |
SEI Investments Co | | | 6,500 | | | | 309,010 | |
Starwood Property Trust Inc | | | 12,400 | | | | 273,792 | |
T Rowe Price Group Inc | | | 10,300 | | | | 962,638 | |
TD Ameritrade Holding Corp | | | 12,700 | | | | 710,565 | |
Toronto-Dominion Bank/The | | | 80,321 | | | | 4,522,876 | |
Travelers Cos Inc/The | | | 11,600 | | | | 1,456,264 | |
US Bancorp | | | 64,846 | | | | 3,317,521 | |
Unum Group | | | 9,400 | | | | 326,744 | |
Voya Financial Inc | | | 7,100 | | | | 329,653 | |
Westpac Banking Corp ADR | | | 151,700 | | | | 2,707,845 | |
Zions Bancorp NA | | | 8,200 | | | | 390,238 | |
| | | | | | | | |
| | | | | | | 82,418,265 | |
| | | | | | | | |
21
DOMINI IMPACT EQUITY FUND
PORTFOLIOOF INVESTMENTS (continued)
January 31, 2019 (Unaudited)
| | | | | | | | |
| SECURITY | | SHARES | | | VALUE | |
| | | | | | | | |
| Health Care – 15.7% | |
ABIOMED Inc (a) | | | 1,900 | | | $ | 667,033 | |
AbbVie Inc | | | 62,611 | | | | 5,027,037 | |
Agilent Technologies Inc | | | 14,000 | | | | 1,064,700 | |
Alexion Pharmaceuticals Inc (a) | | | 9,500 | | | | 1,168,120 | |
Align Technology Inc (a) | | | 3,300 | | | | 821,535 | |
Amgen Inc | | | 27,353 | | | | 5,118,020 | |
Becton Dickinson and Co | | | 11,700 | | | | 2,918,682 | |
Bio-Rad Laboratories Inc Cl A (a) | | | 1,000 | | | | 249,870 | |
Bio-Techne Corp | | | 1,700 | | | | 296,582 | |
BioTelemetry Inc (a) | | | 30,329 | | | | 2,178,229 | |
Biogen Inc (a) | | | 8,739 | | | | 2,916,903 | |
Bristol-Myers Squibb Co | | | 69,787 | | | | 3,445,384 | |
Bruker Corp | | | 4,600 | | | | 161,276 | |
Celgene Corp (a) | | | 30,000 | | | | 2,653,800 | |
Cerner Corp (a) | | | 13,900 | | | | 763,249 | |
Cooper Cos Inc/The | | | 2,200 | | | | 613,272 | |
DENTSPLY SIRONA Inc | | | 9,500 | | | | 398,525 | |
Danaher Corp | | | 27,200 | | | | 3,017,024 | |
DexCom Inc (a) | | | 23,367 | | | | 3,295,448 | |
Edwards Lifesciences Corp (a) | | | 9,200 | | | | 1,567,864 | |
Gilead Sciences Inc | | | 55,365 | | | | 3,876,104 | |
GlaxoSmithKline PLC ADR | | | 108,000 | | | | 4,233,600 | |
Haemonetics Corp (a) | | | 2,351 | | | | 232,537 | |
Henry Schein Inc | | | 6,600 | | | | 512,820 | |
Hill-Rom Holdings Inc | | | 2,800 | | | | 280,056 | |
Hologic Inc (a) | | | 57,781 | | | | 2,565,476 | |
IDEXX Laboratories Inc (a) | | | 3,700 | | | | 787,286 | |
Illumina Inc (a) | | | 6,600 | | | | 1,846,614 | |
Incyte Corp (a) | | | 7,900 | | | | 636,661 | |
Ionis Pharmaceuticals Inc (a) | | | 5,700 | | | | 330,600 | |
Koninklijke Philips NV | | | 39,000 | | | | 1,537,770 | |
Merck & Co Inc | | | 112,901 | | | | 8,403,221 | |
Mettler-Toledo International Inc (a) | | | 1,100 | | | | 701,976 | |
Nektar Therapeutics (a) | | | 7,700 | | | | 326,018 | |
Novartis AG ADR | | | 104,800 | | | | 9,172,096 | |
Novo Nordisk A/S ADR | | | 73,800 | | | | 3,470,076 | |
OraSure Technologies Inc (a) | | | 136,050 | | | | 1,748,243 | |
PerkinElmer Inc | | | 4,800 | | | | 434,400 | |
Perrigo Co PLC | | | 5,900 | | | | 274,055 | |
Pfizer Inc | | | 251,900 | | | | 10,693,155 | |
Quest Diagnostics Inc | | | 5,900 | | | | 515,365 | |
Regeneron Pharmaceuticals Inc (a) | | | 3,500 | | | | 1,502,445 | |
ResMed Inc | | | 6,146 | | | | 584,915 | |
STERIS PLC | | | 3,800 | | | | 433,428 | |
Sanofi ADR | | | 98,500 | | | | 4,279,825 | |
Seattle Genetics Inc (a) | | | 23,942 | | | | 1,829,887 | |
Stryker Corp | | | 13,300 | | | | 2,361,681 | |
Teladoc Health Inc (a) | | | 34,635 | | | | 2,223,567 | |
Thermo Fisher Scientific Inc | | | 17,814 | | | | 4,376,365 | |
22
DOMINI IMPACT EQUITY FUND
PORTFOLIOOF INVESTMENTS (continued)
January 31, 2019 (Unaudited)
| | | | | | | | |
| SECURITY | | SHARES | | | VALUE | |
| | | | | | | | |
| Health Care(Continued) | |
Varian Medical Systems Inc (a) | | | 3,900 | | | $ | 514,917 | |
Veeva Systems Inc Cl A (a) | | | 5,443 | | | | 593,614 | |
Vertex Pharmaceuticals Inc (a) | | | 11,300 | | | | 2,157,283 | |
Waters Corp (a) | | | 3,263 | | | | 754,471 | |
| | | | | | | | |
| | | | | | | 112,533,080 | |
| | | | | | | | |
|
| Industrials – 6.2% | |
3M Co | | | 25,215 | | | | 5,050,565 | |
AO Smith Corp | | | 6,500 | | | | 311,090 | |
Acuity Brands Inc | | | 11,467 | | | | 1,386,475 | |
Alaska Air Group Inc | | | 5,600 | | | | 358,120 | |
Allegion PLC | | | 4,200 | | | | 360,612 | |
Ameresco Inc Cl A (a) | | | 157,039 | | | | 2,344,592 | |
CH Robinson Worldwide Inc | | | 5,900 | | | | 511,943 | |
Canadian Pacific Railway Ltd | | | 6,300 | | | | 1,290,870 | |
Carlisle Cos Inc | | | 2,500 | | | | 269,325 | |
Copart Inc (a) | | | 9,200 | | | | 465,796 | |
Cummins Inc | | | 6,851 | | | | 1,007,851 | |
Deere & Co | | | 13,800 | | | | 2,263,200 | |
Donaldson Co Inc | | | 5,800 | | | | 274,224 | |
Emerson Electric Co | | | 27,400 | | | | 1,793,878 | |
Expeditors International of Washington Inc | | | 7,600 | | | | 526,680 | |
Fastenal Co | | | 12,700 | | | | 767,842 | |
Flowserve Corp | | | 5,900 | | | | 259,836 | |
Fortune Brands Home & Security Inc | | | 6,400 | | | | 289,920 | |
Graco Inc | | | 7,400 | | | | 320,642 | |
HD Supply Holdings Inc (a) | | | 7,500 | | | | 314,550 | |
Hubbell Inc | | | 2,400 | | | | 262,392 | |
IDEX Corp | | | 3,400 | | | | 468,724 | |
IHS Markit Ltd (a) | | | 15,400 | | | | 799,568 | |
Illinois Tool Works Inc | | | 12,700 | | | | 1,743,837 | |
Ingersoll-Rand PLC | | | 10,900 | | | | 1,090,436 | |
JB Hunt Transport Services Inc | | | 3,800 | | | | 406,752 | |
JetBlue Airways Corp (a) | | | 13,588 | | | | 244,448 | |
Johnson Controls International plc | | | 39,800 | | | | 1,344,046 | |
KAR Auction Services Inc | | | 6,100 | | | | 317,261 | |
Lennox International Inc | | | 1,700 | | | | 389,776 | |
Masco Corp | | | 13,100 | | | | 424,571 | |
Nielsen Holdings PLC | | | 15,500 | | | | 398,040 | |
Nordson Corp | | | 2,100 | | | | 272,244 | |
Owens Corning | | | 4,900 | | | | 256,711 | |
PACCAR Inc | | | 15,051 | | | | 986,142 | |
Pentair PLC | | | 7,300 | | | | 300,687 | |
Quanta Services Inc | | | 6,500 | | | | 229,710 | |
Robert Half International Inc | | | 5,451 | | | | 351,208 | |
Rockwell Automation Inc | | | 5,200 | | | | 881,504 | |
Roper Technologies Inc | | | 4,400 | | | | 1,246,344 | |
Sensata Technologies Holding PLC (a) | | | 7,100 | | | | 337,250 | |
Simpson Manufacturing Co Inc | | | 1,900 | | | | 116,622 | |
23
DOMINI IMPACT EQUITY FUND
PORTFOLIOOF INVESTMENTS (continued)
January 31, 2019 (Unaudited)
| | | | | | | | |
| SECURITY | | SHARES | | | VALUE | |
| | | | | | | | |
|
| Industrials(Continued) | |
Snap-on Inc | | | 2,500 | | | $ | 414,975 | |
Sunrun Inc (a) | | | 107,468 | | | | 1,429,324 | |
TPI Composites Inc (a) | | | 42,090 | | | | 1,274,064 | |
Thomson Reuters Corp | | | 7,600 | | | | 397,784 | |
Trex Co Inc | | | 2,700 | | | | 188,352 | |
USG Corp | | | 3,900 | | | | 168,285 | |
United Parcel Service Inc Cl B | | | 30,131 | | | | 3,175,807 | |
United Rentals Inc (a) | | | 3,500 | | | | 438,410 | |
WW Grainger Inc | | | 2,070 | | | | 611,457 | |
Wabtec Corp | | | 3,900 | | | | 269,724 | |
Wolters Kluwer NV ADR | | | 44,617 | | | | 2,781,870 | |
Xylem Inc/NY | | | 7,700 | | | | 548,702 | |
| | | | | | | | |
| | | | | | | 44,735,038 | |
| | | | | | | | |
|
| Information Technology – 29.7% | |
2U Inc (a) | | | 41,082 | | | | 2,335,512 | |
ASML Holding NV | | | 18,200 | | | | 3,185,546 | |
Accenture PLC Cl A | | | 27,600 | | | | 4,237,980 | |
Adobe Inc (a) | | | 21,439 | | | | 5,313,013 | |
Advanced Micro Devices Inc (a) | | | 42,650 | | | | 1,041,087 | |
Akamai Technologies Inc (a) | | | 6,900 | | | | 449,190 | |
Analog Devices Inc | | | 15,800 | | | | 1,561,988 | |
Apple Inc | | | 186,108 | | | | 30,975,816 | |
Applied Materials Inc | | | 42,200 | | | | 1,649,176 | |
Arista Networks Inc (a) | | | 2,300 | | | | 493,994 | |
Atlassian Corp PLC Cl A (a) | | | 31,312 | | | | 3,081,101 | |
Autodesk Inc (a) | | | 28,272 | | | | 4,161,638 | |
Automatic Data Processing Inc | | | 17,900 | | | | 2,503,136 | |
Blackbaud Inc | | | 16,190 | | | | 1,159,204 | |
Blackline Inc (a) | | | 40,426 | | | | 1,923,469 | |
Broadcom Inc | | | 17,700 | | | | 4,748,025 | |
Cadence Design Systems Inc (a) | | | 12,100 | | | | 581,163 | |
Cisco Systems Inc | | | 196,718 | | | | 9,302,794 | |
Citrix Systems Inc | | | 5,685 | | | | 582,940 | |
Cognizant Technology Solutions Corp Cl A | | | 25,300 | | | | 1,762,904 | |
Corning Inc | | | 35,300 | | | | 1,174,078 | |
Cree Inc (a) | | | 69,937 | | | | 3,526,923 | |
DXC Technology Co | | | 12,247 | | | | 785,278 | |
F5 Networks Inc (a) | | | 2,600 | | | | 418,470 | |
Fidelity National Information Services Inc | | | 14,000 | | | | 1,463,420 | |
First Solar Inc (a) | | | 53,091 | | | | 2,685,874 | |
Fiserv Inc | | | 17,600 | | | | 1,459,568 | |
Fortinet Inc (a) | | | 6,400 | | | | 490,048 | |
Gartner Inc (a) | | | 3,900 | | | | 529,971 | |
HP Inc | | | 69,300 | | | | 1,526,679 | |
Hewlett Packard Enterprise Co | | | 66,400 | | | | 1,035,176 | |
IPG Photonics Corp (a) | | | 1,600 | | | | 212,800 | |
Integrated Device Technology Inc (a) | | | 5,800 | | | | 283,330 | |
Intel Corp | | | 195,446 | | | | 9,209,416 | |
24
DOMINI IMPACT EQUITY FUND
PORTFOLIOOF INVESTMENTS (continued)
January 31, 2019 (Unaudited)
| | | | | | | | |
| SECURITY | | SHARES | | | VALUE | |
| | | | | | | | |
|
| Information Technology(Continued) | |
International Business Machines Corp | | | 39,439 | | | $ | 5,301,390 | |
Intuit Inc | | | 10,800 | | | | 2,330,856 | |
Itron Inc (a) | | | 35,908 | | | | 1,961,654 | |
Juniper Networks Inc | | | 14,800 | | | | 383,912 | |
KLA-Tencor Corp | | | 6,600 | | | | 703,362 | |
Lam Research Corp | | | 6,700 | | | | 1,136,186 | |
Mastercard Inc Cl A | | | 39,020 | | | | 8,238,293 | |
Micron Technology Inc (a) | | | 48,700 | | | | 1,861,314 | |
Microsoft Corp | | | 335,412 | | | | 35,027,075 | |
Mitek Systems Inc | | | 146,448 | | | | 1,615,321 | |
Motorola Solutions Inc | | | 7,301 | | | | 853,560 | |
NVIDIA Corp | | | 25,000 | | | | 3,593,750 | |
NetApp Inc | | | 11,208 | | | | 714,734 | |
Nordea Bank Abp ADR | | | 176,900 | | | | 1,623,058 | |
PayPal Holdings Inc (a) | | | 48,600 | | | | 4,313,736 | |
Paychex Inc | | | 14,100 | | | | 998,280 | |
Pluralsight Inc Cl A (a) | | | 58,537 | | | | 1,754,939 | |
Red Hat Inc (a) | | | 7,800 | | | | 1,387,152 | |
Salesforce.com Inc (a) | | | 31,700 | | | | 4,817,449 | |
Seagate Technology PLC | | | 11,100 | | | | 491,508 | |
Skyworks Solutions Inc | | | 7,700 | | | | 562,408 | |
Square Inc Cl A (a) | | | 61,166 | | | | 4,364,194 | |
STMicroelectronics NV | | | 112,147 | | | | 1,776,408 | |
SunPower Corp (a) | | | 148,484 | | | | 862,692 | |
Symantec Corp | | | 27,400 | | | | 575,948 | |
Synopsys Inc (a) | | | 6,300 | | | | 588,105 | |
Texas Instruments Inc | | | 41,400 | | | | 4,168,152 | |
Universal Display Corp | | | 23,649 | | | | 2,455,476 | |
VMware Inc Cl A | | | 3,230 | | | | 487,956 | |
VeriSign Inc (a) | | | 4,700 | | | | 795,569 | |
Visa Inc Cl A | | | 75,900 | | | | 10,247,259 | |
Western Digital Corp | | | 12,400 | | | | 557,876 | |
| | | | | | | | |
| | | | | | | 212,400,279 | |
| | | | | | | | |
|
| Materials – 1.8% | |
Air Products & Chemicals Inc | | | 9,600 | | | | 1,578,144 | |
AptarGroup Inc | | | 2,600 | | | | 257,712 | |
Avery Dennison Corp | | | 3,900 | | | | 407,355 | |
Axalta Coating Systems Ltd (a) | | | 9,700 | | | | 248,514 | |
Ecolab Inc | | | 11,200 | | | | 1,771,504 | |
International Paper Co | | | 17,800 | | | | 844,254 | |
Linde PLC | | | 24,300 | | | | 3,961,143 | |
Nucor Corp | | | 13,792 | | | | 844,622 | |
PPG Industries Inc | | | 10,600 | | | | 1,117,664 | |
Sealed Air Corp | | | 7,100 | | | | 280,450 | |
Steel Dynamics Inc | | | 10,036 | | | | 367,217 | |
Vulcan Materials Co | | | 5,900 | | | | 599,735 | |
Westrock Co | | | 10,985 | | | | 447,199 | |
| | | | | | | | |
| | | | | | | 12,725,513 | |
| | | | | | | | |
25
DOMINI IMPACT EQUITY FUND
PORTFOLIOOF INVESTMENTS (continued)
January 31, 2019 (Unaudited)
| | | | | | | | |
| SECURITY | | SHARES | | | VALUE | |
| | | | | | | | |
| Real Estate – 3.1% | |
American Tower Corp | | | 19,200 | | | $ | 3,318,528 | |
Apartment Investment & Management Company Cl A | | | 6,900 | | | | 341,688 | |
Boston Properties Inc | | | 6,800 | | | | 896,716 | |
CBRE Group Inc Cl A (a) | | | 13,900 | | | | 635,925 | |
Crown Castle International Corp | | | 17,900 | | | | 2,095,374 | |
Digital Realty Trust Inc | | | 9,100 | | | | 985,894 | |
Duke Realty Corp | | | 15,500 | | | | 453,220 | |
Equinix Inc | | | 3,500 | | | | 1,379,000 | |
Essex Property Trust Inc | | | 2,800 | | | | 759,360 | |
Extra Space Storage Inc | | | 5,300 | | | | 522,633 | |
Federal Realty Investment Trust | | | 3,300 | | | | 437,481 | |
Host Hotels & Resorts Inc | | | 33,022 | | | | 596,377 | |
Iron Mountain Inc | | | 12,200 | | | | 453,840 | |
Liberty Property Trust | | | 6,600 | | | | 311,124 | |
Mid-America Apartment Communities Inc | | | 4,900 | | | | 496,272 | |
Prologis Inc | | | 27,500 | | | | 1,901,900 | |
Public Storage | | | 6,600 | | | | 1,402,632 | |
Realty Income Corp | | | 13,000 | | | | 892,970 | |
Regency Centers Corp | | | 6,900 | | | | 448,500 | |
SBA Communications Corp (a) | | | 4,900 | | | | 894,397 | |
UDR Inc | | | 11,400 | | | | 498,750 | |
Ventas Inc | | | 15,500 | | | | 999,595 | |
Welltower Inc | | | 16,500 | | | | 1,278,585 | |
| | | | | | | | |
| | | | | | | 22,000,761 | |
| | | | | | | | |
|
| Utilities – 0.4% | |
Alliant Energy Corp | | | 10,100 | | | | 449,147 | |
Avangrid Inc | | | 2,547 | | | | 127,019 | |
Consolidated Edison Inc | | | 14,227 | | | | 1,104,727 | |
Eversource Energy | | | 13,800 | | | | 957,858 | |
| | | | | | | | |
| | | | | | | 2,638,751 | |
| | | | | | | | |
| | |
| Total Investments – 97.7%(Cost $649,983,320) (b) | | | | | 698,947,084 | |
| | |
| Other Assets, less liabilities – 2.3% | | | | | 16,223,842 | |
| | | | | | | | |
| | |
| Net Assets – 100.0% | | | | | $715,170,926 | |
| | | | | | | | |
(a)Non-income producing security.
(b) The aggregate cost for federal income tax purposes is $652,227,885. The aggregate gross unrealized appreciation is $64,952,264 and the aggregate gross unrealized depreciation is $18,233,065, resulting in net unrealized appreciation of $46,719,199.
ADR — American Depository Receipt
SEE NOTES TO FINANCIAL STATEMENTS
26
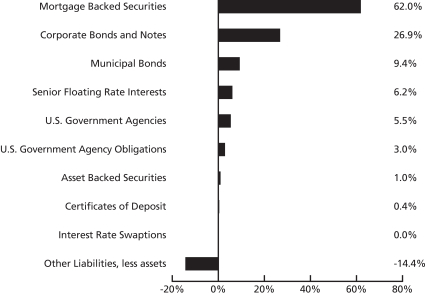
DOMINI IMPACT BOND FUND
Fund Performance and Holdings
The bar chart below provides information as of January 31, 2019, about the percentage of the Domini Impact Bond Fund’s portfolio holdings invested in various types of debt obligations:
PORTFOLIO COMPOSITION (% OF NET ASSETS) (Unaudited)
The Global Industry Classification Standard (“GICS”) was developed by and is the exclusive property and a service mark of MSCI Inc. (“MSCI”) and Standard & Poor’s, a division of The McGraw-Hill Companies, Inc. (“S&P”) and is licensed for use by Domini Impact Investments. Neither MSCI, S&P nor any third party involved in making or compiling the GICS or any GICS classifications makes any express or implied warranties or representations with respect to such standard or classification nor shall any such party have any liability therefrom.
27
| | | | | | | | |
| |
DOMINI IMPACT BOND FUND AVERAGE ANNUAL TOTAL RETURNS (Unaudited) |
| | | |
| | | Investor
shares | | Institutional
shares1 | | Bloomberg Barclays U.S.
Aggregate Index |
| | | | |
| As of 1/31/19 | | 1 Year | | 1.55% | | 1.78% | | 2.25% |
| | | | |
| | 5 Year | | 1.92% | | 2.15% | | 2.44% |
| | | | |
| | | 10 Year | | 2.70% | | 2.70% | | 3.68% |
Past performance is no guarantee of future results.The Fund’s returns quoted above represent past performance after all expenses. The returns reflect any applicable expense waivers in effect during the periods shown. Without such waivers, Fund performance would be lower. Investment return, principal value, and yield will fluctuate. Your shares, when redeemed, may be worth more or less than their original cost. Call1-800-762-6814 or visit www.domini.com for performance information current to the most recentmonth-end, which may be lower or higher than the performance data quoted. A 2.00% redemption fee applies on sales or exchanges of shares made less than 30 days after the settlement of purchase or acquisition through exchange, with certain exceptions. Quoted performance data does not reflect the deduction of this fee, which would reduce the performance quoted. See the prospectus for further information.
Per the prospectus dated December 1, 2018, the Fund’s annual operating expenses totaled: 1.14% (gross)/ 0.87% (net) (Investor), 1.03% (gross)/ 0.57% (net) (Institutional). Domini Impact Investments LLC has contractually agreed to waive certain fees and/or reimburse certain ordinary operating expenses in order to limit Investor and Institutional share expenses to 0.87% and 0.57%, respectively, absent an earlier modification by the Fund’s Board.
The table does not reflect the deduction of fees and taxes that a shareholder would pay on Fund distributions or the redemption of Fund shares. Total return is based on the Fund’s net asset values and assumes all dividends and capital gains were reinvested.
An investment in the Domini Impact Bond Fund is not a bank deposit and is not insured. The Fund is subject to credit, interest rate, liquidity, impact investing and market risks. You may lose money.
During periods of rising interest rates, the Fund can lose value. Some of the Fund’s community development investments may be unrated and may carry greater credit risks than the Fund’s other holdings. The Fund currently holds a large percentage of its portfolio in mortgage-backed securities. During periods of falling interest rates, mortgage-backed securities may prepay the principal due, which may lower the Fund’s return by causing it to reinvest at lower interest rates.
Investments in derivatives can be volatile. Potential risks include currency risk, leverage risk (the risk that small market movements may result in large changes in the value of an investment), liquidity risk, index risk, pricing risk, and counterparty risk (the risk that the counterparty may be unwilling or unable to honor its obligations).
TBA (To Be Announced) securities involve the risk that the security the Fund buys will lose value prior to its delivery. There also is the risk that the security will not be issued or that the other party to the transaction will not meet its obligation, which can adversely affect the Fund’s returns.
The reduction or withdrawal of historical financial market support activities by the U.S. Government and Federal Reserve, or other governments/central banks could negatively impact financial markets generally, and increase market, liquidity and interest rate risks which could adversely affect the Fund’s returns.
The Bloomberg Barclays U.S. Aggregate Index is an index representing securities that are U.S. domestic, taxable, and dollar denominated and covering the U.S. investment grade fixed rate bond market, with index components for government and corporate securities and asset-backed securities. You cannot invest directly in an index.
1Institutional shares were not offered prior to November 30, 2011. All performance information for time periods beginning prior to November 30, 2011, is the performance of the Investor shares. This performance has not been adjusted to reflect the lower expenses of the Institutional shares.
28
DOMINI IMPACT BOND FUND
PORTFOLIOOF INVESTMENTS
January 31, 2019 (Unaudited)
| | | | | | | | |
| | | Principal
Amount* | | | Value | |
| | | | | | | | |
| Long Term Investments – 111.4% | | | | | | |
| Mortgage Backed Securities – 62.0% | | | | | | |
Agency Collateralized Mortgage Obligations – 4.7% | | | | | | | | |
Fannie Mae Connecticut Avenue Securities | | | | | | | | |
6.060%, VR, 7/25/2029 | | | 120,000 | | | $ | 129,453 | |
6.860%, VR, 5/25/2029 | | | 235,000 | | | | 257,033 | |
FHMS KBF1 A, 2.893%, VR, 7/25/2024 | | | 748,000 | | | | 750,054 | |
FHMS KW06 A1, 3.800%, VR, 2/25/2027 | | | 798,862 | | | | 838,819 | |
FHR 3877 LM, 3.500%, 6/15/2026 | | | 780,000 | | | | 804,151 | |
FNR 2017 72 CD, 3.000%, 9/25/2047 | | | 185,976 | | | | 186,517 | |
FNR 2017 72 B, 3.000%, 9/25/2047 | | | 178,424 | | | | 178,675 | |
FNR 2012 17 BC, 3.500%, 3/25/2027 | | | 368,000 | | | | 379,237 | |
FNR 2018 72 BA, 3.500%, 7/25/2054 | | | 286,619 | | | | 290,561 | |
FREMF Mortgage Trust | | | | | | | | |
144A, 3.647%, VR, 11/25/2050 (d) | | | 120,000 | | | | 119,889 | |
144A, 3.675%, VR, 11/25/2049 (d) | | | 250,000 | | | | 247,407 | |
144A, 3.675%, VR, 11/25/2049 (d) | | | 90,000 | | | | 86,726 | |
144A, 3.726%, VR, 10/25/2049 (d) | | | 120,000 | | | | 116,107 | |
144A, 3.726%, VR, 10/25/2049 (d) | | | 40,000 | | | | 37,093 | |
144A, 3.753%, VR, 11/25/2050 (d) | | | 220,000 | | | | 212,354 | |
144A, 3.753%, VR, 11/25/2050 (d) | | | 65,000 | | | | 60,146 | |
144A, 3.972%, VR, 7/25/2049 (d) | | | 175,000 | | | | 177,936 | |
144A, 3.836%, VR, 7/25/2049 (d) | | | 224,000 | | | | 228,150 | |
144A, 3.844%, VR, 10/25/2049 (d) | | | 90,000 | | | | 87,437 | |
144A, 3.880%, VR, 2/25/2050 (d) | | | 100,000 | | | | 101,257 | |
144A, 3.944%, VR, 9/25/2049 (d) | | | 85,000 | | | | 83,722 | |
144A, 3.981%, VR, 5/25/2050 (d) | | | 70,000 | | | | 69,019 | |
144A, 4.022%, VR, 11/25/2032 (d) | | | 67,000 | | | | 56,278 | |
144A, 4.036%, VR, 7/25/2027 (d) | | | 136,000 | | | | 134,266 | |
144A, 4.073%, VR, 7/25/2050 (d) | | | 155,000 | | | | 153,600 | |
144A, 4.081%, VR, 10/25/2031 (d) | | | 461,000 | | | | 431,695 | |
STACR 2018 HRP1 M2 144A 144A, 4.160%, VR, 4/25/2043 (d) | | | 114,358 | | | | 115,376 | |
| | | | | | | | |
| | | | | | | 6,332,958 | |
| | | | | | | | |
| | | | | | | | |
Commercial Mortgage Backed Securities – 5.8% | | | | | | | | |
BWAY Mortgage Trust 144A, 2.809%, 3/10/2033 (d) | | | 143,146 | | | | 141,472 | |
Commercial Mortgage Trust | | | | | | | | |
144A, 3.424%, 3/10/2031 (d) | | | 640,000 | | | | 654,145 | |
144A, 3.726%, 3/10/2031 (d) | | | 644,000 | | | | 662,904 | |
GS Mortgage Securities Trust 144A, 3.209%, VR, 7/15/2032 (d) | | | 395,000 | | | | 390,860 | |
Hudson Yards 144A, 2.835%, 8/10/2038 (d) | | | 1,000,000 | | | | 956,874 | |
JP Morgan Chase Commercial Mortgage Trust 144A, 4.128%, 7/5/2031 (d) | | | 555,000 | | | | 577,617 | |
Madison Avenue Trust 144A, 3.294%, VR, 8/15/2034 (d) | | | 729,000 | | | | 722,474 | |
Morgan Stanley BAML Trust | | | | | | | | |
3.526%, 12/15/2047 | | | 180,167 | | | | 182,608 | |
4.051%, 4/15/2047 | | | 300,000 | | | | 311,460 | |
4.259%, VR, 10/15/2046 | | | 300,000 | | | | 313,498 | |
144A, 3.209%, VR, 11/15/2034 (d) | | | 531,000 | | | �� | 524,975 | |
29
DOMINI IMPACT BOND FUND
PORTFOLIOOF INVESTMENTS (continued)
January 31, 2019 (Unaudited)
| | | | | | | | |
| | | Principal
Amount* | | | Value | |
Commercial Mortgage Backed Securities(Continued) | | | | | | | | |
OBP Depositor LLC Trust 144A, 4.646%, 7/15/2045 (d) | | | 806,000 | | | $ | 817,134 | |
One Market Plaza Trust 144A, 3.614%, 2/10/2032 (d) | | | 710,000 | | | | 720,031 | |
Park Avenue Trust 144A, 3.508%, 6/5/2037 (d) | | | 712,000 | | | | 708,694 | |
| | | | | | | | |
| | | | | | | 7,684,746 | |
| | | | | | | | |
Federal Home Loan Mortgage Corporation – 9.3% | | | | | | | | |
849167, 2.874%, VR, 10/1/2043 (c) | | | 257,579 | | | | 257,869 | |
A12413, 5.000%, 8/1/2033 (c) | | | 22,699 | | | | 24,273 | |
A37619, 4.500%, 9/1/2035 (c) | | | 170,045 | | | | 177,612 | |
A87874, 4.000%, 8/1/2039 (c) | | | 66,404 | | | | 68,510 | |
A89148, 4.000%, 10/1/2039 (c) | | | 101,147 | | | | 104,480 | |
A89384, 4.000%, 10/1/2039 (c) | | | 126,613 | | | | 130,922 | |
A89729, 4.000%, 11/1/2039 (c) | | | 57,307 | | | | 59,257 | |
A93101, 5.000%, 7/1/2040 (c) | | | 93,856 | | | | 99,744 | |
A93996, 4.500%, 9/1/2040 (c) | | | 44,875 | | | | 47,217 | |
A94362, 4.000%, 10/1/2040 (c) | | | 150,963 | | | | 156,095 | |
A94742, 4.000%, 11/1/2040 (c) | | | 25,657 | | | | 26,554 | |
A95084, 4.000%, 11/1/2040 (c) | | | 21,114 | | | | 21,833 | |
A95085, 4.000%, 11/1/2040 (c) | | | 194,929 | | | | 201,563 | |
A95796, 4.000%, 12/1/2040 (c) | | | 92,974 | | | | 96,137 | |
A97047, 4.500%, 2/1/2041 (c) | | | 94,837 | | | | 99,786 | |
FHR 3806 L, 3.500%, 2/15/2026 | | | 847,000 | | | | 875,956 | |
FHR 3800 CB, 3.500%, 2/15/2026 | | | 383,000 | | | | 395,240 | |
FHR 3768 CB, 3.500%, 12/15/2025 | | | 343,000 | | | | 350,266 | |
G01779, 5.000%, 4/1/2035 (c) | | | 28,776 | | | | 30,762 | |
G01828, 4.500%, 4/1/2035 (c) | | | 134,498 | | | | 140,533 | |
G01837, 5.000%, 7/1/2035 (c) | | | 185,665 | | | | 198,465 | |
G01838, 5.000%, 7/1/2035 (c) | | | 32,179 | | | | 34,407 | |
G02424, 5.500%, 12/1/2036 (c) | | | 124,330 | | | | 135,073 | |
G04997, 5.000%, 1/1/2037 (c) | | | 113,496 | | | | 120,823 | |
G05052, 5.000%, 10/1/2033 (c) | | | 12,150 | | | | 12,942 | |
G06079, 6.000%, 7/1/2039 (c) | | | 106,148 | | | | 115,147 | |
G06990, 5.500%, 8/1/2040 (c) | | | 169,753 | | | | 182,276 | |
G08347, 4.500%, 6/1/2039 (c) | | | 295,912 | | | | 310,874 | |
G08499, 3.000%, 7/1/2042 (c) | | | 77,565 | | | | 76,705 | |
G08816, 3.500%, 6/1/2048 (c) | | | 2,953,855 | | | | 2,971,724 | |
G14599, 2.500%, 11/1/2027 (c) | | | 177,636 | | | | 175,757 | |
G30614, 3.500%, 12/1/2032 (c) | | | 281,072 | | | | 286,908 | |
J17791, 3.000%, 1/1/2027 (c) | | | 249,429 | | | | 250,829 | |
J20118, 2.500%, 8/1/2027 (c) | | | 64,694 | | | | 64,009 | |
Q00291, 5.000%, 4/1/2041 (c) | | | 77,109 | | | | 82,051 | |
Q01807, 4.500%, 7/1/2036 (c) | | | 134,579 | | | | 140,298 | |
Q06160, 4.000%, 2/1/2037 (c) | | | 64,623 | | | | 66,247 | |
Q17103, 4.000%, 6/1/2041 (c) | | | 13,204 | | | | 13,538 | |
Q33602, 3.000%, 5/1/2045 (c) | | | 548,917 | | | | 541,725 | |
Z40004, 6.000%, 8/1/2036 (c) | | | 19,279 | | | | 21,087 | |
FHLMC TBA 30 Yr, 4.000%, 2/13/2049 (b) | | | 1,600,000 | | | | 1,638,844 | |
FHLMC TBA 30 Yr, 4.000%, 3/13/2049 (b) | | | 1,500,000 | | | | 1,534,834 | |
| | | | | | | | |
| | | | | | | 12,339,172 | |
| | | | | | | | |
30
DOMINI IMPACT BOND FUND
PORTFOLIOOF INVESTMENTS (continued)
January 31, 2019 (Unaudited)
| | | | | | | | |
| | | Principal
Amount* | | | Value | |
Federal National Mortgage Association – 32.8% | | | | | | | | |
190370, 6.000%, 6/1/2036 (c) | | | 87,322 | | | $ | 95,764 | |
745044, 4.500%, 8/1/2035 (c) | | | 39,854 | | | | 41,664 | |
745327, 6.000%, 3/1/2036 (c) | | | 250,152 | | | | 274,333 | |
889529, 6.000%, 3/1/2038 (c) | | | 39,622 | | | | 43,568 | |
890248, 6.000%, 8/1/2037 (c) | | | 22,487 | | | | 24,657 | |
930672, 4.500%, 3/1/2039 (c) | | | 146,777 | | | | 154,890 | |
932441, 4.000%, 1/1/2040 (c) | | | 473,724 | | | | 489,179 | |
995082, 5.500%, 8/1/2037 (c) | | | 77,978 | | | | 85,030 | |
995243, 4.500%, 8/1/2038 (c) | | | 103,717 | | | | 108,543 | |
AA9846, 4.000%, 8/1/2039 (c) | | | 65,486 | | | | 67,625 | |
AB1343, 4.500%, 8/1/2040 (c) | | | 136,787 | | | | 144,404 | |
AB1763, 4.000%, 11/1/2030 (c) | | | 27,600 | | | | 28,468 | |
AB4168, 3.500%, 1/1/2032 (c) | | | 252,365 | | | | 257,417 | |
AB6472, 2.000%, 10/1/2027 (c) | | | 230,161 | | | | 223,459 | |
AC1877, 4.500%, 9/1/2039 (c) | | | 61,365 | | | | 64,510 | |
AC2817, 4.000%, 10/1/2039 (c) | | | 38,816 | | | | 40,083 | |
AC5401, 5.000%, 10/1/2039 (c) | | | 6,286 | | | | 6,702 | |
AC9564, 4.500%, 2/1/2040 (c) | | | 59,297 | | | | 62,547 | |
AD1649, 4.000%, 3/1/2040 (c) | | | 70,238 | | | | 72,542 | |
AD8033, 4.000%, 8/1/2040 (c) | | | 23,591 | | | | 24,365 | |
AE0215, 4.000%, 12/1/2039 (c) | | | 58,600 | | | | 60,511 | |
AE0216, 4.000%, 8/1/2040 (c) | | | 134,314 | | | | 138,720 | |
AE0624, 4.000%, 11/1/2040 (c) | | | 55,514 | | | | 57,335 | |
AE0625, 4.000%, 12/1/2040 (c) | | | 80,042 | | | | 82,875 | |
AE4113, 4.000%, 10/1/2040 (c) | | | 42,776 | | | | 44,176 | |
AE4192, 4.000%, 10/1/2040 (c) | | | 213,159 | | | | 220,316 | |
AE5143, 4.000%, 11/1/2040 (c) | | | 33,905 | | | | 35,017 | |
AI7951, 4.500%, 8/1/2036 (c) | | | 52,323 | | | | 54,700 | |
AJ5974, 4.000%, 12/1/2036 (c) | | | 45,592 | | | | 47,087 | |
AL0005, 4.500%, 1/1/2041 (c) | | | 51,135 | | | | 53,771 | |
AL0049, 6.000%, 12/1/2035 (c) | | | 44,195 | | | | 48,410 | |
AL1627, 4.500%, 9/1/2041 (c) | | | 96,820 | | | | 101,592 | |
AM5197, 4.200%, 1/1/2030 (c) | | | 1,151,797 | | | | 1,229,859 | |
AM6266, 3.580%, 7/1/2030 (c) | | | 950,853 | | | | 961,439 | |
AM7507, 3.080%, 12/1/2024 | | | 1,021,791 | | | | 1,032,879 | |
AM7598, 3.070%, 12/1/2024 | | | 1,361,143 | | | | 1,375,266 | |
AM7903, 3.380%, 1/1/2027 | | | 656,957 | | | | 671,198 | |
AM8148, 2.680%, 3/1/2027 | | | 985,827 | | | | 960,915 | |
AM8659, 2.880%, 4/1/2031 (c) | | | 1,235,944 | | | | 1,171,441 | |
AM9154, 3.180%, 6/1/2030 (c) | | | 1,032,708 | | | | 1,019,814 | |
AM9239, 3.030%, 6/1/2025 | | | 952,817 | | | | 956,362 | |
AN1410, 3.010%, 5/1/2028 | | | 456,864 | | | | 449,959 | |
AN1767, 2.980%, 6/1/2031 (c) | | | 955,197 | | | | 918,508 | |
AN1840, 2.450%, 6/1/2026 | | | 1,457,583 | | | | 1,404,710 | |
AN2787, 2.600%, 9/1/2028 (c) | | | 1,143,767 | | | | 1,088,419 | |
AN2791, 2.440%, 9/1/2026 | | | 1,099,265 | | | | 1,057,963 | |
AN3383, 2.550%, 11/1/2028 | | | 800,000 | | | | 749,524 | |
AN4301, 3.150%, 1/1/2027 | | | 2,109,700 | | | | 2,116,077 | |
31
DOMINI IMPACT BOND FUND
PORTFOLIOOF INVESTMENTS (continued)
January 31, 2019 (Unaudited)
| | | | | | | | |
| | | Principal
Amount* | | | Value | |
Federal National Mortgage Association(Continued) | | | | | | | | |
AN5557, 2.900%, 5/1/2027 | | | 1,459,677 | | | $ | 1,444,201 | |
AN6744, 2.940%, 9/1/2027 (c) | | | 1,492,535 | | | | 1,470,480 | |
AN7300, 3.290%, 11/1/2027 (c) | | | 1,216,107 | | | | 1,228,594 | |
AN7540, 2.910%, 11/1/2027 (c) | | | 1,500,000 | | | | 1,466,649 | |
AN9459, 3.470%, 7/1/2028 | | | 794,267 | | | | 808,013 | |
AN9483, 3.430%, 6/1/2028 | | | 794,928 | | | | 806,278 | |
AP9592, 3.500%, 10/1/2032 (c) | | | 202,876 | | | | 206,970 | |
AR1524, 2.000%, 1/1/2028 (c) | | | 189,752 | | | | 184,221 | |
AS3608, 2.500%, 12/1/2043 (c) | | | 349,868 | | | | 335,696 | |
AS8449, 2.500%, 12/1/2031 (c) | | | 35,867 | | | | 35,315 | |
AW4685, 2.625%, VR, 5/1/2044 (c) | | | 114,219 | | | | 114,541 | |
AY3370, 2.500%, 4/1/2045 (c) | | | 243,771 | | | | 232,911 | |
BC1171, 3.500%, 6/1/2046 (c) | | | 1,643,743 | | | | 1,657,674 | |
BD1153, 3.000%, 8/1/2046 (c) | | | 93,600 | | | | 92,024 | |
BD1165, 3.000%, 10/1/2046 (c) | | | 1,428,305 | | | | 1,404,258 | |
BE1416, 2.500%, 11/1/2031 (c) | | | 174,629 | | | | 171,943 | |
BE4435, 3.000%, 11/1/2046 (c) | | | 2,120,890 | | | | 2,086,335 | |
BE8063, 3.000%, 12/1/2046 (c) | | | 715,405 | | | | 703,755 | |
BJ6137, 3.500%, 1/1/2048 (c) | | | 1,473,370 | | | | 1,481,309 | |
MA0639, 4.000%, 2/1/2041 (c) | | | 109,938 | | | | 113,545 | |
MA0919, 3.500%, 12/1/2031 (c) | | | 14,460 | | | | 14,751 | |
MA0949, 3.500%, 1/1/2032 (c) | | | 143,201 | | | | 146,089 | |
MA1630, 4.000%, 10/1/2033 (c) | | | 150,275 | | | | 156,120 | |
MA1931, 2.500%, 6/1/2024 (c) | | | 391,701 | | | | 389,020 | |
FNMA TBA 30 Yr, 3.500%, 2/13/2049 (b) | | | 6,616,000 | | | | 6,649,209 | |
| | | | | | | | |
| | | | | | | 43,818,494 | |
| | | | | | | | |
| | | | | | | | |
Government National Mortgage Association – 9.4% | | | | | | | | |
GNMA II TBA 30 Yr, 3.500%, 2/21/2049 (b) | | | 5,300,000 | | | | 5,367,596 | |
GNMA II TBA 30 Yr, 3.000%, 2/21/2049 (b) | | | 3,300,000 | | | | 3,276,023 | |
GNMA II TBA 30 Yr, 4.000%, 2/21/2049 (b) | | | 2,200,000 | | | | 2,263,680 | |
GNMA II TBA 30 Yr, 4.500%, 2/21/2049 (b) | | | 900,000 | | | | 934,594 | |
GNMA II TBA 30 Yr, 4.000%, 3/21/2049 (b) | | | 700,000 | | | | 719,496 | |
| | | | | | | | |
| | | | | | | 12,561,389 | |
| | | | | | | | |
Total Mortgage Backed Securities
(Cost $83,493,465) | | | | | | | 82,736,759 | |
| | | | | | | | |
| | | | | | | | |
| Corporate Bonds and Notes – 26.9% | | | | | | |
Communications – 2.5% | | | | | | | | |
Altice France SA/France senior secured note 144A, 7.375%, 5/1/2026 (d) | | | 200,000 | | | | 193,248 | |
AT&T Inc | | | | | | | | |
3.950%, 1/15/2025 | | | 445,000 | | | | 449,612 | |
4.750%, 5/15/2046 | | | 715,000 | | | | 669,958 | |
CBS Corp, 2.900%, 1/15/2027 | | | 400,000 | | | | 363,104 | |
32
DOMINI IMPACT BOND FUND
PORTFOLIOOF INVESTMENTS (continued)
January 31, 2019 (Unaudited)
| | | | | | | | |
| | | Principal
Amount* | | | Value | |
Communications(Continued) | | | | | | | | |
Charter Communications Operating LLC / Charter Communications Operating Capital senior secured note | | | | | | | | |
5.750%, 4/1/2048 | | | 225,000 | | | $ | 224,525 | |
6.484%, 10/23/2045 | | | 300,000 | | | | 323,355 | |
Cox Communications Inc | | | | | | | | |
144A, 3.150%, 8/15/2024 (d) | | | 165,000 | | | | 160,274 | |
144A, 3.850%, 2/1/2025 (d) | | | 10,000 | | | | 9,934 | |
144A, 4.800%, 2/1/2035 (d) | | | 200,000 | | | | 185,264 | |
Gray Television Inc 144A, 5.875%, 7/15/2026 (d) | | | 200,000 | | | | 197,000 | |
Verizon Communications Inc, 3.376%, 2/15/2025 | | | 424,000 | | | | 423,847 | |
Vodafone Group PLC, 6.150%, 2/27/2037 | | | 185,000 | | | | 202,727 | |
| | | | | | | | |
| | | | | | | 3,402,848 | |
| | | | | | | | |
| | | | | | | | |
Consumer Discretionary – 4.0% | | | | | | | | |
Alibaba Group Holding Ltd, 2.800%, 6/6/2023 | | | 200,000 | | | | 194,729 | |
Amazon.com Inc | | | | | | | | |
3.875%, 8/22/2037 | | | 200,000 | | | | 201,135 | |
4.800%, 12/5/2034 | | | 325,000 | | | | 365,706 | |
Aptiv Corp | | | | | | | | |
4.150%, 3/15/2024 | | | 401,000 | | | | 401,683 | |
3.150%, 11/19/2020 | | | 240,000 | | | | 239,363 | |
AutoNation Inc, 5.500%, 2/1/2020 | | | 500,000 | | | | 510,988 | |
Boston Medical Center Corp, 4.519%, 7/1/2026 | | | 705,000 | | | | 704,362 | |
eBay Inc, 3.600%, 6/5/2027 | | | 195,000 | | | | 185,921 | |
ERAC USA Finance LLC 144A, 3.850%, 11/15/2024 (d) | | | 500,000 | | | | 499,119 | |
Home Depot Inc/The, 5.950%, 4/1/2041 | | | 420,000 | | | | 522,392 | |
Lennar Corp, 4.125%, 1/15/2022 | | | 245,000 | | | | 244,767 | |
Marriott International Inc/MD, 2.875%, 3/1/2021 | | | 500,000 | | | | 494,530 | |
Northeastern University, 5.285%, 3/1/2032 | | | 100,000 | | | | 109,653 | |
O’Reilly Automotive Inc, 3.800%, 9/1/2022 | | | 155,000 | | | | 156,540 | |
Toll Brothers Finance Corp, 4.350%, 2/15/2028 | | | 600,000 | | | | 549,000 | |
| | | | | | | | |
| | | | | | | 5,379,888 | |
| | | | | | | | |
| | | | | | | | |
Consumer Staples – 1.2% | | | | | | | | |
JM Smucker Co/The, 4.250%, 3/15/2035 | | | 380,000 | | | | 349,969 | |
Kroger Co/The, 5.400%, 1/15/2049 | | | 725,000 | | | | 733,611 | |
TreeHouse Foods Inc 144A, 6.000%, 2/15/2024 (d) | | | 530,000 | | | | 546,510 | |
| | | | | | | | |
| | | | | | | 1,630,090 | |
| | | | | | | | |
| | | | | | | | |
Financials – 11.9% | | | | | | | | |
AerCap Ireland Capital DAC / AerCap Global Aviation Trust, 3.500%, 5/26/2022 | | | 450,000 | | | | 440,850 | |
AIA Group Ltd 144A, 4.500%, 3/16/2046 (d) | | | 325,000 | | | | 335,577 | |
Air Lease Corp, 3.625%, 12/1/2027 | | | 500,000 | | | | 456,041 | |
American International Group Inc, 3.900%, 4/1/2026 | | | 380,000 | | | | 376,709 | |
American Tower Corp, 5.000%, 2/15/2024 | | | 362,000 | | | | 382,484 | |
Aon PLC, 4.750%, 5/15/2045 | | | 225,000 | | | | 226,611 | |
33
DOMINI IMPACT BOND FUND
PORTFOLIOOF INVESTMENTS (continued)
January 31, 2019 (Unaudited)
| | | | | | | | |
| | | Principal
Amount* | | | Value | |
Financials(Continued) | | | | | | | | |
AXA SA subordinated note, 8.600%, 12/15/2030 | | | 400,000 | | | $ | 510,388 | |
BNP Paribas SA 144A, 3.800%, 1/10/2024 (d) | | | 245,000 | | | | 243,192 | |
Boston Properties LP | | | | | | | | |
3.650%, 2/1/2026 | | | 430,000 | | | | 422,605 | |
4.500%, 12/1/2028 | | | 500,000 | | | | 517,684 | |
BPCE SA | | | | | | | | |
2.250%, 1/27/2020 | | | 500,000 | | | | 495,821 | |
144A, 4.875%, 4/1/2026 (d) | | | 500,000 | | | | 504,097 | |
Brandywine Operating Partnership LP, 4.550%, 10/1/2029 | | | 500,000 | | | | 494,835 | |
Capital One Financial Corp | | | | | | | | |
3.750%, 3/9/2027 | | | 80,000 | | | | 77,394 | |
3.750%, 7/28/2026 | | | 80,000 | | | | 76,318 | |
4.200%, 10/29/2025 | | | 155,000 | | | | 155,372 | |
Cooperatieve Rabobank UA, 3.950%, 11/9/2022 | | | 375,000 | | | | 378,557 | |
Credit Agricole SA/London 144A, 4.125%, 1/10/2027 (d) | | | 510,000 | | | | 502,005 | |
Crown Castle International Corp, 3.700%, 6/15/2026 | | | 300,000 | | | | 291,486 | |
Discover Financial Services, 3.750%, 3/4/2025 | | | 325,000 | | | | 317,727 | |
Duke Realty LP | | | | | | | | |
3.625%, 4/15/2023 | | | 200,000 | | | | 201,035 | |
4.375%, 6/15/2022 | | | 250,000 | | | | 258,454 | |
Fifth Third Bancorp subordinated note, 8.250%, 3/1/2038 | | | 425,000 | | | | 577,517 | |
Huntington Bancshares Inc/OH, 3.150%, 3/14/2021 | | | 425,000 | | | | 426,124 | |
ING Groep NV | | | | | | | | |
3.950%, 3/29/2027 | | | 200,000 | | | | 195,342 | |
144A, 4.625%, 1/6/2026 (d) | | | 750,000 | | | | 771,694 | |
Kimco Realty Corp, 3.400%, 11/1/2022 | | | 160,000 | | | | 158,250 | |
Liberty Property LP, 3.250%, 10/1/2026 | | | 165,000 | | | | 156,691 | |
Marsh & McLennan Cos Inc, 3.300%, 3/14/2023 | | | 100,000 | | | | 98,789 | |
Morgan Stanley | | | | | | | | |
3.625%, 1/20/2027 | | | 335,000 | | | | 329,626 | |
3.950%, 4/23/2027 | | | 210,000 | | | | 205,268 | |
National City Corp subordinated note, 6.875%, 5/15/2019 | | | 275,000 | | | | 278,127 | |
Nuveen Finance LLC 144A, 4.125%, 11/1/2024 (d) | | | 160,000 | | | | 165,180 | |
Regency Centers LP, 3.750%, 6/15/2024 | | | 300,000 | | | | 298,731 | |
Regions Financial Corp, 3.200%, 2/8/2021 | | | 500,000 | | | | 500,178 | |
Reinsurance Group of America Inc | | | | | | | | |
3.950%, 9/15/2026 | | | 250,000 | | | | 246,615 | |
4.700%, 9/15/2023 | | | 164,000 | | | | 170,665 | |
SBA Tower Trust 144A, 3.168%, 4/9/2047 (d) | | | 290,000 | | | | 287,463 | |
Standard Chartered PLC subordinated note 144A, 5.700%, 3/26/2044 (d) | | | 250,000 | | | | 265,402 | |
Swedbank AB | | | | | | | | |
144A, 2.200%, 3/4/2020 (d) | | | 650,000 | | | | 643,630 | |
144A, 2.800%, 3/14/2022 (d) | | | 250,000 | | | | 246,252 | |
Total System Services Inc, 4.000%, 6/1/2023 | | | 375,000 | | | | 375,779 | |
Turkiye Sinai Kalkinma B, 144A, 5.500%, 1/16/2023 (d) | | | 200,000 | | | | 177,123 | |
Unum Group, 3.000%, 5/15/2021 | | | 180,000 | | | | 177,865 | |
US Bancorp subordinated note, 3.600%, 9/11/2024 | | | 493,000 | | | | 501,473 | |
34
DOMINI IMPACT BOND FUND
PORTFOLIOOF INVESTMENTS (continued)
January 31, 2019 (Unaudited)
| | | | | | | | |
| | | Principal
Amount* | | | Value | |
Financials(Continued) | | | | | | | | |
Ventas Realty LP, 3.500%, 2/1/2025 | | | 500,000 | | | $ | 489,111 | |
Welltower Inc, 5.250%, 1/15/2022 | | | 400,000 | | | | 416,263 | |
| | | | | | | | |
| | | | | | | 15,824,400 | |
| | | | | | | | |
Health Care – 3.1% | | | | | | | | |
AbbVie Inc, 3.600%, 5/14/2025 | | | 220,000 | | | | 217,227 | |
Allina Health System, 4.805%, 11/15/2045 | | | 291,000 | | | | 301,629 | |
Biogen Inc, 5.200%, 9/15/2045 | | | 400,000 | | | | 434,258 | |
Celgene Corp, 3.875%, 8/15/2025 | | | 325,000 | | | | 326,905 | |
Children’s Hospital Corp/The, 4.115%, 1/1/2047 | | | 230,000 | | | | 231,840 | |
City of Hope senior secured note, 5.623%, 11/15/2043 | | | 250,000 | | | | 298,307 | |
Dignity Health | | | | | | | | |
4.500%, 11/1/2042 | | | 408,000 | | | | 385,897 | |
5.267%, 11/1/2064 | | | 250,000 | | | | 253,118 | |
Kaiser Foundation Hospitals, 3.150%, 5/1/2027 | | | 185,000 | | | | 180,778 | |
Memorial Sloan-Kettering Cancer Center | | | | | | | | |
4.125%, 7/1/2052 | | | 120,000 | | | | 121,682 | |
4.200%, 7/1/2055 | | | 10,000 | | | | 10,217 | |
New York and Presbyterian Hospital/The, 4.024%, 8/1/2045 | | | 215,000 | | | | 212,966 | |
Ochsner Clinic Foundation, 5.897%, 5/15/2045 | | | 400,000 | | | | 485,252 | |
Orlando Health Obligated Group, 4.416%, 10/1/2044 | | | 395,000 | | | | 396,767 | |
Thermo Fisher Scientific Inc, 4.150%, 2/1/2024 | | | 265,000 | | | | 273,888 | |
| | | | | | | | |
| | | | | | | 4,130,731 | |
| | | | | | | | |
| | | | | | | | |
Industrials – 1.9% | | | | | | | | |
Cie de Chemin de Fer Canadien Pacifique, 4.500%, 1/15/2022 | | | 400,000 | | | | 411,169 | |
CNH Industrial Capital LLC, 4.875%, 4/1/2021 | | | 750,000 | | | | 763,124 | |
Core & Main LP 144A, 6.125%, 8/15/2025 (d) | | | 45,000 | | | | 43,088 | |
Illinois Tool Works Inc, 4.875%, 9/15/2041 | | | 175,000 | | | | 196,777 | |
Ryder System Inc | | | | | | | | |
2.350%, 2/26/2019 | | | 500,000 | | | | 499,788 | |
2.500%, 5/11/2020 | | | 145,000 | | | | 143,684 | |
United Rentals North America Inc, 4.625%, 7/15/2023 | | | 500,000 | | | | 507,650 | |
| | | | | | | | |
| | | | | | | 2,565,280 | |
| | | | | | | | |
| | | | | | | | |
Materials – 0.5% | | | | | | | | |
Ardagh Packaging Finance PLC / Ardagh Holdings USA Inc senior secured note 144A, 4.250%, 9/15/2022 (d) | | | 260,000 | | | | 257,998 | |
WRKCo Inc 144A, 3.000%, 9/15/2024 (d) | | | 375,000 | | | | 354,901 | |
| | | | | | | | |
| | | | | | | 612,899 | |
| | | | | | | | |
| | | | | | | | |
Technology – 0.8% | | | | | | | | |
Broadcom Corp / Broadcom Cayman Finance Ltd, 3.625%, 1/15/2024 | | | 355,000 | | | | 345,605 | |
Microsoft Corp, 3.700%, 8/8/2046 | | | 5,000 | | | | 4,978 | |
Pitney Bowes Inc, 3.875%, 9/15/2020 | | | 265,000 | | | | 262,019 | |
35
DOMINI IMPACT BOND FUND
PORTFOLIOOF INVESTMENTS (continued)
January 31, 2019 (Unaudited)
| | | | | | | | |
| | | Principal
Amount* | | | Value | |
Technology(Continued) | | | | | | | | |
Xerox Corp, 5.625%, 12/15/2019 | | | 475,000 | | | $ | 483,930 | |
| | | | | | | | |
| | | | | | | 1,096,532 | |
| | | | | | | | |
Utilities – 1.0% | | | | | | | | |
Aegea Finance Sarl 144A, 5.750%, 10/10/2024 (d) | | | 370,000 | | | | 360,750 | |
Greenko Dutch BV senior secured note 144A, 5.250%, 7/24/2024 (d) | | | 545,000 | | | | 506,768 | |
Public Service Co of Colorado, 4.100%, 6/15/2048 | | | 420,000 | | | | 421,826 | |
| | | | | | | | |
| | | | | | | 1,289,344 | |
| | | | | | | | |
Total Corporate Bonds and Notes
(Cost $36,167,560) | | | | | | | 35,932,012 | |
| �� | | | | | | | |
| | | | | | | | |
| Municipal Bonds – 9.4% | | | | | | |
American Municipal Power Inc, 6.270%, 2/15/2050 | | | 490,000 | | | | 609,593 | |
Bay Area Toll Authority | | | | | | | | |
6.918%, 4/1/2040 | | | 125,000 | | | | 168,326 | |
7.043%, 4/1/2050 | | | 325,000 | | | | 472,215 | |
City of Chicago IL | | | | | | | | |
6.207%, 1/1/2032 | | | 250,000 | | | | 249,333 | |
7.045%, 1/1/2029 | | | 55,000 | | | | 58,934 | |
7.375%, 1/1/2033 | | | 250,000 | | | | 272,998 | |
City of Los Angeles Department of Airports, 3.887%, 5/15/2038 | | | 140,000 | | | | 140,316 | |
Cook County Community High School District No 228 Bremen, 5.019%, 12/1/2041 (Insurer: AGM) | | | 435,000 | | | | 467,290 | |
County of Sacramento CA, 5.730%, VR, 8/15/2023 (Insurer: NATL) | | | 340,000 | | | | 365,650 | |
County of San Bernardino CA, 6.020%, 8/1/2023 (Insurer: AGM) | | | 275,000 | | | | 296,381 | |
District of Columbia, 4.125%, 7/1/2027 (e) | | | 500,000 | | | | 501,985 | |
Indiana Finance Authority, 3.624%, 7/1/2036 | | | 235,000 | | | | 227,146 | |
Inland Valley Development Agency, 5.500%, 3/1/2033 (Insurer: AGM) | | | 70,000 | | | | 76,870 | |
Lancaster County Hospital Authority/PA | | | | | | | | |
5.000%, 7/1/2024 | | | 165,000 | | | | 175,588 | |
5.000%, 7/1/2025 | | | 135,000 | | | | 144,370 | |
Maryland Health & Higher Educational Facilities Authority | | | | | | | | |
3.968%, 7/1/2027 | | | 205,000 | | | | 209,619 | |
4.168%, 7/1/2029 | | | 40,000 | | | | 41,276 | |
Massachusetts Development Finance Agency, 4.000%, 10/1/2027 | | | 100,000 | | | | 101,534 | |
Massachusetts Health & Educational Facilities Authority, 6.432%, 10/1/2035 | | | 420,000 | | | | 512,446 | |
Michigan Finance Authority | | | | | | | | |
2.267%, 4/1/2019 | | | 260,000 | | | | 259,787 | |
2.491%, 4/1/2020 | | | 250,000 | | | | 248,933 | |
2.741%, 4/1/2021 | | | 320,000 | | | | 319,875 | |
36
DOMINI IMPACT BOND FUND
PORTFOLIOOF INVESTMENTS (continued)
January 31, 2019 (Unaudited)
| | | | | | | | |
| | | Principal
Amount* | | | Value | |
| Municipal Bonds(Continued) | | | | | | |
New Jersey Economic Development Authority, 3.882%, 6/15/2019 | | | 270,000 | | | $ | 270,543 | |
New Jersey Turnpike Authority | | | | | | | | |
7.102%, 1/1/2041 | | | 225,000 | | | | 316,206 | |
7.414%, 1/1/2040 | | | 200,000 | | | | 289,896 | |
New York Transportation Development Corp, 3.473%, 7/1/2028 | | | 500,000 | | | | 484,015 | |
Oklahoma Development Finance Authority | | | | | | | | |
4.650%, 8/15/2030 (Insurer: AGM) | | | 130,000 | | | | 138,997 | |
5.450%, 8/15/2028 | | | 770,000 | | | | 822,105 | |
Oregon Health & Science University, 5.000%, 7/1/2045 | | | 350,000 | | | | 396,809 | |
Pennsylvania Industrial Development Authority, 144A, 3.556%, 7/1/2024 (d) | | | 505,000 | | | | 499,309 | |
Public Finance Authority | | | | | | | | |
144A, 3.000%, 11/15/2022 (d) | | | 360,000 | | | | 360,036 | |
144A, 3.500%, 11/15/2023 (d) | | | 185,000 | | | | 185,048 | |
Shelby County Health Educational & Housing Facilities Board | | | | | | | | |
4.000%, 9/1/2021 (e) | | | 250,000 | | | | 247,165 | |
4.000%, 9/1/2022 (e) | | | 250,000 | | | | 245,100 | |
State of California, 7.625%, 3/1/2040 | | | 525,000 | | | | 770,448 | |
State of Illinois | | | | | | | | |
3.860%, 4/1/2021 | | | 215,000 | | | | 214,424 | |
5.100%, 6/1/2033 | | | 335,000 | | | | 321,041 | |
5.547%, 4/1/2019 | | | 325,000 | | | | 326,229 | |
5.877%, 3/1/2019 | | | 130,000 | | | | 130,277 | |
Washington State Housing Finance Commission, 4.000%, 1/1/2024 | | | 600,000 | | | | 599,658 | |
| | | | | | | | |
Total Municipal Bonds
(Cost $12,505,507) | | | | | | | 12,537,771 | |
| | | | | | | | |
| | | | | | | | |
| Senior Floating Rate Interests – 6.2% | | | | | | |
Communications – 1.6% | | | | | | | | |
Charter Communications Operating LLC term loan B, 4.500%, 4/30/2025 | | | 292,545 | | | | 289,144 | |
Mission Broadcasting Inc term loan B, 0.000%, 1/17/2024 (f) | | | 27,378 | | | | 26,540 | |
Nexstar Broadcasting Inc term loan B, 0.000%, 1/17/2024 (f) | | | 158,367 | | | | 153,517 | |
Numericable Group SA term loan B, 6.196%, 1/31/2026 | | | 731,395 | | | | 686,596 | |
Shutterfly Inc term loan B, 5.250%, 8/17/2024 | | | 101,599 | | | | 99,440 | |
Sprint Communications Inc term loan B, 5.000%, 2/2/2024 | | | 402,825 | | | | 394,255 | |
Univision Communications Inc term loan, 5.249%, 3/15/2024 | | | 479,018 | | | | 448,180 | |
Zayo Group LLC term loan B, 4.749%, 1/19/2024 | | | 100,095 | | | | 99,460 | |
| | | | | | | | |
| | | | | | | 2,197,132 | |
| | | | | | | | |
| | | | | | | | |
Consumer Discretionary – 1.1% | | | | | | | | |
American Builders & Contractors Supply Co Inc term loan B, 4.499%, 10/31/2023 | | | 884,250 | | | | 863,986 | |
Crown Finance US Inc term loan, 4.999%, 2/28/2025 | | | 188,575 | | | | 184,568 | |
37
DOMINI IMPACT BOND FUND
PORTFOLIOOF INVESTMENTS (continued)
January 31, 2019 (Unaudited)
| | | | | | | | |
| | | Principal
Amount* | | | Value | |
Consumer Discretionary(Continued) | | | | | | | | |
Harbor Freight Tools USA Inc term loan, 4.999%, 8/18/2023 | | | 236,301 | | | $ | 229,549 | |
KAR Auction Services Inc term loan B, 5.313%, 3/9/2023 | | | 114,614 | | | | 114,041 | |
Wyndham Hotels & Resorts Inc term loan B, 4.249%, 5/30/2025 | | | 129,675 | | | | 127,757 | |
| | | | | | | | |
| | | | | | | 1,519,901 | |
| | | | | | | | |
| | | | | | | | |
Consumer Staples – 0.6% | | | | | | | | |
CHG PPC Parent LLC term loan B, 5.249%, 3/31/2025 | | | 99,500 | | | | 97,634 | |
Coty Inc term loan B, 4.771%, 4/7/2025 | | | 607,348 | | | | 577,740 | |
Diamond BC BV term loan, 5.744%, 9/6/2024 | | | 148,500 | | | | 140,147 | |
| | | | | | | | |
| | | | | | | 815,521 | |
| | | | | | | | |
| | | | | | | | |
Financials – 0.8% | | | | | | | | |
Blackhawk Network Holdings Inc term loan B, 5.499%, 6/15/2025 | | | 179,100 | | | | 176,488 | |
Iron Mountain Inc term loan B, 4.249%, 1/2/2026 | | | 143,913 | | | | 139,324 | |
Nets Holding A/S term loan B, 3.000%, 2/6/2025 | | | 176,389 | EUR | | | 200,152 | |
Russell Investments US Institutional Holdco Inc term loan, 5.749%, 6/1/2023 | | | 438,750 | | | | 433,814 | |
USI Inc/NY term loan B, 5.803%, 5/16/2024 | | | 172,813 | | | | 166,224 | |
| | | | | | | | |
| | | | | | | 1,116,002 | |
| | | | | | | | |
| | | | | | | | |
Industrials – 0.4% | | | | | | | | |
Blitz F18 675 Gmbh term loan B, 3.750%, 7/31/2025 | | | 255,000 | EUR | | | 293,752 | |
Blitz F18 675 Gmbh term loan B, 3.750%, 7/31/2025 | | | 180,000 | EUR | | | 207,354 | |
| | | | | | | | |
| | | | | | | 501,106 | |
| | | | | | | | |
| | | | | | | | |
Materials – 0.3% | | | | | | | | |
CROWN Americas LLC term loan B, 4.513%, 4/3/2025 | | | 53,663 | | | | 53,753 | |
Nexeo Solutions LLC term loan B, 5.994%, 6/9/2023 | | | 277,930 | | | | 277,756 | |
| | | | | | | | |
| | | | | | | 331,509 | |
| | | | | | | | |
| | | | | | | | |
Technology – 1.4% | | | | | | | | |
CDW LLC term loan, 4.250%, 8/17/2023 | | | 480,060 | | | | 478,435 | |
Dell International LLC term loan B, 4.500%, 9/7/2023 | | | 251,306 | | | | 248,310 | |
Finastra USA Inc term loan B, 6.303%, 6/13/2024 | | | 258,100 | | | | 248,502 | |
Go Daddy Operating Co LLC term loan B, 4.749%, 2/15/2024 | | | 250,901 | | | | 248,213 | |
MA FinanceCo LLC term loan B, 4.999%, 6/21/2024 | | | 30,007 | | | | 29,094 | |
ON Semiconductor Corp term loan B, 4.249%, 3/31/2023 | | | 166,460 | | | | 164,730 | |
Seattle SpinCo Inc term loan B, 4.999%, 6/21/2024 | | | 202,643 | | | | 196,479 | |
SS&C European Holdings Sarl term loan B, 4.749%, 4/16/2025 | | | 57,836 | | | | 56,772 | |
SS&C Technologies Inc term loan B, 4.749%, 4/16/2025 | | | 150,368 | | | | 147,600 | |
| | | | | | | | |
| | | | | | | 1,818,135 | |
| | | | | | | | |
Total Senior Floating Rate Interests
(Cost $8,507,909) | | | | | | | 8,299,306 | |
| | | | | | | | |
38
DOMINI IMPACT BOND FUND
PORTFOLIOOF INVESTMENTS (continued)
January 31, 2019 (Unaudited)
| | | | | | | | |
| | | Principal
Amount* | | | Value | |
| U.S. Government Agencies – 5.5% | | | | | | |
Fannie Mae, 5.625%, 7/15/2037 (c) | | | 3,086,000 | | | $ | 4,072,662 | |
Federal Farm Credit Bank, 2.780%, 11/2/2037 | | | 1,800,000 | | | | 1,617,536 | |
Federal Farm Credit Bank, 3.510%, 6/11/2040 | | | 725,000 | | | | 711,263 | |
Federal Farm Credit Bank, 3.660%, 3/7/2044 | | | 974,000 | | | | 971,305 | |
| | | | | | | | |
Total U.S. Government Agencies
(Cost $7,556,978) | | | | | | | 7,372,766 | |
| | | | | | | | |
| | | | | | | | |
| Asset Backed Securities – 1.0% | | | | | | |
Carmax Auto Owner Trust | | | | | | | | |
1.900%, 4/15/2022 | | | 95,000 | | | | 93,197 | |
2.160%, 12/15/2021 | | | 135,000 | | | | 133,427 | |
2.200%, 6/15/2022 | | | 75,000 | | | | 73,585 | |
2.560%, 2/15/2022 | | | 260,000 | | | | 257,233 | |
2.700%, 10/16/2023 | | | 250,000 | | | | 246,259 | |
CNH Equipment Trust2016-C, 1.930%, 3/15/2024 | | | 20,000 | | | | 19,542 | |
SBA Tower Trust 144A, 3.869%, VR, 10/15/2049 (d) | | | 500,000 | | | | 506,289 | |
| | | | | | | | |
Total Asset Backed Securities
(Cost $1,334,827) | | | | | | | 1,329,532 | |
| | | | | | | | |
| | | | | | | | |
| Certificates of Deposit – 0.4% | | | | | | |
Self-Help Credit Union, 1.150%, 9/16/2019 | | | 250,000 | | | | 248,012 | |
Self-Help Federal Credit Union, 1.150%, 3/18/2019 | | | 250,000 | | | | 249,672 | |
| | | | | | | | |
Total Certificates of Deposit
(Cost $500,000) | | | | | | | 497,684 | |
| | | | | | | | |
Total Long Term Investments
(Cost $150,066,246) | | | | | | | 148,705,830 | |
| | | | | | | | |
| | |
| Short Term Investments – 3.0% | | | | | | |
U.S. Government Agency Obligations – 3.0% | | | | | | | | |
Federal Home Loan Discount Notes, 0.000%, 3/5/2019 | | | 4,000,000 | | | | 3,991,504 | |
| | | | | | | | |
Total U.S. Government Agency Obligations
(Cost $3,991,556) | | | | | | | 3,991,504 | |
| | | | | | | | |
Total Short Term Investments
(Cost $3,991,556) | | | | | | | 3,991,504 | |
| | | | | | | | |
39
DOMINI IMPACT BOND FUND
PORTFOLIOOF INVESTMENTS (continued)
January 31, 2019 (Unaudited)
| | | | | | | | |
| | | Notional
Amount | | | Value | |
| Options Purchased – 0.0% | | | | | | |
Deutsche Bank: | | | | | | | | |
Pay fixed 3.200%, receive float3-month USD LIBOR Expires 12/09/2019 (e) | | | 2,420,000 | | | $ | 11,824 | |
Pay fixed 3.200%, receive float3-month USD LIBOR Expires 5/30/2019 (e) | | | 4,080,000 | | | | 3,327 | |
| | | | | | | | |
Total Options Purchased
(Cost $93,172) | | | | | | | 15,151 | |
| | | | | | | | |
| | |
Total Investments – 114.4%(Cost $154,150,974) (a) | | | | | | | 152,712,485 | |
| | |
Other Liabilities, less assets – (14.4)% | | | | | | | (19,191,086) | |
| | | | | | | | |
| | |
Net Assets – 100.0% | | | | | | $ | 133,521,399 | |
| | | | | | | | |
* The principal amount is stated in U.S. dollars unless otherwise indicated.
(a) The aggregate cost for book and federal income purposes is $154,248,149. The aggregate gross unrealized appreciation is $1,109,980, and the aggregate gross unrealized depreciation is $2,645,644, resulting in net unrealized depreciation of $1,535,664.
(b) A portion or all of the security was purchased as a when issued or delayed delivery security.
(c) A portion or all of the security was segregated for collateral for when issued or delayed delivery securities.
(d) This security has been determined to be liquid under guidelines established by the Fund’s Board of Trustees.
(e) This security has been determined to be illiquid under guidelines established by the Fund’s Board of Trustees.
(f) Represents an unsettled loan contract. The coupon rate will be determined at time of settlement.
TBA — To Be Announced
VR — Variable interest rate. Rate shown is that on January 31, 2019.
144A — Security that may be sold to qualified institutional buyers under Rule 144A of the Securities Act of 1933, as amended. At January 31, 2019, the aggregate value of these securities was $18,402,789, representing 13.8% of net assets.
AGM — Assured Guaranty Municipal Corporation
NATL — National Public Finance Guarantee Corporation
EUR — Euro
40
DOMINI IMPACT BOND FUND
PORTFOLIOOF INVESTMENTS (continued)
January 31, 2019 (Unaudited)
At January 31, 2019, the Fund had the following forward currency contracts outstanding.
| | | | | | | | | | | | | | | | | | |
| Counterparty | | Currency | | Contract
Type | | | Settlement
Date | | | Value | | | Unrealized
Appreciation
(Depreciation) | |
| | | | | |
Goldman Sachs International | | EUR | | | Sell | | | | 2/28/2019 | | | $ | 751,951 | | | $ | (9,367 | ) |
| | | | | | | | | | | | | | | | | | |
| | | | | |
| | | | | | | | | | | | $ | 751,951 | | | $ | (9,367 | ) |
| | | | | | | | | | | | | | | | | | |
At January 31, 2019, the Fund had the following future contracts outstanding.
| | | | | | | | | | | | | | |
| Description | | Number of
Contracts | | Value | | | Expiration
Date | | | Unrealized
Appreciation
(Depreciation) | |
| | | | |
CAN 10 YR (Short) | | 8 | | $ | 838,438 | | | | 3/20/2019 | | | $ | (2,289 | ) |
| | | | | | | | | | | | | | |
| | | | |
| | | | | | | | | | | | $ | (2,289 | ) |
| | | | | | | | | | | | | | |
At January 31, 2019, the Fund had the following centrally cleared interest rate swap contracts outstanding.
| | | | | | | | | | | | | | | | | | |
| Description | | Counterparty/
Exchange | | Expiration
Date | | | Notional
Amount | | | Value | | | Unrealized
Appreciation
(Depreciation) | |
| | | | | |
Receive Fixed rate 3.0625% Pay Floating rate 3 month USD BBA LIBOR | | Morgan Stanley/LCH | | | 9/27/2021 | | | $ | 3,000,000 | | | $ | 3,037,750 | | | $ | 37,279 | |
| | | | | |
Receive Fixed rate 2.500% Pay Floating rate 3 month USD BBA LIBOR | | Morgan Stanley/LCH | | | 3/21/2048 | | | | 2,060,000 | | | | 1,931,471 | | | | 128,844 | |
| | | | | |
Receive Fixed rate 2.250% Pay Floating rate 3 month USD BBA LIBOR | | Morgan Stanley/LCH | | | 12/20/2020 | | | | 10,505,000 | | | | 10,434,079 | | | | (49,346 | ) |
| | | | | |
Pay Fixed rate 2.250% Receive Floating rate 3 month USD BBA LIBOR | | Morgan Stanley/LCH | | | 9/21/2026 | | | | 5,542,000 | | | | (5,408,483 | ) | | | 48,167 | |
| | | | | |
Pay Fixed rate 2.500% Receive Floating rate 3 month USD BBA LIBOR | | Morgan Stanley/LCH | | | 12/20/2027 | | | | 12,930,000 | | | | (12,795,991 | ) | | | (114,019 | ) |
| | | | | |
Receive Fixed rate 2.500% Pay Floating rate 3 month USD BBA LIBOR | | Morgan Stanley/LCH | | | 12/20/2027 | | | | 1,665,000 | | | | 1,647,744 | | | | (6,152 | ) |
| | | | | | | | | | | | | | | | | | |
| | | | | |
| | | | | | | | $ | 35,702,000 | | | $ | (1,153,430 | ) | | $ | 44,773 | |
| | | | | | | | | | | | | | | | | | |
41
DOMINI IMPACT BOND FUND
PORTFOLIOOF INVESTMENTS (continued)
January 31, 2019 (Unaudited)
At January 31, 2019, the Fund had the following OTC interest rate swap contracts outstanding.
| | | | | | | | | | | | | | | | | | | | | | |
| | | Rate Type | | | | | | | | | | | | | |
| Counterparty | | Payments
made
by the Fund | | Payments
received
by the Fund | | | Expiration
Date | | | Notional
Amount | | | Value | | | Unrealized Appreciation
(Depreciation) | |
| | | | | | |
Deutsche Bank AG | | 1.898% | | | USA-CPI-U | | | | 7/15/2024 | | | $ | 3,758,000 | | | $ | 3,821,428 | | | $ | 63,428 | |
| | | | | | |
Deutsche Bank AG | | 2.004% | | | USA-CPI-U | | | | 1/15/2023 | | | | 2,327,000 | | | | 2,317,474 | | | | (10,228 | ) |
| | | | | | | | | | | | | | | | | | | | | | |
| | | | | | |
| | | | | | | | | | | | $ | 6,085,000 | | | $ | 6,138,902 | | | $ | 53,200 | |
| | | | | | | | | | | | | | | | | | | | | | |
At January 31, 2019, the Fund had the following centrally cleared credit default swap contracts outstanding.
| | | | | | | | | | | | | | | | | | |
| Description | | Counterparty/
Exchange | | Expiration
Date | | | Notional
Amount(h) | | | Value(i) | | | Unrealized
Appreciation
(Depreciation) | |
| | | | | |
Sell Protection(g): | | | | | | | | | | | | | | | | | | |
| | | | | |
CDX-NAIG Series 31, Version 3, 5 Year Index, fixed rate 5.00% (k) | | Morgan Stanley/ICE | | | 12/20/2023 | | | $ | 298,900 | | | $ | 316,780 | | | $ | 5,423 | |
| | | | | |
Buy Protection(g): | | | | | | | | | | | | | | | | | | |
| | | | | |
CDX-NAHY Series 31, Version 1, 5 Year Index, fixed rate 1.00% (j) | | Morgan Stanley/ICE | | | 12/20/2023 | | | | 1,385,000 | | | | (1,405,990 | ) | | | (7,234 | ) |
| | | | | |
iTraxx Europe Series 30, Version 1, 5 Year Index (EUR), fixed rate 1.00% (j) | | Morgan Stanley/ICE | | | 12/20/2023 | | | | 1,195,000 | | | | (1,390,616 | ) | | | (6,857 | ) |
| | | | | |
iTraxx Europe Crossover Series 30, Version 1, 5 Year Index (EUR), fixed rate 5.00% (l) | | Morgan Stanley/ICE | | | 12/20/2023 | | | | 616,663 | | | | (766,411 | ) | | | (7,731 | ) |
| | | | | | | | | | | | | | | | | | |
| | | | | |
| | | | | | | | $ | 3,495,563 | | | $ | (3,246,237 | ) | | $ | (16,399 | ) |
| | | | | | | | | | | | | | | | | | |
ICE — Intercontinental Exchange
LCH — London Clearing House
(g) If the Fund is a buyer/(seller) of protection and a credit event occurs, as defined under the terms of that particular swap agreement, the Fund will either (i) receive from the seller/(pay to the buyer) of protection an amount equal to the notional amount of the swap and deliver/(take delivery) of the referenced obligation or underlying securities comprising the referenced index or (ii) receive/(pay) a net settlement amount in the form of cash or securities equal to the notional amount of the swap less the recovery value of the referenced obligation of underlying securities comprising the referenced index.
(h) The maximum potential amount the Fund could be required to pay as a seller of credit protection or receive as a buyer of credit protection if a credit event occurs as defined under the terms of that particular swap agreement.
(i) The prices and resulting values for credit default swap agreements on credit indices serve as an indicator of the current status of the payment/performance risk and represent the likelihood of an expected liability (or profit) for the credit derivative should the notional amount of the swap agreement be closed/sold as of the period end. Increasing market values, in absolute terms when compared to the notional amount of the swap, represent a deterioration of the referenced entity’s credit soundness and a greater likelihood or risk of default or other credit event occurring as defined under the terms of the agreement.
(j) Ratings of Moody’s/S&P — Baa1/BBB+
(k) Ratings of Moody’s/S&P — B1/B+
(l) Ratings of Moody’s/S&P — Baa3/BBB-
SEE NOTES TO FINANCIAL STATEMENTS
42
DOMINI FUNDS EXPENSE EXAMPLE (Unaudited)
As a shareholder of the Domini Funds, you incur two types of costs:
(1) Transaction costs such as redemption fees deducted from any redemption or exchange proceeds if you sell or exchange shares of the fund after holding them less than 30 days and sales charges (loads) on Class A shares and
(2) Ongoing costs, including management fees, distribution(12b-1) fees, and other Fund expenses.
This example is intended to help you understand your ongoing costs (in dollars) of investing in the Fund and to compare these costs with the ongoing costs of investing in other mutual funds. The example is based on an investment of $1,000 invested on August 1, 2018 and held through January 31, 2019.
Certain Account Fees
Some accounts are subject to recurring annual service fees and maintenance fees that are not included in the expenses shown in the table. If your account was subject to these fees, then the actual account values at the end of the period would be lower and the actual expense would be higher. You may avoid the annual service fee by choosing paperless electronic delivery of statements, prospectuses, shareholder reports and other materials.
Actual Expenses
The line of the table captioned ‘‘Actual Expenses’’ below provides information about actual account value and actual expenses. You may use the information in this line, together with the amount invested, to estimate the expenses that you paid over the period as follows:
(1) Divide your account value by $1,000.
(2) Multiply your result in step 1 by the number in the first line under the heading ‘‘Expenses Paid During Period’’ in the table.
The result equals the estimated expenses you paid on your account during the period.
Hypothetical Expenses
The second line of the table below provides information about hypothetical account values and hypothetical expenses based on the Fund’s actual expense ratio and an assumed rate of return of 5% per year before expenses, which is not the Fund’s return. The hypothetical account values and expenses may not be used to estimate actual ending account balance or expenses you paid for the period. You may use this information to compare the ongoing costs of investing in the Fund and other mutual funds. To do so, compare this 5% hypothetical example with the 5% hypothetical example that appears in the shareholder reports of the other funds.
43
Please note that the expenses shown in the table are meant to highlight your ongoing costs only and do not reflect any transactional costs, such as redemption fees. Therefore, the second line of the table is useful in comparing ongoing costs only, and will not help you determine the relative total costs of owning different funds. In addition, if these transactional costs were included, your costs would have been higher.
| | | | | | | | |
| | | | | |
| Fund Name | | Expenses | | Beginning
Account Value
as of 8/1/2018 | | Ending Account
Value as of
1/31/2019 | | Expenses Paid
During Period
8/1/2018 –
1/31/2019 |
Domini Impact International Equity Fund Investor Shares | | Actual Expenses | | $1,000.00 | | $919.50 | | $6.851 |
| | Hypothetical Expenses
(5% return before expenses) | | $1,000.00 | | $1,018.07 | | $7.201 |
Domini Impact International Equity Fund Class A Shares | | Actual Expenses | | $1,000.00 | | $918.40 | | $6.931 |
| | Hypothetical Expenses
(5% return before expenses) | | $1,000.00 | | $1,017.98 | | $7.291 |
Domini Impact International Equity Fund Institutional Shares | | Actual Expenses | | $1,000.00 | | $920.70 | | $4.961 |
| | Hypothetical Expenses
(5% return before expenses) | | $1,000.00 | | $1,020.04 | | $5.221 |
Domini Impact International Equity Fund Class Y Shares | | Actual Expenses | | $1,000.00 | | $920.90 | | $5.501 |
| | Hypothetical Expenses
(5% return before expenses) | | $1,000.00 | | $1,019.48 | | $5.781 |
Domini Impact
Equity Fund
Investor Shares | | Actual Expenses | | $1,000.00 | | $948.20 | | $5.342 |
| | Hypothetical Expenses
(5% return before expenses) | | $1,000.00 | | $1,019.72 | | $5.542 |
Domini Impact
Equity Fund
Class A Shares | | Actual Expenses | | $1,000.00 | | $948.50 | | $5.302 |
| | Hypothetical Expenses
(5% return before expenses) | | $1,000.00 | | $1,019.77 | | $5.492 |
Domini Impact
Equity Fund
Institutional Shares | | Actual Expenses | | $1,000.00 | | $950.20 | | $3.582 |
| | Hypothetical Expenses
(5% return before expenses) | | $1,000.00 | | $1,021.53 | | $3.712 |
Domini Impact
Equity Fund
Class R Shares | | Actual Expenses | | $1,000.00 | | $949.50 | | $3.872 |
| | Hypothetical Expenses
(5% return before expenses) | | $1,000.00 | | $1,021.23 | | $4.022 |
44
| | | | | | | | |
| | | | | |
| Fund Name | | Expenses | | Beginning
Account Value
as of 8/1/2018 | | Ending Account
Value as of
1/31/2019 | | Expenses Paid
During Period
8/1/2018 –
1/31/2019 |
Domini Impact
Bond Fund Investor Shares | | Actual Expenses | | $1,000.00 | | $1,020.00 | | $4.453 |
| | Hypothetical Expenses
(5% return before expenses) | | $1,000.00 | | $1,020.80 | | $4.453 |
Domini Impact
Bond Fund Institutional Shares | | Actual Expenses | | $1,000.00 | | $1,020.80 | | $2.913 |
| | Hypothetical Expenses
(5% return before expenses) | | $1,000.00 | | $1,022.32 | | $2.913 |
1Expenses are equal to the Fund’s annualized expense ratio of 1.41% for Investor shares, or 1.43% for Class A shares, or 1.02% for Institutional shares, or 1.14% for Class Y shares, multiplied by average account value over the period, multiplied by 184, and divided by 365.
2Expenses are equal to the Fund’s annualized expense ratio of 1.09% for Investor shares, or 1.08% for Class A shares, or 0.73% for Institutional Class, or 0.79% for Class R shares, multiplied by average account value over the period, multiplied by 184, and divided by 365.
3Expenses are equal to the Fund’s annualized expense ratio of 0.87% for Investor Shares, or 0.57% for Institutional Class, multiplied by average account value over the period, multiplied by 184, and divided by 365.
45
STATEMENTS OF ASSETS AND LIABILITIES
January 31, 2019 (Unaudited)
| | | | | | | | |
| | | Domini Impact
International
Equity Fund | | | Domini Impact
Equity Fund | |
ASSETS | | | | | | | | |
Investments at value (cost $1,168,324,469, and $649,983,320, respectively) | | $ | 1,202,038,623 | | | $ | 698,947,084 | |
Cash | | | 25,772,112 | | | | 26,842,247 | |
Foreign currency, at value (cost $–, and $45,534, respectively) | | | - | | | | 45,588 | |
Receivable for securities sold | | | 5,295,362 | | | | 1,503,511 | |
Receivable for capital shares | | | 3,631,564 | | | | 74,036 | |
Dividend receivable | | | 1,697,305 | | | | 792,881 | |
Tax reclaim receivable | | | 1,327,319 | | | | 5,534 | |
| | | | | | | | |
Total assets | | | 1,239,762,285 | | | | 728,210,881 | |
| | | | | | | | |
LIABILITIES | | | | | | | | |
Payable for securities purchased | | | 3,694,363 | | | | 11,580,510 | |
Payable for capital shares | | | 1,847,623 | | | | 711,788 | |
Foreign currency, at value (cost $13,142 and $–, respectively) | | | 13,199 | | | | - | |
Management /Sponsorship fee payable | | | 899,228 | | | | 383,778 | |
Distribution fee payable | | | 117,275 | | | | 122,991 | |
Other accrued expenses | | | 983,229 | | | | 237,644 | |
Foreign tax payable | | | 333,010 | | | | 3,244 | |
| | | | | | | | |
Total liabilities | | | 7,887,927 | | | | 13,039,955 | |
| | | | | | | | |
NET ASSETS | | $ | 1,231,874,358 | | | $ | 715,170,926 | |
| | | | | | | | |
NET ASSETS CONSIST OF | | | | | | | | |
Paid-in capital | | $ | 1,283,663,534 | | | $ | 652,912,792 | |
Total distributable earnings (loss) | | | (51,789,176) | | | | 62,258,134 | |
| | | | | | | | |
NET ASSETS | | $ | 1,231,874,358 | | | $ | 715,170,926 | |
| | | | | | | | |
SEE NOTES TO FINANCIAL STATEMENTS
46
STATEMENTS OF ASSETS AND LIABILITIES (continued)
January 31, 2019 (Unaudited)
| | | | | | | | |
| | | Domini Impact
International
Equity Fund | | | Domini Impact
Equity Fund | |
NET ASSET VALUE PER SHARE | | | | | | | | |
| | |
Investor Shares | | | | | | | | |
Net assets | | $ | 547,239,009 | | | $ | 595,946,769 | |
| | | | | | | | |
Outstanding shares of beneficial interest | | | 71,570,784 | | | | 29,593,303 | |
| | | | | | | | |
Net asset value and offering price per share* | | $ | 7.65 | | | $ | 20.14 | |
| | | | | | | | |
| | |
Class A Shares | | | | | | | | |
Net assets | | $ | 31,289,830 | | | $ | 6,481,920 | |
| | | | | | | | |
Outstanding shares of beneficial interest | | | 3,856,938 | | | | 321,873 | |
| | | | | | | | |
Net asset value* | | $ | 8.11 | | | $ | 20.14 | |
| | | | | | | | |
Maximum offering price per share (net asset value per share /(1-4.75%)) | | $ | 8.51 | | | $ | 21.14 | |
| | | | | | | | |
| | |
Institutional shares | | | | | | | | |
Net assets | | $ | 547,427,440 | | | $ | 96,605,069 | |
| | | | | | | | |
Outstanding shares of beneficial interest | | | 72,041,410 | | | | 4,811,783 | |
| | | | | | | | |
Net asset value and offering price per share* | | $ | 7.60 | | | $ | 20.08 | |
| | | | | | | | |
| | |
Class R shares | | | | | | | | |
Net assets | | | | | | $ | 16,137,168 | |
| | | | | | | | |
Outstanding shares of beneficial interest | | | | | | | 803,452 | |
| | | | | | | | |
Net asset value and offering price per share* | | | | | | $ | 20.08 | |
| | | | | | | | |
| | |
Class Y shares | | | | | | | | |
Net assets | | $ | 105,918,079 | | | | | |
| | | | | | | | |
Outstanding shares of beneficial interest | | | 13,923,394 | | | | | |
| | | | | | | | |
Net asset value and offering price per share* | | $ | 7.61 | | | | | |
| | | | | | | | |
* Redemption price is equal to net asset value less any applicable redemption fees retained by the Fund.
SEE NOTES TO FINANCIAL STATEMENTS
47
STATEMENTS OF OPERATIONS
For the Six Months Ended January 31, 2019 (Unaudited)
| | | | | | | | |
| | | Domini Impact
International
Equity Fund | | | Domini Impact
Equity Fund | |
INCOME | | | | | | | | |
Dividends (net of foreign taxes $759,843, and $51,516, respectively) | | $ | 11,598,335 | | | $ | 8,550,116 | |
| | | | | | | | |
Investment Income | | | 11,598,335 | | | | 8,550,116 | |
| | | | | | | | |
EXPENSES | | | | | | | | |
Management /Sponsorship fees | | | 5,795,366 | | | | 2,589,876 | |
Distribution fees – Investor shares | | | 701,757 | | | | 788,118 | |
Distribution fees – Class A shares | | | 81,848 | | | | 8,565 | |
Transfer agent fees – Investor shares | | | 396,120 | | | | 292,191 | |
Transfer agent fees – Class A shares | | | 46,680 | | | | 3,722 | |
Transfer agent fees – Institutional shares | | | 46,088 | | | | 2,304 | |
Transfer agent fees – Class R shares | | | - | | | | 968 | |
Transfer agent fees – Class Y shares | | | 67,330 | | | | - | |
Custody and Accounting fees | | | 465,807 | | | | 93,364 | |
Registration fees – Investor shares | | | 60,728 | | | | 34,968 | |
Registration fees – Class A shares | | | 17,336 | | | | 14,303 | |
Registration fees – Institutional shares | | | 56,252 | | | | 15,400 | |
Registration fees – Class R shares | | | - | | | | 14,994 | |
Registration fees – Class Y shares | | | 14,765 | | | | - | |
Shareholder Communication fees | | | 124,785 | | | | 50,901 | |
Professional fees | | | 47,099 | | | | 102,047 | |
Trustees fees | | | 36,733 | | | | 23,420 | |
Miscellaneous | | | 33,479 | | | | 44,585 | |
Shareholder Service fees – Investor shares | | | 24,809 | | | | 26,017 | |
Shareholder Service fees – Class A shares | | | 5,256 | | | | 357 | |
Shareholder Service fees – Institutional shares | | | 591 | | | | 77 | |
Shareholder Service fees – Class R shares | | | - | | | | 58 | |
Shareholder Service fees – Class Y shares | | | 6 | | | | - | |
| | | | | | | | |
Total expenses | | | 8,022,835 | | | | 4,106,235 | |
Fees waived and expenses reimbursed | | | - | | | | (168,972) | |
Transfer agent credits | | | (1,609) | | |
| (1,398)
|
|
| | | | | | | | |
Net expenses | | | 8,021,226 | | | | 3,935,865 | |
| | | | | | | | |
NET INVESTMENT INCOME (LOSS) | | | 3,577,109 | | | | 4,614,251 | |
| | | | | | | | |
REALIZED AND UNREALIZED GAIN (LOSS) FROM INVESTMENTS AND FOREIGN CURRENCY | | | | | | | | |
NET REALIZED GAIN (LOSS) FROM: | | | | | | | | |
Investments | | | (74,653,338) | | | | 23,402,322 | |
Foreign currency | | | (253,292) | | | | (6,245) | |
| | | | | | | | |
Net realized gain (loss) | | | (74,906,630) | | | | 23,396,077 | |
NET CHANGES IN UNREALIZED APPRECIATION (DEPRECIATION) FROM: | | | | | | | | |
Investments | | | (46,963,158) | | | | (70,523,043) | |
Translation of assets and liabilities in foreign currencies | | | 18,489 | | | | 54 | |
| | | | | | | | |
Net change in unrealized appreciation (depreciation) | | | (46,944,669) | | | | (70,522,989) | |
| | | | | | | | |
NET REALIZED AND UNREALIZED GAIN (LOSS) | | | (121,851,299) | | | | (47,126,912) | |
| | | | | | | | |
NET INCREASE (DECREASE) IN NET ASSETS RESULTING FROM OPERATIONS | | $ | (118,274,190) | | | $ | (42,512,661) | |
| | | | | | | | |
SEE NOTES TO FINANCIAL STATEMENTS
48
DOMINI IMPACT INTERNATIONAL EQUITY FUND
STATEMENTS OF CHANGES IN NET ASSETS
| | | | | | | | |
| | | Six Months
Ended
January 31, 2019
(Unaudited) | | | Year Ended
July 31, 2018 | |
INCREASE (DECREASE) IN NET ASSETS | | | | | | | | |
OPERATIONS | | | | | | | | |
Net investment income (loss) | | $ | 3,577,109 | | | $ | 25,244,382 | |
Net realized gain (loss) | | | (74,906,630) | | | | 55,062,417 | |
Net change in unrealized appreciation (depreciation) | | | (46,944,669) | | | | (61,775,696) | |
| | | | | | | | |
Net Increase (Decrease) in Net Assets Resulting from Operations | | | (118,274,190) | | | | 18,531,103 | |
| | | | | | | | |
DISTRIBUTIONS TO SHAREHOLDERS | | | | | | | | |
Investor shares | | | (23,418,330) | | | | (16,514,392) | |
Class A shares | | | (1,437,289) | | | | (2,135,355) | |
Institutional shares | | | (27,167,264) | | | | (15,242,059) | |
Class Y shares | | | (6,274,972) | | | | - | |
| | | | | | | | |
Net Decrease in Net Assets from Distributions | | | (58,297,855) | | | | (33,891,806) | |
| | | | | | | | |
CAPITAL SHARE TRANSACTIONS | | | | | | | | |
Proceeds from sale of shares | | | 343,574,021 | | | | 794,630,243 | |
Net asset value of shares issued in reinvestment of distributions and dividends | | | 43,526,189 | | | | 22,168,564 | |
Payments for shares redeemed | | | (393,007,599) | | | | (451,631,004) | |
Redemption fees | | | 4,887 | | | | 15,600 | |
| | | | | | | | |
Net Increase (Decrease) in Net Assets from Capital Share Transactions | | | (5,902,502) | | | | 365,183,403 | |
| | | | | | | | |
Total Increase (Decrease) in Net Assets | | | (182,474,547) | | | | 349,822,700 | |
NET ASSETS | | | | | | | | |
Beginning of period | | $ | 1,414,348,905 | | | $ | 1,064,526,205 | |
| | | | | | | | |
End of period | | $ | 1,231,874,358 | | | $ | 1,414,348,905 | |
| | | | | | | | |
SEE NOTES TO FINANCIAL STATEMENTS
49
DOMINI IMPACT EQUITY FUND
STATEMENTS OF CHANGES IN NET ASSETS
| | | | | | | | |
| | | Six Months
Ended
January 31, 2019
(Unaudited) | | | Year Ended
July 31, 2018 | |
INCREASE (DECREASE) IN NET ASSETS | | | | | | | | |
OPERATIONS | | | | | | | | |
Net investment income (loss) | | $ | 4,614,251 | | | $ | 10,392,597 | |
Net realized gain (loss) | | | 23,396,077 | | | | 91,205,733 | |
Net change in unrealized appreciation (depreciation) | | | (70,522,989) | | | | (17,065,787) | |
| | | | | | | | |
Net Increase (Decrease) in Net Assets Resulting from Operations | | | (42,512,661) | | | | 84,532,543 | |
| | | | | | | | |
DISTRIBUTIONS TO SHAREHOLDERS | | | | | | | | |
Investor shares | | | (69,182,704) | | | | (38,419,518) | |
Class A shares | | | (734,642) | | | | (2,900,734) | |
Institutional shares | | | (12,808,247) | | | | (15,960,858) | |
Class R shares | | | (1,985,887) | | | | (9,142,009) | |
| | | | | | | | |
Net Decrease in Net Assets from Distributions | | | (84,711,480) | | | | (66,423,119) | |
| | | | | | | | |
CAPITAL SHARE TRANSACTIONS | | | | | | | | |
Proceeds from sale of shares | | | 13,406,344 | | | | 41,060,836 | |
Net asset value of shares issued in reinvestment of distributions and dividends | | | 79,159,198 | | | | 64,190,173 | |
Payments for shares redeemed | | | (65,289,554) | | | | (169,946,588) | |
Redemption fees | | | 996 | | | | 6,670 | |
| | | | | | | | |
Net Increase (Decrease) in Net Assets from Capital Share Transactions | | | 27,276,984 | | | | (64,688,909) | |
| | | | | | | | |
Total Increase (Decrease) in Net Assets | | | (99,947,157) | | | | (46,579,485) | |
NET ASSETS | | | | | | | | |
Beginning of period | | $ | 815,118,083 | | | $ | 861,697,568 | |
| | | | | | | | |
End of period | | $ | 715,170,926 | | | $ | 815,118,083 | |
| | | | | | | | |
SEE NOTES TO FINANCIAL STATEMENTS
50
DOMINI IMPACT INTERNATIONAL EQUITY FUND — INVESTOR SHARES
FINANCIAL HIGHLIGHTS
| | | | | | | | | | | | | | | | | | | | | | | | |
| | | Six Months
Ended
January 31, 2019
(Unaudited) | | | Year Ended July 31, | |
| | | 2018 | | | 2017 | | | 2016 | | | 2015 | | | 2014 | |
For a share outstanding for the period: | | | | | | | | | | | | | | | | | | | | | | | | |
Net asset value, beginning of period | | | $8.72 | | | | $8.76 | | | | $7.38 | | | | $8.05 | | | | $8.26 | | | | $7.67 | |
| | | | | | | | | | | | | | | | | | | | | | | | |
Income from investment operations: | | | | | | | | | | | | | | | | | | | | | | | | |
Net investment income (loss) | | | 0.02 | | | | 0.16 | | | | 0.15 | | | | 0.12 | | | | 0.13 | | | | 0.14 | |
Net realized and unrealized gain (loss) on investments | | | (0.75) | | | | 0.02 | | | | 1.35 | | | | (0.53) | | | | 0.20 | | | | 0.85 | |
| | | | | | | | | | | | | | | | | | | | | | | | |
Total income (loss) from investment operations | | | (0.73) | | | | 0.18 | | | | 1.50 | | | | (0.41) | | | | 0.33 | | | | 0.99 | |
| | | | | | | | | | | | | | | | | | | | | | | | |
Less dividends and/or distributions: | | | | | | | | | | | | | | | | | | | | | | | | |
Dividends to shareholders from net investment income | | | (0.11) | | | | (0.22) | | | | (0.12) | | | | (0.07) | | | | (0.11) | | | | (0.25) | |
Distributions to shareholders from net realized gain | | | (0.23) | | | | - | | | | - | | | | (0.19) | | | | (0.43) | | | | (0.15) | |
| | | | | | | | | | | | | | | | | | | | | | | | |
Total distributions | | | (0.34) | | | | (0.22) | | | | (0.12) | | | | (0.26) | | | | (0.54) | | | | (0.40) | |
| | | | | | | | | | | | | | | | | | | | | | | | |
Redemption fee proceeds5 | | | 0.00 | 1 | | | 0.00 | 1 | | | 0.00 | 1 | | | 0.00 | 1 | | | 0.00 | 1 | | | 0.00 | 1 |
| | | | | | | | | | | | | | | | | | | | | | | | |
Net asset value, end of period | | | $7.65 | | | | $8.72 | | | | $8.76 | | | | $7.38 | | | | $8.05 | | | | $8.26 | |
| | | | | | | | | | | | | | | | | | | | | | | | |
Total return 2 | | | -8.05% | | | | 2.08% | | | | 20.61% | | | | -5.12% | | | | 4.65% | | | | 13.15% | |
Portfolio turnover | | | 36% | | | | 68% | | | | 73% | | | | 89% | | | | 88% | | | | 86% | |
Ratios/supplemental data (annualized): | | | | | | | | | | | | | | | | | | | | | | | | |
Net assets, end of period (in millions) | | | $547 | | | | $612 | | | | $595 | | | | $385 | | | | $320 | | | | $232 | |
Ratio of expenses to average net assets | | | 1.41% | 4 | | | 1.41% | | | | 1.46% | | | | 1.52% | | | | 1.59% | | | | 1.60% | 3 |
Ratio of gross expenses to average net assets | | | 1.41% | | | | 1.41% | | | | 1.46% | | | | 1.52% | | | | 1.59% | | | | 1.62% | |
Ratio of net investment income (loss) to average net assets | | | 0.36% | | | | 1.81% | | | | 2.06% | | | | 1.59% | | | | 1.32% | | | | 1.43% | |
1Amount represents less than 0.005 per share.
2Not annualized for periods less than one year.
3Reflects a waiver of fees by the Manager, and the Distributor of the Fund.
4 Ratio of expenses to average net assets includes transfer agent credits. Excluding transfer agent credits the ratio of expenses to average net assets would have been 1.42% for the six months ended January 31, 2019.
5Based on average shares outstanding.
SEE NOTES TO FINANCIAL STATEMENTS
51
DOMINI IMPACT INTERNATIONAL EQUITY FUND — CLASS A SHARES
FINANCIAL HIGHLIGHTS
| | | | | | | | | | | | | | | | | | | | | | | | |
| | | Six Months
Ended
January 31, 2019
(Unaudited) | | | Year Ended July 31, | |
| | | 2018 | | | 2017 | | | 2016 | | | 2015 | | | 2014 | |
For a share outstanding for the period: | | | | | | | | | | | | | | | | | | | | | | | | |
Net asset value, beginning of period | | | $9.18 | | | | $9.21 | | | | $7.76 | | | | $8.45 | | | | $8.64 | | | | $8.00 | |
| | | | | | | | | | | | | | | | | | | | | | | | |
Income from investment operations: | | | | | | | | | | | | | | | | | | | | | | | | |
Net investment income (loss) | | | 0.16 | | | | 0.15 | | | | 0.14 | | | | 0.11 | | | | 0.14 | | | | 0.14 | |
Net realized and unrealized gain (loss) on investments | | | (0.93) | | | | 0.04 | | | | 1.43 | | | | (0.54) | | | | 0.21 | | | | 0.90 | |
| | | | | | | | | | | | | | | | | | | | | | | | |
Total income (loss) from investment operations | | | (0.77) | | | | 0.19 | | | | 1.57 | | | | (0.43) | | | | 0.35 | | | | 1.04 | |
| | | | | | | | | | | | | | | | | | | | | | | | |
Less dividends and/or distributions: | | | | | | | | | | | | | | | | | | | | | | | | |
Dividends to shareholders from net investment income | | | (0.07) | | | | (0.22) | | | | (0.12) | | | | (0.07) | | | | (0.11) | | | | (0.25) | |
Distributions to shareholders from net realized gain | | | (0.23) | | | | - | | | | - | | | | (0.19) | | | | (0.43) | | | | (0.15) | |
| | | | | | | | | | | | | | | | | | | | | | | | |
Total distributions | | | (0.30) | | | | (0.22) | | | | (0.12) | | | | (0.26) | | | | (0.54) | | | | (0.40) | |
| | | | | | | | | | | | | | | | | | | | | | | | |
Redemption fee proceeds5 | | | 0.00 | 1 | | | 0.00 | 1 | | | 0.00 | 1 | | | 0.00 | 1 | | | 0.00 | 1 | | | 0.00 | 1 |
| | | | | | | | | | | | | | | | | | | | | | | | |
Net asset value, end of period | | | $8.11 | | | | $9.18 | | | | $9.21 | | | | $7.76 | | | | $8.45 | | | | $8.64 | |
| | | | | | | | | | | | | | | | | | | | | | | | |
Total return 2 | | | -8.16% | | | | 2.00% | | | | 20.44% | | | | -5.07% | | | | 4.71% | | | | 13.16% | |
Portfolio turnover | | | 36% | | | | 68% | | | | 73% | | | | 89% | | | | 88% | | | | 86% | |
Ratios/supplemental data (annualized): | | | | | | | | | | | | | | | | | | | | | | | | |
Net assets, end of period (in millions) | | | $31 | | | | $81 | | | | $85 | | | | $55 | | | | $51 | | | | $29 | |
Ratio of expenses to average net assets | | | 1.43% | 4 | | | 1.47% | | | | 1.52% | 3 | | | 1.53% | 3 | | | 1.57% | 3 | | | 1.57% | 3 |
Ratio of gross expenses to average net assets | | | 1.43% | | | | 1.47% | | | | 1.53% | | | | 1.59% | | | | 1.68% | | | | 1.82% | |
Ratio of net investment income (loss) to average net assets | | | 0.49% | | | | 1.63% | | | | 1.99% | | | | 1.47% | | | | 1.46% | | | | 1.51% | |
1Amount represents less than 0.005 per share.
2Total return does not reflect sales commissions and is not annualized for periods less than one year.
3Reflects a waiver of fees by the Manager, and the Distributor of the Fund.
4 Ratio of expenses to average net assets includes transfer agent credits. Excluding transfer agent credits the ratio of expenses to average net assets would have been 1.43% for the six months ended January 31, 2019.
5Based on average shares outstanding.
SEE NOTES TO FINANCIAL STATEMENTS
52
DOMINI IMPACT INTERNATIONAL EQUITY FUND — INSTITUTIONAL SHARES
FINANCIAL HIGHLIGHTS
| | | | | | | | | | | | | | | | | | | | | | | | |
| | | Six Months
Ended
January 31, 2019
(Unaudited) | | | Year Ended July 31 | |
| | | 2018 | | | 2017 | | | 2016 | | | 2015 | | | 2014 | |
For a share outstanding for the period: | | | | | | | | | | | | | | | | | | | | | | | | |
Net asset value, beginning of period | | | $8.70 | | | | $8.74 | | | | $7.39 | | | | $8.07 | | | | $8.28 | | | | $7.66 | |
| | | | | | | | | | | | | | | | | | | | | | | | |
Income from investment operations: | | | | | | | | | | | | | | | | | | | | | | | | |
Net investment income (loss) | | | 0.02 | | | | 0.18 | | | | 0.19 | | | | 0.15 | | | | 0.16 | | | | 0.13 | |
Net realized and unrealized gain (loss) on investments | | | (0.74) | | | | 0.05 | | | | 1.32 | | | | (0.54) | | | | 0.21 | | | | 0.89 | |
| | | | | | | | | | | | | | | | | | | | | | | | |
Total income (loss) from investment operations | | | (0.72) | | | | 0.23 | | | | 1.51 | | | | (0.39) | | | | 0.37 | | | | 1.02 | |
| | | | | | | | | | | | | | | | | | | | | | | | |
Less dividends and/or distributions: | | | | | | | | | | | | | | | | | | | | | | | | |
Dividends to shareholders from net investment income | | | (0.15) | | | | (0.27) | | | | (0.16) | | | | (0.10) | | | | (0.15) | | | | (0.25) | |
Distributions to shareholders from net realized gain | | | (0.23) | | | | - | | | | - | | | | (0.19) | | | | (0.43) | | | | (0.15) | |
| | | | | | | | | | | | | | | | | | | | | | | | |
Total distributions | | | (0.38) | | | | (0.27) | | | | (0.16) | | | | (0.29) | | | | (0.58) | | | | (0.40) | |
| | | | | | | | | | | | | | | | | | | | | | | | |
Redemption fee proceeds 5 | | | 0.00 | 1 | | | 0.00 | 1 | | | 0.00 | 1 | | | 0.00 | 1 | | | 0.00 | 1 | | | 0.00 | 1 |
| | | | | | | | | | | | | | | | | | | | | | | | |
Net asset value, end of period | | | $7.60 | | | | $8.70 | | | | $8.74 | | | | $7.39 | | | | $8.07 | | | | $8.28 | |
| | | | | | | | | | | | | | | | | | | | | | | | |
Total return 2 | | | -7.93% | | | | 2.58% | | | | 20.80% | | | | -4.74% | | | | 5.24% | | | | 13.60% | |
Portfolio turnover | | | 36% | | | | 68% | | | | 73% | | | | 89% | | | | 88% | | | | 86% | |
Ratios/supplemental data (annualized): | | | | | | | | | | | | | | | | | | | | | | | | |
Net assets, end of period (in millions) | | | $547 | | | | $580 | | | | $384 | | | | $167 | | | | $61 | | | | $39 | |
Ratio of expenses to average net assets | | | 1.02% | 4 | | | 1.02% | | | | 1.07% | | | | 1.10% | | | | 1.15% | 3 | | | 1.16% | |
Ratio of gross expenses to average net assets | | | 1.02% | | | | 1.02% | | | | 1.07% | | | | 1.10% | | | | 1.15% | | | | 1.16% | |
Ratio of net investment income (loss) to average net assets | | | 0.72% | | | | 2.22% | | | | 2.82% | | | | 2.22% | | | | 1.78% | | | | 1.82% | |
1Amount represents less than 0.005 per share.
2Not annualized for periods less than one year.
3Reflects a waiver of fees by the Manager of the Fund.
4 Ratio of expenses to average net assets includes transfer agent credits. Excluding transfer agent credits the ratio of expenses to average net assets would have been 1.02% for the six months ended January 31, 2019.
5Based on average shares outstanding.
SEE NOTES TO FINANCIAL STATEMENTS
53
DOMINI IMPACT INTERNATIONAL EQUITY FUND — CLASS Y SHARES
FINANCIAL HIGHLIGHTS
| | | | | | | | |
| | | Six Months
Ended
January 31, 2019
(Unaudited) | | | For the Period
July 23, 2018
(commencement of
operations) through
July 31, 2018 | |
For a share outstanding for the period: | | | | | | | | |
Net asset value, beginning of period | | | $8.71 | | | | $8.56 | |
| | | | | | | | |
Income from investment operations: | | | | | | | | |
Net investment income (loss) | | | 0.00 | | | | — | |
Net realized and unrealized gain (loss) on investments | | | (0.72) | | | | 0.15 | |
| | | | | | | | |
Total income (loss) from investment operations | | | (0.72) | | | | 0.15 | |
| | | | | | | | |
Less dividends and/or distributions: | | | | | | | | |
Dividends to shareholders from net investment income | | | (0.15) | | | | — | |
Distributions to shareholders from net realized gain | | | (0.23) | | | | — | |
| | | | | | | | |
Total distributions | | | (0.38) | | | | — | |
| | | | | | | | |
Redemption fee proceeds | | | — | | | | — | |
| | | | | | | | |
Net asset value, end of period | | | $7.61 | | | | $8.71 | |
| | | | | | | | |
Total return 1 | | | -7.91% | | | | 1.75% | |
Portfolio turnover | | | 36% | | | | 68% | |
Ratios/supplemental data (annualized): | | | | | | | | |
Net assets, end of period (in millions) | | | $106 | | | | $142 | |
Ratio of expenses to average net assets | | | 1.14% | 2 | | | 1.13% | |
Ratio of gross expenses to average net assets | | | 1.14% | | | | 1.13% | |
Ratio of net investment income (loss) to average net assets | | | 0.66% | | | | 0.32% | |
1Not annualized for periods less than one year.
2 Ratio of expenses to average net assets includes transfer agent credits. Excluding transfer agent credits the ratio of expenses to average net assets would have been 1.14% for the six months ended January 31, 2019.
SEE NOTES TO FINANCIAL STATEMENTS
54
DOMINI IMPACT EQUITY FUND — INVESTOR SHARES
FINANCIAL HIGHLIGHTS
| | | | | | | | | | | | | | | | | | | | | | | | |
| | | Six Months
Ended
January 31, 2019
(Unaudited) | | | Year Ended July 31, | |
| | | 2018 | | | 2017^ | | | 2016^ | | | 2015^ | | | 2014^ | |
For a share outstanding for the period: | | | | | | | | | | | | | | | | | | | | | | | | |
Net asset value, beginning of period | | | $24.18 | | | | $23.18 | ^ | | | $20.76 | | | | $22.70 | | | | $23.42 | | | | $19.62 | |
| | | | | | | | | | | | | | | | | | | | | | | | |
Income from investment operations: | | | | | | | | | | | | | | | | | | | | | | | | |
Net investment income (loss) | | | 0.07 | | | | 0.27 | 5 | | | 0.21 | 5 | | | 0.45 | | | | 0.26 | 5 | | | 0.20 | |
Net realized and unrealized gain (loss) on investments | | | (1.52) | | | | 2.09 | 5 | | | 2.69 | | | | (1.04) | | | | 0.93 | | | | 3.73 | |
| | | | | | | | | | | | | | | | | | | | | | | | |
Total income (loss) from investment operations | | | (1.45) | | | | 2.36 | | | | 2.90 | | | | (0.59) | | | | 1.19 | | | | 3.93 | |
| | | | | | | | | | | | | | | | | | | | | | | | |
Less dividends and distributions: | | | | | | | | | | | | | | | | | | | | | | | | |
Dividends to shareholders from net investment income | | | (0.11) | | | | (0.17) | ^ | | | (0.12) | | | | (0.24) | | | | (0.18) | | | | (0.13) | |
Distributions to shareholders from net realized gain | | | (2.48) | | | | (1.19) | ^ | | | (0.36) | | | | (1.10) | | | | (1.73) | | | | - | |
Tax return of capital 5 | | | - | | | | - | | | | - | | | | (0.01) | | | | - | | | | - | |
| | | | | | | | | | | | | | | | | | | | | | | | |
Total distributions | | | (2.59) | | | | (1.36) | | | | (0.48) | | | | (1.35) | | | | (1.91) | | | | (0.13) | |
| | | | | | | | | | | | | | | | | | | | | | | | |
Redemption fee proceeds 5 | | | 0.00 | 1 | | | 0.00 | 1 | | | 0.00 | 1 | | | 0.00 | 1 | | | 0.00 | 1 | | | 0.00 | 1 |
| | | | | | | | | | | | | | | | | | | | | | | | |
Net asset value, end of period | | | $20.14 | | | | $24.18 | | | | $23.18 | | | | $20.76 | | | | $22.70 | | | | $23.42 | |
| | | | | | | | | | | | | | | | | | | | | | | | |
Total return 2 | | | -5.18% | | | | 10.32% | | | | 14.07% | | | | -2.47% | | | | 5.21% | | | | 20.07% | |
Portfolio turnover | | | 86% | | | | 78% | | | | 85% | | | | 91% | | | | 103% | | | | 86% | |
Ratios/supplemental data (annualized): | | | | | | | | | | | | | | | | | | | | | | | | |
Net assets, end of period (in millions) | | | $596 | | | | $669 | | | | $675 | | | | $656 | | | | $752 | | | | $699 | |
Ratio of expenses to average net assets | | | 1.09% | 3,4 | | | 1.10% | | | | 1.14% | | | | 1.14% | | | | 1.16% | | | | 1.20% | |
Ratio of gross expenses to average net assets | | | 1.12% | | | | 1.10% | | | | 1.14% | | | | 1.14% | | | | 1.16% | | | | 1.20% | |
Ratio of net investment income (loss) to average net assets | | | 1.15% | | | | 1.15% | | | | 0.94% | | | | 2.06% | | | | 1.10% | | | | 0.80% | |
1Amount represents less than 0.005 per share.
2Not annualized for periods less than one year.
3Reflects a waiver of fees by the Manager, the Sponsor, and the Distributor of the Fund.
4 Ratio of expenses to average net assets includes transfer agent credits. Excluding transfer agent credits the ratio of expenses to average net assets would have been 1.09% for the six months ended January 31, 2019.
5 Based on average shares outstanding.
^ All per share amounts and net asset values have been adjusted as a result of the 1.9988601 for 1 share split on January 26, 2018 ( see Note 4).
SEE NOTES TO FINANCIAL STATEMENTS
55
DOMINI IMPACT EQUITY FUND — CLASS A SHARES
FINANCIAL HIGHLIGHTS
| | | | | | | | | | | | | | | | | | | | | | | | |
| | | Six Months
Ended
January 31, 2019
(Unaudited) | | | Year Ended July 31, | |
| | | 2018 | | | 2017^ | | | 2016^ | | | 2015^ | | | 2014^ | |
For a share outstanding for the period: | | | | | | | | | | | | | | | | | | | | | | | | |
Net asset value, beginning of period | | | $24.17 | | | | $33.41 | ^ | | | $34.01 | | | | $48.90 | | | | $64.35 | | | | $54.93 | |
| | | | | | | | | | | | | | | | | | | | | | | | |
Income from investment operations: | | | | | | | | | | | | | | | | | | | | | | | | |
Net investment income (loss) | | | 0.36 | | | | 0.31 | 5 | | | 0.32 | 5 | | | 1.53 | | | | 0.56 | 5 | | | 1.16 | |
Net realized and unrealized gain (loss) on investments | | | (1.80) | | | | 2.84 | 5 | | | 4.14 | | | | (3.19) | | | | 2.45 | | | | 9.84 | |
| | | | | | | | | | | | | | | | | | | | | | | | |
Total income (loss) from investment operations | | | (1.44) | | | | 3.15 | | | | 4.46 | | | | (1.66) | | | | 3.01 | | | | 11.00 | |
| | | | | | | | | | | | | | | | | | | | | | | | |
Less dividends and/or distributions: | | | | | | | | | | | | | | | | | | | | | | | | |
Dividends to shareholders from net investment income | | | (0.11) | | | | (1.35) | ^ | | | (1.72) | | | | (3.02) | | | | (2.41) | | | | (1.58) | |
Distributions to shareholders from net realized gain | | | (2.48) | | | | (11.04) | ^ | | | (3.34) | | | | (10.21) | | | | (16.05) | | | | - | |
Tax return of capital 5 | | | - | | | | - | | | | - | | | | (0.00) | 1 | | | - | | | | - | |
| | | | | | | | | | | | | | | | | | | | | | | | |
Total distributions | | | (2.59) | | | | (12.39) | | | | (5.06) | | | | (13.23) | | | | (18.46) | | | | (1.58) | |
| | | | | | | | | | | | | | | | | | | | | | | | |
Redemption fee proceeds 5 | | | 0.00 | 1 | | | - | | | | - | | | | - | | | | - | | | | - | |
| | | | | | | | | | | | | | | | | | | | | | | | |
Net asset value, end of period | | | $20.14 | | | | $24.17 | | | | $33.41 | | | | $34.01 | | | | $48.90 | | | | $64.35 | |
| | | | | | | | | | | | | | | | | | | | | | | | |
Total return 2 | | | -5.16% | | | | 10.36% | | | | 13.97% | | | | -2.61% | | | | 5.19% | | | | 20.17% | |
Portfolio turnover | | | 86% | | | | 78% | | | | 85% | | | | 91% | | | | 103% | | | | 86% | |
Ratios/supplemental data (annualized): | | | | | | | | | | | | | | | | | | | | | | | | |
Net assets, end of period (in millions) | | | $6 | | | | $7 | | | | $8 | | | | $8 | | | | $11 | | | | $8 | |
Ratio of expenses to average net assets | | | 1.08% | 3,4 | | | 1.12% | 3 | | | 1.16% | 3 | | | 1.18% | 3 | | | 1.18% | 3 | | | 1.18% | 3 |
Ratio of gross expenses to average net assets | | | 1.54% | | | | 1.38% | | | | 1.46% | | | | 1.41% | | | | 1.39% | | | | 1.54% | |
Ratio of net investment income (loss) to average net assets | | | 1.16% | | | | 1.14% | | | | 0.92% | | | | 2.00% | | | | 1.06% | | | | 0.83% | |
1Amount represents less than 0.005 per share.
2Total return does not reflect sales commissions and is not annualized for periods less than one year.
3Reflects a waiver of fees by the Manager, the Sponsor, and the Distributor of the Fund.
4 Ratio of expenses to average net assets includes transfer agent credits. Excluding transfer agent credits the ratio of expenses to average net assets would have been 1.08% for the six months ended January 31, 2019.
5 Based on average shares outstanding.
^ All per share amounts and net asset values have been adjusted as a result of the 0.2155310 for 1 reverse share split on January 26, 2018 ( see Note 4).
SEE NOTES TO FINANCIAL STATEMENTS
56
DOMINI IMPACT EQUITY FUND — INSTITUTIONAL SHARES
FINANCIAL HIGHLIGHTS
| | | | | | | | | | | | | | | | | | | | | | | | |
| | | Six Months
Ended
January 31, 2019
(Unaudited) | | | Year Ended July 31, | |
| | | 2018 | | | 2017 | | | 2016 | | | 2015 | | | 2014 | |
For a share outstanding for the period: | | | | | | | | | | | | | | | | | | | | | | | | |
Net asset value, beginning of period | | | $24.18 | | | | $24.46 | | | | $22.40 | | | | $25.95 | | | | $28.49 | | | | $23.94 | |
| | | | | | | | | | | | | | | | | | | | | | | | |
Income from investment operations: | | | | | | | | | | | | | | | | | | | | | | | | |
Net investment income (loss) | | | 0.12 | | | | 0.37 | | | | 0.31 | 5 | | | 0.55 | | | | 0.40 | 5 | | | 0.32 | |
Net realized and unrealized gain (loss) on investments | | | (1.52) | | | | 2.17 | | | | 2.87 | | | | (1.20) | | | | 1.11 | | | | 4.60 | |
| | | | | | | | | | | | | | | | | | | | | | | | |
Total income (loss) from investment operations | | | (1.40) | | | | 2.54 | | | | 3.18 | | | | (0.65) | | | | 1.51 | | | | 4.92 | |
| | | | | | | | | | | | | | | | | | | | | | | | |
Less dividends and/or distributions: | | | | | | | | | | | | | | | | | | | | | | | | |
Dividends to shareholders from net investment income | | | (0.22) | | | | (0.44) | | | | (0.40) | | | | (0.70) | | | | (0.59) | | | | (0.37) | |
Distributions to shareholders from net realized gain | | | (2.48) | | | | (2.38) | | | | (0.72) | | | | (2.20) | | | | (3.46) | | | | - | |
Tax return of capital 5 | | | - | | | | - | | | | - | | | | (0.00) | 1 | | | - | | | | - | |
| | | | | | | | | | | | | | | | | | | | | | | | |
Total distributions | | | (2.70) | | | | (2.82) | | | | (1.12) | | | | (2.90) | | | | (4.05) | | | | (0.37) | |
| | | | | | | | | | | | | | | | | | | | | | | | |
Redemption fee proceeds 5 | | | 0.00 | 1 | | | 0.00 | 1 | | | 0.00 | 1 | | | 0.00 | 1 | | | 0.00 | 1 | | | 0.00 | 1 |
| | | | | | | | | | | | | | | | | | | | | | | | |
Net asset value, end of period | | | $20.08 | | | | $24.18 | | | | $24.46 | | | | $22.40 | | | | $25.95 | | | | $28.49 | |
| | | | | | | | | | | | | | | | | | | | | | | | |
Total return 2 | | | -4.98% | | | | 10.68% | | | | 14.51% | | | | -2.14% | | | | 5.56% | | | | 20.59% | |
Portfolio turnover | | | 86% | | | | 78% | | | | 85% | | | | 91% | | | | 103% | | | | 86% | |
Ratios/supplemental data (annualized): | | | | | | | | | | | | | | | | | | | | | | | | |
Net assets, end of period (in millions) | | | $97 | | | | $120 | | | | $157 | | | | $205 | | | | $237 | | | | $260 | |
Ratio of expenses to average net assets | | | 0.73% | 3,4 | | | 0.74% | 3 | | | 0.79% | | | | 0.80% | 3 | | | 0.80% | 3 | | | 0.80% | 3 |
Ratio of gross expenses to average net assets | | | 0.80% | | | | 0.76% | | | | 0.79% | | | | 0.81% | | | | 0.80% | | | | 0.81% | |
Ratio of net investment income (loss) to average net assets | | | 1.52% | | | | 1.52% | | | | 1.31% | | | | 2.40% | | | | 1.47% | | | | 1.19% | |
1Amount represents less than 0.005 per share.
2Not annualized for periods less than one year.
3Reflects a waiver of fees by the Manager, and the Sponsor of the Fund.
4 Ratio of expenses to average net assets includes transfer agent credits. Excluding transfer agent credits the ratio of expenses to average net assets would have been 0.73% for the six months ended January 31, 2019.
5 Based on average shares outstanding.
SEE NOTES TO FINANCIAL STATEMENTS
57
DOMINI IMPACT EQUITY FUND — CLASS R SHARES
FINANCIAL HIGHLIGHTS
| | | | | | | | | | | | | | | | | | | | | | | | |
| | | Six Months
Ended
January 31, 2019
(Unaudited) | | | Year Ended July 31, | |
| | | 2018 | | | 2017^ | | | 2016^ | | | 2015^ | | | 2014^ | |
For a share outstanding for the period: | | | | | | | | | | | | | | | | | | | | | | | | |
Net asset value, beginning of period | | | $24.18 | | | | $37.86 | ^ | | | $39.86 | | | | $60.43 | | | | $82.35 | | | | $70.33 | |
| | | | | | | | | | | | | | | | | | | | | | | | |
Income from investment operations: | | | | | | | | | | | | | | | | | | | | | | | | |
Net investment income (loss) | | | 1.13 | | | | 0.41 | 5 | | | 0.51 | 5 | | | 3.15 | | | | 0.96 | 5 | | | 6.43 | |
Net realized and unrealized gain (loss) on investments | | | (2.55) | | | | 3.21 | 5 | | | 4.69 | | | | (5.08) | | | | 3.15 | | | | 7.90 | |
| | | | | | | | | | | | | | | | | | | | | | | | |
Total income (loss) from investment operations | | | (1.42) | | | | 3.62 | | | | 5.20 | | | | (1.93) | | | | 4.11 | | | | 14.33 | |
| | | | | | | | | | | | | | | | | | | | | | | | |
Less dividends and/or distributions: | | | | | | | | | | | | | | | | | | | | | | | | |
Dividends to shareholders from net investment income | | | (0.20) | | | | (2.00) | ^ | | | (2.57) | | | | (4.50) | | | | (3.79) | | | | (2.31) | |
Distributions to shareholders from net realized gain | | | (2.48) | | | | (15.30) | ^ | | | (4.63) | | | | (14.14) | | | | (22.24) | | | | - | |
Tax return of capital 5 | | | - | | | | - | | | | - | | | | (0.00) | 1 | | | - | | | | - | |
| | | | | | | | | | | | | | | | | | | | | | | | |
Total distributions | | | (2.68) | | | | (17.30) | | | | (7.20) | | | | (18.64) | | | | (26.03) | | | | (2.31) | |
| | | | | | | | | | | | | | | | | | | | | | | | |
Redemption fee proceeds 5 | | | 0.00 | 1 | | | 0.00 | 1 | | | 0.00 | 1 | | | 0.00 | 1 | | | 0.00 | 1 | | | 0.00 | 1 |
| | | | | | | | | | | | | | | | | | | | | | | | |
Net asset value, end of period | | | $20.08 | | | | $24.18 | | | | $37.86 | | | | $39.86 | | | | $60.43 | | | | $82.35 | |
| | | | | | | | | | | | | | | | | | | | | | | | |
Total return 2 | | | -5.05% | | | | 10.71% | | | | 14.20% | | | | -2.22% | | | | 5.55% | | | | 20.52% | |
Portfolio turnover | | | 86% | | | | 78% | | | | 85% | | | | 91% | | | | 103% | | | | 86% | |
Ratios/supplemental data (annualized): | | | | | | | | | | | | | | | | | | | | | | | | |
Net assets, end of period (in millions) | | | $16 | | | | $18 | | | | $21 | | | | $44 | | | | $55 | | | | $49 | |
Ratio of expenses to average net assets | | | 0.79% | 3,4 | | | 0.80% | 3 | | | 0.83% | 3 | | | 0.82% | | | | 0.85% | | | | 0.90% | |
Ratio of gross expenses to average net assets | | | 0.95% | | | | 0.84% | | | | 0.85% | | | | 0.82% | | | | 0.85% | | | | 0.90% | |
Ratio of net investment income (loss) to average net assets | | | 1.45% | | | | 1.46% | | | | 1.28% | | | | 2.39% | | | | 1.41% | | | | 1.07% | |
1Amount represents less than 0.005 per share.
2Not annualized for periods less than one year.
3Reflects a waiver of fees by the Manager, and the Sponsor, of the Fund.
4 Ratio of expenses to average net assets includes transfer agent credits. Excluding transfer agent credits the ratio of expenses to average net assets would have been 0.79% for the six months ended January 31, 2019.
5 Based on average shares outstanding.
^ All per share amounts and net asset values have been adjusted as a result of the 0.1555580 for 1 reverse share split on January 26, 2018 ( see Note 4).
SEE NOTES TO FINANCIAL STATEMENTS
58
DOMINI IMPACT INTERNATIONAL EQUITY FUND
DOMINI IMPACT EQUITY FUND
NOTES TO FINANCIAL STATEMENTS
January 31, 2019 (Unaudited)
1. ORGANIZATION AND SIGNIFICANT ACCOUNTING POLICIES
The Domini Investment Trust (formerly Domini Social Investment Trust) is a Massachusetts business trust registered under the Investment Company Act of 1940 as anopen-end management investment company. The Domini Investment Trust comprises three separate series: Domini Impact International Equity Fund (formerly, Domini International Social Equity Fund), Domini Impact Equity Fund (formerly, Domini Social Equity Fund), and Domini Impact Bond Fund (formerly Domini Social Bond Fund) (each the “Fund,” collectively the “Funds”). The financial statements of the Domini Impact Bond Fund are included on page 75 of this report. The Domini Impact International Equity Fund offers Investor shares, Class A shares, Institutional shares and Class Y shares. Class A, Institutional and Class Y shares of the Domini Impact International Equity Fund were not offered prior to November 28, 2008, November 30, 2012, and June 15, 2018 respectively. The Domini Impact Equity Fund offers Investor shares, Class A shares, Institutional shares and Class R shares. Class R shares of the Domini Impact Equity Fund commenced on November 28, 2003. Class A and Institutional shares of the Domini Impact Equity Fund commenced on November 28, 2008. The Investor shares, Institutional shares, Class R shares and Class Y shares are sold at their offering price, which is net asset value. The Class A shares are sold with afront-end sales charge (load) of up to 4.75%. The Institutional shares may only be purchased by or for the benefit of investors that meet the minimum investment requirements, and fall within the following categories: endowments, foundations, religious organizations and other nonprofit entities, individuals, retirement plan sponsors, family office clients, certain corporate or similar institutions, or omnibus accounts maintained by financial intermediaries and that are approved by the Fund’s Distributor. Class R shares are generally available only to certain eligible retirement plans and endowments, foundations, religious organizations, and othertax-exempt entities that are approved by the Fund’s Distributor. Class Y shares may only be purchased through omnibus accounts held on the books of the Fund for financial intermediaries that have been approved by the Funds’ distributor. All classes of shares have identical rights and voting privileges with respect to the Fund in general and exclusive voting rights on matters that affect that class alone. Earnings, net assets, and net asset value per share may differ due to each class having its own expenses, such as transfer and shareholder servicing agent fees and registration fees, directly attributable to that class. Class R, Institutional and Class Y shares are not subject to distribution and service fees.
59
DOMINI IMPACT INTERNATIONAL EQUITY FUND
DOMINI IMPACT EQUITY FUND
NOTES TO FINANCIAL STATEMENTS(continued)
January 31, 2019 (Unaudited)
The preparation of financial statements in conformity with U.S. generally accepted accounting principles requires management to make estimates and assumptions that affect the reported amounts of assets and liabilities and disclosure of contingent liabilities at the date of the financial statements and the reported amounts of revenues and expenses during the reporting period. Actual results could differ from those estimates. The following is a summary of the Funds’ significant accounting policies.
(A) Valuation of Investments.Securities listed or traded on national securities exchanges are valued at the last sale price reported by the security’s primary exchange or, if there have been no sales that day, at the mean of the current bid and ask price that represents the current value of the security. Securities listed on the NASDAQ National Market System are valued using the NASDAQ Official Closing Price (the “NOCP”). If an NOCP is not available for a security listed on the NASDAQ National Market System, the security will be valued at the last sale price or, if there have been no sales that day, at the mean of the current bid and ask price. Securities for which market quotations are not readily available or as a result of an event occurring after the close of the foreign market but before pricing the Funds are valued at fair value as determined in good faith under procedures established by and under the supervision of the Funds’ Board of Trustees. Securities that are primarily traded on foreign exchanges generally are valued at the closing price of such securities on their respective exchanges, except that if the Trusts’ manager or submanager, as applicable, is of the opinion that such price would result in an inappropriate value for a security, including as a result of an occurrence subsequent to the time a value was so established, then the fair value of those securities may be determined by consideration of other factors (including the use of an independent pricing service) by or under the direction of the Board of Trustees or its delegates.
The Funds follow a fair value hierarchy that distinguishes between (a) market participant assumptions developed based on market data obtained from sources independent of the reporting entity (observable inputs) and (b) the Fund’s own assumptions about market participant assumptions developed based on the best information available in the circumstances (unobservable inputs). These inputs are used in determining the value of the Funds’ investments and are summarized in the following fair value hierarchy:
Level 1 — quoted prices in active markets for identical securities
Level 2 — other significant observable inputs (including quoted prices for similar securities, interest rates, and evaluated quotation obtained from pricing services)
60
DOMINI IMPACT INTERNATIONAL EQUITY FUND
DOMINI IMPACT EQUITY FUND
NOTES TO FINANCIAL STATEMENTS(continued)
January 31, 2019 (Unaudited)
Level 3 — significant unobservable inputs (including the Funds’ own assumptions in determining the fair value of investments)
The inputs or methodology used for valuing securities are not an indication of the risk associated with investing in those securities.
The following is a summary of the inputs used by the Domini Impact International Equity Fund, as of January 31, 2019, in valuing the Fund’s assets carried at fair value:
| | | | | | | | | | | | | | | | |
| | | Level 1 -
Quoted Prices | | | Level 2 -
Other
Significant
Observable
Inputs | | | Level 3 -
Significant
Unobservable
Inputs | | | Total | |
| | | | | | | | | | | | | | | | |
Common Stocks | | | | | | | | | | | | | | | | |
Communication Services | | $ | - | | | $ | 43,206,435 | | | $ | - | | | $ | 43,206,435 | |
Consumer Discretionary | | | - | | | | 158,789,231 | | | | - | | | | 158,789,231 | |
Consumer Staples | | | 22,706,413 | | | | 85,980,246 | | | | - | | | | 108,686,659 | |
Financials | | | 4,775,101 | | | | 234,406,177 | | | | 5,551,202 | | | | 244,732,480 | |
Health Care | | | - | | | | 169,915,095 | | | | - | | | | 169,915,095 | |
Industrials | | | - | | | | 185,551,054 | | | | - | | | | 185,551,054 | |
Information Technology | | | 5,449,832 | | | | 106,653,205 | | | | - | | | | 112,103,037 | |
Materials | | | - | | | | 80,493,900 | | | | - | | | | 80,493,900 | |
Real Estate | | | - | | | | 83,878,827 | | | | - | | | | 83,878,827 | |
Utilities | | | - | | | | 14,681,905 | | | | - | | | | 14,681,905 | |
| | | | | | | | | | | | | | | | |
Total | | $ | 32,931,346 | | | $ | 1,163,556,075 | | | $ | 5,551,202 | | | $ | 1,202,038,623 | |
| | | | | | | | | | | | | | | | |
The following is a summary of the inputs used by the Domini Impact Equity Fund, as of January 31, 2019, in valuing the Fund’s assets carried at fair value:
| | | | | | | | | | | | | | | | |
| | | Level 1 -
Quoted Prices | | | Level 2 -
Other
Significant
Observable
Inputs | | | Level 3 -
Significant
Unobservable
Inputs | | | Total | |
| | | | | | | | | | | | | | | | |
Common Stocks | | | | | | | | | | | | | | | | |
Telecommunication Services | | $ | 77,257,461 | | | $ | - | | | $ | - | | | $ | 77,257,461 | |
Consumer Discretionary | | | 88,079,182 | | | | - | | | | - | | | | 88,079,182 | |
Consumer Staples | | | 44,158,754 | | | | - | | | | - | | | | 44,158,754 | |
Financials | | | 82,418,265 | | | | - | | | | - | | | | 82,418,265 | |
Health Care | | | 112,533,080 | | | | - | | | | - | | | | 112,533,080 | |
Industrials | | | 44,735,038 | | | | - | | | | - | | | | 44,735,038 | |
Information Technology | | | 212,400,279 | | | | - | | | | - | | | | 212,400,279 | |
Materials | | | 12,725,513 | | | | - | | | | - | | | | 12,725,513 | |
Real Estate | | | 22,000,761 | | | | - | | | | - | | | | 22,000,761 | |
Utilities | | | 2,638,751 | | | | - | | | | - | | | | 2,638,751 | |
| | | | | | | | | | | | | | | | |
Total | | $ | 698,947,084 | | | $ | - | | | $ | - | | | $ | 698,947,084 | |
| | | | | | | | | | | | | | | | |
61
DOMINI IMPACT INTERNATIONAL EQUITY FUND
DOMINI IMPACT EQUITY FUND
NOTES TO FINANCIAL STATEMENTS(continued)
January 31, 2019 (Unaudited)
The following is a reconciliation of Level 3 assets for which significant unobservable inputs were used to determine fair value:
| | | | |
| | | Domini Impact
International
Equity Fund | |
| | | | |
Investments in Securities | | | | |
Balance as of July 31, 2018 | | $ | - | |
Realized Gain (loss) | | | - | |
Change in unrealized appreciation (depreciation) | | | (363,563) | |
Purchases | | | - | |
Sales | | | - | |
Transfers in and/or out of Level Three | | | 5,914,765 | |
| | | | |
Balance as of January 31, 2019 | | $ | 5,551,202 | |
| | | | |
The change in unrealized appreciation (depreciation) included in earnings relating to securities still held at January 31, 2019: | | $ | (18,449) | |
| | | | |
For the Domini Impact International Equity Fund transfers from Level 1 to Level 3 included securities valued at $19,174,783 that were transferred as a result of quoted prices in active markets not being readily available. Transfers out of Level 3 into Level 1 included securities valued at $13,260,018 because market values were readily available from a pricing agent for which fair value factors were previously applied.
(B) Foreign Currency Translation.Securities and other assets and liabilities denominated in foreign currencies are translated into U.S. dollar amounts on the date of valuation. Purchases and sales of securities, and income and expense items denominated in foreign currencies, are translated into U.S. dollar amounts on the respective dates of such transactions. Occasionally, events impact the availability or reliability of foreign exchange rates used to convert the U.S. dollar equivalent value. If such an event occurs, the foreign exchange rate will be valued at fair value using procedures established and approved by the Board of Trustees. The Funds do not separately report the effect of fluctuations in foreign exchange rates from changes in market prices on securities held. Such fluctuations are included with the net realized and unrealized gain or loss from investments. Realized foreign exchange gains or losses arise from sales of foreign currencies, currency gains or losses realized between the trade and settlement dates on securities transactions, and the difference between the recorded amounts of dividends, interest, and foreign withholding taxes and the U.S. dollar equivalent of the amounts actually received or paid. Net unrealized foreign exchange gains and losses arise from changes in fair value of assets and liabilities other than investments in securities held at the end of the reporting period, resulting from changes in exchange rates.
62
DOMINI IMPACT INTERNATIONAL EQUITY FUND
DOMINI IMPACT EQUITY FUND
NOTES TO FINANCIAL STATEMENTS(continued)
January 31, 2019 (Unaudited)
(C) Foreign Currency Contracts.When the Funds purchase or sell foreign securities, they enter into foreign exchange contracts to minimize foreign exchange risk from the trade date to the settlement date of the transactions. A foreign exchange contract is an agreement between two parties to exchange different currencies at an agreed-upon exchange rate on a specified date. The Domini Impact Equity Fund had no open foreign currency spot contracts and the Domini Impact International Equity Fund had $1,600,999 outstanding as of January 31, 2019.
(D) Investment Transactions, Investment Income and Dividends to Shareholders.The Funds earn income daily, net of Fund expenses. Dividends to shareholders of the Domini Impact International Equity Fund are usually declared and paid semiannually from net investment income. Dividends to shareholders of the Domini Impact Equity Fund are usually declared and paid quarterly from net investment income. Distributions to shareholders of realized capital gains, if any, are made annually. Distributions are determined in conformity with income tax regulations, which may differ from generally accepted accounting principles. Reclassifications have been made to the Funds’ components of net assets to reflect income and gains available for distribution (or available capital loss carryovers, as applicable) under income tax regulations.
Investment transactions are accounted for on trade date. Realized gains and losses from security transactions are determined on the basis of identified cost. Interest income is recorded on an accrual basis. Dividend income, net of any applicable withholding tax, is recorded on theex-dividend date or for certain foreign securities, when the information becomes available to the Funds.
Effective during the six months ended January 31, 2019, it is no longer required to present certain line items in the Statements of Changes in Net Assets. The prior period amounts affected by this change are shown below as they were in the prior year Statements of Changes in Net Assets.
For the year ended July 31, 2018, distributions to shareholders were as follows:
| | | | | | | | |
| | | Domini Impact
Equity Fund | | | Domini Impact
International
Equity Fund | |
Distributions from net investment income: | | | | | | | | |
Investor shares | | $ | (4,746,471) | | | $ | (16,514,392) | |
Class A shares | | | (325,093) | | | | (2,135,355) | |
Institutional shares | | | (2,441,449) | | | | (15,242,059) | |
Class R shares | | | (1,091,049) | | | | - | |
63
DOMINI IMPACT INTERNATIONAL EQUITY FUND
DOMINI IMPACT EQUITY FUND
NOTES TO FINANCIAL STATEMENTS(continued)
January 31, 2019 (Unaudited)
| | | | | | | | |
| | | Domini Impact
Equity Fund | | | Domini Impact
International
Equity Fund | |
Distributions from net realized gain: | | | | | | | | |
Investor shares | | $ | (33,673,047) | | | $ | - | |
Class A shares | | | (2,575,641) | | | | - | |
Institutional shares | | | (13,519,409) | | | | - | |
Class R shares | | | (8,050,960) | | | | - | |
(E) Federal Taxes.Each Fund’s policy is to comply with the provisions of the Internal Revenue Code applicable to regulated investment companies and to distribute substantially all of its taxable income, including net realized gains, if any, within the prescribed time periods. Accordingly, no provision for federal income or excise tax is deemed necessary. As of January 31, 2019, tax years 2015 through 2018 remain subject to examination by the Funds’ major tax jurisdictions, which include the United States of America, the Commonwealth of Massachusetts, and New York State.
(F) Redemption Fees.Redemptions and exchanges of Fund shares held less than 30 days may be subject to the Funds’ redemption fee, which is 2% of the amount redeemed. The fee is imposed to offset transaction costs and other expenses associated with short-term investing. The fee may be waived in certain circumstances at the discretion of the Funds. Such fees are retained by the Funds and are recorded as an adjustment topaid-in capital.
(G) Other.Income, expenses (other than those attributable to a specific class), gains, and losses are allocated on a daily basis to each class of shares based upon the relative proportion of net assets represented by such class. Operating expenses directly attributable to a specific class are charged against the operations of that class.
(H) Transfer Agent Credits. Per the arrangement with the Funds’ transfer agent, BNY Mellon Investment Servicing (U.S.) Inc., the Funds have arrangements whereby they may receive earnings credits when positive cash balances are maintained, which are used to offset transfer agency fees. For financial reporting purposes, the Funds include earnings credits as an expense offset in the Statement of Operations. For the six months ended January 31, 2019, transfer agent fees of the Funds, under these arrangements, were reduced as follows:
| | | | |
Domini Impact International Equity Fund Investor shares | | $ | 1,299 | |
Domini Impact International Equity Fund Class A shares | | | 275 | |
Domini Impact International Equity Fund Institutional shares | | | 35 | |
Domini Impact International Equity Fund Class Y shares | | | - | |
Domini Impact Equity Fund Investor shares | | | 1,370 | |
Domini Impact Equity Fund Class A shares | | | 19 | |
Domini Impact Equity Fund Class Institutional shares | | | 4 | |
Domini Impact Equity Fund Class R shares | | | 5 | |
64
DOMINI IMPACT INTERNATIONAL EQUITY FUND
DOMINI IMPACT EQUITY FUND
NOTES TO FINANCIAL STATEMENTS(continued)
January 31, 2019 (Unaudited)
(I) Indemnification.The Funds’ organizational documents provide current and former trustees and officers with a limited indemnification against liabilities arising in connection with the performance of their duties to the Funds. In the normal course of business, the Funds may also enter into contracts that provide general indemnifications. The Funds’ maximum exposure under these arrangements is unknown as this would be dependent on future claims that may be made against the Funds. The risk of material loss from such claims is considered remote.
2. TRANSACTIONS WITH AFFILIATES
(A) Manager/Sponsor. The Funds have retained Domini Impact Investments LLC (Domini) to serve as investment manager and administrator. Domini is registered as an investment adviser under the Investment Advisers Act of 1940. The services provided by Domini consist of investment supervisory services, overall operational support, and administrative services. The administrative services include the provision of general office facilities and supervising the overall administration of the Funds. For its services under the Management Agreements, Domini receives from each Fund a fee accrued daily and paid monthly at the annual rate below of the respective Funds’ average daily net assets before any fee waivers:
| | |
| Domini Impact International Equity Fund | | 1.00% of the first $250 million of net assets managed, |
| (prior to May 1, 2017) | | 0.94% of the next $250 million of net assets managed, and |
| | 0.88% of net assets managed in excess of $500 million |
| | |
| (effective May 1, 2017) | | 0.97% of the first $250 million of net assets managed, |
| | 0.92% of the next $250 million of net assets managed, and |
| | 0.855% of the next $500 million of net assets managed |
| | 0.83% of net assets managed in excess of $1 billion |
| | |
Domini Impact Equity Fund (prior to May 1, 2017) | | 0.30% of the first $2 billion of net assets managed, |
| | 0.29% of the next $1 billion of net assets managed, and |
| | 0.28% of net assets managed in excess of $3 billion |
| | |
| (May 1, 2017 to November 30, 2018) | | 0.245% of the first $250 million of net assets managed, |
| | 0.24% of the next $250 million of net assets managed, and |
| | 0.235% of the next $500 million of net assets managed |
| | 0.23% of net assets managed in excess of $1 billion |
| | |
| (effective December 1, 2018) | | 0.20% of the first $2 billion of net assets managed, |
| | 0.19% of the next $1 billion of net assets managed, and |
| | 0.18% of net assets managed in excess of $3 billion |
Pursuant to a Sponsorship Agreement (with respect to the Domini Impact Equity Fund) Domini provides the Funds with the administrative personnel and services necessary to operate the Funds. In addition to general administrative
65
DOMINI IMPACT INTERNATIONAL EQUITY FUND
DOMINI IMPACT EQUITY FUND
NOTES TO FINANCIAL STATEMENTS(continued)
January 31, 2019 (Unaudited)
services and facilities for the Funds similar to those provided by Domini under the Management Agreements, Domini answers questions from the general public and the media regarding the securities holdings of the Funds. For these services and facilities, Domini receives fees accrued daily and paid monthly from the Funds at the annual rate below of the respective Funds’ average daily net assets before any fee waivers:
| | |
| Domini Impact Equity Fund | | 0.45% of the first $2 billion of net assets managed, |
| | 0.44% of the next $1 billion of net assets managed, and |
| | 0.43% of net assets managed in excess of $3 billion |
Effective July 23, 2018, Domini agreed to reduce its fees and reimburse expenses to keep the aggregate annual operating expenses of the International Fund (excluding brokerage fees and commissions, interest, taxes, and other extraordinary expenses), at no greater than 1.15% of the average daily net assets of the Class Y shares of the Fund through November 30, 2019, absent an earlier modification by Fund’s Board. Effective June 15, 2018, Domini agreed to reduce its fees and reimburse expenses to keep the aggregate annual operating expenses of the International Fund (excluding brokerage fees and commissions, interest, taxes, and other extraordinary expenses), at no greater than 1.43% of the average daily net assets of the Class A shares of the Fund through November 30, 2019, absent an earlier modification by Fund’s Board. For the period from November 30, 2017 through June 14, 2018, Domini agreed to reduce its fees and reimburse expenses to keep the aggregate annual operating expenses of the International Fund (excluding brokerage fees and commissions, interest, taxes, and other extraordinary expenses), at no greater than 1.51% of the average daily net assets of the Class A shares of the International Fund, absent an earlier modification by the Board of Trustees which oversee the Funds. For periods prior to November 30, 2017, Domini contractually agreed to reduce its fees and reimburse expenses to keep the aggregate annual operating expenses of the International Fund (excluding brokerage fees and commissions, interest, taxes, and other extraordinary expenses), at no greater than 1.60%, 1.57%, and 1.27% of the average daily net assets of the Investor, Class A, and Institutional shares of the International Fund, respectively, absent an earlier modification by the Board of Trustees which oversee the Fund.
Effective December 1, 2018, Domini agreed to reduce its fees and reimburse expenses to keep the aggregate annual operating expenses of the Equity Fund (excluding brokerage fees and commissions, interest, taxes, and other extraordinary expenses), at no greater than 1.09%, 1.09%, 0.74% and 0.80% of the average daily net assets of the Investor shares, Class A shares,
66
DOMINI IMPACT INTERNATIONAL EQUITY FUND
DOMINI IMPACT EQUITY FUND
NOTES TO FINANCIAL STATEMENTS(continued)
January 31, 2019 (Unaudited)
Institutional shares and Class R shares of the Fund, respectively. This agreement will continue until November 30, 2019, absent an earlier modification by the Board of Trustees which oversee the Funds. For the period from June 15, 2018 through November 30, 2019, Domini contractually agreed to reduce its fees and reimburse expenses to keep the aggregate annual operating expenses of the Equity Fund (excluding brokerage fees and commissions, interest, taxes, and other extraordinary expenses), at no greater than 1.09% of the average daily net assets of the Class A shares of the Equity Fund, respectively, absent an earlier modification by the Board of Trustees which oversee the Fund. For the period from November 30, 2017 through November 30, 2018, Domini contractually agreed to reduce its fees and reimburse expenses to keep the aggregate annual operating expenses of the Equity Fund (excluding brokerage fees and commissions, interest, taxes, and other extraordinary expenses), at no greater than 1.12%, and 0.74% of the average daily net assets of the Class A and Institutional shares of the Equity Fund, respectively, absent an earlier modification by the Board of Trustees which oversee the Fund. For periods prior to November 30, 2017, Domini contractually agreed to reduce its fees and reimburse expenses to keep the aggregate annual operating expenses of the Equity Fund (excluding brokerage fees and commissions, interest, taxes, and other extraordinary expenses), at no greater than 1.25%, 1.18%, 0.80%, and 0.90% of the average daily net assets of the Investor, Class A, Institutional, and Class R shares of the Equity Fund, respectively, absent an earlier modification by the Board of Trustees which oversee the Fund.
For the six months ended January 31, 2019, Domini waived fees and reimbursed expenses as follows:
| | | | | | | | |
| | | FEES WAIVED | | | EXPENSES REIMBURSED | |
| | | | | | | | |
Domini Impact International Equity Fund | | $ | - | | | $ | - | |
Domini Impact Equity Fund | | | - | | | | 160,407 | |
Fees waived and/or expenses reimbursed under the Expense Limitation Agreement are only recoverable by Domini and/or its affiliates in the current fiscal year to the extent actual Fund expenses are less than the contractual expense cap during such year.
As of January 31, 2019, Domini owned less than 1% of any class of the outstanding shares of each Fund.
(B) Submanager. Wellington Management Company LLP (Wellington), a Delaware limited liability partnership, provides investment submanagement services to the Domini Impact International Fund on aday-to-day basis pursuant
67
DOMINI IMPACT INTERNATIONAL EQUITY FUND
DOMINI IMPACT EQUITY FUND
NOTES TO FINANCIAL STATEMENTS(continued)
January 31, 2019 (Unaudited)
to a Submanagement Agreement with Domini. SSGA Funds Management, Inc. (“SSGA”) provides investment submanagement services to the Domini Impact Equity Fund on aday-to-day basis pursuant to a submanagement Agreement with Domini. Prior to December 1, 2018, Wellington provided investment submanagement services to the Domini Impact Equity Fund.
(C) Distributor. The Board of Trustees of the Funds has adopted a Distribution Plan with respect to the Funds’ Investor shares and Class A shares in accordance with Rule12b-1 under the Act. DSIL Investment Services LLC, a wholly owned subsidiary of Domini (DSIL), acts as agent of the Funds in connection with the offering of Investor shares of the Funds pursuant to a Distribution Agreement. Under the Distribution Plan, the Funds pay expenses incurred in connection with the sale of Investor shares and Class A shares and pay DSIL a distribution fee at an aggregate annual rate not to exceed 0.25% of the average daily net assets representing the Investor shares and Class A shares. For the six months ended January 31, 2019, fees waived were as follows:
| | | | |
| | | FEES WAIVED | |
| | | | |
Domini Impact International Equity Fund Investor shares | | $ | - | |
Domini Impact International Equity Fund Class A shares | | | - | |
Domini Impact Equity Fund Investor shares | | | - | |
Domini Impact Equity Fund Class A shares | | | 8,565 | |
DSIL, the Funds’ Distributor, has received commissions related to the sales of fund shares. For the six months ended January 31, 2019, DSIL received $2,882, and $994 from the Domini Impact International Equity Fund Class A Shares, and the Domini Impact Equity Fund Class A shares, respectively.
(D) Shareholder Service Agent. The Trust has retained Domini to provide certain shareholder services with respect to the Domini Impact Equity Fund, and Domini Impact International Equity Fund and their shareholders, which services were previously provided by BNY Asset Servicing (“BNY”) or another fulfillment and mail service provider and are supplemental to services currently provided by BNY, pursuant to a transfer agency agreement between each Fund and BNY. For these services, Domini receives fees from each Fund paid monthly at an annual rate of $4.00 per active account. For the six months ended January 31, 2019, there were no fees waived.
(E) Trustees and Officers. Each of the Independent Trustees receives an annual retainer for serving as a Trustee of the Trust of $23,000. The Lead Independent Trustee and Chair of the Audit Committee receive an additional chairperson fee of $5,000. Each Independent Trustee also receives $2,000 for attendance at each meeting of the Board of the Trust (reduced to $1,000 in the event that a
68
DOMINI IMPACT INTERNATIONAL EQUITY FUND
DOMINI IMPACT EQUITY FUND
NOTES TO FINANCIAL STATEMENTS(continued)
January 31, 2019 (Unaudited)
Trustee participates at anin-person meeting by telephone). In addition, each Trustee receives reimbursement for reasonable expenses incurred in attending meetings. These expenses are allocated on apro-rata basis to each shares class of a Fund according to their respective net assets.
As of January 31, 2019, all Trustees and officers of the Trust as a group owned less than 1% of each Fund’s outstanding shares.
3. INVESTMENT TRANSACTIONS
For the six months ended January 31, 2019, cost of purchase and proceeds from sales of investments other than short-term obligations were as follows:
| | | | | | | | |
| | | PURCHASE | | | SALES | |
Domini Impact International Equity Fund | | $ | 462,312,528 | | | $ | 552,170,110 | |
Domini Impact Equity Fund | | | 645,830,223 | | | | 708,647,592 | |
4. SHARES OF BENEFICIAL INTEREST
At January 31, 2019, there was an unlimited number of shares authorized ($0.00001 par value). Transactions in the Funds’ shares were as follows:
| | | | | | | | | | | | | | | | |
| | | Six Months Ended
January 31, 2019 (unaudited) | | | Year Ended
July 31, 2018 | |
| | | Shares | | | Amount | | | Shares | | | Amount | |
| | | | | | | | | | | | | | | | |
|
Domini Impact International Equity Fund | |
| | | | |
Investor Shares | | | | | | | | | | | | | | | | |
Shares sold | | | 14,766,981 | | | $ | 116,022,507 | | | | 39,894,020 | | | $ | 356,832,367 | |
Shares issued in reinvestment of dividends and distributions | | | 3,012,174 | | | | 21,506,920 | | | | 1,413,528 | | | | 12,462,152 | |
Shares redeemed | | | (16,376,985) | | | | (127,907,226) | | | | (39,056,074) | | | | (341,831,670) | |
Redemption fees | | | - | | | | 1,090 | | | | - | | | | 11,010 | |
| | | | | | | | | | | | | | | | |
Net increase (decrease) | | | 1,402,170 | | | $ | 9,623,291 | | | | 2,251,474 | | | $ | 27,473,859 | |
| | | | | | | | | | | | | | | | |
| | | | |
Class A Shares | | | | | | | | | | | | | | | | |
Shares sold | | | 743,392 | | | $ | 6,386,976 | | | | 3,331,819 | | | $ | 31,380,030 | |
Shares issued in reinvestment of dividends and distributions | | | 175,197 | | | | 1,327,993 | | | | 221,769 | | | | 2,059,863 | |
Shares redeemed | | | (5,899,718) | | | | (47,166,532) | | | | (3,990,387) | | | | (37,650,332) | |
Redemption fees | | | - | | | | 127 | | | | - | | | | 2,370 | |
| | | | | | | | | | | | | | | | |
Net increase (decrease) | | | (4,981,129) | | | $ | (39,451,436) | | | | (436,799) | | | $ | (4,208,069) | |
| | | | | | | | | | | | | | | | |
69
DOMINI IMPACT INTERNATIONAL EQUITY FUND
DOMINI IMPACT EQUITY FUND
NOTES TO FINANCIAL STATEMENTS(continued)
January 31, 2019 (Unaudited)
| | | | | | | | | | | | | | | | |
| | | Six Months Ended
January 31, 2019 (unaudited) | | | Year Ended
July 31, 2018 | |
| | | Shares | | | Amount | | | Shares | | | Amount | |
| | | | |
Institutional Shares | | | | | | | | | | | | | | | | |
Shares sold | | | 22,991,549 | | | $ | 176,893,306 | | | | 29,935,225 | | | $ | 266,559,969 | |
Shares issued in reinvestment of dividends and distributions | | | 2,891,786 | | | | 20,502,761 | | | | 870,749 | | | | 7,646,549 | |
Shares redeemed | | | (20,504,102) | | | | (156,925,117) | | | | (8,085,636) | | | | (71,451,343) | |
Redemption fees | | | - | | | | 3,670 | | | | - | | | | 2,220 | |
| | | | | | | | | | | | | | | | |
Net increase (decrease) | | | 5,379,233 | | | $ | 40,474,620 | | | | 22,720,338 | | | $ | 202,757,395 | |
| | | | | | | | | | | | | | | | |
| | | | |
Class Y Shares | | | | | | | | | | | | | | | | |
Shares sold | | | 5,690,651 | | | $ | 44,271,232 | | | | 16,332,872 | | | $ | 139,857,877 | |
Shares issued in reinvestment of dividends and distributions | | | 26,551 | | | | 188,515 | | | | - | | | | - | |
Shares redeemed | | | (8,046,537) | | | | (61,008,724) | | | | (80,143) | | | | (697,659) | |
Redemption fees | | | - | | | | - | | | | - | | | | - | |
| | | | | | | | | | | | | | | | |
Net increase (decrease) | | | (2,329,335) | | | $ | (16,548,977) | | | | 16,252,729 | | | $ | 139,160,218 | |
| | | | | | | | | | | | | | | | |
| | | | |
Total | | | | | | | | | | | | | | | | |
Shares sold | | | 44,192,573 | | | $ | 343,574,021 | | | | 89,493,936 | | | $ | 794,630,243 | |
Shares issued in reinvestment of dividends and distributions | | | 6,105,708 | | | | 43,526,189 | | | | 2,506,046 | | | | 22,168,564 | |
Shares redeemed | | | (50,827,342) | | | | (393,007,599) | | | | (51,212,240) | | | | (451,631,004) | |
Redemption fees | | | - | | | | 4,887 | | | | - | | | | 15,600 | |
| | | | | | | | | | | | | | | | |
Net increase (decrease) | | | (529,061) | | | $ | (5,902,502) | | | | 40,787,742 | | | $ | 365,183,403 | |
| | | | | | | | | | | | | | | | |
As approved by the Board of Trustees, the Domini Impact Equity Fund Investor Shares effected a 1.9988601 for 1 share split and the Domini Impact Equity Fund Class A Shares and Domini Impact Equity Fund R Shares effected a 0.2155310 for 1 and 0.1555580 for 1 reverse share split, respectively on January 26, 2018. The net asset value of each share class increased or decreased proportionately at that time.
| | | | | | | | | | | | | | | | |
| | | Six Months Ended
January 31, 2019 (unaudited) | | | Year Ended
July 31, 2018 | |
| | | Shares | | | Amount | | | Shares | | | Amount | |
| | | | | | | | | | | | | | | | |
| | | |
Domini Impact Equity Fund | | | | | | | | | | | | | |
| | | | |
Investor Shares | | | | | | | | | | | | | | | | |
Shares sold | | | 389,636 | | | $ | 8,615,473 | | | | 917,893 | | | $ | 29,370,549 | |
Shares issued in reinvestment of dividends and distributions | | | 3,536,339 | | | | 66,571,122 | | | | 838,545 | | | | 36,957,120 | |
Shares redeemed | | | (1,996,265) | | | | (44,291,487) | | | | (3,320,197) | | | | (101,150,879) | |
Redemption fees | | | - | | | | 288 | | | | - | | | | 5,862 | |
Share increase from 1.9988601 for 1 share split | | | - | | | | - | | | | 14,659,938 | | | | - | |
| | | | | | | | | | | | | | | | |
Net increase (decrease) | | | 1,929,710 | | | $ | 30,895,396 | | | | 13,096,179 | | | $ | (34,817,348) | |
| | | | | | | | | | | | | | | | |
70
DOMINI IMPACT INTERNATIONAL EQUITY FUND
DOMINI IMPACT EQUITY FUND
NOTES TO FINANCIAL STATEMENTS(continued)
January 31, 2019 (Unaudited)
| | | | | | | | | | | | | | | | |
| | | Six Months Ended
January 31, 2019 (unaudited) | | | Year Ended
July 31, 2018 | |
| | | Shares | | | Amount | | | Shares | | | Amount | |
| | | | |
Class A Shares | | | | | | | | | | | | | | | | |
Shares sold | | | 26,747 | | | $ | 570,700 | | | | 58,766 | | | $ | 629,074 | |
Shares issued in reinvestment of dividends and distributions | | | 30,283 | | | | 570,718 | | | | 545,022 | | | | 2,812,219 | |
Shares redeemed | | | (44,000) | | | | (1,013,722) | | | | (261,738) | | | | (2,366,902) | |
Redemption fees | | | - | | | | 681 | | | | - | | | | - | |
Share decrease from 0.2155310 for 1 reverse share split | | | - | | | | - | | | | (1,212,001) | | | | - | |
| | | | | | | | | | | | | | | | |
Net increase (decrease) | | | 13,030 | | | $ | 128,377 | | | | (869,951) | | | $ | 1,074,391 | |
| | | | | | | | | | | | | | | | |
| | | | |
Institutional Shares | | | | | | | | | | | | | | | | |
Shares sold | | | 162,258 | | | $ | 3,679,715 | | | | 399,455 | | | $ | 9,760,419 | |
Shares issued in reinvestment of dividends and distributions | | | 535,123 | | | | 10,036,249 | | | | 646,168 | | | | 15,326,138 | |
Shares redeemed | | | (863,533) | | | | (18,110,253) | | | | (2,497,382) | | | | (60,543,234) | |
Redemption fees | | | - | | | | 23 | | | | - | | | | 802 | |
| | | | | | | | | | | | | | | | |
Net increase (decrease) | | | (166,152) | | | $ | (4,394,266) | | | | (1,451,759) | | | $ | (35,455,875) | |
| | | | | | | | | | | | | | | | |
| | | | |
Class R Shares | | | | | | | | | | | | | | | | |
Shares sold | | | 24,431 | | | $ | 540,456 | | | | 155,216 | | | $ | 1,300,794 | |
Shares issued in reinvestment of dividends and distributions | | | 105,484 | | | | 1,981,109 | | | | 2,439,012 | | | | 9,094,696 | |
Shares redeemed | | | (89,827) | | | | (1,874,092) | | | | (537,937) | | | | (5,885,573) | |
Redemption fees | | | - | | | | 4 | | | | - | | | | 6 | |
Share decrease from 0.1555580 for 1 reverse share split | | | - | | | | - | | | | (4,865,777) | | | | - | |
| | | | | | | | | | | | | | | | |
Net increase (decrease) | | | 40,088 | | | $ | 647,477 | | | | (2,809,486) | | | $ | 4,509,923 | |
| | | | | | | | | | | | | | | | |
| | | | | | | | | | | | | | | | |
| | | | |
Total | | | | | | | | | | | | | | | | |
Shares sold | | | 603,072 | | | $ | 13,406,344 | | | | 1,531,330 | | | $ | 41,060,836 | |
Shares issued in reinvestment of dividends and distributions | | | 4,207,229 | | | | 79,159,198 | | | | 4,468,747 | | | | 64,190,173 | |
Shares redeemed | | | (2,993,625) | | | | (65,289,554) | | | | (6,617,254) | | | | (169,946,588) | |
Redemption fees | | | - | | | | 996 | | | | - | | | | 6,670 | |
Share increase from share split | | | - | | | | - | | | | 8,582,160 | | | | - | |
| | | | | | | | | | | | | | | | |
Net increase (decrease) | | | 1,816,676 | | | $ | 27,276,984 | | | | 7,964,983 | | | $ | (64,688,909) | |
| | | | | | | | | | | | | | | | |
71
DOMINI IMPACT INTERNATIONAL EQUITY FUND
DOMINI IMPACT EQUITY FUND
NOTES TO FINANCIAL STATEMENTS(continued)
January 31, 2019 (Unaudited)
5. FEDERAL TAX STATUS
The tax basis of the components of net assets for the Funds at July 31, 2018, is as follows:
| | | | | | | | |
| | | Domini Impact
International
Equity Fund | | | Domini
Impact Equity
Fund | |
Undistributed ordinary income | | $ | 21,526,073 | | | $ | 14,091,309 | |
Undistributed capital gains | | | 36,772,373 | | | | 56,289,547 | |
Unrealized appreciation/(depreciation) | | | 66,484,423 | | | | 119,101,419 | |
| | | | | | | | |
Distributable net earnings/(deficit) | | $ | 124,782,869 | | | $ | 189,482,275 | |
| | | | | | | | |
The difference between components of Distributable Earnings on a tax basis and the amounts reflected in the statement of assets and liabilities is primarily due to differences in book and tax policies. For the year ended July 31, 2018, the Funds made the following reclassifications to the components of net assets to align financial reporting with tax reporting:
| | | | | | | | |
| | | Domini Impact
International
Equity Fund | | | Domini
Impact Equity
Fund | |
Paid-in capital | | $ | 2 | | | $ | 3 | |
Undistributed net investment income (loss) | | | 8,521,982 | | | | (1,133,632) | |
Accumulated net realized gain (loss) | | | (8,521,984) | | | | 1,133,629 | |
To the extent that the Funds realize net capital gains in the future, those gains may be offset by any unused net capital loss carryforwards. The Funds are permitted to carry forward a net capital loss from any taxable year that began on or before December 22, 2010 for eight years following the year of the loss. The Funds are permitted to carry forward net capital losses incurred in taxable years beginning after December 22, 2010, for an unlimited time period. Carryforwards of losses from taxable years that began after December 22, 2010, along with any other capital losses deferred and treated as recognized in any such year, are required to be utilized prior to carryforwards of losses incurred in taxable years that began on or before December 22, 2010. As a result of this ordering rule, carryforwards of losses from taxable years that began on or before December 22, 2010 may be more likely to expire unused. Losses from taxable years that begin after December 22, 2010 that are carried forward will retain their character as either short-term or long-term capital losses.
72
DOMINI IMPACT INTERNATIONAL EQUITY FUND
DOMINI IMPACT EQUITY FUND
NOTES TO FINANCIAL STATEMENTS(continued)
January 31, 2019 (Unaudited)
For federal income tax purposes, dividends paid were characterized as follows:
| | | | | | | | | | | | | | | | |
| | | Domini Impact International
Equity Fund | | | Domini Impact Equity Fund | |
| | | Year Ended July 31, | | | Year Ended July 31, | |
| | | 2018 | | | 2017 | | | 2018 | | | 2017 | |
Ordinary income | | $ | 33,891,806 | | | $ | 12,118,962 | | | $ | 12,405,096 | | | $ | 8,566,436 | |
Long-term capital gain | | | - | | | | - | | | | 54,018,023 | | | | 23,410,947 | |
| | | | | | | | | | | | | | | | |
Total | | $ | 33,891,806 | | | $ | 12,118,962 | | | $ | 66,423,119 | | | $ | 31,977,383 | |
| | | | | | | | | | | | | | | | |
The Funds are subject to the provisions of Accounting Standards Codification ASC 740 Income Taxes (ASC 740). ASC 740 sets forth a minimum threshold for financial statement recognition of the benefit of a tax position taken or expected to be taken in a tax return. The Funds did not have a liability to record for any unrecognized tax benefits in the accompanying financial statements. No provision has been made for taxes on income, capital gains or unrealized appreciation on securities held or for excise tax on income and capital gains.
6. OTHER RISKS
The Fund’s risks include, but are not limited to, some or all of the risks discussed below:
Foreign Securities Risk:The Fund’s investments in securities of foreign issuers or issuers with significant exposure to foreign markets involve additional risk. Foreign countries in which the Funds may invest may have markets that are less liquid, less regulated and more volatile than US markets. The value of the Funds’ investments may decline because of factors affecting the particular issuer as well as foreign markets and issuers generally, such as unfavorable government actions, and political or financial instability.
Liquidity Risk:The Funds may invest in instruments that trade in lower volumes and are less liquid than other investments. Liquidity risk includes the risk that the Funds may make investments that may become less liquid in response to market developments or adverse investor perceptions. Investments that are illiquid or that trade in lower volumes may be more difficult to value. When there is no willing buyer and investments cannot be readily sold at the desired time or price, the Funds may have to accept a lower price or may not be able to sell the instrument at all. An inability to sell a portfolio position can adversely affect the Funds’ value or prevent the Funds from being able to take advantage of other investment opportunities.
73
DOMINI IMPACT INTERNATIONAL EQUITY FUND
DOMINI IMPACT EQUITY FUND
NOTES TO FINANCIAL STATEMENTS(continued)
January 31, 2019 (Unaudited)
Market and Credit Risk:Securities markets may be volatile, and the market prices of the Funds’ securities may decline. Securities fluctuate in price based on changes in an issuer’s financial condition and overall market and economic conditions. If the market prices of the securities owned by the Funds fall, the value of an investment in the Funds will decline. Additionally, the Funds may also be exposed to credit risk in the event that an issuer or guarantor fails to perform or that an institution or entity with which the Funds has unsettled or open transactions defaults.
Emerging Markets Risk:The risks of foreign investments are greater for investments in or exposed to emerging markets. Emerging market countries typically have economic and political systems that are less fully developed, and can be expected to be less stable, than those of more developed countries. For example, the economies of such countries can be subject to rapid and unpredictable rates of inflation or deflation. Low trading volumes may result in a lack of liquidity and price volatility. Emerging market countries may have policies that restrict investment bynon-US investors, or that preventnon-US investors from withdrawing their money at will.
74
DOMINI IMPACT BOND FUND
STATEMENT OF ASSETS AND LIABILITIES
January 31, 2019 (Unaudited)
| | | | |
ASSETS: | | | | |
Investments at value (cost $154,150,974) | | $ | 152,712,485 | |
Cash | | | 1,884,459 | |
Foreign currency (cost $64,955) | | | 65,794 | |
Receivable for securities sold | | | 4,558,540 | |
Interest receivable | | | 952,059 | |
Collateral on certain derivative contracts | | | 592,320 | |
Receivable for capital shares | | | 77,260 | |
Unrealized appreciation on OTC swap contracts | | | 53,200 | |
Cash held at other banks (cost $28,977) | | | 28,990 | |
Receivable for variation margin swaps | | | 28,374 | |
Premium received for OTC swap contracts | | | 702 | |
Receivable for variation margin futures | | | 29 | |
| | | | |
Total assets | | | 160,954,212 | |
| | | | |
LIABILITIES: | | | | |
Payable for securities purchased | | | 26,852,569 | |
Payable for capital shares | | | 167,958 | |
Cash due to broker (cost $118,774) | | | 118,799 | |
Interest payable | | | 118,068 | |
Management fee payable | | | 64,144 | |
Other accrued expenses | | | 30,436 | |
Distribution fee payable | | | 29,763 | |
Premium paid swap contracts | | | 21,151 | |
Dividend payable | | | 20,558 | |
Unrealized depreciation on forward currency contracts | | | 9,367 | |
| | | | |
Total liabilities | | | 27,432,813 | |
| | | | |
NET ASSETS | | $ | 133,521,399 | |
| | | | |
NET ASSETS CONSIST OF: | | | | |
Paid-in capital | | $ | 136,444,061 | |
Total distributable earnings (loss) | | | (2,922,662) | |
| | | | |
| | $ | 133,521,399 | |
| | | | |
NET ASSET VALUE PER SHARE | | | | |
| |
Investor Shares | | | | |
Net assets | | $ | 113,506,363 | |
| | | | |
Outstanding shares of beneficial interest | | | 10,331,568 | |
| | | | |
Net asset value and offering price per share* | | $ | 10.99 | |
| | | | |
| |
Institutional Shares | | | | |
Net assets | | $ | 20,015,036 | |
| | | | |
Outstanding shares of beneficial interest | | | 1,834,346 | |
| | | | |
Net asset value and offering price per share* | | $ | 10.91 | |
| | | | |
* Redemption price is equal to net asset value less any applicable redemption fees retained by the Fund.
SEE NOTES TO FINANCIAL STATEMENTS
75
DOMINI IMPACT BOND FUND
STATEMENT OF OPERATIONS
For the Six Months Ended January 31, 2019 (Unaudited)
| | | | |
INCOME: | | | | |
Interest income | | $ | 2,433,399 | |
| | | | |
EXPENSES: | | | | |
Management fee | | | 235,447 | |
Administrative fee | | | 182,862 | |
Distribution fees – Investor shares | | | 164,269 | |
Transfer agent fees – Investor shares | | | 75,596 | |
Transfer agent fees – Institutional shares | | | 238 | |
Accounting and custody fees | | | 66,574 | |
Registration – Investor shares | | | 9,913 | |
Registration – Institutional shares | | | 14,185 | |
Trustees fees | | | 11,188 | |
Shareholder communications | | | 10,804 | |
Miscellaneous | | | 9,689 | |
Shareholder Service fees – Investor shares | | | 6,271 | |
Shareholder Service fees – Institutional shares | | | 23 | |
Professional fees | | | 4,597 | |
| | | | |
Total expenses | | | 791,656 | |
Fees waived and expense reimbursed | | | (175,143) | |
Transfer agent credits | | | (332) | |
| | | | |
Net expenses | | | 616,181 | |
| | | | |
NET INVESTMENT INCOME | | | 1,817,218 | |
| | | | |
REALIZED AND UNREALIZED GAINS (LOSSES) | | | | |
NET REALIZED GAIN/(LOSS) FROM: | | | | |
Investments | | | (622,080) | |
Swap contracts | | | 298,763 | |
Futures contracts | | | 33,790 | |
Foreign currency | | | 18,227 | |
Options | | | 483 | |
| | | | |
Net realized gain (loss) | | | (270,817) | |
| | | | |
NET CHANGES IN UNREALIZED APPRECIATION (DEPRECIATION) FROM: | | | | |
Investments, futures and swap contracts | | | 920,757 | |
Translation of assets and liabilities in foreign currencies | | | 28,224 | |
| | | | |
Net change in unrealized appreciation (depreciation) | | | 948,981 | |
| | | | |
NET REALIZED AND UNREALIZED GAIN (LOSS) | | | 678,164 | |
| | | | |
NET INCREASE IN NET ASSETS RESULTING FROM OPERATIONS | | $ | 2,495,382 | |
| | | | |
SEE NOTES TO FINANCIAL STATEMENTS
76
DOMINI IMPACT BOND FUND
STATEMENTS OF CHANGES IN NET ASSETS
| | | | | | | | |
| | | Six Months
Ended
January 31, 2019
(Unaudited) | | | Year Ended
July 31, 2018 | |
INCREASE (DECREASE) IN NET ASSETS | | | | | | | | |
OPERATIONS | | | | | | | | |
Net investment income (loss) | | $ | 1,817,218 | | | $ | 3,697,413 | |
Net realized gain (loss) on investments | | | (270,817) | | | | (647,623) | |
Net change in unrealized appreciation (depreciation) on investments | | | 948,981 | | | | (4,142,783) | |
| | | | | | | | |
Net Increase (Decrease) in Net Assets Resulting from Operations | | | 2,495,382 | | | | (1,092,993) | |
| | | | | | | | |
DISTRIBUTIONS TO SHAREHOLDERS | | | | | | | | |
Investor shares | | | (1,741,643) | | | | (3,516,123) | |
Institutional shares | | | (312,131) | | | | (238,435) | |
| | | | | | | | |
Net Decrease in Net Assets from Distributions | | | (2,053,774) | | | | (3,754,558) | |
| | | | | | | | |
CAPITAL SHARE TRANSACTIONS | | | | | | | | |
Proceeds from sale of shares | | | 22,724,460 | | | | 44,398,448 | |
Net asset value of shares issued in reinvestment of distributions and dividends | | | 1,928,308 | | | | 3,554,681 | |
Payment for shares redeemed | | | (48,086,141) | | | | (35,687,603) | |
Redemption fee | | | 304 | | | | 1,846 | |
| | | | | | | | |
Net Increase in Net Assets from Capital Share Transactions | | | (23,433,069) | | | | 12,267,372 | |
| | | | | | | | |
Total Increase (Decrease) in Net Assets | | | (22,991,461) | | | | 7,419,821 | |
NET ASSETS | | | | | | | | |
Beginning of period | | $ | 156,512,860 | | | $ | 149,093,039 | |
| | | | | | | | |
End of period | | $ | 133,521,399 | | | $ | 156,512,860 | |
| | | | | | | | |
SEE NOTES TO FINANCIAL STATEMENTS
77
DOMINI IMPACT BOND FUND — INVESTOR SHARES
FINANCIAL HIGHLIGHTS
| | | | | | | | | | | | | | | | | | | | | | | | |
| | | Six Months
Ended
January 31, 2019
(Unaudited) | | | Year Ended July 31, | |
| | | 2018 | | | 2017 | | | 2016 | | | 2015 | | | 2014 | |
For a share outstanding for the period: | | | | | | | | | | | | | | | | | | | | | | | | |
Net asset value, beginning of period | | | $10.92 | | | | $11.26 | | | | $11.60 | | | | $11.16 | | | | $11.24 | | | | $11.15 | |
| | | | | | | | | | | | | | | | | | | | | | | | |
Income from investment operations: | | | | | | | | | | | | | | | | | | | | | | | | |
Net investment income (loss) | | | 0.13 | | | | 0.26 | | | | 0.23 | | | | 0.24 | | | | 0.17 | | | | 0.16 | |
Net realized and unrealized gain (loss) on investments | | | 0.09 | | | | (0.33) | | | | (0.29) | | | | 0.50 | | | | (0.07) | | | | 0.13 | |
| | | | | | | | | | | | | | | | | | | | | | | | |
Total income (loss) from investment operations | | | 0.22 | | | | (0.07) | | | | (0.06) | | | | 0.74 | | | | 0.10 | | | | 0.29 | |
| | | | | | | | | | | | | | | | | | | | | | | | |
Less dividends and distributions: | | | | | | | | | | | | | | | | | | | | | | | | |
Dividends to shareholders from net investment income | | | (0.15) | | | | (0.26) | | | | (0.23) | | | | (0.24) | | | | (0.17) | | | | (0.16) | |
Distributions to shareholders from net realized gain | | | - | | | | (0.01) | | | | (0.05) | | | | (0.06) | | | | (0.01) | | | | (0.04) | |
Tax return of capital5 | | | - | | | | - | | | | (0.00) | 1 | | | - | | | | - | | | | - | |
| | | | | | | | | | | | | | | | | | | | | | | | |
Total distributions | | | (0.15) | | | | (0.27) | | | | (0.28) | | | | (0.30) | | | | (0.18) | | | | (0.20) | |
| | | | | | | | | | | | | | | | | | | | | | | | |
Redemption fee proceeds5 | | | 0.00 | 1 | | | 0.00 | 1 | | | 0.00 | 1 | | | 0.00 | 1 | | | 0.00 | 1 | | | 0.00 | 1 |
| | | | | | | | | | | | | | | | | | | | | | | | |
Net asset value, end of period | | | $10.99 | | | | $10.92 | | | | $11.26 | | | | $11.60 | | | | $11.16 | | | | $11.24 | |
| | | | | | | | | | | | | | | | | | | | | | | | |
Total return2 | | | 2.00% | | | | -0.74% | | | | -0.32% | | | | 6.73% | | | | 0.89% | | | | 2.59% | |
Portfolio turnover | | | 116% | | | | 326% | | | | 386% | | | | 297% | | | | 348% | | | | 120% | |
Ratios/supplemental data (annualized): | | | | | | | | | | | | | | | | | | | | | | | | |
Net assets, end of period (in millions) | | | $114 | | | | $144 | | | | $143 | | | | $144 | | | | $129 | | | | $126 | |
Ratio of expenses to average net assets | | | 0.87% | 3,4 | | | 0.87% | 3 | | | 0.93% | 3 | | | 0.93% | 3 | | | 0.95% | 3 | | | 0.95% | 3 |
Ratio of gross expenses to average net assets | | | 1.10% | | | | 1.14% | | | | 1.16% | | | | 1.19% | | | | 1.24% | | | | 1.24% | |
Ratio of net investment income to average net assets | | | 2.45% | | | | 2.37% | | | | 2.06% | | | | 2.13% | | | | 1.52% | | | | 1.42% | |
1 Amount represents less than $0.005 per share.
2 Not annualized for periods less than one year.
3 Reflects a waiver of fees by the Manager and the Distributor of the Fund.
4 Ratio of expenses to average net assets includes transfer agent credits. Excluding transfer agent credits the ratio of expenses to average net assets would have been 0.87% for the six months ended January 31, 2019.
5 Based on average shares outstanding.
SEE NOTES TO FINANCIAL STATEMENTS
78
DOMINI IMPACT BOND FUND — INSTITUTIONAL SHARES
FINANCIAL HIGHLIGHTS
| | | | | | | | | | | | | | | | | | | | | | | | |
| | | Six Months
Ended
January 31, 2019
(Unaudited) | | | For the year ended July 31, | |
| | | 2018 | | | 2017 | | | 2016 | | | 2015 | | | 2014 | |
For a share outstanding for the period: | | | | | | | | | | | | | | | | | | | | | | | | |
Net asset value, beginning of period | | | $10.89 | | | | $11.23 | | | | $11.57 | | | | $11.14 | | | | $11.23 | | | | $11.15 | |
| | | | | | | | | | | | | | | | | | | | | | | | |
Income from investment operations: | | | | | | | | | | | | | | | | | | | | | | | | |
Net investment income (loss) | | | 0.14 | | | | 0.30 | | | | 0.27 | | | | 0.27 | | | | 0.20 | | | | 0.19 | |
Net realized and unrealized gain (loss) on investments | | | 0.08 | | | | (0.34) | | | | (0.29) | | | | 0.49 | | | | (0.09) | | | | 0.12 | |
| | | | | | | | | | | | | | | | | | | | | | | | |
Total income (loss) from investment operations | | | 0.22 | | | | (0.04) | | | | (0.02) | | | | 0.76 | | | | 0.11 | | | | 0.31 | |
| | | | | | | | | | | | | | | | | | | | | | | | |
Less dividends and distributions: | | | | | | | | | | | | | | | | | | | | | | | | |
Dividends to shareholders from net investment income | | | (0.20) | | | | (0.29) | | | | (0.27) | | | | (0.27) | | | | (0.20) | | | | (0.19) | |
Distributions to shareholders from net realized gain | | | - | | | | (0.01) | | | | (0.05) | | | | (0.06) | | | | (0.01) | | | | (0.04) | |
Tax return of capital5 | | | | | | | - | | | | (0.00) | 1 | | | - | | | | - | | | | - | |
| | | | | | | | | | | | | | | | | | | | | | | | |
Total distributions | | | (0.20) | | | | (0.30) | | | | (0.32) | | | | (0.33) | | | | (0.21) | | | | (0.23) | |
| | | | | | | | | | | | | | | | | | | | | | | | |
Redemption fee proceeds5 | | | 0.00 | 1 | | | 0.00 | 1 | | | 0.00 | 1 | | | 0.00 | 1 | | | 0.01 | | | | - | |
| | | | | | | | | | | | | | | | | | | | | | | | |
Net asset value, end of period | | | $10.91 | | | | $10.89 | | | | $11.23 | | | | $11.57 | | | | $11.14 | | | | $11.23 | |
| | | | | | | | | | | | | | | | | | | | | | | | |
Total return2 | | | 2.08% | | | | -0.36% | | | | -0.13% | | | | 6.96% | | | | 1.10% | | | | 2.80% | |
Portfolio turnover | | | 116% | | | | 326% | | | | 386% | | | | 297% | | | | 348% | | | | 120% | |
Ratios/supplemental data (annualized): | | | | | | | | | | | | | | | | | | | | | | | | |
Net assets, end of period (in millions) | | | $20 | | | | $13 | | | | $6 | | | | $3 | | | | $2 | | | | $4 | |
Ratio of expenses to average net assets | | | 0.57% | 3,4 | | | 0.57% | 3 | | | 0.62% | 3 | | | 0.63% | 3 | | | 0.65% | 3 | | | 0.65% | 3 |
Ratio of gross expenses to average net assets | | | 0.91% | | | | 1.03% | | | | 1.02% | | | | 1.22% | | | | 1.07% | | | | 1.02% | |
Ratio of net investment income to average net assets | | | 2.75% | | | | 2.67% | | | | 2.38% | | | | 2.46% | | | | 1.79% | | | | 1.73% | |
1 Amount represents less than $0.005 per share.
2 Not annualized for periods less than one year.
3 Reflects a waiver of fees by the Manager of the Fund.
4 Ratio of expenses to average net assets includes transfer agent credits. Excluding transfer agent credits the ratio of expenses to average net assets would have been 0.57% for the six months ended January 31, 2019.
5 Based on average shares outstanding.
SEE NOTES TO FINANCIAL STATEMENTS
79
DOMINI IMPACT BOND FUND
NOTES TO FINANCIAL STATEMENTS
January 31, 2019 (Unaudited)
1. ORGANIZATION AND SIGNIFICANT ACCOUNTING POLICIES
The Domini Impact Bond Fund (formerly Domini Social Bond Fund) (the “Fund”) is a series of the Domini Investment Trust (formerly Domini Social Investment Trust). The Trust is a Massachusetts business trust registered under the Investment Company Act of 1940 as anopen-end management investment company. The Fund offers Investor Shares, Institutional Shares and Class Y shares. Institutional shares and Class Y shares were not offered prior to November 30, 2011, and June 15, 2018, respectively. As of January 31, 2019, the Class Y shares of the Bond Fund had not yet commenced operations. Each class of shares is sold at its offering price, which is net asset value. The Institutional shares may only be purchased by or for the benefit of investors that meet the minimum investment requirements, and fall within the following categories: endowments, foundations, religious organizations and other nonprofit entities, individuals, retirement plan sponsors, family office clients, certain corporate or similar institutions, or omnibus accounts maintained by financial intermediaries and that are approved by the Fund’s Distributor. Class Y shares may only be purchased through omnibus accounts held on the books of the Fund for financial intermediaries that have been approved by the Funds’ distributor. Each class of shares has identical rights and voting privileges with respect to the Fund in general and exclusive voting rights on matters that affect that class alone. Earnings, net assets, and net asset value per share may differ due to each class having its own expenses, such as transfer and shareholder servicing agent fees and registration fees, directly attributable to that class. Institutional and Class Y shares are not subject to distribution fees. The Fund seeks to provide its shareholders with a high level of current income and total return by investing in bonds and other debt instruments that are consistent with the Fund’s social and environmental standards and the submanager’s security selection approach.
The preparation of financial statements in conformity with U.S. generally accepted accounting principles requires management to make estimates and assumptions that affect the reported amounts of assets and liabilities and disclosure of contingent liabilities at the date of the financial statements and the reported amounts of revenues and expenses during the reporting period. Actual results could differ from those estimates. The following is a summary of the Fund’s significant accounting policies.
(A) Valuation of Investments.Bonds and other fixed-income securities (other than obligations with maturities of 60 days or less) are valued on the basis of valuations furnished by an independent pricing service, use of which has been
80
DOMINI IMPACT BOND FUND
NOTES TO FINANCIAL STATEMENTS(continued)
January 31, 2019 (Unaudited)
approved by the Board of Trustees of the Fund. In making such valuations, the pricing service utilizes both dealer-supplied valuations and electronic data processing techniques that take into account appropriate factors such asinstitutional-size trading in similar groups of securities, yield, quality, coupon rate, maturity, type of issue, trading characteristics, and other market data, without exclusive reliance upon quoted prices or exchange orover-the-counter prices, since such valuations are believed to reflect more accurately the fair value of such securities. Short-term obligations of sufficient credit quality (maturing in 60 days or less) are valued at amortized cost, which constitutes fair value as determined by the Board of Trustees of the Fund. Securities (other than short-term obligations with remaining maturities of 60 days or less) for which there are no such quotations or valuations are valued at fair value as determined in good faith by or at the direction of the Fund’s Board of Trustees. The Fund follows a fair value hierarchy that distinguishes between (a) market participant assumptions developed based on market data obtained from sources independent of the reporting entity (observable inputs) and (b) the Fund’s own assumptions about market participant assumptions developed based on the best information available in the circumstances (unobservable inputs). These inputs are used in determining the value of the Fund’s investments and are summarized in the following fair value hierarchy:
Level 1 — quoted prices in active markets for identical securities
Level 2 — other significant observable inputs (including quoted prices for similar securities, interest rates, and evaluated quotation obtained from pricing services)
Level 3 — significant unobservable inputs (including the Fund’s own assumptions in determining the fair value of investments) The inputs or methodology used for valuing securities are not an indication of the risk associated with investing in those securities.
81
DOMINI IMPACT BOND FUND
NOTES TO FINANCIAL STATEMENTS(continued)
January 31, 2019 (Unaudited)
The following is a summary of the inputs used, as of January 31, 2019, in valuing the Fund’s assets carried at fair value:
| | | | | | | | | | | | | | | | |
| | | Level 1 -
Quoted Prices | | | Level 2 -
Other
Significant
Observable
Inputs | | | Level 3 -
Significant
Unobservable
Inputs | | | Total | |
| | | | | | | | | | | | | | | | |
| | | | |
Assets: | | | | | | | | | | | | | | | | |
| | | | |
Long-Term Investments in Securities: | | | | | | | | | | | | | | | | |
Mortgage Backed Securities | | $ | - | | | $ | 82,736,759 | | | $ | - | | | $ | 82,736,759 | |
Corporate Bonds and Notes | | | - | | | | 35,932,012 | | | | - | | | | 35,932,012 | |
Municipal Bonds | | | - | | | | 12,537,771 | | | | - | | | | 12,537,771 | |
Senior Floating Rate Interests | | | - | | | | 8,299,306 | | | | - | | | | 8,299,306 | |
U.S. Government Agencies | | | - | | | | 7,372,766 | | | | - | | | | 7,372,766 | |
Asset Backed Securities | | | - | | | | 1,329,532 | | | | - | | | | 1,329,532 | |
Certificates of Deposit | | | - | | | | 497,684 | | | | - | | | | 497,684 | |
| | | | | | | | | | | | | | | | |
Total Long-Term Securities | | | - | | | | 148,705,830 | | | | - | | | | 148,705,830 | |
| | | | | | | | | | | | | | �� | | |
| | | | |
Short Term Investments in Securities: | | | | | | | | | | | | | | | | |
U.S. Government Agencies | | | - | | | | 3,991,504 | | | | - | | | | 3,991,504 | |
Options Purchased | | | - | | | | 15,151 | | | | - | | | | 15,151 | |
| | | | | | | | | | | | | | | | |
Total Short-Term Securities | | | - | | | | 4,006,655 | | | | - | | | | 4,006,655 | |
| | | | | | | | | | | | | | | | |
Total Investment in Securities | | | - | | | | 152,712,485 | | | | - | | | | 152,712,485 | |
| | | | | | | | | | | | | | | | |
| | | | |
Other Financial Instruments: | | | | | | | | | | | | | | | | |
OTC Swap Contracts | | | - | | | | 53,200 | | | | - | | | | 53,200 | |
Variation Margin Swap Contracts | | | - | | | | 28,374 | | | | - | | | | 28,374 | |
Premium received for OTC Swap Contracts | | | - | | | | 702 | | | | - | | | | 702 | |
Variation Margin Futures | | | - | | | | 29 | | | | - | | | | 29 | |
| | | | | | | | | | | | | | | | |
Total Other Financial Instruments | | | - | | | | 82,305 | | | | - | | | | 82,305 | |
| | | | | | | | | | | | | | | | |
| | | | |
Liabilities: | | | | | | | | | | | | | | | | |
| | | | |
Other Financial Instruments: | | | | | | | | | | | | | | | | |
Forward Currency Contracts | | | - | | | | 9,367 | | | | - | | | | 9,367 | |
Premium paid Swap Contracts | | | - | | | | 21,151 | | | | - | | | | 25,151 | |
| | | | | | | | | | | | | | | | |
Total Other Financial Instruments | | $ | - | | | $ | 30,518 | | | $ | - | | | $ | 30,518 | |
| | | | | | | | | | | | | | | | |
82
DOMINI IMPACT BOND FUND
NOTES TO FINANCIAL STATEMENTS(continued)
January 31, 2019 (Unaudited)
The following is a reconciliation of Level 3 assets for which significant unobservable inputs were used to determine fair value:
| | | | |
Investments in Securities | | | | |
Balance as of July 31, 2018 | | $ | - | |
Realized gain (loss) | | | - | |
Change in unrealized appreciation (depreciation) | | | 5,849 | |
Purchases | | | - | |
Sales | | | - | |
Transfers in and/or out of level three | | | (5,849) | |
| | | | |
Balance as of January 31, 2019 | | $ | - | |
| | | | |
The change in unrealized appreciation (depreciation) included in earnings relating to securities still held at January 31, 2019 | | $ | - | |
| | | | |
Transfers from Level 2 to Level 3 included securities valued at $868,633 that were transferred as a result of quoted prices in active markets not being readily available. Transfers out of Level 3 into Level 2 included securities valued at $874,482 because market values were readily available from a pricing agent for which fair value factors were previously applied. The Level 3 security was valued using a pricing vendor other than the Fund’s primary pricing vendor.
(B) Foreign Currency Translation. Securities and other assets and liabilities denominated in foreign currencies are translated into U.S. dollar amounts on the date of valuation. Purchases and sales of securities, and income and expense items denominated in foreign currencies, are translated into U.S. dollar amounts on the respective dates of such transactions. Occasionally, events impact the availability or reliability of foreign exchange rates used to convert the U.S. dollar equivalent value. If such an event occurs, the foreign exchange rate will be valued at fair value using procedures established and approved by the Board of Trustees. The Funds do not separately report the effect of fluctuations in foreign exchange rates from changes in market prices on securities held. Such fluctuations are included with the net realized and unrealized gain or loss from investments. Realized foreign exchange gains or losses arise from sales of foreign currencies, currency gains or losses realized between the trade and settlement dates on securities transactions, and the difference between the recorded amounts of dividends, interest, and foreign withholding taxes and the U.S. dollar equivalent of the amounts actually received or paid. Net unrealized foreign exchange gains and losses arise from changes in fair value of assets and liabilities other than investments in securities held at the end of the reporting period, resulting from changes in exchange rates.
(C) Foreign Currency Contracts. When the Funds purchase or sell foreign securities they enter into foreign exchange contracts to minimize foreign
83
DOMINI IMPACT BOND FUND
NOTES TO FINANCIAL STATEMENTS(continued)
January 31, 2019 (Unaudited)
exchange risk from the trade date to the settlement date of the transactions. A foreign exchange contract is an agreement between two parties to exchange different currencies at an agreed-upon exchange rate on a specified date. The Fund had no outstanding open foreign currency spot contracts as of January 31, 2019.
(D) Securities Purchased on a When-Issued or Delayed Delivery Basis. The Fund may invest in when-issued or delayed delivery securities where the price of the security is fixed at the time of the commitment but delivery and payment take place beyond customary settlement time. These securities are subject to market fluctuation, and no interest accrues on the security to the purchaser during this period. The payment obligation and the interest rate that will be received on the securities are each fixed at the time the purchaser enters into the commitment. Purchasing obligations on a when-issued or delayed delivery basis is a form of leveraging and can involve a risk that the yields available in the market when the delivery takes place may actually be higher than those obtained in the transaction, which could result in an unrealized loss at the time of delivery. The Fund establishes a segregated account consisting of liquid securities equal to the amount of the commitments to purchase securities on such basis.
(E) TBA Purchase and Forward Sale Commitments. The Fund may enter into TBA commitments to purchase or sell securities for a fixed price at a future date. TBA commitments are considered securities in themselves and involve a risk of loss if the value of the security to be purchase or sold declines or increases prior to the settlement date, which is in addition to the risk of decline in the value of the Fund’s other assets.
(F) Derivative Financial Instruments. The Fund may invest in derivatives in order to hedge market risks, or to seek to increase the Fund’s income or gain. Derivatives in certain circumstances may require that the Fund segregate cash or other liquid assets to the extent the Fund’s obligations are not otherwise covered through ownership of the underlying security, financial instrument, or currency. Derivatives involve special risks, including possible default by the other party to the transaction, illiquidity, and the risk that the use of derivatives could result in greater losses than if it had not been used. Some derivative transactions, including options, swaps, forward contracts, and options on foreign currencies, are entered into directly by the counterparties or through financial institutions acting as market makers (OTC derivatives), rather than being traded on exchanges or in markets registered with the Commodity Futures Trading Commission or the SEC.
84
DOMINI IMPACT BOND FUND
NOTES TO FINANCIAL STATEMENTS(continued)
January 31, 2019 (Unaudited)
(G) Option Contracts. The Fund may purchase or write option contracts primarily to manage and/or gain exposure to interest rate, foreign exchange rate and credit risk. An option is a contract entitling the holder to purchase or sell a specific amount of shares or units of an asset or notional amount of a swap (swaption), at a specified price. Options purchased are recorded as an asset while options written are recorded as a liability. Upon exercise of an option, the acquisition cost or sales proceeds of the underlying investment is adjusted by any premium received or paid. Upon expiration of an option, any premium received or paid is recorded as a realized gain or loss. Upon closing an option other than through expiration or exercise, the difference between the premium and the cost to close the position is recorded as a realized gain or loss. Purchased option contracts outstanding at January 31, 2019 are listed in the Fund’s Portfolio of Investments.
(H) Futures Contracts. The Fund may purchase and sell futures contracts based on various securities, securities indexes, and other financial instruments and indexes. The Fund intends to use futures contracts for hedging purposes. Futures contracts provide for the future sale by one party and purchase by another party of a specified amount of a specified security or financial instrument at a specified future time and at a specified price. When the Fund purchases or sells a futures contract, the Fund must allocate certain of its assets as an initial deposit on the contract. The futures contract is marked to market daily thereafter, and the Fund may be required to pay or entitled to receive additional “variation margin,” based on decrease or increase in the value of the futures contract. Future contracts outstanding at January 31, 2019 are listed in the Fund’s Portfolio of Investments.
(I) Forward Currency Contracts. The Fund may enter into forward currency contracts with counterparties to hedge the value of portfolio securities denominated in particular currencies against fluctuations in relative value or to generate income or gain. These contracts are used to hedge foreign exchange risk and to gain exposure on currency. The U.S. dollar value of forward currency contracts is determined using current forward exchange rates supplied by a quotation service. The fair value of the contract will fluctuate with changes in currency exchange rates. The contract is marked to market daily and the change in fair value is recorded as an unrealized gain or loss. The Fund records a realized gain or loss equal to the difference between the value of the contract at the time it was opened and the value at the time it was closed when the contract matures or by delivery of the currency. The Fund could be exposed to risk if the value of the currency changes unfavorably, if the counterparties to the contracts are unable to meet the terms of their contracts or if the Fund is unable
85
DOMINI IMPACT BOND FUND
NOTES TO FINANCIAL STATEMENTS(continued)
January 31, 2019 (Unaudited)
to enter into a closing position. Risk may exceed amounts recognized on the Statement of Assets and Liabilities. Forward currency contracts outstanding at January 31, 2019 are listed in the Fund’s Portfolio of Investments.
(J) Interest Rate Swap Contracts. The Fund may enter into interest rate swap contracts to hedge interest rate risk. An interest rate swap is an agreement between the Fund and a counterparty to exchange cash flows based on the difference between two interest rates, applied to a notional amount. Interest rate swap contracts are marked to market daily based upon quotations from an independent pricing service or market maker. Any change on an OTC interest rate swap is recorded as an unrealized gain or loss on the Statement of Assets and Liabilities. Daily fluctuations in the value of centrally cleared interest rate swaps are settled though a central clearing agent and are recorded in variation margin on the Statement of Assets and Liabilities and recorded as unrealized gain or loss. OTC and centrally cleared interest rate swap contracts outstanding at January 31, 2019, are listed in the Fund’s Portfolio of Investments.
(K) Credit Default Swap Contracts. The Fund may enter into credit default swap contracts primarily to manage and/or gain exposure to credit risk. A credit default swap is an agreement between the fund and a counterparty whereby the buyer of the contract receives credit protection and the seller of the contract guarantees the credit worthiness of a referenced debt obligation. These agreements may be privately negotiated in theover-the-counter market (“OTC credit default swaps”) or may be executed in a multilateral trade facility platform, such as a registered exchange (“centrally cleared credit default swaps”). The underlying referenced debt obligation may be a single issuer of corporate or sovereign debt, a credit index, or a tranche of a credit index. In the event of a default of the underlying referenced debt obligation, the buyer is entitled to receive the notional amount of the credit default swap contract from the seller in exchange for the referenced debt obligation, a net settlement amount equal to the notional amount of the credit default swap less the recovery value of the referenced debt obligation, or other agreed upon amount. For centrally cleared credit default swaps, required initial margins are pledged by the fund, and the daily change in fair value is accounted for as a variation margin payable or receivable on the Statements of Assets and Liabilities. Over the term of the contract, the buyer pays the seller a periodic stream of payments, provided that no event of default has occurred. Such periodic payments are accrued daily as an unrealized appreciation or depreciation until the payments are made, at which time they are realized. Payments received or paid to initiate a credit default swap contract are reflected on the Statements of Assets and Liabilities and represent compensating factors between stated terms of the credit default swap agreement and prevailing market conditions (credit spreads and
86
DOMINI IMPACT BOND FUND
NOTES TO FINANCIAL STATEMENTS(continued)
January 31, 2019 (Unaudited)
other relevant factors). These upfront payments are amortized over the term of the contract as a realized gain or loss on the Statements of Operations. OTC and centrally cleared credit default swap contracts outstanding at January 31, 2019 are listed in the Fund’s Portfolio of Investments.
(L) Master Agreements. The Fund is a party to ISDA (International Swaps and Derivatives Association, Inc.) Master Agreements that govern OTC derivative and foreign exchange contracts (Master Agreements) with certain counterparties entered into from time to time. The Master Agreements may contain provisions regarding, among other things, the parties’ general obligations, representations, agreements, collateral requirements, events of default and early termination. With respect to certain counterparties, in accordance with the terms of the Master Agreements, collateral posted to the Fund is held in a segregated account by the Fund’s custodian and with respect to those amounts which can be sold or repledged, are presented in the Fund’s portfolio. Collateral pledged by the Fund is segregated by the Fund’s custodian and identified in the Fund’s portfolio. Collateral can be in the form of cash or other marketable securities as agreed to by the Fund and the applicable counterparty. Collateral requirements are determined based on the Fund’s net position with each counterparty.
With respect to ISDA Master Agreements, termination events applicable to the counterparty include certain deteriorations in the credit quality of the counterparty. Termination events applicable to the Fund include failure of the Fund to maintain certain net asset levels and/or limit the decline in net assets over various periods of time. In the event of default or early termination, the ISDA Master Agreement gives thenon-defaulting party the right to net andclose-out all transactions traded, whether or not arising under the ISDA agreement, to one net amount payable by one counterparty to the other. However, absent an event of default or early termination, OTC derivative assets and liabilities are presented gross and not offset in the Statements of Assets and Liabilities. Early termination by the counterparty may result in an immediate payment by the Fund of any net liability owed to that counterparty under the ISDA agreement.
In a centrally cleared swap, while the Fund enters into an agreement with a clearing broker to execute contracts with a counterparty, the performance of the swap is guaranteed by the central clearinghouse, which reduces the Fund’s exposure to counterparty risk. The Fund is still exposed to the counterparty risk through the clearing broker and clearinghouse. The clearinghouse attempts to minimize this risk to its participants through the use of mandatory margin
87
DOMINI IMPACT BOND FUND
NOTES TO FINANCIAL STATEMENTS(continued)
January 31, 2019 (Unaudited)
requirements, daily cash settlements and other procedures. Likewise, the clearing broker reduces its risk through margin requirements and required segregation of customer balances.
(M) Investment Transactions, Investment Income, and Dividends to Shareholders. The Fund earns income daily, net of Fund expenses. Dividends to shareholders are usually declared daily and paid monthly from net investment income. Distributions to shareholders of realized capital gains, if any, are made annually. Distributions are determined in conformity with income tax regulations, which may differ from generally accepted accounting principles. Reclassifications have been made to the Fund’s components of net assets to reflect income and gains available for distribution (or available capital loss carryovers, as applicable) under income tax regulations. Investment transactions are accounted for on trade date. Realized gains and losses from security transactions are determined on the basis of identified cost. Interest income is recorded on an accrual basis.
Effective during the six months ended January 31, 2019, it is no longer required to present certain line items in the Statements of Changes in Net Assets. The prior period amounts affected by this change are shown below as they were in the prior year Statements of Changes in Net Assets.
For the year ended July 31, 2018, distributions to shareholders were as follows:
| | | | |
Distributions from net investment income: | | | | |
Investor shares | | $ | (3,430,176) | |
Institutional shares | | | (234,362) | |
Distributions from net realized gain: | | | | |
Investor shares | | | (85,947) | |
Institutional shares | | | (4,073) | |
(N) Federal Taxes. The Fund’s policy is to comply with the provisions of the Internal Revenue Code applicable to regulated investment companies and to distribute substantially all of its taxable income, including net realized gains, if any, within the prescribed time periods. Accordingly, no provision for federal income or excise tax is deemed necessary. As of January 31, 2019, tax years 2015 through 2018 remain subject to examination by the Fund’s major tax jurisdictions, which include the United States of America, the Commonwealth of Massachusetts, and New York State.
(O) Redemption Fees. Redemptions and exchanges of Fund shares held less than 30 days may be subject to the Fund’s redemption fee, which is 2% of the amount redeemed. The fee is imposed to offset transaction costs and other expenses associated with short-term investing. The fee may be waived in certain
88
DOMINI IMPACT BOND FUND
NOTES TO FINANCIAL STATEMENTS(continued)
January 31, 2019 (Unaudited)
circumstances at the discretion of the Fund. Such fees are retained by the Fund and are recorded as an adjustment topaid-in capital.
(P) Other.Income, expenses (other than those attributable to a specific class), gains, and losses are allocated on a daily basis to each class of shares based upon the relative proportion of net assets represented by such class. Operating expenses directly attributable to a specific class are charged against the operations of that class.
(Q) Transfer Agent Credits.Per the arrangement with the Fund’s transfer agent, BNY Mellon Investment Servicing (U.S.) Inc., the Fund has arrangements whereby it may receive earnings credits when positive cash balances are maintained, which are used to offset transfer agent fees. For financial reporting purposes, the Fund includes earnings credits as an expense offset in the Statement of Operations. For the six months ended January 31, 2019, transfer agency fees of the Fund, under these arrangements, were reduced as follows:
| | | | |
Domini Impact Bond Fund Investor shares | | $ | 330 | |
Domini Impact Bond Fund Institutional shares | | | 2 | |
(R) Indemnification. The Fund’s organizational documents provide current and former trustees and officers with a limited indemnification against liabilities arising in connection with the performance of their duties to the Fund. In the normal course of business, the Fund may also enter into contracts that provide general indemnifications. The Fund’s maximum exposure under these arrangements is unknown as this would be dependent on future claims that may be made against the Fund. The risk of material loss from such claims is considered remote.
2. TRANSACTIONS WITH AFFILIATES
(A) Manager/Administrator. The Fund has retained Domini Impact Investments LLC (Domini) to serve as investment manager and administrator. The services provided by Domini consist of investment supervisory services, overall operational support, and administrative services, including the provision of general office facilities and supervising the overall administration of the Fund. For its services under the Management Agreement, Domini receives from the Fund a fee accrued daily and paid monthly at the annual rate below of the Fund’s average daily net assets before any fee waivers:
| | |
| (prior to May 1, 2017) | | 0.40% of the first $500 million of net assets managed, |
| | 0.38% of the next $500 million of net assets managed, and |
| | 0.35% of net assets managed in excess of $1 billion |
| | |
| (effective May 1, 2017) | | 0.33% of the first $50 million of net assets managed, |
| | 0.32% of the next $50 million of net assets managed, and |
| | 0.315% of net assets managed in excess of $100 million |
89
DOMINI IMPACT BOND FUND
NOTES TO FINANCIAL STATEMENTS(continued)
January 31, 2019 (Unaudited)
For its services under the Administration Agreement, Domini receives from the Fund a fee accrued daily and paid monthly at an annual rate equal to 0.25% of the Fund’s average daily net assets.
Upon commencement of operations, Domini has agreed to reduce its fees and reimburse expenses to keep aggregate annual operating expenses of the Bond Fund (excluding brokerage fees and commission, interest, taxes, and other extraordinary expenses), at no greater than 0.65% of the average daily net assets of the Class Y shares of the Bond Fund, until November 30, 2019, absent an earlier modification by the Fund’s Board. Effective November 30, 2017, Domini agreed to reduce its fees and reimburse expenses to keep the aggregate annual operating expenses of the Bond Fund (excluding brokerage fees and commissions, interest, taxes, and other extraordinary expenses), at no greater than 0.87% and 0.57% of the average daily net assets of the Investor and Institutional shares of the Bond Fund, respectively. This agreement will continue until November 30, 2019, absent an earlier modification by the Board of Trustees which oversee the Funds. For periods prior to November 30, 2017, Domini contractually agreed to reduce its fees and reimburse expenses to keep the aggregate annual operating expenses of the Bond Fund (excluding brokerage fees and commissions, interest, taxes, and other extraordinary expenses), at no greater than 0.95% and 0.65% of the average daily net assets of the Investor and Institutional shares of the Bond Fund, respectively. For the six months ended January 31, 2019, Domini reimbursed expenses totaling $116,811.
Fees waived and/or expenses reimbursed under the Expense Limitation Agreement are only recoverable by Domini and/or its affiliates in the current fiscal year to the extent actual Fund expenses are less than the contractual expense cap during such year.
As of January 31, 2019, Domini owned less than 1% of any class of the outstanding Shares of the Fund.
(B) Submanager.Wellington Management Company LLP (Wellington), a Delaware limited liability partnership, provides investment management services to the Fund on aday-to-day basis pursuant to a submanagement agreement with Domini. Prior to January 7, 2015, Seix Investment Advisors LLC (“Seix”), a wholly owned subsidiary of RidgeWorth LLC (formerly known as RidgeWorth Capital Management, Inc.), and its predecessors, provided investment submanagement services to the Fund.
90
DOMINI IMPACT BOND FUND
NOTES TO FINANCIAL STATEMENTS(continued)
January 31, 2019 (Unaudited)
(C) Distributor.The Board of Trustees of the Fund has adopted a Distribution Plan in accordance with Rule12b-1 under the Act. DSIL Investment Services LLC, a wholly owned subsidiary of Domini (DSIL), acts as agent of the Fund in connection with the offering of shares of the Fund pursuant to a Distribution Agreement. Under the Distribution Plan, the Fund pays expenses incurred in connection with the sale of Investor shares and pays DSIL a distribution fee at an aggregate annual rate not to exceed 0.25% of the average daily net assets representing the Investor shares. For the six months ended January 31, 2019, fees waived by the Investor shares totaled $58,309.
(D) Shareholder Service Agent.The Trust has retained Domini to provide certain shareholder services to the Fund and its shareholders, which services were previously provided by BNY Asset Servicing (“BNY”) or another fulfillment and mail service provider and are supplemental to services currently provided by BNY, pursuant to a transfer agency agreement between each Fund and BNY. For these services, Domini receives a fee from the Fund paid monthly at an annual rate of $4.00 per active account. For the six months ended January 31, 2019, Domini waived fees as follows:
| | | | |
| | | FEES WAIVED | |
| | | | |
Domini Impact Bond Fund Investor shares | | $ | - | |
Domini Impact Bond Fund Institutional shares | | | 23 | |
(E) Trustees and Officers.Each of the Independent Trustees receives an annual retainer for serving as a Trustee of the Trust of $23,000. The Lead Independent Trustee and Chair of the Audit Committee receive an additional chairperson fee of $5,000. Each Independent Trustee also receives $2,500 for attendance at each meeting of the Board of the Trust (reduced to $1,000 in the event that a Trustee participates at anin-person meeting by telephone). In addition, each Trustee receives reimbursement for reasonable expenses incurred in attending meetings. These expenses are allocated on apro-rata basis to each shares class of a Fund according to their respective net assets.
As of January 31, 2019, all Trustees and officers of the Trust as a group owned less than 1% of the Fund’s outstanding shares.
3. INVESTMENT TRANSACTIONS
For the six months ended January 31, 2019, cost of purchase and proceeds from sales of investments other than short-term obligations were as follows:
| | | | | | | | |
| | | PURCHASES | | | SALES | |
U.S. Government Securities | | $ | 175,442,759 | | | $ | 184,009,243 | |
Investments in Securities | | | 8,226,257 | | | | 15,842,648 | |
91
DOMINI IMPACT BOND FUND
NOTES TO FINANCIAL STATEMENTS(continued)
January 31, 2019 (Unaudited)
4. SHARES OF BENEFICIAL INTEREST
At January 31, 2019, there was an unlimited number of shares authorized ($0.00001 par value). Transactions in the Fund’s shares were as follows:
| | | | | | | | | | | | | | | | |
| | | Six Months Ended
January 31, 2019 (Unaudited) | | | Year Ended
July 31, 2018 | |
| | | Shares | | | Amount | | | Shares | | | Amount | |
| | | | | | | | | | | | | | | | |
| | | | |
Investor Shares | | | | | | | | | | | | | | | | |
Shares sold | | | 1,010,251 | | | $ | 10,971,201 | | | | 3,190,767 | | | $ | 35,441,465 | |
Shares issued in reinvestment of dividends and distributions | | | 154,248 | | | | 1,676,318 | | | | 305,407 | | | | 3,390,770 | |
Shares redeemed | | | (4,019,812) | | | | (43,469,112) | | | | (2,968,962) | | | | (32,849,386) | |
Redemption fees | | | - | | | | 128 | | | | - | | | | 1,022 | |
| | | | | | | | | | | | | | | | |
Net increase (decrease) | | | (2,855,313) | | | $ | (30,821,465) | | | | 527,212 | | | $ | 5,983,871 | |
| | | | | | | | | | | | | | | | |
| | | | |
Institutional Shares | | | | | | | | | | | | | | | | |
Shares sold | | | 1,087,287 | | | $ | 11,753,259 | | | | 814,633 | | | $ | 8,956,983 | |
Shares issued in reinvestment of dividends and distributions | | | 23,280 | | | | 251,990 | | | | 14,878 | | | | 163,911 | |
Shares redeemed | | | (427,982) | | | | (4,617,029) | | | | (255,924) | | | | (2,838,217) | |
Redemption fees | | | - | | | | 176 | | | | - | | | | 824 | |
| | | | | | | | | | | | | | | | |
Net increase (decrease) | | | 682,585 | | | $ | 7,388,396 | | | | 573,587 | | | $ | 6,283,501 | |
| | | | | | | | | | | | | | | | |
| | | | |
Total | | | | | | | | | | | | | | | | |
Shares sold | | | 2,097,538 | | | $ | 22,724,460 | | | | 4,005,400 | | | $ | 44,398,448 | |
Shares issued in reinvestment of dividends and distributions | | | 177,528 | | | | 1,928,308 | | | | 320,285 | | | | 3,554,681 | |
Shares redeemed | | | (4,447,794) | | | | (48,086,141) | | | | (3,224,886) | | | | (35,687,603) | |
Redemption fees | | | - | | | | 304 | | | | - | | | | 1,846 | |
| | | | | | | | | | | | | | | | |
Net increase (decrease) | | | (2,172,728) | | | $ | (23,433,069) | | | | 1,100,799 | | | $ | 12,267,372 | |
| | | | | | | | | | | | | | | | |
92
DOMINI IMPACT BOND FUND
NOTES TO FINANCIAL STATEMENTS(continued)
January 31, 2019 (Unaudited)
5. SUMMARY OF DERIVATIVE ACTIVITY
At January 31, 2019, the Fund’s investments in derivative contracts are reflected on the Statement of Assets and Liabilities as follows:
| | | | | | | | | | | | |
| | | Asset Derivatives | | | Liability Derivatives | |
Derivative Contracts Not
Accounted for as
Hedging Instruments | | Statement of Asssets
and Liabilities Location | | Fair Value | | | Statement of Asssets
and Liabilities Location | | Fair Value | |
Interest rate contracts | | Variation Margin / Unrealized appreciation on OTC swap contracts/Net assets consist of - Total distributable earnings | | $ | 277,718 | | | Variation Margin / Unrealized depreciation on OTC swap contracts / Net assets consist of - Total distributable earnings | | $ | 179,745 | |
| | | | | | | | | | | | |
Credit contracts | | Variation Margin / Net assets consist of - Total distributable earnings | | | 5,423 | | | Variation Margin / Net assets consist of - Total distributable earnings | | | 21,822 | |
| | | | | | | | | | | | |
Foreign exchange contracts | | Unrealized appreciation on forward currency contracts / Net assets consist of - Total distributable earnings | | | - | | | Unrealized depreciation on forward currency contracts / Net assets consist of - Total distributable earnings | | | 9,367 | |
| | | | | | | | | | | | |
Future contracts | | Receivable for variation margin futures / Net assets consist of - Total distributable earnings | | | 29 | | | Payable for variation margin futures / Net assets consist of - Total distributable earnings | | | - | |
| | | | | | | | | | | | |
Total | | $ | 283,170 | | | | | $ | 210,934 | |
| | | | | | | | | | | | |
93
DOMINI IMPACT BOND FUND
NOTES TO FINANCIAL STATEMENTS(continued)
January 31, 2019 (Unaudited)
For the six months ended January 31, 2019, the effect of derivative contracts on the Fund’s Statement of Operations was as follows:
| | | | | | | | | | |
Derivative Contracts Not
Accounted for as Hedging
Instruments | | Statement of Operations
Location | | Realized Gain
(Loss) | | | Change in Unrealized
Appreciation
(Depreciation) | |
Interest rate contracts | | Net realized gain (loss) from swap contracts/ Net change in unrealized appreciation (depreciation) from investments, futures and swap contracts | | $ | 331,123 | | | $ | (1,056,051 | ) |
| | | | | | | | | | |
Credit contracts | | Net realized gain (loss) from swap contracts/ Net change in unrealized appreciation (depreciation) from investments, futures and swap contracts | | | (32,360 | ) | | | (10,552 | ) |
| | | | | | | | | | |
Foreign exchange contracts | | Net realized gain (loss) from foreign currency/ Net change in unrealized appreciation (depreciation) from translation of assets and liabilities in foreign currencies | | | 18,227 | | | | 29,127 | |
| | | | | | | | | | |
Futures contracts | | Net realized gain (loss) from futures contracts/ Net change in unrealized appreciation (depreciation) from investments, futures and swap contracts | | | 33,790 | | | | 5,245 | |
| | | | | | | | | | |
Options purchases | | Net realized gain (loss) from options contracts/ Net change in unrealized appreciation (depreciation) from investments, futures and swap contracts | | | 483 | | | | (79,448 | ) |
| | | | | | | | | | |
Total | | $ | 351,263 | | | $ | (1,111,679 | ) |
| | | | | | | | | | |
94
DOMINI IMPACT BOND FUND
NOTES TO FINANCIAL STATEMENTS(continued)
January 31, 2019 (Unaudited)
6. OFFSETTING OF FINANCIAL AND DERIVATIVE ASSETS AND LIABILITIES
The following table summarizes any derivatives, at the end of the reporting period, that are subject to a master netting agreement or similar agreement. For financial reporting purposes, the Fund does not offset assets and liabilites that are subject to the master netting agreements in the Statement of Assets and Liabilities.
| | | | | | | | | | | | | | | | |
| | | Credit
Suisse
International | | | Deutsche
Bank AG | | | Morgan
Stanley | | | Total | |
| | | | |
Assets: | | | | | | | | | | | | | | | | |
Cash held at other banks | | $ | 28,032 | | | $ | - | | | $ | 958 | | | $ | 28,990 | |
Unrealized appreciation on OTC swaps contracts* | | | - | | | | 63,428 | | | | - | | | | 63,428 | |
Receivable for variation margin swaps | | | - | | | | - | | | | 219,713 | | | | 219,713 | |
| | | | | | | | | | | | | | | | |
| | | | |
Total Assets | | $ | 28,032 | | | $ | 63,428 | | | $ | 220,671 | | | $ | 312,131 | |
| | | | |
Liabilities: | | | | | | | | | | | | | | | | |
Cash due to broker | | | 2,101 | | | | - | | | | 116,698 | | | | 118,799 | |
Unrealized depreciation on OTC swaps contracts* | | | - | | | | 10,228 | | | | - | | | | 10,228 | |
Payable for variation margin swaps | | | - | | | | - | | | | 191,339 | | | | 191,339 | |
| | | | | | | | | | | | | | | | |
| | | | |
Total Liabilities | | $ | 2,101 | | | $ | 10,228 | | | $ | 308,037 | | | $ | 320,366 | |
| | | | | | | | | | | | | | | | |
| | | | |
Total Derivative Net Assets | | $ | 25,931 | | | $ | 53,200 | | | $ | (87,366) | | | $ | (8,235) | |
| | | | | | | | | | | | | | | | |
Total collateral received (pledged) | | | - | | | | - | | | | 592,320 | | | | 592,320 | |
| | | | |
Net Amount | | $ | 25,931 | | | $ | 53,200 | | | $ | 504,954 | | | $ | 584,085 | |
| | | | | | | | | | | | | | | | |
* Excludes premiums if any. Included in unrealized appreciation/depreciation on OTC swap contracts on the Statement of Assets and Liabilities.
7. SUMMARY OF DERIVATIVE ACTIVITY
The volume of activity for the reporting period for any derivative type that was held during the period is listed below and was as follows based on an average of the holdings at the end of each fiscal quarter:
| | | | |
Futures contracts (number of contracts) | | | 14 | |
Forward currency contracts (contract amount) | | $ | 4,350,758 | |
OTC interest rate swap contracts (notional) | | $ | 6,811,750 | |
Centrally cleared interest rate swap contracts (notional) | | $ | 39,354,250 | |
Centrally cleared credit default contracts (notional) | | $ | 3,670,891 | |
95
DOMINI IMPACT BOND FUND
NOTES TO FINANCIAL STATEMENTS(continued)
January 31, 2019 (Unaudited)
8. FEDERAL TAX STATUS
The tax basis of the components of net assets at July 31, 2018 is as follows:
| | | | |
Undistributed ordinary income | | $ | 38,476 | |
Capital losses, other losses and other temporary differences | | | (945,977) | |
Unrealized appreciation (depreciation) | | | (2,456,769) | |
| | | | |
Distributable net earnings (deficit) | | $ | (3,364,270) | |
| | | | |
The difference between components of Distributable Earnings on a tax basis and the amounts reflected in the statement of assets and liabilities are primarily due to differences in book and tax policies.
For the year ended July 31, 2018, the Fund reclassified $106,234 from accumulated net realized gain (loss) to undistributed net investment income and $2 from accumulated net realized gain (loss) to paid in capital to align financial reporting and tax reporting.
During the period November 1, 2017 through July 31, 2018, the Domini Impact Bond Fund had net realized capital losses of $888,974. These losses are deferred and will be recognized on August 1, 2018, for tax purposes.
To the extent that the Fund realizes net capital gains in the future, those gains may be offset by any unused net capital loss carryforwards. The Fund is permitted to carry forward a net capital loss from any taxable year that began on or before December 22, 2010 for eight years following the year of the loss. The Fund is permitted to carry forward net capital losses incurred in taxable years beginning after December 22, 2010, for an unlimited time period. Carryforwards of losses from taxable years that began after December 22, 2010, along with any other capital losses deferred and treated as recognized in any such year, are required to be utilized prior to carryforwards of losses incurred in taxable years that began on or before December 22, 2010. As a result of this ordering rule, carryforwards of losses from taxable years that began on or before December 22, 2010 may be more likely to expire unused. Losses from taxable years that begin after December 22, 2010 that are carried forward will retain their character as either short-term or long-term capital losses.
96
DOMINI IMPACT BOND FUND
NOTES TO FINANCIAL STATEMENTS(continued)
January 31, 2019 (Unaudited)
For federal income tax purposes, dividends paid were characterized as follows:
| | | | | | | | |
| | | Year Ended | |
| | | 2018 | | | 2017 | |
| | | | | | | | |
Ordinary income | | $ | 3,664,538 | | | $ | 3,496,189 | |
Long-term capital gain | | | 90,020 | | | | 229,068 | |
Return of capital | | | - | | | | 43,474 | |
| | | | | | | | |
Total | | $ | 3,754,558 | | | $ | 3,768,731 | |
| | | | | | | | |
The Fund is subject to the provisions of Accounting Standards Codification ASC 740Income Taxes(ASC 740). ASC 740 sets forth a minimum threshold for financial statement recognition of the benefit of a tax position taken or expected to be taken in a tax return. The Fund did not have a liability to record for any unrecognized tax benefits in the accompanying financial statements. No provision has been made for taxes on income, capital gains or unrealized appreciation on securities held or for excise tax on income and capital gains.
9. OTHER RISKS
The Fund’s risks include, but are not limited to, some or all of the risks discussed below:
Bond Obligations Risk: The Fund’s holdings, share price, yield and total return may fluctuate in response to bond market movements. The value of bonds may decline for issuer-related reasons, including management performance, financial leverage and reduced demand for the issuer’s goods and services. Certain types of fixed-income obligations also may be subject to “call and redemption risk,” which is the risk that the issuer may call a bond held by the Fund for redemption before it matures and the Fund may not be able to reinvest at the same level and therefore would earn less income.
Derivatives Risk: Derivatives involve special risks and costs and may result in losses to the Fund. The prices of derivatives may move in unexpected ways, especially in abnormal market conditions. Some derivatives are “leveraged” and therefore may magnify or otherwise increase investment losses to the Fund. The Fund’s use of derivatives may also increase the amount of taxes payable by shareholders. Other risks arise from the potential inability to terminate or close out of derivatives positions. A liquid secondary market may not always exist for the Fund’s derivatives positions. Generally, many OTC derivative instruments will not have liquidity beyond the counterparty to the instrument. OTC derivative instruments also involve the risk that the other party will not meet its obligations to the Fund.
97
DOMINI IMPACT BOND FUND
NOTES TO FINANCIAL STATEMENTS(continued)
January 31, 2019 (Unaudited)
Foreign Securities Risk: The Fund’s investments in securities of foreign issuers or issuers with significant exposure to foreign markets involve additional risk. Foreign countries in which the Fund may invest may have markets that are less liquid, less regulated and more volatile than US markets. The value of the Fund’s investments may decline because of factors affecting the particular issuer as well as foreign markets and issuers generally, such as unfavorable government actions, and political or financial instability.
Interest Rate Risk: The market price of the Fund’s investments will change in response to changes in interest rate and other factors. During periods of rising interest rates, the market price of fixed income instruments generally declines. As interest rates increase, slower than expected principal payments may extend the average life of securities, potentially locking in below-market interest rates and reducing the Fund’s value. In typical market interest rate environments, the prices of long-term debt obligations generally fluctuate more than prices of short-term debt obligations as interest rates change. Fluctuations in the market price of the Fund’s instruments will not affect interest income derived from the instruments already owned by the Fund, but will be reflected in the Fund’s NAV.
Liquidity Risk: The Fund may invest in instruments that trade in lower volumes and are less liquid than other investments. Liquidity risk includes the risk that the Fund may make investments that may become less liquid in response to market developments or adverse investor perceptions. Investments that are illiquid or that trade in lower volumes may be more difficult to value. When there is no willing buyer and investments cannot be readily sold at the desired time or price, the Fund may have to accept a lower price or may not be able to sell the instrument at all. An inability to sell a portfolio position can adversely affect the Fund’s value or prevent the Fund from being able to take advantage of other investment opportunities.
Market and Credit Risk: Securities markets may be volatile and the market prices of the Fund’s securities may decline. Securities fluctuate in price based on changes in an issuer’s financial condition and overall market and economic conditions. If the market prices of the securities owned by the Fund fall, the value of an investment in the Fund will decline. Additionally, the Fund may also be exposed to credit risk in the event that an issuer or guarantor fails to perform or that an institution or entity with which the Fund has unsettled or open transactions defaults.
Risks of Investments in Bank Loans: The Fund’s ability to receive payments of principal and interest and other amounts in connection with loans (whether
98
DOMINI IMPACT BOND FUND
NOTES TO FINANCIAL STATEMENTS(continued)
January 31, 2019 (Unaudited)
through participations, assignments or otherwise) will depend primarily on the financial condition of the borrower. The failure by the Fund to receive scheduled interest or principal payments on a loan because of a default, bankruptcy or any other reason would adversely affect the income of the Fund and would likely reduce the value of its assets. Even with loans secured by collateral, there is the risk that the value of the collateral may decline, may be insufficient to meet the obligations of the borrower, or be difficult to liquidate. In the event of a default, the Fund may have difficulty collecting on any collateral and would not have the ability to collect on any collateral for an uncollateralized loan. Further, the Fund’s access to collateral, if any, may be limited by bankruptcy laws.
99
BOARD OF TRUSTEES’ APPROVAL OF SUBMANAGEMENT AGREEMENT (UNAUDITED)
Section 15(c) of the Investment Company Act of 1940, as amended (the “1940 Act”) requires that each mutual fund’s board of trustees, including a majority of those trustees who are not “interested persons” of the mutual fund, as defined in the 1940 Act (the “Independent Trustees”), review and consider a fund’s new submanagement agreement. At itsin-person meeting held on August 22, 2018 (the “Meeting”), the Board of Trustees (“Board” or “Trustees”) of the Domini Investment Trust (the Trust”), including a majority of the Independent Trustees, voted to approve a new Submanagement Agreement (the “Agreement”) between Domini Impact Investments LLC (“Domini”) and SSGA Funds Management, Inc. (“SSGA” or the “Subadviser”) with respect to the Domini Impact Equity Fund “Equity Fund” or “Fund”).
Prior to the August 22, 2018, meeting, the Board requested, received, and reviewed written responses from SSGA to questions posed to them on behalf of the Independent Trustees and supporting materials relating to those questions and responses. The Board considered the materials specifically prepared in connection with the approval of the Agreement considered at the Board’s meeting on August 22, 2018. The Board considered the Amended and Restated Management Agreement between Domini and the Equity Fund, in the course of its review. In doing so, the Board noted the respective roles of the Adviser and Subadviser in providing services to the Funds.
Throughout the process, the Board had the opportunity to ask questions of and request additional information from SSGA. The Board was assisted by legal counsel for the Trust and the Independent Trustees were also separately assisted by independent legal counsel throughout the process. The Independent Trustees also received memoranda from counsel to the Trust discussing the legal standards for their consideration of the Agreements. The Independent Trustees were advised by and met in executive session with their independent legal counsel at which no representatives of management were present to discuss the proposed Agreement at the August 22, 2018 meeting.
In connection with the Board’s consideration of the renewal of the Agreements with respect to each the Fund, the Board received written materials in advance of the meeting, which included information regarding: (i) the nature, extent, and quality of services provided to the Fund by SSGA; (ii) a description of SSGA’s investment management and other personnel and their background and experience; (iii) an overview of SSGA’s operations and financial condition; (iv) a comparison of the Funds’ advisory fee and overall expenses with those of comparable mutual funds selected by Strategic Insight, a third party provider of mutual fund data; (v) performance information for comparable mutual funds and for comparatively managed accounts, if any; (vi) the level of profitability from Domini and SSGA’s relationships with the Funds; (vii) a description of Domini’s and SSGA’s brokerage practices (including any soft dollar arrangements); and (viii) SSGA’s compliance policies and procedures, including policies and
100
procedures for personal securities transactions and with respect to cybersecurity and business continuity and disaster recovery.
In reaching their determination to approve the new Agreement) between Domini and SSGA with respect to the Equity Fund, the Board, including a majority of the Independent Trustees, reviewed and evaluated information and a variety of factors that they believed relevant and appropriate through the exercise of their reasonable business judgment. The Board’s determination to approve the Agreement was based on a comprehensive consideration of information provided to the Board with respect to the approval of such Agreement, including a presentation by SSGA at the Meeting.
The primary factors and the conclusions regarding the Agreement are described below. The Board did not identify any particular information or factor that wasall-important or controlling, and each Trustee may have weighted certain factors differently. In evaluating the Agreement, the Board took into account Domini’s recommendation and performance evaluation with respect to SSGA. The Board also took into account the Trustees’ knowledge of SSGA, its services and of the Fund resulting from their meetings and other information provided to the Board, including the Trustees’ familiarity with SSGA and its services from prior years when SSGA previously served as a submanager to the Equity Fund. The Board also considered other factors (including conditions and trends prevailing generally in the economy, the securities markets and the industry).
Nature, Quality, and Extent of Services to be Provided. The Board reviewed information and materials provided by SSGA related to the Agreement, including the Agreement, SSGA’s Form ADV, a description of the firm and its organizational and management structure, its operational history and its legal and regulatory history, the manner in which investment decisions are made and executed, the financial condition of SSGA and its ability to provide the services required under the Agreement, an overview of the personnel that would perform services for the Fund, and SSGA’s compliance policies and procedures. The Board also considered SSGA’s risk management processes and its policies and procedures with respect to cybersecurity, business continuity and disaster recovery.
The Board reviewed the terms of the Agreement and considered the scope and quality of the services to be provided by SSGA to the Fund under the Agreement. The Board noted that, pursuant to the Agreement, Domini, subject to the direction of the Board, is responsible for providing advice and guidance with respect to the Fund and for managing the investment of the assets of the Fund, and that in connection therewith it would oversee the activities of SSGA. It was noted that Domini would apply its social and environmental standards to select the Fund’s investments and that SSGA would be responsible for purchasing and selling securities to implement Domini’s selections and for managing the amount of the Fund’s assets to be held in short-term investments.
The Board considered the professional experience, tenure, and qualifications of the proposed SSGA portfolio management team and the other senior personnel
101
at SSGA. They also reviewed SSGA’s compliance record. The Board also noted that the Trust’s Chief Compliance Officer (CCO) had reviewed SSGA’s compliance policies and procedures, including its Code of Ethics, and also considered that Domini would be providing compliance oversight with respect to SSGA. The Board also received information with respect to SSGA’s brokerage policies and practices, including with respect to best execution. The terms of the Agreement were also reviewed by the Board. Based on the foregoing, the Trustees concluded that they were satisfied with the nature, quality and extent of services to be provided by SSGA to the Fund under the Agreement.
Performance Information. The Trustees took into account the Fund’s investment performance over the past years. The Trustees noted SSGA’s representation that it does not manage any other client portfolios that have similar investment objectives and strategies to the Fund. They noted that Domini would be responsible for selecting securities identified through proprietary ESG research and that SSGA would purchase and sell securities to implement Domini’s selections and as necessary to manage the amount of the Fund’s assets to be held in short term investments. The Trustees considered the scope of services to be provided by SSGA for the Fund and SSGA’s experience in implementing investment strategies with mandates that were operationally similar to the Fund’s in terms of implementation and SSGA’s historical performance with respect to the same. The Trustees concluded that they had confidence in SSGA’s overall capability to provide such services for Fund.
Fees and Other Expenses. The Trustees considered the subadvisory fees to be paid by Domini to SSGA under the Agreement. The Trustees noted that the Agreement had been negotiated at arms-length between Domini and SSGA. The Trustees noted SSGA’s representation that it does not manage any other client portfolios that have similar investment objectives and strategies to the Fund. (The Board noted that the fees payable under the Agreement were lower than the fees payable under the previous submanagement agreement with respect to the Fund. The Trustees noted that Domini (and not the Fund) pays SSGA from its management fee. The Board noted comparative management fee and total expense information that they had reviewed in connection with their consideration of the Domini Amended and Restated Management Agreement at the Meeting, and that Domini proposed to lower its management fee and impose expense caps in connection with the appointment of SSGA and the related change to the Fund’s investment strategy.
The Trustees determined, based on the nature and quality of the services to be provided by SSGA, and in light of the preceding factors, that the fees to be paid by Domini to SSGA with respect to the Fund were fair and reasonable in relation to the nature and quality of services to be provided and supported approval of the Agreement.
Costs of Services to be Provided and Profitability. The Board reviewed the audited financial statements for the year ended December 31, 2017 of SSGA’s parent, State Street Corporation. The Board noted that it would be difficult for
102
SSGA to estimate profitability with respect to the Fund since it had not yet provided services to the Fund, but that it would be appropriate for the Trustees to consider requesting such information when they considered the continuation of the Agreement. In addition, the Board further considered the relative levels of thesub-advisory fees to be paid to SSGA and the advisory fee retained by Domini in light of, among other factors, the services provided to the Fund by the Domini and by SSGA, and the information prepared by management regarding the level of profits realized by Domini in connection with its operation of the Fund pursuant to the new investment strategy. The Board noted that the amount of management fee retained by Domini would increase but noted the increased level of services to be provided to the Fund by Domini upon implementation of the Fund’s new investment strategy, as well as the proposed decrease in the Fund’s management fee, as well as that Domini had agreed to enter into an expense limitation agreement with respect to the Fund. However, the Board also took into account that the Agreement was negotiated on an arms-length basis and that Domini would be paying the cost of the submanagement fees to be paid to SSGA and not the Fund and for this reason, the consideration of the costs of services to be provided and their profitability with respect to SSGA, was not a relevant factor in the Board’s decision.
Economies of Scale. The Board also considered whether economies of scale would be realized by SSGA as the assets in the Fund increased and the extent to which economies of scale were reflected in the fee schedule under the Agreement. The Board noted that the subadvisory fees are paid by Domini and not the Fund. However, the Board noted the breakpoints in fees payable under the Agreement, as well as breakpoints in the fees payable to Domini under its Management Agreement with respect to the Fund, and concluded that such breakpoints were an effective way to share economies of scale with shareholders as the assets in the Fund grew and supported the approval of the Agreement.
Other Benefits. The Board considered the other benefits that SSGA and its affiliates would receive from their relationship with the Fund. The Board noted that one of SSGA’s affiliates currently served as the Fund’s custodian. The Board also considered the brokerage practices of SSGA. In addition, the Board considered the intangible benefits that could accrue to SSGA and its affiliates by virtue of their relationship with the Fund.
The Board concluded that the benefits to be received by SSGA and its affiliates were reasonable in the context of the relationship between SSGA and the Fund and supported the approval of the Agreement.
Conclusion. After consideration of the factors described above, as well as other factors, the Board, and the Independent Trustees voting separately, concluded that the Agreement, including the fees payable thereunder, was fair and reasonable, and voted to approve the Agreement.
103
PROXY VOTING INFORMATION
The Domini Funds have established Proxy Voting Policies and Procedures that the Funds use to determine how to vote proxies relating to portfolio securities. The Domini Funds’ Proxy Voting Policies and Procedures are available, free of charge, by calling1-800-762-6814, by visitingwww.domini.com/domini-funds/proxy-voting, or by visiting the EDGAR database on the Securities and Exchange Commission’s (SEC) website athttp://www.sec.gov. All proxy votes cast for the Domini Funds are posted to Domini’s website on an ongoing basis over the course of the year. An annual record of all proxy votes cast for the Funds during the most recent12-month period ended June 30 can be obtained, free of charge, atwww.domini.com, and on the EDGAR database on the SEC’s website athttp://www.sec.gov.
QUARTERLY PORTFOLIO SCHEDULE INFORMATION
The Domini Funds file their complete schedule of portfolio holdings with the SEC for the first and third quarters of each fiscal year on FormN-Q. The Domini Funds’ FormsN-Q are available on the EDGAR database on the SEC’s website athttp://www.sec.gov. These Forms may also be reviewed and copied at the SEC’s Public Reference Room in Washington, D.C. Information about the operation of the Public Reference Room may be obtained by calling1-800-SEC-0330. The information on FormN-Q is also available to be viewed atwww.domini.com.
104
DOMINI FUNDS
P.O. Box 9785
Providence, RI 02940-9785
1-800-582-6757
www.domini.com
Investment Manager, Sponsor, and Distributor:
Domini Impact Investments LLC (Investment Manager and Sponsor)
DSIL Investment Services LLC (Distributor)
180 Maiden Lane, Suite 1302
New York, NY 10038-4925
Investment Submanagers:
Domini Impact Equity Fund
SSGA Funds Management, Inc.
1 Iron Street
Boston, MA 02210
Domini Impact International Equity Fund
Domini Impact Bond Fund
Wellington Management Company LLP
280 Congress Street
Boston, MA 02210
Transfer Agent:
BNY Mellon Asset Servicing
760 Moore Road
King of Prussia, PA 19406
Custodian:
State Street Bank and Trust Company
1 Iron Street
Boston, MA 02210
Independent Registered Public Accounting Firm:
KPMG LLP
Two Financial Center
60 South Street
Boston, MA 02111
Legal Counsel:
Morgan, Lewis & Bockius LLP
One Federal Street
Boston, MA 02110
Domini Funds P.O. Box9785 |Providence, RI 029401-800-582-6757 |www.domini.com| @DominiFunds Domini Impact International Equity FundSM InvestorShares: CUSIP 257132704 IDOMIX Class AShares: CUSIP 257132886 IDOMAX Institutional Shares: CUSIP 257132811 IDOMOX Class YShares: CUSIP 257132787 IDOMYX Domini Impact Equity FundSM InvestorShares: CUSIP 257132100 IDSEFX Class AShares: CUSIP 257132860 IDSEPX Institutional Shares: CUSIP 257132852 IDIEQX Class RShares: CUSIP 257132308 IDSFRX Domini ImpactBond FundSM Investor Shares: CUSIP 257132209 IDSBFX Institutional Shares: CUSIP 257132829 IDSBIX Class YShares: CUSIP 257132795 IDSBYX Presorted Standard U.S. Postage PAID Lancaster, PA Permit No.1793
(a) Not applicable to a semi-annual report.
(c) Not applicable.
(d) Not applicable.
| Item 3. | Audit Committee Financial Expert. |
Not applicable to a semi-annual report.
| Item 4. | Principal Accountant Fees and Services. |
Not applicable to a semi-annual report.
| Item 5. | Audit Committee of Listed Registrants. |
Not applicable to the registrant.
| Item 6. | Schedule of Investments. |
(a) The Schedule of Investments is included as part of the report to stockholders filed under Item 1.
(b) Not applicable.
| Item 7. | Disclosure of Proxy Voting Policies and Procedures forClosed-End Management Investment Companies. |
Not applicable to the registrant.
| Item 8. | Portfolio Managers ofClosed-End Management Investment Companies. |
Not applicable to the registrant.
| Item 9. | Purchases of Equity Securities byClosed-End Management Investment Company and Affiliated Purchasers. |
Not applicable to the registrant.
| Item 10. | Submission of Matters to a Vote of Security Holders. |
There have been no material changes to the procedures by which shareholders may submit recommendations for nominees to the registrant’s Board of Trustees.
| Item 11. | Controls and Procedures. |
(a) Within 90 days prior to the filing of this report on FormN-CSR, Carole M. Laible, the registrant’s President and Principal Executive Officer, and Christina M. Povall, the registrant’s Treasurer and Principal Financial Officer, reviewed the registrant’s disclosure controls and procedures (as defined in Rule30a-3(c) of the Investment Company Act of 1940) and evaluated their effectiveness. Based on their evaluation, Ms. Laible and Ms. Povall determined that the disclosure controls and procedures adequately ensure that information required to be disclosed by the registrant in this report on FormN-CSR is recorded, processed, summarized, and reported within the time periods required by the Securities and Exchange Commission’s rules and forms.
(b) There were no changes in the registrant’s internal control over financial reporting (as defined in Rule30a-3(d) under the Investment Company Act of 1940) that occurred during the second fiscal quarter of the period covered by this report that have materially affected, or are reasonably likely to materially affect, the registrant’s internal control over financial reporting.
| Item 12. | Disclosure of Securities Lending Activities forClosed-End Management Investment Companies. |
Not applicable to the registrant
(a)(1) Not applicable to a semi-annual report.
(a)(2) Separate certifications required by Rule30a-2(a) under the Investment Company Act of 1940 for each principal executive officer and principal financial officer of the registrant are filed herewith.
(a)(3) Not applicable to the registrant.
(b) A single certification required by Rule30a-2(b) under the Investment Company Act of 1940, Rule13a-14b or Rule15d-14(b) under the Securities Exchange Act of 1934, and Section 1350 of Chapter 63 of Title 18 of the United States Code for the chief executive officer and the chief financial officer of the registrant is filed herewith.
SIGNATURES
Pursuant to the requirements of the Securities Exchange Act of 1934 and the Investment Company Act of 1940, the registrant has duly caused this report to be signed on its behalf by the undersigned, thereunto duly authorized.
| | |
| DOMINI INVESTMENT TRUST |
| |
| By: | | /s/ Carole M. Laible |
| | Carole M. Laible |
| | President |
Date: April 8, 2019
Pursuant to the requirements of the Securities Exchange Act of 1934 and the Investment Company Act of 1940, this report has been signed below by the following persons on behalf of the registrant and in the capacities and on the dates indicated.
| | |
| By: | | /s/ Carole M. Laible |
| | Carole M. Laible |
| | President (Principal Executive Officer) |
Date: April 8, 2019
| | |
| By: | | /s/ Christina M. Povall |
| | Christina M. Povall |
| | Treasurer (Principal Financial Officer) |
Date: April 8, 2019