UNITED STATES
SECURITIES AND EXCHANGE COMMISSION
Washington, D.C. 20549
FORM N-CSR
CERTIFIED SHAREHOLDER REPORT OF REGISTERED
MANAGEMENT INVESTMENT COMPANIES
Investment Company Act File Number 811-5823
DOMINI INVESTMENT TRUST
(Exact Name of Registrant as Specified in Charter)
180 Maiden Lane, Suite 1302, New York, New York 10038
(Address of Principal Executive Offices)
Amy Domini Thornton
Domini Impact Investments LLC
180 Maiden Lane, Suite 1302
New York, New York 10038
(Name and Address of Agent for Service)
Registrant’s Telephone Number, including Area Code: 212-217-1100
Date of Fiscal Year End: July 31
Date of Reporting Period: January 31, 2021
| Item 1. | Reports to Stockholders. |
| | (a) | A copy of the report transmitted to stockholders pursuant to Rule 30e-1 under the Investment Company Act of 1940 follows. |
TABLE OF CONTENTS
INVESTINGFOR GOOD®
LETTER TO SHAREHOLDERS
Dear Fellow Shareholder,
The six months ending January 31, 2021 were tumultuous ones for our personal and community lives while being as smooth as could be for investors. We were once again reminded that the stock market does not render an accounting of the health of the economy but of certain companies. The six month period ending January 31, 2021 saw the Standard & Poor’s 500 index rise by a stunning 14%. It also saw unemployment figures at levels not seen since the 1930s.
During this time, American citizens struggled with yet another reckoning over racial justice. Marches in our cities motivated many to finally look to government for positive social change. The events around the Presidential election were beyond anything most Americans could have imagined even a decade ago. COVID-19 continued to rip apart families, businesses, and our health care system. Then when a vaccine was made available, the federal government largely stepped aside, leaving the financially depleted and exhausted local governments and agencies to figure out the logistics of actually inoculating enough people to halt the virus before it mutates into something much worse.
Paradoxically, stocks and bonds rose. Stocks returned astonishing results. Of special interest to responsible investors was the dynamic improvement in the opinion of companies that offer solutions to hardships. The backdrop described above caused an urgent need for these solutions. Responsible investors had been intrigued by the concept of distance learning bringing courses from top universities to students in remote locations, but the pandemic made the product urgently needed. We had admired the capacity to offer a kinder, more family-friendly work environment with flexibility of location, but the immediate necessity to work from home caused those companies with such technology to flourish. We had long felt that much of health care could be done more efficiently for the consumer, but not until the pandemic did the market appreciate the need. In short, we witnessed a period during which responsible investors were rewarded for the foresight they had by applying the good-for-people-and-the-planet lens to stock selection.
Another trend we have seen accelerating is the creation, nurturing, and bringing to public markets of a number of companies which were explicitly created to do good. The new generation of entrepreneurs seeking solutions to global climate issues or to providing dignity to people has hit full stride. It is an exciting trend and one that could offer a real contribution to our shared desire for a pleasant future.
2
INVESTINGFOR GOOD®
It is never easy to look back over a six month period and in brief form, summarize the moment. The phrase, “at the crossroads,” comes to mind. The planet stood, perhaps still stands, at the crossroads of choosing democratic institutions for governance, of choosing to limit our lifestyles to save ourselves from climate disaster, to finalize — or not — the definition of humankind as encompassing all human beings, regardless of ethnicity or other potential differentiators. At Domini Impact Investments, we strive to give you, our investors, an opportunity to be part of the solution as we seek the universal human dignity and ecological sustainability necessary for the next seven generations.
Thank you for your continued support and interest in investing with impact.
| | |

Carole Laible CEO | | 
Amy Domini Founder and Chair |
3
INVESTINGFOR GOOD®
STRENGTH IN NUMBERS
Sometimes, the path to impact investing starts small. With a cigarette, for example. As you bear the pain of a lost loved one, you wonder: is my money invested in tobacco companies?
The list may grow.
Weapons. Even if you never buy one personally, are your dollars helping to produce thousands?
Pesticides. Your lawn may not use them to grow, but does your money?
Gambling. You may only bet on a game once a year. But is your money feeding addictions that are causing high levels of debt among others?
The list goes on.
Fossil fuels.
Nuclear power.
For profit-prisons.
The issue becomes not our lack of dislikes — that list grows ever longer — but how we channel our dollars and our dislikes into things we do like; things we can feel good about.
Can you do good by buying stocks? Amy Domini’s answer is yes. In a piece that originally appeared in Kamp Solutions last summer, she calls financial asset management “a vast network of individuals, wired together, responsive immediately to new developments, continuously pricing in the risks and rewards implied by an action taken by a company.”
When used properly, she writes, a system that is ideal for delivering goods and services to people is also perfect for delivering wellbeing on a global scale. All that is needed is an investment adviser that cares, a set of standards that endures, an individual who believes, and a community that builds. Because if enough people come together with a care that’s mutual, the power of small becomes the greatness of all.
4
INVESTINGFOR GOOD®
Think of it as the “better effect.” When investors choose to invest only in companies that consider the environment and society, the definition of ‘better’ crystalizes. Securities markets of the world can begin to revalue the better-behaving companies, thereby delivering an incentive to corporate management for better behavior — and that kind of better is in all of our best interests.
This evolution of better has been part of Domini’s mission from the beginning. To achieve it, we start with standards; we always have. As a small, independent company, our standards loom large and our deep belief in universal human dignity and ecological sustainability, even larger. We seek investments that promote long-term environmental sustainability as well as universal values of fairness, equality, justice, and respect for human rights.
Our Impact Investment Standards
Universal human dignity and ecological sustainability are the goal.
Standards are the path we take to achieve it.
First, we evaluate companies to see if their core business model is aligned with our twin goals. Sometimes our assessment is straightforward because our exclusionary screens lead us to eliminate certain industries all together. Sorry, big tobacco. Hello, renewable energy. But usually, like the world, it’s complicated.
So next, we look at the company’s relations with its key stakeholders. This includes ecosystems; local, national, and global communities; customers; employees; suppliers; investors.
Our Impact Investment Standards focus on key themes that we believe best capture the strength of a corporation’s relations with each of these stakeholders.
Exclusionary Screens
Determining which lines of business are fundamentally misaligned with our goals of universal human dignity and ecological sustainability make some investment decisions easy. Divestment from these industries has allowed us to further debate of some of the most important and difficult issues of our time, such as climate change. The following exclusionary screens are applied consistently across all our Funds:
5
INVESTINGFOR GOOD®
Weapons & Firearms
| | We have a longstanding policy to avoid investment in manufacturers of weapons, including military weapons and civilian firearms, which can be used to cause incalculable harm. We believe it is irresponsible to combine weapons manufacturing with the pressure to maximize profits. |
Nuclear Power
| | We exclude companies involved in nuclear weapons production, as well as owners of nuclear power plants. We believe nuclear power technology presents significant risks to human health and safety, as well as the environment. We also have an exclusion on uranium mining. |
Fossil Fuels
| | We exclude companies in the energy sector involved in oil and natural gas exploration and production, coal mining, oil and gas storage, transportation, refining, marketing, and related services due to the urgent need to accelerate the low-carbon transition and address the environmental, social and financial risks of climate change. We also seek to avoid electric utilities with a majority of installed capacity from coal and exclude any utility that has announced or begun construction on new coal plants following the Paris Agreement. |
For Profit-Prisons
| | We exclude for-profit prisons and immigration detention centers due to the significant civil and human rights concerns that occur as a result of their business models, particularly for marginalized communities. The for-profit prison model incentivizes imprisoning the greatest number of people for the longest duration at the lowest cost to increase growth and profits. |
Tobacco, Alcohol & Gambling
| | We have never invested in companies that are significant manufacturers of tobacco products, alcoholic beverages, or significant providers of gambling goods and services. For these companies, effective marketing often means exploiting customers’ addictions to their products or lack of awareness of potential risks. |
| | In addition to these industry exclusions, we have generally avoided major producers of synthetic pesticides and agricultural chemicals due to environmental concerns related to this business. |
6
INVESTINGFOR GOOD®
Our standards versus the S&P 500
The average investor may not know it, but the S&P 500 Index may include companies they don’t want to own, such as a weapons manufacturer. Here, we show what percentage of the S&P 500 we consider eligible for investment.
S&P 500 Index1
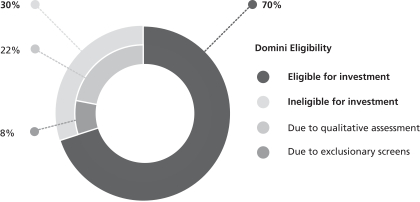
NOTE: The above information is as of December 31, 2020. Eligibility decisions are subject to change.
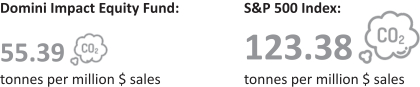
Small carbon footprint, big impact
As supporters of a greener future, we’re proud to report that the Domini Impact Equity Fund’s portfolio as of December 31, 2020 was 55% less carbon intensive than its benchmark.
TCFD Carbon Intensity2
Our standards lead us to be underweight to more carbon-intensive sectors like Utilities and Energy. These numbers don’t happen by chance; we have developed proprietary key performance indicators (KPIs) to help guide our social and environmental research for all asset classes and sub-industries covered by our Funds. We revise these often to ensure we remain focused on the most relevant and meaningful information.
7
INVESTINGFOR GOOD®
For materials companies, for instance, we recently expanded our assessment of greenhouse gas emissions reduction targets to include time-bound transition plans, including reporting aligned with the recommendations of the Taskforce for Climate-related Financial Disclosures (TCFD).
When standards lead, inspiring outcomes follow
Perhaps the best way to understand our investment standards is to look at some of the companies we’re invested in and how these investments support our goals of universal human dignity and ecological sustainability. Here are some recent highlights and insights.
Domini Impact Equity Fund Investment Highlight: Sunrun
Sunrun is the leading residential solar installer in the U.S., with a demonstrated commitment to expanding access to affordable, clean energy. The company designs, installs, finances, insures, monitors and maintains rooftop solar systems, with little to no upfront cost to homeowners and predictable pricing for 20 years, often providing significant savings over the cost of traditional energy. Sunrun’s intelligent Brightbox battery storage solution helps customers maximize savings by optimizing generation and storage and reducing reliance on electric utilities during times of peak demand. As of 2019, Sunrun estimates that its solar systems have prevented 5.2 million metric tons of greenhouse gas emissions, produced over 7 billion kilowatt-hours of clean energy, and saved customers more than $300 million on electricity bills. Through a long-running partnership with GRID Alternatives, Sunrun has also helped provide access to solar power for thousands of low-income families in underserved communities across the country.
Domini Impact Equity Fund Investment Highlight: Salesforce.com
Salesforce.com Inc. engages in the design and development of cloud-based enterprise software for customer relationship management. The company’s internal diversity and inclusion programs are particularly strong, both in disclosure but also in action. The company discloses diversity data by gender, ethnicity, and by positions within the company (tech, non-tech, and leadership) and conducts equal pay audits annually to address unexplained difference in pay based on gender, race and ethnicity. In 2019, the company adjusted pay for 5% of employees globally to assure pay equity among its employees. The company also has strong gender and racial diversity in its executive team and board of directors, with over 30% representation on each.
8
INVESTINGFOR GOOD®
Domini Impact Bond Fund Investment Highlight: MacArthur Foundation
MacArthur Foundation is a not-for-profit organization headquartered in Chicago, Illinois that provides grants to address some of society’s most pressing challenges with the aim of building a more “just, verdant, and peaceful world.” Throughout its history, the Foundation has awarded more than $7.3 billion to nearly 10,000 organizations and individuals in 117 countries. The Domini Impact Bond Fund is invested in a social bond issued by the Foundation, which will be used to fund organizations and further initiatives that seek to address the economic and social challenges resulting from the COVID-19 pandemic, particularly among communities of color and the nonprofit sector more broadly, as well as to address the systemic issues exposed by the pandemic and the protests in response to police use of violence against persons of color, especially African Americans.
Domini Sustainable Solutions Fund
Our standards, applied to all our Funds, ensure we meet our goals of human dignity and environmental sustainability. On April 1, 2020 (yes, right in the middle of the pandemic), we introduced the Domini Sustainable Solutions Fund. This Fund offers high-conviction exposure to solution-oriented companies around the world helping to address the following sustainability themes:
We anticipated the need for a product that focuses solely on sustainability solutions. Think access to health care, access to food that’s clean and wholesome for the planet, and access to transportation that doesn’t rely on petroleum. For example, Tesla, which is our top portfolio holding in this Fund.
Top Ten Portfolio Holdings (%)3
| | | | | | | | | | |
| | | |
| Tesla Inc | | | 5.6 | | | Ameresco Inc Class A | | | 3.9 | |
| | | |
| Enphase Energy Inc | | | 5.5 | | | Atlassion Corp PLC | | | 3.9 | |
| | | |
| Square Inc (Class A) | | | 4.2 | | | First Solar Inc | | | 3.7 | |
| | | |
| Cree Inc | | | 4.1 | | | BlackLine Inc | | | 3.6 | |
| | | |
| Autodesk Inc | | | 4.1 | | | Vestas Wind Systems A/S | | | 3.6 | |
| | | |
| | | | | | Total | | | 42.3 | |
9
INVESTINGFOR GOOD®
Small. It’s the new big.
Our standards have allowed us to lead impact investing before impact investing led. When you uphold standards for over 25 years, impact investing becomes more than a trend; it becomes a tradition. One that knows that the secret to making an impact is small. It’s one individual, believing. It’s one community, sharing. It’s one organization, listening. It’s one founder, creating. It’s one Fund, caring. And it’s all of us, coming together with a care that’s mutual in Funds that are too, ready to tell the big financial world, welcome to Domini, where the power of small is the greatness of all.
Thank you for being an important part of our community.
| | | | |
| | Sign up for Domini news and impact updates at domini.com/subscribe | | |
1 S&P 500 Index weights. Numbers may not add up to totals due to rounding.
2 “TCFD carbon intensity calculations were made using Bloomberg’s Portfolio Carbon Footprint Tool. Carbon intensity is measured as tonnes of carbon dioxide equivalent emitted per USD millions in sales. The figures provided are the weighted averages of each company’s carbon intensity by its allocation in the portfolio or index. The carbon data used is Scope 1 and 2 (as available) for fiscal year 2019, the most recent year for which data was widely available. Where companies do not report Scope 1 and 2 emissions, they are estimated using the median of reported figures within the same industry group. For the calculations provided, such estimates were used for 35% of the Fund’s portfolio and 30% of the index.”
3 Fund Portfolio weights are as of December 31, 2020 and exclude cash and cash equivalents. Numbers may not add up to totals due to rounding.
The holdings discussed above can be found in the portfolio of the Domini Impact Equity Fund, Domini International Opportunities Fund, Domini Sustainable Solutions Fund, Domini Impact International Equity Fund and Domini Impact Bond Fund, included herein. The composition of each portfolio is subject to change.
An investment in the Domini Funds is not a bank deposit, not insured and is subject to certain risks including those described below. You may lose money. Investment return, principal value, and yield will fluctuate so that an investor’s shares, when redeemed, may be worth more or less than their original cost. See the prospectus for more information on risks.
The Domini Impact Equity Fund is subject to impact investing, portfolio management, information, market, recent events, and mid- to large-cap companies risks. The Domini International Opportunities Fund is subject to foreign investing, geographic focus, country, currency, impact investing and recent events risks. The Domini Sustainable Solutions Fund is subject to sustainable investing, portfolio management, information, market, recent events, and mid- to large-cap companies and small-cap companies risks. The Domini Impact International Equity Fund is subject to foreign investing and emerging markets, geographic focus, country, currency, impact investing and recent events risks. Investing internationally involves special risks, such as currency fluctuations, social and economic instability, differing securities regulations and accounting standards, limited public information, possible changes in taxation, and periods of illiquidity. These risks may be heightened in connection with investments in emerging market countries. The Domini Impact Bond Fund is subject to impact investing, portfolio management, style risk, information, market, recent events, interest rate and credit risks.
This report is not authorized for distribution to prospective investors of the Domini Funds referenced herein unless preceded or accompanied by a current prospectus for the relevant Fund. Nothing herein is to be considered a recommendation concerning the merits of any noted company, or an offer of sale or solicitation of an offer to buy shares of any Fund or company referenced herein. Such offering is only made by prospectus, which includes details as to the offering price and other material information. Carefully consider
10
INVESTINGFOR GOOD®
the Funds’ investment objectives, risk factors and charges and expenses before investing. This and other information can be found in the Funds’ prospectus, which may be obtained by calling 1-800-582-6757 or at domini.com. Domini Impact Investments LLC is each Fund’s investment manager. The Funds are subadvised by unaffiliated entities. Shares of the Domini Funds are offered for sale only in the United States DSIL Investment Services LLC, Distributor, Member FINRA. 3/21
11
DOMINI IMPACT EQUITY FUND
Fund Performance and Holdings
The table and bar charts below provide information as of January 31, 2021, about the ten largest holdings of the Domini Impact Equity Fund and its portfolio holdings by industry sector:
TEN LARGEST HOLDINGS (Unaudited)
| | | | | | | | | | |
| | | | |
| SECURITY DESCRIPTION | | % NET
ASSETS | | | SECURITY DESCRIPTION | | % NET
ASSETS | |
| | | | |
| Apple Inc | | | 8.3% | | | Procter + Gamble Co/The | | | 1.3% | |
| | | | |
| Microsoft Corp | | | 7.2% | | | NVIDIA Corp | | | 1.3% | |
| | | | |
| Amazon.com Inc | | | 5.7% | | | Walt Disney Co/The | | | 1.3% | |
| | | | |
| Alphabet Inc Class A | | | 4.6% | | | Home Depot Inc/The | | | 1.2% | |
| | | | |
| Tesla Inc | | | 2.5% | | | Mastercard Inc Class A | | | 1.2% | |
PORTFOLIO HOLDINGS BY INDUSTRY SECTOR (% OF NET ASSETS) (Unaudited)
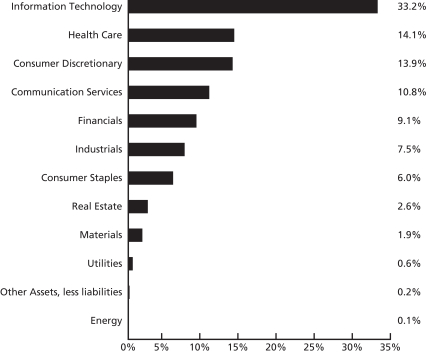
The holdings mentioned above are described in the Domini Impact Equity Fund’s Portfolio of Investments (as of 1/31/21), included herein. The composition of the Fund’s portfolio is subject to change.
The Global Industry Classification Standard (“GICS”) was developed by and is the exclusive property and a service mark of MSCI Inc. (“MSCI”) and Standard & Poor’s, a division of The McGraw-Hill Companies, Inc. (“S&P”) and is licensed for use by Domini Impact Investments. Neither MSCI, S&P nor any third party involved in making or compiling the GICS or any GICS classifications makes any express or implied warranties or representations with respect to such standard or classification nor shall any such party have any liability therefrom.
12
| | | | | | | | | | | | | | |
| |
| AVERAGE ANNUAL TOTAL RETURNS (Unaudited) |
| | | | | | |
| | | Investor
shares | | Class A shares
(with 4.75%
maximum
Sales Charge) | | Class A
shares (without
Sales
Charge) | | Institutional
shares | | Class Y shares | | S&P 500 |
| | | | | | | |
| As of 1/31/21 | | 1 Year | | 29.00% | | 22.87% | | 28.99% | | 29.45% | | 29.34% | | 17.25% |
| | | | | | | |
| | 5 Year | | 16.55% | | 15.40% | | 16.53% | | 16.97% | | 16.90% | | 16.16% |
| | | | | | | |
| | | 10 Year | | 12.04% | | 11.50% | | 12.05% | | 12.46% | | 12.38% | | 13.50% |
NOTE: The Fund’s current investment strategy commenced on December 1, 2018 with SSGA Funds Management, Inc as its subadviser. Performance information for periods prior to December 1, 2018 reflects the investment strategies employed during those periods.
Past performance is no guarantee of future results. The Fund’s returns quoted above represent past performance after all expenses. The returns reflect any applicable expense waivers in effect during the periods shown. Without such waivers, Fund performance would be lower. Investment return, principal value, and yield will fluctuate. Your shares, when redeemed, may be worth more or less than their original cost. Call 1-800-582-6757 or visit domini.com for performance information current to the most recent month-end, which may be lower or higher than the performance data quoted. A 2.00% redemption fee applies on sales or exchanges of shares made less than 30 days after the settlement of purchase or acquisition through exchange, with certain exceptions. Quoted performance data does not reflect the deduction of this fee, which would reduce the performance quoted. See the prospectus for further information.
Per the prospectus dated November 30, 2020, the Fund’s annual operating expenses totaled 1.09% and 0.74% (gross and net) and 1.47%/1.09% and 0.94%/0.80% (gross/net) for Investor, Institutional, Class A, and Class Y shares, respectively. The Fund’s Adviser has contractually agreed to waive certain fees and/or reimburse certain ordinary operating expenses in order to limit Investor shares, Class A, Institutional, and Class Y share expenses to 1.09%, 1.09%, 0.74%, and 0.80%, respectively. These expense limitations are in effect through November 30, 2021. There can be no assurance that the Adviser will extend the expense limitations beyond such time. While in effect, the arrangement may be terminated for a class only by agreement of the Adviser and the Fund’s Board of Trustees.
The table does not reflect the deduction of taxes that a shareholder would pay on Fund distributions or the redemption of Fund shares. Total return for the Fund is based on the Fund’s net asset values and assumes all dividend and capital gains were reinvested.
An investment in the Domini Impact Equity Fund is not a bank deposit and is not insured. The Fund is subject to certain risks, including impact investing, portfolio management, information, market, recent events, and mid- to large-cap companies risks. You may lose money.
The Standard & Poor’s 500 Index (S&P 500) is an unmanaged index of common stocks. Investors cannot invest directly in the S&P 500.
13
DOMINI IMPACT EQUITY FUND
PORTFOLIOOF INVESTMENTS
January 31, 2021 (Unaudited)
| | | | | | | | |
| SECURITY | | SHARES | | | VALUE | |
| Common Stocks – 99.8% | |
| Communication Services – 10.8% | |
Alphabet, Inc., Class A (a) | | | 24,450 | | | $ | 44,678,952 | |
AT&T, Inc. | | | 303,685 | | | | 8,694,502 | |
Charter Communications, Inc., Class A (a) | | | 5,558 | | | | 3,376,819 | |
Comcast Corp., Class A | | | 188,221 | | | | 9,330,115 | |
Electronic Arts, Inc. | | | 12,018 | | | | 1,720,978 | |
Lumen Technologies, Inc. | | | 46,100 | | | | 570,718 | |
Netflix, Inc. (a) | | | 17,438 | | | | 9,283,817 | |
New York Times Co. (The), Class A | | | 49,199 | | | | 2,439,778 | |
Omnicom Group, Inc. | | | 8,700 | | | | 542,706 | |
Take-Two Interactive Software, Inc. (a) | | | 4,581 | | | | 918,261 | |
TELUS Corp. | | | 52,794 | | | | 1,089,140 | |
Verizon Communications, Inc. | | | 172,495 | | | | 9,444,101 | |
Walt Disney Co. (The) (a) | | | 74,993 | | | | 12,611,573 | |
| | | | | | | | |
| | | | | | | 104,701,460 | |
| | | | | | | | |
| | |
| Consumer Discretionary – 13.9% | | | | | | |
Advance Auto Parts, Inc. | | | 2,657 | | | | 396,265 | |
Amazon.com, Inc. (a) | | | 17,319 | | | | 55,528,178 | |
Aptiv PLC | | | 10,800 | | | | 1,442,880 | |
Best Buy Co., Inc. | | | 9,449 | | | | 1,028,240 | |
BorgWarner, Inc. | | | 9,900 | | | | 415,701 | |
Bright Horizons Family Solutions, Inc. (a) | | | 2,400 | | | | 364,728 | |
Chegg, Inc. (a) | | | 59,156 | | | | 5,635,201 | |
Chipotle Mexican Grill, Inc. (a) | | | 1,117 | | | | 1,653,160 | |
Cie Generale des Etablissements Michelin SCA ADR | | | 33,350 | | | | 919,459 | |
eBay, Inc. | | | 27,100 | | | | 1,531,421 | |
Fast Retailing Co., Ltd. ADR | | | 22,253 | | | | 1,924,217 | |
Gap, Inc. (The) (a) | | | 12,345 | | | | 249,986 | |
Garmin, Ltd. | | | 6,246 | | | | 717,416 | |
Home Depot, Inc. (The) | | | 43,451 | | | | 11,767,400 | |
Kohl’s Corp. | | | 6,912 | | | | 304,543 | |
Lowe’s Cos., Inc. | | | 30,141 | | | | 5,029,026 | |
NIKE, Inc., Class B | | | 50,749 | | | | 6,779,559 | |
NVR, Inc. (a) | | | 140 | | | | 622,507 | |
Sony Corp. ADR | | | 49,055 | | | | 4,695,054 | |
Starbucks Corp. | | | 48,967 | | | | 4,740,495 | |
Target Corp. | | | 20,651 | | | | 3,741,342 | |
Tesla, Inc. (a) | | | 31,185 | | | | 24,746,233 | |
Ulta Beauty, Inc. (a) | | | 2,198 | | | | 614,912 | |
Williams-Sonoma, Inc. | | | 3,200 | | | | 412,544 | |
| | | | | | | | |
| | | | | | | 135,260,467 | |
| | | | | | | | |
|
| Consumer Staples – 6.0% | |
Beyond Meat, Inc. (a) | | | 25,405 | | | | 4,524,122 | |
Campbell Soup Co. | | | 7,991 | | | | 384,447 | |
Church & Dwight Co., Inc. | | | 10,112 | | | | 853,756 | |
Clorox Co. (The) | | | 5,200 | | | | 1,089,192 | |
14
DOMINI IMPACT EQUITY FUND
PORTFOLIOOF INVESTMENTS (continued)
January 31, 2021 (Unaudited)
| | | | | | | | |
| SECURITY | | SHARES | | | VALUE | |
|
| Consumer Staples (Continued) | |
Colgate-Palmolive Co. | | | 35,225 | | | $ | 2,747,550 | |
Costco Wholesale Corp. | | | 18,303 | | | | 6,450,526 | |
Estee Lauder Cos., Inc. (The), Class A | | | 8,177 | | | | 1,935,087 | |
General Mills, Inc. | | | 25,199 | | | | 1,464,062 | |
JM Smucker Co. (The) | | | 4,446 | | | | 517,559 | |
Kimberly-Clark Corp. | | | 13,918 | | | | 1,838,568 | |
Kraft Heinz Co. (The) | | | 25,523 | | | | 855,276 | |
Kroger Co. (The) | | | 30,511 | | | | 1,052,629 | |
Lamb Weston Holdings, Inc. | | | 5,800 | | | | 433,260 | |
McCormick & Co., Inc. | | | 10,500 | | | | 940,170 | |
Mondelez International, Inc., Class A | | | 57,947 | | | | 3,212,582 | |
Orkla ASA ADR | | | 29,600 | | | | 288,304 | |
PepsiCo, Inc. | | | 56,631 | | | | 7,734,096 | |
Procter & Gamble Co. (The) | | | 100,925 | | | | 12,939,594 | |
Sysco Corp. | | | 20,003 | | | | 1,430,415 | |
Unilever PLC ADR | | | 103,585 | | | | 6,043,149 | |
Walgreens Boots Alliance, Inc. | | | 29,548 | | | | 1,484,787 | |
| | | | | | | | |
| | | | | | | 58,219,131 | |
| | | | | | | | |
| | |
| Energy – 0.1% | | | | | | |
Legrand SA ADR | | | 52,900 | | | | 973,889 | |
| | | | | | | | |
| | | | | | | 973,889 | |
| | | | | | | | |
| | |
| Financials – 9.1% | | | | | | |
Aflac, Inc. | | | 26,715 | | | | 1,206,984 | |
AGNC Investment Corp. | | | 22,200 | | | | 346,320 | |
American Express Co. | | | 24,848 | | | | 2,888,828 | |
Annaly Capital Management, Inc. | | | 57,600 | | | | 467,712 | |
Bank of America Corp. | | | 312,354 | | | | 9,261,296 | |
Bank of Montreal | | | 26,831 | | | | 1,993,812 | |
Bank of New York Mellon Corp. (The) | | | 33,200 | | | | 1,322,356 | |
Bank of Nova Scotia (The) | | | 49,966 | | | | 2,662,688 | |
BlackRock, Inc. | | | 5,734 | | | | 4,021,025 | |
Capital One Financial Corp. | | | 18,318 | | | | 1,909,835 | |
Cboe Global Markets, Inc. | | | 4,500 | | | | 412,785 | |
Charles Schwab Corp. (The) | | | 61,278 | | | | 3,158,268 | |
Chubb, Ltd. | | | 16,187 | | | | 2,357,960 | |
Cincinnati Financial Corp. | | | 6,311 | | | | 530,692 | |
Citigroup, Inc. | | | 85,308 | | | | 4,947,011 | |
CME Group, Inc. | | | 14,298 | | | | 2,598,519 | |
Comerica, Inc. | | | 5,954 | | | | 340,569 | |
Discover Financial Services | | | 12,200 | | | | 1,019,188 | |
DNB ASA ADR (a) | | | 35,948 | | | | 698,649 | |
East West Bancorp, Inc. | | | 6,000 | | | | 359,640 | |
Equitable Holdings, Inc. | | | 18,600 | | | | 460,908 | |
Everest Re Group, Ltd. | | | 1,700 | | | | 358,836 | |
FactSet Research Systems, Inc. | | | 1,500 | | | | 453,510 | |
Fifth Third Bancorp | | | 29,156 | | | | 843,483 | |
First Republic Bank | | | 7,000 | | | | 1,014,930 | |
15
DOMINI IMPACT EQUITY FUND
PORTFOLIOOF INVESTMENTS (continued)
January 31, 2021 (Unaudited)
| | | | | | | | |
| SECURITY | | SHARES | | | VALUE | |
| | |
| Financials (Continued) | | | | | | |
Franklin Resources, Inc. | | | 11,200 | | | $ | 294,448 | |
Hartford Financial Services Group, Inc. (The) | | | 14,693 | | | | 705,558 | |
Huntington Bancshares, Inc. | | | 40,800 | | | | 539,580 | |
Intercontinental Exchange, Inc. | | | 22,695 | | | | 2,504,393 | |
Invesco, Ltd. | | | 16,303 | | | | 335,679 | |
KeyCorp | | | 39,200 | | | | 660,912 | |
London Stock Exchange Group PLC ADR | | | 56,400 | | | | 1,710,048 | |
MarketAxess Holdings, Inc. | | | 1,500 | | | | 811,140 | |
Marsh & McLennan Cos., Inc. | | | 20,530 | | | | 2,256,452 | |
Moody’s Corp. | | | 6,614 | | | | 1,761,044 | |
Morgan Stanley | | | 58,459 | | | | 3,919,676 | |
MSCI, Inc. | | | 3,205 | | | | 1,266,936 | |
Nasdaq, Inc. | | | 6,000 | | | | 811,620 | |
Northern Trust Corp. | | | 8,200 | | | | 731,358 | |
PNC Financial Services Group, Inc. (The) | | | 16,949 | | | | 2,432,520 | |
Principal Financial Group, Inc. | | | 11,100 | | | | 546,897 | |
Progressive Corp. (The) | | | 24,058 | | | | 2,097,617 | |
Prudential Financial, Inc. | | | 16,461 | | | | 1,288,567 | |
Raymond James Financial, Inc. | | | 5,000 | | | | 499,650 | |
Regions Financial Corp. | | | 38,628 | | | | 657,062 | |
Reinsurance Group of America, Inc. | | | 2,600 | | | | 273,130 | |
S&P Global, Inc. | | | 9,998 | | | | 3,169,366 | |
SEI Investments Co. | | | 5,200 | | | | 274,820 | |
Swiss Re AG ADR | | | 43,893 | | | | 974,864 | |
T Rowe Price Group, Inc. | | | 9,211 | | | | 1,441,337 | |
Toronto-Dominion Bank (The) | | | 74,617 | | | | 4,222,576 | |
Travelers Cos., Inc. (The) | | | 10,516 | | | | 1,433,331 | |
Truist Financial Corp. | | | 54,702 | | | | 2,624,602 | |
US Bancorp | | | 55,716 | | | | 2,387,431 | |
Voya Financial, Inc. | | | 5,000 | | | | 277,300 | |
Zions Bancorp NA | | | 7,099 | | | | 313,350 | |
| | | | | | | | |
| | | | | | | 88,859,068 | |
| | | | | | | | |
| | |
| Health Care – 14.1% | | | | | | |
AbbVie, Inc. | | | 70,352 | | | | 7,209,673 | |
ABIOMED, Inc. (a) | | | 1,800 | | | | 626,850 | |
Agilent Technologies, Inc. | | | 12,500 | | | | 1,502,125 | |
Alcon, Inc. (a) | | | 20,362 | | | | 1,460,159 | |
Alexion Pharmaceuticals, Inc. (a) | | | 8,781 | | | | 1,346,391 | |
Align Technology, Inc. (a) | | | 2,900 | | | | 1,523,602 | |
Alnylam Pharmaceuticals, Inc. (a) | | | 4,800 | | | | 722,304 | |
Amgen, Inc. | | | 23,819 | | | | 5,750,621 | |
Becton Dickinson and Co. | | | 11,751 | | | | 3,076,294 | |
Biogen, Inc. (a) | | | 6,267 | | | | 1,771,117 | |
BioMarin Pharmaceutical, Inc. (a) | | | 7,300 | | | | 604,294 | |
Bio-Rad Laboratories, Inc., Class A (a) | | | 900 | | | | 516,393 | |
Bio-Techne Corp. | | | 1,600 | | | | 519,856 | |
Bristol-Myers Squibb Co. | | | 91,801 | | | | 5,639,335 | |
Bruker Corp. | | | 4,600 | | | | 266,294 | |
16
DOMINI IMPACT EQUITY FUND
PORTFOLIOOF INVESTMENTS (continued)
January 31, 2021 (Unaudited)
| | | | | | | | |
| SECURITY | | SHARES | | | VALUE | |
| | |
| Health Care (Continued) | | | | | | |
Cerner Corp. | | | 12,223 | | | $ | 979,185 | |
Cooper Cos., Inc. (The) | | | 1,900 | | | | 691,676 | |
Danaher Corp. | | | 25,915 | | | | 6,163,624 | |
DENTSPLY SIRONA, Inc. | | | 9,416 | | | | 503,662 | |
DexCom, Inc. (a) | | | 13,507 | | | | 5,063,099 | |
Edwards Lifesciences Corp. (a) | | | 25,072 | | | | 2,070,446 | |
Exact Sciences Corp. (a) | | | 6,200 | | | | 850,392 | |
Gilead Sciences, Inc. | | | 51,846 | | | | 3,401,098 | |
GlaxoSmithKline PLC ADR | | | 101,525 | | | | 3,781,806 | |
Guardant Health, Inc. (a) | | | 3,300 | | | | 513,150 | |
Haemonetics Corp. (a) | | | 2,051 | | | | 234,409 | |
Henry Schein, Inc. (a) | | | 5,700 | | | | 375,345 | |
Hill-Rom Holdings, Inc. | | | 2,800 | | | | 268,912 | |
Hologic, Inc. (a) | | | 67,015 | | | | 5,343,106 | |
IDEXX Laboratories, Inc. (a) | | | 3,419 | | | | 1,636,607 | |
Illumina, Inc. (a) | | | 5,849 | | | | 2,494,248 | |
Incyte Corp. (a) | | | 7,700 | | | | 691,075 | |
Insulet Corp. (a) | | | 2,700 | | | | 721,386 | |
Ionis Pharmaceuticals, Inc. (a) | | | 5,300 | | | | 318,371 | |
Koninklijke Philips NV (a) | | | 36,176 | | | | 1,963,995 | |
Masimo Corp. (a) | | | 2,100 | | | | 537,432 | |
Merck & Co., Inc. | | | 104,435 | | | | 8,048,805 | |
Mettler-Toledo International, Inc. (a) | | | 990 | | | | 1,156,419 | |
Moderna, Inc. (a) | | | 13,500 | | | | 2,337,660 | |
Novo Nordisk A/S ADR | | | 66,278 | | | | 4,612,949 | |
OraSure Technologies, Inc. (a) | | | 307,400 | | | | 4,681,702 | |
PerkinElmer, Inc. | | | 4,700 | | | | 691,229 | |
Pfizer, Inc. | | | 233,470 | | | | 8,381,573 | |
Quest Diagnostics, Inc. | | | 5,715 | | | | 738,092 | |
Regeneron Pharmaceuticals, Inc. (a) | | | 4,142 | | | | 2,086,905 | |
ResMed, Inc. | | | 5,846 | | | | 1,178,378 | |
Sanofi ADR | | | 87,816 | | | | 4,145,793 | |
Seagen, Inc. (a) | | | 30,645 | | | | 5,034,054 | |
STERIS PLC | | | 3,600 | | | | 673,596 | |
Stryker Corp. | | | 13,528 | | | | 2,989,823 | |
Teladoc Health, Inc. (a) | | | 18,598 | | | | 4,906,710 | |
Teleflex, Inc. | | | 1,900 | | | | 717,497 | |
Thermo Fisher Scientific, Inc. | | | 16,588 | | | | 8,454,904 | |
United Therapeutics Corp. (a) | | | 1,800 | | | | 294,876 | |
Varian Medical Systems, Inc. (a) | | | 3,900 | | | | 684,723 | |
Veeva Systems, Inc., Class A (a) | | | 5,406 | | | | 1,494,435 | |
Vertex Pharmaceuticals, Inc. (a) | | | 10,343 | | | | 2,369,374 | |
Waters Corp. (a) | | | 2,563 | | | | 678,349 | |
| | | | | | | | |
| | | | | | | 137,496,178 | |
| | | | | | | | |
| | |
| Industrials – 7.5% | | | | | | |
Alaska Air Group, Inc. | | | 5,100 | | | | 249,033 | |
Allegion PLC | | | 3,900 | | | | 417,339 | |
Ameresco, Inc., Class A (a) | | | 121,931 | | | | 6,839,110 | |
17
DOMINI IMPACT EQUITY FUND
PORTFOLIOOF INVESTMENTS (continued)
January 31, 2021 (Unaudited)
| | | | | | | | |
| SECURITY | | SHARES | | | VALUE | |
| | |
| Industrials (Continued) | | | | | | |
AO Smith Corp. | | | 5,800 | | | $ | 314,940 | |
Assa Abloy AB ADR | | | 78,242 | | | | 965,506 | |
Brambles, Ltd. ADR | | | 30,300 | | | | 490,557 | |
Carlisle Cos., Inc. | | | 2,100 | | | | 304,353 | |
CH Robinson Worldwide, Inc. | | | 5,400 | | | | 462,024 | |
Cintas Corp. | | | 3,600 | | | | 1,145,232 | |
Copart, Inc. (a) | | | 8,800 | | | | 965,800 | |
CoStar Group, Inc. (a) | | | 1,571 | | | | 1,413,444 | |
Cummins, Inc. | | | 6,041 | | | | 1,416,131 | |
Dai Nippon Printing Co., Ltd. ADR | | | 18,200 | | | | 157,976 | |
Deere & Co. | | | 11,445 | | | | 3,305,316 | |
Deutsche Post AG ADR | | | 38,237 | | | | 1,893,114 | |
Donaldson Co., Inc. | | | 5,200 | | | | 309,088 | |
Emerson Electric Co. | | | 24,826 | | | | 1,969,943 | |
Expeditors International of Washington, Inc. | | | 6,600 | | | | 590,832 | |
Fastenal Co. | | | 23,358 | | | | 1,064,891 | |
Fortune Brands Home & Security, Inc. | | | 5,400 | | | | 465,750 | |
Graco, Inc. | | | 6,900 | | | | 475,686 | |
Hubbell, Inc. | | | 2,200 | | | | 342,320 | |
IAA, Inc. (a) | | | 5,500 | | | | 314,270 | |
IDEX Corp. | | | 3,200 | | | | 595,808 | |
IHS Markit, Ltd. | | | 14,994 | | | | 1,305,678 | |
Illinois Tool Works, Inc. | | | 11,752 | | | | 2,282,356 | |
Ingersoll Rand, Inc. (a) | | | 15,169 | | | | 634,671 | |
JB Hunt Transport Services, Inc. | | | 3,400 | | | | 457,844 | |
JetBlue Airways Corp. (a) | | | 13,988 | | | | 200,588 | |
Johnson Controls International PLC | | | 29,736 | | | | 1,481,448 | |
KAR Auction Services, Inc. | | | 5,500 | | | | 101,530 | |
Lennox International, Inc. | | | 1,400 | | | | 385,686 | |
Makita Corp. ADR | | | 9,800 | | | | 491,078 | |
Masco Corp. | | | 10,700 | | | | 581,117 | |
Middleby Corp. (The) (a) | | | 2,400 | | | | 325,728 | |
MSC Industrial Direct Co., Inc., Class A | | | 1,600 | | | | 124,112 | |
Nidec Corp. ADR | | | 81,156 | | | | 2,713,045 | |
Nielsen Holdings PLC | | | 15,500 | | | | 346,115 | |
Nordson Corp. | | | 2,100 | | | | 375,879 | |
Old Dominion Freight Line, Inc. | | | 4,400 | | | | 853,600 | |
Owens Corning | | | 4,533 | | | | 351,761 | |
PACCAR, Inc. | | | 14,200 | | | | 1,295,324 | |
Pentair PLC | | | 6,600 | | | | 359,436 | |
Robert Half International, Inc. | | | 4,751 | | | | 320,693 | |
Rockwell Automation, Inc. | | | 4,772 | | | | 1,185,985 | |
Roper Technologies, Inc. | | | 4,257 | | | | 1,672,618 | |
Schneider Electric SE ADR | | | 109,400 | | | | 3,215,266 | |
Sensata Technologies Holding PLC (a) | | | 6,100 | | | | 332,450 | |
Siemens AG ADR | | | 65,136 | | | | 5,038,270 | |
Simpson Manufacturing Co., Inc. | | | 1,600 | | | | 147,200 | |
SKF AB ADR | | | 18,000 | | | | 492,840 | |
Snap-on, Inc. | | | 2,300 | | | | 413,977 | |
18
DOMINI IMPACT EQUITY FUND
PORTFOLIOOF INVESTMENTS (continued)
January 31, 2021 (Unaudited)
| | | | | | | | |
| SECURITY | | SHARES | | | VALUE | |
| | |
| Industrials (Continued) | | | | | | |
Stanley Black & Decker, Inc. | | | 6,354 | | | $ | 1,102,355 | |
Sunrun, Inc. (a) | | | 84,768 | | | | 5,871,879 | |
Thomson Reuters Corp. | | | 6,700 | | | | 546,385 | |
Toro Co. (The) | | | 4,500 | | | | 424,125 | |
Trane Technologies PLC | | | 9,707 | | | | 1,391,498 | |
Trex Co., Inc. (a) | | | 4,600 | | | | 422,142 | |
United Parcel Service, Inc., Class B | | | 28,393 | | | | 4,400,915 | |
United Rentals, Inc. (a) | | | 3,100 | | | | 753,331 | |
Vestas Wind Systems A/S ADR | | | 23,300 | | | | 1,675,270 | |
Watsco, Inc. | | | 1,300 | | | | 310,037 | |
Westinghouse Air Brake Technologies Corp. | | | 7,591 | | | | 563,328 | |
WW Grainger, Inc. | | | 1,870 | | | | 681,409 | |
Xylem, Inc. | | | 7,300 | | | | 705,107 | |
| | | | | | | | |
| | | | | | | 72,802,539 | |
| | | | | | | | |
| | |
| Information Technology – 33.2% | | | | | | |
Adobe, Inc. (a) | | | 19,261 | | | | 8,836,369 | |
Advanced Micro Devices, Inc. (a) | | | 49,550 | | | | 4,243,462 | |
Apple, Inc. | | | 615,196 | | | | 81,181,264 | |
Applied Materials, Inc. | | | 38,002 | | | | 3,674,033 | |
Atlassian Corp. PLC, Class A (a) | | | 21,852 | | | | 5,050,653 | |
Autodesk, Inc. (a) | | | 16,878 | | | | 4,682,464 | |
Automatic Data Processing, Inc. | | | 16,368 | | | | 2,702,684 | |
Blackline, Inc. (a) | | | 41,710 | | | | 5,406,450 | |
Broadcom, Inc. | | | 16,013 | | | | 7,213,856 | |
Cadence Design Systems, Inc. (a) | | | 10,884 | | | | 1,419,165 | |
Cisco Systems, Inc. | | | 160,991 | | | | 7,176,979 | |
Cree, Inc. (a) | | | 37,462 | | | | 3,786,659 | |
DocuSign, Inc. (a) | | | 7,000 | | | | 1,630,230 | |
Enphase Energy, Inc. (a) | | | 55,714 | | | | 10,159,448 | |
First Solar, Inc. (a) | | | 84,240 | | | | 8,352,396 | |
Intel Corp. | | | 169,579 | | | | 9,413,330 | |
International Business Machines Corp. | | | 36,866 | | | | 4,391,109 | |
Intuit, Inc. | | | 10,022 | | | | 3,620,247 | |
KLA Corp. | | | 6,410 | | | | 1,795,249 | |
Lam Research Corp. | | | 6,100 | | | | 2,952,095 | |
Mastercard, Inc., Class A | | | 35,652 | | | | 11,276,371 | |
Microsoft Corp. | | | 300,661 | | | | 69,741,326 | |
NetApp, Inc. | | | 9,008 | | | | 598,491 | |
NVIDIA Corp. | | | 24,577 | | | | 12,769,963 | |
Paychex, Inc. | | | 13,231 | | | | 1,155,331 | |
Paycom Software, Inc. (a) | | | 1,900 | | | | 721,506 | |
PayPal Holdings, Inc. (a) | | | 45,500 | | | | 10,661,105 | |
salesforce.com, Inc. (a) | | | 35,434 | | | | 7,992,493 | |
Square, Inc., Class A (a) | | | 35,836 | | | | 7,739,143 | |
STMicroelectronics NV, Class Y | | | 122,934 | | | | 4,911,213 | |
Synopsys, Inc. (a) | | | 6,043 | | | | 1,543,684 | |
Texas Instruments, Inc. | | | 37,652 | | | | 6,238,560 | |
Universal Display Corp. | | | 22,822 | | | | 5,267,774 | |
19
DOMINI IMPACT EQUITY FUND
PORTFOLIOOF INVESTMENTS (continued)
January 31, 2021 (Unaudited)
| | | | | | | | |
| SECURITY | | SHARES | | | VALUE | |
| | |
| Information Technology (Continued) | | | | | | |
VMware, Inc., Class A (a) | | | 3,275 | | | $ | 451,459 | |
WEX, Inc. (a) | | | 1,916 | | | | 361,358 | |
Zoom Video Communications, Inc., Class A (a) | | | 9,129 | | | | 3,396,627 | |
| | | | | | | | |
| | | | | | | 322,514,546 | |
| | | | | | | | |
| | |
| Materials – 1.9% | | | | | | |
Air Products and Chemicals, Inc. | | | 9,159 | | | | 2,443,255 | |
AptarGroup, Inc. | | | 2,500 | | | | 332,425 | |
Avery Dennison Corp. | | | 3,500 | | | | 528,045 | |
Ecolab, Inc. | | | 10,548 | | | | 2,157,171 | |
International Paper Co. | | | 15,800 | | | | 794,898 | |
Linde PLC | | | 21,230 | | | | 5,209,842 | |
Novozymes A/S ADR | | | 8,100 | | | | 488,268 | |
Nucor Corp. | | | 12,092 | | | | 589,243 | |
PPG Industries, Inc. | | | 9,842 | | | | 1,325,816 | |
Sherwin-Williams Co. (The) | | | 3,364 | | | | 2,327,215 | |
Sonoco Products Co. | | | 3,900 | | | | 225,849 | |
Steel Dynamics, Inc. | | | 7,800 | | | | 267,306 | |
Vulcan Materials Co. | | | 5,444 | | | | 811,918 | |
Westrock Co. | | | 10,985 | | | | 455,109 | |
| | | | | | | | |
| | | | | | | 17,956,360 | |
| | | | | | | | |
| | |
| Real Estate – 2.6% | | | | | | |
Alexandria Real Estate Equities, Inc. | | | 5,486 | | | | 916,766 | |
American Tower Corp. | | | 17,909 | | | | 4,071,790 | |
Boston Properties, Inc. | | | 6,046 | | | | 551,818 | |
CBRE Group, Inc., Class A (a) | | | 13,822 | | | | 842,866 | |
Crown Castle International Corp. | | | 17,822 | | | | 2,838,332 | |
Digital Realty Trust, Inc. | | | 11,192 | | | | 1,611,088 | |
Duke Realty Corp. | | | 15,500 | | | | 613,180 | |
Equinix, Inc. | | | 3,631 | | | | 2,686,795 | |
Equity LifeStyle Properties, Inc. | | | 6,900 | | | | 419,796 | |
Essex Property Trust, Inc. | | | 2,700 | | | | 646,947 | |
Extra Space Storage, Inc. | | | 5,300 | | | | 603,087 | |
Federal Realty Investment Trust | | | 3,000 | | | | 262,680 | |
Host Hotels & Resorts, Inc. | | | 28,222 | | | | 382,408 | |
Kilroy Realty Corp. | | | 4,600 | | | | 260,498 | |
Mid-America Apartment Communities, Inc. | | | 4,600 | | | | 610,650 | |
Prologis, Inc. | | | 29,995 | | | | 3,095,484 | |
Public Storage | | | 5,977 | | | | 1,360,485 | |
Realty Income Corp. | | | 14,821 | | | | 875,328 | |
Regency Centers Corp. | | | 7,085 | | | | 334,270 | |
SBA Communications Corp. | | | 4,507 | | | | 1,210,896 | |
UDR, Inc. | | | 12,169 | | | | 467,898 | |
Ventas, Inc. | | | 15,263 | | | | 703,166 | |
| | | | | | | | |
| | | | | | | 25,366,228 | |
| | | | | | | | |
| Utilities – 0.6% | | | | | | |
Alliant Energy Corp. | | | 10,200 | | | | 496,230 | |
Avangrid, Inc. | | | 2,547 | | | | 117,850 | |
20
DOMINI IMPACT EQUITY FUND
PORTFOLIOOF INVESTMENTS (continued)
January 31, 2021 (Unaudited)
| | | | | | | | |
| SECURITY | | SHARES | | | VALUE | |
| Utilities (Continued) | | | | | | |
Consolidated Edison, Inc. | | | 14,461 | | | $ | 1,023,550 | |
Eversource Energy | | | 14,158 | | | | 1,238,825 | |
National Grid PLC ADR | | | 28,619 | | | | 1,662,191 | |
Red Electrica Corp. SA ADR | | | 37,300 | | | | 353,604 | |
SSE PLC ADR | | | 42,500 | | | | 866,575 | |
Terna Rete Elettrica Nazionale SpA ADR | | | 18,600 | | | | 406,038 | |
| | | | | | | | |
| | | | | | | 6,164,863 | |
| | | | | | | | |
| |
| Total Investments – 99.8% (Cost $567,747,497) | | | 970,314,729 | |
| |
| Other Assets, less liabilities – 0.2% | | | 2,112,149 | |
| | | | | | | | |
| |
| Net Assets – 100.0% | | | $972,426,878 | |
| | | | | | | | |
(a) Non-income producing security.
Abbreviations
ADR — American Depositary Receipt
SEE NOTES TO FINANCIAL STATEMENTS
21
DOMINI INTERNATIONAL OPPORTUNITIES FUND
Fund Performance and Holdings
The table and bar charts below provide information as of January 31, 2021, about the ten largest holdings of the Domini International Opportunities Fund and its portfolio holdings by industry sector and country:
TEN LARGEST HOLDINGS (Unaudited)
| | | | | | | | | | |
| | | | |
| SECURITY DESCRIPTION | | % NET
ASSETS | | | SECURITY DESCRIPTION | | % NET
ASSETS | |
| | | | |
| ASML Holding NV | | | 3.2% | | | SiemensAG | | | 1.8% | |
| | | | |
| Toyota Motor Corp | | | 2.3% | | | Sony Corp | | | 1.7% | |
| | | | |
| Unilever PLC | | | 2.1% | | | Novo NordiskA/S Class B | | | 1.6% | |
| | | | |
| AIA Group Ltd | | | 2.1% | | | Softbank Group Corp | | | 1.5% | |
| | | | |
| Linde PLC | | | 1.8% | | | Sanofi | | | 1.4% | |
PORTFOLIO HOLDINGS BY INDUSTRY SECTOR (% OF NET ASSETS) (Unaudited)
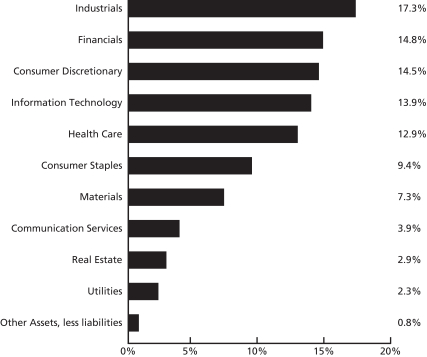
The Global Industry Classification Standard (“GICS”) was developed by and is the exclusive property and a service mark of MSCI Inc. (“MSCI”) and Standard & Poor’s, a division of The McGraw-Hill Companies, Inc. (“S&P”) and is licensed for use by Domini Impact Investments. Neither MSCI, S&P nor any third party involved in making or compiling the GICS or any GICS classifications makes any express or implied warranties or representations with respect to such standard or classification nor shall any such party have any liability therefrom.
22
PORTFOLIO HOLDINGS BY COUNTRY (% OF NET ASSETS) (Unaudited)
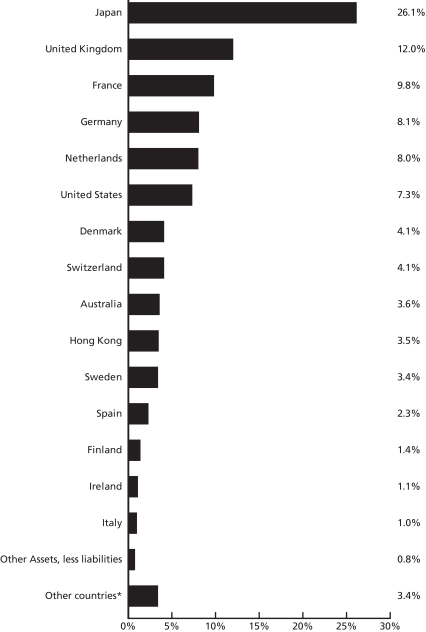
The holdings mentioned above are described in the Fund’s Portfolio of Investments as of 01/31/2021 included herein. The composition of the Fund’s portfolio is subject to change.
* Other countries include Norway 0.7%, China 0.6%, Singapore 0.5%, Belgium 0.4%, Canada 0.4%, New Zealand 0.3%, South Africa 0.2%, Austria 0.1%, Hungary 0.1% and Poland 0.1%.
23
| | | | | | | | |
| |
| AVERAGE ANNUAL TOTAL RETURNS (Unaudited) |
| | | |
| | | Investor
shares | | Institutional
shares | | MSCI EAFE (net) |
| | | | |
| As of 1/31/21 | | 1 Year | | N/A | | N/A | | N/A |
| | | | |
| | 5 Year | | N/A | | N/A | | N/A |
| | | | |
| | 10 Year | | N/A | | N/A | | N/A |
| | | | |
| | | Since Inception1 | | 2.30% | | 2.30% | | 2.23% |
Past performance is no guarantee of future results. The Fund’s returns quoted above represent past performance after all expenses. The returns reflect any applicable expense waivers in effect during the periods shown. Without such waivers, Fund performance would be lower. Investment return, principal value, and yield will fluctuate. Your shares, when redeemed, may be worth more or less than their original cost. Call 1-800-582-6757 or visit domini.com for performance information current to the most recent month-end, which may be lower or higher than the performance data quoted. A 2.00% redemption fee applies on sales or exchanges of shares made less than 30 days after the settlement of purchase or acquisition through exchange, with certain exceptions. Quoted performance data does not reflect the deduction of this fee, which would reduce the performance quoted. See the prospectus for further information.
Per the prospectus date November 30, 2020, the Fund’s (gross/net) annual operating expenses totaled 1.78%/1.40% and 1.53%/1.15% for the Investor and Institutional Class shares, respectively. The Fund’s Adviser has contractually agreed to waive certain fees and/or reimburse certain ordinary operating expenses in order to limit Investor and Institutional share expenses to 1.40% and 1.15%, respectively. These expense limitations are in effect through November 30, 2021. There can be no assurance that the Adviser will extend the expense limitations beyond such time. While in effect, the arrangement may be terminated for a class only by agreement of the Adviser and the Fund’s Board of Trustees.
The table does not reflect the deduction of fees and taxes that a shareholder would pay on Fund distributions or the redemption of Fund shares. Total return is based on the Fund’s net asset values and assumes all dividends and capital gains were reinvested.
An investment in the Domini International Opportunities Fund is not a bank deposit and is not insured. The Fund is subject to certain risks, including, foreign investing, geographic focus, country, currency, impact investing, recent events and market risks. Investing internationally involves special risks, such as currency fluctuations, social and economic instability, differing securities regulations and accounting standards, limited public information, possible changes in taxation, and periods of illiquidity. You may lose money.
The Morgan Stanley Capital International Europe Australasia Far East (MSCI EAFE) index (net) is an unmanaged index of common stocks. MSCI EAFE (net) includes the reinvestment of dividends net of withholding tax, but does not reflect other fees, expenses or taxes. It is not available for direct investment.
1Inception Date 11/30/2020. “Since Inception” for the Morgan Stanley Capital International Europe Australasia Far East (MSCI EAFE) index (net) refers to performance since 11/30/2020.
24
DOMINI INTERNATIONAL OPPORTUNITIES FUND
PORTFOLIOOF INVESTMENTS
January 31, 2021 (Unaudited)
| | | | | | | | | | |
| COUNTRY/SECURITY | | INDUSTRY | | SHARES | | | VALUE | |
| Common Stocks – 99.2% | | | | | | | | |
Australia – 3.6% | | | | | | | | | | |
APA Group | | Utilities | | | 4,023 | | | $ | 30,030 | |
ASX, Ltd. | | Diversified Financials | | | 636 | | | | 34,889 | |
Brambles, Ltd. | | Commercial & Professional Services | | | 4,919 | | | | 39,734 | |
Cochlear, Ltd. | | Health Care Equipment & Services | | | 571 | | | | 86,192 | |
CSL, Ltd. | | Pharmaceuticals, Biotechnology & Life Sciences | | | 1,530 | | | | 318,447 | |
Dexus | | Real Estate | | | 3,614 | | | | 24,846 | |
Fortescue Metals Group, Ltd. | | Materials | | | 5,928 | | | | 98,028 | |
GPT Group (The) | | Real Estate | | | 6,336 | | | | 20,904 | |
Insurance Australia Group, Ltd. | | Insurance | | | 8,188 | | | | 30,300 | |
Magellan Financial Group, Ltd. | | Diversified Financials | | | 492 | | | | 17,946 | |
Mirvac Group | | Real Estate | | | 13,038 | | | | 23,620 | |
Stockland | | Real Estate | | | 7,961 | | | | 26,972 | |
Transurban Group | | Transportation | | | 9,205 | | | | 93,115 | |
| | | | | | | | | | |
| | | | | | | | | 845,023 | |
| | | | | | | | | | |
| | | | | | | | | | |
Austria – 0.1% | | | | | | | | | | |
Erste Group Bank AG (a) | | Banks | | | 1,150 | | | | 35,159 | |
| | | | | | | | | | |
| | | | | | | | | 35,159 | |
| | | | | | | | | | |
| | | | | | | | | | |
Belgium – 0.4% | | | | | | | | | | |
KBC Group NV (a) | | Banks | | | 961 | | | | 67,090 | |
Umicore SA | | Materials | | | 644 | | | | 36,516 | |
| | | | | | | | | | |
| | | | | | | | | 103,606 | |
| | | | | | | | | | |
| | | | | | | | | | |
Canada – 0.4% | | | | | | | | | | |
SunOpta, Inc. (a) | | Food, Beverage & Tobacco | | | 6,637 | | | | 94,113 | |
| | | | | | | | | | |
| | | | | | | | | 94,113 | |
| | | | | | | | | | |
| | | | | | | | | | |
China – 0.6% | | | | | | | | | | |
BYD Co., Ltd., Class H | | Automobiles & Components | | | 4,479 | | | | 135,271 | |
| | | | | | | | | | |
| | | | | | | | | 135,271 | |
| | | | | | | | | | |
| | | | | | | | | | |
Denmark – 4.1% | | | | | | | | | | |
Ambu A/S, Class B | | Health Care Equipment & Services | | | 737 | | | | 34,744 | |
Chr Hansen Holding A/S (a) | | Materials | | | 340 | | | | 30,793 | |
DSV A/S | | Transportation | | | 757 | | | | 118,239 | |
Genmab A/S (a) | | Pharmaceuticals, Biotechnology & Life Sciences | | | 220 | | | | 87,686 | |
GN Store Nord A/S | | Health Care Equipment & Services | | | 426 | | | | 32,489 | |
Novo Nordisk A/S, Class B | | Pharmaceuticals, Biotechnology & Life Sciences | | | 5,546 | | | | 386,796 | |
Novozymes A/S, Class B | | Materials | | | 665 | | | | 39,955 | |
Orsted A/S | | Utilities | | | 613 | | | | 116,551 | |
25
DOMINI INTERNATIONAL OPPORTUNITIES FUND
PORTFOLIOOF INVESTMENTS (continued)
January 31, 2021 (Unaudited)
| | | | | | | | | | |
| COUNTRY/SECURITY | | INDUSTRY | | SHARES | | | VALUE | |
Denmark (Continued) | | | | | | | | | | |
Vestas Wind Systems A/S | | Capital Goods | | | 605 | | | $ | 130,044 | |
| | | | | | | | | | |
| | | | | | | | | 977,297 | |
| | | | | | | | | | |
| | | | | | | | | | |
Finland – 1.4% | | | | | | | | | | |
Elisa Oyj | | Telecommunication Services | | | 484 | | | | 28,848 | |
Kesko OYJ, Class B | | Food & Staples Retailing | | | 1,275 | | | | 33,144 | |
Kone OYJ, Class B | | Capital Goods | | | 1,229 | | | | 96,763 | |
Nordea Bank Abp (a) | | Banks | | | 13,339 | | | | 108,443 | |
Sampo OYJ, Class A | | Insurance | | | 1,554 | | | | 65,405 | |
| | | | | | | | | | |
| | | | | | | | | 332,603 | |
| | | | | | | | | | |
| | | | | | | | | | |
France – 9.8% | | | | | | | | | | |
Air Liquide SA | | Materials | | | 1,592 | | | | 260,656 | |
BioMerieux | | Health Care Equipment & Services | | | 546 | | | | 84,497 | |
BNP Paribas SA (a) | | Banks | | | 3,767 | | | | 180,850 | |
Capgemini SE | | Software & Services | | | 530 | | | | 76,676 | |
Carrefour SA | | Food & Staples Retailing | | | 2,090 | | | | 35,480 | |
Cie Generale des Etablissements Michelin SCA | | Automobiles & Components | | | 539 | | | | 74,361 | |
Credit Agricole SA (a) | | Banks | | | 4,205 | | | | 47,646 | |
Edenred | | Software & Services | | | 817 | | | | 44,301 | |
Eiffage SA (a) | | Capital Goods | | | 261 | | | | 23,717 | |
Gecina SA | | Real Estate | | | 173 | | | | 24,606 | |
Hermes International | | Consumer Durables & Apparel | | | 113 | | | | 115,426 | |
Kering SA | | Consumer Durables & Apparel | | | 253 | | | | 166,237 | |
Legrand SA | | Capital Goods | | | 868 | | | | 79,847 | |
L’Oreal SA | | Household & Personal Products | | | 703 | | | | 247,591 | |
Orange SA | | Telecommunication Services | | | 6,670 | | | | 78,369 | |
Sanofi | | Pharmaceuticals, Biotechnology & Life Sciences | | | 3,631 | | | | 341,869 | |
Sartorius Stedim Biotech | | Pharmaceuticals, Biotechnology & Life Sciences | | | 81 | | | | 33,950 | |
Schneider Electric SE | | Capital Goods | | | 1,795 | | | | 263,010 | |
Unibail – Rodamco-Westfield | | Real Estate | | | 436 | | | | 36,857 | |
Valeo SA | | Automobiles & Components | | | 681 | | | | 25,380 | |
Worldline SA (a)(b) | | Software & Services | | | 773 | | | | 65,414 | |
| | | | | | | | | | |
| | | | | | | | | 2,306,740 | |
| | | | | | | | | | |
| | | | | | | | | | |
Germany – 8.1% | | | | | | | | | | |
adidas AG (a) | | Consumer Durables & Apparel | | | 585 | | | | 185,697 | |
Beiersdorf AG | | Household & Personal Products | | | 321 | | | | 35,078 | |
Continental AG | | Automobiles & Components | | | 354 | | | | 49,599 | |
Deutsche Boerse AG | | Diversified Financials | | | 621 | | | | 99,814 | |
Deutsche Post AG | | Transportation | | | 3,376 | | | | 166,943 | |
Encavis AG | | Utilities | | | 4,231 | | | | 115,293 | |
Henkel AG & Co. KGaA | | Household & Personal Products | | | 998 | | | | 93,422 | |
KION Group AG | | Capital Goods | | | 217 | | | | 18,757 | |
Knorr-Bremse AG | | Capital Goods | | | 220 | | | | 29,181 | |
LEG Immobilien AG | | Real Estate | | | 238 | | | | 34,156 | |
26
DOMINI INTERNATIONAL OPPORTUNITIES FUND
PORTFOLIOOF INVESTMENTS (continued)
January 31, 2021 (Unaudited)
| | | | | | | | | | |
| COUNTRY/SECURITY | | INDUSTRY | | SHARES | | | VALUE | |
Germany (Continued) | | | | | | | | | | |
Merck KGaA | | Pharmaceuticals, Biotechnology & Life Sciences | | | 437 | | | $ | 72,915 | |
Muenchener Rueckversicherungs-Gesellschaft AG in Muenchen | | Insurance | | | 472 | | | | 125,294 | |
Nordex SE (a) | | Capital Goods | | | 3,364 | | | | 95,341 | |
Puma SE (a) | | Consumer Durables & Apparel | | | 302 | | | | 29,585 | |
Sartorius AG, Pfd Shs | | Health Care Equipment & Services | | | 121 | | | | 60,215 | |
Siemens AG | | Capital Goods | | | 2,683 | | | | 416,167 | |
Siemens Healthineers AG (b) | | Health Care Equipment & Services | | | 750 | | | | 42,108 | |
Symrise AG | | Materials | | | 410 | | | | 51,079 | |
Vonovia SE | | Real Estate | | | 1,909 | | | | 127,606 | |
Zalando SE (a)(b) | | Retailing | | | 563 | | | | 64,626 | |
| | | | | | | | | | |
| | | | | | | | | 1,912,876 | |
| | | | | | | | | | |
| | | | | | | | | | |
Hong Kong – 3.5% | | | | | | | | | | |
AIA Group, Ltd. | | Insurance | | | 40,648 | | | | 490,044 | |
Hong Kong Exchanges & Clearing, Ltd. | | Diversified Financials | | | 4,180 | | | | 267,216 | |
Techtronic Industries Co., Ltd. | | Capital Goods | | | 4,508 | | | | 67,337 | |
| | | | | | | | | | |
| | | | | | | | | 824,597 | |
| | | | | | | | | | |
| | | | | | | | | | |
Hungary – 0.1% | | | | | | | | | | |
OTP Bank Nyrt (a) | | Banks | | | 744 | | | | 33,972 | |
| | | | | | | | | | |
| | | | | | | | | 33,972 | |
| | | | | | | | | | |
| | | | | | | | | | |
Ireland – 1.1% | | | | | | | | | | |
CRH PLC | | Materials | | | 2,586 | | | | 106,970 | |
Kerry Group PLC, Class A | | Food, Beverage & Tobacco | | | 508 | | | | 69,016 | |
Kingspan Group plc (a) | | Capital Goods | | | 505 | | | | 34,357 | |
Smurfit Kappa Group PLC | | Materials | | | 847 | | | | 40,832 | |
| | | | | | | | | | |
| | | | | | | | | 251,175 | |
| | | | | | | | | | |
| | | | | | | | | | |
Italy – 1.0% | | | | | | | | | | |
Assicurazioni Generali SpA | | Insurance | | | 3,824 | | | | 65,336 | |
DiaSorin S.p.A. | | Health Care Equipment & Services | | | 104 | | | | 22,768 | |
Intesa Sanpaolo SpA (a) | | Banks | | | 57,655 | | | | 125,834 | |
Terna Rete Elettrica Nazionale SpA | | Utilities | | | 4,671 | | | | 33,913 | |
| | | | | | | | | | |
| | | | | | | | | 247,851 | |
| | | | | | | | | | |
| | | | | | | | | | |
Japan – 26.1% | | | | | | | | | | |
Aeon Co., Ltd. | | Food & Staples Retailing | | | 2,467 | | | | 77,325 | |
Asahi Intecc Co. Ltd. | | Health Care Equipment & Services | | | 738 | | | | 24,242 | |
Asahi Kasei Corp. | | Materials | | | 4,400 | | | | 48,951 | |
27
DOMINI INTERNATIONAL OPPORTUNITIES FUND
PORTFOLIOOF INVESTMENTS (continued)
January 31, 2021 (Unaudited)
| | | | | | | | | | |
| COUNTRY/SECURITY | | INDUSTRY | | SHARES | | | VALUE | |
Japan (Continued) | | | | | | | | | | |
Canon, Inc. | | Technology Hardware & Equipment | | | 3,370 | | | $ | 74,585 | |
Central Japan Railway Co. | | Transportation | | | 562 | | | | 80,512 | |
Daifuku Co., Ltd. | | Capital Goods | | | 372 | | | | 42,476 | |
Daiichi Sankyo Co., Ltd. | | Pharmaceuticals, Biotechnology & Life Sciences | | | 6,488 | | | | 208,955 | |
Daiwa House Industry Co., Ltd. | | Real Estate | | | 1,976 | | | | 56,048 | |
Denso Corp. | | Automobiles & Components | | | 1,454 | | | | 80,859 | |
Eisai Co., Ltd. | | Pharmaceuticals, Biotechnology & Life Sciences | | | 893 | | | | 65,205 | |
FANUC Corp. | | Capital Goods | | | 627 | | | | 163,769 | |
Fast Retailing Co., Ltd. | | Retailing | | | 179 | | | | 153,928 | |
FUJIFILM Holdings Corp. | | Technology Hardware & Equipment | | | 1,232 | | | | 70,605 | |
Hankyu Hanshin Holdings, Inc. | | Transportation | | | 765 | | | | 24,763 | |
Hoya Corp. | | Health Care Equipment & Services | | | 1,214 | | | | 155,410 | |
Japan Real Estate Investment Corp. | | Real Estate | | | 4 | | | | 24,387 | |
Kao Corp. | | Household & Personal Products | | | 1,551 | | | | 112,589 | |
Keio Corp. | | Transportation | | | 361 | | | | 26,432 | |
Keyence Corp. | | Technology Hardware & Equipment | | | 628 | | | | 337,322 | |
Koito Manufacturing Co., Ltd. | | Automobiles & Components | | | 392 | | | | 25,304 | |
Kurita Water Industries, Ltd. | | Capital Goods | | | 2,500 | | | | 101,524 | |
Kyocera Corp. | | Technology Hardware & Equipment | | | 1,077 | | | | 69,060 | |
Lasertec Corp. | | Semiconductors & Semiconductor Equipment | | | 254 | | | | 34,039 | |
LIXIL Corp. | | Capital Goods | | | 900 | | | | 20,998 | |
Makita Corp. | | Capital Goods | | | 800 | | | | 38,194 | |
Mitsubishi Estate Co., Ltd. | | Real Estate | | | 4,100 | | | | 64,893 | |
Mitsui Fudosan Co., Ltd. | | Real Estate | | | 3,100 | | | | 62,953 | |
MS&AD Insurance Group Holdings, Inc. | | Insurance | | | 1,560 | | | | 44,905 | |
Murata Manufacturing Co., Ltd. | | Technology Hardware & Equipment | | | 2,150 | | | | 206,602 | |
Nidec Corp. | | Capital Goods | | | 1,652 | | | | 219,950 | |
Nippon Paint Holdings Co., Ltd. | | Materials | | | 577 | | | | 51,911 | |
Nippon Prologis REIT, Inc. | | Real Estate | | | 7 | | | | 22,830 | |
Nippon Telegraph & Telephone Corp. | | Telecommunication Services | | | 7,900 | | | | 197,545 | |
Nissin Foods Holdings Co., Ltd. | | Food, Beverage & Tobacco | | | 229 | | | | 19,803 | |
Nitto Denko Corp. | | Materials | | | 482 | | | | 43,711 | |
Nomura Holdings, Inc. | | Diversified Financials | | | 10,100 | | | | 53,465 | |
NTT Data Corp. | | Software & Services | | | 2,081 | | | | 29,900 | |
Obic Co., Ltd. | | Software & Services | | | 210 | | | | 39,311 | |
Odakyu Electric Railway Co., Ltd. | | Transportation | | | 2,200 | | | | 63,979 | |
Oisix ra daichi, Inc. (a) | | Retailing | | | 2,500 | | | | 74,327 | |
28
DOMINI INTERNATIONAL OPPORTUNITIES FUND
PORTFOLIOOF INVESTMENTS (continued)
January 31, 2021 (Unaudited)
| | | | | | | | | | |
| COUNTRY/SECURITY | | INDUSTRY | | SHARES | | | VALUE | |
Japan (Continued) | | | | | | | | | | |
Omron Corp. | | Technology Hardware & Equipment | | | 629 | | | $ | 55,754 | |
Ono Pharmaceutical Co., Ltd. | | Pharmaceuticals, Biotechnology & Life Sciences | | | 1,314 | | | | 39,240 | |
Oriental Land Co., Ltd. | | Consumer Services | | | 646 | | | | 101,155 | |
ORIX Corp. | | Diversified Financials | | | 4,105 | | | | 65,900 | |
Panasonic Corp. | | Consumer Durables & Apparel | | | 7,176 | | | | 93,205 | |
Rakuten, Inc. (a) | | Retailing | | | 2,900 | | | | 28,557 | |
Recruit Holdings Co., Ltd. | | Commercial & Professional Services | | | 4,221 | | | | 183,690 | |
Rohm Co., Ltd. | | Semiconductors & Semiconductor Equipment | | | 281 | | | | 28,525 | |
Santen Pharmaceutical Co., Ltd. | | Pharmaceuticals, Biotechnology & Life Sciences | | | 1,243 | | | | 20,568 | |
Sekisui House, Ltd. | | Consumer Durables & Apparel | | | 1,960 | | | | 37,886 | |
Shimano, Inc. | | Consumer Durables & Apparel | | | 252 | | | | 59,115 | |
Shionogi & Co., Ltd. | | Pharmaceuticals, Biotechnology & Life Sciences | | | 1,006 | | | | 54,642 | |
Shiseido Co., Ltd. | | Household & Personal Products | | | 1,303 | | | | 84,631 | |
SMC Corp. | | Capital Goods | | | 206 | | | | 124,723 | |
SoftBank Group Corp. | | Telecommunication Services | | | 4,428 | | | | 343,214 | |
Sony Corp. | | Consumer Durables & Apparel | | | 4,154 | | | | 397,780 | |
Sumitomo Realty & Development Co., Ltd. | | Real Estate | | | 1,093 | | | | 33,009 | |
Sysmex Corp. | | Health Care Equipment & Services | | | 489 | | | | 57,075 | |
TDK Corp. | | Technology Hardware & Equipment | | | 415 | | | | 67,134 | |
Terumo Corp. | | Health Care Equipment & Services | | | 2,334 | | | | 90,756 | |
Tobu Railway Co. Ltd. | | Transportation | | | 646 | | | | 18,238 | |
Tokio Marine Holdings, Inc. | | Insurance | | | 2,100 | | | | 103,203 | |
Tokyu Corp. | | Transportation | | | 1,966 | | | | 23,128 | |
Toray Industries, Inc. | | Materials | | | 4,938 | | | | 32,234 | |
TOTO, Ltd. | | Capital Goods | | | 500 | | | | 27,706 | |
Toyota Motor Corp. | | Automobiles & Components | | | 7,613 | | | | 534,199 | |
Unicharm Corp. | | Household & Personal Products | | | 1,426 | | | | 63,986 | |
Yahoo Japan Corp. | | Media & Entertainment | | | 8,876 | | | | 55,167 | |
Yaskawa Electric Corp. | | Capital Goods | | | 823 | | | | 42,231 | |
| | | | | | | | | | |
| | | | | | | | | 6,180,218 | |
| | | | | | | | | | |
| | | | | | | | | | |
Netherlands – 8.0% | | | | | | | | | | |
ABN AMRO Group NV (a) | | Banks | | | 3,116 | | | | 32,580 | |
Adyen N.V. (a)(b) | | Software & Services | | | 86 | | | | 179,856 | |
Akzo Nobel NV | | Materials | | | 581 | | | | 59,211 | |
Arcadis N.V. (a) | | Capital Goods | | | 3,489 | | | | 122,462 | |
ASML Holding NV | | Semiconductors & Semiconductor Equipment | | | 1,394 | | | | 745,020 | |
Basic-Fit N.V. (a)(b) | | Consumer Services | | | 1,854 | | | | 63,631 | |
Euronext N.V. | | Diversified Financials | | | 202 | | | | 21,779 | |
ING Groep NV (a) | | Banks | | | 12,993 | | | | 115,654 | |
Koninklijke Ahold Delhaize NV | | Food & Staples Retailing | | | 3,672 | | | | 105,520 | |
29
DOMINI INTERNATIONAL OPPORTUNITIES FUND
PORTFOLIOOF INVESTMENTS (continued)
January 31, 2021 (Unaudited)
| | | | | | | | | | |
| COUNTRY/SECURITY | | INDUSTRY | | SHARES | | | VALUE | |
Netherlands (Continued) | | | | | | | | | | |
Koninklijke DSM NV | | Materials | | | 576 | | | $ | 100,805 | |
Koninklijke KPN NV | | Telecommunication Services | | | 11,323 | | | | 35,412 | |
Koninklijke Philips NV (a) | | Health Care Equipment & Services | | | 3,023 | | | | 164,965 | |
NXP Semiconductors NV | | Semiconductors & Semiconductor Equipment | | | 915 | | | | 146,830 | |
| | | | | | | | | | |
| | | | | | | | | 1,893,725 | |
| | | | | | | | | | |
| | | | | | | | | | |
New Zealand – 0.3% | | | | | | | | | | |
Spark New Zealand, Ltd. | | Telecommunication Services | | | 6,173 | | | | 21,256 | |
Xero (a) | | Software & Services | | | 406 | | | | 40,209 | |
| | | | | | | | | | |
| | | | | | | | | 61,465 | |
| | | | | | | | | | |
| | | | | | | | | | |
Norway – 0.7% | | | | | | | | | | |
DNB ASA (a) | | Banks | | | 2,983 | | | | 58,160 | |
NEL ASA (a) | | Capital Goods | | | 24,559 | | | | 86,868 | |
Orkla ASA | | Food, Beverage & Tobacco | | | 2,486 | | | | 24,201 | |
| | | | | | | | | | |
| | | | | | | | | 169,229 | |
| | | | | | | | | | |
| | | | | | | | | | |
Poland – 0.1% | | | | | | | | | | |
CD Projekt SA (a) | | Media & Entertainment | | | 209 | | | | 17,070 | |
| | | | | | | | | | |
| | | | | | | | | 17,070 | |
| | | | | | | | | | |
| | | | | | | | | | |
Singapore – 0.5% | | | | | | | | | | |
DBS Group Holdings, Ltd. | | Banks | | | 5,950 | | | | 112,310 | |
| | | | | | | | | | |
| | | | | | | | | 112,310 | |
| | | | | | | | | | |
| | | | | | | | | | |
South Africa – 0.2% | | | | | | | | | | |
FirstRand, Ltd. | | Diversified Financials | | | 12,369 | | | | 39,035 | |
| | | | | | | | | | |
| | | | | | | | | 39,035 | |
| | | | | | | | | | |
| | | | | | | | | | |
Spain – 2.3% | | | | | | | | | | |
Aena SME SA (a) | | Transportation | | | 223 | | | | 34,429 | |
Amadeus IT Group SA (a) | | Software & Services | | | 1,485 | | | | 94,913 | |
Banco Bilbao Vizcaya Argentaria SA | | Banks | | | 21,782 | | | | 99,496 | |
CaixaBank SA | | Banks | | | 11,510 | | | | 29,078 | |
Grifols SA | | Pharmaceuticals, Biotechnology & Life Sciences | | | 1,789 | | | | 52,722 | |
Industria de Diseno Textil SA | | Retailing | | | 3,723 | | | | 110,540 | |
Red Electrica Corp. SA | | Utilities | | | 1,382 | | | | 26,270 | |
Siemens Gamesa Renewable Energy SA | | Capital Goods | | | 739 | | | | 30,350 | |
Telefonica SA | | Telecommunication Services | | | 16,238 | | | | 70,143 | |
| | | | | | | | | | |
| | | | | | | | | 547,941 | |
| | | | | | | | | | |
| | | | | | | | | | |
Sweden – 3.4% | | | | | | | | | | |
Assa Abloy AB, Class B | | Capital Goods | | | 3,194 | | | | 79,238 | |
30
DOMINI INTERNATIONAL OPPORTUNITIES FUND
PORTFOLIOOF INVESTMENTS (continued)
January 31, 2021 (Unaudited)
| | | | | | | | | | |
| COUNTRY/SECURITY | | INDUSTRY | | SHARES | | | VALUE | |
Sweden (Continued) | | | | | | | | | | |
Autoliv, Inc. | | Automobiles & Components | | | 287 | | | $ | 25,460 | |
Essity AB, Class B | | Household & Personal Products | | | 2,176 | | | | 69,718 | |
Hennes & Mauritz AB, Class B (a) | | Retailing | | | 2,443 | | | | 52,391 | |
Kinnevik AB, Class B (a) | | Diversified Financials | | | 870 | | | | 42,814 | |
MIPS AB | | Consumer Durables & Apparel | | | 2,240 | | | | 132,869 | |
Nibe Industrier AB, Class B | | Capital Goods | | | 1,397 | | | | 46,775 | |
Samhallsbyggnadsbolaget i Norden AB | | Real Estate | | | 9,920 | | | | 32,588 | |
SKF AB, Class B | | Capital Goods | | | 1,437 | | | | 39,452 | |
Svenska Cellulosa AB SCA, Class B (a) | | Materials | | | 2,046 | | | | 36,151 | |
Svenska Handelsbanken AB, Class A (a) | | Banks | | | 5,048 | | | | 50,479 | |
Sweco AB, Class B | | Capital Goods | | | 5,168 | | | | 86,371 | |
Veoneer, Inc. (a) | | Automobiles & Components | | | 3,951 | | | | 103,872 | |
| | | | | | | | | | |
| | | | | | | | | 798,178 | |
| | | | | | | | | | |
| | | | | | | | | | |
Switzerland – 4.1% | | | | | | | | | | |
Chocoladefabriken Lindt & Spruengli AG | | Food, Beverage & Tobacco | | | 7 | | | | 60,727 | |
EMS-Chemie Holding AG | | Materials | | | 22 | | | | 20,777 | |
Geberit AG | | Capital Goods | | | 121 | | | | 74,156 | |
Kuehne + Nagel International AG | | Transportation | | | 188 | | | | 42,836 | |
Lonza Group AG (a) | | Pharmaceuticals, Biotechnology & Life Sciences | | | 248 | | | | 158,602 | |
Sika AG | | Materials | | | 452 | | | | 123,154 | |
STMicroelectronics NV | | Semiconductors & Semiconductor Equipment | | | 3,157 | | | | 126,700 | |
Swiss Re AG | | Insurance | | | 922 | | | | 81,390 | |
Swisscom AG | | Telecommunication Services | | | 86 | | | | 46,868 | |
Temenos AG | | Software & Services | | | 215 | | | | 27,184 | |
Zurich Insurance Group AG | | Insurance | | | 507 | | | | 202,984 | |
| | | | | | | | | | |
| | | | | | | | | 965,378 | |
| | | | | | | | | | |
| | | | | | | | | | |
United Kingdom – 12.0% | | | | | | | | | | |
3i Group PLC | | Diversified Financials | | | 3,235 | | | | 49,131 | |
Admiral Group PLC | | Insurance | | | 885 | | | | 34,956 | |
Barratt Developments PLC (a) | | Consumer Durables & Apparel | | | 3,369 | | | | 29,406 | |
Berkeley Group Holdings PLC | | Consumer Durables & Apparel | | | 411 | | | | 23,557 | |
Bunzl PLC | | Capital Goods | | | 1,111 | | | | 35,742 | |
Burberry Group PLC (a) | | Consumer Durables & Apparel | | | 1,368 | | | | 32,133 | |
Compass Group PLC (a) | | Consumer Services | | | 5,977 | | | | 107,003 | |
GlaxoSmithKline PLC | | Pharmaceuticals, Biotechnology & Life Sciences | | | 16,773 | | | | 312,190 | |
Halma PLC | | Technology Hardware & Equipment | | | 1,268 | | | | 42,835 | |
31
DOMINI INTERNATIONAL OPPORTUNITIES FUND
PORTFOLIOOF INVESTMENTS (continued)
January 31, 2021 (Unaudited)
| | | | | | | | | | |
| COUNTRY/SECURITY | | INDUSTRY | | SHARES | | | VALUE | |
United Kingdom (Continued) | | | | | |
Informa PLC (a) | | Media & Entertainment | | | 5,043 | | | $ | 34,391 | |
Intertek Group PLC | | Commercial & Professional Services | | | 535 | | | | 40,382 | |
J Sainsbury PLC | | Food & Staples Retailing | | | 7,673 | | | | 25,683 | |
Johnson Matthey PLC | | Materials | | | 643 | | | | 25,925 | |
Land Securities Group PLC | | Real Estate | | | 2,503 | | | | 21,004 | |
Legal & General Group PLC | | Insurance | | | 20,256 | | | | 67,519 | |
Linde PLC | | Materials | | | 1,724 | | | | 423,069 | |
London Stock Exchange Group PLC | | Diversified Financials | | | 1,189 | | | | 141,466 | |
Mondi PLC | | Materials | | | 1,613 | | | | 38,070 | |
National Grid PLC | | Utilities | | | 11,932 | | | | 138,907 | |
Next PLC (a) | | Retailing | | | 412 | | | | 43,593 | |
Ocado Group PLC (a) | | Retailing | | | 1,714 | | | | 65,210 | |
Pennon Group PLC | | Utilities | | | 1,413 | | | | 18,083 | |
Prudential PLC | | Insurance | | | 8,588 | | | | 137,709 | |
RELX PLC | | Commercial & Professional Services | | | 6,519 | | | | 161,760 | |
Schroders PLC | | Diversified Financials | | | 499 | | | | 23,322 | |
Segro PLC | | Real Estate | | | 4,028 | | | | 52,539 | |
Spirax-Sarco Engineering PLC | | Capital Goods | | | 243 | | | | 36,821 | |
SSE PLC | | Utilities | | | 3,446 | | | | 69,961 | |
Standard Chartered PLC (a) | | Banks | | | 10,445 | | | | 63,340 | |
Standard Life Aberdeen PLC | | Diversified Financials | | | 7,260 | | | | 29,953 | |
Taylor Wimpey PLC (a) | | Consumer Durables & Apparel | | | 12,384 | | | | 24,771 | |
Unilever PLC | | Household & Personal Products | | | 8,549 | | | | 499,132 | |
| | | | | | | | | | |
| | | | | | | | | 2,849,563 | |
| | | | | | | | | | |
| | | | | | | | | | |
United States – 7.3% | | | | | | | | | | |
Atlassian Corp. PLC, Class A (a) | | Software & Services | | | 500 | | | | 115,565 | |
Autodesk, Inc. (a) | | Software & Services | | | 401 | | | | 111,249 | |
Campbell Soup Co. | | Food, Beverage & Tobacco | | | 660 | | | | 31,753 | |
Church & Dwight Co., Inc. | | Household & Personal Products | | | 819 | | | | 69,148 | |
Clorox Co. (The) | | Household & Personal Products | | | 415 | | | | 86,926 | |
Copart, Inc. (a) | | Commercial & Professional Services | | | 701 | | | | 76,935 | |
Cree, Inc. (a) | | Semiconductors & Semiconductor Equipment | | | 871 | | | | 88,041 | |
Enphase Energy, Inc. (a) | | Semiconductors & Semiconductor Equipment | | | 577 | | | | 105,216 | |
Ferguson PLC | | Capital Goods | | | 759 | | | | 88,323 | |
First Solar, Inc. (a) | | Semiconductors & Semiconductor Equipment | | | 722 | | | | 71,586 | |
General Mills, Inc. | | Food, Beverage & Tobacco | | | 2,013 | | | | 116,955 | |
IHS Markit, Ltd. | | Commercial & Professional Services | | | 1,210 | | | | 105,367 | |
Kroger Co. (The) | | Food & Staples Retailing | | | 2,529 | | | | 87,250 | |
McCormick & Co., Inc. | | Food, Beverage & Tobacco | | | 870 | | | | 77,900 | |
Nucor Corp. | | Materials | | | 990 | | | | 48,243 | |
Pentair PLC | | Capital Goods | | | 533 | | | | 29,027 | |
QIAGEN N.V. (a) | | Pharmaceuticals, Biotechnology & Life Sciences | | | 750 | | | | 40,612 | |
32
DOMINI INTERNATIONAL OPPORTUNITIES FUND
PORTFOLIOOF INVESTMENTS (continued)
January 31, 2021 (Unaudited)
| | | | | | | | | | |
| COUNTRY/SECURITY | | INDUSTRY | | SHARES | | | VALUE | |
United States (Continued) | | | | | | | | | | |
Square, Inc., Class A (a) | | Software & Services | | | 533 | | | $ | 115,107 | |
Tesla, Inc. (a) | | Automobiles & Components | | | 218 | | | | 172,990 | |
Zoom Video Communications, Inc., Class A (a) | | Software & Services | | | 215 | | | | 79,995 | |
| | | | | | | | | | |
| | | | | | | | | 1,718,188 | |
| | | | | | | | | | |
| | |
| Total Investments – 99.2% (Cost $22,885,775) | | | | | 23,452,583 | |
| | |
| Other Assets, less liabilities – 0.8% | | | | | 195,391 | |
| | | | | | | | | | |
| | |
| Net Assets – 100.0% | | | | | $23,647,974 | |
| | | | | | | | | | |
(a) Non-income producing security.
(b) Security that may be sold to qualified institutional buyers under Rule 144A of the Securities Act of 1933, as amended. At January 31, 2021, the aggregate value of these securities was $415,635, representing 1.8% of net assets.
As of the date of this report, certain foreign securities were fair valued by an independent pricing service under the direction of the Board of Trustees or its delegates in accordance with the Trust’s Valuation and Pricing Policies and Procedures.
SEE NOTES TO FINANCIAL STATEMENTS
33
DOMINI SUSTAINABLE SOLUTIONS FUND
Fund Performance and Holdings
The table and bar charts below provide information as of January 31, 2021, about the ten largest holdings of the Domini Sustainable Solutions Fund and its portfolio holdings by industry sector and country:
TEN LARGEST HOLDINGS (Unaudited)
| | | | | | | | | | |
| | | | |
| SECURITY DESCRIPTION | | % NET
ASSETS | | | SECURITY DESCRIPTION | | % NET
ASSETS | |
| | | | |
| Tesla Inc | | | 5.8% | | | Cree Inc | | | 3.6% | |
| | | | |
| Enphase Energy Inc | | | 5.3% | | | Hologic Inc | | | 3.5% | |
| | | | |
| Ameresco Inc Class A | | | 3.8% | | | Atlassian Corp PLC Class A | | | 3.5% | |
| | | | |
| Square Inc Class A | | | 3.8% | | | Autodesk Inc | | | 3.4% | |
| | | | |
| DexCom Inc | | | 3.8% | | | First Solar Inc | | | 3.4% | |
PORTFOLIO HOLDINGS BY INDUSTRY SECTOR (% OF NET ASSETS) (Unaudited)
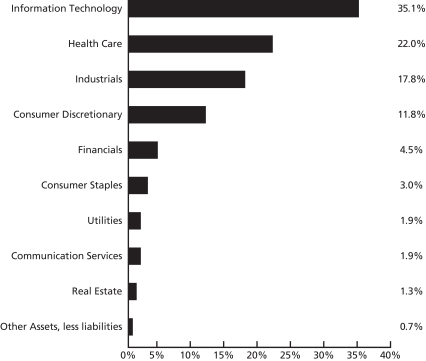
The Global Industry Classification Standard (“GICS”) was developed by and is the exclusive property and a service mark of MSCI Inc. (“MSCI”) and Standard & Poor’s, a division of The McGraw-Hill Companies, Inc. (“S&P”) and is licensed for use by Domini Impact Investments. Neither MSCI, S&P nor any third party involved in making or compiling the GICS or any GICS classifications makes any express or implied warranties or representations with respect to such standard or classification nor shall any such party have any liability therefrom.
34
PORTFOLIO HOLDINGS BY COUNTRY (% OF NET ASSETS) (Unaudited)
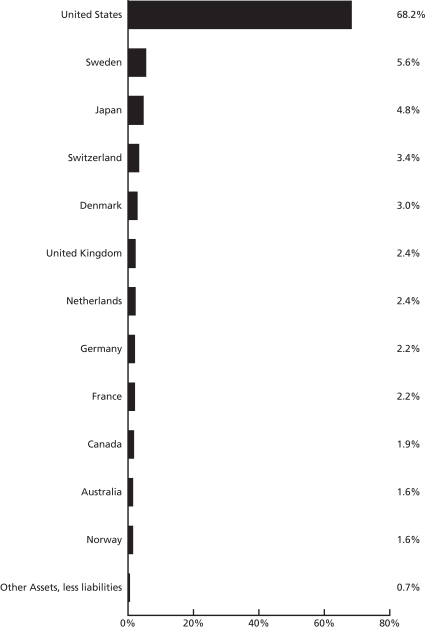
The holdings mentioned above are described in the Domini Sustainable Solutions Fund’s Portfolio of Investments (as of 1/31/2021) included herein. The composition of the Fund’s portfolio is subject to change.
35
| | | | | | | | | | |
| |
| AVERAGE ANNUAL TOTAL RETURNS (Unaudited) |
| | | | |
| | | Investor
shares | | Institutional
shares | | FTSE Global
All Cap Index (gross) | | MSCI World
Investable
Market
Index (net)2 |
| | | | | |
| As of 1/31/21 | | 1 Year | | N/A | | N/A | | N/A | | N/A |
| | | | | |
| | 5 Year | | N/A | | N/A | | N/A | | N/A |
| | | | | |
| | 10 Year | | N/A | | N/A | | N/A | | N/A |
| | | | | |
| | | Since Inception1 | | 107.15% | | 107.55% | | 49.62% | | 47.99% |
Past performance is no guarantee of future results. The Fund’s returns quoted above represent past performance after all expenses. The returns reflect any applicable expense waivers in effect during the periods shown. Without such waivers, Fund performance would be lower. Investment return, principal value, and yield will fluctuate. Your shares, when redeemed, may be worth more or less than their original cost. Call 1-800-582-6757 or visit domini.com for performance information current to the most recent month-end, which may be lower or higher than the performance data quoted. A 2.00% redemption fee applies on sales or exchanges of shares made less than 30 days after the settlement of purchase or acquisition through exchange, with certain exceptions. Quoted performance data does not reflect the deduction of this fee, which would reduce the performance quoted. See the prospectus for further information.
Per the prospectus dated November 30, 2020, the Fund’s (gross/net) annual operating expenses totaled 3.95%/1.40% and 2.89%/1.15% for the Investor and Institutional Class shares, respectively. The Fund’s Adviser has contractually agreed to waive certain fees and/or reimburse certain ordinary operating expenses in order to limit Investor share and Institutional share expenses to 1.40% and 1.15%, respectively. These expense limitations are in effect through November 30, 2021. There can be no assurance that the Adviser will extend the expense limitations beyond such time. While in effect, the arrangement may be terminated for a class only by agreement of the Adviser and the Fund’s Board of Trustees.
The table does not reflect the deduction of fees and taxes that a shareholder would pay on Fund distributions or the redemption of Fund shares. Total return is based on the Fund’s net asset values and assumes all dividends and capital gains were reinvested.
An investment in the Domini Sustainable Solutions Fund is not a bank deposit and is not insured. The Fund is subject to certain risks, including sustainable investing, portfolio management, information, market, recent events, and mid- to large-cap companies and small-cap companies risks. Investing internationally involves special risks, such as currency fluctuations, social and economic instability, differing securities regulations and accounting standards, limited public information, possible changes in taxation, and periods of illiquidity. You may lose money.
The FTSE Global All Cap Index (gross) is a market-capitalization weighted index representing the performance of the large, mid and small cap stocks globally. FTSE Global All Cap Index (gross) reflects the reinvestment of dividends without any withholding tax deduction. The MSCI World Investable Market Index (net) (MSCI IMI) is a market-capitalization weighted index representing the performance of large-mid- and small-capitalization companies in developed markets. The MSCI IMI includes the reinvestment of dividends net of withholding tax, but does not reflect other fees, expenses or taxes. See the prospectus for more information. You cannot invest directly in an index.
1Inception Date 4/1/2020. “Since Inception” for the FTSE Global All Cap Index (gross) and MSCI World Investable Market Index (net) refers to performance since 4/1/2020.
2Effective November 1, 2020, the performance benchmark against which the Fund measures its performance changed from the FTSE Global All Cap Index (gross) to the MSCI World Investable Market Index (net).
36
DOMINI SUSTAINABLE SOLUTIONS FUND
PORTFOLIOOF INVESTMENTS
January 31, 2021 (Unaudited)
| | | | | | | | |
| SECURITY | | SHARES | | | VALUE | |
| Common Stocks – 99.3% | | | | |
| Communication Services – 1.9% | | | | |
New York Times Co. (The), Class A | | | 13,538 | | | $ | 671,349 | |
| | | | | | | | |
| | | | | | | 671,349 | |
| | | | | | | | |
| |
| Consumer Discretionary – 11.8% | | | | |
Chegg, Inc. (a) | | | 10,804 | | | | 1,029,189 | |
MIPS AB | | | 13,176 | | | | 781,555 | |
Oisix ra daichi, Inc. (a) | | | 11,555 | | | | 343,537 | |
Tesla, Inc. (a) | | | 2,645 | | | | 2,098,887 | |
| | | | | | | | |
| | | | | | | 4,253,168 | |
| | | | | | | | |
| |
| Consumer Staples – 3.0% | | | | |
Beyond Meat, Inc. (a) | | | 6,172 | | | | 1,099,110 | |
| | | | | | | | |
| | | | | | | 1,099,110 | |
| | | | | | | | |
| |
| Financials – 4.5% | | | | |
Amalgamated Bank, Class A | | | 23,121 | | | | 338,954 | |
Muenchener Rueckversicherungs-Gesellschaft AG in Muenchen | | | 2,978 | | | | 790,519 | |
Resona Holdings, Inc. | | | 138,976 | | | | 482,668 | |
| | | | | | | | |
| | | | | | | 1,612,141 | |
| | | | | | | | |
| |
| Health Care – 22.0% | | | | |
BioMerieux | | | 5,096 | | | | 788,643 | |
Cochlear, Ltd. | | | 3,777 | | | | 570,136 | |
DexCom, Inc. (a) | | | 3,623 | | | | 1,358,082 | |
Emergent BioSolutions, Inc. (a) | | | 5,671 | | | | 605,946 | |
GlaxoSmithKline PLC | | | 47,075 | | | | 876,190 | |
Hologic, Inc. (a) | | | 15,937 | | | | 1,270,657 | |
OraSure Technologies, Inc. (a) | | | 48,535 | | | | 739,188 | |
Seagen, Inc. (a) | | | 6,882 | | | | 1,130,506 | |
Teladoc Health, Inc. (a) | | | 2,150 | | | | 567,234 | |
| | | | | | | | |
| | | | | | | 7,906,582 | |
| | | | | | | | |
| |
| Industrials – 17.8% | | | | |
Ameresco, Inc., Class A (a) | | | 24,661 | | | | 1,383,235 | |
Kurita Water Industries, Ltd. | | | 22,167 | | | | 900,193 | |
NEL ASA (a) | | | 160,448 | | | | 567,520 | |
Sunrun, Inc. (a) | | | 11,995 | | | | 830,894 | |
Sweco AB, Class B | | | 46,265 | | | | 773,214 | |
Vestas Wind Systems A/S | | | 5,075 | | | | 1,090,867 | |
Wolters Kluwer NV | | | 10,516 | | | | 874,749 | |
| | | | | | | | |
| | | | | | | 6,420,672 | |
| | | | | | | | |
| |
| Information Technology – 35.1% | | | | |
Atlassian Corp. PLC, Class A (a) | | | 5,487 | | | | 1,268,210 | |
Autodesk, Inc. (a) | | | 4,429 | | | | 1,228,738 | |
37
DOMINI SUSTAINABLE SOLUTIONS FUND
PORTFOLIOOF INVESTMENTS (continued)
January 31, 2021 (Unaudited)
| | | | | | | | |
| SECURITY | | SHARES | | | VALUE | |
| |
| Information Technology (Continued) | | | | |
Blackline, Inc. (a) | | | 9,016 | | | $ | 1,168,654 | |
Cree, Inc. (a) | | | 12,903 | | | | 1,304,235 | |
Enphase Energy, Inc. (a) | | | 10,460 | | | | 1,907,381 | |
First Solar, Inc. (a) | | | 12,232 | | | | 1,212,803 | |
Square, Inc., Class A (a) | | | 6,384 | | | | 1,378,689 | |
STMicroelectronics NV | | | 30,086 | | | | 1,207,442 | |
Universal Display Corp. | | | 4,443 | | | | 1,025,533 | |
Zoom Video Communications, Inc., Class A (a) | | | 2,443 | | | | 908,967 | |
| | | | | | | | |
| | | | | | | 12,610,652 | |
| | | | | | | | |
| |
| Real Estate – 1.3% | | | | |
Samhallsbyggnadsbolaget i Norden AB | | | 139,161 | | | | 457,156 | |
| | | | | | | | |
| | | | | | | 457,156 | |
| | | | | | | | |
| | |
| Utilities – 1.9% | | | | | | |
Innergex Renewable Energy, Inc. | | | 29,343 | | | | 673,480 | |
| | | | | | | | |
| | | | | | | 673,480 | |
| | | | | | | | |
| |
| Total Investments – 99.3% (Cost $24,056,557) | | | 35,704,310 | |
| |
| Other Assets, less liabilities – 0.7% | | | 245,722 | |
| | | | | | | | |
| |
| Net Assets – 100.0% | | | $35,950,032 | |
| | | | | | | | |
(a) Non-income producing security.
As of the date of this report, certain foreign securities were fair valued by an independent pricing service under the direction of the Board of Trustees or its delegates in accordance with the Trust’s Valuation and Pricing Policies and Procedures.
Portfolio Holdings by Country (% Of Net Assets) (Unaudited)
| | | | | | | | | | |
| | | | |
| United States | | | 68.2% | | | Netherlands | | | 2.4% | |
| | | | |
| Sweden | | | 5.6% | | | Germany | | | 2.2% | |
| | | | |
| Japan | | | 4.8% | | | France | | | 2.2% | |
| | | | |
| Switzerland | | | 3.4% | | | Canada | | | 1.9% | |
| | | | |
| Denmark | | | 3.0% | | | Australia | | | 1.6% | |
| | | | |
| United Kingdom | | | 2.4% | | | Norway | | | 1.6% | |
| | | | | | | | | | | |
| | | | |
| | | | | | | Total | | | 99.3% | |
SEE NOTES TO FINANCIAL STATEMENTS
38
DOMINI IMPACT INTERNATIONAL EQUITY FUND
Fund Performance and Holdings
The table and bar charts below provide information as of January 31, 2021, about the ten largest holdings of the Domini Impact International Equity Fund and its portfolio holdings by industry sector and country:
TEN LARGEST HOLDINGS (Unaudited)
| | | | | | | | | | |
| | | | |
| SECURITY DESCRIPTION | | % NET
ASSETS | | | SECURITY DESCRIPTION | | % NET
ASSETS | |
| | | | |
| Novartis AG | | | 3.4% | | | Koninklijke Ahold Delhaize NV | | | 1.8% | |
| | | | |
| Schneider Electric SE | | | 2.8% | | | Hennes & Mauritz AB Class B | | | 1.8% | |
| | | | |
| Sanofi | | | 2.5% | | | Intesa Sanpaolo SpA | | | 1.7% | |
| | | | |
| Deutsche Post AG | | | 2.1% | | | Nissan Motor Co Ltd | | | 1.7% | |
| | | | |
| Hong Kong Exchanges & Clearing Ltd | | | 1.9% | | | Adecco Group AG | | | 1.7% | |
PORTFOLIO HOLDINGS BY INDUSTRY SECTOR (% OF NET ASSETS) (Unaudited)
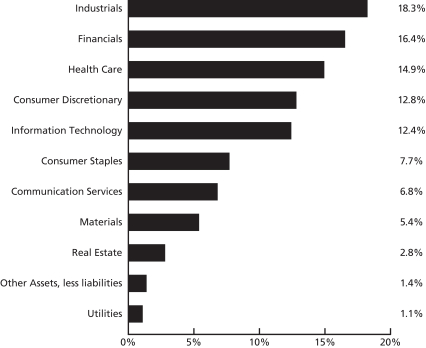
The Global Industry Classification Standard (“GICS”) was developed by and is the exclusive property and a service mark of MSCI Inc. (“MSCI”) and Standard & Poor’s, a division of The McGraw-Hill Companies, Inc. (“S&P”) and is licensed for use by Domini Impact Investments. Neither MSCI, S&P nor any third party involved in making or compiling the GICS or any GICS classifications makes any express or implied warranties or representations with respect to such standard or classification nor shall any such party have any liability therefrom.
39
PORTFOLIO HOLDINGS BY COUNTRY (% OF NET ASSETS) (Unaudited)
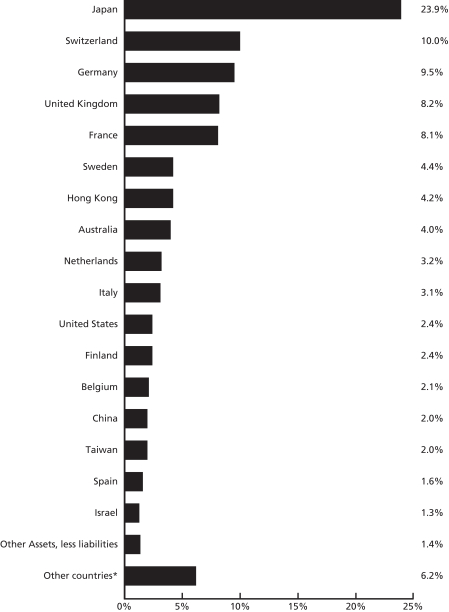
The holdings mentioned above are described in the Fund’s Portfolio of Investments as of 01/31/2021 included herein. The composition of the Fund’s portfolio is subject to change.
* Other countries include Mexico 0.8%, Denmark 0.7%, Jordan 0.6%, Norway 0.6%, South Africa 0.6%, Brazil 0.6%, Singapore 0.5%, South Korea 0.5%, Austria 0.4%, Hungary 0.4%, India 0.3%, Chile 0.1% and Ireland 0.1%.
40
| | | | | | | | | | | | | | |
| |
| AVERAGE ANNUAL TOTAL RETURNS (Unaudited) |
| | | | | | |
| | | Investor
shares | | Class A shares
(with 4.75%
maximum
Sales Charge)1 | | Class A
shares (without
Sales
Charge) | | Institutional
shares | | Class Y
shares | | MSCI EAFE (net) |
| | | | | | | |
| As of 1/31/21 | | 1 Year | | 7.02% | | 1.95% | | 7.04% | | 7.54% | | 7.49% | | 8.94% |
| | | | | | | |
| | 5 Year | | 6.56% | | 5.47% | | 6.50% | | 6.97% | | 6.56%3 | | 8.84% |
| | | | | | | |
| | | 10 Year | | 5.29% | | 4.77% | | 5.28% | | 5.29%2 | | 5.29%3 | | 5.15% |
Past performance is no guarantee of future results. The Fund’s returns quoted above represent past performance after all expenses. The returns reflect any applicable expense waivers in effect during the periods shown. Without such waivers, Fund performance would be lower. Investment return, principal value, and yield will fluctuate. Your shares, when redeemed, may be worth more or less than their original cost. Call 1-800-582-6757 or visit domini.com for performance information current to the most recent month-end, which may be lower or higher than the performance data quoted. A 2.00% redemption fee applies on sales or exchanges of shares made less than 30 days after the settlement of purchase or acquisition through exchange, with certain exceptions. Quoted performance data does not reflect the deduction of this fee, which would reduce the performance quoted. See the prospectus for further information.
Per the prospectus date November 30, 2020, the Fund’s (gross/net) annual operating expenses totaled 1.38%/1.38%, 1.54%/1.40%, 0.95%/0.95%, and 1.06%/1.06% for the Investor, Class A, Institutional, and Class Y shares, respectively. The Fund’s Adviser has contractually agreed to waive certain fees and/or reimburse certain ordinary operating expenses in order to limit Class A share expenses to 1.40%. This expense limitation is in effect through November 30, 2021. There can be no assurance that the Adviser will extend the expense limitations beyond such time. While in effect, the arrangement may be terminated for a class only by agreement of the Adviser and the Fund’s Board of Trustees.
The table does not reflect the deduction of fees and taxes that a shareholder would pay on Fund distributions or the redemption of Fund shares. Total return is based on the Fund’s net asset values and assumes all dividends and capital gains were reinvested.
An investment in the Domini Impact International Equity Fund is not a bank deposit and is not insured. The Fund is subject to certain risks, including foreign investing, emerging markets, geographic focus, country, currency, impact investing, portfolio management, market, recent events and mid- to large-cap companies risks. Investing internationally involves special risks, such as currency fluctuations, social and economic instability, differing securities regulations and accounting standards, limited public information, possible changes in taxation, and periods of illiquidity. You may lose money.
The Morgan Stanley Capital International Europe Australasia Far East (MSCI EAFE) index (net) is an unmanaged index of common stocks. MSCI EAFE (net) includes the reinvestment of dividends net of withholding tax, but does not reflect other fees, expenses or taxes. It is not available for direct investment.
1Performance “With Load” for DOMAX reflects performance with application of highest maximum front-end sales charge (4.75%).
2Institutional Shares were not offered prior to November 30, 2012. All performance information for time periods beginning prior to November 30, 2012 is the performance of the Investor Shares. This performance has not been adjusted to reflect the lower expenses of the Institutional Shares.
3Class Y Shares were not offered prior to July 23, 2018. All performance information for time periods beginning prior to July 23, 2018 is the performance of the Investor Shares. This performance has not been adjusted to reflect the lower expenses of the Class Y Shares.
41
DOMINI IMPACT INTERNATIONAL EQUITY FUND
PORTFOLIOOF INVESTMENTS
January 31, 2021 (Unaudited)
| | | | | | | | | | |
| COUNTRY/SECURITY | | INDUSTRY | | SHARES | | | VALUE | |
| Common Stocks – 98.6% | | | | | | | | |
Australia – 4.0% | | | | | | | | | | |
BlueScope Steel, Ltd. . | | Materials | | | 1,050,332 | | | $ | 13,238,613 | |
Dexus | | Real Estate | | | 171,423 | | | | 1,178,545 | |
Fortescue Metals Group, Ltd. | | Materials | | | 1,174,791 | | | | 19,426,794 | |
Harvey Norman Holdings, Ltd. | | Retailing | | | 1,714,494 | | | | 6,971,094 | |
JB Hi-Fi, Ltd. | | Retailing | | | 121,329 | | | | 4,787,219 | |
Magellan Financial Group, Ltd. | | Diversified Financials | | | 131,870 | | | | 4,810,010 | |
Mirvac Group | | Real Estate | | | 6,693 | | | | 12,125 | |
| | | | | | | | | | |
| | | | | | | | | 50,424,400 | |
| | | | | | | | | | |
| | | | | | | | | | |
Austria – 0.4% | | | | | | | | | | |
Verbund AG | | Utilities | | | 34,012 | | | | 3,068,999 | |
voestalpine AG | | Materials | | | 65,523 | | | | 2,394,080 | |
| | | | | | | | | | |
| | | | | | | | | 5,463,079 | |
| | | | | | | | | | |
| | | | | | | | | | |
Belgium – 2.1% | | | | | | | | | | |
Ageas SA | | Insurance | | | 252,142 | | | | 12,923,271 | |
Etablissements Franz Colruyt NV | | Food & Staples Retailing | | | 25,481 | | | | 1,573,583 | |
UCB SA | | Pharmaceuticals, Biotechnology & Life Sciences | | | 112,599 | | | | 11,672,856 | |
| | | | | | | | | | |
| | | | | | | | | 26,169,710 | |
| | | | | | | | | | |
| | | | | | | | | | |
Brazil – 0.6% | | | | | | | | | | |
Cyrela Brazil Realty SA Empreendimentos e Participacoes | | Consumer Durables & Apparel | | | 247,100 | | | | 1,159,975 | |
Itausa SA, Pfd Shs | | Banks | | | 3,087,300 | | | | 5,999,588 | |
Raia Drogasil SA | | Food & Staples Retailing | | | 2,380 | | | | 10,863 | |
| | | | | | | | | | |
| | | | | | | | | 7,170,426 | |
| | | | | | | | | | |
| | | | | | | | | | |
Chile – 0.1% | | | | | | | | | | |
Antofagasta PLC | | Materials | | | 88,909 | | | | 1,737,796 | |
| | | | | | | | | | |
| | | | | | | | | 1,737,796 | |
| | | | | | | | | | |
| | | | | | | | | | |
China – 2.0% | | | | | | | | | | |
Airtac International Group | | Capital Goods | | | 76,000 | | | | 2,704,015 | |
China Life Insurance Co., Ltd., Class H | | Insurance | | | 2,644,000 | | | | 5,614,803 | |
Li Ning Co., Ltd. | | Consumer Durables & Apparel | | | 920,142 | | | | 5,731,861 | |
Tingyi Cayman Islands Holding Corp. | | Food, Beverage & Tobacco | | | 2,332,000 | | | | 4,633,423 | |
Yangzijiang Shipbuilding Holdings, Ltd. | | Capital Goods | | | 1,937,100 | | | | 1,431,965 | |
42
DOMINI IMPACT INTERNATIONAL EQUITY FUND
PORTFOLIOOF INVESTMENTS (continued)
January 31, 2021 (Unaudited)
| | | | | | | | | | |
| COUNTRY/SECURITY | | INDUSTRY | | SHARES | | | VALUE | |
China (Continued) | | | | | | | | | | |
Zhongsheng Group Holdings, Ltd. | | Retailing | | | 812,000 | | | $ | 4,755,022 | |
| | | | | | | | | | |
| | | | | | | | | 24,871,089 | |
| | | | | | | | | | |
| | | | | | | | | | |
Denmark – 0.7% | | | | | | | | | | |
Novo Nordisk A/S, Class B | | Pharmaceuticals, Biotechnology & Life Sciences | | | 179 | | | | 12,484 | |
Pandora A/S | | Consumer Durables & Apparel | | | 87,332 | | | | 8,412,699 | |
Vestas Wind Systems A/S | | Capital Goods | | | 58 | | | | 12,467 | |
| | | | | | | | | | |
| | | | | | | | | 8,437,650 | |
| | | | | | | | | | |
| | | | | | | | | | |
Finland – 2.4% | | | | | | | | | | |
Kesko OYJ, Class B | | Food & Staples Retailing | | | 128,084 | | | | 3,329,608 | |
Nordea Bank Abp (a) | | Banks | | | 2,359,355 | | | | 19,180,989 | |
Orion Oyj, Class B | | Pharmaceuticals, Biotechnology & Life Sciences | | | 140,123 | | | | 6,436,208 | |
Valmet Oyj | | Capital Goods | | | 53,782 | | | | 1,723,629 | |
| | | | | | | | | | |
| | | | | | | | | 30,670,434 | |
| | | | | | | | | | |
| | | | | | | | | | |
France – 8.1% | | | | | | | | | | |
Adevinta ASA (a) | | Media & Entertainment | | | 182,493 | | | | 2,711,710 | |
BNP Paribas SA (a) | | Banks | | | 246,203 | | | | 11,819,967 | |
Capgemini SE | | Software & Services | | | 26,832 | | | | 3,881,831 | |
Carrefour SA | | Food & Staples Retailing | | | 461,247 | | | | 7,830,280 | |
CNP Assurances (a) | | Insurance | | | 89,361 | | | | 1,355,867 | |
Credit Agricole SA (a) | | Banks | | | 419,060 | | | | 4,748,244 | |
Kering SA | | Consumer Durables & Apparel | | | 18 | | | | 11,827 | |
Rexel SA (a) | | Capital Goods | | | 244,982 | | | | 3,732,000 | |
Sanofi | | Pharmaceuticals, Biotechnology & Life Sciences | | | 343,614 | | | | 32,352,259 | |
Schneider Electric SE | | Capital Goods | | | 239,813 | | | | 35,138,244 | |
| | | | | | | | | | |
| | | | | | | | | 103,582,229 | |
| | | | | | | | | | |
| | | | | | | | | | |
Germany – 9.5% | | | | | | | | | | |
adidas AG (a) | | Consumer Durables & Apparel | | | 33 | | | | 10,475 | |
Allianz SE | | Insurance | | | 13,705 | | | | 3,100,901 | |
Brenntag AG | | Capital Goods | | | 31,906 | | | | 2,502,075 | |
Covestro AG | | Materials | | | 63,981 | | | | 4,351,180 | |
Deutsche Post AG | | Transportation | | | 543,333 | | | | 26,867,828 | |
Deutsche Telekom AG | | Telecommunication Services | | | 1,146,372 | | | | 20,408,111 | |
Evonik Industries AG | | Materials | | | 132,314 | | | | 4,355,860 | |
GEA Group AG | | Capital Goods | | | 188,541 | | | | 6,521,698 | |
Henkel AG & Co. KGaA, Pfd Shs | | Household & Personal Products | | | 36,858 | | | | 3,821,691 | |
LEG Immobilien AG | | Real Estate | | | 48,932 | | | | 7,022,281 | |
ProSiebenSat.1 Media SE (a) | | Media & Entertainment | | | 230,621 | | | | 4,172,091 | |
43
DOMINI IMPACT INTERNATIONAL EQUITY FUND
PORTFOLIOOF INVESTMENTS (continued)
January 31, 2021 (Unaudited)
| | | | | | | | | | |
| COUNTRY/SECURITY | | INDUSTRY | | SHARES | | | VALUE | |
Germany (Continued) | | | | | | | | | | |
Siemens AG | | Capital Goods | | | 125,258 | | | $ | 19,429,089 | |
TeamViewer AG (a) | | Software & Services | | | 60,162 | | | | 3,114,710 | |
Telefonica Deutschland Holding AG | | Telecommunication Services | | | 786,922 | | | | 2,158,913 | |
United Internet AG | | Telecommunication Services | | | 111,357 | | | | 4,837,766 | |
Wacker Chemie AG | | Materials | | | 56,110 | | | | 8,129,711 | |
| | | | | | | | | | |
| | | | | | | | | 120,804,380 | |
| | | | | | | | | | |
| | | | | | | | | | |
Hong Kong – 4.2% | | | | | | | | | | |
AIA Group, Ltd. | | Insurance | | | 254,800 | | | | 3,071,821 | |
Hong Kong Exchanges & Clearing, Ltd. | | Diversified Financials | | | 375,235 | | | | 23,987,726 | |
Man Wah Holdings, Ltd. | | Consumer Durables & Apparel | | | 2,934,000 | | | | 6,470,599 | |
Swire Properties, Ltd. | | Real Estate | | | 388,400 | | | | 1,125,738 | |
Techtronic Industries Co., Ltd. | | Capital Goods | | | 740,000 | | | | 11,053,545 | |
Xinyi Glass Holdings, Ltd. | | Capital Goods | | | 3,338,000 | | | | 8,073,913 | |
| | | | | | | | | | |
| | | | | | | | | 53,783,342 | |
| | | | | | | | | | |
| | | | | | | | | | |
Hungary – 0.4% | | | | | | | | | | |
Richter Gedeon Nyrt | | Pharmaceuticals, Biotechnology & Life Sciences | | | 163,699 | | | | 4,617,999 | |
| | | | | | | | | | |
| | | | | | | | | 4,617,999 | |
| | | | | | | | | | |
| | | | | | | | | | |
India – 0.3% | | | | | | | | | | |
Dr Reddy’s Laboratories, Ltd. | | Pharmaceuticals, Biotechnology & Life Sciences | | | 250 | | | | 15,700 | |
Kotak Mahindra Bank, Ltd. (a) | | Banks | | | 151,832 | | | | 3,551,723 | |
| | | | | | | | | | |
| | | | | | | | | 3,567,423 | |
| | | | | | | | | | |
| | | | | | | | | | |
Ireland – 0.1% | | | | | | | | | | |
Cimpress PLC (a) | | Commercial & Professional Services | | | 14,197 | | | | 1,297,464 | |
| | | | | | | | | | |
| | | | | | | | | 1,297,464 | |
| | | | | | | | | | |
| | | | | | | | | | |
Israel – 1.3% | | | | | | | | | | |
Check Point Software Technologies, Ltd. (a) | | Software & Services | | | 130,918 | | | | 16,723,465 | |
| | | | | | | | | | |
| | | | | | | | | 16,723,465 | |
| | | | | | | | | | |
| | | | | | | | | | |
Italy – 3.1% | | | | | | | | | | |
A2A S.p.A. | | Utilities | | | 1,265,373 | | | | 2,054,189 | |
Banco BPM SpA (a) | | Banks | | | 3,264,117 | | | | 7,151,610 | |
DiaSorin S.p.A. | | Health Care Equipment & Services | | | 25,617 | | | | 5,608,268 | |
Intesa Sanpaolo SpA (a) | | Banks | | | 10,050,483 | | | | 21,935,495 | |
Terna Rete Elettrica Nazionale SpA | | Utilities | | | 322,575 | | | | 2,341,966 | |
| | | | | | | | | | |
| | | | | | | | | 39,091,528 | |
| | | | | | | | | | |
44
DOMINI IMPACT INTERNATIONAL EQUITY FUND
PORTFOLIOOF INVESTMENTS (continued)
January 31, 2021 (Unaudited)
| | | | | | | | | | |
| COUNTRY/SECURITY | | INDUSTRY | | SHARES | | | VALUE | |
Japan – 23.9% | | | | | | | | | | |
Aisin Seiki Co., Ltd. | | Automobiles & Components | | | 64,000 | | | $ | 1,968,045 | |
Alps Alpine Co., Ltd. | | Technology Hardware & Equipment | | | 409,200 | | | | 5,471,009 | |
Benesse Holdings, Inc. | | Consumer Services | | | 107,900 | | | | 2,083,797 | |
Brother Industries, Ltd. | | Technology Hardware & Equipment | | | 500 | | | | 11,155 | |
Central Japan Railway Co. | | Transportation | | | 80 | | | | 11,461 | |
Cosmos Pharmaceutical Corp. | | Food & Staples Retailing | | | 51,400 | | | | 7,840,609 | |
Dai Nippon Printing Co., Ltd. | | Commercial & Professional Services | | | 366,541 | | | | 6,321,149 | |
Dai-ichi Life Holdings, Inc. | | Insurance | | | 1,026,000 | | | | 15,640,412 | |
Denso Corp. | | Automobiles & Components | | | 189,900 | | | | 10,560,651 | |
Eisai Co., Ltd. | | Pharmaceuticals, Biotechnology & Life Sciences | | | 150 | | | | 10,953 | |
Fancl Corp. | | Household & Personal Products | | | 258,986 | | | | 9,513,351 | |
GungHo Online Entertainment, Inc. (a) | | Media & Entertainment | | | 257,514 | | | | 6,422,982 | |
Hachijuni Bank, Ltd. (The) | | Banks | | | 488,522 | | | | 1,562,683 | |
Hino Motors, Ltd. | | Capital Goods | | | 481,900 | | | | 4,155,560 | |
Hoya Corp. | | Health Care Equipment & Services | | | 104,869 | | | | 13,424,803 | |
K’s Holdings Corp. | | Retailing | | | 245,372 | | | | 3,319,462 | |
LIXIL Corp. | | Capital Goods | | | 179,400 | | | | 4,185,659 | |
M3, Inc. | | Health Care Equipment & Services | | | 82,200 | | | | 6,922,463 | |
Medipal Holdings Corp. | | Health Care Equipment & Services | | | 299,857 | | | | 6,142,427 | |
Mitsubishi Estate Co., Ltd. | | Real Estate | | | 920,325 | | | | 14,566,473 | |
Mitsubishi Gas Chemical Co., Inc. | | Materials | | | 284,752 | | | | 6,518,509 | |
Mitsui Fudosan Co., Ltd. | | Real Estate | | | 125,600 | | | | 2,550,600 | |
MS&AD Insurance Group Holdings, Inc. | | Insurance | | | 86,510 | | | | 2,490,198 | |
Nintendo Co., Ltd. | | Media & Entertainment | | | 31,877 | | | | 18,358,287 | |
Nippon Electric Glass Co., Ltd. | | Technology Hardware & Equipment | | | 350,075 | | | | 7,694,719 | |
Nissan Motor Co., Ltd. (a) | | Automobiles & Components | | | 4,209,299 | | | | 21,712,282 | |
Nitori Holdings Co., Ltd. | | Retailing | | | 32,300 | | | | 6,413,415 | |
Nomura Real Estate Holdings, Inc. | | Real Estate | | | 430 | | | | 9,609 | |
Nomura Research Institute, Ltd. | | Software & Services | | | 39,744 | | | | 1,339,391 | |
NTN Corp. (a) | | Capital Goods | | | 5,300 | | | | 14,006 | |
NTT Data Corp. | | Software & Services | | | 230,700 | | | | 3,314,694 | |
Ono Pharmaceutical Co., Ltd. | | Pharmaceuticals, Biotechnology & Life Sciences | | | 328,500 | | | | 9,810,111 | |
ORIX Corp. | | Diversified Financials | | | 630 | | | | 10,114 | |
Otsuka Holdings Co., Ltd. | | Pharmaceuticals, Biotechnology & Life Sciences | | | 30,286 | | | | 1,293,872 | |
45
DOMINI IMPACT INTERNATIONAL EQUITY FUND
PORTFOLIOOF INVESTMENTS (continued)
January 31, 2021 (Unaudited)
| | | | | | | | | | |
| COUNTRY/SECURITY | | INDUSTRY | | SHARES | | | VALUE | |
Japan (Continued) | | | | | | | | | | |
Panasonic Corp. | | Consumer Durables & Apparel | | | 523,000 | | | $ | 6,792,950 | |
Rohm Co., Ltd. | | Semiconductors & Semiconductor Equipment | | | 57,900 | | | | 5,877,506 | |
Sawai Pharmaceutical Co., Ltd. | | Pharmaceuticals, Biotechnology & Life Sciences | | | 26,500 | | | | 1,211,975 | |
Seiko Epson Corp. | | Technology Hardware & Equipment | | | 369,800 | | | | 6,302,515 | |
Seino Holdings Co., Ltd. | | Transportation | | | 455,920 | | | | 5,909,152 | |
SG Holdings Co., Ltd. | | Transportation | | | 96,200 | | | | 2,467,041 | |
Shimamura Co., Ltd. | | Retailing | | | 59,491 | | | | 6,610,153 | |
Sony Corp. | | Consumer Durables & Apparel | | | 170 | | | | 16,279 | |
Sugi Holdings Co., Ltd. | | Food & Staples Retailing | | | 36,900 | | | | 2,426,114 | |
Sumitomo Realty & Development Co., Ltd. | | Real Estate | | | 91,300 | | | | 2,757,280 | |
Sundrug Co., Ltd. | | Food & Staples Retailing | | | 187,194 | | | | 7,430,295 | |
T&D Holdings, Inc. | | Insurance | | | 108,600 | | | | 1,266,209 | |
Taiyo Yuden Co., Ltd. | | Technology Hardware & Equipment | | | 96,800 | | | | 5,681,079 | |
TDK Corp. | | Technology Hardware & Equipment | | | 14,300 | | | | 2,313,298 | |
TIS, Inc. | | Software & Services | | | 250,962 | | | | 5,583,224 | |
Toho Gas Co., Ltd. | | Utilities | | | 98,700 | | | | 5,804,949 | |
Toppan Printing Co., Ltd. | | Commercial & Professional Services | | | 540 | | | | 7,684 | |
Toyo Seikan Group Holdings, Ltd. | | Materials | | | 137,427 | | | | 1,473,483 | |
Trend Micro, Inc. (a) | | Software & Services | | | 176,100 | | | | 9,696,284 | |
Yamada Holding Co., Ltd. | | Retailing | | | 417,000 | | | | 2,126,810 | |
Yamato Holdings Co., Ltd. | | Transportation | | | 747,100 | | | | 18,544,965 | |
Yamazaki Baking Co., Ltd. | | Food, Beverage & Tobacco | | | 148,800 | | | | 2,740,880 | |
| | | | | | | | | | |
| | | | | | | | | 304,705,036 | |
| | | | | | | | | | |
| | | | | | | | | | |
Jordan – 0.6% | | | | | | | | | | |
Hikma Pharmaceuticals PLC | | Pharmaceuticals, Biotechnology & Life Sciences | | | 248,250 | | | | 8,170,511 | |
| | | | | | | | | | |
| | | | | | | | | 8,170,511 | |
| | | | | | | | | | |
| | | | | | | | | | |
Mexico – 0.8% | | | | | | | | | | |
Gruma SAB de C.V., Class B | | Food, Beverage & Tobacco | | | 437,345 | | | | 4,865,757 | |
Grupo Financiero Banorte SAB de C.V. (a) | | Banks | | | 1,140,200 | | | | 5,756,393 | |
| | | | | | | | | | |
| | | | | | | | | 10,622,150 | |
| | | | | | | | | | |
| | | | | | | | | | |
Netherlands – 3.2% | | | | | | | | | | |
Akzo Nobel NV | | Materials | | | 38,243 | | | | 3,897,448 | |
46
DOMINI IMPACT INTERNATIONAL EQUITY FUND
PORTFOLIOOF INVESTMENTS (continued)
January 31, 2021 (Unaudited)
| | | | | | | | | | |
| COUNTRY/SECURITY | | INDUSTRY | | SHARES | | | VALUE | |
Netherlands (Continued) | | | | | | | | | | |
ASM International NV | | Semiconductors & Semiconductor Equipment | | | 45,029 | | | $ | 11,547,831 | |
ASML Holding NV | | Semiconductors & Semiconductor Equipment | | | 3,171 | | | | 1,694,734 | |
Koninklijke Ahold Delhaize NV | | Food & Staples Retailing | | | 816,398 | | | | 23,460,397 | |
| | | | | | | | | | |
| | | | | | | | | 40,600,410 | |
| | | | | | | | | | |
| | | | | | | | | | |
Norway – 0.6% | | | | | | | | | | |
Orkla ASA | | Food, Beverage & Tobacco | | | 445,759 | | | | 4,339,461 | |
Storebrand ASA (a) | | Insurance | | | 451,033 | | | | 3,456,816 | |
| | | | | | | | | | |
| | | | | | | | | 7,796,277 | |
| | | | | | | | | | |
| | | | | | | | | | |
Singapore – 0.5% | | | | | | | | | | |
Mapletree Logistics Trust | | Real Estate | | | 4,535,600 | | | | 6,733,529 | |
| | | | | | | | | | |
| | | | | | | | | 6,733,529 | |
| | | | | | | | | | |
| | | | | | | | | | |
South Africa – 0.6% | | | | | | | | | | |
Clicks Group, Ltd. | | Food & Staples Retailing | | | 312,260 | | | | 5,155,065 | |
Mr Price Group, Ltd. | | Retailing | | | 212,687 | | | | 2,428,367 | |
| | | | | | | | | | |
| | | | | | | | | 7,583,432 | |
| | | | | | | | | | |
| | | | | | | | | | |
South Korea – 0.5% | | | | | | | | | | |
LG Electronics, Inc. | | Consumer Durables & Apparel | | | 44,989 | | | | 6,142,053 | |
| | | | | | | | | | |
| | | | | | | | | 6,142,053 | |
| | | | | | | | | | |
| | | | | | | | | | |
Spain – 1.6% | | | | | | | | | | |
Acerinox SA | | Materials | | | 301,748 | | | | 3,354,167 | |
Banco Bilbao Vizcaya Argentaria SA | | Banks | | | 1,837,581 | | | | 8,393,686 | |
Banco de Sabadell SA | | Banks | | | 5,727,762 | | | | 2,504,365 | |
Banco Santander SA (a) | | Banks | | | 1,676,119 | | | | 4,897,872 | |
EDP Renovaveis SA | | Utilities | | | 45,333 | | | | 1,242,870 | |
| | | | | | | | | | |
| | | | | | | | | 20,392,960 | |
| | | | | | | | | | |
| | | | | | | | | | |
Sweden – 4.4% | | | | | | | | | | |
Essity AB, Class B | | Household & Personal Products | | | 318 | | | | 10,189 | |
Getinge AB, Class B | | Health Care Equipment & Services | | | 73,204 | | | | 1,894,079 | |
Hennes & Mauritz AB, Class B (a) | | Retailing | | | 1,051,569 | | | | 22,551,369 | |
Husqvarna AB, Class B | | Consumer Durables & Apparel | | | 367,739 | | | | 4,563,945 | |
Kinnevik AB, Class B (a) | | Diversified Financials | | | 98,299 | | | | 4,837,395 | |
L E Lundbergforetagen AB, Class B (a) | | Diversified Financials | | | 32,591 | | | | 1,717,058 | |
Sandvik AB (a) | | Capital Goods | | | 840,224 | | | | 20,990,547 | |
| | | | | | | | | | |
| | | | | | | | | 56,564,582 | |
| | | | | | | | | | |
| | | | | | | | | | |
47
DOMINI IMPACT INTERNATIONAL EQUITY FUND
PORTFOLIOOF INVESTMENTS (continued)
January 31, 2021 (Unaudited)
| | | | | | | | | | |
| COUNTRY/SECURITY | | INDUSTRY | | SHARES | | | VALUE | |
Switzerland – 10.0% | | | | | | | | | | |
ABB, Ltd. | | Capital Goods | | | 158,445 | | | $ | 4,679,598 | |
Adecco Group AG | | Commercial & Professional Services | | | 346,833 | | | | 21,693,042 | |
Georg Fischer AG | | Capital Goods | | | 346 | | | | 432,758 | |
Logitech International SA | | Technology Hardware & Equipment | | | 162,578 | | | | 16,906,935 | |
Lonza Group AG | | Pharmaceuticals, Biotechnology & Life Sciences | | | 29,393 | | | | 18,797,562 | |
Novartis AG | | Pharmaceuticals, Biotechnology & Life Sciences | | | 482,780 | | | | 43,769,873 | |
Sonova Holding AG (a) | | Health Care Equipment & Services | | | 4,892 | | | | 1,181,667 | |
STMicroelectronics NV | | Semiconductors & Semiconductor Equipment | | | 490,507 | | | | 19,676,787 | |
| | | | | | | | | | |
| | | | | | | | | 127,138,222 | |
| | | | | | | | | | |
| | | | | | | | | | |
Taiwan – 2.0% | | | | | | | | | | |
ASMedia Technology, Inc. | | Semiconductors & Semiconductor Equipment | | | 39,000 | | | | 2,637,744 | |
Lite-On Technology Corp. | | Technology Hardware & Equipment | | | 932,447 | | | | 1,826,234 | |
Novatek Microelectronics Corp. | | Semiconductors & Semiconductor Equipment | | | 459,277 | | | | 6,440,245 | |
Realtek Semiconductor Corp. | | Semiconductors & Semiconductor Equipment | | | 83,000 | | | | 1,335,189 | |
United Microelectronics Corp. | | Semiconductors & Semiconductor Equipment | | | 3,533,259 | | | | 6,330,764 | |
Wistron Corp. | | Technology Hardware & Equipment | | | 1,199,000 | | | | 1,336,002 | |
Yageo Corp. | | Technology Hardware & Equipment | | | 240,000 | | | | 4,899,576 | |
| | | | | | | | | | |
| | | | | | | | | 24,805,754 | |
| | | | | | | | | | |
| | | | | | | | | | |
United Kingdom – 8.2% | | | | | | | | | | |
3i Group PLC | | Diversified Financials | | | 288,573 | | | | 4,382,629 | |
Avast PLC | | Software & Services | | | 893,282 | | | | 5,772,454 | |
Aviva PLC | | Insurance | | | 275,447 | | | | 1,262,722 | |
Barratt Developments PLC (a) | | Consumer Durables & Apparel | | | 271,885 | | | | 2,373,096 | |
Berkeley Group Holdings PLC | | Consumer Durables & Apparel | | | 79,296 | | | | 4,544,973 | |
Bunzl PLC | | Capital Goods | | | 114,059 | | | | 3,669,407 | |
ConvaTec Group PLC | | Health Care Equipment & Services | | | 1,575,228 | | | | 4,330,533 | |
Direct Line Insurance Group PLC | | Insurance | | | 533,894 | | | | 2,196,172 | |
Inchcape PLC (a) | | Retailing | | | 320,528 | | | | 2,911,531 | |
J Sainsbury PLC | | Food & Staples Retailing | | | 1,795,735 | | | | 6,010,580 | |
48
DOMINI IMPACT INTERNATIONAL EQUITY FUND
PORTFOLIOOF INVESTMENTS (continued)
January 31, 2021 (Unaudited)
| | | | | | | | | | |
| COUNTRY/SECURITY | | INDUSTRY | | SHARES | | | VALUE | |
United Kingdom (Continued) | | | | | | | | | | |
Legal & General Group PLC | | Insurance | | | 700,472 | | | $ | 2,334,859 | |
Liberty Global PLC, Class A (a) | | Telecommunication Services | | | 357,391 | | | | 8,627,419 | |
M&G PLC | | Diversified Financials | | | 787,267 | | | | 1,892,895 | |
Persimmon PLC | | Consumer Durables & Apparel | | | 361,967 | | | | 12,627,546 | |
Phoenix Group Holdings PLC | | Insurance | | | 656,933 | | | | 6,067,602 | |
Standard Life Aberdeen PLC | | Diversified Financials | | | 2,225,736 | | | | 9,182,994 | |
Taylor Wimpey PLC (a) | | Consumer Durables & Apparel | | | 2,419,667 | | | | 4,839,962 | |
Unilever PLC | | Household & Personal Products | | | 237 | | | | 13,837 | |
Vodafone Group PLC | | Telecommunication Services | | | 10,697,115 | | | | 18,308,644 | |
Wm Morrison Supermarkets PLC | | Food & Staples Retailing | | | 1,096,562 | | | | 2,695,189 | |
| | | | | | | | | | |
| | | | | | | | | 104,045,044 | |
| | | | | | | | | | |
| | | | | | | | | | |
United States – 2.4% | | | | | | | | | | |
Ferguson PLC | | Capital Goods | | | 160,157 | | | | 18,637,027 | |
Jazz Pharmaceuticals PLC (a) | |
Pharmaceuticals, Biotechnology & Life Sciences | | | 45,301 | | | | 7,044,305 | |
QIAGEN N.V. (a) | | Pharmaceuticals, Biotechnology & Life Sciences | | | 98,148 | | | | 5,314,714 | |
| | | | | | | | | | |
| | | | | | | | | 30,996,046 | |
| | | | | | | | | | |
| | |
| Total Investments – 98.6% (Cost $1,075,428,525) | | | | | 1,254,708,420 | |
| | |
| Other Assets, less liabilities – 1.4% | | | | | 17,747,120 | |
| | | | | | | | | | |
| | |
| Net Assets – 100.0% | | | | | $1,272,455,540 | |
| | | | | | | | | | |
(a) Non-income producing security.
As of the date of this report, certain foreign securities were fair valued by an independent pricing service under the direction of the Board of Trustees or its delegates in accordance with the Trust’s Valuation and Pricing Policies and Procedures.
SEE NOTES TO FINANCIAL STATEMENTS
49
DOMINI IMPACT BOND FUND
Fund Performance and Holdings
The table and bar charts below provide information as of January 31, 2021, about the percentage of the Domini Impact Bond Fund’s portfolio holdings invested in various types of debt obligations:
PORTFOLIO COMPOSITION (% OF NET ASSETS) (Unaudited)

The Global Industry Classification Standard (“GICS”) was developed by and is the exclusive property and a service mark of MSCI Inc. (“MSCI”) and Standard & Poor’s, a division of The McGraw-Hill Companies, Inc. (“S&P”) and is licensed for use by Domini Impact Investments. Neither MSCI, S&P nor any third party involved in making or compiling the GICS or any GICS classifications makes any express or implied warranties or representations with respect to such standard or classification nor shall any such party have any liability therefrom.
50
| | | | | | | | |
| |
| AVERAGE ANNUAL TOTAL RETURNS (Unaudited) |
| | | |
| | | Investor
shares | | Institutional
shares | | Bloomberg Barclays
U.S. Aggregate
Index (BBUSA) |
| | | | |
| As of 1/31/21 | | 1 Year | | 7.94% | | 8.12% | | 4.72% |
| | | | |
| | 5 Year | | 4.71% | | 4.99% | | 4.00% |
| | | | |
| | | 10 Year | | 3.42% | | 3.42%1 | | 3.75% |
Past performance is no guarantee of future results. The Fund’s returns quoted above represent past performance after all expenses. The returns reflect any applicable expense waivers in effect during the periods shown. Without such waivers, Fund performance would be lower. Investment return, principal value, and yield will fluctuate. Your shares, when redeemed, may be worth more or less than their original cost. Call 1-800-582-6757 or visit domini.com for performance information current to the most recent month-end, which may be lower or higher than the performance data quoted. A 2.00% redemption fee applies on sales or exchanges of shares made less than 30 days after the settlement of purchase or acquisition through exchange, with certain exceptions. Quoted performance data does not reflect the deduction of this fee, which would reduce the performance quoted. See the prospectus for further information.
Per the prospectus dated November 30, 2020, the Fund’s (gross/net) annual operating expenses totaled 1.15%/0.87%, 0.74%/0.57%, and 0.79%/0.65% for the Investor, Institutional, and Class Y shares, respectively. The Fund’s Adviser has contractually agreed to waive certain fees and/or reimburse certain ordinary operating expenses in order to limit Investor, Institutional share, and Class Y expenses to 0.87%, 0.57%, and 0.65%, respectively. These expense limitations are in effect through November 30, 2021. There can be no assurance that the Adviser will extend the expense limitations beyond such time. While in effect, the arrangement may be terminated for a class only by agreement of the Adviser and the Fund’s Board of Trustees.
The table does not reflect the deduction of fees and taxes that a shareholder would pay on Fund distributions or the redemption of Fund shares. Total return is based on the Fund’s net asset values and assumes all dividends and capital gains were reinvested.
An investment in the Domini Impact Bond Fund is not a bank deposit and is not insured. You may lose money. The Fund is subject to certain risks, including impact investing, portfolio management, style risk, information, market, recent events, interest rate and credit risks.
During periods of rising interest rates, the Fund can lose value. Some of the Fund’s community development investments may be unrated and may carry greater credit risks than the Fund’s other holdings. The Fund currently holds a large percentage of its portfolio in mortgage-backed securities. During periods of falling interest rates, mortgage-backed securities may prepay the principal due, which may lower the Fund’s return by causing it to reinvest at lower interest rates.
Investments in derivatives can be volatile. Potential risks include currency risk, leverage risk (the risk that small market movements may result in large changes in the value of an investment), liquidity risk, index risk, pricing risk, and counterparty risk (the risk that the counterparty may be unwilling or unable to honor its obligations).
TBA (To Be Announced) securities involve the risk that the security the Fund buys will lose value prior to its delivery. There also is the risk that the security will not be issued or that the other party to the transaction will not meet its obligation, which can adversely affect the Fund’s returns.
The reduction or withdrawal of historical financial market support activities by the U.S. Government and Federal Reserve, or other governments/central banks could negatively impact financial markets generally, and increase market, liquidity and interest rate risks which could adversely affect the Fund’s returns.
The Bloomberg Barclays U.S. Aggregate Index is an index representing securities that are U.S. domestic, taxable, and dollar denominated and covering the U.S. investment grade fixed rate bond market, with index components for government and corporate securities and asset-backed securities. You cannot invest directly in an index.
1Institutional shares were not offered prior to November 30, 2011. All performance information for time periods beginning prior to November 30, 2011 is the performance of the Investor shares. This performance has not been adjusted to reflect the lower expenses of the Institutional shares.
51
DOMINI IMPACT BOND FUND
PORTFOLIOOF INVESTMENTS
January 31, 2021 (Unaudited)
| | | | | | | | |
| Security | | Principal
Amount* | | | Value | |
| Long Term Investments – 107.1% | | | | | | |
| Mortgage Backed Securities – 44.3% | | | | | | |
Agency Collateralized Mortgage Obligations – 5.8% | | | | | | | | |
Federal Home Loan Mortgage Corp. | | | | | | | | |
Series 3768, Class CB, 3.500%, 12/15/25 | | | 173,517 | | | $ | 182,340 | |
Series 3800, Class CB, 3.500%, 2/15/26 | | | 319,022 | | | | 335,104 | |
Series 3806, Class L, 3.500%, 2/15/26 | | | 770,927 | | | | 817,161 | |
Series 3877, Class LM, 3.500%, 6/15/26 | | | 634,639 | | | | 667,574 | |
Series 4961, Class JB, 2.500%, 12/15/42 | | | 299,432 | | | | 312,650 | |
Federal National Mortgage Association | | | | | | | | |
Series 2012-17, Class BC, 3.500%, 3/25/27 | | | 368,000 | | | | 398,726 | |
Series 2017-72, Class B, 3.000%, 9/25/47 | | | 105,868 | | | | 113,539 | |
Series 2017-72, Class CD, 3.000%, 9/25/47 | | | 110,609 | | | | 118,865 | |
Series 2018-72, Class BA, 3.500%, 7/25/54 | | | 173,415 | | | | 182,487 | |
Series 2019-6, Class GJ, 3.000%, 2/25/49 | | | 139,744 | | | | 148,589 | |
Series 2020-1, Class AC, 3.500%, 8/25/58 | | | 438,927 | | | | 475,746 | |
Federal National Mortgage Association Connecticut Avenue Securities | | | | | | | | |
Series 2016-C07, Class 2M2, 4.480%, (1 Month USD-LIBOR + 4.35%), 5/25/29 (a) | | | 130,500 | | | | 136,480 | |
Series 2017-C01, Class 1M2, 3.680%, (1 Month USD-LIBOR + 3.55%), 7/25/29 (a) | | | 83,712 | | | | 86,725 | |
Freddie Mac Multifamily Structured Pass Through Certificates | | | | | | | | |
Series K103, Class X1, 0.638%, 11/25/29 (a) | | | 8,923,261 | | | | 460,672 | |
Series K111, Class X1, 1.572%, 5/25/30 (a) | | | 1,453,570 | | | | 185,879 | |
Series K112, Class X1, 1.433%, 5/25/30 (a) | | | 1,504,493 | | | | 177,301 | |
Series K113, Class X1, 1.387%, 6/25/30 (a) | | | 2,104,953 | | | | 239,505 | |
Series K114, Class X1, 1.118%, 6/25/30 (a) | | | 1,933,848 | | | | 180,111 | |
Series K119, Class X1, 0.933%, 9/25/30 (a) | | | 4,983,115 | | | | 390,544 | |
Series K121, Class X1, 1.029%, 10/25/30 (a) | | | 664,901 | | | | 57,098 | |
Series K122, Class X1, 0.883%, 11/25/30 (a) | | | 364,957 | | | | 27,418 | |
Series K740, Class X1, 0.762%, 9/25/27 (a) | | | 1,299,496 | | | | 58,744 | |
Series KG03, Class X1, 1.381%, 6/25/30 (a) | | | 3,210,000 | | | | 356,397 | |
Series KG04, Class X1, 0.854%, 11/25/30 (a) | | | 2,419,845 | | | | 174,067 | |
Series KSG1, Class X1, 1.156%, 9/25/30 (a) | | | 4,069,303 | | | | 366,704 | |
FREMF Mortgage Trust | | | | | | | | |
Series 2017-K64, Class B, 3.981%, 5/25/50 (a)(b) | | | 70,000 | | | | 78,158 | |
Series 2017-K65, Class B, 4.073%, 7/25/50 (a)(b) | | | 155,000 | | | | 173,626 | |
Series 2017-K66, Class B, 4.035%, 7/25/27 (a)(b) | | | 136,000 | | | | 152,559 | |
Series 2017-K67, Class B, 3.944%, 9/25/49 (a)(b) | | | 85,000 | | | | 94,985 | |
Series 2017-K67, Class C, 3.944%, 9/25/49 (a)(b) | | | 100,000 | | | | 109,857 | |
Series 2017-K68, Class B, 3.844%, 10/25/49 (a)(b) | | | 90,000 | | | | 100,023 | |
Series 2017-K69, Class C, 3.726%, 10/25/49 (a)(b) | | | 40,000 | | | | 43,432 | |
Series 2017-K71, Class B, 3.753%, 11/25/50 (a)(b) | | | 220,000 | | | | 243,657 | |
Series 2017-K71, Class C, 3.753%, 11/25/50 (a)(b) | | | 65,000 | | | | 70,725 | |
Series 2017-K725, Class B, 3.878%, 2/25/50 (a)(b) | | | 100,000 | | | | 108,544 | |
Series 2017-K726, Class B, 3.984%, 7/25/49 (a)(b) | | | 175,000 | | | | 188,688 | |
Series 2017-K729, Class B, 3.675%, 11/25/49 (a)(b) | | | 250,000 | | | | 268,994 | |
Series 2017-K729, Class C, 3.675%, 11/25/49 (a)(b) | | | 90,000 | | | | 95,498 | |
52
DOMINI IMPACT BOND FUND
PORTFOLIOOF INVESTMENTS (continued)
January 31, 2021 (Unaudited)
| | | | | | | | |
| Security | | Principal
Amount* | | | Value | |
Agency Collateralized Mortgage Obligations (Continued) | | | | | | | | |
Series 2018-K154, Class B, 4.021%, 11/25/32 (a)(b) | | | 67,000 | | | $ | 62,390 | |
Series 2018-K77, Class B, 4.160%, 5/25/51 (a)(b) | | | 355,000 | | | | 402,822 | |
Series 2018-KW07, Class B, 4.081%, 10/25/31 (a)(b) | | | 461,000 | | | | 476,308 | |
Series 2019-100, Class C, 3.490%, 11/25/52 (a)(b) | | | 380,000 | | | | 401,667 | |
Series 2019-K103, Class B, 3.453%, 12/25/51 (a)(b) | | | 525,000 | | | | 576,473 | |
Series 2019-K736, Class C, 3.758%, 7/25/26 (a)(b) | | | 400,000 | | | | 429,300 | |
Series 2019-K95, Class C, 3.919%, 8/25/52 (a)(b) | | | 307,000 | | | | 336,905 | |
Series 2019-K97 Class C, 3.764%, 9/25/51 (a)(b) | | | 204,000 | | | | 223,255 | |
Series K104, Class B, 3.539%, 2/25/52 (a)(b) | | | 520,000 | | | | 574,713 | |
STACR Trust, Series 2018-HRP1, Class M2, 1.780%, (1 Month USD-LIBOR + 1.65%), 4/25/43 (a)(b) | | | 52,657 | | | | 52,451 | |
| | | | | | | | |
| | | | | | | 11,915,456 | |
| | | | | | | | |
| | | | | | | | |
Commercial Mortgage-Backed Securities – 5.3% | | | | | | | | |
BANK | | | | | | | | |
Series 2017-BNK8, Class ASB, 3.314%, 11/15/50 | | | 147,000 | | | | 162,151 | |
Series BN18, Class XA, 0.902%, 5/15/62 (a) | | | 2,145,882 | | | | 138,088 | |
Series BN24, Class XA, 0.648%, 11/15/62 (a) | | | 5,553,978 | | | | 276,156 | |
Series BN28, Class XA, 1.786%, 3/15/63 (a) | | | 1,938,003 | | | | 277,019 | |
Benchmark Mortgage Trust | | | | | | | | |
Series 2019-B10, Class XA, 1.229%, 3/15/62 (a) | | | 2,339,899 | | | | 188,432 | |
Series 2020-B18, Class XA, 1.919%, 7/15/53 (a) | | | 504,782 | | | | 59,949 | |
Series 2020-B22, Class XA, 1.523%, 1/15/54 (a) | | | 886,921 | | | | 111,257 | |
BWAY Mortgage Trust | | | | | | | | |
Series 2013-1515, Class A1, 2.809%, 3/10/33 (b) | | | 100,586 | | | | 104,982 | |
Series 2013-1515, Class A2, 3.454%, 3/10/33 (b) | | | 1,000,000 | | | | 1,089,218 | |
CityLine Commercial Mortgage Trust, Series 2016-CLNE, Class A, 2.778%, 11/10/31 (a)(b) | | | 310,000 | | | | 324,645 | |
COMM Mortgage Trust | | | | | | | | |
Series 2013-WWP, Class A2, 3.424%, 3/10/31 (b) | | | 640,000 | | | | 675,919 | |
Series 2013-WWP, Class B, 3.726%, 3/10/31 (b) | | | 644,000 | | | | 683,696 | |
Series 2020-CX, Class D, 2.683%, 11/10/46 (a)(b) | | | 100,000 | | | | 100,785 | |
Series LC19, Class A4, 3.183%, 2/10/48 | | | 291,000 | | | | 318,054 | |
Series LC6, Class A4, 2.941%, 1/10/46 | | | 304,902 | | | | 316,694 | |
CPT Mortgage Trust, Series 2019-CPT, Class A, 2.865%, 11/13/39 (b) | | | 240,000 | | | | 262,851 | |
DBJPM Mortgage Trust, Series 2020-C9, Class XA, 1.714%, 9/15/53 (a) | | | 643,635 | | | | 69,521 | |
DC Office Trust, Series 2019-MTC, Class A, 2.965%, 9/15/45 (b) | | | 370,000 | | | | 405,940 | |
GS Mortgage Securities Corp. Trust, Series 2017-500K, Class A, 0.827%, (1 Month USD-LIBOR + 0.7%), 7/15/32 (a)(b) | | | 395,000 | | | | 395,289 | |
JP Morgan Chase Commercial Mortgage Securities Corp., Series 2018-AON, Class A, 4.128%, 7/5/31 (b) | | | 555,000 | | | | 598,359 | |
MAD Mortgage Trust, Series 2017-330M, Class A, 3.294%, 8/15/34 (a)(b) | | | 729,000 | | | | 765,880 | |
MKT Mortgage Trust, Series 2020-525M, Class A, 2.694%, 2/12/40 (b) | | | 600,000 | | | | 648,878 | |
53
DOMINI IMPACT BOND FUND
PORTFOLIOOF INVESTMENTS (continued)
January 31, 2021 (Unaudited)
| | | | | | | | |
| Security | | Principal
Amount* | | | Value | |
Commercial Mortgage-Backed Securities (Continued) | | | | | | | | |
Morgan Stanley Bank of America Merrill Lynch Trust | | | | | | | | |
Series 2013-C12, Class A4, 4.259%, 10/15/46 (a) | | | 300,000 | | | $ | 323,412 | |
Series 2014-C15, Class A4, 4.051%, 4/15/47 | | | 300,000 | | | | 328,831 | |
Series 2014-C19, Class A4, 3.526%, 12/15/47 | | | 180,167 | | | | 197,492 | |
Morgan Stanley Capital I Trust | | | | | | | | |
Series 2017-CLS, Class A, 0.826%, (1 Month USD-LIBOR + 0.7%), 11/15/34 (a)(b) | | | 531,000 | | | | 531,645 | |
Series 2017-CLS, Class F, 2.726%, (1 Month USD-LIBOR + 2.6%), 11/15/34 (a)(b) | | | 261,000 | | | | 262,434 | |
One Market Plaza Trust, Series 2017-1MKT, Class A, 3.614%, 2/10/32 (b) | | | 710,000 | | | | 737,705 | |
Wells Fargo Commercial Mortgage Trust, Series 2015-NXS3, Class A4, 3.617%, 9/15/57 | | | 340,000 | | | | 381,022 | |
| | | | | | | | |
| | | | | | | 10,736,304 | |
| | | | | | | | |
| | | | | | | | |
Federal Home Loan Mortgage Corporation – 2.0% | | | | | | | | |
Federal Home Loan Mortgage Corp. 2.500%, 8/1/27 | | | 37,524 | | | | 39,507 | |
2.500%, 11/1/27 | | | 100,077 | | | | 105,911 | |
3.000%, 1/1/27 | | | 142,710 | | | | 152,721 | |
3.000%, 7/1/42 | | | 40,190 | | | | 42,644 | |
3.000%, 5/1/45 | | | 345,461 | | | | 374,566 | |
3.015%, (12 Month USD-LIBOR + 1.629%), 10/1/43 (a) | | | 51,026 | | | | 53,014 | |
3.500%, 12/1/32 | | | 172,646 | | | | 189,686 | |
3.500%, 6/1/48 | | | 985,318 | | | | 1,048,032 | |
4.000%, 2/1/37 | | | 50,001 | | | | 55,204 | |
4.000%, 8/1/39 | | | 36,835 | | | | 40,796 | |
4.000%, 10/1/39 | | | 75,471 | | | | 83,025 | |
4.000%, 10/1/39 | | | 65,672 | | | | 72,654 | |
4.000%, 11/1/39 | | | 34,436 | | | | 37,942 | |
4.000%, 10/1/40 | | | 99,461 | | | | 111,009 | |
4.000%, 11/1/40 | | | 105,424 | | | | 115,436 | |
4.000%, 11/1/40 | | | 18,113 | | | | 20,065 | |
4.000%, 11/1/40 | | | 12,448 | | | | 13,673 | |
4.000%, 12/1/40 | | | 50,718 | | | | 55,535 | |
4.000%, 6/1/41 | | | 8,690 | | | | 9,342 | |
4.500%, 4/1/35 | | | 86,428 | | | | 96,002 | |
4.500%, 9/1/35 | | | 110,182 | | | | 122,311 | |
4.500%, 7/1/36 | | | 88,693 | | | | 98,972 | |
4.500%, 6/1/39 | | | 172,798 | | | | 193,695 | |
4.500%, 9/1/40 | | | 26,816 | | | | 30,140 | |
4.500%, 2/1/41 | | | 54,398 | | | | 61,031 | |
5.000%, 8/1/33 | | | 15,385 | | | | 17,760 | |
5.000%, 10/1/33 | | | 7,963 | | | | 8,934 | |
5.000%, 4/1/35 | | | 19,130 | | | | 22,245 | |
5.000%, 7/1/35 | | | 123,578 | | | | 143,693 | |
5.000%, 7/1/35 | | | 21,075 | | | | 24,492 | |
5.000%, 1/1/37 | | | 76,925 | | | | 89,416 | |
5.000%, 7/1/40 | | | 55,376 | | | | 63,641 | |
54
DOMINI IMPACT BOND FUND
PORTFOLIOOF INVESTMENTS (continued)
January 31, 2021 (Unaudited)
| | | | | | | | |
| Security | | Principal
Amount* | | | Value | |
Federal Home Loan Mortgage Corporation (Continued) | | | | | | | | |
5.000%, 4/1/41 | | | 51,649 | | | $ | 60,082 | |
5.500%, 12/1/36 | | | 78,588 | | | | 91,805 | |
5.500%, 8/1/40 | | | 110,690 | | | | 129,854 | |
6.000%, 8/1/36 | | | 12,717 | | | | 15,303 | |
6.000%, 7/1/39 | | | 75,083 | | | | 90,453 | |
| | | | | | | | |
| | | | | | | 3,980,591 | |
| | | | | | | | |
| | | | | | | | |
Federal National Mortgage Association – 23.2% | | | | | | | | |
Federal National Mortgage Association | | | | | | | | |
2.000%, 10/1/27 | | | 133,649 | | | | 140,669 | |
2.000%, 1/1/28 | | | 110,930 | | | | 116,390 | |
2.500%, 6/1/24 | | | 161,051 | | | | 169,105 | |
2.500%, 11/1/31 | | | 67,967 | | | | 71,471 | |
2.500%, 12/1/31 | | | 23,090 | | | | 24,302 | |
2.500%, 12/1/43 | | | 162,002 | | | | 171,474 | |
2.500%, 4/1/45 | | | 172,393 | | | | 184,391 | |
2.793%, (12 Month USD-LIBOR + 1.58%), 5/1/44 (a) | | | 35,682 | | | | 36,951 | |
3.000%, 8/1/46 | | | 56,170 | | | | 59,633 | |
3.000%, 10/1/46 | | | 967,099 | | | | 1,026,557 | |
3.000%, 11/1/46 | | | 1,145,377 | | | | 1,215,791 | |
3.000%, 12/1/46 | | | 439,808 | | | | 467,952 | |
3.500%, 12/1/31 | | | 9,014 | | | | 9,663 | |
3.500%, 1/1/32 | | | 152,761 | | | | 163,831 | |
3.500%, 1/1/32 | | | 87,079 | | | | 93,342 | |
3.500%, 10/1/32 | | | 128,294 | | | | 140,928 | |
3.500%, 6/1/46 | | | 798,992 | | | | 861,140 | |
3.500%, 1/1/48 | | | 695,996 | | | | 740,358 | |
4.000%, 11/1/30 | | | 15,989 | | | | 17,279 | |
4.000%, 10/1/33 | | | 94,161 | | | | 103,256 | |
4.000%, 12/1/36 | | | 28,596 | | | | 31,648 | |
4.000%, 8/1/39 | | | 38,939 | | | | 43,033 | |
4.000%, 10/1/39 | | | 25,906 | | | | 28,675 | |
4.000%, 12/1/39 | | | 35,395 | | | | 38,976 | |
4.000%, 1/1/40 | | | 306,345 | | | | 337,505 | |
4.000%, 3/1/40 | | | 36,461 | | | | 39,914 | |
4.000%, 8/1/40 | | | 80,392 | | | | 88,556 | |
4.000%, 8/1/40 | | | 13,739 | | | | 15,080 | |
4.000%, 10/1/40 | | | 134,530 | | | | 150,109 | |
4.000%, 10/1/40 | | | 26,132 | | | | 28,819 | |
4.000%, 11/1/40 | | | 29,869 | | | | 32,669 | |
4.000%, 11/1/40 | | | 18,133 | | | | 20,068 | |
4.000%, 12/1/40 | | | 57,311 | | | | 65,028 | |
4.000%, 2/1/41 | | | 67,127 | | | | 73,880 | |
4.500%, 8/1/35 | | | 27,255 | | | | 30,264 | |
4.500%, 8/1/36 | | | 29,874 | | | | 33,302 | |
4.500%, 8/1/38 | | | 67,965 | | | | 76,497 | |
4.500%, 3/1/39 | | | 87,577 | | | | 98,575 | |
4.500%, 9/1/39 | | | 35,258 | | | | 39,548 | |
4.500%, 2/1/40 | | | 39,250 | | | | 44,179 | |
55
DOMINI IMPACT BOND FUND
PORTFOLIOOF INVESTMENTS (continued)
January 31, 2021 (Unaudited)
| | | | | | | | |
| Security | | Principal
Amount* | | | Value | |
Federal National Mortgage Association (Continued) | | | | | | | | |
4.500%, 8/1/40 | | | 90,059 | | | $ | 101,363 | |
4.500%, 1/1/41 | | | 29,871 | | | | 33,445 | |
4.500%, 9/1/41 | | | 56,866 | | | | 63,917 | |
5.000%, 10/1/39 | | | 3,514 | | | | 4,058 | |
5.500%, 8/1/37 | | | 52,744 | | | | 61,659 | |
6.000%, 12/1/35 | | | 30,258 | | | | 35,693 | |
6.000%, 3/1/36 | | | 172,209 | | | | 207,336 | |
6.000%, 6/1/36 | | | 61,205 | | | | 73,706 | |
6.000%, 8/1/37 | | | 16,180 | | | | 19,480 | |
6.000%, 3/1/38 | | | 29,521 | | | | 35,555 | |
TBA 15 Yr, 2.000%, 2/18/36 (c) | | | 4,300,000 | | | | 4,490,981 | |
TBA 15 Yr, 3.000%, 2/18/36 (c) | | | 1,700,000 | | | | 1,796,090 | |
TBA 30 Yr, 2.000%, 2/12/51 (c) | | | 9,380,000 | | | | 9,677,522 | |
TBA 30 Yr, 2.000%, 3/11/51 (c) | | | 9,100,000 | | | | 9,372,289 | |
TBA 30 Yr, 3.000%, 2/12/51 (c) | | | 2,900,000 | | | | 3,049,701 | |
TBA 30 Yr, 3.000%, 3/11/51 (c) | | | 2,900,000 | | | | 3,050,834 | |
TBA 30 Yr, 3.500%, 2/12/51 (c) | | | 900,000 | | | | 956,883 | |
TBA 30 Yr, 3.500%, 3/11/51 (c) | | | 800,000 | | | | 851,031 | |
TBA 30 Yr, 4.000%, 2/12/51 (c) | | | 2,900,000 | | | | 3,109,967 | |
TBA 30 Yr, 4.000%, 3/11/51 (c) | | | 2,900,000 | | | | 3,112,799 | |
| | | | | | | | |
| | | | | | | 47,235,117 | |
| | | | | | | | |
| | | | | | | | |
Government National Mortgage Association – 8.0% | | | | | | | | |
Government National Mortgage Association | | | | | | | | |
TBA 30 Yr, 3.000%, 2/20/51 (c) | | | 7,600,000 | | | | 7,966,789 | |
TBA 30 Yr, 3.500%, 2/20/51 (c) | | | 5,300,000 | | | | 5,615,102 | |
TBA 30 Yr, 4.000%, 2/20/51 (c) | | | 1,600,000 | | | | 1,710,844 | |
TBA 30 Yr, 4.500%, 2/20/51 (c) | | | 900,000 | | | | 969,609 | |
| | | | | | | | |
| | | | | | | 16,262,344 | |
| | | | | | | | |
Total Mortgage Backed Securities
(Cost $88,457,023) | | | | | | | 90,129,812 | |
| | | | | | | | |
| | | | | | | | |
| Corporate Bonds and Notes – 34.8% | | | | | | |
Communications – 2.6% | | | | | | | | |
Alibaba Group Holding, Ltd., 2.800%, 6/6/23 | | | 200,000 | | | | 209,365 | |
Amazon.com, Inc. | | | | | | | | |
3.875%, 8/22/37 | | | 200,000 | | | | 243,257 | |
4.800%, 12/5/34 | | | 325,000 | | | | 433,650 | |
AT&T, Inc. | | | | | | | | |
2.750%, 6/1/31 | | | 1,000,000 | | | | 1,044,607 | |
3.550%, 9/15/55 (b) | | | 572,000 | | | | 545,290 | |
CBS Corp., 2.900%, 1/15/27 | | | 400,000 | | | | 436,080 | |
Charter Communications Operating LLC/Charter Communications Operating Capital, 6.484%, 10/23/45 | | | 300,000 | | | | 410,638 | |
Cox Communications, Inc. | | | | | | | | |
3.150%, 8/15/24 (b) | | | 165,000 | | | | 178,391 | |
3.850%, 2/1/25 (b) | | | 10,000 | | | | 11,115 | |
56
DOMINI IMPACT BOND FUND
PORTFOLIOOF INVESTMENTS (continued)
January 31, 2021 (Unaudited)
| | | | | | | | |
| Security | | Principal
Amount* | | | Value | |
Communications (Continued) | | | | | | | | |
eBay, Inc., 3.600%, 6/5/27 | | | 195,000 | | | $ | 221,203 | |
Gray Television, Inc., 5.875%, 7/15/26 (b) | | | 200,000 | | | | 207,875 | |
Millicom International Cellular SA, 4.500%, 4/27/31 (b) | | | 950,000 | | | | 1,008,363 | |
Verizon Communications, Inc., 3.376%, 2/15/25 | | | 57,000 | | | | 62,713 | |
Vodafone Group PLC | | | | | | | | |
4.375%, 2/19/43 | | | 70,000 | | | | 83,771 | |
6.150%, 2/27/37 | | | 185,000 | | | | 260,341 | |
| | | | | | | | |
| | | | | | | 5,356,659 | |
| | | | | | | | |
| | | | | | | | |
Consumer, Cyclical – 3.0% | | | | | | | | |
Aptiv Corp., 4.150%, 3/15/24 | | | 401,000 | | | | 441,606 | |
Core & Main L.P., 6.125%, 8/15/25 (b) | | | 45,000 | | | | 46,097 | |
Home Depot, Inc. (The), 5.950%, 4/1/41 | | | 420,000 | | | | 635,106 | |
Kohl’s Corp., 9.500%, 5/15/25 | | | 405,000 | | | | 523,986 | |
Lennar Corp., 4.125%, 1/15/22 | | | 245,000 | | | | 250,420 | |
Marriott International, Inc., 2.875%, 3/1/21 | | | 1,025,000 | | | | 1,024,619 | |
O’Reilly Automotive, Inc., 3.800%, 9/1/22 | | | 155,000 | | | | 162,029 | |
Starbucks Corp. | | | | | | | | |
2.550%, 11/15/30 | | | 990,000 | | | | 1,049,533 | |
3.750%, 12/1/47 | | | 275,000 | | | | 311,124 | |
4.450%, 8/15/49 | | | 750,000 | | | | 943,922 | |
Toll Brothers Finance Corp., 4.350%, 2/15/28 | | | 600,000 | | | | 668,136 | |
| | | | | | | | |
| | | | | | | 6,056,578 | |
| | | | | | | | |
| | | | | | | | |
Consumer, Non-cyclical – 10.2% | | | | | | | | |
Advocate Health & Hospitals Corp., 2.211%, 6/15/30 | | | 325,000 | | | | 334,348 | |
Allina Health System, 4.805%, 11/15/45 | | | 291,000 | | | | 378,395 | |
Amgen, Inc. | | | | | | | | |
2.300%, 2/25/31 | | | 1,000,000 | | | | 1,041,540 | |
3.200%, 11/2/27 | | | 525,000 | | | | 590,122 | |
Banner Health, 2.338%, 1/1/30 | | | 1,000,000 | | | | 1,050,230 | |
Biogen, Inc., 5.200%, 9/15/45 | | | 400,000 | | | | 536,209 | |
Bon Secours Mercy Health, Inc., 1.350%, 6/1/25 | | | 155,000 | | | | 158,014 | |
Boston Medical Center Corp., 4.519%, 7/1/26 | | | 705,000 | | | | 787,269 | |
Bristol-Myers Squibb Co., 3.875%, 8/15/25 | | | 325,000 | | | | 368,249 | |
City of Hope, 5.623%, 11/15/43 | | | 250,000 | | | | 361,465 | |
CommonSpirit Health senior secured note | | | | | | | | |
2.782%, 10/1/30 | | | 185,000 | | | | 195,096 | |
3.347%, 10/1/29 | | | 600,000 | | | | 665,130 | |
Conservation Fund A Nonprofit Corp. (The), 3.474%, 12/15/29 | | | 800,000 | | | | 877,621 | |
Dignity Health | | | | | | | | |
4.500%, 11/1/42 | | | 408,000 | | | | 480,733 | |
5.267%, 11/1/64 | | | 250,000 | | | | 342,476 | |
Emergent BioSolutions, Inc., 3.875%, 8/15/28 (b) | | | 500,000 | | | | 514,207 | |
ERAC USA Finance LLC, 3.850%, 11/15/24 (b) | | | 500,000 | | | | 556,867 | |
Fred Hutchinson Cancer, 3.949%, 1/1/50 | | | 900,000 | | | | 1,055,308 | |
Gartner, Inc., 3.750%, 10/1/30 (b) | | | 160,000 | | | | 165,200 | |
57
DOMINI IMPACT BOND FUND
PORTFOLIOOF INVESTMENTS (continued)
January 31, 2021 (Unaudited)
| | | | | | | | |
| Security | | Principal
Amount* | | | Value | |
Consumer, Non-cyclical (Continued) | | | | | | | | |
Gilead Sciences, 1.650%, 10/1/30 | | | 300,000 | | | $ | 296,931 | |
Hologic, Inc., 3.250%, 2/15/29 (b) | | | 695,000 | | | | 706,728 | |
Howard University | | | | | | | | |
2.657%, 10/1/26 | | | 100,000 | | | | 103,884 | |
3.476%, 10/1/41 | | | 1,850,000 | | | | 1,900,247 | |
John D and Catherine T MacArthur Foundation, 1.299%, 12/1/30 | | | 1,440,000 | | | | 1,399,565 | |
Kaiser Foundation Hospitals, 3.150%, 5/1/27 | | | 185,000 | | | | 208,874 | |
McCormick & Co, Inc., 2.500%, 4/15/30 | | | 155,000 | | | | 164,522 | |
Memorial Sloan-Kettering Cancer Center, Series 2015, 4.200%, 7/1/55 | | | 10,000 | | | | 13,123 | |
Northeastern University, 5.285%, 3/1/32 | | | 100,000 | | | | 118,650 | |
Ochsner Clinic Foundation, 5.897%, 5/15/45 | | | 400,000 | | | | 567,052 | |
Orlando Health Obligated Group, 4.416%, 10/1/44 | | | 395,000 | | | | 428,042 | |
PeaceHealth Obligated Group, 1.375%, 11/15/25 | | | 1,000,000 | | | | 1,021,823 | |
Royalty Pharma, 3.300%, 9/2/40 (b) | | | 1,250,000 | | | | 1,292,991 | |
Rush Obligated Group, 3.922%, 11/15/29 | | | 375,000 | | | | 440,153 | |
Stanford Health Care, 3.310%, 8/15/30 | | | 595,000 | | | | 675,859 | |
Thermo Fisher Scientific, Inc. | | | | | | | | |
2.375%, 4/15/32 | | | 305,000 | | | | 444,258 | |
4.133%, 3/25/25 | | | 375,000 | | | | 424,214 | |
| | | | | | | | |
| | | | | | | 20,665,395 | |
| | | | | | | | |
| | | | | | | | |
Energy – 0.5% | | | | | | | | |
Azure Power Solar Energy Pvt, Ltd., 5.650%, 12/24/24 (b) | | | 500,000 | | | | 534,100 | |
Greenko Dutch BV, 5.250%, 7/24/24 (b) | | | 545,000 | | | | 564,544 | |
| | | | | | | | |
| | | | | | | 1,098,644 | |
| | | | | | | | |
| | | | | | | | |
Financial – 11.5% | | | | | | | | |
AerCap Ireland Capital DAC/AerCap Global Aviation Trust, 3.500%, 5/26/22 | | | 775,000 | | | | 799,999 | |
AIA Group, Ltd., 4.500%, 3/16/46 (b) | | | 325,000 | | | | 417,742 | |
Air Lease Corp., 3.625%, 12/1/27 | | | 500,000 | | | | 546,304 | |
American International Group, Inc., 3.900%, 4/1/26 | | | 380,000 | | | | 430,283 | |
American Tower Corp. | | | | | | | | |
3.375%, 5/15/24 | | | 235,000 | | | | 254,613 | |
5.000%, 2/15/24 | | | 362,000 | | | | 407,959 | |
AXA SA, 8.600%, 12/15/30 | | | 400,000 | | | | 625,136 | |
Bank of America Corp. | | | | | | | | |
Series MTN, 2.456%, (3 Month USD-LIBOR + 0.87%), 10/22/25 (a) | | | 545,000 | | | | 577,493 | |
Series MTN, 3.124%, (3 Month USD-LIBOR + 1.16%), 1/20/23 (a) | | | 725,000 | | | | 744,058 | |
BlackRock, Inc., 1.900%, 1/28/31 | | | 740,000 | | | | 755,540 | |
BlueHub Loan Fund, Inc., 2.890%, 1/1/27 | | | 600,000 | | | | 599,160 | |
BNP Paribas SA, 3.800%, 1/10/24 (b) | | | 245,000 | | | | 265,923 | |
Boston Properties L.P., 3.650%, 2/1/26 | | | 430,000 | | | | 484,344 | |
BPCE SA | | | | | | | | |
3.000%, 5/22/22 (b) | | | 250,000 | | | | 258,627 | |
4.875%, 4/1/26 (b) | | | 500,000 | | | | 582,250 | |
58
DOMINI IMPACT BOND FUND
PORTFOLIOOF INVESTMENTS (continued)
January 31, 2021 (Unaudited)
| | | | | | | | |
| Security | | Principal
Amount* | | | Value | |
Financial (Continued) | | | | | | | | |
Brandywine Operating Partnership L.P., 4.550%, 10/1/29 | | | 500,000 | | | $ | 556,389 | |
Brighthouse Financial, Inc., 5.625%, 5/15/30 | | | 890,000 | | | | 1,090,584 | |
Citigroup, Inc. | | | | | | | | |
1.678%, (SOFR + 1.667), 5/15/24 (a) | | | 1,000,000 | | | | 1,025,999 | |
3.352%, (3 Month USD-LIBOR + 0.8966%), 4/24/25 (a) | | | 475,000 | | | | 514,076 | |
Cooperatieve Rabobank UA | | | | | | | | |
3.875%, 9/26/23 (b) | | | 250,000 | | | | 272,793 | |
3.950%, 11/9/22 | | | 375,000 | | | | 397,337 | |
Credit Agricole SA, 4.125%, 1/10/27 (b) | | | 510,000 | | | | 585,915 | |
Crown Castle International Corp., 3.700%, 6/15/26 | | | 300,000 | | | | 336,636 | |
Discover Financial Services, 3.750%, 3/4/25 | | | 325,000 | | | | 357,251 | |
Duke Realty L.P., 3.625%, 4/15/23 | | | 200,000 | | | | 211,717 | |
Fifth Third Bancorp, 8.250%, 3/1/38 | | | 425,000 | | | | 722,977 | |
HAT Holdings I LLC/HAT Holdings II LLC, 6.000%, 4/15/25 (b) | | | 450,000 | | | | 478,687 | |
Huntington Bancshares, Inc., 3.150%, 3/14/21 | | | 425,000 | | | | 425,420 | |
ING Groep NV, 4.625%, 1/6/26 (b) | | | 750,000 | | | | 875,573 | |
Kimco Realty Corp., 3.400%, 11/1/22 | | | 160,000 | | | | 167,455 | |
Marsh & McLennan Cos., Inc., 3.300%, 3/14/23 | | | 100,000 | | | | 105,686 | |
Massachusetts Mutual Life Insurance Co., 3.375%, 4/15/50 (b) | | | 550,000 | | | | 588,525 | |
Morgan Stanley, 3.950%, 4/23/27 | | | 210,000 | | | | 240,487 | |
Nationwide Mutual Insurance Co., 4.350%, 4/30/50 (b) | | | 550,000 | | | | 623,697 | |
New York Life Insurance Co., 3.750%, 5/15/50 (b) | | | 160,000 | | | | 185,043 | |
Nuveen Finance LLC, 4.125%, 11/1/24 (b) | | | 160,000 | | | | 180,203 | |
Prologis L.P., 3.250%, 10/1/26 | | | 165,000 | | | | 185,527 | |
Prudential PLC, 3.125%, 4/14/30 | | | 155,000 | | | | 172,820 | |
Regency Centers L.P., 3.750%, 6/15/24 | | | 300,000 | | | | 323,706 | |
Reinsurance Group of America, Inc. | | | | | | | | |
3.950%, 9/15/26 | | | 250,000 | | | | 287,424 | |
Series MTN, 4.700%, 9/15/23 | | | 164,000 | | | | 180,911 | |
SBA Tower Trust, 3.168%, 4/11/22 (b) | | | 290,000 | | | | 292,518 | |
Scentre Group Trust 1/Scentre Group Trust 2, 4.375%, 5/28/30 (b) | | | 615,000 | | | | 713,373 | |
Standard Chartered PLC, 5.700%, 3/26/44 (b) | | | 250,000 | | | | 334,809 | |
Truist Financial Corp., Series MTN, 3.875%, 3/19/29 | | | 575,000 | | | | 665,082 | |
U.S. Bancorp, Series MTN, 3.600%, 9/11/24 | | | 493,000 | | | | 544,696 | |
Unum Group, 4.500%, 3/15/25 | | | 415,000 | | | | 472,076 | |
USAA Capital Corp., 2.125%, 5/1/30 (b) | | | 885,000 | | | | 923,936 | |
Ventas Realty L.P., 3.500%, 2/1/25 | | | 500,000 | | | | 549,169 | |
| | | | | | | | |
| | | | | | | 23,337,928 | |
| | | | | | | | |
| | | | | | | | |
Industrial – 1.7% | | | | | | | | |
Ardagh Packaging Finance PLC/Ardagh Holdings USA, Inc., 5.250%, 8/15/27 (b) | | | 360,000 | | | | 374,490 | |
CNH Industrial Capital LLC, 4.875%, 4/1/21 | | | 750,000 | | | | 755,430 | |
Klabin Austria GmbH, 5.750%, 4/3/29 (b) | | | 480,000 | | | | 554,880 | |
Nature Conservancy (The), Series A, 1.154%, 7/1/27 (c) | | | 430,000 | | | | 430,000 | |
WRKCo, Inc., 3.000%, 9/15/24 | | | 375,000 | | | | 403,603 | |
59
DOMINI IMPACT BOND FUND
PORTFOLIOOF INVESTMENTS (continued)
January 31, 2021 (Unaudited)
| | | | | | | | |
| Security | | Principal
Amount* | | | Value | |
Industrial (Continued) | | | | | | | | |
Xylem, Inc., 2.250%, 1/30/31 | | | 900,000 | | | $ | 932,095 | |
| | | | | | | | |
| | | | | | | 3,450,498 | |
| | | | | | | | |
| | | | | | | | |
Technology – 2.6% | | | | | | | | |
Apple, Inc., 2.650%, 5/11/50 | | | 300,000 | | | | 302,065 | |
Black Knight InfoServ LLC, 3.625%, 9/1/28 (b) | | | 330,000 | | | | 334,356 | |
Broadcom, Inc., 4.150%, 11/15/30 | | | 1,010,000 | | | | 1,144,899 | |
Change Healthcare Holdings LLC/Change Healthcare Finance, Inc., 5.750%, 3/1/25 (b) | | | 395,000 | | | | 405,645 | |
Hewlett Packard Enterprise Co., 4.650%, 10/1/24 | | | 1,200,000 | | | | 1,360,762 | |
HP, Inc., 3.000%, 6/17/27 | | | 1,250,000 | | | | 1,371,413 | |
Micron Technology, Inc., 4.640%, 2/6/24 | | | 260,000 | | | | 289,198 | |
Microsoft Corp., 3.700%, 8/8/46 | | | 5,000 | | | | 6,142 | |
| | | | | | | | |
| | | | | | | 5,214,480 | |
| | | | | | | | |
| | | | | | | | |
Utilities – 2.7% | | | | | | | | |
Aegea Finance S.a.r.l., 5.750%, 10/10/24 (b) | | | 370,000 | | | | 388,522 | |
Clearway Energy Operating LLC, 4.750%, 3/15/28 (b) | | | 800,000 | | | | 861,840 | |
Consolidated Edison Co of New York, Inc. | | | | | | | | |
3.950%, 4/1/50 | | | 915,000 | | | | 1,085,199 | |
Series A, 4.125%, 5/15/49 | | | 155,000 | | | | 188,846 | |
EDP Finance B.V., 1.710%, 1/24/28 (b) | | | 1,000,000 | | | | 994,815 | |
NSTAR Electric Co., 3.950%, 4/1/30 | | | 830,000 | | | | 992,507 | |
Pattern Energy Operations L.P./Pattern Energy Operations, Inc., 4.500%, 8/15/28 (b) | | | 475,000 | | | | 503,251 | |
Public Service Co. of Colorado, 4.100%, 6/15/48 | | | 420,000 | | | | 526,691 | |
| | | | | | | | |
| | | | | | | 5,541,671 | |
| | | | | | | | |
Total Corporate Bonds and Notes
(Cost $64,363,693) | | | | | | | 70,721,853 | |
| | | | | | | | |
| | | | | | | | |
| Municipal Bonds – 11.8% | | | | | | |
American Municipal Power-Ohio, Inc., (Meldahl Hydroelectric Project), 6.270%, 2/15/50 | | | 490,000 | | | | 714,881 | |
California Health Facilities Financing Authority, 2.984%, 6/1/33 | | | 760,000 | | | | 815,282 | |
Chicago Transit Authority Sales Tax Receipts Fund, 3.912%, 12/1/40 | | | 260,000 | | | | 294,674 | |
Colorado Health Facilities Authority, 4.480%, 12/1/40 | | | 940,000 | | | | 1,019,740 | |
Cook County Community High School District No. 228, IL, 5.019%, 12/1/41 (Insurer AGM) | | | 435,000 | | | | 564,091 | |
County of Riverside, CA | | | | | | | | |
2.963%, 2/15/27 | | | 670,000 | | | | 726,736 | |
3.070%, 2/15/28 | | | 670,000 | | | | 730,997 | |
District of Columbia, (Ingleside at Rock Creek) 3.432%, 4/1/42 | | | 430,000 | | | | 466,283 | |
4.125%, 7/1/27 | | | 500,000 | | | | 509,580 | |
Florida Development Finance Corp., 4.009%, 4/1/40 | | | 925,000 | | | | 991,174 | |
60
DOMINI IMPACT BOND FUND
PORTFOLIOOF INVESTMENTS (continued)
January 31, 2021 (Unaudited)
| | | | | | | | |
| Security | | Principal
Amount* | | | Value | |
| Municipal Bonds (Continued) | | | | | | |
Illinois | | | | | | | | |
3.860%, 4/1/21 | | | 215,000 | | | $ | 215,565 | |
5.100%, 6/1/33 | | | 335,000 | | | | 375,170 | |
Illinois Finance Authority, 3.510%, 5/15/41 | | | 1,000,000 | | | | 1,053,730 | |
Inland Valley Development Agency, 5.500%, 3/1/33 (Insurer AGM) | | | 70,000 | | | | 78,124 | |
Lancaster County Hospital Authority, PA, (Brethren Village) | | | | | | | | |
5.000%, 7/1/24 | | | 165,000 | | | | 177,573 | |
5.000%, 7/1/25 | | | 135,000 | | | | 147,776 | |
Maryland Health and Higher Educational Facilities Authority, (Meritus Medical Center) | | | | | | | | |
3.968%, 7/1/27 | | | 205,000 | | | | 233,766 | |
4.168%, 7/1/29 | | | 40,000 | | | | 46,468 | |
Massachusetts Development Finance Agency, (NewBridge on the Charles, Inc.), 4.000%, 10/1/27 | | | 100,000 | | | | 109,570 | |
Massachusetts Educational Financing Authority, 2.306%, 7/1/25 | | | 200,000 | | | | 207,524 | |
Massachusetts Health and Educational Facilities Authority, (Northeastern University), 6.432%, 10/1/35 | | | 420,000 | | | | 568,995 | |
Metropolitan Transportation Authority | | | | | | | | |
5.000%, 11/15/50 | | | 240,000 | | | | 295,886 | |
5.175%, 11/15/49 | | | 855,000 | | | | 1,142,383 | |
Michigan Finance Authority, (City of Detroit), 2.741%, 4/1/21 | | | 320,000 | | | | 321,258 | |
New Jersey Educational Facilities Authority, 3.958%, 7/1/48 (Insurer AGM) | | | 1,000,000 | | | | 1,035,920 | |
New York Transportation Development Corp., 4.248%, 9/1/35 | | | 610,000 | | | | 672,720 | |
New York Transportation Development Corp., (LaGuardia Airport Terminal B Redevelopment), 3.473%, 7/1/28 | | | 500,000 | | | | 510,145 | |
Oklahoma Development Finance Authority, (OU Medicine) | | | | | | | | |
4.650%, 8/15/30 (Insurer AGM) | | | 130,000 | | | | 153,401 | |
5.450%, 8/15/28 | | | 770,000 | | | | 891,860 | |
Oklahoma State University | | | | | | | | |
3.427%, 9/1/36 | | | 100,000 | | | | 107,849 | |
3.627%, 9/1/40 | | | 880,000 | | | | 934,692 | |
Oregon Health and Science University, 5.000%, 7/1/45 | | | 350,000 | | | | 467,414 | |
Oregon State University, 3.424%, 3/1/60 (Insurer BAM) | | | 1,000,000 | | | | 1,029,150 | |
Pennsylvania Industrial Development Authority, 3.556%, 7/1/24 (b) | | | 505,000 | | | | 531,876 | |
Philadelphia, PA, Water and Wastewater Revenue, 4.189%, 10/1/37 | | | 665,000 | | | | 745,172 | |
Regents of the University of California Medical Center Pooled Revenue, 3.706%, 5/15/20 | | | 900,000 | | | | 993,771 | |
Sacramento, CA, 5.730%, 8/15/23 (Insurer NATL) | | | 340,000 | | | | 371,749 | |
San Bernardino County, CA, Pension Obligation Revenue, 6.020%, 8/1/23 (Insurer AGM) | | | 200,000 | | | | 214,252 | |
61
DOMINI IMPACT BOND FUND
PORTFOLIOOF INVESTMENTS (continued)
January 31, 2021 (Unaudited)
| | | | | | | | |
| Security | | Principal
Amount* | | | Value | |
| Municipal Bonds (Continued) | | | | | | |
Shelby County, Health, Educational and Housing Facilities Board, (Trezevant Manor Project) | | | | | | | | |
4.000%, 9/1/21 | | | 250,000 | | | $ | 249,938 | |
4.000%, 9/1/22 | | | 250,000 | | | | 249,615 | |
Southern Ohio Port Authority, 6.500%, 12/1/30 (b) | | | 470,000 | | | | 508,065 | |
State Board of Administration Finance Corp., 1.258%, 7/1/25 | | | 375,000 | | | | 385,838 | |
Sustainable Energy Utility, Inc., 2.344%, 9/15/29 | | | 900,000 | | | | 919,593 | |
Washington Housing Finance Commission, (Presbyterian Retirement Communities), 4.000%, 1/1/24 | | | 300,000 | | | | 305,319 | |
Washington Housing Finance Commission, (Transforming Age), 3.000%, 1/1/25 | | | 985,000 | | | | 980,971 | |
| | | | | | | | |
Total Municipal Bonds
(Cost $22,158,151) | | | | | | | 24,066,536 | |
| | | | | | | | |
| | | | | | | | |
| U.S. Government Agency Obligations – 7.4% | | | | | | |
Federal Farm Credit Banks Funding Corp. | | | | | | | | |
2.625%, 10/15/49 | | | 1,140,000 | | | | 1,218,294 | |
2.780%, 11/2/37 | | | 1,800,000 | | | | 2,032,863 | |
3.430%, 4/6/45 | | | 1,000,000 | | | | 1,229,100 | |
3.660%, 3/7/44 | | | 974,000 | | | | 1,234,461 | |
Federal Home Loan Banks , 2.375%, 3/14/25 | | | 2,710,000 | | | | 2,933,236 | |
Federal Home Loan Mortgage Corp. , 1.500%, 2/12/25 | | | 5,600,000 | | | | 5,859,537 | |
Federal National Mortgage Association , 5.625%, 7/15/37 | | | 391,000 | | | | 610,188 | |
| | | | | | | | |
Total U.S. Government Agencies
(Cost $14,059,790) | | | | | | | 15,117,679 | |
| | | | | | | | |
| | | | | | | | |
| Senior Floating Rate Interests – 4.3% | | | | | | |
Consumer Discretionary – 1.5% | | | | | | | | |
American Builders & Contractors Supply Co., Inc. 2019 Term Loan, 2.121%, (1 mo. USD LIBOR + 2.000%), 1/15/27 (a) | | | 493,750 | | | | 492,961 | |
Charter Communications Operating, LLC 2019 Term Loan B2, 1.880%, (1 mo. USD LIBOR + 1.750%), 2/1/27 (a) | | | 286,700 | | | | 286,700 | |
Harbor Freight Tools USA, Inc. 2020 Term Loan B, 4.000%, (1 mo. USD LIBOR + 3.250%), 10/19/27 (a) | | | 576,004 | | | | 577,547 | |
Nexstar Broadcasting, Inc. 2018 Term Loan B3, 2.371%, (1 mo. USD LIBOR + 2.250%), 1/17/24 (a) | | | 105,090 | | | | 105,064 | |
UPC Broadband Holding B.V. 2020 USD Term Loan B1 3.627%, (1 mo. USD LIBOR + 3.500%), 1/31/29 (a) | | | 670,000 | | | | 671,629 | |
3.627%, (1 mo. USD LIBOR + 3.500%), 1/31/29 (a) | | | 670,000 | | | | 671,629 | |
USI, Inc. 2017 Repriced Term Loan, 3.254%, (3 mo. USD LIBOR + 3.000%), 5/16/24 (a) | | | 169,312 | | | | 168,360 | |
Wyndham Hotels & Resorts, Inc. Term Loan B, 1.871%, (1 mo. USD LIBOR + 1.750%), 5/30/25 (a) | | | 127,075 | | | | 126,479 | |
| | | | | | | | |
| | | | | | | 3,100,369 | |
| | | | | | | | |
| | | | | | | | |
62
DOMINI IMPACT BOND FUND
PORTFOLIOOF INVESTMENTS (continued)
January 31, 2021 (Unaudited)
| | | | | | | | |
| Security | | Principal
Amount* | | | Value | |
Consumer Staples – 0.0% | | | | | | | | |
Coty, Inc. 2018 USD Term Loan B, 2.382%, (1 mo. USD LIBOR + 2.250%), 4/7/25 (a) | | | 126,628 | | | $ | 119,644 | |
| | | | | | | | |
| | | | | | | 119,644 | |
| | | | | | | | |
| | | | | | | | |
Financials – 0.1% | | | | | | | | |
Iron Mountain, Inc. 2018 Term Loan B, 1.871%, (1 mo. USD LIBOR + 1.750%), 1/2/26 (a) | | | 141,012 | | | | 140,484 | |
| | | | | | | | |
| | | | | | | 140,484 | |
| | | | | | | | |
| | | | | | | | |
Health Care – 1.2% | | | | | | | | |
Adevinta ASA EUR Term Loan B, 0.000%, 10/13/27 (a) | | | 185,000 | EUR | | | 226,021 | |
Biogroup-LCD 2020 EUR Add on Term Loan B 4.750%, (3 mo. EUR EURIBOR + 4.750%), 4/25/26 (a) | | | 170,000 | EUR | | | 206,662 | |
0.000%, 1/28/28 (a) | | | 465,000 | EUR | | | 565,674 | |
Nets Holding A/S EUR Term Loan B1E, 3.250%, (3 mo. EUR EURIBOR + 3.250%), 2/6/25 (a) | | | 176,389 | EUR | | | 214,362 | |
Verisure Holding AB 2021 EUR Term Loan, 0.000%, 1/15/28 (a) | | | 900,000 | EUR | | | 1,095,032 | |
Zephyr German BidCo GmbH EUR Term Loan B, 0.000%, 1/21/28 (a) | | | 100,000 | EUR | | | 121,490 | |
| | | | | | | | |
| | | | | | | 2,429,241 | |
| | | | | | | | |
| | | | | | | | |
Information Technology – 0.1% | | | | | | | | |
Blackhawk Network Holdings, Inc. 2018 1st Lien Term Loan, 3.121%, (1 mo. USD LIBOR + 3.000%), 6/15/25 (a) | | | 175,500 | | | | 173,471 | |
SS&C Technologies Inc. 2018 Term Loan B3, 1.871%, (1 mo. USD LIBOR + 1.750%), 4/16/25 (a) | | | 56,796 | | | | 56,594 | |
| | | | | | | | |
| | | | | | | 230,065 | |
| | | | | | | | |
| | | | | | | | |
Utilities – 1.4% | | | | | | | | |
Adient US LLC Term Loan B, 4.463%, (3 mo. USD LIBOR + 4.250%), 5/6/24 (a) | | | 221,625 | | | | 222,525 | |
Altice France S.A. USD Term Loan B12, 3.814%, (1 mo. USD LIBOR + 3.688%), 1/31/26 (a) | | | 471,024 | | | | 470,877 | |
CHG PPC Parent LLC 2018 Term Loan B, 2.871%, (1 mo. USD LIBOR + 2.750%), 3/31/25 (a) | | | 97,500 | | | | 96,708 | |
Diamond (BC) B.V. USD Term Loan, 3.212%, (3 mo. USD LIBOR + 3.000%), 9/6/24 (a) | | | 145,500 | | | | 145,121 | |
Finastra USA, Inc. USD 1st Lien Term Loan, 4.500%, (6 mo. USD LIBOR + 3.500%), 6/13/24 (a) | | | 252,600 | | | | 248,315 | |
Go Daddy Operating Company, LLC 2017 Repriced Term Loan | | | | | | | | |
1.871%, (1 mo. USD LIBOR + 1.750%), 2/15/24 (a) | | | 184,540 | | | | 184,668 | |
2.621%, (1 mo. USD LIBOR + 2.500%), 8/10/27 (a) | | | 308,450 | | | | 309,084 | |
MA FinanceCo., LLC USD Term Loan B3, 2.871%, (1 mo. USD LIBOR + 2.750%), 6/21/24 (a) | | | 28,980 | | | | 28,785 | |
Russell Investments US Inst’l Holdco, Inc. 2020 Term Loan, 4.000%, (3 mo. USD LIBOR + 3.000%), 5/30/25 (a) | | | 387,551 | | | | 387,672 | |
63
DOMINI IMPACT BOND FUND
PORTFOLIOOF INVESTMENTS (continued)
January 31, 2021 (Unaudited)
| | | | | | | | |
| Security | | Principal
Amount* | | | Value | |
Utilities (Continued) | | | | | | | | |
Seattle Spinco, Inc. USD Term Loan B3, 2.871%, (1 mo. USD LIBOR + 2.750%), 6/21/24 (a) | | | 195,711 | | | $ | 194,390 | |
SS&C Technologies Holdings Europe S.A.R.L. 2018 Term Loan B4, 1.871%, (1 mo. USD LIBOR + 1.750%), 4/16/25 (a) | | | 43,249 | | | | 43,095 | |
Zelis Healthcare Corporation Term Loan B, 4.871%, (1 mo. USD LIBOR + 4.750%), 9/30/26 (a) | | | 472,613 | | | | 473,696 | |
| | | | | | | | |
| | | | | | | 2,804,936 | |
| | | | | | | | |
Total Senior Floating Rate Interests
(Cost $8,770,945) | | | | | | | 8,824,739 | |
| | | | | | | | |
| | | | | | | | |
| Foreign Government & Agency Securities – 3.6% | | | | | | |
City of Toronto Canada, 2.600%, 9/24/39 | | | 1,060,000 | CAD | | | 871,615 | |
Hong Kong Government International Bond, 2.500%, 5/28/24 (b) | | | 750,000 | | | | 799,129 | |
Japan Treasury Discount Bill, 0.000%, 3/15/21 | | | 414,600,000 | JPY | | | 3,960,512 | |
Republic of Chile, 0.830%, 7/2/31 | | | 1,370,000 | EUR | | | 1,734,368 | |
| | | | | | | | |
Total Foreign Government & Agency Securities (Cost $7,086,793) | | | | | | | 7,365,624 | |
| | | | | | | | |
| | | | | | | | |
| Asset Backed Securities – 0.6% | | | | | | |
Carmax Auto Owner Trust Series 2017-4, Class C, 2.700%, 10/16/23 | | | 250,000 | | | | 254,531 | |
Corevest American Finance Trust Series 2020-4 Class C, 2.250%, 12/15/52 (b) | | | 100,000 | | | | 99,740 | |
Mosaic Solar Loan Trust Series 2020-2A, Class A, 1.440%, 8/20/46 (b) | | | 220,797 | | | | 220,401 | |
SBA Tower Trust Series 2014-2A, Class C, 3.869%, 10/15/49 (b)(d) | | | 500,000 | | | | 534,191 | |
| | | | | | | | |
Total Asset Backed Securities
(Cost $1,069,041) | | | | | | | 1,108,863 | |
| | | | | | | | |
| | | | | | | | |
| Certificates of Deposit – 0.3% | | | | | | |
Self-Help Credit Union, 2.200%, 6/25/21 | | | 100,000 | | | | 100,891 | |
Self-Help Federal Credit Union, 2.500%, 6/27/22 | | | 400,000 | | | | 413,765 | |
| | | | | | | | |
Total Certificates of Deposit
(Cost $500,000) | | | | | | | 514,656 | |
| | | | | | | | |
Total Long Term Investments
(Cost $206,465,436) | | | | | | | 217,849,762 | |
| | | | | | | | |
64
DOMINI IMPACT BOND FUND
PORTFOLIOOF INVESTMENTS (continued)
January 31, 2021 (Unaudited)
| | | | | | | | |
| Security | | Principal
Amount* | | | Value | |
| | | | | | | | |
| Short Term Investments – 14.7% | | | | | | |
U.S. Government Agency Obligations – 14.7% | | | | | | | | |
Federal Home Loan Bank Discount Notes | | | | | | | | |
0.000%, 2/17/21 | | | 15,000,000 | | | $ | 14,999,800 | |
0.000%, 2/24/21 | | | 15,000,000 | | | | 14,999,713 | |
| | | | | | | | |
Total Short Term Investments
(Cost $29,998,823) | | | | | | | 29,999,513 | |
| | | | | | | | |
| | |
| Total Investments–121.8% (Cost $236,464,259) | | | | | 247,849,275 | |
| | |
| Other Liabilities, less assets – (21.8)% | | | | | (44,380,830) | |
| | | | | | | | |
| | |
| Net Assets – 100.0% | | | | | $203,468,445 | |
| | | | | | | | |
* The principal amount is stated in U.S. dollars unless otherwise indicated.
(a) Floating/Variable note with current rate and current maturity or next reset date shown. Certain variable rate securities are not based on a published reference rate and spread, but are determined by the issuer or agent and are based on current market conditions. These securities do not indicate a reference rate and spread in their description above.
(b) Security that may be sold to qualified institutional buyers under Rule 144A of the Securities Act of 1933, as amended. At January 31, 2021, the aggregate value of these securities was $33,875,839, representing 16.6% of net assets.
(c) A portion or all of the security was purchased as a when issued or delayed delivery security.
(d) Step coupon bond.
Abbreviations
TBA — To Be Announced
AGM — Assured Guaranty Municipal Corporation
BAM — Build America Mutual
NATL — National Public Finance Guarantee Corporation
CAD — Canadian Dollar
EUR — Euro
JPY — Japanese Yen
65
DOMINI IMPACT BOND FUND
PORTFOLIOOF INVESTMENTS (continued)
January 31, 2021 (Unaudited)
At January 31, 2021, the Fund had the following forward currency contracts outstanding.
| | | | | | | | | | | | | | | | | | | | | | |
| Currency Bought | | Currency Sold | | Counterparty | | | Settlement
Date | | | Quantity | | | Value | | | Unrealized
Appreciation
(Depreciation) | |
| | | | | | |
United States Dollar | | Canadian
Dollar | |
| Morgan
Stanley & Co.
Inc. |
| | | 3/17/21 | | | | 1,052,000 | | | $ | 823,613 | | | $ | 4,114 | |
| | | | | | |
United States Dollar | | Euro | |
| Goldman Sachs
International |
| | | 2/26/21 | | | | 898,000 | | | | 1,091,549 | | | | 2,229 | |
| | | | | | |
United States Dollar | | Euro | | | Citibank N.A. | | | | 2/26/21 | | | | 531,000 | | | | 645,448 | | | | 810 | |
| | | | | | |
United States Dollar | | Euro | |
| Commonwealth
Bank Of
Australia |
| | | 2/26/21 | | | | 100,000 | | | | 121,553 | | | | (440 | ) |
| | | | | | |
United States Dollar | | Euro | |
| BNP Paribas
N.A. |
| | | 3/17/21 | | | | 1,672,000 | | | | 2,033,259 | | | | 195 | |
| | | | | | |
United States Dollar | | Japanese
Yen | |
| JP Morgan
Chase Bank
N.A. |
| | | 3/15/21 | | | | 414,600,000 | | | | 3,961,693 | | | | 35,512 | |
| | | | | | | | | | | | | | | | | | | | | | |
| | | | | | |
| | | | | | | | | | | | | | | | | | | | $ | 42,420 | |
| | | | | | | | | | | | | | | | | | | | | | |
At January 31, 2021, the Fund had the following future contracts outstanding.
| | | | | | | | | | | | | | | | | | | | |
| Description | | Number of
Contracts | | | Notional
Amount | | | Value | | | Expiration
Date | | | Unrealized
Appreciation
(Depreciation) | |
| | | | | |
Euro Bund (Short) | | | 9 | | | $ | (900,000 | ) | | $ | (1,938,069 | ) | | | 3/8/21 | | | $ | (681 | ) |
| | | | | | | | | | | | | | | | | | | | |
| | | | | |
| | | | | | | | | | | | | | | | | | $ | (681 | ) |
| | | | | | | | | | | | | | | | | | | | |
At January 31, 2021, the Fund had the following OTC total return swap contracts outstanding.
| | | | | | | | | | | | | | | | | | | | | | | | | | | | | | |
| Description | | Floating
Rate | | Payment
Frequency | | | Counterparty | | | Maturity
Date | | | Notional
Amount | | | Value | | | Upfront
Premiums
Paid
(Received) | | | Unrealized
Appreciation
(Depreciation) | |
| | | | | | | | |
Pay Total Return IBOXX USD Liquid High Yield Index, Series 1 | | 3 month
USD
BBA
LIBOR | |
| At
maturity |
| |
| Morgan
Stanley |
| | | 12/20/21 | | | | 5,030,000 | | | $ | 17,418 | | | $ | 970 | | | $ | 16,448 | |
66
DOMINI IMPACT BOND FUND
PORTFOLIOOF INVESTMENTS (continued)
January 31, 2021 (Unaudited)
At January 31, 2021, the Fund had the following centrally cleared interest rate swap contracts outstanding.
| | | | | | | | | | | | | | | | | | | | | | |
| Description | | Counterparty/
Exchange | | Expiration
Date | | | Notional
Amount | | | Value | | | Upfront
Premiums
Paid
(Received) | | | Unrealized
Appreciation
(Depreciation) | |
| | | | | | |
Pay Fixed rate semi-annually 0.780% Receive Floating rate quarterly 3 month USD BBA LIBOR | | Morgan
Stanley/LCH | | | 4/14/30 | | | $ | 10,205,000 | | | $ | 255,028 | | | $ | (84,872 | ) | | $ | 339,900 | |
| | | | | | |
Receive Fixed rate semi-annually 0.810% Pay Floating rate quarterly 3 month USD BBA LIBOR | | Morgan
Stanley/LCH | | | 9/16/50 | | | | 2,665,000 | | | | (531,811 | ) | | | (451,441 | ) | | | (80,370 | ) |
| | | | | | |
Receive Fixed rate semi-annually 0.280% Pay Floating rate quarterly 3 month USD BBA LIBOR | | Morgan
Stanley/LCH | | | 9/16/25 | | | | 6,965,000 | | | | (65,045 | ) | | | (43,072 | ) | | | (21,973 | ) |
| | | | | | |
Receive Fixed rate semi-annually 1.090% Pay Floating rate quarterly 3 month USD BBA LIBOR | | Morgan
Stanley/LCH | | | 12/16/50 | | | | 1,715,000 | | | | (224,684 | ) | | | (58,517 | ) | | | (166,167 | ) |
| | | | | | |
Receive Fixed rate semi-annually 1.090% Pay Floating rate quarterly 3 month USD BBA LIBOR | | Morgan
Stanley/LCH | | | 9/16/40 | | | | 1,535,000 | | | | (118,681 | ) | | | (59,580 | ) | | | (59,101 | ) |
| | | | | | |
Receive Fixed rate semi-annually 0.250% Pay Floating rate quarterly 3 month USD BBA LIBOR | | Morgan
Stanley/LCH | | | 12/16/22 | | | | 8,865,000 | | | | 11,843 | | | | 1,859 | | | | 9,984 | |
67
DOMINI IMPACT BOND FUND
PORTFOLIOOF INVESTMENTS (continued)
January 31, 2021 (Unaudited)
| | | | | | | | | | | | | | | | | | | | | | |
| Description | | Counterparty/
Exchange | | Expiration
Date | | | Notional
Amount | | | Value | | | Upfront
Premiums
Paid
(Received) | | | Unrealized
Appreciation
(Depreciation) | |
| | | | | | |
Receive Fixed rate semi-annually 1.340% Pay Floating rate quarterly 3 month USD BBA LIBOR | | Morgan
Stanley/
LCH | | | 3/17/41 | | | $ | 570,000 | | | $ | (20,877 | ) | | $ | 1,215 | | | $ | (22,092 | ) |
| | | | | | |
Receive Fixed rate semi-annually 0.470% Pay Floating rate quarterly 3 month USD BBA LIBOR | | Morgan
Stanley/
LCH | | | 3/17/26 | | | | 5,040,000 | | | | (23,809 | ) | | | (10,584 | ) | | | (13,225 | ) |
| | | | | | |
Receive Floating rate semi-annually 0.690% Pay Fixed rate quarterly 3 month USD BBA LIBOR | | Morgan
Stanley/
LCH | | | 3/17/28 | | | | 5,140,000 | | | | 56,284 | | | | 36,886 | | | | 19,398 | |
| | | | | | | | | | | | | | | | | | | | | | |
| | | | | | |
| | | | | | | | | | | | | | | | $ | (668,106 | ) | | $ | 6,354 | |
| | | | | | | | | | | | | | | | | | | | | | |
At January 31, 2021, the Fund had the following centrally cleared credit default swap contracts outstanding.
| | | | | | | | | | | | | | | | | | | | | | |
| Description | | Counterparty/
Exchange | | Expiration
Date | | | Notional
Amount (a) | | | Value (b) | | | Upfront
Premiums
Paid
(Received) | | | Unrealized
Appreciation
(Depreciation) | |
| | | | | | |
Buy Protection (c): | | | | | | | | | | | | | | | | | | | | | | |
| | | | | | |
CDX-NAHY Series 35, Version 1, 5 Year Index, Fixed rate 5.000% (d) | | Morgan
Stanley/ICE | | | 12/20/25 | | | $ | 3,105,000 | | | $ | (251,853 | ) | | $ | (259,813 | ) | | $ | 7,960 | |
| | | | | | | | | | | | | | | | | | | | | | |
| | | | | | |
| | | | | | | | | | | | | | | | $ | (259,813 | ) | | $ | 7,960 | |
| | | | | | | | | | | | | | | | | | | | | | |
(a) The maximum potential amount the Fund could be required to pay as a seller of credit protection or receive as a buyer of credit protection if a credit event occurs as defined under the terms of that particular swap agreement.
(b) The prices and resulting values for credit default swap agreements on credit indices serve as an indicator of the current status of the payment/performance risk and represent the likelihood of an expected liability (or profit) for the credit derivative should the notional amount of the swap agreement be closed/sold as of the period end. Increasing market values, in absolute terms when compared to the notional amount of the swap, represent a deterioration of the referenced entity’s credit soundness and a greater likelihood or risk of default or other credit event occurring as defined under the terms of the agreement.
68
DOMINI IMPACT BOND FUND
PORTFOLIOOF INVESTMENTS (continued)
January 31, 2021 (Unaudited)
(c) If the Fund is a buyer/(seller) of protection and a credit event occurs, as defined under the terms of that particular swap agreement, the Fund will either (i) receive from the seller/(pay to the buyer) of protection an amount equal to the notional amount of the swap and deliver/(take delivery) of the referenced obligation or underlying securities comprising the referenced index or (ii) receive/(pay) a net settlement amount in the form of cash or securities equal to the notional amount of the swap less the recovery value of the referenced obligation of underlying securities comprising the referenced index.
(d) Ratings of Moody’s/S&P — B1/B+
Abbreviations
LCH — London Clearing House
ICE — Intercontinental Exchange
SEE NOTES TO FINANCIAL STATEMENTS
69
DOMINI FUNDS EXPENSE EXAMPLE (Unaudited)
As a shareholder of the Domini Funds, you incur two types of costs:
(1) Transaction costs such as redemption fees deducted from any redemption or exchange proceeds if you sell or exchange shares of the fund after holding them less than 30 days and sales charges (loads) on Class A shares and
(2) Ongoing costs, including management fees, distribution (12b-1) fees, and other Fund expenses.
This example is intended to help you understand your ongoing costs (in dollars) of investing in the Fund and to compare these costs with the ongoing costs of investing in other mutual funds. The example is based on an investment of $1,000 invested on August 1, 2020 and held through January 31, 2021.
Certain Account Fees
Some accounts are subject to recurring annual service fees and maintenance fees that are not included in the expenses shown in the table. If your account was subject to these fees, then the actual account values at the end of the period would be lower and the actual expense would be higher. You may avoid the annual service fee by choosing paperless electronic delivery of statements, prospectuses, shareholder reports and other materials.
Actual Expenses
The line of the table captioned ‘‘Actual Expenses’’ below provides information about actual account value and actual expenses. You may use the information in this line, together with the amount invested, to estimate the expenses that you paid over the period as follows:
(1) Divide your account value by $1,000.
(2) Multiply your result in step 1 by the number in the first line under the heading ‘‘Expenses Paid During Period’’ in the table.
The result equals the estimated expenses you paid on your account during the period.
Hypothetical Expenses
The second line of the table below provides information about hypothetical account values and hypothetical expenses based on the Fund’s actual expense ratio and an assumed rate of return of 5% per year before expenses, which is not the Fund’s return. The hypothetical account values and expenses may not be used to estimate actual ending account balance or expenses you paid for the period. You may use this information to compare the ongoing costs of investing in the Fund and other mutual funds. To do so, compare this 5% hypothetical example with the 5% hypothetical example that appears in the shareholder reports of the other funds.
70
Please note that the expenses shown in the table are meant to highlight your ongoing costs only and do not reflect any transactional costs, such as redemption fees. Therefore, the second line of the table is useful in comparing ongoing costs only, and will not help you determine the relative total costs of owning different funds. In addition, if these transactional costs were included, your costs would have been higher.
| | | | | | | | |
| | | | | |
| Fund Name | | Expenses | | Beginning
Account Value
as of 8/1/2020 | | Ending Account
value as of
1/31/2021 | | Expenses Paid
During Period
8/1/2020 –
1/31/2021 |
Domini Impact Equity Fund Investor Shares | | Actual Expenses | | $1,000.00 | | $1,172.40 | | $5.971 |
| | Hypothetical Expenses
(5% return before
expenses) | | $1,000.00 | | $1,019.70 | | $5.551 |
Domini Impact Equity Fund Class A Shares | | Actual Expenses | | $1,000.00 | | $1,172.40 | | $5.971 |
| | Hypothetical Expenses
(5% return before
expenses) | | $1,000.00 | | $1,019.70 | | $5.551 |
Domini Impact Equity Fund Institutional Shares | | Actual Expenses | | $1,000.00 | | $1,174.40 | | $4.061 |
| | Hypothetical Expenses
(5% return before
expenses) | | $1,000.00 | | $1,021.50 | | $3.771 |
Domini Impact Equity Fund Class Y Shares (formerly Class R Shares) | | Actual Expenses | | $1,000.00 | | $1,173.90 | | $4.381 |
| | Hypothetical Expenses
(5% return before
expenses) | | $1,000.00 | | $1,021.20 | | $4.081 |
Domini International Opportunities Fund Investor Class | | Actual Expenses | | $1,000.00 | | $1,023.00 | | $2.412 |
| | Hypothetical Expenses
(5% return before
expenses) | | $1,000.00 | | $1,018.10 | | $7.122 |
Domini International Opportunities Fund Institutional Class | | Actual Expenses | | $1,000.00 | | $1,023.00 | | $1.982 |
| | Hypothetical Expenses
(5% return before
expenses) | | $1,000.00 | | $1,019.40 | | $5.852 |
Domini Sustainable Solutions Fund Investor Class | | Actual Expenses | | $1,000.00 | | $1,355.70 | | $8.313 |
| | Hypothetical Expenses
(5% return before
expenses) | | $1,000.00 | | $1,018.10 | | $7.123 |
Domini Sustainable Solutions Fund Institutional Class | | Actual Expenses | | $1,000.00 | | $1,357.40 | | $6.833 |
| | Hypothetical Expenses
(5% return before
expenses) | | $1,000.00 | | $1,019.40 | | $5.853 |
Domini Impact International Equity Fund Investor Shares | | Actual Expenses | | $1,000.00 | | $1,158.40 | | $7.454 |
| | Hypothetical Expenses
(5% return before
expenses) | | $1,000.00 | | $1,018.30 | | $6.974 |
Domini Impact International Equity Fund Class A Shares | | Actual Expenses | | $1,000.00 | | $1,158.60 | | $7.514 |
| | Hypothetical Expenses
(5% return before
expenses) | | $1,000.00 | | $1,018.20 | | $7.024 |
71
| | | | | | | | |
| | | | | |
| Fund Name | | Expenses | | Beginning
Account Value
as of 8/1/2020 | | Ending Account
value as of
1/31/2021 | | Expenses Paid
During Period
8/1/2020 –
1/31/2021 |
Domini Impact International Equity Fund Institutional Shares | | Actual Expenses | | $1,000.00 | | $1,160.10 | | $5.014 |
| | Hypothetical Expenses
(5% return before
expenses) | | $1,000.00 | | $1,020.60 | | $4.694 |
Domini Impact International Equity Fund Class Y Shares | | Actual Expenses | | $1,000.00 | | $1,161.20 | | $5.394 |
| | Hypothetical Expenses
(5% return before
expenses) | | $1,000.00 | | $1,020.20 | | $5.044 |
Domini Impact Bond Fund Investor Shares | | Actual Expenses | | $1,000.00 | | $1,008.70 | | $4.405 |
| | Hypothetical Expenses
(5% return before
expenses) | | $1,000.00 | | $1,020.80 | | $4.435 |
Domini Impact Bond Fund Institutional Shares | | Actual Expenses | | $1,000.00 | | $1,009.30 | | $2.895 |
| | Hypothetical Expenses
(5% return before
expenses) | | $1,000.00 | | $1,022.30 | | $2.915 |
1 Expenses are equal to the Fund’s annualized expense ratio of 1.09% for Investor shares, or 1.09% for Class A shares, or 0.74% for Institutional shares, or 0.80% for Class Y shares(formerly Class R shares), multiplied by average account value over the period, multiplied by 184, and divided by 365.
2 Actual Expenses are equal to the Fund’s annualized expense ratio of 1.40% for Investor shares, or 1.15% for Institutional shares, multiplied by average account value over the period beginning 11/30/20 (commencement of operations), multiplied by 63, and divided by 365. Hypothetical Expenses are equal to the Fund’s annualized expense ratio of 1.40% for Investor shares, or 1.15% for Institutional shares, multiplied by average account value over the period, multiplied by 184, and divided by 365.
3 Expenses are equal to the Fund’s annualized expense ratio of 1.40% for Investor shares, or 1.15% for Institutional shares, multiplied by average account value over the period, multiplied by 184, and divided by 365.
4 Expenses are equal to the Fund’s annualized expense ratio of 1.37% for Investor shares, or 1.38% for Class A shares, or 0.92% for Institutional shares, or 0.99% for Class Y shares, multiplied by average account value over the period, multiplied by 184, and divided by 365.
5 Expenses are equal to the Fund’s annualized expense ratio of 0.87% for Investor shares, or 0.57% for Institutional shares, multiplied by average account value over the period, multiplied by 184, and divided by 365.
72
STATEMENT OF ASSETS AND LIABILITIES
January 31, 2021 (Unaudited)
| | | | |
| | | Domini Impact
Equity Fund | |
ASSETS | | | | |
Investments, at value (cost $567,747,497) | | $ | 970,314,729 | |
Cash | | | 4,145,619 | |
Foreign currency, at value (cost $46,947) | | | 47,015 | |
Receivable for securities sold | | | 2,801,179 | |
Receivable for capital shares | | | 79,794 | |
Dividend receivable | | | 971,069 | |
Tax reclaim receivable | | | 186,784 | |
| | | | |
Total assets | | | 978,546,189 | |
| | | | |
LIABILITIES | | | | |
Payable for securities purchased | | | 4,794,470 | |
Payable for capital shares | | | 121,745 | |
Management fee payable | | | 543,903 | |
Distribution fee payable | | | 178,249 | |
Other accrued expenses | | | 469,896 | |
Foreign tax payable | | | 11,048 | |
| | | | |
Total liabilities | | | 6,119,311 | |
| | | | |
NET ASSETS | | $ | 972,426,878 | |
| | | | |
NET ASSETS CONSISTS OF | | | | |
Paid-in Capital | | $ | 567,719,070 | |
Total distributable earnings (loss) | | | 404,707,808 | |
| | | | |
NET ASSETS | | $ | 972,426,878 | |
| | | | |
NET ASSET VALUE PER SHARE | | | | |
| |
Investor Shares | | | | |
Net assets | | $ | 827,906,808 | |
| | | | |
Outstanding shares of beneficial interest | | | 27,021,244 | |
| | | | |
Net Asset Value And Offering Price Per Share* | | $ | 30.64 | |
| | | | |
| |
Class A Shares | | | | |
Net assets | | $ | 7,059,250 | |
| | | | |
Outstanding shares of beneficial interest | | | 230,631 | |
| | | | |
Net Asset Value And Offering Price Per Share* | | $ | 30.61 | |
| | | | |
Maximum offering price per share (net asset value per share / (1-4.75%)) | | $ | 32.14 | |
| | | | |
| |
Institutional Shares | | | | |
Net assets | | $ | 129,409,125 | |
| | | | |
Outstanding shares of beneficial interest | | | 4,251,937 | |
| | | | |
Net Asset Value And Offering Price Per Share* | | $ | 30.44 | |
| | | | |
| |
Class Y Shares (formerly Class R Shares) | | | | |
Net assets | | $ | 8,051,695 | |
| | | | |
Outstanding shares of beneficial interest | | | 264,089 | |
| | | | |
Net Asset Value And Offering Price Per Share* | | $ | 30.49 | |
| | | | |
* Redemption price is equal to net asset value less any applicable redemption fees retained by the Fund.
SEE NOTES TO FINANCIAL STATEMENTS
73
STATEMENT OF ASSETS AND LIABILITIES
January 31, 2021 (Unaudited)
| | | | |
| | | Domini
International
Opportunities
Fund | |
ASSETS | | | | |
Investments, at value (cost $22,885,775) | | $ | 23,452,583 | |
Cash | | | 371,633 | |
Foreign currency, at value (cost $73,975) | | | 74,311 | |
Receivable for securities sold | | | 244,309 | |
Receivable for capital shares | | | 16,000 | |
Dividend receivable | | | 11,325 | |
Tax reclaim receivable | | | 733 | |
| | | | |
Total assets | | | 24,170,894 | |
| | | | |
LIABILITIES | | | | |
Payable for securities purchased | | | 491,057 | |
Management fee payable | | | 17,426 | |
Other accrued expenses | | | 12,376 | |
Foreign tax payable | | | 2,061 | |
| | | | |
Total liabilities | | | 522,920 | |
| | | | |
NET ASSETS | | $ | 23,647,974 | |
| | | | |
NET ASSETS CONSISTS OF | | | | |
Paid-in Capital | | $ | 23,132,303 | |
Total distributable earnings (loss) | | | 515,671 | |
| | | | |
NET ASSETS | | $ | 23,647,974 | |
| | | | |
NET ASSET VALUE PER SHARE | | | | |
| |
Investor Class | | | | |
Net assets | | $ | 1,169,182 | |
| | | | |
Outstanding shares of beneficial interest | | | 114,321 | |
| | | | |
Net Asset Value And Offering Price Per Share* | | $ | 10.23 | |
| | | | |
| |
Institutional Class | | | | |
Net assets | | $ | 22,478,792 | |
| | | | |
Outstanding shares of beneficial interest | | | 2,197,112 | |
| | | | |
Net Asset Value And Offering Price Per Share* | | $ | 10.23 | |
| | | | |
* Redemption price is equal to net asset value less any applicable redemption fees retained by the Fund.
SEE NOTES TO FINANCIAL STATEMENTS
74
STATEMENT OF ASSETS AND LIABILITIES
January 31, 2021 (Unaudited)
| | | | |
| | | Domini
Sustainable
Solutions Fund | |
ASSETS | | | | |
Investments, at value (cost $24,056,557) | | $ | 35,704,310 | |
Cash | | | 1,294,719 | |
Foreign currency, at value (cost $42,286) | | | 42,307 | |
Receivable for securities sold | | | 39,076 | |
Receivable for capital shares | | | 18,810 | |
Tax reclaim receivable | | | 952 | |
| | | | |
Total assets | | | 37,100,174 | |
| | | | |
LIABILITIES | | | | |
Payable for securities purchased | | | 1,095,881 | |
Payable for capital shares | | | 101 | |
Management fee payable | | | 25,754 | |
Other accrued expenses | | | 28,406 | |
| | | | |
Total liabilities | | | 1,150,142 | |
| | | | |
NET ASSETS | | $ | 35,950,032 | |
| | | | |
NET ASSETS CONSISTS OF | | | | |
Paid-in Capital | | $ | 24,281,838 | |
Total distributable earnings (loss) | | | 11,668,194 | |
| | | | |
NET ASSETS | | $ | 35,950,032 | |
| | | | |
NET ASSET VALUE PER SHARE | | | | |
| |
Investor Class | | | | |
Net assets | | $ | 16,074,592 | |
| | | | |
Outstanding shares of beneficial interest | | | 802,342 | |
| | | | |
Net Asset Value And Offering Price Per Share* | | $ | 20.03 | |
| | | | |
| |
Institutional Class | | | | |
Net assets | | $ | 19,875,440 | |
| | | | |
Outstanding shares of beneficial interest | | | 989,966 | |
| | | | |
Net Asset Value And Offering Price Per Share* | | $ | 20.08 | |
| | | | |
* Redemption price is equal to net asset value less any applicable redemption fees retained by the Fund.
SEE NOTES TO FINANCIAL STATEMENTS
75
STATEMENT OF ASSETS AND LIABILITIES
January 31, 2021 (Unaudited)
| | | | |
| | | Domini Impact
International
Equity Fund | |
ASSETS | | | | |
Investments, at value (cost $1,075,428,525) | | $ | 1,254,708,420 | |
Cash | | | 26,245,992 | |
Foreign currency, at value (cost $2,368,425) | | | 2,367,527 | |
Receivable for securities sold | | | 4,294,442 | |
Receivable for capital shares | | | 3,208,569 | |
Dividend receivable | | | 1,057,576 | |
Tax reclaim receivable | | | 3,082,156 | |
| | | | |
Total assets | | | 1,294,964,682 | |
| | | | |
LIABILITIES | | | | |
Payable for securities purchased | | | 13,589,913 | |
Payable for capital shares | | | 7,155,279 | |
Management fee payable | | | 923,502 | |
Distribution fee payable | | | 95,280 | |
Other accrued expenses | | | 639,752 | |
Foreign tax payable | | | 105,416 | |
| | | | |
Total liabilities | | | 22,509,142 | |
| | | | |
NET ASSETS | | $ | 1,272,455,540 | |
| | | | |
NET ASSETS CONSISTS OF | | | | |
Paid-in Capital | | $ | 1,220,342,247 | |
Total distributable earnings (loss) | | | 52,113,293 | |
| | | | |
NET ASSETS | | $ | 1,272,455,540 | |
| | | | |
NET ASSET VALUE PER SHARE | | | | |
| |
Investor Shares | | | | |
Net assets | | $ | 330,894,894 | |
| | | | |
Outstanding shares of beneficial interest | | | 39,447,582 | |
| | | | |
Net Asset Value And Offering Price Per Share* | | $ | 8.39 | |
| | | | |
| |
Class A Shares | | | | |
Net assets | | $ | 22,785,764 | |
| | | | |
Outstanding shares of beneficial interest | | | 2,543,073 | |
| | | | |
Net Asset Value And Offering Price Per Share* | | $ | 8.96 | |
| | | | |
Maximum offering price per share (net asset value per share / (1-4.75%)) | | $ | 9.41 | |
| | | | |
| |
Institutional Shares | | | | |
Net assets | | $ | 522,915,459 | |
| | | | |
Outstanding shares of beneficial interest | | | 62,989,595 | |
| | | | |
Net Asset Value And Offering Price Per Share* | | $ | 8.30 | |
| | | | |
| |
Class Y Shares | | | | |
Net assets | | $ | 395,859,423 | |
| | | | |
Outstanding shares of beneficial interest | | | 47,650,816 | |
| | | | |
Net Asset Value And Offering Price Per Share* | | $ | 8.31 | |
| | | | |
* Redemption price is equal to net asset value less any applicable redemption fees retained by the Fund.
SEE NOTES TO FINANCIAL STATEMENTS
76
STATEMENT OF OPERATIONS
For the Six Months Ended January 31, 2021 (Unaudited)
| | | | |
| | | Domini Impact
Equity Fund | |
INCOME | | | | |
Dividends (net of foreign taxes $53,095) | | $ | 6,724,815 | |
Interest income | | | 20,328 | |
| | | | |
Investment Income | | | 6,745,143 | |
| | | | |
EXPENSES | | | | |
Management/Sponsorship fees | | | 2,998,656 | |
Distribution fees – Investor Shares | | | 981,560 | |
Distribution fees – Class A Shares | | | 8,488 | |
Transfer agent fees – Investor Shares | | | 359,514 | |
Transfer agent fees – Class A Shares | | | 2,961 | |
Transfer agent fees – Institutional Shares | | | 1,647 | |
Transfer agent fees – Class Y Shares (formerly Class R Shares) | | | 1,171 | |
Custody and Accounting fees | | | 116,444 | |
Miscellaneous | | | 110,090 | |
Registration fees – Investor Shares | | | 24,820 | |
Registration fees – Class A Shares | | | 14,326 | |
Registration fees – Institutional Shares | | | 18,616 | |
Registration fees – Class Y Shares (formerly Class R Shares) | | | 15,882 | |
Shareholder Communication fees | | | 72,923 | |
Professional fees | | | 59,276 | |
Shareholder Service fees – Investor Shares | | | 22,250 | |
Shareholder Service fees – Class A Shares | | | 158 | |
Shareholder Service fees – Institutional Shares | | | 67 | |
Shareholder Service fees – Class Y Shares (formerly Class R Shares) | | | 55 | |
Trustees fees | | | 20,700 | |
| | | | |
Total expenses | | | 4,829,604 | |
Fees waived and expenses reimbursed | | | (30,215) | |
| | | | |
Net expenses | | | 4,799,389 | |
| | | | |
NET INVESTMENT INCOME (LOSS) | | | 1,945,754 | |
| | | | |
REALIZED AND UNREALIZED GAIN (LOSS) FROM INVESTMENTS AND FOREIGN CURRENCY | | | | |
NET REALIZED GAIN (LOSS) FROM: | | | | |
Investments | | | 12,662,156 | |
Foreign currency | | | 2,532 | |
| | | | |
Net realized gain (loss) | | | 12,664,688 | |
| | | | |
NET CHANGES IN UNREALIZED APPRECIATION (DEPRECIATION) FROM: | | | | |
Investments | | | 129,925,837 | |
Translation of assets and liabilities in foreign currencies | | | (74) | |
| | | | |
Net change in unrealized appreciation (depreciation) | | | 129,925,763 | |
| | | | |
NET REALIZED AND UNREALIZED GAIN (LOSS) | | | 142,590,451 | |
| | | | |
NET INCREASE (DECREASE) IN NET ASSETS RESULTING FROM OPERATIONS | | $ | 144,536,205 | |
| | | | |
SEE NOTES TO FINANCIAL STATEMENTS
77
STATEMENT OF OPERATIONS
For the Period Ended January 31, 2021 (Unaudited)
| | | | |
| | | Domini
International
Opportunities
Fund | |
INCOME | | | | |
Dividends (net of foreign taxes $2,845) | | $ | 20,385 | |
| | | | |
Investment Income | | | 20,385 | |
| | | | |
EXPENSES | | | | |
Management fees | | | 34,029 | |
Distribution fees – Investor Class | | | 375 | |
Professional fees | | | 20,563 | |
Transfer agent fees – Investor Class | | | 7,660 | |
Transfer agent fees – Institutional Class | | | 3,939 | |
Miscellaneous | | | 10,616 | |
Custody and Accounting fees | | | 9,000 | |
Registration fees – Investor Class | | | 779 | |
Registration fees – Institutional Class | | | 1,220 | |
Shareholder Communication fees | | | 1,397 | |
Trustees fees | | | 28 | |
Shareholder Service fees – Investor Class | | | 18 | |
Shareholder Service fees – Institutional Class | | | 2 | |
| | | | |
Total expenses | | | 89,626 | |
Fees waived and expenses reimbursed | | | (43,220) | |
| | | | |
Net expenses | | | 46,406 | |
| | | | |
NET INVESTMENT INCOME (LOSS) | | | (26,021) | |
| | | | |
REALIZED AND UNREALIZED GAIN (LOSS) FROM INVESTMENTS AND FOREIGN CURRENCY | | | | |
NET REALIZED GAIN (LOSS) FROM: | | | | |
Investments | | | (3) | |
Foreign currency | | | (25,728) | |
| | | | |
Net realized gain (loss) | | | (25,731) | |
| | | | |
NET CHANGES IN UNREALIZED APPRECIATION (DEPRECIATION) FROM: | | | | |
Investments | | | 566,808 | |
Translation of assets and liabilities in foreign currencies | | | 615 | |
| | | | |
Net change in unrealized appreciation (depreciation) | | | 567,423 | |
| | | | |
NET REALIZED AND UNREALIZED GAIN (LOSS) | | | 541,692 | |
| | | | |
NET INCREASE (DECREASE) IN NET ASSETS RESULTING FROM OPERATIONS | | $ | 515,671 | |
| | | | |
SEE NOTES TO FINANCIAL STATEMENTS
78
STATEMENT OF OPERATIONS
For the Six Months Ended January 31, 2021 (Unaudited)
| | | | |
| | | Domini
Sustainable
Solutions Fund | |
INCOME | | | | |
Dividends (net of foreign taxes $4,392) | | $ | 60,725 | |
| | | | |
Investment Income | | | 60,725 | |
| | | | |
EXPENSES | | | | |
Management fees | | | 114,280 | |
Distribution fees – Investor Class | | | 13,919 | |
Custody and Accounting fees | | | 34,463 | |
Transfer agent fees – Investor Class | | | 33,120 | |
Transfer agent fees – Institutional Class | | | 718 | |
Professional fees | | | 26,842 | |
Registration fees – Investor Class | | | 7,605 | |
Registration fees – Institutional Class | | | 8,251 | |
Miscellaneous | | | 2,679 | |
Shareholder Service fees – Investor Class | | | 611 | |
Shareholder Service fees – Institutional Class | | | 16 | |
Trustees fees | | | 470 | |
Shareholder Communication fees | | | 141 | |
| | | | |
Total expenses | | | 243,115 | |
Fees waived and expenses reimbursed | | | (75,120) | |
| | | | |
Net expenses | | | 167,995 | |
| | | | |
NET INVESTMENT INCOME (LOSS) | | | (107,270) | |
| | | | |
REALIZED AND UNREALIZED GAIN (LOSS) FROM INVESTMENTS AND FOREIGN CURRENCY | | | | |
NET REALIZED GAIN (LOSS) FROM: | | | | |
Investments | | | 902,828 | |
Foreign currency | | | 4,861 | |
| | | | |
Net realized gain (loss) | | | 907,689 | |
| | | | |
NET CHANGES IN UNREALIZED APPRECIATION (DEPRECIATION) FROM: | | | | |
Investments | | | 7,208,800 | |
Translation of assets and liabilities in foreign currencies | | | 32 | |
| | | | |
Net change in unrealized appreciation (depreciation) | | | 7,208,832 | |
| | | | |
NET REALIZED AND UNREALIZED GAIN (LOSS) | | | 8,116,521 | |
| | | | |
NET INCREASE (DECREASE) IN NET ASSETS RESULTING FROM OPERATIONS | | $ | 8,009,251 | |
| | | | |
SEE NOTES TO FINANCIAL STATEMENTS
79
STATEMENT OF OPERATIONS
For the Six Months Ended January 31, 2021 (Unaudited)
| | | | |
| | | Domini Impact
International
Equity Fund | |
INCOME | | | | |
Dividends (net of foreign taxes $533,319) | | $ | 9,793,533 | |
Interest income | | | 627 | |
| | | | |
Investment Income | | | 9,794,160 | |
| | | | |
EXPENSES | | | | |
Management fees | | | 4,997,775 | |
Distribution fees – Investor Shares | | | 447,114 | |
Distribution fees – Class A Shares | | | 27,861 | |
Transfer agent fees – Investor Shares | | | 247,778 | |
Transfer agent fees – Class A Shares | | | 7,671 | |
Transfer agent fees – Institutional Shares | | | 1,291 | |
Transfer agent fees – Class Y Shares | | | 78,329 | |
Custody and Accounting fees | | | 247,907 | |
Miscellaneous | | | 119,681 | |
Registration fees – Investor Shares | | | 26,220 | |
Registration fees – Class A Shares | | | 15,692 | |
Registration fees – Institutional Shares | | | 5,597 | |
Registration fees – Class Y Shares | | | 30,093 | |
Shareholder Communication fees | | | 73,914 | |
Professional fees | | | 55,364 | |
Trustees fees | | | 21,570 | |
Shareholder Service fees – Investor Shares | | | 9,497 | |
Shareholder Service fees – Class A Shares | | | 393 | |
Shareholder Service fees – Institutional Shares | | | 216 | |
Shareholder Service fees – Class Y Shares | | | 38 | |
| | | | |
Total expenses | | | 6,414,001 | |
Fees waived and expenses reimbursed | | | (3,943) | |
| | | | |
Net expenses | | | 6,410,058 | |
| | | | |
NET INVESTMENT INCOME (LOSS) | | | 3,384,102 | |
| | | | |
REALIZED AND UNREALIZED GAIN (LOSS) FROM INVESTMENTS AND FOREIGN CURRENCY | | | | |
NET REALIZED GAIN (LOSS) FROM: | | | | |
Investments | | | 60,874,236 | |
Foreign currency | | | 118,387 | |
| | | | |
Net realized gain (loss) | | | 60,992,623 | |
| | | | |
NET CHANGES IN UNREALIZED APPRECIATION (DEPRECIATION) FROM: | | | | |
Investments | | | 108,088,864 | |
Translation of assets and liabilities in foreign currencies | | | 92,954 | |
| | | | |
Net change in unrealized appreciation (depreciation) | | | 108,181,818 | |
| | | | |
NET REALIZED AND UNREALIZED GAIN (LOSS) | | | 169,174,441 | |
| | | | |
NET INCREASE (DECREASE) IN NET ASSETS RESULTING FROM OPERATIONS | | $ | 172,558,543 | |
| | | | |
SEE NOTES TO FINANCIAL STATEMENTS
80
DOMINI IMPACT EQUITY FUND
STATEMENTS OF CHANGES IN NET ASSETS
| | | | | | | | |
| | | Six Months
Ended
January 31, 2021
(unaudited) | | | Year Ended
July 31, 2020 | |
INCREASE IN NET ASSETS | | | | | | | | |
FROM OPERATIONS | | | | | | | | |
Net investment income (loss) | | $ | 1,945,754 | | | $ | 5,392,589 | |
Net realized gain (loss) | | | 12,664,688 | | | | 10,673,042 | |
Net change in unrealized appreciation (depreciation) | | | 129,925,763 | | | | 141,328,642 | |
| | | | | | | | |
Net Increase (Decrease) in Net Assets Resulting from Operations | | | 144,536,205 | | | | 157,394,273 | |
| | | | | | | | |
DISTRIBUTIONS TO SHAREHOLDERS | | | | | | | | |
Investor Shares | | | (17,855,861) | | | | (16,690,995) | |
Class A Shares | | | (155,207) | | | | (154,455) | |
Institutional Shares | | | (3,244,104) | | | | (3,065,786) | |
Class Y Shares (formerly Class R Shares) | | | (169,012) | | | | (402,768) | |
| | | | | | | | |
Net Decrease in Net Assets from Distributions | | | (21,424,184) | | | | (20,314,004) | |
| | | | | | | | |
CAPITAL SHARE TRANSACTIONS | | | | | | | | |
Proceeds from sale of shares | | | 26,067,781 | | | | 32,168,636 | |
Net asset value of shares issued in reinvestment of distributions and dividends | | | 19,696,146 | | | | 19,005,879 | |
Payments for shares redeemed | | | (41,201,662) | | | | (112,440,380) | |
Redemption fees | | | 16,246 | | | | 7,097 | |
| | | | | | | | |
Net Increase (Decrease) in Net Assets from Capital Share Transactions | | | 4,578,511 | | | | (61,258,768) | |
| | | | | | | | |
Total Increase (Decrease) in Net Assets | | | 127,690,532 | | | | 75,821,501 | |
| | | | | | | | |
NET ASSETS | | | | | | | | |
Beginning of period | | $ | 844,736,346 | | | $ | 768,914,845 | |
| | | | | | | | |
End of period | | $ | 972,426,878 | | | $ | 844,736,346 | |
| | | | | | | | |
SEE NOTES TO FINANCIAL STATEMENTS
81
DOMINI INTERNATIONAL OPPORTUNITIES FUND
STATEMENTS OF CHANGES IN NET ASSETS
| | | | |
| | | For the Period
November 30, 2020
(commencement of
operations) through
January 31, 2021
(unaudited) | |
INCREASE IN NET ASSETS | | | | |
FROM OPERATIONS | | | | |
Net investment income (loss) | | $ | (26,021) | |
Net realized gain (loss) | | | (25,731) | |
Net change in unrealized appreciation (depreciation) | | | 567,423 | |
| | | | |
Net Increase (Decrease) in Net Assets Resulting from Operations | | | 515,671 | |
| | | | |
DISTRIBUTIONS TO SHAREHOLDERS | | | | |
Investor Class | | | - | |
Institutional Class | | | - | |
| | | | |
Net Decrease in Net Assets from Distributions | | | - | |
| | | | |
CAPITAL SHARE TRANSACTIONS | | | | |
Proceeds from sale of shares | | | 23,142,597 | |
Net asset value of shares issued in reinvestment of distributions and dividends | | | - | |
Payments for shares redeemed | | | (10,294) | |
Redemption fees | | | - | |
| | | | |
Net Increase (Decrease) in Net Assets from Capital Share Transactions | | | 23,132,303 | |
| | | | |
Total Increase (Decrease) in Net Assets | | | 23,647,974 | |
| | | | |
NET ASSETS | | | | |
Beginning of period | | $ | - | |
| | | | |
End of period | | $ | 23,647,974 | |
| | | | |
SEE NOTES TO FINANCIAL STATEMENTS
82
DOMINI SUSTAINABLE SOLUTIONS FUND
STATEMENTS OF CHANGES IN NET ASSETS
| | | | | | | | |
| | | Six Months
Ended
January 31, 2021
(unaudited) | | | For the Period
April 1, 2020
(commencement
of operations)
through July 31,
2020 | |
INCREASE IN NET ASSETS | | | | | | | | |
FROM OPERATIONS | | | | | | | | |
Net investment income (loss) | | $ | (107,270) | | | $ | (28,931) | |
Net realized gain (loss) | | | 907,689 | | | | 267,659 | |
Net change in unrealized appreciation (depreciation) | | | 7,208,832 | | | | 4,439,027 | |
| | | | | | | | |
Net Increase (Decrease) in Net Assets Resulting from Operations | | | 8,009,251 | | | | 4,677,755 | |
| | | | | | | | |
DISTRIBUTIONS TO SHAREHOLDERS | | | | | | | | |
Investor Class | | | (428,316) | | | | - | |
Institutional Class | | | (590,496) | | | | - | |
| | | | | | | | |
Net Decrease in Net Assets from Distributions | | | (1,018,812) | | | | - | |
| | | | | | | | |
CAPITAL SHARE TRANSACTIONS | | | | | | | | |
Proceeds from sale of shares | | | 9,512,018 | | | | 15,721,328 | |
Net asset value of shares issued in reinvestment of distributions and dividends | | | 1,006,232 | | | | - | |
Payments for shares redeemed | | | (1,316,597) | | | | (641,146) | |
Redemption fees | | | 3 | | | | - | |
| | | | | | | | |
Net Increase (Decrease) in Net Assets from Capital Share Transactions | | | 9,201,656 | | | | 15,080,182 | |
| | | | | | | | |
Total Increase (Decrease) in Net Assets | | | 16,192,095 | | | | 19,757,937 | |
| | | | | | | | |
NET ASSETS | | | | | | | | |
Beginning of period | | $ | 19,757,937 | | | $ | - | |
| | | | | | | | |
End of period | | $ | 35,950,032 | | | $ | 19,757,937 | |
| | | | | | | | |
SEE NOTES TO FINANCIAL STATEMENTS
83
DOMINI IMPACT INTERNATIONAL EQUITY FUND
STATEMENTS OF CHANGES IN NET ASSETS
| | | | | | | | |
| | | Six Months
Ended
January 31, 2021
(unaudited) | | | Year Ended
July 31, 2020 | |
INCREASE (DECREASE) IN NET ASSETS | | | | | | | | |
FROM OPERATIONS | | | | | | | | |
Net investment income (loss) | | $ | 3,384,102 | | | $ | 12,990,751 | |
Net realized gain (loss) | | | 60,992,623 | | | | (65,181,633) | |
Net change in unrealized appreciation (depreciation) | | | 108,181,818 | | | | 14,745,861 | |
| | | | | | | | |
Net Increase (Decrease) in Net Assets Resulting from Operations | | | 172,558,543 | | | | (37,445,021) | |
| | | | | | | | |
DISTRIBUTIONS TO SHAREHOLDERS | | | | | | | | |
Investor Shares | | | (1,652,734) | | | | (11,113,787) | |
Class A Shares | | | (108,542) | | | | (528,371) | |
Institutional Shares | | | (5,477,410) | | | | (16,980,431) | |
Class Y Shares | | | (3,768,131) | | | | (5,670,750) | |
| | | | | | | | |
Net Decrease in Net Assets from Distributions | | | (11,006,817) | | | | (34,293,339) | |
| | | | | | | | |
CAPITAL SHARE TRANSACTIONS | | | | | | | | |
Proceeds from sale of shares | | | 326,566,449 | | | | 402,564,549 | |
Net asset value of shares issued in reinvestment of distributions and dividends | | | 8,878,948 | | | | 27,442,828 | |
Payments for shares redeemed | | | (289,861,078) | | | | (513,861,795) | |
Redemption fees | | | 1,471 | | | | 13,533 | |
| | | | | | | | |
Net Increase (Decrease) in Net Assets from Capital Share Transactions | | | 45,585,790 | | | | (83,840,885) | |
| | | | | | | | |
Total Increase (Decrease) in Net Assets | | | 207,137,516 | | | | (155,579,245) | |
| | | | | | | | |
NET ASSETS | | | | | | | | |
Beginning of period | | $ | 1,065,318,024 | | | $ | 1,220,897,269 | |
| | | | | | | | |
End of period | | $ | 1,272,455,540 | | | $ | 1,065,318,024 | |
| | | | | | | | |
SEE NOTES TO FINANCIAL STATEMENTS
84
DOMINI IMPACT EQUITY FUND — INVESTOR SHARES
FINANCIAL HIGHLIGHTS
| | | | | | | | | | | | | | | | | | | | | | | | |
| | | Six Months
Ended
January 31, 2021
(unaudited) | | | Year Ended July 31, | |
| | | 2020 | | | 2019 | | | 2018 | | | 2017^ | | | 2016^ | |
For a share outstanding for the period: | | | | | | | | | | | | | | | | | | | | | | | | |
Net asset value, beginning of period | | | $26.72 | | | | $ 22.48 | | | | $24.18 | | | | $23.18 | ^ | | | $20.76 | | | | $22.70 | |
| | | | | | | | | | | | | | | | | | | | | | | | |
Income from investment operations: | | | | | | | | | | | | | | | | | | | | | | | | |
Net investment income (loss) | | | 0.05 | 1 | | | 0.15 | 1 | | | 0.18 | | | | 0.27 | 1 | | | 0.21 | 1 | | | 0.45 | |
Net realized and unrealized gain (loss) on investments | | | 4.54 | 1 | | | 4.69 | 1 | | | 0.81 | | | | 2.09 | 1 | | | 2.69 | | | | (1.04) | |
| | | | | | | | | | | | | | | | | | | | | | | | |
Total Income (loss) From Investment Operations | | | 4.59 | | | | 4.84 | | | | 0.99 | | | | 2.36 | | | | 2.90 | | | | (0.59) | |
| | | | | | | | | | | | | | | | | | | | | | | | |
Less dividends and/or distributions: | | | | | | | | | | | | | | | | | | | | | | | | |
Dividends to shareholders from net investment income | | | (0.04) | | | | (0.14) | | | | (0.21) | | | | (0.17) | ^ | | | (0.12) | | | | (0.24) | |
Distributions to shareholders from net realized gain | | | (0.63) | | | | (0.46) | | | | (2.48) | | | | (1.19)^ | | | | (0.36) | | | | (1.10) | |
Tax return of capital 1 | | | - | | | | - | | | | - | | | | - | | | | - | | | | (0.01) | |
| | | | | | | | | | | | | | | | | | | | | | | | |
Total Distributions | | | (0.67) | | | | (0.60) | | | | (2.69) | | | | (1.36) | | | | (0.48) | | | | (1.35) | |
| | | | | | | | | | | | | | | | | | | | | | | | |
Redemption fee proceeds 1 | | | 0.00 | 2 | | | 0.00 | 2 | | | 0.00 | 2 | | | 0.00 | 2 | | | 0.00 | 2 | | | 0.00 | 2 |
| | | | | | | | | | | | | | | | | | | | | | | | |
Net asset value, end of period | | | $30.64 | | | | $ 26.72 | | | | $22.48 | | | | $24.18 | | | | $23.18 | | | | $20.76 | |
| | | | | | | | | | | | | | | | | | | | | | | | |
Total return 3 | | | 17.24% | | | | 21.98% | | | | 6.31% | | | | 10.32% | | | | 14.07% | | | | -2.47% | |
Portfolio turnover | | | 6% | | | | 21% | | | | 95% | | | | 78% | | | | 85% | | | | 91% | |
Ratios/supplemental data (annualized): | | | | | | | | | | | | | | | | | | | | | | | | |
Net assets, end of period (in millions) | | | $828 | | | | $ 719 | | | | $643 | | | | $669 | | | | $ 675 | | | | $ 656 | |
Ratio of expenses to average net assets | | | 1.09% | | | | 1.08% | 4,5 | | | 1.07% | 4,5 | | | 1.10% | | | | 1.14% | | | | 1.14% | |
Ratio of gross expenses to average net assets | | | 1.09% | | | | 1.09% | | | | 1.09% | | | | 1.10% | | | | 1.14% | | | | 1.14% | |
Ratio of net investment income (loss) to average net assets | | | 0.37% | | | | 0.65% | | | | 0.96% | | | | 1.15% | | | | 0.94% | | | | 2.06% | |
1 Based on average shares outstanding.
2 Amount represents less than $0.005 per share.
3 Not annualized for periods less than one year.
4 Reflects a waiver of fees by the Manager, the Sponsor and the Distributor of the Fund.
5 Ratio of expenses to average net assets includes transfer agent credits. Excluding transfer agent credits the ratio of expenses to average net assets would have been 1.07% for the year ended July 31,2019 and 1.08% for the year ended July 31,2020.
^ All per share amounts and net asset values have been adjusted as a result of the 1.9988601 for 1 share split on January 26, 2018.
SEE NOTES TO FINANCIAL STATEMENTS
85
DOMINI IMPACT EQUITY FUND — CLASS A SHARES
FINANCIAL HIGHLIGHTS
| | | | | | | | | | | | | | | | | | | | | | | | |
| | | Six Months
Ended
January 31, 2021
(unaudited) | | | Year Ended July 31, | |
| | | 2020 | | | 2019 | | | 2018 | | | 2017^ | | | 2016^ | |
For a share outstanding for the period: | | | | | | | | | | | | | | | | | | | | | | | | |
Net asset value, beginning of period | | | $26.70 | | | | $ 22.46 | | | | $24.17 | | | | $33.41 | ^ | | | $34.01 | | | | $48.90 | |
| | | | | | | | | | | | | | | | | | | | | | | | |
Income from investment operations: | | | | | | | | | | | | | | | | | | | | | | | | |
Net investment income (loss) | | | 0.05 | 1 | | | 0.15 | 1 | | | 0.23 | | | | 0.31 | 1 | | | 0.32 | 1 | | | 1.53 | |
Net realized and unrealized gain (loss) on investments | | | 4.54 | 1 | | | 4.69 | 1 | | | 0.75 | | | | 2.84 | 1 | | | 4.14 | | | | (3.19) | |
| | | | | | | | | | | | | | | | | | | | | | | | |
Total Income (loss) From Investment Operations | | | 4.59 | | | | 4.84 | | | | 0.98 | | | | 3.15 | | | | 4.46 | | | | (1.66) | |
| | | | | | | | | | | | | | | | | | | | | | | | |
Less dividends and/or distributions: | | | | | | | | | | | | | | | | | | | | | | | | |
Dividends to shareholders from net investment income | | | (0.05) | | | | (0.14) | | | | (0.21) | | | | (1.35) | ^ | | | (1.72) | | | | (3.02) | |
Distributions to shareholders from net realized gain | | | (0.63) | | | | (0.46) | | | | (2.48) | | | | (11.04) | ^ | | | (3.34) | | | | (10.21) | |
Tax return of capital 1 | | | - | | | | - | | | | - | | | | - | | | | - | | | | (0.00) | 2 |
| | | | | | | | | | | | | | | | | | | | | | | | |
Total Distributions | | | (0.68) | | | | (0.60) | | | | (2.69) | | | | (12.39) | | | | (5.06) | | | | (13.23) | |
| | | | | | | | | | | | | | | | | | | | | | | | |
Redemption fee proceeds 1 | | | - | | | | - | | | | 0.00 | 2 | | | - | | | | - | | | | - | |
| | | | | | | | | | | | | | | | | | | | | | | | |
Net asset value, end of period | | | $30.61 | | | | $ 26.70 | | | | $22.46 | | | | $24.17 | | | | $33.41 | | | | $34.01 | |
| | | | | | | | | | | | | | | | | | | | | | | | |
Total return 3 | | | 17.24% | | | | 22.01% | | | | 6.28% | | | | 10.36% | | | | 13.97% | | | | -2.61% | |
Portfolio turnover | | | 6% | | | | 21% | | | | 95% | | | | 78% | | | | 85% | | | | 91% | |
Ratios/supplemental data (annualized): | | | | | | | | | | | | | | | | | | | | | | | | |
Net assets, end of period (in millions) | | | $7 | | | | $6 | | | | $7 | | | | $7 | | | | $ 8 | | | | $ 8 | |
Ratio of expenses to average net assets | | | 1.09% | 4 | | | 1.09% | 4,5 | | | 1.09% | 4,5 | | | 1.12% | 4 | | | 1.16% | 4 | | | 1.18% | 4 |
Ratio of gross expenses to average net assets | | | 1.52% | | | | 1.47% | | | | 1.43% | | | | 1.38% | | | | 1.46% | | | | 1.41% | |
Ratio of net investment income (loss) to average net assets | | | 0.37% | | | | 0.64% | | | | 0.95% | | | | 1.14% | | | | 0.92% | | | | 2.00% | |
1 Based on average shares outstanding.
2 Amount represents less than $0.005 per share.
3 Total return does not reflect sales commissions and is not annualized for periods less than one year.
4 Reflects a waiver of fees by the Manager, the Sponsor and the Distributor of the Fund.
5 Ratio of expenses to average net assets includes transfer agent credits. Excluding transfer agent credits the ratio of expenses to average net assets would have been 1.09% for the year ended July 31,2019 and 1.09% for the year ended July 31, 2020.
^ All per share amounts and net asset values have been adjusted as a result of the 0.2155310 for 1 reverse share split on January 26, 2018.
SEE NOTES TO FINANCIAL STATEMENTS
86
DOMINI IMPACT EQUITY FUND — INSTITUTIONAL SHARES
FINANCIAL HIGHLIGHTS
| | | | | | | | | | | | | | | | | | | | | | | | |
| | | Six Months
Ended
January 31, 2021
(unaudited) | | | Year Ended July 31, | |
| | | 2020 | | | 2019 | | | 2018 | | | 2017 | | | 2016 | |
For a share outstanding for the period: | | | | | | | | | | | | | | | | | | | | | | | | |
Net asset value, beginning of period | | | $26.59 | | | | $22.41 | | | | $24.18 | | | | $24.46 | | | | $22.40 | | | | $25.95 | |
| | | | | | | | | | | | | | | | | | | | | | | | |
Income from investment operations: | | | | | | | | | | | | | | | | | | | | | | | | |
Net investment income (loss) | | | 0.11 | 1 | | | 0.23 | 1 | | | 0.08 | | | | 0.37 | | | | 0.31 | 1 | | | 0.55 | |
Net realized and unrealized gain (loss) on investments | | | 4.51 | 1 | | | 4.67 | 1 | | | 0.98 | | | | 2.17 | | | | 2.87 | | | | (1.20) | |
| | | | | | | | | | | | | | | | | | | | | | | | |
Total Income (loss) From Investment Operations | | | 4.62 | | | | 4.90 | | | | 1.06 | | | | 2.54 | | | | 3.18 | | | | (0.65) | |
| | | | | | | | | | | | | | | | | | | | | | | | |
Less dividends and/or distributions: | | | | | | | | | | | | | | | | | | | | | | | | |
Dividends to shareholders from net investment income | | | (0.14) | | | | (0.26) | | | | (0.35) | | | | (0.44) | | | | (0.40) | | | | (0.70) | |
Distributions to shareholders from net realized gain | | | (0.63) | | | | (0.46) | | | | (2.48) | | | | (2.38) | | | | (0.72) | | | | (2.20) | |
Tax return of capital 1 | | | - | | | | - | | | | - | | | | - | | | | - | | | | (0.00) | 2 |
| | | | | | | | | | | | | | | | | | | | | | | | |
Total Distributions | | | (0.77) | | | | (0.72) | | | | (2.83) | | | | (2.82) | | | | (1.12) | | | | (2.90) | |
| | | | | | | | | | | | | | | | | | | | | | | | |
Redemption fee proceeds 1 | | | 0.00 | 2 | | | 0.00 | 2 | | | 0.00 | 2 | | | 0.00 | 2 | | | 0.00 | 2 | | | 0.00 | 2 |
| | | | | | | | | | | | | | | | | | | | | | | | |
Net asset value, end of period | | | $30.44 | | | | $26.59 | | | | $22.41 | | | | $24.18 | | | | $24.46 | | | | $22.40 | |
| | | | | | | | | | | | | | | | | | | | | | | | |
Total return 3 | | | 17.44% | | | | 22.43% | | | | 6.69% | | | | 10.68% | | | | 14.51% | | | | -2.14% | |
Portfolio turnover | | | 6% | | | | 21% | | | | 95% | | | | 78% | | | | 85% | | | | 91% | |
Ratios/supplemental data (annualized): | | | | | | | | | | | | | | | | | | | | | | | | |
Net assets, end of period (in millions) | | | $129 | | | | $ 113 | | | | $ 99 | | | | $ 120 | | | | $ 157 | | | | $ 205 | |
Ratio of expenses to average net assets | | | 0.74% | | | | 0.74% | 5 | | | 0.74% | 4,5 | | | 0.74% | 4 | | | 0.79% | | | | 0.80% | 4 |
Ratio of gross expenses to average net assets | | | 0.74% | | | | 0.74% | | | | 0.76% | | | | 0.76% | | | | 0.79% | | | | 0.81% | |
Ratio of net investment income (loss) to average net assets | | | 0.72% | | | | 0.99% | | | | 1.31% | | | | 1.52% | | | | 1.31% | | | | 2.40% | |
1 Based on average shares outstanding.
2 Amount represents less than $0.005 per share.
3 Not annualized for periods less than one year.
4 Reflects a waiver of fees by the Manager and the Sponsor of the Fund.
5 Ratio of expenses to average net assets includes transfer agent credits. Excluding transfer agent credits the ratio of expenses to average net assets would have been 0.74% for the year ended July 31, 2019 and 0.74% for the year ended July 31, 2020.
SEE NOTES TO FINANCIAL STATEMENTS
87
DOMINI IMPACT EQUITY FUND — CLASS Y SHARES (FORMERLY CLASS R SHARES)
FINANCIAL HIGHLIGHTS
| | | | | | | | | | | | | | | | | | | | | | | | |
| | | Six Months
Ended
January 31, 2021
(unaudited) | | | Year Ended July 31, | |
| | | 2020 | | | 2019 | | | 2018 | | | 2017^ | | | 2016^ | |
For a share outstanding for the period: | | | | | | | | | | | | | | | | | | | | | | | | |
Net Asset Value, beginning of period | | | $26.62 | | | | $ 22.42 | | | | $24.18 | | | | $37.86 | ^ | | | $39.86 | | | | $60.43 | |
| | | | | | | | | | | | | | | | | | | | | | | | |
Income from investment operations: | | | | | | | | | | | | | | | | | | | | | | | | |
Net investment income (loss) | | | 0.09 | 1 | | | 0.21 | 1 | | | 3.04 | | | | 0.41 | 1 | | | 0.51 | 1 | | | 3.15 | |
Net realized and unrealized gain (loss) on investments | | | 4.52 | 1 | | | 4.68 | 1 | | | (2.00) | | | | 3.21 | 1 | | | 4.69 | | | | (5.08) | |
| | | | | | | | | | | | | | | | | | | | | | | | |
Total Income (loss) From Investment Operations | | | 4.61 | | | | 4.89 | | | | 1.04 | | | | 3.62 | | | | 5.20 | | | | (1.93) | |
| | | | | | | | | | | | | | | | | | | | | | | | |
Less dividends and/or distributions: | | | | | | | | | | | | | | | | | | | | | | | | |
Dividends to shareholders from net investment income | | | (0.11) | | | | (0.23) | | | | (0.32) | | | | (2.00) | ^ | | | (2.57) | | | | (4.50) | |
Distributions to shareholders from net realized gain | | | (0.63) | | | | (0.46) | | | | (2.48) | | | | (15.30) | ^ | | | (4.63) | | | | (14.14) | |
Tax return of capital 1 | | | - | | | | - | | | | - | | | | - | | | | - | | | | (0.00) | 2 |
| | | | | | | | | | | | | | | | | | | | | | | | |
Total Distributions | | | (0.74) | | | | (0.69) | | | | (2.80) | | | | (17.30) | | | | (7.20) | | | | (18.64) | |
| | | | | | | | | | | | | | | | | | | | | | | | |
Redemption fee proceeds 1 | | | 0.00 | 2 | | | 0.00 | 2 | | | 0.00 | 2 | | | 0.00 | 2 | | | 0.00 | 2 | | | 0.00 | 2 |
| | | | | | | | | | | | | | | | | | | | | | | | |
Net asset value, end of period | | | $30.49 | | | | $ 26.62 | | | | $22.42 | | | | $ 24.18 | | | | $37.86 | | | | $39.86 | |
| | | | | | | | | | | | | | | | | | | | | | | | |
Total return 3 | | | 17.39% | | | | 22.34% | | | | 6.62% | | | | 10.71% | | | | 14.20% | | | | -2.22% | |
Portfolio turnover | | | 6% | | | | 21% | | | | 95% | | | | 78% | | | | 85% | | | | 91% | |
Ratios/supplemental data (annualized): | | | | | | | | | | | | | | | | | | | | | | | | |
Net assets, end of period (in millions) | | | $8 | | | | $6 | | | | $ 20 | | | | $18 | | | | $ 21 | | | | $ 44 | |
Ratio of expenses to average net assets | | | 0.80% | 4 | | | 0.79% | 4,5 | | | 0.80% | 4,5 | | | 0.80% | 4 | | | 0.83% | 4 | | | 0.82% | |
Ratio of gross expenses to average net assets | | | 1.26% | | | | 0.94% | | | | 0.88% | | | | 0.84% | | | | 0.85% | | | | 0.82% | |
Ratio of net investment income (loss) to average net assets | | | 0.65% | | | | 0.92% | | | | 1.23% | | | | 1.46% | | | | 1.28% | | | | 2.39% | |
1 Based on average shares outstanding.
2 Amount represents less than $0.005 per share.
3 Not annualized for periods less than one year.
4 Reflects a waiver of fees by the Manager and the Sponsor of the Fund.
5 Ratio of expenses to average net assets includes transfer agent credits. Excluding transfer agent credits the ratio of expenses to average net assets would have been 0.80% for the year ended July 31, 2019 and 0.79% for the year ended July 31, 2020.
^ All per share amounts and net asset values have been adjusted as a result of the 0.1555580 for 1 reverse share split on January 26, 2018.
SEE NOTES TO FINANCIAL STATEMENTS
88
DOMINI INTERNATIONAL OPPORTUNITIES FUND — INVESTOR SHARES
FINANCIAL HIGHLIGHTS
| | | | |
| | | For the Period
November 30, 2020
(commencement of
operations) through
January 31, 2021
(unaudited) | |
For a share outstanding for the period: | | | | |
Net asset value, beginning of period | | $ | 10.00 | |
| | | | |
Income from investment operations: | | | | |
Net investment income (loss) | | | (0.01) | |
Net realized and unrealized gain (loss) on investments | | | 0.24 | |
| | | | |
Total Income (loss) From Investment Operations | | | 0.23 | |
| | | | |
Less dividends and/or distributions: | | | | |
Dividends to shareholders from net investment income | | | - | |
Distributions to shareholders from net realized gain | | | - | |
| | | | |
Total Distributions | | | - | |
| | | | |
Redemption fee proceeds | | | - | |
| | | | |
Net asset value, end of period | | $ | 10.23 | |
| | | | |
Total return 1 | | | 2.30% | |
Portfolio turnover | | | 0% | |
Ratios/supplemental data (annualized): | | | | |
Net assets, end of period (in millions) | | $ | 1 | |
Ratio of expenses to average net assets | | | 1.40% | 2 |
Ratio of gross expenses to average net assets | | | 11.99% | |
Ratio of net investment income (loss) to average net assets | | | (0.94)% | |
1 Not annualized for periods less than one year.
2 Reflects a waiver of fees by the Manager and the Distributor of the Fund.
SEE NOTES TO FINANCIAL STATEMENTS
89
DOMINI INTERNATIONAL OPPORTUNITIES FUND — INSTITUTIONAL SHARES
FINANCIAL HIGHLIGHTS
| | | | |
| | | For the Period
November 30, 2020
(commencement of
operations) through
January 31, 2021
(unaudited) | |
For a share outstanding for the period: | | | | |
Net asset value, beginning of period | | | $10.00 | |
| | | | |
Income from investment operations: | | | | |
Net investment income (loss) | | | (0.01) | |
Net realized and unrealized gain (loss) on investments | | | 0.24 | |
| | | | |
Total Income (loss) From Investment Operations | | | 0.23 | |
| | | | |
Less dividends and/or distributions: | | | | |
Dividends to shareholders from net investment income | | | - | |
Distributions to shareholders from net realized gain | | | - | |
Tax return of capital | | | - | |
| | | | |
Total Distributions | | | - | |
| | | | |
Redemption fee proceeds | | | - | |
| | | | |
Net asset value, end of period | | | $10.23 | |
| | | | |
Total return 1 | | | 2.30% | |
Portfolio turnover | | | 0% | |
Ratios/supplemental data (annualized): | | | | |
Net assets, end of period (in millions) | | | $22 | |
Ratio of expenses to average net assets | | | 1.15% | 2 |
Ratio of gross expenses to average net assets | | | 1.86% | |
Ratio of net investment income (loss) to average net assets | | | (0.64)% | |
1 Not annualized for periods less than one year.
2 Reflects a waiver of fees by the Manager of the Fund.
SEE NOTES TO FINANCIAL STATEMENTS
90
DOMINI SUSTAINABLE SOLUTIONS FUND — INVESTOR SHARES
FINANCIAL HIGHLIGHTS
| | | | | | | | |
| | | Six Months
Ended
January 31, 2021
(unaudited) | | | For the Period
April 1, 2020
(commencement of
operations) through
July 31, 2020 | |
For a share outstanding for the period: | | | | | | | | |
Net asset value, beginning of period | | | $15.28 | | | | $10.00 | |
| | | | | | | | |
Income from investment operations: | | | | | | | | |
Net investment income (loss) | | | (0.07) | | | | (0.02) | |
Net realized and unrealized gain (loss) on investments | | | 5.46 | | | | 5.30 | |
| | | | | | | | |
Total Income (loss) From Investment Operations | | | 5.39 | | | | 5.28 | |
| | | | | | | | |
Less dividends and/or distributions: | | | | | | | | |
Dividends to shareholders from net investment income | | | - | | | | - | |
Distributions to shareholders from net realized gain | | | (0.64) | | | | - | |
| | | | | | | | |
Total Distributions | | | (0.64) | | | | - | |
| | | | | | | | |
Redemption fee proceeds 1 | | | 0.00 | 2 | | | - | |
| | | | | | | | |
Net asset value, end of period | | | $20.03 | | | | $15.28 | |
| | | | | | | | |
Total return 3 | | | 35.57% | | | | 52.80% | |
Portfolio turnover | | | 19% | | | | 10% | |
Ratios/supplemental data (annualized): | | | | | | | | |
Net assets, end of period (in millions) | | | $16 | | | | $7 | |
Ratio of expenses to average net assets | | | 1.40% | 4 | | | 1.37% | 4,5 |
Ratio of gross expenses to average net assets | | | 2.28% | | | | 3.95% | |
Ratio of net investment income (loss) to average net assets | | | (0.96)% | | | | (0.94)% | |
1 Based on average shares outstanding.
2 Amount represents less than $0.005 per share.
3 Not annualized for periods less than one year.
4 Reflects a waiver of fees by the Manager and the Distributor of the Fund.
5 Ratio of expenses to average net assets includes transfer agent credits. Excluding transfer agent credits the ratio of expenses to average net assets would have been 1.37% for the year ended July 31, 2020.
SEE NOTES TO FINANCIAL STATEMENTS
91
DOMINI SUSTAINABLE SOLUTIONS FUND — INSTITUTIONAL SHARES
FINANCIAL HIGHLIGHTS
| | | | | | | | |
| | | Six Months
Ended
January 31, 2021
(unaudited) | | | For the Period
April 1, 2020
(commencement of
operations) through
July 31, 2020 | |
For a share outstanding for the period: | | | | | | | | |
Net asset value, beginning of period | | | $15.29 | | | | $10.00 | |
| | | | | | | | |
Income from investment operations: | | | | | | | | |
Net investment income (loss) | | | (0.05) | | | | (0.02) | |
Net realized and unrealized gain (loss) on investments | | | 5.48 | | | | 5.31 | |
| | | | | | | | |
Total Income (loss) From Investment Operations | | | 5.43 | | | | 5.29 | |
| | | | | | | | |
Less dividends and/or distributions: | | | | | | | | |
Dividends to shareholders from net investment income | | | - | | | | - | |
Distributions to shareholders from net realized gain | | | (0.64) | | | | - | |
| | | | | | | | |
Total Distributions | | | (0.64) | | | | - | |
| | | | | | | | |
Redemption fee proceeds 1 | | | - | | | | - | |
| | | | | | | | |
Net asset value, end of period | | | $20.08 | | | | $15.29 | |
| | | | | | | | |
Total return 2 | | | 35.74% | | | | 52.90% | |
Portfolio turnover | | | 19% | | | | 10% | |
Ratios/supplemental data (annualized): | | | | | | | | |
Net assets, end of period (in millions) | | | $20 | | | | $12 | |
Ratio of expenses to average net assets | | | 1.15% | 3 | | | 1.12% | 3,4 |
Ratio of gross expenses to average net assets | | | 1.48% | | | | 2.89% | |
Ratio of net investment income (loss) to average net assets | | | (0.68)% | | | | (0.61)% | |
1 Based on average shares outstanding.
2 Not annualized for periods less than one year.
3 Reflects a waiver of fees by the Manager of the Fund.
4 Ratio of expenses to average net assets includes transfer agent credits. Excluding transfer agent credits the ratio of expenses to average net assets would have been 1.12% for the year ended July 31, 2020.
SEE NOTES TO FINANCIAL STATEMENTS
92
DOMINI IMPACT INTERNATIONAL EQUITY FUND — INVESTOR SHARES
FINANCIAL HIGHLIGHTS
| | | | | | | | | | | | | | | | | | | | | | | | |
| | | Six Months
Ended
January 31,
2021
(unaudited) | | | Year Ended July 31, | |
| | | 2020 | | | 2019 | | | 2018 | | | 2017 | | | 2016 | |
For a share outstanding for the period: | | | | | | | | | | | | | | | | | | | | | | | | |
Net asset value, beginning of period | | | $7.28 | | | | $ 7.74 | | | | $ 8.72 | | | | $ 8.76 | | | | $7.38 | | | | $ 8.05 | |
| | | | | | | | | | | | | | | | | | | | | | | | |
Income from investment operations: | | | | | | | | | | | | | | | | | | | | | | | | |
Net investment income (loss) | | | 0.05 | | | | 0.08 | | | | 0.15 | | | | 0.16 | | | | 0.15 | | | | 0.12 | |
Net realized and unrealized gain (loss) on investments | | | 1.10 | | | | (0.33) | | | | (0.77) | | | | 0.02 | | | | 1.35 | | | | (0.53) | |
| | | | | | | | | | | | | | | | | | | | | | | | |
Total Income (loss) From Investment Operations | | | 1.15 | | | | (0.25) | | | | (0.62) | | | | 0.18 | | | | 1.50 | | | | (0.41) | |
| | | | | | | | | | | | | | | | | | | | | | | | |
Less dividends and/or distributions: | | | | | | | | | | | | | | | | | | | | | | | | |
Dividends to shareholders from net investment income | | | (0.04) | | | | (0.21) | | | | (0.13) | | | | (0.22) | | | | (0.12) | | | | (0.07) | |
Distributions to shareholders from net realized gain | | | - | | | | - | | | | (0.23) | | | | - | | | | - | | | | (0.19) | |
| | | | | | | | | | | | | | | | | | | | | | | | |
Total Distributions | | | (0.04) | | | | (0.21) | | | | (0.36) | | | | (0.22) | | | | (0.12) | | | | (0.26) | |
| | | | | | | | | | | | | | | | | | | | | | | | |
Redemption fee proceeds 1 | | | 0.00 | 2 | | | 0.00 | 2 | | | 0.00 | 2 | | | 0.00 | 2 | | | 0.00 | 2 | | | 0.00 | 2 |
| | | | | | | | | | | | | | | | | | | | | | | | |
Net asset value, end of period | | | $8.39 | | | | $ 7.28 | | | | $ 7.74 | | | | $ 8.72 | | | | $8.76 | | | | $ 7.38 | |
| | | | | | | | | | | | | | | | | | | | | | | | |
Total return 3 | | | 15.84% | | | | -3.49% | | | | -6.81% | | | | 2.08% | | | | 20.61% | | | | -5.12% | |
Portfolio turnover | | | 46% | | | | 98% | | | | 77% | | | | 68% | | | | 73% | | | | 89% | |
Ratios/supplemental data (annualized): | | | | | | | | | | | | | | | | | | | | | | | | |
Net assets, end of period (in millions) | | | $331 | | | | $ 397 | | | | $ 432 | | | | $ 612 | | | | $595 | | | | $ 385 | |
Ratio of expenses to average net assets | | | 1.37% | | | | 1.36% | 4,5 | | | 1.41% | 4 | | | 1.41% | | | | 1.46% | | | | 1.52% | |
Ratio of gross expenses to average net assets | | | 1.37% | | | | 1.38% | | | | 1.41% | | | | 1.41% | | | | 1.46% | | | | 1.52% | |
Ratio of net investment income (loss) to average net assets | | | 0.41% | | | | 0.93% | | | | 1.70% | | | | 1.81% | | | | 2.06% | | | | 1.59% | |
1 Based on average shares outstanding.
2 Amount represents less than $0.005 per share.
3 Not annualized for periods less than one year.
4 Reflects a waiver of fees by the Manager and the Distributor of the Fund.
5 Ratio of expenses to average net assets includes transfer agent credits. Excluding transfer agent credits the ratio of expenses to average net assets would have been 1.41% for the year ended July 31, 2019 and 1.36% for the year ended July 31, 2020.
SEE NOTES TO FINANCIAL STATEMENTS
93
DOMINI IMPACT INTERNATIONAL EQUITY FUND — CLASS A SHARES
FINANCIAL HIGHLIGHTS
| | | | | | | | | | | | | | | | | | | | | | | | |
| | | Six Months
Ended
January 31, 2021
(unaudited) | | | Year Ended July 31, | |
| | | 2020 | | | 2019 | | | 2018 | | | 2017 | | | 2016 | |
For a share outstanding for the period: | | | | | | | | | | | | | | | | | | | | | �� | | | |
Net asset value, beginning of period | | | $7.77 | | | | $ 8.22 | | | | $ 9.18 | | | | $ 9.21 | | | | $7.76 | | | | $ 8.45 | |
| | | | | | | | | | | | | | | | | | | | | | | | |
Income from investment operations: | | | | | | | | | | | | | | | | | | | | | | | | |
Net investment income (loss) | | | 0.04 | | | | 0.14 | | | | 0.34 | | | | 0.15 | | | | 0.14 | | | | 0.11 | |
Net realized and unrealized gain (loss) on investments | | | 1.19 | | | | (0.42) | | | | (0.99) | | | | 0.04 | | | | 1.43 | | | | (0.54) | |
| | | | | | | | | | | | | | | | | | | | | | | | |
Total Income (loss) From Investment Operations | | | 1.23 | | | | (0.28) | | | | (0.65) | | | | 0.19 | | | | 1.57 | | | | (0.43) | |
| | | | | | | | | | | | | | | | | | | | | | | | |
Less dividends and/or distributions: | | | | | | | | | | | | | | | | | | | | | | | | |
Dividends to shareholders from net investment income | | | (0.04) | | | | (0.17) | | | | (0.08) | | | | (0.22) | | | | (0.12) | | | | (0.07) | |
Distributions to shareholders from net realized gain | | | - | | | | - | | | | (0.23) | | | | - | | | | - | | | | (0.19) | |
| | | | | | | | | | | | | | | | | | | | | | | | |
Total Distributions | | | (0.04) | | | | (0.17) | | | | (0.31) | | | | (0.22) | | | | (0.12) | | | | (0.26) | |
| | | | | | | | | | | | | | | | | | | | | | | | |
Redemption fee proceeds 1 | | | - | | | | 0.00 | 2 | | | 0.00 | 2 | | | 0.00 | 2 | | | 0.00 | 2 | | | 0.00 | 2 |
| | | | | | | | | | | | | | | | | | | | | | | | |
Net asset value, end of period | | | $8.96 | | | | $ 7.77 | | | | $ 8.22 | | | | $ 9.18 | | | | $9.21 | | | | $ 7.76 | |
| | | | | | | | | | | | | | | | | | | | | | | | |
Total return 3 | | | 15.86% | | | | -3.58% | | | | -6.83% | | | | 2.00% | | | | 20.44% | | | | -5.07% | |
Portfolio turnover | | | 46% | | | | 98% | | | | 77% | | | | 68% | | | | 73% | | | | 89% | |
Ratios/supplemental data (annualized): | | | | | | | | | | | | | | | | | | | | | | | | |
Net assets, end of period (in millions) | | | $23 | | | | $ 21 | | | | $ 27 | | | | $81 | | | | $85 | | | | $ 55 | |
Ratio of expenses to average net assets | | | 1.38% | 4 | | | 1.40% | 4,5 | | | 1.43% | 5 | | | 1.47% | | | | 1.52% | 4 | | | 1.53% | 4 |
Ratio of gross expenses to average net assets | | | 1.42% | | | | 1.54% | | | | 1.43% | | | | 1.47% | | | | 1.53% | | | | 1.59% | |
Ratio of net investment income (loss) to average net assets | | | 0.29% | | | | 0.86% | | | | 1.41% | | | | 1.63% | | | | 1.99% | | | | 1.47% | |
1 Based on average shares outstanding.
2 Amount represents less than $0.005 per share.
3 Total return does not reflect sales commissions and is not annualized for periods less than one year.
4 Reflects a waiver of fees by the Manager and the Distributor of the Fund.
5 Ratio of expenses to average net assets includes transfer agent credits. Excluding transfer agent credits the ratio of expenses to average net assets would have been 1.43% for the year ended July 31, 2019 and 1.41% for the year ended July 31, 2020.
SEE NOTES TO FINANCIAL STATEMENTS
94
DOMINI IMPACT INTERNATIONAL EQUITY FUND — INSTITUTIONAL SHARES
FINANCIAL HIGHLIGHTS
| | | | | | | | | | | | | | | | | | | | | | | | |
| | | Six Months
Ended
January 31, 2021
(unaudited) | | | Year Ended July 31, | |
| | | 2020 | | | 2019 | | | 2018 | | | 2017 | | | 2016 | |
For a share outstanding for the period: | | | | | | | | | | | | | | | | | | | | | | | | |
Net asset value, beginning of period | | $ | 7.23 | | | $ | 7.69 | | | $ | 8.70 | | | $ | 8.74 | | | $ | 7.39 | | | $ | 8.07 | |
| | | | | | | | | | | | | | | | | | | | | | | | |
Income from investment operations: | | | | | | | | | | | | | | | | | | | | | | | | |
Net investment income (loss) | | | 0.03 | | | | 0.09 | | | | 0.18 | | | | 0.18 | | | | 0.19 | | | | 0.15 | |
Net realized and unrealized gain (loss) on investments | | | 1.13 | | | | (0.30) | | | | (0.78) | | | | 0.05 | | | | 1.32 | | | | (0.54) | |
| | | | | | | | | | | | | | | | | | | | | | | | |
Total Income (loss) From Investment Operations | | | 1.16 | | | | (0.21) | | | | (0.60) | | | | 0.23 | | | | 1.51 | | | | (0.39) | |
| | | | | | | | | | | | | | | | | | | | | | | | |
Less dividends and/or distributions: | | | | | | | | | | | | | | | | | | | | | | | | |
Dividends to shareholders from net investment income | | | (0.09) | | | | (0.25) | | | | (0.18) | | | | (0.27) | | | | (0.16) | | | | (0.10) | |
Distributions to shareholders from net realized gain | | | - | | | | - | | | | (0.23) | | | | - | | | | - | | | | (0.19) | |
| | | | | | | | | | | | | | | | | | | | | | | | |
Total Distributions | | | (0.09) | | | | (0.25) | | | | (0.41) | | | | (0.27) | | | | (0.16) | | | | (0.29) | |
| | | | | | | | | | | | | | | | | | | | | | | | |
Redemption fee proceeds 1 | | | - | | | | 0.00 | 2 | | | 0.00 | 2 | | | 0.00 | 2 | | | 0.00 | 2 | | | 0.00 | 2 |
| | | | | | | | | | | | | | | | | | | | | | | | |
Net asset value, end of period | | $ | 8.30 | | | $ | 7.23 | | | $ | 7.69 | | | $ | 8.70 | | | $ | 8.74 | | | $ | 7.39 | |
| | | | | | | | | | | | | | | | | | | | | | | | |
Total return 3 | | | 16.01% | | | | -3.05% | | | | -6.49% | | | | 2.58% | | | | 20.80% | | | | -4.74% | |
Portfolio turnover | | | 46% | | | | 98% | | | | 77% | | | | 68% | | | | 73% | | | | 89% | |
Ratios/supplemental data (annualized): | | | | | | | | | | | | | | | | | | | | | | | | |
Net assets, end of period (in millions) | | $ | 523 | | | $ | 473 | | | $ | 524 | | | $ | 580 | | | $ | 384 | | | $ | 167 | |
Ratio of expenses to average net assets | | | 0.92% | | | | 0.95% | 4 | | | 1.01% | 4 | | | 1.02% | | | | 1.07% | | | | 1.10% | |
Ratio of gross expenses to average net assets | | | 0.92% | | | | 0.95% | | | | 1.01% | | | | 1.02% | | | | 1.07% | | | | 1.10% | |
Ratio of net investment income (loss) to average net assets | | | 0.75% | | | | 1.33% | | | | 2.30% | | | | 2.22% | | | | 2.82% | | | | 2.22% | |
1 Based on average shares outstanding.
2 Amount represents less than $0.005 per share.
3 Not annualized for periods less than one year.
4 Ratio of expenses to average net assets includes transfer agent credits. Excluding transfer agent credits the ratio of expenses to average net assets would have been 1.01% for the year ended July 31, 2019 and 0.95% for the year ended July 31, 2020.
SEE NOTES TO FINANCIAL STATEMENTS
95
DOMINI IMPACT INTERNATIONAL EQUITY FUND — CLASS Y SHARES
FINANCIAL HIGHLIGHTS
| | | | | | | | | | | | | | | | |
| | | Six Months
Ended
January 31, 2021
(unaudited) | | | Year Ended July 31, | | | For the period
July 23, 2018
(commencement
of operations)
through July 31,
2018 | |
| | | 2020 | | | 2019 | |
For a share outstanding for the period: | | | | | | | | | | | | | | | | |
Net asset value, beginning of period | | $ | 7.23 | | | $ | 7.70 | | | $ | 8.71 | | | $ | 8.56 | |
| | | | | | | | | | | | | | | | |
Income from investment operations: | | | | | | | | | | | | | | | | |
Net investment income (loss) | | | (0.01) | | | | 0.12 | | | | 0.23 | | | | - | |
Net realized and unrealized gain (loss) on investments | | | 1.17 | | | | (0.35) | | | | (0.83) | | | | 0.15 | |
| | | | | | | | | | | | | | | | |
Total Income (loss) From Investment Operations | | | 1.16 | | | | (0.23) | | | | (0.60) | | | | 0.15 | |
| | | | | | | | | | | | | | | | |
Less dividends and/or distributions: | | | | | | | | | | | | | | | | |
Dividends to shareholders from net investment income | | | (0.08) | | | | (0.24) | | | | (0.18) | | | | - | |
Distributions to shareholders from net realized gain | | | - | | | | - | | | | (0.23) | | | | - | |
| | | | | | | | | | | | | | | | |
Total Distributions | | | (0.08) | | | | (0.24) | | | | (0.41) | | | | - | |
| | | | | | | | | | | | | | | | |
Redemption fee proceeds 1 | | | 0.00 | 2 | | | - | | | | - | | | | - | |
| | | | | | | | | | | | | | | | |
Net asset value, end of period | | $ | 8.31 | | | $ | 7.23 | | | $ | 7.70 | | | $ | 8.71 | |
| | | | | | | | | | | | | | | | |
Total return 3 | | | 16.12% | | | | -3.28% | | | | -6.50% | | | | 1.75% | |
Portfolio turnover | | | 46% | | | | 98% | | | | 77% | | | | 68% | |
Ratios/supplemental data (annualized): | | | | | | | | | | | | | | | | |
Net assets, end of period (in millions) | | $ | 396 | | | $ | 174 | | | $ | 238 | | | $ | 142 | |
Ratio of expenses to average net assets | | | 0.99% | | | | 1.06% | 4 | | | 1.13% | 4 | | | 1.13% | |
Ratio of expenses to average net assets | | | 0.99% | | | | 1.06% | | | | 1.13% | | | | 1.13% | |
Ratio of net investment income (loss) to average net assets | | | 0.47% | | | | 1.26% | | | | 2.81% | | | | 0.32% | |
1 Based on average shares outstanding.
2 Amount represents less than $0.005 per share.
3 Not annualized for periods less than one year.
4 Ratio of expenses to average net assets includes transfer agent credits. Excluding transfer agent credits the ratio of expenses to average net assets would have been 1.13% for the year ended July 31, 2019 and 1.06% for the year ended July 31, 2020.
SEE NOTES TO FINANCIAL STATEMENTS
96
DOMINI IMPACT EQUITY FUND
DOMINI INTERNATIONAL OPPORTUNITIES FUND
DOMINI SUSTAINABLE SOLUTIONS FUND
DOMINI IMPACT INTERNATIONAL EQUITY FUND
NOTES TO FINANCIAL STATEMENTS
January 31, 2021 (Unaudited)
1. ORGANIZATION AND SIGNIFICANT ACCOUNTING POLICIES
The Domini Investment Trust is a Massachusetts business trust registered under the Investment Company Act of 1940 as an open-end management investment company. The Domini Investment Trust comprises five separate series: Domini Impact Equity Fund, Domini International Opportunities Fund, Domini Sustainable Solutions Fund, Domini Impact International Equity Fund and Domini Impact Bond Fund (each the “Fund,” collectively the “Funds”). The financial statements of the Domini Impact Bond Fund are included on page 114 of this report. Each Fund is an investment company and accordingly follows the investment company accounting and reporting guidance of the Financial Accounting Standards Board (the “FASB”) Accounting Standard Codification Topic 946 “Financial Services — Investment Companies”.
The Domini Impact Equity Fund offers Investor shares, Class A shares, Institutional shares and Class Y shares (formerly Class R shares). Class Y shares of the Domini Impact Equity Fund commenced on November 28, 2003. Class A and Institutional shares of the Domini Impact Equity Fund commenced on November 28, 2008.
The Domini International Opportunities Fund commenced on November 30, 2020 and offers Investor shares and Institutional shares.
The Domini Sustainable Solutions Fund commenced on April 1, 2020 and offers Investor shares and Institutional shares.
The Domini Impact International Equity Fund offers Investor shares, Class A shares, Institutional shares and Class Y shares. Class A, Institutional and Class Y shares of the Domini Impact International Equity Fund were not offered prior to November 28, 2008, November 30, 2012, and June 15, 2018 respectively.
The Investor shares, Institutional shares and Class Y shares are sold at their offering price, which is net asset value. The Class A shares are sold with a front-end sales charge (load) of up to 4.75%. The Institutional shares may only be purchased by or for the benefit of investors that meet the minimum investment requirements, and fall within the following categories: endowments, foundations, religious organizations and other nonprofit entities, individuals, retirement plan sponsors, family office clients, certain corporate or similar
97
DOMINI IMPACT EQUITY FUND
DOMINI INTERNATIONAL OPPORTUNITIES FUND
DOMINI SUSTAINABLE SOLUTIONS FUND
DOMINI IMPACT INTERNATIONAL EQUITY FUND
NOTES TO FINANCIAL STATEMENTS (continued)
January 31, 2021 (Unaudited)
institutions, or omnibus accounts maintained by financial intermediaries and that are approved by the Fund’s Distributor. Class Y shares are generally available only through omnibus accounts held on the books of the Fund for financial intermediaries that have been approved by the Funds’ distributor. Class Y shares are also available to endowments, foundations, religious organizations or other tax—exempt entities, and certain eligible retirement and benefit plans. All classes of shares have identical rights and voting privileges with respect to the Fund in general and exclusive voting rights on matters that affect that class alone. Earnings, net assets, and net asset value per share may differ due to each class having its own expenses, such as transfer and shareholder servicing agent fees and registration fees, directly attributable to that class. Institutional and Class Y shares are not subject to distribution and service fees.
The preparation of financial statements in conformity with U.S. generally accepted accounting principles requires management to make estimates and assumptions that affect the reported amounts of assets and liabilities and disclosure of contingent liabilities at the date of the financial statements and the reported amounts of revenues and expenses during the reporting period. Actual results could differ from those estimates. The following is a summary of the Funds’ significant accounting policies.
(A) Valuation of Investments. Securities listed or traded on national securities exchanges are valued at the last sale price reported by the security’s primary exchange or, if there have been no sales that day, at the mean of the current bid and ask price that represents the current value of the security. Securities listed on the NASDAQ National Market System are valued using the NASDAQ Official Closing Price (the “NOCP”). If an NOCP is not available for a security listed on the NASDAQ National Market System, the security will be valued at the last sale price or, if there have been no sales that day, at the mean of the current bid and ask price. Securities for which market quotations are not readily available or as a result of an event occurring after the close of the foreign market but before pricing the Funds are valued at fair value as determined in good faith under procedures established by and under the supervision of the Funds’ Board of Trustees. Securities that are primarily traded on foreign exchanges generally are valued at the closing price of such securities on their respective exchanges, except that if the Trust’s manager or submanager, as applicable, is of the opinion that such price would result in an inappropriate value for a security, including as a result of an occurrence subsequent to the time a value was so established, then the fair value of those securities may be
98
DOMINI IMPACT EQUITY FUND
DOMINI INTERNATIONAL OPPORTUNITIES FUND
DOMINI SUSTAINABLE SOLUTIONS FUND
DOMINI IMPACT INTERNATIONAL EQUITY FUND
NOTES TO FINANCIAL STATEMENTS (continued)
January 31, 2021 (Unaudited)
determined by consideration of other factors (including the use of an independent pricing service) by or under the direction of the Board of Trustees or its delegates.
The Funds follow a fair value hierarchy that distinguishes between (a) market participant assumptions developed based on market data obtained from sources independent of the reporting entity (observable inputs) and (b) the Fund’s own assumptions about market participant assumptions developed based on the best information available in the circumstances (unobservable inputs). These inputs are used in determining the value of the Funds’ investments and are summarized in the following fair value hierarchy:
Level 1 — quoted prices in active markets for identical securities
Level 2 — other significant observable inputs (including quoted prices for similar securities, interest rates, and evaluated quotation obtained from pricing services)
Level 3 — significant unobservable inputs (including the Funds’ own assumptions in determining the fair value of investments)
The inputs or methodology used for valuing securities are not an indication of the risk associated with investing in those securities.
The following is a summary of the inputs used by the Domini Impact Equity Fund, as of January 31, 2021, in valuing the Fund’s assets carried at fair value:
| | | | | | | | | | | | | | | | |
| | | Level 1 -
Quoted Prices | | | Level 2 -
Other
Significant
Observable
Inputs | | | Level 3 -
Significant
Unobservable
Inputs | | | Total | |
Common Stocks | | | | | | | | | | | | | | | | |
Communication Services | | $ | 104,701,460 | | | $ | - | | | $ | - | | | $ | 104,701,460 | |
Consumer Discretionary | | | 135,260,467 | | | | - | | | | - | | | | 135,260,467 | |
Consumer Staples | | | 58,219,131 | | | | - | | | | - | | | | 58,219,131 | |
Energy | | | 973,889 | | | | - | | | | - | | | | 973,889 | |
Financials | | | 88,859,068 | | | | - | | | | - | | | | 88,859,068 | |
Health Care | | | 137,496,178 | | | | - | | | | - | | | | 137,496,178 | |
Industrials | | | 72,802,539 | | | | - | | | | - | | | | 72,802,539 | |
Information Technology | | | 322,514,546 | | | | - | | | | - | | | | 322,514,546 | |
Materials | | | 17,956,360 | | | | - | | | | - | | | | 17,956,360 | |
Real Estate | | | 25,366,228 | | | | - | | | | - | | | | 25,366,228 | |
Utilities | | | 6,164,863 | | | | - | | | | - | | | | 6,164,863 | |
| | | | | | | | | | | | | | | | |
Total | | $ | 970,314,729 | | | $ | - | | | $ | - | | | $ | 970,314,729 | |
| | | | | | | | | | | | | | | | |
99
DOMINI IMPACT EQUITY FUND
DOMINI INTERNATIONAL OPPORTUNITIES FUND
DOMINI SUSTAINABLE SOLUTIONS FUND
DOMINI IMPACT INTERNATIONAL EQUITY FUND
NOTES TO FINANCIAL STATEMENTS (continued)
January 31, 2021 (Unaudited)
The following is a summary of the inputs used by the Domini International Opportunities Fund, as of January 31, 2021, in valuing the Fund’s assets carried at fair value:
| | | | | | | | | | | | | | | | |
| | | Level 1 -
Quoted Prices | | | Level 2 -
Other
Significant
Observable
Inputs | | | Level 3 -
Significant
Unobservable
Inputs | | | Total | |
Common Stocks | | | | | | | | | | | | | | | | |
Communication Services | | $ | - | | | $ | 928,283 | | | $ | - | | | $ | 928,283 | |
Consumer Discretionary | | | 365,953 | | | | 3,053,970 | | | | - | | | | 3,419,923 | |
Consumer Staples | | | 564,045 | | | | 1,657,046 | | | | - | | | | 2,221,091 | |
Financials | | | - | | | | 3,495,866 | | | | - | | | | 3,495,866 | |
Health Care | | | 74,562 | | | | 2,975,298 | | | | - | | | | 3,049,860 | |
Industrials | | | 274,867 | | | | 3,817,292 | | | | - | | | | 4,092,159 | |
Information Technology | | | 833,589 | | | | 2,455,945 | | | | - | | | | 3,289,534 | |
Materials | | | 512,144 | | | | 1,204,897 | | | | - | | | | 1,717,041 | |
Real Estate | | | - | | | | 689,818 | | | | - | | | | 689,818 | |
Utilities | | | - | | | | 549,008 | | | | - | | | | 549,008 | |
| | | | | | | | | | | | | | | | |
Total | | $ | 2,625,160 | | | $ | 20,827,423 | | | $ | - | | | $ | 23,452,583 | |
| | | | | | | | | | | | | | | | |
The following is a summary of the inputs used by the Domini Sustainable Solutions Fund, as of January 31, 2021, in valuing the Fund’s assets carried at fair value:
| | | | | | | | | | | | | | | | |
| | | Level 1 -
Quoted Prices | | | Level 2 -
Other
Significant
Observable
Inputs | | | Level 3 -
Significant
Unobservable
Inputs | | | Total | |
Common Stocks | | | | | | | | | | | | | | | | |
Communication Services | | $ | 671,349 | | | $ | - | | | $ | - | | | $ | 671,349 | |
Consumer Discretionary | | | 3,128,076 | | | | 1,125,092 | | | | - | | | | 4,253,168 | |
Consumer Staples | | | 1,099,110 | | | | - | | | | - | | | | 1,099,110 | |
Financials | | | 338,954 | | | | 1,273,187 | | | | - | | | | 1,612,141 | |
Health Care | | | 5,671,613 | | | | 2,234,969 | | | | - | | | | 7,906,582 | |
Industrials | | | 2,214,129 | | | | 4,206,543 | | | | - | | | | 6,420,672 | |
Information Technology | | | 11,403,210 | | | | 1,207,442 | | | | - | | | | 12,610,652 | |
Real Estate | | | - | | | | 457,156 | | | | - | | | | 457,156 | |
Utilities | | | 673,480 | | | | - | | | | - | | | | 673,480 | |
| | | | | | | | | | | | | | | | |
Total | | $ | 25,199,921 | | | $ | 10,504,389 | | | $ | - | | | $ | 35,704,310 | |
| | | | | | | | | | | | | | | | |
100
DOMINI IMPACT EQUITY FUND
DOMINI INTERNATIONAL OPPORTUNITIES FUND
DOMINI SUSTAINABLE SOLUTIONS FUND
DOMINI IMPACT INTERNATIONAL EQUITY FUND
NOTES TO FINANCIAL STATEMENTS (continued)
January 31, 2021 (Unaudited)
The following is a summary of the inputs used by the Domini Impact International Equity Fund, as of January 31, 2021, in valuing the Fund’s assets carried at fair value:
| | | | | | | | | | | | | | | | |
| | | Level 1 -
Quoted Prices | | | Level 2 -
Other
Significant
Observable
Inputs | | | Level 3 -
Significant
Unobservable
Inputs | | | Total | |
Common Stocks | | | | | | | | | | | | | | | | |
Communication Services | | $ | 8,627,419 | | | $ | 77,378,504 | | | $ | - | | | $ | 86,005,923 | |
Consumer Discretionary | | | 1,159,975 | | | | 161,737,482 | | | | - | | | | 162,897,457 | |
Consumer Staples | | | 10,031,685 | | | | 87,669,487 | | | | - | | | | 97,701,172 | |
Financials | | | 11,755,981 | | | | 197,349,108 | | | | - | | | | 209,105,089 | |
Health Care | | | 16,689,552 | | | | 173,346,070 | | | | - | | | | 190,035,622 | |
Industrials | | | 1,730,222 | | | | 230,476,766 | | | | - | | | | 232,206,988 | |
Information Technology | | | 21,623,041 | | | | 135,786,334 | | | | - | | | | 157,409,375 | |
Materials | | | - | | | | 68,877,641 | | | | - | | | | 68,877,641 | |
Real Estate | | | - | | | | 35,956,180 | | | | - | | | | 35,956,180 | |
Utilities | | | - | | | | 14,512,973 | | | | - | | | | 14,512,973 | |
| | | | | | | | | | | | | | | | |
Total | | $ | 71,617,875 | | | $ | 1,183,090,545 | | | $ | - | | | $ | 1,254,708,420 | |
| | | | | | | | | | | | | | | | |
(B) Foreign Currency Translation. Securities and other assets and liabilities denominated in foreign currencies are translated into U.S. dollar amounts on the date of valuation. Purchases and sales of securities, and income and expense items denominated in foreign currencies, are translated into U.S. dollar amounts on the respective dates of such transactions. Occasionally, events impact the availability or reliability of foreign exchange rates used to convert the U.S. dollar equivalent value. If such an event occurs, the foreign exchange rate will be valued at fair value using procedures established and approved by the Board of Trustees. The Funds do not separately report the effect of fluctuations in foreign exchange rates from changes in market prices on securities held. Such fluctuations are included with the net realized and unrealized gain or loss from investments. Realized foreign exchange gains or losses arise from sales of foreign currencies, currency gains or losses realized between the trade and settlement dates on securities transactions, and the difference between the recorded amounts of dividends, interest, and foreign withholding taxes and the U.S. dollar equivalent of the amounts actually received or paid. Net unrealized foreign exchange gains and losses arise from changes in fair value of assets and liabilities other than investments in securities held at the end of the reporting period, resulting from changes in exchange rates.
101
DOMINI IMPACT EQUITY FUND
DOMINI INTERNATIONAL OPPORTUNITIES FUND
DOMINI SUSTAINABLE SOLUTIONS FUND
DOMINI IMPACT INTERNATIONAL EQUITY FUND
NOTES TO FINANCIAL STATEMENTS (continued)
January 31, 2021 (Unaudited)
(C) Foreign Currency Contracts. When the Funds purchase or sell foreign securities, they enter into foreign exchange contracts to minimize foreign exchange risk from the trade date to the settlement date of the transactions. A foreign exchange contract is an agreement between two parties to exchange different currencies at an agreed-upon exchange rate on a specified date.
For the six months ended January 31, 2021, open foreign currency contracts were as follows:
| | | | |
Domini Impact Equity Fund | | $ | - | |
Domini International Opportunities Fund | | | 244,000 | |
Domini Sustainable Solutions Fund | | | 39,000 | |
Domini Impact International Equity Fund | | | 4,287,471 | |
(D) Investment Transactions, Investment Income and Dividends to Shareholders. Investment transactions are accounted for on trade date. Realized gains and losses from security transactions are determined on the basis of identified cost. Interest income is recorded on an accrual basis. Dividend income, net of any applicable withholding tax, is recorded on the ex-dividend date or for certain foreign securities, when the information becomes available to the Funds. The Funds earn income daily, net of Fund expenses. Dividends to shareholders of the Domini Impact Equity Fund are usually declared and paid quarterly from net investment income. Dividends to shareholders of the Domini International Opportunities Fund, the Domini Sustainable Solutions Fund and the Domini International Equity Fund are usually declared and paid semiannually from net investment income. Distributions to shareholders of realized capital gains, if any, are made annually. Distributions are determined in conformity with income tax regulations, which may differ from generally accepted accounting principles. Reclassifications have been made to the Funds’ components of net assets to reflect income and gains available for distribution (or available capital loss carryovers, as applicable) under income tax regulations.
(E) Federal Taxes. Each Fund’s policy is to comply with the provisions of the Internal Revenue Code applicable to regulated investment companies and to distribute substantially all of its taxable income, including net realized gains, if any, within the prescribed time periods. Accordingly, no provision for federal income or excise tax is deemed necessary. As of January 31, 2021, tax years 2017 through 2020 remain subject to examination by the Funds’ major tax jurisdictions, which include the United States of America, the Commonwealth of Massachusetts, and New York State.
102
DOMINI IMPACT EQUITY FUND
DOMINI INTERNATIONAL OPPORTUNITIES FUND
DOMINI SUSTAINABLE SOLUTIONS FUND
DOMINI IMPACT INTERNATIONAL EQUITY FUND
NOTES TO FINANCIAL STATEMENTS (continued)
January 31, 2021 (Unaudited)
(F) Redemption Fees. Redemptions and exchanges of Fund shares held less than 30 days may be subject to the Funds’ redemption fee, which is 2% of the amount redeemed. The fee is imposed to offset transaction costs and other expenses associated with short-term investing. The fee may be waived in certain circumstances at the discretion of the Funds. Such fees are retained by the Funds and are recorded as an adjustment to paid-in capital.
(G) Other. Income, expenses (other than those attributable to a specific class), gains, and losses are allocated on a daily basis to each class of shares based upon the relative proportion of net assets represented by such class. Operating expenses directly attributable to a specific class are charged against the operations of that class.
(H) Transfer Agent Credits. Per the arrangement with the Funds’ former transfer agent, BNY Mellon Investment Servicing (U.S.) Inc., prior to June 22, 2020, the Funds had arrangements whereby they received earnings credits when positive cash balances were maintained, which were used to offset transfer agency fees.
(I) Indemnification. The Funds’ organizational documents provide current and former trustees and officers with a limited indemnification against liabilities arising in connection with the performance of their duties to the Funds. In the normal course of business, the Funds may also enter into contracts that provide general indemnifications. The Funds’ maximum exposure under these arrangements is unknown as this would be dependent on future claims that may be made against the Funds. The risk of material loss from such claims is considered remote.
2. TRANSACTIONS WITH AFFILIATES
(A) Manager/Sponsor. The Funds have retained Domini Impact Investments LLC (Domini) to serve as investment manager and administrator. Domini is registered as an investment adviser under the Investment Advisers Act of 1940. The services provided by Domini consist of investment supervisory services, overall operational support, and administrative services. The administrative services include the provision of general office facilities and supervising the overall administration of the Funds. For its services under the Management Agreements, Domini receives from each Fund a fee accrued daily and paid
103
DOMINI IMPACT EQUITY FUND
DOMINI INTERNATIONAL OPPORTUNITIES FUND
DOMINI SUSTAINABLE SOLUTIONS FUND
DOMINI IMPACT INTERNATIONAL EQUITY FUND
NOTES TO FINANCIAL STATEMENTS (continued)
January 31, 2021 (Unaudited)
monthly at the annual rate below of the respective Funds’ average daily net assets before any fee waivers:
| | |
| Domini Impact Equity Fund | | 0.20% of the first $2 billion of net assets managed, |
| | 0.19% of the next $1 billion of net assets managed, and |
| | 0.18% of net assets managed in excess of $3 billion |
| | |
| Domini International Opportunities Fund | | 0.85% of the first $2 billion of net assets managed, |
| | 0.83% of the next $1 billion of net assets mangaged, and |
| | 0.80% of the net assets manged in excess of $3 billion |
| | |
| Domini Sustainable Solutions Fund | | 0.85% of the first $500 million of net assets managed, |
| | 0.83% of the next $500 million of net assets managed, and, |
| | 0.80% of net assets managed in excess of $1 billion |
| | |
| Domini Impact International Equity Fund | | 0.96% of the first $250 million of net assets managed, |
| | 0.88% of the next $250 million of net assets managed, and |
| | 0.785% of net assets managed in excess of $500 million |
Pursuant to a Sponsorship Agreement (with respect to the Domini Impact Equity Fund) Domini provides the Fund with the administrative personnel and services necessary to operate the Fund. In addition to general administrative services and facilities for the Fund similar to those provided by Domini under the Management Agreement, Domini answers questions from the general public and the media regarding the securities holdings of the Fund. For these services and facilities, Domini receives fees accrued daily and paid monthly from the Fund at the annual rate below of the respective Fund’s average daily net assets before any fee waivers:
| | |
| Domini Impact Equity Fund | | 0.45% of the first $2 billion of net assets managed, |
| | 0.44% of the next $1 billion of net assets managed, and |
| | 0.43% of net assets managed in excess of $3 billion |
Domini has contractually agreed to reduce its fees and/or reimburse certain ordinary operating expenses of the Funds (excluding brokerage fees and commissions, interest taxes, and other extraordinary expenses) until November 30, 2021, absent an earlier modification as mutually agreed to by the Adviser and Board of Trustees which oversees the Funds, in order to limit
104
DOMINI IMPACT EQUITY FUND
DOMINI INTERNATIONAL OPPORTUNITIES FUND
DOMINI SUSTAINABLE SOLUTIONS FUND
DOMINI IMPACT INTERNATIONAL EQUITY FUND
NOTES TO FINANCIAL STATEMENTS (continued)
January 31, 2021 (Unaudited)
the annual operating expenses of each share class, net of applicable waivers and reimbursements, as follows:
| | | | |
Domini Impact Equity Fund Investor Shares | | | 1.09% | |
Domini Impact Equity Fund Class A Shares | | | 1.09% | |
Domini Impact Equity Fund Institutional Shares | | | 0.74% | |
Domini Impact Equity Fund Class Y Shares (formerly Class R Shares) | | | 0.80% | |
Domini International Opportunities Fund Investor Class | | | 1.40% | |
Domini International Opportunities Fund Institutional Class | | | 1.15% | |
Domini Sustainable Solutions Fund Investor Class | | | 1.40% | |
Domini Sustainable Solutions Fund Institutional Class | | | 1.15% | |
Domini Impact International Equity Fund Class A Shares | | | 1.40% | |
Domini Impact International Equity Fund Class Y Shares | | | 1.12% | |
For the six months ended January 31, 2021, Domini waived fees and reimbursed expenses as follows:
| | | | | | | | |
| | | FEES WAIVED | | | EXPENSES REIMBURSED | |
Domini Impact Equity Fund | | $ | - | | | $ | 21,727 | |
Domini International Opportunities Fund | | | - | | | | 42,845 | |
Domini Sustainable Solutions Fund | | | - | | | | 61,201 | |
Domini Impact International Equity Fund | | | - | | | | - | |
As of January 31, 2021, Domini owned less than 1% of any class of the outstanding shares of each Fund.
(B) Submanager. SSGA Funds Management, Inc. (“SSGA”) provides investment submanagement services to the Domini International Opportunities Fund, Domini Impact Equity Fund and the Domini Sustainable Solutions Fund on a day-to-day basis pursuant to a submanagement Agreement with Domini. Wellington Management Company LLP (Wellington), a Delaware limited liability partnership, provides investment submanagement services to the Domini Impact International Equity Fund on a day-to-day basis pursuant to a Submanagement Agreement with Domini.
(C) Distributor. The Board of Trustees of the Funds has adopted a Distribution Plan with respect to the Funds’ Investor shares and Class A shares in accordance with Rule 12b-1 under the Act. DSIL Investment Services LLC, a wholly owned subsidiary of Domini (DSIL), acts as agent of the Funds in connection with the offering of Investor shares of the Funds pursuant to a Distribution Agreement. Under the Distribution Plan, the Funds pay expenses incurred in connection with the sale of Investor shares and Class A shares and pay DSIL a distribution fee at an aggregate annual rate not to exceed 0.25% of
105
DOMINI IMPACT EQUITY FUND
DOMINI INTERNATIONAL OPPORTUNITIES FUND
DOMINI SUSTAINABLE SOLUTIONS FUND
DOMINI IMPACT INTERNATIONAL EQUITY FUND
NOTES TO FINANCIAL STATEMENTS (continued)
January 31, 2021 (Unaudited)
the average daily net assets representing the Investor shares and Class A shares. For the six months ended January 31, 2021, fees waived were as follows:
| | | | |
| | | FEES WAIVED | |
Domini Impact Equity Fund Investor Shares | | $ | - | |
Domini Impact Equity Fund Class A Shares | | | 8,488 | |
Domini International Opportunities Fund Investor Class | | | 375 | |
Domini Sustainable Solutions Fund Investor Class | | | 13,919 | |
Domini Impact International Equity Fund Investor Shares | | | - | |
Domini Impact International Equity Fund Class A Shares | | | 3,943 | |
DSIL, the Funds’ Distributor, has received commissions related to the sales of fund shares. For the six months ended January 31, 2021, DSIL received $1,124, and $1,331 from the Domini Impact Equity Fund Class A Shares, and the Domini Impact International Equity Fund Class A shares, respectively.
(D) Shareholder Service Agent. The Trust has retained Domini to provide certain shareholder services with respect to the Funds and their shareholders, which services were previously provided by the former transfer agent for the funds or another fulfillment and mail service provider and are supplemental to services currently provided by Ultimus Fund Solutions, LLC (“Ultimus”), pursuant to a master services agreement between each Fund and Ultimus. Ultimus acts as the transfer agent and provides certain shareholder servicing for the Funds. For these services, Domini receives fees from each Fund paid monthly at an annual rate of $4.00 per active account. For the six months ended January 31, 2021, there were no fees waived.
(E) Trustees and Officers. Each of the Independent Trustees received an annual retainer for serving as a Trustee of the Trust of $28,000. The Lead Independent Trustee and Chair of the Audit Committee receive an additional chairperson fee of $5,000. Each Independent Trustee also receives $2,000 for attendance at each meeting of the Board of the Trust (reduced to $1,000 in the event that a Trustee participates at an in-person meeting by telephone). In addition, each Trustee receives reimbursement for reasonable expenses incurred in attending meetings. These expenses are allocated on a pro-rata basis to each shares class of a Fund according to their respective net assets.
As of January 31, 2021, all Trustees and officers of the Trust as a group owned less than 1% of each Fund’s outstanding shares.
106
DOMINI IMPACT EQUITY FUND
DOMINI INTERNATIONAL OPPORTUNITIES FUND
DOMINI SUSTAINABLE SOLUTIONS FUND
DOMINI IMPACT INTERNATIONAL EQUITY FUND
NOTES TO FINANCIAL STATEMENTS (continued)
January 31, 2021 (Unaudited)
3. INVESTMENT TRANSACTIONS
For the six months ended January 31, 2021, cost of purchase and proceeds from sales of investments other than short-term obligations were as follows:
| | | | | | | | |
| | | PURCHASE | | | SALES | |
Domini Impact Equity Fund | | $ | 55,338,534 | | | $ | 69,710,777 | |
Domini International Opportunities Fund | | | 22,882,165 | | | | - | |
Domini Sustainable Solutions Fund | | | 13,306,590 | | | | 4,823,775 | |
Domini Impact International Equity Fund | | | 558,307,798 | | | | 522,474,992 | |
4. SHARES OF BENEFICIAL INTEREST
At January 31, 2021, there was an unlimited number of shares authorized ($0.00001 par value). Transactions in the Funds’ shares were as follows:
| | | | | | | | | | | | | | | | |
| | | Six Months Ended
January 31, 2021
(unaudited) | | | Year Ended
July 31, 2020 | |
| | | Shares | | | Amount | | | Shares | | | Amount | |
| | |
Domini Impact Equity Fund | | | | | | | | | |
| | | | |
Investor Shares | | | | | | | | | | | | | | | | |
Shares sold | | | 519,415 | | | $ | 15,241,343 | | | | 862,267 | | | $ | 20,063,206 | |
Shares issued in reinvestment of dividends and distributions | | | 574,106 | | | | 17,218,884 | | | | 706,693 | | | | 16,220,552 | |
Shares redeemed | | | (976,433) | | | | (28,587,129) | | | | (3,276,885) | | | | (76,191,366) | |
Redemption fees | | | - | | | | 1,048 | | | | - | | | | 6,010 | |
| | | | | | | | | | | | | | | | |
Net increase (decrease) | | | 117,088 | | | $ | 3,874,146 | | | | (1,707,925) | | | $ | (39,901,598) | |
| | | | | | | | | | | | | | | | |
| | | | |
Class A Shares | | | | | | | | | | | | | | | | |
Shares sold | | | 5,911 | | | $ | 173,388 | | | | 20,280 | | | $ | 459,657 | |
Shares issued in reinvestment of dividends and distributions | | | 4,925 | | | | 147,442 | | | | 6,252 | | | | 144,278 | |
Shares redeemed | | | (22,764) | | | | (648,327) | | | | (93,996) | | | | (2,151,604) | |
Redemption fees | | | - | | | | - | | | | - | | | | - | |
| | | | | | | | | | | | | | | | |
Net decrease | | | (11,928) | | | $ | (327,497) | | | | (67,464) | | | $ | (1,547,669) | |
| | | | | | | | | | | | | | | | |
| | | | |
Institutional Shares | | | | | | | | | | | | | | | | |
Shares sold | | | 309,396 | | | $ | 9,096,342 | | | | 397,105 | | | $ | 9,215,561 | |
Shares issued in reinvestment of dividends and distributions | | | 72,642 | | | | 2,161,051 | | | | 97,693 | | | | 2,238,525 | |
Shares redeemed | | | (372,820) | | | | (10,916,995) | | | | (662,359) | | | | (15,394,066) | |
Redemption fees | | | - | | | | 15,197 | | | | - | | | | 528 | |
| | | | | | | | | | | | | | | | |
Net increase (decrease) | | | 9,218 | | | $ | 355,595 | | | | (167,561) | | | $ | (3,939,452) | |
| | | | | | | | | | | | | | | | |
107
DOMINI IMPACT EQUITY FUND
DOMINI INTERNATIONAL OPPORTUNITIES FUND
DOMINI SUSTAINABLE SOLUTIONS FUND
DOMINI IMPACT INTERNATIONAL EQUITY FUND
NOTES TO FINANCIAL STATEMENTS (continued)
January 31, 2021 (Unaudited)
| | | | | | | | | | | | | | | | |
| | | Six Months Ended
January 31, 2021
(unaudited) | | | Year Ended
July 31, 2020 | |
| | | Shares | | | Amount | | | Shares | | | Amount | |
| | | | |
Class Y Shares
(formerly Class R Shares) | | | | | | | | | | | | | | | | |
Shares sold | | | 50,893 | | | $ | 1,556,708 | | | | 106,860 | | | $ | 2,430,212 | |
Shares issued in reinvestment of dividends and distributions | | | 5,661 | | | | 168,769 | | | | 17,365 | | | | 402,524 | |
Shares redeemed | | | (36,496) | | | | (1,049,211) | | | | (771,266) | | | | (18,703,344) | |
Redemption fees | | | - | | | | 1 | | | | - | | | | 559 | |
| | | | | | | | | | | | | | | | |
Net increase (decrease) | | | 20,058 | | | $ | 676,267 | | | | (647,041) | | | $ | (15,870,049) | |
| | | | | | | | | | | | | | | | |
| | | | |
Total | | | | | | | | | | | | | | | | |
Shares sold | | | 885,615 | | | $ | 26,067,781 | | | | 1,386,512 | | | $ | 32,168,636 | |
Shares issued in reinvestment of dividends and distributions | | | 657,334 | | | | 19,696,146 | | | | 828,003 | | | | 19,005,879 | |
Shares redeemed | | | (1,408,513) | | | | (41,201,662) | | | | (4,804,506) | | | | (112,440,380) | |
Redemption fees | | | - | | | | 16,246 | | | | - | | | | 7,097 | |
| | | | | | | | | | | | | | | | |
Net increase (decrease) | | | 134,436 | | | $ | 4,578,511 | | | | (2,589,991) | | | $ | (61,258,768) | |
| | | | | | | | | | | | | | | | |
| | | | | | | | |
| | | For the period November 30, 2020
(commencement of
operations) through
January 31, 2021
(unaudited) | |
| | | Shares | | | Amount | |
|
Domini International Opportunities Fund | |
| | |
Investor Class | | | | | | | | |
Shares sold | | | 114,592 | | | $ | 1,164,467 | |
Shares issued in reinvestment of dividends and distributions | | | - | | | | - | |
Shares redeemed | | | (271) | | | | (2,859) | |
Redemption fees | | | - | | | | - | |
| | | | | | | | |
Net increase | | | 114,321 | | | $ | 1,161,608 | |
| | | | | | | | |
| | |
Institutional Class | | | | | | | | |
Shares sold | | | 2,197,816 | | | $ | 21,978,130 | |
Shares issued in reinvestment of dividends and distributions | | | - | | | | - | |
Shares redeemed | | | (704) | | | | (7,435) | |
Redemption fees | | | - | | | | - | |
| | | | | | | | |
Net increase | | | 2,197,112 | | | $ | 21,970,695 | |
| | | | | | | | |
| | |
Total | | | | | | | | |
Shares sold | | | 2,312,408 | | | $ | 23,142,597 | |
Shares issued in reinvestment of dividends and distributions | | | - | | | | - | |
Shares redeemed | | | (975) | | | | (10,294) | |
Redemption fees | | | - | | | | - | |
| | | | | | | | |
Net increase | | | 2,311,433 | | | $ | 23,132,303 | |
| | | | | | | | |
108
DOMINI IMPACT EQUITY FUND
DOMINI INTERNATIONAL OPPORTUNITIES FUND
DOMINI SUSTAINABLE SOLUTIONS FUND
DOMINI IMPACT INTERNATIONAL EQUITY FUND
NOTES TO FINANCIAL STATEMENTS (continued)
January 31, 2021 (Unaudited)
| | | | | | | | | | | | | | | | |
| | | Six Months Ended
January 31, 2021
(unaudited) | | | For the Period
April 1, 2020
(commencement of
operations) through
July 31, 2020 | |
| | | Shares | | | Amount | | | Shares | | | Amount | |
| | |
Domini Sustainable Solutions Fund | | | | | | | | | |
| | | | |
Investor Class | | | | | | | | | | | | | | | | |
Shares sold | | | 377,593 | | | $ | 6,845,568 | | | | 481,421 | | | $ | 6,135,189 | |
Shares issued in reinvestment of dividends and distributions | | | 21,954 | | | | 416,020 | | | | - | | | | - | |
Shares redeemed | | | (74,775) | | | | (1,315,627) | | | | (3,851) | | | | (57,181) | |
Redemption fees | | | - | | | | 3 | | | | - | | | | - | |
| | | | | | | | | | | | | | | | |
Net increase | | | 324,772 | | | $ | 5,945,964 | | | | 477,570 | | | $ | 6,078,008 | |
| | | | | | | | | | | | | | | | |
| | | | |
Institutional Class | | | | | | | | | | | | | | | | |
Shares sold | | | 144,106 | | | $ | 2,666,450 | | | | 852,805 | | | $ | 9,586,139 | |
Shares issued in reinvestment of dividends and distributions | | | 31,097 | | | | 590,212 | | | | - | | | | - | |
Shares redeemed | | | (48) | | | | (970) | | | | (37,994) | | | | (583,965) | |
Redemption fees | | | - | | | | - | | | | - | | | | - | |
| | | | | | | | | | | | | | | | |
Net increase | | | 175,155 | | | $ | 3,255,692 | | | | 814,811 | | | $ | 9,002,174 | |
| | | | | | | | | | | | | | | | |
| | | | |
Total | | | | | | | | | | | | | | | | |
Shares sold | | | 521,699 | | | $ | 9,512,018 | | | | 1,334,226 | | | $ | 15,721,328 | |
Shares issued in reinvestment of dividends and distributions | | | 53,051 | | | | 1,006,232 | | | | - | | | | - | |
Shares redeemed | | | (74,823) | | | | (1,316,597) | | | | (41,845) | | | | (641,146) | |
Redemption fees | | | - | | | | 3 | | | | - | | | | - | |
| | | | | | | | | | | | | | | | |
Net increase | | | 499,927 | | | $ | 9,201,656 | | | | 1,292,381 | | | $ | 15,080,182 | |
| | | | | | | | | | | | | | | | |
| | | | | | | | | | | | | | | | |
| | | Six Months Ended January 31, 2021
(unaudited) | | | Year Ended
July 31, 2020 | |
| | | Shares | | | Amount | | | Shares | | | Amount | |
| | |
Domini Impact International Equity Fund | | | | | | | | | |
| | | | |
Investor Shares | | | | | | | | | | | | | | | | |
Shares sold | | | 6,743,278 | | | $ | 53,364,915 | | | | 19,114,068 | | | $ | 136,900,825 | |
Shares issued in reinvestment of dividends and distributions | | | 179,722 | | | | 1,502,479 | | | | 1,249,596 | | | | 10,096,732 | |
Shares redeemed | | | (21,962,899) | | | | (167,792,021) | | | | (21,653,741) | | | | (157,553,525) | |
Redemption fees | | | - | | | | 1,469 | | | | - | | | | 7,071 | |
| | | | | | | | | | | | | | | | |
Net decrease | | | (15,039,899) | | | $ | (112,923,158) | | | | (1,290,077) | | | $ | (10,548,897) | |
| | | | | | | | | | | | | | | | |
109
DOMINI IMPACT EQUITY FUND
DOMINI INTERNATIONAL OPPORTUNITIES FUND
DOMINI SUSTAINABLE SOLUTIONS FUND
DOMINI IMPACT INTERNATIONAL EQUITY FUND
NOTES TO FINANCIAL STATEMENTS (continued)
January 31, 2021 (Unaudited)
| | | | | | | | | | | | | | | | |
| | | Six Months Ended January 31, 2021
(unaudited) | | | Year Ended
July 31, 2020 | |
| | | Shares | | | Amount | | | Shares | | | Amount | |
| | | | |
Class A Shares | | | | | | | | | | | | | | | | |
Shares sold | | | 287,344 | | | $ | 2,461,576 | | | | 360,128 | | | $ | 2,867,073 | |
Shares issued in reinvestment of dividends and distributions | | | 11,551 | | | | 103,150 | | | | 55,690 | | | | 480,601 | |
Shares redeemed | | | (447,570) | | | | (3,808,660) | | | | (1,023,316) | | | | (8,008,184) | |
Redemption fees | | | - | | | | - | | | | - | | | | 670 | |
| | | | | | | | | | | | | | | | |
Net decrease | | | (148,675) | | | $ | (1,243,934) | | | | (607,498) | | | $ | (4,659,840) | |
| | | | | | | | | | | | | | | | |
| | | | |
Institutional Shares | | | | | | | | | | | | | | | | |
Shares sold | | | 8,856,179 | | | $ | 70,008,730 | | | | 22,615,758 | | | $ | 158,744,158 | |
Shares issued in reinvestment of dividends and distributions | | | 451,647 | | | | 3,735,123 | | | | 1,525,183 | | | | 12,201,461 | |
Shares redeemed | | | (11,833,481) | | | | (94,830,868) | | | | (26,751,604) | | | | (187,596,632) | |
Redemption fees | | | - | | | | - | | | | - | | | | 5,792 | |
| | | | | | | | | | | | | | | | |
Net decrease | | | (2,525,655) | | | $ | (21,087,015) | | | | (2,610,663) | | | $ | (16,645,221) | |
| | | | | | | | | | | | | | | | |
| | | | |
Class Y Shares | | | | | | | | | | | | | | | | |
Shares sold | | | 26,051,123 | | | $ | 200,731,228 | | | | 14,391,149 | | | $ | 104,052,493 | |
Shares issued in reinvestment of dividends and distributions | | | 427,318 | | | | 3,538,196 | | | | 581,550 | | | | 4,664,034 | |
Shares redeemed | | | (2,947,453) | | | | (23,429,529) | | | | (21,762,865) | | | | (160,703,454) | |
Redemption fees | | | - | | | | 2 | | | | - | | | | - | |
| | | | | | | | | | | | | | | | |
Net increase (decrease) | | | 23,530,988 | | | $ | 180,839,897 | | | | (6,790,166) | | | $ | (51,986,927) | |
| | | | | | | | | | | | | | | | |
| | | | |
Total | | | | | | | | | | | | | | | | |
Shares sold | | | 41,937,924 | | | $ | 326,566,449 | | | | 56,481,103 | | | $ | 402,564,549 | |
Shares issued in reinvestment of dividends and distributions | | | 1,070,238 | | | | 8,878,948 | | | | 3,412,019 | | | | 27,442,828 | |
Shares redeemed | | | (37,191,403) | | | | (289,861,078) | | | | (71,191,526) | | | | (513,861,795) | |
Redemption fees | | | - | | | | 1,471 | | | | - | | | | 13,533 | |
| | | | | | �� | | | | | | | | | | |
Net increase (decrease) | | | 5,816,759 | | | $ | 45,585,790 | | | | (11,298,404) | | | $ | (83,840,885) | |
| | | | | | | | | | | | | | | | |
110
DOMINI IMPACT EQUITY FUND
DOMINI INTERNATIONAL OPPORTUNITIES FUND
DOMINI SUSTAINABLE SOLUTIONS FUND
DOMINI IMPACT INTERNATIONAL EQUITY FUND
NOTES TO FINANCIAL STATEMENTS (continued)
January 31, 2021 (Unaudited)
5. FEDERAL TAX STATUS
The tax basis of the components of net assets for the Funds at July 31, 2020, are as follows:
| | | | | | | | | | | | |
| | | Domini
Impact Equity
Fund | | | Domini
Sustainable
Solutions
Fund | | | Domini Impact
International
Equity Fund | |
Undistributed Ordinary Income | | $ | 5,577,710 | | | $ | 239,292 | | | $ | 11,006,806 | |
Undistributed capital gains | | | 7,473,177 | | | | - | | | | - | |
Unrealized appreciation/(depreciation) | | | 268,544,900 | | | | 4,438,463 | | | | 64,416,039 | |
Capital losses, other losses and other temporary differences | | | - | | | | - | | | | (184,861,278) | |
| | | | | | | | | | | | |
Distributable net earnings/(deficit) | | $ | 281,595,787 | | | $ | 4,677,755 | | | $ | (109,438,433) | |
| | | | | | | | | | | | |
For the year ended July 31, 2020, the Funds made the following reclassification to the components of net assets to align financial reporting with tax reporting:
| | | | | | | | | | | | |
| | | Domini Impact
Equity Fund | | | Domini
Sustainable
Solutions Fund | | | Domini Impact
International
Equity Fund | |
Paid-in Capital | | $ | - | | | $ | - | | | $ | 573 | |
Distributable Earnings | | | - | | | | - | | | | (573) | |
Carryforwards of losses from previous taxable years do not expire and retain their character as either short-term or long-term capital losses. As of July 31, 2020, the Domini Impact International Equity Fund had a short-term capital loss carryover of $110,979,256 and long-term capital loss carryover of $73,882,022.
For federal income tax purposes, dividends paid were characterized as follows:
| | | | | | | | | | | | | | | | | | | | |
| | | Domini Impact
Equity Fund | | | Domini Sustainable
Solutions Fund | | | Domini Impact
International
Equity Fund | |
| | | Year Ended July 31, | | | For the Period April 1, 2020
(commencement of
operations) through
July 31, | | | Year Ended July 31, | |
| | | 2020 | | | 2019 | | | 2020 | | | 2020 | | | 2019 | |
Ordinary income | | $ | 4,993,996 | | | $ | 21,310,037 | | | $ | - | | | $ | 34,293,339 | | | $ | 25,106,722 | |
Long-term capital gain | | | 15,320,008 | | | | 66,953,629 | | | | - | | | | - | | | | 36,772,373 | |
| | | | | | | | | | | | | | | | | | | | |
Total | | $ | 20,314,004 | | | $ | 88,263,666 | | | $ | - | | | $ | 34,293,339 | | | $ | 61,879,095 | |
| | | | | | | | | | | | | | | | | | | | |
111
DOMINI IMPACT EQUITY FUND
DOMINI INTERNATIONAL OPPORTUNITIES FUND
DOMINI SUSTAINABLE SOLUTIONS FUND
DOMINI IMPACT INTERNATIONAL EQUITY FUND
NOTES TO FINANCIAL STATEMENTS (continued)
January 31, 2021 (Unaudited)
The Funds are subject to the provisions of Accounting Standards Codification ASC 740 Income Taxes (ASC 740). ASC 740 sets forth a minimum threshold for financial statement recognition of the benefit of a tax position taken or expected to be taken in a tax return. The Funds did not have a liability to record for any unrecognized tax benefits in the accompanying financial statements. No provision has been made for taxes on income, capital gains or unrealized appreciation on securities held or for excise tax on income and capital gains.
6. OTHER RISKS
The Funds’ risks include, but are not limited to, some or all of the risks discussed below:
Market Risk: The market values of securities or other assets will fluctuate, sometimes sharply and unpredictably, due to changes in general market conditions, overall economic trends or events, governmental actions or intervention, market disruptions caused by trade disputes or other factors, political developments, recessions, the spread of infectious illness or other public health issues, investor sentiment and other factors that may or may not be related to the issuer of the security or other asset. If the market values of the securities or other assets held by the Funds fall, including a complete loss on any individual security, the value of your investment will go down. Economies and financial markets throughout the world are increasingly interconnected. Economic, financial or political events, trading or tariff arrangements, terrorism, natural disasters, global pandemics and other circumstances in one country or region could have profound impacts on global economies or markets. As a result, whether or not the Funds invests in securities of issuers located in or with significant exposure to the countries directly affected, the value and liquidity of the Funds’ investments may be negatively affected.
Recent Events Risk: The illness COVID-19 caused by a novel coronavirus has resulted in a global pandemic and major disruption to economies and markets around the world, including the United States. Global financial markets have experienced extreme volatility and severe losses, and trading in many instruments has been disrupted. Liquidity for many instruments has been greatly reduced for periods of time. Some interest rates are very low and in some cases yields are negative. Some sectors of the economy and individual issuers have experienced particularly large losses. These circumstances may continue for an extended period of time and may adversely affect the value and/
112
DOMINI IMPACT EQUITY FUND
DOMINI INTERNATIONAL OPPORTUNITIES FUND
DOMINI SUSTAINABLE SOLUTIONS FUND
DOMINI IMPACT INTERNATIONAL EQUITY FUND
NOTES TO FINANCIAL STATEMENTS (continued)
January 31, 2021 (Unaudited)
or liquidity of the Funds’ investments. In addition, the impact of infectious illnesses in emerging market countries may be greater due to generally less established healthcare systems. Public health crises caused by the COVID-19 outbreak may exacerbate other pre-existing political, social and economic risks in certain countries or globally. The ultimate economic fallout from the pandemic, and the long-term impact on economies, markets, industries and individual issuers, are not known. Governments and central banks, including the Federal Reserve in the U.S., have taken extraordinary and unprecedented actions to support national economies and the financial markets. These actions have resulted in significant expansion of public debt, including in the U.S. The impact of these measures, and whether they will be effective to mitigate the economic and market disruption, may not be known for some time. The consequences of high public debt including its future impact on the economy and securities markets, likewise may not be known for some time.
113
DOMINI IMPACT BOND FUND
STATEMENT OF ASSETS AND LIABILITIES
January 31, 2021 (Unaudited)
| | | | |
ASSETS | | | | |
Investments, at value (cost $236,464,259) | | $ | 247,849,275 | |
Cash | | | 11,196,351 | |
Foreign currency, at value (cost $1,319,161) | | | 1,317,096 | |
Receivable for securities sold | | | 16,685,284 | |
Interest receivable | | | 1,197,970 | |
Collateral on certain derivative contracts | | | 635,320 | |
Receivable for variation margin swaps | | | 405,200 | |
Receivable for capital shares | | | 244,296 | |
Cash held at other banks (cost $986,792) | | | 986,785 | |
Unrealized appreciation on forward currency contracts | | | 42,860 | |
Unrealized appreciation on OTC swap contracts | | | 16,448 | |
Premium paid OTC swap contracts | | | 970 | |
| | | | |
Total assets | | | 280,577,855 | |
| | | | |
LIABILITIES | | | | |
Payable for securities purchased | | | 75,251,504 | |
Payable for capital shares | | | 278,623 | |
Payable for variation margin swaps | | | 411,023 | |
Cash due to broker (cost $4) | | | 5 | |
Management fee payable | | | 97,704 | |
Distribution fee payable | | | 40,265 | |
Other accrued expenses | | | 67,074 | |
Dividend payable | | | 34,181 | |
Payable for variation margin futures | | | 672 | |
Premium received swap contracts | | | 927,919 | |
Unrealized depreciation on forward currency contracts | | | 440 | |
| | | | |
Total liabilities | | | 77,109,410 | |
| | | | |
NET ASSETS | | $ | 203,468,445 | |
| | | | |
NET ASSETS CONSISTS OF | | | | |
Paid-in Capital | | $ | 190,912,636 | |
Total distributable earnings (loss) | | | 12,555,809 | |
| | | | |
NET ASSETS | | $ | 203,468,445 | |
| | | | |
NET ASSET VALUE PER SHARE | | | | |
| |
Investor Shares | | | | |
Net assets | | $ | 150,853,040 | |
| | | | |
Outstanding shares of beneficial interest | | | 12,469,213 | |
| | | | |
Net Asset Value And Offering Price Per Share* | | $ | 12.10 | |
| | | | |
| |
Institutional Shares | | | | |
Net assets | | $ | 52,615,405 | |
| | | | |
Outstanding shares of beneficial interest | | | 4,379,244 | |
| | | | |
Net Asset Value And Offering Price Per Share* | | $ | 12.01 | |
| | | | |
* Redemption price is equal to net asset value less any applicable redemption fees retained by the Fund.
SEE NOTES TO FINANCIAL STATEMENTS
114
DOMINI IMPACT BOND FUND
STATEMENT OF OPERATIONS
For the Six Months Ended January 31, 2021 (Unaudited)
| | | | |
INCOME | | | | |
Interest income | | $ | 2,486,858 | |
| | | | |
EXPENSES | | | | |
Management fee | | | 315,244 | |
Administrative fee | | | 246,193 | |
Distribution fees – Investor Shares | | | 185,170 | |
Transfer agent fees – Investor Shares | | | 109,358 | |
Transfer agent fees – Institutional Shares | | | 386 | |
Custody and Accounting fees | | | 71,013 | |
Professional fees | | | 32,528 | |
Registration fees – Investor Shares | | | 8,830 | |
Registration fees – Institutional Shares | | | 14,301 | |
Miscellaneous | | | 20,688 | |
Shareholder Communication fees | | | 16,114 | |
Shareholder Service fees – Investor Shares | | | 5,328 | |
Shareholder Service fees – Institutional Shares | | | 47 | |
Trustees fees | | | 4,663 | |
| | | | |
Total expenses | | | 1,029,863 | |
Fees waived and expenses reimbursed | | | (246,647) | |
| | | | |
Net expenses | | | 783,216 | |
| | | | |
NET INVESTMENT INCOME (LOSS) | | | 1,703,642 | |
| | | | |
REALIZED AND UNREALIZED GAIN (LOSS) FROM INVESTMENTS AND FOREIGN CURRENCY | | | | |
NET REALIZED GAIN (LOSS) FROM: | | | | |
Investments | | | 1,963,346 | |
Swap contracts | | | (353,726) | |
Futures contracts | | | (79,754) | |
Foreign currency | | | (9,692) | |
Forward contracts | | | (196,614) | |
| | | | |
Net realized gain (loss) | | | 1,323,560 | |
| | | | |
NET CHANGES IN UNREALIZED APPRECIATION (DEPRECIATION) FROM: | | | | |
Investments | | | (1,819,088) | |
Swap contracts | | | 360,048 | |
Futures contracts | | | 78,104 | |
Forward contracts | | | 143,013 | |
Translation of assets and liabilities in foreign currencies | | | (15,016) | |
| | | | |
Net change in unrealized appreciation (depreciation) | | | (1,252,939) | |
| | | | |
NET REALIZED AND UNREALIZED GAIN (LOSS) | | | 70,621 | |
| | | | |
NET INCREASE (DECREASE) IN NET ASSETS RESULTING FROM OPERATIONS | | $ | 1,774,263 | |
| | | | |
SEE NOTES TO FINANCIAL STATEMENTS
115
DOMINI IMPACT BOND FUND
STATEMENTS OF CHANGES IN NET ASSETS
| | | | | | | | |
| | | Six Months
Ended
January 31, 2021
(unaudited) | | | Year Ended
July 31, 2020 | |
INCREASE IN NET ASSETS FROM OPERATIONS | | | | | | | | |
Net investment income (loss) | | $ | 1,703,642 | | | $ | 3,258,681 | |
Net realized gain (loss) | | | 1,323,560 | | | | 7,280,305 | |
Net change in unrealized appreciation (depreciation) | | | (1,252,939) | | | | 8,194,990 | |
| | | | | | | | |
Net Increase (Decrease) in Net Assets Resulting from Operations | | | 1,774,263 | | | | 18,733,976 | |
| | | | | | | | |
DISTRIBUTIONS TO SHAREHOLDERS | | | | | | | | |
Investor Shares | | | (5,925,213) | | | | (2,521,089) | |
Institutional Shares | | | (2,127,046) | | | | (903,512) | |
| | | | | | | | |
Net Decrease in Net Assets from Distributions | | | (8,052,259) | | | | (3,424,601) | |
| | | | | | | | |
CAPITAL SHARE TRANSACTIONS | | | | | | | | |
Proceeds from sale of shares | | | 27,403,329 | | | | 40,899,419 | |
Net asset value of shares issued in reinvestment of distributions and dividends | | | 7,094,251 | | | | 2,918,086 | |
Payments for shares redeemed | | | (14,668,728) | | | | (27,333,533) | |
Redemption fees | | | 114 | | | | 3,948 | |
| | | | | | | | |
Net Increase (Decrease) in Net Assets from Capital Share Transactions | | | 19,828,966 | | | | 16,487,920 | |
| | | | | | | | |
Total Increase (Decrease) in Net Assets | | | 13,550,970 | | | | 31,797,295 | |
| | | | | | | | |
NET ASSETS | | | | | | | | |
Beginning of period | | $ | 189,917,475 | | | $ | 158,120,180 | |
| | | | | | | | |
End of period | | $ | 203,468,445 | | | $ | 189,917,475 | |
| | | | | | | | |
SEE NOTES TO FINANCIAL STATEMENTS
116
DOMINI IMPACT BOND FUND — INVESTOR SHARES
FINANCIAL HIGHLIGHTS
| | | | | | | | | | | | | | | | | | | | | | | | |
| | | Six Months
Ended
January 31, 2021
(unaudited) | | | Year Ended July 31, | |
| | | 2020 | | | 2019 | | | 2018 | | | 2017 | | | 2016 | |
For a share outstanding for the period: | | | | | | | | | | | | | | | | | | | | | | | | |
Net asset value, beginning of period | | | $12.49 | | | | $ 11.46 | | | | $10.92 | | | | $11.26 | | | | $11.60 | | | | $11.16 | |
| | | | | | | | | | | | | | | | | | | | | | | | |
Income from investment operations: | | | | | | | | | | | | | | | | | | | | | | | | |
Net investment income (loss) | | | 0.11 | | | | 0.22 | | | | 0.28 | | | | 0.26 | | | | 0.23 | | | | 0.24 | |
Net realized and unrealized gain (loss) on investments | | | - | | | | 1.04 | | | | 0.55 | | | | (0.33) | | | | (0.29) | | | | 0.50 | |
| | | | | | | | | | | | | | | | | | | | | | | | |
Total Income (loss) From Investment Operations | | | 0.11 | | | | 1.26 | | | | 0.83 | | | | (0.07) | | | | (0.06) | | | | 0.74 | |
| | | | | | | | | | | | | | | | | | | | | | | | |
Less dividends and/or distributions: | | | | | | | | | | | | | | | | | | | | | | | | |
Dividends to shareholders from net investment income | | | (0.10) | | | | (0.23) | | | | (0.27) | | | | (0.26) | | | | (0.23) | | | | (0.24) | |
Distributions to shareholders from net realized gain | | | (0.40) | | | | - | | | | - | | | | (0.01) | | | | (0.05) | | | | (0.06) | |
Tax return of capital 1 | | | - | | | | - | | | | (0.02) | | | | - | | | | (0.00) | 2 | | | - | |
| | | | | | | | | | | | | | | | | | | | | | | | |
Total Distributions | | | (0.50) | | | | (0.23) | | | | (0.29) | | | | (0.27) | | | | (0.28) | | | | (0.30) | |
| | | | | | | | | | | | | | | | | | | | | | | | |
Redemption fee proceeds 1 | | | 0.00 | 2 | | | 0.00 | 2 | | | 0.00 | 2 | | | 0.00 | 2 | | | 0.00 | 2 | | | 0.00 | 2 |
| | | | | | | | | | | | | | | | | | | | | | | | |
Net asset value, end of period | | | $12.10 | | | | $ 12.49 | | | | $11.46 | | | | $10.92 | | | | $11.26 | | | | $11.60 | |
| | | | | | | | | | | | | | | | | | | | | | | | |
Total return 3 | | | 0.87% | | | | 11.09% | | | | 7.77% | | | | -0.74% | | | | -0.32% | | | | 6.73% | |
Portfolio turnover | | | 191% | | | | 469% | | | | 319% | | | | 326% | | | | 386% | | | | 297% | |
Ratios/supplemental data (annualized): | | | | | | | | | | | | | | | | | | | | | | | | |
Net assets, end of period (in millions) | | | $151 | | | | $ 144 | | | | $ 121 | | | | $ 144 | | | | $ 143 | | | | $ 144 | |
Ratio of expenses to average net assets | | | 0.87% | 4 | | | 0.86% | 4,5 | | | 0.87% | 4,5 | | | 0.87% | 4 | | | 0.93% | 4 | | | 0.93% | 4 |
Ratio of gross expenses to average net assets | | | 1.14% | | | | 1.15% | | | | 1.20% | | | | 1.14% | | | | 1.16% | | | | 1.19% | |
Ratio of net investment income (loss) to average net assets | | | 1.66% | | | | 1.84% | | | | 2.55% | | | | 2.37% | | | | 2.06% | | | | 2.13% | |
1 Based on average shares outstanding.
2 Amount represents less than $0.005 per share.
3 Not annualized for periods less than one year.
4 Reflects a waiver of fees by the Manager and the Distributor of the Fund.
5 Ratio of expenses to average net assets includes transfer agent credits. Excluding transfer agent credits the ratio of expenses to average net assets would have been 0.87% for the year ended July 31, 2019 and 0.86% for the year ended July 31, 2020.
SEE NOTES TO FINANCIAL STATEMENTS
117
DOMINI IMPACT BOND FUND — INSTITUTIONAL SHARES
FINANCIAL HIGHLIGHTS
| | | | | | | | | | | | | | | | | | | | | | | | |
| | | Six Months
Ended
January 31, 2021
(unaudited) | | | Year Ended July 31, | |
| | | 2020 | | | 2019 | | | 2018 | | | 2017 | | | 2016 | |
For a share outstanding for the period: | | | | | | | | | | | | | | | | | | | | | | | | |
Net asset value, beginning of period | | | $12.41 | | | | $ 11.38 | | | | $10.89 | | | | $11.23 | | | | $11.57 | | | | $11.14 | |
| | | | | | | | | | | | | | | | | | | | | | | | |
Income from investment operations: | | | | | | | | | | | | | | | | | | | | | | | | |
Net investment income (loss) | | | 0.13 | | | | 0.25 | | | | 0.33 | | | | 0.30 | | | | 0.27 | | | | 0.27 | |
Net realized and unrealized gain (loss) on investments | | | (0.01) | | | | 1.04 | | | | 0.53 | | | | (0.34) | | | | (0.29) | | | | 0.49 | |
| | | | | | | | | | | | | | | | | | | | | | | | |
Total Income (loss) From Investment Operations | | | 0.12 | | | | 1.29 | | | | 0.86 | | | | (0.04) | | | | (0.02) | | | | 0.76 | |
| | | | | | | | | | | | | | | | | | | | | | | | |
Less dividends and/or distributions: | | | | | | | | | | | | | | | | | | | | | | | | |
Dividends to shareholders from net investment income | | | (0.12) | | | | (0.26) | | | | (0.34) | | | | (0.29) | | | | (0.27) | | | | (0.27) | |
Distributions to shareholders from net realized gain | | | (0.40) | | | | — | | | | — | | | | (0.01) | | | | (0.05) | | | | (0.06) | |
Tax return of capital 1 | | | — | | | | — | | | | (0.03) | | | | — | | | | (0.00) | 2 | | | — | |
| | | | | | | | | | | | | | | | | | | | | | | | |
Total Distributions | | | (0.52) | | | | (0.26) | | | | (0.37) | | | | (0.30) | | | | (0.32) | | | | (0.33) | |
| | | | | | | | | | | | | | | | | | | | | | | | |
Redemption fee proceeds 1 | | | 0.00 | 2 | | | 0.00 | 2 | | | 0.00 | 2 | | | 0.00 | 2 | | | 0.00 | 2 | | | 0.00 | 2 |
| | | | | | | | | | | | | | | | | | | | | | | | |
Net asset value, end of period | | | $12.01 | | | | $ 12.41 | | | | $11.38 | | | | $10.89 | | | | $11.23 | | | | $11.57 | |
| | | | | | | | | | | | | | | | | | | | | | | | |
Total return 3 | | | 0.93% | | | | 11.49% | | | | 8.06% | | | | -0.36% | | | | -0.13% | | | | 6.96% | |
Portfolio turnover | | | 191% | | | | 469% | | | | 319% | | | | 326% | | | | 386% | | | | 297% | |
Ratios/supplemental data (annualized): | | | | | | | | | | | | | | | | | | | | | | | | |
Net assets, end of period (in millions) | | | $53 | | | | $ 46 | | | | $ 37 | | | | $13 | | | | $ 6 | | | | $ 3 | |
Ratio of expenses to average net assets | | | 0.57% | 4 | | | 0.56% | 4,5 | | | 0.57% | 4,5 | | | 0.57% | 4 | | | 0.62% | 4 | | | 0.63% | 4 |
Ratio of gross expenses to average net assets | | | 0.77% | | | | 0.74% | | | | 0.84% | | | | 1.03% | | | | 1.02% | | | | 1.22% | |
Ratio of net investment income (loss) to average net assets | | | 1.95% | | | | 2.13% | | | | 2.84% | | | | 2.67% | | | | 2.38% | | | | 2.46% | |
1 Based on average shares outstanding.
2 Amount represents less than $0.005 per share.
3 Not annualized for periods less than one year.
4 Reflects a waiver of fees by the Manager of the Fund.
5 Ratio of expenses to average net assets includes transfer agent credits. Excluding transfer agent credits the ratio of expenses to average net assets would have been 0.57% for the year ended July 31, 2019 and 0.56% for the year ended July 31, 2020.
SEE NOTES TO FINANCIAL STATEMENTS
118
DOMINI IMPACT BOND FUND
NOTES TO FINANCIAL STATEMENTS
January 31, 2021 (Unaudited)
1. ORGANIZATION AND SIGNIFICANT ACCOUNTING POLICIES
The Domini Impact Bond Fund (the “Fund”) is a series of the Domini Investment Trust. The Trust is a Massachusetts business trust registered under the Investment Company Act of 1940 as an open-end management investment company. The Fund is an investment company and accordingly follows the investment company accounting and reporting guidance of the Financial Accounting Standards Board (the “FASB”) Accounting Standard Codification Topic 946 “Financial Services — Investment Companies”.
The Fund offers Investor Shares, Institutional Shares and Class Y shares. Institutional shares and Class Y shares were not offered prior to November 30, 2011, and June 15, 2018, respectively. As of January 31, 2021, the Class Y shares of the Bond Fund had not yet commenced operations. Each class of shares is sold at its offering price, which is net asset value.
The Institutional shares may only be purchased by or for the benefit of investors that meet the minimum investment requirements, and fall within the following categories: endowments, foundations, religious organizations and other nonprofit entities, individuals, retirement plan sponsors, family office clients, certain corporate or similar institutions, or omnibus accounts maintained by financial intermediaries and that are approved by the Fund’s Distributor.
Class Y shares may only be purchased through omnibus accounts held on the books of the Fund for financial intermediaries that have been approved by the Funds’ distributor. Each class of shares has identical rights and voting privileges with respect to the Fund in general and exclusive voting rights on matters that affect that class alone. Earnings, net assets, and net asset value per share may differ due to each class having its own expenses, such as transfer and shareholder servicing agent fees and registration fees, directly attributable to that class. Institutional shares are not subject to distribution fees.
The Fund seeks to provide its shareholders with a high level of current income and total return by investing in bonds and other debt instruments that are consistent with the Fund’s social and environmental standards and the submanager’s security selection approach.
The preparation of financial statements in conformity with U.S. generally accepted accounting principles requires management to make estimates and assumptions that affect the reported amounts of assets and liabilities and disclosure of contingent liabilities at the date of the financial statements and the reported amounts of revenues and expenses during the reporting period. Actual results could differ from those estimates. The following is a summary of the Fund’s significant accounting policies.
119
DOMINI IMPACT BOND FUND
NOTES TO FINANCIAL STATEMENTS (continued)
January 31, 2021 (Unaudited)
(A) Valuation of Investments. Bonds and other fixed-income securities (other than obligations with maturities of 60 days or less) are valued on the basis of valuations furnished by an independent pricing service, use of which has been approved by the Board of Trustees of the Fund. In making such valuations, the pricing service utilizes both dealer-supplied valuations and electronic data processing techniques that take into account appropriate factors such as institutional-size trading in similar groups of securities, yield, quality, coupon rate, maturity, type of issue, trading characteristics, and other market data, without exclusive reliance upon quoted prices or exchange or over-the-counter prices, since such valuations are believed to reflect more accurately the fair value of such securities. Short-term obligations of sufficient credit quality (maturing in 60 days or less) are valued at amortized cost, which constitutes fair value as determined by the Board of Trustees of the Fund. Securities (other than short-term obligations with remaining maturities of 60 days or less) for which there are no such quotations or valuations are valued at fair value as determined in good faith by or at the direction of the Fund’s Board of Trustees.
The Fund follows a fair value hierarchy that distinguishes between (a) market participant assumptions developed based on market data obtained from sources independent of the reporting entity (observable inputs) and (b) the Fund’s own assumptions about market participant assumptions developed based on the best information available in the circumstances (unobservable inputs). These inputs are used in determining the value of the Fund’s investments and are summarized in the following fair value hierarchy:
Level 1 — quoted prices in active markets for identical securities
Level 2 — other significant observable inputs (including quoted prices for similar securities, interest rates, and evaluated quotation obtained from pricing services)
Level 3 — significant unobservable inputs (including the Fund’s own assumptions in determining the fair value of investments).
The inputs or methodology used for valuing securities are not an indication of the risk associated with investing in those securities.
120
DOMINI IMPACT BOND FUND
NOTES TO FINANCIAL STATEMENTS (continued)
January 31, 2021 (Unaudited)
The following is a summary of the inputs used, as of January 31, 2021, in valuing the Fund’s assets carried at fair value:
| | | | | | | | | | | | | | | | |
| | | Level 1-
Quoted Prices | | | Level 2 -
Other
Significant
Observable
Inputs | | | Level 3 -
Significant
Unobservable
Inputs | | | Total | |
| | | | | | | | | | | | | | | | |
| | | | |
Assets: | | | | | | | | | | | | | | | | |
| | | | |
Long Term Investments in Securities: | | | | | | | | | | | | | | | | |
Mortgage Backed Securities | | $ | - | | | $ | 90,129,812 | | | $ | - | | | $ | 90,129,812 | |
Corporate Bonds and Notes | | | - | | | | 70,721,853 | | | | - | | | | 70,721,853 | |
Municipal Bonds | | | - | | | | 24,066,536 | | | | - | | | | 24,066,536 | |
U.S. Government Agency Obligations | | | - | | | | 15,117,679 | | | | - | | | | 15,117,679 | |
Senior Floating Rate Interests | | | - | | | | 8,824,739 | | | | - | | | | 8,824,739 | |
Foreign Government & Agency Securities | | | - | | | | 7,365,624 | | | | - | | | | 7,365,624 | |
Asset Backed Securities | | | - | | | | 1,108,863 | | | | - | | | | 1,108,863 | |
Certificates of Deposit | | | - | | | | 514,656 | | | | - | | | | 514,656 | |
| | | | | | | | | | | | | | | | |
Total Long Term Investments | | $ | - | | | $ | 217,849,762 | | | $ | - | | | $ | 217,849,762 | |
| | | | | | | | | | | | | | | | |
| | | | |
Short Term Investments in Securities: | | | | | | | | | | | | | | | | |
U.S. Government Agency Obligations | | | - | | | | 29,999,513 | | | | - | | | | 29,999,513 | |
| | | | | | | | | | | | | | | | |
Total Short Term Investments | | $ | - | | | $ | 29,999,513 | | | $ | – | | | $ | 29,999,513 | |
| | | | | | | | | | | | | | | | |
Total Investment in Securities | | $ | – | | | $ | 247,849,275 | | | $ | – | | | $ | 247,849,275 | |
| | | | | | | | | | | | | | | | |
| | | | |
Other Financial Instruments: | | | | | | | | | | | | | | | | |
Forward Currency Contracts | | | - | | | | 42,860 | | | | - | | | | 42,860 | |
Credit Default Swap - CCP | | | – | | | | 7,960 | | | | – | | | | 7,960 | |
Interest Rate Swap - CCP | | | – | | | | 369,282 | | | | - | | | | 369,282 | |
Total Return Swap - OTC | | | – | | | | 16,448 | | | | – | | | | 16,448 | |
| | | | | | | | | | | | | | | | |
Total Other Financial Instruments | | $ | – | | | $ | 436,550 | | | $ | – | | | $ | 436,550 | |
| | | | | | | | | | | | | | | | |
| | | | |
Liabilities: | | | | | | | | | | | | | | | | |
| | | | |
Other Financial Instruments: | | | | | | | | | | | | | | | | |
Forward Currency Contracts | | | – | | | | (440) | | | | - | | | | (440) | |
Futures | | | - | | | | (681) | | | | - | | | | (681) | |
Interest Rate Swap - CCP | | | – | | | | (362,928) | | | | - | | | | (362,928) | |
| | | | | | | | | | | | | | | | |
Total Other Financial Instruments | | $ | – | | | $ | (364,049) | | | $ | – | | | $ | (364,049) | |
| | | | | | | | | | | | | | | | |
121
DOMINI IMPACT BOND FUND
NOTES TO FINANCIAL STATEMENTS (continued)
January 31, 2021 (Unaudited)
(B) Foreign Currency Translation. Securities and other assets and liabilities denominated in foreign currencies are translated into U.S. dollar amounts on the date of valuation. Purchases and sales of securities, and income and expense items denominated in foreign currencies, are translated into U.S. dollar amounts on the respective dates of such transactions. Occasionally, events impact the availability or reliability of foreign exchange rates used to convert the U.S. dollar equivalent value. If such an event occurs, the foreign exchange rate will be valued at fair value using procedures established and approved by the Board of Trustees. The Funds do not separately report the effect of fluctuations in foreign exchange rates from changes in market prices on securities held. Such fluctuations are included with the net realized and unrealized gain or loss from investments. Realized foreign exchange gains or losses arise from sales of foreign currencies, currency gains or losses realized between the trade and settlement dates on securities transactions, and the difference between the recorded amounts of dividends, interest, and foreign withholding taxes and the U.S. dollar equivalent of the amounts actually received or paid. Net unrealized foreign exchange gains and losses arise from changes in fair value of assets and liabilities other than investments in securities held at the end of the reporting period, resulting from changes in exchange rates.
(C) Foreign Currency Contracts. When the Funds purchase or sell foreign securities they enter into foreign exchange contracts to minimize foreign exchange risk from the trade date to the settlement date of the transactions. A foreign exchange contract is an agreement between two parties to exchange different currencies at an agreed-upon exchange rate on a specified date. The Fund had $121,059 in outstanding open foreign currency spot contracts as of January 31, 2021.
(D) Securities Purchased on a When-Issued or Delayed Delivery Basis. The Fund may invest in when-issued or delayed delivery securities where the price of the security is fixed at the time of the commitment but delivery and payment take place beyond customary settlement time. These securities are subject to market fluctuation, and no interest accrues on the security to the purchaser during this period. The payment obligation and the interest rate that will be received on the securities are each fixed at the time the purchaser enters into the commitment. Purchasing obligations on a when-issued or delayed delivery basis is a form of leveraging and can involve a risk that the yields available in the market when the delivery takes place may be higher than those obtained in the transaction, which could result in an unrealized loss at the time of delivery. The Fund establishes a segregated account consisting of liquid securities equal to the amount of the commitments to purchase securities on such basis.
122
DOMINI IMPACT BOND FUND
NOTES TO FINANCIAL STATEMENTS (continued)
January 31, 2021 (Unaudited)
(E) TBA Purchase and Forward Sale Commitments. The Fund may enter into TBA commitments to purchase or sell securities for a fixed price at a future date. TBA commitments are considered securities in themselves and involve a risk of loss if the value of the security to be purchase or sold declines or increases prior to the settlement date, which is in addition to the risk of decline in the value of the Fund’s other assets.
(F) Derivative Financial Instruments. The Fund may invest in derivatives in order to hedge market risks, or to seek to increase the Fund’s income or gain. Derivatives in certain circumstances may require that the Fund segregate cash or other liquid assets to the extent the Fund’s obligations are not otherwise covered through ownership of the underlying security, financial instrument, or currency. Derivatives involve special risks, including possible default by the other party to the transaction, illiquidity, and the risk that the use of derivatives could result in greater losses than if it had not been used. Some derivative transactions, including options, swaps, forward contracts, and options on foreign currencies, are entered into directly by the counterparties or through financial institutions acting as market makers (OTC derivatives), rather than being traded on exchanges or in markets registered with the Commodity Futures Trading Commission or the SEC.
(G) Option Contracts. The Fund may purchase or write option contracts primarily to manage and/or gain exposure to interest rate, foreign exchange rate and credit risk. An option is a contract entitling the holder to purchase or sell a specific number of shares or units of an asset or notional amount of a swap (swaption), at a specified price. Options purchased are recorded as an asset while options written are recorded as a liability. Upon exercise of an option, the acquisition cost or sales proceeds of the underlying investment is adjusted by any premium received or paid. Upon expiration of an option, any premium received or paid is recorded as a realized gain or loss. Upon closing an option other than through expiration or exercise, the difference between the premium and the cost to close the position is recorded as a realized gain or loss. The Fund had no purchased option contracts outstanding as of January 31, 2021.
(H) Futures Contracts. The Fund may purchase and sell futures contracts based on various securities, securities indexes, and other financial instruments and indexes. The Fund intends to use futures contracts for hedging purposes. Futures contracts provide for the future sale by one party and purchase by another party of a specified amount of a specified security or financial instrument at a specified future time and at a specified price. When the Fund purchases or sells a futures contract, the Fund must allocate certain of its assets
123
DOMINI IMPACT BOND FUND
NOTES TO FINANCIAL STATEMENTS (continued)
January 31, 2021 (Unaudited)
as an initial deposit on the contract. The futures contract is marked to market daily thereafter, and the Fund may be required to pay or entitled to receive additional “variation margin,” based on decrease or increase in the value of the futures contract. Future contracts outstanding at January 31, 2021 are listed in the Fund’s Portfolio of Investments.
(I) Forward Currency Contracts. The Fund may enter into forward currency contracts with counterparties to hedge the value of portfolio securities denominated in particular currencies against fluctuations in relative value or to generate income or gain. These contracts are used to hedge foreign exchange risk and to gain exposure on currency. The U.S. dollar value of forward currency contracts is determined using current forward exchange rates supplied by a quotation service. The fair value of the contract will fluctuate with changes in currency exchange rates. The contract is marked to market daily and the change in fair value is recorded as an unrealized gain or loss. The Fund records a realized gain or loss equal to the difference between the value of the contract at the time it was opened and the value at the time it was closed when the contract matures or by delivery of the currency. The Fund could be exposed to risk if the value of the currency changes unfavorably, if the counterparties to the contracts are unable to meet the terms of their contracts or if the Fund is unable to enter into a closing position. Risk may exceed amounts recognized on the Statement of Assets and Liabilities. Forward currency contracts outstanding at January 31, 2021 are listed in the Fund’s Portfolio of Investments.
(J) Interest Rate Swap Contracts. The Fund may enter into interest rate swap contracts to hedge interest rate risk. An interest rate swap is an agreement between the Fund and a counterparty to exchange cash flows based on the difference between two interest rates, applied to a notional amount. Interest rate swap contracts are marked to market daily based upon quotations from an independent pricing service or market maker. Any change on an OTC interest rate swap is recorded as an unrealized gain or loss on the Statement of Assets and Liabilities. Daily fluctuations in the value of centrally cleared interest rate swaps are settled though a central clearing agent and are recorded in variation margin on the Statement of Assets and Liabilities and recorded as unrealized gain or loss. OTC and centrally cleared interest rate swap contracts outstanding at January 31, 2021, are listed in the Fund’s Portfolio of Investments.
(K) Credit Default Swap Contracts. The Fund may enter into credit default swap contracts primarily to manage and/or gain exposure to credit risk. A credit default swap is an agreement between the fund and a counterparty whereby the buyer of the contract receives credit protection and the seller of the contract guarantees the credit worthiness of a referenced debt obligation. These
124
DOMINI IMPACT BOND FUND
NOTES TO FINANCIAL STATEMENTS (continued)
January 31, 2021 (Unaudited)
agreements may be privately negotiated in the over-the-counter market (“OTC credit default swaps”) or may be executed in a multilateral trade facility platform, such as a registered exchange (“centrally cleared credit default swaps”). The underlying referenced debt obligation may be a single issuer of corporate or sovereign debt, a credit index, or a tranche of a credit index. In the event of a default of the underlying referenced debt obligation, the buyer is entitled to receive the notional amount of the credit default swap contract from the seller in exchange for the referenced debt obligation, a net settlement amount equal to the notional amount of the credit default swap less the recovery value of the referenced debt obligation, or other agreed upon amount. For centrally cleared credit default swaps, required initial margins are pledged by the fund, and the daily change in fair value is accounted for as a variation margin payable or receivable on the Statements of Assets and Liabilities. Over the term of the contract, the buyer pays the seller a periodic stream of payments, provided that no event of default has occurred. Such periodic payments are accrued daily as an unrealized appreciation or depreciation until the payments are made, at which time they are realized. Payments received or paid to initiate a credit default swap contract are reflected on the Statements of Assets and Liabilities and represent compensating factors between stated terms of the credit default swap agreement and prevailing market conditions (credit spreads and other relevant factors). These upfront payments are amortized over the term of the contract as a realized gain or loss on the Statements of Operations. OTC and centrally cleared credit default swap contracts outstanding at January 31, 2021 are listed in the Fund’s Portfolio of Investments.
(L) Total Return Swap Contracts. The Fund may enter into total return swaps to obtain investment exposures that are expected to correlate closely with the Index or a portion of the Index. Total return swaps are agreements in which there is an exchange of cash flows whereby one party commits to make payments on the total return (coupon plus capital gains/losses) of an underlying instrument in exchange for fixed or floating rate interest payments. To the extent the total return of the instrument or index underlying the transaction exceeds or falls short of the offsetting interest rate obligation, the Fund will receive a payment or make a payment to the counterparty. During the term of the outstanding swap agreement, changes in the underlying value of the swap are recorded as unrealized gains and losses. Periodic payments received or made are recorded as realized gains or losses. The Fund is exposed to credit loss in the event of nonperformance by the swap counterparty. Risk may also arise from the unanticipated movements in value of exchange rates, interest rates, securities, or the index.
125
DOMINI IMPACT BOND FUND
NOTES TO FINANCIAL STATEMENTS (continued)
January 31, 2021 (Unaudited)
(M) Master Agreements. The Fund is a party to ISDA (International Swaps and Derivatives Association, Inc.) Master Agreements that govern OTC derivative and foreign exchange contracts (Master Agreements) with certain counterparties entered into from time to time. The Master Agreements may contain provisions regarding, among other things, the parties’ general obligations, representations, agreements, collateral requirements, events of default and early termination. With respect to certain counterparties, in accordance with the terms of the Master Agreements, collateral posted to the Fund is held in a segregated account by the Fund’s custodian and with respect to those amounts which can be sold or repledged, are presented in the Fund’s portfolio. Collateral pledged by the Fund is segregated by the Fund’s custodian and identified in the Fund’s portfolio. Collateral can be in the form of cash or other marketable securities as agreed to by the Fund and the applicable counterparty. Collateral requirements are determined based on the Fund’s net position with each counterparty.
With respect to ISDA Master Agreements, termination events applicable to the counterparty include certain deteriorations in the credit quality of the counterparty. Termination events applicable to the Fund include failure of the Fund to maintain certain net asset levels and/or limit the decline in net assets over various periods of time. In the event of default or early termination, the ISDA Master Agreement gives the non-defaulting party the right to net and close-out all transactions traded, whether or not arising under the ISDA agreement, to one net amount payable by one counterparty to the other. However, absent an event of default or early termination, OTC derivative assets and liabilities are presented gross and not offset in the Statements of Assets and Liabilities. Early termination by the counterparty may result in an immediate payment by the Fund of any net liability owed to that counterparty under the ISDA agreement.
In a centrally cleared swap, while the Fund enters into an agreement with a clearing broker to execute contracts with a counterparty, the performance of the swap is guaranteed by the central clearinghouse, which reduces the Fund’s exposure to counterparty risk. The Fund is still exposed to the counterparty risk through the clearing broker and clearinghouse. The clearinghouse attempts to minimize this risk to its participants through the use of mandatory margin requirements, daily cash settlements and other procedures. Likewise, the clearing broker reduces its risk through margin requirements and required segregation of customer balances.
(N) Investment Transactions, Investment Income, and Dividends to Shareholders. Investment transactions are accounted for on trade date. Realized
126
DOMINI IMPACT BOND FUND
NOTES TO FINANCIAL STATEMENTS (continued)
January 31, 2021 (Unaudited)
gains and losses from security transactions are determined on the basis of identified cost. Interest income is recorded on an accrual basis. The Fund earns income daily, net of Fund expenses. Paydown gains and losses are recorded as an adjustment to interest income. Dividends to shareholders are usually declared daily and paid monthly from net investment income. Distributions to shareholders of realized capital gains, if any, are made annually. Distributions are determined in conformity with income tax regulations, which may differ from generally accepted accounting principles. Reclassifications have been made to the Fund’s components of net assets to reflect income and gains available for distribution (or available capital loss carryovers, as applicable) under income tax regulations.
(O) Federal Taxes. The Fund’s policy is to comply with the provisions of the Internal Revenue Code applicable to regulated investment companies and to distribute substantially all of its taxable income, including net realized gains, if any, within the prescribed time periods.
Accordingly, no provision for federal income or excise tax is deemed necessary. As of January 31, 2021, tax years 2017 through 2020 remain subject to examination by the Fund’s major tax jurisdictions, which include the United States of America, the Commonwealth of Massachusetts, and New York State.
(P) Redemption Fees. Redemptions and exchanges of Fund shares held less than 30 days may be subject to the Fund’s redemption fee, which is 2% of the amount redeemed. The fee is imposed to offset transaction costs and other expenses associated with short-term investing. The fee may be waived in certain circumstances at the discretion of the Fund. Such fees are retained by the Fund and are recorded as an adjustment to paid-in capital.
(Q) Other. Income, expenses (other than those attributable to a specific class), gains, and losses are allocated on a daily basis to each class of shares based upon the relative proportion of net assets represented by such class. Operating expenses directly attributable to a specific class are charged against the operations of that class.
(R) Transfer Agent Credits. Per the arrangement with the Fund’s former transfer agent, BNY Mellon Investment Servicing (U.S.) Inc., prior to June 22, 2020, the Fund had arrangements whereby it received earnings credits when positive cash balances were maintained, which were used to offset transfer agent fees.
(S) Indemnification. The Fund’s organizational documents provide current and former trustees and officers with a limited indemnification against liabilities
127
DOMINI IMPACT BOND FUND
NOTES TO FINANCIAL STATEMENTS (continued)
January 31, 2021 (Unaudited)
arising in connection with the performance of their duties to the Fund. In the normal course of business, the Fund may also enter into contracts that provide general indemnifications. The Fund’s maximum exposure under these arrangements is unknown as this would be dependent on future claims that may be made against the Fund. The risk of material loss from such claims is considered remote.
2. TRANSACTIONS WITH AFFILIATES
(A) Manager/Administrator. The Fund has retained Domini Impact Investments LLC (Domini) to serve as investment manager and administrator. The services provided by Domini consist of investment supervisory services, overall operational support, and administrative services, including the provision of general office facilities and supervising the overall administration of the Fund. For its services under the Management Agreement, Domini receives from the Fund a fee accrued daily and paid monthly at the annual rate of the Fund’s average daily net assets before any fee waivers of 0.33% of the first $50 million of net assets managed, 0.32% of the next $50 million of net assets managed, and 0.315% of next assets managed in excess of $100 million.
For its services under the Administration Agreement, Domini receives from the Fund a fee accrued daily and paid monthly at an annual rate equal to 0.25% of the Fund’s average daily net assets.
Effective November 30, 2020, Domini has contractually agreed to reduce its fees and/or reimburse certain ordinary operating expenses (excluding brokerage fees and commissions, interest, taxes, and other extraordinary expenses) in order to limit Investor, Institutional, and Class Y share expenses to 0.87%, 0.57%, and 0.65%, respectively, until November 30, 2021, absent an earlier modification by the Board of Trustees which oversee the Fund. For the six months ended January 31, 2021, Domini reimbursed expenses totaling $154,042.
As of January 31, 2021, Domini owned less than 1% of any class of the outstanding Shares of the Fund.
(B) Submanager. Wellington Management Company LLP (Wellington), a Delaware limited liability partnership, provides investment management services to the Fund on a day-to-day basis pursuant to a submanagement agreement with Domini.
(C) Distributor. The Board of Trustees of the Fund has adopted a Distribution Plan in accordance with Rule 12b-1 under the Act. DSIL Investment Services
128
DOMINI IMPACT BOND FUND
NOTES TO FINANCIAL STATEMENTS (continued)
January 31, 2021 (Unaudited)
LLC, a wholly owned subsidiary of Domini (DSIL), acts as agent of the Fund in connection with the offering of shares of the Fund pursuant to a Distribution Agreement. Under the Distribution Plan, the Fund pays expenses incurred in connection with the sale of Investor shares and pays DSIL a distribution fee at an aggregate annual rate not to exceed 0.25% of the average daily net assets representing the Investor shares. For the six months ended January 31, 2021, fees waived by the Investor shares totaled $92,558.
(D) Shareholder Service Agent. The Trust has retained Domini to provide certain shareholder services to the Fund and its shareholders, which services were previously provided by the former transfer agent for the Fund or another fulfillment and mail service provider and are supplemental to services currently provided by Ultimus Fund Soultions, LLC (“Ultimus”), as transfer agent to the Fund, pursuant to a master services agreement between the Fund and Ultimus. For these services, Domini receives a fee from the Fund paid monthly at an annual rate of $4.00 per active account. For the six months ended January 31, 2021, Domini waived fees as follows:
| | | | |
| | | FEES WAIVED | |
| | | | |
Domini Impact Bond Fund Investor Shares | | $ | – | |
Domini Impact Bond Fund Institutional Shares | | | 47 | |
(E) Trustees and Officers. Each of the Independent Trustees received an annual retainer for serving as a Trustee of the Trust of $28,000. The Lead Independent Trustee and Chair of the Audit Committee receive an additional chairperson fee of $5,000. Each Independent Trustee also receives $2,500 for attendance at each meeting of the Board of the Trust (reduced to $1,000 in the event that a Trustee participates at an in-person meeting by telephone). In addition, each Trustee receives reimbursement for reasonable expenses incurred in attending meetings. These expenses are allocated on a pro-rata basis to each shares class of a Fund according to their respective net assets.
As of January 31, 2021, all Trustees and officers of the Trust as a group owned less than 1% of the Fund’s outstanding shares.
3. INVESTMENT TRANSACTIONS
For the six months ended January 31, 2021, cost of purchase and proceeds from sales of investments other than short-term obligations were as follows:
| | | | | | | | |
| | | PURCHASES | | | SALES | |
U.S. Government Securities | | $ | 390,159,437 | | | $ | 398,234,539 | |
Investments in Securities | | | 22,524,367 | | | | 18,542,238 | |
129
DOMINI IMPACT BOND FUND
NOTES TO FINANCIAL STATEMENTS (continued)
January 31, 2021 (Unaudited)
4. SHARES OF BENEFICIAL INTEREST
At January 31, 2021, there was an unlimited number of shares authorized ($0.00001 par value). Transactions in the Funds’ shares were as follows:
| | | | | | | | | | | | | | | | |
| | | Six Months Ended
January 31, 2021
(unaudited) | | | Year Ended
July 31, 2020 | |
| | | Shares | | | Amount | | | Shares | | | Amount | |
| | | | |
Investor Shares | | | | | | | | | | | | | | | | |
Shares sold | | | 1,307,913 | | | $ | 16,092,251 | | | | 2,510,484 | | | $ | 29,633,328 | |
Shares issued in reinvestment of dividends and distributions | | | 472,733 | | | | 5,739,519 | | | | 205,156 | | | | 2,438,618 | |
Shares redeemed | | | (856,650) | | | | (10,527,099) | | | | (1,731,485) | | | | (20,462,811) | |
Redemption fees | | | – | | | | 113 | | | | – | | | | 3,893 | |
| | | | | | | | | | | | | | | | |
Net increase | | | 923,996 | | | $ | 11,304,784 | | | | 984,155 | | | $ | 11,613,028 | |
| | | | | | | | | | | | | | | | |
| | | | |
Institutional Shares | | | | | | | | | | | | | | | | |
Shares sold | | | 923,757 | | | $ | 11,311,078 | | | | 960,080 | | | $ | 11,266,091 | |
Shares issued in reinvestment of dividends and distributions | | | 112,334 | | | | 1,354,732 | | | | 40,554 | | | | 479,468 | |
Shares redeemed | | | (339,304) | | | | (4,141,629) | | | | (581,293) | | | | (6,870,722) | |
Redemption fees | | | – | | | | 1 | | | | – | | | | 55 | |
| | | | | | | | | | | | | | | | |
Net increase | | | 696,787 | | | $ | 8,524,182 | | | | 419,341 | | | $ | 4,874,892 | |
| | | | | | | | | | | | | | | | |
| | | | |
Total | | | | | | | | | | | | | | | | |
Shares sold | | | 2,231,670 | | | $ | 27,403,329 | | | | 3,470,564 | | | $ | 40,899,419 | |
Shares issued in reinvestment of dividends and distributions | | | 585,067 | | | | 7,094,251 | | | | 245,710 | | | | 2,918,086 | |
Shares redeemed | | | (1,195,954) | | | | (14,668,728) | | | | (2,312,778) | | | | (27,333,533) | |
Redemption fees | | | – | | | | 114 | | | | – | | | | 3,948 | |
| | | | | | | | | | | | | | | | |
Net increase | | | 1,620,783 | | | $ | 19,828,966 | | | | 1,403,496 | | | $ | 16,487,920 | |
| | | | | | | | | | | | | | | | |
130
DOMINI IMPACT BOND FUND
NOTES TO FINANCIAL STATEMENTS (continued)
January 31, 2021 (Unaudited)
5. SUMMARY OF DERIVATIVE ACTIVITY
At January 31, 2021, the Fund’s investments in derivative contracts are reflected on the Statement of Assets and Liabilities as follows:
| | | | | | | | | | | | |
| | | Asset Derivatives | | | | | Liability Derivatives | | | |
Derivative Contracts Not
Accounted for as
Hedging Instruments | | Statement of Assets
and Liabilities Location | | Fair Value | | | Statement of Assets
and Liabilities Location | | Fair Value | |
Interest Rate contracts | | Receivable for Variation Margin swaps / Unrealized appreciation on OTC swap contracts/Net assets consist of - Total distributable earnings | | | 413,688 | | | Payable for Variation Margin swaps / Unrealized depreciation on OTC swap contracts/Net assets consist of - Total distributable earnings | | $ | 411,023 | |
| | | | | | | | | | | | |
Credit contracts | | Receivable for Variation Margin swaps / Unrealized appreciation on OTC swap contracts/Net assets consist of - Total distributable earnings | | | 7,960 | | | Receivable for Variation Margin swaps / Unrealized depreciation on OTC swap contracts/Net assets consist of - Total distributable earnings | | | - | |
| | | | | | | | | | | | |
Forward currency contracts | | Unrealized appreciation on forward currency contracts/Net assets consist of -Total distributable earnings | | | 42,860 | | | Unrealized depreciation on forward currency contracts/Net assets consist of -Total distributable earnings | | | 440 | |
| | | | | | | | | | | | |
Futures contracts | | Receivable for Variation margin futures/Net assets consist of -Total distributable earnings | | | — | | | Receivable for Variation margin futures/Net assets consist of -Total distributable earnings | | | 672 | |
| | | | | | | | | | | | |
| | | | | | | | | | | | |
Total | | | | $ | 464,508 | | | | | $ | 412,135 | |
| | | | | | | | | | | | |
131
DOMINI IMPACT BOND FUND
NOTES TO FINANCIAL STATEMENTS (continued)
January 31, 2021 (Unaudited)
For the six months ended January 31, 2021, the effect of derivative contracts on the Fund’s Statement of Operations was as follows:
| | | | | | | | |
Derivative Contracts Not
Accounted for as
Hedging Instruments | | Statement of Operations
Location | | Realized Gain
(Loss) | | | Change in Unrealized
Appreciation
(Depreciation) |
Interest rate contracts | | Net realized gain (loss) from swap contracts/ Net change in unrealized appreciation (depreciation) from swap contracts | | | (320,177 | ) | | $354,290 |
| | | | | | | | |
Credit contracts | | Net realized gain (loss) from swap contracts/ Net change in unrealized appreciation (depreciation) from swap contracts | | | (33,549 | ) | | 5,758 |
| | | | | | | | |
Forward currency contracts | | Net realized gain (loss) from forward contracts/ Net change in unrealized appreciation (depreciation) from forward contracts | | | (196,614 | ) | | 143,013 |
| | | | | | | | |
Futures contracts | | Net realized gain (loss) from future contracts/ Net change in unrealized appreciation (depreciation) from future contracts | | | (79,754 | ) | | 78,104 |
| | | | | | | | |
| | | | | | | | |
Total | | | | $ | (630,094 | ) | | $581,165 |
| | | | | | | | |
The average notional cost of futures contracts and average notional amounts of other derivative contracts outstanding during the six months ended January 31, 2021, which are indicative of the volume of these derivative types, were approximately as follows
| | | | |
Futures contracts (notional) | | $ | 7,071,853 | |
Forward currency contracts (contract amount) | | $ | 4,575,064 | |
OTC interest rate swap contracts (notional) | | $ | 5,030,000 | |
Centrally cleared interest rate swap contracts (notional) | | $ | 35,483,645 | |
Centrally cleared credit default contracts (notional) | | $ | 1,889,536 | |
132
DOMINI IMPACT BOND FUND
NOTES TO FINANCIAL STATEMENTS (continued)
January 31, 2021 (Unaudited)
6. FEDERAL TAX STATUS
The tax basis of the components of net assets at July 31, 2020, is as follows:
| | | | |
Undistributed Ordinary Income | | $ | 5,679,765 | |
Undistributed capital gains | | | 388,807 | |
Unrealized appreciation/(depreciation) | | | 12,805,230 | |
Capital losses, other losses and other temporary differences | | | - | |
| | | | |
Distributable net earnings/(deficit) | | $ | 18,873,802 | |
| | | | |
For federal income tax purposes, dividends paid were characterized as follows:
| | | | | | | | |
| | | Year Ended July 31, | |
| | | 2020 | | | 2019 | |
| | | | | | | | |
Ordinary income | | $ | 3,424,601 | | | $ | 3,741,895 | |
Long-term capital gain | | | - | | | | - | |
Return of capital | | | - | | | | 278,159 | |
| | | | | | | | |
Total | | $ | 3,424,601 | | | $ | 4,020,054 | |
| | | | | | | | |
The Fund is subject to the provisions of Accounting Standards Codification ASC 740 Income Taxes (ASC 740). ASC 740 sets forth a minimum threshold for financial statement recognition of the benefit of a tax position taken or expected to be taken in a tax return. The Fund did not have a liability to record for any unrecognized tax benefits in the accompanying financial statements. No provision has been made for taxes on income, capital gains or unrealized appreciation on securities held or for excise tax on income and capital gains.
7. OTHER RISKS
The Fund’s risks include, but are not limited to, some or all of the risks discussed below:
Market Risk: The market values of securities or other assets will fluctuate, sometimes sharply and unpredictably, due to changes in general market conditions, overall economic trends or events, governmental actions or intervention, market disruptions caused by trade disputes or other factors, political developments, recessions, the spread of infectious illness or other public health issues, investor sentiment and other factors that may or may not be related to the issuer of the security or other asset. If the market values of the securities or other assets held by the Fund fall, including a complete loss on any individual security, the value of your investment will go down. Economies and financial markets throughout the world are increasingly interconnected. Economic, financial or political events, trading or tariff arrangements, terrorism, natural disasters, global pandemics and other circumstances in one country or region could have profound impacts on global economies or
133
DOMINI IMPACT BOND FUND
NOTES TO FINANCIAL STATEMENTS (continued)
January 31, 2021 (Unaudited)
markets. As a result, whether or not the Fund invests in securities of issuers located in or with significant exposure to the countries directly affected, the value and liquidity of the Fund’s investments may be negatively affected.
Recent Events Risk: The illness COVID-19 caused by a novel coronavirus has resulted in a global pandemic and major disruption to economies and markets around the world, including the United States. Global financial markets have experienced extreme volatility and severe losses, and trading in many instruments has been disrupted. Liquidity for many instruments has been greatly reduced for periods of time. Some interest rates are very low and in some cases yields are negative. Some sectors of the economy and individual issuers have experienced particularly large losses. These circumstances may continue for an extended period of time and may adversely affect the value and/or liquidity of the Fund’s investments. In addition, the impact of infectious illnesses in emerging market countries may be greater due to generally less established healthcare systems. Public health crises caused by the COVID-19 outbreak may exacerbate other pre-existing political, social and economic risks in certain countries or globally. The ultimate economic fallout from the pandemic, and the long-term impact on economies, markets, industries and individual issuers, are not known. Governments and central banks, including the Federal Reserve in the U.S., have taken extraordinary and unprecedented actions to support national economies and the financial markets. These actions have resulted in significant expansion of public debt, including in the U.S. The impact of these measures, and whether they will be effective to mitigate the economic and market disruption, may not be known for some time. The consequences of high public debt, including its future impact on the economy and securities markets, likewise may not be known for some time.
134
APPROVAL OF AMENDED AND RESTATED MANAGEMENT AGREEMENT AND SUBMANAGEMENT AGREEMENT WITH RESPECT TO THE DOMINI INTERNATIONAL OPPORTUNITIES FUND (UNAUDITED)
Section 15(c) of the Investment Company Act of 1940, as amended (the “1940 Act”) requires that each mutual fund’s board of trustees, including a majority of those trustees who are not “interested persons” of the mutual fund, as defined in the 1940 Act (the “Independent Trustees”), consider and approve the fund’s investment management and submanagement agreements. At its meeting held on July 28, 2020, the Board of Trustees (“Board” or “Trustees”) of the Domini Investment Trust (the Trust”), including all of the Independent Trustees, voted to approve the: (i) the Amended and Restated Management Agreement with Domini Impact Investments LLC (“Domini”) for the Domini International Opportunities Fund (the “International Opportunities Fund” or “Fund’)(the “Management Agreement”) with Domini Impact Investments LLC (“Domini” or the “Adviser”), and (ii) the Submanagement Agreement between Domini and SSGA Funds Management, Inc., (“SSGA” or “Subadviser”) with respect to the International Opportunities Fund (the “Submanagement Agreement” and with the Management Agreement, the “Agreements”).
Prior to the July 28, 2020, meeting, the Board requested, received, and reviewed written responses from Domini and SSGA to questions posed to them on behalf of the Independent Trustees and supporting materials relating to those questions and responses. The Board considered both written and verbal information furnished to the Board at its meetings throughout the year, as well as information specifically prepared in connection with the approval of the Agreements at the Board’s meeting on July 28, 2020. In addition, the Trustees also reviewed and discussed the proposal relating to the Fund at a special meeting held on June 24, 2020. Information provided to the Board at its meetings throughout the year included, among other things, reports on performance, legal and compliance matters, sales and marketing activity, shareholder services, and the other service provided to other Domini Funds by SSGA and Domini and their affiliates.
The Board considered the Management Agreement and the Submanagement Agreement separately in the course of its review. In doing so, the Board noted the respective roles of the Adviser and Subadviser in providing services to the Fund.
Throughout the process, the Board had the opportunity to ask questions of and request additional information from Domini and SSGA. The Board was assisted by legal counsel for the Trust and the Independent Trustees were also separately assisted by independent legal counsel throughout the process. The Independent Trustees also received memoranda from counsel to the Trust discussing the legal standards for their consideration of the Agreements. The Independent Trustees
135
were advised by and met in executive sessions with their independent legal counsel at which no representatives of management were present to discuss the proposed continuation of the Agreements, including at meetings on July 27 and July 28, 2020.
In connection with the Board’s consideration of the approval of the Agreement with respect to the Fund, the Board received written materials in advance of the meeting, which included information regarding: (i) the nature, extent, and quality of services to be provided to the Fund by Domini and by SSGA; (ii) a description of Domini and SSGA’s proposed investment management and other personnel and their background and experience; (iii) an overview of Domini’s and SSGA’s operations and financial condition; (iv) a comparison of the Funds’ estimated advisory fee and overall expenses with those of comparable mutual funds selected by Strategic Insight, a third party provider of mutual fund data; (v) performance information for Domini’s comparably managed accounts; (vi) the anticipated level of profitability from Domini and SSGA’s relationships with respect to the Fund; (vii) a description of Domini’s and SSGA’s brokerage practices (including any soft dollar arrangements); and (viii) Domini’s and SSGA’s compliance policies and procedures, including policies and procedures for personal securities transactions and with respect to cybersecurity, business continuity and disaster recovery.
In reaching their determination to approve the Management Agreement and Submanagement Agreement with respect to the Fund, the Trustees reviewed and evaluated information and a variety of factors that they believed relevant and appropriate through the exercise of their reasonable business judgment. The Trustees’ determination to approve the Agreements was based on a comprehensive consideration of all written and verbal information provided to the Board about Domini and SSGA throughout the year and specifically with respect to the approval of such Agreements, as applicable. In this regard, in addition to the meeting at which approval of the Agreements was considered, the Trustees also reviewed and discussed the proposal relating to the Fund at a special meeting held on June 24, 2020.
APPROVAL OF THE MANAGEMENT AGREEMENT
The primary factors and the conclusions regarding the Management Agreement are described below. The Board did not identify any particular information or factor that was all-important or controlling, and each Trustee may have weighted certain factors differently. The Board noted that the evaluation process with respect to Domini and the Management Agreement is an ongoing one. In evaluating the Management Agreement, the Trustees also took into account their knowledge of Domini, its proposed services with respect to the Fund and the other Domini Funds resulting from their meetings and other information and interactions in past years. The Board also considered other factors (including conditions and trends prevailing generally in the economy, the securities markets and the industry).
136
Nature, Quality, and Extent of Services to be Provided. The Trustees reviewed information and materials provided by Domini related to the Management Agreement, including the Management Agreement, Domini’s Form ADV, a description of the firm and its organizational and management structure, its operational history and its legal and regulatory history, the manner in which investment decisions are expected to be made and executed with respect to the Fund, the financial condition of Domini and its ability to provide the services required under the Management Agreement, an overview of the personnel that are expected to perform services for the Fund, and Domini’s compliance policies and procedures. The Board also considered Domini’s risk management processes and its policies and procedures with respect to cybersecurity, business continuity and disaster recovery. The Board considered Domini’s financial condition and operations during the COVID-19 pandemic and noted that there had been no material disruption of Domini’s services to the other Domini Funds.
The Trustees reviewed the terms of the Management Agreement and considered that, pursuant to the Management Agreement, Domini, subject to the direction of the Board, is responsible for providing advice and guidance with respect to the Fund and for managing the investment of the assets of the Fund, including by engaging and overseeing the activities of the Fund’s submanager. It was noted that Domini would apply its social and environmental standards to select the Fund’s investments and that SSGA Funds Management, Inc. (“SSGA”), the Fund’s submanager, would be responsible for purchasing and selling securities to implement Domini’s selections and manage the amount of the Fund’s assets to be held in short-term investments.
The Trustees considered the scope and the quality of the services to be provided by Domini to the Fund under the Management Agreement. They considered the professional experience, tenure, and qualifications of the investment management team and the other senior personnel at Domini who will be responsible for the management of the Fund, including the oversight of the Fund’s submanager. They also considered Domini’s capabilities and experience in the development and application of social and environmental investment standards and its reputation and leadership in the socially responsible investment community. The Trustees considered the information they had received from Domini concerning the professional experience of its research team. They noted that the senior members of Domini’s research team had years of experience in the development and application of social and environmental investment standards. The terms of the Management Agreement were also reviewed by the Trustees. In addition, they considered Domini’s compliance record. The Trustees also noted that, on a regular basis, they receive information from the Trust’s Chief Compliance Officer regarding Domini’s compliance policies and procedures, including its Code of Ethics. The Trustees took into account the scope of compliance services to be provided by Domini and the undertakings required of Domini in connection with those services.
137
They also considered the quality of Domini’s compliance oversight program with respect to the Fund’s service providers, including the Fund submanager. They also considered both the investment advisory services and the nature, quality and extent of the administrative and other non-advisory services, including shareholder servicing and distribution support services to be provided to the Fund and its shareholders by Domini and its affiliates. The Board also considered the significant risks Domini would assume in connection with the services to be provided to the Fund, including entrepreneurial risk and ongoing risks including investment, operational, enterprise, litigation, regulatory and compliance risks with respect to the Fund.
The Trustees noted that Domini will administer the Fund’s business and other affairs pursuant to the Management Agreement. It was noted that, among other things, Domini will provide the Fund with office space, administrative services and personnel as are necessary for operations, and that Domini will pay all of the compensation of the officers and the Trustees who are not Independent Trustees. The Trustees considered the quality of the administrative services Domini will provide to the Fund, including Domini’s role in coordinating and monitoring the activities of service providers. They noted that they were satisfied with the quality of the management and administrative services to be provided by Domini to the Fund, particularly Domini’s oversight of the Fund’s submanager and development and application of social and environmental investment standards.
Based on the foregoing, the Trustees concluded that the nature, quality and extent of services to be provided by Domini to the Fund under the Management Agreement were expected to be satisifactory.
Performance Information. The Trustees did not consider the Fund’s performance in approving the Management Agreement because the Fund has not commenced operations and does not have a performance history. The Trustees considered the investment performance of the Domini Impact International Equity Fund (“International Equity Fund”) another mutual fund managed by Domini that has a similar investment objective and primarily invests in mid- to large-cap international securities. The Trustees noted however, that the Fund and International Equity Fund utilize different subadvisers and public benchmarks, and that there are differences between each Fund’s investment process and strategies, as well as different portfolio managers. The Trustees concluded that they had confidence in Domini’s overall capability to manage the Fund.
Fees and Other Expenses. The Trustees considered the proposed management fees to be paid by the Fund to Domini, the proposed submanagement fees to be paid by Domini to the Fund’s submanager, the portion of the fees to be retained by Domini, and Domini’s contractual expense limitation arrangement with respect to the Fund.
138
The Trustees considered the information provided to them by Strategic Insight including data relating to the level of the Fund’s proposed management fee versus the aggregate management fee for the relevant Strategic Insight peer groups of SRI funds and compared the Fund’s total expense ratio, after giving effect to contractual fee waiver arrangements, to the total expense ratio of those peers. The Trustees also considered that Domini (and not the Funds) would pay the Fund’s submanager from its advisory fee.
Based on the information provided by Strategic Insight, the Trustees noted that the proposed aggregate management fees for the Fund’s Investor shares, after giving effect to Domini’s contractual fee waiver arrangement, were below the median aggregate management fees of its SRI peer group net of applicable waivers. They also considered that the total expense ratio of the Fund’s Investor shares, after giving effect to the contractual expense waivers, was above the median total expense ratio of the SRI peer group after waivers.
The Board took into account management’s discussion of the Fund’s anticipated expenses, including regarding the differences between the amount of those expenses and the expenses borne by the funds in the Fund’s expense peer group, as well as the impact of the size of the Domini fund complex on expenses relative to those of the other funds in the Fund’s peer group. The Board also noted management’s discussion of the management fee structure and considered that Domini would be waiving and/or reimbursing expenses for the Fund. The Board also took into account Domini’s discussion of the Fund’s proposed management fee as compared to other funds that Domini manages.
Based on the foregoing, the Trustees concluded that the proposed management fees payable by the Fund were fair and reasonable in relation to the nature and quality of services to be provided and supported approval of the Management Agreement.
Costs of Services Provided and Profitability. The Trustees reviewed information provided to them by Domini concerning the estimated costs to be borne by and profitability of Domini in respect of its management relationship with the Fund for the 2020 calendar year, along with a description of the methodology used by Domini in preparing the profitability information. The Trustees also noted that Domini would pay the submanagement fees for the Fund out of the management fees that it received from the Fund. The Trustees also considered that Domini would enter into an expense limitation arrangement with respect to the Fund. The Board also took into account the risks that Domini would assume as adviser including entrepreneurial, operational, reputational, litigation and regulatory risk. The Trustees concluded that they were satisfied that the estimated level of profitability of Domini and its affiliates with respect to the services to be provided to the Fund was not excessive in view of the nature, quality and extent of services to be provided.
139
Economies of Scale. The Trustees also considered whether economies of scale would be realized by Domini as the Fund’s assets increased and the extent to which such economies of scale were reflected in the proposed fees to be charged with respect to the Fund under the Management Agreement. The Trustees noted that there were breakpoints in the management fee schedule. The Trustees concluded that breakpoints were an effective way to share economies of scale and that this was a positive factor in support of the approval of the Management Agreement.
Other Benefits. The Trustees considered the other benefits that Domini and its affiliates would receive from their relationship with the Fund. The Trustees considered the brokerage practices of Domini and noted that, based on information provided to them, Domini would was not expected to receive the benefits of soft dollar commissions with respect to the Fund. The Trustees also considered the intangible benefits that may accrue to Domini and its affiliates by virtue of their relationship with the Fund. The Trustees concluded that the benefits to be received by Domini and its affiliates, as outlined above, were reasonable in the context of the relationship between Domini and the Fund, and supported the approval of the Management Agreement.
APPROVAL OF THE SUBMANAGEMENT AGREEMENT
The primary factors and the conclusions regarding the Submanagement Agreement are described below. The Trustees did not identify any particular information or factor that was all-important or controlling, and each Trustee may have weighted certain factors differently. The Trustees noted that the evaluation process with respect to SSGA and the Submanagement Agreement is an ongoing one. In evaluating the Submanagement Agreement, the Trustees took into account their knowledge of SSGA, its proposed services with respect to the Fund and the other Domini Funds resulting from their meetings and other information and interactions in past years. The Board also considered other factors (including conditions and trends prevailing generally in the economy, the securities markets and the industry).
Nature, Quality, and Extent of Services to be Provided. The Trustees reviewed information and materials provided by SSGA related to the Submanagement Agreement, including the Submanagement Agreement, SSGA’s Form ADV, a description of the firm and its organizational and management structure, its operational history and its legal and regulatory history, the manner in which investment decisions are expected to be made and executed with respect to the Fund, the financial condition of SSGA and its ability to provide the services required under the Submanagement Agreement, an overview of the personnel that are expected to perform services for the
Fund, and SSGA’s compliance policies and procedures. The Board also considered SSGA’s risk management processes and its policies and procedures with respect to cybersecurity, business continuity and disaster recovery. The
140
Board considered SSGA’s financial condition and operations during the COVID-19 pandemic and noted that there had been no material disruption of SSGA’s services to the other Domini Funds for which SSGA provides submanagement services.
The Trustees reviewed the terms of the Submanagement Agreement and considered the scope and quality of the services to be provided by SSGA to the Fund under the Submanagement Agreement. The Trustees noted that pursuant to the Submanagement Agreement, Domini, subject to the direction of the Board, is responsible for providing advice and guidance with respect to the Fund and for managing the investment of the assets of the Fund, which it proposed to do by engaging and overseeing the activities of SSGA. It was noted that Domini would apply its social and environmental standards to select the Fund’s investments and that SSGA would be responsible for purchasing and selling securities to implement Domini’s selections and for managing the amount of the Fund’s assets to be held in short-term investments.
The Trustees then considered the professional experience, tenure, and qualifications of the proposed portfolio management team of the Fund and the other senior personnel at SSGA. They also reviewed SSGA’s compliance record. The Trustees also noted that, on a regular basis, it receives information from the Trust’s Chief Compliance Officer regarding SSGA’s compliance policies and procedures, including its Code of Ethics. The Trustees also received information with respect to SSGA’s brokerage policies and practices, including with respect to best execution and soft dollars. The terms of the Submanagement Agreement were also reviewed by the Trustees.
Based on the foregoing, the Trustees concluded that the nature, quality and extent of services to be provided by SSGA to the Fund under the Submanagement Agreement were expected to be satisfactory.
Performance Information. The Trustees did not consider the Fund’s performance in approving the Submanagement Agreement because the Fund has not commenced operations and does not have a performance history. The Trustees also noted that SSGA did not advise a comparable fund.
Fees and Other Expenses. The Trustees then considered the proposed submanagement fees to be paid by Domini to SSGA under the Submanagement Agreement. The Trustees noted that the Submanagement Agreement had been negotiated at arms-length between Domini and SSGA. The Trustees also compared SSGA’s proposed fee with respect to the Fund against the submanagement fees paid by another Domini Fund submanaged by SSGA under a similar submanagement structure and took into account the different investment strategies of each Fund. The Trustees also noted the comparative sub-advisory fee information, as available, in the report provided by Strategic Insight with respect to the Fund. The Trustees noted that Domini (and not the
141
Fund) would pay SSGA from its management fee and that they had reviewed the proposed management fee and comparative fee information in connection with their consideration of the Management Agreement.
The Trustees determined, based on the nature and quality of the services to be provided by SSGA, and in light of the preceding factors, that the fees to be paid by Domini to SSGA with respect to the Fund were fair and reasonable in relation to the nature and quality of services provided and supported approval of the Submanagement Agreement.
Costs of Services Provided and Profitability. Among other information, the Trustees reviewed SSGA’s financial statements. The Trustees concluded that they were satisfied that the estimated level of profitability of SSGA with respect to services provided to the Fund was not excessive. However, the Board also took into account that the Submanagement Agreement was negotiated on an arms-length basis and that Domini, and not the Fund, would pay the cost of the submanagement fees to be paid to SSGA and that, therefore, the costs of the services to be provided and the profitability to be realized by SSGA was not a material factor in the Board consideration.
Economies of Scale. The Trustees also considered whether economies of scale would be realized by SSGA as the assets in the Fund increased and the extent to which economies of scale were reflected in the proposed fees to be charged under the Submanagement Agreement. The Trustees noted that the submanagement fees would be paid by Domini and not the Fund. However, the Trustees noted the breakpoints in fees payable under the Submanagement Agreement, as well as breakpoints in the fees payable to Domini under the Management Agreement for the Fund, and concluded that such breakpoints were an effective way to share economies of scale with shareholders as the assets in the Fund grew and supported the approval of the Submanagement Agreement.
Other Benefits. The Trustees considered the other benefits that SSGA and its affiliates received from their relationship with the Fund. They considered that SSGA’s affiliate, State Street Bank & Trust Company, provides custody, fund accounting and administration serivces to the Domini Funds, including the Fund. The Trustees also considered the brokerage practices of SSGA including its use of soft dollar arrangements. In addition, the Trustees considered the intangible benefits that may accrue to SSGA and its affiliates by virtue of their relationship with the Fund.
The Trustees concluded that the benefits to be received by SSGA and its affiliates, as noted above, were reasonable in the context of the relationship between SSGA and the Fund and supported the approval of the Submanagement Agreement.
* * * * * *
142
Based on the Board’s evaluation of all factors that the Board deemed to be material, including those factors described above, the Board, including the Independent Trustees, concluded that approval of the Management Agreement and the Submanagement Agreement would be in the best interest of the Fund and its shareholders. Accordingly, the Board, and the Independent Trustees voting separately, approved the Management Agreement and Submanagement Agreement.
143
PROXY VOTING INFORMATION
The Domini Funds have established Proxy Voting Policies and Procedures that the Funds use to determine how to vote proxies relating to portfolio securities. The Domini Funds’ Proxy Voting Policies and Procedures are available, free of charge, by calling 1-800-762-6814, by visiting domini.com/proxyvoting, or by visiting the EDGAR database on the Securities and Exchange Commission’s (SEC) website at sec.gov. All proxy votes cast for the Domini Funds are posted to Domini’s website on an ongoing basis over the course of the year. An annual record of all proxy votes cast for the Funds during the most recent 12-month period ended June 30 can be obtained, free of charge, at domini.com, and on the EDGAR database on the SEC’s website at sec.gov.
QUARTERLY PORTFOLIO SCHEDULE INFORMATION
The Domini Funds file their complete schedule of portfolio holdings with the SEC for the first and third quarters of each fiscal year on Form N-Port EX. The Domini Funds’ Forms NPORT-EX are available on the EDGAR database on the SEC’s website at sec.gov. These Forms may also be reviewed and copied at the SEC’s Public Reference Room in Washington, D.C. Information about the operation of the Public Reference Room may be obtained by calling 1-800-SEC-0330. The information on is also available to be viewed at domini.com.
144
(a) Not applicable to a semi-annual report.
(c) Not applicable.
(d) Not applicable.
| Item 3. | Audit Committee Financial Expert. |
Not applicable to a semi-annual report.
| Item 4. | Principal Accountant Fees and Services. |
Not applicable to a semi-annual report.
| Item 5. | Audit Committee of Listed Registrants. |
Not applicable to the registrant.
| Item 6. | Schedule of Investments. |
(a) The Schedule of Investments is included as part of the report to stockholders filed under Item 1.
(b) Not applicable.
| Item 7. | Disclosure of Proxy Voting Policies and Procedures for Closed-End Management Investment Companies. |
Not applicable to the registrant.
| Item 8. | Portfolio Managers of Closed-End Management Investment Companies. |
Not applicable to the registrant.
| Item 9. | Purchases of Equity Securities by Closed-End Management Investment Company and Affiliated Purchasers. |
Not applicable to the registrant.
| Item 10. | Submission of Matters to a Vote of Security Holders. |
There have been no material changes to the procedures by which shareholders may submit recommendations for nominees to the registrant’s Board of Trustees.
Item 11. Controls and Procedures.
(a) Within 90 days prior to the filing of this report on Form N-CSR, Carole M. Laible, the registrant’s President and Principal Executive Officer, and Christina M. Povall, the registrant’s Treasurer and Principal Financial Officer, reviewed the registrant’s disclosure controls and procedures (as defined in Rule 30a-3(c) of the Investment Company Act of 1940) and evaluated their effectiveness. Based on their evaluation, Ms. Laible and Ms. Povall determined that the disclosure controls and procedures adequately ensure that information required to be disclosed by the registrant in this report on Form N-CSR is recorded, processed, summarized, and reported within the time periods required by the Securities and Exchange Commission’s rules and forms.
(b) There were no changes in the registrant’s internal control over financial reporting (as defined in Rule 30a-3(d) under the Investment Company Act of 1940) that occurred during the second fiscal quarter of the period covered by this report that have materially affected, or are reasonably likely to materially affect, the registrant’s internal control over financial reporting.
Item 12. Disclosure of Securities Lending Activities for Closed-End Management Investment Companies.
Not applicable to the registrant
Item 13. Exhibits.
(a)(1) Not applicable to a semi-annual report.
(a)(2) Separate certifications required by Rule 30a-2(a) under the Investment Company Act of 1940 for each principal executive officer and principal financial officer of the registrant are filed herewith.
(b) A single certification required by Rule 30a-2(b) under the Investment Company Act of 1940, Rule 13a-14b or Rule 15d-14(b) under the Securities Exchange Act of 1934, and Section 1350 of Chapter 63 of Title 18 of the United States Code for the chief executive officer and the chief financial officer of the registrant is filed herewith.
SIGNATURES
Pursuant to the requirements of the Securities Exchange Act of 1934 and the Investment Company Act of 1940, the registrant has duly caused this report to be signed on its behalf by the undersigned, thereunto duly authorized.
| | |
| DOMINI INVESTMENT TRUST |
| |
| By: | | /s/ Carole M. Laible |
| | Carole M. Laible |
| | President |
Date: April 8, 2021
Pursuant to the requirements of the Securities Exchange Act of 1934 and the Investment Company Act of 1940, this report has been signed below by the following persons on behalf of the registrant and in the capacities and on the dates indicated.
| | |
| By: | | /s/ Carole M. Laible |
| | Carole M. Laible |
| | President (Principal Executive Officer) |
Date: April 8, 2021
| | |
| By: | | /s/ Christina M. Povall |
| | Christina M. Povall |
| | Treasurer (Principal Financial Officer) |
Date: April 8, 2021