UNITED STATES
SECURITIES AND EXCHANGE COMMISSION
Washington, D.C. 20549
FORM N-CSR
CERTIFIED SHAREHOLDER REPORT OF REGISTERED
MANAGEMENT INVESTMENT COMPANIES
Investment Company Act File Number 811-5823
DOMINI INVESTMENT TRUST
(Exact Name of Registrant as Specified in Charter)
180 Maiden Lane, Suite 1302, New York, New York 10038
(Address of Principal Executive Offices)
Amy Domini Thornton
Domini Impact Investments LLC
180 Maiden Lane, Suite 1302
New York, New York 10038
(Name and Address of Agent for Service)
Registrant’s Telephone Number, including Area Code: 212-217-1100
Date of Fiscal Year End: July 31
Date of Reporting Period: January 31, 2023
| Item 1. | Reports to Stockholders. |
| | (a) | A copy of the report transmitted to stockholders pursuant to Rule 30e-1 under the Investment Company Act of 1940 follows. |

Semi-Annual Report 2023
January 31, 2023 (Unaudited)

Domini Impact Equity FundSM
Domini International Opportunities FundSM
Domini Sustainable Solutions FundSM
Domini Impact International Equity FundSM
Domini Impact Bond FundSM

Thousands of starfish washed ashore.
A little girl began placing them back in the water
so they wouldn’t die.
“Don’t bother, dear,” her mother said,
“it won’t make a difference.”
The girl stopped for a moment and
looked at the starfish in her hand.
“It will make a difference to this one.”

| | | | |
 | | Sign up for Domini news and impact updates at domini.com/subscribe | |  |
TABLE OF CONTENTS
LETTER TO SHAREHOLDERS
Dear Fellow Shareholder,
In thinking about the six months ending on January 31, 2023, the phrase of Shakespeare’s Macbeth, “full of sound and fury and signifying nothing,” comes to mind. We saw days of extreme optimism followed by dismal headlines only to revert again the following day. But when all was said and done, the semi-annual period resulted in a 1.3% decline of the S&P 500, a widely followed broad U.S. stock market index. That’s minor when taken in context of the swings of the period. Considering that interest rates were raised by the Federal Reserve five times, a record for a six-month period, this sideways drift was quite remarkable, and an indication that investors feel some confidence that the economy will benefit from these actions.
There were several reasons a major sell-off could have taken place. In addition to higher rates, we saw catastrophic weather pummel most of the globe and certainly most of our country. The war in Ukraine has not resolved. Our politicians still remain at opposite sides of the chasm on most policy decisions. Regulators ignored cryptocurrency and it imploded, destroying wealth as it did so. Yes, during such a period, a relatively flat stock market could be interpreted as a strong statement of confidence.
Among this dizzying swirl of events, there was one especially bright spot of special interest to responsible investors. The United Nations Biodiversity Conference (also known as the Biodiversity COP15), held in Montreal, Canada, produced an important, quite possibly planet-saving agreement to protect our natural world. 188 nations agreed to several key strategies aimed at preserving those species now at risk. One resolution is that transnational companies and financial institutions should shoulder a part of the burden by monitoring and disclosing their impacts on biodiversity.
There are those who argue that species loss doesn’t really matter to humans. But consider the effects of severe weather. Would the shorelines be better protected if oysters still thrived along them? Would watersheds naturally channel excess capacity downstream if wolves still kept deer off the banks, thereby allowing vegetation to secure the channel? While the Kunming-Montreal Global Biodiversity Framework of the Biodiversity COP 15 has been adopted and outcomes are difficult to predict, the call for action is evidenced by the consensus of a vast number of nations. This provides hope that we can find a path forward to live in harmony with nature.
2
Each year we provide a topical essay that we believe is of interest to our shareholders. To celebrate the adoption of the Global Biodiversity Framework, Amy Domini’s essay “Back to Nature,” first published in 2014, seemed written for such an occasion. After almost ten years, the relevance and messages of this piece resonate today. Amy’s reflection that “untouched places gave me the ability to find peace in a bird’s stare” stirs us to recognize the value of nature in our lives. And her forthright challenge — to conserve more and live with less — is a reminder that we all have a role in protecting our planet.
We at Domini remain convinced that responsible investors are an essential part of the solution. We have long believed that we can harness the power of finance to help build a better future for all. We thank you for your ongoing support of the field and for your investment with us.
| | |

Carole Laible CEO | | 
Amy Domini Founder and Chair |

3
BACK TO NATURE
In this essay, Amy shares some personal memories about the virtues of spending time in nature. Companies, and we as consumers, hold a responsibility to safeguard nature and biodiversity. She sheds a light on what we need to do to get this done.
For most of my life, I have enjoyed taking long walks by myself in the woods and fields. When I was a young girl, these walks might have lasted a couple of hours. We lived in the Berkshire foothills, so the woods were hilly and full of boulders. As I grew into my teens and twenties, I spent time on Cape Cod and learned about walking over sandy beaches and rocky shores. In recent years, I’ve largely returned to the woods, where beaten trails are shaded and filled with discoverable wonders.
Walks provide a person with a chance to accomplish a great deal. One gets a bit of exercise, a chance to meditate, a chance to discover and, for some, the thrill of exhaustion. As a young girl, I could walk through woods that led to a cow farm. It was only because of an old stone wall that I knew a farm had once been on that location. There was a spongy spot marking a shallow spring, and it was surrounded by a yellow flower I knew was cowslip because I was a Girl Scout and studied such things.
Once, as I was resting against a fallen tree that often had bugs and mushrooms on it, a small bird stopped nearby. We locked eyes and stared at each other for a long time. When I went home, I tried to identify it but failed. Another area had small birch trees, some white and some black. The black birch has bark that is sweet, like spearmint, and I’d stop and suck on bits of it. The thin white birch trees were supple. I could pull their heads low and grab a spot. Then with a little jump I’d be lifted off my feet and gently set down in another spot.
Pristine natural environments give us a gift, and that gift is a lasting one. Pristine places are important. Much as I love the manicured parks of the great cities, and much as I love the manicured little garden on my own land, it was the earlier experience of untouched places that gave me the ability to find peace in a bird’s stare.
Today, I work with ethical investors, and I recognize that our natural environment is an important partner to humankind and to corporations. Corporations depend heavily on a functional natural ecosystem for so many things, but do they recognize that in a partnership there is give and take? That’s what ethical investors care about. For example, most U.S. home-building companies have a business model that is not great for the planet. They find a pristine place and put in roads and yards and houses. The houses they build have terrible carbon footprints and must be arrived at by car, another environmental problem. But in England, the laws are different. Houses are frequently built on old brownfields and other land that has been despoiled.
4
These houses are situated near public transit and bike lanes and are ecologically designed to function as a small village. The website of one company speaks of building around the centuries-old hedges that stood on the land.
So, there is good news. Climate change has not gone unnoticed by institutional investors, who for some years now have been putting pressure on corporate leadership to disclose their carbon footprints, to reduce their waste, and to manage their affairs with greater ecological efficiency. There is also good news on the corporate side as more and more companies take steps to do a better job.
Corporations depend heavily on a functional natural ecosystem for so many things, but do they recognize that in a partnership there is give and take?
Corporations in and of themselves are a problem, but they are not the only one. They survive by selling what people believe they need, or at least want. Who has not seen photographs of children living in favelas built on garbage heaps? Who has not seen photographs of children dipping a cup into a barrel of water, a barrel clearly labeled as containing hazardous materials? These children will never take a long walk out to where the birch trees sway. You and I are the problem, and the reason is our uncontrolled consumption.
Face it: Those reading this column have more than they need. A small home with sparse furnishings and a couple of changes of clothes was plenty for millennia. But because we want more, we feed the beast. And the beast of capitalism finds ways to get us more stuff at a price point we feel good about. That means creating externalities, like not caring where our T-shirt was made or how the copper was mined. We privatize profit to get to get ourselves stuff, while channeling the health and environmental costs onto those poor young children.
It is important that we enjoy and protect pristine spaces. It is also important that we live without every delight our minds can imagine. The pristine space and natural joys of childhood are giving way to our quest for stuff; when you think it through, that’s just wrong.
5
An investment in the Domini Funds is not a bank deposit and is not insured. Investing involves risk, including possible loss of principal. The market value of Fund investments will fluctuate.
An investment in the Domini Impact Equity Fund is subject to certain risks, including impact investing, portfolio management, information, market, mid- to large-cap companies, and small-cap companies risks. An investment in the Domini International Opportunities Fund is subject to certain risks, including foreign investing, geographic focus, country, currency, impact investing, portfolio management, and information risks. An investment in the Domini Sustainable Solutions Fund is subject to certain risks, including sustainable investing, portfolio management, information, market, mid- to large-cap companies, and small-cap companies risks. An investment in the Domini Impact International Equity Fund is subject to certain risks, including foreign investing and emerging markets, geographic focus, country, currency, impact investing, portfolio management, and quantitative investment approach risks. Investing internationally involves special risks, such as currency fluctuations, social and economic instability, differing securities regulations and accounting standards, limited public information, possible changes in taxation, and periods of illiquidity. These risks may be heightened in connection with investments in emerging market countries. An investment in the Domini Impact Bond Fund is subject to certain risks, including impact investing, portfolio management, style, information, market, interest rate, and credit risks.
The Adviser’s evaluation of environmental and social factors in its investment selections and the timing of the Subadviser’s implementation of the Adviser’s investment selections will affect the Fund’s exposure to certain issuers, industries, sectors, regions, and countries and may impact the relative financial performance of the Fund depending on whether such investments are in or out of favor. The value of your investment may decrease if the Adviser’s or Subadviser’s judgment about Fund investments does not produce the desired results. There is a risk that information used by the Adviser to evaluate environmental and social factors, may not be readily available or complete, which could negatively impact the Adviser’s ability to evaluate such factors and Fund performance.
This report is not authorized for distribution to prospective investors of the Domini Funds referenced herein unless preceded or accompanied by a current prospectus for the relevant Fund. Nothing herein is to be considered a recommendation concerning the merits of any noted company, or an offer of sale or solicitation of an offer to buy shares of any Fund or company referenced herein. Such offering is only made by prospectus, which includes details as to the offering price and other material information. Carefully consider the Funds’ investment objectives, risk factors and charges and expenses before investing. This and other important information can be found in the Funds’ prospectus, which may be obtained by calling 1-800-582-6757 or at domini. com.
The Domini Funds are only offered for sale in the United States. DSIL Investment Services LLC, Distributor, Member FINRA. Domini Impact Investments LLC is the Funds’ Adviser. The Funds are subadvised by unafilliated entities. 3/23
6
DOMINI IMPACT EQUITY FUND
Fund Performance and Holdings
The table and bar chart below provide information as of January 31, 2023 about the ten largest holdings of the Domini Impact Equity Fund and its portfolio holdings by industry sector:
TEN LARGEST HOLDING (Unaudited)
| | | | | | | | | | |
| | | | |
| SECURITY DESCRIPTION | | % NET
ASSETS | | | SECURITY DESCRIPTION | | % NET
ASSETS | |
| | | | |
| Apple, Inc. | | | 7.9% | | | Tesla, Inc. | | | 1.7% | |
| | | | |
| Microsoft Corp. | | | 6.8% | | | Visa, Inc. Class A | | | 1.4% | |
| | | | |
| Alphabet, Inc. Class A | | | 4.1% | | | Procter & Gamble Co. (The) | | | 1.2% | |
| | | | |
| Amazon.com, Inc. | | | 3.4% | | | Home Depot, Inc. (The) | | | 1.2% | |
| | | | |
| NVIDIA Corp. | | | 1.7% | | | Mastercard, Inc. Class A | | | 1.2% | |
PORTFOLIO HOLDINGS BY INDUSTRY SECTOR (% OF NET ASSETS) (Unaudited)
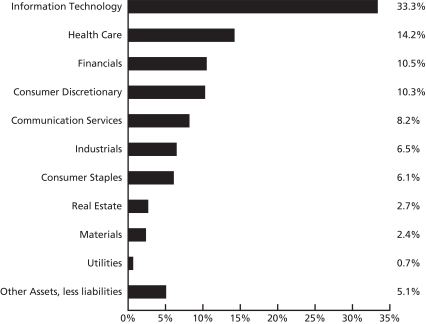
The holdings mentioned above are described in the Fund’s Portfolio of Investments as of 1/31/2023, included herein. The composition of the Fund’s portfolio is subject to change.
The Global Industry Classification Standard (“GICS” was developed by and is the exclusive property and a service mark of MSCI Inc. (“MSCI”) and Standard & Poor’s, a division of The McGraw-Hill Companies, Inc., (“S&P”) and is licensed for use by Domini Impact Investments. Neither MSCI, S&P nor any third party involved in making or compiling the GICS or any GICS classifications makes any express or implied warranties or representations with respect to such standard or classification nor shall any such party have any liability therefrom.
7
| | | | | | | | | | | | |
| |
| DOMINI IMPACT EQUITY FUND |
| | | | | | |
AVERAGE ANNUAL
TOTAL RETURNS as of 1/31/2023
(Unaudited) | | Investor
shares | | Class A
shares
(with 4.75%
maximum
Sales Charge) | | Class A
shares
(without
Sales
Charge) | | Institutional
shares | | Class Y
shares | | S&P 500 |
| | | | | | |
| 1 Year | | -13.28% | | -17.50% | | -13.38% | | -13.06% | | -13.14% | | -8.22% |
| | | | | | |
| 5 Year | | 7.59% | | 6.52% | | 7.57% | | 7.95% | | 7.88% | | 9.54% |
| | | | | | |
| 10 Year | | 10.11% | | 9.56% | | 10.09% | | 10.50% | | 10.42% | | 12.68% |
NOTE: The Fund’s current investment strategy commenced on December 1, 2018, with SSGA Funds Management, Inc as its subadviser. Performance information for periods prior to December 1, 2018, reflects the investment strategies employed during those periods.
Past performance is no guarantee of future results. The Fund’s returns quoted above represent past performance after all expenses. The returns reflect any applicable expense waivers in effect during the periods shown. Without such waivers, Fund performance would be lower. Investment return, principal value, and yield will fluctuate. Your shares, when redeemed, may be worth more or less than their original cost. Call 1-800-582-6757 or visit www.domini.com for performance information current to the most recent month-end, which may be lower or higher than the performance data quoted. A 2.00% redemption fee applied on sales or exchanges of shares made less than 30 days after the settlement of purchase or acquisition through exchange, with certain exceptions. The redemption fee was waived by the Fund’s Board of Trustees and was no longer imposed by the Fund effective August 16, 2021. Quoted performance data does not reflect the deduction of this fee, which would reduce the performance quoted. See the prospectus for further information.
Per the prospectus dated November 30, 2022, the Fund’s annual operating expenses totaled 1.05% and 0.73% (gross and net) for Investor and Institutional shares, respectively, and 1.37%/1.09% and 1.02%/0.80% (gross/net) for Class A and Class Y shares, respectively. The Fund’s adviser has contractually agreed to waive certain fees and/or reimburse certain ordinary operating expenses in order to limit Investor, Class A, Institutional, and Class Y share expenses to 1.09%, 1.09%, 0.74% and 0.80%, respectively. These expense limitations are in effect through November 30, 2023, absent an earlier modification approved by the Funds’ Board of Trustees.
The table does not reflect the deduction of taxes that a shareholder would pay on Fund distributions or the redemption of Fund shares. Total return for the Fund is based on the Fund’s net asset values and assumes all dividend and capital gains were reinvested.
An investment in the Fund is not a bank deposit and is not insured. The Fund is subject to certain risks, including loss of principal, impact investing, portfolio management, information, market, mid- to large-cap companies, and small-cap companies risks. You may lose money.
The Standard & Poor’s 500 Index (S&P 500) is an unmanaged index of common stocks. Investors cannot invest directly in the S&P 500.
8
DOMINI IMPACT EQUITY FUND
PORTFOLIOOF INVESTMENTS
January 31, 2023 (Unaudited)
| | | | | | | | |
| SECURITY | | SHARES | | | VALUE | |
Long Term Investments – 94.9% | |
| Common Stocks – 94.9% | | | | | | |
| Communication Services – 8.2% | | | | | | |
Alphabet, Inc., Class A (a) | | | 360,300 | | | $ | 35,612,052 | |
AT&T, Inc. | | | 227,885 | | | | 4,642,017 | |
Charter Communications, Inc., Class A (a) | | | 3,058 | | | | 1,175,220 | |
Comcast Corp., Class A | | | 138,121 | | | | 5,435,061 | |
Electronic Arts, Inc. | | | 8,718 | | | | 1,121,832 | |
Lumen Technologies, Inc. | | | 33,100 | | | | 173,775 | |
Netflix, Inc. (a) | | | 14,138 | | | | 5,002,873 | |
New York Times Co. (The), Class A | | | 62,327 | | | | 2,171,473 | |
SoftBank Group Corp. ADR | | | 62,164 | | | | 1,470,179 | |
TELUS Corp. | | | 44,694 | | | | 963,156 | |
T-Mobile US, Inc. (a) | | | 19,900 | | | | 2,971,269 | |
Verizon Communications, Inc. | | | 125,395 | | | | 5,212,670 | |
Walt Disney Co. (The) (a) | | | 58,593 | | | | 6,356,754 | |
| | | | | | | | |
| | | | | | | 72,308,331 | |
| | | | | | | | |
| | |
| Consumer Discretionary – 10.3% | | | | | | |
Amazon.com, Inc. (a) | | | 285,580 | | | | 29,451,865 | |
Aptiv PLC (a) | | | 8,600 | | | | 972,574 | |
Best Buy Co., Inc. | | | 6,349 | | | | 563,283 | |
BorgWarner, Inc. | | | 7,200 | | | | 340,416 | |
Bright Horizons Family Solutions, Inc. (a) | | | 2,000 | | | | 153,560 | |
Chipotle Mexican Grill, Inc. (a) | | | 917 | | | | 1,509,731 | |
Cie Generale des Etablissements Michelin SCA ADR | | | 47,400 | | | | 747,972 | |
Dollar General Corp. | | | 7,200 | | | | 1,681,920 | |
eBay, Inc. | | | 17,100 | | | | 846,450 | |
Etsy, Inc. (a) | | | 4,000 | | | | 550,320 | |
Garmin, Ltd. | | | 5,046 | | | | 498,949 | |
Gildan Activewear, Inc. | | | 5,300 | | | | 166,049 | |
Home Depot, Inc. (The) | | | 32,851 | | | | 10,649,309 | |
Lowe’s Cos., Inc. | | | 19,841 | | | | 4,131,888 | |
MercadoLibre, Inc. (a) | | | 1,550 | | | | 1,831,620 | |
NIKE, Inc., Class B | | | 40,449 | | | | 5,150,371 | |
NIO, Inc. ADR (a) | | | 48,700 | | | | 587,809 | |
NVR, Inc. (a) | | | 100 | | | | 527,000 | |
Sony Group Corp. ADR | | | 39,755 | | | | 3,556,482 | |
Starbucks Corp. | | | 35,967 | | | | 3,925,438 | |
Tapestry, Inc. | | | 8,000 | | | | 364,560 | |
Target Corp. | | | 14,751 | | | | 2,539,237 | |
Tesla, Inc. (a) | | | 85,599 | | | | 14,827,459 | |
TJX Cos., Inc. | | | 34,700 | | | | 2,840,542 | |
Ulta Beauty, Inc. (a) | | | 1,598 | | | | 821,308 | |
VF Corp. | | | 11,800 | | | | 365,092 | |
Williams-Sonoma, Inc. | | | 2,200 | | | | 296,868 | |
| | | | | | | | |
| | | | | | | 89,898,072 | |
| | | | | | | | |
9
DOMINI IMPACT EQUITY FUND
PORTFOLIOOF INVESTMENTS (continued)
January 31, 2023 (Unaudited)
| | | | | | | | |
| SECURITY | | SHARES | | | VALUE | |
| Consumer Staples – 6.1% | | | | | | |
Campbell Soup Co. | | | 6,491 | | | $ | 337,078 | |
Church & Dwight Co., Inc. | | | 7,712 | | | | 623,592 | |
Clorox Co. (The) | | | 4,000 | | | | 578,760 | |
Colgate-Palmolive Co. | | | 26,625 | | | | 1,984,361 | |
Costco Wholesale Corp. | | | 14,203 | | | | 7,259,721 | |
Estee Lauder Cos., Inc. (The), Class A | | | 6,777 | | | | 1,877,771 | |
General Mills, Inc. | | | 18,899 | | | | 1,480,926 | |
Haleon PLC ADR (a) | | | 90,325 | | | | 731,633 | |
JM Smucker Co. (The) | | | 3,346 | | | | 511,269 | |
Keurig Dr Pepper, Inc. | | | 27,600 | | | | 973,728 | |
Kimberly-Clark Corp. | | | 10,918 | | | | 1,419,449 | |
Kraft Heinz Co. (The) | | | 25,423 | | | | 1,030,394 | |
Kroger Co. (The) | | | 21,311 | | | | 951,110 | |
Lamb Weston Holdings, Inc. | | | 4,500 | | | | 449,505 | |
L’Oreal SA ADR | | | 38,500 | | | | 3,179,138 | |
McCormick & Co., Inc. | | | 8,800 | | | | 661,056 | |
Mondelez International, Inc., Class A | | | 44,047 | | | | 2,882,436 | |
PepsiCo, Inc. | | | 44,131 | | | | 7,547,284 | |
Procter & Gamble Co. (The) | | | 76,125 | | | | 10,838,677 | |
SunOpta, Inc. (a) | | | 260,887 | | | | 2,131,447 | |
Sysco Corp. | | | 16,403 | | | | 1,270,576 | |
Unilever PLC ADR | | | 79,585 | | | | 4,066,793 | |
Walgreens Boots Alliance, Inc. | | | 23,048 | | | | 849,549 | |
| | | | | | | | |
| | | | | | | 53,636,253 | |
| | | | | | | | |
| | |
| Financials – 10.5% | | | | | | |
Aflac, Inc. | | | 18,415 | | | | 1,353,502 | |
AGNC Investment Corp. | | | 18,200 | | | | 211,120 | |
Allstate Corp. | | | 8,500 | | | | 1,091,995 | |
American Express Co. | | | 17,448 | | | | 3,052,179 | |
Annaly Capital Management, Inc. | | | 14,775 | | | | 346,769 | |
Aon PLC, Class A | | | 6,300 | | | | 2,007,684 | |
Banco do Brasil SA ADR | | | 44,600 | | | | 365,274 | |
Bank of America Corp. | | | 225,054 | | | | 7,984,916 | |
Bank of Montreal | | | 20,831 | | | | 2,096,432 | |
Bank of New York Mellon Corp. (The) | | | 23,600 | | | | 1,193,452 | |
Bank of Nova Scotia (The) | | | 36,266 | | | | 1,963,079 | |
BlackRock, Inc. | | | 4,434 | | | | 3,366,337 | |
Canadian Imperial Bank of Commerce | | | 28,300 | | | | 1,291,046 | |
Capital One Financial Corp. | | | 12,118 | | | | 1,442,042 | |
Cboe Global Markets, Inc. | | | 3,300 | | | | 405,504 | |
Charles Schwab Corp. (The) | | | 48,878 | | | | 3,784,135 | |
Chubb, Ltd. | | | 12,387 | | | | 2,817,919 | |
Cincinnati Financial Corp. | | | 5,111 | | | | 578,310 | |
Citigroup, Inc. | | | 60,608 | | | | 3,164,950 | |
CME Group, Inc. | | | 11,598 | | | | 2,048,903 | |
Comerica, Inc. | | | 4,154 | | | | 304,530 | |
Commerce Bancshares, Inc. | | | 3,885 | | | | 258,586 | |
Discover Financial Services | | | 8,600 | | | | 1,003,878 | |
10
DOMINI IMPACT EQUITY FUND
PORTFOLIOOF INVESTMENTS (continued)
January 31, 2023 (Unaudited)
| | | | | | | | |
| SECURITY | | SHARES | | | VALUE | |
| | |
| Financials (Continued) | | | | | | |
DNB Bank ASA ADR | | | 28,740 | | | $ | 536,001 | |
East West Bancorp, Inc. | | | 49,344 | | | | 3,874,491 | |
Equitable Holdings, Inc. | | | 11,600 | | | | 372,012 | |
Everest Re Group, Ltd. | | | 1,300 | | | | 454,597 | |
FactSet Research Systems, Inc. | | | 1,200 | | | | 507,528 | |
Fifth Third Bancorp | | | 21,956 | | | | 796,783 | |
First Republic Bank | | | 5,800 | | | | 817,104 | |
Hartford Financial Services Group, Inc. (The) | | | 9,993 | | | | 775,557 | |
Huntington Bancshares, Inc. | | | 46,000 | | | | 697,820 | |
Intercontinental Exchange, Inc. | | | 17,595 | | | | 1,892,342 | |
Invesco, Ltd. | | | 13,803 | | | | 255,494 | |
KeyCorp | | | 30,900 | | | | 592,971 | |
London Stock Exchange Group PLC ADR | | | 45,600 | | | | 1,049,712 | |
M&T Bank Corp. | | | 5,500 | | | | 858,000 | |
MarketAxess Holdings, Inc. | | | 1,100 | | | | 400,235 | |
Marsh & McLennan Cos., Inc. | | | 15,830 | | | | 2,768,825 | |
MetLife, Inc. | | | 18,600 | | | | 1,358,172 | |
Moody’s Corp. | | | 5,114 | | | | 1,650,543 | |
Morgan Stanley | | | 41,759 | | | | 4,064,403 | |
MSCI, Inc. | | | 2,505 | | | | 1,331,558 | |
Nasdaq, Inc. | | | 12,900 | | | | 776,451 | |
Northern Trust Corp. | | | 6,600 | | | | 640,002 | |
PNC Financial Services Group, Inc. (The) | | | 12,849 | | | | 2,125,610 | |
Principal Financial Group, Inc. | | | 7,600 | | | | 703,380 | |
Progressive Corp. (The) | | | 18,658 | | | | 2,544,018 | |
Prudential Financial, Inc. | | | 11,661 | | | | 1,223,705 | |
Raymond James Financial, Inc. | | | 6,450 | | | | 727,366 | |
Regions Financial Corp. | | | 29,528 | | | | 695,089 | |
S&P Global, Inc. | | | 10,458 | | | | 3,921,122 | |
Signature Bank | | | 2,000 | | | | 257,900 | |
T Rowe Price Group, Inc. | | | 7,011 | | | | 816,571 | |
Toronto-Dominion Bank (The) | | | 56,817 | | | | 3,932,873 | |
Travelers Cos., Inc. (The) | | | 7,416 | | | | 1,417,346 | |
Truist Financial Corp. | | | 42,202 | | | | 2,084,357 | |
US BanCorp | | | 43,416 | | | | 2,162,117 | |
W R Berkley Corp. | | | 6,700 | | | | 469,938 | |
Zions Bancorp NA | | | 5,000 | | | | 265,800 | |
| | | | | | | | |
| | | | | | | 91,950,335 | |
| | | | | | | | |
| | |
| Health Care – 14.2% | | | | | | |
AbbVie, Inc. | | | 56,752 | | | | 8,385,108 | |
Agilent Technologies, Inc. | | | 9,600 | | | | 1,459,968 | |
Alcon, Inc. | | | 15,762 | | | | 1,185,460 | |
Align Technology, Inc. (a) | | | 2,300 | | | | 620,379 | |
Alnylam Pharmaceuticals, Inc. (a) | | | 3,800 | | | | 860,320 | |
Amgen, Inc. | | | 17,019 | | | | 4,295,596 | |
AstraZeneca PLC ADR | | | 96,100 | | | | 6,282,057 | |
Becton Dickinson and Co. | | | 9,051 | | | | 2,282,843 | |
Biogen, Inc. (a) | | | 4,667 | | | | 1,357,630 | |
11
DOMINI IMPACT EQUITY FUND
PORTFOLIOOF INVESTMENTS (continued)
January 31, 2023 (Unaudited)
| | | | | | | | |
| SECURITY | | SHARES | | | VALUE | |
| | |
| Health Care (Continued) | | | | | | |
BioMarin Pharmaceutical, Inc. (a) | | | 5,800 | | | $ | 669,030 | |
Bio-Rad Laboratories, Inc., Class A (a) | | | 700 | | | | 327,222 | |
Bio-Techne Corp. | | | 5,200 | | | | 414,232 | |
Bristol-Myers Squibb Co. | | | 68,401 | | | | 4,969,333 | |
Catalent, Inc. (a) | | | 5,500 | | | | 294,525 | |
Cooper Cos., Inc. (The) | | | 1,600 | | | | 558,288 | |
CSL, Ltd. ADR | | | 31,000 | | | | 3,268,330 | |
Danaher Corp. | | | 21,215 | | | | 5,608,822 | |
DENTSPLY SIRONA, Inc. | | | 6,416 | | | | 236,301 | |
DexCom, Inc. (a) | | | 15,510 | | | | 1,660,966 | |
Edwards Lifesciences Corp. (a) | | | 19,572 | | | | 1,501,172 | |
Genmab A/S ADR (a) | | | 20,500 | | | | 802,575 | |
Gilead Sciences, Inc. | | | 40,146 | | | | 3,369,855 | |
GSK PLC ADR | | | 64,800 | | | | 2,284,848 | |
Guardant Health, Inc. (a) | | | 3,300 | | | | 103,719 | |
Henry Schein, Inc. (a) | | | 4,200 | | | | 361,830 | |
Hologic, Inc. (a) | | | 53,882 | | | | 4,384,378 | |
IDEXX Laboratories, Inc. (a) | | | 2,619 | | | | 1,258,430 | |
Illumina, Inc. (a) | | | 5,049 | | | | 1,081,496 | |
Incyte Corp. (a) | | | 5,800 | | | | 493,812 | |
Inspire Medical Systems, Inc. (a) | | | 5,173 | | | | 1,309,079 | |
Insulet Corp. (a) | | | 2,200 | | | | 632,104 | |
Intuitive Surgical, Inc. (a) | | | 11,300 | | | | 2,776,297 | |
Koninklijke Philips NV | | | 29,076 | | | | 497,781 | |
Lonza Group AG ADR | | | 24,000 | | | | 1,371,120 | |
Masimo Corp. (a) | | | 1,400 | | | | 238,112 | |
Merck & Co., Inc. | | | 81,135 | | | | 8,714,710 | |
Merck KGaA ADR | | | 20,900 | | | | 870,276 | |
Mettler-Toledo International, Inc. (a) | | | 690 | | | | 1,057,715 | |
Moderna, Inc. (a) | | | 10,700 | | | | 1,883,842 | |
Neurocrine Biosciences, Inc. (a) | | | 3,100 | | | | 343,883 | |
Novo Nordisk A/S ADR | | | 51,978 | | | | 7,213,507 | |
Organon & Co. | | | 22,995 | | | | 692,839 | |
PerkinElmer, Inc. | | | 4,000 | | | | 550,120 | |
Pfizer, Inc. | | | 179,870 | | | | 7,943,059 | |
QIAGEN N.V. (a) | | | 7,600 | | | | 372,400 | |
Quest Diagnostics, Inc. | | | 3,715 | | | | 551,603 | |
Regeneron Pharmaceuticals, Inc. (a) | | | 3,342 | | | | 2,534,807 | |
ResMed, Inc. | | | 4,646 | | | | 1,061,007 | |
Sanofi ADR | | | 72,916 | | | | 3,583,092 | |
Seagen, Inc. (a) | | | 12,149 | | | | 1,694,543 | |
Siemens Healthineers AG ADR | | | 17,900 | | | | 478,145 | |
STERIS PLC | | | 3,300 | | | | 681,483 | |
Stryker Corp. | | | 10,628 | | | | 2,697,493 | |
Takeda Pharmaceutical Co., Ltd. ADR | | | 99,600 | | | | 1,573,680 | |
Teleflex, Inc. | | | 1,500 | | | | 365,130 | |
Thermo Fisher Scientific, Inc. | | | 12,588 | | | | 7,179,314 | |
Veeva Systems, Inc., Class A (a) | | | 4,506 | | | | 768,498 | |
Vertex Pharmaceuticals, Inc. (a) | | | 8,243 | | | | 2,663,313 | |
12
DOMINI IMPACT EQUITY FUND
PORTFOLIOOF INVESTMENTS (continued)
January 31, 2023 (Unaudited)
| | | | | | | | |
| SECURITY | | SHARES | | | VALUE | |
| | |
| Health Care (Continued) | | | | | | |
Waters Corp. (a) | | | 1,963 | | | $ | 645,003 | |
West Pharmaceutical Services, Inc. | | | 2,300 | | | | 610,880 | |
| | | | | | | | |
| | | | | | | 123,933,360 | |
| | | | | | | | |
| | |
| Industrials – 6.5% | | | | | | |
ABB, Ltd. ADR | | | 51,300 | | | | 1,787,805 | |
Allegion PLC | | | 2,700 | | | | 317,385 | |
Ameresco, Inc., Class A (a) | | | 37,626 | | | | 2,425,748 | |
AO Smith Corp. | | | 4,100 | | | | 277,570 | |
Assa Abloy AB ADR | | | 62,342 | | | | 730,025 | |
Brambles, Ltd. ADR | | | 23,000 | | | | 392,380 | |
Carrier Global Corp. | | | 27,300 | | | | 1,242,969 | |
Central Japan Railway Co ADR | | | 55,200 | | | | 669,576 | |
CH Robinson Worldwide, Inc. | | | 3,800 | | | | 380,646 | |
Cintas Corp. | | | 2,800 | | | | 1,242,472 | |
Copart, Inc. (a) | | | 13,500 | | | | 899,235 | |
CoStar Group, Inc. (a) | | | 12,910 | | | | 1,005,689 | |
Cummins, Inc. | | | 4,541 | | | | 1,133,161 | |
Deere & Co. | | | 8,945 | | | | 3,782,304 | |
Donaldson Co., Inc. | | | 4,000 | | | | 249,400 | |
Emerson Electric Co. | | | 19,026 | | | | 1,716,526 | |
Expeditors International of Washington, Inc. | | | 5,300 | | | | 573,195 | |
FANUC Corp. ADR | | | 61,200 | | | | 1,080,792 | |
Fastenal Co. | | | 18,458 | | | | 933,052 | |
Fortune Brands Home & Security, Inc. | | | 4,000 | | | | 258,040 | |
Generac Holdings, Inc. (a) | | | 2,100 | | | | 253,260 | |
Graco, Inc. | | | 5,400 | | | | 368,928 | |
Hubbell, Inc. | | | 1,800 | | | | 412,038 | |
IAA, Inc. (a) | | | 4,400 | | | | 183,612 | |
IDEX Corp. | | | 2,400 | | | | 575,232 | |
Illinois Tool Works, Inc. | | | 8,652 | | | | 2,042,218 | |
Ingersoll Rand, Inc. | | | 12,869 | | | | 720,664 | |
JB Hunt Transport Services, Inc. | | | 2,700 | | | | 510,435 | |
JetBlue Airways Corp. (a) | | | 10,288 | | | | 82,304 | |
Kone Oyj ADR | | | 23,000 | | | | 626,290 | |
Lennox International, Inc. | | | 1,000 | | | | 260,620 | |
Masco Corp. | | | 6,900 | | | | 367,080 | |
Masterbrand, Inc. (a) | | | 4,000 | | | | 36,800 | |
Nidec Corp. ADR | | | 63,156 | | | | 869,027 | |
Nordson Corp. | | | 1,600 | | | | 389,280 | |
Old Dominion Freight Line, Inc. | | | 3,200 | | | | 1,066,368 | |
Otis Worldwide Corp. | | | 13,200 | | | | 1,085,436 | |
Owens Corning | | | 3,133 | | | | 302,804 | |
Pentair PLC | | | 5,500 | | | | 304,590 | |
Plug Power, Inc. (a) | | | 19,000 | | | | 323,380 | |
Recruit Holdings Co., Ltd. ADR | | | 228,100 | | | | 1,449,575 | |
RELX PLC ADR | | | 60,900 | | | | 1,809,339 | |
Robert Half International, Inc. | | | 3,600 | | | | 302,256 | |
Rockwell Automation, Inc. | | | 3,672 | | | | 1,035,614 | |
13
DOMINI IMPACT EQUITY FUND
PORTFOLIOOF INVESTMENTS (continued)
January 31, 2023 (Unaudited)
| | | | | | | | |
| SECURITY | | SHARES | | | VALUE | |
| | |
| Industrials (Continued) | | | | | | |
Schneider Electric SE ADR | | | 89,400 | | | $ | 2,900,136 | |
Siemens AG ADR (a) | | | 51,136 | | | | 3,992,699 | |
Siemens Energy AG ADR | | | 14,900 | | | | 309,622 | |
SMC Corp. ADR | | | 40,200 | | | | 1,019,472 | |
Snap-on, Inc. | | | 1,700 | | | | 422,841 | |
Stanley Black & Decker, Inc. | | | 4,754 | | | | 424,580 | |
Toro Co. (The) | | | 3,200 | | | | 356,864 | |
Trane Technologies PLC | | | 7,407 | | | | 1,326,742 | |
Trex Co., Inc. (a) | | | 3,600 | | | | 189,792 | |
United Parcel Service, Inc., Class B | | | 23,393 | | | | 4,333,085 | |
United Rentals, Inc. (a) | | | 2,200 | | | | 970,090 | |
Vestas Wind Systems A/S ADR | | | 94,100 | | | | 911,829 | |
Westinghouse Air Brake Technologies Corp. | | | 5,691 | | | | 590,783 | |
Wolters Kluwer NV ADR | | | 8,300 | | | | 905,281 | |
WW Grainger, Inc. | | | 1,470 | | | | 866,536 | |
Xylem, Inc. | | | 5,800 | | | | 603,258 | |
| | | | | | | | |
| | | | | | | 56,598,730 | |
| | | | | | | | |
| | |
| Information Technology – 33.3% | | | | | | |
Accenture PLC, Class A | | | 20,300 | | | | 5,664,715 | |
Adobe, Inc. (a) | | | 14,961 | | | | 5,540,657 | |
Advanced Micro Devices, Inc. (a) | | | 51,750 | | | | 3,889,012 | |
Analog Devices, Inc. | | | 16,411 | | | | 2,813,994 | |
Apple, Inc. | | | 481,696 | | | | 69,503,916 | |
Applied Materials, Inc. | | | 27,502 | | | | 3,066,198 | |
ASML Holding NV | | | 13,100 | | | | 8,657,004 | |
Atlassian Corp., Class A (a) | | | 4,600 | | | | 743,452 | |
Autodesk, Inc. (a) | | | 16,747 | | | | 3,603,284 | |
Automatic Data Processing, Inc. | | | 13,268 | | | | 2,996,047 | |
Broadcom, Inc. | | | 12,613 | | | | 7,378,731 | |
Cadence Design Systems, Inc. (a) | | | 8,784 | | | | 1,605,979 | |
Cisco Systems, Inc. | | | 120,991 | | | | 5,888,632 | |
Cloudflare, Inc., Class A (a) | | | 8,600 | | | | 455,026 | |
Crowdstrike Holdings, Inc., Class A (a) | | | 6,900 | | | | 730,710 | |
Dropbox, Inc., Class A (a) | | | 8,400 | | | | 195,132 | |
Enphase Energy, Inc. (a) | | | 32,803 | | | | 7,261,928 | |
First Solar, Inc. (a) | | | 2,900 | | | | 515,040 | |
Fiserv, Inc. (a) | | | 18,700 | | | | 1,994,916 | |
Five9, Inc. (a) | | | 2,300 | | | | 181,194 | |
Infineon Technologies AG ADR (a) | | | 38,300 | | | | 1,374,970 | |
Intel Corp. | | | 132,379 | | | | 3,741,031 | |
International Business Machines Corp. | | | 29,066 | | | | 3,916,062 | |
Intuit, Inc. | | | 8,822 | | | | 3,728,795 | |
KLA Corp. | | | 4,510 | | | | 1,770,085 | |
Lam Research Corp. | | | 4,400 | | | | 2,200,440 | |
Mastercard, Inc., Class A | | | 27,152 | | | | 10,062,531 | |
Micron Technology, Inc. | | | 34,700 | | | | 2,092,410 | |
Microsoft Corp. | | | 239,261 | | | | 59,291,268 | |
NetApp, Inc. | | | 7,008 | | | | 464,140 | |
14
DOMINI IMPACT EQUITY FUND
PORTFOLIOOF INVESTMENTS (continued)
January 31, 2023 (Unaudited)
| | | | | | | | |
| SECURITY | | SHARES | | | VALUE | |
| | |
| Information Technology (Continued) | | | | | | |
NVIDIA Corp. | | | 76,808 | | | $ | 15,005,979 | |
Okta, Inc. (a) | | | 5,000 | | | | 368,050 | |
Palo Alto Networks, Inc. (a) | | | 36,054 | | | | 5,719,607 | |
Paychex, Inc. | | | 10,431 | | | | 1,208,536 | |
Paycom Software, Inc. (a) | | | 1,700 | | | | 550,698 | |
PayPal Holdings, Inc. (a) | | | 36,600 | | | | 2,982,534 | |
QUALCOMM, Inc. | | | 35,900 | | | | 4,782,239 | |
Roper Technologies, Inc. | | | 3,357 | | | | 1,432,600 | |
Salesforce, Inc. (a) | | | 31,134 | | | | 5,229,578 | |
ServiceNow, Inc. (a) | | | 6,500 | | | | 2,958,345 | |
Shopify, Inc., Class A (a) | | | 31,100 | | | | 1,532,297 | |
Snowflake, Inc., Class A (a) | | | 8,800 | | | | 1,376,672 | |
Splunk, Inc. (a) | | | 5,200 | | | | 498,004 | |
STMicroelectronics NV | | | 81,036 | | | | 3,826,520 | |
Synopsys, Inc. (a) | | | 4,943 | | | | 1,748,586 | |
Texas Instruments, Inc. | | | 29,152 | | | | 5,166,026 | |
Visa, Inc., Class A | | | 52,300 | | | | 12,039,983 | |
VMware, Inc., Class A (a) | | | 7,396 | | | | 905,788 | |
WEX, Inc. (a) | | | 1,316 | | | | 243,420 | |
Workday, Inc., Class A (a) | | | 6,400 | | | | 1,161,152 | |
Zoom Video Communications, Inc., Class A (a) | | | 13,431 | | | | 1,007,325 | |
| | | | | | | | |
| | | | | | | 291,071,238 | |
| | | | | | | | |
| | |
| Materials – 2.4% | | | | | | |
Air Liquide SA ADR | | | 83,510 | | | | 2,654,783 | |
Air Products and Chemicals, Inc. | | | 7,159 | | | | 2,294,531 | |
AptarGroup, Inc. | | | 2,100 | | | | 242,844 | |
Avery Dennison Corp. | | | 2,600 | | | | 492,544 | |
CRH PLC ADR | | | 24,400 | | | | 1,148,752 | |
Ecolab, Inc. | | | 8,248 | | | | 1,277,038 | |
International Paper Co. | | | 11,700 | | | | 489,294 | |
Linde PLC | | | 15,730 | | | | 5,205,686 | |
Mondi PLC ADR | | | 8,000 | | | | 300,320 | |
Nitto Denko Corp. ADR | | | 9,817 | | | | 313,260 | |
Novozymes A/S ADR | | | 6,559 | | | | 339,691 | |
Nucor Corp. | | | 8,092 | | | | 1,367,710 | |
PPG Industries, Inc. | | | 7,642 | | | | 996,058 | |
RPM International, Inc. | | | 4,300 | | | | 386,613 | |
Sherwin-Williams Co. (The) | | | 7,692 | | | | 1,819,850 | |
Smurfit Kappa Group PLC ADR | | | 8,400 | | | | 350,784 | |
Steel Dynamics, Inc. | | | 5,200 | | | | 627,328 | |
Vulcan Materials Co. | | | 4,244 | | | | 778,053 | |
Westrock Co. | | | 7,885 | | | | 309,407 | |
| | | | | | | | |
| | | | | | | 21,394,546 | |
| | | | | | | | |
| | |
| Real Estate – 2.7% | | | | | | |
Alexandria Real Estate Equities, Inc. | | | 5,286 | | | | 849,672 | |
American Tower Corp. | | | 14,909 | | | | 3,330,522 | |
Boston Properties, Inc. | | | 4,446 | | | | 331,405 | |
15
DOMINI IMPACT EQUITY FUND
PORTFOLIOOF INVESTMENTS (continued)
January 31, 2023 (Unaudited)
| | | | | | | | |
| SECURITY | | SHARES | | | VALUE | |
| | |
| Real Estate (Continued) | | | | | | |
CBRE Group, Inc., Class A (a) | | | 9,522 | | | $ | 814,226 | |
Crown Castle International Corp. | | | 13,722 | | | | 2,032,365 | |
Digital Realty Trust, Inc. | | | 9,192 | | | | 1,053,587 | |
Equinix, Inc. | | | 2,931 | | | | 2,163,459 | |
Equity LifeStyle Properties, Inc. | | | 5,700 | | | | 409,146 | |
Essex Property Trust, Inc. | | | 2,000 | | | | 452,140 | |
Extra Space Storage, Inc. | | | 4,200 | | | | 662,886 | |
Federal Realty OP LP | | | 2,500 | | | | 278,825 | |
Mid-America Apartment Communities, Inc. | | | 3,800 | | | | 633,536 | |
Prologis, Inc. | | | 29,722 | | | | 3,842,460 | |
Public Storage | | | 4,877 | | | | 1,484,266 | |
SBA Communications Corp. | | | 3,407 | | | | 1,013,685 | |
Simon Property Group, Inc. | | | 10,600 | | | | 1,361,676 | |
UDR, Inc. | | | 10,169 | | | | 433,098 | |
Ventas, Inc. | | | 13,063 | | | | 676,794 | |
Welltower, Inc. | | | 15,100 | | | | 1,133,104 | |
WP Carey, Inc. | | | 6,300 | | | | 538,839 | |
Zillow Group, Inc., Class A (a) | | | 6,100 | | | | 262,056 | |
| | | | | | | | |
| | | | | | | 23,757,747 | |
| | | | | | | | |
| | |
| Utilities – 0.7% | | | | | | |
Alliant Energy Corp. | | | 7,900 | | | | 426,837 | |
Consolidated Edison, Inc. | | | 11,461 | | | | 1,092,348 | |
Eversource Energy | | | 10,958 | | | | 902,172 | |
Fortis, Inc. | | | 15,700 | | | | 646,055 | |
National Grid PLC ADR | | | 23,519 | | | | 1,499,807 | |
Orsted AS ADR | | | 17,900 | | | | 528,229 | |
SSE PLC ADR | | | 34,800 | | | | 739,500 | |
| | | | | | | | |
| | | | | | | 5,834,948 | |
| | | | | | | | |
| |
| Total Investments – 94.9% (Cost $525,630,221) | | | 830,383,560 | |
| |
| Other Assets, less liabilities – 5.1% | | | 44,518,220 | |
| | | | | | | | |
| |
| Net Assets – 100.0% | | | $874,901,780 | |
| | | | | | | | |
(a) Non-income producing security.
Abbreviations
ADR — American Depositary Receipt
SEE NOTES TO FINANCIAL STATEMENTS
16
DOMINI INTERNATIONAL OPPORTUNITIES FUND
Fund Performance and Holdings
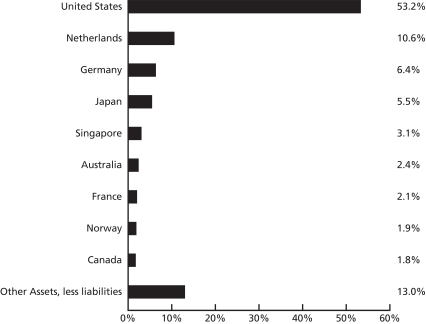
The table and bar charts below provide information as of January 31, 2023 about the ten largest holdings of the Domini International Opportunities Fund and its portfolio holdings by industry sector and country:
TEN LARGEST HOLDINGS (Unaudited)
| | | | | | | | | | |
| | | | |
| SECURITY DESCRIPTION | | % NET
ASSETS | | | SECURITY DESCRIPTION | | % NET
ASSETS | |
| | | | |
| ASML Holding NV | | | 3.5% | | | Toyota Motor Corp. | | | 2.1% | |
| | | | |
| Novo Nordisk A/S Class B | | | 2.9% | | | AIA Group, Ltd. | | | 1.7% | |
| | | | |
| Novartis AG | | | 2.7% | | | Unilever PLC | | | 1.6% | |
| | | | |
| AstraZeneca PLC | | | 2.6% | | | Siemens AG | | | 1.6% | |
| | | | |
| Linde PLC | | | 2.1% | | | SAP SE | | | 1.6% | |
PORTFOLIO HOLDINGS BY INDUSTRY SECTOR (% OF NET ASSETS) (Unaudited)
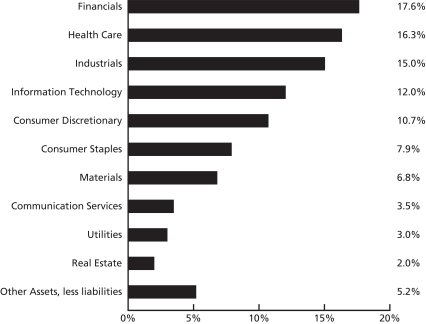
The Global Industry Classification Standard (“GICS”) was developed by and is the exclusive property and a service mark of MSCI Inc. (“MSCI”) and Standard & Poor’s, a division of The McGraw-Hill Companies, Inc., (“S&P”) and is licensed for use by Domini Impact Investments. Neither MSCI, S&P nor any third party involved in making or compiling the GICS or any GICS classifications makes any express or implied warranties or representations with respect to such standard or classification nor shall any such party have any liability therefrom.
17
PORTFOLIO HOLDINGS BY COUNTRY (% OF NET ASSETS) (Unaudited)
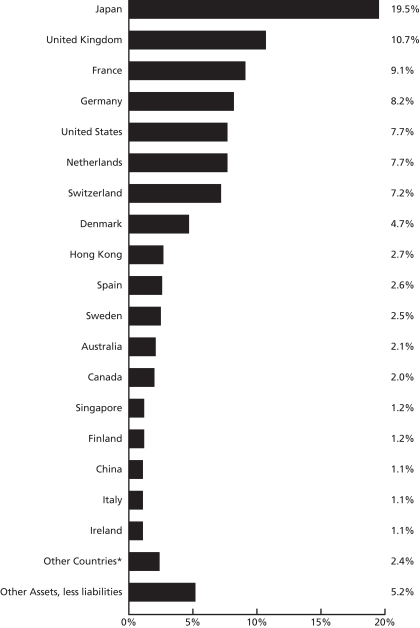
The holdings mentioned above are described in the Fund’s Portfolio of Investments as of 1/31/2023, included herein. The composition of the Fund’s portfolio is subject to change.
*Other countries include Brazil 0.7%, Belgium 0.5%, Norway 0.4%, South Africa 0.3%, Austria 0.3%, New Zealand 0.1%, and Luxemburg 0.1%.
18
| | | | | | |
| | | | |
| DOMINI INTERNATIONAL OPPORTUNITIES FUND | | | | | | |
| | | |
AVERAGE ANNUAL TOTAL RETURNS as of 1/31/2023 (Unaudited) | | Investor shares | | Institutional
shares | | MSCI EAFE
(net) |
| | | |
| 1 Year | | -7.84% | | -7.60% | | -2.83% |
| | | |
| 5 Year | | N/A | | N/A | | N/A |
| | | |
| 10 Year | | N/A | | N/A | | N/A |
| | | |
| Since Inception (11/30/2020) | | -1.24% | | -0.99% | | 2.85% |
Past performance is no guarantee of future results. The Fund’s returns quoted above represent past performance after all expenses. The returns reflect any applicable expense waivers in effect during the periods shown. Without such waivers, Fund performance would be lower. Investment return, principal value, and yield will fluctuate. Your shares, when redeemed, may be worth more or less than their original cost. Call 1-800-582-6757 or visit www.domini.com for performance information current to the most recent month-end, which may be lower or higher than the performance data quoted. A 2.00% redemption fee applied on sales or exchanges of shares made less than 30 days after the settlement of purchase or acquisition through exchange, with certain exceptions. The redemption fee was waived by the Fund’s Board of Trustees and was no longer imposed by the Fund effective August 16, 2021. Quoted performance data does not reflect the deduction of this fee, which would reduce the performance quoted. See the prospectus for further information.
Per the prospectus dated November 30, 2022, the Fund’s annual operating expenses totaled 4.36%/1.40% and 1.79%/1.15% (gross/net) for the Investor and Institutional Class shares, respectively. The Fund’s adviser has contractually agreed to waive certain fees and/or reimburse certain ordinary operating expenses in order to limit Investor and Institutional share expenses to 1.40% and 1.15%, respectively. These expense limitations are in effect through November 30, 2023, absent an earlier modification approved by the Funds’ Board of Trustees.
The table does not reflect the deduction of fees and taxes that a shareholder would pay on Fund distributions or the redemption of Fund shares. Total return is based on the Fund’s net asset values and assumes all dividends and capital gains were reinvested.
An investment in the Fund is not a bank deposit and is not insured. The Fund is subject to certain risks, including loss of principal, foreign investing, geographic focus, country, currency, impact investing, portfolio management, and information risks. Investing internationally involves special risks, such as currency fluctuations, social and economic instability, differing securities regulations and accounting standards, limited public information, possible changes in taxation, and periods of illiquidity. You may lose money.
The Morgan Stanley Capital International Europe Australasia Far East (MSCI EAFE) index (net) is an unmanaged index of common stocks. MSCI EAFE (net) includes the reinvestment of dividends net of withholding tax, but does not reflect other fees, expenses, or taxes. It is not available for direct investment.
19
DOMINI INTERNATIONAL OPPORTUNITIES FUND
PORTFOLIOOF INVESTMENTS
January 31, 2023 (Unaudited)
| | | | | | | | | | |
| COUNTRY/SECURITY | | INDUSTRY | | SHARES | | | VALUE | |
| Long Term Investments – 94.8% | | | | | | | | |
| Common Stocks – 94.8% | | | | | | | | |
Australia – 2.1% | | | | | | | | | | |
ASX, Ltd. | | Diversified Financials | | | 536 | | | $ | 26,185 | |
Brambles, Ltd. | | Commercial & Professional Services | | | 4,004 | | | | 33,990 | |
Cochlear, Ltd. | | Health Care Equipment & Services | | | 491 | | | | 74,053 | |
Dexus | | Real Estate | | | 3,012 | | | | 17,434 | |
Fortescue Metals Group, Ltd. | | Materials | | | 5,068 | | | | 79,916 | |
GPT Group (The) | | Real Estate | | | 5,260 | | | | 17,021 | |
Mirvac Group | | Real Estate | | | 10,820 | | | | 17,451 | |
Pilbara Minerals, Ltd. (a) | | Materials | | | 8,363 | | | | 28,402 | |
Stockland | | Real Estate | | | 6,224 | | | | 17,362 | |
Suncorp Group, Ltd. | | Insurance | | | 3,637 | | | | 32,276 | |
Transurban Group | | Transportation | | | 8,684 | | | | 84,994 | |
Vicinity, Ltd. | | Real Estate | | | 12,059 | | | | 17,613 | |
| | | | | | | | | | |
| | | | | | | | | 446,697 | |
| | | | | | | | | | |
| | | | | | | | | | |
Austria – 0.3% | | | | | | | | | | |
Erste Group Bank AG | | Banks | | | 1,004 | | | | 38,057 | |
Mondi PLC | | Materials | | | 1,403 | | | | 26,420 | |
| | | | | | | | | | |
| | | | | | | | | 64,477 | |
| | | | | | | | | | |
| | | | | | | | | | |
Belgium – 0.5% | | | | | | | | | | |
Ageas SA | | Insurance | | | 496 | | | | 24,191 | |
KBC Group NV | | Banks | | | 809 | | | | 59,860 | |
Umicore SA | | Materials | | | 559 | | | | 21,111 | |
| | | | | | | | | | |
| | | | | | | | | 105,162 | |
| | | | | | | | | | |
| | | | | | | | | | |
Brazil – 0.7% | | | | | | | | | | |
MercadoLibre, Inc. (a) | | Retailing | | | 134 | | | | 158,346 | |
| | | | | | | | | | |
| | | | | | | | | 158,346 | |
| | | | | | | | | | |
| | | | | | | | | | |
Canada – 2.0% | | | | | | | | | | |
Fortis, Inc. | | Utilities | | | 1,314 | | | | 53,836 | |
Saputo, Inc. | | Food, Beverage & Tobacco | | | 800 | | | | 21,991 | |
SunOpta, Inc. (a) | | Food, Beverage & Tobacco | | | 2,420 | | | | 19,772 | |
Toronto-Dominion Bank (The) | | Banks | | | 4,988 | | | | 344,134 | |
| | | | | | | | | | |
| | | | | | | | | 439,733 | |
| | | | | | | | | | |
| | | | | | | | | | |
China – 1.1% | | | | | | | | | | |
BYD Co., Ltd., Class H | | Automobiles & Components | | | 5,773 | | | | 182,877 | |
NIO, Inc. ADR (a) | | Automobiles & Components | | | 4,320 | | | | 52,143 | |
| | | | | | | | | | |
| | | | | | | | | 235,020 | |
| | | | | | | | | | |
| | | | | | | | | | |
Denmark – 4.7% | | | | | | | | | | |
Chr Hansen Holding A/S | | Materials | | | 289 | | | | 21,316 | |
Coloplast A/S, Class B | | Health Care Equipment & Services | | | 353 | | | | 42,575 | |
20
DOMINI INTERNATIONAL OPPORTUNITIES FUND
PORTFOLIOOF INVESTMENTS (continued)
January 31, 2023 (Unaudited)
| | | | | | | | | | |
| COUNTRY/SECURITY | | INDUSTRY | | SHARES | | | VALUE | |
Denmark (Continued) | | | | | | | | | | |
Demant A/S (a) | | Health Care Equipment & Services | | | 250 | | | $ | 7,069 | |
DSV A/S | | Transportation | | | 501 | | | | 82,795 | |
Genmab A/S (a) | | Pharmaceuticals, Biotechnology & Life Sciences | | | 183 | | | | 71,643 | |
Novo Nordisk A/S, Class B | | Pharmaceuticals, Biotechnology & Life Sciences | | | 4,578 | | | | 632,892 | |
Novozymes A/S, Class B | | Materials | | | 585 | | | | 30,410 | |
Orsted A/S | | Utilities | | | 516 | | | | 45,903 | |
Rockwool A/S, Class B | | Capital Goods | | | 35 | | | | 10,024 | |
Vestas Wind Systems A/S | | Capital Goods | | | 2,774 | | | | 81,088 | |
| | | | | | | | | | |
| | | | | | | | | 1,025,715 | |
| | | | | | | | | | |
| | | | | | | | | | |
Finland – 1.2% | | | | | | | | | | |
Kesko OYJ, Class B | | Food & Staples Retailing | | | 917 | | | | 21,339 | |
Kone OYJ, Class B | | Capital Goods | | | 999 | | | | 54,426 | |
Nokia Oyj | | Technology Hardware & Equipment | | | 14,751 | | | | 69,871 | |
Nordea Bank Abp | | Banks | | | 9,231 | | | | 107,788 | |
| | | | | | | | | | |
| | | | | | | | | 253,424 | |
| | | | | | | | | | |
| | | | | | | | | | |
France – 9.1% | | | | | | | | | | |
Air Liquide SA | | Materials | | | 1,475 | | | | 234,621 | |
Amundi SA | | Diversified Financials | | | 159 | | | | 10,399 | |
BioMerieux | | Health Care Equipment & Services | | | 138 | | | | 14,054 | |
BNP Paribas SA | | Banks | | | 3,183 | | | | 218,393 | |
Capgemini SE | | Software & Services | | | 459 | | | | 87,024 | |
Carrefour SA | | Food & Staples Retailing | | | 1,341 | | | | 25,481 | |
Cie Generale des Etablissements Michelin SCA | | Automobiles & Components | | | 2,007 | | | | 63,397 | |
Credit Agricole SA | | Banks | | | 4,127 | | | | 49,644 | |
Edenred | | Software & Services | | | 717 | | | | 39,015 | |
Eiffage SA | | Capital Goods | | | 229 | | | | 24,435 | |
Gecina SA | | Real Estate | | | 146 | | | | 17,276 | |
Hermes International | | Consumer Durables & Apparel | | | 96 | | | | 179,483 | |
Kering SA | | Consumer Durables & Apparel | | | 203 | | | | 126,535 | |
Klepierre SA (a) | | Real Estate | | | 639 | | | | 16,202 | |
Legrand SA | | Capital Goods | | | 739 | | | | 65,826 | |
L’Oreal SA | | Household & Personal Products | | | 685 | | | | 282,558 | |
Nexans SA | | Capital Goods | | | 544 | | | | 57,629 | |
Orange SA | | Telecommunication Services | | | 5,790 | | | | 61,212 | |
Rexel SA (a) | | Capital Goods | | | 857 | | | | 18,940 | |
Sanofi | | Pharmaceuticals, Biotechnology & Life Sciences | | | 3,211 | | | | 314,117 | |
Sartorius Stedim Biotech | | Pharmaceuticals, Biotechnology & Life Sciences | | | 70 | | | | 24,393 | |
Unibail-Rodamco-Westfield (a) | | Real Estate | | | 302 | | | | 19,524 | |
21
DOMINI INTERNATIONAL OPPORTUNITIES FUND
PORTFOLIOOF INVESTMENTS (continued)
January 31, 2023 (Unaudited)
| | | | | | | | | | |
| COUNTRY/SECURITY | | INDUSTRY | | SHARES | | | VALUE | |
France (Continued) | | | | | | | | | | |
Worldline SA (a) | | Software & Services | | | 645 | | | $ | 29,231 | |
| | | | | | | | | | |
| | | | | | | | | 1,979,389 | |
| | | | | | | | | | |
| | | | | | | | | | |
Germany – 8.2% | | | | | | | | | | |
adidas AG | | Consumer Durables & Apparel | | | 459 | | | | 73,832 | |
Beiersdorf AG | | Household & Personal Products | | | 282 | | | | 34,250 | |
Carl Zeiss Meditec AG | | Health Care Equipment & Services | | | 104 | | | | 14,994 | |
Deutsche Boerse AG | | Diversified Financials | | | 518 | | | | 92,598 | |
Deutsche Post AG | | Transportation | | | 2,738 | | | | 117,770 | |
Encavis AG | | Utilities | | | 3,930 | | | | 76,068 | |
Henkel AG & Co. KGaA | | Household & Personal Products | | | 805 | | | | 53,734 | |
Infineon Technologies AG | | Semiconductors & Semiconductor Equipment | | | 3,451 | | | | 124,146 | |
Knorr-Bremse AG | | Capital Goods | | | 189 | | | | 12,410 | |
LEG Immobilien SE | | Real Estate | | | 206 | | | | 16,088 | |
Merck KGaA | | Pharmaceuticals, Biotechnology & Life Sciences | | | 365 | | | | 76,109 | |
Muenchener Rueckversicherungs-Gesellschaft AG in Muenchen | | Insurance | | | 348 | | | | 125,573 | |
Puma SE | | Consumer Durables & Apparel | | | 289 | | | | 19,715 | |
SAP SE | | Software & Services | | | 2,929 | | | | 346,852 | |
Sartorius AG, Preference Shares | | Health Care Equipment & Services | | | 82 | | | | 36,733 | |
Siemens AG | | Capital Goods | | | 2,266 | | | | 353,603 | |
Siemens Energy AG | | Capital Goods | | | 1,264 | | | | 26,402 | |
Siemens Healthineers AG | | Health Care Equipment & Services | | | 799 | | | | 42,806 | |
Symrise AG | | Materials | | | 371 | | | | 39,401 | |
Vonovia SE | | Real Estate | | | 2,188 | | | | 61,744 | |
Zalando SE (a) | | Retailing | | | 647 | | | | 30,142 | |
| | | | | | | | | | |
| | | | | | | | | 1,774,970 | |
| | | | | | | | | | |
| | | | | | | | | | |
Hong Kong – 2.7% | | | | | | | | | | |
AIA Group, Ltd. | | Insurance | | | 33,552 | | | | 379,520 | |
Hong Kong Exchanges & Clearing, Ltd. | | Diversified Financials | | | 3,631 | | | | 163,368 | |
Techtronic Industries Co., Ltd. | | Capital Goods | | | 3,732 | | | | 48,128 | |
| | | | | | | | | | |
| | | | | | | | | 591,016 | |
| | | | | | | | | | |
| | | | | | | | | | |
Ireland – 1.1% | | | | | | | | | | |
Bank of Ireland Group PLC | | Banks | | | 2,873 | | | | 30,663 | |
CRH PLC | | Materials | | | 2,115 | | | | 98,587 | |
Kerry Group PLC, Class A | | Food, Beverage & Tobacco | | | 451 | | | | 42,216 | |
Kingspan Group plc | | Capital Goods | | | 441 | | | | 28,335 | |
22
DOMINI INTERNATIONAL OPPORTUNITIES FUND
PORTFOLIOOF INVESTMENTS (continued)
January 31, 2023 (Unaudited)
| | | | | | | | | | |
| COUNTRY/SECURITY | | INDUSTRY | | SHARES | | | VALUE | |
Ireland (Continued) | | | | | | | | | | |
Smurfit Kappa Group PLC | | Materials | | | 742 | | | $ | 31,121 | |
| | | | | | | | | | |
| | | | | | | | | 230,922 | |
| | | | | | | | | | |
| | | | | | | | | | |
Italy – 1.1% | | | | | | | | | | |
DiaSorin SpA | | Health Care Equipment & Services | | | 67 | | | | 8,713 | |
Intesa Sanpaolo SpA | | Banks | | | 47,671 | | | | 125,213 | |
Moncler SpA | | Consumer Durables & Apparel | | | 567 | | | | 35,451 | |
Prysmian SpA | | Capital Goods | | | 738 | | | | 30,108 | |
Terna – Rete Elettrica Nazionale | | Utilities | | | 4,061 | | | | 32,098 | |
| | | | | | | | | | |
| | | | | | | | | 231,583 | |
| | | | | | | | | | |
| | | | | | | | | | |
Japan – 19.5% | | | | | | | | | | |
Aeon Co., Ltd. | | Food & Staples Retailing | | | 2,077 | | | | 42,621 | |
Canon, Inc. | | Technology Hardware & Equipment | | | 2,800 | | | | 62,196 | |
Central Japan Railway Co. | | Transportation | | | 472 | | | | 57,625 | |
Chiba Bank, Ltd. (The) | | Banks | | | 1,900 | | | | 14,390 | |
Dai Nippon Printing Co., Ltd. | | Commercial & Professional Services | | | 644 | | | | 15,219 | |
Daifuku Co., Ltd. | | Capital Goods | | | 317 | | | | 17,471 | |
Dai-ichi Life Holdings, Inc. | | Insurance | | | 2,705 | | | | 63,525 | |
Daiichi Sankyo Co., Ltd. | | Pharmaceuticals, Biotechnology & Life Sciences | | | 5,340 | | | | 167,868 | |
Daiwa House Industry Co., Ltd. | | Real Estate | | | 1,753 | | | | 42,137 | |
FANUC Corp. | | Capital Goods | | | 527 | | | | 93,201 | |
Fast Retailing Co., Ltd. | | Retailing | | | 152 | | | | 92,404 | |
FUJIFILM Holdings Corp. | | Technology Hardware & Equipment | | | 1,039 | | | | 55,036 | |
Hankyu Hanshin Holdings, Inc. | | Transportation | | | 642 | | | | 19,099 | |
Hoya Corp. | | Health Care Equipment & Services | | | 988 | | | | 108,753 | |
Kao Corp. | | Household & Personal Products | | | 1,282 | | | | 51,869 | |
Keikyu Corp. | | Transportation | | | 700 | | | | 7,261 | |
Keio Corp. | | Transportation | | | 352 | | | | 12,932 | |
Keisei Electric Railway Co., Ltd. | | Transportation | | | 400 | | | | 11,678 | |
Keyence Corp. | | Technology Hardware & Equipment | | | 520 | | | | 239,613 | |
Kurita Water Industries, Ltd. | | Capital Goods | | | 1,698 | | | | 76,851 | |
Lasertec Corp. | | Semiconductors & Semiconductor Equipment | | | 212 | | | | 40,174 | |
Lixil Corp. | | Capital Goods | | | 778 | | | | 13,444 | |
Makita Corp. | | Capital Goods | | | 643 | | | | 17,143 | |
Mitsubishi Estate Co., Ltd. | | Real Estate | | | 3,316 | | | | 42,660 | |
Mitsui Fudosan Co., Ltd. | | Real Estate | | | 2,451 | | | | 45,983 | |
23
DOMINI INTERNATIONAL OPPORTUNITIES FUND
PORTFOLIOOF INVESTMENTS (continued)
January 31, 2023 (Unaudited)
| | | | | | | | | | |
| COUNTRY/SECURITY | | INDUSTRY | | SHARES | | | VALUE | |
Japan (Continued) | | | | | | | | | | |
MS&AD Insurance Group Holdings, Inc. | | Insurance | | | 1,235 | | | $ | 39,648 | |
Murata Manufacturing Co., Ltd. | | Technology Hardware & Equipment | | | 1,715 | | | | 98,086 | |
Nidec Corp. | | Capital Goods | | | 1,364 | | | | 75,661 | |
Nintendo Co., Ltd. | | Media & Entertainment | | | 3,280 | | | | 142,345 | |
Nippon Express Holdings, Inc. | | Transportation | | | 200 | | | | 11,617 | |
Nippon Prologis REIT, Inc. | | Real Estate | | | 6 | | | | 13,627 | |
Nippon Telegraph & Telephone Corp. | | Telecommunication Services | | | 5,930 | | | | 177,978 | |
Nissin Foods Holdings Co., Ltd | | Food, Beverage & Tobacco | | | 181 | | | | 14,163 | |
Nitto Denko Corp. | | Materials | | | 402 | | | | 26,008 | |
Nomura Holdings, Inc. | | Diversified Financials | | | 8,405 | | | | 33,574 | |
NTT Data Corp. | | Software & Services | | | 1,728 | | | | 26,828 | |
Odakyu Electric Railway Co., Ltd. | | Transportation | | | 1,000 | | | | 13,160 | |
Omron Corp. | | Technology Hardware & Equipment | | | 532 | | | | 30,810 | |
Oriental Land Co., Ltd. | | Consumer Services | | | 552 | | | | 92,059 | |
ORIX Corp. | | Diversified Financials | | | 3,329 | | | | 58,588 | |
Panasonic Holdings Corp. | | Consumer Durables & Apparel | | | 6,401 | | | | 59,414 | |
Recruit Holdings Co., Ltd. | | Commercial & Professional Services | | | 3,950 | | | | 127,150 | |
Renesas Electronics Corp. (a) | | Semiconductors & Semiconductor Equipment | | | 3,343 | | | | 34,418 | |
Resona Holdings, Inc. | | Banks | | | 14,671 | | | | 81,260 | |
Rohm Co., Ltd. | | Semiconductors & Semiconductor Equipment | | | 235 | | | | 18,848 | |
Sekisui House, Ltd. | | Consumer Durables & Apparel | | | 1,713 | | | | 32,404 | |
Shimano, Inc. | | Consumer Durables & Apparel | | | 220 | | | | 39,270 | |
Shionogi & Co., Ltd. | | Pharmaceuticals, Biotechnology & Life Sciences | | | 814 | | | | 38,827 | |
Shiseido Co., Ltd. | | Household & Personal Products | | | 1,098 | | | | 57,122 | |
SMC Corp. | | Capital Goods | | | 170 | | | | 86,425 | |
SoftBank Group Corp. | | Telecommunication Services | | | 2,659 | | | | 125,999 | |
Sony Group Corp. | | Consumer Durables & Apparel | | | 3,533 | | | | 315,970 | |
Sysmex Corp. | | Health Care Equipment & Services | | | 421 | | | | 27,974 | |
Terumo Corp. | | Health Care Equipment & Services | | | 1,982 | | | | 57,750 | |
Tobu Railway Co., Ltd. | | Transportation | | | 528 | | | | 12,400 | |
Tokio Marine Holdings, Inc. | | Insurance | | | 5,245 | | | | 109,956 | |
Tokyo Electron, Ltd. | | Semiconductors & Semiconductor Equipment | | | 414 | | | | 144,837 | |
Tokyu Corp. | | Transportation | | | 1,598 | | | | 20,568 | |
TOTO, Ltd. | | Capital Goods | | | 399 | | | | 15,521 | |
Toyota Industries Corp. | | Capital Goods | | | 400 | | | | 24,372 | |
Toyota Motor Corp. | | Automobiles & Components | | | 30,697 | | | | 451,223 | |
Unicharm Corp. | | Household & Personal Products | | | 1,102 | | | | 42,075 | |
24
DOMINI INTERNATIONAL OPPORTUNITIES FUND
PORTFOLIOOF INVESTMENTS (continued)
January 31, 2023 (Unaudited)
| | | | | | | | | | |
| COUNTRY/SECURITY | | INDUSTRY | | SHARES | | | VALUE | |
Japan (Continued) | | | | | | | | | | |
Yaskawa Electric Corp. | | Capital Goods | | | 705 | | | $ | 27,583 | |
| | | | | | | | | | |
| | | | | | | | | 4,216,671 | |
| | | | | | | | | | |
| | | | | | | | | | |
Luxembourg – 0.1% | | | | | | | | | | |
Eurofins Scientific SE | | Pharmaceuticals, Biotechnology & Life Sciences | | | 372 | | | | 26,656 | |
| | | | | | | | | | |
| | | | | | | | | 26,656 | |
| | | | | | | | | | |
| | | | | | | | | | |
Netherlands – 7.7% | | | | | | | | | | |
Aalberts NV | | Capital Goods | | | 268 | | | | 12,659 | |
ABN AMRO Bank NV GDR | | Banks | | | 2,590 | | | | 42,944 | |
Adyen NV (a) | | Software & Services | | | 75 | | | | 113,278 | |
Akzo Nobel NV | | Materials | | | 503 | | | | 37,428 | |
Alfen Beheer BV (a) | | Capital Goods | | | 627 | | | | 58,113 | |
Arcadis NV | | Commercial & Professional Services | | | 2,448 | | | | 106,186 | |
ASML Holding NV | | Semiconductors & Semiconductor Equipment | | | 1,150 | | | | 760,125 | |
Basic-Fit NV (a) | | Consumer Services | | | 1,820 | | | | 59,743 | |
Euronext NV | | Diversified Financials | | | 253 | | | | 20,480 | |
ING Groep NV | | Banks | | | 10,522 | | | | 152,207 | |
Koninklijke Ahold Delhaize NV | | Food & Staples Retailing | | | 2,868 | | | | 85,515 | |
Koninklijke DSM NV | | Materials | | | 486 | | | | 62,437 | |
Koninklijke Philips NV | | Health Care Equipment & Services | | | 2,527 | | | | 43,586 | |
NN Group NV | | Insurance | | | 798 | | | | 34,637 | |
Wolters Kluwer NV | | Commercial & Professional
Services | | | 718 | | | | 78,199 | |
| | | | | | | | | | |
| | | | | | | | | 1,667,537 | |
| | | | | | | | | | |
| | | | | | | | | | |
New Zealand – 0.1% | | | | | | | | | | |
Contact Energy, Ltd. | | Utilities | | | 2,240 | | | | 11,263 | |
Spark New Zealand, Ltd. | | Telecommunication Services | | | 5,100 | | | | 17,192 | |
| | | | | | | | | | |
| | | | | | | | | 28,455 | |
| | | | | | | | | | |
| | | | | | | | | | |
Norway – 0.4% | | | | | | | | | | |
DNB Bank ASA | | Banks | | | 2,498 | | | | 46,680 | |
Gjensidige Forsikring ASA | | Insurance | | | 524 | | | | 9,412 | |
Orkla ASA | | Food, Beverage & Tobacco | | | 2,053 | | | | 15,317 | |
Storebrand ASA | | Insurance | | | 855 | | | | 7,438 | |
| | | | | | | | | | |
| | | | | | | | | 78,847 | |
| | | | | | | | | | |
| | | | | | | | | | |
Singapore – 1.2% | | | | | | | | | | |
DBS Group Holdings, Ltd. | | Banks | | | 5,157 | | | | 141,120 | |
STMicroelectronics NV | | Semiconductors & Semiconductor Equipment | | | 2,437 | | | | 114,603 | |
| | | | | | | | | | |
| | | | | | | | | 255,723 | |
| | | | | | | | | | |
| | | | | | | | | | |
25
DOMINI INTERNATIONAL OPPORTUNITIES FUND
PORTFOLIOOF INVESTMENTS (continued)
January 31, 2023 (Unaudited)
| | | | | | | | | | |
| COUNTRY/SECURITY | | INDUSTRY | | SHARES | | | VALUE | |
South Africa – 0.3% | | | | | | | | | | |
FirstRand, Ltd. | | Diversified Financials | | | 10,755 | | | $ | 39,898 | |
Nedbank Group, Ltd. | | Banks | | | 1,156 | | | | 14,936 | |
Sanlam, Ltd. | | Insurance | | | 4,823 | | | | 15,581 | |
| | | | | | | | | | |
| | | | | | | | | 70,415 | |
| | | | | | | | | | |
| | | | | | | | | | |
Spain – 2.6% | | | | | | | | | | |
Acciona SA | | Utilities | | | 64 | | | | 12,474 | |
Aena SME SA (a) | | Transportation | | | 204 | | | | 30,620 | |
Amadeus IT Group SA (a) | | Software & Services | | | 1,274 | | | | 80,186 | |
Banco Bilbao Vizcaya Argentaria SA | | Banks | | | 15,893 | | | | 112,151 | |
Banco de Sabadell SA | | Banks | | | 15,636 | | | | 20,421 | |
Banco Santander SA | | Banks | | | 47,126 | | | | 164,536 | |
Bankinter SA | | Banks | | | 1,818 | | | | 13,103 | |
CaixaBank SA | | Banks | | | 11,069 | | | | 49,063 | |
Grifols SA (a) | | Pharmaceuticals, Biotechnology & Life Sciences | | | 1,415 | | | | 18,713 | |
Telefonica SA | | Telecommunication Services | | | 14,390 | | | | 54,612 | |
| | | | | | | | | | |
| | | | | | | | | 555,879 | |
| | | | | | | | | | |
| | | | | | | | | | |
Sweden – 2.5% | | | | | | | | | | |
Alfa Laval AB | | Capital Goods | | | 841 | | | | 26,398 | |
Assa Abloy AB, Class B | | Capital Goods | | | 2,750 | | | | 64,704 | |
Autoliv, Inc. | | Automobiles & Components | | | 223 | | | | 20,543 | |
Axfood AB | | Food & Staples Retailing | | | 1,716 | | | | 44,145 | |
Castellum AB | | Real Estate | | | 863 | | | | 11,828 | |
Essity AB, Class B | | Household & Personal Products | | | 1,819 | | | | 47,464 | |
Fabege AB | | Real Estate | | | 753 | | | | 7,109 | |
H & M Hennes & Mauritz AB, Class B | | Retailing | | | 2,074 | | | | 25,514 | |
Industrivarden AB, Class A | | Diversified Financials | | | 824 | | | | 21,803 | |
Nibe Industrier AB, Class B | | Capital Goods | | | 4,627 | | | | 49,933 | |
Sandvik AB | | Capital Goods | | | 2,973 | | | | 61,373 | |
Skandinaviska Enskilda Banken AB, Class A | | Banks | | | 4,287 | | | | 51,837 | |
Skanska AB, Class B | | Capital Goods | | | 916 | | | | 16,149 | |
SKF AB, Class B | | Capital Goods | | | 1,069 | | | | 18,897 | |
SSAB AB, Class A | | Materials | | | 2,448 | | | | 17,477 | |
Svenska Cellulosa AB SCA, Class B | | Materials | | | 1,819 | | | | 25,230 | |
Svenska Handelsbanken AB, Class A | | Banks | | | 4,244 | | | | 44,205 | |
| | | | | | | | | | |
| | | | | | | | | 554,609 | |
| | | | | | | | | | |
| | | | | | | | | | |
Switzerland – 7.2% | | | | | | | | | | |
ABB, Ltd. | | Capital Goods | | | 4,519 | | | | 156,775 | |
Adecco Group AG | | Commercial & Professional Services | | | 466 | | | | 17,246 | |
Chocoladefabriken Lindt & Spruengli AG | | Food, Beverage & Tobacco | | | 6 | | | | 65,663 | |
26
DOMINI INTERNATIONAL OPPORTUNITIES FUND
PORTFOLIOOF INVESTMENTS (continued)
January 31, 2023 (Unaudited)
| | | | | | | | | | |
| COUNTRY/SECURITY | | INDUSTRY | | SHARES | | | VALUE | |
Switzerland (Continued) | | | | | | | | | | |
Geberit AG | | Capital Goods | | | 98 | | | $ | 55,563 | |
Helvetia Holding AG | | Insurance | | | 95 | | | | 11,842 | |
Kuehne + Nagel International AG | | Transportation | | | 147 | | | | 34,929 | |
Lonza Group AG | | Pharmaceuticals, Biotechnology & Life Sciences | | | 210 | | | | 119,369 | |
Novartis AG | | Pharmaceuticals, Biotechnology & Life Sciences | | | 6,395 | | | | 576,121 | |
Schindler Holding AG | | Capital Goods | | | 180 | | | | 36,283 | |
Sika AG | | Materials | | | 434 | | | | 122,884 | |
Sonova Holding AG | | Health Care Equipment & Services | | | 138 | | | | 34,388 | |
Straumann Holding AG | | Health Care Equipment & Services | | | 298 | | | | 38,881 | |
Swatch Group AG | | Consumer Durables & Apparel | | | 108 | | | | 38,965 | |
Swisscom AG | | Telecommunication Services | | | 73 | | | | 42,980 | |
Zurich Insurance Group AG | | Insurance | | | 426 | | | | 209,924 | |
| | | | | | | | | | |
| | | | | | | | | 1,561,813 | |
| | | | | | | | | | |
| | | | | | | | | | |
United Kingdom – 10.7% | | | | | | | | | | |
3i Group PLC | | Diversified Financials | | | 2,767 | | | | 53,907 | |
AstraZeneca PLC | | Pharmaceuticals, Biotechnology & Life Sciences | | | 4,248 | | | | 555,751 | |
Bunzl PLC | | Capital Goods | | | 976 | | | | 35,779 | |
Burberry Group PLC | | Consumer Durables & Apparel | | | 1,116 | | | | 33,946 | |
Compass Group PLC | | Consumer Services | | | 4,982 | | | | 118,841 | |
Halma PLC | | Technology Hardware & Equipment | | | 808 | | | | 21,482 | |
Hiscox, Ltd. | | Insurance | | | 989 | | | | 13,746 | |
Informa PLC | | Media & Entertainment | | | 4,126 | | | | 34,077 | |
Intermediate Capital Group PLC | | Diversified Financials | | | 834 | | | | 14,331 | |
Intertek Group PLC | | Commercial & Professional Services | | | 465 | | | | 24,957 | |
J Sainsbury PLC | | Food & Staples Retailing | | | 5,503 | | | | 17,821 | |
Land Securities Group PLC | | Real Estate | | | 2,085 | | | | 18,240 | |
Legal & General Group PLC | | Insurance | | | 16,925 | | | | 53,186 | |
Linde PLC | | Materials | | | 1,373 | | | | 454,381 | |
London Stock Exchange Group PLC | | Diversified Financials | | | 1,029 | | | | 94,066 | |
M&G PLC | | Diversified Financials | | | 6,626 | | | | 16,524 | |
National Grid PLC | | Utilities | | | 10,569 | | | | 134,166 | |
Phoenix Group Holdings PLC | | Insurance | | | 2,467 | | | | 19,525 | |
Schroders PLC | | Diversified Financials | | | 2,691 | | | | 15,891 | |
Segro PLC | | Real Estate | | | 3,491 | | | | 35,884 | |
Spirax-Sarco Engineering PLC | | Capital Goods | | | 213 | | | | 30,382 | |
SSE PLC | | Utilities | | | 3,064 | | | | 65,307 | |
Unilever PLC | | Household & Personal Products | | | 7,059 | | | | 358,786 | |
Vodafone Group PLC | | Telecommunication Services | | | 77,955 | | | | 89,818 | |
| | | | | | | | | | |
| | | | | | | | | 2,310,794 | |
| | | | | | | | | | |
| | | | | | | | | | |
27
DOMINI INTERNATIONAL OPPORTUNITIES FUND
PORTFOLIOOF INVESTMENTS (continued)
January 31, 2023 (Unaudited)
| | | | | | | | | | |
| COUNTRY/SECURITY | | INDUSTRY | | SHARES | | | VALUE | |
United States – 7.7% | | | | | | | | | | |
Alliant Energy Corp. | | Utilities | | | 700 | | | $ | 37,821 | |
Autodesk, Inc. (a) | | Software & Services | | | 112 | | | | 24,098 | |
Campbell Soup Co. | | Food, Beverage & Tobacco | | | 553 | | | | 28,717 | |
Clorox Co. (The) | | Household & Personal Products | | | 339 | | | | 49,050 | |
Consolidated Edison, Inc. | | Utilities | | | 983 | | | | 93,690 | |
Copart, Inc. (a) | | Commercial & Professional Services | | | 1,188 | | | | 79,133 | |
CSL, Ltd. | | Pharmaceuticals, Biotechnology & Life Sciences | | | 1,354 | | | | 285,412 | |
Enphase Energy, Inc. (a) | | Semiconductors & Semiconductor Equipment | | | 182 | | | | 40,291 | |
Eversource Energy | | Utilities | | | 952 | | | | 78,378 | |
Ferguson PLC | | Capital Goods | | | 595 | | | | 83,714 | |
General Mills, Inc. | | Food, Beverage & Tobacco | | | 1,650 | | | | 129,294 | |
GSK PLC | | Pharmaceuticals, Biotechnology & Life Sciences | | | 2,520 | | | | 44,201 | |
Haleon PLC (a) | | Household & Personal Products | | | 3,151 | | | | 12,609 | |
Kroger Co. (The) | | Food & Staples Retailing | | | 1,900 | | | | 84,797 | |
McCormick & Co., Inc. | | Food, Beverage & Tobacco | | | 734 | | | | 55,138 | |
Nucor Corp. | | Materials | | | 722 | | | | 122,032 | |
Pentair PLC | | Capital Goods | | | 450 | | | | 24,921 | |
QIAGEN N.V. (a) | | Pharmaceuticals, Biotechnology & Life Sciences | | | 600 | | | | 29,400 | |
Schneider Electric SE | | Capital Goods | | | 1,564 | | | | 253,448 | |
Signify NV | | Capital Goods | | | 360 | | | | 13,021 | |
Swiss Re AG | | Insurance | | | 817 | | | | 85,246 | |
Tesla, Inc. (a) | | Automobiles & Components | | | 94 | | | | 16,283 | |
| | | | | | | | | | |
| | | | | | | | | 1,670,694 | |
| | | | | | | | | | |
| | |
Total Investments – 94.8% (Cost $20,514,059) | | | | | | | 20,534,547 | |
| | |
| Other Assets, less liabilities – 5.2% | | | | | 1,122,399 | |
| | | | | | | | | | |
| | | |
| Net Assets – 100.0% | | | | | | | $21,656,946 | |
| | | | | | | | | | |
(a) Non-income producing security.
Abbreviations
ADR — American Depositary Receipt
As of the date of this report, certain foreign securities were fair valued by an independent pricing service in accordance with the Trust’s Valuation and Pricing Policies and Procedures.
SEE NOTES TO FINANCIAL STATEMENTS
28
DOMINI SUSTAINABLE SOLUTIONS FUND
Fund Performance and Holdings
The table and bar charts below provide information as of January 31, 2023 about the ten largest holdings of the Domini Sustainable Solutions Fund and its portfolio holdings by industry sector and country:
TEN LARGEST HOLDINGS (Unaudited)
| | | | | | | | | | |
| | | | |
| SECURITY DESCRIPTION | | % NET
ASSETS | | | SECURITY DESCRIPTION | | % NET
ASSETS | |
| | | | |
| Muenchener Rueckversicherungs-Gesellschaft AG in Muenchen | | | 5.4% | | | East West Bancorp, Inc. | | | 3.6% | |
| | | | |
| ASML Holding NV | | | 4.1% | | | Enphase Energy, Inc. | | | 3.6% | |
| | | | |
| Palo Alto Networks, Inc. | | | 4.0% | | | GSK PLC | | | 3.4% | |
| | | | |
| Federal Agricultural Mortgage Corp. Class C | | | 3.9% | | | Wolters Kluwer NV | | | 3.4% | |
| | | | |
| Autodesk, Inc. | | | 3.8% | | | Resona Holdings, Inc. | | | 3.1% | |
PORTFOLIO HOLDINGS BY INDUSTRY SECTOR (% OF NET ASSETS) (Unaudited)
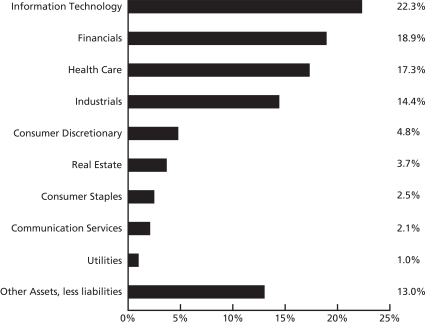
The Global Industry Classification Standard (“GICS”) was developed by and is the exclusive property and a service mark of MSCI Inc. (“MSCI”) and Standard & Poor’s, a division of The McGraw-Hill Companies, Inc., (“S&P”) and is licensed for use by Domini Impact Investments. Neither MSCI, S&P nor any third party involved in making or compiling the GICS or any GICS classifications makes any express or implied warranties or representations with respect to such standard or classification nor shall any such party have any liability therefrom.
29
PORTFOLIO HOLDINGS BY COUNTRY (% OF NET ASSETS) (Unaudited)
The holdings mentioned above are described in the Fund’s Portfolio of Investments as of 1/31/2023, included herein. The composition of the Fund’s portfolio is subject to change.
30
| | | | | | |
| |
| DOMINI SUSTAINABLE SOLUTIONS FUND |
| | | |
AVERAGE ANNUAL TOTAL RETURNS as of 1/31/2023 (Unaudited) | | Investor
shares | | Institutional
shares | | MSCI World
Investable Market
Index (net) |
| | | |
| 1 Year | | -11.33% | | -11.10% | | -7.05% |
| | | |
| 5 Year | | N/A | | N/A | | N/A |
| | | |
| 10 Year | | N/A | | N/A | | N/A |
| | | |
| Since Inception (4/1/2020) | | 14.48% | | 14.74% | | 17.54% |
Past performance is no guarantee of future results. The Fund’s returns quoted above represent past performance after all expenses. The returns reflect any applicable expense waivers in effect during the periods shown. Without such waivers, Fund performance would be lower. Investment return, principal value, and yield will fluctuate. Your shares, when redeemed, may be worth more or less than their original cost. Call 1-800-582-6757 or visit www.domini.com for performance information current to the most recent month-end, which may be lower or higher than the performance data quoted. A 2.00% redemption fee applied on sales or exchanges of shares made less than 30 days after the settlement of purchase or acquisition through exchange, with certain exceptions. The redemption fee was waived by the Fund’s Board of Trustees and was no longer imposed by the Fund effective August 16, 2021. Quoted performance data does not reflect the deduction of this fee, which would reduce the performance quoted. See the prospectus for further information.
Per the prospectus dated November 30, 2022, the Fund’s annual operating expenses totaled 1.99%/1.40% and 1.40%/1.15% (gross/net) for the Investor and Institutional Class shares, respectively. The Fund’s adviser has contractually agreed to waive certain fees and/or reimburse certain ordinary operating expenses in order to limit Investor share and Institutional share expenses to 1.40% and 1.15%, respectively. These expenses are limitations are in effect through November 30, 2023, absent an earlier modification approved by the Funds’ Board of Trustees.
The table does not reflect the deduction of fees and taxes that a shareholder would pay on Fund distributions or the redemption of Fund shares. Total return is based on the Fund’s net asset values and assumes all dividends and capital gains were reinvested.
An investment in the Fund is not a bank deposit and is not insured. The Fund is subject to certain risks, including loss of principal, sustainable investing, portfolio management, information, market, mid- to large-cap companies, and small-cap companies risks. Investing internationally involves special risks, such as currency fluctuations, social and economic instability, differing securities regulations and accounting standards, limited public information, possible changes in taxation, and periods of illiquidity. You may lose money.
The MSCI World Investable Market Index (net) (MSCI IMI) is a market capitalization weighted index representing the performance of large-mid- and small-capitalization companies in developed markets. The MSCI IMI includes the reinvestment of dividends net of withholding tax, but does not reflect other fees, expenses, or taxes. See the prospectus for more information. You cannot invest directly in an index.
31
DOMINI SUSTAINABLE SOLUTIONS FUND
PORTFOLIOOF INVESTMENTS
January 31, 2023 (Unaudited)
| | | | | | | | |
| SECURITY | | SHARES | | | VALUE | |
Long Term Investments – 87.0% | |
Common Stocks – 87.0% | |
| Communication Services – 2.1% | |
New York Times Co. (The), Class A | | | 17,840 | | | $ | 621,546 | |
| | | | | | | | |
| | | | | | | 621,546 | |
| | | | | | | | |
|
| Consumer Discretionary – 4.8% | |
Levi Strauss & Co., Class A | | | 34,008 | | | | 625,747 | |
Tesla, Inc. (a) | | | 4,676 | | | | 809,977 | |
| | | | | | | | |
| | | | | | | 1,435,724 | |
| | | | | | | | |
|
| Consumer Staples – 2.5% | |
Haleon PLC (a) | | | 52,933 | | | | 211,821 | |
SunOpta, Inc. (a) | | | 66,123 | | | | 540,225 | |
| | | | | | | | |
| | | | | | | 752,046 | |
| | | | | | | | |
|
| Financials – 18.9% | |
Amalgamated Financial Corp. | | | 12,676 | | | | 290,914 | |
East West Bancorp, Inc. | | | 13,949 | | | | 1,095,276 | |
Federal Agricultural Mortgage Corp., Class C | | | 8,688 | | | | 1,155,243 | |
Muenchener Rueckversicherungs-Gesellschaft AG in Muenchen | | | 4,471 | | | | 1,613,323 | |
Resona Holdings, Inc. | | | 169,462 | | | | 938,621 | |
Storebrand ASA | | | 65,160 | | | | 566,877 | |
| | | | | | | | |
| | | | | | | 5,660,254 | |
| | | | | | | | |
|
| Health Care – 17.3% | |
Cochlear, Ltd. | | | 4,700 | | | | 708,853 | |
DexCom, Inc. (a) | | | 5,219 | | | | 558,903 | |
GSK PLC | | | 58,842 | | | | 1,032,094 | |
Halozyme Therapeutics, Inc. (a) | | | 10,283 | | | | 532,351 | |
Hologic, Inc. (a) | | | 10,306 | | | | 838,599 | |
Inspire Medical Systems, Inc. (a) | | | 2,362 | | | | 597,728 | |
Organon & Co. | | | 13,502 | | | | 406,815 | |
Seagen, Inc. (a) | | | 3,581 | | | | 499,478 | |
| | | | | | | | |
| | | | | | | 5,174,821 | |
| | | | | | | | |
|
| Industrials – 14.4% | |
Acuity Brands, Inc. | | | 3,027 | | | | 570,650 | |
Alfen Beheer BV (a) | | | 6,687 | | | | 619,781 | |
Ameresco, Inc., Class A (a) | | | 7,456 | | | | 480,688 | |
Arcadis NV | | | 7,557 | | | | 327,796 | |
Kurita Water Industries, Ltd | | | 15,413 | | | | 697,592 | |
Nexans SA | | | 5,801 | | | | 614,536 | |
Wolters Kluwer NV | | | 9,252 | | | | 1,007,660 | |
| | | | | | | | |
| | | | | | | 4,318,703 | |
| | | | | | | | |
|
| Information Technology – 22.3% | |
ASML Holding NV | | | 1,869 | | | | 1,235,110 | |
Autodesk, Inc. (a) | | | 5,368 | | | | 1,154,979 | |
32
DOMINI SUSTAINABLE SOLUTIONS FUND
PORTFOLIOOF INVESTMENTS (continued)
January 31, 2023 (Unaudited)
| | | | | | | | |
| SECURITY | | SHARES | | | VALUE | |
| |
| Information Technology (Continued) | | | | |
Crowdstrike Holdings, Inc., Class A (a) | | | 2,187 | | | $ | 231,603 | |
Enphase Energy, Inc. (a) | | | 4,859 | | | | 1,075,685 | |
International Business Machines Corp. | | | 1,936 | | | | 260,837 | |
Palo Alto Networks, Inc. (a) | | | 7,559 | | | | 1,199,160 | |
STMicroelectronics NV | | | 19,812 | | | | 931,680 | |
Zoom Video Communications, Inc., Class A (a) | | | 7,880 | | | | 591,000 | |
| | | | | | | | |
| | | | | | | 6,680,054 | |
| | | | | | | | |
| |
| Real Estate – 3.7% | | | | |
Alexandria Real Estate Equities, Inc. | | | 3,171 | | | | 509,706 | |
American Tower Corp. | | | 2,707 | | | | 604,717 | |
| | | | | | | | |
| | | | | | | 1,114,423 | |
| | | | | | | | |
| |
| Utilities – 1.0% | | | | |
Encavis AG | | | 16,104 | | | | 311,707 | |
| | | | | | | | |
| | | | | | | 311,707 | |
| | | | | | | | |
| |
| Total Investments – 87.0% (Cost $22,695,600) | | | 26,069,278 | |
| |
| Other Assets, less liabilities – 13.0% | | | 3,901,013 | |
| | | | | | | | |
| |
| Net Assets – 100.0% | | | $29,970,291 | |
| | | | | | | | |
(a) Non-income producing security.
As of the date of this report, certain foreign securities were fair valued by an independent pricing service in accordance with the Trust’s Valuation and Pricing Policies and Procedures.
| | | | | | | | | | |
| | | | |
| COUNTRY | | % NET
ASSETS | | | COUNTRY | | % NET
ASSETS | |
| | | | |
| United States | | | 53.2% | | | Australia | | | 2.4% | |
| | | | |
| Netherlands | | | 10.6% | | | France | | | 2.1% | |
| | | | |
| Germany | | | 6.4% | | | Norway | | | 1.9% | |
| | | | |
| Japan | | | 5.5% | | | Canada | | | 1.8% | |
| | | | | | | | | | | |
| | | | |
| Singapore | | | 3.1% | | | Total | | | 87.0% | |
SEE NOTES TO FINANCIAL STATEMENTS
33
DOMINI IMPACT INTERNATIONAL EQUITY FUND
Fund Performance and Holdings
The table and bar charts below provide information as of January 31, 2023 about the ten largest holdings of the Domini Impact International Equity Fund and its portfolio holdings by industry sector and country:
TEN LARGEST HOLDINGS (Unaudited)
| | | | | | | | | | |
| | | | |
| SECURITY DESCRIPTION | | % NET
ASSETS | | | SECURITY DESCRIPTION | | % NET
ASSETS | |
| | | | |
| Novartis AG | | | 3.9% | | | Carrefour SA | | | 1.9% | |
| | | | |
| ASML Holding NV | | | 3.7% | | | InterContinental Hotels Group PLC | | | 1.8% | |
| | | | |
| BNP Paribas SA | | | 2.2% | | | Recruit Holdings Co., Ltd. | | | 1.8% | |
| | | | |
| DBS Group Holdings, Ltd. | | | 2.0% | | | Nintendo Co., Ltd. | | | 1.8% | |
| | | | |
| Vodafone Group PLC | | | 2.0% | | | CNH Industrial NV | | | 1.7% | |
PORTFOLIO HOLDINGS BY INDUSTRY SECTOR (% OF NET ASSETS) (Unaudited)
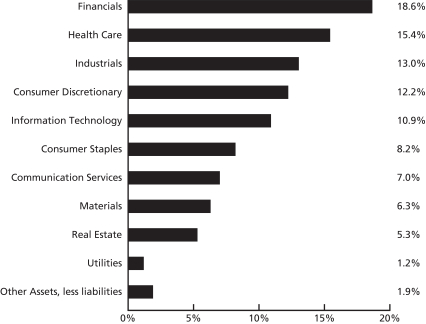
The Global Industry Classification Standard (“GICS”) was developed by and is the exclusive property and a service mark of MSCI Inc. (“MSCI”) and Standard & Poor’s, a division of The McGraw-Hill Companies, Inc., (“S&P”) and is licensed for use by Domini Impact Investments. Neither MSCI, S&P nor any third party involved in making or compiling the GICS or any GICS classifications makes any express or implied warranties or representations with respect to such standard or classification nor shall any such party have any liability therefrom.
34
PORTFOLIO HOLDINGS BY COUNTRY (% OF NET ASSETS) (Unaudited)
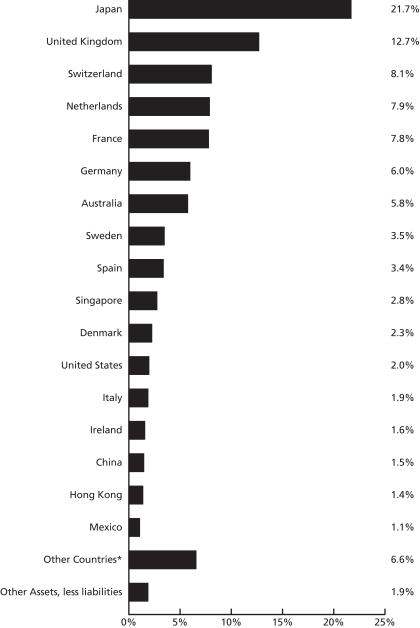
The holdings mentioned above are described in the Fund’s Portfolio of Investments as of 1/31/2023, included herein. The composition of the Fund’s portfolio is subject to change.
*Other countries include Brazil 0.9%, Thailand 0.9%, Norway 0.7%, Taiwan 0.7%, Finland 0.7%, South Africa 0.6%, Belgium 0.5%, Turkey 0.5%, South Korea 0.4%, Israel 0.4%, Hungary 0.2%, Austria, 0.1% and India 0.0%.
35
| | | | | | | | | | | | |
| |
| DOMINI IMPACT INTERNATIONAL EQUITY FUND |
| | | | | | |
AVERAGE ANNUAL
TOTAL RETURNS
as of 1/31/2023
(Unaudited) | | Investor
shares | | Class A
shares
(with 4.75%
maximum
Sales
Charge) | | Class A
shares
(without
Sales
Charge) | | Institutional
Shares | | Class Y
shares | | MSCI EAFE
(net) |
| | | | | | |
| 1 Year | | -8.80% | | -13.19% | | -8.86% | | -8.42% | | -8.41% | | -2.83% |
| | | | | | |
| 5 Year | | -1.33% | | -2.33% | | -1.37% | | -0.94% | | -1.33%1 | | 2.13% |
| | | | | | |
| 10 Year | | 4.17% | | 3.64% | | 4.15% | | 4.59% | | 4.17%1 | | 4.95% |
Past performance is no guarantee of future results. The Fund’s returns quoted above represent past performance after all expenses. The returns reflect any applicable expense waivers in effect during the periods shown. Without such waivers, Fund performance would be lower. Investment return, principal value, and yield will fluctuate. Your shares, when redeemed, may be worth more or less than their original cost. Call 1-800-582-6757 or visit www.domini.com for performance information current to the most recent month-end, which may be lower or higher than the performance data quoted. A 2.00% redemption fee applied on sales or exchanges of shares made less than 30 days after the settlement of purchase or acquisition through exchange, with certain exceptions. The redemption fee was waived by the Fund’s Board of Trustees and was no longer imposed by the Fund effective August 16, 2021. Quoted performance data does not reflect the deduction of this fee, which would reduce the performance quoted. See the prospectus for further information.
Per the prospectus dated November 30, 2022, the Fund’s annual operating expenses totaled 1.34%, 1.37%, 0.89%, and 0.95% (gross and net) for the Investor, Class A, Institutional, and Class Y shares, respectively. The Fund’s adviser has contractually agreed to waive certain fees and/or reimburse certain ordinary operating expenses in order to limit Class A and Class Y share expenses to 1.40% and 1.12%, respectively. These expenses are limitations are in effect through November 30, 2023, absent an earlier modification approved by the Funds’ Board of Trustees.
The table does not reflect the deduction of fees and taxes that a shareholder would pay on Fund distributions or the redemption of Fund shares. Total return is based on the Fund’s net asset values and assumes all dividends and capital gains were reinvested.
An investment in the Fund is not a bank deposit and is not insured. The Fund is subject to certain risks, including loss of principal, foreign investing and emerging markets, geographic focus, country, currency, impact investing, portfolio management and quantitative investment approach risks. Investing internationally involves special risks, such as currency fluctuations, social and economic instability, differing securities regulations and accounting standards, limited public information, possible changes in taxation, and periods of illiquidity. You may lose money.
The Morgan Stanley Capital International Europe Australasia Far East (MSCI EAFE) index (net) is an unmanaged index of common stocks. MSCI EAFE (net) includes the reinvestment of dividends net of withholding tax, but does not reflect other fees, expenses, or taxes. It is not available for direct investment.
1Class Y Shares were not offered prior to July 23, 2018. All performance information for time periods beginning prior to July 23, 2018, is the performance of the Investor Shares. This performance has not been adjusted to reflect the lower expenses of the Class Y Shares.
36
DOMINI IMPACT INTERNATIONAL EQUITY FUND
PORTFOLIOOF INVESTMENTS
January 31, 2023 (Unaudited)
| | | | | | | | | | |
| COUNTRY/SECURITY | | INDUSTRY | | SHARES | | | VALUE | |
| Long Term Investments – 98.1% | | | | | | |
| Common Stocks – 98.1% | | | | | | | | |
Australia – 5.8% | | | | | | | | | | |
Bank of Queensland, Ltd. | | Banks | | | 735,115 | | | $ | 3,628,855 | |
Bendigo & Adelaide Bank, Ltd. | | Banks | | | 439,113 | | | | 3,124,856 | |
BlueScope Steel, Ltd. | | Materials | | | 600,726 | | | | 8,177,865 | |
Fortescue Metals Group, Ltd. | | Materials | | | 1,081,839 | | | | 17,059,201 | |
IGO, Ltd. | | Materials | | | 93,977 | | | | 975,256 | |
JB Hi-Fi, Ltd. | | Retailing | | | 139,442 | | | | 4,786,215 | |
Mirvac Group | | Real Estate | | | 6,693 | | | | 10,795 | |
Pilbara Minerals, Ltd. (a) | | Materials | | | 1,327,602 | | | | 4,508,717 | |
Pro Medicus, Ltd. | | Health Care Equipment & Services | | | 74,702 | | | | 3,561,607 | |
QBE Insurance Group, Ltd. | | Insurance | | | 103,803 | | | | 1,011,076 | |
Suncorp Group, Ltd. | | Insurance | | | 245,000 | | | | 2,174,187 | |
WiseTech Global, Ltd. | | Software & Services | | | 236,266 | | | | 10,226,974 | |
| | | | | | | | | | |
| | | | | | | | | 59,245,604 | |
| | | | | | | | | | |
| | | | | | | | | | |
Austria – 0.1% | | | | | | | | | | |
ams-OSRAM AG (a) | | Semiconductors & Semiconductor Equipment | | | 120,612 | | | | 1,122,778 | |
| | | | | | | | | | |
| | | | | | | | | 1,122,778 | |
| | | | | | | | | | |
| | | | | | | | | | |
Belgium – 0.5% | | | | | | | | | | |
Elia Group SA | | Utilities | | | 34,881 | | | | 4,892,973 | |
| | | | | | | | | | |
| | | | | | | | | 4,892,973 | |
| | | | | | | | | | |
| | | | | | | | | | |
Brazil – 0.9% | | | | | | | | | | |
Banco do Brasil SA | | Banks | | | 351,600 | | | | 2,810,618 | |
BB Seguridade Participacoes SA | | Insurance | | | 739,500 | | | | 5,487,299 | |
Raia Drogasil SA | | Food & Staples Retailing | | | 2,380 | | | | 11,607 | |
StoneCo, Ltd., Class A (a) | | Software & Services | | | 122,794 | | | | 1,370,381 | |
| | | | | | | | | | |
| | | | | | | | | 9,679,905 | |
| | | | | | | | | | |
| | | | | | | | | | |
China – 1.5% | | | | | | | | | | |
Lenovo Group, Ltd. | | Technology Hardware & Equipment | | | 3,922,100 | | | | 3,146,838 | |
Ping An Insurance Group Co. of China, Ltd., Class H | | Insurance | | | 638,000 | | | | 4,957,437 | |
SITC International Holdings Co. Ltd. | | Transportation | | | 604,000 | | | | 1,319,936 | |
Wharf Holdings, Ltd. (The) | | Real Estate | | | 509,000 | | | | 1,326,452 | |
Yangzijiang Shipbuilding Holdings, Ltd. | | Capital Goods | | | 4,896,500 | | | | 4,825,199 | |
| | | | | | | | | | |
| | | | | | | | | 15,575,862 | |
| | | | | | | | | | |
| | | | | | | | | | |
37
DOMINI IMPACT INTERNATIONAL EQUITY FUND
PORTFOLIOOF INVESTMENTS (continued)
January 31, 2023 (Unaudited)
| | | | | | | | | | |
| COUNTRY/SECURITY | | INDUSTRY | | SHARES | | | VALUE | |
Denmark – 2.3% | | | | | | | | | | |
Genmab A/S (a) | | Pharmaceuticals, Biotechnology
& Life Sciences | | | 18,731 | | | $ | 7,333,004 | |
ISS A/S (a) | | Commercial & Professional Services | | | 135,978 | | | | 2,969,900 | |
Novo Nordisk A/S, Class B | | Pharmaceuticals, Biotechnology & Life Sciences | | | 31,342 | | | | 4,332,916 | |
Pandora A/S | | Consumer Durables & Apparel | | | 111,943 | | | | 9,311,934 | |
Vestas Wind Systems A/S | | Capital Goods | | | 290 | | | | 8,477 | |
| | | | | | | | | | |
| | | | | | | | | 23,956,231 | |
| | | | | | | | | | |
| | | | | | | | | | |
Finland – 0.7% | | | | | | | | | | |
Metso Outotec Oyj | | Capital Goods | | | 242,605 | | | | 2,785,407 | |
Nokia Oyj | | Technology Hardware & Equipment | | | 834,914 | | | | 3,954,751 | |
| | | | | | | | | | |
| | | | | | | | | 6,740,158 | |
| | | | | | | | | | |
| | | | | | | | | | |
France – 7.8% | | | | | | | | | | |
BNP Paribas SA | | Banks | | | 323,459 | | | | 22,193,286 | |
Capgemini SE | | Software & Services | | | 23,112 | | | | 4,381,884 | |
Carrefour SA | | Food & Staples Retailing | | | 1,012,114 | | | | 19,231,901 | |
Eiffage SA | | Capital Goods | | | 45,645 | | | | 4,870,433 | |
Gecina SA | | Real Estate | | | 11,389 | | | | 1,347,658 | |
Kering SA | | Consumer Durables & Apparel | | | 18 | | | | 11,220 | |
Klepierre SA (a) | | Real Estate | | | 116,858 | | | | 2,962,895 | |
Nexans SA | | Capital Goods | | | 20,368 | | | | 2,157,709 | |
Rexel SA (a) | | Capital Goods | | | 228,794 | | | | 5,056,349 | |
Sanofi | | Pharmaceuticals, Biotechnology & Life Sciences | | | 120,602 | | | | 11,797,927 | |
Unibail-Rodamco-Westfield (a) | | Real Estate | | | 37,215 | | | | 2,405,941 | |
Worldline SA (a) | | Software & Services | | | 76,061 | | | | 3,447,082 | |
| | | | | | | | | | |
| | | | | | | | | 79,864,285 | |
| | | | | | | | | | |
| | | | | | | | | | |
Germany – 6.0% | | | | | | | | | | |
adidas AG | | Consumer Durables & Apparel | | | 33 | | | | 5,308 | |
Deutsche Telekom AG | | Telecommunication Services | | | 232,551 | | | | 5,175,713 | |
GEA Group AG | | Capital Goods | | | 101,650 | | | | 4,581,796 | |
HUGO BOSS AG | | Consumer Durables & Apparel | | | 227,349 | | | | 15,423,678 | |
Infineon Technologies AG | | Semiconductors & Semiconductor Equipment | | | 168,822 | | | | 6,073,204 | |
Knorr-Bremse AG | | Capital Goods | | | 36,519 | | | | 2,397,892 | |
Merck KGaA | | Pharmaceuticals, Biotechnology & Life Sciences | | | 66,270 | | | | 13,818,416 | |
Scout24 SE | | Media & Entertainment | | | 47,240 | | | | 2,747,435 | |
Telefonica Deutschland Holding AG | | Telecommunication Services | | | 2,072,935 | | | | 6,099,384 | |
Wacker Chemie AG | | Materials | | | 36,739 | | | | 5,547,095 | |
| | | | | | | | | | |
| | | | | | | | | 61,869,921 | |
| | | | | | | | | | |
| | | | | | | | | | |
38
DOMINI IMPACT INTERNATIONAL EQUITY FUND
PORTFOLIOOF INVESTMENTS (continued)
January 31, 2023 (Unaudited)
| | | | | | | | | | |
| COUNTRY/SECURITY | | INDUSTRY | | SHARES | | | VALUE | |
Hong Kong – 1.4% | | | | | | | | | | |
AIA Group, Ltd. | | Insurance | | | 90,600 | | | $ | 1,024,812 | |
Cathay Pacific Airways, Ltd. (a) | | Transportation | | | 965,000 | | | | 962,050 | |
Swire Pacific, Ltd., Class A | | Real Estate | | | 1,098,600 | | | | 10,070,788 | |
Swire Properties, Ltd. | | Real Estate | | | 816,200 | | | | 2,294,737 | |
| | | | | | | | | | |
| | | | | | | | | 14,352,387 | |
| | | | | | | | | | |
| | | | | | | | | | |
Hungary – 0.2% | | | | | | | | | | |
Richter Gedeon Nyrt | | Pharmaceuticals, Biotechnology & Life Sciences | | | 100,312 | | | | 2,260,150 | |
| | | | | | | | | | |
| | | | | | | | | 2,260,150 | |
| | | | | | | | | | |
| | | | | | | | | | |
India – 0.0% | | | | | | | | | | |
Dr Reddy’s Laboratories, Ltd. | | Pharmaceuticals, Biotechnology & Life Sciences | | | 250 | | | | 13,307 | |
| | | | | | | | | | |
| | | | | | | | | 13,307 | |
| | | | | | | | | | |
| | | | | | | | | | |
Ireland – 1.6% | | | | | | | | | | |
Bank of Ireland Group PLC | | Banks | | | 626,638 | | | | 6,688,126 | |
CRH PLC | | Materials | | | 200,213 | | | | 9,344,992 | |
| | | | | | | | | | |
| | | | | | | | | 16,033,118 | |
| | | | | | | | | | |
| | | | | | | | | | |
Israel – 0.4% | | | | | | | | | | |
Wix.com, Ltd. (a) | | Software & Services | | | 45,466 | | | | 3,954,633 | |
| | | | | | | | | | |
| | | | | | | | | 3,954,633 | |
| | | | | | | | | | |
| | | | | | | | | | |
Italy – 1.9% | | | | | | | | | | |
Banco BPM SpA | | Banks | | | 3,072,807 | | | | 13,816,068 | |
FinecoBank Banca Fineco SpA | | Banks | | | 129,121 | | | | 2,315,614 | |
Intesa Sanpaolo SpA | | Banks | | | 404,352 | | | | 1,062,074 | |
Unipol Gruppo SpA | | Insurance | | | 521,545 | | | | 2,728,756 | |
| | | | | | | | | | |
| | | | | | | | | 19,922,512 | |
| | | | | | | | | | |
| | | | | | | | | | |
Japan – 21.7% | | | | | | | | | | |
Bandai Namco Holdings, Inc. | | Consumer Durables & Apparel | | | 58,000 | | | | 3,882,256 | |
Brother Industries, Ltd. | | Technology Hardware & Equipment | | | 500 | | | | 7,773 | |
Central Japan Railway Co | | Transportation | | | 80 | | | | 9,767 | |
Dai Nippon Printing Co., Ltd. | | Commercial & Professional Services | | | 44,200 | | | | 1,044,509 | |
Eisai Co., Ltd. | | Pharmaceuticals, Biotechnology & Life Sciences | | | 150 | | | | 9,289 | |
Fast Retailing Co., Ltd. | | Retailing | | | 25,200 | | | | 15,319,578 | |
Hachijuni Bank, Ltd. (The) | | Banks | | | 570,722 | | | | 2,481,143 | |
Hoya Corp. | | Health Care Equipment & Services | | | 68,969 | | | | 7,591,652 | |
Kao Corp. | | Household & Personal Products | | | 272,600 | | | | 11,029,160 | |
39
DOMINI IMPACT INTERNATIONAL EQUITY FUND
PORTFOLIOOF INVESTMENTS (continued)
January 31, 2023 (Unaudited)
| | | | | | | | | | |
| COUNTRY/SECURITY | | INDUSTRY | | SHARES | | | VALUE | |
Japan (Continued) | | | | | | | | | | |
Kobayashi Pharmaceutical Co., Ltd. | | Household & Personal Products | | | 37,700 | | | $ | 2,709,060 | |
Kose Corp. | | Household & Personal Products | | | 142,987 | | | | 15,790,723 | |
Medipal Holdings Corp. | | Health Care Equipment & Services | | | 337,557 | | | | 4,510,876 | |
Mitsubishi Estate Co., Ltd. | | Real Estate | | | 1,355,825 | | | | 17,442,659 | |
Mitsui Fudosan Co., Ltd. | | Real Estate | | | 433,100 | | | | 8,125,362 | |
MS&AD Insurance Group Holdings, Inc. | | Insurance | | | 77,410 | | | | 2,485,117 | |
Nihon M&A Center Holdings, Inc. | | Commercial & Professional Services | | | 428,500 | | | | 4,384,771 | |
Nintendo Co., Ltd. | | Media & Entertainment | | | 421,170 | | | | 18,277,841 | |
Nippon Express Holdings, Inc. | | Transportation | | | 35,000 | | | | 2,033,019 | |
Nomura Real Estate Holdings, Inc. | | Real Estate | | | 430 | | | | 9,486 | |
NTN Corp. | | Capital Goods | | | 5,300 | | | | 10,997 | |
Ono Pharmaceutical Co., Ltd. | | Pharmaceuticals, Biotechnology & Life Sciences | | | 509,900 | | | | 11,074,368 | |
Oracle Corp. Japan | | Software & Services | | | 39,600 | | | | 2,715,374 | |
ORIX Corp. | | Diversified Financials | | | 630 | | | | 11,088 | |
Otsuka Corp. | | Software & Services | | | 76,000 | | | | 2,502,672 | |
Panasonic Holdings Corp. | | Consumer Durables & Apparel | | | 113,700 | | | | 1,055,355 | |
Park24 Co., Ltd. (a) | | Commercial & Professional Services | | | 192,100 | | | | 3,261,162 | |
Persol Holdings Co., Ltd. | | Commercial & Professional Services | | | 167,000 | | | | 3,664,939 | |
Pola Orbis Holdings, Inc. | | Household & Personal Products | | | 466,000 | | | | 6,729,519 | |
Recruit Holdings Co., Ltd. | | Commercial & Professional Services | | | 575,700 | | | | 18,531,747 | |
Ricoh Co., Ltd. | | Technology Hardware & Equipment | | | 1,092,800 | | | | 8,490,815 | |
Shimano, Inc. | | Consumer Durables & Apparel | | | 11,300 | | | | 2,017,049 | |
Sony Group Corp. | | Consumer Durables & Apparel | | | 77,970 | | | | 6,973,168 | |
Sumitomo Realty & Development Co., Ltd. | | Real Estate | | | 296,800 | | | | 7,241,808 | |
Sundrug Co., Ltd. | | Food & Staples Retailing | | | 265 | | | | 7,505 | |
Taisho Pharmaceutical Holdings Co., Ltd. | | Pharmaceuticals, Biotechnology & Life Sciences | | | 25,600 | | | | 1,077,875 | |
Tokio Marine Holdings, Inc. | | Insurance | | | 78,300 | | | | 1,641,484 | |
TOPPAN, Inc. | | Commercial & Professional Services | | | 540 | | | | 8,709 | |
Toyo Seikan Group Holdings, Ltd. | | Materials | | | 126,027 | | | | 1,637,450 | |
Trend Micro, Inc. | | Software & Services | | | 249,400 | | | | 12,360,191 | |
USS Co., Ltd. | | Retailing | | | 351,000 | | | | 5,778,633 | |
Yamazaki Baking Co., Ltd. | | Food, Beverage & Tobacco | | | 234,900 | | | | 2,750,800 | |
ZOZO, Inc. | | Retailing | | | 246,900 | | | | 6,406,346 | |
| | | | | | | | | | |
| | | | | | | | | 223,093,095 | |
| | | | | | | | | | |
| | | | | | | | | | |
40
DOMINI IMPACT INTERNATIONAL EQUITY FUND
PORTFOLIOOF INVESTMENTS (continued)
January 31, 2023 (Unaudited)
| | | | | | | | | | |
| COUNTRY/SECURITY | | INDUSTRY | | SHARES | | | VALUE | |
Mexico – 1.1% | | | | | | | | | | |
Arca Continental SAB de CV | | Food, Beverage & Tobacco | | | 459,600 | | | $ | 4,060,615 | |
Grupo Aeroportuario del Sureste SAB de CV ADR | | Transportation | | | 17,428 | | | | 4,740,416 | |
Grupo Bimbo SAB de CV | | Food, Beverage & Tobacco | | | 251,600 | | | | 1,251,175 | |
Grupo Financiero Banorte SAB de CV, Class O | | Banks | | | 187,500 | | | | 1,555,851 | |
| | | | | | | | | | |
| | | | | | | | | 11,608,057 | |
| | | | | | | | | | |
| | | | | | | | | | |
Netherlands – 7.9% | | | | | | | | | | |
Aegon NV | | Insurance | | | 2,583,384 | | | | 14,234,983 | |
Argenx SE (a) | | Pharmaceuticals, Biotechnology & Life Sciences | | | 20,434 | | | | 7,775,156 | |
ASML Holding NV | | Semiconductors & Semiconductor Equipment | | | 57,144 | | | | 37,770,922 | |
Koninklijke Ahold Delhaize NV | | Food & Staples Retailing | | | 351,557 | | | | 10,482,288 | |
NN Group NV | | Insurance | | | 236,882 | | | | 10,281,649 | |
| | | | | | | | | | |
| | | | | | | | | 80,544,998 | |
| | | | | | | | | | |
| | | | | | | | | | |
Norway – 0.7% | | | | | | | | | | |
Norsk Hydro ASA | | Materials | | | 884,196 | | | | 7,164,154 | |
Orkla ASA | | Food, Beverage & Tobacco | | | 1,040 | | | | 7,759 | |
| | | | | | | | | | |
| | | | | | | | | 7,171,913 | |
| | | | | | | | | | |
| | | | | | | | | | |
Singapore – 2.8% | | | | | | | | | | |
DBS Group Holdings, Ltd. | | Banks | | | 753,656 | | | | 20,623,657 | |
Oversea-Chinese Banking Corp., Ltd. | | Banks | | | 174,200 | | | | 1,720,436 | |
STMicroelectronics NV | | Semiconductors & Semiconductor Equipment | | | 24,652 | | | | 1,164,067 | |
United Overseas Bank, Ltd. | | Banks | | | 245,000 | | | | 5,566,674 | |
| | | | | | | | | | |
| | | | | | | | | 29,074,834 | |
| | | | | | | | | | |
| | | | | | | | | | |
South Africa – 0.6% | | | | | | | | | | |
Nedbank Group, Ltd. | | Banks | | | 390,566 | | | | 5,046,263 | |
Sappi, Ltd. | | Materials | | | 302,100 | | | | 891,869 | |
| | | | | | | | | | |
| | | | | | | | | 5,938,132 | |
| | | | | | | | | | |
| | | | | | | | | | |
South Korea – 0.4% | | | | | | | | | | |
F&F Co., Ltd. | | Consumer Durables & Apparel | | | 6,568 | | | | 814,783 | |
LG Display Co., Ltd. | | Technology Hardware & Equipment | | | 176,129 | | | | 1,961,225 | |
LG Uplus Corp. | | Telecommunication Services | | | 154,300 | | | | 1,395,372 | |
| | | | | | | | | | |
| | | | | | | | | 4,171,380 | |
| | | | | | | | | | |
| | | | | | | | | | |
41
DOMINI IMPACT INTERNATIONAL EQUITY FUND
PORTFOLIOOF INVESTMENTS (continued)
January 31, 2023 (Unaudited)
| | | | | | | | | | |
| COUNTRY/SECURITY | | INDUSTRY | | SHARES | | | VALUE | |
Spain – 3.4% | | | | | | | | | | |
Acciona SA | | Utilities | | | 20,760 | | | $ | 4,046,177 | |
Banco Bilbao Vizcaya Argentaria SA | | Banks | | | 1,538,624 | | | | 10,857,488 | |
Banco de Sabadell SA | | Banks | | | 3,202,215 | | | | 4,182,221 | |
Banco Santander SA | | Banks | | | 2,168 | | | | 7,569 | |
Bankinter SA | | Banks | | | 156,912 | | | | 1,130,975 | |
CaixaBank SA | | Banks | | | 2,235,092 | | | | 9,906,975 | |
Corp. ACCIONA Energias Renovables SA | | Utilities | | | 39,120 | | | | 1,598,158 | |
Merlin Properties Socimi SA | | Real Estate | | | 128,600 | | | | 1,255,494 | |
Red Electrica Corp. SA | | Utilities | | | 123,542 | | | | 2,184,344 | |
| | | | | | | | | | |
| | | | | | | | | 35,169,401 | |
| | | | | | | | | | |
| | | | | | | | | | |
Sweden – 3.5% | | | | | | | | | | |
Axfood AB | | Food & Staples Retailing | | | 64,600 | | | | 1,661,881 | |
Boliden AB | | Materials | | | 83,500 | | | | 3,742,861 | |
Essity AB, Class B | | Household & Personal Products | | | 318 | | | | 8,298 | |
Getinge AB, Class B | | Health Care Equipment & Services | | | 393,710 | | | | 8,858,997 | |
H & M Hennes & Mauritz AB, Class B | | Retailing | | | 431,383 | | | | 5,306,845 | |
Nibe Industrier AB, Class B | | Capital Goods | | | 343,379 | | | | 3,705,635 | |
Swedish Orphan Biovitrum AB (a) | | Pharmaceuticals, Biotechnology & Life Sciences | | | 156,425 | | | | 3,484,301 | |
Telefonaktiebolaget LM Ericsson, Class B | | Technology Hardware & Equipment | | | 641,827 | | | | 3,718,554 | |
Trelleborg AB, Class B | | Capital Goods | | | 223,935 | | | | 5,592,853 | |
| | | | | | | | | | |
| | | | | | | | | 36,080,225 | |
| | | | | | | | | | |
| | | | | | | | | | |
Switzerland – 8.1% | | | | | | | | | | |
ABB, Ltd. | | Capital Goods | | | 147,100 | | | | 5,103,266 | |
Baloise Holding AG | | Insurance | | | 34,568 | | | | 5,665,386 | |
Novartis AG | | Pharmaceuticals, Biotechnology & Life Sciences | | | 447,353 | | | | 40,301,683 | |
Sonova Holding AG | | Health Care Equipment & Services | | | 42,637 | | | | 10,624,588 | |
Swatch Group AG | | Consumer Durables & Apparel | | | 38,250 | | | | 13,800,131 | |
Swiss Life Holding AG | | Insurance | | | 12,167 | | | | 7,175,538 | |
| | | | | | | | | | |
| | | | | | | | | 82,670,592 | |
| | | | | | | | | | |
| | | | | | | | | | |
Taiwan – 0.7% | | | | | | | | | | |
AUO Corp. | | Technology Hardware & Equipment | | | 1,939,000 | | | | 1,090,336 | |
Cathay Financial Holding Co., Ltd. | | Insurance | | | 1,479,000 | | | | 2,105,624 | |
eMemory Technology, Inc. | | Semiconductors & Semiconductor Equipment | | | 20,000 | | | | 1,096,568 | |
Fubon Financial Holding Co., Ltd. | | Insurance | | | 1,249,000 | | | | 2,515,589 | |
| | | | | | | | | | |
| | | | | | | | | 6,808,117 | |
| | | | | | | | | | |
| | | | | | | | | | |
42
DOMINI IMPACT INTERNATIONAL EQUITY FUND
PORTFOLIOOF INVESTMENTS (continued)
January 31, 2023 (Unaudited)
| | | | | | | | | | |
| COUNTRY/SECURITY | | INDUSTRY | | SHARES | | | VALUE | |
Thailand – 0.9% | | | | | | | | | | |
Bumrungrad Hospital PCL | | Health Care Equipment & Services | | | 713,100 | | | $ | 4,687,752 | |
TMBThanachart Bank PCL | | Banks | | | 109,691,500 | | | | 4,884,778 | |
| | | | | | | | | | |
| | | | | | | | | 9,572,530 | |
| | | | | | | | | | |
| | | | | | | | | | |
Turkey – 0.5% | | | | | | | | | | |
BIM Birlesik Magazalar AS | | Food & Staples Retailing | | | 716,739 | | | | 4,752,317 | |
| | | | | | | | | | |
| | | | | | | | | 4,752,317 | |
| | | | | | | | | | |
| | | | | | | | | | |
United Kingdom – 12.7% | | | | | | | | | | |
3i Group PLC | | Diversified Financials | | | 91,191 | | | | 1,776,586 | |
Ashtead Group PLC | | Commercial & Professional Services | | | 43,600 | | | | 2,867,802 | |
Auto Trader Group PLC | | Media & Entertainment | | | 845,646 | | | | 6,551,617 | |
Burberry Group PLC | | Consumer Durables & Apparel | | | 324,110 | | | | 9,858,671 | |
CNH Industrial NV | | Capital Goods | | | 1,006,500 | | | | 17,788,323 | |
DS Smith PLC | | Materials | | | 499,178 | | | | 2,182,253 | |
Inchcape PLC | | Retailing | | | 114,285 | | | | 1,286,703 | |
InterContinental Hotels Group PLC | | Consumer Services | | | 271,692 | | | | 18,835,050 | |
Investec PLC | | Banks | | | 241,200 | | | | 1,536,968 | |
J Sainsbury PLC | | Food & Staples Retailing | | | 341,760 | | | | 1,106,782 | |
Johnson Matthey PLC | | Materials | | | 133,333 | | | | 3,719,073 | |
Marks & Spencer Group PLC (a) | | Food & Staples Retailing | | | 1,204,868 | | | | 2,170,273 | |
RELX PLC | | Commercial & Professional Services | | | 186,202 | | | | 5,524,005 | |
Rentokil Initial PLC | | Commercial & Professional Services | | | 1,547,101 | | | | 9,367,419 | |
Rightmove PLC | | Media & Entertainment | | | 1,534,802 | | | | 11,135,869 | |
Smiths Group PLC | | Capital Goods | | | 347,060 | | | | 7,398,177 | |
Spirax-Sarco Engineering PLC | | Capital Goods | | | 19,164 | | | | 2,733,537 | |
Travis Perkins PLC | | Capital Goods | | | 301,962 | | | | 3,782,666 | |
Unilever PLC | | Household & Personal Products | | | 237 | | | | 12,046 | |
Vodafone Group PLC | | Telecommunication Services | | | 17,659,771 | | | | 20,347,146 | |
| | | | | | | | | | |
| | | | | | | | | 129,980,966 | |
| | | | | | | | | | |
| | | | | | | | | | |
43
DOMINI IMPACT INTERNATIONAL EQUITY FUND
PORTFOLIOOF INVESTMENTS (continued)
January 31, 2023 (Unaudited)
| | | | | | | | | | |
| COUNTRY/SECURITY | | INDUSTRY | | SHARES | | | VALUE | |
United States – 2.0% | | | | | | | | | | |
CyberArk Software, Ltd. (a) | | Software & Services | | | 8,038 | | | $ | 1,132,394 | |
GSK PLC | | Pharmaceuticals, Biotechnology & Life Sciences | | | 855,027 | | | | 14,997,244 | |
Samsonite International SA (a) | | Consumer Durables & Apparel | | | 1,523,600 | | | | 4,540,287 | |
| | | | | | | | | | |
| | | | | | | | | 20,669,925 | |
| | | | | | | | | | |
| | |
Total Investments – 98.1% (Cost $930,748,293) | | | | | | | 1,006,790,306 | |
| | |
| Other Assets, less liabilities – 1.9% | | | | | 19,535,798 | |
| | | | | | | | | | |
| | | |
| Net Assets – 100.0% | | | | | | | $1,026,326,104 | |
| | | | | | | | | | |
(a) Non-income producing security.
Abbreviations
ADR — American Depositary Receipt
As of the date of this report, certain foreign securities were fair valued by an independent pricing service in accordance with the Trust’s Valuation and Pricing Policies and Procedures.
SEE NOTES TO FINANCIAL STATEMENTS
44
DOMINI IMPACT BOND FUND
Fund Performance and Holdings
The bar chart below provides information as of January 31, 2023 about the percentage of the Domini Impact Bond Fund’s portfolio holdings invested in various types of debt obligations:
PORTFOLIO COMPOSITION (% OF NET ASSETS) (Unaudited)
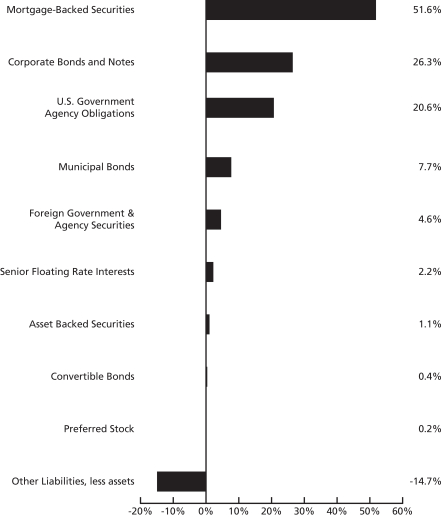
The Global Industry Classification Standard (“GICS”) was developed by and is the exclusive property and a service mark of MSCI Inc. (“MSCI”) and Standard & Poor’s, a division of The McGraw-Hill Companies, Inc., (“S&P”) and is licensed for use by Domini Impact Investments. Neither MSCI, S&P nor any third party involved in making or compiling the GICS or any GICS classifications makes any express or implied warranties or representations with respect to such standard or classification nor shall any such party have any liability therefrom.
45
| | | | | | | | |
| |
| DOMINI IMPACT BOND FUND |
| | | | |
AVERAGE ANNUAL TOTAL RETURNS
as of 1/31/2023 (UNAUDITED) | | Investor shares | | Institutional
shares | | Class Y
shares | | Bloomberg U.S.
Aggregate Index
(BUSA) |
| | | | |
| 1 Year | | -9.83% | | -9.56% | | -9.63% | | -8.36% |
| | | | |
| 5 Year | | 1.03% | | 1.33% | | 1.03%1 | | 0.86% |
| | | | |
| 10 Year | | 1.28% | | 1.55% | | 1.28%1 | | 1.43% |
Past performance is no guarantee of future results. The Fund’s returns quoted above represent past performance after all expenses. The returns reflect any applicable expense waivers in effect during the periods shown. Without such waivers, Fund performance would be lower. Investment return, principal value, and yield will fluctuate. Your shares, when redeemed, may be worth more or less than their original cost. Call 1-800-582-6757 or visit www.domini.com for performance information current to the most recent month-end, which may be lower or higher than the performance data quoted. A 2.00% redemption fee applied on sales or exchanges of shares made less than 30 days after the settlement of purchase or acquisition through exchange, with certain exceptions. The redemption fee was waived by the Fund’s Board of Trustees and was no longer imposed by the Fund effective August 16, 2021. Quoted performance data does not reflect the deduction of this fee, which would reduce the performance quoted. See the prospectus for further information.
Per the prospectus dated November 30, 2022, the Fund’s annual operating expenses totaled 1.08%/ 0.87%, 0.72%/0.57%, and 0.96%/0.65% (gross/net) for the Investor, Institutional, and Class Y Shares, respectively. The Fund’s adviser has contractually agreed to waive certain fees and/or reimburse certain ordinary operating expenses in order to limit Investor, Institutional, and Class Y share expenses to 0.87%, 0.57%, and 0.65%, respectively. These expense limitations are in effect through November 30, 2023, absent an earlier modification approved by the Fund’s Board of Trustees.
The table does not reflect the deduction of fees and taxes that a shareholder would pay on Fund distributions or the redemption of Fund shares. Total return is based on the Fund’s net asset values and assumes all dividends and capital gains were reinvested.
An investment in the Fund is not a bank deposit and is not insured. The Fund is subject to certain risks, including loss of principal, impact investing, portfolio management, style, information, market, interest rate and credit risks. You may lose money.
During periods of rising interest rates, the Fund can lose value. Some of the Fund’s community development investments may be unrated and may carry greater credit risks than the Fund’s other holdings. The Fund currently holds a large percentage of its portfolio in mortgage-backed securities. During periods of falling interest rates, mortgage-backed securities may prepay the principal due, which may lower the Fund’s return by causing it to reinvest at lower interest rates.
Investments in derivatives can be volatile. Potential risks include currency risk, leverage risk (the risk that small market movements may result in large changes in the value of an investment), liquidity risk, index risk, pricing risk, and counterparty risk (the risk that the counterparty may be unwilling or unable to honor its obligations).
TBA (To Be Announced) securities involve the risk that the security the Fund buys will lose value prior to its delivery. There also is the risk that the security will not be issued or that the other party to the transaction will not meet its obligation, which can adversely affect the Fund’s returns.
The reduction or withdrawal of historical financial market support activities by the U.S. Government and Federal Reserve, or other governments/central banks could negatively impact financial markets generally, and increase market, liquidity, and interest rate risks which could adversely affect the Fund’s returns.
The Bloomberg U.S. Aggregate Index is an index representing securities that are U.S. domestic, taxable, and dollar denominated and covering the U.S. investment grade fixed rate bond market, with index components for government and corporate securities and asset-backed securities. You cannot invest directly in an index.
1Class Y shares were not offered prior to June 1, 2021. All performance information for time periods beginning prior to June 1, 2021, is the performance of the Investor shares. This performance has not been adjusted to reflect the lower expenses of the Class Y shares.
46
DOMINI IMPACT BOND FUND
PORTFOLIOOF INVESTMENTS
January 31, 2023 (Unaudited)
| | | | | | | | |
| Security | | Principal
Amount* | | | Value | |
| Long Term Investments – 114.7% | | | | | | |
| Mortgage Backed Securities – 51.6% | | | | | | |
Agency Collateralized Mortgage Obligations – 7.8% | | | | | | | | |
CHNGE Mortgage Trust | | | | | | | | |
Series 2, Class A1, 3.757%, 3/25/67 (a) (b) | | | 626,681 | | | $ | 600,970 | |
Series 4, Class A1, 6.000%, 10/25/57 (a) (f) | | | 570,839 | | | | 571,017 | |
Federal Home Loan Mortgage Corp. | | | | | | | | |
Series 3768, Class CB, 3.500%, 12/15/25 | | | 62,065 | | | | 60,921 | |
Series 3800, Class CB, 3.500%, 2/15/26 | | | 105,330 | | | | 103,455 | |
Series 3806, Class L, 3.500%, 2/15/26 | | | 381,585 | | | | 374,388 | |
Series 3877, Class LM, 3.500%, 6/15/26 | | | 231,717 | | | | 227,465 | |
Series 4961, Class JB, 2.500%, 12/15/42 | | | 190,290 | | | | 175,208 | |
Federal National Mortgage Association | | | | | | | | |
Series 2012-120, Class ZB, 3.500%, 11/25/42 | | | 443,545 | | | | 419,890 | |
Series 2012-17, Class BC, 3.500%, 3/25/27 | | | 319,753 | | | | 311,294 | |
Series 2017-105, Class ZE, 3.000%, 1/25/48 | | | 934,104 | | | | 745,847 | |
Series 2020-1, Class AC, 3.500%, 8/25/58 | | | 243,036 | | | | 234,509 | |
Series 2020-1, Class L, 2.500%, 2/25/50 | | | 1,246,009 | | | | 875,956 | |
Federal National Mortgage Association Connecticut Avenue Securities | | | | | | | | |
Series 2016-C07, Class 2M2, 8.856%, (1 Month USD-LIBOR + 4.35%), 5/25/29 (b) | | | 89,027 | | | | 92,038 | |
Series 2017-C01, Class 1M2, 8.056%, (1 Month USD-LIBOR + 3.55%), 7/25/29 (b) | | | 53,204 | | | | 54,393 | |
Freddie Mac Multiclass Certificates | | | | | | | | |
Series 2021-ML12, Class XUS, 1.222%, 7/25/41 | | | 1,193,068 | | | | 125,069 | |
Series 2021-P011, Class X1, 1.792%, 9/25/45 (b) | | | 2,230,495 | | | | 284,538 | |
Freddie Mac Multifamily Structured Pass Through Certificates | | | | | | | | |
Series K103, Class X1, 0.639%, 11/25/29 (b) | | | 8,905,073 | | | | 315,005 | |
Series K111, Class X1, 1.572%, 5/25/30 (b) | | | 1,447,359 | | | | 128,817 | |
Series K112, Class X1, 1.434%, 5/25/30 (b) | | | 1,499,873 | | | | 122,744 | |
Series K113, Class X1, 1.380%, 6/25/30 (b) | | | 2,536,919 | | | | 199,601 | |
Series K114, Class X1, 1.116%, 6/25/30 (b) | | | 2,344,746 | | | | 152,082 | |
Series K119, Class X1, 0.930%, 9/25/30 (b) | | | 4,958,585 | | | | 274,451 | |
Series K121, Class X1, 1.024%, 10/25/30 (b) | | | 658,141 | | | | 39,278 | |
Series K122, Class X1, 0.881%, 11/25/30 (b) | | | 363,650 | | | | 19,082 | |
Series K124, Class X1, 0.720%, 12/25/30 (b) | | | 1,465,256 | | | | 65,203 | |
Series K740, Class X1, 0.754%, 9/25/27 (b) | | | 1,286,911 | | | | 36,532 | |
Series KG03, Class X1, 1.379%, 6/25/30 (b) | | | 3,199,935 | | | | 247,087 | |
Series KG04, Class X1, 0.851%, 11/25/30 (b) | | | 2,415,772 | | | | 121,884 | |
Series KG05, Class X1, 0.312%, 1/25/31 (b) | | | 2,465,000 | | | | 50,458 | |
Series KG06, Class X1, 0.532%, 10/25/31 (b) | | | 2,297,542 | | | | 82,724 | |
Series KSG1, Class X1, 1.154%, 9/25/30 (b) | | | 4,056,047 | | | | 268,531 | |
Series Q014, Class X, 2.793%, 10/25/55 (b) | | | 2,106,455 | | | | 396,808 | |
FREMF Mortgage Trust | | | | | | | | |
Series 2017-K64, Class B, 3.997%, 5/25/50 (a) (b) | | | 70,000 | | | | 66,615 | |
Series 2017-K65, Class B, 4.077%, 7/25/50 (a) (b) | | | 155,000 | | | | 148,547 | |
Series 2017-K66, Class B, 4.038%, 7/25/27 (a) (b) | | | 136,000 | | | | 129,341 | |
Series 2017-K67, Class B, 3.946%, 9/25/49 (a) (b) | | | 85,000 | | | | 80,673 | |
47
DOMINI IMPACT BOND FUND
PORTFOLIOOF INVESTMENTS (continued)
January 31, 2023 (Unaudited)
| | | | | | | | |
| Security | | Principal
Amount* | | | Value | |
Agency Collateralized Mortgage Obligations (Continued) | | | | | | | | |
Series 2017-K67, Class C, 3.946%, 9/25/49 (a)(b) | | | 100,000 | | | $ | 93,352 | |
Series 2017-K68, Class B, 3.842%, 10/25/49 (a)(b) | | | 90,000 | | | | 84,833 | |
Series 2017-K69, Class C, 3.727%, 10/25/49 (a)(b) | | | 40,000 | | | | 36,971 | |
Series 2017-K71, Class B, 3.752%, 11/25/50 (a)(b) | | | 220,000 | | | | 206,280 | |
Series 2017-K71, Class C, 3.752%, 11/25/50 (a)(b) | | | 65,000 | | | | 60,061 | |
Series 2017-K725, Class B, 3.905%, 2/25/50 (a)(b) | | | 100,000 | | | | 97,596 | |
Series 2017-K726, Class B, 4.000%, 7/25/49 (a)(b) | | | 175,000 | | | | 170,899 | |
Series 2017-K729, Class B, 3.673%, 11/25/49 (a)(b) | | | 250,000 | | | | 240,933 | |
Series 2017-K729, Class C, 3.673%, 11/25/49 (a)(b) | | | 90,000 | | | | 86,158 | |
Series 2018-K154, Class B, 4.025%, 11/25/32 (a)(b) | | | 67,000 | | | | 59,352 | |
Series 2018-K77, Class B, 4.161%, 5/25/51 (a)(b) | | | 1,070,000 | | | | 1,023,860 | |
Series 2018-K85, Class C, 4.320%, 12/25/50 (a)(b) | | | 550,000 | | | | 517,782 | |
Series 2018-KW07, Class B, 4.084%, 10/25/31 (a)(b) | | | 461,000 | | | | 386,658 | |
Series 2019-K100, Class C, 3.495%, 11/25/52 (a)(b) | | | 700,000 | | | | 617,399 | |
Series 2019-K103, Class B, 3.455%, 12/25/51 (a)(b) | | | 525,000 | | | | 471,532 | |
Series 2019-K736, Class C, 3.760%, 7/25/26 (a)(b) | | | 400,000 | | | | 375,751 | |
Series 2019-K95, Class B, 3.921%, 8/25/52 (a)(b) | | | 500,000 | | | | 465,260 | |
Series 2019-K95, Class C, 3.921%, 8/25/52 (a)(b) | | | 307,000 | | | | 278,868 | |
Series 2019-K97 , Class C, 3.767%, 9/25/51 (a)(b) | | | 204,000 | | | | 183,390 | |
Series 2019-K99, Class B, 3.645%, 10/25/52 (a)(b) | | | 565,000 | | | | 514,421 | |
Series 2020-K104, Class B, 3.541%, 2/25/52 (a)(b) | | | 520,000 | | | | 468,651 | |
GCAT Trust, Series CM2, Class A1, 2.352%, 8/25/66 (a)(b) | | | 356,640 | | | | 327,134 | |
Government National Mortgage Association | | | | | | | | |
Series 2019-132, Class NZ, 3.500%, 10/20/49 (b) | | | 361,326 | | | | 281,003 | |
Series 2021-66, Class PY, 2.000%, 3/20/50 (b) | | | 1,885,902 | | | | 1,201,604 | |
Series 2022-136, Class KZ, 4.000%, 8/20/52 (b) | | | 588,305 | | | | 498,528 | |
STACR Trust, Series 2018-HRP1, Class M2, 6.156%, (1 Month USD-LIBOR + 1.65%), 4/25/43 (a)(b) | | | 4,393 | | | | 4,394 | |
| | | | | | | | |
| | | | | | | 16,955,091 | |
| | | | | | | | |
| | | | | | | | |
Commercial Mortgage-Backed Securities – 8.3% | | | | | | | | |
245 Park Avenue Trust, Series 2017-245P, Class A, 3.508%, 6/5/37 (a) | | | 800,000 | | | | 733,387 | |
Bank | | | | | | | | |
Series 2017-BNK8, Class ASB, 3.314%, 11/15/50 | | | 141,093 | | | | 135,380 | |
Series 2019-BN18, Class XA, 0.892%, 5/15/62 (b) | | | 2,122,896 | | | | 90,871 | |
Series 2019-BN24, Class XA, 0.639%, 11/15/62 (b) | | | 5,494,482 | | | | 193,135 | |
Series 2020-BN28, Class XA, 1.764%, 3/15/63 (b) | | | 1,892,915 | | | | 188,127 | |
Benchmark Mortgage Trust | | | | | | | | |
Series 2019-B10, Class XA, 1.221%, 3/15/62 (b) | | | 2,319,201 | | | | 119,698 | |
Series 2020-B18, Class XA, 1.789%, 7/15/53 (b) | | | 502,813 | | | | 39,371 | |
Series 2020-B22, Class XA, 1.516%, 1/15/54 (b) | | | 883,173 | | | | 76,469 | |
BWAY Mortgage Trust | | | | | | | | |
Series 2013-1515, Class A1, 2.809%, 3/10/33 (a) | | | 54,385 | | | | 52,027 | |
Series 2013-1515, Class A2, 3.454%, 3/10/33 (a) | | | 1,000,000 | | | | 938,833 | |
BX Commercial Mortgage Trust, Series AHP, Class A, 5.468%, (1 Month USD SOFR CME + 0.990%), 1/17/39 (a)(b) | | | 1,465,000 | | | | 1,432,699 | |
48
DOMINI IMPACT BOND FUND
PORTFOLIOOF INVESTMENTS (continued)
January 31, 2023 (Unaudited)
| | | | | | | | |
| Security | | Principal
Amount* | | | Value | |
Commercial Mortgage-Backed Securities (Continued) | | | | | | | | |
BX Trust | | | | | | | | |
Series 2022-CLS, Class A, 5.760%, 10/13/27 (a) | | | 892,000 | | | $ | 882,320 | |
Series 2022-CLS, Class B, 6.300%, 10/13/27 (a) | | | 375,000 | | | | 373,019 | |
CityLine Commercial Mortgage Trust, Series 2016-CLNE, Class A, 2.778%, 11/10/31 (a)(b) | | | 800,000 | | | | 774,911 | |
COMM Mortgage Trust | | | | | | | | |
Series 2015-LC19, Class A4, 3.183%, 2/10/48 | | | 291,000 | | | | 280,102 | |
Series 2020-CX, Class A, 2.173%, 11/10/46 (a) | | | 825,000 | | | | 674,261 | |
Series 2020-CX, Class B, 2.446%, 11/10/46 (a) | | | 524,000 | | | | 416,698 | |
Series 2020-CX, Class C, 2.683%, 11/10/46 (a)(b) | | | 100,000 | | | | 78,128 | |
Series 2020-CX, Class D, 2.683%, 11/10/46 (a)(b) | | | 100,000 | | | | 73,217 | |
Series 2020-SBX, Class A, 1.670%, 1/10/38 (a) | | | 595,000 | | | | 534,684 | |
DBJPM Mortgage Trust, Series 2020-C9, Class XA, 1.709%, 9/15/53 (b) | | | 641,109 | | | | 44,338 | |
DC Office Trust, Series 2019-MTC, Class A, 2.965%, 9/15/45 (a) | | | 1,030,000 | | | | 862,276 | |
Grace Trust, Series 2020-GRCE, Class A, 2.347%, 12/10/40 (a) | | | 925,000 | | | | 745,656 | |
Hudson Yards Mortgage Trust | | | | | | | | |
Series 2016-10HY, Class A, 2.835%, 8/10/38 (a) | | | 915,000 | | | | 826,053 | |
Series 2019-30HY, Class A, 3.228%, 7/10/39 (a) | | | 700,000 | | | | 628,715 | |
JP Morgan Chase Commercial Mortgage Securities Corp. | | | | | | | | |
Series 2021-NYAH, Class G, 7.099%, (1 Month USD-LIBOR + 2.64%), 6/15/38 (a)(b) | | | 655,000 | | | | 599,082 | |
Series 2022-OPO, Class A, 3.024%, 1/5/39 (a) | | | 2,150,000 | | | | 1,882,078 | |
Life Mortgage Trust, Series 2021-BMR, Class D, 5.859%, (1 Month USD-LIBOR + 1.4%), 3/15/38 (a)(b) | | | 117,956 | | | | 113,739 | |
Morgan Stanley Bank of America Merrill Lynch Trust | | | | | | | | |
Series 2013-C12, Class A4, 4.259%, 10/15/46 (b) | | | 300,000 | | | | 297,069 | |
Series 2014-C15, Class A4, 4.051%, 4/15/47 | | | 300,000 | | | | 296,074 | |
Series 2014-C19, Class A4, 3.526%, 12/15/47 | | | 180,167 | | | | 174,636 | |
SLG Office Trust | | | | | | | | |
Series OVA, Class B, 2.707%, 7/15/41 (a) | | | 445,000 | | | | 363,256 | |
Series OVA, Class C, 2.851%, 7/15/41 (a) | | | 835,000 | | | | 668,225 | |
STWD 2021-LIH Mortgage Trust, Series LIH, Class E, 7.362%, (1 Month USD-LIBOR + 2.903%), 11/15/36 (a)(b) | | | 955,000 | | | | 898,664 | |
SUMIT Mortgage Trust, Series 2022-BVUE, Class A, 2.789%, 2/12/41 (a) | | | 1,615,000 | | | | 1,376,055 | |
Wells Fargo Commercial Mortgage Trust, Series 2015-NXS3, Class A4, 3.617%, 9/15/57 | | | 340,000 | | | | 326,068 | |
| | | | | | | | |
| | | | | | | 18,189,321 | |
| | | | | | | | |
| | | | | | | | |
Federal Home Loan Mortgage Corporation – 0.9% | | | | | | | | |
Federal Home Loan Mortgage Corp. | | | | | | | | |
2.500%, 8/1/27 | | | 18,003 | | | | 17,305 | |
2.500%, 11/1/27 | | | 47,535 | | | | 45,688 | |
3.000%, 1/1/27 | | | 63,067 | | | | 61,249 | |
3.000%, 7/1/42 | | | 21,562 | | | | 20,297 | |
49
DOMINI IMPACT BOND FUND
PORTFOLIOOF INVESTMENTS (continued)
January 31, 2023 (Unaudited)
| | | | | | | | |
| Security | | Principal
Amount* | | | Value | |
Federal Home Loan Mortgage Corporation (Continued) | | | | | | | | |
3.000%, 5/1/45 | | | 203,037 | | | $ | 189,584 | |
3.010%, (12 Month USD-LIBOR + 1.627%), 10/1/43 (b) | | | 33,633 | | | | 33,455 | |
3.500%, 12/1/32 | | | 101,928 | | | | 100,289 | |
3.500%, 6/1/48 | | | 375,692 | | | | 359,001 | |
4.000%, 2/1/37 | | | 40,094 | | | | 39,643 | |
4.000%, 8/1/39 | | | 21,687 | | | | 21,443 | |
4.000%, 10/1/39 | | | 42,943 | | | | 42,460 | |
4.000%, 10/1/39 | | | 41,306 | | | | 40,842 | |
4.000%, 11/1/39 | | | 18,637 | | | | 18,427 | |
4.000%, 10/1/40 | | | 65,096 | | | | 64,645 | |
4.000%, 11/1/40 | | | 55,967 | | | | 55,336 | |
4.000%, 11/1/40 | | | 9,621 | | | | 9,493 | |
4.000%, 11/1/40 | | | 7,584 | | | | 7,499 | |
4.000%, 12/1/40 | | | 26,481 | | | | 26,182 | |
4.000%, 6/1/41 | | | 5,718 | | | | 5,666 | |
4.500%, 4/1/35 | | | 55,904 | | | | 56,603 | |
4.500%, 9/1/35 | | | 78,597 | | | | 79,693 | |
4.500%, 7/1/36 | | | 54,218 | | | | 55,058 | |
4.500%, 6/1/39 | | | 98,712 | | | | 100,376 | |
4.500%, 9/1/40 | | | 14,060 | | | | 14,304 | |
4.500%, 2/1/41 | | | 30,040 | | | | 30,562 | |
5.000%, 8/1/33 | | | 9,903 | | | | 10,184 | |
5.000%, 10/1/33 | | | 4,377 | | | | 4,464 | |
5.000%, 4/1/35 | | | 11,431 | | | | 11,756 | |
5.000%, 7/1/35 | | | 77,371 | | | | 79,569 | |
5.000%, 7/1/35 | | | 12,806 | | | | 13,170 | |
5.000%, 1/1/37 | | | 48,586 | | | | 49,967 | |
5.000%, 7/1/40 | | | 30,792 | | | | 31,595 | |
5.000%, 4/1/41 | | | 28,664 | | | | 29,481 | |
5.500%, 12/1/36 | | | 48,287 | | | | 50,748 | |
5.500%, 8/1/40 | | | 67,493 | | | | 70,956 | |
6.000%, 8/1/36 | | | 7,773 | | | | 8,221 | |
6.000%, 7/1/39 | | | 39,482 | | | | 41,684 | |
| | | | | | | | |
| | | | | | | 1,896,895 | |
| | | | | | | | |
| | | | | | | | |
Federal National Mortgage Association – 30.3% | | | | | | | | |
Federal National Mortgage Association | | | | | | | | |
2.000%, 10/1/27 | | | 66,886 | | | | 63,666 | |
2.000%, 1/1/28 | | | 60,738 | | | | 57,601 | |
2.000%, 2/1/52 | | | 4,809,895 | | | | 4,085,962 | |
2.000%, 3/1/52 | | | 4,646,442 | | | | 3,987,180 | |
2.500%, 6/1/24 | | | 34,001 | | | | 33,398 | |
2.500%, 11/1/31 | | | 43,929 | | | | 41,807 | |
2.500%, 12/1/31 | | | 13,346 | | | | 12,701 | |
2.500%, 12/1/43 | | | 106,861 | | | | 95,155 | |
2.500%, 4/1/45 | | | 119,121 | | | | 106,065 | |
2.500%, 12/1/51 | | | 5,285,548 | | | | 4,631,914 | |
50
DOMINI IMPACT BOND FUND
PORTFOLIOOF INVESTMENTS (continued)
January 31, 2023 (Unaudited)
| | | | | | | | |
| Security | | Principal
Amount* | | | Value | |
Federal National Mortgage Association (Continued) | | | | | | | | |
2.500%, 12/1/51 | | | 3,024,585 | | | $ | 2,665,883 | |
2.778%, (12 Month USD-LIBOR + 1.58%), 5/1/44 (b) | | | 12,050 | | | | 12,019 | |
3.000%, 8/1/46 | | | 27,779 | | | | 25,616 | |
3.000%, 10/1/46 | | | 532,027 | | | | 492,146 | |
3.000%, 11/1/46 | | | 624,959 | | | | 574,767 | |
3.000%, 12/1/46 | | | 238,014 | | | | 218,588 | |
3.000%, 1/1/52 | | | 2,817,976 | | | | 2,562,268 | |
3.000%, 2/1/52 | | | 4,989,053 | | | | 4,547,998 | |
3.000%, 6/1/52 | | | 4,849,201 | | | | 4,456,983 | |
3.500%, 12/1/31 | | | 4,965 | | | | 4,929 | |
3.500%, 1/1/32 | | | 81,521 | | | | 80,934 | |
3.500%, 1/1/32 | | | 48,952 | | | | 48,599 | |
3.500%, 10/1/32 | | | 63,963 | | | | 62,871 | |
3.500%, 6/1/46 | | | 359,384 | | | | 343,686 | |
3.500%, 1/1/48 | | | 199,612 | | | | 190,450 | |
4.000%, 11/1/30 | | | 8,916 | | | | 8,872 | |
4.000%, 10/1/33 | | | 55,848 | | | | 55,578 | |
4.000%, 12/1/36 | | | 16,791 | | | | 16,585 | |
4.000%, 8/1/39 | | | 21,373 | | | | 21,111 | |
4.000%, 10/1/39 | | | 14,859 | | | | 14,677 | |
4.000%, 12/1/39 | | | 19,865 | | | | 19,622 | |
4.000%, 1/1/40 | | | 182,042 | | | | 179,810 | |
4.000%, 3/1/40 | | | 21,555 | | | | 21,291 | |
4.000%, 8/1/40 | | | 43,642 | | | | 43,107 | |
4.000%, 8/1/40 | | | 7,895 | | | | 7,799 | |
4.000%, 10/1/40 | | | 101,584 | | | | 100,778 | |
4.000%, 10/1/40 | | | 13,849 | | | | 13,679 | |
4.000%, 11/1/40 | | | 14,161 | | | | 13,987 | |
4.000%, 11/1/40 | | | 11,051 | | | | 10,915 | |
4.000%, 12/1/40 | | | 36,605 | | | | 36,703 | |
4.000%, 2/1/41 | | | 34,092 | | | | 33,673 | |
4.000%, 10/1/49 | | | 2,259,574 | | | | 2,202,241 | |
4.500%, 8/1/35 | | | 16,343 | | | | 16,526 | |
4.500%, 8/1/36 | | | 9,784 | | | | 9,892 | |
4.500%, 8/1/38 | | | 37,380 | | | | 37,932 | |
4.500%, 3/1/39 | | | 53,727 | | | | 54,556 | |
4.500%, 9/1/39 | | | 17,653 | | | | 17,941 | |
4.500%, 2/1/40 | | | 26,014 | | | | 26,439 | |
4.500%, 8/1/40 | | | 54,425 | | | | 55,314 | |
4.500%, 1/1/41 | | | 16,458 | | | | 16,727 | |
4.500%, 9/1/41 | | | 33,464 | | | | 34,011 | |
5.000%, 10/1/39 | | | 2,035 | | | | 2,086 | |
5.500%, 8/1/37 | | | 32,184 | | | | 33,677 | |
6.000%, 12/1/35 | | | 17,430 | | | | 18,029 | |
6.000%, 3/1/36 | | | 112,096 | | | | 120,062 | |
6.000%, 6/1/36 | | | 36,885 | | | | 38,824 | |
6.000%, 8/1/37 | | | 10,088 | | | | 10,561 | |
6.000%, 3/1/38 | | | 19,196 | | | | 20,284 | |
51
DOMINI IMPACT BOND FUND
PORTFOLIOOF INVESTMENTS (continued)
January 31, 2023 (Unaudited)
| | | | | | | | |
| Security | | Principal
Amount* | | | Value | |
Federal National Mortgage Association (Continued) | | | | | | | | |
TBA 30 Yr, 2.000%, 2/13/53 (c) | | | 4,800,000 | | | $ | 4,038,188 | |
TBA 30 Yr, 2.500%, 2/13/53 (c) | | | 4,177,000 | | | | 3,652,264 | |
TBA 30 Yr, 3.500%, 2/15/50 (c) | | | 1,700,000 | | | | 1,593,717 | |
TBA 30 Yr, 4.000%, 2/15/50 (c) | | | 5,800,000 | | | | 5,595,414 | |
TBA 30 Yr, 4.500%, 2/13/53 (c) | | | 19,030,000 | | | | 18,780,992 | |
| | | | | | | | |
| | | | | | | 66,377,050 | |
| | | | | | | | |
| | | | | | | | |
Government National Mortgage Association – 4.3% | | | | | | | | |
Government National Mortgage Association | | | | | | | | |
TBA 30 Yr, 2.500%, 2/21/53 (c) | | | 2,200,000 | | | | 1,961,266 | |
TBA 30 Yr, 3.500%, 2/15/50 (c) | | | 5,300,000 | | | | 5,010,674 | |
TBA 30 Yr, 4.000%, 2/21/53 (c) | | | 1,600,000 | | | | 1,553,312 | |
TBA 30 Yr, 4.500%, 2/22/52 (c) | | | 900,000 | | | | 893,110 | |
| | | | | | | | |
| | | | | | | 9,418,362 | |
| | | | | | | | |
Total Mortgage Backed Securities
(Cost $119,121,269) | | | | | | | 112,836,719 | |
| | | | | | | | |
| | | | | | | | |
| Corporate Bonds and Notes – 26.3% | | | | | | |
Communications – 2.5% | | | | | | | | |
Alibaba Group Holding, Ltd., 2.800%, 6/6/23 | | | 200,000 | | | | 198,430 | |
AT&T, Inc., 2.750%, 6/1/31 | | | 1,285,000 | | | | 1,106,738 | |
Axian Telecom, 7.375%, 2/16/27 (a) | | | 445,000 | | | | 412,181 | |
Charter Communications Operating LLC/Charter Communications Operating Capital, 6.484%, 10/23/45 | | | 1,325,000 | | | | 1,301,853 | |
Cox Communications, Inc. | | | | | | | | |
3.150%, 8/15/24 (a) | | | 57,000 | | | | 55,299 | |
3.850%, 2/1/25 (a) | | | 10,000 | | | | 9,735 | |
Millicom International Cellular SA, 4.500%, 4/27/31 (a) | | | 950,000 | | | | 805,486 | |
Paramount Global | | | | | | | | |
2.900%, 1/15/27 | | | 400,000 | | | | 367,654 | |
4.950%, 1/15/31 | | | 985,000 | | | | 907,870 | |
Vodafone Group PLC | | | | | | | | |
4.375%, 2/19/43 | | | 70,000 | | | | 60,364 | |
6.150%, 2/27/37 | | | 185,000 | | | | 198,552 | |
| | | | | | | | |
| | | | | | | 5,424,162 | |
| | | | | | | | |
| | | | | | | | |
Consumer, Cyclical – 1.3% | | | | | | | | |
General Motors Co., 5.400%, 10/15/29 | | | 1,200,000 | | | | 1,190,030 | |
Toll Brothers Finance Corp., 4.350%, 2/15/28 | | | 600,000 | | | | 563,960 | |
YMCA of Greater New York | | | | | | | | |
2.303%, 8/1/26 | | | 765,000 | | | | 690,556 | |
Series 2020, 3.230%, 8/1/32 | | | 375,000 | | | | 314,743 | |
| | | | | | | | |
| | | | | | | 2,759,289 | |
| | | | | | | | |
| | | | | | | | |
52
DOMINI IMPACT BOND FUND
PORTFOLIOOF INVESTMENTS (continued)
January 31, 2023 (Unaudited)
| | | | | | | | |
| Security | | Principal
Amount* | | | Value | |
Consumer, Non-cyclical – 7.0% | | | | | | | | |
Advocate Health & Hospitals Corp. | | | | | | | | |
Series 2020, 2.211%, 6/15/30 | | | 325,000 | | | $ | 274,619 | |
3.829%, 8/15/28 | | | 1,115,000 | | | | 1,065,816 | |
Beth Israel Lahey Health, Inc., 2.220%, 7/1/28 | | | 1,400,000 | | | | 1,212,046 | |
Bon Secours Mercy Health, Inc., 1.350%, 6/1/25 | | | 155,000 | | | | 140,874 | |
Boston Medical Center Corp., 4.519%, 7/1/26 | | | 705,000 | | | | 673,363 | |
CommonSpirit Health, 2.782%, 10/1/30 | | | 185,000 | | | | 157,526 | |
Conservation Fund A Nonprofit Corp. (The), 3.474%, 12/15/29 | | | 800,000 | | | | 703,700 | |
Dignity Health, 5.267%, 11/1/64 | | | 250,000 | | | | 238,667 | |
ERAC USA Finance LLC, 3.850%, 11/15/24 (a) | | | 500,000 | | | | 487,167 | |
Hologic, Inc., 3.250%, 2/15/29 (a) | | | 570,000 | | | | 502,258 | |
Howard University | | | | | | | | |
Series 2020, 1.991%, 10/1/25 (Insurer AGM) | | | 120,000 | | | | 110,512 | |
Series 2020, 2.657%, 10/1/26 (Insurer AGM) | | | 100,000 | | | | 92,298 | |
Series 2020, 3.476%, 10/1/41 (Insurer AGM) | | | 865,000 | | | | 671,347 | |
Series 22A, 5.209%, 10/1/52 | | | 470,000 | | | | 385,002 | |
John D and Catherine T MacArthur Foundation, 1.299%, 12/1/30 | | | 1,440,000 | | | | 1,142,043 | |
Kaiser Foundation Hospitals, 3.150%, 5/1/27 | | | 185,000 | | | | 176,909 | |
Leland Stanford Junior University, 4.249%, 5/11/54 | | | 1,200,000 | | | | 1,138,837 | |
Mount Sinai Hospitals Group, Inc., 3.831%, 7/1/35 | | | 1,400,000 | | | | 1,244,856 | |
PeaceHealth Obligated Group, 1.375%, 11/15/25 | | | 1,000,000 | | | | 908,693 | |
President & Fellows of Harvard College, 3.300%, 7/15/56 | | | 1,125,000 | | | | 896,358 | |
Royalty Pharma PLC | | | | | | | | |
2.150%, 9/2/31 | | | 350,000 | | | | 277,932 | |
3.300%, 9/2/40 | | | 1,250,000 | | | | 932,360 | |
Stanford Health Care, 3.310%, 8/15/30 | | | 595,000 | | | | 551,759 | |
StoneCo, Ltd., 3.950%, 6/16/28 (d) | | | 1,200,000 | | | | 911,652 | |
Thomas Jefferson University , 3.847%, 11/1/57 | | | 700,000 | | | | 546,318 | |
| | | | | | | | |
| | | | | | | 15,442,912 | |
| | | | | | | | |
| | | | | | | | |
Energy – 0.9% | | | | | | | | |
Greenko Dutch BV, 3.850%, 3/29/26 (a) | | | 869,050 | | | | 780,215 | |
Vena Energy Capital Pte, Ltd., 3.133%, 2/26/25 (d) | | | 1,380,000 | | | | 1,289,521 | |
| | | | | | | | |
| | | | | | | 2,069,736 | |
| | | | | | | | |
| | | | | | | | |
Financial – 9.5% | | | | | | | | |
Air Lease Corp., 3.625%, 12/1/27 | | | 500,000 | | | | 466,346 | |
American International Group, Inc., 3.900%, 4/1/26 | | | 190,000 | | | | 185,996 | |
American Tower Corp. | | | | | | | | |
3.375%, 5/15/24 | | | 235,000 | | | | 229,947 | |
5.000%, 2/15/24 | | | 362,000 | | | | 361,902 | |
AXA SA, 8.600%, 12/15/30 | | | 400,000 | | | | 493,725 | |
Bank of America Corp., 2.456%, (3 Month USD-LIBOR + 0.87%), 10/22/25 (b) | | | 545,000 | | | | 521,029 | |
Bank of Ireland Group PLC, 6.253%, (1-Yr. CMT + 2.65%), 9/16/26 (a)(b) | | | 1,200,000 | | | | 1,210,262 | |
53
DOMINI IMPACT BOND FUND
PORTFOLIOOF INVESTMENTS (continued)
January 31, 2023 (Unaudited)
| | | | | | | | |
| Security | | Principal
Amount* | | | Value | |
Financial (Continued) | | | | | | | | |
BlueHub Loan Fund, Inc., 2.890%, 1/1/27 | | | 600,000 | | | $ | 548,490 | |
BNP Paribas SA, 3.800%, 1/10/24 (a) | | | 245,000 | | | | 242,043 | |
Boston Properties L.P., 3.650%, 2/1/26 | | | 430,000 | | | | 414,419 | |
BPCE SA, 4.875%, 4/1/26 (a) | | | 500,000 | | | | 489,323 | |
Brandywine Operating Partnership L.P., 4.550%, 10/1/29 | | | 500,000 | | | | 427,533 | |
Brighthouse Financial, Inc., 5.625%, 5/15/30 | | | 1,500,000 | | | | 1,499,751 | |
Citigroup, Inc. | | | | | | | | |
1.678%, (SOFR + 1.667), 5/15/24 (b) | | | 1,000,000 | | | | 990,118 | |
2.561%, (SOFR + 1.167), 5/1/32 (b) | | | 500,000 | | | | 415,747 | |
3.352%, (3 Month USD-LIBOR + 0.8966%), 4/24/25 (b) | | | 475,000 | | | | 464,663 | |
4.412%, (SOFR + 3.914), 3/31/31 (b) | | | 750,000 | | | | 718,315 | |
Credit Agricole SA, 4.125%, 1/10/27 (a) | | | 1,000,000 | | | | 969,670 | |
Discover Financial Services, 3.750%, 3/4/25 | | | 325,000 | | | | 315,533 | |
ING Groep NV, 4.625%, 1/6/26 (a) | | | 750,000 | | | | 749,619 | |
Kreditanstalt fuer Wiederaufbau, 0.000%, 6/29/37 | | | 6,000,000 | | | | 3,455,790 | |
Morgan Stanley | | | | | | | | |
Series MTN, 2.511%, (SOFR + 1.200), 10/20/32 (b) | | | 1,000,000 | | | | 824,392 | |
Series GMTN, 2.699%, (SOFR + 1.143), 1/22/31 (b) | | | 640,000 | | | | 554,555 | |
Nuveen Finance LLC, 4.125%, 11/1/24 (a) | | | 160,000 | | | | 156,337 | |
Regency Centers L.P., 3.750%, 6/15/24 | | | 300,000 | | | | 292,061 | |
Reinsurance Group of America, Inc., 4.700%, 9/15/23 | | | 164,000 | | | | 163,448 | |
Scentre Group Trust 1/Scentre Group Trust 2, 4.375%, 5/28/30 (a) | | | 615,000 | | | | 574,087 | |
Sumitomo Mitsui Trust Bank, Ltd., 1.550%, 3/25/26 (a) | | | 1,500,000 | | | | 1,354,589 | |
U.S. Bancorp, Series MTN, 3.600%, 9/11/24 | | | 493,000 | | | | 486,391 | |
USAA Capital Corp., 2.125%, 5/1/30 (a) | | | 885,000 | | | | 751,961 | |
Ventas Realty L.P., 3.500%, 2/1/25 | | | 500,000 | | | | 484,457 | |
Yuzhou Group Holdings Co., Ltd., 6.350%, 1/13/27 (d) | | | 255,000 | | | | 40,481 | |
| | | | | | | | |
| | | | | | | 20,852,980 | |
| | | | | | | | |
| | | | | | | | |
Government – 1.1% | | | | | | | | |
European Investment Bank, 0.750%, 9/23/30 | | | 3,000,000 | | | | 2,428,402 | |
| | | | | | | | |
| | | | | | | 2,428,402 | |
| | | | | | | | |
| | | | | | | | |
Industrial – 1.0% | | | | | | | | |
HTA Group, Ltd., 7.000%, 12/18/25 (d) | | | 500,000 | | | | 472,380 | |
Klabin Austria GmbH, 5.750%, 4/3/29 (a) | | | 905,000 | | | | 905,860 | |
Nature Conservancy (The), Series A, 1.154%, 7/1/27 | | | 430,000 | | | | 377,007 | |
WRKCo, Inc., 3.000%, 9/15/24 | | | 375,000 | | | | 361,329 | |
| | | | | | | | |
| | | | | | | 2,116,576 | |
| | | | | | | | |
| | | | | | | | |
Technology – 1.3% | | | | | | | | |
Apple, Inc., 2.650%, 5/11/50 | | | 300,000 | | | | 211,744 | |
Black Knight InfoServ LLC, 3.625%, 9/1/28 (a) | | | 200,000 | | | | 178,000 | |
Broadcom, Inc. | | | | | | | | |
3.187%, 11/15/36 (a) | | | 852,000 | | | | 649,668 | |
4.150%, 11/15/30 | | | 1,200,000 | | | | 1,118,132 | |
54
DOMINI IMPACT BOND FUND
PORTFOLIOOF INVESTMENTS (continued)
January 31, 2023 (Unaudited)
| | | | | | | | |
| Security | | Principal
Amount* | | | Value | |
Technology (Continued) | | | | | | | | |
Microsoft Corp., 3.041%, 3/17/62 | | | 1,000,000 | | | $ | 752,584 | |
| | | | | | | | |
| | | | | | | 2,910,128 | |
| | | | | | | | |
| | | | | | | | |
Utilities – 1.7% | | | | | | | | |
Aegea Finance Sarl, 6.750%, 5/20/29 (a) | | | 1,200,000 | | | | 1,194,726 | |
Clearway Energy Operating LLC, 3.750%, 2/15/31 (a) | | | 560,000 | | | | 472,800 | |
Interchile SA, 4.500%, 6/30/56 (a) | | | 1,315,000 | | | | 1,125,377 | |
Investment Energy Resources, Ltd., 6.250%, 4/26/29 (a) | | | 925,000 | | | | 884,069 | |
| | | | | | | | |
| | | | | | | 3,676,972 | |
| | | | | | | | |
Total Corporate Bonds and Notes
(Cost $65,078,126) | | | | | | | 57,681,157 | |
| | | | | | | | |
| | | | | | | | |
| U.S. Government Agency Obligations – 20.6% | | | | | | |
Federal Farm Credit Banks Funding Corp. | | | | | | | | |
2.625%, 10/15/49 | | | 3,250,000 | | | | 2,367,395 | |
2.780%, 11/2/37 | | | 1,800,000 | | | | 1,521,740 | |
3.430%, 4/6/45 | | | 1,000,000 | | | | 854,662 | |
3.660%, 3/7/44 | | | 974,000 | | | | 832,990 | |
Federal Home Loan Bank Discount Notes | | | | | | | | |
0.000%, 2/22/23 | | | 2,835,000 | | | | 2,827,446 | |
0.000%, 7/11/23 | | | 8,000,000 | | | | 7,836,097 | |
Federal Home Loan Banks | | | | | | | | |
0.900%, 2/26/27 | | | 3,000,000 | | | | 2,657,832 | |
2.375%, 3/14/25 | | | 2,710,000 | | | | 2,606,985 | |
3.250%, 11/16/28 | | | 5,000,000 | | | | 4,890,690 | |
Federal Home Loan Mortgage Corp. , 1.500%, 2/12/25 | | | 5,600,000 | | | | 5,315,851 | |
Federal National Mortgage Association | | | | | | | | |
0.750%, 10/8/27 | | | 5,000,000 | | | | 4,373,580 | |
0.875%, 8/5/30 | | | 8,000,000 | | | | 6,544,670 | |
5.625%, 7/15/37 | | | 2,000,000 | | | | 2,370,250 | |
| | | | | | | | |
Total U.S. Government Agency Obligations
(Cost $49,852,304) | | | | | | | 45,000,188 | |
| | | | | | | | |
| | | | | | | | |
| Municipal Bonds – 7.7% | | | | | | |
Colorado Health Facilities Authority, 4.480%, 12/1/40 | | | 940,000 | | | | 852,568 | |
Commonwealth of Massachusetts, 4.110%, 7/15/31 | | | 1,850,000 | | | | 1,829,076 | |
Cook County Community High School District No. 228, IL, 5.019%, 12/1/41 (Insurer AGM) | | | 435,000 | | | | 432,209 | |
County of Riverside, CA | | | | | | | | |
2.963%, 2/15/27 | | | 670,000 | | | | 630,104 | |
3.070%, 2/15/28 | | | 670,000 | | | | 623,399 | |
District of Columbia, (Ingleside at Rock Creek) | | | | | | | | |
3.432%, 4/1/42 | | | 430,000 | | | | 340,480 | |
4.125%, 7/1/27 | | | 425,000 | | | | 408,466 | |
Florida Development Finance Corp., 4.009%, 4/1/40 | | | 925,000 | | | | 726,652 | |
Illinois Finance Authority, 3.510%, 5/15/41 | | | 1,000,000 | | | | 775,226 | |
55
DOMINI IMPACT BOND FUND
PORTFOLIOOF INVESTMENTS (continued)
January 31, 2023 (Unaudited)
| | | | | | | | |
| Security | | Principal
Amount* | | | Value | |
| Municipal Bonds (Continued) | | | | | | |
Lancaster County Hospital Authority, PA, (Brethren Village) | | | | | | | | |
5.000%, 7/1/24 | | | 165,000 | | | $ | 165,327 | |
5.000%, 7/1/25 | | | 135,000 | | | | 135,298 | |
Maryland Health and Higher Educational Facilities Authority, (Meritus Medical Center), 3.968%, 7/1/27 | | | 205,000 | | | | 199,387 | |
Massachusetts Development Finance Agency, (NewBridge on the Charles, Inc.), 4.000%, 10/1/27 | | | 100,000 | | | | 101,185 | |
Massachusetts Educational Financing Authority | | | | | | | | |
1.921%, 7/1/27 | | | 615,000 | | | | 545,173 | |
2.305%, 7/1/29 | | | 1,000,000 | | | | 851,760 | |
2.306%, 7/1/25 | | | 200,000 | | | | 188,169 | |
3.911%, 7/1/25 | | | 125,000 | | | | 122,117 | |
Metropolitan Government of Nashville and Davidson County, TN, (Vanderbilt University), 3.235%, 7/1/52 | | | 800,000 | | | | 550,300 | |
New Jersey Educational Facilities Authority, 3.958%, 7/1/48 (Insurer AGM) | | | 1,000,000 | | | | 782,515 | |
New York Transportation Development Corp., 4.248%, 9/1/35 | | | 500,000 | | | | 489,491 | |
New York Transportation Development Corp., (LaGuardia Airport Terminal B Redevelopment), 3.473%, 7/1/28 | | | 500,000 | | | | 464,826 | |
Oklahoma Development Finance Authority, (OU Medicine) | | | | | | | | |
4.650%, 8/15/30 (Insurer AGM) | | | 130,000 | | | | 117,141 | |
5.450%, 8/15/28 | | | 770,000 | | | | 631,194 | |
Oklahoma State University, 3.427%, 9/1/36 | | | 100,000 | | | | 86,975 | |
Oregon State University, 3.424%, 3/1/60 (Insurer BAM) | | | 1,000,000 | | | | 760,263 | |
Pennsylvania Industrial Development Authority, 3.556%, 7/1/24 (a) | | | 271,000 | | | | 267,827 | |
Redevelopment Authority of the City of Philadelphia, 2.339%, 9/1/30 | | | 1,000,000 | | | | 841,271 | |
Regents of the University of California Medical Center Pooled Revenue, 3.706%, 5/15/20 | | | 900,000 | | | | 629,812 | |
Sacramento, CA, 5.730%, 8/15/23 (Insurer NATL) | | | 99,189 | | | | 99,611 | |
San Bernardino County, CA, Pension Obligation Revenue, 6.020%, 8/1/23 (Insurer AGM) | | | 80,000 | | | | 80,433 | |
Southern Ohio Port Authority, 6.500%, 12/1/30 | | | 470,000 | | | | 367,283 | |
State Board of Administration Finance Corp., 1.258%, 7/1/25 | | | 375,000 | | | | 346,314 | |
University of Virginia, 4.179%, 9/1/17 | | | 1,000,000 | | | | 844,135 | |
Uptown Development Authority, 2.581%, 9/1/31 (Insurer AGM) | | | 100,000 | | | | 84,255 | |
Washington Housing Finance Commission, (Presbyterian Retirement Communities), 4.000%, 1/1/24 | | | 100,000 | | | | 98,202 | |
Wisconsin Health & Educational Facilities Authority | | | | | | | | |
3.940%, 8/15/41 | | | 335,000 | | | | 272,106 | |
4.190%, 8/15/55 | | | 190,000 | | | | 140,254 | |
| | | | | | | | |
Total Municipal Bonds
(Cost $19,370,344) | | | | | | | 16,880,804 | |
| | | | | | | | |
| | | | | | | | |
56
DOMINI IMPACT BOND FUND
PORTFOLIOOF INVESTMENTS (continued)
January 31, 2023 (Unaudited)
| | | | | | | | |
| Security | | Principal
Amount* | | | Value | |
| Foreign Government & Agency Securities – 4.6% | | | | | | |
City of Ottawa Ontario, 2.500%, 5/11/51 | | | 1,240,000 | CAD | | | $663,360 | |
City of Toronto Canada, 2.600%, 9/24/39 | | | 1,060,000 | CAD | | | 635,489 | |
Hong Kong Government International Bond, 2.500%, 5/28/24 (a) | | | 750,000 | | | | 731,614 | |
Japan Treasury Discount Bill, 0.000%, 3/6/23 | | | 500,000,000 | JPY | | | 3,845,318 | |
Japan Treasury Discount Bill, 0.000%, 3/10/23 | | | 500,000,000 | JPY | | | 3,845,387 | |
Republic of Chile, 0.830%, 7/2/31 (b) | | | 324,000 | EUR | | | 279,354 | |
| | | | | | | | |
Total Foreign Government & Agency Securities
(Cost $9,802,072) | | | | | | | 10,000,522 | |
| | | | | | | | |
| | | | | | | | |
| Senior Floating Rate Interests – 2.2% | | | | | | |
Communication Services – 0.3% | | | | | | | | |
Charter Communications Operating LLC 2019 Term Loan B2, 6.320%, (1 mo. USD LIBOR + 1.750%), 2/1/27 (b) | | | 280,893 | | | | 280,287 | |
Go Daddy Operating Company LLC 2021 Term Loan B4, 6.570%, (1 mo. USD LIBOR + 2.000%), 8/10/27 (b) | | | 302,250 | | | | 302,099 | |
Xplornet Communications, Inc. 2021 Term Loan, 8.570%, (1 mo. USD LIBOR + 4.000%), 10/2/28 (b) | | | 167,129 | | | | 134,643 | |
| | | | | | | | |
| | | | | | | 717,029 | |
| | | | | | | | |
| | | | | | | | |
Consumer Discretionary – 0.2% | | | | | | | | |
American Builders & Contractors Supply Co., Inc. 2019 Term Loan, 6.570%, (1 mo. USD LIBOR + 2.000%), 1/15/27 (b) | | | 210,419 | | | | 210,458 | |
Crocs, Inc. Term Loan B, 7.800%, (1 mo. USD SOFR CME + 3.500%), 2/20/29 (b) | | | 167,500 | | | | 166,663 | |
| | | | | | | | |
| | | | | | | 377,121 | |
| | | | | | | | |
| | | | | | | | |
Consumer Staples – 0.7% | | | | | | | | |
Biogroup-LCD 2021 EUR Term Loan B, 4.742%, (3 mo. EUR EURIBOR + 3.000%), 2/9/28 (b) | | | 465,000 | EUR | | | 467,521 | |
Boels Topholding BV 2021 EUR Term Loan B, 5.012%, (3 mo. EUR EURIBOR + 3.250%), 2/6/27 (b) | | | 400,000 | EUR | | | 427,578 | |
Insulet Corp. Term Loan B,
7.926%, (3 mo. USD SOFR CME + 3.250%), 5/4/28 (b) | | | 261,025 | | | | 261,514 | |
Verisure Holding AB 2021 EUR Term Loan,
5.378%, (3 mo. EUR EURIBOR + 3.250%), 3/27/28 (b) | | | 300,000 | EUR | | | 311,425 | |
| | | | | | | | |
| | | | | | | 1,468,038 | |
| | | | | | | | |
| | | | | | | | |
Financials – 0.3% | | | | | | | | |
Blackhawk Network Holdings, Inc. 2018 1st Lien Term Loan, 7.538%, (1 mo. USD SOFR CME + 3.000%), 6/15/25 (b) | | | 171,900 | | | | 170,145 | |
57
DOMINI IMPACT BOND FUND
PORTFOLIOOF INVESTMENTS (continued)
January 31, 2023 (Unaudited)
| | | | | | | | |
| Security | | Principal
Amount* | | | Value | |
Financials (Continued) | | | | | | | | |
Russell Investments US Inst’l Holdco, Inc. 2020 Term Loan, 8.070%, (1 mo. USD LIBOR + 3.500%), 5/30/25 (b) | | | 383,461 | | | $ | 376,545 | |
USI, Inc. 2022 Incremental Term Loan, 8.330%, (3 mo. USD SOFR CME + 3.750%), 11/22/29 (b) | | | 165,834 | | | | 165,955 | |
| | | | | | | | |
| | | | | | | 712,645 | |
| | | | | | | | |
| | | | | | | | |
Industrials – 0.1% | | | | | | | | |
Avient Corp. Term Loan B, 7.926%, (3 mo. USD SOFR CME + 3.250%), 8/29/29 (b) | | | 70,379 | | | | 70,540 | |
Zephyr German BidCo GmbH EUR Term Loan B1, 5.678%, (3 mo. EUR EURIBOR + 3.400%), 3/10/28 (b) | | | 100,000 | EUR | | | 102,700 | |
| | | | | | | | |
| | | | | | | 173,240 | |
| | | | | | | | |
| | | | | | | | |
Information Technology – 0.6% | | | | | | | | |
Athenahealth, Inc. | | | | | | | | |
2022 Delayed Draw Term Loan 3.500%, 2/15/29 (b)(e) | | | 43,478 | | | | 41,291 | |
2022 Term Loan B, 8.012%, (1 mo. USD SOFR CME + 3.500%), 2/15/29 (b) | | | 354,812 | | | | 336,960 | |
DCert Buyer, Inc. 2019 Term Loan B, 8.696%, (3 mo. USD SOFR CME + 4.000%), 10/16/26 (b) | | | 383,916 | | | | 379,974 | |
SS&C European Holdings S.A.R.L., 2018 Term Loan B4, 6.320%, (1 mo. USD LIBOR + 1.750%), 4/16/25 (b) | | | 35,817 | | | | 35,792 | |
SS&C Technologies, Inc. 2018 Term Loan B3, 6.320%, (1 mo. USD LIBOR + 1.750%), 4/16/25 (b) | | | 40,760 | | | | 40,731 | |
Zelis Healthcare Corporation 2021 Term Loan, 8.070%, (1 mo. USD LIBOR + 3.500%), 9/30/26 (b) | | | 463,161 | | | | 462,726 | |
| | | | | | | | |
| | | | | | | 1,297,474 | |
| | | | | | | | |
Total Senior Floating Rate Interests
(Cost $5,029,101) | | | | | | | 4,745,547 | |
| | | | | | | | |
| | | | | | | | |
| Asset Backed Securities – 1.1% | | | | | | |
CoreVest American Finance Ltd. Series 2020-4 , 2.250%, 12/15/52 (a) | | | 100,000 | | | | 81,501 | |
FHF Trust Series 2022-1A, 4.430%, 1/18/28 (a) | | | 459,735 | | | | 450,827 | |
Lendbuzz Securitization Trust | | | | | | | | |
Series 2021-1A, 1.460%, 6/15/26 (a) | | | 286,839 | | | | 274,448 | |
Series 2022-1A, 4.220%, 5/17/27 (a) | | | 923,099 | | | | 887,150 | |
Mosaic Solar Loan Trust Series 2020-2A, 1.440%, 8/20/46 (a) | | | 131,153 | | | | 112,121 | |
SBA Tower Trust Series 2014-2A,
3.869%, 10/15/49 (a)(f) | | | 500,000 | | | | 484,972 | |
Tricolor Auto Securitization Trust Series 2022-1A, 3.300%, 2/18/25 (a) | | | 182,745 | | | | 180,933 | |
| | | | | | | | |
Total Asset Backed Securities
(Cost $2,582,441) | | | | | | | 2,471,952 | |
| | | | | | | | |
| | | | | | | | |
58
DOMINI IMPACT BOND FUND
PORTFOLIOOF INVESTMENTS (continued)
January 31, 2023 (Unaudited)
| | | | | | | | |
| Security | | Principal
Amount* | | | Value | |
| Convertible Bonds – 0.4% | | | | | | |
Consumer Discretionary – 0.1% | | | | | | | | |
Etsy, Inc. | | | | | | | | |
0.125%, 10/1/26 | | | 110,000 | | | $ | 189,035 | |
0.125%, 9/1/27 | | | 50,000 | | | | 51,655 | |
| | | | | | | | |
| | | | | | | 240,690 | |
| | | | | | | | |
| | | | | | | | |
Health Care – 0.2% | | | | | | | | |
Dexcom, Inc., 0.250%, 11/15/25 | | | 205,000 | | | | 216,890 | |
Insulet Corp., 0.375%, 9/1/26 | | | 195,000 | | | | 270,173 | |
| | | | | | | | |
| | | | | | | 487,063 | |
| | | | | | | | |
| | | | | | | | |
Technology – 0.1% | | | | | | | | |
Square, Inc., 0.125%, 3/1/25 | | | 215,000 | | | | 219,300 | |
| | | | | | | | |
| | | | | | | 219,300 | |
| | | | | | | | |
Total Convertible Bonds
(Cost $1,197,376) | | | | | | | 947,053 | |
| | | | | | | | |
| | | | | | | | |
| Preferred Stocks – 0.2% | | | | | | |
Health Care – 0.2% | | | | | | | | |
Becton Dickinson and Co., Series B, 6.000%, 6/1/23 | | | 5,000 | | | | 251,800 | |
Danaher Corp., 5.000%, 4/15/23 | | | 170 | | | | 228,480 | |
| | | | | | | | |
| | | | | | | 480,280 | |
| | | | | | | | |
Total Preferred Stocks
(Cost $548,610) | | | | | | | 480,280 | |
| | | | | | | | |
Total Long Term Investments
(Cost $272,581,643) | | | | | | | 251,044,222 | |
| | | | | | | | |
| | | | | | | | |
| | |
| Total Investments – 114.7% (Cost $272,581,643) | | | | | 251,044,222 | |
| | |
| Less Unfunded Loan Commitments – (0.0)% (g) | | | | | (41,291) | |
| | | | | | | | |
| | |
| Net Investments – 114.7% (Cost $272,538,165) | | | | | 251,002,931 | |
| | |
| Other Liabilities, less assets – (14.7)% | | | | | (32,160,818) | |
| | | | | | | | |
| | |
| Net Assets – 100.0% | | | | | $218,842,113 | |
| | | | | | | | |
* The principal amount is stated in U.S. dollars unless otherwise indicated.
(a) Security that may be sold to qualified institutional buyers under Rule 144A of the Securities Act of 1933, as amended. At January 31, 2023, the aggregate value of these securities was $42,728,806, representing 19.5% of net assets.
(b) Floating/Variable note with current rate and current maturity or next reset date shown. Certain variable rate securities are not based on a published reference rate and spread, but are determined by the issuer or agent and are based on current market conditions. These securities do not indicate a reference rate and spread in their description above.
59
DOMINI IMPACT BOND FUND
PORTFOLIOOF INVESTMENTS (continued)
January 31, 2023 (Unaudited)
(c) A portion or all of the security was purchased as a when issued or delayed delivery security.
(d) Security exempt from registration under Regulation S of the Securities Act of 1933, as amended, which exempts from registration securities offered and sold outside the United States. Security may not be offered or sold in the United States except pursuant to an exemption from, or in a transaction not subject to, the registration requirements of the Securities Act of 1933, as amended. At January 31, 2023, the aggregate value of these securities is $2,714,034 or 1.2% of the Fund’s net assets.
(e) Unfunded or partially unfunded loan commitments. The stated interest rate reflects the weighted average of the reference rate and spread for the funded portion, if any, and the commitment fees on the portion of the loan that is unfunded. At January 31, 2023, the total value of unfunded loan commitments is $43,478.
(f) Step coupon bond.
(g) Amount is less than 0.05%.
Abbreviations
TBA — To Be Announced
AGM — Assured Guaranty Municipal Corporation
BAM — Build America Mutual
NATL — National Public Finance Guarantee Corporation
CAD — Canadian Dollar
EUR — Euro
JPY — Japanese Yen
At January 31, 2023, the Fund had the following forward currency contracts outstanding.
| | | | | | | | | | | | | | | | | | | | | | |
Currency
Bought | | Currency
Sold | | Counterparty | | | Settlement
Date | | | Quantity | | | Value | | | Unrealized
Appreciation
(Depreciation) | |
| | | | | | |
United States Dollar | | Canadian
Dollar | |
| Morgan
Stanley & Co. Inc. |
| | | 3/15/23 | | | | 3,242,000 | | | $ | 2,430,346 | | | $ | (32,901 | ) |
| | | | | | |
United States Dollar | | Euro
Currency | |
| Toronto
Dominion Bank |
| | | 2/28/23 | | | | 1,448,000 | | | | 1,575,257 | | | | 7,567 | |
| | | | | | |
United States Dollar | | Euro
Currency | |
| JPMorgan Chase
Bank N.A. |
| | | 3/15/23 | | | | 197,000 | | | | 214,514 | | | | (3,691 | ) |
| | | | | | |
United States Dollar | | Japanese
Yen | |
| JPMorgan Chase
Bank N.A. |
| | | 3/6/23 | | | | 600,000,000 | | | | 4,633,791 | | | | (249,093 | ) |
| | | | | | |
United States Dollar | | Japanese
Yen | |
| Toronto
Dominion Bank |
| | | 3/10/23 | | | | 500,000,000 | | | | 3,863,662 | | | | (306,311 | ) |
| | | | | | |
Japanese
Yen | | United States
Dollar | |
| Morgan
Stanley & Co. Inc. |
| | | 3/6/23 | | | | (100,000,000 | ) | | | 772,299 | | | | 39,953 | |
| | | | | | |
Canadian Dollar | | United States
Dollar | |
| Morgan
Stanley & Co. Inc. |
| | | 3/15/23 | | | | (1,586,000 | ) | | | 1,188,935 | | | | 16,058 | |
| | | | | | | | | | | | | | | | | | | | | | |
| | | | | | |
| | | | | | | | | | | | | | | | | | | | $ | (528,418 | ) |
| | | | | | | | | | | | | | | | | | | | | | |
60
DOMINI IMPACT BOND FUND
PORTFOLIOOF INVESTMENTS (continued)
January 31, 2023 (Unaudited)
At January 31, 2023, the Fund had the following future contracts outstanding.
| | | | | | | | | | | | | | | | | | | | |
| Description | | Number of
Contracts | | | Notional
Amount | | | Value | | | Expiration
Date | | | Unrealized
Appreciation
(Depreciation) | |
| | | | | |
10-Year Canadian Government Bond (Short) | | | 102 | | | $ | (9,600,576 | ) | | $ | (9,651,531 | ) | | | 3/22/23 | | | $ | (50,955 | ) |
| | | | | |
Euro-Buxl (Short) | | | 10 | | | | (1,614,251 | ) | | | (1,563,912 | ) | | | 3/8/23 | | | | 50,339 | |
| | | | | |
Euro-Bund (Short) | | | 8 | | | | (1,204,509 | ) | | | (1,188,747 | ) | | | 3/8/23 | | | | 15,762 | |
| | | | | |
Euro-Schatz (Short) | | | 61 | | | | (7,056,702 | ) | | | (7,005,505 | ) | | | 3/8/23 | | | | 51,197 | |
| | | | | | | | | | | | | | | | | | | | |
| | | | | |
| | | | | | | | | | | | | | | | | | $ | 66,343 | |
| | | | | | | | | | | | | | | | | | | | |
At January 31, 2023, the Fund had the following centrally cleared interest rate swap contracts outstanding.
| | | | | | | | | | | | | | | | | | | | | | |
| Description | | Counterparty/
Exchange | | Expiration
Date | | | Notional
Amount | | | Value | | | Upfront
Premiums
Paid
(Received) | | | Unrealized
Appreciation
(Depreciation) | |
| | | | | | |
Receive Fixed rate annually 0.821% Pay Floating rate annually 12 month SOFR | | Morgan
Stanley/LCH | | | 6/16/26 | | | $ | 3,495,000 | | | $ | (315,379 | ) | | $ | (26,160 | ) | | $ | (289,219 | ) |
| | | | | | |
Pay Fixed rate annually 2.660% Receive Floating rate annually 12 month SOFR | | Morgan
Stanley/LCH | | | 6/15/32 | | | | 4,145,000 | | | | 188,834 | | | | 190,774 | | | | (1,940 | ) |
| | | | | | |
Receive Fixed rate annually 2.630% Pay Floating rate annually 12 month SOFR | | Morgan
Stanley/LCH | | | 6/15/42 | | | | 1,910,000 | | | | (156,721 | ) | | | 44,721 | | | | (201,442 | ) |
| | | | | | |
Receive Fixed rate annually 2.630% Pay Floating rate annually 12 month SOFR | | Morgan
Stanley/LCH | | | 6/15/24 | | | | 6,800,000 | | | | (183,249 | ) | | | (1,537 | ) | | | (181,712 | ) |
| | | | | | |
Receive Fixed rate annually 2.690% Pay Floating rate annually 12 month SOFR | | Morgan
Stanley/LCH | | | 9/15/52 | | | | 3,645,000 | | | | (218,564 | ) | | | 3,804 | | | | (222,368 | ) |
61
DOMINI IMPACT BOND FUND
PORTFOLIOOF INVESTMENTS (continued)
January 31, 2023 (Unaudited)
| | | | | | | | | | | | | | | | | | | | | | |
| Description | | Counterparty/
Exchange | | Expiration
Date | | | Notional
Amount | | | Value | | | Upfront
Premiums
Paid
(Received) | | | Unrealized
Appreciation
(Depreciation) | |
| | | | | | |
Pay Fixed rate annually 2.560% Receive Floating rate annually 12 month SOFR | | Morgan
Stanley/LCH | | | 9/21/29 | | | | 9,795,000 | | | | 431,086 | | | | 10,796 | | | | 420,290 | |
| | | | | | |
Receive Fixed rate annually 3.560% Pay Floating rate annually 12 month SOFR | | Morgan
Stanley/LCH | | | 12/21/29 | | | | 9,717,000 | | | | 158,144 | | | | 116,320 | | | | 41,824 | |
| | | | | | |
Pay Fixed rate annually 4.030% Pay Floating rate annually 12 month SOFR | | Morgan
Stanley/LCH | | | 12/21/27 | | | | 9,390,000 | | | | (246,072 | ) | | | (119,705 | ) | | | (126,367 | ) |
| | | | | | |
Pay Fixed rate annually 4.380% Receive Floating rate annually 12 month SOFR | | Morgan
Stanley/LCH | | | 12/21/24 | | | | 34,430,000 | | | | (38,972 | ) | | | 11,836 | | | | (50,808 | ) |
| | | | | | |
Receive Fixed rate annually 3.530% Pay Floating rate annually 12 month SOFR | | Morgan
Stanley/LCH | | | 12/21/52 | | | | 5,900,000 | | | | 609,753 | | | | 456,980 | | | | 152,773 | |
| | | | | | |
Receive Fixed rate annually 3.090% Pay Floating rate annually 12 month SOFR | | Morgan
Stanley/LCH | | | 3/15/43 | | | | 1,175,000 | | | | (15,285 | ) | | | (14,704 | ) | | | (581 | ) |
| | | | | | |
Receive Fixed rate annually 2.840% Pay Floating rate annually 12 month SOFR | | Morgan
Stanley/LCH | | | 3/15/53 | | | | 675,000 | | | | (18,407 | ) | | | (180 | ) | | | (18,227 | ) |
| | | | | | |
Pay Fixed rate annually 2.970% Receive Floating rate annually 12 month SOFR | | Morgan
Stanley/LCH | | | 3/15/53 | | | | 2,700,000 | | | | 5,753 | | | | 10,743 | | | | (4,990 | ) |
| | | | | | |
Receive Fixed rate annually 3.720% Pay Floating rate annually 12 month SOFR | | Morgan
Stanley/LCH | | | 3/15/28 | | | | 6,165,000 | | | | 93,869 | | | | 100,333 | | | | (6,464 | ) |
| | | | | | | | | | | | | | | | | | | | | | |
| | | | | | |
| | | | | | | | | | | | | | | | $ | 784,021 | | | $ | (489,231 | ) |
| | | | | | | | | | | | | | | | | | | | | | |
62
DOMINI IMPACT BOND FUND
PORTFOLIOOF INVESTMENTS (continued)
January 31, 2023 (Unaudited)
At January 31, 2023, the Fund had the following centrally cleared credit default swap contracts outstanding.
| | | | | | | | | | | | | | | | | | | | | | |
| Description | | Counterparty/
Exchange | | Expiration
Date | | | Notional
Amount (a) | | | Value (b) | | | Upfront
Premiums
Paid
(Received) | | | Unrealized
Appreciation
(Depreciation) | |
| | | | | | |
Sell Protection (c): | | | | | | | | | | | | | | | | | | | | | | |
| | | | | | |
CDX-NAHY,
Series 39, Version1, 5 Year Index , Fixed Rate 5.000% (d) | | Morgan
Stanley/ICE | | | 12/20/27 | | | $ | 1,480,000 | | | $ | 39,738 | | | $ | 38,363 | | | $ | 1,375 | |
| | | | | | | | | | | | | | | | | | | | | | |
| | | | | | |
| | | | | | | | | | | | | | | | $ | 38,363 | | | $ | 1,375 | |
| | | | | | | | | | | | | | | | | | | | | | |
(a) The maximum potential amount the Fund could be required to pay as a seller of credit protection or receive as a buyer of credit protection if a credit event occurs as defined under the terms of that particular swap agreement.
(b) The prices and resulting values for credit default swap agreements on credit indices serve as an indicator of the current status of the payment/performance risk and represent the likelihood of an expected liability (or profit) for the credit derivative should the notional amount of the swap agreement be closed/sold as of the period end. Increasing market values, in absolute terms when compared to the notional amount of the swap, represent a deterioration of the referenced entity’s credit soundness and a greater likelihood or risk of default or other credit event occurring as defined under the terms of the agreement.
(c) If the Fund is a buyer/(seller) of protection and a credit event occurs, as defined under the terms of that particular swap agreement, the Fund will either (i) receive from the seller/(pay to the buyer) of protection an amount equal to the notional amount of the swap and deliver/(take delivery) of the referenced obligation or underlying securities comprising the referenced index or (ii) receive/(pay) a net settlement amount in the form of cash or securities equal to the notional amount of the swap less the recovery value of the referenced obligation of underlying securities comprising the referenced index.
(d) Ratings of Moody’s/S&P — B1/B+
Abbreviations
LCH — London Clearing House
ICE — Intercontinental Exchange
SEE NOTES TO FINANCIAL STATEMENTS
63
DOMINI FUNDS EXPENSE EXAMPLE (Unaudited)
As a shareholder of the Domini Funds, you incur two types of costs:
(1) Transaction costs such as sales charges (loads) on Class A shares and
(2) Ongoing costs, including management fees, distribution (12b-1) fees, and other Fund expenses.
This example is intended to help you understand your ongoing costs (in dollars) of investing in the Fund and to compare these costs with the ongoing costs of investing in other mutual funds. The example is based on an investment of $1,000 invested on August 1, 2022 and held through January 31, 2023.
Certain Account Fees
Some accounts are subject to recurring annual service fees and maintenance fees that are not included in the expenses shown in the table. If your account was subject to these fees, then the actual account values at the end of the period would be lower and the actual expense would be higher. You may avoid the annual service fee by choosing paperless electronic delivery of statements, prospectuses, shareholder reports and other materials.
Actual Expenses
The line of the table captioned ‘‘Actual Expenses’’ below provides information about actual account value and actual expenses. You may use the information in this line, together with the amount invested, to estimate the expenses that you paid over the period as follows:
(1) Divide your account value by $1,000.
(2) Multiply your result in step 1 by the number in the first line under the heading ‘‘Expenses Paid During Period’’ in the table.
The result equals the estimated expenses you paid on your account during the period.
Hypothetical Expenses
The second line of the table below provides information about hypothetical account values and hypothetical expenses based on the Fund’s actual expense ratio and an assumed rate of return of 5% per year before expenses, which is not the Fund’s return. The hypothetical account values and expenses may not be used to estimate actual ending account balance or expenses you paid for the period. You may use this information to compare the ongoing costs of investing in the Fund and other mutual funds. To do so, compare this 5% hypothetical example with the 5% hypothetical example that appears in the shareholder reports of the other funds.
64
Please note that the expenses shown in the table are meant to highlight your ongoing costs only and do not reflect any transactional costs, such as redemption fees. Therefore, the second line of the table is useful in comparing ongoing costs only, and will not help you determine the relative total costs of owning different funds. In addition, if these transactional costs were included, your costs would have been higher.
| | | | | | | | | | |
| | | | | |
| Fund Name | | Expenses | | Beginning
Account Value
as of 8/1/2022 | | Ending Account
value as of
1/31/2023 | | | Expenses Paid
During Period
8/1/2022 –
1/31/2023 |
Domini Impact Equity Fund Investor Shares | | Actual Expenses | | $1,000.00 | | $ | 973.50 | | | $4.971 |
| | Hypothetical Expenses
(5% return before expenses) | | $1,000.00 | | $ | 1,020.20 | | | $5.091 |
Domini Impact Equity Fund Class A Shares | | Actual Expenses | | $1,000.00 | | $ | 972.80 | | | $5.421 |
| | Hypothetical Expenses
(5% return before expenses) | | $1,000.00 | | $ | 1,019.70 | | | $5.551 |
Domini Impact Equity Fund Institutional Shares | | Actual Expenses | | $1,000.00 | | $ | 974.50 | | | $3.531 |
| | Hypothetical Expenses
(5% return before expenses) | | $1,000.00 | | $ | 1,021.60 | | | $3.621 |
Domini Impact Equity Fund Class Y Shares | | Actual Expenses | | $1,000.00 | | $ | 974.20 | | | $3.981 |
| | Hypothetical Expenses (5% return before expenses) | | $1,000.00 | | $ | 1,021.20 | | | $4.081 |
Domini International Opportunities Fund Investor Class | | Actual Expenses | | $1,000.00 | | $ | 1,064.70 | | | $7.292 |
| | Hypothetical Expenses (5% return before expenses) | | $1,000.00 | | $ | 1,018.10 | | | $7.122 |
Domini International Opportunities Fund Institutional Class | | Actual Expenses | | $1,000.00 | | $ | 1,066.50 | | | $5.992 |
| | Hypothetical Expenses (5% return before expenses) | | $1,000.00 | | $ | 1,019.40 | | | $5.852 |
Domini Sustainable Solutions Fund Investor Class | | Actual Expenses | | $1,000.00 | | $ | 987.70 | | | $7.013 |
| | Hypothetical Expenses (5% return before expenses) | | $1,000.00 | | $ | 1,018.10 | | | $7.123 |
Domini Sustainable Solutions Fund Institutional Class | | Actual Expenses | | $1,000.00 | | $ | 988.40 | | | $5.763 |
| | Hypothetical Expenses (5% return before expenses) | | $1,000.00 | | $ | 1,019.40 | | | $5.853 |
Domini Impact International Equity Fund Investor Shares | | Actual Expenses | | $1,000.00 | | $ | 1,078.10 | | | $6.974 |
| | Hypothetical Expenses (5% return before expenses) | | $1,000.00 | | $ | 1,018.50 | | | $6.774 |
Domini Impact International Equity Fund Class A Shares | | Actual Expenses | | $1,000.00 | | $ | 1,078.40 | | | $7.234 |
| | Hypothetical Expenses
(5% return before expenses) | | $1,000.00 | | $ | 1,018.20 | | | $7.024 |
65
| | | | | | | | | | |
| | | | | |
| Fund Name | | Expenses | | Beginning
Account Value
as of 8/1/2022 | | Ending Account
value as of
1/31/2023 | | | Expenses Paid
During Period
8/1/2022 –
1/31/2023 |
Domini Impact International Equity Fund Institutional Shares | | Actual Expenses | | $1,000.00 | | $ | 1,081.10 | | | $4.774 |
| | Hypothetical Expenses (5% return before expenses) | | $1,000.00 | | $ | 1,020.60 | | | $4.634 |
Domini Impact International Equity Fund Class Y Shares | | Actual Expenses | | $1,000.00 | | $ | 1,081.60 | | | $5.044 |
| | Hypothetical Expenses
(5% return before expenses) | | $1,000.00 | | $ | 1,020.40 | | | $4.894 |
Domini Impact Bond Fund Investor Shares | | Actual Expenses | | $1,000.00 | | $ | 976.60 | | | $4.335 |
| | Hypothetical Expenses (5% return before expenses) | | $1,000.00 | | $ | 1,020.80 | | | $4.435 |
Domini Impact Bond Fund Institutional Shares | | Actual Expenses | | $1,000.00 | | $ | 978.80 | | | $2.845 |
| | Hypothetical Expenses (5% return before expenses) | | $1,000.00 | | $ | 1,022.30 | | | $2.915 |
Domini Impact Bond Fund Class Y Shares | | Actual Expenses | | $1,000.00 | | $ | 977.80 | | | $3.245 |
| | Hypothetical Expenses
(5% return before expenses) | | $1,000.00 | | $ | 1,021.90 | | | $3.315 |
1 Expenses are equal to the Fund’s annualized expense ratio of 1.00% for Investor shares, or 1.09% for Class A shares, or 0.71% for Institutional shares, or 0.80% for Class Y shares, multiplied by average account value over the period, multiplied by 184, and divided by 365.
2 Expenses are equal to the Fund’s annualized expense ratio of 1.40% for Investor shares, or 1.15% for Institutional shares, multiplied by average account value over the period, multiplied by 184, and divided by 365.
3 Expenses are equal to the Fund’s annualized expense ratio of 1.40% for Investor shares, or 1.15% for Institutional shares, multiplied by average account value over the period, multiplied by 184, and divided by 365.
4 Expenses are equal to the Fund’s annualized expense ratio of 1.33% for Investor shares, or 1.38% for Class A shares, or 0.91% for Institutional shares, or 0.96% for Class Y shares, multiplied by average account value over the period, multiplied by 184, and divided by 365.
5 Expenses are equal to the Fund’s annualized expense ratio of 0.87% for Investor shares, or 0.57% for Institutional shares or 0.65% for Class Y shares, multiplied by average account value over the period, multiplied by 184, and divided by 365.
66
STATEMENT OF ASSETS AND LIABILITIES
January 31, 2023 (Unaudited)
| | | | |
| | | Domini Impact
Equity Fund | |
ASSETS | | | | |
Investments, at value (cost $525,630,221) | | $ | 830,383,560 | |
Cash | | | 44,960,784 | |
Foreign currency, at value (cost $47,276) | | | 47,418 | |
Receivable for capital shares | | | 17,835 | |
Dividend receivable | | | 770,258 | |
Tax reclaim receivable | | | 292,992 | |
| | | | |
Total assets | | | 876,472,847 | |
| | | | |
LIABILITIES | | | | |
Payable for capital shares | | | 99,463 | |
Management fee payable | | | 466,783 | |
Distribution fee payable | | | 151,639 | |
Other accrued expenses | | | 842,756 | |
Foreign tax payable | | | 10,426 | |
| | | | |
Total liabilities | | | 1,571,067 | |
| | | | |
NET ASSETS | | $ | 874,901,780 | |
| | | | |
NET ASSETS CONSISTS OF | | | | |
Paid-in capital | | $ | 575,719,580 | |
Total distributable earnings (loss) | | | 299,182,200 | |
| | | | |
NET ASSETS | | $ | 874,901,780 | |
| | | | |
NET ASSET VALUE PER SHARE | | | | |
| |
Investor Shares | | | | |
Net assets | | | 738,315,317 | |
| | | | |
Outstanding shares of beneficial interest | | | 26,868,865 | |
| | | | |
Net Asset Value And Offering Price Per Share | | $ | 27.48 | |
| | | | |
| |
Class A Shares | | | | |
Net assets | | | 5,926,943 | |
| | | | |
Outstanding shares of beneficial interest | | | 216,231 | |
| | | | |
Net Asset Value And Offering Price Per Share | | $ | 27.41 | |
| | | | |
Maximum offering price per share (net asset value per share / (1-4.75%)) | | $ | 28.78 | |
| | | | |
| |
Institutional Shares | | | | |
Net assets | | | 121,132,341 | |
| | | | |
Outstanding shares of beneficial interest | | | 4,442,531 | |
| | | | |
Net Asset Value And Offering Price Per Share | | $ | 27.27 | |
| | | | |
| |
Class Y Shares | | | | |
Net assets | | | 9,527,179 | |
| | | | |
Outstanding shares of beneficial interest | | | 348,819 | |
| | | | |
Net Asset Value And Offering Price Per Share | | $ | 27.31 | |
| | | | |
SEE NOTES TO FINANCIAL STATEMENTS
67
STATEMENT OF ASSETS AND LIABILITIES
January 31, 2023 (Unaudited)
| | | | |
| | | Domini
International
Opportunities
Fund | |
ASSETS | | | | |
Investments, at value (cost $20,514,059) | | $ | 20,534,547 | |
Cash | | | 1,012,991 | |
Foreign currency, at value (cost $80,871) | | | 82,479 | |
Receivable for capital shares | | | 50 | |
Dividend receivable | | | 20,859 | |
Tax reclaim receivable | | | 35,563 | |
| | | | |
Total assets | | | 21,686,489 | |
| | | | |
LIABILITIES | | | | |
Management fee payable | | | 15,215 | |
Other accrued expenses | | | 11,688 | |
Foreign tax payable | | | 2,640 | |
| | | | |
Total liabilities | | | 29,543 | |
| | | | |
NET ASSETS | | $ | 21,656,946 | |
| | | | |
NET ASSETS CONSISTS OF | | | | |
Paid-in capital | | $ | 23,052,343 | |
Total distributable earnings (loss) | | | (1,395,397) | |
| | | | |
NET ASSETS | | $ | 21,656,946 | |
| | | | |
NET ASSET VALUE PER SHARE | | | | |
| |
Investor Class | | | | |
Net assets | | | 2,850,702 | |
| | | | |
Outstanding shares of beneficial interest | | | 298,661 | |
| | | | |
Net Asset Value And Offering Price Per Share | | $ | 9.54 | |
| | | | |
| |
Institutional Class | | | | |
Net assets | | | 18,806,244 | |
| | | | |
Outstanding shares of beneficial interest | | | 1,968,646 | |
| | | | |
Net Asset Value And Offering Price Per Share | | $ | 9.55 | |
| | | | |
SEE NOTES TO FINANCIAL STATEMENTS
68
STATEMENT OF ASSETS AND LIABILITIES
January 31, 2023 (Unaudited)
| | | | |
| | | Domini
Sustainable
Solutions Fund | |
ASSETS | | | | |
Investments, at value (cost $22,695,600) | | $ | 26,069,278 | |
Cash | | | 3,862,729 | |
Foreign currency, at value (cost $59,874) | | | 61,058 | |
Receivable for capital shares. | | | 456 | |
Dividend receivable | | | 4,223 | |
Tax reclaim receivable | | | 12,901 | |
| | | | |
Total assets | | | 30,010,645 | |
| | | | |
LIABILITIES | | | | |
Management fee payable | | | 20,331 | |
Other accrued expenses | | | 20,023 | |
| | | | |
Total liabilities | | | 40,354 | |
| | | | |
NET ASSETS | | $ | 29,970,291 | |
| | | | |
NET ASSETS CONSISTS OF | | | | |
Paid-in capital | | $ | 30,550,163 | |
Total distributable earnings (loss) | | | (579,872) | |
| | | | |
NET ASSETS | | $ | 29,970,291 | |
| | | | |
NET ASSET VALUE PER SHARE | | | | |
| |
Investor Class | | | | |
Net assets | | | 17,002,816 | |
| | | | |
Outstanding shares of beneficial interest | | | 1,248,436 | |
| | | | |
Net Asset Value And Offering Price Per Share | | $ | 13.62 | |
| | | | |
| |
Institutional Class | | | | |
Net assets | | | 12,967,475 | |
| | | | |
Outstanding shares of beneficial interest | | | 947,069 | |
| | | | |
Net Asset Value And Offering Price Per Share | | $ | 13.69 | |
| | | | |
SEE NOTES TO FINANCIAL STATEMENTS
69
STATEMENT OF ASSETS AND LIABILITIES
January 31, 2023 (Unaudited)
| | | | |
| | | Domini Impact
International
Equity Fund | |
ASSETS | | | | |
Investments, at value (cost $930,748,293) | | $ | 1,006,790,306 | |
Cash | | | 17,124,739 | |
Foreign currency, at value (cost $2,699,036) | | | 2,699,036 | |
Receivable for securities sold | | | 45,246,009 | |
Receivable for capital shares | | | 423,192 | |
Dividend receivable | | | 1,519,183 | |
Tax reclaim receivable | | | 4,676,589 | |
| | | | |
Total assets | | | 1,078,479,054 | |
| | | | |
LIABILITIES | | | | |
Payable for securities purchased | | | 49,557,309 | |
Payable for capital shares | | | 888,336 | |
Management fee payable | | | 730,720 | |
Distribution fee payable | | | 40,515 | |
Other accrued expenses | | | 753,751 | |
Foreign tax payable | | | 182,319 | |
| | | | |
Total liabilities | | | 52,152,950 | |
| | | | |
NET ASSETS | | $ | 1,026,326,104 | |
| | | | |
NET ASSETS CONSISTS OF | | | | |
Paid-in capital | | $ | 1,126,290,801 | |
Total distributable earnings (loss) | | | (99,964,697) | |
| | | | |
NET ASSETS | | $ | 1,026,326,104 | |
| | | | |
NET ASSET VALUE PER SHARE | | | | |
| |
Investor Shares | | | | |
Net assets | | | 184,414,666 | |
| | | | |
Outstanding shares of beneficial interest | | | 23,317,512 | |
| | | | |
Net Asset Value And Offering Price Per Share | | $ | 7.91 | |
| | | | |
| |
Class A Shares | | | | |
Net assets | | | 10,512,196 | |
| | | | |
Outstanding shares of beneficial interest | | | 1,241,025 | |
| | | | |
Net Asset Value And Offering Price Per Share | | $ | 8.47 | |
| | | | |
Maximum offering price per share (net asset value per share / (1-4.75%)) | | $ | 8.89 | |
| | | | |
| |
Institutional Shares | | | | |
Net assets | | | 449,861,507 | |
| | | | |
Outstanding shares of beneficial interest | | | 57,828,622 | |
| | | | |
Net Asset Value And Offering Price Per Share | | $ | 7.78 | |
| | | | |
| |
Class Y Shares | | | | |
Net assets | | | 381,537,735 | |
| | | | |
Outstanding shares of beneficial interest | | | 48,987,739 | |
| | | | |
Net Asset Value And Offering Price Per Share | | $ | 7.79 | |
| | | | |
SEE NOTES TO FINANCIAL STATEMENTS
70
STATEMENT OF OPERATIONS
For the Six Months Ended January 31, 2023 (Unaudited)
| | | | |
| | | Domini Impact
Equity Fund | |
INCOME | | | | |
Dividends (net of foreign taxes $59,931) | | $ | 5,595,485 | |
Interest income | | | 223,259 | |
| | | | |
Investment Income | | | 5,818,744 | |
| | | | |
EXPENSES | | | | |
Management/Sponsorship fees | | | 2,786,062 | |
Distribution fees – Investor Shares | | | 906,615 | |
Distribution fees – Class A Shares | | | 7,400 | |
Transfer agent fees – Investor Shares | | | 147,098 | |
Transfer agent fees – Class A Shares | | | 394 | |
Transfer agent fees – Institutional Shares | | | 600 | |
Transfer agent fees – Class Y Shares | | | 3,270 | |
Custody and Accounting fees | | | 67,050 | |
Professional fees | | | 26,062 | |
Registration fees – Investor Shares | | | 18,414 | |
Registration fees – Class A Shares | | | 17,439 | |
Registration fees – Institutional Shares | | | 11,310 | |
Registration fees – Class Y Shares | | | 13,908 | |
Shareholder Communication fees | | | 18,710 | |
Miscellaneous | | | 69,191 | |
Trustees fees | | | 24,013 | |
Shareholder Service fees – Investor Shares | | | 20,774 | |
Shareholder Service fees – Class A Shares | | | 146 | |
Shareholder Service fees – Institutional Shares | | | 75 | |
Shareholder Service fees – Class Y Shares | | | 53 | |
| | | | |
Total expenses | | | 4,138,584 | |
Fees waived and expenses reimbursed | | | (27,296) | |
| | | | |
Net expenses | | | 4,111,288 | |
| | | | |
NET INVESTMENT INCOME (LOSS) | | | 1,707,456 | |
| | | | |
REALIZED AND UNREALIZED GAIN (LOSS) FROM INVESTMENTS AND FOREIGN CURRENCY | | | | |
NET REALIZED GAIN (LOSS) FROM: | | | | |
Investments | | | (1,977,612) | |
Foreign currency | | | (865) | |
| | | | |
Net realized gain (loss) | | | (1,978,477) | |
| | | | |
NET CHANGES IN UNREALIZED APPRECIATION (DEPRECIATION) FROM: | | | | |
Investments | | | (24,772,910) | |
Translation of assets and liabilities in foreign currencies | | | (39) | |
| | | | |
Net change in unrealized appreciation (depreciation) | | | (24,772,949) | |
| | | | |
NET REALIZED AND UNREALIZED GAIN (LOSS) | | | (26,751,426) | |
| | | | |
NET INCREASE (DECREASE) IN NET ASSETS RESULTING FROM OPERATIONS | | $ | (25,043,970) | |
| | | | |
SEE NOTES TO FINANCIAL STATEMENTS
71
STATEMENT OF OPERATIONS
For the Six Months Ended January 31, 2023 (Unaudited)
| | | | |
| | | Domini
International
Opportunities
Fund | |
INCOME | | | | |
Dividends (net of foreign taxes $10,969) | | $ | 130,003 | |
| | | | |
Investment Income | | | 130,003 | |
| | | | |
EXPENSES | | | | |
Management fees | | | 85,107 | |
Distribution fees – Investor Class | | | 3,149 | |
Transfer agent fees – Investor Class | | | 17,000 | |
Transfer agent fees – Institutional Class | | | 100 | |
Custody and Accounting fees | | | 88,797 | |
Professional fees | | | 20,837 | |
Registration fees – Investor Class | | | 12,388 | |
Registration fees – Institutional Class | | | 20,472 | |
Shareholder Communication fees | | | 1,099 | |
Miscellaneous | | | 3,171 | |
Trustees fees | | | 537 | |
Shareholder Service fees – Investor Class | | | 387 | |
Shareholder Service fees – Institutional Class | | | 4 | |
| | | | |
Total expenses | | | 253,048 | |
Fees waived and expenses reimbursed | | | (134,754) | |
| | | | |
Net expenses | | | 118,294 | |
| | | | |
NET INVESTMENT INCOME (LOSS) | | | 11,709 | |
| | | | |
REALIZED AND UNREALIZED GAIN (LOSS) FROM INVESTMENTS AND FOREIGN CURRENCY | | | | |
NET REALIZED GAIN (LOSS) FROM: | | | | |
Investments | | | (838,632) | |
Foreign currency | | | (3,761) | |
| | | | |
Net realized gain (loss) | | | (842,393) | |
| | | | |
NET CHANGES IN UNREALIZED APPRECIATION (DEPRECIATION) FROM: | | | | |
Investments | | | 2,107,062 | |
Translation of assets and liabilities in foreign currencies | | | 4,045 | |
| | | | |
Net change in unrealized appreciation (depreciation) | | | 2,111,107 | |
| | | | |
NET REALIZED AND UNREALIZED GAIN (LOSS) | | | 1,268,714 | |
| | | | |
NET INCREASE (DECREASE) IN NET ASSETS RESULTING FROM OPERATIONS | | $ | 1,280,423 | |
| | | | |
SEE NOTES TO FINANCIAL STATEMENTS
72
STATEMENT OF OPERATIONS
For the Six Months Ended January 31, 2023 (Unaudited)
| | | | |
| | | Domini
Sustainable
Solutions Fund | |
INCOME | | | | |
Dividends (net of foreign taxes $2,604) | | $ | 104,609 | |
| | | | |
Investment Income | | | 104,609 | |
| | | | |
EXPENSES | | | | |
Management fees | | | 118,089 | |
Distribution fees – Investor Class | | | 19,556 | |
Transfer agent fees – Investor Class | | | 18,559 | |
Transfer agent fees – Institutional Class | | | 310 | |
Custody and Accounting fees | | | 34,235 | |
Professional fees | | | 13,028 | |
Registration fees – Investor Class | | | 7,685 | |
Registration fees – Institutional Class | | | 7,512 | |
Shareholder Communication fees | | | 1,602 | |
Miscellaneous | | | 3,562 | |
Trustees fees | | | 734 | |
Shareholder Service fees – Investor Class | | | 1,382 | |
Shareholder Service fees – Institutional Class | | | 21 | |
| | | | |
Total expenses | | | 226,275 | |
Fees waived and expenses reimbursed | | | (46,997) | |
| | | | |
Net expenses | | | 179,278 | |
| | | | |
NET INVESTMENT INCOME (LOSS) | | | (74,669) | |
| | | | |
REALIZED AND UNREALIZED GAIN (LOSS) FROM INVESTMENTS AND FOREIGN CURRENCY | | | | |
NET REALIZED GAIN (LOSS) FROM: | | | | |
Investments | | | (1,079,552) | |
Foreign currency | | | (321) | |
| | | | |
Net realized gain (loss) | | | (1,079,873) | |
| | | | |
NET CHANGES IN UNREALIZED APPRECIATION (DEPRECIATION) FROM: | | | | |
Investments | | | 872,692 | |
Translation of assets and liabilities in foreign currencies | | | 4,285 | |
| | | | |
Net change in unrealized appreciation (depreciation) | | | 876,977 | |
| | | | |
NET REALIZED AND UNREALIZED GAIN (LOSS) | | | (202,896) | |
| | | | |
NET INCREASE (DECREASE) IN NET ASSETS RESULTING FROM OPERATIONS | | $ | (277,565) | |
| | | | |
SEE NOTES TO FINANCIAL STATEMENTS
73
STATEMENT OF OPERATIONS
For the Six Months Ended January 31, 2023 (Unaudited)
| | | | |
| | | Domini Impact
International
Equity Fund | |
INCOME | | | | |
Dividends (net of foreign taxes $649,887) | | $ | 10,328,296 | |
Interest income | | | 39,182 | |
| | | | |
Investment Income | | | 10,367,478 | |
| | | | |
EXPENSES | | | | |
Management fees | | | 4,429,478 | |
Distribution fees – Investor Shares | | | 224,403 | |
Distribution fees – Class A Shares | | | 15,717 | |
Transfer agent fees – Investor Shares | | | 103,473 | |
Transfer agent fees – Class A Shares | | | 677 | |
Transfer agent fees – Institutional Shares | | | 1,904 | |
Transfer agent fees – Class Y Shares | | | 83,733 | |
Custody and Accounting fees | | | 184,251 | |
Professional fees | | | 6,291 | |
Registration fees – Investor Shares | | | 11,758 | |
Registration fees – Class A Shares | | | 12,289 | |
Registration fees – Institutional Shares | | | 20,192 | |
Registration fees – Class Y Shares | | | 2,313 | |
Shareholder Communication fees | | | 71,182 | |
Miscellaneous | | | 38,691 | |
Trustees fees | | | 33,397 | |
Shareholder Service fees – Investor Shares | | | 8,332 | |
Shareholder Service fees – Class A Shares | | | 287 | |
Shareholder Service fees – Institutional Shares | | | 215 | |
Shareholder Service fees – Class Y Shares | | | 56 | |
| | | | |
Net expenses | | | 5,248,639 | |
| | | | |
NET INVESTMENT INCOME (LOSS) | | | 5,118,839 | |
| | | | |
REALIZED AND UNREALIZED GAIN (LOSS) FROM INVESTMENTS AND FOREIGN CURRENCY | | | | |
NET REALIZED GAIN (LOSS) FROM: | | | | |
Investments | | | (77,211,858) | |
Foreign currency | | | (517,644) | |
| | | | |
Net realized gain (loss) | | | (77,729,502) | |
| | | | |
NET CHANGES IN UNREALIZED APPRECIATION (DEPRECIATION) FROM: | | | | |
Investments | | | 141,572,945 | |
Translation of assets and liabilities in foreign currencies | | | 256,167 | |
| | | | |
Net change in unrealized appreciation (depreciation) | | | 141,829,112 | |
| | | | |
NET REALIZED AND UNREALIZED GAIN (LOSS) | | | 64,099,610 | |
| | | | |
NET INCREASE (DECREASE) IN NET ASSETS RESULTING FROM OPERATIONS | | $ | 69,218,449 | |
| | | | |
SEE NOTES TO FINANCIAL STATEMENTS
74
DOMINI IMPACT EQUITY FUND
STATEMENTS OF CHANGES IN NET ASSETS
| | | | | | | | |
| | | Six Months
Ended
January 31, 2023
(unaudited) | | | Year Ended
July 31, 2022 | |
DECREASE IN NET ASSETS FROM OPERATIONS | | | | | | | | |
Net investment income (loss) | | $ | 1,707,456 | | | $ | 1,920,360 | |
Net realized gain (loss) | | | (1,978,477) | | | | 21,250,065 | |
Net change in unrealized appreciation (depreciation) | | | (24,772,949) | | | | (156,725,788) | |
| | | | | | | | |
Net Increase (Decrease) in Net Assets Resulting from Operations | | | (25,043,970) | | | | (133,555,363) | |
| | | | | | | | |
DISTRIBUTIONS TO SHAREHOLDERS | | | | | | | | |
Investor Shares | | | (12,266,230) | | | | (54,087,151) | |
Class A Shares | | | (101,874) | | | | (474,850) | |
Institutional Shares | | | (2,437,821) | | | | (9,304,327) | |
Class Y Shares | | | (177,130) | | | | (572,465) | |
| | | | | | | | |
Net Decrease in Net Assets from Distributions | | | (14,983,055) | | | | (64,438,793) | |
| | | | | | | | |
CAPITAL SHARE TRANSACTIONS | | | | | | | | |
Proceeds from sale of shares | | | 16,794,868 | | | | 33,781,629 | |
Net asset value of shares issued in reinvestment of distributions and dividends | | | 13,766,257 | | | | 59,547,412 | |
Payments for shares redeemed | | | (32,377,455) | | | | (76,933,665) | |
Redemption fees | | | - | | | | 224 | |
| | | | | | | | |
Net Increase (Decrease) in Net Assets from Capital Share Transactions | | | (1,816,330) | | | | 16,395,600 | |
| | | | | | | | |
Total Increase (Decrease) in Net Assets | | | (41,843,355) | | | | (181,598,556) | |
| | | | | | | | |
NET ASSETS | | | | | | | | |
Beginning of period | | $ | 916,745,135 | | | $ | 1,098,343,691 | |
| | | | | | | | |
End of period | | $ | 874,901,780 | | | $ | 916,745,135 | |
| | | | | | | | |
SEE NOTES TO FINANCIAL STATEMENTS
75
DOMINI INTERNATIONAL OPPORTUNITIES FUND
STATEMENTS OF CHANGES IN NET ASSETS
| | | | | | | | |
| | | Six Months
Ended
January 31, 2023
(unaudited) | | | Year Ended
July 31, 2022 | |
INCREASE (DECREASE) IN NET ASSETS FROM OPERATIONS | | | | | | | | |
Net investment income (loss) | | $ | 11,709 | | | $ | 250,464 | |
Net realized gain (loss) | | | (842,393) | | | | (546,450) | |
Net change in unrealized appreciation (depreciation) | | | 2,111,107 | | | | (4,455,022) | |
| | | | | | | | |
Net Increase (Decrease) in Net Assets Resulting from Operations | | | 1,280,423 | | | | (4,751,008) | |
| | | | | | | | |
DISTRIBUTIONS TO SHAREHOLDERS | | | | | | | | |
Investor Class | | | - | | | | (40,010) | |
Institutional Class | | | (10,705) | | | | (386,867) | |
| | | | | | | | |
Net Decrease in Net Assets from Distributions | | | (10,705) | | | | (426,877) | |
| | | | | | | | |
CAPITAL SHARE TRANSACTIONS | | | | | | | | |
Proceeds from sale of shares | | | 196,155 | | | | 922,878 | |
Net asset value of shares issued in reinvestment of distributions and dividends | | | 10,705 | | | | 426,681 | |
Payments for shares redeemed | | | (1,141,909) | | | | (1,294,530) | |
Redemption fees | | | - | | | | - | |
| | | | | | | | |
Net Increase (Decrease) in Net Assets from Capital Share Transactions | | | (935,049) | | | | 55,029 | |
| | | | | | | | |
Total Increase (Decrease) in Net Assets | | | 334,669 | | | | (5,122,856) | |
| | | | | | | | |
NET ASSETS | | | | | | | | |
Beginning of period | | $ | 21,322,277 | | | $ | 26,445,133 | |
| | | | | | | | |
End of period | | $ | 21,656,946 | | | $ | 21,322,277 | |
| | | | | | | | |
SEE NOTES TO FINANCIAL STATEMENTS
76
DOMINI SUSTAINABLE SOLUTIONS FUND
STATEMENTS OF CHANGES IN NET ASSETS
| | | | | | | | |
| | | Six Months
Ended
January 31, 2023
(unaudited) | | | Year Ended
July 31, 2022 | |
DECREASE IN NET ASSETS FROM OPERATIONS | | | | | | | | |
Net investment income (loss) | | $ | (74,669) | | | $ | (160,339) | |
Net realized gain (loss) | | | (1,079,873) | | | | (1,908,248) | |
Net change in unrealized appreciation (depreciation) | | | 876,977 | | | | (6,953,772) | |
| | | | | | | | |
Net Increase (Decrease) in Net Assets Resulting from Operations | | | (277,565) | | | | (9,022,359) | |
| | | | | | | | |
DISTRIBUTIONS TO SHAREHOLDERS | | | | | | | | |
Investor Class | | | - | | | | (764,084) | |
Institutional Class | | | - | | | | (637,340) | |
| | | | | | | | |
Net Decrease in Net Assets from Distributions | | | - | | | | (1,401,424) | |
| | | | | | | | |
CAPITAL SHARE TRANSACTIONS | | | | | | | | |
Proceeds from sale of shares | | | 2,582,978 | | | | 5,156,026 | |
Net asset value of shares issued in reinvestment of distributions and dividends | | | - | | | | 1,380,967 | |
Payments for shares redeemed | | | (1,088,044) | | | | (5,991,177) | |
Redemption fees | | | - | | | | - | |
| | | | | | | | |
Net Increase (Decrease) in Net Assets from Capital Share Transactions | | | 1,494,934 | | | | 545,816 | |
| | | | | | | | |
Total Increase (Decrease) in Net Assets | | | 1,217,369 | | | | (9,877,967) | |
| | | | | | | | |
NET ASSETS | | | | | | | | |
Beginning of period | | $ | 28,752,922 | | | $ | 38,630,889 | |
| | | | | | | | |
End of period | | $ | 29,970,291 | | | $ | 28,752,922 | |
| | | | | | | | |
SEE NOTES TO FINANCIAL STATEMENTS
77
DOMINI IMPACT INTERNATIONAL EQUITY FUND
STATEMENTS OF CHANGES IN NET ASSETS
| | | | | | | | |
| | | Six Months
Ended
January 31, 2023
(unaudited) | | | Year Ended
July 31, 2022 | |
INCREASE (DECREASE) IN NET ASSETS FROM OPERATIONS | | | | | | | | |
Net investment income (loss) | | $ | 5,118,839 | | | $ | 27,375,131 | |
Net realized gain (loss) | | | (77,729,502) | | | | (41,946,353) | |
Net change in unrealized appreciation (depreciation) | | | 141,829,112 | | | | (307,145,612) | |
| | | | | | | | |
Net Increase (Decrease) in Net Assets Resulting from Operations | | | 69,218,449 | | | | (321,716,834) | |
| | | | | | | | |
DISTRIBUTIONS TO SHAREHOLDERS | | | | | | | | |
Investor Shares | | | (1,514,784) | | | | (3,017,144) | |
Class A Shares | | | (58,676) | | | | (197,922) | |
Institutional Shares | | | (6,884,912) | | | | (11,678,797) | |
Class Y Shares | | | (4,929,244) | | | | (11,865,489) | |
| | | | | | | | |
Net Decrease in Net Assets from Distributions | | | (13,387,616) | | | | (26,759,352) | |
| | | | | | | | |
CAPITAL SHARE TRANSACTIONS | | | | | | | | |
Proceeds from sale of shares | | | 118,476,465 | | | | 423,391,788 | |
Net asset value of shares issued in reinvestment of distributions and dividends | | | 10,487,705 | | | | 21,950,922 | |
Payments for shares redeemed | | | (427,885,937) | | | | (403,422,877) | |
Redemption fees | | | - | | | | 1,054 | |
| | | | | | | | |
Net Increase (Decrease) in Net Assets from Capital Share Transactions | | | (298,921,767) | | | | 41,920,887 | |
| | | | | | | | |
Total Increase (Decrease) in Net Assets | | | (243,090,934) | | | | (306,555,299) | |
| | | | | | | | |
NET ASSETS | | | | | | | | |
Beginning of period | | $ | 1,269,417,038 | | | $ | 1,575,972,337 | |
| | | | | | | | |
End of period | | $ | 1,026,326,104 | | | $ | 1,269,417,038 | |
| | | | | | | | |
SEE NOTES TO FINANCIAL STATEMENTS
78
DOMINI IMPACT EQUITY FUND — INVESTOR SHARES
FINANCIAL HIGHLIGHTS
| | | | | | | | | | | | | | | | | | | | | | | | |
| | | Six Months
Ended
January 31, 2023
(unaudited) | | | Year Ended July 31, | |
| | | 2022 | | | 2021 | | | 2020 | | | 2019 | | | 2018 | |
For a share outstanding for the period: | | | | | | | | | | | | | | | | | | | | | | | | |
Net asset value, beginning of period | | $ | 28.71 | | | $ | 34.82 | | | $ | 26.72 | | | $ | 22.48 | | | $ | 24.18 | | | $ | 23.18 | ^ |
| | | | | | | | | | | | | | | | | | | | | | | | |
Income from investment operations: | | | | | | | | | | | | | | | | | | | | | | | | |
Net investment income (loss) | | | 0.05 | | | | 0.03 | | | | 0.08 | | | | 0.15 | 1 | | | 0.18 | | | | 0.27 | 1 |
Net realized and unrealized gain (loss) on investments | | | (0.82) | | | | (4.08) | | | | 8.74 | | | | 4.69 | 1 | | | 0.81 | | | | 2.09 | 1 |
| | | | | | | | | | | | | | | | | | | | | | | | |
Total Income (loss) From Investment Operations | | | (0.77) | | | | (4.05) | | | | 8.82 | | | | 4.84 | | | | 0.99 | | | | 2.36 | |
| | | | | | | | | | | | | | | | | | | | | | | | |
Less dividends and/or distributions: | | | | | | | | | | | | | | | | | | | | | | | | |
Dividends to shareholders from net investment income | | | (0.02) | | | | (0.01) | | | | (0.09) | | | | (0.14) | | | | (0.21) | | | | (0.17) | ^ |
Distributions to shareholders from net realized gain | | | (0.44) | | | | (2.05) | | | | (0.63) | | | | (0.46) | | | | (2.48) | | | | (1.19) | ^ |
| | | | | | | | | | | | | | | | | | | | | | | | |
Total Distributions | | | (0.46) | | | | (2.06) | | | | (0.72) | | | | (0.60) | | | | (2.69) | | | | (1.36) | |
| | | | | | | | | | | | | | | | | | | | | | | | |
Redemption fee proceeds 1 | | | - | | | | 0.00 | 2 | | | 0.00 | 2 | | | 0.00 | 2 | | | 0.00 | 2 | | | 0.00 | 2 |
| | | | | | | | | | | | | | | | | | | | | | | | |
Net asset value, end of period | | $ | 27.48 | | | $ | 28.71 | | | $ | 34.82 | | | $ | 26.72 | | | $ | 22.48 | | | $ | 24.18 | |
| | | | | | | | | | | | | | | | | | | | | | | | |
Total return 3 | | | (2.65)% | | | | (12.65)% | | | | 33.43% | | | | 21.98% | | | | 6.31% | | | | 10.32% | |
Portfolio turnover | | | 1% | | | | 6% | | | | 23% | | | | 21% | | | | 95% | | | | 78% | |
Ratios/supplemental data (annualized): | | | | | | | | | | | | | | | | | | | | | | | | |
Net assets, end of period (in millions) | | $ | 738 | | | $ | 776 | | | $ | 927 | | | $ | 719 | | | $ | 643 | | | $ | 669 | |
Ratio of expenses to average net assets | | | 1.00% | | | | 1.05% | | | | 1.09% | | | | 1.08% | 4,5 | | | 1.07% | 4,5 | | | 1.10% | |
Ratio of gross expenses to average net assets | | | 1.00% | | | | 1.05% | | | | 1.09% | | | | 1.09% | | | | 1.09% | | | | 1.10% | |
Ratio of net investment income (loss) to average net assets | | | 0.36% | | | | 0.14% | | | | 0.24% | | | | 0.65% | | | | 0.96% | | | | 1.15% | |
1 Based on average shares outstanding.
2 Amount represents less than $0.005 per share.
3 Not annualized for periods less than one year.
4 Ratio of expenses to average net assets includes transfer agent credits. Excluding transfer agent credits the ratio of expenses to average net assets would have been 1.07% for the year ended July 31, 2019 and 1.08% for the year ended July 31, 2020.
5 Reflects a waiver of fees by the Manager, the Sponsor and the Distributor of the Fund.
^ All per share amounts and net asset values have been adjusted as a result of the 1.9988601 for 1 share split on January 26, 2018.
SEE NOTES TO FINANCIAL STATEMENTS
79
DOMINI IMPACT EQUITY FUND — CLASS A SHARES
FINANCIAL HIGHLIGHTS
| | | | | | | | | | | | | | | | | | | | | | | | |
| | | Six Months
Ended
January 31, 2023
(unaudited) | | | Year Ended July 31, | |
| | | 2022 | | | 2021 | | | 2020 | | | 2019 | | | 2018 | |
For a share outstanding for the period: | | | | | | | | | | | | | | | | | | | | | | | | |
Net asset value, beginning of period | | | $28.66 | | | | $34.79 | | | | $26.70 | | | | $22.46 | | | | $24.17 | | | | $33.41 | ^ |
| | | | | | | | | | | | | | | | | | | | | | | | |
Income from investment operations: | | | | | | | | | | | | | | | | | | | | | | | | |
Net investment income (loss) | | | (0.14) | | | | (0.12) | | | | (0.46) | | | | 0.15 | 1 | | | 0.23 | | | | 0.31 | 1 |
Net realized and unrealized gain (loss) on investments | | | (0.65) | | | | (3.94) | | | | 9.27 | | | | 4.69 | 1 | | | 0.75 | | | | 2.84 | 1 |
| | | | | | | | | | | | | | | | | | | | | | | | |
Total Income (loss) From Investment Operations | | | (0.79) | | | | (4.06) | | | | 8.81 | | | | 4.84 | | | | 0.98 | | | | 3.15 | |
| | | | | | | | | | | | | | | | | | | | | | | | |
Less dividends and/or distributions: | | | | | | | | | | | | | | | | | | | | | | | | |
Dividends to shareholders from net investment income | | | (0.02) | | | | (0.02) | | | | (0.09) | | | | (0.14) | | | | (0.21) | | | | (1.35) | ^ |
Distributions to shareholders from net realized gain | | | (0.44) | | | | (2.05) | | | | (0.63) | | | | (0.46) | | | | (2.48) | | | | (11.04) | ^ |
| | | | | | | | | | | | | | | | | | | | | | | | |
Total Distributions | | | (0.46) | | | | (2.07) | | | | (0.72) | | | | (0.60) | | | | (2.69) | | | | (12.39) | |
| | | | | | | | | | | | | | | | | | | | | | | | |
Redemption fee proceeds 1 | | | - | | | | - | | | | - | | | | - | | | | 0.00 | 2 | | | - | |
| | | | | | | | | | | | | | | | | | | | | | | | |
Net asset value, end of period | | | $27.41 | | | | $28.66 | | | | $34.79 | | | | $26.70 | | | | $22.46 | | | | $24.17 | |
| | | | | | | | | | | | | | | | | | | | | | | | |
Total return 3 | | | (2.72)% | | | | (12.67)% | | | | 33.42% | | | | 22.01% | | | | 6.28% | | | | 10.36% | |
Portfolio turnover | | | 1% | | | | 6% | | | | 23% | | | | 21% | | | | 95% | | | | 78% | |
Ratios/supplemental data (annualized): | | | | | | | | | | | | | | | | | | | | | | | | |
Net assets, end of period (in millions) | | | $6 | | | | $6 | | | | $8 | | | | $6 | | | | $7 | | | | $7 | |
Ratio of expenses to average net assets | | | 1.09% | 4 | | | 1.09% | 4 | | | 1.09% | 4 | | | 1.09% | 4,5 | | | 1.09% | 4,5 | | | 1.12% | 4 |
Ratio of gross expenses to average net assets | | | 1.55% | | | | 1.37% | | | | 1.31% | | | | 1.47% | | | | 1.43% | | | | 1.38% | |
Ratio of net investment income (loss) to average net assets | | | 0.26% | | | | 0.10% | | | | 0.24% | | | | 0.64% | | | | 0.95% | | | | 1.14% | |
1 Based on average shares outstanding.
2 Amount represents less than $0.005 per share.
3 Total return does not reflect sales commissions and is not annualized for periods less than one year.
4 Reflects a waiver of fees by the Manager, the Sponsor and the Distributor of the Fund.
5 Ratio of expenses to average net assets includes transfer agent credits. Excluding transfer agent credits the ratio of expenses to average net assets would have been 1.09% for the year ended July 31, 2019 and 1.09% for the year ended July 31, 2020.
^ All per share amounts and net asset values have been adjusted as a result of the 0.2155310 for 1 reverse share split on January 26, 2018.
SEE NOTES TO FINANCIAL STATEMENTS
80
DOMINI IMPACT EQUITY FUND — INSTITUTIONAL SHARES
FINANCIAL HIGHLIGHTS
| | | | | | | | | | | | | | | | | | | | | | | | |
| | | Six Months
Ended
January 31, 2023
(unaudited) | | | Year Ended July 31, | |
| | | 2022 | | | 2021 | | | 2020 | | | 2019 | | | 2018 | |
For a share outstanding for the period: | | | | | | | | | | | | | | | | | | | | | | | | |
Net asset value, beginning of period | | | $28.56 | | | | $34.60 | | | | $26.59 | | | | $22.41 | | | | $24.18 | | | | $24.46 | |
| | | | | | | | | | | | | | | | | | | | | | | | |
Income from investment operations: | | | | | | | | | | | | | | | | | | | | | | | | |
Net investment income (loss) | | | 0.11 | | | | 0.12 | | | | 0.28 | | | | 0.23 | 1 | | | 0.08 | | | | 0.37 | |
Net realized and unrealized gain (loss) on investments | | | (0.84) | | | | (4.05) | | | | 8.60 | | | | 4.67 | 1 | | | 0.98 | | | | 2.17 | |
| | | | | | | | | | | | | | | | | | | | | | | | |
Total Income (loss) From Investment Operations | | | (0.73) | | | | (3.93) | | | | 8.88 | | | | 4.90 | | | | 1.06 | | | | 2.54 | |
| | | | | | | | | | | | | | | | | | | | | | | | |
Less dividends and/or distributions: | | | | | | | | | | | | | | | | | | | | | | | | |
Dividends to shareholders from net investment income | | | (0.12) | | | | (0.06) | | | | (0.24) | | | | (0.26) | | | | (0.35) | | | | (0.44) | |
Distributions to shareholders from net realized gain | | | (0.44) | | | | (2.05) | | | | (0.63) | | | | (0.46) | | | | (2.48) | | | | (2.38) | |
| | | | | | | | | | | | | | | | | | | | | | | | |
Total Distributions | | | (0.56) | | | | (2.11) | | | | (0.87) | | | | (0.72) | | | | (2.83) | | | | (2.82) | |
| | | | | | | | | | | | | | | | | | | | | | | | |
Redemption fee proceeds 1 | | | - | | | | - | | | | 0.00 | 2 | | | 0.00 | 2 | | | 0.00 | 2 | | | 0.00 | 2 |
| | | | | | | | | | | | | | | | | | | | | | | | |
Net asset value, end of period | | | $27.27 | | | | $28.56 | | | | $34.60 | | | | $26.59 | | | | $22.41 | | | | $24.18 | |
| | | | | | | | | | | | | | | | | | | | | | | | |
Total return 3 | | | (2.55)% | | | | (12.36)% | | | | 33.89% | | | | 22.43% | | | | 6.69% | | | | 10.68% | |
Portfolio turnover | | | 1% | | | | 6% | | | | 23% | | | | 21% | | | | 95% | | | | 78% | |
Ratios/supplemental data (annualized): | | | | | | | | | | | | | | | | | | | | | | | | |
Net assets, end of period (in millions) | | | $121 | | | | $125 | | | | $154 | | | | $113 | | | | $99 | | | | $120 | |
Ratio of expenses to average net assets | | | 0.71% | | | | 0.73% | | | | 0.74% | | | | 0.74% | 4 | | | 0.74% | 4,5 | | | 0.74% | 5 |
Ratio of gross expenses to average net assets | | | 0.71% | | | | 0.73% | | | | 0.74% | | | | 0.74% | | | | 0.76% | | | | 0.76% | |
Ratio of net investment income (loss) to average net assets | | | 0.64% | | | | 0.46% | | | | 0.59% | | | | 0.99% | | | | 1.31% | | | | 1.52% | |
1 Based on average shares outstanding.
2 Amount represents less than $0.005 per share.
3 Not annualized for periods less than one year.
4 Ratio of expenses to average net assets includes transfer agent credits. Excluding transfer agent credits the ratio of expenses to average net assets would have been 0.74% for the year ended July 31, 2019 and 0.74% for the year ended July 31, 2020.
5 Reflects a waiver of fees by the Manager and the Sponsor of the Fund.
SEE NOTES TO FINANCIAL STATEMENTS
81
DOMINI IMPACT EQUITY FUND — CLASS Y SHARES (FORMERLY CLASS R SHARES)
FINANCIAL HIGHLIGHTS
| | | | | | | | | | | | | | | | | | | | | | | | |
| | | Six Months
Ended
January 31, 2023
(unaudited) | | | Year Ended July 31, | |
| | | 2022 | | | 2021 | | | 2020 | | | 2019 | | | 2018 | |
For a share outstanding for the period: | | | | | | | | | | | | | | | | | | | | | | | | |
Net Asset Value, beginning of period | | | $28.60 | | | | $34.66 | | | | $26.62 | | | | $22.42 | | | | $24.18 | | | | $37.86 | ^ |
| | | | | | | | | | | | | | | | | | | | | | | | |
Income from investment operations: | | | | | | | | | | | | | | | | | | | | | | | | |
Net investment income (loss) | | | 3.42 | | | | 7.56 | | | | 7.50 | | | | 0.21 | 1 | | | 3.04 | | | | 0.41 | 1 |
Net realized and unrealized gain (loss) on investments | | | (4.17) | | | | (11.52) | | | | 1.37 | | | | 4.68 | 1 | | | (2.00) | | | | 3.21 | 1 |
| | | | | | | | | | | | | | | | | | | | | | | | |
Total Income (loss) From Investment Operations | | | (0.75) | | | | (3.96) | | | | 8.87 | | | | 4.89 | | | | 1.04 | | | | 3.62 | |
| | | | | | | | | | | | | | | | | | | | | | | | |
Less dividends and/or distributions: | | | | | | | | | | | | | | | | | | | | | | | | |
Dividends to shareholders from net investment income | | | (0.10) | | | | (0.05) | | | | (0.20) | | | | (0.23) | | | | (0.32) | | | | (2.00) | ^ |
Distributions to shareholders from net realized gain | | | (0.44) | | | | (2.05) | | | | (0.63) | | | | (0.46) | | | | (2.48) | | | | (15.30) | ^ |
| | | | | | | | | | | | | | | | | | | | | | | | |
Total Distributions | | | (0.54) | | | | (2.10) | | | | (0.83) | | | | (0.69) | | | | (2.80) | | | | (17.30) | |
| | | | | | | | | | | | | | | | | | | | | | | | |
Redemption fee proceeds 1 | | | - | | | | - | | | | 0.00 | 2 | | | 0.00 | 2 | | | 0.00 | 2 | | | 0.00 | 2 |
| | | | | | | | | | | | | | | | | | | | | | | | |
Net asset value, end of period | | | $27.31 | | | | $28.60 | | | | $34.66 | | | | $26.62 | | | | $22.42 | | | | $24.18 | |
| | | | | | | | | | | | | | | | | | | | | | | | |
Total return 3 | | | (2.58)% | | | | (12.42)% | | | | 33.81% | | | | 22.34% | | | | 6.62% | | | | 10.71% | |
Portfolio turnover | | | 1% | | | | 6% | | | | 23% | | | | 21% | | | | 95% | | | | 78% | |
Ratios/supplemental data (annualized): | | | | | | | | | | | | | | | | | | | | | | | | |
Net assets, end of period (in millions) | | | $10 | | | | $9 | | | | $10 | | | | $6 | | | | $20 | | | | $18 | |
Ratio of expenses to average net assets | | | 0.80% | 4 | | | 0.80% | 4 | | | 0.80% | 4 | | | 0.79% | 4,5 | | | 0.80% | 4,5 | | | 0.80% | 4 |
Ratio of gross expenses to average net assets | | | 1.10% | | | | 1.02% | | | | 1.05% | | | | 0.94% | | | | 0.88% | | | | 0.84% | |
Ratio of net investment income (loss) to average net assets | | | 0.55% | | | | 0.40% | | | | 0.51% | | | | 0.92% | | | | 1.23% | | | | 1.46% | |
1 Based on average shares outstanding.
2 Amount represents less than $0.005 per share.
3 Not annualized for periods less than one year.
4 Reflects a waiver of fees by the Manager and the Sponsor of the Fund.
5 Ratio of expenses to average net assets includes transfer agent credits. Excluding transfer agent credits the ratio of expenses to average net assets would have been 0.80% for the year ended July 31, 2019 and 0.79% for the year ended July 31, 2020.
^ All per share amounts and net asset values have been adjusted as a result of the 0.1555580 for 1 reverse share split on January 26, 2018.
SEE NOTES TO FINANCIAL STATEMENTS
82
DOMINI INTERNATIONAL OPPORTUNITIES FUND — INVESTOR SHARES
FINANCIAL HIGHLIGHTS
| | | | | | | | | | | | |
| | | Six Months
Ended
January 31,
2023
(unaudited) | | | Year Ended
July 31, 2022 | | | For the Period
November 30, 2020
(commencement
of operations)
through July 31,
2021 | |
| |
For a share outstanding for the period: | | | | | | | | | | | | |
Net asset value, beginning of period | | | $8.96 | | | | $11.08 | | | | $10.00 | |
| | | | | | | | | | | | |
Income from investment operations: | | | | | | | | | | | | |
Net investment income (loss) | | | (0.01) | | | | 0.08 | | | | 0.04 | |
Net realized and unrealized gain (loss) on investments | | | 0.59 | | | | (2.05) | | | | 1.09 | |
| | | | | | | | | | | | |
Total Income (loss) From Investment Operations | | | 0.58 | | | | (1.97) | | | | 1.13 | |
| | | | | | | | | | | | |
Less dividends and/or distributions: | | | | | | | | | | | | |
Dividends to shareholders from net investment income | | | - | | | | (0.07) | | | | (0.05) | |
Distributions to shareholders from net realized gain | | | - | | | | (0.08) | | | | - | |
| | | | | | | | | | | | |
Total Distributions | | | - | | | | (0.15) | | | | (0.05) | |
| | | | | | | | | | | | |
Redemption fee proceeds 1 | | | - | | | | - | | | | 0.00 | 2 |
| | | | | | | | | | | | |
Net asset value, end of period | | | $9.54 | | | | $8.96 | | | | $11.08 | |
| | | | | | | | | | | | |
Total return 3 | | | 6.47% | | | | (17.88)% | | | | 11.31% | |
Portfolio turnover | | | 7% | | | | 20% | | | | 16% | |
Ratios/supplemental data (annualized): | | | | | | | | | | | | |
Net assets, end of period (in millions) | | | $3 | | | | $3 | | | | $2 | |
Ratio of expenses to average net assets | | | 1.40% | 4 | | | 1.40% | 4 | | | 1.40% | 4 |
Ratio of gross expenses to average net assets | | | 4.36% | | | | 4.36% | | | | 4.88% | |
Ratio of net investment income (loss) to average net assets | | | (0.11)% | | | | 0.84% | | | | 0.80% | |
1 Based on average shares outstanding.
2 Amount represents less than $0.005 per share.
3 Not annualized for periods less than one year.
4 Reflects a waiver of fees by the Manager and the Distributor of the Fund.
SEE NOTES TO FINANCIAL STATEMENTS
83
DOMINI INTERNATIONAL OPPORTUNITIES FUND — INSTITUTIONAL SHARES
FINANCIAL HIGHLIGHTS
| | | | | | | | | | | | |
| | | Six Months
Ended
January 31,
2023
(unaudited) | | | Year Ended
July 31, 2022 | | | For the Period
November 30, 2020
(commencement
of operations)
through July 31,
2021 | |
| |
For a share outstanding for the period: | | | | | | | | | | | | |
Net asset value, beginning of period | | | $8.96 | | | | $11.08 | | | | $10.00 | |
| | | | | | | | | | | | |
Income from investment operations: | | | | | | | | | | | | |
Net investment income (loss) | | | 0.01 | | | | 0.11 | | | | 0.06 | |
Net realized and unrealized gain (loss) on investments | | | 0.59 | | | | (2.05) | | | | 1.08 | |
| | | | | | | | | | | | |
Total Income (loss) From Investment Operations | | | 0.60 | | | | (1.94) | | | | 1.14 | |
| | | | | | | | | | | | |
Less dividends and/or distributions: | | | | | | | | | | | | |
Dividends to shareholders from net investment income | | | (0.01) | | | | (0.10) | | | | (0.06) | |
Distributions to shareholders from net realized gain | | | - | | | | (0.08) | | | | - | |
| | | | | | | | | | | | |
Total Distributions | | | (0.01) | | | | (0.18) | | | | (0.06) | |
| | | | | | | | | | | | |
Redemption fee proceeds 1 | | | - | | | | - | | | | - | |
| | | | | | | | | | | | |
Net asset value, end of period | | | $9.55 | | | | $8.96 | | | | $11.08 | |
| | | | | | | | | | | | |
Total return 2 | | | 6.65% | | | | (17.65)% | | | | 11.44% | |
Portfolio turnover | | | 7% | | | | 20% | | | | 16% | |
Ratios/supplemental data (annualized): | | | | | | | | | | | | |
Net assets, end of period (in millions) | | | $19 | | | | $19 | | | | $24 | |
Ratio of expenses to average net assets | | | 1.15% | 3 | | | 1.15% | 3 | | | 1.15% | 3 |
Ratio of gross expenses to average net assets | | | 2.26% | | | | 1.79% | | | | 2.00% | |
Ratio of net investment income (loss) to average net assets | | | 0.15% | | | | 1.03% | | | | 0.84% | |
1 Based on average shares outstanding.
2 Not annualized for periods less than one year.
3 Reflects a waiver of fees by the Manager of the Fund.
SEE NOTES TO FINANCIAL STATEMENTS
84
DOMINI SUSTAINABLE SOLUTIONS FUND — INVESTOR SHARES
FINANCIAL HIGHLIGHTS
| | | | | | | | | | | | | | | | |
| | | Six Months
Ended
January 31,
2023
(unaudited) | | | Year Ended
July 31, | | | For the Period
April 1, 2020
(commencement
of operations)
through July 31,
2020 | |
| | | 2022 | | | 2021 | |
For a share outstanding for the period: | | | | | | | | | | | | | | | | |
Net asset value, beginning of period | | | $13.79 | | | | $19.06 | | | | $15.28 | | | | $10.00 | |
| | | | | | | | | | | | | | | | |
Income from investment operations: | | | | | | | | | | | | | | | | |
Net investment income (loss) | | | (0.04) | | | | (0.10) | | | | (0.12) | | | | (0.02) | |
Net realized and unrealized gain (loss) on investments | | | (0.13) | | | | (4.45) | | | | 4.54 | | | | 5.30 | |
| | | | | | | | | | | | | | | | |
Total Income (loss) From Investment Operations | | | (0.17) | | | | (4.55) | | | | 4.42 | | | | 5.28 | |
| | | | | | | | | | | | | | | | |
Less dividends and/or distributions: | | | | | | | | | | | | | | | | |
Dividends to shareholders from net investment income | | | - | | | | - | | | | - | | | | - | |
Distributions to shareholders from net realized gain | | | - | | | | (0.72) | | | | (0.64) | | | | - | |
| | | | | | | | | | | | | | | | |
Total Distributions | | | - | | | | (0.72) | | | | (0.64) | | | | - | |
| | | | | | | | | | | | | | | | |
Redemption fee proceeds 1 | | | - | | | | - | | | | 0.00 | 2 | | | - | |
| | | | | | | | | | | | | | | | |
Net asset value, end of period | | | $13.62 | | | | $13.79 | | | | $19.06 | | | | $15.28 | |
| | | | | | | | | | | | | | | | |
Total return 3 | | | (1.23)% | | | | (24.60)% | | | | 28.94% | | | | 52.80% | |
Portfolio turnover | | | 15% | | | | 51% | | | | 65% | | | | 10% | |
Ratios/supplemental data (annualized): | | | | | | | | | | | | | | | | |
Net assets, end of period (in millions) | | | $17 | | | | $16 | | | | $19 | | | | $7 | |
Ratio of expenses to average net assets | | | 1.40% | 4 | | | 1.40% | 4 | | | 1.40% | 4 | | | 1.37% | 4,5 |
Ratio of gross expenses to average net assets | | | 1.83% | | | | 1.99% | | | | 2.12% | | | | 3.95% | |
Ratio of net investment income (loss) to average net assets | | | (0.65)% | | | | (0.59)% | | | | (0.87)% | | | | (0.94)% | |
1 Based on average shares outstanding.
2 Amount represents less than $0.005 per share.
3 Not annualized for periods less than one year.
4 Reflects a waiver of fees by the Manager and the Distributor of the Fund.
5 Ratio of expenses to average net assets includes transfer agent credits. Excluding transfer agent credits the ratio of expenses to average net assets would have been 1.37% for the year ended July 31, 2020.
SEE NOTES TO FINANCIAL STATEMENTS
85
DOMINI SUSTAINABLE SOLUTIONS FUND — INSTITUTIONAL SHARES
FINANCIAL HIGHLIGHTS
| | | | | | | | | | | | | | | | |
| | | Six Months
Ended
January 31,
2023
(unaudited) | | | Year Ended
July 31, | | | For the Period
April 1, 2020
(commencement
of operations)
through July 31,
2020 | |
| | | 2022 | | | 2021 | |
For a share outstanding for the period: | | | | | | | | | | | | | | | | |
Net asset value, beginning of period | | | $13.85 | | | | $19.12 | | | | $15.29 | | | | $10.00 | |
| | | | | | | | | | | | | | | | |
Income from investment operations: | | | | | | | | | | | | | | | | |
Net investment income (loss) | | | (0.02) | | | | (0.06) | | | | (0.10) | | | | (0.02) | |
Net realized and unrealized gain (loss) on investments | | | (0.14) | | | | (4.46) | | | | 4.57 | | | | 5.31 | |
| | | | | | | | | | | | | | | | |
Total Income (loss) From Investment Operations | | | (0.16) | | | | (4.52) | | | | 4.47 | | | | 5.29 | |
| | | | | | | | | | | | | | | | |
Less dividends and/or distributions: | | | | | | | | | | | | | | | | |
Dividends to shareholders from net investment income | | | - | | | | (0.03) | | | | - | | | | - | |
Distributions to shareholders from net realized gain | | | - | | | | (0.72) | | | | (0.64) | | | | - | |
| | | | | | | | | | | | | | | | |
Total Distributions | | | - | | | | (0.75) | | | | (0.64) | | | | - | |
| | | | | | | | | | | | | | | | |
Redemption fee proceeds 1 | | | - | | | | - | | | | - | | | | - | |
| | | | | | | | | | | | | | | | |
Net asset value, end of period | | | $13.69 | | | | $13.85 | | | | $19.12 | | | | $15.29 | |
| | | | | | | | | | | | | | | | |
Total return 2 | | | (1.16)% | | | | (24.39)% | | | | 29.25% | | | | 52.90% | |
Portfolio turnover | | | 15% | | | | 51% | | | | 65% | | | | 10% | |
Ratios/supplemental data (annualized): | | | | | | | | | | | | | | | | |
Net assets, end of period (in millions) | | | $13 | | | | $13 | | | | $19 | | | | $12 | |
Ratio of expenses to average net assets | | | 1.15% | 3 | | | 1.15% | 3 | | | 1.15% | 3 | | | 1.12% | 3,4 |
Ratio of gross expenses to average net assets | | | 1.37% | | | | 1.40% | | | | 1.43% | | | | 2.89% | |
Ratio of net investment income (loss) to average net assets | | | (0.39)% | | | | (0.37)% | | | | (0.62)% | | | | (0.61)% | |
1 Based on average shares outstanding.
2 Not annualized for periods less than one year.
3 Reflects a waiver of fees by the Manager and the Sponsor of the Fund.
4 Ratio of expenses to average net assets includes transfer agent credits. Excluding transfer agent credits the ratio of expenses to average net assets would have been 1.12% for the year ended July 31, 2020.
SEE NOTES TO FINANCIAL STATEMENTS
86
DOMINI IMPACT INTERNATIONAL EQUITY FUND — INVESTOR SHARES
FINANCIAL HIGHLIGHTS
| | | | | | | | | | | | | | | | | | | | | | | | |
| | | Six Months
Ended
January 31, 2023
(unaudited) | | | Year Ended July 31, | |
| | | 2022 | | | 2021 | | | 2020 | | | 2019 | | | 2018 | |
For a share outstanding for the period: | | | | | | | | | | | | | | | | | | | | | | | | |
Net asset value, beginning of period | | | $7.39 | | | | $9.29 | | | | $7.28 | | | | $7.74 | | | | $8.72 | | | | $8.76 | |
| | | | | | | | | | | | | | | | | | | | | | | | |
Income from investment operations: | | | | | | | | | | | | | | | | | | | | | | | | |
Net investment income (loss) | | | 0.06 | | | | 0.16 | | | | 0.19 | | | | 0.08 | | | | 0.15 | | | | 0.16 | |
Net realized and unrealized gain (loss) on investments | | | 0.52 | | | | (1.95) | | | | 1.94 | | | | (0.33) | | | | (0.77) | | | | 0.02 | |
| | | | | | | | | | | | | | | | | | | | | | | | |
Total Income (loss) From Investment Operations | | | 0.58 | | | | (1.79) | | | | 2.13 | | | | (0.25) | | | | (0.62) | | | | 0.18 | |
| | | | | | | | | | | | | | | | | | | | | | | | |
Less dividends and/or distributions: | | | | | | | | | | | | | | | | | | | | | | | | |
Dividends to shareholders from net investment income | | | (0.06) | | | | (0.11) | | | | (0.12) | | | | (0.21) | | | | (0.13) | | | | (0.22) | |
Distributions to shareholders from net realized gain | | | - | | | | - | | | | - | | | | - | | | | (0.23) | | | | - | |
| | | | | | | | | | | | | | | | | | | | | | | | |
Total Distributions | | | (0.06) | | | | (0.11) | | | | (0.12) | | | | (0.21) | | | | (0.36) | | | | (0.22) | |
| | | | | | | | | | | | | | | | | | | | | | | | |
Redemption fee proceeds 1 | | | - | | | | 0.00 | 2 | | | 0.00 | 2 | | | 0.00 | 2 | | | 0.00 | 2 | | | 0.00 | 2 |
| | | | | | | | | | | | | | | | | | | | | | | | |
Net asset value, end of period | | | $7.91 | | | | $7.39 | | | | $9.29 | | | | $7.28 | | | | $7.74 | | | | $8.72 | |
| | | | | | | | | | | | | | | | | | | | | | | | |
Total return 3 | | | 7.81% | | | | (19.23)% | | | | 29.34% | | | | (3.49)% | | | | (6.81)% | | | | 2.08% | |
Portfolio turnover | | | 46% | | | | 88% | | | | 88% | | | | 98% | | | | 77% | | | | 68% | |
Ratios/supplemental data (annualized): | | | | | | | | | | | | | | | | | | | | | | | | |
Net assets, end of period (in millions) | | | $184 | | | | $201 | | | | $292 | | | | $397 | | | | $432 | | | | $612 | |
Ratio of expenses to average net assets | | | 1.33% | | | | 1.34% | | | | 1.37% | | | | 1.36% | 4,5 | | | 1.41% | 4 | | | 1.41% | |
Ratio of gross expenses to average net assets | | | 1.33% | | | | 1.34% | | | | 1.37% | | | | 1.38% | | | | 1.41% | | | | 1.41% | |
Ratio of net investment income (loss) to average net assets | | | 0.65% | | | | 1.40% | | | | 1.32% | | | | 0.93% | | | | 1.70% | | | | 1.81% | |
1 Based on average shares outstanding.
2 Amount represents less than $0.005 per share.
3 Not annualized for periods less than one year.
4 Ratio of expenses to average net assets includes transfer agent credits. Excluding transfer agent credits the ratio of expenses to average net assets would have been 1.41% for the year ended July 31, 2019 and 1.36% for the year ended July 31, 2020.
5 Reflects a waiver of fees by the Manager and the Distributor of the Fund.
SEE NOTES TO FINANCIAL STATEMENTS
87
DOMINI IMPACT INTERNATIONAL EQUITY FUND — CLASS A SHARES
FINANCIAL HIGHLIGHTS
| | | | | | | | | | | | | | | | | | | | | | | | |
| | | Six Months
Ended
January 31, 2023
(unaudited) | | | Year Ended July 31, | |
| | | 2022 | | | 2021 | | | 2020 | | | 2019 | | | 2018 | |
For a share outstanding for the period: | | | | | | | | | | | | | | | | | | | | | | | | |
Net asset value, beginning of period | | | $7.90 | | | | $9.91 | | | | $7.77 | | | | $8.22 | | | | $9.18 | | | | $9.21 | |
| | | | | | | | | | | | | | | | | | | | | | | | |
Income from investment operations: | | | | | | | | | | | | | | | | | | | | | | | | |
Net investment income (loss) | | | 0.43 | | | | 0.21 | | | | 0.25 | | | | 0.14 | | | | 0.34 | | | | 0.15 | |
Net realized and unrealized gain (loss) on investments | | | 0.19 | | | | (2.12) | | | | 2.02 | | | | (0.42) | | | | (0.99) | | | | 0.04 | |
| | | | | | | | | | | | | | | | | | | | | | | | |
Total Income (loss) From Investment Operations | | | 0.62 | | | | (1.91) | | | | 2.27 | | | | (0.28) | | | | (0.65) | | | | 0.19 | |
| | | | | | | | | | | | | | | | | | | | | | | | |
Less dividends and/or distributions: | | | | | | | | | | | | | | | | | | | | | | | | |
Dividends to shareholders from net investment income | | | (0.05) | | | | (0.10) | | | | (0.13) | | | | (0.17) | | | | (0.08) | | | | (0.22) | |
Distributions to shareholders from net realized gain | | | - | | | | - | | | | - | | | | - | | | | (0.23) | | | | - | |
| | | | | | | | | | | | | | | | | | | | | | | | |
Total Distributions | | | (0.05) | | | | (0.10) | | | | (0.13) | | | | (0.17) | | | | (0.31) | | | | (0.22) | |
| | | | | | | | | | | | | | | | | | | | | | | | |
Redemption fee proceeds 1 | | | - | | | | - | | | | - | | | | 0.00 | 2 | | | 0.00 | 2 | | | 0.00 | 2 |
| | | | | | | | | | | | | | | | | | | | | | | | |
Net asset value, end of period | | | $8.47 | | | | $7.90 | | | | $9.91 | | | | $7.77 | | | | $8.22 | | | | $9.18 | |
| | | | | | | | | | | | | | | | | | | | | | | | |
Total return 3 | | | 7.84% | | | | (19.26)% | | | | 29.31% | | | | (3.58)% | | | | (6.83)% | | | | 2.00% | |
Portfolio turnover | | | 46% | | | | 88% | | | | 88% | | | | 98% | | | | 77% | | | | 68% | |
Ratios/supplemental data (annualized): | | | | | | | | | | | | | | | | | | | | | | | | |
Net assets, end of period (in millions) | | | $11 | | | | $15 | | | | $21 | | | | $21 | | | | $27 | | | | $81 | |
Ratio of expenses to average net assets | | | 1.38% | | | | 1.37% | | | | 1.38% | | | | 1.40% | 4,5 | | | 1.43% | 4 | | | 1.47% | |
Ratio of gross expenses to average net assets | | | 1.38% | | | | 1.37% | | | | 1.38% | | | | 1.54% | | | | 1.43% | | | | 1.47% | |
Ratio of net investment income (loss) to average net assets | | | 0.72% | | | | 1.37% | | | | 1.27% | | | | 0.86% | | | | 1.41% | | | | 1.63% | |
1 Based on average shares outstanding.
2 Amount represents less than $0.005 per share.
3 Total return does not reflect sales commissions and is not annualized for periods less than one year.
4 Ratio of expenses to average net assets includes transfer agent credits. Excluding transfer agent credits the ratio of expenses to average net assets would have been 1.43% for the year ended July 31, 2019 and 1.41% for the year ended July 31, 2020.
5 Reflects a waiver of fees by the Manager and the Distributor of the Fund.
SEE NOTES TO FINANCIAL STATEMENTS
88
DOMINI IMPACT INTERNATIONAL EQUITY FUND — INSTITUTIONAL SHARES
FINANCIAL HIGHLIGHTS
| | | | | | | | | | | | | | | | | | | | | | | | |
| | | Six Months
Ended
January 31, 2023
(unaudited) | | | Year Ended July 31, | |
| | | 2022 | | | 2021 | | | 2020 | | | 2019 | | | 2018 | |
For a share outstanding for the period: | | | | | | | | | | | | | | | | | | | | | | | | |
Net asset value, beginning of period | | | $7.30 | | | | $9.19 | | | | $7.23 | | | | $7.69 | | | | $8.70 | | | | $8.74 | |
| | | | | | | | | | | | | | | | | | | | | | | | |
Income from investment operations: | | | | | | | | | | | | | | | | | | | | | | | | |
Net investment income (loss) | | | 0.03 | | | | 0.16 | | | | 0.16 | | | | 0.09 | | | | 0.18 | | | | 0.18 | |
Net realized and unrealized gain (loss) on investments | | | 0.56 | | | | (1.89) | | | | 1.99 | | | | (0.30) | | | | (0.78) | | | | 0.05 | |
| | | | | | | | | | | | | | | | | | | | | | | | |
Total Income (loss) From Investment Operations | | | 0.59 | | | | (1.73) | | | | 2.15 | | | | (0.21) | | | | (0.60) | | | | 0.23 | |
| | | | | | | | | | | | | | | | | | | | | | | | |
Less dividends and/or distributions: | | | | | | | | | | | | | | | | | | | | | | | | |
Dividends to shareholders from net investment income | | | (0.11) | | | | (0.16) | | | | (0.19) | | | | (0.25) | | | | (0.18) | | | | (0.27) | |
Distributions to shareholders from net realized gain | | | - | | | | - | | | | - | | | | - | | | | (0.23) | | | | - | |
| | | | | | | | | | | | | | | | | | | | | | | | |
Total Distributions | | | (0.11) | | | | (0.16) | | | | (0.19) | | | | (0.25) | | | | (0.41) | | | | (0.27) | |
| | | | | | | | | | | | | | | | | | | | | | | | |
Redemption fee proceeds 1 | | | - | | | | 0.00 | 2 | | | 0.00 | 2 | | | 0.00 | 2 | | | 0.00 | 2 | | | 0.00 | 2 |
| | | | | | | | | | | | | | | | | | | | | | | | |
Net asset value, end of period | | | $7.78 | | | | $7.30 | | | | $9.19 | | | | $7.23 | | | | $7.69 | | | | $8.70 | |
| | | | | | | | | | | | | | | | | | | | | | | | |
Total return 3 | | | 8.11% | | | | (18.88)% | | | | 29.80% | | | | (3.05)% | | | | (6.49)% | | | | 2.58% | |
Portfolio turnover | | | 46% | | | | 88% | | | | 88% | | | | 98% | | | | 77% | | | | 68% | |
Ratios/supplemental data (annualized): | | | | | | | | | | | | | | | | | | | | | | | | |
Net assets, end of period (in millions) | | | $450 | | | | $525 | | | | $636 | | | | $473 | | | | $524 | | | | $580 | |
Ratio of expenses to average net assets | | | 0.91% | | | | 0.89% | | | | 0.91% | | | | 0.95% | 4 | | | 1.01% | 4 | | | 1.02% | |
Ratio of gross expenses to average net assets | | | 0.91% | | | | 0.89% | | | | 0.91% | | | | 0.95% | | | | 1.01% | | | | 1.02% | |
Ratio of net investment income (loss) to average net assets | | | 1.08% | | | | 1.91% | | | | 1.79% | | | | 1.33% | | | | 2.30% | | | | 2.22% | |
1 Based on average shares outstanding.
2 Amount represents less than $0.005 per share.
3 Not annualized for periods less than one year.
4 Ratio of expenses to average net assets includes transfer agent credits. Excluding transfer agent credits the ratio of expenses to average net assets would have been 1.01% for the year ended July 31, 2019 and 0.95% for the year ended July 31, 2020.
SEE NOTES TO FINANCIAL STATEMENTS
89
DOMINI IMPACT INTERNATIONAL EQUITY FUND — CLASS Y SHARES
FINANCIAL HIGHLIGHTS
| | | | | | | | | | | | | | | | | | | | |
| | | Six Months
Ended
January 31, 2023
(unaudited) | | | Year Ended July 31, | |
| | | 2022 | | | 2021 | | | 2020 | | | 2019 | |
For a share outstanding for the period: | | | | | | | | | | | | | | | | | | | | |
Net asset value, beginning of period | | | $7.30 | | | | $9.20 | | | | $7.23 | | | | $7.70 | | | | $8.71 | |
| | | | | | | | | | | | | | | | | | | | |
Income from investment operations: | | | | | | | | | | | | | | | | | | | | |
Net investment income (loss) | | | 0.05 | | | | 0.16 | | | | 0.11 | | | | 0.12 | | | | 0.23 | |
Net realized and unrealized gain (loss) on investments | | | 0.54 | | | | (1.90) | | | | 2.04 | | | | (0.35) | | | | (0.83) | |
| | | | | | | | | | | | | | | | | | | | |
Total Income (loss) From Investment Operations | | | 0.59 | | | | (1.74) | | | | 2.15 | | | | (0.23) | | | | (0.60) | |
| | | | | | | | | | | | | | | | | | | | |
Less dividends and/or distributions: | | | | | | | | | | | | | | | | | | | | |
Dividends to shareholders from net investment income | | | (0.10) | | | | (0.16) | | | | (0.18) | | | | (0.24) | | | | (0.18) | |
Distributions to shareholders from net realized gain | | | - | | | | - | | | | - | | | | - | | | | (0.23) | |
| | | | | | | | | | | | | | | | | | | | |
Total Distributions | | | (0.10) | | | | (0.16) | | | | (0.18) | | | | (0.24) | | | | (0.41) | |
| | | | | | | | | | | | | | | | | | | | |
Redemption fee proceeds 1 | | | - | | | | - | | | | 0.00 | 2 | | | - | | | | - | |
| | | | | | | | | | | | | | | | |
Net asset value, end of period | | | $7.79 | | | | $7.30 | | | | $9.20 | | | | $7.23 | | | | $7.70 | |
| | | | | | | | | | | | | | | | | | | | |
Total return 3 | | | 8.16% | | | | (19.01)% | | | | 29.88% | | | | (3.28)% | | | | (6.50)% | |
Portfolio turnover | | | 46% | | | | 88% | | | | 88% | | | | 98% | | | | 77% | |
Ratios/supplemental data (annualized): | | | | | | | | | | | | | | | | | | | | |
Net assets, end of period (in millions) | | | $382 | | | | $528 | | | | $627 | | | | $174 | | | | $238 | |
Ratio of expenses to average net assets | | | 0.96% | | | | 0.95% | | | | 0.98% | | | | 1.06% | 4 | | | 1.13% | 4 |
Ratio of gross expenses to average net assets | | | 0.96% | | | | 0.95% | | | | 0.98% | | | | 1.06% | | | | 1.13% | |
Ratio of net investment income (loss) to average net assets | | | 1.03% | | | | 1.87% | | | | 1.82% | | | | 1.26% | | | | 2.81% | |
1 Based on average shares outstanding.
2 Amount represents less than $0.005 per share.
3 Not annualized for periods less than one year.
4 Ratio of expenses to average net assets includes transfer agent credits. Excluding transfer agent credits the ratio of expenses to average net assets would have been 1.13% for the year ended July 31, 2019 and 1.06% for the year ended July 31, 2020.
SEE NOTES TO FINANCIAL STATEMENTS
90
DOMINI IMPACT EQUITY FUND
DOMINI INTERNATIONAL OPPORTUNITIES FUND
DOMINI SUSTAINABLE SOLUTIONS FUND
DOMINI IMPACT INTERNATIONAL EQUITY FUND
NOTES TO FINANCIAL STATEMENTS
January 31, 2023 (Unaudited)
1. ORGANIZATION
The Domini Investment Trust is a Massachusetts business trust registered under the Investment Company Act of 1940 as an open-end management investment company. The Domini Investment Trust comprises five separate series: Domini Impact Equity Fund, Domini International Opportunities Fund, Domini Sustainable Solutions Fund, Domini Impact International Equity Fund and Domini Impact Bond Fund (each the “Fund,” collectively the “Funds”). The financial statements of the Domini Impact Bond Fund are included on page 111 of this report. Each Fund is an investment company and accordingly follows the investment company accounting and reporting guidance of the Financial Accounting Standards Board (the “FASB”) Accounting Standard Codification Topic 946 “Financial Services — Investment Companies”.
The Domini Impact Equity Fund offers four classes of shares: Investor shares, Class A shares, Institutional shares, and Class Y shares. The Domini International Opportunities Fund offers two classes of shares: Investor shares and Institutional shares. The Domini Sustainable Solutions Fund offers two classes of shares: Investor shares and Institutional shares. The Domini Impact International Equity Fund offers four classes of shares: Investor shares, Class A shares, Institutional shares, and Class Y shares. The Investor shares, Institutional shares and Class Y shares are sold at their offering price, which is net asset value. The Class A shares are sold with a front-end sales charge (load) of up to 4.75%.
All classes of shares have identical rights and voting privileges with respect to the Fund in general and exclusive voting rights on matters that affect that class alone. Earnings, net assets, and net asset value per share may differ due to each class having its own expenses, directly attributable to that class. The Funds seek to provide their shareholders with long-term total return.
2. SIGNIFICANT ACCOUNTING POLICIES
The preparation of financial statements in conformity with U.S. generally accepted accounting principles requires management to make estimates and assumptions that affect the reported amounts of assets and liabilities and disclosure of contingent liabilities at the date of the financial statements and the reported amounts of revenues and expenses during the reporting period. Actual results could differ from those estimates. The following is a summary of the Funds’ significant accounting policies.
91
DOMINI IMPACT EQUITY FUND
DOMINI INTERNATIONAL OPPORTUNITIES FUND
DOMINI SUSTAINABLE SOLUTIONS FUND
DOMINI IMPACT INTERNATIONAL EQUITY FUND
NOTES TO FINANCIAL STATEMENTS (continued)
January 31, 2023 (Unaudited)
(A) Valuation of Investments. Securities listed or traded on national securities exchanges are generally valued at the last sale price reported by the security’s primary exchange or, if there have been no sales that day, at the mean of the current bid and ask price that represents the current value of the security. Securities listed on the NASDAQ National Market System are valued using the NASDAQ Official Closing Price (the ‘NOCP’). If an NOCP is not available for a security listed on the NASDAQ National Market System, the security will be valued at the last sale price or, if there have been no sales that day, at the mean of the current bid and ask price.
Securities for which market quotations are not readily available or are considered to be unreliable are valued at fair value as determined in good faith by Domini Impact Investments LLC (Domini), the Funds’ valuation designee.
Effective September 8, 2022, Domini was designated as the Funds’ valuation designee in accordance with Rule 2a-5 under the 1940 Act, with responsibility for fair valuation, subject to oversight by the Funds’ Board of Trustees.
The Domini International Opportunities Fund, Domini Sustainable Solutions Fund and Domini Impact International Equity Fund may invest primarily in the stocks of non-U.S. companies. Non-U.S. equity securities are valued on the basis of their most recent closing market prices at 4 p.m. Eastern Time on each day that the NYSE is open for trading except under the circumstances described herein. Most non-U.S. markets close before 4 p.m. Eastern Time. If Domini determines that developments between the close of the non-U.S. market and 4 p.m. Eastern Time will, in its judgment, materially affect the value of some or all of the Fund’s securities, it will adjust the previous closing prices to reflect what it believes to be the fair value of the securities as of 4 p.m. Eastern Time. In deciding whether to make these adjustments, Domini reviews a variety of factors, including developments in foreign markets, the performance of U.S. securities markets, and the performance of instruments trading in U.S. markets that represent foreign securities and baskets of foreign securities. Domini may also fair value securities in other situations, for example, when a particular foreign market is closed but the Fund is open. Outside pricing services approved by Domini may be used to provide closing market prices and information used for adjusting those prices. The fair value for a foreign security reported on by such service with a confidence level approved by Domini generally shall be the value provided by such service.
92
DOMINI IMPACT EQUITY FUND
DOMINI INTERNATIONAL OPPORTUNITIES FUND
DOMINI SUSTAINABLE SOLUTIONS FUND
DOMINI IMPACT INTERNATIONAL EQUITY FUND
NOTES TO FINANCIAL STATEMENTS (continued)
January 31, 2023 (Unaudited)
The valuation designee follows a fair value hierarchy that distinguishes between (a) market participant assumptions developed based on market data obtained from sources independent of the reporting entity (observable inputs) and (b) the valuation designee’s own assumptions about market participant assumptions developed based on the best information available in the circumstances (unobservable inputs). These inputs are used in determining the value of the Funds’ investments and are summarized in the following fair value hierarchy:
Level 1 — quoted prices in active markets for identical securities
Level 2 — other significant observable inputs (including quoted prices for similar securities, interest rates, and evaluated quotation obtained from pricing services)
Level 3 — significant unobservable inputs (including the valuation designee’s own assumptions in determining the fair value of investments)
The inputs or methodology used for valuing securities are not an indication of the risk associated with investing in those securities.
The following is a summary of the inputs used by the Domini Impact Equity Fund, as of January 31, 2023, in valuing the Fund’s assets carried at fair value:
| | | | | | | | | | | | | | | | |
| | | Level 1 -
Quoted Prices | | | Level 2 -
Other
Significant
Observable
Inputs | | | Level 3 -
Significant
Unobservable
Inputs | | | Total | |
| | | | | | | | | | | | | | | | |
Common Stocks | | | | | | | | | | | | | | | | |
Communication Services | | $ | 72,308,331 | | | $ | - | | | $ | - | | | $ | 72,308,331 | |
Consumer Discretionary | | | 89,898,072 | | | | - | | | | - | | | | 89,898,072 | |
Consumer Staples | | | 53,636,253 | | | | - | | | | - | | | | 53,636,253 | |
Financials | | | 91,950,335 | | | | - | | | | - | | | | 91,950,335 | |
Health Care | | | 123,933,360 | | | | - | | | | - | | | | 123,933,360 | |
Industrials | | | 56,598,730 | | | | - | | | | - | | | | 56,598,730 | |
Information Technology | | | 291,071,238 | | | | - | | | | - | | | | 291,071,238 | |
Materials | | | 21,394,546 | | | | - | | | | - | | | | 21,394,546 | |
Real Estate | | | 23,757,747 | | | | - | | | | - | | | | 23,757,747 | |
Utilities | | | 5,834,948 | | | | - | | | | - | | | | 5,834,948 | |
| | | | | | | | | | | | | | | | |
Total | | $ | 830,383,560 | | | $ | - | | | $ | - | | | $ | 830,383,560 | |
| | | | | | | | | | | | | | | | |
93
DOMINI IMPACT EQUITY FUND
DOMINI INTERNATIONAL OPPORTUNITIES FUND
DOMINI SUSTAINABLE SOLUTIONS FUND
DOMINI IMPACT INTERNATIONAL EQUITY FUND
NOTES TO FINANCIAL STATEMENTS (continued)
January 31, 2023 (Unaudited)
The following is a summary of the inputs used by the Domini International Opportunities Fund, as of January 31, 2023, in valuing the Fund’s assets carried at fair value:
| | | | | | | | | | | | | | | | |
| | | Level 1 -
Quoted Prices | | | Level 2 -
Other
Significant
Observable
Inputs | | | Level 3 -
Significant
Unobservable
Inputs | | | Total | |
| | | | | | | | | | | | | | | | |
Common Stocks | | | | | | | | | | | | | | | | |
Australia | | $ | - | | | $ | 446,697 | | | $ | - | | | $ | 446,697 | |
Austria | | | - | | | | 64,477 | | | | - | | | | 64,477 | |
Belgium | | | - | | | | 105,162 | | | | - | | | | 105,162 | |
Brazil | | | 158,346 | | | | - | | | | - | | | | 158,346 | |
Canada | | | 439,733 | | | | - | | | | - | | | | 439,733 | |
China | | | 52,143 | | | | 182,877 | | | | - | | | | 235,020 | |
Denmark | | | - | | | | 1,025,715 | | | | - | | | | 1,025,715 | |
Finland | | | - | | | | 253,424 | | | | - | | | | 253,424 | |
France | | | - | | | | 1,979,389 | | | | - | | | | 1,979,389 | |
Germany | | | - | | | | 1,774,970 | | | | - | | | | 1,774,970 | |
Hong Kong | | | - | | | | 591,016 | | | | - | | | | 591,016 | |
Ireland | | | - | | | | 230,922 | | | | - | | | | 230,922 | |
Italy | | | - | | | | 231,583 | | | | - | | | | 231,583 | |
Japan | | | - | | | | 4,216,671 | | | | - | | | | 4,216,671 | |
Luxembourg | | | - | | | | 26,656 | | | | - | | | | 26,656 | |
Netherlands | | | - | | | | 1,667,537 | | | | - | | | | 1,667,537 | |
New Zealand | | | - | | | | 28,455 | | | | - | | | | 28,455 | |
Norway | | | - | | | | 78,847 | | | | - | | | | 78,847 | |
Singapore | | | - | | | | 255,723 | | | | - | | | | 255,723 | |
South Africa | | | 30,517 | | | | 39,898 | | | | - | | | | 70,415 | |
Spain | | | - | | | | 555,879 | | | | - | | | | 555,879 | |
Sweden | | | 20,543 | | | | 534,066 | | | | - | | | | 554,609 | |
Switzerland | | | - | | | | 1,561,813 | | | | - | | | | 1,561,813 | |
United Kingdom | | | 454,381 | | | | 1,856,413 | | | | - | | | | 2,310,794 | |
United States | | | 893,043 | | | | 777,651 | | | | - | | | | 1,670,694 | |
| | | | | | | | | | | | | | | | |
Total | | $ | 2,048,706 | | | $ | 18,485,841 | | | $ | - | | | $ | 20,534,547 | |
| | | | | | | | | | | | | | | | |
94
DOMINI IMPACT EQUITY FUND
DOMINI INTERNATIONAL OPPORTUNITIES FUND
DOMINI SUSTAINABLE SOLUTIONS FUND
DOMINI IMPACT INTERNATIONAL EQUITY FUND
NOTES TO FINANCIAL STATEMENTS (continued)
January 31, 2023 (Unaudited)
The following is a summary of the inputs used by the Domini Sustainable Solutions Fund, as of January 31, 2023, in valuing the Fund’s assets carried at fair value:
| | | | | | | | | | | | | | | | |
| | | Level 1 -
Quoted Prices | | | Level 2 -
Other
Significant
Observable
Inputs | | | Level 3 -
Significant
Unobservable
Inputs | | | Total | |
| | | | | | | | | | | | | | | | |
Common Stocks | | | | | | | | | | | | | | | | |
Communication Services | | $ | 621,546 | | | $ | - | | | $ | - | | | $ | 621,546 | |
Consumer Discretionary | | | 1,435,724 | | | | - | | | | - | | | | 1,435,724 | |
Consumer Staples | | | 540,225 | | | | 211,821 | | | | - | | | | 752,046 | |
Financials | | | 2,541,433 | | | | 3,118,821 | | | | - | | | | 5,660,254 | |
Health Care | | | 3,433,874 | | | | 1,740,947 | | | | - | | | | 5,174,821 | |
Industrials | | | 1,051,338 | | | | 3,267,365 | | | | - | | | | 4,318,703 | |
Information Technology | | | 5,748,374 | | | | 931,680 | | | | - | | | | 6,680,054 | |
Real Estate | | | 1,114,423 | | | | - | | | | - | | | | 1,114,423 | |
Utilities | | | - | | | | 311,707 | | | | - | | | | 311,707 | |
| | | | | | | | | | | | | | | | |
Total | | $ | 16,486,937 | | | $ | 9,582,341 | | | $ | - | | | $ | 26,069,278 | |
| | | | | | | | | | | | | | | | |
The following is a summary of the inputs used by the Domini Impact International Equity Fund, as of January 31, 2023, in valuing the Fund’s assets carried at fair value:
| | | | | | | | | | | | | | | | |
| | | Level 1 -
Quoted Prices | | | Level 2 -
Other
Significant
Observable
Inputs | | | Level 3 -
Significant
Unobservable
Inputs | | | Total | |
| | | | | | | | | | | | | | | | |
Common Stocks | | | | | | | | | | | | | | | | |
Australia | | $ | - | | | $ | 59,245,604 | | | $ | - | | | $ | 59,245,604 | |
Austria | | | - | | | | 1,122,778 | | | | - | | | | 1,122,778 | |
Belgium | | | - | | | | 4,892,973 | | | | - | | | | 4,892,973 | |
Brazil | | | 9,679,905 | | | | - | | | | - | | | | 9,679,905 | |
China | | | 4,957,437 | | | | 10,618,425 | | | | - | | | | 15,575,862 | |
Denmark | | | - | | | | 23,956,231 | | | | - | | | | 23,956,231 | |
Finland | | | - | | | | 6,740,158 | | | | - | | | | 6,740,158 | |
France | | | - | | | | 79,864,285 | | | | - | | | | 79,864,285 | |
Germany | | | - | | | | 61,869,921 | | | | - | | | | 61,869,921 | |
Hong Kong | | | - | | | | 14,352,387 | | | | - | | | | 14,352,387 | |
Hungary | | | - | | | | 2,260,150 | | | | - | | | | 2,260,150 | |
India | | | - | | | | 13,307 | | | | - | | | | 13,307 | |
Ireland | | | - | | | | 16,033,118 | | | | - | | | | 16,033,118 | |
Israel | | | 3,954,633 | | | | - | | | | - | | | | 3,954,633 | |
Italy | | | - | | | | 19,922,512 | | | | - | | | | 19,922,512 | |
Japan | | | - | | | | 223,093,095 | | | | - | | | | 223,093,095 | |
Mexico | | | 11,608,057 | | | | - | | | | - | | | | 11,608,057 | |
95
DOMINI IMPACT EQUITY FUND
DOMINI INTERNATIONAL OPPORTUNITIES FUND
DOMINI SUSTAINABLE SOLUTIONS FUND
DOMINI IMPACT INTERNATIONAL EQUITY FUND
NOTES TO FINANCIAL STATEMENTS (continued)
January 31, 2023 (Unaudited)
| | | | | | | | | | | | | | | | |
| | | Level 1 -
Quoted Prices | | | Level 2 -
Other
Significant
Observable
Inputs | | | Level 3 -
Significant
Unobservable
Inputs | | | Total | |
Netherlands | | $ | - | | | $ | 80,544,998 | | | $ | - | | | $ | 80,544,998 | |
Norway | | | - | | | | 7,171,913 | | | | - | | | | 7,171,913 | |
Singapore | | | 1,164,067 | | | | 27,910,767 | | | | - | | | | 29,074,834 | |
South Africa | | | 5,938,132 | | | | - | | | | - | | | | 5,938,132 | |
South Korea | | | - | | | | 4,171,380 | | | | - | | | | 4,171,380 | |
Spain | | | - | | | | 35,169,401 | | | | - | | | | 35,169,401 | |
Sweden | | | - | | | | 36,080,225 | | | | - | | | | 36,080,225 | |
Switzerland | | | - | | | | 82,670,592 | | | | - | | | | 82,670,592 | |
Taiwan | | | - | | | | 6,808,117 | | | | - | | | | 6,808,117 | |
Thailand | | | - | | | | 9,572,530 | | | | - | | | | 9,572,530 | |
Turkey | | | - | | | | 4,752,317 | | | | - | | | | 4,752,317 | |
United Kingdom | | | 1,536,968 | | | | 128,443,998 | | | | - | | | | 129,980,966 | |
United States | | | 1,132,394 | | | | 19,537,531 | | | | - | | | | 20,669,925 | |
| | | | | | | | | | | | | | | | |
Total | | $ | 39,971,593 | | | $ | 966,818,713 | | | $ | - | | | $ | 1,006,790,306 | |
| | | | | | | | | | | | | | | | |
(B) Foreign Currency Translation. Securities and other assets and liabilities denominated in foreign currencies are translated into U.S. dollar amounts on the date of valuation. Purchases and sales of securities, and income and expense items denominated in foreign currencies, are translated into U.S. dollar amounts on the respective dates of such transactions. Occasionally, events impact the availability or reliability of foreign exchange rates used to convert the U.S. dollar equivalent value. If such an event occurs, the foreign exchange rate will be valued at fair value using procedures established and approved by the Board of Trustees. The Funds do not separately report the effect of fluctuations in foreign exchange rates from changes in market prices on securities held. Such fluctuations are included with the net realized and unrealized gain or loss from investments. Realized foreign exchange gains or losses arise from sales of foreign currencies, currency gains or losses realized between the trade and settlement dates on securities transactions, and the difference between the recorded amounts of dividends, interest, and foreign withholding taxes and the U.S. dollar equivalent of the amounts actually received or paid. Net unrealized foreign exchange gains and losses arise from changes in fair value of assets and liabilities other than investments in securities held at the end of the reporting period, resulting from changes in exchange rates.
(C) Foreign Currency Contracts. When the Funds purchase or sell foreign securities, they enter into foreign exchange contracts to minimize foreign
96
DOMINI IMPACT EQUITY FUND
DOMINI INTERNATIONAL OPPORTUNITIES FUND
DOMINI SUSTAINABLE SOLUTIONS FUND
DOMINI IMPACT INTERNATIONAL EQUITY FUND
NOTES TO FINANCIAL STATEMENTS (continued)
January 31, 2023 (Unaudited)
exchange risk from the trade date to the settlement date of the transactions. A foreign exchange contract is an agreement between two parties to exchange different currencies at an agreed-upon exchange rate on a specified date.
As of January 31, 2023, open foreign currency spot contracts were as follows:
| | | | |
Domini Impact Equity Fund | | $ | - | |
Domini International Opportunities Fund | | | - | |
Domini Sustainable Solutions Fund | | | - | |
Domini Impact International Equity Fund | | | 18,059,173 | |
(D) Investment Transactions, Investment Income and Dividends to Shareholders. Investment transactions are accounted for on trade date. Realized gains and losses from security transactions are determined on the basis of identified cost. Interest income is recorded on an accrual basis. Dividend income, net of any applicable withholding tax, is recorded on the ex-dividend date or for certain foreign securities, when the information becomes available to the Funds. The Funds earn income daily, net of Fund expenses. Dividends to shareholders of the Domini Impact Equity Fund are usually declared and paid quarterly from net investment income. Dividends to shareholders of the Domini International Opportunities Fund, the Domini Sustainable Solutions Fund and the Domini Impact International Equity Fund are usually declared and paid semiannually from net investment income. Distributions to shareholders of realized capital gains, if any, are made annually. Distributions are determined in conformity with income tax regulations, which may differ from generally accepted accounting principles. Reclassifications have been made to the Funds’ components of net assets to reflect income and gains available for distribution (or available capital loss carryovers, as applicable) under income tax regulations.
(E) Federal Taxes. Each Fund’s policy is to comply with the provisions of the Internal Revenue Code applicable to regulated investment companies and to distribute substantially all of its taxable income, including net realized gains, if any, within the prescribed time periods. Accordingly, no provision for federal income or excise tax is deemed necessary. As of January 31, 2023, tax years 2019 through 2022 remain subject to examination by the Funds’ major tax jurisdictions, which include the United States of America, the Commonwealth of Massachusetts, and New York State.
(F) Redemption Fees. Redemptions and exchanges of Fund shares held less than 30 days may be subject to the Funds’ redemption fee, which is 2% of the
97
DOMINI IMPACT EQUITY FUND
DOMINI INTERNATIONAL OPPORTUNITIES FUND
DOMINI SUSTAINABLE SOLUTIONS FUND
DOMINI IMPACT INTERNATIONAL EQUITY FUND
NOTES TO FINANCIAL STATEMENTS (continued)
January 31, 2023 (Unaudited)
amount redeemed. The fee is imposed to offset transaction costs and other expenses associated with short-term investing. The fee may be waived in certain circumstances at the discretion of the Funds. Such fees are retained by the Funds and are recorded as an adjustment to paid-in capital.
The redemption fee was waived by the Funds’ Board of Trustees and was no longer imposed by the Fund effective August 16, 2021.
(G) Other. Income, expenses (other than those attributable to a specific class), gains, and losses are allocated on a daily basis to each class of shares based upon the relative proportion of net assets represented by such class. Operating expenses directly attributable to a specific class are charged against the operations of that class.
(H) Transfer Agent Credits. Per the arrangement with the Funds’ former transfer agent, BNY Mellon Investment Servicing (U.S.) Inc., the Funds had arrangements prior to June 22, 2020, whereby they received earnings credits when positive cash balances were maintained. Such credits were used to offset transfer agency fees.
(I) Indemnification. The Funds’ organizational documents provide current and former trustees and officers with a limited indemnification against liabilities arising in connection with the performance of their duties to the Funds. In the normal course of business, the Funds may also enter into contracts that provide general indemnifications. The Funds’ maximum exposure under these arrangements is unknown as this would be dependent on future claims that may be made against the Funds. The risk of material loss from such claims is considered remote.
3. TRANSACTIONS WITH AFFILIATES
(A) Manager/Sponsor. The Funds have retained Domini to serve as investment manager and administrator. Domini is registered as an investment adviser under the Investment Advisers Act of 1940. The services provided by Domini consist of investment supervisory services, overall operational support, and administrative services. The administrative services include the provision of general office facilities and supervising the overall administration of the Funds. For its services under the Management Agreements, Domini receives from each
98
DOMINI IMPACT EQUITY FUND
DOMINI INTERNATIONAL OPPORTUNITIES FUND
DOMINI SUSTAINABLE SOLUTIONS FUND
DOMINI IMPACT INTERNATIONAL EQUITY FUND
NOTES TO FINANCIAL STATEMENTS (continued)
January 31, 2023 (Unaudited)
Fund a fee accrued daily and paid monthly at the annual rate below of the respective Funds’ average daily net assets before any fee waivers:
| | |
| Domini Impact Equity Fund | | 0.20% of the first $2 billion of net assets managed, |
| | 0.19% of the next $1 billion of net assets managed, and |
| | 0.18% of net assets managed in excess of $3 billion |
| | |
| Domini International Opportunities Fund | | 0.85% of the first $2 billion of net assets managed, |
| | 0.83% of the next $1 billion of net assets mangaged, and |
| | 0.80% of the net assets manged in excess of $3 billion |
| | |
| Domini Sustainable Solutions Fund | | 0.85% of the first $500 million of net assets managed, |
| | 0.83% of the next $500 million of net assets managed, and, |
| | 0.80% of net assets managed in excess of $1 billion |
| | |
| Domini Impact International Equity Fund | | 0.96% of the first $250 million of net assets managed, |
| | 0.88% of the next $250 million of net assets managed, and |
| | 0.785% of net assets managed in excess of $500 million |
Pursuant to a Sponsorship Agreement (with respect to the Domini Impact Equity Fund) Domini provides the Fund with the administrative personnel and services necessary to operate the Fund. In addition to general administrative services and facilities for the Fund similar to those provided by Domini under the Management Agreement, Domini answers questions from the general public and the media regarding the securities holdings of the Fund. For these services and facilities, Domini receives fees accrued daily and paid monthly from the Fund at the annual rate below of the respective Fund’s average daily net assets before any fee waivers:
| | |
| Domini Impact Equity Fund | | 0.45% of the first $2 billion of net assets managed, |
| | 0.44% of the next $1 billion of net assets managed, and |
| | 0.43% of net assets managed in excess of $3 billion |
Effective November 30, 2022, Domini has contractually agreed to reduce its fees and/or reimburse certain ordinary operating expenses of the Funds (excluding brokerage fees and commissions, “interest, taxes” and other extraordinary expenses) until November 30, 2023, absent an earlier modification as mutually agreed to by the Adviser and Board of Trustees which oversees the Fund, in order to limit the annual operating expenses of each share class, net of applicable waivers and reimbursements, as follows:
| | | | |
Domini Impact Equity Fund Class A Shares | | | 1.09% | |
Domini Impact Equity Fund Institutional Shares | | | 0.74% | |
Domini Impact Equity Fund Investor Shares | | | 1.09% | |
Domini Impact Equity Fund Class Y Shares | | | 0.80% | |
Domini International Opportunities Fund Institutional Class | | | 1.15% | |
99
DOMINI IMPACT EQUITY FUND
DOMINI INTERNATIONAL OPPORTUNITIES FUND
DOMINI SUSTAINABLE SOLUTIONS FUND
DOMINI IMPACT INTERNATIONAL EQUITY FUND
NOTES TO FINANCIAL STATEMENTS (continued)
January 31, 2023 (Unaudited)
| | | | |
Domini International Opportunities Fund Investor Class | | | 1.40% | |
Domini Sustainable Solutions Fund Institutional Class | | | 1.15% | |
Domini Sustainable Solutions Fund Investor Class | | | 1.40% | |
Domini Impact International Equity Fund Class A Shares | | | 1.40% | |
Domini Impact International Equity Fund Class Y Shares | | | 1.12% | |
For the six months ended January 31, 2023, Domini waived fees and reimbursed expenses as follows:
| | | | | | | | |
| | | FEES WAIVED | | | EXPENSES REIMBURSED | |
Domini Impact Equity Fund | | $ | - | | | $ | 19,896 | |
Domini International Opportunities Fund | | | - | | | | 131,605 | |
Domini Sustainable Solutions Fund | | | - | | | | 27,441 | |
Domini Impact International Equity Fund | | | - | | | | - | |
As of January 31, 2023, Domini owned less than 2% of any class of the outstanding shares of each Fund.
(B) Submanager. SSGA Funds Management, Inc. (“SSGA”) provides investment submanagement services to the Domini Impact Equity Fund, Domini International Opportunities Fund, Domini Sustainable Solutions Fund on a day-to-day basis pursuant to a Submanagement Agreement with Domini. Wellington Management Company LLP (Wellington), a Delaware limited liability partnership, provides investment submanagement services to the Domini Impact International Equity Fund on a day-to-day basis pursuant to a Submanagement Agreement with Domini. The fees for submanagement services are paid by the adviser and are not an incremental Fund expense. For the six months ended January 31, 2023, the fees received by each Fund’s submanager were as follows:
| | | | |
Domini Impact Equity Fund | | $ | 110,931 | |
Domini International Opportunities Fund | | | 87,500 | |
Domini Sustainable Solutions Fund | | | 87,500 | |
Domini Impact International Equity Fund | | | 2,085,092 | |
(C) Distributor. The Board of Trustees of the Funds has adopted a Distribution Plan with respect to the Funds’ Investor shares and Class A shares in accordance with Rule 12b-1 under the Act. DSIL Investment Services LLC (DSIL), a wholly owned subsidiary of Domini, acts as agent of the Funds in connection with the offering of Investor shares of the Funds pursuant to a Distribution Agreement. Under the Distribution Plan, the Funds pay expenses incurred in connection with the sale of Investor shares and Class A shares and pay DSIL a distribution fee at an aggregate annual rate not to exceed 0.25% of
100
DOMINI IMPACT EQUITY FUND
DOMINI INTERNATIONAL OPPORTUNITIES FUND
DOMINI SUSTAINABLE SOLUTIONS FUND
DOMINI IMPACT INTERNATIONAL EQUITY FUND
NOTES TO FINANCIAL STATEMENTS (continued)
January 31, 2023 (Unaudited)
the average daily net assets representing the Investor shares and Class A shares. For the six months ended January 31, 2023, fees waived were as follows:
| | | | |
| | | FEES WAIVED | |
Domini Impact Equity Fund Investor Shares | | $ | - | |
Domini Impact Equity Fund Class A Shares | | | 7,400 | |
Domini International Opportunities Fund Investor Class | | | 3,149 | |
Domini Sustainable Solutions Fund Investor Class | | | 19,556 | |
Domini Impact International Equity Fund Investor Shares | | | - | |
Domini Impact International Equity Fund Class A Shares | | | - | |
DSIL, the Funds’ Distributor, retained front-end sales charges, net of commissions paid to unaffiliated brokers/dealers, related to the sale of Class A shares. Front-end sales charges do not represent expenses of the Funds. These charges are deducted from the proceeds of sales of Fund shares prior to investment. For the six months ended January 31, 2023, DSIL retained sales charges of $1,149, and $92 from the Domini Impact Equity Fund Class A Shares, and the Domini Impact International Equity Fund Class A shares, respectively.
(D) Shareholder Service Agent. The Trust has retained Domini to provide certain shareholder services with respect to the Funds and their shareholders, which services were previously provided by the former transfer agent for the funds or another fulfillment and mail service provider and are supplemental to services currently provided by Ultimus Fund Solutions, LLC (“Ultimus”), pursuant to a master services agreement between each Fund and Ultimus. Ultimus acts as the transfer agent and provides certain shareholder servicing for the Funds. For these services, Domini receives fees from each Fund paid monthly at an annual rate of $4.00 per active account. For the six months ended January 31, 2023, there were no fees waived.
(E) Trustees and Officers. Each of the Independent Trustees receive an annual retainer for serving as a Trustee of the Trust of $32,000. The Lead Independent Trustee and Chair of the Audit Committee receive an additional chairperson fee of $5,000. Each Independent Trustee also receives $2,000 for attendance at each meeting of the Board of the Trust (reduced to $1,000 in the event that a Trustee participates at an in-person meeting by telephone or video conference). In addition, each Trustee receives reimbursement for reasonable expenses incurred in attending meetings. These expenses are allocated on a pro-rata basis to each shares class of a Fund according to their respective net assets.
101
DOMINI IMPACT EQUITY FUND
DOMINI INTERNATIONAL OPPORTUNITIES FUND
DOMINI SUSTAINABLE SOLUTIONS FUND
DOMINI IMPACT INTERNATIONAL EQUITY FUND
NOTES TO FINANCIAL STATEMENTS (continued)
January 31, 2023 (Unaudited)
As of January 31, 2023, all Trustees and officers of the Trust as a group owned less than 3% of each Fund’s outstanding shares.
4. INVESTMENT TRANSACTIONS
For the six months ended January 31, 2023, cost of purchase and proceeds from sales of investments other than short-term obligations were as follows:
| | | | | | | | |
| | | PURCHASE | | | SALES | |
Domini Impact Equity Fund | | $ | 11,859,418 | | | $ | 24,182,221 | |
Domini International Opportunities Fund | | | 1,310,462 | | | | 2,265,301 | |
Domini Sustainable Solutions Fund | | | 4,192,214 | | | | 3,742,128 | |
Domini Impact International Equity Fund | | | 473,583,535 | | | | 785,175,427 | |
102
DOMINI IMPACT EQUITY FUND
DOMINI INTERNATIONAL OPPORTUNITIES FUND
DOMINI SUSTAINABLE SOLUTIONS FUND
DOMINI IMPACT INTERNATIONAL EQUITY FUND
NOTES TO FINANCIAL STATEMENTS (continued)
January 31, 2023 (Unaudited)
5. SHARES OF BENEFICIAL INTEREST
At January 31, 2023, there was an unlimited number of shares authorized ($0.00001 par value). Transactions in the Fund’s shares were as follows:
| | | | | | | | | | | | | | | | |
| | | Six Months Ended
January 31, 2023
(unaudited) | | | Year Ended
July 31, 2022 | |
| | | Shares | | | Amount | | | Shares | | | Amount | |
| | | | | | | | | | | | | | | | |
| | |
Domini Impact Equity Fund | | | | | | | | | |
| | | | |
Investor Shares | | | | | | | | | | | | | | | | |
Shares sold | | | 278,259 | | | $ | 7,419,730 | | | | 640,000 | | | $ | 20,742,061 | |
Shares issued in reinvestment of dividends and distributions | | | 440,812 | | | | 11,863,915 | | | | 1,506,831 | | | | 52,184,644 | |
Shares redeemed | | | (875,771) | | | | (23,299,123) | | | | (1,751,515) | | | | (56,415,893) | |
Redemption fees | | | - | | | | - | | | | - | | | | 224 | |
| | | | | | | | | | | | | | | | |
Net increase (decrease) | | | (156,700) | | | $ | (4,015,478) | | | | 395,316 | | | $ | 16,511,036 | |
| | | | | | | | | | | | | | | | |
| | | | |
Class A Shares | | | | | | | | | | | | | | | | |
Shares sold | | | 7,143 | | | $ | 199,002 | | | | 9,184 | | | $ | 319,581 | |
Shares issued in reinvestment of dividends and distributions | | | 3,194 | | | | 85,775 | | | | 12,760 | | | | 440,944 | |
Shares redeemed | | | (15,084) | | | | (393,913) | | | | (26,248) | | | | (805,563) | |
Redemption fees | | | - | | | | - | | | | - | | | | - | |
| | | | | | | | | | | | | | | | |
Net decrease | | | (4,747) | | | $ | (109,136) | | | | (4,304) | | | $ | (45,038) | |
| | | | | | | | | | | | | | | | |
| | | | |
Institutional Shares | | | | | | | | | | | | | | | | |
Shares sold | | | 314,853 | | | $ | 8,325,409 | | | | 341,565 | | | $ | 10,833,984 | |
Shares issued in reinvestment of dividends and distributions | | | 61,401 | | | | 1,639,437 | | | | 185,197 | | | | 6,349,359 | |
Shares redeemed | | | (317,496) | | | | (8,316,720) | | | | (580,624) | | | | (18,500,644) | |
Redemption fees | | | - | | | | - | | | | - | | | | - | |
| | | | | | | | | | | | | | | | |
Net increase (decrease) | | | 58,758 | | | $ | 1,648,126 | | | | (53,862) | | | $ | (1,317,301) | |
| | | | | | | | | | | | | | | | |
| | | | |
Class Y Shares | | | | | | | | | | | | | | | | |
Shares sold | | | 32,908 | | | $ | 850,727 | | | | 66,196 | | | $ | 1,886,003 | |
Shares issued in reinvestment of dividends and distributions | | | 6,622 | | | | 177,130 | | | | 16,672 | | | | 572,465 | |
Shares redeemed | | | (13,937) | | | | (367,699) | | | | (37,462) | | | | (1,211,565) | |
Redemption fees | | | - | | | | - | | | | - | | | | - | |
| | | | | | | | | | | | | | | | |
Net increase | | | 25,593 | | | $ | 660,158 | | | | 45,406 | | | $ | 1,246,903 | |
| | | | | | | | | | | | | | | | |
| | | | |
Total | | | | | | | | | | | | | | | | |
Shares sold | | | 633,163 | | | $ | 16,794,868 | | | | 1,056,945 | | | $ | 33,781,629 | |
Shares issued in reinvestment of dividends and distributions | | | 512,029 | | | | 13,766,257 | | | | 1,721,460 | | | | 59,547,412 | |
Shares redeemed | | | (1,222,288) | | | | (32,377,455) | | | | (2,395,849) | | | | (76,933,665) | |
Redemption fees | | | - | | | | - | | | | - | | | | 224 | |
| | | | | | | | | | | | | | | | |
Net increase (decrease) | | | (77,096) | | | $ | (1,816,330) | | | | 382,556 | | | $ | 16,395,600 | |
| | | | | | | | | | | | | | | | |
103
DOMINI IMPACT EQUITY FUND
DOMINI INTERNATIONAL OPPORTUNITIES FUND
DOMINI SUSTAINABLE SOLUTIONS FUND
DOMINI IMPACT INTERNATIONAL EQUITY FUND
NOTES TO FINANCIAL STATEMENTS (continued)
January 31, 2023 (Unaudited)
| | | | | | | | | | | | | | | | |
| | | Six Months Ended
January 31, 2023
(unaudited) | | | Year Ended
July 31, 2022 | |
| | | Shares | | | Amount | | | Shares | | | Amount | |
| | | | | | | | | | | | | | | | |
| | |
Domini International Opportunities Fund | | | | | | | | | |
| | | | |
Investor Class | | | | | | | | | | | | | | | | |
Shares sold | | | 22,052 | | | $ | 196,146 | | | | 74,077 | | | $ | 772,878 | |
Shares issued in reinvestment of dividends and distributions | | | - | | | | - | | | | 4,105 | | | | 39,814 | |
Shares redeemed | | | (12,010) | | | | (95,009) | | | | (8,750) | | | | (84,434) | |
Redemption fees | | | - | | | | - | | | | - | | | | - | |
| | | | | | | | | | | | | | | | |
Net increase | | | 10,042 | | | $ | 101,137 | | | | 69,432 | | | $ | 728,258 | |
| | | | | | | | | | | | | | | | |
| | | | |
Institutional Class | | | | | | | | | | | | | | | | |
Shares sold | | | 1 | | | $ | 9 | | | | 14,111 | | | $ | 150,000 | |
Shares issued in reinvestment of dividends and distributions | | | 1,173 | | | | 10,705 | | | | 39,300 | | | | 386,867 | |
Shares redeemed | | | (122,429) | | | | (1,046,900) | | | | (130,732) | | | | (1,210,096) | |
Redemption fees | | | - | | | | - | | | | - | | | | - | |
| | | | | | | | | | | | | | | | |
Net decrease | | | (121,255) | | | $ | (1,036,186) | | | | (77,321) | | | $ | (673,229) | |
| | | | | | | | | | | | | | | | |
| | | | |
Total | | | | | | | | | | | | | | | | |
Shares sold | | | 22,053 | | | $ | 196,155 | | | | 88,188 | | | $ | 922,878 | |
Shares issued in reinvestment of dividends and distributions | | | 1,173 | | | | 10,705 | | | | 43,405 | | | | 426,681 | |
Shares redeemed | | | (134,439) | | | | (1,141,909) | | | | (139,482) | | | | (1,294,530) | |
Redemption fees | | | - | | | | - | | | | - | | | | - | |
| | | | | | | | | | | | | | | | |
Net increase (decrease) | | | (111,213) | | | $ | (935,049) | | | | (7,889) | | | $ | 55,029 | |
| | | | | | | | | | | | | | | | |
104
DOMINI IMPACT EQUITY FUND
DOMINI INTERNATIONAL OPPORTUNITIES FUND
DOMINI SUSTAINABLE SOLUTIONS FUND
DOMINI IMPACT INTERNATIONAL EQUITY FUND
NOTES TO FINANCIAL STATEMENTS (continued)
January 31, 2023 (Unaudited)
| | | | | | | | | | | | | | | | |
| | | Six Months Ended
January 31, 2023
(unaudited) | | | Year Ended
July 31, 2022 | |
| | | Shares | | | Amount | | | Shares | | | Amount | |
| | | | | | | | | | | | | | | | |
| | |
Domini Sustainable Solutions Fund | | | | | | | | | |
| | | | |
Investor Class | | | | | | | | | | | | | | | | |
Shares sold | | | 129,731 | | | $ | 1,685,228 | | | | 263,358 | | | $ | 4,364,119 | |
Shares issued in reinvestment of dividends and distributions | | | - | | | | - | | | | 44,625 | | | | 762,202 | |
Shares redeemed | | | (43,477) | | | | (565,155) | | | | (155,586) | | | | (2,539,380) | |
Redemption fees | | | - | | | | - | | | | - | | | | - | |
| | | | | | | | | | | | | | | | |
Net increase | | | 86,254 | | | $ | 1,120,073 | | | | 152,397 | | | $ | 2,586,941 | |
| | | | | | | | | | | | | | | | |
| | | | |
Institutional Class | | | | | | | | | | | | | | | | |
Shares sold | | | 67,265 | | | $ | 897,750 | | | | 55,357 | | | $ | 791,907 | |
Shares issued in reinvestment of dividends and distributions | | | - | | | | - | | | | 36,122 | | | | 618,765 | |
Shares redeemed | | | (38,852) | | | | (522,889) | | | | (186,297) | | | | (3,451,797) | |
Redemption fees | | | - | | | | - | | | | - | | | | - | |
| | | | | | | | | | | | | | | | |
Net increase (decrease) | | | 28,413 | | | $ | 374,861 | | | | (94,818) | | | $ | (2,041,125) | |
| | | | | | | | | | | | | | | | |
| | | | |
Total | | | | | | | | | | | | | | | | |
Shares sold | | | 196,996 | | | $ | 2,582,978 | | | | 318,715 | | | $ | 5,156,026 | |
Shares issued in reinvestment of dividends and distributions | | | - | | | | - | | | | 80,747 | | | | 1,380,967 | |
Shares redeemed | | | (82,329) | | | | (1,088,044) | | | | (341,883) | | | | (5,991,177) | |
Redemption fees | | | - | | | | - | | | | - | | | | - | |
| | | | | | | | | | | | | | | | |
Net increase | | | 114,667 | | | $ | 1,494,934 | | | | 57,579 | | | $ | 545,816 | |
| | | | | | | | | | | | | | | | |
105
DOMINI IMPACT EQUITY FUND
DOMINI INTERNATIONAL OPPORTUNITIES FUND
DOMINI SUSTAINABLE SOLUTIONS FUND
DOMINI IMPACT INTERNATIONAL EQUITY FUND
NOTES TO FINANCIAL STATEMENTS (continued)
January 31, 2023 (Unaudited)
| | | | | | | | | | | | | | | | |
| | | Six Months Ended
January 31, 2023
(unaudited) | | | Year Ended
July 31, 2022 | |
| | | Shares | | | Amount | | | Shares | | | Amount | |
| | | | | | | | | | | | | | | | |
| | |
Domini Impact International Equity Fund | | | | | | | | | |
| | | | |
Investor Shares | | | | | | | | | | | | | | | | |
Shares sold | | | 1,627,000 | | | $ | 11,403,420 | | | | 4,110,647 | | | $ | 35,883,354 | |
Shares issued in reinvestment of dividends and distributions | | | 168,496 | | | | 1,253,612 | | | | 341,085 | | | | 2,587,548 | |
Shares redeemed | | | (5,643,041) | | | | (39,627,935) | | | | (8,738,393) | | | | (74,017,365) | |
Redemption fees | | | - | | | | - | | | | - | | | | 322 | |
| | | | | | | | | | | | | | | | |
Net decrease | | | (3,847,545) | | | $ | (26,970,903) | | | | (4,286,661) | | | $ | (35,546,141) | |
| | | | | | | | | | | | | | | | |
| | | | |
Class A Shares | | | | | | | | | | | | | | | | |
Shares sold | | | 130,565 | | | $ | 1,000,614 | | | | 393,681 | | | $ | 3,600,529 | |
Shares issued in reinvestment of dividends and distributions | | | 6,908 | | | | 55,059 | | | | 23,207 | | | | 186,931 | |
Shares redeemed | | | (784,955) | | | | (6,141,660) | | | | (643,836) | | | | (5,901,972) | |
Redemption fees | | | - | | | | - | | | | - | | | | - | |
| | | | | | | | | | | | | | | | |
Net decrease | | | (647,482) | | | $ | (5,085,987) | | | | (226,948) | | | $ | (2,114,512) | |
| | | | | | | | | | | | | | | | |
| | | | |
Institutional Shares | | | | | | | | | | | | | | | | |
Shares sold | | | 7,720,868 | | | $ | 53,942,717 | | | | 18,809,690 | | | $ | 157,920,292 | |
Shares issued in reinvestment of dividends and distributions | | | 611,500 | | | | 4,470,066 | | | | 1,002,033 | | | | 7,769,188 | |
Shares redeemed | | | (22,451,569) | | | | (159,823,342) | | | | (17,007,125) | | | | (138,811,340) | |
Redemption fees | | | - | | | | - | | | | - | | | | 732 | |
| | | | | | | | | | | | | | | | |
Net increase (decrease) | | | (14,119,201) | | | $ | (101,410,559) | | | | 2,804,598 | | | $ | 26,878,872 | |
| | | | | | | | | | | | | | | | |
| | | | |
Class Y Shares | | | | | | | | | | | | | | | | |
Shares sold | | | 7,356,343 | | | $ | 52,129,714 | | | | 26,185,395 | | | $ | 225,987,613 | |
Shares issued in reinvestment of dividends and distributions | | | 643,302 | | | | 4,708,968 | | | | 1,471,214 | | | | 11,407,255 | |
Shares redeemed | | | (31,368,987) | | | | (222,293,000) | | | | (23,483,647) | | | | (184,692,200) | |
Redemption fees | | | - | | | | - | | | | - | | | | - | |
| | | | | | | | | | | | | | | | |
Net increase (decrease) | | | (23,369,342) | | | $ | (165,454,318) | | | | 4,172,962 | | | $ | 52,702,668 | |
| | | | | | | | | | | | | | | | |
| | | | |
Total | | | | | | | | | | | | | | | | |
Shares sold | | | 16,834,776 | | | $ | 118,476,465 | | | | 49,499,413 | | | $ | 423,391,788 | |
Shares issued in reinvestment of dividends and distributions | | | 1,430,206 | | | | 10,487,705 | | | | 2,837,539 | | | | 21,950,922 | |
Shares redeemed | | | (60,248,552) | | | | (427,885,937) | | | | (49,873,001) | | | | (403,422,877) | |
Redemption fees | | | - | | | | - | | | | - | | | | 1,054 | |
| | | | | | | | | | | | | | | | |
Net increase (decrease) | | | (41,983,570) | | | $ | (298,921,767) | | | | 2,463,951 | | | $ | 41,920,887 | |
| | | | | | | | | | | | | | | | |
106
DOMINI IMPACT EQUITY FUND
DOMINI INTERNATIONAL OPPORTUNITIES FUND
DOMINI SUSTAINABLE SOLUTIONS FUND
DOMINI IMPACT INTERNATIONAL EQUITY FUND
NOTES TO FINANCIAL STATEMENTS (continued)
January 31, 2023 (Unaudited)
6. FEDERAL TAX STATUS
The tax basis of the components of net assets for the Funds at July 31, 2022, are as follows:
| | | | | | | | | | | | | | | | |
| | | Domini
Impact Equity
Fund | | | Domini
Opportunities
International
Fund | | | Domini
Sustainable
Solutions Fund | | | Domini Impact
International
Equity Fund | |
Undistributed Ordinary Income | | $ | 204,150 | | | $ | - | | | $ | - | | | $ | 13,387,610 | |
Undistributed capital gains | | | 11,682,780 | | | | - | | | | - | | | | - | |
Unrealized appreciation/(depreciation) | | | 327,322,295 | | | | (2,215,292) | | | | 2,472,316 | | | | (71,061,096) | |
Capital losses, other losses and other temporary differences | | | - | | | | - | | | | - | | | | (98,122,044) | |
Late year ordinary and post Oct capital loss deferrals | | | - | | | | (449,823) | | | | (2,774,623) | | | | - | |
| | | | | | | | | | | | | | | | |
Distributable net earnings/(deficit) | | $ | 339,209,225 | | | $ | (2,665,115) | | | $ | (302,307) | | | $ | (155,795,530) | |
| | | | | | | | | | | | | | | | |
Carryforwards of losses from previous taxable years do not expire and retain their character as either short-term or long-term capital losses. As of July 31, 2022, the Domini Impact International Equity Fund had a short-term capital loss carryover of $98,122,044 and long-term capital loss carryover of $0.
For tax purposes, the Funds may elect to defer any portion of a post October capital loss deferral or late year ordinary loss to the first day of the following fiscal year. At July 31, 2022, the Domini International Opportunities Fund deferred post October capital losses of $449,823 and the Domini Sustainable Solutions Fund deferred post October losses of $2,753,910 and late year ordinary losses of $20,713.
107
DOMINI IMPACT EQUITY FUND
DOMINI INTERNATIONAL OPPORTUNITIES FUND
DOMINI SUSTAINABLE SOLUTIONS FUND
DOMINI IMPACT INTERNATIONAL EQUITY FUND
NOTES TO FINANCIAL STATEMENTS (continued)
January 31, 2023 (Unaudited)
For federal income tax purposes, dividends paid were characterized as follows:
| | | | | | | | | | | | | | | | | | | | | | | | | | | | | | | | |
| | | Domini Impact
Equity Fund | | | Domini
International
Opportunities Fund | | | Domini Sustainable
Solutions Fund | | | Domini Impact
International
Equity Fund | |
| | | Year Ended July 31, | | | Year Ended July 31, | | | Year Ended | | | July 31, | | | Year Ended July 31, | |
| | | 2022 | | | 2021 | | | 2022 | | | 2021 | | | 2022 | | | 2021 | | | 2022 | | | 2021 | |
Ordinary income | | $ | 5,844,084 | | | $ | 9,314,253 | | | $ | 426,877 | | | $ | 151,254 | | | $ | 49,109 | | | $ | 1,018,812 | | | $ | 26,759,352 | | | $ | 26,500,889 | |
Long-term capital gain | | | 58,594,709 | | | | 13,824,026 | | | | - | | | | - | | | | 1,352,315 | | | | - | | | | - | | | | - | |
| | | | | | | | | | | | | | | | | | | | | | | | | | | | | | | | |
Total | | $ | 64,438,793 | | | $ | 23,138,279 | | | $ | 426,877 | | | $ | 151,254 | | | $ | 1,401,424 | | | $ | 1,018,812 | | | $ | 26,759,352 | | | $ | 26,500,889 | |
| | | | | | | | | | | | | | | | | | | | | | | | | | | | | | | | |
The Funds are subject to the provisions of Accounting Standards Codification ASC 740 Income Taxes (ASC 740). ASC 740 sets forth a minimum threshold for financial statement recognition of the benefit of a tax position taken or expected to be taken in a tax return. The Funds did not have a liability to record for any unrecognized tax benefits in the accompanying financial statements. No provision has been made for taxes on income, capital gains or unrealized appreciation on securities held or for excise tax on income and capital gains.
7. OTHER RISKS
The Funds’ risks include, but are not limited to, some or all of the risks discussed below:
Market Risk. The market values of securities or other assets will fluctuate, sometimes sharply and unpredictably, due to changes in general market conditions, overall economic trends or events, governmental actions or intervention, market disruptions caused by trade disputes or other factors, political developments, recessions, inflation, changes in interest or currency rates, the spread of infectious illness or other public health issues, armed conflict, market disruptions caused by tariffs, trade disputes, sanctions or other government actions, or other factors or adverse investor sentiment that may or may not be related to the issuer of the security or other asset. If the market values of the securities or other assets held by the Funds fall, including a complete loss on any individual security, the value of your investment will go down. A change in financial condition or other event affecting a single issuer or market may adversely impact securities markets as a whole. Rates of inflation have recently risen. The value of assets or income from an investment may be
108
DOMINI IMPACT EQUITY FUND
DOMINI INTERNATIONAL OPPORTUNITIES FUND
DOMINI SUSTAINABLE SOLUTIONS FUND
DOMINI IMPACT INTERNATIONAL EQUITY FUND
NOTES TO FINANCIAL STATEMENTS (continued)
January 31, 2023 (Unaudited)
worth less in the future as inflation decreases the value of money. As inflation increases, the real value of the Funds’ assets can decline as can the value of the Funds’ distributions.
The global pandemic of the novel coronavirus respiratory disease designated COVID-19 has resulted in major disruption to economies and markets around the world, including the U.S. Global financial markets have experienced extreme volatility and severe losses, and trading in many instruments has been disrupted. Liquidity for many instruments has been greatly reduced for periods of time. Some sectors of the economy and individual issuers have experienced particularly large losses. These circumstances may continue for an extended period of time and may continue to affect adversely the value and liquidity of the Fund’s investments. Following Russia’s invasion of Ukraine, Russian securities have lost all, or nearly all, their market value. Other securities or markets could be similarly affected by past or future geopolitical or other events or conditions.
Governments and central banks, including the U.S. Federal Reserve, have taken extraordinary and unprecedented actions to support local and global economies and the financial markets. These actions have resulted in significant expansion of public debt, including in the U.S. The consequences of high public debt, including its future impact on the economy and securities markets, may not be known for some time. Although they have started to increase, interest rates are still very low, which means there is more risk that they may go up. U.S. Federal Reserve or other U.S. or non-U.S. governmental or central bank actions, including increases or decreases in interest rates, or contrary actions by different governments, could negatively affect financial markets generally, increase market volatility and reduce the value and liquidity of securities in which the Fund invests. Policy and legislative changes in the U.S. and in other countries are affecting many aspects of financial regulation, and these and other events affecting global markets, such as the U.K.’s exit from the European Union (or Brexit), potential trade imbalances with China or other countries, or sanctions or other government actions against Russia, other nations or individuals or companies (or their countermeasures), may contribute to decreased liquidity and increased volatility in the financial markets. The impact of these changes on the markets, and the implications for market participants, may not be fully known for some time.
109
DOMINI IMPACT EQUITY FUND
DOMINI INTERNATIONAL OPPORTUNITIES FUND
DOMINI SUSTAINABLE SOLUTIONS FUND
DOMINI IMPACT INTERNATIONAL EQUITY FUND
NOTES TO FINANCIAL STATEMENTS (continued)
January 31, 2023 (Unaudited)
Economies and financial markets throughout the world are increasingly interconnected. Economic, financial or political events, trading or tariff arrangements, armed conflict including Russia’s military invasion of Ukraine, terrorism, natural disasters, infectious illness or public health issues, cybersecurity events, supply chain disruptions, sanctions against Russia, other nations or individuals or companies and possible countermeasures, and other circumstances in one country or region could have profound impacts on other countries or regions and on global economies or markets. As a result, whether or not the Funds invest in securities of issuers located in or with significant exposure to the countries or regions directly affected, the value and liquidity of the Funds’ investments may be negatively affected.
110
DOMINI IMPACT BOND FUND
STATEMENT OF ASSETS AND LIABILITIES
January 31, 2023 (Unaudited)
| | | | |
ASSETS | | | | |
Investments, at value (cost $272,538,165) | | $ | 251,002,931 | |
Cash | | | 7,124,680 | |
Foreign currency, at value (cost $94,469) | | | 92,086 | |
Receivable for securities sold | | | 18,166,788 | |
Interest receivable | | | 1,275,702 | |
Collateral on certain derivative contracts | | | 930,000 | |
Receivable for variation margin swaps | | | 2,226,110 | |
Receivable for capital shares | | | 176,714 | |
Cash held at other banks (cost $546,540) | | | 546,893 | |
Unrealized appreciation on forward currency contracts | | | 63,578 | |
Receivable for variation margin futures | | | 18,548 | |
| | | | |
Total assets | | | 281,624,030 | |
| | | | |
LIABILITIES | | | | |
Payable for securities purchased | | | 59,578,911 | |
Payable for capital shares | | | 128,378 | |
Payable for variation margin swaps | | | 1,918,231 | |
Cash due to broker (cost $340,243) | | | 338,678 | |
Management fee payable | | | 104,764 | |
Distribution fee payable | | | 33,623 | |
Other accrued expenses | | | 36,216 | |
Dividend payable | | | 43,915 | |
Payable for variation margin futures | | | 5,018 | |
Unrealized depreciation on forward currency contracts | | | 591,996 | |
Unealized depreciation on unfunded loan commitments | | | 2,187 | |
| | | | |
Total liabilities | | | 62,781,917 | |
| | | | |
NET ASSETS | | $ | 218,842,113 | |
| | | | |
NET ASSETS CONSISTS OF | | | | |
Paid-in capital | | $ | 253,611,156 | |
Total distributable earnings (loss) | | | (34,769,043) | |
| | | | |
NET ASSETS | | $ | 218,842,113 | |
| | | | |
NET ASSET VALUE PER SHARE | | | | |
| |
Investor Shares | | | | |
Net assets | | | 118,740,650 | |
| | | | |
Outstanding shares of beneficial interest | | | 11,733,498 | |
| | | | |
Net asset value and offering price per share | | $ | 10.12 | |
| | | | |
| |
Institutional Shares | | | | |
Net assets | | | 81,675,247 | |
| | | | |
Outstanding shares of beneficial interest | | | 8,128,401 | |
| | | | |
Net asset value and offering price per share | | $ | 10.05 | |
| | | | |
| |
Class Y Shares | | | | |
Net assets | | | 18,426,216 | |
| | | | |
Outstanding shares of beneficial interest | | | 1,819,185 | |
| | | | |
Net asset value and offering price per share | | $ | 10.13 | |
| | | | |
SEE NOTES TO FINANCIAL STATEMENTS
111
DOMINI IMPACT BOND FUND
STATEMENT OF OPERATIONS
For the Six Months Ended January 31, 2023 (Unaudited)
| | | | |
INCOME | | | | |
Interest income | | $ | 3,575,460 | |
Dividends | | | 11,750 | |
| | | | |
Investment Income | | | 3,587,210 | |
| | | | |
EXPENSES | | | | |
Management fee | | | 366,900 | |
Administrative fee | | | 287,190 | |
Distribution fees – Investor Shares | | | 155,603 | |
Transfer agent fees – Investor Shares | | | 76,927 | |
Transfer agent fees – Institutional Shares | | | 925 | |
Transfer agent fees – Class Y Shares | | | 9,424 | |
Custody and accounting fees | | | 74,709 | |
Professional fees | | | 16,253 | |
Registration fees – Investor Shares | | | 8,963 | |
Registration fees – Institutional Shares | | | 15,164 | |
Registration fees – Class Y Shares | | | 1,735 | |
Shareholder communication fees | | | 16,613 | |
Miscellaneous | | | 32,418 | |
Trustees fees | | | 6,897 | |
Shareholder service fees – Investor Shares | | | 4,938 | |
Shareholder service fees – Institutional Shares | | | 72 | |
Shareholder service fees – Class Y Shares | | | 12 | |
| | | | |
Total expenses | | | 1,074,743 | |
Fees waived and expenses reimbursed | | | (225,740) | |
| | | | |
Net expenses | | | 849,003 | |
| | | | |
NET INVESTMENT INCOME (LOSS) | | | 2,738,207 | |
| | | | |
REALIZED AND UNREALIZED GAIN (LOSS) FROM INVESTMENTS AND FOREIGN CURRENCY | | | | |
NET REALIZED GAIN (LOSS) FROM: | | | | |
Investments | | | (6,230,690) | |
Swap contracts | | | 274,174 | |
Futures contracts | | | 499,692 | |
Forward contracts | | | 128,384 | |
Foreign currency | | | (14,241) | |
| | | | |
Net realized gain (loss) | | | (5,342,681) | |
| | | | |
NET CHANGES IN UNREALIZED APPRECIATION (DEPRECIATION) FROM: | | | | |
Investments | | | (4,033,925) | |
Swap contracts | | | 595,667 | |
Futures contracts | | | 294,171 | |
Forward contracts | | | (579,573) | |
Translation of assets and liabilities in foreign currencies | | | (28,997) | |
| | | | |
Net change in unrealized appreciation (depreciation) | | | (3,752,657) | |
| | | | |
NET REALIZED AND UNREALIZED GAIN (LOSS) | | | (9,095,338) | |
| | | | |
NET INCREASE (DECREASE) IN NET ASSETS RESULTING FROM OPERATIONS | | $ | (6,357,131) | |
| | | | |
SEE NOTES TO FINANCIAL STATEMENTS
112
DOMINI IMPACT BOND FUND
STATEMENTS OF CHANGES IN NET ASSETS
| | | | | | | | |
| | | Six Months
Ended
January 31, 2023
(unaudited) | | | Year Ended
July 31, 2022 | |
DECREASE IN NET ASSETS FROM OPERATIONS | | | | | | | | |
Net investment income (loss) | | $ | 2,738,207 | | | $ | 4,221,274 | |
Net realized gain (loss) | | | (5,342,681) | | | | (5,237,983) | |
Net change in unrealized appreciation (depreciation) | | | (3,752,657) | | | | (29,386,765) | |
| | | | | | | | |
Net Increase (Decrease) in Net Assets Resulting from Operations | | | (6,357,131) | | | | (30,403,474) | |
| | | | | | | | |
DISTRIBUTIONS TO SHAREHOLDERS | | | | | | | | |
Investor Shares | | | (1,725,438) | | | | (3,580,840) | |
Institutional Shares | | | (1,331,101) | | | | (2,969,089) | |
Class Y Shares | | | (281,426) | | | | (347,605) | |
| | | | | | | | |
Net Decrease in Net Assets from Distributions | | | (3,337,965) | | | | (6,897,534) | |
| | | | | | | | |
CAPITAL SHARE TRANSACTIONS | | | | | | | | |
Proceeds from sale of shares | | | 31,828,660 | | | | 112,493,683 | |
Net asset value of shares issued in reinvestment of distributions and dividends | | | 3,013,168 | | | | 6,319,095 | |
Payments for shares redeemed | | | (49,593,843) | | | | (91,381,454) | |
Redemption fees | | | - | | | | 16 | |
| | | | | | | | |
Net Increase (Decrease) in Net Assets from Capital Share Transactions | | | (14,752,015) | | | | 27,431,340 | |
| | | | | | | | |
Total Increase (Decrease) in Net Assets | | | (24,447,111) | | | | (9,869,668) | |
| | | | | | | | |
NET ASSETS | | | | | | | | |
Beginning of period | | $ | 243,289,224 | | | $ | 253,158,892 | |
| | | | | | | | |
End of period | | $ | 218,842,113 | | | $ | 243,289,224 | |
| | | | | | | | |
SEE NOTES TO FINANCIAL STATEMENTS
113
DOMINI IMPACT BOND FUND — INVESTOR SHARES
FINANCIAL HIGHLIGHTS
| | | | | | | | | | | | | | | | | | | | | | | | |
| | | Six Months
Ended
January 31, 2023
(unaudited) | | | Year Ended July 31, | |
| | | 2022 | | | 2021 | | | 2020 | | | 2019 | | | 2018 | |
For a share outstanding for the period: | | | | | | | | | | | | | | | | | | | | | | | | |
Net asset value, beginning of period | | | $10.51 | | | | $12.04 | | | | $12.49 | | | | $11.46 | | | | $10.92 | | | | $11.26 | |
| | | | | | | | | | | | | | | | | | | | | | | | |
Income from investment operations: | | | | | | | | | | | | | | | | | | | | | | | | |
Net investment income (loss) | | | 0.09 | | | | 0.16 | | | | 0.18 | | | | 0.22 | | | | 0.28 | | | | 0.26 | |
Net realized and unrealized gain (loss) on investments | | | (0.36) | | | | (1.41) | | | | (0.05) | | | | 1.04 | | | | 0.55 | | | | (0.33) | |
| | | | | | | | | | | | | | | | | | | | | | | | |
Total Income (loss) From Investment Operations | | | (0.27) | | | | (1.25) | | | | 0.13 | | | | 1.26 | | | | 0.83 | | | | (0.07) | |
| | | | | | | | | | | | | | | | | | | | | | | | |
Less dividends and/or distributions: | | | | | | | | | | | | | | | | | | | | | | | | |
Dividends to shareholders from net investment income | | | (0.11) | | | | (0.17) | | | | (0.18) | | | | (0.23) | | | | (0.27) | | | | (0.26) | |
Distributions to shareholders from net realized gain | | | (0.01) | | | | (0.11) | | | | (0.40) | | | | - | | | | - | | | | (0.01) | |
Tax return of capital 1 | | | - | | | | - | | | | - | | | | - | | | | (0.02) | | | | - | |
| | | | | | | | | | | | | | | | | | | | | | | | |
Total Distributions | | | (0.12) | | | | (0.28) | | | | (0.58) | | | | (0.23) | | | | (0.29) | | | | (0.27) | |
| | | | | | | | | | | | | | | | | | | | | | | | |
Redemption fee proceeds 1 | | | - | | | | 0.00 | 2 | | | 0.00 | 2 | | | 0.00 | 2 | | | 0.00 | 2 | | | 0.00 | 2 |
| | | | | | | | | | | | | | | | | | | | | | | | |
Net asset value, end of period | | | $10.12 | | | | $10.51 | | | | $12.04 | | | | $12.49 | | | | $11.46 | | | | $10.92 | |
| | | | | | | | | | | | | | | | | | | | | | | | |
Total return 3 | | | (2.34)% | | | | (10.53)% | | | | 1.06% | | | | 11.09% | | | | 7.77% | | | | (0.74)% | |
Portfolio turnover | | | 145% | | | | 383% | | | | 378% | | | | 469% | | | | 319% | | | | 326% | |
Ratios/supplemental data (annualized): | | | | | | | | | | | | | | | | | | | | | | | | |
Net assets, end of period (in millions) | | | $119 | | | | $133 | | | | $151 | | | | $144 | | | | $121 | | | | $144 | |
Ratio of expenses to average net assets | | | 0.87% | 4 | | | 0.87% | 4 | | | 0.87% | 4 | | | 0.86% | 4,5 | | | 0.87% | 4,5 | | | 0.87% | 4 |
Ratio of gross expenses to average net assets | | | 1.10% | | | | 1.08% | | | | 1.10% | | | | 1.15% | | | | 1.20% | | | | 1.14% | |
Ratio of net investment income (loss) to average net assets | | | 2.25% | | | | 1.47% | | | | 1.47% | | | | 1.84% | | | | 2.55% | | | | 2.37% | |
1 Based on average shares outstanding.
2 Amount represents less than $0.005 per share.
3 Not annualized for periods less than one year.
4 Reflects a waiver of fees by the Manager and the Distributor of the Fund.
5 Ratio of expenses to average net assets includes transfer agent credits. Excluding transfer agent credits the ratio of expenses to average net assets would have been 0.87% for the year ended July 31, 2019 and 0.86% for the year ended July 31, 2020.
SEE NOTES TO FINANCIAL STATEMENTS
114
DOMINI IMPACT BOND FUND — INSTITUTIONAL SHARES
FINANCIAL HIGHLIGHTS
| | | | | | | | | | | | | | | | | | | | | | | | |
| | | Six Months
Ended
January 31, 2023
(unaudited) | | | Year Ended July 31, | |
| | | 2022 | | | 2021 | | | 2020 | | | 2019 | | | 2018 | |
For a share outstanding for the period: | | | | | | | | | | | | | | | | | | | | | | | | |
Net asset value, beginning of period | | | $10.43 | | | | $11.96 | | | | $12.41 | | | | $11.38 | | | | $10.89 | | | | $11.23 | |
| | | | | | | | | | | | | | | | | | | | | | | | |
Income from investment operations: | | | | | | | | | | | | | | | | | | | | | | | | |
Net investment income (loss) | | | 0.10 | | | | 0.20 | | | | 0.23 | | | | 0.25 | | | | 0.33 | | | | 0.30 | |
Net realized and unrealized gain (loss) on investments | | | (0.35) | | | | (1.42) | | | | (0.07) | | | | 1.04 | | | | 0.53 | | | | (0.34) | |
| | | | | | | | | | | | | | | | | | | | | | | | |
Total Income (loss) From Investment Operations | | | (0.25) | | | | (1.22) | | | | 0.16 | | | | 1.29 | | | | 0.86 | | | | (0.04) | |
| | | | | | | | | | | | | | | | | | | | | | | | |
Less dividends and/or distributions: | | | | | | | | | | | | | | | | | | | | | | | | |
Dividends to shareholders from net investment income | | | (0.12) | | | | (0.20) | | | | (0.21) | | | | (0.26) | | | | (0.34) | | | | (0.29) | |
Distributions to shareholders from net realized gain | | | (0.01) | | | | (0.11) | | | | (0.40) | | | | - | | | | - | | | | (0.01) | |
Tax return of capital 1 | | | - | | | | - | | | | - | | | | - | | | | (0.03) | | | | - | |
| | | | | | | | | | | | | | | | | | | | | | | | |
Total Distributions | | | (0.13) | | | | (0.31) | | | | (0.61) | | | | (0.26) | | | | (0.37) | | | | (0.30) | |
| | | | | | | | | | | | | | | | | | | | | | | | |
Redemption fee proceeds 1 | | | - | | | | - | | | | 0.00 | 2 | | | 0.00 | 2 | | | 0.00 | 2 | | | 0.00 | 2 |
| | | | | | | | | | | | | | | | | | | | | | | | |
Net asset value, end of period | | | $10.05 | | | | $10.43 | | | | $11.96 | | | | $12.41 | | | | $11.38 | | | | $10.89 | |
| | | | | | | | | | | | | | | | | | | | | | | | |
Total return 3 | | | (2.12)% | | | | (10.34)% | | | | 1.35% | | | | 11.49% | | | | 8.06% | | | | (0.36)% | |
Portfolio turnover | | | 145% | | | | 383% | | | | 378% | | | | 469% | | | | 319% | | | | 326% | |
Ratios/supplemental data (annualized): | | | | | | | | | | | | | | | | | | | | | | | | |
Net assets, end of period (in millions) | | | $82 | | | | $93 | | | | $91 | | | | $46 | | | | $37 | | | | $13 | |
Ratio of expenses to average net assets | | | 0.57% | 4 | | | 0.57% | 4 | | | 0.57% | 4 | | | 0.56% | 4,5 | | | 0.57% | 4,5 | | | 0.57% | 4 |
Ratio of gross expenses to average net assets | | | 0.72% | | | | 0.72% | | | | 0.73% | | | | 0.74% | | | | 0.84% | | | | 1.03% | |
Ratio of net investment income (loss) to average net assets | | | 2.55% | | | | 1.74% | | | | 1.72% | | | | 2.13% | | | | 2.84% | | | | 2.67% | |
1 Based on average shares outstanding.
2 Amount represents less than $0.005 per share.
3 Not annualized for periods less than one year.
4 Reflects a waiver of fees by the Manager of the Fund.
5 Ratio of expenses to average net assets includes transfer agent credits. Excluding transfer agent credits the ratio of expenses to average net assets would have been 0.57% for the year ended July 31, 2019 and 0.56% for the year ended July 31, 2020.
SEE NOTES TO FINANCIAL STATEMENTS
115
DOMINI IMPACT BOND FUND — CLASS Y SHARES
FINANCIAL HIGHLIGHTS
| | | | | | | | | | | | |
| | | Six Months
Ended
January 31, 2023
(unaudited) | | | Year Ended
July 31, 2022 | | | For the Period
June 1, 2021
(commencement
of operations)
through
July 31, 2021 | |
For a share outstanding for the period: | | | | | | | | | | | | |
Net asset value, beginning of period | | | $10.52 | | | | $12.05 | | | | $11.85 | |
| | | | | | | | | | | | |
Income from investment operations: | | | | | | | | | | | | |
Net investment income (loss) | | | 0.10 | | | | 0.19 | | | | 0.03 | |
Net realized and unrealized gain (loss) on investments | | | (0.36) | | | | (1.41) | | | | 0.20 | |
| | | | | | | | | | | | |
Total Income (loss) From Investment Operations | | | (0.26) | | | | (1.22) | | | | 0.23 | |
| | | | | | | | | | | | |
Less dividends and/or distributions: | | | | | | | | | | | | |
Dividends to shareholders from net investment income | | | (0.12) | | | | (0.20) | | | | (0.03) | |
Distributions to shareholders from net realized gain | | | (0.01) | | | | (0.11) | | | | - | |
| | | | | | | | | | | | |
Total Distributions | | | (0.13) | | | | (0.31) | | | | (0.03) | |
| | | | | | | | | | | | |
Redemption fee proceeds | | | - | | | | - | | | | - | |
| | | | | | | | | | | | |
Net asset value, end of period | | | $10.13 | | | | $10.52 | | | | $12.05 | |
| | | | | | | | | | | | |
Total return 1 | | | (2.22)% | | | | (10.32)% | | | | 1.93% | |
Portfolio turnover | | | 145% | | | | 383% | | | | 378% | |
Ratios/supplemental data (annualized): | | | | | | | | | | | | |
Net assets, end of period (in millions) | | | $18 | | | | $18 | | | | $11 | |
Ratio of expenses to average net assets | | | 0.65% | 2 | | | 0.65% | 2 | | | 0.65% | 2 |
Ratio of gross expenses to average net assets | | | 0.79% | | | | 0.96% | | | | 1.03% | |
Ratio of net investment income (loss) to average net assets | | | 2.47% | | | | 1.74% | | | | 1.36% | |
1 Not annualized for periods less than one year.
2 Reflects a waiver of fees by the Manager of the Fund.
SEE NOTES TO FINANCIAL STATEMENTS
116
DOMINI IMPACT BOND FUND
NOTES TO FINANCIAL STATEMENTS
January 31, 2023 (Unaudited)
1. ORGANIZATION
The Domini Impact Bond Fund (the “Fund”) is a series of the Domini Investment Trust. The Trust is a Massachusetts business trust registered under the Investment Company Act of 1940 as an open-end management investment company. The Fund is an investment company and accordingly follows the investment company accounting and reporting guidance of the Financial Accounting Standards Board (the “FASB”) Accounting Standard Codification Topic 946 “Financial Services — Investment Companies”.
The Fund offers three classes of shares: Investor Shares, Institutional Shares and Class Y shares. Each class of shares is sold at its offering price, which is net asset value.
Each class of shares has identical rights and voting privileges with respect to the Fund in general and exclusive voting rights on matters that affect that class alone. Earnings, net assets, and net asset value per share may differ due to each class having its own expenses, such as transfer and shareholder servicing agent fees and registration fees, directly attributable to that class. The Fund seeks to provide its shareholders with a high level of current income and total return.
2. SIGNIFICANT ACCOUNTING POLICIES
The preparation of financial statements in conformity with U.S. generally accepted accounting principles requires management to make estimates and assumptions that affect the reported amounts of assets and liabilities and disclosure of contingent liabilities at the date of the financial statements and the reported amounts of revenues and expenses during the reporting period. Actual results could differ from those estimates. The following is a summary of the Fund’s significant accounting policies.
(A) Valuation of Investments. Bonds and other fixed-income securities (other than obligations with maturities of 60 days or less) are valued on the basis of valuations furnished by an independent pricing service. In making such valuations, the pricing service utilizes both dealer-supplied valuations and electronic data processing techniques that take into account appropriate factors such as institutional-size trading in similar groups of securities, yield, quality, coupon rate, maturity, type of issue, trading characteristics, and other market data, without exclusive reliance upon quoted prices or exchange or over-the-counter prices, since such valuations are believed to reflect more accurately the fair value of such securities.
117
DOMINI IMPACT BOND FUND
NOTES TO FINANCIAL STATEMENTS (continued)
January 31, 2023 (Unaudited)
Securities of sufficient credit quality (maturing in 60 days or less) are valued at amortized cost, which constitutes fair value as determined by Domini Impact Investments LLC (Domini), the Fund’s valuation designee.
To Be Announced (TBA) or when-issued securities are valued at their issue price for up to five (5) trading days, or until broker quotes are readily available or an Authorized Pricing Service begins to provide quotations, whichever is shorter.
Derivative contracts traded on an exchange are valued at their most recent sale or official closing price on the exchange on which they are primarily traded, or, if no sales are reported on such exchange, at the mean between the last available bid and asked quotations on the exchange on which they are primarily traded.
Option contracts on securities, currencies and other financial instruments traded over-the-counter are valued at the most recent bid quotation in the case of purchased options and at the most recent asked quotation in the case of written options.
Futures contracts are valued at the most recent settlement price.
Foreign currency forward contracts are valued at the value of the underlying currencies at the prevailing currency exchange rates.
Swap contracts are valued at the evaluated price provided by an independent pricing service or, if a reliable price is not available, the quoted bid price from an independent broker-dealer.
Securities (other than short-term obligations with remaining maturities of 60 days or less) for which there are no such quotations or valuations are valued at fair value as determined in good faith by Domini, the Fund’s valuation designee.
Effective September 8, 2022, Domini was designated as the Fund’s valuation designee in accordance with Rule 2a-5 under the 1940 Act, with responsibility for fair valuation, subject to oversight by the Fund’s Board of Trustees.
The valuation designee follows a fair value hierarchy that distinguishes between (a) market participant assumptions developed based on market data obtained from sources independent of the reporting entity (observable inputs) and (b) the valuation designee’s own assumptions about market participant assumptions developed based on the best information available in the circumstances
118
DOMINI IMPACT BOND FUND
NOTES TO FINANCIAL STATEMENTS (continued)
January 31, 2023 (Unaudited)
(unobservable inputs). These inputs are used in determining the value of the Fund’s investments and are summarized in the following fair value hierarchy:
Level 1 — quoted prices in active markets for identical securities
Level 2 — other significant observable inputs (including quoted prices for similar securities, interest rates, and evaluated quotation obtained from pricing services)
Level 3 — significant unobservable inputs (including the valuation designee’s own assumptions in determining the fair value of investments)
The inputs or methodology used for valuing securities are not an indication of the risk associated with investing in those securities.
The following is a summary of the inputs used, as of January 31, 2023, in valuing the Fund’s assets carried at fair value:
| | | | | | | | | | | | | | | | |
| | | Level 1 -
Quoted Prices | | | Level 2 -
Other
Significant
Observable
Inputs | | | Level 3 -
Significant
Unobservable
Inputs | | | Total | |
Assets: | | | | | | | | | | | | | | | | |
| | | | |
Long Term Investments in Securities: | | | | | | | | | | | | | | | | |
Mortgage Backed Securities | | $ | - | | | $ | 112,836,719 | | | $ | - | | | $ | 112,836,719 | |
Corporate Bonds and Notes | | | - | | | | 57,681,157 | | | | - | | | | 57,681,157 | |
U.S. Government Agency Obligations | | | - | | | | 45,000,188 | | | | - | | | | 45,000,188 | |
Municipal Bonds | | | - | | | | 16,880,804 | | | | - | | | | 16,880,804 | |
Foreign Government & Agency Securities | | | - | | | | 10,000,522 | | | | - | | | | 10,000,522 | |
Senior Floating Rate Interests | | | - | | | | 4,745,547 | | | | - | | | | 4,745,547 | |
Asset Backed Securities | | | - | | | | 2,471,952 | | | | - | | | | 2,471,952 | |
Convertible Bonds | | | - | | | | 947,053 | | | | - | | | | 947,053 | |
Preferred Stocks | | | 480,280 | | | | - | | | | - | | | | 480,280 | |
| | | | | | | | | | | | | | | | |
Total Long Term Investments | | $ | 480,280 | | | $ | 250,563,942 | | | $ | - | | | $ | 251,044,222 | |
| | | | | | | | | | | | | | | | |
Total Investment in Securities | | $ | 480,280 | | | $ | 250,563,942 | | | $ | - | | | $ | 251,044,222 | |
| | | | | | | | | | | | | | | | |
| | | | |
Other Financial Instruments: | | | | | | | | | | | | | | | | |
Forward Currency Contracts | | | - | | | | 63,578 | | | | - | | | | 63,578 | |
Futures | | | 117,298 | | | | - | | | | - | | | | 117,298 | |
Credit Default Swap - CCP- | | | - | | | | 1,375 | | | | - | | | | 1,375 | |
Interest Rate Swap - CCP- | | | - | | | | 614,887 | | | | - | | | | 614,887 | |
| | | | | | | | | | | | | | | | |
Total Other Financial Instruments | | $ | 117,298 | | | $ | 679,840 | | | $ | - | | | $ | 797,138 | |
| | | | | | | | | | | | | | | | |
119
DOMINI IMPACT BOND FUND
NOTES TO FINANCIAL STATEMENTS (continued)
January 31, 2023 (Unaudited)
| | | | | | | | | | | | | | | | |
| | | Level 1 -
Quoted Prices | | | Level 2 -
Other
Significant
Observable
Inputs | | | Level 3 -
Significant
Unobservable
Inputs | | | Total | |
Liabilities: | | | | | | | | | | | | | | | | |
| | | | |
Other Financial Instruments: | | | | | | | | | | | | | | | | |
Forward Currency Contracts | | $ | - | | | $ | (591,996) | | | $ | - | | | $ | (591,996) | |
Futures | | | (50,955) | | | | - | | | | - | | | | (50,955) | |
Interest Rate Swap - CCP | | | - | | | | (1,104,118) | | | | - | | | | (1,104,118) | |
Unfunded Loans | | | - | | | | (2,187) | | | | - | | | | (2,187) | |
| | | | | | | | | | | | | | | | |
Total Other Financial Instruments | | $ | (50,955) | | | $ | (1,698,301) | | | $ | - | | | $ | (1,749,256) | |
| | | | | | | | | | | | | | | | |
(B) Foreign CurrencyTranslation. Securities and other assets and liabilities denominated in foreign currencies are translated into U.S. dollar amounts on the date of valuation. Purchases and sales of securities, and income and expense items denominated in foreign currencies, are translated into U.S. dollar amounts on the respective dates of such transactions. Occasionally, events impact the availability or reliability of foreign exchange rates used to convert the U.S. dollar equivalent value. If such an event occurs, the foreign exchange rate will be valued at fair value using procedures established and approved by the Board of Trustees. The Fund does not separately report the effect of fluctuations in foreign exchange rates from changes in market prices on securities held. Such fluctuations are included with the net realized and unrealized gain or loss from investments. Realized foreign exchange gains or losses arise from sales of foreign currencies, currency gains or losses realized between the trade and settlement dates on securities transactions, and the difference between the recorded amounts of dividends, interest, and foreign withholding taxes and the U.S. dollar equivalent of the amounts actually received or paid. Net unrealized foreign exchange gains and losses arise from changes in fair value of assets and liabilities other than investments in securities held at the end of the reporting period, resulting from changes in exchange rates.
(C) Foreign Currency Contracts. When the Fund purchases or sells foreign securities it enters into foreign exchange contracts to minimize foreign exchange risk from the trade date to the settlement date of the transactions. A foreign exchange contract is an agreement between two parties to exchange different currencies at an agreed-upon exchange rate on a specified date. The Fund had no outstanding open foreign currency spot contracts as of January 31, 2023.
(D) Securities Purchased on a When-Issued or Delayed Delivery Basis. The Fund may invest in when-issued or delayed delivery securities where the price of the security is fixed at the time of the commitment but delivery and payment take
120
DOMINI IMPACT BOND FUND
NOTES TO FINANCIAL STATEMENTS (continued)
January 31, 2023 (Unaudited)
place beyond customary settlement time. These securities are subject to market fluctuation, and no interest accrues on the security to the purchaser during this period. The payment obligation and the interest rate that will be received on the securities are each fixed at the time the purchaser enters into the commitment. Purchasing obligations on a when-issued or delayed delivery basis is a form of leveraging and can involve a risk that the yields available in the market when the delivery takes place may be higher than those obtained in the transaction, which could result in an unrealized loss at the time of delivery. The Fund establishes a segregated account consisting of liquid securities equal to the amount of the commitments to purchase securities on such basis.
(E) TBA Purchase and Forward Sale Commitments. The Fund may enter into TBA commitments to purchase or sell securities for a fixed price at a future date. TBA commitments are considered securities in themselves and involve a risk of loss if the value of the security to be purchase or sold declines or increases prior to the settlement date, which is in addition to the risk of decline in the value of the Fund’s other assets.
(F) Derivative Financial Instruments. The Fund may invest in derivatives in order to hedge market risks, or to seek to increase the Fund’s income or gain. Derivatives in certain circumstances may require that the Fund segregate cash or other liquid assets to the extent the Fund’s obligations are not otherwise covered through ownership of the underlying security, financial instrument, or currency. Derivatives involve special risks, including possible default by the other party to the transaction, illiquidity, and the risk that the use of derivatives could result in greater losses than if it had not been used. Some derivative transactions, including options, swaps, forward contracts, and options on foreign currencies, are entered into directly by the counterparties or through financial institutions acting as market makers (OTC derivatives), rather than being traded on exchanges or in markets registered with the Commodity Futures Trading Commission or the SEC.
(G) Option Contracts. The Fund may purchase or write option contracts primarily to manage and/or gain exposure to interest rate, foreign exchange rate and credit risk. An option is a contract entitling the holder to purchase or sell a specific number of shares or units of an asset or notional amount of a swap (swaption), at a specified price. Options purchased are recorded as an asset while options written are recorded as a liability. Upon exercise of an option, the acquisition cost or sales proceeds of the underlying investment is adjusted by any premium received or paid. Upon expiration of an option, any premium received or paid is recorded as a realized gain or loss. Upon closing an option
121
DOMINI IMPACT BOND FUND
NOTES TO FINANCIAL STATEMENTS (continued)
January 31, 2023 (Unaudited)
other than through expiration or exercise, the difference between the premium and the cost to close the position is recorded as a realized gain or loss. The Fund had no purchased option contracts outstanding as of January 31, 2023.
(H) Futures Contracts. The Fund may purchase and sell futures contracts based on various securities, securities indexes, and other financial instruments and indexes. The Fund intends to use futures contracts for hedging purposes. Futures contracts provide for the future sale by one party and purchase by another party of a specified amount of a specified security or financial instrument at a specified future time and at a specified price. When the Fund purchases or sells a futures contract, the Fund must allocate certain of its assets as an initial deposit on the contract. The futures contract is marked to market daily thereafter, and the Fund may be required to pay or entitled to receive additional “variation margin,” based on decrease or increase in the value of the futures contract. Future contracts outstanding at January 31, 2023 are listed in the Fund’s Portfolio of Investments.
(I) Forward Currency Contracts. The Fund may enter into forward currency contracts with counterparties to hedge the value of portfolio securities denominated in particular currencies against fluctuations in relative value or to generate income or gain. These contracts are used to hedge foreign exchange risk and to gain exposure on currency. The U.S. dollar value of forward currency contracts is determined using current forward exchange rates supplied by a quotation service. The fair value of the contract will fluctuate with changes in currency exchange rates. The contract is marked to market daily and the change in fair value is recorded as an unrealized gain or loss. The Fund records a realized gain or loss equal to the difference between the value of the contract at the time it was opened and the value at the time it was closed when the contract matures or by delivery of the currency. The Fund could be exposed to risk if the value of the currency changes unfavorably, if the counterparties to the contracts are unable to meet the terms of their contracts or if the Fund is unable to enter into a closing position. Risk may exceed amounts recognized on the Statement of Assets and Liabilities. Forward currency contracts outstanding at January 31, 2023 are listed in the Fund’s Portfolio of Investments.
(J) Interest Rate Swap Contracts. The Fund may enter into interest rate swap contracts to hedge interest rate risk. An interest rate swap is an agreement between the Fund and a counterparty to exchange cash flows based on the difference between two interest rates, applied to a notional amount. Interest rate swap contracts are marked to market daily based upon quotations from an independent pricing service or market maker. Any change on an OTC interest rate swap is recorded as an unrealized gain or loss on the Statement of Assets
122
DOMINI IMPACT BOND FUND
NOTES TO FINANCIAL STATEMENTS (continued)
January 31, 2023 (Unaudited)
and Liabilities. Daily fluctuations in the value of centrally cleared interest rate swaps are settled though a central clearing agent and are recorded in variation margin on the Statement of Assets and Liabilities and recorded as unrealized gain or loss. OTC and centrally cleared interest rate swap contracts outstanding at January 31, 2023, are listed in the Fund’s Portfolio of Investments.
(K) Credit Default Swap Contracts. The Fund may enter into credit default swap contracts primarily to manage and/or gain exposure to credit risk. A credit default swap is an agreement between the fund and a counterparty whereby the buyer of the contract receives credit protection and the seller of the contract guarantees the credit worthiness of a referenced debt obligation. These agreements may be privately negotiated in the over-the-counter market (“OTC credit default swaps”) or may be executed in a multilateral trade facility platform, such as a registered exchange (“centrally cleared credit default swaps”). The underlying referenced debt obligation may be a single issuer of corporate or sovereign debt, a credit index, or a tranche of a credit index. In the event of a default of the underlying referenced debt obligation, the buyer is entitled to receive the notional amount of the credit default swap contract from the seller in exchange for the referenced debt obligation, a net settlement amount equal to the notional amount of the credit default swap less the recovery value of the referenced debt obligation, or other agreed upon amount. For centrally cleared credit default swaps, required initial margins are pledged by the fund, and the daily change in fair value is accounted for as a variation margin payable or receivable on the Statement of Assets and Liabilities. Over the term of the contract, the buyer pays the seller a periodic stream of payments, provided that no event of default has occurred. Such periodic payments are accrued daily as an unrealized appreciation or depreciation until the payments are made, at which time they are realized. Payments received or paid to initiate a credit default swap contract are reflected on the Statement of Assets and Liabilities and represent compensating factors between stated terms of the credit default swap agreement and prevailing market conditions (credit spreads and other relevant factors). These upfront payments are amortized over the term of the contract as a realized gain or loss on the Statement of Operations. OTC and centrally cleared credit default swap contracts outstanding at January 31, 2023 are listed in the Fund’s Portfolio of Investments.
(L) Total Return Swap Contracts. The Fund may enter into total return swaps to obtain investment exposures that are expected to correlate closely with the Index or a portion of the Index. Total return swaps are agreements in which there is an exchange of cash flows whereby one party commits to make
123
DOMINI IMPACT BOND FUND
NOTES TO FINANCIAL STATEMENTS (continued)
January 31, 2023 (Unaudited)
payments on the total return (coupon plus capital gains/losses) of an underlying instrument in exchange for fixed or floating rate interest payments. To the extent the total return of the instrument or index underlying the transaction exceeds or falls short of the offsetting interest rate obligation, the Fund will receive a payment or make a payment to the counterparty. During the term of the outstanding swap agreement, changes in the underlying value of the swap are recorded as unrealized gains and losses. Periodic payments received or made are recorded as realized gains or losses. The Fund is exposed to credit loss in the event of nonperformance by the swap counterparty. Risk may also arise from the unanticipated movements in value of exchange rates, interest rates, securities, or the index.
(M) Master Agreements. The Fund is a party to ISDA (International Swaps and Derivatives Association, Inc.) Master Agreements that govern OTC derivative and foreign exchange contracts (Master Agreements) with certain counterparties entered into from time to time. The Master Agreements may contain provisions regarding, among other things, the parties’ general obligations, representations, agreements, collateral requirements, events of default and early termination. With respect to certain counterparties, in accordance with the terms of the Master Agreements, collateral posted to the Fund is held in a segregated account by the Fund’s custodian and with respect to those amounts which can be sold or repledged, are presented in the Fund’s portfolio. Collateral pledged by the Fund is segregated by the Fund’s custodian and identified in the Fund’s portfolio. Collateral can be in the form of cash or other marketable securities as agreed to by the Fund and the applicable counterparty. Collateral requirements are determined based on the Fund’s net position with each counterparty.
With respect to ISDA Master Agreements, termination events applicable to the counterparty include certain deteriorations in the credit quality of the counterparty. Termination events applicable to the Fund include failure of the Fund to maintain certain net asset levels and/or limit the decline in net assets over various periods of time. In the event of default or early termination, the ISDA Master Agreement gives the non-defaulting party the right to net and close-out all transactions traded, whether or not arising under the ISDA agreement, to one net amount payable by one counterparty to the other. However, absent an event of default or early termination, OTC derivative assets and liabilities are presented gross and not offset in the Statement of Assets and Liabilities. Early termination by the counterparty may result in an immediate payment by the Fund of any net liability owed to that counterparty under the ISDA agreement.
124
DOMINI IMPACT BOND FUND
NOTES TO FINANCIAL STATEMENTS (continued)
January 31, 2023 (Unaudited)
In a centrally cleared swap, while the Fund enters into an agreement with a clearing broker to execute contracts with a counterparty, the performance of the swap is guaranteed by the central clearinghouse, which reduces the Fund’s exposure to counterparty risk. The Fund is still exposed to the counterparty risk through the clearing broker and clearinghouse. The clearinghouse attempts to minimize this risk to its participants through the use of mandatory margin requirements, daily cash settlements and other procedures. Likewise, the clearing broker reduces its risk through margin requirements and required segregation of customer balances.
(N) Investment Transactions, Investment Income, and Dividends to Shareholders. Investment transactions are accounted for on trade date. Realized gains and losses from security transactions are determined on the basis of identified cost. Interest income is recorded on an accrual basis. The Fund earns income daily, net of Fund expenses. Paydown gains and losses are recorded as an adjustment to interest income. Dividends to shareholders are usually declared daily and paid monthly from net investment income. Distributions to shareholders of realized capital gains, if any, are made annually. Distributions are determined in conformity with income tax regulations, which may differ from generally accepted accounting principles. Reclassifications have been made to the Fund’s components of net assets to reflect income and gains available for distribution (or available capital loss carryovers, as applicable) under income tax regulations.
(O) Federal Taxes. The Fund’s policy is to comply with the provisions of the Internal Revenue Code applicable to regulated investment companies and to distribute substantially all of its taxable income, including net realized gains, if any, within the prescribed time periods. Accordingly, no provision for federal income or excise tax is deemed necessary. As of January 31, 2023, tax years 2019 through 2022 remain subject to examination by the Fund’s major tax jurisdictions, which include the United States of America, the Commonwealth of Massachusetts, and New York State.
(P) Redemption Fees. Redemptions and exchanges of Fund shares held less than 30 days may be subject to the Fund’s redemption fee, which is 2% of the amount redeemed. The fee is imposed to offset transaction costs and other expenses associated with short-term investing. The fee may be waived in certain circumstances at the discretion of the Fund. Such fees are retained by the Fund and are recorded as an adjustment to paid-in capital.
The redemption fee was waived by the Fund’s Board of Trustees and was no longer imposed by the Fund effective August 16, 2021.
125
DOMINI IMPACT BOND FUND
NOTES TO FINANCIAL STATEMENTS (continued)
January 31, 2023 (Unaudited)
(Q) Other. Income, expenses (other than those attributable to a specific class), gains, and losses are allocated on a daily basis to each class of shares based upon the relative proportion of net assets represented by such class. Operating expenses directly attributable to a specific class are charged against the operations of that class.
(R) Transfer Agent Credits. Per the arrangement with the Fund’s former transfer agent, BNY Mellon Investment Servicing (U.S.) Inc., the Fund had arrangements prior to June 22, 2020, whereby it received earnings credits when positive cash balances were maintained. Such credits were used to offset transfer agent fees.
(S) Indemnification. The Fund’s organizational documents provide current and former trustees and officers with a limited indemnification against liabilities arising in connection with the performance of their duties to the Fund. In the normal course of business, the Fund may also enter into contracts that provide general indemnifications. The Fund’s maximum exposure under these arrangements is unknown as this would be dependent on future claims that may be made against the Fund. The risk of material loss from such claims is considered remote.
3. TRANSACTIONS WITH AFFILIATES
(A) Manager/Administrator. The Fund has retained Domini to serve as investment manager and administrator. The services provided by Domini consist of investment supervisory services, overall operational support, and administrative services, including the provision of general office facilities and supervising the overall administration of the Fund. For its services under the Management Agreement, Domini receives from the Fund a fee accrued daily and paid monthly at the annual rate of the Fund’s average daily net assets before any fee waivers of 0.33% of the first $50 million of net assets managed, 0.32% of the next $50 million of net assets managed, and 0.315% of net assets managed in excess of $100 million.
For its services under the Administration Agreement, Domini receives from the Fund a fee accrued daily and paid monthly at an annual rate equal to 0.25% of the Fund’s average daily net assets.
Effective November 30, 2022, Domini has contractually agreed to reduce its fees and/or reimburse certain ordinary operating expenses (excluding brokerage fees and commissions, interest, taxes, and other extraordinary expenses) in order to limit Investor, Institutional, and Class Y share expenses to 0.87%,
0.57%, and 0.65%, respectively, until November 30, 2023, absent an earlier
126
DOMINI IMPACT BOND FUND
NOTES TO FINANCIAL STATEMENTS (continued)
January 31, 2023 (Unaudited)
modification by the Board of Trustees which oversee the Fund. For the six months ended January 31, 2023, Domini reimbursed expenses totaling $166,132.
As of January 31, 2023, Domini owned less than 1% of any class of the outstanding Shares of the Fund.
(B) Submanager. Wellington Management Company LLP (Wellington), a Delaware limited liability partnership, provides investment management services to the Fund on a day-to-day basis pursuant to a Submanagement Agreement with Domini. The fee for submanagement services is paid by the adviser and is not an incremental Fund expense. For the period ended January 31, 2023, the fees received by the Fund’s submanager were $229,752.
(C) Distributor. The Board of Trustees of the Fund has adopted a Distribution Plan in accordance with Rule 12b-1 under the Act. DSIL Investment Services LLC (DSIL), a wholly owned subsidiary of Domini, acts as agent of the Funds in connection with the offering of Investor shares of the Funds pursuant to a Distribution Agreement. Under the Distribution Plan, the Fund pays expenses incurred in connection with the sale of Investor shares and pays DSIL a distribution fee at an aggregate annual rate not to exceed 0.25% of the average daily net assets representing the Investor shares. For the six months ended January 31, 2023, fees waived by DSIL for the Investor shares totaled $59,536.
(D) Shareholder Service Agent. The Trust has retained Domini to provide certain shareholder services to the Fund and its shareholders, which services were previously provided by the former transfer agent for the Fund or another fulfillment and mail service provider and are supplemental to services currently provided by Ultimus Fund Soultions, LLC (“Ultimus”), as transfer agent to the Fund, pursuant to a master services agreement between the Fund and Ultimus. For these services, Domini receives a fee from the Fund paid monthly at an annual rate of $4.00 per active account. For the six months ended January 31, 2023, Domini waived fees as follows:
| | | | |
| | | FEES WAIVED | |
Domini Impact Bond Fund Investor Shares | | $ | - | |
Domini Impact Bond Fund Institutional Shares | | | 72 | |
Domini Impact Bond Fund Class Y Shares | | | - | |
(E) Trustees and Officers. Each of the Independent Trustees receive an annual retainer for serving as a Trustee of the Trust of $32,000. The Lead Independent Trustee and Chair of the Audit Committee each receive an additional chairperson fee of $5,000. Each Independent Trustee also receives $2,000 for attendance at each meeting of the Board of the Trust (reduced to $1,000 in the
127
DOMINI IMPACT BOND FUND
NOTES TO FINANCIAL STATEMENTS (continued)
January 31, 2023 (Unaudited)
event that a Trustee participates at an in-person meeting by telephone or video conference). In addition, each Trustee receives reimbursement for reasonable expenses incurred in attending meetings. These expenses are allocated on a pro-rata basis to each shares class of a Fund according to their respective net assets.
As of January 31, 2023, all Trustees and officers of the Trust as a group owned less than 1% of the Fund’s outstanding shares.
4. INVESTMENT TRANSACTIONS
For the six months ended January 31, 2023, cost of purchase and proceeds from sales of investments other than short-term obligations were as follows:
| | | | | | | | |
| | | PURCHASES | | | SALES | |
U.S. Government Securities | | $ | 341,173,306 | | | $ | 347,459,835 | |
Investments in Securities | | | 10,238,569 | | | | 33,487,465 | |
128
DOMINI IMPACT BOND FUND
NOTES TO FINANCIAL STATEMENTS (continued)
January 31, 2023 (Unaudited)
5. SHARES OF BENEFICIAL INTEREST
At January 31, 2023, there was an unlimited number of shares authorized ($0.00001 par value). Transactions in the Fund’s shares were as follows:
| | | | | | | | | | | | | | | | |
| | | Six Months Ended January 31, 2023 (unaudited) | | | Year Ended July 31, 2022 | |
| | | Shares | | | Amount | | | Shares | | | Amount | |
| | | | |
Investor Shares | | | | | | | | | | | | | | | | |
Shares sold | | | 1,282,367 | | | $ | 12,907,912 | | | | 3,067,967 | | | $ | 34,632,081 | |
Shares issued in reinvestment of dividends and distributions | | | 172,455 | | | | 1,703,129 | | | | 310,574 | | | | 3,527,801 | |
Shares redeemed | | | (2,358,957) | | | | (23,390,731) | | | | (3,248,110) | | | | (36,084,839) | |
Redemption fees | | | - | | | | - | | | | - | | | | 16 | |
| | | | | | | | | | | | | | | | |
Net increase (decrease) | | | (904,135) | | | $ | (8,779,690) | | | | 130,431 | | | $ | 2,075,059 | |
| | | | | | | | | | | | | | | | |
| | | | |
Institutional Shares | | | | | | | | | | | | | | | | |
Shares sold | | | 1,394,008 | | | $ | 13,858,922 | | | | 5,754,588 | | | $ | 66,482,490 | |
Shares issued in reinvestment of dividends and distributions | | | 104,881 | | | | 1,028,621 | | | | 216,772 | | | | 2,443,689 | |
Shares redeemed | | | (2,263,229) | | | | (22,226,521) | | | | (4,714,669) | | | | (51,690,642) | |
Redemption fees | | | - | | | | - | | | | - | | | | - | |
| | | | | | | | | | | | | | | | |
Net increase (decrease) | | | (764,340) | | | $ | (7,338,978) | | | | 1,256,691 | | | $ | 17,235,537 | |
| | | | | | | | | | | | | | | | |
| | | | |
Class Y Shares | | | | | | | | | | | | | | | | |
Shares sold | | | 507,699 | | | $ | 5,061,826 | | | | 1,044,534 | | | $ | 11,379,112 | |
Shares issued in reinvestment of dividends and distributions | | | 28,460 | | | | 281,418 | | | | 30,866 | | | | 347,605 | |
Shares redeemed | | | (398,440) | | | | (3,976,591) | | | | (325,034) | | | | (3,605,973) | |
Redemption fees | | | - | | | | - | | | | - | | | | - | |
| | | | | | | | | | | | | | | | |
Net increase | | | 137,719 | | | $ | 1,366,653 | | | | 750,366 | | | $ | 8,120,744 | |
| | | | | | | | | | | | | | | | |
| | | | |
Total | | | | | | | | | | | | | | | | |
Shares sold | | | 3,184,074 | | | $ | 31,828,660 | | | | 9,867,089 | | | $ | 112,493,683 | |
Shares issued in reinvestment of dividends and distributions | | | 305,796 | | | | 3,013,168 | | | | 558,212 | | | | 6,319,095 | |
Shares redeemed | | | (5,020,626) | | | | (49,593,843) | | | | (8,287,813) | | | | (91,381,454) | |
Redemption fees | | | - | | | | - | | | | - | | | | 16 | |
| | | | | | | | | | | | | | | | |
Net increase (decrease) | | | (1,530,756) | | | $ | (14,752,015) | | | | 2,137,488 | | | $ | 27,431,340 | |
| | | | | | | | | | | | | | | | |
129
DOMINI IMPACT BOND FUND
NOTES TO FINANCIAL STATEMENTS (continued)
January 31, 2023 (Unaudited)
6. SUMMARY OF DERIVATIVE ACTIVITY
At January 31, 2023, the Fund’s investments in derivative contracts are reflected on the Statement of Assets and Liabilities as follows:
| | | | | | | | | | | | |
| | | Asset Derivatives | | | | | Liability Derivatives | | | |
Derivative Contracts Not
Accounted for as
Hedging Instruments | | Statement of Assets
and Liabilities Location | | Fair Value | | | Statement of Assets
and Liabilities Location | | Fair Value | |
Interest Rate Risk | | Receivable for variation margin swaps / Receivable for variation margin futures / Net assets consist of - Total distributable earnings | | $ | 2,294,831 | * | | Payable for variation margin swaps/Payable for variation margin futures / Net assets consist of - Total distributable earnings | | $ | 1,969,186 | * |
| | | | | | | | | | | | |
Credit Risk | | Receivable for variation margin swaps / Net assets consist of - Total distributable earnings | | | 48,577 | | | Payable for variation margin swaps /Net assets consist of - Total distributable earnings | | | - | |
| | | | | | | | | | | | |
Foreign Exchange
Risk | | Unrealized appreciation on forward currency contracts/Net assets consist of - Total distributable earnings | | | 63,578 | | | Unrealized depreciation on forward currency contracts/Net assets consist of - Total distributable earnings | | | 591,996 | |
| | | | | | | | | | | | |
| | | | | | | | | | | | |
Total | | | | $ | 2,406,986 | | | | | $ | 2,561,182 | |
| | | | | | | | | | | | |
* Includes cumulative appreciation/depreciation of futures contracts as reported in Portfolio of Investments/footnotes. Only current day’s variation margin is reported within the Statement of Assets and Liabilities.
130
DOMINI IMPACT BOND FUND
NOTES TO FINANCIAL STATEMENTS (continued)
January 31, 2023 (Unaudited)
For the six months ended January 31, 2023, the effect of derivative contracts on the Fund’s Statement of Operations was as follows:
| | | | | | | | | | |
Derivative Contracts Not
Accounted for as
Hedging Instruments | | Statement of Operations
Location | | Realized Gain
(Loss) | | | Change in Unrealized
Appreciation
(Depreciation) | |
Interest Rate Risk | | Net realized gain (loss) from swap and future contracts/ Net change in unrealized appreciation (depreciation) from swap and future contracts | | $ | 749,375 | | | $ | 803,680 | |
| | | | | | | | | | |
Credit Risk | | Net realized gain (loss) from swap contracts/ Net change in unrealized appreciation (depreciation) from swap contracts | | | 24,491 | | | | 86,158 | |
| | | | | | | | | | |
Foreign Exchange Risk | | Net realized gain (loss) from forward contracts/ Net change in unrealized appreciation (depreciation) from forward contracts | | | 128,384 | | | $ | (579,573 | ) |
| | | | | | | | | | |
| | | | | | | | | | |
Total | | | | $ | 902,249 | | | $ | 310,265 | |
| | | | | | | | | | |
The average notional cost of futures contracts and average notional amounts of other derivative contracts outstanding during the six months ended January 31, 2023, which are indicative of the volume of these derivative types, were approximately as follows:
| | | | |
Futures contracts (notional) | | $ | 15,363,655 | |
Forward currency contracts (contract amount) | | $ | 10,958,120 | |
Centrally cleared interest rate swap contracts (notional) | | $ | 97,383,286 | |
Centrally cleared credit default contracts (notional) | | $ | 2,540,000 | |
131
DOMINI IMPACT BOND FUND
NOTES TO FINANCIAL STATEMENTS (continued)
January 31, 2023 (Unaudited)
7. FEDERAL TAX STATUS
The tax basis of the components of net assets at July 31, 2022, is as follows:
| | | | |
Unrealized appreciation/(depreciation) | | $ | (18,179,835) | |
Capital losses, other losses and other temporary differences | | | - | |
Late year ordinary and post Oct capital loss deferrals | | | (6,894,115) | |
| | | | |
Distributable net earnings/(deficit) | | $ | (25,073,950) | |
| | | | |
For tax purposes, the Fund may elect to defer any portion of a post October capital loss deferral or late year ordinary Loss to the first day of the following fiscal year. At July 31, 2022, the Fund deferred post October capital losses of $6,894,115.
For federal income tax purposes, dividends paid were characterized as follows:
| | | | | | | | |
| | | Year Ended July 31, | |
| | | 2022 | | | 2021 | |
| | | | | | | | |
Ordinary income | | $ | 4,772,788 | | | $ | 8,904,751 | |
Long-term capital gain | | | 2,124,746 | | | | 754,786 | |
| | | | | | | | |
Total | | $ | 6,897,534 | | | $ | 9,659,537 | |
| | | | | | | | |
The Fund is subject to the provisions of Accounting Standards Codification ASC 740 Income Taxes (ASC 740). ASC 740 sets forth a minimum threshold for financial statement recognition of the benefit of a tax position taken or expected to be taken in a tax return. The Fund did not have a liability to record for any unrecognized tax benefits in the accompanying financial statements. No provision has been made for taxes on income, capital gains or unrealized appreciation on securities held or for excise tax on income and capital gains.
8. OTHER RISKS
The Fund’s risks include, but are not limited to, some or all of the risks discussed below:
Market Risk. The market values of securities or other assets will fluctuate, sometimes sharply and unpredictably, due to changes in general market conditions, overall economic trends or events, governmental actions or intervention, market disruptions caused by trade disputes or other factors, political developments, recessions, inflation, changes in interest or currency rates, the spread of infectious illness or other public health issues, armed conflict, market disruptions caused by tariffs, trade disputes, sanctions or other government actions, or other factors or adverse investor sentiment that may or may not be related to the issuer of the security or other asset. If the market values of the securities or other assets held by the Fund fall, including a
132
DOMINI IMPACT BOND FUND
NOTES TO FINANCIAL STATEMENTS (continued)
January 31, 2023 (Unaudited)
complete loss on any individual security, the value of your investment will go down. A change in financial condition or other event affecting a single issuer or market may adversely impact securities markets as a whole. Rates of inflation have recently risen. The value of assets or income from an investment may be worth less in the future as inflation decreases the value of money. As inflation increases, the real value of the Fund’s assets can decline as can the value of the Fund’s distributions.
The global pandemic of the novel coronavirus respiratory disease designated COVID-19 has resulted in major disruption to economies and markets around the world, including the U.S. Global financial markets have experienced extreme volatility and severe losses, and trading in many instruments has been disrupted. Liquidity for many instruments has been greatly reduced for periods of time. Some sectors of the economy and individual issuers have experienced particularly large losses. These circumstances may continue for an extended period of time and may continue to affect adversely the value and liquidity of the Fund’s investments. Following Russia’s invasion of Ukraine, Russian securities have lost all, or nearly all, their market value. Other securities or markets could be similarly affected by past or future geopolitical or other events or conditions.
Governments and central banks, including the U.S. Federal Reserve, have taken extraordinary and unprecedented actions to support local and global economies and the financial markets. These actions have resulted in significant expansion of public debt, including in the U.S. The consequences of high public debt, including its future impact on the economy and securities markets, may not be known for some time. Although they have started to increase, interest rates are still very low, which means there is more risk that they may go up. U.S. Federal Reserve or other U.S. or non-U.S. governmental or central bank actions, including increases or decreases in interest rates, or contrary actions by different governments, could negatively affect financial markets generally, increase market volatility and reduce the value and liquidity of securities in which the Fund invests. Policy and legislative changes in the U.S. and in other countries are affecting many aspects of financial regulation, and these and other events affecting global markets, such as the U.K.’s exit from the European Union (or Brexit), potential trade imbalances with China or other countries, or sanctions or other government actions against Russia, other nations or individuals or companies (or their countermeasures), may contribute to decreased liquidity and increased volatility in the financial markets. The impact of these changes on the markets, and the implications for market participants, may not be fully known for some time.
133
DOMINI IMPACT BOND FUND
NOTES TO FINANCIAL STATEMENTS (continued)
January 31, 2023 (Unaudited)
Economies and financial markets throughout the world are increasingly interconnected. Economic, financial or political events, trading or tariff arrangements, armed conflict including Russia’s military invasion of Ukraine, terrorism, natural disasters, infectious illness or public health issues, cybersecurity events, supply chain disruptions, sanctions against Russia, other nations or individuals or companies and possible countermeasures, and other circumstances in one country or region could have profound impacts on other countries or regions and on global economies or markets. As a result, whether or not the Fund invests in securities of issuers located in or with significant exposure to the countries or regions directly affected, the value and liquidity of the Fund’s investments may be negatively affected.
134
PROXY VOTING INFORMATION
The Domini Funds have established Proxy Voting Policies and Procedures that the Funds use to determine how to vote proxies relating to portfolio securities. The Domini Funds’ Proxy Voting Policies and Procedures are available, free of charge, by calling 1-800-582-6757, by visiting domini.com/proxyvoting, or by visiting the EDGAR database on the Securities and Exchange Commission’s (SEC) website at sec.gov. All proxy votes cast for the Domini Funds are posted to Domini’s website on an ongoing basis over the course of the year. An annual record of all proxy votes cast for the Funds during the most recent 12-month period ended June 30 can be obtained, free of charge, at domini.com and on the EDGAR database on the SEC’s website at sec.gov.
QUARTERLY PORTFOLIO SCHEDULE INFORMATION
Disclosure of each Fund’s portfolio holdings is made within 60 days of the end of each fiscal semi-annual period (each July 31 and January 31) in the Annual Report and the Semi-Annual Report to Fund shareholders and as of the end of its first and third fiscal quarters (each October 31 and April 30) in publicly available filings of Form N-PORT on the EDGAR database on the SEC’s website, sec.gov. Portfolio holdings information is also available online at domini.com/funddocuments.
To obtain copies of Annual and Semi-Annual Reports, free of charge, call 1-800-582-6757. Each Annual Report and Semi-Annual Report is available online at domini.com/funddocuments and in publicly available filings of Form N-CSR on the EDGAR database on the SEC’s website, sec.gov.
135
DOMINI FUNDS
P.O. Box 46707
Cincinnati, OH 45246-0707
1-800-582-6757
domini.com
Investment Manager, Sponsor, and Distributor:
Domini Impact Investments LLC (Investment Manager and Sponsor)
DSIL Investment Services LLC (Distributor)
180 Maiden Lane, Suite 1302
New York, NY 10038-4925
Investment Submanagers:
Domini Impact Equity Fund
Domini International Opportunities Fund
Domini Sustainable Solutions Fund
SSGA Funds Management, Inc.
1 Iron Street
Boston, MA 02210
Domini Impact International Equity Fund
Domini Impact Bond Fund
Wellington Management Company LLP
280 Congress Street
Boston, MA 02210
Transfer Agent:
Ultimus Fund Solutions, LLC
225 Pictoria Drive, Suite 450
Cincinnati, OH 45246
Custodian:
State Street Bank and Trust Company
100 Summer Street
Boston, MA 02210
Independent Registered Public Accounting Firm:
KPMG LLP
Two Financial Center
60 South Street
Boston, MA 02111
Legal Counsel:
Morgan, Lewis & Bockius LLP
One Federal Street
Boston, MA 02110
| | |
Sign up for Domini news and impact updates at domini.com/subscribe | |  |
| | |

Domini Funds P.O. Box 46707 | Cincinnati, OH 45246-0707 1-800-582-6757 | domini.com | @DominiFunds Subscribe to Domini news at domini.com/subscribe | |  |
Domini Impact Equity FundSM
Investor Shares: CUSIP 257132100 | DSEFX
Institutional Shares: CUSIP 257132852 | DIEQX
Class Y Shares: CUSIP 257132308 | DSFRX
Class A Shares: CUSIP 257132860 | DSEPX
Domini International Opportunities FundSM
Investor Shares: CUSIP 257132753 | RISEX
Institutional Shares: CUSIP 257132746 | LEADX
Domini Sustainable Solutions FundSM
Investor Shares: 257132761 | CAREX
Institutional Shares: 257132779 | LIFEX
Domini Impact International Equity FundSM
Investor Shares: CUSIP 257132704 | DOMIX
Institutional Shares: CUSIP 257132811 | DOMOX
Class Y Shares: CUSIP 257132787 | DOMYX
Class A Shares: CUSIP 257132886 | DOMAX
| | |
Domini Impact Bond FundSM Investor Shares: CUSIP 257132209 | DSBFX Institutional Shares: CUSIP 257132829 | DSBIX Class Y Shares: CUSIP 257132795 | DSBYX | |   |
| (a) | Not applicable to a semi-annual report. |
| Item 3. | Audit Committee Financial Expert. |
Not applicable to a semi-annual report.
| Item 4. | Principal Accountant Fees and Services. |
Not applicable to a semi-annual report.
| Item 5. | Audit Committee of Listed Registrants. |
Not applicable to the registrant.
| Item 6. | Schedule of Investments. |
(a) The Schedule of Investments is included as part of the report to stockholders filed under Item 1.
(b) Not applicable.
| Item 7. | Disclosure of Proxy Voting Policies and Procedures for Closed-End Management Investment Companies. |
Not applicable to the registrant.
| Item 8. | Portfolio Managers of Closed-End Management Investment Companies. |
Not applicable to the registrant.
| Item 9. | Purchases of Equity Securities by Closed-End Management Investment Company and Affiliated Purchasers. |
Not applicable to the registrant.
| Item 10. | Submission of Matters to a Vote of Security Holders. |
There have been no material changes to the procedures by which shareholders may submit recommendations for nominees to the registrant’s Board of Trustees.
| Item 11. | Controls and Procedures. |
(a) Within 90 days prior to the filing of this report on Form N-CSR, Carole M. Laible, the registrant’s President and Principal Executive Officer, and Christina M. Povall, the registrant’s Treasurer and Principal Financial Officer, reviewed the registrant’s disclosure controls and procedures (as defined in Rule 30a-3(c) of the Investment Company Act of 1940) and evaluated their effectiveness. Based on their evaluation, Ms. Laible and Ms. Povall determined that the disclosure controls and procedures adequately ensure that information required to be disclosed by the registrant in this report on Form N-CSR is recorded, processed, summarized, and reported within the time periods required by the Securities and Exchange Commission’s rules and forms.
(b) There were no changes in the registrant’s internal control over financial reporting (as defined in Rule 30a-3(d) under the Investment Company Act of 1940) that occurred during the period covered by this report that have materially affected, or is reasonably likely to materially affect, the registrant’s internal control over financial reporting.
| Item 12. | Disclosure of Securities Lending Activities for Closed-End Management Investment Companies. |
Not applicable to the registrant
(a)(1) Not applicable to a semi-annual report.
(a)(2) Separate certifications required by Rule 30a-2(a) under the Investment Company Act of 1940 for each principal executive officer and principal financial officer of the registrant are filed herewith.
(b) A single certification required by Rule 30a-2(b) under the Investment Company Act of 1940, Rule 13a-14b or Rule 15d-14(b) under the Securities Exchange Act of 1934, and Section 1350 of Chapter 63 of Title 18 of the United States Code for the chief executive officer and the chief financial officer of the registrant is filed herewith.
SIGNATURES
Pursuant to the requirements of the Securities Exchange Act of 1934 and the Investment Company Act of 1940, the registrant has duly caused this report to be signed on its behalf by the undersigned, thereunto duly authorized.
DOMINI INVESTMENT TRUST
| | |
| By: | | /s/ Carole M. Laible |
| | Carole M. Laible |
| | President |
|
| Date: April 5, 2023 |
Pursuant to the requirements of the Securities Exchange Act of 1934 and the Investment Company Act of 1940, this report has been signed below by the following persons on behalf of the registrant and in the capacities and on the dates indicated.
| | |
| By: | | /s/ Carole M. Laible |
| | Carole M. Laible |
| | President (Principal Executive Officer) |
|
| Date: April 5, 2023 |
| |
| By: | | /s/ Christina M. Povall |
| | Christina M. Povall |
| | Treasurer (Principal Financial Officer) |
|
| Date: April 5, 2023 |