UNITED STATES
SECURITIES AND EXCHANGE COMMISSION
Washington, D.C. 20549
FORMN-CSR
CERTIFIED SHAREHOLDER REPORT OF REGISTERED
MANAGEMENT INVESTMENT COMPANIES
Investment Company Act File Number811-5823
DOMINI INVESTMENT TRUST
(Exact Name of Registrant as Specified in Charter)
180 Maiden Lane, Suite 1302, New York, New York 10038
(Address of Principal Executive Offices)
Amy Domini Thornton
Domini Impact Investments LLC
180 Maiden Lane, Suite 1302
New York, New York 10038
(Name and Address of Agent for Service)
Registrant’s Telephone Number, including Area Code:212-217-1100
Date of Fiscal Year End: July 31
Date of Reporting Period: January 31, 2020
| Item 1. | Reports to Stockholders. |
A copy of the report transmitted to stockholders pursuant to Rule30e-1 under the Investment Company Act of 1940 follows.
SEMI-ANNUAL REPORT 2020 January 31, 2020 DOMINI IMPACT INTERNATIONAL EQUITY FUNDSM DOMINI IMPACT EQUITY FUNDSM DOMINI IMPACT BOND FUNDSM
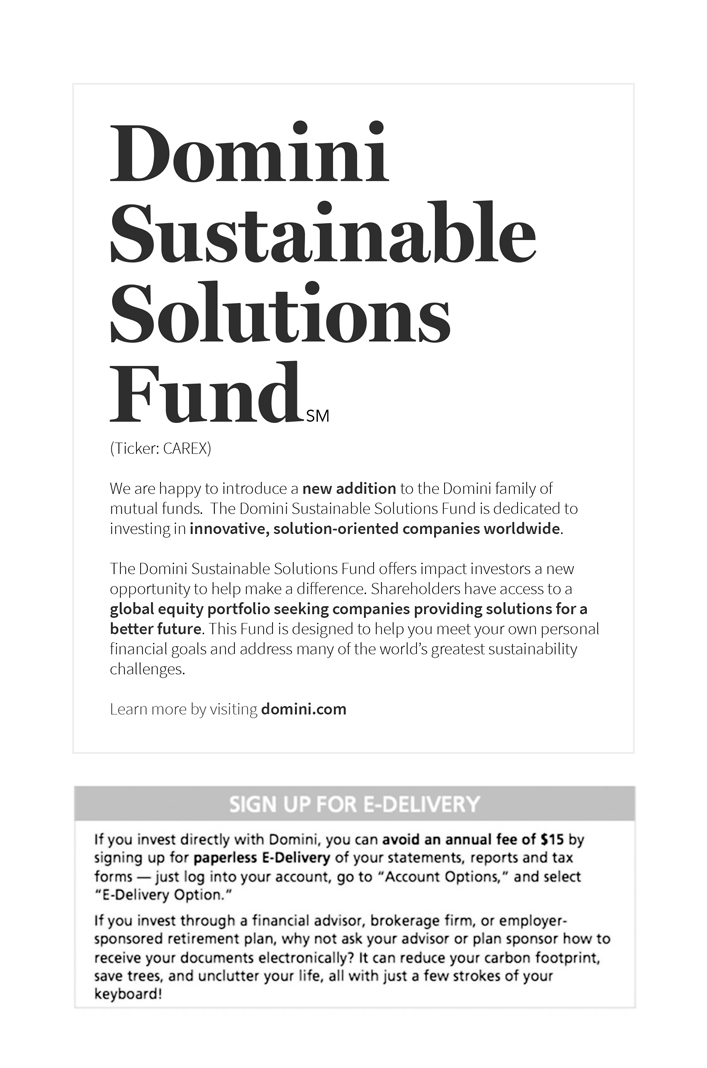
Domini Sustainable Solutions Fund SM (Ticker:CAREX) We are happy to introduce a new addition to the Domini family of mutual funds. The Domini Sustainable Solutions Fund is dedicated to investing innovative, solution-oriented companied worldwide. The Domini Sustainable Solutions Fund offers impact investors a new opportunity to help make a difference. Shareholders have access to a global equity portfolio seeking companies providing solutions for a better future. This Fund is designed to help you meet your own personal financial goals and address many of the world's greatest sustainability challenges.Learn more by visiting domini.comSIGN UP FOR E-DELIVERYIf you invest directly with Domini, you can avoid an annual fee $15 by signing up for paperless E-Delivery of your statements, reports and tax forms-just log into your account, go to Account Options and select E-Delivery Option. If you invest through a financial advisor, brokerage firm, or employer-sponsored retirement plan, why not ask your advisor or plan sponsor how to receive your documents electronically? It can reduce your carbon footprint, save trees, and unclutter your life, all with just a few strokes of your keyboard!
TABLE OF CONTENTS
INVESTINGFOR GOOD®
LETTER TO SHAREHOLDERS
Dear Fellow Shareholder,
At Domini Impact Investments every stock or bond we own has been chosen carefully based on the impact it has on people and on the planet. By examining clues in corporate culture, we seek to identify investments that are peer leaders in addressing their key sustainability challenges.
Each industry faces unique risks and challenges, so our research takes anindustry-by-industry approach. We identify the most egregious practices within each industry as well as the best. We then systematically review each company with the lens of these key indicators to determine which companies to invest in.
A frustrating problem we must often confront is the inadequate monetary accounting for corporate impact. Simply stated, current corporate disclosure requirements and practices ignore the full cost of adverse behaviors. But these costs are high and are worth examining further.
One example to consider is air pollution. Sulfur dioxide is a compound which largely results from coal-fired electricity-generating power plants and industrial processes such as refining or metal processing. Once airborne, the toxic gas transforms into particles that blow for hundreds of miles. Pollutants like sulfur dioxide are a leading cause of asthma, but the metal smelting operator (for example) does not pay for the resulting health care cost and most certainly not the human cost. The asthmatic population and their families, the healthcare system, and the general public shoulders the expense, while the metal smelting operator reaps the profits.
This example illustrates the challenge of a full impact evaluation. To be effective, we need to stand back and attempt to understand just how a company’s behavior effects the natural ecosystem and our social systems. Then we must decide whether to own it in our portfolios. This is the primary way that responsible investors respond to and raise awareness of our planet’s greatest challenges.
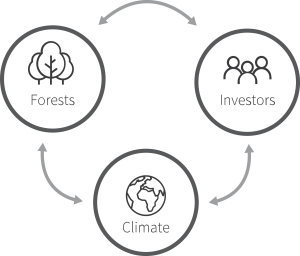
In this semi-annual report, we present you with our work on forests, an area where we employ this full-system view. This report is especially timely given the ongoing rampant destruction of forests, both as a result of climate change and deliberate actions by corporations or their suppliers. Forests are the lungs of our planet and to save them we must go beyond avoiding drivers of deforestation. Now is the time for investors, companies and consumers to appropriately value forests, so we can account for and steward their immense value.
2
INVESTINGFOR GOOD®
Consider the value we receive fromold-growth forests that remove carbon dioxide from the atmosphere. Unlike newly regrown forests, old forests have created a dense soil resulting from centuries of plants and animals dying, decomposing and nurturing new growth. Theold-growth forests sequester carbon in their soil, trees, and the rich web of life they harbor. Since carbon dioxide is the primary cause of climate change, naturally trapping the carbon in the earth and out of our atmosphere is crucial to slowing climate change and its already unfolding disasters. Forests are part of the climate solution and reforestation and rewilding can provide significant carbon sinks.
Climate change has real monetary consequences and therefore a monetary analysis of the value of carbon sequestration by forests is possible. But the work remains ahead; we still disagree about how to value our undeniably precious environment. It is not the first time we have been confronted by the shortcomings of our measurements of wellbeing. In 1968 Robert F. Kennedy, referring to the Gross Domestic Product (GDP), said, “It measures everything in short, except that which makes life worthwhile.”
We cannot dismiss the truth unfolding before us. We must conscientiously review the facts, strive for greater disclosure and better solutions, and raise the alarm about breakdowns in many systems that we humans depend upon. Forests are one such core system and the following pages discuss why.
To shift away from today’s unsustainable paradigm, investors, companies and consumers must change how we understand our impact. We must step back to see the whole picture and the whole planet. Only then will our solutions be grand enough to match our challenges.
Thank you for your continued support of the responsible investing movement. Your investment with us is, we believe, a part of the solution.
| | |

Carole Laible CEO | | 
Amy Domini Founder and Chair |
3
INVESTINGFOR GOOD®
YOUR MONEY AT WORK
Focusing on Forests
Companies Drive Deforestation. Investors Can Stop Them.
Most tropical deforestation is driven by just four commodities: palm oil, cattle, soy, and wood products. These products are produced and bought by major corporations and find their way into our everyday lives. With fires raging in the Amazon and Indonesia, as well as Australia and California, many people are asking what they can do to protect the world’s forests. Investors, both institutional and individual, have a huge role to play in preserving and enhancing forests. Investors can pressure companies to halt deforestation in their supply chains and can divest from companies that engage in forest-harming practices. Investors that fail to address deforestation in their portfolios are not only exposed to cross-sector risk, but also miss the opportunity to help create the much-needed forest solutions we need.
The unprecedented forests fires have reminded us how much we care about forests and the animals that inhabit them. These disasters have also highlighted how much we depend on forests for clean air and a stable climate. Forests’ capacity for carbon capture could be a powerful solution to climate change, but currently an estimated 15% of all greenhouse gas emissions result from deforestation. In addition, deforestation is a threat to biodiversity and rural and indigenous communities that depend upon forests for their livelihoods.
4
INVESTINGFOR GOOD®
Supporting Forests
Domini Impact Investments has a long history of working to support forests. We both avoid investing in drivers of deforestation and work to create sustainable practices. In practice, this goal means we avoid investments in industrial agriculture and other environmentally intensive practices that can have detrimental impacts on land and water resources, including forests.
In Brazil, for example, most forest loss is driven by land-clearing, including intentional fires, to increase agricultural production. Much of this land-clearing is illegal but persists due to Brazil’s poor enforcement of environmental laws and insufficiently resourced regulatory agencies. Industrial farming in Brazil is centered on large-scale cattle ranching and soy plantations. Due to violations of environmental regulations including widespread deforestation, as well as corruption, encroachment into indigenous territory, and the waste and emissions in meat production, we avoid companies engaging in soy and cattle farming in Brazil and companies that export and trade these products.
Instead, we seek investments that promote the protection and preservation of forests, wildlife and ecosystems. We favor companies that integrate sustainable practices into their global supply chains, such as using rigorous sustainability certifications for timber. We also look for companies that are reducing pollution of air and waterways, understand and report on how their operations impact forests and local ecosystems, and responsibly manage relations with local and indigenous communities. We recently reviewed our proprietary key performance indicators across all sectors to codify risks related to deforestation to help us better identify companies that are having a positive impact on forests.
We seek investments that promote
the protection and preservation of
forests, wildlife and ecosystems.
To support solutions to forest loss, we raise awareness of the crucial functions of forests with corporations and industry partners. We push companies to achieve deforestation-free supply chains. We work with portfolio companies, including food manufacturers and retailers, to reduce demand for products that cause deforestation and help them to work with their suppliers to create deforestation-free supply chains for inputs.
Many companies we approve for investment are already having a positive impact. These include Klabin SA, a Brazilian packaging and agroforestry company. Klabin has 100%FSC-certified forests, the first company in the Southern Hemisphere with the certification, and the company’s
5
INVESTINGFOR GOOD®
production facilities are alsoFSC-certified. We consider FSC to be the best forestry standard, as it includes biodiversity and community factors in its assessment. The company maintains 48% of forest area for conservation and maintenance of biodiversity in accordance with Brazil’s Forest Code, which requires20-80% of holdings be set aside as legal reserves, depending on plot size and location. Klabin uses a mosaic concept for forest management, wherein pine and eucalyptus plantations are mixed with areas of native forests in order to create ecological corridors.
Good governance, including strong legal protections and enforcement, is crucial for sustainable forests. Apart from direct company and sector work, we have supported legislation that would require companies involved in public procurement to haveno-deforestation policies and enforcement mechanisms in place. We recently organized investor support for the California Deforestation-Free Procurement Act. The Act would require companies doing business with California to have policies, certification and public disclosure regarding deforestation and human rights. This disclosure would help investors identify companies that are fulfilling their zero deforestation commitments.
Stewarding Forests
Companies and investors must go beyond avoiding deforestation to creating solutions and restoring forest landscapes. In our discussions about forests with portfolio companies, those that have the best forest practices recognize risk exposure goes beyond their own impact and supply chain. They know that deforestation is complicated and try to work with many partners, including vertically, horizontally and across sectors to scale change. And they recognize that dire nature of deforestation means they must seek solutions proactively, without waiting on peers or government action.
Companies and investors must go beyond
avoiding deforestation to creating solutions
and restoring forest landscapes.
This year we engaged with 68 companies in our portfolios that both impact forests and depend on them, whether for forest-derived products or ecosystem services. We had positive responses from many corporations, holding discussions with them about how they consider the value they obtain from forests and how they can better work to steward it. Through these dialogues we have begun to identify corporate actors that are effectively protecting and supporting forests and some of the specific practices and qualities that set them apart.
6
INVESTINGFOR GOOD®
Investors must also fundamentally change their mindset about how they consider forest value. We find two root causes underlying continued deforestation. First, today’s focus on short-term profit leads to practices that extract value while perversely undermining the very source of the value. Second, without an appropriate value and cost framework, investors and corporations do not feel the need or responsibility to steward the forests we all rely upon.
We are uniquely positioned to make the case to our peers that they must do more to identify and manage forest value. Carole Laible, our CEO, addressed audiences at Responsible Investor New York about the connection between forests and food security. She explained the urgent need for investors and companies to understand how much value their operations receive from natural ecosystems, especially forests, and called on the attendees to steward environmental and social systems.
If we recognize how much value we receive from ecosystems, we can begin to foster and enhance that value, with benefits for our businesses, employees, rural communities, and the environment.
Carole also spoke to financial advisors at a Money Management Institute event, explaining how we consider and act on forests’ economic value and work to improve how deforestation is addressed. She illustrated how investors must go beyond mitigating harm to forests through portfolio operations to positively enhancing forest systems in order to preserve and enhance the value in their investments.
To send a public message in response to the surge in fires in the Amazon rainforest this summer, we joined 230 investors representing over $16 trillion in assets to call for urgent action on the fires in the Amazon. The statement asked investors and corporations to take actions ranging from public statements to making commitments about supply chain practices.
Moving to a Forest-Positive Economy
Large corporations and their investors often drive deforestation. Through conventional investing practices, investors contribute to the worsening of profound environmental change that poses systemic environmental risks with potentially adverse impacts on their holdings across all asset classes. These investors should consider their impact on forests when making investment decisions. Investors can encourage proper valuation of natural services from forests and inclusion of reforestation in climate change strategies, while helping corporations not only avoid harming forests but positively impacting them.
7
INVESTINGFOR GOOD®
Domini recognizes forests’ critical role in global environmental and social systems. We can and do drive change, not only helping to combat commodity-driven deforestation but encouraging reforestation, biodiversity conservation, and sustainable development. We will continue prioritizing forests as a key foundation for a sustainable economy, divesting when necessary and working with our partners and portfolio companies to foster forest health.

If we recognize how much value we receive from ecosystems, we can begin to foster and enhance that value, with benefits for our businesses, employees, rural communities, and the environment.
8
INVESTINGFOR GOOD®
The holdings discussed above can be found in the portfolio of the Domini Impact Equity Fund and Domini Impact Bond Fund, included herein. The composition of each portfolio is subject to change.
The Domini Funds are not bank deposits and are not insured. You may lose money. Investment return, principal value and yield will fluctuate. Your shares, when redeemed, may be worth more or less than their original cost.
The Domini Impact Equity Fund is subject to market, recent events, impact investing, portfolio management, information, andmid-to large cap companies risks. The Domini Impact Bond Fund is subject to market, recent events, impact investing, style, information, interest rate and credit risks. The Domini Sustainable Solutions Fund is subject to market, recent events, sustainable investing, portfolio management, information andmid-tolarge-cap companies risks.
This report is not authorized for distribution to prospective investors of the Domini Funds referenced herein unless preceded or accompanied by a current prospectus for the relevant Fund. Nothing contained herein is to be considered a recommendation concerning the merits of any noted company or security, or an offer of sale or a solicitation of an offer to buy shares of any Fund or issuer referenced in this report. Such offering is only made by prospectus, which includes details as to the offering price and other material information. Carefully consider the Funds’ investment objectives, risk factors and charges and expenses before investing. This and other information can be found in the Funds’ prospectus, which may be obtained by calling 1-800-582-6757 or at www.domini.com. Domini Impact Investments LLC is each Fund’s investment manager. The Funds are subadvised by unaffiliated entities. Shares of the Domini Funds are offered for sale only in the United States. DSIL Investment Services LLC, Distributor, member FINRA. 03/20
9
DOMINI IMPACT INTERNATIONAL EQUITY FUND
Fund Performance and Holdings
The table and bar charts below provide information as of January 31, 2020, about the ten largest holdings of the Domini Impact International Equity Fund and its portfolio holdings by industry sector and country:
TEN LARGEST HOLDINGS (Unaudited)
| | | | | | | | | | |
| | | | |
| SECURITY DESCRIPTION | | % NET
ASSETS | | | SECURITY DESCRIPTION | | % NET
ASSETS | |
| | | | |
| GlaxoSmithKline PLC | | | 2.6% | | | Sonova Holding AG | | | 2.0% | |
| | | | |
| Novartis AG | | | 2.3% | | | Coca-Cola European Partners PLC | | | 1.9% | |
| | | | |
| Kering SA | | | 2.3% | | | Intesa Sanpaolo SpA | | | 1.8% | |
| | | | |
| Merck KGaA | | | 2.3% | | | BNP Paribas SA | | | 1.8% | |
| | | | |
| adidas AG | | | 2.2% | | | Koninklijke Ahold Delhaize NV | | | 1.7% | |
PORTFOLIO HOLDINGS BY INDUSTRY SECTOR (% OF NET ASSETS) (Unaudited)
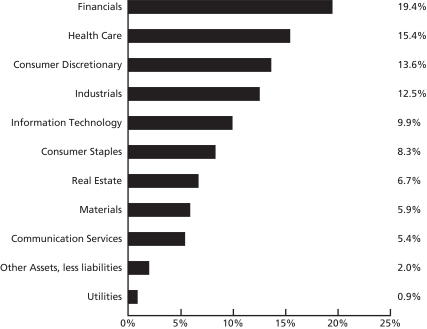
The Global Industry Classification Standard (“GICS”) was developed by and is the exclusive property and a service mark of MSCI Inc. (“MSCI”) and Standard & Poor’s, a division of The McGraw-Hill Companies, Inc. (“S&P”) and is licensed for use by Domini Impact Investments. Neither MSCI, S&P nor any third party involved in making or compiling the GICS or any GICS classifications makes any express or implied warranties or representations with respect to such standard or classification nor shall any such party have any liability therefrom.
10
PORTFOLIO HOLDINGS BY COUNTRY (% OF NET ASSETS) (Unaudited)
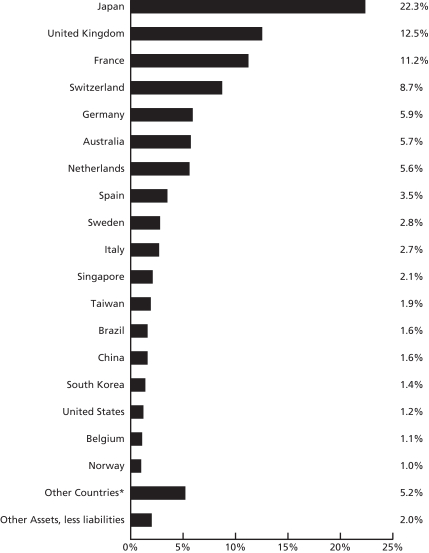
The holdings mentioned above are described in the Domini Impact International Equity Fund’s Portfolio of Investments as of 01/31/2020 included herein. The composition of the Fund’s portfolio is subject to change.
*Other countries include Finland 0.8%, South Africa 0.7%, Israel 0.7%, Denmark 0.6%, Jordan 0.6%, Hong Kong 0.5%, Panama 0.5%, Austria 0.4%, Malaysia 0.2%, Hungary 0.1%, Turkey 0.1%, India 0.0% and Ireland 0.0%.
11
| | | | | | | | | | | | | | |
| |
DOMINI IMPACT INTERNATIONAL EQUITY FUND AVERAGE ANNUAL TOTAL RETURNS (Unaudited) |
| | | | | | |
| | | Investor
shares | | Class A shares
(with 4.75%
maximum
Sales Charge) | | Class A shares
(without
Sales Charge) | | Institutional
shares1 | | Class Y
Shares2 | | MSCI EAFE
(net) |
| | | | | | | |
| As of 1/31/20 | | 1 Year | | 5.87% | | 0.83% | | 5.86% | | 6.23% | | 6.08% | | 12.10% |
| | | | | | | |
| | 5 Year | | 3.98% | | 2.90% | | 3.90% | | 4.36% | | 3.98% | | 5.12% |
| | | | | | | |
| | | 10 Year | | 6.36% | | 5.83% | | 6.34% | | 6.36% | | 6.36% | | 5.76% |
Past performance is no guarantee of future results.The Fund’s returns quoted above represent past performance after all expenses. The returns reflect any applicable expense waivers in effect during the periods shown. Without such waivers, Fund performance would be lower. Investment return, principal value, and yield will fluctuate. Your shares, when redeemed, may be worth more or less than their original cost.Call1-800-582-6757 or visit www.domini.com for performance information current to the most recentmonth-end, which may be lower or higher than the performance data quoted. A 2.00% redemption fee applies on sales or exchanges of shares made less than 30 days after the settlement of purchase or acquisition through exchange, with certain exceptions. Quoted performance data does not reflect the deduction of this fee, which would reduce the performance quoted. See the prospectus for further information.
Per the prospectus date November 29, 2019, the Fund’s annual operating expenses totaled: 1.41% (Investor), 1.43% (Class A), 1.01% (Institutional), 1.13% (Class Y). The Fund’s adviser has contractually agreed to waive certain fees and/or reimburse certain ordinary operating expenses in order to limit Class A and Class Y share expenses to 1.43% and 1.15%, respectively, until November 30, 2020, absent an earlier modification approved by the Fund’s Board of Trustees.
The table does not reflect the deduction of fees and taxes that a shareholder would pay on Fund distributions or the redemption of Fund shares. Total return is based on the Fund’s net asset values and assumes all dividends and capital gains were reinvested.
An investment in the Fund is not a bank deposit and is not insured. You may lose money. The Fund is subject to market, recent events, impact investing risk, style, information, and foreign investing and emerging markets risks. Investing internationally involves special risks, such as currency fluctuations, social and economic instability, differing security regulations and accounting standards, limited public information, possible changes in taxation, and periods of illiquidity.
The Morgan Stanley Capital International Europe Australasia Far East (MSCI EAFE) index (net) is an unmanaged index of common stocks. MSCI EAFE (net) includes the reinvestment of dividends net of withholding tax, but does not reflect other fees, expenses or taxes. It is not available for direct investment.
1Institutional shares were not offered prior to November 30, 2012. All performance information for time periods beginning prior to November 30, 2012, is the performance of the Investor shares. This performance has not been adjusted to reflect the lower expenses of the Institutional shares.
2Y Shares did not commence operations until July 23, 2018. All performance information for time periods beginning prior to July 23, 2018 is the performance of the Investor Shares. Unless otherwise noted, this performance has not been adjusted to reflect the lower expenses of the Class Y shares.
12
DOMINI IMPACT INTERNATIONAL EQUITY FUND
PORTFOLIOOF INVESTMENTS
January 31, 2020 (Unaudited)
| | | | | | | | | | |
| COUNTRY/SECURITY | | INDUSTRY | | SHARES | | | VALUE | |
| Common Stocks – 98.0% | | | | | | | | |
Australia – 5.7% | | | | | | | | | | |
BlueScope Steel, Ltd. | | Materials | | | 1,246,650 | | | $ | 11,668,227 | |
Dexus | | Real Estate | | | 1,089,811 | | | | 9,196,656 | |
Fortescue Metals Group, Ltd. | | Materials | | | 2,097,284 | | | | 15,537,467 | |
Harvey Norman Holdings, Ltd. | | Retailing | | | 1,455,788 | | | | 4,085,638 | |
Magellan Financial Group, Ltd. | | Diversified Financials | | | 58,419 | | | | 2,572,922 | |
Mirvac Group | | Real Estate | | | 6,578,894 | | | | 14,842,832 | |
Scentre Group | | Real Estate | | | 1,703,133 | | | | 4,370,275 | |
Stockland | | Real Estate | | | 1,513,774 | | | | 4,949,290 | |
| | | | | | | | | | |
| | | | | | | | | 67,223,307 | |
| | | | | | | | | | |
| | | | | | | | | | |
Austria – 0.4% | |
Raiffeisen Bank International AG | | Banks | | | 188,678 | | | | 4,294,609 | |
| | | | | | | | | | |
| | | | | | | | | 4,294,609 | |
| | | | | | | | | | |
| | | | | | | | | | |
Belgium – 1.1% | |
Ageas | | Insurance | | | 186,584 | | | | 10,280,649 | |
Galapagos NV (a) | | Pharmaceuticals, Biotechnology & Life Sciences | | | 14,344 | | | | 3,212,587 | |
| | | | | | | | | | |
| | | | | | | | | 13,493,236 | |
| | | | | | | | | | |
| | | | | | | | | | |
Brazil – 1.6% | |
Banco do Brasil SA | | Banks | | | 360,671 | | | | 4,096,875 | |
Cia de Transmissao de Energia Eletrica Paulista | | Utilities | | | 565,900 | | | | 2,939,912 | |
Cyrela Brazil Realty SA Empreendimentos e Participacoes | | Consumer Durables & Apparel | | | 784,165 | | | | 5,835,476 | |
Equatorial Energia SA | | Utilities | | | 538,200 | | | | 3,002,560 | |
Raia Drogasil SA | | Food & Staples Retailing | | | 115,700 | | | | 3,363,307 | |
| | | | | | | | | | |
| | | | | | | | | 19,238,130 | |
| | | | | | | | | | |
| | | | | | | | | | |
China – 1.6% | |
China Aoyuan Group, Ltd. | | Real Estate | | | 1,622,204 | | | | 2,162,311 | |
China Life Insurance Co., Ltd., Class H | | Insurance | | | 2,442,000 | | | | 5,832,856 | |
Li Ning Co., Ltd. | | Consumer Durables & Apparel | | | 1,674,142 | | | | 4,890,198 | |
Ping An Insurance Group Co of China, Ltd., Class H | | Insurance | | | 481,590 | | | | 5,446,940 | |
Yangzijiang Shipbuilding Holdings, Ltd. | | Capital Goods | | | 1,624,858 | | | | 1,115,103 | |
| | | | | | | | | | |
| | | | | | | | | 19,447,408 | |
| | | | | | | | | | |
| | | | | | | | | | |
13
DOMINI IMPACT INTERNATIONAL EQUITY FUND
PORTFOLIOOF INVESTMENTS (continued)
January 31, 2020 (Unaudited)
| | | | | | | | | | |
| COUNTRY/SECURITY | | INDUSTRY | | SHARES | | | VALUE | |
Denmark – 0.6% | |
DSV A/S | | Transportation | | | 43,728 | | | $ | 4,743,658 | |
Novo Nordisk A/S, Class B | | Pharmaceuticals, Biotechnology & Life Sciences | | | 179 | | | | 10,887 | |
Vestas Wind Systems A/S | | Capital Goods | | | 20,267 | | | | 2,010,227 | |
| | | | | | | | | | |
| | | | | | | | | 6,764,772 | |
| | | | | | | | | | |
| | | | | | | | | | |
Finland – 0.8% | |
Metso Oyj | | Capital Goods | | | 128,782 | | | | 4,566,314 | |
Valmet Oyj | | Capital Goods | | | 227,077 | | | | 4,908,306 | |
| | | | | | | | | | |
| | | | | | | | | 9,474,620 | |
| | | | | | | | | | |
| | | | | | | | | | |
France – 11.2% | |
Alstom SA | | Capital Goods | | | 300,851 | | | | 15,932,967 | |
BNP Paribas SA | | Banks | | | 394,470 | | | | 20,917,515 | |
Carrefour SA | | Food & Staples Retailing | | | 375 | | | | 6,341 | |
CNP Assurances | | Insurance | | | 136,184 | | | | 2,449,473 | |
Credit Agricole SA | | Banks | | | 458,322 | | | | 6,187,253 | |
Edenred | | Commercial & Professional Services | | | 169,418 | | | | 9,141,828 | |
Eiffage SA | | Capital Goods | | | 136,709 | | | | 15,834,319 | |
Ingenico Group SA | | Technology Hardware & Equipment | | | 45,358 | | | | 5,270,781 | |
Kering SA | | Consumer Durables & Apparel | | | 44,792 | | | | 27,347,874 | |
Peugeot SA | | Automobiles & Components | | | 734,906 | | | | 15,120,309 | |
Schneider Electric SE | | Capital Goods | | | 149,358 | | | | 14,883,540 | |
| | | | | | | | | | |
| | | | | | | | | 133,092,200 | |
| | | | | | | | | | |
| | | | | | | | | | |
Germany – 5.9% | |
adidas AG | | Consumer Durables & Apparel | | | 81,905 | | | | 25,871,493 | |
Allianz SE | | Insurance | | | 59,833 | | | | 14,273,796 | |
GEA Group AG | | Capital Goods | | | 48,540 | | | | 1,452,307 | |
HeidelbergCement AG | | Materials | | | 19,209 | | | | 1,294,485 | |
Merck KGaA | | Pharmaceuticals, Biotechnology & Life Sciences | | | 212,023 | | | | 27,166,772 | |
| | | | | | | | | | |
| | | | | | | | | 70,058,853 | |
| | | | | | | | | | |
| | | | | | | | | | |
Hong Kong – 0.5% | |
AIA Group, Ltd. | | Insurance | | | 120,829 | | | | 1,197,550 | |
Wharf Holdings, Ltd. (The) | | Real Estate | | | 825,526 | | | | 2,039,699 | |
Wheelock & Co., Ltd. | | Real Estate | | | 297,708 | | | | 1,812,594 | |
Xinyi Glass Holdings, Ltd. | | Automobiles & Components | | | 1,046,000 | | | | 1,311,223 | |
| | | | | | | | | | |
| | | | | | | | | 6,361,066 | |
| | | | | | | | | | |
| | | | | | | | | | |
Hungary – 0.1% | |
Richter Gedeon Nyrt | | Pharmaceuticals, Biotechnology & Life Sciences | | | 62,772 | | | | 1,347,316 | |
| | | | | | | | | | |
| | | | | | | | | 1,347,316 | |
| | | | | | | | | | |
| | | | | | | | | | |
14
DOMINI IMPACT INTERNATIONAL EQUITY FUND
PORTFOLIOOF INVESTMENTS (continued)
January 31, 2020 (Unaudited)
| | | | | | | | | | |
| COUNTRY/SECURITY | | INDUSTRY | | SHARES | | | VALUE | |
India – 0.0% | |
Dr Reddy’s Laboratories, Ltd. | | Pharmaceuticals, Biotechnology & Life Sciences | | | 250 | | | $ | 10,925 | |
| | | | | | | | | | |
| | | | | | | | | 10,925 | |
| | | | | | | | | | |
| | | | | | | | | | |
Ireland – 0.0% | |
Irish Bank Resolution Corp., Ltd. (a) (b) | | Real Estate | | | 138,674 | | | | 0 | |
| | | | | | | | | | |
| | | | | | | | | 0 | |
| | | | | | | | | | |
| | | | | | | | | | |
Israel – 0.7% | |
Check Point Software Technologies, Ltd. (a) | | Software & Services | | | 67,933 | | | | 7,765,421 | |
| | | | | | | | | | |
| | | | | | | | | 7,765,421 | |
| | | | | | | | | | |
| | | | | | | | | | |
Italy – 2.7% | |
Buzzi Unicem SpA | | Materials | | | 338,751 | | | | 7,904,935 | |
Intesa Sanpaolo SpA | | Banks | | | 8,698,493 | | | | 21,586,291 | |
Unipol Gruppo SpA | | Insurance | | | 430,286 | | | | 2,189,173 | |
| | | | | | | | | | |
| | | | | | | | | 31,680,399 | |
| | | | | | | | | | |
| | | | | | | | | | |
Japan – 22.3% | |
Alfresa Holdings Corp. | | Health Care Equipment & Services | | | 66,994 | | | | 1,345,685 | |
Brother Industries, Ltd. | | Technology Hardware & Equipment | | | 500 | | | | 9,654 | |
Central Japan Railway Co. | | Transportation | | | 81,682 | | | | 16,028,233 | |
Coca-Cola Bottlers Japan Holdings, Inc. | | Food & Beverage | | | 120,493 | | | | 3,170,606 | |
Dai Nippon Printing Co., Ltd. | | Commercial & Professional Services | | | 207,741 | | | | 5,726,777 | |
Eisai Co., Ltd. | | Pharmaceuticals, Biotechnology & Life Sciences | | | 150 | | | | 11,301 | |
Fancl Corp. | | Household & Personal Products | | | 304,386 | | | | 7,943,944 | |
FUJIFILM Holdings Corp. | | Technology Hardware & Equipment | | | 349,385 | | | | 17,347,220 | |
GungHo Online Entertainment, Inc. | | Media & Entertainment | | | 231,114 | | | | 4,203,321 | |
Hachijuni Bank, Ltd. (The) | | Banks | | | 627,522 | | | | 2,396,177 | |
Hoya Corp. | | Health Care Equipment & Services | | | 147,769 | | | | 14,138,379 | |
K’s Holdings Corp. | | Retailing | | | 540,872 | | | | 6,565,865 | |
Matsumotokiyoshi Holdings Co., Ltd. | | Food & Staples Retailing | | | 147,200 | | | | 5,884,376 | |
Medipal Holdings Corp. | | Health Care Equipment & Services | | | 299,857 | | | | 6,352,205 | |
Mitsubishi Estate Co., Ltd. | | Real Estate | | | 403,525 | | | | 7,900,632 | |
Mitsubishi Gas Chemical Co., Inc. | | Materials | | | 532,252 | | | | 8,056,032 | |
Mitsui Fudosan Co., Ltd. | | Real Estate | | | 498,939 | | | | 13,210,992 | |
Mixi, Inc. | | Media & Entertainment | | | 99,201 | | | | 1,743,805 | |
15
DOMINI IMPACT INTERNATIONAL EQUITY FUND
PORTFOLIOOF INVESTMENTS (continued)
January 31, 2020 (Unaudited)
| | | | | | | | | | |
| COUNTRY/SECURITY | | INDUSTRY | | SHARES | | | VALUE | |
Japan(Continued) | | | | | | | | | | |
MS&AD Insurance Group Holdings, Inc. | | Insurance | | | 310 | | | $ | 10,293 | |
Murata Manufacturing Co., Ltd. | | Technology Hardware & Equipment | | | 22,300 | | | | 1,262,160 | |
Nikon Corp. | | Consumer Durables & Apparel | | | 360,727 | | | | 4,354,568 | |
Nintendo Co., Ltd. | | Media & Entertainment | | | 41,377 | | | | 15,216,549 | |
Nippon Electric Glass Co., Ltd. | | Technology Hardware & Equipment | | | 287,175 | | | | 5,546,126 | |
Nissan Motor Co., Ltd. | | Automobiles & Components | | | 3,359,299 | | | | 18,223,503 | |
Nomura Holdings, Inc. | | Diversified Financials | | | 2,938,709 | | | | 15,040,272 | |
Nomura Real Estate Holdings, Inc. | | Real Estate | | | 54,936 | | | | 1,352,479 | |
Nomura Research Institute, Ltd. | | Software & Services | | | 542,744 | | | | 11,940,148 | |
NTN Corp. | | Capital Goods | | | 5,300 | | | | 14,041 | |
ORIX Corp. | | Diversified Financials | | | 630 | | | | 10,639 | |
Otsuka Holdings Co., Ltd. | | Pharmaceuticals, Biotechnology & Life Sciences | | | 276,186 | | | | 12,266,275 | |
Rohm Co., Ltd. | | Semiconductors & Semiconductor Equipment | | | 15,800 | | | | 1,136,265 | |
Seino Holdings Co., Ltd. | | Transportation | | | 383,120 | | | | 4,895,753 | |
Shimamura Co., Ltd. | | Retailing | | | 14,191 | | | | 1,065,921 | |
Sony Corp. | | Consumer Durables & Apparel | | | 170 | | | | 11,884 | |
Sundrug Co., Ltd. | | Food & Staples Retailing | | | 105,529 | | | | 3,575,189 | |
Suzuken Co., Ltd. | | Health Care Equipment & Services | | | 29,972 | | | | 1,148,806 | |
Taiyo Yuden Co., Ltd. | | Technology Hardware & Equipment | | | 365,596 | | | | 10,539,011 | |
TIS, Inc. | | Software & Services | | | 126,554 | | | | 7,600,793 | |
Tokyo Electron, Ltd. | | Semiconductors & Semiconductor Equipment | | | 41,668 | | | | 9,162,175 | |
Toppan Printing Co., Ltd. | | Commercial & Professional Services | | | 541,898 | | | | 10,797,051 | |
Toyo Seikan Group Holdings, Ltd. | | Materials | | | 271,427 | | | | 4,590,624 | |
Welcia Holdings Co., Ltd. | | Food & Staples Retailing | | | 41,200 | | | | 2,261,816 | |
| | | | | | | | | | |
| | | | | | | | | 264,057,545 | |
| | | | | | | | | | |
| | | | | | | | | | |
Jordan – 0.6% | |
Hikma Pharmaceuticals PLC | | Pharmaceuticals, Biotechnology & Life Sciences | | | 310,869 | | | | 7,493,594 | |
| | | | | | | | | | |
| | | | | | | | | 7,493,594 | |
| | | | | | | | | | |
| | | | | | | | | | |
Malaysia – 0.2% | |
RHB Bank Bhd | | Banks | | | 1,375,648 | | | | 1,910,063 | |
| | | | | | | | | | |
| | | | | | | | | 1,910,063 | |
| | | | | | | | | | |
| | | | | | | | | | |
Netherlands – 5.6% | |
Akzo Nobel NV | | Materials | | | 148,207 | | | | 13,975,214 | |
Altice Europe NV (a) | | Media & Entertainment | | | 1,609,749 | | | | 10,338,191 | |
16
DOMINI IMPACT INTERNATIONAL EQUITY FUND
PORTFOLIOOF INVESTMENTS (continued)
January 31, 2020 (Unaudited)
| | | | | | | | | | |
| COUNTRY/SECURITY | | INDUSTRY | | SHARES | | | VALUE | |
Netherlands(Continued) | | | | | | | | | | |
Koninklijke Ahold Delhaize NV | | Food & Staples Retailing | | | 816,398 | | | $ | 20,020,245 | |
Koninklijke Philips NV | | Health Care Equipment & Services | | | 313,940 | | | | 14,366,635 | |
NXP Semiconductors NV | | Semiconductors & Semiconductor Equipment | | | 56,856 | | | | 7,212,752 | |
| | | | | | | | | | |
| | | | | | | | | 65,913,037 | |
| | | | | | | | | | |
| | | | | | | | | | |
Norway – 1.0% | |
DNB ASA | | Banks | | | 327,578 | | | | 5,714,573 | |
Orkla ASA | | Food & Beverage | | | 687,181 | | | | 6,619,612 | |
| | | | | | | | | | |
| | | | | | | | | 12,334,185 | |
| | | | | | | | | | |
| | | | | | | | | | |
Panama – 0.5% | |
Copa Holdings SA, Class A | | Transportation | | | 56,698 | | | | 5,554,136 | |
| | | | | | | | | | |
| | | | | | | | | 5,554,136 | |
| | | | | | | | | | |
| | | | | | | | | | |
Singapore – 2.1% | |
CapitaLand, Ltd. | | Real Estate | | | 956,100 | | | | 2,518,936 | |
Mapletree Commercial Trust | | Real Estate | | | 3,164,900 | | | | 5,434,012 | |
Singapore Exchange, Ltd. | | Diversified Financials | | | 1,085,622 | | | | 6,886,073 | |
United Overseas Bank, Ltd. | | Banks | | | 517,879 | | | | 9,657,422 | |
| | | | | | | | | | |
| | | | | | | | | 24,496,443 | |
| | | | | | | | | | |
| | | | | | | | | | |
South Africa – 0.7% | |
Clicks Group, Ltd. | | Food & Staples Retailing | | | 264,866 | | | | 4,275,986 | |
Impala Platinum Holdings (a) | | Materials | | | 495,842 | | | | 4,662,027 | |
| | | | | | | | | | |
| | | | | | | | | 8,938,013 | |
| | | | | | | | | | |
| | | | | | | | | | |
South Korea – 1.4% | |
BNK Financial Group, Inc. | | Banks | | | 445,386 | | | | 2,512,063 | |
Industrial Bank of Korea | | Banks | | | 354,518 | | | | 3,175,986 | |
LG Electronics, Inc. | | Consumer Durables & Apparel | | | 27,377 | | | | 1,492,837 | |
LG Uplus Corp. | | Telecommunication Services | | | 500,226 | | | | 5,536,740 | |
Woori Financial Group, Inc. | | Banks | | | 412,218 | | | | 3,479,971 | |
| | | | | | | | | | |
| | | | | | | | | 16,197,597 | |
| | | | | | | | | | |
| | | | | | | | | | |
Spain – 3.5% | |
Acciona SA | | Utilities | | | 38,496 | | | | 4,366,191 | |
Banco Bilbao Vizcaya Argentaria SA | | Banks | | | 3,305,060 | | | | 17,095,849 | |
Banco Santander SA | | Banks | | | 2,078 | | | | 8,183 | |
Telefonica SA | | Telecommunication Services | | | 2,911,270 | | | | 19,675,895 | |
| | | | | | | | | | |
| | | | | | | | | 41,146,118 | |
| | | | | | | | | | |
| | | | | | | | | | |
17
DOMINI IMPACT INTERNATIONAL EQUITY FUND
PORTFOLIOOF INVESTMENTS (continued)
January 31, 2020 (Unaudited)
| | | | | | | | | | |
| COUNTRY/SECURITY | | INDUSTRY | | SHARES | | | VALUE | |
Sweden – 2.8% | |
Castellum AB | | Real Estate | | | 53,489 | | | $ | 1,312,995 | |
Essity AB, Class B | | Household & Personal Products | | | 172,633 | | | | 5,473,712 | |
Getinge AB, Class B | | Health Care Equipment & Services | | | 367,724 | | | | 6,254,793 | |
Hennes & Mauritz AB, Class B | | Retailing | | | 384,491 | | | | 8,425,366 | |
ICA Gruppen AB | | Food & Staples Retailing | | | 154,932 | | | | 6,803,967 | |
Telefonaktiebolaget LM Ericsson, Class B | | Technology Hardware & Equipment | | | 687,884 | | | | 5,401,841 | |
| | | | | | | | | | |
| | | | | | | | | 33,672,674 | |
| | | | | | | | | | |
| | | | | | | | | | |
Switzerland – 8.7% | |
Adecco Group AG | | Commercial & Professional Services | | | 227,559 | | | | 13,314,978 | |
Geberit AG | | Capital Goods | | | 9,471 | | | | 4,991,667 | |
Novartis AG | | Pharmaceuticals, Biotechnology & Life Sciences | | | 292,670 | | | | 27,612,144 | |
PSP Swiss Property AG | | Real Estate | | | 8,811 | | | | 1,330,558 | |
Sonova Holding AG | | Health Care Equipment & Services | | | 92,732 | | | | 23,224,389 | |
Swiss Life Holding AG | | Insurance | | | 34,350 | | | | 17,244,481 | |
Swiss Prime Site AG (a) | | Real Estate | | | 7,949 | | | | 970,908 | |
Swisscom AG | | Telecommunication Services | | | 10,406 | | | | 5,701,990 | |
Zurich Insurance Group AG | | Insurance | | | 21,695 | | | | 8,994,304 | |
| | | | | | | | | | |
| | | | | | | | | 103,385,419 | |
| | | | | | | | | | |
| | | | | | | | | | |
Taiwan – 1.9% | |
Asia Cement Corp. | | Materials | | | 1,132,232 | | | | 1,684,113 | |
Globalwafers Co., Ltd. | | Semiconductors & Semiconductor Equipment | | | 95,220 | | | | 1,260,816 | |
Lite-On Technology Corp. | | Technology Hardware & Equipment | | | 2,970,447 | | | | 4,601,827 | |
MediaTek, Inc. | | Semiconductors & Semiconductor Equipment | | | 163,000 | | | | 2,062,338 | |
Novatek Microelectronics Corp. | | Semiconductors & Semiconductor Equipment | | | 213,277 | | | | 1,503,851 | |
Realtek Semiconductor Corp. | | Semiconductors & Semiconductor Equipment | | | 709,662 | | | | 5,701,788 | |
Unimicron Technology Corp. | | Technology Hardware & Equipment | | | 823,000 | | | | 1,023,783 | |
United Microelectronics Corp. | | Semiconductors & Semiconductor Equipment | | | 9,056,259 | | | | 4,420,855 | |
| | | | | | | | | | |
| | | | | | | | | 22,259,371 | |
| | | | | | | | | | |
| | | | | | | | | | |
Turkey – 0.1% | |
Turkiye Garanti Bankasi AS (a) | | Banks | | | 672,920 | | | | 1,335,332 | |
| | | | | | | | | | |
| | | | | | | | | 1,335,332 | |
| | | | | | | | | | |
| | | | | | | | | | |
United Kingdom – 12.5% | |
3i Group PLC | | Diversified Financials | | | 1,126,535 | | | | 16,358,905 | |
AVEVA Group PLC | | Software & Services | | | 69,514 | | | | 4,499,765 | |
18
DOMINI IMPACT INTERNATIONAL EQUITY FUND
PORTFOLIOOF INVESTMENTS (continued)
January 31, 2020 (Unaudited)
| | | | | | | | | | |
| COUNTRY/SECURITY | | INDUSTRY | | SHARES | | | VALUE | |
United Kingdom(Continued) | | | | | | | | | | |
Aviva PLC | | Insurance | | | 1,526,529 | | | $ | 7,985,829 | |
Barratt Developments PLC | | Consumer Durables & Apparel | | | 752,971 | | | | 7,958,221 | |
Berkeley Group Holdings PLC | | Consumer Durables & Apparel | | | 226,177 | | | | 15,622,882 | |
Burberry Group PLC | | Consumer Durables & Apparel | | | 214,070 | | | | 5,479,283 | |
Coca-Cola European Partners PLC | | Food & Beverage | | | 435,560 | | | | 22,914,812 | |
GlaxoSmithKline PLC | | Pharmaceuticals, Biotechnology & Life Sciences | | | 1,303,658 | | | | 30,555,820 | |
Next PLC | | Retailing | | | 96,167 | | | | 8,724,384 | |
Rentokil Initial PLC | | Commercial & Professional Services | | | 198,510 | | | | 1,220,407 | |
Royal Mail PLC | | Transportation | | | 1,357,800 | | | | 3,542,954 | |
Sage Group PLC (The) | | Software & Services | | | 165,954 | | | | 1,612,854 | |
Segro PLC | | Real Estate | | | 370,905 | | | | 4,446,035 | |
Standard Chartered PLC | | Banks | | | 209,577 | | | | 1,739,690 | |
Standard Life Aberdeen PLC | | Diversified Financials | | | 2,107,349 | | | | 8,358,809 | |
Travis Perkins PLC | | Capital Goods | | | 92,286 | | | | 1,881,839 | |
Unilever PLC | | Household & Personal Products | | | 99,462 | | | | 5,922,708 | |
| | | | | | | | | | |
| | | | | | | | | 148,825,197 | |
| | | | | | | | | | |
| | | | | | | | | | |
United States – 1.2% | |
Ferguson PLC | | Capital Goods | | | 81,035 | | | | 7,264,418 | |
Jazz Pharmaceuticals PLC (a) | | Pharmaceuticals, Biotechnology & Life Sciences | | | 45,301 | | | | 6,493,898 | |
| | | | | | | | | | |
| | | | | | | | | 13,758,316 | |
| | | | | | | | | | |
| | |
| Total Investments – 98.0%(Cost $1,055,302,604) | | | | | 1,161,529,302 | |
| | |
| Other Assets, less liabilities – 2.0% | | | | | 24,197,559 | |
| | | | | | | | | | |
| | |
| Net Assets – 100.0% | | | | | $1,185,726,861 | |
| | | | | | | | | | |
(a)Non-income producing security.
(b) Securities for which there are no such quotations or valuations are valued at fair value as determined in good faith by or at the direction of the Fund’s Board of Trustees.
As of the date of this report, certain foreign securities were fair valued by an independent pricing service under the direction of the Board of Trustees or its delegates in accordance with the Trust’s Valuation and Pricing Policies and Procedures.
SEE NOTES TO FINANCIAL STATEMENTS
19
DOMINI IMPACT EQUITY FUND
Fund Performance and Holdings
The table and bar charts below provide information as of January 31, 2020, about the ten largest holdings of the Domini Impact Equity Fund and its portfolio holdings by industry sector:
TEN LARGEST HOLDINGS (Unaudited)
| | | | | | | | | | |
| | | | |
| SECURITY DESCRIPTION | | % NET
ASSETS | | | SECURITY DESCRIPTION | | % NET
ASSETS | |
| | | | |
| Microsoft Corp | | | 6.9% | | | Procter & Gamble Co. (The) | | | 1.7% | |
| | | | |
| Apple, Inc | | | 6.5% | | | Intel Corp | | | 1.5% | |
| | | | |
| Alphabet, Inc. Class A | | | 4.6% | | | Mastercard, Inc. Class A | | | 1.5% | |
| | | | |
| Amazon.com, Inc | | | 4.5% | | | AT&T, Inc | | | 1.5% | |
| | | | |
| Visa, Inc. Class A | | | 1.8% | | | Bank of America Corp | | | 1.4% | |
PORTFOLIO HOLDINGS BY INDUSTRY SECTOR (% OF NET ASSETS) (Unaudited)
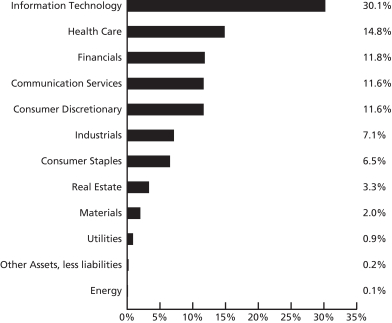
The holdings mentioned above described in the Domini Impact Equity Fund’s Portfolio of Investments as of 1/31/20, included herein. The composition of the Fund’s portfolio is subject to change.
The Global Industry Classification Standard (“GICS”) was developed by and is the exclusive property and a service mark of MSCI Inc. (“MSCI”) and Standard & Poor’s, a division of The McGraw-Hill Companies, Inc. (“S&P”) and is licensed for use by Domini Impact Investments. Neither MSCI, S&P nor any third party involved in making or compiling the GICS or any GICS classifications makes any express or implied warranties or representations with respect to such standard or classification nor shall any such party have any liability therefrom.
20
| | | | | | | | | | | | | | |
| |
DOMINI IMPACT EQUITY FUND AVERAGE ANNUAL TOTAL RETURNS (Unaudited) |
| | | | | | |
| | | Investor
shares | | Class A shares
(with 4.75%
maximum
Sales Charge) | | Class A shares
(without Sales
Charge) | | Institutional
shares | | Class R
shares | | S&P 500 |
| | | | | | | |
| As of 1/31/20 | | 1 Year | | 24.29% | | 18.37% | | 24.27% | | 24.72% | | 24.70% | | 21.68% |
| | | | | | | |
| | 5 Year | | 8.24% | | 7.17% | | 8.22% | | 8.62% | | 8.57% | | 12.37% |
| | | | | | | |
| | | 10 Year | | 11.31% | | 10.79% | | 11.33% | | 11.75% | | 11.67% | | 13.97% |
NOTE: The Fund’s current investment strategy commenced on December 1, 2018 with SSGA Funds Management, Inc as its subadviser. Performance information for periods prior to December 1, 2018 reflects the investment strategies employed during those periods.
Past performance is no guarantee of future results.The Fund’s returns quoted above represent past performance after all expenses. The returns reflect any applicable expense waivers in effect during the periods shown. Without such waivers, Fund performance would be lower. Investment return, principal value, and yield will fluctuate. Your shares, when redeemed, may be worth more or less than their original cost.Call1-800-582-6757 or visit www.domini.com for performance information current to the most recentmonth-end, which may be lower or higher than the performance data quoted. A 2.00% redemption fee applies on sales or exchanges of shares made less than 30 days after the settlement of purchase or acquisition through exchange, with certain exceptions. Quoted performance data does not reflect the deduction of this fee, which would reduce the performance quoted. See the prospectus for further information.
Per the prospectus date November 29, 2019, the Fund’s annual operating expenses totaled 1.09% (Investor), 1.43% (gross)/1.09% (net)/ (Class A), 0.76% (gross)/0.74% (net) (Institutional), 0.88% (gross)/0.80% (net) (Class R). The Fund’s adviser has contractually agreed to waive certain fees and/or reimburse certain ordinary operating expenses in order to limit Investor, Class A, Institutional and Class R share expenses to 1.09%, 1.09%, 0.74%, and 0.80%, respectively, until November 30, 2020, absent an earlier modification approved by the Funds’ Board of Trustees.
The table does not reflect the deduction of fees and taxes that a shareholder would pay on Fund distributions or the redemption of Fund shares. Total return for the Fund is based on the Fund’s net asset values and assumes all dividend and capital gains were reinvested.
An investment in the Fund is not a bank deposit and is not insured. You may lose money. The Fund is subject to market, recent events, impact investing, portfolio management, information, andmid-tolarge-cap companies risks.
The Standard & Poor’s 500 Index (S&P 500) is an unmanaged index of common stocks. Investors cannot invest directly in the S&P 500.
21
DOMINI IMPACT EQUITY FUND
PORTFOLIOOF INVESTMENTS
January 31, 2020 (Unaudited)
| | | | | | | | |
| SECURITY | | SHARES | | | VALUE | |
| Long Term Investments – 99.8% | | | | | | |
| Common Stocks – 99.8% | | | | | | |
| Communication Services – 11.6% | | | | | | |
Alphabet, Inc., Class A (a) | | | 26,200 | | | $ | 37,538,836 | |
AT&T, Inc. | | | 319,585 | | | | 12,022,788 | |
CenturyLink, Inc. | | | 46,100 | | | | 629,726 | |
Charter Communications, Inc., Class A (a) | | | 6,658 | | | | 3,445,249 | |
Comcast Corp., Class A | | | 197,708 | | | | 8,539,008 | |
Electronic Arts, Inc. (a) | | | 12,418 | | | | 1,340,150 | |
Netflix, Inc. (a) | | | 18,745 | | | | 6,468,712 | |
New York Times Co. (The), Class A | | | 6,000 | | | | 192,060 | |
Omnicom Group, Inc. | | | 9,500 | | | | 715,445 | |
Take-Two Interactive Software, Inc. (a) | | | 4,981 | | | | 620,832 | |
TELUS Corp. | | | 25,897 | | | | 1,038,729 | |
Verizon Communications, Inc. | | | 180,496 | | | | 10,728,682 | |
Walt Disney Co. (The) | | | 78,789 | | | | 10,897,307 | |
| | | | | | | | |
| | | | | | | 94,177,524 | |
| | | | | | | | |
| | |
| Consumer Discretionary – 11.6% | | | | | | |
Advance Auto Parts, Inc. | | | 2,957 | | | | 389,585 | |
Amazon.com, Inc. (a) | | | 18,259 | | | | 36,677,218 | |
Best Buy Co., Inc. | | | 10,049 | | | | 851,050 | |
Chegg, Inc. (a) | | | 70,328 | | | | 2,899,623 | |
Chipotle Mexican Grill, Inc. (a) | | | 1,223 | | | | 1,060,047 | |
Cie Generale des Etablissements Michelin SCA ADR | | | 38,750 | | | | 895,513 | |
eBay, Inc. | | | 33,600 | | | | 1,127,616 | |
Fast Retailing Co., Ltd. ADR | | | 23,653 | | | | 1,265,435 | |
Gap, Inc. (The) | | | 12,345 | | | | 214,926 | |
Garmin, Ltd. | | | 6,646 | | | | 644,330 | |
Home Depot, Inc. (The) | | | 47,851 | | | | 10,914,813 | |
Kohl’s Corp. | | | 6,912 | | | | 295,488 | |
Lennar Corp., Class A | | | 12,000 | | | | 796,320 | |
Lowe’s Cos., Inc. | | | 33,541 | | | | 3,898,806 | |
Marriott International, Inc., Class A | | | 11,368 | | | | 1,592,202 | |
NIKE, Inc., Class B | | | 53,749 | | | | 5,176,029 | |
NVR, Inc. (a) | | | 150 | | | | 572,546 | |
O’Reilly Automotive, Inc. (a) | | | 3,219 | | | | 1,307,236 | |
Sony Corp. ADR | | | 53,955 | | | | 3,786,562 | |
Starbucks Corp. | | | 50,167 | | | | 4,255,667 | |
Target Corp. | | | 22,351 | | | | 2,475,150 | |
Tesla, Inc. (a) | | | 7,719 | | | | 5,021,750 | |
Tiffany & Co. | | | 5,100 | | | | 683,502 | |
Toyota Motor Corp. ADR | | | 49,648 | | | | 6,893,128 | |
Ulta Salon Cosmetics & Fragrance, Inc. (a) | | | 2,398 | | | | 642,448 | |
| | | | | | | | |
| | | | | | | 94,336,990 | |
| | | | | | | | |
| | |
| Consumer Staples – 6.5% | | | | | | |
Beyond Meat, Inc. (a) | | | 18,618 | | | | 2,055,800 | |
Campbell Soup Co. | | | 7,991 | | | | 386,684 | |
22
DOMINI IMPACT EQUITY FUND
PORTFOLIOOF INVESTMENTS (continued)
January 31, 2020 (Unaudited)
| | | | | | | | |
| SECURITY | | SHARES | | | VALUE | |
| | |
| Consumer Staples(Continued) | | | | | | |
Church & Dwight Co., Inc. | | | 10,612 | | | $ | 787,623 | |
Clorox Co. (The) | | | 5,500 | | | | 865,205 | |
Colgate-Palmolive Co. | | | 37,525 | | | | 2,768,595 | |
Costco Wholesale Corp. | | | 18,877 | | | | 5,767,301 | |
Estee Lauder Cos., Inc. (The), Class A | | | 9,677 | | | | 1,888,563 | |
General Mills, Inc. | | | 26,199 | | | | 1,368,112 | |
JM Smucker Co. (The) | | | 4,746 | | | | 491,733 | |
Kimberly-Clark Corp. | | | 14,918 | | | | 2,136,854 | |
Kraft Heinz Co. (The) | | | 28,823 | | | | 841,632 | |
Kroger Co. (The) | | | 34,311 | | | | 921,593 | |
Lamb Weston Holdings, Inc. | | | 6,400 | | | | 584,384 | |
Mondelez International, Inc., Class A | | | 61,747 | | | | 3,543,043 | |
PepsiCo, Inc. | | | 60,731 | | | | 8,625,017 | |
Procter & Gamble Co. (The) | | | 107,725 | | | | 13,424,689 | |
Sysco Corp. | | | 21,303 | | | | 1,749,828 | |
Unilever PLC ADR | | | 48,385 | | | | 2,891,971 | |
Walgreens Boots Alliance, Inc. | | | 32,748 | | | | 1,665,236 | |
| | | | | | | | |
| | | | | | | 52,763,863 | |
| | | | | | | | |
| | |
| Energy – 0.1% | | | | | | |
Legrand SA ADR | | | 56,600 | | | | 905,034 | |
| | | | | | | | |
| | | | | | | 905,034 | |
| | | | | | | | |
| | |
| Financials – 11.8% | | | | | | |
Aflac, Inc. | | | 30,015 | | | | 1,547,874 | |
Amalgamated Bank, Class A | | | 67,253 | | | | 1,159,442 | |
American Express Co. | | | 26,848 | | | | 3,486,750 | |
Bank of America Corp. | | | 351,954 | | | | 11,554,650 | |
Bank of Montreal | | | 27,931 | | | | 2,128,901 | |
Bank of New York Mellon Corp. (The) | | | 36,400 | | | | 1,629,992 | |
Bank of Nova Scotia (The) | | | 53,666 | | | | 2,931,237 | |
BlackRock, Inc. | | | 4,800 | | | | 2,531,280 | |
Capital One Financial Corp. | | | 20,318 | | | | 2,027,736 | |
Cboe Global Markets, Inc. | | | 4,900 | | | | 603,778 | |
Charles Schwab Corp. (The) | | | 50,400 | | | | 2,295,720 | |
Chubb, Ltd. | | | 16,989 | | | | 2,582,158 | |
Cincinnati Financial Corp. | | | 6,911 | | | | 725,309 | |
Citigroup, Inc. | | | 95,408 | | | | 7,099,309 | |
CME Group, Inc. | | | 15,412 | | | | 3,346,099 | |
Comerica, Inc. | | | 5,954 | | | | 364,147 | |
Discover Financial Services | | | 13,500 | | | | 1,014,255 | |
DNB ASA ADR | | | 44,548 | | | | 780,481 | |
E*TRADE Financial Corp. | | | 9,514 | | | | 405,487 | |
East West Bancorp, Inc. | | | 6,000 | | | | 275,040 | |
Equitable Holdings, Inc. | | | 18,500 | | | | 444,370 | |
Everest Re Group, Ltd. | | | 1,700 | | | | 470,169 | |
FactSet Research Systems, Inc. | | | 1,700 | | | | 486,387 | |
Federal Agricultural Mortgage Corp., Class C | | | 23,255 | | | | 1,774,356 | |
Fifth Third Bancorp | | | 30,956 | | | | 880,698 | |
23
DOMINI IMPACT EQUITY FUND
PORTFOLIOOF INVESTMENTS (continued)
January 31, 2020 (Unaudited)
| | | | | | | | |
| SECURITY | | SHARES | | | VALUE | |
| | |
| Financials(Continued) | | | | | | |
Franklin Resources, Inc. | | | 12,700 | | | $ | 321,310 | |
Hartford Financial Services Group, Inc. (The) | | | 15,793 | | | | 936,209 | |
Huntington Bancshares, Inc. | | | 43,800 | | | | 594,366 | |
Intercontinental Exchange, Inc. | | | 23,995 | | | | 2,393,261 | |
Invesco, Ltd. | | | 18,603 | | | | 321,832 | |
KeyCorp | | | 42,900 | | | | 802,659 | |
MarketAxess Holdings, Inc. | | | 1,600 | | | | 566,688 | |
Marsh & McLennan Cos., Inc. | | | 22,130 | | | | 2,475,462 | |
Moody’s Corp. | | | 7,114 | | | | 1,826,804 | |
Morgan Stanley | | | 53,934 | | | | 2,818,591 | |
MSCI, Inc. | | | 3,605 | | | | 1,030,309 | |
Nasdaq, Inc. | | | 4,900 | | | | 570,654 | |
Northern Trust Corp. | | | 8,900 | | | | 870,509 | |
PNC Financial Services Group, Inc. (The) | | | 17,549 | | | | 2,606,904 | |
Principal Financial Group, Inc. | | | 11,800 | | | | 624,810 | |
Progressive Corp. (The) | | | 25,358 | | | | 2,046,137 | |
Prudential Financial, Inc. | | | 17,761 | | | | 1,617,317 | |
Raymond James Financial, Inc. | | | 5,400 | | | | 493,722 | |
Regions Financial Corp. | | | 41,028 | | | | 638,806 | |
Reinsurance Group of America, Inc. | | | 2,600 | | | | 374,530 | |
S&P Global, Inc. | | | 10,698 | | | | 3,142,323 | |
SEI Investments Co. | | | 5,900 | | | | 385,034 | |
State Street Corp. | | | 15,300 | | | | 1,157,139 | |
Swiss Re AG ADR | | | 49,093 | | | | 1,384,423 | |
T Rowe Price Group, Inc. | | | 10,111 | | | | 1,350,122 | |
TD Ameritrade Holding Corp. | | | 11,000 | | | | 522,280 | |
Toronto-Dominion Bank (The) | | | 79,717 | | | | 4,405,161 | |
Travelers Cos., Inc. (The) | | | 11,116 | | | | 1,463,088 | |
Truist Financial Corp. | | | 33,158 | | | | 1,709,958 | |
US Bancorp | | | 62,831 | | | | 3,343,866 | |
Voya Financial, Inc. | | | 6,100 | | | | 364,353 | |
Zions Bancorp NA | | | 7,099 | | | | 322,933 | |
| | | | | | | | |
| | | | | | | 96,027,185 | |
| | | | | | | | |
| | |
| Health Care – 14.8% | | | | | | |
AbbVie, Inc. | | | 64,470 | | | | 5,223,359 | |
ABIOMED, Inc. (a) | | | 1,800 | | | | 335,322 | |
Agilent Technologies, Inc. | | | 13,600 | | | | 1,122,816 | |
Alcon, Inc. (a) | | | 21,262 | | | | 1,253,182 | |
Alexion Pharmaceuticals, Inc. (a) | | | 9,381 | | | | 932,378 | |
Align Technology, Inc. (a) | | | 3,200 | | | | 822,720 | |
Amgen, Inc. | | | 25,919 | | | | 5,599,800 | |
Becton Dickinson and Co. | | | 11,826 | | | | 3,254,279 | |
Biogen, Inc. (a) | | | 7,881 | | | | 2,118,807 | |
BioMarin Pharmaceutical, Inc. (a) | | | 7,700 | | | | 642,950 | |
Bio-Rad Laboratories, Inc., Class A (a) | | | 900 | | | | 324,828 | |
Bio-Techne Corp. | | | 1,600 | | | | 335,952 | |
BioTelemetry, Inc. (a) | | | 57,542 | | | | 2,814,955 | |
Bristol-Myers Squibb Co. | | | 71,501 | | | | 4,500,988 | |
24
DOMINI IMPACT EQUITY FUND
PORTFOLIOOF INVESTMENTS (continued)
January 31, 2020 (Unaudited)
| | | | | | | | |
| SECURITY | | SHARES | | | VALUE | |
| | |
| Health Care(Continued) | | | | | | |
Bruker Corp. | | | 4,600 | | | $ | 227,562 | |
Cerner Corp. | | | 13,123 | | | | 942,625 | |
Cooper Cos., Inc. (The) | | | 2,200 | | | | 763,158 | |
Danaher Corp. | | | 27,815 | | | | 4,474,599 | |
DENTSPLY SIRONA, Inc. | | | 9,416 | | | | 527,296 | |
DexCom, Inc. (a) | | | 11,603 | | | | 2,793,422 | |
Edwards Lifesciences Corp. (a) | | | 9,048 | | | | 1,989,293 | |
Gilead Sciences, Inc. | | | 55,441 | | | | 3,503,871 | |
GlaxoSmithKline PLC ADR | | | 108,703 | | | | 5,087,300 | |
Haemonetics Corp. (a) | | | 2,051 | | | | 220,257 | |
Henry Schein, Inc. (a) | | | 6,300 | | | | 434,322 | |
Hill-Rom Holdings, Inc. | | | 2,800 | | | | 298,172 | |
Hologic, Inc. (a) | | | 64,127 | | | | 3,432,077 | |
IDEXX Laboratories, Inc. (a) | | | 3,619 | | | | 980,785 | |
Illumina, Inc. (a) | | | 6,449 | | | | 1,870,662 | |
Incyte Corp. (a) | | | 8,200 | | | | 599,174 | |
Ionis Pharmaceuticals, Inc. (a) | | | 5,300 | | | | 309,096 | |
Koninklijke Philips NV | | | 39,521 | | | | 1,809,271 | |
Merck & Co., Inc. | | | 111,039 | | | | 9,487,172 | |
Mettler-Toledo International, Inc. (a) | | | 990 | | | | 749,608 | |
Nektar Therapeutics (a) | | | 7,100 | | | | 141,219 | |
Novartis AG ADR | | | 102,584 | | | | 9,695,214 | |
Novo Nordisk A/S ADR | | | 72,888 | | | | 4,433,777 | |
PerkinElmer, Inc. | | | 4,800 | | | | 443,904 | |
Pfizer, Inc. | | | 241,397 | | | | 8,989,624 | |
Quest Diagnostics, Inc. | | | 5,715 | | | | 632,479 | |
Regeneron Pharmaceuticals, Inc. (a) | | | 3,642 | | | | 1,230,778 | |
ResMed, Inc. | | | 6,146 | | | | 977,030 | |
Sanofi ADR | | | 92,742 | | | | 4,476,656 | |
Seattle Genetics, Inc. (a) | | | 21,453 | | | | 2,325,291 | |
STERIS PLC | | | 3,600 | | | | 542,484 | |
Stryker Corp. | | | 14,138 | | | | 2,978,877 | |
Teladoc Health, Inc. (a) | | | 31,885 | | | | 3,243,023 | |
Thermo Fisher Scientific, Inc. | | | 17,554 | | | | 5,497,737 | |
Varian Medical Systems, Inc. (a) | | | 3,900 | | | | 548,223 | |
Veeva Systems, Inc., Class A (a) | | | 5,606 | | | | 821,896 | |
Vertex Pharmaceuticals, Inc. (a) | | | 11,236 | | | | 2,551,134 | |
Waters Corp. (a) | | | 2,863 | | | | 640,711 | |
| | | | | | | | |
| | | | | | | 119,952,115 | |
| | | | | | | | |
| | |
| Industrials – 7.1% | | | | | | |
Acuity Brands, Inc. | | | 19,969 | | | | 2,353,746 | |
Alaska Air Group, Inc. | | | 5,100 | | | | 329,409 | |
Allegion PLC | | | 3,900 | | | | 504,348 | |
Ameresco, Inc., Class A (a) | | | 81,556 | | | | 1,565,060 | |
AO Smith Corp. | | | 5,800 | | | | 247,602 | |
Assa Abloy AB ADR | | | 82,142 | | | | 970,918 | |
Brambles, Ltd. ADR | | | 33,300 | | | | 554,445 | |
Carlisle Cos., Inc. | | | 2,400 | | | | 374,952 | |
25
DOMINI IMPACT EQUITY FUND
PORTFOLIOOF INVESTMENTS (continued)
January 31, 2020 (Unaudited)
| | | | | | | | |
| SECURITY | | SHARES | | | VALUE | |
| | |
| Industrials(Continued) | | | | | | |
CH Robinson Worldwide, Inc. | | | 5,900 | | | $ | 426,098 | |
Cintas Corp. | | | 3,800 | | | | 1,060,086 | |
Copart, Inc. (a) | | | 9,200 | | | | 933,432 | |
CoStar Group, Inc. (a) | | | 1,571 | | | | 1,025,847 | |
Cummins, Inc. | | | 6,541 | | | | 1,046,364 | |
Dai Nippon Printing Co., Ltd. ADR | | | 22,500 | | | | 312,075 | |
Deere & Co. | | | 13,845 | | | | 2,195,540 | |
Deutsche Post AG ADR | | | 42,837 | | | | 1,491,584 | |
Donaldson Co., Inc. | | | 5,200 | | | | 269,620 | |
Emerson Electric Co. | | | 26,626 | | | | 1,907,220 | |
Expeditors International of Washington, Inc. | | | 7,200 | | | | 525,888 | |
Fastenal Co. | | | 24,558 | | | | 856,583 | |
Flowserve Corp. | | | 5,300 | | | | 247,404 | |
Fortune Brands Home & Security, Inc. | | | 5,800 | | | | 398,518 | |
Graco, Inc. | | | 7,600 | | | | 403,940 | |
HD Supply Holdings, Inc. (a) | | | 7,500 | | | | 305,550 | |
Hubbell, Inc. | | | 2,400 | | | | 343,752 | |
IAA, Inc. (a) | | | 5,500 | | | | 259,930 | |
IDEX Corp. | | | 3,200 | | | | 524,320 | |
IHS Markit, Ltd. (a) | | | 16,494 | | | | 1,300,717 | |
Illinois Tool Works, Inc. | | | 12,252 | | | | 2,143,855 | �� |
Ingersoll-Rand PLC | | | 10,507 | | | | 1,399,848 | |
JB Hunt Transport Services, Inc. | | | 3,800 | | | | 410,134 | |
JetBlue Airways Corp. (a) | | | 13,588 | | | | 269,450 | |
Johnson Controls International PLC | | | 35,136 | | | | 1,386,115 | |
KAR Auction Services, Inc. | | | 5,500 | | | | 115,610 | |
Lennox International, Inc. | | | 1,600 | | | | 372,768 | |
Makita Corp. ADR | | | 10,500 | | | | 401,100 | |
Masco Corp. | | | 12,400 | | | | 589,248 | |
Middleby Corp. (The) (a) | | | 2,400 | | | | 269,184 | |
Nidec Corp. ADR | | | 43,828 | | | | 1,391,101 | |
Nielsen Holdings PLC | | | 15,500 | | | | 316,200 | |
Nordson Corp. | | | 2,100 | | | | 354,606 | |
Old Dominion Freight Line, Inc. | | | 3,200 | | | | 627,936 | |
Owens Corning | | | 4,533 | | | | 274,201 | |
PACCAR, Inc. | | | 14,900 | | | | 1,105,729 | |
Pentair PLC | | | 7,300 | | | | 313,389 | |
Quanta Services, Inc. | | | 6,000 | | | | 234,900 | |
Robert Half International, Inc. | | | 4,751 | | | | 276,366 | |
Rockwell Automation, Inc. | | | 5,072 | | | | 972,100 | |
Roper Technologies, Inc. | | | 4,457 | | | | 1,701,059 | |
Sensata Technologies Holding PLC (a) | | | 7,100 | | | | 335,617 | |
Siemens AG ADR | | | 70,300 | | | | 4,326,262 | |
Simpson Manufacturing Co., Inc. | | | 1,600 | | | | 132,272 | |
SKF AB ADR | | | 18,000 | | | | 328,680 | |
Snap-on, Inc. | | | 2,300 | | | | 367,149 | |
Stanley Black & Decker, Inc. | | | 6,754 | | | | 1,076,115 | |
Sunrun, Inc. (a) | | | 189,203 | | | | 3,222,127 | |
Thomson Reuters Corp. | | | 7,300 | | | | 586,482 | |
26
DOMINI IMPACT EQUITY FUND
PORTFOLIOOF INVESTMENTS (continued)
January 31, 2020 (Unaudited)
| | | | | | | | |
| SECURITY | | SHARES | | | VALUE | |
| | |
| Industrials(Continued) | | | | | | |
Toro Co. (The) | | | 4,500 | | | $ | 360,090 | |
Trex Co., Inc. (a) | | | 2,700 | | | | 265,248 | |
United Parcel Service, Inc., Class B | | | 30,793 | | | | 3,187,691 | |
United Rentals, Inc. (a) | | | 3,300 | | | | 447,777 | |
Vestas Wind Systems A/S ADR | | | 25,600 | | | | 846,259 | |
Wabtec Corp. | | | 7,591 | | | | 560,671 | |
Watts Water Technologies, Inc., Class A | | | 26,707 | | | | 2,662,955 | |
WW Grainger, Inc. | | | 1,970 | | | | 596,260 | |
Xylem, Inc. | | | 7,700 | | | | 628,782 | |
| | | | | | | | |
| | | | | | | 57,590,284 | |
| | | | | | | | |
| | |
| Information Technology – 30.1% | | | | | | |
Adobe, Inc. (a) | | | 21,161 | | | | 7,430,474 | |
Advanced Micro Devices, Inc. (a) | | | 48,050 | | | | 2,258,350 | |
Apple, Inc. | | | 170,949 | | | | 52,910,425 | |
Applied Materials, Inc. | | | 40,302 | | | | 2,337,113 | |
Autodesk, Inc. (a) | | | 22,995 | | | | 4,526,566 | |
Automatic Data Processing, Inc. | | | 17,568 | | | | 3,010,980 | |
Blackbaud, Inc. | | | 18,143 | | | | 1,421,141 | |
Broadcom, Inc. | | | 16,936 | | | | 5,168,190 | |
Cadence Design Systems, Inc. (a) | | | 12,084 | | | | 871,377 | |
Cisco Systems, Inc. | | | 185,791 | | | | 8,540,812 | |
Cognizant Technology Solutions Corp., Class A | | | 23,923 | | | | 1,468,394 | |
Cree, Inc. (a) | | | 65,352 | | | | 3,038,214 | |
First Solar, Inc. (a) | | | 63,627 | | | | 3,154,627 | |
Fiserv, Inc. (a) | | | 24,634 | | | | 2,921,839 | |
Intel Corp. | | | 190,379 | | | | 12,170,929 | |
International Business Machines Corp. | | | 38,731 | | | | 5,566,807 | |
Intuit, Inc. | | | 10,952 | | | | 3,070,722 | |
Itron, Inc. (a) | | | 40,160 | | | | 3,283,080 | |
KLA Corp. | | | 6,910 | | | | 1,145,263 | |
Lam Research Corp. | | | 6,300 | | | | 1,878,723 | |
Mastercard, Inc., Class A | | | 38,426 | | | | 12,140,310 | |
Microsoft Corp. | | | 328,761 | | | | 55,964,985 | |
NetApp, Inc. | | | 9,708 | | | | 518,407 | |
NVIDIA Corp. | | | 25,650 | | | | 6,064,429 | |
Paychex, Inc. | | | 14,031 | | | | 1,203,439 | |
Pluralsight, Inc., Class A (a) | | | 164,033 | | | | 3,180,600 | |
salesforce.com, Inc. (a) | | | 36,778 | | | | 6,704,997 | |
Square, Inc., Class A (a) | | | 47,419 | | | | 3,541,725 | |
STMicroelectronics NV, Class Y | | | 107,501 | | | | 2,993,903 | |
SunPower Corp. (a) | | | 253,601 | | | | 2,160,681 | |
Synopsys, Inc. (a) | | | 6,443 | | | | 950,407 | |
Texas Instruments, Inc. | | | 40,669 | | | | 4,906,715 | |
Universal Display Corp. | | | 16,601 | | | | 2,924,598 | |
Visa, Inc., Class A | | | 74,303 | | | | 14,784,068 | |
VMware, Inc., Class A (a) | | | 3,275 | | | | 484,896 | |
WEX, Inc. (a) | | | 1,916 | | | | 415,619 | |
| | | | | | | | |
| | | | | | | 245,113,805 | |
| | | | | | | | |
27
DOMINI IMPACT EQUITY FUND
PORTFOLIOOF INVESTMENTS (continued)
January 31, 2020 (Unaudited)
| | | | | | | | |
| SECURITY | | SHARES | | | VALUE | |
| Materials – 2.0% | | | | | | |
Air Products & Chemicals, Inc. | | | 9,622 | | | $ | 2,296,868 | |
Avery Dennison Corp. | | | 3,500 | | | | 459,340 | |
Ecolab, Inc. | | | 11,148 | | | | 2,186,234 | |
International Paper Co. | | | 17,100 | | | | 696,312 | |
Linde PLC | | | 23,424 | | | | 4,758,117 | |
Novozymes A/S ADR | | | 9,200 | | | | 477,848 | |
Nucor Corp. | | | 12,992 | | | | 616,990 | |
PPG Industries, Inc. | | | 10,342 | | | | 1,239,385 | |
Sherwin-Williams Co. (The) | | | 3,564 | | | | 1,985,112 | |
Vulcan Materials Co. | | | 5,944 | | | | 841,849 | |
Westrock Co. | | | 10,985 | | | | 428,415 | |
| | | | | | | | |
| | | | | | | 15,986,470 | |
| | | | | | | | |
| | |
| Real Estate – 3.3% | | | | | | |
Alexandria Real Estate Equities, Inc. | | | 4,981 | | | | 812,899 | |
American Tower Corp. | | | 19,415 | | | | 4,499,232 | |
Boston Properties, Inc. | | | 6,646 | | | | 952,704 | |
CBRE Group, Inc., Class A (a) | | | 13,922 | | | | 849,938 | |
Crown Castle International Corp. | | | 18,122 | | | | 2,715,400 | |
Digital Realty Trust, Inc. | | | 8,992 | | | | 1,105,926 | |
Duke Realty Corp. | | | 15,500 | | | | 562,805 | |
Equinix, Inc. | | | 3,742 | | | | 2,206,770 | |
Extra Space Storage, Inc. | | | 5,700 | | | | 630,876 | |
Federal Realty Investment Trust | | | 3,400 | | | | 425,068 | |
Host Hotels & Resorts, Inc. | | | 31,322 | | | | 511,801 | |
Iron Mountain, Inc. | | | 12,200 | | | | 385,642 | |
Kilroy Realty Corp. | | | 4,600 | | | | 379,822 | |
Liberty Property Trust | | | 7,200 | | | | 451,080 | |
Mid-America Apartment Communities, Inc. | | | 4,900 | | | | 672,329 | |
Prologis, Inc. | | | 27,535 | | | | 2,557,451 | |
Public Storage | | | 6,677 | | | | 1,494,046 | |
Realty Income Corp. | | | 14,121 | | | | 1,107,228 | |
Regency Centers Corp. | | | 7,085 | | | | 439,553 | |
SBA Communications Corp. | | | 4,807 | | | | 1,199,635 | |
UDR, Inc. | | | 13,169 | | | | 630,927 | |
Ventas, Inc. | | | 15,963 | | | | 923,619 | |
Welltower, Inc. | | | 17,671 | | | | 1,500,445 | |
| | | | | | | | |
| | | | | | | 27,015,196 | |
| | | | | | | | |
| | |
| Utilities – 0.9% | | | | | | |
Alliant Energy Corp. | | | 11,000 | | | | 652,960 | |
Avangrid, Inc. | | | 2,547 | | | | 135,653 | |
Consolidated Edison, Inc. | | | 14,361 | | | | 1,349,934 | |
Eversource Energy | | | 14,158 | | | | 1,308,766 | |
National Grid PLC ADR | | | 30,482 | | | | 2,020,347 | |
Pattern Energy Group, Inc., Class A | | | 3,600 | | | | 96,876 | |
Red Electrica Corp. SA ADR | | | 37,300 | | | | 370,762 | |
SSE PLC ADR | | | 43,400 | | | | 861,924 | |
28
DOMINI IMPACT EQUITY FUND
PORTFOLIOOF INVESTMENTS (continued)
January 31, 2020 (Unaudited)
| | | | | | | | |
| SECURITY | | SHARES | | | VALUE | |
| | |
| Utilities(Continued) | | | | | | |
Terna Rete Elettrica Nazionale SpA ADR | | | 20,500 | | | $ | 426,912 | |
| | | | | | | | |
| | | | | | | 7,224,134 | |
| | | | | | | | |
| | |
| Rights – 0.0% | | | | | | |
| | |
| Health Care – 0.0% | | | | | | |
Bristol-Myers Squibb Co., Exp. 3/31/21 (a) | | | 30,910 | | | | 107,567 | |
| | | | | | | | |
| | | | | | | 107,567 | |
| | | | | | | | |
| | |
| Total Investments – 99.8%(Cost $602,847,521) | | | | | 811,200,167 | |
| | |
| Other Assets, less liabilities – 0.2% | | | | | 1,549,782 | |
| | | | | | | | |
| | |
| Net Assets – 100.0% | | | | | $812,749,949 | |
| | | | | | | | |
(a)Non-income producing security.
Abbreviations
ADR — American Depositary Receipt
SEE NOTES TO FINANCIAL STATEMENTS
29
DOMINI IMPACT BOND FUND
Fund Performance and Holdings
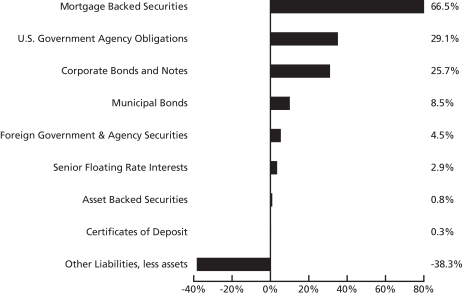
The bar chart below provides information as of January 31, 2020, about the percentage of the Domini Impact Bond Fund’s portfolio holdings invested in various types of debt obligations:
PORTFOLIO COMPOSITION (% OF NET ASSETS) (Unaudited)
During periods of rising interest rates, bond funds can lose value. Some of the Fund’s community development investments may be unrated and may carry greater risks than the Fund’s other holdings. The Fund currently holds a large percentage of its portfolio in mortgage-backed securities. During periods of falling interest rates these securities may prepay the principal due, which may lower the Fund’s return by causing it to reinvest at lower interest rates.
Investments in derivatives can be volatile. Potential risks include currency risk, leverage risk (the risk that small market movements may result in large changes in the value of an investment), liquidity risk, index risk, pricing risk, and counterparty risk (the risk that the counterparty may be unwilling or unable to honor its obligations). TBA (To Be Announced) securities involve the risk that the security the Fund buys will lose value prior to its delivery. There also is the risk that the security will not be issued or that the other party to the transaction will not meet its obligation, which can adversely affect the Fund’s returns.
The reduction or withdrawal of historical financial market support activities by the U.S. Government and Federal Reserve, or other governments/central banks could negatively impact financial markets generally, and increase market, liquidity and interest rate risks which could adversely affect the Fund’s returns.
The Global Industry Classification Standard (“GICS”) was developed by and is the exclusive property and a service mark of MSCI Inc. (“MSCI”) and Standard & Poor’s, a division of The McGraw-Hill Companies, Inc. (“S&P”) and is licensed for use by Domini Impact Investments. Neither MSCI, S&P nor any third party involved in making or compiling the GICS or any GICS classifications makes any express or implied warranties or representations with respect to such standard or classification nor shall any such party have any liability therefrom.
30
| | | | | | | | |
| |
DOMINI IMPACT BOND FUND AVERAGE ANNUAL TOTAL RETURNS (Unaudited) |
| | | |
| | | Investor
shares | | Institutional
shares1 | | Bloomberg Barclays U.S.
Aggregate Index |
| | | | |
| As of 1/31/20 | | 1 Year | | 9.70% | | 10.18% | | 9.64% |
| | | | |
| | 5 Year | | 2.92% | | 3.22% | | 3.01% |
| | | | |
| | | 10 Year | | 3.00% | | 3.00% | | 3.79% |
Past performance is no guarantee of future results.The Fund’s returns quoted above represent past performance after all expenses. The returns reflect any applicable expense waivers in effect during the periods shown. Without such waivers, Fund performance would be lower. Investment return, principal value, and yield will fluctuate. Your shares, when redeemed, may be worth more or less than their original cost. Call1-800-582-6757 or visit www.domini.com for performance information current to the most recentmonth-end, which may be lower or higher than the performance data quoted. A 2.00% redemption fee applies on sales or exchanges of shares made less than 30 days after the settlement of purchase or acquisition through exchange, with certain exceptions. Quoted performance data does not reflect the deduction of this fee, which would reduce the performance quoted. See the prospectus for further information.
Per the prospectus date November 29, 2019, the Fund’s annual operating expenses totaled: 1.20% (gross)/0.87% (net) (Investor), 0.84% (gross)/0.57% (net) (Institutional), 0.89% (gross)/0.65% (net) (class Y) Domini Impact Investments LLC has contractually agreed to waive certain fees and/or reimburse certain ordinary operating expenses in order to limit Investor, Institutional, and Class Y share expenses to 0.87%, 0.57%, and 0.65%, respectively, until November 30, 2020, absent an earlier modification by the Fund’s Board.
The table does not reflect the deduction of fees and taxes that a shareholder would pay on Fund distributions or the redemption of Fund shares. Total return is based on the Fund’s net asset values and assumes all dividends and capital gains were reinvested.
An investment in the Domini Impact Bond Fund is not a bank deposit and is not insured. You may lose money. The Fund is subject to market, recent events, impact investing, style, information, interest rate, and credit risks.
TBA (To Be Announced) securities involve the risk that the security the Fund buys will lose value prior to its delivery. There also is the risk that the security will not be issued or that the other party to the transaction will not meet its obligation, which can adversely affect the Fund’s returns.
The Bloomberg Barclays U.S. Aggregate Index is an index representing securities that are U.S. domestic, taxable, and dollar denominated and covering the U.S. investment grade fixed rate bond market, with index components for government and corporate securities and asset-backed securities. You cannot invest directly in an index.
1Institutional shares were not offered prior to November 30, 2011. All performance information for time periods beginning prior to November 30, 2011, is the performance of the Investor shares. This performance has not been adjusted to reflect the lower expenses of the Institutional shares.
31
DOMINI IMPACT BOND FUND
PORTFOLIOOF INVESTMENTS
January 31, 2020 (Unaudited)
| | | | | | | | |
| Security | | Principal
Amount* | | | Value | |
| Long Term Investments – 115.0% | | | | | | |
| Mortgage Backed Securities – 66.5% | | | | | | |
Agency Collateralized Mortgage Obligations – 3.7% | | | | | | | | |
Federal Home Loan Mortgage Corp. | | | | | | | | |
Series 3768, Class CB, 3.500%, 12/15/25 | | | 261,919 | | | $ | 271,558 | |
Series 3800, Class CB, 3.500%, 2/15/26 | | | 383,000 | | | | 403,971 | |
Series 3806, Class L, 3.500%, 2/15/26 | | | 847,000 | | | | 893,623 | |
Series 3877, Class LM, 3.500%, 6/15/26 | | | 780,000 | | | | 812,693 | |
Federal National Mortgage Association | | | | | | | | |
Series2012-17, Class BC, 3.500%, 3/25/27 | | | 368,000 | | | | 395,393 | |
Series2017-72, Class B, 3.000%, 9/25/47 | | | 150,341 | | | | 156,164 | |
Series2017-72, Class CD, 3.000%, 9/25/47 | | | 157,895 | | | | 163,560 | |
Series2018-72, Class BA, 3.500%, 7/25/54 | | | 224,551 | | | | 233,434 | |
Series2020-1, Class AC, 3.500%, 8/25/58 | | | 557,000 | | | | 583,632 | |
Federal National Mortgage Association Connecticut Avenue Securities | | | | | | | | |
Series C01, Class 1M2, 5.211%, (1 MonthUSD-LIBOR + 3.550%), 7/25/29 (a) | | | 120,000 | | | | 126,727 | |
Series C07, Class 2M2, 6.011%, (1 MonthUSD-LIBOR + 4.350%), 5/25/29 (a) | | | 190,988 | | | | 202,436 | |
FREMF Mortgage Trust | | | | | | | | |
Series2017-K64, Class B, 4.117%, 5/25/50 (a)(b) | | | 70,000 | | | | 76,027 | |
Series2017-K65, Class B, 4.214%, 7/25/50 (a)(b) | | | 155,000 | | | | 167,363 | |
Series2017-K66, Class B, 4.173%, 7/25/27 (a)(b) | | | 136,000 | | | | 147,150 | |
Series2017-K67, Class B, 4.079%, 9/25/49 (a)(b) | | | 85,000 | | | | 91,779 | |
Series2017-K68, Class B, 3.975%, 10/25/49 (a)(b) | | | 90,000 | | | | 96,567 | |
Series2017-K69, Class C, 3.854%, 10/25/49 (a)(b) | | | 40,000 | | | | 41,650 | |
Series2017-K71, Class B, 3.882%, 11/25/50 (a)(b) | | | 220,000 | | | | 234,432 | |
Series2017-K71, Class C, 3.882%, 11/25/50 (a)(b) | | | 65,000 | | | | 67,746 | |
Series 2017-K725, Class B, 4.012%, 2/25/50 (a)(b) | | | 100,000 | | | | 104,872 | |
Series 2017-K726, Class B, 4.108%, 7/25/49 (a)(b) | | | 175,000 | | | | 184,718 | |
Series 2017-K729, Class B, 3.800%, 11/25/49 (a)(b) | | | 250,000 | | | | 261,144 | |
Series 2017-K729, Class C, 3.800%, 11/25/49 (a)(b) | | | 90,000 | | | | 93,114 | |
Series 2018-K154, Class B, 4.159%, 11/25/32 (a)(b) | | | 67,000 | | | | 68,359 | |
Series 2018-KW07, Class B, 4.221%, 10/25/31 (a)(b) | | | 461,000 | | | | 473,247 | |
STACR Trust, Series 2018-HRP1, Class M2, 3.311%, (1 MonthUSD-LIBOR + 1.650%), 4/25/43 (a)(b) | | | 72,921 | | | | 73,259 | |
| | | | | | | | |
| | | | | | | 6,424,618 | |
| | | | | | | | |
| | | | | | | | |
Commercial Mortgage-Backed Securities – 4.4% | | | | | | | | |
245 Park Avenue Trust, Series 2017-245P, Class A, 3.508%, 6/5/37 (b) | | | 712,000 | | | | 776,291 | |
BWAY Mortgage Trust, Series 2013-1515, Class A1, 2.809%, 3/10/33 (b) | | | 122,234 | | | | 124,612 | |
COMM Mortgage Trust | | | | | | | | |
Series2013-WWP, Class A2, 3.424%, 3/10/31 (b) | | | 640,000 | | | | 671,252 | |
Series2013-WWP, Class B, 3.726%, 3/10/31 (b) | | | 644,000 | | | | 680,993 | |
CPT Mortgage Trust, Series2019-CPT, Class A, 2.865%, 11/13/39 (b) | | | 415,000 | | | | 437,804 | |
32
DOMINI IMPACT BOND FUND
PORTFOLIOOF INVESTMENTS (continued)
January 31, 2020 (Unaudited)
| | | | | | | | |
| Security | | Principal
Amount* | | | Value | |
Commercial Mortgage-Backed Securities(Continued) | | | | | | | | |
GS Mortgage Securities Corp. Trust, Series 2017-500K, Class A, 2.376%, (1 MonthUSD-LIBOR + 0.700%), 7/15/32 (a)(b) | | | 395,000 | | | $ | 395,091 | |
Hudson Yards Mortgage Trust, Series 2016-10HY, Class A, 2.835%, 8/10/38 (b) | | | 1,000,000 | | | | 1,044,563 | |
JP Morgan Chase Commercial Mortgage Securities Corp.,Series 2018-AON, Class A, 4.128%, 7/5/31 (b) | | | 555,000 | | | | 595,618 | |
MAD Mortgage Trust, Series 2017-330M, Class A, 3.294%, 8/15/34 (a)(b) | | | 729,000 | | | | 754,258 | |
Morgan Stanley Bank of America Merrill Lynch Trust | | | | | | | | |
Series2013-C12, Class A4, 4.259%, 10/15/46 (a) | | | 300,000 | | | | 324,262 | |
Series2014-C15, Class A4, 4.051%, 4/15/47 | | | 300,000 | | | | 324,790 | |
Series2014-C19, Class A4, 3.526%, 12/15/47 | | | 180,167 | | | | 193,037 | |
Morgan Stanley Capital I Trust, Series2017-CLS, Class A, 2.376%, (1 MonthUSD-LIBOR + 0.700%), 11/15/34 (a)(b) | | | 531,000 | | | | 531,005 | |
One Market Plaza Trust, Series 2017-1MKT, Class A, 3.614%, 2/10/32 (b) | | | 710,000 | | | | 738,196 | |
| | | | | | | | |
| | | | | | | 7,591,772 | |
| | | | | | | | |
| | | | | | | | |
Federal Home Loan Mortgage Corporation – 3.7% | | | | | | | | |
Federal Home Loan Mortgage Corp. | | | | | | | | |
2.500%, 8/1/27 | | | 52,097 | | | | 53,188 | |
2.500%, 11/1/27 | | | 137,553 | | | | 140,754 | |
2.883%, (12 MonthUSD-LIBOR + 1.635%), 10/1/43 (a) | | | 193,666 | | | | 198,312 | |
3.000%, 1/1/27 | | | 186,984 | | | | 193,259 | |
3.000%, 7/1/42 | | | 69,499 | | | | 72,222 | |
3.000%, 5/1/45 | | | 445,873 | | | | 463,008 | |
3.500%, 12/1/32 | | | 236,567 | | | | 248,916 | |
3.500%, 6/1/48 | | | 2,367,298 | | | | 2,458,790 | |
4.000%, 2/1/37 | | | 57,102 | | | | 60,825 | |
4.000%, 8/1/39 | | | 51,757 | | | | 55,797 | |
4.000%, 10/1/39 | | | 105,139 | | | | 113,285 | |
4.000%, 10/1/39 | | | 84,360 | | | | 90,907 | |
4.000%, 11/1/39 | | | 47,405 | | | | 51,103 | |
4.000%, 10/1/40 | | | 134,807 | | | | 145,776 | |
4.000%, 11/1/40 | | | 164,704 | | | | 177,578 | |
4.000%, 11/1/40 | | | 22,894 | | | | 24,683 | |
4.000%, 11/1/40 | | | 18,567 | | | | 20,039 | |
4.000%, 12/1/40 | | | 78,195 | | | | 84,311 | |
4.000%, 6/1/41 | | | 12,006 | | | | 12,603 | |
4.500%, 4/1/35 | | | 112,805 | | | | 123,354 | |
4.500%, 9/1/35 | | | 157,586 | | | | 172,115 | |
4.500%, 7/1/36 | | | 104,529 | | | | 114,352 | |
4.500%, 6/1/39 | | | 246,748 | | | | 269,875 | |
4.500%, 9/1/40 | | | 38,549 | | | | 42,168 | |
4.500%, 2/1/41 | | | 77,722 | | | | 85,018 | |
5.000%, 8/1/33 | | | 18,833 | | | | 20,912 | |
5.000%, 10/1/33 | | | 10,204 | | | | 11,187 | |
33
DOMINI IMPACT BOND FUND
PORTFOLIOOF INVESTMENTS (continued)
January 31, 2020 (Unaudited)
| | | | | | | | |
| Security | | Principal
Amount* | | | Value | |
Federal Home Loan Mortgage Corporation(Continued) | | | | | | | | |
5.000%, 4/1/35 | | | 23,911 | | | $ | 26,565 | |
5.000%, 7/1/35 | | | 155,891 | | | | 173,193 | |
5.000%, 7/1/35 | | | 27,121 | | | | 30,134 | |
5.000%, 1/1/37 | | | 96,206 | | | | 106,861 | |
5.000%, 7/1/40 | | | 79,081 | | | | 87,865 | |
5.000%, 4/1/41 | | | 65,042 | | | | 72,315 | |
5.500%, 12/1/36 | | | 103,919 | | | | 117,381 | |
5.500%, 8/1/40 | | | 139,272 | | | | 156,421 | |
6.000%, 8/1/36 | | | 15,957 | | | | 18,392 | |
6.000%, 7/1/39 | | | 92,267 | | | | 106,356 | |
| | | | | | | | |
| | | | | | | 6,399,820 | |
| | | | | | | | |
| | | | | | | | |
Federal National Mortgage Association – 36.6% | | | | | | | | |
Federal National Mortgage Association | | | | | | | | |
2.000%, 10/1/27 | | | 182,674 | | | | 184,292 | |
2.000%, 1/1/28 | | | 148,813 | | | | 150,133 | |
2.500%, 6/1/24 | | | 269,202 | | | | 274,061 | |
2.500%, 11/1/31 | | | 133,901 | | | | 136,646 | |
2.500%, 12/1/31 | | | 30,930 | | | | 31,564 | |
2.500%, 12/1/43 | | | 308,931 | | | | 313,402 | |
2.500%, 4/1/45 | | | 211,990 | | | | 215,059 | |
2.612%, (12 MonthUSD-LIBOR + 1.580%), 5/1/44 (a) | | | 74,146 | | | | 75,625 | |
3.000%, 8/1/46 | | | 84,002 | | | | 86,747 | |
3.000%, 10/1/46 | | | 1,332,816 | | | | 1,376,475 | |
3.000%, 11/1/46 | | | 1,740,179 | | | | 1,798,605 | |
3.000%, 12/1/46 | | | 625,753 | | | | 646,758 | |
3.000%, 2/25/49 | | | 172,585 | | | | 178,216 | |
3.500%, 12/1/31 | | | 12,087 | | | | 12,688 | |
3.500%, 1/1/32 | | | 217,802 | | | | 228,644 | |
3.500%, 1/1/32 | | | 120,569 | | | | 126,565 | |
3.500%, 10/1/32 | | | 167,061 | | | | 175,694 | |
3.500%, 6/1/46 | | | 1,373,350 | | | | 1,436,538 | |
3.500%, 1/1/48 | | | 1,295,548 | | | | 1,350,176 | |
4.000%, 11/1/30 | | | 22,898 | | | | 24,505 | |
4.000%, 10/1/33 | | | 123,886 | | | | 132,592 | |
4.000%, 12/1/36 | | | 38,242 | | | | 41,219 | |
4.000%, 8/1/39 | | | 55,529 | | | | 59,799 | |
4.000%, 10/1/39 | | | 34,325 | | | | 36,976 | |
4.000%, 12/1/39 | | | 49,481 | | | | 53,296 | |
4.000%, 1/1/40 | | | 418,459 | | | | 450,723 | |
4.000%, 3/1/40 | | | 56,667 | | | | 61,069 | |
4.000%, 8/1/40 | | | 113,430 | | | | 122,237 | |
4.000%, 8/1/40 | | | 20,066 | | | | 21,621 | |
4.000%, 10/1/40 | | | 187,062 | | | | 202,181 | |
4.000%, 10/1/40 | | | 36,610 | | | | 39,458 | |
4.000%, 11/1/40 | | | 46,142 | | | | 49,757 | |
4.000%, 11/1/40 | | | 28,140 | | | | 30,324 | |
4.000%, 12/1/40 | | | 69,440 | | | | 75,908 | |
34
DOMINI IMPACT BOND FUND
PORTFOLIOOF INVESTMENTS (continued)
January 31, 2020 (Unaudited)
| | | | | | | | |
| Security | | Principal
Amount* | | | Value | |
Federal National Mortgage Association(Continued) | | | | | | | | |
4.000%, 2/1/41 | | | 95,468 | | | $ | 102,877 | |
4.500%, 8/1/35 | | | 34,080 | | | | 37,228 | |
4.500%, 8/1/36 | | | 40,310 | | | | 44,074 | |
4.500%, 8/1/38 | | | 88,571 | | | | 96,719 | |
4.500%, 3/1/39 | | | 119,583 | | | | 130,778 | |
4.500%, 9/1/39 | | | 51,881 | | | | 56,684 | |
4.500%, 2/1/40 | | | 51,630 | | | | 56,515 | |
4.500%, 8/1/40 | | | 115,666 | | | | 127,723 | |
4.500%, 1/1/41 | | | 43,372 | | | | 47,410 | |
4.500%, 9/1/41 | | | 77,314 | | | | 84,535 | |
5.000%, 10/1/39 | | | 5,078 | | | | 5,579 | |
5.500%, 8/1/37 | | | 65,992 | | | | 74,469 | |
6.000%, 12/1/35 | | | 35,546 | | | | 40,702 | |
6.000%, 3/1/36 | | | 211,241 | | | | 243,185 | |
6.000%, 6/1/36 | | | 74,340 | | | | 85,640 | |
6.000%, 8/1/37 | | | 19,241 | | | | 22,156 | |
6.000%, 3/1/38 | | | 33,904 | | | | 39,059 | |
TBA 15 Yr, 2.500%, 2/15/35 (c) | | | 2,600,000 | | | | 2,646,922 | |
TBA 15 Yr, 3.000%, 2/15/35 (c) | | | 3,600,000 | | | | 3,708,844 | |
TBA 30 Yr, 3.000%, 2/15/50 (c) | | | 32,200,000 | | | | 32,932,338 | |
TBA 30 Yr, 3.500%, 2/15/50 (c) | | | 6,400,000 | | | | 6,607,000 | |
TBA 30 Yr, 4.000%, 2/15/50 (c) | | | 5,800,000 | | | | 6,060,094 | |
| | | | | | | | |
| | | | | | | 63,450,084 | |
| | | | | | | | |
| | | | | | | | |
Government National Mortgage Association – 18.1% | | | | | | | | |
Government National Mortgage Association | | | | | | | | |
4.000%, 7/20/49 | | | 2,150,547 | | | | 2,233,633 | |
TBA 30 Yr, 3.000%, 2/20/50 (c) | | | 22,100,000 | | | | 22,730,195 | |
TBA 30 Yr, 3.500%, 2/15/50 (c) | | | 2,951,000 | | | | 3,044,371 | |
TBA 30 Yr, 3.500%, 3/23/50 (c) | | | 2,349,000 | | | | 2,421,122 | |
TBA 30 Yr, 4.500%, 2/20/50 (c) | | | 900,000 | | | | 945,598 | |
| | | | | | | | |
| | | | | | | 31,374,919 | |
| | | | | | | | |
Total Mortgage Backed Securities
(Cost $113,620,624) | | | | | | | 115,241,213 | |
| | | | | | | | |
| | | | | | | | |
| Corporate Bonds and Notes – 25.7% | | | | | | |
Communications – 3.2% | | | | | | | | |
Alibaba Group Holding, Ltd., 2.800%, 6/6/23 | | | 200,000 | | | | 204,784 | |
Amazon.com, Inc. | | | | | | | | |
3.875%, 8/22/37 | | | 200,000 | | | | 234,852 | |
4.800%, 12/5/34 | | | 325,000 | | | | 418,484 | |
AT&T, Inc. | | | | | | | | |
3.950%, 1/15/25 | | | 445,000 | | | | 483,678 | |
4.750%, 5/15/46 | | | 715,000 | | | | 829,127 | |
CBS Corp., 2.900%, 1/15/27 | | | 400,000 | | | | 408,841 | |
35
DOMINI IMPACT BOND FUND
PORTFOLIOOF INVESTMENTS (continued)
January 31, 2020 (Unaudited)
| | | | | | | | |
| Security | | Principal
Amount* | | | Value | |
Communications(Continued) | | | | | | | | |
Charter Communications Operating LLC/Charter Communications Operating Capital senior secured note | | | | | | | | |
5.750%, 4/1/48 | | | 225,000 | | | $ | 269,468 | |
6.484%, 10/23/45 | | | 300,000 | | | | 390,368 | |
Cox Communications, Inc. | | | | | | | | |
3.150%, 8/15/24 (b) | | | 165,000 | | | | 172,722 | |
3.850%, 2/1/25 (b) | | | 10,000 | | | | 10,750 | |
4.800%, 2/1/35 (b) | | | 250,000 | | | | 291,692 | |
eBay, Inc., 3.600%, 6/5/27 | | | 195,000 | | | | 207,399 | |
Gray Television, Inc., 5.875%, 7/15/26 (b) | | | 200,000 | | | | 209,620 | |
Verizon Communications, Inc. | | | | | | | | |
3.376%, 2/15/25 | | | 57,000 | | | | 60,930 | |
3.875%, 2/8/29 | | | 210,000 | | | | 236,779 | |
4.016%, 12/3/29 | | | 370,000 | | | | 421,417 | |
Vodafone Group PLC | | | | | | | | |
4.375%, 2/19/43 | | | 400,000 | | | | 446,167 | |
6.150%, 2/27/37 | | | 185,000 | | | | 250,464 | |
| | | | | | | | |
| | | | | | | 5,547,542 | |
| | | | | | | | |
| | | | | | | | |
Consumer, Cyclical – 2.8% | | | | | | | | |
Aptiv Corp., 4.150%, 3/15/24 | | | 401,000 | | | | 431,752 | |
AutoNation, Inc., 5.500%, 2/1/20 | | | 500,000 | | | | 500,000 | |
Core & Main L.P., 6.125%, 8/15/25 (b) | | | 45,000 | | | | 46,344 | |
Home Depot, Inc. (The), 5.950%, 4/1/41 | | | 420,000 | | | | 612,077 | |
Lennar Corp., 4.125%, 1/15/22 | | | 245,000 | | | | 251,867 | |
Marriott International, Inc., 2.875%, 3/1/21 | | | 1,025,000 | | | | 1,036,415 | |
O’Reilly Automotive, Inc., 3.800%, 9/1/22 | | | 155,000 | | | | 161,783 | |
Starbucks Corp. | | | | | | | | |
3.750%, 12/1/47 | | | 275,000 | | | | 292,421 | |
4.450%, 8/15/49 | | | 750,000 | | | | 889,557 | |
Toll Brothers Finance Corp., 4.350%, 2/15/28 | | | 600,000 | | | | 633,209 | |
| | | | | | | | |
| | | | | | | 4,855,425 | |
| | | | | | | | |
| | | | | | | | |
Consumer,Non-cyclical – 5.0% | | | | | | | | |
Allina Health System, 4.805%, 11/15/45 | | | 291,000 | | | | 373,322 | |
Amgen, Inc., 3.200%, 11/2/27 | | | 525,000 | | | | 564,761 | |
Biogen, Inc., 5.200%, 9/15/45 | | | 400,000 | | | | 497,725 | |
Boston Medical Center Corp., 4.519%, 7/1/26 | | | 705,000 | | | | 777,561 | |
Bristol-Myers Squibb Co., 3.875%, 8/15/25 (b) | | | 325,000 | | | | 356,676 | |
Children’s Hospital Corp. (The), 4.115%, 1/1/47 | | | 230,000 | | | | 277,890 | |
City of Hope, 5.623%, 11/15/43 | | | 250,000 | | | | 351,974 | |
Conservation Fund A Nonprofit Corp. (The), 3.474%, 12/15/29 | | | 800,000 | | | | 824,354 | |
Dignity Health | | | | | | | | |
4.500%, 11/1/42 | | | 408,000 | | | | 458,758 | |
5.267%, 11/1/64 | | | 250,000 | | | | 313,552 | |
ERAC USA Finance LLC, 3.850%, 11/15/24 (b) | | | 500,000 | | | | 539,199 | |
JM Smucker Co. (The), 4.250%, 3/15/35 | | | 380,000 | | | | 427,304 | |
36
DOMINI IMPACT BOND FUND
PORTFOLIOOF INVESTMENTS (continued)
January 31, 2020 (Unaudited)
| | | | | | | | |
| Security | | Principal
Amount* | | | Value | |
Consumer,Non-cyclical(Continued) | | | | | | | | |
Kaiser Foundation Hospitals, 3.150%, 5/1/27 | | | 185,000 | | | $ | 198,717 | |
Memorial Sloan-Kettering Cancer Center | | | | | | | | |
4.125%, 7/1/52 | | | 120,000 | | | | 148,735 | |
Series 2015, 4.200%, 7/1/55 | | | 10,000 | | | | 12,556 | |
New York and Presbyterian Hospital (The), 4.024%, 8/1/45 | | | 215,000 | | | | 255,782 | |
Northeastern University, 5.285%, 3/1/32 | | | 100,000 | | | | 121,512 | |
Ochsner Clinic Foundation, 5.897%, 5/15/45 | | | 400,000 | | | | 558,915 | |
Orlando Health Obligated Group, 4.416%, 10/1/44 | | | 395,000 | | | | 478,312 | |
Thermo Fisher Scientific, Inc., 4.150%, 2/1/24 | | | 265,000 | | | | 287,496 | |
Trinity Health Corp., 3.434%, 12/1/48 | | | 800,000 | | | | 847,131 | |
| | | | | | | | |
| | | | | | | 8,672,232 | |
| | | | | | | | |
| | | | | | | | |
Energy – 0.6% | | | | | | | | |
Azure Power Solar Energy Pvt, Ltd., 5.650%, 12/24/24 (b) | | | 500,000 | | | | 517,348 | |
Greenko Dutch BV, 5.250%, 7/24/24 (b) | | | 545,000 | | | | 553,788 | |
| | | | | | | | |
| | | | | | | 1,071,136 | |
| | | | | | | | |
| | | | | | | | |
Financial – 10.6% | | | | | | | | |
AerCap Ireland Capital DAC/AerCap Global Aviation Trust, 3.500%, 5/26/22 | | | 775,000 | | | | 798,360 | |
AIA Group, Ltd., 4.500%, 3/16/46 (b) | | | 325,000 | | | | 398,173 | |
Air Lease Corp., 3.625%, 12/1/27 | | | 500,000 | | | | 530,566 | |
American International Group, Inc., 3.900%, 4/1/26 | | | 380,000 | | | | 414,041 | |
American Tower Corp. | | | | | | | | |
3.375%, 5/15/24 | | | 235,000 | | | | 247,092 | |
5.000%, 2/15/24 | | | 362,000 | | | | 403,285 | |
Aon PLC, 4.750%, 5/15/45 | | | 500,000 | | | | 627,501 | |
AXA SA, 8.600%, 12/15/30 | | | 400,000 | | | | 593,270 | |
Bank of America Corp. | | | | | | | | |
Series MTN, 2.456%, (3 MonthUSD-LIBOR + 0.870%), 10/22/25 (a) | | | 545,000 | | | | 557,085 | |
Series MTN, 3.124%, (3 MonthUSD-LIBOR + 1.160%), 1/20/23 (a) | | | 725,000 | | | | 742,568 | |
BlueHub Loan Fund, Inc., 2.890%, 1/1/27 | | | 600,000 | | | | 608,145 | |
BNP Paribas SA, 3.800%, 1/10/24 (b) | | | 245,000 | | | | 260,856 | |
Boston Properties L.P. | | | | | | | | |
3.650%, 2/1/26 | | | 430,000 | | | | 465,877 | |
4.500%, 12/1/28 | | | 500,000 | | | | 582,672 | |
BPCE SA | | | | | | | | |
3.000%, 5/22/22 (b) | | | 250,000 | | | | 255,904 | |
4.875%, 4/1/26 (b) | | | 500,000 | | | | 563,381 | |
Brandywine Operating Partnership L.P., 4.550%, 10/1/29 | | | 500,000 | | | | 564,950 | |
Capital One Financial Corp. subordinated note | | | | | | | | |
3.750%, 7/28/26 | | | 80,000 | | | | 85,250 | |
3.750%, 3/9/27 | | | 80,000 | | | | 86,773 | |
4.200%, 10/29/25 | | | 155,000 | | | | 169,406 | |
37
DOMINI IMPACT BOND FUND
PORTFOLIOOF INVESTMENTS (continued)
January 31, 2020 (Unaudited)
| | | | | | | | |
| Security | | Principal
Amount* | | | Value | |
Financial(Continued) | | | | | | | | |
Citigroup, Inc., 3.352%, (3 MonthUSD-LIBOR + 0.8966%), 4/24/25 (a) | | | 475,000 | | | $ | 500,105 | |
Cooperatieve Rabobank UA | | | | | | | | |
3.875%, 9/26/23 (b) | | | 250,000 | | | | 267,547 | |
3.950%, 11/9/22 | | | 375,000 | | | | 394,049 | |
Credit Agricole SA, 4.125%, 1/10/27 (b) | | | 510,000 | | | | 561,622 | |
Crown Castle International Corp., 3.700%, 6/15/26 | | | 300,000 | | | | 324,211 | |
Discover Financial Services, 3.750%, 3/4/25 | | | 325,000 | | | | 347,121 | |
Duke Realty L.P. | | | | | | | | |
3.625%, 4/15/23 | | | 200,000 | | | | 209,728 | |
4.375%, 6/15/22 | | | 250,000 | | | | 262,826 | |
Fifth Third Bancorp, 8.250%, 3/1/38 | | | 425,000 | | | | 692,509 | |
Huntington Bancshares, Inc., 3.150%, 3/14/21 | | | 425,000 | | | | 431,351 | |
ING Groep NV | | | | | | | | |
3.950%, 3/29/27 | | | 200,000 | | | | 221,270 | |
4.625%, 1/6/26 (b) | | | 750,000 | | | | 848,789 | |
Kimco Realty Corp., 3.400%, 11/1/22 | | | 160,000 | | | | 166,443 | |
Liberty Property L.P., 3.250%, 10/1/26 | | | 165,000 | | | | 176,890 | |
Marsh & McLennan Cos., Inc., 3.300%, 3/14/23 | | | 100,000 | | | | 104,343 | |
Morgan Stanley | | | | | | | | |
3.625%, 1/20/27 | | | 335,000 | | | | 363,738 | |
3.950%, 4/23/27 | | | 210,000 | | | | 228,985 | |
Nuveen Finance LLC, 4.125%, 11/1/24 (b) | | | 160,000 | | | | 176,165 | |
Regency Centers L.P., 3.750%, 6/15/24 | | | 300,000 | | | | 319,483 | |
Reinsurance Group of America, Inc. | | | | | | | | |
3.950%, 9/15/26 | | | 250,000 | | | | 271,771 | |
Series MTN, 4.700%, 9/15/23 | | | 164,000 | | | | 179,505 | |
SBA Tower Trust, 3.168%, 4/11/22 (b) | | | 290,000 | | | | 295,355 | |
Standard Chartered PLC, 5.700%, 3/26/44 (b) | | | 250,000 | | | | 326,907 | |
Truist Financial Corp., 3.875%, 3/19/29 | | | 575,000 | | | | 643,763 | |
U.S. Bancorp, 3.600%, 9/11/24 | | | 493,000 | | | | 531,305 | |
Ventas Realty L.P., 3.500%, 2/1/25 | | | 500,000 | | | | 530,417 | |
| | | | | | | | |
| | | | | | | 18,331,353 | |
| | | | | | | | |
| | | | | | | | |
Industrial – 1.6% | | | | | | | | |
Ardagh Packaging Finance PLC/Ardagh Holdings USA, Inc., 4.250%, 9/15/22 (b) | | | 260,000 | | | | 263,898 | |
CNH Industrial Capital LLC, 4.875%, 4/1/21 | | | 750,000 | | | | 772,845 | |
Illinois Tool Works, Inc., 4.875%, 9/15/41 | | | 175,000 | | | | 233,864 | |
Keysight Technologies, Inc., 4.550%, 10/30/24 | | | 500,000 | | | | 553,924 | |
Klabin Austria GmbH, 5.750%, 4/3/29 (b) | | | 480,000 | | | | 521,688 | |
Ryder System, Inc., 2.500%, 5/11/20 | | | 145,000 | | | | 145,167 | |
WRKCo, Inc., 3.000%, 9/15/24 | | | 375,000 | | | | 389,673 | |
| | | | | | | | |
| | | | | | | 2,881,059 | |
| | | | | | | | |
| | | | | | | | |
Technology – 0.4% | | | | | | | | |
Broadcom Corp/Broadcom Cayman Finance, Ltd., 3.625%, 1/15/24 | | | 355,000 | | | | 371,634 | |
38
DOMINI IMPACT BOND FUND
PORTFOLIOOF INVESTMENTS (continued)
January 31, 2020 (Unaudited)
| | | | | | | | |
| Security | | Principal
Amount* | | | Value | |
Technology(Continued) | | | | | | | | |
Micron Technology, Inc., 4.640%, 2/6/24 | | | 260,000 | | | $ | 283,906 | |
Microsoft Corp., 3.700%, 8/8/46 | | | 5,000 | | | | 5,892 | |
| | | | | | | | |
| | | | | | | 661,432 | |
| | | | | | | | |
| | | | | | | | |
Utilities – 1.5% | | | | | | | | |
Aegea Finance S.a.r.l., 5.750%, 10/10/24 (b) | | | 370,000 | | | | 390,966 | |
Clearway Energy Operating LLC, 4.750%, 3/15/28 (b) | | | 800,000 | | | | 824,080 | |
Consolidated Edison Co of New York, Inc., 4.125%, 5/15/49 | | | 750,000 | | | | 891,810 | |
Public Service Co. of Colorado, 4.100%, 6/15/48 | | | 420,000 | | | | 516,316 | |
| | | | | | | | |
| | | | | | | 2,623,172 | |
| | | | | | | | |
Total Corporate Bonds and Notes
(Cost $40,559,067) | | | | | | | 44,643,351 | |
| | | | | | | | |
| | | | | | | | |
| Municipal Bonds – 8.5% | | | | | | |
American Municipal Power-Ohio, Inc., (Meldahl Hydroelectric Project), 6.270%, 2/15/50 | | | 490,000 | | | | 696,506 | |
Bay Area Toll Authority, CA, Toll Bridge Revenue | | | | | | | | |
6.918%, 4/1/40 | | | 125,000 | | | | 192,963 | |
7.043%, 4/1/50 | | | 325,000 | | | | 564,268 | |
California, 7.625%, 3/1/40 | | | 525,000 | | | | 884,383 | |
California Health Facilities Financing Authority, 2.984%, 6/1/29 | | | 760,000 | | | | 795,674 | |
Commonwealth Financing Authority, 2.758%, 6/1/30 | | | 850,000 | | | | 888,683 | |
Cook County Community High School District No. 228, IL, 5.019%, 12/1/41 (AGM) | | | 435,000 | | | | 565,248 | |
District of Columbia, (Ingleside at Rock Creek), 4.125%, 7/1/24 | | | 500,000 | | | | 528,940 | |
Illinois | | | | | | | | |
3.860%, 4/1/21 | | | 215,000 | | | | 218,593 | |
5.100%, 6/1/33 | | | 335,000 | | | | 377,960 | |
Indiana Finance Authority Revenue, 3.624%, 7/1/36 | | | 235,000 | | | | 263,233 | |
Inland Valley Development Agency, 5.500%, 3/1/24 (AGM) | | | 70,000 | | | | 78,947 | |
Lancaster County Hospital Authority, PA, (Brethren Village) | | | | | | | | |
5.000%, 7/1/24 | | | 165,000 | | | | 182,767 | |
5.000%, 7/1/25 | | | 135,000 | | | | 151,463 | |
Los Angeles Department of Airports, CA, (Los Angeles International Airport), 3.887%, 5/15/38 | | | 140,000 | | | | 158,141 | |
Maryland Health and Higher Educational Facilities Authority, (Meritus Medical Center) | | | | | | | | |
3.968%, 7/1/27 | | | 205,000 | | | | 228,093 | |
4.168%, 7/1/29 | | | 40,000 | | | | 45,738 | |
Massachusetts Development Finance Agency, (NewBridge on the Charles, Inc.), 4.000%, 10/1/22 | | | 100,000 | | | | 108,897 | |
Massachusetts Health and Educational Facilities Authority, (Northeastern University), 6.432%, 10/1/35 | | | 420,000 | | | | 570,881 | |
Michigan Finance Authority, (City of Detroit) | | | | | | | | |
2.491%, 4/1/20 | | | 250,000 | | | | 250,243 | |
2.741%, 4/1/21 | | | 320,000 | | | | 323,702 | |
39
DOMINI IMPACT BOND FUND
PORTFOLIOOF INVESTMENTS (continued)
January 31, 2020 (Unaudited)
| | | | | | | | |
| Security | | Principal
Amount* | | | Value | |
| Municipal Bonds(Continued) | | | | | | |
New Jersey Turnpike Authority | | | | | | | | |
7.102%, 1/1/41 | | | 225,000 | | | $ | 362,192 | |
7.414%, 1/1/40 | | | 200,000 | | | | 330,204 | |
New York Transportation Development Corp., (LaGuardia Airport Terminal B Redevelopment), 3.473%, 7/1/28 | | | 500,000 | | | | 528,625 | |
Oklahoma Development Finance Authority, (OU Medicine) | | | | | | | | |
4.650%, 8/15/30 (AGM) | | | 130,000 | | | | 152,766 | |
5.450%, 8/15/28 | | | 770,000 | | | | 888,441 | |
Oregon Health and Science University, 5.000%, 1/1/45 | | | 350,000 | | | | 480,441 | |
Pennsylvania Industrial Development Authority, 3.556%, 7/1/24 (b) | | | 505,000 | | | | 525,725 | |
Philadelphia, PA, Water and Wastewater Revenue, 4.189%, 10/1/37 | | | 665,000 | | | | 728,973 | |
Sacramento, CA, 5.730%, 8/15/23 (NATL) (a) | | | 340,000 | | | | 376,302 | |
San Bernardino County, CA, Pension Obligation Revenue, 6.020%, 8/1/23 (AGM) | | | 245,000 | | | | 267,893 | |
Shelby County, Health, Educational and Housing Facilities Board, (Trezevant Manor Project) | | | | | | | | |
4.000%, 9/1/21 | | | 250,000 | | | | 249,653 | |
4.000%, 9/1/22 | | | 250,000 | | | | 249,025 | |
Washington Housing Finance Commission, (Presbyterian Retirement Communities), 4.000%, 1/1/24 | | | 400,000 | | | | 410,228 | |
Washington Housing Finance Commission, (Transforming Age), 3.000%, 7/1/21 | | | 985,000 | | | | 988,231 | |
| | | | | | | | |
Total Municipal Bonds
(Cost $13,395,685) | | | | | | | 14,614,022 | |
| | | | | | | | |
| | | | | | | | |
| U.S. Government Agency Obligations – 5.8% | | | | | | |
Federal Farm Credit Banks Funding Corp. | | | | | | | | |
2.625%, 10/15/49 | | | 1,140,000 | | | | 1,149,941 | |
2.780%, 11/2/37 | | | 1,800,000 | | | | 1,924,388 | |
3.430%, 4/6/45 | | | 1,000,000 | | | | 1,163,716 | |
3.660%, 3/7/44 | | | 974,000 | | | | 1,174,619 | |
Federal National Mortgage Association , 5.625%, 7/15/37 | | | 3,086,000 | | | | 4,678,676 | |
| | | | | | | | |
Total U.S. Government Agencies
(Cost $9,017,885) | | | | | | | 10,091,340 | |
| | | | | | | | |
| | | | | | | | |
| Foreign Government & Agency Securities – 4.5% | | | | | | |
City of Toronto Canada, 2.600%, 9/24/39 | | | 1,060,000 | CAD | | | 821,823 | |
Hong Kong Government International Bond, 2.500%, 5/28/24 (b) | | | 750,000 | | | | 773,464 | |
Japan Treasury Discount Bill, 0.000%, 2/10/20 | | | 500,000,000 | JPY | | | 4,613,311 | |
Republic of Chile, 0.830%, 7/2/31 | | | 1,370,000 | EUR | | | 1,547,688 | |
| | | | | | | | |
Total Foreign Government & Agency Securities
(Cost $7,730,729) | | | | | | | 7,756,286 | |
| | | | | | | | |
| | | | | | | | |
40
DOMINI IMPACT BOND FUND
PORTFOLIOOF INVESTMENTS (continued)
January 31, 2020 (Unaudited)
| | | | | | | | |
| Security | | Principal
Amount* | | | Value | |
| Senior Floating Rate Interests – 2.9% | | | | | | |
Communication Services – 0.3% | | | | | | | | |
Sprint Communications, Inc. First Lien Term Loan B, 4.188%, (1 mo. USD LIBOR + 2.500%), 2/2/24 | | | 398,725 | | | $ | 393,865 | |
Zayo Group, LLC Term Loan, 3.895%, (1 mo. USD LIBOR + 2.250%), 1/19/24 | | | 100,095 | | | | 100,361 | |
| | | | | | | | |
| | | | | | | 494,226 | |
| | | | | | | | |
Consumer Discretionary – 0.9% | | | | | | | | |
American Builders & Contractors Supply Co., Inc. Term Loan, 3.645%, (1 mo. USD LIBOR + 2.000%), 1/15/27 | | | 498,750 | | | | 500,057 | |
Charter Communications Operating, LLC Term Loan B2, 3.400%, (1 mo. USD LIBOR + 1.750%), 2/1/27 | | | 289,603 | | | | 291,172 | |
Harbor Freight Tools USA, Inc. Term Loan B, 4.145%, (1 mo. USD LIBOR + 2.500%), 8/18/23 | | | 235,097 | | | | 234,039 | |
Mission Broadcasting, Inc. Term Loan B3, 4.031%, (1 mo. USD LIBOR + 2.250%), 1/17/24 | | | 27,104 | | | | 27,182 | |
Nexstar Broadcasting, Inc. Term Loan B3, 3.900%, (1 mo. USD LIBOR + 2.250%), 1/17/24 | | | 133,145 | | | | 133,527 | |
USI, Inc. Term Loan, 4.945%, (3 mo. USD LIBOR + 3.000%), 5/16/24 | | | 171,062 | | | | 170,661 | |
Wyndham Hotels & Resorts, Inc. Term Loan B, 3.395%, (1 mo. USD LIBOR + 1.750%), 5/30/25 | | | 128,375 | | | | 129,358 | |
| | | | | | | | |
| | | | | | | 1,485,996 | |
| | | | | | | | |
| | | | | | | | |
Consumer Staples – 0.1% | | | | | | | | |
Coty Inc. Term Loan B, 3.942%, (1 mo. USD LIBOR + 2.250%), 4/7/25 | | | 204,267 | | | | 202,990 | |
| | | | | | | | |
| | | | | | | 202,990 | |
| | | | | | | | |
| | | | | | | | |
Financials – 0.1% | | | | | | | | |
Iron Mountain, Inc. Term Loan B, 3.395%, (1 mo. USD LIBOR + 1.750%), 1/2/26 | | | 142,462 | | | | 142,344 | |
| | | | | | | | |
| | | | | | | 142,344 | |
| | | | | | | | |
| | | | | | | | |
Health Care – 0.1% | | | | | | | | |
Nets Holding A/S Term Loan B1E, 3.250%, (3 mo. EUR EURIBOR + 3.250%), 2/6/25 | | | 176,389 | EUR | | | 195,889 | |
| | | | | | | | |
| | | | | | | 195,889 | |
| | | | | | | | |
| | | | | | | | |
Information Technology – 0.2% | | | | | | | | |
Blackhawk Network Holdings, Inc First Lien Term Loan, 4.645%, (1 mo. USD LIBOR + 3.000%), 6/15/25 | | | 177,300 | | | | 177,787 | |
SS&C Technologies Holdings Europe S.A.R.L. Term Loan B4, 3.395%, (1 mo. USD LIBOR + 1.750%), 4/16/25 | | | 48,315 | | | | 48,440 | |
SS&C Technologies Inc. Term Loan B3, 3.395%, (1 mo. USD LIBOR + 1.750%), 4/16/25 | | | 67,709 | | | | 67,884 | |
| | | | | | | | |
| | | | | | | 294,111 | |
| | | | | | | | |
41
DOMINI IMPACT BOND FUND
PORTFOLIOOF INVESTMENTS (continued)
January 31, 2020 (Unaudited)
| | | | | | | | |
| Security | | Principal
Amount* | | | Value | |
Utilities – 1.2% | | | | | | | | |
Adient US LLC Term Loan B, 6.182%, (3 mo. USD LIBOR + 4.250%), 5/6/24 | | | 223,875 | | | $ | 224,528 | |
Almonde, Inc. First Lien Term Loan, 5.277%, (6 mo. USD LIBOR + 3.500%), 6/13/24 | | | 255,350 | | | | 253,230 | |
Altice France S.A. Term Loan B12, 5.364%, (1 mo. USD LIBOR + 3.688%), 1/31/26 | | | 475,892 | | | | 475,047 | |
CHG PPC Parent LLC Term Loan B, 4.395%, (1 mo. USD LIBOR + 2.750%), 3/31/25 | | | 98,500 | | | | 99,116 | |
Crown Finance US, Inc. Term Loan, 3.895%, (1 mo. USD LIBOR + 2.250%), 2/28/25 | | | 155,247 | | | | 154,165 | |
Diamond (BC) B.V. Term Loan, 4.777%, (3 mo. USD LIBOR + 3.000%), 9/6/24 | | | 147,000 | | | | 143,141 | |
Go Daddy Operating Company, LLC Term Loan, 3.395%, (1 mo. USD LIBOR + 1.750%), 2/15/24 | | | 187,090 | | | | 187,777 | |
MA FinanceCo., LLC Term Loan B3, 4.145%, (1 mo. USD LIBOR + 2.500%), 6/21/24 | | | 28,980 | | | | 28,867 | |
Russell Investments US Inst’l Holdco, Inc. Term Loan B, 4.895%, (1 mo. USD LIBOR + 3.250%), 6/1/23 | | | 399,226 | | | | 400,474 | |
Seattle Spinco, Inc. Term Loan B3, 4.145%, (1 mo. USD LIBOR + 2.500%), 6/21/24 | | | 195,711 | | | | 194,947 | |
| | | | | | | | |
| | | | | | | 2,161,292 | |
| | | | | | | | |
Total Senior Floating Rate Interests
(Cost $4,978,871) | | | | | | | 4,976,848 | |
| | | | | | | | |
| | | | | | | | |
| Asset Backed Securities – 0.8% | | | | | | |
Carmax Auto Owner Trust | | | | | | | | |
Series2016-2, Class B, 2.160%, 12/15/21 | | | 135,000 | | | | 135,172 | |
Series2016-2, Class C, 2.560%, 2/15/22 | | | 260,000 | | | | 260,343 | |
Series2016-3, Class B, 1.900%, 4/15/22 | | | 95,000 | | | | 95,121 | |
Series2016-3, Class C, 2.200%, 6/15/22 | | | 75,000 | | | | 75,244 | |
Series2017-4, Class C, 2.700%, 10/16/23 | | | 250,000 | | | | 254,073 | |
CNH Equipment Trust Series2016-C, Class B, 1.930%, 3/15/24 | | | 20,000 | | | | 19,986 | |
SBA Tower Trust Series2014-2A, Class C, 3.869%, 10/15/49 (a)(b) | | | 500,000 | | | | 529,287 | |
| | | | | | | | |
Total Asset Backed Securities
(Cost $1,334,827) | | | | | | | 1,369,226 | |
| | | | | | | | |
| | | | | | | | |
| Certificates of Deposit – 0.3% | | | | | | |
Self-Help Credit Union, 2.200%, 6/25/21 | | | 100,000 | | | | 100,759 | |
Self-Help Federal Credit Union, 2.500%, 6/27/22 | | | 400,000 | | | | 407,531 | |
| | | | | | | | |
Total Certificates of Deposit
(Cost $500,000) | | | | | | | 508,290 | |
| | | | | | | | |
Total Long Term Investments
(Cost $191,137,688) | | | | | | | 199,200,576 | |
| | | | | | | | |
| | | | | | | | |
42
DOMINI IMPACT BOND FUND
PORTFOLIOOF INVESTMENTS (continued)
January 31, 2020 (Unaudited)
| | | | | | | | |
| Security | | Principal
Amount* | | | Value | |
| Short Term Investments – 23.3% | | | | | | |
U.S. Government Agency Obligations – 23.3% | | | | | | | | |
Federal Home Loan Bank Discount Notes | | | | | | | | |
0.000%, 2/7/20 | | | 10,500,000 | | | $ | 10,498,203 | |
0.000%, 2/28/20 | | | 12,000,000 | | | | 11,987,167 | |
0.000%, 3/25/20 | | | 12,000,000 | | | | 11,973,650 | |
0.000%, 4/8/20 | | | 5,000,000 | | | | 4,985,917 | |
0.000%, 5/1/20 | | | 1,000,000 | | | | 996,187 | |
| | | | | | | | |
Total Short Term Investments
(Cost $40,437,534) | | | | | | | 40,441,124 | |
| | | | | | | | |
| | |
| Total Investments – 138.3%(Cost $231,575,222) | | | | | 239,641,700 | |
| | |
| Other Liabilities, less assets – (38.3)% | | | | | (66,426,429) | |
| | | | | | | | |
| | |
| Net Assets – 100.0% | | | | | $173,215,271 | |
| | | | | | | | |
* The principal amount is stated in U.S. dollars unless otherwise indicated.
(a) Floating/Variable note with current rate and current maturity or next reset date shown. Certain variable rate securities are not based on a published reference rate and spread, but are determined by the issuer or agent and are based on current market conditions. These securities do not indicate a reference rate and spread in their description above.
(b) Security that may be sold to qualified institutional buyers under Rule 144A of the Securities Act of 1933, as amended. At January 31, 2020, the aggregate value of these securities was $19,413,056, representing 11.2% of net assets.
(c) A portion or all of the security was purchased as a when issued or delayed delivery security.
Abbreviations
TBA — To Be Announced
AGM — Assured Guaranty Municipal Corporation
NATL — National Public Finance Guarantee Corporation
CAD — Canadian Dollar
EUR — Euro
JPY — Japanese Yen
43
DOMINI IMPACT BOND FUND
PORTFOLIOOF INVESTMENTS (continued)
January 31, 2020 (Unaudited)
At January 31, 2020, the Fund had the following forward currency contracts outstanding.
| | | | | | | | | | | | | | | | | | | | | | |
| Currency | | Counterparty | | Contract
Type | | | Settlement
Date | | | Quantity | | | Value | | | Unrealized
Appreciation
(Depreciation) | |
| | | | | | |
Canadian Dollar | | Royal Bank Of
Canada | | | Sell | | | | 3/18/20 | | | | 1,052,000 | | | $ | 795,406 | | | $ | 4,093 | |
| | | | | | |
Euro | | Citibank, N.A. | | | Sell | | | | 2/28/20 | | | | 181,000 | | | | 200,879 | | | | (1,091 | ) |
| | | | | | |
Euro | | Citibank, N.A. | | | Sell | | | | 3/18/20 | | | | 1,370,000 | | | | 1,522,257 | | | | 7,129 | |
| | | | | | |
Japanese Yen | | JP Morgan
Chase Bank
N.A. | | | Sell | | | | 2/10/20 | | | | 500,000,000 | | | | 4,614,647 | | | | 43,383 | |
| | | | | | | | | | | | | | | | | | | | | | |
| | | | | | |
| | | | | | | | | | | | | | | | | | | | $ | 53,514 | |
| | | | | | | | | | | | | | | | | | | | | | |
At January 31, 2020, the Fund had the following future contracts outstanding.
| | | | | | | | | | | | | | | | | | |
| Description | | Number of
Contracts | | Notional
Amount | | | Value | | | Expiration
Date | | | Unrealized
Appreciation
(Depreciation) | |
| | | | | |
Euro Bund (Short) | | 10 | | $ | (1,000,000 | ) | | $ | (1,939,794 | ) | | | 3/6/20 | | | $ | (35,197 | ) |
| | | | | | | | | | | | | | | | | | |
| | | | | |
| | | | | | | | | | | | | | | | $ | (35,197 | ) |
| | | | | | | | | | | | | | | | | | |
At January 31, 2020, the Fund had the following centrally cleared interest rate swap contracts outstanding.
| | | | | | | | | | | | | | | | | | | | | | |
| Description | | Counterparty/
Exchange | | Expiration
Date | | | Notional
Amount | | | Value | | | Upfront
Premiums
Paid
(Received) | | | Unrealized
Appreciation
(Depreciation) | |
| | | | | | |
Receive Fixed rate 2.500% Pay Floating rate 3 month USD BBA LIBOR | | Morgan
Stanley LCH | | | 3/21/48 | | | $ | 770,000 | | | $ | 145,996 | | | $ | 94,081 | | | $ | 51,915 | |
| | | | | | |
Receive Fixed rate 2.590% Pay Floating rate 3 month USD BBA LIBOR | | Morgan
Stanley LCH | | | 2/5/24 | | | | 8,940,000 | | | | 442,891 | | | | 237,687 | | | | 205,204 | |
| | | | | | |
Pay fixed rate 1.769% Receive Floating rate 3 month USD BBA LIBOR | | Morgan
Stanley LCH | | | 10/30/29 | | | | 445,000 | | | | (12,647 | ) | | | - | | | | (12,647 | ) |
| | | | | | |
Pay fixed rate 1.766% Receive Floating rate 3 month USD BBA LIBOR | | Morgan
Stanley LCH | | | 10/30/29 | | | | 405,000 | | | | (11,380 | ) | | | - | | | | (11,380 | ) |
44
DOMINI IMPACT BOND FUND
PORTFOLIOOF INVESTMENTS (continued)
January 31, 2020 (Unaudited)
| | | | | | | | | | | | | | | | | | | | | | |
| Description | | Counterparty/
Exchange | | Expiration
Date | | | Notional
Amount | | | Value | | | Upfront
Premiums
Paid
(Received) | | | Unrealized
Appreciation
(Depreciation) | |
| | | | | | |
Pay fixed rate 1.727% Receive Floating rate 3 month USD BBA LIBOR | | Morgan
Stanley LCH | | | 10/29/29 | | | $ | 890,000 | | | $ | (21,810 | ) | | $ | - | | | $ | (21,810 | ) |
| | | | | | |
Pay fixed rate 1.721% Receive Floating rate 3 month USD BBA LIBOR | | Morgan
Stanley LCH | | | 10/29/29 | | | | 535,000 | | | | (12,816 | ) | | | - | | | | (12,816 | ) |
| | | | | | |
Pay fixed rate 1.716% Receive Floating rate 3 month USD BBA LIBOR | | Morgan
Stanley LCH | | | 10/29/29 | | | | 275,000 | | | | (6,462 | ) | | | - | | | | (6,462 | ) |
| | | | | | |
Pay fixed rate 1.765% Receive Floating rate 3 month USD BBA LIBOR | | Morgan
Stanley LCH | | | 10/30/29 | | | | 450,000 | | | | (12,603 | ) | | | - | | | | (12,603 | ) |
| | | | | | |
Pay fixed rate 1.770% Receive Floating rate 3 month USD BBA LIBOR | | Morgan
Stanley LCH | | | 10/30/29 | | | | 410,000 | | | | (11,690 | ) | | | - | | | | (11,690 | ) |
| | | | | | |
Receive Fixed rate 1.430% Pay Floating rate 3 month USD BBA LIBOR | | Morgan
Stanley LCH | | | 8/28/29 | | | | 1,790,000 | | | | (3,983 | ) | | | - | | | | (3,983 | ) |
| | | | | | |
Pay fixed rate 1.780% Receive Floating rate 3 month USD BBA LIBOR | | Morgan
Stanley LCH | | | 1/9/30 | | | | 1,910,000 | | | | (55,530 | ) | | | (2,070 | ) | | | (53,460 | ) |
| | | | | | |
Pay fixed rate 1.495% Receive Floating rate 3 month USD BBA LIBOR | | Morgan
Stanley LCH | | | 1/28/25 | | | | 1,880,000 | | | | (14,866 | ) | | | - | | | | (14,866 | ) |
| | | | | | |
Pay fixed rate 1.428% Receive Floating rate 3 month USD BBA LIBOR | | Morgan
Stanley LCH | | | 1/28/25 | | | | 1,881,000 | | | | (8,983 | ) | | | - | | | | (8,983 | ) |
45
DOMINI IMPACT BOND FUND
PORTFOLIOOF INVESTMENTS (continued)
January 31, 2020 (Unaudited)
| | | | | | | | | | | | | | | | | | | | | | |
| Description | | Counterparty/
Exchange | | Expiration
Date | | | Notional
Amount | | | Value | | | Upfront
Premiums
Paid
(Received) | | | Unrealized
Appreciation
(Depreciation) | |
| | | | | | |
Pay fixed rate 1.463% Receive Floating rate 3 month USD BBA LIBOR | | Morgan
Stanley LCH | | | 1/30/25 | | | $ | 945,000 | | | $ | (6,111 | ) | | $ | - | | | $ | (6,111 | ) |
| | | | | | |
Pay fixed rate 1.468% Receive Floating rate 3 month USD BBA LIBOR | | Morgan
Stanley LCH | | | 1/30/25 | | | | 945,000 | | | | (6,340 | ) | | | - | | | | (6,340 | ) |
| | | | | | |
Pay fixed rate 1.433% Receive Floating rate 3 month USD BBA LIBOR | | Morgan
Stanley LCH | | | 1/31/25 | | | | 1,880,000 | | | | (9,391 | ) | | | - | | | | (9,391 | ) |
| | | | | | |
Pay fixed rate 1.500% Receive Floating rate 3 month USD BBA LIBOR | | Morgan
Stanley LCH | | | 2/28/27 | | | | 2,565,000 | | | | (21,939 | ) | | | (12,468 | ) | | | (9,471 | ) |
| | | | | | |
Receive Fixed rate 1.940% Pay Floating rate 3 month USD BBA LIBOR | | Morgan
Stanley LCH | | | 11/8/49 | | | | 1,715,000 | | | | 108,090 | | | | 5,126 | | | | 102,964 | |
| | | | | | | | | | | | | | | | | | | | | | |
| | | | | | |
| | | | | | | | | | | | | | | | $ | 322,356 | | | $ | 158,070 | |
| | | | | | | | | | | | | | | | | | | | | | |
At January 31, 2020, the Fund had the following OTC interest rate swap contracts outstanding.
| | | | | | | | | | | | | | | | | | | | | | | | | | |
| | | Rate Type | | | | | | | | | | | | | | | | |
| Counterparty | | Payments
made
by the Fund | | Payments
received
by the Fund | | | Expiration
Date | | | Notional
Amount | | | Value | | | Upfront
Premiums
Paid
(Received) | | | Unrealized
Appreciation
(Depreciation) | |
| | | | | | | |
Deutsche Bank AG | | 1.898% | | | USA-CPI-U | | | | 7/15/24 | | | $ | 3,088,000 | | | $ | 14,584 | | | $ | - | | | $ | 14,584 | |
| | | | | | | | | | | | | | | | | | | | | | | | | | |
| | | | | | | |
| | | | | | | | | | | | | | | | | | | | $ | - | | | $ | 14,584 | |
| | | | | | | | | | | | | | | | | | | | | | | | | | |
46
DOMINI IMPACT BOND FUND
PORTFOLIOOF INVESTMENTS (continued)
January 31, 2020 (Unaudited)
At January 31, 2020, the Fund had the following centrally cleared credit default swap contracts outstanding.
| | | | | | | | | | | | | | | | | | | | | | |
| Description | | Counterparty/
Exchange | | Expiration
Date | | | Notional
Amount(a) | | | Value(b) | | | Upfront
Premiums
Paid
(Received) | | | Unrealized
Appreciation
(Depreciation) | |
| | | | | | |
Buy Protection (c): | | | | | | | | | | | | | | | | | | | | | | |
| | | | | | |
CDX-NAHY Series 33, Version 2, 5 Year Index, fixed rate 5.000% (d) | | Morgan
Stanley ICE | | | 12/20/24 | | | $ | 143,550 | | | $ | (11,871 | ) | | $ | (13,711 | ) | | $ | 1,840 | |
| | | | | | | | | | | | | | | | | | | | | | |
| | | | | | |
| | | | | | | | | | | | | | | | $ | (13,711 | ) | | $ | 1,840 | |
| | | | | | | | | | | | | | | | | | | | | | |
(a) The maximum potential amount the Fund could be required to pay as a seller of credit protection or receive as a buyer of credit protection if a credit event occurs as defined under the terms of that particular swap agreement.
(b) The prices and resulting values for credit default swap agreements on credit indices serve as an indicator of the current status of the payment/performance risk and represent the likelihood of an expected liability (or profit) for the credit derivative should the notional amount of the swap agreement be closed/sold as of the period end. Increasing market values, in absolute terms when compared to the notional amount of the swap, represent a deterioration of the referenced entity’s credit soundness and a greater likelihood or risk of default or other credit event occurring as defined under the terms of the agreement.
(c) If the Fund is a buyer/(seller) of protection and a credit event occurs, as defined under the terms of that particular swap agreement, the Fund will either (i) receive from the seller/(pay to the buyer) of protection an amount equal to the notional amount of the swap and deliver/(take delivery) of the referenced obligation or underlying securities comprising the referenced index or (ii) receive/(pay) a net settlement amount in the form of cash or securities equal to the notional amount of the swap less the recovery value of the referenced obligation of underlying securities comprising the referenced index.
(d) Ratings of Moody’s/S&P — B1/B+
Abbreviations
LCH — London Clearing House
ICE — Intercontinental Exchange
USA-CPI-U — USA Consumer Price Index Urban Consumers NSA
SEE NOTES TO FINANCIAL STATEMENTS
47
DOMINI FUNDS EXPENSE EXAMPLE (Unaudited)
As a shareholder of the Domini Funds, you incur two types of costs:
(1) Transaction costs such as redemption fees deducted from any redemption or exchange proceeds if you sell or exchange shares of the fund after holding them less than 30 days and sales charges (loads) on Class A shares and
(2) Ongoing costs, including management fees, distribution(12b-1) fees, and other Fund expenses.
This example is intended to help you understand your ongoing costs (in dollars) of investing in the Fund and to compare these costs with the ongoing costs of investing in other mutual funds. The example is based on an investment of $1,000 invested on August 1, 2019 and held through January 31, 2020.
Certain Account Fees
Some accounts are subject to recurring annual service fees and maintenance fees that are not included in the expenses shown in the table. If your account was subject to these fees, then the actual account values at the end of the period would be lower and the actual expense would be higher. You may avoid the annual service fee by choosing paperless electronic delivery of statements, prospectuses, shareholder reports and other materials.
Actual Expenses
The line of the table captioned ‘‘Actual Expenses’’ below provides information about actual account value and actual expenses. You may use the information in this line, together with the amount invested, to estimate the expenses that you paid over the period as follows:
(1) Divide your account value by $1,000.
(2) Multiply your result in step 1 by the number in the first line under the heading ‘‘Expenses Paid During Period’’ in the table.
The result equals the estimated expenses you paid on your account during the period.
Hypothetical Expenses
The second line of the table below provides information about hypothetical account values and hypothetical expenses based on the Fund’s actual expense ratio and an assumed rate of return of 5% per year before expenses, which is not the Fund’s return. The hypothetical account values and expenses may not be used to estimate actual ending account balance or expenses you paid for the period. You may use this information to compare the ongoing costs of investing in the Fund and other mutual funds. To do so, compare this 5% hypothetical example with the 5% hypothetical example that appears in the shareholder reports of the other funds.
48
Please note that the expenses shown in the table are meant to highlight your ongoing costs only and do not reflect any transactional costs, such as redemption fees. Therefore, the second line of the table is useful in comparing ongoing costs only, and will not help you determine the relative total costs of owning different funds. In addition, if these transactional costs were included, your costs would have been higher.
| | | | | | | | |
| | | | | |
| Fund Name | | Expenses | | Beginning
Account Value
as of 8/1/2019 | | Ending Account
value as of
1/31/2020 | | Expenses Paid
During Period
8/1/2019 –
1/31/2020 |
Domini Impact International Equity Fund Investor Shares | | Actual Expenses | | $1,000.00 | | $1,044.60 | | $7.091 |
| | Hypothetical Expenses
(5% return before
expenses) | | $1,000.00 | | $1,018.20 | | $7.001 |
Domini Impact International Equity Fund Class A Shares | | Actual Expenses | | $1,000.00 | | $1,043.60 | | $7.351 |
| | Hypothetical Expenses
(5% return before
expenses) | | $1,000.00 | | $1,017.95 | | $7.251 |
Domini Impact International Equity Fund Institutional Shares | | Actual Expenses | | $1,000.00 | | $1,045.90 | | $5.041 |
| | Hypothetical Expenses
(5% return before
expenses) | | $1,000.00 | | $1,020.21 | | $4.981 |
Domini Impact International Equity Fund Class Y Shares | | Actual Expenses | | $1,000.00 | | $1,044.80 | | $5.711 |
| | Hypothetical Expenses
(5% return before
expenses) | | $1,000.00 | | $1,019.56 | | $5.631 |
Domini Impact Equity Fund Investor Shares | | Actual Expenses | | $1,000.00 | | $1,108.60 | | $5.782 |
| | Hypothetical Expenses
(5% return before
expenses) | | $1,000.00 | | $1,019.66 | | $5.532 |
Domini Impact Equity Fund Class A Shares | | Actual Expenses | | $1,000.00 | | $1,108.90 | | $5.782 |
| | Hypothetical Expenses
(5% return before
expenses) | | $1,000.00 | | $1,019.66 | | $5.532 |
Domini Impact Equity Fund Institutional Shares | | Actual Expenses | | $1,000.00 | | $1,110.70 | | $3.932 |
| | Hypothetical Expenses
(5% return before
expenses) | | $1,000.00 | | $1,021.42 | | $3.762 |
Domini Impact Equity Fund Class R Shares | | Actual Expenses | | $1,000.00 | | $1,110.40 | | $4.242 |
| | Hypothetical Expenses
(5% return before
expenses) | | $1,000.00 | | $1,021.11 | | $4.062 |
49
| | | | | | | | |
| | | | | |
| Fund Name | | Expenses | | Beginning
Account Value
as of 8/1/2019 | | Ending Account
value as of
1/31/2020 | | Expenses Paid
During Period
8/1/2019 –
1/31/2020 |
Domini Impact Bond Fund Investor Shares | | Actual Expenses | | $1,000.00 | | $1,038.30 | | $4.463 |
| | Hypothetical Expenses
(5% return before
expenses) | | $1,000.00 | | $1,020.76 | | $4.423 |
Domini Impact Bond Fund Institutional Shares | | Actual Expenses | | $1,000.00 | | $1,040.90 | | $2.923 |
| | Hypothetical Expenses
(5% return before
expenses) | | $1,000.00 | | $1,022.27 | | $2.903 |
1Expenses are equal to the Fund’s annualized expense ratio of 1.38% for Investor shares, or 1.43% for Class A shares, or 0.98% for Institutional shares, or 1.11% for Class Y shares, multiplied by average account value over the period, multiplied by 184, and divided by 366.
2Expenses are equal to the Fund’s annualized expense ratio of 1.09% for Investor shares, or 1.09% for Class A shares, or 0.74% for Institutional shares, or 0.80% for Class R shares, multiplied by average account value over the period, multiplied by 184, and divided by 366.
3Expenses are equal to the Fund’s annualized expense ratio of 0.87% for Investor shares, or 0.57% for Institutional shares, multiplied by average account value over the period, multiplied by 184, and divided by 366.
50
STATEMENTS OF ASSETS AND LIABILITIES
January 31, 2020 (Unaudited)
| | | | | | | | |
| | | Domini Impact
International
Equity Fund | | | Domini Impact
Equity Fund | |
ASSETS | | | | | | | | |
Investments, at value (cost $1,055,302,604 and $602,847,521, respectively) | | $ | 1,161,529,302 | | | $ | 811,200,167 | |
Cash | | | 22,877,859 | | | | 841,699 | |
Foreign currency, at value (cost $1,574,018 and $45,423, respectively) | | | 1,566,499 | | | | 45,412 | |
Receivable for securities sold | | | 4,514,740 | | | | 1,135,339 | |
Receivable for capital shares | | | 3,579,149 | | | | 58,930 | |
Dividend receivable | | | 1,091,596 | | | | 883,816 | |
Tax reclaim receivable | | | 2,315,991 | | | | 76,873 | |
| | | | | | | | |
Total assets | | | 1,197,475,136 | | | | 814,242,236 | |
| | | | | | | | |
LIABILITIES | | | | | | | | |
Payable for securities purchased | | | 8,681,931 | | | | - | |
Payable for capital shares | | | 1,123,860 | | | | 598,846 | |
Management/Sponsorship fee payable | | | 906,738 | | | | 452,601 | |
Other accrued expenses | | | 706,368 | | | | 437,482 | |
Foreign tax payable | | | 329,378 | | | | 3,358 | |
| | | | | | | | |
Total liabilities | | | 11,748,275 | | | | 1,492,287 | |
| | | | | | | | |
NET ASSETS | | $ | 1,185,726,861 | | | $ | 812,749,949 | |
| | | | | | | | |
NET ASSETS CONSISTS OF | | | | | | | | |
Paid-in Capital | | $ | 1,204,972,335 | | | $ | 603,327,574 | |
Total distributable earnings (loss) | | | (19,245,474) | | | | 209,422,375 | |
| | | | | | | | |
NET ASSETS | | $ | 1,185,726,861 | | | $ | 812,749,949 | |
| | | | | | | | |
NET ASSET VALUE PER SHARE | | | | | | | | |
| | |
Investor Shares | | | | | | | | |
Net assets | | $ | 426,523,889 | | | $ | 688,532,693 | |
| | | | | | | | |
Outstanding shares of beneficial interest | | | 54,163,866 | | | | 28,190,207 | |
| | | | | | | | |
Net asset value and offering price per share* | | $ | 7.87 | | | $ | 24.42 | |
| | | | | | | | |
| | |
Class A Shares | | | | | | | | |
Net assets | | $ | 25,777,391 | | | $ | 5,866,411 | |
| | | | | | | | |
Outstanding shares of beneficial interest | | | 3,066,420 | | | | 240,389 | |
| | | | | | | | |
Net asset value* | | $ | 8.41 | | | $ | 24.40 | |
| | | | | | | | |
Maximum offering price per share (net asset value per share /(1-4.75%)) | | $ | 8.83 | | | $ | 25.62 | |
| | | | | | | | |
| | |
Institutional Shares | | | | | | | | |
Net assets | | $ | 535,250,472 | | | $ | 103,800,169 | |
| | | | | | | | |
Outstanding shares of beneficial interest | | | 68,616,284 | | | | 4,271,667 | |
| | | | | | | | |
Net asset value and offering price per share* | | $ | 7.80 | | | $ | 24.30 | |
| | | | | | | | |
| | |
Class R Shares | | | | | | | | |
Net assets | | $ | - | | | $ | 14,550,676 | |
| | | | | | | | |
Outstanding shares of beneficial interest | | | - | | | | 598,308 | |
| | | | | | | | |
Net asset value and offering price per share* | | $ | - | | | $ | 24.32 | |
| | | | | | | | |
| | |
Class Y Shares | | | | | | | | |
Net assets | | $ | 198,175,109 | | | $ | - | |
| | | | | | | | |
Outstanding shares of beneficial interest | | | 25,372,339 | | | | - | |
| | | | | | | | |
Net Asset Value And Offering Price Per Share* | | $ | 7.81 | | | $ | - | |
| | | | | | | | |
* Redemption price is equal to net asset value less any applicable redemption fees retained by the Fund.
SEE NOTES TO FINANCIAL STATEMENTS
51
STATEMENTS OF OPERATIONS
For the Six Months Ended January 31, 2020 (Unaudited)
| | | | | | | | |
| | | Domini Impact
International
Equity Fund | | | Domini Impact
Equity Fund | |
INCOME | | | | | | | | |
Dividends (net of foreign taxes $827,723 and $40,833, respectively) | | $ | 10,067,245 | | | $ | 6,585,291 | |
Interest income | | | 13,484 | | | | 1,599 | |
| | | | | | | | |
Investment Income | | | 10,080,729 | | | | 6,586,890 | |
| | | | | | | | |
EXPENSES | | | | | | | | |
Management/Sponsorship fees | | | 5,353,570 | | | | 2,545,937 | |
Distribution fees – Investor Shares | | | 539,541 | | | | 822,598 | |
Distribution fees – Class A Shares | | | 33,054 | | | | 7,978 | |
Transfer agent fees – Investor Shares | | | 400,812 | | | | 396,544 | |
Transfer agent fees – Class A Shares | | | 49,457 | | | | 4,452 | |
Transfer agent fees – Institutional Shares | | | 1,997 | | | | 1,548 | |
Transfer agent fees – Class R Shares | | | - | | | | 1,913 | |
Transfer agent fees – Class Y Shares | | | 73,817 | | | | - | |
Custody and Accounting fees | | | 389,618 | | | | 81,782 | |
Registration fees – Investor Shares | | | 16,994 | | | | 13,536 | |
Registration fees – Class A Shares | | | 15,642 | | | | 14,324 | |
Registration fees – Institutional Shares | | | 16,011 | | | | 14,662 | |
Registration fees – Class R Shares | | | - | | | | 19,790 | |
Registration fees – Class Y Shares | | | 14,190 | | | | - | |
Professional fees | | | 42,939 | | | | 27,297 | |
Trustees fees | | | 31,050 | | | | 24,025 | |
Shareholder Communication fees | | | 29,393 | | | | 31,820 | |
Shareholder Service fees – Investor Shares | | | 19,940 | | | | 23,381 | |
Shareholder Service fees – Class A Shares | | | 4,008 | | | | 229 | |
Shareholder Service fees – Institutional Shares | | | 331 | | | | 65 | |
Shareholder Service fees – Class R Shares | | | - | | | | 61 | |
Shareholder Service fees – Class Y Shares | | | 18 | | | | - | |
Miscellaneous | | | 2,603 | | | | 61,012 | |
| | | | | | | | |
Total expenses | | | 7,034,985 | | | | 4,092,954 | |
| | | | | | | | |
Fees waived and expenses reimbursed | | | (79,706) | | | | (41,622) | |
Transfer agent credits | | | (1,098) | | | | (1,100) | |
| | | | | | | | |
Net expenses | | | 6,954,181 | | | | 4,050,232 | |
| | | | | | | | |
NET INVESTMENT INCOME (LOSS) | | | 3,126,548 | | | | 2,536,658 | |
| | | | | | | | |
REALIZED AND UNREALIZED GAIN (LOSS) FROM INVESTMENTS AND FOREIGN CURRENCY | | | | | | | | |
NET REALIZED GAIN (LOSS) FROM: | | | | | | | | |
Investments | | | 38,872 | | | | 1,834,613 | |
Foreign currency | | | (42,949) | | | | (752) | |
| | | | | | | | |
Net realized gain (loss) | | | (4,077) | | | | 1,833,861 | |
| | | | | | | | |
NET CHANGES IN UNREALIZED APPRECIATION (DEPRECIATION) FROM: | | | | | | | | |
Investments | | | 49,581,044 | | | | 77,039,933 | |
Translation of assets and liabilities in foreign currencies | | | 43,850 | | | | (30) | |
| | | | | | | | |
Net change in unrealized appreciation (depreciation) | | | 49,624,894 | | | | 77,039,903 | |
| | | | | | | | |
NET REALIZED AND UNREALIZED GAIN (LOSS) | | | 49,620,817 | | | | 78,873,764 | |
| | | | | | | | |
NET INCREASE (DECREASE) IN NET ASSETS RESULTING FROM OPERATIONS | | $ | 52,747,365 | | | $ | 81,410,422 | |
| | | | | | | | |
SEE NOTES TO FINANCIAL STATEMENTS
52
DOMINI IMPACT INTERNATIONAL EQUITY FUND
STATEMENTS OF CHANGES IN NET ASSETS
| | | | | | | | |
| | | Six Months
Ended
January 31, 2020
(unaudited) | | | Year Ended
July 31, 2019
| |
INCREASE (DECREASE) IN NET ASSETS FROM OPERATIONS | | | | | | | | |
Net investment income (loss) | | $ | 3,126,548 | | | $ | 26,743,684 | |
Net realized gain (loss) | | | (4,077) | | | | (103,322,449) | |
Net change in unrealized appreciation (depreciation) | | | 49,624,894 | | | | (24,024,512) | |
| | | | | | | | |
Net Increase (Decrease) in Net Assets Resulting from Operations | | | 52,747,365 | | | | (100,603,277) | |
| | | | | | | | |
DISTRIBUTIONS TO SHAREHOLDERS | | | | | | | | |
Investor Shares | | | (11,113,787) | | | | (24,163,150) | |
Class A Shares | | | (528,371) | | | | (1,460,369) | |
Institutional Shares | | | (16,980,431) | | | | (29,162,105) | |
Class Y Shares | | | (5,670,750) | | | | (7,093,471) | |
| | | | | | | | |
Net Decrease in Net Assets from Distributions | | | (34,293,339) | | | | (61,879,095) | |
| | | | | | | | |
CAPITAL SHARE TRANSACTIONS | | | | | | | | |
Proceeds from sale of shares | | | 191,101,626 | | | | 676,424,309 | |
Net asset value of shares issued in reinvestment of distributions and dividends | | | 27,442,829 | | | | 46,072,573 | |
Payments for shares redeemed | | | (272,174,881) | | | | (753,471,348) | |
Redemption fees | | | 5,992 | | | | 5,202 | |
| | | | | | | | |
Net Increase (Decrease) in Net Assets from Capital Share Transactions | | | (53,624,434) | | | | (30,969,264) | |
| | | | | | | | |
Total Increase (Decrease) in Net Assets | | | (35,170,408) | | | | (193,451,636) | |
| | | | | | | | |
NET ASSETS | | | | | | | | |
Beginning of period | | $ | 1,220,897,269 | | | $ | 1,414,348,905 | |
| | | | | | | | |
End of period | | $ | 1,185,726,861 | | | $ | 1,220,897,269 | |
| | | | | | | | |
SEE NOTES TO FINANCIAL STATEMENTS
53
DOMINI IMPACT EQUITY FUND
STATEMENTS OF CHANGES IN NET ASSETS
| | | | | | | | |
| | | Six Months
Ended
January 31, 2020
(unaudited) | | | Year Ended
July 31, 2019
| |
INCREASE IN NET ASSETS FROM OPERATIONS | | | | | | | | |
Net investment income (loss) | | $ | 2,536,658 | | | $ | 7,664,039 | |
Net realized gain (loss) | | | 1,833,861 | | | | 23,806,945 | |
Net change in unrealized appreciation (depreciation) | | | 77,039,903 | | | | 11,825,925 | |
| | | | | | | | |
Net Increase (Decrease) in Net Assets Resulting from Operations | | | 81,410,422 | | | | 43,296,909 | |
| | | | | | | | |
DISTRIBUTIONS TO SHAREHOLDERS | | | | | | | | |
Investor Shares | | | (13,575,696) | | | | (71,979,925) | |
Class A Shares | | | (127,658) | | | | (768,457) | |
Institutional Shares | | | (2,439,630) | | | | (13,430,821) | |
Class R Shares | | | (360,581) | | | | (2,084,463) | |
| | | | | | | | |
Net Decrease in Net Assets from Distributions | | | (16,503,565) | | | | (88,263,666) | |
| | | | | | | | |
CAPITAL SHARE TRANSACTIONS | | | | | | | | |
Proceeds from sale of shares | | | 13,935,815 | | | | 31,531,132 | |
Net asset value of shares issued in reinvestment of distributions and dividends | | | 15,530,430 | | | | 82,374,138 | |
Payments for shares redeemed | | | (50,541,466) | | | | (115,143,001) | |
Redemption fees | | | 3,468 | | | | 1,250 | |
| | | | | | | | |
Net Increase (Decrease) in Net Assets from Capital Share Transactions | | | (21,071,753) | | | | (1,236,481) | |
| | | | | | | | |
Total Increase (Decrease) in Net Assets | | | 43,835,104 | | | | (46,203,238) | |
| | | | | | | | |
NET ASSETS | | | | | | | | |
Beginning of period | | $ | 768,914,845 | | | $ | 815,118,083 | |
| | | | | | | | |
End of period | | $ | 812,749,949 | | | $ | 768,914,845 | |
| | | | | | | | |
SEE NOTES TO FINANCIAL STATEMENTS
54
DOMINI IMPACT INTERNATIONAL EQUITY FUND — INVESTOR SHARES
FINANCIAL HIGHLIGHTS
| | | | | | | | | | | | | | | | | | | | | | | | |
| | | Six Months
Ended
January 31, 2020
(unaudited) | | | Year Ended July 31, | |
| | | 2019
| | | 2018
| | | 2017
| | | 2016
| | | 2015
| |
For a share outstanding for the period: | | | | | | | | | | | | | | | | | | | | | | | | |
Net asset value, beginning of period | | | $7.74 | | | | $8.72 | | | | $8.76 | | | | $7.38 | | | | $8.05 | | | | $8.26 | |
| | | | | | | | | | | | | | | | | | | | | | | | |
Income from investment operations: | | | | | | | | | | | | | | | | | | | | | | | | |
Net investment income (loss) | | | 0.02 | | | | 0.15 | | | | 0.16 | | | | 0.15 | | | | 0.12 | | | | 0.13 | |
Net realized and unrealized gain (loss) on investments | | | 0.32 | | | | (0.77) | | | | 0.02 | | | | 1.35 | | | | (0.53) | | | | 0.20 | |
| | | | | | | | | | | | | | | | | | | | | | | | |
Total income (loss) from investment operations | | | 0.34 | | | | (0.62) | | | | 0.18 | | | | 1.50 | | | | (0.41) | | | | 0.33 | |
| | | | | | | | | | | | | | | | | | | | | | | | |
Less dividends and/or distributions: | | | | | | | | | | | | | | | | | | | | | | | | |
Dividends to shareholders from net investment income | | | (0.21) | | | | (0.13) | | | | (0.22) | | | | (0.12) | | | | (0.07) | | | | (0.11) | |
Distributions to shareholders from net realized gain | | | - | | | | (0.23) | | | | - | | | | - | | | | (0.19) | | | | (0.43) | |
| | | | | | | | | | | | | | | | | | | | | | | | |
Total distributions | | | (0.21) | | | | (0.36) | | | | (0.22) | | | | (0.12) | | | | (0.26) | | | | (0.54) | |
| | | | | | | | | | | | | | | | | | | | | | | | |
Redemption fee proceeds 1 | | | 0.00 | 2 | | | 0.00 | 2 | | | 0.00 | 2 | | | 0.00 | 2 | | | 0.00 | 2 | | | 0.00 | 2 |
| | | | | | | | | | | | | | | | | | | | | | | | |
Net asset value, end of period | | | $7.87 | | | | $7.74 | | | | $8.72 | | | | $8.76 | | | | $7.38 | | | | $8.05 | |
| | | | | | | | | | | | | | | | | | | | | | | | |
Total return 3 | | | 4.46% | | | | -6.81% | | | | 2.08% | | | | 20.61% | | | | -5.12% | | | | 4.65% | |
Portfolio turnover | | | 40% | | | | 77% | | | | 68% | | | | 73% | | | | 89% | | | | 88% | |
Ratios/supplemental data (annualized): | | | | | | | | | | | | | | | | | | | | | | | | |
Net assets, end of period (in millions) | | | $427 | | | | $432 | | | | $612 | | | | $595 | | | | $385 | | | | $320 | |
Ratio of expenses to average net assets | | | 1.38% | 4,5 | | | 1.41% | 4 | | | 1.41% | | | | 1.46% | | | | 1.52% | | | | 1.59% | |
Ratio of gross expenses to average net assets | | | 1.40% | | | | 1.41% | | | | 1.41% | | | | 1.46% | | | | 1.52% | | | | 1.59% | |
Ratio of net investment income (loss) to average net assets | | | 0.28% | | | | 1.70% | | | | 1.81% | | | | 2.06% | | | | 1.59% | | | | 1.32% | |
1 Based on average shares outstanding.
2 Amount represents less than $0.005 per share.
3 Not annualized for periods less than one year.
4 Ratio of expenses to average net assets includes transfer agent credits. Excluding transfer agent credits the ratio of expenses to average net assets would have been 1.41% for the year ended July 31, 2019 and 1.38% for the period ended January 31, 2020.
5 Reflects a waiver of fees by the Manager and the Distributor of the Fund.
SEE NOTES TO FINANCIAL STATEMENTS
55
DOMINI IMPACT INTERNATIONAL EQUITY FUND — CLASS A SHARES
FINANCIAL HIGHLIGHTS
| | | | | | | | | | | | | | | | | | | | | | | | |
| | | Six Months
Ended
January 31, 2020
(unaudited) | | | Year Ended July 31, | |
| | | 2019
| | | 2018
| | | 2017
| | | 2016
| | | 2015
| |
For a share outstanding for the period: | | | | | | | | | | | | | | | | | | | | | | | | |
Net asset value, beginning of period | | | $8.22 | | | | $9.18 | | | | $9.21 | | | | $7.76 | | | | $8.45 | | | | $8.64 | |
| | | | | | | | | | | | | | | | | | | | | | | | |
Income from investment operations: | | | | | | | | | | | | | | | | | | | | | | | | |
Net investment income (loss) | | | 0.04 | | | | 0.34 | | | | 0.15 | | | | 0.14 | | | | 0.11 | | | | 0.14 | |
Net realized and unrealized gain (loss) on investments | | | 0.32 | | | | (0.99) | | | | 0.04 | | | | 1.43 | | | | (0.54) | | | | 0.21 | |
| | | | | | | | | | | | | | | | | | | | | | | | |
Total income (loss) from investment operations | | | 0.36 | | | | (0.65) | | | | 0.19 | | | | 1.57 | | | | (0.43) | | | | 0.35 | |
| | | | | | | | | | | | | | | | | | | | | | | | |
Less dividends and/or distributions: | | | | | | | | | | | | | | | | | | | | | | | | |
Dividends to shareholders from net investment income | | | (0.17) | | | | (0.08) | | | | (0.22) | | | | (0.12) | | | | (0.07) | | | | (0.11) | |
Distributions to shareholders from net realized gain | | | - | | | | (0.23) | | | | - | | | | - | | | | (0.19) | | | | (0.43) | |
| | | | | | | | | | | | | | | | | | | | | | | | |
Total distributions | | | (0.17) | | | | (0.31) | | | | (0.22) | | | | (0.12) | | | | (0.26) | | | | (0.54) | |
| | | | | | | | | | | | | | | | | | | | | | | | |
Redemption fee proceeds 1 | | | - | | | | 0.00 | 2 | | | 0.00 | 2 | | | 0.00 | 2 | | | 0.00 | 2 | | | 0.00 | 2 |
| | | | | | | | | | | | | | | | | | | | | | | | |
Net asset value, end of period | | | $8.41 | | | | $8.22 | | | | $9.18 | | | | $9.21 | | | | $7.76 | | | | $8.45 | |
| | | | | | | | | | | | | | | | | | | | | | | | |
Total return 3 | | | 4.36% | | | | -6.83% | | | | 2.00% | | | | 20.44% | | | | -5.07% | | | | 4.71% | |
Portfolio turnover | | | 40% | | | | 77% | | | | 68% | | | | 73% | | | | 89% | | | | 88% | |
Ratios/supplemental data (annualized): | | | | | | | | | | | | | | | | | | | | | | | | |
Net assets, end of period (in millions) | | | $26 | | | | $27 | | | | $81 | | | | $85 | | | | $55 | | | | $51 | |
Ratio of expenses to average net assets | | | 1.43% | 4,5 | | | 1.43% | 4 | | | 1.47% | | | | 1.52% | 5 | | | 1.53% | 5 | | | 1.57% | 5 |
Ratio of gross expenses to average net assets | | | 1.65% | | | | 1.43% | | | | 1.47% | | | | 1.53% | | | | 1.59% | | | | 1.68% | |
Ratio of net investment income (loss) to average net assets | | | 0.23% | | | | 1.41% | | | | 1.63% | | | | 1.99% | | | | 1.47% | | | | 1.46% | |
1 Based on average shares outstanding.
2 Amount represents less than $0.005 per share.
3 Total return does not reflect sales commissions and is not annualized for periods less than one year.
4 Ratio of expenses to average net assets includes transfer agent credits. Excluding transfer agent credits the ratio of expenses to average net assets would have been 1.43% for the year ended July 31, 2019 and 1.43% for the period ended January 31, 2020.
5 Reflects a waiver of fees by the Manager and the Distributor of the Fund.
SEE NOTES TO FINANCIAL STATEMENTS
56
DOMINI IMPACT INTERNATIONAL EQUITY FUND — INSTITUTIONAL SHARES
FINANCIAL HIGHLIGHTS
| | | | | | | | | | | | | | | | | | | | | | | | |
| | | Six Months
Ended
January 31, 2020
(unaudited) | | | Year Ended July 31, | |
| | | 2019
| | | 2018
| | | 2017
| | | 2016
| | | 2015
| |
For a share outstanding for the period: | | | | | | | | | | | | | | | | | | | | | | | | |
Net asset value, beginning of period | | | $7.69 | | | | $8.70 | | | | $8.74 | | | | $7.39 | | | | $8.07 | | | | $8.28 | |
| | | | | | | | | | | | | | | | | | | | | | | | |
Income from investment operations: | | | | | | | | | | | | | | | | | | | | | | | | |
Net investment income (loss) | | | 0.03 | | | | 0.18 | | | | 0.18 | | | | 0.19 | | | | 0.15 | | | | 0.16 | |
Net realized and unrealized gain (loss) on investments | | | 0.33 | | | | (0.78) | | | | 0.05 | | | | 1.32 | | | | (0.54) | | | | 0.21 | |
| | | | | | | | | | | | | | | | | | | | | | | | |
Total income (loss) from investment operations | | | 0.36 | | | | (0.60) | | | | 0.23 | | | | 1.51 | | | | (0.39) | | | | 0.37 | |
| | | | | | | | | | | | | | | | | | | | | | | | |
Less dividends and/or distributions: | | | | | | | | | | | | | | | | | | | | | | | | |
Dividends to shareholders from net investment income | | | (0.25) | | | | (0.18) | | | | (0.27) | | | | (0.16) | | | | (0.10) | | | | (0.15) | |
Distributions to shareholders from net realized gain | | | - | | | | (0.23) | | | | - | | | | - | | | | (0.19) | | | | (0.43) | |
| | | | | | | | | | | | | | | | | | | | | | | | |
Total distributions | | | (0.25) | | | | (0.41) | | | | (0.27) | | | | (0.16) | | | | (0.29) | | | | (0.58) | |
| | | | | | | | | | | | | | | | | | | | | | | | |
Redemption fee proceeds 1 | | | 0.00 | 2 | | | 0.00 | 2 | | | 0.00 | 2 | | | 0.00 | 2 | | | 0.00 | 2 | | | 0.00 | 2 |
| | | | | | | | | | | | | | | | | | | | | | | | |
Net asset value, end of period | | | $7.80 | | | | $7.69 | | | | $8.70 | | | | $8.74 | | | | $7.39 | | | | $8.07 | |
| | | | | | | | | | | | | | | | | | | | | | | | |
Total return 3 | | | 4.59% | | | | -6.49% | | | | 2.58% | | | | 20.80% | | | | -4.74% | | | | 5.24% | |
Portfolio turnover | | | 40% | | | | 77% | | | | 68% | | | | 73% | | | | 89% | | | | 88% | |
Ratios/supplemental data (annualized): | | | | | | | | | | | | | | | | | | | | | | | | |
Net assets, end of period (in millions) | | | $535 | | | | $524 | | | | $580 | | | | $384 | | | | $167 | | | | $61 | |
Ratio of expenses to average net assets | | | 0.98% | 4 | | | 1.01% | 4 | | | 1.02% | | | | 1.07% | | | | 1.10% | | | | 1.15% | |
Ratio of gross expenses to average net assets | | | 0.98% | | | | 1.01% | | | | 1.02% | | | | 1.07% | | | | 1.10% | | | | 1.15% | |
Ratio of net investment income (loss) to average net assets | | | 0.67% | | | | 2.30% | | | | 2.22% | | | | 2.82% | | | | 2.22% | | | | 1.78% | |
1 Based on average shares outstanding.
2 Amount represents less than $0.005 per share.
3 Not annualized for periods less than one year.
4 Ratio of expenses to average net assets includes transfer agent credits. Excluding transfer agent credits the ratio of expenses to average net assets would have been 1.01% for the year ended July 31, 2019 and 0.98% for the period ended January 31, 2020.
SEE NOTES TO FINANCIAL STATEMENTS
57
DOMINI IMPACT INTERNATIONAL EQUITY FUND — CLASS Y SHARES
FINANCIAL HIGHLIGHTS
| | | | | | | | | | | | |
| | | Six Months
Ended
January 31, 2020
(unaudited) | | | Year Ended July 31, | |
| | | 2019
| | | 2018
| |
For a share outstanding for the period: | | | | | | | | | | | | |
Net asset value, beginning of period | | | $7.70 | | | | $8.71 | | | | $8.56 | |
| | | | | | | | | | | | |
Income from investment operations: | | | | | | | | | | | | |
Net investment income (loss) | | | 0.06 | | | | 0.23 | | | | - | |
Net realized and unrealized gain (loss) on investments | | | 0.29 | | | | (0.83) | | | | 0.15 | |
| | | | | | | | | | | | |
Total income (loss) from investment operations | | | 0.35 | | | | (0.60) | | | | 0.15 | |
| | | | | | | | | | | | |
Less dividends and/or distributions: | | | | | | | | | | | | |
Dividends to shareholders from net investment income | | | (0.24) | | | | (0.18) | | | | - | |
Distributions to shareholders from net realized gain | | | - | | | | (0.23) | | | | - | |
| | | | | | | | | | | | |
Total Distributions | | | (0.24) | | | | (0.41) | | | | - | |
| | | | | | | | | | | | |
Redemption fee proceeds | | | - | | | | - | | | | - | |
| | | | | | | | | | | | |
Net asset value, end of period | | | $7.81 | | | | $7.70 | | | | $8.71 | |
| | | | | | | | | | | | |
Total return 1 | | | 4.48% | | | | -6.50% | | | | 1.75% | |
Portfolio turnover | | | 40% | | | | 77% | | | | 68% | |
Ratios/supplemental data (annualized): | | | | | | | | | | | | |
Net assets, end of period (in millions) | | | $198 | | | | $238 | | | | $142 | |
Ratio of expenses to average net assets | | | 1.11% | 2 | | | 1.13% | 2 | | | 1.13% | |
Ratio of gross expenses to average net assets | | | 1.11% | | | | 1.13% | | | | 1.13% | |
Ratio of net investment income (loss) to average net assets | | | 0.64% | | | | 2.81% | | | | 0.32% | |
1 Not annualized for periods less than one year.
2 Ratio of expenses to average net assets includes transfer agent credits. Excluding transfer agent credits the ratio of expenses to average net assets would have been 1.13% for the year ended July 31, 2019 and 1.11% for the period ended January 31, 2020.
SEE NOTES TO FINANCIAL STATEMENTS
58
DOMINI IMPACT EQUITY FUND — INVESTOR SHARES
FINANCIAL HIGHLIGHTS
| | | | | | | | | | | | | | | | | | | | | | | | |
| | | Six Months
Ended
January 31, 2020
(unaudited) | | | Year Ended July 31, | |
| | | 2019 | | | 2018 | | | 2017^ | | | 2016^ | | | 2015^ | |
For a share outstanding for the period: | | | | | | | | | | | | | | | | | | | | | | | | |
Net asset value, beginning of period | | | $22.48 | | | | $24.18 | | | | $23.18 | ^ | | | $20.76 | | | | $22.70 | | | | $23.42 | |
| | | | | | | | | | | | | | | | | | | | | | | | |
Income from investment operations: | | | | | | | | | | | | | | | | | | | | | | | | |
Net investment income (loss) | | | 0.08 | | | | 0.18 | | | | 0.27 | 1 | | | 0.21 | 1 | | | 0.45 | | | | 0.26 | 1 |
Net realized and unrealized gain (loss) on investments | | | 2.34 | | | | 0.81 | | | | 2.09 | 1 | | | 2.69 | | | | (1.04) | | | | 0.93 | |
| | | | | | | | | | | | | | | | | | | | | | | | |
Total income (loss) from investment operations | | | 2.42 | | | | 0.99 | | | | 2.36 | | | | 2.90 | | | | (0.59) | | | | 1.19 | |
| | | | | | | | | | | | | | | | | | | | | | | | |
Less dividends and/or distributions: | | | | | | | | | | | | | | | | | | | | | | | | |
Dividends to shareholders from net investment income | | | (0.02) | | | | (0.21) | | | | (0.17) | ^ | | | (0.12) | | | | (0.24) | | | | (0.18) | |
Distributions to shareholders from net realized gain | | | (0.46) | | | | (2.48) | | | | (1.19) | ^ | | | (0.36) | | | | (1.10) | | | | (1.73) | |
Tax return of capital 1 | | | - | | | | - | | | | - | | | | - | | | | (0.01) | | | | - | |
| | | | | | | | | | | | | | | | | | | | | | | | |
Total distributions | | | (0.48) | | | | (2.69) | | | | (1.36) | | | | (0.48) | | | | (1.35) | | | | (1.91) | |
| | | | | | | | | | | | | | | | | | | | | | | | |
Redemption fee proceeds 1 | | | 0.00 | 2 | | | 0.00 | 2 | | | 0.00 | 2 | | | 0.00 | 2 | | | 0.00 | 2 | | | 0.00 | 2 |
| | | | | | | | | | | | | | | | | | | | | | | | |
Net asset value, end of period | | | $24.42 | | | | $22.48 | | | | $24.18 | | | | $23.18 | | | | $20.76 | | | | $22.70 | |
| | | | | | | | | | | | | | | | | | | | | | | | |
Total return 3 | | | 10.86% | | | | 6.31% | | | | 10.32% | | | | 14.07% | | | | -2.47% | | | | 5.21% | |
Portfolio turnover | | | 7% | | | | 95% | | | | 78% | | | | 85% | | | | 91% | | | | 103% | |
Ratios/supplemental data (annualized): | | | | | | | | | | | | | | | | | | | | | | | | |
Net assets, end of period (in millions) | | | $689 | | | | $643 | | | | $669 | | | | $675 | | | | $656 | | | | $752 | |
Ratio of expenses to average net assets | | | 1.09% | 4,5 | | | 1.07% | 4,5 | | | 1.10% | | | | 1.14% | | | | 1.14% | | | | 1.16% | |
Ratio of gross expenses to average net assets | | | 1.09% | | | | 1.09% | | | | 1.10% | | | | 1.14% | | | | 1.14% | | | | 1.16% | |
Ratio of net investment income (loss) to average net assets | | | 0.60% | | | | 0.96% | | | | 1.15% | | | | 0.94% | | | | 2.06% | | | | 1.10% | |
1 Based on average shares outstanding.
2 Amount represents less than $0.005 per share.
3 Not annualized for periods less than one year.
4 Ratio of expenses to average net assets includes transfer agent credits. Excluding transfer agent credits the ratio of expenses to average net assets would have been 1.07% for the year ended July 31, 2019 and 1.09% for the period ended January 31, 2020.
5 Reflects a waiver of fees by the Manager, the Sponsor, and the Distributor of the Fund.
^ All per share amounts and net asset values have been adjusted as a result of the 1.9988601 for 1 share split on January 26, 2018 (see Note 4).
SEE NOTES TO FINANCIAL STATEMENTS
59
DOMINI IMPACT EQUITY FUND — CLASS A SHARES
FINANCIAL HIGHLIGHTS
| | | | | | | | | | | | | | | | | | | | | | | | |
| | | Six Months
Ended
January 31, 2020
(unaudited) | | | Year Ended July 31, | |
| | | 2019 | | | 2018 | | | 2017^ | | | 2016^ | | | 2015^ | |
For a share outstanding for the period: | | | | | | | | | | | | | | | | | | | | | | | | |
Net asset value, beginning of period | | | $22.46 | | | | $24.17 | | | | $33.41 | ^ | | | $34.01 | | | | $48.90 | | | | $64.35 | |
| | | | | | | | | | | | | | | | | | | | | | | | |
Income from investment operations: | | | | | | | | | | | | | | | | | | | | | | | | |
Net investment income (loss) | | | 0.07 | 1 | | | 0.23 | | | | 0.31 | 1 | | | 0.32 | 1 | | | 1.53 | | | | 0.56 | 1 |
Net realized and unrealized gain (loss) on investments | | | 2.36 | | | | 0.75 | | | | 2.84 | 1 | | | 4.14 | | | | (3.19) | | | | 2.45 | |
| | | | | | | | | | | | | | | | | | | | | | | | |
Total income (loss) from investment operations | | | 2.43 | | | | 0.98 | | | | 3.15 | | | | 4.46 | | | | (1.66) | | | | 3.01 | |
| | | | | | | | | | | | | | | | | | | | | | | | |
Less dividends and/or distributions: | | | | | | | | | | | | | | | | | | | | | | | | |
Dividends to shareholders from net investment income | | | (0.03) | | | | (0.21) | | | | (1.35) | ^ | | | (1.72) | | | | (3.02) | | | | (2.41) | |
Distributions to shareholders from net realized gain | | | (0.46) | | | | (2.48) | | | | (11.04) | ^ | | | (3.34) | | | | (10.21) | | | | (16.05) | |
Tax return of capital 1 | | | - | | | | - | | | | - | | | | - | | | | (0.00) | 2 | | | - | |
| | | | | | | | | | | | | | | | | | | | | | | | |
Total distributions | | | (0.49) | | | | (2.69) | | | | (12.39) | | | | (5.06) | | | | (13.23) | | | | (18.46) | |
| | | | | | | | | | | | | | | | | | | | | | | | |
Redemption fee proceeds 1 | | | - | | | | 0.00 | 2 | | | - | | | | - | | | | - | | | | - | |
| | | | | | | | | | | | | | | | | | | | | | | | |
Net asset value, end of period | | | $24.40 | | | | $22.46 | | | | $24.17 | | | | $33.41 | | | | $34.01 | | | | $48.90 | |
| | | | | | | | | | | | | | | | | | | | | | | | |
Total return 3 | | | 10.89% | | | | 6.28% | | | | 10.36% | | | | 13.97% | | | | -2.61% | | | | 5.19% | |
Portfolio turnover | | | 7% | | | | 95% | | | | 78% | | | | 85% | | | | 91% | | | | 103% | |
Ratios/supplemental data (annualized): | | | | | | | | | | | | | | | | | | | | | | | | |
Net assets, end of period (in millions) | | | $6 | | | | $7 | | | | $7 | | | | $8 | | | | $8 | | | | $11 | |
Ratio of expenses to average net assets | | | 1.09% | 4,5 | | | 1.09% | 4,5 | | | 1.12% | 5 | | | 1.16% | 5 | | | 1.18% | 5 | | | 1.18% | 5 |
Ratio of gross expenses to average net assets | | | 1.55% | | | | 1.43% | | | | 1.38% | | | | 1.46% | | | | 1.41% | | | | 1.39% | |
Ratio of net investment income (loss) to average net assets | | | 0.59% | | | | 0.95% | | | | 1.14% | | | | 0.92% | | | | 2.00% | | | | 1.06% | |
1 Based on average shares outstanding.
2 Amount represents less than $0.005 per share.
3 Total return does not reflect sales commissions and is not annualized for periods less than one year.
4 Ratio of expenses to average net assets includes transfer agent credits. Excluding transfer agent credits the ratio of expenses to average net assets would have been 1.09% for the year ended July 31, 2019 and 1.09% for the period ended January 31, 2020.
5 Reflects a waiver of fees by the Manager, the Sponsor, and the Distributor of the Fund.
^ All per share amounts and net asset values have been adjusted as a result of the 0.2155310 for 1 reverse share split on January 26, 2018 (see Note 4).
SEE NOTES TO FINANCIAL STATEMENTS
60
DOMINI IMPACT EQUITY FUND — INSTITUTIONAL SHARES
FINANCIAL HIGHLIGHTS
| | | | | | | | | | | | | | | | | | | | | | | | |
| | | Six Months
Ended
January 31, 2020
(unaudited) | | | Year Ended July 31, | |
| | | 2019 | | | 2018 | | | 2017 | | | 2016 | | | 2015 | |
For a share outstanding for the period: | | | | | | | | | | | | | | | | | | | | | | | | |
Net asset value, beginning of period | | | $22.41 | | | | $24.18 | | | | $24.46 | | | | $22.40 | | | | $25.95 | | | | $28.49 | |
| | | | | | | | | | | | | | | | | | | | | | | | |
Income from investment operations: | | | | | | | | | | | | | | | | | | | | | | | | |
Net investment income (loss) | | | 0.11 | 1 | | | 0.08 | | | | 0.37 | | | | 0.31 | 1 | | | 0.55 | | | | 0.40 | 1 |
Net realized and unrealized gain (loss) on investments | | | 2.35 | | | | 0.98 | | | | 2.17 | | | | 2.87 | | | | (1.20) | | | | 1.11 | |
| | | | | | | | | | | | | | | | | | | | | | | | |
Total income (loss) from investment operations | | | 2.46 | | | | 1.06 | | | | 2.54 | | | | 3.18 | | | | (0.65) | | | | 1.51 | |
| | | | | | | | | | | | | | | | | | | | | | | | |
Less dividends and/or distributions: | | | | | | | | | | | | | | | | | | | | | | | | |
Dividends to shareholders from net investment income | | | (0.11) | | | | (0.35) | | | | (0.44) | | | | (0.40) | | | | (0.70) | | | | (0.59) | |
Distributions to shareholders from net realized gain | | | (0.46) | | | | (2.48) | | | | (2.38) | | | | (0.72) | | | | (2.20) | | | | (3.46) | |
Tax return of capital 1 | | | - | | | | - | | | | - | | | | - | | | | (0.00) | 2 | | | - | |
| | | | | | | | | | | | | | | | | | | | | | | | |
Total distributions | | | (0.57) | | | | (2.83) | | | | (2.82) | | | | (1.12) | | | | (2.90) | | | | (4.05) | |
| | | | | | | | | | | | | | | | | | | | | | | | |
Redemption fee proceeds 1 | | | 0.00 | 2 | | | 0.00 | 2 | | | 0.00 | 2 | | | 0.00 | 2 | | | 0.00 | 2 | | | 0.00 | 2 |
| | | | | | | | | | | | | | | | | | | | | | | | |
Net asset value, end of period | | | $24.30 | | | | $22.41 | | | | $24.18 | | | | $24.46 | | | | $22.40 | | | | $25.95 | |
| | | | | | | | | | | | | | | | | | | | | | | | |
Total return 3 | | | 11.07% | | | | 6.69% | | | | 10.68% | | | | 14.51% | | | | -2.14% | | | | 5.56% | |
Portfolio turnover | | | 7% | | | | 95% | | | | 78% | | | | 85% | | | | 91% | | | | 103% | |
Ratios/supplemental data (annualized): | | | | | | | | | | | | | | | | | | | | | | | | |
Net assets, end of period (in millions) | | | $104 | | | | $99 | | | | $120 | | | | $157 | | | | $205 | | | | $237 | |
Ratio of expenses to average net assets | | | 0.74% | 4,5 | | | 0.74% | 4,5 | | | 0.74% | 5 | | | 0.79% | | | | 0.80% | 5 | | | 0.80% | 5 |
Ratio of gross expenses to average net assets | | | 0.74% | | | | 0.76% | | | | 0.76% | | | | 0.79% | | | | 0.81% | | | | 0.80% | |
Ratio of net investment income (loss) to average net assets | | | 0.94% | | | | 1.31% | | | | 1.52% | | | | 1.31% | | | | 2.40% | | | | 1.47% | |
1 Based on average shares outstanding.
2 Amount represents less than $0.005 per share.
3 Not annualized for periods less than one year.
4 Ratio of expenses to average net assets includes transfer agent credits. Excluding transfer agent credits the ratio of expenses to average net assets would have been 0.74% for the year ended July 31, 2019 and 0.74% for the period ended January 31, 2020.
5 Reflects a waiver of fees by the Manager, and the Sponsor of the Fund.
SEE NOTES TO FINANCIAL STATEMENTS
61
DOMINI IMPACT EQUITY FUND — CLASS R SHARES
FINANCIAL HIGHLIGHTS
| | | | | | | | | | | | | | | | | | | | | | | | |
| | | Six Months
Ended
January 31, 2020
(unaudited) | | | Year Ended July 31, | |
| | | 2019 | | | 2018 | | | 2017^ | | | 2016^ | | | 2015^ | |
For a share outstanding for the period: | | | | | | | | | | | | | | | | | | | | | | | | |
Net asset value, beginning of period | | | $22.42 | | | | $24.18 | | | | $37.86 | ^ | | | $39.86 | | | | $60.43 | | | | $82.35 | |
| | | | | | | | | | | | | | | | | | | | | | | | |
Income from investment operations: | | | | | | | | | | | | | | | | | | | | | | | | |
Net investment income (loss) | | | 0.10 | 1 | | | 3.04 | | | | 0.41 | 1 | | | 0.51 | 1 | | | 3.15 | | | | 0.961 | |
Net realized and unrealized gain (loss) on investments | | | 2.35 | | | | (2.00) | | | | 3.21 | 1 | | | 4.69 | | | | (5.08) | | | | 3.15 | |
| | | | | | | | | | | | | | | | | | | | | | | | |
Total income (loss) from investment operations | | | 2.45 | | | | 1.04 | | | | 3.62 | | | | 5.20 | | | | (1.93) | | | | 4.11 | |
| | | | | | | | | | | | | | | | | | | | | | | | |
Less dividends and/or distributions: | | | | | | | | | | | | | | | | | | | | | | | | |
Dividends to shareholders from net investment income | | | (0.09) | | | | (0.32) | | | | (2.00) | ^ | | | (2.57) | | | | (4.50) | | | | (3.79) | |
Distributions to shareholders from net realized gain | | | (0.46) | | | | (2.48) | | | | (15.30) | ^ | | | (4.63) | | | | (14.14) | | | | (22.24) | |
Tax return of capital 1 | | | - | | | | - | | | | - | | | | - | | | | (0.00) | 2 | | | - | |
| | | | | | | | | | | | | | | | | | | | | | | | |
Total distributions | | | (0.55) | | | | (2.80) | | | | (17.30) | | | | (7.20) | | | | (18.64) | | | | (26.03) | |
| | | | | | | | | | | | | | | | | | | | | | | | |
Redemption fee proceeds 1 | | | 0.00 | 2 | | | 0.00 | 2 | | | 0.00 | 2 | | | 0.00 | 2 | | | 0.00 | 2 | | | 0.00 | 2 |
| | | | | | | | | | | | | | | | | | | | | | | | |
Net asset value, end of period | | | $24.32 | | | | $22.42 | | | | $24.18 | | | | $37.86 | | | | $39.86 | | | | $60.43 | |
| | | | | | | | | | | | | | | | | | | | | | | | |
Total return 3 | | | 11.04% | | | | 6.62% | | | | 10.71% | | | | 14.20% | | | | -2.22% | | | | 5.55% | |
Portfolio turnover | | | 7% | | | | 95% | | | | 78% | | | | 85% | | | | 91% | | | | 103% | |
Ratios/supplemental data (annualized): | | | | | | | | | | | | | | | | | | | | | | | | |
Net assets, end of period (in millions) | | | $15 | | | | $20 | | | | $18 | | | | $21 | | | | $44 | | | | $55 | |
Ratio of expenses to average net assets | | | 0.80% | 4,5 | | | 0.80% | 4,5 | | | 0.80% | 5 | | | 0.83% | 5 | | | 0.82% | | | | 0.85% | |
Ratio of gross expenses to average net assets | | | 0.95% | | | | 0.88% | | | | 0.84% | | | | 0.85% | | | | 0.82% | | | | 0.85% | |
Ratio of net investment income (loss) to average net assets | | | 0.88% | | | | 1.23% | | | | 1.46% | | | | 1.28% | | | | 2.39% | | | | 1.41% | |
1 Based on average shares outstanding.
2 Amount represents less than $0.005 per share.
3 Not annualized for periods less than one year.
4 Ratio of expenses to average net assets includes transfer agent credits. Excluding transfer agent credits the ratio of expenses to average net assets would have been 0.80% for the year ended July 31, 2019 and 0.80% for the period ended January 31, 2020.
5 Reflects a waiver of fees by the Manager, and the Sponsor of the Fund.
^ All per share amounts and net asset values have been adjusted as a result of the 0.1555580 for 1 reverse share split on January 26, 2018 (see Note 4).
SEE NOTES TO FINANCIAL STATEMENTS
62
DOMINI IMPACT INTERNATIONAL EQUITY FUND
DOMINI IMPACT EQUITY FUND
NOTES TO FINANCIAL STATEMENTS
January 31, 2020 (Unaudited)
1. ORGANIZATION AND SIGNIFICANT ACCOUNTING POLICIES
The Domini Investment Trust is a Massachusetts business trust registered under the Investment Company Act of 1940 as anopen-end management investment company. The Domini Investment Trust comprises three separate series: Domini Impact International Equity Fund, Domini Impact Equity Fund, and Domini Impact Bond Fund (each the “Fund,” collectively the “Funds”). The financial statements of the Domini Impact Bond Fund are included on page 80 of this report. Each Fund is an investment company and accordingly follows the investment company accounting and reporting guidance of the Financial Accounting Standards Board (the “FASB”) Accounting Standard Codification Topic 946 “Financial Services — Investment Companies”. The Domini Impact International Equity Fund offers Investor shares, Class A shares, Institutional shares and Class Y shares. Class A, Institutional and Class Y shares of the Domini Impact International Equity Fund were not offered prior to November 28, 2008, November 30, 2012, and June 15, 2018 respectively. The Domini Impact Equity Fund offers Investor shares, Class A shares, Institutional shares and Class R shares. Class R shares of the Domini Impact Equity Fund commenced on November 28, 2003. Class A and Institutional shares of the Domini Impact Equity Fund commenced on November 28, 2008. The Investor shares, Institutional shares, Class R shares and Class Y shares are sold at their offering price, which is net asset value. The Class A shares are sold with afront-end sales charge (load) of up to 4.75%. The Institutional shares may only be purchased by or for the benefit of investors that meet the minimum investment requirements, and fall within the following categories: endowments, foundations, religious organizations and other nonprofit entities, individuals, retirement plan sponsors, family office clients, certain corporate or similar institutions, or omnibus accounts maintained by financial intermediaries and that are approved by the Fund’s Distributor. Class R shares are generally available only to certain eligible retirement plans and endowments, foundations, religious organizations, and othertax-exempt entities that are approved by the Fund’s Distributor. Class Y shares may only be purchased through omnibus accounts held on the books of the Fund for financial intermediaries that have been approved by the Funds’ distributor. All classes of shares have identical rights and voting privileges with respect to the Fund in general and exclusive voting rights on matters that affect that class alone. Earnings, net assets, and net asset value per share may differ due to each class having its own expenses, such as transfer and shareholder servicing agent fees and registration fees, directly attributable to that class. Class R, Institutional and Class Y shares are not subject to distribution and service fees.
63
DOMINI IMPACT INTERNATIONAL EQUITY FUND
DOMINI IMPACT EQUITY FUND
NOTES TO FINANCIAL STATEMENTS(continued)
January 31, 2020 (Unaudited)
The preparation of financial statements in conformity with U.S. generally accepted accounting principles requires management to make estimates and assumptions that affect the reported amounts of assets and liabilities and disclosure of contingent liabilities at the date of the financial statements and the reported amounts of revenues and expenses during the reporting period. Actual results could differ from those estimates. The following is a summary of the Funds’ significant accounting policies.
(A) Valuation of Investments. Securities listed or traded on national securities exchanges are valued at the last sale price reported by the security’s primary exchange or, if there have been no sales that day, at the mean of the current bid and ask price that represents the current value of the security. Securities listed on the NASDAQ National Market System are valued using the NASDAQ Official Closing Price (the “NOCP”). If an NOCP is not available for a security listed on the NASDAQ National Market System, the security will be valued at the last sale price or, if there have been no sales that day, at the mean of the current bid and ask price. Securities for which market quotations are not readily available or as a result of an event occurring after the close of the foreign market but before pricing the Funds are valued at fair value as determined in good faith under procedures established by and under the supervision of the Funds’ Board of Trustees. Securities that are primarily traded on foreign exchanges generally are valued at the closing price of such securities on their respective exchanges, except that if the Trusts’ manager or submanager, as applicable, is of the opinion that such price would result in an inappropriate value for a security, including as a result of an occurrence subsequent to the time a value was so established, then the fair value of those securities may be determined by consideration of other factors (including the use of an independent pricing service) by or under the direction of the Board of Trustees or its delegates.
The Funds follow a fair value hierarchy that distinguishes between (a) market participant assumptions developed based on market data obtained from sources independent of the reporting entity (observable inputs) and (b) the Fund’s own assumptions about market participant assumptions developed based on the best information available in the circumstances (unobservable inputs). These inputs are used in determining the value of the Funds’ investments and are summarized in the following fair value hierarchy:
Level 1 — quoted prices in active markets for identical securities
Level 2 — other significant observable inputs (including quoted prices for similar securities, interest rates, and evaluated quotation obtained from pricing services)
64
DOMINI IMPACT INTERNATIONAL EQUITY FUND
DOMINI IMPACT EQUITY FUND
NOTES TO FINANCIAL STATEMENTS(continued)
January 31, 2020 (Unaudited)
Level 3 — significant unobservable inputs (including the Funds’ own assumptions in determining the fair value of investments)
The inputs or methodology used for valuing securities are not an indication of the risk associated with investing in those securities.
The following is a summary of the inputs used by the Domini Impact International Equity Fund, as of January 31, 2020, in valuing the Fund’s assets carried at fair value:
| | | | | | | | | | | | | | | | |
| | | Level 1 -
Quoted Prices | | | Level 2 -
Other
Significant
Observable
Inputs | | | Level 3 -
Significant
Unobservable
Inputs | | | Total | |
| | | | | | | | | | | | | | | | |
Common Stocks | | | | | | | | | | | | | | | | |
Communication Services | | $ | - | | | $ | 62,416,491 | | | $ | - | | | $ | 62,416,491 | |
Consumer Discretionary | | | 21,458,358 | | | | 140,928,567 | | | | - | | | | 162,386,925 | |
Consumer Staples | | | 26,278,119 | | | | 71,958,502 | | | | - | | | | 98,236,621 | |
Financials | | | 6,006,938 | | | | 225,233,878 | | | | - | | | | 231,240,816 | |
Health Care | | | 11,053,801 | | | | 171,958,610 | | | | - | | | | 183,012,411 | |
Industrials | | | 5,554,136 | | | | 144,266,687 | | | | - | | | | 149,820,823 | |
Information Technology | | | 16,238,989 | | | | 100,643,235 | | | | - | | | | 116,882,224 | |
Materials | | | - | | | | 69,373,124 | | | | - | | | | 69,373,124 | |
Real Estate | | | 1,312,995 | | | | 76,538,209 | | | | - | | | | 77,851,204 | |
Utilities | | | 5,942,472 | | | | 4,366,191 | | | | - | | | | 10,308,663 | |
| | | | | | | | | | | | | | | | |
Total | | $ | 93,845,808 | | | $ | 1,067,683,494 | | | $ | - | | | $ | 1,161,529,302 | |
| | | | | | | | | | | | | | | | |
65
DOMINI IMPACT INTERNATIONAL EQUITY FUND
DOMINI IMPACT EQUITY FUND
NOTES TO FINANCIAL STATEMENTS(continued)
January 31, 2020 (Unaudited)
The following is a summary of the inputs used by the Domini Impact Equity Fund, as of January 31, 2020, in valuing the Fund’s assets carried at fair value:
| | | | | | | | | | | | | | | | |
| | | Level 1 -
Quoted Prices | | | Level 2 -
Other
Significant
Observable
Inputs | | | Level 3 -
Significant
Unobservable
Inputs | | | Total | |
| | | | | | | | | | | | | | | | |
Common Stocks | | | | | | | | | | | | | | | | |
Communication Services | | $ | 94,177,524 | | | $ | - | | | $ | - | | | $ | 94,177,524 | |
Consumer Discretionary | | | 94,336,990 | | | | - | | | | - | | | | 94,336,990 | |
Consumer Staples | | | 52,763,863 | | | | - | | | | - | | | | 52,763,863 | |
Energy | | | 905,034 | | | | - | | | | - | | | | 905,034 | |
Financials | | | 96,027,185 | | | | - | | | | - | | | | 96,027,185 | |
Health Care | | | 119,952,115 | | | | - | | | | - | | | | 119,952,115 | |
Industrials | | | 57,590,284 | | | | - | | | | - | | | | 57,590,284 | |
Information Technology | | | 245,113,805 | | | | - | | | | - | | | | 245,113,805 | |
Materials | | | 15,986,470 | | | | - | | | | - | | | | 15,986,470 | |
Real Estate | | | 27,015,196 | | | | - | | | | - | | | | 27,015,196 | |
Utilities | | | 7,224,134 | | | | - | | | | - | | | | 7,224,134 | |
Rights | | | | | | | | | | | | | | | | |
Health Care | | | 107,567 | | | | - | | | | - | | | | 107,567 | |
| | | | | | | | | | | | | | | | |
Total | | $ | 811,200,167 | | | $ | - | | | $ | - | | | $ | 811,200,167 | |
| | | | | | | | | | | | | | | | |
(B) Foreign Currency Translation. Securities and other assets and liabilities denominated in foreign currencies are translated into U.S. dollar amounts on the date of valuation. Purchases and sales of securities, and income and expense items denominated in foreign currencies, are translated into U.S. dollar amounts on the respective dates of such transactions. Occasionally, events impact the availability or reliability of foreign exchange rates used to convert the U.S. dollar equivalent value. If such an event occurs, the foreign exchange rate will be valued at fair value using procedures established and approved by the Board of Trustees. The Funds do not separately report the effect of fluctuations in foreign exchange rates from changes in market prices on securities held. Such fluctuations are included with the net realized and unrealized gain or loss from investments. Realized foreign exchange gains or losses arise from sales of foreign currencies, currency gains or losses realized between the trade and settlement dates on securities transactions, and the difference between the recorded amounts of dividends, interest, and foreign withholding taxes and the U.S. dollar equivalent of the amounts actually received or paid. Net unrealized foreign exchange gains and losses arise from changes in fair value of assets and liabilities other than investments in securities held at the end of the reporting period, resulting from changes in exchange rates.
66
DOMINI IMPACT INTERNATIONAL EQUITY FUND
DOMINI IMPACT EQUITY FUND
NOTES TO FINANCIAL STATEMENTS(continued)
January 31, 2020 (Unaudited)
(C) Foreign Currency Contracts. When the Funds purchase or sell foreign securities, they enter into foreign exchange contracts to minimize foreign exchange risk from the trade date to the settlement date of the transactions. A foreign exchange contract is an agreement between two parties to exchange different currencies at an agreed-upon exchange rate on a specified date. The Domini Impact Equity Fund had no open foreign currency spot contracts and the Domini Impact International Equity Fund had $3,597,878 outstanding as of January 31, 2020.
(D) Investment Transactions, Investment Income and Dividends to Shareholders. Investment transactions are accounted for on trade date. Realized gains and losses from security transactions are determined on the basis of identified cost. Interest income is recorded on an accrual basis. Dividend income, net of any applicable withholding tax, is recorded on theex-dividend date or for certain foreign securities, when the information becomes available to the Funds. The Funds earn income daily, net of Fund expenses. Dividends to shareholders of the Domini Impact International Equity Fund are usually declared and paid semiannually from net investment income. Dividends to shareholders of the Domini Impact Equity Fund are usually declared and paid quarterly from net investment income. Distributions to shareholders of realized capital gains, if any, are made annually. Distributions are determined in conformity with income tax regulations, which may differ from generally accepted accounting principles. Reclassifications have been made to the Funds’ components of net assets to reflect income and gains available for distribution (or available capital loss carryovers, as applicable) under income tax regulations.
(E) Federal Taxes. Each Fund’s policy is to comply with the provisions of the Internal Revenue Code applicable to regulated investment companies and to distribute substantially all of its taxable income, including net realized gains, if any, within the prescribed time periods. Accordingly, no provision for federal income or excise tax is deemed necessary. As of January 31, 2020, tax years 2016 through 2019 remain subject to examination by the Funds’ major tax jurisdictions, which include the United States of America, the Commonwealth of Massachusetts, and New York State.
(F) Redemption Fees. Redemptions and exchanges of Fund shares held less than 30 days may be subject to the Funds’ redemption fee, which is 2% of the amount redeemed. The fee is imposed to offset transaction costs and other expenses associated with short-term investing. The fee may be waived in certain circumstances at the discretion of the Funds. Such fees are retained by the Funds and are recorded as an adjustment topaid-in capital.
67
DOMINI IMPACT INTERNATIONAL EQUITY FUND
DOMINI IMPACT EQUITY FUND
NOTES TO FINANCIAL STATEMENTS(continued)
January 31, 2020 (Unaudited)
(G) Other. Income, expenses (other than those attributable to a specific class), gains, and losses are allocated on a daily basis to each class of shares based upon the relative proportion of net assets represented by such class. Operating expenses directly attributable to a specific class are charged against the operations of that class.
(H) Transfer Agent Credits. Per the arrangement with the Funds’ transfer agent, BNY Mellon Investment Servicing (U.S.) Inc., the Funds have arrangements whereby they may receive earnings credits when positive cash balances are maintained, which are used to offset transfer agency fees. For financial reporting purposes, the Funds include earnings credits as an expense offset in the Statement of Operations. For the six months ended January 31, 2020, Transfer agency fees of the Funds, under these arrangements, were reduced as follows:
| | | | |
Domini Impact International Equity Fund Investor Shares | | $ | 899 | |
| |
Domini Impact International Equity Fund Class A Shares | | | 184 | |
| |
Domini Impact International Equity Fund Institutional Shares | | | 14 | |
| |
Domini Impact International Equity Fund Class Y Shares | | | 1 | |
| |
Domini Impact Equity Fund Investor Shares | | | 1,081 | |
| |
Domini Impact Equity Fund Class A Shares | | | 11 | |
| |
Domini Impact Equity Fund Institutional Shares | | | 3 | |
| |
Domini Impact Equity Fund Class R Shares | | | 5 | |
(I) Indemnification. The Funds’ organizational documents provide current and former trustees and officers with a limited indemnification against liabilities arising in connection with the performance of their duties to the Funds. In the normal course of business, the Funds may also enter into contracts that provide general indemnifications. The Funds’ maximum exposure under these arrangements is unknown as this would be dependent on future claims that may be made against the Funds. The risk of material loss from such claims is considered remote.
2. TRANSACTIONS WITH AFFILIATES
(A) Manager/Sponsor. The Funds have retained Domini Impact Investments LLC (Domini) to serve as investment manager and administrator. Domini is registered as an investment adviser under the Investment Advisers Act of 1940. The services provided by Domini consist of investment supervisory services, overall operational support, and administrative services. The administrative services include the provision of general office facilities and supervising the overall administration of the Funds. For its services under the Management Agreements, Domini receives from each Fund a fee accrued daily and paid
68
DOMINI IMPACT INTERNATIONAL EQUITY FUND
DOMINI IMPACT EQUITY FUND
NOTES TO FINANCIAL STATEMENTS(continued)
January 31, 2020 (Unaudited)
monthly at the annual rate below of the respective Funds’ average daily net assets before any fee waivers:
| | |
| Domini Impact International Equity Fund | | 1.00% of the first $250 million of net assets managed, |
| (prior to May 1, 2017) | | 0.94% of the next $250 million of net assets managed, and |
| | 0.88% of net assets managed in excess of $500 million |
| | |
| (effective May 1, 2017) | | 0.97% of the first $250 million of net assets managed, |
| | 0.92% of the next $250 million of net assets managed, and |
| | 0.855% of the next $500 million of net assets managed |
| | 0.83% of net assets managed in excess of $1 billion |
| | |
| Domini Impact Equity Fund | | 0.30% of the first $2 billion of net assets managed, |
| (prior to May 1, 2017) | | 0.29% of the next $1 billion of net assets managed, and |
| | 0.28% of net assets managed in excess of $3 billion |
| | |
| (May 1, 2017 to November 30, 2018) | | 0.245% of the first $250 million of net assets managed, |
| | 0.24% of the next $250 million of net assets managed, and |
| | 0.235% of the next $500 million of net assets managed |
| | 0.23% of net assets managed in excess of $1 billion |
| | |
| (effective December 1, 2018) | | 0.20% of the first $2 billion of net assets managed, |
| | 0.19% of the next $1 billion of net assets managed, and |
| | 0.18% of net assets managed in excess of $3 billion |
Pursuant to a Sponsorship Agreement (with respect to the Domini Impact Equity Fund) Domini provides the Fund with the administrative personnel and services necessary to operate the Fund. In addition to general administrative services and facilities for the Fund similar to those provided by Domini under the Management Agreements, Domini answers questions from the general public and the media regarding the securities holdings of the Fund. For these services and facilities, Domini receives fees accrued daily and paid monthly from the Fund at the annual rate below of the respective Fund’s average daily net assets before any fee waivers:
| | |
| Domini Impact Equity Fund | | 0.45% of the first $2 billion of net assets managed, |
| | 0.44% of the next $1 billion of net assets managed, and |
| | 0.43% of net assets managed in excess of $3 billion |
Effective November 29, 2019, Domini has contractually agreed to reduce its fees and/or reimburse certain ordinary operating expenses (excluding brokerage fees and commissions, interest, taxes, and other extraordinary expenses) in order to limit Class A and Class Y share expenses of the Domini Impact International Equity Fund (International Fund) to 1.43% and 1.15%, respectively, until November 30, 2020, absent an earlier modification by the Board of Trustees which oversee the Fund. Effective July 23, 2018, Domini agreed to reduce its fees and reimburse expenses to keep the aggregate annual operating expenses of the International Fund (excluding brokerage fees and
69
DOMINI IMPACT INTERNATIONAL EQUITY FUND
DOMINI IMPACT EQUITY FUND
NOTES TO FINANCIAL STATEMENTS(continued)
January 31, 2020 (Unaudited)
commissions, interest, taxes, and other extraordinary expenses), at no greater than 1.15% of the average daily net assets of the Class Y shares of the Fund through November 30, 2019, absent an earlier modification by Fund’s Board. Effective June 15, 2018, Domini agreed to reduce its fees and reimburse expenses to keep the aggregate annual operating expenses of the International Fund (excluding brokerage fees and commissions, interest, taxes, and other extraordinary expenses), at no greater than 1.43% of the average daily net assets of the Class A shares of the Fund through November 30, 2019, absent an earlier modification by the Fund’s Board. For the period from November 30, 2017, through June 14, 2018, Domini agreed to reduce its fees and reimburse expenses to keep the aggregate annual operating expenses (excluding brokerage fees and commissions, interest, taxes, and other extraordinary expenses), at no greater than 1.51% of the average daily net assets of the Class A shares of the International Fund, absent an earlier modification by the Board of Trustees which oversee the Funds. For periods prior to November 30, 2017, Domini contractually agreed to reduce its fees and reimburse expenses to keep the aggregate annual operating expenses (excluding brokerage fees and commissions, interest, taxes, and other extraordinary expenses), at no greater than 1.60%, 1.57%, and 1.27% of the average daily net assets of the Investor, Class A, and Institutional shares of the International Fund, respectively, absent an earlier modification by the Board of Trustees which oversee the Fund.
Effective November 29, 2019, Domini has contractually agreed to reduce its fees and/or reimburse certain ordinary operating expenses (excluding brokerage fees and commissions, interest, taxes, and other extraordinary expenses) in order to limit Investor, Class A, Institutional, and Class R share expenses of the Domini Impact Equity Fund (Equity Fund) to 1.09%, 1.09%, 0.74%, and 0.80%, respectively, until November 30, 2020, absent an earlier modification by the Board of Trustees which oversee the Fund. Effective December 1, 2018, Domini agreed to reduce its fees and reimburse expenses to keep the aggregate annual operating expenses of the Equity Fund (excluding brokerage fees and commissions, interest, taxes, and other extraordinary expenses), at no greater than 1.09%, 1.09%, 0.74% and 0.80% of the average daily net assets of the Investor shares, Class A shares, Institutional shares and Class R shares of the Fund, respectively. For the period from June 15, 2018, through November 30, 2019, Domini contractually agreed to reduce its fees and reimburse expenses to keep the aggregate annual operating expenses (excluding brokerage fees and commissions, interest, taxes, and other extraordinary expenses), at no greater than 1.09% of the average daily net assets of the Class A shares of the Equity Fund, respectively, absent an earlier modification by the Board of Trustees
70
DOMINI IMPACT INTERNATIONAL EQUITY FUND
DOMINI IMPACT EQUITY FUND
NOTES TO FINANCIAL STATEMENTS(continued)
January 31, 2020 (Unaudited)
which oversee the Fund. For the period from November 30, 2017, through November 30, 2018, Domini contractually agreed to reduce its fees and reimburse expenses to keep the aggregate annual operating expenses (excluding brokerage fees and commissions, interest, taxes, and other extraordinary expenses), at no greater than 1.12%, and 0.74% of the average daily net assets of the Class A and Institutional shares of the Equity Fund, respectively, absent an earlier modification of the Board of Trustees which oversee the Fund. For the period from November 30, 2017 through November 30, 2018, Domini contractually agreed to reduce its fees and reimburse expenses to keep the aggregate annual operating expenses (excluding brokerage fees and commissions, interest, taxes, and other extraordinary expenses), at no greater than 0.74% of the average daily net assets of the Institutional shares of the Equity Fund, respectively, absent an earlier modification by the Board of Trustees which oversee the Fund. For periods prior to November 30, 2017, Domini contractually agreed to reduce its fees and reimburse expenses to keep the aggregate annual operating expenses (excluding brokerage fees and commissions, interest, taxes, and other extraordinary expenses), at no greater than 1.25%, 1.18%, 0.80%, and 0.90% of the average daily net assets of the Investor, Class A, Institutional, and Class R shares of the Equity Fund, respectively, absent an earlier modification by the Board of Trustees which oversee the Fund.
For the six months ended January 31, 2020, Domini waived fees and reimbursed expenses as follows:
| | | | | | | | |
| | | FEES WAIVED | | | EXPENSES REIMBURSED | |
| | | | | | | | |
Domini Impact International Equity Fund | | $ | - | | | $ | 79,706 | |
Domini Impact Equity Fund | | | - | | | | 33,645 | |
Fees waived and/or expenses reimbursed under the Expense Limitation Agreement are only recoverable by Domini and/or its affiliates in the current fiscal year to the extent actual Fund expenses are less than the contractual expense cap during such year.
As of January 31, 2020, Domini owned less than 1% of any class of the outstanding shares of each Fund.
(B) Submanager. Domini, and not the Funds, pays a portion of the management fee it receives from each Fund to the applicable submanager as compensation for subadvisory services to the Fund.
Wellington Management Company LLP (Wellington Management), a Delaware limited liability partnership, provides investment submanagement services to the
71
DOMINI IMPACT INTERNATIONAL EQUITY FUND
DOMINI IMPACT EQUITY FUND
NOTES TO FINANCIAL STATEMENTS(continued)
January 31, 2020 (Unaudited)
Domini Impact International Equity Fund on a day-to-day basis pursuant to a Submanagement Agreement with Domini. For its services under the Submanagement Agreement, Wellington Management receives: 0.50% of the first $300 million of net assets managed; 0.425% of the next $700 million of net assets managed; and 0.400% of net assets managed in excess of $1 billion. For the six months ended January 31, 2020, Domini paid Wellington Management $2,649,235.
SSGA Funds Management, Inc. (SSGA), provides investment submanagement services to the Domini Impact Equity Fund (Equity Fund) on a day-to-day basis pursuant to a Submanagement Agreement with Domini. For its services under the Submanagement Agreement, SSGA receives: 0.030% of the first $500 million of average daily net assets managed; 0.020% of the next $1.0 billion of average daily net assets managed; and 0.010% of average daily net assets managed in excess of $1.5 billion (Subject to a $175,000 annual minimum). For the period from November 30, 2006 through November 30, 2018, Wellington Management provided investment submanagement services to the Fund. For its services under the Submanagement Agreement, Wellington Management received: 0.25% of the first $250 million of net assets managed; 0.20% of the next $250 million of net assets managed; and 0.175% of net assets managed in excess of $500 million. For the six months ended January 31, 2020, Domini paid SSGA $103,473.
(C) Distributor. The Board of Trustees of the Funds has adopted a Distribution Plan with respect to the Funds’ Investor shares and Class A shares in accordance with Rule12b-1 under the Act. DSIL Investment Services LLC, a wholly owned subsidiary of Domini (DSIL), acts as agent of the Funds in connection with the offering of Investor shares of the Funds pursuant to a Distribution Agreement. Under the Distribution Plan, the Funds pay expenses incurred in connection with the sale of Investor shares and Class A shares and pay DSIL a distribution fee at an aggregate annual rate not to exceed 0.25% of the average daily net assets representing the Investor shares and Class A shares. For the six months ended January 31, 2020, fees waived were as follows:
| | | | |
| | | FEES WAIVED | |
Domini Impact International Equity Fund Investor Shares | | $ | - | |
Domini Impact International Equity Fund Class A Shares | | | - | |
Domini Impact Equity Fund Investor Shares | | | - | |
Domini Impact Equity Fund Class A Shares | | | 7,977 | |
DSIL, the Funds’ Distributor, has received commissions related to the sales of fund shares. For the six months ended January 31, 2020, DSIL received $689,
72
DOMINI IMPACT INTERNATIONAL EQUITY FUND
DOMINI IMPACT EQUITY FUND
NOTES TO FINANCIAL STATEMENTS(continued)
January 31, 2020 (Unaudited)
and $485 from the Domini Impact International Equity Fund Class A Shares, and the Domini Impact Equity Fund Class A shares, respectively.
(D) Shareholder Service Agent. The Trust has retained Domini to provide certain shareholder services with respect to the Domini Impact Equity Fund, and Domini Impact International Equity Fund and their shareholders, which services were previously provided by BNY Asset Servicing (“BNY”) or another fulfillment and mail service provider and are supplemental to services currently provided by BNY, pursuant to a transfer agency agreement between each Fund and BNY. For these services, Domini receives fees from each Fund paid monthly at an annual rate of $4.00 per active account. For the six months ended January 31, 2020, there were no fees waived.
(E) Trustees and Officers. Each of the Independent Trustees received an annual retainer for serving as a Trustee of the Trust of $28,000. The Lead Independent Trustee and Chair of the Audit Committee receive an additional chairperson fee of $5,000. Each Independent Trustee also receives $2,000 for attendance at each meeting of the Board of the Trust (reduced to $1,000 in the event that a Trustee participates at anin-person meeting by telephone). In addition, each Trustee receives reimbursement for reasonable expenses incurred in attending meetings. These expenses are allocated on apro-rata basis to each shares class of a Fund according to their respective net assets.
As of January 31, 2020, all Trustees and officers of the Trust as a group owned less than 1% of each Fund’s outstanding shares.
3. INVESTMENT TRANSACTIONS
For the six months ended January 31, 2020, cost of purchase and proceeds from sales of investments other than short-term obligations were as follows:
| | | | | | | | |
| | | PURCHASE | | | SALES | |
Domini Impact International Equity Fund | | $ | 473,183,388 | | | $ | 564,932,223 | |
Domini Impact Equity Fund | | | 51,504,551 | | | | 89,987,382 | |
73
DOMINI IMPACT INTERNATIONAL EQUITY FUND
DOMINI IMPACT EQUITY FUND
NOTES TO FINANCIAL STATEMENTS(continued)
January 31, 2020 (Unaudited)
4. SHARES OF BENEFICIAL INTEREST
At January 31, 2020, there was an unlimited number of shares authorized ($0.00001 par value). Transactions in the Funds’ shares were as follows:
| | | | | | | | | | | | | | | | |
| | | Six Months Ended
January 31, 2020
(unaudited) | | | Year Ended
July 31, 2019
| |
| | | Shares | | | Amount | | | Shares | | | Amount | |
| | | | |
Domini Impact International Equity Fund | | | | | | | | | | | | | | | | |
| | | | |
Investor Shares | | | | | | | | | | | | | | | | |
Shares sold | | | 7,918,206 | | | $ | 62,176,829 | | | | 24,303,904 | | | $ | 190,673,932 | |
Shares issued in reinvestment of dividends and distributions | | | 1,249,596 | | | | 10,096,732 | | | | 3,091,753 | | | | 22,137,191 | |
Shares redeemed | | | (10,781,494) | | | | (84,868,344) | | | | (41,786,713) | | | | (323,770,731) | |
Redemption fees | | | - | | | | 5,931 | | | | - | | | | 805 | |
| | | | | | | | | | | | | | | | |
Net decrease | | | (1,613,692) | | | $ | (12,588,852) | | | | (14,391,056) | | | $ | (110,958,803) | |
| | | | | | | | | | | | | | | | |
| | | | |
Class A Shares | | | | | | | | | | | | | | | | |
Shares sold | | | 143,506 | | | $ | 1,202,291 | | | | 967,602 | | | $ | 8,251,715 | |
Shares issued in reinvestment of dividends and distributions | | | 55,690 | | | | 480,602 | | | | 177,655 | | | | 1,348,666 | |
Shares redeemed | | | (432,022) | | | | (3,592,202) | | | | (6,684,078) | | | | (53,663,751) | |
Redemption fees | | | - | | | | - | | | | - | | | | 124 | |
| | | | | | | | | | | | | | | | |
Net decrease | | | (232,826) | | | $ | (1,909,309) | | | | (5,538,821) | | | $ | (44,063,246) | |
| | | | | | | | | | | | | | | | |
| | | | |
Institutional Shares | | | | | | | | | | | | | | | | |
Shares sold | | | 8,660,597 | | | $ | 67,719,476 | | | | 33,570,307 | | | $ | 259,151,456 | |
Shares issued in reinvestment of dividends and distributions | | | 1,525,183 | | | | 12,201,461 | | | | 3,069,246 | | | | 21,899,374 | |
Shares redeemed | | | (9,695,409) | | | | (76,071,656) | | | | (35,175,817) | | | | (270,160,153) | |
Redemption fees | | | - | | | | 61 | | | | - | | | | 4,273 | |
| | | | | | | | | | | | | | | | |
Net increase | | | 490,371 | | | $ | 3,849,342 | | | | 1,463,736 | | | $ | 10,894,950 | |
| | | | | | | | | | | | | | | | |
| | | | |
Class Y Shares | | | | | | | | | | | | | | | | |
Shares sold | | | 7,689,532 | | | $ | 60,003,030 | | | | 28,384,340 | | | $ | 218,347,206 | |
Shares issued in reinvestment of dividends and distributions | | | 581,550 | | | | 4,664,034 | | | | 89,854 | | | | 687,342 | |
Shares redeemed | | | (13,808,737) | | | | (107,642,679) | | | | (13,816,929) | | | | (105,876,713) | |
Redemption fees | | | - | | | | - | | | | - | | | | - | |
| | | | | | | | | | | | | | | | |
Net decrease (increase) | | | (5,537,655) | | | $ | (42,975,615) | | | | 14,657,265 | | | $ | 113,157,835 | |
| | | | | | | | | | | | | | | | |
74
DOMINI IMPACT INTERNATIONAL EQUITY FUND
DOMINI IMPACT EQUITY FUND
NOTES TO FINANCIAL STATEMENTS(continued)
January 31, 2020 (Unaudited)
| | | | | | | | | | | | | | | | |
| | | Six Months Ended
January 31, 2020
(unaudited) | | | Year Ended
July 31, 2019
| |
| | | Shares | | | Amount | | | Shares | | | Amount | |
| | | | |
Total | | | | | | | | | | | | | | | | |
Shares sold | | | 24,411,841 | | | $ | 191,101,626 | | | | 87,226,153 | | | $ | 676,424,309 | |
Shares issued in reinvestment of dividends and distributions | | | 3,412,019 | | | | 27,442,829 | | | | 6,428,508 | | | | 46,072,573 | |
Shares redeemed | | | (34,717,662) | | | | (272,174,881) | | | | (97,463,537) | | | | (753,471,348) | |
Redemption fees | | | - | | | | 5,992 | | | | - | | | | 5,202 | |
| | | | | | | | | | | | | | | | |
Net decrease | | | (6,893,802) | | | $ | (53,624,434) | | | | (3,808,876) | | | $ | (30,969,264) | |
| | | | | | | | | | | | | | | | |
As approved by the Board of Trustees, the Domini Impact Equity Fund Investor Shares effected a 1.9988601 for 1 share split and the Domini Impact Equity Fund Class A Shares and Domini Impact Equity Fund R Shares effected a 0.2155310 for 1 and 0.1555580 for 1 reverse share split, respectively on January 26, 2018. The net asset value of each share class increased or decreased proportionately at that time.
| | | | | | | | | | | | | | | | |
| | | Six Months Ended
January 31, 2020
(unaudited) | | | Year Ended
July 31, 2019
| |
| | | Shares | | | Amount | | | Shares | | | Amount | |
| | | | |
Domini Impact Equity Fund | | | | | | | | | | | | | | | | |
| | | | |
Investor Shares | | | | | | | | | | | | | | | | |
Shares sold | | | 363,679 | | | $ | 8,479,036 | | | | 879,355 | | | $ | 19,126,285 | |
Shares issued in reinvestment of dividends and distributions | | | 557,554 | | | | 13,228,929 | | | | 3,661,035 | | | | 69,217,851 | |
Shares redeemed | | | (1,343,107) | | | | (31,120,487) | | | | (3,591,902) | | | | (78,754,646) | |
Redemption fees | | | - | | | | 3,099 | | | | - | | | | 445 | |
| | | | | | | | | | | | | | | | |
Net decrease (increase) | | | (421,874) | | | $ | (9,409,423) | | | | 948,488 | | | $ | 9,589,935 | |
| | | | | | | | | | | | | | | | |
| | | | |
Class A Shares | | | | | | | | | | | | | | | | |
Shares sold | | | 3,855 | | | $ | 90,163 | | | | 42,283 | | | $ | 898,425 | |
Shares issued in reinvestment of dividends and distributions | | | 5,034 | | | | 119,287 | | | | 31,521 | | | | 597,049 | |
Shares redeemed | | | (78,523) | | | | (1,795,871) | | | | (72,624) | | | | (1,633,260) | |
Redemption fees | | | - | | | | - | | | | - | | | | 681 | |
| | | | | | | | | | | | | | | | |
Net decrease (increase) | | | (69,634) | | | $ | (1,586,421) | | | | 1,180 | | | $ | (137,105) | |
| | | | | | | | | | | | | | | | |
| | | | |
Institutional Shares | | | | | | | | | | | | | | | | |
Shares sold | | | 157,356 | | | $ | 3,724,688 | | | | 352,336 | | | $ | 7,669,099 | |
Shares issued in reinvestment of dividends and distributions | | | 77,234 | | | | 1,821,833 | | | | 555,983 | | | | 10,479,770 | |
Shares redeemed | | | (373,203) | | | | (8,674,814) | | | | (1,475,974) | | | | (31,469,527) | |
Redemption fees | | | - | | | | 282 | | | | - | | | | 119 | |
| | | | | | | | | | | | | | | | |
Net decrease | | | (138,613) | | | $ | (3,128,011) | | | | (567,655) | | | $ | (13,320,539) | |
| | | | | | | | | | | | | | | | |
75
DOMINI IMPACT INTERNATIONAL EQUITY FUND
DOMINI IMPACT EQUITY FUND
NOTES TO FINANCIAL STATEMENTS(continued)
January 31, 2020 (Unaudited)
| | | | | | | | | | | | | | | | |
| | | Six Months Ended
January 31, 2020
(unaudited) | | | Year Ended
July 31, 2019
| |
| | | Shares | | | Amount | | | Shares | | | Amount | |
| | | | |
Class R Shares | | | | | | | | | | | | | | | | |
Shares sold | | | 71,441 | | | $ | 1,641,928 | | | | 172,370 | | | $ | 3,837,323 | |
Shares issued in reinvestment of dividends and distributions | | | 15,282 | | | | 360,381 | | | | 110,110 | | | | 2,079,468 | |
Shares redeemed | | | (379,487) | | | | (8,950,294) | | | | (154,772) | | | | (3,285,568) | |
Redemption fees | | | - | | | | 87 | | | | - | | | | 5 | |
| | | | | | | | | | | | | | | | |
Net decrease (increase) | | | (292,764) | | | $ | (6,947,898) | | | | 127,708 | | | $ | 2,631,228 | |
| | | | | | | | | | | | | | | | |
| | | | |
Total | | | | | | | | | | | | | | | | |
Shares sold | | | 596,331 | | | $ | 13,935,815 | | | | 1,446,344 | | | $ | 31,531,132 | |
Shares issued in reinvestment of dividends and distributions | | | 655,104 | | | | 15,530,430 | | | | 4,358,649 | | | | 82,374,138 | |
Shares redeemed | | | (2,174,320) | | | | (50,541,466) | | | | (5,295,272) | | | | (115,143,001) | |
Redemption fees | | | - | | | | 3,468 | | | | - | | | | 1,250 | |
| | | | | | | | | | | | | | | | |
Net decrease (increase) | | | (922,885) | | | $ | (21,071,753) | | | | 509,721 | | | $ | (1,236,481) | |
| | | | | | | | | | | | | | | | |
5. FEDERAL TAX STATUS
The tax basis of the components of net assets for the Funds at July 31, 2019, are as follows:
| | | | | | | | |
| | | Domini Impact
International
Equity Fund | | | Domini
Impact Equity
Fund | |
Undistributed Ordinary Income | | $ | 34,293,912 | | | $ | 385,594 | |
Undistributed capital gains | | | - | | | | 15,320,007 | |
Unrealized appreciation/(depreciation) | | | 33,899,831 | | | | 128,809,917 | |
Capital losses, other losses and other temporary differences | | | (105,893,243) | | | | - | |
| | | | | | | | |
Distributable net earnings/(deficit) | | $ | (37,699,500) | | | $ | 144,515,518 | |
| | | | | | | | |
The difference between components of Distributable Earnings on a tax basis and the amounts reflected in the statement of assets and liabilities is primarily due to differences in book and tax policies. For the year ended July 31, 2019, the Funds made the following reclassification to the components of net assets to align financial reporting with tax reporting:
| | | | | | | | |
| | | Domini Impact
International
Equity Fund | | | Domini
Impact Equity
Fund | |
Paid-in Capital | | $ | (3) | | | $ | - | |
Undistributed net investment income (loss) | | | 1,574,618 | | | | (59,718) | |
Accumulated Net Realized Gain (Losses) | | | (1,574,615) | | | | 59,718 | |
76
DOMINI IMPACT INTERNATIONAL EQUITY FUND
DOMINI IMPACT EQUITY FUND
NOTES TO FINANCIAL STATEMENTS(continued)
January 31, 2020 (Unaudited)
To the extent that the Funds realize net capital gains in the future, those gains may be offset by any unused net capital loss carryforwards. The Funds are permitted to carry forward a net capital loss from any taxable year that began on or before December 22, 2010 for eight years following the year of the loss. The Funds are permitted to carry forward net capital losses incurred in taxable years beginning after December 22, 2010, for an unlimited time period. Carryforwards of losses from taxable years that began after December 22, 2010, along with any other capital losses deferred and treated as recognized in any such year, are required to be utilized prior to carryforwards of losses incurred in taxable years that began on or before December 22, 2010. As a result of this ordering rule, carryforwards of losses from taxable years that began on or before December 22, 2010 may be more likely to expire unused. Losses from taxable years that begin after December 22, 2010 that are carried forward will retain their character as either short-term or long-term capital losses. As of July 31, 2019, the Domini Impact Equity Fund had a short-term capital loss carryover of $69,035,664 and long-term capital loss carryover of $36,857,579.
For federal income tax purposes, dividends paid were characterized as follows:
| | | | | | | | | | | | | | | | |
| | | Domini Impact
International
Equity Fund | | | Domini
Impact Equity
Fund | |
| | | Year Ended July 31, | | | Year Ended July 31, | |
| | | 2019 | | | 2018 | | | 2019 | | | 2018 | |
| | | | | | | | | | | | | | | | |
Ordinary income | | $ | 25,106,722 | | | $ | 33,891,806 | | | $ | 21,310,037 | | | $ | 12,405,096 | |
Long-term capital gain | | | 36,772,373 | | | | - | | | | 66,953,629 | | | | 54,018,023 | |
| | | | | | | | | | | | | | | | |
Total | | $ | 61,879,095 | | | $ | 33,891,806 | | | $ | 88,263,666 | | | $ | 66,423,119 | |
| | | | | | | | | | | | | | | | |
The Funds are subject to the provisions of Accounting Standards Codification ASC 740 Income Taxes (ASC 740). ASC 740 sets forth a minimum threshold for financial statement recognition of the benefit of a tax position taken or expected to be taken in a tax return. The Funds did not have a liability to record for any unrecognized tax benefits in the accompanying financial statements. No provision has been made for taxes on income, capital gains or unrealized appreciation on securities held or for excise tax on income and capital gains.
77
DOMINI IMPACT INTERNATIONAL EQUITY FUND
DOMINI IMPACT EQUITY FUND
NOTES TO FINANCIAL STATEMENTS(continued)
January 31, 2020 (Unaudited)
6. OTHER RISKS
The Funds’ risks include, but are not limited to, some or all of the risks discussed below:
Market Risk: The market values of securities or other assets will fluctuate, sometimes sharply and unpredictably, due to changes in general market conditions, overall economic trends or events, governmental actions or intervention, market disruptions caused by trade disputes or other factors, political developments, recessions, the spread of infectious illness or other public health issues, investor sentiment and other factors that may or may not be related to the issuer of the security or other asset. If the market values of the securities or other assets held by the Funds fall, including a complete loss on any individual security, the value of your investment will go down. Economies and financial markets throughout the world are increasingly interconnected. Economic, financial or political events, trading or tariff arrangements, terrorism, natural disasters and other circumstances in one country or region could have profound impacts on global economies or markets. As a result, whether or not the Funds invests in securities of issuers located in or with significant exposure to the countries directly affected, the value and liquidity of the Funds’ investments may be negatively affected.
Recent Events Risk: The respiratory illness COVID-19 caused by a novel coronavirus has resulted in a global pandemic and major disruption to economies and markets around the world, including the United States. Financial markets have experienced extreme volatility and severe losses, and trading in many instruments has been disrupted. Liquidity for many instruments has been greatly reduced for periods of time. Some interest rates are very low and in some cases yields are negative. Some sectors of the economy and individual issuers have experienced particularly large losses. These circumstances may continue for an extended period of time, and may continue to affect adversely the value and liquidity of the Funds’ investments. The ultimate economic fallout from the pandemic, and the long-term impact on economies, markets, industries and individual issuers, are not known. Governments and central banks, including the Federal Reserve in the U.S., have taken extraordinary and unprecedented actions to support local and global economies and the financial markets. The impact of these measures, and whether they will be effective to mitigate the economic and market disruption, will not be known for some time.
Impact Investing Risk: The application of the adviser’s environmental and social standards and the timing of the subadviser’s implementation of such standards will affect the Fund’s exposure to certain issuers, industries, sectors,
78
DOMINI IMPACT INTERNATIONAL EQUITY FUND
DOMINI IMPACT EQUITY FUND
NOTES TO FINANCIAL STATEMENTS(continued)
January 31, 2020 (Unaudited)
regions, and countries and may impact the relative financial performance of the Fund — positively or negatively — depending on whether such investments are in or out of favor.
Information Risk: There is a risk that information used by the adviser to evaluate the environmental and social performance of issuers, industries, markets, sectors, and regions may not be readily available, complete, or accurate, which could negatively impact the adviser’s ability to apply its environmental and social standards, which may negatively impact Fund performance. This may also lead the Funds to avoid investment in certain issuers, industries, markets, sectors, or regions.
Foreign Investing and Emerging Markets Risk: Investments in foreign regions may be more volatile and less liquid than U.S. investments due to adverse political, social, and economic developments, such as nationalization or expropriation of assets, confiscatory taxation, terrorism and political or financial instability; regulatory differences, such as accounting, auditing, and financial reporting standards and practices; natural disasters; and the degree of government oversight and supervision. With respect to the Domini Impact International Equity Fund, these risks may be heightened in connection with investments in emerging-market countries.
Portfolio Management Risk: With respect to the Equity Fund, the value of your investment may decrease if the Adviser’s judgment about the attractiveness or value of, or market trends affecting a particular security, industry, sector or region, or about market movements, is incorrect or does not produce the desired results. In addition, the Equity Fund’s investment strategies or policies may change from time to time. Those changes may not lead to the results intended by the Adviser and could have an adverse effect on the value or performance of the Equity Fund.
Style Risk: With respect to the International Fund, the value of your investment may decrease if the subadviser’s quantitative investment approach does not respond well to current market conditions or its judgment regarding the quality, value, or market trends affecting a particular security, industry, sector, or region is incorrect. The subadviser’s quantitative model relies upon a complex software system, and failure of the system to function or the presence of software errors could have an adverse impact on the value of International Fund performance.
79
DOMINI IMPACT BOND FUND
STATEMENT OF ASSETS AND LIABILITIES
January 31, 2020 (Unaudited)
| | | | |
ASSETS | | | | |
Investments, at value (cost $231,575,222) | | $ | 239,641,700 | |
Cash | | | 13,425,339 | |
Foreign currency, at value (cost $12,407) | | | 12,472 | |
Receivable for securities sold | | | 9,506,758 | |
Interest receivable | | | 819,240 | |
Collateral on certain derivative contracts | | | 165,320 | |
Premium received for swap contracts | | | 308,645 | |
Receivable for variation margin swaps | | | 503,227 | |
Receivable for capital shares | | | 1,251,145 | |
Cash held at other banks (cost $58,448) | | | 58,443 | |
Unrealized appreciation on OTC swap contracts | | | 14,584 | |
Unrealized appreciation on forward currency contracts | | | 54,605 | |
| | | | |
Total assets | | | 265,761,478 | |
| | | | |
LIABILITIES | | | | |
Payable for securities purchased | | | 91,357,799 | |
Payable for variation margins swaps | | | 278,307 | |
Payable for capital shares | | | 164,865 | |
Cash due to broker (cost $515,648) | | | 515,567 | |
Management fee payable | | | 82,062 | |
Distribution fee payable | | | 29,811 | |
Other accrued expenses | | | 35,602 | |
Dividend payable | | | 45,623 | |
Payable for variation margins futures | | | 35,185 | |
Unrealized depreciation on forward currency contracts | | | 1,091 | |
Foreign tax payable | | | 295 | |
| | | | |
Total liabilities | | | 92,546,207 | |
| | | | |
NET ASSETS | | $ | 173,215,271 | |
| | | | |
NET ASSETS CONSISTS OF | | | | |
Paid-in capital | | $ | 165,036,757 | |
Total distributable earnings (loss) | | | 8,178,514 | |
| | | | |
NET ASSETS | | $ | 173,215,271 | |
| | | | |
NET ASSET VALUE PER SHARE | | | | |
| |
Investor Shares | | | | |
Net assets | | | 131,294,605 | |
| | | | |
Outstanding shares of beneficial interest | | | 11,142,613 | |
| | | | |
Net asset value and offering price per share* | | $ | 11.78 | |
| | | | |
| |
Institutional Shares | | | | |
Net assets | | | 41,920,666 | |
| | | | |
Outstanding shares of beneficial interest | | | 3,581,441 | |
| | | | |
Net asset value and offering price per share* | | $ | 11.70 | |
| | | | |
* Redemption price is equal to net asset value less any applicable redemption fees retained by the Fund.
SEE NOTES TO FINANCIAL STATEMENTS
80
DOMINI IMPACT BOND FUND
STATEMENT OF OPERATIONS
For the Six Months Ended January 31, 2020 (Unaudited)
| | | | |
INCOME | | | | |
Interest income | | $ | 2,336,146 | |
| | | | |
EXPENSES | | | | |
Management fee | | | 261,791 | |
Administrative fee | | | 203,781 | |
Distribution fees – Investor shares | | | 155,884 | |
Transfer agent fees – Investor shares | | | 99,298 | |
Transfer agent fees – Institutional shares | | | 482 | |
Custody and Accounting fees | | | 70,218 | |
Professional fees | | | 9,529 | |
Registration fees – Investor shares | | | 9,723 | |
Registration fees – Institutional shares | | | 14,216 | |
Shareholder Communication fees | | | 616 | |
Miscellaneous | | | 14,189 | |
Trustees fees | | | 4,143 | |
Shareholder Service fees – Investor shares | | | 5,486 | |
Shareholder Service fees – Institutional shares | | | 41 | |
| | | | |
Total expenses | | | 849,397 | |
Fees waived and expenses reimbursed | | | (197,202) | |
Transfer agent credits | | | (253) | |
| | | | |
Net expenses | | | 651,942 | |
| | | | |
NET INVESTMENT INCOME (LOSS) | | | 1,684,204 | |
| | | | |
REALIZED AND UNREALIZED GAIN (LOSS) FROM INVESTMENTS AND FOREIGN CURRENCY | | | | |
NET REALIZED GAIN (LOSS) FROM | | | | |
Investments | | | 1,411,668 | |
Swap contracts | | | (541,586) | |
Futures contracts | | | (39,158) | |
Forward contracts | | | 55,465 | |
Foreign currency | | | 31,523 | |
| | | | |
Net realized gain (loss) | | | 917,912 | |
| | | | |
NET CHANGES IN UNREALIZED APPRECIATION (DEPRECIATION) FROM | | | | |
Investments | | | 2,942,412 | |
Swap contracts | | | 768,046 | |
Futures contracts | | | (7,482) | |
Forward contracts | | | 53,961 | |
Translation of assets and liabilities in foreign currencies | | | 191 | |
| | | | |
Net change in unrealized appreciation (depreciation) | | | 3,757,128 | |
| | | | |
NET REALIZED AND UNREALIZED GAIN (LOSS) | | | 4,675,040 | |
| | | | |
NET INCREASE (DECREASE) IN NET ASSETS RESULTING FROM OPERATIONS | | $ | 6,359,244 | |
| | | | |
SEE NOTES TO FINANCIAL STATEMENTS
81
DOMINI IMPACT BOND FUND
STATEMENT OF CHANGES IN NET ASSETS
| | | | | | | | |
| | | Six Months
Ended
January 31, 2020
(unaudited) | | | Year Ended
July 31, 2019 | |
INCREASE IN NET ASSETS FROM OPERATIONS | | | | | | | | |
Net investment income (loss) | | $ | 1,684,204 | | | $ | 3,784,465 | |
Net realized gain (loss) | | | 917,912 | | | | 27,122 | |
Net change in unrealized appreciation (depreciation) | | | 3,757,128 | | | | 6,819,008 | |
| | | | | | | | |
Net Increase (Decrease) in Net Assets Resulting from Operations | | | 6,359,244 | | | | 10,630,595 | |
| | | | | | | | |
DISTRIBUTIONS TO SHAREHOLDERS | | | | | | | | |
Investor shares | | | (1,260,368) | | | | (3,063,693) | |
Institutional shares | | | (444,792) | | | | (678,202) | |
Tax return of capital distribution | | | | | | | | |
Investor Shares | | | - | | | | (212,844) | |
Institutional Shares | | | - | | | | (65,315) | |
| | | | | | | | |
Net Decrease in Net Assets from Distributions | | | (1,705,160) | | | | (4,020,054) | |
| | | | | | | | |
CAPITAL SHARE TRANSACTIONS | | | | | | | | |
Proceeds from sale of shares | | | 21,182,398 | | | | 51,634,024 | |
Net asset value of shares issued in reinvestment of distributions and dividends | | | 1,432,906 | | | | 3,641,521 | |
Payments for shares redeemed | | | (12,177,124) | | | | (60,280,384) | |
Redemption fees | | | 2,827 | | | | 1,618 | |
| | | | | | | | |
Net Increase (Decrease) in Net Assets from Capital Share Transactions | | | 10,441,007 | | | | (5,003,221) | |
| | | | | | | | |
Total Increase (Decrease) in Net Assets | | | 15,095,091 | | | | 1,607,320 | |
NET ASSETS | | | | | | | | |
Beginning of period | | $ | 158,120,180 | | | $ | 156,512,860 | |
| | | | | | | | |
End of period | | $ | 173,215,271 | | | $ | 158,120,180 | |
| | | | | | | | |
SEE NOTES TO FINANCIAL STATEMENTS
82
DOMINI IMPACT BOND FUND — INVESTOR SHARES
FINANCIAL HIGHLIGHTS
| | | | | | | | | | | | | | | | | | | | | | | | |
| | | Six Months
Ended
January 31, 2020
(unaudited) | | | Year Ended July 31, | |
| | | 2019 | | | 2018 | | | 2017 | | | 2016 | | | 2015 | |
For a share outstanding for the period: | | | | | | | | | | | | | | | | | | | | | | | | |
Net asset value, beginning of period | | | $11.46 | | | | $10.92 | | | | $11.26 | | | | $11.60 | | | | $11.16 | | | | $11.24 | |
| | | | | | | | | | | | | | | | | | | | | | | | |
Income from investment operations: | | | | | | | | | | | | | | | | | | | | | | | | |
Net investment income (loss) | | | 0.12 | | | | 0.28 | | | | 0.26 | | | | 0.23 | | | | 0.24 | | | | 0.17 | |
Net realized and unrealized gain (loss) on investments | | | 0.32 | | | | 0.55 | | | | (0.33) | | | | (0.29) | | | | 0.50 | | | | (0.07) | |
| | | | | | | | | | | | | | | | | | | | | | | | |
Total income (loss) from investment operations | | | 0.44 | | | | 0.83 | | | | (0.07) | | | | (0.06) | | | | 0.74 | | | | 0.10 | |
| | | | | | | | | | | | | | | | | | | | | | | | |
Less dividends and/or distributions: | | | | | | | | | | | | | | | | | | | | | | | | |
Dividends to shareholders from net investment income | | | (0.12) | | | | (0.27) | | | | (0.26) | | | | (0.23) | | | | (0.24) | | | | (0.17) | |
Distributions to shareholders from net realized gain | | | - | | | | - | | | | (0.01) | | | | (0.05) | | | | (0.06) | | | | (0.01) | |
Tax return of capital 1 | | | - | | | | (0.02) | | | | - | | | | (0.00) | 2 | | | - | | | | - | |
| | | | | | | | | | | | | | | | | | | | | | | | |
Total distributions | | | (0.12) | | | | (0.29) | | | | (0.27) | | | | (0.28) | | | | (0.30) | | | | (0.18) | |
| | | | | | | | | | | | | | | | | | | | | | | | |
Redemption fee proceeds 1 | | | 0.00 | 2 | | | 0.00 | 2 | | | 0.00 | 2 | | | 0.00 | 2 | | | 0.00 | 2 | | | 0.00 | 2 |
| | | | | | | | | | | | | | | | | | | | | | | | |
Net asset value, end of period | | | $11.78 | | | | $11.46 | | | | $10.92 | | | | $11.26 | | | | $11.60 | | | | $11.16 | |
| | | | | | | | | | | | | | | | | | | | | | | | |
Total return 3 | | | 3.83% | | | | 7.77% | | | | -0.74% | | | | -0.32% | | | | 6.73% | | | | 0.89% | |
Portfolio turnover | | | 189% | | | | 319% | | | | 326% | | | | 386% | | | | 297% | | | | 348% | |
Ratios/supplemental data (annualized): | | | | | | | | | | | | | | | | | | | | | | | | |
Net assets, end of period (in millions) | | | $131 | | | | $121 | | | | $144 | | | | $143 | | | | $144 | | | | $129 | |
Ratio of expenses to average net assets | | | 0.87%4,5 | | | | 0.87%4,5 | | | | 0.87%5 | | | | 0.93%5 | | | | 0.93%5 | | | | 0.95%5 | |
Ratio of gross expenses to average net assets | | | 1.12% | | | | 1.20% | | | | 1.14% | | | | 1.16% | | | | 1.19% | | | | 1.24% | |
Ratio of net investment income (loss) to average net assets | | | 2.00% | | | | 2.55% | | | | 2.37% | | | | 2.06% | | | | 2.13% | | | | 1.52% | |
1 Based on average shares outstanding.
2 Amount represents less than $0.005 per share.
3 Not annualized for periods less than one year.
4 Ratio of expenses to average net assets includes transfer agent credits. Excluding transfer agent credits the ratio of expenses to average net assets would have been 0.87% for the year ended July 31, 2019 and 0.87% for the period ended January 31, 2020.
5 Reflects a waiver of fees by the Manager and the Distributor of the Fund.
SEE NOTES TO FINANCIAL STATEMENTS
83
DOMINI IMPACT BOND FUND — INSTITUTIONAL SHARES
FINANCIAL HIGHLIGHTS
| | | | | | | | | | | | | | | | | | | | | | | | |
| | | Six Months
Ended
January 31, 2020
(unaudited) | | | Year Ended July 31, | |
| | | 2019 | | | 2018 | | | 2017 | | | 2016 | | | 2015 | |
For a share outstanding for the period: | | | | | | | | | | | | | | | | | | | | | | | | |
Net asset value, beginning of period | | | $11.38 | | | | $10.89 | | | | $11.23 | | | | $11.57 | | | | $11.14 | | | | $11.23 | |
| | | | | | | | | | | | | | | | | | | | | | | | |
Income from investment operations: | | | | | | | | | | | | | | | | | | | | | | | | |
Net investment income (loss) | | | 0.13 | | | | 0.33 | | | | 0.30 | | | | 0.27 | | | | 0.27 | | | | 0.20 | |
Net realized and unrealized gain (loss) on investments | | | 0.32 | | | | 0.53 | | | | (0.34) | | | | (0.29) | | | | 0.49 | | | | (0.09) | |
| | | | | | | | | | | | | | | | | | | | | | | | |
Total income (loss) from investment operations | | | 0.45 | | | | 0.86 | | | | (0.04) | | | | (0.02) | | | | 0.76 | | | | 0.11 | |
Less dividends and/or distributions: | | | | | | | | | | | | | | | | | | | | | | | | |
Dividends to shareholders from net investment income | | | (0.13) | | | | (0.34) | | | | (0.29) | | | | (0.27) | | | | (0.27) | | | | (0.20) | |
Distributions to shareholders from net realized gain | | | - | | | | - | | | | (0.01) | | | | (0.05) | | | | (0.06) | | | | (0.01) | |
Tax return of capital 1 | | | - | | | | (0.03) | | | | - | | | | (0.00) | 2 | | | - | | | | - | |
| | | | | | | | | | | | | | | | | | | | | | | | |
Total distributions | | | (0.13) | | | | (0.37) | | | | (0.30) | | | | (0.32) | | | | (0.33) | | | | (0.21) | |
| | | | | | | | | | | | | | | | | | | | | | | | |
Redemption fee proceeds 1 | | | 0.00 | 2 | | | 0.00 | 2 | | | 0.00 | 2 | | | 0.00 | 2 | | | 0.00 | 2 | | | 0.01 | |
| | | | | | | | | | | | | | | | | | | | | | | | |
Net asset value, end of period | | | $11.70 | | | | $11.38 | | | | $10.89 | | | | $11.23 | | | | $11.57 | | | | $11.14 | |
| | | | | | | | | | | | | | | | | | | | | | | | |
Total return 3 | | | 4.09% | | | | 8.06% | | | | -0.36% | | | | -0.13% | | | | 6.96% | | | | 1.10% | |
Portfolio turnover | | | 189% | | | | 319% | | | | 326% | | | | 386% | | | | 297% | | | | 348% | |
Ratios/supplemental data (annualized): | | | | | | | | | | | | | | | | | | | | | | | | |
Net assets, end of period (in millions) | | | $42 | | | | $37 | | | | $13 | | | | $6 | | | | $3 | | | | $2 | |
Ratio of expenses to average net assets | | | 0.57%4,5 | | | | 0.57%4,5 | | | | 0.57%5 | | | | 0.62%5 | | | | 0.63%5 | | | | 0.65%5 | |
Ratio of gross expenses to average net assets | | | 0.78% | | | | 0.84% | | | | 1.03% | | | | 1.02% | | | | 1.22% | | | | 1.07% | |
Ratio of net investment income (loss) to average net assets | | | 2.29% | | | | 2.84% | | | | 2.67% | | | | 2.38% | | | | 2.46% | | | | 1.79% | |
1 Based on average shares outstanding.
2 Amount represents less than $0.005 per share.
3 Not annualized for periods less than one year.
4 Ratio of expenses to average net assets includes transfer agent credits. Excluding transfer agent credits the ratio of expenses to average net assets would have been 0.57% for the year ended July 31, 2019 and 0.57% for the period ended January 31, 2020.
5 Reflects a waiver of fees by the Manager of the Fund.
SEE NOTES TO FINANCIAL STATEMENTS
84
DOMINI IMPACT BOND FUND
NOTES TO FINANCIAL STATEMENTS
January 31, 2020 (Unaudited)
1. ORGANIZATION AND SIGNIFICANT ACCOUNTING POLICIES
The Domini Impact Bond Fund (the “Fund”) is a series of the Domini Investment Trust. The Trust is a Massachusetts business trust registered under the Investment Company Act of 1940 as anopen-end management investment company. The Fund is an investment company and accordingly follows the investment company accounting and reporting guidance of the Financial Accounting Standards Board (the “FASB”) Accounting Standard Codification Topic 946 “Financial Services — Investment Companies”. The Fund offers Investor Shares, Institutional Shares and Class Y shares. Institutional shares and Class Y shares were not offered prior to November 30, 2011, and June 15, 2018, respectively. As of January 31, 2020, the Class Y shares of the Bond Fund had not yet commenced operations. Each class of shares is sold at its offering price, which is net asset value. The Institutional shares may only be purchased by or for the benefit of investors that meet the minimum investment requirements, and fall within the following categories: endowments, foundations, religious organizations and other nonprofit entities, individuals, retirement plan sponsors, family office clients, certain corporate or similar institutions, or omnibus accounts maintained by financial intermediaries and that are approved by the Fund’s Distributor. Class Y shares may only be purchased through omnibus accounts held on the books of the Fund for financial intermediaries that have been approved by the Funds’ distributor. Each class of shares has identical rights and voting privileges with respect to the Fund in general and exclusive voting rights on matters that affect that class alone. Earnings, net assets, and net asset value per share may differ due to each class having its own expenses, such as transfer and shareholder servicing agent fees and registration fees, directly attributable to that class. Institutional shares are not subject to distribution fees. The Fund seeks to provide its shareholders with a high level of current income and total return by investing in bonds and other debt instruments that are consistent with the Fund’s social and environmental standards and the submanager’s security selection approach.
The preparation of financial statements in conformity with U.S. generally accepted accounting principles requires management to make estimates and assumptions that affect the reported amounts of assets and liabilities and disclosure of contingent liabilities at the date of the financial statements and the reported amounts of revenues and expenses during the reporting period. Actual results could differ from those estimates. The following is a summary of the Fund’s significant accounting policies.
85
DOMINI IMPACT BOND FUND
NOTES TO FINANCIAL STATEMENTS(continued)
January 31, 2020 (Unaudited)
(A) Valuation of Investments. Bonds and other fixed-income securities (other than obligations with maturities of 60 days or less) are valued on the basis of valuations furnished by an independent pricing service, use of which has been approved by the Board of Trustees of the Fund. In making such valuations, the pricing service utilizes both dealer-supplied valuations and electronic data processing techniques that take into account appropriate factors such asinstitutional-size trading in similar groups of securities, yield, quality, coupon rate, maturity, type of issue, trading characteristics, and other market data, without exclusive reliance upon quoted prices or exchange orover-the-counter prices, since such valuations are believed to reflect more accurately the fair value of such securities. Short-term obligations of sufficient credit quality (maturing in 60 days or less) are valued at amortized cost, which constitutes fair value as determined by the Board of Trustees of the Fund. Securities (other than short-term obligations with remaining maturities of 60 days or less) for which there are no such quotations or valuations are valued at fair value as determined in good faith by or at the direction of the Fund’s Board of Trustees.
The Fund follows a fair value hierarchy that distinguishes between (a) market participant assumptions developed based on market data obtained from sources independent of the reporting entity (observable inputs) and (b) the Fund’s own assumptions about market participant assumptions developed based on the best information available in the circumstances (unobservable inputs). These inputs are used in determining the value of the Fund’s investments and are summarized in the following fair value hierarchy:
Level 1 — quoted prices in active markets for identical securities
Level 2 — other significant observable inputs (including quoted prices for similar securities, interest rates, and evaluated quotation obtained from pricing services)
Level 3 — significant unobservable inputs (including the Fund’s own assumptions in determining the fair value of investments). The inputs or methodology used for valuing securities are not an indication of the risk associated with investing in those securities.
86
DOMINI IMPACT BOND FUND
NOTES TO FINANCIAL STATEMENTS(continued)
January 31, 2020 (Unaudited)
The following is a summary of the inputs used, as of January 31, 2020, in valuing the Fund’s assets carried at fair value:
| | | | | | | | | | | | | | | | |
| | | Level 1 -
Quoted Prices | | | Level 2 -
Other
Significant
Observable
Inputs | | | Level 3 -
Significant
Unobservable
Inputs | | | Total | |
| | | | | | | | | | | | | | | | |
Assets: | | | | | | | | | | | | | | | | |
| | | | |
Long Term Investments in Securities: | | | | | | | | | | | | | | | | |
Mortgage Backed Securities | | $ | - | | | $ | 115,241,213 | | | $ | - | | | $ | 115,241,213 | |
Corporate Bonds and Notes | | | - | | | | 44,643,351 | | | | - | | | | 44,643,351 | |
Municipal Bonds | | | - | | | | 14,614,022 | | | | - | | | | 14,614,022 | |
U.S. Government Agency Obligations | | | - | | | | 10,091,340 | | | | - | | | | 10,091,340 | |
Foreign Government & Agency Securities | | | - | | | | 7,756,286 | | | | - | | | | 7,756,286 | |
Senior Floating Rate Interests | | | - | | | | 4,976,848 | | | | - | | | | 4,976,848 | |
Asset Backed Securities | | | - | | | | 1,369,226 | | | | - | | | | 1,369,226 | |
Certificates of Deposit | | | - | | | | 508,290 | | | | - | | | | 508,290 | |
| | | | | | | | | | | | | | | | |
Total Long Term Investments | | $ | - | | | $ | 199,200,576 | | | $ | - | | | $ | 199,200,576 | |
| | | | | | | | | | | | | | | | |
| | | | |
Short Term Investments in Securities: | | | | | | | | | | | | | | | | |
U.S. Government Agency Obligations | | | - | | | | 40,441,124 | | | | - | | | | 40,441,124 | |
| | | | | | | | | | | | | | | | |
Total Short Term Investments | | $ | - | | | $ | 40,441,124 | | | $ | - | | | $ | 40,441,124 | |
| | | | | | | | | | | | | | | | |
Total Investment in Securities | | $ | - | | | $ | 239,641,700 | | | $ | - | | | $ | 239,641,700 | |
| | | | | | | | | | | | | | | | |
| | | | |
Other Financial Instruments: | | | | | | | | | | | | | | | | |
Forward Currency Contracts- | | | - | | | | 54,605 | | | | - | | | | 54,605 | |
Credit Default Swap - CCP | | | - | | | | 1,840 | | | | - | | | | 1,840 | |
Interest Rate Swap - CCP | | | - | | | | 360,083 | | | | - | | | | 360,083 | |
Interest Rate Swap - OTC | | | - | | | | 14,584 | | | | - | | | | 14,584 | |
| | | | | | | | | | | | | | | | |
Total Other Financial Instruments | | $ | - | | | $ | 431,112 | | | $ | - | | | $ | 431,112 | |
| | | | | | | | | | | | | | | | |
Liabilities: | | | | | | | | | | | | | | | | |
| | | | |
Other Financial Instruments: | | | | | | | | | | | | | | | | |
Forward Currency Contracts | | | - | | | | (1,091) | | | | - | | | | (1,091) | |
Futures | | | - | | | | (35,197) | | | | - | | | | (35,197) | |
Interest Rate Swap - CCP | | | - | | | | (202,013) | | | | - | | | | (202,013) | |
| | | | | | | | | | | | | | | | |
Total Other Financial Instruments | | $ | - | | | $ | (238,301) | | | $ | - | | | $ | (238,301) | |
| | | | | | | | | | | | | | | | |
(B) Foreign Currency Translation. Securities and other assets and liabilities denominated in foreign currencies are translated into U.S. dollar amounts on the date of valuation. Purchases and sales of securities, and income and expense items denominated in foreign currencies, are translated into U.S. dollar amounts
87
DOMINI IMPACT BOND FUND
NOTES TO FINANCIAL STATEMENTS(continued)
January 31, 2020 (Unaudited)
on the respective dates of such transactions. Occasionally, events impact the availability or reliability of foreign exchange rates used to convert the U.S. dollar equivalent value. If such an event occurs, the foreign exchange rate will be valued at fair value using procedures established and approved by the Board of Trustees. The Funds do not separately report the effect of fluctuations in foreign exchange rates from changes in market prices on securities held. Such fluctuations are included with the net realized and unrealized gain or loss from investments. Realized foreign exchange gains or losses arise from sales of foreign currencies, currency gains or losses realized between the trade and settlement dates on securities transactions, and the difference between the recorded amounts of dividends, interest, and foreign withholding taxes and the U.S. dollar equivalent of the amounts actually received or paid. Net unrealized foreign exchange gains and losses arise from changes in fair value of assets and liabilities other than investments in securities held at the end of the reporting period, resulting from changes in exchange rates.
(C) Foreign Currency Contracts. When the Funds purchase or sell foreign securities they enter into foreign exchange contracts to minimize foreign exchange risk from the trade date to the settlement date of the transactions. A foreign exchange contract is an agreement between two parties to exchange different currencies at an agreed-upon exchange rate on a specified date. The Fund had no outstanding open foreign currency spot contracts as of January 31, 2020.
(D) Securities Purchased on a When-Issued or Delayed Delivery Basis. The Fund may invest in when-issued or delayed delivery securities where the price of the security is fixed at the time of the commitment but delivery and payment take place beyond customary settlement time. These securities are subject to market fluctuation, and no interest accrues on the security to the purchaser during this period. The payment obligation and the interest rate that will be received on the securities are each fixed at the time the purchaser enters into the commitment. Purchasing obligations on a when-issued or delayed delivery basis is a form of leveraging and can involve a risk that the yields available in the market when the delivery takes place may be higher than those obtained in the transaction, which could result in an unrealized loss at the time of delivery. The Fund establishes a segregated account consisting of liquid securities equal to the amount of the commitments to purchase securities on such basis.
(E) TBA Purchase and Forward Sale Commitments. The Fund may enter into TBA commitments to purchase or sell securities for a fixed price at a future date. TBA commitments are considered securities in themselves and involve a
88
DOMINI IMPACT BOND FUND
NOTES TO FINANCIAL STATEMENTS(continued)
January 31, 2020 (Unaudited)
risk of loss if the value of the security to be purchase or sold declines or increases prior to the settlement date, which is in addition to the risk of decline in the value of the Fund’s other assets.
(F) Derivative Financial Instruments. The Fund may invest in derivatives in order to hedge market risks, or to seek to increase the Fund’s income or gain. Derivatives in certain circumstances may require that the Fund segregate cash or other liquid assets to the extent the Fund’s obligations are not otherwise covered through ownership of the underlying security, financial instrument, or currency. Derivatives involve special risks, including possible default by the other party to the transaction, illiquidity, and the risk that the use of derivatives could result in greater losses than if it had not been used. Some derivative transactions, including options, swaps, forward contracts, and options on foreign currencies, are entered into directly by the counterparties or through financial institutions acting as market makers (OTC derivatives), rather than being traded on exchanges or in markets registered with the Commodity Futures Trading Commission or the SEC.
(G) Option Contracts. The Fund may purchase or write option contracts primarily to manage and/or gain exposure to interest rate, foreign exchange rate and credit risk. An option is a contract entitling the holder to purchase or sell a specific number of shares or units of an asset or notional amount of a swap (swaption), at a specified price. Options purchased are recorded as an asset while options written are recorded as a liability. Upon exercise of an option, the acquisition cost or sales proceeds of the underlying investment is adjusted by any premium received or paid. Upon expiration of an option, any premium received or paid is recorded as a realized gain or loss. Upon closing an option other than through expiration or exercise, the difference between the premium and the cost to close the position is recorded as a realized gain or loss. The Fund had no purchased option contracts outstanding as of January 31, 2020.
(H) Futures Contracts. The Fund may purchase and sell futures contracts based on various securities, securities indexes, and other financial instruments and indexes. The Fund intends to use futures contracts for hedging purposes. Futures contracts provide for the future sale by one party and purchase by another party of a specified amount of a specified security or financial instrument at a specified future time and at a specified price. When the Fund purchases or sells a futures contract, the Fund must allocate certain of its assets as an initial deposit on the contract. The futures contract is marked to market daily thereafter, and the Fund may be required to pay or entitled to receive
89
DOMINI IMPACT BOND FUND
NOTES TO FINANCIAL STATEMENTS(continued)
January 31, 2020 (Unaudited)
additional “variation margin,” based on decrease or increase in the value of the futures contract. Future contracts outstanding at January 31, 2020 are listed in the Fund’s Portfolio of Investments.
(I) Forward Currency Contracts. The Fund may enter into forward currency contracts with counterparties to hedge the value of portfolio securities denominated in particular currencies against fluctuations in relative value or to generate income or gain. These contracts are used to hedge foreign exchange risk and to gain exposure on currency. The U.S. dollar value of forward currency contracts is determined using current forward exchange rates supplied by a quotation service. The fair value of the contract will fluctuate with changes in currency exchange rates. The contract is marked to market daily and the change in fair value is recorded as an unrealized gain or loss. The Fund records a realized gain or loss equal to the difference between the value of the contract at the time it was opened and the value at the time it was closed when the contract matures or by delivery of the currency. The Fund could be exposed to risk if the value of the currency changes unfavorably, if the counterparties to the contracts are unable to meet the terms of their contracts or if the Fund is unable to enter into a closing position. Risk may exceed amounts recognized on the Statement of Assets and Liabilities. Forward currency contracts outstanding at January 31, 2020 are listed in the Fund’s Portfolio of Investments.
(J) Interest Rate Swap Contracts. The Fund may enter into interest rate swap contracts to hedge interest rate risk. An interest rate swap is an agreement between the Fund and a counterparty to exchange cash flows based on the difference between two interest rates, applied to a notional amount. Interest rate swap contracts are marked to market daily based upon quotations from an independent pricing service or market maker. Any change on an OTC interest rate swap is recorded as an unrealized gain or loss on the Statement of Assets and Liabilities. Daily fluctuations in the value of centrally cleared interest rate swaps are settled though a central clearing agent and are recorded in variation margin on the Statement of Assets and Liabilities and recorded as unrealized gain or loss. OTC and centrally cleared interest rate swap contracts outstanding at January 31, 2020, are listed in the Fund’s Portfolio of Investments.
(K) Credit Default Swap Contracts. The Fund may enter into credit default swap contracts primarily to manage and/or gain exposure to credit risk. A credit default swap is an agreement between the fund and a counterparty whereby the buyer of the contract receives credit protection and the seller of the contract guarantees the credit worthiness of a referenced debt obligation. These agreements may be privately negotiated in theover-the-counter market (“OTC credit default swaps”) or may be executed in a multilateral trade facility
90
DOMINI IMPACT BOND FUND
NOTES TO FINANCIAL STATEMENTS(continued)
January 31, 2020 (Unaudited)
platform, such as a registered exchange (“centrally cleared credit default swaps”). The underlying referenced debt obligation may be a single issuer of corporate or sovereign debt, a credit index, or a tranche of a credit index. In the event of a default of the underlying referenced debt obligation, the buyer is entitled to receive the notional amount of the credit default swap contract from the seller in exchange for the referenced debt obligation, a net settlement amount equal to the notional amount of the credit default swap less the recovery value of the referenced debt obligation, or other agreed upon amount. For centrally cleared credit default swaps, required initial margins are pledged by the fund, and the daily change in fair value is accounted for as a variation margin payable or receivable on the Statements of Assets and Liabilities. Over the term of the contract, the buyer pays the seller a periodic stream of payments, provided that no event of default has occurred. Such periodic payments are accrued daily as an unrealized appreciation or depreciation until the payments are made, at which time they are realized. Payments received or paid to initiate a credit default swap contract are reflected on the Statements of Assets and Liabilities and represent compensating factors between stated terms of the credit default swap agreement and prevailing market conditions (credit spreads and other relevant factors). These upfront payments are amortized over the term of the contract as a realized gain or loss on the Statements of Operations. OTC and centrally cleared credit default swap contracts outstanding at January 31, 2020 are listed in the Fund’s Portfolio of Investments.
(L) Master Agreements. The Fund is a party to ISDA (International Swaps and Derivatives Association, Inc.) Master Agreements that govern OTC derivative and foreign exchange contracts (Master Agreements) with certain counterparties entered into from time to time. The Master Agreements may contain provisions regarding, among other things, the parties’ general obligations, representations, agreements, collateral requirements, events of default and early termination. With respect to certain counterparties, in accordance with the terms of the Master Agreements, collateral posted to the Fund is held in a segregated account by the Fund’s custodian and with respect to those amounts which can be sold or repledged, are presented in the Fund’s portfolio. Collateral pledged by the Fund is segregated by the Fund’s custodian and identified in the Fund’s portfolio. Collateral can be in the form of cash or other marketable securities as agreed to by the Fund and the applicable counterparty. Collateral requirements are determined based on the Fund’s net position with each counterparty.
With respect to ISDA Master Agreements, termination events applicable to the counterparty include certain deteriorations in the credit quality of the
91
DOMINI IMPACT BOND FUND
NOTES TO FINANCIAL STATEMENTS(continued)
January 31, 2020 (Unaudited)
counterparty. Termination events applicable to the Fund include failure of the Fund to maintain certain net asset levels and/or limit the decline in net assets over various periods of time. In the event of default or early termination, the ISDA Master Agreement gives thenon-defaulting party the right to net andclose-out all transactions traded, whether or not arising under the ISDA agreement, to one net amount payable by one counterparty to the other. However, absent an event of default or early termination, OTC derivative assets and liabilities are presented gross and not offset in the Statements of Assets and Liabilities. Early termination by the counterparty may result in an immediate payment by the Fund of any net liability owed to that counterparty under the ISDA agreement.
In a centrally cleared swap, while the Fund enters into an agreement with a clearing broker to execute contracts with a counterparty, the performance of the swap is guaranteed by the central clearinghouse, which reduces the Fund’s exposure to counterparty risk. The Fund is still exposed to the counterparty risk through the clearing broker and clearinghouse. The clearinghouse attempts to minimize this risk to its participants through the use of mandatory margin requirements, daily cash settlements and other procedures. Likewise, the clearing broker reduces its risk through margin requirements and required segregation of customer balances.
(M) Investment Transactions, Investment Income, and Dividends to Shareholders. Investment transactions are accounted for on trade date. Realized gains and losses from security transactions are determined on the basis of identified cost. Interest income is recorded on an accrual basis. The Fund earns income daily, net of Fund expenses. Dividends to shareholders are usually declared daily and paid monthly from net investment income. Distributions to shareholders of realized capital gains, if any, are made annually. Distributions are determined in conformity with income tax regulations, which may differ from generally accepted accounting principles. Reclassifications have been made to the Fund’s components of net assets to reflect income and gains available for distribution (or available capital loss carryovers, as applicable) under income tax regulations.
(N) Federal Taxes. The Fund’s policy is to comply with the provisions of the Internal Revenue Code applicable to regulated investment companies and to distribute substantially all of its taxable income, including net realized gains, if any, within the prescribed time periods. Accordingly, no provision for federal income or excise tax is deemed necessary. As of January 31, 2020, tax years
92
DOMINI IMPACT BOND FUND
NOTES TO FINANCIAL STATEMENTS(continued)
January 31, 2020 (Unaudited)
2016 through 2019 remain subject to examination by the Fund’s major tax jurisdictions, which include the United States of America, the Commonwealth of Massachusetts, and New York State.
(O) Redemption Fees. Redemptions and exchanges of Fund shares held less than 30 days may be subject to the Fund’s redemption fee, which is 2% of the amount redeemed. The fee is imposed to offset transaction costs and other expenses associated with short-term investing. The fee may be waived in certain circumstances at the discretion of the Fund. Such fees are retained by the Fund and are recorded as an adjustment topaid-in capital.
(P) Other. Income, expenses (other than those attributable to a specific class), gains, and losses are allocated on a daily basis to each class of shares based upon the relative proportion of net assets represented by such class. Operating expenses directly attributable to a specific class are charged against the operations of that class.
(Q) Transfer Agent Credits. Per the arrangement with the Fund’s transfer agent, BNY Mellon Investment Servicing (U.S.) Inc., the Fund has arrangements whereby it may receive earnings credits when positive cash balances are maintained, which are used to offset transfer agent fees. For financial reporting purposes, the Fund includes earnings credits as an expense offset in the Statement of Operations. For the six months ended January 31, 2020, transfer agent fees of the Fund, under these arrangements, were reduced as follows:
| | | | |
Domini Impact Bond Fund Investor Shares | | $ | 251 | |
| |
Domini Impact Bond Fund Institutional Shares | | $ | 2 | |
(R) Indemnification. The Fund’s organizational documents provide current and former trustees and officers with a limited indemnification against liabilities arising in connection with the performance of their duties to the Fund. In the normal course of business, the Fund may also enter into contracts that provide general indemnifications. The Fund’s maximum exposure under these arrangements is unknown as this would be dependent on future claims that may be made against the Fund. The risk of material loss from such claims is considered remote.
2. TRANSACTIONS WITH AFFILIATES
(A) Manager/Administrator. The Fund has retained Domini Impact Investments LLC (Domini) to serve as investment manager and administrator. The services provided by Domini consist of investment supervisory services, overall operational support, and administrative services, including the provision of
93
DOMINI IMPACT BOND FUND
NOTES TO FINANCIAL STATEMENTS(continued)
January 31, 2020 (Unaudited)
general office facilities and supervising the overall administration of the Fund. For its services under the Management Agreement, Domini receives from the Fund a fee accrued daily and paid monthly at the annual rate below of the Fund’s average daily net assets before any fee waivers:
| | |
| (prior to May 1, 2017) | | 0.40% of the first $500 million of net assets managed, |
| | 0.38% of the next $500 million of net assets managed, and |
| | 0.35% of net assets managed in excess of $1 billion |
| | |
| (effective May 1, 2017) | | 0.33% of the first $50 million of net assets managed, |
| | 0.32% of the next $50 million of net assets managed, and |
| | 0.315% of net assets managed in excess of $100 million |
For its services under the Administration Agreement, Domini receives from the Fund a fee accrued daily and paid monthly at an annual rate equal to 0.25% of the Fund’s average daily net assets.
Effective November 29, 2019, Domini has contractually agreed to reduce its fees and/or reimburse certain ordinary operating expenses (excluding brokerage fees and commissions, interest, taxes, and other extraordinary expenses) in order to limit Investor, Institutional, and Class Y share expenses of the Fund to 0.87%, 0.57%, and 0.65%, respectively, until November 30, 2020, absent an earlier modification by the Board of Trustees which oversee the Fund. Domini agreed to reduce its fees and reimburse expenses to keep aggregate annual operating expenses (excluding brokerage fees and commission, interest, taxes, and other extraordinary expenses), at no greater than 0.65% of the average daily net assets of the Class Y shares of the Fund, until November 30, 2019, absent an earlier modification by the Fund’s Board. Effective November 30, 2017, Domini agreed to reduce its fees and reimburse expenses to keep the aggregate annual operating expenses (excluding brokerage fees and commissions, interest, taxes, and other extraordinary expenses), at no greater than 0.87% and 0.57% of the average daily net assets of the Investor and Institutional shares of the Fund, respectively. For periods prior to November 30, 2017, Domini contractually agreed to reduce its fees and reimburse expenses to keep the aggregate annual operating expenses (excluding brokerage fees and commissions, interest, taxes, and other extraordinary expenses), at no greater than 0.95% and 0.65% of the average daily net assets of the Investor and Institutional shares of the Fund, respectively. For the six months ended January 31, 2020, Domini reimbursed expenses totaling $113,916.
Fees waived and/or expenses reimbursed under the Expense Limitation Agreement are only recoverable by Domini and/or its affiliates in the current
94
DOMINI IMPACT BOND FUND
NOTES TO FINANCIAL STATEMENTS(continued)
January 31, 2020 (Unaudited)
fiscal year to the extent actual Fund expenses are less than the contractual expense cap during such year.
As of January 31, 2020, Domini owned less than 1% of any class of the outstanding Shares of the Fund.
(B) Submanager. Domini, and not the Domini Impact Bond Fund (Bond Fund), pays a portion of the management fee it receives from the Fund to the submanager as compensation for subadvisory services to the Fund.
Wellington Management Company LLP (Wellington Management), a Delaware limited liability partnership, provides investment submanagement services to the Bond Fund on a day-to-day basis pursuant to a Submanagement Agreement with Domini. For its services under the Submanagement Agreement, Wellington Management receives: 0.20% on the first $500 million of net assets managed and 0.18% on the net assets managed in excess of $500 million. For the six months ended January 31, 2020, Domini paid Wellington Management $163,024.
(C) Distributor. The Board of Trustees of the Fund has adopted a Distribution Plan in accordance with Rule12b-1 under the Act. DSIL Investment Services LLC, a wholly owned subsidiary of Domini (DSIL), acts as agent of the Fund in connection with the offering of shares of the Fund pursuant to a Distribution Agreement. Under the Distribution Plan, the Fund pays expenses incurred in connection with the sale of Investor shares and pays DSIL a distribution fee at an aggregate annual rate not to exceed 0.25% of the average daily net assets representing the Investor shares. For the six months ended January 31, 2020, fees waived by the Investor shares totaled $83,245.
(D) Shareholder Service Agent. The Trust has retained Domini to provide certain shareholder services to the Fund and its shareholders, which services were previously provided by BNY Asset Servicing (“BNY”) or another fulfillment and mail service provider and are supplemental to services currently provided by BNY, pursuant to a transfer agency agreement between the Fund and BNY. For these services, Domini receives a fee from the Fund paid monthly at an annual rate of $4.00 per active account. For the six months ended January 31, 2020, Domini waived fees as follows:
| | | | |
| | | FEES WAIVED | |
| | | | |
Domini Impact Bond Fund Investor Shares | | $ | - | |
Domini Impact Bond Fund Institutional Shares | | | 41 | |
95
DOMINI IMPACT BOND FUND
NOTES TO FINANCIAL STATEMENTS(continued)
January 31, 2020 (Unaudited)
(E) Trustees and Officers. Each of the Independent Trustees received an annual retainer for serving as a Trustee of the Trust of $28,000. The Lead Independent Trustee and Chair of the Audit Committee receive an additional chairperson fee of $5,000. Each Independent Trustee also receives $2,500 for attendance at each meeting of the Board of the Trust (reduced to $1,000 in the event that a Trustee participates at anin-person meeting by telephone). In addition, each Trustee receives reimbursement for reasonable expenses incurred in attending meetings. These expenses are allocated on apro-rata basis to each shares class of a Fund according to their respective net assets.
As of January 31, 2020, all Trustees and officers of the Trust as a group owned less than 1% of the Fund’s outstanding shares.
3. INVESTMENT TRANSACTIONS
For the six months ended January 31, 2020, cost of purchase and proceeds from sales of investments other than short-term obligations were as follows:
| | | | | | | | |
| | | PURCHASES | | | SALES | |
U.S. Government Securities | | $ | 350,507,167 | | | $ | 331,091,670 | |
Investments in Securities | | | 8,379,616 | | | | 7,735,088 | |
4. SHARES OF BENEFICIAL INTEREST
At January 31, 2020, there was an unlimited number of shares authorized ($0.00001 par value). Transactions in the Funds’ shares were as follows:
| | | | | | | | | | | | | | | | |
| | | Six Months Ended
January 31, 2020
(unaudited) | | | Year Ended
July 31, 2019 | |
| | | Shares | | | Amount | | | Shares | | | Amount | |
| | | | | | | | | | | | | | | | |
| | | | |
Investor Shares | | | | | | | | | | | | | | | | |
Shares sold | | | 1,319,976 | | | $ | 15,341,890 | | | | 1,920,264 | | | $ | 21,154,970 | |
Shares issued in reinvestment of dividends and distributions | | | 103,600 | | | | 1,208,653 | | | | 284,558 | | | | 3,141,224 | |
Shares redeemed | | | (842,025) | | | | (9,793,775) | | | | (4,830,641) | | | | (52,541,300) | |
Redemption fees | | | - | | | | 2,804 | | | | - | | | | 1,403 | |
| | | | | | | | | | | | | | | | |
Net increase (decrease) | | | 581,551 | | | $ | 6,759,572 | | | | (2,625,819) | | | $ | (28,243,703) | |
| | | | | | | | | | | | | | | | |
| | | | |
Institutional Shares | | | | | | | | | | | | | | | | |
Shares sold | | | 504,625 | | | $ | 5,840,508 | | | | 2,776,997 | | | $ | 30,479,054 | |
Shares issued in reinvestment of dividends and distributions | | | 19,351 | | | | 224,253 | | | | 45,513 | | | | 500,297 | |
Shares redeemed | | | (205,651) | | | | (2,383,349) | | | | (711,155) | | | | (7,739,084) | |
Redemption fees | | | - | | | | 23 | | | | - | | | | 215 | |
| | | | | | | | | | | | | | | | |
Net increase | | | 318,325 | | | $ | 3,681,435 | | | | 2,111,355 | | | $ | 23,240,482 | |
| | | | | | | | | | | | | | | | |
96
DOMINI IMPACT BOND FUND
NOTES TO FINANCIAL STATEMENTS(continued)
January 31, 2020 (Unaudited)
| | | | | | | | | | | | | | | | |
| | | Six Months Ended
January 31, 2020
(unaudited) | | | Year Ended
July 31, 2019 | |
| | | Shares | | | Amount | | | Shares | | | Amount | |
| | | | | | | | | | | | | | | | |
| | | | |
Total | | | | | | | | | | | | | | | | |
Shares sold | | | 1,824,601 | | | $ | 21,182,398 | | | | 4,697,261 | | | $ | 51,634,024 | |
Shares issued in reinvestment of dividends and distributions | | | 122,951 | | | | 1,432,906 | | | | 330,071 | | | | 3,641,521 | |
Shares redeemed | | | (1,047,676) | | | | (12,177,124) | | | | (5,541,796) | | | | (60,280,384) | |
Redemption fees | | | - | | | | 2,827 | | | | - | | | | 1,618 | |
| | | | | | | | | | | | | | | | |
Net increase (decrease) | | | 899,876 | | | $ | 10,441,007 | | | | (514,464) | | | $ | (5,003,221) | |
| | | | | | | | | | | | | | | | |
5. SUMMARY OF DERIVATIVE ACTIVITY
At January 31, 2020, the Fund’s investments in derivative contracts are reflected on the Statement of Assets and Liabilities as follows:
| | | | | | | | | | | | |
| | | Asset Derivatives | | | Liability Derivatives | |
Derivative Contracts Not
Accounted for as
Hedging Instruments | | Statement of Assets
and Liabilities Location | | Fair Value | | | Statement of Assets
and Liabilities Location | | Fair Value | |
Interest rate contracts | | Variation Margin swaps / Unrealized appreciation on OTC swap contracts / Net assets consist of - Total distributable earnings | | $ | 515,971 | | | Variation Margin swaps / Unrealized depreciation on OTC swap contracts / Net assets consist of - Total distributable earnings | | | 275,142 | |
| | | | | | | | | | | | |
Credit contracts | | Variation Margin swaps / Net assets consist of - Total distributable earnings | | | 1,840 | | | Variation Margin swaps / Net assets consist of - Total distributable earnings | | | 3,165 | |
| | | | | | | | | | | | |
Forward currency contracts | | Unrealized appreciation on forward currency contracts / Net assets consist of - Total distributable earnings | | | 54,605 | | | Unrealized depreciation on forward currency contracts / Net assets consist of - Total distributable earnings | | | 1,091 | |
| | | | | | | | | | | | |
Futures contracts | | Variation margin futures / Net assets consist of - Total distributable earnings | | | - | | | Variation margin futures / Net assets consist of - Total distributable earnings | | | 35,185 | |
| | | | | | | | | | | | |
Total | | $ | 572,416 | | | | | $ | 314,583 | |
| | | | | | | | | | | | |
97
DOMINI IMPACT BOND FUND
NOTES TO FINANCIAL STATEMENTS(continued)
January 31, 2020 (Unaudited)
For the six months ended January 31, 2020, the effect of derivative contracts on the Fund’s Statement of Operations was as follows:
| | | | | | | | | | |
Derivative Contracts Not
Accounted for as Hedging
Instruments | | Statement of Operations
Location | | Realized Gain
(Loss) | | | Change in Unrealized
Appreciation
(Depreciation) | |
Interest rate contracts | | Net realized gain (loss) from swap contracts/ Net change in unrealized appreciation (depreciation) from swap contracts | | $ | (563,128 | ) | | | 755,810 | |
| | | | | | | | | | |
Credit contracts | | Net realized gain (loss) from swap contracts/ Net change in unrealized appreciation (depreciation) from swap contracts | | | 21,542 | | | | 12,236 | |
| | | | | | | | | | |
Forward currency contracts | | Net realized gain (loss) from forward contracts/ Net change in unrealized appreciation (depreciation) from forward contracts | | | 55,465 | | | | 53,961 | |
| | | | | | | | | | |
Futures contracts | | Net realized gain (loss) from future contracts/ Net change in unrealized appreciation (depreciation) from future contracts | | | (39,158 | ) | | | (7,482 | ) |
| | | | | | | | | | |
| | | | | | | | | | |
Total | | $ | (525,279 | ) | | $ | 814,525 | |
| | | | | | | | | | |
The average notional cost of futures contracts and average notional amounts of other derivative contracts outstanding during the six months ended January 31, 2020, which are indicative of the volume of these derivative types, were approximately as follows:
| | | | |
Futures contracts (notional) | | | 2,621,975 | |
Forward currency contracts (contract amount) | | $ | 7,919,603 | |
OTC interest rate swap contracts (notional) | | $ | 4,372,429 | |
Centrally cleared interest rate swap contracts (notional) | | $ | 43,116,143 | |
Centrally cleared credit default contracts (notional) | | $ | 471,207 | |
The average notional amount for forward foreign currency exchange contracts is based on the absolute value of notional amounts of currency purchased and currency sold.
98
DOMINI IMPACT BOND FUND
NOTES TO FINANCIAL STATEMENTS(continued)
January 31, 2020 (Unaudited)
6. OFFSETTING OF FINANCIAL AND DERIVATIVE ASSETS AND LIABILITIES
The following table summarizes any derivatives, at the end of the reporting period, that are subject to a master netting agreement or similar agreement. For financial reporting purposes, the Fund does not offset assets and liabilities that are subject to the master netting agreements in the Statement of Assets and Liabilities.
| | | | | | | | | | | | | | | | | | | | | | | | |
Counterparty | | Derivative Assets
Subject to
Master Netting
Agreement | | | Derivatives
Available
for Offset | | | Non-cash
Collateral
Received | | | Cash
Collateral
Received | | | Net Amount
of Derivative
Assets | | | Total Cash
Collateral
Received | |
Deutsche Bank AG | | $ | 14,584 | | | $ | - | | | $ | - | | | $ | - | | | $ | 14,584 | | | $ | - | |
JPMorgan Chase Bank N.A. | | | 43,383 | | | | - | | | | - | | | | - | | | | 43,383 | | | | - | |
| | | | | | | | | | | | | | | | | | | | | | | | |
| | $ | 57,967 | | | $ | - | | | $ | - | | | $ | - | | | $ | 57,967 | | | $ | - | |
| | | | | | | | | | | | | | | | | | | | | | | | |
| | | | | | | | | | | | | | | | | | | | | | | | |
Counterparty | | Derivative Liabilities
Subject to
Master Netting
Agreement | | | Derivatives
Available
for Offset | | | Non-cash
Collateral
Pledged | | | Cash
Collateral
Pledged | | | Net Amount
of Derivative
Liabilities | | | Total Cash
Collateral
Pledged | |
Deutsche Bank AG | | $ | - | | | $ | - | | | $ | - | | | $ | - | | | $ | - | | | $ | - | |
JPMorgan Chase Bank N.A. | | | - | | | | - | | | | - | | | | - | | | | - | | | | - | |
| | | | | | | | | | | | | | | | | | | | | | | | |
| | $ | - | | | $ | - | | | $ | - | | | $ | - | | | $ | - | | | $ | - | |
| | | | | | | | | | | | | | | | | | | | | | | | |
7. FEDERAL TAX STATUS
The tax basis of the components of net assets at July 31, 2019, is as follows:
| | | | |
Unrealized appreciation/(depreciation) | | $ | 4,446,174 | |
Capital losses, other losses and other temporary differences | | | (921,744) | |
| | | | |
Distributable net earnings/(deficit) | | $ | 3,524,430 | |
| | | | |
The difference between components of Distributable Earnings on a tax basis and the amounts reflected in the statement of assets and liabilities are primarily due to differences in book and tax policies.
For the year ended July 31, 2019, the Fund reclassified $177,035 from undistributed net investment income to accumulated net realized gain (loss) to align financial reporting and tax reporting.
99
DOMINI IMPACT BOND FUND
NOTES TO FINANCIAL STATEMENTS(continued)
January 31, 2020 (Unaudited)
During the period November 1, 2018 through July 31, 2019, the Domini Impact Bond Fund had net ordinary capital of $164,171. These losses are deferred and will be recognized on August 1, 2019, for tax purposes.
To the extent that the Fund realizes net capital gains in the future, those gains may be offset by any unused net capital loss carryforwards. The Fund is permitted to carry forward a net capital loss from any taxable year that began on or before December 22, 2010 for eight years following the year of the loss. The Fund is permitted to carry forward net capital losses incurred in taxable years beginning after December 22, 2010, for an unlimited time period. Carryforwards of losses from taxable years that began after December 22, 2010, along with any other capital losses deferred and treated as recognized in any such year, are required to be utilized prior to carryforwards of losses incurred in taxable years that began on or before December 22, 2010. As a result of this ordering rule, carryforwards of losses from taxable years that began on or before December 22, 2010 may be more likely to expire unused. Losses from taxable years that begin after December 22, 2010 that are carried forward will retain their character as either short-term or long-term capital losses. As of July 31, 2019, the Fund had short-term capital loss carryover of $174,847 and a long-term capital loss carryover of $612,428.
For federal income tax purposes, dividends paid were characterized as follows:
| | | | | | | | |
| | | Year Ended July 31, | |
| | | 2019 | | | 2018 | |
Ordinary income | | $ | 3,741,895 | | | $ | 3,664,538 | |
Long-term capital gain | | | - | | | | 90,020 | |
Return of capital | | | 278,159 | | | | - | |
| | | | | | | | |
Total | | $ | 4,020,054 | | | $ | 3,754,558 | |
| | | | | | | | |
The Fund is subject to the provisions of Accounting Standards Codification ASC 740 Income Taxes (ASC 740). ASC 740 sets forth a minimum threshold for financial statement recognition of the benefit of a tax position taken or expected to be taken in a tax return. The Fund did not have a liability to record for any unrecognized tax benefits in the accompanying financial statements. No provision has been made for taxes on income, capital gains or unrealized appreciation on securities held or for excise tax on income and capital gains.
100
DOMINI IMPACT BOND FUND
NOTES TO FINANCIAL STATEMENTS(continued)
January 31, 2020 (Unaudited)
8. OTHER RISKS
The Fund’s risks include, but are not limited to, some or all of the risks discussed below:
Market Risk: The market values of securities or other assets will fluctuate, sometimes sharply and unpredictably, due to changes in general market conditions, overall economic trends or events, governmental actions or intervention, market disruptions caused by trade disputes or other factors, political developments, recessions, the spread of infectious illness or other public health issues, investor sentiment and other factors that may or may not be related to the issuer of the security or other asset. If the market values of the securities or other assets held by the Fund fall, including a complete loss on any individual security, the value of your investment will go down. Economies and financial markets throughout the world are increasingly interconnected. Economic, financial or political events, trading or tariff arrangements, terrorism, natural disasters and other circumstances in one country or region could have profound impacts on global economies or markets. As a result, whether or not the Fund invests in securities of issuers located in or with significant exposure to the countries directly affected, the value and liquidity of the Fund’s investments may be negatively affected
Recent Events Risk: The respiratory illness COVID-19 caused by a novel coronavirus has resulted in a global pandemic and major disruption to economies and markets around the world, including the United States. Financial markets have experienced extreme volatility and severe losses, and trading in many instruments has been disrupted. Liquidity for many instruments has been greatly reduced for periods of time. Some interest rates are very low and in some cases yields are negative. Some sectors of the economy and individual issuers have experienced particularly large losses. These circumstances may continue for an extended period of time, and may continue to affect adversely the value and liquidity of the Fund’s investments. The ultimate economic fallout from the pandemic, and the long-term impact on economies, markets, industries and individual issuers, are not known. Governments and central banks, including the Federal Reserve in the U.S., have taken extraordinary and unprecedented actions to support local and global economies and the financial markets. The impact of these measures, and whether they will be effective to mitigate the economic and market disruption, will not be known for some time.
Impact Investing Risk: The application of the adviser’s environmental and social standards and the timing of the subadviser’s implementation of such standards will affect the Fund’s exposure to certain issuers, industries, sectors,
101
DOMINI IMPACT BOND FUND
NOTES TO FINANCIAL STATEMENTS(continued)
January 31, 2020 (Unaudited)
regions, and countries and may impact the relative financial performance of the Fund — positively or negatively — depending on whether such investments are in or out of favor.
Style Risk: The value of your investment may decrease if the subadviser’s quantitative investment approach does not respond well to current market conditions or its judgment regarding the quality, value, or market trends affecting a particular security, industry, sector, or region is incorrect. The subadviser’s quantitative model relies upon a complex software system, and failure of the system to function or the presence of software errors could have an adverse impact on the value of Fund performance.
Information Risk: There is a risk that information used by the adviser to evaluate the environmental and social performance of issuers, industries, markets, sectors, and regions may not be readily available, complete, or accurate, which could negatively impact the adviser’s ability to apply its environmental and social standards, which may negatively impact Fund performance. This may also lead the Fund to avoid investment in certain issuers, industries, markets, sectors, or regions.
Interest Rate Risk: The value of your investment will fluctuate with changes in interest rates. If interest rates rise, the price of a fixed-income security declines and will generally reduce the value of the Fund’s share price. A rise in rates tends to have a greater impact on securities with longer maturities or higher durations. However, calculations of maturity and duration may be based on estimates and may not reliably predict a security’s price sensitivity to changes in interest rates. A general rise in interest rates could adversely affect the price and liquidity of fixed income securities and could also result in increased redemptions from the Fund.
102
PROXY VOTING INFORMATION
The Domini Funds have established Proxy Voting Policies and Procedures that the Funds use to determine how to vote proxies relating to portfolio securities. The Domini Funds’ Proxy Voting Policies and Procedures are available, free of charge, by calling1-800-762-6814, by visitingwww.domini.com/domini-funds/proxy-voting, or by visiting the EDGAR database on the Securities and Exchange Commission’s (SEC) website athttp://www.sec.gov. All proxy votes cast for the Domini Funds are posted to Domini’s website on an ongoing basis over the course of the year. An annual record of all proxy votes cast for the Funds during the most recent12-month period ended June 30 can be obtained, free of charge, atwww.domini.com, and on the EDGAR database on the SEC’s website athttp://www.sec.gov.
QUARTERLY PORTFOLIO SCHEDULE INFORMATION
The Domini Funds file their complete schedule of portfolio holdings with the SEC for the first and third quarters of each fiscal year on FormN-Q. The Domini Funds’ FormsN-Q are available on the EDGAR database on the SEC’s website athttp://www.sec.gov. These Forms may also be reviewed and copied at the SEC’s Public Reference Room in Washington, D.C. Information about the operation of the Public Reference Room may be obtained by calling1-800-SEC-0330. The information on FormN-Q is also available to be viewed atwww.domini.com.
103
DOMINI FUNDS
P.O. Box 9785
Providence, RI 02940-9785
1-800-582-6757
www.domini.com
Investment Manager, Sponsor, and Distributor:
Domini Impact Investments LLC (Investment Manager and Sponsor)
DSIL Investment Services LLC (Distributor)
180 Maiden Lane, Suite 1302
New York, NY 10038-4925
Investment Submanagers:
Domini Impact Equity Fund
SSGA Funds Management, Inc.
1 Iron Street
Boston, MA 02210
Domini Impact International Equity Fund
Domini Impact Bond Fund
Wellington Management Company LLP
280 Congress Street
Boston, MA 02210
Transfer Agent:
BNY Mellon Asset Servicing
760 Moore Road
King of Prussia, PA 19406
Custodian:
State Street Bank and Trust Company
1 Iron Street
Boston, MA 02210
Independent Registered Public Accounting Firm:
KPMG LLP
Two Financial Center
60 South Street
Boston, MA 02111
Legal Counsel:
Morgan, Lewis & Bockius LLP
One Federal Street
Boston, MA 02110
Presorted Standard U.S.Postage PAID Lancaster, PA Permit No.1793 Domini Funds P.O. Box 9785 | Providence, RI 02940 1-800-582-6757 | www.domini.com | @DominiFunds Domini Impact International Equity FundSM Investor Shares: CUSIP 257132704 I DOMIX Class A Shares: CUSIP 257132886 I DOMAX Institutional Shares: CUSIP 257132811 I DOMOX Class Y Shares: CUSIP 257132787 I DOMYX Domini Impact Equity FundSM Investor Shares: CUSIP 257132100 I DSEFX Class A Shares: CUSIP 257132860 I DSEPX Institutional Shares: CUSIP 257132852 I DIEQX Class R Shares: CUSIP 257132308 I DSFRX Domini Impact Bond FundSM Investor Shares: CUSIP 257132209 I DSBFX Institutional Shares: CUSIP 257132829 I DSBIX Class Y Shares: CUSIP 257132795 I DSBYX
(a) Not applicable to a semi-annual report.
(c) Not applicable.
(d) Not applicable.
| Item 3. | Audit Committee Financial Expert. |
Not applicable to a semi-annual report.
| Item 4. | Principal Accountant Fees and Services. |
Not applicable to a semi-annual report.
| Item 5. | Audit Committee of Listed Registrants. |
Not applicable to the registrant.
| Item 6. | Schedule of Investments. |
| (a) | The Schedule of Investments is included as part of the report to stockholders filed under Item 1. |
| Item 7. | Disclosure of Proxy Voting Policies and Procedures forClosed-End Management Investment Companies. |
Not applicable to the registrant.
| Item 8. | Portfolio Managers ofClosed-End Management Investment Companies. |
Not applicable to the registrant.
| Item 9. | Purchases of Equity Securities byClosed-End Management Investment Company and Affiliated Purchasers. |
Not applicable to the registrant.
| Item 10. | Submission of Matters to a Vote of Security Holders. |
There have been no material changes to the procedures by which shareholders may submit recommendations for nominees to the registrant’s Board of Trustees.
| Item 11. | Controls and Procedures. |
(a) Within 90 days prior to the filing of this report on FormN-CSR, Carole M. Laible, the registrant’s President and Principal Executive Officer, and Christina M. Povall, the registrant’s Treasurer and Principal Financial Officer, reviewed the registrant’s disclosure controls and procedures (as defined in Rule30a-3(c) of the Investment Company Act of 1940) and evaluated their effectiveness. Based on their evaluation, Ms. Laible and Ms. Povall determined that the disclosure controls and procedures adequately ensure that information required to be disclosed by the registrant in this report on FormN-CSR is recorded, processed, summarized, and reported within the time periods required by the Securities and Exchange Commission’s rules and forms.
(b) There were no changes in the registrant’s internal control over financial reporting (as defined in Rule30a-3(d) under the Investment Company Act of 1940) that occurred during the period covered by this report that have materially affected, or are reasonably likely to materially affect, the registrant’s internal control over financial reporting.
| Item 12. | Disclosure of Securities Lending Activities forClosed-End Management Investment Companies. |
Not applicable to the registrant
(a)(1) Not applicable to a semi-annual report.
(a)(2) Separate certifications required by Rule30a-2(a) under the Investment Company Act of 1940 for each principal executive officer and principal financial officer of the registrant are filed herewith.
(a)(3) Not applicable to the registrant.
(b) A single certification required by Rule30a-2(b) under the Investment Company Act of 1940, Rule13a-14b or Rule15d-14(b) under the Securities Exchange Act of 1934, and Section 1350 of Chapter 63 of Title 18 of the United States Code for the chief executive officer and the chief financial officer of the registrant is filed herewith.
SIGNATURES
Pursuant to the requirements of the Securities Exchange Act of 1934 and the Investment Company Act of 1940, the registrant has duly caused this report to be signed on its behalf by the undersigned, thereunto duly authorized.
DOMINI INVESTMENT TRUST
| | |
| By: | | /s/ Carole M. Laible |
| | Carole M. Laible |
| | President |
Date: April 9, 2020
Pursuant to the requirements of the Securities Exchange Act of 1934 and the Investment Company Act of 1940, this report has been signed below by the following persons on behalf of the registrant and in the capacities and on the dates indicated.
| | |
| By: | | /s/ Carole M. Laible |
| | Carole M. Laible |
| | President (Principal Executive Officer) |
Date: April 9, 2020
| | |
| By: | | /s/ Christina M. Povall |
| | Christina M. Povall |
| | Treasurer (Principal Financial Officer) |
Date: April 9, 2020