Item 1: Report to Shareholders
 |
| Institutional Emerging Markets Equity Fund | October 31, 2006 |
The views and opinions in this report were current as of October 31, 2006. They are not guarantees of performance or investment results and should not be taken as investment advice. Investment decisions reflect a variety of factors, and the managers reserve the right to change their views about individual stocks, sectors, and the markets at any time. As a result, the views expressed should not be relied upon as a forecast of the fund’s future investment intent. The report is certified under the Sarbanes-Oxley Act of 2002, which requires mutual funds and other public companies to affirm that, to the best of their knowledge, the information in their financial reports is fairly and accurately stated in all material respects.
Dear Investor
Emerging markets stocks and your fund posted strong gains for the year ended October 31, 2006, despite the underwhelming returns generated in the past six months. After a sharp correction in May and June, investors in emerging market countries apparently regained their appetites for risk, sparking a late-period rally.

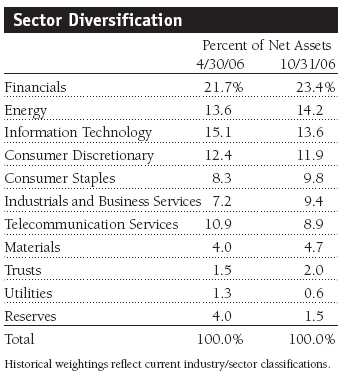
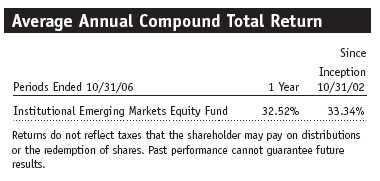
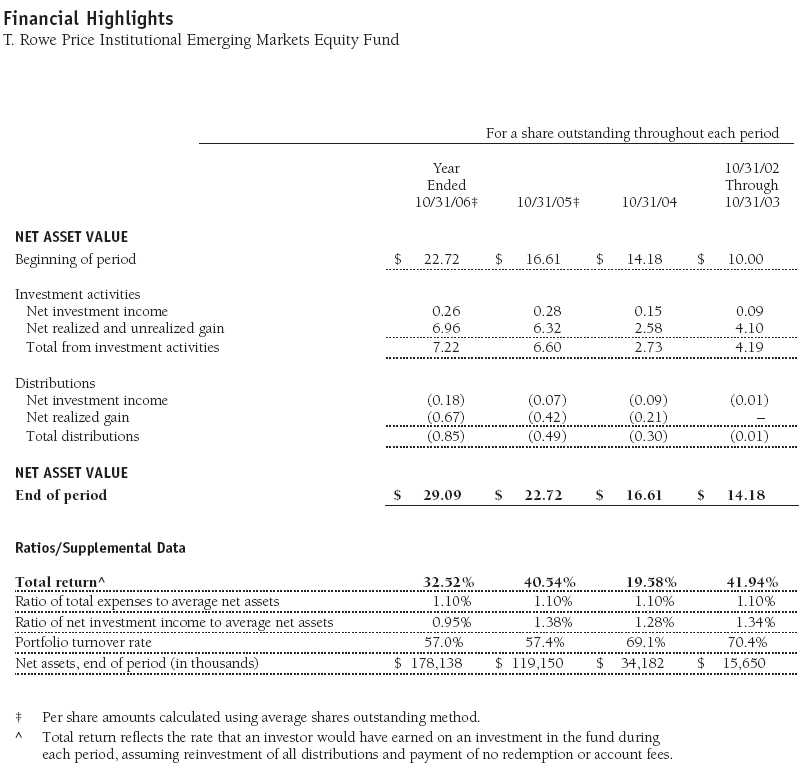
The past six months has been a challenging period for emerging markets investors. As shown in the table, the portfolio posted a small loss but held up better than the MSCI Emerging Markets Index and the Lipper Emerging Markets Funds Average. For the year, your fund returned a strong 32.52% but trailed both benchmarks. Over the past 12 months, the fund’s best absolute and relative contributor was the energy sector (an overweight and solid stock selection). Stock selection in information technology and an underweight in health care were also solid contributors versus the MSCI index, while stock selection in consumer discretionary and an underweight in materials detracted.
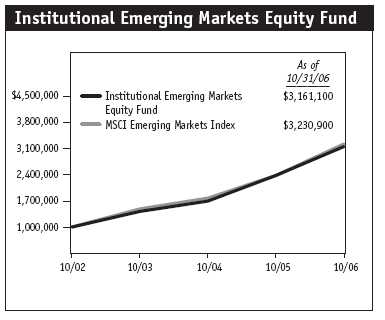
Because your fund has generated extremely strong gains since its inception four years ago (216.11%, or 33.34% compounded annually), it is important to remember that returns of this magnitude are unusual and unlikely to be sustained. Even though we remain positive about the prospects for emerging markets, we want to remind shareholders that emerging markets investments can be volatile and are appropriate for only a portion of an investor’s portfolio.
MARKET AND PORTFOLIO REVIEW
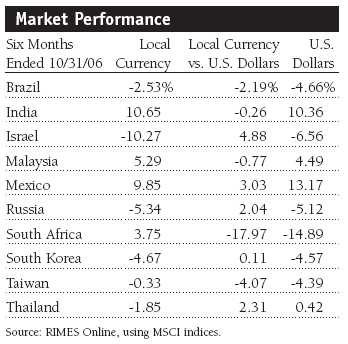
Within the MSCI Emerging Markets Index, Asian and Latin American markets were strongest for the six months and year. Among the countries where we have significant allocations, India and Mexico were top performers in both periods, while South Africa, Turkey, and several smaller emerging markets lagged in both periods. Many markets reached all-time high levels in early May, but subsequently suffered a sharp correction into June due to concerns about a global economic slowdown that led to a bout of risk aversion. Those markets with current account deficits and those with highly cyclical industries—including heavy reliance on commodities—were hit hardest and have yet to fully recover. However, in recent months, performance for the overall asset class has improved and now seems more closely linked to the performance in developed markets.
Far East
Since our report six months ago, Asian markets overall modestly outperformed the MSCI Emerging Markets Index. India was the region’s strongest major market over the past six months. Despite concerns that company valuations are starting to look extended, investors continued to be attracted by the country’s solid economic growth and the market’s powerful long-term results. Chinese equities were also strong following an extended period of underperformance. The economic growth rate in China has remained high, and it seems that investors are increasingly able to find higher-quality companies in which to invest. South Korea—the biggest market in the regional index—lagged for the six-month period. Domestic consumption is improving, but economic growth was somewhat disappointing. Taiwan, the second-largest market, also underperformed, hurt by unfavorable conditions in its export-led economy.
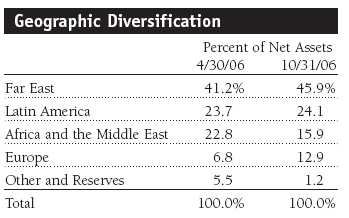
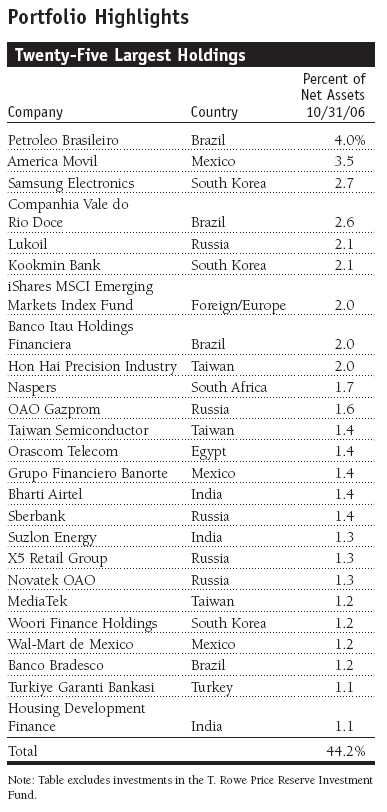
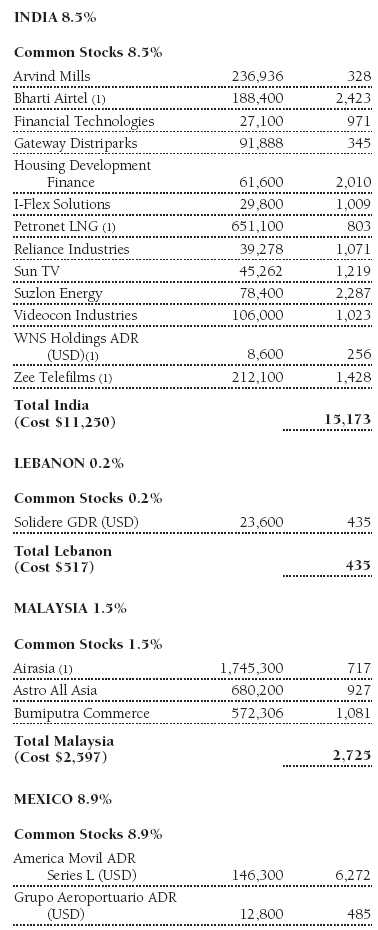
We made several significant shifts in the portfolio’s regional diversification over the past six months. In Asia, we trimmed Indian exposure to an underweight allocation because of our valuation concerns ahead of the sharp sell-off in May and June. We remained underweight in the Asian region at the end of the reporting period but added to our positions in India over the past six months. In particular, we like Housing Development Finance due to the growth in mortgage lending, Zee Telefilms because of its gains in pay television and improving prospects from the recent restructuring, and Videocon Industries, a TV manufacturer that is benefiting from rising television ownership. We also started a new position in Reliance Industries, which is benefiting from Indian infrastructure spending and rising oil and gas exploration and production spending. (Please refer to the fund’s portfolio of investments for a detailed list of holdings and the amount each represents of the portfolio.)
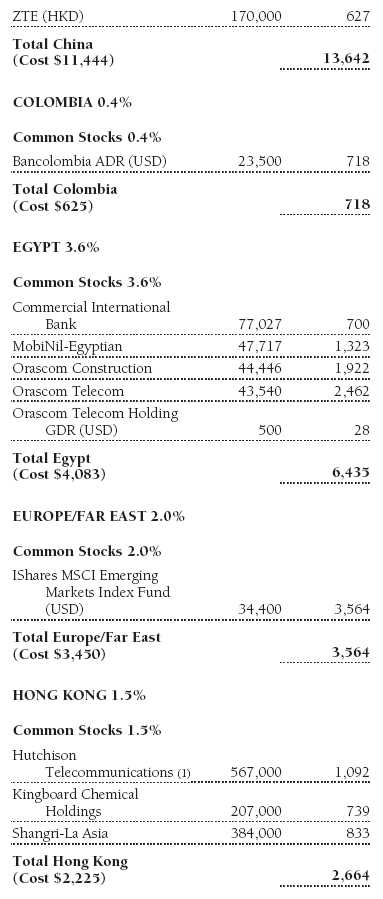
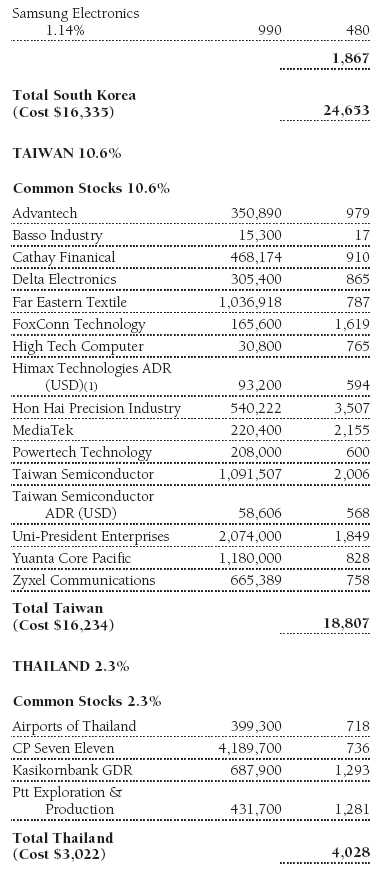
Thailand’s government was deposed in a bloodless military coup in September after a year of political unrest. It may be a sign of improvement in investors’ perception of risk in our asset class that the markets expressed little concern over the coup, either in Thailand or the rest of the region. We increased our weighting in Thailand because the economy appears to be in fairly good shape. We established a position in Airports of Thailand, as we believe the new airport in Bangkok should be able to handle more passenger traffic. We also built a position in Hong Kong-based Shangri-La Asia, which operates hotels across the region, particularly in China.
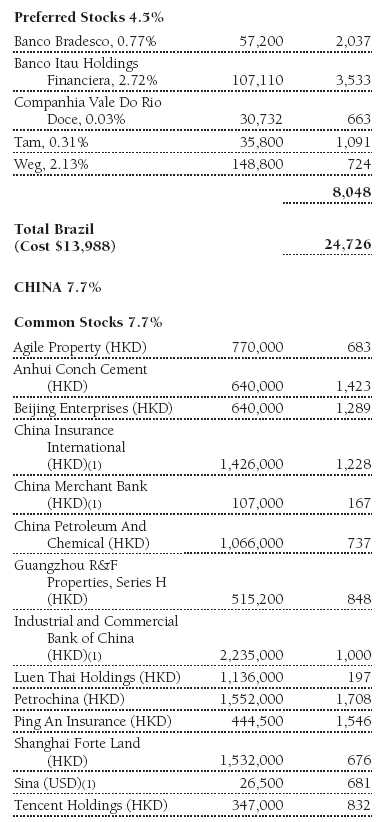
Overall, we have been underweight in China and Taiwan compared with the benchmark, but our significant additions over the past six months have brought the allocations closer to neutral. In China, we purchased banks and insurance companies, many of which are new and hold the promise of years of growth in an underpenetrated market. The most significant purchases we made in this area were Industrial and Commercial Bank of China and Ping An Insurance. We also bought several companies that should benefit from increasing infrastructure spending, such as Anhui Conch Cement.
In Taiwan, we continue to be selective about our information technology holdings, owning only those in niche growth areas. We also increased our financials holdings through purchases of brokerage firm Yuanta Core Pacific, and Cathay Financial, a banking and insurance company with a growing presence in China. Both of these additions were modest second-half detractors.
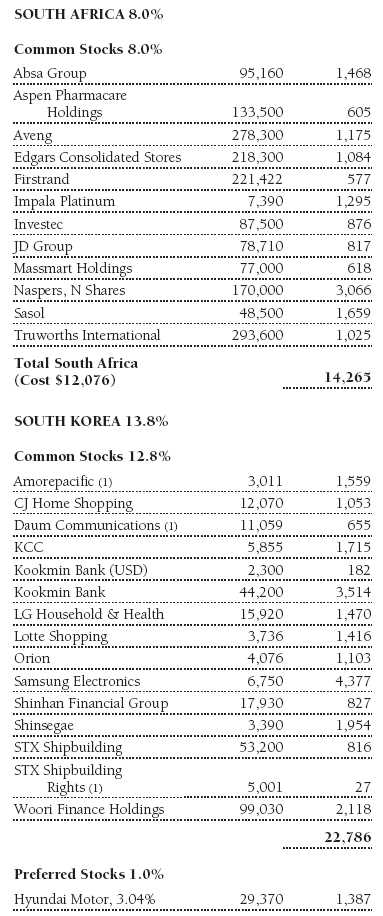
South Korea now represents our largest country underweight after we pared several of our holdings that had experienced weakness. We sold a significant part of our holdings in Kookmin Bank due to the pressure on current earnings and LG Electronics because of pricing pressure, especially on LCD TVs. We also trimmed Samsung Electronics due to the potential for earnings downgrades caused by an oversupply of memory chips and eroding margins in its handset business.
Europe, Middle East, and Africa
The Europe, Middle East, and Africa (EMEA) region underperformed the emerging markets index over the past six months. Turkey, South Africa, and Hungary were the weakest countries in the EMEA region since April. The Czech Republic, a relative safe haven in Central Europe, was the region’s best performer.
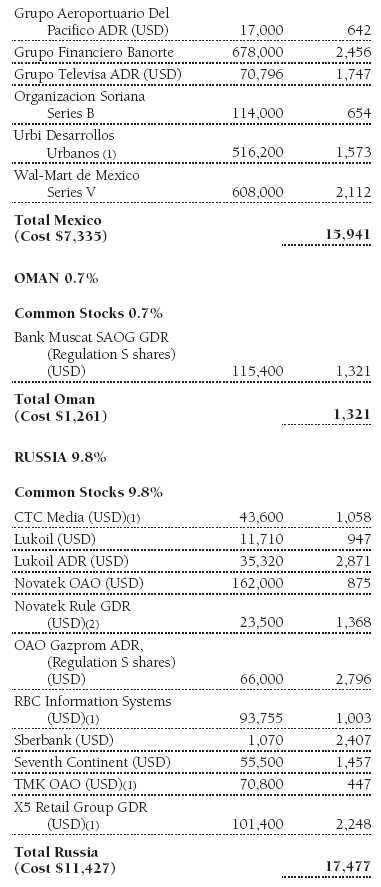
The portfolio benefited from strong stock selection and an underweight in Russia. We were underweight in OAO Gazprom—the largest stock in the Russian market—which declined with falling oil prices. We like the company but believe it is approaching full valuation. We prefer Novatek OAO, which is heavily exposed to domestic gas prices, but we sold some of this profitable position when its valuation also became stretched. Our consumer-related holdings, including retailers X5 Retail Group (formerly Pyaterochka) and Seventh Continent, and commercial bank Sberbank, generated good performance. During the past six months, we established substantial positions in TMK OAO, a seamless pipe manufacturer that is benef iting from rapid growth in exploration and production of oil and gas in Russia, and CTC Media, the Russian-language TV broadcaster.
South Africa remained a challenging market, and your portfolio suffered losses as the rand depreciated sharply and signs of an economic slowdown emerged. We sold our entire stake in African Bank Investments and trimmed our holdings in Absa Group and Firstrand on signs of a slowdown in loan growth. We sold our entire position in wireless telecom MTN Group because we think there will be softness in mobile phone penetration rates. At this juncture, we favor retailers, such as Edgars Consolidated Stores and Truworths International, and Naspers, South Africa’s leading pay TV and Internet service provider. Although the portfolio’s exposure to large mining and g old companies is lighter than our benchmark, we have a small overweight in Impala Platinum.
Egypt was the portfolio’s second-largest country overweight, but we trimmed the position significantly in the past six months through sales of Vodafone Egypt. Egyptian telecommunication services companies have recovered somewhat after a weak showing in the first half of our fiscal year. Orascom Telecom and MobiNil-Egyptian benefited from increasing mobile phone use in Egypt and North Africa.
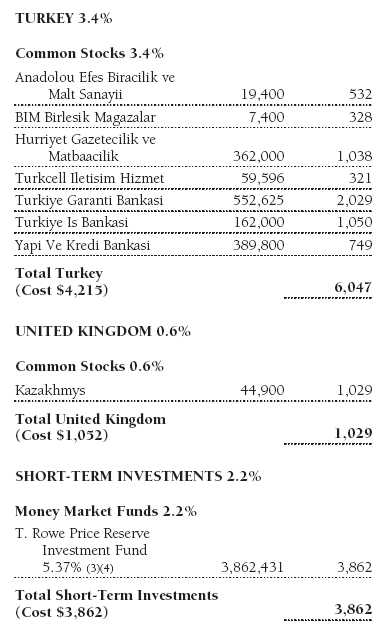
We also reduced our overweight in Turkey. We have concerns about rising interest rates, which led us to sell several bank holdings. We sold our entire position in Finansbank and DenizBank before the sharp market declines. We also trimmed Turkiye Is Bankasi, which is experiencing slower loan growth. However, we maintained a sizable position in Turkiye Garanti Bankasi.
Latin America
Latin America’s markets overall outperformed the MSCI Emerging Markets Index and remained the portfolio’s most overweight region compared with the index. Brazil—our largest country overweight and historically more than half of our Latin American exposure—fell in the second half of our fiscal year along with oil and commodity prices. For the year, however, the market generated a 37% return. While reform is not happening at the pace that investors would like, the economy continued to improve and the ongoing interest rate cuts this year were beneficial. With presidential elections out of the way, we expect the market to increasingly focus on the country’s improving fundamentals, although we have low expectations for any meaningful pickup in reform momentum.
Mexico performed well over the past six and 12 months, as the economic backdrop and corporate earnings remained strong. We added to our positions, encouraged by a positive outcome from the elections and the country’s strong economic performance. America Movil was the portfolio’s largest absolute contributor thanks to penetration gains in Mexico and other key Latin American markets. Grupo Financiero Banorte, the third-best absolute contributor, benefited from the economy’s strength and increased demand for financial products. Homebuilder Urbi Desarrollos Urbanos also benefited from the buoyant economy. Retailing giant Wal-Mart de Mexico continues to grow and post robust earnings results ahead of consensus expectations. TV broadcaster Grupo Televisa posted strong results driven by one-time events including the World Cup, presidential elections, and new programming content.
OUTLOOK
As expected, politics has been a key risk across emerging markets this year. The Thai market took a sanguine view of the recent coup, and we expect this to continue because of the good economic fundamentals and cheap valuations. We also think Mexico and Brazil will settle down from here. However, there are still uncertainties in Hungary, Poland, and South Africa. We are pleased to note that the political disturbances this year have not resulted in contagion to other markets, as might have occurred in the 1990s. We believe improving underlying economic fundamentals are responsible for this.
Global economic conditions, particularly the direction of the U.S. economy, will continue to have the heaviest influence on emerging markets returns in the near term. We believe that long-term growth in emerging markets will be driven by increasing individual wealth and, consequently, consumer spending. Sectors sensitive to improving consumption such as consumer discretionary, consumer staples, financials, and even infrastructure offer promising prospects across emerging markets. We intend to focus on these themes and will generally avoid export-sensitive or cyclical companies. Returns are unlikely to be as high as in recent years, but we believe the asset class continues to present excellent growth prospects for long-term investors.
Respectfully submitted,

David J.L. Warren
President, T. Rowe Price International Funds, Inc.
November 15, 2006
| Risks of International Investing |
Funds that invest overseas generally carry more risk than funds that invest strictly in U.S. assets. Funds investing in a single country or in a limited geographic region tend to be riskier than more diversified funds. Risks can result from varying stages of economic and political development; differing regulatory environments, trading days, and accounting standards; and higher transaction costs of non-U.S. markets. Non-U.S. investments are also subject to currency risk, or a decline in the value of a foreign currency versus the U.S. dollar, which reduces the dollar value of securities denominated in that currency.
| Glossary |
Lipper averages: The averages of available mutual fund performance returns for specified time periods in defined categories as tracked by Lipper Inc.
MSCI Emerging Markets Index: A capitalization-weighted index of stocks from 26 emerging market countries that only includes securities that may be traded by foreign investors.
| Performance Comparison |
This chart shows the value of a hypothetical $1,000,000 investment in the fund over the past 10 fiscal year periods or since inception (for funds lacking 10-year records). The result is compared with benchmarks, which may include a broad-based market index and a peer group average or index. Market indexes do not include expenses, which are deducted from fund returns as well as mutual fund averages and indexes.
This table shows how the fund would have performed each year if its actual (or cumulative) returns for the periods shown were earned at a constant rate.
Fund Expense Example
Actual Expenses
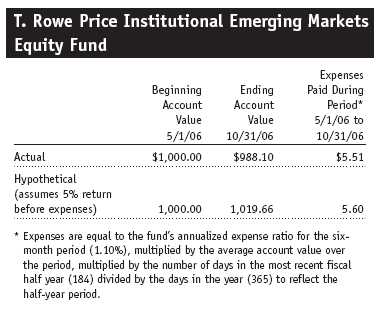
As a mutual fund shareholder, you may incur two types of costs: (1) transaction costs, such as redemption fees or sales loads, and (2) ongoing costs, including management fees, distribution and service (12b-1) fees, and other fund expenses. The following example is intended to help you understand your ongoing costs (in dollars) of investing in the fund and to compare these costs with the ongoing costs of investing in other mutual funds. The example is based on an investment of $1,000 invested at the beginning of the most recent six-month period and held for the entire period.
Actual Expenses
The first line of the following table (“Actual”) provides information about actual account values and actual expenses. You may use the information in this line, together with your account balance, to estimate the expenses that you paid over the period. Simply divide your account value by $1,000 (for example, an $8,600 account value divided by $1,000 = 8.6), then multiply the result by the number in the first line under the heading “Expenses Paid During Period” to estimate the expenses you paid on your account during this period.
Hypothetical Example for Comparison Purposes
The information on the second line of the table (“Hypothetical”) is based on hypothetical account values and expenses derived from the fund’s actual expense ratio and an assumed 5% per year rate of return before expenses (not the fund’s actual return). You may compare the ongoing costs of investing in the fund with other funds by contrasting this 5% hypothetical example and the 5% hypothetical examples that appear in the shareholder reports of the other funds. The hypothetical account values and expenses may not be used to estimate the actual ending account balance or expenses you paid for the period.
You should also be aware that the expenses shown in the table highlight only your ongoing costs and do not reflect any transaction costs, such as redemption fees or sales loads. Therefore, the second line of the table is useful in comparing ongoing costs only and will not help you determine the relative total costs of owning different funds. To the extent a fund charges transaction costs, however, the total cost of owning that fund is higher.
The accompanying notes are an integral part of these financial statements.
The accompanying notes are an integral part of these financial statements.
The accompanying notes are an integral part of these financial statements.
The accompanying notes are an integral part of these financial statements.
The accompanying notes are an integral part of these financial statements.
Notes to Financial Statements
T. Rowe Price Institutional Emerging Markets Equity Fund
October 31, 2006
NOTE 1 - SIGNIFICANT ACCOUNTING POLICIES
T. Rowe Price Institutional International Funds, Inc. (the corporation), is registered under the Investment Company Act of 1940 (the 1940 Act). The Institutional Emerging Markets Equity Fund (the fund), a diversified, open-end management investment company, is one portfolio established by the corporation. The fund commenced operations on October 31, 2002. The fund seeks long-term growth of capital through investments primarily in the common stocks of companies located (or with primary operations) in emerging markets.
The accompanying financial statements were prepared in accordance with accounting principles generally accepted in the United States of America, which require the use of estimates made by fund management. Fund management believes that estimates and security valuations are appropriate; however, actual results may differ from those estimates, and the security valuations reflected in the financial statements may differ from the value the fund ultimately realizes upon sale of the securities.
Valuation The fund values its investments and computes its net asset value per share at the close of the New York Stock Exchange (NYSE), normally 4 p.m. ET, each day that the NYSE is open for business. Equity securities listed or regularly traded on a securities exchange or in the over-the-counter (OTC) market are valued at the last quoted sale price or, for certain markets, the official closing price at the time the valuations are made, except for OTC Bulletin Board securities, which are valued at the mean of the latest bid and asked prices. A security that is listed or traded on more than one exchange is valued at the quotation on the exchange determined to be the primary market for such security. Listed securities not traded on a particular day are valued at the mean of the latest bid and asked prices for domestic securities and the last quoted sale price for international securities.
Investments in mutual funds are valued at the mutual fund’s closing net asset value per share on the day of valuation.
Other investments, including restricted securities, and those for which the above valuation procedures are inappropriate or are deemed not to reflect fair value are stated at fair value as determined in good faith by the T. Rowe Price Valuation Committee, established by the fund’s Board of Directors.
Most foreign markets close before the close of trading on the NYSE. If the fund determines that developments between the close of a foreign market and the close of the NYSE will, in its judgment, materially affect the value of some or all of its portfolio securities, which in turn will affect the fund’s share price, the fund will adjust the previous closing prices to reflect the fair value of the securities as of the close of the NYSE, as determined in good faith by the T. Rowe Price Valuation Committee, established by the fund’s Board of Directors. A fund may also fair value securities in other situations, such as when a particular foreign market is closed but the fund is open. In deciding whether to make fair value adjustments, the fund reviews a variety of factors, including developments in foreign markets, the performance of U.S. securities markets, and the performance of instruments trading in U.S. markets that represent foreign securities and baskets of foreign securities . The fund uses outside pricing services to provide it with closing market prices and information used for adjusting those prices. The fund cannot predict when and how often it will use closing prices and when it will adjust those prices to reflect fair value. As a means of evaluating its fair value process, the fund routinely compares closing market prices, the next day’s opening prices in the same markets, and adjusted prices.
Currency Translation Assets, including investments, and liabilities denominated in foreign currencies are translated into U.S. dollar values each day at the prevailing exchange rate, using the mean of the bid and asked prices of such currencies against U.S. dollars as quoted by a major bank. Purchases and sales of securities, income, and expenses are translated into U.S. dollars at the prevailing exchange rate on the date of the transaction. The effect of changes in foreign currency exchange rates on realized and unrealized security gains and losses is reflected as a component of security gains and losses.
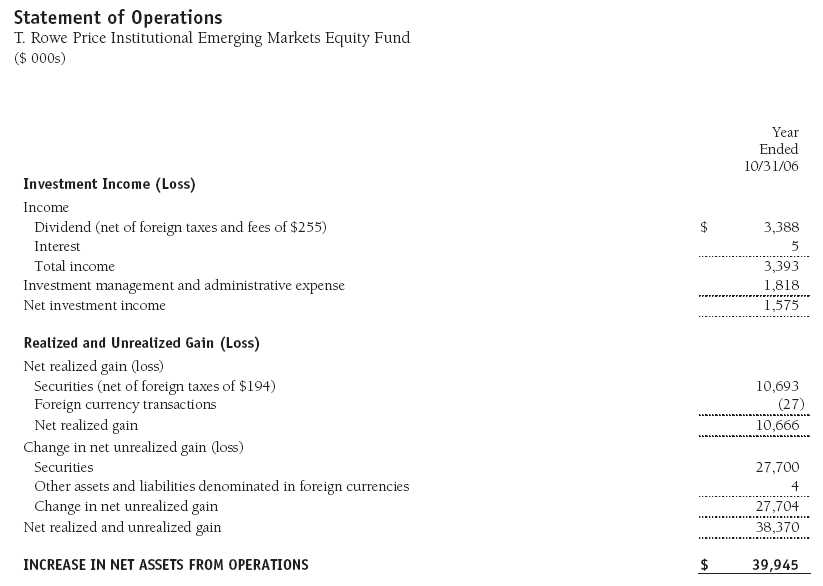
Rebates Subject to best execution, the fund may direct certain security trades to brokers who have agreed to rebate a portion of the related brokerage commission to the fund in cash. Commission rebates are reflected as realized gain on securities in the accompanying financial statements and totaled $18,000 for the year ended October 31, 2006.
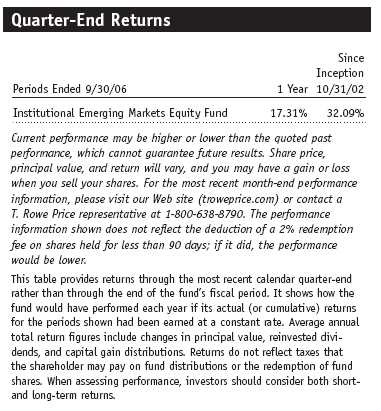
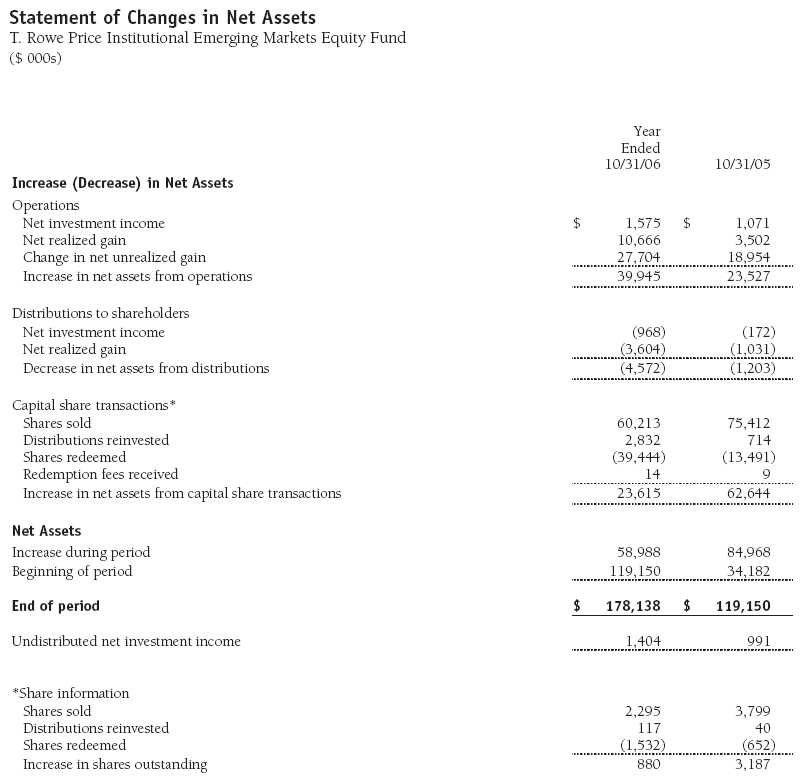
Redemption Fees A 2% fee is assessed on redemptions of fund shares held less than 90 days to deter short-term trading and to protect the interests of long-term shareholders. Redemption fees are withheld from proceeds that shareholders receive from the sale or exchange of fund shares. The fees are paid to the fund, and are recorded as an increase to paid-in capital. The fees may cause the redemption price per share to differ from the net asset value per share.
Investment Transactions, Investment Income, and Distributions Income and expenses are recorded on the accrual basis. Dividends received from mutual fund investments are reflected as dividend income; capital gain distributions are reflected as realized gain/loss. Dividend income and capital gain distributions are recorded on the ex-dividend date. Investment transactions are accounted for on the trade date. Realized gains and losses are reported on the identified cost basis. Distributions to shareholders are recorded on the ex-dividend date. Income distributions are declared and paid on an annual basis. Capital gain distributions, if any, are declared and paid by the fund, typically on an annual basis.
New Accounting Pronouncements In June 2006, the Financial Accounting Standards Board (“FASB”) issued FASB Interpretation No. 48 (“FIN 48”), Accounting for Uncertainty in Income Taxes, a clarification of FASB Statement No. 109, Accounting for Income Taxes. FIN 48 establishes financial reporting rules regarding recognition and measurement of tax positions taken or expected to be taken on a tax return. Management is evaluating the anticipated impact on the fund from FIN 48, which is effective for the fund’s fiscal year beginning November 1, 2007.
NOTE 2 - INVESTMENT TRANSACTIONS
Consistent with its investment objective, the fund engages in the following practices to manage exposure to certain risks or to enhance performance. The investment objective, policies, program, and risk factors of the fund are described more fully in the fund’s prospectus and Statement of Additional Information.
Emerging Markets At October 31, 2006, approximately 98% of the fund’s net assets were invested in securities of companies located in emerging markets or denominated in or linked to the currencies of emerging market countries. Future economic or political developments could adversely affect the liquidity or value, or both, of such securities.
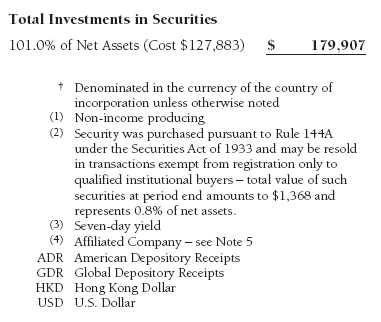
Restricted Securities The fund may invest in securities that are subject to legal or contractual restrictions on resale. Although certain of these securities may be readily sold, for example, under Rule 144A, others may be illiquid, their sale may involve substantial delays and additional costs, and prompt sale at an acceptable price may be difficult.
Other Purchases and sales of portfolio securities, other than short-term securities, aggregated $113,884,000 and $90,888,000, respectively, for the year ended October 31, 2006.
NOTE 3 - FEDERAL INCOME TAXES
No provision for federal income taxes is required since the fund intends to continue to qualify as a regulated investment company under Subchapter M of the Internal Revenue Code and distribute to shareholders all of its taxable income and gains. Federal income tax regulations differ from generally accepted accounting principles; therefore, distributions determined in accordance with tax regulations may differ significantly in amount or character from net investment income and realized gains for financial reporting purposes. Financial reporting records are adjusted for permanent book/ tax differences to reflect tax character. Financial records are not adjusted for temporary differences.
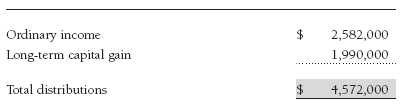
Distributions during the year ended October 31, 2006, were characterized as follows for tax purposes:
At October 31, 2006, the tax-basis components of net assets were as follows:

For the year ended October 31, 2006, the fund recorded the following permanent reclassifications to reflect tax character. Reclassifications between income and gain relate primarily to the character of foreign capital gain taxes. Results of operations and net assets were not affected by these reclassifications.
At October 31, 2006, the cost of investments for federal income tax purposes was $127,883,000.
NOTE 4 - FOREIGN TAXES
The fund is subject to foreign income taxes imposed by certain countries in which it invests. Additionally, capital gains realized by the fund upon disposition of securities issued in or by certain foreign countries are subject to capital gains tax imposed by those countries, which is payable prior to repatriation of sale proceeds. Similarly, a tax on net profits, including interest income and realized and unrealized capital gains, is imposed by certain other countries. All taxes are computed in accordance with the applicable foreign tax law, and, to the extent permitted, capital losses are used to offset capital gains. Tax expense attributable to income is accrued by the fund as a reduction of income. Current and deferred tax expense attributable to net capital gains is reflected as a component of realized and/or change in unrealized gain/loss on securities in the accompanying financial statements. At October 31, 2006, the fund had a tax refund receivable of $23,000 attributable to foreig n securities, no deferred tax liability attributable to foreign securities, and no foreign capital loss carryforwards.
NOTE 5 - RELATED PARTY TRANSACTIONS
The fund is managed by T. Rowe Price International, Inc. (the manager), a wholly owned subsidiary of T. Rowe Price Associates, Inc. (Price Associates), which is wholly owned by T. Rowe Price Group, Inc. The investment management and administrative agreement between the fund and the manager provides for an all-inclusive annual fee equal to 1.10% of the fund’s average daily net assets. The fee is computed daily and paid monthly. The agreement provides that investment management, shareholder servicing, transfer agency, accounting, and custody services are provided to the fund, and interest, taxes, brokerage commissions, and extraordinary expenses are paid directly by the fund.
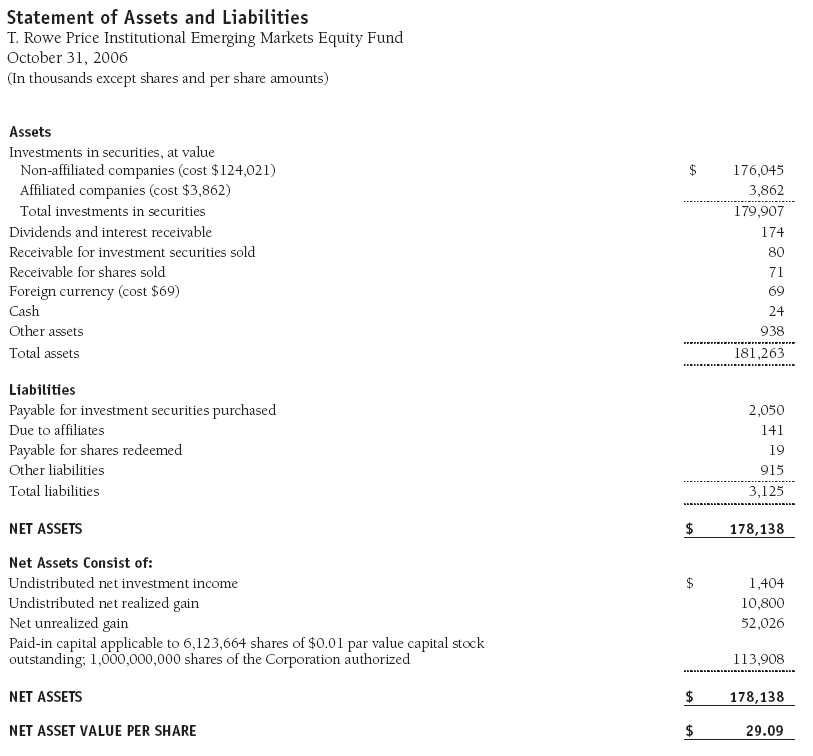
The fund may invest in the T. Rowe Price Reserve Investment Fund and the T. Rowe Price Government Reserve Investment Fund (collectively, the T. Rowe Price Reserve Funds), open-end management investment companies managed by Price Associates and affiliates of the fund. The T. Rowe Price Reserve Funds are offered as cash management options to mutual funds, trusts, and other accounts managed by Price Associates and/or its affiliates, and are not available for direct purchase by members of the public. The T. Rowe Price Reserve Funds pay no investment management fees. During the year ended October 31, 2006, dividend income from the T. Rowe Price Reserve Funds totaled $180,000, and the value of shares of the T. Rowe Price Reserve Funds held at October 31, 2006, and October 31, 2005, was $3,862,000 and $2,806,000, respectively.
As of October 31, 2006, T. Rowe Price Group, Inc., and/or its wholly owned subsidiaries owned 217,330 shares of the fund, representing 4% of the fund’s net assets.
Report of Independent Registered Public Accounting Firm
To the Board of Directors of T. Rowe Price Institutional International Funds, Inc. and Shareholders of T. Rowe Price Institutional Emerging Markets Equity Fund
In our opinion, the accompanying statement of assets and liabilities, including the portfolio of investments, and the related statements of operations and of changes in net assets and the financial highlights present fairly, in all material respects, the financial position of T. Rowe Price Institutional Emerging Markets Equity Fund (one of the portfolios comprising T. Rowe Price Institutional International Funds, Inc., hereafter referred to as the “Fund”) at October 31, 2006, the results of its operations for the year then ended, the changes in its net assets for each of the two years in the period then ended and the financial highlights for each of the periods indicated, in conformity with accounting principles generally accepted in the United States of America. These financial statements and financial highlights (hereafter referred to as “financial statements”) are the responsibility of the Fund’s management; our responsibility is to express an opinion on these financial statements based on our audits. We conducted our audits of these financial statements in accordance with the auditing standards of the Public Company Accounting Oversight Board (United States). Those standards require that we plan and perform the audit to obtain reasonable assurance about whether the financial statements are free of material misstatement. An audit includes examining, on a test basis, evidence supporting the amounts and disclosures in the financial statements, assessing the accounting principles used and significant estimates made by management, and evaluating the overall financial statement presentation. We believe that our audits, which included confirmation of securities at October 31, 2006 by correspondence with the custodian and by agreement to the underlying ownership records for T. Rowe Price Reserve Investment Fund, provide a reasonable basis for our opinion.
PricewaterhouseCoopers LLP
Baltimore, Maryland
December 12, 2006
| Tax Information (Unaudited) for the Tax Year Ended 10/31/06 |
We are providing this information as required by the Internal Revenue Code. The amounts shown may differ from those elsewhere in this report because of differences between tax and financial reporting requirements.
The fund’s distributions to shareholders included:
- $1,614,000 from short-term capital gains,
- $1,990,000 from long-term capital gains, subject to the 15% rate gains category.
For taxable non-corporate shareholders, $2,515,000 of the fund’s income represents qualified dividend income subject to the 15% rate category.
The fund will pass through foreign source income of $3,009,000 and foreign taxes paid of $444,000.
| Information on Proxy Voting Policies, Procedures, and Records |
A description of the policies and procedures used by T. Rowe Price funds and portfolios to determine how to vote proxies relating to portfolio securities is available in each fund’s Statement of Additional Information, which you may request by calling 1-800-225-5132 or by accessing the SEC’s Web site, www.sec.gov. The description of our proxy voting policies and procedures is also available on our Web site, www.troweprice.com. To access it, click on the words “Company Info” at the top of our homepage for individual investors. Then, in the window that appears, click on the “Proxy Voting Policy” navigation button in the top left corner.
Each fund’s most recent annual proxy voting record is available on our Web site and through the SEC’s Web site. To access it through our Web site, follow the directions above, then click on the words “Proxy Voting Record” at the bottom of the Proxy Voting Policy page.
| How to Obtain Quarterly Portfolio Holdings |
The fund files a complete schedule of portfolio holdings with the Securities and Exchange Commission for the first and third quarters of each fiscal year on Form N-Q. The fund’s Form N-Q is available electronically on the SEC’s Web site (www.sec.gov); hard copies may be reviewed and copied at the SEC’s Public Reference Room, 450 Fifth St. N.W., Washington, DC 20549. For more information on the Public Reference Room, call 1-800-SEC-0330.
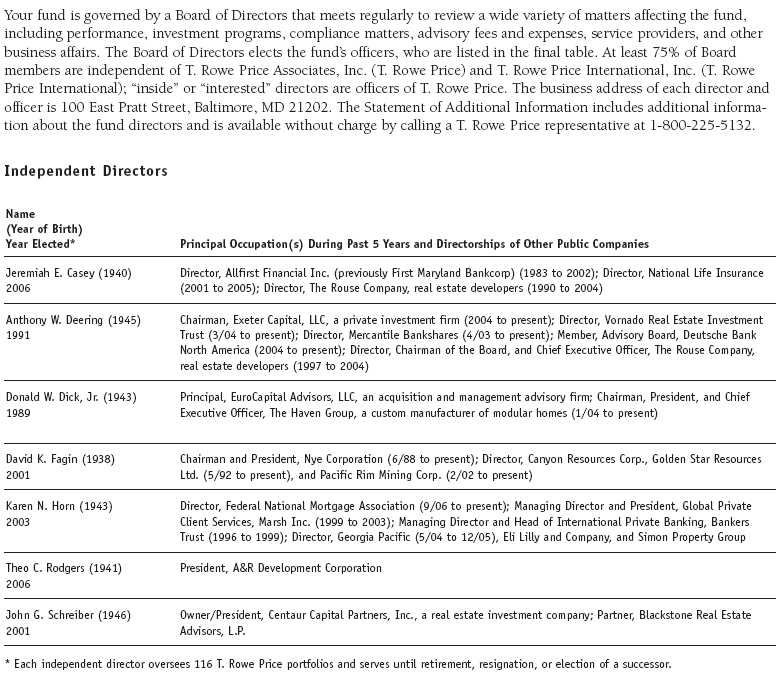
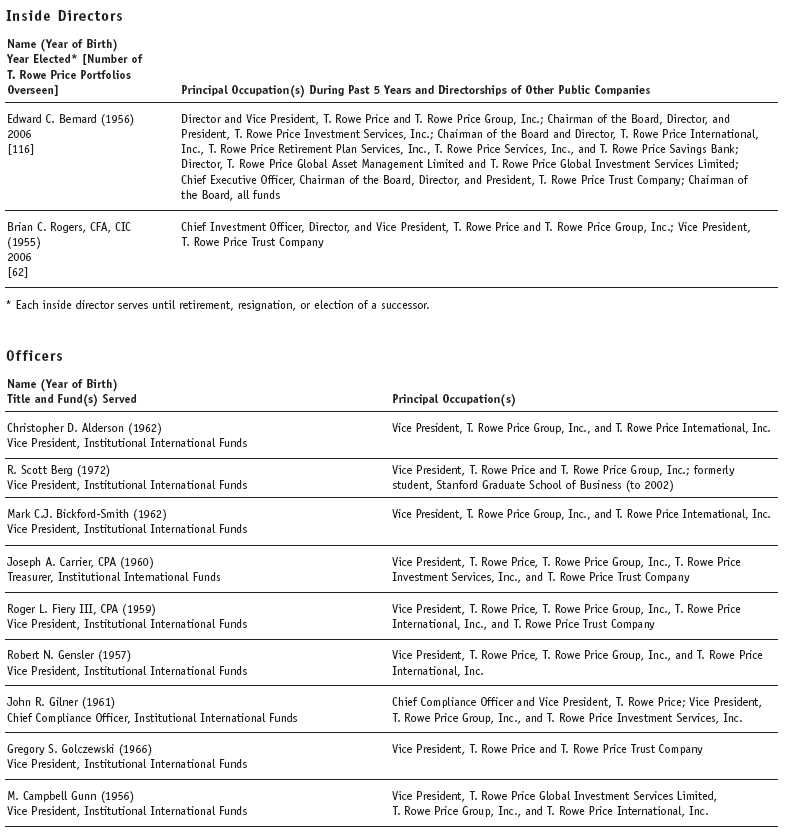
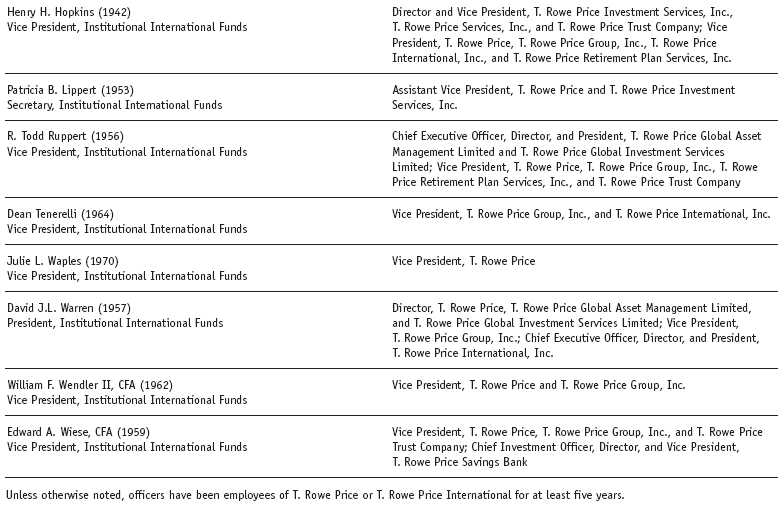
| About the Fund’s Directors and Officers |
The registrant has adopted a code of ethics, as defined in Item 2 of Form N-CSR, applicable to its principal executive officer, principal financial officer, principal accounting officer or controller, or persons performing similar functions. A copy of this code of ethics is filed as an exhibit to this Form N-CSR. No substantive amendments were approved or waivers were granted to this code of ethics during the period covered by this report.
Item 3. Audit Committee Financial Expert.
The registrant’s Board of Directors/Trustees has determined that Mr. Donald W. Dick Jr. qualifies as an audit committee financial expert, as defined in Item 3 of Form N-CSR. Mr. Dick is considered independent for purposes of Item 3 of Form N-CSR.
Item 4. Principal Accountant Fees and Services.
(a) – (d) Aggregate fees billed to the registrant for the last two fiscal years for professional services rendered by the registrant’s principal accountant were as follows:
| 2006 | 2005 | |
| Audit Fees | $12,679 | $10,572 |
| Audit-Related Fees | 1,081 | 732 |
| Tax Fees | 2,143 | 1,737 |
| All Other Fees | 150 | 368 |
Audit fees include amounts related to the audit of the registrant’s annual financial statements and services normally provided by the accountant in connection with statutory and regulatory filings. Audit-related fees include amounts reasonably related to the performance of the audit of the registrant’s financial statements and specifically include the issuance of a report on internal controls and, if applicable, agreed-upon procedures related to fund acquisitions. Tax fees include amounts related to services for tax compliance, tax planning, and tax advice. The nature of these services specifically includes the review of distribution calculations and the preparation of Federal, state, and excise tax returns. Reclassification from tax fees to audit fees of fiscal 2005 amounts related to the auditing of tax disclosures within the registrant’s annual financial statements has been made in order to conform to fiscal 2006 presentation. All other fees include the registrant’s pro-rata share of amounts for agreed-upon procedures in conjunction with service contract approvals by the registrant’s Board of Directors/Trustees.
(e)(1) The registrant’s audit committee has adopted a policy whereby audit and non-audit services performed by the registrant’s principal accountant for the registrant, its investment adviser, and any entity controlling, controlled by, or under common control with the investment adviser that provides ongoing services to the registrant require pre-approval in advance at regularly scheduled audit committee meetings. If such a service is required between regularly scheduled audit committee meetings, pre-approval may be authorized by one audit committee member with ratification at the next scheduled audit committee meeting. Waiver of pre-approval for audit or non-audit services requiring fees of a de minimis amount is not permitted.
(2) No services included in (b) – (d) above were approved pursuant to paragraph (c)(7)(i)(C) of Rule 2-01 of Regulation S-X.
(f) Less than 50 percent of the hours expended on the principal accountant’s engagement to audit the registrant’s financial statements for the most recent fiscal year were attributed to work performed by persons other than the principal accountant’s full-time, permanent employees.
(g) The aggregate fees billed for the most recent fiscal year and the preceding fiscal year by the registrant’s principal accountant for non-audit services rendered to the registrant, its investment adviser, and any entity controlling, controlled by, or under common control with the investment adviser that provides ongoing services to the registrant were $1,200,000 and $883,000, respectively, and were less than the aggregate fees billed for those same periods by the registrant’s principal accountant for audit services rendered to the T. Rowe Price Funds. Preceding fiscal year amount reflects the reclassification of tax fees described in (a) – (d) above.
(h) All non-audit services rendered in (g) above were pre-approved by the registrant’s audit committee. Accordingly, these services were considered by the registrant’s audit committee in maintaining the principal accountant’s independence.Item 5. Audit Committee of Listed Registrants.
Not applicable.
Item 6. Schedule of Investments.
Not applicable. The complete schedule of investments is included in Item 1 of this Form N-CSR.
Item 7. Disclosure of Proxy Voting Policies and Procedures for Closed-End Management Investment Companies.
Not applicable.
Item 8. Portfolio Managers of Closed-End Management Investment Companies.
Not applicable.
Item 9. Purchases of Equity Securities by Closed-End Management Investment Company and Affiliated Purchasers.
Not applicable.
Item 10. Submission of Matters to a Vote of Security Holders.
Not applicable.
Item 11. Controls and Procedures.
(a) The registrant’s principal executive officer and principal financial officer have evaluated the registrant’s disclosure controls and procedures within 90 days of this filing and have concluded that the registrant’s disclosure controls and procedures were effective, as of that date, in ensuring that information required to be disclosed by the registrant in this Form N-CSR was recorded, processed, summarized, and reported timely.
(b) The registrant’s principal executive officer and principal financial officer are aware of no change in the registrant’s internal control over financial reporting that occurred during the registrant’s second fiscal quarter covered by this report that has materially affected, or is reasonably likely to materially affect, the registrant’s internal control over financial reporting.
Item 12. Exhibits.
(a)(1) The registrant’s code of ethics pursuant to Item 2 of Form N-CSR is attached.
(2) Separate certifications by the registrant's principal executive officer and principal financial officer, pursuant to Section 302 of the Sarbanes-Oxley Act of 2002 and required by Rule 30a-2(a) under the Investment Company Act of 1940, are attached.
(3) Written solicitation to repurchase securities issued by closed-end companies: not applicable.
(b) A certification by the registrant's principal executive officer and principal financial officer, pursuant to Section 906 of the Sarbanes-Oxley Act of 2002 and required by Rule 30a-2(b) under the Investment Company Act of 1940, is attached.
SIGNATURES | |
| Pursuant to the requirements of the Securities Exchange Act of 1934 and the Investment | |
| Company Act of 1940, the registrant has duly caused this report to be signed on its behalf by the | |
| undersigned, thereunto duly authorized. | |
| T. Rowe Price Institutional International Funds, Inc. | |
| By | /s/ Edward C. Bernard |
| Edward C. Bernard | |
| Principal Executive Officer | |
| Date | December 15, 2006 |
| Pursuant to the requirements of the Securities Exchange Act of 1934 and the Investment | |
| Company Act of 1940, this report has been signed below by the following persons on behalf of | |
| the registrant and in the capacities and on the dates indicated. | |
| By | /s/ Edward C. Bernard |
| Edward C. Bernard | |
| Principal Executive Officer | |
| Date | December 15, 2006 |
| By | /s/ Joseph A. Carrier |
| Joseph A. Carrier | |
| Principal Financial Officer | |
| Date | December 15, 2006 |