Item 1: Report to Shareholders
 |
| Institutional Foreign Equity Fund | October 31, 2006 |
The views and opinions in this report were current as of October 31, 2006. They are not guarantees of performance or investment results and should not be taken as investment advice. Investment decisions reflect a variety of factors, and the managers reserve the right to change their views about individual stocks, sectors, and the markets at any time. As a result, the views expressed should not be relied upon as a forecast of the fund’s future investment intent. The report is certified under the Sarbanes-Oxley Act of 2002, which requires mutual funds and other public companies to affirm that, to the best of their knowledge, the information in their financial reports is fairly and accurately stated in all material respects.
Dear Investor
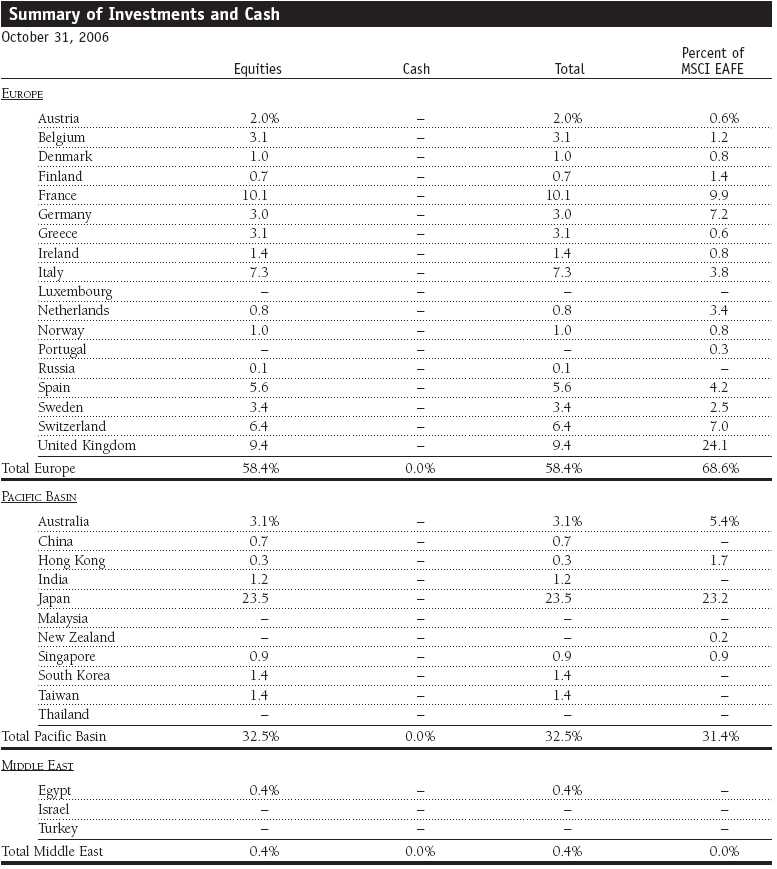
International stocks produced modest gains over the past six months, although performance over the 12 months ended October 31, 2006, was quite robust. Developed European and Latin American markets posted gains during the half year. Japan was sharply lower, and a declining yen versus the dollar deepened losses for U.S. investors. Emerging markets overall were flat.
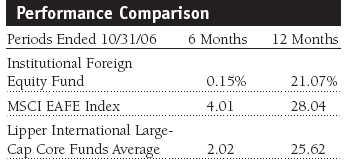
Your fund’s return was essentially flat during the recent six-month period but strong over the 12 months ended October 31, 2006. Fund results lagged those of the MSCI EAFE Index and the Lipper International Large-Cap Core Funds Average during both periods. The major reason for the fund’s trailing results versus the index was weak stock selection in various sectors.
MARKET REVIEW
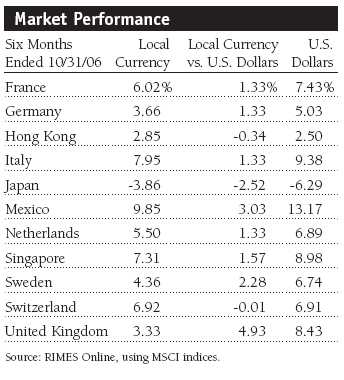
International equity markets regained some of the ground lost earlier in the year but only managed to eke out modest advances overall during the past six months. Global economic data remained strong, and most countries are experiencing healthy non-inflationary growth. Oil and commodity prices fell, but ongoing conflict in the Middle East and further instability in North Korea weighed on the markets. The European Central Bank (ECB) and the Bank of Japan raised interest rates to head off inflation, but the U.S. Federal Reserve paused in its two-year cycle of monetary tightening. Japan did poorly, while developed Europe provided better results. Emerging markets managed to recoup their earlier losses. The dollar was stronger against the yen, weakening returns for U.S. investors in that market, while dollar weakness versus the euro boosted results.
In Europe, economic fundamentals were encouraging. The continent’s economy grew faster in the first half of the year than previously reported, but by the end of the period, there were fears that it might be slowing. The ECB projected the growth rate for the year at about 2.5%, which would be the fastest pace since 2000. ECB President Jean-Claude Trichet warned of higher rates of inflation and said the bank would exercise “strong vigilance” to defend price stability. Merger activity continued at a fast pace, enhancing returns.
Japan’s economic data painted a confusing picture. In late August, data indicated year-to-date capital spending had grown at its fastest pace since the bubble years, but later reports led some to believe that Japan’s recovery might be in jeopardy. China continues to record strong economic growth despite attempts by the authorities to rein it in. The central bank raised interest rates in August for the second time in four months, and officials indicated they could continue to squeeze the nation’s money supply. China’s trade surplus is expected to exceed last year’s before year-end. Two other regional heavyweights, Taiwan and South Korea, were hamstrung by internal political trouble, disappointing corporate earnings, and slowing economies.
PORTFOLIO PERFORMANCE AND STRATEGY

As we mentioned in our last report, our primary focus is on individual stock selection rather than on sector and regional allocation. We remained disciplined during the period about selecting stocks of companies in which we have a high level of conviction. Unfortunately, certain portfolio holdings did not pan out as well as anticipated, and the fund’s performance versus the MSCI EAFE Index suffered as a result.
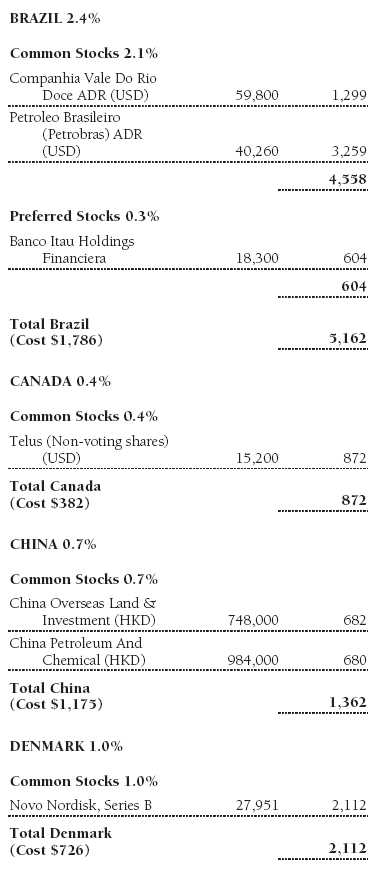
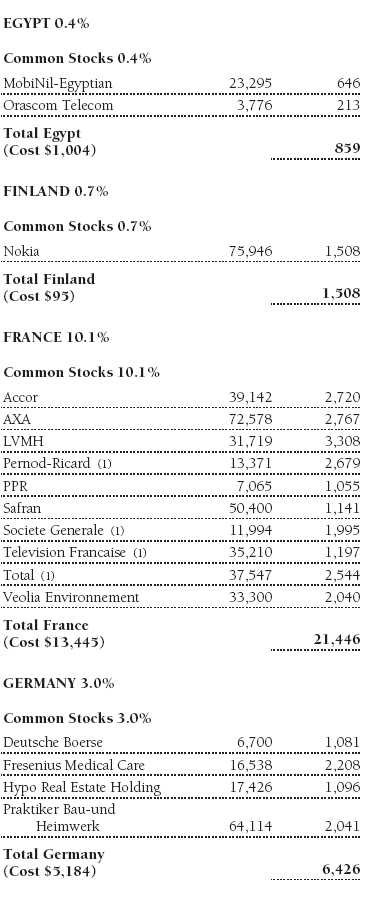
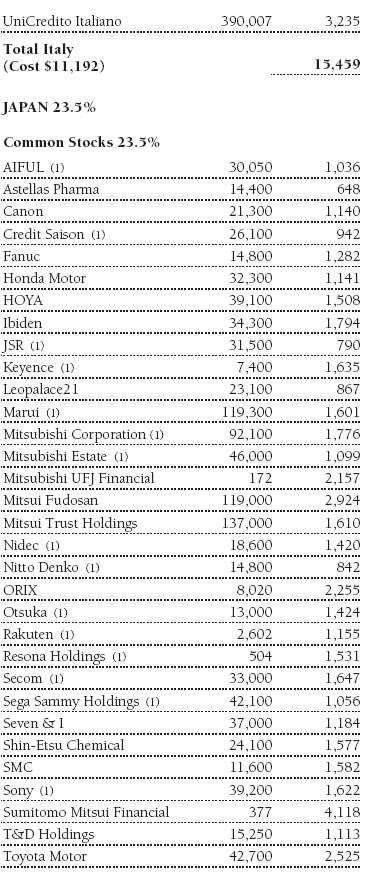
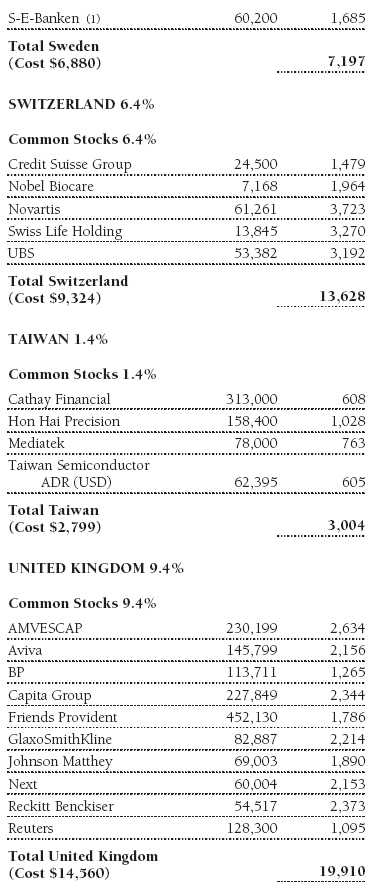
During the past six months, poor performance from some of our major financial positions, including Japan’s AIFUL, Turkey’s Turkiye Garanti, and Germany’s Commerzbank, hurt relative results. Regarding Japan, we have been favoring stocks tied to the domestic economy in the belief that the recovery will benefit them to a greater degree than export-related stocks. We remain optimistic about this bias even though the latter group outperformed during the recent six-month period. Frankly, we were somewhat surprised by the weakness of the yen versus the U.S. dollar, which hurt the types of stocks we selected for the portfolio. We have continued to take strong positions in Japanese banks, real estate, retail, and service sector stocks. (Please refer to the fund’s portfolio of investments for a detailed list of holdings and the amount ea ch represents of the portfolio.)
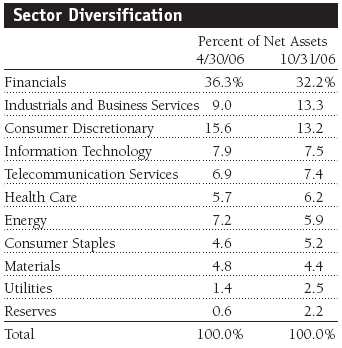
Historical weightings reflect current industry/sector classifications.
The portfolio’s consumer discretionary holdings were also a negative during the period as Internet retailers and leisure stocks delivered less-than-stellar returns. Rakuten, a Japanese Internet retailer and consumer finance company, continued to languish following a scandal in the first quarter of the year and additional corporate governance problems in the second quarter. Japan’s Sega Sammy Holdings reported a substantial decline in earnings in the second quarter, which trimmed fund performance. An underweight in utilities, which enjoyed a good run considering their defensive characteristics in weak markets, was another deterrent.
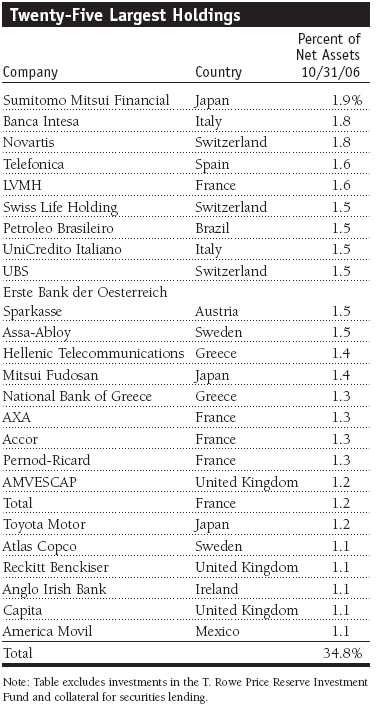
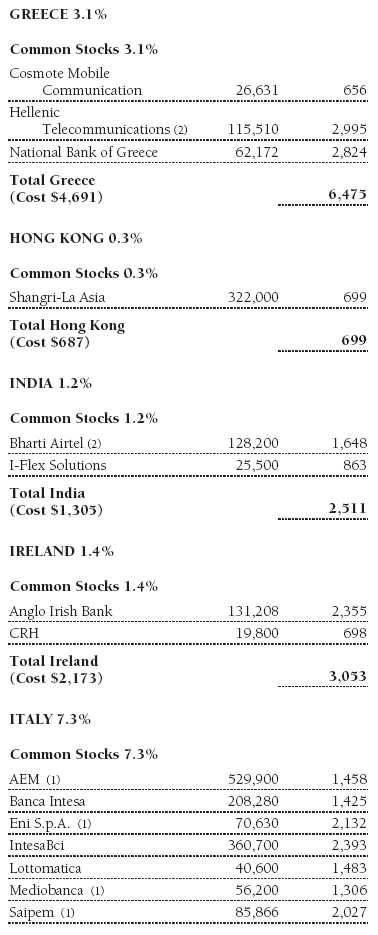
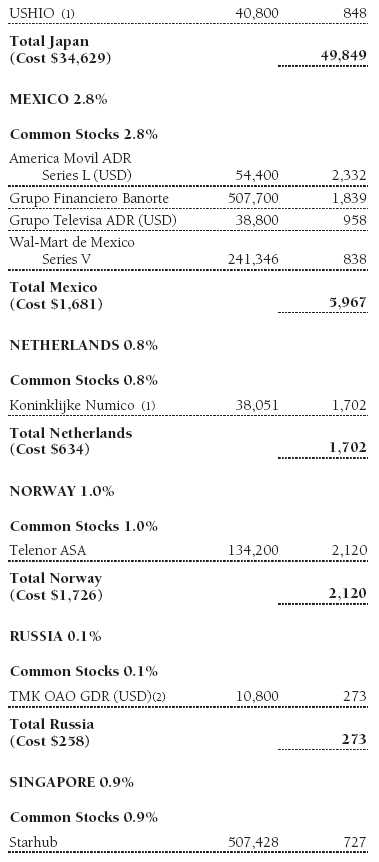
The primary positive contributors to relative results versus the benchmark were Italian insurer Toro Assicurazioni, which was acquired by another company; Mexican bank Grupo Financiero Banorte, which reported stellar earnings and benefited from merger speculation; and another Italian holding, Banca Intesa, which has been a longtime top performer. An overweight in telecom holdings also aided results, as Spain’s Telefonica and Norway’s Telenor were standout contributors. Telenor enjoys significant exposure to attractive mobile assets in emerging markets, while Telefonica’s Latin American operations are providing good revenue growth and rapid expansion in earnings margins.
Regarding investment strategy, we decided not to become defensive during the correction and, instead, took advantage of the opportunity to add to capital goods and industrial stocks since we expect to see an acceleration in earnings growth in those areas. We believe this tack has already begun to show results, as has our strategy vis-à-vis Japan.
INVESTMENT OUTLOOK
We remain optimistic about international equities. Stock valuations appear reasonable, particularly in the developed markets of Europe, and the pace of international economic growth will continue to be driven by events in the U.S. The prospect of stronger economic growth is brighter in areas where we are most heavily invested, although we do anticipate some slowing during the second half of 2007. The equity markets have recovered from their lows this past July, as we have witnessed a return to a greater tolerance for risk.
Emerging market stock valuations are not overly expensive, but neither are they as compelling relative to developed European markets as they had been. In Japan, as mentioned, we feel strongly that our strategy of focusing on domestic rather than export-driven stocks is the right one. Deflation there is now a phenomenon of the past, and inflationary trends are moderate. Positive forces seem firmly in place, and we believe the yen will strengthen once again versus the U.S. dollar following another rate increase by the Bank of Japan.
Our strategy will continue to emphasize a bottom-up approach of selecting stocks with strong growth potential rather than a bias toward sector or regional allocations.
Respectfully submitted,

David J.L. Warren
President, T. Rowe Price International Funds, Inc.
November 17, 2006
| Risks of International Investing |
Funds that invest overseas generally carry more risk than funds that invest strictly in U.S. assets. Funds investing in a single country or in a limited geographic region tend to be riskier than more diversified funds. Risks can result from varying stages of economic and political development; differing regulatory environments, trading days, and accounting standards; and higher transaction costs of non-U.S. markets. Non-U.S. investments are also subject to currency risk, or a decline in the value of a foreign currency versus the U.S. dollar, which reduces the dollar value of securities denominated in that currency.
| Glossary |
GDP: Gross domestic product is the total market value of all goods and services produced in a country in a given year.
Lipper averages: The averages of available mutual fund performance returns for specified periods in defined categories as tracked by Lipper Inc.
MSCI EAFE Index: Widely accepted as the benchmark for international stock performance (EAFE refers to Europe, Australasia, and Far East). The index represents the major markets of the world.
Price/earnings ratio: Calculated by dividing a stock’s market value per share by the company’s earnings per share for the past 12 months or by expected earnings for the coming year.
Portfolio Highlights
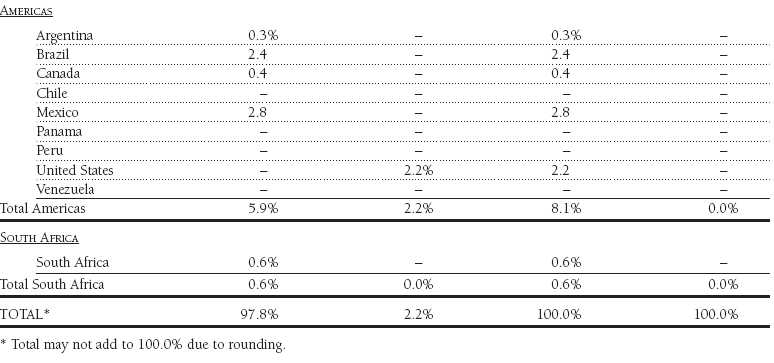
| Performance Comparison |
This chart shows the value of a hypothetical $1,000,000 investment in the fund over the past 10 fiscal year periods or since inception (for funds lacking 10-year records). The result is compared with benchmarks, which may include a broad-based market index and a peer group average or index. Market indexes do not include expenses, which are deducted from fund returns as well as mutual fund averages and indexes.
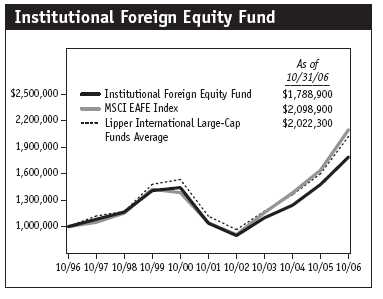
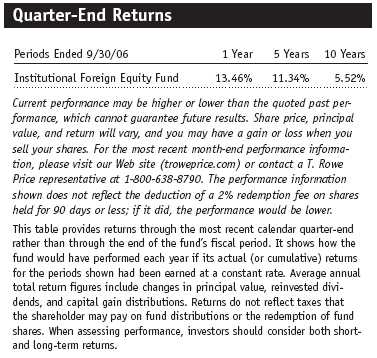
This table shows how the portfolio and its benchmarks would have performed each year if their actual (or cumulative) returns for the periods shown were earned at a constant rate.
Fund Expense Example
As a mutual fund shareholder, you may incur two types of costs: (1) transaction costs, such as redemption fees or sales loads, and (2) ongoing costs, including management fees, distribution and service (12b-1) fees, and other fund expenses. The following example is intended to help you understand your ongoing costs (in dollars) of investing in the fund and to compare these costs with the ongoing costs of investing in other mutual funds. The example is based on an investment of $1,000 invested at the beginning of the most recent six-month period and held for the entire period.
Actual Expenses
The first line of the following table (“Actual”) provides information about actual account values and actual expenses. You may use the information in this line, together with your account balance, to estimate the expenses that you paid over the period. Simply divide your account value by $1,000 (for example, an $8,600 account value divided by $1,000 = 8.6), then multiply the result by the number in the first line under the heading “Expenses Paid During Period” to estimate the expenses you paid on your account during this period.
Hypothetical Example for Comparison Purposes
The information on the second line of the table (“Hypothetical”) is based on hypothetical account values and expenses derived from the fund’s actual expense ratio and an assumed 5% per year rate of return before expenses (not the fund’s actual return). You may compare the ongoing costs of investing in the fund with other funds by contrasting this 5% hypothetical example and the 5% hypothetical examples that appear in the shareholder reports of the other funds. The hypothetical account values and expenses may not be used to estimate the actual ending account balance or expenses you paid for the period.
You should also be aware that the expenses shown in the table highlight only your ongoing costs and do not reflect any transaction costs, such as redemption fees or sales loads. Therefore, the second line of the table is useful in comparing ongoing costs only and will not help you determine the relative total costs of owning different funds. To the extent a fund charges transaction costs, however, the total cost of owning that fund is higher.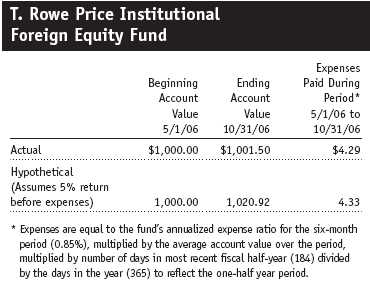
![]()
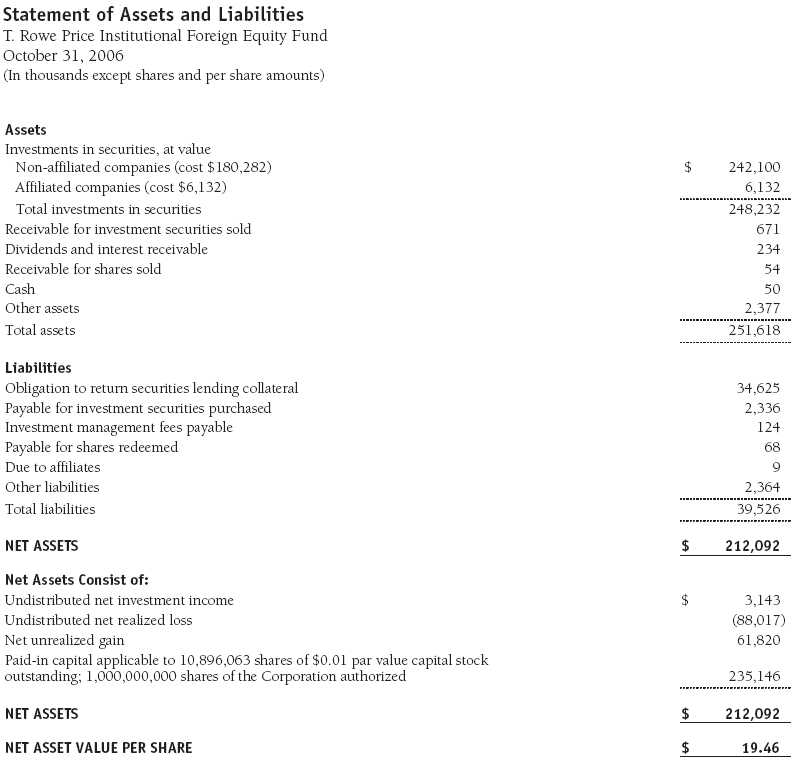
The accompanying notes are an integral part of these financial statements.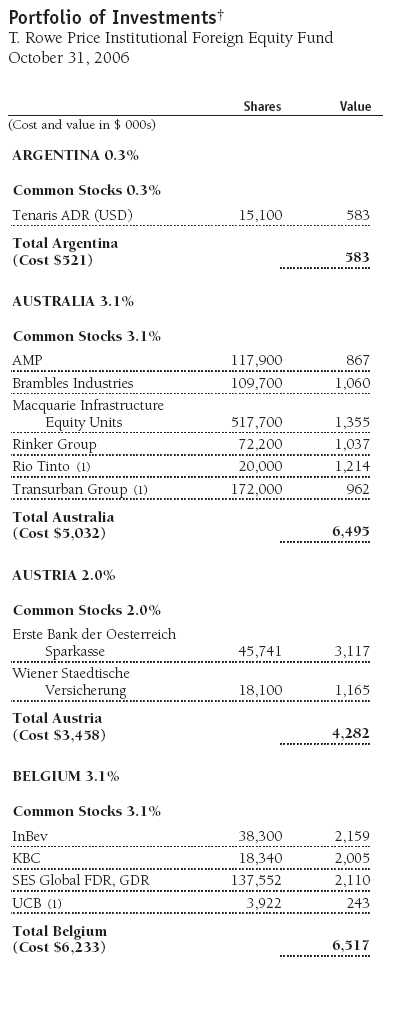

The accompanying notes are an integral part of these financial statements.
The accompanying notes are an integral part of these financial statements.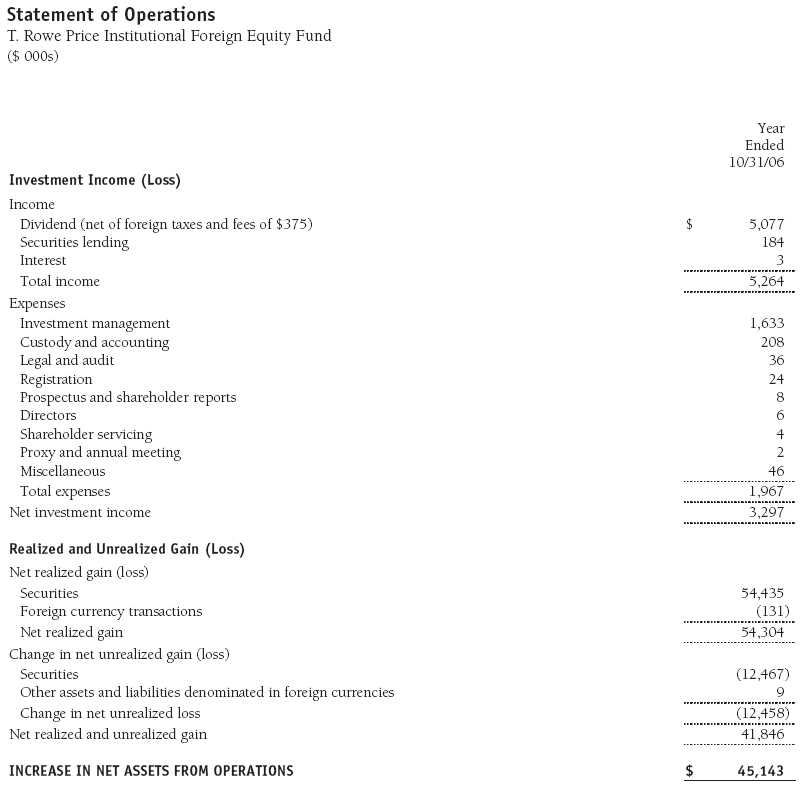
The accompanying notes are an integral part of these financial statements.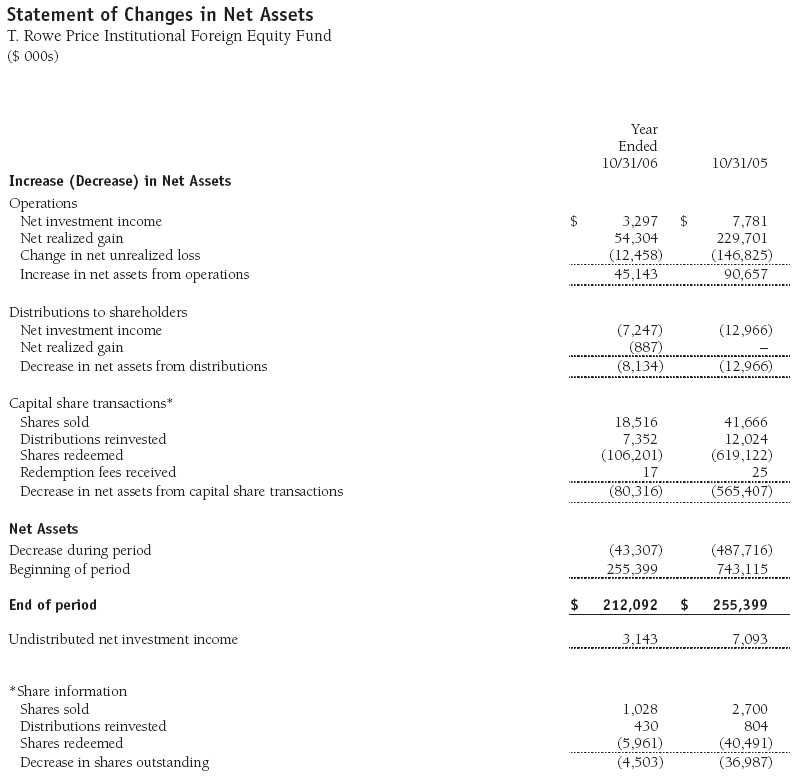
The accompanying notes are an integral part of these financial statements.
Notes to Financial Statements
NOTE 1 - SIGNIFICANT ACCOUNTING POLICIES
T. Rowe Price Institutional International Funds, Inc. (the corporation), is registered under the Investment Company Act of 1940 (the 1940 Act). The Institutional Foreign Equity Fund (the fund), a diversified, open-end management investment company, is one portfolio established by the corporation. The fund commenced operations on September 7, 1989. The fund seeks long-term growth of capital through investments primarily in the common stocks of established, non-U.S. companies.
The accompanying financial statements were prepared in accordance with accounting principles generally accepted in the United States of America, which require the use of estimates made by fund management. Fund management believes that estimates and security valuations are appropriate; however, actual results may differ from those estimates, and the security valuations reflected in the financial statements may differ from the value the fund ultimately realizes upon sale of the securities.
Valuation The fund values its investments and computes its net asset value per share at the close of the New York Stock Exchange (NYSE), normally 4 p.m. ET, each day that the NYSE is open for business. Equity securities listed or regularly traded on a securities exchange or in the over-the-counter (OTC) market are valued at the last quoted sale price or, for certain markets, the official closing price at the time the valuations are made, except for OTC Bulletin Board securities, which are valued at the mean of the latest bid and asked prices. A security that is listed or traded on more than one exchange is valued at the quotation on the exchange determined to be the primary market for such security. Listed securities not traded on a particular day are valued at the mean of the latest bid and asked prices for domestic securities and the last quoted sale price for international securities.
Investments in mutual funds are valued at the mutual fund’s closing net asset value per share on the day of valuation.
Other investments, including restricted securities, and those for which the above valuation procedures are inappropriate or are deemed not to reflect fair value are stated at fair value as determined in good faith by the T. Rowe Price Valuation Committee, established by the fund’s Board of Directors.
Most foreign markets close before the close of trading on the NYSE. If the fund determines that developments between the close of a foreign market and the close of the NYSE will, in its judgment, materially affect the value of some or all of its portfolio securities, which in turn will affect the fund’s share price, the fund will adjust the previous closing prices to reflect the fair value of the securities as of the close of the NYSE, as determined in good faith by the T. Rowe Price Valuation Committee, established by the fund’s Board of Directors. A fund may also fair value securities in other situations, such as when a particular foreign market is closed but the fund is open. In deciding whether to make fair value adjustments, the fund reviews a variety of factors, including developments in foreign markets, the performance of U.S. securities markets, and the performance of instruments trading in U.S. markets that represent foreign securities and baskets o f foreign securities. The fund uses outside pricing services to provide it with closing market prices and information used for adjusting those prices. The fund cannot predict when and how often it will use closing prices and when it will adjust those prices to reflect fair value. As a means of evaluating its fair value process, the fund routinely compares closing market prices, the next day’s opening prices in the same markets, and adjusted prices.
Currency Translation Assets, including investments, and liabilities denominated in foreign currencies are translated into U.S. dollar values each day at the prevailing exchange rate, using the mean of the bid and asked prices of such currencies against U.S. dollars as quoted by a major bank. Purchases and sales of securities, income, and expenses are translated into U.S. dollars at the prevailing exchange rate on the date of the transaction. The effect of changes in foreign currency exchange rates on realized and unrealized security gains and losses is reflected as a component of security gains and losses.
Rebates and Credits Subject to best execution, the fund may direct certain security trades to brokers who have agreed to rebate a portion of the related brokerage commission to the fund in cash. Commission rebates are reflected as realized gain on securities in the accompanying financial statements and totaled $42,000 for the year ended October 31, 2006. Additionally, the fund earns credits on temporarily uninvested cash balances at the custodian that reduce the fund’s custody charges. Custody expense in the accompanying financial statements is presented before reduction for credits.
Redemption Fees A 2% fee is assessed on redemptions of fund shares held less than 90 days to deter short-term trading and to protect the interests of long-term shareholders. Redemption fees are withheld from proceeds that shareholders receive from the sale or exchange of fund shares. The fees are paid to the fund, and are recorded as an increase to paid-in capital. The fees may cause the redemption price per share to differ from the net asset value per share.
Investment Transactions, Investment Income, and Distributions Income and expenses are recorded on the accrual basis. Dividends received from mutual fund investments are reflected as dividend income; capital gain distributions are reflected as realized gain/loss. Dividend income and capital gain distributions are recorded on the ex-dividend date. Investment transactions are accounted for on the trade date. Realized gains and losses are reported on the identified cost basis. Distributions to shareholders are recorded on the ex-dividend date. Income distributions are declared and paid on an annual basis. Capital gain distributions, if any, are declared and paid by the fund, typically on an annual basis.
In June 2006, the Financial Accounting Standards Board (“FASB”) issued FASB Interpretation No. 48 (“FIN 48”), Accounting for Uncertainty in Income Taxes, a clarification of FASB Statement No. 109, Accounting for Income Taxes. FIN 48 establishes financial reporting rules regarding recognition and measurement of tax positions taken or expected to be taken on a tax return. Management is evaluating the anticipated impact on the fund from FIN 48, which is effective for the fund’s fiscal year beginning November 1, 2007.
NOTE 2 - INVESTMENT TRANSACTIONS
Consistent with its investment objective, the fund engages in the following practices to manage exposure to certain risks or to enhance performance. The investment objective, policies, program, and risk factors of the fund are described more fully in the fund’s prospectus and Statement of Additional Information.
Emerging Markets At October 31, 2006, approximately 13% of the fund’s net assets were invested in securities of companies located in emerging markets or denominated in or linked to the currencies of emerging market countries. Future economic or political developments could adversely affect the liquidity or value, or both, of such securities.
Restricted Securities The fund may invest in securities that are subject to legal or contractual restrictions on resale. Although certain of these securities may be readily sold, for example, under Rule 144A, others may be illiquid, their sale may involve substantial delays and additional costs, and prompt sale at an acceptable price may be difficult.
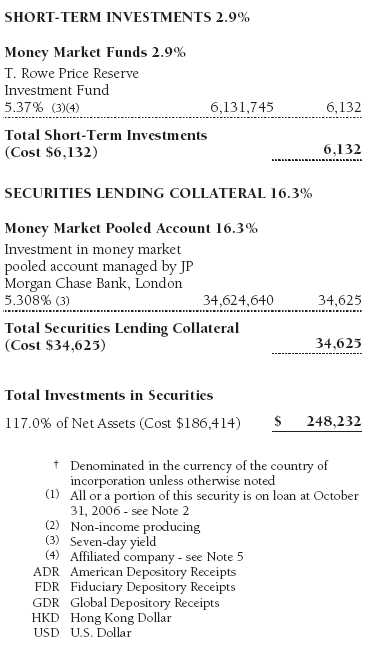
Securities Lending The fund lends its securities to approved brokers to earn additional income. It receives as collateral cash and U.S. government securities valued at 102% to 105% of the value of the securities on loan. Cash collateral is invested in a money market pooled account managed by the fund’s lending agent in accordance with investment guidelines approved by fund management. Collateral is maintained over the life of the loan in an amount not less than the value of loaned securities, as determined at the close of fund business each day; any additional collateral required due to changes in security values is delivered to the fund the next business day. Although risk is mitigated by the collateral, the fund could experience a delay in recovering its securities and a possible loss of income or value if the borrower fails to return the securities. Securities lending revenue recognized by the fund consists of earnings on invested collateral and borrowin g fees, net of any rebates to the borrower and compensation to the lending agent. At October 31, 2006, the value of loaned securities was $33,085,000; aggregate collateral consisted of $34,625,000 in the money market pooled account.
Other Purchases and sales of portfolio securities, other than short-term securities, aggregated $151,527,000 and $232,416,000, respectively, for the year ended October 31, 2006.
NOTE 3 - FEDERAL INCOME TAXES
No provision for federal income taxes is required since the fund intends to continue to qualify as a regulated investment company under Subchapter M of the Internal Revenue Code and distribute to shareholders all of its taxable income and gains. Federal income tax regulations differ from generally accepted accounting principles; therefore, distributions determined in accordance with tax regulations may differ significantly in amount or character from net investment income and realized gains for financial reporting purposes. Financial reporting records are adjusted for permanent book/tax differences to reflect tax character. Financial records are not adjusted for temporary differences.
Distributions during the year ended October 31, 2006, totaled $8,134,000 and were characterized as ordinary income for tax purposes. At October 31, 2006, the tax-basis components of net assets were as follows:

Federal income tax regulations require the fund to treat the gain/loss on passive foreign investment companies as realized on the last day of the tax year; accordingly, $1,508,000 of unrealized gains reflected in the accompanying financial statements were realized for tax purposes as of October 31, 2006. The fund intends to retain realized gains to the extent of available capital loss carryforwards. During the fiscal year ended October 31, 2006, the fund utilized $54,181,000 of capital loss carryforwards. As of October 31, 2006, the fund had $86,683,000 of capital loss carryforwards, of which $47,256,000 expire in fiscal 2010, and $39,427,000 expire in fiscal 2011.
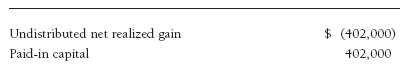
For the year ended October 31, 2006, the fund recorded the following permanent reclassifications to reflect tax character. Reclassifications to paid-in capital relate primarily to a tax practice that treats a portion of the proceeds from each redemption of capital shares as a distribution of taxable net investment income and/or realized capital gain. Results of operations and net assets were not affected by these reclassifications.
At October 31, 2006, the cost of investments for federal income tax purposes was $187,922,000.
NOTE 4 - FOREIGN TAXES
The fund is subject to foreign income taxes imposed by certain countries in which it invests. Additionally, capital gains realized by the fund upon disposition of securities issued in or by certain foreign countries are subject to capital gains tax imposed by those countries, which is payable prior to repatriation of sale proceeds. Similarly, a tax on net profits, including interest income and realized and unrealized capital gains, is imposed by certain other countries. All taxes are computed in accordance with the applicable foreign tax law, and, to the extent permitted, capital losses are used to offset capital gains. Tax expense attributable to income is accrued by the fund as a reduction of income. Current and deferred tax expense attributable to net capital gains is reflected as a component of realized and/or change in unrealized gain/loss on securities in the accompanying financial statements.
At October 31, 2006, the fund had no taxes payable attributable to foreign securities, no deferred tax liability attributable to foreign securities, and $24,067,000 of foreign capital loss carryforwards, including $1,166,000 that expire in 2009, $15,725,000 that expire in 2010, and $7,176,000 that expire thereafter through 2013.
NOTE 5 - RELATED PARTY TRANSACTIONS
The fund is managed by T. Rowe Price International, Inc. (the manager), a wholly owned subsidiary of T. Rowe Price Associates, Inc. (Price Associates), which is wholly owned by T. Rowe Price Group, Inc. The investment management agreement between the fund and the manager provides for an annual investment management fee equal to 0.70% of the fund’s average daily net assets. The fee is computed daily and paid monthly.
In addition, the fund has entered into service agreements with Price Associates and a wholly owned subsidiary of Price Associates (collectively, Price). Price Associates computes the daily share price and provides certain other administrative services to the fund. T. Rowe Price Services, Inc., provides shareholder and administrative services in its capacity as the fund’s transfer and dividend disbursing agent. For the year ended October 31, 2006, expenses incurred pursuant to these service agreements were $108,000 for Price Associates and $4,000 for T. Rowe Price Services. The total amount payable at period-end pursuant to these service agreements is reflected as Due to Affiliates in the accompanying financial statements.
The fund may invest in the T. Rowe Price Reserve Investment Fund and the T. Rowe Price Government Reserve Investment Fund (collectively, the T. Rowe Price Reserve Funds), open-end management investment companies managed by Price Associates and affiliates of the fund. The T. Rowe Price Reserve Funds are offered as cash management options to mutual funds, trusts, and other accounts managed by Price Associates and/or its affiliates, and are not available for direct purchase by members of the public. The T. Rowe Price Reserve Funds pay no investment management fees. During the year ended October 31, 2006, dividend income from the T. Rowe Price Reserve Funds totaled $147,000, and the value of shares of the T. Rowe Price Reserve Funds held at October 31, 2006, and October 31, 2005, was $6,132,000 and $8,022,000, respectively.
NOTE 6 - INTERFUND BORROWING
Pursuant to its prospectus, the fund may borrow up to 33 1/3% of its total assets. The fund is party to an interfund borrowing agreement between itself and other T. Rowe Price-sponsored mutual funds, which permits it to borrow or lend cash at rates beneficial to both the borrowing and lending funds. Loans totaling 10% or more of a borrowing fund’s total assets are collateralized at 102% of the value of the loan; loans of less than 10% are unsecured. During the year ended October 31, 2006, the fund had outstanding borrowings on 10 days, in the average amount of $15,860,000, and at an average annual rate of 4.63%. There were no borrowings outstanding at October 31, 2006.
Report of Independent Registered Public Accounting Firm
To the Board of Directors of T. Rowe Price Institutional International Funds, Inc. and Shareholders of T. Rowe Price Institutional Foreign Equity Fund
In our opinion, the accompanying statement of assets and liabilities, including the portfolio of investments, and the related statements of operations and of changes in net assets and the financial highlights present fairly, in all material respects, the financial position of T. Rowe Price Institutional Foreign Equity Fund (one of the portfolios comprising T. Rowe Price Institutional International Funds, Inc., hereafter referred to as the “Fund”) at October 31, 2006, the results of its operations for the year then ended, the changes in its net assets for each of the two years in the period then ended and the financial highlights for each of the five years in the period then ended, in conformity with accounting principles generally accepted in the United States of America. These financial statements and financial highlights (hereafter referred to as “financial statements”) are the responsibility of the Fund’s management; our responsibility is to express an opinion on these financial statements based on our audits. We conducted our audits of these financial statements in accordance with the auditing standards of the Public Company Accounting Oversight Board (United States). Those standards require that we plan and perform the audit to obtain reasonable assurance about whether the financial statements are free of material misstatement. An audit includes examining, on a test basis, evidence supporting the amounts and disclosures in the financial statements, assessing the accounting principles used and significant estimates made by management, and evaluating the overall financial statement presentation. We believe that our audits, which included confirmation of securities at October 31, 2006 by correspondence with the custodian and by agreement to the underlying ownership records for T. Rowe Price Reserve Investment Fund, provide a reasonable basis for our opinion.
PricewaterhouseCoopers LLP
Baltimore, Maryland
December 12, 2006
| Tax Information (Unaudited) for the Tax Year Ended 10/31/06 |
We are providing this information as required by the Internal Revenue Code. The amounts shown may differ from those elsewhere in this report because of differences between tax and financial reporting requirements.
The fund’s distributions to shareholders included $1,289,000 from short-term capital gains.
For taxable non-corporate shareholders, $2,671,000 of the fund’s income represents qualified dividend income subject to the 15% rate category.
The fund will pass through foreign source income of $3,882,000 and foreign taxes paid of $119,000.
| Information on Proxy Voting Policies, Procedures, and Records |
A description of the policies and procedures used by T. Rowe Price funds and portfolios to determine how to vote proxies relating to portfolio securities is available in each fund’s Statement of Additional Information, which you may request by calling 1-800-225-5132 or by accessing the SEC’s Web site, www.sec.gov. The description of our proxy voting policies and procedures is also available on our Web site, www.troweprice.com. To access it, click on the words “Company Info” at the top of our homepage for individual investors. Then, in the window that appears, click on the “Proxy Voting Policy” navigation button in the top left corner.
Each fund’s most recent annual proxy voting record is available on our Web site and through the SEC’s Web site. To access it through our Web site, follow the directions above, then click on the words “Proxy Voting Record” at the bottom of the Proxy Voting Policy page.
| How to Obtain Quarterly Portfolio Holdings |
The fund files a complete schedule of portfolio holdings with the Securities and Exchange Commission for the first and third quarters of each fiscal year on Form N-Q. The fund’s Form N-Q is available electronically on the SEC’s Web site (www.sec.gov); hard copies may be reviewed and copied at the SEC’s Public Reference Room, 450 Fifth St. N.W., Washington, DC 20549. For more information on the Public Reference Room, call 1-800-SEC-0330.
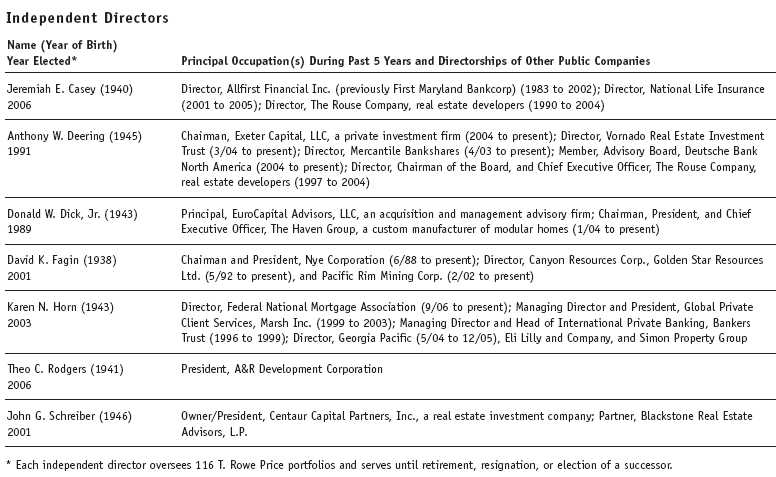
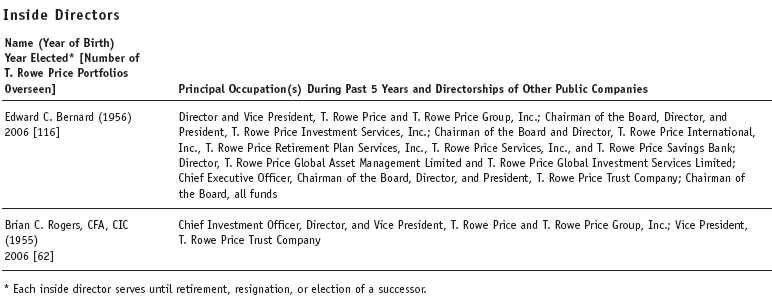
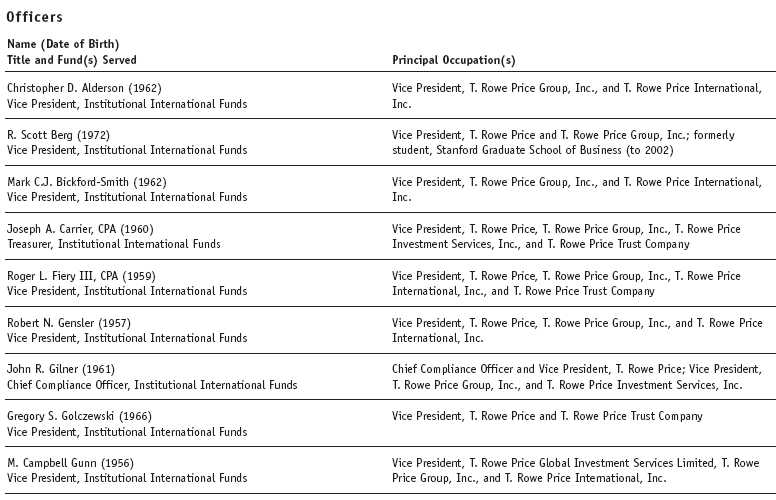
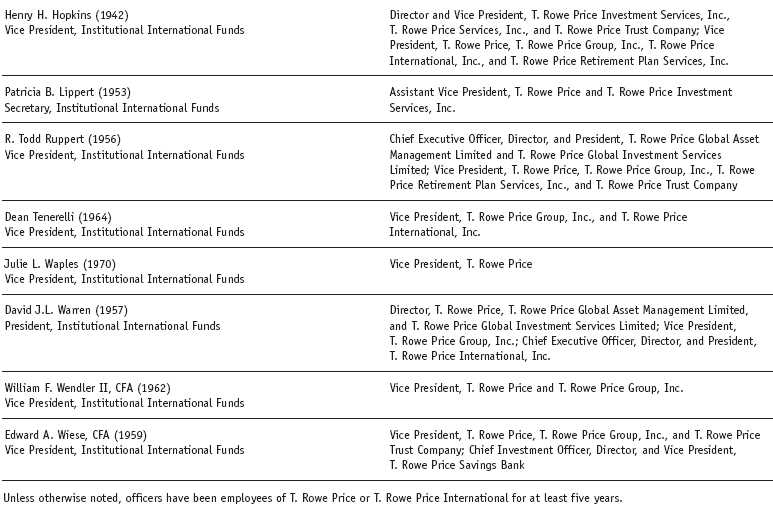
| About the Fund’s Directors and Officers |
Your fund is governed by a Board of Directors that meets regularly to review a wide variety of matters affecting the fund, including performance, investment programs, compliance matters, advisory fees and expenses, service providers, and other business affairs. The Board of Directors elects the fund’s officers, who are listed in the final table. At least 75% of Board members are independent of T. Rowe Price Associates, Inc. (T. Rowe Price) and T. Rowe Price International, Inc. (T. Rowe Price International); “inside” or “interested” directors are officers of T. Rowe Price. The business address of each director and officer is 100 East Pratt Street, Baltimore, MD 21202. The Statement of Additional Information includes additional information about the fund directors and is available without charge by calling a T. Rowe Price representative at 1-800-225-5132.
The registrant has adopted a code of ethics, as defined in Item 2 of Form N-CSR, applicable to its principal executive officer, principal financial officer, principal accounting officer or controller, or persons performing similar functions. A copy of this code of ethics is filed as an exhibit to this Form N-CSR. No substantive amendments were approved or waivers were granted to this code of ethics during the period covered by this report.
Item 3. Audit Committee Financial Expert.
The registrant’s Board of Directors/Trustees has determined that Mr. Donald W. Dick Jr. qualifies as an audit committee financial expert, as defined in Item 3 of Form N-CSR. Mr. Dick is considered independent for purposes of Item 3 of Form N-CSR.
Item 4. Principal Accountant Fees and Services.
(a) – (d) Aggregate fees billed to the registrant for the last two fiscal years for professional services rendered by the registrant’s principal accountant were as follows:
| 2006 | 2005 | |
| Audit Fees | $14,353 | $14,442 |
| Audit-Related Fees | 1,214 | 1,129 |
| Tax Fees | 2,420 | 2,372 |
| All Other Fees | 150 | 368 |
Audit fees include amounts related to the audit of the registrant’s annual financial statements and services normally provided by the accountant in connection with statutory and regulatory filings. Audit-related fees include amounts reasonably related to the performance of the audit of the registrant’s financial statements and specifically include the issuance of a report on internal controls and, if applicable, agreed-upon procedures related to fund acquisitions. Tax fees include amounts related to services for tax compliance, tax planning, and tax advice. The nature of these services specifically includes the review of distribution calculations and the preparation of Federal, state, and excise tax returns. Reclassification from tax fees to audit fees of fiscal 2005 amounts related to the auditing of tax disclosures within the registrant’s annual financial statements has been made in order to conform to fiscal 2006 presentation. All other fees include the registrant’s pro-rata share of amounts for agreed-upon procedures in conjunction with service contract approvals by the registrant’s Board of Directors/Trustees.
(e)(1) The registrant’s audit committee has adopted a policy whereby audit and non-audit services performed by the registrant’s principal accountant for the registrant, its investment adviser, and any entity controlling, controlled by, or under common control with the investment adviser that provides ongoing services to the registrant require pre-approval in advance at regularly scheduled audit committee meetings. If such a service is required between regularly scheduled audit committee meetings, pre-approval may be authorized by one audit committee member with ratification at the next scheduled audit committee meeting. Waiver of pre-approval for audit or non-audit services requiring fees of a de minimis amount is not permitted.
(2) No services included in (b) – (d) above were approved pursuant to paragraph (c)(7)(i)(C) of Rule 2-01 of Regulation S-X.
(f) Less than 50 percent of the hours expended on the principal accountant’s engagement to audit the registrant’s financial statements for the most recent fiscal year were attributed to work performed by persons other than the principal accountant’s full-time, permanent employees.
(g) The aggregate fees billed for the most recent fiscal year and the preceding fiscal year by the registrant’s principal accountant for non-audit services rendered to the registrant, its investment adviser, and any entity controlling, controlled by, or under common control with the investment adviser that provides ongoing services to the registrant were $1,200,000 and $883,000, respectively, and were less than the aggregate fees billed for those same periods by the registrant’s principal accountant for audit services rendered to the T. Rowe Price Funds. Preceding fiscal year amount reflects the reclassification of tax fees described in (a) – (d) above.
(h) All non-audit services rendered in (g) above were pre-approved by the registrant’s audit committee. Accordingly, these services were considered by the registrant’s audit committee in maintaining the principal accountant’s independence.
Item 5. Audit Committee of Listed Registrants.
Not applicable.
Item 6. Schedule of Investments.
Not applicable. The complete schedule of investments is included in Item 1 of this Form N-CSR.
Item 7. Disclosure of Proxy Voting Policies and Procedures for Closed-End Management Investment Companies.
Not applicable.
Item 8. Portfolio Managers of Closed-End Management Investment Companies.
Not applicable.
Item 9. Purchases of Equity Securities by Closed-End Management Investment Company and Affiliated Purchasers.
Not applicable.
Item 10. Submission of Matters to a Vote of Security Holders.
Not applicable.
Item 11. Controls and Procedures.
(a) The registrant’s principal executive officer and principal financial officer have evaluated the registrant’s disclosure controls and procedures within 90 days of this filing and have concluded that the registrant’s disclosure controls and procedures were effective, as of that date, in ensuring that information required to be disclosed by the registrant in this Form N-CSR was recorded, processed, summarized, and reported timely.
(b) The registrant’s principal executive officer and principal financial officer are aware of no change in the registrant’s internal control over financial reporting that occurred during the registrant’s second fiscal quarter covered by this report that has materially affected, or is reasonably likely to materially affect, the registrant’s internal control over financial reporting.
Item 12. Exhibits.
(a)(1) The registrant’s code of ethics pursuant to Item 2 of Form N-CSR is attached.
(2) Separate certifications by the registrant's principal executive officer and principal financial officer, pursuant to Section 302 of the Sarbanes-Oxley Act of 2002 and required by Rule 30a-2(a) under the Investment Company Act of 1940, are attached.
(3) Written solicitation to repurchase securities issued by closed-end companies: not applicable.
(b) A certification by the registrant's principal executive officer and principal financial officer, pursuant to Section 906 of the Sarbanes-Oxley Act of 2002 and required by Rule 30a-2(b) under the Investment Company Act of 1940, is attached.
SIGNATURES | |
| Pursuant to the requirements of the Securities Exchange Act of 1934 and the Investment | |
| Company Act of 1940, the registrant has duly caused this report to be signed on its behalf by the | |
| undersigned, thereunto duly authorized. | |
| T. Rowe Price Institutional International Funds, Inc. | |
| By | /s/ Edward C. Bernard |
| Edward C. Bernard | |
| Principal Executive Officer | |
| Date | December 15, 2006 |
| Pursuant to the requirements of the Securities Exchange Act of 1934 and the Investment | |
| Company Act of 1940, this report has been signed below by the following persons on behalf of | |
| the registrant and in the capacities and on the dates indicated. | |
| By | /s/ Edward C. Bernard |
| Edward C. Bernard | |
| Principal Executive Officer | |
| Date | December 15, 2006 |
| By | /s/ Joseph A. Carrier |
| Joseph A. Carrier | |
| Principal Financial Officer | |
| Date | December 15, 2006 |