Item 1: Report to Shareholders
 |
| Institutional Foreign Equity Fund | October 31, 2007 |
The views and opinions in this report were current as of October 31, 2007. They are not guarantees of performance or investment results and should not be taken as investment advice. Investment decisions reflect a variety of factors, and the managers reserve the right to change their views about individual stocks, sectors, and the markets at any time. As a result, the views expressed should not be relied upon as a forecast of the fund’s future investment intent. The report is certified under the Sarbanes-Oxley Act, which requires mutual funds and other public companies to affirm that, to the best of their knowledge, the information in their financial reports is fairly and accurately stated in all material respects.
Manager’s Letter
Welcome From Bob Smith
This is my first opportunity to correspond with you as lead portfolio manager of the T. Rowe Price Institutional Foreign Equity Fund. I would like to thank you for your continued belief in our ability to produce solid returns for your investments. Although the fund’s long-term absolute performance has been good, results relative to our peer group have been disappointing. The change in portfolio management allows us to take advantage of the firm’s expanded research capabilities in international markets and, we believe, improve the fund’s performance versus its benchmarks. I want to reassure you that the portfolio remains focused on growth companies. Going forward, however, we will do so through one lens, rather than through three regional lenses. In the past, we used a multi-manager regional approach to cover the broad opportunity set of companies outside the U.S. Over the past several years, T. Rowe Price has recruited and trained a talented team of international research analysts. We feel that the combination of in-house analytical depth and a single, comprehensive management approach will serve you well over time.
Dear Investor
International stocks produced robust gains for the 6- and 12-month periods ended October 31, 2007. Despite heightened volatility—including sharp sell-offs in February and August—non-U.S. equities overall were stronger than their U.S. counterparts. Emerging markets handily outperformed developed markets over the past six months and for the year, and in a reversal of a multi-year trend, growth stocks generally distanced value shares, especially in the past six months.
| Highlights |
• International stock markets posted solid gains for the six months and year ended October 31.
• The fund modestly outperformed its Lipper peer group for the past six and 12 months.
• The portfolio’s emerging markets holdings delivered outstanding gains, and our lighter exposure to Japan contributed to relative performance.
• The slowing of the U.S. economy could hurt global growth in the short term, but our medium- and longer-term outlook remains optimistic.
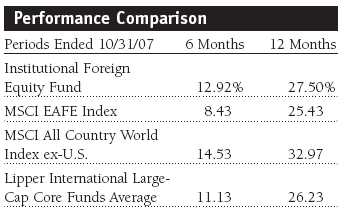
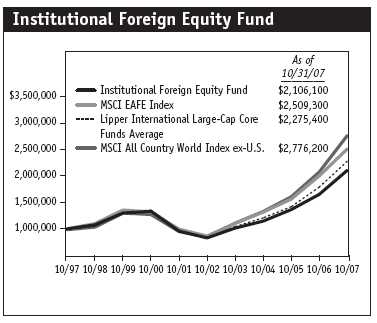
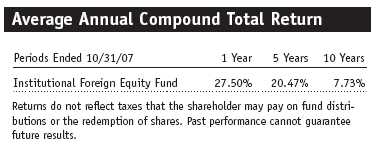
Your fund posted solid results for the 12 months ended October 31, 2007—the gains were identical in each of the past two six-month periods. As shown in the table, the fund generated a 12.92% return since the end of April, bringing the 12-month total return to 27.50%, which was slightly better than the 25.43% result for the MSCI EAFE Index. We are introducing a new fund benchmark in this report. Going forward we will compare the portfolio’s results to the MSCI All Country World Index ex-U.S. We believe this benchmark more closely matches the portfolio’s blend of holdings in developed and emerging markets, while the MSCI EAFE Index is focused exclusively on developed market companies. As shown in the table, we modestly trailed our new benchmark.
MARKET REVIEW
International equities advanced, albeit unevenly, over the past six months. Emerging markets led the way as the strong economic momentum in these countries showed little sign of slowing. However, in July and August fears about contagion from the poor credit quality of assets linked to U.S. subprime mortgages hurt equities. Merger and acquisition activity, which had provided support earlier in the summer, dried up as the credit markets contracted. Central banks were forced to inject liquidity to counter a loss of confidence among financial institutions, and, in an effort to bolster the flagging U.S. economy, the Federal Reserve cut short-term interest rates.
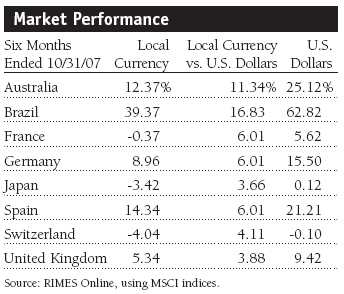
The global economy has been experiencing a substantial expansion with contained inflation, but conditions appear to be changing. Because of a weak residential real estate market, higher oil prices, a plummeting dollar, and a business cycle that may be peaking, the U.S. economic outlook has become more clouded. Six months ago, it appeared that Europe was poised for a period of accelerated economic growth, reflecting market-friendly reforms in Germany, France, and a number of Eastern European countries, noninflationary employment growth in much of the region, and strong exports that were expected to fuel economic momentum. However, Europe’s consumer demand remained stagnant despite higher employment. Overheated real estate markets in Spain and Ireland cooled, and in August concerns about growing defaults in the U.S. subprime mortgage market roiled the world’s credit markets.
Pacific ex-Japan equities delivered the best returns among the leading developed regions, followed by European stocks. Hong Kong, Singapore, and Australia all benefited from China’s rapid economic growth and large cash reserves. Once again, Japan lagged other markets. Although the country has experienced its longest expansion since the end of World War II, its domestic consumption remains weak, and there are periodic and worrisome signs that deflation may reappear. Emerging Asia and Latin America markets registered strong gains. The robust growth, coming from strength in commodity prices and the industrialization in many Asian countries, continued to increase domestic economic activity.
PORTFOLIO STRATEGY
Before discussing the current market dynamics, I would like to address our philosophy and approach to investing:
Our belief is that over time stocks move with earnings and cash-flow growth, meaning simply that if a company grows free cash flow 15% a year, its stock should appreciate at roughly the same rate as well. We search for companies that we think can generate double-digit growth over time by participating in expanding markets, taking market share, or improving profitability at a rate much faster than sales. We think that if we can find those companies, and pay a fair price for their stock, we can compound absolute returns at double-digit levels and provide solid long-term relative returns.
With this objective in mind, our industry analysts dedicated to this strategy, as well as other T. Rowe Price portfolio managers, travel the world trying to find companies that fit these criteria. While most of this investment strategy is consistent with past practices, the major difference is that we will now use one lens for determining purchases and sales. We will not be looking for the best stocks in Europe and the best stocks in Japan and the best stocks in emerging markets; we will be looking for the best non-U.S. stocks wherever we may find them.
For a while this fall, the market appeared to be threading a needle. Even though the U.S. housing market was weak, the global economy was strong. Even though commodities were flying high, inflation remained contained; and even though financials faced write-downs on mortgage derivatives, it seemed that global growth would be financed. As I write this report, the market is questioning all three statements. The thread appears to be missing the needle.
PERFORMANCE REVIEW
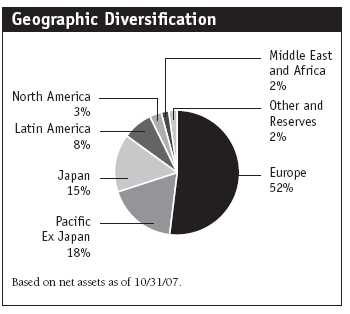
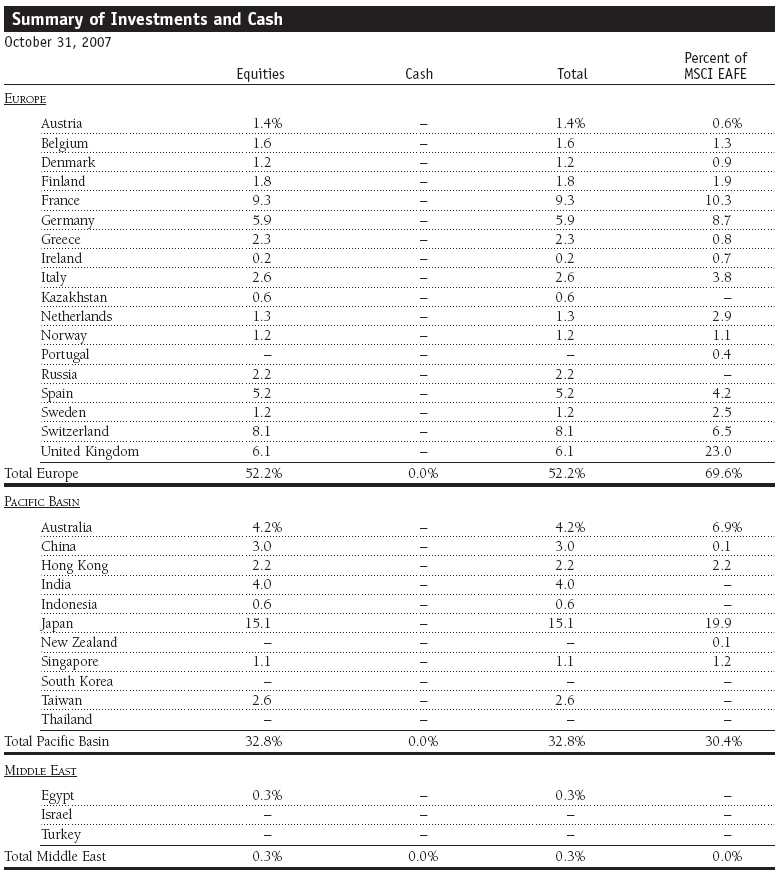
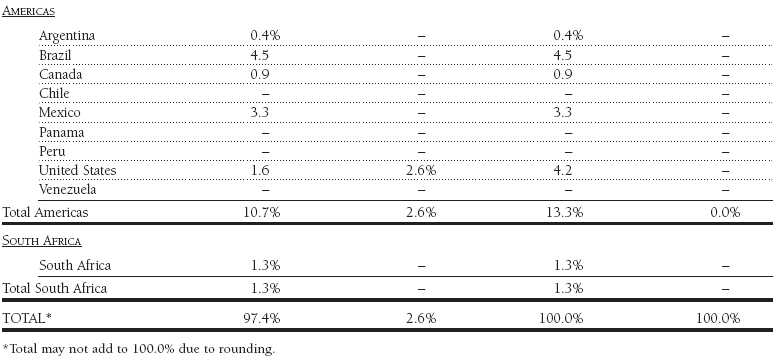
Over the past six months, we made several significant shifts to the portfolio’s regional allocation. However, this was entirely due to individual stock selection rather than a decision to overweight or underweight a region. As shown in the table, our allocation to European stocks at the end of the reporting period was 52%, down from 61% six months ago. Our Japanese holdings at the end of October were down about three percentage points at 15% of the portfolio’s assets. Both shifts represent our lack of conviction in individual stocks in these regions rather than a macroeconomic outlook. Over the past six months, the largest increase in our regional allocation was a seven percentage point increase to our holdings in the Pacific Rim, purely because we are finding a greater number of solid growth stocks at attractive valuations there.
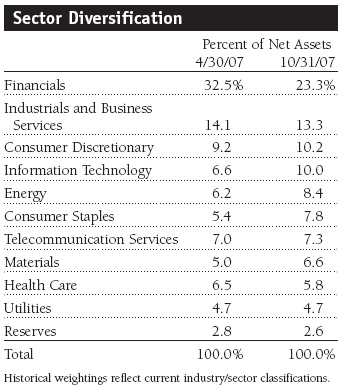
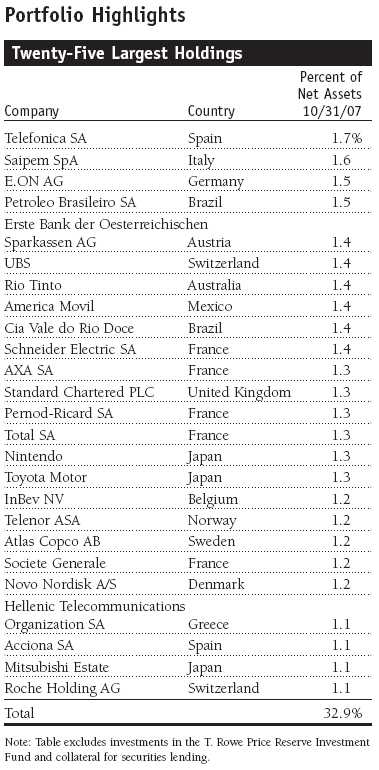
Energy stocks made the strongest contribution to the portfolio’s performance over the past six months, led by holdings in oil, gas, and consumable fuels. The portfolio’s largest contributor since our April shareholder letter (and second best for the past 12 months) was Petroleo Brasileiro (Petrobras). The Brazilian oil giant benefited from the strength in oil prices. Although we took some profits in our Petrobras position late in the period as its shares surged to all-time highs, it remains a core fund holding. (Please refer to the fund’s portfolio of investments for a detailed list of holdings and the amount each represents in the portfolio.)
During the period, we added several new positions to the energy sector, including Bumi Resources (Indonesia), Gazprom (Russia), China Petroleum and Chemical, and Suncor Energy (Canada), all of which generated good gains for the portfolio and represent additions to our emerging markets exposure. Italian energy equipment and services firm Saipem was also a top contributor for the past six months. This oil rig production equipment and services company has a strong presence in offshore drilling, an area of increasing importance for exploration companies.
We added to our information technology holdings over the past six months, and the sector generated the second-largest contribution to results. Japanese electronic equipment and instruments manufacturer Ibiden posted solid gains, as did Nokia (Finland), and Mediatek (Taiwan). Although the sector was overall a strong contributor since our midyear report, our IT services holdings Otsuka (Japan) and Infosys Technologies (India)—both added to the portfolio in the past 12 months—posted losses. Infosys, one of India’s largest companies, felt the pinch of an appreciating rupee (up double-digits this year versus the dollar) and rising wage costs.
The materials and telecommunication services sectors also generated noteworthy gains. Brazil’s Companhia Vale do Rio Doce (CVRD), the second-largest mining company in the world, was the second-best contributor for the past six months and the portfolio’s leading contributor for the year. It is the world’s largest producer and exporter of iron ore and a world-class provider of nickel, manganese, and other assorted metals. We have a slightly larger position in Australia-based Rio Tinto, the third-largest mining company, and it performed almost as well as CVRD. The fund’s largest holding and third-best performer in the second half of our fiscal year was Telefonica, a multinational telecommunications provider of fixed and mobile telephony services in its homeland Spain, Europe, and Latin America. Other strong contributors in the telecom space include Bharti Airtel (India), America Movil (Mexico), and Hellenic Telecommunications (Greece).
The portfolio’s worst-performing sector for the past six months was health care. Although multinational pharmaceuticals manufacturer Novo Nordisk (Denmark) posted solid returns, those good results were overwhelmed by losses at Chugai Pharmaceutical (Japan) and Switzerland-based holdings Roche and Novartis. We eliminated our position in Chugai in part due to concerns about the loss of its marketing collaboration with Sanofi-Aventis. Roche was recently added because of its history of steady earnings growth. Although its share price has drifted lower, we believe the company is on track to generate 20% earnings gains this year, making it the best growth story among the leading large-cap drug companies.
Despite reducing our financials sector allocation significantly, we incurred large losses in our commercial banks and consumer finance holdings. Societe Generale (France) and Anglo Irish Bank were among our largest detractors. We continue to hold them for turnaround prospects. We also eliminated several commercial banks that did not fit our growth criteria, including Banco Popolare di Verona (Italy), Greek Postal Savings, and Banco Bilbao Vizcaya Argenta (Spain). In consumer finance, we continue to hold a relatively small position in ORIX but eliminated our stake in Credit Saison. Both Japanese companies endured significant declines this summer. We added two real estate companies during the period, Shimo Property (China) and DLF Limited (India), and each produced solid results.
INVESTMENT OUTLOOK
While our medium-term view is for solid global growth, a U.S. economic slowdown could be a slight detractor. Although the current financial crisis may linger and even deepen, we believe that global economies will work their way through this issue. Earnings gains may become somewhat tougher to sustain and companies will depend more on emerging markets economic growth, but we believe this should favor our holdings.
In this slightly more challenging and volatile environment, we will continue to work diligently on your behalf to find companies that provide solid longer-term returns.
Respectfully submitted,

Robert W. Smith
Chairman of the Investment Advisory Committee
November 15, 2007
The committee chairman has day-to-day responsibility for managing the portfolio and works with committee members in developing and executing the fund’s investment program.
Performance and Expenses
| Performance Comparison |
This chart shows the value of a hypothetical $1 million investment in the fund over the past 10 fiscal year periods or since inception (for funds lacking 10-year records). The result is compared with benchmarks, which may include a broad-based market index and a peer group average or index. Market indexes do not include expenses, which are deducted from fund returns as well as mutual fund averages and indexes.
This table shows how the fund would have performed each year if its actual (or cumulative) returns for the periods shown had been earned at a constant rate.
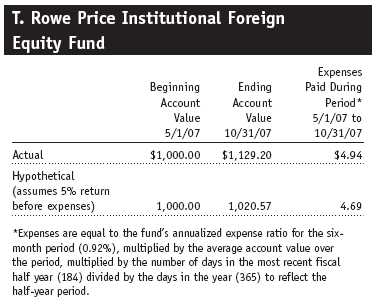
Fund Expense Example
As a mutual fund shareholder, you may incur two types of costs: (1) transaction costs, such as redemption fees or sales loads, and (2) ongoing costs, including management fees, distribution and service (12b-1) fees, and other fund expenses. The following example is intended to help you understand your ongoing costs (in dollars) of investing in the fund and to compare these costs with the ongoing costs of investing in other mutual funds. The example is based on an investment of $1,000 invested at the beginning of the most recent six-month period and held for the entire period.
Actual Expenses
The first line of the following table (“Actual”) provides information about actual account values and actual expenses. You may use the information in this line, together with your account balance, to estimate the expenses that you paid over the period. Simply divide your account value by $1,000 (for example, an $8,600 account value divided by $1,000 = 8.6), then multiply the result by the number in the first line under the heading “Expenses Paid During Period” to estimate the expenses you paid on your account during this period.
Hypothetical Example for Comparison Purposes
The information on the second line of the table (“Hypothetical”) is based on hypothetical account values and expenses derived from the fund’s actual expense ratio and an assumed 5% per year rate of return before expenses (not the fund’s actual return). You may compare the ongoing costs of investing in the fund with other funds by contrasting this 5% hypothetical example and the 5% hypothetical examples that appear in the shareholder reports of the other funds. The hypothetical account values and expenses may not be used to estimate the actual ending account balance or expenses you paid for the period.
You should also be aware that the expenses shown in the table highlight only your ongoing costs and do not reflect any transaction costs, such as redemption fees or sales loads. Therefore, the second line of the table is useful in comparing ongoing costs only and will not help you determine the relative total costs of owning different funds. To the extent a fund charges transaction costs, however, the total cost of owning that fund is higher.
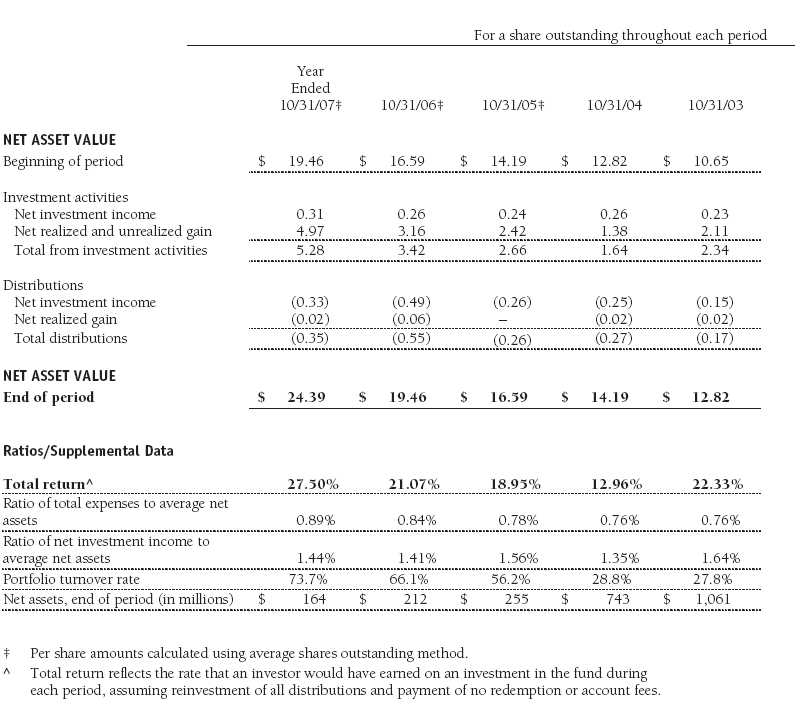
Financial Highlights
The accompanying notes are an integral part of these financial statements.
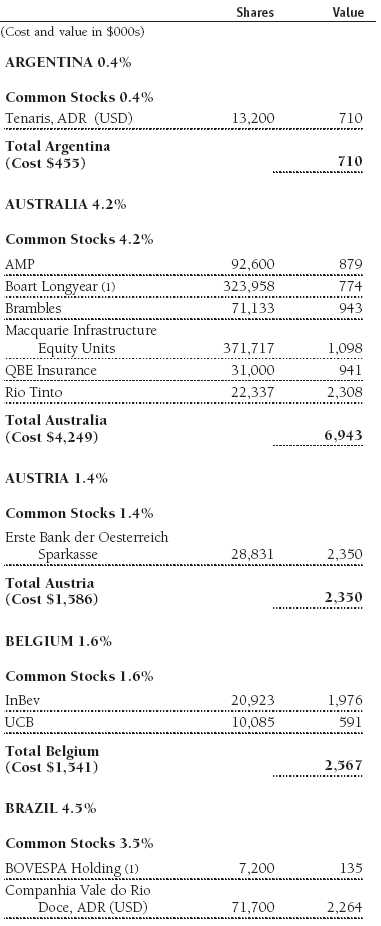
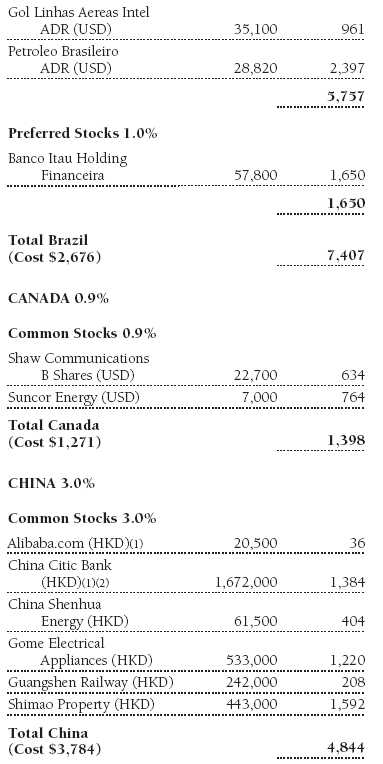
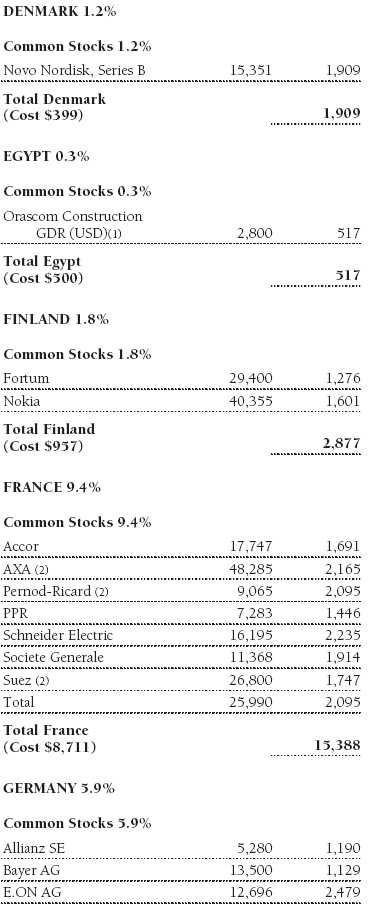
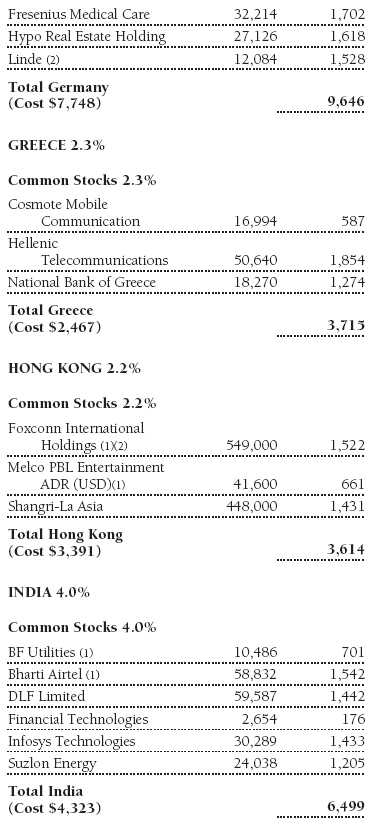
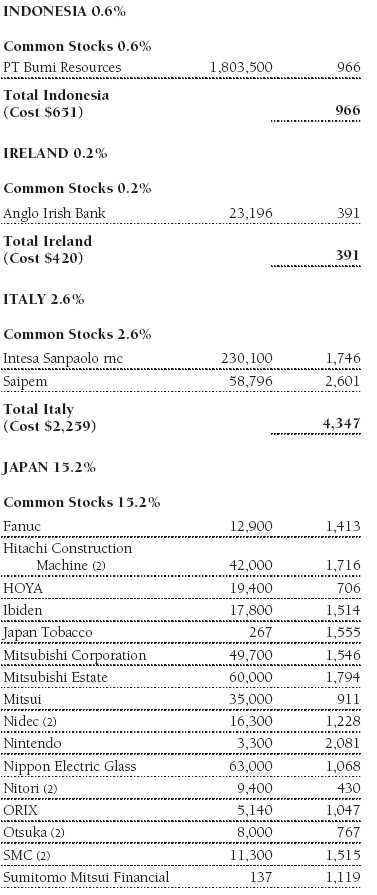
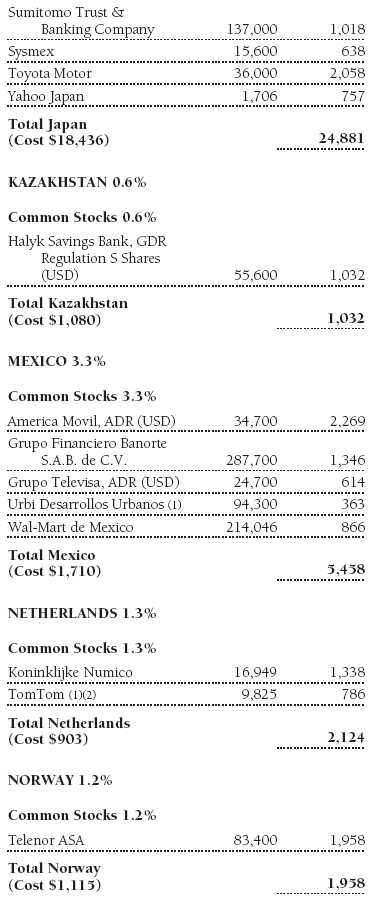
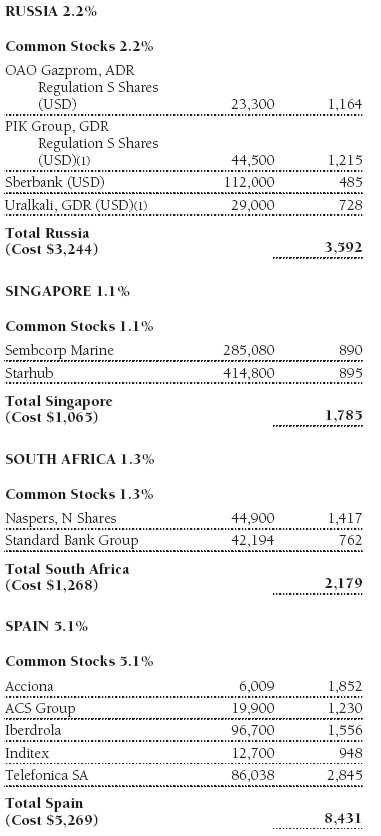
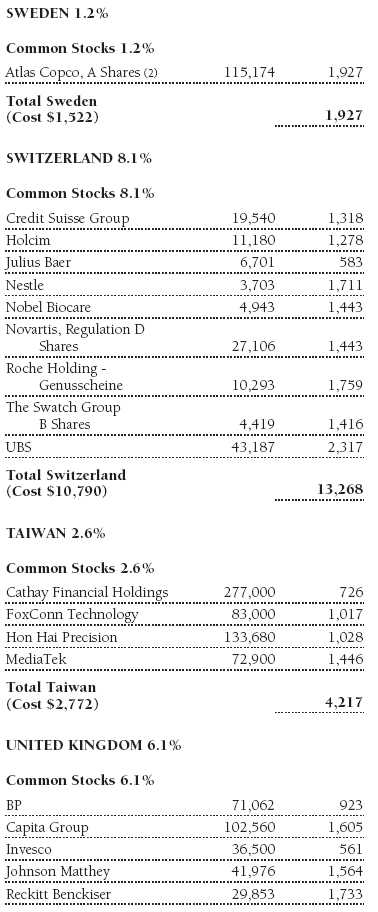
Portfolio of Investments ‡

The accompanying notes are an integral part of these financial statements.
Statement of Assets and Liabilities
T. Rowe Price Institutional Foreign Equity Fund
October 31, 2007
($000s except shares and per share amounts)
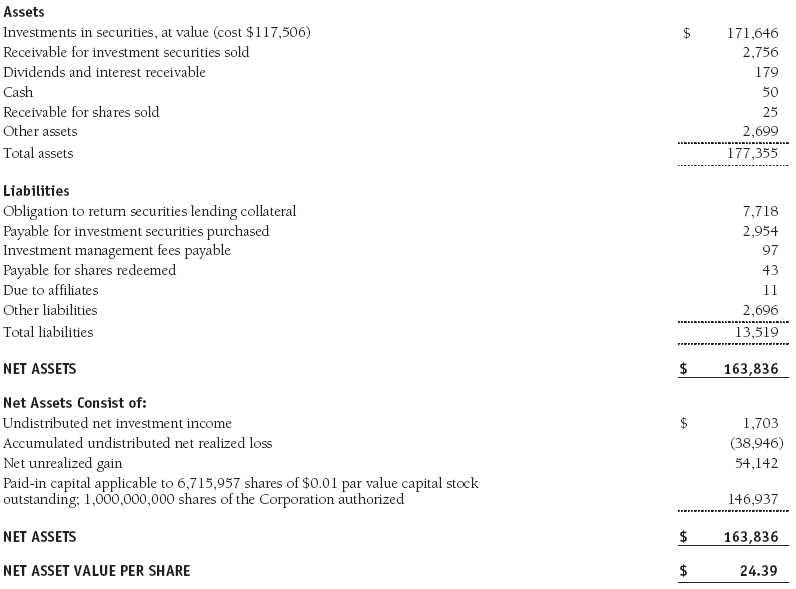
The accompanying notes are an integral part of these financial statements.
Statement of Operations
T. Rowe Price Institutional Foreign Equity Fund
($000s)
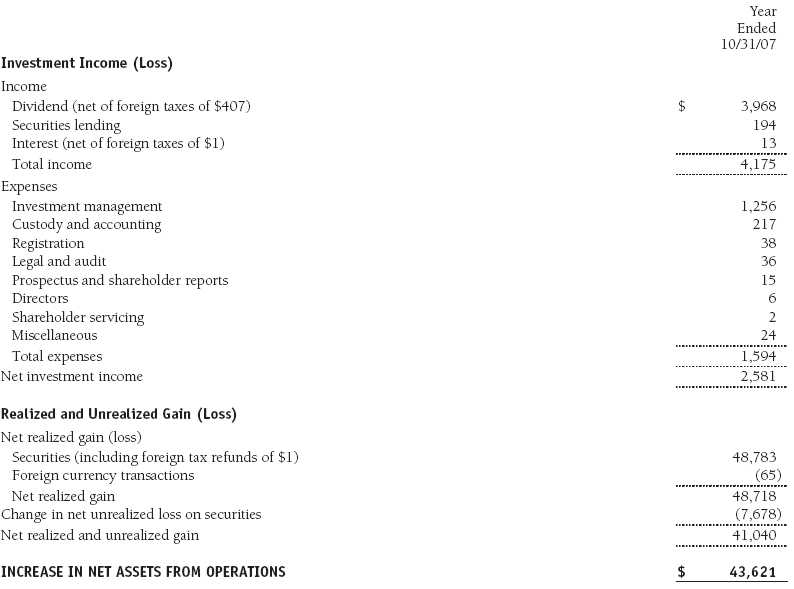
The accompanying notes are an integral part of these financial statements.
Statement of Changes in Net Assets
T. Rowe Price Institutional Foreign Equity Fund
($000s)
The accompanying notes are an integral part of these financial statements.
Notes to Financial Statements
NOTE 1 - SIGNIFICANT ACCOUNTING POLICIES
T. Rowe Price Institutional International Funds, Inc. (the corporation), is registered under the Investment Company Act of 1940 (the 1940 Act). The Institutional Foreign Equity Fund (the fund), a diversified, open-end management investment company, is one portfolio established by the corporation. The fund commenced operations on September 7, 1989. The fund seeks long-term growth of capital through investments primarily in the common stocks of established, non-U.S. companies.
The accompanying financial statements were prepared in accordance with accounting principles generally accepted in the United States of America, which require the use of estimates made by fund management. Fund management believes that estimates and security valuations are appropriate; however, actual results may differ from those estimates, and the security valuations reflected in the financial statements may differ from the value the fund ultimately realizes upon sale of the securities.
Valuation The fund values its investments and computes its net asset value per share at the close of the New York Stock Exchange (NYSE), normally 4 p.m. ET, each day that the NYSE is open for business. Equity securities listed or regularly traded on a securities exchange or in the over-the-counter (OTC) market are valued at the last quoted sale price or, for certain markets, the official closing price at the time the valuations are made, except for OTC Bulletin Board securities, which are valued at the mean of the latest bid and asked prices. A security that is listed or traded on more than one exchange is valued at the quotation on the exchange determined to be the primary market for such security. Listed securities not traded on a particular day are valued at the mean of the latest bid and asked prices for domestic securities and the last quoted sale price for international securities.
Investments in mutual funds are valued at the mutual fund’s closing net asset value per share on the day of valuation.
Other investments, including restricted securities, and those for which the above valuation procedures are inappropriate or are deemed not to reflect fair value are stated at fair value as determined in good faith by the T. Rowe Price Valuation Committee, established by the fund’s Board of Directors.
Most foreign markets close before the close of trading on the NYSE. If the fund determines that developments between the close of a foreign market and the close of the NYSE will, in its judgment, materially affect the value of some or all of its portfolio securities, which in turn will affect the fund’s share price, the fund will adjust the previous closing prices to reflect the fair value of the securities as of the close of the NYSE, as determined in good faith by the T. Rowe Price Valuation Committee, established by the fund’s Board of Directors. A fund may also fair value securities in other situations, such as when a particular foreign market is closed but the fund is open. In deciding whether to make fair value adjustments, the fund reviews a variety of factors, including developments in foreign markets, the performance of U.S. securities markets, and the performance of instruments trading in U.S. markets that represent foreign securities and baskets of foreign securities. The fund uses outside pricing services to provide it with closing market prices and information used for adjusting those prices. The fund cannot predict when and how often it will use closing prices and when it will adjust those prices to reflect fair value. As a means of evaluating its fair value process, the fund routinely compares closing market prices, the next day’s opening prices in the same markets, and adjusted prices.
Currency Translation Assets, including investments, and liabilities denominated in foreign currencies are translated into U.S. dollar values each day at the prevailing exchange rate, using the mean of the bid and asked prices of such currencies against U.S. dollars as quoted by a major bank. Purchases and sales of securities, income, and expenses are translated into U.S. dollars at the prevailing exchange rate on the date of the transaction. The effect of changes in foreign currency exchange rates on realized and unrealized security gains and losses is reflected as a component of security gains and losses.
Rebates Subject to best execution, the fund may direct certain security trades to brokers who have agreed to rebate a portion of the related brokerage commission to the fund in cash. Commission rebates are reflected as realized gain on securities in the accompanying financial statements.
Redemption Fees A 2% fee is assessed on redemptions of fund shares held for 90 days or less to deter short-term trading and to protect the interests of long-term shareholders. Redemption fees are withheld from proceeds that shareholders receive from the sale or exchange of fund shares. The fees are paid to the fund, and are recorded as an increase to paid-in capital. The fees may cause the redemption price per share to differ from the net asset value per share.
Investment Transactions, Investment Income, and Distributions Income and expenses are recorded on the accrual basis. Dividends received from mutual fund investments are reflected as dividend income; capital gain distributions are reflected as realized gain/loss. Dividend income and capital gain distributions are recorded on the ex-dividend date. Income tax-related interest and penalties, if incurred, would be recorded as income tax expense. Investment transactions are accounted for on the trade date. Realized gains and losses are reported on the identified cost basis. Distributions to shareholders are recorded on the ex-dividend date. Income distributions are declared and paid on an annual basis. Capital gain distributions, if any, are declared and paid by the fund, typically on an annual basis.
New Accounting Pronouncements In June 2006, the Financial Accounting Standards Board (FASB) issued FASB Interpretation No. 48 (FIN 48), Accounting for Uncertainty in Income Taxes, a clarification of FASB Statement No. 109, Accounting for Income Taxes. FIN 48 establishes financial reporting rules regarding recognition and measurement of tax positions taken or expected to be taken on a tax return. No impact on the fund’s net assets or results of operations is expected upon adoption of FIN 48 on November 1, 2007.
In September 2006, the FASB released the Statement of Financial Accounting Standard No. 157 (FAS 157), Fair Value Measurements. FAS 157 clarifies the definition of fair value and establishes the framework for measuring fair value, as well as proper disclosure of this methodology in the financial statements. It will be effective for the fund’s fiscal year beginning November 1, 2008. Management is evaluating the effects of FAS 157; however, it is not expected to have a material impact on the fund’s net assets or results of operations.
NOTE 2 - INVESTMENT TRANSACTIONS
Consistent with its investment objective, the fund engages in the following practices to manage exposure to certain risks or to enhance performance. The investment objective, policies, program, and risk factors of the fund are described more fully in the fund’s prospectus and Statement of Additional Information.
Emerging Markets At October 31, 2007, approximately 23% of the fund’s net assets were invested in securities of companies located in emerging markets or denominated in or linked to the currencies of emerging market countries. Future economic or political developments could adversely affect the liquidity or value, or both, of such securities.
Restricted Securities The fund may invest in securities that are subject to legal or contractual restrictions on resale. Although certain of these securities may be readily sold, for example, under Rule 144A, others may be illiquid, their sale may involve substantial delays and additional costs, and prompt sale at an acceptable price may be difficult.
Securities Lending The fund lends its securities to approved brokers to earn additional income. It receives as collateral cash and U.S. government securities valued at 102% to 105% of the value of the securities on loan. Cash collateral is invested in a money market pooled account managed by the fund’s lending agent in accordance with investment guidelines approved by fund management. Collateral is maintained over the life of the loan in an amount not less than the value of loaned securities, as determined at the close of fund business each day; any additional collateral required due to changes in security values is delivered to the fund the next business day. Although risk is mitigated by the collateral, the fund could experience a delay in recovering its securities and a possible loss of income or value if the borrower fails to return the securities. Securities lending revenue recognized by the fund consists of earnings on invested collateral and borrowing fees, net of any rebates to the borrower and compensation to the lending agent. At October 31, 2007, the value of loaned securities was $7,206,000; aggregate collateral consisted of $7,718,000 in the money market pooled account.
Other Purchases and sales of portfolio securities, other than short-term securities, aggregated $127,465,000 and $216,842,000, respectively, for the year ended October 31, 2007.
NOTE 3 - FEDERAL INCOME TAXES
No provision for federal income taxes is required since the fund intends to continue to qualify as a regulated investment company under Subchapter M of the Internal Revenue Code and distribute to shareholders all of its taxable income and gains. Federal income tax regulations differ from generally accepted accounting principles; therefore, distributions determined in accordance with tax regulations may differ significantly in amount or character from net investment income and realized gains for financial reporting purposes. Financial reporting records are adjusted for permanent book/tax differences to reflect tax character. Financial records are not adjusted for temporary differences.
Distributions during the year ended October 31, 2007, totaled $3,668,000 and were characterized as ordinary income for tax purposes. At October 31, 2007, the tax-basis components of net assets were as follows:
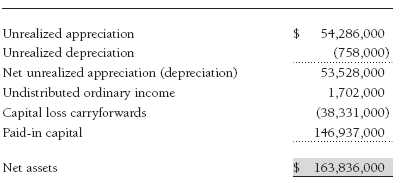
Federal income tax regulations require the fund to treat the gain/loss on passive foreign investment companies as realized on the last day of the tax year; accordingly, $615,000 of unrealized gains reflected in the accompanying financial statements were realized for tax purposes as of October 31, 2007.
The fund intends to retain realized gains to the extent of available capital loss carryforwards. During the fiscal year ended October 31, 2007, the fund utilized $48,352,000 of capital loss carryforwards. As of October 31, 2007, the fund had $38,331,000 of capital loss carryforwards that expire in fiscal 2011.
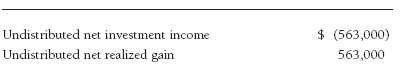
For the year ended October 31, 2007, the fund recorded the following permanent reclassifications to reflect tax character. Reclassifications between income and gain relate primarily to the character of passive foreign investment companies. Results of operations and net assets were not affected by these reclassifications.
At October 31, 2007, the cost of investments for federal income tax purposes was $118,120,000.
NOTE 4 - FOREIGN TAXES
The fund is subject to foreign income taxes imposed by certain countries in which it invests. Additionally, capital gains realized by the fund upon disposition of securities issued in or by certain foreign countries are subject to capital gains tax imposed by those countries. Similarly, a tax on net profits, including interest income and realized and unrealized capital gains, is imposed by certain other countries. All taxes are computed in accordance with the applicable foreign tax law, and, to the extent permitted, capital losses are used to offset capital gains. Tax expense attributable to income is accrued by the fund as a reduction of income. Current and deferred tax expense attributable to net capital gains is reflected as a component of realized and/or change in unrealized gain/loss on securities in the accompanying financial statements. At October 31, 2007, the fund had no deferred tax liability attributable to foreign securities, and $26,604,000 of foreign capital loss carryforwards, including $462,000 that expire in 2009, $17,944,000 that expire in 2010, and $8,198,000 that expire thereafter through 2013.
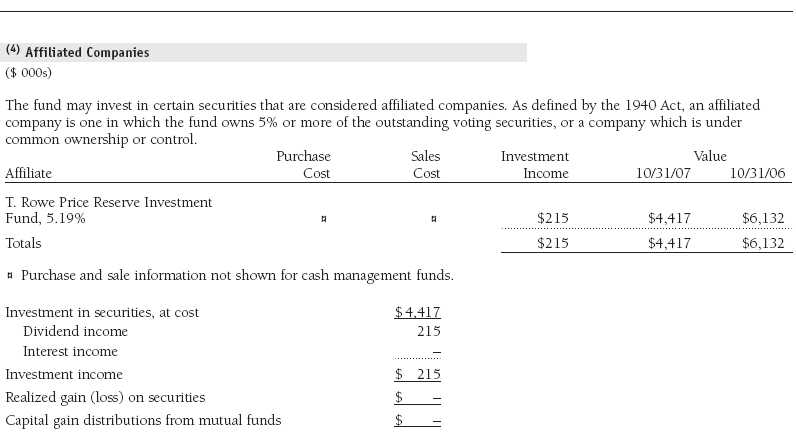
NOTE 5 - RELATED PARTY TRANSACTIONS
The fund is managed by T. Rowe Price International, Inc. (the manager), a wholly owned subsidiary of T. Rowe Price Associates, Inc. (Price Associates), which is wholly owned by T. Rowe Price Group, Inc. The investment management agreement between the fund and the manager provides for an annual investment management fee equal to 0.70% of the fund’s average daily net assets. The fee is computed daily and paid monthly.
In addition, the fund has entered into service agreements with Price Associates and a wholly owned subsidiary of Price Associates (collectively, Price). Price Associates computes the daily share price and provides certain other administrative services to the fund. T. Rowe Price Services, Inc., provides shareholder and administrative services in its capacity as the fund’s transfer and dividend disbursing agent. For the year ended October 31, 2007, expenses incurred pursuant to these service agreements were $124,000 for Price Associates and $2,000 for T. Rowe Price Services, Inc. The total amount payable at period-end pursuant to these service agreements is reflected as Due to Affiliates in the accompanying financial statements.
The fund may invest in the T. Rowe Price Reserve Investment Fund and the T. Rowe Price Government Reserve Investment Fund (collectively, the T. Rowe Price Reserve Investment Funds), open-end management investment companies managed by Price Associates and affiliates of the fund. The T. Rowe Price Reserve Investment Funds are offered as cash management options to mutual funds, trusts, and other accounts managed by Price Associates and/or its affiliates, and are not available for direct purchase by members of the public. The T. Rowe Price Reserve Investment Funds pay no investment management fees.
Report of Independent Registered Public Accounting Firm
To the Board of Directors of T. Rowe Price Institutional International Funds, Inc. and Shareholders of T. Rowe Price Institutional Foreign Equity Fund
In our opinion, the accompanying statement of assets and liabilities, including the portfolio of investments, and the related statements of operations and of changes in net assets and the financial highlights present fairly, in all material respects, the financial position of T. Rowe Price Institutional Foreign Equity Fund (one of the portfolios comprising T. Rowe Price Institutional International Funds, Inc., hereafter referred to as the “Fund”) at October 31, 2007, the results of its operations for the year then ended, the changes in its net assets for each of the two years in the period then ended and the financial highlights for each of the five years in the period then ended, in conformity with accounting principles generally accepted in the United States of America. These financial statements and financial highlights (hereafter referred to as “financial statements”) are the responsibility of the Fund’s management; our responsibility is to express an opinion on these financial statements based on our audits. We conducted our audits of these financial statements in accordance with the auditing standards of the Public Company Accounting Oversight Board (United States). Those standards require that we plan and perform the audit to obtain reasonable assurance about whether the financial statements are free of material misstatement. An audit includes examining, on a test basis, evidence supporting the amounts and disclosures in the financial statements, assessing the accounting principles used and significant estimates made by management, and evaluating the overall financial statement presentation. We believe that our audits, which included confirmation of securities at October 31, 2007, by correspondence with the custodian and by agreement to the underlying ownership records for T. Rowe Price Reserve Investment Fund, provide a reasonable basis for our opinion.
PricewaterhouseCoopers LLP
Baltimore, Maryland
December 12, 2007
| Tax Information (Unaudited) for the Tax Year Ended 10/31/07 |
We are providing this information as required by the Internal Revenue Code. The amounts shown may differ from those elsewhere in this report because of differences between tax and financial reporting requirements.
The fund’s distributions to shareholders included $210,000 from short-term capital gains.
For taxable non-corporate shareholders, $2,263,000 of the fund’s income represents qualified dividend income subject to the 15% rate category.
The fund will pass through foreign source income of $2,263,000 and foreign taxes paid of $210,000.
| Information on Proxy Voting Policies, Procedures, and Records |
A description of the policies and procedures used by T. Rowe Price funds and portfolios to determine how to vote proxies relating to portfolio securities is available in each fund’s Statement of Additional Information, which you may request by calling 1-800-225-5132 or by accessing the SEC’s Web site, www.sec.gov. The description of our proxy voting policies and procedures is also available on our Web site, www.troweprice.com. To access it, click on the words “Company Info” at the top of our homepage for individual investors. Then, in the window that appears, click on the “Proxy Voting Policy” navigation button in the top left corner.
Each fund’s most recent annual proxy voting record is available on our Web site and through the SEC’s Web site. To access it through our Web site, follow the directions above, then click on the words “Proxy Voting Record” at the bottom of the Proxy Voting Policy page.
| How to Obtain Quarterly Portfolio Holdings |
The fund files a complete schedule of portfolio holdings with the Securities and Exchange Commission for the first and third quarters of each fiscal year on Form N-Q. The fund’s Form N-Q is available electronically on the SEC’s Web site (www.sec.gov); hard copies may be reviewed and copied at the SEC’s Public Reference Room, 450 Fifth St. N.W., Washington, DC 20549. For more information on the Public Reference Room, call 1-800-SEC-0330.
| About the Fund’s Directors and Officers |
Your fund is governed by a Board of Directors (Board) that meets regularly to review a wide variety of matters affecting the fund, including performance, investment programs, compliance matters, advisory fees and expenses, service providers, and other business affairs. The Board elects the fund’s officers, who are listed in the final table. At least 75% of Board members are independent of T. Rowe Price Associates, Inc. (T. Rowe Price), and T. Rowe Price International, Inc. (T. Rowe Price International); “inside” or “interested” directors are employees or officers of T. Rowe Price. The business address of each director and officer is 100 East Pratt Street, Baltimore, Maryland 21202. The Statement of Additional Information includes additional information about the fund directors and is available without charge by calling a T. Rowe Price representative at 1-800-225-5132.
| Independent Directors | |
| Name (Year of Birth) | |
| Year Elected* | Principal Occupation(s) During Past 5 Years and Directorships of Other Public Companies |
| Jeremiah E. Casey (1940) | Director, National Life Insurance (2001 to 2005); Director, The Rouse Company, real estate developers |
| 2006 | (1990 to 2004); Director, Allfirst Financial Inc. (previously First Maryland Bancorp) (1983 to 2002) |
| Anthony W. Deering (1945) | Chairman, Exeter Capital, LLC, a private investment firm (2004 to present); Director, Vornado Real Estate Investment |
| 1991 | Trust (3/04 to present); Member, Advisory Board, Deutsche Bank North America (2004 to present); Director, Chairman |
| of the Board, and Chief Executive Officer, The Rouse Company, real estate developers (1997 to 2004) | |
| Donald W. Dick, Jr. (1943) | Principal, EuroCapital Advisors, LLC, an acquisition and management advisory firm; Chairman, The Haven Group, |
| 1989 | a custom manufacturer of modular homes (1/04 to present) |
| David K. Fagin (1938) | Chairman and President, Nye Corporation (6/88 to present); Chairman, Canyon Resources Corp. (8/07 to present); |
| 2001 | Director, Golden Star Resources Ltd. (5/92 to present); Director, Pacific Rim Mining Corp. (2/02 to present) |
| Karen N. Horn (1943) | Director, Federal National Mortgage Association (9/06 to present); Managing Director and President, Global Private |
| 2003 | Client Services, Marsh Inc. (1999 to 2003); Director, Georgia Pacific (5/04 to 12/05), Eli Lilly and Company, and |
| Simon Property Group | |
| Theo C. Rodgers (1941) | President, A&R Development Corporation (1977 to present) |
| 2006 | |
| John G. Schreiber (1946) | Owner/President, Centaur Capital Partners, Inc., a real estate investment company; Partner, Blackstone Real Estate |
| 2001 | Advisors, L.P. |
| *Each independent director oversees 121 T. Rowe Price portfolios and serves until retirement, resignation, or election of a successor. | |
| Inside Directors | |
| Name (Year of Birth) | |
| Year Elected* [Number of | |
| T. Rowe Price Portfolios | |
| Overseen] | Principal Occupation(s) During Past 5 Years and Directorships of Other Public Companies |
| Edward C. Bernard (1956) | Director and Vice President, T. Rowe Price; Vice Chairman of the Board, Director, and Vice President, T. Rowe Price |
| 2006 [121] | Group, Inc.; Chairman of the Board, Director, and President, T. Rowe Price Investment Services, Inc.; Chairman of |
| the Board and Director, T. Rowe Price Global Asset Management Limited, T. Rowe Price Global Investment Services | |
| Limited, T. Rowe Price Retirement Plan Services, Inc., T. Rowe Price Savings Bank, and T. Rowe Price Services, Inc.; | |
| Director, T. Rowe Price International, Inc.; Chief Executive Officer, Chairman of the Board, Director, and President, | |
| T. Rowe Price Trust Company; Chairman of the Board, all funds | |
| Brian C. Rogers, CFA, CIC (1955) | Chief Investment Officer, Director, and Vice President, T. Rowe Price; Chairman of the Board, Chief Investment Officer, |
| 2006 [68] | Director, and Vice President, T. Rowe Price Group, Inc.; Vice President, T. Rowe Price Trust Company |
| *Each inside director serves until retirement, resignation, or election of a successor. | |
| Officers | |
| Name (Date of Birth) | |
| Title and Fund(s) Served | Principal Occupation(s) |
| Christopher D. Alderson (1962) | Vice President, T. Rowe Price Group, Inc., and T. Rowe Price |
| Vice President, Institutional International Funds | International, Inc. |
| R. Scott Berg (1972) | Vice President, T. Rowe Price and T. Rowe Price Group, Inc. |
| Vice President, Institutional International Funds | |
| Mark C.J. Bickford-Smith (1962) | Vice President, T. Rowe Price Group, Inc., and T. Rowe Price |
| Vice President, Institutional International Funds | International, Inc. |
| Joseph A. Carrier, CPA (1960) | Vice President, T. Rowe Price, T. Rowe Price Group, Inc., T. Rowe Price |
| Treasurer, Institutional International Funds | Investment Services, Inc., and T. Rowe Price Trust Company |
| Michael J. Conelius, CFA (1964) | Vice President, T. Rowe Price, T. Rowe Price Group, Inc., and T. Rowe Price |
| Vice President, Institutional International Funds | International, Inc. |
| Roger L. Fiery III, CPA (1959) | Vice President, T. Rowe Price, T. Rowe Price Group, Inc., T. Rowe Price |
| Vice President, Institutional International Funds | International, Inc., and T. Rowe Price Trust Company |
| Robert N. Gensler (1957) | Vice President, T. Rowe Price, T. Rowe Price Group, Inc., and T. Rowe Price |
| Vice President, Institutional International Funds | International, Inc. |
| John R. Gilner (1961) | Chief Compliance Officer and Vice President, T. Rowe Price; Vice President, |
| Chief Compliance Officer, Institutional International Funds | T. Rowe Price Group, Inc., and T. Rowe Price Investment Services, Inc. |
| Gregory S. Golczewski (1966) | Vice President, T. Rowe Price and T. Rowe Price Trust Company |
| Vice President, Institutional International Funds | |
| M. Campbell Gunn (1956) | Vice President, T. Rowe Price Global Investment Services Limited, |
| Vice President, Institutional International Funds | T. Rowe Price Group, Inc., and T. Rowe Price International, Inc. |
| Henry H. Hopkins (1942) | Director and Vice President, T. Rowe Price Investment Services, Inc., |
| Vice President, Institutional International Funds | T. Rowe Price Services, Inc., and T. Rowe Price Trust Company; Vice |
| President, T. Rowe Price, T. Rowe Price Group, Inc., T. Rowe Price | |
| International, Inc., and T. Rowe Price Retirement Plan Services, Inc. | |
| Ian D. Kelson (1956) | Vice President, T. Rowe Price, T. Rowe Price Group, Inc., and T. Rowe Price |
| Vice President, Institutional International Funds | International, Inc. |
| Patricia B. Lippert (1953) | Assistant Vice President, T. Rowe Price and T. Rowe Price Investment |
| Secretary, Institutional International Funds | Services, Inc. |
| R. Todd Ruppert (1956) | Chief Executive Officer, Director, and President, T. Rowe Price Global Asset |
| Vice President, Institutional International Funds | Management Limited and T. Rowe Price Global Investment Services |
| Limited; Vice President, T. Rowe Price, T. Rowe Price Group, Inc., T. Rowe | |
| Price Retirement Plan Services, Inc., and T. Rowe Price Trust Company | |
| Robert W. Smith (1961) | Vice President, T. Rowe Price, T. Rowe Price Group, Inc., and T. Rowe Price |
| Executive Vice President, Institutional International Funds | Trust Company |
| Dean Tenerelli (1964) | Vice President, T. Rowe Price Group, Inc., and T. Rowe Price |
| Vice President, Institutional International Funds | International, Inc. |
| Julie L. Waples (1970) | Vice President, T. Rowe Price |
| Vice President, Institutional International Funds | |
| David J.L. Warren (1957) | Director, T. Rowe Price, T. Rowe Price Global Asset Management Limited, |
| President, Institutional International Funds | and T. Rowe Price Global Investment Services Limited; Vice President, |
| T. Rowe Price Group, Inc.; Chief Executive Officer, Director, and President, | |
| T. Rowe Price International, Inc. | |
| William F. Wendler II, CFA (1962) | Vice President, T. Rowe Price and T. Rowe Price Group, Inc. |
| Vice President, Institutional International Funds | |
| Edward A. Wiese, CFA (1959) | Vice President, T. Rowe Price, T. Rowe Price Group, Inc., and T. Rowe Price |
| Vice President, Institutional International Funds | Trust Company; Chief Investment Officer, Director, and Vice President, |
| T. Rowe Price Savings Bank | |
| Unless otherwise noted, officers have been employees of T. Rowe Price or T. Rowe Price International for at least five years. | |
Item 2. Code of Ethics.
The registrant has adopted a code of ethics, as defined in Item 2 of Form N-CSR, applicable to its principal executive officer, principal financial officer, principal accounting officer or controller, or persons performing similar functions. A copy of this code of ethics is filed as an exhibit to this Form N-CSR. No substantive amendments were approved or waivers were granted to this code of ethics during the period covered by this report.
Item 3. Audit Committee Financial Expert.
The registrant’s Board of Directors/Trustees has determined that Ms. Karen N. Horn qualifies as an audit committee financial expert, as defined in Item 3 of Form N-CSR. Ms. Horn is considered independent for purposes of Item 3 of Form N-CSR.
Item 4. Principal Accountant Fees and Services.
(a) – (d) Aggregate fees billed to the registrant for the last two fiscal years for professional services rendered by the registrant’s principal accountant were as follows:
Audit fees include amounts related to the audit of the registrant’s annual financial statements and services normally provided by the accountant in connection with statutory and regulatory filings. Audit-related fees include amounts reasonably related to the performance of the audit of the registrant’s financial statements and specifically include the issuance of a report on internal controls and, if applicable, agreed-upon procedures related to fund acquisitions. Tax fees include amounts related to services for tax compliance, tax planning, and tax advice. The nature of these services specifically includes the review of distribution calculations and the preparation of Federal, state, and excise tax returns. All other fees include the registrant’s pro-rata share of amounts for agreed-upon procedures in conjunction with service contract approvals by the registrant’s Board of Directors/Trustees.
(e)(1) The registrant’s audit committee has adopted a policy whereby audit and non-audit services performed by the registrant’s principal accountant for the registrant, its investment adviser, and any entity controlling, controlled by, or under common control with the investment adviser that provides ongoing services to the registrant require pre-approval in advance at regularly scheduled audit committee meetings. If such a service is required between regularly scheduled audit committee meetings, pre-approval may be authorized by one audit committee member with ratification at the next scheduled audit committee meeting. Waiver of pre-approval for audit or non-audit services requiring fees of a de minimis amount is not permitted.
(2) No services included in (b) – (d) above were approved pursuant to paragraph (c)(7)(i)(C) of Rule 2-01 of Regulation S-X.
(f) Less than 50 percent of the hours expended on the principal accountant’s engagement to audit the registrant’s financial statements for the most recent fiscal year were attributed to work performed by persons other than the principal accountant’s full-time, permanent employees.
(g) The aggregate fees billed for the most recent fiscal year and the preceding fiscal year by the registrant’s principal accountant for non-audit services rendered to the registrant, its investment adviser, and any entity controlling, controlled by, or under common control with the investment adviser that provides ongoing services to the registrant were $1,531,000 and $1,200,000, respectively, and were less than the aggregate fees billed for those same periods by the registrant’s principal accountant for audit services rendered to the T. Rowe Price Funds.
(h) All non-audit services rendered in (g) above were pre-approved by the registrant’s audit committee. Accordingly, these services were considered by the registrant’s audit committee in maintaining the principal accountant’s independence.
Item 5. Audit Committee of Listed Registrants.
Not applicable.
Item 6. Schedule of Investments.
Not applicable. The complete schedule of investments is included in Item 1 of this Form N-CSR.
Item 7. Disclosure of Proxy Voting Policies and Procedures for Closed-End Management Investment Companies.
Not applicable.
Item 8. Portfolio Managers of Closed-End Management Investment Companies.
Not applicable.
Item 9. Purchases of Equity Securities by Closed-End Management Investment Company and Affiliated Purchasers.
Not applicable.
Item 10. Submission of Matters to a Vote of Security Holders.
Not applicable.
Item 11. Controls and Procedures.
(a) The registrant’s principal executive officer and principal financial officer have evaluated the registrant’s disclosure controls and procedures within 90 days of this filing and have concluded that the registrant’s disclosure controls and procedures were effective, as of that date, in ensuring that information required to be disclosed by the registrant in this Form N-CSR was recorded, processed, summarized, and reported timely.
(b) The registrant’s principal executive officer and principal financial officer are aware of no change in the registrant’s internal control over financial reporting that occurred during the registrant’s second fiscal quarter covered by this report that has materially affected, or is reasonably likely to materially affect, the registrant’s internal control over financial reporting.
Item 12. Exhibits.
(a)(1) The registrant’s code of ethics pursuant to Item 2 of Form N-CSR is attached.
(2) Separate certifications by the registrant's principal executive officer and principal financial officer, pursuant to Section 302 of the Sarbanes-Oxley Act of 2002 and required by Rule 30a-2(a) under the Investment Company Act of 1940, are attached.
(3) Written solicitation to repurchase securities issued by closed-end companies: not applicable.
(b) A certification by the registrant's principal executive officer and principal financial officer, pursuant to Section 906 of the Sarbanes-Oxley Act of 2002 and required by Rule 30a-2(b) under the Investment Company Act of 1940, is attached.
SIGNATURES | |
| Pursuant to the requirements of the Securities Exchange Act of 1934 and the Investment | |
| Company Act of 1940, the registrant has duly caused this report to be signed on its behalf by the | |
| undersigned, thereunto duly authorized. | |
| T. Rowe Price Institutional International Funds, Inc. | |
| By | /s/ Edward C. Bernard |
| Edward C. Bernard | |
| Principal Executive Officer | |
| Date | December 18, 2007 |
| Pursuant to the requirements of the Securities Exchange Act of 1934 and the Investment | |
| Company Act of 1940, this report has been signed below by the following persons on behalf of | |
| the registrant and in the capacities and on the dates indicated. | |
| By | /s/ Edward C. Bernard |
| Edward C. Bernard | |
| Principal Executive Officer | |
| Date | December 18, 2007 |
| By | /s/ Joseph A. Carrier |
| Joseph A. Carrier | |
| Principal Financial Officer | |
| Date | December 18, 2007 |