Item 1: Report to Shareholders
 |
| Institutional Global Equity Fund | October 31, 2007 |
The views and opinions in this report were current as of October 31, 2007. They are not guarantees of performance or investment results and should not be taken as investment advice. Investment decisions reflect a variety of factors, and the managers reserve the right to change their views about individual stocks, sectors, and the markets at any time. As a result, the views expressed should not be relied upon as a forecast of the fund’s future investment intent. The report is certified under the Sarbanes-Oxley Act, which requires mutual funds and other public companies to affirm that, to the best of their knowledge, the information in their financial reports is fairly and accurately stated in all material respects.
Manager’s Letter
Dear Investor
Global equities posted solid returns during the past 6- and 12-month periods, led by emerging markets where strong economic momentum showed few signs of slowing. At the end of July, however, concerns about the tumult in U.S. subprime mortgages had a negative impact on most markets. Global equities moved higher again in October as a positive outlook for economic growth outweighed dislocations in the U.S. housing market.
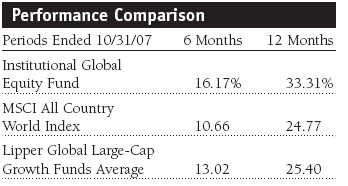
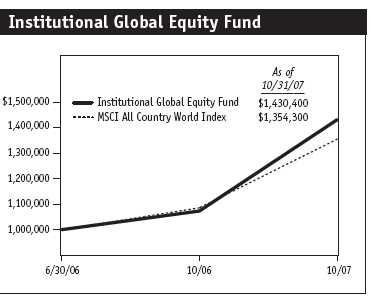
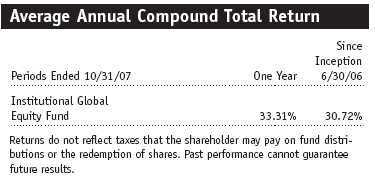
Your fund surpassed the returns of the MSCI All Country World Index and the Lipper Global Large-Cap Growth Funds Average during the 6- and 12-month periods ended October 31, 2007. Superior stock selection was responsible for the fund’s relatively strong performance in both periods.
Market Review
During the period under review, central banks were compelled to inject liquidity into their financial systems to counter a loss of confidence among financial institutions. Investors’ appetite for risk diminished as the euro and yen appreciated sharply versus the U.S. dollar. Despite these negative influences, equities proved resilient, bolstered to a great degree by expectations of a cut in short-term U.S. interest rates. Pacific Basin stocks delivered the best returns among the leading developed regions, followed by European stocks. Japan lagged other markets yet again, losing ground because of anemic domestic growth and fears about the impact of a stronger yen on exporters. Emerging markets registered strong gains, led by Asia outside of Japan. The robust growth coming from industrialization in many Asian countries continued to increase domestic economic activity.
| Highlights |
• Global equities posted solid returns during the 6- and 12-month periods ended October 31, 2007, led by emerging markets where strong economic momentum showed few signs of slowing.
• The fund surpassed the returns of its major benchmarks during both periods thanks to beneficial stock selection.
• Our key holdings in various sectors, along with an overweight in emerging markets and an underweight in Japan, were the main drivers of fund performance during the past six months.
• We remain optimistic about the prospects for global stocks in the coming year, although we caution investors that the stellar returns in emerging markets are unsustainable long term.
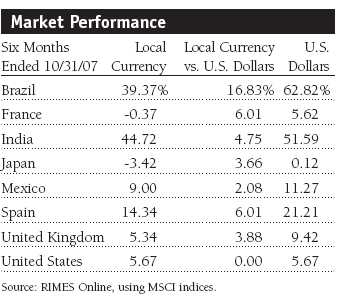
The Federal Reserve cut interest rates twice during the past six months in an effort to keep the U.S. economy from stalling, but the continuing weakness of the U.S. dollar led to resurgent commodities prices, with oil soaring close to $100 per barrel. U.S. equities registered respectable gains, with tech companies performing well after encouraging earnings releases from key companies in the sector. Returns in Europe were generally good, led by the telecom and utilities sectors, but Japan continued to lag as political stagnation and concerns about deflation restrained consumer spending. Emerging markets again delivered outstanding returns, with both the Chinese and Indian stock markets up more than 15% measured in local currencies, and even more in U.S. dollar terms.
Portfolio Performance and Strategy
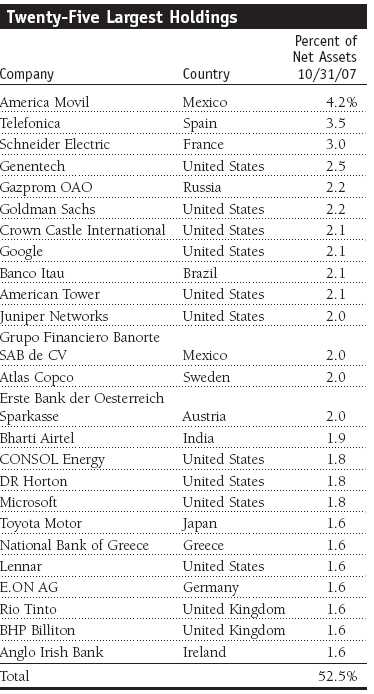
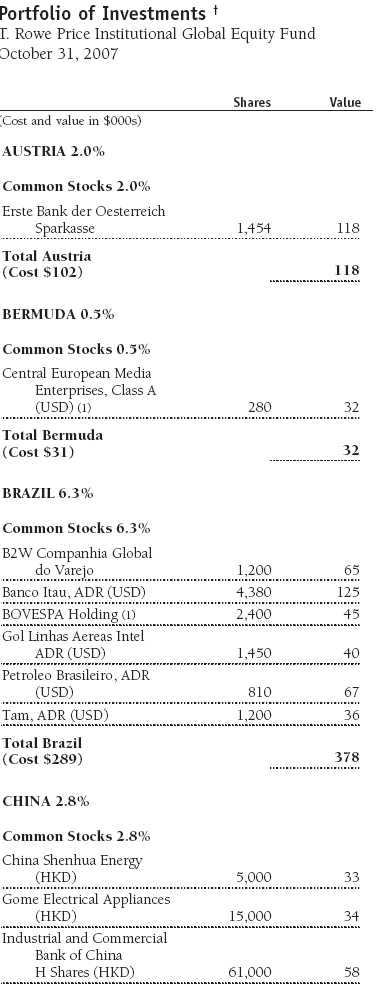
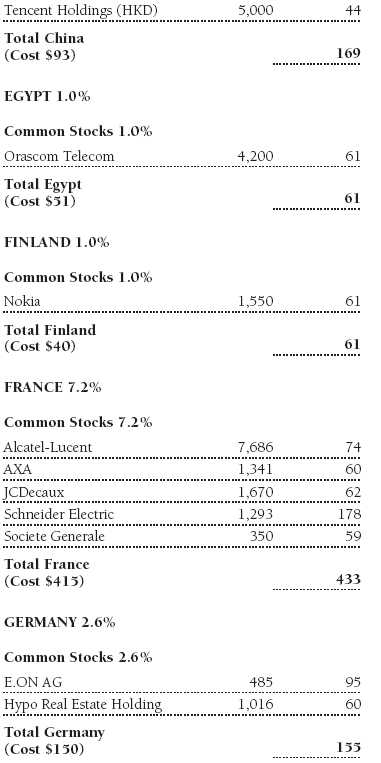
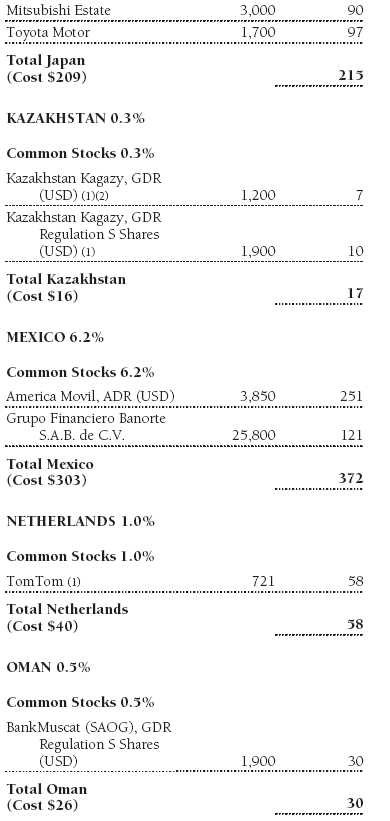
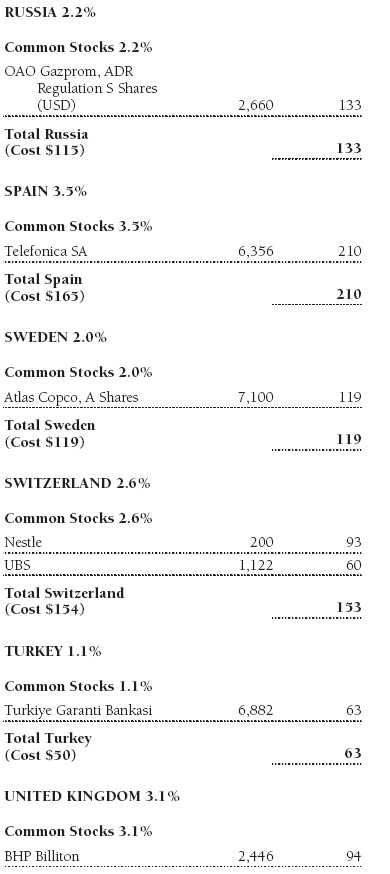
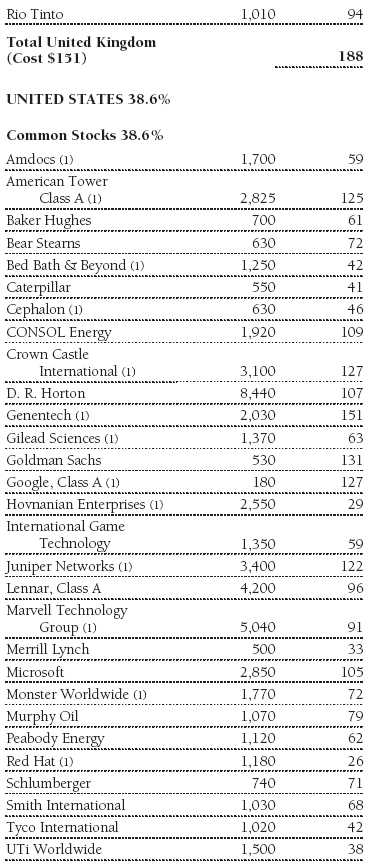
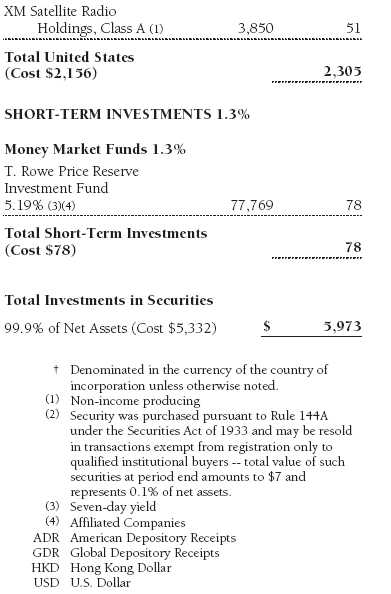
Stock selection added nearly all of the value versus the benchmarks during the period. Within information technology, Juniper Networks led the way thanks to its lineup of strong new products and earnings, which beat consensus estimates. The company announced a stock buyback program, which added to the stock’s appeal. Our energy stock selection was also strong. China Shenhua Energy benefited from rising coal prices in Asia and an upgrade in its stock exchange listing. Telecom stock selection likewise aided relative results as Spain’s Telefonica SA enjoyed good revenue growth and earnings margin expansion from its Latin American operations. (Please refer to the fund’s portfolio of investments for a detailed list of holdings and the amount each represents of the portfolio.)
Despite the sector’s weak showing overall, our financials stocks contributed handsomely as Banco Itau delivered good results against the backdrop of the robust Brazilian market. The Brazilian economy is strong, largely due to interest rates that are at their lowest level in years. The portfolio’s materials holdings benefited results, a notable example being Taiwan’s Formosa Plastic, which received news that competitors on the Chinese mainland are less likely to pose serious competition.
Regionally, our overweight allocation to emerging markets and an underweighting in Japan were positive for fund results. On a negative note, an underweight position in the materials sector and stock selection within the consumer discretionary sector hampered relative results. Among stocks that did not deliver for us during the period were U.S. homebuilders DR Horton and Hovnanian Enterprises and French industrial stock Schneider Electric, one of our major holdings. Schneider was punished when the company’s CEO expressed negative sentiments about the U.S. market.
During the period, we added to Schneider, a leader in the field of electrical equipment distribution. The company has exposure to the European construction industry at a time when the macroeconomic background looks attractive. We also added to Telefonica, the Spanish fixed-line operator with a stable collection of businesses. The company benefits from good management, and the stock trades at a substantial discount to its peers. In addition, we bought more DR Horton, since we think the intermediate-term housing fundamentals are much healthier than consensus. The company has strong management and low-cost leadership, along with a compelling stock valuation.
One of our major sales was Wynn Resorts. The company has seen a surge in gaming supply, property expansions, and new openings. These changes and the government’s visa restrictions appear to be having a negative impact on business. We also sold Romania’s BRD-Groupe Societe Generale on strength when the company delivered good results despite branch expansion, and insurer Aetna, after the company announced higher-than-expected medical costs. The company actually exceeded earnings estimates and was a victim of investor overreaction in the marketplace, in our view.
Regarding our portfolio positioning going forward, we have primarily preferred banks in emerging markets that are enjoying strong loan growth resulting from burgeoning consumer and commercial demand and government deregulation, which is making mortgages and consumer loans more widely available in many markets. These banks have been largely immune to the credit crisis that has plagued major U.S. and Western European banks in recent months. We remain optimistic about these holdings and have added to some of them on weakness.
We believe there will be more bad news and write-downs from major U.S. and European banks, which makes us cautious about their near-term prospects. That said, stocks have corrected significantly, and valuations are reaching appealing levels. We are selectively looking for value during this period of turmoil and are focusing on businesses with strong long-term earnings potential and leading market positions. In this context, we have added to some capital markets companies, such as Merrill Lynch and Bear Stearns. We continue to own Goldman Sachs and UBS but have reduced our exposure to insurance companies.
As always, we are making adjustments to take advantage of opportunities created by financial market turmoil and to further limit the portfolio’s risks. These steps include maintaining our positions in emerging markets banks, selectively adding to leading capital markets companies, and buying emerging markets stock exchange companies benefiting from heightened transaction volumes and new listings. On the whole, we have increased our exposure to the financials sector, but the mix of investments has shifted. Our financials positions should be seen in the broader context of our view that the global economy is slowing. Within this context, we are inclined to own financials that will continue to benefit from superior emerging markets growth, and we will patiently sift through developed market opportunities that enjoy leading market positions and offer compelling value.

Investment Outlook
Equity valuations remain attractive when compared with the pace of international economic expansion. We believe corporate profit and free cash flow margins can maintain their current levels for some time, even though they are close to secular highs. Inflationary pressures remain the main threat to profit margins, but any weakness in U.S. consumer spending caused by the slumping housing market could prove useful in dampening the global economy enough so that it does not overheat.
In Europe, the rate of economic growth has slowed somewhat from its dynamic pace. Structural change and merger-and-acquisition activity continue to spur stock prices, but this activity is moderating. In Japan, a disappointing electoral result for Prime Minister Abe roiled the markets, but business confidence remains strong. Concerns have surfaced about Japan’s ability to stay the course with its economic reforms, but there does not seem to be an immediate threat to the conditions that have propelled the nation’s six years of recovery. Exports have been driving the economy and are less dependent on the U.S. economy. However, further strengthening of the yen could have a negative impact.
As mentioned, we expect emerging markets to remain relatively unscathed by problems in the developed financial markets, since they are better positioned now than in the past to stand on their own. The prosperity generated by their strong economic growth has fostered the positive developments associated with a growing middle class, such as greater purchasing power and demand for credit and real estate. While we expect continued positive returns, however, it is unlikely that emerging markets will maintain the rate of advance seen in the last few years.
Respectfully submitted,

Robert N. Gensler
Chairman of the fund’s Investment Advisory Committee
November 16, 2007
The committee chairman has day-to-day responsibility for managing the portfolio and works with committee members in developing and executing the fund’s investment program.
| Risks of International Investing |
Funds that invest overseas generally carry more risk than funds that invest strictly in U.S. assets. Funds investing in a single country or in a limited geographic region tend to be riskier than more diversified funds. Risks can result from varying stages of economic and political development; differing regulatory environments, trading days, and accounting standards; and higher transaction costs of non-U.S. markets. Non-U.S. investments are also subject to currency risk, or a decline in the value of a foreign currency versus the U.S. dollar, which reduces the dollar value of securities denominated in that currency.
| Glossary |
Gross domestic product (GDP): The total market value of all goods and services produced in a country in a given year.
Lipper averages: The averages of available mutual fund performance returns for specified periods in defined categories as tracked by Lipper Inc.
MSCI All Country World Index: A capitalization-weighted index of stocks from developed and emerging markets worldwide.
Price/earnings (P/E) ratio: Calculated by dividing a stock’s market value per share by the company’s earnings per share for the past 12 months or by expected earnings for the coming year.
Portfolio Highlights
Performance and Expenses
| Performance Comparison |
This chart shows the value of a hypothetical $1 million investment in the fund over the past 10 fiscal year periods or since inception (for funds lacking 10-year records). The result is compared with benchmarks, which may include a broad-based market index and a peer group average or index. Market indexes do not include expenses, which are deducted from fund returns as well as mutual fund averages and indexes.
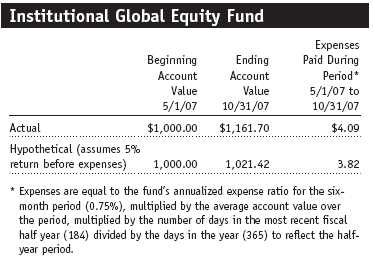
Fund Expense Example
As a mutual fund shareholder, you may incur two types of costs: (1) transaction costs, such as redemption fees or sales loads, and (2) ongoing costs, including management fees, distribution and service (12b-1) fees, and other fund expenses. The following example is intended to help you understand your ongoing costs (in dollars) of investing in the fund and to compare these costs with the ongoing costs of investing in other mutual funds. The example is based on an investment of $1,000 invested at the beginning of the most recent six-month period and held for the entire period.
Actual Expenses
The first line of the following table (“Actual”) provides information about actual account values and actual expenses. You may use the information in this line, together with your account balance, to estimate the expenses that you paid over the period. Simply divide your account value by $1,000 (for example, an $8,600 account value divided by $1,000 = 8.6), then multiply the result by the number in the first line under the heading “Expenses Paid During Period” to estimate the expenses you paid on your account during this period.
Hypothetical Example for Comparison Purposes
The information on the second line of the table (“Hypothetical”) is based on hypothetical account values and expenses derived from the fund’s actual expense ratio and an assumed 5% per year rate of return before expenses (not the fund’s actual return). You may compare the ongoing costs of investing in the fund with other funds by contrasting this 5% hypothetical example and the 5% hypothetical examples that appear in the shareholder reports of the other funds. The hypothetical account values and expenses may not be used to estimate the actual ending account balance or expenses you paid for the period.
You should also be aware that the expenses shown in the table highlight only your ongoing costs and do not reflect any transaction costs, such as redemption fees or sales loads. Therefore, the second line of the table is useful in comparing ongoing costs only and will not help you determine the relative total costs of owning different funds. To the extent a fund charges transaction costs, however, the total cost of owning that fund is higher.
The accompanying notes are an integral part of these financial statements.
The accompanying notes are an integral part of these financial statements.
The accompanying notes are an integral part of these financial statements.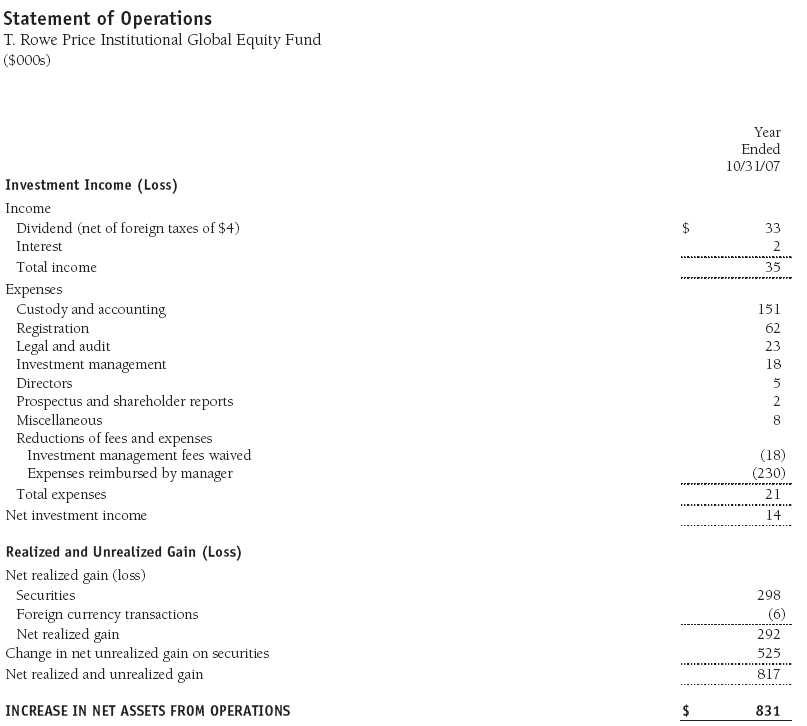
The accompanying notes are an integral part of these financial statements.
The accompanying notes are an integral part of these financial statements.
Notes to Financial Statements
NOTE 1 - SIGNIFICANT ACCOUNTING POLICIES
T. Rowe Price Institutional International Funds, Inc. (the corporation), is registered under the Investment Company Act of 1940 (the 1940 Act). The Institutional Global Equity Fund (the fund), a diversified, open-end management investment company, is one portfolio established by the corporation. The fund commenced operations on June 30, 2006. The fund seeks long-term growth of capital through investments primarily in the common stocks of established companies throughout the world, including the U.S.
The accompanying financial statements were prepared in accordance with accounting principles generally accepted in the United States of America, which require the use of estimates made by fund management. Fund management believes that estimates and security valuations are appropriate; however, actual results may differ from those estimates, and the security valuations reflected in the financial statements may differ from the value the fund ultimately realizes upon sale of the securities.
Valuation The fund values its investments and computes its net asset value per share at the close of the New York Stock Exchange (NYSE), normally 4 p.m. ET, each day that the NYSE is open for business. Equity securities listed or regularly traded on a securities exchange or in the over-the-counter (OTC) market are valued at the last quoted sale price or, for certain markets, the official closing price at the time the valuations are made, except for OTC Bulletin Board securities, which are valued at the mean of the latest bid and asked prices. A security that is listed or traded on more than one exchange is valued at the quotation on the exchange determined to be the primary market for such security. Listed securities not traded on a particular day are valued at the mean of the latest bid and asked prices for domestic securities and the last quoted sale price for international securities.
Debt securities with original maturities of less than one year are valued at amortized cost in local currency, which approximates fair value when combined with accrued interest.
Investments in mutual funds are valued at the mutual fund’s closing net asset value per share on the day of valuation.
Other investments, including restricted securities, and those for which the above valuation procedures are inappropriate or are deemed not to reflect fair value are stated at fair value as determined in good faith by the T. Rowe Price Valuation Committee, established by the fund’s Board of Directors.
Most foreign markets close before the close of trading on the NYSE. If the fund determines that developments between the close of a foreign market and the close of the NYSE will, in its judgment, materially affect the value of some or all of its portfolio securities, which in turn will affect the fund’s share price, the fund will adjust the previous closing prices to reflect the fair value of the securities as of the close of the NYSE, as determined in good faith by the T. Rowe Price Valuation Committee, established by the fund’s Board of Directors. A fund may also fair value securities in other situations, such as when a particular foreign market is closed but the fund is open. In deciding whether to make fair value adjustments, the fund reviews a variety of factors, including developments in foreign markets, the performance of U.S. securities markets, and the performance of instruments trading in U.S. markets that represent foreign securities and baskets of foreign securities. The fund uses outside pricing services to provide it with closing market prices and information used for adjusting those prices. The fund cannot predict when and how often it will use closing prices and when it will adjust those prices to reflect fair value. As a means of evaluating its fair value process, the fund routinely compares closing market prices, the next day’s opening prices in the same markets, and adjusted prices.
Currency Translation Assets, including investments, and liabilities denominated in foreign currencies are translated into U.S. dollar values each day at the prevailing exchange rate, using the mean of the bid and asked prices of such currencies against U.S. dollars as quoted by a major bank. Purchases and sales of securities, income, and expenses are translated into U.S. dollars at the prevailing exchange rate on the date of the transaction. The effect of changes in foreign currency exchange rates on realized and unrealized security gains and losses is reflected as a component of security gains and losses.
Credits The fund earns credits on temporarily uninvested cash balances at the custodian that reduce the fund’s custody charges. Custody expense in the accompanying financial statements is presented before reduction for credits.
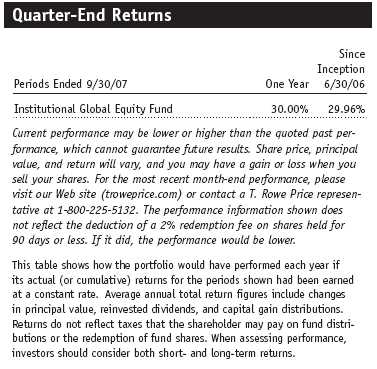
Redemption Fees A 2% fee is assessed on redemptions of fund shares held for 90 days or less to deter short-term trading and to protect the interests of long-term shareholders. Redemption fees are withheld from proceeds that shareholders receive from the sale or exchange of fund shares. The fees are paid to the fund, and are recorded as an increase to paid-in capital. The fees may cause the redemption price per share to differ from the net asset value per share.
Investment Transactions, Investment Income, and Distributions Income and expenses are recorded on the accrual basis. Premiums and discount on debt securities are amortized for financial reporting purposes. Dividends received from mutual fund investments are reflected as dividend income; capital gain distributions are reflected as realized gain/loss. Dividend income and capital gain distributions are recorded on the ex-dividend date. Income tax-related interest and penalties, if incurred, would be recorded as income tax expense. Investment transactions are accounted for on the trade date. Realized gains and losses are reported on the identified cost basis. Distributions to shareholders are recorded on the ex-dividend date. Income distributions are declared and paid on an annual basis. Capital gain distributions, if any, are declared and paid by the fund, typically on an annual basis.
New Accounting Pronouncements In June 2006, the Financial Accounting Standards Board (FASB) issued FASB Interpretation No. 48 (FIN 48), Accounting for Uncertainty in Income Taxes, a clarification of FASB Statement No. 109, Accounting for Income Taxes. FIN 48 establishes financial reporting rules regarding recognition and measurement of tax positions taken or expected to be taken on a tax return. No impact on the fund’s net assets or results of operations is expected upon adoption of FIN 48 on November 1, 2007.
In September 2006, the FASB released the Statement of Financial Accounting Standard No. 157 (FAS 157), Fair Value Measurements. FAS 157 clarifies the definition of fair value and establishes the framework for measuring fair value, as well as proper disclosure of this methodology in the financial statements. It will be effective for the fund’s fiscal year beginning November 1, 2008. Management is evaluating the effects of FAS 157; however, it is not expected to have a material impact on the fund’s net assets or results of operations.
NOTE 2 - INVESTMENT TRANSACTIONS
Consistent with its investment objective, the fund engages in the following practices to manage exposure to certain risks or to enhance performance. The investment objective, policies, program, and risk factors of the fund are described more fully in the fund’s prospectus and Statement of Additional Information.
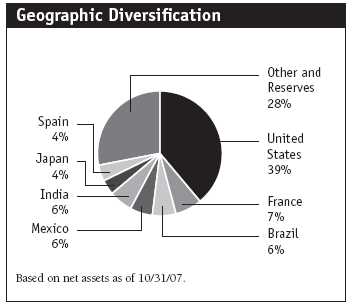
Emerging Markets At October 31, 2007, approximately 27% of the fund’s net assets were invested in securities of companies located in emerging markets or denominated in or linked to the currencies of emerging market countries. Future economic or political developments could adversely affect the liquidity or value, or both, of such securities.
Restricted Securities The fund may invest in securities that are subject to legal or contractual restrictions on resale. Although certain of these securities may be readily sold, for example, under Rule 144A, others may be illiquid, their sale may involve substantial delays and additional costs, and prompt sale at an acceptable price may be difficult.
Other Purchases and sales of portfolio securities, other than short-term securities, aggregated $6,637,000 and $3,671,000, respectively, for the year ended October 31, 2007.
NOTE 3 - FEDERAL INCOME TAXES
No provision for federal income taxes is required since the fund intends to continue to qualify as a regulated investment company under Subchapter M of the Internal Revenue Code and distribute to shareholders all of its taxable income and gains. Federal income tax regulations differ from generally accepted accounting principles; therefore, distributions determined in accordance with tax regulations may differ significantly in amount or character from net investment income and realized gains for financial reporting purposes. Financial reporting records are adjusted for permanent book/tax differences to reflect tax character. Financial records are not adjusted for temporary differences.
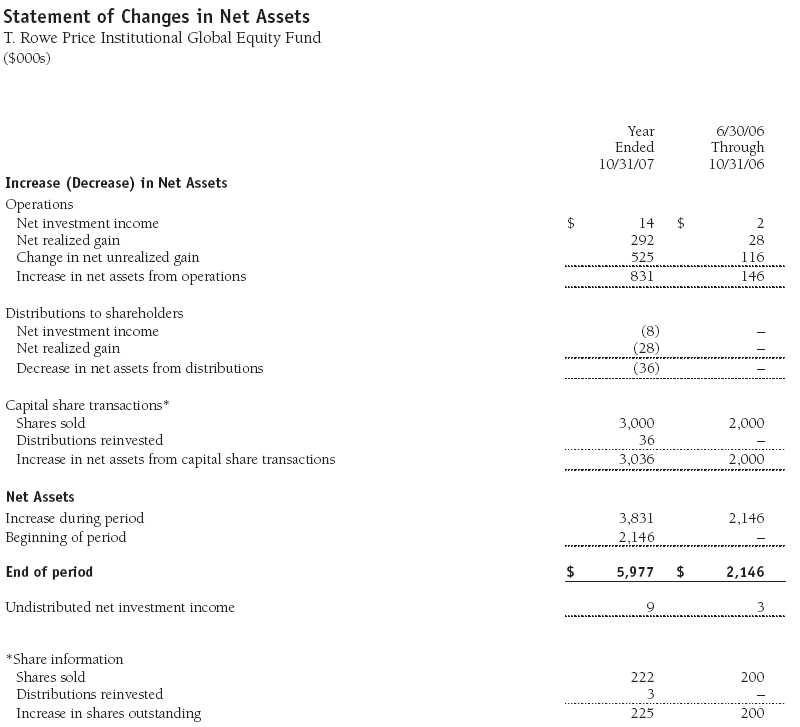
Distributions during the year ended October 31, 2007, totaled $36,000 and were characterized as ordinary income for tax purposes. At October 31, 2007, the tax-basis components of net assets were as follows:
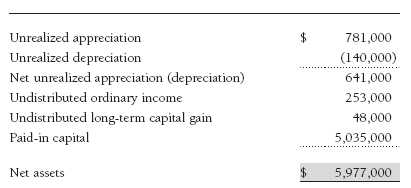
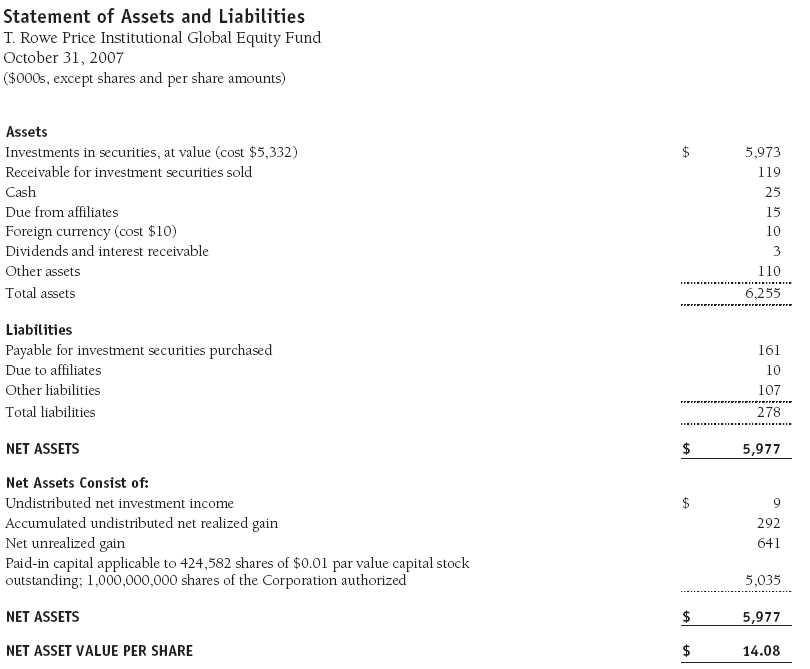
At October 31, 2007, the cost of investments for federal income tax purposes was $5,332,000.
NOTE 4 - FOREIGN TAXES
The fund is subject to foreign income taxes imposed by certain countries in which it invests. Additionally, capital gains realized by the fund upon disposition of securities issued in or by certain foreign countries are subject to capital gains tax imposed by those countries. Similarly, a tax on net profits, including interest income and realized and unrealized capital gains, is imposed by certain other countries. All taxes are computed in accordance with the applicable foreign tax law, and, to the extent permitted, capital losses are used to offset capital gains. Tax expense attributable to income is accrued by the fund as a reduction of income. Current and deferred tax expense attributable to net capital gains is reflected as a component of realized and/or change in unrealized gain/loss on securities in the accompanying financial statements. At October 31, 2007, the fund had no deferred tax liabilities or foreign capital loss carryforwards attributable to foreign securities.
NOTE 5 - RELATED PARTY TRANSACTIONS
The fund is managed by T. Rowe Price International, Inc. (the manager), a wholly owned subsidiary of T. Rowe Price Associates, Inc. (Price Associates), which is wholly owned by T. Rowe Price Group, Inc. The investment management agreement between the fund and the manager provides for an annual investment management fee equal to 0.65% of the fund’s average daily net assets. The fee is computed daily and paid monthly.
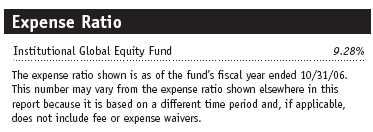
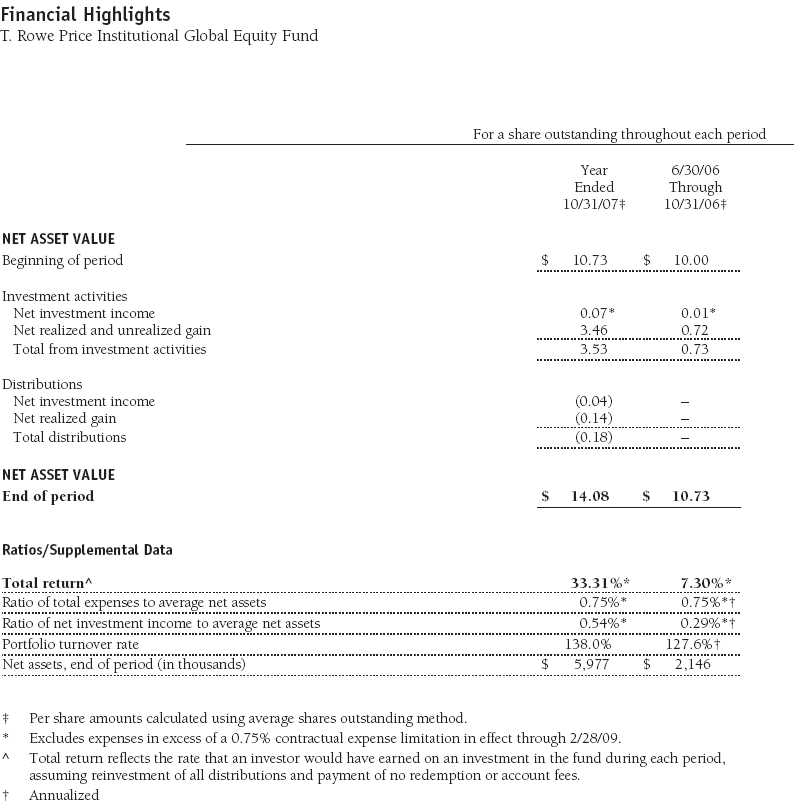
The fund is also subject to a contractual expense limitation through February 28, 2009. During the limitation period, the manager is required to waive its management fee and reimburse the fund for any expenses, excluding interest, taxes, brokerage commissions, and extraordinary expenses, that would otherwise cause the fund’s ratio of annualized total expenses to average net assets (expense ratio) to exceed its expense limitation of 0.75%. For a period of three years after the date of any reimbursement or waiver, the fund is required to repay the manager for expenses previously reimbursed and management fees waived to the extent its net assets have grown or expenses have declined sufficiently to allow repayment without causing the fund’s expense ratio to exceed its expense limitation. Pursuant to this agreement, management fees in the amount of $18,000 were waived and expenses in the amount of $230,000 were reimbursed by the manager during the year ended Octobe r 31, 2007. Including these amounts, management fees waived and expenses previously reimbursed by the manager in the amount of $306,000 remain subject to repayment at October 31, 2007.
In addition, the fund has entered into service agreements with Price Associates and a wholly owned subsidiary of Price Associates (collectively, Price). Price Associates computes the daily share price and provides certain other administrative services to the fund. T. Rowe Price Services, Inc., provides shareholder and administrative services in its capacity as the fund’s transfer and dividend disbursing agent. For the year ended October 31, 2007, expenses incurred pursuant to these service agreements were $118,000 for Price Associates and $0 for T. Rowe Price Services, Inc. The total amount payable at period-end pursuant to these service agreements is reflected as Due to Affiliates in the accompanying financial statements.
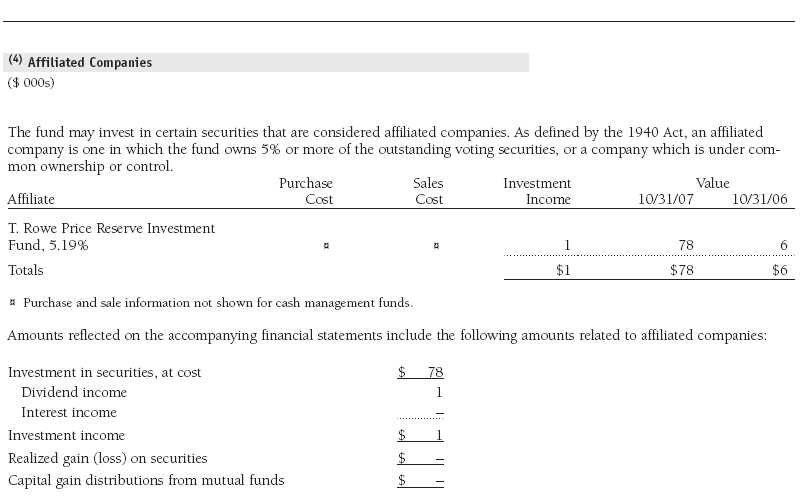
The fund may invest in the T. Rowe Price Reserve Investment Fund and the T. Rowe Price Government Reserve Investment Fund (collectively, the T. Rowe Price Reserve Investment Funds), open-end management investment companies managed by Price Associates and affiliates of the fund. The T. Rowe Price Reserve Investment Funds are offered as cash management options to mutual funds, trusts, and other accounts managed by Price Associates and/or its affiliates, and are not available for direct purchase by members of the public. The T. Rowe Price Reserve Investment Funds pay no investment management fees.
As of October 31, 2007, T. Rowe Price Group, Inc., and/or its wholly owned subsidiaries owned 203,180 shares of the fund, representing 48% of the fund’s net assets.
Report of Independent Registered Public Accounting Firm
To the Board of Directors of T. Rowe Price Institutional International Funds, Inc.
and Shareholders of T. Rowe Price Institutional Global Equity Fund
In our opinion, the accompanying statement of assets and liabilities, including the portfolio of investments, and the related statements of operations and of changes in net assets and the financial highlights present fairly, in all material respects, the financial position of T. Rowe Price Institutional Global Equity Fund (one of the portfolios comprising T. Rowe Price Institutional International Funds, Inc., hereafter referred to as the “Fund”) at October 31, 2007, and the results of its operations for the year then ended, the changes in its net assets and the financial highlights for each of the fiscal periods presented, in conformity with accounting principles generally accepted in the United States of America. The financial statements and financial highlights (hereafter referred to as the “financial statements”) are the responsibility of the Fund’s management; our responsibility is to express an opinion on these financial statements based on our audit. We conducted our audit of these financial statements in accordance with the auditing standards of the Public Company Accounting Oversight Board (United States). Those standards require that we plan and perform the audit to obtain reasonable assurance about whether the financial statements are free of material misstatement. An audit includes examining, on a test basis, evidence supporting the amounts and disclosures in the financial statements, assessing the accounting principles used and significant estimates made by management, and evaluating the overall financial statement presentation. We believe that our audit, which included confirmation of securities at October 31, 2007, by correspondence with the custodian and by agreement to the underlying ownership records for T. Rowe Price Reserve Investment Fund, provides a reasonable basis for our opinion.
PricewaterhouseCoopers LLP
Baltimore, Maryland
December 12, 2007
| Tax Information (Unaudited) for the Tax Year Ended 10/31/07 |
We are providing this information as required by the Internal Revenue Code. The amounts shown may differ from those elsewhere in this report because of differences between tax and financial reporting requirements.
The fund’s distributions to shareholders included $28,000 from short-term capital gains.
For taxable non-corporate shareholders, $33,000 of the fund’s income represents qualified dividend income subject to the 15% rate category.
For corporate shareholders, $5,000 of the fund’s income qualifies for the dividends-received deduction.
The fund will pass through foreign source income of $29,000 and foreign taxes paid of $4,000.
| Information on Proxy Voting Policies, Procedures, and Records |
A description of the policies and procedures used by T. Rowe Price funds and portfolios to determine how to vote proxies relating to portfolio securities is available in each fund’s Statement of Additional Information, which you may request by calling 1-800-225-5132 or by accessing the SEC’s Web site, www.sec.gov. The description of our proxy voting policies and procedures is also available on our Web site, www.troweprice.com. To access it, click on the words “Company Info” at the top of our homepage for individual investors. Then, in the window that appears, click on the “Proxy Voting Policy” navigation button in the top left corner.
Each fund’s most recent annual proxy voting record is available on our Web site and through the SEC’s Web site. To access it through our Web site, follow the directions above, then click on the words “Proxy Voting Record” at the bottom of the Proxy Voting Policy page.
| How to Obtain Quarterly Portfolio Holdings |
The fund files a complete schedule of portfolio holdings with the Securities and Exchange Commission for the first and third quarters of each fiscal year on Form N-Q. The fund’s Form N-Q is available electronically on the SEC’s Web site (www.sec.gov); hard copies may be reviewed and copied at the SEC’s Public Reference Room, 450 Fifth St. N.W., Washington, DC 20549. For more information on the Public Reference Room, call 1-800-SEC-0330.
| About the Fund’s Directors and Officers |
Your fund is governed by a Board of Directors (Board) that meets regularly to review a wide variety of matters affecting the fund, including performance, investment programs, compliance matters, advisory fees and expenses, service providers, and other business affairs. The Board elects the fund’s officers, who are listed in the final table. At least 75% of Board members are independent of T. Rowe Price Associates, Inc. (T. Rowe Price), and T. Rowe Price International, Inc. (T. Rowe Price International); “inside” or “interested” directors are employees or officers of T. Rowe Price. The business address of each director and officer is 100 East Pratt Street, Baltimore, Maryland 21202. The Statement of Additional Information includes additional information about the fund directors and is available without charge by calling a T. Rowe Price representative at 1-800-225-5132.
| Independent Directors | |
| Name (Year of Birth) | |
| Year Elected* | Principal Occupation(s) During Past 5 Years and Directorships of Other Public Companies |
| Jeremiah E. Casey (1940) | Director, National Life Insurance (2001 to 2005); Director, The Rouse Company, real estate developers (1990 to |
| 2006 | 2004); Director, Allfirst Financial Inc. (previously First Maryland Bancorp) (1983 to 2002) |
| Anthony W. Deering (1945) | Chairman, Exeter Capital, LLC, a private investment firm (2004 to present); Director, Vornado Real Estate Investment |
| 1991 | Trust (3/04 to present); Member, Advisory Board, Deutsche Bank North America (2004 to present); Director, Chairman |
| of the Board, and Chief Executive Officer, The Rouse Company, real estate developers (1997 to 2004) | |
| Donald W. Dick, Jr. (1943) | Principal, EuroCapital Advisors, LLC, an acquisition and management advisory firm; Chairman, The Haven Group, a |
| 1989 | custom manufacturer of modular homes (1/04 to present) |
| David K. Fagin (1938) | Chairman and President, Nye Corporation (6/88 to present); Chairman, Canyon Resources Corp. (8/07 to present); |
| 2001 | Director, Golden Star Resources Ltd. (5/92 to present); Director, Pacific Rim Mining Corp. (2/02 to present) |
| Karen N. Horn (1943) | Director, Federal National Mortgage Association (9/06 to present); Managing Director and President, Global Private |
| 2003 | Client Services, Marsh Inc. (1999 to 2003); Director, Georgia Pacific (5/04 to 12/05), Eli Lilly and Company, and |
| Simon Property Group | |
| Theo C. Rodgers (1941) | President, A&R Development Corporation (1977 to present) |
| 2006 | |
| John G. Schreiber (1946) | Owner/President, Centaur Capital Partners, Inc., a real estate investment company; Partner, Blackstone Real Estate |
| 2001 | Advisors, L.P. |
| *Each independent director oversees 121 T. Rowe Price portfolios and serves until retirement, resignation, or election of a successor. |
| Inside Directors | |
| Name (Year of Birth) | |
| Year Elected* [Number of | |
| T. Rowe Price Portfolios | |
| Overseen] | Principal Occupation(s) During Past 5 Years and Directorships of Other Public Companies |
| Edward C. Bernard (1956) | Director and Vice President, T. Rowe Price; Vice Chairman of the Board, Director, and Vice President, T. Rowe Price |
| 2006 [121] | Group, Inc.; Chairman of the Board, Director, and President, T. Rowe Price Investment Services, Inc.; Chairman of |
| the Board and Director, T. Rowe Price Global Asset Management Limited, T. Rowe Price Global Investment Services | |
| Limited, T. Rowe Price Retirement Plan Services, Inc., T. Rowe Price Savings Bank, and T. Rowe Price Services, Inc.; | |
| Director, T. Rowe Price International, Inc.; Chief Executive Officer, Chairman of the Board, Director, and President, | |
| T. Rowe Price Trust Company; Chairman of the Board, all funds | |
| Brian C. Rogers, CFA, CIC (1955) | Chief Investment Officer, Director, and Vice President, T. Rowe Price; Chairman of the Board, Chief Investment Officer, |
| 2006 [68] | Director, and Vice President, T. Rowe Price Group, Inc.; Vice President, T. Rowe Price Trust Company |
| *Each inside director serves until retirement, resignation, or election of a successor. |
| Officers | |
| Name (Date of Birth) | |
| Title and Fund(s) Served | Principal Occupation(s) |
| Christopher D. Alderson (1962) | Vice President, T. Rowe Price Group, Inc., and T. Rowe Price |
| Vice President, Institutional International Funds | International, Inc. |
| R. Scott Berg (1972) | Vice President, T. Rowe Price and T. Rowe Price Group, Inc. |
| Vice President, Institutional International Funds | |
| Mark C.J. Bickford-Smith (1962) | Vice President, T. Rowe Price Group, Inc., and T. Rowe Price |
| Vice President, Institutional International Funds | International, Inc. |
| Joseph A. Carrier, CPA (1960) | Vice President, T. Rowe Price, T. Rowe Price Group, Inc., T. Rowe Price |
| Treasurer, Institutional International Funds | Investment Services, Inc., and T. Rowe Price Trust Company |
| Michael J. Conelius, CFA (1964) | Vice President, T. Rowe Price, T. Rowe Price Group, Inc., and T. Rowe Price |
| Vice President, Institutional International Funds | International, Inc. |
| Roger L. Fiery III, CPA (1959) | Vice President, T. Rowe Price, T. Rowe Price Group, Inc., T. Rowe Price |
| Vice President, Institutional International Funds | International, Inc., and T. Rowe Price Trust Company |
| Robert N. Gensler (1957) | Vice President, T. Rowe Price, T. Rowe Price Group, Inc., and T. Rowe Price |
| Vice President, Institutional International Funds | International, Inc. |
| John R. Gilner (1961) | Chief Compliance Officer and Vice President, T. Rowe Price; Vice President, |
| Chief Compliance Officer, Institutional International Funds | T. Rowe Price Group, Inc., and T. Rowe Price Investment Services, Inc. |
| Gregory S. Golczewski (1966) | Vice President, T. Rowe Price and T. Rowe Price Trust Company |
| Vice President, Institutional International Funds | |
| M. Campbell Gunn (1956) | Vice President, T. Rowe Price Global Investment Services Limited, |
| Vice President, Institutional International Funds | T. Rowe Price Group, Inc., and T. Rowe Price International, Inc. |
| Henry H. Hopkins (1942) | Director and Vice President, T. Rowe Price Investment Services, Inc., |
| Vice President, Institutional International Funds | T. Rowe Price Services, Inc., and T. Rowe Price Trust Company; Vice |
| President, T. Rowe Price, T. Rowe Price Group, Inc., T. Rowe Price | |
| International, Inc., and T. Rowe Price Retirement Plan Services, Inc. | |
| Ian D. Kelson (1956) | Vice President, T. Rowe Price, T. Rowe Price Group, Inc., and T. Rowe Price |
| Vice President, Institutional International Funds | International, Inc. |
| Patricia B. Lippert (1953) | Assistant Vice President, T. Rowe Price and T. Rowe Price Investment |
| Secretary, Institutional International Funds | Services, Inc. |
| R. Todd Ruppert (1956) | Chief Executive Officer, Director, and President, T. Rowe Price Global Asset |
| Vice President, Institutional International Funds | Management Limited and T. Rowe Price Global Investment Services |
| Limited; Vice President, T. Rowe Price, T. Rowe Price Group, Inc., T. Rowe | |
| Price Retirement Plan Services, Inc., and T. Rowe Price Trust Company | |
| Robert W. Smith (1961) | Vice President, T. Rowe Price, T. Rowe Price Group, Inc., and T. Rowe Price |
| Executive Vice President, Institutional International Funds | Trust Company |
| Dean Tenerelli (1964) | Vice President, T. Rowe Price Group, Inc., and T. Rowe Price |
| Vice President, Institutional International Funds | International, Inc. |
| Julie L. Waples (1970) | Vice President, T. Rowe Price |
| Vice President, Institutional International Funds | |
| David J.L. Warren (1957) | Director, T. Rowe Price, T. Rowe Price Global Asset Management Limited, |
| President, Institutional International Funds | and T. Rowe Price Global Investment Services Limited; Vice President, |
| T. Rowe Price Group, Inc.; Chief Executive Officer, Director, and President, | |
| T. Rowe Price International, Inc. | |
| William F. Wendler II, CFA (1962) | Vice President, T. Rowe Price and T. Rowe Price Group, Inc. |
| Vice President, Institutional International Funds | |
| Edward A. Wiesez, CFA (1959) | Vice President, T. Rowe Price, T. Rowe Price Group, Inc., and T. Rowe Price |
| Vice President, Institutional International Funds | Trust Company; Chief Investment Officer, Director, and Vice President, |
| T. Rowe Price Savings Bank | |
Unless otherwise noted, officers have been employees of T. Rowe Price or T. Rowe Price International for at least five years.
Item 2. Code of Ethics.
The registrant has adopted a code of ethics, as defined in Item 2 of Form N-CSR, applicable to its principal executive officer, principal financial officer, principal accounting officer or controller, or persons performing similar functions. A copy of this code of ethics is filed as an exhibit to this Form N-CSR. No substantive amendments were approved or waivers were granted to this code of ethics during the period covered by this report.
Item 3. Audit Committee Financial Expert.
The registrant’s Board of Directors/Trustees has determined that Ms. Karen N. Horn qualifies as an audit committee financial expert, as defined in Item 3 of Form N-CSR. Ms. Horn is considered independent for purposes of Item 3 of Form N-CSR.
Item 4. Principal Accountant Fees and Services.
(a) – (d) Aggregate fees billed to the registrant for the last two fiscal years for professional services rendered by the registrant’s principal accountant were as follows:
Audit fees include amounts related to the audit of the registrant’s annual financial statements and services normally provided by the accountant in connection with statutory and regulatory filings. Audit-related fees include amounts reasonably related to the performance of the audit of the registrant’s financial statements and specifically include the issuance of a report on internal controls and, if applicable, agreed-upon procedures related to fund acquisitions. Tax fees include amounts related to services for tax compliance, tax planning, and tax advice. The nature of these services specifically includes the review of distribution calculations and the preparation of Federal, state, and excise tax returns. All other fees include the registrant’s pro-rata share of amounts for agreed-upon procedures in conjunction with service contract approvals by the registrant’s Board of Directors/Trustees.
(e)(1) The registrant’s audit committee has adopted a policy whereby audit and non-audit services performed by the registrant’s principal accountant for the registrant, its investment adviser, and any entity controlling, controlled by, or under common control with the investment adviser that provides ongoing services to the registrant require pre-approval in advance at regularly scheduled audit committee meetings. If such a service is required between regularly scheduled audit committee meetings, pre-approval may be authorized by one audit committee member with ratification at the next scheduled audit committee meeting. Waiver of pre-approval for audit or non-audit services requiring fees of a de minimis amount is not permitted.
(2) No services included in (b) – (d) above were approved pursuant to paragraph (c)(7)(i)(C) of Rule 2-01 of Regulation S-X.
(f) Less than 50 percent of the hours expended on the principal accountant’s engagement to audit the registrant’s financial statements for the most recent fiscal year were attributed to work performed by persons other than the principal accountant’s full-time, permanent employees.
(g) The aggregate fees billed for the most recent fiscal year and the preceding fiscal year by the registrant’s principal accountant for non-audit services rendered to the registrant, its investment adviser, and any entity controlling, controlled by, or under common control with the investment adviser that provides ongoing services to the registrant were $1,531,000 and $1,200,000, respectively, and were less than the aggregate fees billed for those same periods by the registrant’s principal accountant for audit services rendered to the T. Rowe Price Funds.
(h) All non-audit services rendered in (g) above were pre-approved by the registrant’s audit committee. Accordingly, these services were considered by the registrant’s audit committee in maintaining the principal accountant’s independence.
Item 5. Audit Committee of Listed Registrants.
Not applicable.
Item 6. Schedule of Investments.
Not applicable. The complete schedule of investments is included in Item 1 of this Form N-CSR.
Item 7. Disclosure of Proxy Voting Policies and Procedures for Closed-End Management Investment Companies.
Not applicable.
Item 8. Portfolio Managers of Closed-End Management Investment Companies.
Not applicable.
Item 9. Purchases of Equity Securities by Closed-End Management Investment Company and Affiliated Purchasers.
Not applicable.
Item 10. Submission of Matters to a Vote of Security Holders.
Not applicable.
Item 11. Controls and Procedures.
(a) The registrant’s principal executive officer and principal financial officer have evaluated the registrant’s disclosure controls and procedures within 90 days of this filing and have concluded that the registrant’s disclosure controls and procedures were effective, as of that date, in ensuring that information required to be disclosed by the registrant in this Form N-CSR was recorded, processed, summarized, and reported timely.
(b) The registrant’s principal executive officer and principal financial officer are aware of no change in the registrant’s internal control over financial reporting that occurred during the registrant’s second fiscal quarter covered by this report that has materially affected, or is reasonably likely to materially affect, the registrant’s internal control over financial reporting.
Item 12. Exhibits.
(a)(1) The registrant’s code of ethics pursuant to Item 2 of Form N-CSR is attached.
(2) Separate certifications by the registrant's principal executive officer and principal financial officer, pursuant to Section 302 of the Sarbanes-Oxley Act of 2002 and required by Rule 30a-2(a) under the Investment Company Act of 1940, are attached.
(3) Written solicitation to repurchase securities issued by closed-end companies: not applicable.
(b) A certification by the registrant's principal executive officer and principal financial officer, pursuant to Section 906 of the Sarbanes-Oxley Act of 2002 and required by Rule 30a-2(b) under the Investment Company Act of 1940, is attached.
SIGNATURES | |
| Pursuant to the requirements of the Securities Exchange Act of 1934 and the Investment | |
| Company Act of 1940, the registrant has duly caused this report to be signed on its behalf by the | |
| undersigned, thereunto duly authorized. | |
| T. Rowe Price Institutional International Funds, Inc. | |
| By | /s/ Edward C. Bernard |
| Edward C. Bernard | |
| Principal Executive Officer | |
| Date | December 18, 2007 |
| Pursuant to the requirements of the Securities Exchange Act of 1934 and the Investment | |
| Company Act of 1940, this report has been signed below by the following persons on behalf of | |
| the registrant and in the capacities and on the dates indicated. | |
| By | /s/ Edward C. Bernard |
| Edward C. Bernard | |
| Principal Executive Officer | |
| Date | December 18, 2007 |
| By | /s/ Joseph A. Carrier |
| Joseph A. Carrier | |
| Principal Financial Officer | |
| Date | December 18, 2007 |